Sanofi-aventis Form 20-F 2008
320
UNITED STATES SECURITIES AND EXCHANGE COMMISSION Washington, D.C. 20549 FORM 20-F (Mark One) ‘ REGISTRATION STATEMENT PURSUANT TO SECTION 12(b) OR (g) OF THE SECURITIES EXCHANGE ACT OF 1934 OR È ANNUAL REPORT PURSUANT TO SECTION 13 OR 15(d) OF THE SECURITIES EXCHANGE ACT OF 1934 For the fiscal year ended December 31, 2008 OR ‘ TRANSITION REPORT PURSUANT TO SECTION 13 OR 15(d) OF THE SECURITIES EXCHANGE ACT OF 1934 OR ‘ SHELL COMPANY REPORT PURSUANT TO SECTION 13 OR 15(d) OF THE SECURITIES EXCHANGE ACT OF 1934 Date of event requiring this shell company report .................... For the transition period from to Commission File Number: 001-31368 Sanofi-Aventis (Exact name of registrant as specified in its charter) N/A (Translation of registrant’s name into English) France (Jurisdiction of incorporation or organization) 174, avenue de France, 75013 Paris, France (Address of principal executive offices) Karen Linehan, General Counsel. 174, avenue de France, 75013 Paris, France. Fax: 011 + 33 1 53 77 43 03 (Name, Telephone, E-mail and/or Facsimile number and Address of Company Contact Person) Securities registered or to be registered pursuant to Section 12(b) of the Act: Title of each class: Name of each exchange on which registered: American Depositary Shares, each representing one half of one ordinary share, par value €2 per share New York Stock Exchange Ordinary shares, par value €2 per share New York Stock Exchange (for listing purposes only) Securities registered pursuant to Section 12(g) of the Act: American Depositary Shares, each representing one quarter of a Participating Share Series A, par value €70.89 per share (removed from listing and registration on the New York Stock Exchange effective July 31, 1995). The number of outstanding shares of each of the issuer’s classes of capital or common stock as of December 31, 2008 was: Ordinary shares: 1,315,525,463 Indicate by check mark if the registrant is a well-known seasoned issuer, as defined in Rule 405 of the Securities Act. YES È NO ‘. If this report is an annual or transition report, indicate by check mark if the registrant is not required to file reports pursuant to Section 13 or 15(d) of the Securities Exchange Act of 1934. YES ‘ NO È. Note — Checking the box above will not relieve any registrant required to file reports pursuant to Section 13 or 15(d) of the Securities Exchange Act of 1934 from their obligations under those Sections. Indicate by check mark whether the registrant (1) has filed all reports required to be filed by Section 13 or 15(d) of the Securities Exchange Act of 1934 during the preceding 12 months (or for such shorter period that the registrant was required to file such reports), and (2) has been subject to such filing requirements for the past 90 days. Yes È No ‘ Indicate by check mark whether the registrant is a large accelerated filer, an accelerated filer, or a non-accelerated filer. See definition of “accelerated filer and large accelerated filer” in Rule 12b-2 of the Exchange Act. (Check one): Large accelerated filer È Accelerated filer ‘ Non-accelerated filer ‘ Indicate by check mark which basis of accounting the registrant has used to prepare the financial statements included in this filing: U.S. GAAP ‘ International Financial Reporting Standards as issued by the International Accounting Standards Board È Other ‘ If “Other” has been checked in response to the previous question, indicate by check mark which financial statement item the registrant has elected to follow. Item 17 ‘ Item 18 ‘ If this is an annual report, indicate by check mark whether the registrant is a shell company (as defined in Rule 12b-2 of the Exchange Act). YES ‘ NO È.
-
Upload
khangminh22 -
Category
Documents
-
view
1 -
download
0
Transcript of Sanofi-aventis Form 20-F 2008
UNITED STATESSECURITIES AND EXCHANGE COMMISSION
Washington, D.C. 20549
FORM 20-F(Mark One)
‘ REGISTRATION STATEMENT PURSUANT TO SECTION 12(b) OR (g) OF THE SECURITIES EXCHANGE ACT OF 1934OR
È ANNUAL REPORT PURSUANT TO SECTION 13 OR 15(d) OF THE SECURITIES EXCHANGE ACT OF 1934For the fiscal year ended December 31, 2008
OR‘ TRANSITION REPORT PURSUANT TO SECTION 13 OR 15(d) OF THE SECURITIES EXCHANGE ACT OF 1934
OR‘ SHELL COMPANY REPORT PURSUANT TO SECTION 13 OR 15(d) OF THE SECURITIES EXCHANGE ACT OF 1934
Date of event requiring this shell company report . . . . . . . . . . . . . . . . . . . .For the transition period from to
Commission File Number: 001-31368
Sanofi-Aventis(Exact name of registrant as specified in its charter)
N/A(Translation of registrant’s name into English)
France(Jurisdiction of incorporation or organization)174, avenue de France, 75013 Paris, France
(Address of principal executive offices)
Karen Linehan, General Counsel. 174, avenue de France, 75013 Paris, France. Fax: 011 + 33 1 53 77 43 03(Name, Telephone, E-mail and/or Facsimile number and Address of Company Contact Person)
Securities registered or to be registered pursuant to Section 12(b) of the Act:
Title of each class:Name of each exchange
on which registered:American Depositary Shares, each
representing one half of one ordinary share, parvalue €2 per share
New York Stock Exchange
Ordinary shares, par value €2 per share New York Stock Exchange(for listing purposes only)
Securities registered pursuant to Section 12(g) of the Act:American Depositary Shares, each representing one quarter of a Participating Share Series A, par value €70.89 per share (removed from listingand registration on the New York Stock Exchange effective July 31, 1995).
The number of outstanding shares of each of the issuer’s classes of capital orcommon stock as of December 31, 2008 was:
Ordinary shares: 1,315,525,463Indicate by check mark if the registrant is a well-known seasoned issuer, as defined in Rule 405
of the Securities Act.YES È NO ‘.
If this report is an annual or transition report, indicate by check mark if the registrant is notrequired to file reports pursuant to Section 13 or 15(d) of the Securities Exchange Act of 1934.
YES ‘ NO È.Note — Checking the box above will not relieve any registrant required to file reports pursuant to Section 13 or 15(d) of the Securities ExchangeAct of 1934 from their obligations under those Sections.Indicate by check mark whether the registrant (1) has filed all reports required to be filed by Section 13 or 15(d) of the SecuritiesExchange Act of 1934 during the preceding 12 months (or for such shorter period that the registrant was required to file such reports),and (2) has been subject to such filing requirements for the past 90 days.
Yes È No ‘
Indicate by check mark whether the registrant is a large accelerated filer, an accelerated filer, or a non-accelerated filer. See definitionof “accelerated filer and large accelerated filer” in Rule 12b-2 of the Exchange Act. (Check one):
Large accelerated filer È Accelerated filer ‘ Non-accelerated filer ‘
Indicate by check mark which basis of accounting the registrant has used to prepare the financial statements included in this filing:U.S. GAAP ‘ International Financial Reporting Standards as issued by the International Accounting Standards Board È Other ‘
If “Other” has been checked in response to the previous question, indicate by check mark which financial statement item the registranthas elected to follow.
Item 17 ‘ Item 18 ‘
If this is an annual report, indicate by check mark whether the registrant is a shell company (as defined in Rule 12b-2 of the Exchange Act).YES ‘ NO È.


PRESENTATION OF FINANCIAL AND OTHER INFORMATION
The consolidated financial statements contained in this annual report on Form 20-F have been prepared inaccordance with International Financial Reporting Standards (IFRS) as issued by the International AccountingStandards Board (IASB) and with IFRS as adopted by the European Union, as of December 31, 2008.
Unless the context requires otherwise, the terms “sanofi-aventis,” the “Company,” the “Group,” “we,” “our”or “us” refer to sanofi-aventis and our consolidated subsidiaries.
All references herein to “United States” or “U.S.” are to the United States of America, references to“dollars” or “$” are to the currency of the United States, references to “France” are to the Republic of France,and references to “euro” and “€” are to the currency of the European Union member states (including France)participating in the European Monetary Union.
Brand names appearing in this annual report are trademarks of sanofi-aventis and/or its affiliates, with theexception of:
— trademarks used or that may be or have been used under license by sanofi-aventis and /or its affiliates,such as Actonel®, Actonelcombi®, Optinate® and Acrel®, trademarks of Procter & GamblePharmaceuticals, Copaxone®, a trademark of Teva Pharmaceutical Industries, Exubera®, a trademarkof Pfizer Products Inc., Mutagrip®, a trademark of Institut Pasteur, TroVax®, a trademark of OxfordBioMedica, Gardasil® and Rotateq®, trademarks of Merck & Co., Inc., Herceptin®, a trademark ofGenentech, NanoCrystal®, a trademark of Elan Pharmaceuticals, Xyzal®, a trademark of UCB;
— trademarks sold by sanofi-aventis and/or its affiliates to a third party, such as Altace®, a trademark ofKing Pharmaceuticals in the United States, Arixtra® and Fraxiparine®, trademarks ofGlaxoSmithKline, StarLink®, Liberty Link® and Liberty® trademarks of Bayer AG, Sabril®, atrademark of Ovation Pharmaceuticals in the United States; and
— other third party trademarks such as Cipro® in the United States and Aspirin®, trademarks of BayerAG, Ivomec® , Eprinex®, Frontline®, Heartgard®, Vaxxitek®, Circovac® and Zactran™, trademarks ofMerial and Hexavac®, Repevax® and Revaxis® trademarks of Sanofi Pasteur MSD.
The data relative to market shares and ranking information presented in “Item 4. Information on theCompany — B. Business Overview — Markets — Marketing and distribution” is based on sales data from IMSHealth MIDAS (IMS), retail and hospital, for calendar year 2008, in constant euros (unless otherwise indicated).
While we believe that the IMS sales data we present below are generally useful comparative indicators forour industry, they may not precisely match the sales figures published by the companies that sell the products(including our company and other pharmaceutical companies). In particular, the rules used by IMS to attributethe sales of a product covered by an alliance or license agreement do not always exactly match the rules of theagreement.
In order to allow a reconciliation with our basis of consolidation as defined in “Item 5. Operating andFinancial Review and Prospects — Presentation of Net Sales,” IMS data shown in the present document havebeen adjusted and include:
(i) sales as published by IMS excluding sales generated by the vaccines business, equating to the scope ofour pharmaceutical operations;
(ii) adjustments to data for Germany, to reflect the significant impact of parallel imports;
(iii) IMS sales of products sold under alliance or license agreements which we recognize in ourconsolidated net sales but which are not attributed to us in the reports published by IMS; and
(iv) adjustments related to the exclusion of IMS sales for products which we do not recognize in ourconsolidated net sales but which are attributed to us by IMS.
Data relative to market shares and ranking information presented herein for our vaccines business is based oninternal estimates unless stated otherwise.
Product indications described in this annual report are composite summaries of the major indicationsapproved in the product’s principal markets. Not all indications are necessarily available in each of the markets inwhich the products are approved. The summaries presented herein for the purpose of financial reporting do notsubstitute for careful consideration of the full labeling approved in each market.
CAUTIONARY STATEMENT REGARDING FORWARD-LOOKING STATEMENTS
This annual report contains forward-looking statements. We may also make written or oral forward-lookingstatements in our periodic reports to the Securities and Exchange Commission on Form 6-K, in our annual reportto shareholders, in our proxy statements, in our offering circulars and prospectuses, in press releases and otherwritten materials and in oral statements made by our officers, directors or employees to third parties. Examplesof such forward-looking statements include:
• projections of operating revenues, net income, adjusted net income, earnings per share, adjustedearnings per share, capital expenditures, positive or negative synergies, dividends, capital structure orother financial items or ratios;
• statements of our plans, objectives or goals, including those relating to products, clinical trials,regulatory approvals and competition;
• statements about our future economic performance or that of France, the United States or any othercountries in which we operate; and
• statements of assumptions underlying such statements.
Words such as “believe,” “anticipate,” “plan,” “expect,” “intend,” “target,” “estimate,” “project,” “predict,”“forecast,” “guideline,” “should” and similar expressions are intended to identify forward-looking statements butare not the exclusive means of identifying such statements.
Forward-looking statements involve inherent risks and uncertainties. We caution you that a number ofimportant factors could cause actual results to differ materially from those contained in any forward-lookingstatements. Such factors, some of which are discussed under “Item 3. Key Information — D. Risk Factors”below, include but are not limited to:
• approval of generic versions of our products in one or more of their major markets;
• our ability to renew our product portfolio;
• the increasingly challenging regulatory environment for the pharmaceutical industry;
• uncertainties over the pricing and reimbursement of pharmaceutical products;
• fluctuations in currency exchange rates; and
• slowdown of global economic growth.
We caution you that the foregoing list of factors is not exclusive and that other risks and uncertainties maycause actual results to differ materially from those in forward-looking statements.
Forward-looking statements speak only as of the date they are made. Other than required by law, we do notundertake any obligation to update them in light of new information or future developments.

TABLE OF CONTENTS
Part IItem 1. Identity of Directors, Senior Management and Advisers . . . . . . . . . . . . . . . . . . . . . . . . . . . 1Item 2. Offer Statistics and Expected Timetable . . . . . . . . . . . . . . . . . . . . . . . . . . . . . . . . . . . . . . . . 1Item 3. Key Information . . . . . . . . . . . . . . . . . . . . . . . . . . . . . . . . . . . . . . . . . . . . . . . . . . . . . . . . . . 1
A. Selected Financial Data . . . . . . . . . . . . . . . . . . . . . . . . . . . . . . . . . . . . . . . . . . . . . . . . . . 1B. Capitalization and Indebtedness . . . . . . . . . . . . . . . . . . . . . . . . . . . . . . . . . . . . . . . . . . . . 3C. Reasons for Offer and Use of Proceeds . . . . . . . . . . . . . . . . . . . . . . . . . . . . . . . . . . . . . . 3D. Risk Factors . . . . . . . . . . . . . . . . . . . . . . . . . . . . . . . . . . . . . . . . . . . . . . . . . . . . . . . . . . . 3
Item 4. Information on the Company . . . . . . . . . . . . . . . . . . . . . . . . . . . . . . . . . . . . . . . . . . . . . . . . 13A. History and Development of the Company . . . . . . . . . . . . . . . . . . . . . . . . . . . . . . . . . . . 14B. Business Overview . . . . . . . . . . . . . . . . . . . . . . . . . . . . . . . . . . . . . . . . . . . . . . . . . . . . . . 15C. Organizational Structure . . . . . . . . . . . . . . . . . . . . . . . . . . . . . . . . . . . . . . . . . . . . . . . . . . 66D. Property, Plant and Equipment . . . . . . . . . . . . . . . . . . . . . . . . . . . . . . . . . . . . . . . . . . . . . 66
Item 4A. Unresolved Staff Comments . . . . . . . . . . . . . . . . . . . . . . . . . . . . . . . . . . . . . . . . . . . . . . . . 68Item 5. Operating and Financial Review and Prospects . . . . . . . . . . . . . . . . . . . . . . . . . . . . . . . . . . 68Item 6. Directors, Senior Management and Employees . . . . . . . . . . . . . . . . . . . . . . . . . . . . . . . . . . 105
A. Directors and Senior Management . . . . . . . . . . . . . . . . . . . . . . . . . . . . . . . . . . . . . . . . . . 105B. Compensation . . . . . . . . . . . . . . . . . . . . . . . . . . . . . . . . . . . . . . . . . . . . . . . . . . . . . . . . . . 116C. Board Practices . . . . . . . . . . . . . . . . . . . . . . . . . . . . . . . . . . . . . . . . . . . . . . . . . . . . . . . . . 124D. Employees . . . . . . . . . . . . . . . . . . . . . . . . . . . . . . . . . . . . . . . . . . . . . . . . . . . . . . . . . . . . 128E. Share Ownership . . . . . . . . . . . . . . . . . . . . . . . . . . . . . . . . . . . . . . . . . . . . . . . . . . . . . . . . 130
Item 7. Major Shareholders and Related Party Transactions . . . . . . . . . . . . . . . . . . . . . . . . . . . . . . 134A. Major Shareholders . . . . . . . . . . . . . . . . . . . . . . . . . . . . . . . . . . . . . . . . . . . . . . . . . . . . . 134B. Related Party Transactions . . . . . . . . . . . . . . . . . . . . . . . . . . . . . . . . . . . . . . . . . . . . . . . . 135C. Interests of Experts and Counsel . . . . . . . . . . . . . . . . . . . . . . . . . . . . . . . . . . . . . . . . . . . 135
Item 8. Financial Information . . . . . . . . . . . . . . . . . . . . . . . . . . . . . . . . . . . . . . . . . . . . . . . . . . . . . . 136A. Consolidated Financial Statements and Other Financial Information . . . . . . . . . . . . . . . 136B. Significant Changes . . . . . . . . . . . . . . . . . . . . . . . . . . . . . . . . . . . . . . . . . . . . . . . . . . . . . 137
Item 9. The Offer and Listing . . . . . . . . . . . . . . . . . . . . . . . . . . . . . . . . . . . . . . . . . . . . . . . . . . . . . .A. Offer and Listing Details . . . . . . . . . . . . . . . . . . . . . . . . . . . . . . . . . . . . . . . . . . . . . . . . .B. Plan of Distribution . . . . . . . . . . . . . . . . . . . . . . . . . . . . . . . . . . . . . . . . . . . . . . . . . . . . .
137137138
C. Markets . . . . . . . . . . . . . . . . . . . . . . . . . . . . . . . . . . . . . . . . . . . . . . . . . . . . . . . . . . . . . . . 138D. Selling Shareholders . . . . . . . . . . . . . . . . . . . . . . . . . . . . . . . . . . . . . . . . . . . . . . . . . . . . .E. Dilution . . . . . . . . . . . . . . . . . . . . . . . . . . . . . . . . . . . . . . . . . . . . . . . . . . . . . . . . . . . . . . .
140140
Item 10.F. Expenses of the Issue . . . . . . . . . . . . . . . . . . . . . . . . . . . . . . . . . . . . . . . . . . . . . . . . . . . .Additional Information . . . . . . . . . . . . . . . . . . . . . . . . . . . . . . . . . . . . . . . . . . . . . . . . . . . . .
140141
A. Share Capital . . . . . . . . . . . . . . . . . . . . . . . . . . . . . . . . . . . . . . . . . . . . . . . . . . . . . . . . . .B. Memorandum and Articles of Association . . . . . . . . . . . . . . . . . . . . . . . . . . . . . . . . . . . .
141141
C. Material Contracts . . . . . . . . . . . . . . . . . . . . . . . . . . . . . . . . . . . . . . . . . . . . . . . . . . . . . . 155D. Exchange Controls . . . . . . . . . . . . . . . . . . . . . . . . . . . . . . . . . . . . . . . . . . . . . . . . . . . . . .E. Taxation . . . . . . . . . . . . . . . . . . . . . . . . . . . . . . . . . . . . . . . . . . . . . . . . . . . . . . . . . . . . . .
155155
Item 11.
F. Dividends and Paying Agents . . . . . . . . . . . . . . . . . . . . . . . . . . . . . . . . . . . . . . . . . . . . . .G. Statement by Experts . . . . . . . . . . . . . . . . . . . . . . . . . . . . . . . . . . . . . . . . . . . . . . . . . . . .H. Documents on Display . . . . . . . . . . . . . . . . . . . . . . . . . . . . . . . . . . . . . . . . . . . . . . . . . . .I. Subsidiary Information . . . . . . . . . . . . . . . . . . . . . . . . . . . . . . . . . . . . . . . . . . . . . . . . . . .Quantitative and Qualitative Disclosures about Market Risk . . . . . . . . . . . . . . . . . . . . . . . .
161161162162162
Item 12. Description of Securities other than Equity Securities . . . . . . . . . . . . . . . . . . . . . . . . . . . . . 166Part II
Item 13. Defaults, Dividend Arrearages and Delinquencies . . . . . . . . . . . . . . . . . . . . . . . . . . . . . . . . 167Item 14. Material Modifications to the Rights of Security Holders . . . . . . . . . . . . . . . . . . . . . . . . . . 167Item 15. Controls and Procedures . . . . . . . . . . . . . . . . . . . . . . . . . . . . . . . . . . . . . . . . . . . . . . . . . . . . 167Item 16. [Reserved] . . . . . . . . . . . . . . . . . . . . . . . . . . . . . . . . . . . . . . . . . . . . . . . . . . . . . . . . . . . . . . . 167Item 16A. Audit Committee Financial Expert . . . . . . . . . . . . . . . . . . . . . . . . . . . . . . . . . . . . . . . . . . . . 167Item 16B. Code of Ethics . . . . . . . . . . . . . . . . . . . . . . . . . . . . . . . . . . . . . . . . . . . . . . . . . . . . . . . . . . . . 168Item 16C. Principal Accountants’ Fees and Services . . . . . . . . . . . . . . . . . . . . . . . . . . . . . . . . . . . . . . 168Item 16D. Exemptions from the Listing Standards for Audit Committees . . . . . . . . . . . . . . . . . . . . . . 168Item 16E. Purchases of Equity Securities by the Issuer and Affiliated Purchasers . . . . . . . . . . . . . . . . 168Item 16F. Change in Registrant’s Certifying Accountant . . . . . . . . . . . . . . . . . . . . . . . . . . . . . . . . . . 168Item 16G. Corporate Governance . . . . . . . . . . . . . . . . . . . . . . . . . . . . . . . . . . . . . . . . . . . . . . . . . . . . . 168
Part IIIItem 17. Financial Statements . . . . . . . . . . . . . . . . . . . . . . . . . . . . . . . . . . . . . . . . . . . . . . . . . . . . . . . 170Item 18. Financial Statements . . . . . . . . . . . . . . . . . . . . . . . . . . . . . . . . . . . . . . . . . . . . . . . . . . . . . . . 170Item 19. Exhibits . . . . . . . . . . . . . . . . . . . . . . . . . . . . . . . . . . . . . . . . . . . . . . . . . . . . . . . . . . . . . . . . . 170


PART I
Item 1. Identity of Directors, Senior Management and Advisers
N/A
Item 2. Offer Statistics and Expected Timetable
N/A
Item 3. Key Information
A. Selected Financial Data
SUMMARY SELECTED FINANCIAL DATA
The tables below set forth selected consolidated financial data for sanofi-aventis. These financial data arederived from the sanofi-aventis consolidated financial statements. The sanofi-aventis consolidated financialstatements for the years ended December 31, 2008, 2007 and 2006 are included in Item 18 of this annual report.
The consolidated financial statements of sanofi-aventis for the years ended December 31, 2008, 2007 and2006 have been prepared in compliance with IFRS issued by the International Accounting Standards Board(IASB) and with IFRS adopted by the European Union. The term “IFRS” refers collectively to internationalaccounting and financial reporting standards (IAS and IFRS) and to interpretations of the interpretationscommittees (SIC and IFRIC). The opening balance sheet as of the IFRS transition date (January 1, 2004) and thecomparative financial statements for the year ended December 31, 2004 have been prepared in accordance withthe same principles.
Sanofi-aventis reports its financial results in euros.
1

SELECTED CONDENSED FINANCIAL INFORMATION
As of and for the year ended December 31,
(€ million, except per share data) 2008 2007 2006 2005 2004
IFRS Income statement dataNet sales . . . . . . . . . . . . . . . . . . . . . . . . . . . . . . . . . . . . . . . . . . 27,568 28,052 28,373 27,311 14,871Gross profit . . . . . . . . . . . . . . . . . . . . . . . . . . . . . . . . . . . . . . . . 21,480 21,636 21,902 20,947 11,294Operating income . . . . . . . . . . . . . . . . . . . . . . . . . . . . . . . . . . . 4,394 5,911 4,828 2,888 2,426Net income attributable to equity holders of the Company . . . 3,851 5,263 4,006 2,258 1,986Earnings per share: basic (€) (a) . . . . . . . . . . . . . . . . . . . . . . . . 2.94 3.91 2.97 1.69 2.18Earnings per share: diluted (€) (b) . . . . . . . . . . . . . . . . . . . . . . . 2.94 3.89 2.95 1.68 2.17
IFRS Balance sheet dataIntangible assets and goodwill . . . . . . . . . . . . . . . . . . . . . . . . . 43,423 46,381 52,210 60,463 61,567Total assets . . . . . . . . . . . . . . . . . . . . . . . . . . . . . . . . . . . . . . . . 71,987 71,914 77,763 86,945 85,557Outstanding share capital . . . . . . . . . . . . . . . . . . . . . . . . . . . . . 2,611 2,657 2,701 2,686 2,668Equity attributable to equity holders of the Company . . . . . . . 44,866 44,542 45,600 46,128 40,810Long term debt . . . . . . . . . . . . . . . . . . . . . . . . . . . . . . . . . . . . . 4,173 3,734 4,499 4,750 8,654
Cash dividend paid per share (€) (c) . . . . . . . . . . . . . . . . . . . . . 2.20(d) 2.07 1.75 1.52 1.20Cash dividend paid per share ($) (c)(e) . . . . . . . . . . . . . . . . . . . . 3.06(d) 3.02 2.31 1.80 1.62
(a) Based on the weighted average number of shares outstanding in each period used to compute basic earnings per share, equal to1,309.3 million shares in 2008, 1,346.9 million shares in 2007, 1,346.8 million shares in 2006, 1,336.5 million shares in 2005, and910.3 million shares in 2004.
(b) Based on the weighted average number of shares outstanding in each period used to compute diluted earnings per share, equal to1,310.9 million shares in 2008, 1,353.9 million shares in 2007, 1,358.8 million shares in 2006, 1,346.5 million shares in 2005, and914.8 million shares in 2004.
(c) Each American Depositary Share, or ADS, represents one half of one share.(d) Dividends for 2008 will be proposed for approval at the annual general meeting scheduled for April 17, 2009.(e) Based on the relevant year-end exchange rate.
2

EXCHANGE RATE INFORMATION
Exchange rate information
The following table sets forth, for the periods and dates indicated, certain information concerning theexchange rates for the euro from 2004 through February 2009 expressed in U.S. dollar per euro. The informationconcerning the U.S. dollar exchange rate is based on the noon buying rate in New York City for cable transfers inforeign currencies as certified for customs purposes by the Federal Reserve Bank of New York (the “NoonBuying Rate”). We provide the exchange rates below solely for your convenience. We do not represent that euroswere, could have been, or could be, converted into U.S. dollars at these rates or at any other rate. For informationregarding the effect of currency fluctuations on our results of operations, see “Item 5. Operating and FinancialReview and Prospects.”
Period- Averageend Rate Rate (1) High Low
(U.S. dollar per euro)
2004 . . . . . . . . . . . . . . . . . . . . . . . . . . . . . . . . . . . . . . . . . . . . . . . . . . . . . . . . . . . . 1.35 1.25 1.36 1.182005 . . . . . . . . . . . . . . . . . . . . . . . . . . . . . . . . . . . . . . . . . . . . . . . . . . . . . . . . . . . . 1.18 1.24 1.35 1.172006 . . . . . . . . . . . . . . . . . . . . . . . . . . . . . . . . . . . . . . . . . . . . . . . . . . . . . . . . . . . . 1.32 1.27 1.33 1.192007 . . . . . . . . . . . . . . . . . . . . . . . . . . . . . . . . . . . . . . . . . . . . . . . . . . . . . . . . . . . . 1.46 1.38 1.49 1.292008 . . . . . . . . . . . . . . . . . . . . . . . . . . . . . . . . . . . . . . . . . . . . . . . . . . . . . . . . . . . . 1.39 1.47 1.60 1.24Last 6 months2008
September . . . . . . . . . . . . . . . . . . . . . . . . . . . . . . . . . . . . . . . . . . . . . . . . . . . 1.41 1.43 1.47 1.39October . . . . . . . . . . . . . . . . . . . . . . . . . . . . . . . . . . . . . . . . . . . . . . . . . . . . . 1.27 1.33 1.41 1.24November . . . . . . . . . . . . . . . . . . . . . . . . . . . . . . . . . . . . . . . . . . . . . . . . . . . 1.27 1.27 1.3 1.25December . . . . . . . . . . . . . . . . . . . . . . . . . . . . . . . . . . . . . . . . . . . . . . . . . . . . 1.39 1.35 1.44 1.26
2009January . . . . . . . . . . . . . . . . . . . . . . . . . . . . . . . . . . . . . . . . . . . . . . . . . . . . . . 1.28 1.32 1.39 1.28February . . . . . . . . . . . . . . . . . . . . . . . . . . . . . . . . . . . . . . . . . . . . . . . . . . . . . 1.27 1.28 1.31 1.25
(1) The average of the Noon Buying Rates on the last business day of each month during the relevant period for year average, on eachbusiness day of the month for monthly average.
B. Capitalization and Indebtedness
N/A
C. Reasons for Offer and Use of Proceeds
N/A
D. Risk Factors
Important factors that could cause actual financial, business, research or operating results to differmaterially from expectations are disclosed in this annual report, including without limitation the following riskfactors and the factors described under “Cautionary Statement Regarding Forward-Looking Statements.” Inaddition to the risks listed below, we may be subject to other material risks that as of the date of this report arenot currently known to us or that we deem immaterial at this time.
3
Risks Relating to Legal Matters
Generic versions of some of our products may be approved for sale in one or more of their major markets.
Competitors may file marketing authorization requests for generic versions of some of our products.Approval and market entry of a generic product would reduce the price that we receive for these products and/orthe volume of the product that we would be able to sell, and could materially adversely affect our business,results of operations and financial condition. Our products could also be affected if a competitor’s innovativedrug were to become available as a generic. Additionally, a number of our products acquired through businesscombinations have substantial balance sheet carrying values, as disclosed at Note D.4. to our consolidatedfinancial statements, which could be substantially impaired by the introduction of a generic competitor, withadverse effects on our financial condition and assets.
Through patent and other proprietary rights, we hold exclusivity rights for a number of our research-basedproducts, and are involved in litigation worldwide to enforce these rights against generics and proposed generics.(See “Item 8. Financial Information — A. Consolidated Financial Statements and Other Financial Information —Information on Legal or Arbitration Proceedings” and Note D.22.b) to our consolidated financial statementsincluded in this annual report at Item 18 for additional information.) However, these rights are limited in timeand do not always provide effective protection for our products: competitors may successfully avoid our patentsthrough design innovation, we may not hold sufficient evidence of infringement to bring suit, or our infringementclaim may not result in a decision that our rights are valid, enforceable and infringed.
Moreover, even in cases where we do ultimately prevail in our infringement claim, legal remedies availablefor harm caused to us by infringing products may be inadequate to make us whole. A competitor may launch “atrisk” before the initiation or completion of the court proceedings, and the court may decline to grant us apreliminary injunction to halt further “at risk” sales and remove the infringing product from the market.Additionally, while we would be entitled to obtain damages in such a case, the amount that we may ultimately beawarded and able to collect may be insufficient to compensate all harm caused to us.
Finally, our successful assertion of a given patent against one competing product is not necessarilypredictive of our future success or failure in asserting the same patent — or a fortiori the corresponding foreignpatent — against a second competing product because of such factors as possible differences in the formulationsof the competing products, intervening developments in law or jurisprudence, local variations in the patents anddifferences in national patent law and legal systems.
A number of the Group’s products are already subject to aggressive generic competition (in particular, in theUnited States where legislative initiatives to further facilitate the introduction of generic drugs or comparablebiologic products through accelerated approval procedures may create further challenges) and additional productscould become subject to generic competition in the future. A few particularly significant products that may facethe risk of generic competition in a major market as early as 2009 are described below:
• Lovenox® may face generic competition in the United States following a decision by a U.S. court(upheld on appeal in May 2008) to the effect that our patent is unenforceable. While we have petitionedthe U.S. Supreme Court to hear this case, there can be no assurance that it will do so or that the U.S.Supreme Court’s ruling would change the outcome of this case. While we are not aware of any Foodand Drug Administration (FDA) decision to approve any of the related Abbreviated New DrugApplications (ANDAs) filed to date, there currently is no stay in effect against FDA approval.
• Plavix® (clopidogrel bisulfate) faces competition in Germany following a May 2008 decision by theGerman health authorities to approve a clopidogrel salt (clopidogrel besylate) different from the specificclopidogrel salt expressly claimed by our European patent. In addition, our data exclusivity protection inthe European Union expired in July 2008, and we believe that competitors have filed marketing requeststhroughout Europe, which may lead to generic competition in a number of markets.
• Ambien® CR may face generic competition in the United States following the expiration of dataprotection in March 2009. Several ANDAs have been filed in respect of different generic formulationsof this product, but we have only filed patent infringement suits to oppose certain of these.
4
• Eloxatine® may face generic competition in the United States following the expiration of data protection inFebruary 2008 and the submission of more than a dozen ANDAs relating to this product. While all ANDAfilers are currently subject to regulatory 30-month stays against FDA approval as a result of our pendingpatent litigation, if the court were to render an unfavorable decision (including on summary judgment) in2009, the regulatory stay would be lifted (the stay is currently expected to expire in August 2010).
Product liability claims could adversely affect our business, results of operations and financial condition.
Product liability is a significant business risk for us, particularly in the United States where product liabilityclaims can be particularly costly. Substantial damage awards have been made in certain jurisdictions againstpharmaceutical companies based upon claims for injuries allegedly caused by the use of their products. Not allpossible side effects of a drug can be anticipated based on preapproval clinical studies involving only severalhundred to several thousand patients. Routine review and analysis of the continually growing body of post-marketing safety surveillance and clinical trials provide additional information — for example, potentialevidence of rare, population-specific or long-term adverse reactions or of drug interactions that were notobserved in preapproval clinical studies — and may cause product labeling to evolve, restriction of therapeuticindications and potentially even the suspension or withdrawal of a product. Several pharmaceutical companieshave recalled or withdrawn products from the market because of actual or suspected adverse reactions to theirproducts, and currently face significant product liability claims. We are currently defending a number of productliability claims (see Note D.22.a) to the consolidated financial statements included at Item 18 of this annualreport and “Item 8. Financial Information — A. Consolidated Financial Statements and Other FinancialInformation — Information on Legal or Arbitration Proceedings”), and there can be no assurance that the Groupwill not face additional claims in the future.
Although we continue to insure part of our product liability, product liability coverage is increasinglydifficult and costly to obtain, and in the future it is possible that self-insurance may become the solecommercially reasonable means available for managing the product liability risk of our pharmaceutical andvaccines businesses. The availability of insurance capacity may also suffer from the possible effects of the globalfinancial crisis on insurers that remain active in this market. Moreover, given the long time span required toevaluate risks that have actually materialized, the insolvency of a carrier could negatively affect our ability toachieve the practical recovery of the coverage for which we have already paid a premium.
Product liability claims, regardless of their merits or the ultimate success of the Group’s defense, are costly,divert management attention and harm our reputation and demand for our products. Substantial product liabilityclaims, if successful, could adversely affect our business, results of operations and financial condition.
Claims and investigations relating to marketing practices and competition law could adversely affect ourbusiness, results of operations and financial condition.
The marketing of our products is heavily regulated, and alleged failures to comply fully with applicableregulations could subject us to substantial fines, penalties and injunctive or administrative remedies, potentiallyleading to the imposition of additional regulatory controls or exclusion from government reimbursementprograms. Sanofi-aventis and certain of its subsidiaries are under investigation by various government entitiesand are defending a number of lawsuits relating to antitrust and/or pricing and marketing practices, including, forexample, class action lawsuits and whistle blower litigation. See “Item 8. Financial Information — A.Consolidated Financial Statements and other Financial Information — Information on Legal or ArbitrationProceedings” and Note D.22.c) to our consolidated financial statements included at Item 18 of this annual report.
Because many of these cases allege substantial unquantified damages, may be subject to treble damages andfrequently seek significant punitive damages and penalties, it is possible that any final determination of liabilityor settlement of these claims or investigations could have a material adverse effect on our business, results ofoperations or financial condition.
There are other legal matters in which adverse outcomes or changes in law could have a material adverseeffect on our business, results of operations and financial condition.
The Group faces significant litigation and government investigations including litigation concerning productpricing, allegations of securities law violations, employment matters, patent and intellectual property disputes,
5
and consumer law claims. In a similar vein, in the United States, committees of the Senate and House ofRepresentatives are conducting a series of hearings concerning the FDA and the conditions under which anumber of products, including Ketek®, were approved.
Unfavorable outcomes in pending litigation matters or in future litigation could preclude thecommercialization of products, negatively affect the profitability of existing products and subject us tosubstantial fines, penalties and injunctive or administrative remedies, potentially leading to the imposition ofadditional regulatory controls or exclusion from government reimbursement programs. Any such result couldmaterially and adversely affect our results of operations, financial condition, or business. See “Item 8. FinancialInformation — A. Consolidated Financial Statements and other Financial Information — Information on Legalor Arbitration Proceedings” and Notes D.22.c) and D.22.d) to our consolidated financial statements included atItem 18 of this annual report.
In addition, changes in tax laws or in their application with respect to matters such as tax rates, transferpricing, dividends, controlled companies or a restriction in certain forms of tax relief, could affect our effectivetax rate and our future results.
Risks Relating to Our Business
We may fail to adequately renew our product portfolio whether through our own research anddevelopment or through the making of acquisitions or strategic alliances.
To be successful in the highly competitive pharmaceutical industry, we must commit substantial resourceseach year to research and development in order to develop new products to take the place of products facingexpiration of patent and regulatory data exclusivity. In 2008, we spent €4,575 million on research anddevelopment, amounting to approximately 16.6% of our net sales. See “Item 4. Information on the Company —B. Business Overview — Pharmaceutical Research & Development” and “— Vaccines Research andDevelopment”. There can be no assurance that any of these compounds will be proven safe or effective.
The research and development process typically takes from 10 to 15 years from discovery to commercialproduct launch. This process is conducted in various stages, and during each stage there is a substantial risk thatwe will not achieve our goals and will have to abandon a product in which we have invested substantial amountsincluding in late stage development (Phase III). Each regulatory authority may impose its own requirements inorder to grant a license to market the product, including requiring local clinical studies, and may delay or refuseto grant approval, even though a product has already been approved in another country. In addition, obtainingregulatory marketing approval is not a guarantee that the product will achieve commercial success.
The patent protection that we are able to obtain for our products may also prove unsatisfactory (whether interms of scope of coverage or expiration dates). Our ongoing investments in new product launches and researchand development for future products could therefore result in increased costs without a proportionate increase inrevenues.
As a complement to its portfolio of products in development, sanofi-aventis pursues a strategy ofacquisitions, in-licensing and partnerships. The implementation of this strategy depends on our ability to identifybusiness development opportunities at a reasonable cost and under acceptable conditions of financing. Because ofthe active competition among pharmaceutical groups for such business development opportunities, there can beno assurance of our success in completing these transactions when such opportunities are identified.
The regulatory environment is increasingly challenging for the pharmaceutical industry.
The pharmaceutical industry worldwide faces a changing regulatory environment and heightened publicscrutiny, which simultaneously require greater assurances than ever as to the safety and efficacy of medicationson the one hand, and effectively providing reduced incentives for innovative pharmaceutical research on theother hand.
Health authorities and notably the U.S. FDA have imposed increasingly burdensome requirements onpharmaceutical companies in terms of the volume of data needed to demonstrate a product’s efficacy and safety.
6
These requirements have reduced the number of products that get approved. Marketed products are also subjectto continual review even after regulatory approval. Later discovery of previously undetected problems may resultin marketing restrictions or the suspension or withdrawal of the product, as well as an increased risk of litigation.
At the same time, as it is becoming increasingly difficult to bring innovative products to market for thesereasons, government authorities are increasingly looking to facilitate generic competition to existing productsthrough proposals to change existing patent and data exclusivity rules in major markets and, in the United States,add accelerated generic approval procedures for large-molecule biologicals.
To the extent new regulations raise the costs of obtaining and maintaining product approval, or limit theeconomic value of a new product to its inventor, the growth prospects of our industry and of our Company arediminished.
The European Commission’s pharmaceutical sector inquiry may lead to significant legislative changes orother actions that adversely affect our business or results of operations.
On November 28, 2008, the European Commission’s Directorate General for Competition published apreliminary report relating to competition in the European pharmaceutical sector following an inquiry that beganin January 2008. In its report, the staff found that the number of novel medicines reaching the market hasdeclined in recent years, and alleged that certain practices in the pharmaceutical sector tend to delay the marketentry of less expensive generic medicines. As a result of this inquiry, in addition to possible actions againstindividual companies, the European Commission may decide to propose a number of significant revisions to thepharmaceutical industry’s regulatory environment in Europe, which may effectively further limit the marketexclusivity enjoyed by innovative products and thereby negatively affect our business and future results.
We face uncertainties over the pricing and reimbursement of pharmaceutical products.
The commercial success of our products depends in part on the conditions under which our products arereimbursed. Pressure on pricing and reimbursement is strong due to:
• price controls imposed by governments in many countries;
• removal of a number of drugs from government reimbursement schemes;
• increased difficulty in obtaining and maintaining satisfactory drug reimbursement rates; and
• the tendency of governments and private health care providers to favor generic pharmaceuticals.
In addition to the pricing pressures they exert, state and private third-party payers and purchasers ofpharmaceutical products may reduce volumes of sales by restricting access to formularies or otherwisediscouraging physician prescriptions of our products. Changes in the pricing environments in the United Statesmarket in particular could have a significant impact on our sales and results of operations. Risks in the UnitedStates include future revisions to health care reimbursement policies, possible cost control regulations, andpossible unfavorable developments in coverage of prescription drugs by Medicare. See “Item 4. Information onthe Company — B. Business Overview — Markets — Pricing & Reimbursement” for a description of certainregulatory pricing systems that affect our Group.
Our results may also be adversely affected by parallel imports, a practice by which traders exploit pricedifferentials among markets by purchasing in lower-priced markets for resale in higher-priced markets, especiallyin the European Union.
A slowdown of global economic growth could have negative consequences for our business.(1)
Over the past several years, growth of the global pharmaceutical market has become increasingly tied toglobal economic growth. In this context, a substantial and long lasting slowdown of the global economy or majornational economies such as the United States could negatively affect growth in the global pharmaceutical marketand, as a result, adversely affect our business. This effect may be expected to be particularly strong in marketshaving significant co-pays or lacking a developed third-party payer system, as individual patients may delay or
(1) Information in this section is complementary to Note B.8.8. to our consolidated financial statements included at Item 18 of this annualreport, with regards to information required by IFRS 7, and is covered by our independent registered public accounting firms’ report onthe consolidated financial statements.
7

decrease out-of-pocket healthcare expenditures. Such a slowdown could also reduce the sources of funding fornational social security systems, leading to heightened pressure on drug prices, increased substitution of genericdrugs, and the exclusion of certain products from formularies.
Additionally, to the extent the slowing economic environment may lead to financial difficulties or even thefailure of major players including wholesalers, the Group could experience disruptions in the distribution of itsproducts as well as the adverse effects described below at “— We are subject to the risk of non-payment by ourcustomers.”
We rely on third parties for the marketing of some of our products.
We market some of our products in collaboration with other pharmaceutical companies. For example, wecurrently have major collaborative arrangements with Bristol-Myers Squibb (BMS) for the marketing of Plavix®
and Aprovel® in the United States and several other countries, with Procter & Gamble Pharmaceuticals for theosteoporosis treatment Actonel®, with Teva for Copaxone®, and with Merck & Co., Inc. for the distribution ofvaccines in Europe. See “Item 4. Information on the Company — B. Business Overview — Markets —Alliances.” When we market our products through collaboration arrangements, we are subject to the risk thatcertain decisions, such as the establishment of budgets and promotion strategies, are subject to the control of ourcollaboration partners, and that deadlocks may adversely affect the activities conducted through the collaborationarrangements. For example, our alliances with BMS are subject to the operational management of BMS in somecountries, including the United States. We cannot be certain that our partners will perform their obligations asexpected. Further, our partners might pursue their own existing or alternative technologies or product candidatesin preference to those being developed or marketed in collaboration with us.
The manufacture of our products is technically complex, and supply interruptions, product recalls orinventory losses caused by unforeseen events may reduce sales, delay the launch of new products andadversely affect our operating results and financial condition.
Many of our products are manufactured using technically complex processes requiring specialized facilities,highly specific raw materials and other production constraints. Our vaccine products in particular are subject tothe risk of manufacturing stoppages or the risk of loss of inventory because of the difficulties inherent to thesterile processing of biological materials and the potential for the unavailability of adequate amounts of rawmaterials meeting our standards. Additionally, specific conditions must be respected both by the Group and itscustomers for the storage and distribution of many of our products, e.g., cold storage for certain vaccines andinsulin-based products. The complexity of these processes, as well as strict company and government standardsfor the manufacture of our products, subject us to risks. The occurrence or suspected occurrence ofout-of-specification production or storage can lead to lost inventories, and in some cases product recalls, withconsequential reputational damage and the risk of product liability (See “— Risks Relating to Legal Matters —Product liability claims could adversely affect our business, results of operations and financial condition,”above). The investigation and remediation of any identified problems can cause production delays, substantialexpense, lost sales and the delay of new product launches.
We rely on third parties for the manufacture and supply of a substantial portion of our raw materials,active ingredients and medical devices.
Third parties supply us with a substantial portion of our raw materials, active ingredients and medicaldevices, which exposes us to the risk of a supply interruption in the event that our suppliers experience financialdifficulties or are unable to manufacture a sufficient supply of our products meeting Group quality standards. Italso increases the risk of quality issues, even at the most scrupulously selected suppliers. For example, in 2008we recalled a limited number of batches of Lovenox® and depreciated significant unused inventory following thediscovery of quality issues at a Chinese supplier of raw materials. If disruptions or quality concerns were to arisein the third-party supply of raw materials, active ingredients or medical devices, this could adversely affect ourability to sell our products in the quantities demanded by the market and could damage our reputation andrelationships with our customers. See also “— The manufacture of our products is technically complex, andsupply interruptions, product recalls or inventory losses caused by unforeseen events may reduce sales, delay thelaunch of new products and adversely affect our operating results and financial condition,” above. Even though
8
we aim to have backup sources of supply whenever possible, including by manufacturing backup supplies of ourprincipal active ingredients at a second or third facility when practicable, we cannot be certain they will besufficient if our principal sources become unavailable. Switching sources and manufacturing facilities mayrequire significant time. Some raw materials essential to the manufacture of our products are not widely availablefrom sources we consider reliable; for example, we have approved only a limited number of suppliers of heparinsfor use in the manufacture of Lovenox®. See “Item 4. Information on the Company — B. Business Overview —Production and Raw Materials” for a description of these outsourcing arrangements. Any of these factors couldadversely affect our business, operating results or financial condition.
Counterfeit products could harm our business.
The prescription drug supply has been increasingly challenged by vulnerability of distribution channels toillegal counterfeiting and the presence of counterfeit products in a growing number of markets and over theinternet. Counterfeit products are frequently unsafe or ineffective, and can be potentially life-threatening. Todistributors and users, counterfeits may be visually indistinguishable from the authentic version. Reports ofadverse reactions to counterfeit drugs or increased levels of counterfeiting could materially affect patientconfidence in the authentic product, and could harm the business of companies such as sanofi-aventis.Additionally, it is possible that adverse events caused by unsafe counterfeit products will mistakenly be attributedto the authentic product, entailing substantial reputational and financial harm to the manufacturer of the authenticproduct.
Use of biologically derived ingredients may face patient resistance, which could adversely affect sales andcause us to incur substantial costs.
In line with industry practice, we manufacture our vaccines and many of our prescription pharmaceuticalproducts with ingredients derived from animal or plant tissue. Most of these products cannot be madeeconomically, if at all, with synthetic ingredients. We subject our products incorporating these ingredients toextensive tests and believe them to be safe. There have been instances in the past where the use of biologicallyderived ingredients by sanofi-aventis or its competitors has been alleged to be an actual or theoretical source ofharm, including infection or allergic reaction, or instances where production facilities have been subject toprolonged periods of closure because of possible contamination. Such allegations have on occasion led todamage claims and increased resistance on the part of patients to such ingredients. A substantial claim of harmcaused by a product incorporating biologically derived ingredients or a contamination event could lead us toincur potentially substantial costs as a result of, among other things, litigation of claims, product recalls, adoptionof additional safety measures, manufacturing delays, investment in patient education, and development ofsynthetic substitutes for ingredients of biological origin. Such claims could also generate patient resistance, witha corresponding adverse effect on sales and results of operations.
We are subject to the risk of non-payment by our customers.(1)
We run the risk of non-payment by our customers, which consist principally of wholesalers, distributors,pharmacies, hospitals, clinics and government agencies. While we seek to manage our exposure to client creditthrough such measures as the establishment of client credit profiles and credit limits, obtaining guarantees andinsurance, and credit risk surveillance via tracking of payment times and late payments, it is not possible toeliminate this risk which is accentuated by the current worldwide financial crisis. The United States, which is ourlargest market in terms of sales, poses particular client credit risk issues, because of the concentrated distributionsystem in which approximately 87% of our consolidated U.S. pharmaceutical sales were accounted for by justthree wholesalers. We are also exposed to large wholesalers in other markets, particularly in Europe. An inabilityof one or more of these wholesalers to honor their debts to us could adversely affect our financial condition.
Our pension liabilities are affected by factors such as the performance of plan assets, interest rates,actuarial data and experience and changes in laws and regulations.
Our future funding obligations for our main defined-benefit pension plans depend on changes in the futureperformance of assets held in trust for these plans, the interest rates used to determine funding levels, actuarial
(1) Information in this section is complementary to Note B.8.8. to our consolidated financial statements included at Item 18 of this annualreport, with regards to information required by IFRS 7, and is covered by our independent registered public accounting firms’ report onthe consolidated financial statements.
9
data and experience, inflation trends, the level of benefits provided for by the plans, as well as changes in lawsand regulations. Adverse changes of those factors could increase our unfunded obligations under such plans,which would require more funds to be contributed and hence negatively affect our cash flow and results.
Environmental Risks of Our Industrial Activities
Risks from the handling of hazardous materials could adversely affect our results of operations.
Pharmaceutical manufacturing activities, such as the chemical manufacturing of the active ingredients in ourproducts and the related storage and transportation of raw materials, products and wastes, expose us to variousrisks, including:
• fires and/or explosions from inflammable substances;
• storage tank leaks and ruptures; and
• discharges or releases of toxic or hazardous substances.
These operating risks can cause personal injury, property damage and environmental contamination, andmay result in:
• the shutdown of affected facilities; and
• the imposition of civil or criminal penalties.
The occurrence of any of these events may significantly reduce the productivity and profitability of aparticular manufacturing facility and adversely affect our operating results.
Although we maintain property, business interruption and casualty insurance that we believe is inaccordance with customary industry practices, we cannot assure you that this insurance will be adequate to coverfully all potential hazards incidental to our business. For more detailed information on environmental issues, see“Item 4. Information on the Company — B. Business Overview — Health, Safety and Environment (HSE).”
Environmental liabilities and compliance costs may have a significant adverse effect on our results ofoperations.
The environmental laws of various jurisdictions impose actual and potential obligations on our Group toremediate contaminated sites. These obligations may relate to sites:
• that we currently own or operate;
• that we formerly owned or operated; or
• where waste from our operations was disposed.
These environmental remediation obligations could significantly reduce our operating results. In particular,our accruals for these obligations may be insufficient if the assumptions underlying these accruals proveincorrect or if we are held responsible for additional, currently undiscovered contamination. Sanofi-aventisaccrues reserves for remediation when our management believes the need is probable and that it is reasonablypossible to estimate the cost. These judgments and estimates may later prove inaccurate, and any shortfalls couldhave a material adverse effect on our results of operations. See “Item 4. Information on the Company —B. Business Overview — Health, Safety and Environment (HSE)” for additional information regarding ourenvironmental policies.
Furthermore, we are or may become involved in claims, lawsuits and administrative proceedings relating toenvironmental matters. Some current and former sanofi-aventis subsidiaries have been named as “potentiallyresponsible parties” or the equivalent under the U.S. Comprehensive Environmental Response, Compensationand Liability Act of 1980, as amended (also known as “Superfund”), and similar statutes in France, Germany,Italy, Brazil and elsewhere. As a matter of statutory or contractual obligation, we and/or our subsidiaries mayretain responsibility for environmental liabilities at some of the sites our predecessor companies, or our
10
subsidiaries that we demerged, divested or may divest. We have disputes outstanding, for example, with Rhodiaover environmental remediation at several sites no longer owned by the Group. An adverse outcome in suchdisputes might have a significant adverse effect on our operating results. See Note D.22.e) to the consolidatedfinancial statements included at Item 18 of this annual report.
Finally, stricter environmental, safety and health laws and enforcement policies could result in substantialcosts and liabilities to our Group and could subject our handling, manufacture, use, reuse or disposal ofsubstances or pollutants to more rigorous scrutiny than is currently the case. Consequently, compliance withthese laws could result in significant capital expenditures as well as other costs and liabilities, thereby adverselyaffecting our business, results of operations or financial condition.
Risks Related to Financial Markets(1)
Fluctuations in currency exchange rates could adversely affect our results of operations and financialcondition.
Because we sell our products in numerous countries, our results of operations and financial condition couldbe adversely affected by fluctuations in currency exchange rates. We are particularly sensitive to movements inexchange rates between the euro and the U.S. dollar, the British pound, the Japanese yen, and to currencies inemerging countries. In 2008, approximately 31% of our net sales were realized in the United States. While weincur expenses in those currencies, the impact of currency exchange rates on these expenses does not fully offsetthe impact of currency exchange rates on our revenues. As a result, currency exchange rate movements can havea considerable impact on our earnings. When deemed appropriate and when technically feasible, we enter intotransactions to hedge our exposure to foreign exchange risks. These efforts, when undertaken, may fail to offsetthe effect of adverse currency exchange rate fluctuations on our results of operations or financial condition. Formore information concerning our exchange rate exposure, see “Item 11. Quantitative and Qualitative Disclosuresabout Market Risk.”
In the context of the worldwide financial crisis, our liquidity may be constrained.
As of December 31, 2008, the Group’s net debt amounted to €1.8 billion. In addition to debt outstanding,the Group has contracted a number of credit lines and put into place commercial paper and medium term noteprograms with the aim of providing liquidity. See “Item 11. Quantitative and Qualitative Disclosures aboutMarket Risk.” In the context of a market-wide liquidity crisis, the Group may be faced with reduced access tosources of financing, including under programs currently in place, or less favorable conditions. Were our sourcesof financing to be substantially reduced, we cannot guarantee that the Group would be in a position to refinanceexisting debt or incur new debt on terms that we would consider to be commercially reasonable if at all.
Risks Relating to an Investment in our Shares or ADSs
Foreign exchange fluctuations may adversely affect the U.S. dollar value of our ADSs and dividends (ifany).
Holders of ADSs face exchange rate risk. Our ADSs trade in U.S. dollars and our shares trade in euros. Thevalue of the ADSs and our shares could fluctuate as the exchange rates between these currencies fluctuate. If andwhen we do pay dividends, they would be denominated in euros. Fluctuations in the exchange rate between theeuro and the U.S. dollar will affect the U.S. dollar amounts received by owners of ADSs upon conversion by thedepositary of cash dividends, if any. Moreover, these fluctuations may affect the U.S. dollar price of the ADSs onthe New York Stock Exchange (NYSE), whether or not we pay dividends in addition to the amounts, if any, thata holder would receive upon our liquidation or upon the sale of assets, merger, tender offer or similar transactionsdenominated in euros or any foreign currency other than U.S. dollars.
(1) Information in this section is complementary to Note B.8.8. to our consolidated financial statementsincluded at Item 18 of this annual report with regard to information required by IFRS 7, and is covered byour independent registered public accounting firms’ report on the consolidated financial statements.
11
Persons holding ADSs rather than shares may have difficulty exercising certain rights as a shareholder.
Holders of ADSs may have more difficulty exercising their rights as a shareholder than if they directly heldshares. For example, if we offer new shares and they have the right to subscribe for a portion of them, thedepositary is allowed, at its own discretion, to sell for their benefit that right to subscribe for new shares insteadof making it available to them. Also, to exercise their voting rights, as holders of ADSs, they must instruct thedepositary how to vote their shares. Because of this extra procedural step involving the depositary, the processfor exercising voting rights will take longer for holders of ADSs than for holders of shares. ADSs for which thedepositary does not receive timely voting instructions will not be voted at any meeting.
Our two largest shareholders own a significant percentage of the share capital and voting rights of sanofi-aventis.
At December 31, 2008, Total and L’Oréal, our two largest shareholders, held approximately 11.29% and8.99% of our issued share capital, respectively, accounting for approximately 18.27% and approximately14.89%, respectively, of the voting rights (excluding treasury shares) of sanofi-aventis. See “Item 7. MajorShareholders and Related Party Transactions — A. Major Shareholders.” Affiliates of each of these shareholdersare currently serving on our Board of Directors. To the extent these shareholders continue to hold a largepercentage of our share capital and voting rights, Total and L’Oréal will remain in a position to exert heightenedinfluence in the election of the directors and officers of sanofi-aventis and in other corporate actions that requireshareholders’ approval.
Sales of our shares may cause the market price of our shares or ADSs to decline.
Neither Total nor L’Oréal is, to our knowledge, subject to any contractual restrictions on the sale of theshares each holds in our Company. Both of these shareholders have announced their intent to sell all or part oftheir stakes in our company, and have recently liquidated part of their respective holdings. Sales of a substantialnumber of our shares, or a perception that such sales may occur, could adversely affect the market price for ourshares and ADSs.
12

Item 4. Information on the Company
Introduction
We are a global pharmaceutical group engaged in the research, development, manufacture and marketing ofhealthcare products. In 2008, our net sales amounted to €27,568 million. Based on 2008 sales, we are the fourthlargest pharmaceutical group in the world and the largest pharmaceutical group in Europe (source: IMS salesyear end 2008; all available channels). Sanofi-aventis is the parent of a consolidated group of companies. A listof the principal subsidiaries included in this consolidation is shown at Note F. to our consolidated financialstatements included at Item 18 of this annual report.
Our business includes two main activities: (i) pharmaceuticals and (ii) human vaccines through sanofipasteur.
In our pharmaceutical activity, which generated net sales of €24,707 million in 2008, we specialize in sixtherapeutic areas:
• Thrombosis: Our thrombosis medicines include two leading drugs in their categories: Plavix®, an anti-platelet agent indicated for a number of atherothrombotic conditions, and Lovenox®, a low molecularweight heparin indicated for prophylaxis and treatment of deep vein thrombosis and for unstable anginaand myocardial infarction;
• Cardiovascular: Our cardiovascular medicines include two major hypertension treatments: Aprovel®
and Tritace®;
• Metabolic Disorders: Our leading medicines in this area are related to diabetes. They include Lantus®, along acting analog insulin which is a leading brand in the insulin market, and Amaryl®, an oral once-daily sulfonylurea;
• Oncology: Our leading products in the strategic oncology market are Taxotere®, a taxane derivativerepresenting a cornerstone therapy in several cancer types, and Eloxatine®, an innovative platinumagent, which is a leading treatment of colorectal cancer;
• Central Nervous System (CNS): Our major CNS medicines include Stilnox®/Ambien® CR, the world’sleading insomnia prescription medication; Copaxone®, an immunomodulating agent indicated inmultiple sclerosis; and Depakine®, a leading epilepsy treatment; and
• Internal Medicine: In internal medicine, we are present in several fields. In respiratory/allergy, ourproducts include Allegra®, a non-sedating prescription antihistamine, and Nasacort®, a localcorticosteroid indicated in allergic rhinitis. In urology, we are present with Xatral®, a leading treatmentfor benign prostatic hypertrophy. In osteoporosis, we are present with Actonel®.
The global portfolio of sanofi-aventis also comprises a wide range of other pharmaceutical products,including prescription drugs and products sold over the counter (OTC), making up our “base business”.
We are the world leader in the vaccines industry. Our net sales amounted to €2,861 million in 2008, withleading vaccines in five areas:
• Pediatric combination vaccines providing protection against diseases such as pertussis, diphtheria,tetanus, and Haemophilus influenzae type b infections. Our main products are Daptacel®, Tripedia®,Act-HIB®, Pentacel®, Pediacel® and Pentaxim®/Pentavac®. We are also a leading producer of injectablepoliomyelitis (polio) vaccines, such as Ipol® and Imovax® Polio, as well as oral polio formulations, allof which contribute to polio eradication and disease control strategies in both developed and developingcountries;
• Influenza vaccines such as Fluzone® and Vaxigrip®, used for seasonal campaigns, the latter in bothhemispheres. Additionally, we manufacture pre-pandemic avian influenza vaccines (including H5N1vaccines) as part of the global pandemic preparedness efforts in both our French and U.S. facilities;
13
• Adult and adolescent booster vaccines protecting against pertussis, tetanus, diphtheria and polio. Ourmain products include: Adacel® (the first trivalent booster against pertussis, tetanus and diphtheria foradolescents and adults, launched in the United States in 2005), Decavac®, Repevax® and Revaxis®;
• Meningitis vaccines, with Menactra®, a quadrivalent conjugate vaccine launched in the United States in2005 and in Canada in 2006, Menomune®, a quadrivalent polysaccharide vaccine, and a bivalentmeningococcal A and C vaccine;
• Travel and Endemic vaccines, which include a wide range of products against hepatitis A, typhoid,rabies, yellow fever, Japanese encephalitis, cholera, measles, mumps, rubella and antivenoms. Keyproducts include Imovax® Rabies, Verorab®, Typhim Vi®, Avaxim® and Vivaxim®.
In 2008, our vaccines activity was favorably influenced by the launch of Pentacel® and the growth ofMenactra® and Adacel® in the United States and by the sales growth of Pentaxim® in the international region.Sanofi Pasteur also strengthened its leadership position in both seasonal and pre-pandemic influenza.
We have a strong commitment to research and development with 29 research centers.
In the description below, the following should be kept in mind:
•
•
•
•
A drug can be referred to either by its international non-proprietary name (INN), or by its brand name,which is normally exclusive to the company that markets it. In most cases, our brand names, which mayvary from country to country, are protected by trademark registrations. In general, we have chosen inthis annual report to refer to our products by the brand names that we use in France, except for Allegra®
(sold in France as Telfast®), Tritace® (sold in France as Triatec®), and Amaryl® (sold in France asAmarel®) as well as Ambien® CR (an extended-release formulation of zolpidem tartrate, not sold inFrance);
For our pharmaceutical activity, except where otherwise stated, all market share percentages andrankings are based on full-year 2008 sales figures from IMS Health MIDAS;
For our vaccines activity, market shares and rankings are based on our own estimates. These estimateshave been made from assembled public domain information based on various sources, includingstatistical data collected by industry associations and information published by competitors; and
We present our consolidated net sales from our leading products sold directly and through alliances. Asregards the products sold through our alliance with BMS, we also present the worldwide sales ofPlavix® and Aprovel® whether consolidated by sanofi-aventis or by BMS. A definition of worldwidesales can be found in “Item 5. Operating and Financial Review and Prospects — Results of Operations”.
A. History and Development of the Company
Sanofi-aventis was incorporated under the laws of France in 1994 as a société anonyme, a form of limitedliability company, for a term of 99 years. We operate under the commercial name “sanofi-aventis”. Ourregistered office is located at 174, avenue de France, 75013 Paris, France, and our main telephone number is+33 1 53 77 40 00. Our principal U.S. subsidiary’s office is located at 55 Corporate Drive, Bridgewater, NJ08807 ; Telephone: +1 (908) 981-5000.
We are present in more than 100 countries on five continents with more than 98,000 employees worldwideat year end 2008. Our legacy companies, Sanofi-Synthélabo (formed by a merger between Sanofi and Synthélaboin 1999) and Aventis (formed by the combination of Rhône-Poulenc and Hoechst also in 1999), bring to theGroup more than a century of experience in the pharmaceutical industry.
Sanofi was founded in 1973 by Elf Aquitaine, a French oil company, when it took control of the Labazgroup, a pharmaceutical company. Its first significant venture into the United States market was the acquisitionof the prescription pharmaceuticals business of Sterling Winthrop — an affiliate of Eastman Kodak — in 1994.
Synthélabo was founded in 1970 through the merger of two French pharmaceutical laboratories,Laboratoires Dausse (founded in 1834) and Laboratoires Robert & Carrière (founded in 1899). In 1973, theFrench cosmetics group L’Oréal acquired the majority of its share capital.
14

Hoechst traces its origins to the second half of the 19th century, with the German industrial revolution andthe emergence of the chemical industry. Traditionally active in pharmaceuticals, Hoechst strengthened itsposition in that industry by taking a controlling interest in Roussel-Uclaf in 1974 and the U.S. pharmaceuticalcompany Marion Merrell in 1995.
Rhône-Poulenc was formed in 1928 from the merger of two French companies: a chemical company createdby the Poulenc brothers and the Société Chimique des Usines du Rhône, which was founded in 1895. Thecompany’s activities in the first half of the 20th century focused on producing chemicals, textiles andpharmaceuticals. Rhône-Poulenc began to focus its activities on life sciences in the 1990s, which led to thesuccessive purchases of Rorer, a U.S. pharmaceutical company acquired in two stages in 1990 and 1997, PasteurMérieux Connaught in the area of vaccines in 1994 and the U.K.-based pharmaceuticals company Fisons in 1995.
Sanofi-Synthélabo took control of Aventis in August 2004 and changed its registered name to “sanofi-aventis”. On December 31, 2004, Aventis merged with and into sanofi-aventis, with sanofi-aventis as thesurviving company.
B. Business Overview
Strategy
As a leading player in the pharmaceutical industry (number 1 in Europe and number 4 in the world based on2008 IMS sales) sanofi-aventis has core strengths in the field of healthcare: a global presence, market leadershipin vaccines, major biological products (such as Lovenox® and Lantus®) and a strong and long-establishedpresence in emerging markets, as well as a track record of adapting cost structures and a solid financial situation.However, although these are solid foundations, we, like most of our competitors, are faced with the foreseencompetition from generics for some of our major products. Our environment is also subject to cost containmentpressures from healthcare authorities, and increased regulatory barriers. Given the significant challenges facingthe pharmaceutical industry, we need to develop new platforms for growth. Our response to these challenges isan ambitious one: to deliver sustainable growth, we need to transform ourselves into a diversified globalhealthcare leader.
This is why we initiated a wide-ranging transformation program at the end of 2008, focusing on three keythemes:
• Increasing innovation in Research & Development
At the end of 2008, we began a complete and objective review of our research portfolio, in order to reassessthe allocation of resources. This review has already led to a rationalization of our portfolio and will be ongoing inthe first half of 2009. In the future, we must focus our Research & Development (R&D) strategy on keytechnologies and diseases to better serve the needs of patients. Our internal R&D division needs to be organizedto maximize flexibility and innovation, and some of our existing resources in R&D need to be reallocated toexternal collaborations. Finally, we will redefine the decision-making process in R&D so that new commercialpotential and the scope for value creation are better integrated into our development choices. As part of thistransformation and in response to the new industry environment, we have created two new positions: a ChiefMedical Officer, who will closely monitor the benefit/risk balance in both marketed products and those indevelopment; and a Scientific Advisor, who will contribute to R&D decision-making processes relating to bothour pipeline and our strategy, and in particular the creation of alliances.
• Adapting our structures to meet the challenges of the future
We intend to adapt our operating model, currently too focused on our traditional major markets, to reflectthe diversity of our activities and our geographical reach. This means tailoring our strategy, structure and offeringto each region’s needs, so as to deliver the most appropriate solution to each patient. It also means combining ourvarious activities, so as to address our customers’ needs more thoroughly and take best advantage of all localgrowth opportunities. Anticipating future changes in volumes and analyzing growth opportunities will enable usto realign our industrial capacity. Simplifying our organizational structures and operational processes willtranslate into a reduction of our general and administrative costs.
15

• Exploring external growth opportunities
Business development must be perfectly integrated in our overall strategy, and translate into disciplinedacquisitions and alliances that build or strengthen the platforms for long-term growth that will create value forour shareholders. We have already taken the first steps in this direction through our alliance with RegeneronPharmaceuticals, Inc (Regeneron), our acquisitions of Acambis Plc (Acambis), Symbion CP Holdings Pty Ltd(Symbion Consumer), and Zentiva N.V. (Zentiva). We are encouraging business development initiatives withinoperations in order to reinforce our regional approach. Our external research collaborations will be broadened tobring maximum creativity to R&D and hence deliver innovation to patients. The position of Chief StrategicOfficer has been created at Executive Committee level to achieve this integrated approach to strategy andbusiness development.
This transformation program has already led to the rollout of a number of initiatives, the conclusions ofwhich will be implemented from mid-2009.
Pharmaceutical Products
Main Pharmaceutical Products
Within our pharmaceuticals business, we focus on six main therapeutic areas: thrombosis, cardiovascular,metabolic disorders, oncology, central nervous system and internal medicine.
The following table sets forth the net sales of our best selling pharmaceutical products for the year endedDecember 31, 2008. These products are major contributors to public health. The sections that follow provideadditional information on the indications and market position of these products in their principal markets. TheGroup’s intellectual property relating to our products is material to our operations and is described at “— Patents,Intellectual Property and Other Rights — Product Overview,” below. As disclosed in Note D.22.b) to ourconsolidated financial statements included at Item 18 of this annual report, we are involved in significantlitigation concerning the patent protection of a number of these products.
16
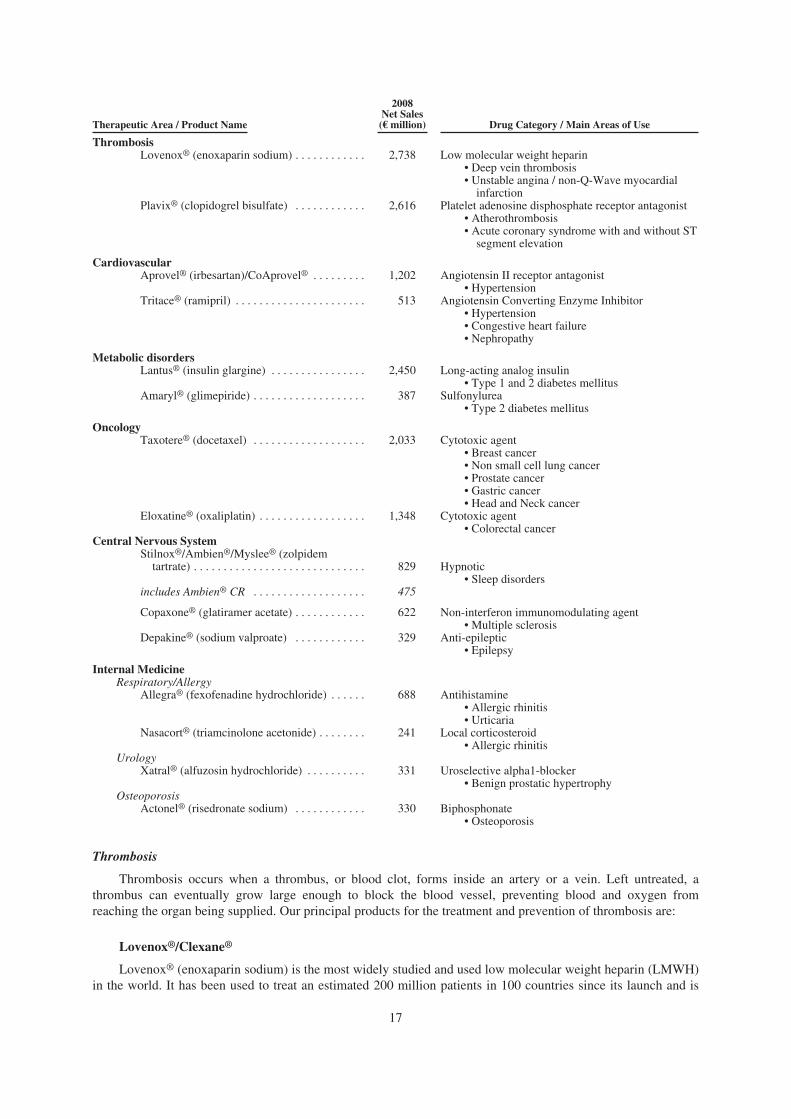
Therapeutic Area / Product Name
2008Net Sales(€ million) Drug Category / Main Areas of Use
ThrombosisLovenox® (enoxaparin sodium) . . . . . . . . . . . . 2,738
Plavix® (clopidogrel bisulfate) . . . . . . . . . . . . 2,616
CardiovascularAprovel® (irbesartan)/CoAprovel® . . . . . . . . . 1,202
Tritace® (ramipril) . . . . . . . . . . . . . . . . . . . . . . 513
Metabolic disordersLantus® (insulin glargine) . . . . . . . . . . . . . . . . 2,450
Amaryl® (glimepiride) . . . . . . . . . . . . . . . . . . . 387
OncologyTaxotere® (docetaxel) . . . . . . . . . . . . . . . . . . . 2,033
Eloxatine® (oxaliplatin) . . . . . . . . . . . . . . . . . . 1,348
Central Nervous SystemStilnox®/Ambien®/Myslee® (zolpidem
tartrate) . . . . . . . . . . . . . . . . . . . . . . . . . . . . . 829
includes Ambien® CR . . . . . . . . . . . . . . . . . . . 475
Copaxone® (glatiramer acetate) . . . . . . . . . . . . 622
Depakine® (sodium valproate) . . . . . . . . . . . . 329
Internal MedicineRespiratory/Allergy
Allegra® (fexofenadine hydrochloride) . . . . . . 688
Nasacort® (triamcinolone acetonide) . . . . . . . . 241
UrologyXatral® (alfuzosin hydrochloride) . . . . . . . . . . 331
OsteoporosisActonel® (risedronate sodium) . . . . . . . . . . . . 330
Low molecular weight heparin• Deep vein thrombosis• Unstable angina / non-Q-Wave myocardial
infarctionPlatelet adenosine disphosphate receptor antagonist
• Atherothrombosis• Acute coronary syndrome with and without ST
segment elevation
Angiotensin II receptor antagonist• Hypertension
Angiotensin Converting Enzyme Inhibitor• Hypertension• Congestive heart failure• Nephropathy
Long-acting analog insulin• Type 1 and 2 diabetes mellitus
Sulfonylurea• Type 2 diabetes mellitus
Cytotoxic agent• Breast cancer• Non small cell lung cancer• Prostate cancer• Gastric cancer• Head and Neck cancer
Cytotoxic agent• Colorectal cancer
Hypnotic• Sleep disorders
Non-interferon immunomodulating agent• Multiple sclerosis
Anti-epileptic• Epilepsy
Antihistamine• Allergic rhinitis• Urticaria
Local corticosteroid• Allergic rhinitis
Uroselective alpha1-blocker• Benign prostatic hypertrophy
Biphosphonate• Osteoporosis
Thrombosis
Thrombosis occurs when a thrombus, or blood clot, forms inside an artery or a vein. Left untreated, athrombus can eventually grow large enough to block the blood vessel, preventing blood and oxygen fromreaching the organ being supplied. Our principal products for the treatment and prevention of thrombosis are:
Lovenox®/Clexane®
Lovenox® (enoxaparin sodium) is the most widely studied and used low molecular weight heparin (LMWH)in the world. It has been used to treat an estimated 200 million patients in 100 countries since its launch and is
17

approved for more clinical indications than any other LMWH. A comprehensive dossier of clinical studies hasdemonstrated the benefits and safety of Lovenox® in the prophylaxis and treatment of deep vein thrombosis(DVT) and in acute coronary syndromes (ACS). It has become the product of reference in clinical trials for thedevelopment of new anticoagulants in both venous and arterial indications.
In the field of venous thromboembolism (VTE) prevention, Lovenox® use continues to grow especially forprevention of VTE in medical patients.
The initial findings of the EXCLAIM trial had demonstrated the benefit of extended thromboprophylaxis inacutely ill medical patients with reduced mobility. Further analyses presented at the American Society ofHematology Congress in December 2008 have demonstrated that some patient populations, such as the elderly(aged 75 and above) or stroke patients, may potentially benefit more than the overall population from extendedtreatment.
Lovenox®/Clexane® was approved for marketing in Japan for the prevention of VTE in patients undergoingorthopedic surgery of the lower limbs such as total hip replacement, total knee replacement and hip fracturesurgery in January 2008 and in patients undergoing abdominal surgery in February 2009.
In the cardiovascular area, Lovenox® was approved in the United States in 2007 for the treatment of patientswith ST-segment Elevation Myocardial Infarction (STEMI) based on the results of the ExTRACT-TIMI 25 trial,and since then has been approved in more than 40 countries worldwide for this indication.
Supporting the results of the ExTRACT PCI sub-study showing that Lovenox® can be safely used beforeand in the catheterization laboratory data from the STACKENOX trial were presented at the European Society ofCardiology meeting in September 2008. STACKENOX showed that using standard dosing of Lovenox® issufficient to provide proper anticoagulation levels. It also provided new evidence against the practice ofadministering unfractionated heparin to patients who already received enoxaparin sodium, as it results in over-anticoagulation that may lead to excess bleeding as seen in trials like OASIS 5.
In terms of medical practice registries, GRACE (the Global Registry of Acute Coronary Events) hasevaluated over 100,000 patients worldwide with acute coronary syndrome as of today and has led to thepublication of more than 75 manuscripts in a variety of peer review medical journals. Furthermore, the GRACERisk Score has been incorporated into various international guidelines on the treatment of patients with ACS,providing a valuable tool to physicians treating those patients.
Lovenox®/Clexane® is the leader in antithrombotics in the United States, Germany, France, Italy, Spain, andthe United Kingdom (source: IMS 2008 sales, all available channels).
Plavix® / Iscover®
Plavix® (clopidogrel bisulfate), a platelet adenosine diphosphate (ADP) receptor antagonist with a rapidonset of action that selectively inhibits platelet aggregation induced by ADP, is indicated for long-termprevention of atherothrombotic events in patients with a history of recent myocardial infarction, recent ischemicstroke or established peripheral arterial disease. Plavix® is currently the only drug indicated for the secondaryprevention of atherothrombosis regardless of the location of the arteries initially affected (heart, brain, lowerlimbs). This indication is supported by the results of the landmark CAPRIE trial, including almost 20,000patients. CAPRIE demonstrated the superior efficacy of Plavix® over acetylsalicylic acid (ASA, the activeingredient of Aspirin®), with a comparable safety profile.
Following the significant results of the CURE, CLARITY and COMMIT clinical trials, Plavix® is now alsoindicated for the treatment of acute coronary syndrome with and without ST segment elevation (ACS; Q-waveand non-Q-wave myocardial infarction and unstable angina) in combination with ASA. These indications areincorporated into the guidelines of the American Heart Association, the American College of Cardiology and theEuropean Society of Cardiology.
18
In addition to the 75mg tablet, a new Plavix® 300mg tablet was launched in over 15 countries during 2008.This new 300mg tablet reinforces Plavix® early use by simplifying its approved loading dose administration inpatients with acute coronary syndrome (unstable angina, myocardial infraction). The 300mg tablet isbioequivalent to four 75 mg tablets of Plavix®.
The extensive clinical program for Plavix® including all completed, ongoing and planned studies, is one ofthe largest of its kind and has involved more than 100,000 patients overall. In addition, over 92 million patientsworldwide are estimated to have been treated with Plavix® since its launch, providing significant evidence ofreal-life efficacy and safety experience with this product.
The ongoing clinical trials that are designed to support the long-term value of Plavix® by providingcomplementary clinical data include:
•
•
•
The ACTIVE study, which is intended to assess the value of Plavix® on top of ASA compared withASA alone in patients with atrial fibrillation (who cannot take an oral anticoagulant) for the reduction ofcardio-embolic and atherothrombotic events. This study has completed recruitment (14,000 patientsincluded, currently in the follow-up phase). While one arm of the study — ACTIVE-W — wasterminated early, the other two arms, ACTIVE-A and ACTIVE-I, are ongoing. The results of bothACTIVE-A and ACTIVE-I are expected in 2009;
The CURRENT study, which aims to optimize the dosing regimen of clopidogrel bisulfate in 25,000patients with ACS scheduled for percutaneous coronary intervention. A loading dose of 600 mgfollowed by 150 mg daily for 6 days then followed by 75 mg daily up to the end of the study (30 days)is compared to the currently approved regimen (300 mg loading dose followed by 75 mg daily). Therecruitment started in 2006 and results are expected in 2009; and
Following an FDA written request for pediatric data, the development of a pediatric indication forPlavix® in the United States is ongoing. The dose ranging Phase II (PICOLO study) has helpeddetermine the right dose to be studied in Phase III (CLARINET). CLARINET is ongoing and results areexpected in 2010. A pediatric investigational plan was approved in 2008 by the European MedicinesAgency.
Plavix® is marketed in over 115 countries, including the United States, through our alliance with Bristol-Myers Squibb (BMS).
Sales of Plavix® in Japan are consolidated by sanofi-aventis and are outside the scope of our alliance withBMS. In Japan, a New Drug Application (NDA) for marketing authorization was approved in January 2006 forthe reduction of recurrence after ischemic cerebrovascular disorder and launch took place in May 2006. InOctober 2007, the Japanese Health Authorities approved a new indication in cardiology for patients with AcuteCoronary Syndrome for whom percutaneous coronary intervention is being planned.
Plavix® is the leading antiplatelet in the European and the U.S. markets (source: IMS 2008 sales, allavailable channels). Germany has been affected by competition from clopidogrel besylates since August 2008 inthe monotherapy segment. The share of the German market by volume retained by Plavix®/Iscover® inDecember 2008 remains approximately 75% (source: IMS Pharmatrend, week of December 22, 2008).
Cardiovascular
Within the cardiovascular market, hypertension remains the most prevalent disease. Hypertension is definedas blood pressure above the normal level and is one of the main causes of severe heart, brain, blood vessel andeye complications. Our principal products for the treatment of cardiovascular diseases are:
Aprovel®/Avapro®/Karvea®
Aprovel® (irbesartan) belongs to the fastest growing class of antihypertensives, angiotensin II receptorantagonists. These highly effective antagonists act by blocking the effect of angiotensin, the hormone responsiblefor blood vessel contraction, thereby enabling blood pressure to return to normal. In addition to Aprovel®/Avapro®/Karvea®, we also market CoAprovel®/Avalide®/Karvezide®, a fixed dose combination of irbesartan
19

and hydrochlorothiazide (HCTZ), a diuretic that increases the excretion of water by the kidneys and provides anadditive blood pressure lowering effect. These products achieve control of blood pressure in over 80% of patientswith a very good safety profile.
Aprovel® and CoAprovel® tablets are available in various dosages, to fit the needs of patients with differentlevels of hypertension severity.
Aprovel® is indicated as a first-line treatment for hypertension and for the treatment of nephropathy inhypertensive patients with type 2 diabetes, in both Europe and the United States. CoAprovel® may be used inappropriate patients whose blood pressure is not adequately controlled on monotherapy, and as initial therapy inappropriate patients who are likely to need multiple drugs to achieve their blood pressure goals (in the UnitedStates only).
Several clinical trials have been undertaken in recent years in an effort to demonstrate the effects ofAprovel® beyond blood pressure control:
• The i-PRESERVE study evaluated the effect of irbesartan in the treatment of heart failure withpreserved ejection fraction (also called diastolic heart failure), a very specific disease for which there isno reference treatment. The results were published in November 2008 and were consistent with previoustrials conducted in this patient population. Although the study did not meet its principal end point interms of efficacy, i-PRESERVE confirmed the good safety profile of irbesartan in an already well-treated population.
• ACTIVE-I evaluates the efficacy of Aprovel® combined with clopidogrel bisulfate (the active ingredientin Plavix®), in preventing complications in patients suffering from atrial fibrillation. We began thisclinical program in 2003, with enrolment for the 10,000-patient study ongoing. Results are expected bylate 2009.
Aprovel® and CoAprovel® are marketed in more than 80 countries, including the United States — under thebrand names Avapro® and Avalide®, respectively — through an alliance with Bristol-Myers Squibb (BMS).
In Japan, where the product is licensed/sub-licensed to Shionogi Co., Ltd and Dainippon Sumitomo PharmaCo., Ltd, respectively, specific 50 mg and 100 mg dosages developed for the Japanese market were launched inJune 2008.
In 2008, based on the total sales of Aprovel®/Avapro®/Karvea® and CoAprovel®/Avalide®/Karvezide®, ourmain markets are Europe and the United States, where we rank second and fourth respectively among theangiotensin II receptor antagonists in the hypertension market (source: IMS, 2008 sales).
Tritace®/Triatec®/Delix®/Altace®
Tritace® (ramipril) is an angiotensin converting enzyme (ACE) inhibitor indicated for the treatment ofhypertension, congestive heart failure following or in the absence of acute myocardial infarction andnephropathy.
The Heart Outcomes Prevention Evaluation (HOPE) study showed it to be effective in reducing theincidence of stroke, heart attacks and cardiovascular-related death in high-risk patients. Tritace® is the only ACEinhibitor approved for the prevention of stroke, heart attack and death in these patients and has the broadestspectrum of indications among ACE inhibitors for the treatment of cardiovascular disease.
The most recent European Society of Hypertension (ESH) / European Society of Cardiology (ESC)guidelines on the management of hypertension have highlighted the importance of taking global cardiovascularrisk into account and the need to control hypertension. Based on the protective effect confirmed in theON-TARGET study, the available combinations with diuretics (ramipril + hydrochlorothiazide) and calciumchannel blockers (ramipril + felodipine) are listed as preferred combinations in the recent guidelines forphysicians to help patients reach their blood pressure goals without worsening their metabolic profile.
20

Tritace® (ramipril) is available in tablets and capsules. It is marketed in over 70 countries. We have norights on this product in the United States. Launches in several countries in Eastern Europe, the Middle-East andAsia are scheduled in 2009.
The three leading countries for sales of Tritace® in 2008 were Italy, Poland and Canada (source: IMS, 2008sales). Generic ramipril became available in Italy in 2008, negatively affecting our sales there.
Metabolic Disorders
The prevalence of diabetes is expected to increase significantly over the next 20 years, as a direct result ofsedentary lifestyle, excessive weight and obesity, unhealthy diet and population aging. Our principal products areLantus®, an insulin analog, and Amaryl®, a sulfonylurea.
Lantus®
Lantus® (insulin glargine) is a long-acting basal insulin analog, offering improved pharmacokinetic andpharmacodynamic profiles compared to other basal insulins. Lantus® is indicated for once-daily subcutaneousadministration in the treatment of adult patients with type 2 diabetes mellitus (T2DM), who require basal insulinfor the control of hyperglycemia, and for adult and pediatric patients aged six years and above with type 1diabetes mellitus (T1DM).
Lantus® can be administered subcutaneously thanks to syringes or specific pens including Lantus®
SoloSTAR®. Lantus® SoloSTAR® is a pre-filled disposable pen available in over 50 countries worldwide. It isthe only disposable pen that combines the following advantages; a low injection force, up to 80 units perinjection and ease-of-use. In 2007, it was awarded a GOOD DESIGN™ Award by the Chicago AthenaeumMuseum of Architecture and Design.
Lantus®, the number-one prescribed insulin in the world in both sales and units (source: IMS, 2008 sales), isthe only once-daily, 24-hour duration of action, peakless basal insulin.
The uniqueness of the Lantus® profile was confirmed in a direct comparison to detemir, another basalinsulin analog, where Lantus® was shown to have activity levels more than 4 times greater than detemir duringthe period from 12 to 24 hours after administration. The same study showed a marked and highly significantdifference in terms of duration of action: Lantus® showed a 24-hour coverage whereas detemir had a duration ofaction of only 17.5 hours. Indeed, a large clinical study confirmed that, while Lantus® is effective once a day,55% of patients need detemir twice daily. Moreover, in this study Lantus® patients used a 40% smaller dose andhad 3 times fewer injection site reactions.
The Lantus® profile allows a once-daily regimen that can be taken at any time (albeit at the same time everyday) with titration under safer conditions and less hypoglycemia than with the basal human insulin NPH. Patientscan titrate Lantus® easily and safely toward Fasting Plasma Glucose target thanks to the Lantus® profile. Theresults in terms of glycemic control are particularly consistent with Lantus® given once-a-day and properlytitrated: e.g., the final mean A1C (HbA1c, a measure indicating good control of long-term blood sugar levels) onLantus® ranged from 6.9% to 7.2% in seven studies where aggressive titration was performed and strictmonitoring was used.
In 2008, the American Diabetes Association (ADA) and European Association for the Study of Diabetes(EASD) released the updated treatment recommendations for type 2 diabetes. Designed by a team of diabetesexperts, the updated recommendations provide healthcare professionals with a consensus algorithm that furtherestablishes basal insulins such as Lantus®, or a sulfonylurea such as Amaryl®, as two preferred second-linetreatment options for people with diabetes who are unable to achieve glycemic control targets with lifestyleintervention and metformin alone. These new treatment recommendations reinforce the timely use of basalinsulin as a “Core Therapy” for type 2 Diabetes.
21

A number of controlled and randomized studies have investigated the efficacy and safety of Lantus® plusoral antidiabetic agents (OADs) in type 2 diabetes mellitus:
•
•
•
•
•
•
The recently published TULIP study demonstrated the advantage of prescribing Lantus® as soon aspatients’ glycemic targets are not achieved with diet, exercise and oral medications alone, bringing thembelow the recommended glycemic goal of 7%;
A recent meta-analysis of 5 studies comparing Lantus® to NPH, confirmed a lower rate of all nocturnalhypoglycemia including severe hypoglycemia with Lantus® as compared to NPH in patients with type 2diabetes;
The APOLLO study published in 2008 in The Lancet compared two strategies for insulin initiation inpatients with type 2 diabetes after OAD failure: a prandial versus a basal insulin strategy with Lantus®.APOLLO showed that after OAD failure in type 2 patients Lantus® reduces A1C to target with fewerhypoglycemic events, fewer injections and blood glucose monitoring than with a prandial insulinstrategy;
The INITIATE study showed that Lantus® is an easy and effective method of insulin initiation inpatients with type 2 diabetes on OADs. In this study, within 24 weeks, Lantus® lowered A1C by 2% toreach a mean A1C of 6.8-6.9% with a concomitant treatment satisfaction improvement;
The SCHREIBER study, an observational study of everyday practice conducted in more than 12,000patients, showed that Lantus®, when added to oral diabetes medications, brings the patients to a targetA1C of 7.0% after an average 9-month period. This glycemic control is sustained in the long term, 32months after Lantus® initiation. In addition, the neutral effect on weight observed at 9 months wasconfirmed at 32 months; and
The GINGER study demonstrated the superiority of a basal bolus regimen with Lantus® and Apidra® toa premixed insulin regimen in terms of blood glucose control with no excess in hypoglycaemia rate in apopulation of advanced type 2 diabetes patients.
Several studies presented in 2008 demonstrated the advantages of Lantus® in a real-life setting compared toother basal insulins:
• Lantus® is more effective at lowering A1C than detemir and provides cost savings (THIN Study);
• Lantus® is more effective at lowering A1C, results in a lower rate of hypoglycemia, and reduces totalhealthcare cost compared to NPH (ROLE Study);
• Lantus® results in better patient satisfaction than NPH (LIVE-DE Study); and
• Patients who failed to achieve glycemic goals on NPH significantly improve theirR after they areswitched to Lantus®. They also had less hypoglycemia and improved treatment satisfaction (LAURELSpain).
Sanofi-aventis has set up a comprehensive clinical program to evaluate the acute and long-term effect ofLantus® on cardiovascular outcomes. As part of this program, the INTENSIVE trial in patients with STEMI andthe ORIGIN morbidity/mortality trial in high-risk dysglycemic patients are still ongoing and results are expectedin 2012.
Lantus® is available in over 70 countries worldwide.
The three leading countries for sales of Lantus® in 2008 are the United States, Germany and France (source:IMS 2008 sales).
Amaryl®/Amarel®/Solosa®
Amaryl® (glimepiride) is a latest-generation, orally administered once-daily sulfonylurea (a glucose-lowering agent) indicated as an adjunct to diet and exercise to improve glycaemic control in patients with type 2diabetes. Amaryl® reduces the body’s blood sugar level in two ways: by helping the body to produce moreinsulin both at mealtime and between meals and by decreasing insulin resistance. Amaryl® has a more rapidonset and longer duration of action than first-generation agents, allowing patients to achieve a very good level ofcontrol with a lower risk of hypoglycemia.
22
Amaryl® was the first oral diabetes drug in its class to receive approval for administration in one of threeways: either as a monotherapy or in combination with insulin or metformin.
The American Diabetes Association (ADA) and the European Association for the Study of Diabetes(EASD) recommendations for type 2 diabetes were updated in 2008: they further establish the combination ofmetformin and second generation sulfonylureas such as Amaryl® as a one of the two preferred second-linetreatment options for people with diabetes who are unable to achieve glycemic control targets with lifestyleintervention and metformin alone. The second recommanded option is to add to metformin a basal insulin, suchas Lantus®.
The combination of metformin (which reduces hepatic glucose production and improves insulin resistance)with a sulfonylurea (which stimulates insulin secretion) is the rational combination for counteracting the twodefects seen in type 2 diabetes. It is the most prescribed combination of diabetes drugs worldwide. Amaryl M®, afixed-dose combination of glimepiride plus metformin in a single presentation was launched in 2007. The fixeddose treatment is more efficacious than either agent alone in patients with type 2 diabetes and has equal efficacyand better compliance than the free combination of glimepiride and metformin. In 2008, Amaryl M® waslaunched in India, Mexico and Brazil among other countries.
Our leading market for Amaryl® is Japan, where it is the leading oral antidiabetes product by volume(source: IMS 2008 sales).
Acomplia®
Acomplia® (rimonabant) is a selective CB-1 receptor blocker developed in the treatment of obese oroverweight patients with associated cardiometabolic risk factors such as type 2 diabetes or dyslipidemia. It hadbeen marketed in Europe and in certain other countries, but in 2008 was withdrawn from all selling andmarketing.
In October 2008, the European Medicines Agency (EMEA) recommended the temporary suspension of themarketing authorization of Acomplia® for the approved indication of overweight and obese patients. Sanofi-aventis subsequently definitively stopped selling and marketing Acomplia® in all countries concerned. TheGroup has filed to withdraw marketing authorizations worldwide, and in January 2009, the European Unionwithdrew the marketing authorization.
Oncology
Sanofi-aventis is a leader in the oncology field, primarily in chemotherapy, with two major agents:Taxotere® and Eloxatine®.
Taxotere®
Taxotere® (docetaxel), a taxoid class derivative, inhibits cancer cell division by essentially “freezing” thecell’s internal skeleton, which is comprised of microtubules. Microtubules assemble and disassemble during acell cycle. Taxotere® promotes their assembly and blocks their disassembly, thereby preventing many cancercells from dividing and resulting in death in some cancer cells.
Taxotere® is available in more than 100 countries as an injectable solution. It has gained approval for use ineleven indications in five different tumor types — breast, prostate, gastric, lung and head and neck. Taxotere® isindicated for early stage and metastatic breast cancer, first-line and second-line metastatic non-small cell lungcancer (NSCLC), androgen-independent (hormone-refractory) metastatic prostate cancer, advanced gastricadenocarcinoma, including adenocarcinoma of the gastroesophageal junction and for the induction treatment ofpatients with locally advanced squamous cell carcinoma of the head and neck.
In breast cancer, Taxotere® in combination with carboplatin and Herceptin® (TCH) was approved by theFDA in early stage breast cancer in May 2008. This combination, which presents a better safety profile than theanthracycline-based treatment, allows the treatment of a larger number of patients with Taxotere®. The TCHtreatment combination is now a standard of care in United States for patients with early stage breast cancer,HER2 positive and node positive. In Europe too, Taxotere®-based treatments excluding anthracycline areprescribed to an increasing number of patients with early stage localized breast cancer.
23

Taxotere® was approved in September 2008 by the Japanese Ministry of Health, Labor and Welfare(MHLW) following a supplemental New Drug Application (sNDA) for a new indication as a treatment ofmetastatic hormone refractory prostate cancer. Only a limited number of drugs with health insurance coverageare used to treat mHRPC in Japan. For this reason, Japanese urologists quickly recognized Taxotere® as thestandard of care in this indication. In the United States and Europe, Taxotere® is also considered as the standardtreatment in this indication.
Important new results of clinical studies on Taxotere® presented in 2008, in major international oncologyconferences, should lead to a more frequent use of Taxotere® for patients with breast, prostate or head and neckcancers:
• The GEICAM 9805 trial, including 1,100 patients with node negative early stage breast cancer,demonstrated a significant survival benefit in favor of the Taxotere® regimen compared to afluorouracil-based regimen. Efficacy results were presented during the 44th annual meeting of theAmerican Society of Clinical Oncology (ASCO). Those new data will be part of the EMEA and FDAdossier planned to be filed in the first quarter of 2009 for a new indication of Taxotere® in associationwith doxorubicin and cyclophosphamide for the treatment of patients with node negative early stagebreast cancer.
• For patients with androgen-independent (hormone-refractory) metastatic prostate cancer, the results ofthe Triade retrospective study presented at ASCO demonstrated that re-treatment with Taxotere® after afirst-line treatment with Taxotere® is feasible and efficient.
• The first clinical trial comparing the Taxotere®-based induction treatment with a treatment withoutinduction for patients with locally advanced head and neck cancer was presented at the 44th ASCOmeeting. An induction treatment is aimed at reducing the tumor size before a chemo-radiotherapy. Theresults demonstrated significant efficacy results on the primary endpoint in favor of the Taxotere®-basedinduction compared to chemo-radiotherapy alone. This could make the induction-based treatment thenew standard of care in this indication. The results of the clinical trial have been submitted to theJournal of Clinical Oncology with an expected publication date in the first half of 2009.
The top four countries contributing to the sales of Taxotere® in 2008 were the United States, France,Germany and Japan (source: IMS, 2008 sales).
Eloxatine®
Eloxatine® (oxaliplatin) is a platinum-based cytotoxic agent.
Eloxatine® is indicated in combination with 5-fluorouracil and folinic acid in adjuvant treatment of stage IIIcolon cancer patients who have undergone complete resection of the primary tumor and for the treatment ofadvanced carcinoma of the colon or rectum (metastatic colorectal cancer).
The development of Eloxatine® has led to major progress in the treatment of metastatic colorectal cancer.Thanks to its demonstrated ability to reduce the size and number of liver metastases, Eloxatine® increases thechances of having complete surgical removal of liver metastases and has given the hope of a potential cure in asignificant proportion of patients with initially unresectable liver metastases. Furthermore, in patients withresectable liver only metastases from colorectal cancer, the results of the EPOC study demonstrated that peri-operative chemotherapy with Eloxatine® given in combination with 5-fluorouracil/folinic acid leucovorin (theFOLFOX regimen) significantly reduced the risk of relapse compared to surgery alone.
Due to its consistently high and sustained efficacy in treating metastatic colorectal cancer, the FOLFOXregimen is a mainstay treatment of metastatic colorectal cancer in the United States, Europe and certain countriesin the Asia-Pacific region.
Eloxatine® has been developed for adjuvant treatment of colon cancer. The 6-year survival analysis of thelandmark MOSAIC study presented at the American Society of Clinical Oncology meeting in 2007 showed thatFOLFOX significantly improved the overall survival in Stage III colon cancer surgically resected. In May 2008,following the publication of the final results of the study, the FDA approved the inclusion of six-year Overall
24
Survival analysis and five-year Disease Free Survival data for stage III colon cancer patients treated followingsurgery to remove the primary tumor in the Eloxatine® Prescribing Information.
FOLFOX is now the standard treatment for stage III colon cancer patients who have undergone completeresection of the primary tumor.
Following the end of the Eloxatine® European regulatory data exclusivity in April 2006, a number ofoxaliplatin generics have received marketing authorization and have now been launched throughout Europe.
Eloxatine® is in-licensed from Debiopharm and is marketed in more than 70 countries worldwide. The threeleading countries in for sales of Eloxatine® in 2008 were the United States, France and Canada (source: IMS,2008 sales).
Central Nervous System
We have long-standing expertise in the Central Nervous System therapeutic area. Our principal products inthis area are:
Stilnox®/Ambien®/Myslee®
Stilnox® (zolpidem tartrate) is the leading hypnotic worldwide and is indicated in the short-term treatmentof insomnia.
Stilnox® is available in 5 mg and 10 mg tablets. Stilnox® rapidly induces sleep that is qualitatively close tonatural sleep and devoid of certain side effects that are characteristic of the benzodiazepine class as a whole. Itsaction lasts for a minimum of six hours, and it is generally well tolerated, allowing the patient to awake with areduced risk of impaired attention, decreased alertness or memory lapses throughout the day. The risk ofdependence is minimal when Stilnox® is used at the recommended dosage and duration of use. Stilnox® iscurrently the only hypnotic demonstrated to be suitable for “as needed” use based on an extensive program ofeight clinical trials, which together enrolled over 6,000 patients. This mode of administration avoids thesystematic intake of a hypnotic by patients who suffer only occasionally from insomnia.
We have developed a controlled release formulation of zolpidem tartrate, sold in the United States under thebrand name Ambien® CR in 6.25 mg and 12.5 mg tablets.
Stilnox® is marketed in over 100 countries. It was launched in Japan under the brand name Myslee® inDecember 2000 and became the leading hypnotic on the market within three years of its launch. Myslee® hasbeen copromoted jointly with Astellas since 2006. We launched Ambien® CR in the United Sates in September2005.
The top three markets for Stilnox® (both immediate and controlled release formulations) are the UnitedStates, Japan and Italy (based on 2008 net sales).
Generic zolpidem tartrate has been available in France since 2004. In the United States, generics of theimmediate release formulation of Ambien® have been available since 2007.
Copaxone®
Copaxone® (glatiramer acetate) is an immunomodulating agent indicated for reducing the frequency ofrelapses in patients with relapsing-remitting multiple sclerosis. Copaxone® is available as a self-injectablepre-filled syringe storable at room temperature for up to one month. This formulation allows improved productdelivery, increased patient comfort and convenient transportation and storage.
This disease-modifying drug is characterized by an original and specific mode of action on multiplesclerosis. Clinical studies have shown that Copaxone® is more effective than placebo at two years, but also that ithas a clinical efficacy over 15 years both in reducing relapses and progression of disability. A significant effecton lesions has also been confirmed by nuclear magnetic resonance imaging.
25

Recent results of the PreCISe study have demonstrated that Copaxone® reduces the risk of developingconfirmed multiple sclerosis in patients having Clinical Isolated Syndrome (CIS) by 45% as compared to aplacebo. In February 2009 the Medicines and Healthcare products Regulatory Agency (MHRA) approved anexpanded label for Copaxone® to include the treatment of patients with CIS suggestive of multiple sclerosis(MS). This approval includes 24 EU member countries that take part in the MHRA “mutual recognitionprocedure”. Applications have been submitted to national Health Authorities of other European countries,including France and Switzerland. Approval of an expanded label for Copaxone® to include the treatment of CISpatients was also provided by the Australian Health Authority (the Therapeutic Goods Administration) inDecember 2008.
The three leading countries for Copaxone® are the United States, Germany, and France (based on 2008 netsales).
Copaxone® is in-licensed from Teva and marketed via our agreement with that company. Teva assumed theCopaxone® business, including sales of the product in the United States and Canada, on March 31, 2008. Underthe terms of our agreement, the Copaxone® business in other countries will be transferred to Teva over a periodrunning from Q4 2009 to Q1 2012 at the latest, depending on the country. Additional details on this agreementcan be found in “— Alliances” below.
Depakine®
Depakine® (sodium valproate) is a broad-spectrum anti-epileptic that has been prescribed for more than 40years. Numerous clinical trials, as well as long years of experience have shown that it is effective for all types ofepileptic seizures and epileptic syndromes, and is generally well tolerated. Consequently, Depakine® remains areference treatment for epilepsy worldwide.
Depakine® is also a mood stabilizer, registered in the treatment of manic episodes associated with bipolardisorder and in numerous countries in the prevention of mood episodes. Valproate is recommended as a first-linetreatment in these indications by international guidelines such as the guidelines of the American PsychiatricAssociation, the Canadian Network for Mood and Anxiety Treatments and the U.K. NICE Guidance.
We provide a wide range of formulations of Depakine® which permits its adaptation to most types ofpatients: syrup, oral solution, injection, enteric-coated tablets, Chrono® (a sustained release formulation intablets) and Chronosphere® (sustained release formulation of Depakine® packaged in stick packs, facilitating itsuse by children, the elderly and adults with difficulties swallowing).
Depakine® is marketed in over 100 countries, including the United States, where it is licensed to Abbott.
The top three markets for Depakine® are the United Kingdom, France and Italy (based on 2008 net sales).
Internal Medicine
Our main products in the internal medicine therapeutic area are in the fields of respiratory/allergy, urologyand osteoporosis.
Respiratory/Allergy
Allegra®/Telfast®
Allegra® (fexofenadine hydrochloride) is an effective, long-lasting (12- and 24-hour) non-sedatingprescription antihistamine for the treatment of seasonal allergic rhinitis (hay fever) and for the treatment ofuncomplicated skin manifestations of chronic idiopathic urticaria (hives). It offers patients significant relieffrom allergy symptoms without causing drowsiness.
Allegra® Oral Suspension 30 mg/5 ml (6 mg/ml) was commercially launched in the United States in2007 for the treatment of hay fever symptoms in children between the ages of 2 and 11 years and thetreatment of the uncomplicated skin manifestations of hives in children aged 6 months to 11 years. Allegra®
Orally Disintegrating Tablets (ODT), 30 mg was launched in the United States in February 2008 for use inthe treatment of hay fever symptoms and uncomplicated skin manifestations of hives in children betweenthe ages of 6 and 11 years.
26

We also market Allegra-D® 12-Hour and Allegra-D® 24-Hour, antihistamine/decongestantcombination products with an extended-release decongestant for effective non-drowsy relief of seasonalallergy symptoms, including nasal congestion.
Allegra®’s largest market is Japan (based on 2008 net sales). Allegra-D® 12-Hour and Allegra-D®
24-Hour’s biggest market is the United States (based on 2008 net sales).
The single-entity formulation of Allegra® already faces generic competition in its major marketsoutside Japan. In settlement of patent litigation, Barr has been granted a license to sell a generic Allegra®D-12 Hours in the United States starting in November 2009.
Nasacort®
Nasacort®AQ Spray (NAQ) (triamcinolone acetonide) is an unscented, water-based metered-dosepump spray formulation unit containing a microcrystalline suspension of triamcinolone acetonide in anaqueous medium. First launched in 1996, NAQ is an intranasal corticosteroid, which is recommended intreatment guidelines as first-line treatment for moderate to severe allergic rhinitis patients. NAQ offerssignificant relief from nasal allergy symptoms to patients, with no scent, alcohol or taste.
Previously indicated for the treatment of the nasal symptoms of seasonal and perennial allergic rhinitisin adults and children six years of age and older, Nasacort®AQ received an additional approval for theseasonal and annual treatment of pediatric patients between the ages of 2 and 5 years from the FDA inSeptember 2008.
Our leading markets for Nasacort®AQ Spray are the United States, France and Turkey (based on 2008net sales).
In settlement of patent litigation, Barr has been granted a license to sell a generic triamcinoloneacetonide in the United States as early as 2011.
Urology
Xatral®/Uroxatral®
Xatral® (alfuzosin) belongs to the class of alpha1-blockers. Capable of acting selectively on the lowerurinary tract, it was the first alpha1-blocker indicated and marketed exclusively for the treatment ofsymptoms of benign prostatic hyperplasia (BPH). It is also the unique alpha1-blocker indicated as anadjunctive therapy with catheterization for acute urinary retention (AUR), a painful and distressingcomplication of BPH. Since 2003, Xatral® has obtained authorizations of this extension of the indication in56 countries worldwide including 16 European countries.
Xatral® OD (extended release formulation) is active from the first dose, provides a rapid and lastingsymptom relief and improves patient quality of life.
The benefits of Xatral® on AUR — demonstrated with the ALFAUR study — have been confirmed bythe largest international registry ever conducted on the management of AUR, Reten-World. Final resultswere based on 6,074 patients catheterized for AUR associated with BPH; demonstrating that a trial withoutcatheter is now the standard of care worldwide (78% of cases) and that 86% of patients received an alpha1-blocker (Xatral® in seven case out of ten) at the time of catheter removal. The survey also confirmed thatreturn to normal voiding was significantly higher in patients who received an alpha1-blocker (mainlyXatral®) at the time of catheter removal.
The ALTESS study had shown that Xatral® significantly reduced the risk of overall BPH progression.The long term results of the ALF-ONE real life practice study were published in April 2008. The study,which enrolled some 700 patients treated with Xatral® over a three-year period , confirmed its efficacy andsafety and showed that patients experiencing BPH progression could be rapidly identified as they are in factnot responding to Xatral® treatment.
Lastly, Xatral® is the only alpha1-blocker showing no deleterious effect on ejaculation, as shown bythe final results of the international ALF-LIFE trial.
The results of the Phase III clinical trial undertaken as part of the development of Xatral® in Japan willbe discussed with the health authorities as part of a preliminary consultation in 2009.
27
The once-daily formulation of Xatral® (branded Uroxatral® in the United States) has been registered inover 90 countries and is marketed worldwide, with the exception of Australia and Japan.
Over four billion treatment days of alfuzosin have been prescribed worldwide since launch. The threeleading countries for sales of Xatral® in 2008 were the United States, Italy and France (based on 2008 netsales). Generic alfuzosin became available in Italy in 2008, negatively affecting our sales there.
Osteoporosis
Actonel®/Optinate®/Acrel®
Actonel® (risedronate sodium) belongs to the bisphosphonate class. The bisphosphonates areantiresorptive treatments that inhibit osteoclast-mediated bone resorption and therefore help to preventosteoporotic fractures.
Actonel® is the only osteoporosis treatment that reduces the risk of vertebral fracture and non-vertebralfractures in just six months. Actonel® also provides reduced risk of fracture at all key osteoporotic sites:vertebral, hip and non-vertebral sites studied as a composite endpoint (hip, wrist, humerus, clavicle, leg andpelvis).
Actonel® is available in various formulations (tablets and sachets) and dosages to better fit patients’needs:
Actonel® 5 mg daily is indicated for the prevention of postmenopausal osteoporosis (PMO) in Europeand for the treatment of PMO and glucocorticoid-induced osteoporosis in Europe and the United States. Inthe United States, it is indicated for patients either initiating or continuing systemic glucocorticoid treatment(daily dosage of 7.5 mg or more of prednisone or equivalent) for chronic diseases.
Actonel® 35 mg once-a-week is indicated for treatment of this disease and for treatment ofosteoporosis in men in both Europe and the United States, and for prevention of PMO in the United States.
Actonel® 30 mg is approved for the treatment of Paget’s disease, a rare bone disorder.
Actonel® 75 mg, already available in the United States, was launched in France and Italy in September2008. Actonel® 75 mg is a monthly treatment dosed on two consecutive days during the month, for thetreatment of PMO.
Actonel® 150 mg was launched in the United States in June 2008 for the treatment of PMO. Recentyear-2 results confirmed that 150 mg Actonel® given once-a-month was overall similar to 5 mg dailyActonel® in both efficacy and safety/tolerability when used in the treatment of postmenopausalosteoporosis.
Actonelcombi®, the combination of Actonel® 35 mg and calcium/vitamin D pouch form was launchedin France in January 2008.
Actonel® is in-licensed from Procter & Gamble Pharmaceuticals (P&G). It is marketed by sanofi-aventis and P&G in more than 75 countries through the “Alliance for Better Bone Health”. Additionaldetails on this alliance can be found in “— Alliances” below. In Japan, Actonel® is marketed by Eisai.
The top four markets for Actonel® are the United States, France, Canada and Spain (source: IMS, 2008sales, all available channels).
Other Pharmaceutical Products
The global portfolio of sanofi-aventis comprises a wide range of other pharmaceutical products, includingprescription drugs and products sold over the counter (OTC), making up our “base business”. These productsrepresent almost one third of the Group’s worldwide pharmaceutical net sales (32.6% in 2008) and account formore than 57% of pharmaceutical net sales in the five “BRIC-M” countries (Brazil, Russia, India, China andMexico) with growth of some 13% in 2008 (comparable data).
These products account for a significant share of our sales in some emerging, fast growing markets, inparticular thanks to the so-called “local star” products, whose penetration in specific national markets is verydeep, and also to “tail” products whose long presence on the market, effectiveness and safety has induced strongbrand recognition by healthcare professionals and patients.
28

We are already active on the market for generic drugs through our brand Winthrop®, which combines thegeneric promotion of our own mature molecules together with a broad-based portfolio of over 300 genericmolecules originating from other laboratories. We seek to enhance our generic business through the acquisitionof a controlling interest in Zentiva N.V. scheduled to close on March 11, 2009. Zentiva N.V. is a branded genericgroup of which we already own 24.9%, with products tailored to the Eastern and Central Europe markets. Seealso “Item 7. Major Shareholders and Related Party Transactions — B. Related Party Transactions” and NoteD.21. to our consolidated financial statements included at Item 18 of this annual report.
With over 2% market share based on 2008 sales of €1,415 million (an increase of 5.3% on a comparablebasis), sanofi-aventis ranks sixth (source: Nicholas Hall, DB6 2007 MSP, based on “owner” perimeter) in theworld OTC market. Our portfolio includes well known brands, whose aggregate sales accounted for 44% of ourOTC sales in 2008 and are expected to continue growing substantially. In 2008, we also acquired SymbionConsumer, the Australian leader in nutraceuticals (vitamins, minerals and food supplements) and OTC brandsand intend to offer this portfolio internationally.
Vaccines Products
Sanofi Pasteur is a fully integrated vaccine division offering the broadest range of vaccines in the industry.In 2008, sanofi pasteur immunized over 500 million people against 20 serious diseases and generated net sales of€2,861 million. Sales were favorably impacted by the strong growth in markets outside of North America andEurope, the launch of Pentacel® in the United States in 2008 and the continued growth of Adacel® andMenactra® in the same market. Sales growth was also due to an uptake of Pentaxim® sales in the internationalregion, and the successful seasonal influenza vaccine campaigns.
Sanofi Pasteur is the world leader in the vaccine industry. It holds a leading position in most countries. Inthe United States and Canada, sanofi pasteur is the market leader in the segments where we compete.
In Europe, our vaccine products are marketed by Sanofi Pasteur MSD, a joint venture held equally by sanofipasteur and Merck & Co., which serves 19 countries. Sanofi Pasteur MSD is the market leader in Europe overalland in particular in France. In 2008, net sales of Sanofi Pasteur MSD, which are accounted for using the equitymethod, amounted to €1,272 million.
Sanofi Pasteur has established a leading position in Latin America. It has also been expanding in Asia,particularly in China and India, and is very active in international publicly-funded markets. We also have asignificant activity in other developed, middle income and emerging markets throughout the world.
The table below details net sales of our Vaccines activity by range of products:
(€ million) Net Sales
Pediatric Combination and Poliomyelitis Vaccines . . . . . . . . . . . . . . . . . . . . . . . . . 768Influenza Vaccines * . . . . . . . . . . . . . . . . . . . . . . . . . . . . . . . . . . . . . . . . . . . . . . . . . 736Meningitis/Pneumonia Vaccines . . . . . . . . . . . . . . . . . . . . . . . . . . . . . . . . . . . . . . . 472Adult and Adolescent Booster Vaccines . . . . . . . . . . . . . . . . . . . . . . . . . . . . . . . . . 399Travel and Endemic Vaccines . . . . . . . . . . . . . . . . . . . . . . . . . . . . . . . . . . . . . . . . . 309Other Vaccines . . . . . . . . . . . . . . . . . . . . . . . . . . . . . . . . . . . . . . . . . . . . . . . . . . . . .
Total Human Vaccines . . . . . . . . . . . . . . . . . . . . . . . . . . . . . . . . . . . . . . . . . . . . . .
177
2,861
2008
* Seasonal and pandemic influenza vaccines.
Pediatric Combination and Poliomyelitis (polio) Vaccines
These vaccines vary in composition due to diverse immunization schedules throughout the world. Thisgroup of products — which protect against up to five diseases in a single injection — is anchored by acellularpertussis components.
Daptacel®, a trivalent vaccine against pertussis, diphtheria and tetanus, was launched in the United States in2002 and has become a strong sales contributor due to its adaptation to immunization schedules. In 2008, the
29

FDA licensed Daptacel® vaccine for the fifth consecutive dose in the pediatric DTaP immunization series.Daptacel® is now licensed in the United States for the entire immunization series to protect against diphtheria,tetanus, and pertussis, enabling health care professionals to administer the same brand of DTaP vaccines.
Act-HIB®, for the prevention of Haemophilus influenzae type b infections, is also an important growthdriver within the pediatric product line. In 2008, Act-HIB® became the first Hib vaccine to be approved in Japan.In the United States, sanofi pasteur successfully improved its market supply to respond to a competitor’s supplyshortage.
Pentacel®, which is a vaccine protecting against five diseases (pertussis, diphtheria, tetanus, polio andHaemophilus influenzae type b), launched in the United States in 2008, is approved in ten countries and has beenthe standard for preventive care in Canada since its launch in 1997.
Pediacel®, another acellular pertussis-based pentavalent vaccine, was launched in the United Kingdom in2004 and licensed in the Netherlands and Portugal in 2005.
Sanofi Pasteur is one of the world’s leading developers and manufacturers of polio vaccines, both in oral(OPV) and enhanced injectable (eIPV). We expect the use of eIPV to gradually increase given that the globaleradication of polio is within reach, with only four countries in the world remaining polio-endemic. As a result,sanofi pasteur is expanding its production capacity to meet this growing demand. The worldwide polioeradication initiative of the World Health Organization (WHO) and UNICEF has positioned sanofi pasteur as aglobal preferred partner with both OPV and eIPV vaccines. In 2005, sanofi pasteur developed the first new poliovaccine in nearly 30 years for use in eradication, Oral Monovalent Polio Vaccine-type 1. This product is stillbeing used as part of the WHO strategy to end polio transmission in endemic countries. In 2007, Pentaxim®, anacellular-based pentavalent vaccine containing eIPV, was launched in the international region, including Mexicoand Turkey. Mexico is the first Latin American country to integrate eIPV in its pediatric immunization schedule.In 2008, eIPV was launched in Russia following the decision by the Russian authorities to choose the inactivatedpolio vaccine from sanofi pasteur for primary immunization of all infants. eIPV is the vaccine of choice for post-eradication polio immunization programs in the Russian federation.
Influenza vaccines
Sanofi Pasteur is the world leader in the production and marketing of influenza vaccines. Sales of theinfluenza vaccines Fluzone® and Vaxigrip®/Mutagrip® have more than tripled since 1995 and annual productionreached more than 170 million doses in 2008 to better meet increasing demand. We expect the global demand forinfluenza vaccines to continue to grow within the next decade, due to an increased disease awareness and widergovernment immunization recommendations. Given the awareness of a potential influenza pandemic amongsthealth authorities, medical professionals and the public at large, the demand for influenza vaccines has increasedin general.
In recent years, influenza vaccine demand has experienced strong growth in many other countries,particularly in China, South Korea and Mexico. This trend is expected to continue over the coming years. SanofiPasteur will remain focused on maintaining its leadership in the influenza market and on meeting the increaseddemand. In November 2007, sanofi pasteur signed an agreement with the Chinese authorities for a project tobuild an influenza vaccine facility in Shenzhen (Guangdong Province) with the goal of producing influenzavaccines for the Chinese market by 2012. The foundation stone of this new facility was laid in October 2008. InNovember 2008, sanofi pasteur signed an agreement with Birmex and the Mexican Health Authorities for aproject to build a new influenza vaccine facility in Ocoyoacac. The building of the plant is planned to start in2009.
In April 2007, sanofi pasteur received the first U.S. license for a vaccine against avian influenza in humans,marking an important milestone in pandemic preparedness. The licensure of this vaccine was based on a clinicaltrial conducted by the National Institute of Allergy and Infectious Diseases.
In April 2008, the U.S. Department of Health and Human Services (HHS) accepted H5N1 bulk vaccineantigen to produce approximately 38.5 million doses of vaccine to protect against a new strain of avian influenza.Sanofi Pasteur has a multi-year contract with HHS as part of its pandemic program, and received a payment of$192.5 million for acceptance of the bulk vaccine lot.
30

On February 26, 2009 the European Commission granted marketing authorization for sanofi pasteur’sINTANZA®/IDflu®, the first intradermal (ID) microinjection influenza vaccine. The advantages of this vaccine,in particular the convenience and the ease of administration, should help improve the coverage rate in Europe.This new vaccine for seasonal influenza will be marketed as Intanza® or IDflu®. Intanza®/IDflu® vaccine is nowapproved in the European Union territory for the prevention of seasonal influenza in both the adult (aged 18 andover) and elderly (aged 60 and over) populations.
Adult and Adolescent Boosters
The incidence of pertussis (whooping cough) is on the rise globally, affecting children, adolescents andadults. Its resurgence, combined with an increased awareness of the dangers of vaccine-preventable diseases ingeneral, has led to higher sales of this product group in recent years. Adacel®, the first trivalent adolescent andadult booster against diphtheria, tetanus and pertussis, was licensed and launched in the United States in 2005.Adacel® has been the standard of care in Canada since 2004, where most provinces provide routine adolescentimmunization. This product plays an important role in efforts to better control pertussis, not only by preventingthe disease in adolescents and adults but also by breaking the cycle of transmission to infants too young to beimmunized or only partially vaccinated.
Meningitis and pneumonia vaccines
Sanofi Pasteur is at the forefront of developing vaccines to prevent meningitis and introduced the firstconjugate quadrivalent vaccine against meningococcal meningitis, arguably the deadliest form of meningitis inthe world. In 2008, sales of Menactra® continued to grow in the United States following the implementation ofthe recommendations of the Advisory Committee on Immunization Practices (ACIP) for routine vaccination ofpre-adolescents (11-12 years old), adolescents at high school entry (15 years old) and college freshmen living indormitories. In October 2007, FDA granted sanofi pasteur licensure to expand the indication of Menactra® tochildren 2 years through 10 years of age. Menactra® is now indicated for people aged 2-55 years in the UnitedStates as well as in Canada. Additional submissions are expected during the coming years in various parts of theworld. Use of meningococcal meningitis vaccines is expected to grow significantly through anticipated future usein multiple segments of the population.
For over 30 years, sanofi pasteur has supplied vaccines against A and C meningococcal meningitis used tocombat annual epidemics occurring in Sub-Saharan countries (African meningitis belt).
Travel and Endemic Vaccines
Sanofi Pasteur’s Travel/Endemic vaccines provide the widest range of traveler vaccines in the industry, andinclude hepatitis A, typhoid, rabies, yellow fever, cholera, measles, mumps, rubella (MMR) and antivenoms.These vaccines are used in endemic settings in the developing world and are the basis for important partnershipswith governments and organizations such as UNICEF. These vaccines are also used by military and travelers toendemic areas. As the global market leader in the majority of these vaccine markets, sanofi pasteur’s Travel/Endemic activity has exhibited stable growth.
Other vaccines
ACAM2000 was licensed in August 2007 as a live, attenuated vaccine against smallpox that ismanufactured using modern cell culture technologies. Its aim is to be used to guard against bioterrorism. In thisregard, a warm-based manufacturing contract was entered into with the U.S. government in April 2008 fordeveloping a vaccine stockpile.
In December 2008, sanofi pasteur received the approval to market its smallpox VV Lister/CEP vaccine inthe United Kingdom.
Pharmaceutical Research & Development
The objective of our Research & Development (R&D) organization for pharmaceutical activities is todiscover, develop, register and launch worldwide highly innovative compounds answering major unmet medicalneeds.
31

Global and focused organizations: Discovery and Development
Discovery Research
In 2008, Discovery Research continued to enrich sanofi-aventis Development’s portfolio with a pipeline ofhigh quality, innovative drugs with the potential to fulfill unmet medical needs or provide improved treatmentsfor patients. In this respect 15 new drug substances (small molecules or bio-therapeutics) entered intodevelopment.
The majority of these 2008 development entries are innovative in nature with 8 out of 15 representingfirst-in-class products.
The expertise of our scientists is developed in 6 major therapeutic areas: Metabolic Disorders,Cardiovascular Diseases, Thrombosis, Central Nervous System Diseases (neurology and psychiatry), InternalMedicine and Oncology. Our research activities currently target 12 out of the 16 diseases/conditions identified asdemonstrating pharmaceutical gaps according to the World Health Organization.
In 2008, we strengthened several key areas of innovation such as:
• Orphan G protein coupled receptors through dedication of biological and chemistry resources from ourStrasbourg (France) site, in order to increase the efficiency of the selection and optimization ofinnovative tool-compounds, agonist or antagonist of these receptors, for in vitro / in vivo evaluation.
• The search for novel anti-infectives through formalization of the organization and ramping up ofscouting for external opportunities.
Five of our new entries in preclinical development from 2008 belong to the bio-therapeutics: two originatedpurely from internal efforts and three from outside collaborations:
Opening our organization to the outside world
• Reinforcement of the interactions between Discovery and “Partnership & Innovation” led to the monthlyscreening of about twenty external opportunities at various stages of advancement and to the selectionon a yearly basis of about five to ten of them for in-depth evaluation and negotiations for putativein-licensing.
• Setting up an organization in China to boost our network of collaborations with small biotechcompanies, with public laboratories and research institutes. A team in charge of the identification ofoptions and coordination of our activities has been created with local representatives based in Beijingand Paris.
• A major agreement has been signed with the Institutes for Biological Sciences of Shanghai in order todiscover innovative drugs for the treatment of neurological disorders, Diabetes and Cancer.
• Sanofi-aventis has also signed a collaboration agreement with the University of Baltimore (JohnsHopkins School of Medicine, Maryland, United States) for the discovery of novel treatments forrespiratory illnesses (e.g. asthma, Chronic Obstructive Pulmonary Disease), from original targetidentification new evaluation methodologies and biomarkers selection.
New operating models
We have been rationalizing our organization and interfaces in order to increase productivity in Research.For instance:
• Reinforcement of interactions at the interface between Discovery and Preclinical/clinical Developmenthas enabled us to reach ambitious objectives in terms of developability of bio-therapeutics with the aimof shortening development times. A number of joint assessments will be prepared by Research andDevelopment in order to address early on any potential issues related to resources, means andtechnologies to produce and purify monoclonal antibodies and to better anticipate the entry of theseproducts into development.
32

• A solid portfolio of bio-therapeutics programs has been created with the objective to enter three to fivecandidates of biological type (such as therapeutic protein, monoclonal antibodies or protein trap) intopreclinical development per year originating either from external collaborations/in licensing or frominternal efforts.
In conclusion, the sanofi-aventis Discovery Research function is adapting to the targeted diversificationobjective of the Company towards bio-therapeutics approaches making full use of existing internal competencies.Our internal efforts are significantly complemented by a number of external opportunities. In 2008, DiscoveryResearch has continued to improve its interfaces with development in order to improve the quality of results anddossiers in full alignment with patient needs and regulatory requirements.
Development
Sanofi-aventis development relies on a strong matrix organization that leads and coordinates the efforts andexpertise of representatives from all functions, and at all stages of development, from preclinical to marketing.
Most clinical trials are monitored through the sanofi-aventis internal Clinical Research Units (CRU)network which is deployed in more than 40 countries on the five continents to ensure best patient follow-upworldwide. This international dimension allows sanofi-aventis to study global and local diseases, to meet theexpectations of local scientists, to have access to cutting-edge research and, in some countries, to fulfill a localregulatory prerequisite to obtain marketing authorization.
Sanofi-aventis has expanded its development presence in China. After the creation of a Clinical ResearchUnit in Shanghai in 2005, a state-of-the-art self-sufficient Biometrics Center was opened in Beijing in 2008. Thiscenter is devoted to study design, data management and statistical analysis of global and local Phase I to IVclinical trials, and will sustain the rapid growth of the Group Research & Development and support registrationdossiers in China.
Sanofi-aventis is maintaining its efforts for high quality standards and ensuring best patient safety:
• The majority of clinical trials started in 2008 use electronic data capture; this new technology givesdevelopment teams quicker access to patient clinical data, allows better study management, tight patientsafety follow-up and helps to improve the quality of clinical data, while meeting time compressionobjectives in the conduct of the studies.
• Most Phase II-III clinical trials are monitored by an independent external DMC (Data MonitoringCommittee), whose members are selected for their expertise in the clinical, methodological, statisticaland ethics fields. The DMC’s role and responsibilities are described in a predefined charter prepared incollaboration with sanofi-aventis. The DMC’s mission is to review on a regular basis the efficacy andsafety data collected during the trial and to propose any appropriate measure to ensure the safety of thepatients included in the study.
• An internal sanofi-aventis advisory committee was established in 2008 to evaluate the profile of thedrug-candidates in term of benefit/risk balance throughout the life of the molecules in development.
• Clinical trials as well as the systems and processes involved in these trials are regularly audited by theScientific Quality department which is independent from Development.
• Special attention is paid to the training of both sanofi-aventis employees involved in the conduct ofclinical trials (Internal Procedures, Good Clinical Practice, Regulatory requirements) and staff workingin clinical investigation sites.
Sanofi-aventis continues to commit to disseminate clinical information in a transparent manner (inaccordance with the Joint Position Statement issued by the Pharmaceutical Industry associations in January 2005)by disclosing protocol summaries of new and ongoing clinical studies on the publicly available websitewww.clinicaltrials.gov as well as posting non-exploratory clinical trial results, whether positive or not, on thepublic site www.clinicalstudyresults.org within a year of the launch of the product or of the end of the study foralready marketed product.
33
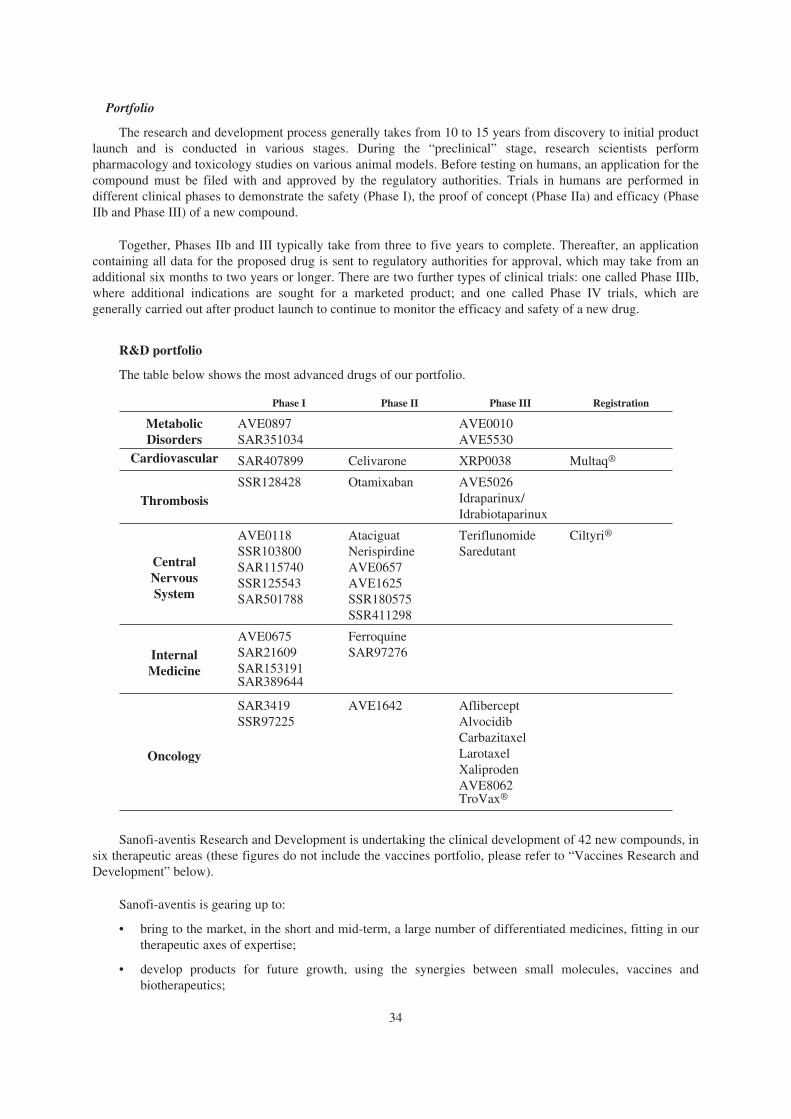
Portfolio
The research and development process generally takes from 10 to 15 years from discovery to initial productlaunch and is conducted in various stages. During the “preclinical” stage, research scientists performpharmacology and toxicology studies on various animal models. Before testing on humans, an application for thecompound must be filed with and approved by the regulatory authorities. Trials in humans are performed indifferent clinical phases to demonstrate the safety (Phase I), the proof of concept (Phase IIa) and efficacy (PhaseIIb and Phase III) of a new compound.
Together, Phases IIb and III typically take from three to five years to complete. Thereafter, an applicationcontaining all data for the proposed drug is sent to regulatory authorities for approval, which may take from anadditional six months to two years or longer. There are two further types of clinical trials: one called Phase IIIb,where additional indications are sought for a marketed product; and one called Phase IV trials, which aregenerally carried out after product launch to continue to monitor the efficacy and safety of a new drug.
R&D portfolio
The table below shows the most advanced drugs of our portfolio.
Phase I Phase II Phase III Registration
Metabolic AVE0897 AVE0010Disorders SAR351034 AVE5530
Cardiovascular SAR407899 Celivarone XRP0038 Multaq®
SSR128428 Otamixaban AVE5026
Thrombosis Idraparinux/Idrabiotaparinux
AVE0118 Ataciguat Teriflunomide Ciltyri®
CentralNervousSystem
SSR103800SAR115740SSR125543SAR501788
NerispirdineAVE0657AVE1625SSR180575
Saredutant
SSR411298
AVE0675 Ferroquine
Internal SAR21609 SAR97276
Medicine SAR153191SAR389644
SAR3419 AVE1642 AfliberceptSSR97225 Alvocidib
Carbazitaxel
Oncology LarotaxelXaliprodenAVE8062TroVax®
Sanofi-aventis Research and Development is undertaking the clinical development of 42 new compounds, insix therapeutic areas (these figures do not include the vaccines portfolio, please refer to “Vaccines Research andDevelopment” below).
Sanofi-aventis is gearing up to:
• bring to the market, in the short and mid-term, a large number of differentiated medicines, fitting in ourtherapeutic axes of expertise;
• develop products for future growth, using the synergies between small molecules, vaccines andbiotherapeutics;
34

• strengthen internal, but also external growth, taking advantage of our expertise and track record inalliances; and
• adapt to the environment, develop scenarios and anticipate changes, mainly in medical needs and in theevaluation of health costs versus the benefits provided.
Sanofi-Aventis Research and Development Achievements in 2008
The dynamics of the sanofi-aventis portfolio are illustrated through the R&D achievements and projectshighlights in 2008.
In 2008, 15 new compounds entered preclinical development (see “— Global and focused organizations:Discovery and Development — Discovery Research” above).
In 2008, several partnerships were initiated (see “— Principal Partnerships” below). With Dyax Corp. anagreement was signed granting sanofi-aventis an exclusive worldwide license for the development andcommercialization of a fully human monoclonal antibody SAR161578/DX2240, as well as a worldwide nonexclusive license to Dyax Corp’s proprietary antibody Phage display technology.
In 2008, seven compounds entered Phase I, while five projects entered Phase II and seven Phase IIIprograms were initiated. For Japan, where regulatory authorities require local studies, two Phase I and one PhaseIII development programs have been initiated (Compounds having progressed in a new phase and beingterminated subsequently were not counted).
Two NDAs for new chemical entities were submitted in the United States and in Europe: Multaq®
(dronedarone), an antiarrhythmic drug in atrial fibrillation, and Ciltyri® (eplivanserin), a 5-HT2A antagonist ininsomnia.
In Japan, the Fasturtec® dossier was submitted in February 2008 for hyperuricemia. One JNDA wassubmitted in 2008 for Lovenox® in VTE prevention after abdominal surgery.
Several sNDAs were granted in the United States and Europe in 2008 to major products like Apidra®,Actonel®, Plavix® or Lantus®.
In Japan, a new indication was approved for Taxotere® injection for the treatment of patients with prostatecancer having progressed or relapsed prostate cancer after surgical or medical castration. In April 2008,Aprovel® (irbesartan) received its first approval from the Japanese Health Authorities in the treatment ofhypertension.
A full review of the Research and Development portfolio has been initiated in order to reassess theallocation of resources and distribute them to the projects with the highest potential in the currently prevailinghealthcare environment. Consequently, a number of projects have been discontinued either on the basis of anunsatisfactory benefit/risk ratio or inadequate additional clinical benefit, or because of the expected sub-optimalreturn on investment. This review will continue through April 2009.
The following programs were halted in 2008:
• Cardiovascular: Ilepatril (AVE7688, vasopeptidase inhibitor, uncontrolled or resistant hypertension,chronic kidney disease stage 3; Phase IIB). Development was stopped based on an unfavorable expectedbenefit/risk ratio as compared to current and potential future therapies. SL65.0472 (5-HT1B/5-HT2Aantagonist, peripheral artery disease; Phase IIb). Development was stopped following results of theMASCOT Phase IIb study which showed no significant difference of the investigational drug comparedto placebo and cilostazol.
• Metabolism: the clinical development program relating to Acomplia® (rimonabant), a CB-1 antagonist,was discontinued in all indications following the European Medicines Agency recommendation tosuspend the marketing authorization for the approved indication of overweight and obese patients.AVE2268, an SGLT-2 inhibitor which was developed for Type 2 diabetes mellitus was discontinuedbecause of lack of competitiveness. A sustained release injectable form of AVE0010 in Type 2 diabetesmellitus was discontinued because of lack of competitiveness.
35

• Oncology: S-1 (oral fluropyrimidine, gastric and colorectal cancer; Phase III) rights were returned toTaiho Pharmaceuticals in July 2008 following negative results from Phase III in metastatic gastriccancer. The development of larotaxel and carbazitaxel has been discontinued in the treatment of breastcancer indication. Development in other indications is ongoing.
• CNS: Amibegron (SR58611, beta-3 agonist; Phase III) in Major Depressive Disorders (MDD) inmonotherapy and in combination with SSRI and SSR149415 (V1b antagonist; Phase IIB) in MDD andGeneral Anxiety Disorders (GAD) were discontinued due to an unfavorable product profile. Surinabant(SR147778, CB-1 receptor antagonist) was discontinued after a Phase IIb study in smoking cessationdid not achieve statistically significant results. Volinanserin (M100907, 5-HT2A antagonist, insomnia— Phase III) developed in sleep maintenance insomnia, was stopped after the results of the Phase IIIstudy for insufficient efficacy.
• Internal Medicine: Aquilda® (Satavaptan, SR121463, vasopressin V2 receptor antagonist, dilutionalhyponatremia; cirrhotic ascites). Based upon the recommendation of the DSMB (Data and SafetyMonitoring Board) to stop the Phase III program on cirrhotic ascites and the subsequent reassessment ofthe overall viability of the project, the development was discontinued. SSR240600 (NK1 antagonistoveractive bladder/urge urinary incontinence; Phase IIb). The project was stopped, following theoutcome of the dose ranging study (insufficient expected benefit/risk ratio).
Project Highlights
Our main compounds currently in clinical development Phase IIb or III are described in the paragraphsbelow.
Life Cycle Management (LCM) development programs for our marketed pharmaceutical products aredescribed above in “— Pharmaceutical Products”.
Thrombosis
The following compounds are currently in later-stage development in thrombosis:
• Idraparinux sodium (SR34006, long acting pentasaccharide, indirect factor Xa inhibitor,thromboembolic events; Phase III). Idraparinux sodium is a synthetic pentasaccharide evaluated inthe long-term treatment of thromboembolic events in patients suffering from deep-vein thrombosis(DVT) or pulmonary embolism (PE) (the VAN GOGH Phase III program) and in the prevention ofthromboembolic events associated with atrial fibrillation (AMADEUS study). The results of theVAN GOGH program and of the AMADEUS study were published in “The New England Journalof Medicine” (September 2007) and in “The Lancet” (January 2008), respectively. All the datagenerated with idraparinux sodium will be used to support registration of idrabiotaparinux sodium(see below).
• Idrabiotaparinux sodium (SSR126517, neutralizable long acting pentasaccharide, indirect factorXa inhibitor, thromboembolic events; Phase III). SSR126517 is a long-acting syntheticpentasaccharide, with the same structure and the same pharmacological activity as idraparinuxsodium. However, the addition of a “biotin hook” to the pentasaccharide structure allowsneutralization following the infusion of avidin. This unique profile potentially providesSSR126517 with a competitive advantage over current oral anticoagulants. The clinicaldevelopment program was designed to bridge clinical results obtained with idraparinux to thosewith idrabiotaparinux. The results of the bioequipotency study in patients with DVT (EQUINOX)were presented at the Annual Meeting of the American Society of Hematology (ASH) in December2008. They showed a similar PD profile between idraparinux and idrabiotaparinux, an efficientneutralization of idrabiotaparinux by avidin and a comparable efficacy / safety profile ofidraparinux and idrabiotaparinux.
The safety and efficacy study in patients with PE (CASSIOPEA) and the Phase III trial todemonstrate the efficacy of idrabiotaparinux in the prevention of stroke in atrial fibrillation patients(BOREALIS) are ongoing.
36

• AVE5026 (indirect factor Xa/IIa inhibitor, prevention of VTE; Phase III). AVE5026 is aninjectable ultra low molecular weight heparin with a high ratio of anti-factor Xa activity to anti-factor IIa activity, as compared to low-molecular-weight heparins (LMWHs). This once-a-day anti-thrombotic agent has a 100% bioavailability and is not anticipated to have drug interaction. It isbeing developed primarily in the primary prevention of venous thromboembolic events in patientsundergoing knee replacement surgery, hip replacement surgery or hip fracture surgery as well as inpatients undergoing abdominal surgery and in cancer patients undergoing chemotherapy accordingto the original plans. Regarding the medical indications for AVE 5026, it was decided to currentlyproceed only with those that target oncology patients.
• Otamixaban (XRP0673, direct factor Xa inhibitor, acute coronary syndrome; Phase IIb).Otamixaban is an injectable, selective direct inhibitor of coagulation factor Xa. It is a syntheticsmall molecule. It has predictable pharmacokinetic and pharmacodynamic properties with lowvariability. Otamixaban exhibits a fast on- and off-set of action. SEPIA-PCI, a Phase IIa study inpatients undergoing elective PCI, showed a good safety profile with predictable and dose-proportional anticoagulant activity. SEPIA-ACS, a Phase IIb study in acute coronary syndrome, iscurrently ongoing.
Cardiovascular
Certain of our principal compounds in the field of cardiovascular medicine currently in Phase II orPhase III clinical trials are described below.
• Multaq® (dronedarone, SR33589, atrial fibrillation; submitted). The results of the ATHENA trialshowed a statistically significant 24% reduction of cardiovascular hospitalization or death inpatients with atrial fibrillation (AF). In addition, a decreased risk of stroke by 34% in patients withAF already adequately treated by antithrombotic therapy was demonstrated. In ATHENA,dronedarone significantly reduced the total number of hospital nights by 28% and decreased by35% the total length of time spent in hospital for cardiovascular reasons. DIONYSOS study resultsshowed the respective profiles of dronedarone and amiodarone: in the primary endpoint, atrialfibrillation after electrical cardioversion occurred in 36.5% of patients in the dronedarone armversus 24.3% of patients in the amiodarone arm. However, in the dronedarone arm less thyroidevents (2 versus 15), neurological events (3 versus 17) and premature study drug discontinuationdue to any adverse events (13 versus 28) were observed. The FDA granted a priority review statusfor the use of Multaq® in patients with AF in August 2008. In November 2008, the FDA informedsanofi-aventis that they intended to discuss the Multaq® (dronedarone) application at the Cardio-Renal Advisory Committee on March 18, 2009.
• Celivarone (SSR149744, antiarrhythmic; Phase IIb). Following the results of the ICARIOS trial,which demonstrated celivarone’s effects on reducing the firing rate of implantable cardioverter/defibrillator (ICD) by 46% for either ventricular tachycardia or fibrillation versus placebo, thedevelopment of celivarone was stopped in atrial fibrillation. Its future development will depend onthe outcome of the Multaq® Advisory Committee on March 18, 2009.
• XRP0038 (NV1FGF, non-viral fibroblast growth factor 1, critical limb ischemia; Phase III).XRP0038 is an injectable non-viral DNA plasmid and gene therapy-based approach for thepromotion of angiogenesis in patients with peripheral arterial disease that statistically significantlyprolonged time to amputation as compared to placebo in a Phase IIb study in patients with criticallimb ischemia. A Phase III program (TAMARIS study) is currently ongoing. The primaryobjective is to demonstrate the safety and effectiveness of XRP0038 in the prevention of majoramputations in critical limb ischemia patients. Submission is planned for end of 2010.
Metabolic Disorders
Our main compounds currently in clinical development Phase II or III for metabolic disorders aredescribed below.
• The AVE1625 (CB1 antagonist) development program in metabolism is discontinued and thedevelopment is focused in CNS indications (see “— Central Nervous System”, below).
37
• AVE0010 (GLP-1 agonist, type 2 diabetes mellitus; Phase III). In Phase IIb, once-a-day dosingwith AVE0010 was shown to be effective in lowering blood sugar and decreasing body-weightwith a good tolerability. A Phase III program in patients with type 2 diabetes mellitus was initiatedduring the second quarter of 2008. Completion of this program is projected for 2010 (AVE0010was licensed-in from Zealand Pharma A/S).
• AVE5530 (Cholesterol absorption inhibitor, hypercholesterolemia; Phase III). In a Phase II study,AVE5530 demonstrated that it decreased LDL-C (Low Density Lipoproteins-Cholesterol) inpatients with hypercholesterolemia. The Phase III program (four studies) was initiated in 2008 withtwo doses of AVE5530 (25 mg and 50 mg) once daily.
Oncology
The sanofi-aventis oncology portfolio represents a broad spectrum of novel agents with a variety ofmechanisms of action for treating cancer and/or cancer side-effects, including cytotoxic agents, antimitoticagents, anti-angiogenic agents, antivascular agents, monoclonal antibodies, and cancer vaccines as well assupportive care therapies. Our principal compounds in the field of oncology currently in clinical trials aredescribed below.
• Xaliproden (SR57746, neurotrophic, chemotherapy-induced neuropathy; Phase III). Xaliproden isan orally active neurotrophic agent which is currently being studied in Phase III trials for thetreatment of chemotherapy-induced neuropathy with a go/no go decision for regulatorysubmissions anticipated in the second half of 2009.
• Larotaxel (XRP9881, taxoid, pancreas and bladder cancers; Phase III). XRP9881 is a taxanederivative that has been designed to overcome resistance to existing taxanes, docetaxel andpaclitaxel. Larotaxel in monotherapy has shown to be active in tumors progressing afteranthracycline/taxane therapy (metastatic breast cancer, Phase II). Based on the results of Phase IIIin second-line pancreas cancer, regulatory submissions are planned in the United States and inEurope in June 2010. A Phase III in first-line bladder cancer in combination with cisplatin wasinitiated at end 2007 and is ongoing.
• Carbazitaxel (XRP6258, taxoid, prostate cancer; Phase III). XRP6258 is a new taxane derivative.XRP6258 has shown to be active in tumors progressing after taxane therapy (metastatic BC, Ph II).A Phase III study in hormone resistant prostate cancer after failure of Taxotere® is ongoing, withdata expected in 2009.
• Alvocidib (flavopiridol, HMR1275, cyclin-dependent kinase inhibitor, chronic lymphocyticleukaemia (CLL); Phase III). Alvocidib is being developed in collaboration with Ohio StateUniversity and the U.S. National Cancer Institute. A pivotal clinical Phase II/III program tosupport accelerated/conditional approval in refractory CLL patients is on going in Europe and theUnited States. Additional studies will be exploring the potential benefit of alvocidib in variousother hematological malignancies.
• Aflibercept (VEGF Trap, AVE0005, anti-angiogenesis agent; solid tumors; Phase III). VEGF(Vascular Endothelial Growth Factor) Trap is being developed under an alliance with RegeneronPharmaceuticals. VEGF Trap is a novel anti-angiogenesis agent that acts as a decoy receptor or“Trap” for circulating VEGF. Four Phase III studies in combination with chemotherapy in patientswith several solid tumors are ongoing in the following indications: in first line advanced prostatecancer (with Taxotere®/prednisone), in second line non-small cell lung cancer (with Taxotere®), insecond line metastatic colorectal cancer (with FOLFIRI) and in first line metastatic pancreascancer (with gemcitabine). Additional exploratory studies in earlier stage disease or otherindications are being conducted either by sanofi-aventis and Regeneron or in collaboration with theU.S. National Cancer Institute. Registration in refractory ovarian cancer as single agent wascancelled as the results, although demonstrating biological activity, are unlikely to meet regulatoryrequirements.
• TroVax® (advanced renal cell cancer, Phase III) is a cancer therapeutic vaccine in-licensed inMarch 2007 from Oxford BioMedica targeting a broad spectrum Tumor-Associated Antigen called
38

5T4, which is broadly distributed throughout a wide range of solid tumors. In Phase II studies,TroVax® has been shown to induce a strong immune humoral and cellular response, both as singleagent and in combination with immunotherapy (renal cancer) and chemotherapy (metastaticcolorectal cancer). TroVax® is being evaluated in a Phase III study in advanced renal cellcarcinoma patients (TRIST). However, following its fourth interim review of the data, the DMC(Data Monitoring Committee) advised that TroVax®, administered according to the protocol, willnot meet the predefined primary efficacy endpoint, and therefore recommended to discontinuefurther vaccinations but continue follow-up of patients.
• AVE8062 (combretastatin derivative) is a new antivascular licensed from Ajinomoto. Single agentand combination studies with cisplatin, docetaxel and oxaliplatin have been conducted withAVE8062 over recent years. In these studies, AVE8062 has been shown to dramatically decreasethe tumor blood flow, resulting in anti-tumor efficacy, mainly in combination. At therecommended dose, AVE8062 appears to be well tolerated. Based on these data, a Phase III insarcoma in combination with cisplatin has been initiated in 2008.
• AVE1642 is an anti-IGF1R monoclonal antibody developed in collaboration with ImmunoGen.Single agent and combination studies with docetaxel have confirmed the good tolerance of the drugas well as encouraging signs of activity, mainly in combination. Further combinations with otheranticancer agents are being explored. Based on these encouraging data, a randomized Phase IIstudy in combination with fulvestrant in women with hormone sensitive breast cancer has beeninitiated.
Central Nervous System
Certain of our principal compounds in the Central Nervous System field currently in Phase II or IIIclinical trials are described below.
• Teriflunomide (HMR1726, immunomodulator, multiple sclerosis; Phase III). Teriflunomide is anorally active dihydroorotate dehydrogenase inhibitor. An international Phase III developmentprogram is progressing in multiple sclerosis.
• Saredutant (SR48968, NK2 antagonist, depression, anxiety; Phase III). Saredutant is anon-peptide selective antagonist of the human brain NK2 receptors developed for the treatment ofmajor depressive disorders (MDD). Five short-term Phase III studies demonstrated an overallstatistically significant efficacy versus placebo. In the long-term efficacy trial, benefit ofcontinuing saredutant for one year in responders to an initial 3-month saredutant course was notdemonstrated. The decision on submitting saredutant for regulatory approval will depend on theresults of the two ongoing trials, assessing the product in combination with two selective serotoninreuptake inhibitors (SSRIs), which are due to be completed in the first half of 2009.
• Ciltyri® (eplivanserin (SR46349), 5-HT2A antagonist, insomnia; submitted). Ciltyri® is a newnon-sedative sleep agent developed for the treatment of chronic insomnia characterized bydifficulties with sleep maintenance. A large world-wide Phase III program was completed whichincluded more than 2,700 patients. At 5mg /day Ciltyri® improves sleep maintenance bydecreasing the wake time after sleep onset and the number of nocturnal awakenings and improvingthe quality of sleep/refreshing quality of sleep. Ciltyri® is overall well tolerated and, unlike otheravailable sedative sleep agents is devoid of next-day residual effects. The registration dossier wasfiled in the United States and Europe in late 2008.
• AVE1625 (CB1 antagonist, schizophrenia; Phase IIb). AVE1625 is an oral selective and potentantagonist of cannabinoid receptors. A Phase II development program for cognitive impairment inschizophrenia is ongoing.
• Ataciguat (HMR1766, NO-independent activator of soluble guanylate cyclase; Phase IIb). ThePhase IIb study (ACCELA) was completed. The results of this study did not show a significantdifference of HMR1766 compared to placebo or cilostazol in patients with intermittentclaudication, Fontaine classification stage II. A clinical investigation in patients with neuropathicpain is ongoing.
39
• Nerispirdine (HP184 K+ and Na+ Channel Blocker, symptomatic treatment for MS; Phase II)initiated the Phase II program for symptomatic treatment of all forms of multiple sclerosis (MS).
• SSR411298 (FAAH inhibitor; Phase II). A dose finding study has been initiated in 2008 in MajorDepressive Disorders in elderly patients.
Internal Medicine
Our principal compounds in the field of Internal Medicine currently in late-phase clinical trials aredescribed below.
• Ferroquine (SSR97193, 4-aminoquinoline, malaria; Phase II). Ferroquine is a new4-aminoquinoline which is being developed for the treatment of acute uncomplicated Plasmodiumfalciparum malaria in combination with another antimalarial (artesunate, an artemisininederivative). A Phase II study aimed at evaluating the safety and activity of the association in adultAfrican patients has just been completed. Further evaluation of the drug’s therapeutic potential inchildren (the most at risk for the disease) is planned to start in 2009.
• Besides ferroquine, one other antimalarial drug with an innovative mechanism of action iscurrently in development. SAR97276 is developed for the treatment of severe Plasmodiumfalciparum malaria in adults and children. Phase II started in 2008 in Africa.
These projects are part of the global commitment of sanofi-aventis to fight against neglected diseases whichheavily impact the developing world.
Principal Partnerships
Through partnerships and alliances established with biotechnology firms and other pharmaceutical groups,sanofi-aventis is able to access new technology and to extend or strengthen existing areas of research. Further tothose already mentioned, some examples are described below.
Discovery Research
Two types of partnerships are being used to enhance Discovery Research:
• Technological partnerships giving sanofi-aventis teams access to new technology and extending theirresearch and skills areas. The following are examples of such partnerships:
- Elan (Dublin, Ireland): license for NanoCrystal® formulation technology, which can enableformulation and improve compound activity and final product characteristics.
- Critical Path Institute (Tucson, Arizona, United States): sanofi-aventis is a member of thePredictive Safety Testing Consortium (PSTC), which aims at identifying and developing methodsfor testing drug safety.
- Dyax Corp. (Cambridge, Massachusetts, United States): see “— sanofi-aventis Research andDevelopment Achievements in 2008” above.
- dScreen Consortium: founded with the assistance of the “Alsace Biovalley” cluster (France),sanofi-aventis launched in September 2008 a research initiative conducted with RaindanceTechnologies (Lexington, Massachusetts, United States) and Louis Pasteur University(Strasbourg, France) to develop the new generation of High-Throughput Screening (HTS) for drugdiscovery applications.
• Partnerships on innovative products, to maximize opportunities of exploring new leads in ourtherapeutic areas of excellence. The following are examples of such partnerships:
- Immunogen (Cambridge, Massachusetts, United States): identifying and developing “naked”antibodies or immuno-conjugates (monoclonal antibodies associated with an anticancer agent) inoncology. On the technology side, sanofi-aventis has licensed the rights to Immunogen’sproprietary resurfacing technology to humanize antibodies. The research collaboration ended onAugust 31, 2008, but compounds are still in the development portfolio.
40
- Regeneron Pharmaceuticals, Inc. (Tarrytown, New York, United States): very active, global,strategic collaboration agreement (signed in 2007) to discover, develop, and commercialize fully-human therapeutic antibodies. In 2008, two antibodies entered into preclinical development (seealso “—Discovery Research”).
- Institute of Hematology and Blood Diseases Hospital, Chinese Academy of Medical Sciences(Tianjin, China): the purpose of the agreement is the isolation of acute myeloid leukemia stemcells and the generation of monoclonal antibodies against these cells with the aim to capitalize onthe increasing evidence of the role of cancer-stem cells. Such antibodies would serve as valuablevectors to study these rare cells and may become the basis for new therapeutic strategies.
- Coley (Wellesley, Massachusetts, United States): global license and collaboration agreement onresearch into CpG (Cytosine phospodiester Guanine) oligonucleotides, which act asimmunomodulators, for the treatment of certain respiratory disorders.
- Mitsubishi Pharmaceutical Corp. (Tokyo, Japan): identifying and developing new protectiveagents for the treatment of neurodegenerative diseases.
- Genfit (Lille, France): collaboration covering several projects, particularly pharmacologicalcharacterization and selection of the best drug candidates of sanofi-aventis to act on an innovativetarget involved in metabolic and inflammatory mechanisms and launch of a new program basedon a new target involved in inflammatory diseases.
- INSERM/Innogenetics (through affiliate INSERM Transfert, Paris, France and Gent, Belgium):collaboration that will make it possible to study the role of specific forms of the key Alzheimerprotein amyloid beta, and to discover new therapeutic avenues for Alzheimer’s disease.
- Global Alliance for TB drug Development: collaboration agreement to accelerate the discovery,development and clinical use of drugs against tuberculosis.
As part of the “Impact Malaria” program, three cooperative programs were continued in 2006. Ferroquine,co-developed with the Université Scientifique et Technique de Lille (France), is currently in Phase IIb of clinicaldevelopment.
In the same field, sanofi-aventis and Medicines for Malaria Ventures (Geneva, Switzerland) have enteredinto a collaboration to fight malaria. Sanofi-aventis will share information with MMV on its malaria drugsportfolio, and will define specific collaborative actions for development of the portfolio projects.
Sanofi-aventis is engaged in numerous partnerships with academic institutions: such as INSERM, CNRS,CEA or Institut Pasteur in France, Frankfurt University in Germany, Rockefeller University in the United States.
License and development agreements
• Regeneron Pharmaceuticals, Inc. (Tarrytown, New York, United States): joint development of arecombinant fusion protein, the VEGF Trap (AVE005), that produces soluble decoy-receptors whichbind to VEGF (Vascular Endothelial Growth Factor), stopping it from stimulating the natural VEGFreceptor and thus preventing angiogenesis. The VEGF Trap has now entered Phase III of clinicaldevelopment.
• Zealand: AVE0010 is a glucagon-like peptide 1, or “GLP-1”, receptor agonist, currently in Phase IIIclinical trials, intended to treat type 2 diabetes.
• Ajinomoto: AVE8062 is an antivascular agent for the treatment of solid tumors, currently in Phase IIIclinical trials.
• Oxford BioMedica (Oxford, United Kingdom): exclusive global licensing agreement to develop andcommercialize TroVax®, an immunotherapy product for the treatment and prevention of cancers.Based on the broad distribution of the 5T4 tumor antigen, TroVax® has potential application in a widerange of solid tumors, including renal, colorectal, lung, breast and prostate cancer. The compound is inPhase III.
41

• Dyax Corp (Cambridge, Massachusetts, United States): as part of the strategic antibody collaboration,sanofi-aventis has been granted an exclusive global license for the development and commercializationof DX-2240, a fully human monoclonal antibody that targets the Tie-1 receptor on tumor blood vesselsand has therapeutic potential in numerous oncology indications.
• Novozymes (Bagsvaerd, Denmark): a global licensing and collaboration agreement was signed inDecember 2008, for the development and marketing of a potential new antibiotic (plectazin NZ2114).
Partnerships for access to medicines
Sanofi-aventis works in partnership with the World Health Organization (WHO) in several fields, inparticular in neglected tropical diseases. Initiated in 2001 to combat sleeping sickness, this partnership wasrenewed in 2006 for an additional five years to include leishmaniasis, Buruli ulcer and Chagas’ disease. In closeliaison with the WHO, sanofi-aventis is implementing an innovative pharmacovigilance program on antimalarialdrugs in Sub Saharan Africa with the support of MMV (Medicines for Malaria Venture) and DNDi (Drugs forNeglected Diseases initiative).
Sanofi-aventis is also involved in partnerships with several organizations actively supported by the Bill &Melinda Gates Foundation, such as the Global Alliance for Vaccines and Immunization, Medicines for MalariaVenture (for antimalarial drugs) and the Global Alliance for TB Drug Development (for antituberculosis drugs).
Vaccines Research and Development
Our human vaccine R&D remains focused on improving existing vaccines, as well as on the development ofnew prophylactic vaccines.
Sanofi Pasteur R&D Pipeline
The sanofi pasteur R&D portfolio includes 22 vaccines currently in advanced development as shown in thetable below.
Phase I Phase IIa Phase IIb Phase III Submitted
Meninge A,C,Y,W conj. Flu (1) Cell Culture DTP-HepB- Hexaxim™ Emerflu™ EU2nd generation New production method Polio-Hib (1) DTP-HepB- Pandemic flu H5N1Meningitis in infants Polio-Hib (1)
West Nile ACAM C. diffPneumo Prevention of disease Prevention of C. difficile Unifive™
Meningitis & pneumonia associated diarrhea DTP-HepB-Hib (1)
in infants Rabies (CDAD)(Monovalent) mAb post exposure Pediacel® EU
prophylaxis Dengue DTP-Polio-Hib (1)
Tuberculosis Mild-to-severePrevention of disease Melanoma dengue fever ADACEL®
Tumor antigen DTP(1) 4-6 yearsFlu Pandemia administeredLow dose through viral vector Menactra®
Treatment of Menactra Infant/ToddlerACAM-Flu-A stage III & IV 9-12 monthsBroad protection againstinfluenza A strains Flu(1) Micro-injection
New method of deliveryU.S.
IMOJEV™
Japanese encephalitisPrevention of infection
HIV (Thailand)Prevention ofinfectionProof of concept
FluNew formulation U.S.
(1) D=Diphtheria, T=Tetanus, Hib=Haemophilus influenzae b, HepB=Hepatitis B, P=Pertussis, Flu=Influenza.
42
Project highlights
Influenza
To sustain our global leadership in the development of influenza vaccine, our Research & Developmentefforts are focused on innovative approaches for assessing new formulations and alternate delivery systems aswell as diversifying our flu manufacturing technologies for increased vaccine efficacy, acceptance or both. Weremain actively engaged in pandemic preparedness activities.
A new formulation (increased dosage) was developed with the aim of improving vaccine effectiveness in theelderly population. The elderly experience a progressive reduction in their immune system with increasing age aswell as reduced antibody responses to inactivated virus vaccines. Results from a recent Phase III influenzavaccine study with 4,000 participants demonstrated increased immune responses among adults 65 years of ageand older who received a high-dose influenza vaccine as compared to those that received the standard inactivatedvaccine formulation used for the 2006-2007 season. Following an agreement with the Center for BiologicsEvaluation and Research (CBER) of the FDA on the registration strategy, this formulation will be submitted forapproval in the next few months.
To assess whether vaccine efficacy could be enhanced by using a new delivery system, clinical evaluationcontinued in 2008 with the novel microinjection system (micro-needles used to deliver vaccine to the dermallayer of the skin) that was developed in collaboration with Becton Dickinson. The data from the Phase III trial inEurope involving 7,000 adults or elderly participants evaluated the safety of the system and its ability to generatean immune response that meets all criteria required by the European Medicines Agency (EMEA). A fullsubmission with an updated common technical document (CTD) was sent to the EMEA in November 2008. InDecember 2008, Intanza®/IDflu®, the first influenza vaccine delivered by intradermal (ID) microinjection,received a positive opinion from Europe’s Committee for Medicinal Products for Human Use (CHMP), thescientific committee of EMEA. On February 26, 2009 the European Commission granted marketingauthorization for INTANZA®/IDflu® for the prevention of seasonal influenza in both the adult and elderlypopulations. This represents a key step towards recognition of the ID route as an alternative for vaccineadministration. Enrollment in the Phase III trial in the United States has been completed.
As part of an initiative to diversify flu vaccine manufacturing technologies, a cell culture based process isbeing developed in partnership with Crucell and Lonza. The project has been carried out under contract with theU.S. government. Results of a Phase II clinical study showed that the product appears to be safe andimmunogenic. The results also highlighted opportunities to further improve the process. This is ongoing.
• ACAM-Flu-A — Phase I has been completed to evaluate the ability to elicit Flu M2-specificresponses. This project is a recombinant form of M2 protein as an adjunct to trivalent vaccine.
• Pandemic Preparedness — Efforts in pandemic preparedness continued in 2008 with dose sparinginitiatives using a proprietary adjuvant. Building on the promising results from the Phase I study inhealthy adults where vaccine doses as low as 1.9 μg of an H5N1 vaccine formulated with a proprietaryadjuvant reached the 70% seroprotection threshold accompanied by a significant increase in crossreactivity with variant H5 viruses, preparations have been underway in 2008 for a Phase II/III study tobe initiated in 2009. Results of a subsequent Phase I study (antigen and adjuvant dose ranging inadults) in 2008 allowed the antigen and adjuvant dose selection for the Phase II/III study. Progress hasalso been made in scaling up the proprietary adjuvant. These efforts continue to support increasedstockpiling and response capabilities.
Pediatric Combination & Adolescent/Adult Booster Vaccines
A number of pediatric vaccines are in development. Tailored for specific markets, they are aimed atprotecting against five or all six of the following diseases: diphtheria, tetanus, pertussis, poliomyelitis (polio),Haemophilus influenzae type b infections and hepatitis B.
• Pentacel® — The FDA granted a license in June 2008 and the product was launched later that year.
• Pediacel® — Clinical trials continued throughout 2008. All clinical results for the CTD are nowavailable to support licensure in the rest of Europe of this pentavalent pediatric vaccine that is the
43

standard of care in the United Kingdom and Netherlands for protecting against diphtheria, tetanus,pertussis, polio and Haemophilus influenzae type b disease. Our first Pediatric Investigation Plansubmission received a positive response from the Pediatric Committee of the EMEA, with noadditional studies required.
• Unifive® and Hexaxim® — two multivalent (one pentavalent and one hexavalent) pediatric vaccinesaimed specifically at the international zone are in development. Multiple Phase III trials have continuedin several countries.
• Adacel® — a trivalent vaccine to boost immunity in adolescents and adults against diphtheria, tetanus,and pertussis is currently marketed in Canada, Germany and the United States. In 2008, effortsremained focused on expanding its area of licensure and on extending its indications — primarily thepre-school booster indication in countries where the product is already marketed.
Meningitis Program
Neisseria meningitidis has been a leading cause of meningitis in the United States, Europe and elsewhere,striking the very young as well as adolescents. Five serogroups contribute to the vast majority of the incidencesof the disease worldwide: A, C, W-135, Y and B. A polysaccharide vaccine comprised of serogroups A, C,W-135 and Y, Menomune®, has proven its efficacy for many years. In 2005, the first ever quadrivalentconjugate-based vaccine, Menactra®, was licensed in the United States for indications against invasivemeningococcal diseases in patients aged 11-55 years. As a conjugate vaccine, Menactra® provides longerimmunity than the polysaccharide vaccine. The primary focus of several ongoing projects related to Menactra® isto decrease the age at which one can first receive this vaccine. As part of this objective, Menactra® was licensedin Canada for ages 2-55 years in 2006 and a supplement to the U.S. Menactra® license lowering the minimumrecommended age and effectively broadening the age range to 2-55 years, was approved by the FDA in 2007. InFebruary 2008, the Advisory Committee on Immunization Practices (ACIP) recommended Menactra® for highrisk 2-10 year olds. Additional international license submissions will occur in the near future.
• Menactra® Infant/Toddler (9-12 months) — this project is aimed at lowering the age of administrationbelow twelve months of age. Phase III clinical studies continued in 2008 and are at various stages ofadvancement.
• Meninge A, C, Y, W conj. Second Generation — this project targets the infant primary/booster seriesschedule for introduction of a second generation meningococcal vaccine that uses an alternativeconjugation technology.
• Meninge B — The MenB project is aimed at preventing severe disease in infants and young adults.This project is entering development following progress from in-house and partnered discovery efforts.
Pneumococcal Vaccine Program
Streptococcus pneumoniae is the leading etiological agent of severe infections such as pneumonia,septicemia, meningitis and otitis media and causes over 3 million deaths per year worldwide, of which onemillion are children. Antimicrobial resistance in Streptococcus pneumoniae has complicated the treatment ofpneumococcal disease and further emphasized the need for vaccination to prevent large-scale morbidity andmortality.
Sanofi Pasteur is focused on the development of a protein-based pneumococcal vaccine. This approachshould result in a vaccine with superior serotype coverage as compared to current polysaccharide or conjugatebased vaccines. Data from early clinical trials and supportive epidemiological studies have provided strongsupport for a protein-based approach. Antigens for the multivalent vaccine formulation have been selected forfurther development and clinical evaluation.
Rabies Vaccine
The Vero serum-free improvement of our current Verorab® rabies vaccine will provide a worldwide, singlerabies vaccine as a follow-up to our current vaccine offerings.
44
Rabies mAb Post Exposure Prophylaxis — In January 2008, we announced the signature of an exclusivecollaboration and commercialization agreement with Crucell for their combination of two rabies monoclonalantibodies (MoABs) which will be used in association with the rabies vaccine for post-exposure prophylaxis.Based on the successful results of the Phase I studies, a Phase II study in adolescents and children in thePhilippines completed enrollment in 2008. Additional Phase II studies are planned.
New Vaccine Targets
• Dengue — Dengue fever is of growing epidemiological importance due to global socio-climaticchanges, and is a major medical and economic burden in the endemic areas of Asia, Pacific, LatinAmerica and Africa; it is also one of the leading causes of fever among travelers. Multiple approacheswere tested to develop a vaccine covering the four viral serotypes of dengue fever in order to preventthis disease and its severe complications (hemorrhagic fever). Results of a Phase II clinical trial ofadults in the United States demonstrated proof of concept of the lead vaccine candidate that is based onthe ChimeriVax™ technology. Administration of the quadrivalent candidate vaccine against denguefever promoted neutralizing antibodies against the four serotypes responsible for dengue fever.Expanded Phase II studies are ongoing in endemic areas in adults as well as children. Sanofi Pasteurhas maintained its relationship with the WHO and the Pediatric Dengue Vaccine Initiative, a programof the International Vaccine Institute funded by the Gates Foundation to make dengue a vaccinepreventable disease and to accelerate vaccine introduction in the pediatric endemic population throughdisease burden evaluation, vaccine advocacy and vaccine access. In February 2009, the sanofi pasteurdengue vaccine entered into a pediatric clinical study in Thailand.
• IMOJEV™ — The ChimeriVax™ technology was further leveraged to develop a vaccine for protectionagainst infection with Japanese encephalitis virus (JEV). Japanese encephalitis is endemic in SoutheastAsia; replacement of the currently available vaccines with the single dose product is anticipated toprovide a strong competitive advantage. Positive Phase III results were obtained in adults. Extension ofclinical testing (Phase IIb) in children and toddlers (12-24 months) occurred in 2008. In addition,recruitment for the Phase III bridging trial for the Thai licensing was completed.
• West Nile virus — Further extension of the ChimeriVax™ technology included the development of aWest Nile virus vaccine. The West Nile virus vaccine was safe and immunogenic in Phase II studies.
• Malaria — The malaria vaccine project remained in the preclinical stage in 2008 with selectedantigens from the malaria partnership network and vaccine adjuvant technology developed in-house.
• Chlamydia trachomatis — Chlamydia trachomatis is the most commonly reported sexually transmittedbacterial pathogen and produces serious morbidity and long-term sequellae, especially in women.Chlamydia-host immunobiology is characterized by acute infection followed by immunity or bypersistent infection that is associated with tissue damage and disease sequellae. The Chlamydiatrachomatis project goal is to develop a recombinant protein vaccine for prophylactic vaccination againstthe Chlamydia trachomatis sexually transmitted infection. The target population is pre-sexually activewomen who are between 11 and 14 years of age. The project continued in the preclinical stage in 2008 asthe composition of the candidate prototype vaccine for further clinical development was identified.
• Cytomegalovirus (CMV) — Results from a proof of concept study in women of child-bearing agesuggest a glycoprotein B vaccine has the potential to prevent maternal and congenital infection bycytomegalovirus. However, the durability of protection appears short-lived. Subsequent formulationswill be studied to look to enhance breadth and durability of vaccine protection.
• Tuberculosis — Statens Serum Institute of Denmark (SSI) granted sanofi pasteur a license to itstechnology with regard to the use of certain fusion proteins in the development of a tuberculosis vaccine.The license from SSI includes access to the Intercell IC31® adjuvant. The candidate vaccine is made upof recombinant protein units currently in a clinical Phase I trial. A previous study in adults indicated thecandidate SSI sub-unit vaccine to be safe and immunogenic. Multiple Phase I clinical trials are currentlyongoing using the SSI recombinant protein-based vaccine. If the development is successful, sanofi pasteurwould manufacture and commercialize the vaccine. An effective vaccine is urgently needed astuberculosis is estimated to cause the death of two million people worldwide each year.
45
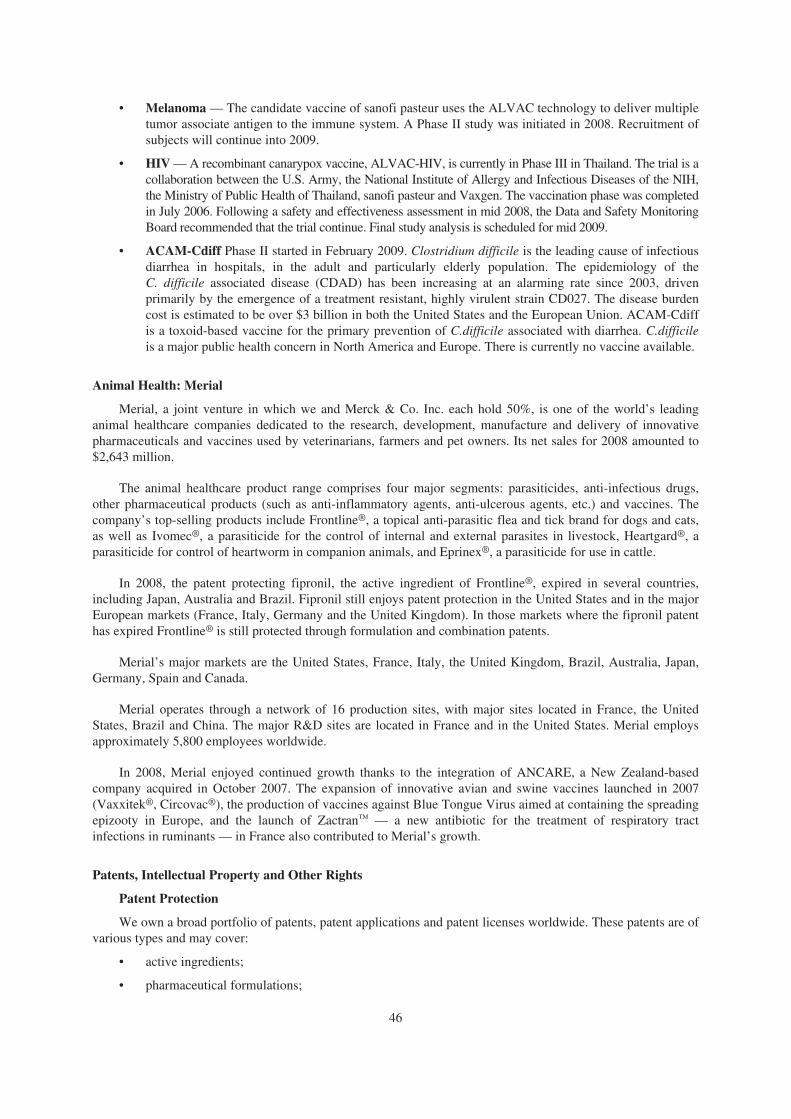
• Melanoma — The candidate vaccine of sanofi pasteur uses the ALVAC technology to deliver multipletumor associate antigen to the immune system. A Phase II study was initiated in 2008. Recruitment ofsubjects will continue into 2009.
• HIV — A recombinant canarypox vaccine, ALVAC-HIV, is currently in Phase III in Thailand. The trial is acollaboration between the U.S. Army, the National Institute of Allergy and Infectious Diseases of the NIH,the Ministry of Public Health of Thailand, sanofi pasteur and Vaxgen. The vaccination phase was completedin July 2006. Following a safety and effectiveness assessment in mid 2008, the Data and Safety MonitoringBoard recommended that the trial continue. Final study analysis is scheduled for mid 2009.
• ACAM-Cdiff Phase II started in February 2009. Clostridium difficile is the leading cause of infectiousdiarrhea in hospitals, in the adult and particularly elderly population. The epidemiology of theC. difficile associated disease (CDAD) has been increasing at an alarming rate since 2003, drivenprimarily by the emergence of a treatment resistant, highly virulent strain CD027. The disease burdencost is estimated to be over $3 billion in both the United States and the European Union. ACAM-Cdiffis a toxoid-based vaccine for the primary prevention of C.difficile associated with diarrhea. C.difficileis a major public health concern in North America and Europe. There is currently no vaccine available.
Animal Health: Merial
Merial, a joint venture in which we and Merck & Co. Inc. each hold 50%, is one of the world’s leadinganimal healthcare companies dedicated to the research, development, manufacture and delivery of innovativepharmaceuticals and vaccines used by veterinarians, farmers and pet owners. Its net sales for 2008 amounted to$2,643 million.
The animal healthcare product range comprises four major segments: parasiticides, anti-infectious drugs,other pharmaceutical products (such as anti-inflammatory agents, anti-ulcerous agents, etc.) and vaccines. Thecompany’s top-selling products include Frontline®, a topical anti-parasitic flea and tick brand for dogs and cats,as well as Ivomec®, a parasiticide for the control of internal and external parasites in livestock, Heartgard®, aparasiticide for control of heartworm in companion animals, and Eprinex®, a parasiticide for use in cattle.
In 2008, the patent protecting fipronil, the active ingredient of Frontline®, expired in several countries,including Japan, Australia and Brazil. Fipronil still enjoys patent protection in the United States and in the majorEuropean markets (France, Italy, Germany and the United Kingdom). In those markets where the fipronil patenthas expired Frontline® is still protected through formulation and combination patents.
Merial’s major markets are the United States, France, Italy, the United Kingdom, Brazil, Australia, Japan,Germany, Spain and Canada.
Merial operates through a network of 16 production sites, with major sites located in France, the UnitedStates, Brazil and China. The major R&D sites are located in France and in the United States. Merial employsapproximately 5,800 employees worldwide.
In 2008, Merial enjoyed continued growth thanks to the integration of ANCARE, a New Zealand-basedcompany acquired in October 2007. The expansion of innovative avian and swine vaccines launched in 2007(Vaxxitek®, Circovac®), the production of vaccines against Blue Tongue Virus aimed at containing the spreadingepizooty in Europe, and the launch of Zactran™ — a new antibiotic for the treatment of respiratory tractinfections in ruminants — in France also contributed to Merial’s growth.
Patents, Intellectual Property and Other Rights
Patent Protection
We own a broad portfolio of patents, patent applications and patent licenses worldwide. These patents are ofvarious types and may cover:
• active ingredients;
• pharmaceutical formulations;
46

• product manufacturing processes;
• intermediate chemical compounds;
• therapeutic indications/methods of use;
• delivery systems; and
• enabling technologies, such as assays.
Patent protection for individual products typically extends for 20 years from the patent filing date incountries where we seek patent protection. A substantial part of the 20 year life span of a patent on a newchemical entity has generally already passed by the time the related product obtains marketing approval. As aresult, the effective period of patent protection for an approved product’s active ingredient is significantly shorterthan 20 years. In some cases, this period of effective protection may be extended by procedures established tocompensate significant regulatory delay in Europe (a supplementary protection certificate, SPC), the UnitedStates (a Patent Term Extension, PTE) and Japan (PTE). The product may additionally benefit from theprotection of patents obtained during development or after the product’s initial marketing approval.
The protection a patent affords the related product depends upon the type of patent and its scope ofcoverage, and may also vary from country to country. In Europe for instance, applications for new patents maybe submitted to the European Patent Office (EPO), an intergovernmental organization which centralizes filingand prosecution. As of January 2008, an EPO patent application may cover the 34 EP Convention member statesincluding all 27 member states of the European Union. The granted “European patent” establishes correspondingnational patents with uniform patent claims among the member states. However, some older patents were notapproved through this centralized process, resulting in patents having claim terms for the same invention thatdiffer by country. Additionally, a number of patents prosecuted through the EPO may pre-date the EPConvention accession of some current EP Convention member states, resulting in different treatment in thosecountries.
We monitor our competitors and vigorously seek to challenge patent infringements when such challengeswould further our business objectives.
The expiration or loss of a product patent may result in significant competition from generic products andcan result in a dramatic reduction in sales of the original branded product. In some cases, it is possible tocontinue to obtain commercial benefits from product manufacturing trade secrets or other types of patents, suchas patents on processes, intermediates, product, structure, formulations, methods of treatment, indications ordelivery systems. Certain categories of products, such as traditional vaccines and insulins, have been historicallyrelatively less reliant on patent protection and may in many cases have no patent coverage, although it isincreasingly frequent for novel vaccines and insulins to be patent protected. See “Focus on Biologics” below.
One of the main limitations on our operations in some countries outside the United States and Europe is thelack of effective intellectual property protection or enforcement for our products. The World TradeOrganization’s (WTO) Agreement on Trade-Related Aspects of Intellectual Property Rights (TRIP) has requireddeveloping countries to amend their intellectual property laws to provide patent protection for pharmaceuticalproducts since January 1, 2005 although it provides a limited number of developing countries an extension to2016. While the situation has gradually improved, the lack of protection for intellectual property rights or thelack of robust enforcement of intellectual property rights poses difficulties in certain countries. Additionally, inrecent years a number of countries faced with health crises have waived or threatened to waive intellectualproperty protection for specific products, for example through compulsory licensing.
Regulatory Exclusivity
In some markets, including the European Union and the United States, many of our products may alsobenefit from multi-year regulatory exclusivity periods, during which a generic competitor may not rely upon ourclinical trial and safety data in its drug application. Exclusivity is meant to encourage investment in research anddevelopment by providing innovators the exclusive use of the innovation represented by a newly approved drugproduct for a limited time. This exclusivity operates independently of patent protection and may protect theproduct from generic competition even if there is no patent covering the product.
47

In the United States, the FDA will not grant final marketing approval to a generic competitor for a NewChemical Entity (“NCE”) until the expiration of the regulatory exclusivity period (generally five years) thatcommences upon the first marketing authorization of the reference product. It will accept the filing of anAbbreviated New Drug Application (ANDA) containing a patent challenge a year before the end of thisregulatory exclusivity period (see the descriptions of ANDAs, below). In addition to this exclusivity granted tonew drug products, significant line extensions of existing NCEs may qualify for an additional 3-year regulatoryexclusivity. Also, under certain limited conditions, it is possible to extend any unexpired U.S. regulatory andpatent-related exclusivities by a pediatric extension. See “— Pediatric Extension”, below).
In the European Union, generic drug applications will not be accepted for review until eight years after thefirst marketing authorization (data exclusivity) or approved for marketing until ten years after the first marketingauthorization of the reference product (marketing exclusivity). These exclusivities may be extended in somecases. While this exclusivity is intended to be applicable throughout the European Union, in a decentralizedsystem, national authorities may act in ways that are inconsistent with EU data exclusivity. For example,although European marketing exclusivity for clopidogrel expired in July 2008, in May 2008 the German Healthauthority BfArM had already registered a competitor’s clopidogrel product based on a contested interpretation ofthe law and in 2006 the Polish and Bulgarian authorities registered generics of clopidogrel bisulfate based onthese countries’ contested position that EU marketing exclusivities need not be applied by individual countrieswhere generics had been approved prior to their accession date.
No data protection is available in Canada for products for which the first marketing authorization (NOC)was issued before June 2006. A generic drug application for marketing in Canada will not be accepted for sixyears after the first NOC or approved for marketing for eight years after the first marketing authorization but onlyfor products where the first NOC is issued after June 2006. The eight year period can be supplemented by a sixmonth pediatric extension.
In Japan, the regulatory exclusivity period varies from four years (for medicinal products with newindications, formulations, dosages, or compositions with related prescriptions) to six years (for new drugscontaining a medicinal composition, or requiring a new route of administration) to eight years (for drugscontaining a new chemical entity) to ten years (for orphan drugs or new drugs requiring pharmaco-epidemiological study).
Pediatric Extension
In the United States and Europe, under certain conditions, it is possible to extend a product’s regulatoryexclusivities for an additional period of time by providing data regarding pediatric studies. In the United States,this also extends any FDA exclusivities related to the product’s patents.
In the United States, the FDA may ask for pediatric studies if it has determined that information related tothe use of the drugs in the pediatric population may produce health benefits. The FDA has invited us by writtenrequest to provide additional pediatric data on several of our top 15 products. Under the Hatch-Waxman Act,timely provision of data meeting the FDA’s requirements may result in the FDA treating the product as if itsregulatory exclusivity and patent life had been extended by six months, to the extent these protections have notalready expired (the so-called “pediatric exclusivity”). The Top 15 products having received past FDA grants ofpediatric exclusivity are Aprovel®, Lantus®, Amaryl®, Allegra®, Eloxatine®, and Ambien®/Ambien® CR.Written requests have also been issued to us with respect to Plavix®, Taxotere® and Lovenox®.
In Europe, a new regulation on pediatric medicines entered into force on January 26, 2007. This regulationprovides for the progressive implementation through 2009 of pediatric research obligations with associatedpossible rewards including an extension of patent protection (for patented medicinal products) and regulatoryexclusivity for pediatric marketing authorization (for off-patent medicinal products). For additional details,see ”— Regulation” below.
Japanese regulations do not currently offer the possibility of similar extensions in exchange for pediatricstudy results.
48

Product Overview
We summarize below the intellectual property coverage in our major markets of the products describedabove at “— Principal Pharmaceutical Products”. In the discussion of patents below, we focus on compoundpatents and any secondary patents listed in the FDA’s list of Approved Drug Products with TherapeuticEquivalence Evaluations (the “Orange Book”) or on their foreign equivalents, because these patents tend to bethe most relevant in the event of an application by a competitor to produce a generic version of one of ourproducts or the equivalent of these patents in other countries (see “— Challenges to Patented Products”, below).In some cases, products may also benefit from pending patent applications and from patents not eligible forOrange Book listing (e.g., patents claiming industrial processes). In each case below, we specify whether theactive ingredient is claimed by an unexpired patent. Where patent terms have been extended to compensate forregulatory delay, the extended dates are presented below. U.S. patent expirations presented below reflect U.S.Patent and Trademark Office dates, and therefore do not reflect six-month pediatric extensions to the FDA’sOrange Book dates for the products concerned (Aprovel®, Lantus®, Amaryl®, Eloxatine®, Stilnox®/Ambien® CRand Allegra®). We do not provide secondary patent information relating to formulations already available as anunlicensed generic. References below to patent protection in Europe indicate the existence of relevant patents inmost major markets in the European Union. Specific situations may vary country by country, most notably withrespect to older patents and to countries having only recently joined the European Union. See ”— Patents,Intellectual Property and other Rights” above.
We additionally set out any regulatory exclusivity from which these products continue to benefit in theUnited States, European Union or Japan. Regulatory exclusivities presented below incorporate any pediatricextensions obtained. While EU regulatory exclusivity is intended to be applied throughout the European Union,in some cases member states have taken positions prejudicial to our exclusivity rights. See “— RegulatoryExclusivity,” above.
Lovenox® (enoxaparin sodium)
U.S.Compound: Declared unenforceableby a February 2007 U.S. DistrictCourt decision
E.U.Compound: June 2011 in most ofEU; exceptions: June 2010 inFrance, no compound patent inforce in Spain, Portugal, Finland,Norway, Greece and much ofEastern Europe
JapanCompound: expired
Regulatory exclusivity until 2016
Plavix® (clopidogrel bisulfate)
U.S.Compound: November 2011
Secondary: two patents covering thecrystalline form 2 each expiring in2019
E.U.Compound: 2013 in most of EU;no compound patent in force inSpain, Portugal, Finland, Norwayand much of Eastern Europe.
Secondary: crystalline form 2(2019)
JapanCompound: 2013
Secondary: crystalline form 2(2020)
Regulatory exclusivity until 2014
Aprovel® (irbesartan)
U.S.Compound: September 2011
Secondary: Formulation (2015)
E.U.Compound: August 2012 in mostof EU; exceptions: expires March2011 in the Czech Republic,Hungary, Romania, Slovakia and2013 in Lithuania and Latvia. Nocompound patent in force inSpain, Portugal, Finland, Norwayand much of Eastern Europe
Secondary: coverage rangingthrough 2016 (Formulation patent)
JapanCompound: 2016
Secondary: Formulation (2021)
Regulatory exclusivity until 2016
49
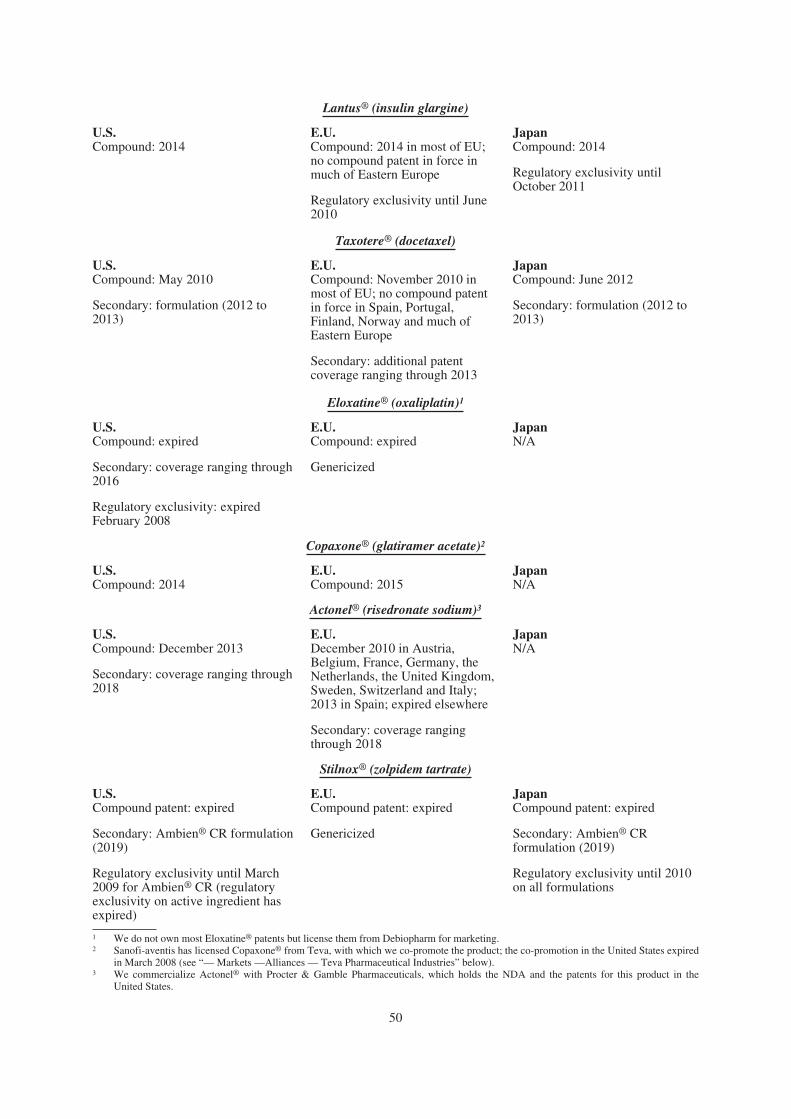
Lantus® (insulin glargine)
U.S.Compound: 2014
E.U.Compound: 2014 in most of EU;no compound patent in force inmuch of Eastern Europe
Regulatory exclusivity until June2010
JapanCompound: 2014
Regulatory exclusivity untilOctober 2011
Taxotere® (docetaxel)
U.S.Compound: May 2010
Secondary: formulation (2012 to2013)
E.U.Compound: November 2010 inmost of EU; no compound patentin force in Spain, Portugal,Finland, Norway and much ofEastern Europe
Secondary: additional patentcoverage ranging through 2013
JapanCompound: June 2012
Secondary: formulation (2012 to2013)
Eloxatine® (oxaliplatin)1
U.S.Compound: expired
Secondary: coverage ranging through2016
Regulatory exclusivity: expiredFebruary 2008
E.U.Compound: expired
Genericized
JapanN/A
Copaxone® (glatiramer acetate)2
U.S.Compound: 2014
E.U.Compound: 2015
JapanN/A
Actonel® (risedronate sodium)3
U.S.Compound: December 2013
Secondary: coverage ranging through2018
E.U.December 2010 in Austria,Belgium, France, Germany, theNetherlands, the United Kingdom,Sweden, Switzerland and Italy;2013 in Spain; expired elsewhere
Secondary: coverage rangingthrough 2018
JapanN/A
Stilnox® (zolpidem tartrate)
U.S.Compound patent: expired
Secondary: Ambien® CR formulation(2019)
Regulatory exclusivity until March2009 for Ambien® CR (regulatoryexclusivity on active ingredient hasexpired)
E.U.Compound patent: expired
Genericized
JapanCompound patent: expired
Secondary: Ambien® CRformulation (2019)
Regulatory exclusivity until 2010on all formulations
1 We do not own most Eloxatine® patents but license them from Debiopharm for marketing.2 Sanofi-aventis has licensed Copaxone® from Teva, with which we co-promote the product; the co-promotion in the United States expired
in March 2008 (see “— Markets —Alliances — Teva Pharmaceutical Industries” below).3 We commercialize Actonel® with Procter & Gamble Pharmaceuticals, which holds the NDA and the patents for this product in the
United States.
50
Allegra® (fexofenadine hydrochloride)
U.S.Compound: expired
Secondary: coverage ranging through2017
Single entity form genericized,licensed generic D®-12 Hour form inNovember 20091
E.U.Compound: expired
Genericized
JapanCompound: expired
Secondary: coverage rangingthrough 2016
Depakine® (sodium valproate)
U.S.N/A
E.U.Compound: expired
Secondary: Depakine®
Chronosphere® formulation(2017)
JapanCompound: expired
Secondary: Depakine®
Chronosphere® formulation(2017)
Nasacort® (triamcinolone acetonide)
U.S.Compound: expired
Secondary: formulation and methodof use 2016
Generic licensed as early as 20111
E.U.Compound: expired
Secondary: formulation 2017
JapanCompound: expired
Secondary: formulation 2017(application pending)
Xatral® (alfuzosin hydrochloride)
U.S.Compound: expired
Secondary: formulation 2017
Regulatory exclusivity: expired June2008
E.U.Compound: expired
Secondary: formulation 2017
JapanCompound: expired
Secondary: formulation 2017
Tritace® (ramipril)
U.S.N/A
E.U.Compound: expired
Genericized
JapanCompound: expired
Amaryl® (glimepiride)
U.S.Compound: expired
Genericized
E.U.Compound: expired
Genericized
JapanCompound: expired
Regulatory exclusivity untilMarch 2009
1 License granted to Barr in settlement of patent litigation.
Patents held or licensed by the Group do not in all cases provide effective protection against acompetitor’s generic version of our products. For example, notwithstanding the patents listed abovecompetitors have launched generic versions of Eloxatine® in Europe, Allegra® in the United States andPlavix® in Germany.
In 2008, we agreed to settle certain U.S. patent litigation pertaining to Allegra®, Allegra® D-12 Hourand Nasacort®. As disclosed in Note D.22.b) to our consolidated financial statements included at Item 18 ofthis annual report, we are involved in significant litigation concerning the patent protection of a number ofproducts.
51

We caution the reader that there can be no assurance that we will prevail when we assert a patent inlitigation and that there may be instances in which the Group determines that it does not have a sufficient basis toassert one or more of the patents mentioned in this report, for example in cases where a competitor proposes aformulation not appearing to fall within the claims of our formulation patent, a salt or crystalline form notclaimed by our composition of matter patent, or an indication not covered by our method of use patent.
Challenges to Patented Products
In the United States, companies have filed Abbreviated New Drug Applications (ANDAs), containingchallenges to patents related to a number of our products. An ANDA is an application by a drug manufacturer toreceive authority to market a generic version of another company’s approved product, by demonstrating that thepurportedly generic version has the same properties as the original approved product. ANDAs may not be filedwith respect to drugs licensed as a biological. See “Focus on Biologics” below. An ANDA relies on the safetyand other technical data of the original approved product, and does not generally require the genericmanufacturer to conduct clinical trials (thus the name “abbreviated” new drug application), presenting asignificant benefit in terms of time and cost. As a result of regulatory protection of our safety and other technicaldata, the ANDA may generally be filed only five years following the initial U.S. marketing authorization of theoriginal product. This period is reduced to four years if the ANDA includes a challenge to a patent listed in theFDA’s list of Approved Drug Products with Therapeutic Equivalence Evaluations, also known as the “OrangeBook”, and owned by or licensed to the manufacturer of the original version. However, in such a case if thepatent holder or licensee brings suit in response to the patent challenge within the statutory window, then theFDA is barred from granting a final approval to an ANDA during the 30 months following the patent challenge(this bar being referred to in our industry as a “30 month stay”), unless, before the end of the 30 months, a courtdecision or settlement has determined either that the ANDA does not infringe the listed patent or that the listedpatent is invalid and/or unenforceable. FDA approval of an ANDA after this 30-month period does not resolveoutstanding patent disputes, but it does remove the regulatory impediments to a product launch by a genericmanufacturer willing to take the risk of later being ordered to pay damages to the patent holder. Procedurescomparable to the ANDA exist in other major markets.
In Canada, an Abbreviated New Drug Submission may be filed with respect to a generic version of anexisting drug only after data exclusivity has expired, and a stay on regulatory approval of a generic for up to 24months may be obtained if a listed patent is asserted.
In the European Union, a generic drug manufacturer may reference the data of the regulatory file for theoriginal approved product after data exclusivity has expired. However, there is no patent listing system in Europecomparable to the Orange Book, which would allow the patent holder to bar the competent authorities fromgranting the marketing approval by bringing patent infringement litigation prior to approval. As a result, genericproducts may be approved for marketing following the expiration of marketing exclusivity without regard to thepatent holder’s rights.
Nevertheless, in most of these jurisdictions once the product is launched and in some jurisdictions alreadybefore (once launch is imminent), the patent holder can seek an injunction against this marketing if its patents areinfringed. See “Item 8. Financial Information — A. Consolidated Financial Statements and Other Information —Information on Legal or Arbitral Proceedings” and Note D.22.b) to our consolidated financial statementsincluded at Item 18 of this annual report.
The accelerated ANDA-type procedures are potentially applicable to most, but not all, of the products wemanufacture. See “— Focus on Biologics” and “— Regulation” below. We seek to defend our patent rightsvigorously in these cases. Success or failure in the assertion of a given patent against one competing product isnot necessarily predictive of the future success or failure in the assertion of the same patent — or a fortiori thecorresponding foreign patent — against a second competing product because of such factors as possibledifferences in the formulations of the competing products, intervening developments in law or jurisprudence,local variations in the patents and differences in national patent law and legal systems.
52
Trademarks
Our products are sold around the world under brand-name trademarks that we consider to be of materialimportance in the aggregate. It is our policy to register our trademarks worldwide, and to monitor the trademarksin our portfolio and defend them worldwide.
The degree of trademark protection varies country by country, as each state implements its own lawsapplicable to trademarks used in its territory. In most countries, trademark rights may only be obtained byregistration. In some countries, trademark protection is primarily based on use. Registrations are granted for afixed term (in most cases ten years) and are renewable indefinitely, but in some instances may be subject to thecontinued use of the trademark. When trademark protection is based on use, it covers the products and servicesfor which the trademark is used. When trademark protection is based on registration, it covers only the productsand services designated in the registration. Additionally, in certain cases, we may enter into a coexistenceagreement with a third-party that owns potentially conflicting rights in order to better protect and defend ourtrademarks.
Production and Raw Materials
Our principal manufacturing processes consist of three stages: the manufacture of active ingredients, theincorporation of those ingredients into products, and packaging.
We generally develop and manufacture the active ingredients that we use in our products. We have a generalpolicy of producing the active ingredients for our principal products at our own plants in order to minimize ourdependence on external manufacturers and control the product throughout the production cycle. In some caseshowever, we have outsourced certain production elements, especially as part of supply agreements entered intowithin the framework of plant divestitures. Thus we outsource a part of the production of the active ingredientsused in Stilnox® or Xatral®, a part of the chemical activity linked with Lovenox® and certain formulations ofvarious pharmaceutical products. Our main subcontractors are Patheon, Famar, Catalent, GSK-NDB, Haupt andSofarimex. These subcontractors are required to follow our guidelines in terms of quality, logistics and othercriteria.
Among our other key products, we also depend on third parties in connection with the manufacture ofEloxatine®. Under the terms of our license agreement, we purchase the active ingredient from Debiopharm, andthe production of the finished lyophilized product is outsourced to two manufacturers. The manufacturing of theliquid form of Eloxatine® is conducted at our facility in Dagenham (United Kingdom).
Under our partnership with BMS, a multi-sourcing organization and security stock are in place for Plavix® /clopidogrel bisulfate and Aprovel® / irbesartan.
We purchase the raw materials used to produce Lovenox® from a number of sources. In 2008, we recalled alimited number of batches of Lovenox® and depreciated substantial unused stocks following the discovery ofimpurities in raw materials purchased from a Chinese supplier.
Our main European pharmaceutical production facilities are located in France, Germany, Italy, Spain, theUnited Kingdom and Hungary. In North America, we run two facilities in the United States (Kansas City andSaint Louis) and one in Canada (Laval). We have one plant in Japan (Kawagoe) and additional facilities locatedin many other parts of the world. To carry out the production of vaccines, sanofi pasteur uses a wide industrialoperations network, with sites located in North America, France, China, Thailand and Argentina.
All our facilities are Good Manufacturing Practices (GMP) compliant in accordance with internationalguidelines. Our main facilities are also FDA approved, including our pharmaceutical facilities in Ambarès,Tours, Le Trait, Maisons-Alfort and Compiègne in France, Dagenham and Holmes Chapel in the UnitedKingdom, Frankfurt in Germany, Veresegyhaz in Hungary, Saint Louis and Kansas City in the United States andLaval in Canada and our Vaccines facilities of Marcy l’Etoile and the Val de Reuil distribution center in France,Swiftwater in the United States and Toronto in Canada. Wherever possible, we seek to have multiple plantsapproved for the production of key active ingredients and finished products.
53

More details about our manufacturing sites are set forth below under “ — D. Property, Plant andEquipment”.
Health, Safety and Environment (HSE)
The manufacturing and research operations of sanofi-aventis are subject to increasingly stringent health,safety and environmental laws and regulations. These laws and regulations are complex and rapidly changing,and sanofi-aventis invests the necessary sums for compliance with them. This investment, which aims to respecthealth, safety and the environment, varies from year to year and totaled approximately €120 million in 2008.
The applicable environmental laws and regulations may require sanofi-aventis to eradicate or reduce theeffects of chemical substance usage and release at its various sites. The sites in question may belong to thecompany, be currently operational, or they may have been owned or operational in the past. Under some of theselaws and regulations, a current or previous owner or operator of a property may be held liable for the costs ofremoval or remediation of hazardous substances on, under or in its property, or transported from its property tothird party sites, without regard to whether the owner or operator knew of, or under certain circumstances causedthe presence of the contaminants, or at the time site operations occurred, the discharge of those substances wasauthorized.
Moreover, as for a number of companies involved in the pharmaceutical, chemical and agrochemicalindustries, soil and groundwater contamination has occurred at some company sites in the past, and may stilloccur or be discovered at others. In the Group’s case, such sites are mainly located in the United States,Germany, France, Hungary, Brazil, Italy and the United Kingdom. As part of a program of environmental auditsconducted over the last few years, detailed assessments of the risk of soil and subsoil contamination have beencarried out at current and former company sites. In cooperation with national and local authorities, the Groupconstantly assesses the rehabilitation work required and this work has been implemented when appropriate.Long-term rehabilitation work has been completed or is in progress in Rochester, Cincinnati, Mount-Pleasant,East Palo Alto, Ambler and Portland in the United States; Frankfurt in Germany; Beaucaire, Valernes, Limay,Rousset and Vitry in France; Dagenham in the United Kingdom; Brindisi and Garessio in Italy; and on a numberof sites divested to third parties and covered by contractual environmental guarantees granted by sanofi-aventis.Sanofi-aventis may also have potential liability for investigation and cleanup at several other sites. Provisionshave been established for the sites already identified and to cover contractual guarantees for environmentalliabilities for sites that have been divested. For example, in 2007 the State of New Jersey initiated a claim againstBayer CropScience seeking compensation for damages caused to natural resources (NRD) at a former Rhône-Poulenc site in the United States, resulting in indemnification claims by Bayer CropScience against the Groupunder contractual environmental guarantees granted at the time of Bayer’s acquisition of the CropSciencebusiness. Rehabilitation studies and an NRD assessment are underway in a similar project in Portland, Oregon.Potential environmental contingencies arising from certain business divestitures are described in Note D.22.e) tothe consolidated financial statements included at Item 18 of this annual report. In 2008, sanofi-aventis spent morethan €48 million on rehabilitating sites previously contaminated by ground pollution. As of December 2008, themost comprehensive review possible had been carried out of the legacy of environmental pollution. In light ofdata collected during this review, the Group adjusted the provisions to approximately €589 million as atDecember 31, 2008.
Because of changes in environmental regulations governing site remediation the Group’s provisions forremediation obligations may not be adequate due to the multiple factors involved, such as the complexity ofoperational or previously operational sites, the nature of claims received, the rehabilitation techniquesconsidered, the planned timetable for rehabilitation, and the outcome of discussions with national RegulatoryAuthorities or other potentially responsible parties, as in the case of multiparty sites. Given the long industrialhistory of some of our sites and the legacy obligations of Aventis arising from its past involvement in thechemical and agrochemical industries, it is impossible to quantify the future impact of these laws and regulationswith precision.
To our knowledge, the Group is not currently subject to liabilities for non-compliance with current HSElaws and regulations that could be expected to significantly jeopardize its activities, financial situation oroperating income. We also believe that we are in substantial compliance with current HSE laws and regulations
54
and that all the environmental permits required to operate our facilities have been obtained. Regular HSE audits(45 in 2008) are carried out by the Group in order to detect possible instances of non-compliance with regulationsand to initiate corrective measures. Moreover, 88 loss prevention technical visits were carried out in 2008.
Sanofi-aventis has implemented a worldwide policy on health, safety and the environment to promote thehealth and well-being of the employees and contractors working on its sites and respect for the environment. Weconsider this policy to be an integral part of our commitment to social responsibility. In order to implement thispolicy, 77 rules have been drawn up in the key fields of HSE management, Good HSE Practices, safety in theworkplace, process safety, industrial hygiene, health in the workplace and protection of the environment.
Health
From the development of compounds to the commercial launch of new drugs, sanofi-aventis researchscientists continuously assess the effect of products on human health. This expertise is made available toemployees through two committees responsible for chemical and biological risk assessment. The COVALIScommittee classifies all chemical and pharmaceutical products handled within the Group and establishesworkplace exposure limits for each of them. The TRIBIO Committee is responsible for classifying all biologicalagents according to their degree of pathogenicity, and applies rules for their containment and the preventivemeasures to be respected throughout the Group.
Appropriate Industrial Hygiene practices and programs are defined and implemented in each site. Thesepractices consist essentially of containment measures of collective and individual protection against exposure inall workplaces where chemical substances or biological agents are handled. All personnel are monitored with anappropriate initial and routine medical program, focused on the potential occupational health risks linked to theirduties.
Safety
Sanofi-aventis has a rigorous policy to identify and evaluate risks and to develop preventive measures, andmethods for checking their efficacy. Additionally, sanofi-aventis invests in training that is designed to instill inall employees a sense of concern for safety, regardless of their duties. These policies are implemented on aworldwide scale to ensure the safety of all employees and to protect their health. Each project, whether inresearch, development or manufacturing, is subject to evaluation procedures, incorporating the chemicalsubstance and process data communicated by the COVALIS and TRIBIO committees described above. Thepreventive measures are designed primarily to reduce the number and seriousness of work accidents and tominimize exposures involving permanent and temporary sanofi-aventis employees as well as our sub-contractors.In addition, a committee has been set up to prepare and support the implementation of the new European UnionREACH regulation on Registration, Evaluation, Authorization and Restriction of Chemicals.
The French chemical manufacturing sites in Aramon, Neuville-sur-Saône, Saint-Aubin-lès-Elbeuf, Sisteron,Vertolaye and Vitry, as well as the plants located in the Hoechst Industry Park in Frankfurt, Germany, and thechemical production site in Budapest, Hungary, are listed Seveso II (from the name of the European directivethat deals with potentially dangerous sites through a list of activities and substances associated with classificationthresholds). In accordance with the French law on technological risk prevention, the French sites are also subjectto heightened security inspections in light of the toxic or flammable materials stored on the sites and used in theoperating processes.
Risk assessments of processes and their installations are drawn up according to standards and internalguidelines incorporating the best state-of-the-art benchmarks for the industry. These assessments are used tofulfill regulatory requirements and are regularly updated. Particular attention is paid to any risk-generatingchanges: process or installation changes, as well as changes in production scale and transfers between industrialor research units.
Our laboratories that specialize in process safety testing, which are fully integrated into our chemicaldevelopment activities, apply methods to obtain the physico-chemical parameters of manufactured chemicalsubstances (intermediate chemical compounds and active ingredients) and apply models to measure the effect of
55
potentially leachable substances in the event of a major accident. In these laboratories the parameters forqualifying hazardous reactions are also determined to define scale-up process conditions while transferring fromdevelopment stage to industrial scale. All these data ensure the relevance of the risk assessments.
We believe that the safety management systems implemented at each site, the hazard studies carried out andthe risk management methods implemented, as well as the insurance policies covering any third-party materialdamages, are consistent with legal requirements and the best practices in the industry.
Environment
The main objectives of the environmental policy of sanofi-aventis are to implement clean manufacturingtechniques, minimize the use of natural resources and reduce the environmental impact of its activities. In orderto optimize and improve our environmental performance, sanofi-aventis is committed to progressively obtainingISO 14001 certification. 34 manufacturing sites and three Research & Development sites are currently certified.This commitment is part of a strategy of continuous improvement practiced at all Group sites through the annualimplementation of HSE progress plans. We believe that this strategy clearly expresses the commitment of bothmanagement and individuals to health, safety and the environment. As of January 1, 2008, six of the Group’sEuropean sites were included in the scope of the European CO2 Emissions Credit Trading Scheme aimed athelping to reach the targets set by the Kyoto protocol.
The recent efforts of the Group in terms of environmental protection have mainly targeted reductions inenergy consumption, greenhouse gas emissions control, improvements in the performance of water treatmentinstallations, reduction of volatile organic compound emissions, raw material savings and recycling, andreductions in waste materials or increases in the percentage being recycled. Since 2005 we have reduced carbondioxide emissions caused by our sales representation car fleet by 11% and our direct and indirect carbon dioxideemissions in relation to our activity levels per unit produced by 10%.
In order to assess the environmental impact of the pharmaceutical agents found in products marketed bysanofi-aventis, a committee of experts called ECOVAL has been set up. It has developed an environmental riskassessment methodology and runs programs to collect the necessary data for such assessments. Additionalecotoxicity assessments are being performed on certain substances which predate current regulations, in order toobtain information that was not gathered when they were launched (as regulatory requirements were different atthat time) and evaluate environmental risks resulting from their use by patients.
Markets
A breakdown of revenues by activity and by geographic market for 2006, 2007 and 2008 can be found atNote D.35. to our consolidated financial statements included at Item 18 of this annual report.
The following market shares and ranking information is based on sales data from IMS Health MIDAS, retailand hospital, for calendar year 2008, in constant euros (unless otherwise indicated). For more information, see“Presentation of Financial and Other Information” at the beginning of this document.
Marketing and Distribution
Sanofi-aventis has a commercial presence in approximately 100 countries, and our products are available inmore than 170. Our main markets in terms of net sales are, respectively:
• the United States, also the world’s largest pharmaceutical market
We rank 12th in the United States with a 3.45% market share. Key events in 2008 include:
- strong performance of Lovenox®, Taxotere® and Lantus® driven by SoloSTAR®;
- the transfer of the Copaxone® business to Teva effective April;
- the full-year effect of the launch in October 2007 of our prescription allergy treatment Xyzal®.
56

• Europe
We are France’s leading pharmaceutical company, but were affected during 2008 by growingcompetition from generics for several of our products and public authorities’ cost containment measures.Our market share is 13.14%. Plavix®, Lovenox®, Taxotere® and Lantus® are the top-selling products intheir respective fields. In 2008, Lovenox® shipments were affected by the impact on inventories of lowlevels of an impurity in some batches.
We rank second in Germany, with a 5.7% market share. Our major products are Plavix®, Lovenox®,Lantus® and Taxotere®. In 2008, we had to face the launch of two clopidogrel besylates competing withPlavix® in the monotherapy segment, and public authorities’ cost containment measures.
• Japan
We rank 10th in Japan with a 2.8% market share, representing a sharp rise versus 2007, with a strongcontribution from Plavix®. Our main products are Allegra®, Amaryl®, Taxotere® and zolpidem tartrate, soldunder the brand name Myslee®. Key events in 2008 include:
- strong ramp-up of Plavix® and Myslee® sales;
- launch of Lantus® SoloSTAR®;
- approval of Taxotere® in the treatment of prostate cancer.
We are also enhancing our presence in certain developing markets with significant growth prospects,especially Brazil, Russia, India, China, and Mexico. A breakdown of our sales by geographic market is presentedin “Item 5. Operating and Financial Review and Prospects — Results of Operations — Year EndedDecember 31, 2008 Compared with Year Ended December 31, 2007.”
Although specific distribution patterns vary by country, we sell prescription drugs primarily to wholesaledrug distributors, independent and chain retail drug outlets, hospitals, clinics, managed care organizations andgovernment institutions. With the exception of OTC products, these drugs are ordinarily dispensed to the patientsby pharmacies upon presentation of a doctor’s prescription.
We use a selection of channels to disseminate our information about and promote our products amonghealthcare professionals and patients, ensuring that they not only cover our latest therapeutic advances but alsoour mature products, as they provide the foundation for satisfying major therapeutic needs.
Our medical sales representatives, who work closely with healthcare professionals, use their expertise topromote and provide information on our drugs. They represent our values on a day-to-day basis and are requiredto adhere to a code of ethics. Throughout 2008 we carried on our worldwide project initiated in 2007 aimed atincreasing our sales forces’ competitiveness and productivity. It resulted in the deployment of new managementtools and the building of a more customer-focused selling model, that more comprehensively takes intoconsideration all stakeholders in access to medicine decisions.
We have a global sales force of some 33,500 representatives, including approximately 10,400 in Europe,7,600 in the United States, 1,800 in Japan and 2,300 in China.
We also use modern communication tools in our relations with healthcare professionals and patients, such aswebsites, to reinforce communication about our mature products and accelerate the penetration of our morerecent products.
As most pharmaceutical companies do, we market and promote our products through a variety ofadvertising, public relations and promotional tools. We regularly advertise in medical journals and exhibit atmajor medical congresses. In some countries, products are also marketed directly to patients by way oftelevision, radio, newspapers and magazines, and we sometimes use specific media channels to market ourproducts. National education and prevention campaigns are used to improve patients’ coverage on conditionssuch as deep vein thrombosis, osteoporosis, uncontrolled diabetes, influenza and arterial diseases in markets suchas Germany, France and the United States.
Although we market most of our products with our own sales forces, we have entered into and continue toform partnerships to co-promote/co-market certain products in specific geographic areas. Our major alliances aredetailed below under “— Alliances”.
57

Our Vaccines are sold and distributed through multiple channels, including physicians, pharmacies anddistributors in the private sector, and governmental entities and non-governmental organizations in the public andinternational donor markets, respectively.
Alliances
We have two principal alliances through which three of our main products are marketed. The first, withBristol-Myers Squibb, governs the development and marketing of Plavix® and Aprovel®/CoAprovel®. Thesecond, with Procter & Gamble Pharmaceuticals, governs the development and commercialization of Actonel®.We also have a marketing agreement with Teva Pharmaceutical Industries regarding Copaxone®.
The financial impact of our principal alliances on our financial condition or income is significant and isdescribed under “Item 5. Operating and Financial Review and Prospects — Financial Presentation of Alliances.”
Bristol-Myers Squibb (BMS)
We market Plavix® and Aprovel® through a series of alliances with BMS. The alliance agreements includemarketing and financial arrangements that vary depending on the country in which the products are marketed.
There are three principal marketing arrangements that are used in the BMS alliance:
• co-marketing: each company markets the products independently under its own brand names;
• exclusive marketing: one company has the exclusive right to market the products; and
• co-promotion: the products are marketed through the alliance arrangements (either by contractualarrangements or by separate entities) under a single brand name.
Under the alliance arrangements, there are two territories, one under our operational management and theother under the operational management of BMS. The territory under our operational management consists ofEurope and most of Africa and Asia, while the territory under the operational management of BMS consists ofthe rest of the world excluding Japan. In Japan, Aprovel® has been marketed jointly by Shionogi Pharmaceuticalsand Dainippon Sumitomo Pharma Co. Ltd since June 2008 through license and sub-license agreements signedwith BMS. The BMS alliance does not cover rights to Plavix® in Japan.
In the territory under our operational management, the marketing arrangements are as follows:
•
•
•
we use the co-promotion system for most of the countries of Western Europe for Aprovel® and Plavix®
and for certain Asian countries for Plavix®;
we use the co-marketing system in Germany, Spain and Greece for both Aprovel® and Plavix® and inItaly for Aprovel®; and
we have the exclusive right to market Aprovel® and Plavix® in Eastern Europe, Africa and the MiddleEast, and we have the exclusive right to market Aprovel® in Asia (excluding Japan). Since September2006, we have had the exclusive right to market Aprovel® in Scandinavia and Ireland.
In the territory under BMS operational management, the marketing arrangements are as follows:
•
•
•
we use the co-promotion system in the United States and Canada, where the products are sold throughthe alliances under the operational management of BMS;
we use the co-marketing system in Brazil, Mexico, Argentina and Australia for Plavix® and Aprovel®
and in Colombia only for Plavix®; and
we have the exclusive right to market the products in certain other countries of Latin America.
In countries where the products are marketed by BMS on a co-marketing basis, or through alliances underthe operational management of BMS, we often sell the active ingredients for the products to BMS or suchentities.
58

Procter & Gamble Pharmaceuticals (P&G)
We in-license Actonel® from P&G. An alliance with P&G was concluded in April 1997 for theco-development and marketing of Actonel®. The 1997 agreements were amended following the acquisition ofAventis by sanofi-aventis, and later with respect to the marketing rights for Actonel® in certain countries inEurope.
The alliance agreement with P&G includes the development and marketing arrangements for Actonel®
worldwide (except Japan). The ongoing R&D costs for the product are shared equally between the parties, whilethe marketing arrangements vary depending on the country in which the product is marketed.
Under the alliance arrangements with P&G, there are five principal territories with different marketingarrangements:
• co-promotion territory: the product is jointly marketed through the alliance arrangements under thebrand name Actonel® with sales booked by P&G. The co-promotion territory includes the United States,Canada and France. The Netherlands were also included until March 31, 2008;
• secondary co-promotion territory: the product is jointly marketed through the alliance arrangementsunder the brand name Actonel® with sales booked by sanofi-aventis. The secondary co-promotionterritory includes Ireland, Sweden, Finland, Greece, Switzerland, Austria, Portugal and Australia. TheUnited Kingdom was also included until December 31, 2008. P&G may also at a later date exercise anoption to co-promote the product in Denmark, Norway, Mexico and/or Brazil;
• co-marketing territory: each company markets the products independently under its own brand name.This territory currently includes Italy. In Italy the product is sold under the brand name Actonel® byP&G and under the brand name Optinate® by sanofi-aventis. Each company also markets the productindependently under its own brand name in Spain, although Spain is not included in the co-marketingterritory; the product is marketed in Spain under the brand name Acrel® by P&G and under the brandname Actonel® by sanofi-aventis;
• P&G only territory: the product has been marketed by P&G independently under the brand nameActonel® in Germany, Belgium and Luxembourg since January 1, 2008, in the Netherlands sinceApril 1, 2008 and in the United Kingdom since January 1, 2009;
• sanofi-aventis only territory: the product is marketed by sanofi-aventis independently under the brandname Actonel® or another agreed trademark in all other territories.
Teva Pharmaceutical Industries (Teva)
We in-license Copaxone® from Teva and market it through an agreement with Teva, which was originallyconcluded in 1995, and has been amended several times, most recently in 2005.
Under the agreement with Teva, marketing and financial arrangements vary depending on the country inwhich the products are marketed.
Outside the United States and Canada, there are two principal marketing arrangements:
• exclusive marketing: we have the exclusive right to market the product. This system is used in a numberof European countries (Portugal, Italy, Greece, Finland, Denmark, Sweden, Norway, Iceland, Ireland,Luxembourg, Poland, Lichtenstein, Switzerland), as well as in Australia and New Zealand; and
• co-promotion: the product is marketed under a single brand name. We use the co-promotion system inGermany, the United Kingdom, France, the Netherlands, Austria, Belgium, the Czech Republic andSpain.
In the United States and Canada, Copaxone® was sold and distributed by sanofi-aventis but marketed byTeva until March 31, 2008. On March 31, 2008 Teva assumed the Copaxone® business, including sales of theproduct, in the United States and Canada. As a result, sanofi-aventis no longer shares certain marketing expenseswith respect to the United States and Canada and, for a period of two years, will receive from Teva a royalty of25% of sales in these markets.
59

Under the terms of our agreement, the Copaxone® business in countries other than the United States andCanada will be transferred to Teva over a period running from the fourth quarter of 2009 to the first quarter of2012 at the latest, depending on the country.
Competition
The pharmaceutical industry is currently experiencing significant changes in its competitive environment.Innovative drugs, a broad product range, and a presence in all geographical markets are key factors inmaintaining a strong position relative to the competition.
There are four types of competition in the pharmaceutical market:
• competition between pharmaceutical companies to research and develop new patented products or newtherapeutic indications;
• competition between different patented pharmaceutical products marketed for the same therapeuticindication;
• competition between original and generic products or between original biological products andbiosimilars, at the end of patent protection; and
• competition between generic or biosimilar products.
We compete with other pharmaceutical companies in all major markets to develop innovative new products.We may develop new technologies and new patented products wholly in-house, but we also enter intocollaborative R&D agreements in order to access new technologies.
Our prescription drugs compete in all major markets against patented drugs from major pharmaceuticalcompanies like Abbott in benign prostatic hyperplasia; AstraZeneca in cardiovascular disease, hypertension andoncology; Bayer in thrombosis; Boehringer-Ingelheim in atherothrombosis and benign prostatic hyperplasia;Bristol-Myers Squibb in oncology; Eli Lilly in osteoporosis, diabetes and oncology; GlaxoSmithKline inoncology, allergies, diabetes and thrombosis; Merck & Co. in hypertension, osteoporosis, diabetes and benignprostatic hyperplasia; Novartis in hypertension and oncology; Novo Nordisk in diabetes; Pfizer in antibiotics,oncology, thrombosis and allergies; and Roche in oncology and osteoporosis.
In our vaccines business, we compete primarily with Merck & Co, GlaxoSmithKline, Wyeth and Novartis.
We also face competition from generic drugs that enter the market when our patent protection or regulatoryexclusivity expires, or when we lose a patent infringement lawsuit (see “— Patents, Intellectual Property andOther Rights” above). Similarly, when a competing patented drug from another pharmaceutical company facesgeneric competition, these generic products can also affect the competitive environment of our own patentedproduct.
Competition from producers of generics has increased sharply in response to healthcare cost containmentmeasures and to the increased number of products going off patent.
Generics manufacturers who have received all necessary regulatory approvals for a product may decide tolaunch a generic version before the patent expiry date. This may occur notwithstanding the fact that the owner ofthe original product may already have commenced patent infringement litigation against the genericsmanufacturer. Such launches are said to be “at risk” for the promoter of the generic product because of the risk itwill be required to pay damages to the owner of the original product; however, they may also significantly impairthe profitability of the pharmaceutical company whose product is challenged.
Another competitive issue drug manufacturers are facing is the increasing incidence of parallel trade, alsoknown as reimportation. This takes place when drugs sold abroad under the same brand name as in a domesticmarket, are then imported into that domestic market by parallel traders, who may repackage or resize the originalproduct or sell it through alternative channels such as mail order or the Internet. This issue is of particularrelevance to the European Union, where these practices have been encouraged by the current regulatoryframework. Parallel traders take advantage of the price differentials between markets for a product arising fromfactors including sales costs, market conditions (such as intermediate trading stages), tax rates, or nationalregulation of prices.
60
Finally, pharmaceutical companies face illegal competition from counterfeit drugs. The WHO estimates thatcounterfeit products account for 10% of the market worldwide, rising to as much as 30% in some countries.However, in markets where powerful regulatory controls are in place, counterfeit drugs are estimated to representless than 1% of market value. The WHO also estimates that 50% of sales over the Internet are of counterfeitdrugs.
Regulation
The global production and distribution of pharmaceuticals is highly regulated. National and supranationalregulatory authorities administer a vast array of laws, directives and regulations that dictate the pre-approvaltesting, and the quality standards, in order to ensure safety and efficacy of a new drug. These authorities alsoregulate product labeling, manufacturing, importation/exportation and marketing as well as post-approvalcommitments which the product manufacturer is required to honor.
The submission of an application to a regulatory authority does not guarantee product approval, or that alicense to market the product will be granted. Furthermore, each regulatory authority may impose its ownrequirements during the course of the development or during product review. It may refuse to grant approval, ormay require additional data before and also after granting an approval, even though the relevant product hasalready been approved in one or several other countries. Regulatory authorities also have the authority to requestproduct recalls, seizure of products and other penalties for violations of regulations based on data that are madeavailable to them.
Europe, the United States, Japan and other Health Authorities all have high standards for pharmaceuticaltechnical appraisal. Product approval usually takes one to two years, but depending on the country it can varyfrom six months to, in some cases, several years from the date of application. Factors such as the quality of datasubmitted, the degree of control exercised by the regulatory authority, the review procedures, the nature of theproduct and the condition to be treated, play a major role in the length of time a product is under review.
In recent years, intensive efforts have been made among the United States, the European Union, Japan andalso other regions to harmonize product development and regulatory submission requirements. An example ofthis is that many pharmaceutical companies are now able to prepare and submit a common technical document(CTD) that can be used in different regions for a particular product with only local or regional adaptation.
However, the requirement of many countries (including Japan and several Member States of the EuropeanUnion) to negotiate selling prices or reimbursement rates for pharmaceutical products with governmentregulators can substantially extend the time for market entry to long after initial marketing approval is granted.While marketing authorizations for new pharmaceutical products in the European Union have been substantiallycentralized with the European Medicines Agency (EMEA), pricing and reimbursement remain a matter ofnational competence. See “— Pricing & Reimbursement” below.
In the European Union, there are three main procedures by which to apply for marketing authorization:
• the Centralized Procedure is compulsory for medicinal products derived from biotechnology and fordrugs intended to treat certain conditions and is also available at the request of companies for any otherinnovative products. In the Centralized Procedure the license application is submitted directly to theEMEA. The Committee for Medicinal Products (CHMP) evaluates the application for human use. TheEuropean Commission makes the final binding decision. Once granted, an approval via the CentralizedProcedure is valid throughout the European Union without further action and the drug may be marketedwithin all European Union member states;
• the Mutual Recognition Procedure (MRP) operates by having one country (i.e., the Reference MemberState, RMS) carry out the primary evaluation of a new compound. Once the first license is granted bythe RMS, other European Union member states (Concerned Member States, CMS) must then decidewhether they will accept, request clarifications or reject the approval granted by the RMS; and
• the Decentralized Procedure applies to products that have not yet obtained a marketing authorization ina European member state. The key procedural difference compared to the Mutual RecognitionProcedure is that an initial evaluation is done by the RMS with all the CMS being involved earlier in theprocess by contributing to the draft assessment report.
61

The EMEA has introduced a series of initiatives aiming at improving the openness and the transparency ofits activities, such as procedures dealing with the publication of the European Public Assessment Report (forapproved, withdrawn or rejected projects), which will now be more detailed. New initiatives are being proposedwith regard to the publication of question and answer documents and of safety bulletins on medicines for humanuse.
National authorizations are still possible, but are only for products intended for commercialization in asingle EU Member State, or for line extensions to existing national product licenses.
A new regulation in pediatric development came into force in January 2007 with implementation ongoinguntil 2009. It is aimed at promoting the development of drugs well adapted to children and ensuring safe use inthe pediatric population. Incentives are proposed such as extension of SPC (Supplementary ProtectionCertificate) or data protection for PUMA (Pediatric Use Marketing Authorization).
Generic drugs are subject to harmonized European procedures in all countries of the European Union. Ageneric drug contains the same active medicinal substance as an originator pharmaceutical product. Genericapplications are abridged: generic manufacturers only need to submit quality data and demonstrate that thegeneric drug is “bioequivalent” to the originator product — i.e. that it works in essentially the same way in thepatient’s body, but there is no need to submit safety or efficacy data as regulatory authorities refer to theoriginator product’s dossier. Generic drugs can be filed and approved by the European Union Health Authoritiesonly after the eight year data exclusivity period has expired. Further, generic manufacturers can only market theirgeneric products after a 10- or 11-year period from the date of approval of the reference product has elapsed.
In the United States, applications for drug approval are submitted for review by the U.S. Food and DrugAdministration (FDA). The FDA has broad regulatory powers over all pharmaceutical products that are intendedfor sale and marketing in the United States. To commercialize a product in the United States, a New DrugApplication (NDA) or Biological License Application (BLA) is filed with the FDA with data that sufficientlydemonstrate the drug’s quality, safety and efficacy. Specifically, the FDA must decide whether the drug is safeand effective for its proposed use, if the benefits of the drug’s use outweigh its risks, whether the drug’s labelingis adequate, and if the manufacturing of the drug and the controls used for maintaining quality are adequate topreserve the drug’s identity, strength, quality and purity. Based upon this review, the FDA can require post-approval commitments. Approval for a new indication of a previously registered drug requires the submission ofa supplemental NDA (sNDA).
Pharmaceutical manufacturers have committed to publishing protocols and results of clinical studiesperformed with their compounds in publicly accessible registries (Clinical Trials Registry and Clinical TrialResults Registry).
Once marketing authorization is granted, the new drug may be prescribed by physicians. Thereafter, thedrug owner must submit periodic reports to the regulatory authorities including assessment of adverse reactions.For some medications, regulatory authorities may require additional studies to evaluate long-term effects or togather information on the use of the product under special conditions. In addition, manufacturing facilities mustbe approved by regulatory authorities, and are subject to periodic inspections. Non-U.S. manufacturing facilitiesthat export products for sale in the United States must be approved by the FDA in addition to local regulatoryapprovals, and are also subject to periodic FDA inspections.
In the United States, generic drug manufacturers may file an Abbreviated NDA (ANDA). Theseapplications are “abbreviated” because they are generally not required to include preclinical data, such as animalstudies and human clinical data to establish safety and effectiveness. Instead, generic manufacturers need todemonstrate that their product is bioequivalent, i.e., that it performs in humans in the same manner as theinnovator’s product. Consequently, the length of time and cost required for development of such product can beconsiderably less than for the innovator’s drug. See “— Patents, Intellectual Property and Other Rights”, above,for additional information. The ANDA procedures in the United States can be used exclusively forpharmaceutical products approved under an NDA. See “— Focus on Biologics” below.
In Japan, the regulatory authorities can require local development studies; they can also request bridgingstudies to verify that foreign clinical data are applicable to Japanese patients and also require data to determine
62
the appropriateness of the dosages for Japanese patients. In the past, these additional procedures have createddifferences of several years in the registration dates of some of our products in Japan compared to our othermajor countries.
Focus on Biologics
Products are usually referred to as “biologics” when they are derived from plant or animal tissues (e.g.,blood products) or manufactured within living cells (e.g., antibodies, insulins, vaccines). Most biologics arecomplex molecules or mixture of molecules which are difficult if not impossible to fully characterize. For thecharacterisation and determination of these products’ quality a combination of physico-chemical-biologicaltesting, together with their production process and its control, is needed.
Consequently the concept of “generic” cannot apply to most of these products; it is the concept of“biosimilar products” that must be considered. Because the cost of developing and maintaining the industrialexpertise and capacity required to manufacture biologicals and, follow-on versions of a biologic (so-called“biosimilar” versions) frequently face cost structures and development times similar to that of the referenceproduct, as well as the time and expense of clinical trials. Indeed the simple bioequivalence study used fortraditional generics is normally insufficient where biologicals are concerned. For these reasons, applications withrespect to proposed biosimilar versions of biologics have in practice been substantially less frequent than genericapplications with respect to traditional synthetic chemical drugs.
In the European Union, a specific regulatory scheme has been in place since 2003 which establishes anabbreviated procedure for registration of biosimilar versions of existing biological drugs. The CHMP has issuedseveral guidelines on specific classes of biosimilar products. Biosimilar applications frequently requirepreclinical and clinical trials to be conducted in healthy subjects and patients in order to demonstrate safety andefficacy. With respect to vaccines in particular, the CHMP has taken the position that currently it is unlikely thatthese products may be characterized at the molecular level, and that each vaccine product must be evaluated on acase by case basis. With respect to Low Molecular Weight Heparins (LMWH) such as Lovenox®, the draft“Guideline on Similar Biological Medicinal Products Containing LMWHs” issued by the CHMP in April 2008addresses in its clinical section the efficacy and safety studies to be conducted for demonstrating two LMWHsbeing similar biological medicinal products. We therefore expect that in final CHMP guidance clinical trials willbe required prior to registration of a biosimilar version of LMWH.
In Japan a draft guideline on biosimilar products has been released in September 2008 for public comments.
In the United States, the regulations do not currently establish procedures for “biosimilar” versions of areference drug registered as a biological under the Public Health Service Act. Inclusion of an abbreviatedpathway for these products would require the law to be revised.
However, in the United States for historical reasons a few biologicals have been registered under the Food,Drug & Cosmetic Act (FDCA) following the NDA scheme used for traditional well characterized smallmolecules. It is currently still technically possible to file an ANDA with respect to those particular products(among the Group’s products Lovenox® is one example). Because an ANDA provides for no clinical trials otherthan bioequivalence studies, the appropriateness of an ANDA with respect to these NDA-registered biologicalsraises significant policy issues for the FDA.
The FDCA provides for another abbreviated registration pathway for some biosimilar products; the so-called “505(b)(2)” route. This pathway may be used notably for recombinant proteins. The registration file maypartially refer to the existing data for the reference product but must be completed with data specific to thebiosimilar version, notably with preclinical and clinical data. However the FDA indicated that this pathwayshould remain limited to relatively simple cases and that taking into consideration the current state of scientificknowledge, it is unlikely that it could be applied to more complex products either from a structural orpharmacological point of view.
63
Pricing & Reimbursement
Rising overall health care costs are leading to efforts to curb drug expenditures in most markets in whichsanofi-aventis operates. Increasingly these efforts result in pricing and market access controls forpharmaceuticals. The nature and impact of these controls vary from country to country, but some commonthemes are reference pricing, systematic price reductions, formularies, volume limitations, patient co-payrequirements, and generic substitution. In addition, governments and third-party payers are increasingly utilizingemerging healthcare information technologies such as electronic prescribing and health records to enforcetransparency and tight compliance with these regulations and controls. As a result, the environment in whichpharmaceutical companies must operate in order to make their products available to patients and providers whoneed them continues to grow more complex each year.
In the United States, the government does not currently control pharmaceutical costs directly except in thecase of prescriptions purchased or reimbursed by government entities such as Medicaid, Veterans Affairs, andthe Department of Defense. These entities provide health insurance coverage to approximately 16.9% of the U.S.population. Third-party payers administer private plans that cover part of the U.S. population, as well as theMedicare prescription benefit for the elderly, which the federal government funds but does not manage. Whilethey cannot directly control prices, third-party payers seek to decrease drug costs through reimbursementrestrictions such as patient co-pays, step therapy protocols (protocols under which a brand product may beprescribed and reimbursed only if therapy has already failed using at least one low-cost generic drug, also knownas “fail first”), and prior authorization (requirements that a prescriber obtain third-party payer authorization priorto prescribing certain medications), in addition to rebate contracting with manufacturers. However, the newDemocratic leadership in both the presidency and Congress has announced an intention to seek reform that couldincrease direct government involvement throughout the healthcare system in issues involving cost, equality andcoverage.
Outside the United States, governments frequently directly control pricing and reimbursement of drugs.Some of these countries, especially in the European Union, either currently have or are consideringreimbursement limitations based on comparative effectiveness data, in addition to traditional clinical efficacy andsafety criteria. Other issues include decentralization of healthcare authority in some countries, as well as parallelimportation in many markets. All of these factors, which are specific to each country, represent additionalfinancial and logistical challenges to pharmaceutical organizations.
Regardless of the exact method, we believe that third-party payers will continue to act to curb the cost ofpharmaceutical products. While the impact of these measures cannot be predicted with certainty, sanofi-aventis istaking the necessary steps to defend the accessibility and price of our products which reflects the value of ourinnovative product offerings:
• We actively engage with our key stakeholders on the value of our products as it specifically pertains totheir needs. These stakeholders — including physicians, patient groups, pharmacists, governmentauthorities, and third-party payers — can have significant impact on the market accessibility of ourproducts;
• We continue to add flexibility and adaptability to our operations to better prepare, diagnose, and addressissues in individual markets. For instance, in several countries, account management and sales functionshave been reorganized and empowered to make decisions based on regional markets;
• Keeping in mind the importance of recognizing the value of our products and the high cost of researchand development, we continue to analyze innovative pricing and access strategies that balance patientaccessibility with appropriate reward for innovation.
Insurance and Risk Coverage
We are protected by four key insurance programs, drawing not only on the traditional corporate insuranceand reinsurance market but also on a mutual insurance company established by various pharmaceutical groupsand our captive insurance company, Carraig Insurance Ltd.
These four key programs cover Property & Business Interruption, General Liability, Stock and Transit, andDirectors & Officers Liability.
64
Our captive, which participates in the first three of these programs, is run as an insurance company underthe supervision of the Irish regulatory authorities, and has sufficient resources to meet the risks that it covers. Itsets premiums for Group entities at market rates. Claims are assessed using the traditional models applied byinsurance and reinsurance companies, and the company’s reserves are regularly checked and confirmed byindependent actuaries.
Our Property & Business Interruption program covers all Group entities worldwide, wherever it is possibleto use a centralized program operated by our captive insurance company. This approach shares risk betweenGroup entities, enabling us to set deductibles appropriate to the needs of local entities. A further benefit of thisprogram is that traditional insurance cover is supplemented by specialist cover, thanks to the involvement of aninternational mutual insurance company established by a number of pharmaceutical groups. It also incorporates aprevention program, including a comprehensive site visit program covering our production, storage, research anddistribution facilities and standardized repair and maintenance procedures across all sites. Specialist site visits areconducted every year to address specific needs, such as testing of sprinkler systems or emergency plans to dealwith flooding risks.
The Stock and Transit program protects goods of all kind owned by the Group that are in transit nationallyor internationally, whatever the means of transport, and all our inventories wherever they are located. Sharingrisk between Group entities means that we can set deductibles at appropriate levels, for instance differentiatingbetween goods that require temperature controlled distribution and those that do not. Over the last two years, wehave been working with our insurers to develop a prevention program, implementing best practices in this area atour distribution sites. This program, which is led by our captive insurance company, has substantial capacity,largely to deal with the growth in sea freight which can lead to a concentration of value in a single ship.
Our General Liability & Product Liability program has been renewed for all our subsidiaries worldwidewherever it was possible to do so, despite the increasing reluctance in the insurance and reinsurance market tocover product liability risks for large pharmaceutical groups. For several years, insurers have been reducingproduct liability cover because of the difficulty of insuring some products that have been subject to numerousclaims. These products are excluded from the cover provided by insurers, and hence from the cover obtained byus on the insurance market. This applies to a few of our products, principally those described in Note D.22.a) toour consolidated financial statements included at Item 18 in this annual report. Because of these marketconditions we have increased, year by year, the extent to which we self-insure.
The principal risk exposure for our pharmaceutical products is covered with low deductibles at countrylevel, the greatest level of risk being retained by our captive insurance company. The level of risk self-insured bythe Group — including our captive reinsurance company — enables us to retain control over the managementand prevention of risk. Our negotiations with third-party insurers and reinsurers are tailored to our specific risks.In particular, they allow for differential treatment of products in the development phase, for the discrepancies inrisk exposure between European countries and the United States, and for specific issues arising in certainjurisdictions.
Our cover for risks that are not specific to the pharmaceutical industry (general liability) is designed toaddress the potential impacts of our operations.
The Directors & Officers Liability program protects all our legal entities and their directors and officers.Our captive insurance company is not involved in this program.
These insurance programs are backed by best-in-class insurers and reinsurers. Our cover has been designedto reflect our risk profile and the capacity available in the insurance market. By centralizing our major programs,not only do we reduce costs, but we also provide world-class coverage for the entire Group.
65

C. Organizational Structure
Sanofi-aventis is the holding company of a consolidated group of subsidiaries. The table below sets forthour significant subsidiaries and affiliates as of December 31, 2008. For a complete list of our main consolidatedsubsidiaries, see Note F. to our consolidated financial statements, included in this annual report at Item 18.
Significant Subsidiary or Affiliate CountryOwnership
Interest
Aventis Inc. . . . . . . . . . . . . . . . . . . . . . . . . . . . . . . . . . . . . . . . . . . . . . . . . United States 100%Aventis Pharma S.A. . . . . . . . . . . . . . . . . . . . . . . . . . . . . . . . . . . . . . . . . . France 100%Hoechst GmbH . . . . . . . . . . . . . . . . . . . . . . . . . . . . . . . . . . . . . . . . . . . . . . Germany 100%Sanofi-aventis Amerique du Nord S.N.C. . . . . . . . . . . . . . . . . . . . . . . . . France 100%Sanofi-aventis Deutschland GmbH . . . . . . . . . . . . . . . . . . . . . . . . . . . . . . Germany 100%Sanofi-aventis Europe S.A.S. . . . . . . . . . . . . . . . . . . . . . . . . . . . . . . . . . . France 100%Sanofi-aventis France S.A. . . . . . . . . . . . . . . . . . . . . . . . . . . . . . . . . . . . . France 100%Sanofi-aventis Participation S.A.S. . . . . . . . . . . . . . . . . . . . . . . . . . . . . . France 100%Sanofi-aventis US LLC . . . . . . . . . . . . . . . . . . . . . . . . . . . . . . . . . . . . . . . . United States 100%Sanofi-aventis US Inc. . . . . . . . . . . . . . . . . . . . . . . . . . . . . . . . . . . . . . . . . United States 100%Sanofi Pasteur Inc. . . . . . . . . . . . . . . . . . . . . . . . . . . . . . . . . . . . . . . . . . . . United States 100%Sanofi Pasteur S.A. . . . . . . . . . . . . . . . . . . . . . . . . . . . . . . . . . . . . . . . . . . France 100%Sanofi Winthrop Industrie S.A. . . . . . . . . . . . . . . . . . . . . . . . . . . . . . . . . France 100%
Sanofi-aventis and its subsidiaries form a Group, organized around two business segments: pharmaceuticalproducts and human vaccines.
The patents and trademarks of the pharmaceuticals activity are primarily owned by the sanofi-aventis parentcompany, Aventis Pharma S.A. (France), Hoechst GmbH (Germany) and Sanofi-Aventis Deutschland GmbH(Germany).
Within the Group, the holding company oversees research and development activities, by defining strategicpriorities, coordinating work, and taking out the industrial property rights under its own name and at its ownexpense. In order to fulfill this role, sanofi-aventis subcontracts research and development to its specializedFrench and foreign subsidiaries, in many cases licensing its patents, manufacturing know-how and trademarks. Inthese cases, the licensee subsidiaries manufacture and distribute the Group’s products, either directly or via localdistribution entities.
In certain countries, sanofi-aventis carries out part of its business operations through ventures with localpartners. In addition, the Group has signed worldwide alliances by which two of its products (Plavix® andAprovel®) are marketed through an alliance with BMS (see “— Alliances,” above).
For most Group subsidiaries, sanofi-aventis provides financing and centrally manages their cash surpluses.Under the alliance arrangement with BMS, cash surpluses and cash needs arising within alliance entities give riseto symmetrical monthly transfers between the two groups. The holding company also operates a centralizedforeign exchange risk management system, which enters into positions to manage the operational risks of itsmain subsidiaries.
D. Property, Plant and Equipment
Our worldwide headquarters and principal executive offices are located in Paris, France. Our U.S.headquarters are located in Bridgewater, New Jersey.
We operate our business through offices and research, production and logistics facilities in approximately110 countries. All our support functions operate out of our office premises.
A breakdown of these sites by nature and ownership/leasehold status is provided below. Breakdowns arebased on surface area. All surface area figures are unaudited.
66

Breakdown of sites by nature
Industrial . . . . . . . 55%Research . . . . . . . 14%Offices . . . . . . . . . 24%Logistics . . . . . . . 7%
Research and Development Sites for the Pharmaceutical Activity
Research and Development activities are housed at 29 sites:
• 13 sites in France, the largest in terms of surface area being in Vitry/Alfortville (approximately 96,000sq.m), Montpellier (78,000 sq.m), Chilly/Longjumeau (77,000 sq.m) and Toulouse (38,000 sq.m);
• 7 sites in other European countries (Germany, United Kingdom, Hungary and Italy), the largest being inFrankfurt, Germany (84,000 sq.m). In Italy, a Research center located in Milan was inaugurated in May2008;
• 5 sites in the United States, the largest being in Bridgewater, New Jersey (111,000 sq.m);
• 2 sites in Japan, in Tokyo and Kawagoe;
• 2 sites in China: the main Research and Development operations are located in Shanghai, with a ClinicalResearch Unit in Beijing.
Industrial sites for the Pharmaceutical Activity
Production of chemical and pharmaceutical products is the responsibility of the Industrial AffairsDirectorate, which is also in charge of most of our logistics facilities (distribution and storage centers).
We have 64 industrial sites worldwide. The sites where the major sanofi-aventis drugs, active ingredientsand medical devices are manufactured are:
• France: Ambarès (Aprovel®, Depakine®), Le Trait (Lovenox®), Maisons Alfort (Lovenox®), Neuville(dronedarone), Quetigny (Stilnox®, Plavix®), Sisteron (clopidogrel bisulfate, dronedarone, zolpidemtartrate), Tours (Stilnox®, Aprovel®, Xatral®), Vitry/Alfortville (docetaxel) ;
• Germany: Frankfurt (insulins, ramipril, Lantus®, Tritace®, pens);
• Italy: Scoppito (Tritace®, Amaryl®);
• United Kingdom: Dagenham (Taxotere®), Fawdon (Plavix®, Aprovel®);
• Hungary: Ujpest (irbesartan), Csanyikvölgy (Lovenox®);
• United States: Kansas City (Allegra®, Amaryl®).
Sanofi Pasteur Sites
The headquarters of our Vaccines division, sanofi pasteur, are located in Lyon, France. Sanofi Pasteur’sproduction and/or Research and Development sites are located in Swiftwater, Cambridge*, Rockville* andCanton* (United States), Toronto (Canada), Marcy l’Etoile and Val de Reuil (France), Shenzhen (China) andPilar (Argentina).
Breakdown of sites between owned and leased
Leased . . . . . . . . . 72%Owned . . . . . . . . . 28%
We own most of sanofi pasteur’s Research and Development and production sites, either freehold or underfinance leases with a purchase option exercisable at expiration.
* Sites acquired in 2008 with Acambis.
67

We believe that our production plants and research facilities are in full compliance with regulatoryrequirements, well maintained, and generally adequate to meet our needs for the foreseeable future. However, wereview our production facilities on a regular basis with regard to environmental, health, safety and securityissues, quality compliance, and capacity utilization. For more information about our property, plant andequipment, see Note D.3. to our consolidated financial statements included at Item 18 of this annual report.
Capital Expenditures and Divestitures
The book value of our property, plant and equipment at December 31, 2008 was €6,961 million. During2008, we invested €1,359 million (see Note D.3. to the consolidated financial statements) in increasing capacityand improving productivity at our various production and R&D sites.
The Group’s principal capital expenditures and divestitures for the years 2008, 2007 and 2006 are set out inthis annual report at “Item 5. Operating and Financial Review and Prospects — Divestments”, “— Acquisitions”and “— Liquidity and Capital Resources” and in the notes to the consolidated financial statements (Note D.1.“Significant Acquisitions”, Note D.2. “Significant Divestments” and Note D.4. “Intangible assets andGoodwill”).
Our principal investments in progress are related to:
• the Pharmaceutical activity with the construction or expansion of several Research and Developmentfacilities in France (Chilly/Longjumeau, Montpellier, Toulouse, Massy and Vitry/Alfortville) and theUnited States (Tucson, Az.) and the construction of a filling and conditioning lines in Le Trait (France);
• the Vaccines activity with the construction of a state-of-the-art research facility in Toronto (Canada), thecreation of a new vaccine campus in Neuville (France), the construction of formulation and fillingfacilities in Val de Reuil, of a bacteriological bulk facility in Marcy l’Etoile (France), of a flu bulkfacility in Shenzhen (China) and the finalization of bulk and filling facilities in Swiftwater (UnitedStates), mainly dedicated to influenza and meningitis.
We believe that our existing cash resources and unused credit facilities will be sufficient to finance theseinvestments.
Item 4A. Unresolved Staff Comments
N/A
Item 5. Operating and Financial Review and Prospects
You should read the following discussion in conjunction with our consolidated financial statements and thenotes thereto included in this annual report at Item 18.
Our consolidated financial statements have been prepared in accordance with International FinancialReporting Standards (IFRS) as issued by the International Accounting Standards Board (IASB) and with IFRSadopted by the European Union as of December 31, 2008.
The following discussion contains forward-looking statements that involve inherent risks and uncertainties.Actual results may differ materially from those contained in such forward-looking statements. See“— Cautionary Statement Regarding Forward-Looking Statements” at the beginning of this document.
2008 Overview
During 2008, sanofi-aventis once again demonstrated its ability to meet the challenge of delivering solidperformances in a global market undergoing profound upheavals.
We generated net sales for the year of €27,568 million, an increase of 3.7% on a comparable basis(excluding the effects of exchange rates and changes in Group structure, See “— Presentation of Net Sales”below) relative to 2007, driven by very good performances from flagship products such as Lantus®, Lovenox®,
68
Taxotere®, Plavix® and Aprovel®, and by the buoyancy of our human vaccines business. Sales growth in Europewas again hampered by the impact of generics of Eloxatine®, and over the closing months of the year bycompetition from clopidogrel besylates in Germany affecting part of the market for Plavix®. On the positive side,we continued to record growth ahead of the market in the United States, despite the impact of generics ofAmbien® IR from the second quarter of 2007. We also achieved double-digit growth in emerging markets during2008. In the fourth quarter of 2008, the U.S. Court of Appeals for the Federal Circuit upheld an earlier favorableruling in the Plavix® patent infringement suit brought against a generics manufacturer, thereby also upholding theinjunction preventing that manufacturer from selling a generic of Plavix® until the patent protection expires.
We also continued with measures to adapt our resources in Europe and the United States during 2008,resulting in a further improvement in operating ratios. Our selling and general expenses fell by 5.1%, andrepresented just 26.0% of our net sales compared with 26.9% in 2007.
Operating income before restructuring, impairment of property, plant and equipment and intangibles, gains/losses on disposals, and litigation rose by 5.7% in absolute terms in 2008, to €6,457 million (+1.6 points of netsales), largely as a result of the reduction in selling and general expenses (-0.9 of a point of net sales).
Operating income fell by 25.7% to €4,394 million (-5.1 points of net sales), reflecting the recognition ofimpairment losses on intangible assets (€1,554 million, versus €58 million in 2007) and restructuring costs(€585 million, versus €137 million in 2007).
Net income attributable to equity holders of the Company for 2008 was €3,851 million against€5,263 million for 2007. Our adjusted net income amounted to €7,068 million in 2008, 0.6% lower than in 2007(€7,110 million), mainly due to restructuring costs (€389 million, versus €95 million in 2007, net of taxes).Adjusted net income represented 25.6% of net sales in 2008, compared with 25.3% in 2007.
Adjusted net income is a non-GAAP financial measure which our management uses to monitor ouroperational performance, and which is defined at “— Sources of Revenues and Expenses — Adjusted NetIncome,” below.
Earnings per share (EPS) for the year ended December 31, 2008 was €2.94, compared with €3.91 for theprevious year (based on an average number of shares outstanding of 1,309.3 million in 2008 and 1,346.9 millionin 2007). Adjusted earnings per share (adjusted EPS) was €5.40 for 2008, 2.3% higher than the 2007 figure(€5.28), with the year-on-year trend boosted by the implementation of the €3 billion share repurchase programauthorized by the Shareholders’ Annual General Meeting in May 2007.
Our operations generate significant cash flow. We recorded €8,523 million of net cash provided byoperating activities in 2008 against €7,106 million in 2007. In 2004, we incurred significant debt to finance theacquisition of Aventis. As of year end 2008, we have reimbursed substantially all of this debt. In terms offinancial position, we ended 2008 with our debt, net of cash and cash equivalents (meaning the sum of short-termdebt and long-term debt less cash and cash equivalents) reduced to €1.8 billion (2007: €4.2 billion) despite sharerepurchases of €1.2 billion and a dividend payout of €2.7 billion in 2008. Debt, net of cash and cash equivalents,is a financial indicator that is used by management and investors to measure the Company’s overall netindebtedness and to assess the Company’s financing risk as measured by its gearing ratio (debt, net of cash andcash equivalents, to total equity). The gearing ratio improved from 9.5% at the end of 2007 to 3.9% at the end of2008. See “Liquidity and Capital Resources — Consolidated Balance Sheet and Debt”, below.
In response to the profound changes in our markets and the challenges facing the pharmaceutical industryover the coming years, our Board of Directors recommended the adoption of a new strategy, and announced itsdecision to appoint Christopher Viehbacher to oversee the implementation of this strategy as Chief ExecutiveOfficer with effect from December 1, 2008.
Our new strategic vision hinges on three priorities: establishing a new R&D model, adapting our structuresto meet the challenges of the future, and exploring external growth opportunities. The broad outlines of this newvision were unveiled to coincide with the announcement of our 2008 full-year results.
69
We stepped up our acquisitions and alliances policy during 2008. In June, we announced an offer for theentire share capital of Zentiva N.V., in which we already own a 24.88% stake. Zentiva offers a portfolio ofbranded equivalent drugs tailored to the needs of markets in Central and Eastern Europe. The offer periodexpired on February 20, 2009 and on February 25, 2009 sanofi-aventis announced that enough shares had beentendered to bring its holding to about 94%. The offer closes on March 11, 2009. In the field of vaccines, weacquired Acambis plc in September. Acambis plc has a portfolio that includes a smallpox vaccine, threeprograms in clinical development (previously conducted under collaboration agreements with sanofi pasteur) todevelop and market vaccines against Japanese encephalitis, dengue fever and West Nile virus, and novel earlystage programs in clostridium difficile, influenza and genital herpes. Also in September, we acquired SymbionCP Holdings Pty Ltd, an Australian company specializing in nutraceuticals (vitamins and mineral supplements)and over the counter medicines. In biotechnologies, we signed a number of alliance and license agreements(principally with Dyax Corp. in February and with Novozymes in December), giving us access to newtechnologies and expanding or enhancing our expertise in our existing research fields.
Purchase Accounting Effects (primarily the acquisition of Aventis in 2004)
Our results of operations and financial condition for the years ended December 31, 2008, December 31,2007 and December 31, 2006 have been significantly affected by our August 2004 acquisition of Aventis andcertain subsequent transactions.
The acquisition gave rise to significant amortization (€3,298 million in 2008, €3,511 million in 2007 and€3,866 million in 2006) and impairments of intangible assets (€1,503 million in 2008, €58 million in 2007 and€946 million in 2006).
In order to isolate the impact of these items, we use as an evaluation tool a non-GAAP financial measurethat we refer to as “adjusted net income.” For a further discussion and definition of “adjusted net income”, see“Sources of Revenues and Expenses — Adjusted Net Income,” below. For consistency of application of thisprinciple, adjusted net income is also adjusted for the impact of our subsequent acquisitions.
Adjusted net income breaks down as follows:
(€ million, except per share data) 2008 2007 2006
Net income attributable to equity holders of the Company . . . . . . . . . . . . . . . 3,851 5,263 4,006
Material accounting adjustments related to business combinations . . . . . . . . 3,217 1,847 2,969• elimination of expense arising on the workdown of acquired
inventories remeasured at fair value, net of tax 2(1) —• elimination of expenses arising on amortization and impairment of
intangible assets, net of tax (portion attributable to equity holders of theCompany) 3,137(2) 1,684(3) 2,935
• elimination of expenses arising from the impact of the acquisitions onequity investees (workdown of acquired inventory, amortization andimpairment of intangible assets, and impairment of goodwill) 78(4) 163(4) 13(5)
• elimination of impairment losses charged against goodwill — — —Elimination of acquisition-related integration and restructuring charges,
net of tax . . . . . . . . . . . . . . . . . . . . . . . . . . . . . . . . . . . . . . . . . . . . . . . . . . . . . . — —
Adjusted net income . . . . . . . . . . . . . . . . . . . . . . . . . . . . . . . . . . . . . . . . . . . . . . .
Adjusted earnings per share (in euro) (6) . . . . . . . . . . . . . . . . . . . . . . . . . . . . . .
7,068
5.40
7,110
5.28
7,040
5.23
21
65
(1) Impact of the acquisition of Symbion Consumer (see Note D.1. to our consolidated financial statements included at Item 18 of thisannual report).
(2) Includes €1,485 million of impairment losses (€972 million net of tax) on Aventis intangible assets. (see Note D.5. to our consolidatedfinancial statements included at Item 18 of this annual report).
(3) Includes a gain of €566 million due to the effect of cuts in tax rates (primarily in Germany) on deferred tax liabilities recognized in 2004on the remeasurement of acquired intangible assets of Aventis.
(4) Includes the impact of the Zentiva acquisition: €3 million in 2008, and €108 million in 2007 (including €102 million of impairmentlosses on the investment in Zentiva).
(5) Includes the impact of the Zentiva acquisition (€11 million); amortization and impairment (net of tax) associated with the acquisition ofAventis (€97 million); and reversal of a deferred tax liability relating to the investment in Merial (€95 million).
(6) Based on 1,309.3 million shares for 2008, 1,346.9 million shares for 2007 and 1,346.8 million shares for 2006, representing the weightedaverage number of shares outstanding.
70

Sources of Revenues and Expenses
Revenue. Revenue arising from the sale of goods is presented in the income statement under “Net sales.”Net sales comprise revenue from sales of pharmaceutical products, vaccines, and active ingredients, net of salesreturns, of customer incentives and discounts, and of certain sales-based payments paid or payable to thehealthcare authorities. Returns, discounts, incentives and rebates described above are recognized in the period inwhich the underlying sales are recognized, as a reduction of sales revenue. See Note B.14. to the consolidatedfinancial statements included at Item 18 of this annual report. We sell pharmaceutical products and humanvaccines directly, through alliances, and through licensees throughout the world. When we sell products directly,we record sales revenues as part of our consolidated net sales. When we sell products through alliances, therevenues reflected in our consolidated financial statements are based on the overall level of sales of the productsand on the arrangements governing those alliances. For more information about our alliances, see “— FinancialPresentation of Alliances,” below. When we sell products through licensees, we receive royalty income that werecord in “Other revenues.” See Note C. to the consolidated financial statements included at Item 18 of thisannual report.
Cost of Sales. Our cost of sales consists primarily of the cost of purchasing active ingredients and rawmaterials, labor and other costs relating to our manufacturing activities, packaging materials, payments madeunder licensing agreements and distribution costs. We have license agreements under which we distributeproducts that are patented by other companies and license agreements under which other companies distributeproducts that we have patented. When we pay royalties, we record them in cost of sales, and when we receiveroyalties, we record them in “Other revenues” as discussed above.
Adjusted Net Income. We believe that investors’ understanding of our operational performance followingthe combination of Sanofi-Synthélabo and Aventis is enhanced by disclosing our “adjusted net income.”
We define “adjusted net income,” an unaudited non-GAAP financial measure, as net income attributable toequity holders of the Company determined under IFRS, adjusted to exclude (i) the material impacts of theapplication of purchase accounting to acquisitions (primarily the Aventis acquisition) and (ii) certain acquisition-related integration and restructuring costs. We view adjusted net income as an operating performance measureand believe that the most directly comparable IFRS measure is net income attributable to equity holders of theCompany.
Non-GAAP adjusted net income excludes the effects of purchase-accounting treatment under IFRS relatedto acquisitions (primarily our acquisition of Aventis). We believe that excluding these non-cash charges willenhance an investor’s understanding of our underlying economic performance after the combination with Aventisbecause we do not consider that the excluded charges reflect the combined entity’s ongoing operatingperformance. Rather, we consider that each of the excluded charges reflects the decision to acquire the businessesconcerned.
The purchase-accounting effects on net income primarily relate to:
• the charges to cost of sales resulting from the workdown of acquired inventory that was written up tofair value, net of tax;
• the charges related to the impairment of the goodwill; and
• the charges related to the amortization and impairment of intangible assets, net of tax and minorityinterests.
For the periods under review the principal non-Aventis adjustments relate to the impact of the acquisition ofa minority stake in Zentiva (purchased in 2006). The purchase-accounting effects of this acquisition on 2008 netincome primarily relate to the amortization of Zentiva intangible assets (€3 million). The purchase-accountingeffects on 2007 net income primarily relate to impairment losses on the investment in Zentiva (€102 million).The purchase-accounting effects on 2006 net income primarily relate to the charges to cost of sales resultingfrom the workdown of acquired inventory that was written up to fair value, net of tax and to the charges relatedto the amortization and impairment of Zentiva definite-lived intangible assets. Zentiva is accounted for as anassociate using the equity method.
71
We believe (subject to the material limitations discussed below) that disclosing non-GAAP adjusted netincome also enhances the comparability of our ongoing operating performance. The elimination of thenon-recurring items, such as the increase in cost of sales arising from the workdown of inventories remeasured atfair value, improves comparability between one period and the next. Lastly, we believe that the elimination ofcharges related to the amortization of definite-lived intangible assets also enhances the comparability of ourongoing operating performance relative to our peers in the pharmaceutical industry that carry these intangibleassets (principally patents and trademarks) at low book values either because they are the result of in-houseresearch and development that has already been expensed in prior periods or because they were acquired throughbusiness combinations that were accounted for as poolings-of-interest.
As a result of the acquisition of Aventis, we have incurred significant integration and restructuring costs.We believe it is appropriate to exclude these costs from non-GAAP adjusted net income because they are directlyand only incurred in connection with the acquisition of Aventis. As of year-end 2006, the Company had incurredall the announced integration and restructuring costs related to the acquisition of Aventis and the subsequentmerger. No such cost was incurred in 2007 and 2008.
Our management uses and intends to use non-GAAP adjusted net income to manage and to evaluate ourperformance and we believe it is appropriate to disclose this non-GAAP financial measure, as a supplement toour IFRS reporting, to assist investors in analyzing the factors and trends affecting our business performance. Wealso report non-GAAP adjusted net income as a subtotal in reporting our segment information. See Note D.35. toour consolidated financial statements included in Item 18 of this annual report. Our management also uses themeasure as a component in setting incentive compensation targets, because it better measures the underlyingoperational performance of the business and excludes charges over which managers have no control. Ourmanagement also uses adjusted net income as the basis for proposing dividend policy for the Group.Accordingly, management believes that an investor’s understanding of trends in our dividend policy is enhancedby disclosing non-GAAP adjusted net income.
We have also decided to report adjusted earnings per share. Adjusted earnings per share is a specificfinancial indicator, which we define as adjusted net income divided by the weighted average number of sharesoutstanding. Our management also intends to give earnings guidance based on adjusted earnings per share.
We remind investors, however, that non-GAAP adjusted net income should not be considered in isolationfrom, or as a substitute for, net income reported in accordance with IFRS. In addition, we strongly encourageinvestors and potential investors not to rely on any single financial measure but to review our financialstatements, including the notes thereto, and our other publicly filed reports, carefully and in their entirety.
There are material limitations associated with the use of non-GAAP adjusted net income as compared to theuse of IFRS net income in evaluating our performance, as described below:
• The results presented by non-GAAP adjusted net income cannot be achieved without incurring thefollowing costs that the measure excludes:
• Amortization of identifiable intangible assets acquired, primarily from Aventis. Although thisamortization is a non-cash charge, it is important for investors to consider it because it represents anallocation in each reporting period of a portion of the purchase price that we paid for the identifiableintangible assets of Aventis (principally patents and trademarks). We paid an aggregate of€31,279 million for these intangible assets (which, in general, will be amortized over their usefullives, which represents an average amortization period of eight years). A large part of our revenuesafter the combination could not be generated without owning these assets. Also, a significant portionof the purchase price paid for these assets has been financed by debt obligations, a portion of whichwill continue to be repaid in cash in the future. Further, if we do not continuously replace revenue-generating intangible assets as they become unproductive (for example, through researching anddeveloping new pharmaceutical products), we may not be able to maintain or grow our revenues.
• Integration and restructuring costs. Non-GAAP adjusted net income does not reflect any integrationand restructuring costs even though it reflects any synergies that arise from the merger of sanofi-aventis and Aventis.
72
• The difference in treatment of similar charges may complicate the use of non-GAAP adjusted netincome as a comparative measure:
• Amortization of identifiable intangible assets. Non-GAAP adjusted net income reflects amortizationcharges related to intangible assets that we owned at the time that we acquired Aventis and tointangible assets that we may acquire after that acquisition, even though non-GAAP adjusted netincome will not reflect the amortization charges related to identifiable intangible assets acquiredfrom Aventis and potential future other business combinations.
We compensate for the above-described material limitations by using non-GAAP adjusted net income onlyto supplement our IFRS financial reporting and by ensuring that our disclosures provide sufficient informationfor a full understanding of all adjustments included in non-GAAP adjusted net income. In addition, subject toapplicable law, we may in the future decide to report additional non-GAAP financial measures which, incombination with non-GAAP adjusted net income, may compensate further for some of the material limitationsdescribed above.
In determining the level of future dividend payments, and in analyzing dividend policy on the basis ofnon-GAAP adjusted net income, our management intends to take into account the fact that the adjustmentsreflected in non-GAAP adjusted net income have no effect on the underlying amount of cash available to paydividends, and that although the adjustments relating to the elimination of the effect of the purchase accountingtreatment of the Aventis acquisition and other acquisitions represent non-cash charges, the adjustments relatingto integration and restructuring costs represent significant cash charges in the periods immediately following theclosing of the acquisition.
This Item 5 contains discussion and analysis of adjusted net income on the basis of consolidated financialdata. Because our non-GAAP adjusted net income is not a standardized measure, it may not be comparable withthe non-GAAP financial measures of other companies having the same or a similar name.
Presentation of Net Sales
In the discussion below, we present our consolidated net sales for 2008, 2007 and 2006. We break down ournet sales among various categories, such as by business segment, product and geographic region. We refer to ourconsolidated net sales as “reported” sales.
In addition to reported sales, we also present and discuss comparable sales, another unaudited non-GAAPindicator that we believe is a useful measurement tool to explain changes in our reported net sales.
When we refer to the change in our net sales on a “comparable” basis, we mean that we exclude the impactof exchange rate fluctuations and changes in our group structure (due to acquisitions and divestitures of entitiesand rights to products, and changes in the consolidation percentage for consolidated entities). For any twoperiods, we exclude the impact of exchange rates by recalculating net sales for the earlier period on the basis ofexchange rates used in the later period. We exclude the impact of acquisitions by including sales for a portion ofthe prior period equal to the portion of the current period during which we owned the entity or product rightsbased on sales information we receive from the party from whom we make the acquisition. Similarly, we excludesales in the relevant portion of the prior period when we have sold an entity or rights to a product. If there is achange in the consolidation percentage of a consolidated entity, the prior period is recalculated on the basis of theconsolidation method used for the current period.
A reconciliation of our reported net sales to our comparable net sales is provided at “Results of Operations— Year Ended December 31, 2008 compared with Year Ended December 31, 2007 — Net Sales” and “Resultsof Operations — Year Ended December 31, 2007 compared with Year Ended December 31, 2006 — Net Sales”below.
Financial Presentation of Alliances
We have entered into a number of alliances for the development, co-promotion and/or co-marketing of ourproducts. We believe that a presentation of our two principal alliances is useful to an understanding of ourfinancial statements.
73

Bristol-Myers Squibb (BMS) Alliance
Our revenues, expenses and operating income are affected significantly by the presentation of our alliancewith BMS in our consolidated financial statements.
There are three principal marketing arrangements that are used:
• Co-marketing. Under the co-marketing system, each company markets the products independently underits own brand names. We record our own sales and related costs in our consolidated financialstatements.
• Exclusive Marketing. Under the exclusive marketing system, one company has the exclusive right tomarket the products. We record our own sales and related costs in our consolidated financial statements.
• Co-promotion. Under the co-promotion system, the products are marketed through the alliancearrangements (either by contractual arrangements or by separate entities) under a single brand name.The accounting treatment of the co-promotion arrangement depends upon who has majority ownershipand operational management in that territory, as discussed below.
The alliance arrangements include two royalty streams that are applied on a worldwide basis (excludingJapan), regardless of the marketing system and regardless of which company has majority ownership andoperational management:
• Discovery Royalty. As inventor of the two molecules, we earn a discovery royalty on all sales ofAprovel® and Plavix® regardless of the marketing system. The discovery royalty is reflected in ourconsolidated income statement in “other revenues.”
• Development Royalty. In addition to the discovery royalty, we and BMS are each entitled to adevelopment royalty related to certain know-how and other intellectual property in connection withsales of Aprovel® and Plavix®. Each legal entity that markets products pays a development royalty. Werecord development royalties paid to BMS in our consolidated income statement as an increase to ourcost of sales in countries where we consolidate sales of the products. We record development royaltiesthat we receive as “other revenues” in countries where BMS consolidates sales of the products.
Under the alliance arrangements, there are two territories, one under our operational management and theother under the operational management of BMS. The territory under our operational management consists ofEurope and most of Africa and Asia, while the territory under the operational management of BMS consists ofthe rest of the world (excluding Japan). In Japan, Aprovel® has been marketed jointly by ShionogiPharmaceuticals and Dainippon Sumitomo Pharma Co.Ltd since June 2008 through license and sub-licenseagreements entered into with BMS. Our alliance with BMS does not cover distribution rights to Plavix® in Japan,which is marketed by sanofi-aventis.
Territory under our operational management. In the territory under our operational management, themarketing arrangements and recognition of operations by the Group are as follows:
• we use the co-promotion system for most of the countries of Western Europe for Aprovel® and Plavix®
and for certain Asian countries for Plavix®. We record 100% of all alliance revenues and expenses inour consolidated financial statements. We also record, as selling and general expenses, payments toBMS for the cost of BMS’s personnel involved in the promotion of the products. BMS’s share of theoperating income of the alliances is recorded as “minority interests”;
• we use the co-marketing system in Germany, Spain and Greece for both Aprovel® and Plavix® and inItaly for Aprovel®;
• we have the exclusive right to market Aprovel® and Plavix® in Eastern Europe, Africa and the MiddleEast, and we have the exclusive right to market Aprovel® in Asia (excluding Japan). Since September2006, we have had the exclusive right to market Aprovel® in Scandinavia and in Ireland.
74

Territory under BMS operational management. In the territory under BMS operational management, themarketing arrangements and recognition of operations by the Group are as follows:
• we use the co-promotion system in the United States and Canada, where the products are sold through thealliances under the operational management of BMS. With respect to Avapro® (the brand name used in theUnited States for Aprovel®) and Plavix®, we record our share of the alliance’s operating income under “shareof profit/loss of associates”. We also record payments from BMS for the cost of our personnel in connectionwith the promotion of the product as a deduction from our selling and general expenses;
• we use the co-marketing system in Brazil, Mexico, Argentina and Australia for Plavix® and Aprovel®
and in Colombia for Plavix®;
• we have the exclusive right to market the products in certain other countries of Latin America.
In countries where the products are marketed by BMS on a co-marketing basis, or through alliances underthe operational management of BMS, we also earn revenues from the sale of the active ingredients for theproducts to BMS or such entities, which we record as “Net sales” in our consolidated income statement.
The financial impact of the alliances on the Company’s income statement is described in “Results ofOperations”, in particular in “— Net sales”, “— Other Revenues”, “— Share of Profit/Loss of Associates” and“— Net Income Attributable to Minority Interests”.
Procter & Gamble Pharmaceuticals (P&G) Alliance
The agreement with P&G covers the worldwide development and marketing arrangements of Actonel®,except Japan for which we hold no rights. The local marketing arrangements may take various forms.
• Co-promotion, whereby sales resources are pooled but only one of the two partners invoices productsales. Co-promotion is carried out under contractual agreements and is not based on any specific legalentity. P&G sells the product and incurs all the related costs for the following countries: United States,Canada and France. This co-promotion scheme also included Germany, Belgium and Luxembourg untilDecember 31, 2007 and the Netherlands until March 31, 2008. We recognize our share of income underthe agreement in the income statement as a component of operating income on the line “Other operatingincome”. In the secondary co-promotion territories (the United Kingdom until December 31, 2008,Ireland, Sweden, Finland, Greece, Switzerland, Austria, Portugal and Australia), we sell the product andrecognize all the revenues from sales of the product along with the corresponding expenses in ourconsolidated income statement;
• Co-marketing, which applies in Italy and Spain, whereby each partner sells the product in the countryunder its own brand name and recognizes all revenues and expenses from its own operations in itsincome statement;
• P&G only territories: the product has been marketed by P&G independently under the brand nameActonel® in Germany, Belgium and Luxembourg since January 1, 2008, in the Netherlands sinceApril 1, 2008 and in the United Kingdom since January 1, 2009; and
• sanofi-aventis only territories: we have exclusive rights to sell the product in all other territories. Werecognize all revenues and expenses from our own operations in our income statement, but in return forthese exclusive rights pay P&G a royalty based on actual sales. This royalty is recognized in “Cost ofsales”.
Impact of Exchange Rates
We report our consolidated financial statements in euros. Because we earn a significant portion of ourrevenues in countries where the euro is not the local currency, our results of operations can be significantlyaffected by exchange rate movements between the euro and other currencies, primarily the U.S. dollar and, to alesser extent, the British pound, the Japanese yen, and currencies in emerging countries. We experience theseeffects even though certain of these countries do not account for a large portion of our net sales. In 2008, weearned 31.2% of our net sales in the United States. A decrease in the value of the U.S. dollar against the euro hasa negative impact on our revenues, which is not offset by an equal reduction in our costs and therefore negativelyaffects our operating income. A decrease in the value of the U.S. dollar has a particularly significant impact onour operating income, which is higher in the United States than elsewhere, and on the contribution to net income
75
of our alliance with BMS in the United States, which is under the operational management of BMS, as describedin “Financial Presentation of Alliances — BMS Alliance” above.
For a description of positions entered into to manage operational exchange rate risks as well as our hedgingpolicy, see “Item 11. Quantitative and Qualitative Disclosures about Market Risk.”
Divestments
There were no significant divestments during 2008 and 2007.
Our main divestment during 2006 was the transfer of our rights to Exubera® and our interest in the Diabeljoint venture to Pfizer. In return for the transfer of these assets and rights, sanofi-aventis received a payment of$1.3 billion (net of German taxes). The impact of this transaction in 2006 was a pre-tax gain of €460 million,recognized in Gains and losses on disposals, and litigation, and an after-tax gain of €384 million.
Acquisitions
• The principal acquisitions during 2008 were as follows:
On September 25, 2008, sanofi-aventis completed the acquisition of Acambis plc for £285 million. Acambisplc became Sanofi Pasteur Holding Ltd, a wholly-owned subsidiary of Sanofi Pasteur Holding S.A. Thiscompany develops novel vaccines that address unmet medical needs or substantially improve current standards ofcare. Sanofi Pasteur and Acambis plc were already developing vaccines in a successful partnership of more thana decade: Acambis plc was conducting three of its major projects under exclusive collaboration agreements withsanofi pasteur, for vaccines against dengue, Japanese Encephalitis and West Nile virus. See Note D.4. to ourconsolidated financial statements included at item 18 of this annual report.
On September 1, 2008, sanofi-aventis completed the acquisition of the Australian company Symbion CPHoldings Pty Ltd (Symbion Consumer) for AUD560 million. Symbion Consumer manufactures, markets anddistributes nutraceuticals (vitamins and mineral supplements) and over the counter brands throughout Australiaand New Zealand. Symbion Consumer has a portfolio of brands including Natures Own, Cenovis, Bio-organics,Golden Glow and Microgenics. In 2007, Symbion Consumer sales amounted to around AUD190 million.Symbion Consumer is the market leader in Australia, with an estimated 21% market share. See Note D.4. to ourconsolidated financial statements included at item 18 of this annual report.
• The principal acquisition during 2007 was as follows:
In June 2007, sanofi-aventis bought out preferred shares representing a financial interest of 36.7% inCarderm Capital LP for $250 million. (See Note D.18.4. to our consolidated financial statements included atItem 18).
In November 2007, sanofi-aventis acquired 12 million newly-issued shares in the biopharmaceuticalcompany Regeneron Pharmaceuticals for $312 million, raising its interest in Regeneron from approximately 4%to approximately 19%. These shares are classified as an available-for-sale financial asset, and are included in“Financial assets — non-current” (see Note D.7. to our consolidated financial statements included at Item 18).
• The principal acquisition during 2006 was as follows:
On March 27, 2006, sanofi-aventis paid €433 million (including acquisition costs) to acquire the entireinterest in Zentiva N.V. (7,487,742 shares) held by Warburg Pincus, and a further 1,998,921 shares held bycertain managers and employees of Zentiva. On completion of this transaction and as of December 31, 2008,sanofi-aventis held a 24.9% interest in the capital of Zentiva. Sanofi-aventis has appointed two members ofZentiva’s Board of Directors. In 2008, sanofi-aventis made an offer to acquire all the shares of Zentiva (see NoteD.21. to our consolidated financial statements included at Item 18).
As of December 31, 2008, sanofi-aventis does not control Zentiva, although as a result of its significantinterest in Zentiva, this investment is accounted for using the equity method (see Note D.6. to our consolidatedfinancial statements included at Item 18).
Zentiva is an international pharmaceutical company that develops, manufactures and markets low-costbranded pharmaceutical products. The company has very strong positions in the Czech Republic, Slovakia andRomania, and is expanding rapidly in Poland, Turkey, Russia and the Baltic countries.
76

Results of Operations
Year Ended December 31, 2008 Compared with Year Ended December 31, 2007
The consolidated income statements for the years ended December 31, 2008 and December 31, 2007 breakdown as follows:
(under IFRS) 2008 2007
as % of as % of(€ million) net sales net sales
Net sales . . . . . . . . . . . . . . . . . . . . . . . . . . . . . . . . . . . . . . . . . . . . 27,568 100.0% 28,052 100.0%Other revenues . . . . . . . . . . . . . . . . . . . . . . . . . . . . . . . . . . . . . . . 1,249 4.5% 1,155 4.1%Cost of sales . . . . . . . . . . . . . . . . . . . . . . . . . . . . . . . . . . . . . . . . . (7,337) (26.6%) (7,571) (27.0%)Gross profit . . . . . . . . . . . . . . . . . . . . . . . . . . . . . . . . . . . . . . . . . 21,480 77.9% 21,636 77.1%Research & development expenses . . . . . . . . . . . . . . . . . . . . . . . . (4,575) (16.6%) (4,537) (16.2%)Selling & general expenses . . . . . . . . . . . . . . . . . . . . . . . . . . . . . . (7,168) (26.0%) (7,554) (26.9%)Other operating income . . . . . . . . . . . . . . . . . . . . . . . . . . . . . . . . . 556 2.0% 522 1.9%Other operating expenses . . . . . . . . . . . . . . . . . . . . . . . . . . . . . . . (353) (1.3%) (307) (1.1%)Amortization of intangibles . . . . . . . . . . . . . . . . . . . . . . . . . . . . . . (3,483) (12.6%) (3,654) (13.0%)Operating income before restructuring, impairment of
property, plant & equipment and intangibles, gains &losses on disposals, and litigation . . . . . . . . . . . . . . . . . . . . . . 6,457 23.4% 6,106 21.8%
Restructuring costs . . . . . . . . . . . . . . . . . . . . . . . . . . . . . . . . . . . . (585) (2.1%) (137) (0.5%)Impairment of property, plant & equipment and intangibles . . . . (1,554) (5.6%) (58) (0.2%)Gains and losses on disposals, and litigation . . . . . . . . . . . . . . . . 76 0.3% — —Operating income . . . . . . . . . . . . . . . . . . . . . . . . . . . . . . . . . . . . 4,394 16.0% 5,911 21.1%Financial expenses . . . . . . . . . . . . . . . . . . . . . . . . . . . . . . . . . . . . (335) (1.2%) (329) (1.2%)Financial income . . . . . . . . . . . . . . . . . . . . . . . . . . . . . . . . . . . . . . 103 0.4% 190 0.7%Income before tax and associates . . . . . . . . . . . . . . . . . . . . . . . . 4,162 15.2% 5,772 20.6%Income tax expense . . . . . . . . . . . . . . . . . . . . . . . . . . . . . . . . . . . . (682) (2.5%) (687) (2.5%)Share of profit/loss of associates . . . . . . . . . . . . . . . . . . . . . . . . . . 812 2.9% 597 2.1%Net income . . . . . . . . . . . . . . . . . . . . . . . . . . . . . . . . . . . . . . . . . . 4,292 15.6% 5,682 20.2%- attributable to minority interests . . . . . . . . . . . . . . . . . . . . . . . . . 441 1.6% 419 1.5%
- attributable to equity holders of the Company . . . . . . . . . . . 3,851 14.0% 5,263 18.7%
Average number of shares outstanding (million) . . . . . . . . . . . . . 1,309.3 — 1,346.9 —Basic earnings per share (in euros) . . . . . . . . . . . . . . . . . . . . . . . . 2.94 — 3.91 —
Net Sales
Net sales for the year ended December 31, 2008 were €27,568 million, down by 3.7% on a comparable basisrelative to 2007. Exchange rate movements had a negative effect of 3.9 points, nearly 75% of which was relatedto the U.S. dollar. Changes in Group structure had a negative effect of 1.5 points. After taking these effects intoaccount, net sales fell by 1.7% on a reported basis.
The following table sets forth a reconciliation of our reported net sales for the year ended December 31,2007 to our comparable net sales for that year based on 2008 exchange rates and Group structure:
(€ million) 2007
2007 Net Sales . . . . . . . . . . . . . . . . . . . . . . . . . . . . . . . . . . . . . . . . . . . . . . . . . . . . . . 28,052Impact of changes in Group structure . . . . . . . . . . . . . . . . . . . . . . . . . . . . . . . . . . . . (393)Impact of exchange rates . . . . . . . . . . . . . . . . . . . . . . . . . . . . . . . . . . . . . . . . . . . . . . (1,083)
2007 Comparable Net Sales . . . . . . . . . . . . . . . . . . . . . . . . . . . . . . . . . . . . . . . . . . . 26,576
77

Our net sales are generated by our two business segments: Pharmaceuticals and Human Vaccines(Vaccines). The following table breaks down our 2008 and 2007 net sales by business segment:
(€ million) 20082007
Reported2007
Comparable
Reportedbasis growth
(%)
Comparablebasis growth
(%)
Pharmaceuticals . . . . . . . . . . . . . . . . . . . . . . . . . . . . 24,707 25,274 23,965 -2.2% +3.1%Vaccines . . . . . . . . . . . . . . . . . . . . . . . . . . . . . . . . . .
Total . . . . . . . . . . . . . . . . . . . . . . . . . . . . . . . . . . . . .
2,861
27,568
2,778
28,052
2,611
26,576
+3.0%
-1.7%
+9.6%
+3.7%
Net Sales by Product — Pharmaceuticals
Our pharmaceutical business generated net sales of €24,707 million in 2008, up by 3.1% on a comparablebasis and down by 2.2% on a reported basis.
Net sales of our top 15 products advanced by 5.2% on a comparable basis to €16,657 million in 2008,representing 67.4% of pharmaceutical net sales against 67.5% in 2007 (on a comparable basis). The introductionof generics of Ambien® IR in the United States and of Eloxatine® in Europe (i.e. excluding net sales ofAmbien® IR in the United States in the first quarter of 2007 and in the first quarter of 2008, and of Eloxatine® inEurope in 2007 and 2008) pared around 2.2 points off growth (on a comparable basis).
Net sales of other pharmaceutical products fell by 1.1% on a comparable basis to €8,050 million in 2008.Sales of these products were down by 4.8% on a comparable basis in Europe (at €4,831 million) and up by 7.7%on a comparable basis in the United States (at €602 million) in 2008. In the “Other Countries” region, theseproducts reported sales growth of 4.4% to €2,617 million.
For a description of our other pharmaceutical products, see “Item 4. Information on the Company — B.Business Overview — Other Pharmaceutical Products.”
The following table breaks down our net sales for the pharmaceutical business by product:
Reportedbasis growth
(%)
Comparable(€ million)
Product2007
Reported2007 basis growth
Indication 2008 Comparable (%)
Lovenox® . . . . . . . . . . . . . . . . . Thrombosis 2,738 2,612 2,475 +4.8% +10.6%Plavix® . . . . . . . . . . . . . . . . . . . Atherothrombosis 2,616 2,424 2,368 +7.9% +10.5%Lantus® . . . . . . . . . . . . . . . . . . . Diabetes 2,450 2,031 1,918 +20.6% +27.7%Taxotere® . . . . . . . . . . . . . . . . . Breast, Non small cell lung,
Prostate, Gastric, Head and neckcancers 2,033 1,874 1,796 +8.5% +13.2%
Eloxatine® . . . . . . . . . . . . . . . . . Colorectal cancer 1,348 1,521 1,430 -11.4% -5.7%Aprovel®/CoAprovel® . . . . . . . Hypertension 1,202 1,080 1,053 +11.3% +14.2%Stilnox®/Ambien®/Myslee® . . . Sleep disorders 829 1,250 1,258 -33.7% -34.1%Allegra® . . . . . . . . . . . . . . . . . . Allergic rhinitis, Urticaria 688 706 674 -2.5% +2.1%Copaxone® . . . . . . . . . . . . . . . . Multiple sclerosis 622 1,177 520 -47.2% +19.6%Tritace® . . . . . . . . . . . . . . . . . . . Hypertension, Congestive heart
failure after myocardinalinfarction 513 741 734 -30.8% -30.1%
Amaryl® . . . . . . . . . . . . . . . . . . Diabetes 387 392 392 -1.3% -1.3%Xatral® . . . . . . . . . . . . . . . . . . . Benign prostatic hyperplasia 331 333 320 -0.6% +3.4%Actonel® . . . . . . . . . . . . . . . . . . Osteoporosis 330 320 309 +3.1% +6.8%Depakine® . . . . . . . . . . . . . . . . . Epilepsy 329 316 306 +4.1% +7.5%Nasacort® . . . . . . . . . . . . . . . . . Allergic rhinitis 241 294 274 -18.0% -12.0%Sub-total Top 15 products . . . . . . . . . . . . . . . . . . . . . . . . . . . . . . . . 16,657 17,071 15,827 -2.4% +5.2%
Other products . . . . . . . . . . . . . . . . . . . . . . . . . . . . . . . . . . . . . . . . . . 8,050 8,203 8,138 -1.9% -1.1%
Total Pharmaceuticals . . . . . . . . . . . . . . . . . . . . . . . . . . . . . . . . . . . 24,707 25,274 23,965 -2.2% +3.1%
78

The table below breaks down sales of our top 15 products by geographic region in 2008:
(€ million) Comparablebasis growth United
Comparablebasis growth Other
Comparablebasis growth
Product Europe (%) States (%) countries (%)
Lovenox® . . . . . . . . . . . . . . . . . . . . . . . . . . . 815 +8.1% 1,625 +11.7% 298 +12.0%Plavix® . . . . . . . . . . . . . . . . . . . . . . . . . . . . . 1,732 +3.5% 172 +3.0% 712 +34.8%Lantus® . . . . . . . . . . . . . . . . . . . . . . . . . . . . . 713 +16.3% 1,452 +30.8% 285 +46.2%Taxotere® . . . . . . . . . . . . . . . . . . . . . . . . . . . 900 +10.8% 737 +15.9% 396 +13.8%Eloxatine® . . . . . . . . . . . . . . . . . . . . . . . . . . 214 -42.6% 948 +6.2% 186 +13.4%Aprovel®/CoAprovel® . . . . . . . . . . . . . . . . . 910 +9.9% — — 292 +29.8%Stilnox®/Ambien®/Myslee® . . . . . . . . . . . . 82 -4.7% 547 -44.9% 200 +11.1%
®Allegra . . . . . . . . . . . . . . . . . . . . . . . . . . . . 39 -25.0% 333 -0.9% 316 +10.5%Copaxone . . . . . . . . . . . . . . . . . . . . . . . . . .®
Tritace® . . . . . . . . . . . . . . . . . . . . . . . . . . . .381358
+18.3%-29.4%
210—
+19.3%—
31155
+40.9%-31.4%
Amaryl® . . . . . . . . . . . . . . . . . . . . . . . . . . . .Xatral® . . . . . . . . . . . . . . . . .
100. . . . . . . . . . . . 148
-15.3%-10.3%
6119
-25.0%+20.2%
28164
+5.6%+14.3%
Actonel® . . . . . . . . . . . . . . . . . . . . . . . . . . . . 220 +8.9% — — 110 +2.8%Depakine® . . . . . . . . . . . . . . . . . . . . . . . . . .Nasacort® . . . . . . . . . . . . . . .
219. . . . . . . . . . . . 39
+3.3%-9.3%
—175
—-13.8%
11027
+17.0%-3.6%
Top 15 Products (1)
Over 2008 as a whole, net sales of Lovenox®, the leading low molecular weight heparin on the market, wereup 10.6% on a comparable basis at €2,738 million. In the United States, the product reported growth of 11.7% ona comparable basis at €1,625 million. In Europe, after two quarters adversely affected by limited productavailability (following the withdrawal of certain batches in which small quantities of an impurity were present),Lovenox® achieved growth of 8.1% on a comparable basis, to €815 million (double digit growth in the fourthquarter of 11.1% on a comparable basis).
Lantus®, the world’s leading insulin brand, was the biggest contributor to the Group’s top-line growth in2008. The product achieved strong growth in all three regions: 30.8% in the United States, 16.3% in Europe and46.2% in the “Other Countries” region, on a comparable basis. The new-generation Lantus® SoloSTAR® penwas a significant driver of sales growth in the United States. Our goal is to establish Lantus® as the leading anti-diabetic in the world by value.
Full-year sales of Taxotere® exceeded €2 billion for the first time in 2008 (€2,033 million), with double-digit growth (on a comparable basis) in all three regions: 15.9% in the United States (where net sales were drivenby the product’s use in adjuvant breast cancer treatment and in prostate cancer), 10.8% in Europe, and 13.8% inthe “Other Countries” region.
Full-year sales of the hypnotics Ambien® CR and Ambien® IR in the United States were $681 million and$125 million respectively. In Japan, Myslee®, the leading hypnotic on the market, again performed well: netsales (consolidated by sanofi-aventis since January 1, 2008) increased by 14.9% on a comparable basis to€142 million over the full year.
In the United States, net sales of Eloxatine®, the leading cytotoxic agent in the colorectal cancer market asan adjuvant and in the metastatic phase, rose by 6.2% (on a comparable basis) to €948 million over 2008 as awhole, driven by the adjuvant indication. In the “Other Countries” region, the product reported robust growth of13.4% on a comparable basis to €186 million.
Sales of Tritace® were €513 million in 2008, down by 30.1% on a comparable basis. Sales were hamperedby competition from generics in Canada in 2007. A generic version of ramipril became available in Italy in 2008,negatively affecting our sales there.
(1) Sales of Plavix® and Aprovel® are discussed below under “Worldwide Presence of Plavix® and Aprovel®”.
79
In addition to the blockbuster products described above, each of which registered annual net sales of over€1 billion in 2008, our remaining top 15 pharmaceutical products contributed net sales in the aggregate ofapproximately €4,270 million in 2008, or about 17.3% of our total pharmaceutical sales for the year.
Net sales of Acomplia®, which was withdrawn from the market in the fourth quarter, totaled €72 million in2008.
Net Sales — Human Vaccines (Vaccines)
Our Vaccines business generated net sales of €2,861 million in 2008, an increase of 9.6% on a comparablebasis (3.0% on a reported basis), including €1,683 million in 2008 in the United States (an increase of 9.7% on acomparable basis).
Net sales of influenza vaccines rose by 1.5% (on a comparable basis) in 2008 to €736 million, a figure thatincludes the shipment during the second quarter of H5N1 vaccine for the U.S. Department of Health and HumanServices worth $192.5 million (compared with $113 million in 2007).
Pentacel® (the first 5-in-1 pediatric combination vaccine to protect against diphtheria, tetanus, pertussis,polio and haemophilus influenzae type b), which was launched in the United States in July 2008, confirmed itssuccess with net sales of €82 million in 2008.
Net sales of Menactra® (quadrivalent meningococcal meningitis vaccine) were up 7.9% on a comparablebasis at €404 million in 2008.
Adacel® (adult and adolescent tetanus-diphtheria-pertussis booster) continued to perform very well in theUnited States, driving net sales up by 20.0% (on a comparable basis) over 2008 as a whole to €255 million.
Sales of Act-Hib® increased by 19.9% (on a comparable basis) to €120 million in 2008, driven by asignificant commercial and industrial effort to provide additional doses to the U.S. market during a competitor’ssupply shortage combined with the launch of Act-Hib® in Japan in December 2008.
2008 sales growth was also driven by the uptake of Pentaxim® (another 5-in-1 pediatric combo vaccine,which protects against diphtheria, tetanus, pertussis, polio and haemophilus influenzae type b) in the “OtherCountries” region.
The following table presents the 2008 sales of our Vaccines activity by range of products:
(€ million) 20082007
Reported2007
Comparable
Reportedbasis growth
(%)
Comparablebasis growth
(%)
Pediatric Combination and Polio. Vaccines . . . . . . . . . . . . . 768 660 630 +16.4% +21.9%Influenza Vaccines* . . . . . . . . . . . . . . . . . . . . . . . . . . . . . . . 736 766 725 -3.9% +1.5%Meningitis/Pneumonia Vaccines . . . . . . . . . . . . . . . . . . . . . . 472 482 441 -2.1% +7.0%Adult and Adolescent Booster Vaccines . . . . . . . . . . . . . . . . 399 402 369 -0.7% +8.1%Travel and Endemic Vaccines . . . . . . . . . . . . . . . . . . . . . . . . 309 327 314 -5.5% -1.6%Other Vaccines . . . . . . . . . . . . . . . . . . . . . . . . . . . . . . . . . . .
Total Human Vaccines . . . . . . . . . . . . . . . . . . . . . . . . . . . . 2,861 2,778 2,611 +3.0% +9.6%
177 141 132 +25.5% +34.1%
* Seasonal and pandemic influenza vaccines.
The following table presents the 2008 sales of our Vaccines activity by range of products and by region:
(€ million) Europe
Comparablebasis growth
(%)UnitedStates
Comparablebasis growth
(%)Other
countries
Comparablebasis growth
(%)
Pediatric Combination and Polio. Vaccines . . . . . 160 +20.3% 317 +36.6% 291 +9.8%Influenza Vaccines* . . . . . . . . . . . . . . . . . . . . . . . 94 -8.7% 459 +3.1% 183 +3.4%Meningitis/Pneumonia Vaccines . . . . . . . . . . . . . 11 -8.3% 400 +7.0% 61 +10.9%Adult and Adolescent Booster Vaccines . . . . . . . 54 +22.7% 317 +5.7% 28 +12.0%Travel and Endemic Vaccines . . . . . . . . . . . . . . . 31 -3.1% 76 -8.4% 202 +1.5%Other Vaccines . . . . . . . . . . . . . . . . . . . . . . . . . . . 45 +181.3% 114 +14.0% 18 +12.5%
* Seasonal and pandemic influenza vaccines.
80

In addition to the Vaccines activity reflected in our consolidated net sales, sales of Sanofi Pasteur MSD, thejoint venture with Merck & Co. in Western Europe, reached €1,272 million in 2008, an increase of 21.8% on areported basis. Full-year net sales of Gardasil®, the first vaccine licensed in Europe against papillomavirusinfection, a major cause of cervical cancer, were €584 million, compared with €341 million in 2007.
Sales generated by Sanofi Pasteur MSD are not included in our consolidated net sales.
Net Sales by Geographic Region
We divide our sales geographically into three regions: Europe, the United States and other countries. Thefollowing table breaks down our 2008 and 2007 net sales by region:
(€ million) 20082007
Reported2007
Comparable
Reportedbasis growth
(%)
Comparablebasis growth
(%)
Europe . . . . . . . . . . . . . . . . . . . . . . . . . . . . . . . . . . . . 12,096 12,184 12,173 -0.7% -0.6%United States . . . . . . . . . . . . . . . . . . . . . . . . . . . . . . . 8,609 9,474 8,169 -9.1% +5.4%Other countries . . . . . . . . . . . . . . . . . . . . . . . . . . . . .
Total . . . . . . . . . . . . . . . . . . . . . . . . . . . . . . . . . . . . . 27,568 28,052 26,576 -1.7% +3.7%
6,863 6,394 6,234 +7.3% +10.1%
During 2008, sales in France and Germany hampered net sales in Europe, which fell slightly (by 0.6% on acomparable basis). Generics of Eloxatine® (i.e. excluding net sales of Eloxatine® in Europe in 2007 and 2008)(especially in France) pared around 1.3 points of growth in Europe. Since August 2008, sales of Plavix® inGermany have been affected by competition from several clopidogrel besylates in certain indications.
In the United States, sales growth resumed at a healthier pace in the last two quarters of 2008 after havingbeen hampered by competition from generics of Ambien® IR, due to particularly excellent performances fromLantus® and Taxotere®. Generics of Ambien® IR (i.e. excluding net sales of Ambien® IR in the United States inthe first quarter of 2007 and the first quarter of 2008) cost 4.6 points of sales growth over 2008 as a whole (on acomparable basis).
Net sales in the “Other Countries” region during 2008 were lifted by a particularly strong performance inJapan (up 18.5% on a comparable basis at €1,408 million), driven by the success of Plavix® (net sales reached€182 million in 2008 vs. €66 million in 2007) and Myslee® (net sales reached €142 million in 2008, up 14.9% ona comparable basis).
Worldwide Presence of Plavix® and Aprovel®
Two of our leading products — Plavix® and Aprovel® — were discovered by sanofi-aventis and jointlydeveloped with Bristol-Myers Squibb (BMS) under an alliance agreement. Worldwide, these products are sold bysanofi-aventis and/or BMS under the terms of this agreement which is described in “— Financial Presentation ofAlliances — BMS Alliance” above, with the exception of Plavix® in Japan which is outside the scope of thealliance.
The worldwide sales of these two products are an important indicator of the global market presence ofsanofi-aventis products, and we believe this information facilitates a financial statement user’s understanding andanalysis of our consolidated income statement, particularly in terms of understanding our overall profitability inrelation to consolidated revenues, and also facilitates a user’s ability to understand and assess the effectiveness ofour research and development efforts.
Also, disclosing sales made by BMS of these two products enables the investor to have a clearerunderstanding of trends in different lines of our income statement, in particular the lines “Other revenues” whereroyalties received on those sales are booked (see “— Other Revenues”); “Share of profit/loss of associates” (see“— Share of Profit/Loss of Associates”) where our share of profit/loss of entities included in the BMS Allianceand under BMS operational management is recorded; and “Net income attributable to minority interests” (see“— Net Income Attributable to Minority Interests”) where the BMS share of profit/loss of entities included in theBMS Alliance and under our operational management is recorded.
81

The table below sets forth the worldwide sales of Plavix® and Aprovel® in 2008 and 2007, by geographicregion:
(€ million) 2008 2007 Change (%)
sanofi- sanofi-aventis (2) BMS (3) Total aventis (2) BMS (3) Total
Plavix®/Iscover® (1)
Europe . . . . . . . . . . . . . . . . . . . . . . . . . . . . . . 1,622 211 1,833 1,583 225 1,808 +1.4%United States . . . . . . . . . . . . . . . . . . . . . . . . . — 3,351 3,351 — 2,988 2,988 +12.1%Other countries . . . . . . . . . . . . . . . . . . . . . . . 711 248 959 553 273 826 +16.1%
Total . . . . . . . . . . . . . . . . . . . . . . . . . . . . . . . 2,333 3,810 6,143 2,136 3,486 5,622 +9.3%
(€ million) 2008 2007 Change (%)
sanofi- sanofi-aventis (5) BMS (3) Total aventis (5) BMS (3) Total
Aprovel®/Avapro®/Karvea® (4)
Europe . . . . . . . . . . . . . . . . . . . . . . . . . . . . . . 816 176 992 750 172 922 +7.6%United States . . . . . . . . . . . . . . . . . . . . . . . . . — 499 499 — 507 507 -1.6%Other countries . . . . . . . . . . . . . . . . . . . . . . . 291 184 475 243 179 422 +12.6%
Total . . . . . . . . . . . . . . . . . . . . . . . . . . . . . . . 1,107 859 1,966 993 858 1,851 +6.2%
(1) Plavix® is marketed under the trademarks Plavix® and Iscover®.(2) Net sales of Plavix® consolidated by sanofi-aventis, excluding sales to BMS (€282 million in 2008 and €288 million in 2007).(3) Translated into euros by sanofi-aventis using the method described in Note B.2 to our consolidated financial statements (Foreign
currency translation) included at Item 18 in this annual report.(4) Aprovel® is marketed under the trademarks Aprovel®, Avapro® and Karvea®.(5) Net sales of Aprovel® consolidated by sanofi-aventis, excluding sales to BMS (€94 million in 2008 and €87 million in 2007).
Comparable-basis trends in worldwide sales of Plavix® and Aprovel® in 2008 and 2007 by geographicregion are as follows:
(€ million) 20082007
Reported2007
Comparable
Comparablebasis growth
(%)
Plavix®/Iscover®
Europe . . . . . . . . . . . . . . . . . . . . . . . . . . . . . . . . . . . . . . . . . . . . . . . . 1,833 1,808 1,776 +3.2%United States . . . . . . . . . . . . . . . . . . . . . . . . . . . . . . . . . . . . . . . . . . . 3,351 2,988 2,768 +21.1%Other countries . . . . . . . . . . . . . . . . . . . . . . . . . . . . . . . . . . . . . . . . .
Total . . . . . . . . . . . . . . . . . . . . . . . . . . . . . . . . . . . . . . . . . . . . . . . . .
959
6,143
826
5,622
786
5,330
+22.0%
+15.3%
Aprovel®/Avapro®/Karvea®
Europe . . . . . . . . . . . . . . . . . . . . . . . . . . . . . . . . . . . . . . . . . . . . . . . . 992 922 912 +8.8%United States . . . . . . . . . . . . . . . . . . . . . . . . . . . . . . . . . . . . . . . . . . . 499 507 469 +6.4%Other countries . . . . . . . . . . . . . . . . . . . . . . . . . . . . . . . . . . . . . . . . . 475 422 394 +20.6%
Total . . . . . . . . . . . . . . . . . . . . . . . . . . . . . . . . . . . . . . . . . . . . . . . . . 1,966 1,851 1,775 +10.8%
Full-year 2008 sales of Plavix® (clopidogrel bisulfate) in the United States (consolidated by BMS) weresharply higher than in 2007 (growth of 21.1% on a comparable basis), when sales were affected by competitionfrom a generic version in the early part of the year.
In Europe, net sales were €1,833 million in 2008. The product’s 3.2% growth rate reflected competitionfrom several clopidogrel besylates in the monotherapy segment since August in Germany, where the marketshare of Plavix®/Iscover® by volume was still around 75% in December (IMS Pharmatrend, week commencingDecember 22, 2008).
In the “Other Countries” region, growth for Plavix® benefited from its success in Japan, where net salesreached €182 million over 2008 as a whole (vs. €66 million in 2007).
82
Despite a very competitive environment, worldwide sales of Aprovel® achieved double-digit growth in 2008(10.8% on a comparable basis), to €1,966 million.
In September 2008, the Committee for Medicinal Products for Human Use (CHMP) issued a positiveopinion on the authorization of a generic of irbesartan (the active ingredient for Aprovel®) as a monotherapy inEurope. However, the active ingredient of irbesartan is protected by a patent in the principal European countriesuntil August 2012. In some countries (Spain, Portugal, Finland, Norway, and some Eastern European countries),irbesartan is not protected by this active ingredient patent, though other patents may be in force locally. Net salesof Aprovel® as a monotherapy in European countries not covered by the active ingredient patent wereapproximately €50 million in 2008.
Other Revenues
Other revenues, which mainly comprise royalty income under licensing agreements contracted in connectionwith ongoing operations, amounted to €1,249 million in 2008 compared with €1,155 million in 2007.
License revenues under the worldwide alliance with Bristol-Myers Squibb (BMS) on Plavix® and Aprovel®
amounted to €985 million in 2008, compared with €897 million in 2007. These revenues were boosted by thestrong rise in U.S. sales of Plavix® (up 21.1% on a comparable basis in 2008), but were adversely affected by theunfavorable trend in the U.S. dollar/euro exchange rate.
Gross Profit
Gross profit for 2008 was €21,480 million, against €21,636 in 2007. The gross margin ratio was 77.9% in2008, compared with 77.1% in 2007.
The 0.8-point increase in the gross margin ratio reflected a 0.4-point increase in royalty income and a0.4-point improvement in the ratio of cost of sales to net sales.
The main reasons for the improvement in the ratio of cost of sales to net sales were a favorable product mixplus, from April 1, 2008, the discontinuation by sanofi-aventis of commercialization of Copaxone® in NorthAmerica, a product that generated a lower level of contractual gross margin than the average for the portfolio.These effects were partly offset by the introduction of generics of Ambien® IR in the United States as fromApril 1, 2007 and the weakening of the U.S. dollar against the euro.
Research and Development Expenses
Research and development expenses rose by 0.8% in 2008 to €4,575 million (2007: €4,537 million), andrepresented 16.6% of net sales (as compared to 16.2% in 2007). Excluding the effect of exchange rates (i.e. at2007 actual exchange rates), research and development expenses rose by 3.2%. Phase III programs werelaunched in 2008 in thrombosis, metabolic disorders and oncology. We also incurred costs under clinicalprograms for further development of existing products (Plavix®, Allegra®), through alliances such as thoserecently concluded with Regeneron Pharmaceuticals Inc, and from the discontinuation of programs (primarilyAcomplia®).
Selling and General Expenses
Selling and general expenses totaled €7,168 million in 2008 (26.0% of net sales), compared with€7,554 million in 2007 (26.9% of net sales). This represents a reduction of 5.1% (or 2.0% after excluding theeffect of exchange rates, i.e. at 2007 actual exchange rates), reflecting the impact of our ongoing selective costadaptation policy. This policy is a response to the local erosion of some product sales in Europe and in the UnitedStates, in an environment marked by competition from generic drugs and pressure on selling prices. We have,however, increased spending on resources in emerging markets.
In addition, in accordance with the terms of its agreement with sanofi-aventis, Teva PharmaceuticalsIndustries (Teva) took over the selling of Copaxone® on April 1, 2008, in the United States and Canada. As fromthis date, sanofi-aventis stopped sharing some commercialization costs in these countries.
83
Other Operating Income and Expenses
In 2008, we recorded other operating income of €556 million (2007: €522 million) and other operatingexpenses of €353 million (as compared to €307 million in 2007). This represents a net other operating incomefigure of €203 million, compared with €215 million in 2007. Net other operating income generated withpharmaceutical partners (€294 million in 2008 compared with €212 million in 2007) includes from April 1, 2008onwards the share of profit on Copaxone® following the takeover by Teva of commercialization of this productin the United States and Canada. We also recorded gains on disposals on current operations (€24 million in 2008against €60 million in 2007) and a net operating foreign exchange loss (€94 million against €33 million in 2007).
The 2007 figures included an expense of €61 million arising from the signature of agreements on welfareand healthcare obligations in France for retirees and their beneficiaries.
Amortization of Intangibles
Amortization charged against intangible assets totaled €3,483 million in the year ended December 31, 2008,compared with €3,654 million in the year ended December 31, 2007. The reduction was mainly due to theweakening of the U.S. dollar against the euro.
These charges mainly relate to the amortization of intangible assets remeasured at fair value at the time ofthe Aventis acquisition (€3,298 million in 2008 as compared with €3,511 million in 2007).
Operating Income before Restructuring, Impairment of Property, Plant & Equipment and Intangibles, Gainsand Losses on Disposals, and Litigation
This indicator came to €6,457 million in 2008, compared with €6,106 million in 2007.
The table below shows trends in “Operating income before restructuring, impairment of property, plant &equipment and intangibles, gains and losses on disposals, and litigation” by business segment in 2008 and 2007:
(€ million) 2008 2007
Pharmaceuticals . . . . . . . . . . . . . . . . . . . . . . . . . . . . . . . . . . . . . . . . . . . . . 5,864 5,509Vaccines . . . . . . . . . . . . . . . . . . . . . . . . . . . . . . . . . . . . . . . . . . . . . . . . . . .
Total . . . . . . . . . . . . . . . . . . . . . . . . . . . . . . . . . . . . . . . . . . . . . . . . . . . . . .
593
6,457
597
6,106
The table below shows “Operating income before restructuring, impairment of property, plant & equipmentand intangibles, gains and losses on disposals, and litigation” by geographic region in 2008 and 2007:
(€ million) 2008 2007
Europe . . . . . . . . . . . . . . . . . . . . . . . . . . . . . . . . . . . . . . . . . . . . . . . . . . . . . 5,001 4,742United States . . . . . . . . . . . . . . . . . . . . . . . . . . . . . . . . . . . . . . . . . . . . . . . . 4,718 4,952Other countries . . . . . . . . . . . . . . . . . . . . . . . . . . . . . . . . . . . . . . . . . . . . . . 2,454 2,173Unallocated costs (1) . . . . . . . . . . . . . . . . . . . . . . . . . . . . . . . . . . . . . . . . . . (5,716) (5,761)
Total (2) . . . . . . . . . . . . . . . . . . . . . . . . . . . . . . . . . . . . . . . . . . . . . . . . . . . . 6,457 6,106
(1) Unallocated costs consist mainly of fundamental research and worldwide development of pharmaceutical molecules, and part of the costof support functions.
(2) After charges for amortization of intangible assets of €3,483 million in 2008 and €3,654 million in 2007.
84
Restructuring Costs
Restructuring costs amounted to €585 million in 2008, compared with €137 million in 2007. The 2008figure relates to costs incurred on the adaptation of industrial facilities in France and measures taken to adjust oursales force in response to the changing pharmaceutical markets in Europe (primarily France, Italy, Spain,Portugal) and in the United States. In 2007, restructuring costs related to the ongoing adaptation plan in Franceand in Germany.
Impairment of Property, Plant & Equipment and Intangibles
Net impairment losses charged against property, plant and equipment and intangible assets were€1,554 million in 2008. This charge reflected the results of impairment tests conducted further to thediscontinuation of research projects and to the introduction of generics of existing products commercialized bythe Group, originating mainly from Aventis.
The discontinuation of research projects relates to larotaxel and cabazitaxel (new taxane derivatives) inbreast cancer (€1,175 million) and the antihypertensive ilepatril (€57 million) (all of which were recognized asassets on the acquisition of Aventis in 2004), plus the oral anti-cancer agent S-1 following the termination of theagreement with Taiho Pharmaceutical for the development and commercialization of the product (€51 million).In addition, Nasacort® (recognized as an asset on the acquisition of Aventis) has been impaired further to thesettlement agreed with Barr in the United States (€114 million).
In 2007, net impairment losses charged against property, plant and equipment and intangible assets were€58 million. This charge reflected the results of impairment tests, which identified impairment losses in respectof intangible assets recognized as part of the allocation of the purchase price of Aventis.
Gains and Losses on Disposals, and Litigation
In 2008, this line comprised €76 million of releases of provisions for litigation.
The Group did not make any major disposals during 2008 and 2007.
Operating Income
Operating income for 2008 came to €4,394 million, compared with €5,911 million for 2007.
Financial Income and Expenses
Net financial expense amounted to €232 million in 2008, compared with €139 million in 2007, an increaseof €93 million.
Interest expense directly related to our debt, net of cash and cash equivalents (short-term debt plus long-term debt, minus cash and cash equivalents) totaled €183 million in 2008, against €209 million in 2007. Thissituation reflects two contrasting trends: a reduction in the amount of our debt during the period and theunfavorable interest rate trends.
Sanofi-aventis tendered its shares in Millennium Pharmaceuticals, Inc. (Millennium) to the public tenderoffer for Millennium by Takeda Pharmaceuticals Company Ltd. This transaction generated a gain of €38 million,recognized in the first half of 2008.
We recorded a net foreign exchange loss for 2008 of €74 million, compared to a net gain of €87 million in2007. This was mainly due to the impact of the differential in interest rates between the U.S. dollar and the euroon hedges of cash invested by our American subsidiaries. This impact was favorable in 2007.
Income before Tax and Associates
Income before tax and associates for 2008 was €4,162 million, compared with €5,772 million for 2007.
Income Tax Expense
The reported tax rate for 2008 was 16.3%, compared with 11.9% for 2007.
85

In 2008, this reduced tax rate was a result of a gain of €221 million on reversals of tax provisions, related tothe settlement of tax audits.
In 2007, this item comprised a net gain of €336 million on net reversals of tax provisions, related to thesettlement of tax audits, and a net gain of €515 million on the change in deferred tax liabilities arising from cutsin tax rates, primarily in Germany, including a gain of €566 million relating to deferred tax liabilities recognizedin 2004 on the remeasurement of acquired intangible assets of Aventis.
Share of Profit/Loss of Associates
Our share of the net profits of associates was €812 million in 2008, compared with €597 million in 2007.This item mainly comprises our share of after-tax profits from the territories managed by BMS under the Plavix®
and Avapro® alliance (€624 million in 2008, compared to €525 million in 2007). The increase in our profit sharewas a direct result of the increase in Plavix® sales during the period, despite the unfavorable trends in the euro/U.S. dollar exchange rate.
In addition, Sanofi Pasteur MSD made a positive contribution in 2008. The contribution from our interest inMerial showed a further decrease, penalized by the unfavorable trends in the euro/U.S. dollar exchange rate.
In 2007, this line also included an impairment loss of €102 million on the equity-accounted investment inZentiva.
Net Income
Net income (before minority interests) totaled €4,292 million in 2008, compared with €5,682 million in2007.
Net Income Attributable to Minority Interests
Net income attributable to minority interests totaled €441 million in 2008, compared to €419 million in2007. This item includes the share of pre-tax income paid over to BMS from territories managed by sanofi-aventis (€422 million in 2008, compared to €403 million in 2007).
Net Income Attributable to Equity Holders of the Company
Net income attributable to equity holders of the Company for 2008 was €3,851 million, against€5,263 million for 2007.
The table below shows trends in net income attributable to equity holders of the Company by businesssegment for 2008 and 2007:
(€ million) 2008 2007
Pharmaceuticals . . . . . . . . . . . . . . . . . . . . . . . . . . . . . . . . . . . . . . . . . . . . . . . . . . . . . . . 3,429 4,851Vaccines . . . . . . . . . . . . . . . . . . . . . . . . . . . . . . . . . . . . . . . . . . . . . . . . . . . . . . . . . . . . 422 412
Total net income attributable to equity holders of the Company . . . . . . . . . . . . . . 3,851 5,263
Earnings per share (EPS) was €2.94, compared with €3.91 for 2007, based on an average number of sharesoutstanding of 1,309.3 million in 2008 (2007: 1,346.9 million).
86
Adjusted Net Income
Adjusted net income breaks down as follows:
(€ million, except per share data) 2008 2007
Net income attributable to equity holders of the Company . . . . . . . . . . . . . . . . . . . . . . . . . . . . 3,851 5,263
Material accounting adjustments related to business combinations . . . . . . . . . . . . . . . . . . . . 3,217 1,847• elimination of expense arising on the workdown of acquired inventories remeasured at
fair value, net of tax 2(1) —• elimination of expenses arising on amortization and impairment of intangible assets,
net of tax (portion attributable to equity holders of the Company) 3,137(2) 1,684(3)
• elimination of expenses arising from the impact of the acquisitions on equity investees(workdown of acquired inventory, amortization and impairment of intangible assets,and impairment of goodwill) 78(4) 163(4)
• elimination of impairment losses charged against goodwill — —
—Elimination of acquisition-related integration and restructuring charges, net of tax . . . . . . —
Adjusted net income . . . . . . . . . . . . . . . . . . . . . . . . . . . . . . . . . . . . . . . . . . . . . . . . . . . . . . . . . . .
Adjusted earnings per share (in euro) (5) . . . . . . . . . . . . . . . . . . . . . . . . . . . . . . . . . . . . . . . . . . .
7,068
5.40
7,110
5.28
(1) Impact of the acquisition of Symbion Consumer (see Note D.1. to our consolidated financial statements included at Item 18 of thisannual report).
(2) Includes €1,485 million of impairment losses (€972 million net of tax) on Aventis intangible assets (see Note D.5. to our consolidatedfinancial statements included at Item 18 of this annual report).
(3) Includes a gain of €566 million due to the effect of cuts in tax rates (primarily in Germany) on deferred tax liabilities recognized in 2004on the remeasurement of acquired intangible assets of Aventis.
(4) Includes the impact of the Zentiva acquisition: €3 million in 2008, and €108 million in 2007 (including €102 million of impairmentlosses on the investment in Zentiva).
(5) Based on 1,309.3 million shares for 2008 and 1,346.9 million shares for 2007, representing the weighted average number of sharesoutstanding.
Adjusted net income for 2008 was €7,068 million, a decrease of 0.6% on the 2007 figure of €7,110 million,and represented 25.6% of net sales compared with 25.3% in 2007. The decrease was mainly due to restructuringcosts recognized in 2008 (€389 million net of tax) as compared with 2007 (€95 million net of tax).
The table below shows trends in adjusted net income by business segment for 2008 and 2007:
(€ million) 2008 2007
Pharmaceuticals . . . . . . . . . . . . . . . . . . . . . . . . . . . . . . . . . . . . . . . . . . . . . . . . . . . . . . . 6,455 6,501Vaccines . . . . . . . . . . . . . . . . . . . . . . . . . . . . . . . . . . . . . . . . . . . . . . . . . . . . . . . . . . . .
Total adjusted net income . . . . . . . . . . . . . . . . . . . . . . . . . . . . . . . . . . . . . . . . . . . . . .
613
7,068
609
7,110
Adjusted Earnings Per Share
We also report adjusted earnings per share, a specific financial indicator, which we define as adjusted netincome divided by the weighted average number of shares outstanding. Our adjusted earnings per share for 2008was €5.40 (up 2.3% on the 2007 adjusted earnings per share figure of €5.28), boosted by the €3 billion sharerepurchase program authorized by the Shareholders’ Annual General Meeting of May 2007. The weightedaverage number of shares outstanding was 1,309.3 million in 2008 and 1,346.9 million in 2007.
87

Year Ended December 31, 2007 Compared with Year Ended December 31, 2006
The consolidated income statements for the years ended December 31, 2007 and December 31, 2006 breakdown as follows:
(under IFRS) 2007 2006
as % of as % of(€ million) net sales net sales
Net sales . . . . . . . . . . . . . . . . . . . . . . . . . . . . . . . . . . . . . . . . . . . . . . . . . . 28,052 100.0% 28,373 100.0%Other revenues . . . . . . . . . . . . . . . . . . . . . . . . . . . . . . . . . . . . . . . . . . . . . . 1,155 4.1% 1,116 3.9%Cost of sales . . . . . . . . . . . . . . . . . . . . . . . . . . . . . . . . . . . . . . . . . . . . . . . (7,571) (27.0%) (7,587) (26.7%)Gross profit . . . . . . . . . . . . . . . . . . . . . . . . . . . . . . . . . . . . . . . . . . . . . . . 21,636 77.1% 21,902 77.2%Research & development expenses . . . . . . . . . . . . . . . . . . . . . . . . . . . . . . (4,537) (16.2%) (4,430) (15.6%)Selling & general expenses . . . . . . . . . . . . . . . . . . . . . . . . . . . . . . . . . . . . (7,554) (26.9%) (8,020) (28.3%)Other operating income . . . . . . . . . . . . . . . . . . . . . . . . . . . . . . . . . . . . . . . 522 1.9% 391 1.4%Other operating expenses . . . . . . . . . . . . . . . . . . . . . . . . . . . . . . . . . . . . . (307) (1.1%) (116) (0.4%)Amortization of intangibles . . . . . . . . . . . . . . . . . . . . . . . . . . . . . . . . . . . . (3,654) (13.0%) (3,998) (14.1%)Operating income before restructuring, impairment of property,
plant & equipment and intangibles, gains & losses on disposals,and litigation . . . . . . . . . . . . . . . . . . . . . . . . . . . . . . . . . . . . . . . . . . . . 6,106 21.8% 5,729 20.2%
Restructuring costs . . . . . . . . . . . . . . . . . . . . . . . . . . . . . . . . . . . . . . . . . . (137) (0.5%) (274) (1.0%)Impairment of property, plant & equipment and intangibles . . . . . . . . . . (58) (0.2%) (1,163) (4.1%)Gains and losses on disposals, and litigation . . . . . . . . . . . . . . . . . . . . . . — — 536 1.9%Operating income . . . . . . . . . . . . . . . . . . . . . . . . . . . . . . . . . . . . . . . . . . 5,911 21.1% 4,828 17.0%Financial expenses . . . . . . . . . . . . . . . . . . . . . . . . . . . . . . . . . . . . . . . . . . (329) (1.2%) (455) (1.6%)Financial income . . . . . . . . . . . . . . . . . . . . . . . . . . . . . . . . . . . . . . . . . . . . 190 0.7% 375 1.3%Income before tax and associates . . . . . . . . . . . . . . . . . . . . . . . . . . . . . . 5,772 20.6% 4,748 16.7%Income tax expense . . . . . . . . . . . . . . . . . . . . . . . . . . . . . . . . . . . . . . . . . . (687) (2.5%) (800) (2.8%)Share of profit/loss of associates . . . . . . . . . . . . . . . . . . . . . . . . . . . . . . . . 597 2.1% 451 1.6%Net income . . . . . . . . . . . . . . . . . . . . . . . . . . . . . . . . . . . . . . . . . . . . . . . . 5,682 20.2% 4,399 15.5%- attributable to minority interests . . . . . . . . . . . . . . . . . . . . . . . . . . . . . . . 419 1.5% 393 1.4%
- attributable to equity holders of the Company . . . . . . . . . . . . . . . . . 5,263 18.7% 4,006 14.1%
Average number of shares outstanding (million) . . . . . . . . . . . . . . . . . . . 1,346.9 — 1,346.8 —Basic earnings per share (in euros) . . . . . . . . . . . . . . . . . . . . . . . . . . . . . . 3.91 — 2.97 —
Net Sales
Net sales for the year ended December 31, 2007 were €28,052 million, a rise of 2.8% on a comparable basisrelative to 2006. Exchange rate movements had a negative effect of 3.8 points, nearly 80% of which was relatedto the U.S. dollar. Changes in Group structure had a negative effect of 0.1 of a point. After taking these effectsinto account, net sales fell by 1.1% on a reported basis.
The following table sets forth a reconciliation of our reported net sales for the year ended December 31,2006 to our comparable net sales for that year based on 2007 exchange rates and Group structure:
(€ million) 2006
2006 Net Sales . . . . . . . . . . . . . . . . . . . . . . . . . . . . . . . . . . . . . . . . . . . . . . . . . . . . . . 28,373Impact of changes in Group structure . . . . . . . . . . . . . . . . . . . . . . . . . . . . . . . . . . . . (15)Impact of exchange rates . . . . . . . . . . . . . . . . . . . . . . . . . . . . . . . . . . . . . . . . . . . . . . (1,069)
2006 Comparable Net Sales . . . . . . . . . . . . . . . . . . . . . . . . . . . . . . . . . . . . . . . . . . . 27,289
88
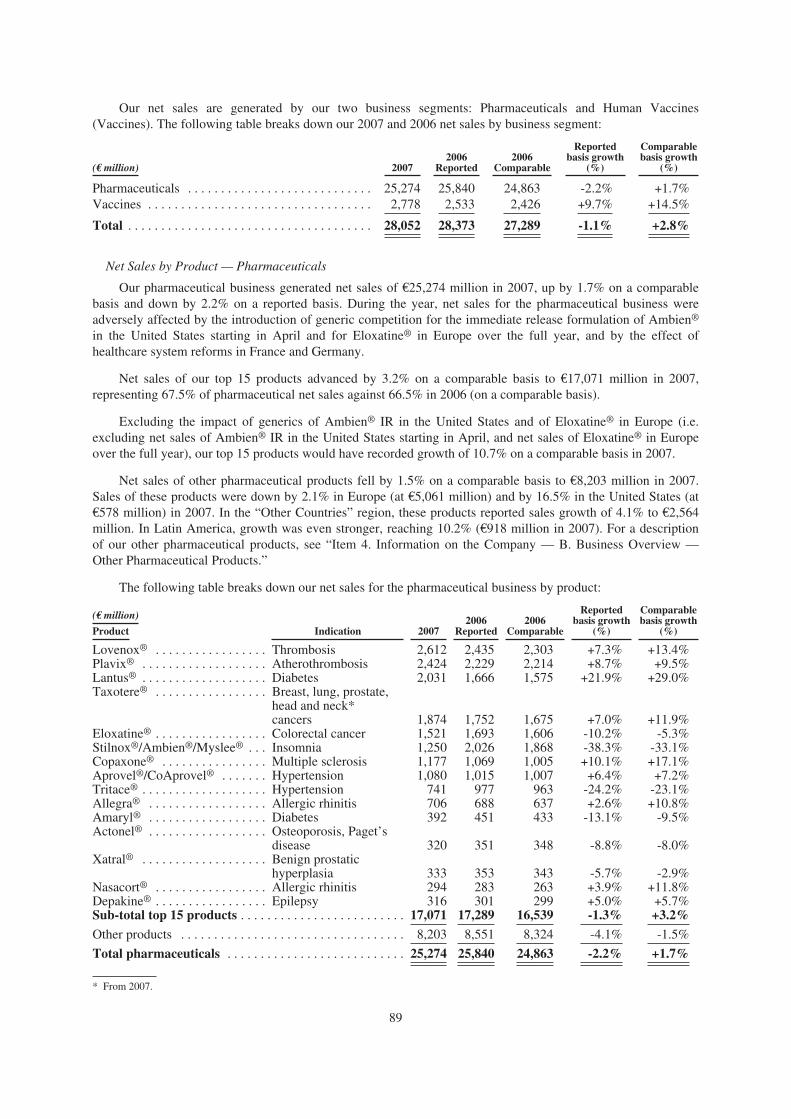
Our net sales are generated by our two business segments: Pharmaceuticals and Human Vaccines(Vaccines). The following table breaks down our 2007 and 2006 net sales by business segment:
(€ million) 20072006
Reported2006
Comparable
Reportedbasis growth
(%)
Comparablebasis growth
(%)
Pharmaceuticals . . . . . . . . . . . . . . . . . . . . . . . . . . . . 25,274 25,840 24,863 -2.2% +1.7%Vaccines . . . . . . . . . . . . . . . . . . . . . . . . . . . . . . . . . .
Total . . . . . . . . . . . . . . . . . . . . . . . . . . . . . . . . . . . . .
2,778
28,052
2,533
28,373
2,426
27,289
+9.7%
-1.1%
+14.5%
+2.8%
Net Sales by Product — Pharmaceuticals
Our pharmaceutical business generated net sales of €25,274 million in 2007, up by 1.7% on a comparablebasis and down by 2.2% on a reported basis. During the year, net sales for the pharmaceutical business wereadversely affected by the introduction of generic competition for the immediate release formulation of Ambien®
in the United States starting in April and for Eloxatine® in Europe over the full year, and by the effect ofhealthcare system reforms in France and Germany.
Net sales of our top 15 products advanced by 3.2% on a comparable basis to €17,071 million in 2007,representing 67.5% of pharmaceutical net sales against 66.5% in 2006 (on a comparable basis).
Excluding the impact of generics of Ambien® IR in the United States and of Eloxatine® in Europe (i.e.excluding net sales of Ambien® IR in the United States starting in April, and net sales of Eloxatine® in Europeover the full year), our top 15 products would have recorded growth of 10.7% on a comparable basis in 2007.
Net sales of other pharmaceutical products fell by 1.5% on a comparable basis to €8,203 million in 2007.Sales of these products were down by 2.1% in Europe (at €5,061 million) and by 16.5% in the United States (at€578 million) in 2007. In the “Other Countries” region, these products reported sales growth of 4.1% to €2,564million. In Latin America, growth was even stronger, reaching 10.2% (€918 million in 2007). For a descriptionof our other pharmaceutical products, see “Item 4. Information on the Company — B. Business Overview —Other Pharmaceutical Products.”
The following table breaks down our net sales for the pharmaceutical business by product:
Reported Comparable(€ million) 2006 2006 basis growth basis growthProduct Indication 2007 Reported Comparable (%) (%)
Lovenox® . . . . . . . . . . . . . . . . . Thrombosis 2,612 2,435 2,303 +7.3% +13.4%Plavix® . . . . . . . . . . . . . . . . . . . Atherothrombosis 2,424 2,229 2,214 +8.7% +9.5%Lantus® . . . . . . . . . . . . . . . . . . . Diabetes 2,031 1,666 1,575 +21.9% +29.0%Taxotere® . . . . . . . . . . . . . . . . . Breast, lung, prostate,
head and neck*cancers 1,874 1,752 1,675 +7.0% +11.9%
Eloxatine® . . . . . . . . . . . . . . . . . Colorectal cancer 1,521 1,693 1,606 -10.2% -5.3%Stilnox®/Ambien®/Myslee® . . . Insomnia 1,250 2,026 1,868 -38.3% -33.1%Copaxone® . . . . . . . . . . . . . . . . Multiple sclerosis 1,177 1,069 1,005 +10.1% +17.1%Aprovel®/CoAprovel® . . . . . . . Hypertension 1,080 1,015 1,007 +6.4% +7.2%Tritace® . . . . . . . . . . . . . . . . . . . Hypertension 741 977 963 -24.2% -23.1%Allegra® . . . . . . . . . . . . . . . . . . Allergic rhinitis 706 688 637 +2.6% +10.8%Amaryl® . . . . . . . . . . . . . . . . . . Diabetes 392 451 433 -13.1% -9.5%Actonel® . . . . . . . . . . . . . . . . . . Osteoporosis, Paget’s
disease 320 351 348 -8.8% -8.0%Xatral® . . . . . . . . . . . . . . . . . . . Benign prostatic
hyperplasia 333 353 343 -5.7% -2.9%Nasacort® . . . . . . . . . . . . . . . . . Allergic rhinitis 294 283 263 +3.9% +11.8%Depakine® . . . . . . . . . . . . . . . . . Epilepsy 316 301 299 +5.0% +5.7%Sub-total top 15 products . . . . . . . . . . . . . . . . . . . . . . . . . 17,071 17,289 16,539 -1.3% +3.2%
Other products . . . . . . . . . . . . . . . . . . . . . . . . . . . . . . . . . . 8,203 8,551 8,324 -4.1% -1.5%
Total pharmaceuticals . . . . . . . . . . . . . . . . . . . . . . . . . . . 25,274 25,840 24,863 -2.2% +1.7%
* From 2007.
89

The table below breaks down sales of our top 15 products by geographic region in 2007:
(€ million)
Europe
Comparablebasis growth
(%)UnitedStates
Comparablebasis growth
(%)Other
countries
Comparablebasis growth
(%)Product
Lovenox® . . . . . . . . . . . . . . . . . . . . . . . . . . . 756 +9.4% 1,579 +14.8% 277 +16.9%Plavix® . . . . . . . . . . . . . . . . . . . . . . . . . . . . . 1,704 +5.3% 167 +7.7% 553 +25.7%Lantus® . . . . . . . . . . . . . . . . . . . . . . . . . . . . . 627 +20.6% 1,200 +30.3% 204 +52.2%Taxotere® . . . . . . . . . . . . . . . . . . . . . . . . . . . 819 +14.5% 691 +6.5% 364 +17.0%Eloxatine® . . . . . . . . . . . . . . . . . . . . . . . . . . 374 -33.7% 971 +9.8% 176 +11.4%Stilnox®/Ambien®/Myslee® . . . . . . . . . . . .Copaxone® . . . . . . . . . . . . . . . . . . . . . . . . . .Aprovel®/CoAprovel® . . . . . . . . . . . . . . . . .Tritace® . . . . . . . . . . . . . . . . . . . . . . . . . . . .
85324838466
-11.5%+16.1%+3.8%-8.8%
1,093801—
1
-35.0%+19.4%
—-92.9%
7252
242274
-20.0%-5.5%
+21.0%-37.4%
Allegra® . . . . . . . . . . . . . . . . . . . . . . . . . . . .Amaryl® . . . . . . . . . . . . . . . . . . . . . . . . . . . .Actonel® . . . . . . . . . . . . . . . . . . . . . . . . . . . .
54116204
+3.8%-33.7%-16.0%
3699
—
+4.8%-35.7%
—
283267116
+21.5%+9.4%
+10.5%Xatral® . . . . . . . . . . . . . . . . . . . . . . . . . . . . . 167 -20.5% 107 +25.9% 59 +22.9%Nasacort® . . . . . . . . . . . . . . . . . . . . . . . . . . . 44 +10.0% 222 +13.3% 28 +3.7%Depakine® . . . . . . . . . . . . . . . . . . . . . . . . . . 216 2.4% — — 100 +13.6%
Top 15 Products (1)
Net sales of Lovenox® totaled €2,612 million in 2007, a rise of 7.3% on a reported basis and of 13.4% on acomparable basis. The product reported strong growth across all three regions: 14.8% in the United States, 9.4%in Europe, and 16.9% in the “Other Countries” region. In the United States, increased use in medical prophylaxisremained the main growth driver.
Lantus® became the first insulin brand in the world to exceed €2 billion of sales (€2,031 million in 2007).During 2007, the product enjoyed strong growth across all three regions. The new SoloSTAR® disposable penused to administer Lantus® helped to drive this product’s growth.
Taxotere® enjoyed strong growth during 2007 in both Europe and the “Other Countries” region, where salesincreased by 14.5% and 17.0% respectively on a comparable basis. In the United States, net sales rose by 6.5%on a comparable basis.
Ambien® CR reported net sales of $751 million in the United States in 2007. Net sales of Ambien® IR,which went off patent in the United States on April 20, 2007, totaled $30 million in the fourth quarter of 2007,against $352 million in the comparable period of 2006. Full-year net sales of Ambien® IR were $538 million inthe United States.
In Japan, sales of Myslee® (not included in our consolidated net sales for the periods under review) reached€118 million in 2007, an increase of 9.8% on a comparable basis.
In the United States, Eloxatine® posted net sales growth of 9.8% in 2007 (on a comparable basis), to €971million. In Europe, where the introduction of generic versions of the product was ongoing in 2007, full-year netsales fell by 33.7% on a comparable basis to €374 million. In the “Other Countries” region, net sales ofEloxatine® rose by 11.4% on a comparable basis to €176 million.
In addition to the blockbuster products described above, each of which registered annual net sales of over€1 billion in 2007, our remaining top 15 pharmaceutical products contributed net sales in the aggregate ofapproximately €3,102 million in 2007, or about 12.3% of our total pharmaceutical sales for the year.
Net sales of Tritace®, hampered by competition from generics in Canada in 2007, fell by 23.1% (on acomparable basis) to €741 million in 2007.
Net sales of Acomplia® totaled €79 million in 2007.
(1) Sales of Plavix® and Aprovel® are discussed below under “Worldwide Presence of Plavix® and Aprovel®”.
90

Xyzal®, a new prescription oral antihistamine, was launched by sanofi-aventis and UCB in the United Statesat the start of October 2007. Fourth-quarter net sales were €8 million.
Net Sales — Human Vaccines (Vaccines)
Our Vaccines business generated net sales of €2,778 million in 2007, an increase of 14.5% on a comparablebasis and of 9.7% on a reported basis.
Net sales of Menactra® for 2007 totaled €415 million, up 86.1% on a comparable basis. An extension to theproduct’s indications, covering children aged 2 to 10, was obtained in the United States in October 2007.
Adacel™ reported 2007 net sales of €234 million, an increase of 64.5% on a comparable basis.
Sanofi Pasteur produced over 180 million doses of seasonal influenza vaccine in 2007: the number of dosesshipped represented an estimated 40%(1) of the world market. Excluding sales of H5N1 vaccines, sales ofseasonal influenza vaccines rose by 2.6% on a comparable basis.
The following table presents the sales of our Vaccines activity by range of products:
(€ million) 20072006
Reported2006
Comparable
Reportedbasis growth
(%)
Comparablebasis growth
(%)
Influenza Vaccines* . . . . . . . . . . . . . . . . . . . . . . . . . . 766 835 790 -8.3% -3.0%Pediatric Combination and Polio. Vaccines . . . . . . . . 660 633 628 +4.3% +5.1%Meningitis/Pneumonia Vaccines . . . . . . . . . . . . . . . . 482 310 292 +55.5% +65.1%Adult and Adolescent Booster Vaccines . . . . . . . . . . 402 337 317 +19.3% +26.8%Travel and Endemic Vaccines . . . . . . . . . . . . . . . . . . 327 284** 285 +15.1% +14.7%Other Vaccines . . . . . . . . . . . . . . . . . . . . . . . . . . . . . . 141 134** 114 +5.2% +23.7%
Total Human Vaccines . . . . . . . . . . . . . . . . . . . . . . . 2,778 2,533 2,426 +9.7% +14.5%
* Seasonal and pandemic influenza vaccines.** After reclassification of €45 million of net sales generated by MMR (Measles / Mumps / Rubella) vaccines from the “Other Vaccines”
category to the “Travel and Other Endemics Vaccines” category.
The following table presents the 2007 sales of our Vaccines activity by range of products and by region:
(€ million) Europe
Comparablebasis growth
(%)UnitedStates
Comparablebasis growth
(%)Other
countries
Comparablebasis growth
(%)
Influenza Vaccines* . . . . . . . . . . . . . . . . . . . . . . . . 100 -5.7% 485 -6.9% 181 +11.0%Pediatric Combination and Polio. Vaccines . . . . . 129 +6.6% 255 -4.9% 276 +15.5%Meningitis/Pneumonia Vaccines . . . . . . . . . . . . . . 12 +9.1% 414 +74.7% 56 +27.3%Adult and Adolescent Booster Vaccines . . . . . . . . 42 -6.7% 332 +36.1% 28 0.0%Travel and Endemic Vaccines . . . . . . . . . . . . . . . . 31 -6.1% 91 +15.2% 205 +18.5%Other Vaccines . . . . . . . . . . . . . . . . . . . . . . . . . . . . 15 +50.0% 110 +25.0% 16 0.0%
* Seasonal and pandemic influenza vaccines.
In addition to the Vaccines activity reflected in our consolidated net sales, sales of Sanofi Pasteur MSD, thejoint venture with Merck & Co. in Europe, reached €1,040 million in 2007, up 43.6% on a reported basis. Saleswere buoyed by the success of Gardasil®, which posted full-year net sales of €341 million and which SanofiPasteur MSD began marketing in Europe at the end of 2006.
Sales generated by Sanofi Pasteur MSD are not included in our consolidated net sales.
(1) Internal estimate
91
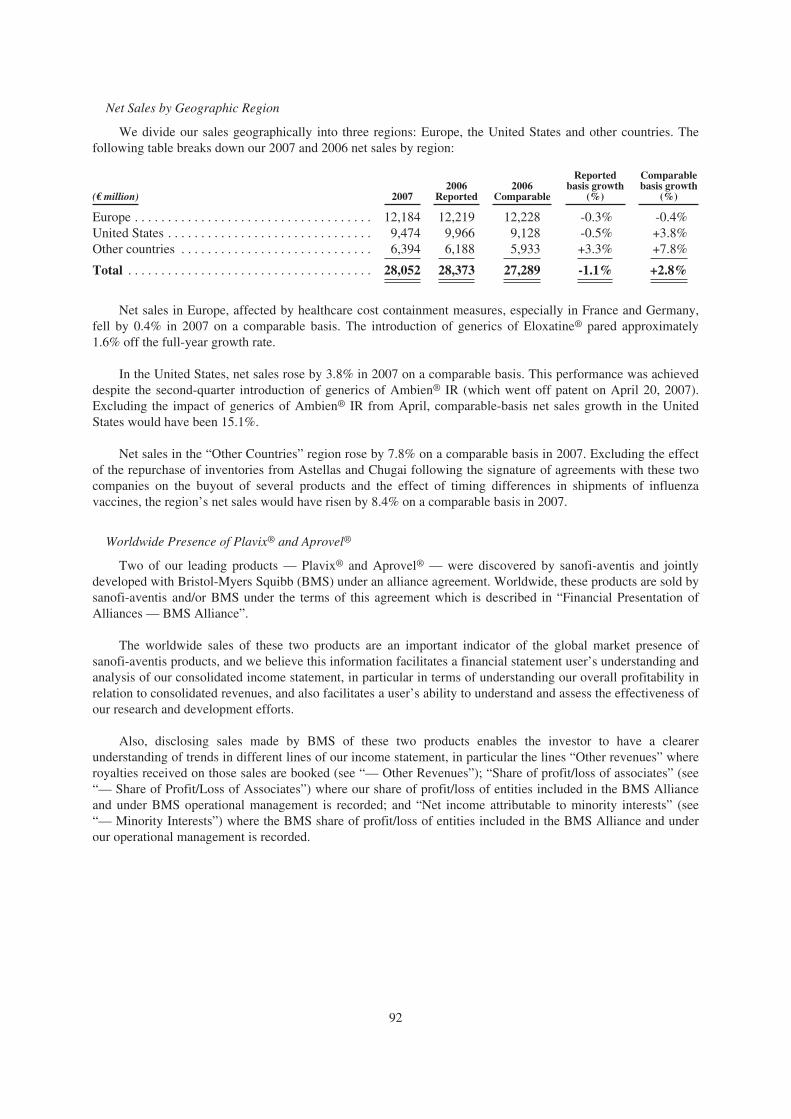
Net Sales by Geographic Region
We divide our sales geographically into three regions: Europe, the United States and other countries. Thefollowing table breaks down our 2007 and 2006 net sales by region:
(€ million) 20072006
Reported2006
Comparable
Reportedbasis growth
(%)
Comparablebasis growth
(%)
Europe . . . . . . . . . . . . . . . . . . . . . . . . . . . . . . . . . . . . 12,184 12,219 12,228 -0.3% -0.4%United States . . . . . . . . . . . . . . . . . . . . . . . . . . . . . . . 9,474 9,966 9,128 -0.5% +3.8%Other countries . . . . . . . . . . . . . . . . . . . . . . . . . . . . . 6,394 6,188 5,933 +3.3% +7.8%
Total . . . . . . . . . . . . . . . . . . . . . . . . . . . . . . . . . . . . . 28,052 28,373 27,289 -1.1% +2.8%
Net sales in Europe, affected by healthcare cost containment measures, especially in France and Germany,fell by 0.4% in 2007 on a comparable basis. The introduction of generics of Eloxatine® pared approximately1.6% off the full-year growth rate.
In the United States, net sales rose by 3.8% in 2007 on a comparable basis. This performance was achieveddespite the second-quarter introduction of generics of Ambien® IR (which went off patent on April 20, 2007).Excluding the impact of generics of Ambien® IR from April, comparable-basis net sales growth in the UnitedStates would have been 15.1%.
Net sales in the “Other Countries” region rose by 7.8% on a comparable basis in 2007. Excluding the effectof the repurchase of inventories from Astellas and Chugai following the signature of agreements with these twocompanies on the buyout of several products and the effect of timing differences in shipments of influenzavaccines, the region’s net sales would have risen by 8.4% on a comparable basis in 2007.
Worldwide Presence of Plavix® and Aprovel®
Two of our leading products — Plavix® and Aprovel® — were discovered by sanofi-aventis and jointlydeveloped with Bristol-Myers Squibb (BMS) under an alliance agreement. Worldwide, these products are sold bysanofi-aventis and/or BMS under the terms of this agreement which is described in “Financial Presentation ofAlliances — BMS Alliance”.
The worldwide sales of these two products are an important indicator of the global market presence ofsanofi-aventis products, and we believe this information facilitates a financial statement user’s understanding andanalysis of our consolidated income statement, in particular in terms of understanding our overall profitability inrelation to consolidated revenues, and also facilitates a user’s ability to understand and assess the effectiveness ofour research and development efforts.
Also, disclosing sales made by BMS of these two products enables the investor to have a clearerunderstanding of trends in different lines of our income statement, in particular the lines “Other revenues” whereroyalties received on those sales are booked (see “— Other Revenues”); “Share of profit/loss of associates” (see“— Share of Profit/Loss of Associates”) where our share of profit/loss of entities included in the BMS Allianceand under BMS operational management is recorded; and “Net income attributable to minority interests” (see“— Minority Interests”) where the BMS share of profit/loss of entities included in the BMS Alliance and underour operational management is recorded.
92

The table below sets forth the worldwide sales of Plavix® and Aprovel® in 2007 and 2006, by geographicregion:
(€ million) 2007 2006 Change (%)
sanofi- sanofi-aventis (2) BMS (3) Total aventis (2) BMS (3) Total
Plavix®/Iscover® (1)
Europe . . . . . . . . . . . . . . . . . . . . . . . . . . . . . . 1,583 225 1,808 1,485 230 1,715 +5.4%United States . . . . . . . . . . . . . . . . . . . . . . . . . — 2,988 2,988 10 2,157 2,167 +37.9%Other countries . . . . . . . . . . . . . . . . . . . . . . . 553 273 826 456 246 702 +17.7%
Total . . . . . . . . . . . . . . . . . . . . . . . . . . . . . . . 2,136 3,486 5,622 1,951 2,633 4,584 +22.6%
(€ million) 2007 2006 Change (%)
sanofi- sanofi-aventis (5) BMS (3) Total aventis (5) BMS (3) Total
Aprovel®/Avapro®/Karvea® (4)
Europe . . . . . . . . . . . . . . . . . . . . . . . . . . . . . . 750 172 922 704 174 878 +5.0%United States . . . . . . . . . . . . . . . . . . . . . . . . . — 507 507 — 516 516 -1.7%Other countries . . . . . . . . . . . . . . . . . . . . . . .
Total . . . . . . . . . . . . . . . . . . . . . . . . . . . . . . .
243
993
179
858
422
1,851
207
911
163
853
370
1,764
+14.1%
+4.9%
(1) Plavix® is marketed under the trademarks Plavix® and Iscover®.(2) Net sales of Plavix® consolidated by sanofi-aventis, excluding sales to BMS (€288 million in 2007 and €279 million in 2006).(3) Translated into euros by sanofi-aventis using the method described in Note B.2 to our consolidated financial statements (Foreign
currency translation) included at Item 18 in this annual report.(4) Aprovel® is marketed under the trademarks Aprovel®, Avapro® and Karvea®.(5) Net sales of Aprovel® consolidated by sanofi-aventis, excluding sales to BMS (€87 million in 2007 and €104 million in 2006).
Comparable-basis trends in worldwide sales of Plavix® and Aprovel® in 2007 and 2006 by geographicregion were as follows:
(€ million) 20072006
Reported2006
Comparable
Comparablebasis growth
(%)
Plavix®/Iscover®
Europe . . . . . . . . . . . . . . . . . . . . . . . . . . . . . . . . . . . . . . . . . . . . . . . . 1,808 1,715 1,717 +5.3%United States . . . . . . . . . . . . . . . . . . . . . . . . . . . . . . . . . . . . . . . . . . . 2,988 2,167 1,987 +50.4%Other countries . . . . . . . . . . . . . . . . . . . . . . . . . . . . . . . . . . . . . . . . . 826 702 672 +22.9%
Total . . . . . . . . . . . . . . . . . . . . . . . . . . . . . . . . . . . . . . . . . . . . . . . . . 5,622 4,584 4,376 +28.5%
Aprovel®/Avapro®/Karvea®
Europe . . . . . . . . . . . . . . . . . . . . . . . . . . . . . . . . . . . . . . . . . . . . . . . . 922 878 877 +5.1%United States . . . . . . . . . . . . . . . . . . . . . . . . . . . . . . . . . . . . . . . . . . . 507 516 473 +7.2%Other countries . . . . . . . . . . . . . . . . . . . . . . . . . . . . . . . . . . . . . . . . .
Total . . . . . . . . . . . . . . . . . . . . . . . . . . . . . . . . . . . . . . . . . . . . . . . . .
422
1,851
370
1,764
352
1,702
+19.9%
+8.8%
In the United States, sales of Plavix® (consolidated by BMS) totaled €2,988 million in 2007, up 50.4% on acomparable basis relative to 2006, when the product was affected by the availability of a generic version.
In Europe, 2007 full-year net sales of Plavix® reached €1,808 million, up 5.3% on a comparable basis,though sales were still affected by parallel imports in Germany.
In the “Other Countries” region, Plavix® posted net sales of €826 million, representing comparable-basisgrowth of 22.9%, boosted by the product’s success in Japan. The two-week limit on prescriptions imposed by theJapanese authorities was lifted in May 2007, triggering an acceleration in sales growth, especially in the fourthquarter. Over the full year, Plavix® recorded Japanese sales of €61 million, compared with €11 million in 2006.
Worldwide sales of Aprovel®/Avapro®/Karvea® in 2007 were €1,851 million, up 8.8% on a comparable basis.
93

Other Revenues
Other revenues, which mainly comprise royalty income under licensing agreements contracted in connectionwith ongoing operations, amounted to €1,155 million in 2007 compared with €1,116 million in 2006.
This rise was mainly due to an increase in royalty income from Plavix® and Aprovel® in the United States(despite the unfavorable effect of movements in the euro/U.S. dollar exchange rate), which more than offset thediscontinuation of royalties from sales of fipronil (€99 million in 2006) previously paid by Merial (our joint venturewith Merck & Co. Inc.) with effect from January 2007 under the terms of the agreement between the two companies.
License revenues under the worldwide alliance with Bristol-Myers Squibb (BMS) on Plavix® and Aprovel®
amounted to €897 million in 2007, compared with €697 million in 2006.
Gross Profit
Gross profit for 2007 was €21,636 million. The gross margin ratio was 77.1% in 2007, compared with77.2% in 2006.
The 0.1-point deterioration in the gross margin ratio reflected a 0.3-point increase in the ratio of cost of salesto net sales, offset by a 0.2-point improvement in royalty income. The main reason for the higher ratio of cost ofsales to net sales was the effect of the introduction of generics of Ambien® IR in the United States from April2007.
During 2007, we recognized royalty expense of €99 million (2006: €90 million) under the worldwidealliance with BMS on Plavix® and Aprovel®.
Research and Development Expenses
Research and development expenses rose by 2.4% in 2007 to €4,537 million (2006: €4,430 million), andrepresented 16.2% of net sales (2006: 15.6%).
We continued to focus efforts on our seven fields of expertise (thrombosis, cardiovascular, metabolicdisorders, oncology, central nervous system, internal medicine, and vaccines). New clinical programs started in2007 included Plavix®, Xatral® (Japan), Acomplia®, volinanserin, otamixaban (acute coronary syndrome),eplivanserin (sleep disorders), amibegron and saredutant (depression and anxiety), dianicline (smokingcessation), the CB-1 receptor antagonist and GLP1 receptor agonist, and teriflunomide (multiple sclerosis). Wealso incurred research and development expenses under our ongoing collaboration agreements, in particular inthe field of oncology with Taiho (agreement to develop and commercialize S-1, an oral anticancer agent) andwith Oxford BioMedica (exclusive global licensing agreement to develop and commercialize the therapeuticvaccine TroVax®).
Selling and General Expenses
Selling and general expenses totaled €7,554 million in 2007 (26.9% of net sales), compared with€8,020 million in 2006 (28.3% of net sales). Apart from the favorable impact of the weakness of the U.S. dollaragainst the euro during 2007, this line showed the benefits of the adaptation measures we initiated in 2006 and2007, especially in France, Germany and the United States, along with our ongoing cost control policy.Conversely, we increased spending on resources in high-growth regions of the world.
Other Operating Income and Expenses
In 2007, we recorded other operating income of €522 million and other operating expenses of €307 million.This represents a net other operating income figure of €215 million, compared with €275 million in 2006. Themain reason for the year-on-year change was the recognition of an expense of €61 million arising from thesignature of agreements on welfare and healthcare obligations in France for retirees and their beneficiaries.
Amortization of Intangibles
Amortization charged against intangible assets totaled €3,654 million in the year ended December 31, 2007,compared with €3,998 million in the year ended December 31, 2006. The reduction was mainly due to theweakening of the U.S. dollar against the euro.
94

These charges mainly relate to the amortization of intangible assets remeasured at fair value at the time ofthe Aventis acquisition (€3,511 million in 2007, compared to €3,866 million in 2006).
Operating Income before Restructuring, Impairment of Property, Plant & Equipment and Intangibles, Gainsand Losses on Disposals, and Litigation
This indicator came to €6,106 million in 2007, compared with €5,729 million in 2006.
The table below shows trends in “Operating income before restructuring, impairment of property, plant &equipment and intangibles, gains and losses on disposals, and litigation” by business segment in 2007 and 2006:
(€ million) 2007 2006
Pharmaceuticals . . . . . . . . . . . . . . . . . . . . . . . . . . . . . . . . . . . . . . . . . . . . . 5,509 5,217Vaccines . . . . . . . . . . . . . . . . . . . . . . . . . . . . . . . . . . . . . . . . . . . . . . . . . . .
Total . . . . . . . . . . . . . . . . . . . . . . . . . . . . . . . . . . . . . . . . . . . . . . . . . . . . . .
597
6,106
512
5,729
The table below shows “Operating income before restructuring, impairment of property, plant & equipmentand intangibles, gains and losses on disposals, and litigation” by geographic region in 2006 and 2007:
(€ million) 2007 2006
Europe . . . . . . . . . . . . . . . . . . . . . . . . . . . . . . . . . . . . . . . . . . . . . . . . . . . . . 4,742 4,603United States . . . . . . . . . . . . . . . . . . . . . . . . . . . . . . . . . . . . . . . . . . . . . . . . 4,952 4,560Other countries . . . . . . . . . . . . . . . . . . . . . . . . . . . . . . . . . . . . . . . . . . . . . . 2,173 2,082Unallocated costs (1) . . . . . . . . . . . . . . . . . . . . . . . . . . . . . . . . . . . . . . . . . . (5,761) (5,516)
Total (2) . . . . . . . . . . . . . . . . . . . . . . . . . . . . . . . . . . . . . . . . . . . . . . . . . . . . 6,106 5,729
(1) Unallocated costs consist mainly of fundamental research and worldwide development of pharmaceutical molecules, and part of the costof support functions.
(2) After charges for amortization of intangible assets of €3,654 million in 2007and €3,998 million in 2006.
Restructuring Costs
Restructuring costs amounted to €137 million in 2007, compared with €274 million in 2006, and comprisecosts incurred on measures taken in response to the changing economic environment in Europe, primarily inFrance and Germany (€137 million, versus €176 million in 2006). The 2006 figure also included the residualcosts associated with the acquisition of Aventis (€98 million).
Impairment of Property, Plant & Equipment and Intangibles
Net impairment losses charged against property, plant and equipment and intangible assets during 2007were €58 million. This charge reflects the results of impairment tests, which identified impairment losses inrespect of intangible assets recognized as part of the allocation of the purchase price of Aventis.
In 2006, net impairment losses charged against property, plant and equipment and intangible assets were€1,163 million. The bulk of this amount (€953 million) related to the impairment of intangible assets, primarilythe antibiotic Ketek® (following a restriction on the product’s indications in the United States) andTritace®/Altace® (following the “at-risk” launch of a generic version in Canada by Apotex).
Gains and Losses on Disposals, and Litigation
We made no major asset disposals during 2007.
In 2006, this line showed a net gain of €536 million. This included €550 million of gains on disposals(including a pre-tax gain of €460 million on the sale of the Exubera® rights to Pfizer, and €45 million on the saleof the residual 30% interest in an animal nutrition business).
95

Operating Income
Operating income for 2007 came to €5,911 million, compared with €4,828 million for 2006.
Financial Income and Expenses
Net financial expense amounted to €139 million in 2007, compared with €80 million in 2006, an increase of€59 million.
Interest expense directly related to our debt, net of cash and cash equivalents (short-term debt plus long-term debt, minus cash and cash equivalents) totaled €209 million in 2007, against €275 million in 2006. Thisdecrease reflects two contrasting trends: a reduction in the amount of our debt, and the unfavorable impact ofhigher interest rates.
Gains on disposals of investments totaled €7 million, against €108 million in 2006 (including a gain of€101 million on the sale of shares in Rhodia).
Financial instruments generated a net gain of €4 million, compared with €68 million in 2006. The 2006figure was mainly due to the remeasurement of the additional purchase consideration receivable from CSL on thesale of Aventis Behring. We received this additional consideration on February 5, 2007, in advance of theoriginal contractual due date. See Note D.20.2. to our consolidated financial statements included at Item 18 ofthis annual report.
We recorded a net foreign exchange gain for the year of €87 million, compared with €68 million in 2006.
Income before Tax and Associates
Income before tax and associates for 2007 was €5,772 million, compared with €4,748 million for 2006.
Income Tax Expense
The reported tax rate for 2007 was 11.9%, compared with 16.8% for 2006. The main reasons for the lowerrate in 2007 were:
• a net gain of €336 million on net reversals of provisions, related to the settlement of tax audits;
• a net gain of €515 million on the change in deferred tax liabilities arising from cuts in tax rates,primarily in Germany, including a gain of €566 million relating to deferred tax liabilities recognized in2004 on the remeasurement of acquired intangible assets of Aventis.
In 2006, this line included a specific tax charge of €77 million on the disposal of the Exubera® rights, whichwas calculated at a reduced tax rate.
Share of Profit/Loss of Associates
Our share of the net profits of associates was €597 million in 2007, compared with €451 million in 2006.This item mainly comprises our share of after-tax profits from the territories managed by BMS under the Plavix®
and Avapro® alliance (€525 million in 2007, compared to €320 million in 2006). The increase in our profit sharewas a direct result of the recovery in sales of Plavix® during 2007 in the United States, where sales had beenadversely affected by the availability of a generic version until the second quarter of 2007. This favorable effectwas offset by unfavorable trends in the euro/U.S. dollar exchange rate.
In 2007, this line also included an impairment loss of €102 million on the equity-accounted investment inZentiva. The contribution from our interest in Merial showed a further increase.
Net Income
Net income (before minority interests) totaled €5,682 million in 2007, compared to €4,399 million in 2006.
96
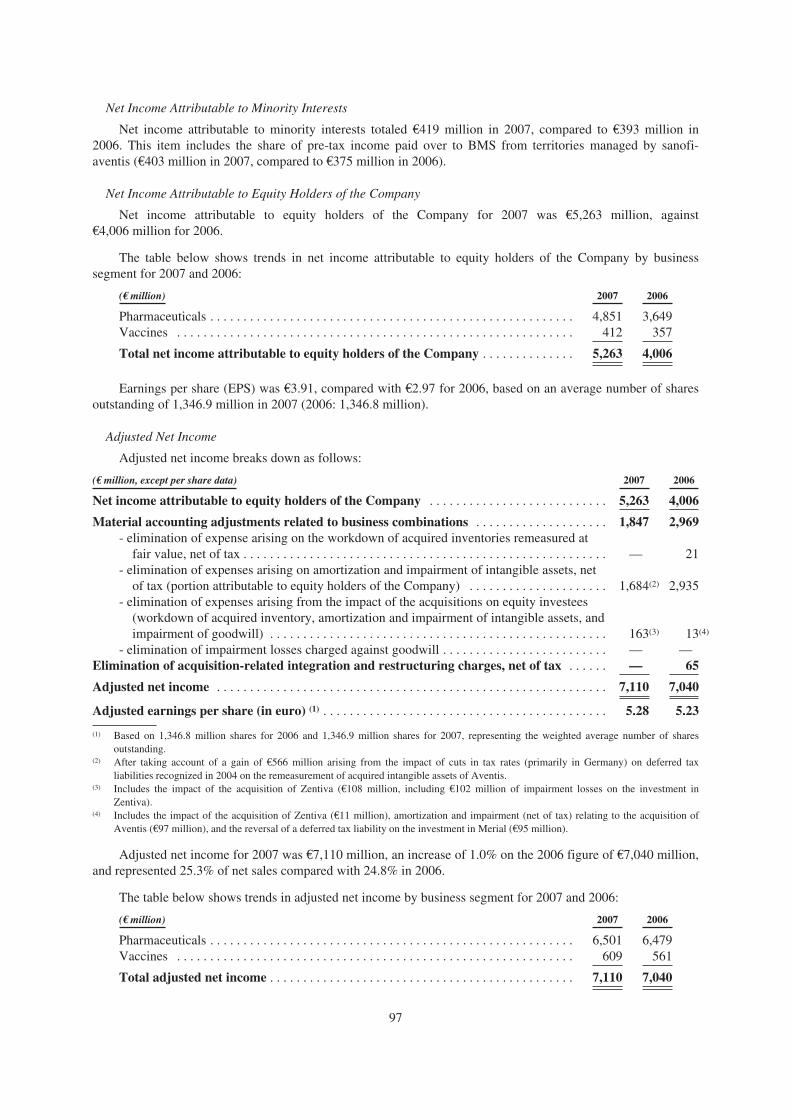
Net Income Attributable to Minority Interests
Net income attributable to minority interests totaled €419 million in 2007, compared to €393 million in2006. This item includes the share of pre-tax income paid over to BMS from territories managed by sanofi-aventis (€403 million in 2007, compared to €375 million in 2006).
Net Income Attributable to Equity Holders of the Company
Net income attributable to equity holders of the Company for 2007 was €5,263 million, against€4,006 million for 2006.
The table below shows trends in net income attributable to equity holders of the Company by businesssegment for 2007 and 2006:
(€ million) 2007 2006
Pharmaceuticals . . . . . . . . . . . . . . . . . . . . . . . . . . . . . . . . . . . . . . . . . . . . . . . . . . . . . . . 4,851 3,649Vaccines . . . . . . . . . . . . . . . . . . . . . . . . . . . . . . . . . . . . . . . . . . . . . . . . . . . . . . . . . . . .
Total net income attributable to equity holders of the Company . . . . . . . . . . . . . .
412
5,263
357
4,006
Earnings per share (EPS) was €3.91, compared with €2.97 for 2006, based on an average number of sharesoutstanding of 1,346.9 million in 2007 (2006: 1,346.8 million).
Adjusted Net Income
Adjusted net income breaks down as follows:
(€ million, except per share data) 2007 2006
Net income attributable to equity holders of the Company . . . . . . . . . . . . . . . . . . . . . . . . . . . 5,263 4,006
Material accounting adjustments related to business combinations . . . . . . . . . . . . . . . . . . . . 1,847 2,969- elimination of expense arising on the workdown of acquired inventories remeasured at
fair value, net of tax . . . . . . . . . . . . . . . . . . . . . . . . . . . . . . . . . . . . . . . . . . . . . . . . . . . . . . . — 21- elimination of expenses arising on amortization and impairment of intangible assets, net
of tax (portion attributable to equity holders of the Company) . . . . . . . . . . . . . . . . . . . . . 1,684(2) 2,935- elimination of expenses arising from the impact of the acquisitions on equity investees
(workdown of acquired inventory, amortization and impairment of intangible assets, andimpairment of goodwill) . . . . . . . . . . . . . . . . . . . . . . . . . . . . . . . . . . . . . . . . . . . . . . . . . . . 163(3) 13(4)
- elimination of impairment losses charged against goodwill . . . . . . . . . . . . . . . . . . . . . . . . . — —Elimination of acquisition-related integration and restructuring charges, net of tax . . . . . . — 65
Adjusted net income . . . . . . . . . . . . . . . . . . . . . . . . . . . . . . . . . . . . . . . . . . . . . . . . . . . . . . . . . . .
Adjusted earnings per share (in euro) (1) . . . . . . . . . . . . . . . . . . . . . . . . . . . . . . . . . . . . . . . . . . .
7,110
5.28
7,040
5.23
(1) Based on 1,346.8 million shares for 2006 and 1,346.9 million shares for 2007, representing the weighted average number of sharesoutstanding.
(2) After taking account of a gain of €566 million arising from the impact of cuts in tax rates (primarily in Germany) on deferred taxliabilities recognized in 2004 on the remeasurement of acquired intangible assets of Aventis.
(3) Includes the impact of the acquisition of Zentiva (€108 million, including €102 million of impairment losses on the investment inZentiva).
(4) Includes the impact of the acquisition of Zentiva (€11 million), amortization and impairment (net of tax) relating to the acquisition ofAventis (€97 million), and the reversal of a deferred tax liability on the investment in Merial (€95 million).
Adjusted net income for 2007 was €7,110 million, an increase of 1.0% on the 2006 figure of €7,040 million,and represented 25.3% of net sales compared with 24.8% in 2006.
The table below shows trends in adjusted net income by business segment for 2007 and 2006:
(€ million) 2007 2006
Pharmaceuticals . . . . . . . . . . . . . . . . . . . . . . . . . . . . . . . . . . . . . . . . . . . . . . . . . . . . . . . 6,501 6,479Vaccines . . . . . . . . . . . . . . . . . . . . . . . . . . . . . . . . . . . . . . . . . . . . . . . . . . . . . . . . . . . .
Total adjusted net income . . . . . . . . . . . . . . . . . . . . . . . . . . . . . . . . . . . . . . . . . . . . . .
609
7,110
561
7,040
97
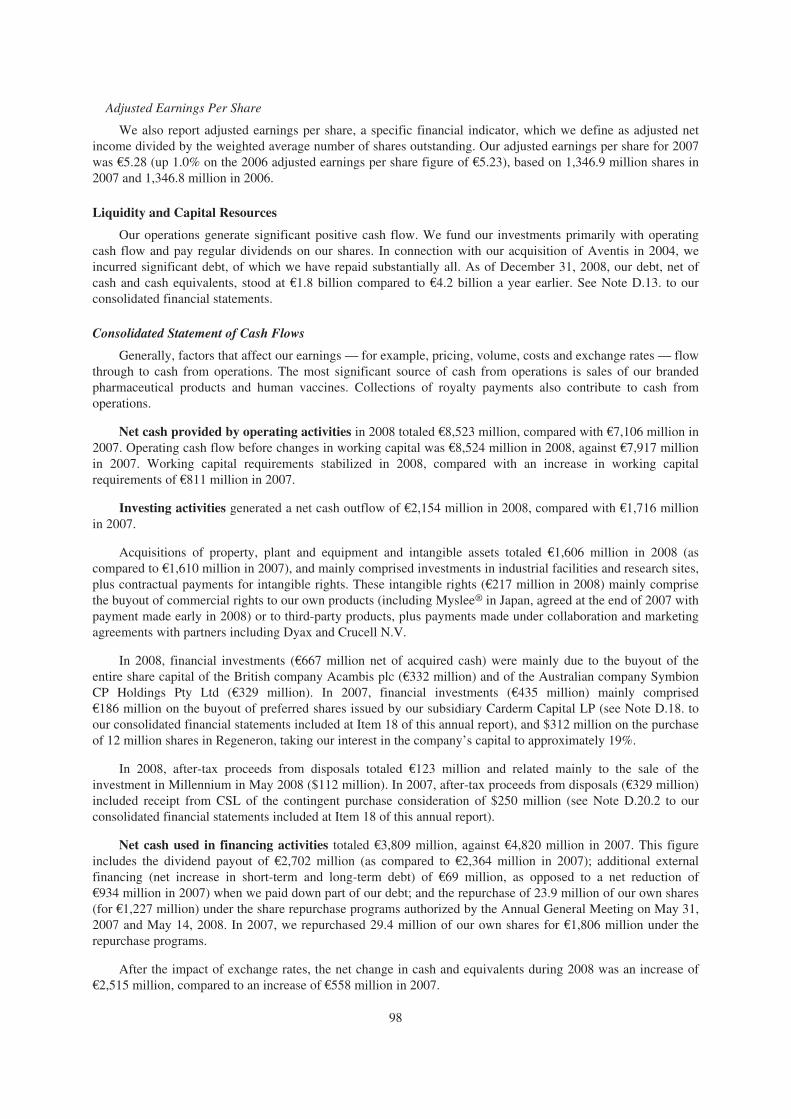
Adjusted Earnings Per Share
We also report adjusted earnings per share, a specific financial indicator, which we define as adjusted netincome divided by the weighted average number of shares outstanding. Our adjusted earnings per share for 2007was €5.28 (up 1.0% on the 2006 adjusted earnings per share figure of €5.23), based on 1,346.9 million shares in2007 and 1,346.8 million in 2006.
Liquidity and Capital Resources
Our operations generate significant positive cash flow. We fund our investments primarily with operatingcash flow and pay regular dividends on our shares. In connection with our acquisition of Aventis in 2004, weincurred significant debt, of which we have repaid substantially all. As of December 31, 2008, our debt, net ofcash and cash equivalents, stood at €1.8 billion compared to €4.2 billion a year earlier. See Note D.13. to ourconsolidated financial statements.
Consolidated Statement of Cash Flows
Generally, factors that affect our earnings — for example, pricing, volume, costs and exchange rates — flowthrough to cash from operations. The most significant source of cash from operations is sales of our brandedpharmaceutical products and human vaccines. Collections of royalty payments also contribute to cash fromoperations.
Net cash provided by operating activities in 2008 totaled €8,523 million, compared with €7,106 million in2007. Operating cash flow before changes in working capital was €8,524 million in 2008, against €7,917 millionin 2007. Working capital requirements stabilized in 2008, compared with an increase in working capitalrequirements of €811 million in 2007.
Investing activities generated a net cash outflow of €2,154 million in 2008, compared with €1,716 millionin 2007.
Acquisitions of property, plant and equipment and intangible assets totaled €1,606 million in 2008 (ascompared to €1,610 million in 2007), and mainly comprised investments in industrial facilities and research sites,plus contractual payments for intangible rights. These intangible rights (€217 million in 2008) mainly comprisethe buyout of commercial rights to our own products (including Myslee® in Japan, agreed at the end of 2007 withpayment made early in 2008) or to third-party products, plus payments made under collaboration and marketingagreements with partners including Dyax and Crucell N.V.
In 2008, financial investments (€667 million net of acquired cash) were mainly due to the buyout of theentire share capital of the British company Acambis plc (€332 million) and of the Australian company SymbionCP Holdings Pty Ltd (€329 million). In 2007, financial investments (€435 million) mainly comprised€186 million on the buyout of preferred shares issued by our subsidiary Carderm Capital LP (see Note D.18. toour consolidated financial statements included at Item 18 of this annual report), and $312 million on the purchaseof 12 million shares in Regeneron, taking our interest in the company’s capital to approximately 19%.
In 2008, after-tax proceeds from disposals totaled €123 million and related mainly to the sale of theinvestment in Millennium in May 2008 ($112 million). In 2007, after-tax proceeds from disposals (€329 million)included receipt from CSL of the contingent purchase consideration of $250 million (see Note D.20.2 to ourconsolidated financial statements included at Item 18 of this annual report).
Net cash used in financing activities totaled €3,809 million, against €4,820 million in 2007. This figureincludes the dividend payout of €2,702 million (as compared to €2,364 million in 2007); additional externalfinancing (net increase in short-term and long-term debt) of €69 million, as opposed to a net reduction of€934 million in 2007) when we paid down part of our debt; and the repurchase of 23.9 million of our own shares(for €1,227 million) under the share repurchase programs authorized by the Annual General Meeting on May 31,2007 and May 14, 2008. In 2007, we repurchased 29.4 million of our own shares for €1,806 million under therepurchase programs.
After the impact of exchange rates, the net change in cash and equivalents during 2008 was an increase of€2,515 million, compared to an increase of €558 million in 2007.
98

Consolidated Balance Sheet and Debt
Total assets stood at €71,987 million at December 31, 2008, €73 million higher than the previous year-endfigure of €71,914 million.
At December 31, 2008, our debt, net of cash and cash equivalents stood at €1.8 billion, compared with €4.2billion at December 31, 2007. We define debt, net of cash and cash equivalents as short-term debt plus long-termdebt, minus cash and cash equivalents. “Debt, net of cash and cash equivalents” is a non-GAAP financialindicator used by management and investors to measure the Company’s overall net indebtedness.
The table below shows changes in the Group’s financial position over the last three years:
(€ million) 2008 2007 2006
Debt . . . . . . . . . . . . . . . . . . . . . . . . . . . . . . . . . . . . . . . . . . 6,006 5,941 6,944Cash and cash equivalents . . . . . . . . . . . . . . . . . . . . . . . . . (4,226) (1,711) (1,153)
Debt, net of cash and cash equivalents . . . . . . . . . . . . . 1,780 4,230 5,791
The gearing ratio (debt, net of cash and cash equivalents, to total equity) improved from 9.5% at the end of2007 to 3.9% in 2008.
For an analysis of our debt at December 31, 2008 by type, maturity, interest rate and currency, see NoteD.17. to our consolidated financial statements included in Item 18 of this financial annual report.
The financing in place at December 31, 2008 is not subject to covenants regarding financial ratios, andcontains no clause linking credit spreads or fees to our credit rating.
Other key movements in balance sheet items for the period under review are summarized below.
Shareholders’ equity totaled €45,071 million at December 31, 2008, against €44,719 million atDecember 31, 2007. This net increase reflected the following factors:
• Increases: net income attributable to equity holders of the Company for 2008 (€3,851 million); the netchange in the cumulative translation difference following the appreciation of various currencies againstthe euro (€948 million, mainly on the U.S. dollar); and capital movements linked to share-basedpayment plans (€43 million, arising from the exercise of stock options plus proceeds from the sale oftreasury shares on exercise of stock options).
• Reductions: payment of the 2007 dividend to our shareholders (€2,702 million); repurchases of our ownshares (€1,227 million); and actuarial losses on employee benefit obligations under the option offered bythe amendment to IAS 19 (€693 million net of taxes).
At December 31, 2008, we held 10 million of our own shares (recorded as a deduction from shareholders’equity), representing 0.76% of our share capital. We canceled 51.4 million of our treasury shares during 2008.
Goodwill (€28,163 million at December 31, 2008) showed a net increase of €964 million year-on-year,mainly due to the net change in the cumulative translation difference arising from the appreciation of variouscurrencies against the euro (impact: €567 million, mainly on the U.S. dollar). The increase also takes account ofgoodwill arising on the acquisitions of Symbion CP Holdings Pty Ltd (Symbion Consumer — €206 million) andof Acambis Plc (Acambis — €197 million).
Intangible assets (€15,260 million at December 31, 2008) fell by €3,922 million. Amortization expensesand impairment losses accounted for €5,088 million, including €1,554 million of impairment losses recognizedon the basis of the results of impairment tests. Intangible assets recognized in the purchase price allocation on theacquisition of Symbion Consumer and Acambis totaled €116 million and €223 million respectively, including€198 million for research projects. Other acquisitions of intangible assets during the year totaled €103 million,mainly in connection with license agreements (including collaboration agreements signed with Dyax Corp. andNovozymes). The net effect of the appreciation of various currencies (mainly the U.S. dollar and the yen) againstthe euro amounted to €674 million.
99
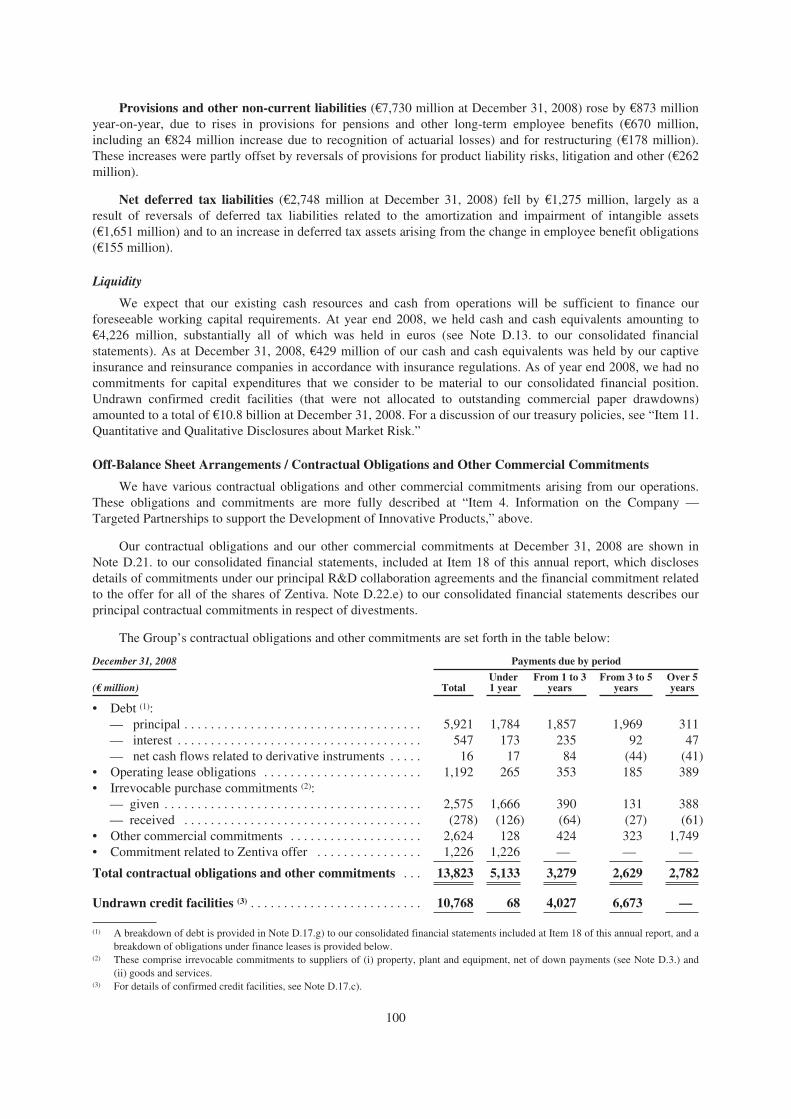
Provisions and other non-current liabilities (€7,730 million at December 31, 2008) rose by €873 millionyear-on-year, due to rises in provisions for pensions and other long-term employee benefits (€670 million,including an €824 million increase due to recognition of actuarial losses) and for restructuring (€178 million).These increases were partly offset by reversals of provisions for product liability risks, litigation and other (€262million).
Net deferred tax liabilities (€2,748 million at December 31, 2008) fell by €1,275 million, largely as aresult of reversals of deferred tax liabilities related to the amortization and impairment of intangible assets(€1,651 million) and to an increase in deferred tax assets arising from the change in employee benefit obligations(€155 million).
Liquidity
We expect that our existing cash resources and cash from operations will be sufficient to finance ourforeseeable working capital requirements. At year end 2008, we held cash and cash equivalents amounting to€4,226 million, substantially all of which was held in euros (see Note D.13. to our consolidated financialstatements). As at December 31, 2008, €429 million of our cash and cash equivalents was held by our captiveinsurance and reinsurance companies in accordance with insurance regulations. As of year end 2008, we had nocommitments for capital expenditures that we consider to be material to our consolidated financial position.Undrawn confirmed credit facilities (that were not allocated to outstanding commercial paper drawdowns)amounted to a total of €10.8 billion at December 31, 2008. For a discussion of our treasury policies, see “Item 11.Quantitative and Qualitative Disclosures about Market Risk.”
Off-Balance Sheet Arrangements / Contractual Obligations and Other Commercial Commitments
We have various contractual obligations and other commercial commitments arising from our operations.These obligations and commitments are more fully described at “Item 4. Information on the Company —Targeted Partnerships to support the Development of Innovative Products,” above.
Our contractual obligations and our other commercial commitments at December 31, 2008 are shown inNote D.21. to our consolidated financial statements, included at Item 18 of this annual report, which disclosesdetails of commitments under our principal R&D collaboration agreements and the financial commitment relatedto the offer for all of the shares of Zentiva. Note D.22.e) to our consolidated financial statements describes ourprincipal contractual commitments in respect of divestments.
The Group’s contractual obligations and other commitments are set forth in the table below:
December 31, 2008 Payments due by period
Under From 1 to 3 From 3 to 5 Over 5(€ million) Total 1 year years years years
• Debt (1):— principal . . . . . . . . . . . . . . . . . . . . . . . . . . . . . . . . . . . . 5,921 1,784 1,857 1,969 311— interest . . . . . . . . . . . . . . . . . . . . . . . . . . . . . . . . . . . . . 547 173 235 92 47— net cash flows related to derivative instruments . . . . . 16 17 84 (44) (41)
• Operating lease obligations . . . . . . . . . . . . . . . . . . . . . . . . 1,192 265 353 185 389• Irrevocable purchase commitments (2):
— given . . . . . . . . . . . . . . . . . . . . . . . . . . . . . . . . . . . . . . . 2,575 1,666 390 131 388— received . . . . . . . . . . . . . . . . . . . . . . . . . . . . . . . . . . . . (278) (126) (64) (27) (61)
• Other commercial commitments . . . . . . . . . . . . . . . . . . . . 2,624 128 424 323 1,749• Commitment related to Zentiva offer . . . . . . . . . . . . . . . .
Total contractual obligations and other commitments . . .
Undrawn credit facilities (3) . . . . . . . . . . . . . . . . . . . . . . . . . .
1,226
13,823
10,768
1,226
5,133
68
—
3,279
4,027
—
2,629
6,673
—
2,782
—
(1) A breakdown of debt is provided in Note D.17.g) to our consolidated financial statements included at Item 18 of this annual report, and abreakdown of obligations under finance leases is provided below.
(2) These comprise irrevocable commitments to suppliers of (i) property, plant and equipment, net of down payments (see Note D.3.) and(ii) goods and services.
(3) For details of confirmed credit facilities, see Note D.17.c).
100

We may have payments due to our current or former research and development partners under collaborativeagreements. These agreements typically cover multiple products, and give us the option to participate indevelopment on a product-by-product basis. When we exercise our option with respect to a product, we pay ourcollaboration partner a fee and receive intellectual property rights to the product in exchange. We also aregenerally required to fund some or all of the development costs for the products that we select, and to makepayments to our partners when those products reach development milestones.
We have entered into collaboration agreements under which we have rights to acquire products ortechnology from third parties through the acquisition of shares, loans, license agreements, joint development,co-marketing and other contractual arrangements. In addition to upfront payments on signature of the agreement,our contracts frequently require us to make payments contingent upon the completion of development milestonesby our alliance partner or upon the granting of approvals or licenses.
Because of the uncertain nature of development work, it is impossible to predict (i) whether sanofi-aventiswill exercise further options for products, or (ii) whether the expected milestones will be achieved, or (iii) thenumber of compounds that will reach the relevant milestones. It is therefore impossible to estimate the maximumaggregate amount that sanofi-aventis will actually pay in the future under existing collaboration agreements.
Given the nature of its business, it is highly unlikely that sanofi-aventis will exercise all options for allproducts or that all milestones will be achieved.
The main collaborative agreements in the Pharmaceuticals segment are described below.
• On December 22, 2008, sanofi-aventis announced the signature of a global licensing and collaborationagreement with Novozymes for the development and commercialization of a new antibiotic namedplectasin NZ2114 that targets the treatment of severe infections such as pneumonia and septicemia.Under the terms of the agreement, sanofi-aventis was granted an exclusive worldwide license for thedevelopment, registration, and commercialization of the drug. The two companies will work jointly todevelop and implement industrial-scale manufacturing of the plectasin NZ2114 drug substance, using arecombinant process that builds on Novozyme’s proprietary expression technology. Future milestonepayments under the agreement could reach up to $64 million.
• On February 12, 2008, sanofi-aventis and Dyax Corp. entered into agreements that granted sanofi-aventis an exclusive worldwide license for the development and commercialization of Dyax’s fullyhuman monoclonal antibody DX-2240, as well as a worldwide non-exclusive license to Dyax’sproprietary Phage Display technology. Under the terms of the two agreements, Dyax could receive up to$270 million in license fees and milestone payments, in the event of full commercial success in threeindications for the DX-2240 project under development, and in one indication for the first antibodycandidates developed by sanofi-aventis alone using the Phage Display technology.
• On March 28, 2007, sanofi-aventis and Oxford BioMedica announced that they had entered into anexclusive global license agreement to develop and commercialize TroVax® for the treatment andprevention of cancers. Future milestone payments could reach up to €450 million. Oxford BioMedicawill be entitled to escalating royalties on global sales of TroVax®, and to sales milestone payments ifand when net sales of TroVax® reach certain levels.
• In September 2003, sanofi-aventis signed a collaboration agreement with Regeneron in oncology todevelop the Vascular Endothelial Growth Factor (VEGF) Trap program. Development milestonepayments and royalties on VEGF Trap sales are payable under the contract. Total milestone paymentscould reach $400 million if all indications specified in the contract obtain approval in the United States,Europe and Japan. Sanofi-aventis will pay 100% of the development costs of the VEGF Trap. Once aVEGF Trap product starts to be marketed, Regeneron will repay 50% of the development costs(originally paid by sanofi-aventis) in accordance with a formula based on Regeneron’s share of theprofits, including royalties received in Japan. In 2005, the VEGF Trap program was extended to Japan,and the treatment of ocular pathologies was excluded from the scope of the collaboration agreement.
• In November 2007, sanofi-aventis signed a further collaboration agreement with Regeneron to discover,develop and commercialize fully-human therapeutic antibodies.
101
Under the terms of the research agreement, the Group will fund up to $416 million of research over thenext five years. Sanofi-aventis will have an option to extend the research agreement for an additionalthree years. Under the terms of the development agreement, sanofi-aventis will fund 100% of thedevelopment costs. Once a product begins to be marketed, Regeneron will repay out of its profits(provided they are sufficient) half of the development costs borne by sanofi-aventis.
In addition, Regeneron will be entitled to receive up to a total of $250 million of sales milestonepayments when the collaboration achieves certain aggregate annual excluding U.S. sales levels.
• A collaboration agreement with IDM was signed in 2001. Under this agreement, IDM granted sanofi-aventis 20 development options on current and future research and development programs. For each optionthat leads to a commercially marketed product, IDM could receive between €17 million and €32 milliondepending on the potential of the market, plus reimbursement of the development costs. Contractually,sanofi-aventis may suspend the development program for each option exercised at any time and withoutpenalty. In 2007, sanofi-aventis decided to suspend the development program for the treatment ofmelanoma, the only program for which it has exercised its option since the collaboration agreement withIDM was signed. At December 31, 2008, sanofi-aventis still had an option on 6 programs.
• Under a collaboration agreement with Zealand Pharma signed in June 2003, sanofi-aventis obtainedrights relating to the development and worldwide marketing of ZP10, an agent used in the treatment oftype 2 diabetes. Under this agreement, sanofi-aventis is responsible for the development of thiscompound. Payments to Zealand Pharma could reach a total of $85 million, contingent upon marketingapprovals being obtained.
• Under a co-promotion agreement with UCB, signed in September 2006, sanofi-aventis co-promotesXyzal® in the United States jointly with UCB. Xyzal® is a prescription antihistamine. The agreementrequires payments to be made on attainment of development and marketing milestones, based onregulatory approvals and sales targets. Total future payments under the agreement could reach $130million. The agreement also specifies how profits are split between sanofi-aventis and UCB.
• Sanofi-aventis has entered into various other collaboration agreements with partners includingImmunogen, Coley, Wayne State University, Innogenetics and Inserm, under which sanofi-aventis maybe required to make total contingent payments of approximately €31 million over the next five years.
• In 2008, sanofi-aventis returned its territory rights for the development and commercialization of theoral anti-cancer agent S-1 to Taiho Pharmaceutical Co., Ltd. As from the termination date, the milestonepayments specified in this agreement no longer constitute commercial commitments. As ofDecember 31, 2007, they represented a commitment of $295 million.
The main collaborative agreements in the Vaccines segment are described below:
• Following the acquisition of Acambis plc by sanofi pasteur during 2008, the agreements previouslysigned with Acambis (vaccines against Japanese encephalitis, West Nile virus and dengue fever) havebeen integrated into the Group’s pipeline. These agreements represented future milestone payments of€57 million as of December 31, 2007.
• In December 2007, sanofi pasteur signed an exclusive collaboration and commercialization agreementwith Crucell N.V. for Crucell’s rabies monoclonal antibodies. Under the terms of the agreement, Crucellwill continue to develop and manufacture the product. The contract includes milestone payments thatcould reach $53 million.
• Sanofi Pasteur has entered into a number of other collaboration agreements with partners includingBecton Dickinson, Crucell, Intercell, Vactech, Maxigen and SSI, under which sanofi pasteur may berequired to make total contingent payments of around €52 million over the next five years.
Critical accounting and reporting policies
Our consolidated financial statements are affected by the accounting and reporting policies that we use.Certain of our accounting and reporting policies are critical to an understanding of our results of operations andfinancial condition, and in some cases the application of these critical policies can be significantly affected by the
102
estimates, judgments and assumptions made by management during the preparation of our consolidated financialstatements. The accounting and reporting policies that we have identified as fundamental to a full understandingof our results of operations and financial condition are the following:
• Revenue recognition. Our policies with respect to revenue recognition are discussed in Note B.14. to ourconsolidated financial statements included at Item 18 of this annual report. Revenue arising from the saleof goods is presented in the income statement under “Net sales”. Net sales comprise revenue from sales ofpharmaceutical products, vaccines, and active ingredients, net of sales returns, of customer incentives anddiscounts, and of certain sales-based payments paid or payable to the healthcare authorities. Revenue isrecognized when all of the following conditions have been met: the risks and rewards of ownership havebeen transferred to the customer; the Group no longer has effective control over the goods sold; the amountof revenue and costs associated with the transaction can be measured reliably; and it is probable that theeconomic benefits associated with the transaction will flow to the Group.
We offer various types of price reductions on our products. In particular, products sold in the UnitedStates are covered by various programs (such as Medicare and Medicaid) under which products are soldat a discount. Rebates are granted to healthcare authorities, and under contractual arrangements withcertain customers. Some wholesalers are entitled to chargeback incentives based on the selling price tothe end customer, under specific contractual arrangements. Cash discounts may also be granted forprompt payment. The discounts, incentives and rebates described above are estimated on the basis ofspecific contractual arrangements with our customers or of specific terms of the relevant regulationsand/or agreements applicable for transactions with healthcare authorities, and of assumptions of theattainment of sales targets. They are recognized in the period in which the underlying sales arerecognized, as a reduction of sales revenue. We also estimate the amount of product returns, on the basisof contractual sales terms and reliable historical data; the same recognition principles apply to salesreturns. For additional details regarding the financial impact of discounts, rebates and sales returns seeNote D.23. to our consolidated financial statements included at Item 18 of this annual report.
Non-product revenues, mainly comprising royalty income from license arrangements that constituteongoing operations of the Group, are presented in “Other revenues”.
• Impairment Testing of Intangible Assets and Goodwill. As discussed in Note B.6. (Impairment ofproperty, plant and equipment, goodwill, intangible assets, and investments in associates) and in NoteD.5. (Impairment of property, plant and equipment, goodwill and intangibles) to our consolidatedfinancial statements included at Item 18 of this annual report, we test our intangible assets periodicallyfor impairment. The most significant intangible assets that we test for impairment are those resultingfrom the business combination of Sanofi-Synthélabo and Aventis in 2004. We test for impairment onthe basis of the same objective criteria that were used for the initial valuation. Our initial valuation andongoing tests are based on the relationship of the value of our projected future cash flows associatedwith the asset to either the purchase price of the asset (for its initial valuation) or the carrying amount ofthe asset (for ongoing tests). The determination of the underlying assumptions related to therecoverability of intangible assets is subjective and requires the exercise of considerable judgment. Anychanges in key assumptions about our business and prospects, or changes in market conditions, couldresult in an impairment charge.
• Pension and Retirement Benefits. As described in Note B.23. (Employee Benefit Obligations) to ourconsolidated financial statements included at Item 18 of this annual report, we recognize our pensionand retirement benefit commitments as liabilities on the basis of an actuarial estimate of the potentialrights vested in employees and retirees as of the balance sheet date, net of the valuation of funds to meetthese obligations. We prepare this estimate at least on an annual basis, taking into account actuarialassumptions, including life expectancy, staff turnover, salary growth, long-term return on plan assets,retirement and discounting of amounts payable. Depending on the assumptions and estimates used, thepension and post-retirement benefit expense could vary within a range of outcomes and have a materialeffect on reported earnings.
• Deferred Taxes. As discussed in Note B.22. (Income tax expense) to our consolidated financialstatements included at Item 18 of this annual report, we account for deferred taxes using the liabilitymethod, whereby deferred income taxes are recognized on tax loss carry-forwards, and on the differencebetween the tax base and carrying amount of assets and liabilities. We calculate our deferred tax assetsand liabilities using enacted tax rates applicable for the years during which we estimate that the
103
temporary differences are expected to reverse. We do not record deferred tax assets when it is morelikely than not that the deferred tax assets will not be realized. The estimates of recognized deferred taxassets are based on our assumptions regarding future profits and the timing of reversal of temporarydifferences. These assumptions are regularly reviewed; however, final deferred income tax could differfrom those estimates.
• Provisions for risks. Sanofi-aventis and its subsidiaries and affiliates may be involved in litigation,arbitration or other legal proceedings. These proceedings typically are related to product liability claims,intellectual property rights, compliance and trade practices, commercial claims, employment andwrongful discharge claims, tax assessment claims, waste disposal and pollution claims, and claimsunder warranties or indemnification arrangements relating to business divestitures. As discussed in NoteB.12. (Provisions for risks) at Item 18 of this annual report, we record a provision where we have apresent obligation, whether legal or constructive, as a result of a past event; when it is probable that anoutflow of resources embodying economic benefits will be required to settle the obligation; and when areliable estimate can be made of the amount of the outflow of resources. For additional details regardingthe financial impact of provisions for risks see Notes D.18.3. (Other provisions) and D.22. (Legal andArbitral Proceedings) to our consolidated financial statements included at Item 18 of this annual report.
Provisions are estimated on the basis of events and circumstances related to present obligations at thebalance sheet date, of past experience, and to the best of management’s knowledge at the date ofpreparation of the financial statements. The assessment of provisions can involve a series of complexjudgments about future events and can rely heavily on estimates and assumptions. Given the inherentuncertainties related to these estimates and assumptions, the actual outflows resulting from therealization of those risks could differ from our estimates.
104

Item 6. Directors, Senior Management and Employees
A. Directors and Senior Management
Since January 1, 2007, the office of Chairman has been separated from that of the Chief Executive Officer.The decision to separate the two offices was motivated by the need for effective succession planning at seniormanagement level, in order to safeguard the dynamism and continuity of our corporate culture.
The Board of Directors, at its meeting of September 10, 2008, decided that the time was right for a changein strategic direction and hence for a change at senior management level. The Board therefore decided to appointChristopher Viehbacher as Chief Executive Officer in place of Gérard Le Fur, effective December 1, 2008. TheBoard also set out three strategic imperatives for senior management:
– the research and development of major innovative products, which remains one of the indispensabledrivers of growth, must be better adapted to the new regulatory and economic constraints of the market;
– the strong positions of the Group and its momentum in emerging markets must be significantlyreinforced;
– the development of other activities related to medicines and Healthcare must be actively continued.
The Chairman represents the Board of Directors. He organizes and directs the work of the Board, and isaccountable for this to the Shareholders’ General Meeting. He is also responsible for ensuring that the corporatedecision-making bodies chaired by him (Board of Directors and Shareholders’ General Meeting) operateproperly.
If the offices of Chairman and Chief Executive Officer are separated, the Chairman may remain in officeuntil the Ordinary General Meeting called to approve the financial statements and held during the calendar yearin which he reaches the age of 70.
The Chief Executive Officer is responsible for the management of the Company, and represents it indealings with third parties. He has the broadest powers to act in the name of the Company.
The Chief Executive Officer must be less than 65 years old.
Limits placed by the Board on the powers of the Chief Executive Officer.
The Board of Directors has placed the following limits on the powers of the Chief Executive Officer tocommit the Group in respect of investments and acquisitions:
• a limit of €500 million for commitments made within a previously-approved strategy; and
• a limit of €150 million for commitments made outside an approved strategy.
Board of Directors
Sanofi-aventis is administered by a Board of Directors with sixteen members.
The Shareholders’ Annual General Meeting of May 14, 2008 appointed four new directors and reappointednine existing directors. The terms of office of these directors were staggered, such that in each year from 2010 to2012 one-third of the Board will be required to seek re-election each year.
The Board meeting of April 29, 2008 discussed the issue of director independence, subject to the decisionon the appointment and reappointment of directors at the Shareholders’ Annual General Meeting held on May 14,2008. Out of the sixteen directors, eight were regarded as independent: Uwe Bicker, Jean-Marc Bruel, LordDouro, Jean-René Fourtou, Claudie Haigneré, Klaus Pohle, Gunter Thielen and Gérard Van Kemmel.
A director is regarded as independent if he or she has no relationship of any kind with the Company, theGroup or its management that is liable to impair his or her judgment. It is the responsibility of the Board, actingupon the recommendation of the Appointments and Governance Committee, to assess the independence of itsmembers.
No more than one-third of the serving members of our Board of Directors may be aged more than 70.
105

Subject to the authority expressly reserved by law to Shareholders’ General Meetings and within the scopeof the corporate objects, the Board of Directors deals with and takes decisions upon all issues relating to theproper management of the Company and other matters concerning the Board.
Composition of the Board of Directors at December 31, 2008
Jean-François DehecqChairman of the Board of DirectorsDirector
Age 69Nationality FrenchFirst elected May 1999Last reappointment May 2008Term as director expires 2011
395,469 shares Other directorships and appointments• Chairman of Policy Committee of the French Strategic Investment Found• Director of Air France, Agence Nationale de la Recherche and Veolia
Environnement• Member of IFPMA (International Federation of Pharmaceutical Manufacturers
Associations)• Chairman of Association Nationale de la Recherche Technique• Chairman of the Board of Directors of ENSAM (Ecole Nationale Supérieure
d’Arts et Métiers)• Member of Fondation Française pour la Recherche sur l’Epilepsie
Christopher ViehbacherChief Executive OfficerDirector
Age 48Nationalities German and CanadianFirst elected December 2008Term as director expires 2010
10,000 sharesacquired inFebruary 2009
Other directorships and appointments• Member of the Board of Directors of Health Leadership Council (United States),
Research America (United States) and Burroughs Wellcome Fund (United States)• Member of Advisory Council of Center for Healthcare Transformation (United
States)• Member of the Board of Visitors of Fuqua School of Business, Duke University
(United States)
Uwe BickerIndependent Director
Age 63Nationality GermanFirst elected May 2008Term expires 2012
300 shares Other directorships and appointments• Chairman of the Supervisory Board of Dade Behring Holding GmbH (Germany)• Vice Chairman of the Supervisory Board of Epigenomics AG (Germany)• Member of the Supervisory Boards of Future Capital AG (Germany) and
Definiens AG (Germany)• Director of Fondation Aventis (Foundation, Germany)• Chairman of the Board of Marburg University (Germany)• Member of the Board of Trustees of Bertelsmann Stiftung (Bertelsmann
Foundation, Germany)
Jean-Marc BruelIndependent Director
Age 73Nationality FrenchFirst elected August 2004Last reappointment May 2008Term expires 2010
7,958 shares Other directorships and appointments• Director of Institut Curie and Villette Entreprise
106
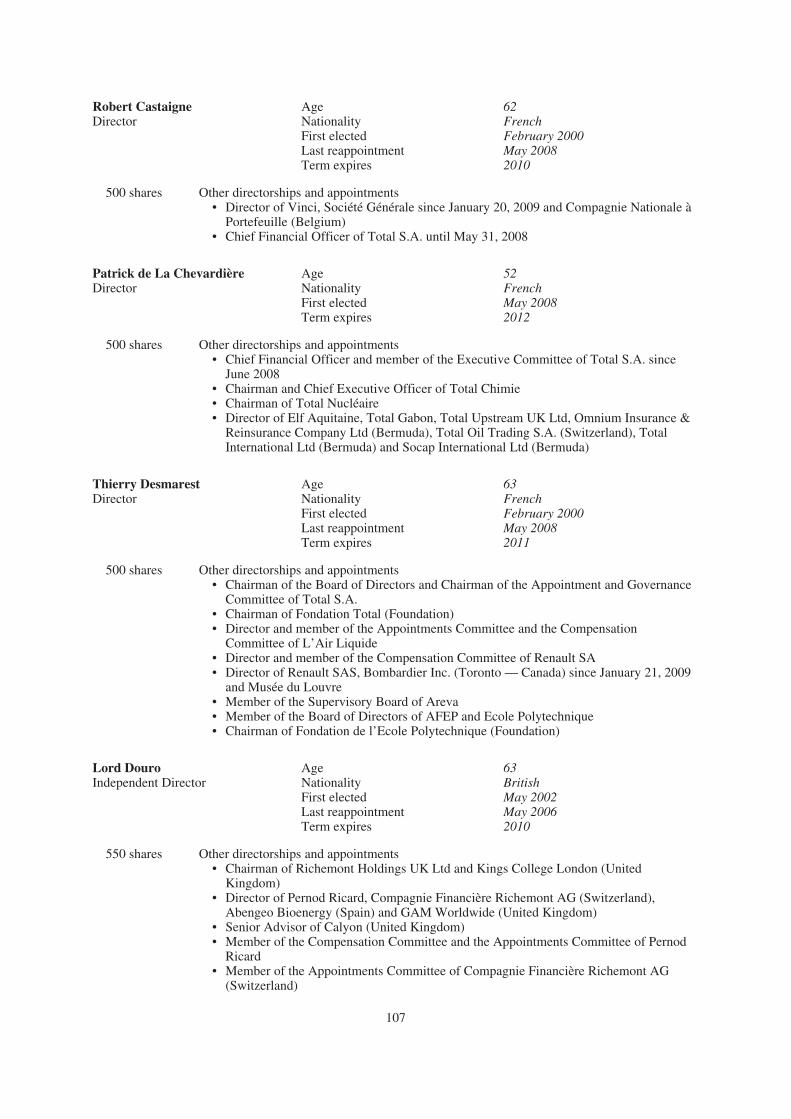
Robert CastaigneDirector
Age 62Nationality FrenchFirst elected February 2000Last reappointment May 2008Term expires 2010
500 shares Other directorships and appointments• Director of Vinci, Société Générale since January 20, 2009 and Compagnie Nationale à
Portefeuille (Belgium)• Chief Financial Officer of Total S.A. until May 31, 2008
Patrick de La ChevardièreDirector
Age 52Nationality FrenchFirst elected May 2008Term expires 2012
500 shares Other directorships and appointments• Chief Financial Officer and member of the Executive Committee of Total S.A. since
June 2008• Chairman and Chief Executive Officer of Total Chimie• Chairman of Total Nucléaire• Director of Elf Aquitaine, Total Gabon, Total Upstream UK Ltd, Omnium Insurance &
Reinsurance Company Ltd (Bermuda), Total Oil Trading S.A. (Switzerland), TotalInternational Ltd (Bermuda) and Socap International Ltd (Bermuda)
Thierry DesmarestDirector
Age 63Nationality FrenchFirst elected February 2000Last reappointment May 2008Term expires 2011
500 shares Other directorships and appointments• Chairman of the Board of Directors and Chairman of the Appointment and Governance
Committee of Total S.A.• Chairman of Fondation Total (Foundation)• Director and member of the Appointments Committee and the Compensation
Committee of L’Air Liquide• Director and member of the Compensation Committee of Renault SA• Director of Renault SAS, Bombardier Inc. (Toronto — Canada) since January 21, 2009
and Musée du Louvre• Member of the Supervisory Board of Areva• Member of the Board of Directors of AFEP and Ecole Polytechnique• Chairman of Fondation de l’Ecole Polytechnique (Foundation)
Lord DouroIndependent Director
Age 63Nationality BritishFirst elected May 2002Last reappointment May 2006Term expires 2010
550 shares Other directorships and appointments• Chairman of Richemont Holdings UK Ltd and Kings College London (United
Kingdom)• Director of Pernod Ricard, Compagnie Financière Richemont AG (Switzerland),
Abengeo Bioenergy (Spain) and GAM Worldwide (United Kingdom)• Senior Advisor of Calyon (United Kingdom)• Member of the Compensation Committee and the Appointments Committee of Pernod
Ricard• Member of the Appointments Committee of Compagnie Financière Richemont AG
(Switzerland)
107

Jean-René FourtouIndependent Director
Age 69Nationality FrenchFirst elected August 2004Last reappointment May 2008Term expires 2012
2,891 shares Other directorships and appointments• Chairman of the Supervisory Boards of Vivendi and Groupe Canal +• Member of the Supervisory Boards of Axa and Maroc Telecom• Director of Cap Gemini SA, Axa Millésimes SAS, Nestlé (Switzerland) and
NBC Universal Inc. (United States),
Claudie HaigneréIndependent Director
Age 51Nationality FrenchFirst elected May 2008Term expires 2012
500 shares Other directorships and appointments• Vice President of the IAA (International Academy of Astronautics)• Advisor to the Director General of the ESA (European Space Agency)• Director of France Telecom, Cité des Sciences et de l’Industrie, Aéro-Club de
France, and of Fondation de France, Fondation CGénial and Fondationd’Entreprise L’Oréal (Foundations)
• Member of the Académie des Technologies, the Académie des Sports and theAcadémie Nationale de l’Air et de l’Espace
Igor LandauDirector
Age 64Nationality FrenchFirst elected August 2004Last reappointment May 2008Term expires 2011
11,693 shares Other directorships and appointments• Director of HSBC France and INSEAD• Member of the Supervisory Boards of Allianz AG (Germany) and Adidas
(Germany)
Christian MulliezDirector
Age 48Nationality FrenchFirst elected June 2004Last reappointment May 2008Term expires 2010
1,013 shares Other directorships and appointments• Vice President, General Manager Administration and Finance of L’Oréal• Chairman of the Board of Directors of Regefi• Director of DG 17 Invest, L’Oréal USA Inc. and The Body Shop International
(United Kingdom)
Lindsay Owen-JonesDirector
Age 63Nationality BritishFirst elected May 1999Last reappointment May 2008Term expires 2012
15,000 shares Other directorships and appointments• Chairman of the Board of Directors of L’Oréal• Chairman of the Strategy Committee of L’Oréal• Chairman of the Board of Directors of Fondation d’Entreprise L’Oréal
(Foundation)• Chairman of Alba Plus, L’Oréal UK Ltd and L’Oréal USA Inc.• Vice Chairman of the Board of Directors of L’Air Liquide• Director of Ferrari S.p.A. (Italia)
108

Klaus PohleIndependent Director
Age 71Nationality GermanFirst elected August 2004Last reappointment May 2008Term expires 2012
2,500 shares Other directorships and appointments• Director of Labelux Group GmbH (Austria)• Director and Chairman of the Audit Committee of Coty Inc., New York• Member of the Supervisory Board and Chairman of the Audit Committee of
DWS Investment GmbH, Frankfurt (Germany)
Gunter ThielenIndependent Director
Age 66Nationality GermanFirst elected May 2008Term expires 2011
500 shares Other directorships and appointments• Chairman of the Supervisory Boards of Bertelsmann AG (Germany), Sixt AG
(Germany) and Sixt Allgemeine Leasing GmbH (Germany)• Member of the Supervisory Boards of Leipziger Messe (Germany) and Groupe
Bruxelles Lambert (Belgium)• Chairman of the Executive Board of Bertelsmann Stiftung AG (Foundation,
Germany)
Gérard Van KemmelIndependent Director
Age 69Nationality FrenchFirst elected May 2003Last reappointment May 2007Term expires 2011
500 shares Other directorships and appointments• Director of Groupe Eurotunnel, Europacorp and Eurotunnel NRS Holders
Company Limited (United Kingdom)• Member of the Audit Committee of Europacorp
During 2008, the Board of Directors met eight times, with an overall attendance rate among Board membersof 92%.
Executive Committee
The Executive Committee is chaired by the Chief Executive Officer.
The Committee meets twice a month, and has the following permanent members:
• Christopher Viehbacher, Chief Executive Officer;
• Marc Cluzel, Senior Vice President Research & Development;
• Laurence Debroux, Senior Vice President Chief Strategic Officer, Senior Vice President ChiefFinancial Officer;
• Gilles Lhernould, Senior Vice President Human Resources;
• Karen Linehan, Senior Vice President Legal Affairs and General Counsel;
• Philippe Luscan, Senior Vice President Industrial Affairs; and
• Hanspeter Spek, Executive Vice President Pharmaceutical Operations.
109

Management Committee
The Management Committee is chaired by the Chief Executive Officer.
At the beginning of March 2009, the Management Committee comprised:
Christopher ViehbacherChief Executive OfficerChairman of the Management CommitteeChairman of the Executive Committeesince December 1, 2008Age: 48
Christopher Viehbacher is both a graduate in Commerce of the Queens University (Ontario — Canada) anda certified public accountant. After beginning his career at Price Waterhouse, he spent the major part of hisprofessional life (1988-2008) in the GlaxoSmithKline (GSK) company where he acquired broad internationalexperience in different positions across Europe, in the United States and Canada. In his last position, he wasPresident Pharmaceutical Operations North America, Co-Chairman of the Portfolio Management Board and amember of the Board of Directors of GSK plc. He was appointed to his present position effective December2008.
Hanspeter SpekMember of the Management CommitteeExecutive Vice President Pharmaceutical OperationsMember of the Executive CommitteeAge: 59
Hanspeter Spek graduated from business school in Germany. In 1974, he completed a management trainingprogram at Pfizer International, and then joined Pfizer RFA as a junior product manager. He served in variouspositions at Pfizer RFA, including as manager of the marketing division. Mr. Spek joined Sanofi Pharma GmbH,a German subsidiary of Sanofi, in 1985 as Marketing Director, and served in various positions in Germany andthen at Sanofi in France, before being named Senior Vice President Europe following the merger withSynthélabo in 1999. He served as Executive Vice President, International Operations from October 2000, untilJanuary 2003, when he was named in charge of worldwide operations of Sanofi-Synthélabo. He was appointed tohis present position in August 2004.
Pierre ChancelMember of the Management CommitteeSenior Vice President Global Marketing & AccessAge: 52
Pierre Chancel, a pharmacist, is a graduate of the Institut de Pharmacie Industrielle in Paris. At Rhône-Poulenc, from 1994 to 1996, he was Marketing Director for Théraplix. From 1997 to 1999, Mr. Chancel servedas Business Unit Manager in charge of products in the central nervous system, rheumatology and hormonereplacement therapy fields. From 2003, he served as Managing Director of Aventis Operations in the UnitedKingdom and Ireland. Before being appointed to this position, he was in charge of global strategy development atAventis, which led to the launch of the new diabetes treatment Lantus®. He was appointed to his present positionin August 2004.
Olivier CharmeilMember of the Management CommitteeSenior Vice President Pharmaceutical Operations, Asia / Pacific & JapanAge: 46
Olivier Charmeil is a graduate of HEC (Ecole des Hautes Etudes Commerciales) and of the Institut d’EtudesPolitiques in Paris. From 1989 to 1994, he worked in the Mergers & Acquisitions department of Banque del’Union européenne. He joined Sanofi Pharma in 1994 as head of Business Development. Subsequently, he heldvarious posts within the Group, including Chief Financial Officer (Asia) for Sanofi-Synthélabo in 1999 andAttaché to the Chairman, Jean-François Dehecq, in 2000, before being appointed as Vice President, Development
110
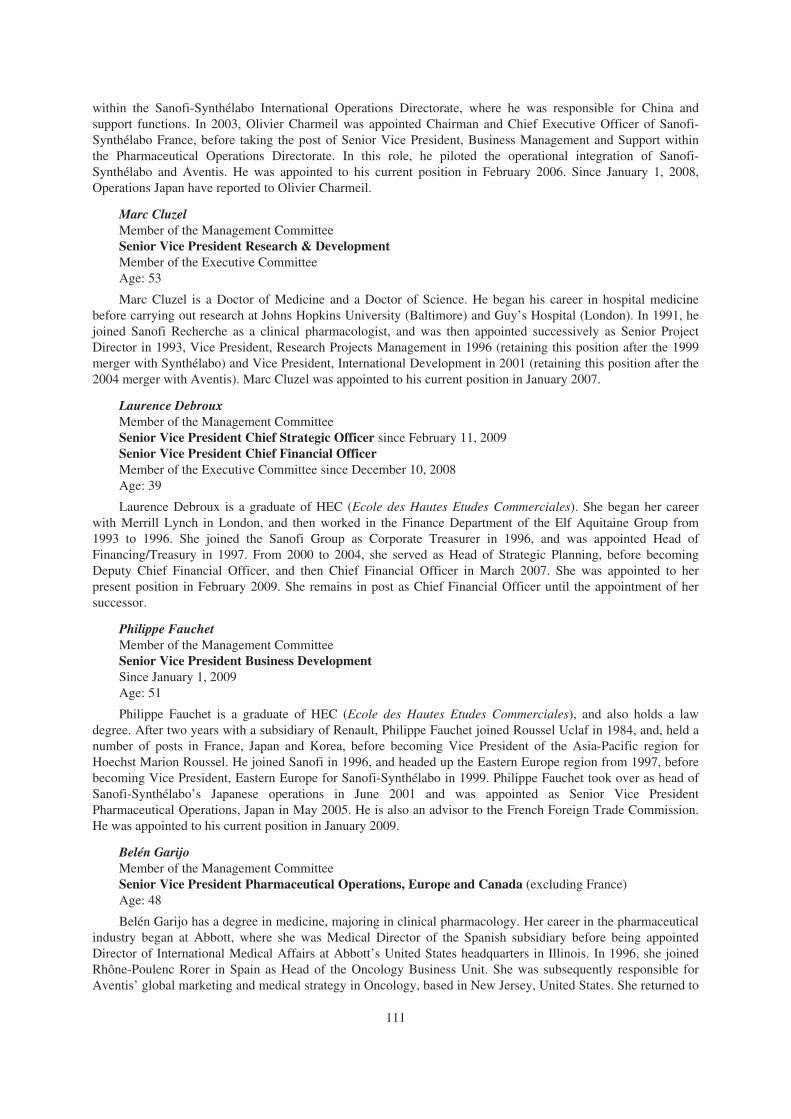
within the Sanofi-Synthélabo International Operations Directorate, where he was responsible for China andsupport functions. In 2003, Olivier Charmeil was appointed Chairman and Chief Executive Officer of Sanofi-Synthélabo France, before taking the post of Senior Vice President, Business Management and Support withinthe Pharmaceutical Operations Directorate. In this role, he piloted the operational integration of Sanofi-Synthélabo and Aventis. He was appointed to his current position in February 2006. Since January 1, 2008,Operations Japan have reported to Olivier Charmeil.
Marc CluzelMember of the Management CommitteeSenior Vice President Research & DevelopmentMember of the Executive CommitteeAge: 53
Marc Cluzel is a Doctor of Medicine and a Doctor of Science. He began his career in hospital medicinebefore carrying out research at Johns Hopkins University (Baltimore) and Guy’s Hospital (London). In 1991, hejoined Sanofi Recherche as a clinical pharmacologist, and was then appointed successively as Senior ProjectDirector in 1993, Vice President, Research Projects Management in 1996 (retaining this position after the 1999merger with Synthélabo) and Vice President, International Development in 2001 (retaining this position after the2004 merger with Aventis). Marc Cluzel was appointed to his current position in January 2007.
Laurence DebrouxMember of the Management CommitteeSenior Vice President Chief Strategic Officer since February 11, 2009Senior Vice President Chief Financial OfficerMember of the Executive Committee since December 10, 2008Age: 39
Laurence Debroux is a graduate of HEC (Ecole des Hautes Etudes Commerciales). She began her careerwith Merrill Lynch in London, and then worked in the Finance Department of the Elf Aquitaine Group from1993 to 1996. She joined the Sanofi Group as Corporate Treasurer in 1996, and was appointed Head ofFinancing/Treasury in 1997. From 2000 to 2004, she served as Head of Strategic Planning, before becomingDeputy Chief Financial Officer, and then Chief Financial Officer in March 2007. She was appointed to herpresent position in February 2009. She remains in post as Chief Financial Officer until the appointment of hersuccessor.
Philippe FauchetMember of the Management CommitteeSenior Vice President Business DevelopmentSince January 1, 2009Age: 51
Philippe Fauchet is a graduate of HEC (Ecole des Hautes Etudes Commerciales), and also holds a lawdegree. After two years with a subsidiary of Renault, Philippe Fauchet joined Roussel Uclaf in 1984, and, held anumber of posts in France, Japan and Korea, before becoming Vice President of the Asia-Pacific region forHoechst Marion Roussel. He joined Sanofi in 1996, and headed up the Eastern Europe region from 1997, beforebecoming Vice President, Eastern Europe for Sanofi-Synthélabo in 1999. Philippe Fauchet took over as head ofSanofi-Synthélabo’s Japanese operations in June 2001 and was appointed as Senior Vice PresidentPharmaceutical Operations, Japan in May 2005. He is also an advisor to the French Foreign Trade Commission.He was appointed to his current position in January 2009.
Belén GarijoMember of the Management CommitteeSenior Vice President Pharmaceutical Operations, Europe and Canada (excluding France)Age: 48
Belén Garijo has a degree in medicine, majoring in clinical pharmacology. Her career in the pharmaceuticalindustry began at Abbott, where she was Medical Director of the Spanish subsidiary before being appointedDirector of International Medical Affairs at Abbott’s United States headquarters in Illinois. In 1996, she joinedRhône-Poulenc Rorer in Spain as Head of the Oncology Business Unit. She was subsequently responsible forAventis’ global marketing and medical strategy in Oncology, based in New Jersey, United States. She returned to
111
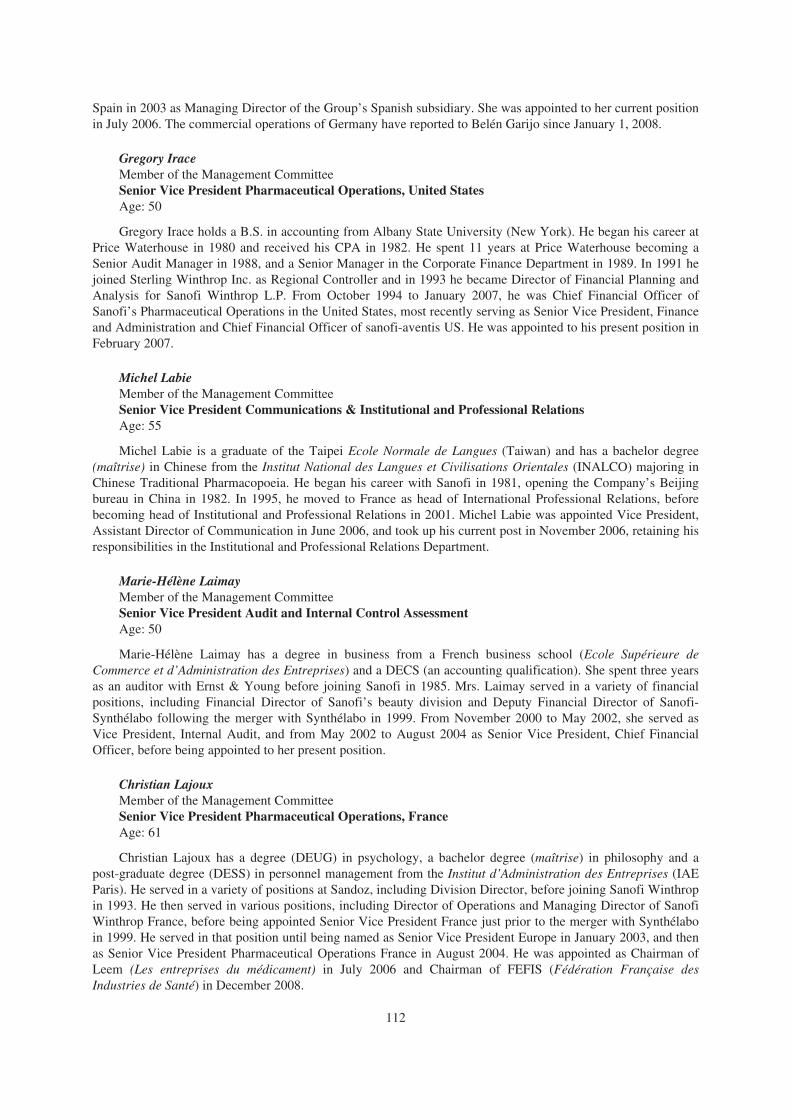
Spain in 2003 as Managing Director of the Group’s Spanish subsidiary. She was appointed to her current positionin July 2006. The commercial operations of Germany have reported to Belén Garijo since January 1, 2008.
Gregory IraceMember of the Management CommitteeSenior Vice President Pharmaceutical Operations, United StatesAge: 50
Gregory Irace holds a B.S. in accounting from Albany State University (New York). He began his career atPrice Waterhouse in 1980 and received his CPA in 1982. He spent 11 years at Price Waterhouse becoming aSenior Audit Manager in 1988, and a Senior Manager in the Corporate Finance Department in 1989. In 1991 hejoined Sterling Winthrop Inc. as Regional Controller and in 1993 he became Director of Financial Planning andAnalysis for Sanofi Winthrop L.P. From October 1994 to January 2007, he was Chief Financial Officer ofSanofi’s Pharmaceutical Operations in the United States, most recently serving as Senior Vice President, Financeand Administration and Chief Financial Officer of sanofi-aventis US. He was appointed to his present position inFebruary 2007.
Michel LabieMember of the Management CommitteeSenior Vice President Communications & Institutional and Professional RelationsAge: 55
Michel Labie is a graduate of the Taipei Ecole Normale de Langues (Taiwan) and has a bachelor degree(maîtrise) in Chinese from the Institut National des Langues et Civilisations Orientales (INALCO) majoring inChinese Traditional Pharmacopoeia. He began his career with Sanofi in 1981, opening the Company’s Beijingbureau in China in 1982. In 1995, he moved to France as head of International Professional Relations, beforebecoming head of Institutional and Professional Relations in 2001. Michel Labie was appointed Vice President,Assistant Director of Communication in June 2006, and took up his current post in November 2006, retaining hisresponsibilities in the Institutional and Professional Relations Department.
Marie-Hélène LaimayMember of the Management CommitteeSenior Vice President Audit and Internal Control AssessmentAge: 50
Marie-Hélène Laimay has a degree in business from a French business school (Ecole Supérieure deCommerce et d’Administration des Entreprises) and a DECS (an accounting qualification). She spent three yearsas an auditor with Ernst & Young before joining Sanofi in 1985. Mrs. Laimay served in a variety of financialpositions, including Financial Director of Sanofi’s beauty division and Deputy Financial Director of Sanofi-Synthélabo following the merger with Synthélabo in 1999. From November 2000 to May 2002, she served asVice President, Internal Audit, and from May 2002 to August 2004 as Senior Vice President, Chief FinancialOfficer, before being appointed to her present position.
Christian LajouxMember of the Management CommitteeSenior Vice President Pharmaceutical Operations, FranceAge: 61
Christian Lajoux has a degree (DEUG) in psychology, a bachelor degree (maîtrise) in philosophy and apost-graduate degree (DESS) in personnel management from the Institut d’Administration des Entreprises (IAEParis). He served in a variety of positions at Sandoz, including Division Director, before joining Sanofi Winthropin 1993. He then served in various positions, including Director of Operations and Managing Director of SanofiWinthrop France, before being appointed Senior Vice President France just prior to the merger with Synthélaboin 1999. He served in that position until being named as Senior Vice President Europe in January 2003, and thenas Senior Vice President Pharmaceutical Operations France in August 2004. He was appointed as Chairman ofLeem (Les entreprises du médicament) in July 2006 and Chairman of FEFIS (Fédération Française desIndustries de Santé) in December 2008.
112

Jean-Pierre LehnerMember of the Management CommitteeSenior Vice President Chief Medical OfficerSince February 11, 2009Age: 61
Jean-Pierre Lehner holds a Medical degree from the School of Medicine, University of Paris, France. Afterspending four years as Chef de Clinique, Paris Hospitals, Department of Cardiology (Prof. Tricot), BichatHospital, Paris, France, Jean-Pierre Lehner joined Roussel Laboratories in 1981 as Medical Director (1981-1986), and was then appointed Medical Director of Roussel-Uclaf (1986-1992). He served successively as SeniorDirector of Clinical Investigations of Sanofi Recherche (1992-1996), as Scientific Senior Director of SanofiWinthrop (1996-2002), as Vice President Medical Affairs Europe of sanofi-aventis (2003-2005), and as SeniorVice-President, Medical & Regulatory Affairs (2005-February 2009). He was appointed to his present position inFebruary 2009.
Gilles LhernouldMember of the Management CommitteeSenior Vice President Human Resources since September 1, 2008Member of the Executive CommitteeAge: 53
Gilles Lhernould has a diploma in pharmacy and a master’s degree (DEA) in industrial pharmacy. He beganhis career as a manufacturing supervisor at Laboratoires Bruneau, and in 1983 joined one of Sanofi’s subsidiarieswhere he managed production and later the factory. Mr. Lhernould then served in a variety of positions withinthe Sanofi Group, including Director of Human Resources — Pharmaceuticals for Sanofi Pharma and Director ofOperational Human Resources for Sanofi. Following the merger with Synthélabo in 1999, he served as VicePresident in charge of integration and then Vice President of Information Systems, before being named as SeniorVice President, Industrial Affairs and Senior Vice President Industrial Affairs of sanofi-aventis. He wasappointed to his present position effective September 2008.
Karen LinehanMember of the Management CommitteeSenior Vice President Legal Affairs and General CounselMember of the Executive Committee since December 10, 2008Age: 50
Karen Linehan graduated from Georgetown University with bachelor of arts and juris doctorate degrees.Prior to practicing law, Ms. Linehan served on the congressional staff of the Speaker of the U.S. House ofRepresentatives from September 1977 to August 1986. Until December 1990, she was an Associate in a mid-sizelaw firm in New York, New York. In January 1991, she joined Sanofi as Assistant General Counsel of its U.S.subsidiary. In July 1996, Ms. Linehan moved to Paris to work on international matters within the Group and shehas held a number of positions within the Legal Department, most recently as Vice President — Deputy Head ofLegal Operations. She was appointed to her current position in March 2007.
Philippe LuscanMember of the Management CommitteeSenior Vice President Industrial Affairs since September 1, 2008Member of the Executive Committee since September 1, 2008Age: 46
Philippe Luscan is a graduate in Biotechnology of the Ecole Polytechnique and the Ecole des Mines in Paris.He began his career in 1987 as a Production Manager at Danone. In 1990, he joined the Group as Director of theSanofi Chimie plant at Sisteron, France, and subsequently served as Industrial Director of Sanofi in the UnitedStates, as Vice President Supply Chain and as Vice President Chemistry. He was appointed to his presentposition effective September 2008.
113

Antoine OrtoliMember of the Management CommitteeSenior Vice President Pharmaceutical Operations, IntercontinentalAge: 55
Antoine Ortoli is a graduate of the Ecole Supérieure de Commerce in Rouen, France, and of INSEAD. Healso holds a law degree and an accountancy qualification. He began his career in 1980 as a financial and systemsauditor with Arthur Young and Co. In December 1981, he joined the Sanofi Group, where he served in a varietyof positions, including Finance Director of the Pharmaceuticals Division and Director of the Latin Americaregion. Following the merger with Synthélabo in 1999, he was named as Vice President, Latin America, and thenas Senior Vice President, Asia Middle East in June 2001. In June 2003, he took on the role of Vice President,Intercontinental region at Sanofi-Synthélabo. He was appointed to his present position in January 2005.
Philippe PeyreMember of the Management CommitteeSenior Vice President Corporate AffairsAge: 58
Philippe Peyre is a graduate of the Ecole Polytechnique, and began his career in management consultancywith Bossard before being appointed as a member of the General Management Committee of Bossard GeminiConsulting. In 1998, he joined Rhône-Poulenc Rorer as Senior Vice President Special Projects, and then servedas Head of Integration at Aventis Pharma, and as Company Secretary and Senior Vice President, BusinessTransformation of Aventis. He was appointed to his present position in August 2004.
Wayne PisanoMember of the Management CommitteeSenior Vice President VaccinesAge: 54
Wayne Pisano holds a bachelor’s degree in biology from St. John Fisher College, Rochester, New York, andan MBA from the University of Dayton, Ohio. Prior to sanofi pasteur he held various marketing and salespositions with Reed and Carnrick Pharmaceuticals and Sandoz/Novartis. He joined sanofi pasteur as VicePresident, U.S. Marketing in May 1997 and then served as Senior Vice President of U.S. Marketing &Sales, Executive Vice President of sanofi pasteur North America and Senior Vice President, Global CommercialOperations. He was appointed to his present position in August 2007.
Jean-Philippe SantoniMember of the Management CommitteeSenior Vice President International DevelopmentAge: 54
Jean-Philippe Santoni holds a doctorate in Medicine and a masters’ degree in Human Biology. He began hiscareer as a clinician specializing in hospital medicine and biology at various Academic Hospitals from the“Assistance Publique–Hôpitaux de Paris” (APHP group). From 1985, he held various posts with responsibilityfor international clinical development and medical/regulatory affairs, first with Servier and subsequently withAmerican Cyanamid/Lederlé. In 1990, he joined Synthélabo as International Medical Director. Following themerger with Sanofi in 1999, he served successively as Associate Vice President Medical and Regulatory Affairs,Vice President International Clinical Operations and Vice President International Clinical Development, aposition he retained after the merger with Aventis in 2004. He was appointed to his present position in January2007.
As of December 31, 2008, none of the members of the Management Committee had any principal businessactivities outside of sanofi-aventis.
114

Composition of the Management Committee at the beginning of March 2009
Human ResourcesGilles Lhernould*
Corporate AffairsPhilippe Peyre
Audit & Internal ControlAssessment
Marie-Hélène Laimay
Chief Executive Officer
Christopher Viehbacher*
Research & DevelopmentMarc Cluzel*
Pharmaceutical OperationsHanspeter Spek*
VaccinesWayne Pisano
MedicalJean-Pierre Lehner
Europe & Canada Asia/PacificFrance United States Intercontinental
(excluding France) & JapanChristian Lajoux Gregory Irace Antoine Ortoli
Belén Garijo Olivier Charmeil
CommunicationsMichel Labie
FinanceLaurence Debroux*
Industrial AffairsPhilippe Luscan*
International DevelopmentJean-Philippe Santoni
StrategyLaurence Debroux*
Business DevelopmentPhilippe Fauchet
Legal Affairs& General CounselKaren Linehan*
Global Marketing & AccessPierre Chancel
* also members of the Executive Committee
115

B. Compensation
Compensation and pension arrangements for corporate officers
Jean-François Dehecq is the Chairman of the Board of Directors of sanofi-aventis and ChristopherViehbacher is the Chief Executive Officer, having succeeded Gérard Le Fur effective December 1, 2008.
Jean-François Dehecq has been Chairman of the Board of Directors since January 1, 2007. He also chairsthe Strategy Committee and the Appointments and Governance Committee. In accordance with the Internal Rulesof the Board and in close collaboration with the Senior Management, he represents the Company in high-leveldealings with governmental bodies and with the Group’s key partners, both nationally and internationally, as wellas playing a role in defining major strategic choices, especially as regards mergers, acquisitions and alliances. Hemaintains regular contact with the Chief Executive Officer, so that each is kept fully informed of the other’sactions. The Chairman of the Board receives compensation in the form of fixed compensation, benefits in kind,and variable compensation. In addition, he may be granted stock options and performance shares. The overallcompensation package is determined by the Board of Directors on the recommendation of the CompensationCommittee.
The compensation of the Chief Executive Officer is determined by reference to the compensation paid to thechief executive officers of the leading global pharmaceutical companies and of the leading companies in theCAC 40 index. The Chief Executive Officer receives compensation in the form of fixed compensation, benefitsin kind, and variable compensation. In addition, he may be granted stock options and performance shares. Theoverall compensation package is determined by the Board of Directors on the recommendation of theCompensation Committee. With effect from 2009, stock options granted to the Chief Executive Officer will besubject to performance conditions.
The Board of Directors has nevertheless decided that no performance shares will be awarded to executiveDirectors, members of the Executive Committee or members of the Management Committee in 2009.
However, an exception was made in the case of Christopher Viehbacher, Chief Executive Officer, who wasawarded 65,000 performance shares on March 2, 2009, in line with the undertakings made on September 10,2008, on the announcement of his appointment as Chief Executive Officer of sanofi-aventis effectiveDecember 1, 2008; these undertakings were made as compensation for loss of the benefits to which he had beenentitled from his previous employer. The shares awarded to Christopher Viehbacher are subject to a performancecondition.
Executive directors do not receive attendance fees in connection with their role as directors of sanofi-aventis. Nor does Jean-François Dehecq receive attendance fees in his capacity as chairman of the sanofi-aventisAppointments and Governance Committee or chairman of the Strategy Committee. Christopher Viehbacher doesnot receive attendance fees in his capacity as a member of the Strategy Committee.
Jean-François Dehecq
Compensation, options and shares awarded to Jean-François Dehecq
(in euros) 2007 2008
Compensation payable for the year (details provided in the table below) . . . . . . . . . . . . . . . . . 2,215,146 2,279,853Value of stock subscription options awarded during the year(1) . . . . . . . . . . . . . . . . . . . . . . . . 1,490,000 0Value of performance shares awarded during the year . . . . . . . . . . . . . . . . . . . . . . . . . . . . . . .
Total . . . . . . . . . . . . . . . . . . . . . . . . . . . . . . . . . . . . . . . . . . . . . . . . . . . . . . . . . . . . . . . . . . . . . .
0
3,705,146
0
2,279,853
(1) Valued at date of grant using the Black & Scholes method.
116

Compensation payable and paid to Jean-François Dehecq
2007 2008
(in euros) Payable Paid Payable Paid
Fixed compensation (1) . . . . . . . . . . . . . . . . . . . . . . . . . . . . . . . . . 1,300,000 1,300,000 1,300,000 1,300,000Variable compensation (2) . . . . . . . . . . . . . . . . . . . . . . . . . . . . . . 910,000 1,898,000 975,000 910,000Exceptional compensation . . . . . . . . . . . . . . . . . . . . . . . . . . . . . . 0 0 0Attendance fees . . . . . . . . . . . . . . . . . . . . . . . . . . . . . . . . . . . . . . 0 0 0Benefits in kind . . . . . . . . . . . . . . . . . . . . . . . . . . . . . . . . . . . . . . 5,146 5,146 4,853 4,853
00
Total . . . . . . . . . . . . . . . . . . . . . . . . . . . . . . . . . . . . . . . . . . . . . . 2,215,146 3,203,146 2,279,853 2,214,853
The amounts reported are gross amounts before taxes.
(1) Fixed compensation payable in respect of a given year is paid during that year.(2) Variable compensation in respect of a given year is determined and paid at the start of the following year.
The amount reported for benefits in kind relates to a company car.
The variable compensation of Jean-François Dehecq for 2008 was based 25% on a quantitative criterion and75% on qualitative criteria.
The quantitative criterion used is linked to adjusted earnings per share excluding selected items (see“Item 5. Operating and Financial Review and Prospects — Sources of Revenues and Expenses — Adjusted NetIncome”).
The qualitative criteria are essentially based on the support provided to the Chief Executive Officer,leadership of the Board of Directors, input on the Group’s global strategy, and representation of high-levelinterests of the Group.
The variable compensation may represent between 60% and 75% of his fixed compensation.
Taking into account the above mentioned criteria, the Board of Directors fixed the variable compensation ofJean-François Dehecq for 2008 at €975,000, i.e., 75% of the fixed portion of his compensation.
His variable compensation is paid in 2009.
No stock options were granted in 2008. The basic characteristics of previously granted options are set out inthe table under “— Share Ownership — Existing Option Plans as of December 31, 2008” below.
The fixed compensation of Jean-François Dehecq for 2009 was maintained at €1,300,000. The criteria forthe variable compensation are unchanged.
Stock options held by Jean-François Dehecq
Origin
Date ofshareholder
authorization
Date ofBoardgrant
Number ofoptionsgranted
Start dateof exercise
periodExpiration
date
Exerciceprice(in €)
Numberof optionsexercised
as of12/31/2008
Number ofoptions
cancelledor lapsed
Number ofoptions
outstanding
Sanofi-Synthélabo . . . 05/18/99 05/24/00 160,000 05/25/04 05/24/10 43.25 153,586 0 6,414Sanofi-Synthélabo . . . 05/18/99 05/10/01 145,000 05/11/05 05/10/11 64.50 0 0 145,000Sanofi-Synthélabo . . . 05/18/99 05/22/02 145,000 05/23/06 05/22/12 69.94 0 0 145,000Sanofi-Synthélabo . . . 05/18/99 12/10/03 150,000 12/11/07 12/10/13 55.74 0 0 150,000Sanofi-aventis . . . . . . 05/31/05 05/31/05 250,000 06/01/09 05/31/15 70.38 0 0 250,000Sanofi-aventis . . . . . . 05/31/05 12/14/06 250,000 12/15/10 12/14/16 66.91 0 0 250,000Sanofi-aventis . . . . . . 05/31/07 12/13/07 125,000 12/14/11 12/13/17 62.33 0 0 125,000
Total . . . . . . . . . . . . . 1,225,000 1,071,414
117
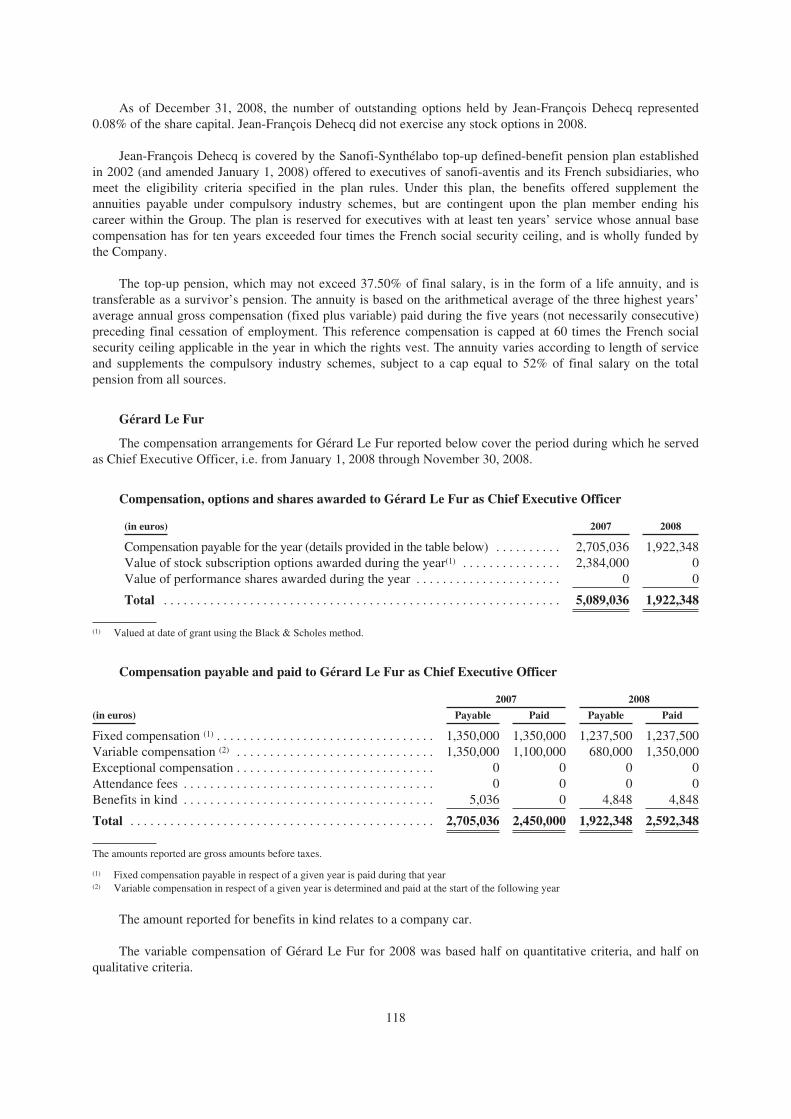
As of December 31, 2008, the number of outstanding options held by Jean-François Dehecq represented0.08% of the share capital. Jean-François Dehecq did not exercise any stock options in 2008.
Jean-François Dehecq is covered by the Sanofi-Synthélabo top-up defined-benefit pension plan establishedin 2002 (and amended January 1, 2008) offered to executives of sanofi-aventis and its French subsidiaries, whomeet the eligibility criteria specified in the plan rules. Under this plan, the benefits offered supplement theannuities payable under compulsory industry schemes, but are contingent upon the plan member ending hiscareer within the Group. The plan is reserved for executives with at least ten years’ service whose annual basecompensation has for ten years exceeded four times the French social security ceiling, and is wholly funded bythe Company.
The top-up pension, which may not exceed 37.50% of final salary, is in the form of a life annuity, and istransferable as a survivor’s pension. The annuity is based on the arithmetical average of the three highest years’average annual gross compensation (fixed plus variable) paid during the five years (not necessarily consecutive)preceding final cessation of employment. This reference compensation is capped at 60 times the French socialsecurity ceiling applicable in the year in which the rights vest. The annuity varies according to length of serviceand supplements the compulsory industry schemes, subject to a cap equal to 52% of final salary on the totalpension from all sources.
Gérard Le Fur
The compensation arrangements for Gérard Le Fur reported below cover the period during which he servedas Chief Executive Officer, i.e. from January 1, 2008 through November 30, 2008.
Compensation, options and shares awarded to Gérard Le Fur as Chief Executive Officer
(in euros) 2007 2008
Compensation payable for the year (details provided in the table below) . . . . . . . . . . 2,705,036 1,922,348Value of stock subscription options awarded during the year(1) . . . . . . . . . . . . . . . 2,384,000 0Value of performance shares awarded during the year . . . . . . . . . . . . . . . . . . . . . .
Total . . . . . . . . . . . . . . . . . . . . . . . . . . . . . . . . . . . . . . . . . . . . . . . . . . . . . . . . . . . .
0
5,089,036
0
1,922,348
(1) Valued at date of grant using the Black & Scholes method.
Compensation payable and paid to Gérard Le Fur as Chief Executive Officer
2007 2008
Payable Paid(in euros) Payable Paid
Fixed compensation (1) . . . . . . . . . . . . . . . . . . . . . . . . . . . . . . . . . 1,350,000 1,350,000 1,237,500 1,237,500Variable compensation (2) . . . . . . . . . . . . . . . . . . . . . . . . . . . . . . 1,350,000 1,100,000 680,000 1,350,000Exceptional compensation . . . . . . . . . . . . . . . . . . . . . . . . . . . . . . 0 0 0Attendance fees . . . . . . . . . . . . . . . . . . . . . . . . . . . . . . . . . . . . . . 0 0 0Benefits in kind . . . . . . . . . . . . . . . . . . . . . . . . . . . . . . . . . . . . . .
Total . . . . . . . . . . . . . . . . . . . . . . . . . . . . . . . . . . . . . . . . . . . . . .
5,036 0
2,705,036 2,450,000
4,848 4,848
1,922,348 2,592,348
00
The amounts reported are gross amounts before taxes.
(1) Fixed compensation payable in respect of a given year is paid during that year(2) Variable compensation in respect of a given year is determined and paid at the start of the following year
The amount reported for benefits in kind relates to a company car.
The variable compensation of Gérard Le Fur for 2008 was based half on quantitative criteria, and half onqualitative criteria.
118
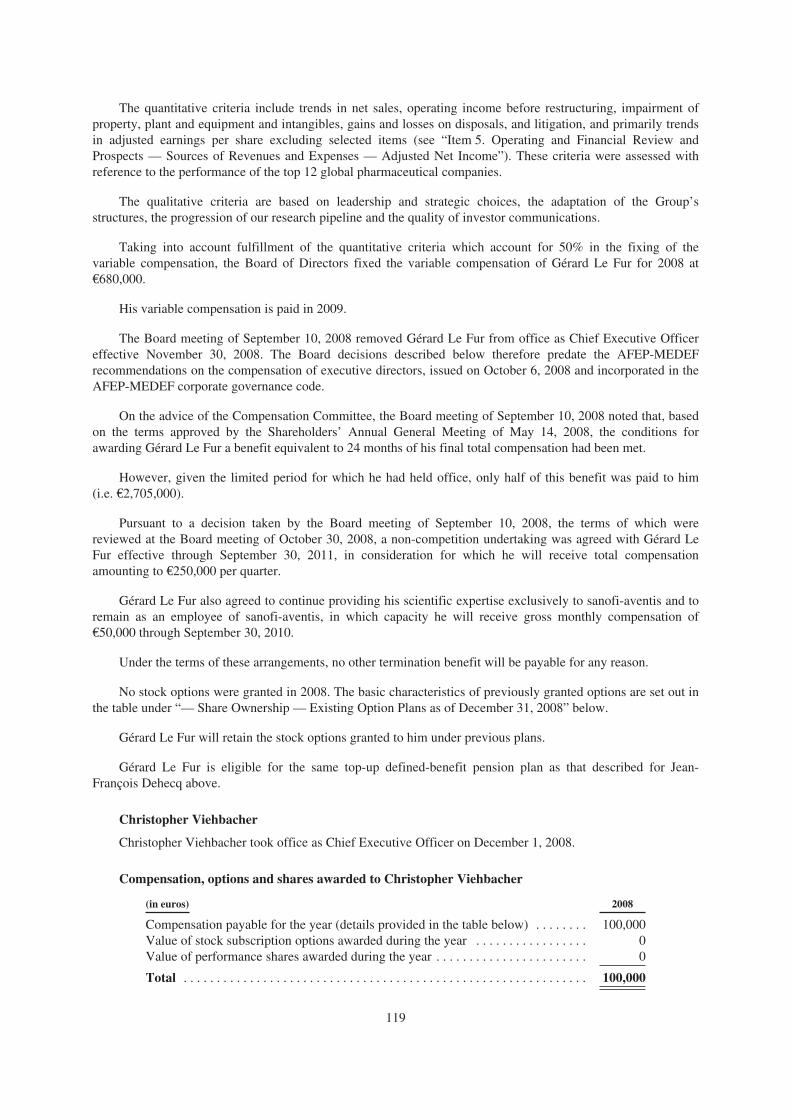
The quantitative criteria include trends in net sales, operating income before restructuring, impairment ofproperty, plant and equipment and intangibles, gains and losses on disposals, and litigation, and primarily trendsin adjusted earnings per share excluding selected items (see “Item 5. Operating and Financial Review andProspects — Sources of Revenues and Expenses — Adjusted Net Income”). These criteria were assessed withreference to the performance of the top 12 global pharmaceutical companies.
The qualitative criteria are based on leadership and strategic choices, the adaptation of the Group’sstructures, the progression of our research pipeline and the quality of investor communications.
Taking into account fulfillment of the quantitative criteria which account for 50% in the fixing of thevariable compensation, the Board of Directors fixed the variable compensation of Gérard Le Fur for 2008 at€680,000.
His variable compensation is paid in 2009.
The Board meeting of September 10, 2008 removed Gérard Le Fur from office as Chief Executive Officereffective November 30, 2008. The Board decisions described below therefore predate the AFEP-MEDEFrecommendations on the compensation of executive directors, issued on October 6, 2008 and incorporated in theAFEP-MEDEF corporate governance code.
On the advice of the Compensation Committee, the Board meeting of September 10, 2008 noted that, basedon the terms approved by the Shareholders’ Annual General Meeting of May 14, 2008, the conditions forawarding Gérard Le Fur a benefit equivalent to 24 months of his final total compensation had been met.
However, given the limited period for which he had held office, only half of this benefit was paid to him(i.e. €2,705,000).
Pursuant to a decision taken by the Board meeting of September 10, 2008, the terms of which werereviewed at the Board meeting of October 30, 2008, a non-competition undertaking was agreed with Gérard LeFur effective through September 30, 2011, in consideration for which he will receive total compensationamounting to €250,000 per quarter.
Gérard Le Fur also agreed to continue providing his scientific expertise exclusively to sanofi-aventis and toremain as an employee of sanofi-aventis, in which capacity he will receive gross monthly compensation of€50,000 through September 30, 2010.
Under the terms of these arrangements, no other termination benefit will be payable for any reason.
No stock options were granted in 2008. The basic characteristics of previously granted options are set out inthe table under “— Share Ownership — Existing Option Plans as of December 31, 2008” below.
Gérard Le Fur will retain the stock options granted to him under previous plans.
Gérard Le Fur is eligible for the same top-up defined-benefit pension plan as that described for Jean-François Dehecq above.
Christopher Viehbacher
Christopher Viehbacher took office as Chief Executive Officer on December 1, 2008.
Compensation, options and shares awarded to Christopher Viehbacher
(in euros) 2008
Compensation payable for the year (details provided in the table below) . . . . . . . . 100,000Value of stock subscription options awarded during the year . . . . . . . . . . . . . . . . . 0Value of performance shares awarded during the year . . . . . . . . . . . . . . . . . . . . . . .
Total . . . . . . . . . . . . . . . . . . . . . . . . . . . . . . . . . . . . . . . . . . . . . . . . . . . . . . . . . . . . .
0
100,000
119

Compensation payable and paid to Christopher Viehbacher
(in euros)
2008
Payable Paid
Fixed compensation (1) . . . . . . . . . . . . . . . . . . . . . . . . . . . . . . . . . . . . . . . . . . . . 100,000 100,000Variable compensation (2) . . . . . . . . . . . . . . . . . . . . . . . . . . . . . . . . . . . . . . . . . . 0 0Exceptional compensation (3) . . . . . . . . . . . . . . . . . . . . . . . . . . . . . . . . . . . . . . . 2,200,000 0Attendance fees . . . . . . . . . . . . . . . . . . . . . . . . . . . . . . . . . . . . . . . . . . . . . . . . . 0 0Benefits in kind . . . . . . . . . . . . . . . . . . . . . . . . . . . . . . . . . . . . . . . . . . . . . . . . .
Total . . . . . . . . . . . . . . . . . . . . . . . . . . . . . . . . . . . . . . . . . . . . . . . . . . . . . . . . . .
6,016
2,306,016
6,016
106,016
The amounts reported are gross amounts before taxes.
(1) Fixed compensation payable in respect of a given year is paid during that year.(2) Variable compensation in respect of a given year is determined and paid at the start of the following year.(3) Exceptional compensation comprises the €2,200,000 benefit described below.
The amount reported for benefits in kind relates to a company car, and primarily to the payment ofChristopher Viehbacher’s relocation expenses from the United States to France and the cost of healthcare coverfor his family in the United States pending their relocation to France. The Company also agreed to meet the costof advice from a firm of tax consultants to assist Christopher Viehbacher in preparing his tax returns.
The fixed compensation of Christopher Viehbacher for 2009 was maintained at €1,200,000.
The variable compensation of Christopher Viehbacher will be based half on quantitative criteria and half onqualitative criteria.
The quantitative criteria include trends in our net sales relative to the objectives set by us and by ourcompetitors, trends in our current operating income (operating income before restructuring, impairment ofproperty, plant and equipment and intangibles, gains/losses on disposals, and litigation) relative to the objectivesset by us and by our competitors, and trends in our adjusted net income per share excluding selected items (See“Item 5. Operating and Financial Review and Prospects — Sources of Revenues and Expenses — Adjusted NetIncome”). These criteria will be assessed by reference to the performances of the leading global pharmaceuticalcompanies.
The qualitative criteria relate to leadership and strategic choices, adaptation of our structures to theindustry’s environment, reconfiguration of our research efforts, commitment in terms of organic and externalgrowth, and the quality of investor communications.
The variable compensation of Christopher Viehbacher may represent between 0% and 200% of his fixedcompensation. In case of exceptional performance, it may exceed 200% of the fixed compensation.
To compensate him for the benefits lost in leaving his former employer, Christopher Viehbacher was alsoawarded the following benefits:
• A benefit of €2,200,000, which was paid in January 2009.
• 250,000 stock subscription options (representing 0.02% of the share capital as of December 31, 2008)were granted to him on March 2, 2009, i.e., 50,000 more than had been contemplated on theannouncement of his appointment in September 2008. The stock subscription options awarded toChristopher Viehbacher are subject to a performance condition.
• 65,000 performance shares (representing 0.005% of the share capital as of December 31, 2008) wereawarded to him on March 2, 2009. These 65,000 performance shares were awarded to ChristopherViehbacher in line with the undertakings made on September 10, 2008, on the announcement of hisappointment as Chief Executive Officer of sanofi-aventis effective December 1, 2008. The sharesawarded to Christopher Viehbacher are subject to a performance condition.
• An award of ten years of deemed service for the purposes of the top-up defined-benefit pension plan.
120

At its meeting of December 17, 2008, the Board of Directors decided to ask the Shareholders’ AnnualGeneral Meeting of April 17, 2009 to approve the termination benefit entitlement of Chris Viehbacher on thefollowing terms:
In the event of his removal from office as Chief Executive Officer, Christopher Viehbacher would receive atermination benefit equivalent to 24 months of total compensation on the basis of his fixed compensationeffective on the date he ceases to hold office and the last variable compensation received prior to that date,subject to the performance criteria described below.
In accordance with article L. 225-42-1 of the Commercial Code, payment of the termination benefit will becontingent upon fulfillment of two of the three performance criteria, assessed over the three financial yearspreceding his ceasing to hold office or, if he leaves office prior to the end of the 2011 financial year, the mostrecently ended financial years.
The three criteria are:
• the average of the ratios of adjusted net earnings (excluding selected items) to net sales for eachfinancial year must be at least 15% (see “Item 5. Operating and Financial Review and Prospects —Sources of Revenues and Expenses — Adjusted Net Income”);
• the average of the ratios of operating cash flow before changes in working capital to net sales for eachfinancial year must be at least 18%;
• the average of the growth rates for the Group’s activities, measured for each financial year in terms ofnet sales on a comparable basis, must be at least equal to the average of the growth rates of thePharmaceutical and Vaccines activities of the top 12 global pharmaceutical companies, measured foreach financial year in terms of net sales adjusted for the principal effects of exchange rates and changesin scope of consolidation.
Any activation of this termination benefit would be carried out in compliance with the AFEP-MEDEFcorporate governance code.
At its meeting of December 17, 2008, the Board of Directors also authorized the admission of ChristopherViehbacher to the sanofi-aventis top-up defined benefit pension plan offered to executives of sanofi-aventis andits French subsidiaries, who meet the eligibility criteria specified in the plan rules. This plan was set up onOctober 1, 2008 as the final stage in the process of harmonizing the status of personnel across the Frenchsubsidiaries, and its principal features are identical to those of the Sanofi-Synthélabo plan described above forJean-François Dehecq and Gérard Le Fur.
Commitments in favor of executive directors in post as of December 31, 2008
Executive directorContract ofemployment
Top-up pensionplan
Compensation or benefitspayable or potentially
payable on terminationof office or change in
control
Compensationpayable under
non-competitionclause
Jean-François Dehecq . . . . . . . . . . . . . . . . . No Yes Yes NoChristopher Viehbacher . . . . . . . . . . . . . . . . No Yes Yes No
Jean-François Dehecq’s termination benefit has been approved by the Shareholders’ Annual GeneralMeeting, most recently on May 14, 2008. Payment of the termination benefit, which is equivalent to 20 monthsof his last total compensation (fixed plus variable), is contingent upon fulfillment of two out of three performancecriteria.
The first criterion is that the sanofi-aventis share price has outperformed the CAC 40 index since he firsttook office as Chairman and Chief Executive Officer of the Company on February 15, 1988.
121

The two other criteria, the fulfillment of which will be assessed over the three financial years preceding hisceasing to hold office, are:
• The average of the ratios of adjusted net earnings (excluding selected items) to net sales for eachfinancial year must be at least 15% (see “Item 5. Operating and Financial Review and Prospects —Sources of Revenues and Expenses — Adjusted Net Income”).
• The average of the ratios of operating cash flow before changes in working capital to net sales for eachfinancial year must be at least 18%.
The terms for the termination benefit entitlement of Christopher Viehbacher, which will be submitted forapproval by the Shareholders’ Annual General Meeting of April 17, 2009, are described above.
Lock-up period for shares obtained on exercise of stock options by, or disposition of performanceshares to, the Chairman of the Board of Directors and the Chief Executive Officer
The Chairman and the Chief Executive Officer will be required to retain in the form of sanofi-aventis shares50% of any capital gains (net of taxes and social contributions) obtained by the exercise of stock options awardedunder the 2007 and later plans until they cease to hold office.
The Chief Executive Officer will be required to retain in the form of sanofi-aventis shares 50% of any capitalgains (net of taxes and social contributions) upon the disposition of the performance shares awarded in 2009.
They must continue to hold these shares as registered shares until they cease to hold office.
Compensation and pension arrangements for directors other than the Chairman and the ChiefExecutive Officer
Attendance fees
The table below shows amounts paid to each member of the sanofi-aventis Board of Directors in respect of2007 and 2008, including those whose term of office ended during the year.
Attendance fees in respect of 2007, the amount of which was set by the Board meeting of February 11,2008, were paid in 2008.
Attendance fees in respect of 2008, the amount of which was set by the Board meeting of February 10,2009, were paid in 2009.
For 2008, the basic annual attendance fee was set at €15,000, apportioned on a time basis for directors whoassumed or left office during the year.
122

The variable portion of the fee is linked to actual attendance by directors:
• directors resident in France receive €5,000 per Board or Committee meeting attended, except for AuditCommittee meetings for which the fee is €7,500 per meeting;
• directors resident outside France receive €7,000 per Board meeting attended, and €7,500 perCommittee meeting attended;
• the chairman of the Compensation Committee receives €7,500 per Committee meeting;
• the chairman of the Audit Committee, who is resident outside France, receives €10,000 per Committeemeeting.
(in euros) 2007 2008
Name
Attendance fees inrespect of 2007 tobe paid in 2008
Pensionpaid in2007
Total grosscompensation
Attendance fees inrespect of 2008 tobe paid in 2009
Pensionpaid in2008
Total grosscompensation
Fixed Variable Fixed Variable
René Barbier de La Serre (1) . . . . . . . . . . 15,000 105,000 120,000 6,250 47,500 53,750Uwe Bicker (2) . . . . . . . . . . . . . . . . . . . . . — — — 10,000 42,000 52,000Jean-Marc Bruel . . . . . . . . . . . . . . . . . . . 15,000 75,000 366,560 456,560 15,000 72,500 373,700 461,200Robert Castaigne . . . . . . . . . . . . . . . . . . . 15,000 25,000 40,000 15,000 42,500 57,500Patrick de La Chevardière (2) . . . . . . . . . . — — — 10,000 25,000 35,000Thierry Desmarest . . . . . . . . . . . . . . . . . . 15,000 45,000 60,000 15,000 80,000 95,000Jürgen Dormann (1) . . . . . . . . . . . . . . . . . 15,000 28,000 1,562,487 1,605,487 6,250 29,000 1,593,750 1,629,000Lord Douro . . . . . . . . . . . . . . . . . . . . . . . 15,000 42,000 57,000 15,000 56,000 71,000Jean-René Fourtou . . . . . . . . . . . . . . . . . . 15,000 40,000 1,559,475 1,614,475 15,000 80,000 1,590,040 1,685,040Claudie Haigneré (2) . . . . . . . . . . . . . . . . . — — — 10,000 30,000 40,000Serge Kampf (3) . . . . . . . . . . . . . . . . . . . . 11,250 15,000 26,250 — — —Igor Landau . . . . . . . . . . . . . . . . . . . . . . . 15,000 25,000 2,135,061 2,175,061 15,000 35,000 2,176,908 2,226,908Hubert Markl (1) . . . . . . . . . . . . . . . . . . . . 15,000 42,000 57,000 6,250 14,000 20,250Christian Mulliez . . . . . . . . . . . . . . . . . . . 15,000 30,000 45,000 15,000 40,000 55,000Lindsay Owen-Jones . . . . . . . . . . . . . . . . 15,000 30,000 45,000 15,000 65,000 80,000Klaus Pohle . . . . . . . . . . . . . . . . . . . . . . . 15,000 112,000 127,000 15,000 126,000 141,000Gunter Thielen (2) . . . . . . . . . . . . . . . . . . . — — — 10,000 35,500 45,500Gérard Van Kemmel . . . . . . . . . . . . . . . . 15,000 82,500 97,500 15,000 125,000 140,000Bruno Weymuller (1) . . . . . . . . . . . . . . . . 15,000 30,000 45,000 6,250 10,000 16,250
Total . . . . . . . . . . . . . . . . . . . . . . 221,250 726,500 5,623,583 6,571,333 215,000 955,000 5 734 398 6 904 398Total attendance fees . . . . . . . . . . . . . 947,750 1,170,000
(1) Left office May 14, 2008.(2) Assumed office May 14, 2008.(3) Resigned from office October 30, 2007.
Pensions
The total amount recognized in 2008 in respect of corporate pension plans for corporate officers withcurrent or past executive responsibilities at sanofi-aventis (or companies whose obligations have been assumedby sanofi-aventis) was €6.7 million.
As retirees, Jean-Marc Bruel, Jürgen Dormann, Jean-René Fourtou and Igor Landau are covered by the“GRCD” top-up pension plan instituted in 1977 for senior executives of Rhône-Poulenc. This plan was amendedin 1994, 1996, 1999 and 2003, and currently applies to 31 active or retired executives. At its meeting ofDecember 17, 2008, the Board of Directors decided to close this plan to new entrants.
This is a defined-benefit plan, which covers the differential between the benefits available to members underother schemes and the overall defined benefit level. It aims to provide a replacement income of 60%-65% ofsalary, depending on length of service and the age at which the benefit is claimed. The benefit takes the form of alife annuity, indexed to the average revaluation of the basic Social Security annuity and to trends in the INSEEretail price index.
123
Compensation of senior management
In 2008, total gross compensation before social charges paid to or accrued for the members of ourManagement Committee in post in 2008, including the Chief Executive Officer, amounted to €17 million,including €7 million for the members of the Executive Committee. Fixed compensation represented €9 million,including €3 million for the members of the Executive Committee.
The compensation of the other Management Committee and Executive Committee members is based on ananalysis of the practices of major global pharmaceutical companies and the opinion of the CompensationCommittee.
In addition to fixed compensation, these key executives receive variable compensation, the amount of whichis determined by the actual performance and growth of the business areas for which he or she is responsible.Variable compensation generally represents 50% to 110% of their fixed compensation.
These compensation packages may be supplemented by the granting of stock options and performanceshares (see “Item 6. Directors, Senior Management and Employees — E. Share Ownership”).
The total amount accrued and recognized in the income statement for the year ended December 31, 2008 inrespect of corporate pension plans for (i) corporate officers with current or past executive responsibilities atsanofi-aventis or at companies whose obligations have been assumed by sanofi-aventis and (ii) members of theExecutive Committee and Management Committee was €12.7 million.
This total amount accrued for the year ended December 31, 2008 included €7 million for members of theManagement Committee collectively (including €3.7 million for members of the Executive Committeecollectively).
No stock options were granted in 2008. In light of the financial crisis and the turmoil in the financialmarkets at the end of 2008, the Board of Directors decided at its meeting of December 17, 2008, on therecommendation of the Compensation Committee, to defer any award of stock options and/or shares until March2009, after the 2008 financial statements have been published.
As of December 31, 2008, 3,182,968 options had been granted to the members of our ManagementCommittee, including 1,238,500 options to the members of our Executive Committee. As of the same date,2,902,903 options granted to the members of our Management Committee were outstanding, including 1,165,210options to the members of our Executive Committee. The exercise date and other basic characteristics of suchoptions are set out in the table “— Share Ownership — Existing Options Plans as of December 31, 2008” below.These figures do not include the options granted to Gérard Le Fur who has not been a member of ourManagement Committee and our Executive Committee since December 1, 2008.
Under French law, directors may not receive options solely as compensation for service on our Board, andthus our Company may grant options only to those directors who are also our officers.
Because some of our non-executive directors were formerly officers or executive officers of our Companyor its predecessor companies, some of our non-executive directors hold sanofi-aventis stock options.
We do not have separate profit-sharing plans for key executives. As employees, they are able to participatein our voluntary and statutory profit-sharing schemes on the same terms as our other employees. These plans aredescribed below under “— Employees — Profit-sharing schemes.”
C. Board Practices
Neither we nor our subsidiaries have entered into service contracts with members of our Board of Directorsproviding for benefits. With respect to Christopher Viehbacher, Gérard Le Fur and Jean-François Dehecq, seealso “Item 6. Directors, Senior Management and Employees — B. Compensation — Compensation and pensionarrangements for Jean-François Dehecq”; “Item 6. Directors, Senior Management and Employees — B.
124

Compensation — Compensation and pension arrangements for Gérard Le Fur”; and “Item 6. Directors, SeniorManagement and Employees — B. Compensation — Compensation and pension arrangements for ChristopherViehbacher” above.
Sanofi-aventis applies the guidance contained in the AFEP-MEDEF corporate governance code ofDecember 2008.
Since 1999, our Board of Directors has been assisted in its deliberations and decisions by specialistcommittees.
During 2008, the Board of Directors decided to establish a Strategy Committee and to split theCompensation, Appointments and Governance Committee into two separate committees: a CompensationCommittee and an Appointments and Governance Committee.
Members of these committees are chosen by the Board from among its members, based on their experience.
Audit Committee
At December 31, 2008, the Audit Committee comprised:
• Klaus Pohle, Chairman;
• Jean-Marc Bruel;
• Robert Castaigne; and
• Gérard Van Kemmel.
The Audit Committee is composed of three independent Board members. Robert Castaigne is alsoindependent within the terms of the Sarbanes-Oxley Act. All four members of this committee have financial oraccounting expertise as a result of their training and work experience. Two members qualify as financial expertswithin the terms of the Sarbanes-Oxley Act. See “Item 16A. Audit Committee Financial Expert.”
The roles of the Audit Committee are to review:
• the scope of consolidation;
• the annual parent company financial statements, the annual, half-year and quarterly consolidatedfinancial statements, the annual and half-year management reports, and the statutory auditors’ report;
• control procedures, the report of management on internal control, and the statutory auditors’ report onthis report;
• internal audit work programs, and periodic summaries of internal audit reports;
• the appropriateness of elective accounting treatments;
• the Group’s cash position;
• material risks and off balance sheet commitments;
• any issue liable to have a material financial or accounting impact;
• the use of non-GAAP indicators in financial communication; and
• major litigation, on an annual basis.
The Audit Committee may visit or interview persons responsible for operational entities in furtherance of itsrole, having previously informed the Chairman of the Board and the Chief Executive Officer.
In carrying out its role, the Audit Committee may seek, via the Chairman of the Board or the ChiefExecutive Officer, interviews with persons involved in the preparation of the financial statements (ChiefFinancial and Chief Accounting Officers, persons responsible for Internal Audit), with or without the Chairmanof the Board and Chief Executive Officer being present, and may request that it be supplied with all necessaryinformation. The Audit Committee may interview the statutory auditors with or without management beingpresent, and may consult external experts.
125

In addition, the Committee:
• directs selection procedures for the statutory auditors when their mandates are due for renewal,monitors fees paid to the statutory auditors, ensures that signatory partners are rotated every five years,and monitors compliance with auditor independence rules;
• approves in advance any request to the statutory auditors to provide services unrelated to the audit ofthe financial statements, in compliance with the relevant laws;
• ensures that internal early warning procedures relating to accounting, internal accounting controls andaudit are in place and properly applied; and
• ensures that independent directors receive no compensation other than attendance fees.
During 2008, the Audit Committee met seven times.
Compensation, Appointments and Governance Committee
The Compensation, Appointments and Governance Committee was divided into two separate committees in2008.
Until April 29, 2008, this Committee was composed of:
• René Barbier de La Serre, Chairman;
• Thierry Desmarest;
• Jürgen Dormann;
• Jean-René Fourtou; and
• Lindsay Owen-Jones.
The Compensation, Appointments and Governance Committee was composed of five Board members, threeof whom were independent.
The Compensation, Appointments and Governance Committee met twice in 2008.
Compensation Committee
At December 31, 2008, this Committee was composed of:
• Gérard Van Kemmel, Chairman;
• Thierry Desmarest;
• Jean-René Fourtou;
• Lindsay Owen-Jones; and
• Gunter Thielen.
The Compensation Committee is composed of five Board members, three of whom are independent.
The roles of the Compensation Committee are:
• to make recommendations and proposals to the Board concerning the compensation, pension andwelfare plans, top-up pension plans, benefits in kind and other pecuniary benefits of executive officers,and the granting of stock options;
• to establish rules for determining the variable component of executive directors’ compensation, and toensure that these rules are applied;
• to formulate general policy on the granting of stock options, and to determine the frequency of grantsfor each category of grantee;
• to review the system for allocating attendance fees between directors; and
• to advise Senior Management on the compensation of key senior executives.
126

The Compensation Committee met three times in 2008.
Appointments and Governance Committee
At December 31, 2008, this Committee was composed of:
• Jean-François Dehecq, Chairman;
• Thierry Desmarest;
• Lord Douro;
• Jean-René Fourtou;
• Claudie Haigneré;
• Lindsay Owen-Jones; and
• Gérard Van Kemmel.
The Appointments and Governance Committee is composed of seven Board members, four of whom areindependent.
The roles of the Appointments and Governance Committee are:
• to recommend suitable candidates to the Board for appointment as directors or as corporate officers;
• to establish corporate governance rules for the Company, and to check that those rules are applied;
• to check that there is adequate succession planning for the Company’s executive bodies;
• to check compliance with ethical standards within the Company and in its dealings with third parties;
• on an annual basis, to provide the Board of Directors with a list of directors who can be regarded asindependent; and
• to formulate procedures for evaluating Board practices, and to check that those procedures are applied.
The Appointments and Governance Committee met twice in 2008.
Strategy Committee
At December 31, 2008 this Committee was composed of:
• Jean-François Dehecq, Chairman;
• Christopher Viehbacher;
• Uwe Bicker;
• Thierry Desmarest;
• Jean-René Fourtou; and
• Lindsay Owen-Jones.
The Strategy Committee is composed of six Board members, two of whom are independent.
The Strategy Committee is tasked with assessing major strategic options with a view to the development ofthe Company’s business.
It briefs the Board of Directors on issues of major strategic interest, such as:
• acquisition, merger and alliance opportunities;
• the development priorities put forward by Senior Management;
• financial and stock market strategies, and compliance with key financial ratios;
• potential diversification opportunities; and
• and more generally, any strategic option judged to be essential to the Company’s future.
127
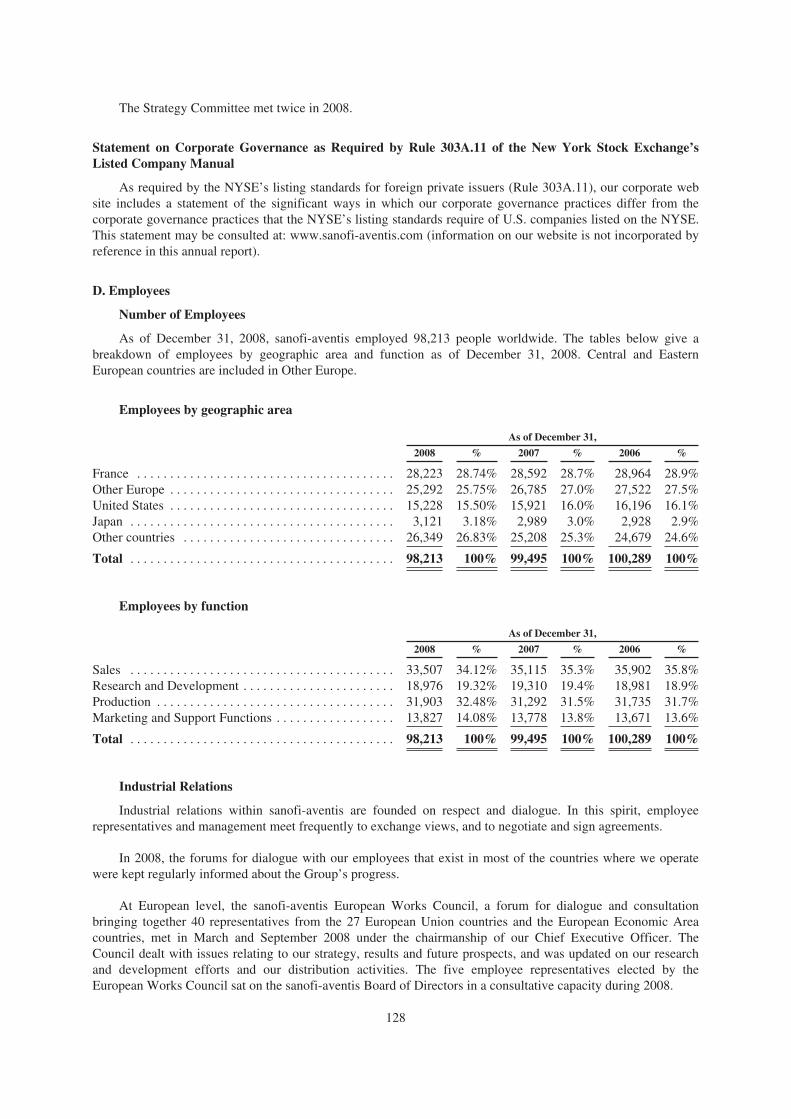
The Strategy Committee met twice in 2008.
Statement on Corporate Governance as Required by Rule 303A.11 of the New York Stock Exchange’sListed Company Manual
As required by the NYSE’s listing standards for foreign private issuers (Rule 303A.11), our corporate website includes a statement of the significant ways in which our corporate governance practices differ from thecorporate governance practices that the NYSE’s listing standards require of U.S. companies listed on the NYSE.This statement may be consulted at: www.sanofi-aventis.com (information on our website is not incorporated byreference in this annual report).
D. Employees
Number of Employees
As of December 31, 2008, sanofi-aventis employed 98,213 people worldwide. The tables below give abreakdown of employees by geographic area and function as of December 31, 2008. Central and EasternEuropean countries are included in Other Europe.
Employees by geographic area
As of December 31,
2008 % 2007 % 2006 %
France . . . . . . . . . . . . . . . . . . . . . . . . . . . . . . . . . . . . . . . 28,223 28.74% 28,592 28.7% 28,964 28.9%Other Europe . . . . . . . . . . . . . . . . . . . . . . . . . . . . . . . . . . 25,292 25.75% 26,785 27.0% 27,522 27.5%United States . . . . . . . . . . . . . . . . . . . . . . . . . . . . . . . . . . 15,228 15.50% 15,921 16.0% 16,196 16.1%Japan . . . . . . . . . . . . . . . . . . . . . . . . . . . . . . . . . . . . . . . . 3,121 3.18% 2,989 3.0% 2,928 2.9%Other countries . . . . . . . . . . . . . . . . . . . . . . . . . . . . . . . . 26,349 26.83% 25,208 25.3% 24,679 24.6%
Total . . . . . . . . . . . . . . . . . . . . . . . . . . . . . . . . . . . . . . . . 98,213 100% 99,495 100% 100,289 100%
Employees by function
As of December 31,
2008 % 2007 % 2006 %
Sales . . . . . . . . . . . . . . . . . . . . . . . . . . . . . . . . . . . . . . . . 33,507 34.12% 35,115 35.3% 35,902 35.8%Research and Development . . . . . . . . . . . . . . . . . . . . . . . 18,976 19.32% 19,310 19.4% 18,981 18.9%Production . . . . . . . . . . . . . . . . . . . . . . . . . . . . . . . . . . . . 31,903 32.48% 31,292 31.5% 31,735 31.7%Marketing and Support Functions . . . . . . . . . . . . . . . . . . 13,827 14.08% 13,778 13.8% 13,671 13.6%
Total . . . . . . . . . . . . . . . . . . . . . . . . . . . . . . . . . . . . . . . . 98,213 100% 99,495 100% 100,289 100%
Industrial Relations
Industrial relations within sanofi-aventis are founded on respect and dialogue. In this spirit, employeerepresentatives and management meet frequently to exchange views, and to negotiate and sign agreements.
In 2008, the forums for dialogue with our employees that exist in most of the countries where we operatewere kept regularly informed about the Group’s progress.
At European level, the sanofi-aventis European Works Council, a forum for dialogue and consultationbringing together 40 representatives from the 27 European Union countries and the European Economic Areacountries, met in March and September 2008 under the chairmanship of our Chief Executive Officer. TheCouncil dealt with issues relating to our strategy, results and future prospects, and was updated on our researchand development efforts and our distribution activities. The five employee representatives elected by theEuropean Works Council sat on the sanofi-aventis Board of Directors in a consultative capacity during 2008.
128

In France, the Group’s French Works Council (comprising 25 members and 25 alternates, plusrepresentatives and alternates appointed by the trade unions) met in June and December 2008 under thechairmanship of our Chief Executive Officer. At these meetings, the Council was informed about our activities,financial position and employment trends.
A summary of collective agreements negotiated during the year is provided below.
Following the harmonization of the status of our French employees, a number of agreements applicable toall of our French companies were either renewed or amended:
- Group voluntary profit-sharing agreement applicable to France for 2008, 2009 and 2010;
- agreement on the employer’s contribution to the Group employee savings plan;
- amendment to the agreement on the Group employee savings plan;
- agreement on creating and maintaining employment opportunities for people with disabilities; and
- agreement on the “CAVDI” top-up retirement, death and disability insurance scheme.
Many other specific agreements were signed within Group companies (sanofi-aventis Recherche etDéveloppement, Sanofi Winthrop Industrie, Sanofi Chimie, sanofi-aventis France, sanofi pasteur and sanofi-aventis Groupe), on issues such as career and skills planning, gender equality, flexible working, the compteépargne temps plan (which enables employees to work hours of paid leave in return for additional compensationor future paid leave entitlement), and part-time working.
During 2008, we conducted negotiations in Europe associated with the reorganization plans required in anumber of countries, especially in our sales operations, in response to changes in government healthcare policies.
Profit-sharing Schemes, Employee Savings Schemes and Employee Share Ownership
Profit-sharing Schemes
All employees of our French companies belong to voluntary and statutory profit-sharing schemes.
Voluntary Scheme (Intéressement des salariés)
These are collective schemes which are optional for the employer and contingent upon performance. Theaim is to give employees an interest in the growth of the business and improvements in its performance.
The amount distributed by our French companies during 2008 in respect of voluntary profit-sharing for theyear ended December 31, 2007 represented 2.4% of total payroll.
In June 2005, sanofi-aventis signed a three-year Group-wide agreement, effective from the 2005 financialyear, and applicable to all French companies more than 50% owned by sanofi-aventis (except for sanofi pasteur,which remained outside the agreement for 2005 and 2006). Under the agreement, payments under the Groupvoluntary profit-sharing scheme are linked to growth in our adjusted net income excluding selected items. For adefinition of “adjusted net income”, see “Item 5. Operating and Financial Review and Prospects — Sources ofRevenues and Expenses — Adjusted Net Income”.
Statutory Scheme (Participation des salariés aux résultats de l’entreprise)
The scheme is a French legal obligation for companies with more than 50 employees that made a profit inthe previous financial year.
The amount distributed by our French companies during 2008 in respect of the statutory scheme for the yearended December 31, 2007 represented 9.0% of total payroll.
In November 2007, sanofi-aventis signed a new Group-wide agreement for an indefinite period, covering allthe employees of our French companies.
129

Distribution Formula
In order to favor lower-paid employees, the voluntary and statutory profit-sharing agreements entered intosince 2005 split the benefit between those entitled as follows:
- 60% on the basis of attendance during the year; and
- 40% on the basis of annual salary, up to a limit of three times the Social Security ceiling.
Employee Savings Schemes and Collective Retirement Savings Plan
The employee savings arrangements operated by sanofi-aventis are based on a Group savings scheme (PlanEpargne Groupe) and a collective retirement savings plan (Plan Epargne pour la Retraite Collectif). Theseschemes reinvest the sums derived from the statutory and voluntary profit-sharing schemes (compulsoryinvestments), and voluntary contributions by employees.
Since June 1, 2008, all of these arrangements have been open to all the employees of our French companies.
In June 2008, 78% of the employees who benefited from the profit-sharing schemes opted to invest in thecollective retirement savings plan.
In 2008, €126.7 million and €56.9 million were invested in the Group savings scheme and the collectiveretirement savings plan respectively through the voluntary and statutory schemes for 2007, and through top-upcontributions.
Employee Share Ownership
At December 31, 2008, shares held by employees of sanofi-aventis and of related companies and by formeremployees under Group employee savings schemes amounted to 1.32% of the share capital.
E. Share Ownership
Senior Management
Members of the Management Committee hold shares of our Company amounting in the aggregate to lessthan 1% of the Company’s share capital.
At December 31, 2008, a total of 2,902,903 unexercised options to subscribe for or to purchase sanofi-aventis shares were held by the members of the Management Committee of sanofi-aventis including the1,165,210 unexercised options to subscribe for or to purchase sanofi-aventis shares held by members of theExecutive Committee. The terms of these options are summarized in the tables below. No stock options weregranted in 2008.
During 2008, the members of the Management Committee of sanofi-aventis exercised 18,297 options topurchase or to subscribe for shares (including those exercised by Gérard Le Fur when he was still a member ofthe Management Committee).
Existing Option Plans as of December 31, 2008
As of December 31, 2008, a total of 85,304,950 options were outstanding, including 77,233,922 options tosubscribe for and 8,071,028 options to purchase sanofi-aventis shares. Out of this total, 48,713,680 wereimmediately exercisable, including 40,642,652 options to subscribe for shares and 8,071,028 options to purchaseshares.
Stock options (which may be stock subscription options or stock purchase options) are granted to employeesand corporate officers by the Board of Directors on the basis of recommendations from the CompensationCommittee.
Granting options is a way of recognizing the grantee’s contribution to the Group’s development, and also ofsecuring his or her future commitment to the Group.
130
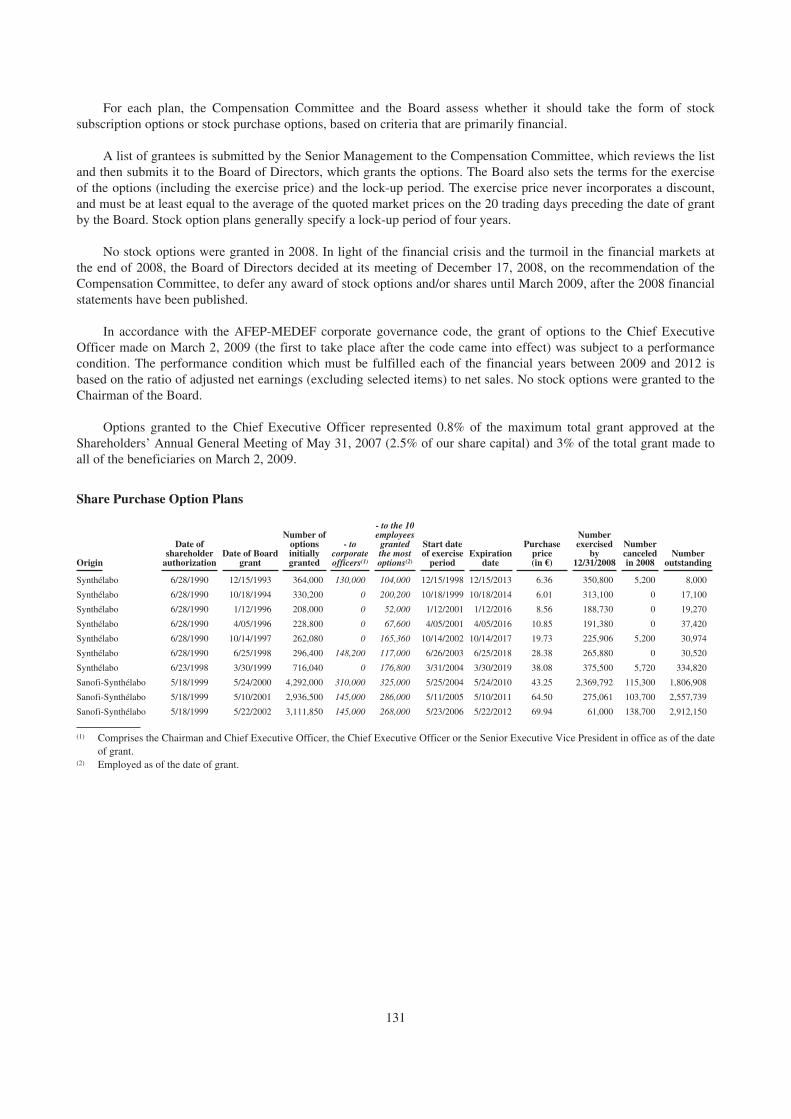
For each plan, the Compensation Committee and the Board assess whether it should take the form of stocksubscription options or stock purchase options, based on criteria that are primarily financial.
A list of grantees is submitted by the Senior Management to the Compensation Committee, which reviews the listand then submits it to the Board of Directors, which grants the options. The Board also sets the terms for the exerciseof the options (including the exercise price) and the lock-up period. The exercise price never incorporates a discount,and must be at least equal to the average of the quoted market prices on the 20 trading days preceding the date of grantby the Board. Stock option plans generally specify a lock-up period of four years.
No stock options were granted in 2008. In light of the financial crisis and the turmoil in the financial markets atthe end of 2008, the Board of Directors decided at its meeting of December 17, 2008, on the recommendation of theCompensation Committee, to defer any award of stock options and/or shares until March 2009, after the 2008 financialstatements have been published.
In accordance with the AFEP-MEDEF corporate governance code, the grant of options to the Chief ExecutiveOfficer made on March 2, 2009 (the first to take place after the code came into effect) was subject to a performancecondition. The performance condition which must be fulfilled each of the financial years between 2009 and 2012 isbased on the ratio of adjusted net earnings (excluding selected items) to net sales. No stock options were granted to theChairman of the Board.
Options granted to the Chief Executive Officer represented 0.8% of the maximum total grant approved at theShareholders’ Annual General Meeting of May 31, 2007 (2.5% of our share capital) and 3% of the total grant made toall of the beneficiaries on March 2, 2009.
Share Purchase Option Plans
Origin
Date ofshareholder
authorizationDate of Board
grant
Number ofoptionsinitiallygranted
- tocorporateofficers(1)
- to the 10employees
grantedthe mostoptions(2)
Start dateof exercise
periodExpiration
date
Purchaseprice(in €)
Numberexercised
by12/31/2008
Numbercanceledin 2008
Numberoutstanding
Synthélabo 6/28/1990 12/15/1993 364,000 130,000 104,000 12/15/1998 12/15/2013 6.36 350,800 5,200 8,000
Synthélabo 6/28/1990 10/18/1994 330,200 0 200,200 10/18/1999 10/18/2014 6.01 313,100 0 17,100
Synthélabo 6/28/1990 1/12/1996 208,000 0 52,000 1/12/2001 1/12/2016 8.56 188,730 0 19,270
Synthélabo 6/28/1990 4/05/1996 228,800 0 67,600 4/05/2001 4/05/2016 10.85 191,380 0 37,420
Synthélabo 6/28/1990 10/14/1997 262,080 0 165,360 10/14/2002 10/14/2017 19.73 225,906 5,200 30,974
Synthélabo 6/28/1990 6/25/1998 296,400 148,200 117,000 6/26/2003 6/25/2018 28.38 265,880 0 30,520
Synthélabo 6/23/1998 3/30/1999 716,040 0 176,800 3/31/2004 3/30/2019 38.08 375,500 5,720 334,820
Sanofi-Synthélabo 5/18/1999 5/24/2000 4,292,000 310,000 325,000 5/25/2004 5/24/2010 43.25 2,369,792 115,300 1,806,908
Sanofi-Synthélabo 5/18/1999 5/10/2001 2,936,500 145,000 286,000 5/11/2005 5/10/2011 64.50 275,061 103,700 2,557,739
Sanofi-Synthélabo 5/18/1999 5/22/2002 3,111,850 145,000 268,000 5/23/2006 5/22/2012 69.94 61,000 138,700 2,912,150
(1) Comprises the Chairman and Chief Executive Officer, the Chief Executive Officer or the Senior Executive Vice President in office as of the dateof grant.
(2) Employed as of the date of grant.
131

Hoechst GmbH Share Purchase Option Plans
A total of 316,127 Hoechst GmbH options to purchase shares remained outstanding on December 31, 2008.
Share Subscription Option Plans
Origin
Date ofshareholder
authorizationDate ofgrant
Number ofoptionsinitiallygranted
- tocorporateofficers(1)
- to the 10employees
grantedthe mostoptions(2)
Start dateof exercise
periodExpiration
date
Subscriptionprice(in €)
Numberexercised
by12/31/2008
Numbercanceledin 2008
Numberoutstanding
Aventis 4/23/1997 12/15/1998 6,372,000 704,348 664,215 1/06/2002 12/15/2008 34.14 5,427,028 944,972 0Aventis 5/26/1999 12/15/1999 5,910,658 586,957 463,485 1/06/2003 12/15/2009 50.04 2,731,307 544,567 2,634,784
Aventis 5/26/1999 5/11/2000 877,766 0 86,430 5/11/2003 5/11/2010 49.65 531,872 91,773 254,121
Aventis 5/24/2000 11/14/2000 13,966,871 1,526,087 1,435,000 11/15/2003 11/14/2010 67.93 1,272,007 2,299,433 10,395,431
Aventis 5/24/2000 3/29/2001 612,196 0 206,000 3/30/2004 3/29/2011 68.94 28,476 36,964 546,756
Aventis 5/24/2000 11/07/2001 13,374,051 1,068,261 875,200 11/08/2004 11/07/2011 71.39 880,241 2,745,756 9,748,054
Aventis 5/24/2000 3/06/2002 1,173,913 1,173,913 0 3/07/2005 3/06/2012 69.82 0 7 1,173,906
Aventis 5/14/2002 11/12/2002 11,775,414 352,174 741,100 11/13/2005 11/12/2012 51.34 4,560,846 1,722,432 5,492,136
Aventis 5/14/2002 12/02/2003 12,012,414 352,174 715,000 12/03/2006 12/02/2013 40.48 3,897,148 1,595,522 6,519,744
Sanofi-Synthélabo 5/18/1999 12/10/2003 4,217,700 240,000 393,000 12/11/2007 12/10/2013 55.74 177,780 162,200 3,877,720
Sanofi-aventis 5/31/2005 5/31/2005 15,228,505 400,000 550,000 6/01/2009 5/31/2015 70.38 6,500 1,501,855 13,720,150
Sanofi-aventis 5/31/2005 12/14/2006 11,772,050 450,000 585,000 12/15/2010 12/14/2016 66.91 0 576,590 11,195,460
Sanofi-aventis 5/31/2007 12/13/2007 11,988,975 325,000 625,000 12/14/2011 12/13/2017 62.33 0 313,315 11,675,660
(1) Comprises the Chairman and Chief Executive Officer, the Chief Executive Officer, the Senior Executive Vice President or members ofthe Management Board in office as of the date of grant.
(2) Employed as of the date of grant.
The main characteristics of our stock options are also described in Note D.15.8 to our consolidated financialstatements, included in Item 18 of this annual report.
Awards of Shares
In 2009, the Board of Directors for the first time awarded shares to certain employees in order to give thema direct stake in the Company’s future and performances via trends in the share price, as a partial substitute forthe granting of stock options.
No shares were awarded to executive Directors, members of the Executive Committee or members of theManagement Committee in 2009.
However, an exception was made in the case of Christopher Viehbacher, Chief Executive Officer, who wasawarded 65,000 performance shares on March 2, 2009, in line with the undertakings made on September 10,2008, on the announcement of his appointment as Chief Executive Officer of sanofi-aventis effectiveDecember 1, 2008; these undertakings were made as compensation for loss of the benefits to which he had beenentitled from his previous employer. The shares awarded to Christopher Viehbacher are subject to a performancecondition. The performance condition which must be fulfilled each of the financial years before the transfer ofthe shares (i.e., 2009 and 2010) is based on the ratio of adjusted net earnings (excluding selected items) to netsales (see “Item 5. Operating and Financial Review and Prospects — Sources of Revenues and Expenses —Adjusted Net Income”).
Shares are awarded to employees on the basis of a list put forward to the Compensation Committee, whichthen submits the list to the Board of Directors, which awards the shares. The Board sets the vesting conditions forthe award, and any lock-up conditions for the shares. No performance conditions are attached.
Shares Owned by Members of the Board of Directors
As of December 31, 2008, members of our Board of Directors held in the aggregate 440,374 shares, orunder 1% of the share capital and of the voting rights, excluding the beneficial ownership of 148,559,513 sharesheld by Total as of such date which may be attributed to Thierry Desmarest (who disclaims beneficial ownershipof such shares) and excluding the beneficial ownership of 118,227,307 shares held by L’Oréal as of such datewhich may be attributed to Lindsay Owen-Jones (who disclaims beneficial ownership of such shares).
132

Transactions in Shares by Members of the Board of Directors
On March 12, 2008, Gérard Le Fur, Chief Executive Officer, exercised 15,000 options to buy 15,000 sharesat a price of €43.25 per share (Sanofi-Synthélabo plan of May 24, 2000).
On March 26, 2008, Uwe Bicker, member of the Board of Directors, bought 300 shares at a price of€51.90 per share.
On July 1, 2008, Claudie Haigneré, member of the Board of Directors, bought 500 shares at a price of€42.24 per share.
On August 11, 2008, Gunther Thielen, member of the Board of Directors, bought 500 shares at a price of€48.03 per share.
On December 8, 2008, Christian Mulliez, member of the Board of Directors, bought 450 shares at a price of€45.34 per share.
On December 15, 2008, Jean-René Fourtou, member of the Board of Directors, sold 1,932 shares at a priceof €43.45 per share.
133

Item 7. Major Shareholders and Related Party Transactions
A. Major Shareholders
The table below shows the ownership of our shares as of January 31, 2009, indicating the beneficial ownersof our shares. To the best of our knowledge and on the basis of the notifications received as disclosed below,except as described below no shareholder holds more than 5% of our share capital or voting rights.
Outstanding Shares Actual Voting Rights (2) Published Voting Rights (3)
Number % Number % Number %
Total . . . . . . . . . . . . . . . . . . . . . . . . . . . . . . . . . . 145,929,513 11.09 287,442,340 18.11 287,442,340 17.99L’Oréal . . . . . . . . . . . . . . . . . . . . . . . . . . . . . . . . 118,227,307 8.99 236,454,614 14.89 236,454,614 14.80Treasury shares . . . . . . . . . . . . . . . . . . . . . . . . . 10,014,471 0.76 — — 10,014,471 0.63- of which held directly by sanofi-aventis . . . . . . 9,647,801 0.73 — — — —Employees (1) . . . . . . . . . . . . . . . . . . . . . . . . . . . . 17,158,705 1.30 31,106,735 1.96 31,106,735 1.95Public . . . . . . . . . . . . . . . . . . . . . . . . . . . . . . . . . . 1,024,196,708 77.86 1,032,539,407 65.04 1,032,539,407 64.63
Total . . . . . . . . . . . . . . . . . . . . . . . . . . . . . . . . . . 1,315,526,704 100 1,587,543,096 100 1,597,557,567 100
(1) Shares held via the sanofi-aventis Group Employee Savings Plan.(2) Based on the total number of voting rights as of January 31, 2009.(3) Based on the total number of voting rights as of January 31, 2009 as published in accordance with article 223-11 and seq. of the General
Regulations of the Autorité des Marchés Financiers (i.e., calculated before suspension of the voting rights of treasury shares).
Our statuts (bylaws) provide for double voting rights for shares held in registered form for at least twoyears. For more information relating to our shares, see “Item 10. Additional Information — B. Memorandum andArticles of Association.”
Total and L’Oréal are the only two entities known to hold more than 5% of the outstanding sanofi-aventisordinary shares. As described below, these entities reduced their holdings in 2007 and 2008 after no significantchanges in 2006 and 2005.
In accordance with our statuts, shareholders are required to notify us once they have passed the threshold of1% of our share capital or our voting rights and each time they cross an incremental 1% threshold (see “Item 10.Additional Information — B. Memorandum and Articles of Association — Requirements for HoldingsExceeding Certain Percentages”).
For the year ended December 31, 2008, we were informed that the following share ownership declarationthresholds had been passed:
• Natixis Asset Management disclosed that the Fonds Communs de Placement d’Entreprise Actionssanofi-aventis (mutual fund) that it manages had gone below and then exceeded the 1% thresholdstipulated in our statuts and held an interest of 1.05% (notification dated March 12, 2008);
• Total disclosed that, following the modification of the total number of shares and voting rights, it hadexceeded the 13% threshold stipulated in our statuts and held an interest of 13.09% of our share capitaland 19.64% of our voting rights (notification dated May 30, 2008);
• Crédit Agricole Asset Management disclosed that through its Fonds Communs de Placement mutualfunds it had exceeded and then gone below the 2% voting rights threshold stipulated in our statuts andheld an interest of 2.03% of our share capital (notification dated June 13, 2008);
• Caisse des Dépôts et Consignations disclosed that, following the modification of the total number ofshares and voting rights, it had exceeded the 2% threshold stipulated in our statuts and held an interestof 2.02% of our share capital and 1.61% of our voting rights (notification dated May 15, 2008);
• Dodge & Cox disclosed that it had exceeded the 4% threshold stipulated in our statuts and held 4.014%of our share capital on behalf of its clients (notification dated June 24, 2008);
• Total disclosed that, following several sales of shares, it had gone below the 13% and 12% ownershipthresholds and 19% voting right threshold stipulated in our statuts and held 11.99% of our share capitaland 18.73% of our voting rights (notification dated November 7, 2008); and
• Franklin Resources, Inc. disclosed that it had gone below the 2% threshold stipulated in our statuts andheld 2.40% of our share capital and 1.97% of our voting rights on behalf of its clients (notification datedNovember 4, 2008);
134

Since January 1, 2009 we have been informed that the following share ownership declaration thresholdshave been passed:
• Total disclosed that, following several sales of shares, it had gone below the 11% ownership thresholdand 18% voting right threshold stipulated in our statuts and held 10.99% of our share capital and17.91% of our voting rights (notification dated February 16, 2009); and
• Crédit Agricole Asset Management disclosed that through its Fonds Communs de Placement (mutualfunds) it had exceeded the 2% voting right threshold stipulated in our statuts and held an interest of2.42% of our share capital (notification dated January 23, 2009).
We estimate that we have approximately one million individual shareholders (including employees of sanofi-aventis and its subsidiaries, as well as retired employees holding shares via the sanofi-aventis Group EmployeeSavings Plan), composed of primarily French (49%) and American (32%) shareholders, of which a majority holdsAmerican Depositary Shares (ADS). Individual shareholders hold approximately 8% of our share capital.
Institutional shareholders (excluding Total and L’Oréal) hold approximately 70% of our share capital. Suchshareholders are primarily American (27.1%), French (19.6%) and British (9.4%). German institutions hold 3.3%of our share capital, Swiss institutions hold 1%, institutions from other European countries hold 5.1% andCanadian institutions hold 1.2% of our share capital.
Other international institutional investors (excluding those from Europe, the United States and Canada) holdapproximately 3.6% of our share capital; Chinese investors began holding shares in 2008.
(source: a survey conducted by Euroclear France as of December 30, 2008, and internal information).
Shareholders’ Agreement
We are unaware of any shareholders’ agreement currently in force.
B. Related Party Transactions
In the ordinary course of business, we purchase materials, supplies and services from numerous companiesthroughout the world. Members of our Board of Directors are affiliated with some of these companies. Weconduct our transactions with such companies on an arm’s-length basis and do not consider the amounts involvedin such transactions to be material.
On September 19, 2008, our wholly-owned subsidiary Sanofi-Aventis Europe and our associate ZentivaN.V. in which we hold 24.88% interest signed an agreement on the unanimous recommendation by Zentiva of anintended improved all-cash public offer of CZK 1,150 per share (compared to CZK 1,050 initially proposed)including, inter alia, a non-solicitation clause, matching rights, provisions relating to the termination of theagreement in certain circumstances, and a break fee of €25 million in the event that Zentiva withdraws itsrecommendation of the improved offer. Other than this agreement, during 2008 and through the date of thisannual report, we have not been involved in, and we do not currently anticipate becoming involved in, anytransactions with related parties that are material to us or to any of our related parties and that are unusual in theirnature or conditions. We have not made any outstanding loans to or for the benefit of:
• enterprises that, directly or indirectly, control or are controlled by, or are under common control with us;
• enterprises or associates in which we have significant influence or that have significant influence overus;
• shareholders beneficially owning a 10.0% or greater interest in our voting power;
• any member of our Management Committee or Board of Directors or close members of suchindividuals’ families; or
• enterprises in which persons described above own, directly or indirectly, a substantial interest in thevoting power or over which persons described above are able to exert significant influence.
C. Interests of Experts and Counsel
N/A
135

Item 8. Financial Information
A. Consolidated Financial Statements and Other Financial Information
Our consolidated financial statements as of and for the years ended December 31, 2008, 2007, and 2006 areincluded in this annual report at “Item 18. Financial Statements.”
Dividends on Ordinary Shares
We paid annual dividends for the years ended December 31, 2004, 2005, 2006 and 2007 and ourshareholders will be asked to approve the payment of an annual dividend of €2.20 per share for the 2008 fiscalyear at our next annual shareholders’ meeting. If approved, this dividend will be paid on April 28, 2009.
We expect that we will continue to pay regular dividends based on our financial condition and results ofoperations. The proposed 2008 dividend equates to a distribution of 40.7% of our adjusted earnings per share.For information on the non-GAAP financial measure, “adjusted earnings per share”, see “Item 5. Operating andFinancial Review and Prospects — Sources of Revenues and Expenses — Adjusted Net Income.”
The following table sets forth information with respect to the dividends paid by our Company in respect ofthe 2004, 2005, 2006 and 2007 fiscal years and the dividend that will be proposed for approval by ourshareholders in respect of the year ended in 2008 at our April 17, 2009 shareholders’ meeting.
2008(1) 2007 2006 2005 2004
Net Dividend per Share (in €) . . . . . . . . . . . . . . . . . . . . . . . . . . . . . . . . . . . . . . 2.20 2.07 1.75 1.52 1.20Net Dividend per Share (in $) (2) . . . . . . . . . . . . . . . . . . . . . . . . . . . . . . . . . . . . 3.06 3.02 2.31 1.80 1.62
(1) Proposal, subject to shareholder approval.(2) Based on the relevant year-end exchange rate.
The declaration, amount and payment of any future dividends will be determined by majority vote of theholders of our shares at an ordinary general meeting, following the recommendation of our Board of Directors.Any declaration will depend on our results of operations, financial condition, cash requirements, future prospectsand other factors deemed relevant by our shareholders. Accordingly, we cannot assure you that we will paydividends in the future on a continuous and regular basis. Under French law, we are required to pay dividendsapproved by an ordinary general meeting of shareholders within nine months following the meeting at whichthey are approved.
Annual Payments on Participating Share Series A (“PSSA”)
The table below sets forth, for the years indicated, the amount of dividends paid per PSSA; see “Item 9. TheOffer and Listing” for further detail). In the United States, the PSSAs exist in the form of American DepositaryShares issued by The Bank of New York Mellon, formerly known as The Bank of New York, as depositary, eachrepresenting one-quarter of a PSSA (“PSSA-ADSs”). The PSSAs are generally entitled to receive an annualpayment determined according to a specific formula and subject to certain conditions.
The annual payments on the PSSAs are equal to the sum of a fixed portion (€1.14 per PPSA) and a variableportion equal to the greater of 704% of the dividend per ordinary share or 150% of an amount calculated pursuantto a formula which takes into account changes in consolidated sales and consolidated net income.
Such amounts have been translated in each case into dollars and adjusted for the one-to-four ratio of PSSAsto PSSA-ADSs. Annual payments paid to holders of PSSA-ADSs will generally be exempt from Frenchwithholding tax.
In 2008, the annual payment per PSSA in respect of 2007 was equal to €15.7234.
2007 2006 2005 2004 2003
Annual payment per PSSA . . . . . . . . . . . . . . . . . . . . . . . . . . . €15.7234 €13.4695 €12.9929 €0 €6.0634Annual payment per PSSA-ADS . . . . . . . . . . . . . . . . . . . . . . $ 5.8550 $ 4.5877 $ 4.1438 $0 $1.8530
136

Information on Legal or Arbitration Proceedings
Our principal legal proceedings are described in Note D.22 to the consolidated financial statements includedat Item 18 of this annual report, which we incorporate herein by reference, and are further updated below toreflect material developments through the date of this document.
We are also involved from time to time in a number of legal proceedings incidental to the normal conduct ofour business, including proceedings involving product liability claims, intellectual property rights (particularlyclaims by generic product manufacturers seeking to limit the patent protection of sanofi-aventis products),compliance and trade practices, commercial claims, employment and wrongful discharge claims, tax assessmentclaims, waste disposal and pollution claims and claims under warranties or indemnification arrangements relatingto business divestitures.
• Sanofi Pasteur Inc. Thimerosal Litigation
(Update to the caption “Sanofi Pasteur Inc. Thimerosal Litigation” at Note D.22.a) to our consolidatedfinancial statements included herein at Item 18.)
On February 12, 2009, the U.S. Court of Federal Claims announced decisions in the first three test caseswhich were the subject of hearings completed in 2007. In each decision it was held that the petitioners failed toestablish that their claimed injuries were caused in any way by thimerosal containing vaccines and the MMRvaccine, and no compensation was awarded to any of them under the National Vaccine Injury CompensationProgram (VICP). The claimants have 30 days to seek review of the decisions by the Claims Court, and thereaftermay seek appellate review in the U. S. Court of Appeals for the Federal Circuit.
• SoloSTAR® Patent Litigation
(Update to the caption “SoloSTAR® Patent Litigation” at Note D.22.b) to our consolidated financialstatements included herein at Item 18.)
On February 11, 2009 the German Patent and Trademark Office cancelled at the request of sanofi-aventisNovo Nordisk’s German Utility Model DE 200 23 819. The same Utility Model was already at stake in theinfringement suit filed by Novo Nordisk regarding the SoloSTAR® disposable insulin pen that had beendismissed on May 20, 2008 by the Court of Mannheim.
• Lovenox® Patent Litigation
(Update to the caption “Lovenox® Patent Litigation” at Note D.22.b) to our consolidated financialstatements included herein at Item 18.)
On February 17, 2009 the United States District Court for the Central District of California dismissedwithout prejudice Amphastar’s antitrust counterclaims in the Lovenox® patent litigation.
B. Significant Changes
In addition to the information included elsewhere in this annual report, we bring to your attention thefollowing developments since the end of 2008.
Sanofi-aventis announced on February 25, 2009 that all conditions to the offer made by its subsidiary sanofi-aventis Europe to acquire Zentiva had been successfully fulfilled. The settlement of the offer will occur on March11, 2009. Following settlement, and including the shares already held by sanofi-aventis Europe prior to the offer,sanofi-aventis Europe expects to hold around 94% of the outstanding share capital and voting rights of Zentiva.
Item 9. The Offer and Listing
A. Offer and Listing Details
We have one class of shares. Each American Depositary Share, or ADS, represents one-half of one share. TheADSs are evidenced by American Depositary Receipts, or ADRs, which are issued by JPMorgan Chase Bank.
Our shares trade on the Eurolist market of Euronext Paris (Compartment A) and our ADSs trade on the NewYork Stock Exchange. There can be no assurances as to the establishment or continuity of a public market for ourshares or ADSs.
137
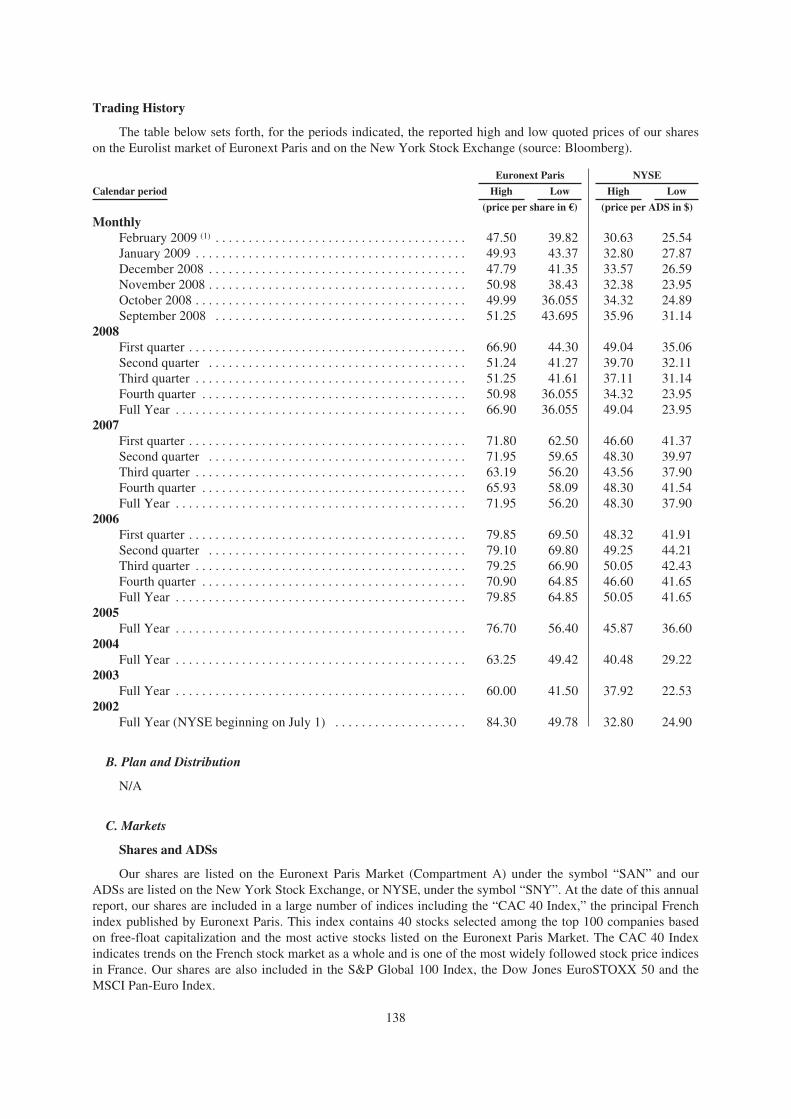
Trading History
The table below sets forth, for the periods indicated, the reported high and low quoted prices of our shareson the Eurolist market of Euronext Paris and on the New York Stock Exchange (source: Bloomberg).
Euronext Paris NYSE
Calendar period High Low High Low
(price per share in €) (price per ADS in $)
MonthlyFebruary 2009 (1) . . . . . . . . . . . . . . . . . . . . . . . . . . . . . . . . . . . . . .January 2009 . . . . . . . . . . . . . . . . . . . . . . . . . . . . . . . . . . . . . . . . .December 2008 . . . . . . . . . . . . . . . . . . . . . . . . . . . . . . . . . . . . . . .
47.5049.9347.79
39.8243.3741.35
30.6332.8033.57
25.5427.8726.59
November 2008 . . . . . . . . . . . . . . . . . . . . . . . . . . . . . . . . . . . . . . . 50.98 38.43 32.38 23.95October 2008 . . . . . . . . . . . . . . . . . . . . . . . . . . . . . . . . . . . . . . . . . 49.99 36.055 34.32 24.89September 2008 . . . . . . . . . . . . . . . . . . . . . . . . . . . . . . . . . . . . . . 51.25 43.695 35.96 31.14
2008First quarter . . . . . . . . . . . . . . . . . . . . . . . . . . . . . . . . . . . . . . . . . . 66.90 44.30 49.04 35.06Second quarter . . . . . . . . . . . . . . . . . . . . . . . . . . . . . . . . . . . . . . . 51.24 41.27 39.70 32.11Third quarter . . . . . . . . . . . . . . . . . . . . . . . . . . . . . . . . . . . . . . . . . 51.25 41.61 37.11 31.14Fourth quarter . . . . . . . . . . . . . . . . . . . . . . . . . . . . . . . . . . . . . . . . 50.98 36.055 34.32 23.95Full Year . . . . . . . . . . . . . . . . . . . . . . . . . . . . . . . . . . . . . . . . . . . . 66.90 36.055 49.04 23.95
2007First quarter . . . . . . . . . . . . . . . . . . . . . . . . . . . . . . . . . . . . . . . . . . 71.80 62.50 46.60 41.37Second quarter . . . . . . . . . . . . . . . . . . . . . . . . . . . . . . . . . . . . . . . 71.95 59.65 48.30 39.97Third quarter . . . . . . . . . . . . . . . . . . . . . . . . . . . . . . . . . . . . . . . . . 63.19 56.20 43.56 37.90Fourth quarter . . . . . . . . . . . . . . . . . . . . . . . . . . . . . . . . . . . . . . . . 65.93 58.09 48.30 41.54Full Year . . . . . . . . . . . . . . . . . . . . . . . . . . . . . . . . . . . . . . . . . . . . 71.95 56.20 48.30 37.90
2006First quarter . . . . . . . . . . . . . . . . . . . . . . . . . . . . . . . . . . . . . . . . . . 79.85 69.50 48.32 41.91Second quarter . . . . . . . . . . . . . . . . . . . . . . . . . . . . . . . . . . . . . . . 79.10 69.80 49.25 44.21Third quarter . . . . . . . . . . . . . . . . . . . . . . . . . . . . . . . . . . . . . . . . . 79.25 66.90 50.05 42.43Fourth quarter . . . . . . . . . . . . . . . . . . . . . . . . . . . . . . . . . . . . . . . . 70.90 64.85 46.60 41.65Full Year . . . . . . . . . . . . . . . . . . . . . . . . . . . . . . . . . . . . . . . . . . . . 79.85 64.85 50.05 41.65
2005Full Year . . . . . . . . . . . . . . . . . . . . . . . . . . . . . . . . . . . . . . . . . . . . 76.70 56.40 45.87 36.60
2004Full Year . . . . . . . . . . . . . . . . . . . . . . . . . . . . . . . . . . . . . . . . . . . . 63.25 49.42 40.48 29.22
2003Full Year . . . . . . . . . . . . . . . . . . . . . . . . . . . . . . . . . . . . . . . . . . . . 60.00 41.50 37.92 22.53
2002Full Year (NYSE beginning on July 1) . . . . . . . . . . . . . . . . . . . . 84.30 49.78 32.80 24.90
B. Plan and Distribution
N/A
C. Markets
Shares and ADSs
Our shares are listed on the Euronext Paris Market (Compartment A) under the symbol “SAN” and ourADSs are listed on the New York Stock Exchange, or NYSE, under the symbol “SNY”. At the date of this annualreport, our shares are included in a large number of indices including the “CAC 40 Index,” the principal Frenchindex published by Euronext Paris. This index contains 40 stocks selected among the top 100 companies basedon free-float capitalization and the most active stocks listed on the Euronext Paris Market. The CAC 40 Indexindicates trends on the French stock market as a whole and is one of the most widely followed stock price indicesin France. Our shares are also included in the S&P Global 100 Index, the Dow Jones EuroSTOXX 50 and theMSCI Pan-Euro Index.
138

The Euronext Paris Market
In February 2005, Euronext Paris overhauled its listing structure by implementing the Eurolist Market, anew single regulated market, which replaced the regulated cash markets formerly operated by Euronext Paris,i.e., the Bourse de Paris (which comprised the Premier Marché and the Second Marché) and the NouveauMarché. As part of this process, Euronext Paris transferred on February 21, 2005 all shares and bonds listed onthe Premier Marché, Second Marché and Nouveau Marché to the Eurolist Market.
Since February 21, 2005, all securities approved for admission to trading on Euronext Paris have beentraded on a single market: Eurolist by Euronext, which was renamed Euronext Paris Market on November 28,2007. The Euronext Paris Market is a regulated market operated and managed by Euronext Paris, a marketoperator (entreprise de marché) responsible for the admission of securities and the supervision of trading in listedsecurities. Euronext Paris publishes a daily official price list that includes price information on listed securities.The Euronext Paris Market is divided into three capitalization compartments: “A” for capitalizations over €1billion, “B” for capitalizations between €1 billion and €150 million, and “C” for capitalizations less than €150million.
Trading on the Euronext Paris Market
Securities admitted to trading on the Euronext Paris Market are officially traded through authorizedfinancial institutions that are members of Euronext Paris. Euronext Paris places securities admitted to trading onthe Euronext Paris Market in one of two categories (continuous (“continu”) or fixing), depending on whetherthey belong to certain indices or compartments and/or on their trading volume. Our shares trade in the categoryknown as continu, which includes the most actively traded securities. Shares are traded on each trading day from9:00 a.m. to 5:30 p.m. (Paris time), with a pre-opening session from 7:15 a.m. to 9:00 a.m. and a post-closingsession from 5:30 p.m. to 5:35 p.m. (during which pre-opening and post-closing sessions trades are recorded butnot executed until the opening auction at 9:00 a.m. and the closing auction at 5:35 p.m., respectively). Inaddition, from 5:35 p.m. to 5:40 p.m., trading can take place at the closing auction price. Trading in a sharebelonging to the continu category after 5:40 p.m. until the beginning of the pre-opening session of the followingtrading day may take place at a price that must be within the closing auction price plus or minus 1%.
Euronext Paris may temporarily interrupt trading in a security admitted to trading on the Euronext ParisMarket if purchases and sales recorded in the system would inevitably result in a price beyond a certainthreshold, determined on the basis of a percentage fluctuation from a reference price. With respect to sharesbelonging to the continu category, once trading has commenced, volatility interruptions for a reservation periodof 2 minutes (subject to extension by Euronext Paris) are possible if the price varies either by more than 5% froma reference price (e.g., opening auction price) or by more than 2% (with respect to CAC 40 issuers) from the lasttrade on such securities. Euronext Paris may also suspend trading of a security admitted to trading on theEuronext Paris Market in certain circumstances including the occurrence of unusual trading activity in a security.In addition, in exceptional cases, including, for example, upon announcement of a takeover bid, the Frenchmarket regulator (Autorité des marchés financiers or “AMF”) may also require Euronext Paris to suspendtrading.
Trades of securities admitted to trading on the Euronext Paris Market are settled on a cash basis on the thirdday following the trade. For certain securities, market intermediaries are also permitted to offer investors theopportunity to place orders through a deferred settlement service (Ordres Stipulés à Règlement-LivraisonDifférés — OSRD) for a fee. The deferred settlement service is only available for trades in securities that haveboth a total market capitalization of at least €1 billion and a daily average volume of trades of at least €1 million.Investors can elect on or before the determination date (jour de liquidation), which is the fifth trading day beforethe end of the month, either to settle by the last trading day of the month or to pay an additional fee and postponethe settlement decision to the determination date of the following month. At the date of this annual report, ourshares are currently eligible for the deferred settlement service.
Equity securities traded on a deferred settlement basis are considered to have been transferred only afterthey have been recorded in the purchaser’s account. Under French securities regulations, if the sale takes placebefore, but during the month of, a dividend payment date, the purchaser’s account will be credited with anamount equal to the dividend paid.
139
Prior to any transfer of securities listed on the Euronext Paris Market held in registered form, the securitiesmust be converted into bearer form and accordingly recorded in an account maintained by an accreditedintermediary with Euroclear France S.A., a registered central security depositary. Transactions in securities areinitiated by the owner giving the instruction (through an agent, if appropriate) to the relevant accreditedintermediary. Trades of securities listed on the Euronext Paris Market are cleared through LCH.Clearnet andsettled through Euroclear France using a continuous net settlement system. A fee or commission is payable to theaccredited intermediary or other agent involved in the transaction.
Participating Shares Series A
Further to a public offer to exchange ordinary shares for PSSAs in 1993, a tender offer to purchase for cashall of the outstanding PSSA-ADSs in 1995 and repurchases in private transactions since that date, there are only3,296 PSSAs outstanding as of December 31, 2008, of which substantially all were represented by PSSA-ADSs.In view of the small number of PSSAs that remain outstanding, at some time in the future, sanofi-aventis intendsto terminate the Deposit Agreement for the PSSA-ADSs and apply to the U.S. Securities and ExchangeCommission to terminate registration of the PSSAs and the PSSA-ADSs under the Securities Exchange Act of1934, as amended.
We are not aware of any non-U.S. trading market for our Participating Shares Series A. In the United States,the PSSAs exist in the form of American Depositary Shares issued by The Bank of New York Mellon, formerlyknown as the Bank of New York, as depositary, each representing one-quarter of a PSSA. We are not aware ofany U.S. trading market for the PSSA-ADSs since their suspension from trading on the NYSE on May 18, 1995,and their subsequent removal from listing on the NYSE on July 31, 1995. Prior to their delisting, the PSSA-ADSs traded on the NYSE under the symbol RP PrA.
Trading Practices and Trading in own Shares
Under French law, a company may not issue shares to itself, but it may purchase its own shares in thelimited cases described at “Item 10. Additional Information — B. Memorandum and Articles of Association —Trading in Our Own Shares.”
D. Selling Shareholders
N/A
E. Dilution
N/A
F. Expenses of the Issue
N/A
140

Item 10. Additional Information
A. Share Capital
N/A
B. Memorandum and Articles of Association
General
Our Company is a société anonyme, a form of limited liability company, organized under the laws ofFrance.
In this section, we summarize material information concerning our share capital, together with materialprovisions of applicable French law and our statuts, an English translation of which has been filed as an exhibitto this annual report. For a description of certain provisions of our statuts relating to our Board of Directors andstatutory auditors, see “Item 6. Directors, Senior Management and Employees.” You may obtain copies of ourstatuts in French from the greffe (Clerk) of the Registre du Commerce et des Sociétés de Paris (Registry ofCommerce and Companies of Paris, France, registration number: 395 030 844). Please refer to that full documentfor additional details.
Our statuts specify that our corporate affairs are governed by:
• applicable laws and regulations (in particular, Title II of the French Commercial Code), and
• the statuts themselves.
Article 3 of our statuts specifies that the Company’s corporate purposes, in France and abroad, are:
• Acquiring interests and holdings, in any form whatsoever, in any company or enterprise, in existence orto be created, connected directly or indirectly with the health and fine chemistry sectors, human andanimal therapeutics, nutrition and bio-industry;
in the following areas :
• Purchase and sale of all raw materials and products necessary for these activities;
• Research, study and development of new products, techniques and processes;
• Manufacture and sale of all chemical, biological, dietary and hygienic products;
• Obtaining or acquiring all intellectual property rights related to results obtained and, in particular, filingall patents, trademarks and models, processes or inventions;
• Operating directly or indirectly, purchasing, and transferring — for free or for consideration — pledgingor securing all intellectual property rights, particularly all patents, trademarks and models, processes orinventions;
• Obtaining, operating, holding and granting all licenses; and
• Within the framework of a group-wide policy and subject to compliance with the relevant legislation,participating in treasury management transactions, whether as lead company or otherwise, in the form ofcentralized currency risk management or intra-group netting, or any other form permitted under therelevant laws and regulations;
And, more generally:
• All commercial, industrial, real or personal property, financial or other transactions, connected directlyor indirectly, totally or partially, with the activities described above and with all similar or relatedactivities or having any other purposes likely to encourage or develop the company’s activities.
141

Directors
Transactions in which Directors Are Materially Interested
Under French law, any agreement entered into (directly or through an intermediary) between our Companyand any one of the members of the Board of Directors that is not entered into (i) in the ordinary course of ourbusiness and (ii) under normal conditions is subject to the prior authorization of the disinterested members of theBoard of Directors. The same provision applies to agreements between our Company and another company if oneof the members of the Board of Directors is the owner, general partner, manager, director, general manager ormember of the executive or supervisory board of the other company, as well as to agreements in which one of themembers of the Board of Directors has an indirect interest.
The Board of Directors must also authorize any undertaking taken by our Company for the benefit of ourChairman, Chief Executive Officer (directeur général) or his delegates (directeurs généraux délégués) pursuantto which such persons will or may be granted compensation, benefit or any other advantage as a result of thetermination or change in their offices or following such termination or change.
In addition, such termination package, except any non-compete indemnity and certain pension benefits:(i) must be authorized by our shareholders by adopting a separate general shareholders meeting resolution foreach such beneficiary, which has to be renewed at each renewal of such beneficiary’s mandate, and (ii) cannot bepaid to such beneficiary unless the Board of Directors decides that such beneficiary has satisfied certainconditions, linked to such beneficiary’s performances measured by our Company’s performances, that must havebeen defined by the Board of Directors when granting such package, and such decision is made publiclyavailable.
Directors’ Compensation
The aggregate amount of attendance fees (jetons de présence) of the Board of Directors is determined at theordinary general meeting of the shareholders. The Board of Directors then divides this aggregate amount upamong its members, by a simple majority vote. In addition, exceptional compensation (rémunérationsexceptionnelles) may be granted to directors on a case-by-case basis for special assignments. The Board may alsoauthorize the reimbursement of travel and accommodation expenses, as well as other expenses incurred byDirectors in the corporate interest. See also “Item 6. Directors, Senior Management and Employees.”
Board of Directors’ Borrowing Powers
All loans or borrowings may be decided by the Board of Directors within the limits, if any, duly authorizedby the general meeting of the shareholders.
Directors’ Age Limits
For a description of the provisions of our statuts relating to age limits applicable to our Directors, see“Item 6. Directors, Senior Management and Employees.”
Directors’ Share Ownership Requirements
For a description of the provisions of our statuts relating to the number of shares which our Directors arerequired to hold, see “Item 6. Directors, Senior Management and Employees.”
Share Capital
As of December 31, 2008, our share capital amounted to €2,631,050,926, divided into 1,315,525,463outstanding shares with a par value of €2 per share. All of our outstanding shares are of the same class and arefully paid. Of these shares, we or entities controlled by us held 10,014,971 shares (or 0.76% of our outstandingshare capital), as treasury shares as of such date. As of December 31, 2008, the book value of such shares was€552 million.
At an extraordinary general meeting held on May 31, 2007, our shareholders authorized our Board ofDirectors to increase our share capital, through the issuance of shares or other securities giving access to theshare capital with or without preemptive rights, by an aggregate maximum nominal amount of €1.6 billion. See“Changes in Share Capital — Increases in Share Capital”, below.
142

The maximum total amount of authorized but unissued shares as of December 31, 2008 was 863.5 million,reflecting the unused part of the May 31, 2007 shareholder authorization and outstanding options to subscribe forshares.
Stock Options
Stock Options
Types of Stock Options
We have two types of stock options outstanding: options to subscribe for shares (options de souscriptiond’actions) and options to purchase shares (options d’achat d’actions). Upon exercise of an option to subscribe forshares, we issue new shares, whereas upon exercise of an option to purchase shares, the option holder receivesexisting shares. We purchase our shares on the market prior to the grant of the options to purchase in order toprovide the option holder with shares upon exercise. Following the merger of Aventis with and into sanofi-aventis, all previously granted options for the shares of Aventis were converted into options for our shares.
Because the exercise of options to purchase shares will be satisfied with existing shares repurchased on themarket or held in treasury, the exercise of options to purchase shares has no impact on our equity capital.
Stock Option Plans
Our ordinary and extraordinary shareholders’ meeting of May 31, 2007 authorized our Board of Directorsfor 26 months to grant options to subscribe for shares and options to purchase shares to members of our salariedstaff and/or corporate officers as well as to members of salaried staff and/or corporate officers of companies oreconomic interest groups related to our Company under the conditions referred to in Article L.225-180 of theFrench Commercial Code.
The aggregate number of options to subscribe for shares and options to purchase shares that may be grantedunder this authorization may not give entitlement to a total number of shares exceeding 2.5% of the share capitalas of the day the decision to grant options is made by the Board. Under such a resolution, the price payable on theexercise of options may not be lower than the average of the first quoted prices of sanofi-aventis ordinary shareson Euronext Paris during the 20 consecutive trading days preceding the date on which the options are granted.
The authorization entails the express waiver by the shareholders, in favor of the grantees of options tosubscribe for shares, of their preemptive rights in respect of shares that are to be issued as and when options areexercised.
The Board of Directors sets the terms on which options are granted and the arrangements as regards thedividend entitlement of the shares.
See “Item 6. Directors, Senior Management and Employees — E. Share Ownership” for a description of ouroption plans currently in force.
Changes in Share Capital in 2008
See Note D.15.1 to our consolidated financial statements included at Item 18 of this annual report.
Voting Rights
In general, each shareholder is entitled to one vote per share at any general shareholders’ meeting. However,our statuts provide that any fully paid-up shares that have been held in registered form under the name of thesame shareholder for at least two years acquire double voting rights. As of December 31, 2008, there were282,058,863 shares that were entitled to double voting rights, representing 21.44% of our total share capital,approximately 35.53% of our voting rights held by holders other than us and our subsidiaries, and 35.31% of ourtotal voting rights.
Double voting rights are not taken into account in determining whether a quorum exists.
143
Under the French Commercial Code, shares of a company held in treasury or by entities controlled by thatcompany are not entitled to voting rights and do not count for quorum purposes.
Our statuts allow us to obtain from Euroclear France the name, nationality, address and number of sharesheld by holders of our securities that have, or may in the future have, voting rights. If we have reason to believethat a person on any list provided by Euroclear France holds securities on behalf of another person, our statutsallow us to request such information regarding beneficial ownership directly from such person. See“— Memorandum and Articles of Association — Form, Holding and Transfer of Shares” below.
Our statuts provide that Board members are elected on a rolling basis for a maximum tenure of four years.Our statuts do not provide for cumulative voting rights.
Shareholders’ Agreement
We are not aware of any shareholder’s agreement currently in force concerning our shares.
Shareholders’ Meetings
General
In accordance with the French Commercial Code, there are three types of shareholders’ meetings: ordinary,extraordinary and special.
Ordinary general meetings of shareholders are required for matters such as:
• electing, replacing and removing directors;
• appointing independent auditors;
• approving the annual financial statements;
• declaring dividends or authorizing dividends to be paid in shares, provided the statuts contain aprovision to that effect; and
• approval of share repurchase programs.
Extraordinary general meetings of shareholders are required for approval of matters such as amendments toour statuts, including any amendment required in connection with extraordinary corporate actions. Extraordinarycorporate actions include:
• changing our Company’s name or corporate purpose;
• increasing or decreasing our share capital;
• creating a new class of equity securities;
• authorizing the issuance of securities giving access to our share capital or giving the right to receive debtinstruments;
• establishing any other rights to equity securities;
• selling or transferring substantially all of our assets; and
• the voluntary liquidation of our Company.
Special meetings of shareholders of a certain category of shares or shares with certain specific rights (suchas shares with double voting rights) are required for any modification of the rights derived from that category ofshares. The resolutions of the shareholders’ general meeting affecting these rights are effective only afterapproval by the relevant special meeting.
Annual Ordinary Meetings
The French Commercial Code requires the Board of Directors to convene an annual ordinary generalmeeting of shareholders for approval of the annual financial statements. This meeting must be held within
144

six months of the end of each fiscal year. This period may be extended by an order of the President of theCommercial Court. The Board of Directors may also convene an ordinary or extraordinary general meeting ofshareholders upon proper notice at any time during the year. If the Board of Directors fails to convene ashareholders’ meeting, our independent auditors may call the meeting. In case of bankruptcy, the liquidator orcourt-appointed agent may also call a shareholders’ meeting in some instances. In addition, any of the followingmay request the court to appoint an agent for the purpose of calling a shareholders’ meeting:
• one or several shareholders holding at least 5% of our share capital;
• duly qualified associations of shareholders who have held their shares in registered form for at least twoyears and who together hold at least 1% of our voting rights;
• the works council in cases of urgency; or
• any interested party in cases of urgency.
Notice of Shareholders’ Meetings
We must announce general meetings at least 35 days in advance by means of a preliminary notice (avis deréunion), which is published in the Bulletin des Annonces Légales Obligatoires, or BALO. The preliminary noticemust first be sent to the AMF. The AMF also recommends that, prior to or simultaneously with the publication ofthe preliminary notice, we publish a summary of the notice indicating the date and place of the meeting in anewspaper of national circulation in France. The preliminary notice must contain, among other things, theagenda, a draft of the resolutions to be submitted to the shareholders and the procedure for voting by mail.
At least 15 days prior to the date set for a first call, and at least six days prior to any second call, we mustsend a final notice (avis de convocation) containing the final agenda, the date, time and place of the meeting andother information for the meeting. Such final notice must be sent by mail to all registered shareholders who haveheld shares in registered form for more than one month prior to the date of the final notice and by registered mail,if shareholders have asked for it and paid the corresponding charges. The final notice must also be published in anewspaper authorized to publish legal announcements in the local administrative department (département) inwhich our Company is registered as well as in the BALO, with prior notice having been given to the AMF. If noshareholder has proposed any new resolutions to be submitted to the vote of the shareholders at the meeting andprovided that the Board of Directors has not altered the draft resolutions included in the preliminary notice, weare not required to publish the final notice; publishing a preliminary notice that stipulates that it shall be deemedto be equivalent to a final notice will be deemed sufficient.
In general, shareholders can only take action at shareholders’ meetings on matters listed on the agenda. Asan exception to this rule, shareholders may take action with respect to the dismissal of directors even though thisaction has not been included on the agenda. Additional resolutions to be submitted for approval by theshareholders at the meeting may be proposed to the Board of Directors, for recommendation to the shareholders,as from the publication of the preliminary notice in the BALO and until 25 days prior to the general meeting or,alternatively within 20 days following the publication of the preliminary notice in the BALO if such preliminarynotice was published more than 45 days prior to the general meeting:
• one or several shareholders together holding a specified percentage of shares;
• a duly qualified association of shareholders who have held their shares in registered form for at least twoyears and who together hold at least 1% of our voting rights; or
• the works council.
The Board of Directors must submit these resolutions to a vote of the shareholders after having made arecommendation thereon.
Following the date on which documents must be made available to the shareholders, shareholders maysubmit written questions to the Board of Directors relating to the agenda for the meeting until the fourth businessday prior to the general meeting. The Board of Directors must respond to these questions during the meeting.
145
Attendance at Shareholders’ Meetings; Proxies and Votes by Mail
In general, all shareholders may participate in general meetings either in person or by proxy. Shareholdersmay vote in person, by proxy or by mail.
The right of shareholders to participate in general meetings is subject to the recording (enregistrementcomptable) of their shares on the third business day, zero hour (Paris time), preceding the general meeting:
• for holders of registered shares: in the registered shareholder account held by the Company or on itsbehalf by an agent appointed by it; and
• for holders of bearer shares: in the bearer shareholder account held by the accredited financialintermediary with whom such holders have deposited their shares; such financial intermediaries shalldeliver to holders of bearer shares a shareholding certificate (attestation de participation) enabling themto participate in the general meeting.
Attendance in Person
Any shareholder may attend ordinary general meetings and extraordinary general meetings and exercise itsvoting rights subject to the conditions specified in the French Commercial Code and our statuts.
Proxies and Votes by Mail
Proxies are sent to any shareholder upon request received between the publication of the final notice ofmeeting and six days before the general meeting. In order to be counted, such proxies must be received at ourregistered office, or at any other address indicated on the notice convening the meeting, prior to the date of themeeting (in practice, we request that shareholders return proxies at least three business days prior to the meeting).A shareholder may grant proxies only to his or her spouse or to another shareholder. A shareholder that is acorporation may grant proxies to a legal representative. Alternatively, the shareholder may send us a blank proxywithout nominating any representative. In this case, the chairman of the meeting will vote the blank proxies infavor of all resolutions proposed or approved by the Board of Directors and against all others.
With respect to votes by mail, we must send shareholders a voting form upon request. The completed formmust be returned to us at least three days prior to the date of the shareholders’ meeting.
Quorum
The French Commercial Code requires that shareholders together holding at least 20% of the shares entitledto vote must be present in person, or vote by mail or by proxy, in order to fulfill the quorum requirement for:
• an ordinary general meeting; and
• an extraordinary general meeting where the only resolutions pertain to either (a) an increase in our sharecapital is proposed through incorporation of reserves, profits or share premium, or (b) the potentialissuance of free share warrants in the event of a public offering on our shares (article L. 233-32 of theFrench Commercial Code).
For any other extraordinary general meeting the quorum requirement is at least 25% of the shares entitled tovote, present in person, or voting by mail or by proxy.
For a special meeting of holders of a certain category of shares, the quorum requirement is one third of theshares entitled to vote in that category, present in person, or voting by mail or by proxy.
If a quorum is not present at a meeting, the meeting is adjourned. However, only questions that were on theagenda of the adjourned meeting may be discussed and voted upon.
When an adjourned meeting is resumed, there is no quorum requirement for meetings cited in the firstparagraph of this “Quorum” section. In the case of any other reconvened extraordinary general meeting or specialmeeting, the quorum requirement is 20% of the shares entitled to vote (or voting shares belonging to the relevantcategory for special meetings of holders of shares of such specific category), present in person or voting by mailor by proxy. If a quorum is not present, the reconvened meeting may be adjourned for a maximum of two monthswith the same quorum requirement. No deliberation or action by the shareholders may take place without aquorum.
146
Votes Required for Shareholder Action
A simple majority of shareholders may pass a resolution at either an ordinary general meeting or anextraordinary general meeting where the only resolution(s) pertain to either (a) an increase in our share capital isproposed through incorporation of reserves, profits or share premium, or (b) the potential issuance of free sharewarrants in the event of a public offering on our shares (article L. 233-32 of the French Commercial Code). Atany other extraordinary general shareholders meeting and at any special meeting of holders of a specific categoryof shares, a two-thirds majority of the shareholder votes cast is required.
Abstention from voting by those present or those represented by proxy or voting by mail is counted as a voteagainst the resolution submitted to a shareholder vote.
Changes to Shareholders’ Rights
Under French law, a two-thirds majority vote at the extraordinary shareholders’ meeting is required tochange our statuts, which set out the rights attaching to our shares except for capital increases throughincorporation of reserves, profits or share premium, or through the issuance of free share warrants in the event ofa public offering on our shares (article L. 233-32 of the French Commercial Code).
The rights of a class of shareholders can be amended only after a special meeting of the class ofshareholders affected has taken place. The voting requirements applicable to this type of special meeting are thesame as those applicable to an extraordinary general shareholders meeting. The quorum requirements for aspecial meeting are one third of the voting shares, or 20% upon resumption of an adjourned meeting.
A unanimous shareholder vote is required to increase the liabilities of shareholders.
Financial Statements and Other Communications with Shareholders
In connection with any shareholders’ meeting, we must provide a set of documents including our annualreport and a summary of the financial results of the five previous fiscal years to any shareholder who so requests.
Dividends
We may only distribute dividends out of our “distributable profits,” plus any amounts held in our reservethat the shareholders decide to make available for distribution, other than those reserves that are specificallyrequired by law or our statuts. “Distributable profits” consist of our unconsolidated net profit in each fiscal year,as increased or reduced by any profit or loss carried forward from prior years, less any contributions to thereserve accounts pursuant to law or our statuts.
Legal Reserve
The French Commercial Code requires us to allocate 5% of our unconsolidated statutory net profit for eachyear to our legal reserve fund before dividends may be paid with respect to that year. Funds must be allocateduntil the amount in the legal reserve is equal to 10% of the aggregate par value of the issued and outstandingshare capital. This restriction on the payment of dividends also applies to each of our French subsidiaries on anunconsolidated basis. At December 31, 2008, our legal reserve amounted to €282,280,863 representing 10.73%of the aggregate par value of our issued and outstanding share capital as of that date. The legal reserve of anycompany subject to this requirement may only be distributed to shareholders upon liquidation of the company.
Approval of Dividends
According to the French Commercial Code, our Board of Directors may propose a dividend for approval bythe annual general meeting of shareholders. If we have earned distributable profits since the end of the precedingfiscal year, as reflected in an interim income statement certified by our independent auditors, our Board ofDirectors may distribute interim dividends to the extent of the distributable profits for the period covered by theinterim income statement. Our Board of Directors exercises this authority subject to French law and regulationsand may do so without obtaining shareholder approval.
147

Distribution of Dividends
Dividends are distributed to shareholders pro rata according to their respective holdings of shares. In thecase of interim dividends, distributions are made to shareholders on the date of our Board of Directors’ meetingin which the distribution of interim dividends is approved. The actual dividend payment date is decided by theshareholders at an ordinary general shareholders meeting or by our Board of Directors in the absence of such adecision by the shareholders. Shareholders that own shares on the actual payment date are entitled to thedividend.
Dividends may be paid in cash or, if the shareholders’ meeting so decides, in kind, provided that allshareholders receive a whole number of assets of the same nature paid in lieu of cash. Our statuts provide that,upon a decision of the shareholders’ meeting taken by ordinary resolution, each shareholder may be given thechoice to receive his dividend in cash or in shares.
Timing of Payment
According to the French Commercial Code, we must pay any existing dividends within nine months of theend of our fiscal year, unless otherwise authorized by court order. Dividends on shares that are not claimedwithin five years of the date of declared payment revert to the French State.
Changes in Share Capital
Increases in Share Capital
As provided by the French Commercial Code, our share capital may be increased only with theshareholders’ approval at an extraordinary general shareholders meeting following the recommendation of ourBoard of Directors. Increases in our share capital may be effected by:
• issuing additional shares;
• increasing the par value of existing shares;
• creating a new class of equity securities; or
• exercise of rights attached to securities giving access to the share capital.
Increases in share capital by issuing additional securities may be effected through one or a combination ofthe following:
• in consideration for cash;
• in consideration for assets contributed in kind;
• through an exchange offer;
• by conversion of previously issued debt instruments;
• by capitalization of profits, reserves or share premium; or
• subject to various conditions, in satisfaction of debt incurred by our Company.
Decisions to increase the share capital through the capitalization of reserves, profits and/or share premiumor through the issuance of free share warrants in the event of a public offering on our shares (article L. 233-32 ofthe French Commercial Code) require the approval of an extraordinary general shareholders meeting, actingunder the quorum and majority requirements applicable to ordinary shareholders’ meetings. Increases effected byan increase in the par value of shares require unanimous approval of the shareholders, unless effected bycapitalization of reserves, profits or share premium. All other capital increases require the approval of anextraordinary general shareholders meeting acting under the regular quorum and majority requirements for suchmeetings. See “— Quorum” and “— Votes Required for Shareholder Action” above.
Since the entry into force of order 2004-604 of June 24, 2004, the shareholders may delegate to our Board ofDirectors either the authority (délégation de compétence) or the power (délégation de pouvoir) to carry out anyincrease in share capital. Our Board of Directors may further delegate this power to our Chief Executive Officeror, subject to our Chief Executive Officer’s approval, to his delegates (directeurs généraux délégués).
148

On May 31, 2007, our shareholders approved different resolutions delegating to the Board of Directors theauthority to increase our share capital through the issuance of shares or securities giving access to the sharecapital, subject to an overall cap set at €1.6 billion. This cap applies to all the resolutions whereby theextraordinary shareholders’ meeting delegated to the Board of Directors the authority to increase the sharecapital, it being also specified that:
- the maximum aggregate par value amount of capital increases that may be carried out with preemptiverights maintained was set at €1.4 billion;
- the maximum aggregate par value amount of capital increases that may be carried out withoutpreemptive rights was set at €800 million;
- the maximum aggregate par value amount of capital increases that may be carried out by capitalizationof share premium, reserves, profits or other items was set at €500 million; and
- capital increases resulting in the issuance of securities to employees, early retirees or retirees under ouremployee savings plans are limited to 2% of the share capital as computed on the date of the Board’sdecision, and such issuances may be made at a discount of 20% (or 30% if certain French lawrestrictions on resales were to apply);
On May 31, 2007, our shareholders also approved resolutions delegating to the Board of Directors theauthority to increase the share capital by granting options or free shares to our employees and/or corporateofficers, subject to the overall cap mentioned above and under the following terms and conditions:
- authorization, for a period of 26 months, to grant options to purchase or to subscribe for our shares toemployees and/or corporate officers; such options may not give entitlement to a total number of sharesexceeding 2.5% of the share capital as computed on the day of the Board’s decision; See “— StockOptions and Warrants” above;
- authorization, for a period of 38 months, to grant existing or new shares free of consideration toemployees and/or corporate officers, up to a limit of 1% of the share capital as computed on the day ofthe Board’s decision.
See also “Item 6. Directors, Senior Management and Employees — E. Share Ownership”.
Decreases in Share Capital
According to the French Commercial Code, any decrease in our share capital requires approval by theshareholders entitled to vote at an extraordinary general meeting. The share capital may be reduced either bydecreasing the par value of the outstanding shares or by reducing the number of outstanding shares. The numberof outstanding shares may be reduced either by an exchange of shares or by the repurchase and cancellation ofshares. Holders of each class of shares must be treated equally unless each affected shareholder agrees otherwise.
In addition, specific rules exist to permit the cancellation of treasury shares, by which the shareholders’meeting may authorize the cancellation of up to 10% of a company’s share capital per 24-month period. OnMay 31, 2007, our shareholders delegated the right to our Board of Directors to reduce our share capital bycanceling our own shares.
On April 29, 2008, our Board of Directors cancelled 51,437,419 shares, of which 70,919 had been allocatedto stock purchase options which had elapsed and 51,366,500 had been held with a view to their futurecancellation.
Preemptive Rights
According to the French Commercial Code, if we issue additional securities to be paid in cash, currentshareholders will have preemptive rights to these securities on a pro rata basis. These preemptive rights requireus to give priority treatment to current shareholders. The rights entitle the individual or entity that holds them tosubscribe to the issuance of any securities that may increase the share capital of our Company by means of a cashpayment or a set-off of cash debts. Preemptive rights are transferable during the subscription period relating to aparticular offering. These rights may also be listed on Euronext Paris.
149

Preemptive rights with respect to any particular offering may be waived by a vote of shareholders holding atwo-thirds majority of the shares entitled to vote at an extraordinary general meeting. Our Board of Directors andour independent auditors are required by French law to present reports that specifically address any proposal towaive preemptive rights. In the event of a waiver, the issue of securities must be completed within the periodprescribed by law. Shareholders also may notify us that they wish to waive their own preemptive rights withrespect to any particular offering if they so choose.
The shareholders may decide at extraordinary general meetings to give the existing shareholders anon-transferable priority right to subscribe to the new securities, for a limited period of time.
In the event of a capital increase without preemptive rights to existing shareholders, French law requires thatthe capital increase be made at a price equal to or exceeding the weighted average market prices of the shares forthe last three trading days on Euronext Paris prior to the determination of the subscription price of the capitalincrease less 5%.
Form, Holding and Transfer of Shares
Form of Shares
Our statuts provide that the shares may be held in either bearer form or registered form at the option of theholder.
Holding of Shares
In accordance with French law relating to the dematerialization of securities, shareholders’ ownership rightsare represented by book entries instead of share certificates. We maintain a share account with Euroclear France(a French clearing system, which holds securities for its participants) for all shares in registered form, which isadministered by BNP Paribas Securities Services. In addition, we maintain separate accounts in the name of eachshareholder either directly or, at a shareholder’s request, through the shareholder’s accredited intermediary. Eachshareholder account shows the name of the holder and the number of shares held. BNP Paribas SecuritiesServices issues confirmations (attestations d’inscription en compte) to each registered shareholder as to sharesregistered in the shareholder’s account, but these confirmations are not documents of title.
Shares of a listed company may also be issued in bearer form. Shares held in bearer form are held andregistered on the shareholder’s behalf in an account maintained by an accredited financial intermediary and arecredited to an account at Euroclear France maintained by such intermediary. Each accredited financialintermediary maintains a record of shares held through it and issues certificates of inscription for the shares itholds. Transfers of shares held in bearer form may only be made through accredited financial intermediaries andEuroclear France.
Shares held by persons who are not domiciled in France may be registered in the name of intermediarieswho act on behalf of one or more investors. When shares are so held, we are entitled to request from suchintermediaries the names of the investors. Also, we may request any legal person (personne morale) who holdsmore than 2.5% of our shares or voting rights, to disclose the name of any person who owns, directly orindirectly, more than one third of its share capital or of its voting rights. A person not providing the completerequested information in time, or who provides incomplete or false information, will be deprived of its votingrights at shareholders’ meetings and will have its payment of dividends withheld until it has provided therequested information in strict compliance with French law. If such person acted willfully, the person may bedeprived by a French court of either its voting rights or its dividends or both for a period of up to five years.
Transfer of Shares
Our statuts do not contain any restrictions relating to the transfer of shares.
Registered shares must be converted into bearer form before being transferred on Euronext Paris on theshareholders’ behalf and, accordingly, must be registered in an account maintained by an accredited financialintermediary on the shareholders’ behalf. A shareholder may initiate a transfer by giving instructions to the
150

relevant accredited financial intermediary. A fee or commission is payable to the broker involved in thetransaction, regardless of whether the transaction occurs within or outside France. No registration duty isnormally payable in France unless a transfer instrument has been executed in France.
Redemption of Shares
Under French law, our Board of Directors is entitled to redeem a set number of shares as authorized by theextraordinary shareholders’ meeting. In the case of such an authorization, the shares redeemed must be cancelledwithin one month after the end of the offer to purchase such shares from shareholders. However, shares redeemedon the open market need not be cancelled if the company redeeming the shares grants options on or awards thoseshares to its employees within one year of the acquisition. See also “— Trading in Our Own Shares” below.
Sinking Fund Provisions.
Our statuts do not provide for any sinking fund provisions.
Liability to Further Capital Calls
Shareholders are liable for corporate liabilities only up to the par value of the shares they hold; they are notliable to further capital calls.
Liquidation Rights
If we are liquidated, any assets remaining after payment of our debts, liquidation expenses and all of ourremaining obligations will first be distributed to repay in full the par value of our shares. Any surplus will bedistributed pro rata among shareholders in proportion to the par value of their shareholdings.
Requirements for Holdings Exceeding Certain Percentages
The French Commercial Code provides that any individual or entity, acting alone or in concert with others,that becomes the owner, directly or indirectly, of more than 5%, 10%, 15%, 20%, 25%, 331⁄3%, 50%, 662⁄3%,90% or 95% of the outstanding shares or voting rights of a listed company in France, such as our Company, orthat increases or decreases its shareholding or voting rights above or below any of those percentages, must notifythe company, within five trading days of the date it crosses the threshold, of the number of shares it holds andtheir voting rights. The individual or entity must also notify the AMF within five trading days of the date itcrosses the threshold. The AMF makes the notice public.
French law and AMF regulations impose additional reporting requirements on persons who acquire morethan 10% or 20% of the outstanding shares or voting rights of a listed company. These persons must file a reportwith the company and the AMF within ten trading days of the date they cross the threshold. In the report, theacquirer must specify if it acts alone or in concert with others and specify its intentions for the following12-month period, including whether or not it intends to continue its purchases, to acquire control of the companyin question or to seek representation on to the board of directors. The AMF makes the report public. The acquirermay amend its stated intentions, provided that it does so on the basis of significant changes in its own situation orshareholding. Upon any change of intention, it must file a new report.
Starting August 1, 2009, the requirements of the preceding paragraph will be expanded. They will also applyto persons who acquire more than 15% or 25% of the outstanding shares or voting rights of a listed company, andfile the report with the company and the AMF within a number of days of the date they cross the threshold asdetermined by law. The content of the report will be expanded and the duration of its validity shortened. In thereport, the acquirer will have to specify if it acts alone or in concert with others and specify the means offinancing of the acquisition, its intentions for the following 6-month period, including whether or not it intends tocontinue its purchases, to acquire control of the company in question, the strategy it contemplates vis-à-vis theissuer and the way it intends to implement it, any agreement for the temporary transfer of shares or voting rights,and whether it seeks representation on to the board of directors. Upon any change of intention, it will have to filea new report for the following 6-month period.
151
In order to permit shareholders to give the required notice, we must each month publish on our website andsend the AMF a written notice setting forth the total number of our shares and voting rights (including treasuryshares) whenever they vary from the figures previously published.
If any shareholder fails to comply with the legal notification requirement, the shares in excess of therelevant threshold will be deprived of voting rights for all shareholders’ meetings until the end of a two-yearperiod following the date on which the owner complies with the notification requirements. In addition, anyshareholder who fails to comply with these requirements may have all or part of its voting rights suspended forup to five years by the Commercial Court at the request of our Chairman, any shareholder or the AMF, and maybe subject to criminal fines.
Under AMF regulations, and subject to limited exemptions granted by the AMF, any person or entity, actingalone or in concert, that crosses the threshold of 331⁄3% of the share capital or voting rights of a French listedcompany must initiate a public tender offer for the balance of the shares and securities giving access to the sharecapital or voting rights of such company.
In addition, our statuts provide that any person or entity, acting alone or in concert with others, whobecomes the owner of 1%, or any multiple of 1% of our share capital or our voting rights must notify us bycertified mail, return receipt requested, within five trading days of the total number of shares and securitiesgiving access to our share capital and voting rights that such person then owns. The same provisions of ourstatuts apply whenever such owner increases or decreases its ownership of our share capital or our voting rightsto such extent that it respectively went above or below one of the thresholds described in the preceding sentence.Any person or entity that fails to comply with such notification requirements, will, upon the request of one ormore shareholders holding at least 5% of our share capital or of our voting rights made at the generalshareholders’ meeting, be deprived of voting rights with respect to the shares in excess of the relevant thresholdfor all shareholders’ meetings until the end of a two-year period following the date on which such person orentity complies with the notification requirements.
Change in Control/Anti-takeover
There are no provisions in our statuts that would have the effect of delaying, deferring or preventing achange in control of our Company or that would operate only with respect to a merger, acquisition or corporaterestructuring involving our Company or any of our subsidiaries. Further, there are no provisions in our statutsthat allow for the issuance of preferred stock upon the occurrence of a takeover attempt or the addition of other“anti-takeover” measures without a shareholder vote.
Our statuts do not include any provisions discriminating against any existing or prospective holder of oursecurities as a result of such shareholder owning a substantial number of shares.
Trading in Our Own Shares
Under French law, sanofi-aventis may not issue shares to itself. However, we may, either directly or througha financial intermediary acting on our behalf, acquire up to 10% of our issued share capital within a maximumperiod of 18 months, provided our shares are listed on a regulated market. Prior to acquiring our shares, we mustpublish a description of the share repurchase program (descriptif du programme de rachat d’actions).
We may not cancel more than 10% of our issued share capital over any 24-month period. Our repurchase ofshares must not result in our Company holding, directly or through a person acting on our behalf, more than 10%of our issued share capital. We must hold any shares that we repurchase in registered form. These shares must befully paid up. Shares repurchased by us continue to be deemed “issued” under French law but are not entitled todividends or voting rights so long as we hold them directly or indirectly, and we may not exercise the preemptiverights attached to them.
The shareholders, at an extraordinary general shareholders meeting, may decide not to take these shares intoaccount in determining the preemptive rights attached to the other shares. However, if the shareholders decide totake them into account, we must either sell the rights attached to the shares we hold on the market before the endof the subscription period or distribute them to the other shareholders on a pro rata basis.
152
On May 14, 2008, our shareholders approved a resolution authorizing us to repurchase up to 10% of ourshares over an 18-month period. Under this authorization, the purchase price for each sanofi-aventis ordinaryshare may not be greater than €100.00 and the maximum amount that sanofi-aventis may pay for the repurchasesis €13,659,166,440. A description of this share repurchase program as adopted by the Board of Directors onMay 14, 2008 (descriptif du programme de rachat d’actions) was published on March 6, 2008.
Purposes of Share Repurchase Programs
European regulation n°2273/2003, dated December 22, 2003 (which we refer to in this section as the“Regulation”), in application of European directive 2003/6/EC, dated January 28, 2003, known as the “MarketAbuse Directive” (the “Directive”) relating to share repurchase programs and the stabilization of financialinstruments, came into effect on October 13, 2004.
The entry into force of the Regulation has resulted in changes in the manner in which share repurchaseprograms are implemented. Under the Regulation, an issuer will benefit from a safe harbor for share transactionsthat comply with certain conditions relating in particular to the pricing, volume and timing of transactions (seebelow) and that are made in connection with a share repurchase program the purpose of which is:
• to reduce the share capital through the cancellation of treasury shares; and/or
• to meet obligations arising from debt instruments exchangeable into equity instruments and/or theimplementation of employee share option programs or other employee share allocation plans.
Safe harbor transactions will by definition not be considered market abuses under the Regulation.Transactions that are carried out for other purposes than those mentioned above do not qualify for the safeharbor. However, as permitted by the Directive, which provides for the continuation of existing practices that donot constitute market manipulation and that conform with certain criteria set forth in European directive 2004/72,dated April 29, 2004, the AMF published exceptions on March 22, 2005 to permit the following existing marketpractices:
• transactions pursuant to a liquidity agreement entered into with a financial services intermediary thatcomplies with the ethical code (charte de déontologie) approved by the AMF; and
• the purchase of shares that are subsequently used as acquisition currency in a business combinationtransaction.
The AMF confirmed that all transactions directed at maintaining the liquidity of an issuer’s shares must beconducted pursuant to a liquidity agreement with a financial services intermediary acting independently.
Additionally, our program could be used for any purpose that is authorized or could be authorized underapplicable laws and regulations.
Pricing, Volume and Other Restrictions
In order to qualify for the safe harbor, the issuer must generally comply with the following pricing andvolume restrictions:
• a share purchase must not be made at a price higher than the higher of the price of the last independenttrade and the highest current independent bid on the trading venues where the purchase is carried out;
• subject to certain exceptions for illiquid securities, the issuer must not purchase more than 25% of theaverage daily volume of the shares in any one day on the regulated market on which the purchase iscarried out. The average daily volume figure must be based on the average daily volume traded in themonth preceding the month of public disclosure of the share repurchase program and fixed on that basisfor the authorized period of that program. If the program does not make reference to this volume, theaverage daily volume figure must be based on the average daily volume traded in the 20 trading dayspreceding the date of purchase.
153

In addition, an issuer must not:
• resell the shares acquired pursuant to the repurchase program (without prejudice to the right of the issuerto meet its obligations under employee share option programs or other employee share allocation plansor to use shares as acquisition currency as mentioned above); it being further specified that suchprohibition is not applicable if the share repurchase program is implemented by a financial servicesintermediary pursuant to a liquidity agreement as mentioned above;
• effect any transaction during a “blackout period” imposed by the applicable law of the Member State inwhich the transaction occurs (i.e., under French law, during the period between the date on which thecompany is aware of insider information and the date on which such information is made public andduring the 15-day period preceding the date of publication of annual and interim financial statements),without prejudice to transactions carried out pursuant to a liquidity agreement as mentioned above; or
• effect any transaction in securities with respect to which the issuer has decided to defer disclosure of anymaterial, non-public information.
Use of Share Repurchase Programs
Pursuant to the AMF rules, issuers must immediately allocate the repurchased shares to one of the purposesprovided for in the Regulation and must not subsequently use the shares for a different purpose. As an exceptionto the foregoing, shares repurchased with a view to covering stock option plans may, if no longer needed for thispurpose, be re-allocated for cancellation or sold in compliance with AMF requirements relating in particular toblackout periods. Shares repurchased in connection with one of the market practices authorized by the AMF (seeabove) may also be re-allocated to one of the purposes contemplated by the Regulation or sold in compliancewith AMF requirements. Shares repurchased with a view to their cancellation must be cancelled within 24months following their acquisition.
During the year ended December 31, 2008, we used the authority delegated by our shareholders torepurchase our shares on the stock market. The shares repurchased during the year end December 31, 2008 wereacquired with a view to cancellation. We repurchased 23,862,169 shares at an average cost of €51.457 per share,i.e. an overall cost of €1,227,689,566, including €1,061,076 of transaction costs not including corporate incometax.
As of December 31, 2008, we directly owned 9,647,801 sanofi-aventis shares with an aggregate par value of€19,295,602 (representing around 0.73% of our share capital and with a value estimated at the share price uponpurchase of €538,825,311).
In 2008, of the 8,359,206 shares allocated to stock purchase option plans outstanding at December 31, 2007,94,816 shares were transferred to grantees of options, comprising:
• 89,201 shares transferred directly by us;
• 5,615 shares transferred indirectly (by Hoechst GmbH).
Following these transfers, the shares owned directly or indirectly by us were allocated as follows:
• 8,193,471 shares were allocated to outstanding stock purchase option plans comprising:
– 7,826,301 directly-owned shares, representing 0.59% of our share capital;
– 367,170 indirectly-owned shares, representing 0.03% of our share capital.
• 1,821,500 shares were allocated to cancellation, representing 0.14% of our share capital.
On April 29, 2008, our Board of Directors cancelled 51,437,419 shares, of which 70,919 had been allocatedto stock purchase options that had elapsed and 51,366,500 had been held with a view to their future cancellation.
There has been no reallocation.
154
Reporting obligations
Pursuant to the AMF Regulation and the French Commercial Code, issuers trading in their own shares aresubject to the following reporting obligations:
• Issuers must report all transactions in their own shares publicly within seven trading days of thetransaction in a prescribed format, unless such transactions are carried out pursuant to a liquidityagreement that complies with the ethical code approved by the AMF; and
• Issuers must declare to the AMF on a monthly basis all transactions completed under the sharerepurchase program unless they provide the same information on a weekly basis.
Ownership of Shares by Non-French Persons
The French Commercial Code and our statuts currently do not limit the right of non-residents of France ornon-French persons to own or, where applicable, to vote our securities. However, non-residents of France mustfile an administrative notice with the French authorities in connection with the acquisition of a controllinginterest in our Company. Under existing administrative rulings, ownership of 331⁄3% or more of our share capitalor voting rights is regarded as a controlling interest, but a lower percentage might be held to be a controllinginterest in certain circumstances depending upon factors such as:
• the acquiring party’s intentions;
• the acquiring party’s ability to elect directors; or
• financial reliance by the company on the acquiring party.
Enforceability of Civil Liabilities
We are a limited liability company (société anonyme) organized under the laws of France, and most of ourdirectors and officers reside outside the United States. In addition, a substantial portion of our assets is located inFrance. As a result, it may be difficult for investors to effect service of process within the United States on suchpersons. It may also be difficult to enforce against them, either inside or outside the United States, judgmentsobtained against them in U.S. courts, or to enforce in U.S. courts, judgments obtained against them in courts injurisdictions outside the United States, in any action based on civil liabilities under the U.S. federal securitieslaws. There is doubt as to the enforceability against such persons in France, whether in original actions or inactions to enforce judgments of U.S. courts, of liabilities based solely on the U.S. federal securities laws. Actionsfor enforcement of foreign judgments against such persons would require such persons who are of Frenchnationality to waive their right under Article 15 of the French Civil Code to be sued only in France. We believethat no such French persons have waived such right with respect to actions predicated solely upon U.S. federalsecurities laws. In addition, actions in the United States under the U.S. federal securities laws could be affectedunder certain circumstances by the French law of July 26, 1968, as amended, which may preclude or restrict theobtaining of evidence in France or from French persons in connection with such actions. Additionally, awards ofpunitive damages in actions brought in the United States or elsewhere may be unenforceable in France.
C. Material Contracts
N/A
D. Exchange Controls
French exchange control regulations currently do not limit the amount of payments that we may remit tonon-residents of France. Laws and regulations concerning foreign exchange controls do require, however, that allpayments or transfers of funds made by a French resident to a non-resident be handled by an accreditedintermediary. In France, all registered banks and most credit establishments are accredited intermediaries.
E. Taxation
General
The following generally summarizes the material French and U.S. federal income tax consequences to U.S.holders (as defined below) of owning and disposing of our ADSs, ordinary shares, PSSAs and PSSA-ADSs
155
(collectively the “Securities”). This discussion is intended only as a descriptive summary and does not purport tobe a complete analysis or listing of all potential tax effects of the purchase, ownership or disposition of ourSecurities.
This summary does not constitute a legal opinion or tax advice. Holders are urged to consult their own taxadvisers regarding the tax consequences of the purchase, ownership and disposition of Securities in light of theirparticular circumstances, including the effect of any U.S. federal, state, local or other national tax laws.
The description of the French and U.S. federal income tax consequences set forth below is based on the laws(including, for U.S. federal income tax purposes, the Internal Revenue Code of 1986, as amended (the “Code”),final, temporary and proposed U.S. Treasury Regulations promulgated thereunder and administrative and judicialinterpretations thereof) in force as of the date of this annual report, the Convention Between the Government ofthe United States of America and the Government of the French Republic for the Avoidance of Double Taxationand the Prevention of Fiscal Evasion with Respect to Taxes on Income and Capital of August 31, 1994 (the“Treaty”), which entered into force on December 30, 1995 (as amended by any subsequent protocols), and thetax regulations issued by the French tax authorities (the “Regulations”) in force as of the date of this report. Allof the foregoing is subject to change. Such changes could apply retroactively and could affect the consequencesdescribed below.
In particular, the United States and France signed a protocol on January 13, 2009, that, upon ratification,will make several changes to the Treaty, including changes to the “Limitation on Benefits” provision. Theprovisions of the protocol will be effective as soon as the ratification occurs in both jurisdictions, and withrespect to withholding taxes will be effective for amounts paid or accrued on or after the first day of the year inwhich the protocol enters into force. U.S. holders are advised to consult their own tax advisors regarding theeffect the protocol may have on their eligibility for Treaty benefits in light of their own particular circumstances.
For the purposes of this discussion, a U.S. holder is a beneficial owner of Securities that is (i) an individualwho is a U.S. citizen or resident for U.S. federal income tax purposes, (ii) a U.S. domestic corporation or certainother entities created or organized in or under the laws of the United States or any state thereof, including theDistrict of Colombia, or (iii) otherwise subject to U.S. federal income taxation on a net income basis in respect ofSecurities. A non-U.S. holder is a person other than a U.S. holder.
If a partnership holds Securities, the tax treatment of a partner generally will depend upon the status of thepartner and the activities of the partnership. If a U.S. holder is a partner in a partnership that holds Securities,the holder is urged to consult its own tax adviser regarding the specific tax consequences of acquiring, owningand disposing of Securities.
This discussion is intended only as a general summary and does not purport to be a complete analysis orlisting of all potential tax effects of the acquisition, ownership or disposition of the Securities to any particularinvestor, and does not discuss tax considerations that arise from rules of general application or that are generallyassumed to be known by investors. The discussion applies only to investors that hold our Securities as capitalassets, that have the U.S. dollar as their functional currency, that are entitled to Treaty benefits under the“Limitation on Benefits” provision contained in the Treaty, and whose ownership of the Securities is noteffectively connected to a permanent establishment or a fixed base in France. Certain holders (including, but notlimited to, U.S. expatriates, partnerships or other entities classified as partnerships for U.S. federal income taxpurposes, banks, insurance companies, regulated investment companies, tax-exempt organizations, financialinstitutions, persons subject to the alternative minimum tax, persons who acquired the Securities pursuant to theexercise of employee stock options or otherwise as compensation, persons that own (directly, indirectly or byattribution) 5% or more of our voting stock or 10% or more of our outstanding share capital, dealers in securitiesor currencies, persons that elect to mark their securities to market for U.S. federal income tax purposes andpersons holding Securities as a position in a synthetic security, straddle or conversion transaction) may be subjectto special rules not discussed below. Holders of Securities are advised to consult their own tax advisers withregard to the application of French tax law and U.S. federal income tax law to their particular situations, as wellas any tax consequences arising under the laws of any state, local or other foreign jurisdiction.
156

French Taxes
New Tax Distribution Regime
Holders of Securities should be aware that the French Finance Bill for 2004 (No. 2003-1311 datedDecember 30, 2003) provided for the suppression of the avoir fiscal and the précompte with respect to dividendspaid on or after January 1, 2005. However, non-individual shareholders were already no longer entitled to use theavoir fiscal as of January 1, 2005.
Estate and Gift Taxes and Transfer Taxes
In general, a transfer of Securities by gift or by reason of death of a U.S. holder that would otherwise besubject to French gift or inheritance tax, respectively, will not be subject to such French tax by reason of theConvention between the Government of the United States of America and the Government of the FrenchRepublic for the Avoidance of Double Taxation and the Prevention of Fiscal Evasion with Respect to Taxes onEstates, Inheritances and Gifts, dated November 24, 1978, unless the donor or the transferor is domiciled inFrance at the time of making the gift or at the time of his or her death, or the Securities were used in, or held foruse in, the conduct of a business through a permanent establishment or a fixed base in France.
Generally, transfers of Securities (other than ordinary shares) are not subject to French registration or stampduty. Generally, transfers of ordinary shares will not be subject to French registration or stamp duty if suchtransfers are not evidenced by a written agreement or if such an agreement is executed outside of France.
Wealth Tax
The French wealth tax impôt de solidarité sur la fortune does not generally apply to the Securities if theholder is a U.S. resident, as defined pursuant to the provisions of the Treaty.
U.S. Taxes
Ownership of the Securities
Deposits and withdrawals by a U.S. holder of ordinary shares in exchange for ADSs, or of PSSAs inexchange for PSSA-ADSs (including in connection with the intended termination of the deposit agreement withrespect to the PSSA-ADSs), will not be taxable events for U.S. federal income tax purposes. For U.S. taxpurposes, holders of ADSs will be treated as owners of the ordinary shares represented by such ADSs, andholders of PSSA-ADSs will be treated as owners of the PSSAs represented by such PSSA-ADSs. Accordingly,the discussion that follows regarding the U.S. federal income tax consequences of acquiring, owning anddisposing of ordinary shares and PSSAs is equally applicable to ADSs and PSSA-ADSs, respectively.
Information Reporting and Backup Withholding Tax
Distributions made to holders and proceeds paid from the sale, exchange, redemption or disposal ofSecurities may be subject to information reporting to the Internal Revenue Service. Such payments may besubject to backup withholding taxes unless the holder (i) is a corporation or other exempt recipient or(ii) provides a taxpayer identification number and certifies that no loss of exemption from backup withholdinghas occurred. Holders that are not U.S. persons generally are not subject to information reporting or backupwithholding. However, such a holder may be required to provide a certification of its non-U.S. status inconnection with payments received within the United States or through a U.S.-related financial intermediary toestablish that it is an exempt recipient. Backup withholding is not an additional tax. Amounts withheld as backupwithholding may be credited against a holder’s U.S. federal income tax liability. A holder may obtain a refund ofany excess amounts withheld under the backup withholding rules by filing the appropriate claim for refund withthe Internal Revenue Service and furnishing any required information.
State and Local Taxes
In addition to U.S. federal income tax, U.S. holders of Securities may be subject to U.S. state and local taxeswith respect to such Securities. Holders of Securities are advised to consult their own tax advisers with regard tothe application of U.S. state and local income tax law to their particular situation.
157

ADSs-Ordinary Shares
French Taxes
Taxation of Dividends
Dividends received by French resident individuals are either included in their total income and subject to theprogressive income tax, or they can alternatively be subject to an 18% levy at source at the option of thebeneficiary.
When no option is exercised by the French resident individuals, they are only taxed on 60% of dividendsreceived (by application of a first 40% allowance) and, in addition to a second fixed annual allowance of €3,050for couples subject to joint taxation and €1,525 for single persons, widows, widowers or divorced persons, areentitled to a tax credit equal to 50% of all dividends received within one year (the “Tax Credit”). The Tax Creditis capped for all dividends received within one year at €230 for married couples and members of a civil unionagreement subject to joint taxation and €115 for single persons, widows or widowers, divorced or marriedpersons subject to separate taxation.
As a result of the French Finance Bill for 2008, French resident individuals can elect to have all or part ofthe dividends received subject to an 18% levy at source at the irrevocable option of the shareholder exercised nolater than at the time of payment if it occurs in France. If the option is exercised only for a portion of thedividends received during the year (whether they are distributed by sanofi-aventis or any other company), theremaining dividends subject to the progressive income tax lose the benefit of the aforementioned allowances andthe Tax Credit.
Dividends paid to non-residents are not normally eligible for the Tax Credit described above. However,under the Treaty, qualifying non-resident individuals may benefit from a refund of the Tax Credit (net ofapplicable withholding tax) under certain conditions, subject to compliance with the procedures for claimingbenefits under the Treaty. The French tax authorities have not yet issued any guidance with regard to theprocedures for claiming the refund of the Tax Credit to non-resident individuals. Individual U.S. holders areurged to consult their own tax advisers in this respect.
When the new protocol to the Treaty becomes effective, the Treaty will no longer specifically provide forany entitlement to a refund of the Tax Credit, and individual U.S. holders will not continue to benefit from such arefund.
Under French law, dividends paid by a French corporation, such as sanofi-aventis, to non-residents ofFrance are generally subject to French withholding tax at a rate of 25% (18% for distributions made as fromJanuary 1, 2008 to individuals that are resident in the European Economic Area, except Liechtenstein). Under theTreaty, the rate of French withholding tax on dividends paid to an eligible U.S. holder whose ownership of theordinary shares or ADSs is not effectively connected with a permanent establishment or fixed base that such U.S.holder has in France is reduced to 15% and a U.S. holder may claim a refund from the French tax authorities ofthe amount withheld in excess of the Treaty rate of 15%, if any. For U.S. holders that are not individuals, therequirements for eligibility for Treaty benefits, including the reduced 15% withholding tax rate, contained in the“Limitation on Benefits” provision of the Treaty are complicated, and there are certain technical changes beingmade to these requirements by the new protocol. U.S. holders are advised to consult their own tax advisorsregarding their eligibility for Treaty benefits, and whether the protocol may affect their eligibility, in light of theirown particular circumstances.
Dividends paid to an eligible U.S. holder are immediately subject to the reduced rate of 15%, provided thatsuch holder establishes before the date of payment that it is a U.S. resident under the Treaty by completing andproviding the depositary with a treaty form (Form 5000). Dividends paid to a U.S. holder that has not filed theForm 5000 before the dividend payment date will be subject to French withholding tax at the rate of 25% andthen reduced at a later date to 15%, provided that such holder duly completes and provides the French taxauthorities with the treaty forms Form 5000 and Form 5001 before December 31 of the second calendar yearfollowing the year during which the dividend is paid. Pension funds and certain other tax-exempt entities aresubject to the same general filing requirements as other U.S. holders except that they may have to supplyadditional documentation evidencing their entitlement to these benefits.
158
Form 5000 and Form 5001, together with instructions, will be provided by the depositary to all U.S. holdersregistered with the depositary and is also available from the U.S. Internal Revenue Service. The depositary willarrange for the filing with the French Tax authorities of all such forms properly completed and executed by U.S.holders of ordinary shares or ADSs and returned to the depositary in sufficient time that they may be filed withthe French tax authorities before the distribution so as to obtain immediately a reduced withholding tax rate.
The withholding tax refund, if any, ordinarily is paid within 12 months of filing the applicable FrenchTreasury Form, but not before January 15 of the year following the calendar year in which the related dividend ispaid.
Tax on Sale or Other Disposition
In general, under the Treaty, a U.S. holder who is a U.S. resident for purposes of the Treaty will not besubject to French tax on any capital gain from the redemption, sale or exchange of ordinary shares or ADSsunless the ordinary shares or the ADSs form part of the business property of a permanent establishment or fixedbase that the U.S. holder has in France. Special rules apply to individuals who are residents of more than onecountry.
U.S. Taxes
Taxation of Dividends
For U.S. federal income tax purposes, the gross amount of any distribution and Tax Credit (as definedabove) paid to U.S. holders (that is, the net distribution received plus any tax withheld therefrom) will be treatedas ordinary dividend income to the extent paid or deemed paid out of the current or accumulated earnings andprofits of sanofi-aventis (as determined under U.S. federal income tax principles). Dividends paid by sanofi-aventis will not be eligible for the dividends-received deduction generally allowed to corporate U.S. holders.
Subject to certain exceptions for short-term and hedged positions, the U.S. dollar amount of dividendsreceived by an individual U.S. holder with respect to taxable years beginning before January 1, 2011, withrespect to the ADSs or our ordinary shares will be subject to taxation at a maximum rate of 15% if the dividendsare “qualified dividends.” Dividends paid on the ordinary shares or ADSs will be treated as qualified dividends if(i) the issuer is eligible for the benefits of a comprehensive income tax treaty with the United States that theInternal Revenue Service has approved for the purposes of the qualified dividend rules and (ii) the issuer was not,in the year prior to the year in which the dividend was paid, and is not, in the year in which the dividend is paid, apassive foreign investment company (“PFIC”). The Treaty has been approved for the purposes of the qualifieddividend rules. Based on our audited financial statements and relevant market and shareholder data, we believesanofi-aventis was not a PFIC for U.S. federal income tax purposes with respect to its 2008 taxable year. Inaddition, based on its audited financial statements and current expectations regarding the value and nature of itsassets, the sources and nature of its income, and relevant market and shareholder data, we do not anticipate thatsanofi-aventis will become a PFIC for its 2009 taxable year. Holders of ordinary shares and ADSs should consulttheir own tax advisers regarding the availability of the reduced dividend tax rate in light of their own particularcircumstances.
If you are a U.S. holder, dividend income received by you with respect to ADSs or ordinary shares generallywill be treated as foreign source income for foreign tax credit purposes. The limitation on foreign taxes eligiblefor credit is calculated separately with respect to specific classes of income. Distributions out of earnings andprofits with respect to the ADSs or ordinary shares generally will be treated as “passive category” income (or, inthe case of certain U.S. holders, “general category” income). Subject to certain limitations, French income taxwithheld in connection with any distribution with respect to the ADSs or ordinary shares may be claimed as acredit against the U.S. federal income tax liability of a U.S. holder if such U.S. holder elects for that year tocredit all foreign income taxes. Alternatively, such French withholding tax may be taken as a deduction againsttaxable income. Foreign tax credits will not be allowed for withholding taxes imposed in respect of certain short-term or hedged positions in Securities and may not be allowed in respect of certain arrangements in which a U.S.holder’s expected economic profit is insubstantial. The U.S. federal income tax rules governing the availabilityand computation of foreign tax credits are complex. U.S. holders should consult their own tax advisersconcerning the implications of these rules in light of their particular circumstances.
159

To the extent that an amount received by a U.S. holder exceeds the allocable share of our current andaccumulated earnings and profits, such excess will be applied first to reduce such U.S. holder’s tax basis in itsordinary shares or ADSs and then, to the extent it exceeds the U.S. holder’s tax basis, it will constitute capitalgain from a deemed sale or exchange of such ordinary shares or ADSs (see “— Tax on Sale or OtherDisposition”, below).
The amount of any distribution or Tax Credit paid in euros will be equal to the U.S. dollar value of the euroamount distributed, calculated by reference to the exchange rate in effect on the date the dividend is received by aU.S. holder of ordinary shares (or by the depositary, in the case of ADSs) regardless of whether the payment is infact converted into U.S. dollars on such date. U.S. holders should consult their own tax advisers regarding thetreatment of foreign currency gain or loss, if any, on any euros received by a U.S. holder or depositary that areconverted into U.S. dollars on a date subsequent to receipt.
Tax on Sale or Other Disposition
In general, for U.S. federal income tax purposes, a U.S. holder that sells, exchanges or otherwise disposes ofits ordinary shares or ADSs will recognize capital gain or loss in an amount equal to the U.S. dollar value of thedifference between the amount realized for the ordinary shares or ADSs and the U.S. holder’s adjusted tax basis(determined in U.S. dollars and under U.S. federal income tax rules) in the ordinary shares or ADSs. Such gain orloss generally will be U.S. -source gain or loss, and will be treated as long-term capital gain or loss if the U.S.holder’s holding period in the ordinary shares or ADSs exceeds one year at the time of disposition. If the U.S.holder is an individual, any capital gain generally will be subject to U.S. federal income tax at preferential rates(currently a maximum of 15%) if specified minimum holding periods are met. The deductibility of capital lossesis subject to significant limitations.
Participating Shares Series “A” (PSSAs) and PSSA-ADSs
French Taxes
Taxation of Annual Payments and Any Reorganization Payment
Under French law, no French withholding tax is imposed on Annual Payments on the Participating SharesSeries “A” (PSSAs). Pursuant to Article 131 quater of the French General Tax Code, the withholding taxexemption on Annual Payments is not subject to any filing requirement because the PSSAs have been offeredexclusively outside France. In the event that French law should change and a French withholding tax becomesapplicable to the Annual Payments, (i) sanofi-aventis or an affiliate shall be obligated, to the extent it maylawfully do so, to gross up such payments (with certain exceptions relating to the holder’s connection withFrance, failure to claim an exemption or failure to present timely such shares for payment) so that, after thepayment of such withholding tax, the holder will receive an amount equal to the amount which the holder wouldhave received had there been no withholding or (ii) sanofi-aventis may redeem the PSSAs.
Taxation of Redemption
In general, under the Treaty, a U.S. holder who is a U.S. resident for purposes of the Treaty will not besubject to French tax on any capital gain from the redemption, sale or exchange of PSSAs or PSSA-ADSs.Special rules apply to individuals who are residents of more than one country.
U.S. Taxes
Taxation of Annual Payments
For U.S. federal income tax purposes, the gross amount of the annual payments paid to U.S. holders entitledthereto will be treated as ordinary dividend income (in an amount equal to the cash or fair market value of theproperty received) to the extent paid out of our current or accumulated earnings and profits (as determined underU.S. federal income tax principles). Such dividends generally will be foreign-source income and generally willbe treated as “passive category” (or, in the case of certain U.S. holders, “general category”) income for foreigntax credit purposes. Dividends paid by sanofi-aventis will not be eligible for the dividends-received deductiongenerally allowed to corporate U.S. holders.
160

Subject to certain exceptions for short-term and hedged positions, the U.S. dollar amount of dividends receivedby a U.S. holder that is an individual with respect to taxable years beginning before January 1, 2011 with respect tothe PSSAs or PSSA-ADSs will be subject to taxation at a maximum rate of 15% if the dividends are “qualifieddividends.” Dividends paid on the PSSAs or PSSA-ADSs will be treated as qualified dividends if (i) the issuer iseligible for the benefits of a comprehensive income tax treaty with the United States that the Internal RevenueService has approved for the purposes of the qualified dividend rules and (ii) the issuer was not, in the year prior tothe year in which the dividend was paid, and is not, in the year in which the dividend is paid, a passive foreigninvestment company (PFIC). The Treaty has been approved for the purposes of the qualified dividend rules. Basedon our audited financial statements and relevant market and shareholder data, we believe we were not a PFIC forU.S. federal income tax purposes with respect to our 2008 taxable year. In addition, based on our audited financialstatements and current expectations regarding the value and nature of our assets, the sources and nature of ourincome, and relevant market and shareholder data, we do not anticipate that we will become a PFIC for our 2009taxable year. Holders of PSSAs and PSSA-ADSs should consult their own tax advisers regarding the availability ofthe reduced dividend tax rate in light of their own particular circumstances.
To the extent that an amount received by a U.S. holder exceeds the allocable share of our current andaccumulated earnings and profits, such excess will be applied first to reduce such U.S. holder’s tax basis in itsPSSAs or PSSA-ADSs and then, to the extent it exceeds the U.S. holder’s tax basis, it will constitute gain from adeemed sale or exchange of such PSSAs or PSSA-ADSs (see “— Tax on Sale or Other Disposition (IncludingRedemption)”, below).
The amount of any distribution paid in euros will be equal to the U.S. dollar value of the distributed euros,calculated by reference to the exchange rate in effect on the date the dividend is received by a U.S. holder ofPSSAs (or by the depositary, in the case of PSSA-ADSs), regardless of whether the payment is in fact convertedinto U.S. dollars on such date. U.S. holders should consult their own tax advisers regarding the treatment offoreign currency gain or loss, if any, on any euros received by a U.S. holder or depositary that are converted intoU.S. dollars on a date subsequent to receipt.
Tax on Sale or Other Disposition (Including Redemption)
In general, for U.S. federal income tax purposes, a U.S. holder that sells, exchanges or otherwise disposes ofPSSAs or PSSA-ADSs will recognize capital gain or loss in an amount equal to the U.S. dollar value of thedifference between the amount realized for the PSSAs or PSSA-ADSs and the holder’s adjusted tax basis(determined in U.S. dollars) in the PSSAs or PSSA-ADSs. Such gain or loss generally will be U.S. -source gainor loss, and will be treated as long-term capital gain or loss if the U.S. holder’s holding period in the PSSAs orPSSA-ADSs exceeds one year at the time of disposition. If the U.S. holder is an individual, any capital gaingenerally will be subject to U.S. federal income tax at preferential rates (currently a maximum of 15%) ifspecified minimum holding periods are met. The deductibility of capital losses is subject to significantlimitations.
If, however, a U.S. holder’s PSSAs or PSSA-ADSs are redeemed and it has a direct or indirect stock interestin sanofi-aventis after such redemption, then amounts received in a redemption could, under applicable U.S. taxrules, be treated as a distribution taxable as a dividend that is measured by the full amount of cash received bysuch U.S. holder (to the extent of the current and accumulated earnings and profits of sanofi-aventis, as describedabove in “Taxation of Annual Payments”). U.S. holders should consult their own tax advisers as to theapplication of these rules to any such redemption.
F. Dividends and Paying Agents
N/A
G. Statement by Experts
N/A
161

H. Documents on Display
We are subject to the information requirements of the U.S. Securities Exchange Act of 1934, as amended,and, in accordance therewith, we are required to file reports, including annual report on Form 20-F, and otherinformation with the U.S. Securities and Exchange Commission by electronic means. Our public filings areavailable to the public over the Internet at the Commission’s Website at http://www.sec.gov (these documents arenot incorporated by reference in this annual report).
I. Subsidiary Information
N/A
Item 11. Quantitative and Qualitative Disclosures about Market Risk(1)
General Policy
Liquidity risk, foreign exchange risk and interest rate risk, as well as related counterparty risk, are managedcentrally by our dedicated treasury team within the Group Finance Department. Where it is not possible tomanage these risks centrally, in particular due to regulatory restrictions (such as foreign exchange controls) orlocal tax restrictions, credit facilities and/or currency lines guaranteed by the parent company are contracted byour subsidiaries locally with banks, under the supervision of the central treasury team.
Our investment and financing strategies, as well as our interest rate and currency hedging strategies, arereviewed monthly by the Group Finance Department.
Our policy on derivatives prohibits speculative exposure.
Liquidity Risk
We operate a centralized treasury platform according to which all surplus cash and financing needs of oursubsidiaries are invested with or funded by the parent company (where permitted by local legislation), at marketconditions. The central treasury department manages the Group’s current and projected financing (debt, net ofcash and cash equivalents), and ensures that the Group is able to meet its financial commitments by maintainingsufficient cash and confirmed credit facilities for the size of our operations and the maturity of our debt.
As of December 31, 2008, cash and cash equivalents amounted to €4,226 million. The Group tends todiversify its short term investments with leading banks on monetary supports with a maturity of less than threemonths. As of December 31, 2008, these short term investments were comprised of:
• Bank term deposits with a maturity of less than two months and Certificates of Deposit with a maturityof less than three months. These short-term investments are entered into with leading financialinstitutions.
• Mutual fund deposits classified as “monétaires euros” (Euro Money-Market) by the AMF, subject to alimit of 10% of invested assets.
As of December 31, 2008, the Group had €10.8 billion of undrawn confirmed credit facilities that were notallocated to outstanding commercial paper drawdowns, of which €6.7 billion expire in 2012, €0.3 billion in 2011,€3.7 billion in 2010 and €0.1 billion in 2009. Our credit facilities are not subject to financial covenant ratios.
Our policy is to diversify our sources of funding and optimize our cost of funding on a recurring basisthrough public or private issuances of debt securities, in particular under our Euro Medium Term Note program,and by issuing commercial paper in France and the United States. Short-term commercial paper programs (U.S.dollar-denominated commercial paper swapped into euro and euro-denominated commercial paper) are used to
(1) Information in this section is complementary to Note B.8.8 to our consolidated financial statements included at Item 18 of this annualreport, with regards to information required by IFRS 7, and is covered by our independent registered public accounting firms’ report onthe consolidated financial statements.
162

meet our short-term financing needs. Drawdowns under these programs are generally renewed for periods ofthree months and their total outstanding amounts as of December 31, 2008 were €0.7 billion. The commercialpaper programs are backed by confirmed credit facilities (expiring in 2009 and 2010) totaling €4.5 billion, topermit the Group to continue to access financing if raising funds via commercial paper is no longer possible (formore information, see Note D.17 to the consolidated financial statements).
In the context of a market-wide liquidity crisis, the Group could be exposed to a scarcity of its sources offunding including the above-mentioned programs, or to a deterioration of their conditions. This situation coulddamage the capacity of the Group to refinance its debt or to issue new debt at reasonable conditions. Please referto “Item 3. Key Information — D. Risk Factors — Liquidity Risk.”
Interest Rate Risk
Our interest rate risk exposure arises from the fact that most of our debt is floating-rate (credit facilities,commercial paper and floating rate notes), with reference to Eonia, U.S. Libor and Euribor. To optimize the costof our short-term and medium-term debt and reduce its volatility, we use interest rate swaps, cross-currencyswaps, and, if the case arises, interest rate options (purchases of caps, or combined purchases of caps and sales offloors) to alter the structure of our debt. (see Note D.20. to our consolidated financial statements included atItem 18 of this annual report).
As of December 31, 2008, 43% of our total debt (amounting to €5,938 million), was floating-rate and 57%was fixed-rate after taking account of interest rate derivatives. Our cash and cash equivalents (amounting to€4,226 million) are fully floating rate.
As of December 31, 2008, the sensitivity of the total debt to interest rate fluctuations is detailed in the tablebelow on a yearly basis:
Change in 3-month EuriborImpact on pre-tax
net income (in € million)
+100 bp (17)+ 25 bp (4)- 25 bp 4
- 100 bp 17
Foreign Exchange Risk
a. Operational Foreign Exchange Risk
A substantial proportion of our net sales is generated in countries in which the euro, which is our reportingcurrency, is not the functional currency. In 2008, for example, 31.2% of our consolidated net sales weregenerated in the United States. Although we also incur expenses in those countries, the impact of those expensesis not enough wholly to offset the impact of exchange rates on net sales. Consequently, our operating incomemay be materially affected by fluctuations in the exchange rate between the euro and other currencies, primarilythe U.S. dollar.
We operate a foreign exchange risk hedging policy to reduce the exposure of our operating income toexchange rate movements. This policy involves regular assessments of our worldwide foreign currency exposure,based on budget estimates of foreign-currency transactions to be carried out by the parent company and itssubsidiaries. These transactions mainly comprise sales, purchases, research costs, co-marketing andco-promotion expenses, and royalties. To reduce the exposure of these transactions to exchange rate movements,we contract currency hedges using liquid financial instruments such as forward purchases and sales of currencyas well as call and put options, and combinations of currency options (collars).
The table below shows operational currency hedging derivatives in place as of December 31, 2008, with thenotional amount translated into euros at the relevant closing exchange rate. See also Note D.20. to ourconsolidated financial statements included at Item 18 of this annual report for the accounting classification ofthese instruments as of December 31, 2008.
163

Operational foreign exchange derivatives as of December 31, 2008 (1):
Notional Fair(in € million) amount value
Forward currency sales . . . . . . . . . . . . . . . . . . . . . . . . . . . . . . . . . . . . . . . . . . . . . . . . . . . . . . . . . 3,305 219of which: U.S. dollar . . . . . . . . . . . . . . . . . . . . . . . . . . . . . . . . . . . . . . . . . . . . . . . . . . . . . . . . . . . . 2,461 182
Japanese yen . . . . . . . . . . . . . . . . . . . . . . . . . . . . . . . . . . . . . . . . . . . . . . . . . . . . . . . . . . 191 (5)Russian rouble . . . . . . . . . . . . . . . . . . . . . . . . . . . . . . . . . . . . . . . . . . . . . . . . . . . . . . . . . 134 15Pound sterling . . . . . . . . . . . . . . . . . . . . . . . . . . . . . . . . . . . . . . . . . . . . . . . . . . . . . . . . . 104 6Saudi Arabian rial . . . . . . . . . . . . . . . . . . . . . . . . . . . . . . . . . . . . . . . . . . . . . . . . . . . . . . 58 5Polish zloty . . . . . . . . . . . . . . . . . . . . . . . . . . . . . . . . . . . . . . . . . . . . . . . . . . . . . . . . . . . 53 6
Forward currency purchases . . . . . . . . . . . . . . . . . . . . . . . . . . . . . . . . . . . . . . . . . . . . . . . . . . . . 601 (11)of which: Hungarian forint . . . . . . . . . . . . . . . . . . . . . . . . . . . . . . . . . . . . . . . . . . . . . . . . . . . . . . . 175 (1)
U.S dollar . . . . . . . . . . . . . . . . . . . . . . . . . . . . . . . . . . . . . . . . . . . . . . . . . . . . . . . . . . . . 140 3Pound sterling . . . . . . . . . . . . . . . . . . . . . . . . . . . . . . . . . . . . . . . . . . . . . . . . . . . . . . . . . 75 (6)Russian rouble . . . . . . . . . . . . . . . . . . . . . . . . . . . . . . . . . . . . . . . . . . . . . . . . . . . . . . . . . 72 (6)Canadian dollar . . . . . . . . . . . . . . . . . . . . . . . . . . . . . . . . . . . . . . . . . . . . . . . . . . . . . . . . 51 (1)
Put options purchased . . . . . . . . . . . . . . . . . . . . . . . . . . . . . . . . . . . . . . . . . . . . . . . . . . . . . . . . . . 24 —Call options written . . . . . . . . . . . . . . . . . . . . . . . . . . . . . . . . . . . . . . . . . . . . . . . . . . . . . . . . . . . .
Total . . . . . . . . . . . . . . . . . . . . . . . . . . . . . . . . . . . . . . . . . . . . . . . . . . . . . . . . . . . . . . . . . . . . . . . .
48
3,978
(7)
201
(1) As of December 31, 2007, the notional amount of forward currency sales was €2,205 million with a fair value of €30 million (includingforward sales of U.S. dollars of a notional amount of €1,288 million with a fair value of €20 million). As of December 31, 2007, thenotional amount of forward currency purchases was €464 million with an immaterial fair value (including forward sales of U.S. dollarsof a notional amount of €48 million with a fair value of -€1 million). In addition, as of December 31, 2007, the Group portfolio includedpurchased put options of a notional amount of €409 million with a fair value of €4 million, written call options of a notional amount of€741 million with a fair value of -€1 million and written put options of a notional amount of €12 million with an immaterial fair value.
As of December 31, 2008, none of these instruments had an expiry date after December 31, 2009.
These positions hedge:
• future foreign-currency cash flows arising after the balance sheet date in relation to transactions carriedout during the year ended December 31, 2008 and recognized in the balance sheet at that date. Gainsand losses on derivative instruments (forward contracts) have been and will continue to be calculatedand recognized in parallel with the recognition of gains and losses on the hedged items. Due to thishedging relationship, the foreign exchange gain or loss on these items (derivative instruments andunderlying assets) will be close to zero in 2009; and
• forecast foreign-currency cash flows relating to commercial transactions to be carried out in 2009.These hedges (forward contracts and options) cover approximately 20% to 40% of the expected netcash flows for 2009 in currencies subject to budgetary hedging. The portfolio of derivatives relating to2009 dollar U.S. denominated cash flows consists entirely of forward contracts and accounts forone-third of the expected cash flows. Given that these forward contracts were designated as cash flowhedges as of December 31, 2008, the sensitivity of the foreign exchange gain or loss and the impact onequity related to these instruments would be as follows:
Constant euro/U.S. dollarexchange rate over 2009
Foreign exchangegain/(loss) on
U.S. dollar hedgingin € million
Impact onequity
Depreciation of 10% in the U.S. dollar (€1 = $1.5309) . . . . . . . . . . . . . . . . . 234.1 123.5Exchange rate maintained at the December 31, 2008 rate (€1 = $1.3917) . . . 110.7 —Appreciation of 10% in the U.S. dollar (€1 = $1.2525) . . . . . . . . . . . . . . . . . (40.2) (150.9)
164
b. Financial Foreign Exchange Risk
Some of our financing activities, such as the cash pooling arrangements for foreign subsidiaries outside theeuro zone and our U.S. commercial paper issues (equivalent value: €0.7 billion as of December 31, 2008), exposecertain entities, especially the sanofi-aventis parent company, to financial foreign exchange risk (i.e., the risk ofchanges in the value of loans and borrowings denominated in a currency other than the functional currency of thelender or borrower). The net foreign exchange exposure for each currency and entity is hedged by firm financialinstruments, usually currency swaps. (see Note D.20. to our consolidated financial statements included at Item 18of this annual report).
The table below shows financial currency hedging instruments in place as of December 31, 2008, calculatedusing exchange rates prevailing as of that date.
Financial foreign exchange derivatives as of December 31, 2008 (1):
Notionalamount
Fairvalue(in € million) Expiry
Forward currency purchases . . . . . . . . . . . . . . . . . . . . . . . . . . . . . . . . . . . . . . . . . . . . . 9,210 (80)of which: U.S. dollar (*) . . . . . . . . . . . . . . . . . . . . . . . . . . . . . . . . . . . . . . . . . . . . . . . . . . . 8,256 (66) 2009
Pound Sterling . . . . . . . . . . . . . . . . . . . . . . . . . . . . . . . . . . . . . . . . . . . . . . . . . . 235 (4) 2009Canadian dollar . . . . . . . . . . . . . . . . . . . . . . . . . . . . . . . . . . . . . . . . . . . . . . . . . 189 (13) 2009
Forward currency sales . . . . . . . . . . . . . . . . . . . . . . . . . . . . . . . . . . . . . . . . . . . . . . . . . . 1,954 (22)of which: U.S. dollar . . . . . . . . . . . . . . . . . . . . . . . . . . . . . . . . . . . . . . . . . . . . . . . . . . . . . 1,043 (23) 2009
Japanese yen . . . . . . . . . . . . . . . . . . . . . . . . . . . . . . . . . . . . . . . . . . . . . . . . . . . 665 (7) 2009Hungarian forint . . . . . . . . . . . . . . . . . . . . . . . . . . . . . . . . . . . . . . . . . . . . . . . .
Total . . . . . . . . . . . . . . . . . . . . . . . . . . . . . . . . . . . . . . . . . . . . . . . . . . . . . . . . . . . . . . . . . .
95
11,164
1
(102)
2009
(*) Includes €7,537 million used to hedge U.S. dollar intra-group deposits placed with the sanofi-aventis parent company.(1) As of December 31, 2007, the notional amount of forward currency purchases was €8,261 million with a fair value of -€179 million
(including forward purchases of U.S. dollars of a notional amount of €7,348 million with a fair value of -€167 million). As ofDecember 31, 2007, the notional amount of forward currency sales was €1,563 million with a fair value of €26 million (includingforward sales of U.S. dollars of a notional amount of €936 million with a fair value of €20 million).
These swaps generate a net foreign exchange financial result corresponding to the difference between theinterest rates of the hedged currency and the euro. As regards the U.S. dollar, the interest rate spread related toforward currency purchases, positive in 2007, became negative in 2008, leading to an unfavorable variation ofthe financial foreign exchange profit and loss for €119 million. The change in value of short-term financial assetsand liabilities denominated in foreign currencies due to movements in exchange rate is compensated by thechange of intrinsic value of derivative instruments.
As of December 31, 2008, none of the instruments had an expiry date after January 31, 2009.
We may also hedge some future foreign-currency investment or divestment cash flows.
c. Other Foreign Exchange Risks
A significant proportion of our consolidated net assets is denominated in U.S. dollars. For a breakdown ofnet assets see Note D.35.2 to the consolidated financial statement. As a result, any fluctuation in the U.S. dollaragainst the euro affects shareholders’ equity as expressed in euros. As of December 31, 2008, we had noderivative instruments in place to limit the effect of such fluctuations.
Counterparty Risk
Our financing and investing operations as well as our currency and interest rate hedges, are contracted withleading banks. Concerning the investing operations and the derivative instruments, a limit is set for each financialinstitution, depending on its rating. The respect of the limits, computed on the basis of the notional amounts ofthe operations and level-headed by the remaining duration and the nature of the commitment, is subject to a dailyfollow-up.
165
As of December 31, 2008, the distribution of the exposure by rating and the percentage committed to thedominant counterparty were as follows:
% / rating of thedominant
counterparty as ofAA- ratings A+, A- and A BBB ratings December 31,and higher ratings and not rated 2008
Cash equivalents (excluding mutual funds) (1) . . . . . . . . . . 801 322 — 27% / AA-Notional amounts of currency hedges (2) . . . . . . . . . . . . . . . 6,789 8,619 — 14% / A+Notional amounts of interest rate hedges (2) . . . . . . . . . . . . . 1,372 681 — 24% / AA-Credit facilities . . . . . . . . . . . . . . . . . . . . . . . . . . . . . . . . . . . 6,275 6,236 — 11% / A+
(1) Cash equivalents include €2,601 million of mutual fund deposits classified as “monétaires euros” (Euro money-market) by the AMF.(2) The notional amounts are computed on the basis of the forward rates negotiated at the initiation date of the derivative instruments.
Materialization of counterparty risk could impact the Group’s liquidity in certain circumstances.
Stock Market Risk
It is our policy not to trade on the stock market for speculative purposes.
Item 12. Descriptions of Securities other than Equity Securities
N/A
166

PART II
Item 13. Defaults, Dividend Arrearages and Delinquencies
N/A
Item 14. Material Modifications to the Rights of Security Holders
N/A
Item 15. Controls and Procedures
(a) Our Chief Executive Officer and principal financial officer, after evaluating the effectiveness of ourdisclosure controls and procedures (as defined in Exchange Act Rule 13a-15(e)) as of the end of the periodcovered by this Form 20-F, have concluded that, as of such date, our disclosure controls and procedures wereeffective to ensure that material information relating to sanofi-aventis was timely made known to them by otherswithin the Group.
(b) Report of Management on Internal Control Over Financial Reporting
Management of the Company is responsible for establishing and maintaining adequate internal control overfinancial reporting, as such term is defined in Exchange Act Rule 13a-15(f). Management assessed theeffectiveness of internal control over financial reporting as of December 31, 2008 based on the framework in“Internal Control — Integrated Framework” issued by the Committee of Sponsoring Organizations of theTreadway Commission (COSO).
Based on that assessment, management has concluded that the Company’s internal control over financialreporting was effective as of December 31, 2008 to provide reasonable assurance regarding the reliability of itsfinancial reporting and the preparation of its financial statements for external purposes, in accordance withInternational Financial Reporting Standards (IFRS) as issued by the International Accounting Standards Board(IASB) and with IFRS adopted by the European Union as of December 31, 2008.
Due to its inherent limitations, internal control over financial reporting may not prevent or detectmisstatements, and can only provide reasonable assurance regarding the reliability of financial reporting and thepreparation of financial statements. Also, projections of any evaluation of effectiveness to future periods aresubject to the risk that controls may become inadequate because of changes in conditions, or that the degree ofcompliance with the policies or procedures may deteriorate.
The effectiveness of the Company’s internal control over financial reporting has been audited byPricewaterhouseCoopers Audit and Ernst & Young Audit, independent registered public accounting firms, asstated in their report on the Company’s internal control over financial reporting as of December 31, 2008, whichis included herein. See paragraph (c) of the present Item 15, below.
(c) See report of PricewaterhouseCoopers Audit and Ernst & Young Audit, independent registered publicaccounting firms, included under “Item 18. Financial Statements” on page F-3.
(d) There were no changes to our internal control over financial reporting that occurred during the periodcovered by this Form 20-F that have materially affected, or are reasonably likely to materially affect, our internalcontrol over financial reporting.
Item 16.
[Reserved]
A. Audit Committee Financial Expert
Our Board of Directors has determined that Gérard Van Kemmel and Klaus Pohle, independent directorsserving on the Audit Committee, are financial experts. The Board of Directors determined that Mr. Van Kemmel
167

qualifies as an independent financial expert based on his experience as a partner at an international accountingfirm. The Board of Directors held on May 2, 2008 also qualified Mr. Klaus Pohle as an independent financialexpert taking into account his education and professional experience in financial matters, accountancy andinternal control.
B. Code of Ethics
We have adopted a financial code of ethics, as defined in Item 16.B. of Form 20-F under the Exchange Act.Our financial code of ethics applies to our Chief Executive Officer, Chief Financial Officer, Chief AccountingOfficer and other officers performing similar functions, as designated from time to time. Our financial code ofethics is available on our Website at www.sanofi-aventis.com (information on our website is not incorporated byreference in this annual report). A copy of our financial code of ethics may also be obtained without charge byaddressing a written request to the attention of Individual Shareholder Relations at our headquarters in Paris. Wewill disclose any amendment to the provisions of such financial code of ethics on our website.
C. Principal Accountants’ Fees and Services
See Note E to our consolidated financial statements included at Item 18 of this annual report.
D. Exemptions from the Listing Standards for Audit Committees
N/A
E. Purchases of Equity Securities by the Issuer and Affiliated Purchasers
In 2008, sanofi-aventis made the following purchases of ordinary shares of sanofi-aventis.
Period(a) Total Number
of Shares Purchased(b) Average Price
Paid per Share
(c) Total Number of SharesPurchased as Part of Publicly
Announced Plans or Programs
(d) Approximate Value ofShares that May Yet Be
Purchased Under thePlans or Programs (1)
January 2008 . . . . . . . 4,200,000 €63.46 4,200,000 € 983,311,226(2)
February 2008 . . . . . . 5,300,000 €52.05 5,300,000 € 707,446,226March 2008 . . . . . . . . 8,450,000 €47.11 8,450,000 € 309,336,726April 2008 . . . . . . . . . 4,090,669 €48.68 4,090,669 € 110,232,959May 2008 . . . . . . . . . 1,011,500 €50.74 1,011,500 €3,000,000,000(3)
June 2008 . . . . . . . . . 760,000 €44.12 760,000 €2,966,468,800July 2008 . . . . . . . . . . — — — €2,966,468,800August 2008 . . . . . . . 50,000 €46.95 50,000 €2,964,121,300September 2008 . . . . — — — €2,964,121,300October 2008 . . . . . . — — — €2,964,121,300November 2008 . . . . — — — €2,964,121,300December 2008 . . . . . — — — €2,964,121,300
(1) Measured at month end.(2) As of year end 2007, a residual authorization of €1.2 billion remained available under the €3 billion share repurchase program
established by the Company on August 1, 2007 in implementation of the shareholders resolution adopted at the Annual ShareholdersMeeting of May 31, 2007.
(3) The prior program was replaced by a new share repurchase program of up to €3 billion following the Annual Shareholders Meeting ofMay 31, 2008 which authorized the Board of Directors to repurchase up to 10% of the Company’s capital subject to specified conditionsand expiring after 18 months.
F. Change in Registrant’s Certifying Accountant
N/A
G. Corporate Governance
Sanofi-aventis is incorporated under the laws of France, with securities publicly traded on markets in theUnited States (New York Stock Exchange) and France (Euronext Paris). Consequently, as described further in
168

our annual report, our corporate governance framework reflects the mandatory provisions of French corporatelaw, the securities laws and regulations of France and the United States and the rules of the aforementionedpublic markets. In addition, we generally follow the so-called “AFEP-MEDEF” corporate governancerecommendations for French listed issuers. As a result, our corporate governance framework is similar in manyrespects to, and provides investor protections that are comparable to — or in some cases, more stringent than —the corresponding rules of the New York Stock Exchange. Nevertheless, there are important differences to keepin mind.
In line with New York Stock Exchange rules applicable to domestic issuers, a majority of sanofi-aventisboard members are independent. Sanofi-aventis evaluates the independence of members of our Board ofDirectors using the standards of the French AFEP-MEDEF corporate governance recommendations as theprincipal reference. We believe that AFEP-MEDEF’s overarching criteria for independence — no relationship ofany kind whatsoever with the Company, its group or the management of either that is such as to color a Boardmember’s judgment — are on the whole consistent with the goals of the New York Stock Exchange’s rulesalthough the specific tests proposed under the two standards may vary on some points. Additionally, we havecomplied with the audit committee independence and other requirements of the Rule 10A-3 under the U.S.Securities Exchange Act of 1934, as amended, adopted pursuant to the Sarbanes-Oxley Act of 2002.
Under French law, the committees of our Board of Directors are advisory only, and where the New YorkStock Exchange Listed Company Manual would vest certain decision-making powers with specific committeesby delegation (e.g., nominating or audit committees), our Board of Directors remains by law the only competentbody to take such decisions, albeit taking into account the recommendation of the relevant committees.Additionally, under French corporate law, it is the shareholder meeting of sanofi-aventis that is competent toappoint our auditors upon the proposal of our Board of Directors, although our internal rules provide that theBoard of Directors will make its proposal on the basis of the recommendation of our Audit Committee. Webelieve that this requirement of French law, together with the additional legal requirement that two sets ofstatutory auditors be appointed, share the New York Stock Exchange’s underlying goal of ensuring that the auditof our accounts be conducted by auditors independent from company management.
In addition to the oversight role of our Compensation Committee for questions of managementcompensation including by way of equity, under French law any option plans or other share capital increases,whether for the benefit of top management or employees, may only be adopted by management pursuant to andwithin the limits of a shareholder resolution approving the related capital increase and delegating to the board theauthority to implement such operations.
As described above, a number of issues, which could be resolved directly by a board or its committees in theUnited States, require the additional protection of direct shareholder consultation in France. On the other hand,there is not a tradition of non-executive Board of Director sessions. Our audit committee is entirely composed ofindependent directors as that term is defined in Rule 10A-3 under the U.S. Securities Exchange Act of 1934, asamended, adopted pursuant to the Sarbanes-Oxley Act of 2002. The composition of our CompensationCommittee, and Appointments and Governance Committee includes directors who are also officers of ourprincipal shareholders.
As a ‘foreign private issuer’ under the U.S. securities laws, our Chief Executive Officer and our ChiefFinancial Officer issue the certifications required by §302 and §906 of the Sarbanes Oxley Act of 2002 on anannual basis (with the filing of our annual report on U.S. Form 20-F) rather than on a quarterly basis as would bethe case of a U.S. corporation filing quarterly reports on U.S. Form 10-Q.
French corporate law provides that the Board of Directors must vote to approve a broadly defined range oftransactions that could potentially create conflicts of interest between sanofi-aventis on the one hand and itsdirectors and officers on the other hand. This legal safeguard operates in place of certain provisions of the NYSEListed Company Manual.
169
PART III
Item 17. Financial Statements
See Item 18.
Item 18. Financial Statements
See pages F-1 through F-110 incorporated herein by reference.
Item 19. Exhibits
1.1 Bylaws (statuts) of sanofi-aventis (English translation)
2.1 Form of Deposit Agreement between sanofi-aventis and JPMorgan Chase Bank, N.A., as depositary(incorporated herein by reference to Exhibit A to the Registration Statement on Form F-6 datedAugust 7, 2007 relating to our American Depositary Shares, SEC File No. 333-145177)
2.2 Instrument defining rights of holders of American Depositary Shares each representing one quarter of aParticipating Share Series A (incorporated by reference to Item. 3 Exhibit (a) of the RegistrationStatement on Form F-6 (Registration No. 33-31904) dated November 21, 1989)
8.1 List of significant subsidiaries, see “Item 4. Information on the Company — C. OrganizationalStructure”
12.1 Certification by Christopher Viehbacher, Chief Executive Officer, required by Section 302 of theSarbanes-Oxley Act of 2002
12.2 Certification by Laurence Debroux, Principal Financial Officer, required by Section 302 of theSarbanes-Oxley Act of 2002
13.1 Certification by Christopher Viehbacher, Chief Executive Officer, required by Section 906 of theSarbanes-Oxley Act of 2002
13.2 Certification by Laurence Debroux, Principal Financial Officer, required by Section 906 of theSarbanes-Oxley Act of 2002
23.1 Consent of Ernst & Young Audit dated March 3, 2009
23.2 Consent of PricewaterhouseCoopers Audit dated March 3, 2009
99.1 Report of the Chairman of the Board of Directors for 2008 as required by Art. 225-37 paragraph 6 ofthe French Commercial Code
99.2 Extract from the Internal Rules of the Board of Directors
170

Signatures
The registrant hereby certifies that it meets all of the requirements for filing on Form 20-F and that it hasduly caused and authorized the undersigned to sign this annual report on its behalf.
by: /s/ CHRISTOPHER VIEHBACHER
Christopher ViehbacherChief Executive Officer
Date: March 3, 2009
171

ANNUAL CONSOLIDATED FINANCIAL STATEMENTS
The financial statements are presented in accordance withInternational Financial Reporting Standards (IFRS)
REPORTS OF INDEPENDENT REGISTERED PUBLIC ACCOUNTING FIRMS . . . . . . . F-2 - F-3
CONSOLIDATED BALANCE SHEETS . . . . . . . . . . . . . . . . . . . . . . . . . . . . . . . . . . . . . . . . . . . F-4 - F-5
CONSOLIDATED INCOME STATEMENTS . . . . . . . . . . . . . . . . . . . . . . . . . . . . . . . . . . . . . . F-6
CONSOLIDATED STATEMENTS OF CASH FLOWS . . . . . . . . . . . . . . . . . . . . . . . . . . . . . . F-7
CONSOLIDATED STATEMENTS OF RECOGNIZED INCOME AND EXPENSE . . . . . . F-8
NOTES TO THE CONSOLIDATED FINANCIAL STATEMENTS . . . . . . . . . . . . . . . . . . . . F-9
- A. Basis of preparation . . . . . . . . . . . . . . . . . . . . . . . . . . . . . . . . . . . . . . . . . . . . . . . . . . . . . . F-9 - F-10
- B. Summary of significant accounting policies . . . . . . . . . . . . . . . . . . . . . . . . . . . . . . . . . . . F-10 - F-31
- C. Alliances . . . . . . . . . . . . . . . . . . . . . . . . . . . . . . . . . . . . . . . . . . . . . . . . . . . . . . . . . . . . . . F-31 - F-33
- D. Detailed notes to the financial statements . . . . . . . . . . . . . . . . . . . . . . . . . . . . . . . . . . . . . F-33 - F-106
- E. Principal Accountants’ Fees and Services . . . . . . . . . . . . . . . . . . . . . . . . . . . . . . . . . . . . F-106
- F. List of principal companies included in the consolidation for the year endedDecember 31, 2008 . . . . . . . . . . . . . . . . . . . . . . . . . . . . . . . . . . . . . . . . . . . . . . . . . . . . . . F-107 - F-110
F-1
REPORT OF INDEPENDENT REGISTEREDPUBLIC ACCOUNTING FIRMS
SANOFI-AVENTIS
To the Board of Directors and Shareholders of sanofi-aventis,
We have audited the accompanying consolidated balance sheets of sanofi-aventis and its subsidiaries(together the “Group”) as of December 31, 2008, 2007 and 2006, and the related consolidated statements ofincome, cash flows and recognized income and expense for each of the three years in the period endedDecember 31, 2008. These financial statements are the responsibility of the Group’s management. Ourresponsibility is to express an opinion on these financial statements based on our audits.
We conducted our audits in accordance with the standards of the Public Company Accounting OversightBoard (United States), (the “PCAOB”). Those standards require that we plan and perform the audit to obtainreasonable assurance about whether the financial statements are free of material misstatement. An audit includesexamining, on a test basis, evidence supporting the amounts and disclosures in the financial statements. An auditalso includes assessing the accounting principles used and significant estimates made by management, andevaluating the overall financial statement presentation. We believe that our audits provide a reasonable basis forour opinion.
In our opinion, the consolidated financial statements referred to above present fairly, in all material respects,the consolidated financial position of the Group as of December 31, 2008, 2007 and 2006, and the consolidatedresults of its operations and its cash flows for each of the three years in the period ended December 31, 2008, inconformity with International Financial Reporting Standards as issued by the International Accounting StandardsBoard.
We also have audited, in accordance with the standards of the PCAOB, the effectiveness of the Group’sinternal control over financial reporting as of December 31, 2008, based on criteria established in InternalControl — Integrated Framework issued by the Committee of Sponsoring Organizations of the TreadwayCommission and our report dated March 3, 2009 expressed an unqualified opinion thereon.
Neuilly-sur-Seine and Paris-La Défense, March 3, 2009
PricewaterhouseCoopers Audit Ernst & Young Audit
Catherine Pariset Philippe Vogt Gilles Puissochet Jacques Pierres
F-2
REPORT OF INDEPENDENT REGISTEREDPUBLIC ACCOUNTING FIRMS
SANOFI-AVENTIS
To the Board of Directors and Shareholders of sanofi-aventis,
We have audited internal control over financial reporting of sanofi-aventis and its subsidiaries (together “theGroup”) as of December 31, 2008, based on criteria established in Internal Control — Integrated Frameworkissued by the Committee of Sponsoring Organizations of the Treadway Commission (the COSO criteria). TheGroup’s management is responsible for maintaining effective internal control over financial reporting, and for itsassessment of the effectiveness of internal control over financial reporting included in the accompanying Reportof Management on Internal Control Over Financial Reporting. Our responsibility is to express an opinion on thecompany’s internal control over financial reporting based on our audit.
We conducted our audit in accordance with the standards of the Public Company Accounting OversightBoard (United States), (the “PCAOB”). Those standards require that we plan and perform the audit to obtainreasonable assurance about whether effective internal control over financial reporting was maintained in allmaterial respects. Our audit included obtaining an understanding of internal control over financial reporting,assessing the risk that a material weakness exists, testing and evaluating the design and operating effectiveness ofinternal control based on the assessed risk, and performing such other procedures as we considered necessary inthe circumstances. We believe that our audit provides a reasonable basis for our opinion.
A company’s internal control over financial reporting is a process designed to provide reasonable assuranceregarding the reliability of financial reporting and the preparation of financial statements for external purposes inaccordance with generally accepted accounting principles. A company’s internal control over financial reportingincludes those policies and procedures that (1) pertain to the maintenance of records that, in reasonable detail,accurately and fairly reflect the transactions and dispositions of the assets of the company; (2) provide reasonableassurance that transactions are recorded as necessary to permit preparation of financial statements in accordancewith generally accepted accounting principles, and that receipts and expenditures of the company are being madeonly in accordance with authorizations of management and directors of the company; and (3) provide reasonableassurance regarding prevention or timely detection of unauthorized acquisition, use, or disposition of thecompany’s assets that could have a material effect on the financial statements.
Because of its inherent limitations, internal control over financial reporting may not prevent or detectmisstatements. Also, projections of any evaluation of effectiveness to future periods are subject to the risk thatcontrols may become inadequate because of changes in conditions, or that the degree of compliance with thepolicies or procedures may deteriorate.
In our opinion, the Group maintained, in all material respects, effective internal control over financialreporting as of December 31, 2008, based on the COSO criteria.
We also have audited, in accordance with the standards of the PCAOB, the consolidated balance sheets ofthe Group as of December 31, 2008, 2007 and 2006, and the related consolidated statements of income, cashflows and recognized income and expense for each of the three years in the period ended December 31, 2008 andour report dated March 3, 2009 expressed an unqualified opinion thereon.
Neuilly-sur-Seine and Paris-La Défense, March 3, 2009
PricewaterhouseCoopers Audit Ernst & Young Audit
Catherine Pariset Philippe Vogt Gilles Puissochet Jacques Pierres
F-3

CONSOLIDATED BALANCE SHEETS
December 31, December 31, December 31,(€ million) Note 2008 2007 2006
ASSETS
Property, plant and equipment . . . . . . . . . . . . . . . . . . . . . D.3. 6,961 6,538 6,219
Goodwill . . . . . . . . . . . . . . . . . . . . . . . . . . . . . . . . . . . . . . D.4. 28,163 27,199 28,472
Intangible assets . . . . . . . . . . . . . . . . . . . . . . . . . . . . . . . . D.4. 15,260 19,182 23,738
Investments in associates . . . . . . . . . . . . . . . . . . . . . . . . . D.6. 2,459 2,493 2,637
Financial assets — non-current . . . . . . . . . . . . . . . . . . . . D.7. 821 1,037 1,045
Deferred tax assets . . . . . . . . . . . . . . . . . . . . . . . . . . . . . . D.14. 2,920 2,912 3,492
Non-current assets . . . . . . . . . . . . . . . . . . . . . . . . . . . . . 56,584 59,361 65,603
Assets held for sale . . . . . . . . . . . . . . . . . . . . . . . . . . . . . . D.8. — —
Inventories . . . . . . . . . . . . . . . . . . . . . . . . . . . . . . . . . . . . D.9. 3,590 3,729 3,659
Accounts receivable . . . . . . . . . . . . . . . . . . . . . . . . . . . . . D.10. 5,303 4,904 5,032
Other current assets . . . . . . . . . . . . . . . . . . . . . . . . . . . . . D.11. 1,881 2,126 2,208
Financial assets — current . . . . . . . . . . . . . . . . . . . . . . . . D.12. 403 83 108
Cash and cash equivalents . . . . . . . . . . . . . . . . . . . . . . . . D.13.-D.17. 4,226 1,711 1,153
Current assets . . . . . . . . . . . . . . . . . . . . . . . . . . . . . . . . . 15,403 12,553 12,160
TOTAL ASSETS . . . . . . . . . . . . . . . . . . . . . . . . . . . . . . 71,987 71,914 77,763
—
The accompanying notes on pages F-9 to F-110 are an integral part of the consolidated financial statements.
F-4
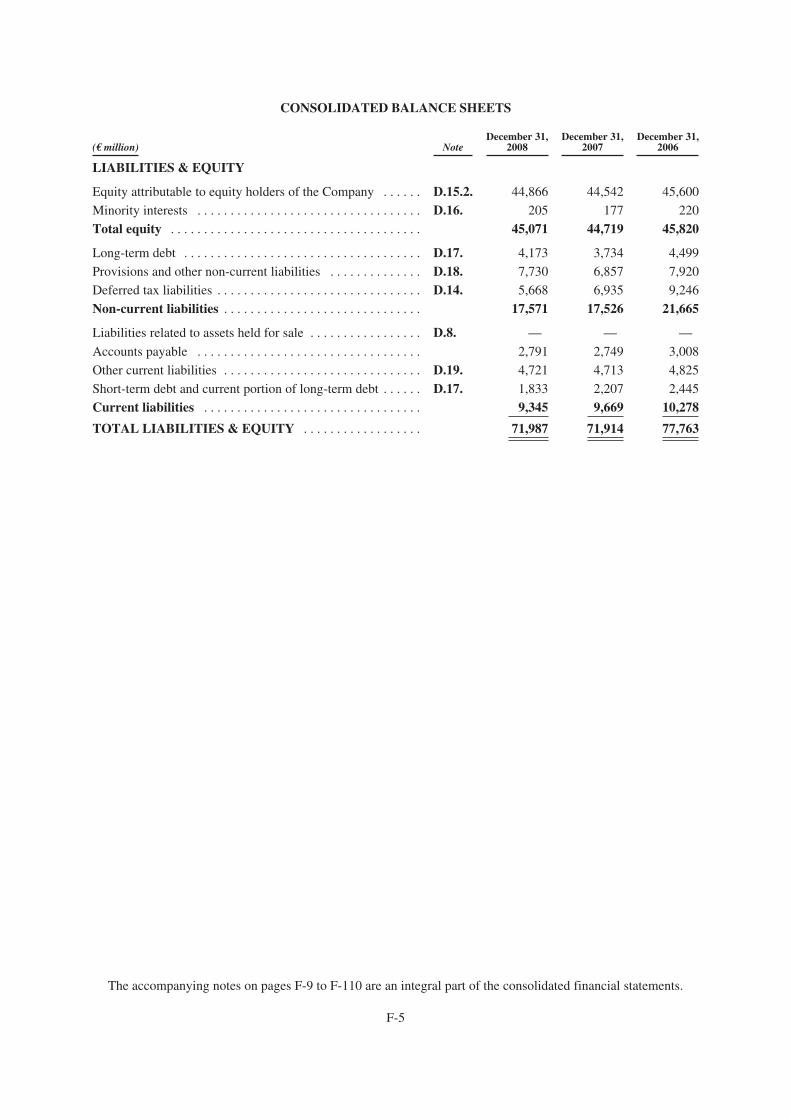
CONSOLIDATED BALANCE SHEETS
December 31, December 31, December 31,(€ million) Note 2008 2007 2006
LIABILITIES & EQUITY
Equity attributable to equity holders of the Company . . . . . . D.15.2. 44,866 44,542 45,600
Minority interests . . . . . . . . . . . . . . . . . . . . . . . . . . . . . . . . . . D.16. 205 177 220
Total equity . . . . . . . . . . . . . . . . . . . . . . . . . . . . . . . . . . . . . . 45,071 44,719 45,820
Long-term debt . . . . . . . . . . . . . . . . . . . . . . . . . . . . . . . . . . . . D.17. 4,173 3,734 4,499
Provisions and other non-current liabilities . . . . . . . . . . . . . . D.18. 7,730 6,857 7,920
Deferred tax liabilities . . . . . . . . . . . . . . . . . . . . . . . . . . . . . . . D.14. 5,668 6,935 9,246
Non-current liabilities . . . . . . . . . . . . . . . . . . . . . . . . . . . . . . 17,571 17,526 21,665
Liabilities related to assets held for sale . . . . . . . . . . . . . . . . . D.8. — — —
Accounts payable . . . . . . . . . . . . . . . . . . . . . . . . . . . . . . . . . . 2,791 2,749 3,008
Other current liabilities . . . . . . . . . . . . . . . . . . . . . . . . . . . . . . D.19. 4,721 4,713 4,825
Short-term debt and current portion of long-term debt . . . . . . D.17. 1,833 2,207 2,445
Current liabilities . . . . . . . . . . . . . . . . . . . . . . . . . . . . . . . . . 9,345 9,669 10,278
TOTAL LIABILITIES & EQUITY . . . . . . . . . . . . . . . . . . 71,987 71,914 77,763
The accompanying notes on pages F-9 to F-110 are an integral part of the consolidated financial statements.
F-5

CONSOLIDATED INCOME STATEMENTS
Year ended Year ended Year endedDecember 31, December 31, December 31,
(€ million) Note 2008 2007 2006
Net sales . . . . . . . . . . . . . . . . . . . . . . . . . . . . . . . . . . . . . . . . D.35.1. 27,568 28,052 28,373Other revenues . . . . . . . . . . . . . . . . . . . . . . . . . . . . . . . . . . . 1,249 1,155 1,116
Cost of sales . . . . . . . . . . . . . . . . . . . . . . . . . . . . . . . . . . . . . (7,337) (7,571) (7,587)
Gross profit . . . . . . . . . . . . . . . . . . . . . . . . . . . . . . . . . . . . . 21,480 21,636 21,902Research and development expenses . . . . . . . . . . . . . . . . . . (4,575) (4,537) (4,430)
Selling and general expenses . . . . . . . . . . . . . . . . . . . . . . . . (7,168) (7,554) (8,020)
Other operating income . . . . . . . . . . . . . . . . . . . . . . . . . . . . . D.25. 556 522 391
Other operating expenses . . . . . . . . . . . . . . . . . . . . . . . . . . . D.26. (353) (307) (116)
Amortization of intangibles . . . . . . . . . . . . . . . . . . . . . . . . . (3,483) (3,654) (3,998)
Operating income before restructuring, impairment ofproperty, plant and equipment and intangibles, gainsand losses on disposals, and litigation . . . . . . . . . . . . . . 6,457 6,106 5,729
Restructuring costs . . . . . . . . . . . . . . . . . . . . . . . . . . . . . . . . D.27. (585) (137) (274)
Impairment of property, plant and equipment andintangibles . . . . . . . . . . . . . . . . . . . . . . . . . . . . . . . . . . . . . D.5. (1,554) (58) (1,163)
Gains and losses on disposals, and litigation . . . . . . . . . . . . D.28. 76 — 536
Operating income . . . . . . . . . . . . . . . . . . . . . . . . . . . . . . . . 4,394 5,911 4,828Financial expenses . . . . . . . . . . . . . . . . . . . . . . . . . . . . . . . . D.29. (335) (329) (455)
Financial income . . . . . . . . . . . . . . . . . . . . . . . . . . . . . . . . . . D.29. 103 190 375
Income before tax and associates . . . . . . . . . . . . . . . . . . . . 4,162 5,772 4,748Income tax expense . . . . . . . . . . . . . . . . . . . . . . . . . . . . . . . . D.30. (682) (687) (800)
Share of profit/loss of associates . . . . . . . . . . . . . . . . . . . . . . D.31. 812 597 451
Net income . . . . . . . . . . . . . . . . . . . . . . . . . . . . . . . . . . . . . . 4,292 5,682 4,399
Net income attributable to minority interests . . . . . . . . . . . . D.32. 441 419 393Net income attributable to equity holders of the
Company . . . . . . . . . . . . . . . . . . . . . . . . . . . . . . . . . . . . . 3,851 5,263 4,006
Average number of shares outstanding (million) . . . . . . . . . 1,309.3 1,346.9 1,346.8
Average number of shares outstanding after dilution(million) . . . . . . . . . . . . . . . . . . . . . . . . . . . . . . . . . . . . . . D.15.9. 1,310.9 1,353.9 1,358.8
- Basic earnings per share (in euros) . . . . . . . . . . . . . . . . . . . 2.94 3.91 2.97
- Diluted earnings per share (in euros) . . . . . . . . . . . . . . . . . 2.94 3.89 2.95
The accompanying notes on pages F-9 to F-110 are an integral part of the consolidated financial statements.
F-6
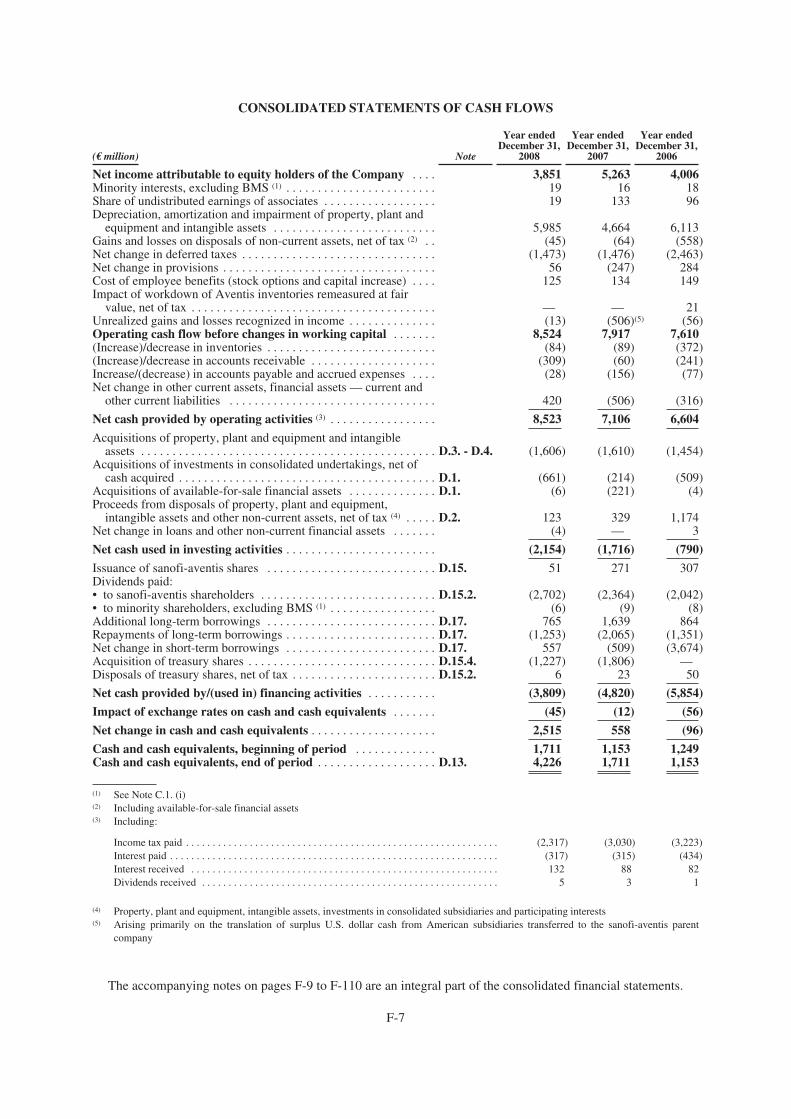
CONSOLIDATED STATEMENTS OF CASH FLOWS
Year ended Year endedDecember 31,
2007
Year endedDecember 31, December 31,
(€ million) Note 2008 2006
Net income attributable to equity holders of the Company . . . . 3,851 5,263 4,006Minority interests, excluding BMS (1) . . . . . . . . . . . . . . . . . . . . . . . . 19 16 18Share of undistributed earnings of associates . . . . . . . . . . . . . . . . . . 19 133 96Depreciation, amortization and impairment of property, plant and
equipment and intangible assets . . . . . . . . . . . . . . . . . . . . . . . . . . 5,985 4,664 6,113Gains and losses on disposals of non-current assets, net of tax (2) . . (45) (64) (558)Net change in deferred taxes . . . . . . . . . . . . . . . . . . . . . . . . . . . . . . . (1,473) (1,476) (2,463)Net change in provisions . . . . . . . . . . . . . . . . . . . . . . . . . . . . . . . . . . 56 (247) 284Cost of employee benefits (stock options and capital increase) . . . . 125 134 149Impact of workdown of Aventis inventories remeasured at fair
value, net of tax . . . . . . . . . . . . . . . . . . . . . . . . . . . . . . . . . . . . . . . — — 21Unrealized gains and losses recognized in income . . . . . . . . . . . . . . (13) (506)(5) (56)Operating cash flow before changes in working capital . . . . . . . 8,524 7,917 7,610(Increase)/decrease in inventories . . . . . . . . . . . . . . . . . . . . . . . . . . . (84) (89) (372)(Increase)/decrease in accounts receivable . . . . . . . . . . . . . . . . . . . . (309) (60) (241)Increase/(decrease) in accounts payable and accrued expenses . . . . (28) (156) (77)Net change in other current assets, financial assets — current and
other current liabilities . . . . . . . . . . . . . . . . . . . . . . . . . . . . . . . . . 420 (506) (316)
Net cash provided by operating activities (3) . . . . . . . . . . . . . . . . . 8,523 7,106 6,604
Acquisitions of property, plant and equipment and intangibleassets . . . . . . . . . . . . . . . . . . . . . . . . . . . . . . . . . . . . . . . . . . . . . . . D.3. - D.4. (1,606) (1,610) (1,454)
Acquisitions of investments in consolidated undertakings, net ofcash acquired . . . . . . . . . . . . . . . . . . . . . . . . . . . . . . . . . . . . . . . . . D.1. (661) (214) (509)
Acquisitions of available-for-sale financial assets . . . . . . . . . . . . . . D.1. (6) (221) (4)Proceeds from disposals of property, plant and equipment,
intangible assets and other non-current assets, net of tax (4) . . . . . D.2. 123 329 1,174Net change in loans and other non-current financial assets . . . . . . . (4) — 3
Net cash used in investing activities . . . . . . . . . . . . . . . . . . . . . . . . (2,154) (1,716) (790)
Issuance of sanofi-aventis shares . . . . . . . . . . . . . . . . . . . . . . . . . . . D.15. 51 271 307Dividends paid:• to sanofi-aventis shareholders . . . . . . . . . . . . . . . . . . . . . . . . . . . . D.15.2. (2,702) (2,364) (2,042)• to minority shareholders, excluding BMS (1) . . . . . . . . . . . . . . . . . (6) (9) (8)Additional long-term borrowings . . . . . . . . . . . . . . . . . . . . . . . . . . . D.17. 765 1,639 864Repayments of long-term borrowings . . . . . . . . . . . . . . . . . . . . . . . . D.17. (1,253) (2,065) (1,351)Net change in short-term borrowings . . . . . . . . . . . . . . . . . . . . . . . . D.17. 557 (509) (3,674)Acquisition of treasury shares . . . . . . . . . . . . . . . . . . . . . . . . . . . . . . D.15.4. (1,227) (1,806) —Disposals of treasury shares, net of tax . . . . . . . . . . . . . . . . . . . . . . . D.15.2. 6 23
Net cash provided by/(used in) financing activities . . . . . . . . . . . (3,809) (4,820) (5,854)
Impact of exchange rates on cash and cash equivalents . . . . . . . (45) (12) (56)
Net change in cash and cash equivalents . . . . . . . . . . . . . . . . . . . . 2,515 558 (96)
Cash and cash equivalents, beginning of period . . . . . . . . . . . . . 1,711 1,153 1,249Cash and cash equivalents, end of period . . . . . . . . . . . . . . . . . . . D.13. 4,226 1,711 1,153
50
(1) See Note C.1. (i)(2) Including available-for-sale financial assets(3) Including:
Income tax paid . . . . . . . . . . . . . . . . . . . . . . . . . . . . . . . . . . . . . . . . . . . . . . . . . . . . . . . . . . . (2,317) (3,030) (3,223)Interest paid . . . . . . . . . . . . . . . . . . . . . . . . . . . . . . . . . . . . . . . . . . . . . . . . . . . . . . . . . . . . . . (317) (315) (434)Interest received . . . . . . . . . . . . . . . . . . . . . . . . . . . . . . . . . . . . . . . . . . . . . . . . . . . . . . . . . . 132 88 82Dividends received . . . . . . . . . . . . . . . . . . . . . . . . . . . . . . . . . . . . . . . . . . . . . . . . . . . . . . . . 5 3 1
(4) Property, plant and equipment, intangible assets, investments in consolidated subsidiaries and participating interests(5) Arising primarily on the translation of surplus U.S. dollar cash from American subsidiaries transferred to the sanofi-aventis parent
company
The accompanying notes on pages F-9 to F-110 are an integral part of the consolidated financial statements.
F-7

CONSOLIDATED STATEMENTS OF RECOGNIZED INCOME AND EXPENSE
Year ended Year ended Year endedDecember 31, December 31, December 31,
(€ million) 2008 2007 2006
Change in fair value of available-for-sale financial assets (1) . . . . . . . . (132) (5) (27)Change in fair value of derivatives designated as hedging
instruments (1) . . . . . . . . . . . . . . . . . . . . . . . . . . . . . . . . . . . . . . . . . . 104 8 57Actuarial gains and (losses) (1) . . . . . . . . . . . . . . . . . . . . . . . . . . . . . . . (829) 282 346Tax effect of items recognized directly in equity (1) . . . . . . . . . . . . . . . 132 (119) (160)Change in cumulative translation difference recognized in equity . . . 948 (2,764) (3,197)
(2,981)
4,399
Total income/(expense) recognized directly in equity (2) . . . . . . . . . 223 (2,598)
Net income for the period . . . . . . . . . . . . . . . . . . . . . . . . . . . . . . . . . . 4,292 5,682
Total recognized income/(expense) for the period . . . . . . . . . . . . . . 4,515 3,084 1,418
Attributable to equity holders of the Company . . . . . . . . . . . . . . . 4,090 2,666 1,028Attributable to minority interests . . . . . . . . . . . . . . . . . . . . . . . . . 425 418 390
(1) See analysis in Note D.15.7.(2) See the consolidated statements of changes in shareholders’ equity provided in Note D.15.2.
The accompanying notes on pages F-9 to F-110 are an integral part of the consolidated financial statements.
F-8

NOTES TO THE CONSOLIDATED FINANCIAL STATEMENTSYear ended December 31, 2008
INTRODUCTION
The sanofi-aventis Group (sanofi-aventis and its subsidiaries) is a leading player in the worldpharmaceuticals industry, engaged in the development, manufacture and marketing of healthcare products inseven major therapeutic fields: thrombosis, cardiovascular, metabolic disorders, oncology, central nervoussystem, internal medicine and vaccines.
Its international R&D effort provides a platform for the Group to develop leadership positions in itsmarkets.
Sanofi-aventis, the parent company, is a société anonyme (a form of limited liability company) incorporatedunder the laws of France. The registered office is at 174, avenue de France, 75013 Paris, France.
Sanofi-aventis is listed in Paris (Euronext: SAN) and New York (NYSE: SNY).
The consolidated financial statements for the year ended December 31, 2008, and the notes thereto, wereadopted by the sanofi-aventis Board of Directors on February 10, 2009.
A. BASIS OF PREPARATION
A.1. International Financial Reporting Standards (IFRS)
The consolidated financial statements cover the twelve-month periods ended December 31, 2008, 2007 and2006.
In accordance with Regulation No. 1606/2002 of the European Parliament and Council of July 19, 2002 onthe application of international accounting standards, sanofi-aventis has presented its consolidated financialstatements in accordance with IFRS since January 1, 2005. The term “IFRS” refers collectively to internationalaccounting and financial reporting standards (IASs and IFRSs) and to interpretations of the interpretationscommittees (SIC and IFRIC), mandatorily applicable as of December 31, 2008.
The consolidated financial statements of sanofi-aventis as of December 31, 2008 have been prepared incompliance with IFRS as issued by the International Accounting Standards Board (IASB) and with IFRS adoptedby the European Union as of December 31, 2008. Pronouncements issued by the IASB but not yet adopted by theEuropean Union are not applicable to sanofi-aventis.
IFRS adopted by the European Union as of December 31, 2008 are available under the heading “IASs/IFRSs, SICs and IFRICs adopted by the Commission” via the web link http://ec.europa.eu/internal_market/accounting/ias_en.htm.
The consolidated financial statements have been prepared in accordance with the IFRS general principles offair presentation, going concern, accrual basis of accounting, consistency of presentation, materiality, andaggregation.
New standards, amendments and interpretations applied in the consolidated financial statements for the firsttime in the year ended December 31, 2008 are described in Note A.2. Standards, amendments and interpretationsissued by the IASB but not mandatorily applicable in 2008 are described in Note B.28.
A.2. New standards, amendments and interpretations applicable in 2008
In October and November 2008, the IASB issued two amendments to IAS 39 and IFRS 7, respectively,allowing entities to reclassify non-derivative financial assets out of the fair value through profit or loss categoryin particular circumstances, with retrospective effect from July 1, 2008. These amendments applied withimmediate effect, and were adopted immediately by the European Union. Sanofi-aventis did not identify anyassets that required such reclassification, and hence did not use the option offered by these amendments duringthe second half of 2008.
F-9

NOTES TO THE CONSOLIDATED FINANCIAL STATEMENTS—(Continued)Year ended December 31, 2008
The following interpretations became mandatorily applicable in 2008:
• IFRIC 11 (Group and Treasury Share Transactions), which relates to options awarded within a group ofcompanies and treasury shares acquired to meet obligations under stock option plans. Thisinterpretation confirms the treatment to be applied by an entity in its separate financial statements, andhence has no effect on the sanofi-aventis consolidated financial statements.
• IFRIC 12 (Service Concession Arrangements), not yet adopted by the European Union, which does notapply to the Group’s activities.
• IFRIC 14 (The Limit on a Defined Benefit Asset, Minimum Funding Requirements and theirInteraction), issued in July 2007, was adopted by the European Union in December 2008. Thisinterpretation specifies the criteria for measuring the economic benefit available as a refund or as areduction in future contributions that may be recognized as a pension plan surplus under IAS 19.Applying IFRIC 14 has no material effect on the sanofi-aventis consolidated financial statements forthe year ended December 31, 2008.
A.3. Use of estimates
The preparation of financial statements requires management to make reasonable estimates andassumptions, based on information available at the date of preparation of the financial statements, that may affectthe reported amounts of assets, liabilities, revenues and expenses in the financial statements, and disclosures ofcontingent assets and contingent liabilities.
Examples include:
– amounts deducted from sales for projected sales returns, chargeback incentives, rebates and pricereductions (see Note B.14.);
– the extent of impairment of accounts receivable (see Note B.8.2.) and of provisions for product claims(see Note D.22.);
– impairment of property, plant and equipment, goodwill, intangible assets and investments inassociates (see Note B.6.);
– the valuation of goodwill and the valuation and useful life of acquired intangible assets (see Notes B.3.and B.4.3.);
– the amount of post-employment benefit obligations (see Note B.23.);
– the amount of provisions for restructuring, tax risks, environmental risks and litigation (see Note B.12.);
– share-based payment expenses (see Note B.24.1.);
– the fair values of derivative financial instruments (see Note B.8.).
Actual results could differ from these estimates.
B. SUMMARY OF SIGNIFICANT ACCOUNTING POLICIES
B.1. Basis of consolidation
The consolidated financial statements include the accounts of sanofi-aventis and subsidiaries controlled bysanofi-aventis, using the full consolidation method. The existence of effectively exercisable or convertiblepotential voting rights is taken into account in determining whether control exists.
Joint ventures are accounted for by the equity method in accordance with the option in IAS 31 (Interests inJoint Ventures).
F-10
NOTES TO THE CONSOLIDATED FINANCIAL STATEMENTS—(Continued)Year ended December 31, 2008
Companies over which sanofi-aventis exercises significant influence are accounted for by the equitymethod.
Material transactions between consolidated companies and intragroup profits are eliminated.
Companies are consolidated from the date on which control (exclusive or joint) or significant influence istransferred to the Group. The Group’s share of post-acquisition profits or losses is taken to the income statement,and post-acquisition movements in the acquiree’s reserves are taken to consolidated reserves. Companies areexcluded from consolidation from the date on which the Group transfers control or significant influence.
B.2. Foreign currency translation
Accounting for transactions in foreign currencies in individual company accounts
Non-current assets (other than receivables) and inventories acquired in foreign currencies are translated intothe functional currency using the exchange rate prevailing at the date of acquisition.
All amounts receivable or payable in foreign currencies are translated using the exchange rate prevailing atthe balance sheet date. The resulting gains and losses are recorded in the income statement. However, foreignexchange gains and losses arising from the translation of advances between consolidated subsidiaries for whichsettlement is neither planned nor likely to occur in the foreseeable future are recognized directly in equity inCumulative translation difference.
Foreign currency translation of the financial statements of foreign subsidiaries
In accordance with IAS 21 (The Effects of Changes in Foreign Exchange Rates), each Group subsidiarytranslates foreign currency transactions into the currency that is most representative of its economic environment(the functional currency).
All assets and liabilities are translated into euros using the exchange rate of the subsidiary’s functionalcurrency prevailing at the balance sheet date. Income statements are translated using a weighted averageexchange rate for the period. The resulting translation difference is shown as a separate component of equity andis recognized in the income statement only when the subsidiary is sold or is wholly or partially liquidated.
Under the exemptions allowed by IFRS 1, sanofi-aventis elected to eliminate through equity all cumulativetranslation differences for foreign operations at the January 1, 2004 IFRS transition date.
B.3. Business combinations
B.3.1. Accounting treatment
Business combinations consummated subsequent to the IFRS transition date (January 1, 2004) areaccounted for by the purchase method in accordance with IFRS 3 (Business Combinations).
Under this method, the acquiree’s identifiable assets, liabilities and contingent liabilities that satisfy therecognition criteria of IFRS 3 are measured initially at their fair values as at the date of acquisition, except fornon-current assets classified as held for sale, which are measured at fair value less costs to sell.
Only identifiable liabilities that satisfy the criteria for recognition as a liability by the acquiree arerecognized in a business combination. Consequently, restructuring liabilities are not recognized as a liability ofthe acquiree unless the acquiree has an obligation as at the date of the acquisition to carry out the restructuring.
Adjustments to the values of assets and liabilities initially determined provisionally (pending the results ofindependent valuations or further analysis) are recognized as a retrospective adjustment to goodwill if they aremade within twelve months of the acquisition date. Once this twelve-month period has elapsed, the effects of anyadjustments are recognized directly in the income statement, unless they qualify as an error correction.
F-11
NOTES TO THE CONSOLIDATED FINANCIAL STATEMENTS—(Continued)Year ended December 31, 2008
Under the exemptions allowed by IFRS 1, sanofi-aventis elected not to restate in accordance with IFRS 3any business combinations that were consummated prior to the January 1, 2004 transition date. This includes thecombination between Sanofi and Synthélabo that took place in 1999.
B.3.2. Goodwill
The difference between the cost of an acquisition (including any costs directly attributable to theacquisition) and the Group’s interest in the fair value of the identifiable assets, liabilities and contingent liabilitiesof the acquiree is recognized as goodwill at the date of the business combination.
Goodwill arising on the acquisition of subsidiaries is shown as a separate line in the balance sheet underGoodwill, whereas goodwill arising on the acquisition of associates is recorded in Investments in associates.
Goodwill arising on the acquisition of foreign entities is measured in the functional currency of the acquiredentity and translated using the exchange rate prevailing at the balance sheet date.
In accordance with IFRS 3 and with IAS 36 (Impairment of Assets), goodwill is carried at cost lessaccumulated impairment.
Goodwill is tested for impairment annually and whenever events or circumstances indicate that impairmentmight exist. Such events or circumstances include significant changes liable to have an other-than-temporaryimpact on the substance of the original investment.
B.4. Intangible assets
Intangible assets are initially measured at acquisition cost or production cost, including any directlyattributable costs of preparing the asset for its intended use, or (in the case of assets acquired in a businesscombination) at fair value as at the date of the combination. They are amortized on a straight line basis over theiruseful lives.
The useful lives of intangible assets are reviewed at each reporting date. The effect of any adjustment touseful lives is recognized prospectively as a change of accounting estimate.
Amortization of intangible assets is recognized in the income statement under Amortization of intangibleswith the exception of amortization of acquired or internally-developed software, which is recognized on therelevant line of the income statement according to the purpose for which the software is used.
Sanofi-aventis does not own any intangible assets with an indefinite useful life.
Intangible assets are carried at cost less accumulated amortization and accumulated impairment, if any, inaccordance with IAS 36 (see Note B.6.).
B.4.1. Research and development not acquired in a business combination
• Internally generated research and development
In accordance with IAS 38 (Intangible Assets), internally generated research expenditure is expensedas incurred under Research and development expenses.
Under IAS 38, internally generated development expenses are recognized as an intangible asset if, andonly if, all the following six criteria can be demonstrated: (a) the technical feasibility of completing thedevelopment project; (b) the Group’s intention to complete the project; (c) the Group’s ability to usethe project; (d) the probability that the project will generate future economic benefits; (e) theavailability of adequate technical, financial and other resources to complete the project; and (f) theability to measure the development expenditure reliably.
F-12

NOTES TO THE CONSOLIDATED FINANCIAL STATEMENTS—(Continued)Year ended December 31, 2008
Due to the risks and uncertainties relating to regulatory approval and to the research and developmentprocess, the six criteria for capitalization are considered not to have been met until marketing approvalhas been obtained from the regulatory authorities. Consequently, internally generated developmentexpenses arising before marketing approval has been obtained, mainly the cost of clinical trials, areexpensed as incurred under Research and development expenses.
Chemical industrial development expenses incurred to develop a second-generation process areincurred after initial regulatory approval has been obtained, in order to improve the industrial processfor an active ingredient. To the extent that the six IAS 38 criteria are considered as being met, theseexpenses are capitalized under Intangible assets as incurred.
• Separately acquired research and development
Payments for separately acquired research and development are capitalized under Intangible assetsprovided that they meet the definition of an intangible asset: a resource that is (i) controlled by theGroup, (ii) expected to provide future economic benefits, and (iii) identifiable, i.e. is either separable orarises from contractual or legal rights. Under paragraph 25 of IAS 38, the first condition forcapitalization (the probability that the expected future economic benefits will flow to the entity) isconsidered to be satisfied for separately acquired research and development. Because the amount of thepayments is determinable, the second condition for capitalization (the cost can be measured reliably) isalso met.
Consequently, rights to pharmaceutical products acquired from third parties prior to receipt ofregulatory approval to market the products are recognized as intangible assets, and are amortized on astraight line basis over their useful lives from the date on which regulatory approval is obtained.
Payments under research and development arrangements relating to access to technology or todatabases and payments made to purchase generics files are also capitalized, and amortized over theuseful life of the intangible asset.
Subcontracting arrangements, payments for research and development services and continuouspayments under research and development collaborations unrelated to the outcome of the research anddevelopment efforts are expensed over the service term.
B.4.2. Other intangible assets
Patents are capitalized at acquisition cost and amortized over the shorter of the period of legal protection ortheir useful life.
Licenses other than those related to pharmaceutical products and research projects, in particular softwarelicenses, are capitalized at acquisition cost, including any directly attributable cost of preparing the software forits intended use. Software licenses are amortized on a straight line basis over their useful lives (three to fiveyears).
Internally generated costs incurred to develop or upgrade software are capitalized if the IAS 38 criteria forrecognition as an intangible asset are satisfied, and amortized on a straight line basis over the useful life of thesoftware from the date on which the software is ready for use.
B.4.3. Intangible assets acquired in a business combination
Intangible assets acquired in a business combination (in particular the acquisition of Aventis) which relate toin-process research and development and are reliably measurable are separately identified from goodwill andcapitalized in Intangible assets in accordance with IFRS 3 (Business Combinations) and IAS 38 (IntangibleAssets). The related deferred tax liability is also recognized.
In-process research and development acquired in a business combination is amortized on a straight linebasis over its useful life from the date of receipt of regulatory approval for the product derived from the researchand development work.
F-13

NOTES TO THE CONSOLIDATED FINANCIAL STATEMENTS—(Continued)Year ended December 31, 2008
Rights to products sold by the Group, mainly acquired through the acquisition of Aventis, are amortized ona straight line basis over their useful lives, which are calculated on the basis of cash flow forecasts that takeaccount of (among other factors) the period of legal protection of the related patents. On this basis, the averageinitial amortization period for products sold by the Group is eight years.
B.5. Property, plant and equipment
Property, plant and equipment is initially measured and recognized at acquisition cost, including anydirectly attributable cost of preparing the asset for its intended use, or (in the case of assets acquired in a businesscombination) at fair value as at the date of the acquisition. The component-based approach to accounting forproperty, plant and equipment is applied. Under this approach, each component of an item of property, plant andequipment with a cost which is significant in relation to the total cost of the item and which has a different usefullife from the other components must be depreciated separately.
After initial measurement, property, plant and equipment is carried at cost less accumulated depreciationand impairment, except for land which is carried at cost less impairment.
Subsequent costs are not recognized as assets unless (i) it is probable that future economic benefitsassociated with these costs will flow to the Group and (ii) the costs can be measured reliably.
Day-to-day maintenance costs of property, plant and equipment are expensed as incurred.
Borrowing costs attributable to the financing of items of property, plant and equipment and incurred duringthe construction period of such items are capitalized as part of the acquisition cost of the item.
Government grants relating to non-current assets are deducted from the acquisition cost of the asset to whichthey relate.
In accordance with IAS 17 (Leases), items of property, plant and equipment leased by sanofi-aventis aslessee under finance leases are recognized as an asset in the balance sheet, with the related lease obligationrecognized as a liability. A lease qualifies as a finance lease if it transfers substantially all the risks and rewardsof ownership of the asset to the Group. Assets held under finance leases are carried at the lower of the fair valueof the leased asset or the present value of the minimum lease payments, and are depreciated over the shorter ofthe useful life of the asset or the term of the lease.
The depreciable amount of items of property, plant and equipment, net of any residual value, is depreciatedon a straight line basis over the useful life of the asset. The useful life of an asset is usually equivalent to itseconomic life.
The useful lives of property, plant and equipment are as follows:
Buildings . . . . . . . . . . . . . . . . . . . . . . . . . . . . . . . . . . . . . 15 to 40 yearsFixtures . . . . . . . . . . . . . . . . . . . . . . . . . . . . . . . . . . . . . . 10 to 20 yearsPlant and equipment . . . . . . . . . . . . . . . . . . . . . . . . . . . . 5 to 15 yearsOther tangible assets . . . . . . . . . . . . . . . . . . . . . . . . . . . . 3 to 15 years
Useful lives and residual values of property, plant and equipment are reviewed annually. The effect of anyadjustment to useful lives or residual values is recognized prospectively as a change of accounting estimate.
Depreciation of property, plant and equipment is recognized as an expense in the income statement, in therelevant classification of expense by function.
F-14

NOTES TO THE CONSOLIDATED FINANCIAL STATEMENTS—(Continued)Year ended December 31, 2008
B.6. Impairment of property, plant and equipment, goodwill, intangible assets, and investments inassociates
B.6.1. Impairment of property, plant and equipment, goodwill and intangible assets
Assets that generate separate cash flows and assets included in cash-generating units (CGUs) are assessedfor impairment in accordance with IAS 36 (Impairment of Assets) when events or changes in circumstancesindicate that the asset or CGU may be impaired.
A CGU is the smallest identifiable group of assets that generates cash inflows that are largely independentof the cash inflows from other assets or groups of assets.
Quantitative and qualitative indications of impairment (primarily relating to pharmacovigilance, patentprotection and the launch of competing products) are reviewed at each reporting date. If there is any internal orexternal indication of impairment, the Group estimates the recoverable amount of the asset or CGU.
Property, plant and equipment and intangible assets not yet available for use (such as capitalized in-processresearch and development), and CGUs that include goodwill, are tested for impairment annually whether or notthere is any indication of impairment, and more frequently if any event or circumstance indicates that they mightbe impaired. These assets are not amortized.
When there is an internal or external indication of impairment, the Group estimates the recoverable amountof the asset and recognizes an impairment loss when the carrying amount of the asset exceeds its recoverableamount. Where it is not possible to estimate the recoverable amount of any particular asset, the Group determinesthe recoverable amount of the CGU to which the asset belongs. The recoverable amount of the asset is the higherof its fair value less costs to sell or its value in use. To determine the value in use, the Group uses estimates offuture cash flows generated by the asset or CGU, prepared using the same methods as those used in the initialmeasurement of the asset or CGU on the basis of the medium-term plans of each business activity.
In the case of goodwill, estimates of future cash flows are based on a five-year strategic plan, plus anextrapolation of the cash flows for the next five years, plus a terminal value. In the case of intangible assets, theperiod used is based on the shorter of the period of patent protection or the economic life of the asset. Any cashflows beyond this period are estimated by applying a positive or negative growth rate to future periods.
Estimated cash flows are discounted at long-term market interest rates that reflect the best estimate bysanofi-aventis of the time value of money, the risks specific to the asset or CGU, and economic conditions in thegeographical regions in which the business activity associated with the asset or CGU is located.
Certain assets and liabilities that are not directly attributable to a specific CGU, and goodwill, are allocatedbetween CGUs on a reasonable and consistent basis.
Goodwill is tested for impairment by being allocated to CGUs. Given the international nature of the Group’soperating activities, the CGUs used for the allocation and impairment testing of goodwill are the same businesssegments and geographical segments as used for segmental reporting.
Impairment losses in respect of property, plant and equipment and intangible assets are recognized underImpairment of property, plant and equipment and intangibles in the income statement.
B.6.2. Impairment of investments in associates
In accordance with IAS 28 (Investments in Associates), the Group applies the criteria specified in IAS 39(see Note B.8.2.) to determine whether an investment in an associate may be impaired. If an investment isimpaired, the amount of the impairment loss is determined by applying IAS 36 (see Note B.6.1.) and recognizedin Share of profit/loss of associates.
F-15
NOTES TO THE CONSOLIDATED FINANCIAL STATEMENTS—(Continued)Year ended December 31, 2008
B.6.3. Reversals of impairment losses charged against property, plant and equipment, intangible assets,and investments in associates
At each reporting date, the Group assesses if events or changes in circumstances indicate that an impairmentloss recognized in a prior period in respect of an asset (other than goodwill) or an investment in an associate canbe reversed. If this is the case, and the recoverable amount as determined based on the new estimates exceeds thecarrying amount of the asset, the Group reverses the impairment loss only to the extent of the carrying amountthat would have been determined had no impairment loss been recognized for the asset.
Reversals of impairment losses in respect of property, plant and equipment and intangible assets arerecognized in the income statement under Impairment of property, plant and equipment and intangibles, whilereversals of impairment losses in respect of investments in associates are recognized in the income statementunder Share of profit/loss of associates. Impairment losses taken against goodwill are never reversed, unless thegoodwill relates to an investment in an associate.
B.7. Assets held for sale
Under IFRS 5 (Non-Current Assets Held for Sale and Discontinued Operations), non-current assets held forsale are defined as assets that will be realized through sale rather than continuing use. Once they have beenclassified as such, non-current assets held for sale are measured at the lower of carrying amount or fair value lesscosts to sell net of any impairment losses, and are not depreciated or amortized.
B.8. Financial instruments
B.8.1. Financial assets
Under IFRS, and in accordance with IAS 39 and IAS 32, sanofi-aventis has adopted the followingclassification for participating interests and investment securities, based on management intent at the date ofacquisition (except for investments already held at the transition date and reclassified at that date in accordancewith IFRS 1). The designation and classification of these investments is carried out at initial recognition andreassessed at each reporting date.
Purchases of investments are recognized on the date when sanofi-aventis becomes party to the contractualterms of such investments. On initial recognition, financial assets are measured at fair value, plus directtransaction costs in the case of financial assets not designated as fair value through profit or loss.
Classification, presentation and subsequent measurement of financial assets are as follows:
• Financial assets at fair value through profit or loss
These assets are classified in the balance sheet under Financial assets — current and Cash and cashequivalents.
Financial assets at fair value through profit or loss comprise financial assets held for trading andfinancial instruments designated as fair value through profit and loss on initial recognition, inaccordance with the conditions for application of the fair value option. This category consists offinancial assets acquired principally for the purpose of selling them in the near term (usually within lessthan 12 months). Derivative instruments are classified as held for trading unless they are designated ashedging instruments.
These financial assets are carried at fair value, without any deduction for transaction costs that may beincurred on sale. Realized and unrealized gains and losses resulting from changes in the fair value ofthese assets are recognized in the income statement, in Financial income or Financial expenses.
Realized and unrealized foreign exchange gains and losses on financial assets in currencies other thanthe euro are recognized in the income statement in Financial income or Financial expenses.
F-16

NOTES TO THE CONSOLIDATED FINANCIAL STATEMENTS—(Continued)Year ended December 31, 2008
• Available-for-sale financial assets
Available-for-sale financial assets are non-derivative financial assets that are (i) designated bymanagement as available-for-sale or (ii) not classified as “financial assets at fair value through profit orloss”, “held-to-maturity investments” or “loans and receivables”. This category includes participatinginterests in quoted or unquoted companies (other than investments in associates and joint ventures) thatmanagement intends to hold on a long-term basis. Available-for-sale financial assets are classified innon-current assets under Financial assets — non-current.
Available-for-sale financial assets are measured at fair value, without any deduction for transactioncosts that may be incurred on sale. Gains and losses arising from changes in the fair value of theseassets, including unrealized foreign exchange gains and losses, are recognized directly in equity in theconsolidated statement of recognized income and expense in the period in which they occur except forimpairment losses and foreign exchange gains and losses on debt instruments. On derecognition of anavailable-for-sale financial asset, or on recognition of an impairment loss on such an asset, thecumulative gains and losses previously recognized in equity are recognized in the income statement forthe period under Financial income or Financial expenses.
Interest income and dividends on equity instruments are recognized in the income statement underFinancial income when the Group is entitled to receive payment.
Available-for-sale financial assets in the form of participating interests in companies not quoted in anactive market are measured at cost if their fair value cannot be determined.
Realized foreign exchange gains and losses are recognized in the income statement under Financialincome or Financial expenses.
• Held-to-maturity investments
Held-to-maturity investments are non-derivative financial assets with fixed or determinable paymentsand fixed maturities that the Group has the positive intention and ability to hold to maturity.
These investments are measured at amortized cost using the effective interest method.
Sanofi-aventis did not hold any such investments during the years ended December 31, 2008, 2007 or2006.
• Loans and receivables
Loans and receivables are non-derivative financial assets with fixed or determinable payments that arenot quoted in an active market. They are presented in current assets, under Other current assets in thecase of loans and under Accounts receivable in the case of receivables. Loans with a maturity of morethan 12 months are presented in “Long-term loans and advances” under Financial assets — noncurrent. Loans and receivables are measured at amortized cost using the effective interest method.
Realized and unrealized foreign exchange gains and losses are recognized in the income statementunder Financial expenses or Financial income.
B.8.2. Impairment of financial assets
Indicators of impairment are reviewed for all financial assets at each reporting date. Such indicators includedefault in contractual payments, significant financial difficulties of the issuer or debtor, probability ofbankruptcy, or prolonged or significant decline in quoted market price. An impairment loss is recognized in theincome statement when there is objective evidence that an asset is impaired.
Impairment losses are measured and recognized as follows.
The impairment loss on loans and receivables, which are measured at amortized cost, is the differencebetween the carrying amount of the asset and the present value of estimated future cash flows discounted at thefinancial asset’s original effective interest rate.
F-17

NOTES TO THE CONSOLIDATED FINANCIAL STATEMENTS—(Continued)Year ended December 31, 2008
When an impairment loss is identified on an available-for-sale financial asset, the cumulative lossespreviously recognized directly in equity are recorded in the income statement. The loss recognized in the incomestatement is the difference between the acquisition cost (net of principal repayment and amortization) and the fairvalue at the time of impairment, less any impairment loss previously recognized in the income statement.
The impairment loss on investments in companies that are not quoted in an active market and are measuredat cost is the difference between the carrying amount of the investment and the present value of its estimatedfuture cash flows discounted at the current market interest rate for similar financial assets.
Impairment losses in respect of loans are recognized under Financial expenses in the income statement.
Impairment losses in respect of receivables are recognized in the relevant classification of expense byfunction in the income statement.
Impairment losses on investments in companies that are not quoted in an active market and are measured atcost, and on equity instruments classified as available-for-sale financial assets, cannot be reversed through theincome statement.
B.8.3. Derivative instruments
Derivative instruments not designated as hedges of operating transactions are initially and subsequentlymeasured at fair value, with changes in fair value recognized in the income statement, under Financial incomeor Financial expenses, in the period when they arise.
Derivative instruments qualifying as hedging instruments are measured in accordance with the hedgeaccounting requirements of IAS 39 (see Note B.8.4.).
B.8.4. Hedging
Hedging involves the use of derivative financial instruments. Changes in the fair value of these instrumentsare intended to offset the exposure of the hedged items to changes in fair value.
As part of its overall interest rate risk and foreign exchange risk management policy, the Group enters intovarious transactions involving derivative instruments. Derivative instruments used in connection with theGroup’s hedging policy may include forward exchange contracts, currency options, interest rate swaps andinterest rate options.
Derivative financial instruments qualify as hedging instruments for hedge accounting purposes when (a) atthe inception of the hedge there is formal designation and documentation of the hedging relationship and of therisk management strategy and objective; (b) the hedge is expected to be highly effective in offsetting the risk;(c) the forecast transaction being hedged is highly probable and presents an exposure to variations in cash flowsthat could ultimately affect profit or loss; (d) the effectiveness of the hedge can be reliably measured; and (e) thehedge is assessed on an ongoing basis and determined actually to have been highly effective throughout thereporting periods for which the hedge was designated.
These criteria are applied when the Group uses derivative instruments designated as a fair value hedge, acash flow hedge or a hedge of a net investment in a foreign operation.
• Fair value hedge
A fair value hedge is a hedge of the exposure to changes in fair value of a recognized asset or liabilityor unrecognized firm commitment that could affect profit or loss.
F-18
NOTES TO THE CONSOLIDATED FINANCIAL STATEMENTS—(Continued)Year ended December 31, 2008
Changes in fair value of the hedging instrument and changes in fair value of the hedged itemattributable to the hedged risk are recognized in the income statement, under Other operating incomefor hedges of operating activities and under Financial income or Financial expenses for hedges ofinvesting or financing activities.
• Cash flow hedge
A cash flow hedge is a hedge of the exposure to variability in cash flows attributable to a particular riskassociated with a recognized asset or liability, or a highly probable forecast transaction, that couldaffect profit or loss.
Changes in fair value of the hedging instrument attributable to the effective portion of the hedge arerecognized directly in equity in the consolidated statement of recognized income and expense. Changesin fair value attributable to the ineffective portion of the hedge are recognized in the income statementunder Other operating income for hedges of operating activities, and under Financial income orFinancial expenses for hedges of investing or financing activities.
Cumulative changes in fair value of the hedging instrument previously recognized in equity aretransferred to the income statement when the hedged transaction affects profit or loss. Thesetransferred gains and losses are recorded under Other operating income for hedges of operatingactivities and Financial income or Financial expenses for hedges of investing or financing activities.
When a forecast transaction results in the recognition of a non-financial asset or liability, cumulativechanges in the fair value of the hedging instrument previously recognized in equity are included in theinitial measurement of the asset or liability.
When the hedging instrument expires or is sold, terminated or exercised, the cumulative gain or losspreviously recognized in equity remains separately recognized in equity until the forecast transactionoccurs. However, if the Group no longer expects the forecast transaction to occur, the cumulative gainor loss previously recognized in equity is recognized immediately in the income statement.
• Hedge of a net investment in a foreign operation
A hedge of a net investment in a foreign operation is accounted for in the same way as a cash flowhedge. Changes in fair value of the hedging instrument attributable to the effective portion of the hedgeare recognized directly in equity in the consolidated statement of recognized income and expense.Changes in fair value attributable to the ineffective portion of the hedge are recognized in the incomestatement under Financial income or Financial expenses. When the investment in the foreignoperation is sold, or wholly or partially liquidated, the changes in the fair value of the hedginginstrument previously recognized in equity are transferred to the income statement under Financialincome or Financial expenses.
Hedge accounting is discontinued when (a) the hedging instrument expires or is sold, terminated orexercised, or (b) the hedge no longer meets the criteria for hedge accounting, or (c) the Group revokes the hedgedesignation, or (d) management no longer expects the forecast transaction to occur.
B.8.5. Financial liabilities
Bank borrowings and debt instruments are initially measured at fair value of the consideration received, netof directly attributable transaction costs.
Subsequently, they are measured at amortized cost using the effective interest method. All costs related tothe issuance of borrowings or debt instruments, and all differences between the issue proceeds net of transactioncosts and the value on redemption, are recognized under Financial expenses in the income statement over theterm of the debt using the effective interest method.
F-19

NOTES TO THE CONSOLIDATED FINANCIAL STATEMENTS—(Continued)Year ended December 31, 2008
B.8.6. Fair value of financial instruments
Fair value is the amount for which an asset could be exchanged, or a liability settled, betweenknowledgeable, willing parties in an arm’s length transaction.
The fair value of financial assets and liabilities that are traded in an active market is determined by referenceto stock market prices at the balance sheet date in the case of participating interests and investment securities,and by reference to market prices at the balance sheet date in the case of derivative instruments traded in anactive market. The fair value of financial assets or liabilities that are not quoted in an active market is based onvarious valuation methods and assumptions made by sanofi-aventis with reference to market conditionsprevailing at the balance sheet date.
Because of the short maturity of non-derivative current financial assets, the Group regards their carryingamount in the balance sheet (historical cost less any provisions for credit risk) as equivalent to fair value.
B.8.7. Derecognition of financial instruments
Sanofi-aventis derecognizes financial assets when the contractual rights to cash flows from these assets haveended or have been transferred and when the Group has transferred substantially all risks and rewards ofownership of these assets. If the Group has neither transferred nor retained substantially all the risks and rewardsof ownership of these assets, they are derecognized if the Group does not retain the control of these assets.
Financial liabilities are derecognized when the Group’s contractual obligations in respect of such liabilitiesare discharged or cancelled or expire.
B.8.8. Risks relating to financial instruments
Market risks in respect of non-current financial assets, cash equivalents, derivative instruments and debt aredescribed in the risk factors presented in Item 3.D. and Item 11.
Credit risk is the risk that customers may fail to pay their debts. This risk also arises as a result of theconcentration of the Group’s sales with its largest customers, in particular certain wholesalers in the UnitedStates. Customer credit risk is described in the risk factors presented in Item 3.D.
B.9. Inventories
Inventories are measured at the lower of cost or net realizable value. Cost is calculated using the weightedaverage cost method or the first-in, first-out method, depending on the nature of the inventory.
The cost of finished goods inventories includes costs of purchase, costs of conversion and other costsincurred in bringing the inventories to their present location and condition.
Net realizable value is the estimated selling price in the ordinary course of business less the estimated costsof completion and the estimated costs necessary to make the sale.
B.10. Cash and cash equivalents
Cash and cash equivalents as shown in the consolidated balance sheet and statement of cash flows comprisecash, plus liquid short-term investments that are (i) readily convertible into cash and (ii) subject to aninsignificant risk of changes in value in the event of movements in interest rates.
B.11. Treasury shares
In accordance with IAS 32, sanofi-aventis treasury shares are deducted from equity irrespective of thepurpose for which they are held. No gain or loss is recognized in the income statement on the purchase, sale,impairment or cancellation of treasury shares.
F-20
NOTES TO THE CONSOLIDATED FINANCIAL STATEMENTS—(Continued)Year ended December 31, 2008
B.12. Provisions for risks
In accordance with IAS 37 (Provisions, Contingent Liabilities and Contingent Assets), sanofi-aventisrecords a provision where it has a present obligation, whether legal or constructive, as a result of a past event; itis probable that an outflow of resources embodying economic benefits will be required to settle the obligation;and a reliable estimate can be made of the amount of the outflow of resources. If the obligation is expected to besettled more than twelve months after the balance sheet date, or has no definite settlement date, the provision isrecorded under Provisions and other non-current liabilities.
Contingent liabilities are not recognized, but are disclosed in the notes to the financial statements unless thepossibility of an outflow of economic resources is remote.
Provisions are estimated on the basis of events and circumstances related to present obligations at thebalance sheet date, of past experience, and to the best of management’s knowledge at the date of preparation ofthe financial statements.
Reimbursements offsetting the probable outflow of resources are recognized as assets only if it is virtuallycertain that they will be received. Contingent assets are not recognized.
Restructuring provisions are recognized if the Group has a detailed, formal restructuring plan at the balancesheet date and has announced its intention to implement this plan to those affected by it.
No provisions are recorded for future operating losses.
Sanofi-aventis records long-term provisions for certain obligations such as legal environmental obligationsand litigation where an outflow of resources is probable. Where the effect of the time value of money is material,these provisions are measured at the present value of the expenditures expected to be required to settle theobligation, calculated using a discount rate that reflects an estimate of the time value of money and the risksspecific to the obligation.
Increases in provisions to reflect the effects of the passage of time are recognized in Financial expenses.
B.13. Emission rights
Under international agreements, the European Union has committed to reducing greenhouse gas emissionsand instituted an emissions allowance trading scheme. Approximately ten sanofi-aventis sites in Europe arecovered by the scheme. Sanofi-aventis accounts for emission allowances as follows: the annual allowancesallocated by government are recognized as intangible assets measured at fair value at the date of initialrecognition, with a matching liability recognized to reflect the government grant effectively arising from the factthat allowances are issued free of charge. As and when allowances are consumed, they are transferred to“Deliverable allowances” in order to recognize the liability to government in respect of actual CO2 emissions. Ifthe allocated allowances are insufficient to cover actual emissions, an expense is recognized in order to reflectthe additional allowances deliverable; this expense is measured at the market value of the allowances.
B.14. Revenue recognition
Revenue arising from the sale of goods is presented in the income statement under Net sales. Net salescomprise revenue from sales of pharmaceutical products, vaccines, and active ingredients, net of sales returns, ofcustomer incentives and discounts, and of certain sales-based payments paid or payable to the healthcareauthorities.
Revenue is recognized when all of the following conditions have been met: the risks and rewards ofownership have been transferred to the customer; the Group no longer has effective control over the goods sold;
F-21
NOTES TO THE CONSOLIDATED FINANCIAL STATEMENTS—(Continued)Year ended December 31, 2008
the amount of revenue and costs associated with the transaction can be measured reliably; and it is probable thatthe economic benefits associated with the transaction will flow to the Group, in accordance with IAS 18(Revenue).
Sanofi-aventis offers various types of price reductions on its products. In particular, products sold in theUnited States are covered by various governmental programs (such as Medicare and Medicaid) under whichproducts are sold at a discount. Rebates are granted to healthcare authorities, and under contractual arrangementswith certain customers. Some wholesalers are entitled to chargeback incentives based on the selling price to theend customer, under specific contractual arrangements. Cash discounts may also be granted for prompt payment.
Returns, discounts, incentives and rebates as described above are recognized in the period in which theunderlying sales are recognized, as a reduction of sales revenue.
These amounts are calculated as follows:
• Provisions for chargeback incentives are estimated on the basis of the relevant subsidiary’s standardsales terms and conditions, and in certain cases on the basis of specific contractual arrangements withthe customer. They represent management’s best estimate of the ultimate amount of chargebackincentives that will eventually be claimed by the customer.
• Provisions for rebates based on attainment of sales targets are estimated and accrued as each of theunderlying sales transactions is recognized.
• Provisions for price reductions under Government and State programs, largely in the United States, areestimated on the basis of the specific terms of the relevant regulations and/or agreements, and accruedas each of the underlying sales transactions is recognized.
• Provisions for sales returns are calculated on the basis of management’s best estimate of the amount ofproduct that will ultimately be returned by customers.
In each case, the provisions are subject to continuous review and adjustment as appropriate based on themost recent information available to management.
The Group believes that it has the ability to measure each of the above provisions reliably, using thefollowing factors in developing its estimates:
• the nature and patient profile of the underlying product;
• the applicable regulations and/or the specific terms and conditions of contracts with governmentalauthorities, wholesalers and other customers;
• historical data relating to similar contracts, in the case of qualitative and quantitative rebates andchargeback incentives;
• past experience and sales growth trends for the same or similar products;
• actual inventory levels in distribution channels, monitored by the Group using internal sales data andexternally provided data;
• the shelf life of the Group’s products;
• market trends including competition, pricing and demand;
• the possibility of reusing returned goods.
Non-product revenues, mainly comprising royalty income from license arrangements that constitute ongoingoperations of the Group (see Note C.), are presented in Other revenues.
F-22

NOTES TO THE CONSOLIDATED FINANCIAL STATEMENTS—(Continued)Year ended December 31, 2008
B.15. Cost of sales
Cost of sales consists primarily of the industrial cost of goods sold, payments made under licensingagreements, and distribution costs.
B.16. Research and development expenses
Internally generated research costs are expensed as incurred.
Internally generated pharmaceutical development costs are also expensed as incurred; they are notcapitalized, because the criteria for capitalization are considered not to have been met until marketing approvalfor the related product has been obtained from the regulatory authorities. Recharges to or contributions fromalliance partners are recorded as a reduction in Research and development expenses.
Note B.4.1., Research and development not acquired in a business combination, and Note B.4.3., Intangibleassets acquired in a business combination, describe the principles applied to the recognition of separatelyacquired research and development.
B.17. Other operating income
Other operating income includes the share of profits that sanofi-aventis is entitled to receive from alliancepartners, principally Procter & Gamble Pharmaceuticals, in respect of product marketing agreements (seeNote C.2.). It also includes revenues generated under certain complex agreements, which may includepartnership and co-promotion agreements.
Upfront payments received are deferred for as long as a service obligation remains. Milestone payments areassessed on a case by case basis, and recognized in the income statement on delivery of the products and/orprovision of the services in question. Revenue generated in connection with these services is recognized on thebasis of delivery of the goods or provision of the services to the other contracting party.
This line also includes realized and unrealized foreign exchange gains and losses on operating activities (seeNote B.8.4.), and operating gains on disposals not regarded as major disposals (see Note B.20.).
B.18. Other operating expenses
Other operating expenses mainly comprise the share of profits that alliance partners are entitled to receivefrom sanofi-aventis under product marketing agreements.
B.19. Amortization of intangibles
The expenses recorded on this line mainly comprise amortization of product rights (see Note D.4.), whichare presented as a separate item because the benefit of these rights to the Group’s commercial, industrial anddevelopment functions cannot be separately identified.
Amortization of software is recognized as an expense in the income statement, in the relevant classificationof expense by function.
B.20. Operating income before restructuring, impairment of property, plant and equipment andintangibles, gains and losses on disposals, and litigation
“Operating income before restructuring, impairment of property, plant and equipment and intangibles, gainsand losses on disposals, and litigation” is presented as a separate line item in the consolidated income statementin accordance with paragraph 83 of IAS 1 (Presentation of Financial Statements), because it is relevant to an
F-23

NOTES TO THE CONSOLIDATED FINANCIAL STATEMENTS—(Continued)Year ended December 31, 2008
understanding of the Group’s financial performance. This line item allows the Group to present separately itemswhich, although they are components of operating income, nonetheless have a low degree of predictabilitybecause of their nature, frequency and/or materiality, and which if not presented separately would impair theunderstanding of the Group’s financial performance.
This line item corresponds to operating income before the three items described below:
• Restructuring costs
Restructuring costs include early retirement benefits, compensation for early termination of contracts, andrationalization costs relating to restructured sites. Asset impairment losses directly attributable to restructuringare also recorded on this line. Restructuring costs included on this line relate only to unusual and majorrestructuring plans.
• Impairment of property, plant and equipment and intangibles
This line includes major impairment losses (other than those directly attributable to restructuring) onproperty, plant and equipment and intangibles, including goodwill. It also includes any reversals of such losses.
• Gains and losses on disposals, and litigation
This line comprises gains and losses on major disposals of property, plant and equipment and intangibleassets, and costs and provisions related to major litigation.
B.21. Financial expenses/income
B.21.1. Financial expenses
Financial expenses mainly comprise interest charges on debt financing, negative changes in the fair valueof financial instruments (where changes in fair value are taken to the income statement), realized and unrealizedforeign exchange losses on financing and investing activities, and impairment losses on financial instruments.They also include any reversals of impairment losses on financial instruments.
Financial expenses also include the expenses arising from the unwinding of discount on long-termprovisions, except provisions for retirement benefits and other long-term employee benefits. This line does notinclude cash discounts, which are deducted from net sales.
B.21.2. Financial income
Financial income includes interest and dividend income, positive changes in the fair value of financialinstruments (where changes in fair value are taken to the income statement), realized and unrealized foreignexchange gains on financing and investing activities, and gains or losses on disposals of financial assets.
B.22. Income tax expense
Income tax expense includes all current and deferred taxes of consolidated companies.
Sanofi-aventis accounts for deferred taxes in accordance with IAS 12 (Income Taxes), using the methodsdescribed below.
Deferred tax assets and liabilities are recognized on taxable and deductible temporary differences, and taxloss carryforwards. Temporary differences are differences between the carrying amount of an asset or liability inthe balance sheet and its tax base.
F-24
NOTES TO THE CONSOLIDATED FINANCIAL STATEMENTS—(Continued)Year ended December 31, 2008
Deferred tax assets and liabilities are calculated using the tax rate expected to apply in the period when atemporary difference is expected to reverse, based on tax rates enacted or substantively enacted at the balancesheet date.
Unused tax losses and unused tax credits are recognized as deferred tax assets to the extent that it isprobable that future taxable profits will be available against which they can be utilized.
Sanofi-aventis recognizes a deferred tax liability for temporary differences relating to investments insubsidiaries and associates and to interests in joint ventures except when the Group is able to control the timingof the reversal of the temporary differences. This applies in particular when the Group is able to control dividendpolicy and it is probable that the temporary differences will not reverse in the foreseeable future.
No deferred tax is recognized on intragroup transfers of investments in subsidiaries or associates.
For consolidation purposes, each tax entity calculates its own net deferred tax position. All net deferred taxasset and liability positions are then aggregated and shown as separate line items on the assets and liabilities sidesof the consolidated balance sheet respectively. Deferred tax assets and liabilities can be offset only if (i) theGroup has a legally enforceable right to set off current tax assets and current tax liabilities, and (ii) the deferredtax assets and deferred tax liabilities relate to income taxes levied by the same taxation authority.
Deferred taxes are not discounted, except implicitly in the case of deferred taxes on assets and liabilitieswhich are themselves discounted.
Withholding taxes on intragroup royalties and dividends, and on royalties and dividends collected from thirdparties, are accounted for as current income taxes.
In accounting for business combinations, sanofi-aventis complies with IFRS 3 as regards the recognition ofdeferred tax assets after the initial accounting period. This means that if any deferred tax assets are recognized bythe acquiree after the end of this period on temporary differences or tax loss carryforwards existing at the date ofthe combination, a corresponding reduction is made to the amount of goodwill.
B.23. Employee benefit obligations
Sanofi-aventis offers retirement benefits to employees and retirees of the Group. These benefits areaccounted for in accordance with IAS 19 (Employee Benefits).
These benefits are in the form of either defined-contribution plans or defined-benefit plans.
In the case of defined-contribution plans, the contributions paid by sanofi-aventis are expensed in the periodin which they occur, and no actuarial estimate is performed.
In the case of defined-benefit plans, sanofi-aventis recognizes its obligations to employees as a liability,based on an actuarial estimate of the rights vested and/or currently vesting in employees and retirees using theprojected unit credit method, net of the estimated fair value of plan assets.
These estimates are performed at least once a year, and rely on assumptions about life expectancy, employeeturnover, and salary increases. The estimated obligation is discounted.
Obligations in respect of other post-employment benefits (healthcare, life insurance) offered by Groupcompanies to employees are also recognized as a liability based on an actuarial estimate of the rights vested orcurrently vesting in employees and retirees at the balance sheet date.
F-25

NOTES TO THE CONSOLIDATED FINANCIAL STATEMENTS—(Continued)Year ended December 31, 2008
Actuarial gains and losses relating to defined-benefit plans (pensions and other post-employment benefits),arising from the effects of changes in actuarial assumptions and experience adjustments, are recognized in equitynet of deferred taxes via the consolidated statement of recognized income and expense, under the option allowedby the amendment to IAS 19. All unrecognized actuarial gains and losses at the transition date (January 1, 2004)were recognized in retained earnings at that date in accordance with the optional treatment allowed in IFRS 1(First-time Adoption of International Financial Reporting Standards).
Past service cost is recognized as an expense on a straight-line basis over the average period until thebenefits become vested. If benefits are already vested on the introduction of, or changes to, a defined benefitplan, past service cost is recognized immediately.
Actuarial gains and losses relating to other long-term employee benefits are recognized immediately in theincome statement.
B.24. Share-based payment
B.24.1. Stock option plans
Sanofi-aventis has granted a number of equity-settled share-based payment plans (stock option plans) tosome of its employees.
In accordance with IFRS 2 (Share-Based Payment), services received from employees as consideration forstock options are recognized as an expense in the income statement, with the matching entry recognized inequity. The expense corresponds to the fair value of the stock option plans, and is charged to income on astraight-line basis over the three-year or four-year vesting period of the plan.
The fair value of stock option plans is measured at the date of grant using the Black-Scholes valuationmodel, taking into account the expected life of the options. In recognizing this fair value as an expense,allowance is made for the expected cancellation rate of the options. The expense is adjusted over the vestingperiod to reflect the actual cancellation rates resulting from the departure of the holders of the options.
B.24.2. Employee share ownership plans
The sanofi-aventis Group may offer its employees the opportunity to subscribe to reserved share issues at adiscount to the reference market price. Shares allotted to employees under these plans fall within the scope ofIFRS 2. The discount is measured at the subscription date and recognized as an expense, with no reduction forany lock-up period.
B.25. Earnings per share
Basic earnings per share is calculated using the weighted average number of shares outstanding during thereporting period, adjusted on a time-weighted basis from the acquisition date to reflect the number of sanofi-aventis shares held by the Group. Diluted earnings per share is calculated on the basis of the weighted averagenumber of ordinary shares, computed using the treasury stock method.
This method assumes that (a) all outstanding dilutive options and warrants are exercised and (b) the Groupacquires its own shares at the quoted market price for an amount equivalent to the cash received as considerationfor the exercise of the options or warrants, plus the expense arising on unamortized stock options.
In the event of a stock split or consideration free issue of shares, earnings per share for prior periods isadjusted accordingly.
F-26
NOTES TO THE CONSOLIDATED FINANCIAL STATEMENTS—(Continued)Year ended December 31, 2008
B.26. Segment information
In accordance with IAS 14 (Segment Reporting), the Group reports information by business segment andgeographical segment.
The primary level of the Group’s segment reporting is the business segment.
A business segment is a distinguishable component of the Group that is engaged in providing a group ofrelated products and services and is subject to different risks and returns from those of other business segments.The Group has two business segments: Pharmaceuticals and Vaccines (human vaccines).
The secondary level of segment reporting is the geographical segment. A geographical segment is adistinguishable component of the Group that is engaged in providing a group of related products and serviceswithin a particular economic environment and is subject to different risks and returns from those of componentsoperating in other economic environments. The Group has three geographical segments: Europe, the UnitedStates, and Other Countries.
The split between these segments is based on the organizational and management structure, and onindicators used for internal management reporting purposes.
B.27. Management of capital
In order to maintain or adjust the capital structure, the Group can adjust the amount of dividends paid toshareholders, or repurchase its own shares, or issue new shares, or issue securities giving access to its capital.
The following objectives are defined under the terms of the Group’s share repurchase programs:
– the implementation of any stock option plan giving entitlement to purchase shares in the sanofi-aventisparent company;
– the allotment or sale of shares to employees under statutory profit-sharing schemes and employeesavings plans;
– the allotment of consideration free shares;
– the cancellation of some or all of the repurchased shares;
– market-making in the secondary market in the shares by an investment services provider under aliquidity contract in compliance with the ethical code recognized by the Autorité des MarchésFinanciers;
– the delivery of shares on the exercise of rights attached to securities giving access to the capital byredemption, conversion, exchange, presentation of a warrant or any other means;
– the delivery of shares (in exchange, as payment, or otherwise) in connection with mergers andacquisitions;
– the execution by an investment services provider of purchases, sales or transfers by any means, inparticular via off-market trading;
– or any other purpose that is or may in future be authorized under the applicable laws and regulations.
The Group is not subject to any constraints on equity capital imposed by third parties.
The gearing ratio (the ratio of debt, net of cash and cash equivalents to total equity) is a non-GAAP financialindicator used by management to measure overall net indebtedness and to manage the Group’s equity capital.
F-27
NOTES TO THE CONSOLIDATED FINANCIAL STATEMENTS—(Continued)Year ended December 31, 2008
Total equity includes equity attributable to equity holders of the Company and minority interests, as shownon the consolidated balance sheet. See Note D.15.2. for a consolidated statement of changes in equity.
Debt, net of cash and cash equivalents is defined as short-term debt plus long-term debt, minus cash andcash equivalents.
For trends in this ratio, see Note D.17.
B.28. New IASB standards, amendments and interpretations applicable from 2009 onwards
New standards and interpretations applied in the consolidated financial statements for the first time in 2008are described in Note A.2. The note below describes standards, amendments and interpretations issued by theIASB that will be mandatorily applicable in 2009 or subsequent years, and the Group’s position regarding futureapplication.
Standards and amendments applicable to the consolidated financial statements of sanofi-aventis
An amendment to IFRS 2 (Share-based Payment) has been issued, dealing with the definition of vestingconditions and the accounting treatment of cancellations. This amendment, which has been adopted by theEuropean Union, states that only service and performance conditions are vesting conditions and hence includedin the stock option expense for the period. Conversely, market conditions are not vesting conditions, and hencemust be included in the fair value of the stock option plan at the date of grant. The amendment also specifies thatthe same accounting treatment must be applied to all cancellations, irrespective of whether cancellation is due tothe actions of the entity or a third party or to failure by the entity or the employee to meet a vesting condition.The Group will apply this amendment from the 2009 financial year, and does not anticipate that it will have amaterial impact on the consolidated financial statements.
Early in 2008, the IASB issued a revised IFRS 3 (Business Combinations) and amendments to IAS 27(Consolidated and Separate Financial Statements). These revised and amended standards are mandatorilyapplicable in 2010 at the latest, and may be early adopted provided that they are applied simultaneously. Theprincipal changes to IFRS 3 and IAS 27 are described below:
• The revised IFRS 3 alters the way in which the purchase method is applied to business combinations.First, it allows an option to calculate the goodwill on a partial acquisition by reference either to the fairvalue of the acquired entity or to the proportionate interest in the net assets acquired; this option can beapplied individually to each acquisition. Second, it requires that in the case of a step acquisition, thepreviously-held equity interest must be remeasured at fair value on the date when control is acquired,with any difference relative to the carrying amount of that equity interest recognized in profit or lossalong with any components of comprehensive income relating to the equity interest that arereclassifiable to profit or loss. Third, contingent consideration must be recognized at fair value at theacquisition date irrespective of the probability of payment, with the resulting obligation recognized asdebt or equity; subsequent adjustments must be recognized in profit or loss or in equity, depending onthe original accounting treatment. Finally, acquisition-related costs must be recognized as expenses atthe acquisition date, and deferred tax assets not recognized at the acquisition date (or during thetwelve-month measurement period in which goodwill may be adjusted) must be recognized as a gain.
• The amended IAS 27 alters the accounting treatment of transactions with non-controlling interests: ifsuch transactions do not result in a change of control, they are accounted for as equity transactions. Inaddition, in the case of a partial disposal leading to loss of control, the investment retained must beremeasured at fair value, while the gain on disposal will include the effect of this remeasurement andthe gain or loss on the shares sold, including any items previously recognized in equity that must bereclassified to profit or loss.
F-28
NOTES TO THE CONSOLIDATED FINANCIAL STATEMENTS—(Continued)Year ended December 31, 2008
These changes will apply to new acquisitions and disposals with effect from the application date elected bythe Group, except for the recognition of deferred tax assets subsequent to the acquisition date (because in suchcases, the gain must be recognized even if the acquisition predates the application date of the revised IFRS 3; thisapplies, for example, to the acquisition of Aventis). The Group is currently considering the possibility of earlyadoption of the revised IFRS 3 and of the amendments to IAS 27 with effect from the 2009 financial year, subjectto their adoption by the European Union.
IAS 14 (Segment Reporting) has been replaced by IFRS 8 (Operating Segments), which has been adoptedby the European Union and is mandatorily applicable from January 1, 2009 but has not been early adopted bysanofi-aventis. IFRS 8 requires financial information to be reported on the same basis as is used internally forevaluating operating segment performance and deciding how to allocate resources to operating segments. It alsospecifies new criteria for identifying reportable segments. The information reported by sanofi-aventis for itsprimary segments under IAS 14 is already derived from information used internally.
The revised IAS 1 (Presentation of Financial Statements), issued in 2007, is mandatorily applicable in 2009and has been adopted by the European Union. The revised standard requires the separate reporting of(i) transactions with the owners of the entity (the shareholders), presented in the statement of changes in equityand (ii) other changes in equity, presented either in a single statement of comprehensive income or in twostatements (a separate income statement and a statement of comprehensive income). Because sanofi-aventisapplies the option allowed by the amendment to IAS 19 (Employee Benefits) to recognize actuarial gains andlosses in equity, comprehensive income is already presented separately from the consolidated income statement,in the consolidated statement of recognized income and expense. Consequently, the main impact of applying therevised IAS 1 in 2009 will be the presentation of the additional information required by the revised standard, inparticular the presentation of a balance sheet as at the beginning of the earliest comparative reporting periodwhen the balance sheet has been retrospectively restated; disclosure of income tax relating to each component ofcomprehensive income; and disclosure of amounts reclassified from equity to profit or loss.
The amended IAS 23 (Borrowing Costs) is applicable from 2009 and has been adopted by the EuropeanUnion. This amendment requires entities to recognize borrowing costs generated by the acquisition or thein-house construction of items of property, plant and equipment as an asset, and removes the option ofrecognizing these costs as an expense. Because the Group elected to recognize such borrowing costs as assets onfirst-time adoption of IFRS, applying this amendment in 2009 will have no impact on the consolidated financialstatements.
The IASB has issued an amendment to IAS 39 relating to eligible hedged items. This amendment has notyet been adopted by the European Union. It specifies the conditions required for the inflation risk of a debtinstrument to be eligible as a hedged item for accounting purposes, and the treatment of hedge ineffectivenessrelating to the time value of options designated as hedges. This amendment will have no impact on theconsolidated financial statements, because sanofi-aventis has no inflation index-linked debt instruments in issueand because the accounting treatment applied by the Group to the time value of options designated as hedgesalready complies with the treatment required by the amendment.
In May 2008, the IASB published the first “Improvements to IFRSs”, part of an annual process of revisionand improvements to standards. “Improvements to IFRSs” comprises a series of amendments to variousstandards, with effective dates and transition arrangements specific to each amendment, and was adopted by theEuropean Union in January 2009. The amendments described below are those that are most relevant to sanofi-aventis. These amendments are intended to clarify the existing standards, and hence are not inconsistent withthose standards. All are applicable from 2009 onwards, and none has any impact on the consolidated financialstatements because the accounting treatment applied by the Group is already consistent with that specified in therelevant amendment.
• Amendments to IAS 28 (Investments in Associates), IAS 32 (Financial Instruments: Presentation), andIFRS 7 (Financial Instruments: Disclosures) relating to the accounting treatment of provisions for
F-29

NOTES TO THE CONSOLIDATED FINANCIAL STATEMENTS—(Continued)Year ended December 31, 2008
impairment of an investment in an associate. These amendments specify that if an investment in anassociate is impaired, the impairment loss should not be allocated to any asset that forms part of theinvestment, including goodwill. Consequently, the impairment loss can be reversed if the recoverableamount subsequently increases.
• Amendment to IAS 20 (Accounting for Government Grants and Disclosure of Government Assistance)relating to the accounting treatment of government loans at below-market rates of interest. Thisamendment requires such loans to be measured at fair value in accordance with IAS 39, with market-rate interest recognized as an expense. The difference between the nominal value and the fair value ofthe loan represents a grant, which must be accounted for in accordance with IAS 20.
• Amendment to IAS 38 (Intangible Assets) relating to advertising and promotional activities. Under thisamendment, promotional expenses are recognized as an expense (i) in the case of the supply of goods,when the entity has a right to access those goods and (ii) in the case of the supply of services, when itreceives those services. Advance payments are recognized as an asset until the entity obtains a right toaccess the goods or receives the services.
Standards and amendments that do not apply to the consolidated financial statements of sanofi-aventis
The IASB has also issued the following standards and amendments:
• Revised version of IFRS 1 (First-Time Adoption of International Financial Reporting Standards). Thestructure of IFRS 1, which had become complex due to the numerous changes required as a result ofamendments to other standards, has been revised and simplified, but with no change in its generalprinciples. Because this standard applies only to first-time adopters of IFRS, it is not applicable to theGroup.
• Amendments to IFRS 1 and IAS 27 relating to the definition of the cost of the net investment in asubsidiary, jointly controlled entity or associate, and the accounting treatment of such investments inthe separate financial statements of entities reporting under IFRS. These amendments relate solely toseparate financial statements, and hence have no impact on the consolidated financial statements ofsanofi-aventis.
• Amendments to IAS 32 and IAS 1 relating to puttable financial instruments and obligations arising onliquidation. These specify the conditions under which an issuer must classify as equity (i) puttablefinancial instruments and (ii) instruments that impose obligations on the issuer in the event of itsliquidation. Because sanofi-aventis has not issued any instruments of this type, these amendments haveno impact on the consolidated financial statements.
All these amendments have been adopted by the European Union except for the amendment to IFRS 1.
New interpretations
The IASB has also issued the following interpretations (IFRIC 13, IFRIC 15 and IFRIC 16 are mandatorilyapplicable from 2009 onwards, while IFRIC 17 and IFRIC 18 are mandatorily applicable from 2010 onwards):
• IFRIC 13 (Customer Loyalty Programmes), which specifies the accounting treatment applied torewards offered by an entity to its customers when they buy goods or services. Because sanofi-aventisdoes not offer incentives of this kind, this interpretation is not applicable to the Group’s activities.
• IFRIC 15 (Agreements for the Construction of Real Estate), which clarifies which method (oncompletion, or by the percentage of completion method) is to be used for recognizing revenue on salesof real estate, especially off plan sales. This interpretation is not applicable to the Group’s activities.
• IFRIC 16 (Hedges of a Net Investment in a Foreign Operation), clarifying the risks that are eligible forthis type of hedge and the applicable accounting treatment. The risk eligible for hedge accounting is theforeign currency exposure arising between the functional currency of the foreign operation and the
F-30
NOTES TO THE CONSOLIDATED FINANCIAL STATEMENTS—(Continued)Year ended December 31, 2008
functional currency of an intermediate or ultimate parent entity. On disposal, the effective portion ofthe hedge previously recognized in other components of comprehensive income is reclassified to profitor loss, as is the portion of the translation reserve relating to the entity disposed of. The Group does notanticipate any material impact from the application of IFRIC 16.
• IFRIC 17 (Distributions of Non-cash Assets to Owners), which requires distributions of dividends inassets other than cash to be recognized when the declaration of dividend is authorized by the relevantauthority, and measured at the fair value of the assets distributed. The fair value of those assets must beremeasured at the end of each reporting period and at the date of settlement, with adjustments to theamount of dividend payable taken to equity. On settlement, the difference between the carrying amountof the distributed assets and the amount of dividend payable is recognized in profit or loss. Becausesanofi-aventis does not distribute non-cash assets, this interpretation is not applicable to theconsolidated financial statements.
• IFRIC 18 (Transfer of Assets from Customers), which specifies the treatment applied to property, plantand equipment received from a customer by a public service operator. This interpretation does notapply to the Group’s activities.
The only one of these interpretations to have been adopted by the European Union is IFRIC 13.
C. ALLIANCES
C.1. Alliance arrangements with Bristol-Myers Squibb (BMS)
Two of the Group’s leading products were jointly developed with BMS: the antihypertensive agentirbesartan (Aprovel®/Avapro®/Karvea®) and the anti-atherothrombosis treatment clopidogrel bisulfate (Plavix®/Iscover®).
As inventor of the two molecules, sanofi-aventis is paid a royalty on all sales generated by these products.This royalty is recorded in Other revenues.
As co-developers of the products, sanofi-aventis and BMS each receive equal development royalties fromtheir two licensees, which have been responsible, since 1997, for marketing the products using their localdistribution networks, composed of subsidiaries of both groups. These licensees operate in two separateterritories: (i) Europe, Africa and Asia, under the operational management of sanofi-aventis; and (ii) othercountries (excluding Japan), under the operational management of BMS. In Japan, Aprovel® has since June 2008been marketed jointly by Shionogi Pharmaceuticals and Dainippon Sumitomo Pharma Co. Ltd., under licenseand sub-license agreements contracted with BMS. The alliance with BMS does not cover the rights to Plavix® inJapan, where the product is marketed by sanofi-aventis.
The products are marketed in different ways in different countries.
Co-promotion consists of a pooling of sales resources under a single brand name, and is preferably achievedthrough contracts or through appropriate tax-transparent legal entities. Each partner records directly its share oftaxable income.
Co-marketing consists of separate marketing of the products by each local affiliate using its own name andresources under different brand names for the product.
In certain countries of Eastern Europe, Africa, Asia, Latin America and the Middle East, the products aremarketed on an exclusive basis, either by sanofi-aventis or by BMS.
F-31
NOTES TO THE CONSOLIDATED FINANCIAL STATEMENTS—(Continued)Year ended December 31, 2008
In the territory managed by sanofi-aventis, operations are recognized by the Group as follows:
(i) In most countries of Western Europe and Asia (excluding Japan) for clopidogrel bisulfate (Plavix®/Iscover®) only, co-promotion is used for both products. The legal entities used are partnerships(sociétés en participation) or other tax-transparent entities, which are majority-owned by and under theoperational management of the Group. Sanofi-aventis recognizes all the revenue associated with thesale of the drugs, as well as the corresponding expenses. The share of profits reverting to BMSsubsidiaries is shown in Minority interests in the income statement, with no tax effect (because BMSreceives a pre-tax share of profits).
The presentation of Minority interests in the consolidated statement of cash flows takes account of thespecific terms of the alliance agreement.
(ii) In Germany, Spain and Greece, and in Italy for irbesartan (Aprovel®/Avapro®/Karvea®) only,co-marketing is used for both products, and sanofi-aventis recognizes revenues and expenses generatedby its own operations.
(iii) In those countries in Eastern Europe, Africa, the Middle East and Asia (excluding Japan) for Aprovel®
only, where the products are marketed exclusively by sanofi-aventis, the Group recognizes revenuesand expenses generated by its own operations. Since September 2006, sanofi-aventis has had theexclusive right to market Aprovel® in Scandinavia and in Ireland.
In the territory managed by BMS, operations are recognized by the Group as follows:
(i) Co-promotion is used in the United States and Canada through entities that are majority-owned by andunder the operational management of BMS. Sanofi-aventis does not recognize revenues; rather, itinvoices the entity for its promotion expenses, records its royalty income in Other revenues, andrecords its share of profits (net of tax) in Share of profit/loss of associates.
(ii) In Brazil, Mexico, Argentina and Australia for clopidogrel bisulfate (Plavix®/Iscover®) and forirbesartan (Aprovel®/Avapro®/Karvea®) and in Colombia for clopidogrel bisulfate only, co-marketingis used, and sanofi-aventis recognizes revenues and expenses generated by its own operations.
(iii) In certain other Latin American countries, where the products are marketed exclusively by sanofi-aventis, the Group recognizes revenues and expenses generated by its own operations.
C.2. Alliance agreements with Procter & Gamble Pharmaceuticals (P&G)
Actonel® (risedronate sodium) is a new-generation biphosphonate indicated for the treatment and preventionof osteoporosis. Actonel® is developed and marketed in collaboration with P&G. This alliance covers theworldwide development and marketing of the product except for Japan for which sanofi-aventis holds no rights.
Local marketing arrangements may take various forms:
• Co-promotion, whereby sales resources are pooled but only one of the two partners invoices productsales. Co-promotion is carried out under contractual agreements and is not based on any specific legalentity. P&G sells the product and incurs all the related costs in the United States, Canada and France.This co-promotion scheme also included Germany, Belgium and Luxembourg until December 31,2007, and the Netherlands until March 31, 2008. Sanofi-aventis recognizes its share of revenues underthe agreement as a component of operating income on the Other operating income line. In thesecondary co-promotion territories (the United Kingdom, Ireland, Sweden, Finland, Greece,Switzerland, Austria, Portugal and Australia) sanofi-aventis sells the product, and recognizes all therevenues from sales of the product along with the corresponding expenses.
• Co-marketing, which applies in Italy and in Spain, whereby each partner sells the product in thecountry under its own name, and recognizes all revenue and expenses from its own operations in itsincome statement.
F-32

NOTES TO THE CONSOLIDATED FINANCIAL STATEMENTS—(Continued)Year ended December 31, 2008
• The product has been marketed by P&G independently in Germany, Belgium and Luxembourg sinceJanuary 1, 2008, and in the Netherlands since April 1, 2008.
• In all other territories, sanofi-aventis has exclusive rights to sell the product. The Group recognizes allrevenue and expenses from its own operations in its income statement, but in return for these exclusiverights pays P&G a royalty based on actual sales. This royalty is recognized in Cost of sales.
D. DETAILED NOTES TO THE FINANCIAL STATEMENTS
D.1. Acquisitions
• The principal acquisitions during 2008 were as follows:
- Acambis
On September 25, 2008, sanofi-aventis completed the acquisition of Acambis plc for £285 million. Acambisplc became Sanofi Pasteur Holding Ltd, a wholly-owned subsidiary of Sanofi Pasteur Holding S.A. Thiscompany develops novel vaccines that address unmet medical needs or substantially improve current standards ofcare. Sanofi Pasteur and Acambis plc were already developing vaccines in a successful partnership of more thana decade: Acambis plc was conducting three of its major projects under exclusive collaboration agreements withsanofi pasteur, for vaccines against dengue fever, Japanese encephalitis and West Nile virus (see Note D.4.).
- Symbion Consumer
On September 1, 2008, sanofi-aventis completed the acquisition of the Australian company Symbion CPHoldings Pty Ltd (Symbion Consumer) for AUD560 million. Symbion Consumer manufactures, markets anddistributes nutraceuticals (vitamins and mineral supplements) and over the counter brands throughout Australiaand New Zealand. Symbion Consumer has a portfolio of brands including Natures Own, Cenovis, Bio-organics,Golden Glow and Microgenics. In 2007, Symbion Consumer sales amounted to around AUD190 million.Symbion Consumer is the market leader in Australia, with an estimated 21% market share (see Note D.4.).
• The principal acquisition during 2007 was as follows:
In November 2007, sanofi-aventis acquired 12 million newly-issued shares in the biopharmaceuticalcompany Regeneron Pharmaceuticals Inc. (Regeneron) for $312 million, raising its interest in Regeneron fromapproximately 4% to approximately 19%. These shares are classified as an available-for-sale financial asset, andare included in Financial assets — non-current (see Note D.7.).
• The principal acquisition during 2006 was as follows:
Zentiva is an international pharmaceutical company that develops, manufactures and marketscompetitively-priced branded pharmaceutical products. The company has very strong positions in the CzechRepublic, Slovakia and Romania, and is expanding rapidly in Poland, Turkey, Russia and the Baltic countries.
On March 27, 2006, sanofi-aventis paid €433 million (including acquisition costs) to acquire the entireinterest in Zentiva N.V. (7,487,742 shares) held by Warburg Pincus, and a further 1,998,921 shares held bycertain managers and employees of Zentiva. On completion of this transaction and as of December 31, 2008,sanofi-aventis held a 24.9% interest in the capital of Zentiva. Sanofi-aventis appoints two members of Zentiva’sBoard of Directors.
As of December 31, 2008, sanofi-aventis does not control Zentiva, although as a result of its significantinterest in Zentiva, this investment is accounted for using the equity method (see Note D.6.).
In 2008, sanofi-aventis made an offer to acquire all the shares of Zentiva (see Note D.21. — Financialcommitment related to the offer for Zentiva shares).
F-33

NOTES TO THE CONSOLIDATED FINANCIAL STATEMENTS—(Continued)Year ended December 31, 2008
D.2. Divestments
There were no significant divestments during 2007 and 2008.
The principal divestment in 2006 was as follows:
• Transfer of rights to Exubera® and interest in Diabel
Sanofi-aventis transferred its rights to Exubera®, an inhaled human insulin, to Pfizer. The terms of the1998 alliance between Aventis and Pfizer to jointly develop, manufacture and market Exubera®
included a change of control clause, which Pfizer decided to activate following the acquisition ofAventis by Sanofi-Synthélabo.
Under the terms of the agreement signed on January 13, 2006, sanofi-aventis sold to Pfizer its share inthe worldwide rights for the development, manufacturing and marketing of Exubera®, along with itsinterest in the Diabel joint venture (based in Frankfurt, Germany), which owns the insulinmanufacturing facility used in the production of Exubera®.
In return for the transfer of these assets and rights, sanofi-aventis received a payment of $1.3 billion.
The impact of this transaction in 2006 was a pre-tax gain of €460 million, recognized in Gains andlosses on disposals, and litigation, and an after-tax gain of €384 million.
F-34

NOTES TO THE CONSOLIDATED FINANCIAL STATEMENTS—(Continued)Year ended December 31, 2008
D.3. Property, plant and equipment
Property, plant and equipment (including assets held under finance leases) comprise:
(€ million) Land BuildingsPlant &
equipmentFixtures,
fittings & other
Property, plantand equipment
in process Total
Gross value at January 1, 2006 . . . . . . . . . . . . . . 262 2,553 3,686 924 1,016 8,441
(2)Changes in scope of consolidation . . . . . . . . . . . — — (3) 1 —Acquisitions and other increases . . . . . . . . . . . . — 28 77 85 1,070 1,260Disposals and other decreases . . . . . . . . . . . . . . (27) (11) (12) (14) (13) (77)Translation differences . . . . . . . . . . . . . . . . . . . . (8) (120) (74) (31) (38) (271)Transfers . . . . . . . . . . . . . . . . . . . . . . . . . . . . . . . 6 361 398 247 (1,024) (12)
9,339Gross value at December 31, 2006 . . . . . . . . . . . 233 2,811 4,072 1,212 1,011
Changes in scope of consolidation . . . . . . . . . . . (3) — 1 1 — (1)Acquisitions and other increases . . . . . . . . . . . . 3 34 90 86 1,122 1,335Disposals and other decreases . . . . . . . . . . . . . . (23) (29) (7) (3) (4) (66)Translation differences . . . . . . . . . . . . . . . . . . . . — (94) (67) (27) (34) (222)Transfers . . . . . . . . . . . . . . . . . . . . . . . . . . . . . . . 3 272 409 113 (804) (7)
Gross value at December 31, 2007 . . . . . . . . . . . 213 2,994 4,498 1,382 1,291 10,378
39Changes in scope of consolidation . . . . . . . . . . . 5 13 9 — 12Acquisitions and other increases . . . . . . . . . . . . — 30 55 67 1,207 1,359Disposals and other decreases . . . . . . . . . . . . . . (4) (6) (4) (58) (1) (73)Translation differences . . . . . . . . . . . . . . . . . . . . (7) (46) (80) (22) 13 (142)Transfers . . . . . . . . . . . . . . . . . . . . . . . . . . . . . . . 8 315 501 176 (1,010) (10)
11,551Gross value at December 31, 2008 . . . . . . . . . 215 3,300 4,979 1,545 1,512
Accumulated depreciation & impairment atJanuary 1, 2006 . . . . . . . . . . . . . . . . . . . . . . . (27) (507) (1,211) (512) — (2,257)
(793)Depreciation expense . . . . . . . . . . . . . . . . . . . . . — (199) (438) (156) —Impairment losses . . . . . . . . . . . . . . . . . . . . . . . . (3) (66) (113) (6) (21) (209)Disposals . . . . . . . . . . . . . . . . . . . . . . . . . . . . . . 13 — — — — 13Translation differences . . . . . . . . . . . . . . . . . . . . 2 53 45 19 — 119Transfers . . . . . . . . . . . . . . . . . . . . . . . . . . . . . . . — (5) 136 (124) — 7
Accumulated depreciation & impairment atDec. 31, 2006 . . . . . . . . . . . . . . . . . . . . . . . . . (15) (724) (1,581) (779) (21) (3,120)
Depreciation expense . . . . . . . . . . . . . . . . . . . . . — (192) (469) (158) — (819)Impairment losses . . . . . . . . . . . . . . . . . . . . . . . . — (10) — — (12) (22)Disposals . . . . . . . . . . . . . . . . . . . . . . . . . . . . . . 11 — — — — 11Translation differences . . . . . . . . . . . . . . . . . . . . — 45 41 16 — 102Transfers . . . . . . . . . . . . . . . . . . . . . . . . . . . . . . . 1 (7) 33 (19) — 8
Accumulated depreciation & impairment atDec. 31, 2007 . . . . . . . . . . . . . . . . . . . . . . . . . (3) (888) (1,976) (940) (33) (3,840)
Depreciation expense . . . . . . . . . . . . . . . . . . . . . — (205) (476) (161) — (842)Impairment losses . . . . . . . . . . . . . . . . . . . . . . . . (1) (17) (14) (5) (4) (41)Disposals . . . . . . . . . . . . . . . . . . . . . . . . . . . . . . — — — 50 — 50Translation differences . . . . . . . . . . . . . . . . . . . . — 11 46 13 — 70Transfers . . . . . . . . . . . . . . . . . . . . . . . . . . . . . . . — 6 20 (13) — 13
Accumulated depreciation & impairment atDec. 31, 2008 . . . . . . . . . . . . . . . . . . . . . . . . . (4) (1,093) (2,400) (1,056) (37) (4,590)
Net book value: January 1, 2006 . . . . . . . . . . . . 235 2,046 2,475 412 1,016 6,184
6,219
6,538
6,961
Net book value: December 31, 2006 . . . . . . . . . 218 2,087 2,491 433 990
Net book value: December 31, 2007 . . . . . . . . .
Net book value: December 31, 2008 . . . . . . . .
210
211
2,106
2,207
2,522
2,579
442
489
1,258
1,475
F-35
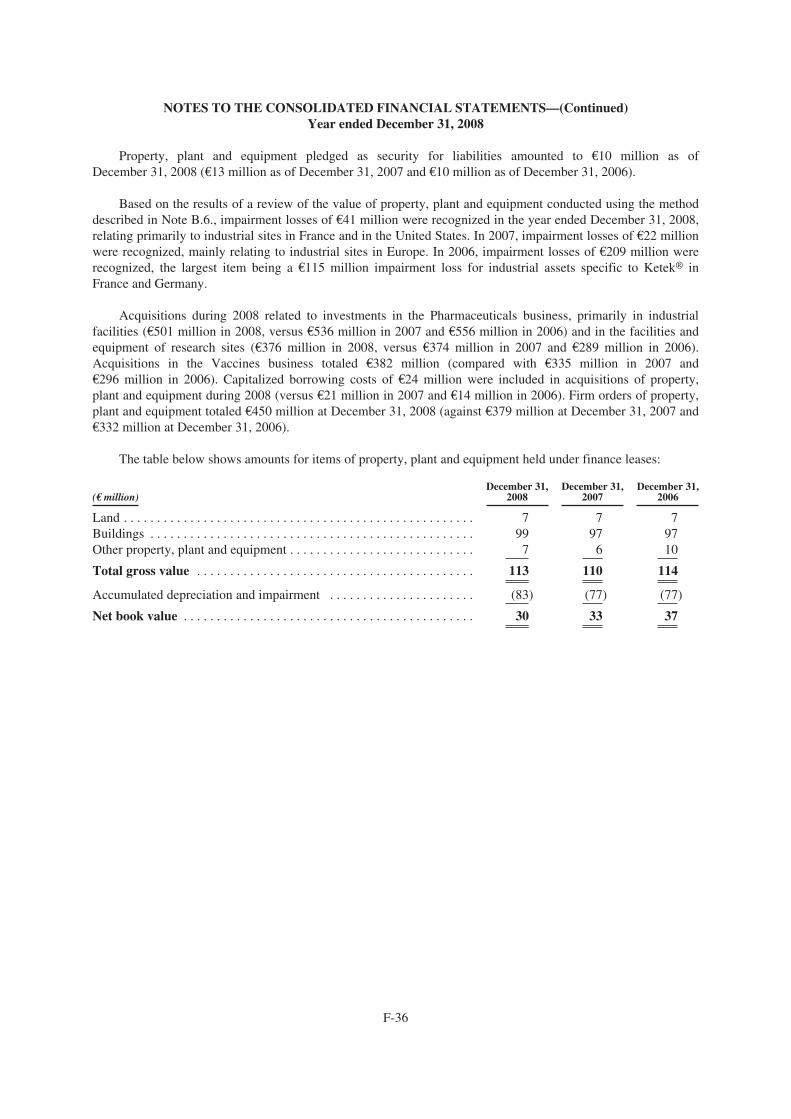
NOTES TO THE CONSOLIDATED FINANCIAL STATEMENTS—(Continued)Year ended December 31, 2008
Property, plant and equipment pledged as security for liabilities amounted to €10 million as ofDecember 31, 2008 (€13 million as of December 31, 2007 and €10 million as of December 31, 2006).
Based on the results of a review of the value of property, plant and equipment conducted using the methoddescribed in Note B.6., impairment losses of €41 million were recognized in the year ended December 31, 2008,relating primarily to industrial sites in France and in the United States. In 2007, impairment losses of €22 millionwere recognized, mainly relating to industrial sites in Europe. In 2006, impairment losses of €209 million wererecognized, the largest item being a €115 million impairment loss for industrial assets specific to Ketek® inFrance and Germany.
Acquisitions during 2008 related to investments in the Pharmaceuticals business, primarily in industrialfacilities (€501 million in 2008, versus €536 million in 2007 and €556 million in 2006) and in the facilities andequipment of research sites (€376 million in 2008, versus €374 million in 2007 and €289 million in 2006).Acquisitions in the Vaccines business totaled €382 million (compared with €335 million in 2007 and€296 million in 2006). Capitalized borrowing costs of €24 million were included in acquisitions of property,plant and equipment during 2008 (versus €21 million in 2007 and €14 million in 2006). Firm orders of property,plant and equipment totaled €450 million at December 31, 2008 (against €379 million at December 31, 2007 and€332 million at December 31, 2006).
The table below shows amounts for items of property, plant and equipment held under finance leases:
December 31, December 31, December 31,(€ million) 2008 2007 2006
Land . . . . . . . . . . . . . . . . . . . . . . . . . . . . . . . . . . . . . . . . . . . . . . . . . . . . . 7 7 7Buildings . . . . . . . . . . . . . . . . . . . . . . . . . . . . . . . . . . . . . . . . . . . . . . . . . 99 97 97Other property, plant and equipment . . . . . . . . . . . . . . . . . . . . . . . . . . . . 7 6 10
Total gross value . . . . . . . . . . . . . . . . . . . . . . . . . . . . . . . . . . . . . . . . . . 113 110 114
Accumulated depreciation and impairment . . . . . . . . . . . . . . . . . . . . . . (83) (77) (77)
Net book value . . . . . . . . . . . . . . . . . . . . . . . . . . . . . . . . . . . . . . . . . . . . 30 33 37
F-36
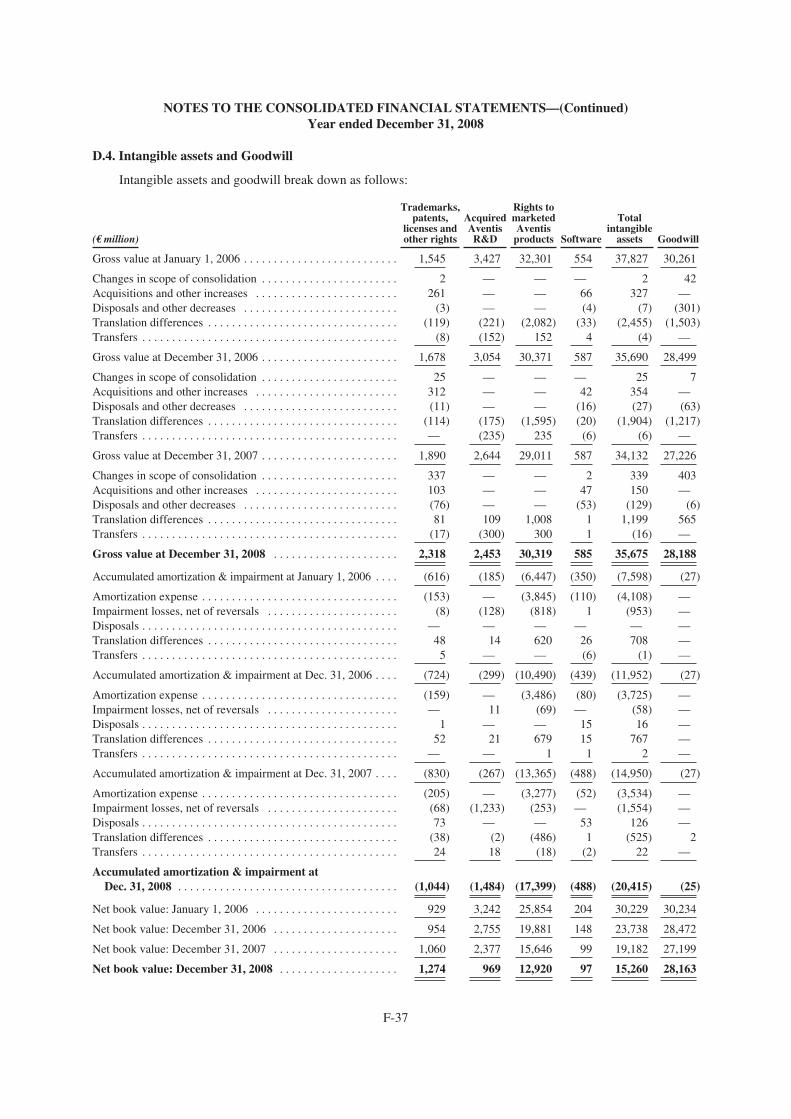
NOTES TO THE CONSOLIDATED FINANCIAL STATEMENTS—(Continued)Year ended December 31, 2008
D.4. Intangible assets and Goodwill
Intangible assets and goodwill break down as follows:
(€ million)
Trademarks,patents,
licenses andother rights
AcquiredAventisR&D
Rights tomarketedAventis
products Software
Totalintangible
assets Goodwill
Gross value at January 1, 2006 . . . . . . . . . . . . . . . . . . . . . . . . . . 1,545 3,427 32,301 554 37,827 30,261
42Changes in scope of consolidation . . . . . . . . . . . . . . . . . . . . . . . 2 — — — 2Acquisitions and other increases . . . . . . . . . . . . . . . . . . . . . . . . 261 — — 66 327 —Disposals and other decreases . . . . . . . . . . . . . . . . . . . . . . . . . . (3) — — (4) (7) (301)Translation differences . . . . . . . . . . . . . . . . . . . . . . . . . . . . . . . . (119) (221) (2,082) (33) (2,455) (1,503)Transfers . . . . . . . . . . . . . . . . . . . . . . . . . . . . . . . . . . . . . . . . . . . (8) (152) 152 4 (4) —
Gross value at December 31, 2006 . . . . . . . . . . . . . . . . . . . . . . . 1,678 3,054 30,371 587 35,690 28,499
7Changes in scope of consolidation . . . . . . . . . . . . . . . . . . . . . . . 25 — — — 25Acquisitions and other increases . . . . . . . . . . . . . . . . . . . . . . . . 312 — — 42 354 —Disposals and other decreases . . . . . . . . . . . . . . . . . . . . . . . . . . (11) — — (16) (27) (63)Translation differences . . . . . . . . . . . . . . . . . . . . . . . . . . . . . . . . (114) (175) (1,595) (20) (1,904) (1,217)Transfers . . . . . . . . . . . . . . . . . . . . . . . . . . . . . . . . . . . . . . . . . . . — (235) 235 (6) (6) —
Gross value at December 31, 2007 . . . . . . . . . . . . . . . . . . . . . . . 1,890 2,644 29,011 587 34,132 27,226
403Changes in scope of consolidation . . . . . . . . . . . . . . . . . . . . . . . 337 — — 2 339Acquisitions and other increases . . . . . . . . . . . . . . . . . . . . . . . . 103 — — 47 150 —Disposals and other decreases . . . . . . . . . . . . . . . . . . . . . . . . . . (76) — — (53) (129) (6)Translation differences . . . . . . . . . . . . . . . . . . . . . . . . . . . . . . . . 81 109 1,008 1 1,199 565Transfers . . . . . . . . . . . . . . . . . . . . . . . . . . . . . . . . . . . . . . . . . . . (17) (300) 300 1 (16) —
Gross value at December 31, 2008 . . . . . . . . . . . . . . . . . . . . . 2,318 2,453 30,319 585 35,675 28,188
Accumulated amortization & impairment at January 1, 2006 . . . . (616) (185) (6,447) (350) (7,598) (27)
Amortization expense . . . . . . . . . . . . . . . . . . . . . . . . . . . . . . . . . (153) — (3,845) (110) (4,108) —Impairment losses, net of reversals . . . . . . . . . . . . . . . . . . . . . . (8) (128) (818) 1 (953) —Disposals . . . . . . . . . . . . . . . . . . . . . . . . . . . . . . . . . . . . . . . . . . . — — — — — —Translation differences . . . . . . . . . . . . . . . . . . . . . . . . . . . . . . . . 48 14 620 26 708 —Transfers . . . . . . . . . . . . . . . . . . . . . . . . . . . . . . . . . . . . . . . . . . . 5 — — (6) (1) —
Accumulated amortization & impairment at Dec. 31, 2006 . . . . (724) (299) (10,490) (439) (11,952) (27)
Amortization expense . . . . . . . . . . . . . . . . . . . . . . . . . . . . . . . . . (159) — (3,486) (80) (3,725) —Impairment losses, net of reversals . . . . . . . . . . . . . . . . . . . . . . — 11 (69) — (58) —Disposals . . . . . . . . . . . . . . . . . . . . . . . . . . . . . . . . . . . . . . . . . . . 1 — — 15 16 —Translation differences . . . . . . . . . . . . . . . . . . . . . . . . . . . . . . . . 52 21 679 15 767 —Transfers . . . . . . . . . . . . . . . . . . . . . . . . . . . . . . . . . . . . . . . . . . . — — 1 1 2 —
Accumulated amortization & impairment at Dec. 31, 2007 . . . . (830) (267) (13,365) (488) (14,950) (27)
Amortization expense . . . . . . . . . . . . . . . . . . . . . . . . . . . . . . . . . (205) — (3,277) (52) (3,534) —Impairment losses, net of reversals . . . . . . . . . . . . . . . . . . . . . . (68) (1,233) (253) — (1,554) —Disposals . . . . . . . . . . . . . . . . . . . . . . . . . . . . . . . . . . . . . . . . . . . 73 — — 53 126 —Translation differences . . . . . . . . . . . . . . . . . . . . . . . . . . . . . . . . (38) (2) (486) 1 (525) 2Transfers . . . . . . . . . . . . . . . . . . . . . . . . . . . . . . . . . . . . . . . . . . . 24 18 (18) (2) 22 —
Accumulated amortization & impairment atDec. 31, 2008 . . . . . . . . . . . . . . . . . . . . . . . . . . . . . . . . . . . . . (1,044) (1,484) (17,399) (488) (20,415) (25)
Net book value: January 1, 2006 . . . . . . . . . . . . . . . . . . . . . . . . 929 3,242 25,854 204 30,229 30,234
28,472
27,199
28,163
Net book value: December 31, 2006 . . . . . . . . . . . . . . . . . . . . . 954 2,755 19,881 148 23,738
Net book value: December 31, 2007 . . . . . . . . . . . . . . . . . . . . .
Net book value: December 31, 2008 . . . . . . . . . . . . . . . . . . . .
1,060
1,274
2,377
969
15,646
12,920
99
97
19,182
15,260
F-37
NOTES TO THE CONSOLIDATED FINANCIAL STATEMENTS—(Continued)Year ended December 31, 2008
• Aventis Acquisition
On August 20, 2004, sanofi-aventis acquired Aventis, a global pharmaceutical group created in 1999 by themerger between Rhône-Poulenc and Hoechst.
As part of the process of creating the new Group, the two former parent companies — Sanofi-Synthélabo(renamed sanofi-aventis) and Aventis — were merged on December 31, 2004.
The total purchase price as measured under IFRS 3 (Business Combinations) was €52,908 million, of which€15,894 million was settled in cash.
The goodwill arising from the acquisition of Aventis amounted to €27,632 million at December 31, 2008(€27,034 million at December 31, 2007, €28,286 million at December 31, 2006).
Rights to marketed products and goodwill arising on the Aventis acquisition were allocated on the basis ofthe split of the Group’s operations into business and geographical segments, and valued in the currency of therelevant geographical segment (mainly euros and U.S. dollars) with assistance from an independent valuer. Theaverage period of amortization for marketed products was initially set at 8 years, based on cash flow forecastswhich, among other factors, take account of the period of legal protection offered by the related patents.
Rights to marketed Aventis products represent a diversified portfolio of rights relating to many differentproducts. As of December 31, 2008, 85.8% of the net book value of these rights related to the Pharmaceuticalssegment, and 14.2% to the Vaccines segment. The five principal pharmaceutical products in this portfolio by netbook value (Lantus®: €2,097 million, Lovenox®: €1,527 million; Taxotere®: €1,346 million; Actonel®:€952 million; Tritace®: €278 million) accounted for approximately 55.9% of the total net book value of productrights for the Pharmaceuticals business as of December 31, 2008.
During 2006, some of the acquired Aventis research and development (€152 million) came into commercialuse; it is being amortized from the date of marketing approval. The main products involved are Taxotere®,Lantus®, Apidra®, and Menactra® in Canada.
The amount shown for goodwill on the “Disposals and other decreases” line for 2006 corresponds to therecognition of deferred tax assets associated with the acquisition of Aventis, in accordance with the principledescribed in Note B.22.
During 2007, some of the acquired Aventis research and development (€235 million) came into commercialuse; it is being amortized from the date of marketing approval. The main items involved are the Lantus®-Apidra®
pens, and new indications for Taxotere®.
During 2008, some of the acquired Aventis research and development (€300 million) came into commercialuse; it is being amortized from the date of marketing approval. The main products involved are Pentacel® vaccinein the United States and the “once-a-month” dose of Actonel® in the United States.
• Other acquisitions
The purchase price allocation on the Symbion Consumer acquisition (see Note D.1.) resulted in therecognition of intangible assets totaling €116 million as of December 31, 2008. Goodwill arising on thisacquisition amounted to €206 million. The purchase price allocation on the Acambis acquisition (see Note D.1.)led to the recognition of intangible assets totaling €223 million (including €198 million for research projects).Goodwill arising on this acquisition amounted to €197 million.
Acquisitions of intangible assets (other than software) in 2008 were €103 million, and related mainly tolicense agreements, including the collaboration agreements signed with Dyax Corp. and Novozymes (see NoteD.21.).
F-38

NOTES TO THE CONSOLIDATED FINANCIAL STATEMENTS—(Continued)Year ended December 31, 2008
Acquisitions of intangible assets (other than software) in 2007 were €312 million. This amount includespayments made under collaboration agreements, including those signed during the year with Oxford BioMedica(Trovax®) and Regeneron (see Note D.21.). It also includes the buyout of the Japanese rights for Panaldine®
(Daiichi) and Myslee® (Astellas).
Acquisitions of intangible assets (other than software) in 2006 mainly comprised the buyout of the entirerights to Plavix®, Cordarone® and rimonabant in Japan, and payments made under the agreements with Taiho(S-1) and UCB (Xyzal®) (see Note D.21.).
Amortization of intangible assets is recognized in the income statement under Amortization of intangiblesexcept for amortization of software, which is recognized on the relevant line of the income statement accordingto the purpose for which the software is used:
Year ended Year ended Year endedDecember 31, December 31, December 31,
(€ million) 2008 2007 2006
Cost of sales . . . . . . . . . . . . . . . . . . . . . . . . . . . . . . . . . . . . . . . . . . . . . 10 18 29Research and development expenses . . . . . . . . . . . . . . . . . . . . . . . . . . 14 16 26Selling and general expenses . . . . . . . . . . . . . . . . . . . . . . . . . . . . . . . . 28 45 54Other operating expenses . . . . . . . . . . . . . . . . . . . . . . .
Total . . . . . . . . . . . . . . . . . . . . . . . . . . . . . . . . . . . . . . .
. . . . . . . . . . . . —
. . . . . . . . . . . . 52
1
80
1
110
D.5. Impairment of property, plant and equipment, goodwill and intangibles
The allocation of goodwill to segmental cash-generating units (CGUs) is shown below:
December 31, December 31, December 31,2008 2007 2006
Pharma- Pharma- Pharma-(€ million) ceuticals Vaccines Total ceuticals Vaccines Total ceuticals Vaccines Total
Europe . . . . . . . . . . . . . . . . . . . . 12,414 — 12,414 12,428 — 12,428 12,426 — 12,426United States . . . . . . . . . . . . . . . 10,496 693 11,189 9,917 464 10,381 11,141 519 11,660Other countries . . . . . . . . . . . . . .
Total carrying amount . . . . . . .
4,391 169
27,301 862
4,560
28,163
4,221 169 4,390
26,566 633 27,199
4,225 161 4,386
27,792 680 28,472
In testing goodwill for impairment, the recoverable amount of the segmental CGUs was determined byreference to the value in use of each CGU based on the discounted estimates of the future cash flows from theCGU, as described in Note B.6.1.
The assumptions used in testing goodwill for impairment in 2008 were:
Pharmaceuticals Vaccines
Operating margin . . . . . . . . . . . . . . . . . . . . . . . . . . . . . . . . . . . . . . . . . . . . . . . . . . . . 31% - 37% 32% - 33%Perpetual growth rate . . . . . . . . . . . . . . . . . . . . . . . . . . . . . . . . . . . . . . . . . . . . . . . . . 4% - 5% 5%After-tax discount rate . . . . . . . . . . . . . . . . . . . . . . . . . . . . . . . . . . . . . . . . . . . . . . . . 10% 11%
Some of these assumptions were determined with the assistance of an independent valuer at the time of theAventis acquisition, and are reviewed annually by the Group.
• The operating margin used is the range of values per the five-year plan for each business segment.
• The perpetual growth rate is an average rate by business segment and geographical area.
• The discount rate is the average for all geographical areas within a single business segment.
F-39

NOTES TO THE CONSOLIDATED FINANCIAL STATEMENTS—(Continued)Year ended December 31, 2008
No impairment losses have been recognized against goodwill.
Goodwill relating to the Pharmaceuticals segment relates primarily to Europe and the United States. Theassumptions used to calculate the value in use of these two CGUs comprise an after-tax discount rate of 10% anda perpetual growth rate of 4%. A zero perpetual growth rate would not result in any impairment of the goodwillrelating to these CGUs.
Similarly, no impairment would need to be recognized against the goodwill relating to these CGUs unlessthe discount rate were to exceed the 10% rate used by more than 2.8 percentage points.
The assumptions used for intangible assets in 2008 were:
Pharmaceuticals Vaccines
After-tax discount rate- Acquired in-process R&D . . . . . . . . . . . . . . . . . . . . . . . . . . . . . . . . . . . . . . . . . . . 11% 12%- Rights to marketed products . . . . . . . . . . . . . . . . . . . . . . . . . . . . . . . . . . . . . . . . . 10% 11%
Certain intangible assets for which indications of potential impairment were identified in the years endedDecember 31, 2008, 2007 and 2006 were tested for impairment.
In 2008, impairment losses were recognized to take account of:
– the discontinuation of research projects, principally larotaxel and cabazitaxel (new taxane derivativesintended as treatments for breast cancer, €1,175 million) and ilepatril (antihypertensive, €57 million),both of which were recognized as assets on the acquisition of Aventis, plus the oral anti-cancer agentS-1 following the termination of the agreement with Taiho Pharmaceutical on development andmarketing of this product (€51 million);
– settlements reached with Barr in the United States relating to the marketed product Nasacort® (€114million), and the impact of generics on some products (€139 million).
In 2007, impairment losses totaling €69 million were recognized based on the results of impairment tests.These losses related to Amaryl® (€46 million) and Ketek® (€23 million). In addition, reversals of impairmentlosses totaling €11 million were recognized during the year.
In 2006, impairment losses of €1,077 million were recognized based on the results of impairment tests.These losses related mainly to Altace® (€638 million) and Ketek® (€423 million). Also in 2006, previously-recognized impairment losses of €124 million were reversed due to favorable events occurring in that year.Consequently, net impairment losses for 2006 totaled €953 million.
Impairment losses taken against property, plant and equipment are disclosed in Note D.3.
D.6. Investments in associates
Associates consist of companies over which sanofi-aventis exercises significant influence, and jointventures. Sanofi-aventis accounts for joint ventures using the equity method (i.e. as associates), in accordancewith the allowed alternative treatment specified in IAS 31 (Financial Reporting of Interests in Joint Ventures).
F-40
NOTES TO THE CONSOLIDATED FINANCIAL STATEMENTS—(Continued)Year ended December 31, 2008
Investments in associates break down as follows:
Dec. 31, Dec. 31, Dec. 31,(€ million) % interest 2008 2007 2006
Sanofi Pasteur MSD . . . . . . . . . . . . . . . . . . . . . . . . . . . . . . . . . . . . . . . . . . . 50.0 427 467 500Merial . . . . . . . . . . . . . . . . . . . . . . . . . . . . . . . . . . . . . . . . . . . . . . . . . . . . . . 50.0 1,203 1,151 1,257InfraServ Höchst . . . . . . . . . . . . . . . . . . . . . . . . . . . . . . . . . . . . . . . . . . . . . . 30.0 96 97 97Entities and companies managed by Bristol-Myers Squibb (1) . . . . . . . . . . . 49.9 196 178 120Zentiva . . . . . . . . . . . . . . . . . . . . . . . . . . . . . . . . . . . . . . . . . . . . . . . . . . . . . 24.9 332(2) 346 453Financière des Laboratoires de Cosmétologie Yves Rocher . . . . . . . . . . . . 39.1 119 103 92Other investments . . . . . . . . . . . . . . . . . . . . . . . . . . . . . . . . . . . . . . . . . . . . .
Total . . . . . . . . . . . . . . . . . . . . . . . . . . . . . . . . . . . . . . . . . . . . . . . . . . . . . . .
— 86
2,459
151
2,493
118
2,637
(1) Under the terms of the agreements with BMS (see Note C.1.), the Group’s share of the net assets of entities and companies majority-owned by BMS is recorded in Investments in associates.
(2) The value of the investment held by sanofi-aventis based on the quoted market price at December 31, 2008 was €380 million. OnJune 18, 2008, sanofi-aventis announced an improved offer for the shares of Zentiva (see Notes D.1. and D.21.). The carrying amount isnet of an impairment loss of €102 million recognized in 2007.
The financial statements include commercial transactions between the Group and certain of its associates:
December 31, December 31, December 31,(€ million) 2008 2007 2006
Sales . . . . . . . . . . . . . . . . . . . . . . . . . . . . . . . . . . . . . . . . . 432 404 374Royalties (1) . . . . . . . . . . . . . . . . . . . . . . . . . . . . . . . . . . . . 1,014 945 748Accounts receivable (1) . . . . . . . . . . . . . . . . . . . . . . . . . . . 354 355 243
Purchases . . . . . . . . . . . . . . . . . . . . . . . . . . . . . . . . . . . . . . 254 236 197Accounts payable . . . . . . . . . . . . . . . . . . . . . . . . . . . . . . . 30 29 17Other liabilities (1) . . . . . . . . . . . . . . . . . . . . . . . . . . . . . . . 242 365 104
(1) These items mainly relate to entities and companies managed by BMS.
Key financial indicators for associates, excluding the effects of purchase price allocations, are shown below:
(€ million)Principal associates (1)
100% impactPrincipal joint ventures (2)
Share held by sanofi-aventis
Dec. 31, Dec. 31, Dec. 31, Dec. 31, Dec. 31, Dec. 31,2008 2007 2006 2008 2007 2006
Non-current assets . . . . . . . . . . . . . . . . . . . . . . . . . . . . . . . 1,919 1,950 1,343 354 323 285Current assets . . . . . . . . . . . . . . . . . . . . . . . . . . . . . . . . . . . 2,717 2,788 2,680 688 687 693Non-current liabilities . . . . . . . . . . . . . . . . . . . . . . . . . . . . . 913 1,190 599 99 104 96Current liabilities . . . . . . . . . . . . . . . . . . . . . . . . . . . . . . . . 1,798 1,552 1,531 404 418 395Equity attributable to equity holders of the company . . . . . 1,622 1,712 1,630 536 486 485Minority interests . . . . . . . . . . . . . . . . . . . . . . . . . . . . . . . . 303 284 263 2 2 2
Net sales . . . . . . . . . . . . . . . . . . . . . . . . . . . . . . . . . . . . . . . 9,770 9,165 7,795 1,537 1,431 1,247Cost of sales . . . . . . . . . . . . . . . . . . . . . . . . . . . . . . . . . . . . 2,555 2,371 1,850 433 394 295Operating income . . . . . . . . . . . . . . . . . . . . . . . . . . . . . . . . 2,838 2,338 1,722 372 313 280Net income . . . . . . . . . . . . . . . . . . . . . . . . . . . . . . . . . . . . . 2,384 2,054 1,475 225 206 199
(1) The following associates and joint ventures are included in this table for 2008, 2007 and 2006: BMS/Sanofi Pharmaceuticals HoldingPartnership, BMS/Sanofi Pharmaceuticals Partnership, BMS/Sanofi-Synthelabo Partnership, Yves Rocher, Merial, Sanofi Pasteur MSD,and Zentiva. Full-year figures are shown, before allocation of partnership profits.
(2) The principal joint ventures are:
Partner Business
Merial . . . . . . . . . . . . . . . . . . . . . . . . . . . . . . . . . . . . . . . . . . . . . . . . . . . . . . . . . . . . . . . . Merck & Co., Inc. Animal HealthSanofi Pasteur MSD . . . . . . . . . . . . . . . . . . . . . . . . . . . . . . . . . . . . . . . . . . . . . . . . . . . . . Merck & Co., Inc. Vaccines
F-41
NOTES TO THE CONSOLIDATED FINANCIAL STATEMENTS—(Continued)Year ended December 31, 2008
D.7. Financial assets — non-current
The main items included in Financial assets — non-current are:
December 31, December 31, December 31,(€ million) 2008 2007 2006
Available-for-sale financial assets . . . . . . . . . . . . . . . . . . . . . . . . . . . . . 491 676 525Pre-funded pension obligations (see Note D.18.1.) . . . . . . . . . . . . . . . . 1 7 3Long-term loans and advances . . . . . . . . . . . . . . . . . . . . . . . . . . . . . . . . 186 219 237Assets recognized under the fair value option . . . . . . . . . . . . . . . . . . . . 72 85 75Derivative financial instruments (see Note D.20.)
Total . . . . . . . . . . . . . . . . . . . . . . . . . . . . . . . . . . .
. . . . . . . . . . . . . . . . .
. . . . . . . . . . . . . . . . .
71
821
50
1,037
205
1,045
Equity investments classified as available-for-sale financial assets include:
• An interest in the biopharmaceuticals company Regeneron, with which sanofi-aventis has research anddevelopment collaboration agreements (see Note D.21.). This investment had a carrying amount of€195 million at December 31, 2008 (€243 million at December 31, 2007 and €42 million atDecember 31, 2006). In November 2007, sanofi-aventis acquired an additional 12 million newly-issuedshares in Regeneron, taking its interest in Regeneron’s common stock to approximately 19%. As part ofthis transaction, sanofi-aventis signed an Investor Agreement which limits its ability to exercise certainvoting rights. Consequently, the acquisition of this additional interest does not give sanofi-aventissignificant influence over Regeneron.
• A 13% interest in ProStrakan, carried at an amount of €24 million as of December 31, 2008 (€23 millionat December 31, 2007 and €43 million at December 31, 2006).
• Interests in research and development companies such as Proteome Science (€3 million at December 31,2008, €9 million at December 31, 2007 and €14 million at December 31, 2006) and Genfit (€4 million atDecember 31, 2008).
• Financial assets held to match commitments (€223 million at December 31, 2008, €306 million atDecember 31, 2007 and €324 million at December 31, 2006).
• During 2008, the Group divested its equity interest in Millennium (carrying amount €46 million),generating a pre-tax gain of €38 million (see Note D.29.).
The cumulative unrealized net after-tax loss recognized directly in equity on available-for-sale financialassets at December 31, 2008 was €49 million, and related principally to the investment in Regeneron (€49million). The situation of Regeneron at the balance sheet date does not reflect a significant or prolonged declinein the quoted share price and does not represent objective evidence of a decrease in the intrinsic value of thisasset that would require the recognition of an impairment loss in the income statement. As at December 31, 2007and 2006, there were cumulative unrealized net after-tax gains recognized in equity for available-for-salefinancial assets amounting to €48 million and €64 million respectively (see Note D.15.7.).
The impact of a 10% fall in stock prices on listed shares included in available-for-sale assets atDecember 31, 2008 would have been as follows:
(€ million) Sensitivity
Income/(expense) recognized directly in equity, before tax . . . . . . . . . . . . . . . . . . . . . . . . . . . . . .Income before tax . . . . . . . . . . . . . . . . . . . . . . . . . . . . . . . . . . . . . . . . . . . . . . . . . . . . . . . . . . . . . .
(34)(3)
Total . . . . . . . . . . . . . . . . . . . . . . . . . . . . . . . . . . . . . . . . . . . . . . . . . . . . . . . . . . . . . . . . . . . . . . . . (37)
F-42

NOTES TO THE CONSOLIDATED FINANCIAL STATEMENTS—(Continued)Year ended December 31, 2008
A 10% fall in stock prices combined with a simultaneous 0.5% rise in the yield curve would have had thefollowing impact at December 31, 2008:
(€ million) Sensitivity
Income/(expense) recognized directly in equity, before tax . . . . . . . . . . . . . . . . . . . . . . . . . . . . . . (13)Income before tax . . . . . . . . . . . . . . . . . . . . . . . . . . . . . . . . . . . . . . . . . . . . . . . . . . . . . . . . . . . . . .
Total (1) . . . . . . . . . . . . . . . . . . . . . . . . . . . . . . . . . . . . . . . . . . . . . . . . . . . . . . . . . . . . . . . . . . . . . .
—
(13)
(1) This impact would represent approximately 6% of the value of the underlying assets.
Available-for-sale financial assets also include equity investments not quoted in an active market. Theseinvestments had a carrying amount of €34 million at December 31, 2008, against €36 million at December 31,2007 and €43 million at December 31, 2006.
Loans and long-term advances are measured at amortized cost, which at the balance sheet date was notmaterially different from their fair value.
Assets recognized under the fair value option represent a portfolio of financial investments held to fund adeferred compensation plan offered to certain employees.
D.8. Assets held for sale
As of December 31, 2008, sanofi-aventis had assets held for sale relating to the ongoing divestment of aplant at Colomiers in the Haute-Garonne region of France. However, these assets were fully written down as ofthat date.
There were no assets held for sale as of December 31, 2007 and December 31, 2006.
D.9. Inventories
Inventories break down as follows:
December 31, December 31, December 31,2008 2007 2006
(€ million) Gross Impairment Net Gross Impairment Net Gross Impairment Net
Raw materials . . . . . . . . . 615 (91) 524 607 (83) 524 728 (42) 686Work in process . . . . . . . . 2,028 (226) 1,802 2,073 (230) 1,843 1,741 (200) 1,541Finished goods . . . . . . . . . 1,449 (185) 1,264 1,534 (172) 1,362 1,646 (214) 1,432
Total . . . . . . . . . . . . . . . . 4,092 (502) 3,590 4,214 (485) 3,729 4,115 (456) 3,659
The impact of changes in provisions for impairment of inventories in 2008 was a net expense of €30 million,compared with a net expense of €39 million in 2007 and a net expense of €159 million in 2006.
Impairment losses taken against inventory at December 31, 2008 relate primarily to the products Ketek® andLovenox®.
Inventories pledged as security for liabilities amounted to €10 million at December 31, 2008.
F-43

NOTES TO THE CONSOLIDATED FINANCIAL STATEMENTS—(Continued)Year ended December 31, 2008
D.10. Accounts receivable
Accounts receivable break down as follows:
December 31, December 31, December 31,(€ million) 2008 2007 2006
Gross value . . . . . . . . . . . . . . . . . . . . . . . . . . . . . . . . . . . . . . . . . . . . . . . 5,391 5,034 5,208Impairment . . . . . . . . . . . . . . . . . . . . . . . . . . . . . . . . . . . . . . . . . . . . . . . (88) (130) (176)
Net value . . . . . . . . . . . . . . . . . . . . . . . . . . . . . . . . . . . . . . . . . . . . . . . . . 5,303 4,904 5,032
The impact of changes in provisions for impairment of accounts receivable in 2008 was a net expense of€7 million (against a net reversal of €17 million in 2007 and a net expense of €15 million in 2006).
The gross value of overdue receivables at December 31, 2008 was €794 million (versus €801 million atDecember 31, 2007 and €1,055 million at December 31, 2006).
Overdue accounts Overdue < Overdue from Overdue from Overdue from Overdue >(€ million) Gross value 1 month 1 to 3 months 3 to 6 months 6 to 12 months 12 months
December 31, 2008 . . . . . . 794 267 146 121 95 165December 31, 2007 . . . . . . 801 218 166 130 115 172
Amounts overdue by more than one month relate mainly to public-sector customers.
Group policy is to retain receivables until maturity, and hence not to use receivables securitizationprograms.
D.11. Other current assets
Other current assets break down as follows:
December 31, December 31, December 31,(€ million) 2008 2007 2006
Taxes recoverable . . . . . . . . . . . . . . . . . . . . . . . . . . . . . . . . . . . . . . . . . . 927 1,185 1,097Other receivables (1) . . . . . . . . . . . . . . . . . . . . . . . . . . . . . . . . . . . . . . . . . 781 754 947Prepaid expenses . . . . . . . . . . . . . . . . . . . . . . .
Total . . . . . . . . . . . . . . . . . . . . . . . . . . . . . . . .
. . . . . . . . . . . . . . . . . . . . 173
. . . . . . . . . . . . . . . . . . . . 1,881
187
2,126
164
2,208
(1) This line mainly comprises amounts due from alliance partners, advance payments to suppliers, sales commission receivable, andamounts due from employees.
D.12. Financial assets — current
Financial assets — current break down as follows:
December 31, December 31, December 31,(€ million) 2008 2007 2006
Interest rate derivatives measured at fair value (see Note D.20.) . . . . . . 33 — —Currency derivatives measured at fair value (see Note D.20.) . . . . . . . . 348 67 70Other current financial assets . . . . . . . . . . . . . . . . . . . . . . . . . . . . . . . . .
Total . . . . . . . . . . . . . . . . . . . . . . . . . . . . . . . . . . . . . . . . . . . . . . . . . . . .
22
403
16
83
38
108
F-44

NOTES TO THE CONSOLIDATED FINANCIAL STATEMENTS—(Continued)Year ended December 31, 2008
D.13. Cash and cash equivalents
December 31, December 31, December 31,(€ million) 2008 2007 2006
Cash . . . . . . . . . . . . . . . . . . . . . . . . . . . . . . . . . . . . . . . . . . . . . . . . . . . . . 502 831 844Cash equivalents (1) . . . . . . . . . . . . . . . . . . . . . . . . . . . . . . . . . . . . . . . . .
Cash and cash equivalents (2) . . . . . . . . . . . . . . . . . . . . . . . . . . . . . . . .
3,724
4,226
880
1,711
309
1,153
(1) Cash equivalents at December 31, 2008 included €2,601 million invested in collective investment schemes classified as Euro Money-Market Funds by the Autorité des Marchés Financiers, €481 million in certificates of deposit with a maturity of less than three monthson issue, and €604 million of term deposits with a maturity of less than three months on inception.
(2) Includes cash held by captive insurance and reinsurance companies in accordance with insurance regulations amounting to €429 millionat December 31, 2008, €420 million at December 31, 2007, and €427 million at December 31, 2006.
D.14. Net deferred tax position
The net deferred tax position breaks down as follows:
December 31, December 31, December 31,(€ million) 2008 2007 2006
Deferred tax on:• Consolidation adjustments (intragroup margin on inventory) . . . . . . . 845 808 961• Provision for pensions and other employee benefits . . . . . . . . . . . . . . 1,070 915 1,134• Remeasurement of acquired intangible assets (1) . . . . . . . . . . . . . . . . . (4,805) (6,123) (8,378)• Recognition of Aventis property, plant and equipment at fair
value . . . . . . . . . . . . . . . . . . . . . . . . . . . . . . . . . . . . . . . . . . . . . . . . . . (65) (77) (89)• Tax cost of distributions made from reserves (2) . . . . . . . . . . . . . . . . . (769) (693) (720)• Stock options . . . . . . . . . . . . . . . . . . . . . . . . . . . . . . . . . . . . . . . . . . . . 6 48 96• Tax losses available for carry-forward (see below) . . . . . . . . . . . . . . . 171 266 99• Other non-deductible provisions and other items . . . . . . . . . . . . . . . .
Net deferred tax liability . . . . . . . . . . . . . . . . . . . . . . . . . . . . . . . . . . . .
799
(2,748)
833
(4,023)
1,143
(5,754)
(1) Mainly arising on the remeasurement of Aventis intangible assets (see Note D.4.).(2) In certain countries, the Group is liable to withholding taxes and other tax charges when dividends are distributed. Consequently, the
Group recognizes a deferred tax liability on those reserves (approximately €8 billion) which the Group regards as likely to be distributedin the foreseeable future.
The table below shows when the tax losses available for carry-forward are due to expire:
Tax loss carry- Tax loss carry- Tax loss carry-forwards at forwards at forwards at
December 31, December 31, December 31,(€ million) 2008 (*) 2007 (*) 2006
2007 . . . . . . . . . . . . . . . . . . . . . . . . . . . . . . . . . . . . . . . — — 142008 . . . . . . . . . . . . . . . . . . . . . . . . . . . . . . . . . . . . . . . — 63 452009 . . . . . . . . . . . . . . . . . . . . . . . . . . . . . . . . . . . . . . . 30 32 472010 . . . . . . . . . . . . . . . . . . . . . . . . . . . . . . . . . . . . . . . 50 33 432011 . . . . . . . . . . . . . . . . . . . . . . . . . . . . . . . . . . . . . . . 20 23 302012 and later . . . . . . . . . . . . . . . . . . . . . . . . . . . . . . . . 745 919 621
Total . . . . . . . . . . . . . . . . . . . . . . . . . . . . . . . . . . . . . . . 845 1,070 800
(*) Excluding tax loss carry-forwards on asset disposals. These carry-forwards amounted to €776 million at December 31, 2008 and to€653 million at December 31, 2007.
Use of these tax loss carry-forwards is limited to the entity in which they arose. In jurisdictions where taxconsolidations are applied, carry-forwards can be netted against taxable income generated by the entities in theconsolidated tax group.
F-45
NOTES TO THE CONSOLIDATED FINANCIAL STATEMENTS—(Continued)Year ended December 31, 2008
Deferred tax assets not recognized because their future recovery was not considered probable given thelikely future results of the entities in question amounted to €374 million at December 31, 2008 (including€162 million on asset disposals), compared with €274 million at December 31, 2007 (including €131 million onasset disposals) and €369 million at December 31, 2006.
Deferred tax assets requiring a corresponding adjustment to goodwill amounted to €6 million atDecember 31, 2008, €43 million at December 31, 2007, and €301 million at December 31, 2006.
D.15. Consolidated shareholders’ equity
D.15.1. Share capital
The share capital of €2,631,050,926 comprises 1,315,525,463 shares with a par value of €2.
Treasury shares held by the Group are as follows:
Closing Number of shares %
December 31, 2008 . . . . . . . . . . . . . . . . . . . . . . . . . . . . . . . . . . . . . . . . . . . . 10,014,971 0.76%December 31, 2007 . . . . . . . . . . . . . . . . . . . . . . . . . . . . . . . . . . . . . . . . . . . . 37,725,706 2.76%December 31, 2006 . . . . . . . . . . . . . . . . . . . . . . . . . . . . . . . . . . . . . . . . . . . . 8,940,598 0.66%January 1, 2006 . . . . . . . . . . . . . . . . . . . . . . . . . . . . . . . . . . . . . . . . . . . . . . . 58,211,254 4.15%
Treasury shares are deducted from shareholders’ equity. Gains and losses on disposals of treasury shares aretaken directly to equity and not recognized in net income for the period.
Movements in the share capital of the sanofi-aventis parent company over the last three years are presentedbelow:
(€ million)
Additional
Date TransactionNumber of
sharesSharecapital
paid-incapital
January 1, 2006 . . . . . . . . . . . . . . . . . . . . . . 1,401,306,569 2,803 11,147
During 2006 . . . . . . . . . . . . . . . . . . . . . . . . . . Capital increase by exercise ofstock subscription options 6,022,984 12 295
Board meeting of February 23, 2006 . . . . . . . Capital reduction by cancellationof treasury shares (48,013,520) (96) (2,308)
Shareholders’ meeting of May 31, 2006 . . . . Capital increase on merger ofRhône Cooper into sanofi-aventis 118,650 — 4
December 31, 2006 . . . . . . . . . . . . . . . . . . . . 1,359,434,683 2,719 9,138
During 2007 . . . . . . . . . . . . . . . . . . . . . . . . . . Capital increase by exercise ofstock subscription options 4,950,010 10 201
Shareholders’ meeting of May 31, 2007 . . . . Capital increase reserved foremployees 1,531,951 3 71
December 31, 2007 . . . . . . . . . . . . . . . . . . . . 1,365,916,644 2,732 9,410
During 2008 . . . . . . . . . . . . . . . . . . . . . . . . . . Capital increase by exercise ofstock subscription options 1,046,238 2 37
Board meeting of April 29, 2008 . . . . . . . . . . Capital reduction by cancellationof treasury shares (51,437,419) (103) (2,843)
December 31, 2008 . . . . . . . . . . . . . . . . . . . . 1,315,525,463 2,631 6,604
F-46
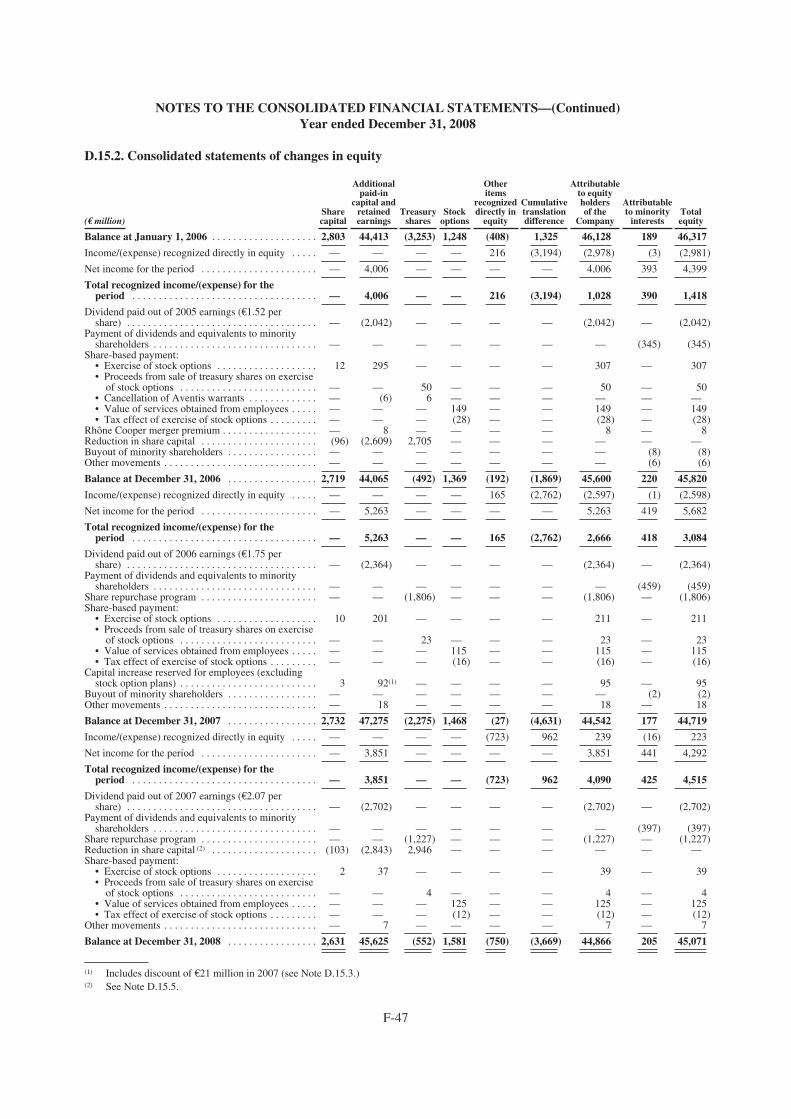
NOTES TO THE CONSOLIDATED FINANCIAL STATEMENTS—(Continued)Year ended December 31, 2008
D.15.2. Consolidated statements of changes in equity
Additional Other Attributablepaid-in items to equity
capital and recognized Cumulative holders AttributableShare retained Treasury Stock directly in translation of the to minority Total
(€ million) capital earnings shares options equity difference Company interests equity
Balance at January 1, 2006 . . . . . . . . . . . . . . . . . . . . 2,803 44,413 (3,253) 1,248 (408) 1,325 46,128 189 46,317
(2,981)
4,399
Income/(expense) recognized directly in equity . . . . . — — — — 216 (3,194) (2,978) (3)
Net income for the period . . . . . . . . . . . . . . . . . . . . . . — 4,006 — — — — 4,006 393
Total recognized income/(expense) for theperiod . . . . . . . . . . . . . . . . . . . . . . . . . . . . . . . . . . . — 4,006 — — 216 (3,194) 1,028 390 1,418
Dividend paid out of 2005 earnings (€1.52 pershare) . . . . . . . . . . . . . . . . . . . . . . . . . . . . . . . . . . . . — (2,042) — — — — (2,042) — (2,042)
Payment of dividends and equivalents to minorityshareholders . . . . . . . . . . . . . . . . . . . . . . . . . . . . . . . — — — — — — — (345) (345)
Share-based payment:• Exercise of stock options . . . . . . . . . . . . . . . . . . . 12 295 — — — — 307 — 307• Proceeds from sale of treasury shares on exercise
of stock options . . . . . . . . . . . . . . . . . . . . . . . . . . — — 50 — — — 50 — 50• Cancellation of Aventis warrants . . . . . . . . . . . . . — (6) 6 — — — — — —• Value of services obtained from employees . . . . . — — — 149 — — 149 — 149• Tax effect of exercise of stock options . . . . . . . . . — — — (28) — — (28) — (28)
Rhône Cooper merger premium . . . . . . . . . . . . . . . . . . — 8 — — — — 8 — 8Reduction in share capital . . . . . . . . . . . . . . . . . . . . . . (96) (2,609) 2,705 — — — — — —Buyout of minority shareholders . . . . . . . . . . . . . . . . . — — — — — — — (8) (8)Other movements . . . . . . . . . . . . . . . . . . . . . . . . . . . . . — — — — — — — (6) (6)
Balance at December 31, 2006 . . . . . . . . . . . . . . . . . 2,719 44,065 (492) 1,369 (192) (1,869) 45,600 220 45,820
(2,598)
5,682
3,084
Income/(expense) recognized directly in equity . . . . . — — — — 165 (2,762) (2,597) (1)
Net income for the period . . . . . . . . . . . . . . . . . . . . . . — 5,263 — — — — 5,263 419
Total recognized income/(expense) for theperiod . . . . . . . . . . . . . . . . . . . . . . . . . . . . . . . . . . . — 5,263 — — 165 (2,762) 2,666 418
Dividend paid out of 2006 earnings (€1.75 pershare) . . . . . . . . . . . . . . . . . . . . . . . . . . . . . . . . . . . . — (2,364) — — — — (2,364) — (2,364)
Payment of dividends and equivalents to minorityshareholders . . . . . . . . . . . . . . . . . . . . . . . . . . . . . . . — — — — — — — (459) (459)
Share repurchase program . . . . . . . . . . . . . . . . . . . . . . — — (1,806) — — — (1,806) — (1,806)Share-based payment:
• Exercise of stock options . . . . . . . . . . . . . . . . . . . 10 201 — — — — 211 — 211• Proceeds from sale of treasury shares on exercise
of stock options . . . . . . . . . . . . . . . . . . . . . . . . . . — — 23 — — — 23 — 23• Value of services obtained from employees . . . . . — — — 115 — — 115 — 115• Tax effect of exercise of stock options . . . . . . . . . — — — (16) — — (16) — (16)
Capital increase reserved for employees (excludingstock option plans) . . . . . . . . . . . . . . . . . . . . . . . . . . 3 92(1) — — — — 95 — 95
Buyout of minority shareholders . . . . . . . . . . . . . . . . . — — — — — — — (2) (2)Other movements . . . . . . . . . . . . . . . . . . . . . . . . . . . . . — 18 — — — — 18 — 18
Balance at December 31, 2007 . . . . . . . . . . . . . . . . . 2,732 47,275 (2,275) 1,468 (27) (4,631) 44,542 177 44,719
Income/(expense) recognized directly in equity . . . . . — — — — (723) 962 239 (16) 223
4,292Net income for the period . . . . . . . . . . . . . . . . . . . . . . — 3,851 — — — — 3,851 441
Total recognized income/(expense) for theperiod . . . . . . . . . . . . . . . . . . . . . . . . . . . . . . . . . . . — 3,851 — — (723) 962 4,090 425 4,515
Dividend paid out of 2007 earnings (€2.07 pershare) . . . . . . . . . . . . . . . . . . . . . . . . . . . . . . . . . . . . — (2,702) — — — — (2,702) — (2,702)
Payment of dividends and equivalents to minorityshareholders . . . . . . . . . . . . . . . . . . . . . . . . . . . . . . . — — — — — — — (397) (397)
Share repurchase program . . . . . . . . . . . . . . . . . . . . . . — — (1,227) — — — (1,227) — (1,227)Reduction in share capital (2) . . . . . . . . . . . . . . . . . . . . (103) (2,843) 2,946 — — — — — —Share-based payment:
• Exercise of stock options . . . . . . . . . . . . . . . . . . . 2 37 — — — — 39 — 39• Proceeds from sale of treasury shares on exercise
of stock options . . . . . . . . . . . . . . . . . . . . . . . . . . — — 4 — — — 4 — 4• Value of services obtained from employees . . . . . — — — 125 — — 125 — 125• Tax effect of exercise of stock options . . . . . . . . . — — — (12) — — (12) — (12)
Other movements . . . . . . . . . . . . . . . . . . . . . . . . . . . . . — 7 — — — — 7 — 7
Balance at December 31, 2008 . . . . . . . . . . . . . . . . . 2,631 45,625 (552) 1,581 (750) (3,669) 44,866 205 45,071
(1) Includes discount of €21 million in 2007 (see Note D.15.3.)(2) See Note D.15.5.
F-47

NOTES TO THE CONSOLIDATED FINANCIAL STATEMENTS—(Continued)Year ended December 31, 2008
D.15.3. Capital increase reserved for employees (employee share ownership plan)
At its meeting of October 30, 2007, the Board of Directors used the authorization granted by theShareholders’ Annual General Meeting of May 31, 2007 to launch an employee share ownership plan by carryingout a share issue reserved for employees. The plan involved the issuance of a maximum of 6.8 million shares,ranking for dividend from January 1, 2007 and priced at €48.55 per share. The subscription period was fromNovember 19, 2007 through November 30, 2007, and a total of 1,531,951 shares were subscribed. An expense of€21 million was recognized in respect of this share issue in the income statement for the year endedDecember 31, 2007.
There were no share issues reserved for employees in either 2008 or 2006.
D.15.4. Repurchase of sanofi-aventis shares
The Shareholders’ Annual General Meeting of May 31, 2007 authorized a share repurchase program for aperiod of 18 months. Under this program, sanofi-aventis repurchased 23,052,169 of its own shares in the periodfrom January 1, 2008 through May 14, 2008 for a total of €1,191 million (including transaction costs). Under thesame program, sanofi-aventis had previously acquired 29,366,500 of its own shares during the second half of2007 for a total of €1,806 million (including transaction costs). The Board of Directors’ meeting of April 29,2008 decided to cancel 51,407,169 shares.
The Shareholders’ Annual General Meeting of May 14, 2008 authorized a further share repurchase program.Under this new program, sanofi-aventis acquired 810,000 of its own shares during the period from June 6, 2008through August 21, 2008 for a total of €36 million (including transaction costs).
During 2006, sanofi-aventis did not repurchase any of its own shares under the share repurchase programsauthorized by the Shareholders’ Annual General Meetings of May 31, 2005 and May 31, 2006.
D.15.5. Reduction in share capital
The Board of Directors’ meeting of April 29, 2008 decided to cancel 51,437,419 treasury shares (€2,946million), of which 51,407,169 had been repurchased through April 14, 2008 under the share repurchase program,representing 3.77% of the share capital as of that date; see Note D.15.4.
The Board of Directors’ meeting of February 23, 2006 decided to cancel 48,013,520 treasury sharesrepresenting 3.42% of the share capital as of that date. The same meeting also decided to cancel 257,248.50warrants (acquired as part of the public offer for Aventis) giving entitlement to subscribe for 301,986 sanofi-aventis shares.
These cancellations had no effect on consolidated shareholders’ equity.
D.15.6. Cumulative translation differences
Cumulative translation differences break down as follows:
December 31, December 31, December 31,(€ million) 2008 2007 2006
Attributable to equity holders of the Company . . . . . . . . . . . . . . . . . . . . (3,669) (4,631) (1,869)Attributable to minority interests . . . . . . . . . . . . . . . . . . . . . . . . . . . . . .
Total . . . . . . . . . . . . . . . . . . . . . . . . . . . . . . . . . . . . . . . . . . . . . . . . . . . .
(16)
(3,685)
(2)
(4,633)
—
(1,869)
The movement in cumulative translation differences during the period was mainly due to the effect ofchanges in the U.S. dollar exchange rate, primarily on goodwill, intangible assets and deferred taxes.
F-48

NOTES TO THE CONSOLIDATED FINANCIAL STATEMENTS—(Continued)Year ended December 31, 2008
In accordance with the accounting policy described in Note B.8.4., cumulative translation differencesattributable to equity holders of the Company include the post-tax effect of currency hedges of net investments inforeign operations, totaling €98 million at December 31, 2008; this amount is unchanged from December 31,2007 and December 31, 2006.
D.15.7. Other items recognized directly in equity
Movements in other items recognized directly in equity break down as follows:
Year ended Year ended Year endedDecember 31, December 31, December 31,
(€ million) 2008 2007 2006
Balance, beginning of period . . . . . . . . . . . . . . . . . . . . . . . . . . . . . . . (26) (192) (408)
Available-for-sale financial assets:• Change in fair value . . . . . . . . . . . . . . . . . . . . . . . . . . . . . . . . . . (132)(1) (5) (27)• Deferred taxes on these changes in fair value . . . . . . . . . . . . . . 33 (10) (7)
Derivatives designated as hedging instruments:• Change in fair value, other than on derivatives relating to
held-for-sale assets (see Note D.20.1.b) and c)) . . . . . . . . . . . . 104(2) 8 50• Change in fair value of derivatives relating to held-for-sale
assets (Exubera®) . . . . . . . . . . . . . . . . . . . . . . . . . . . . . . . . . . . — — 7• Deferred taxes on these changes . . . . . . . . . . . . . . . . . . . . . . . . (37) (3) (20)
Actuarial gains and losses and impact of asset ceiling:• Asset ceiling . . . . . . . . . . . . . . . . . . . . . . . . . . . . . . . . . . . . . . . 2 (6) —• Actuarial gains/(losses) excluding associates and joint
ventures (see Note D.18.1.) . . . . . . . . . . . . . . . . . . . . . . . . . . . (824) 282 354• Actuarial gains/(losses) in associates and joint ventures . . . . . (7) 6 (8)• Deferred taxes on actuarial gains and losses . . . . . . . . . . . . . . .
Balance, end of period . . . . . . . . . . . . . . . . . . . . . . . . . . . . . . . . . . . .
136
(751)
(106)
(26)
(133)
(192)
(1) Includes matching entries for changes recognized in the income statement of €(11) million. (2007: €11 million; 2006: €(98) million, ofwhich €(101) million relates to the gain on the sale of the investment in Rhodia).
(2) Includes matching entries for changes recognized in the income statement of €(9) million in operating income and €(17) million infinancial income/expense. (2007: €(7) million in operating income and €(8) million in financial income/expense; 2006: €5 million inoperating income and €3 million in financial income/expense).
D.15.8. Share-based payment
Stock option plans and share warrants
a) Assumption by sanofi-aventis of the obligations of Aventis
Stock subscription option plans
With effect from December 31, 2004, sanofi-aventis substituted for Aventis in all the rights and obligationsof the issuer in respect of stock subscription options granted to employees and former corporate officers ofAventis and of related companies (as defined in article L.225-180 of the Commercial Code) and not exercised asof that date.
F-49
NOTES TO THE CONSOLIDATED FINANCIAL STATEMENTS—(Continued)Year ended December 31, 2008
With effect from December 31, 2004, stock subscription options granted by Aventis and not yet exercisedmay be exercised in sanofi-aventis shares on the same terms, subject to the adjustments described below. Thenumber and subscription price of the optioned shares have been adjusted to reflect the share exchange ratioapplicable to Aventis shareholders, subject to possible further adjustment in the event of future capitaltransactions. The new terms for the exercise of options, subject to future financial adjustments, are as follows:
• The number of sanofi-aventis shares for which each grantee may subscribe under a given stock optionplan equals the number of Aventis shares to which the grantee may subscribe under that plan multipliedby the exchange ratio applicable to the shareholders (i.e. 27/23), rounded down to the nearest wholenumber.
• The subscription price per sanofi-aventis share equals the subscription price per Aventis share dividedby the exchange ratio applicable to the shareholders (i.e. 27/23), rounded down to the nearest euro cent.
Stock purchase option plans
In the case of stock option plans issued by Aventis Inc. and Hoechst AG entitling the grantees to purchaseAventis shares, the plan regulations have been amended in accordance with the principles described above so asto enable the grantees to purchase sanofi-aventis shares. The other terms of exercise are unchanged.
Share warrants
Under two capital increases reserved for Aventis Group employees belonging to the Aventis Groupemployee savings plan, carried out in September 2002 (“Plan Horizon 2002”) and December 2003 (“PlanHorizon 2003”), Aventis issued, to certain German employees of the Aventis Group, shares accompanied bywarrants giving entitlement to subscribe for Aventis shares. These shares with warrants attached were subscribedfor on behalf of these employees by two dedicated mutual funds, “Aventis Deutschland 2002” and “AventisDeutschland 2003”.
Sanofi-aventis acquired the share warrants issued in 2002 and 2003 as part of the public offer for Aventis.
These share warrants were cancelled in 2006 (see Note D.15.5.).
b) Description of stock option plans
2007 stock subscription option plan granted by sanofi-aventis
On December 13, 2007, the Board of Directors granted 11,988,975 stock subscription options at an exerciseprice of €62.33 per share.
The vesting period is four years and the plan expires on December 13, 2017.
2006 stock subscription option plan granted by sanofi-aventis
On December 14, 2006, the Board of Directors granted 11,772,050 stock subscription options at an exerciseprice of €66.91 per share.
The vesting period is four years and the plan expires on December 14, 2016.
Stock purchase option plans
Sanofi and Synthélabo awarded several stock option plans which allow grantees to purchase a fixed numberof shares at a pre-determined price over a specified period. Options generally vest two to five years from the dateof grant and expire seven to twenty years from the date of grant. Shares acquired under these plans generally maynot be disposed of prior to the fifth anniversary of the date of grant.
F-50
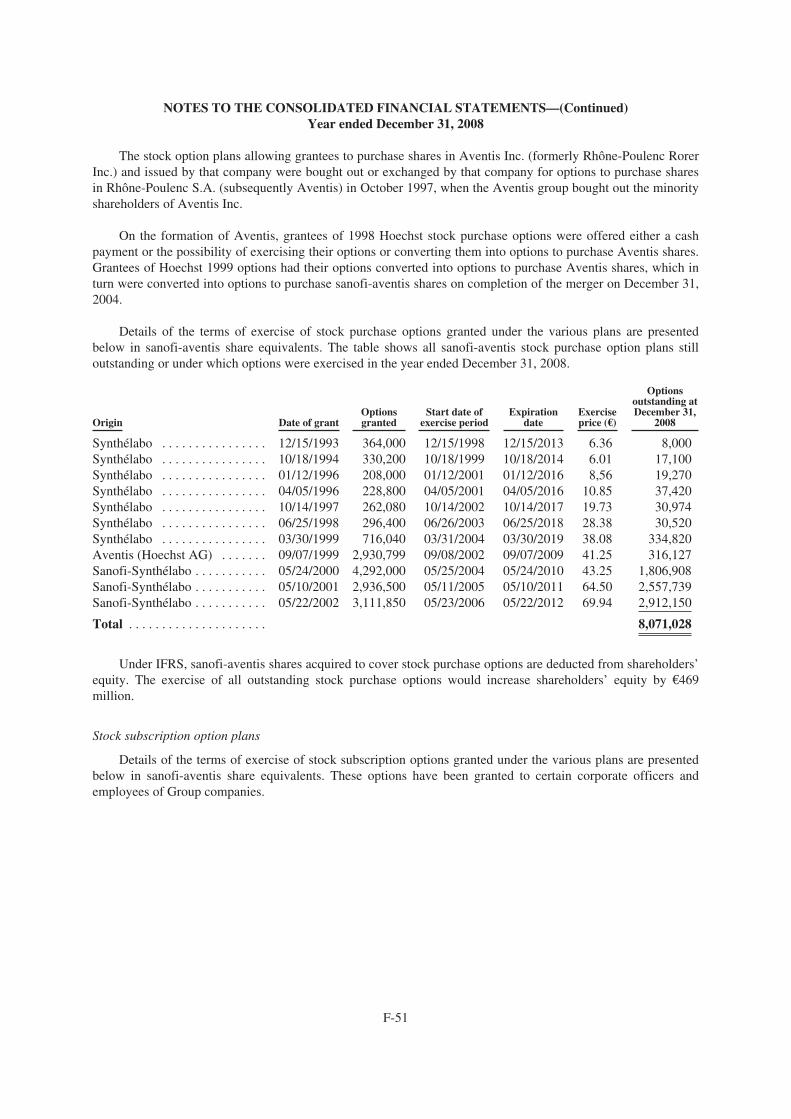
NOTES TO THE CONSOLIDATED FINANCIAL STATEMENTS—(Continued)Year ended December 31, 2008
The stock option plans allowing grantees to purchase shares in Aventis Inc. (formerly Rhône-Poulenc RorerInc.) and issued by that company were bought out or exchanged by that company for options to purchase sharesin Rhône-Poulenc S.A. (subsequently Aventis) in October 1997, when the Aventis group bought out the minorityshareholders of Aventis Inc.
On the formation of Aventis, grantees of 1998 Hoechst stock purchase options were offered either a cashpayment or the possibility of exercising their options or converting them into options to purchase Aventis shares.Grantees of Hoechst 1999 options had their options converted into options to purchase Aventis shares, which inturn were converted into options to purchase sanofi-aventis shares on completion of the merger on December 31,2004.
Details of the terms of exercise of stock purchase options granted under the various plans are presentedbelow in sanofi-aventis share equivalents. The table shows all sanofi-aventis stock purchase option plans stilloutstanding or under which options were exercised in the year ended December 31, 2008.
Origin Date of grantOptionsgranted
Start date ofexercise period
Expirationdate
Exerciseprice (€)
Optionsoutstanding atDecember 31,
2008
Synthélabo . . . . . . . . . . . . . . . . 12/15/1993 364,000 12/15/1998 12/15/2013 6.36 8,000Synthélabo . . . . . . . . . . . . . . . . 10/18/1994 330,200 10/18/1999 10/18/2014 6.01 17,100Synthélabo . . . . . . . . . . . . . . . . 01/12/1996 208,000 01/12/2001 01/12/2016 8,56 19,270Synthélabo . . . . . . . . . . . . . . . . 04/05/1996 228,800 04/05/2001 04/05/2016 10.85 37,420Synthélabo . . . . . . . . . . . . . . . . 10/14/1997 262,080 10/14/2002 10/14/2017 19.73 30,974Synthélabo . . . . . . . . . . . . . . . . 06/25/1998 296,400 06/26/2003 06/25/2018 28.38 30,520Synthélabo . . . . . . . . . . . . . . . . 03/30/1999 716,040 03/31/2004 03/30/2019 38.08 334,820Aventis (Hoechst AG) . . . . . . . 09/07/1999 2,930,799 09/08/2002 09/07/2009 41.25 316,127Sanofi-Synthélabo . . . . . . . . . . . 05/24/2000 4,292,000 05/25/2004 05/24/2010 43.25 1,806,908Sanofi-Synthélabo . . . . . . . . . . . 05/10/2001 2,936,500 05/11/2005 05/10/2011 64.50 2,557,739Sanofi-Synthélabo . . . . . . . . . . . 05/22/2002 3,111,850 05/23/2006 05/22/2012 69.94 2,912,150
Total . . . . . . . . . . . . . . . . . . . . . 8,071,028
Under IFRS, sanofi-aventis shares acquired to cover stock purchase options are deducted from shareholders’equity. The exercise of all outstanding stock purchase options would increase shareholders’ equity by €469million.
Stock subscription option plans
Details of the terms of exercise of stock subscription options granted under the various plans are presentedbelow in sanofi-aventis share equivalents. These options have been granted to certain corporate officers andemployees of Group companies.
F-51

NOTES TO THE CONSOLIDATED FINANCIAL STATEMENTS—(Continued)Year ended December 31, 2008
The table shows all sanofi-aventis stock subscription option plans which are still outstanding or for whichexercise took place in the year ended December 31, 2008.
Origin Date of grantOptionsgranted
Start date ofexercise period
Expirationdate
Exerciseprice (€)
Optionsoutstanding atDecember 31,
2008
Aventis . . . . . . . . . . . . . . . . . . 12/15/1998 6,372,000 01/06/2002 12/15/2008 34.14 —Aventis . . . . . . . . . . . . . . . . . . 12/15/1999 5,910,658 01/06/2003 12/15/2009 50.04 2,634,784Aventis . . . . . . . . . . . . . . . . . . 05/11/2000 877,766 05/11/2003 05/11/2010 49.65 254,121Aventis . . . . . . . . . . . . . . . . . . 11/14/2000 13,966,871 11/15/2003 11/14/2010 67.93 10,395,431Aventis . . . . . . . . . . . . . . . . . . 03/29/2001 612,196 03/30/2004 03/29/2011 68.94 546,756Aventis . . . . . . . . . . . . . . . . . . 11/07/2001 13,374,051 11/08/2004 11/07/2011 71.39 9,748,054Aventis . . . . . . . . . . . . . . . . . . 03/06/2002 1,173,913 03/07/2005 03/06/2012 69.82 1,173,906Aventis . . . . . . . . . . . . . . . . . . 11/12/2002 11,775,414 11/13/2005 11/12/2012 51.34 5,492,136Aventis . . . . . . . . . . . . . . . . . . 12/02/2003 12,012,414 12/03/2006 12/02/2013 40.48 6,519,744Sanofi-Synthélabo . . . . . . . . . . 12/10/2003 4,217,700 12/11/2007 12/10/2013 55.74 3,877,720Sanofi-aventis . . . . . . . . . . . . . 05/31/2005 15,228,505 06/01/2009 05/31/2015 70.38 13,720,150Sanofi-aventis . . . . . . . . . . . . . 12/14/2006 11,772,050 12/15/2010 12/14/2016 66.91 11,195,460Sanofi-aventis . . . . . . . . . . . . . 12/13/2007 11,988,975 12/14/2011 12/13/2017 62.33 11,675,660
Total . . . . . . . . . . . . . . . . . . . . 77,233,922
The exercise of all outstanding stock subscription options would increase shareholders’ equity byapproximately €4,871 million. The exercise of each option results in the issuance of one share.
Summary of stock option plans
A summary of stock options outstanding at each balance sheet date, and of changes during the relevantperiods, is presented below:
Exercise price
Weightedaverage
Number of per share Totaloptions (€) (€ million)
4,688Options outstanding at January 1, 2006 . . . . . . . . . . . . . . . . . . . . . . . . . . 79,330,701 59.10Of which exercisable . . . . . . . . . . . . . . . . . . . . . . . . . . . . . . . . . . . . . . . . . 43,860,426 59.60 2,614
788Options granted . . . . . . . . . . . . . . . . . . . . . . . . . . . . . . . . . . . . . . . . . . . . . 11,772,050 66.91Options exercised . . . . . . . . . . . . . . . . . . . . . . . . . . . . . . . . . . . . . . . . . . . (7,259,259) 49.56 (360)Options cancelled (1) . . . . . . . . . . . . . . . . . . . . . . . . . . . . . . . . . . . . . . . . . . (1,230,478) 62.06 (77)Options forfeited . . . . . . . . . . . . . . . . . . . . . . . . . . . . . . . . . . . . . . . . . . . . (13,354) 18.23 —
Options outstanding at December 31, 2006 . . . . . . . . . . . . . . . . . . . . . . . 82,599,660 61.00 5,039Of which exercisable . . . . . . . . . . . . . . . . . . . . . . . . . . . . . . . . . . . . . . . . . 50,920,604 58.02 2,954
747Options granted . . . . . . . . . . . . . . . . . . . . . . . . . . . . . . . . . . . . . . . . . . . . . 11,988,975 62.33Options exercised . . . . . . . . . . . . . . . . . . . . . . . . . . . . . . . . . . . . . . . . . . . (5,530,880) 42.07 (233)Options cancelled (1) . . . . . . . . . . . . . . . . . . . . . . . . . . . . . . . . . . . . . . . . . . (712,658) 68.05 (48)Options forfeited . . . . . . . . . . . . . . . . . . . . . . . . . . . . . . . . . . . . . . . . . . . . (69,402) 29.14 (2)
5,503Options outstanding at December 31, 2007 . . . . . . . . . . . . . . . . . . . . . . . 88,275,695 62.34Of which exercisable . . . . . . . . . . . . . . . . . . . . . . . . . . . . . . . . . . . . . . . . . 50,643,150 59.05 2,991
(42)Options exercised . . . . . . . . . . . . . . . . . . . . . . . . . . . . . . . . . . . . . . . . . . . (1,141,554) 36.82Options cancelled (1) . . . . . . . . . . . . . . . . . . . . . . . . . . . . . . . . . . . . . . . . . . (1,682,800) 65.51 (110)Options forfeited . . . . . . . . . . . . . . . . . . . . . . . . . . . . . . . . . . . . . . . . . . . . (146,391) 34.14 (5)
5,345Options outstanding at December 31, 2008 . . . . . . . . . . . . . . . . . . . . . . . 85,304,950 62.66Of which exercisable . . . . . . . . . . . . . . . . . . . . . . . . . . . . . . . . . . . . . . . . . 48,713,680 59.59 2,903
(1) Cancellations mainly due to the departure of the grantees.
F-52
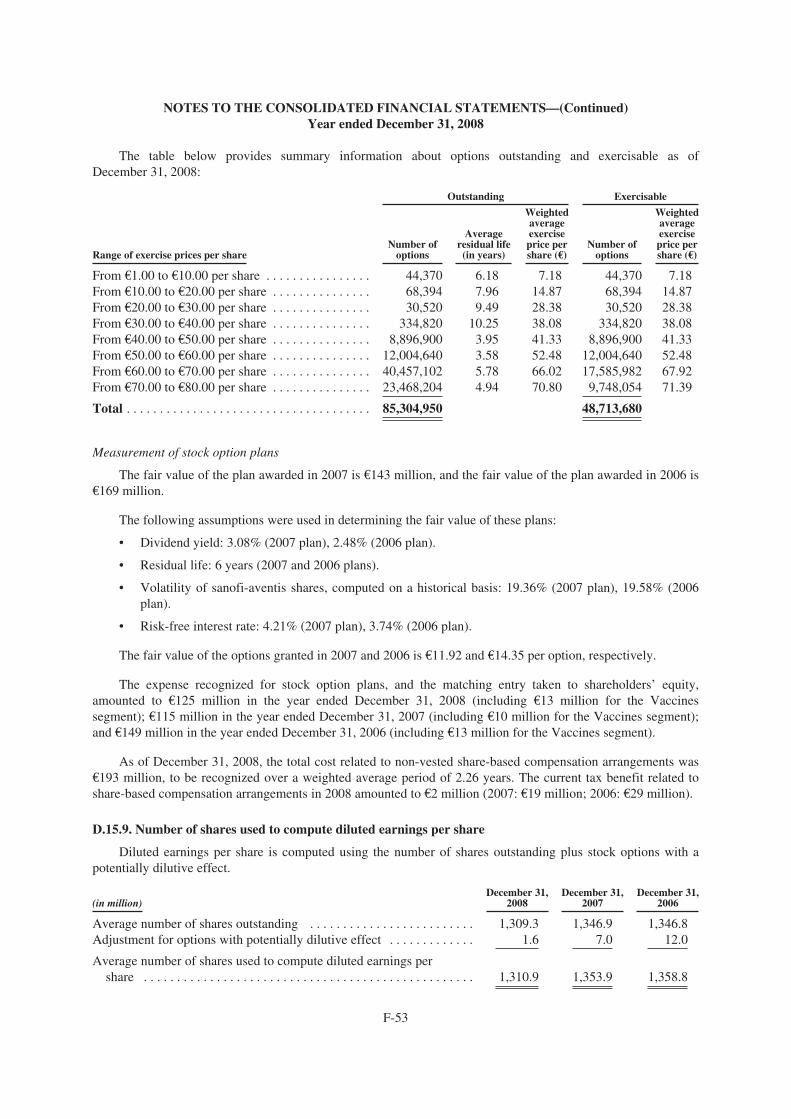
NOTES TO THE CONSOLIDATED FINANCIAL STATEMENTS—(Continued)Year ended December 31, 2008
The table below provides summary information about options outstanding and exercisable as ofDecember 31, 2008:
Outstanding Exercisable
Weighted Weightedaverage average
Average exercise exerciseNumber of residual life price per Number of price per
Range of exercise prices per share options (in years) share (€) options share (€)
From €1.00 to €10.00 per share . . . . . . . . . . . . . . . . 44,370 6.18 7.18 44,370 7.18From €10.00 to €20.00 per share . . . . . . . . . . . . . . . 68,394 7.96 14.87 68,394 14.87From €20.00 to €30.00 per share . . . . . . . . . . . . . . . 30,520 9.49 28.38 30,520 28.38From €30.00 to €40.00 per share . . . . . . . . . . . . . . . 334,820 10.25 38.08 334,820 38.08From €40.00 to €50.00 per share . . . . . . . . . . . . . . . 8,896,900 3.95 41.33 8,896,900 41.33From €50.00 to €60.00 per share . . . . . . . . . . . . . . . 12,004,640 3.58 52.48 12,004,640 52.48From €60.00 to €70.00 per share . . . . . . . . . . . . . . . 40,457,102 5.78 66.02 17,585,982 67.92From €70.00 to €80.00 per share . . . . . . . . . . . . . . . 23,468,204 4.94 70.80 9,748,054 71.39
Total . . . . . . . . . . . . . . . . . . . . . . . . . . . . . . . . . . . . . 85,304,950 48,713,680
Measurement of stock option plans
The fair value of the plan awarded in 2007 is €143 million, and the fair value of the plan awarded in 2006 is€169 million.
The following assumptions were used in determining the fair value of these plans:
• Dividend yield: 3.08% (2007 plan), 2.48% (2006 plan).
• Residual life: 6 years (2007 and 2006 plans).
• Volatility of sanofi-aventis shares, computed on a historical basis: 19.36% (2007 plan), 19.58% (2006plan).
• Risk-free interest rate: 4.21% (2007 plan), 3.74% (2006 plan).
The fair value of the options granted in 2007 and 2006 is €11.92 and €14.35 per option, respectively.
The expense recognized for stock option plans, and the matching entry taken to shareholders’ equity,amounted to €125 million in the year ended December 31, 2008 (including €13 million for the Vaccinessegment); €115 million in the year ended December 31, 2007 (including €10 million for the Vaccines segment);and €149 million in the year ended December 31, 2006 (including €13 million for the Vaccines segment).
As of December 31, 2008, the total cost related to non-vested share-based compensation arrangements was€193 million, to be recognized over a weighted average period of 2.26 years. The current tax benefit related toshare-based compensation arrangements in 2008 amounted to €2 million (2007: €19 million; 2006: €29 million).
D.15.9. Number of shares used to compute diluted earnings per share
Diluted earnings per share is computed using the number of shares outstanding plus stock options with apotentially dilutive effect.
December 31, December 31, December 31,(in million) 2008 2007 2006
Average number of shares outstanding . . . . . . . . . . . . . . . . . . . . . . . . . 1,309.3 1,346.9 1,346.8Adjustment for options with potentially dilutive effect . . . . . . . . . . . . . 1.6 7.0 12.0
Average number of shares used to compute diluted earnings pershare . . . . . . . . . . . . . . . . . . . . . . . . . . . . . . . . . . . . . . . . . . . . . . . . . . 1,310.9 1,353.9 1,358.8
F-53

NOTES TO THE CONSOLIDATED FINANCIAL STATEMENTS—(Continued)Year ended December 31, 2008
In 2008, a total of 76.2 million stock options were not taken into account in the calculation because they didnot have a potentially dilutive effect, compared with 65.4 million in 2007 and 26.1 million in 2006.
D.16. Minority interests
Minority interests in consolidated companies break down as follows:
December 31, December 31, December 31,(€ million) 2008 2007 2006
Minority interests of ordinary shareholders:• BMS (1) . . . . . . . . . . . . . . . . . . . . . . . . . . . . . . . . . . . . . . . . . . . . . . . . . 111 80 127• Aventis Pharma Ltd India . . . . . . . . . . . . . . . . . . . . . . . . . . . . . . . . . . 60 64 54• Maphar . . . . . . . . . . . . . . . . . . . . . . . . . . . . . . . . . . . . . . . . . . . . . . . . . 6 6 6• Sanofi-aventis Pakistan . . . . . . . . . . . . . . . . . . . . . . . . . . . . . . . . . . . . 5 6 6• Other . . . . . . . . . . . . . . . . . . . . . . . . . . . . . . . . . . . . . . . . . . . . . . . . . .
Total . . . . . . . . . . . . . . . . . . . . . . . . . . . . . . . . . . . . . . . . . . . . . . . . . . . .
23
205
21
177
27
220
(1) Under the terms of the agreements with BMS (see Note C.1.), the BMS share of the net assets of entities majority-owned by sanofi-aventis is recognized in Minority interests (refer to the statement of changes in equity in Note D.15.2.).
D.17. Debt, cash and cash equivalents
The table below shows changes in the Group’s financial position over the last three years:
December 31, December 31, December 31,(€ million) 2008 2007 2006
Long-term debt, at amortized cost . . . . . . . . . . . . . . . . . . . . . . . . . . . . . 4,173 3,734 4,499Short-term debt and current portion of long-term debt . . . . . . . . . . . . . . 1,833 2,207 2,445
Total debt . . . . . . . . . . . . . . . . . . . . . . . . . . . . . . . . . . . . . . . . . . . . . . . . 6,006 5,941 6,944
Cash and cash equivalents . . . . . . . . . . . . . . . . . . . . . . . . . . . . . . . . . . . . (4,226) (1,711) (1,153)
Debt, net of cash and cash equivalents . . . . . . . . . . . . . . . . . . . . . . . . 1,780 4,230 5,791
“Debt, net of cash and cash equivalents” is a non-GAAP financial indicator used by management andinvestors to measure the company’s overall net indebtedness.
Trends in the gearing ratio are shown below:
December 31, December 31, December 31,(€ million) 2008 2007 2006
Debt, net of cash and cash equivalents . . . . . . . . . . . . . . . . . . . . . . . . . . 1,780 4,230 5,791Total equity . . . . . . . . . . . . . . . . . . . . . . . . . . . . . . . . . . . . . . . . . . . . . . . 45,071 44,719 45,820Gearing ratio . . . . . . . . . . . . . . . . . . . . . . . . . . . . . . . . . . . . . . . . . . . . . 3.9% 9.5% 12.6%
A reconciliation of carrying amount to value on redemption is shown below:
Carryingamount:
Dec. 31, 2008Amortized
cost
Adjustment todebt measured
at fair value
Value onredemption
(€ million) Dec. 31, 2008 Dec. 31, 2007 Dec. 31, 2006
Long-term debt . . . . . . . . . . . . . . . 4,173 7 (57) 4,123 3,686 4,448Short-term debt and current
portion of long-term debt . . . . . 1,833 — (18) 1,815 2,187 2,425
6,873
(1,153)
Total debt . . . . . . . . . . . . . . . . . . 6,006 7 (75) 5,938 5,873
Cash and cash equivalents . . . . . . (4,226) — — (4,226) (1,711)
Debt, net of cash and cashequivalents . . . . . . . . . . . . . . . 1,780 7 (75) 1,712 4,162 5,720
F-54
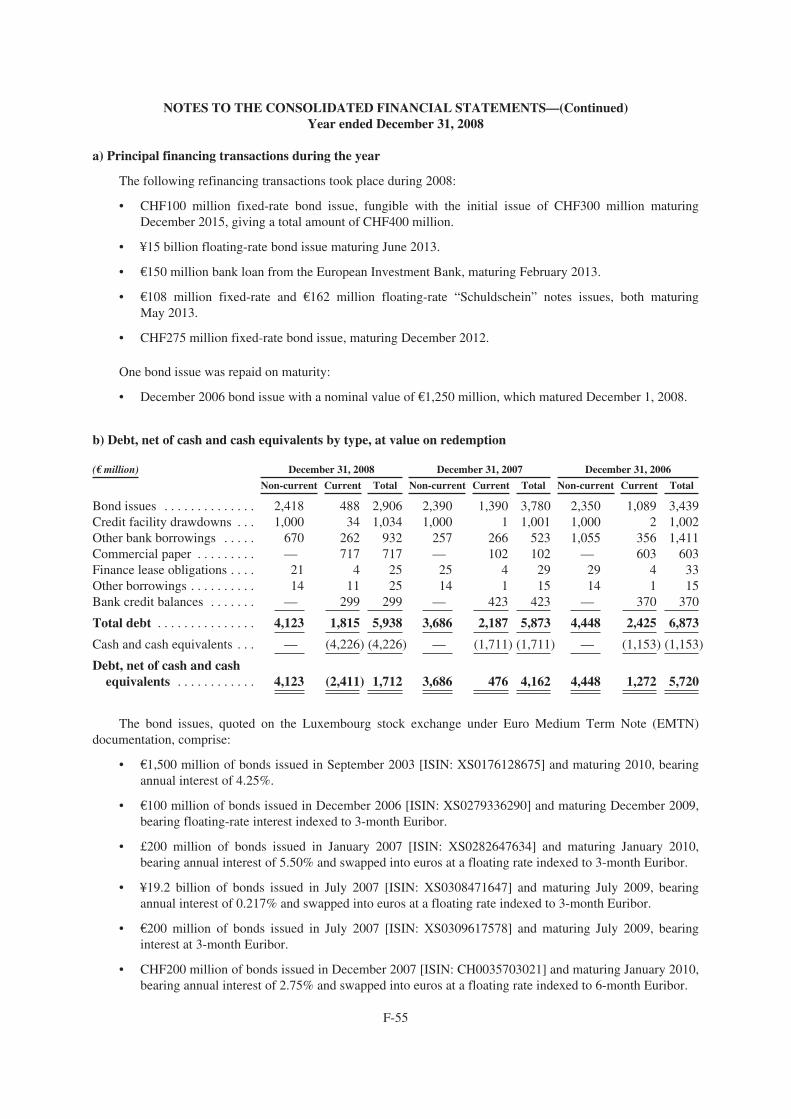
NOTES TO THE CONSOLIDATED FINANCIAL STATEMENTS—(Continued)Year ended December 31, 2008
a) Principal financing transactions during the year
The following refinancing transactions took place during 2008:
• CHF100 million fixed-rate bond issue, fungible with the initial issue of CHF300 million maturingDecember 2015, giving a total amount of CHF400 million.
• ¥15 billion floating-rate bond issue maturing June 2013.
• €150 million bank loan from the European Investment Bank, maturing February 2013.
• €108 million fixed-rate and €162 million floating-rate “Schuldschein” notes issues, both maturingMay 2013.
• CHF275 million fixed-rate bond issue, maturing December 2012.
One bond issue was repaid on maturity:
• December 2006 bond issue with a nominal value of €1,250 million, which matured December 1, 2008.
b) Debt, net of cash and cash equivalents by type, at value on redemption
(€ million) December 31, 2008 December 31, 2007 December 31, 2006
Non-current Current Total Non-current Current Total Non-current Current Total
Bond issues . . . . . . . . . . . . . . 2,418 488 2,906 2,390 1,390 3,780 2,350 1,089 3,439Credit facility drawdowns . . . 1,000 34 1,034 1,000 1 1,001 1,000 2 1,002Other bank borrowings . . . . . 670 262 932 257 266 523 1,055 356 1,411Commercial paper . . . . . . . . . — 717 717 — 102 102 — 603 603Finance lease obligations . . . . 21 4 25 25 4 29 29 4 33Other borrowings . . . . . . . . . . 14 11 25 14 1 15 14 1 15Bank credit balances . . . . . . . — 299 299 — 423 423 — 370 370
Total debt . . . . . . . . . . . . . . . 4,123 1,815 5,938 3,686 2,187 5,873 4,448 2,425 6,873
Cash and cash equivalents . . . — (4,226) (4,226) — (1,711) (1,711) — (1,153) (1,153)
Debt, net of cash and cashequivalents . . . . . . . . . . . . 4,123 (2,411) 1,712 3,686 476 4,162 4,448 1,272 5,720
The bond issues, quoted on the Luxembourg stock exchange under Euro Medium Term Note (EMTN)documentation, comprise:
• €1,500 million of bonds issued in September 2003 [ISIN: XS0176128675] and maturing 2010, bearingannual interest of 4.25%.
• €100 million of bonds issued in December 2006 [ISIN: XS0279336290] and maturing December 2009,bearing floating-rate interest indexed to 3-month Euribor.
• £200 million of bonds issued in January 2007 [ISIN: XS0282647634] and maturing January 2010,bearing annual interest of 5.50% and swapped into euros at a floating rate indexed to 3-month Euribor.
• ¥19.2 billion of bonds issued in July 2007 [ISIN: XS0308471647] and maturing July 2009, bearingannual interest of 0.217% and swapped into euros at a floating rate indexed to 3-month Euribor.
• €200 million of bonds issued in July 2007 [ISIN: XS0309617578] and maturing July 2009, bearinginterest at 3-month Euribor.
• CHF200 million of bonds issued in December 2007 [ISIN: CH0035703021] and maturing January 2010,bearing annual interest of 2.75% and swapped into euros at a floating rate indexed to 6-month Euribor.
F-55
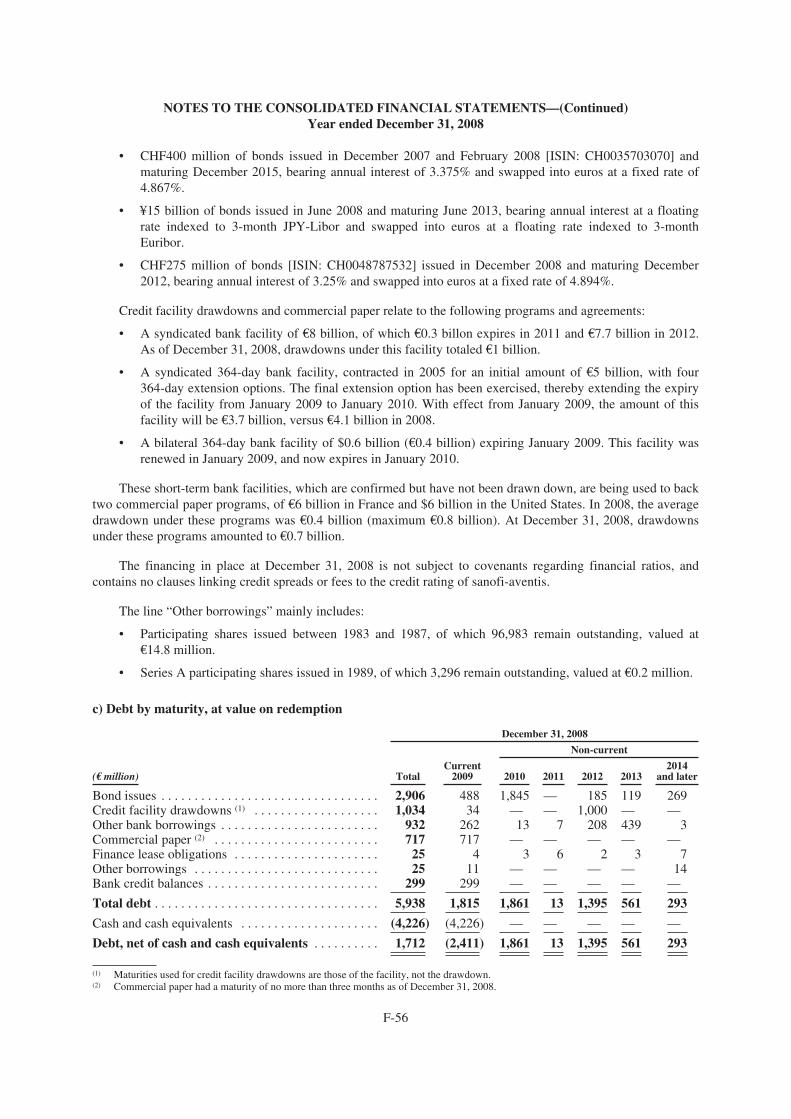
NOTES TO THE CONSOLIDATED FINANCIAL STATEMENTS—(Continued)Year ended December 31, 2008
• CHF400 million of bonds issued in December 2007 and February 2008 [ISIN: CH0035703070] andmaturing December 2015, bearing annual interest of 3.375% and swapped into euros at a fixed rate of4.867%.
• ¥15 billion of bonds issued in June 2008 and maturing June 2013, bearing annual interest at a floatingrate indexed to 3-month JPY-Libor and swapped into euros at a floating rate indexed to 3-monthEuribor.
• CHF275 million of bonds [ISIN: CH0048787532] issued in December 2008 and maturing December2012, bearing annual interest of 3.25% and swapped into euros at a fixed rate of 4.894%.
Credit facility drawdowns and commercial paper relate to the following programs and agreements:
• A syndicated bank facility of €8 billion, of which €0.3 billon expires in 2011 and €7.7 billion in 2012.As of December 31, 2008, drawdowns under this facility totaled €1 billion.
• A syndicated 364-day bank facility, contracted in 2005 for an initial amount of €5 billion, with four364-day extension options. The final extension option has been exercised, thereby extending the expiryof the facility from January 2009 to January 2010. With effect from January 2009, the amount of thisfacility will be €3.7 billion, versus €4.1 billion in 2008.
• A bilateral 364-day bank facility of $0.6 billion (€0.4 billion) expiring January 2009. This facility wasrenewed in January 2009, and now expires in January 2010.
These short-term bank facilities, which are confirmed but have not been drawn down, are being used to backtwo commercial paper programs, of €6 billion in France and $6 billion in the United States. In 2008, the averagedrawdown under these programs was €0.4 billion (maximum €0.8 billion). At December 31, 2008, drawdownsunder these programs amounted to €0.7 billion.
The financing in place at December 31, 2008 is not subject to covenants regarding financial ratios, andcontains no clauses linking credit spreads or fees to the credit rating of sanofi-aventis.
The line “Other borrowings” mainly includes:
• Participating shares issued between 1983 and 1987, of which 96,983 remain outstanding, valued at€14.8 million.
• Series A participating shares issued in 1989, of which 3,296 remain outstanding, valued at €0.2 million.
c) Debt by maturity, at value on redemption
December 31, 2008
Current 2014(€ million) Total 2009 2010 2011 2012 2013 and later
Bond issues . . . . . . . . . . . . . . . . . . . . . . . . . . . . . . . . . 2,906 488 1,845 — 185 119 269Credit facility drawdowns (1) . . . . . . . . . . . . . . . . . . . 1,034 34 — — 1,000 — —Other bank borrowings . . . . . . . . . . . . . . . . . . . . . . . . 932 262 13 7 208 439 3Commercial paper (2) . . . . . . . . . . . . . . . . . . . . . . . . . 717 717 — — — — —Finance lease obligations . . . . . . . . . . . . . . . . . . . . . . 25 4 3 6 2 3Other borrowings . . . . . . . . . . . . . . . . . . . . . . . . . . . . 25 11 — — — — 14Bank credit balances . . . . . . . . . . . . . . . . . . . . . . . . . . 299 299 — — — — —
Total debt . . . . . . . . . . . . . . . . . . . . . . . . . . . . . . . . . . 5,938 1,815 1,861 13 1,395 561 293
Cash and cash equivalents . . . . . . . . . . . . . . . . . . . . .
Debt, net of cash and cash equivalents . . . . . . . . . .
(4,226)
1,712
(4,226)
(2,411)
—
1,861
—
13
—
1,395
—
561
—
293
Non-current
7
(1) Maturities used for credit facility drawdowns are those of the facility, not the drawdown.(2) Commercial paper had a maturity of no more than three months as of December 31, 2008.
F-56
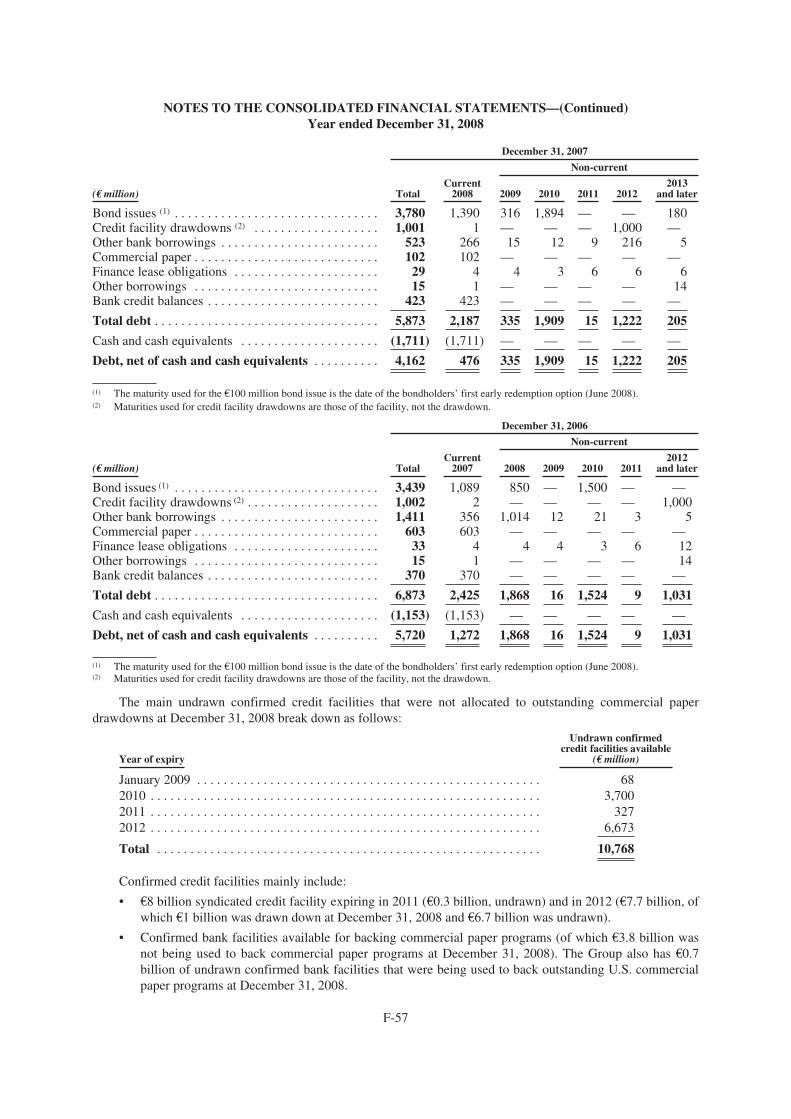
NOTES TO THE CONSOLIDATED FINANCIAL STATEMENTS—(Continued)Year ended December 31, 2008
December 31, 2007
Current 2013(€ million) Total 2008 2009 2010 2011 2012 and later
Bond issues (1) . . . . . . . . . . . . . . . . . . . . . . . . . . . . . . . 3,780 1,390 316 1,894 — — 180Credit facility drawdowns (2) . . . . . . . . . . . . . . . . . . . 1,001 1 — — — 1,000 —Other bank borrowings . . . . . . . . . . . . . . . . . . . . . . . . 523 266 15 12 9 216 5Commercial paper . . . . . . . . . . . . . . . . . . . . . . . . . . . . 102 102 — — — — —Finance lease obligations . . . . . . . . . . . . . . . . . . . . . . 29 4 4 3 6 6 6Other borrowings . . . . . . . . . . . . . . . . . . . . . . . . . . . . 15 1 — — — — 14Bank credit balances . . . . . . . . . . . . . . . . . . . . . . . . . . 423 423 — — — — —
Total debt . . . . . . . . . . . . . . . . . . . . . . . . . . . . . . . . . . 5,873 2,187 335 1,909 15 1,222 205
Cash and cash equivalents . . . . . . . . . . . . . . . . . . . . .
Debt, net of cash and cash equivalents . . . . . . . . . .
(1,711)
4,162
(1,711)
476
—
335
—
1,909
—
15
—
1,222
—
205
Non-current
(1) The maturity used for the €100 million bond issue is the date of the bondholders’ first early redemption option (June 2008).(2) Maturities used for credit facility drawdowns are those of the facility, not the drawdown.
December 31, 2006
Current 2012(€ million) Total 2007 2008 2009 2010 2011 and later
Bond issues (1) . . . . . . . . . . . . . . . . . . . . . . . . . . . . . . . 3,439 1,089 850 — 1,500 — —Credit facility drawdowns (2) . . . . . . . . . . . . . . . . . . . . 1,002 2 — — — — 1,000Other bank borrowings . . . . . . . . . . . . . . . . . . . . . . . . 1,411 356 1,014 12 21 3 5Commercial paper . . . . . . . . . . . . . . . . . . . . . . . . . . . . 603 603 — — — — —Finance lease obligations . . . . . . . . . . . . . . . . . . . . . . 33 4 4 4 3 6Other borrowings . . . . . . . . . . . . . . . . . . . . . . . . . . . . 15 1 — — — —Bank credit balances . . . . . . . . . . . . . . . . . . . . . . . . . . 370 370 — — — — —
1,031
—
1,031
Total debt . . . . . . . . . . . . . . . . . . . . . . . . . . . . . . . . . . 6,873 2,425 1,868 16 1,524 9
Cash and cash equivalents . . . . . . . . . . . . . . . . . . . . .
Debt, net of cash and cash equivalents . . . . . . . . . .
(1,153)
5,720
(1,153)
1,272
—
1,868
—
16
—
1,524
—
9
Non-current
1214
(1) The maturity used for the €100 million bond issue is the date of the bondholders’ first early redemption option (June 2008).(2) Maturities used for credit facility drawdowns are those of the facility, not the drawdown.
The main undrawn confirmed credit facilities that were not allocated to outstanding commercial paperdrawdowns at December 31, 2008 break down as follows:
Undrawn confirmedcredit facilities available
Year of expiry (€ million)
January 2009 . . . . . . . . . . . . . . . . . . . . . . . . . . . . . . . . . . . . . . . . . . . . . . . . . . . . 682010 . . . . . . . . . . . . . . . . . . . . . . . . . . . . . . . . . . . . . . . . . . . . . . . . . . . . . . . . . . . 3,7002011 . . . . . . . . . . . . . . . . . . . . . . . . . . . . . . . . . . . . . . . . . . . . . . . . . . . . . . . . . . . 3272012 . . . . . . . . . . . . . . . . . . . . . . . . . . . . . . . . . . . . . . . . . . . . . . . . . . . . . . . . . . . 6,673
Total . . . . . . . . . . . . . . . . . . . . . . . . . . . . . . . . . . . . . . . . . . . . . . . . . . . . . . . . . . 10,768
Confirmed credit facilities mainly include:
• €8 billion syndicated credit facility expiring in 2011 (€0.3 billion, undrawn) and in 2012 (€7.7 billion, ofwhich €1 billion was drawn down at December 31, 2008 and €6.7 billion was undrawn).
• Confirmed bank facilities available for backing commercial paper programs (of which €3.8 billion wasnot being used to back commercial paper programs at December 31, 2008). The Group also has €0.7billion of undrawn confirmed bank facilities that were being used to back outstanding U.S. commercialpaper programs at December 31, 2008.
F-57
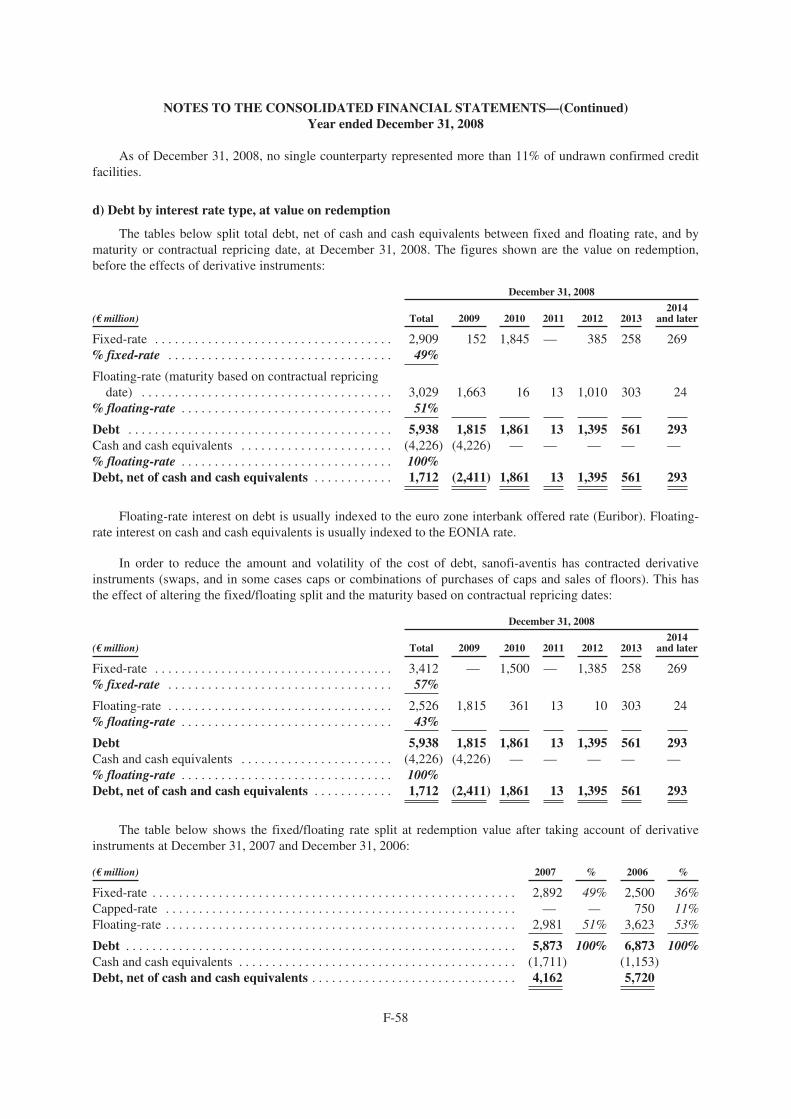
NOTES TO THE CONSOLIDATED FINANCIAL STATEMENTS—(Continued)Year ended December 31, 2008
As of December 31, 2008, no single counterparty represented more than 11% of undrawn confirmed creditfacilities.
d) Debt by interest rate type, at value on redemption
The tables below split total debt, net of cash and cash equivalents between fixed and floating rate, and bymaturity or contractual repricing date, at December 31, 2008. The figures shown are the value on redemption,before the effects of derivative instruments:
December 31, 2008
2014(€ million) Total 2009 2010 2011 2012 2013 and later
Fixed-rate . . . . . . . . . . . . . . . . . . . . . . . . . . . . . . . . . . . . 2,909 152 1,845 — 385 258 269% fixed-rate . . . . . . . . . . . . . . . . . . . . . . . . . . . . . . . . . . 49%
Floating-rate (maturity based on contractual repricingdate) . . . . . . . . . . . . . . . . . . . . . . . . . . . . . . . . . . . . . . 3,029 1,663 16 13 1,010 303 24
% floating-rate . . . . . . . . . . . . . . . . . . . . . . . . . . . . . . . . 51%
Debt . . . . . . . . . . . . . . . . . . . . . . . . . . . . . . . . . . . . . . . . 5,938 1,815 1,861 13 1,395 561 293Cash and cash equivalents . . . . . . . . . . . . . . . . . . . . . . . (4,226) (4,226) — — — — —% floating-rate . . . . . . . . . . . . . . . . . . . . . . . . . . . . . . . . 100%Debt, net of cash and cash equivalents . . . . . . . . . . . . 1,712 (2,411) 1,861 13 1,395 561 293
Floating-rate interest on debt is usually indexed to the euro zone interbank offered rate (Euribor). Floating-rate interest on cash and cash equivalents is usually indexed to the EONIA rate.
In order to reduce the amount and volatility of the cost of debt, sanofi-aventis has contracted derivativeinstruments (swaps, and in some cases caps or combinations of purchases of caps and sales of floors). This hasthe effect of altering the fixed/floating split and the maturity based on contractual repricing dates:
December 31, 2008
2014(€ million) Total 2009 2010 2011 2012 2013 and later
Fixed-rate . . . . . . . . . . . . . . . . . . . . . . . . . . . . . . . . . . . . 3,412 — 1,500 — 1,385 258 269% fixed-rate . . . . . . . . . . . . . . . . . . . . . . . . . . . . . . . . . . 57%
2,526 1,815 361 13 10 303 24Floating-rate . . . . . . . . . . . . . . . . . . . . . . . . . . . . . . . . . .% floating-rate . . . . . . . . . . . . . . . . . . . . . . . . . . . . . . . . 43%
Debt 5,938 1,815 1,861 13 1,395 561 293Cash and cash equivalents . . . . . . . . . . . . . . . . . . . . . . . (4,226) (4,226) — — — — —% floating-rate . . . . . . . . . . . . . . . . . . . . . . . . . . . . . . . . 100%Debt, net of cash and cash equivalents . . . . . . . . . . . . 1,712 (2,411) 1,861 13 1,395 561 293
The table below shows the fixed/floating rate split at redemption value after taking account of derivativeinstruments at December 31, 2007 and December 31, 2006:
(€ million) 2007 % 2006 %
Fixed-rate . . . . . . . . . . . . . . . . . . . . . . . . . . . . . . . . . . . . . . . . . . . . . . . . . . . . . . . 2,892 49% 2,500 36%Capped-rate . . . . . . . . . . . . . . . . . . . . . . . . . . . . . . . . . . . . . . . . . . . . . . . . . . . . . — — 750 11%Floating-rate . . . . . . . . . . . . . . . . . . . . . . . . . . . . . . . . . . . . . . . . . . . . . . . . . . . . . 2,981 51% 3,623 53%
Debt . . . . . . . . . . . . . . . . . . . . . . . . . . . . . . . . . . . . . . . . . . . . . . . . . . . . . . . . . . . 5,873 100% 6,873 100%Cash and cash equivalents . . . . . . . . . . . . . . . . . . . . . . . . . . . . . . . . . . . . . . . . . . (1,711) (1,153)Debt, net of cash and cash equivalents . . . . . . . . . . . . . . . . . . . . . . . . . . . . . . . 4,162 5,720
F-58
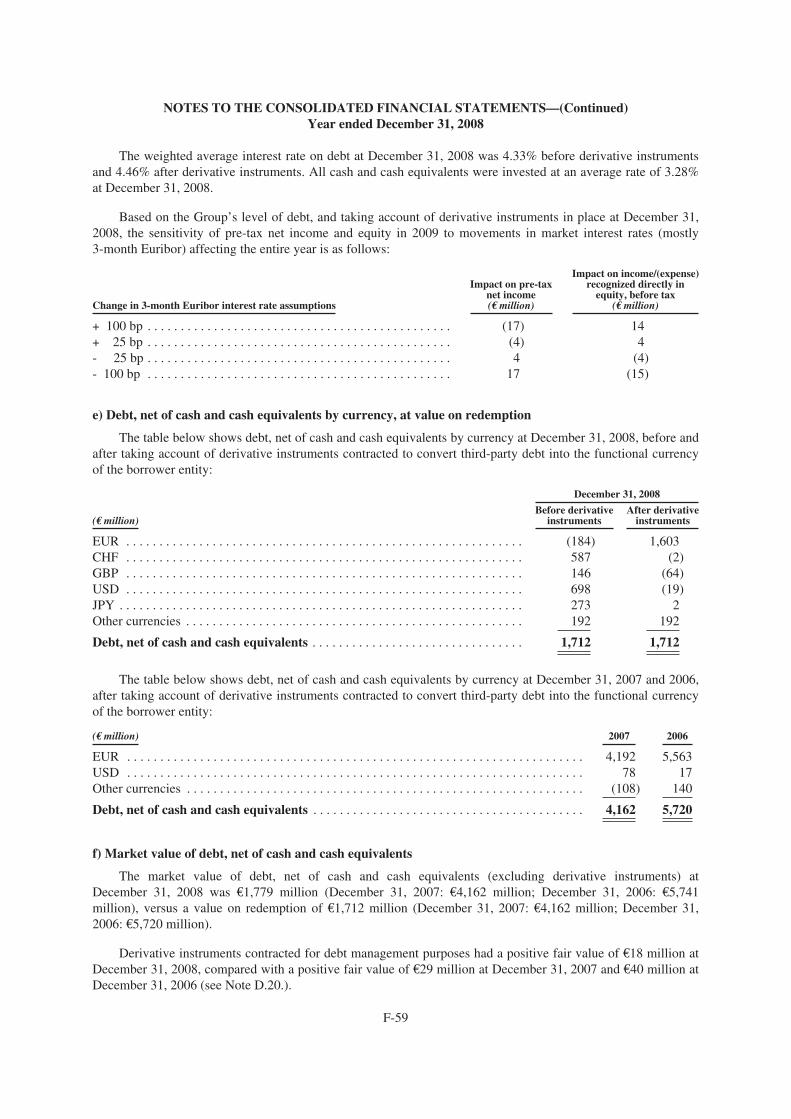
NOTES TO THE CONSOLIDATED FINANCIAL STATEMENTS—(Continued)Year ended December 31, 2008
The weighted average interest rate on debt at December 31, 2008 was 4.33% before derivative instrumentsand 4.46% after derivative instruments. All cash and cash equivalents were invested at an average rate of 3.28%at December 31, 2008.
Based on the Group’s level of debt, and taking account of derivative instruments in place at December 31,2008, the sensitivity of pre-tax net income and equity in 2009 to movements in market interest rates (mostly3-month Euribor) affecting the entire year is as follows:
Change in 3-month Euribor interest rate assumptions
Impact on pre-taxnet income(€ million)
Impact on income/(expense)recognized directly in
equity, before tax(€ million)
+ 100 bp . . . . . . . . . . . . . . . . . . . . . . . . . . . . . . . . . . . . . . . . . . . . . . (17) 14+ 25 bp . . . . . . . . . . . . . . . . . . . . . . . . . . . . . . . . . . . . . . . . . . . . . . (4) 4- 25 bp . . . . . . . . . . . . . . . . . . . . . . . . . . . . . . . . . . . . . . . . . . . . . . 4 (4)- 100 bp . . . . . . . . . . . . . . . . . . . . . . . . . . . . . . . . . . . . . . . . . . . . . . 17 (15)
e) Debt, net of cash and cash equivalents by currency, at value on redemption
The table below shows debt, net of cash and cash equivalents by currency at December 31, 2008, before andafter taking account of derivative instruments contracted to convert third-party debt into the functional currencyof the borrower entity:
December 31, 2008
Before derivative After derivative(€ million) instruments instruments
EUR . . . . . . . . . . . . . . . . . . . . . . . . . . . . . . . . . . . . . . . . . . . . . . . . . . . . . . . . . . . . (184) 1,603CHF . . . . . . . . . . . . . . . . . . . . . . . . . . . . . . . . . . . . . . . . . . . . . . . . . . . . . . . . . . . . 587 (2)GBP . . . . . . . . . . . . . . . . . . . . . . . . . . . . . . . . . . . . . . . . . . . . . . . . . . . . . . . . . . . . 146 (64)USD . . . . . . . . . . . . . . . . . . . . . . . . . . . . . . . . . . . . . . . . . . . . . . . . . . . . . . . . . . . . 698 (19)JPY . . . . . . . . . . . . . . . . . . . . . . . . . . . . . . . . . . . . . . . . . . . . . . . . . . . . . . . . . . . . . 273 2Other currencies . . . . . . . . . . . . . . . . . . . . . . . . . . . . . . . . . . . . . . . . . . . . . . . . . . .
Debt, net of cash and cash equivalents . . . . . . . . . . . . . . . . . . . . . . . . . . . . . . . .
192
1,712
192
1,712
The table below shows debt, net of cash and cash equivalents by currency at December 31, 2007 and 2006,after taking account of derivative instruments contracted to convert third-party debt into the functional currencyof the borrower entity:
(€ million) 2007 2006
EUR . . . . . . . . . . . . . . . . . . . . . . . . . . . . . . . . . . . . . . . . . . . . . . . . . . . . . . . . . . . . . . . . . . . . . 4,192 5,563USD . . . . . . . . . . . . . . . . . . . . . . . . . . . . . . . . . . . . . . . . . . . . . . . . . . . . . . . . . . . . . . . . . . . . . 78 17Other currencies . . . . . . . . . . . . . . . . . . . . . . . . . . . . . . . . . . . . . . . . . . . . . . . . . . . . . . . . . . . .
Debt, net of cash and cash equivalents . . . . . . . . . . . . . . . . . . . . . . . . . . . . . . . . . . . . . . . . .
(108)
4,162
140
5,720
f) Market value of debt, net of cash and cash equivalents
The market value of debt, net of cash and cash equivalents (excluding derivative instruments) atDecember 31, 2008 was €1,779 million (December 31, 2007: €4,162 million; December 31, 2006: €5,741million), versus a value on redemption of €1,712 million (December 31, 2007: €4,162 million; December 31,2006: €5,720 million).
Derivative instruments contracted for debt management purposes had a positive fair value of €18 million atDecember 31, 2008, compared with a positive fair value of €29 million at December 31, 2007 and €40 million atDecember 31, 2006 (see Note D.20.).
F-59
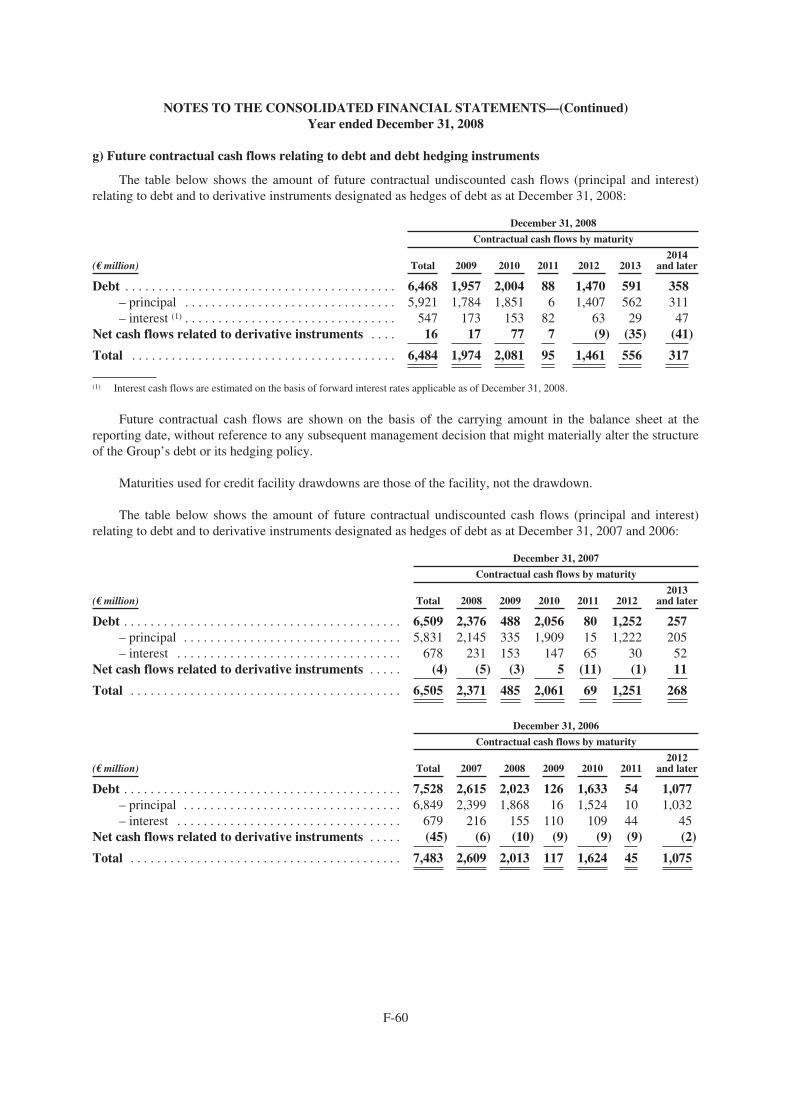
NOTES TO THE CONSOLIDATED FINANCIAL STATEMENTS—(Continued)Year ended December 31, 2008
g) Future contractual cash flows relating to debt and debt hedging instruments
The table below shows the amount of future contractual undiscounted cash flows (principal and interest)relating to debt and to derivative instruments designated as hedges of debt as at December 31, 2008:
December 31, 2008
2014(€ million) Total 2009 2010 2011 2012 2013 and later
Debt . . . . . . . . . . . . . . . . . . . . . . . . . . . . . . . . . . . . . . . . . 6,468 1,957 2,004 88 1,470 591 358– principal . . . . . . . . . . . . . . . . . . . . . . . . . . . . . . . . 5,921 1,784 1,851 6 1,407 562 311– interest (1) . . . . . . . . . . . . . . . . . . . . . . . . . . . . . . . . 547 173 153 82 63 29 47
Net cash flows related to derivative instruments
Total . . . . . . . . . . . . . . . . . . . . . . . . . . . . . . . . . . . .
. . . .
. . . .
16
6,484
17
1,974
77
2,081
7
95
(9)
1,461
(35)
556
(41)
317
Contractual cash flows by maturity
(1) Interest cash flows are estimated on the basis of forward interest rates applicable as of December 31, 2008.
Future contractual cash flows are shown on the basis of the carrying amount in the balance sheet at thereporting date, without reference to any subsequent management decision that might materially alter the structureof the Group’s debt or its hedging policy.
Maturities used for credit facility drawdowns are those of the facility, not the drawdown.
The table below shows the amount of future contractual undiscounted cash flows (principal and interest)relating to debt and to derivative instruments designated as hedges of debt as at December 31, 2007 and 2006:
December 31, 2007
2013(€ million) Total 2008 2009 2010 2011 2012 and later
Debt . . . . . . . . . . . . . . . . . . . . . . . . . . . . . . . . . . . . . . . . . . 6,509 2,376 488 2,056 80 1,252 257– principal . . . . . . . . . . . . . . . . . . . . . . . . . . . . . . . . . 5,831 2,145 335 1,909 15 1,222 205– interest . . . . . . . . . . . . . . . . . . . . . . . . . . . . . . . . . . 678 231 153 147 65 30 52
Net cash flows related to derivative instruments . . . . .
Total . . . . . . . . . . . . . . . . . . . . . . . . . . . . . . . . . . . . . . . . .
(4)
6,505
(5)
2,371
(3)
485
5
2,061
(11)
69
(1)
1,251
11
268
Contractual cash flows by maturity
December 31, 2006
2012(€ million) Total 2007 2008 2009 2010 2011 and later
Debt . . . . . . . . . . . . . . . . . . . . . . . . . . . . . . . . . . . . . . . . . . 7,528 2,615 2,023 126 1,633 54 1,077– principal . . . . . . . . . . . . . . . . . . . . . . . . . . . . . . . . . 6,849 2,399 1,868 16 1,524 10 1,032– interest . . . . . . . . . . . . . . . . . . . . . . . . . . . . . . . . . . 679 216 155 110 109 44 45
Net cash flows related to derivative instruments . . . . . (45) (6) (10) (9) (9) (9) (2)
Total . . . . . . . . . . . . . . . . . . . . . . . . . . . . . . . . . . . . . . . . . 7,483 2,609 2,013 117 1,624 45 1,075
Contractual cash flows by maturity
F-60

NOTES TO THE CONSOLIDATED FINANCIAL STATEMENTS—(Continued)Year ended December 31, 2008
D.18. Provisions and other non-current liabilities
Provisions and other non-current liabilities break down as follows:
Provisions forpensions and
other long-term Restructuring Other Otherbenefits provisions provisions non-current
(€ million) (D.18.1.) (D.18.2.) (D.18.3.) liabilities Total
January 1, 2006 . . . . . . . . . . . . . . . . . . . . . . . . . . . 4,259 151 3,426 414 8,250
(1)Changes in scope of consolidation . . . . . . . . . . . . . (2) — 1 —Charged during the period . . . . . . . . . . . . . . . . . . . . 348 98 931 22 1,399Provisions utilized . . . . . . . . . . . . . . . . . . . . . . . . . . (414) (54) (240) (53) (761)Reversals of unutilized provisions (3) . . . . . . . . . . . . (27) (11) (440) — (478)Transfers (1) . . . . . . . . . . . . . . . . . . . . . . . . . . . . . . . 94 35 (46) (47) 36Unwinding of discount . . . . . . . . . . . . . . . . . . . . . . — 1 31 6 38Unrealized gains and losses . . . . . . . . . . . . . . . . . . . — — — (6) (6)Translation differences . . . . . . . . . . . . . . . . . . . . . . (66) (2) (109) (27) (204)Actuarial gains/losses on defined-benefit plans . . . (353) — — — (353)
7,920
1
December 31, 2006 . . . . . . . . . . . . . . . . . . . . . . . . . 3,839 218 3,554 309
Changes in scope of consolidation . . . . . . . . . . . . . — — 1 —Charged during the period . . . . . . . . . . . . . . . . . . . . 346 64 670 — 1,080Provisions utilized (4) . . . . . . . . . . . . . . . . . . . . . . . . (401) (26) (171) (186) (784)Reversals of unutilized provisions (3) . . . . . . . . . . . . (14) (12) (614) — (640)Transfers (1) . . . . . . . . . . . . . . . . . . . . . . . . . . . . . . . (1) (54) (285) 35 (305)Unwinding of discount . . . . . . . . . . . . . . . . . . . . . . — — 35 4 39Unrealized gains and losses . . . . . . . . . . . . . . . . . . . — — — (6) (6)Translation differences . . . . . . . . . . . . . . . . . . . . . . (94) (2) (64) (11) (171)Actuarial gains/losses on defined-benefit plans . . . (277) — — — (277)
6,857
33
December 31, 2007 . . . . . . . . . . . . . . . . . . . . . . . . . 3,398 188 3,126 145
Changes in scope of consolidation . . . . . . . . . . . . . — — 33 —Charged during the period . . . . . . . . . . . . . . . . . . . . 334 290 828(2) — 1,452Provisions utilized . . . . . . . . . . . . . . . . . . . . . . . . . . (365) (33) (223) (3) (624)Reversals of unutilized provisions (3) . . . . . . . . . . . . (65) — (531) — (596)Transfers (1) . . . . . . . . . . . . . . . . . . . . . . . . . . . . . . . 1 (84) (176) 51 (208)Unwinding of discount . . . . . . . . . . . . . . . . . . . . . . — 5 31 1 37Unrealized gains and losses . . . . . . . . . . . . . . . . . . . — — — 14(5) 14Translation differences . . . . . . . . . . . . . . . . . . . . . . (59) — (4) 4 (59)Actuarial gains/losses on defined-benefit plans . . .
December 31, 2008 . . . . . . . . . . . . . . . . . . . . . . . . .
824
4,068
—
366
—
3,084
—
212
824
7,730
(1) This line includes transfers between current and non-current provisions.(2) Amounts charged during the period mainly comprise provisions to cover tax exposures in various countries and changes to estimates of
future expenditure on environmental risks, including risks relating to sites formerly operated by sanofi-aventis or sold to third parties (seeNote D.26.).
(3) Reversals of unutilized provisions:• Reversals of unutilized provisions for pensions and other long-term benefits are due to the effect of plan curtailments (see Note
D.18.1.). In both 2008 and 2007, plan curtailments related mainly to early retirement programs in France.• Reversals of other provisions relate mainly to provisions for tax exposures, reversed either because (i) the risk exposure became
time-barred during the reporting period or (ii) the tax dispute was settled during the period and the outcome proved more favorablethan expected for sanofi-aventis.
(4) Provisions utilized:• In other non-current liabilities for 2007, this relates to settlement of the Carderm liability for €184 million. On June 28, 2001, a
financial investor paid $250 million to acquire preferred shares in Carderm Capital LP (Carderm), which owned certain assets ofAventis Pharma U.S. Sanofi-aventis had an option to repurchase these preferred shares on or after March 10, 2007. In accordancewith the terms of the agreement, the preferred shares were repurchased in June 2007 for $250 million.
(5) Remeasurement of interest rate derivatives recognized in equity.
F-61

NOTES TO THE CONSOLIDATED FINANCIAL STATEMENTS—(Continued)Year ended December 31, 2008
D.18.1. Provisions for pensions and other benefits
The Group and its subsidiaries have a significant number of pension plans covering the majority of theiremployees. The specific features (benefit formulas, funding policies and types of assets held) of the plans varydepending on laws and regulations in the particular country in which the employees work. Several of these plansare defined benefit plans and cover certain members of the Board of Directors as well as employees.
Actuarial valuations of the Group’s benefit obligations were computed by external actuaries as ofDecember 31, 2008, 2007 and 2006. The calculations incorporate the following:
• Assumptions on staff turnover and life expectancy, specific to each country.
• A retirement age of 60 to 65 for a total working life allowing for full rate retirement rights foremployees of French companies, and retirement assumptions reflecting local economic anddemographic factors specific to employees of foreign companies.
• A salary inflation rate for the principal countries ranging from 3% to 5% at December 31, 2008, from2.75% to 5% at December 31, 2007, and from 2.75% to 5.6% at December 31, 2006.
• An annuity inflation rate for the principal countries ranging from 2% to 3% at December 31, 2008,from 2% to 4% at December 31, 2007, and from 2% to 3% at December 31, 2006.
• A weighted average long-term healthcare cost inflation rate of 4.53% at December 31, 2008, 4.49% atDecember 31, 2007, and 4.82% at December 31, 2006, applied to post-employment benefits.
• Discount rates used to determine the present value of defined benefit obligations at the balance sheetdate, as shown in the table below:
Pensions and otherlong-term benefits
Other post-employmentbenefits
Year ended December 31, Year ended December 31,
Discount rate 2008 2007 2006 2008 2007 2006
Weighted average for allregions: . . . . . . . . . . . . . . 5.98% 5.42% 4.80% 6.01% 5.93% 5.62%
- Euro zone . . . . . . . . . 5.75% or 6%(1) 5% or 5.25% 4.25% or 4.50% 6% 5.25% 4.50%- United States . . . . . . . 6% 6% 5.75% 6% 6% 5.75%- United Kingdom . . . . 6.5% 5.75% 5% 6.5% 5.75% 5%
(1) Depends on the term of the plan: 5.75% medium-term, 6% long-term.
The discount rates used are based on market rates for high quality corporate bonds (AA) the term of whichapproximates that of the expected benefit payments of the plans. The principal benchmark indices used are theIboxx Corporate € index for the euro zone, the Iboxx Corporate £ index for the United Kingdom, and theCitigroup Pension Liability Index for the United States. Rates fluctuated significantly during 2008. Sanofi-aventis restated the Iboxx rates as of December 31, 2008 to adjust for the overweighting of financial sectorissuers in these indices and thereby approximate the effect of the corrections made to exclude some financialsector issuers from the benchmark index at the start of 2009. In the case of the United States, the composition ofthe benchmark index (the Citigroup Pension Liability Index) was corrected during December 2008, so sanofi-aventis was able to use the benchmark without adjustment.
F-62

NOTES TO THE CONSOLIDATED FINANCIAL STATEMENTS—(Continued)Year ended December 31, 2008
Sensitivity analysis of pension plans and other post-employment benefits in the principal countries showsthat a 0.5% reduction in the discount rate would increase the Group’s obligation by approximately €400 million,of which approximately €110 million would relate to the United Kingdom and €80 million to the United States.
• Expected long-term rates of return for plan assets which (depending on the company) range from 2.5%to 13.5% for the year to December 31, 2008, 2.5% to 12% for the year to December 31, 2007, and 2%to 11.5% for the year to December 31, 2006. The majority of fund assets are invested in Germany, theUnited States and the United Kingdom. The long-term rates of return used are as follows:
Pensions and otherlong-term benefits
Other post-employmentbenefits
Year ended December 31, Year ended December 31,
Expected long-term rate of return on plan assets 2008 2007 2006 2008 2007 2006
Weighted average for all regions . . . . . . . . . . . . . . . . . . . . . . . . 6.97% 7.01% 6.67% 8% 8% 7.75%- Germany . . . . . . . . . . . . . . . . . . . . . . . . . . . . . . . . . . . . . 6.75% 7% 6.50% — — —- United States . . . . . . . . . . . . . . . . . . . . . . . . . . . . . . . . . . 8% 8% 7.75% 8% 8% 7.75%- United Kingdom . . . . . . . . . . . . . . . . . . . . . . . . . . . . . . . 7% 6.75% 6.55% — — —
The average long-term rate of return on plan assets was determined on the basis of actual long-term rates ofreturn in the financial markets. These returns vary according to the asset category (equities, bonds, real estate,other). As a general rule, sanofi-aventis applies the risk premium concept in assessing the return on equitiesrelative to bond yields.
F-63

NOTES TO THE CONSOLIDATED FINANCIAL STATEMENTS—(Continued)Year ended December 31, 2008
The table below reconciles the net obligation in respect of the Group’s pension plans and other employeebenefits with the amounts recognized in the consolidated financial statements:
(€ million)Pensions and otherlong-term benefits
Other post-employmentbenefits (healthcare cover)
2008 2007 2006 2008 2007 2006
Valuation of obligation:Beginning of period . . . . . . . . . . . . . . . . . . . . . . . . . . . . . . . . . 8,481 9,187 9,425 339 321 224Service cost . . . . . . . . . . . . . . . . . . . . . . . . . . . . . . . . . . . . . . . 228 236 276 12 13 16Contributions from plan members . . . . . . . . . . . . . . . . . . . . . . 4 6 9 — — —Interest cost . . . . . . . . . . . . . . . . . . . . . . . . . . . . . . . . . . . . . . . 435 414 407 19 18 17Actuarial (gain)/loss . . . . . . . . . . . . . . . . . . . . . . . . . . . . . . . . (579) (437) (172) 5 (12) (2)Plan amendments . . . . . . . . . . . . . . . . . . . . . . . . . . . . . . . . . . . 71 (24) (11) — 45 (2)Translation differences . . . . . . . . . . . . . . . . . . . . . . . . . . . . . . (336) (326) (179) 8 (29) (34)Plan curtailments/settlements . . . . . . . . . . . . . . . . . . . . . . . . . (68) (51) (23) — — —Changes in scope of consolidation, transfers . . . . . . . . . . . . . 34 (5) (44) 2 — 122Benefits paid . . . . . . . . . . . . . . . . . . . . . . . . . . . . . . . . . . . . . . (528) (519) (501) (17) (17) (20)
Obligation at end of period . . . . . . . . . . . . . . . . . . . . . . . . . . 7,742 8,481 9,187 368 339 321
Fair value of plan assets:Beginning of period . . . . . . . . . . . . . . . . . . . . . . . . . . . . . . . . . 5,362 5,575 5,350 51 56 —Expected return on plan assets (1) . . . . . . . . . . . . . . . . . . . . . . . 362 366 343 4 4 4Difference between actual and expected return on plan
assets . . . . . . . . . . . . . . . . . . . . . . . . . . . . . . . . . . . . . . . . . . (1,348) (161) 189 (12) 1 2Translation differences . . . . . . . . . . . . . . . . . . . . . . . . . . . . . . (270) (257) (129) 2 (6) (6)Contributions from plan members . . . . . . . . . . . . . . . . . . . . . . 4 6 9 — — —Employer’s contributions . . . . . . . . . . . . . . . . . . . . . . . . . . . . 175 146 274 — — —Plan settlements . . . . . . . . . . . . . . . . . . . . . . . . . . . . . . . . . . . . (2) (39) — — — —Changes in scope of consolidation, transfers . . . . . . . . . . . . . 25 — (83) — — 60Benefits paid . . . . . . . . . . . . . . . . . . . . . . . . . . . . . . . . . . . . . . (351) (274) (378) (4) (4) (4)
Fair value of plan assets at end of period . . . . . . . . . . . . . . 3,957 5,362 5,575 41 51 56
Net amount shown in the balance sheet:Net obligation . . . . . . . . . . . . . . . . . . . . . . . . . . . . . . . . . . . . . 3,785 3,119 3,612 327 288 265Unrecognized past service cost . . . . . . . . . . . . . . . . . . . . . . . . (55) (28) (60) 6 6 19Effect of asset ceiling . . . . . . . . . . . . . . . . . . . . . . . . . . . . . . . 4 6 — — — —
Net amount shown in the balance sheet . . . . . . . . . . . . . . . . 3,734 3,097 3,552 333 294 284
Amounts recognized in the balance sheet:Pre-funded obligations (see Note D.7.) . . . . . . . . . . . . . . . . . . (1) (7) (3) — — —Obligations provided for (2) . . . . . . . . . . . . . . . . . . . . . . . . . . . 3,735 3,104 3,555 333 294 284
Net amount recognized . . . . . . . . . . . . . . . . . . . . . . . . . . . . . 3,734 3,097 3,552 333 294 284
Benefit cost for the period:Service cost . . . . . . . . . . . . . . . . . . . . . . . . . . . . . . . . . . . . . . . 228 236 276 12 13 16Interest cost . . . . . . . . . . . . . . . . . . . . . . . . . . . . . . . . . . . . . . . 435 414 407 19 18 17Expected return on plan assets . . . . . . . . . . . . . . . . . . . . . . . . (362) (366) (343) (4) (4) (4)Amortization of past service cost . . . . . . . . . . . . . . . . . . . . . . 42 9 (10) — 34 (2)Recognition of actuarial (gains)/losses . . . . . . . . . . . . . . . . . . (38) (8) (9) — — —Effect of plan settlements . . . . . . . . . . . . . . . . . . . . . . . . . . . . (38) (9) — — — —Effect of plan curtailments . . . . . . . . . . . . . . . . . . . . . . . . . . .
Benefit cost for the period . . . . . . . . . . . . . . . . . . . . . . . . . . .
(27)
240
(3)
273
(27)
294
—
27
—
61
—
27
(1) Given the fall in the market value of plan assets at the end of 2008, the expected return on plan assets for 2009 is estimated at €272million.
(2) Long-term benefits awarded to employees prior to retirement (mainly discretionary bonuses, long service awards and deferredcompensation plans) accounted for €346 million of these obligations at December 31, 2008, €367 million at December 31, 2007, and€379 million at December 31, 2006 (including €101 million transferred from other current liabilities to long-term benefits in 2006). Theexpense associated with these obligations totaled €31 million in 2008, €44 million in 2007 and €52 million in 2006.
F-64

NOTES TO THE CONSOLIDATED FINANCIAL STATEMENTS—(Continued)Year ended December 31, 2008
Actuarial gains and losses on pensions and other post-employment benefits break down as follows:
(€ million) 2008 2007 2006
Actuarial gain/(loss) arising during the period . . . . . . . . . . . . . . . . . . . . . . . . . . . . . . . . (786)(1) 289 359
Comprising:• gain/(loss) on experience adjustments . . . . . . . . . . . . . . . . . . . . . . . . . . . . . . . . (1,326) (135) 126• gain/(loss) on changes in assumptions (2) . . . . . . . . . . . . . . . . . . . . . . . . . . . . . . 540 424 233
Breakdown of experience adjustments:• gain/(loss) on plan assets (3) . . . . . . . . . . . . . . . . . . . . . . . . . . . . . . . . . . . . . . . . . (1,360) (160) 191• gain/(loss) on obligations . . . . . . . . . . . . . . . . . . . . . . . . . . . . . . . . . . . . . . . . . . 34 25 (65)
9,508Amount of obligations at the balance sheet date . . . . . . . . . . . . . . . . . . . . . . . . . . . . . . 8,110 8,820Fair value of plan assets at the balance sheet date . . . . . . . . . . . . . . . . . . . . . . . . . . . . . 3,998 5,413 5,631
(1) Comprises a loss of €824 million recognized in equity (see Note D.15.7.) and a gain of €38 million taken directly to the incomestatement.
(2) Changes in assumptions mainly relate to changes in the discount rate.(3) The negative experience adjustments of €1,360 million arising in 2008 are due to trends in the financial markets (especially equity
markets) during the year.
The net actuarial loss before tax (and excluding associates) recognized directly in equity was €974 millionas of December 31, 2008 and €150 million at December 31, 2007.
As of December 31, 2008, the present value of obligations in respect of pensions and similar benefits underwholly or partially funded plans was €5,924 million, and the present value of unfunded obligations was€1,817 million (compared with, respectively, €6,557 million and €1,924 million at December 31, 2007 and with€7,252 million and €1,935 million at December 31, 2006).
In Germany, sanofi-aventis is a member of a Pensionskasse multi-employer plan. This is a definedcontribution plan which covers the current level of annuities. However, the obligation arising from futureincreases in annuity rates is recognized as part of the overall pension obligation; it amounted to €393 million atDecember 31, 2008, €428 million at December 31, 2007 and €465 million at December 31, 2006.
The table below shows the sensitivity of (i) the benefit cost recognized in the consolidated incomestatement, and (ii) the obligation in the consolidated balance sheet, to changes in healthcare costs associated withpost-employment benefits.
(€ million)
Sensitivity ofassumptions
2008
1% increase in healthcare costs• Impact on benefit cost for the period . . . . . . . . . . . . . . . . . . . . . . . . . . . . . . . . . . . . . . . . . . . . . 4• Impact on obligation in the balance sheet . . . . . . . . . . . . . . . . . . . . . . . . . . . . . . . . . . . . . . . . . 65
1% reduction in healthcare costs• Impact on benefit cost for the period . . . . . . . . . . . . . . . . . . . . . . . . . . . . . . . . . . . . . . . . . . . . . (4)• Impact on obligation in the balance sheet . . . . . . . . . . . . . . . . . . . . . . . . . . . . . . . . . . . . . . . . . (55)
The total cost relating to pensions and other benefits (excluding the effect of plan curtailments andsettlements) for 2008 was €332 million, compared with €346 million in 2007 and €348 million in 2006, split asfollows:
• Selling and general expenses: €180 million in 2008, €200 million in 2007, and €201 million in 2006
• Cost of sales: €91 million in 2008, €87 million in 2007 and 2006
• Research and development expenses: €61 million in 2008, €59 million in 2007, and €60 million in2006
F-65
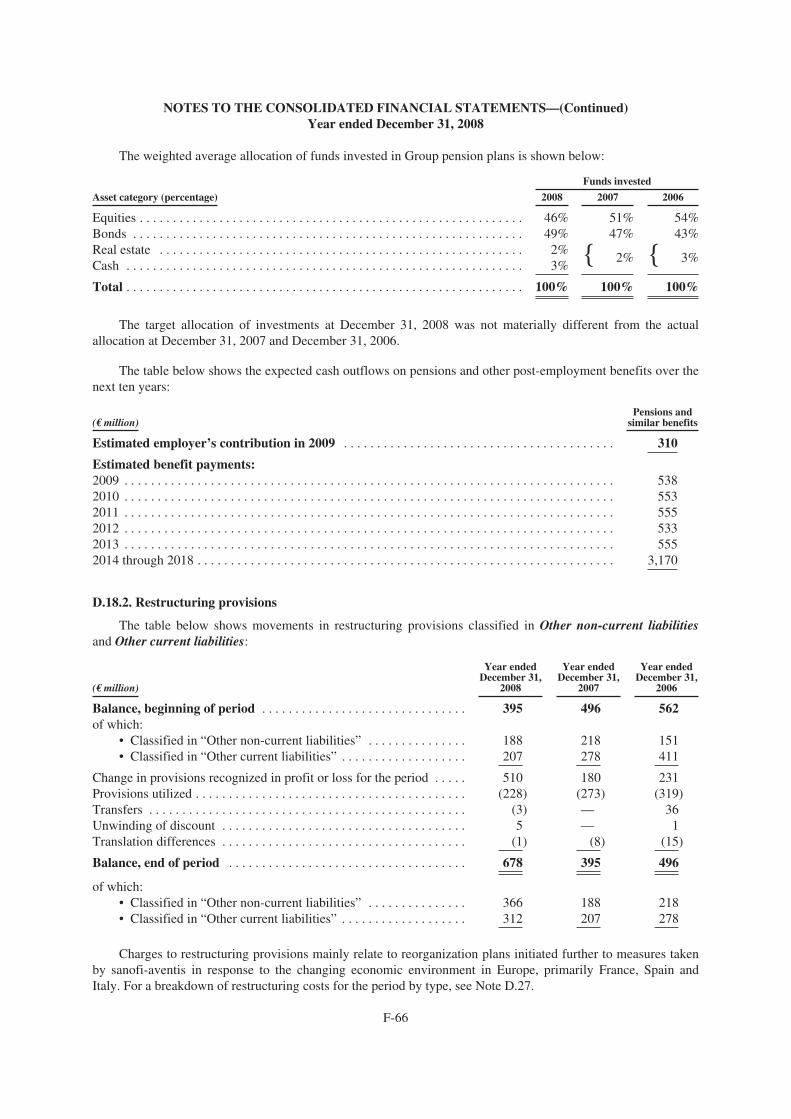
NOTES TO THE CONSOLIDATED FINANCIAL STATEMENTS—(Continued)Year ended December 31, 2008
The weighted average allocation of funds invested in Group pension plans is shown below:
Funds invested
Asset category (percentage) 2008 2007 2006
Equities . . . . . . . . . . . . . . . . . . . . . . . . . . . . . . . . . . . . . . . . . . . . . . . . . . . . . . . . . . 46% 51% 54%Bonds . . . . . . . . . . . . . . . . . . . . . . . . . . . . . . . . . . . . . . . . . . . . . . . . . . . . . . . . . . . 49% 47% 43%Real estate . . . . . . . . . . . . . . . . . . . . . . . . . . . . . . . . . . . . . . . . . . . . . . . . . . . . . . .Cash . . . . . . . . . . . . . . . . . . . . . . . . . . . . . . . . . . . . . . . . . . . . . . . . . . . . . . . . . . . .
Total . . . . . . . . . . . . . . . . . . . . . . . . . . . . . . . . . . . . . . . . . . . . . . . . . . . . . . . . . . . .
2%3%
100%
{ 2%
100%
{ 3%
100%
The target allocation of investments at December 31, 2008 was not materially different from the actualallocation at December 31, 2007 and December 31, 2006.
The table below shows the expected cash outflows on pensions and other post-employment benefits over thenext ten years:
Pensions and(€ million) similar benefits
Estimated employer’s contribution in 2009 . . . . . . . . . . . . . . . . . . . . . . . . . . . . . . . . . . . . . . . . . 310
Estimated benefit payments:2009 . . . . . . . . . . . . . . . . . . . . . . . . . . . . . . . . . . . . . . . . . . . . . . . . . . . . . . . . . . . . . . . . . . . . . . . . . . 5382010 . . . . . . . . . . . . . . . . . . . . . . . . . . . . . . . . . . . . . . . . . . . . . . . . . . . . . . . . . . . . . . . . . . . . . . . . . . 5532011 . . . . . . . . . . . . . . . . . . . . . . . . . . . . . . . . . . . . . . . . . . . . . . . . . . . . . . . . . . . . . . . . . . . . . . . . . . 5552012 . . . . . . . . . . . . . . . . . . . . . . . . . . . . . . . . . . . . . . . . . . . . . . . . . . . . . . . . . . . . . . . . . . . . . . . . . . 5332013 . . . . . . . . . . . . . . . . . . . . . . . . . . . . . . . . . . . . . . . . . . . . . . . . . . . . . . . . . . . . . . . . . . . . . . . . . . 5552014 through 2018 . . . . . . . . . . . . . . . . . . . . . . . . . . . . . . . . . . . . . . . . . . . . . . . . . . . . . . . . . . . . . . . 3,170
D.18.2. Restructuring provisions
The table below shows movements in restructuring provisions classified in Other non-current liabilitiesand Other current liabilities:
Year ended Year ended Year endedDecember 31, December 31, December 31,
(€ million) 2008 2007 2006
Balance, beginning of period . . . . . . . . . . . . . . . . . . . . . . . . . . . . . . . 395 496 562of which:
• Classified in “Other non-current liabilities” . . . . . . . . . . . . . . . 188 218 151• Classified in “Other current liabilities” . . . . . . . . . . . . . . . . . . . 207 278 411
Change in provisions recognized in profit or loss for the period . . . . . 510 180 231Provisions utilized . . . . . . . . . . . . . . . . . . . . . . . . . . . . . . . . . . . . . . . . . (228) (273) (319)Transfers . . . . . . . . . . . . . . . . . . . . . . . . . . . . . . . . . . . . . . . . . . . . . . . . (3) — 36Unwinding of discount . . . . . . . . . . . . . . . . . . . . . . . . . . . . . . . . . . . . . 5 — 1Translation differences . . . . . . . . . . . . . . . . . . . . . . . . . . . . . . . . . . . . . (1) (8) (15)
Balance, end of period . . . . . . . . . . . . . . . . . . . . . . . . . . . . . . . . . . . . 678 395 496
of which:• Classified in “Other non-current liabilities” . . . . . . . . . . . . . . . 366 188 218• Classified in “Other current liabilities” . . . . . . . . . . . . . . . . . . . 312 207 278
Charges to restructuring provisions mainly relate to reorganization plans initiated further to measures takenby sanofi-aventis in response to the changing economic environment in Europe, primarily France, Spain andItaly. For a breakdown of restructuring costs for the period by type, see Note D.27.
F-66
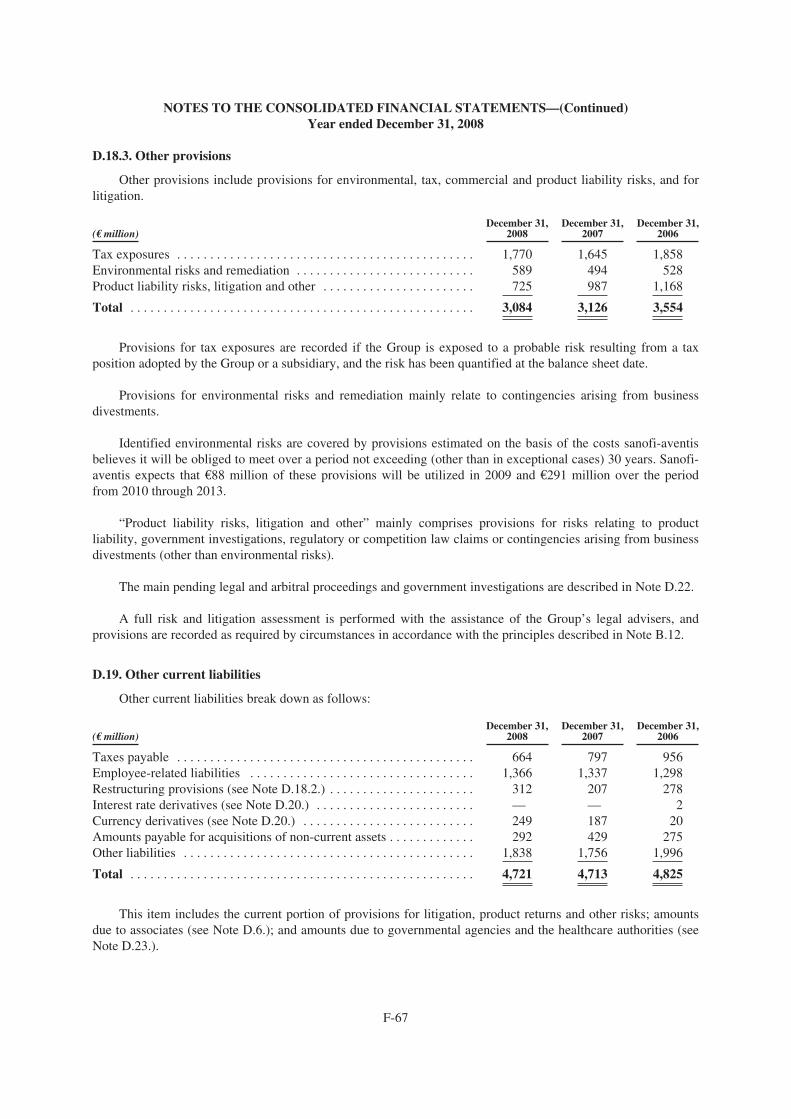
NOTES TO THE CONSOLIDATED FINANCIAL STATEMENTS—(Continued)Year ended December 31, 2008
D.18.3. Other provisions
Other provisions include provisions for environmental, tax, commercial and product liability risks, and forlitigation.
December 31, December 31, December 31,(€ million) 2008 2007 2006
Tax exposures . . . . . . . . . . . . . . . . . . . . . . . . . . . . . . . . . . . . . . . . . . . . . 1,770 1,645 1,858Environmental risks and remediation . . . . . . . . . . . . . . . . . . . . . . . . . . . 589 494 528Product liability risks, litigation and other . . . . . . . . . . . .
Total . . . . . . . . . . . . . . . . . . . . . . . . . . . . . . . . . . . . . . . . .
. . . . . . . . . . . 725
. . . . . . . . . . . 3,084
987
3,126
1,168
3,554
Provisions for tax exposures are recorded if the Group is exposed to a probable risk resulting from a taxposition adopted by the Group or a subsidiary, and the risk has been quantified at the balance sheet date.
Provisions for environmental risks and remediation mainly relate to contingencies arising from businessdivestments.
Identified environmental risks are covered by provisions estimated on the basis of the costs sanofi-aventisbelieves it will be obliged to meet over a period not exceeding (other than in exceptional cases) 30 years. Sanofi-aventis expects that €88 million of these provisions will be utilized in 2009 and €291 million over the periodfrom 2010 through 2013.
“Product liability risks, litigation and other” mainly comprises provisions for risks relating to productliability, government investigations, regulatory or competition law claims or contingencies arising from businessdivestments (other than environmental risks).
The main pending legal and arbitral proceedings and government investigations are described in Note D.22.
A full risk and litigation assessment is performed with the assistance of the Group’s legal advisers, andprovisions are recorded as required by circumstances in accordance with the principles described in Note B.12.
D.19. Other current liabilities
Other current liabilities break down as follows:
December 31, December 31, December 31,(€ million) 2008 2007 2006
Taxes payable . . . . . . . . . . . . . . . . . . . . . . . . . . . . . . . . . . . . . . . . . . . . . 664 797 956Employee-related liabilities . . . . . . . . . . . . . . . . . . . . . . . . . . . . . . . . . . 1,366 1,337 1,298Restructuring provisions (see Note D.18.2.) . . . . . . . . . . . . . . . . . . . . . . 312 207 278Interest rate derivatives (see Note D.20.) . . . . . . . . . . . . . . . . . . . . . . . . — — 2Currency derivatives (see Note D.20.) . . . . . . . . . . . . . . . . . . . . . . . . . . 249 187 20Amounts payable for acquisitions of non-current assets . . . . . . . . . . . . . 292 429 275Other liabilities . . . . . . . . . . . . . . . . . . . . . . . . . . . . . . . . . . . . . . . . . . . . 1,838 1,756 1,996
Total . . . . . . . . . . . . . . . . . . . . . . . . . . . . . . . . . . . . . . . . . . . . . . . . . . . . 4,721 4,713 4,825
This item includes the current portion of provisions for litigation, product returns and other risks; amountsdue to associates (see Note D.6.); and amounts due to governmental agencies and the healthcare authorities (seeNote D.23.).
F-67

NOTES TO THE CONSOLIDATED FINANCIAL STATEMENTS—(Continued)Year ended December 31, 2008
D.20. Derivative financial instruments and market risks
The table below shows the fair value of derivative instruments as of December 31, 2008:
Fair value at Fair value at Fair value atNon-current Current Total Non-current Current Total Dec. 31, Dec. 31, Dec. 31,
(€ million) assets assets assets liabilities liabilities liabilities 2008 (net) 2007 (net) 2006 (net)
Currencyderivatives . . . . . . . . — 348 348 — (249) (249) 99 (120) 50
• operational . . . . — 243 243 — (42) (42) 201 33 6• financial . . . . . . — 105 105 — (207) (207) (102) (153) 44• net investment
hedges . . . . . . . . — — — — — — — — —Interest rate
derivatives . . . . . . . . 71 33 104 (86) — (86) 18 29 40Equity derivatives . . .
Total . . . . . . . . . . . . . . .
—
71
—
381
—
452
—
(86)
—
(249)
—
(335)
—
117
—
(91)
163
253
Objectives of the use of derivative financial instruments
Sanofi-aventis uses derivative instruments primarily to manage operational exposure to movements inexchange rates, and financial exposure to movements in interest rates and exchange rates (where debt is notcontracted in the functional currency of the borrower or lender entity). Less frequently, sanofi-aventis uses equityderivatives in connection with asset divestments.
Sanofi-aventis performs periodic reviews of its transactions and contractual agreements in order to identifyany embedded derivatives, which are accounted for separately from the host contract in accordance with IAS 39.As of December 31, 2008, sanofi-aventis had no material embedded derivatives.
Counterparty risk
As of December 31, 2008, all currency and interest rate hedges were contracted with leading banks, and nosingle counterparty accounted for more than 17% of the Group’s overall currency or interest rate positions.
D.20.1. Currency and interest rate derivatives
a) Valuation methods
Sanofi-aventis estimates the fair value of financial instruments using methods and data based on financialmarket sources, as described below:
• Currency forward and options contracts:
Market data Source
Spot priceInterest rates: less than 1 yearInterest rates: more than 1 yearVolatility
ECB FixingMid Money MarketMid Zero CouponReuters Mid ATM
Instrument to be assessed Model used
Forward contracts: less than 1 yearForward contracts: more than 1 yearPlain vanilla options
Proportional formulaActuarial formulaBlack-Scholes
F-68

NOTES TO THE CONSOLIDATED FINANCIAL STATEMENTS—(Continued)Year ended December 31, 2008
• Interest rate forward and options contracts:
Market data Source
Interest rates: less than 1 yearInterest rates: more than 1 yearCap/Floor volatility
LIFFE Mid Money Market and interest rate futuresMid Zero CouponBloomberg volatility matrix, per strike
Instrument to be assessed Model used
SwapCross currencyPlain vanilla options
NPV/cash flow projectionAs for swap + ECB fixing for conversionBlack-Scholes
b) Currency derivatives used to manage operational risk exposures
Sanofi-aventis operates a foreign exchange risk hedging policy to reduce the exposure of operating incometo fluctuations in foreign currencies, in particular the U.S. dollar. This policy involves regular assessments of theGroup’s worldwide foreign currency exposure, based on budget estimates of foreign-currency transactions to becarried out by the parent company and its subsidiaries. These transactions mainly comprise sales, purchases,research costs, co-marketing and co-promotion expenses, and royalties. To reduce the exposure of thesetransactions to exchange rate movements, sanofi-aventis contracts economic hedges using liquid financialinstruments such as forward purchases and sales of currency, call and put options, and combinations of currencyoptions (collars).
December 31, 2008
Notional(€ million) amount value amount value in equity amount Fair value
Forward currency sales . . . . . . . . . . . . . 3,305 219 1,562 121 123 1,743 98• of which U.S. dollar . . . . . . . . . . . 2,461 182 1,358 108 111 1,103 74• of which Japanese yen . . . . . . . . . 191 (5) 95 3 2 96 (8)• of which Russian rouble . . . . . . . . 134 15 — — — 134 15• of which Pound sterling . . . . . . . . 104 6 — — — 104 6• of which Saudi Arabian riyal . . . . 58 5 4 — — 54 5• of which Polish zloty . . . . . . . . . . . 53 6 33 5 6 20 1
Forward currency purchases . . . . . . . . 601 (11) — — — 601 (11)• of which Hungarian forint . . . . . . 175 (1) — — — 175 (1)• of which U.S. dollar . . . . . . . . . . . 140 3 — — — 140 3• of which Pound sterling . . . . . . . . 75 (6) — — — 75 (6)• of which Russian rouble . . . . . . . . 72 (6) — — — 72 (6)• of which Canadian dollar . . . . . . . 51 (1) — — — 51 (1)
Put options purchased . . . . . . . . . . . . . . 24 — 2 — — 22 —Call options written . . . . . . . . . . . . . . . .
Total . . . . . . . . . . . . . . . . . . . . . . . . . . . .
48
3,978
(7)
201
2
1,566
—
121
—
123
46
2,412
(7)
80
Fair
Of which derivatives designatedas cash flow hedges
Of which derivatives not eligiblefor hedge accounting
Notional FairOf which
recognized Notional
As of December 31, 2008, none of these instruments had an expiry date after December 31, 2009.
These positions hedge:
• All material future foreign-currency cash flows arising after the balance sheet date in relation totransactions carried out during the year ended December 31, 2008 and recognized in the balance sheetat that date. Gains and losses on hedging instruments (forward contracts) have been and will continueto be calculated and recognized in parallel with the recognition of gains and losses on the hedged items.Consequently, the commercial foreign exchange gain or loss to be recognized on these items (hedgesand hedged instruments) in 2009 is not expected to be material.
F-69

NOTES TO THE CONSOLIDATED FINANCIAL STATEMENTS—(Continued)Year ended December 31, 2008
• Forecast foreign-currency cash flows relating to commercial transactions to be carried out in 2009.These hedges (forward contracts and options) cover approximately 20% to 40% of the expected netcash flows for 2009 in currencies subject to budgetary hedging. The portfolio of derivatives contractedto cover 2009 U.S. dollar cash flows consists solely of forward contracts, and represents approximatelyone-third of the forecast net cash flows for 2009. Given the designation of these forward sales as cashflow hedges, the estimated sensitivity of these positions in terms of foreign exchange gains/losses andequity impact for 2009 is as follows:
Assumes a constant €/$ exchange rate over the year ending December 31, 2009 (€ million) (€ million)
Depreciation of 10% in the U.S. dollar (€1 = $1.5309) . . . . . . . . . . . . . . . . . . 234.1 123.5Exchange rate maintained at the December 31, 2008 rate (€1 = $1.3917) . . . . 110.7 —Appreciation of 10% in the U.S. dollar (€1 = $1.2525) . . . . . . . . . . . . . . . . . . (40.2) (150.9)
Foreign exchangegain/(loss) on
U.S. dollar hedges
Impact onequity at
December 31, 2008
The table below shows operational currency hedging instruments in place as of December 31, 2007, with thenotional amount translated into euros at the relevant closing exchange rate.
December 31, 2007
Notional(€ million) amount value amount value in equity amount value
Forward currency sales . . . . . . . . . . 2,205 30 486 8 8 1,719 22• of which U.S. dollar . . . . . . . . . 1,288 20 239 3 3 1,049 17• of which Russian rouble . . . . . . 224 — — — — 224 —• of which Japanese yen . . . . . . . 132 4 77 4 3 55 1• of which Pound sterling . . . . . . 119 3 — — — 119 3• of which Polish zloty . . . . . . . . 62 (2) 33 (1) (1) 29 —• of which Australian dollar . . . . 45 2 36 2 2 9 —• of which Mexican peso . . . . . . . 43 1 19 — — 24 1• of which Turkish lira . . . . . . . . 39 — — — — 39 —• of which Korean won . . . . . . . . 33 1 — — — 33 1• of which Slovakian koruna . . . . 33 — 10 — — 23 —
Forward currency purchases . . . . . . 464 — — — — 464 —• of which Hungarian forint . . . . 214 1 — — — 214 1• of which Swiss franc . . . . . . . . 54 — — — — 54 —• of which U.S. dollar . . . . . . . . . 48 (1) — — — 48 (1)• of which Canadian dollar . . . . . 47 — — — — 47 —
Put options purchased . . . . . . . . . . . . 409 4 15 1 1 394 3• of which U.S. dollar knock-out
options (1) . . . . . . . . . . . . . . . . . 326 3 — — — 326 3Call options written . . . . . . . . . . . . . . 741 (1) 15 — — 726 (1)
• of which U.S. dollar knock-outoptions (1) . . . . . . . . . . . . . . . . . 652 (2) — — — 652 (2)
Put options written . . . . . . . . . . . . . .
Total . . . . . . . . . . . . . . . . . . . . . . . . . .
12
3,831
—
33
—
516
—
9
—
9
12
3,315
—
24
Fair
Of which derivatives designatedas cash flow hedges
Of which derivatives not eligiblefor hedge accounting
Notional FairOf which
recognized Notional Fair
(1) Knock-out options expire worthless once a specified level of gain is reached.
F-70

NOTES TO THE CONSOLIDATED FINANCIAL STATEMENTS—(Continued)Year ended December 31, 2008
The table below shows operational currency hedging instruments in place as of December 31, 2006:
December 31, 2006
Notional(€ million) amount value amount value in equity amount value
Forward currency sales . . . . . . . . . . . 1,615 7 352 6 7 1,263 1• of which U.S. dollar . . . . . . . . . 800 10 114 7 7 686 3• of which Russian rouble . . . . . . 126 — — — — 126 —• of which Australian dollar . . . . 86 — 66 — — 20 —• of which Singapore dollar . . . . 73 — — — — 73 —• of which Japanese yen . . . . . . . 66 1 — — — 66 1• of which Polish zloty . . . . . . . . . 66 — 47 — — 19 —• of which Mexican peso . . . . . . . 65 1 42 1 2 23 —• of which Korean won . . . . . . . . 52 — — — — 52 —• of which Slovakian koruna . . . . 49 (2) 18 (1) (1) 31 (1)• of which Czech koruna . . . . . . . 40 (1) 22 (1) (1) 18 (1)
Forward currency purchases . . . . . . 351 (1) — — — 351 (1)• of which Swiss franc . . . . . . . . . 92 (1) — — — 92 (1)• of which Pound sterling . . . . . . 81 — — — — 81 —• of which Canadian dollar . . . . . 71 (1) — — — 71 (1)• of which Hungarian forint . . . . 33 — — — — 33 —
Put options purchased . . . . . . . . . . . . 18 — 18 — — — —Call options written . . . . . . . . . . . . . .
Total . . . . . . . . . . . . . . . . . . . . . . . . . .
36
2,020
—
6
18
388
—
6
—
7
18
1,632
—
—
Fair
Of which derivatives designatedas cash flow hedges
Of which derivatives not eligiblefor hedge accounting
Notional FairOf which
recognized Notional Fair
c) Currency and interest rate derivatives used to manage financial risk exposures
Cash pooling arrangements for foreign subsidiaries outside the euro zone, and some of the Group’sfinancing activities such as U.S. commercial paper issues (equivalent to €0.7 billion as of December 31, 2008),expose certain entities — in particular the sanofi-aventis parent company — to financial foreign exchange risk.This is the risk of changes in the value of borrowings and loans denominated in a currency (mainly the U.S.dollar) other than the functional currency of the borrower or lender. The Group’s net foreign exchange exposureis hedged by firm financial instruments (usually currency swaps).
The table below shows instruments used to manage financial risk exposures as of December 31, 2008, withthe notional amount translated into euros at the relevant closing exchange rate.
December 31, 2008 December 31, 2007 December 31, 2006
(€ million) amount value Expiry amount value Expiry amount value Expiry
Forward currency purchases . . . . . . 9,210 (80) 8,261 (179) 5,708 —• of which U.S. dollar (1) . . . . . . . 8,256 (66) 2009 7,348 (167) 2008 4,984 2 2007• of which Pound sterling . . . . . . 235 (4) 2009 442 (11) 2008 146 — 2007• of which Canadian dollar . . . . 189 (13) 2009 — — — 1 — 2007
Forward currency sales . . . . . . . . . . 1,954 (22) 1,563 26 1,470 44• of which U.S. dollar . . . . . . . . . 1,043 (23) 2009 936 20 2008 1,032 44 2007• of which Japanese yen . . . . . . . 695 (7) 2009 206 3 2008 83 2 2007• of which Hungarian forint . . . .
Total . . . . . . . . . . . . . . . . . . . . . . . . . .
95
11,164
1
(102)
2009 246
9,824
(1)
(153)
2008 176
7,178
(1)
44
2007
Notional Fair Notional Fair Notional Fair
(1) Includes €7,537 million used to hedge U.S. dollar intragroup deposits placed with the sanofi-aventis parent company as of December 31,2008.
F-71
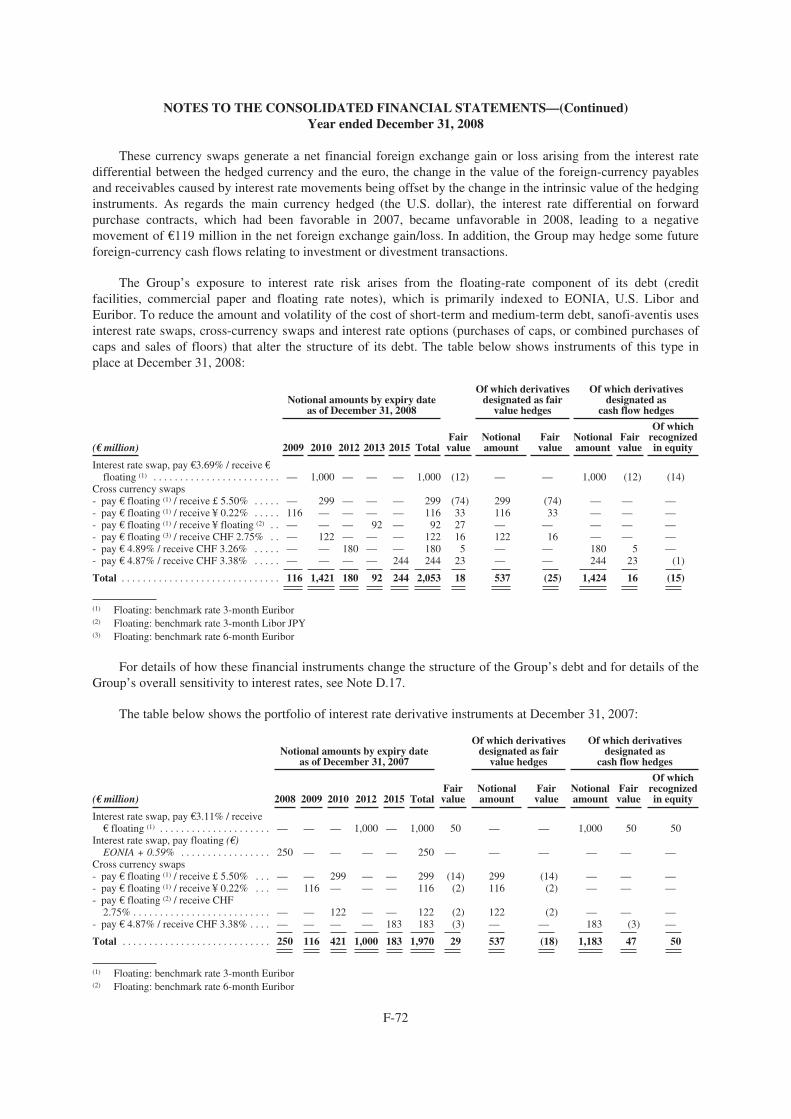
NOTES TO THE CONSOLIDATED FINANCIAL STATEMENTS—(Continued)Year ended December 31, 2008
These currency swaps generate a net financial foreign exchange gain or loss arising from the interest ratedifferential between the hedged currency and the euro, the change in the value of the foreign-currency payablesand receivables caused by interest rate movements being offset by the change in the intrinsic value of the hedginginstruments. As regards the main currency hedged (the U.S. dollar), the interest rate differential on forwardpurchase contracts, which had been favorable in 2007, became unfavorable in 2008, leading to a negativemovement of €119 million in the net foreign exchange gain/loss. In addition, the Group may hedge some futureforeign-currency cash flows relating to investment or divestment transactions.
The Group’s exposure to interest rate risk arises from the floating-rate component of its debt (creditfacilities, commercial paper and floating rate notes), which is primarily indexed to EONIA, U.S. Libor andEuribor. To reduce the amount and volatility of the cost of short-term and medium-term debt, sanofi-aventis usesinterest rate swaps, cross-currency swaps and interest rate options (purchases of caps, or combined purchases ofcaps and sales of floors) that alter the structure of its debt. The table below shows instruments of this type inplace at December 31, 2008:
Notional amounts by expiry dateas of December 31, 2008
Of which derivativesdesignated as fair
value hedges
Of which derivativesdesignated as
cash flow hedges
(€ million) 2009 2010 2012 2013 2015 TotalFairvalue
Notionalamount
Fairvalue
Notionalamount
Fairvalue
Of whichrecognizedin equity
Interest rate swap, pay €3.69% / receive €
floating (1) . . . . . . . . . . . . . . . . . . . . . . . . — 1,000 — — — 1,000 (12) — — 1,000 (12) (14)Cross currency swaps- pay € floating (1) / receive £ 5.50% . . . . . — 299 — — — 299 (74) 299 (74) — — —- pay € floating (1) / receive ¥ 0.22% . . . . . 116 — — — — 116 33 116 33 — — —- pay € floating (1) / receive ¥ floating (2) . . — — — 92 — 92 27 — — — — —- pay € floating (3) / receive CHF 2.75% . . — 122 — — — 122 16 122 16 — — —- pay € 4.89% / receive CHF 3.26% . . . . . — — 180 — — 180 5 — — 180 5 —- pay € 4.87% / receive CHF 3.38% . . . . .
Total . . . . . . . . . . . . . . . . . . . . . . . . . . . . . .
—
116
—
1,421
—
180
—
92
244
244
244
2,053
23
18
—
537
—
(25)
244
1,424
23
16
(1)
(15)
(1) Floating: benchmark rate 3-month Euribor(2) Floating: benchmark rate 3-month Libor JPY(3) Floating: benchmark rate 6-month Euribor
For details of how these financial instruments change the structure of the Group’s debt and for details of theGroup’s overall sensitivity to interest rates, see Note D.17.
The table below shows the portfolio of interest rate derivative instruments at December 31, 2007:
Notional amounts by expiry dateas of December 31, 2007
Of which derivativesdesignated as fair
value hedges
Of which derivativesdesignated as
cash flow hedges
(€ million) 2008 2009 2010 2012 2015 TotalFairvalue
Notionalamount
Fairvalue
Notionalamount
Fairvalue
Of whichrecognizedin equity
Interest rate swap, pay €3.11% / receive€ floating (1) . . . . . . . . . . . . . . . . . . . . . — — — 1,000 — 1,000 50 — — 1,000 50 50
Interest rate swap, pay floating (€)EONIA + 0.59% . . . . . . . . . . . . . . . . . 250 — — — — 250 — — — — — —
Cross currency swaps- pay € floating (1) / receive £ 5.50% . . . — — 299 — — 299 (14) 299 (14) — — —- pay € floating (1) / receive ¥ 0.22% . . . — 116 — — — 116 (2) 116 (2) — — —- pay € floating (2) / receive CHF
2.75% . . . . . . . . . . . . . . . . . . . . . . . . . . — — 122 — — 122 (2) 122 (2) — — —- pay € 4.87% / receive CHF 3.38% . . . .
Total . . . . . . . . . . . . . . . . . . . . . . . . . . . .
—
250
—
116
—
421
—
1,000
183
183
183
1,970
(3)
29
—
537
—
(18)
183
1,183
(3)
47
—
50
(1) Floating: benchmark rate 3-month Euribor(2) Floating: benchmark rate 6-month Euribor
F-72
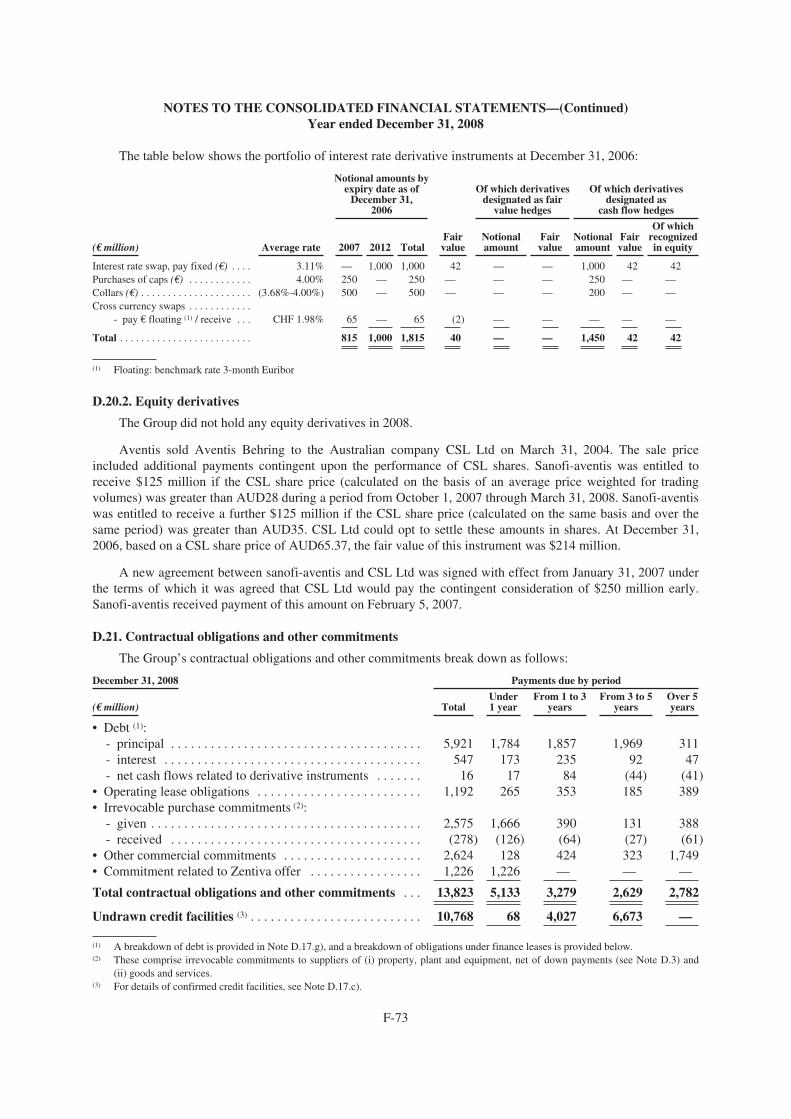
NOTES TO THE CONSOLIDATED FINANCIAL STATEMENTS—(Continued)Year ended December 31, 2008
The table below shows the portfolio of interest rate derivative instruments at December 31, 2006:
(€ million) Average rate 2007 2012 Total value amount value amount value in equity
Interest rate swap, pay fixed (€) . . . . 3.11% — 1,000 1,000 42 — — 1,000 42 42Purchases of caps (€) . . . . . . . . . . . . 4.00% 250 — 250 — — — 250 — —Collars (€) . . . . . . . . . . . . . . . . . . . . . (3.68%-4.00%) 500 — 500 — — — 200 — —Cross currency swaps . . . . . . . . . . . .
- pay € floating (1) / receive . . .
Total . . . . . . . . . . . . . . . . . . . . . . . . .
CHF 1.98% 65
815
—
1,000
65
1,815
(2)
40
—
—
—
—
—
1,450
—
42
—
42
Notional amounts byexpiry date as of
December 31,2006
Of which derivativesdesignated as fair
value hedges
Of which derivativesdesignated as
cash flow hedges
Fair Notional Fair Notional FairOf which
recognized
(1) Floating: benchmark rate 3-month Euribor
D.20.2. Equity derivatives
The Group did not hold any equity derivatives in 2008.
Aventis sold Aventis Behring to the Australian company CSL Ltd on March 31, 2004. The sale priceincluded additional payments contingent upon the performance of CSL shares. Sanofi-aventis was entitled toreceive $125 million if the CSL share price (calculated on the basis of an average price weighted for tradingvolumes) was greater than AUD28 during a period from October 1, 2007 through March 31, 2008. Sanofi-aventiswas entitled to receive a further $125 million if the CSL share price (calculated on the same basis and over thesame period) was greater than AUD35. CSL Ltd could opt to settle these amounts in shares. At December 31,2006, based on a CSL share price of AUD65.37, the fair value of this instrument was $214 million.
A new agreement between sanofi-aventis and CSL Ltd was signed with effect from January 31, 2007 underthe terms of which it was agreed that CSL Ltd would pay the contingent consideration of $250 million early.Sanofi-aventis received payment of this amount on February 5, 2007.
D.21. Contractual obligations and other commitments
The Group’s contractual obligations and other commitments break down as follows:
December 31, 2008 Payments due by period
(€ million) TotalUnder1 year
From 1 to 3years
From 3 to 5years
Over 5years
• Debt (1):- principal . . . . . . . . . . . . . . . . . . . . . . . . . . . . . . . . . . . . . . 5,921 1,784 1,857 1,969 311- interest . . . . . . . . . . . . . . . . . . . . . . . . . . . . . . . . . . . . . . . 547 173 235 92 47- net cash flows related to derivative instruments . . . . . . . 16 17 84 (44) (41)
• Operating lease obligations . . . . . . . . . . . . . . . . . . . . . . . . . 1,192 265 353 185 389• Irrevocable purchase commitments (2):
- given . . . . . . . . . . . . . . . . . . . . . . . . . . . . . . . . . . . . . . . . . 2,575 1,666 390 131 388- received . . . . . . . . . . . . . . . . . . . . . . . . . . . . . . . . . . . . . . (278) (126) (64) (27) (61)
• Other commercial commitments . . . . . . . . . . . . . . . . . . . . . 2,624 128 424 323 1,749• Commitment related to Zentiva offer . . . . . . . . . . . . . . . . .
Total contractual obligations and other commitments . . .
Undrawn credit facilities (3) . . . . . . . . . . . . . . . . . . . . . . . . . .
1,226
13,823
10,768
1,226
5,133
68
—
3,279
4,027
—
2,629
6,673
—
2,782
—
(1) A breakdown of debt is provided in Note D.17.g), and a breakdown of obligations under finance leases is provided below.(2) These comprise irrevocable commitments to suppliers of (i) property, plant and equipment, net of down payments (see Note D.3) and
(ii) goods and services.(3) For details of confirmed credit facilities, see Note D.17.c).
F-73

NOTES TO THE CONSOLIDATED FINANCIAL STATEMENTS—(Continued)Year ended December 31, 2008
Leases
Finance leases
Future minimum lease payments due under finance leases at December 31, 2008 were €31 million (€35million at December 31, 2007 and €38 million at December 31, 2006), including interest of €5 million (€6million at December 31, 2007 and €5 million at December 31, 2006). The payment schedule is as follows:
December 31, 2008 Payments due by period
(€ million) Total 1 year years years years
• Finance lease obligations:- principal . . . . . . . . . . . . . . . . . . . . . . . . . . . . . . . . . . . . . . . 25 4 9 5 7- interest . . . . . . . . . . . . . . . . . . . . . . . . . .
Total . . . . . . . . . . . . . . . . . . . . . . . . . . . . . . . . .
. . . . . . . . . . . . . . 5
. . . . . . . . . . . . . . 30
1
5
2
11
1
6
1
8
Under From 1 to 3 From 3 to 5 Over 5
Operating leases
Sanofi-aventis leases certain of its properties and equipment used in the ordinary course of business underoperating leases. Future minimum lease payments due under non-cancelable operating leases at December 31,2008 amounted to €1,192 million (€1,283 million at December 31, 2007, €1,462 million at December 31, 2006).
Total rental expense recognized in the year ended December 31, 2008 was €282 million (€292 million in theyear ended December 31, 2007, €322 million in the year ended December 31, 2006).
Guarantees
Guarantees given and received (mainly surety bonds) are as follows:
(€ million) 2008 2007 2006
Guarantees given . . . . . . . . . . . . . . . . . . . . . . . . . . . . . . . . . . . . . . . . . . . . . . . . . . . . . . . . . 1,524 1,895 2,223Guarantees received . . . . . . . . . . . . . . . . . . . . . . . . . . . . . . . . . . . . . . . . . . . . . . . . . . . . . . (218) (195) (215)
Commercial commitments
This includes commitments to third parties under collaboration agreements. In pursuance of its strategy,sanofi-aventis acquires technologies and rights to products. Such acquisitions may be made in various contractualforms: acquisitions of shares, loans, license agreements, joint development and co-marketing. These contractsusually involve upfront payments on signature of the agreement, and development milestone payments. Some ofthese complex agreements include undertakings to finance research programs in future years, and paymentscontingent upon completion of development milestones, or upon the granting of approvals or licenses, or uponthe attainment of sales targets once a product is on the market.
The main collaboration agreements in the Pharmaceuticals segment are described below:
• In December 2008, sanofi-aventis announced the signature of a global licensing and collaborationagreement with Novozymes for the development and commercialization of a new antibiotic, plectasinNZ2114, for the treatment of severe infections such as pneumonia and septicemia. Under the terms ofthe agreement, sanofi-aventis was granted an exclusive worldwide license for the development,registration and commercialization of the drug. The two companies will work jointly to develop andimplement industrial-scale manufacturing of the plectasin NZ2114 drug substance, using a recombinantprocess that builds on Novozymes’ proprietary expression technology. Future milestone payments underthe agreement could reach €64 million.
F-74

NOTES TO THE CONSOLIDATED FINANCIAL STATEMENTS—(Continued)Year ended December 31, 2008
• In February 2008, sanofi-aventis and Dyax Corp. entered into agreements that granted sanofi-aventis anexclusive worldwide license for the development and commercialization of Dyax’s fully humanmonoclonal antibody DX-2240, as well as a worldwide non-exclusive license to use Dyax’s proprietaryPhage Display technology (phage expression and antibody banks). Under the terms of the twoagreements, Dyax could receive up to $270 million in license fees and milestone payments in the eventof commercial success in three indications for the DX-2240 project currently under development and inone indication for the first antibody candidates developed by sanofi-aventis alone using the PhageDisplay technology. In addition, Dyax will receive royalties on sales of the antibody candidates.
• In March 2007, sanofi-aventis and Oxford BioMedica announced that they had entered into an exclusiveglobal license agreement to develop and commercialize TroVax® for the treatment and prevention ofcancers. Future milestone payments could reach up to €450 million. Oxford BioMedica will be entitledto escalating royalties on global sales of TroVax®, and to sales milestones payments if and when netsales of TroVax® reach certain levels.
• In September 2003, sanofi-aventis signed a collaboration agreement with Regeneron in oncology todevelop the Vascular Endothelial Growth Factor (VEGF) Trap program. Development milestonepayments and royalties on VEGF Trap sales are payable under the contract. Total milestone paymentscould reach $400 million if all indications specified in the contract obtain approval in the United States,Europe and Japan. Sanofi-aventis will pay 100% of the development costs of the VEGF Trap. Once aVEGF Trap product starts to be marketed, Regeneron will repay 50% of the development costs(originally paid by sanofi-aventis) in accordance with a formula based on Regeneron’s share of theprofits, including royalties received in Japan. In 2005, the VEGF Trap program was extended to Japan,and the treatment of ocular pathologies was excluded from the scope of the collaboration agreement.
• In November 2007, sanofi-aventis signed a further collaboration agreement with Regeneron to discover,develop and commercialize fully-human therapeutic antibodies.
Under the terms of the research agreement, the Group will fund up to $416 million of research over thenext five years. Sanofi-aventis will have an option to extend the research agreement for an additionalthree years. Under the terms of the development agreement, sanofi-aventis will fund 100% of thedevelopment costs. Once a product begins to be marketed, Regeneron will repay out of its profits(provided they are sufficient) half of the development costs borne by sanofi-aventis.
In addition, Regeneron will be entitled to receive up to a total of $250 million of sales milestonepayments when the collaboration achieves certain aggregate annual excluding U.S. sales levels.
• A collaboration agreement with IDM was signed in 2001. Under this agreement, IDM granted sanofi-aventis 20 development options on current and future research and development programs. For eachoption that leads to a commercially marketed product, IDM could receive between €17 million and€32 million depending on the potential of the market, plus reimbursement of the development costs.Contractually, sanofi-aventis may suspend the development program for each option exercised at anytime and without penalty. In 2007, sanofi-aventis decided to suspend the development program for thetreatment of melanoma, the only program for which it has exercised its option since the collaborationagreement with IDM was signed. At December 31, 2008, sanofi-aventis still had an option on 6programs.
• Under a collaboration agreement with Zealand Pharma signed in June 2003, sanofi-aventis obtainedrights relating to the development and worldwide marketing of ZP10, an agent used in the treatment oftype 2 diabetes. Under this agreement, sanofi-aventis is responsible for the development of thiscompound. Payments to Zealand Pharma could reach a total of $85 million, contingent upon marketingapprovals being obtained.
• Under a co-promotion agreement with UCB, signed in September 2006, sanofi-aventis co-promotesXyzal® in the United States jointly with UCB. Xyzal® is a prescription antihistamine. The agreementrequires payments to be made on attainment of development and marketing milestones, based onregulatory approvals and sales targets. Total future payments under the agreement could reach $130million. The agreement also specifies how profits are split between sanofi-aventis and UCB.
F-75
NOTES TO THE CONSOLIDATED FINANCIAL STATEMENTS—(Continued)Year ended December 31, 2008
• Sanofi-aventis has entered into various other collaboration agreements with partners includingImmunogen, Coley, Wayne State University, Innogenetics and Inserm, under which sanofi-aventis maybe required to make total contingent payments of approximately €31 million over the next five years.
• In 2008, sanofi-aventis returned its territory rights for the development and commercialization of theoral anti-cancer agent S-1 to Taiho Pharmaceutical Co., Ltd. As from the termination date, the milestonepayments specified in this agreement no longer constitute commercial commitments. As ofDecember 31, 2007, they represented a commitment of $295 million.
The main collaboration agreements in the Vaccines segment are described below:
• Following the acquisition of Acambis plc by sanofi pasteur during 2008, the agreements previouslysigned with Acambis (vaccines against Japanese encephalitis, West Nile virus and dengue fever) havebeen integrated into the Group’s pipeline. These agreements represented future milestone payments of€57 million as of December 31, 2007.
• In December 2007, sanofi pasteur signed an exclusive collaboration and commercialization agreementwith Crucell N.V. for Crucell’s rabies monoclonal antibodies. Under the terms of the agreement, Crucellwill continue to develop and manufacture the product. The contract includes milestone payments thatcould reach $53 million.
• Sanofi Pasteur has entered into a number of other collaboration agreements with partners includingBecton Dickinson, Crucell, Intercell, Vactech, Maxigen and SSI, under which sanofi pasteur may berequired to make total contingent payments of around €52 million over the next five years.
Financial commitment related to the offer for Zentiva shares
As of December 31, 2008 sanofi-aventis held 9.5 million shares (see Note D.1.) representing around 24.9%of the share capital of Zentiva, which is accounted for as an associate (see Note D.6.).
On June 18, 2008 sanofi-aventis made an offer to acquire all the issued ordinary shares — including sharesheld in the form of Global Depositary Receipts (GDRs) — that make up Zentiva’s share capital, at a price ofCZK1,050 per share payable in cash.
On September 22, 2008 sanofi-aventis raised its cash offer price to CZK1,150 per share. This improvedoffer was recommended by the Board of Directors of Zentiva, and represents a 25.5% premium to Zentiva’sApril 30, 2008 closing share price.
The offer was opened by sanofi-aventis Europe on July 11, 2008 for an initial period of 10 weeks, closingon September 19, 2008. On September 18, 2008 sanofi-aventis announced a 10-week extension in the offerperiod until November 28, 2008, with the agreement of the Czech National Bank and as set out in the OfferMemorandum published July 11, 2008, additional time being required to meet the offer conditions. The CzechNational Bank subsequently issued a decision authorizing sanofi-aventis Europe to extend the offer periodbeyond November 28, 2008 for an additional-12 week period ending February 20, 2009.
As of December 31, 2008 this offer was subject to two conditions: (i) obtaining the required clearances fromthe antitrust authorities, and (ii) meeting the minimum tender condition of 10.3 million shares (including sharesheld in the form of GDRs), which is designed to ensure that on the closing date of the Offer sanofi-aventis wouldhold directly or indirectly over 50.0% of Zentiva’s share capital and voting rights.
On February 4, 2009 the European Commission cleared the acquisition of Zentiva by sanofi-aventis Europe.
As of December 31, 2008, sanofi-aventis had a financial commitment of €1,226 million relating to theacquisition of the 28.6 million Zentiva shares not yet held by the Group.
F-76

NOTES TO THE CONSOLIDATED FINANCIAL STATEMENTS—(Continued)Year ended December 31, 2008
D.22. Legal and Arbitral Proceedings
Sanofi-aventis and its affiliates are involved in litigation, arbitration and other legal proceedings. Theseproceedings typically are related to product liability claims, intellectual property rights (particularly claimsagainst generic companies seeking to limit the patent protection of sanofi-aventis products), compliance andtrade practices, commercial claims, employment and wrongful discharge claims, tax assessment claims, wastedisposal and pollution claims, and claims under warranties or indemnification arrangements relating to businessdivestitures. Provisions related to legal and arbitral proceedings are recorded in accordance with the principlesdescribed in Note B.12.
Most of these claims involve highly complex issues, actual damages and other matters. Often these issuesare subject to substantial uncertainties, and, therefore, the probability of loss and an estimation of damages aredifficult to ascertain. Consequently, for a majority of these claims, we are unable to make a reasonable estimateof the expected financial effect that will result from ultimate resolution of the proceeding. In those cases, we havenot accrued a reserve for the potential outcome, but disclose information with respect to the nature of thecontingency.
In the cases that have been settled or adjudicated, or where quantifiable fines and penalties have beenassessed, we have indicated our losses or the amount of provision accrued that is the estimate of the probableloss.
In a limited number of ongoing cases, while we are able to make a reasonable estimate of the expected lossor range of the possible loss and have accrued a provision for such loss, we believe that publication of thisinformation on a case-by-case basis or by class would seriously prejudice the Company’s position in the ongoinglegal proceedings or in any related settlement discussions. Accordingly, in those cases, we have disclosedinformation with respect to the nature of the contingency but have not disclosed our estimate of the range ofpotential loss, in accordance with paragraph 92 of IAS 37.
These assessments can involve a series of complex judgments about future events and can rely heavily onestimates and assumptions. Our assessments are based on estimates and assumptions that have been deemedreasonable by management. We believe that the aggregate provisions recorded for the above matters are adequatebased upon currently available information. However, given the inherent uncertainties related to these cases andinvolved in estimating contingent liabilities, we could in the future incur judgments that could have a materialadverse effect on our net income in any particular period.
Long term provisions other than provisions for pensions and other long-term benefits and restructuringprovisions are disclosed in Note D.18.3.
• “Provisions for product liability risks, litigation and other” amount to €725 million in 2008. Theseprovisions are mainly related to product liabilities, government investigations, competition law,regulatory claims, contingencies that have arisen from business divestitures other than environmentalmatters and other claims.
• “Provisions for environmental risks and remediation” amount to €589 million in 2008, the majority ofwhich are related to contingencies that have arisen from business divestitures.
When a legal claim involves a challenge to the patent protection of a pharmaceutical product, the principalrisk to sanofi-aventis is that the sales of the product might decline following the introduction of a competinggeneric product in the relevant market. In cases where the product rights have been capitalized as an asset on thebalance sheet (i.e., assets acquired through a separate acquisition or through a business combination — see NoteB.4., such a decline in sales could negatively affect the value of the intangible asset. In those cases, the Companyperforms impairment tests in accordance with the principles disclosed in Note B.6.1., based upon the bestavailable information and, where appropriate, records an impairment loss to reduce the carrying amount of therelated intangible asset to its estimated fair value. The amounts of such impairments are disclosed in Note D.5.
F-77

NOTES TO THE CONSOLIDATED FINANCIAL STATEMENTS—(Continued)Year ended December 31, 2008
The principal ongoing legal and arbitral proceedings are described below.
a) Products
• Sabril® Litigation (anti-epilepsy)
Aventis Pharma Ltd, UK, has settled a group litigation consisting of 166 active claimants in the UnitedKingdom relating to the anti-epilepsy drug Sabril®. The action alleged that patients have suffered irreversiblevisual field constriction as a result of taking Sabril®. In November 2008 the court validated full and finalsettlement by Aventis Pharma Ltd, with no admission of liability, for a global settlement sum of around£18 million (more than half of which consists of claimants’ recoverable costs and interest). A small number ofindividual claims remain pending in the United Kingdom and other jurisdictions.
• Sanofi Pasteur Hepatitis B Vaccine Litigation
More than 180 lawsuits have been filed in various French civil courts against Sanofi Pasteur S.A. or SanofiPasteur MSD, two French subsidiaries of sanofi-aventis, in which the plaintiffs allege that they suffer from avariety of neurological disorders and autoimmune diseases, including multiple sclerosis or Guillain-Barrésyndrome as a result of receiving the hepatitis B vaccine. More than 50 judgments in France have rejected claimsalleging a causal link between the hepatitis B vaccine and the claimants’ alleged injuries. On May 22, 2008 theCour de cassation (the French Supreme Court) rendered two decisions with Sanofi Pasteur S.A. as defendant. Inone case, it decided to reject the claims relating to hepatitis B vaccination, ending this case. In the second case, itoverruled a Court of Appeals decision in favor of sanofi pasteur, holding that the lower court’s decision did notcontain sufficient grounds to reject plaintiffs claims. This case has been remanded back to the Court of Appeal ofParis.
Since January 31, 2008, both the legal entity Sanofi-Pasteur MSD and a corporate officer are underinvestigation in an ongoing criminal inquiry in France relating to alleged side effects caused by the hepatitis Bvaccine.
• Sanofi Pasteur Inc. Thimerosal Litigation
Since early 2001, Sanofi Pasteur Inc. has been a defendant in lawsuits filed in several federal and statecourts in the United States alleging that serious personal injuries resulted from the presence of mercury in thepreservative thimerosal, trace amounts of which are contained in vaccines manufactured by Sanofi Pasteur Inc.
Currently, there are 285 such cases pending. Several of the cases seek certification to proceed as classactions.
Sanofi Pasteur Inc. believes that under U.S. law, all of these claims must first be filed in the U.S. Court ofFederal Claims to determine whether the claim qualifies for compensation by the National Vaccine InjuryCompensation Program (VICP) before the claimants may bring direct actions against the company. The U.S.Court of Federal Claims (Claims Court) has established a process designed to facilitate the handling of the almost5000 thimerosal claims within the VICP. The process involves a committee of petitioners’ representatives andrepresentatives of the U.S. Department of Justice, who represent the government in the VICP. As originallyplanned, the process called for petitioners’ representatives to designate three “test cases” in each of the threedifferent theories of general causation advanced by the petitioners. Hearings on two of the theories werecompleted in 2007. No time frame for the decisions has been specified.
Currently, all of the 285 cases are either in the preliminary response stage, in the discovery process, havebeen stayed pending adjudication by the U.S. Court of Federal Claims, or have pending plaintiffs’ requests forreconsideration of preliminary determinations to stay proceedings pending such adjudication by the U.S. Court ofFederal Claims.
F-78
NOTES TO THE CONSOLIDATED FINANCIAL STATEMENTS—(Continued)Year ended December 31, 2008
• Sanofi Pasteur Blood Products Litigation
Sanofi pasteur S.A. and/or its subsidiaries have been named in civil claims in Argentina and France onbehalf of individuals with hemophilia, alleging that they became infected with the Human ImmunodeficiencyVirus (HIV) or hepatitis C virus (HCV) as a result of the administration of non-heat-treated antihemophilic factor(AHF) manufactured in France in the early 1980s by a predecessor company.
• Other Blood Products Litigation
On June 2, 2003 a purported worldwide class action was filed against current and former Group affiliatesArmour Pharmaceutical Company, Aventis Behring, Aventis Inc. and against three other U.S. plasmafractionators, on behalf of a purported class of foreign and domestic plaintiffs alleging infection with HIV and/orhepatitis C from 1978-1990. This action is pending before the U.S. District Court for the Northern District ofIllinois. On March 3, 2005, the U.S. District Court for the Northern District of Illinois denied plaintiffs’ requeststo certify class actions with respect to the cases before it. Many plaintiffs chose not to proceed with individualclaims, and most of the approximately 2,650 remaining plaintiffs’ cases have remained before the U.S. DistrictCourt for the Northern District of Illinois because of shared questions of fact.
All of the United Kingdom claimants have been dismissed from the U.S. litigation on jurisdictional grounds.Since that decision, approximately 160 HIV/HCV claims have been filed in the United Kingdom, presumably bysome of the same claimants. In 2008, the U.S. District Court also dismissed plaintiffs from Argentina and Israelon similar jurisdictional grounds. At present there are a number of additional motions pending with the Court todismiss plaintiffs from Germany and Taiwan on the same basis.
• Agreal® Product Litigation
The Group faces civil, criminal or administrative claims chiefly in Spain from women alleging that themenopause treatment Agreal® (veralipride) has caused a range of neurological and psychological harm. In 2007,decisions in suits involving several hundred claimants were handed down by civil tribunals in Spain. In themajority of cases to date, the decisions have been favorable to the Group, generally on the basis of a finding thatcausation was not proven by the claimants and/or that the leaflet gave adequate notice of potential side effects. Asmall number of the civil cases have been decided adversely to sanofi-aventis and sanofi-aventis has appealedeach of these. On November 27, 2007 the Appeal Court of Barcelona confirmed a decision holding that theproduct is defective due to insufficient information in the leaflet on side effect. Sanofi-aventis hasappealed against this decision before the Tribunal Superior de Justicia de Catalonia. Any amounts awarded todate have not been material. A substantial number of claims remain to be adjudicated, and new civil, criminaland administrative claims have been recently filed. There can be no assurance that cases decided to date will berepresentative of future decisions and that additional claims will not be filed in Spain or other countries.
• Plavix® Product Litigation
Affiliates of the Group and Bristol-Myers Squibb are named in a number of individual actions seekingrecovery under state law for personal injuries allegedly sustained in connection with the use of Plavix®. Theactions are primarily venued in the U.S. District Court for the District of New Jersey, which has administrativelystayed the proceedings pending a U.S. Supreme Court decision in the Levine case, which presents issues offederal preemption relevant to state law claims. The parties have also entered into a tolling agreement relating tothe unfiled claims of a number of additional potential plaintiffs.
b) Patents
• Plavix® Patent Litigation
United States. On March 21, 2002, sanofi-aventis, Sanofi-Synthélabo Inc. and Bristol-Myers Squibb SanofiPharmaceuticals Holding Partnership (or “BMS Sanofi Holding”, our partnership with Bristol-Myers Squibb)
F-79

NOTES TO THE CONSOLIDATED FINANCIAL STATEMENTS—(Continued)Year ended December 31, 2008
filed suit in the U.S. District Court for the Southern District of New York against Apotex Inc. and Apotex Corp.(hereinafter Apotex) for the infringement of U.S. patent rights relating to Plavix® as a result of an ANDA filedby Apotex including a paragraph IV challenge to U.S. Patent No. 4,847,265 (the “ ‘265 patent”), expiring in2011, which discloses and claims inter alia the clopidogrel bisulfate compound, the active ingredient in Plavix®.Apotex asserted antitrust counterclaims.
On January 24, 2006, sanofi-aventis learned that the FDA had granted final approval to the Apotex ANDA.This FDA approval allowed Apotex to manufacture a generic version of clopidogrel bisulfate, but it did notresolve the outstanding patent claims against Apotex.
On March 21, 2006, sanofi-aventis and BMS announced that they had reached an agreement subject tocertain conditions (including antitrust review and clearance by the Federal Trade Commission (FTC) and stateattorneys general) with Apotex to settle the patent infringement lawsuit pending among the parties. On June 25,2006, sanofi-aventis, BMS and Apotex announced that, in response to concerns to the settlement as initiallyproposed raised by the FTC and certain state attorneys general, the companies had entered into a revisedagreement.
On July 28, 2006, sanofi-aventis learned that the revised agreement had failed to receive required antitrustclearance. On August 8, 2006, Apotex announced the launch at risk of its generic product in the United States.On August 31, 2006, the District Court granted sanofi-aventis’ motion for a preliminary injunction orderingApotex to halt its sales of a generic version of clopidogrel bisulfate product that competes with Plavix® until thepending patent infringement lawsuit was resolved.
On June 19, 2007, the U.S. District Court issued a decision upholding the validity and enforceability of theprincipal Plavix® patent, and permanently enjoined Apotex from further sale of generic clopidogrel bisulfate. OnDecember 12, 2008 the U.S. Court of Appeals for the Federal Circuit upheld this decision. Apotex has petitionedthe Court of Appeals for a rehearing by the original judges that decided the case and an en-banc review of suchdecision by all of the judges on the Court.
Sanofi-aventis and Bristol-Myers Squibb are seeking damages from Apotex, in reparation of harm caused bythat company’s marketing and sale of an infringing generic version of Plavix® in 2006. Trial on damage claimsagainst Apotex will be held on a schedule to be determined by the District Court.
The same plaintiffs filed suit on May 14, 2002 in the U.S. District Court for the Southern District of NewYork against Dr. Reddy’s Laboratories for infringement of these same patent rights in an ANDA. Although itwas filed in the same court, this suit was not tried concurrently with the Apotex suit. In January 2008, FDAgranted final approval to Dr. Reddy’s ANDA. This FDA approval does not resolve the outstanding patent claims,and the litigation against Dr. Reddy’s remains pending before the same judge that ruled against Apotex. OnJanuary 23, 2008, the District Court entered an order requiring Dr. Reddy’s provide notice 10 business daysbefore selling or marketing a generic version of clopidogrel bisulfate or committing most other acts ofinfringement of the ‘265 patent, so as to permit sanofi-aventis and BMS to seek injunctive relief prior to theinfringing act.
Subsequent to the Apotex and Dr Reddy’s cases, each of Cobalt, Ivax, Mylan, Roxane Laboratories, Sandoz,Sun and Teva notified sanofi-aventis that it had filed an ANDA with the FDA with regard to purported genericversions of form 1 of clopidogrel bisulfate in the United States. Only the Teva, Cobalt and Sun ANDAs containsa paragraph IV certification contesting the ‘265 patent claiming form 1. Teva and Cobalt’s respective ANDAsclaim the purported form 1 generics do not infringe patents related to a second crystalline form of clopidogrelbisulfate known as “form 2”. Form 2 is claimed by separate patents. Sanofi-aventis has filed suit against Tevaand Cobalt for infringement of the ‘265 patent and against Sun for infringement of both form 1 and form 2patents. In separate stipulations approved by the U.S. District Court for the Southern District of New York onApril 15, 2005, all parties to each of the Teva and Cobalt patent infringement suits agreed to be bound by theoutcome of the litigation in the District Court against Apotex or Dr. Reddy’s. Teva and Cobalt are now bound bythe Court of Appeals decision against Apotex and in January 2009, Sun agreed also to be bound by it.
F-80
NOTES TO THE CONSOLIDATED FINANCIAL STATEMENTS—(Continued)Year ended December 31, 2008
Certain more significant Plavix®-related patent suits outside of the United States are described below.
Korea. A number of companies have received marketing authorizations in Korea for generic forms ofclopidogrel bisulfate and other salts of clopidogrel. Sanofi-aventis has asserted the Korean patent for Plavix®
(Korean Patent No. 103094) in patent infringement actions against a number of companies. On June 28, 2006, ina nullity action filed by several companies against Korean Patent No. 103094, the Korean Intellectual PropertyTribunal issued a decision holding that this patent’s claims were not patentable under Korean law. OnJanuary 18, 2008 this Intellectual Property Tribunal decision was upheld on appeal. Sanofi-aventis appealed tothe Supreme Court on February 15, 2008 and the Supreme Court accepted the appeal.
Canada. In March 2005 the Canadian Federal Court of Ottawa issued an order of prohibition against theMinister of Health and Apotex Inc. in relation to Apotex’s 2003 application in Canada to market a genericversion of clopidogrel bisulfate tablets. In its order, the Canadian Federal Court held that the asserted claims ofCanadian Patent No. 1,336,777 (which corresponds to the U.S. form 1 patent) are novel, not obvious andinfringed. Attempts by Apotex to overturn the decision were dismissed on December 22, 2006, by the CanadianFederal Court of Appeals and on November 6, 2008, by the Supreme Court of Canada.
In similar litigation relating to their respective Canadian applications for a proposed generic clopidogrelbisulfate product, each of Pharmascience, Novopharm and Cobalt have agreed with sanofi-aventis that they willbe bound by the final outcome of the Apotex case described above. Those proceedings are now being terminatedgiven the decision of the Canadian Supreme Court.
Australia. On August 17, 2007, GenRX, a subsidiary of Apotex obtained registration of a genericclopidogrel bisulfate product on the Australian Register of Therapeutic Goods and sent notice to sanofi-aventisthat it had in parallel applied to the Federal Court of Australia for an order revoking the Australian enantiomerpatent claiming clopidogrel salts. On September 21, 2007, sanofi-aventis obtained a preliminary injunction fromthe Federal Court preventing commercial launch of this generic clopidogrel bisulfate product until judgment onthe substantive issues of patent validity and infringement. In February 2008 Spirit also introduced a nullity actionagainst the enantiomer patent. Spirit Proceeding was consolidated with the Apotex Proceeding.
On August 12, 2008 the Federal Court confirmed that the claim directed to clopidogrel bisulfate was validand infringed. Claims covering the hydrochloride, hydrobromide and taurocholate salts also were found valid.However claim 1 of the patent directed to clopidogrel base and its unspecified salts has been found to be invalid.All parties have appealed. The Apotex and Spirit appeals are expected to be heard during the first quarter of2009.
Germany. On May 28, 2008, sanofi-aventis became aware that the German federal drug agency (BfArM)had reviewed and approved three applications for marketing approval relating to clopidogrel besylate inGermany, ahead of the expiry date of the data exclusivity period for clopidogrel in the European Union (July 15,2008). Clopidogrel besylate is a different pharmaceutical salt of clopidogrel from the one used in Plavix®, andthe approvals granted cover only some of the indications of Plavix®. Sanofi-aventis believes that theseapplications — which rely on data from sanofi-aventis and Bristol-Myers Squibb, who developed Plavix®/Iscover® (clopidogrel bisulfate) — should not have been accepted by a regulatory body within the EuropeanUnion before July 15, 2008. Starting in May 2008, sanofi-aventis therefore instigated a number of civil,administrative and regulatory actions, which initially led to the suspension of the marketing authorizationspending further review by the BfArM. On July 29, 2008, the German Administrative Court in Cologne issued anorder ending the suspension of these marketing authorizations. This order was later confirmed in appeal. OnNovember 17, 2008 BfArM dismissed the third party objection filed by sanofi-aventis. Further to this BfArMdecision, sanofi-aventis and Bristol-Myers Squibb filed administrative actions for the annulment of the marketingauthorizations before the Administrative Court of Cologne. These clopidogrel besylate products remainauthorized for sale on the German market, and there can be no assurance that generics of Plavix® will not beauthorized in other European markets.
F-81

NOTES TO THE CONSOLIDATED FINANCIAL STATEMENTS—(Continued)Year ended December 31, 2008
• Allegra® Patent Litigation
United States. Sanofi-aventis has been engaged in patent infringement actions concerning Allegra® since thefirst ANDA referring to this product was submitted to the FDA in 2001. In 2005, Barr Laboratories Inc. and Tevalaunched a generic version of Allegra® “at risk”, despite the patent infringement litigation pending against themand other ANDA filers. In November 2008, sanofi-aventis U.S. entered into agreements to settle the U.S. patentinfringement suits related to Barr and Teva’s generic version of Allegra® (fexofenadine hydrochloride), as wellas the U.S. patent infringement suit related to Barr’s proposed generic version of Allegra® D-12 Hour(fexofenadine hydrochloride; pseudoephedrine hydrochloride). The respective settlements each took effect onJanuary 2, 2009.
Under the settlement agreements, the U.S. patent suits, including any damage claims, against Barr and Tevarelated to sanofi-aventis’ U.S. Allegra® patent and against Barr related to its U.S. Allegra® D-12 Hour patentwere dismissed without prejudice; the Barr/Teva generic version of Allegra® product remains on the marketunder a non-exclusive license and Barr has been granted a non-exclusive license starting in November 2009 forthe commercialization of Allegra® D-12 Hour in the United States (this date may be accelerated under certaincircumstances), in each case with royalties paid to sanofi-aventis.
Sanofi-aventis U.S. continues to be involved in ongoing U.S. patent litigation against other parties inrelation to the Allegra® single entity formulation (Mylan, Dr. Reddy’s, Sandoz), Allegra® D-12 Hour (Impax,Mylan, Dr. Reddy’s, Sandoz and Sun Pharma Global) as well as Allegra® D-24 Hour (Dr. Reddy’s). These othersuits were not settled by the agreements described above. The previously disclosed Israeli litigation against Tevahas been resolved favorably for the Group.
• Actonel® Patent Litigation
Actonel® is marketed by the Alliance for Better Bone Health, an alliance between Procter & GambleCompany and P&G Pharmaceuticals (together “P&G”) and Aventis Pharmaceuticals Inc. (API). P&G filedpatent infringement litigation in 2004 against Teva Pharmaceuticals USA in the U.S. District Court for theDistrict of Delaware in response to Teva’s application to market a generic version of Actonel® (risedronatesodium) tablets in the United States. Sanofi-aventis is not a party to this action. On February 28, 2008 the UnitedDistrict Court for the District of Delaware held U.S. Patent 5,538,122 owned by P&G and claiming the activeingredient of Actonel® to be valid and enforceable.
P&G filed additional patent infringement actions against Teva in 2008 in response to Teva’s applications tomarket a generic version of Actonel® 75mg tablets and Actonel® plus Calcium. In May 2008, the District Courtjudge entered an order of final judgment in favor of P&G in both cases and Teva has appealed all three finaljudgments. The three appeals have been consolidated by the Federal Circuit and a Hearing was held December 2,2008.
In September 2008 and January 2009, P&G and Roche brought suit in the U.S. District Court of Delawarein response to respectively Teva’s and Sun Pharma Global applications to market a generic version of the 150mgActonel® tablets. These cases remain pending.
• Lovenox® Patent Litigation (enoxaparin sodium)
United States. In June 2003, Aventis Pharmaceuticals Inc. (API) received notice that both AmphastarPharmaceuticals and Teva Pharmaceuticals were seeking approval from the FDA for purportedly genericversions of Lovenox® (pre-filled syringes) and were challenging U.S. Patent No. 5,389,618 (the “ ‘618 patent”)listed in the Orange Book for Lovenox®. API brought a patent infringement suit against both Amphastar andTeva in U.S. District Court (Central District of California) on the ‘618 patent.
On February 8, 2007, the U.S. District Court for the Central District of California issued a decision in thesanofi-aventis Lovenox® patent infringement suit against Amphastar and Teva holding the ‘618 patent
F-82
NOTES TO THE CONSOLIDATED FINANCIAL STATEMENTS—(Continued)Year ended December 31, 2008
unenforceable. The defendant’s antitrust counterclaims have not been resolved by this decision and remainpending before the district court. On May 14, 2008, the Federal Circuit Court of Appeals denied sanofi-aventis’appeal of the District Court’s decision and subsequently refused sanofi-aventis’ petition to rehear the appeal enbanc. In January 2009 Sanofi-aventis has petitioned the U.S. Supreme Court to hear the case.
Further to the Federal Circuit Amphastar decision of May 14, 2008, the U.S. District Court for the CentralDistrict of California has entered judgment against sanofi-aventis in two patent infringement suits broughtagainst Sandoz and Hospira as a result of these companies’ respective ANDAs relating to pre-filled syringe andmultidose presentations of Lovenox®.
Italy. The company Opocrin has filed suit in Italy before the Tribunale di Milano (civil section) seeking adeclaratory judgment of invalidity and of non-infringement with respect to the Italian patent covering Clexane®
(enoxaparin sodium) which is the Italian counterpart to the U.S. patent number 5,389,618. The suit remainspending. Biofer and Chemi had also filed a similar suit in 2001. A judgment against these companies upholdingthe validity of the patent, within certain limitations, is under appeal.
Germany. The companies Hexal, Ratiopharm, Chemi and Opocrin have filed opposition proceedings withthe German Federal Patent Court, requesting the revocation of the German patent DE 41 21 115 which claims theactive ingredient of Clexane® (enoxaparin sodium) and is the German counterpart to the U.S. patent number5,389,618. Following a hearing held in January 2009, judgment is awaited in the first quarter of 2009.
• Ramipril Canada Patent Litigation
Sanofi-aventis is involved in a number of legal proceedings involving companies which market genericAltace® (ramipril) in Canada. Not withstanding proceedings initiated by sanofi-aventis, the following eightmanufacturers, Apotex (in 2006), Novopharm, Sandoz and Cobalt (in 2007), Riva, Genpharm, Ranbaxy and ProDoc (in 2008), have now obtained marketing authorizations from the Canadian Minister of Health for genericversions of ramipril in Canada. Following the marketing of these products, sanofi-aventis filed patentinfringement actions against all eight companies. Trial for patent infringement actions involving Apotex andNovopharm has been underway since January 2009. Each of Novopharm and Riva subsequently initiateddamages claims against sanofi-aventis, seeking compensation for their alleged inability to market a genericramipril during the time taken to resolve the proceedings against the Canadian Ministry of Health. TheNovopharm claim has been stayed pending outcome of the infringement trial and the Riva proceeding is in aearly stage.
• Taxotere® Patent Litigation
United States. Sanofi-aventis has received notification from Hospira and Apotex who have filed(505(b)(2)) applications with the U.S. Food and Drug Administration (“FDA”) respectively in 2007 and 2008seeking to market generic versions of Taxotere®. In response to these notifications, sanofi-aventis has filed patentinfringement lawsuits against each applicant in 2007 and 2008. Presently, the lawsuits are pending in the U.S.District Court for the District of Delaware. Neither application contests U.S. patent 4,814,470 claiming the activeingredient, which expires in May 2010.
Canada. In October 2007, sanofi-aventis learned that Hospira Healthcare Coporation had filed anapplication with Canadian authorities for a marketing authorization for a proposed docetaxel product which is theactive ingredient of Taxotere®, alleging that Aventis Pharma S.A.’s Canadian Patent Nos. 2,102,777 and2,102,778 for docetaxel were invalid and not infringed. On November 29, 2007, sanofi-aventis’ Canadiansubsidiary and Aventis Pharma S.A. commenced an application for judicial review in the Federal Court ofCanada. In Canada, the compound patent relating to this product has expired.
• Eloxatin® (oxaliplatin) Patent Litigation
Europe. Sanofi-aventis is no longer pursuing infringement suits or defending nullity actions relating toEloxatine® in Europe (cases were previously pending in Germany, France and Austria).
F-83

NOTES TO THE CONSOLIDATED FINANCIAL STATEMENTS—(Continued)Year ended December 31, 2008
United States. Starting in February 2007, sanofi-aventis has received several ANDA certifications relating toEloxatine® (oxaliplatin) solution and/or lyophilized products in the United States contesting part or all of theOrange Book patents under paragraph IV. Each of the generic manufacturers has been sued for infringement ofone or more of the Orange-Book listed patents before the U.S. District Court for the District of New Jersey. U.S.regulatory data exclusivity expired in February 2008.
Discovery is underway and the New Jersey court has permitted several generic filers to submit motions for asummary judgment. The first such motions, filed by Mayne Pharma Limited with respect to the U.S. PatentNo. 5,338,874 (‘874) and by Sandoz concerning allegations of invalidity and non-infringement of the ‘874 patentand U.S. Patent No. 5,716,988, are expected to be decided in the first half of 2009. Summary judgment againstsanofi-aventis on one or more of these motions could permit generic market entry, assuming FDA approval of thegeneric product has been obtained.
• Ambien® CR Patent Litigation
Starting in 2007, sanofi-aventis filed suits for infringement of U.S. patent 6,514,531 in the U.S. DistrictCourt for the District of New Jersey based on ANDAs for a generic version of Ambien® CR filed by Synthon,Barr, Mutual and Sandoz.
Sanofi-aventis has not brought suit against Anchen, which was the first to notify sanofi-aventis of itsparagraph-IV ANDA, or against Abrika, Lupin, Andrx and PTS Consulting. In addition to its Orange-Book listedpatent 6,514,531 expiring in 2019, Ambien® CR benefits from an FDA marketing exclusivity in the United Statesexpiring in March 2009.
• Nasacort® AQ Patent Litigation
In March 2006, sanofi-aventis was notified that Barr Laboratories had submitted an ANDA to the FDAcontaining a paragraph IV patent certification relating to triamcinolone acetonide 55 microgram nasal spray(Nasacort® AQ). Further to this notification, sanofi-aventis filed a patent infringement lawsuit in the U.S. DistrictCourt of Delaware against Barr Laboratories, Inc. regarding two Nasacort® AQ patents (U.S. Patent nos.5,976,573 and 6,143,329). In November 2008, sanofi-aventis U.S. and Barr entered into an agreement to settlethe U.S. patent infringement suits related to Barr’s proposed generic version of Nasacort® (triamcinoloneacetonide) AQ. This settlement took effect on January 2, 2009.
Under the settlement agreement, the U.S. patent suit has been dismissed without prejudice and Barr has beengranted a license authorizing production and marketing of a generic of this product for the United States marketno earlier than June 2011 and at the latest December 2013; this date may be accelerated under certain conditions.
• SoloSTAR® Patent Litigation
On July 10, 2007, Novo Nordisk filed complaints in the Courts of Düsseldorf and Mannheim in Germany,and in the U.S. district Court for the District of New Jersey, alleging the Group’s new Lantus® SoloSTAR®
disposable insulin pen infringes various Novo Nordisk patent and intellectual property rights. For the New Jerseyaction Novo Nordisk also served a motion for a preliminary injunction for the court to enjoin the selling of theSoloSTAR® device in the United States. On February 19, 2008 the United States District Court for the District ofNew Jersey denied Novo Nordisk’s request for a preliminary injunction against sanofi-aventis. On July 30, 2008,this ruling was confirmed on appeal. In September 2008, Novo Nordisk filed a motion for summary judgment foralleged infringement of its patent rights. No hearing date has been set.
On May 20, 2008, the Court of Mannheim dismissed Novo Nordisk’s suit based on infringement of itsGerman Utility Model by the Lantus® SoloSTAR® disposable insulin pen. On August 8, 2008 the court ofDüsseldorf dismissed Novo Nordisk’s suit based on infringement of its German patent by theLantus®SoloSTAR® insulin pen. Novo Nordisk has appealed in each case.
F-84

NOTES TO THE CONSOLIDATED FINANCIAL STATEMENTS—(Continued)Year ended December 31, 2008
Sanofi-aventis has also been involved in related patent litigation with a subsidiary of Ypsomed, the supplierof OptiPen®, OptiSet®, and OptiClik® to Sanofi-Aventis Deutschland GmbH. On April 18, 2008 sanofi-aventisand Ypsomed agreed to settle all currently pending patent disputes and other litigations in Germany andSwitzerland between these companies regarding the new Lantus® SoloSTAR® and Apidra® SoloSTAR®
disposable insulin pens. Those cases were withdrawn in May 2008.
• Xatral® Patent Litigation
Starting in August 2007, sanofi-aventis has received several ANDA certifications relating to Xatral® in theUnited States under paragraph IV. Each of the generic manufacturers has been sued for infringement of one orboth of the Orange-Book listed patents before the U.S. District Court, District of Delaware. Trial has beenscheduled for March 2010.
• Xyzal® Tablets ANDA
Sanofi-aventis has a co-commercialization agreement with UCB Inc. with respect to Xyzal® in the UnitedStates. Sanofi-aventis is aware that UCB has received four paragraph IV certifications since February 2008 fromSynthon Pharma. Inc., Sun Pharmaceuticals, Sandoz Inc., and Barr Laboratories. All the generic manufacturershave been sued by UCB for patent infringement in cases pending before the U.S. District Court of NorthCarolina.
Glossary of Patent Terminology
A number of technical terms used above in Note D.22.b are defined below for the convenience of the reader.
ANDA or Abbreviated New Drug Application (United States): An application by a drug manufacturer toreceive authority from the U.S. FDA to market a generic version of another company’s approved product, bydemonstrating that the purportedly generic version has the same properties (bioequivalence) as the originalapproved product. As a result of data exclusivity, the ANDA may be filed only several years after the initialmarket authorization of the original product.
Paragraph III and Paragraph IV Certifications: ANDAs relating to approved products for which a patenthas been listed in the FDA’s list of Approved Drug Products with Therapeutic Equivalence Evaluations, alsoknown as the “Orange Book”, must specify whether final FDA approval of the ANDA is sought only afterexpiration of the listed patent(s) (this is known as a paragraph III certification under the Hatch-Waxman Act) orwhether final FDA approval is sought prior to expiration of one or more listed patents (a paragraph IVcertification). ANDAs including a paragraph IV certification may be subject to the 30-Month Stay defined below.
Section 505(b)(2) application: A section 505(b)(2) application may be used to seek FDA approval for,among other things, combination products, different salts of listed drugs, products that do not demonstratebioequivalence to a listed drug and over-the-counter versions of prescription drugs.
Summary judgment: A judgment granted on a claim or defense about which there is no genuine issue ofmaterial fact and upon which the movant is entitled to prevail as a matter of law. This procedural device allowsthe speedy disposition of a controversy without the need for trial.
30-Month Stay (United States): If patent claims cover a product listed in the FDA’s list of Approved DrugProducts with Therapeutic Equivalence Evaluations, also known as the “Orange Book”, and are owned by orlicensed to the manufacturer of the original version, the FDA is barred from granting a final approval to anANDA during the 30 months following the patent challenge, unless, before the end of the 30 months, a courtdecision or settlement has determined either that the ANDA does not infringe the listed patent or that the listedpatent is invalid and/or unenforceable. FDA approval of an ANDA after this 30 month period does not resolveoutstanding patent disputes, which may continue to be litigated in the courts.
F-85

NOTES TO THE CONSOLIDATED FINANCIAL STATEMENTS—(Continued)Year ended December 31, 2008
c) Government Investigations, Competition Law and Regulatory Claims
• Government Investigations — Plavix® Settlement
The Antitrust Division of the United States Department of Justice is conducting a criminal investigationregarding the proposed settlement described at “Patents — Plavix® Patent Litigation — United States” above,and sanofi-aventis U.S. has received grand jury subpoenas seeking the production of documents. In addition, in2006 the U.S. Federal Trade Commission and the State of New York’s Attorney General served subpoenas onsanofi-aventis’ U.S. subsidiary requesting production of certain documents and information relating to theproposed settlement of the U.S. Plavix® patent litigation against Apotex. Sanofi-aventis U.S. has provided allinformation required in response to these investigations. It is not possible at this time reasonably to assess theoutcome of these investigations or their potential impact on the group.
• Government Investigations — Pricing and Marketing Practices
Private Label. The U.S. Attorney’s Office in Boston had conducted a civil and criminal investigation intowhether sales by Aventis Pharmaceuticals Inc. (API) of certain products to a managed care organization forresale under that organization’s own label should have been included in the “best price” calculations that are usedto compute the Medicaid rebates for API products. Medicaid is a public medical insurance program jointlyfinanced by the U.S. state and federal governments. It is alleged that not including these sales in the calculationresulted in incorrect Medicaid rebates. API has responded to all requests for information in this matter. Althoughthe Group believes that API acted in accordance with the law as it and other pharmaceutical companiesinterpreted it, the Group is progressing significantly in settlement talks with the Department of Justice, as a resultof which the Group has aligned the level of its reserves.
Massachusetts Physician. The U.S. Attorney’s Office in Boston is also conducting a civil and criminalinvestigation with regard to interactions API had with a Massachusetts physician, and affiliated managed careentities. Sanofi-aventis has responded to all subpoenas related to this investigation.
Managed Care Investigation. The U.S. Attorney’s Office in Boston is conducting an investigation related tomanaged care entities which includes allegations that API directly or indirectly made payments to customers orto those in a position to influence sales of API pharmaceuticals in order to obtain or keep drug business and toevade Medicaid best price reporting requirements. As part of the investigation the government served API with asubpoena investigating criminal federal health care violations related to health care benefit programs. Thesubpoena asked for documents related to API interactions with, and payments to, managed care customers,formulary placement, sales and marketing of specific products to those managed care customers, as well ascontracts with wholesalers and distributors and payments to non-Aventis employees. Sanofi-aventis hasresponded to this subpoena.
Lahey Clinic. In 2004, API and Aventis Behring received subpoenas issued by the U.S. Attorney’s office inBoston requesting documents concerning payments and contacts between these companies and the Lahey Clinic,a Massachusetts healthcare facility, or certain of its employees, relating to various periods between January 1995and October 2004. API and Aventis Behring have provided documents in response to these subpoenas.
Lovenox® Marketing. The U.S. Attorney’s Office in Chicago, Illinois has conducted a civil and criminalinvestigation with regard to Lovenox® sales and marketing practices for a period starting January 1,1999. Without prejudice to its right to pursue any further investigation in the future, the U.S government hasdeclined to intervene in a Federal False Claims Act case related to the facts under investigation brought by twoformer employees, and the matter is proceeding against the Company as civil litigation in Illinois federal courtunder federal and Illinois whistleblower statutes.
Ambien® and Ambien® CR Marketing. On 11 August 2008, sanofi-aventis U.S. received subpoena issued bythe Office of Inspector General. The subpoena requested information regarding Ambien® and Ambien® CR in
F-86

NOTES TO THE CONSOLIDATED FINANCIAL STATEMENTS—(Continued)Year ended December 31, 2008
connection with an investigation of possible false or otherwise improper claims for payment under Medicare andMedicaid. Sanofi-aventis U.S. is providing documents in response to these subpoenas.
• Civil Suits — Pricing and Marketing Practices
Average Wholesale Prices (AWP). Class Actions. Aventis Pharmaceuticals Inc. (API) is a defendant inseveral U.S. lawsuits seeking damages on behalf of multiple putative classes of individuals and entities thatallegedly overpaid for certain pharmaceuticals as a result of the AWP pricing which were used to set Medicareand Medicaid reimbursement levels. Aventis Behring and Sanofi-Synthelabo, Inc. were also defendants in someof these cases. These suits allege violations of various statutes, including state unfair trade, unfair competition,consumer protection and false claim statutes.
A group of eleven defendants, including API, reached a tentative global settlement of the claims of theinsurers and consumers, for a total of $125 million. This settlement was granted preliminary approval by the U.S.District Court in Boston in early July, 2008. Subject to the final approval hearing set for April 27, 2009, all theclass actions suits against API before the U.S. District Court in Boston will be ended consistent with thissettlement. Two additional purported class actions remain in two distinct states.
AWP Public Entity Suits. U.S. subsidiaries of the Group together with several dozen other pharmaceuticalcompanies are defendants in lawsuits brought starting in 2002 by the states of Alabama, Alaska, Hawaii, Idaho,Iowa, Illinois, Kansas, Kentucky, Mississippi, Pennsylvania Utah, and Wisconsin for AWP pricing issuesdescribed above. These suits alleged violations of state unfair trade, consumer protection and false claimsstatutes, breach of contract, and Medicaid fraud. The Iowa and Utah cases are before the federal district court inBoston. All of the other state suits are pending before other federal courts or in the state courts in which theywere filed. Arizona, Montana and Nevada suits were settled in 2008.
Aventis Pharmaceuticals Inc., Sanofi-Synthelabo Inc. and other pharmaceutical companies had also beensued by the state of New York, several individual New York State counties and the City of New York, in suitsalleging similar violations of state laws concerning pricing and marketing practices. A settlement of all theseclaims was completed in April 2008.
§ 340B Suits. On August 18, 2005, the County of Santa Clara, California filed a suit against AventisPharmaceuticals Inc. and fourteen other pharmaceutical companies in the Superior Court of the State ofCalifornia, County of Alameda alleging that the defendants had overcharged Public Health Service entities fortheir pharmaceutical products. Plaintiff seeks to proceed on behalf of a California-wide class of similarly situatedcities and counties in California. On September 15, 2005, the case was removed from Alameda Superior Court tothe U.S. District Court. On July 28, 2006 the defendants were successful in dismissing plaintiffs’ complaint in itsentirety, with prejudice, for failure to state a claim. In August 2008, the Court of Appeals reversed the districtcourt’s decision with respect to one cause of action, specifically breach of contract, and remanded the case backto the District Court. In December 2008, Plaintiffs formally amended the complaint to assert this breach ofcontract claim.
• Pharmaceutical Industry Antitrust Litigation
Approximately 135 cases remain pending of the numerous complaints that were filed in the mid-1990’s byretail pharmacies in both federal and state court. These complaints shared the same basic allegations: that thedefendant pharmaceutical manufacturers and wholesalers, including sanofi-aventis predecessor companies,violated the Sherman Act, the Robinson Patman Act, and various state antitrust and unfair competition laws byconspiring to deny all pharmacies, including chains and buying groups, discounts off the list prices of brand-name drugs. Shortly before a November 2004 trial in the U.S. District Court for the Eastern District of NewYork, sanofi-aventis and the remaining manufacturer defendants settled the Sherman Act claims of the majorityof the remaining plaintiffs. These settlements did not dispose of the remaining plaintiffs’ Robinson Patman Actclaims.
F-87

NOTES TO THE CONSOLIDATED FINANCIAL STATEMENTS—(Continued)Year ended December 31, 2008
• Vitamin Antitrust Litigation
Since 1999, sanofi-aventis, some of its subsidiaries in its former animal nutrition business, and other vitaminmanufacturers have been defendants in a number of class actions and individual lawsuits in U.S. courts relatingto alleged anticompetitive practices in the market for bulk vitamins. Sanofi-aventis has settled all claims broughtby direct purchasers of the relevant vitamin products and the majority of actions brought on behalf of indirectpurchasers.
In February 2006, sanofi-aventis and Aventis Pharmaceuticals Inc. learned that they had been namedtogether with several other companies in a complaint filed by the Attorney General of Mississippi on the groundsof state antitrust law.
Regarding the same matter, all but one of the UK claimants have agreed to settle the civil litigation againstsanofi-aventis and some of its subsidiaries for an amount not material in amount to the Group. The settlementagreement, if approved by the court, is expected to take effect in 2009.
In connection with the sale of its animal nutrition business to CVC Capital Partners, sanofi-aventis retainsliability arising out of these antitrust issues.
• Methionine Antitrust Litigation
Sanofi-aventis has settled all direct purchaser civil claims brought in the United States against sanofi-aventisand its subsidiaries relating to methionine sales and has settled the majority of claims brought by indirectpurchasers starting in 2002. In connection with the sale of its animal nutrition business to CVC Capital Partners,sanofi-aventis retains liability arising out of these antitrust issues.
• European Commission Fines
On June 18, 2008, the European Court of First Instance, reduced from €99 million to €74.25 million the fineimposed against Hoechst GmbH in 2003 by the European Commission in connection with Hoechst’sinvolvement in anti-competitive activity in the Sorbates sector. Pursuant to the 1999 Demerger Agreementbetween Hoechst and Celanese, all fines, costs, and expenses relating to Sorbates cartel matters have been sharedin a 80/20 ratio between Hoechst and Celanese.
The appeal regarding the MCAA market fine (€74 million) filed by Hoechst GmbH remains pending.
• European Commission proceeding in connection with the pharmaceuticals Sector Inquiry
In January 2008, the European Commission’s Directorate General for Competition opened a sector inquiryinto the functioning of the market to investigate what it considered to be a low level of competition in thepharmaceuticals industry in the European Union. The inquiry commenced with unannounced information-gathering inspections at a number of companies including sanofi-aventis. According to the Commission, thesector inquiry ultimately involved information gathering from 43 originator companies and 27 genericcompanies. The sector inquiry continues, with an interim report published on November 28, 2008, and a finalreport and possible subsequent legislative and other actions in 2009.
On May 15, 2008, the European Commission opened a formal investigation into whether sanofi-aventis hadillegally obstructed the inspection of its premises. The controversy with the Commission centered on a questionof procedure concerning the handing over of a single document requested by the European Commission and infact delivered by sanofi-aventis during the inspection. In October 2008, that investigation was closed with noaction taken by the Commission.
• Cipro® Antitrust Litigation
Since August 2000, Aventis Pharmaceuticals Inc. (API) has been a defendant in several related cases in U.S.state and federal courts alleging that API and certain other pharmaceutical manufacturers violated U.S. antitrust
F-88
NOTES TO THE CONSOLIDATED FINANCIAL STATEMENTS—(Continued)Year ended December 31, 2008
laws and various state laws by settling a patent dispute regarding the brand-name prescription drug Cipro® in amanner which allegedly delayed the arrival of generic competition. In March 2005, the U.S. District Court for theEastern District of New York granted sanofi-aventis’ summary judgment motions, and issued a judgment in favorof API and the other defendants in this litigation. By order entered October 15, 2008, the United States Court ofAppeals for the Federal Circuit affirmed the District Court’s ruling in the appeal by indirect purchaser plaintiffs;the direct purchaser plaintiffs’ appeal has yet to be heard by the United States Court of Appeals for the SecondCircuit.
• DDAVP® Antitrust Litigation
Subsequent to the decision of the U.S. District Court for the Southern District of New York in February2005 holding the patent rights at issue in the DDAVP® tablet litigation to be unenforceable as a result ofinequitable conduct, eight putative class actions have been filed claiming injury as a result of Ferring B.V. andAventis Pharmaceuticals Inc.’s alleged scheme to monopolize the market for DDAVP® tablets in violation of theSherman Act and the antitrust and deceptive trade practices statutes of several states. On November 6, 2006, theDistrict Court dismissed these claims. Plaintiffs have appealed the decision to dismiss.
• Plavix® Antitrust Claim
On March 23, 2006, the U.S. retailer The Kroger Co. filed an antitrust complaint in the District Court for theSouthern District of Ohio against sanofi-aventis, Bristol-Myers Squibb Co. and Apotex Corp alleging antitrustviolations by the defendants in relation to their tentative agreement to settle the U.S. Plavix® patent litigation (see“Plavix® Patent Litigation — United States,” above, for a description of the transaction). 17 other complaintshave since been filed by direct and indirect purchasers of Plavix® on the same or similar grounds. Plaintiffs seekrelief including injunctive relief and monetary damages.
• Arava® Antitrust Litigation
Sanofi-aventis and certain U.S. subsidiaries of the Group were defendants in a lawsuit brought in the U.SDistrict Court for the Southern District of New York in August, 2007 by Louisiana Wholesale Drug Co. onbehalf of itself and a proposed class of all direct purchasers of Arava®. Under the federal antitrust laws plaintiffsalleged that the Group had misused the Citizen Petition process in an attempt to delay approval of genericleflunomide by the U.S Food and Drug Administration, thereby injuring the class. On November 20, 2008 a juryrejected plaintiffs’ allegations that sanofi-aventis had inappropriately filed the Citizen Petition. The plaintiffshave requested the judge to reconsider the jury’s verdict.
• Lovenox® Antitrust Litigation
On August 2008, Eisai Inc. (“Eisai”) brought suit against sanofi-aventis U.S., LLC and sanofi-aventis U.S.,Inc. in the United States District Court for the District of New Jersey (Newark) alleging that certain contractingpractices for Lovenox® violate federal and state antitrust laws. In October 2008, the defendants filed a motion todismiss Eisai’s complaint.
d) Other litigation and arbitration
• Hoechst Shareholder Litigation
On December 21, 2004 the extraordinary General Meeting of sanofi-aventis’ German subsidiary HoechstAG (now Hoechst GmbH) approved a resolution transferring the shares held by minority shareholders to sanofi-aventis for compensation of €56.50 per share. Certain minority shareholders filed claims contesting the validityof the resolution, preventing its registration with the commercial register of Frankfurt and entry into effect.
On July 12, 2005, this litigation was settled. As a consequence, the squeeze out has been registered in thecommercial register making sanofi-aventis the sole shareholder of Hoechst AG.
F-89

NOTES TO THE CONSOLIDATED FINANCIAL STATEMENTS—(Continued)Year ended December 31, 2008
According to the settlement agreement the cash compensation has been increased to €63.80 per share. Thecash compensation was further increased by another €1.20 per share for those outstanding shareholders who interalia waived in advance any increase of the cash compensation obtained through a judicial appraisal proceeding(Spruchverfahren) brought by former minority shareholders. Subsequently, a number of former minorityshareholders of Hoechst initiated a judicial appraisal proceeding with the local Frankfurt court LandgerichtFrankfurt am Main contesting the amount of the cash compensation paid in the squeeze out. The amount soughthas not been specified. The proceedings are ongoing.
• Apotex Settlement Claim
Canada — On April 18, 2007, Apotex Inc. and Apotex Corporation filed a claim before Ontario Court ofJustice against sanofi-aventis, sanofi-aventis Inc, Bristol-Myers Squibb Company and Bristol-Myers SquibbSanofi Pharmaceuticals Holding Partnership, claiming the payment of $60 million, allegedly pursuant to theterms of the initial settlement agreement of March 2006 relating to the U.S. Plavix® patent litigation (described at“Patents — Plavix® Patent Litigation — United States”). Sanofi-aventis and BMS contested both the substanceand the admissibility of this claim. In January 2008, the Court determined that Apotex’s claim wasnon-admissible on the basis of the jurisdiction/forum non conveniens. Apotex’s appeal was denied in the lastquarter of 2008.
United States — On November 13, 2008 Apotex filed a complaint before a state court in New Jersey againstsanofi-aventis and BMS claiming the payment of a $60 million as break-up fee, pursuant to the terms of theinitial settlement agreement of March 2006 relating to the U.S. Plavix® patent litigation (see “Patents — Plavix®
Patent Litigation — United States”). Sanofi-aventis and BMS have removed the case to the U.S. District Courtfor the District of New Jersey, and Apotex subsequently filed a motion to remand the case back to New Jerseystate court.
• Zimulti® /Acomplia® (rimonabant) class action
In November 2007 a purported class action was filed in the United States District Court for the SouthernDistrict of New York on behalf of purchasers of sanofi-aventis shares. The complaint charges sanofi-aventis andcertain of its current and former officers and directors with violations of the Securities Exchange Act of 1934.The complaint alleges that defendants’ statements regarding rimonabant were materially false and misleadingwhen made because defendants allegedly concealed data concerning rimonabant’s propensity to causedepression. An amended complaint was filed by the plaintiffs on April 29, 2008. On June 30, 2008 sanofi-aventisfiled a response including a motion to dismiss the amended complaint, and hearings will be held in the first partof 2009.
• U.S. Gender discrimination
Certain female U.S. pharmaceutical sales representatives of sanofi-aventis brought a putative class actionlawsuit against sanofi-aventis U.S. LLC in the United States District Court for the Southern District of New Yorkalleging gender discrimination. The parties are currently engaged in discovery regarding the individual claims ofthe named plaintiffs and the question of whether the case can be properly certified as a class action.
e) Contingencies arising from certain Business Divestitures
Sanofi-aventis and its subsidiaries, Hoechst and Aventis Agriculture, divested a variety of mostly chemical,including agro-chemical, businesses as well as certain health product businesses in previous years. As a result ofthese divestitures, the Group is subject to a number of ongoing contractual and legal obligations regarding thestate of the sold businesses, their assets, and their liabilities.
F-90

NOTES TO THE CONSOLIDATED FINANCIAL STATEMENTS—(Continued)Year ended December 31, 2008
• Aventis Behring
The divestment of Aventis Behring and related protein therapies assets became effective on March 31, 2004.The purchase agreement contained customary representations and warranties running from sanofi-aventis asseller to CSL Limited as purchaser. Sanofi-aventis has indemnification obligations that generally expired onMarch 31, 2006 (the second anniversary of the Closing Date). However, some indemnification obligations havinga longer duration, remain in effect, for example: indemnification obligations relating to the due organization,capital stock and ownership of Aventis Behring Companies runs through March 31, 2014, environmentalindemnification through March 31, 2009, and product liability indemnification through March 31, 2019, subjectto extension for claims related to types of product liability notified before such date. Furthermore, for tax relatedissues, sanofi-aventis indemnification obligation covers all taxable periods that end on or before the Closing Dateand expires thirty days after the expiration of the applicable statute of limitations. In addition, theindemnification obligations relating to certain specified liabilities, including HIV liability, survive indefinitely.
Under the indemnification agreement, sanofi-aventis is generally obligated to indemnify, only to the extentindemnifiable, losses exceeding $10 million and up to a maximum aggregate amount of $300 million. Forenvironmental claims, the indemnification due by sanofi-aventis equals 90% of the indemnifiable losses. Productliability claims are generally treated separately, and the aggregate indemnification is capped at $500 million.Certain indemnification obligations, including those related to HIV liability, as well as tax claims, are not cappedin amount.
• Aventis CropScience
The sale by Aventis Agriculture and Hoechst (both predecessor companies of sanofi-aventis) of theiraggregate 76% participation in Aventis CropScience Holding (ACS) to Bayer and Bayer CropScience AG (BCS),the wholly owned subsidiary of Bayer which holds the ACS shares, was effective on June 3, 2002. The StockPurchase Agreement dated October 2, 2001 contained customary representations and warranties with respect tothe sold business as well as a number of indemnifications, in particular with respect to: environmental liabilities(the representations and warranties and the environmental indemnification are subject to a cap of €836 million,except for certain legal representations and warranties and specific environmental liabilities notably third-partysite claims (i) such as the natural resources damages (NRD) claim filed by the state of New Jersey against BCS in2007 in relation to the Factory Lane site and (ii) a remediation and NRD project underway in Portland, Oregon);taxes; certain legal proceedings; claims related to StarLink® corn; and certain pre-closing liabilities, in particular,product liability cases (which are subject to a cap of €418 million). There are various periods of limitationdepending upon the nature or subject of the indemnification claim. Further, Bayer and Bayer CropScience aresubject to a number of obligations regarding mitigation and cooperation.
Starting with a first settlement agreement signed in December 2005, Aventis Agriculture and Hoechst haveresolved a substantial number of disputes with Bayer and Bayer CropScience AG, including the termination ofarbitration proceedings, for an alleged breach of a financial statement-related representation contained in theStock Purchase Agreement, and numerous other warranty and indemnification claims asserted under the StockPurchase Agreement, including claims relating to certain environmental liabilities. A number of otheroutstanding claims remain unresolved.
LLRICE601 and LLRICE604 — U.S. Litigation: Bayer CropScience has sent sanofi-aventis notice ofpotential claims for indemnification under various provisions of the Stock Purchase Agreement. These potentialclaims relate to several class-action and individual complaints that have been filed since August 2006 by ricegrowers, millers, and distributors in U.S. state and federal courts against a number of current and formersubsidiaries (collectively the “CropScience Companies”) which were part of the Aventis CropScience group priorto Bayer’s acquisition of the ACS shares. Plaintiffs in these cases seek to recover damages, of an unspecifiedamount, in connection with the detection of trace amounts of the genetically modified rice called “Liberty Link®
Rice 601” (also known as “LLRICE601”) or “Liberty Link® Rice 604” (also known as “LLRICE604”) insamples of commercial long-grain rice. LLRICE601 and LLRICE604, each a variety of long grain rice
F-91
NOTES TO THE CONSOLIDATED FINANCIAL STATEMENTS—(Continued)Year ended December 31, 2008
genetically altered to resist Liberty® Herbicide, were grown in field tests in the United States from the years 1998to 2001. Plaintiffs assert a number of causes of action, alleging that the CropScience Companies failed to takeadequate measures to prevent cross-pollination or commingling of LLRICE601 and/or LLRICE604 withconventional rice.
Sanofi-aventis denies direct or indirect liability for these cases, and has so notified Bayer CropScience.
In a related development, the FDA has concluded that the presence of LLRICE601 in the food and feedsupply poses no safety concerns and on November 24, 2006, the United States Department of Agriculture(USDA) announced it would deregulate LLRICE601. With respect to LLRICE 604, the USDA announced inMarch 2007 that the PAT protein contained in LLRICE604 has a long history of safe use and is present in manyderegulated products. Further to an investigation regarding the causation chain that led to contamination, inOctober 2007 the USDA declined to pursue enforcement against Bayer CropScience.
• Aventis Animal Nutrition
Aventis Animal Nutrition S.A. and Aventis (both predecessor companies of sanofi-aventis) signed anagreement for the sale to Drakkar Holdings SA of the Aventis Animal Nutrition business effective in April 2002.The sale agreement contained customary representations and warranties. Sanofi-aventis’ indemnificationobligations ran through April 2004, except for environmental indemnification obligations (which run throughApril 2012), tax indemnification obligations (which run through the expiration of the applicable statutorylimitation period), and antitrust indemnification obligations (which extend indefinitely). The indemnificationundertakings are subject to an overall cap of €223 million, with a lower cap for certain environmental claims.Indemnification obligations for antitrust and tax claims are not capped.
• Messer Griesheim GmbH
Pursuant to an agreement dated December 30/31, 2000, Hoechst sold its 66.7% participation in the industrialgasses company Messer Griesheim GmbH. All purchaser claims under the representations and warranties of theagreement except those relating to tax and environmental matters were settled under an agreement entered into inJuly 2003. Tax and environmental claims are handled on an ongoing case by case basis.
• Celanese AG
The demerger of the specialty chemicals business to Celanese AG became effective on October 22, 1999.Under the demerger agreement between Hoechst and Celanese, Hoechst expressly excluded any representationsand warranties regarding the shares and assets demerged to Celanese. However, the following obligations ofHoechst are ongoing:
• While all obligations of Hoechst (i) resulting from public law or (ii) pursuant to current or futureenvironmental laws or (iii) vis-à-vis third parties pursuant to private or public law related tocontamination (as defined) have been transferred to Celanese in full, Hoechst split with Celanese anysuch cost incurred under these obligations applying a 2:1 ratio.
• To the extent Hoechst is liable to purchasers of certain of its divested businesses (as listed in thedemerger agreement), Celanese must indemnify Hoechst, as far as environmental damages areconcerned, for aggregate liabilities up to €250 million, liabilities exceeding such amount will be borneby Hoechst alone up to €750 million, and amounts exceeding €750 million will be borne 2/3 by Hoechstand 1/3 by Celanese without any further caps.
Compensation paid to third parties by Celanese under the aforementioned clause, through December 31,2008 was significantly below the first threshold of €250 million.
F-92

NOTES TO THE CONSOLIDATED FINANCIAL STATEMENTS—(Continued)Year ended December 31, 2008
• Rhodia
In connection with the initial public offering of Rhodia in 1998, Rhône-Poulenc (later named Aventis, towhich sanofi-aventis is the legal successor in interest) entered into an Environmental Indemnification Agreementwith Rhodia on May 26, 1998 under which, subject to certain conditions, Rhodia was entitled to claimindemnification from Aventis with respect to direct losses resulting from third party claims or public authorityinjunctions for environmental damages. Aventis and Rhodia entered into a settlement agreement on March 27,2003 under the terms of which the parties settled all environmental claims in connection with the EnvironmentalIndemnification Agreement. Nothwithstanding this settlement agreement, Rhodia and certain of its subsidiarieshave unsuccessfully sought indemnification for environmental costs in the United States and Brazil. In bothinstances, the suits were decided in sanofi-aventis’ favor with the court holding that the settlement precluded theindemnification claims. The decision in Brazil is currently under appeal by Rhodia.
On April 13, 2005 Rhodia initiated an ad hoc arbitration procedure seeking indemnification from sanofi-aventis for the financial consequences of the environmental liabilities and pension obligations that were allocatedto Rhodia through the various operations leading to the formation of Rhodia in 1997, amounting respectively to€125 million and €531 million. Rhodia additionally sought indemnification for future costs related to transferredenvironmental liabilities and coverage of all costs necessary to fully fund the transfer of pension liabilities out ofRhodia’s accounts. The arbitral tribunal has determined that it has no jurisdiction to rule on pension claims andthat Rhodia’s environmental claims are without merit. In May 2008, the Paris Court of Appeals rejected theaction initiated by Rhodia to nullify the 2006 arbitral award in favor of sanofi-aventis.
On July 10, 2007 sanofi-aventis was served with a civil suit brought by Rhodia before the Paris CommercialCourts seeking indemnification on the same grounds as described above. The relief sought in the ParisCommercial Court is identical to the relief claimed in Rhodia’s arbitration demand. The procedure is stillpending.
• Rhodia Shareholder Litigation
In January 2004, two minority shareholders of Rhodia and their respective investment vehicles filed twoclaims before the Commercial Court of Paris (Tribunal de Commerce de Paris) against Aventis, to which sanofi-aventis is successor in interest, together with other defendants including former directors and statutory auditors ofRhodia from the time of the alleged events. The claimants seek a judgment holding the defendants collectivelyliable for alleged management errors and for alleged publication of misstatements between 1999 and 2002 andinter alia regarding Rhodia’s acquisition of the companies Albright & Wilson and ChiRex. These shareholdersseek a finding of joint and several liability for damages to be awarded to Rhodia in an amount of €925 million foralleged harm to the Company (a derivative action), as well as personal claims of €4.3 million and €125.4 millionfor their own alleged individual losses. Sanofi-aventis contests both the substance and the admissibility of theseclaims.
Sanofi-aventis is also aware of three criminal complaints filed in France by the same plaintiffs and of acriminal investigation order issued by the Paris public prosecutor following the submission of the report issuedby the Autorité des marchés financiers regarding Rhodia’s financial communications. In 2006, the CommercialCourt of Paris accepted sanofi-aventis and the other defendants’ motion to stay the civil litigation pending theconclusion of the criminal proceedings. The plaintiffs’ appeals against this decision, first before the Court ofAppeals, and then before the Cour de cassation (the French Supreme Court), were both rejected.
• Clariant — Specialty Chemicals Business
Hoechst conveyed its specialty chemicals business to Clariant AG pursuant to a 1997 agreement. WhileClariant has undertaken to indemnify Hoechst for all costs incurred for environmental matters relating topurchased sites, certain ongoing indemnification obligations of Hoechst for environmental matters in favor ofClariant can be summarized as follows:
• Costs for environmental matters at the sites taken over directly or indirectly by Clariant and notattributable to a specific activity of Hoechst or of a third party not related to the business transferred to
F-93

NOTES TO THE CONSOLIDATED FINANCIAL STATEMENTS—(Continued)Year ended December 31, 2008
Clariant are to be borne by Clariant to the extent the accumulated costs since the closing in any year donot exceed a threshold amount for the then current year. The threshold increases annually fromapproximately €102 million in 1997/98 to approximately €816 million in the fifteenth year after theclosing. Only the amount by which Clariant’s accumulated costs exceed the then-current year’sthreshold must be compensated by Hoechst. No payments have yet become due under this rule.
• Hoechst must indemnify Clariant indefinitely (i) for costs attributable to four defined waste deposit sitesin Germany which are located outside the sites taken over by Clariant (to the extent exceeding anindexed amount of approximately €20.5 million), (ii) for costs from certain locally concentratedpollutions in the sites taken over by Clariant but not caused by specialty chemicals activities in the past,and (iii) for 75% of the costs relating to a specific waste deposit site in Frankfurt, Germany.
• InfraServ Höchst
By the Asset Contribution Agreement dated December 19/20, 1996 as amended in 1997, Hoechstcontributed all land, buildings, and related assets of the Hoechst site at Frankfurt-Höchst to InfraServ HöchstGmbH & Co KG. InfraServ Höchst undertook to indemnify Hoechst against environmental liabilities at theHöchst site and with respect to certain landfills. As consideration for the indemnification undertaking, Hoechsttransferred to InfraServ approximately €57 million to fund reserves. In 1997, Hoechst also agreed it wouldreimburse current and future InfraServ Höchst environmental expenses up to €143 million. As a former owner ofthe land and as a former user of the landfills Hoechst may ultimately be liable for costs of remedial action inexcess of this amount.
• DyStar
Hoechst held a 35% interest in the DyStar group of companies, whose business is the manufacturing andmarketing of textile dyestuffs. The other shareholders were Bayer Chemicals AG (35%) and BASF AG (30%).Hoechst, as well as Bayer and BASF, sold their interests to an investment vehicle of Platinum Equities LLP inAugust 2004. In addition to customary representations and warranties, the selling shareholders agreed to aguarantee on certain minimum purchases by the sellers from the DyStar group (including a certain minimumreturn to DyStar) within a period of four years following the closing. Various purchasers have submitted claimsrelated to environmental and tax matters, as well as under the minimum purchase guarantee are handled on anongoing case by case basis.
• Albemarle Arbitration
In 1992, Rhône-Poulenc S.A. (a predecessor company of sanofi-aventis) signed with Ethyl OverseasDevelopment, now known as Albemarle, a Stock Purchase Agreement by which Rhône-Poulenc sold 100% ofthe share capital of Potasse et Produits Chimiques S.A. (PPC) to Ethyl. Under the terms of the Stock PurchaseAgreement, Rhône-Poulenc agreed to indemnify Albemarle for and to hold it harmless from any claims, losses,damages, costs or any other present and prospective liabilities arising out of soil and/or groundwatercontamination at the site of the Thann facility. Albemarle sought indemnification by sanofi-aventis forenvironmental expenses incurred, citing the Stock Purchase Agreement. Following a dispute concerning itsclaims to indemnification, Albemarle initiated arbitration proceedings in the International Chamber of Commercein Paris against sanofi-aventis.
In August 2006, Albemarle Corporation sold Albemarle France (the party to the above mentionedarbitration) to the German company, International Chemical Investors. In April 2008, sanofi-aventis andInternational Chemical Investors agreed to settle the ongoing dispute for an amount of €19 million to be paid bysanofi-aventis. This settlement was approved by the arbitral tribunal on June 4, 2008 and the correspondingamount was paid by sanofi-aventis to International Chemical Investors on June 12, 2008. This dispute is nowconsidered as closed.
F-94
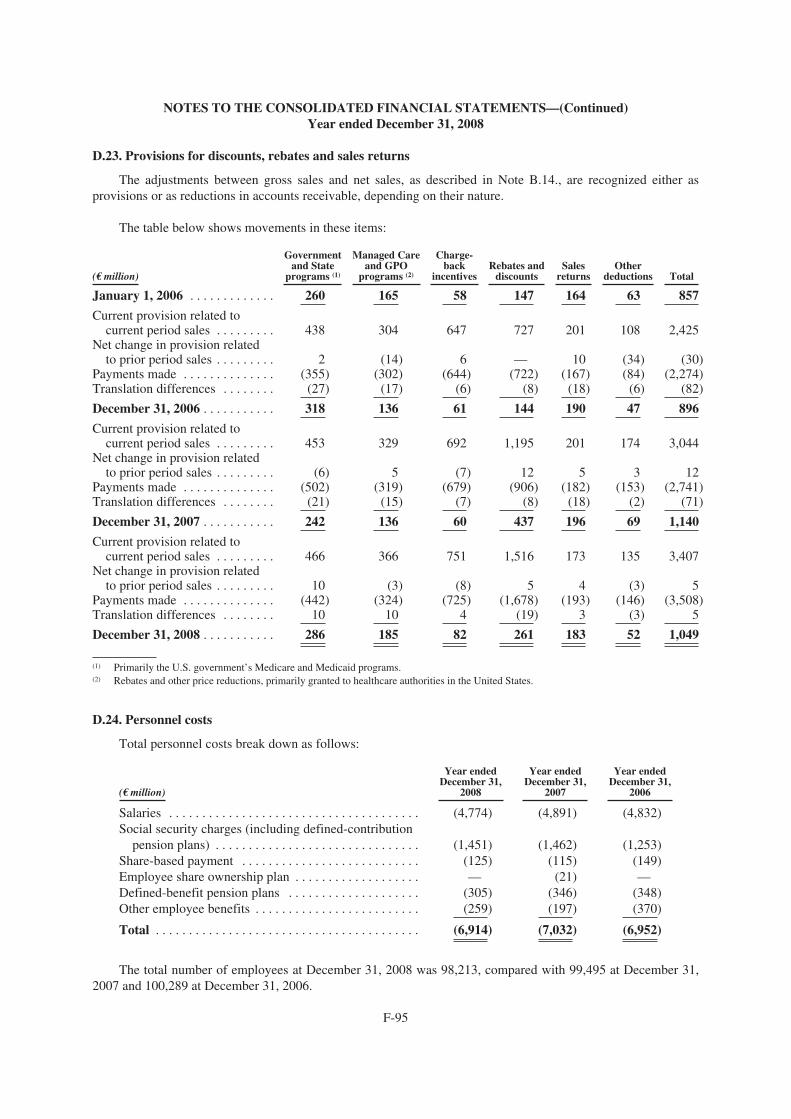
NOTES TO THE CONSOLIDATED FINANCIAL STATEMENTS—(Continued)Year ended December 31, 2008
D.23. Provisions for discounts, rebates and sales returns
The adjustments between gross sales and net sales, as described in Note B.14., are recognized either asprovisions or as reductions in accounts receivable, depending on their nature.
The table below shows movements in these items:
(€ million)
Governmentand State
programs (1)
Managed Careand GPO
programs (2)
Charge-back
incentivesRebates and
discountsSales
returnsOther
deductions Total
January 1, 2006 . . . . . . . . . . . . . 260 165 58 147 164 63 857
Current provision related tocurrent period sales . . . . . . . . . 438 304 647 727 201 108 2,425
Net change in provision relatedto prior period sales . . . . . . . . . 2 (14) 6 — 10 (34) (30)
Payments made . . . . . . . . . . . . . . (355) (302) (644) (722) (167) (84) (2,274)Translation differences . . . . . . . . (27) (17) (6) (8) (18) (6) (82)
December 31, 2006 . . . . . . . . . . . 318 136 61 144 190 47 896
Current provision related tocurrent period sales . . . . . . . . . 453 329 692 1,195 201 174 3,044
Net change in provision relatedto prior period sales . . . . . . . . . (6) 5 (7) 12 5 3 12
Payments made . . . . . . . . . . . . . . (502) (319) (679) (906) (182) (153) (2,741)Translation differences . . . . . . . . (21) (15) (7) (8) (18) (2) (71)
December 31, 2007 . . . . . . . . . . . 242 136 60 437 196 69 1,140
Current provision related tocurrent period sales . . . . . . . . . 466 366 751 1,516 173 135 3,407
Net change in provision relatedto prior period sales . . . . . . . . . 10 (3) (8) 5 4 (3) 5
Payments made . . . . . . . . . . . . . . (442) (324) (725) (1,678) (193) (146) (3,508)Translation differences . . . . . . . .
December 31, 2008 . . . . . . . . . . .
10
286
10
185
4
82
(19)
261
3
183
(3)
52
5
1,049
(1) Primarily the U.S. government’s Medicare and Medicaid programs.(2) Rebates and other price reductions, primarily granted to healthcare authorities in the United States.
D.24. Personnel costs
Total personnel costs break down as follows:
(€ million)
Year endedDecember 31,
2008
Year endedDecember 31,
2007
Year endedDecember 31,
2006
Salaries . . . . . . . . . . . . . . . . . . . . . . . . . . . . . . . . . . . . . . (4,774) (4,891) (4,832)Social security charges (including defined-contribution
pension plans) . . . . . . . . . . . . . . . . . . . . . . . . . . . . . . . (1,451) (1,462) (1,253)Share-based payment . . . . . . . . . . . . . . . . . . . . . . . . . . . (125) (115) (149)Employee share ownership plan . . . . . . . . . . . . . . . . . . . — (21) —Defined-benefit pension plans . . . . . . . . . . . . . . . . . . . . (305) (346) (348)Other employee benefits . . . . . . . . . . . . . . . . . . . . . . . . . (259) (197) (370)
Total . . . . . . . . . . . . . . . . . . . . . . . . . . . . . . . . . . . . . . . . (6,914) (7,032) (6,952)
The total number of employees at December 31, 2008 was 98,213, compared with 99,495 at December 31,2007 and 100,289 at December 31, 2006.
F-95

NOTES TO THE CONSOLIDATED FINANCIAL STATEMENTS—(Continued)Year ended December 31, 2008
Employee numbers by function at December 31, 2008, 2007 and 2006 were as follows:
December 31, December 31, December 31,2008 2007 2006
Production . . . . . . . . . . . . . . . . . . . . . . . . . . . . . . . . . . . . . 31,903 31,292 31,735Research and development . . . . . . . . . . . . . . . . . . . . . . . . 18,976 19,310 18,981Sales force . . . . . . . . . . . . . . . . . . . . . . . . . . . . . . . . . . . . . 33,507 35,115 35,902Marketing and support functions . . . . . . . . . . . . . . . . . . . . 13,827 13,778 13,671
Total . . . . . . . . . . . . . . . . . . . . . . . . . . . . . . . . . . . . . . . . . 98,213 99,495 100,289
D.25. Other operating income
Other operating income totaled €556 million in 2008, against €522 million in 2007 and €391 million in2006. This item includes income arising from alliance agreements in pharmaceuticals (€472 million in 2008,versus €323 million in 2007 and €382 million in 2006), in particular the alliance with Procter & GamblePharmaceuticals for the development and marketing of Actonel® on a worldwide basis, and the Group’s share ofprofits from Copaxone® from April 1, 2008, the date on which the marketing of this product in the United Statesand Canada reverted to Teva Pharmaceutical Industries. It also includes net foreign exchange losses on operatingitems of €94 million in 2008, €33 million in 2007 and €13 million in 2006. Finally, it includes €24 million ofproceeds from disposals related to ongoing operations (versus €60 million in 2007).
D.26. Other operating expenses
Other operating expenses were €353 million in 2008, compared with €307 million in 2007 and €116 millionin 2006. This item includes shares of profits due to alliance partners (other than BMS and Procter & Gamble)under product marketing agreements, primarily in Europe, Japan, the United States and Canada (€178 million in2008, versus €136 million in 2007 and €116 million in 2006). The 2007 figure also includes an expense of€61 million arising from the signature of agreements on welfare and healthcare obligations in France for retireesand their beneficiaries.
In 2008, this item includes an expense of €113 million arising from changes to estimates of futureexpenditure on environmental risks at sites formerly operated by sanofi-aventis or sold to third parties (see noteD.22. (e), “Contingencies arising from certain Business Divestitures”). Reversals of these provisions areclassified in Other operating income (see Note D.25.).
D.27. Restructuring costs
Restructuring costs recognized in 2008 amounted to €585 million (€137 million in 2007 and €274 million in2006), and break down as follows:
(€ million) 2008 2007 2006
Employee-related expenses . . . . . . . . . . . . . . . . . . . . . . . . . . . . . . . . . . 498 137 219Compensation for early termination of contracts (other than contracts
of employment) . . . . . . . . . . . . . . . . . . . . . . . . . . . . . . . . . . . . . . . . . — — 16Abandonment of software . . . . . . . . . . . . . . . . . . . . . . . . . . . . . . . . . . . — — 3Other restructuring costs . . . . . . . . . . . . . . . . . . . . . . . . . . . . . . . . . . . .
Total . . . . . . . . . . . . . . . . . . . . . . . . . . . . . . . . . . . . . . . . . . . . . . . . . . .
87
585
—
137
36
274
Year endedDecember 31,
Year endedDecember 31,
Year endedDecember 31,
In 2008, restructuring costs related primarily to adaptation of industrial facilities in France and to measurestaken by sanofi-aventis to adjust its sales force to reflect changing pharmaceutical market conditions in variousEuropean countries — mainly France, Italy, Spain and Portugal — and in the United States.
F-96

NOTES TO THE CONSOLIDATED FINANCIAL STATEMENTS—(Continued)Year ended December 31, 2008
In 2007, restructuring costs related to the cost of measures taken by sanofi-aventis in response to changes inthe economic and regulatory environment in France and Germany.
In 2006, the principal item recorded on this line was the cost of measures taken by sanofi-aventis inresponse to the changing economic environment in Europe, mainly France and Germany (€176 million). Inaddition, €98 million of restructuring costs associated with the acquisition of Aventis were recognized in 2006.
D.28. Gains and losses on disposals, and litigation
In 2008, this item includes €76 million of reversals of provisions in respect of litigation in the United Stateson pricing and market practices (see Note D.22. (c), “Government Investigations, Competition Law andRegulatory Claims”).
Sanofi-aventis made no major divestments in the years ended December 31, 2008 or 2007.
In 2006, this line mainly comprised the €460 million gain on the sale of the Exubera® brand, and the€45 million gain on the sale of the residual interest in the Drakkar animal nutrition business.
D.29. Financial income and expenses
Financial income and expenses break down as follows:
(€ million) 2008 2007 2006
Cost of debt (1) . . . . . . . . . . . . . . . . . . . . . . . . . . . . . . . . . . . . . . . . . . . . (315) (297) (356)Interest income . . . . . . . . . . . . . . . . . . . . . . . . . . . . . . . . . . . . . . . . . . . 132 88 81
Cost of debt, net of cash and cash equivalents . . . . . . . . . . . . . . . . . (183) (209) (275)
Foreign exchange gains (non-operating) . . . . . . . . . . . . . . . . . . . . . . . (74) 87 68Fair value gains/(losses) on other derivatives . . . . . . . . . . . . . . . . . . . . — 4 68Unwinding of discounting of provisions (2) . . . . . . . . . . . . . . . . . . . . . (37) (38) (35)Net gains/(losses) on disposals of financial assets (3) . . . . . . . . . . . . . . 41 7 108Impairment losses on financial assets, net of reversals (4) . . . . . . . . . . (8) (14) (38)Other items . . . . . . . . . . . . . . . . . . . . . . . . . . . . . . . . . . . . . . . . . . . . . . 29 24 24
Net financial income/(expenses) . . . . . . . . . . . . . . . . . . . . . . . . . . . . . (232) (139) (80)
comprising: Financial expenses . . . . . . . . . . . . . . . . . . . . . . . . . . . . . . (335) (329) (455)Financial income . . . . . . . . . . . . . . . . . . . . . . . . . . . . . . . 103 190 375
Year endedDecember 31,
Year endedDecember 31,
Year endedDecember 31,
(1) Includes gains/losses on interest rate derivatives used to hedge debt: €2 million loss in 2008, €13 million gain in 2007, €35 million gainin 2006.
(2) Excluding provisions for pensions and similar obligations.(3) Includes €38 million from the sale of the investment in Millennium in 2008, and €101 million from the sale of the investment in Rhodia
in 2006 (see Note D.7.).(4) Primarily available-for-sale financial assets.
The impact of the ineffective portion of hedging relationships was not material in 2008, 2007 or 2006.
F-97
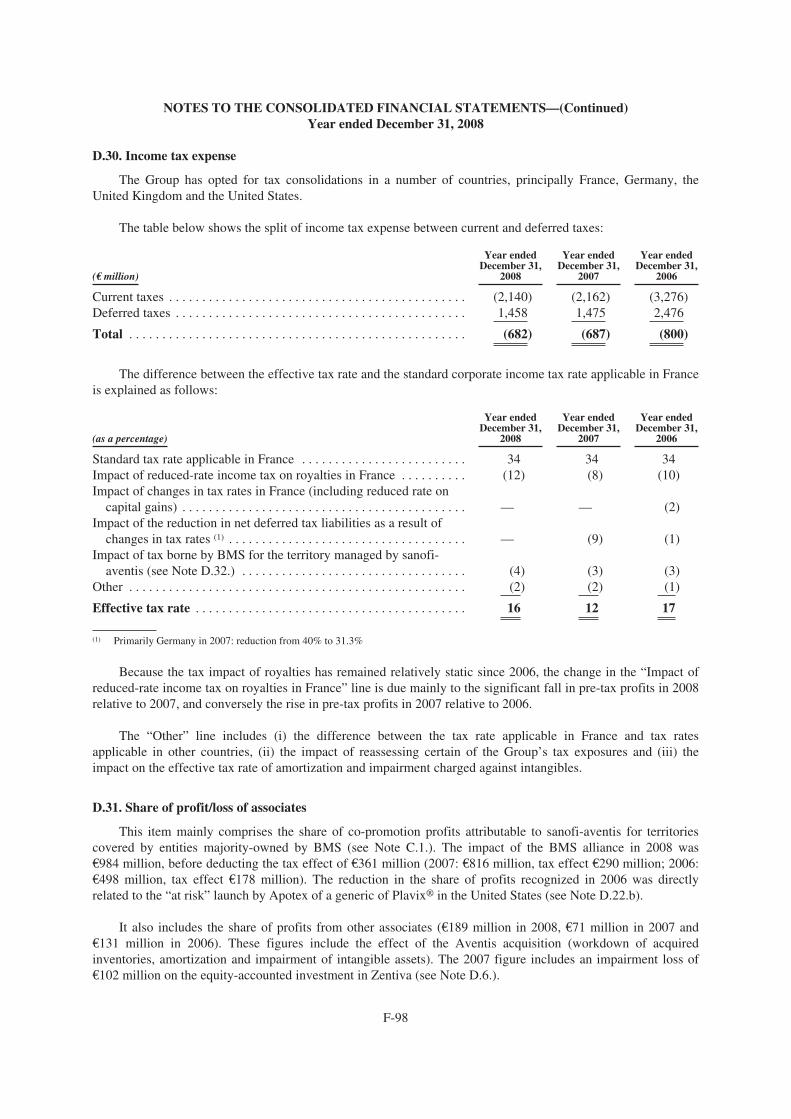
NOTES TO THE CONSOLIDATED FINANCIAL STATEMENTS—(Continued)Year ended December 31, 2008
D.30. Income tax expense
The Group has opted for tax consolidations in a number of countries, principally France, Germany, theUnited Kingdom and the United States.
The table below shows the split of income tax expense between current and deferred taxes:
(€ million) 2008 2007 2006
Current taxes . . . . . . . . . . . . . . . . . . . . . . . . . . . . . . . . . . . . . . . . . . . . . (2,140) (2,162) (3,276)Deferred taxes . . . . . . . . . . . . . . . . . . . . . . . . . . . . . . . . . . . . . . . . . . . . 1,458 1,475 2,476
Total . . . . . . . . . . . . . . . . . . . . . . . . . . . . . . . . . . . . . . . . . . . . . . . . . . . (682) (687) (800)
Year endedDecember 31,
Year endedDecember 31,
Year endedDecember 31,
The difference between the effective tax rate and the standard corporate income tax rate applicable in Franceis explained as follows:
(as a percentage) 2008 2007 2006
Standard tax rate applicable in France . . . . . . . . . . . . . . . . . . . . . . . . . 34 34 34Impact of reduced-rate income tax on royalties in France . . . . . . . . . . (12) (8) (10)Impact of changes in tax rates in France (including reduced rate on
capital gains) . . . . . . . . . . . . . . . . . . . . . . . . . . . . . . . . . . . . . . . . . . . — — (2)Impact of the reduction in net deferred tax liabilities as a result of
changes in tax rates (1) . . . . . . . . . . . . . . . . . . . . . . . . . . . . . . . . . . . . — (9) (1)Impact of tax borne by BMS for the territory managed by sanofi-
aventis (see Note D.32.) . . . . . . . . . . . . . . . . . . . . . . . . . . . . . . . . . . (4) (3) (3)Other . . . . . . . . . . . . . . . . . . . . . . . . . . . . . . . . . . . . . . . . . . . . . . . . . . . (2) (2) (1)
Effective tax rate . . . . . . . . . . . . . . . . . . . . . . . . . . . . . . . . . . . . . . . . . 16 12 17
Year endedDecember 31,
Year endedDecember 31,
Year endedDecember 31,
(1) Primarily Germany in 2007: reduction from 40% to 31.3%
Because the tax impact of royalties has remained relatively static since 2006, the change in the “Impact ofreduced-rate income tax on royalties in France” line is due mainly to the significant fall in pre-tax profits in 2008relative to 2007, and conversely the rise in pre-tax profits in 2007 relative to 2006.
The “Other” line includes (i) the difference between the tax rate applicable in France and tax ratesapplicable in other countries, (ii) the impact of reassessing certain of the Group’s tax exposures and (iii) theimpact on the effective tax rate of amortization and impairment charged against intangibles.
D.31. Share of profit/loss of associates
This item mainly comprises the share of co-promotion profits attributable to sanofi-aventis for territoriescovered by entities majority-owned by BMS (see Note C.1.). The impact of the BMS alliance in 2008 was€984 million, before deducting the tax effect of €361 million (2007: €816 million, tax effect €290 million; 2006:€498 million, tax effect €178 million). The reduction in the share of profits recognized in 2006 was directlyrelated to the “at risk” launch by Apotex of a generic of Plavix® in the United States (see Note D.22.b).
It also includes the share of profits from other associates (€189 million in 2008, €71 million in 2007 and€131 million in 2006). These figures include the effect of the Aventis acquisition (workdown of acquiredinventories, amortization and impairment of intangible assets). The 2007 figure includes an impairment loss of€102 million on the equity-accounted investment in Zentiva (see Note D.6.).
F-98

NOTES TO THE CONSOLIDATED FINANCIAL STATEMENTS—(Continued)Year ended December 31, 2008
D.32. Net income attributable to minority interests
This line includes the share of co-promotion profits attributable to BMS for territories covered by entitiesmajority-owned by sanofi-aventis (see Note C.1.). The amount involved was €422 million in 2008, €403 millionin 2007 and €375 million in 2006. There is no tax effect, because BMS receives its share before tax.
It also includes the share of net income attributable to the other minority shareholders (€19 million in 2008,€16 million in 2007 and €18 million in 2006).
D.33. Related party transactions
The principal related parties of sanofi-aventis are companies over which the Group has significant influence,as well as joint ventures, key management personnel, and principal shareholders.
The Group has not entered into any transactions with any key management personnel. Financial relationswith the Group’s principal shareholders, in particular the Total group, fall within the ordinary course of businessand were immaterial as of December 31, 2008, December 31, 2007 and December 31, 2006.
Details of transactions with related companies are disclosed in Note D.6.
Key management personnel comprise corporate officers (including 4 directors covered by supplementarypension plans, see Item 6.B.) and the members of the Management Committee (22 members during 2008, 21members during 2007 and 23 members during 2006).
The table below shows, by type, the compensation paid to key management personnel:
(€ million) 2008 2007 2006
Short-term benefits (1) . . . . . . . . . . . . . . . . . . . . . . . . . . . 37 30 27Post-employment benefits (2) . . . . . . . . . . . . . . . . . . . . . . 16 14 13Share-based payment (3) . . . . . . . . . . . . . . . .
Total recognized in the income statement
. . . . . . . . .
. . . . . . . . .
11
64
12
56
12
52
Year endedDecember 31,
Year endedDecember 31,
Year endedDecember 31,
(1) Compensation, employer’s social security contributions, directors’ attendance fees, and any termination benefits.(2) Estimated pension cost, calculated in accordance with IAS 19.(3) Stock option expense computed using the Black-Scholes model, plus expense relating to the discount arising under the 2007 and
2005 employee share ownership plans
The aggregate amount of supplementary pension obligations to corporate officers and key managementpersonnel was €183 million at December 31, 2008, versus €163 million at December 31, 2007 and €172 millionat December 31, 2006. The aggregate amount of lump-sum retirement benefits payable to corporate officers andkey management personnel was €10 million at December 31, 2008, versus €12 million euros at December 31,2007 and December 31, 2006.
D.34. Split of net sales
Credit risk is the risk that customers (wholesalers, distributors, pharmacies, hospitals, clinics or governmentagencies) may fail to pay their debts. The Group manages credit risk by pre-vetting customers in order to setcredit limits and risk levels and asking for guarantees where necessary, performing controls, and monitoringqualitative and quantitative indicators of accounts receivable balances such as the period of credit taken andoverdue payments.
F-99

NOTES TO THE CONSOLIDATED FINANCIAL STATEMENTS—(Continued)Year ended December 31, 2008
Customer credit risk also arises as a result of the concentration of the Group’s sales with its largestcustomers, in particular certain wholesalers in the United States. The Group’s three largest customers accountedrespectively for 8.7%, 8.3% and 7.7% of gross sales in 2008.
D.35. Segment information
D.35.1. Business segments
The Group has two business segments: Pharmaceuticals and Vaccines. Investments in all associates andjoint ventures are included in the Pharmaceuticals segment with one principal exception: the Sanofi Pasteur MSDjoint venture, which is included in the Vaccines segment.
Adjusted net income
Adjusted net income, reported in segment information, is an internal performance indicator defined as netincome attributable to equity holders of the Company, adjusted for the material impacts of the application ofpurchase accounting to acquisitions (primarily the acquisition of Aventis) and for certain restructuring costsassociated with acquisitions.
Management uses adjusted net income as an internal performance indicator, as a significant factor indetermining variable compensation, and as a basis for determining dividend policy.
The main adjustments between net income attributable to equity holders of the Company and adjusted netincome are:
• elimination of expenses arising on the workdown of acquired inventories remeasured at fair value, netof tax;
• elimination of expenses arising on amortization and impairment of intangible assets acquired inbusiness combinations (acquired in-process R&D and acquired product rights), net of tax (portionattributable to equity holders of the Company);
• elimination of expenses arising from the impact of acquisitions on associates (workdown of acquiredinventories, amortization and impairment of intangible assets, and impairment of goodwill);
• elimination of any impairment of goodwill.
Sanofi-aventis also excludes from adjusted net income integration and restructuring costs (net of tax)incurred specifically in connection with acquisitions.
F-100
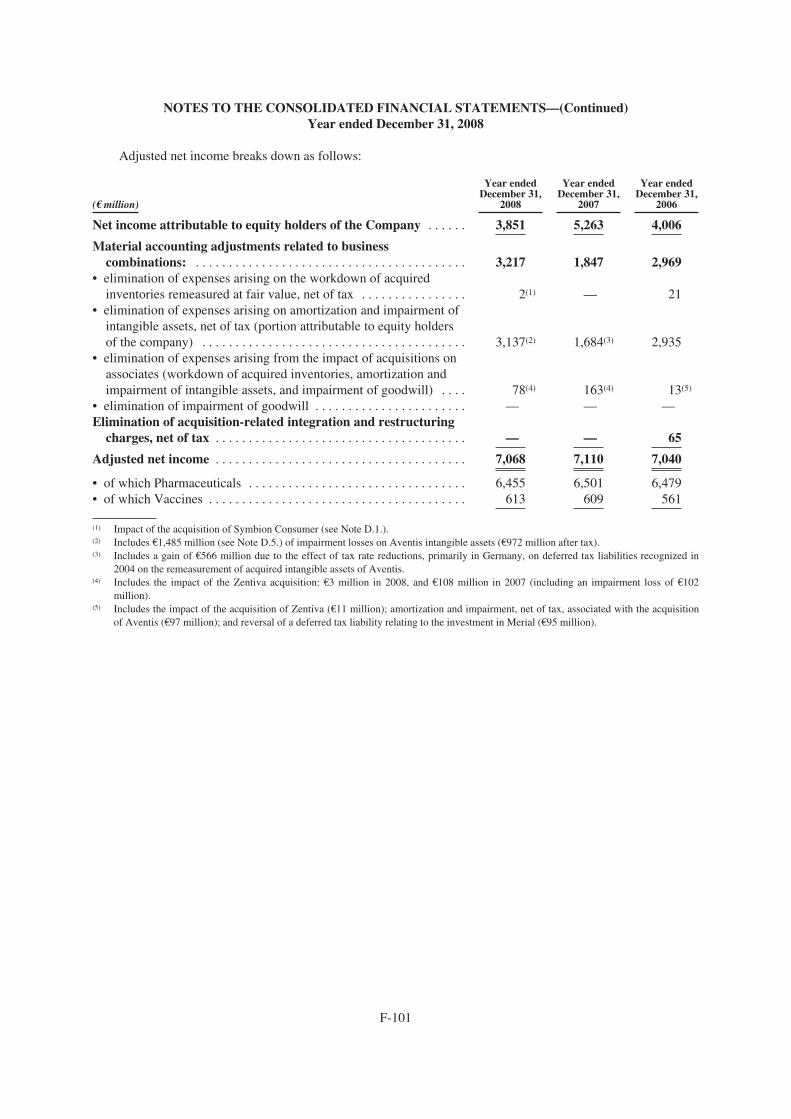
NOTES TO THE CONSOLIDATED FINANCIAL STATEMENTS—(Continued)Year ended December 31, 2008
Adjusted net income breaks down as follows:
(€ million) 2008 2007 2006
Net income attributable to equity holders of the Company . . . . . . 3,851 5,263 4,006
Material accounting adjustments related to businesscombinations: . . . . . . . . . . . . . . . . . . . . . . . . . . . . . . . . . . . . . . . . . 3,217 1,847 2,969
• elimination of expenses arising on the workdown of acquiredinventories remeasured at fair value, net of tax . . . . . . . . . . . . . . . . 2(1) — 21
• elimination of expenses arising on amortization and impairment ofintangible assets, net of tax (portion attributable to equity holdersof the company) . . . . . . . . . . . . . . . . . . . . . . . . . . . . . . . . . . . . . . . . 3,137(2) 1,684(3) 2,935
• elimination of expenses arising from the impact of acquisitions onassociates (workdown of acquired inventories, amortization andimpairment of intangible assets, and impairment of goodwill) . . . . 78(4) 163(4) 13(5)
• elimination of impairment of goodwill . . . . . . . . . . . . . . . . . . . . . . . — — —Elimination of acquisition-related integration and restructuring
charges, net of tax . . . . . . . . . . . . . . . . . . . . . . . . . . . . . . . . . . . . . . — — 65
Adjusted net income . . . . . . . . . . . . . . . . . . . . . . . . . . . . . . . . . . . . . . 7,068 7,110 7,040
• of which Pharmaceuticals . . . . . . . . . . . . . . . . . . . . . . . . . . . . . . . . . 6,455 6,501 6,479• of which Vaccines . . . . . . . . . . . . . . . . . . . . . . . . . . . . . . . . . . . . . . . 613 609 561
Year endedDecember 31,
Year endedDecember 31,
Year endedDecember 31,
(1) Impact of the acquisition of Symbion Consumer (see Note D.1.).(2) Includes €1,485 million (see Note D.5.) of impairment losses on Aventis intangible assets (€972 million after tax).(3) Includes a gain of €566 million due to the effect of tax rate reductions, primarily in Germany, on deferred tax liabilities recognized in
2004 on the remeasurement of acquired intangible assets of Aventis.(4) Includes the impact of the Zentiva acquisition: €3 million in 2008, and €108 million in 2007 (including an impairment loss of €102
million).(5) Includes the impact of the acquisition of Zentiva (€11 million); amortization and impairment, net of tax, associated with the acquisition
of Aventis (€97 million); and reversal of a deferred tax liability relating to the investment in Merial (€95 million).
F-101

NOTES TO THE CONSOLIDATED FINANCIAL STATEMENTS—(Continued)Year ended December 31, 2008
Income statement information by business segment
Net sales of sanofi-aventis comprise net sales generated by the Pharmaceuticals segment and net salesgenerated by the Vaccines segment. The table below shows net sales of the top 15 products of thePharmaceuticals segment:
Year ended December 31,
(€ million)
Product Indication 2008 2007 2006
Lovenox® . . . . . . . . . . . . . . . . . . . . . . . Thrombosis 2,738 2,612 2,435Plavix® . . . . . . . . . . . . . . . . . . . . . . . . . Atherothrombosis 2,616 2,424 2,229Lantus® . . . . . . . . . . . . . . . . . . . . . . . . . Diabetes 2,450 2,031 1,666Taxotere® . . . . . . . . . . . . . . . . . . . . . . . Breast cancer, lung cancer, prostate cancer,
stomach cancer, head & neck cancer 2,033 1,874 1,752Eloxatine® . . . . . . . . . . . . . . . . . . . . . . . Colorectal cancer 1,348 1,521 1,693Aprovel®/CoAprovel® . . . . . . . . . . . . . Hypertension 1,202 1,080 1,015Stilnox®/Ambien®/Myslee® . . . . . . . . . Insomnia 829 1,250 2,026Allegra® . . . . . . . . . . . . . . . . . . . . . . . . Allergic rhinitis, urticaria 688 706 688Copaxone® . . . . . . . . . . . . . . . . . . . . . . Multiple sclerosis 622 1,177 1,069Tritace® . . . . . . . . . . . . . . . . . . . . . . . . . Hypertension, congestive heart failure
after myocardial infarction 513 741 977Amaryl® . . . . . . . . . . . . . . . . . . . . . . . . Diabetes 387 392 451Xatral® . . . . . . . . . . . . . . . . . . . . . . . . . Benign prostatic hyperplasia 331 333 353Actonel® . . . . . . . . . . . . . . . . . . . . . . . . Osteoporosis 330 320 351Depakine® . . . . . . . . . . . . . . . . . . . . . . . Epilepsy 329 316 301Nasacort® . . . . . . . . . . . . . . . . . . . . . . . Allergic rhinitis 241 294 283
Sub-total: top 15 products . . . . . . . . . . . . . . . . . . . . . . . . . . . . . . . . . . . . . . . . . . . . . . 16,657 17,071 17,289
Other products . . . . . . . . . . . . . . . . . . . . . . . . . . . . . . . . . . . . . . . . . . . . . . . . . . . . . . . . 8,050 8,203 8,551
Total: Pharmaceuticals segment . . . . . . . . . . . . . . . . . . . . . . . . . . . . . . . . . . . . . . . . . 24,707 25,274 25,840
Net sales by range of products recorded for the Vaccines segment are shown below:
Year ended December 31,
(€ million) 2008 2007 2006
Pediatric Combination and Poliomyelitis Vaccines . . . . . . . . . . . . . . . . . . . . . . . . . . . . . . . 768 660 633Influenza Vaccines* . . . . . . . . . . . . . . . . . . . . . . . . . . . . . . . . . . . . . . . . . . . . . . . . . . . . . . . 736 766 835Meningitis/Pneumonia Vaccines . . . . . . . . . . . . . . . . . . . . . . . . . . . . . . . . . . . . . . . . . . . . . 472 482 310Adult and Adolescent Booster Vaccines . . . . . . . . . . . . . . . . . . . . . . . . . . . . . . . . . . . . . . . 399 402 337Travel and Endemic Vaccines . . . . . . . . . . . . . . . . . . . . . . . . . . . . . . . . . . . . . . . . . . . . . . . 309 327 284Other Vaccines . . . . . . . . . . . . . . . . . . . . . . . . . . . . . . . . . . . . . . . . . . . . . . . . . . . . . . . . . . .
Total: Vaccines segment . . . . . . . . . . . . . . . . . . . . . . . . . . . . . . . . . . . . . . . . . . . . . . . . . .
177
2,861
141
2,778
134
2,533
* Seasonal and pandemic influenza vaccines.
F-102

NOTES TO THE CONSOLIDATED FINANCIAL STATEMENTS—(Continued)Year ended December 31, 2008
The table below shows the principal income statement indicators by business segment:
Year ended December 31, 2008 Year ended December 31, 2007 Year ended December 31, 2006
(€ million) ceuticals Vaccines consolidated ceuticals Vaccines consolidated ceuticals Vaccines consolidated
Net sales . . . . . . . . . . . . . . . . . . . 24,707 2,861 27,568 25,274 2,778 28,052 25,840 2,533 28,373Other revenues . . . . . . . . . . . . . . 1,208 41 1,249 1,085 70 1,155 1,045 71 1,116Research and development
expenses . . . . . . . . . . . . . . . . . (4,150) (425) (4,575) (4,108) (429) (4,537) (4,035) (395) (4,430)Selling and general expenses . . . (6,648) (520) (7,168) (7,032) (522) (7,554) (7,515) (505) (8,020)Amortization of intangibles . . . . (3,222) (261) (3,483) (3,383) (271) (3,654) (3,707) (291) (3,998)Operating income before
restructuring, impairment ofproperty, plant and equipmentand intangibles, gains andlosses on disposals, andlitigation . . . . . . . . . . . . . . . . . 5,864 593 6,457 5,509 597 6,106 5,217 512 5,729
Impairment of property, plantand equipment andintangibles . . . . . . . . . . . . . . . (1,554) — (1,554) (58) — (58) (1,162) (1) (1,163)
Operating income . . . . . . . . . . . . 3,801 593 4,394 5,314 597 5,911 4,318 510 4,828Financial expenses . . . . . . . . . . . (313) (22) (335) (326) (3) (329) (450) (5) (455)Financial income . . . . . . . . . . . . 89 14 103 179 11 190 374 1 375Income tax expense . . . . . . . . . . (516) (166) (682) (518) (169) (687) (660) (140) (800)Share of profit/loss of
associates (1) . . . . . . . . . . . . . . 809 3 812 621 (24) 597 459 (8) 451Net income . . . . . . . . . . . . . . . . . 3,870 422 4,292 5,270 412 5,682 4,041 358 4,399
Attributable to minorityinterests . . . . . . . . . . . . . . . . . 441 — 441 419 — 419 392 1 393
Attributable to equity holdersof the Company . . . . . . . . . . 3,429 422 3,851 4,851 412 5,263 3,649 357 4,006
Pharma-Sanofi-aventis Pharma-
Sanofi-aventis Pharma-
Sanofi-aventis
(1) Financial information for associates is included in the Pharmaceuticals segment, except for associates specifically involved in theVaccines business.
Inter-segment transactions are not material. Transfer prices between segments are determined on an arm’slength basis.
F-103
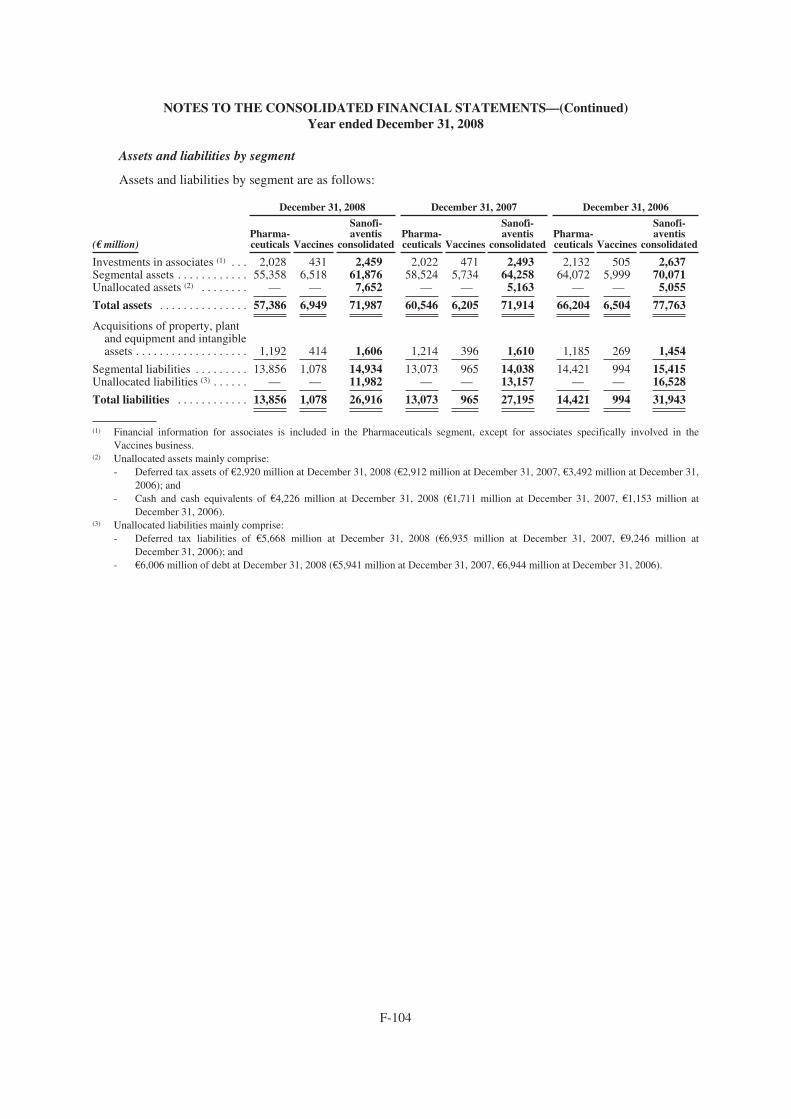
NOTES TO THE CONSOLIDATED FINANCIAL STATEMENTS—(Continued)Year ended December 31, 2008
Assets and liabilities by segment
Assets and liabilities by segment are as follows:
December 31, 2008 December 31, 2007 December 31, 2006
(€ million)Pharma-ceuticals Vaccines
Sanofi-aventis
consolidatedPharma-ceuticals Vaccines
Sanofi-aventis
consolidatedPharma-ceuticals Vaccines
Sanofi-aventis
consolidated
Investments in associates (1) . . . 2,028 431 2,459 2,022 471 2,493 2,132 505 2,637Segmental assets . . . . . . . . . . . . 55,358 6,518 61,876 58,524 5,734 64,258 64,072 5,999 70,071Unallocated assets (2) . . . . . . . . — — 7,652 — — 5,163 — — 5,055
Total assets . . . . . . . . . . . . . . . 57,386 6,949 71,987 60,546 6,205 71,914 66,204 6,504 77,763
Acquisitions of property, plantand equipment and intangibleassets . . . . . . . . . . . . . . . . . . . 1,192 414 1,606 1,214 396 1,610 1,185 269 1,454
15,41516,528
31,943
Segmental liabilities . . . . . . . . .Unallocated liabilities (3) . . . . . .
Total liabilities . . . . . . . . . . . .
13,856—
13,856
1,078—
1,078
14,93411,982
26,916
13,073—
13,073
965—
965
14,03813,157
27,195
14,421—
14,421
994—
994
(1) Financial information for associates is included in the Pharmaceuticals segment, except for associates specifically involved in theVaccines business.
(2) Unallocated assets mainly comprise:- Deferred tax assets of €2,920 million at December 31, 2008 (€2,912 million at December 31, 2007, €3,492 million at December 31,
2006); and- Cash and cash equivalents of €4,226 million at December 31, 2008 (€1,711 million at December 31, 2007, €1,153 million at
December 31, 2006).(3) Unallocated liabilities mainly comprise:
- Deferred tax liabilities of €5,668 million at December 31, 2008 (€6,935 million at December 31, 2007, €9,246 million atDecember 31, 2006); and
- €6,006 million of debt at December 31, 2008 (€5,941 million at December 31, 2007, €6,944 million at December 31, 2006).
F-104

NOTES TO THE CONSOLIDATED FINANCIAL STATEMENTS—(Continued)Year ended December 31, 2008
D.35.2. Information by geographical segment
Information by geographical segment for the year ended December 31, 2008 is as follows:
United Other Unallocated(€ million) Total Europe States countries costs (1)
Net sales . . . . . . . . . . . . . . . . . . . . . . . . . . . . . . . . . . . . . . . . . . 27,568 12,096 8,609 6,863 —Operating income before restructuring, impairment of
property, plant and equipment and intangibles, gains andlosses on disposals, and litigation (2) . . . . . . . . . . . . . . . . . . . 6,457 5,001 4,718 2,454 (5,716)
Acquisitions of property, plant and equipment and intangibleassets . . . . . . . . . . . . . . . . . . . . . . . . . . . . . . . . . . . . . . . . . . . 1,606 1,062 237 307 —
Total assets . . . . . . . . . . . . . . . . . . . . . . . . . . . . . . . . . . . . . . . . 71,987 35,826 23,395 12,766 —Of which non-current assets other than deferred tax
assets (3) . . . . . . . . . . . . . . . . . . . . . . . . . . . . . . . . . . . . . . . . . 53,664 24,262 20,517 8,885 —
(1) Unallocated costs consist mainly of fundamental research and worldwide development of pharmaceutical molecules, and part of the costof support functions.
(2) After amortization of intangible assets (€3,483 million).(3) Includes goodwill of €28,163 million and intangible assets of €15,260 million.
Information by geographical segment for the year ended December 31, 2007 is as follows:
United Other Unallocated(€ million) Total Europe States countries costs (1)
Net sales . . . . . . . . . . . . . . . . . . . . . . . . . . . . . . . . . . . . . . . . . . 28,052 12,184 9,474 6,394 —Operating income before restructuring, impairment of
property, plant and equipment and intangibles, gains andlosses on disposals, and litigation (2) . . . . . . . . . . . . . . . . . . . 6,106 4,742 4,952 2,173 (5,761)
Acquisitions of property, plant and equipment and intangibleassets . . . . . . . . . . . . . . . . . . . . . . . . . . . . . . . . . . . . . . . . . . . 1,610 1,178 316 116 —
Total assets . . . . . . . . . . . . . . . . . . . . . . . . . . . . . . . . . . . . . . . . 71,914 35,356 23,744 12,814 —Of which non-current assets other than deferred tax
assets (3) . . . . . . . . . . . . . . . . . . . . . . . . . . . . . . . . . . . . . . . . . 56,449 25,912 21,129 9,408 —
(1) Unallocated costs consist mainly of fundamental research and worldwide development of pharmaceutical molecules, and part of the costof support functions.
(2) After amortization of intangible assets (€3,654 million).(3) Includes goodwill of €27,199 million and intangible assets of €19,182 million.
F-105
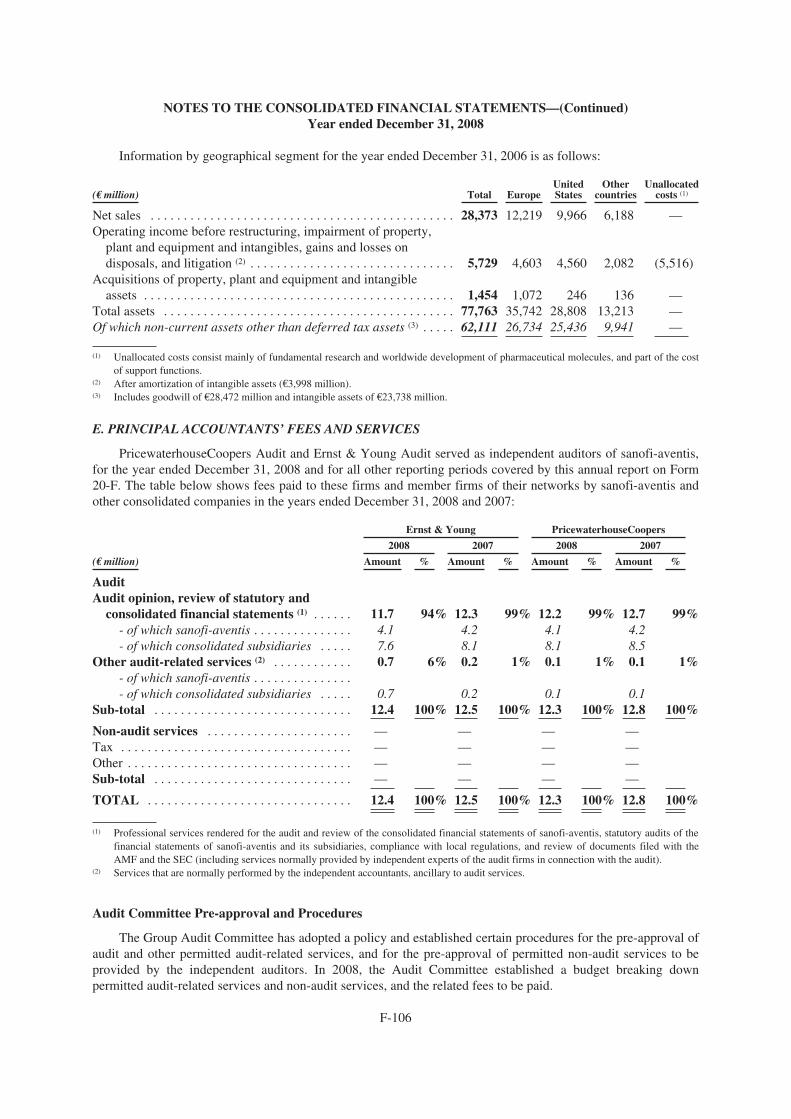
NOTES TO THE CONSOLIDATED FINANCIAL STATEMENTS—(Continued)Year ended December 31, 2008
Information by geographical segment for the year ended December 31, 2006 is as follows:
United Other Unallocated(€ million) Total Europe States countries costs (1)
Net sales . . . . . . . . . . . . . . . . . . . . . . . . . . . . . . . . . . . . . . . . . . . . . . 28,373 12,219 9,966 6,188 —Operating income before restructuring, impairment of property,
plant and equipment and intangibles, gains and losses ondisposals, and litigation (2) . . . . . . . . . . . . . . . . . . . . . . . . . . . . . . . 5,729 4,603 4,560 2,082 (5,516)
Acquisitions of property, plant and equipment and intangibleassets . . . . . . . . . . . . . . . . . . . . . . . . . . . . . . . . . . . . . . . . . . . . . . . 1,454 1,072 246 136 —
Total assets . . . . . . . . . . . . . . . . . . . . . . . . . . . . . . . . . . . . . . . . . . . . 77,763 35,742 28,808 13,213 —Of which non-current assets other than deferred tax assets (3) . . . . . 62,111 26,734 25,436 9,941 —
(1) Unallocated costs consist mainly of fundamental research and worldwide development of pharmaceutical molecules, and part of the costof support functions.
(2) After amortization of intangible assets (€3,998 million).(3) Includes goodwill of €28,472 million and intangible assets of €23,738 million.
E. PRINCIPAL ACCOUNTANTS’ FEES AND SERVICES
PricewaterhouseCoopers Audit and Ernst & Young Audit served as independent auditors of sanofi-aventis,for the year ended December 31, 2008 and for all other reporting periods covered by this annual report on Form20-F. The table below shows fees paid to these firms and member firms of their networks by sanofi-aventis andother consolidated companies in the years ended December 31, 2008 and 2007:
(€ million) Amount % Amount % Amount % Amount %
AuditAudit opinion, review of statutory and
consolidated financial statements (1) . . . . . . 11.7 94% 12.3 99% 12.2 99% 12.7 99%- of which sanofi-aventis . . . . . . . . . . . . . . . 4.1 4.2 4.1 4.2- of which consolidated subsidiaries . . . . . 7.6 8.1 8.1 8.5
Other audit-related services (2) . . . . . . . . . . . . 0.7 6% 0.2 1% 0.1 1% 0.1 1%- of which sanofi-aventis . . . . . . . . . . . . . . .- of which consolidated subsidiaries . . . . . 0.7 0.2 0.1 0.1
Sub-total . . . . . . . . . . . . . . . . . . . . . . . . . . . . . . 12.4 100% 12.5 100% 12.3 100% 12.8 100%
Non-audit services . . . . . . . . . . . . . . . . . . . . . . — — — —Tax . . . . . . . . . . . . . . . . . . . . . . . . . . . . . . . . . . . — — — —Other . . . . . . . . . . . . . . . . . . . . . . . . . . . . . . . . . . — — — —Sub-total . . . . . . . . . . . . . . . . . . . . . . . . . . . . . .
TOTAL . . . . . . . . . . . . . . . . . . . . . . . . . . . . . . .
—
12.4
—
100% 12.5
—
100% 12.3
—
100% 12.8 100%
Ernst & Young PricewaterhouseCoopers
2008 2007 2008 2007
(1) Professional services rendered for the audit and review of the consolidated financial statements of sanofi-aventis, statutory audits of thefinancial statements of sanofi-aventis and its subsidiaries, compliance with local regulations, and review of documents filed with theAMF and the SEC (including services normally provided by independent experts of the audit firms in connection with the audit).
(2) Services that are normally performed by the independent accountants, ancillary to audit services.
Audit Committee Pre-approval and Procedures
The Group Audit Committee has adopted a policy and established certain procedures for the pre-approval ofaudit and other permitted audit-related services, and for the pre-approval of permitted non-audit services to beprovided by the independent auditors. In 2008, the Audit Committee established a budget breaking downpermitted audit-related services and non-audit services, and the related fees to be paid.
F-106

NOTES TO THE CONSOLIDATED FINANCIAL STATEMENTS—(Continued)Year ended December 31, 2008
F. LIST OF PRINCIPAL COMPANIES INCLUDED IN THE CONSOLIDATION FOR THE YEAR ENDEDDECEMBER 31, 2008
F.1. Principal fully-consolidated companies
The principal companies in the Group’s areas of operations and business segments are:
interestEurope %
Sanofi-Aventis Deutschland GmbH . . . . . . . . . . . . . . . . . . . . . . . . . . . . . Germany 100Hoechst GmbH . . . . . . . . . . . . . . . . . . . . . . . . . . . . . . . . . . . . . . . . . . . . . Germany 100Winthrop Arzneimittel GmbH . . . . . . . . . . . . . . . . . . . . . . . . . . . . . . . . . Germany 100Sanofi-Aventis Gesmbh / Bristol-Myers Squibb GesmbH OHG (1) . . . . . Austria 51Sanofi-Aventis GmbH . . . . . . . . . . . . . . . . . . . . . . . . . . . . . . . . . . . . . . . Austria 100Sanofi-Aventis Belgium . . . . . . . . . . . . . . . . . . . . . . . . . . . . . . . . . . . . . . Belgium 100Sanofi-Aventis Denmark A/S . . . . . . . . . . . . . . . . . . . . . . . . . . . . . . . . . . Denmark 100Sanofi Winthrop BMS partnership (JV DK) (1) . . . . . . . . . . . . . . . . . . . . Denmark 51Sanofi-Aventis SA . . . . . . . . . . . . . . . . . . . . . . . . . . . . . . . . . . . . . . . . . . Spain 100Sanofi Winthrop BMS partnership (1) . . . . . . . . . . . . . . . . . . . . . . . . . . . . Finland 51Sanofi-Aventis Finland OY . . . . . . . . . . . . . . . . . . . . . . . . . . . . . . . . . . . Finland 100Sanofi-Aventis Europe S.A.S. . . . . . . . . . . . . . . . . . . . . . . . . . . . . . . . . . France 100Sanofi-Aventis Participations S.A.S. . . . . . . . . . . . . . . . . . . . . . . . . . . . . France 100Sanofi-Aventis Amérique du Nord S.N.C. . . . . . . . . . . . . . . . . . . . . . . . . France 100Sanofi Pasteur Holding S.A. . . . . . . . . . . . . . . . . . . . . . . . . . . . . . . . . . . . France 100Aventis Pharma S.A. . . . . . . . . . . . . . . . . . . . . . . . . . . . . . . . . . . . . . . . . France 100Sanofi Pasteur S.A. . . . . . . . . . . . . . . . . . . . . . . . . . . . . . . . . . . . . . . . . . . France 100Aventis Agriculture S.A. . . . . . . . . . . . . . . . . . . . . . . . . . . . . . . . . . . . . . France 100Francopia S.A.R.L. . . . . . . . . . . . . . . . . . . . . . . . . . . . . . . . . . . . . . . . . . . France 100Winthrop Médicaments S.A. . . . . . . . . . . . . . . . . . . . . . . . . . . . . . . . . . . France 100Sanofi Chimie S.A. . . . . . . . . . . . . . . . . . . . . . . . . . . . . . . . . . . . . . . . . . . France 100Sanofi Participations S.A.S. . . . . . . . . . . . . . . . . . . . . . . . . . . . . . . . . . . . France 100Sanofi Pharma Bristol-Myers Squibb S.N.C. (1) . . . . . . . . . . . . . . . . . . . . France 51Sanofi-Aventis S.A. . . . . . . . . . . . . . . . . . . . . . . . . . . . . . . . . . . . . . . . . . France 100Sanofi-Aventis France S.A. . . . . . . . . . . . . . . . . . . . . . . . . . . . . . . . . . . . France 100Sanofi-Aventis Groupe S.A. . . . . . . . . . . . . . . . . . . . . . . . . . . . . . . . . . . . France 100Sanofi-Aventis Recherche et Développement S.A. . . . . . . . . . . . . . . . . . France 100Sanofi Winthrop Industrie S.A. . . . . . . . . . . . . . . . . . . . . . . . . . . . . . . . . France 100Sanofi-Aventis Greece . . . . . . . . . . . . . . . . . . . . . . . . . . . . . . . . . . . . . . . Greece 100Chinoin Pharmaceutical and Chemical Works Co Ltd . . . . . . . . . . . . . . Hungary 100Sanofi-Aventis ZRT . . . . . . . . . . . . . . . . . . . . . . . . . . . . . . . . . . . . . . . . . Hungary 100Cahir Insurance Ltd . . . . . . . . . . . . . . . . . . . . . . . . . . . . . . . . . . . . . . . . . Ireland 100Carraig Insurance Ltd . . . . . . . . . . . . . . . . . . . . . . . . . . . . . . . . . . . . . . . . Ireland 100Sanofi-Aventis Ireland Ltd . . . . . . . . . . . . . . . . . . . . . . . . . . . . . . . . . . . . Ireland 100Sanofi-Aventis Spa . . . . . . . . . . . . . . . . . . . . . . . . . . . . . . . . . . . . . . . . . . Italy 100Sanofi-Aventis AS . . . . . . . . . . . . . . . . . . . . . . . . . . . . . . . . . . . . . . . . . . Norway 100Sanofi Winthrop BMS partnership ANS (1) . . . . . . . . . . . . . . . . . . . . . . . Norway 51Sanofi-Aventis Netherland BV . . . . . . . . . . . . . . . . . . . . . . . . . . . . . . . . . Netherlands 100Sanofi Winthrop BMS VOF (1) . . . . . . . . . . . . . . . . . . . . . . . . . . . . . . . . . Netherlands 51Sanofi-Aventis Sp Zoo . . . . . . . . . . . . . . . . . . . . . . . . . . . . . . . . . . . . . . . Poland 100Winthrop Farmaceutica Portugal Lda . . . . . . . . . . . . . . . . . . . . . . . . . . . Portugal 100Sanofi-Aventis Produtos Farmaceuticos SA . . . . . . . . . . . . . . . . . . . . . . Portugal 100Sanofi Winthrop BMS AEIE (1) . . . . . . . . . . . . . . . . . . . . . . . . . . . . . . . . Portugal 51Sanofi-Aventis sro . . . . . . . . . . . . . . . . . . . . . . . . . . . . . . . . . . . . . . . . . . Czech Republic 100Aventis Pharma UK Ltd . . . . . . . . . . . . . . . . . . . . . . . . . . . . . . . . . . . . . . United Kingdom 100
Financial
(1) Partnership with Bristol-Myers Squibb (see Note C.1.).
F-107
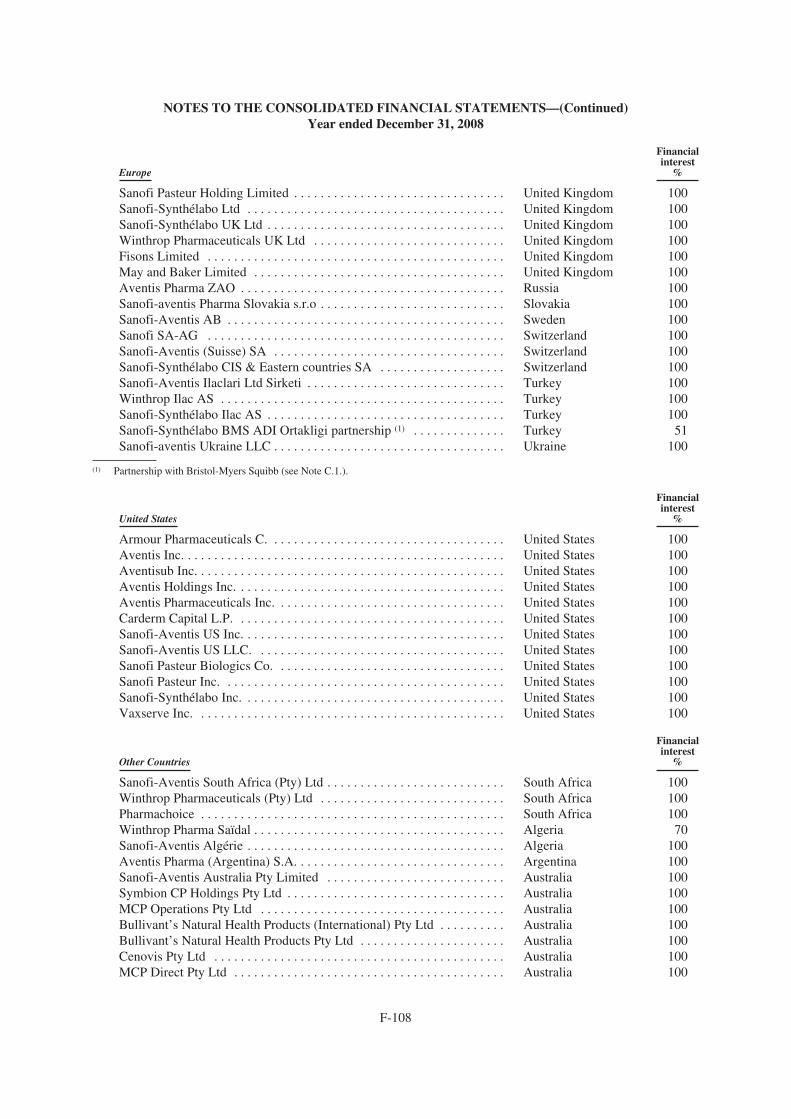
NOTES TO THE CONSOLIDATED FINANCIAL STATEMENTS—(Continued)Year ended December 31, 2008
Europe %
Sanofi Pasteur Holding Limited . . . . . . . . . . . . . . . . . . . . . . . . . . . . . . . . United Kingdom 100Sanofi-Synthélabo Ltd . . . . . . . . . . . . . . . . . . . . . . . . . . . . . . . . . . . . . . . United Kingdom 100Sanofi-Synthélabo UK Ltd . . . . . . . . . . . . . . . . . . . . . . . . . . . . . . . . . . . . United Kingdom 100Winthrop Pharmaceuticals UK Ltd . . . . . . . . . . . . . . . . . . . . . . . . . . . . . United Kingdom 100Fisons Limited . . . . . . . . . . . . . . . . . . . . . . . . . . . . . . . . . . . . . . . . . . . . . United Kingdom 100May and Baker Limited . . . . . . . . . . . . . . . . . . . . . . . . . . . . . . . . . . . . . . United Kingdom 100Aventis Pharma ZAO . . . . . . . . . . . . . . . . . . . . . . . . . . . . . . . . . . . . . . . . Russia 100Sanofi-aventis Pharma Slovakia s.r.o . . . . . . . . . . . . . . . . . . . . . . . . . . . . Slovakia 100Sanofi-Aventis AB . . . . . . . . . . . . . . . . . . . . . . . . . . . . . . . . . . . . . . . . . . Sweden 100Sanofi SA-AG . . . . . . . . . . . . . . . . . . . . . . . . . . . . . . . . . . . . . . . . . . . . . Switzerland 100Sanofi-Aventis (Suisse) SA . . . . . . . . . . . . . . . . . . . . . . . . . . . . . . . . . . . Switzerland 100Sanofi-Synthélabo CIS & Eastern countries SA . . . . . . . . . . . . . . . . . . . Switzerland 100Sanofi-Aventis Ilaclari Ltd Sirketi . . . . . . . . . . . . . . . . . . . . . . . . . . . . . . Turkey 100Winthrop Ilac AS . . . . . . . . . . . . . . . . . . . . . . . . . . . . . . . . . . . . . . . . . . . Turkey 100Sanofi-Synthélabo Ilac AS . . . . . . . . . . . . . . . . . . . . . . . . . . . . . . . . . . . . Turkey 100Sanofi-Synthélabo BMS ADI Ortakligi partnership (1) . . . . . . . . . . . . . . Turkey 51Sanofi-aventis Ukraine LLC . . . . . . . . . . . . . . . . . . . . . . . . . . . . . . . . . . . Ukraine 100
Financialinterest
(1) Partnership with Bristol-Myers Squibb (see Note C.1.).
United States %
Armour Pharmaceuticals C. . . . . . . . . . . . . . . . . . . . . . . . . . . . . . . . . . . . United States 100Aventis Inc. . . . . . . . . . . . . . . . . . . . . . . . . . . . . . . . . . . . . . . . . . . . . . . . . United States 100Aventisub Inc. . . . . . . . . . . . . . . . . . . . . . . . . . . . . . . . . . . . . . . . . . . . . . . United States 100Aventis Holdings Inc. . . . . . . . . . . . . . . . . . . . . . . . . . . . . . . . . . . . . . . . . United States 100Aventis Pharmaceuticals Inc. . . . . . . . . . . . . . . . . . . . . . . . . . . . . . . . . . . United States 100Carderm Capital L.P. . . . . . . . . . . . . . . . . . . . . . . . . . . . . . . . . . . . . . . . . United States 100Sanofi-Aventis US Inc. . . . . . . . . . . . . . . . . . . . . . . . . . . . . . . . . . . . . . . . United States 100Sanofi-Aventis US LLC. . . . . . . . . . . . . . . . . . . . . . . . . . . . . . . . . . . . . . United States 100Sanofi Pasteur Biologics Co. . . . . . . . . . . . . . . . . . . . . . . . . . . . . . . . . . . United States 100Sanofi Pasteur Inc. . . . . . . . . . . . . . . . . . . . . . . . . . . . . . . . . . . . . . . . . . . United States 100Sanofi-Synthélabo Inc. . . . . . . . . . . . . . . . . . . . . . . . . . . . . . . . . . . . . . . . United States 100Vaxserve Inc. . . . . . . . . . . . . . . . . . . . . . . . . . . . . . . . . . . . . . . . . . . . . . . United States 100
Financialinterest
Other Countries %
Sanofi-Aventis South Africa (Pty) Ltd . . . . . . . . . . . . . . . . . . . . . . . . . . . South Africa 100Winthrop Pharmaceuticals (Pty) Ltd . . . . . . . . . . . . . . . . . . . . . . . . . . . . South Africa 100Pharmachoice . . . . . . . . . . . . . . . . . . . . . . . . . . . . . . . . . . . . . . . . . . . . . . South Africa 100Winthrop Pharma Saïdal . . . . . . . . . . . . . . . . . . . . . . . . . . . . . . . . . . . . . . Algeria 70Sanofi-Aventis Algérie . . . . . . . . . . . . . . . . . . . . . . . . . . . . . . . . . . . . . . . Algeria 100Aventis Pharma (Argentina) S.A. . . . . . . . . . . . . . . . . . . . . . . . . . . . . . . . Argentina 100Sanofi-Aventis Australia Pty Limited . . . . . . . . . . . . . . . . . . . . . . . . . . . Australia 100Symbion CP Holdings Pty Ltd . . . . . . . . . . . . . . . . . . . . . . . . . . . . . . . . . Australia 100MCP Operations Pty Ltd . . . . . . . . . . . . . . . . . . . . . . . . . . . . . . . . . . . . . Australia 100Bullivant’s Natural Health Products (International) Pty Ltd . . . . . . . . . . Australia 100Bullivant’s Natural Health Products Pty Ltd . . . . . . . . . . . . . . . . . . . . . . Australia 100Cenovis Pty Ltd . . . . . . . . . . . . . . . . . . . . . . . . . . . . . . . . . . . . . . . . . . . . Australia 100MCP Direct Pty Ltd . . . . . . . . . . . . . . . . . . . . . . . . . . . . . . . . . . . . . . . . . Australia 100
Financialinterest
F-108
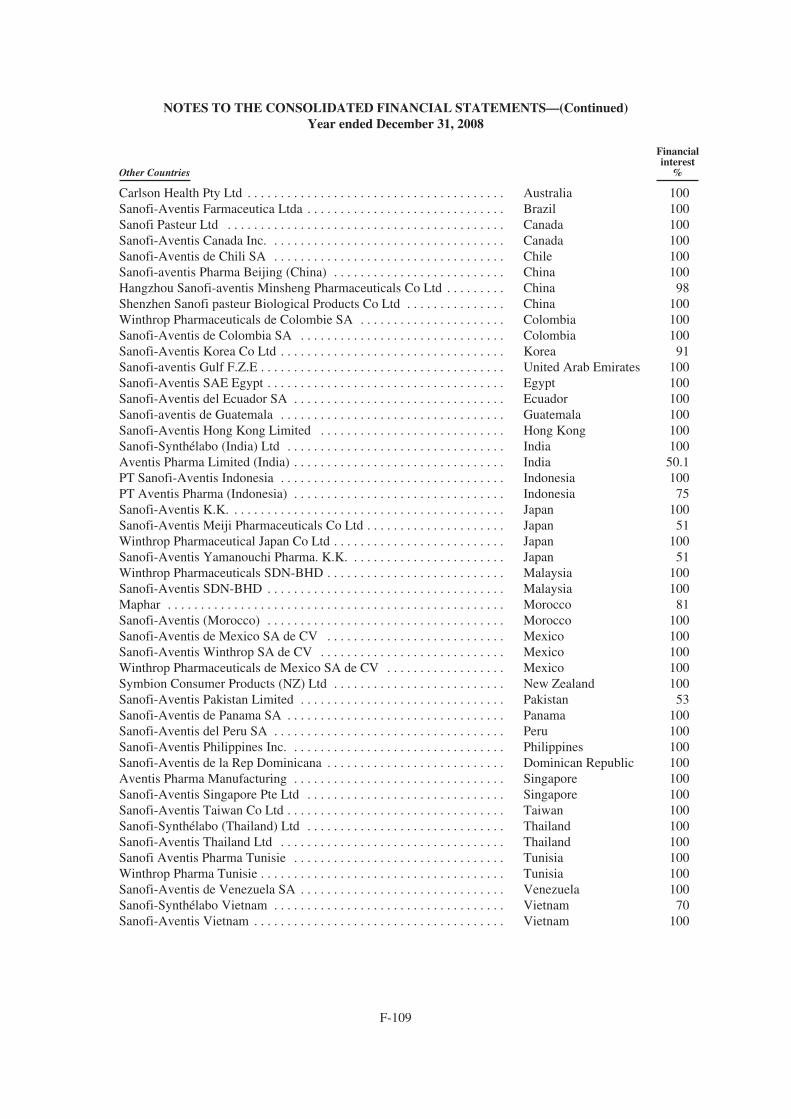
NOTES TO THE CONSOLIDATED FINANCIAL STATEMENTS—(Continued)Year ended December 31, 2008
Other Countries %
Carlson Health Pty Ltd . . . . . . . . . . . . . . . . . . . . . . . . . . . . . . . . . . . . . . . Australia 100Sanofi-Aventis Farmaceutica Ltda . . . . . . . . . . . . . . . . . . . . . . . . . . . . . . Brazil 100Sanofi Pasteur Ltd . . . . . . . . . . . . . . . . . . . . . . . . . . . . . . . . . . . . . . . . . . Canada 100Sanofi-Aventis Canada Inc. . . . . . . . . . . . . . . . . . . . . . . . . . . . . . . . . . . . Canada 100Sanofi-Aventis de Chili SA . . . . . . . . . . . . . . . . . . . . . . . . . . . . . . . . . . . Chile 100Sanofi-aventis Pharma Beijing (China) . . . . . . . . . . . . . . . . . . . . . . . . . . China 100Hangzhou Sanofi-aventis Minsheng Pharmaceuticals Co Ltd . . . . . . . . . China 98Shenzhen Sanofi pasteur Biological Products Co Ltd . . . . . . . . . . . . . . . China 100Winthrop Pharmaceuticals de Colombie SA . . . . . . . . . . . . . . . . . . . . . . Colombia 100Sanofi-Aventis de Colombia SA . . . . . . . . . . . . . . . . . . . . . . . . . . . . . . . Colombia 100Sanofi-Aventis Korea Co Ltd . . . . . . . . . . . . . . . . . . . . . . . . . . . . . . . . . . Korea 91Sanofi-aventis Gulf F.Z.E . . . . . . . . . . . . . . . . . . . . . . . . . . . . . . . . . . . . . United Arab Emirates 100Sanofi-Aventis SAE Egypt . . . . . . . . . . . . . . . . . . . . . . . . . . . . . . . . . . . . Egypt 100Sanofi-Aventis del Ecuador SA . . . . . . . . . . . . . . . . . . . . . . . . . . . . . . . . Ecuador 100Sanofi-aventis de Guatemala . . . . . . . . . . . . . . . . . . . . . . . . . . . . . . . . . . Guatemala 100Sanofi-Aventis Hong Kong Limited . . . . . . . . . . . . . . . . . . . . . . . . . . . . Hong Kong 100Sanofi-Synthélabo (India) Ltd . . . . . . . . . . . . . . . . . . . . . . . . . . . . . . . . . India 100Aventis Pharma Limited (India) . . . . . . . . . . . . . . . . . . . . . . . . . . . . . . . . India 50.1PT Sanofi-Aventis Indonesia . . . . . . . . . . . . . . . . . . . . . . . . . . . . . . . . . . Indonesia 100PT Aventis Pharma (Indonesia) . . . . . . . . . . . . . . . . . . . . . . . . . . . . . . . . Indonesia 75Sanofi-Aventis K.K. . . . . . . . . . . . . . . . . . . . . . . . . . . . . . . . . . . . . . . . . . Japan 100Sanofi-Aventis Meiji Pharmaceuticals Co Ltd . . . . . . . . . . . . . . . . . . . . . Japan 51Winthrop Pharmaceutical Japan Co Ltd . . . . . . . . . . . . . . . . . . . . . . . . . . Japan 100Sanofi-Aventis Yamanouchi Pharma. K.K. . . . . . . . . . . . . . . . . . . . . . . . Japan 51Winthrop Pharmaceuticals SDN-BHD . . . . . . . . . . . . . . . . . . . . . . . . . . . Malaysia 100Sanofi-Aventis SDN-BHD . . . . . . . . . . . . . . . . . . . . . . . . . . . . . . . . . . . . Malaysia 100Maphar . . . . . . . . . . . . . . . . . . . . . . . . . . . . . . . . . . . . . . . . . . . . . . . . . . . Morocco 81Sanofi-Aventis (Morocco) . . . . . . . . . . . . . . . . . . . . . . . . . . . . . . . . . . . . Morocco 100Sanofi-Aventis de Mexico SA de CV . . . . . . . . . . . . . . . . . . . . . . . . . . . Mexico 100Sanofi-Aventis Winthrop SA de CV . . . . . . . . . . . . . . . . . . . . . . . . . . . . Mexico 100Winthrop Pharmaceuticals de Mexico SA de CV . . . . . . . . . . . . . . . . . . Mexico 100Symbion Consumer Products (NZ) Ltd . . . . . . . . . . . . . . . . . . . . . . . . . . New Zealand 100Sanofi-Aventis Pakistan Limited . . . . . . . . . . . . . . . . . . . . . . . . . . . . . . . Pakistan 53Sanofi-Aventis de Panama SA . . . . . . . . . . . . . . . . . . . . . . . . . . . . . . . . . Panama 100Sanofi-Aventis del Peru SA . . . . . . . . . . . . . . . . . . . . . . . . . . . . . . . . . . . Peru 100Sanofi-Aventis Philippines Inc. . . . . . . . . . . . . . . . . . . . . . . . . . . . . . . . . Philippines 100Sanofi-Aventis de la Rep Dominicana . . . . . . . . . . . . . . . . . . . . . . . . . . . Dominican Republic 100Aventis Pharma Manufacturing . . . . . . . . . . . . . . . . . . . . . . . . . . . . . . . . Singapore 100Sanofi-Aventis Singapore Pte Ltd . . . . . . . . . . . . . . . . . . . . . . . . . . . . . . Singapore 100Sanofi-Aventis Taiwan Co Ltd . . . . . . . . . . . . . . . . . . . . . . . . . . . . . . . . . Taiwan 100Sanofi-Synthélabo (Thailand) Ltd . . . . . . . . . . . . . . . . . . . . . . . . . . . . . . Thailand 100Sanofi-Aventis Thailand Ltd . . . . . . . . . . . . . . . . . . . . . . . . . . . . . . . . . . Thailand 100Sanofi Aventis Pharma Tunisie . . . . . . . . . . . . . . . . . . . . . . . . . . . . . . . . Tunisia 100Winthrop Pharma Tunisie . . . . . . . . . . . . . . . . . . . . . . . . . . . . . . . . . . . . . Tunisia 100Sanofi-Aventis de Venezuela SA . . . . . . . . . . . . . . . . . . . . . . . . . . . . . . . Venezuela 100Sanofi-Synthélabo Vietnam . . . . . . . . . . . . . . . . . . . . . . . . . . . . . . . . . . . Vietnam 70Sanofi-Aventis Vietnam . . . . . . . . . . . . . . . . . . . . . . . . . . . . . . . . . . . . . . Vietnam 100
Financialinterest
F-109
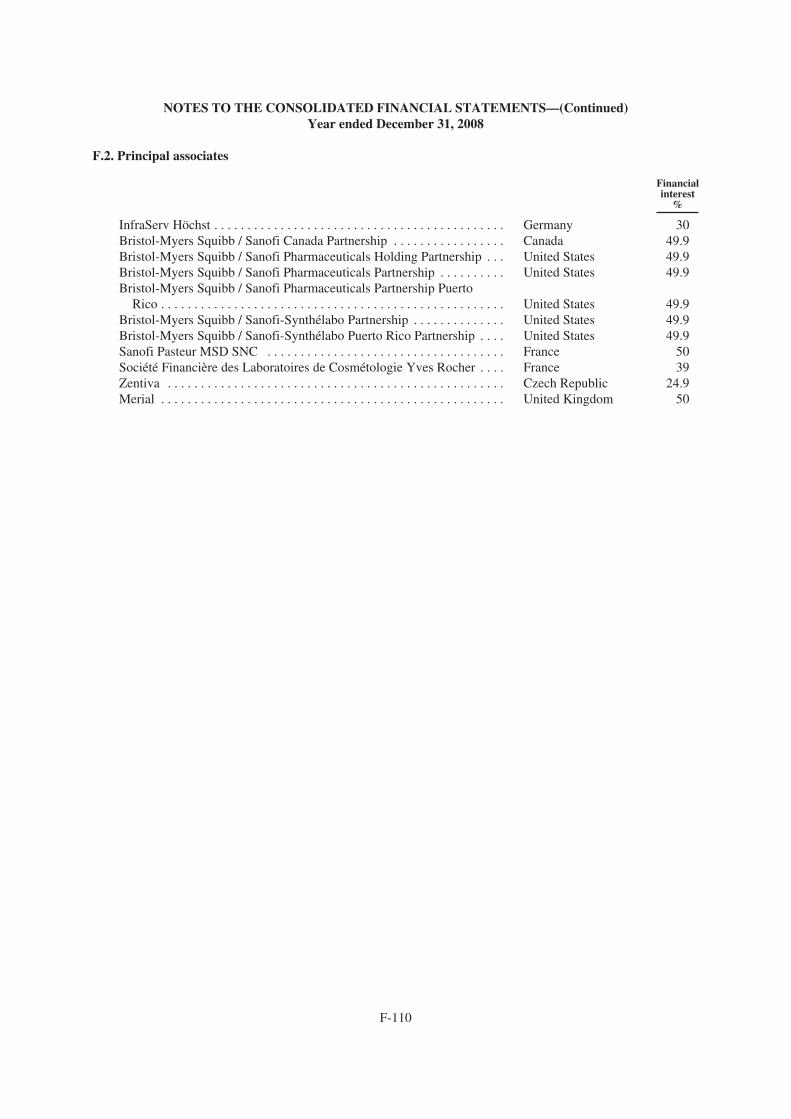
NOTES TO THE CONSOLIDATED FINANCIAL STATEMENTS—(Continued)Year ended December 31, 2008
F.2. Principal associates
Financialinterest
InfraServ Höchst . . . . . . . . . . . . . . . . . . . . . . . . . . . . . . . . . . . . . . . . . . . . Germany
%
30Bristol-Myers Squibb / Sanofi Canada Partnership . . . . . . . . . . . . . . . . . Canada 49.9Bristol-Myers Squibb / Sanofi Pharmaceuticals Holding Partnership . . . United States 49.9Bristol-Myers Squibb / Sanofi Pharmaceuticals Partnership . . . . . . . . . . United States 49.9Bristol-Myers Squibb / Sanofi Pharmaceuticals Partnership Puerto
Rico . . . . . . . . . . . . . . . . . . . . . . . . . . . . . . . . . . . . . . . . . . . . . . . . . . . . United States 49.9Bristol-Myers Squibb / Sanofi-Synthélabo Partnership . . . . . . . . . . . . . . United States 49.9Bristol-Myers Squibb / Sanofi-Synthélabo Puerto Rico Partnership . . . . United States 49.9Sanofi Pasteur MSD SNC . . . . . . . . . . . . . . . . . . . . . . . . . . . . . . . . . . . . France 50Société Financière des Laboratoires de Cosmétologie Yves Rocher . . . . France 39Zentiva . . . . . . . . . . . . . . . . . . . . . . . . . . . . . . . . . . . . . . . . . . . . . . . . . . . Czech Republic 24.9Merial . . . . . . . . . . . . . . . . . . . . . . . . . . . . . . . . . . . . . . . . . . . . . . . . . . . . United Kingdom 50
F-110


Exhibit 1.1
This text is a free translation from the French language and is supplied solely for information purposes. Only the original version in the French language has legal force.
SANOFI-AVENTIS
Limited liability company (Société Anonyme à conseil d’administration)
Registered capital: 2,631,050,926 euros
Registered office: 174, avenue de France, 75013 PARIS
Registration number: PARIS 395 030 844
BYLAWS
Updated February 10, 2009

This text is a free translation from the French language and is supplied solely for information purposes. Only the original version in the French language has legal force.
PART I
GENERAL PROVISIONS
Article 1 – Form of company The company, in the form of a limited liability company (société anonyme), is governed by applicable laws and regulations as well as by these bylaws (statuts).
Article 2 – Corporate name The name of the company is: Sanofi-Aventis.
Article 3 – Corporate Purposes The company’s corporate purposes, in France and abroad, are:
in the following areas:
And, more generally:
Article 4 – Registered office The registered office is located at: 174, Avenue de France, PARIS 75013.
Should a transfer of the registered office be decided upon by the Board of Directors (conseil d’administration), the Board is authorised to modify the statutes accordingly.
Article 5 – Term of company The term of the company will expire on May 18, 2093 unless dissolved prior to that date or extended by a decision of the extraordinary general shareholder’s meeting.
2.
• Acquiring interests and holdings, in any form whatsoever, in any company or enterprise, in existence or to be created, connected directly or indirectly with the health and fine chemistry sectors, human and animal therapeutics, nutrition and bio-industry;
• Purchase and sale of all raw materials and products necessary for these activities;
• Research, study, and development of new products, techniques and processes;
• Manufacture and sale of all chemical, biological, dietary and hygienic products;
• Obtaining or acquiring all intellectual property rights related to results obtained and, in particular, filing all patents, trademarks and models, processes or inventions;
• Operating directly or indirectly, purchasing, and transferring – for free or for consideration – pledging or securing all intellectual property rights, particularly all patents, trademarks and models, processes or inventions;
• Obtaining, operating, holding and granting all licences; • Within the framework of a group-wide policy and subject to compliance with the relevant legislation, participating in treasury
management transactions, whether as lead company or otherwise, in the form of centralized currency risk management or intra-group netting, or any other form permitted under the relevant laws and regulations;
• All commercial, industrial, real or personal, property financial or other transactions, connected directly or indirectly, totally or partially, with the activities described above and with all similar or related activities and with any other purposes likely to encourage or develop the company’s activities.
This text is a free translation from the French language and is supplied solely for information purposes. Only the original version in the French language has legal force.
PART II
SHARE CAPITAL
Article 6 – Registered Capital The registered capital is €2,631,050,926 (two billion, six hundred and thirty-one million, fifty thousand, nine hundred and twenty-six euros).
€
It is divided into 1,315,525,463 shares with a par value of €2 each, all of the same class and fully paid. €
Article 7 – Form of shares The shares are registered or bearer shares, according to the shareholder’s choice, under the conditions established by applicable legal provisions.
The company may apply legislative and regulatory provisions concerning the identification of holders of securities giving them the immediate or future right to vote.
Any individual or entity, acting individually or jointly, who acquires a number of shares representing a proportion of the capital or of voting rights equal to or exceeding 1% of the share capital, or any multiple of this percentage, even beyond the minimum declaration limits laid down by the legal and regulatory provisions, must inform the company of the total number of shares and voting rights held by the individual or entity and also of any securities giving future access to the capital or voting rights which may potentially be attached. Notification is to be made by registered mail, return receipt requested, within five stock exchange days of the date on which the threshold was reached.
The obligation to notify the company also applies when the shareholder’s holding of the capital or voting rights falls to a level below each of those thresholds described in the third paragraph of this article.
The legal penalties applicable to failure to declare the crossing of a statutory threshold apply equally to a failure to declare the crossing of any threshold stipulated in the bylaws and recorded in the minutes of the shareholders’ meeting at the request of one or more shareholders holding at least 5% of the company’s share capital or voting rights.
Article 8 – Conveyance and transfer of shares The shares are freely negotiable.
The transfer of shares occurs by transfer from one account to another in accordance with the conditions laid down by law and regulations.
Article 9 – Rights and obligations attached to each share
2) Whenever it is necessary to possess a certain number of shares to exercise a right, the owners who do not possess that number of shares are responsible for taking any steps to combine the number required.
A double voting right is assigned to each registered share that is paid for in full and that has been registered in the name of the same shareholder for at least two years. The double vote ceases automatically for any share converted into a bearer share or transferred from one owner to another, subject to exceptions laid down by law. Bonus shares arising from an increase of share capital by incorporation of reserves, profits or share premiums receive the benefit of the double vote as from the time of their issue in so far as they have been assigned on the basis of shares already benefiting from this right.
Article 10 – Paying-up (libération) of shares Sums that are due on shares to be paid for in cash are requested by the Board of Directors which determines the dates and extent of the calls for funds.
3.
1) With regard to ownership of the corporate assets, sharing of profits and the liquidation surplus, each share entitles its owner to an amount in proportion to the number of existing shares.
3) Each shareholder has as many votes as the number of shares he owns or represents subject to the provisions below.

This text is a free translation from the French language and is supplied solely for information purposes. Only the original version in the French language has legal force.
Shareholders who do not make the payments due on the shares they hold automatically owe the company default interest calculated on a daily basis starting from the due date, at the legal rate in business matters increased by three points, without prejudice to the compulsory enforcement measures provided by law.
PART III
MANAGEMENT OF THE COMPANY
Article 11 – Board of Directors The company shall be administered by a Board of Directors composed of between three and eighteen members.
As soon as the number of directors aged over 70 represents more than one-third of the directors in office, the oldest director shall be deemed to have resigned; his term of office shall end at the date of the next Ordinary General Meeting.
Each director must own at least one share during his term of office.
Directors shall hold office for a maximum of four years; reappointment of directors shall be on a rotation basis.
The Ordinary General Meeting shall set the term of office of directors such that members of the Board are reappointed on a regular basis in the most equal proportions possible. However, terms of office in progress shall continue until the expiry date originally set.
Each member standing down shall be eligible for reappointment.
Article 12 – Chairman and Vice-Chairman of the Board of Directors The Board of Directors shall elect from among its members a Chairman, who must be a natural person. Except in the circumstances specified in article 16 when he also assumes the function of Chief Executive Officer, the Chairman may hold office until the Ordinary General Meeting called to approve the financial statements of the immediately preceding financial year and held in the calendar year in which he reaches the age of 70.
The Board may appoint from among its members a Vice-Chairman, who must be a natural person less than 65 years of age.
They may be appointed for their entire term of office as directors.
In the event of the temporary incapacity, resignation, death or non-reappointment of the Chairman, the Board of Directors may delegate another director to act as chairman. In the event of temporary incapacity, such delegation shall be given for a limited period and shall be renewable. In other cases, it shall be valid until a new Chairman is elected.
The Chairman shall organise and direct the work of the Board, and be accountable for this to the General Meeting.
He shall ensure that the company’s organs of management operate properly and in particular that the directors are capable of fulfilling their duties.
Article 13 – Deliberations of the Board The Board of Directors shall meet as often as required by the interests of the company, either at the registered office or at any other place indicated in the notice of the meeting. The Chairman may notify the directors of meetings of the Board of Directors by any means, even orally.
Meetings of the Board of Directors shall be chaired by the Chairman of the Board of Directors or in his absence by the Vice-Chairman. If the Chairman and Vice-Chairman are both absent, the Board of Directors shall appoint, for each meeting, a member who will chair the meeting.
Decisions shall be taken on the quorum and majority conditions stipulated by law.
The secretary of the Board of Directors shall be authorised to certify as a true record copies of and extracts from minutes of Board meetings.
Article 14 – Board’s powers The Board of Directors shall determine the strategic orientations of the company’s business and ensure they are implemented.
4.

This text is a free translation from the French language and is supplied solely for information purposes. Only the original version in the French language has legal force.
Subject to powers expressly granted to shareholders’ meetings and within the limits of the corporate objects, the Board shall address any issue of relevance to the proper functioning of the company, and shall by its deliberations settle all matters that concern it.
The Board shall perform controls and tests as it sees fit. Each director shall receive all the information necessary for the fulfilment of his duties, and may have disclosed to him all documents that he judges to be useful.
Article 15 – Committees The Board may appoint one or several committees. The members of committees are responsible for examining any matters referred to them by the Board or the Chairman.
Article 16 – Management In accordance with the law, the executive management of the company shall be conducted under the responsibility of the Chairman of the Board of Directors, either by himself or by another natural person appointed by the Board of Directors and bearing the title of Chief Executive Officer.
The Board of Directors shall decide which of these two methods of executive management to adopt on a majority of directors present or represented.
The Board of Directors shall appoint from among its members, or from outside the Board, the Chief Executive Officer, who shall be a physical person aged less than 65. The Chief Executive Officer shall have the broadest powers to act in all circumstances in the name of the company, within the limits of the corporate objects and subject to powers expressly reserved by law for shareholders’ meetings and the Board of Directors. He shall represent the company in its dealings with third parties.
If the executive management of the company is conducted by the Chairman, the provisions contained in the law and regulations and in the bylaws relating to the Chief Executive Officer shall apply to him except those relating to the age limit. He shall take the title of Chairman and Chief Executive Officer and shall hold office until the Ordinary General Meeting called to approve the financial statements of the immediately preceding financial year and held in the calendar year in which he reaches the age of 68.
On a proposal by the Chief Executive Officer, whether this function be assumed by the Chairman of the Board or by another person, the Board of Directors may appoint from one to five persons in charge of assisting the Chief Executive Officer, with the title of Deputy Chief Executive Officer.
In agreement with the Chief Executive Officer, the Board of Directors shall determine the scope and duration of the powers granted to the Deputy Chief Executive Officers.
In dealings with third parties, the Deputy Chief Executive Officers shall have the same powers as the Chief Executive Officer.
Article 17 – Observers (censeurs) On the Chairman’s proposal, the Board may appoint up to two observers (censeurs). Observers are chosen from amongst the shareholders and are appointed for a period of five years. The observers may be re-appointed. They may be dismissed at any time by decision of the Board of Directors.
They are responsible for ensuring that the bylaws are strictly observed. They are invited to attend Board meetings in a consultative capacity; however, their absence from such meetings is not detrimental to the validity of the proceedings.
They examine the annual accounts and address comments to the members of the ordinary general shareholders’ meeting as they deem necessary.
The Board may remunerate the observers by deducting sums from the amount of the attendance fees allotted by the general shareholders’ meeting to Board members.
PART IV
STATUTORY AUDITORS
Article 18 – Statutory Auditors One or several principal auditors are appointed and carry out their audit assignment in compliance with the law.
5.

This text is a free translation from the French language and is supplied solely for information purposes. Only the original version in the French language has legal force.
PART V
GENERAL SHAREHOLDERS’ MEETINGS
Article 19 – Right of access – Representation
3) All shareholders may also, if the Board of Directors so decides at the time the meeting is called, participate in and vote at meetings by video-conference link or by any means of telecommunication that enables the shareholder to be identified on the conditions stipulated by and in accordance with the terms laid down by the legal provisions in force. Such decision shall be notified in the notice of the meeting published in the “Bulletin des Annonces Légales Obligatoires”.
Shareholders who within the required time limit use the electronic voting form provided on the website set up by the organizer of the meeting shall be deemed equivalent to shareholders who are present or represented at the meeting. The electronic form may be completed and signed directly on this website using an identity code and password, in accordance with the first sentence of the second paragraph of article 1316-4 of the Civil Code. Proxies or votes expressed electronically in this way before the meeting, and the confirmation of receipt given in reply, shall be regarded as irrevocable written instructions enforceable on all parties, it being stipulated that if the shares are sold before midnight Paris time on the third business day preceding the meeting, the company shall invalidate or amend, as the case may, proxies or votes expressed before such date and time.
Article 20 – Notice of general shareholders’ meetings The meetings are convened by the Board of Directors under the conditions and within the time limits prescribed by law. They are held at the registered office or at in any other place indicated in the convening letter or notice.
Article 21 – Meeting committee The general shareholders’ meeting is presided over by the Chairman of the Board of Directors or, in his absence, by a director appointed by the Board.
The duties of examiner (scrutateur) are fulfilled by the two shareholders, present and willing, who hold the greatest number of votes both in their own name and in their capacity as authorised agents.
The committee appoints a secretary who need not be a member of the general meeting.
Article 22 – General shareholders’ meetings Ordinary and extraordinary general shareholders’ meetings, acting under the conditions of quorum and majority laid down by law, exercise the powers assigned to them in compliance with the law.
PART VI
ALLOCATION OF PROFITS
Article 23 – Financial year
Each financial year starts on January 1st and ends on December 31st.
Article 24 – Allocation of profits
6.
1) All shareholders shall be entitled to attend personally or by proxy, on presentation of proof of identity and of share ownership, in the form and at the places indicated in the notice of the meeting, no later than midnight Paris time three business days before the date of the meeting.
2) All shareholders may be represented by their spouse or by another shareholder at all meetings. They may also vote by mail on the conditions stipulated by law.
1) The profit or loss of the financial year is the difference between the income and expenses of the financial year, after deduction of depreciation, amortization and provisions, as shown in the profit and loss account.
2) From the profit of the financial year, decreased, as the case may be, by prior losses, a deduction of at least five per cent is made, this deduction being allocated for the creation of a reserve fund known as the “legal reserve”. This deduction is no longer
This text is a free translation from the French language and is supplied solely for information purposes. Only the original version in the French language has legal force.
The remaining balance, increased, as the case may be, by the profit carried forward, constitutes the distributable profit. On the Board’s proposal, the ordinary general shareholders’ meeting may decide that the distributable profit may, totally or partially, be carried forward or assigned to one or several general or special reserve funds.
Article 25 – Dividends The general shareholders’ meeting, voting on the accounts of the financial year, may grant each shareholder for all or part of the dividend to be distributed, the option to choose between receiving payment of the dividends in cash or shares.
Subject to prevailing legal or regulatory provisions, the Board of Directors may pay interim dividends in cash or shares, even during the course of the financial year.
PART VII
DISSOLUTION – LIQUIDATION
Article 26 On the expiry of the term of the company or in case of dissolution prior to that date, the general shareholders’ meeting rules on the mode of liquidation and appoints one or several liquidators whose powers it determines and who carry out their duties, in compliance with the law.
The liquidation proceeds are first used to pay liabilities. Subsequent to this payment and after payment of liquidation costs, the surplus is used to reimburse the nominal value of the shares; the balance is distributed amongst the shareholders in the same proportions as their participation in the share capital.
PART VIII
DISPUTES
Article 27 Any disputes that may arise during the life of the company or its liquidation, either between the shareholders and the company or between the shareholders themselves, concerning the interpretation or enforcement of these statutes or generally regarding corporate business, are subject to the jurisdiction of the competent courts.
7.
compulsory when the amount of the legal reserve reaches one-tenth of the registered capital. The deduction begins again if, for any reason whatsoever, the legal reserve falls to a level below the said fraction.
Exhibit 12.1
I, Christopher Viehbacher, certify that:
Date: March 3, 2009
1. I have reviewed this annual report on Form 20-F of sanofi-aventis;
2. Based on my knowledge, this report does not contain any untrue statement of a material fact or omit to state a material fact necessary to make the statements made, in light of the circumstances under which such statements were made, not misleading with respect to the period covered by this report;
3. Based on my knowledge, the financial statements, and other financial information included in this report, fairly present in all material respects the financial condition, results of operations and cash flows of the company as of, and for, the periods presented in this report;
4. The company’s other certifying officer and I are responsible for establishing and maintaining disclosure controls and procedures (as defined in Exchange Act Rules 13a-15(e) and 15d-15(e)) and internal control over financial reporting (as defined in Exchange Act Rules 13a-15(f) and 15d-15(f)) for the company and have:
(a) Designed such disclosure controls and procedures, or caused such disclosure controls and procedures to be designed under our supervision, to ensure that material information relating to the company, including its consolidated subsidiaries, is made known to us by others within those entities, particularly during the period in which this report is being prepared;
(b) Designed such internal control over financial reporting, or caused such internal control over financial reporting to be designed under our supervision, to provide reasonable assurance regarding the reliability of financial reporting and the preparation of financial statements for external purposes in accordance with generally accepted accounting principles;
(c) Evaluated the effectiveness of the company’s disclosure controls and procedures and presented in this report our
conclusions about the effectiveness of the disclosure controls and procedures, as of the end of the period covered by this report based on such evaluation; and
(d) Disclosed in this report any change in the company’s internal control over financial reporting that occurred during
the period covered by the annual report that has materially affected, or is reasonably likely to materially affect, the company’s internal control over financial reporting; and
5. The company’s other certifying officer and I have disclosed, based on our most recent evaluation of internal control over financial reporting, to the company’s auditors and the Audit Committee of the company’s Board of Directors (or persons performing the equivalent functions):
(a) All significant deficiencies and material weaknesses in the design or operation of internal control over financial
reporting which are reasonably likely to adversely affect the company’s ability to record, process, summarize and report financial information; and
(b) Any fraud, whether or not material, that involves management or other employees who have a significant role in the
company’s internal control over financial reporting.
By: /s/ Christopher ViehbacherName: Christopher ViehbacherTitle: Chief Executive Officer

Exhibit 12.2
I, Laurence Debroux, certify that:
5. The company’s other certifying officer and I have disclosed, based on our most recent evaluation of internal control over financial reporting, to the company’s auditors and the Audit Committee of the company’s Board of Directors (or persons performing the equivalent functions):
Date: March 3, 2009
1. I have reviewed this annual report on Form 20-F of sanofi-aventis;
2. Based on my knowledge, this report does not contain any untrue statement of a material fact or omit to state a material fact necessary to make the statements made, in light of the circumstances under which such statements were made, not misleading with respect to the period covered by this report;
3. Based on my knowledge, the financial statements, and other financial information included in this report, fairly present in all material respects the financial condition, results of operations and cash flows of the company as of, and for, the periods presented in this report;
4. The company’s other certifying officer and I are responsible for establishing and maintaining disclosure controls and procedures (as defined in Exchange Act Rules 13a-15(e) and 15d-15(e)) and internal control over financial reporting (as defined in Exchange Act Rules 13a-15(f) and 15d-15(f)) for the company and have:
(a) Designed such disclosure controls and procedures, or caused such disclosure controls and procedures to be designed under our supervision, to ensure that material information relating to the company, including its consolidated subsidiaries, is made known to us by others within those entities, particularly during the period in which this report is being prepared;
(b) Designed such internal control over financial reporting, or caused such internal control over financial reporting to be designed under our supervision, to provide reasonable assurance regarding the reliability of financial reporting and the preparation of financial statements for external purposes in accordance with generally accepted accounting principles;
(c) Evaluated the effectiveness of the company’s disclosure controls and procedures and presented in this report our
conclusions about the effectiveness of the disclosure controls and procedures, as of the end of the period covered by this report based on such evaluation; and
(d) Disclosed in this report any change in the company’s internal control over financial reporting that occurred during
the period covered by the annual report that has materially affected, or is reasonably likely to materially affect, the company’s internal control over financial reporting; and
(a) All significant deficiencies and material weaknesses in the design or operation of internal control over financial
reporting which are reasonably likely to adversely affect the company’s ability to record, process, summarize and report financial information; and
(b) Any fraud, whether or not material, that involves management or other employees who have a significant role in the
company’s internal control over financial reporting.
By: /s/ Laurence DebrouxName: Laurence DebrouxTitle: Senior Vice President
Chief Financial Officer
(1)
(1) Principal financial officer.

Exhibit 13.1
Pursuant to section 906 of the Sarbanes-Oxley Act of 2002 (subsections (a) and (b) of section 1350, Chapter 63 of Title 18, United States Code), the undersigned officer of sanofi-aventis, a French société anonyme (the “Company”), does hereby certify, to such officer’s knowledge, that:
The annual report on Form 20-F for the year ended December 31, 2008 (the “Form 20-F”) of the Company fully complies with the requirements of section 13(a) or 15(d) of the Securities Exchange Act of 1934 and information contained in the Form 20-F fairly presents, in all material respects, the financial condition and results of operations of the Company.
Date: March 3, 2009
A signed original of this written statement required by Section 906 has been provided to sanofi-aventis and will be retained by sanofi-aventis and furnished to the Securities and Exchange Commission or its staff upon request.
1
By: /s/ Christopher Viehbacher Christopher Viehbacher Chief Executive Officer
Exhibit 13.2
Pursuant to section 906 of the Sarbanes-Oxley Act of 2002 (subsections (a) and (b) of section 1350, Chapter 63 of Title 18, United States Code), the undersigned officer of sanofi-aventis, a French société anonyme (the “Company”), does hereby certify, to such officer’s knowledge, that:
The annual report on Form 20-F for the year ended December 31, 2008 (the “Form 20-F”) of the Company fully complies with the requirements of section 13(a) or 15(d) of the Securities Exchange Act of 1934 and information contained in the Form 20-F fairly presents, in all material respects, the financial condition and results of operations of the Company.
Date: March 3, 2009
A signed original of this written statement required by Section 906 has been provided to sanofi-aventis and will be retained by sanofi-aventis and furnished to the Securities and Exchange Commission or its staff upon request.
1
By: /s/ Laurence Debroux Laurence Debroux
Chief Financial OfficerSenior Vice President
(1)
(1) Principal financial officer.

Exhibit 23.1
CONSENT OF INDEPENDENT REGISTERED PUBLIC ACCOUNTING FIRM
We hereby consent to the incorporation by reference in the Registration Statements (Form S-8 Nos. 333-149203, 333-145074, 333-139555, 333-125490, 333-121584, 333-121583, and 333-107238) of sanofi-aventis, of our reports dated March 3, 2009, with respect to the consolidated financial statements of sanofi-aventis and the effectiveness of internal control over financial reporting of sanofi-aventis, included in this Annual Report (Form 20-F) for the year ended December 31, 2008.
Ernst & Young Audit
Represented by Gilles Puissochet and Jacques Pierres
Paris-La Défense, France March 3, 2009

Exhibit 23.2
CONSENT OF INDEPENDENT REGISTERED PUBLIC ACCOUNTING FIRM
We hereby consent to the incorporation by reference in the Registration Statements on Form S-8 of sanofi-aventis, dated February 13, 2008 (No. 333-149203), August 2, 2007 (No. 333-145074), December 21, 2006 (No. 333-139555), June 3, 2005 (No. 333-125490), December 23, 2004 (No. 333-121584 and 333-121583) and July 22, 2003 (No. 333-107238), of our reports dated March 3, 2009 relating to the consolidated financial statements and the effectiveness of internal control over financial reporting, which appear in this annual report on Form 20-F for the year ended December 31, 2008.
Neuilly-sur-Seine, France
March 3, 2009
PricewaterhouseCoopers Audit Catherine Pariset Philippe Vogt

Exhibit 99.1
Chapter 3 3.2. Report of the Chairman of the Board of Directors – Internal Control
(Section L. 225-37 of the French Commercial Code) 3.2.1. Chairman’s report In preparing this report, the Chairman consulted the Senior Vice President Chief Financial Officer and the Senior Vice President
Audit and Internal Control Assessment.
The Board of Directors was informed of the conclusions of the specialist committees and of the Statutory Auditors, and approved the Chairman’s report.
3.2.1.1. Corporate Governance Sanofi-aventis applies the guidance contained in the AFEP-MEDEF corporate governance code of December 2008, available on
the MEDEF website: www.medef.fr and on the Company website: www.sanofi-aventis.com. A detailed descriptions of how this code is applied by sanofi-aventis and of other corporate governance practices adopted by sanofi-aventis, are provided in our French-language Annual Report, in sections 1.2. “Gouvernement d’entreprise”, 1.1.10 “Assemblées Générales”, and 3.1.11 “Informations complémentaires”.
For an English-language description of our corporate governance practices, refer to Item 6 “— Directors, Senior Management and Employees” of our Annual Report on Form 20-F, and to Exhibit 99.2 “Extracts from the Internal Rules of the Board of Directors”. References to specific corporate governance practices are provided below:
For a description of the principles and rules agreed by the Board of Directors for the determination of compensation and all other benefits awarded to corporate officers, refer to Item 6B, — “Compensation”.
For a description of the composition of the Board of Directors, and of the preparation and organization of the duties of the Board of Directors, refer to Item 6A, “Directors and Senior Management” and Item 6C, “Board Practices”.
For a description of the limits placed by the Board on the powers of the Chief Executive Officer, refer to Item 6A., “Directors and Senior Management”.
For a description of the arrangements for shareholders to participate in General Meetings of sanofi-aventis, refer to Item 10B, “Memorandum and Articles of Association — Shareholders’ Meetings”.
Factors that are liable to have an impact in the event of a public offer for the Company’s shares are discussed in Item 3 D. “Risk Factors, — “Risks Relating to an Investment in our Shares or ADSs” and Item 10, “Additional Information”, in particular B — Memorandum and Articles of Association”.
3.2.1.2 Internal control procedures and risk management implemented by the Company The Group’s Senior Management has a clear ongoing commitment to maintaining and enhancing a reliable and effective internal
control system built on ethical principles, appropriate organizational structures, well-defined responsibilities and demonstrated competencies. The overall objective is to promote the key elements of good corporate governance: transparency of management and providing shareholders with quality information.
3.2.1.2. A. Internal control system The internal control system covers all entities consolidated by the Group. Since 2006, this system has included internal control
assessment procedures relating to financial reporting with a view to ensuring compliance with Section 404 of the Sarbanes-Oxley Act (SOA 404).
3.2.1.2. A.a. Reference framework for the internal control system The internal control system is based on the five components contained in the “Internal Control – Integrated Framework” issued
by the Committee of Sponsoring Organizations of the Treadway Commission (COSO).
The internal control system is developed and implemented by the Group’s senior management, middle management and all of its employees, with the aim of providing directors, corporate officers and shareholders with reasonable assurance that the following objectives are met:

1
• reliability of accounting and financial information;
3.2.1.2. A.b. Underlying principles of internal control The internal control system is built upon core principles:
An internal control system can only give reasonable assurance, and can never give absolute assurance, that these objectives are met. The probability of meeting these objectives is subject to the limitations inherent to all internal control systems, including the possibility of defective judgment in decision-making, the need for cost/benefit analysis before implementing controls, and the risk of deficiencies caused by human failings or mere error.
3.2.1.2. A.c. Organization, formalization and assessment procedure for internal control over financial reporting In 2004, to comply with legal requirements on internal control in both France and the United States, sanofi-aventis implemented
a dedicated internal control assessment department reporting to the Audit and Internal Control Assessment Department.
Capitalizing on the Group’s existing internal control system, this department developed a methodology to comply with Sarbanes-Oxley Act Section 404 (SOA 404), with the objective of improving the effectiveness of internal control over financial reporting. This methodology relies on an approach scaled to local risks and adapted to available resources. It applies to Group activities in proportion to their contribution to the consolidated financial statements and their risk profile, and provides a consistent basis for identifying, consolidating and qualifying identified deficiencies in internal control over financial reporting. The internal control assessment system applies a top-down risk-based approach defined at Group level and implemented locally, in accordance with the recommendations of the Securities and Exchange Commission (SEC) published in June 2007.
To ensure full acceptance and implementation of this methodology for the assessment of internal control over financial reporting, the internal control assessment department:
The first report complying with SOA 404 was issued in March 2007 and related to the 2006 financial statements. Since that date, the Group has performed an annual assessment of internal control over financial reporting to meet legal requirements in the United States. The Report of Management on Internal Control Over Financial Reporting complying with SOA 404 is presented in Item 15 of the Annual Report for the year ended December 31, 2008 on Form 20-F.
3.2.1.2. B. Control environment The control environment, which is the cornerstone of all other internal control components, refers to the degree of awareness
Group staff have of internal control. It relies on standards presented in the form of codes or charters.
3.2.1.2. B.a. Group code of ethics The sanofi-aventis code of ethics has been disseminated throughout the Group. Not only has it been posted on the Group’s
intranet, but it has also been printed in a booklet distributed to all sanofi-aventis staff worldwide. Within each subsidiary, designated Compliance Officers organize the promotion of the code, and reinforce its messages by awareness campaigns, in particular for new employees, tailored to reflect the cultural diversity of the countries where the Group operates.
2
• effectiveness and efficiency in the conduct of operations; • compliance with applicable laws and regulations; and • safeguarding of corporate assets.
• responsibility of all employees of the Group for the implementation and effectiveness of internal control; • distribution of frameworks and compliance with Group-wide policies and procedures; and
• segregation of duties, in other words ensuring that those who perform tasks are not responsible for approving or controlling the performance thereof.
• defines responsibilities and establishes timetables; • circulates an internal control assessment manual, supplemented with instructions, describing the methodology and the relevant
tools; • develops and delivers training modules on the concepts, tools and phases of the approach, and coordinates the network;
• liaises with external auditors; and • conducts the assessment of internal control over financial reporting.

3.2.1.2. B.b. Code of financial ethics
Sanofi-aventis has adopted a code of financial ethics pursuant to United States securities legislation. This code is available on the Group’s intranet.
3.2.1.2. B.c. Code of conduct – prevention of insider dealing As a result of the dual listing of sanofi-aventis in France and in the United States, both French and U.S. rules apply. Other
countries’ rules may also apply. The code of conduct – prevention of insider dealing aims at providing background information and familiarizing employees with basic concepts of insider dealing and the confidentiality of information obtained in the course of their employment. The code was communicated in 2008 via the Group’s intranet.
3.2.1.2. B.d. Code of internal control principles The Internal control assessment department published the code of internal control principles in May 2008. This code sets out the
key principles of governance and internal control, locking in action taken by the Group to implement internal control and improve its effectiveness. It was distributed to the management of Group entities in an awareness campaign backed by senior management, and has been made available to Group employees via the Group’s intranet.
3.2.1.2. B.e. Charters Sanofi-aventis has provided all employees with charters that structure and promote the internal control environment. The main
charters available to date include:
3.2.1.2. B.f. Other standards The pharmaceutical industry is subject to very strict regulatory constraints at both national and supra-national level. A large
body of laws and regulations governs each stage of operations, from evaluation and selection of compounds to standards applied to the manufacturing, packaging, distribution and marketing of medicines and vaccines.
Sanofi-aventis applies many other internal standards derived from these external standards, adapted to the specific processes carried out by each entity, thereby contributing to internal control.
All Group codes, charters and procedures are available on the Group’s intranet.
3.2.1.2. C. Risk identification, assessment and management The internal control system is based on the internal control environment and on an ongoing process of identifying, assessing and
managing risk factors which may adversely affect the achievement of goals and opportunities aimed at improving performance.
Responsibility for the identification, evaluation and management of risks is drilled down to all appropriate levels of the Group’s organization.
3.2.1.2. C.a. Group bodies responsible for identifying, assessing and managing risks and opportunities The Group’s organizational structure is geared to managing the risks and opportunities associated with the activities of sanofi-
aventis.
Responsibility for risk management is assumed at all levels within the Group. Corporate, operational and support teams constitute the staff responsible for internal control and contribute to the risk control system by conducting control processes within their area of responsibility. The main committees in charge of identifying, assessing and managing risks and opportunities are the Executive Committee, the Management Committee, the Operations Committee, the Drug Development Board and the Product Value Proposition. Their members rely on their experience to anticipate risks and opportunities arising further to developments in the pharmaceutical sector.
3
• the information systems usage charter, which establishes rules governing the use of information technology (IT) resources;
• the personal data protection charter, underscoring the Group’s commitment to respecting privacy and protecting data of a personal nature;
• the social charter, reflecting the Group’s commitment to corporate social responsibility which incorporates the principles of the United Nations Global Compact on Labor, which sanofi-aventis is committed to follow; and
• the ethical charter for purchasing provided to all Group employees involved regularly or occasionally in purchasing activities which describes the conduct to be adopted by sanofi-aventis employees when carrying out their duties.
� Executive Committee and Management Committee The Executive Committee, chaired by the Chief Executive Officer, is a select group of key executives that meets twice a month
in order to facilitate rapid decision-making.
It implements the Group’s overall strategy, oversees arbitration between departments and allocates resources, in furtherance at its high-level management role.
Its members comprise the Senior Vice President Research and Development, the Senior Vice President Chief Financial Officer, the Senior Vice President Legal Affairs and General Counsel, the Senior Vice President Industrial Affairs, the Executive Vice President Pharmaceutical Operations and the Senior Vice President Group Human Resources. Other participants are invited on an ad hoc basis, according to the agenda.
The Management Committee is also chaired by the Chief Executive Officer and meets once a month. Its members comprise all the senior executive officers of the Group’s major Departments. It reviews ongoing group operations, and is a forum for exchanging ideas and information between functions and for coordinating transversal projects across the organization.
� Operations Committee The Operations Committee is chaired by the Executive Vice President Pharmaceutical Operations. It meets once a month and is
attended by the regional managers and corporate managers from Pharmaceutical Operations. It deals with Group performance issues, and assesses changes in the environment and the requisite responses.
� New committees in 2008 The operating model adopted by the Group to address the changes and constraints affecting the pharmaceuticals sector is built
on two key principles: transversality, and decentralization of operations, implemented via Regional Strategic Councils that aim to maximize local growth opportunities.
Two other new committees have been established:
The Drug Development Board intervenes in the early phases of a product’s life cycle making decisions on whether to move the product into development. As part of this role, the Board sets projected development timelines, devises development strategies and validates the successive phases.
This committee’s role is to optimize the conditions for bringing products to market and to implement Phase III programs. It examines a product’s potential, competitive environment and probability of success. The committee also devises a differentiation strategy for product development, aimed at documenting medical and cost benefits for patients while taking into account of healthcare budget constraints. Product Value Proposition recommendations are built into the Phase III strategy proposed by the Drug Development Board and presented to the Executive Committee.
3.2.1.2. C.b. Approach to identifying, assessing and managing financial risks Under SOA 404 and obligations imposed by French legislation, the Group has adopted a process of identifying, assessing and
managing financial risks. This process has identified the control activities that need to be put in place and ensures that the internal control system over financial reporting is reliable.
To ensure the reliability of internal control over financial reporting, the approach identifies risks to be covered and then identifies controls to be implemented.
The methodology developed by the internal control assessment department covers the five COSO components and comprises:
• Drug Development Board
• Product Value Proposition
• a reference framework of processes used to prepare and process financial and accounting information; • a reference framework of the financial risks, integrating the risk of fraud. This framework is structured to carry out the assessment
at all levels of the Group; • a group evaluation tool comprising three reference frameworks applying at different levels of the organization and designed to
produce an evaluation at Group level while adapting the workload to the identified risks. On the basis of these frameworks, each entity can assess its capacity to control risks and identify any deficiency in its internal control system; and
• a fraud detection and prevention process based on the various elements of the control environment (See section “3.2.1.2.B. Control environment”) that specifies the obligations incumbent on each manager in respect of identifying, reporting and dealing with

4
acknowledged fraud incidents. This process also covers safeguarding of assets and corruption issues, which fall outside the financial reporting process.

The purpose of this methodology is to identify, track and report financial risks. All those whose permanent duties include assessing internal control are responsible for ensuring that all such financial risks are under control. They are also required to notify the Group of any residual deficiency in internal control.
A Qualification Committee conducts an annual assessment of internal control and financial risks, the purpose of which is to assess the materiality of each duly identified financial risk and the likelihood of occurrence. It notifies the Audit Committee of any residual risks that may have a significant or material impact on published financial statements that could call into question the reliability of the Group’s disclosures. This committee comprises the Senior Vice President Chief Financial Officer, the Senior Vice President Audit and Internal Control Assessment, the Vice President Corporate Accounting, the Vice President Information Systems and the Director of Internal Control Assessment, assisted if need be by representatives of the Group’s functions.
3.2.1.2. C.c. Identification, assessment and monitoring of risks relating to activities in the pharmaceutical sector The identification, assessment and monitoring of risks relating to the activities of the pharmaceutical sector are the responsibility of the following departments:
The main risks relating to the activities in the pharmaceutical sector and the main financial risks are discussed in “Item 3. Key Information – D. Risk Factors” of the Annual Report on Form-20F.
The Group also has a crisis management procedure designed to anticipate, as far as possible, the potential emergence of crises, via management principles and early warning systems covering all Group activities
� Pharmacovigilance The Pharmacovigilance Department reports to the Research and Development Department (pharmaceuticals) or the Vaccines
Department (vaccines). The department is responsible for implementing organizational structures and tools that enable the safety profile of products under development, and of licensed and marketed drugs or vaccines, to be assessed. Operating procedures define the roles and responsibilities of those involved in the management of pharmacovigilance data, and in the reporting of such data (immediately or periodically) to the healthcare authorities and/or to investigators.
In addition to assessing the safety profile of products under development and marketed products, the Pharmacovigilance Department is responsible for detecting and analyzing warning signals in order to, if necessary, issue recommendations to limit the occurrence of side-effects, ensure the product is used properly, and provide healthcare professionals and patients with up-to-date medical information.
The Pharmacovigilance Department helps assess the risk/benefit profile of products, whether they are in clinical development or already on the market.
Working with the clinical development and regulatory affairs teams and the epidemiology unit, the Pharmacovigilance Department helps prepare and follow up the related risk management plans. These plans summarize the safety profile of the products as established during the development phase, describe the measures in place to monitor identified or potential risks, and propose steps to ensure the drug or vaccine is properly used.
In monitoring tolerance through the clinical trials phase and gathering unsolicited information about products already on the market, this department relies on the network of pharmacovigilance units based in the subsidiaries, and on contractual ties with development and marketing alliance partners. These units also act as an interface between the local healthcare authorities and other departments within the subsidiary.
The Pharmacovigilance Department develops or updates tools or specific procedures designed to ensure all regulatory requirements falling within its responsibilities are met.
5
• pharmacovigilance; • legal department, in particular as regards obtaining or enforcing patent rights and other industrial property rights; • a structured health, safety and environment department in each of the Group’s activities and in each business unit, relying on the
application of an internal policy; • an insurance department, which among other things provides subsidiaries with advice and risk prevention support; and • a corporate economic security department, responsible for protecting the Group’s workforce and tangible and intellectual property
and assets.

A Group pharmacovigilance unit collates all information about side-effects from all over the world, whatever the source. An early warning procedure has been put in place to detect any risk liable to trigger the crisis management procedure and to notify the Chief Executive Officer without delay.
3.2.1.2. D. Control activities ensuring the reliability of the internal control system Conducted at all hierarchical and functional levels of the organization, control activities are based on procedures that are
available on the Group’s intranet, information systems, operating methods, tools and good practices. They are geared to the existing internal control environment and the risks and errors to be prevented, and are under the responsibility of management.
The process of preparing financial statements relies on operational processes encompassing sales administration, purchases, production process and inventory management, human resources, information systems and the monitoring of legal affairs as they contribute to the production of financial and accounting information. Control activities identified in all these processes are included in the scope of the assessment conducted under the Sarbanes-Oxley Act section 404.
The Group Finance Department is structured to enable it to carry out its various duties (preparing separate and consolidated financial statements, accounting standards, controlling, treasury and tax affairs). It coordinates and oversees local finance departments. Accounts committees, which are responsible for reviewing the tax, legal, cash and financing position of companies and validating the application of Group accounting policies, meet annually on the basis of the accounts as of end of September. Their objective is to review the accounts of Group companies with a view to preparing the Group’s annual consolidated financial statements and the separate financial statements of Group companies. For each entity examined, these accounts committees are made up of the Chief Financial Officers of the main subsidiaries, representatives from the zone or activity finance department, representatives from the expert functions of the Group Finance Department (tax, consolidation, treasury, financing, etc) and representatives from Legal Affairs.
A treasury committee, chaired by the Senior Vice President Chief Financial Officier, meets monthly to review strategies related to financing, investment, and the hedging of interest rate risk, currency risk, banking counterparty risk and liquidity risk.
Further to the requirement to file an Annual Report with the United States Securities and Exchange Commission (SEC), and pursuant to section 302 of the Sarbanes-Oxley Act, the Chief Executive Officer and the Senior Vice President Chief Financial Officer are required to carry out an evaluation of the adequacy and effectiveness of the Group’s control over published financial information and over fraud, relying partly on representation letters signed by the Chief Executive Officers and Chief Financial Officers of the different consolidated legal entities and on the fraud prevention and detection process (see section “ 3.2.1.2. C.b. Approach to identifying, assessing and managing financial risks”).
3.2.1.2. E. Information and communication Information and communication represents the flow of information accompanying internal control procedures, from the
guidelines laid down by management to action plans. It contributes to establishing the control environment, disseminating a culture of internal control and promoting relevant control activities that contribute to risk control.
In its organizational choices, the Group strives to abide by the principles of safe and effective operations while factoring in the constraints imposed by its pharmaceutical activities and its regulatory, economic and social environments. A legal unit and a managerial organization, structured around internal and external delegations of power, have been established to conduct operations and to circulate and apply the Group’s strategy at the appropriate level of the organization.
Information and communication rely on information systems. The Group intranet is a communication vector for the elements of the internal control environment. The information systems (IS) function is responsible for all the Group’s information systems. It is organized in such a way that Group operations (Research and Development, Industrial Affairs, Pharmaceutical Operations, Vaccines) are encouraged to run their operational and business-specific activities independently. It comprises departments under the direct authority of the Group information systems department and decentralized departments within operations.
The various departments of the Group’s information systems department formulate Group IS policies, coordinate processes for managing the IS function and administer infrastructures and IT services worldwide consistent with Group priorities. The decentralized information system departments develop and administer business-specific applications and run dedicated IT infrastructures and services.
The information systems function council, comprising the managers of the decentralized IS departments and of the Group information systems department, coordinates Group-wide matters and approves Group-wide policies, in particular IS security, quality policies and IT infrastructures.
The Group information systems department has a team dedicated to facilitating implementation of the internal control assessment process for the IS function.

6

3.2.1.2. F. Monitoring of the internal control system The Group’s senior management oversees and supervises internal control, largely through managerial committees and the
departments of each business unit.
This supervisory role is supplemented by active monitoring of internal control practices with a view to taking corrective action or adapting the internal control system.
Through the Audit Committee, the Board of Directors participates in monitoring and supervising activities.
3.2.1.2. F.a. The Board of Directors and its Committees The composition of the Board of Directors and its specialist committees, and the way their work is organized, contributes to the
effective and transparent conduct of the Group’s affairs; see Exhibit 99.2.
3.2.1.2. F.b. Senior management The Group’s senior management sets overall guidelines for internal control and ensures they are implemented. In the
subsidiaries, each manager is required to follow these guidelines and ensure they are duly applied.
The Group’s decentralized structure, organized into autonomous units, means the Group can be broken down into key Departments. This gives the front line genuine autonomy and the power to make decisions, while strategic decisions are prepared and decided at Group level.
3.2.1.2. F.c. Ethics Committee The Ethics Committee reports to senior management. Its main role is to monitor Group-wide compliance with the ethical
principles, values and rules of conduct contained in the code of ethics. The committee meets at least once a quarter, as required by its operating charter. The early warning procedure set up in accordance with the code of ethics empowers staff to report any violation or breach of the principles set out in the code to the corporate compliance department, which then informs the Ethics Committee of its response to reported violations or breaches. The Ethics Committee approves this information for communication to the Audit Committee.
3.2.1.2. F.d. Published Information Review Committee The Published Information Review Committee is responsible for reviewing and validating key documents intended for
shareholders and the public, and for assessing the procedures and controls used in preparing such documents.
The Committee has implemented a process of reporting information to the Committee’s secretary to ensure that the Committee is kept informed of any significant event liable to impact the share price. The secretary then consults Committee members to determine what approach to adopt as far as informing the public is concerned.
3.2.1.2. F.e. Audits Several types of audits are in place, covering all Group consolidated companies.
The roles and missions of internal audit and information system audit are described in a charter, available on the Group’s intranet.
The Group’s internal audit department is independent and objective, reporting directly to the Chief Executive Officer. It has neither authority over nor responsibility for the operations it reviews, and has complete freedom of action. Internal audit is responsible for providing senior management, and the Board of Directors via the Audit Committee, with reasonable assurance on the level of control over operations within the Group and the effectiveness of internal control. The Audit Committee is periodically informed about the results of internal audit activities, the implementation status of internal audit recommendations, the audit plan and the related resource needs. The internal audit function of sanofi-aventis obtained certification from IFACI (the French Institute of Internal Audit and Internal Control) in 2006, providing assurance that it complies with international professional standards.
The information systems audit department is completely independent of the Group Information Systems Department. It is organized along similar lines to the Group internal audit function, but conducts its assignments using a methodology specific to information systems auditing.
Internal audit and information systems audit are under the authority of the Audit and Internal Control Assessment Department.
The quality assurance departments, which are an integral part of functions and activities, carry out regular audits to assess good practices and ensure that procedures are applied and comply with the regulations governing their area of expertise.

7
Exhibit 99.2
Extracts from the Internal Rules of the Board of Directors ………………………………………………………………………………………………………………………………………………
The Internal Rules of the Board of Directors describe the rights and obligations of Board members; the composition, role and operating procedures of the Board and Board committees; and the roles and powers of the Chairman and the Chief Executive Officer.
In their current form, the Internal Rules comply fully with the spirit of the AFEP-MEDEF corporate governance code. We intend to revise them during 2009 to bring them even more closely into line with the code’s recommendations.
Composition of the Board of Directors At least half of the members of the Board of Directors shall be independent directors.
A director is regarded as independent if he or she has no relationship of any kind with the Company, the Group or its management that is liable to impair his or her judgment. It is the responsibility of the Board, acting upon the recommendation of the Appointments and Governance Committee, to assess the independence of its members.
Obligations of directors In addition to the requirements contained in the bylaws, it is preferred that each director hold at least five hundred sanofi-aventis shares in his or her own name.
When a director participates in Board deliberations and votes at Board meetings, he or she represents all the shareholders of the Company and shall act in the Company’s corporate interests.
In preparing for meetings of the Board and of any Committee on which the Board requests them to sit, directors shall devote the time necessary to examining the supporting documentation sent to them. They shall receive all information necessary to fulfill their responsibilities and may request that they be sent any document they regard as useful.
Directors must inform the Board of any actual or potential conflict of interest, and may not be involved in a personal capacity in any business that is in competition with the Company without having previously informed the Board and obtained its consent.
Directors who are in possession of privileged information must, for as long as this information has not been made public, refrain from directly or indirectly entering into any transaction involving the financial instruments of the Company and from disclosing such information to third parties.
Role of the Board of Directors The Board deliberates on issues that are within its competence by law or under the Company’s bylaws.
The Board of Directors shall determine the orientations of the Company’s activities and oversee the implementation of these orientations. It shall address any issue of relevance to the proper conduct of the Company’s affairs and shall, through its deliberations, settle matters concerning the Company. Within the scope of its role, the Board shall inter alia:
Operations of the Board of Directors The Board of Directors shall meet at least four times a year, and whenever circumstances require.
A discussion of the operating procedures of the Board must be included on the agenda of at least one Board meeting a year. A formal evaluation shall be performed every three years.
• deliberate on the strategy of sanofi-aventis and on transactions arising from that strategy, and more generally on any significant transactions, in particular major investments and divestments;
• appoint corporate officers responsible for managing the business, and oversee their management; • oversee the quality of the information provided to the shareholders and the markets via the financial statements and annual report,
and on the occasion of very large corporate actions.

Within a reasonable period in advance of each meeting, the directors shall receive the agenda for the meeting and all necessary information for their consideration, other than in exceptional circumstances.
The Board shall assess the appropriateness of establishing permanent or ad hoc specialist committees, and determine the composition of such committees in light of the issues they are required to address. It shall ensure that any such committees function properly.
Within the overall limit set by the Shareholders’ General Meeting, the Board shall allocate attendance fees to the directors, and may allocate additional attendance fees to directors who sit on specialist committees to reflect the time they devote to such committees. The Board may also allocate additional attendance fees to directors living outside France to reflect the necessity of their traveling to attend meetings.
Roles and powers of the Chairman and the Chief Executive Officer The Chairman shall represent the Board of Directors and, other than in exceptional circumstances, shall have sole authority to act and speak on behalf of the Board of Directors.
The Chairman shall organize and direct the work of the Board of Directors and ensure that the corporate decision-making bodies are operating effectively in accordance with the principles of good governance. He or she shall co-ordinate the work of the Board of Directors with that of the committees.
He or she shall ensure that directors have access on a timely basis to clear and appropriate information required for the performance of their duties.
In close collaboration with the Senior Management, the Chairman may represent the Company in high-level dealings with governmental bodies and with the Group’s key partners, both nationally and internationally, as well as playing a role in defining major strategic choices, especially as regards mergers, acquisitions and alliances.
The Chairman shall prepare the report on corporate governance and internal control stipulated in article L. 225-37 of the French Commercial Code.
The Chief Executive Officer shall assume responsibility for the Senior Management of the Company, and shall chair the Group Management Committee and Executive Committee.
He or she shall have the broadest powers to act in the name of the Company in all circumstances, subject to powers attributed by law to the Board of Directors or the Shareholders’ General Meeting and to the Company’s own corporate governance rules.
At each Board meeting, the Chief Executive Officer shall present a report on significant matters affecting the Group’s affairs.
Audit Committee Role The role of the Audit Committee shall be to review:
•
• the scope of consolidation; • the annual parent company financial statements, the annual, half-year and quarterly consolidated financial statements, the annual
and half-year management reports, and the statutory auditors’ report;
• control procedures, the report of management on internal control, and the statutory auditors’ report on this report; • internal audit work programs, and periodic summaries of internal audit reports;
• the appropriateness of elective accounting treatments; • the Group’s cash position;
material risks and off balance sheet commitments; • any issue liable to have a material financial or accounting impact;
• the use of non-GAAP indicators in financial communication;

The Audit Committee may visit or interview persons responsible for operational entities in furtherance of its role, having previously informed the Chairman of the Board and the Chief Executive Officer.
In carrying out its role, the Audit Committee may seek, via the Chairman of the Board or the Chief Executive Officer, interviews with persons involved in the preparation of the financial statements (Chief Financial and Chief Accounting Officers, persons responsible for Internal Audit), with or without the Chairman of the Board and Chief Executive Officer being present, and may request that it be supplied with all necessary information. The Audit Committee may interview the statutory auditors with or without management being present, and may consult external experts.
In addition, the Committee shall:
Composition – Operation The Committee shall have at least three members with financial or accounting expertise, to be chosen by the Board from among the independent directors, at least one of whom must qualify as a financial expert within the meaning of U.S. securities legislation.
The Committee shall meet as often as it sees fit and at least four times a year, in particular prior to the publication of the financial statements. The Chairman of the Board may call a meeting of the Committee if he or she thinks it necessary. Minutes shall be kept of Committee meetings.
The chairman of the Committee shall report on its work to the Board of Directors.
The annual report shall include a description of the Committee’s work during the past financial year.
Compensation Committee The role of the Committee shall be to:
The Committee shall consist of at least three members appointed by the Board from among the non-executive directors. At least half of the Committee members shall be independent directors.
The Committee shall meet as often as it sees fit and at least twice a year. The Chairman of the Board may call a meeting of the Committee if he or she thinks it necessary. Minutes shall be kept of Committee meetings.
The chairman of the Committee shall report on its work to the Board of Directors.
The annual report shall include a description of the Committee’s work during the past financial year.
• major litigation, on an annual basis.
• direct selection procedures for the statutory auditors when their mandates are due for renewal, monitors fees paid to the statutory auditors, ensure that signatory partners are rotated every five years, and monitor compliance with auditor independence rules;
• approve in advance any request to the statutory auditors to provide services unrelated to the audit of the financial statements, in compliance with the relevant laws;
• ensure that internal early warning procedures relating to accounting, internal accounting controls and audit are in place and properly applied;
• ensure that independent directors receive no compensation other than attendance fees.
• make recommendations and proposals to the Board concerning the compensation, pension and welfare plans, top-up pension plans, benefits in kind and other pecuniary benefits of executive officers, and the granting of stock options;
• establish rules for determining the variable component of executive directors’ compensation, and ensure that these rules are applied;
• formulate general policy on the granting of stock options, and determine the frequency of grants for each category of grantee;
• review the system for allocating attendance fees between directors;
• advise Senior Management on the compensation of key senior executives.
Appointments and Governance Committee The role of the Appointments and Governance Committee shall be to:
The Committee shall consist of the Chairman of the Board of Directors, the chairman of the Committee, and the members of the Compensation Committee. The Committee may suggest to the Board that it be augmented by the appointment of one or more directors who are not members of the Compensation Committee.
The Committee shall meet as often as it sees fit and at least twice a year. The Chairman of the Board may call a meeting of the Committee if he or she thinks it necessary. Minutes shall be kept of Committee meetings.
The chairman of the Committee shall report on its work to the Board of Directors.
The annual report shall include a description of the Committee’s work during the past financial year.
Strategy Committee The Strategy Committee is tasked with assessing major strategic options with a view to the development of the Company’s business.
It shall brief the Board of Directors on issues of major strategic interest, such as:
The Committee shall consist of the corporate officer(s) and at least three directors, and shall be chaired by the Chairman of the Board of Directors.
It shall meet as often as necessary, with meetings called by its chairman or at the request of a majority of its members.
• recommend suitable candidates to the Board for appointment as directors or as corporate officers; • establish corporate governance rules for the Company, and check that those rules are applied;
• check that there is adequate succession planning for the Company’s executive bodies;
• check compliance with ethical standards within the Company and in its dealings with third parties; • on an annual basis, provide the Board of Directors with a list of directors who can be regarded as independent; • formulate procedures for evaluating Board practices, and check that those procedures are applied.
• acquisition, merger and alliance opportunities; • the development priorities put forward by Senior Management;
•
financial and stock market strategies, and compliance with key financial ratios;
• potential diversification opportunities;
• and more generally, any strategic option judged to be essential to the Company’s future.