Extraction of built-up areas from Landsat imagery using the object-oriented classification method
6
Extraction of built-up areas from Landsat imagery using the object-oriented classification method Akjol Djenaliev * and Olaf Hellwich ** * Geodesy and Geoinformatics, N. Isanov Kyrgyz State University of Construction, Transport and Architecture, Bishkek, Kyrgyzstan ** Computer Vision and Remote Sensing, Technical University of Berlin, Germany Email: * [email protected] , ** [email protected] Abstract—In the last years, optical satellite imagery with different spatial and spectral resolutions has become an important source for the extraction of built-up areas. The medium resolution Landsat images are available for the time period since 1972, and they successfully have been used for a multi-temporal analysis of urban areas. The time- series Landsat images are helpful to extract the urban extent area between the image acquisition years and to determine the urban growth by use of the common approach of the change detection analysis. This paper presents results of object-oriented classification based on Landsat imageries conducted using eCognition Developer software. The extraction of built-up area task is focused to analysis of urban extent of the Karakol city in Kyrgyzstan as the case study area. The overall accuracy was 88 %, 91 % and 94 % for the classified images in 1977, 1990 and 2011, respectively. Keywords: multi-resolution segmentation, object-oriented classification, urban area expansion, eCognition Developer I. INTRODUCTION Historically, remote sensing imagery has been an important source for the extraction of land use information. Remotely sensed data are widely have been using for land use/land cover classification in order to monitoring natural resources and urban environment. However, the cost of aerial photography and very high spatial resolution (VHR) data acquisition are expensive for the large geographic areas. It is one of the most challenging tasks for local municipality agencies to get up-to-date spatial information and for teaching purposes at the state educational institutions in the developing countries. Usually, this task has solutions only by obtaining financial support from international organizations through a various project development. An alternative is to acquire the needed information from the Landsat satellite imagery, which began acquiring data in 1972. The Landsat imagery has several advantages: (1) image coverage of large geographic areas, (2) the classified land use/land cover data are compatible with geographic information systems (GIS), which eliminate the necessity of manual digitizing of spatial information, (3) time series analysis and land use/land cover maps can be generated at considerably less cost than other methods [1]. The main objective of this research work is the extraction of built-up areas from Landsat imagery using object-oriented classification method for time periods 1977, 1990, and 2011. The research results allow analyzing of urban spatial expansion, which gives great importance for local urban planners and decision makers. Many researchers have made use of Landsat imagery for the extraction of built-up information to discriminate from non built-up areas. Reference [2] applied object- based image analysis to extract urban structures together with their main characteristics from multi-resolution satellite imagery for the case of Bishkek, Kyrgyzstan. The medium-resolution satellite imagery was used to delineate urban extent to derive the age of urban structures and the spatial distribution of predominant building types. The detailed delineation of buildings is carried out using high-resolution optical satellite images. Authors in [3] developed a robust, readily applicable, and reproducible method that leads to accurate and reliable results from the series of satellite images. This method based on image segmentation in combination with an object-oriented and rule based classification. In [4] applied a Standardized, object-oriented, automatable classification method to extract the landscape objects over Zimbabwe. A knowledge-based approach was then used to classify the objects into information categories, using fuzzy logic based on attributes of image objects and their mutual relations. [5] has extracted the spatial distribution of building ages to create building inventory data that contribute to earthquake damage estimation. The various indices were calculated and used through threshold value processing have showed the areas of change from vegetation to built-up and from bare ground to built-up areas. Reference [6] showed the advantage of object-oriented approach based on fuzzy logic classification to distinguish land cover by hierarchical structures of objects corresponding to the selection of several indices. In [7] compared the object-oriented with traditional pixel-based classification and proved that object-oriented method has provided high accuracy classification. Standard Nearest Neighbor classification method was used to discriminate the land cover classes. AIS 2014 • 9th International Symposium on Applied Informatics and Related Areas • November 12, 2014 • Székesfehérvár, Hungary 156
Transcript of Extraction of built-up areas from Landsat imagery using the object-oriented classification method
Extraction of built-up areas from Landsat imagery using the object-oriented classification
method
Akjol Djenaliev* and Olaf Hellwich** * Geodesy and Geoinformatics, N. Isanov Kyrgyz State University of Construction, Transport and Architecture,
Bishkek, Kyrgyzstan ** Computer Vision and Remote Sensing, Technical University of Berlin, Germany
Email: * [email protected], ** [email protected]
Abstract—In the last years, optical satellite imagery with different spatial and spectral resolutions has become an important source for the extraction of built-up areas. The medium resolution Landsat images are available for the time period since 1972, and they successfully have been used for a multi-temporal analysis of urban areas. The time-series Landsat images are helpful to extract the urban extent area between the image acquisition years and to determine the urban growth by use of the common approach of the change detection analysis. This paper presents results of object-oriented classification based on Landsat imageries conducted using eCognition Developer software. The extraction of built-up area task is focused to analysis of urban extent of the Karakol city in Kyrgyzstan as the case study area. The overall accuracy was 88 %, 91 % and 94 % for the classified images in 1977, 1990 and 2011, respectively.
Keywords: multi-resolution segmentation, object-oriented classification, urban area expansion, eCognition Developer
I. INTRODUCTION
Historically, remote sensing imagery has been an important source for the extraction of land use information. Remotely sensed data are widely have been using for land use/land cover classification in order to monitoring natural resources and urban environment. However, the cost of aerial photography and very high spatial resolution (VHR) data acquisition are expensive for the large geographic areas. It is one of the most challenging tasks for local municipality agencies to get up-to-date spatial information and for teaching purposes at the state educational institutions in the developing countries. Usually, this task has solutions only by obtaining financial support from international organizations through a various project development. An alternative is to acquire the needed information from the Landsat satellite imagery, which began acquiring data in 1972. The Landsat imagery has several advantages: (1) image coverage of large geographic areas, (2) the classified land use/land cover data are compatible with geographic information systems (GIS), which eliminate the necessity of manual digitizing of spatial information, (3) time series analysis and land use/land cover maps can
be generated at considerably less cost than other methods [1]. The main objective of this research work is the extraction of built-up areas from Landsat imagery using object-oriented classification method for time periods 1977, 1990, and 2011. The research results allow analyzing of urban spatial expansion, which gives great importance for local urban planners and decision makers. Many researchers have made use of Landsat imagery for the extraction of built-up information to discriminate from non built-up areas. Reference [2] applied object-based image analysis to extract urban structures together with their main characteristics from multi-resolution satellite imagery for the case of Bishkek, Kyrgyzstan. The medium-resolution satellite imagery was used to delineate urban extent to derive the age of urban structures and the spatial distribution of predominant building types. The detailed delineation of buildings is carried out using high-resolution optical satellite images. Authors in [3] developed a robust, readily applicable, and reproducible method that leads to accurate and reliable results from the series of satellite images. This method based on image segmentation in combination with an object-oriented and rule based classification. In [4] applied a Standardized, object-oriented, automatable classification method to extract the landscape objects over Zimbabwe. A knowledge-based approach was then used to classify the objects into information categories, using fuzzy logic based on attributes of image objects and their mutual relations. [5] has extracted the spatial distribution of building ages to create building inventory data that contribute to earthquake damage estimation. The various indices were calculated and used through threshold value processing have showed the areas of change from vegetation to built-up and from bare ground to built-up areas. Reference [6] showed the advantage of object-oriented approach based on fuzzy logic classification to distinguish land cover by hierarchical structures of objects corresponding to the selection of several indices. In [7] compared the object-oriented with traditional pixel-based classification and proved that object-oriented method has provided high accuracy classification. Standard Nearest Neighbor classification method was used to discriminate the land cover classes.
AIS 2014 • 9th International Symposium on Applied Informatics and Related Areas • November 12, 2014 • Székesfehérvár, Hungary
156

Figure 1. Landsat imagery: a) MSS 1977, b) TM 1990, c) TM 2011
II. STUDY AREA AND MATERIAL
Karakol city, formerly Przhevalsk, is the fourth largest city in Kyrgyzstan, which is located about 1750 m above the mean sea level and near the eastern tip of Issyk-Kul Lake, about 150 kilometers from the Kyrgyzstan-China border and 380 kilometers from the national capital Bishkek city. It is the administrative capital of Issyk-Kul Province with 48 square km area and population of 67100 according to the Population and Housing Census of 2009. The Landsat imagery data are the longest operating program for acquisition the earth surface images from space with available a large archive of image data [8]. We searched first for the cloud-free and good quality image data on Karakol city and have found the oldest from 1977, which is Landsat Multispectral Scanner (MSS) image (path 160, row 030) acquired on 7 September 1977 and has 60 meter spatial resolution. In order to get data by age, we then searched for data on images which coincides to the last years of Soviet Union period, when Kyrgyzstan has acquired independency in 1991. Unfortunately, 1991 images were mostly covered with clouds and not good quality. We found data on cloudless images in 1990, which is Landsat Thematic Mapper (TM) image (path 148, row 030) acquired on 31 July 1990 and includes seven bands in the visible to near-infrared with 28.5 meter spatial resolutions, except for thermal infrared image which is not used in our research work. For the next time series analysis we decided to use very high resolution (VHR) images observed in 2011 and granted to the Kyrgyz State University of Construction, Transport and Architecture (KSUCTA) within a project of the Consortium for seismic risk analysis in Central Asia (COSERICA), coordinated by the German Research Centre for Geosciences (GFZ). The subset area of this granted data was preliminary analyzed by author in [9].
This VHR data is used as reference data for the selected Landtsat Thematic Mapper (TM) image (path 148, row 30) acquired on 02 August 2011, which includes sevenbands in the visible to near-infrared with 30 meter spatial resolution, except for thermal infrared image which is not used. Sub-scenes covering Karakol city were extracted from these three Landsat images (Figure 1). These data set have projections of the Universal Transversal Mercator (UTM) in zone 44 North within the reference spheroid World Geodetic System 1984 (WGS 84).
III. OBJECT-ORIENTED CLASSIFICATION
Formerly, the pixel-based classification method is concerned to each individual pixel of the spectral information within a single or multi-band image, where it could be implemented by different pixel-based algorithms. Unfortunately, today this analysis has limitations, especially in processing very high spatial resolution satellite images, where the neighboring pixels belong to the same land cover classes [10]. This problem is found as ‘salt-and-pepper’ effect that aimed of grouping pixels into image objects. Therefore, in Remote sensing techniques with the main purposes for delineating of homogenous groups of pixels into meaningful objects based on object’s texture, size, shape and other information have led to object-oriented classification method. With these parameters, it has been successfully applied in various applications and has proved that object-oriented classification is more accurate than pixel based classification method [4, 6, 11]. The first general object-oriented image analysis software on the market was eCognition. We have used eCognition Developer 9.0 software in our research work. Two things are necessary in the object-oriented image analysis. The first, use of segmentation for representing a scene according to the
157

Figure 3. Example of segmentation view (Level 2)
Figure 2. Example of segmentation view (Level 1)
spectral information of the pixels and also the hierarchical structure of object could be used for multi-scale representation. The second, providing expert knowledge by using rule-based systems is performed on the base of object hierarchy with setting up several thresholds for each feature classes [6]. This feature class could be discriminated based on calculated various indices.
A. Segmentation
Segmentation is the most important step in object-oriented image analysis. As a result, the homogeneity of each pixel is grouped into separate image objects. The degree of homogeneity of objects is controlled by the following parameters: scale, colour, shape, compactness and smoothness. The scale parameter determines the highest heterogeneity for the resulting image objects. Assigned a larger scale value creates larger image objects. The color criterion is the most important for creating meaningful objects. The value of the shape criterion modifies the relationship between shape and color criterion, where helps to improve the quality of extracting objects. The compactness criterion optimizes the resulting image objects in regard to the overall compactness within the shape criterion. The smoothness optimizes the resulting image objects in regard to smooth borders within the shape criterion [12]. An image analyst can control these parameters and change them to obtain the best segmentation results. Human interpretation is the best way to evaluate the segmentation results [11]. eCognition Developer software provides several different approaches to segmentation, and multiresolution segmentation is used for our image analysis purposes. It is a bottom-up segmentation based on a pairwise region merging technique. Multiresolution segmentation is an optimization procedure which, for a given number of image objects, minimizes the average heterogeneity and maximizes their respective homogeneity [12]. There are two main approaches in the multiresolution segmentation. The first is that small objects are aggregated into larger objects. And the second is that a larger object is split into smaller objects [11, 12]. Multiresolution segmentation produces different levels of segmentation that are known as a class hierarchy [12]. The class hierarchy is important for the classification process. Therefore, the class hierarchy was applied at two levels in our research work. Each level has its own parameters. At the higher level (Level 2), for the Landsat TM image of 2011, the scale parameter was assigned a value of 15. It is considered high value such as our research purpose is to distinguish between built-up and non built-up areas in the study area. The shape and compactness values were 0.3 and 0.7, respectively (Figure 2). At the smaller level (Level 1), the scale parameter was 5, the shape and compactness values were 0.2 and 0.8, respectively (Figure 3). The result of segmentation process with entire image divided into 409 objects at the Level 2 and 3948 objects at the Level 1.
The given values of parameters including the number of segmented objects of Landsat images are illustrated in below tables I and II.
B. Calculation indices
An urban area is a complex ecosystem of heterogeneous materials and is complicated for obtaining good classification results from image due to the spectral values and the objects structure. Therefore, to assess built-up or vegetation areas in Landsat imagery, it is effective to calculate interband images to calculate
TABLE II. SEGMENTATION PARAMETERS USED FOR LANDSAT MSS 1977
Level 1 2
Scale parameter 3 8
Shape 0.1 0.3
Compactness 0.9 0.8
Resulted numbers of the Segmented objects
3920 490
TABLE I. SEGMENTATION PARAMETERS USED FOR LANDSAT TM 1990
Level 1 2
Scale parameter 5 15
Shape 0.1 0.2
Compactness 0.9 0.7
Resulted numbers s of the Segmented objects
4693 564
158

Figure 4. View of Class hierarchy
indices. It represents the possible existence of land features. We made a survey of some indices to extract built-up areas. Kauth-Thoma’s Tasseled Cap transformation is based on Gram-Schmidt sequential orthogonalization techniques that produce an orthogonal transformation of original four-channel MSS data space to a new four-dimensional space [13]. For the Landsat MSS data to making the separation of vegetated surface from barren soils, the Green Vegetation Index (GVI) and the Soil Brightness Index (SBI) were calculated using the following formula:
SBI=0.332MSS1+0.603MSS2+0.675MSS3+0.262MSS4 (1)
GVI=-0.283MSS1-0.660MSS2+0.577MSS3+0.388MSS4 (2)
Several indices calculated for the Landsat TM data were described in this section. Although nearly everyone working with the remote sensing imagery knows the Normalized Difference Index (NDVI), which is expressed by the following equation:
NDVI = (NIR – Red)/(NIR + Red) (3)
The near-infrared bands (NIR) indicate pixel values of band 4 image, Red of band 3 images, respectively. NDVI, widely used to assess vegetation area where indicates that the greater value of pixel is a vegetation area. NDVI can only work effectively in the area with plant cover above 30 percent, and the Soil Adjusted Vegetation Index (SAVI) can be used in areas with plant cover low than 15 percent [14]. The SAVI is calculated using the following equation [15]:
SAVI = (NIR – Red)(1 + L)/(NIR + Red + L) (4)
where L is a soil adjustment factor ranging from 0 for very high densities to 1 for very low densities. For our study region a value of 0.5 was used to produce enhanced vegetation image, and this value is found as constant L=0.5 in [15];
Authors in [16] for the built-up area extraction has developed the Normalized Built-up Index (NDBI), which is expressed by the following equation:
NDBI = (MIR – NIR) / (MIR + NIR) (5)
This index is based on the spectral response of built-up lands that have higher reflectance in MIR, which indicate pixel value of band 5 image range than in NIR wavelength range. However, some studies showed and this study also found that many pixels of vegetation and water areas have positive NDBI values [14]. It present as noise mixed with built-up features where the built-up areas could not be extracted with a high accuracy. To solve this problem, author in [17] used the combination of indices to create a new Index-based Built-up Index (IBI) which is determined by the following equation:
IBI = [NDBI – (SAVI + MNDWI)/2] / [NDBI + (SAVI + MNDWI)/2] (6)
Where: MNDWI = (Green – MIR) / (Green – MIR) (7)
Here, Green indicates pixel value of band 2 image. MNDWI can enhance the contrast between built-up areas and water where the built-up areas have negative values while keeping the water of positive values. Based on these indices, the built-up areas and other land features can be extracted efficiently, if a suitable threshold is used.
C. Image classification
There are several methods for image classification algorithms in object-oriented analysis. As our image is segmented at two levels, we need to select the appropriate algorithms for achieving good results. The segmented image at larger Level 2 makes difficulties to distinguish some unused land features from built-up areas inside of the city. This task could be easily recognized at the lower Level 1. In this case, the classification process has to be stated from top to down approaches. At the Level 2, the purpose was to distinguish land classes are belonging to urban areas inside of the city, and non urban areas outside of the city (Figure 5). The Nearest Neighbor classifier was used with an appropriate number of training samples chosen for each land class in the image. The several samples for each class were selected and the hierarchical classification algorithm was run for obtaining the classification result. The classified image at the Level 2 considers as upper class and land classes at the Level 1 considers as subclasses. In case of overlapping the upper class with subclasses, the non urban area classes have to be automatically classified as Non built-up areas at the Level 1. Logically it means the existence of upper object classes, where non urban areas are the non built-up areas. For the discrimination of some vegetated areas, like parks or impervious surface from built-up areas the specific values of the calculated indices have to be used. For instance, the existence of ‘Urban vegetation’ in upper class, where NDVI>50 at the subclasses is classified as ‘Non Built-Up’, and other remaining is considered as ‘Built-Up’ classes. For the whole classification process was developed a Rule set, and used threshold condition for each classes. The final classification result is shown in Figure 5.
159
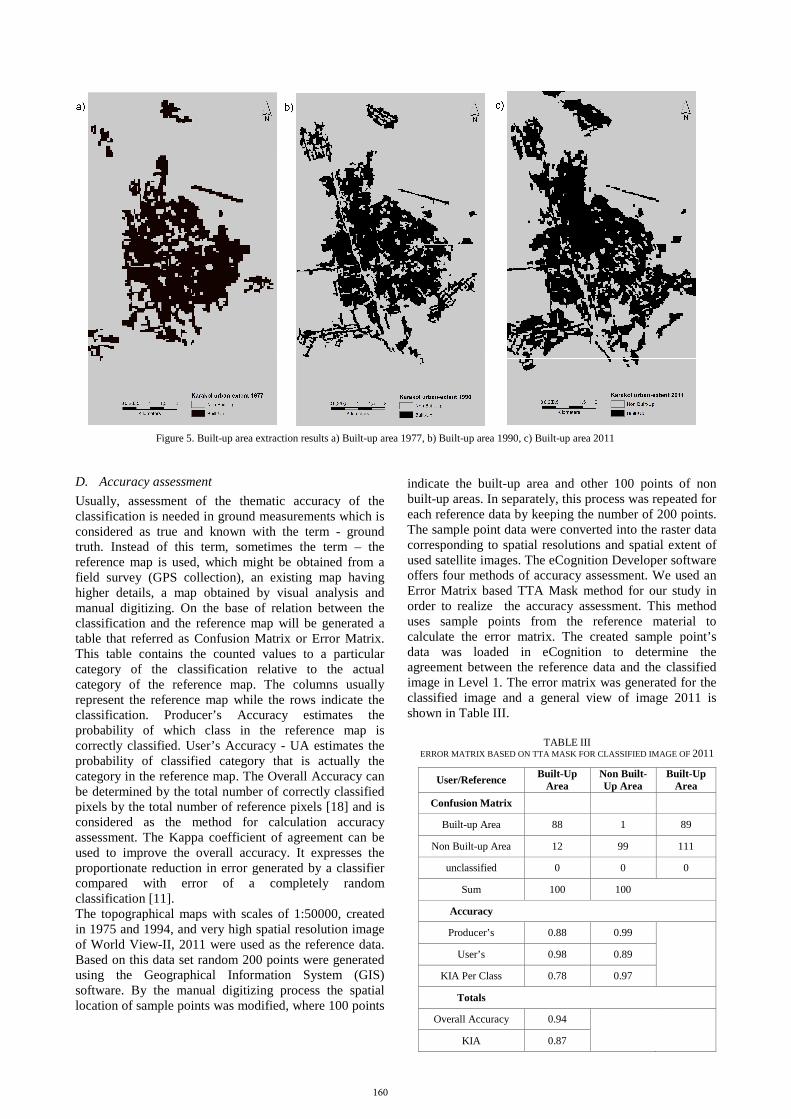
Figure 5. Built-up area extraction results a) Built-up area 1977, b) Built-up area 1990, c) Built-up area 2011
D. Accuracy assessment
Usually, assessment of the thematic accuracy of the classification is needed in ground measurements which is considered as true and known with the term - ground truth. Instead of this term, sometimes the term – the reference map is used, which might be obtained from a field survey (GPS collection), an existing map having higher details, a map obtained by visual analysis and manual digitizing. On the base of relation between the classification and the reference map will be generated a table that referred as Confusion Matrix or Error Matrix. This table contains the counted values to a particular category of the classification relative to the actual category of the reference map. The columns usually represent the reference map while the rows indicate the classification. Producer’s Accuracy estimates the probability of which class in the reference map is correctly classified. User’s Accuracy - UA estimates the probability of classified category that is actually the category in the reference map. The Overall Accuracy can be determined by the total number of correctly classified pixels by the total number of reference pixels [18] and is considered as the method for calculation accuracy assessment. The Kappa coefficient of agreement can be used to improve the overall accuracy. It expresses the proportionate reduction in error generated by a classifier compared with error of a completely random classification [11]. The topographical maps with scales of 1:50000, created in 1975 and 1994, and very high spatial resolution image of World View-II, 2011 were used as the reference data. Based on this data set random 200 points were generated using the Geographical Information System (GIS) software. By the manual digitizing process the spatial location of sample points was modified, where 100 points
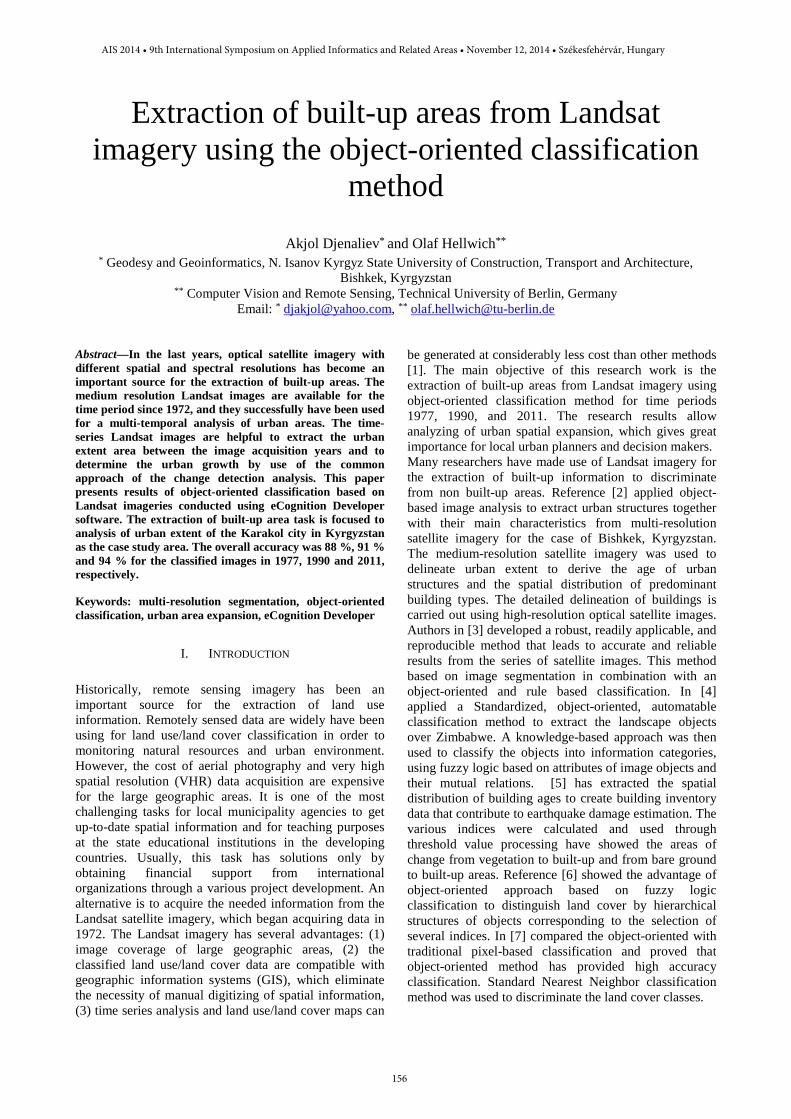
indicate the built-up area and other 100 points of non built-up areas. In separately, this process was repeated for each reference data by keeping the number of 200 points. The sample point data were converted into the raster data corresponding to spatial resolutions and spatial extent of used satellite images. The eCognition Developer software offers four methods of accuracy assessment. We used an Error Matrix based TTA Mask method for our study in order to realize the accuracy assessment. This method uses sample points from the reference material to calculate the error matrix. The created sample point’s data was loaded in eCognition to determine the agreement between the reference data and the classified image in Level 1. The error matrix was generated for the classified image and a general view of image 2011 is shown in Table III.
TABLE III ERROR MATRIX BASED ON TTA MASK FOR CLASSIFIED IMAGE OF 2011
User/Reference Built-Up
Area Non Built-Up Area
Built-Up Area
Confusion Matrix
Built-up Area 88 1 89
Non Built-up Area 12 99 111
unclassified 0 0 0
Sum 100 100
Accuracy
Producer’s 0.88 0.99
User’s 0.98 0.89
KIA Per Class 0.78 0.97
Totals
Overall Accuracy 0.94
KIA 0.87
160

Figure 6. View of Class hierarchy
Table IV contains the overall accuracy and kappa statistic for images of 1977 and 1990. The calculated area of Karakol city and its expansion is given in Figure 6.
IV. CONCLUSION
This research work is concerned to the Karakol city expansion of 1977, 1990 and 2011. Object-oriented image classification method is used to distinguish built-up from non built-up areas by hierarchical structures of objects. eCognition Developer software was used for this research work. A Rule set was developed for the implementation of image classification process using the three Landsata images. In contains all the processes starting from the segmentation to exporting classification results including the threshold values of indices. The overall accuracy is obtained 88 %, 91 % and 94 % for the images 1977, 1990 and 2011. The further research work is focused to the extraction of spatial distribution of predominant building types from a recent Landsat ETM+ imagery. At a building-by-building scale, a more detailed analysis of the buildings will be carried out using a high-resolution World View-II satellite image. Object-based image analysis will be implemented for the extraction of urban information.
ACKNOWLEDGMENT
We would like to thank the German academic exchange service (DAAD) and the Technical University of Berlin in Germany for the financial support provided for this research work. We also thank the Trimble Company for granting eCognition Developer software to the Kyrgyz State University of Construction, Transport and Architecture for educational and research purposes.
REFERENCES [1] M. Bauer, F. Yuan, K. Sawaya. “Multi-temporal landsat image
classification and change analysis of land cover in the twin Cities (Minnesota) metropolitan area”. MutiTemp-2003, Second International Workshop on the Analysis of Multi-temporal Remote Sensing Images, Ispra, Italy, 2003.
[2] M. Wieland, M. Pittore, S. Parolai, J. Zschau, “Exposure estimation from multi-resolution optical satellite imagery for seismic risk assessment”, ISPRS International Journal of Geo-Information, 1 (2012) 69-88.
[3] M. Moeller, W. Stefanov, M.Netzband, “Characterizing landcover changes in a rapidly growing metropolitan area using long term satellite imagery”, ASPRS Annual Conference Proceeding, Denver, Colorado, 2004.
[4] G. Ruvimbo, M. Philippe, D. Morgan, “Precision change detection: based on knowledge-based and object-oriented satellite image analysis in Central Zimbabwe”, ASPRS 2006, Annual Conference, Reno, Nevada, 2006.
[5] M. Matsuoka, H. Miura, S. Midorikawa, and M. Estrada, “Extraction of urban information for seismic hazard and risk assessment in Lima, Peru using satellite imagery”, Journal of Disaster Research Vol.8 No.2, 2013.
[6] T. Thu, P. Lan, T. Ai, “Rule set of object-oriented classification using Landsat imagery in Donganh, Hanoi, Vietnam”, Journal of the Korean Society of Surveying, Geodesy, Photogrammetry and Cartography, Vol. 31, No.6-2, 521-527, 20113.
[7] S. Lewinski, “Object-oriented classification of Landsat ETM+ satellite image”, Journal of Water and Land Development, No.10, 2006: 91-106
[8] http://landsat.usgs.gov/index.php [9] Djenaliev, “Object-based image analysis for building footprints
delineation from satellite images”. Proceedings of the Seventh Central Asia GIS Conference – GISCA’13. Connected Regions: Societies, Economies and Environments. Almaty, Kazakhstan 2013. 55-63 p.
[10] Blaschke, T., Strobl, J., 2001. What's wrong with pixels? Some recent developments interfacing remote sensing and GIS.
[11] H. Mashee, T. Malthus, “Object-oriented image analysis for monitoring urban expansion in the city of Riyadh, Saudi Arabia”.
[12] User Guide. Trimble Documentation: eCognition Developer 9.0, 2014
[13] Kauth, R.J. and Thomas, G.S. 1976, The Tasselled Cap—A Graphic Description of the Spectral-Temporal Development of Agricultural Crops as Seen by LANDSAT. LARS Symposia, paper 159.
[14] H. Xu, “Extraction of urban built-up land features from Landsat imagery using a thematic-oriented index combination technique”, Photogrammetric Engineering and Remote sensing, Vol. 73, No.12, 2007. pp. 1381-1391
[15] A. Huete, “A soil-adjusted vegetation index (SAVI)”, Remote Sensing of Environment, 17(7):1425-1432, 1998
[16] Y. Zha, J. Gao, and S. Ni., “Use of normalized difference built-up index in automatically mapping urban areas from TM imagery”, International Journal of Remote Sensing, 24(3):583-594, 2003
[17] H. Xu, “A new index for delineating built-up land features in satellite imagery”, International Journal of Remote Sensing. Vol. 29, No. 14, 4269-4276, 2008.
[18] Congalton, R.G., Review of Assessing the Accuracy of Classifications of Remotely Sensed Data
TABLE IV OVERALL ACCURACY AND KAPPA VALUES
Accuracy Statistics
Landsat Image 1977
Landsat Image 1990
Overall Accuracy (%)
88 91
Overall Kappa Statistic (%)
77 81
161