External Evaluation of District Development Cooperation ...
291
The opinions expressed in this document represent the authors’ points of view, and do not necessarily reflect the opinion of ICEIDA, The Icelandic Embassy in Uganda, Kalangala District staff or any of the individual persons or institutions consulted. External Evaluation of District Development Cooperation Programmes in Kalangala District in Uganda FINAL REPORT [V3-2] Prepared by: GOPA Experts Tore Laugerud Godfrey Mukwaya Andrew Arinaitwe 13 August 2018
-
Upload
khangminh22 -
Category
Documents
-
view
0 -
download
0
Transcript of External Evaluation of District Development Cooperation ...
The opinions expressed in this document represent the authors’ points of view, and do not necessarily reflect the opinion of ICEIDA, The Icelandic Embassy in Uganda, Kalangala District staff or any of the
individual persons or institutions consulted.
External Evaluation of
District Development Cooperation Programmes
in Kalangala District in Uganda
FINAL REPORT
[V3-2]
Prepared by: GOPA
Experts
Tore Laugerud
Godfrey Mukwaya
Andrew Arinaitwe
13 August 2018
EXECUTIVE SUMMARY
GOPA CONSULTANTS
External Evaluation of Kalangala District Development Programme (KDDP) 2006-15, Uganda
Executive Summary
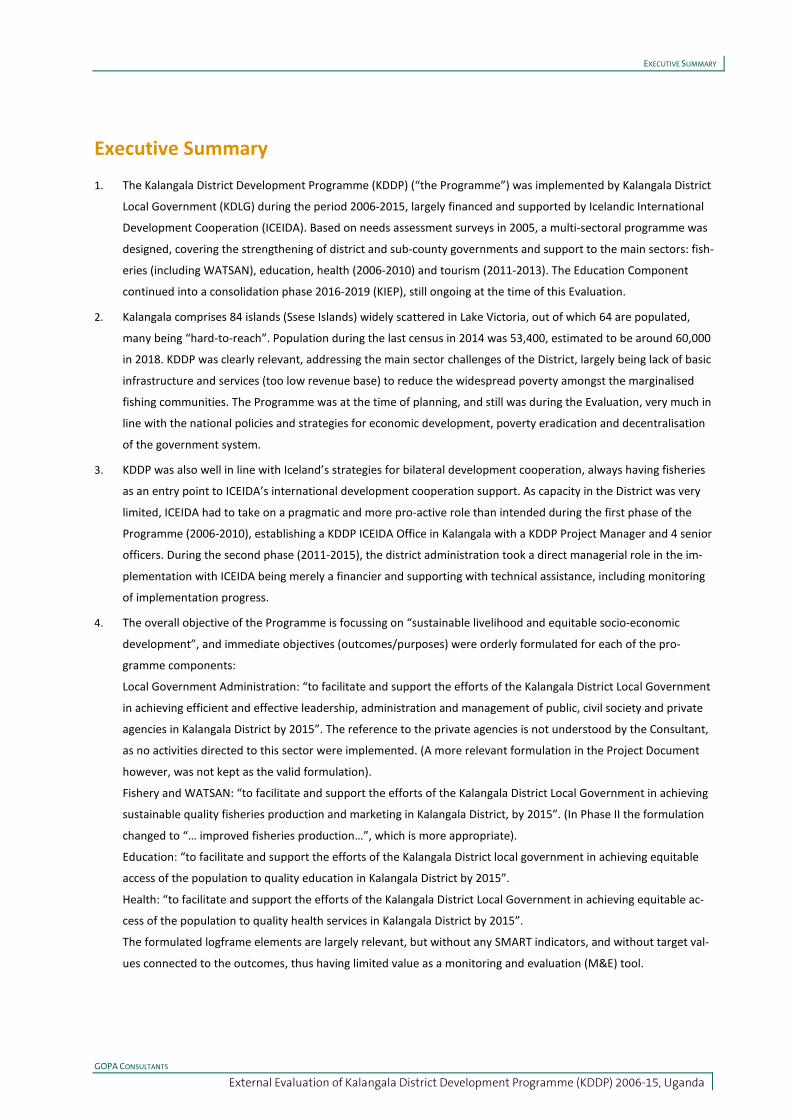
1. The Kalangala District Development Programme (KDDP) (“the Programme”) was implemented by Kalangala District
Local Government (KDLG) during the period 2006-2015, largely financed and supported by Icelandic International
Development Cooperation (ICEIDA). Based on needs assessment surveys in 2005, a multi-sectoral programme was
designed, covering the strengthening of district and sub-county governments and support to the main sectors: fish-
eries (including WATSAN), education, health (2006-2010) and tourism (2011-2013). The Education Component
continued into a consolidation phase 2016-2019 (KIEP), still ongoing at the time of this Evaluation.
2. Kalangala comprises 84 islands (Ssese Islands) widely scattered in Lake Victoria, out of which 64 are populated,
many being “hard-to-reach”. Population during the last census in 2014 was 53,400, estimated to be around 60,000
in 2018. KDDP was clearly relevant, addressing the main sector challenges of the District, largely being lack of basic
infrastructure and services (too low revenue base) to reduce the widespread poverty amongst the marginalised
fishing communities. The Programme was at the time of planning, and still was during the Evaluation, very much in
line with the national policies and strategies for economic development, poverty eradication and decentralisation
of the government system.
3. KDDP was also well in line with Iceland’s strategies for bilateral development cooperation, always having fisheries
as an entry point to ICEIDA’s international development cooperation support. As capacity in the District was very
limited, ICEIDA had to take on a pragmatic and more pro-active role than intended during the first phase of the
Programme (2006-2010), establishing a KDDP ICEIDA Office in Kalangala with a KDDP Project Manager and 4 senior
officers. During the second phase (2011-2015), the district administration took a direct managerial role in the im-
plementation with ICEIDA being merely a financier and supporting with technical assistance, including monitoring
of implementation progress.
4. The overall objective of the Programme is focussing on “sustainable livelihood and equitable socio-economic
development”, and immediate objectives (outcomes/purposes) were orderly formulated for each of the pro-
gramme components:
Local Government Administration: “to facilitate and support the efforts of the Kalangala District Local Government
in achieving efficient and effective leadership, administration and management of public, civil society and private
agencies in Kalangala District by 2015”. The reference to the private agencies is not understood by the Consultant,
as no activities directed to this sector were implemented. (A more relevant formulation in the Project Document
however, was not kept as the valid formulation).
Fishery and WATSAN: “to facilitate and support the efforts of the Kalangala District Local Government in achieving
sustainable quality fisheries production and marketing in Kalangala District, by 2015”. (In Phase II the formulation
changed to “… improved fisheries production…”, which is more appropriate).
Education: “to facilitate and support the efforts of the Kalangala District local government in achieving equitable
access of the population to quality education in Kalangala District by 2015”.
Health: “to facilitate and support the efforts of the Kalangala District Local Government in achieving equitable ac-
cess of the population to quality health services in Kalangala District by 2015”.
The formulated logframe elements are largely relevant, but without any SMART indicators, and without target val-
ues connected to the outcomes, thus having limited value as a monitoring and evaluation (M&E) tool.
EXECUTIVE SUMMARY
GOPA CONSULTANTS
External Evaluation of Kalangala District Development Programme (KDDP) 2006-15, Uganda
5. The overall effectiveness of the Programme has been satisfactory. The managerial set-up, with a Project Superviso-
ry Committee (PSC), a Project Management Team (PMT) and two Project Implementation Teams (PITs), has been
appropriate. The decision of ICEIDA to be pro-active in the first phase was decided in order to maintain a certain
implementation momentum and to be able to show some tangible results in this phase while capacity was built
with the district and sub-county governments. The outputs were delivered largely as planned, with some delays in
the infrastructure development in Phase I.
6. The Health Component, with activities spread widely out, was discontinued in 2010, mainly due to lack of local staff
to build capacity with. Sponsoring of the education of two medical doctors and 3 medical assistants continued into
Phase II, proving to be a useful investment, as the two doctors remained in Kalangala. The Tourism Component was
closed after 3 years with no tangible results, and with no involvement of the private sector, which surely is a stake-
holder that is imperative to successes in tourism at large. These activities were not continued due to lack of
funding. The efforts towards the civil society, with 7 rounds of small grants to Civil Society Organisations (CSOs),
could not even be detected at the time of the Evaluation (the summary reports from the small grants in the 2 phas-
es were not available, although seemingly produced).
7. The outcomes, being the effects of the outputs, had indicators only partly adequately formulated and without
target values. The post-harvest loss in fisheries has evidently been reduced and the revenue for fisheries has in-
creased. The WATSAN structures on the fish landing sites are however deteriorating due to lack of O&M, except in
Kasekulo-Ttubi. Positive results can clearly be found in the Education Component (construction of classrooms, toi-
lets, kitchens, provision of furniture and textbooks, etc.), where enrolment of pupils in primary schools has
increased, and Kalangala Primary Leaving Examination (PLE) results in the District are amongst the best in the coun-
try. There seems to be no visible outcomes from the Health Component efforts today, rather than some solar
panels still being operational, and the medical doctors, which education was sponsored by KDDP, operating in the
Kalangala Health Centre (HC).
8. Progress reporting was undertaken by the ICEIDA KDDP Programme Office during the first phase and by KDLG in
the second phase. Progress reports are mostly focussing on activity progress and delivering of planned outputs. It is
however noted that during Phase II the annual reports also have sections analysing performance against outcomes
for each component, which is commendable. Monitoring was a shared responsibility mostly between ICEIDA and
the District, but also with the Ministry of Local Government (MoLG) involved in joint missions. Most monitoring re-
ports were prepared by the ICEIDA Senior Programme Officers in the Icelandic Embassy in Kampala.
9. Efficiency also seems to be satisfactory under the prevailing circumstances. Capacity building (construction of new
offices, training of staff and procurement of equipment) in the District and sub-county governments has led to less
staff turnover and has reduced the staffing gap. Efficiency with O&M in the sub-county governments are, however,
not up to standards (deteriorating structures). ICEIDA has exercised far more flexibility in the funding modality than
normally is the case with donors (added funds as needs have surfaced, appreciated by the District), but the man-
agement costs in the Programme seem to be on the high side.
10. Possible programme impact, being the longer-term effect beyond the planned outputs and outcomes, are based on
field observations, key informant interviews and a household (HH) survey in 34 villages (of which 22 were “inter-
vention villages”, in which KDDP directly supported fish landing structures, WATSAN facilities and/or schools). The
355 households interviewed have more female heads than reported in the Mid-term Review (MTR) HH survey in
2010 (35% against 21%). The increased school enrolment (due to improved learning environment) has led to higher
population ratio of students/pupils now than in 2010 (34% against 6%), with girls attending schools even during
EXECUTIVE SUMMARY
GOPA CONSULTANTS
External Evaluation of Kalangala District Development Programme (KDDP) 2006-15, Uganda
their monthly period (due to good sanitation facilities). 60% of the HHs believe quality of education is good/fair.
Main occupation amongst the population is still farming, followed by fisheries. The only recognisable impact from
the KDDP Health Component is the increase in Caesarean operations undertaken in Kalangala Health Centre by
doctors educated with ICEIDA funding.
11. The Evaluation Team strongly believes that KDDP has contributed to the increased general livelihood of people in
the target areas. 64% of the HHs reporting improved welfare since 2011, the majority due to increased income.
36% do not experience improved welfare, and 14% of the population reported lack of income and “bad govern-
ance” as reasons. A large percentage reports improved housing conditions, and 96% of the HHs has at least one
mobile phone (45% have two), an improvement from around 50% in the baseline survey (2008). A rather low per-
centage of the population have recognised ICEIDA as the real funder of the improved education environment, due
to lack of signboards announcing such funding.
12. 80% of the HHs considered water supply to be good/average, but a disappointingly low percentage of the popula-
tion understands that payment for water services is required for achieving adequate O&M. A positive observation
reflecting basic understanding of the hygiene issues: 96% answered that people would fall sick if they cannot main-
tain proper hygiene practices. On the other hand, the deteriorating WATSAN facilities and buildings in most fish
landing sites might indicate lack of community ownership and understanding of the importance of O&M. A main
reason for this situation might be the discontinuation of the Beach Management Units (BMUs) in 2015, which had a
very negative impact on the operations of the landing sites in general. The present Fishery Landing Site Committees
(FLSCs) have no formal mandate to execute any services and get no money to do anything.
13. With the capacity building in the local government administrations (training of staff, and construction of district
and sub-county office buildings supplied with furniture, procurement of various equipment, etc.) the probability of
institutional sustainability has significantly increased. However, the financial sustainability is unsatisfactory, as the
district sub-county administrations have little (read: no) funds for proper O&M. The infrastructure, especially in the
fish landing sites of Kyagalanyi, Namisoke and Kachungwa show clear signs of deterioration. The water supply sys-
tems in the two latter locations are not operated satisfactorily and run the risk of breaking down in the foreseeable
future. The pumps are running on overtime as regards service, there is no chlorination of water anymore (no funds
to buy chemicals), the toilets are lacking water for handwashing, etc. A positive exception is Kasekulo-Ttubi fish
landing site on the main island Buggala, which is operated adequately with structures in good condition being well
maintained.
14. It is noted that almost all the brass water taps everywhere have broken handles, and the surroundings of the water
stand posts are partly filthy and unpleasant, also in the schools. The batteries in the solar systems installed in
schools and health centres have limited lifetime and most of the ones initially installed under KDDP are not func-
tioning anymore. Some new ones are purchased with local money but some cannot afford new ones. The district
administration has no funding for undertaking inspection visits to the outer islands, and cannot advice in, or give di-
rect support to, O&M, meaning the risk of further deterioration of infrastructure is large.
15. A main recommendation is that the donor should carefully assess the future ability of the recipients to undertake
proper O&M of the developed infrastructure, and rather opt for simple, more appropriate technical solutions that
the beneficiaries can afford to operate and maintain. May be handpumps are more suitable than solar pumping in
hard-to-reach communities, especially where the villagers themselves have operational responsibilities? Communi-
ty participation in implementation, even with free self-help, might increase the local ownership of the facilities and
increase sustainability probability.
EXECUTIVE SUMMARY
GOPA CONSULTANTS
External Evaluation of Kalangala District Development Programme (KDDP) 2006-15, Uganda
16. It is concluded that proper initial logframes with few realistic SMART indicators will ease the M&E work later. A
simple “need-to-know” M&E system for infrastructure should be instigated, also in Kalangala District Local Gov-
ernment, so that follow-up, especially in remote islands, is possible. Also, awareness raising in communities, on
proper personal hygiene practices and on the need for people to pay for water supply, must be continued. Sensiti-
sation in schools on maintaining a clean environment around the water points should be initiated by the district
administration. Finally, the broken brass taps in the water points must be replaced by more sturdy one-handle type
of taps, and the urban type elevated water cistern in flushing toilets should be avoided in rural areas, with a manu-
al bucket flushing system introduced instead.
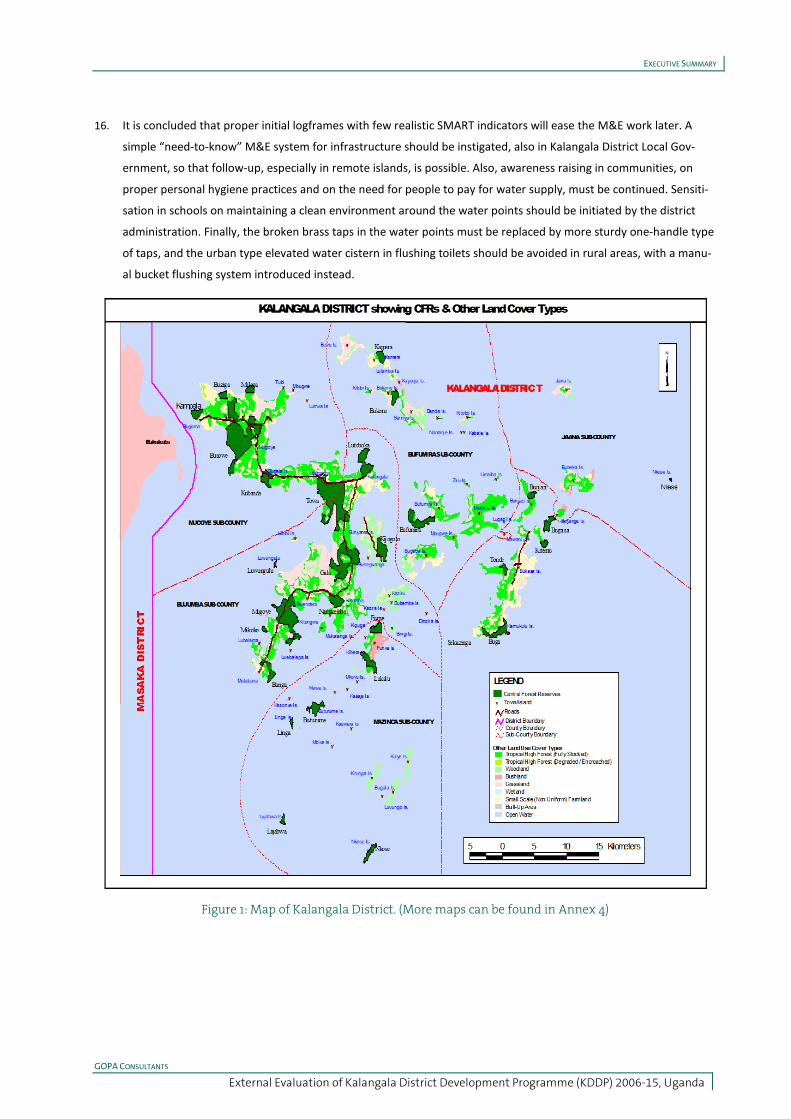
Figure 1: Map of Kalangala District. (More maps can be found in Annex 4)
EXECUTIVE SUMMARY
GOPA CONSULTANTS
External Evaluation of Kalangala District Development Programme (KDDP) 2006-15, Uganda
Summary of programme profile
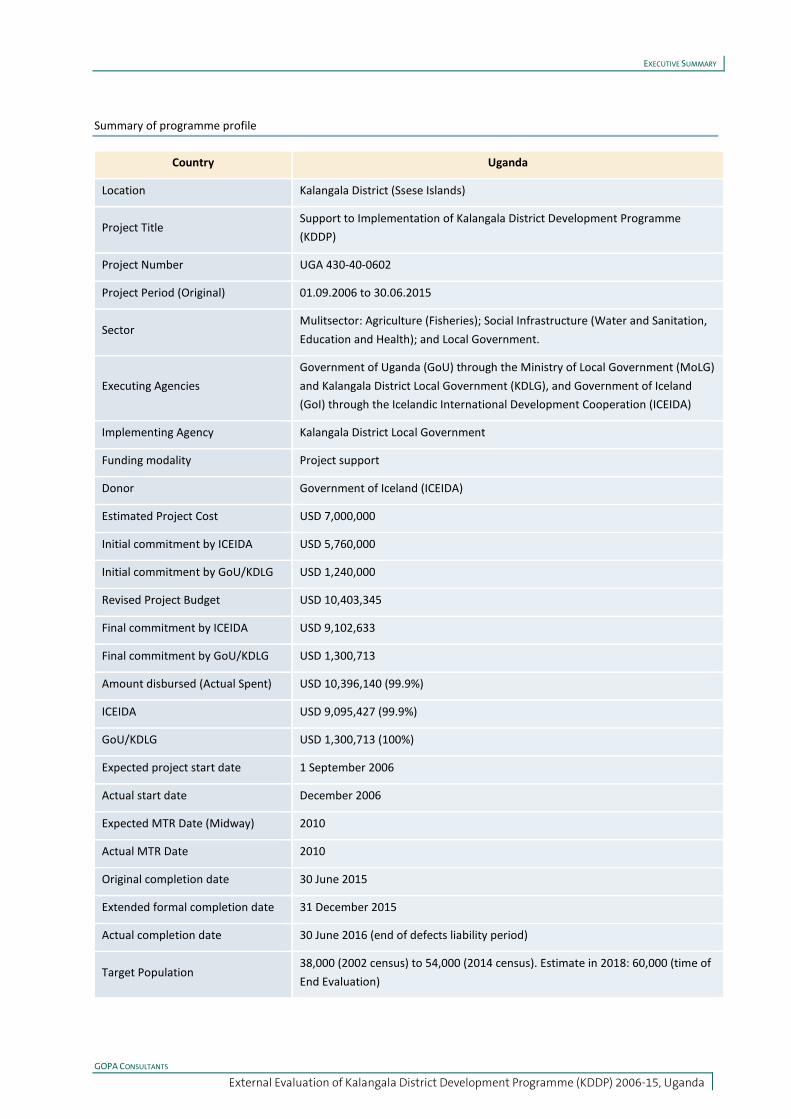
Country Uganda
Location Kalangala District (Ssese Islands)
Project Title Support to Implementation of Kalangala District Development Programme (KDDP)
Project Number UGA 430-40-0602
Project Period (Original) 01.09.2006 to 30.06.2015
Sector Mulitsector: Agriculture (Fisheries); Social Infrastructure (Water and Sanitation, Education and Health); and Local Government.
Executing Agencies Government of Uganda (GoU) through the Ministry of Local Government (MoLG) and Kalangala District Local Government (KDLG), and Government of Iceland (GoI) through the Icelandic International Development Cooperation (ICEIDA)
Implementing Agency Kalangala District Local Government
Funding modality Project support
Donor Government of Iceland (ICEIDA)
Estimated Project Cost USD 7,000,000
Initial commitment by ICEIDA USD 5,760,000
Initial commitment by GoU/KDLG USD 1,240,000
Revised Project Budget USD 10,403,345
Final commitment by ICEIDA USD 9,102,633
Final commitment by GoU/KDLG USD 1,300,713
Amount disbursed (Actual Spent) USD 10,396,140 (99.9%)
ICEIDA USD 9,095,427 (99.9%)
GoU/KDLG USD 1,300,713 (100%)
Expected project start date 1 September 2006
Actual start date December 2006
Expected MTR Date (Midway) 2010
Actual MTR Date 2010
Original completion date 30 June 2015
Extended formal completion date 31 December 2015
Actual completion date 30 June 2016 (end of defects liability period)
Target Population 38,000 (2002 census) to 54,000 (2014 census). Estimate in 2018: 60,000 (time of End Evaluation)
i
CONTENTS
GOPA CONSULTANTS
External Evaluation of Kalangala District Development Programme (KDDP) 2006-15, Uganda
Contents
1 Introduction ...................................................................................................................................... 1
1.1 Background and Context ....................................................................................................................... 1 1.1.1 Background ............................................................................................................................................... 1 1.1.2 Justifications and Problems Addressed ............................................................................................. 2 1.1.3 Important Programme Surveys, Reviews and Milestones ........................................................... 3
1.2 The External Evaluation ......................................................................................................................... 7 1.2.1 Methodological Approach ..................................................................................................................... 7 1.2.2 The Household (HH) Survey ................................................................................................................. 8 1.2.3 Interviews with Key Stakeholders ...................................................................................................... 9 1.2.4 Structure of the Report ....................................................................................................................... 10
2 Design and Relevance ................................................................................................................... 11
2.1 Policy and Strategy ................................................................................................................................ 11 2.1.1 National and Local Policies and Strategies ..................................................................................... 11 2.1.2 Iceland’s Development Strategy........................................................................................................ 12 2.1.3 Programme Strategy ............................................................................................................................. 12
2.2 The Logframe .......................................................................................................................................... 13
2.3 Conclusion ............................................................................................................................................... 15
3 Effectiveness.................................................................................................................................. 16
3.1 Programme Management .................................................................................................................. 16 3.1.1 Managerial Setup ................................................................................................................................. 16 3.1.2 Programme Reporting and Monitoring ........................................................................................... 18
3.2 Programme Achievements and Effectiveness .............................................................................. 22 3.2.1 Programme Activities and Outputs ................................................................................................. 22 3.2.2 Programme Outcomes ........................................................................................................................ 26 3.2.3 Cross-Cutting Issues ............................................................................................................................. 33
3.3 Conclusion .............................................................................................................................................. 36
4 Efficiency ........................................................................................................................................ 38
4.1 Implementation Efficiency ................................................................................................................. 38
4.2 Programme Expenditures and Cost-effectiveness ...................................................................... 39
4.3 Risk Management .................................................................................................................................. 41
4.4 Conclusion ............................................................................................................................................... 41
5 Impact ............................................................................................................................................. 42
ii
CONTENTS
GOPA CONSULTANTS
External Evaluation of Kalangala District Development Programme (KDDP) 2006-15, Uganda
5.1 Field Observations and Household Survey .................................................................................... 42
5.2 Conclusion ..............................................................................................................................................49
6 Sustainability ................................................................................................................................. 50
6.1 Various Sustainability Aspects .......................................................................................................... 50
6.2 Conclusion .............................................................................................................................................. 52
7 Conclusions and Recommendations ......................................................................................... 54
7.1 Overall Conclusions .............................................................................................................................. 54
7.2 Lessons Learned .................................................................................................................................... 56
7.3 Recommendations ............................................................................................................................... 57 7.3.1 Recommendations to ICEIDA ............................................................................................................ 57 7.3.2 Recommendations to Kalangala District ........................................................................................ 58
iii
ANNEXES
GOPA CONSULTANTS
External Evaluation of Kalangala District Development Programme (KDDP) 2006-15, Uganda
ANNEXES
Annex 1 The Consultant’s Terms of reference and fieldwork itinerary
Annex 2 List of persons met and consulted
Annex 3 List of Documents
Annex 4 Various maps, figures and tables
Annex 5 Household Survey Questionnaire and Key Informant Questions
Annex 6 Programme output indicators and achievements
Annex 7 List of infrastructure, materials and equipment supplied under Programme
Annex 8 Programme outcome indicators and achievements
Annex 9 The Household Survey
Annex 10 Illustration photos
Annex 11 Comments to the Draft Report
iv
ACKNOWLEDGEMENTS
GOPA CONSULTANTS
External Evaluation of Kalangala District Development Programme (KDDP) 2006-15, Uganda
ACKNOWLEDGEMENTS
The consultants wish to acknowledge the advice and support received in the course of the mission. Particular mention in
this regard should be made of Mr Árni H. Helgason, Mr Ben Twikirize and Mr Pius Ichariat, who were actively preparing
for the fieldwork of the Consultant, and with great forthcomingness and patience provided information and analytical
responses to the Consultant during the reporting period. The Embassy of Iceland also provided car and boat transport to
and from the District for the International Key Expert, which was very much appreciated and largely facilitated the
logistics of the fieldwork.
Thanks also to all the staff in the various departments in the Kalangala District HQs for setting aside time to meet with
the Consultant and to provide the required information requested. A special thanks to Mr Mohammed Mukasa, Head of
Human Resources Dept. in Kalangala Local Government, for setting up meetings with staff in all the departments. Thanks
also to the many health care professionals, teachers, community leaders and members of fish landing site committees
with whom the Evaluation Team was fortunate to interact.
The Consultant is responsible for any misunderstandings or misinterpretations in the report.
v
ACRONYMS AND ABBREVIATIONS
GOPA CONSULTANTS
External Evaluation of Kalangala District Development Programme (KDDP) 2006-15, Uganda
ACRONYMS AND ABBREVIATIONS
ARV Antiretroviral drug (HIV/AIDS medicine)
BMU Beach Management Unit
CAO Chief Administrative Officer
CBMS Community based maintenance system
CFO Chief Financial Officer
CSO Civil Society Organisation
CSP Country Strategy Paper
CPI Corruption Perception Index
DHIS District Health Information System
DSA Daily Subsistence Allowance
DTA Data Tracking Mechanism
EEA European Economic Area
EFTA European Free Trade Association
EIA Environmental Impact Assessment
FAL Functional Adult Literacy
FALP Functional Adult Literacy Programme (Uganda)
FDS Fiscal Decentralization Strategy
FLSC Fish Landing Site Committees
FY Financial Year
GEF Global Environment Facility
GER Gross Enrolment rate
GoI Government of Iceland
GoU Government of Uganda
HC Health Centre
HH Household
HIV/AIDS Human Immunodeficiency Virus/Acquired Immune Deficiency Syndrome
HQs Headquarters
HUMC Health Units Management Committees
IAF Inter-Agency Forum
ICEMB Icelandic Embassy in Kampala
ICEIDA Icelandic International Development Cooperation
vi
ACRONYMS AND ABBREVIATIONS
GOPA CONSULTANTS
External Evaluation of Kalangala District Development Programme (KDDP) 2006-15, Uganda
KADEFO Kalangala District Education Forum
KADINGO Kalangala District NGO Forum
KDDP Kalangala District Development Programme
KDLG Kalangala District Local Government
KIEP Kalangala-ICEIDA Development Partnership: Development in Education Sector, 2016-2019 (a project)
KTDA Kalangala Tourism Development Association
LG Local Government
LLG Lower Local Government
M&E Monitoring and Evaluation
MDD Music, Dance and Drama (in schools)
MDGs Millennium Development Goals
MoLG Ministry of Local Government
MoU Memorandum of Understanding
MTR Mid-term Review
NGO Non-Governmental Organisation
NDP National Development Plan
OECD DAC Organisation for Economic Co-operation and Development’s Development Assistance Committee
O&M Operation and Maintenance
ORRI Oracle based accounting system (used by ICEIDA)
OVC Orphan and vulnerable children
PC Personal Computer
PD Project Document
PEAP Poverty Eradication Action Plan
PHA People living with HIV/AIDS
PIT Project Implementation Team
PLE Primary Leaving Examination
PMT Project Management Team
PRSP Poverty Reduction Strategy Paper
PPA Priority Programme Area
PSC Project Supervisory Committee
PSO Private Sector Organisation
vii
ACRONYMS AND ABBREVIATIONS
GOPA CONSULTANTS
External Evaluation of Kalangala District Development Programme (KDDP) 2006-15, Uganda
PWDs People with disabilities
RBM Result-based management
SMART Specific, Measurable, Achievable, Realistic, Timely (about indicators)
SMC School Management Committee
TA Technical Assistance
UBoS Uganda Bureau of Statistics
UGX Uganda Shillings
UN United Nations
UNU-GEST United Nations University Gender Equality Studies and Training Programme
UPDF Ugandan People’s Defence Forces (the Ugandan army)
UPE Universal Primary Education
USAID United States Agency for International Development
USD United States Dollars
WASH Water, Sanitation and Hygiene
WATSAN Water and Sanitation
1
CHAPTER 1
Introduction
GOPA CONSULTANTS
External Evaluation of Kalangala District Development Programme (KDDP) 2006-15, Uganda
CHAPTER
1 Introduction
1.1 Background and Context
1.1.1 Background
The Kalangala District Development Programme (KDDP, hereafter “the Programme”)1 was a multi-sector intervention
implemented by Kalangala District Local Government (KDLG), under the overall supervision of Uganda’s Ministry of
Local Government (MoLG), financed and supported by Government of Iceland through the Icelandic International
Development Agency (ICEIDA).
The development cooperation between Iceland and Uganda started with the signing of a General Agreement on 27
Sept 20002, and the first joint intervention was the Functional Adult Literacy Programme (FALP) 2002-20053, improv-
ing literacy of the fishing communities on the islands. Following successful implementation of FALP, the KDLG
requested further assistance from Iceland also in other sectors (local administration, fisheries, education and health).
The request was presented to an Icelandic delegation led by the Minister of Foreign Affairs visiting the islands in
October 2003, and ICEIDA accepted to extend support to a wider KDDP addressing the needs of the population in the
islands. A letter of intent was then signed between ICEIDA and Kalangala District Local Government in May 2005,
providing the interim framework for the cooperation based on identified problems in each sector. Thereafter fol-
lowed a series of needs assessment surveys from January to June 2005 to identify problems to be addressed in the
mentioned sectors. Further consultations were held with key stakeholders during project identification in November
2005, and the programme planning meetings held in Entebbe and Masaka in January to February 2006.
These needs assessment surveys revealed critical gaps in service delivery in the District, and based on them a Project
Document4 was submitted in September 2006. The Plan of Operation (a “Memorandum of Understanding”-like
document) for KDDP was signed 9 November 2006 forming the main steering legal document of the Programme.
Following the recommendations of the Mid-term Review (MTR) in 2010, a new MoU was signed 25 October 2011
covering the remaining part of the KDDP up to 2015, also incorporating tourism sector, in addition to fisheries and
education sectors, and with continued support to the local administration. The support to the health sector ended in
2010 and was thus not continued from this point in time.
1 It is noted that the ICEIDA funding modality was formally “project support” and the Programme was conceived as “multi-sector project”. Thus, in some documents the Programme is termed «project» and the two terms are used inter-changeably in an inconsistent way in various documents. As there are several components of the intervention on-going over several years, the Consultant believes that term programme is the most appropriate one to use, and has tried to consistently use this in the report. 2 «General Agreement on Forms and Procedures for Development Cooperation …» 3 FALP was later extended up to 2010. Implemented with the Ministry of Gender, Labour and Social Development and Kalangala District local government. 4 Notably, the Project Document divided the Programme in to 4 phases: initial Phase for two years 2006-2008; Implementation Phase A for three years 2008-2010; Implementation Phase B for three years 2010-2013, and Phasing-Out Phase for two years 2013-2015. The Consult-ant observed that this division in phases was never referred to later during implementation, as the main milestone was the Mid-Term Review (MTR) when the implementation strategy was changed, before the MTR was Phase 1 and after Phase 2.
2
CHAPTER 1
Introduction
GOPA CONSULTANTS
External Evaluation of Kalangala District Development Programme (KDDP) 2006-15, Uganda
In 2015 the partners commissioned an internal review supported by an external independent consultant, who
recommended, among others, the extension of the KDDP to consolidate the gains made, especially in the education
sector. Consequently, a short-term consolidation phase was approved extending implementation of KDDP from July
to December 2015, mainly focusing on installation of improved WASH facilities in schools. After the end of KDDP
implementation period in December 2015, the partners further agreed to extend cooperation over the medium term
through a separate education project, Kalangala-ICEIDA Development Partnership: Development in Education Sector
2016-2019 (KIEP). KIEP is thus construed as the consolidation phase of the KDDP in the education sector, aligned with
the current ICEIDA Uganda Country Strategy Paper (CSP) 2014-2019.
1.1.2 Justifications and Problems Addressed
Kalangala District Local Government (KDLG) was established in 1989 (separated from Masaka District. Reference to
the map in Figure 1.1 in Annex 4 showing the district location). The District comprises 84 widely scattered islands in
Lake Victoria, also popularly called “Ssese Islands”, of which 64 islands are populated. The main town and district
headquarters (HQs) is Kalangala Town, located on the largest island – Buggala. The last Population and Housing
Census before start-up showed a total population of around 36,700. The 2014 National Population and Housing
Census established Kalangala district having 53,400. The population growth was 3.6% during 2002-2014 which was a
significant decline from 6.5% during the 1991-2002 period. The overall goal of the Government of Uganda was
initially to reduce absolute poverty from 38% (2003) to less than 10% of the population by 2017 (Poverty Eradication
Action Plan, 2004). Kalangala District is divided into 2 counties; Bujumba and Kyamuswa (the outer islands). These
are further sub-divided into 6 sub-counties (Mugoye Bujumba, Bufumira, Kyamuswa, Bubeke and Mazinga) and 1
Town Council (Kalangala). The sub-counties and Town Council are divided into 15 parishes and 2 town wards respec-
tively, which are made up of a total of 92 villages.
The initial rationale for ICEIDA support to KDDP came from the need for a special intervention to facilitate access to
basic services in order to reduce the widespread poverty among the marginalised fishing communities of the islands.
The Programme was designed to address development problems aligned to the national priority programme areas
(PPAs) of agriculture (fisheries), water and sanitation, education and health, as identified under Uganda Poverty
Eradication Action Plan (PEAP). KDDP was specifically intended to facilitate Kalangala District Local Government to
fulfil its mandate in the delivery of decentralized services focusing not only on the PPAs, but also addressing its local
priorities in the areas of administrative infrastructure, boarding facilities in primary schools, basic equipment and
working tools, and capacity development of both public and partner civil society, and private sector organisations.
The justification for support to KDDP was based on three main reasons:
• The islands were historically neglected owing to their hard-to-reach remote location in Lake Victoria. When
Kalangala District was established (due to “administrative expediency”) it lacked basic infrastructure for service
delivery and yet it was not given start-up funds to put them in place.
• The District had a small population base that could not generate sufficient local revenue to finance service
delivery operations, leave alone put in place the required basic infrastructure. Besides, the population was mi-
gratory and still needed time to settle so that it could own and make meaningful contribution to sustainable
local development efforts.
3
CHAPTER 1
Introduction
GOPA CONSULTANTS
External Evaluation of Kalangala District Development Programme (KDDP) 2006-15, Uganda
• The geography of the District, with widespread islands, posed unique development challenges, especially
limitations relating to transport among the islands and between the District and the mainland. This made the
delivery of basic public services to the population extremely expensive, resulting in low coverage and access to
the services in all sectors.
The pre-Programme needs assessment studies undertaken in the sectors of fisheries, health, education and admin-
istration revealed that despite the previous and on-going investments in the District, a significant proportion of the
population was not accessing the basic public services. The problems addressed by KDDP were identified through
wide consultations involving a broad spectrum of stakeholders from the central government line ministries, Kalangala
District Local Government, ICEIDA country office, independent consultants, local community members and civil
society organisations in Kalangala. These stakeholders participated in various ways during needs assessment studies,
preparation of the Project Document, in planning workshops that developed the project logframe, and during joint
technical meetings that finalised the Project Document.
The overall strategy of ICEIDA has from the very first day been to support the KDLG in implementing the Programme.
During the period 2006-2010, a Programme Office, with ICEIDA-recruited technical assistance (TA) staff, was located
in Kalangala. From end of 2010, this office operation was discontinued and all responsibility for implementation was
transferred to the KDLG. From that time, support and monitoring services were provided by ICEIDA staff in the
Icelandic Embassy in Kampala through frequent visits to the islands. Figure 1.3 in Annex 4 shows some of the mile-
stones in the Programme in a time schedule.
1.1.3 Important Programme Surveys, Reviews and Milestones
a) Baseline Survey
A baseline survey was carried out in 5 fish landing sites (Kasekulo, Kyagalanyi (Mulabana), Kisaba, Namisoke (Musisi)
and Kachungwa)5 in July 2008 by the Institute of Statistics and Applied Economics at Makerere University (map in
Figure 1.2 in Annex 4 refers), and the report was submitted 18 March 2009. Notably, the baseline survey was not
undertaken at the very start-up of the Programme, as the first 2 years of implementation was considered an “initial
phase”, where pre-implementation issues were put in place (project launching, mobilization and sensitization events,
establishing programme office and minimum institutional and technical capacities, revising logframes for health
component, undertaking procurements, etc.). The End Evaluation Consultant (“the Consultant”) appreciates this
explanation, but believes that ideally a baseline in general should be undertaken somewhat earlier, as some inter-
ventions on the ground obviously started during this first two years, to judge from the progress reports. Also, the
baseline in fact took place only 2 years prior to the Mid-term Review, which is a relatively short period, when some
results should be monitored. The delay in submitting the final report (9 months after the fieldwork) was obviously on
the part of the consultant and outside the control of the project management.
5 Neither schools nor health centres were visited during the baseline survey
4
CHAPTER 1
Introduction
GOPA CONSULTANTS
External Evaluation of Kalangala District Development Programme (KDDP) 2006-15, Uganda
The population in the 5 selected fish landing sites at the time of the survey was estimated at 3,842. The survey
largely collected data regarding demographic distribution, housing conditions, education level, health situation,
economic activities and environment. The survey report also presented some key recommendations:
• “Kalangala District should urgently be equipped with facilities to enable her carry out HIV/AIDS tests within the
district and lower level health centres be supplied with Antiretroviral drugs (ARVs).
• The district should have a strategy of stopping school going children from dropping out of school and encourag-
ing the men to attend functional adult literacy class.
• The baseline survey results should form an input to the review of the plans and implementation of the urbani-
zation of the fishing village’s development plans.
• Periodic monitoring, evaluations will enable the project determine the achievements in realization of the
programme objectives and review the targets as the implementation progresses”.
b) Mid-Term Review (MTR)
After the completion of the first years of KDDP implementation from 2006 to 2010, an external MTR was undertaken
by a contracted consultant6, covering 7 sub-counties (Kyamuswa, Bubeke, Mugoye, Bujumba, Bufumira, Mazinga and
Kalangala Town Council), visiting fish landing and handling sites, schools and health centres (Figure 1.2 in Annex 4
refers). The MTR undertook a household (HH) survey in 409 HHs using a standardized questionnaire with elaborate
and detailed questions, in addition to key informant interviews and focus group discussions. The questionnaire
enabled the review team to generate data on: household demographics; livelihood/food security; water and sanita-
tion issues; education and education delivery, health as well as fisheries. The population was assumed to be around
46,500 at the time of the MTR.
The MTR found that development objective and the overall strategy of the Programme were still relevant, and that
KDDP addressed the most critical needs/priorities of target communities and collaborated with the relevant govern-
ment structures/departments. It was concluded that e.g. the fish landing sites that had been supported were still few
as compared to the demand, and this had resulted in high pressure on the two landing sites that were constructed by
KDDP. On the other hand, in the areas where the people received the programme support, there were visible im-
provements on the quality of life. In addition those places had experienced a surge in the number of new people that
were settling there. It was also concluded that the education interventions had positive impact (dormitories con-
structed, learning material supplied, WATSAN facilities improved, etc.). KDDP had improved service delivery in health
units, e.g. with solar panel installation, staff capacity development, etc., but had been involved in too many activities.
The review team especially noted that the KDDP got involved in too many health-related issues and this could poten-
tially have reduced its impact in the sector.
Several recommendations were made for the second phase of KDDP and following these, adjustments were made in
terms of the sector focus whereby the health sector was dropped and support was instead extended to the tourism
development component, which was an attempt to realign the interventions to the policy shifts brought about by the
first National Development Plan (NDP-I) for financial years 2010/11-2014/15, putting more emphasis on economic
transformation and wealth creation, thereby intertwining sustainable economic growth with poverty eradication
6 Windsor Consult Limited, Kampala
5
CHAPTER 1
Introduction
GOPA CONSULTANTS
External Evaluation of Kalangala District Development Programme (KDDP) 2006-15, Uganda
agenda. In terms of sector focus the NDP-I prioritized tourism among the primary growth sectors that were necessary
to spur economic transformation.
The Consultant notes that a lot of detailed information and data were collected during the HH survey, but these were
just to a very limited extent systematically analysed and presented in the MTR report. This meant that a lot of data
obviously was collected “in vain”, and the data was not properly linked to the baseline survey. The reason for this
shortcoming is not known to the Consultant.
c) Kalangala District Administration Assessment
As a follow up of the MTR, an Assessment of the Capacity of Kalangala District to Manage Donor Funds was under-
taken June-August 2011 by a team of consultants hired by ICEIDA, with the purpose “to review existing financial
structures in Kalangala District and its capacity to administer direct funding availed by ICEIDA”. The findings, recom-
mendations and proposed framework would guide implementation during the second phase of the Programme
(2011-15). The review report concluded that due to the extensive capacity building exercises undertaken during the
first phase “the district staff should be well prepared taking over full responsibility of the project”. It was also iterated
that “corruption in Uganda is still on worrying high level compare to other countries” and that “weakness in service
delivery and financial management and accountability and lack of supervision is still a major challenge”. It was
however noted that “the District has received a clean opinion on the financial statements for at least three FYs …”.
The main recommendations were:
• “Handover should be 1st October 2011, and if the fund transfer system is working well and both parties agree
after one year of implementation the project cycle can be prolonged.
• MoU between ICEIDA and Uganda Local Government and Kalangala District to be prepared, …, stipulating the
role and each responsibility as well as structure and implantation plan ….
• District Chief Administration Officer (CAO) has to assign an officer among his staff to coordinate the project on
his behalf.
• ICEIDA to close its Kalangala office by end of year 20117.
• ICEIDA staff to continue supporting KDDP project implementation as well as continue strengthening Kalangala
capacity.
• ICEIDA Senior Project Officer to work with Kalangala District Finance Unit, Administration Unit and Internal
Audit Unit … in order to make sure project handover and systems are in good compliance.
• ICEIDA M&E Officer to continue supporting the District Planning Unit and Work Units in order to strengthening
the overall capacity in project structure, planning and monitoring.
• ICEIDA Engineer Officer to continue advising and support District Departments of Works to oversee infrastruc-
ture under the project.
• After the closure of each financial year ICEIDA should in cooperation with the MoLG… evaluate productivity,
efficiency, financial management and its meaningful achievement in order to ensure value for money through
timely execution of the project”.
7 The ICEIDA office had in fact been discontinued from end of 2010.
6
CHAPTER 1
Introduction
GOPA CONSULTANTS
External Evaluation of Kalangala District Development Programme (KDDP) 2006-15, Uganda
d) Other Studies and milestones
Of other events undertaken should be mentioned:
• Tracking and audit of text books provision in Kalangala District primary schools (report July 2014). The exer-
cise, undertaken by two external consultants, was ordered by ICEIDA as part of its monitoring responsibilities
under the KDDP. The objectives of the exercise were to establish the current curriculum requirements for text-
books; the available standard text books on the Ugandan market; the actual stock of text books available in
schools; the current pupil to text book ratios; the quality and shelve life of text books; availability of storage
space for books in schools; and availability of text books for use by pupils at school and at home.
• KDDP Internal Review. Before the end of the phase-out period in 2015, the partners undertook an internal
review based on a study report by an external independent consultant8. The study adopted a mix of data col-
lection methods: i) Household survey (377 HHs) to collect data on dropout and non-transiting pupils and
parents; ii) Key informants’ interviews; iii) Focus group discussion sessions in grassroots communities, the in-
school pupils and dropouts; and iv) Use of a social services infrastructure mapping tool to assess the availability,
functionality and usability of school infrastructure and the social investments. The study showed that improved
performance at primary education level is contingent of a combination of factors and not one factor is most
significant.
• A detailed review of KDDP Education Component. This was a follow-up of the Internal Review, and the follow-
ing main recommendations were given related to the sector: i) Accelerate lobbying/ advocacy to harmonize the
involvement of other key stakeholders engaged in the sector, to minimize excessive drop-outs, ii) increase col-
laboration between CSOs and the Government for synergy to better enable achievement of education
outcomes; iii) identify activities that best consolidate gains from education investment; iv) identify measures
that reverse poor performance in drop-out; v) fill infrastructure and professional gaps; vi) identify strategies
that promote accelerated educational performance through a community-state-development partners’ in-
volvement; vii) identify support measures that a) encourage community-driven participation in school
governance, b) develop mechanisms for community monitoring school-going age, c) undertake intensive sensi-
tisation to ensure internalization and appreciation of investing in the child education, d) promote community
appreciation that school feeding leads to better pupil performances; and viii) identify measures where grass-
roots communities are linked to wealth creation Functional Adult Literacy (FAL) interventions.
• Beach Management Units (BMUs) were established in Lake Victoria in 1998, instigating co-management
between Government, civil society, industry, and fisherfolk to leverage their combined knowledge to promote a
sustainable approach to resource use. The success of these BMUs was however mixed. While they clearly gave
fishers and fishing communities an active voice in the management of the fishery and tasked with self-enforcing
fishery regulations through norm setting, for example leadership, and reporting; they were also accused of cor-
ruption and ineptitude. The BMUs also became a lightning rod for complaints about illegal fishing. However
also, in some landing sites, fishers argued that BMU leaders were taking bribes to turn a blind eye to illegal fish-
ing.
In response to protests about corrupt BMU leadership, on 15 November 2015 President Yoweri Museveni dis-
banded Uganda’s BMUs and recalled government fisheries officers charged with enforcing regulations.
8 Greenstar International (U) Ltd, Development and Management Consultants. Report dated August 2015.
7
CHAPTER 1
Introduction
GOPA CONSULTANTS
External Evaluation of Kalangala District Development Programme (KDDP) 2006-15, Uganda
Ironically, the problem of illegal fishing appeared to increase following the disbandment of BMUs. Without the
collective norms set by BMUs, and exacerbated by the absence of trained fisheries enforcement officers, fishers
had little incentive to follow the law. The President then in March 2017 tasked the Ugandan People’s Defence
Force (UPDF, being the Ugandan army), with enforcing fisheries laws. Throughout 2017, the UPDF took the law
breakers to courts that imposed fines or imprisoned the offenders. Illegal fishing gears were also confiscated
and destroyed. During the Evaluation it was clear that most landing sites had reduced population following the
cracking down on illegal fishing, with many fishermen and their families moving to other locations (e.g. urban
areas) where alternative forms of employment exist.
With the disbandment of the BMUs, informal Fish Landing Site Committees (FLSC) took over some of the func-
tions of the BMUs, but without formally having the mandate of the BMUs. In some places the staff of the BMUs
were retained in the FLSC, and in other places completely new persons were brought on board. However, the
FLSC did not have any income for operations like the BMUs had (25% of the landing site revenue went back to
the BMUs). This meant that no funds were available for O&M of the infrastructure built under KDDP, and nota-
bly the WASH structure suffered from this with deterioration starting. This was clearly observed during the visit
of the Evaluation Team to the fish landing sites.
1.2 The External Evaluation
1.2.1 Methodological Approach
The Evaluation in Kalangala was undertaken by a team led by the International Key Expert. (There was one team
undertaking a similar evaluation of ICEIDA support in Mangochi District in Malawi). Additionally, the team in Uganda
comprised a National Expert responsible for implementing the household (HH) survey, in addition to 5 enumerators
visiting the households and one expert being responsible for entering the data collected in the HH survey and analyse
these (also taking part in the HH survey interviews). In addition, minor inputs to the planning of the Evaluation and
the reporting related to fisheries was given by a national Fishery Expert. The Evaluation took place during the period
1 March - 13 August 20189, with inception visits to both countries during 12-17 March 2018.
In pursuit of the ToR, the Consultant applied a mix of methodological approaches, which included:
• Documentary review (a list of consulted documents is presented in Annex 3).
• Field visits to the District and visiting selected interventions implemented.
• Household (HH) surveys in selected communities (HH survey questionnaire in Annex 5 and HH survey report in
Annex 9).
• Interviews with key stakeholders, including key district government staff (standardised questions for the key
respondent interviews were developed based on the ToR, in close consultation with the Icelandic Embassy in
Kampala, see in Annex 5.)
• Debriefing meeting with the Icelandic Embassy and presentation of the main findings in ICEIDA in Reykjavik on
24 August 2018.
9 This is the date of the final report from GOPA. The Consultant’s presentation in ICEIDA in Reykjavik was held on 24 August 2018.
8
CHAPTER 1
Introduction
GOPA CONSULTANTS
External Evaluation of Kalangala District Development Programme (KDDP) 2006-15, Uganda
Wherever possible, and this was constrained by the tight timeframe, the Consultant employed participatory meth-
odologies. The Terms of Reference (ToR) for the Evaluation in both countries is enclosed in Annex 1 together with the
overall time schedule and the itinerary of the HH survey in Uganda. Annex 2 comprises the list of persons met with
and consulted during the Evaluation. Figure 1.4 in Annex 4 shows the locations visited during the Evaluation.
1.2.2 The Household (HH) Survey
In the HH survey, 34 villages were sampled in the whole district, of which 22 were “intervention” villages (11 from
each of the two counties - Bujumba County and Kyamuswa County)10. 12 villages were “control” villages (5 from
Bujumba County and 7 from Kyamuswa County)11. The HH survey was conducted during the period 23rd April – 8th
May 2018, and the Kalangala District Local Government put at the team’s disposal a fibreglass boat with a coxswain
and a vehicle with driver. During the visit to Mazinga Sub-County, the Embassy of Iceland provided the survey team
with a larger speed boat that tackled the heavy weather better than the smaller boat. The Consultant paid for the
fuel and other associated costs.
Basing on the number of selected households in the 2014 Population and Housing Census, the proportion of house-
holds was 0.49 for Bujumba County and 0.51 Kyamuswa County, 173 and 182 households respectively, totalling 355
households. The number of households to be selected for each village was determined based on proportionate
numbering.
The training of enumerators was conducted on 23rd and 24th April at a venue provided by Kalangala District Local
Government at the district headquarters. 4 enumerators, plus a “reserve” enumerator, were trained. The “reserve”
enumerator was to be called upon in case of any unforeseen events that would prevent any of the 4 enumerators to
continue with the exercise (and participated in the interviews in Mazinga). The training comprised a brief background
of KDDP/ICEIDA interventions; the role of the survey team during the evaluation; a detailed explanation and how to
administer the questionnaire and pretesting the results. Part of the training was pre-testing of the questionnaire in
the nearby Kizzi village (4 HHs for each remunerator and the data analyst). Data entry was started while the team
was gathered in Kalangala, and was completed in Kampala.
S
10 A list of the sample villages is enclosed with the HH Survey Report (Annex 9). 11 For purposes of the HH Survey “ intervention” villages (in Annex 9 referred to as “intervention location” villages) were the villages and/or landing sites where KDDP-supported projects/interventions physically were located (e.g. fish landing structures, WATSAN facilities or schools). “Control” villages were those villages with no KDDP supported projects / interventions in the villages themselves. (The interven-tions considered in this case exclude administrative infrastructures e.g. the district HQs and sub-county offices). With respect to the education and health interventions, it should be noted that the control villages do not carry the usual meaning of “control groups” (i.e. groups that received no benefit), because virtually all villages in Kalangala District benefited from KDDP interventions in varying degrees depending on the sectors, though the intervention villages may have benefited to a greater extent. It is therefore apparent that the distinction between the intervention and control villages is the degree of access to the service facilities (e.g. schools, health centers, improved fish handling facilities, water and sanitation facilities), mainly defined by physical distance. (For example, in the education sector one primary school may serve several villages in a parish and since all schools in the district were supported, the distinction between the intervention and control villages by default becomes ”blurred”, whereas for sectors like fisheries and WATSAN, a clear distinction can be made between intervention and so-called control villages).
9
CHAPTER 1
Introduction
GOPA CONSULTANTS
External Evaluation of Kalangala District Development Programme (KDDP) 2006-15, Uganda
ome challenges faced by the HH survey team were: the rainy and windy weather on several days; unavailability of
complete household lists in some villages, necessitating on-spot sampling with the help of respective village leaders;
distances between villages in Bukasa and Bubeke islands required not planned transporting the team using motorcy-
cles (locally referred to as “Boda-Boda”); and the survey team had to spend 2 nights off the main island in very basic
accommodations.
Detailed description of the HH survey and analysis of the results are presented in Annex 9.
1.2.3 Interviews with Key Stakeholders
The International Key Expert had several meetings with key informants that had been involved in the Programme.
These, in addition to the staff at the Icelandic Embassy that earlier had been working in the Programme Office in
Kalangala, included: 19 staff in the Kalangala District Administration and sub-county administrations; 1 NGO staff,
and 1 employee at the Kalangala Tourist Information Centre. Additionally, the International Key Expert, together with
the National Expert, met with interviewees in 16 primary schools (PSs), including 1 community school, (out of 26 PSs
in total in the District, being 62%), 5 fish landing sites, 2 sub-county administrations and 5 health centres.
The Consultant believes that the key interviews undertaken were sufficient to get a fairly good picture of the out-
comes and impact of the Programme. The following limitations/challenges were however encountered:
• Of the 4 sub-county offices that were visited, 2 had no-one present to answer any questions (Bufumira, with
open doors, and Kalangala Town Council, which was closed two days in a row). Neither Bubeke sub-county of-
fice had anyone present, but the Consultant met the Chairperson of the Local Council incidentally in Bubeke PS,
and went with him to the office.
• The fish landing site buildings in Kachungwa were locked up (the adjacent village is named Kachanga), so the
Consultant could not inspect the office/store building and the toilet/washroom building. The Fisheries Officer in
Mazinga Sub-County had taken the keys with him and was not present on the island (reasons unknown).
• Most of the staff at the health centres had come on board after 2010 when the Health Component of the
Programme ended. Thus, they had very little knowledge of the activities that were implemented before this
date.
• Certain departments in the District Administration (e.g. Health Dept.) were very slow in submitting simple
statistics on various topics, even if agreed to with the Consultant. Some information was still lacking when the
draft report was submitted.
Some key programme documents were not submitted to the Consultant when the Draft Evaluation Report was
prepared and submitted, most importantly the annual reports from Phase II of the Programme. This led to a couple
of wrong conclusions by the Consultant in the Draft Evaluation Report, and created some unnecessary additional
work in the final reporting.
10
CHAPTER 1
Introduction
GOPA CONSULTANTS
External Evaluation of Kalangala District Development Programme (KDDP) 2006-15, Uganda
1.2.4 Structure of the Report
The report is structured in accordance with standard OECD DAC criteria. In Chapter 2, the relevance of the Pro-
gramme, including the design and assessment of the logframe is assessed. Chapter 3 is discussing the effectiveness
of the Programme, including description of the programme management and assessment of the outputs/deliverables
and most importantly the outcomes. Chapter 4 is assessing the efficiency and Chapter 5 the preliminary impact of the
Programme, followed by Chapter 6 assessing the sustainability. Chapter 7 presents the overall conclusions and
outlines the Consultant’s recommendations arising from the foregoing.
In order to reduce the size of the report, all figures, tables and illustrations are included in annexes. This format has
also made it easier for the Consultant when several people are working on the document and will subsequently make
it easier to comment on the document without “disturbing” the formatting. It is emphasised that the illustration
photos in Annex 10 is an integral part of the report and makes it much easier to comprehend some of the issues
taken up in the report. In addition to the mentioned annexes above, Annex 4 contains maps, figures and smaller
tables, Annex 6 lists the outputs and Annex 7 lists the outcome achievements. Annex 11 contains the comments to
the Draft Evaluation Report.
11
CHAPTER 2
Design and Relevance
GOPA CONSULTANTS
External Evaluation of Kalangala District Development Programme (KDDP) 2006-15, Uganda
CHAPTER
2 Design and Relevance
2.1 Policy and Strategy
2.1.1 National and Local Policies and Strategies
At the time of preparing the Programme (2005), the most prevalent steering policy document in Uganda was the
Poverty Eradication Action Plan (PEAP), being Uganda's national development framework and medium term planning
tool; prepared in 1997 through wide stakeholder consultations and participation. The PEAP was also the national
instrument of the Millennium Development Goals (MDGs), and constituted the country's Poverty Reduction Strategy
Paper (PRSP), guiding the formulation of government policy and implementation of programmes through sector wide
approaches and a decentralized governance system. Since year 2000, the PEAP has been updated three times in
annual PRSP Progress Reports. The key pillars of the PEAP were: Economic management; enhancing production,
competitiveness and incomes; security and conflict resolution and disaster management; governance; and human
development; in addition to crosscutting issues including HIV/AIDS, gender and environment (2004 PEAP version).
PEAP 2004 also contained the vision of the Government of Uganda to reduce absolute poverty from 38% (2003) to
less than 10% of the population by 201712.
The policy instrument for development at local level was (and still is) decentralization. A Decentralization Policy was
launched as early as in 1992, and laid out in the Local Governments Act from 1997. In 2001, Government agreed on a
Fiscal Decentralization Strategy (FDS), strengthening the process of decentralization in Uganda, through increasing
local governments’ autonomy, widening local participation in decision-making and streamlining of fiscal transfer
modalities to local governments in order to increase the efficiency and effectiveness of local governments.
A new National Development Plan 2010/11–2014/15 (NDP) stipulated Uganda’s medium-term strategic direction,
development priorities and implementation strategies, including government-development partner relations. The
aim was to accelerate socio-economic transformation to achieve the National Vision of a transformed Ugandan
society “from a peasant to a modern and prosperous country within 30 years” (Vision 2040).
National development planning and budgeting mechanisms have been well integrated into the local government
structures in Kalangala District, e.g. the 2014 Local Government Development Planning Guidelines, ensuring citizen
participation in planning, budgeting, implementation monitoring and reporting in service delivery, used for prepara-
tion of the FY2015/16 budget.
The Consultant concludes that the Programme at the planning stage, and further during implementation to the
completion in 2015, have been fully in compliance with national and district policies and strategies.
12 Current estimate 25.8% (Min. of Finance budget speech 2018/19)
12
CHAPTER 2
Design and Relevance
GOPA CONSULTANTS
External Evaluation of Kalangala District Development Programme (KDDP) 2006-15, Uganda
2.1.2 Iceland’s Development Strategy
ICEIDA started cooperation with Uganda through the signing of a General Agreement on development cooperation
on 27 September 200013, and the Icelandic Embassy in Kampala was opened in June 2004. The point of entry of
Iceland into development cooperation has always been related to fisheries, in one form or another, as this is the
sector where the country is strong and thus has a comparative advantage. Iceland’s policy on international develop-
ment cooperation in general, and in Uganda in particular, has therefore from the beginning prioritized natural
resources (fisheries), and social sectors (education and health) and governance (local administration and civil society
organizations) related to communities with fisheries as major source of income. The justification for support to KDDP
was based on Kalangala’s unique development challenges that arose from its history, geographical set up, and
demographical features, which resulted in sub-standard delivery of public services. Clearly, the 4 sectors supported
by ICEIDA in Kalangala captures the priority sectors of Iceland, making support to KDDP highly relevant14.
ICEIDA 15 is responsible for the delivery of Iceland’s bilateral development cooperation in accordance with Act No.
121/2008 on Iceland’s International Development Cooperation Act, Regulation No. 894/2009 and the Strategy for
Iceland’s International Development Cooperation 2013–2016. These are the first important steering documents for
ICEIDA in relation to the support also in Uganda, and the former document focused on a programme-based approach
in its aid delivery with a more holistic support to districts with significant fishing communities. ICEIDA’s first Uganda
Country Strategy Paper (CSP) 2014-2019 intertwined the development visions, strategies and priorities of the part-
ners, drew from lessons learned and was further informed by extensive consultations with key stakeholders. A Policy
for Gender Equality in Iceland’s international development cooperation for the period 2013–2016 was published in
2013. Furthermore, in 2012 ICEIDA published guiding principles for addressing environmental issues in its projects.
Also, the KDDP was designed in accordance with Iceland’s international commitments, in particular the Paris Agree-
ment, the Accra Accord and Busan Partnership Agreement.
The Consultant therefore concludes that KDDP has been fully in line with Iceland’s development cooperation policy
and strategy from the beginning in 2005 and, still at the time of the Evaluation, the continuation of the Education
Component (KIEP) is very relevant.
2.1.3 Programme Strategy
The overall implementation strategy from the very planning of the Programme has been to build capacity in the
District, and support and advice the District on its implementation of development interventions. As such, ICEIDA is
being a “backseat driver”, intended to operate as a programme supporter only. However, following the needs
assessment survey undertaken in 2006, it became clear that due to the significant lack of capacity in the district
administration to implement the Programme, ICEIDA had to take on a more pro-active part in the first programme
13 The citation of the agreement is: “General Agreement on Forms and Procedures for Development Cooperation between the Republic of Iceland and Government of the Republic of Uganda”. 14 The first support to the fisheries sector was assistance to the quality assurance of Fish Products in Uganda, in the Fish Quality Laboratory in Entebbe (2002-2005). 15 It is noted that ICEIDA up to end of 2015 stood for Icelandic International Development Agency that was an autonomous body under the Ministry of Foreign Affairs, responsible for administration of bilateral cooperation of Iceland. Since 2016, ICEIDA as an autonomous agency was abolished, and its functions were absorbed under the Ministry of Foreign Affairs, Directorate of International Development Coopera-tion. The Abbreviation “ICEIDA” was however retained – and now standing for Icelandic International Development Cooperation. Bilateral cooperation is administered by the Directorate of International Development Cooperation through Icelandic Embassies.
13
CHAPTER 2
Design and Relevance
GOPA CONSULTANTS
External Evaluation of Kalangala District Development Programme (KDDP) 2006-15, Uganda
phase. ICEIDA therefore established an office in Kalangala town, with a Project Manager and 4 senior officers, provid-
ing support and TA to the programme components. This was the only way that the momentum from the planning
stage and the expectations for tangible results with the stakeholders could be maintained. If not ideal, this surely was
a pragmatic solution that gave the Programme a kickstart. The ICEIDA Office was closed by the end of 2010.
In the second phase of KDDP, funding and implementation support was channelled through the existing district
government mechanisms and the role of ICEIDA became purely financing the Programme and giving minor technical
assistance. ICEIDA has therefore all the way been giving support fully in line with national and local policies and
strategies. With the managerial set-up, having Project Supervisory Committee, Project Management Team and
Project Implementation Teams through both phases of the Programme, the continuity was secured in both phases,
also with frequent ICEIDA support visits form Kampala in the second phase.
2.2 The Logframe
The Project Document (PD) from September 2006 defines the following Development Objective:
“Sustainable livelihoods and equitable socio-economic development (in Uganda, particularly in Kalangala District)”.
(The Evaluation Team is a bit uncertain as to whether the part in brackets is part of the formulation. In any case, the
reference to Uganda as a whole is not appropriate in this Programme).
As the Programme is multi-sectoral, the PD includes formulation of purposes/immediate objectives for all the pro-
gramme components (given in the separate section for each component, with a shorter form in the Summary Section
at the beginning of the PD, although the main contents are kept):
Local Government Administration Component: “to facilitate and support the efforts of the Kalangala District Local
Government in achieving efficient and effective leadership, administration and management of public, civil society
and private agencies in Kalangala District by 2015”. (It is noted that in the Summary section of the PD, the formula-
tion is “efficient and effective leadership in the district together with quality administration and management of
public services along with strong private sector and civil society organisations”).
Fishery and WATSAN Sectors Component: “to facilitate and support the efforts of the Kalangala District Local Gov-
ernment in achieving sustainable quality fisheries production and marketing in Kalangala District, by 2015”.
Education Sector Component: “to facilitate and support the efforts of the Kalangala District local government in
achieving equitable access of the population to quality education in Kalangala District by 2015”.
Health Sector Component: “to facilitate and support the efforts of the Kalangala District Local Government in achiev-
ing equitable access of the population to quality health services in Kalangala District by 2015”.
In the purpose for the Local Government Administration Component, the reference to “private agencies” is not fully
understood, as such agencies has hardly been an issue at all in the Programme. The Consultant also realizes that the
formulation in the PD Summary, formally speaking, is different from the formulation in the main PD text, as it does
not expect “leadership, administration and management of …... private agencies”, but rather wants to achieve
“quality administration and management of public services along with strong private sector….”, which might indicate
14
CHAPTER 2
Design and Relevance
GOPA CONSULTANTS
External Evaluation of Kalangala District Development Programme (KDDP) 2006-15, Uganda
a hope for “co-management” of the public sector together with the private sector and civil society organisation.
Without going too much into semantics, the latter formulation seems to be more appropriate, although the Consult-
ant does not fully understand why the private sector organisations are mentioned at all in this context.
The logframe for the first programme phase lists some indicators for the outcomes, but with no target values con-
nected, with most of them being qualitative:
• “No. and coverage of district and LLG policies and ordinances/bye-laws formulated and implemented
• Community priorities (lower councils, gender, PWDs, youth, elderly, PHA) integrated in LG development plans
and budgets
• Proportion of activities in LG Development Plans implemented and monitored on schedule, by sector and
location
• Availability of data disaggregated by sector, sex, age and location
• Number of departments/ actors producing activity and financial performance reports on schedule, by level
• Local revenue generated, by source and location
• Number of active NGOs, PSOs and networks in the district, by sector
• Administrative infrastructure and facilities in place”.
In addition, there are several outputs for the period 2006-10 listed, with target values for the indicators, for each of
the components, supported by a list of activities.
Following the Mid-term Review in 2010, a new logframe was formulated for Phase 2 (2011-15), no longer with the
Health Component included. This revised logframe with indicators and target values are enclosed in Annex 6 and
Annex 7 respectively for the outputs and the outcomes.
The overall objective/development objective remained unchanged from the first phase of the Programme (with the
reference to Uganda taken out, being an improvement). The immediate objectives (outcomes) for the programme
components also remained almost identical with the ones in the PD, where the formulation from the main text of the
PD is kept for the Local Government Administration Component. It is noted that the purpose for the Fishery Compo-
nent has been formulated as less ambitious in the second phase (“improved quality fisheries…” has taken the place of
“sustainable quality fisheries”), which seems to be a realistic change. The new Tourism Component got the purpose:
“Improved exploitation of Kalangala District tourism potential by 2015”, which proved to be utterly unrealistic.
It is noted that there are no target values listed for the outcome indicators. The project management confirms that
this was not done at the time, but refers to the national and sector targets, which is not included in the logframe
document. This makes it more cumbersome for outsiders to easily verify whether the targets were reached or not.
The Completion Report from the Programme (June 2017) nevertheless lists some outcomes and achievements for the
components, also with reference to the baseline year. (This is further commented upon below in Section 3.2.2).
The Consultant finds the logframe formulations largely relevant, with some minor shortcomings commented upon
above, although none of the indicators are fully SMART (specific, measurable, achievable, realistic and timely).
However, target values for the outcome indicators have not been formulated, and some outcomes are of a very
general nature, difficult to measure. This is a shortcoming, as the outcomes constitutes the main reasons for the
15
CHAPTER 2
Design and Relevance
GOPA CONSULTANTS
External Evaluation of Kalangala District Development Programme (KDDP) 2006-15, Uganda
interventions being implemented in the first place, representing the effects of the outputs/deliverables that are
guaranteed by the programme management. As such, the implementation progress reporting in Phase I and the
monitoring reports in Phase II are mainly outputs focused. It is however noted that the annual reports in Phase II
(2012, 2013 and 2014) prepared by the district authorities have sections assessing the outcomes.16.
2.3 Conclusion
The Consultant concludes that the Programme has been very relevant related to the national and local development
policies and strategies from the very start of the planning and until the programme completion in 2015. The design of
the Programme, with the components related to local administration strengthening, fisheries and WATSAN, educa-
tion and sports, and health in the first phase responded directly to the critical shortcomings in Kalangala District. The
design is also in line with national policies and strategies, namely Uganda Poverty Eradication Action Plan (PEAP), the
Millennium Development Goals (MDGs), the National Development Plan (NDP) and the national decentralisation
policy. The Tourism Component that came on board in the second phase of the Programme, was an unrealistic
attempt to create short-term economic benefits in the District.
The Programme is also relevant in relation to Iceland’s policy and strategy or development cooperation, namely
Iceland’s International Development Cooperation Act, Regulation No. 894/2009 and the Strategy for Iceland’s Inter-
national Development Cooperation 2013–2016, ICEIDA’s first Uganda Country Strategy Paper (CSP) 2014-2019 and
Policy for Gender Equality published in 2013. Furthermore, in 2012 ICEIDA published guiding principles for addressing
environmental issues in its projects. KDDP was designed in accordance with the Paris Agreement, the Accra Accord
and Busan Partnership Agreement regulating international development cooperation. The Consultant therefore
concludes that KDDP has been fully in line with Iceland’s development cooperation policy and strategy from the
beginning in 2005 and, still at the time of the Evaluation, the continuation of the Education Component (KIEP) is very
relevant.
The logframe for both phases are very much output-focused, no SMART indicators and no indicator target values are
connected to the outcomes, although this result level is the most important in any development intervention. The
mentioning of the private agencies in the formulation of immediate objective to the Local Government Administra-
tion Component is irrelevant, as long as no interventions have been targeting such stakeholders.
16 The Icelandic Embassy (ICEMB) in their comments to the Draft Evaluation Report: “The findings on the shortcomings in the project logframe formulation are appreciated. However, there are accepted methods of addressing such weaknesses during project implementa-tion, monitoring and evaluation (iterative and incremental process informed by knowledge accumulated through lessons learned). The methods include, but are not limited to: baseline reconstruction, and use of benchmarks in lieu of missing targets etc. In view of that, the KDDP Project Completion Report and the earlier KDDP Internal Review Report by Partners (2015) reported on outcomes using leverage indicators and the assessment of achievement was benchmarked on national actual performance or targets, as well as international targets”. The Consultant appreciates this distinction, and agrees that the 2 reports compare results with national targets.
16
CHAPTER 3
Effectiveness
GOPA CONSULTANTS
External Evaluation of Kalangala District Development Programme (KDDP) 2006-15, Uganda
CHAPTER
3 Effectiveness
3.1 Programme Management
3.1.1 Managerial Setup
It is emphasised that Iceland’s role as a donor has, from the very beginning, clearly been to support Kalangala District
in their development efforts, meaning taking on an advisory and facilitating role. As the District’s capacity during
Phase I of the Programme was limited, Iceland however had to take on a pragmatic and more pro-active role in order
to get activities started, at the same time as building capacity with the district staff. The priority areas in focus
derived from the priorities that were set by the District Council and the programme management was participatory
and consultative as far as reality allowed. The programme management however changed in 2010 following the Mid-
term Review.
a) During Phase I of the Programme (2006-2010)
In order to achieve accountability, several managerial levels were instigated:
• At the national level a Project Supervisory Committee (PSC) was established, with the Permanent Secretary of
the Ministry of Local Government (or his appointed representative) representing Government of Uganda (GoU)
as (chair); ICEIDA Country Director from the Icelandic Embassy representing Government of Iceland (GoI) as the
co-chair. In addition, the PSC had the following members: the Chief Administrative Officer (CAO) of Kalangala
District (secretary) and District Chairperson (member) representing Kalangala District Local Government, and
the ICEIDA Programme Director (technical advisor).
The PSC met bi-annually to review and approve the project progress reports and annual work plans and budgets
for the coming year. The PSC was in reality a policy interface arena between the donor and the Ugandan Gov-
ernment, helping the GoU and the GoI to maintain a good bilateral relationship.
• At district level a Project Management Team (PMT) was established, chaired by the CAO and with the following
members: the KDDP Project Manager (Icelandic) based in the ICEIDA Programme Office in Kalangala, and all
members of the (permanent) District Technical Planning Committee in Kalangala district administration repre-
senting all relevant departments (Administration, Audit Section, Community Development, Education, Finance,
Fisheries, Health, Natural Resources, Production and Marketing, the District Engineer and the Senior Water En-
gineer, with the District Planning Unit as the secretariat). There was additionally a member from the Civil
Society in Kalangala (Kalangala District NGO Forum), also seemingly representing the private sector organisa-
tions. (This arrangement is not understood by the Consultant, as such set-up is not in line with “normal” modus
operandi of the civil society versus the private sector)17.
17 ICEMB in their comments to the Draft Evaluation Report: ”During project implementation, the envisaged private sector organisations (of nature of umbrella organisation serving the common good of individual private agencies) were not fully established. The project concen-trated on KADINGO, which was already as an established umbrella body for CSOs, and was specified for support in the project document”. The Consultant thus remains with the comment in the text.
17
CHAPTER 3
Effectiveness
GOPA CONSULTANTS
External Evaluation of Kalangala District Development Programme (KDDP) 2006-15, Uganda
The PMT was responsible for the management functions of the Programme; planning and budgeting, direction
and control of implementation, supervision and monitoring, and reporting and accountability. The PMT was col-
lectively responsible to the PSC for the use of project inputs and delivery of project results at output and
outcome level. The PMT took responsibility for ensuring that the Programme remained on course and that it
satisfied both the policy aspirations of the GoU and the interests of the donor. Through its regular strategic
guidance on both programme and finance issues the PMT worked both as a reference team and as a quality
control mechanism that guided programme focus, helped the Programme Implementation Teams (PITs) to deal
with contextual challenges all of which enhanced programme delivery, efficiency and impact.
• The implementation of activities was planned at the sector (district department) level. 2 Project Implementa-
tion Teams (PITs) were established: a PIT for Administration and Fishery; and a PIT for Education and Health.
The PITs comprised 2 ICEIDA Project Officers (national) based in the ICEIDA Kalangala Programme Office and 4
Senior Sector Officers from the district administration representing the main departments supported (i) Local
Administration (including crosscutting departments: administration, finance, planning, audit, and civil society
and private sector organizations); ii) Education and Sports; iii) Health Services; and iv) Fisheries sub-sector (un-
der Production and Marketing Department)).
• The PITs prepared the work plans and budget and undertook implementation, supervision and monitoring,
quality control and reporting in the Programme, also securing accountability. The PITs processed workplans,
requisitions, and reports through the sector heads, up to the CAO for approval, and eventually to the Kalangala-
based KDDP Project Manager for final authorization. All other processes like procurement of goods and services
were handled in accordance with systems and procedures being in compliance with GoU. There were however
exceptions allowed whereby some procurements or payments were processed directly by ICEIDA, on request of
the District. In addition to the Project Manager and the two Project Officers, the Kalangala ICEIDA Programme
Office comprised a Senior Project Officer responsible for Finance and Administration issues, and a KDDP Advisor
(Engineer) responsible for supervision and quality control of the infrastructure development component. After
2010, when the ICEIDA KDDP Programme Office was closed (formally closed by the signing of the Phase II MoU
October 2011, but in practical term closing by the end of 2010), all the 4 officers were absorbed into the ICEIDA
Country Office structure (in the Iceland Embassy Office), and later pre-designated as Senior Programme Offic-
ers18. The input from two of the officers were gradually reduced in the Programme, whereas two were retained
and were still working with the Embassy at the time of the Evaluation (also partly supporting KIEP).
18 KDDP Project Manager came on board the Programme in December 2006 and left at the end of 2011. Project Officer PIT Health and Education came in 2007 and left ICEIDA in March 2011. The KDDP Advisor came in April 2008, became ICEIDA Senior Programme Officer and left at end of 2015. ICEIDA Project officer for Finance and Administration started in November 2006 and Project Officer for Administra-tion and Fisheries in January 2007, both being Senior Programme Officer with ICEIDA today.
18
CHAPTER 3
Effectiveness
GOPA CONSULTANTS
External Evaluation of Kalangala District Development Programme (KDDP) 2006-15, Uganda
b) During Phase II (2011-2015)
The Mid-term Review recommended that the daily management of the Programme be left with Kalangala District
from 2011, and that the daily ICEIDA support to the PITs should be discontinued. The Icelandic Embassy therefore in
June-August 2011 instigated a study to assess the capacity and capability of the District to take on this role19. The
main recommendations are listed in Section 1.1.3 c) above. The ICEIDA office in Kalangala was closed by the end of
2010 and the implementation teams continued with staff from the district administration, but with frequent support
and advisory visits by the Senior Programme Officers from that time being located at the Icelandic Embassy in Kam-
pala (previously being at the Kalangala office). However, the health advisory services by ICEIDA ended following the
recommendations of the MTR. The PSC and PMT continued as before, but without the KDDP Project Manager joining
the PMT meetings.
The Consultant believes that the managerial set-up at large was pragmatic and seemingly well-functioning. In order
to get the activities started on the ground, the establishment of the PITs during the first phase seems to have been
the only viable solution. Showing some tangible results to the stakeholders, and the beneficiaries in particular, was
assumed important to maintain the enthusiasm and keep up the momentum while at the same time building capaci-
ty with the district administration.
In case the Programme had waited until the District had enough capacity to start implementation by themselves, the
momentum and good spirit from the start would surely have dwindled. It also seemed to be the right moment to
hand over more responsibility to the district administration in 2011, as evidenced by the findings of the mentioned
study undertaken. On the other hand, the Consultant believes that the rather extensive technical assistance input by
ICEIDA staff, especially during the first phase until 2010 (operating a local programme office with 5 employees at its
peak), has been relatively costly consuming a fair bit of the donor funds (see below). The sharing of responsibility and
accountability between the programme partners at different levels, and the various programme groups, has seem-
ingly worked as intended.
3.1.2 Programme Reporting and Monitoring
(Please note that a distinction has been made between “progress reports” and “monitoring reports” below, directly
reflecting the title of the reports. This might seem like focussing on semantics, but the Consultant believes it is not in
this case. Normally, progress reports are prepared by the main implementing partner, which in the first phase was
the KDDP Programme Office and in the second phase the Kalangala District Local Government. Monitoring could in
principle be undertaken by “anyone”, internal monitoring by the implementing partners and/or external monitoring
by outsiders, like mostly in the case of KDDP in Phase II).
19 Assessment of the capacity of Kalangala District to management donor funds. With a special focus on KDDP project funded by ICEIDA. June to August 2011. Undertaken by an ICEIDA consultant with support from three consultants from Uganda Ministry of Local Government (1 from Planning and Administration Unit and 2 from Financial Management and Audit Unit).
19
CHAPTER 3
Effectiveness
GOPA CONSULTANTS
External Evaluation of Kalangala District Development Programme (KDDP) 2006-15, Uganda
a) Progress Reporting
The Programme has had an extensive monitoring and reporting system during the first phase. There are 9 Progress
Reports produced by the PITs at sector level while ICEIDA had a KDDP Programme Office in Kalangala. The reports
were processed by the Project Management Team (PMT) and presented to, and approved by, the Project Supervisory
Committee (PSC), covering the period from October-December 2006 up to and including the period January-March
2009. Additionally, a Mid-term Review Report, October 2010 summarised the achievements in Phase I of the Pro-
gramme, and a Midterm (five year) Report (2006-2010) submitted in December 2010, also listed the same
achievements/outputs during Phase I. The reports are to a limited degree reporting on outcomes, but where such
data were readily available outcomes of a qualitative nature was mentioned. The format of the produced progress
reports during Phase I were very informative and orderly presented, with sections on undertaken activities and
achieved outputs (in tabular format) for each sector supported (Administration, Fishery, Education, Health, and
Infrastructure Development, the latter treated as a separate sector), in addition to sections on problems/challenges
met with, the financial status, and the activity plan and budget for the next period.
After 2010, in Phase II, KDDP progress reports (annual and biannual) were prepared by the District, coordinated by
the District Planning Unit, and processed at district level by the District Technical Planning Committee (DTPC) and
submitted to the PSC for perusal and approval20. All reports from 2011 onwards were submitted by the District,
including the KDDP Completion Report. The annual reports from Phase II made available are also orderly structured,
having sections reporting on programme inputs, detailed activities and produced outputs on each of the programme
sectors, also presenting Infrastructure Development as a separate component. The reports also have a separate
section on Performance Against Outcomes, which is commendable. The reports additionally summarises the Chal-
lenges, Lessons and Recommendations, and presents in tabular form the work plan and budget for the coming year.
The bi-annual report reviewed by the Consultant summarises the progress and achievements in a bulleted form,
separated on the programme components.
Regarding the financial reporting in the Programme, the following modality was prevalent:
Under the first phase of KDDP, ICEIDA operated the Programme Office in Kalangala and the ICEIDA Project Manager,
along with CAO/Chief Financial Officer (CFO) of Kalangala district administration, was signatory to the KDDP bank
account in Stanbic Bank. This meant that all payments were under shared control/co-management. The funds were
accounted for in the GoI's Oracle-based accounting system (ORRI), used by the Icelandic Embassy in Kampala, with
special codes for various types of costs for every transaction.
In the second phase of KDDP, an intermittent system was used, from primo 2011 to end of 2013, where all transfers
to the KDDP bank account were debited to an interim account in ORRI (“float account"), and debited in ORRI follow-
ing monthly accountability reports from the District. This procedure was abandoned by end of 2013 and from that
point in time and onwards, ICEIDA transferred funds to the account in Stanbic Bank in Kalangala on a regular basis
and as needed, and it was entered in ORRI under one code only (“Contribution to foreign parties”). The responsibility
for the KDDP project account was then shifted entirely to Kalangala district and the CAO and the CFO became signa-
tories of the account. The use of these funds was continued to be monitored by ICEIDA as part of the monthly
20 Annual reports for 2011-2013, and a copy of biannual report for 2014, were made available to the Consultant as part of the Icelandic Embassy’s comments to the Draft Evaluation Report.
20
CHAPTER 3
Effectiveness
GOPA CONSULTANTS
External Evaluation of Kalangala District Development Programme (KDDP) 2006-15, Uganda
accountability and reconciliation reports from the District21.
Control and accountability for the use of funds in Phase I was on a monthly basis, where transactions on KDDP bank
account statement were checked against approved activities. This in principle continued in Phase II. The responsible
ICEIDA Senior Programme Officer checked on a monthly basis that all transactions on the bank account could be
linked to a particular approved KDDP activity, but after end 2013 the expenditures appeared as “lump sums“ in ORRI.
As far as control and accountability is concerned, every transaction on the KDDP bank account was checked and
reconciled by the KDDP-SPO on a monthly basis throughout the programme period 2006-2015, so the financial
reporting is after all considered to have been good.
b) Monitoring
Following the closing of the ICEIDA KDDP Programme Office in Kalangala, an M&E Plan was produced (not existing in
the first phase): Monitoring and Evaluation Plan for Kalangala Local Government. Support to the implementation of
KDDP. Final M&E Plan. February 2011. The lack of such plan in Phase I was also commented upon in the MTR report.
In addition to definition of key M&E terms, the plan contains description of programme background, objectives of
the M&E, monitoring tools and M&E management, a list of indicators to be monitored under each programme
component (also at outcome and impact levels), in addition to establishment of a “dynamic computerised database
LOGICS” to be “operationalised in collaboration with MoLG headquarters and the Planning Unit at district level” and
elaborated in the Management Information System. The District Planning Unit would “coordinate and monitor” the
M&E system and generate reports. At sector level monthly reports should be generated (internal district administra-
tion). Quarterly monitoring reports and periodic evaluation reports should also be generated and submitted to the
PSC for discussion. The Consultant believes the M&E plan prepared is rather a “textbook plan” than a realistic and
practical M&E system22. As far as understood the M&E plan was not followed as presented by the District. (Notably,
the Planning Unit claimed they were lacking staff and equipment to follow the plan as laid out. ICEIDA however
emphasised in the comments to the Draft Evaluation Report that the District did some monitoring themselves23).
21 Notably not all payments of costs for the KDDP after 2011 were paid from the District operated KDDP bank account. In some cases (some consultants contracts and infrastructure contracts) payments were made directly from the ICEIDA office in Kampala. 22 ICEMB in their comments to the Draft Evaluation Report writes: “The development and application of M&E as management tool in development projects has evolved overtime and based on knowledge accumulated overtime the current projects have better designs than the previous ones. Uganda developed the first M&E policy in 2011 and it was approved in 2013. Similarly, the OECD-DAC Evaluation standards were developed in 2010. Notwithstanding the weaknesses the consultant found in the document, the efforts of the partners to develop the M&E Plan that early merits some recognition. - As admitted by the consultant, the M&E Plan which was part of the development of the Logframes for 2011-2015 refined the immediate objective for the support to the fisheries and WATSAN sector and added a timeframe of 2015. - The plan added measurable indicators for support to administration sector (especially performance on minimum capacity requirement and performance quality attracting rewards (minimum conditions and performance measures). - The plan emphasized the need for putting in place key structures and personnel – leading to a functional planning unit”. 23 ICEMB in their comments to the Draft Evaluation Report writes: “- A functional District Planning Unit was established with 100% staffing (District Planner, Senior Economist, Statistician and Population Officer)– this was set as precondition for funding the second five phases of KDDP implementation - District Technical Planning Committee Members and the entire district planning unit staff (total of 13 officials) were sponsored to under-take training in monitoring and evaluation at Uganda Management Institute (UMI). - The District Planning Unit was equipped with basic equipment and tools e.g. computers - The M&E Unit based in the District Planning Unit headed by the Senior Economist coordinated reporting activities of KDDP involving collection, analysis and integration of sector reports into cumulative quarterly reports for the period 2011-2014 – culminating into the KDDP project completion report.
21
CHAPTER 3
Effectiveness
GOPA CONSULTANTS
External Evaluation of Kalangala District Development Programme (KDDP) 2006-15, Uganda
It was also noted that the M&E database was never established24.
In principle, the monitoring of KDDP was a shared responsibility. Joint monitoring missions involved the district,
ICEIDA and MoLG, multi-sector monitoring involved the districts sectors, and ICEIDA also carried out independent
monitoring. The following monitoring mission reports have been made available to the Consultant: Monitoring
Report February 2013 (covering July-December 2012); Monitoring Report April 2013 (covering first quarter 2013);
Synthesis Report On Analysis of KDDP Annual Report for 2013 (and KDDP Annual Work Plan and Budget for 2014);
Quarterly Monitoring Report for the Period Ending June 30, 2014; Joint Monitoring Mission Report, October 2014;
and Final Report of KDDP Joint Monitoring Mission, 15-17 November 2016. All these monitoring reports are prepared
by the ICEIDA Senior Programme Officers at that time based in the Iceland Embassy offices in Kampala, except for the
one from 2016 which was jointly prepared by ICEIDA and the District. Mostly, the monitoring missions comprised the
two ICEIDA Senior Project Officers (Monitoring/Evaluation and Finance), meeting with all district administrative staff
and visited selected programme locations. During the monitoring mission in October 2014 however 2 groups took
part, with 12 and 13 participants respectively. On the final monitoring mission in December 2016, 16 persons partici-
pated (with 3 participants from ICEIDA, 1 from the MoLG and the rest from the district administration).
The format of the monitoring mission reports varies, and presents a mixture of tabular and narrative reporting,
depending on the purpose and scope of the monitoring. The December 2016 report being (by default) the most
elaborate. Monitoring reporting would have benefitted from having a standardized format and table of contents,
which would have made it easier for outsiders to follow the monitoring throughout. Having said that, the reports all
contain relevant information of the Progress of Implementation, Achievements of Results (outputs), Validation of
Results on the Ground, What Worked and What Worked Not, and also give Recommendations.
- Joint monitoring missions (ICEIDA, MoLG and KDLG) and multi-sector monitoring mission (District level sectors) were conducted to validate reports and get feedback from beneficiaries and mission reports were prepared by District Planning Unit”. 24 ICEMB emphasises in a comment to the Draft Evaluation Report:: “It is true that a separate computerized database for KDDP was not established. All reports are backed by source paper records filed in the District Central Registry. The copies of paper files were further filed by ICEIDA in the Gopro database/filing system. Some sectors supported have operational databases at district level linked to the sector Ministries (education, health, water and sanitation and local government) but some are under upgrades, especially the LoGICS database under the Ministry of Local Government”.
22
CHAPTER 3
Effectiveness
GOPA CONSULTANTS
External Evaluation of Kalangala District Development Programme (KDDP) 2006-15, Uganda
3.2 Programme Achievements and Effectiveness
Effectiveness reviews the contribution of individual interventions to the output and outcome achievements of the
defined result areas.
3.2.1 Programme Activities and Outputs
The Project Document from September 2006 contains narrative descriptions of the all the activities to be undertaken
and the output indicators with target values in an orderly format. This set-up was also referred to in the progress
reporting, and Annex 6 lists the achievements related to the targets for easy reference (as presented in the June
2017 KDDP Completion Report). May be more interesting for the Evaluation of KDDP is the achievement in Phase II,
based on the revised logframe from January 2011, and this is also enclosed in Annex 6. As seen, the reporting on
achievements from both phases is very orderly presented. Below follows some brief comments to the achievements.
a) Local Government Administration Component
It is noted that Phase I comprised a lot of capacity building of the administrative staff (e.g. planning/budgeting,
revenue enhancement, administration/M&E, generic skills, and various short courses). In addition, the data bank was
established but few District Statistical Abstracts were produced. The development of district and sub-county office
blocks were largely lagging behind, with the planned district block not finalised as planned. 3+4 rounds of grants for
CSO support was undertaken in Phase I and Phase II respectively, but the Programme came short on the preparation
of development plans for villages (only 40% achieved).
Seemingly Phase II had a larger rate of target achievements, with all the capacity building in e.g. planning, M&E,
gender planning, revenue enhancement and data collection capacity building achieved. However, also in this phase
the Programme came short on data collection, in addition to the update of the district website (which never properly
came up running and is non-existent at the time of the Evaluation). 4 District Statistical Abstracts were produced and
submitted to Uganda Bureaux of Statistics (UBoS) for data quality check and approval before they were published for
official use by user departments at district level and other stakeholders. Although the capacity building in revenue
enhancement was undertaken, and even a fiberglass boat was procured for inspection on the islands25, the data-
based revenue management system was never developed and consultancy for “enacting ordinances to collect cess
tax on palm oil produce and lading site fees” not undertaken. This lack of progress on enhancement of revenue in the
district is a shortcoming, as increased income to the District is imperative to sustainability of all public services! On
the other hand, the scholarships to the 2 medical doctors and the 3 clinical officers budgeted under this component
(as the health component in Phase I was discontinued in the second phase), was a positive achievement (see below).
b) Fishery and WATSAN Component
In Phase I, the capacity building on fish quality was nearly fulfilled, whereas all the equipment was purchased as
planned (PCs, boats and engines, motor cycles, filing cabinets, office chairs and tables). The two fish handling facili-
ties on the main island was never constructed, the facilities on the other islands constructed to around 70%, and the
planting of trees and greening in the fishing villages and preparation of Environmental Impact Assessments (EIAs) in
25 The Consultant does not know what happened to the boat.
23
CHAPTER 3
Effectiveness
GOPA CONSULTANTS
External Evaluation of Kalangala District Development Programme (KDDP) 2006-15, Uganda
the same was delivered to only 40%. It is further noted that the capacity building related to WATSAN in the fishing
villages had serious shortcomings like the construction of water supply systems, eco-friendly pit latrines, and com-
post and refuse sites.
During Phase II basically all the outputs were delivered to 100%, which also included capacity building on fish quality,
HIV/AIDS, gender, fish handling, and procurement of landing site equipment (fiberglass boats, inspection kits, protec-
tive kits, weighing scales) and furnishing of BMU offices. Positive impact from such capacity building noted as
reduced fish post-harvest losses. Contrary to Phase I, all the community sensitisation on WATSAN O&M, and capacity
building of WATSAN Committees, was undertaken, as the Programme’s approach was using community-based
maintenance system. The Evaluation Team however unfortunately found little positive impact from such WATSAN
capacity building during the Evaluation26.
c) Education & Sports Component
Capacity building of education officers and primary school teachers in Phase I was only partly achieved as planned,
with training in interventions for special needs, gender, curriculum interpretation and HIV/AIDS coming the shortest.
Training of School Management Committees (SMCs) in leadership was achieved to 100%. The number of sensitisation
meetings for parents/guardians on e.g. child rights came seriously short of target, whereas the procured equipment
was, not surprisingly, fulfilled to 100% (boats and engines, motor cycles and PCs/printer, sport equipment, musical
instruments). The construction of schools kitchen was lagging seriously behind schedule, but 3 dormitory blocks were
constructed giving a chance for schooling to children in remote islands from the schools. It is noted that the pro-
curement of 228 “assessment stationary kits”, meaning exam papers, were fully undertaken. This gave the schools an
long-wanted opportunity to measure their skills in national exams, an opportunity they did not have earlier due to
lack of funding. This was obviously well remembered by the school teachers interviewed during the Evaluation, and
very much appreciated!
In Phase II, almost all outputs were delivered as planned (mid-term and end-of-term exams, text books, sport
kits/trophies, training of sports teachers and Music, Dance and Drama (MDD) teachers, competitions held, parents
meetings, etc.). Refresher courses for teachers were fulfilled to 150%. Also outputs directed to secondary and voca-
tion education was fulfilled to 100% (learners’ assessment, procurement of solar power systems, libraries with books
and laboratories).
It should be mentioned again that the Education Component continued into a consolidation phase 2016-2019 (KIEP),
and was thus still ongoing by the time of the Evaluation, basically continuing with some of the same activities as in
Phase II, but with emphasis on improving the quality of the education at large, and also with more focus on the
secondary education level27.
26 ICEEMB in the comments to the Draft evaluation report: “The main issue is that strategy of using community based maintenance system (CBMS) which was original designed for simple water point sources was not effective for the piped water systems – this is one of the lessoned learned and in the design of the WASH project in the district of Buikwe”. 27 ICEMB elaborated this in the comments to the Draft Evaluation Report: “There was a fundamental change from Education component supported under KDDP to the consolidation phase under KIEP: 1. Immediate objective of KIEP puts emphasis on improving quality of education (whereas in KDDP the immediate objective covered the
elements of access, equity and quality). 2. Under KIEP Primary education is still a priority with focus on the following key result areas
24
CHAPTER 3
Effectiveness
GOPA CONSULTANTS
External Evaluation of Kalangala District Development Programme (KDDP) 2006-15, Uganda
d) Health Component
During Phase I the Health Component delivered achievements to a varying degree. All the equipment and facilities
build were delivered (boats and engines; water tanks; mortuaries built, furniture procured; telephone lines and
phones; motor vehicle; motor cycles), except for the ambulance boat with engine; and some of the training of staff
(in childhood illnesses and T.B. treatment). Other activities came seriously short of target (e.g. outreaches in hard-to-
reach areas totally failed28; number of school visits by the health centres; number of facilities and equipment main-
tained; strengthening of Health Unit Management Committees (HUMCs); training of private sector staff (0); radio
shows and management meetings in the districts). Scholarship support to the two medical students were included
and seemed to have been a good investment in the sector to judge from the observations during the Evaluation. (In
Phase II this support was accounted for under the Local Administration Component).
The Health Component was ended after Phase I of the Programme, the main reason being “mounting implementa-
tion challenges arising from failure of the district partner to fulfil the project preconditions, especially recruitment of
critical qualified health staff” (ref. the Completion Report). However, some of the health staff interviewed during the
Evaluation, including the staff at district administration level, claimed they did not understand why the Health
Component suddenly stopped, and claimed they never were given any explanation for this29. The Consultant believes
that reasons for such comments could be that some of the interviewees came on board after the component had
ended, and some simply had a “selective memory”, may be even in hope for the support to come back. The Health
Department also claimed that the support to the Health Component very much was “steered” by the ICEIDA KDDP
Programme Office and that the Health Department was not properly “consulted” at the time of closing the Pro-
gramme component. According to ICEIDA however, such lack of consultation did not exist, as the KDDP was managed
through formal national structures30. (It is also reminded that the MTR Report mentioned that the component had
spread too much out and the risk of not giving a proper impact was prevalent, which surely would be a reason for
discontinuing the donor support to the sector).
a. Improved learning to acquire basic skills (literacy and numeracy) in early grades P1-P4 b. Increased cohort survival to grade 5 and completion of P7 c. Increased pass rates in PLE in Division I-III so that learners qualify for tuition free universal secondary education
3. Lower secondary education is emphasised with the following key result areas a. Increased transition to secondary education or equivalent training b. Increased cohort survival and completion of lower secondary education (senior four) c. Increased transition to higher secondary education”.
28 But boat and engine was procured for this purpose …. Lack of fuel to undertake the outreach most likely the reason for failure? 29 One officer at district level commented that “. a staff member in ICEIDA had negative attitude towards health and claimed that “health was a department that did not need help””. 30 ICEMB says: “KDDP was managed through formal structures – PSC as coordination structure at National level, PMT as the management structure at District level. Decisions were made or communicated through these formal structures. The PMT at District level comprised of key sector heads including the District Health Officer. Hence the question of the department not being consulted or informed does not arise.”
25
CHAPTER 3
Effectiveness
GOPA CONSULTANTS
External Evaluation of Kalangala District Development Programme (KDDP) 2006-15, Uganda
e) Tourism Component
The Tourism Component came on board the Programme in Phase II and only lasted for 3 years. Some of the planned
outputs were delivered as per target (consultancy for preparation of a District Tourism Master Plan and the following
Tourism Implementation Strategy was procured; stakeholder/community meetings; PC and filing cabinet to Commer-
cial Office; training for Natural Resources Dept. and Commercial Section; tourist sites mapping). A couple of outputs
were not at all delivered (private sector support and study tours) and some were delivered to a minor degree (mar-
keting of Ssese Islands tourism, incl. website (not functioning today) and through other media). An external
consultant was hired in 2013 to update the strategy presented in the Master Plan, submitting a report in November
2013 (Needs Assessment Report for the Tourism Component of KDDP), also containing the work plan for the remain-
ing period of 2013 and the beginning of 2014. Also a Tourism Component Workplan for January- December 2014 was
prepared, totalling activities with a budget of around USD 190,000, expecting ICEIDA to cover 74%, the district 22%
and the rest by private investors and communities. The workplan largely looks like a theoretical “wish list”, but with
the discontinuation of the ICEIDA support, nothing was implemented as planned, and in practical terms almost all
activities related to the tourism sector stopped. The Consultant is somewhat surprised that the Tourism Component
was started at all, and a realistic risk assessment before start-up would mostly likely have revealed the risk of failure
really materialising later.
f) Infrastructure Development and Equipment
Although this was not a separate component in the Programme, the management decided to compile the infrastruc-
ture outputs in Phase II of all the other components under this heading also, in more detail than under the other
components. The Consultant believes that was a wise move that gives a good overview of the main infrastructure “at
a glance”. All the infrastructure was completed as planned, except for the Transient Hostels in Bubeke and Mainga
(under Administration Sector) and some primary school kitchens under Education and Sports Component. The latter
are being constructed later under KIEP (2016-2019).
A lot of equipment and material were purchased during KDDP for all components, and it was of course impossible for
the Evaluation Team to inspect even a fraction of such. The equipment was inspected to the degree they were an
integral part of the visits to the various locations. Annex 8 contains a list of equipment, materials and infrastructure
supplied in the KDDP taken from the Completion Report, with the status of the equipment as recorded per mid-
201731. The following was noted in the passing:
• All wooden boats purchased are written off and not in use.
• All fibre glass boats as still in use, with most of the engines.
• Of the 10 motor cycles purchased, all except 2 are operational.
• All the vehicles are in operational condition, except for the Toyota Hilux, which needs to be transported to
Kampala for major overhaul.
• Of the desktop PCs purchased, only a couple are in daily use today. The senior officers at the district now have
laptops.
31 The Consultant was in fact informed that the status was as per December 2017, but this must be a misunderstanding as the date of the Completion Report is June 2017.
26
CHAPTER 3
Effectiveness
GOPA CONSULTANTS
External Evaluation of Kalangala District Development Programme (KDDP) 2006-15, Uganda
• All the filing cabinets and office tables and chairs are in use.
• Some of the metal racks for drying fish are rusty and not in use (see photos in Annex 10). Other racks are in use
in some locations and not in use in some others (local social-cultural habits?).
• Most rainwater harvest tanks are functioning, but a couple had been broken were the water tap is mounted
(due to frequent moving of the tap making the tank to leak and finally a hole is opened).
• Most brass taps in water supply systems are broken and need replacement.
• None of the floating markers on location of the submersible intake water pumps remain (to mark no fishing in
that vicinity), with a danger of fishing gear getting stuck in the pumps or destroying the pumps.
• The latrines are mostly functional and regularly cleaned, with a few exceptions (see photos). However, the
“urban style” water flushing toilets with elevated water tank does not seem to be appropriate in a rural setting,
as this is a too sophisticated mechanical system prone to easy breakdowns.
• Most of the MDD and sport equipment in schools are still available, just prone to normal wear and tear (e.g.
balls are worn out, drums with hide need repair, etc.).
• All solar energy batteries are worn out and new are purchased in most places (normal lifetime with guaranteed
effect is 5-6 years for good quality Western batteries. Obviously the batteries purchased were of inferior quality
or counterfeit).
• The digital camera is written off and the video camera, which is noted as written off, in fact was never deliv-
ered, although it had been paid in advance (according to a procurement officer). The money was refunded.
The total investments in infrastructure, materials and equipment was USD 4,010,513, distributed as follows: Admin-
istration (incl. tourism)-24%; Education and Sports-45%; Fisheries and WATSAN-28%; and Health-4%, in total
constituting 38.6% of the total programme budget.
3.2.2 Programme Outcomes
It is reminded as a backdrop that outcomes are the immediate (short- and medium-term) effects of the outputs,
when these have been delivered as planned. This is illustrated in the Results Chain shown in Figure 3.1 in Annex 4,
being according to the OECD DAC definitions for result-based management (RBM). The expected outcomes, often
captured in a formulated purpose for a project/programme, are the main reason for any (Western) donor funding of
development interventions/activities in the first place. One should also remember that fulfilment of the outcomes
cannot in theory be guaranteed by the project management, but will (hopefully) materialise with a high probability, if
the outputs are delivered. (It should be noted that as the HH survey is undertaken more than 2 years after the
Programme ended, the information collected and observed is reported upon under the Impact section in this report).
As mentioned in Section 2.2, some outcomes are not well formulated (which in general indeed is difficult and re-
quires a lot of experience in such formulations to get them appropriate), are difficult to measure, and all are lacking
target values (although a reference to national standard is truly given ...). In general, an indicator without a target
value is not so useful for monitoring the purpose of any intervention being achieved. Reference is made to the table
in Annex 7 for the comments below. In the table comments on indicators and achievements from both programme
partners and the Consultant are included32.
32 See ICEMB’s comments to the table in the introductory text in Annex 7.
27
CHAPTER 3
Effectiveness
GOPA CONSULTANTS
External Evaluation of Kalangala District Development Programme (KDDP) 2006-15, Uganda
It is also reminded that the immediate objective of the Local Government Administration Component of the Pro-
gramme is formulated as “to facilitate and support the efforts of the Kalangala District Local Government in achieving
efficient and effective leadership, administration and management of public, civil society and private agencies in
Kalangala District by 2015”. In other words, as a result of the Programme it was expected (hoped for) that the civil
society and private agencies should have more efficient leadership, administration and management. This is of
course a formulation which is clearly unrealistic, as the civil society and private sector are operating independently of
the public authorities.
Nevertheless, the Programme had an activity directly targeting the civil society, namely 3 batches of small grants to
support local CSOs during 2006-2010 (UGX 200 mill) and 4 rounds during 2010-15 (total grant amount unknown to
the Consultant33). The implementation of this small grants project financed under KDDP was monitored by the
Kalangala District NGO Forum (KADINGO), having a contract with KDDP and also receiving a motorbike and a boat for
this monitoring purpose (still operational at the time of the Evaluation). Notably, the Completion Report for the
Programme contains little information about these small grant schemes, and neither do the Final Report or the Mid-
Term (5 year) Report.
However, two final reports from the CSO support in the two phases were seemingly prepared (according to infor-
mation by KADINGO), but it was not possible for the Consultant to retrieve these reports during the fieldwork or the
draft reporting period of the Evaluation, neither from the District nor from the Icelandic Embassy. (A significant
number of documents regarding the CSO support were however sent to the Consultant as part of the Icelandic
Embassy’s comments to the Draft Evaluation Report, but not any report covering all the grant batches in the second
phase)34.
There has been no direct programme support to the private sector, except for the hiring of contractors to build the
infrastructure (tendering) and suppliers for various equipment. One person from KADINGO was member of the PMT,
seemingly representing both the civil society sector and the private sector, which is “strange” set-up indeed.
a) Local Government Administration Component
At least 5 of the outcomes are not well formulated, and none have timing indicated. The most important outcome is
that in 2014 all the 8 local governments (LGs, meaning sub-counties) in Kalangala District met the minimum function-
al capacity requirements in the key areas defined by the national authorities, and 70% gained rewards in
performance measures. According to the Daily Monitor News Paper of Thursday June 2018, the Government released
the report on performance of local governments for the Financial Year 2017/2018, showing that Kalangala scored
61% compared to the best LG that scored 85% and the worst that scored 28%. The districts and municipal councils
were assessed on their performance in the health, education and water offices, as well as cross-cutting issues such as
33 In 2010 total grants of UGX 88.7 mill were awarded to 14 CSO (according to the 2010 Monitoring Report by KADINGO); and in 2011 total grants of UGX 72.6 mill (according to the KDDP Grant Committee Declaration). 34 ICEMB in their comments to the Draft Evaluation Report writes: ”It is admitted there was a filing problem between the district and ICEIDA, but this was a successful intervention with verifiable impact. The organizations supported have sustained their operations up to now. See the initial reports on this folder; Example are including, among other, the following: - Kalangala District Education Forum (KADEFO) – Is currently engaged to implement community sensitization under KIEP - SHED has won a grant from USAID to sensitize parents and their role in promoting earl grade learning - KAFOPHAN is an active network for people living with HIV/AIDS”.
28
CHAPTER 3
Effectiveness
GOPA CONSULTANTS
External Evaluation of Kalangala District Development Programme (KDDP) 2006-15, Uganda
accountability and filing of quarterly reports. Kalangala District was ranked the 43rd out of 138 local governments
(district and municipal councils35). The local revenue realisation rate increased from 24% in the Financial Year (FY)
2009/10 to 66% in FY 2015/1636, which is encouraging, but still on the low side.
The most positive achievement is that the district administration and the LGs have all received basic infrastructure,
largely meaning office buildings with furniture, enabling them to operate as mandated and expected (none of the LGs
had this in 2006). However, the construction of infrastructure is clearly an output indicator, whereas the improved
service delivery by the LGs is the wanted outcome (ref. to indicator of functional capacity). The support to 5 of the 8
LGs administration by KDDP was also seemingly according to target (although no target was really set), but again this
is an output and not an outcome.
b) Fishery and WATSAN Component
The most important outcome is that post-harvest fish loss has been reduced from 25-30% in 2005 to 1-5% in 2014
(not substantiated by real figures, but merely a subjective assessment by the programme partners). The Completion
Report claims that Kalangala was still amongst the top 3 district using illegal gillnets for fishing at that time. Later, the
army (UPDF) intervened, and during the Consultant’s visit to the Fish Landing Sites (FLSs), all the members of the FLS
Committees (FLSCs) interviewed claimed that there was virtually no illegal fishing any more on those sites (“.. the
ones that undertook illegal fishing have moved…..”).
Also the revenue from fishing has increased, from around 40% contribution in 2012/13 to 50% in 2015/16, a positive
development indeed. However, from the interviews in the FLSs, and also with sub-county staff, it seemed that not all
fish movements were reported to the authorities, although the control has been stricter now when the army control
the landing sites and the Directorate of Fisheries Resources carries out a strict registration of fishermen and traders
through issuing licences. It is reported that all FLSs are complying with rules related to the non-encroachment zone at
the beaches, which is a positive development.
Related to WATSAN, the Completion Report claims that there have been no reported cases of cholera and dysentery
since 2010 in the 5 focal fish landing sites. On the other hand, the statistics from the District Health Information
System (DHIS) shows that in the District there have been some individual cases of cholera the last years (2012-5
cases, 2014-2 cases, 2015-4 cases, 2017-1 case), and dysentery (2012-311 cases, 2013-1,031 cases, 2014-933 cases,
2015-459 cases, 2016-909 cases and 2017-687 cases), as seen in Table 3.1 in Annex 4. The statistics also show that
there has been a significant increase in diarrhoea cases the last three years, whereas the number of typhoid cases
have been fairly stable. The reasons for this development have not been given.
35Information given by the Icelandic Embassy with the comments to the Draft Evaluation Report. They also informed that the assessment of performance of local governments was taken-over by Office of Prime Minister (OPM) from MoLG and the OPM released the latest report in 2018. (http://www.monitor.co.ug/News/National/Govt-names-best--and-worst-districts/688334-4635104-hy84cm/index.html)”. 36 The Financial Year notably goes from 1 July to 30 June.
29
CHAPTER 3
Effectiveness
GOPA CONSULTANTS
External Evaluation of Kalangala District Development Programme (KDDP) 2006-15, Uganda
c) Education & Sports Component
In the Completion Report, the KDDP outputs and outcomes are reported on for the period 2006-2015. KIEP started in
2016 onwards and its expected outputs were listed separately and independent of KDDP. However, as the activities
largely continued seamlessly from KDDP into KIEP, some interviewees in the schools visited by the Evaluation Team
had difficulties in remembering what came before 2015 under KDDP and what came after under KIEP. Some school
staff were also employed after 2015 and thus did not have the direct experience with KDDP activities.
Notwithstanding the fact that some of the outcome indicators are clearly output indicators (namely indicators 9, 10
and 11), education indicators in general are fairly easy to formulate and thus are all relevant. The outcome table
under this component reports on the years 2014 and 2015. However, some more recent data has been obtained
from the Education Dept. in the District and are referred to below.
• Indicator 1: the Gross Enrolment Rate (GER) has increased from 73% in 2005 to 86% in 2014 (national average
was informed to be 117%37). Table 3.2 in Annex 4 show the enrolment figures for the years 2011-2018, which
indicates the changes since the MTR and thus the outcome of the efforts in the Programme since then. It shows
that enrolment for all grades have increased by 27.2% . However, the enrolment in Grade 1 has increased by
only 8.4% from 2011 to 2018 (with only 1.8% increase for girls).
• Indicator 2: The Completion rate was 40% in 2009 and this has increased to 53% in 2015, as compared to the
national average that year of 62%. This indicates a relatively high drop-out rate still prevalent in Kalangala.
From the pupils enrolling in 2011, only 21.5% graduated after 7 years, meaning a dropout rate of 78.5%. The
dropout rates for boys were 87.5 and for girls 69.5%. (In comparison: The total dropout rate for the period
2012-2018 was 70.3%, but it remains to see whether this reduction trend will last). Interestingly enough the
largest dropouts are the first year (Grade 1 to 2 with 38.9%) and the last year (Grade 6 to 7 with 46.2%), with
the lowest from grade 3 to 4 (2.6%). According to the district Education Dept. there might be several reasons
for this, of which the most important are listed as:
− High HIV/AIDS prevalence rate in Kalangala District (25%-30%) leading to "Child-headed families", increased
numbers of OVCs, stigmatization, deaths, etc.
− Child labour due to many oil palm plantations where children are used especially during harvesting season;
and rice growing where children are forced to keep birds away from rice gardens and fishing.
− Long distances from the nearest school (5 km+) where children have to walk through thick forests, oil palm
plantations, etc..
− Inaccessibility to schools among children especially from outlying islands with no school and at the same
time disadvantaged to afford boarding charges.
− Migratory tendencies of the fisher communities who keep on moving with their families from one island to
another in pursuit of "big fish catches".
37 The Education and Sports Sector Fact Sheet 2002-2016 from the Ministry http://www.education.go.ug/files/downloads/FACT%20%20%20SHEET%202016.pdf presents the national average as 117% in 2014, but this is assumed to be a misprint, as the figures could possibly not be more than 100%. (Neither the Education Dept. in the District could explain this but never came back with a verification on the issue).
30
CHAPTER 3
Effectiveness
GOPA CONSULTANTS
External Evaluation of Kalangala District Development Programme (KDDP) 2006-15, Uganda
− Target workers among non-permanent members of the community, especially among the workers of oil
palm plantations, who are ferried from other districts with their families to work in the plantations.
− A recent crackdown by the Government on illegal fishing has demobilized many families; many families
have relocated to other districts.
− Early pregnancies (defilement and rape) among the girl children.
− Early marriages by very poor families.
• Indicator 3: The transition rates for KDDP alone have not been established and baseline figures were not given.
• Indicator 4: Pass rates in national exams (Primary Leaving Examination - PLE) have increased significantly in
Kalangala. In 2006 the rate in Division 1-2 was 35%, and in 2015 it was 67%38 (national average being 86% that
year). The overall pass rate for all 4 divisions increased from 71% to 89% in the same period.
The Kalangala performance in Divisions 1-4 is listed in Table 3.3a for the years 2010-2017, being a good proxy
for the outcome/impact of the efforts in the Programme. The table shows that there has been an increase in
Kalangala in all 4 divisions during 2015-2017 from 90.1% to 92.8% passes. The national average figure for 2017
was 90.9%, so Kalangala is above the average! The aim is always to increase PLE performance for the upper di-
visions, and there is in fact an increase in Division 1 and 2 from 66.7% to 71.8% (2015-17), with an increase from
52.6% to 61.5% for Division 2 alone! (Subsequently there has been decrease in Divisions 3 and 4). The im-
provement in Kalangala is also shown in the PLE Performance Index39 shown in Table 3.3.b, illustrating the
develop from the very beginning of the Programme up to the end in 2015 (more updated figures have unfortu-
nately not been readily provided to the Consultant). The index for Kalangala has moved from 46% in 2005
(below national average) to 65.3% in 2015, being well above national average, putting the District as number 11
amongst the 112 districts in Uganda!
• Indicator 5: The construction of infrastructure is an output, and has been reported accordingly.
• Indicator 6: All 23 government schools have functional management bodies (Schools Management Committees
– SMCs).
• Indicator 7: Table 3.4 shows the number of teachers in Kalangala in 2018. There are in total 117 teachers (67.5%
governmental 32.5% and the rest privately employed). This mean that the teacher-pupil ratio is 0.021, com-
pared to the national average of 0.018 in government schools (2016 figures, being the latest available).
• Indicator 8: The Pupil-textbook ratio was reported to be 1:1 in 2014, with the national average of 4:1. However,
visiting the schools during the Evaluation revealed that some schools still have a lower ratio, but clearly are ap-
proaching 1:1. This is indeed a very good achievement (also resulting from the activities post-2015 in KIEP),
which cannot be attributed to ICEIDA alone, as the Evaluation Team observed several new books that were giv-
en by others, e.g. Rotary Club.
38 Notably at the end of primary Grade 7, pupils sit their first major national exams, the primary leaving examinations (PLE). Presently PLE has 4 examinable subjects – English language, mathematics, science and social studies. The best possible mark pupils can achieve is a total of 4 with the worst being 36 (means a failure). Students with 4-12 points pass the PLE with a first grade, or Division 1. Scores 13-23 get a Division 2, 24-29 get a Division 3, while those with 30-34 pass with a Division 4. 39 The PLE Performance Index measures the quality of passing at all levels of education. (The number of candidates passing in each grade or were ungraded multiplied by a respective weight factor, and then the actual weight is summed up and expressed as a ratio of the expected weight for maximum performance. The official designed weights are division one (20), division two (15), division three (10), division four (5), division U (0)).
31
CHAPTER 3
Effectiveness
GOPA CONSULTANTS
External Evaluation of Kalangala District Development Programme (KDDP) 2006-15, Uganda
There is no doubt that the support to the education sector in Kalangala has been successful, although there is always
need for improvements. The Consultant firmly believes that all the interventions jointly (renovation of classrooms;
construction of kitchens with energy-saving stoves (reduced fuelwood consumption of up to 2/3!); building of dormi-
tories to capture pupils from the outer islands; construction of latrines and water supply systems (mostly rainwater
harvesting); provision of books, sports equipment and MDD material, etc.) have significantly contributed to the
improved school enrolments figures and performance results. Many school teachers interviewed also proudly point-
ed at the increased status of the schools within the communities, now looking proper and being able to give the
pupils adequate education. Relatively more families are willing to send their children to schools than before, in spite
of the drop-out rate still being high (of reasons outside the control of the sector per se). The serving of meals at
schools also most likely will have a positive effect on the child health in the District, and also contributing to creating
a better learning environment.
d) Health Component
There seems to be no significant difference in the outcome disease statistics for the health centres supported by
ICEIDA up to 2010 and the ones that did not get support (meaning statistics from 2011 onwards, which could indicate
any outcomes of the ICEIDA-supported interventions). Nothing else was expected as the support to the HCs ended
many years ago, and the present lack of operational funds is the same with all HCs40.
Little seems to remain of the equipment given to the HCs under KDDP, except for the solar panels mostly being in
use, although the batteries have been changed. The desktop telephones with antennas was said to have lasted
around 1 year the most, but at least in one of the HCs visited it had never been in use since the day it was installed.
(The Consultant saw only one such dusty telephone stored away in a cupboard in a HC). The car and one of the two
motor bikes given to the District Health Dept. were still operating, in addition to the two boats, where one was given
to Mazinga Sub-County (hard-to-reach). It is also assumed that the training given under KDDP to the health workers
still has an effect as such knowledge stays with individuals, but this is impossible to measure as many of the trained
staff have moved to other places, and taken their knowledge with them.
There is however one KDDP output that obviously can show positive outcome, and that is the sponsoring of the
education of 2 medical doctors (females) and 3 clinical officers. The two doctors were coming from Kalangala, and
started working in Kalangala after education in 2015 and 2016 respectively41. Both were still working in Kalangala at
the time of the Evaluation42, and wanted to continue working there. (The 3 clinical officers were under education to
become medical doctors at the time of the Evaluation). Together with the renovation of the maternity staff houses in
Kalangala HC this was said to have given positive tangible results on the number of maternal deaths in Kalangala HC.
However, this was not the case by judging from the statistics received from the Health Dept. in the District. (The
number of maternal deaths have been fairly stable the last years, although the new doctors started to work in 2015
and 2016 (respectively: 2011-1, 2012-, 2013-0, 2014-2, 2015-0, 2016-1, 2017-3). On the other hand, Figure 3.2 in
40 For example, the Health Management Committees (HMCs) in Kalangala were active and meeting regularly (quarterly) supported by ICEIDA under KDDP (transport and lunch). However, today they are not so active and rarely meeting, except for the HMCs on the main island, due to lack of funding to facilitate the meetings. It was informed that the HMCs are only working in the districts in Uganda where there is donor support. 41 One was first deployed to Kyamuswa Health Centre (in Kalangala) and later transferred to Kalangala HC. 42 It was informed that one of the doctors was still using the vehicle provided to the Kalangala Health Centre by ICEIDA.
32
CHAPTER 3
Effectiveness
GOPA CONSULTANTS
External Evaluation of Kalangala District Development Programme (KDDP) 2006-15, Uganda
Annex 4 shows the significant increase in Caesarean surgery following the arrival of the medical female doctors (more
than doubled from 2016 to 2017). It was also informed that the number of more complicated cases referred to the
hospitals in Entebbe and Masaka has been reduced the last couple of years, meaning more cases are treated in
Kalangala43.
e) Tourism Component
The Tourism Component, as mentioned earlier, started in 2011 and ended in 2013. The formulated indicators for
tourism outcome are as taken from a “textbook” and could be suitable in a well-functioning city with a strong private
sector and a good reporting system. In the Kalangala setting such indicators does not even have an “academic
interest”. The main issue is that there is no system in the District of recording the number of tourists entering the
island. Such data are registered by the Ministry of Works at the ferry terminals in Entebbe and Masaka, but there is
no requirement for the ministry to share this info with the District, which neither is done automatically. The district
HQs did not have any tourism statistics readily available at the time of the Evaluation.
However, the District Commercial Officer managed later to get some statistics on the tourism sector as follows: the
number of tourists in Kalangala has gradually doubled since 2012 and around 10,000 were registered in 2017 (with a
reduction in the number in 2013 and 2014 due to irregular ferry routes)44. Information from the Business Centre in
Kalangala Town Council shows that the revenue from tourism has been insignificant but fairly stable the last 4
financial years, with around UGX 3 million in 2017 (around € 680 only). According to information given to the Con-
sultant, there has been some investment in tourism-related facilities, seemingly the last 4 years, e.g. improvements
in 5 resorts45, building of a green park hosting celebrations/weddings, 8 restaurants and bars opened, 7 super mar-
kets open, 10 private garden “home stays” and 200 new self-contained houses for rent.
There was obviously no use in continuing the Tourism Component under KDDP beyond the 3 years. The Consultant
could easily in retro perspective say that it should not have been started at all, as it would be obvious, and simply
based on common sense, that a boost in this sector could not realistically be expected in the foreseeable future. This
is not due to the lack of interesting sites to visit in Kalangala, but because there is simply no market for extensive
tourism on the islands, especially so when considering what the island can offer as compared other locations in East
Africa. What Kalangala can offer, at least to foreign tourists, only targets a very narrow group at present. (The Ssese
Island being amongst the top 10 of the World’s Best Secret Islands in Lonely Planet 2010 targeting such groups of
“explorers”).
The main reason is of course that the infrastructure is not developed to a point where the islands could be competi-
tive with other locations on mass tourism. Even during the Evaluation, the infrastructure by mere observations
proved to be sub-standard (limited internet coverage, and even in the best hotels it was intermittent and very weak,
the roads are bad, there is no readily available guides or boats for transport to the island sites, and no accommoda-
tion in those places, etc.). Even if it was a noble idea to develop tourism in order to get more income revenue, it
should be realised that it is the private sector that always must be by the steering wheel in the tourism sector and 43 Kalangala HC has applied, and promised by the Ministry of Health, to get a hospital status, but this is still pending the President’s approval. Normally, districts with more than 500,000 people would get a hospital, but due to the location of Kalangala and far to reach islands, an exception would be made in this case. 44 There is not information whether these were national or foreign tourists 45 Dream Land Gust House, Fephilo Leisure Garden, Happy Times, Camp David Beach and Brovad Beach.
33
CHAPTER 3
Effectiveness
GOPA CONSULTANTS
External Evaluation of Kalangala District Development Programme (KDDP) 2006-15, Uganda
not the district authorities per se. If there is a tourist market potential, the private sector will surely develop it. So far
this has happened to a limited degree, and according to its “own pace”.
Following the arrangement of the World Tourism Day in 2017 the Kalangala Tourism Development Association
(KTDA) was established comprising some small tourist-related association46. Lately they had one meeting in 2016 and
one in 2017, but without any funding for development initiatives (no sponsors so far), no activities have been under-
taken.
The Consultant visited the Ssese Island Tourism Centre being located in a building next to the District HQs in Kalanga-
la. There were some few artefacts displayed in a disorderly manner, and a café was offering drinks (instant coffee
and tea) and food (brought from nearby cafés). The centre was established in November 2017 by a private family and
had a full time manager to run the place, in addition to a waitress and a cook, with no support from the district
authorities. The manager produces some simple handicraft that is sold in the café. She informed that there are very
few customers, with the café being visited by a couple of people per day in average. In December 2017 there were 6
foreign tourists visiting the centre (from Poland and Germany). The Centre was a sad sight indeed, but probably
representative for the state of the tourism sector in Kalangala at large.
3.2.3 Cross-Cutting Issues
a) Gender
The Project Document emphasises the need for reporting and analysing on gender in the education sector. (Notably,
this is also a national requirement and all statistics are reporting on gender). Reference is also made to the Millenni-
um Development Goals (MDGs) and the need to promote gender equity and empowering women, and iterates that
training will be given in implementation of gender analysis and mainstreaming. It is also reminded that the fishing-
dependent communities include marginalized women in decision-making, management and utilization of the fisher-
ies resource. This includes inadequate access to basic services, especially health, including safe water, sanitation and
hygiene (WASH) facilities, and education, which invariably affect women/girls more than men/boys.
In the Programme, all reporting under the Education Component has thus by default been on gender, as all data and
statistics are always presenting figures for boys and girls. (It is also noted that this is reflected in the logframe indica-
tors). The Completion Report concludes that gender issues have been fully integrated and mainstreamed in all the
interventions. Specifically, the following gender-related issues should be highlighted:
• Capacity development interventions have emphasized participation of both men and women to benefit from
the skills training, community sensitisation and awareness campaigns; and a specific training in gender planning
and budgeting was implemented (under the Local Administration Component).
• Infrastructure development interventions clearly focused on gender issues by addressing the different needs of
men/boys and women/girls, especially in construction of WASH facilities for community use and schools (e.g.
washrooms for menstruation management). This also included the WASH facilities at the fish landing sites. At
the fish processing facilities, such as the silver fish (Mukene) drying racks and the choker kilns for drying fish47, 46 Ssese Islands Beach Association, Lake Victoria Development Initiatives, Kalangala Farmers Association, Ssese Islands Nature Conservation and Tourism Association, Ssese Islands Farm Packers Association, Ssese Tourism Guides Association 47 Notably, at the time of the Evaluation, such choker kilns have been banned and were thus not in use.
34
CHAPTER 3
Effectiveness
GOPA CONSULTANTS
External Evaluation of Kalangala District Development Programme (KDDP) 2006-15, Uganda
specific needs of women who were mainly involved in post-harvest fish trade, was addressed (as they could not
benefit from the infrastructure and facilities designed to handle fresh fish for the export market where men
were dominant).
• ICEIDA arranged training in gender issues conducted by United Nations University Gender Equality Studies and
Training Programme (UNU-GEST) where the programme management and technical staff and officials from
partner districts participated. The district gender focal person was sponsored for course in gender studies at the
UNU-GEST in Iceland.
• Gender equality was considered during the selection process for sponsorship of the medical personnel whereby
the 2 medical doctors were female and one of the 3 medical assistants/clinical officers trained, was a female.
• The district authorities were encouraged to promote gender equality in recruitment of staff, and as a result the
District Natural Resources Officer and the Senior Economist recruited during the project implementation period
are females (referred to as “soft diplomacy” by the programme management).
The Consultant concludes that the gender issues have been well incorporated in the Programme, and well blended
with the local social-cultural aspects of division of work between men and women. The constructed infrastructure
meeting the special needs of females has surely made daily life easier for e.g. girls in schools and women in the
communities at large, by meeting their special needs.
b) Environment
The core challenge of Uganda’s fisheries was over-exploitation of the fish stock and subsequent degradation of
ecosystems, due to population increase and improper fishing practices (e.g. use of illegal gillnets and fishing of
immature fish) leading to low fish catches. The mere rationale for the KDDP was contributing to the efforts of sus-
tained benefits for the poor communities who depend on fish for income and food security. As such, environmental
challenges were the basis for the interventions in the first place and have been addressed in the Programme through
several actions, to mention some:
• Compliance with non-encroachment environment lakeshore protection zones was emphasized while develop-
ing fish handling infrastructure, in accordance with Uganda’s National Environmental Act (CAP 153). (For
example: The population were shifted away from the lakeshore protection zone, ideally a minimum of 200 me-
ters, but down to 100 meters was allowed).
• All fish handling infrastructure and facilities were developed after project briefs were prepared by the Natural
Resources Dept., to ensure that their construction and utilization would not contribute to degradation of the
environment on both land and water48).
• The Programme supported the Natural Resources Dept. at district level to undertake regular environment
inspections, data collection and production of state of environment reports.
• The WATSAN interventions supported under KDDP addressed environmental issues of poor sanitation and risks
posed by open defecation and use of unsafe water to the communities.
48 The project briefs provided a management plan to ensure regulated public use of the lakeshore protection zones, prevention of siltation of the lake, and control of pollution or degrading activities, in line with the objectives and principles specified in the environmental regulations.
35
CHAPTER 3
Effectiveness
GOPA CONSULTANTS
External Evaluation of Kalangala District Development Programme (KDDP) 2006-15, Uganda
• Kitchen saving stoves in schools addressed environment concerns by reducing the demand for wood fuel (down
to 1/3 of previous consumption) hence reducing pressure on forests.
• Environment issues were mainstreamed in capacity building trainings, and sensitisation and awareness cam-
paigns undertaken under the Programme.
The Consultant concludes that the Programme has encouraged sustainable natural resources management in an
appropriate way, and that the activities have not caused any negative environmental impact.
c) Anti-Corruption
The issue of anti-corruption work in developing countries at risk is a concern with most likeminded Western donors.
The Project Document makes reference to the Poverty Eradication Action Plan (PEAP), on which principles the Pro-
gramme is built, mentioning the focus on “… transparency, accountability and elimination of corruption”. This issue is
however not part of the programme strategy, not at all mentioned in the list of activities and not reported upon in
the Completion Report.
The Consultant believes that this should have been addressed in the planning documents and the activity list, espe-
cially as part of the capacity building/training of district staff under the Local Government Administration
Component. Especially so, when Uganda is considered to be struggling with high level of corruption and is ranked as
number 151 in Transparency International list of 180 countries (2017), with a Corruption Perception Index (CPI) of 26
(where 0 is highly corrupt and 100 is very clean). Only Somalia (180/180) and South Sudan (179/180) is ranked lower
in the region. In 2005, when the Programme was planned, Uganda raked as 117 of 158 countries49 (with Iceland
ranked on top…).
The only document is which corruption is mentioned, is in the “Assessment of the capacity of Kalangala District to
manage donor funds” where such consideration has a natural place anyway. In addition to stating Uganda’s raking in
the Transparency International list, it lists some positive development in the country in relation to corruption and
investments, including establishment of The Public Procurement and Disposal of Public Assets Authority (PPDA) in
2003; the Government’s anti-corruption strategies as well as the coordinating body Inter-Agency Forum (IAF); the
Anti-Corruption Act 2009; the Data Tracking Mechanism (DTM) initiative launched in 2009; to monitor corruption
trends in Uganda on an annual basis; and the Whistle-blowers Protection Act enacted into law in April 2010, also
monetary incentives for reporting on corruption. The document additionally lists some risks in very general terms
related to national corruption and bribery, with no mentioning of possible risks in Kalangala District, making this
assessment of little use indeed.
49 With e.g. Tanzania, Malawi, Zambia and Zimbabwe having better ranking, but Kenya and Somalia and Sudan having lower ranking.
36
CHAPTER 3
Effectiveness
GOPA CONSULTANTS
External Evaluation of Kalangala District Development Programme (KDDP) 2006-15, Uganda
3.3 Conclusion
The Consultant concludes that the effectiveness of the Programme has been satisfactory, but with some shortcom-
ings.
The managerial set-up has been implemented as described in the Project Document, but ICEIDA took on a more pro-
active managerial role in the first phase due the lack of implementation capacity in the district administration. This
was a pragmatic decision to keep up the momentum of the Programme and some tangible results, while at the same
time building capacity in the District. The ICEIDA KDDP Programme Office in Kalangala was closed in 2010 and from
then ICEIDA only operated as funder and sole advisors. Progress reporting was undertaken by the ICEIDA KDDP
Programme Office in Phase I, and in Phase II the district administration prepared progress reports. The Phase I
progress reports and the annual reports in Phase II are orderly and commendably reporting on activities, output, and
the latter also on outcomes. During Phase II monitoring reports, in various formats, were produced mainly by ICEIDA
staff following the joint monitoring visits (with one exception where also the District took part on the reporting). The
comprehensive textbook-like M&E Plan was never followed as outlined by the District, although some monitoring
was undertaken.
The planned outputs have been delivered to a satisfactory degree, with a few shortcomings especially in Phase I, e.g.
preparation of village development plans and delayed infrastructure development. All capacity building, procure-
ment of equipment and most building of infrastructure were achieved, but the district website and the data-based
revenue management system never materialised. Sponsoring education of medical staff was a positive achievement.
The Tourism Component, lasting for 3 years in Phase II seemed to have been based on very unrealistic assumptions
from the very beginning, and produced no tangible useful results (just “reports”). The lack of private sector involve-
ment seems to have been the stumbling block. Most of the main equipment, material and infrastructure purchased
are still operational, but with some natural wear and tear materialising.
The outcomes, being the effects of the outputs, is more important, but these indicators are not well formulated and
without target values listed. The effect of the small grants to the civil society cannot be directly detected (no sum-
mary reports were available from these grants, except from one year). The local governments have all got improved
office facilities as basis for giving improved services to the population.
The post-harvest loss at the Fish Landing Sites (FLS) have been reduced, and the revenue from fisheries have in-
creased. The WATSAN structures surely have made life easier for the inhabitants at the FLSs, but the technical
condition of the systems seems to be sub-standard, as proper O&M is lacking (except in Kasekulo-Ttubi).
The Education Component (with activities seamlessly continued into KIEP after 2015) has evidently given a positive
contribution to the District, with increasing enrolment of pupils (one factor being new dormitories) and PLE results
above the national average. The pupil to textbook ratio is close to 1:1, but school dropout rate remains high.
Few effects of the ICEIDA support to health can be seen today, except for the increase in Caesarean surgery in
Kalangala Health Centre due to the medical doctors which education was sponsored by ICEIDA.
There is no effect of the Tourism Component, as no funds have been set aside in the District and no donor is support-
ing such efforts today. At large, tourism development is entirely depending on private initiatives, and some few
37
CHAPTER 3
Effectiveness
GOPA CONSULTANTS
External Evaluation of Kalangala District Development Programme (KDDP) 2006-15, Uganda
positive development signs have been detected, although development is slow and infrastructure in Kalangala is still
not en par with modern tourism requirements.
38
CHAPTER 4
Efficiency
GOPA CONSULTANTS
External Evaluation of Kalangala District Development Programme (KDDP) 2006-15, Uganda
CHAPTER
4 Efficiency
It is reminded that efficiency is an indication to what degree the programme outputs have been delivered in accord-
ance with Programme Documents, at the appropriate quality and quantity and at planned cost.
4.1 Implementation Efficiency
In Section 3.1.1 the Consultant concluded that the managerial set-up seems to have been pragmatic and effective to
implement the Programme. Following appropriate capacity building in the first phase of the Programme, the district
administration themselves took over a more leading role in the second phase, which also seemed to have worked
satisfactorily. Notwithstanding this fact, it is still at the time of the Evaluation noted that the district administration
has a staffing gap as compared to the ideal and mandated set-up. The last available figures from October 2017 show
that 571 positions are filled out of 723 position in total (79%). This includes all staff at the district HQs, the health
centres, the sub-county governments and the schools, and is indeed good as compared to the staffing level in 2005,
being only around 48%50. The improvement is assumed largely attributed to the support from ICEIDA, in construction
of district HQs, sub-county offices and schools, making it more attractive to work in the administration, in addition to
the equipment provided and the training of the district staff. Through interviews with district staff it was clear that
the staff turnover in the district administration had been reduced and that staff stay in their positions for a much
longer time (although no statistics is readily found on this).
In spite of the ICEIDA support being efficient, under the prevailing circumstances, the hardware support of the
capacity building has by default created increased need of capacity and resources in the District for post-Programme
O&M of the facilities and equipment. Such adequate O&M can clearly not be met by the District as evidenced at the
time of the Evaluation, which puts the sustainability at risk. As such, and even if the efficiency during programme
implementation was satisfactory, the District seems to have “taken a too big bite of the apple, not being able to
swallow it”. In other words, the efficiency post-Programme to manage and administer the gains achieved through the
Programme is not good enough.
50 Figure not including the health sector.
39
CHAPTER 4
Efficiency
GOPA CONSULTANTS
External Evaluation of Kalangala District Development Programme (KDDP) 2006-15, Uganda
4.2 Programme Expenditures and Cost-effectiveness
The initial budget for the Programme was USD 7 million (82.3% grants from ICEIDA, the rest from GoU/KDLG). Includ-
ed in this budget was around USD 1.620 mill in technical assistance (TA) from ICEIDA, 1.085 mill for district local staff,
USD 0.050 mill for evaluation and USD 4.245 in direct monetary contributions from ICIEDA. The budget was later
revised in several steps, as follows (Table 4.1 in Annex 4 refers):
• The total expenditure out of ICEIDA contribution during Phase I was USD 3,964,014, leaving USD 1,795,986
available for Phase II.
• In the MoU agreed upon in October 2011 for Phase II, additional activities to the cost of USD 1,450,250 were
approved for funding by ICEIDA, bringing the total budget for Phase II to USD 3,250,236.
• Additional activities and administrative costs of USD 1,093,222, not planned for in the original programme plan,
were approved by ICEIDA for funding during 2014-2015 (based on i) availability of funds from ICEIDA HQ; and
ii) the activities were considered being a valuable addition to the Programme and likely to enhance and
strengthen the outcomes).
• Finally, additional funding of USD 772,941 was approved by ICEIDA to cover various administrative/overhead
costs occurring in Phase II, which had not been included in the MoU of October 2011 (salaries of local staff, op-
eration of the KDDP Programme Office, etc.).
USD 10,396,14051 was actually in total spent in the Programme, with USD 9,080,413 coming from ICEIDA. The nation-
al contribution was USD 1,300,713, but this was never accounted for as part of the programme accounting. This was
a contribution in kind by the national Government/ Kalangala District Local Government, where most of funds that
pay salaries of district staff are transfers from the Central Government.. It is not known how much of this local
contribution that really covered management/ administration costs/staff at district and national level, but it is
assumed to be the bulk of the money/time.
Table 4.2 in Annex 4 shows ICEIDA’s direct monetary contribution to the KDDP during the entire programme period
2006-2015 divided on components. The support was distributed to the various sectors/components as follows:
Administration - 19.6%, Education and Sports - 38.2%. Fisheries/ WATSAN - 13.8%, Health - 3.7%, Tourism - 1.6% and
Overhead costs - 23.1%. The Overhead Costs comprises operation of the ICEIDA KDDP Programme Office in Kalangala
up to 2010 and thereafter TA from ICEIDA, Kampala.
Of the ICEIDA support, in total USD 2,847,666 were direct transfer to the District, which is not posted under the
various ORRI codes in the ICEIDA accounts, but is accounted for as “Direct transfers undistributed to cost Codes”52.
These figures are expenditures accrued from January 2014, when the accounting and money transfer system
changed (explained in the Section 3.1.2 on Reporting). According to ICEIDA, the District accounted for all the funds
spent on a monthly basis, submitted together with the electronic cash book and certified bank statement for verifica-
tion and validation. The transfers were made in lump sums within the approved budget for that period, but are not
broken down into expenditure codes as previously done.
51 There is a variance of USD 22,220 in this total figure and the total figure given in the Completion Report (USD 9,080,413 vs. USD 9,102,633). The Embassy is looking for a clarification for this, which is most likely a calculation error, not influencing on the explanations for the revised costs given. 52 In the ORRI system posted under a special code “59182-Contribution to foreign parties”.
40
CHAPTER 4
Efficiency
GOPA CONSULTANTS
External Evaluation of Kalangala District Development Programme (KDDP) 2006-15, Uganda
It is close to impossible to calculate the management costs (or rather the value of the management input) under
KDDP, but nevertheless the Consultant has made an attempt to assess the magnitude of such costs. In case all the
contribution by national/local funds could be characterised as “management/ administration”, it means that around
USD 3,398,736 in total was used for administration and management, being around 33% of the programme budget.
Assuming that only 50% of the local contribution was used for managerial purposes, this gives USD 2,748,379, or 26%
of the budget for management/administration. The real figure most likely is somewhere between the two. Even the
lowest figure is a relatively high transaction cost by most standards53. There is however no internationally accepted
“rule of thumb” for how much the transaction costs for international development cooperation should be, especially
when the donor is operating his own programme support office for a period of time, and capacity building and TA are
prevalent cost items.
For comparison however, most NGOs receiving project support from donors, have administration cost of 7-8%, but
this is of course not directly comparable with the situation in KDDP. EU allows 7% of the eligible costs as flat rate to
cover indirect costs (no supporting document required) in their international development cooperation projects and
EEA Financial Mechanism Office (representing EFTA countries) allows for 7.5%. Typical figures for UN institutions are
in the same magnitude. It is for example noted that implementing partners working with Global Environment Facility
(GEF) funds receive a 10% fee to manage, administrate and supervise the day-to-day activities of projects54.
The Consultant appreciates that during the first phase, and as capacity building of the local administration took place,
ICEIDA had to provide TA (through the ICEIDA Kalangala Office) in order to produce tangible results on the ground
and keep up a certain implementation momentum from the planning phase. This is not necessarily a wrong ap-
proach, and it is always a question of how much TA should be provided as compared to waiting with the bulk of the
implementation until ample national capacity had been built with the local implementing agencies. It is therefore
concluded that based on the approach chosen, with extensive TA the first years, the cost-effectiveness is satisfactory,
although on the high side.
53 ICEMB in their comments to the Draft Evaluation Report states: “The analysis of project management costs under KDDP and any compar-isons with international best practices should be put into context, otherwise it can be misleading: 1. Contribution in kind by district though monetised in terms of staff salaries should be treated as in-kind contribution and excluded from
the analysis of project management costs. First the district would have incurred this cost with or without the support to KDDP. Second-ary, the determination of the district contribution did not include other non-wage contributions by government and other development partners.
2. The relevant measure is commitment of the district which the in-kind contribution was meant to reflect – i.e. recruitment and deploy-ment of staff for project management and implementation (key staff were recruited and deployed in the community development department, natural resources department and District Planning Unit)”.
The Consultant appreciates the comments, but disagrees to the statement of the in-kind contribution to be kept outside the manage-ment cost calculations. The main purpose of this exercise is to get some idea of the managerial/administrative input, or value, in the Programme, as this might be a good proxy of the transaction costs. 54 In addition the GEF Agencies that administer the funds (like UN organisations) get a fee of 9.5% (for GEF project/program financing up to and including USD 10 million); 9.0% (for GEF project/program financing above USD 10 million); and 4.0% (for GEF Small Grants Pro-grammes).
41
CHAPTER 4
Efficiency
GOPA CONSULTANTS
External Evaluation of Kalangala District Development Programme (KDDP) 2006-15, Uganda
4.3 Risk Management
The Project Document contains a section on “Risks and Assumptions”. This merely comprises a list of keywords but
no elaboration on what the risks/assumptions really comprise, and no rating of the risk likelihood and impact (small,
medium or large), and with no description of mitigating measures. The listing is also repeated in the logframe table.
Amongst the key listings are found (some repeated…): Political stability and security; stakeholders´ commitment;
absence of natural calamities and war; adequate numbers of qualified and committed staff [which indeed required a
lot of capacity building]; political will and stability (local government); favourable market for fish (fishery sector);
adequate water quality and quantity; functional BMUs [a risk materialising with large consequences for sustainabil-
ity]; prudent management of equipment and facilities; existence of a school policy on maintenance (education
sector); etc. This listing could as such not be characterised as a real “risk assessment”.
The Mid-term Review Report contains nothing on risks, and neither do the Mid-term (5 year) Report, the Final Report
nor the Completion Report. The KDDP Assessment of District Capacity to Hand Donor Funds only mentions risk of
corruption. Neither do any of the progress reports (2013-14) contain any risk assessment, although the report deals
with implementation challenges in general and what works well and what do not.
4.4 Conclusion
Under the prevalent circumstances, the Consultant concludes that the efficiency has been satisfactory, with mana-
gerial costs seemingly on the high side. The capacity building in the District under the Programme (training, building
of office infrastructure, procurement of material and equipment) has certainly led to reducing the staffing gap in the
District (from 48% in 2005 to 79% in 2018), and less staff turnover. It is more attractive to work in Kalangala now than
before. However, the efficiency of the district administration post-Programme does not seem to keep up with the
requirements for O&M and is thus not efficient enough to maintain the benefits.
ICEIDA has increased the grants to the Programme in several steps through implementation, as needs have been
revealed or unforeseen costs have surfaced. Such flexibility and willingness to “go an extra mile” from the donor’s
side should really be appreciated by the District, as this is rare in the donor community. ICEIDA has not left their
Ugandan partners in Kalangala in limbo, but followed them all through implementation, also evidence by the contin-
uation of the Education Component in KIEP. Such long-term support to a sector is also rare by all standards with
donors, and in this case it has born fruits. The managerial/transaction costs seem to be on the high side as compared
to programmes/project financed by other donors, but then again, KDDP is not a “typical” programme, so direct
comparisons is difficult. There has been no proper risk assessment in the programme planning or in the progress
reporting.
42
CHAPTER 5
Impact
GOPA CONSULTANTS
External Evaluation of Kalangala District Development Programme (KDDP) 2006-15, Uganda
CHAPTER
5 Impact
5.1 Field Observations and Household Survey
Impact refers to positive or negative, intended or unintended, long-term effects from the interventions. However,
there is always a question what is “long-term”. Since the KDDP was completed in 2015 (except for the Education
Component) it should be possible to detect any impacts at the time of the Evaluation, in this case effects clearly
beyond the planned outputs and outcomes, where the latter are the immediate and medium-term effects of the
outputs. It is however always a question which of the positive impacts where initially planned for and which were not
planned for, and indeed whether an effect should be characterised as outcome or impact. Surely, the question of
improved livelihood and socio-economic conditions amongst the beneficiaries is a typical parameter to measure
impact, and in this case the basic reason for embarking on the interventions in the first place.
The Consultant has in this case chosen to consider the findings in the HH survey representing mostly impacts, as
some time has elapsed since the Programme ended (except for the Education Component still ongoing under KIEP,
but presented hereunder nevertheless). Annex 9 comprises a comprehensive presentation of the results of the HH
survey, with comments connected to selected results. The document might be read as a separate stand-alone report,
but the text below must surely be read with direct reference to Annex 9. Only some of the findings from the HH
survey are referred to below, to the degree they relate to possible important programme impacts.
It is reminded that the HH survey was undertaken in 355 households in 34 villages, of which 22 villages where pro-
gramme interventions had taken place (intervention villages) and 12 nearby villages without any interventions by the
Programme (control villages, see explanation in Section 1.2.2). The households interviewed were selected by random
sampling. Of all the HHs, 65% were male-headed and 35% female-headed. In the Mid-term Review (MTR) in 201055
only 21% were female-headed, roughly in the same magnitude as in the baseline survey in the 5 fish landing sites in
2008. The reason for increase in female-headed villages might be that more men have moved out of the villages to
seek income-generating work, also connected to the strict control of illegal fishing from March 2017 onwards. The
Consultant might also suspect that the high alcohol consumption amongst male fishers in the communities could be a
contributing reason, although such question was not part of the HH survey.
66% of the HHs have lived in the villages for more than 10 years, thus have experienced the benefits of KDDP, where
implemented. Around 67% had lived outside Kalangala District previously, meaning they had also experience from
other villages in Uganda. Interestingly enough, the average number of people in the HHs have increased since the
MTR (2.6), with 44% having 5-10 family members. The reason for this could be improved health care and social
services, immunization, treatment of diseases, and more stable incomes (improved predictability of local economy in
the islands). It is realised that a common tendency is for fishermen to move around in search for better fish catches,
55 It is reminded that the MTR HH survey asked a lot of detailed questions, but hardly any of these are presented in any survey report or even in analysis, that naturally should have been presented in the MTR Report. The Consultant does not know why this was not done, but it means that several of the parameters covered in the end evaluation HH survey cannot be compared with the situation in 2010, which is really a pity.
43
CHAPTER 5
Impact
GOPA CONSULTANTS
External Evaluation of Kalangala District Development Programme (KDDP) 2006-15, Uganda
better prices, better social services and amenities in general. In the event that most of these benefits/services can be
accessed predictably in one place, the effect could be that individuals establish more fixed dwellings and assets, and
run “stable” families.
The HH survey shows that related to occupation, as much as 34% are students/pupils, and 13% are involved in
fisheries, whereas comparable figures from 2010 (MTR) were 6% and 24% respectively. (Almost 34% have “others”
occupation, e.g. farming). The reduction in fishers might be attributed to the crackdown on illegal fishing, as well as
maybe enforcement against use of child labour. The increase in number of pupils most likely result from better
learning environment (heavily supported by ICEIDA) and the fact that a larger ratio of the population are children in
school-age, in addition to increased awareness raising to parents on the importance of schooling, and general en-
couragement by the authorities on increasing level of education. The number of people involved in “Sales & Services”
has decreased from 29% in the MTR56 to 12% now, one reason assumed to be the reduced demand for goods and
services following the reduction in the number of fishermen. The main source of income however is from farming
(37%, which might coincide with the high figure for “others” in occupation) followed by fisheries (27%)57.
Below are some comments related directly to the programme components, based on observations, key informant
interviews and mostly the HH survey:
Education:
Education: Around 4% of the household members have had no schooling at all and 5% of the school children (6-13
years) are not at all attending school. The population (English) literacy is around 80%58. Almost 40% of the school
children live less than 1 km from the school, whereas nearly 30% live more than 3 km away or on another island,
creating special challenges related to transport and commuting in general. (The pupils in control villages have longer
distance to school, and spend more time getting to schools, than pupils in the intervention villages. This is merely by
default as the improved schools are located in the latter villages). Nearly 60% of the pupils spend 1-2 hours to reach
school, and 54% of the households have children that are attending school (the last 30 days). 88% claim that there
are no Functional Adult Literacy (FAL) classes available any more.
Of the children that missed some days in schools the last 30 days, sickness is the main reason (48%), with “lack of
scholastic material” being around 36%. This is not properly understood by the Consultant, as most of the schools in
the District now have a pupil-textbook ratio close to 1:1, which means that there must be other “materials” lacking
(for example: school uniforms, pens and pencils). An interesting observation is that more pupils missed school due to
sickness on the main island (Bujumba County) than on the remote islands (Kyamuswa County), with 54% and 42%
56 Referred to as «Business» in the MTR, being a similar occupation. 57 When a comparison is made between the two counties, the results show that the majority of households in Bujumba County rely
on farming (52.0%), fishing activities (17.9%), and others (14.5%) for income; and in Kyamuswa County it is fishing activities
(36.3%), farming (22.5%) and others (15.9%). Notably, the National Population and Household Census from 2014 shows that in
average 22% of the district population was doing “subsistence farming” (25.3% in Bujumba County and 18.8% in Kyamuswa
County). However, the figures are not directly comparable, as “farming” in the HH Survey encompasses more than only “subsist-
ence” farming. The figures nevertheless show the same distribution trend between the two counties.
58 81% in intervention villages and 77% in control villages, not a significant difference.
44
CHAPTER 5
Impact
GOPA CONSULTANTS
External Evaluation of Kalangala District Development Programme (KDDP) 2006-15, Uganda
respectively. The reason for this is neither understood by the Consultant. On the other hand, missing school due to
other reasons (bad weather, attending funerals, etc.) was, not surprisingly, higher on the remote islands (20%,
against 9% in Bujumba County).
A positive development is that none of the girls are home from schools due to their monthly periods, and this goes
both for intervention and control villages. The high school dropout rate noted in the district statistics is not directly
detected in the HH survey, as only 6% of the HHs report dropout59. Only 1 HH report pregnancy as the reason for
drop-out, so the problems might have been somewhat “exaggerated” by the district administration, or the house-
holds are “under-reporting” this problem60.
The main result of the survey is however that 60% of the HHs believe that the quality of education is good or aver-
age/fair (36% and 25% respectively), with 17% who do not know. Amongst the reasons for believing the quality is
good, the following could be noted, with direct relation to the KDDP and KIEP supported by ICEIDA:
• Better performance of pupils in PLE
• Pupils understand what they are taught
• Pupil and teacher absenteeism reduced
• Schools have more qualified teachers
• Construction and renovation of school infrastructure/good classroom environment
• Introduction of boarding sections in most schools [Consultant’s observation: Parents do not have to take
children to boarding schools in Masaka District anymore]
• Provision of school necessities like books
The Consultant also noted during the key informant interviews that a positive impact is that money that was spent
for boarding schooling earlier could now be used to cover other needs in the households (improved housing,
health/medicine, etc.).
Health:
The impact of the KDDP Health Component, ending in 2010, is difficult to see with the various health centres visited,
although it is anticipated that the training of staff has an impact “somewhere in the country”. (The solar panels are
mostly in operation although the batteries have been changed). However, the sponsoring of especially the two
medical doctors’ education show some positive impact (increased number of Caesarean operations undertaken in
Kalangala HC). It is believed, with a large degree of certainty, that ICEIDA’s support has had a positive impact in this
case, although it cannot be verified through other statistics (e.g. maternal deaths, see above under “outcomes”).
The HH survey shows that 85% of the population have a distance less than 5 km to get to the nearest health centre.
(The MTR considered this distance the maximum in order to be ”accessible” to the population). 22% of the HHs have
experienced Malaria cases the last 30 days and 5% experienced Diarrhoea. (The health centre staff interviewed had
59 Only 12 households answered the question on reasons for dropout, and 42% gave the reasons that schools fees/charges were too high. Only 1 family reported pregnancy as the reason. 60 ICEMB indicates: “It could be the other way around. The households may not be reporting accurately. The apparent cohort survival rates by grade, which is a relatively more reliable quantitative data, indicates that dropout rates were indeed high”.
45
CHAPTER 5
Impact
GOPA CONSULTANTS
External Evaluation of Kalangala District Development Programme (KDDP) 2006-15, Uganda
the perception that the number of Diarrhoea cases had gone down, but there are no comparable data from the MTR
to verify this). Around 3% of the inhabitants experienced water/sanitation-related sickness the last 30 days. There is
no significant difference between number of cases in intervention and control villages, and neither was this ex-
pected. 39.3% of the HHs believe that the health services are good, and 36.3% believes they are fair/average (same
percentage in intervention and control villages). Interestingly enough, only 30% of the inhabitants in Bujumba
Country believe that health services are good, whereas the portion is 48% in Kyamuswa County (the more remote
islands). The reasons for this is not understood by the Consultant, as one would expect that the communities closer
to the largest health centres would be more satisfied.
The HH survey also shows that there is less correlation than expected between distance from the health centre and
the satisfaction with the services, with 23% of the inhabitants living less than 1 km from the health centre consider-
ing the services as being bad/poor. (On the other hand, as expected, 63% of the inhabitants living on another island
and/or more than 6 km from the health centre consider the services to be bad/poor). Amongst the reasons for
believing the quality of health services are good, the following could be noted, but largely without any direct relation
to the KDDP, but may be an indirect correlation could be found:
• Availability of adequate drugs most of the time (minimal irregularities with availability of medicines)
• Health services are readily available
• Services of health workers are satisfactory.
• Well-equipped health centres.
Fishery:
The HH survey shows that of the 27% of household income coming from fisheries (24% in intervention and 35% in
control villages), 80% is coming directly from catching and selling to/buying from traders (83% in intervention and
75% in control villages). This means that the relatively low number of the inhabitants occupied with fishing contrib-
ute to a relatively high portion of the community income (see above)61. Trading constituted 23% in the MTR whereas
only 10% now. Another issue noted from the HH survey is that all 5 fish landing sites report availability of fish drying
racks. However, at least in two of the sites those racks were not in use (due to rust, etc.).
Hand wash facilities are reported in all five sites but running water is only found in Kasekulo-Ttubi. Soap for hand
washing was reported available in 3 sites, but the Consultant only found soap in Kasekulo-Ttubi and Kisaba. (Protec-
tive gear was also observed in Kasekulo-Ttubi, although reported in 3 sites). Smoking kilns are found in all sites but
61 In the MTR, 33.8% got their income from fisheries and 26.4% from farming, meaning that the two sectors have changed importance related to income during the last 8 years. Income from fishing is thus not so important income source anymore. The reasons for the present situation could be increased catch due to better fishing method, and/or reduced post-harvest losses and/or a result of the en-forcement by UPDF. However, as no specific study has been carried out to assess changes in fish catches before and after the enforcement by UPDF it is difficult to conclude. The Consultant also cannot find compelling evidence of significantly increased prices. However, given that much of the catch is marketed as fresh fish, the quality is prone to rapid deterioration. Any effort that facilitates preservation and extension of shelf life therefore implies that the fisherman/fishmonger can keep all his fish on the market in fresh form still fetching the good price of fresh fish as opposed to being compelled to take it to further processing. This ultimately means the buyers have access to high quality fish for which they are willing to pay a good price. ICEMB’s comment is also appreciated “At the time of the evaluation, fishing activities had been on standstill and this could account for the responses the household made”.
46
CHAPTER 5
Impact
GOPA CONSULTANTS
External Evaluation of Kalangala District Development Programme (KDDP) 2006-15, Uganda
authorities have banned the use of such kilns62. Access to toilet facilities are reported in all sites, but notably the
toilets in Kachungwa landing site were closed at the time of the Consultants’ visit. 90% of all HHs answer that there
are solid waste bins available at the fish landing sites, which coincided with the observations of the Consultant.
However, the standard waste bins made of concrete does not have any hatch/opening for easy emptying of garbage,
as emptying has to be done manually by climbing into the bin and shuffling garbage out manually. In other words:
the access to various facilities reported in the HH survey does not necessarily reflect the reality at any point in time,
and does not say anything about the quality of the services/facilities.
Local government services and social welfare:
Local government services and social welfare: Regarding the capacity of the District Government and the sub-county
governments to deliver basic services to the population, the picture is somewhat mixed to judge from the key in-
formant interviews. One impact is that the staff turnover in the district administration obviously has been reduced
after new office facilities were built and equipment purchased under the Programme. But has this resulted in im-
proved services to the populations? The HH survey answers show that 64% report improved HH welfare since 2011
(intervention villages-67%, control villages-57%, not being a significant difference), with no difference in the two
counties. On the reasons for improved welfare, 77% answered increased income, and only 10% answered improved
access to various services in general (same magnitude in both intervention and control villages), the same percentage
as “Improved yields & availability of market for farm produce”, surely also connected to the increased income level.
Amongst the 36% that do not report on improved HH welfare, 40% say that they had become poorer since 2011 (43%
in intervention and 35% in control villages), meaning 14% of total number of district population, with lack of income
and “bad governance” being the main reasons, followed by “lack of credit”. (The Consultant is a bit uncertain how
people perceive “bad governance” in this case, but it is likely they refer to local government performance and ser-
vices. The distribution of the ones that had become poorer in the countries are: Bujumba-44% and Kyamuswa-35%,
which is somewhat contrary to what would be expected. The answers on perceived poverty is somewhat surprising
and means that (“relative”) poverty in the District has increased the last 7-8 years.
On the other hand, 64% report that they save some of their income (68% in intervention village and 57% in control
villages). 13% of these are saving more than 30% of their income63, and 72% are saving 10-30% of their income (little
difference between intervention and control villages), which is encouraging. At the same time, expenditures of most
households have increased since 2011, especially on education (tuition fees, textbooks, uniforms, school operation
contribution, etc., where 44% report to spend more than 40% of their expenditures), followed by food and health.
The increased expenditures on education might be due to the fact that the education environment has improved and
more families are sending their children to school.
Around 52% of the HHs report improved housing structures, with only 3% reporting decreased quality of structures.
On the observed standard of housing by the enumerators, it was reported that around 47% of the houses have
cement screed floor, whereas the baseline reported between 1-10% only in the 5 fishing villages. This observation
62 There is a reluctance to deploy this design of kiln because of the risk of accumulating potentially carcinogenic compounds (polycyclic aromatic hydrocarbons) from the smoke into the fish, rendering it unsafe for human consumption. Although seemingly a “safer” type of kiln has been developed. 63 Although the MTR HH survey asked questions about saving, the answers were unfortunately never reported upon.
47
CHAPTER 5
Impact
GOPA CONSULTANTS
External Evaluation of Kalangala District Development Programme (KDDP) 2006-15, Uganda
could serve as a good proxy for improved housing/living standards, and coincides well with the HH answers64. A
majority of the HHs report unchanged status on livestock, and also unchanged status on assets within agriculture and
fishing.
It is interesting to note that 96% of the households interviewed have at least one mobile phone, with around 45%
having 2 phones (no difference between intervention and control villages). The baseline survey in 2008 indicated that
around 45-55% had mobile phones (with only 25% of the women in Namisoke, being the lowest). As with all poor
communities in the developing world, the mobile phone has really made a difference in ordinary people’s life.
On the questions related to development efforts in the villages since 2011, KDDP/ICEIDA is specifically mentioned as
supporter to education, but indeed second to the District Government. The reason could be that ICEIDA is not
mentioned once in the signboards placed on the new school buildings, where the District in fact is mentioned as
“funder”. Also related to development efforts in sanitation/hygiene, fisheries/trade and health, the District is per-
ceived to be much more important that KDDP/ICEIDA, not so surprising related to health (ending in 2010). On the
other hand, all HHs say that the communities had been benefitting from the development interventions.
In relation to the perception of improvements in provision of public services since 2011, 54% say “yes” related to
education (intervention villages - 58%, control villages -4 5%), 37% to water (intervention villages - 46%, control
villages - 19%, being significant), 29% to fisheries, 27% to sanitation and as much as 50% in relation to health (the 3
last with no difference between intervention and control villages). The improvements in education could most likely
be attributed to the ICEIDA support, but the improvement in health is due to other support than from KDDP, for
example through the last years’ comprehensive support to many health centres under the Kalangala Comprehensive
Health Services Project (KCHSP). Amongst the reasons for improved services related to education the Consultant
largely found the same statements as for education listed above. There is no significant difference between the two
counties related to the perception of household changes in education, fishery/trade, health and sanitation, but a
significant difference in water (“yes” in Bujumba County - 49%, Kyamuswa County - 26%).
Water and Sanitation:
Some questions in the HH survey related to WATSAN facilities, whereas nothing was reported from the MTR HH
survey in comparison. Around 74% of the population report to have water supply from a safe source (“piped wa-
ter”65, borehole, protected spring or well, etc.), with 83% in the intervention villages and only 55% in the control
villages66. Only 16% in the intervention villages use the lake as main water sources, whereas 44% in the control
villages, which surely is a result of the KDDP efforts.
Around 80% consider the water quality as being good (63%) or average, coinciding well with the perception of “safe
source”. This could most likely be attributed to the District/ICEIDA support in the intervention villages. Most house-
64 It is noted that the 2014 Census states that 20% of the households have “permanent” floor structure, which might indicate a trend of increased welfare the last 4 years. 65 «Piped water» does not necessarily guarantee that the source itself is safe, as it just refers to the method of transporting the water from the source to the consumer…… 66 In comparison, the 2014 Census shows that in the whole district around 47% used a “protected” source for drinking (piped water, borehole, protected well/spring, gravity flow and bottled water). It is however noted that already at the time of the Census, all landing site villages under KDDP had got improved water supply, so indisputably KDDP has made a difference in the intervention villages.
48
CHAPTER 5
Impact
GOPA CONSULTANTS
External Evaluation of Kalangala District Development Programme (KDDP) 2006-15, Uganda
holds, not surprisingly, have the lake as their second water supply source, and around 77% say they use secondary
sources due to “unavailability” or “unreliability” of protected sources. On the other hand, the baseline survey in 2008
indicated that in 4 of the fish landing sites around 93% had “reliable water supply” (Kachungwa, Kasekulo, Kisaba,
and Namisoke), one having 50% (Kyagalanyi). This in fact means that the perception of what was “good water sup-
ply” in four villages was higher during the baseline period than 10 years later! This is not fully understood by the
Consultant, but it might be due to the perception of what is “good” or not changing with time and the operational
status of the present facilities, regardless of what kind of facilities.
90% of the respondents spend less than 30 minutes collecting water from their main source (80% from the secondary
source), which is a fully acceptable result by all standards. Almost 60% of the HHs are consuming 50-100 litres of
water per day (but the amount depends on the number of family members), and 98% boil the water (as treatment).
This high number is a very encouraging result and might be attributed to effective awareness raising amongst the
population as to the importance of treating water for human consumption. 80% of the respondents have perennial
water supply, with no difference between the two counties. 48% are paying for water from their primary source,
with 54% in the intervention villages and 35% in the control villages. Ideally then, higher payment in the intervention
villages should result in improved services/O&M (quantity, quality, availability) and improved state of repair of the
infrastructure.
Hereunder, the survey also confirms that 20% more HHs in the control villages are saying that protected sources are
not available, than in the intervention villages. Nearly 60% of the households say that water is affordable/low, but
surprisingly only 21% answer that the payment for water should be used for improved O&M, much fewer in the
intervention villages answering this (16%!), with 57% in the intervention villages saying that “government rules” is
the reason for them paying (38% only in control villages). This is indeed surprising, and shows that in this respect the
awareness raising in the intervention villages might have failed to get the main message through to some degree.
64% believed that the water supply system is well maintained (with 72% in the intervention villages and 47% in the
control villages, being encouraging. But the answer from the intervention villages is not properly understood when
compared to the reasons for people having to pay for the water, but might have to do with inadequate sensitisation
in the intervention communities).
In average 48% say they were using private latrines (mostly simple pit latrine), with 52% in intervention villages and
40% in control villages67. However, slightly more do not at all use a latrine in the intervention villages than in the
control villages. As much as 68% of the latrines do not have water and soap available (50% in the public latrines), but
almost 80% believe that public latrines are clean/satisfactory. This is also the impression of the Consultant from
having inspected the latrines during the fieldwork.
64% of the HHs confirm that there has been sensitisation meetings on hygiene and sanitation held, with 49% in
Bujumba County and 78% in Kyamuswa County, which could mean that the health workers on the outer islands have
been more active on awareness raising. 70% of the inhabitants claim to have acquired increased knowledge from
such sensitisation meetings, with 61% in Bujumba County and 78% in Kyamuswa County. It is a bit surprising that the
67 The 2014 Census shows that only 27% of the households in the District had «improved toilet» (flush toilet, VIP Latrine, covered pit latrine with a slab, compost toilet, not shared with others). The high coverage in the intervention villages is a strong indication that the awareness raising on improving hygiene practices has given results.
49
CHAPTER 5
Impact
GOPA CONSULTANTS
External Evaluation of Kalangala District Development Programme (KDDP) 2006-15, Uganda
inhabitants on the outer islands perceive to have acquired more knowledge than the ones living closer to the district
HQs.
5.2 Conclusion
Impact in this case represents the longer terms effects beyond the outputs and outcomes, based on observations in
the field and analysis from the HH survey, covering 34 villages (355 randomly sampled HHs), of which 22 had received
direct interventions of KDDP support. The female-headed HHs has increased since the MTR HH survey in 2010 (from
21% to 35%), amongst others indicating migration of male workers to outside Kalangala. There are also more stu-
dents/pupils now than during the MTR in 2010 (34% against 6%), reflecting the increased school enrolment most
likely due to improved learning environment created under KDDP and KIEP. The main occupation is still farming,
followed by fisheries. However, a relatively larger proportion of the community income is coming from fisheries
today than some years back.
The majority of pupils missing schools report sickness and lack of scholastic material as the causes, which is not
properly understood by the Consultant (as pupil-textbook ratio being close to 1:1). Girls are now attending schools
during their monthly period. 60% of the HHs believe the quality of education is good/fair, thanks to several of the
interventions under KDDP and KIEP. On the other hand, any impact from the KDDP Health Component interventions
up to 2010 cannot be detected, apart from the increase in Caesarean operations today undertaken in Kalangala HC,
with doctors educated partly by ICEIDA funding.
Based on the HH survey results, the field visits to the communities and the interviews with programme partners and
stakeholders, the Consultant concludes that the Programme has had a positive impact on the livelihood of people in
general. 64% of the HHs report improved welfare since 2011, the majority due to increased income, and 13% manage
to save more than 30% of their income. Of the 36% not experiencing improved welfare, 14% of the district popula-
tion report lack of income and “bad governance”. Only 3% report decreased standard of housing structures, 96% of
the HHs have a mobile phone, an improvement from 45-55% in the baseline survey, with 45% now having 2 mobile
phones. It is however impossible assessing to what degree KDDP has directly contributed to this increased welfare. A
rather low percentage have recognised ICEIDA as funder of the improved education environment, as now signboard
reveal the real funder.
80% of the HHs consider water supply to be good/average, whereas the baseline survey in the 5 fish landing sites
alone showed that 93% had “reliable water supply”. It is a bit surprising that relatively few inhabitants in the inter-
vention villages recognise that they pay for water because of required O&M of the systems. On the consequences of
failing to maintain proper hygiene practices, 96% answer that people would fall sick, which is a positive feedback
reflecting some basic understanding of the hygiene issues. Visual observations (see photos) revealed that the
WATSAN facilities in the fish landing sites, and partly the buildings constructed, show clear signs of deterioration and
in a couple of locations are not at all properly maintained (see sustainability below).
The discontinuation of the BMU, a happening totally outside the control of the Programme, surely had a very nega-
tive impact on the operations of the landing sites, with the present Fishery Landing Site Committees having no formal
mandate to execute any services and getting no money to do anything.
50
CHAPTER 6
Sustainability
GOPA CONSULTANTS
External Evaluation of Kalangala District Development Programme (KDDP) 2006-15, Uganda
CHAPTER
6 Sustainability
6.1 Various Sustainability Aspects
Sustainability is the ability for the District and the local communities to continue the benefits from the outputs and
outcomes after the programme support has ended. As the Programme ended in 2015, it is in this case possible to
verify if at least some of the interventions were sustainable. For most programmes where the end evaluation is
undertaken right at the completion of the interventions, one must often make assumptions of the sustainability.
In principle, there are several issues related to sustainability that should be considered, the most important being:
institutional, financial and environmental. The last one is not so relevant here as the Ugandan army now is control-
ling the beaches and is cracking down on illegal fishing, meaning controlling the possible over-exploitation of the
fishery resources in the Lake, having nothing to do with the Programme as such. The ban on building living houses
closer than 100-200 m from the lake at the fish landing sites to maintain a green zone seem to be respected so far, at
least to judge from the observations during the field visits. Time will however show whether such ban is sustainable
in the long run.
With the improved infrastructure at district level, and the capacity building at large, the institutional sustainability
has improved. It is reported that the staff turnover has been reduced, as it is much more attractive to work in a
spacious “modern” office building. Also at sub-county level the available office space forms a good basis for the staff
to perform better, and the office environment is much more welcoming for community members visiting. (It is said
to be an “open house policy” prevailing, and in one sub-county, the Consultant found all doors open but with no
officers present…68). It is understood that all the furniture purchased under the Programme is still in use, although
most of the desktop PCs are not in use anymore in the district HQs, as their lifetime has certainly ended. Most of the
motor vehicles are still in use, as are the fiberglass boats and engines, although the wooden boats are all written off.
It is also assumed that the training and awareness raising of the District and sub-county staff has at least to some
extent led to better understanding of the communities’ needs and thus resulting in improved service level.
The stumbling block for achieving good sustainability is however the financial factors. Like any poor developing
country district, Kalangala is also struggling with lack of income from revenue and national government grants to
ensure the required O&M of the infrastructure facilities built. (Reference is made to the photos in Annex 10 as
illustration to the following text). This especially was observed in the water supply system on the fish landing sites
and partly on the sanitation facilities, with one exception - the Kasekulo-Ttubi site which was run smoothly and
maintained properly (even with wet paint on the concrete pedestrian path marked at the time of the evaluation
visit). It is believed that all the water supply systems were in good order and well operating at the time of handing
over the systems to the BMUs. Design of the systems were carried out by a consultant and various contractors built
68 The fact that few local government staff were present in their offices at the time of the Evaluation could however be a worrying sign. Where the staff “around” in the communities to interact with people locally or where they temporarily away in Kalangala town or in their home areas where life is more pleasant to live…..?
51
CHAPTER 6
Sustainability
GOPA CONSULTANTS
External Evaluation of Kalangala District Development Programme (KDDP) 2006-15, Uganda
the systems with the Senior Water Engineer in the District as construction supervisor, visiting the sites frequently
during construction.
In Kisaba landing site the floating barges are broken (holes in bottom) and there are no funds to repair them. Also the
needed rehabilitation of 2 latrines (broken walls) is unaffordable to the community, although the water supply is
maintained well so far (gravity system with relatively low O&M costs), and metal pipes have been replaced with
plastic ones. In Kyagalanyi landing site the bats destroying the fish-stand ceiling have (almost) been removed, but the
broken staircase to the water has to be reconstructed, and new batteries to the solar system have to be purchased.
Although the latrines at the site are clean (hardly in use), there is no handwashing facilities any more.
In Namisoke and Kachungwa lading sites, the water supply systems are barely working, in the latter not giving
enough water even with two pumps running all the time. There is no chlorine for disinfection and has not been for
several months (maybe years?), and the present (and fairly new) pump operator in Namisoke has not received any
training on the system operations69. She only switches on the pumps twice per week70. There has been no mainte-
nance on the pumps since the BMUs disappeared in 2015, but until that day the pumps were seemingly serviced
regularly as required. The Grundfos submersible pumps used for lake water intake should ideally be taken up and
serviced every 6 months71. The Consultant fears that some of the pumps in these two locations are running on
“borrowed time” and might stop working in the foreseeable future. There is no cleaning undertaken of the houses in
which the switches and valves are placed, and the solar panels were also in need of cleaning at the time of the
Evaluation (dust and bird droppings). As with the other sites, the floating markers to locate the submersible pumps
have gone missing, which makes retrieving the pumps for servicing more difficult and might lead to conflicts with
fishing gears getting stuck in the intake structure72.
Most of the latrines visited at the fish landing sites and adjacent villages during the Evaluation were clean, with the
exception of the public latrine in Namisoke (which was very smelly) and the public latrine in Kasekulo-Ttubi commu-
nity (!). Except for Kasekulo-Ttubi, none of the fish landing sites had running water for hand washing in the toilets,
and neither had the village latrines. It was observed that the “urban” type of flushing toilet with elevated water tank
does not seem to work in a rural setting. Also in the schools the latrines were fairly clean, and in most places it was
the pupils that cleaned the toilets on a rotating basis. None of the schools had soap available for hand washing. Some
latrine structures proved to have crumbling concrete and rotten wooden doors.
The environment surrounding the water taps in schools in general need more attention. By simple means the area of
the water tap could be made more user-friendly, e.g. by putting stones or bricks on the ground to stand on while
filling cans, to make proper drainage channels leading the spill-water away from the tap points, and finally simply to
remove litter and debris from the area giving it a more attractive appearance. The awareness raising amongst the
pupils and the teachers on such operational procedures must be intensified.
69 The previous WATSAN Committee in the village got training during construction, but they were accused of mismanaging the collected water fees and a completely new committee was selected, not being given any training at all. 70 In fact the operator said that she is starting the pumps every day, but the villagers claimed that they only got water two days per week. 71 Information by the Senior Water Engineer in the District. 72 The Consultant was informed by the Sen. Water Engineer in the District that the GoU is now considering taking the responsibility of O&M from the communities and contracting it out to private companies that service and maintain the system regularly. The Consultant has not be able to verify this information and has doubts as to whether the authorities can afford such a solution, especially for the most remote areas.
52
CHAPTER 6
Sustainability
GOPA CONSULTANTS
External Evaluation of Kalangala District Development Programme (KDDP) 2006-15, Uganda
The handle was broken on almost all the brass water taps in the schools, obviously being a weak point in the materi-
al. These taps should be removed and new ones put in place. The Consultant recommends a simpler (but more
expensive) tap with a metal handle having on/off on a 90 degree swing (see photos). This kind of taps are in use in for
example the one private school visited (Lake Victoria Learning Centre) and in the new system being constructed in
Bubeke PS.
The solar energy systems installed in health centres, schools and sub-country offices might be an appropriate solu-
tion in case it is operated and maintained properly. The weak part is the batteries where such are installed, as these
normally have to be renewed every 6-7 years (good industrial batteries might last longer), as the capacity is signifi-
cantly reduced at that time. However, in KDDP many batteries lost capacity long before that time, e.g. after 2 years,
which might indicate that the batteries were of inferior/counterfeit quality. Surely, when such batteries are installed,
the user must make sure to set aside money to renew the batteries when time comes, and several of the beneficiar-
ies have obviously been able to get funds for such renewal. Some have however not been able to raise money for
such purchases. The Consultant’s reflection is that a donor could support installation of smaller solar power systems
in special institutions, where selected staff are trained to maintain the systems and where the institution is really
depending on such system for giving the required service to the public. Typical institutions could be health centres
where medicine has to be cooled and where night light is absolutely required. However, in places where a communi-
ty takes joint responsibility of O&M and where there is staff turnover (typically landing sites), such systems should be
avoided and more simple solution considered (e.g. handpumps for water supply).
At present, the District seemingly have no funds (for fuel, DSA, etc.) for sending any of the district officers on inspec-
tion visits to the fish landing sites and communities. Also to judge from the interviews with the district staff, very few
such visits are arranged in a year, if any at all. However, “they all travel together” once there is a transport available,
preferably paid by a “project”, but this is more like haphazardly taking place and is not part of regular inspection
procedures. For the hard-to-reach areas (where Namisoke and Kachungwa are two) this means that deterioration will
gradually continue until things reach a state of “beyond repair”, and some of the infrastructure might end up as so-
called “white elephants”.
6.2 Conclusion
Environmental sustainability seem to be secured, both regarding maintaining a green zone by the lake shore in the
fish landing sites and regarding stopping the over-exploitation of the fish resources due to the guarding by the
Ugandan army. The institutional sustainability has seemingly improved, with reduced staff turnover in the District
and the sub-county governments. The difficult part is, as in most developing countries, the financial sustainability.
With low tax income and limited support from the national government, the district government cannot afford to
keep up proper O&M of the infrastructure and facilities built under KDDP, especially in the fish landing sites.
Kasekulo-Ttubi fish landing site is running fairly smoothly, but the others show clear sign of deterioration, especially
of the water supply systems, where pumps are not serviced and are run at their maximum capacity; there are no
chemicals for disinfection; and the systems are in some cases not operated 24/7 as intended. There is no follow-up of
the systems from the district water experts. Although most latrines appeared clean, some have damaged concrete
and wooden doors. The environment around the water taps, especially in schools, should be cleaned my simple
53
CHAPTER 6
Sustainability
GOPA CONSULTANTS
External Evaluation of Kalangala District Development Programme (KDDP) 2006-15, Uganda
means, and the broken brass taps exchanged to simpler make. All batteries supplied with the solar energy systems
(in health centres, sub-county offices and schools alike) were worn out and some replaced, but the initial solar panels
were still operating.
54
CHAPTER 7
Conclusions and Recommendations
GOPA CONSULTANTS
External Evaluation of Kalangala District Development Programme (KDDP) 2006-15, Uganda
CHAPTER
7 Conclusions and Recommendations
7.1 Overall Conclusions
The KDDP was relevant when it was planned and designed, and still remained so at the time of the Evaluation. The
Programme was designed with components fully in accordance with the national policies and strategies, namely
Uganda Poverty Eradication Action Plan (PEAP), the Millennium Development Goals (MDGs), the National Develop-
ment Plan (NDP) and the national decentralisation policy. The Consultant also concludes that KDDP has been fully in
line with Iceland’s development cooperation visions, policy and strategy from the beginning in 2005 and still is at the
time of the Evaluation, with the continuation of the Education Component under KIEP still being relevant. KDDP was
also in accordance with Iceland’s international commitments (e.g. the Paris Agreement, the Accra Accord and Busan
Partnership Agreement).
The programme logframe formulations are largely relevant, but with some shortcomings. The reference in the
objective of the Local Government Administration Component to the “private agencies” is not understood, as no
activities were directed towards the private sector. The logframe is in general very much output-focused, and the
outcome indicators are formulated in general terms with no target values listed. Thus, these are almost useless for
measuring success and effects. The purpose of the Tourism Component (2011-2013) proved to be unrealistically
formulated.
The effectiveness of the Programme has largely been satisfactory, with some shortcomings. The programme man-
agement set-up seems to have been effective, considering the prevailing circumstances. ICEIDA however took on a
rather pro-active role during Phase I, having an ICEIDA KDDP Programme Office in Kalangala until 2010, virtually
controlling the programme implementation. From 2011, it was left with the district administration to be fully in
charge, leaving ICEIDA more to a donor role with TA support only. In Phase I proper progress reports where produced
by the ICEIDA KDDP Programme Office, and the District continued to produce such reports in Phase II. The M&E Plan
prepared was never followed by the district administration.
The outputs, especially during Phase II, have been delivered to a satisfactory degree. It is noted that all capacity
building (training, procurement of equipment and building of infrastructure) was achieved as planned, and much of
the equipment is still in use at the time of the Evaluation (except e.g. desktop PCs). The outcomes are not properly
formulated and the indicators have no target values. The revenue from the fisheries have increased and the post-
harvest loss has been reduced. The WATSAN infrastructure built has made life easier for the population, but the lack
of O&M is evident. The Education Component continued after 2015 in a consolidation phase, KIEP, and the outcomes
here are promising (increased pupil enrolment and PLE results in the District being above national average). Few
outcomes from the Health Component can be seen today (activities stopped in 2010). The Tourism Component was
based on unrealistic assumptions from the very start. No funding have been available to implement any tourism
strategy, as this will depend entirely on private sector involvement.
Programme efficiency has been satisfactory. The use of funds for capacity building in the district administration has
reduced the staff turnover and filled staffing gaps. ICEIDA has been flexible as to gradual increase in the programme
55
CHAPTER 7
Conclusions and Recommendations
GOPA CONSULTANTS
External Evaluation of Kalangala District Development Programme (KDDP) 2006-15, Uganda
budget as needs arose during implementation, a modality being rare amongst donors. Management/administration
costs in the Programme seem to be on the high side.
The HH survey covered 34 villages (355 randomly sampled HHs), of which 22 were KDDP interventions had been
implemented. There are relatively more students/pupils amongst the population now than in 2010, most likely
reflecting a positive effect form the improved learning environment under KDDP and KIEP. Although the number of
fishermen has reduced, the relative community income from fisheries have increased.
60% of the HHs believe quality of education is good/fair, thanks to several of the measures under KDDP and KIEP,
with girls attending schools during their monthly period. An increased number of Caesarean operations are under-
taken in Kalangala HC, a positive impact from the funding of doctor education under KDPP.
In general, the Consultant concludes that the Programme has had a positive impact on the livelihood of people in
general, with 64% of the HHs reported improved welfare since 2011. Only 3% reported decreased standard of hous-
ing structures, and as much as 96% of the HHs has at least one mobile phone. A rather low percentage have
recognised ICEIDA as funder of the improve education environment, as this is not displayed anywhere. 80% of the
HHs considered water supply to be good/average. People have not properly realised that they have to pay for water
because of O&M needs. Negative impact has been experienced following the disbandment of the BMUs in 2015 (by
the President), which might have contributed to the deteriorating situation on the fish landing sites infrastructure.
Institutional sustainability in the District and sub-counties has improved with the capacity building and construction
of office facilities, and staff turnover in the local governments have seemingly been reduced due to this. Financial
sustainability is weak, as the District has insufficient revenue income, and grants from the National Government, to
properly operate and maintain the equipment and facilities developed under KDDP. Especially, the infrastructure on
the islands suffers from this lack of O&M, as the district staff have no funds for undertaking inspection visits to the
hard-to-reach communities. The communities themselves lack training and/or funds to properly maintain the infra-
structure. Especially the water supply systems in Namisoke and Kachungwa are in a bad state of condition, due to
lack of O&M, with no service on the pumps since 2015. Chlorine for disinfection is not used any more. A positive
exception is Kasekulo fish landing site, which is operating well. Most brass water taps, also in the schools, were
broken and need replacement. The environment around the school water posts needs to be improved with proper
drainage and cleaning. Batteries for the solar energy systems need replacement after some years, requiring funds,
but some users (read: health centres) in fact have been able to buy new ones with own funds.
56
CHAPTER 7
Conclusions and Recommendations
GOPA CONSULTANTS
External Evaluation of Kalangala District Development Programme (KDDP) 2006-15, Uganda
7.2 Lessons Learned
Some few general lessons learned could be listed from the experience gained with KDDP:
1. Almost needless to repeat: Flexibility from the donor side as to increasing the financial support when needs
(always) arise during implementation will most likely give the best results in the long run, and is of course ap-
preciated by the beneficiary stakeholders. This should however not relieve the recipients from undertaking
proper planning and budgeting of the interventions. Such funding modality is of course only possible when the
donor has adequate funds to fill gaps that might materialise underway.
2. Interventions having a long-term perspective and being supported over a longer period by donors have a larger
chance of bringing impact and being sustainable, and thus simply making a difference. The Education Compo-
nent under KDDP is a good example of such support, where ICEIDA with KDDP and KIEP will support primary
education in Kalangala District for 13 years, a positive and rare case amongst donors in general.
3. Changing of old socio-cultural habits and procedures takes time and awareness raising related to such aspects
must always be an integral part of capacity building, also in connection with improved infrastructure and pro-
curement of equipment. The non-use of new fish drying racks in certain locations is a typical example.
4. It is imperative to develop systems using appropriate technology, especially in remote places, as this makes it
easier for communities to operate and cheaper to maintain. Sophisticated infrastructure, e.g. solar-powered
water pumping with submersible pumps and chlorination needs skilled staff to be properly operated, a contin-
ued supply of chlorine (if such is needed), and money to buy such; so in some cases maybe simpler solutions
should be considered, although not being so “modern”.
5. Design and construction of infrastructure (buildings, WATSAN systems, etc.) need close supervision and moni-
toring in order to secure proper quality. Technical specifications must be quality assured, in order to, to the
extent possible, avoiding purchase of inferior material (counterfeit solar batteries, fish drying racks that rust,
etc.).
6. It is important that proper training in O&M of infrastructure and equipment is an integral part of the develop-
ment efforts. This should go beyond the compulsory on-the job training by suppliers. Especially so when the
communities should remain with responsibility of the O&M post-project, as community ownership to the struc-
tures is imperative. Community participation in the implementation process might be better than leaving all
implementation to contractors, with e.g. contribution to provision of local building materials and free labour, as
this gives better ownership than just receiving a “gift”. Training too few operators of for example WATSAN
structures, makes the O&M very vulnerable, especially when such trained people disappear/move.
7. The brass taps commonly used in water supply stand posts are vulnerable to frequent use with the handle
prone to break. The one-handle on-off tap have proven more sturdy.
8. The flushing toilets with “urban-type” high level cistern is not so suitable in rural areas. More simple solutions
with water buckets for manual flushing is preferred.
9. In case of inferior programme logframe, it is difficult to measure the outcomes/effects and long-term impact of
the interventions. Formulation of realistic SMART indicators is imperative in this respect, and establishing a
proper logframe is normally done by experience staff, used to the modality and terminologies.
57
CHAPTER 7
Conclusions and Recommendations
GOPA CONSULTANTS
External Evaluation of Kalangala District Development Programme (KDDP) 2006-15, Uganda
7.3 Recommendations
7.3.1 Recommendations to ICEIDA
1. The donor should in general carefully assess the probable future capacity and capability of the recipient benefi-
ciaries (being local communities and local governments alike) to operate and maintain hardware facilities (e.g.
buildings, water supply systems, solar power systems, etc.). The experience from Kalangala shows that during
programme planning, there were obviously unrealistic expectations (or over-selling?) in the District as to the fu-
ture ability to undertake proper O&M of the assets. The more hardware assets given, the more funds are
needed for O&M.
2. The donor should encourage appropriate technology solutions to be introduced, especially in remote communi-
ties where capacity and capability for proper O&M is lacking. This includes remote fishing communities where,
based on experience, trained operators easily move away and inhabitants in general come and go. In such plac-
es there might be less joint community ownership and responsibility to maintain the assets. Solar pumping
systems should only be installed for special purposes in smaller locations (e.g. health centres, where for exam-
ple cooling of medicine is imperative), where permanent dedicated employees take responsibility for operation.
In larger communities in remote places the donor should consider simpler solutions, for example handpumps
for water supply, even if the local recipients request more “modern” technology73. Systems that require steady
supply of chemicals (e.g. for chlorination of water), should be avoided.
3. Proper logframes for new projects and programmes must be formulated as part of the design, as this will ease
the M&E later on. This should not be done as “left hand work” by someone who only knows the theory, but ra-
ther formulations should be led by experts that have long-term experience from such work. The formulation of
realistic useful SMART indicators that can be used for monitoring and reporting purposes, requires state-of-the-
art knowledge!
4. The donor should seriously consider introducing more community contribution in infrastructure development
efforts, for example in form of free self-help work (carrying building material, trench digging, etc.). Experience
from all around the world show that such contributions will increase the local ownership of the structures and
give a higher probability of sustainable O&M afterwards.
73 ICEMB’s comments to the Draft Evaluation Report: “The Uganda Vision 2040 aims to increase percentage of the population with access to safe piped water from 15% (2010) to 100% (2040). To that effect, Government issued a circular to all districts (Letter Ref. No. ADM/107/01, dated 14th March 2016- by Permanent Secretary of Ministry of Water and Environment to all Chief Administrative Officers) which guided that with effect from the financial year 2016/2017the priority for Water Development would be as follows : First, extension of National Water and Sewerage Water System; Second, Construction of solar mini piped water systems. Construction of point water sources should be developed in areas where it is not possible to develop the 1st and 2nd option”. The Consultant appreciates this policy, and considers the remote fish landing site villages falling in the last category.
58
CHAPTER 7
Conclusions and Recommendations
GOPA CONSULTANTS
External Evaluation of Kalangala District Development Programme (KDDP) 2006-15, Uganda
7.3.2 Recommendations to Kalangala District
1. The district must set aside funds for major service of the water supply structures in the fish landing sites. This
especially concerns the Grundfos submersible pumps, that have not been serviced since 2015. Service must be
undertaken by qualified personnel from the supplier, and the floating markers in the Lake must be re-installed.
2. A simple M&E system should be instigated locally in development interventions, and not a sophisticated one
based on theoretical textbook set-up. It is much better to monitor a few parameters which are really needed
and possible to follow up, than trying to include as many aspects as possible, where none are properly fulfilled.
3. Such M&E system must include procedures for regular inspection visits from the district HQs staff to the fish
landing sites and adjacent communities, to ensure proper O&M of the infrastructure. This especially goes for
the water supply and sanitation systems that was built under KDDP, but also for buildings. Such inspections
should include refresher courses for operational staff in O&M, and feedback to suppliers when more sophisti-
cated repairs are required.
4. Most brass taps must be removed, and the one-handle on-off type with metal handle should be installed
instead.
5. The District and local government administrations must continue raising awareness in the communities on the
importance of people paying for the water, in order to upkeep proper O&M. Sensitisation must also continue
on aspects related to personal hygiene, for example the importance of washing hands after toilet visits.
6. The District and local government administrations must raise awareness in all the schools on the importance of
having a clean environment around the water supply points. This can be done by simple means and it should be
the Health Clubs in the schools that take responsible for such measures, once trained.
7. The information and filing system in the District must be improved. It seems that some statistics and reports are
very difficult to retrieve sometime after programme completion. (One example in Kalangala are the reports
connected to the small grants for the CSOs under KDDP, which simply could not be found anywhere).
External Evaluation of District Development Cooperation Programmes in Kalangala District in Uganda/GOPA/June 2018 1
Annex 1: Terms of Reference, evaluation time schedule and fieldwork itinerary
Terms of Reference External Evaluation of District Development Cooperation Programmes in
Mangochi District in Malawi and Kalangala District in Uganda
1. Introduction
Malawi and Uganda have been bilateral partner countries in Icelandic development cooperation since, 1989 and 2001 respectively. In 2006 Iceland started district development cooperation with Kalangala district in Uganda based on previous development project cooperation. This was the start of a district approach, focusing on support through district governments to improve livelihoods and provide basic services, which was later adopted more widely by the Icelandic International Development Agency (ICEIDA, which has now merged with MFA Iceland). In 2012 a formal district cooperation programme was started in Mangochi District in Malawi, building on previous development cooperation projects, which had been implemented in the district.
In both cases, the chosen approach has placed MFA-ICEIDA as a key external partner to the district authorities and as the single largest financier of investments in social infrastructure, such as water and sanitation (both countries), education (both countries), maternal and child health (Mangochi). In Kalangala, MFA-ICEIDA has been a key financier of economic infrastructure for fisheries. In both countries/districts financing for capacity building and administrative strengthening has been provided. The two districts are very different in many aspects. Mangochi district has a population of more than one million people, while Kalangala has a population of less than one hundred thousand. While in Mangochi fisheries is a sizeable activity, and the reason Iceland started support there, agriculture is the dominant economic activity, whereas in Kalangala it is fisheries. The population in Kalangala is highly transient, while in Mangochi it is stationary and engaged in cultivation. Nevertheless, both districts face similar challenges in social infrastructure: insufficient access to clean water, insufficient provision of quality education, insufficient public health access.
The main purpose of the evaluation is to provide an external, independent and objective assessment of the two cooperation programmes, to strengthen mutual accountability for development results and provide lessons learned for stakeholders for future planning and decision-making.
Thus, the team of evaluators, henceforth referred to as the Consultant, have a twofold task within this assignment. The first and main task is to conduct an evaluation of the two distinct development programmes in Mangochi and Kalangala Districts with a focus on results achieved, potential impact and sustainability. The second task is to assess the effectiveness of the district level approach with reference to the two programmes, including benefits, challenges and risks, and provide recommendations as may be applicable with reference to district cooperation and strategic partnerships in the respective countries. MFA Iceland is now seeking a team of consultants (the Consultant) with at least 10 years of experience in evaluations in international development, including vast experience in evaluating projects in Southern and East Africa, knowledge and experience of working in Malawi and/or Uganda is required.
External Evaluation of District Development Cooperation Programmes in Kalangala District in Uganda/GOPA/June 2018 2
2. The programmes to be evaluated
Two district level development programmes under Icelandic bi-lateral cooperation are the subjects of this evaluation.
1. Malawi – Mangochi Basic Services Programme 2012-2016 (extended to 2017) New phase has recently started.
2. Uganda – Support to Kalangala District Development Programme 2006-2015 (extended to 2017)
2.1. Malawi - Mangochi Basic Services Programme: Programme Support by ICEIDA to theMangochi District Council for the Improvement of Basic Services in Mangochi District 2012-2016.
Project Number: MAL16050-1201
Implementation period: 2012-2017
Partners: Mangochi District Council and Ministry of Local Government and Rural Development
Implementing Agent: Mangochi District Council
Sector DAC: Multisector aid for basic social services – 16050
Estimated funding: 15 million USD
A Country Strategy Plan (CSP) 2012-2016 (extended to 2018) for cooperation between Iceland and Malawi was approved by the Ministry for Foreign Affairs in Iceland and Government of Malawi. The CSP is aligned with the Malawi Growth and Development Strategy 2011-2016 (MGDS II) of the Government of Malawi. Prior to MBSP, ICEIDA had been collaborating on various development projects in the Monkey Bay area of Mangochi district.
The Mangochi Basic Services Programme was subject to a tripartite partnership agreement on funding, management, implementation and monitoring, between the Ministry of Local Government and Rural Development (MoLGRD) and Mangochi District Council on behalf of the Government of Malawi (GoM) and ICEIDA on behalf of the Government of Iceland.
Under MBSP, ICEIDA provided programme based assistance to the District Council of Mangochi to achieve the goals of its development strategy in areas of social services, which included, water and sanitation, education and public health. The Programme has included capacity building at district level which was incorporated into all relevant areas of support.
The overall objective of the MBSP 2012-2016 was to assist the Malawian Government and the Mangochi District Council to improve living standards in the rural communities in Mangochi District. This was expected to result in a more resilient population in adversity and a more resourceful one for self-sufficiency. The programme consisted of these four main components:
1. In water and sanitation the main objectives were to increase access of the population to potable water and improving hygiene practices with the use of adequate sanitation facilities to reduce waterborne diseases and to promote better health and well-being. The immediate objective of the water and sanitation programme was: Increased and sustainable access to and use of improved safe water sources and improved sanitation practices in TA Chimwala.
External Evaluation of District Development Cooperation Programmes in Kalangala District in Uganda/GOPA/June 2018 3
2. In public health the main goal was to reduce maternal and neonatal mortality through increased availability, access and utilization of improved maternal and neonatal health care services. The immediate objective of the Public Health Programme was: Increased availability, access and utilisation of high impact, quality maternal and child health services in Mangochi.
3. In education the programme objective was to provide more equitable access to education, to improve the quality of education facilities and to increase the pass rate in primary schools by means of improving school facilities and training of staff. The immediate objective of the Education Programme is: Improve quality of education in target schools to reduce drop-out and repetition and promote ef fective learning.
4. Capacity building to strengthen the ability of Mangochi District Council to deliver quality services and ensure successful implementation of the MBSP.
Throughout the MBSP, two cross cutting issues, gender and environment, were to be systematically
considered and indicators developed to measure progress towards gender equality.
For monitoring and reporting purposes the MBSP has followed the District monitoring and reporting
system. Furthermore a specific M&E plan was developed for the programme and extensive monitoring data are available for the programmes, which shall be incorporated in the evaluation.
In 2016, the current programme was extended for a period of one year, and in 2017 a new programme was designed and approved, which will be implemented from late 2017.
A mid-term review was conducted of MBSP in 2014.
Key documents:
• Malawi Country Strategy Paper 2012-2016 – ICEIDA
• Partnership Agreement 2012-2016
• Mangochi Basic Services Programme Master Programme Document 2012-2016
• Mangochi ICEIDA Partnership in Water and Sanitation 2012-2016 Part I
• Mangochi ICEIDA Partnership in Public Health 2012-2016 Part-II
• Mangochi ICEIDA Partnership in Education 2012-2016 Part-III
• Mangochi Basic Services Programme – Mid-term Evaluation – Final Report 2014Ä
External Evaluation of District Development Cooperation Programmes in Kalangala District in Uganda/GOPA/June 2018 4
2.2. Uganda - Support to the Implementation of Kalangala District Development Programme (KDDP) 2006-2015
Project Number: UGA43040-0602
Implementation period: 2006-2015
Partners: Ministry of Local Government and Kalangala District Local Government
Implementing Agency: Local government Kalangala with ICEIDA support
Sector – DAC: Multisector aid for basic social services – 16050
MFA-ICEIDA funding: 9.1 million USD
The project was initiated on the request of Kalangala District Local Government, through the Ministry of Local Government, to address deficiencies in service delivery in the district. The project preparations started in 2005 and the project plan of operation was signed in September 2006. Prior to KDDP, ICEIDA had been collaborating with the Ministry of Gender, Labour and Social Development and Kalangala district in the implementation of functional adult literacy programme (FALP) to improve literacy of the fishing communities in the district.
The project implementation commenced in December 2006, in 2010 a new logframe was approved for the second phase of implementation, which was finalized in 2015. Based on internal review in 2015 a four year consolidation phase for education was designed and approved, which is currently under implementation.
The development objective of the KDDP was conceived in line with Uganda’s Poverty Eradication Action Plan (PEAP), to contribute to sustainable livelihoods and equitable socio-economic development in Uganda, particularly in Kalangala District. The overall strategy was to support Kalangala district local government to implement its development plan in the sectors of fisheries (integrating water and sanitation), education and health sectors, an integral part of the approach was to develop capacity for local governance to improve service delivery to the population of the district. In line with this strategy, the immediate objectives of the KDDP were fourfold:
1. Under local administration sector; to support the efforts of the Kalangala district local government to achieve efficient and effective leadership in the district together with quality administration and management of public services along with strong private sector and civil society organisations by 2015.
2. Under Fisheries, and Water and Sanitation; to support the efforts of Kalangala district local government to achieve sustainable quality fisheries production and marketing in the whole district 2015.
3. Under Education and Sports sector; to support the efforts of Kalangala district local government to achieve equitable access for the citizens to quality primary and secondary education 2015.
4. Under Health sector; to support the efforts of Kalangala district local government to achieve equitable access for the citizens to quality health services at district level by 2015.
In the revised logframe from 2010, an additional immediate object is defined, following recommendations presented in the mid term review in 2010:
1. Improved exploitation of Kalangala District tourism potential by 2015
External Evaluation of District Development Cooperation Programmes in Kalangala District in Uganda/GOPA/June 2018 5
Gender equality and environmental matters were to be addressed in the project as cross cutting issues. It may be noted that the mid-term review in 2010, made recommendation for improvement of monitoring progress in gender equality indicators.
Mid term review of KDDP was conducted in 2010.
Key documents:
• Project document 2006-2015
• Mid-term review 2010
• Revised logframe 2010-2015
• Internal review document for programme partners 2015
• Project Completion report 2017
3. Purpose and objectives of the evaluation
In accordance with MFA policy on development evaluations and Iceland’s Strategy for Development Cooperation, evaluations shall be carried out on development interventions.
This evaluation is both carried out for accountability and learning purposes. It is meant to provide evidence on the outcome, impact and sustainability of the two respective programmes, and to provide MFA-ICEIDA, the respective district councils in Mangochi and Kalangala and other stakeholders with evidence of results and recommendation on how to strengthen their work further with a focus on results based management.
The evaluation is expected to shed light on the degree to which outcomes have been or are likely to be achieved in the two respective programmes, whether outputs have been produced as planned and whether inputs have been employed efficiently. Furthermore, the relevance of the programmes as well as its impact on local communities (intended and unintended) and the likelihood that results are sustainable shall be addressed.
The three main objectives of this evaluation assignment are:
1. To provide independent and objective assessment of the results (outputs, outcome and impact, as well as relevance and sustainability) achieved by the respective programmes in the two districts.
2. To provide assessment of the relevance and effectiveness of working directly with district authorities as implementing partners in Iceland’s development cooperation, including the main benefits, challenges and risks of such cooperation. This included an assessment of to what extent decentralization structures and linkages between local and central government support or hinder such arrangements?
3. To provide recommendation to strengthen further results-based management in the implementation of district development programmes.
As outlined above the evaluation shall follow the current OECD-DAC Quality Standards for Development Evaluations and address: relevance, effectiveness, efficiency, impact and the sustainability of the programmes.
External Evaluation of District Development Cooperation Programmes in Kalangala District in Uganda/GOPA/June 2018 6
4. Scope of the evaluation
The scope of the evaluation is to assess, whether and to what degree the immediate objectives of the programmes were achieved and have contributed to the long term objectives of sustainable livelihoods in Kalangala (economic and social living conditions) and improved living standards of rural population in Mangochi district. It shall also assess whether the programme components were well implemented in terms of producing the planned outputs through efficient use of inputs. Furthermore, the relevance of the programmes, its impact on local communities (intended and unintended) and the likelihood that results are sustainable shall be addressed. The evaluation shall address, but not be limited, to the following issues:
Relevance
• Were the programmes an appropriate response to the needs of the identified beneficiaries in the two districts?
• Did the programmes address an important issue in relation to priorities in Malawi and Uganda, development plans at the district level, and was it in line with Iceland’s development strategy?
• How can the results of this evaluation inform the current and planned reviews of Country Strategy Papers for Malawi and Uganda?
Effectiveness
Have the intended outcomes, as defined in Programme Documents been achieved or are they likely to be achieved– and to what degree? To what extent, has the KDDP through the Kalangala District local government, contributed to:
• Efficient and effective leadership in the district together with quality administration and management of public services along with strong private sector and civil society organisations.
• Improved quality fisheries production and marketing in the Kalangala district.
• Equitable access to quality education in Kalangala district.
• Equitable access for the citizens to quality health services at district level (2006-2010).
• Improved exploitation of Kalangala District tourism potential (2010-2013). To what extent has the MBSP, contribute to:
• Increased and sustainable access to and use of improved safe water sources and improved sanitation practices in TA Chimwala.
• Increased availability, access and utilisation of high impact, quality maternal and child health services in Mangochi.
• Improved quality of education in target schools to reduce drop-out and repetition and promote effective learning.
• Improved institutional capacity for delivery of basic services, including health, water and sanitation and education, at the Mangochi district government.
External Evaluation of District Development Cooperation Programmes in Kalangala District in Uganda/GOPA/June 2018 7
Efficiency
• To what degree have the programmed outputs been delivered in accordance with Programme Documents, at the appropriate quality and quantity and at planned cost?
• Assess the sharing of responsibility and accountability among the stakeholders, including MFAICEIDA, District governments and respective Ministries.
• To what degree has the use of inputs in implementation been efficient?
▪ Construction and procurement of goods and equipment
▪ Arrangement of training
▪ Monitoring and Evaluation (provide comments and recommendations on the implementation of M&E plans)
▪ The work of the “Programme Steering Committees” and project management
• Do the district councils have the absorption capacity to effectively manage and administer the funding and activities?
Impact
Have the two programmes and their implementation had an impact, beyond the defined outcomes and outputs, on benefitting communities. Have the programmes contributed to improved livelihoods – measurable and perceived - among beneficiaries, including indicators from the key sectors of health, education, fisheries and water and sanitation, as defined in the respective project documents and government strategies in Malawi and Uganda.
• To what extent has the KDDP contributed to sustainable livelihoods and equitable socioeconomic development in Kalangala District?
• To what extent has the MBSP contributed to improved living standards in the rural communities in Mangochi District and a more resilient population in adversity and a more resourceful one for self-sufficiency.
• Has the capacity of the district local governments improved in terms of delivering basic services to the population?
The consultancy is expected to extract from its evaluation an overall analysis drawn from diverse resources of available indicators and information whether the programmes have had impact (positive or negative) on beneficiary communities, or specific groups within those, notably different socio-economic classes.
Sustainability
• Is it likely that the outputs can be maintained and operated for the benefits of the population without programme support? This should in particular address matters concerning operations and maintenance of infrastructure. If not, what further support will be needed?
• Has the contribution from the programmes been within limits of the absorption capacity of the two districts?
• Are outcomes likely to be sustained without support from the Programmes? If not, what further support will be needed?
External Evaluation of District Development Cooperation Programmes in Kalangala District in Uganda/GOPA/June 2018 8
• To what extent has capacity building of the district governments been sustainable, for instance with regard to retention of qualified/trained district staff, and has it contributed to improved sustainability of project outputs and outcomes?
• What factors influence or challenge sustainability of the two programmes?
• In the case of Kalangala, what impact will the end of the project have for delivery of services in the supported sectors?
Crosscutting Issues
Gender
• Have both genders benefited from the programmes on equal terms?
• Have the programmes contributed to increased gender equality?
• To what extent did the two programmes create equal opportunities for men and women / boys and girls to participate?
Environment
• Have the programmes caused any significant environmental impact, positive or negative?
• To what extent have the programmes encouraged sustainable natural resource management?
• Were proper environmental considerations followed during implementation of activities where applicable?
With reference to the questions above and relevant M&E plans and available data for the programmes the Consultant will during the Inception phase, produce an evaluation framework in collaboration with the key stakeholders, including the district governments that identifies the relevant evaluation questions, formulated with reference to the objectives and indicators of each programme.
5. Methodology
The evaluation shall be based on study of relevant documents, available monitoring data and statistics for relevant indicators, surveys and interviews with relevant stakeholders and field visits. It is expected that mixed methods will be applied, qualitative and quantitative. It is expected that interviews will be carried out with key stakeholders and that fieldwork will be carried out for about two weeks in Kalangala and Mangochi Districts (total four weeks), including household surveys with the assistance of local consultants.
Wrap-up and validation meetings should be conducted with stakeholders at the end of field visits in each district.
It is expected that local experts will form a part of the evaluation team in each country to assist with surveys, interviews, translations etc. Such input shall be budgeted in the financial proposal, and qualified local consultants proposed.
During the preparation stages the Consultant will work on defining in detail the appropriate methodological approach, which is likely to yield evidence based assessment and develop a detailed evaluation matrix in cooperation with MFA and the respective stakeholders, which will be presented in the Inception report.
External Evaluation of District Development Cooperation Programmes in Kalangala District in Uganda/GOPA/June 2018 9
6. Deliverables
The deliverables for this consultancy consist of the following outputs:
• Inception report including an evaluation plan/matrix, key indicators and statistics to be used with reference to Project Document and M&E plans, workplan, interview guides, questionnaire etc. There may be one Inception report for the two programmes, but two evaluation matrixes shall be developed for the respective programmes.
• Draft report 1 including the two case study reports and analysis of the relevance and effectiveness of the district level cooperation mechanism and lessons learned.
• Draft report 2 incorporating feedback from Draft report 1.
• Organizing a feedback meeting with stakeholders in Malawi and Uganda to present the findings of the Draft 2 report and discuss comments and feedback.
• Final report including Executive summary and recommendations
• Evaluation brief not exceeding 4 pages
7. Timeframe
It is expected that the assignment will be carried out from the beginning of February 2018 and be finalized by June 2018. The Inception report shall be submitted within four weeks from the start of the assignment. The assignment is budgeted with an estimated input from the Consultant of up to 30 weeks (150 days), thereof 10 weeks allocated for local consultants.
8. Management and Logistics
The evaluation will be managed by the Evaluation Unit at MFA. The evaluation shall be led by a team leader. With respect to the overall management and execution of the evaluation the following assignment of responsibilities is expected:
The Evaluation Manager at MFA
The Evaluation Manager at MFA will be the primary MFA representative for this evaluation and be a focal point for communication with other MFA personnel when required. The Evaluation Manager is responsible for:
• Facilitating the Consultant’s access to pertinent MFA documents and personnel.
• Providing overall management responsibility for the evaluation.
• Approving all deliverables.
The Icelandic Embassies in Malawi and Uganda
• Will contribute appropriately to all steps in the evaluation process without affecting the independency of the evaluation proper.
• Assist the consultant in establishing contact with all stakeholders as applicable.
• Arrange and provide transportation for the Consultant for field visits.
• Provide the Consultant with access to relevant documents.
External Evaluation of District Development Cooperation Programmes in Kalangala District in Uganda/GOPA/June 2018 10
• Provide feedback and comments on the reports.
• Arrange stakeholder meeting for feedback on draft evaluation report.
The Consultant
The Consultant is responsible for:
• Conducting the evaluation in accordance with the ToR and the approved Inception report and evaluation plan.
• Managing day-to-day operations related to the evaluation.
• Making relevant travel arrangements related to the assignment and Consultant’s work.
• Arranging all applicable visa’s and health procedures as may be required.
• Providing regular progress updates to MFA’s Evaluation Manager.
• Producing deliverables in accordance with the contractual requirements.
9. Consultant’s Qualifications
The evaluation team (The Consultant) shall be comprised of two key experts and one or two local nonkey experts in each country. The evaluation team shall combine core evaluation competencies with strong experience in international development evaluations in particular in Southern and East Africa.
The evaluation team leader shall be proposed who will manage and coordinate the work, and provide the overall editorial guidance and synthesis of the evaluation report.
Specific qualifications and experience of the two key experts:
1. An advanced university degree in relevant discipline.
2. A minimum of 10 years experience in evaluations for international development, demonstrated by at least two evaluation reports for development project of considerable scope.
3. Experience from working in Malawi and/or Uganda.
4. Experience in evaluations covering at least three of the following sectors; decentralization, education, health, water and sanitation and institutional capacity building.
5. Demonstrated professionalism in all aspects of work, possess excellent communication and interpersonal skills as well as good planning and organizational skills.
6. Excellent command of oral and written English.
The two key experts shall complement each others qualifications.
Specific qualifications and experience of the local non-key experts (one or two may be proposed for each country)
1. An advanced university degree in relevant discipline.
2. A minimum of 5 years evaluation experience.
3. Experience in evaluations covering at least two of the following sectors; decentralization, education, health, water and sanitation, fisheries (for Uganda) and institutional capacity building.
External Evaluation of District Development Cooperation Programmes in Kalangala District in Uganda/GOPA/June 2018 11
4. Knowledge and experience in relevant social science methods, including interviews and household surveys.
5. Demonstrated professionalism in all aspects of work, possess excellent communication and interpersonal skills as well as good planning and organizational skills.
6. Fluent in relevant local languages in Manghochi (Chichewa and Yao) and Kalangala (Luganda) districts and excellent command of oral and written English.
10. Application procedure
The Consultant shall prepare and submit the following:
1. A cover letter, outlining the qualifications of the consultant/team for the assignment, including references to previous relevant work.
2. Technical proposal (4-5 pages), responding to this ToR, outlining the envisioned evaluation process, proposed methods and workplan.
3. CV’s of the two key experts and the local experts proposed for each country, detailing relevant skills and experience.
4. Two examples of recent evaluation reports for international development.
5. Financial proposal, in a separate file, based on the premises outlined in this ToR, including expected travel costs. The budget shall include:
a. Remuneration for the two key experts for a period of 100 days in total
b. Remuneration for the local experts for a period of 50 days in total
c. Inception mission to Malawi and Uganda, 3 working days expected in each country.
d. Fieldwork in Uganda and Malawi for a period of 2 weeks in each country, for both key experts.
e. Reimbursable costs associated with the evaluation
6. Two contactable references from similar assignments, or reference letters.
Evaluation of proposals will be based on Quality and Cost Based Selection (QCBS), the evaluation of quality will be based on the following criteria:
1. Adequacy and quality of the proposed methodology, work plan and team composition in responding to the Terms of Reference (50%)
a. Approach and methods
b. Workplan and team composition, including the non-key experts
2. Key Experts’ qualifications and competence for the Assignment (50%)
For inquiries or clarifications on this assignment, please send an email to [email protected]. Responses to all inquiries will be posted on the website: http://www.iceida.is/english/tenders/
MFA is not bound to accept any proposal, and reserves the right to annul the selection process at any time prior to Contract award.
Proposals shall be submitted in electronic format to [email protected], before 16:00 Icelandic time, 15 December 2017. Proposals received after this time will not be considered.
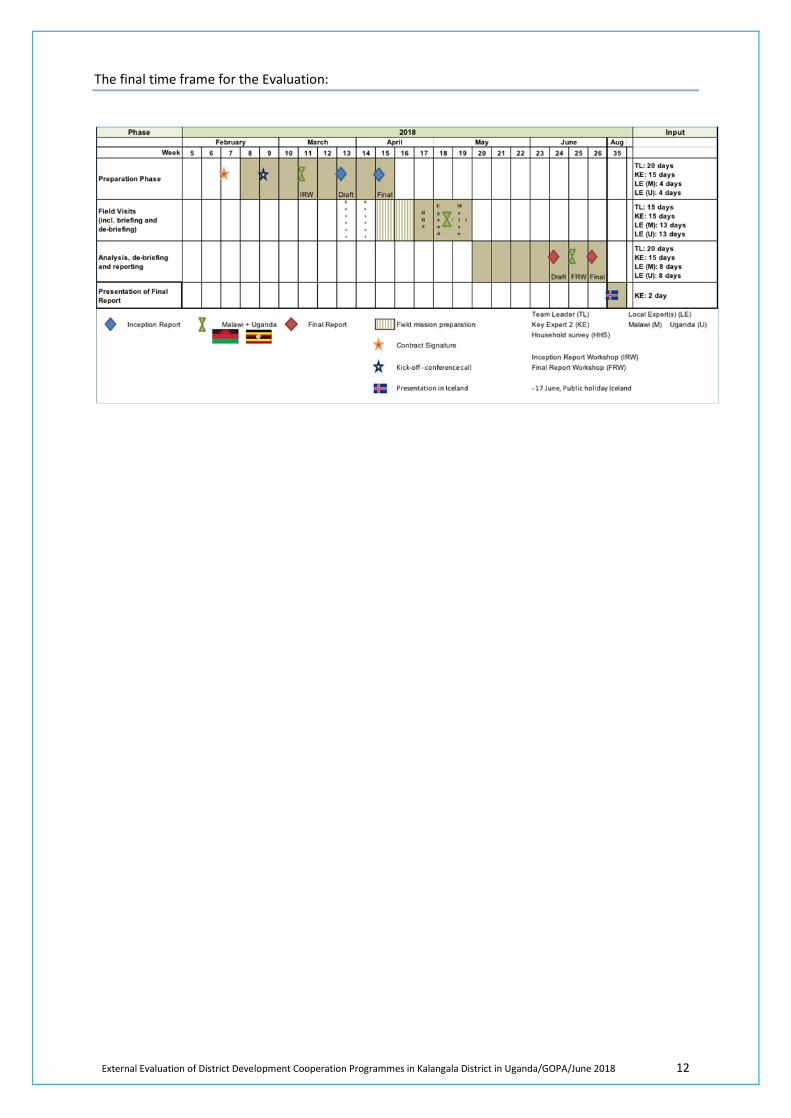
External Evaluation of District Development Cooperation Programmes in Kalangala District in Uganda/GOPA/June 2018 12
The final time frame for the Evaluation:
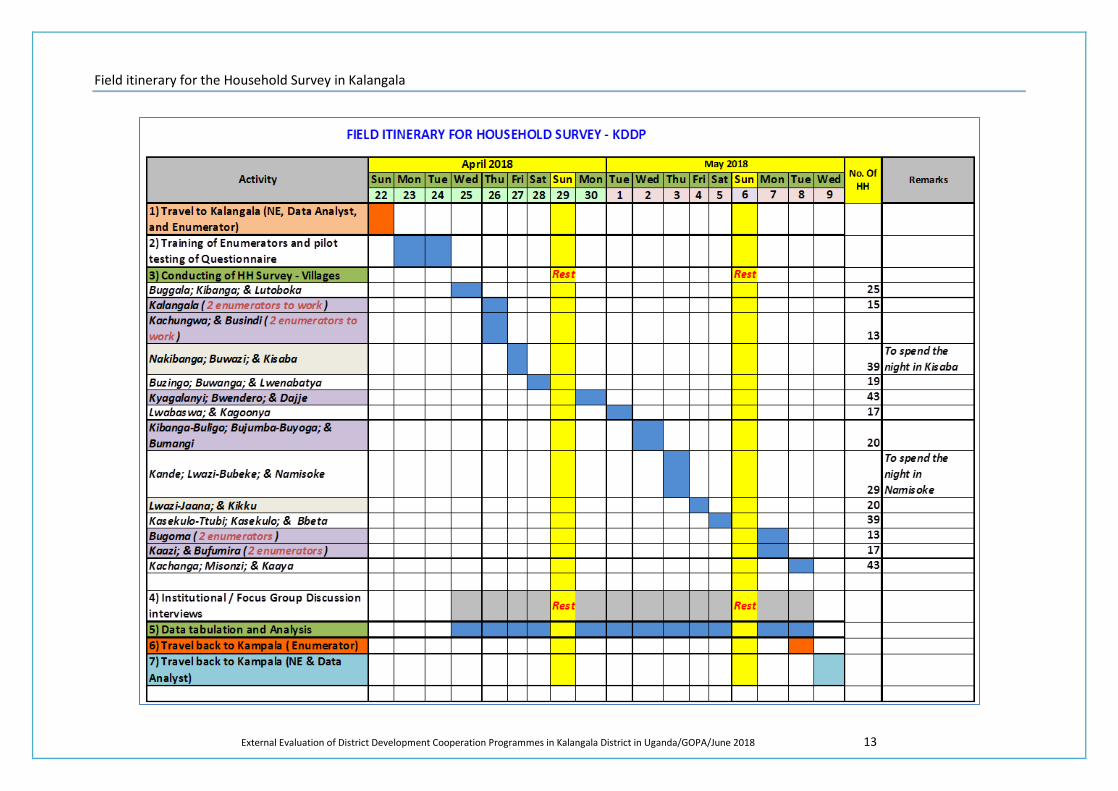
External Evaluation of District Development Cooperation Programmes in Kalangala District in Uganda/GOPA/June 2018 13
Field itinerary for the Household Survey in Kalangala
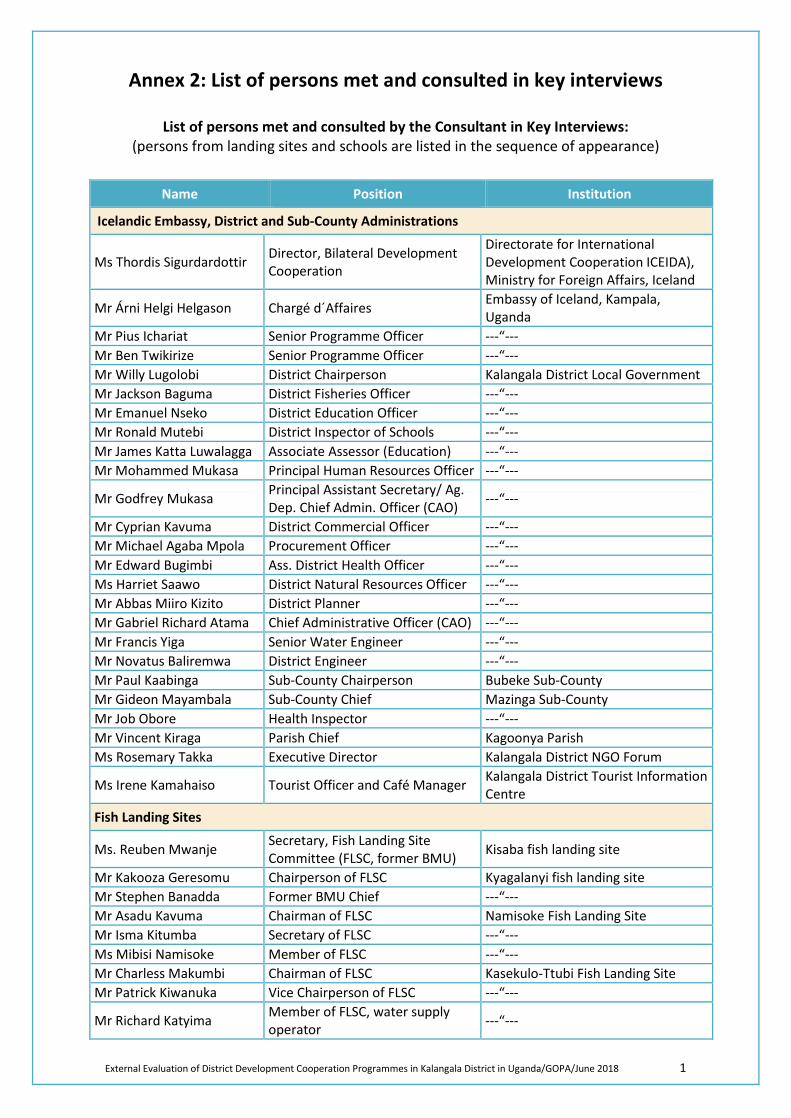
External Evaluation of District Development Cooperation Programmes in Kalangala District in Uganda/GOPA/June 2018 1
Annex 2: List of persons met and consulted in key interviews
List of persons met and consulted by the Consultant in Key Interviews: (persons from landing sites and schools are listed in the sequence of appearance)
Name Position Institution
Icelandic Embassy, District and Sub-County Administrations
Ms Thordis Sigurdardottir Director, Bilateral Development Cooperation
Directorate for International Development Cooperation ICEIDA), Ministry for Foreign Affairs, Iceland
Mr Árni Helgi Helgason Chargé d´Affaires Embassy of Iceland, Kampala, Uganda
Mr Pius Ichariat Senior Programme Officer ---“--- Mr Ben Twikirize Senior Programme Officer ---“--- Mr Willy Lugolobi District Chairperson Kalangala District Local Government Mr Jackson Baguma District Fisheries Officer ---“--- Mr Emanuel Nseko District Education Officer ---“--- Mr Ronald Mutebi District Inspector of Schools ---“--- Mr James Katta Luwalagga Associate Assessor (Education) ---“--- Mr Mohammed Mukasa Principal Human Resources Officer ---“---
Mr Godfrey Mukasa Principal Assistant Secretary/ Ag. Dep. Chief Admin. Officer (CAO) ---“---
Mr Cyprian Kavuma District Commercial Officer ---“--- Mr Michael Agaba Mpola Procurement Officer ---“--- Mr Edward Bugimbi Ass. District Health Officer ---“--- Ms Harriet Saawo District Natural Resources Officer ---“--- Mr Abbas Miiro Kizito District Planner ---“--- Mr Gabriel Richard Atama Chief Administrative Officer (CAO) ---“--- Mr Francis Yiga Senior Water Engineer ---“--- Mr Novatus Baliremwa District Engineer ---“--- Mr Paul Kaabinga Sub-County Chairperson Bubeke Sub-County Mr Gideon Mayambala Sub-County Chief Mazinga Sub-County Mr Job Obore Health Inspector ---“--- Mr Vincent Kiraga Parish Chief Kagoonya Parish Ms Rosemary Takka Executive Director Kalangala District NGO Forum
Ms Irene Kamahaiso Tourist Officer and Café Manager Kalangala District Tourist Information Centre
Fish Landing Sites
Ms. Reuben Mwanje Secretary, Fish Landing Site Committee (FLSC, former BMU) Kisaba fish landing site
Mr Kakooza Geresomu Chairperson of FLSC Kyagalanyi fish landing site Mr Stephen Banadda Former BMU Chief ---“--- Mr Asadu Kavuma Chairman of FLSC Namisoke Fish Landing Site Mr Isma Kitumba Secretary of FLSC ---“--- Ms Mibisi Namisoke Member of FLSC ---“--- Mr Charless Makumbi Chairman of FLSC Kasekulo-Ttubi Fish Landing Site Mr Patrick Kiwanuka Vice Chairperson of FLSC ---“---
Mr Richard Katyima Member of FLSC, water supply operator ---“---
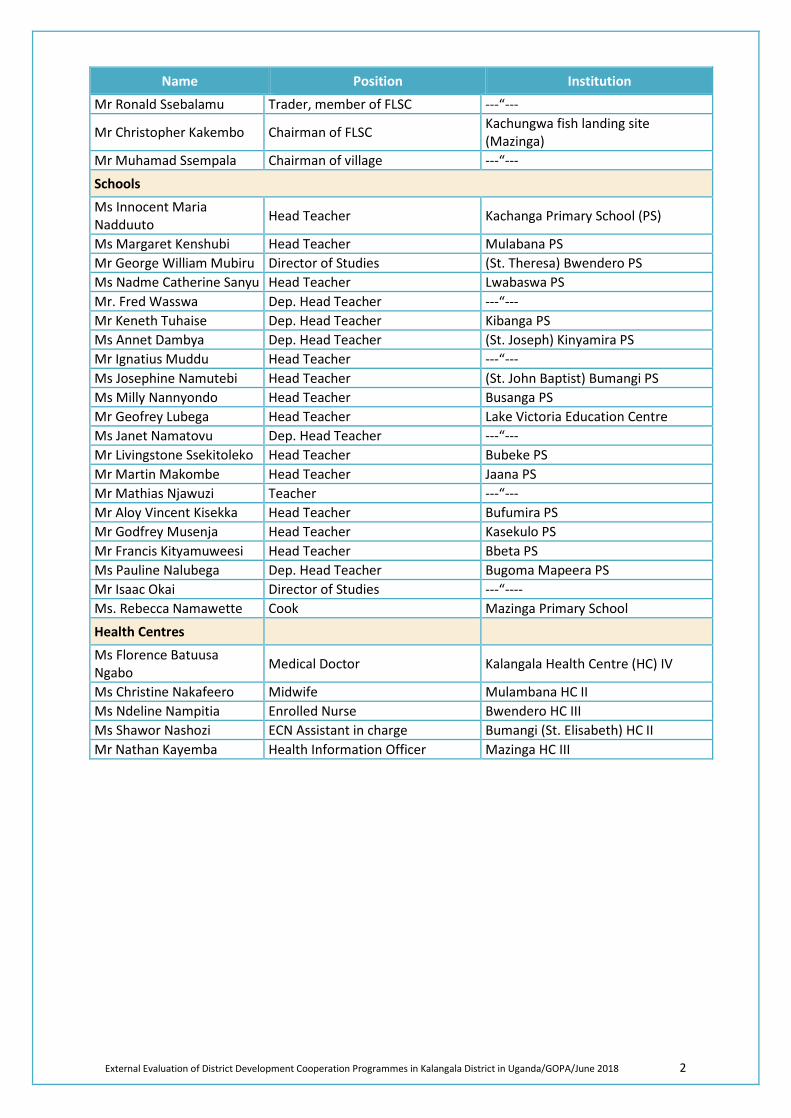
External Evaluation of District Development Cooperation Programmes in Kalangala District in Uganda/GOPA/June 2018 2
Name Position Institution Mr Ronald Ssebalamu Trader, member of FLSC ---“---
Mr Christopher Kakembo Chairman of FLSC Kachungwa fish landing site (Mazinga)
Mr Muhamad Ssempala Chairman of village ---“---
Schools Ms Innocent Maria Nadduuto Head Teacher Kachanga Primary School (PS)
Ms Margaret Kenshubi Head Teacher Mulabana PS Mr George William Mubiru Director of Studies (St. Theresa) Bwendero PS Ms Nadme Catherine Sanyu Head Teacher Lwabaswa PS Mr. Fred Wasswa Dep. Head Teacher ---“--- Mr Keneth Tuhaise Dep. Head Teacher Kibanga PS Ms Annet Dambya Dep. Head Teacher (St. Joseph) Kinyamira PS Mr Ignatius Muddu Head Teacher ---“--- Ms Josephine Namutebi Head Teacher (St. John Baptist) Bumangi PS Ms Milly Nannyondo Head Teacher Busanga PS Mr Geofrey Lubega Head Teacher Lake Victoria Education Centre Ms Janet Namatovu Dep. Head Teacher ---“--- Mr Livingstone Ssekitoleko Head Teacher Bubeke PS Mr Martin Makombe Head Teacher Jaana PS Mr Mathias Njawuzi Teacher ---“--- Mr Aloy Vincent Kisekka Head Teacher Bufumira PS Mr Godfrey Musenja Head Teacher Kasekulo PS Mr Francis Kityamuweesi Head Teacher Bbeta PS Ms Pauline Nalubega Dep. Head Teacher Bugoma Mapeera PS Mr Isaac Okai Director of Studies ---“---- Ms. Rebecca Namawette Cook Mazinga Primary School
Health Centres
Ms Florence Batuusa Ngabo Medical Doctor Kalangala Health Centre (HC) IV
Ms Christine Nakafeero Midwife Mulambana HC II Ms Ndeline Nampitia Enrolled Nurse Bwendero HC III Ms Shawor Nashozi ECN Assistant in charge Bumangi (St. Elisabeth) HC II Mr Nathan Kayemba Health Information Officer Mazinga HC III
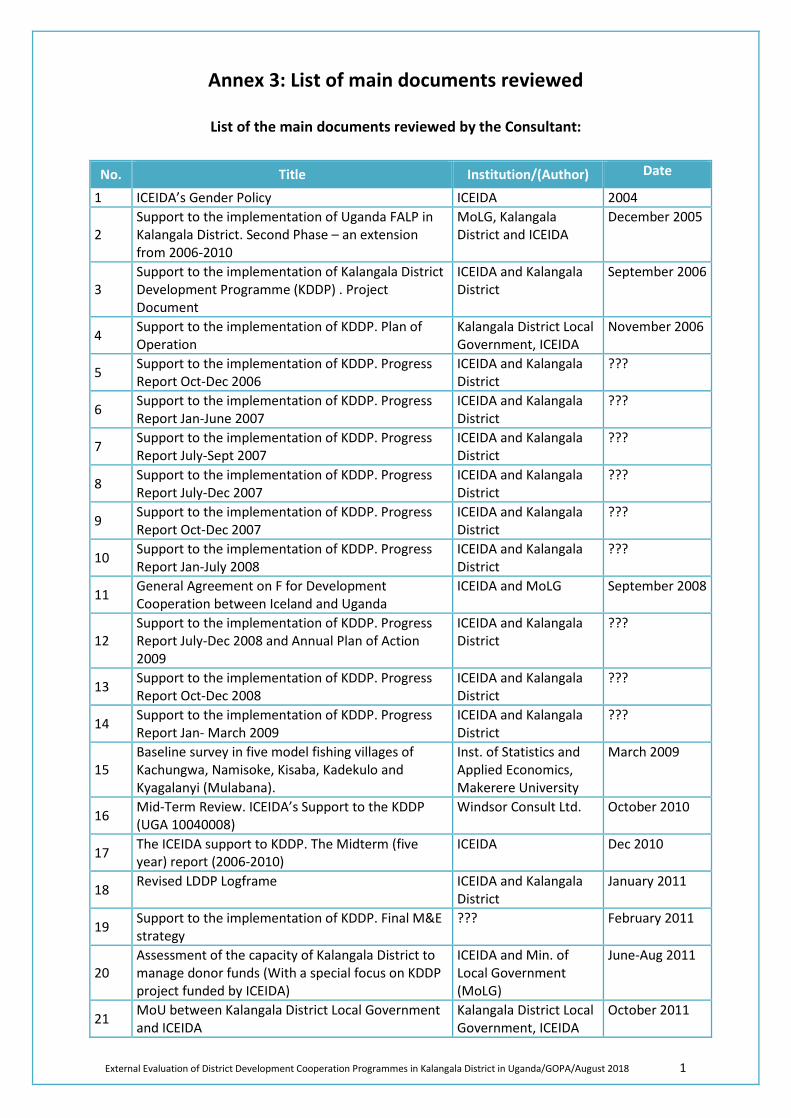
External Evaluation of District Development Cooperation Programmes in Kalangala District in Uganda/GOPA/August 2018 1
Annex 3: List of main documents reviewed
List of the main documents reviewed by the Consultant:
No. Title Institution/(Author) Date
1 ICEIDA’s Gender Policy ICEIDA 2004
2 Support to the implementation of Uganda FALP in Kalangala District. Second Phase – an extension from 2006-2010
MoLG, Kalangala District and ICEIDA
December 2005
3 Support to the implementation of Kalangala District Development Programme (KDDP) . Project Document
ICEIDA and Kalangala District
September 2006
4 Support to the implementation of KDDP. Plan of Operation
Kalangala District Local Government, ICEIDA
November 2006
5 Support to the implementation of KDDP. Progress Report Oct-Dec 2006
ICEIDA and Kalangala District
???
6 Support to the implementation of KDDP. Progress Report Jan-June 2007
ICEIDA and Kalangala District
???
7 Support to the implementation of KDDP. Progress Report July-Sept 2007
ICEIDA and Kalangala District
???
8 Support to the implementation of KDDP. Progress Report July-Dec 2007
ICEIDA and Kalangala District
???
9 Support to the implementation of KDDP. Progress Report Oct-Dec 2007
ICEIDA and Kalangala District
???
10 Support to the implementation of KDDP. Progress Report Jan-July 2008
ICEIDA and Kalangala District
???
11 General Agreement on F for Development Cooperation between Iceland and Uganda
ICEIDA and MoLG September 2008
12 Support to the implementation of KDDP. Progress Report July-Dec 2008 and Annual Plan of Action 2009
ICEIDA and Kalangala District
???
13 Support to the implementation of KDDP. Progress Report Oct-Dec 2008
ICEIDA and Kalangala District
???
14 Support to the implementation of KDDP. Progress Report Jan- March 2009
ICEIDA and Kalangala District
???
15 Baseline survey in five model fishing villages of Kachungwa, Namisoke, Kisaba, Kadekulo and Kyagalanyi (Mulabana).
Inst. of Statistics and Applied Economics, Makerere University
March 2009
16 Mid-Term Review. ICEIDA’s Support to the KDDP (UGA 10040008)
Windsor Consult Ltd. October 2010
17 The ICEIDA support to KDDP. The Midterm (five year) report (2006-2010)
ICEIDA Dec 2010
18 Revised LDDP Logframe ICEIDA and Kalangala District
January 2011
19 Support to the implementation of KDDP. Final M&E strategy
??? February 2011
20 Assessment of the capacity of Kalangala District to manage donor funds (With a special focus on KDDP project funded by ICEIDA)
ICEIDA and Min. of Local Government (MoLG)
June-Aug 2011
21 MoU between Kalangala District Local Government and ICEIDA
Kalangala District Local Government, ICEIDA
October 2011
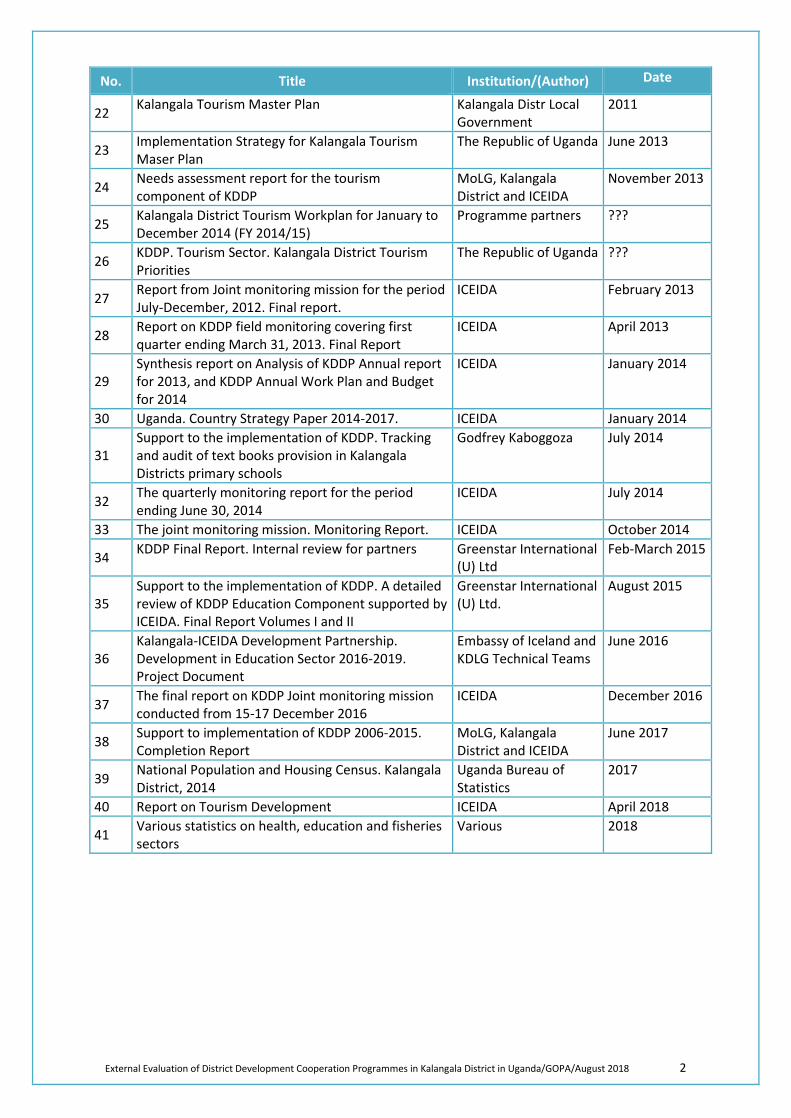
External Evaluation of District Development Cooperation Programmes in Kalangala District in Uganda/GOPA/August 2018 2
No. Title Institution/(Author) Date
22 Kalangala Tourism Master Plan Kalangala Distr Local Government
2011
23 Implementation Strategy for Kalangala Tourism Maser Plan
The Republic of Uganda June 2013
24 Needs assessment report for the tourism component of KDDP
MoLG, Kalangala District and ICEIDA
November 2013
25 Kalangala District Tourism Workplan for January to December 2014 (FY 2014/15)
Programme partners ???
26 KDDP. Tourism Sector. Kalangala District Tourism Priorities
The Republic of Uganda ???
27 Report from Joint monitoring mission for the period July-December, 2012. Final report.
ICEIDA February 2013
28 Report on KDDP field monitoring covering first quarter ending March 31, 2013. Final Report
ICEIDA April 2013
29 Synthesis report on Analysis of KDDP Annual report for 2013, and KDDP Annual Work Plan and Budget for 2014
ICEIDA January 2014
30 Uganda. Country Strategy Paper 2014-2017. ICEIDA January 2014
31 Support to the implementation of KDDP. Tracking and audit of text books provision in Kalangala Districts primary schools
Godfrey Kaboggoza July 2014
32 The quarterly monitoring report for the period ending June 30, 2014
ICEIDA July 2014
33 The joint monitoring mission. Monitoring Report. ICEIDA October 2014
34 KDDP Final Report. Internal review for partners Greenstar International (U) Ltd
Feb-March 2015
35 Support to the implementation of KDDP. A detailed review of KDDP Education Component supported by ICEIDA. Final Report Volumes I and II
Greenstar International (U) Ltd.
August 2015
36 Kalangala-ICEIDA Development Partnership. Development in Education Sector 2016-2019. Project Document
Embassy of Iceland and KDLG Technical Teams
June 2016
37 The final report on KDDP Joint monitoring mission conducted from 15-17 December 2016
ICEIDA December 2016
38 Support to implementation of KDDP 2006-2015. Completion Report
MoLG, Kalangala District and ICEIDA
June 2017
39 National Population and Housing Census. Kalangala District, 2014
Uganda Bureau of Statistics
2017
40 Report on Tourism Development ICEIDA April 2018
41 Various statistics on health, education and fisheries sectors
Various 2018
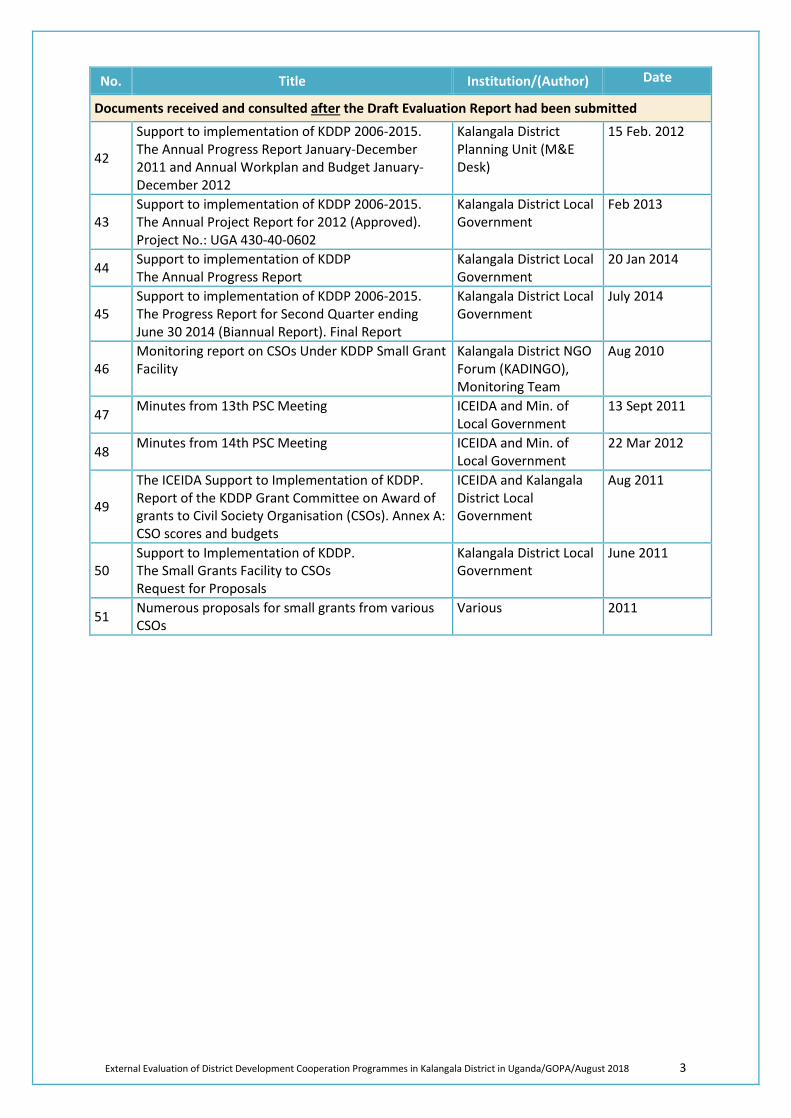
External Evaluation of District Development Cooperation Programmes in Kalangala District in Uganda/GOPA/August 2018 3
No. Title Institution/(Author) Date
Documents received and consulted after the Draft Evaluation Report had been submitted
42
Support to implementation of KDDP 2006-2015. The Annual Progress Report January-December 2011 and Annual Workplan and Budget January-December 2012
Kalangala District Planning Unit (M&E Desk)
15 Feb. 2012
43 Support to implementation of KDDP 2006-2015. The Annual Project Report for 2012 (Approved). Project No.: UGA 430-40-0602
Kalangala District Local Government
Feb 2013
44 Support to implementation of KDDP The Annual Progress Report
Kalangala District Local Government
20 Jan 2014
45 Support to implementation of KDDP 2006-2015. The Progress Report for Second Quarter ending June 30 2014 (Biannual Report). Final Report
Kalangala District Local Government
July 2014
46 Monitoring report on CSOs Under KDDP Small Grant Facility
Kalangala District NGO Forum (KADINGO), Monitoring Team
Aug 2010
47 Minutes from 13th PSC Meeting ICEIDA and Min. of Local Government
13 Sept 2011
48 Minutes from 14th PSC Meeting ICEIDA and Min. of Local Government
22 Mar 2012
49
The ICEIDA Support to Implementation of KDDP. Report of the KDDP Grant Committee on Award of grants to Civil Society Organisation (CSOs). Annex A: CSO scores and budgets
ICEIDA and Kalangala District Local Government
Aug 2011
50 Support to Implementation of KDDP. The Small Grants Facility to CSOs Request for Proposals
Kalangala District Local Government
June 2011
51 Numerous proposals for small grants from various CSOs
Various 2011
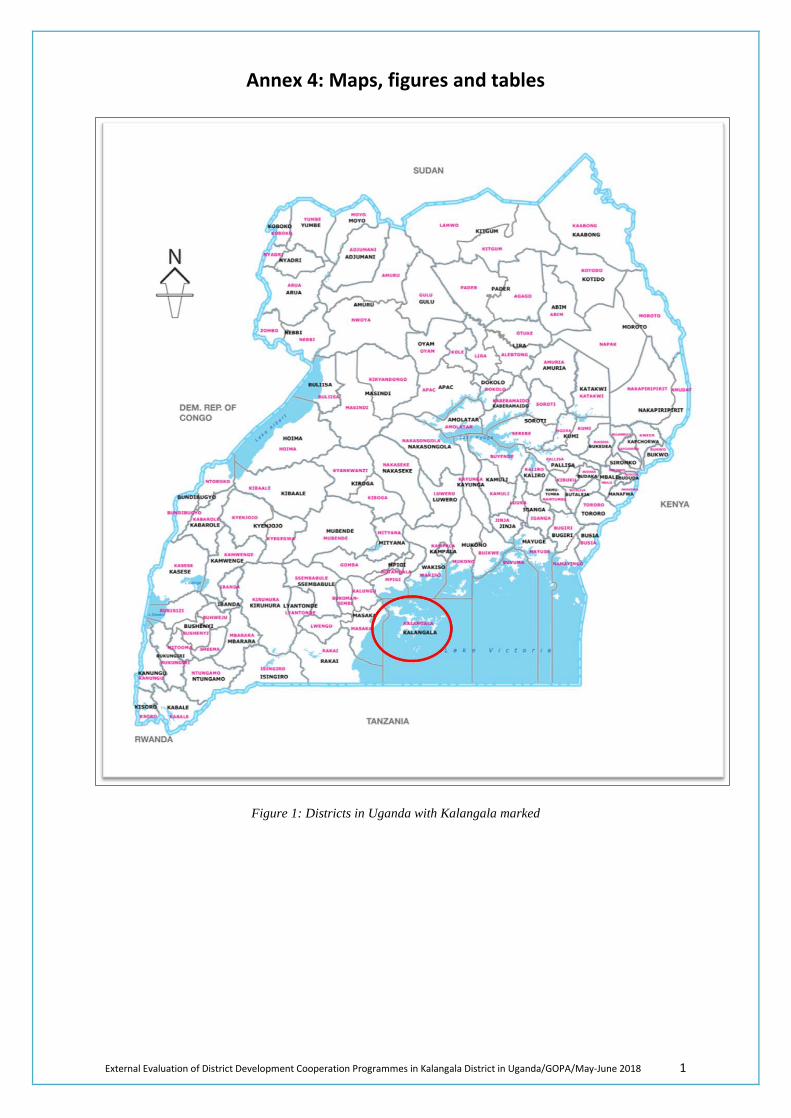
External Evaluation of District Development Cooperation Programmes in Kalangala District in Uganda/GOPA/May-June 2018 1
Annex 4: Maps, figures and tables
Figure 1: Districts in Uganda with Kalangala marked
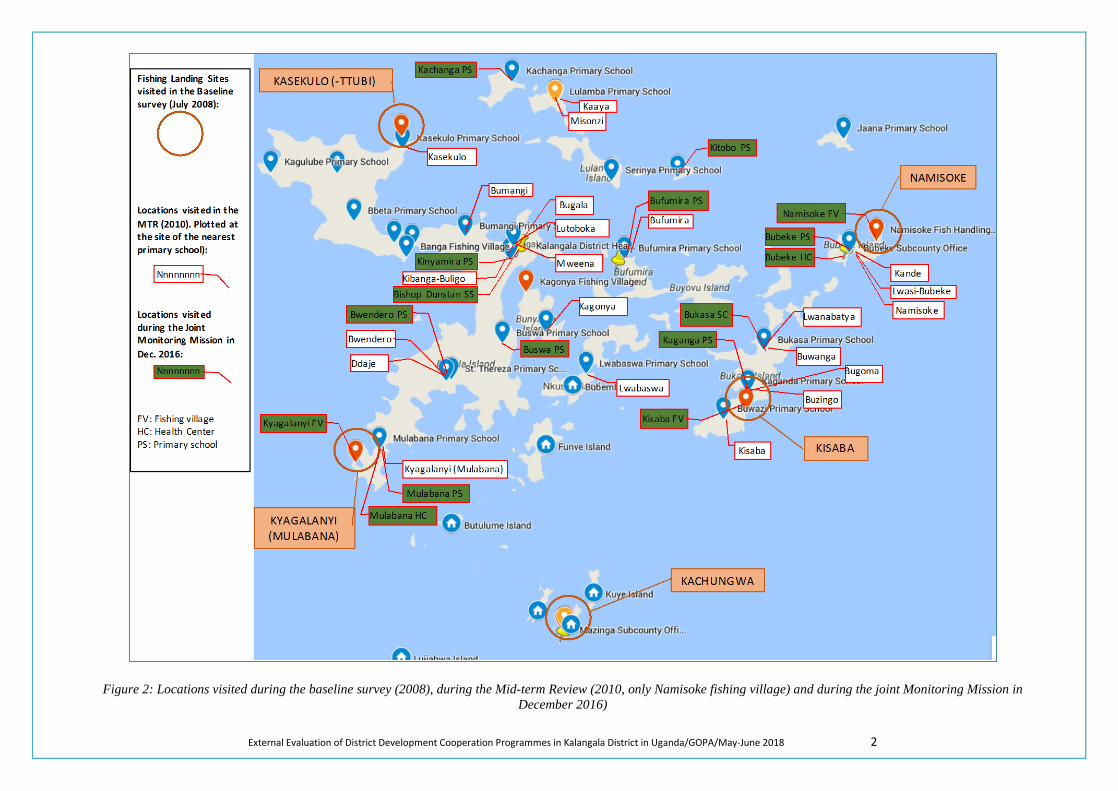
External Evaluation of District Development Cooperation Programmes in Kalangala District in Uganda/GOPA/May-June 2018 2
Figure 2: Locations visited during the baseline survey (2008), during the Mid-term Review (2010, only Namisoke fishing village) and during the joint Monitoring Mission in December 2016)
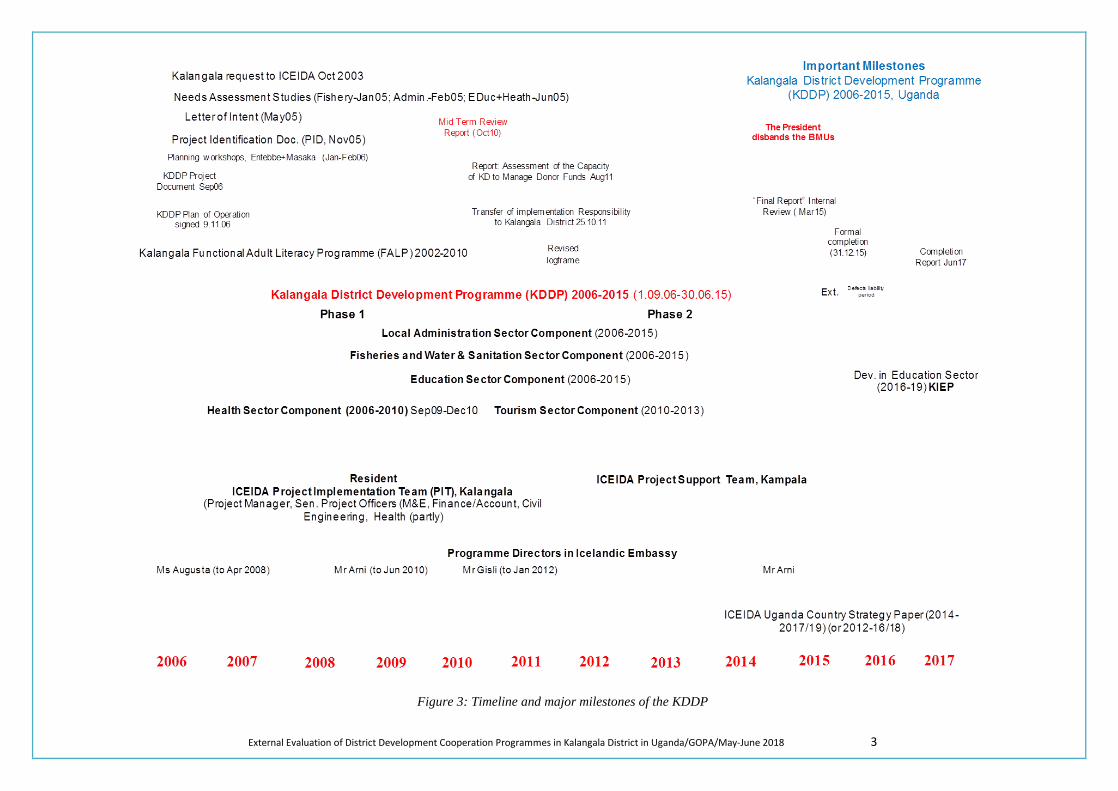
External Evaluation of District Development Cooperation Programmes in Kalangala District in Uganda/GOPA/May-June 2018 3
Figure 3: Timeline and major milestones of the KDDP
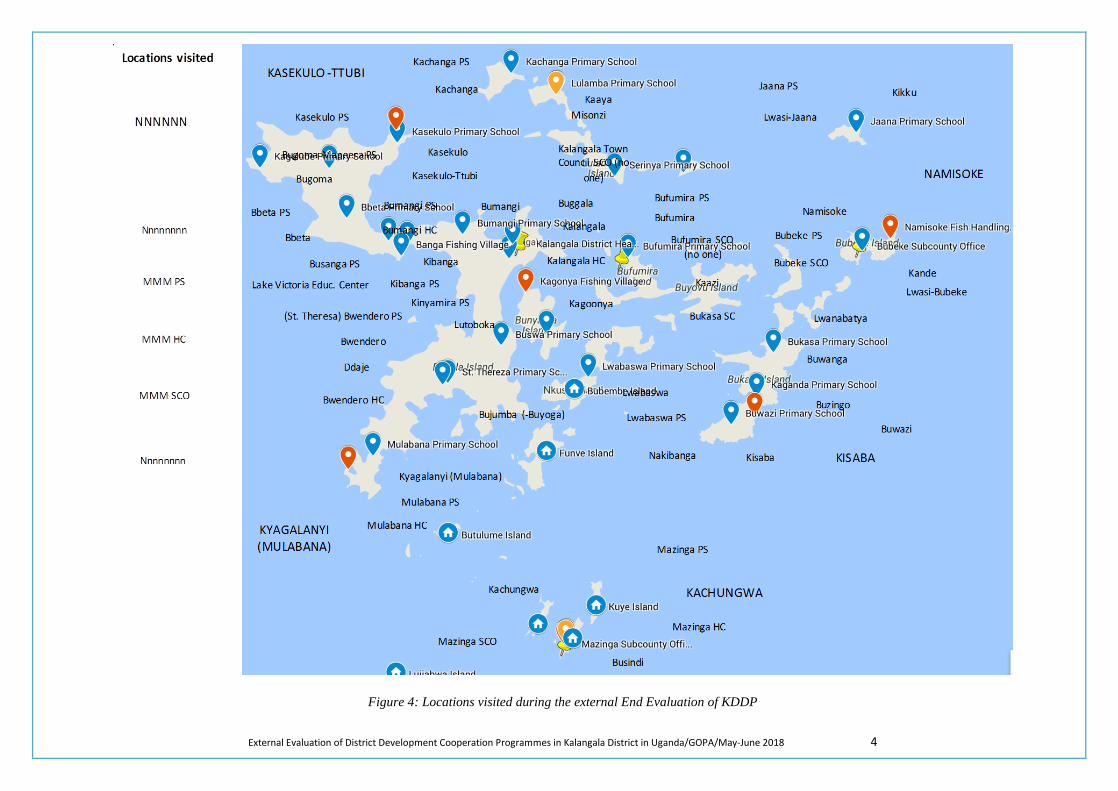
External Evaluation of District Development Cooperation Programmes in Kalangala District in Uganda/GOPA/May-June 2018 4
Figure 4: Locations visited during the external End Evaluation of KDDP
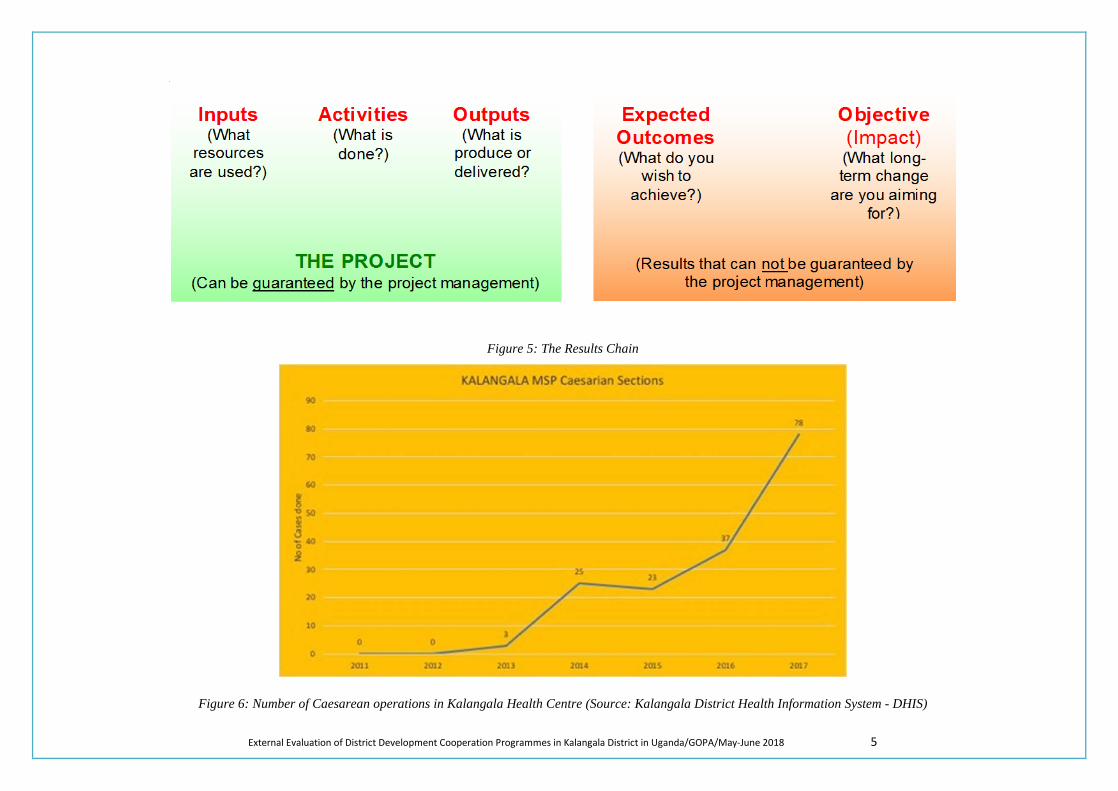
External Evaluation of District Development Cooperation Programmes in Kalangala District in Uganda/GOPA/May-June 2018 5
Figure 5: The Results Chain
Figure 6: Number of Caesarean operations in Kalangala Health Centre (Source: Kalangala District Health Information System - DHIS)
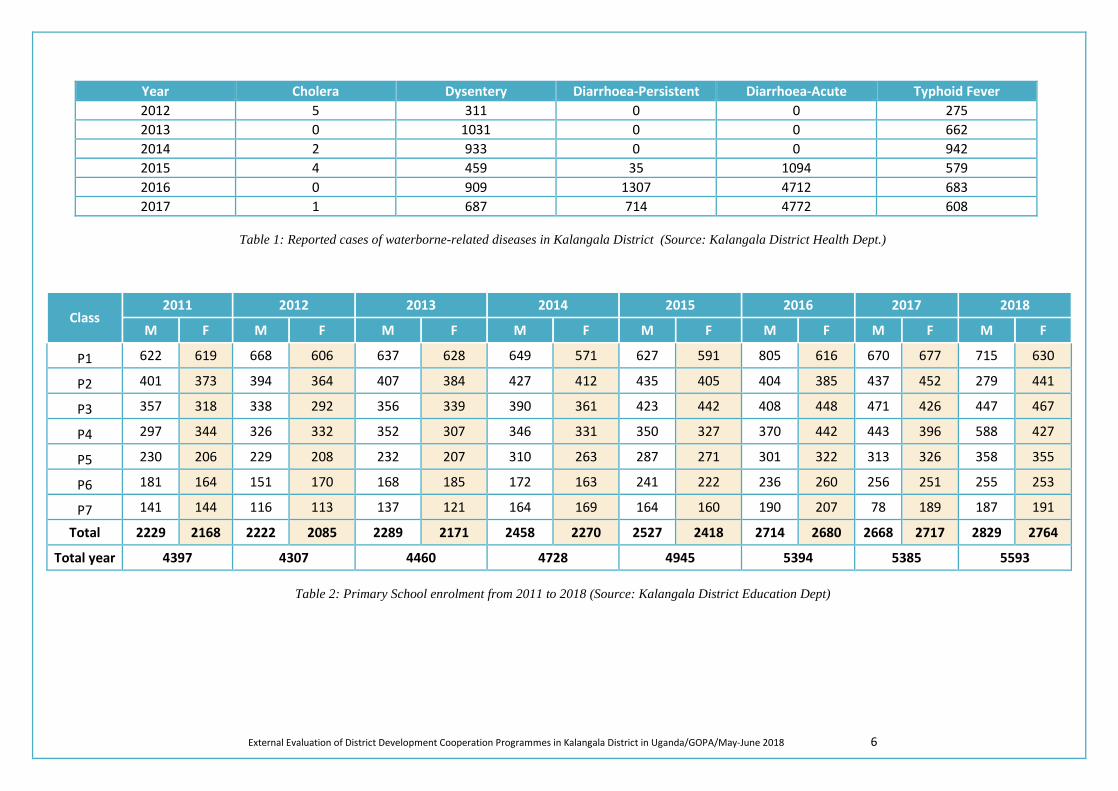
External Evaluation of District Development Cooperation Programmes in Kalangala District in Uganda/GOPA/May-June 2018 6
Year Cholera Dysentery Diarrhoea-Persistent Diarrhoea-Acute Typhoid Fever 2012 5 311 0 0 275 2013 0 1031 0 0 662 2014 2 933 0 0 942 2015 4 459 35 1094 579 2016 0 909 1307 4712 683 2017 1 687 714 4772 608
Table 1: Reported cases of waterborne-related diseases in Kalangala District (Source: Kalangala District Health Dept.)
Class 2011 2012 2013 2014 2015 2016 2017 2018
M F M F M F M F M F M F M F M F
P1 622 619 668 606 637 628 649 571 627 591 805 616 670 677 715 630
P2 401 373 394 364 407 384 427 412 435 405 404 385 437 452 279 441
P3 357 318 338 292 356 339 390 361 423 442 408 448 471 426 447 467
P4 297 344 326 332 352 307 346 331 350 327 370 442 443 396 588 427
P5 230 206 229 208 232 207 310 263 287 271 301 322 313 326 358 355
P6 181 164 151 170 168 185 172 163 241 222 236 260 256 251 255 253
P7 141 144 116 113 137 121 164 169 164 160 190 207 78 189 187 191
Total 2229 2168 2222 2085 2289 2171 2458 2270 2527 2418 2714 2680 2668 2717 2829 2764
Total year 4397 4307 4460 4728 4945 5394 5385 5593
Table 2: Primary School enrolment from 2011 to 2018 (Source: Kalangala District Education Dept)
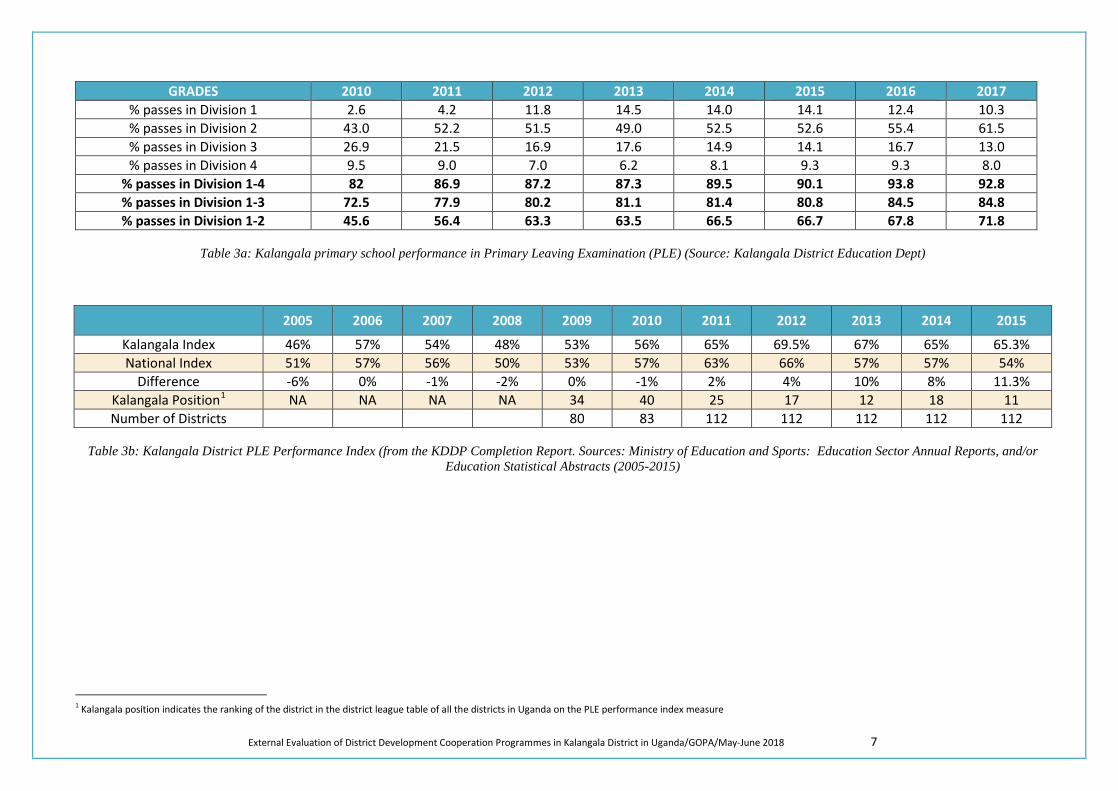
External Evaluation of District Development Cooperation Programmes in Kalangala District in Uganda/GOPA/May-June 2018 7
GRADES 2010 2011 2012 2013 2014 2015 2016 2017 % passes in Division 1 2.6 4.2 11.8 14.5 14.0 14.1 12.4 10.3 % passes in Division 2 43.0 52.2 51.5 49.0 52.5 52.6 55.4 61.5 % passes in Division 3 26.9 21.5 16.9 17.6 14.9 14.1 16.7 13.0 % passes in Division 4 9.5 9.0 7.0 6.2 8.1 9.3 9.3 8.0
% passes in Division 1-4 82 86.9 87.2 87.3 89.5 90.1 93.8 92.8 % passes in Division 1-3 72.5 77.9 80.2 81.1 81.4 80.8 84.5 84.8 % passes in Division 1-2 45.6 56.4 63.3 63.5 66.5 66.7 67.8 71.8
Table 3a: Kalangala primary school performance in Primary Leaving Examination (PLE) (Source: Kalangala District Education Dept)
2005 2006 2007 2008 2009 2010 2011 2012 2013 2014 2015
Kalangala Index 46% 57% 54% 48% 53% 56% 65% 69.5% 67% 65% 65.3% National Index 51% 57% 56% 50% 53% 57% 63% 66% 57% 57% 54%
Difference -6% 0% -1% -2% 0% -1% 2% 4% 10% 8% 11.3% Kalangala Position1 NA NA NA NA 34 40 25 17 12 18 11 Number of Districts 80 83 112 112 112 112 112
Table 3b: Kalangala District PLE Performance Index (from the KDDP Completion Report. Sources: Ministry of Education and Sports: Education Sector Annual Reports, and/or
Education Statistical Abstracts (2005-2015)
1 Kalangala position indicates the ranking of the district in the district league table of all the districts in Uganda on the PLE performance index measure
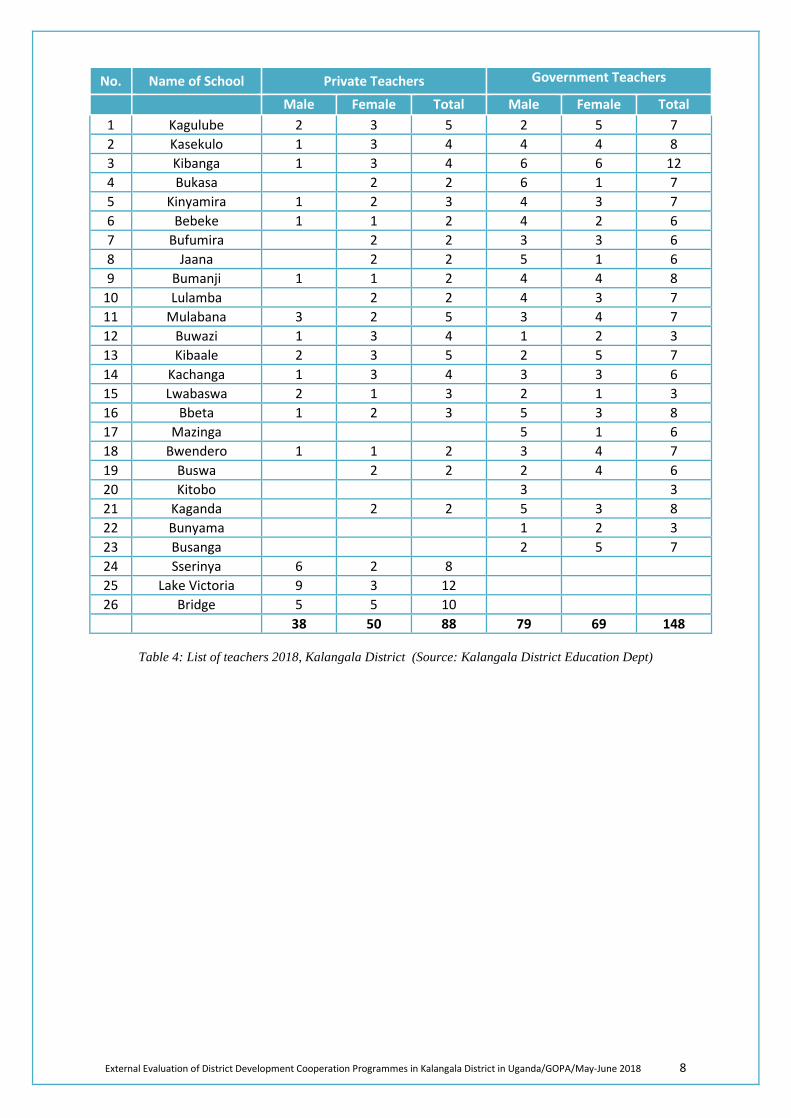
External Evaluation of District Development Cooperation Programmes in Kalangala District in Uganda/GOPA/May-June 2018 8
No. Name of School Private Teachers Government Teachers
Male Female Total Male Female Total 1 Kagulube 2 3 5 2 5 7 2 Kasekulo 1 3 4 4 4 8 3 Kibanga 1 3 4 6 6 12 4 Bukasa 2 2 6 1 7 5 Kinyamira 1 2 3 4 3 7 6 Bebeke 1 1 2 4 2 6 7 Bufumira 2 2 3 3 6 8 Jaana 2 2 5 1 6 9 Bumanji 1 1 2 4 4 8
10 Lulamba 2 2 4 3 7 11 Mulabana 3 2 5 3 4 7 12 Buwazi 1 3 4 1 2 3 13 Kibaale 2 3 5 2 5 7 14 Kachanga 1 3 4 3 3 6 15 Lwabaswa 2 1 3 2 1 3 16 Bbeta 1 2 3 5 3 8 17 Mazinga 5 1 6 18 Bwendero 1 1 2 3 4 7 19 Buswa 2 2 2 4 6 20 Kitobo 3 3 21 Kaganda 2 2 5 3 8 22 Bunyama 1 2 3 23 Busanga 2 5 7 24 Sserinya 6 2 8 25 Lake Victoria 9 3 12 26 Bridge 5 5 10
38 50 88 79 69 148
Table 4: List of teachers 2018, Kalangala District (Source: Kalangala District Education Dept)
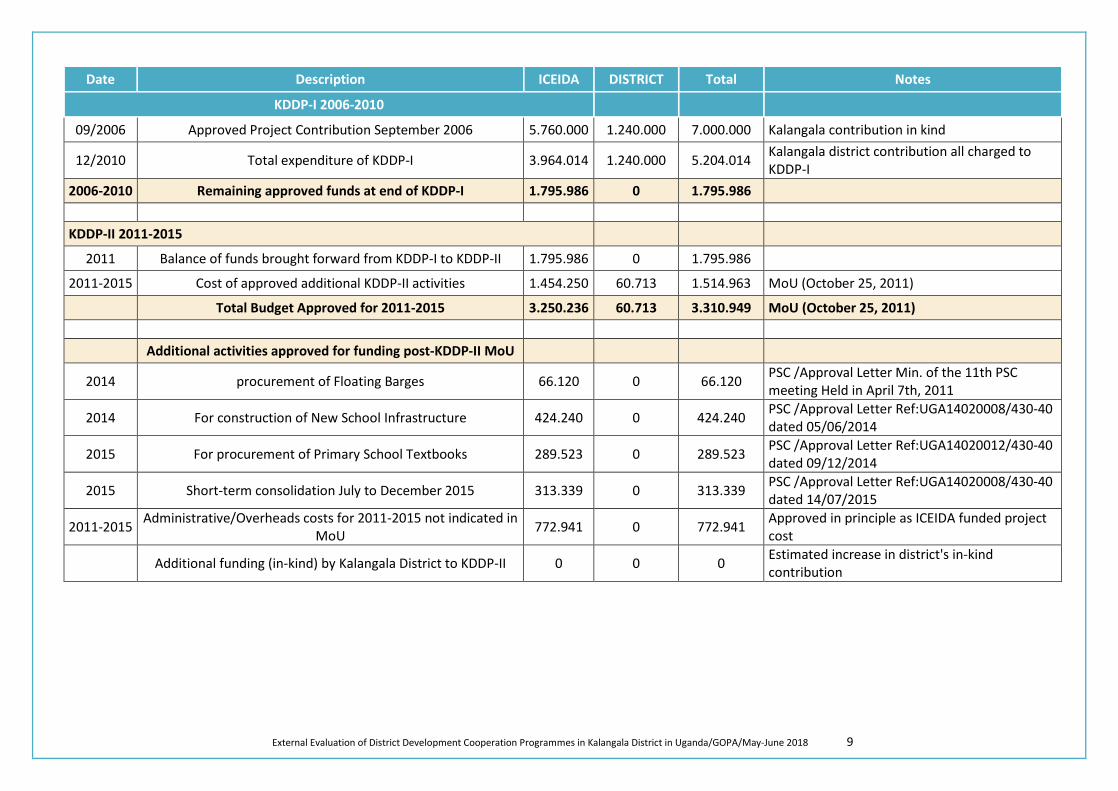
External Evaluation of District Development Cooperation Programmes in Kalangala District in Uganda/GOPA/May-June 2018 9
Date Description ICEIDA DISTRICT Total Notes
KDDP-I 2006-2010
09/2006 Approved Project Contribution September 2006 5.760.000 1.240.000 7.000.000 Kalangala contribution in kind
12/2010 Total expenditure of KDDP-I 3.964.014 1.240.000 5.204.014 Kalangala district contribution all charged to KDDP-I
2006-2010 Remaining approved funds at end of KDDP-I 1.795.986 0 1.795.986
KDDP-II 2011-2015
2011 Balance of funds brought forward from KDDP-I to KDDP-II 1.795.986 0 1.795.986
2011-2015 Cost of approved additional KDDP-II activities 1.454.250 60.713 1.514.963 MoU (October 25, 2011)
Total Budget Approved for 2011-2015 3.250.236 60.713 3.310.949 MoU (October 25, 2011) Additional activities approved for funding post-KDDP-II MoU
2014 procurement of Floating Barges 66.120 0 66.120 PSC /Approval Letter Min. of the 11th PSC meeting Held in April 7th, 2011
2014 For construction of New School Infrastructure 424.240 0 424.240 PSC /Approval Letter Ref:UGA14020008/430-40 dated 05/06/2014
2015 For procurement of Primary School Textbooks 289.523 0 289.523 PSC /Approval Letter Ref:UGA14020012/430-40 dated 09/12/2014
2015 Short-term consolidation July to December 2015 313.339 0 313.339 PSC /Approval Letter Ref:UGA14020008/430-40 dated 14/07/2015
2011-2015 Administrative/Overheads costs for 2011-2015 not indicated in MoU 772.941 0 772.941 Approved in principle as ICEIDA funded project
cost
Additional funding (in-kind) by Kalangala District to KDDP-II 0 0 0 Estimated increase in district's in-kind contribution
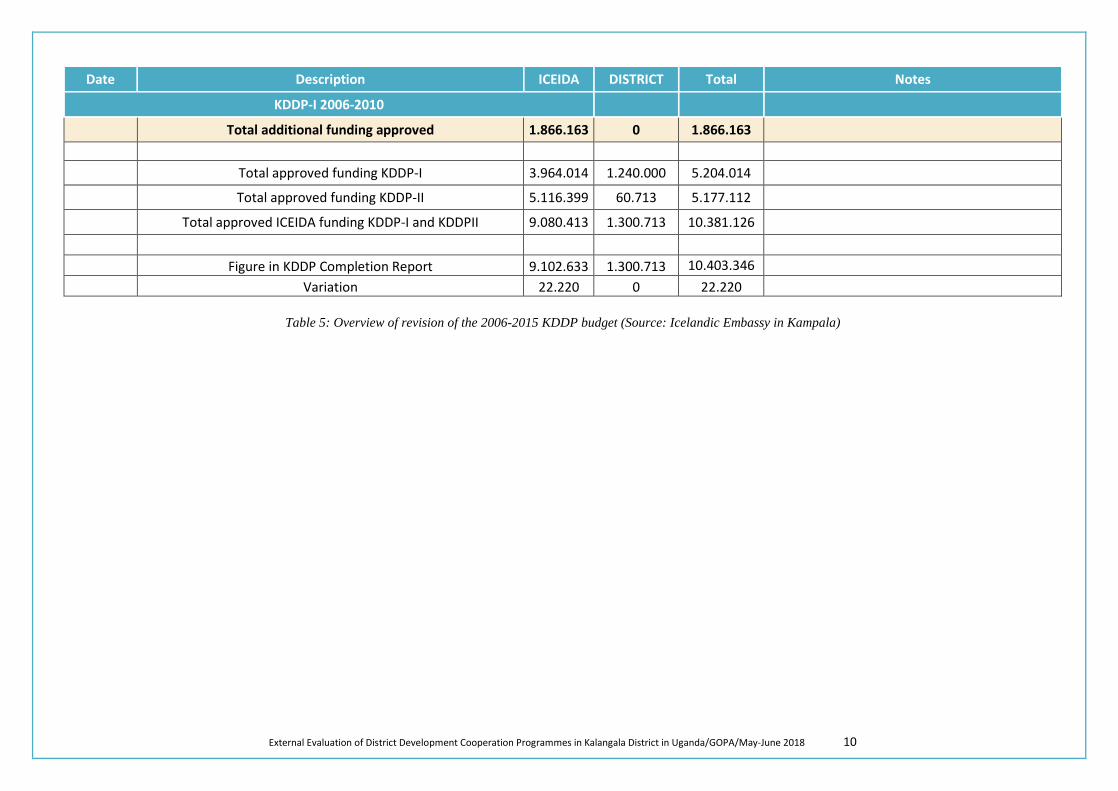
External Evaluation of District Development Cooperation Programmes in Kalangala District in Uganda/GOPA/May-June 2018 10
Date Description ICEIDA DISTRICT Total Notes
KDDP-I 2006-2010
Total additional funding approved 1.866.163 0 1.866.163 Total approved funding KDDP-I 3.964.014 1.240.000 5.204.014
Total approved funding KDDP-II 5.116.399 60.713 5.177.112
Total approved ICEIDA funding KDDP-I and KDDPII 9.080.413 1.300.713 10.381.126
Figure in KDDP Completion Report 9.102.633 1.300.713 10.403.346 Variation 22.220 0 22.220
Table 5: Overview of revision of the 2006-2015 KDDP budget (Source: Icelandic Embassy in Kampala)
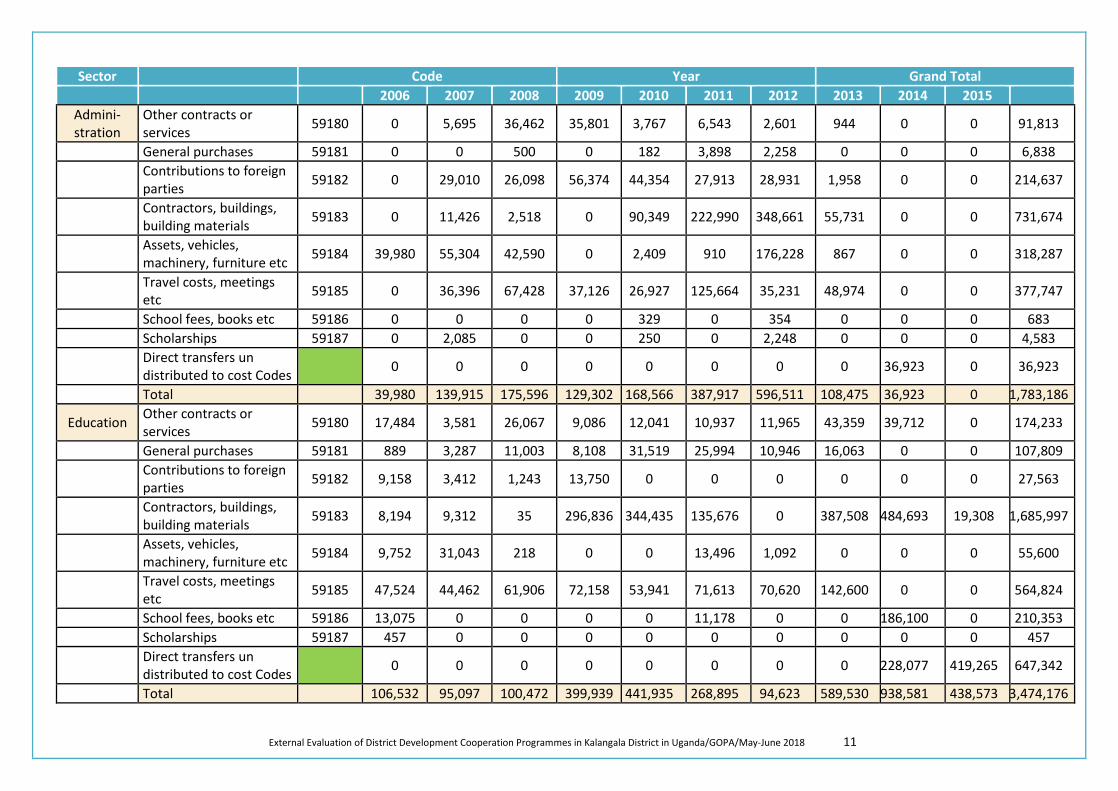
External Evaluation of District Development Cooperation Programmes in Kalangala District in Uganda/GOPA/May-June 2018 11
Sector Code Year Grand Total 2006 2007 2008 2009 2010 2011 2012 2013 2014 2015
Admini-stration
Other contracts or services 59180 0 5,695 36,462 35,801 3,767 6,543 2,601 944 0 0 91,813
General purchases 59181 0 0 500 0 182 3,898 2,258 0 0 0 6,838
Contributions to foreign parties 59182 0 29,010 26,098 56,374 44,354 27,913 28,931 1,958 0 0 214,637
Contractors, buildings, building materials 59183 0 11,426 2,518 0 90,349 222,990 348,661 55,731 0 0 731,674
Assets, vehicles, machinery, furniture etc 59184 39,980 55,304 42,590 0 2,409 910 176,228 867 0 0 318,287
Travel costs, meetings etc 59185 0 36,396 67,428 37,126 26,927 125,664 35,231 48,974 0 0 377,747
School fees, books etc 59186 0 0 0 0 329 0 354 0 0 0 683 Scholarships 59187 0 2,085 0 0 250 0 2,248 0 0 0 4,583
Direct transfers un distributed to cost Codes 0 0 0 0 0 0 0 0 36,923 0 36,923
Total 39,980 139,915 175,596 129,302 168,566 387,917 596,511 108,475 36,923 0 1,783,186
Education Other contracts or services 59180 17,484 3,581 26,067 9,086 12,041 10,937 11,965 43,359 39,712 0 174,233
General purchases 59181 889 3,287 11,003 8,108 31,519 25,994 10,946 16,063 0 0 107,809
Contributions to foreign parties 59182 9,158 3,412 1,243 13,750 0 0 0 0 0 0 27,563
Contractors, buildings, building materials 59183 8,194 9,312 35 296,836 344,435 135,676 0 387,508 484,693 19,308 1,685,997
Assets, vehicles, machinery, furniture etc 59184 9,752 31,043 218 0 0 13,496 1,092 0 0 0 55,600
Travel costs, meetings etc 59185 47,524 44,462 61,906 72,158 53,941 71,613 70,620 142,600 0 0 564,824
School fees, books etc 59186 13,075 0 0 0 0 11,178 0 0 186,100 0 210,353 Scholarships 59187 457 0 0 0 0 0 0 0 0 0 457
Direct transfers un distributed to cost Codes 0 0 0 0 0 0 0 0 228,077 419,265 647,342
Total 106,532 95,097 100,472 399,939 441,935 268,895 94,623 589,530 938,581 438,573 3,474,176
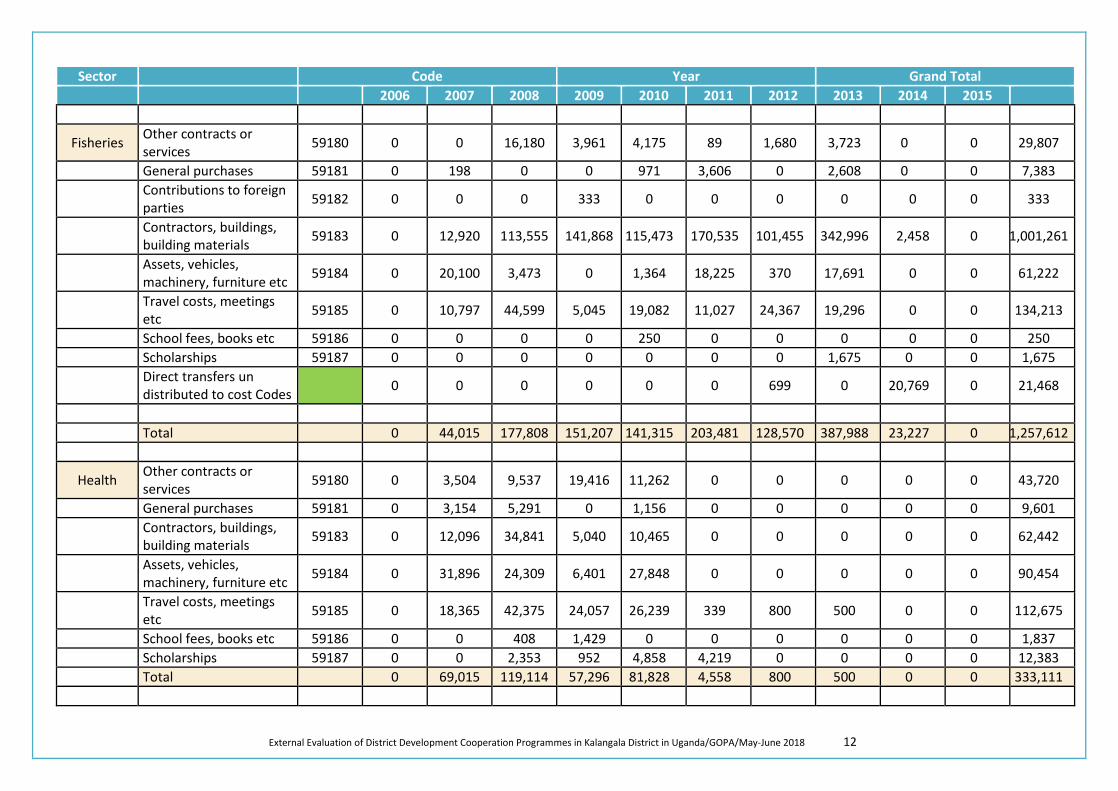
External Evaluation of District Development Cooperation Programmes in Kalangala District in Uganda/GOPA/May-June 2018 12
Sector Code Year Grand Total 2006 2007 2008 2009 2010 2011 2012 2013 2014 2015
Fisheries Other contracts or services 59180 0 0 16,180 3,961 4,175 89 1,680 3,723 0 0 29,807
General purchases 59181 0 198 0 0 971 3,606 0 2,608 0 0 7,383
Contributions to foreign parties 59182 0 0 0 333 0 0 0 0 0 0 333
Contractors, buildings, building materials 59183 0 12,920 113,555 141,868 115,473 170,535 101,455 342,996 2,458 0 1,001,261
Assets, vehicles, machinery, furniture etc 59184 0 20,100 3,473 0 1,364 18,225 370 17,691 0 0 61,222
Travel costs, meetings etc 59185 0 10,797 44,599 5,045 19,082 11,027 24,367 19,296 0 0 134,213
School fees, books etc 59186 0 0 0 0 250 0 0 0 0 0 250 Scholarships 59187 0 0 0 0 0 0 0 1,675 0 0 1,675
Direct transfers un distributed to cost Codes 0 0 0 0 0 0 699 0 20,769 0 21,468
Total 0 44,015 177,808 151,207 141,315 203,481 128,570 387,988 23,227 0 1,257,612
Health Other contracts or services 59180 0 3,504 9,537 19,416 11,262 0 0 0 0 0 43,720
General purchases 59181 0 3,154 5,291 0 1,156 0 0 0 0 0 9,601
Contractors, buildings, building materials 59183 0 12,096 34,841 5,040 10,465 0 0 0 0 0 62,442
Assets, vehicles, machinery, furniture etc 59184 0 31,896 24,309 6,401 27,848 0 0 0 0 0 90,454
Travel costs, meetings etc 59185 0 18,365 42,375 24,057 26,239 339 800 500 0 0 112,675
School fees, books etc 59186 0 0 408 1,429 0 0 0 0 0 0 1,837 Scholarships 59187 0 0 2,353 952 4,858 4,219 0 0 0 0 12,383 Total 0 69,015 119,114 57,296 81,828 4,558 800 500 0 0 333,111
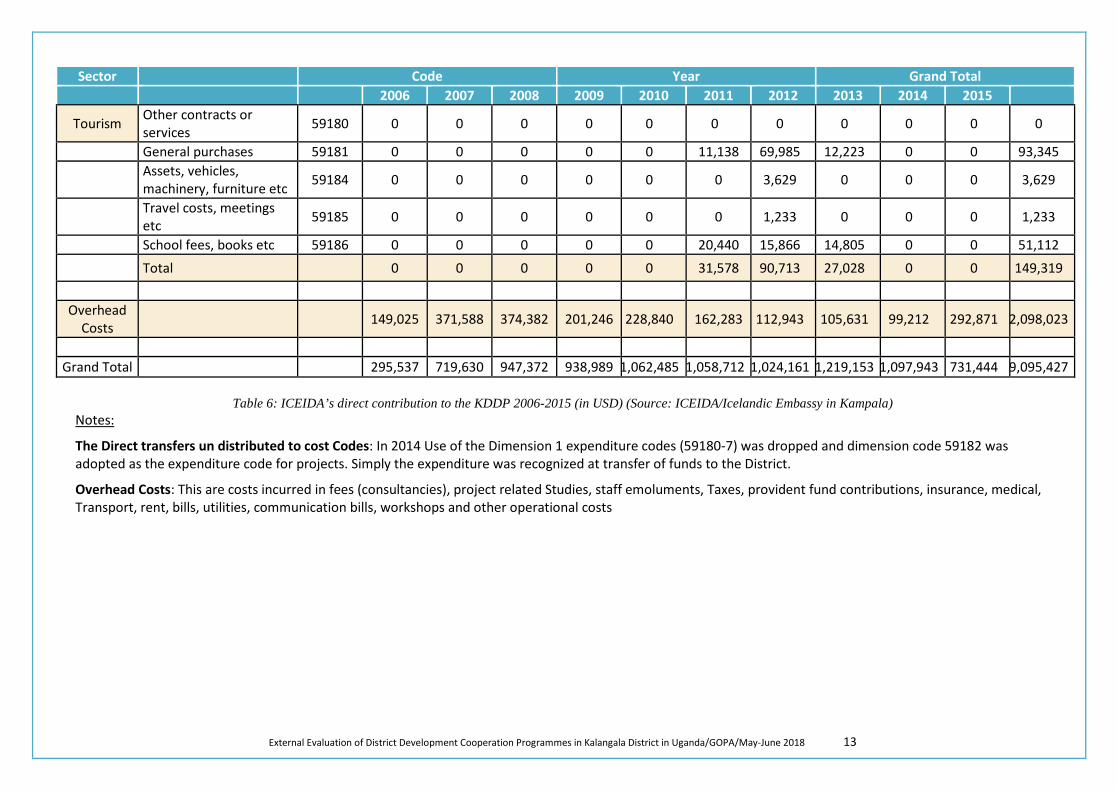
External Evaluation of District Development Cooperation Programmes in Kalangala District in Uganda/GOPA/May-June 2018 13
Sector Code Year Grand Total 2006 2007 2008 2009 2010 2011 2012 2013 2014 2015
Tourism Other contracts or services 59180 0 0 0 0 0 0 0 0 0 0 0
General purchases 59181 0 0 0 0 0 11,138 69,985 12,223 0 0 93,345
Assets, vehicles, machinery, furniture etc 59184 0 0 0 0 0 0 3,629 0 0 0 3,629
Travel costs, meetings etc 59185 0 0 0 0 0 0 1,233 0 0 0 1,233
School fees, books etc 59186 0 0 0 0 0 20,440 15,866 14,805 0 0 51,112 Total 0 0 0 0 0 31,578 90,713 27,028 0 0 149,319
Overhead Costs 149,025 371,588 374,382 201,246 228,840 162,283 112,943 105,631 99,212 292,871 2,098,023
Grand Total 295,537 719,630 947,372 938,989 1,062,485 1,058,712 1,024,161 1,219,153 1,097,943 731,444 9,095,427
Table 6: ICEIDA’s direct contribution to the KDDP 2006-2015 (in USD) (Source: ICEIDA/Icelandic Embassy in Kampala)
Notes: The Direct transfers un distributed to cost Codes: In 2014 Use of the Dimension 1 expenditure codes (59180-7) was dropped and dimension code 59182 was adopted as the expenditure code for projects. Simply the expenditure was recognized at transfer of funds to the District.
Overhead Costs: This are costs incurred in fees (consultancies), project related Studies, staff emoluments, Taxes, provident fund contributions, insurance, medical, Transport, rent, bills, utilities, communication bills, workshops and other operational costs
External Evaluation of District Development Cooperation Programmes in Kalangala District in Uganda/GOPA/June 2018 1
Annex 5: Household Survey Questionnaire and Key Informant Questions
KALANGALA DISTRICT LOCAL GOVERNMENT
END OF PROGRAMME EVALUATION HOUSEHOLD SURVEY QUESTIONNAIRE
Final Draft – Version 10 (17 April 2018)
HOUSEHOLD SURVEY CONDUCTED BY GOPA CONSULTANTS WITH SUPPORT FROM ICEIDA
Date of interview: ……………………………………………… Name of Enumerator: …………………………………………………… Mobile: ……………………………… Email: ……………………………...…
External Evaluation of District Development Cooperation Programmes in Kalangala District in Uganda/GOPA/June 2018 2
My name is ... I am currently working as an Enumerator for the final evaluation of the Kalangala District Development Program (KDDP), implemented by the District Local Government, supported by Iceland Development Cooperation (ICEIDA). KDDP has been implementing the programme in the sectors of fisheries, water and sanitation, education, health, and capacity building of the District Local Government Authorities; with the overall objective of contributing to sustainable livelihoods and equitable social development. The Household Survey is conducted mainly to assess programme performance, its impact and sustainability, as well as to document lessons that can be used to improve the planning of similar programmes in future. You have been selected to participate in the survey as a community member and potential beneficiary of the programme.
The evaluation report will be used by partners, though led by Iceland. The data and/or information collected during this interview will be presented in aggregate terms only, and will not be traced to individuals. Confidentiality of the data and/or information provided shall be highly respected. As such, the names of the respondents in households, or the names of the household heads will remain anonymous, and will NOT appear in any report.
Would you mind if I asked you some questions?
THANK YOU FOR YOUR COOPERATION!
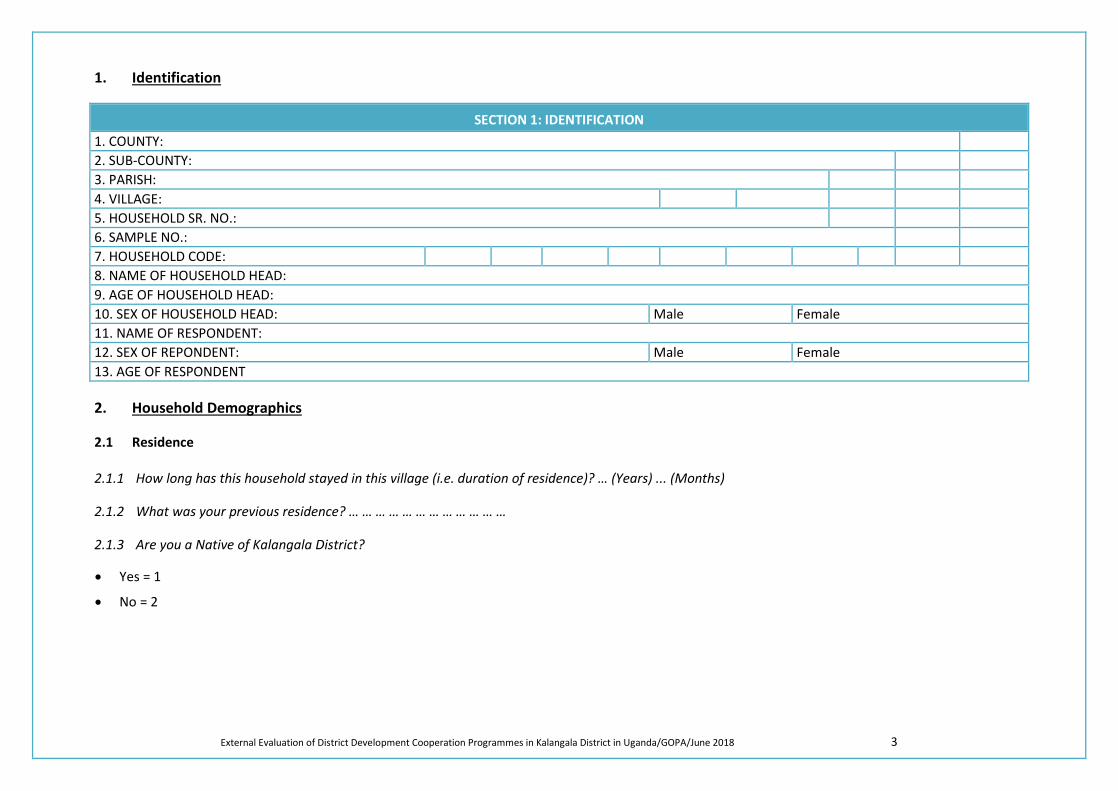
External Evaluation of District Development Cooperation Programmes in Kalangala District in Uganda/GOPA/June 2018 3
1. Identification
SECTION 1: IDENTIFICATION 1. COUNTY: 2. SUB-COUNTY: 3. PARISH: 4. VILLAGE: 5. HOUSEHOLD SR. NO.: 6. SAMPLE NO.: 7. HOUSEHOLD CODE: 8. NAME OF HOUSEHOLD HEAD: 9. AGE OF HOUSEHOLD HEAD: 10. SEX OF HOUSEHOLD HEAD: Male Female 11. NAME OF RESPONDENT: 12. SEX OF REPONDENT: Male Female 13. AGE OF RESPONDENT
2. Household Demographics
2.1 Residence
2.1.1 How long has this household stayed in this village (i.e. duration of residence)? … (Years) ... (Months)
2.1.2 What was your previous residence? … … … … … … … … … … … …
2.1.3 Are you a Native of Kalangala District?
• Yes = 1
• No = 2
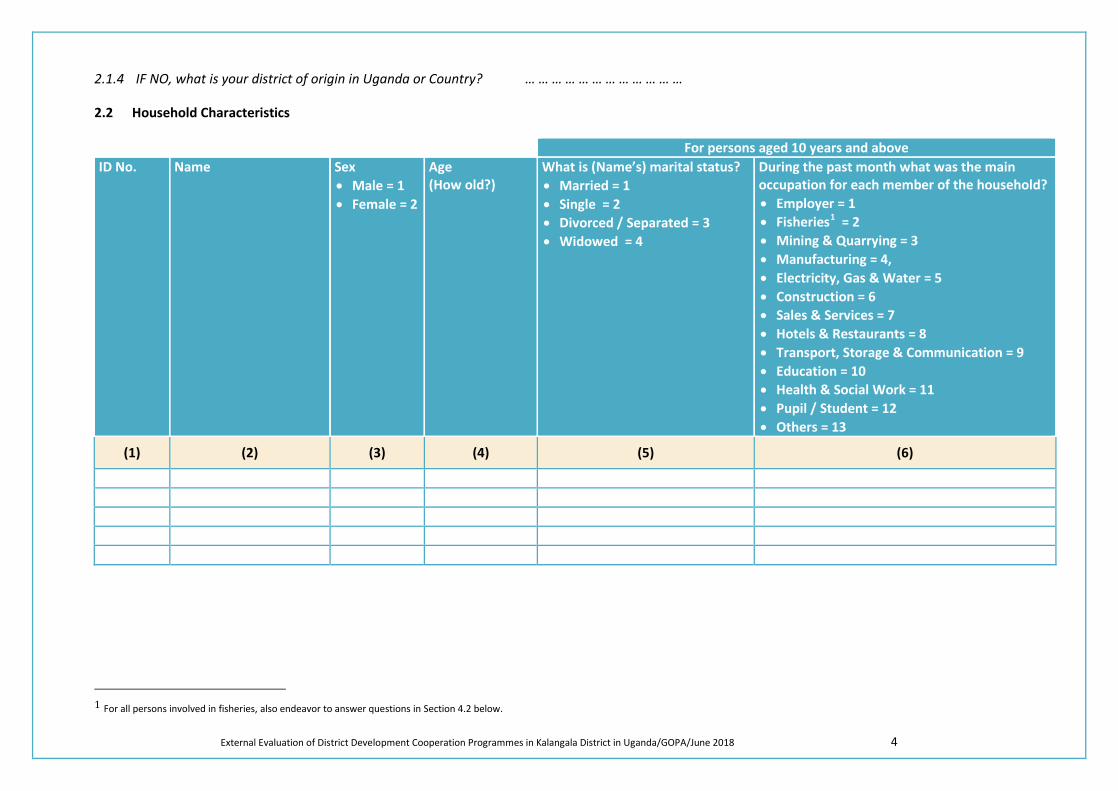
External Evaluation of District Development Cooperation Programmes in Kalangala District in Uganda/GOPA/June 2018 4
2.1.4 IF NO, what is your district of origin in Uganda or Country? … … … … … … … … … … … …
2.2 Household Characteristics
For persons aged 10 years and above ID No. Name Sex
• Male = 1 • Female = 2
Age (How old?)
What is (Name’s) marital status? • Married = 1 • Single = 2 • Divorced / Separated = 3 • Widowed = 4
During the past month what was the main occupation for each member of the household? • Employer = 1 • Fisheries1 = 2 • Mining & Quarrying = 3 • Manufacturing = 4, • Electricity, Gas & Water = 5 • Construction = 6 • Sales & Services = 7 • Hotels & Restaurants = 8 • Transport, Storage & Communication = 9 • Education = 10 • Health & Social Work = 11 • Pupil / Student = 12 • Others = 13
(1) (2) (3) (4) (5) (6)
1 For all persons involved in fisheries, also endeavor to answer questions in Section 4.2 below.
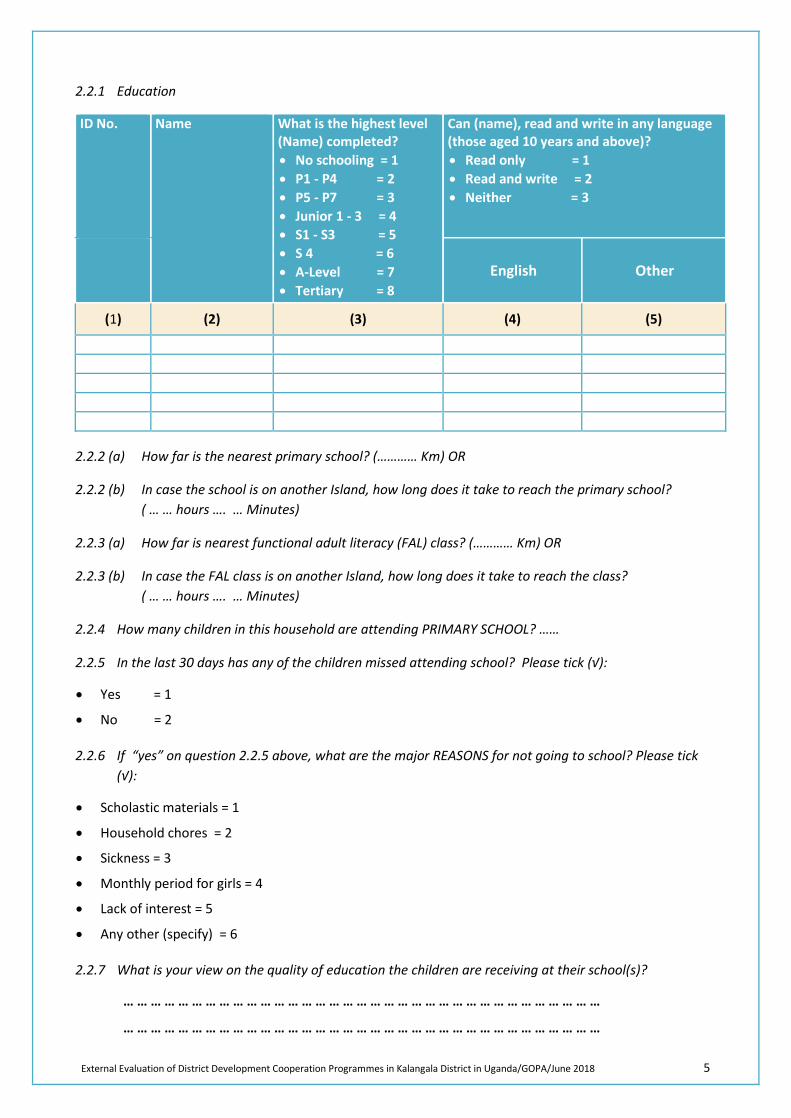
External Evaluation of District Development Cooperation Programmes in Kalangala District in Uganda/GOPA/June 2018 5
2.2.1 Education
ID No. Name What is the highest level (Name) completed? • No schooling = 1 • P1 - P4 = 2 • P5 - P7 = 3 • Junior 1 - 3 = 4 • S1 - S3 = 5 • S 4 = 6 • A-Level = 7 • Tertiary = 8
Can (name), read and write in any language (those aged 10 years and above)? • Read only = 1 • Read and write = 2 • Neither = 3
English Other
(1) (2) (3) (4) (5)
2.2.2 (a) How far is the nearest primary school? (………… Km) OR
2.2.2 (b) In case the school is on another Island, how long does it take to reach the primary school? ( … … hours …. … Minutes)
2.2.3 (a) How far is nearest functional adult literacy (FAL) class? (………… Km) OR
2.2.3 (b) In case the FAL class is on another Island, how long does it take to reach the class? ( … … hours …. … Minutes)
2.2.4 How many children in this household are attending PRIMARY SCHOOL? ……
2.2.5 In the last 30 days has any of the children missed attending school? Please tick (√):
• Yes = 1
• No = 2
2.2.6 If “yes” on question 2.2.5 above, what are the major REASONS for not going to school? Please tick (√):
• Scholastic materials = 1
• Household chores = 2
• Sickness = 3
• Monthly period for girls = 4
• Lack of interest = 5
• Any other (specify) = 6
2.2.7 What is your view on the quality of education the children are receiving at their school(s)?
… … … … … … … … … … … … … … … … … … … … … … … … … … … … … … … … … … …
… … … … … … … … … … … … … … … … … … … … … … … … … … … … … … … … … … …
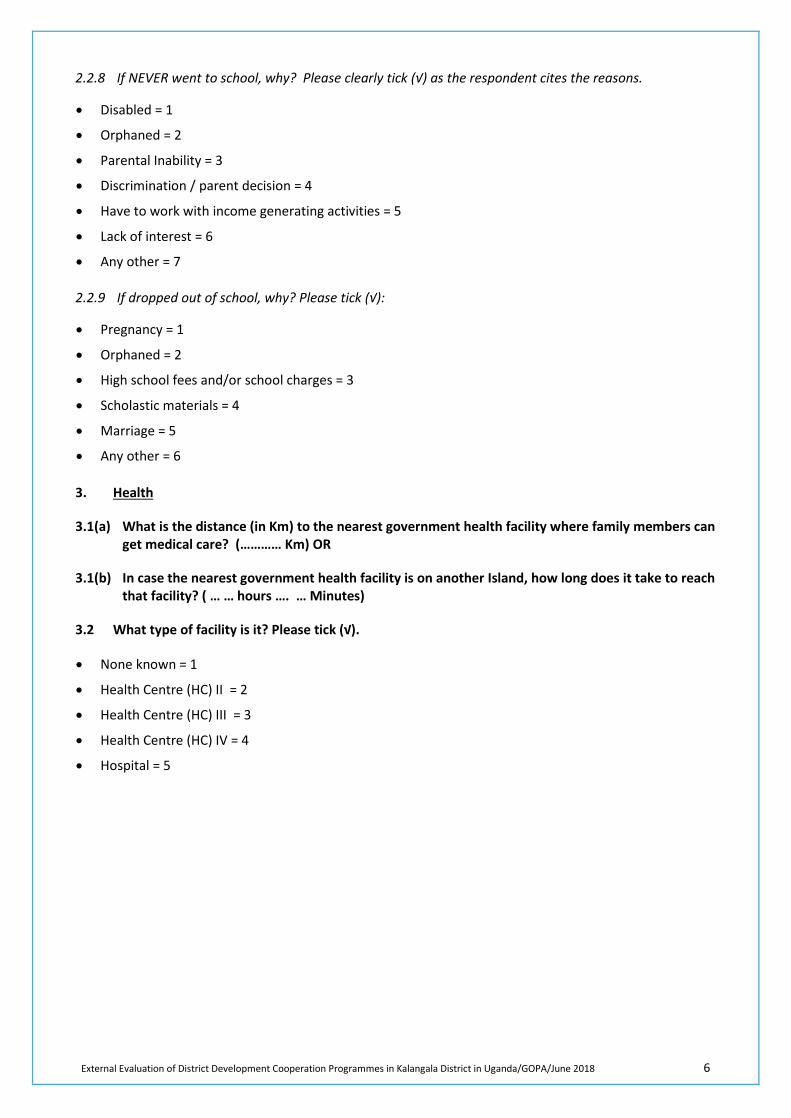
External Evaluation of District Development Cooperation Programmes in Kalangala District in Uganda/GOPA/June 2018 6
2.2.8 If NEVER went to school, why? Please clearly tick (√) as the respondent cites the reasons.
• Disabled = 1
• Orphaned = 2
• Parental Inability = 3
• Discrimination / parent decision = 4
• Have to work with income generating activities = 5
• Lack of interest = 6
• Any other = 7
2.2.9 If dropped out of school, why? Please tick (√):
• Pregnancy = 1
• Orphaned = 2
• High school fees and/or school charges = 3
• Scholastic materials = 4
• Marriage = 5
• Any other = 6
3. Health
3.1(a) What is the distance (in Km) to the nearest government health facility where family members can get medical care? (………… Km) OR
3.1(b) In case the nearest government health facility is on another Island, how long does it take to reach that facility? ( … … hours …. … Minutes)
3.2 What type of facility is it? Please tick (√).
• None known = 1
• Health Centre (HC) II = 2
• Health Centre (HC) III = 3
• Health Centre (HC) IV = 4
• Hospital = 5
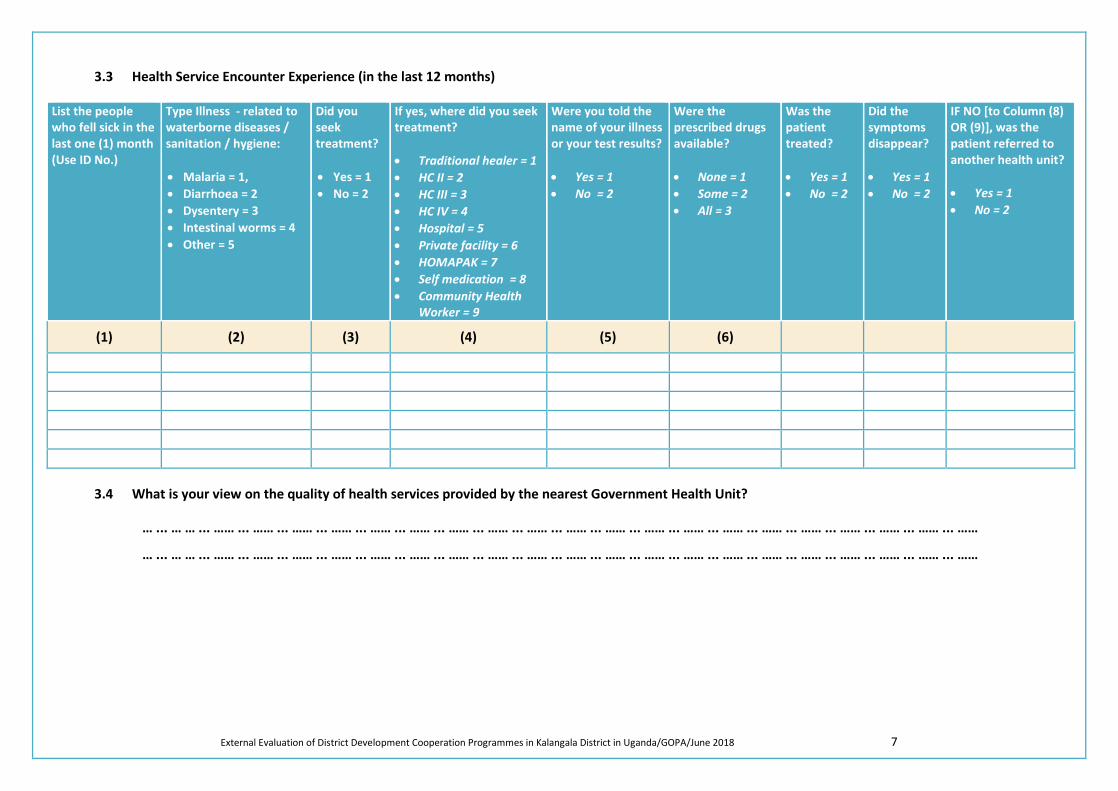
External Evaluation of District Development Cooperation Programmes in Kalangala District in Uganda/GOPA/June 2018 7
3.3 Health Service Encounter Experience (in the last 12 months)
List the people who fell sick in the last one (1) month (Use ID No.)
Type Illness - related to waterborne diseases / sanitation / hygiene: • Malaria = 1, • Diarrhoea = 2 • Dysentery = 3 • Intestinal worms = 4 • Other = 5
Did you seek treatment? • Yes = 1 • No = 2
If yes, where did you seek treatment? • Traditional healer = 1 • HC II = 2 • HC III = 3 • HC IV = 4 • Hospital = 5 • Private facility = 6 • HOMAPAK = 7 • Self medication = 8 • Community Health
Worker = 9
Were you told the name of your illness or your test results? • Yes = 1 • No = 2
Were the prescribed drugs available? • None = 1 • Some = 2 • All = 3
Was the patient treated? • Yes = 1 • No = 2
Did the symptoms disappear? • Yes = 1 • No = 2
IF NO [to Column (8) OR (9)], was the patient referred to another health unit? • Yes = 1 • No = 2
(1) (2) (3) (4) (5) (6)
3.4 What is your view on the quality of health services provided by the nearest Government Health Unit?
… ... … … ... …… ... …… ... …… ... …… ... …… ... …… ... …… ... …… ... …… ... …… ... …… ... …… ... …… ... …… ... …… ... …… ... …… ... …… ... …… ... ……
… ... … … ... …… ... …… ... …… ... …… ... …… ... …… ... …… ... …… ... …… ... …… ... …… ... …… ... …… ... …… ... …… ... …… ... …… ... …… ... …… ... ……
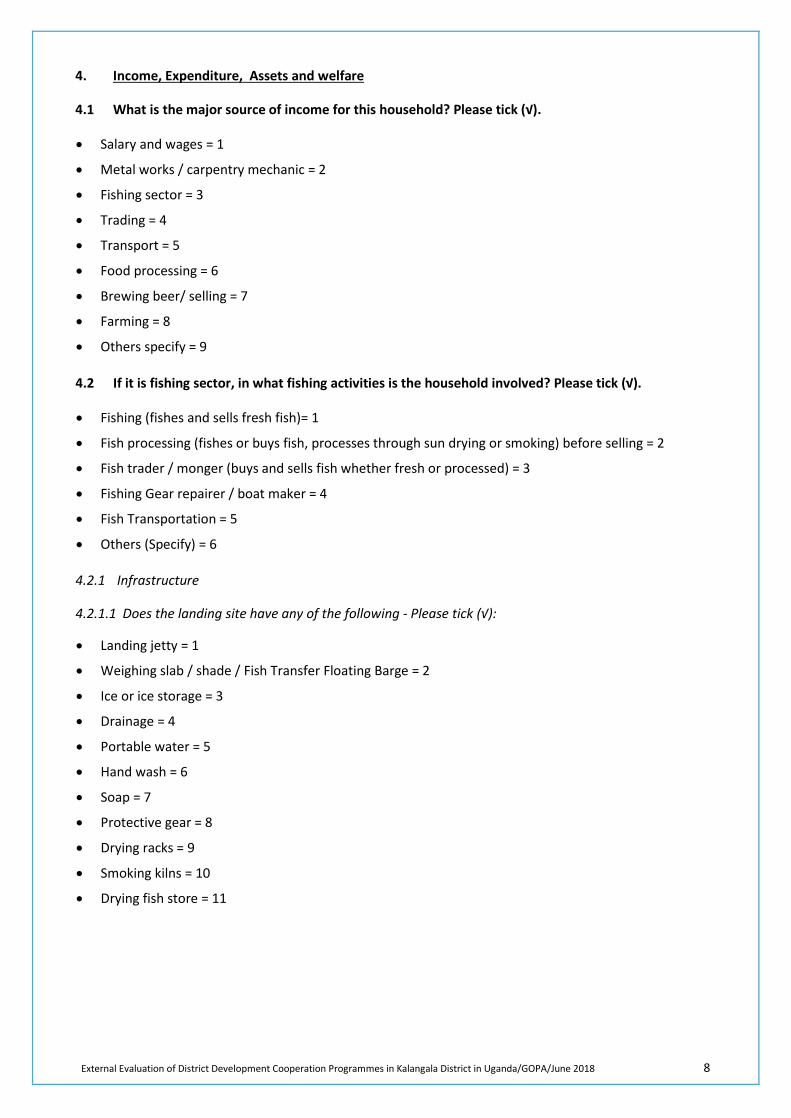
External Evaluation of District Development Cooperation Programmes in Kalangala District in Uganda/GOPA/June 2018 8
4. Income, Expenditure, Assets and welfare
4.1 What is the major source of income for this household? Please tick (√).
• Salary and wages = 1
• Metal works / carpentry mechanic = 2
• Fishing sector = 3
• Trading = 4
• Transport = 5
• Food processing = 6
• Brewing beer/ selling = 7
• Farming = 8
• Others specify = 9
4.2 If it is fishing sector, in what fishing activities is the household involved? Please tick (√).
• Fishing (fishes and sells fresh fish)= 1
• Fish processing (fishes or buys fish, processes through sun drying or smoking) before selling = 2
• Fish trader / monger (buys and sells fish whether fresh or processed) = 3
• Fishing Gear repairer / boat maker = 4
• Fish Transportation = 5
• Others (Specify) = 6
4.2.1 Infrastructure
4.2.1.1 Does the landing site have any of the following - Please tick (√):
• Landing jetty = 1
• Weighing slab / shade / Fish Transfer Floating Barge = 2
• Ice or ice storage = 3
• Drainage = 4
• Portable water = 5
• Hand wash = 6
• Soap = 7
• Protective gear = 8
• Drying racks = 9
• Smoking kilns = 10
• Drying fish store = 11
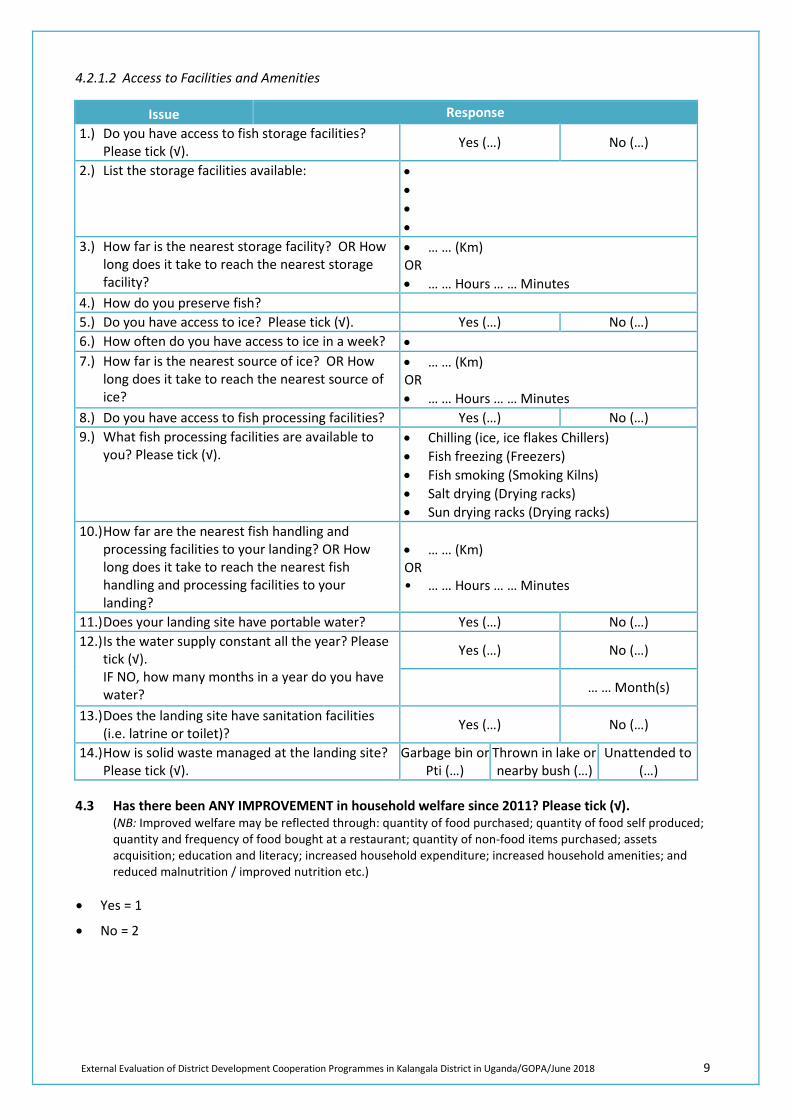
External Evaluation of District Development Cooperation Programmes in Kalangala District in Uganda/GOPA/June 2018 9
4.2.1.2 Access to Facilities and Amenities
Issue Response 1.) Do you have access to fish storage facilities?
Please tick (√). Yes (…) No (…)
2.) List the storage facilities available: • • • •
3.) How far is the nearest storage facility? OR How long does it take to reach the nearest storage facility?
• … … (Km) OR • … … Hours … … Minutes
4.) How do you preserve fish? 5.) Do you have access to ice? Please tick (√). Yes (…) No (…) 6.) How often do you have access to ice in a week? • 7.) How far is the nearest source of ice? OR How
long does it take to reach the nearest source of ice?
• … … (Km) OR • … … Hours … … Minutes
8.) Do you have access to fish processing facilities? Yes (…) No (…) 9.) What fish processing facilities are available to
you? Please tick (√). • Chilling (ice, ice flakes Chillers) • Fish freezing (Freezers) • Fish smoking (Smoking Kilns) • Salt drying (Drying racks) • Sun drying racks (Drying racks)
10.) How far are the nearest fish handling and processing facilities to your landing? OR How long does it take to reach the nearest fish handling and processing facilities to your landing?
• … … (Km) OR • … … Hours … … Minutes
11.) Does your landing site have portable water? Yes (…) No (…) 12.) Is the water supply constant all the year? Please
tick (√). IF NO, how many months in a year do you have water?
Yes (…) No (…)
… … Month(s)
13.) Does the landing site have sanitation facilities (i.e. latrine or toilet)? Yes (…) No (…)
14.) How is solid waste managed at the landing site? Please tick (√).
Garbage bin or Pti (…)
Thrown in lake or nearby bush (…)
Unattended to (…)
4.3 Has there been ANY IMPROVEMENT in household welfare since 2011? Please tick (√). (NB: Improved welfare may be reflected through: quantity of food purchased; quantity of food self produced; quantity and frequency of food bought at a restaurant; quantity of non-food items purchased; assets acquisition; education and literacy; increased household expenditure; increased household amenities; and reduced malnutrition / improved nutrition etc.)
• Yes = 1
• No = 2
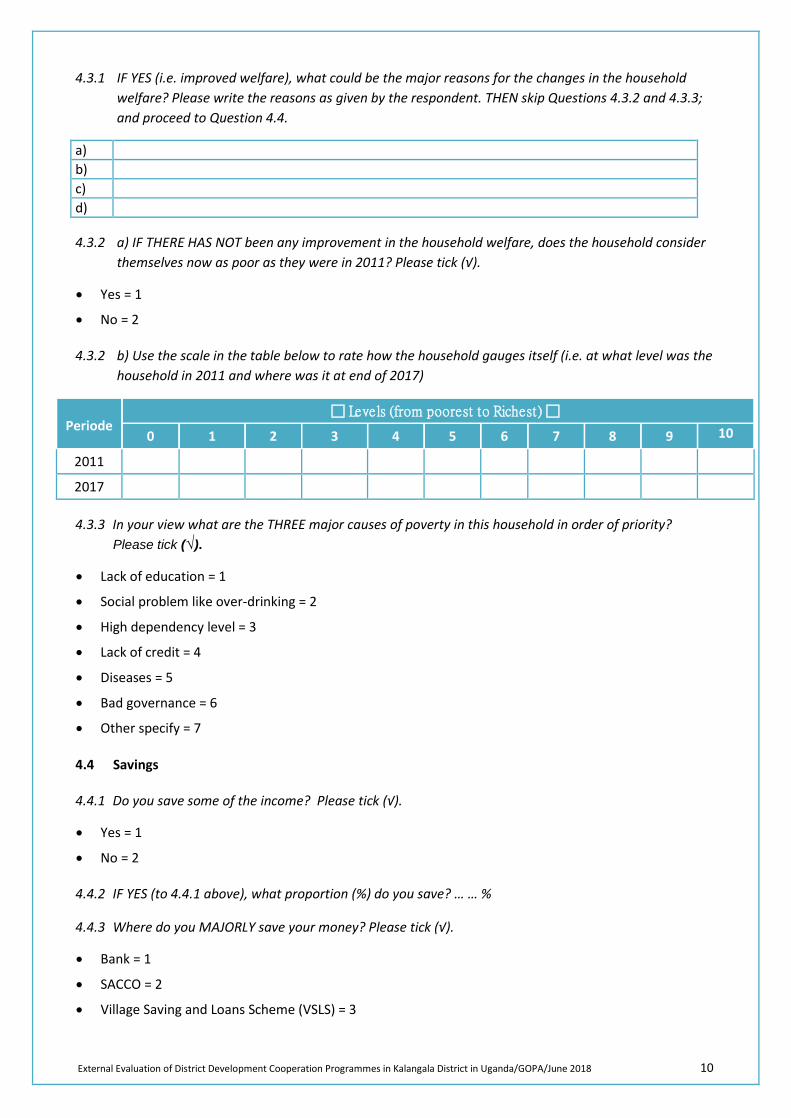
External Evaluation of District Development Cooperation Programmes in Kalangala District in Uganda/GOPA/June 2018 10
4.3.1 IF YES (i.e. improved welfare), what could be the major reasons for the changes in the household welfare? Please write the reasons as given by the respondent. THEN skip Questions 4.3.2 and 4.3.3; and proceed to Question 4.4.
a) b) c) d)
4.3.2 a) IF THERE HAS NOT been any improvement in the household welfare, does the household consider themselves now as poor as they were in 2011? Please tick (√).
• Yes = 1
• No = 2
4.3.2 b) Use the scale in the table below to rate how the household gauges itself (i.e. at what level was the household in 2011 and where was it at end of 2017)
Periode Levels (from poorest to Richest)
0 1 2 3 4 5 6 7 8 9 10
2011
2017
4.3.3 In your view what are the THREE major causes of poverty in this household in order of priority? Please tick (√).
• Lack of education = 1
• Social problem like over-drinking = 2
• High dependency level = 3
• Lack of credit = 4
• Diseases = 5
• Bad governance = 6
• Other specify = 7
4.4 Savings
4.4.1 Do you save some of the income? Please tick (√).
• Yes = 1
• No = 2
4.4.2 IF YES (to 4.4.1 above), what proportion (%) do you save? … … %
4.4.3 Where do you MAJORLY save your money? Please tick (√).
• Bank = 1
• SACCO = 2
• Village Saving and Loans Scheme (VSLS) = 3
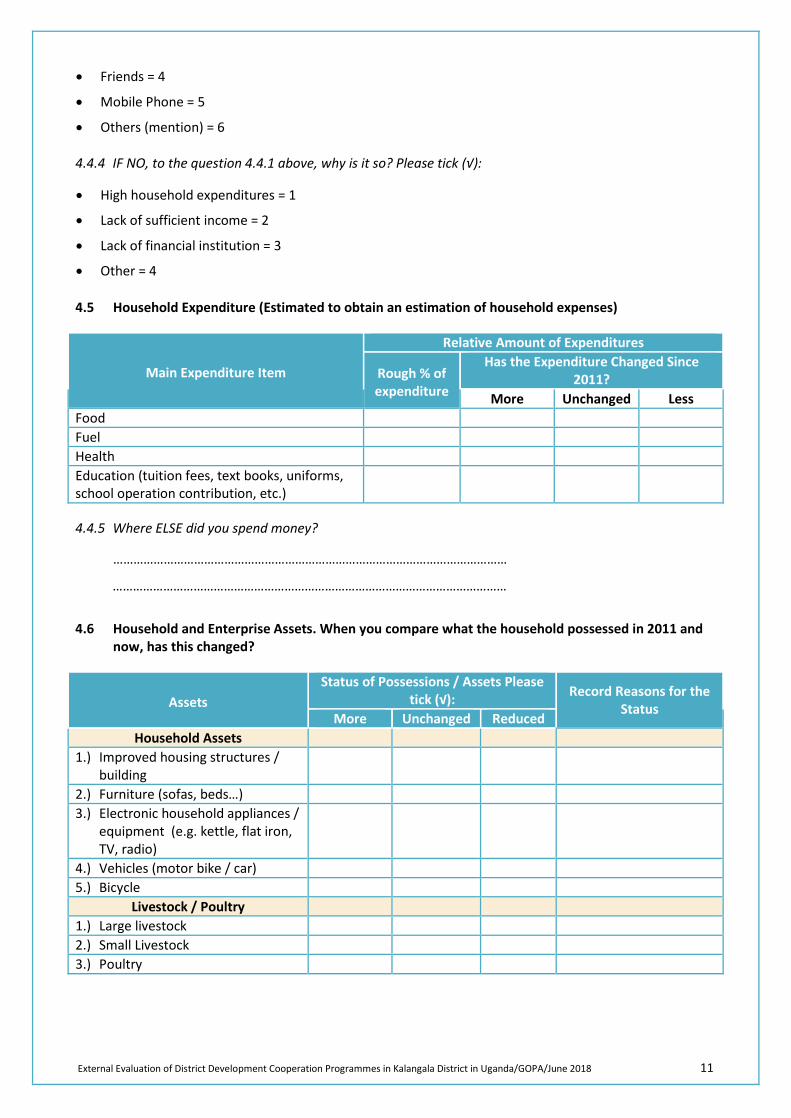
External Evaluation of District Development Cooperation Programmes in Kalangala District in Uganda/GOPA/June 2018 11
• Friends = 4
• Mobile Phone = 5
• Others (mention) = 6
4.4.4 IF NO, to the question 4.4.1 above, why is it so? Please tick (√):
• High household expenditures = 1
• Lack of sufficient income = 2
• Lack of financial institution = 3
• Other = 4
4.5 Household Expenditure (Estimated to obtain an estimation of household expenses)
Main Expenditure Item
Relative Amount of Expenditures
Rough % of expenditure
Has the Expenditure Changed Since 2011?
More Unchanged Less Food Fuel Health Education (tuition fees, text books, uniforms, school operation contribution, etc.)
4.4.5 Where ELSE did you spend money?
………………………………………………………………………………………………………
………………………………………………………………………………………………………
4.6 Household and Enterprise Assets. When you compare what the household possessed in 2011 and now, has this changed?
Assets Status of Possessions / Assets Please
tick (√): Record Reasons for the Status
More Unchanged Reduced Household Assets
1.) Improved housing structures / building
2.) Furniture (sofas, beds…) 3.) Electronic household appliances /
equipment (e.g. kettle, flat iron, TV, radio)
4.) Vehicles (motor bike / car) 5.) Bicycle
Livestock / Poultry 1.) Large livestock 2.) Small Livestock 3.) Poultry
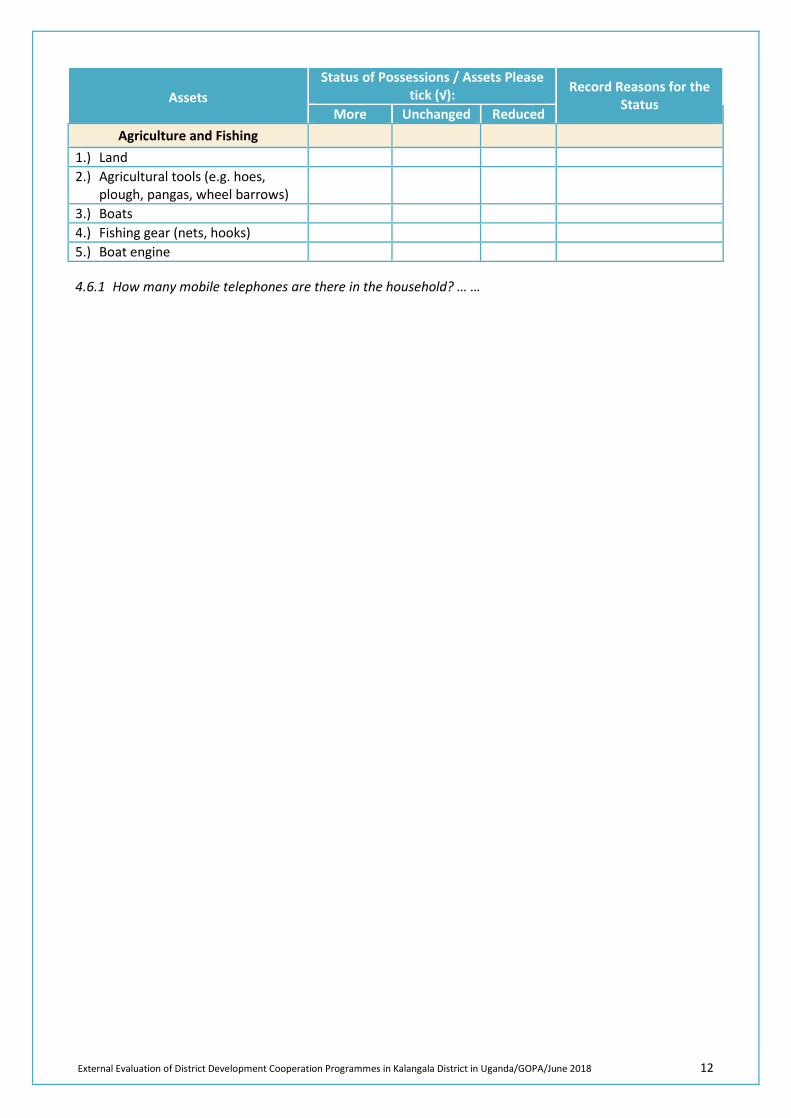
External Evaluation of District Development Cooperation Programmes in Kalangala District in Uganda/GOPA/June 2018 12
Assets Status of Possessions / Assets Please
tick (√): Record Reasons for the Status
More Unchanged Reduced Agriculture and Fishing
1.) Land 2.) Agricultural tools (e.g. hoes,
plough, pangas, wheel barrows)
3.) Boats 4.) Fishing gear (nets, hooks) 5.) Boat engine
4.6.1 How many mobile telephones are there in the household? … …
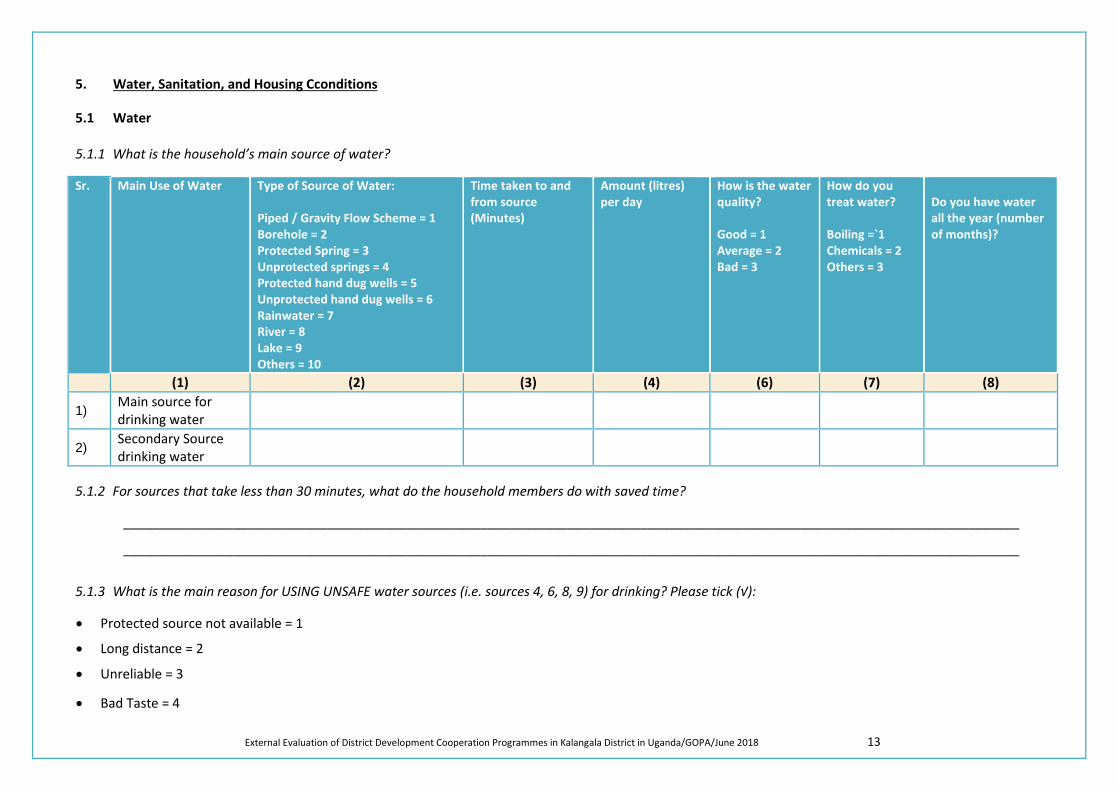
External Evaluation of District Development Cooperation Programmes in Kalangala District in Uganda/GOPA/June 2018 13
5. Water, Sanitation, and Housing Cconditions
5.1 Water
5.1.1 What is the household’s main source of water?
Sr. Main Use of Water Type of Source of Water: Piped / Gravity Flow Scheme = 1 Borehole = 2 Protected Spring = 3 Unprotected springs = 4 Protected hand dug wells = 5 Unprotected hand dug wells = 6 Rainwater = 7 River = 8 Lake = 9 Others = 10
Time taken to and from source (Minutes)
Amount (litres) per day
How is the water quality? Good = 1 Average = 2 Bad = 3
How do you treat water? Boiling =`1 Chemicals = 2 Others = 3
Do you have water all the year (number of months)?
(1) (2) (3) (4) (6) (7) (8)
1) Main source for drinking water
2) Secondary Source drinking water
5.1.2 For sources that take less than 30 minutes, what do the household members do with saved time?
___________________________________________________________________________________________________________________________
___________________________________________________________________________________________________________________________
5.1.3 What is the main reason for USING UNSAFE water sources (i.e. sources 4, 6, 8, 9) for drinking? Please tick (√):
• Protected source not available = 1
• Long distance = 2
• Unreliable = 3
• Bad Taste = 4
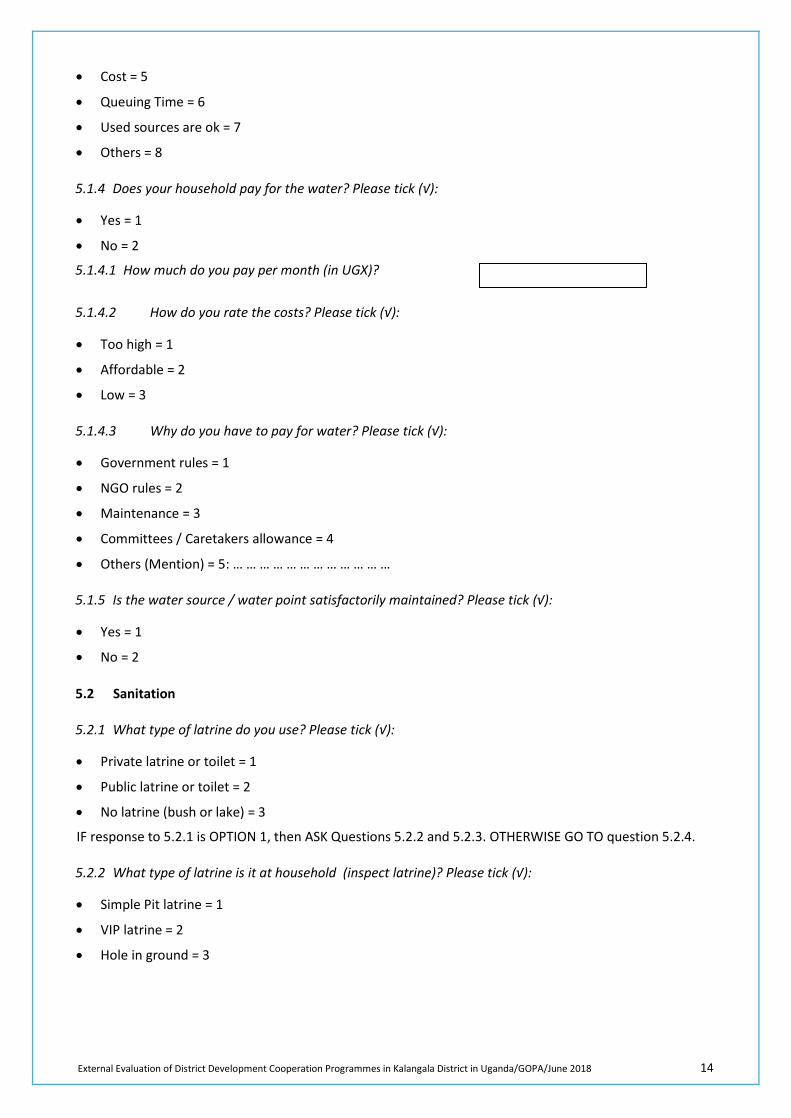
External Evaluation of District Development Cooperation Programmes in Kalangala District in Uganda/GOPA/June 2018 14
• Cost = 5
• Queuing Time = 6
• Used sources are ok = 7
• Others = 8
5.1.4 Does your household pay for the water? Please tick (√):
• Yes = 1
• No = 2
5.1.4.1 How much do you pay per month (in UGX)?
5.1.4.2 How do you rate the costs? Please tick (√):
• Too high = 1
• Affordable = 2
• Low = 3
5.1.4.3 Why do you have to pay for water? Please tick (√):
• Government rules = 1
• NGO rules = 2
• Maintenance = 3
• Committees / Caretakers allowance = 4
• Others (Mention) = 5: … … … … … … … … … … … …
5.1.5 Is the water source / water point satisfactorily maintained? Please tick (√):
• Yes = 1
• No = 2
5.2 Sanitation
5.2.1 What type of latrine do you use? Please tick (√):
• Private latrine or toilet = 1
• Public latrine or toilet = 2
• No latrine (bush or lake) = 3
IF response to 5.2.1 is OPTION 1, then ASK Questions 5.2.2 and 5.2.3. OTHERWISE GO TO question 5.2.4.
5.2.2 What type of latrine is it at household (inspect latrine)? Please tick (√):
• Simple Pit latrine = 1
• VIP latrine = 2
• Hole in ground = 3
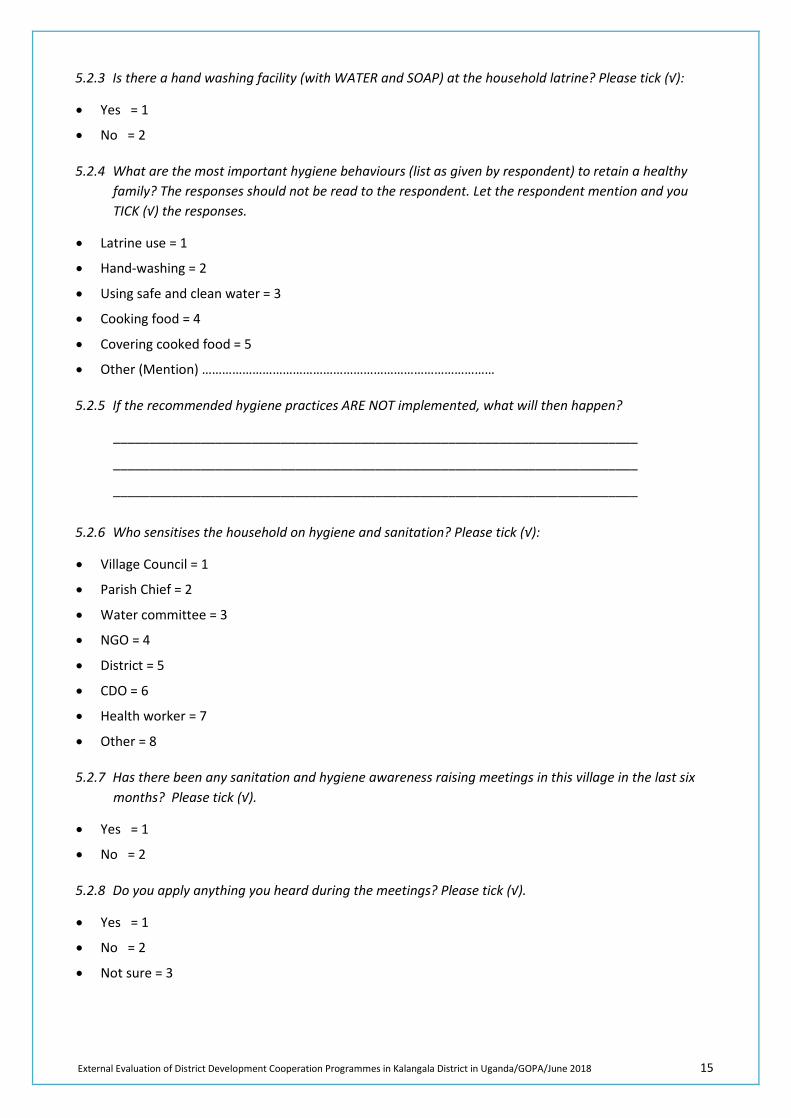
External Evaluation of District Development Cooperation Programmes in Kalangala District in Uganda/GOPA/June 2018 15
5.2.3 Is there a hand washing facility (with WATER and SOAP) at the household latrine? Please tick (√):
• Yes = 1
• No = 2
5.2.4 What are the most important hygiene behaviours (list as given by respondent) to retain a healthy family? The responses should not be read to the respondent. Let the respondent mention and you TICK (√) the responses.
• Latrine use = 1
• Hand-washing = 2
• Using safe and clean water = 3
• Cooking food = 4
• Covering cooked food = 5
• Other (Mention) ……………………………………………………………………………
5.2.5 If the recommended hygiene practices ARE NOT implemented, what will then happen?
________________________________________________________________________
________________________________________________________________________
________________________________________________________________________
5.2.6 Who sensitises the household on hygiene and sanitation? Please tick (√):
• Village Council = 1
• Parish Chief = 2
• Water committee = 3
• NGO = 4
• District = 5
• CDO = 6
• Health worker = 7
• Other = 8
5.2.7 Has there been any sanitation and hygiene awareness raising meetings in this village in the last six months? Please tick (√).
• Yes = 1
• No = 2
5.2.8 Do you apply anything you heard during the meetings? Please tick (√).
• Yes = 1
• No = 2
• Not sure = 3
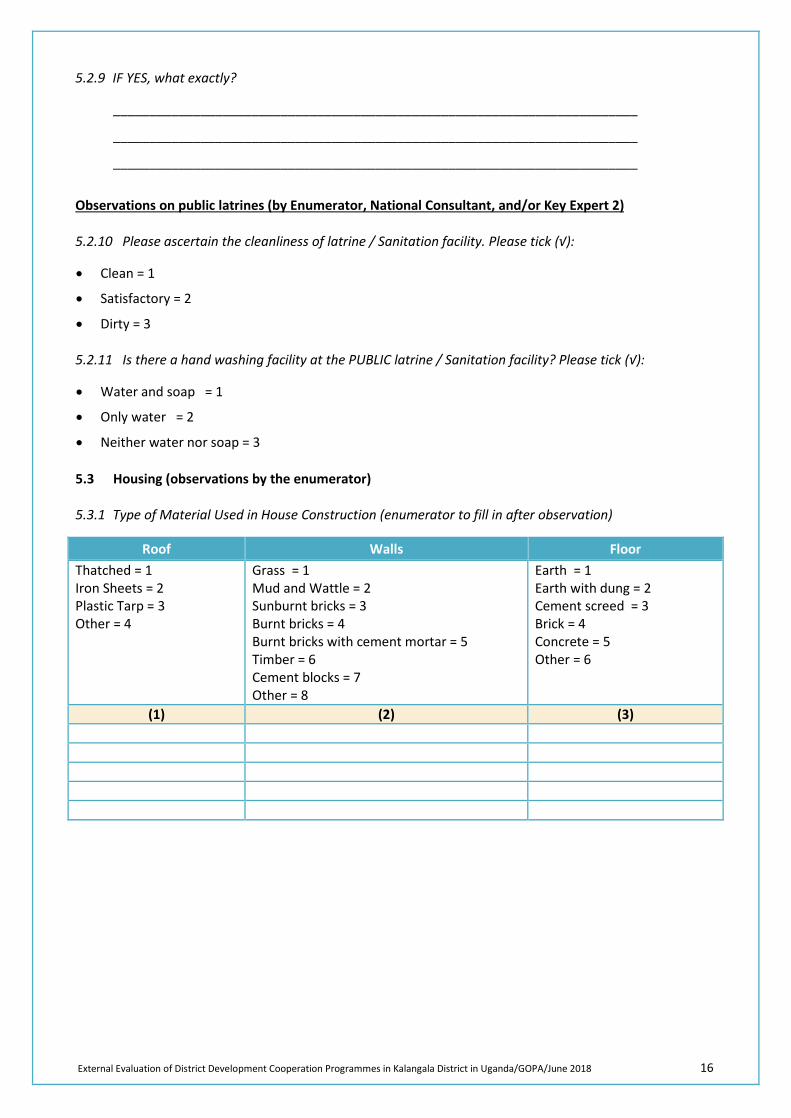
External Evaluation of District Development Cooperation Programmes in Kalangala District in Uganda/GOPA/June 2018 16
5.2.9 IF YES, what exactly?
________________________________________________________________________
________________________________________________________________________
________________________________________________________________________
Observations on public latrines (by Enumerator, National Consultant, and/or Key Expert 2)
5.2.10 Please ascertain the cleanliness of latrine / Sanitation facility. Please tick (√):
• Clean = 1
• Satisfactory = 2
• Dirty = 3
5.2.11 Is there a hand washing facility at the PUBLIC latrine / Sanitation facility? Please tick (√):
• Water and soap = 1
• Only water = 2
• Neither water nor soap = 3
5.3 Housing (observations by the enumerator)
5.3.1 Type of Material Used in House Construction (enumerator to fill in after observation)
Roof Walls Floor Thatched = 1 Iron Sheets = 2 Plastic Tarp = 3 Other = 4
Grass = 1 Mud and Wattle = 2 Sunburnt bricks = 3 Burnt bricks = 4 Burnt bricks with cement mortar = 5 Timber = 6 Cement blocks = 7 Other = 8
Earth = 1 Earth with dung = 2 Cement screed = 3 Brick = 4 Concrete = 5 Other = 6
(1) (2) (3)
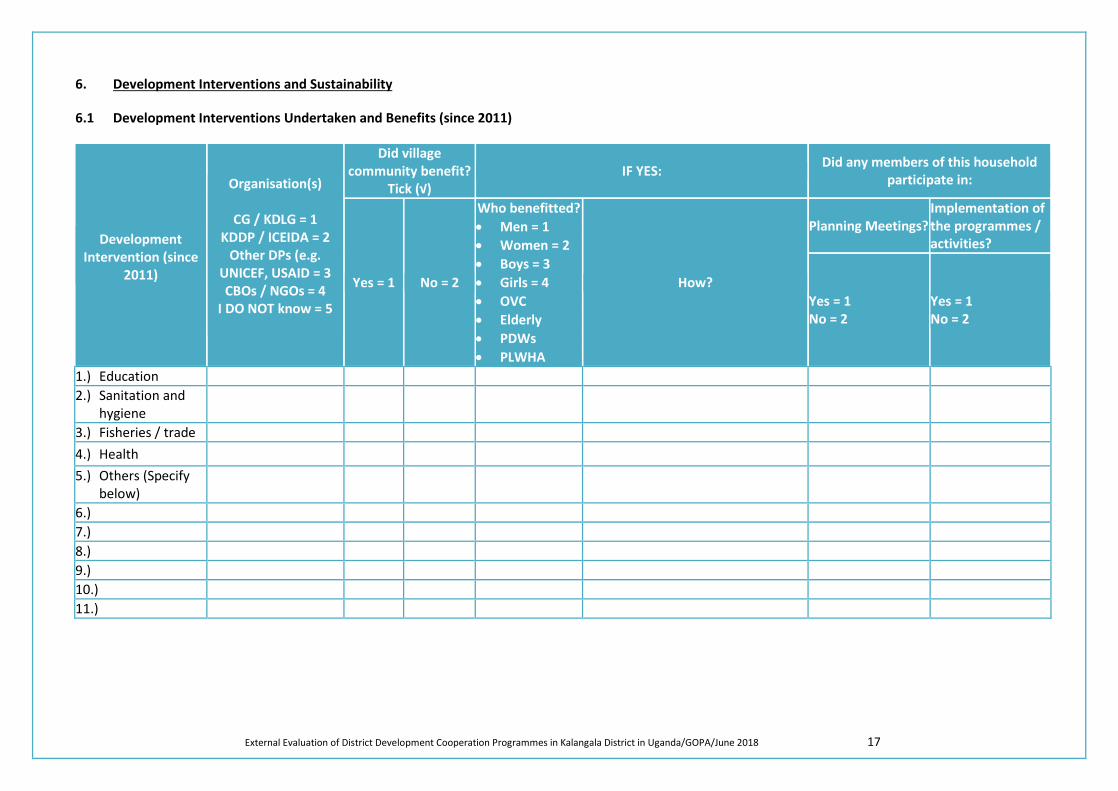
External Evaluation of District Development Cooperation Programmes in Kalangala District in Uganda/GOPA/June 2018 17
6. Development Interventions and Sustainability
6.1 Development Interventions Undertaken and Benefits (since 2011)
Development Intervention (since
2011)
Organisation(s)
CG / KDLG = 1 KDDP / ICEIDA = 2
Other DPs (e.g. UNICEF, USAID = 3 CBOs / NGOs = 4
I DO NOT know = 5
Did village community benefit?
Tick (√) IF YES: Did any members of this household
participate in:
Yes = 1 No = 2
Who benefitted? • Men = 1 • Women = 2 • Boys = 3 • Girls = 4 • OVC • Elderly • PDWs • PLWHA
How?
Planning Meetings? Implementation of the programmes / activities?
Yes = 1 No = 2
Yes = 1 No = 2
1.) Education 2.) Sanitation and
hygiene
3.) Fisheries / trade 4.) Health 5.) Others (Specify
below)
6.) 7.) 8.) 9.) 10.) 11.)
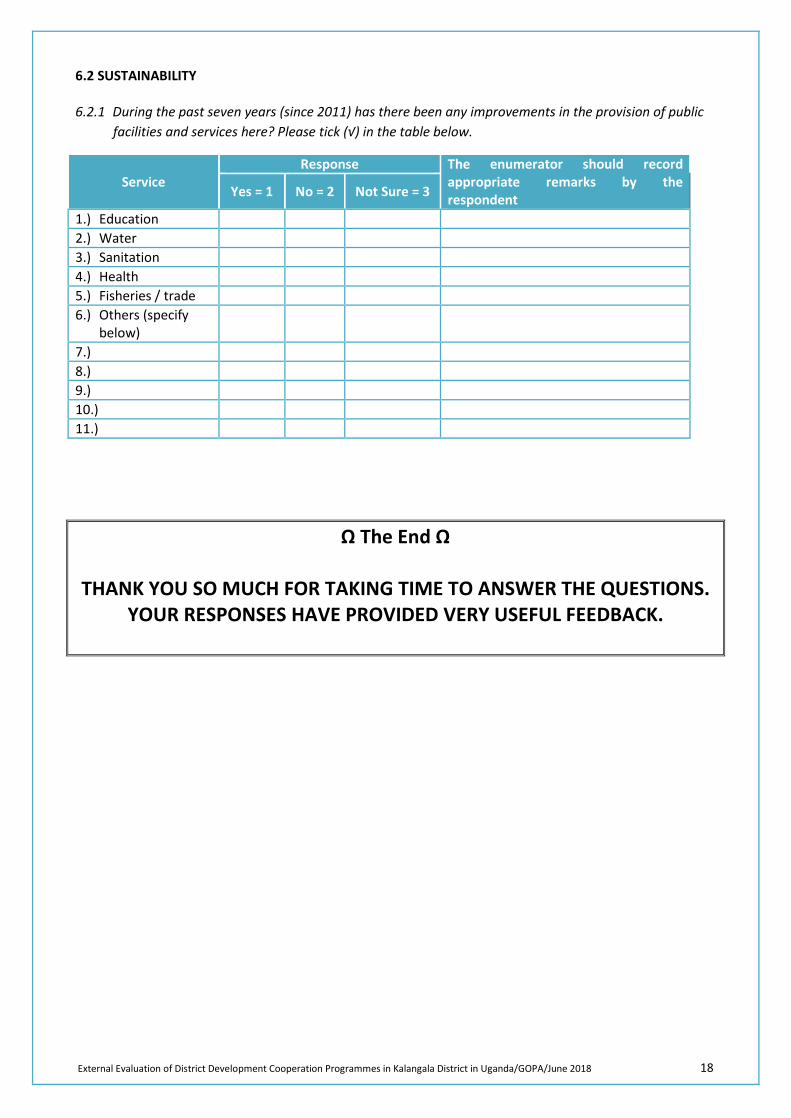
External Evaluation of District Development Cooperation Programmes in Kalangala District in Uganda/GOPA/June 2018 18
6.2 SUSTAINABILITY
6.2.1 During the past seven years (since 2011) has there been any improvements in the provision of public facilities and services here? Please tick (√) in the table below.
Service Response The enumerator should record
appropriate remarks by the respondent Yes = 1 No = 2 Not Sure = 3
1.) Education 2.) Water 3.) Sanitation 4.) Health 5.) Fisheries / trade 6.) Others (specify
below)
7.) 8.) 9.) 10.) 11.)
Ω The End Ω
THANK YOU SO MUCH FOR TAKING TIME TO ANSWER THE QUESTIONS. YOUR RESPONSES HAVE PROVIDED VERY USEFUL FEEDBACK.
External Evaluation of District Development Cooperation Programmes in Kalangala District in Uganda/GOPA/June 2018 19
KALANGALA DISTRICT LOCAL GOVERNMENT
END OF PROGRAMME EVALUATION KEY INTERVIEW
and FOCUS GROUP INTERVIEW GUIDE
Final (Version 3 April 2018)
CONDUCTED BY GOPA CONSULTANTS WITH SUPPORT FROM ICEIDA
Date of interview: ……………………………………………… Location of Interview (District/ Sub-county/ Village/ Landing site/ School/ Health Centre): ………………………………………………………………………………………………………………………………………………… ……………………………………………………………………………………………………………………………………………… ……………………………………………………………………………………………………………………………………………… Name and position of persons interviewed: ………………………………………………………………………… Name of interviewer:……………………………..……………………………………………………………………………
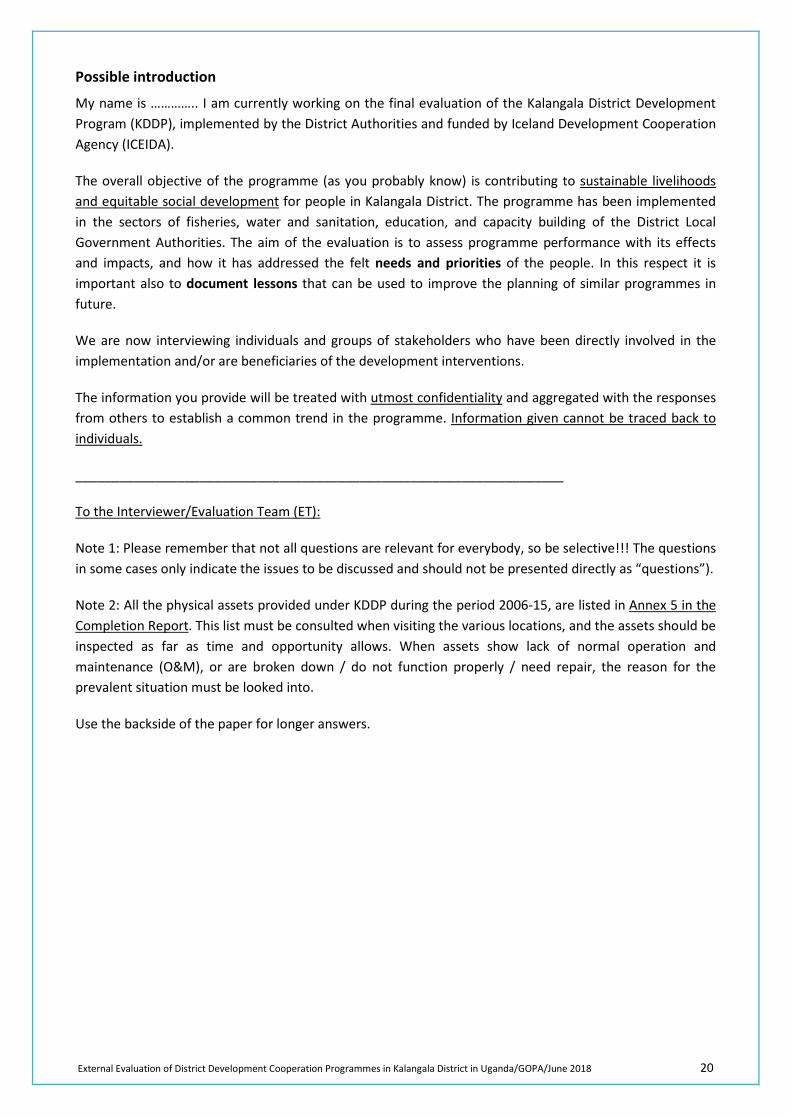
External Evaluation of District Development Cooperation Programmes in Kalangala District in Uganda/GOPA/June 2018 20
Possible introduction
My name is ………….. I am currently working on the final evaluation of the Kalangala District Development Program (KDDP), implemented by the District Authorities and funded by Iceland Development Cooperation Agency (ICEIDA).
The overall objective of the programme (as you probably know) is contributing to sustainable livelihoods and equitable social development for people in Kalangala District. The programme has been implemented in the sectors of fisheries, water and sanitation, education, and capacity building of the District Local Government Authorities. The aim of the evaluation is to assess programme performance with its effects and impacts, and how it has addressed the felt needs and priorities of the people. In this respect it is important also to document lessons that can be used to improve the planning of similar programmes in future.
We are now interviewing individuals and groups of stakeholders who have been directly involved in the implementation and/or are beneficiaries of the development interventions.
The information you provide will be treated with utmost confidentiality and aggregated with the responses from others to establish a common trend in the programme. Information given cannot be traced back to individuals.
___________________________________________________________________
To the Interviewer/Evaluation Team (ET):
Note 1: Please remember that not all questions are relevant for everybody, so be selective!!! The questions in some cases only indicate the issues to be discussed and should not be presented directly as “questions”).
Note 2: All the physical assets provided under KDDP during the period 2006-15, are listed in Annex 5 in the Completion Report. This list must be consulted when visiting the various locations, and the assets should be inspected as far as time and opportunity allows. When assets show lack of normal operation and maintenance (O&M), or are broken down / do not function properly / need repair, the reason for the prevalent situation must be looked into.
Use the backside of the paper for longer answers.
External Evaluation of District Development Cooperation Programmes in Kalangala District in Uganda/GOPA/June 2018 21
1. Health Centres
1.1 As the health component in the programme ended in 2010, the main issue is to detect the trend in community health since then. We should ask for data / statistics showing reported cases of e.g. Malaria, Diarrhoea, Dysentery, Intestinal worms, Other, - meaning especially the diseases connected to water, sanitation and hygiene. (The statistics will also be compared to the statistics kept with the District authorities).
1.2 If significant changes, ask what the health personnel believe that reasons could be.
………………………………………………………………………………………………………………………………………………………………………
1.3 In general, are there more consultations today than some 7 years back (since 2010)? ………………………………………………………………………………………………………………………………………………………………………
IF YES, what could be the reasons?
………………………………………………………………………………………………………………………………………………………………………
1.4 Have the cases where the patients are not treated / cured in this HC increased / reduced, and patients are referred to other health unit?
……………………………………………………………………………………………………………………………………………………………………………………………………………………
1.5 Any increase in verified cases of HIV/AIDS?
……………………………………………………………………………………………………………………………………………………………………………………………………………………
1.6 Is there adequate number of staff, properly educated and trained at the health centre? Has staff been added and trained since 2010?
……………………………………………………………………………………………………………………………………………………………………………………………………………………
1.7 From the list of infrastructure and equipment/materials provided by the project (found in Annex 5 in the Completion Report), ask the staff if all are in good operational condition and visibly inspect and verify as much as possible. If O&M seems to be lacking and there are needs for repair, what are the reasons for these shortcomings (financial, human capacity, etc.).
………………………………………………………………………………………………………………………………………………………………………………………………………………………………………………………………………………………………………………………………………………
1.8 To the interviewer: In case WASH infrastructure was fubded by the project, visibly inspect and verify the operational condition of latrines or toilets and domestic and process water supply systems as much as possible. Especially inspect the cleanliness of the latrines and the functioning / accessibility of the water supply.
………………………………………………………………………………………………………………………………………………………………………………………………………………………………………………………………………………………………………………………………………………
External Evaluation of District Development Cooperation Programmes in Kalangala District in Uganda/GOPA/June 2018 22
2. Schools
2.1 The Education and Sports component ended in 2015, but support from ICEIDA to the sector continued through the consolidation phase (2015-19). The main issue is to detect the trend of key indicators in the school from MTR (in 2010) until now. Such indictors are mainly with gender ratio / gender parity index for all:
• Pass rates in national primary leaving examinations (PLE)
• Gross enrolment rate (GER)
• Retention rate / survival rate in the school (survival rate to grade 5 and gender parity index.)
• Survival rate to grade 7 and gender parity index.
• Completion rate for boys and girls.
• Access to basic school infrastructure and facilities, including provision of learning and teaching materials.
• Pupil to textbook ratio.
• Pupil to teacher ratio
[Ask for reasons why the trend is pointing up or down!! The statistics will also be compared to the statistics kept with the District Authorities].
2.2 Are all teacher positions filled with qualified people?
………………………………………………………………………………………………………………………………………………………………………
2.3 From the list of infrastructure and equipment/materials provided by the project (found in Annex 5 in the Completion Report), ask the staff if all are in good operational condition and visibly inspect and verify as much as possible.
………………………………………………………………………………………………………………………………………………………………………
a) If O&M seems to be lacking and there are needs for repair, what are the reasons for these shortcomings (financial, human capacity, etc.).
………………………………………………………………………………………………………………………………………………………………………
b) If pupils are involved in the O&M of WASH infrastruture (e.g. cleaning of latrines, providing water for hand washing, etc.), ask some of the pupils how this system works, and if they see the usefulness of this (questions to be asked as the interview proceeds). If there is soap available for hand washing, ask if the soap is always available (and not only put there because the evaluation team is coming), etc.
………………………………………………………………………………………………………………………………………………………………………
c) Ask the teachers and the adolescent girls (separately, the latter may be with a female teacher present) about attendance in school when the girls have the menstrual periods. Has it increased since 2010 (or since they started in school)?
………………………………………………………………………………………………………………………………………………………………………
External Evaluation of District Development Cooperation Programmes in Kalangala District in Uganda/GOPA/June 2018 23
2.4 To the interviewer: In case WASH infrastructure was fubded by the project, visibly inspect and verify the operational condition of latrines or toilets and domestic and process water supply systems as much as possible. Especially inspect the cleanliness of the latrines and the functioning / accessibility of the water supply.
………………………………………………………………………………………………………………………………………………………………………
External Evaluation of District Development Cooperation Programmes in Kalangala District in Uganda/GOPA/June 2018 24
3. Fish Management Units (BMU / Fishery Landing Sites)
3.1 Has the population on and around the landing site increased / reduced the last 3 years?
………………………………………………………………………………………………………………………………………………………………………
3.2 Is the BMU still operational / functional – officially or unofficially? Meeting regularly?
………………………………………………………………………………………………………………………………………………………………………
3.3 Do all the Fish Handling Sites (FHS) with improved infrastructure work satisfactorily?
…………………………………………………………………………………………………………
In case NOT - what does not work and why?
………………………………………………………………………………………………………………………………………………………………………
………………………………………………………………………………………………………………………………………………………………………
3.4 Who are supporting the FHS at present and what sort of support is it?
………………………………………………………………………………………………………………………………………………………………………
3.5 Has the quality of the fish improved since 2010, and even more from 2014, till today? (Ask to see Fish Health Certificates and other records).
………………………………………………………………………………………………………………………………………………………………………
3.6 Has there been any change in post-harvest loss from the in 2014 till today? (Ask to see the ledger book where such is recorded).
………………………………………………………………………………………………………………………………………………………………………
3.7 Has there been any changes in sales of fish the last since 2014?
…………………………………………………………………………………………………………………………………………………………………
IF YES, how much / percentage?
………………………………………………………………………………………………………………………………………………………………………
3.8 a) Does the water supply systems for fish processing and domestic use function properly?
……………………………………………………………………………………………………..…..
b) Who are operating and maintaining these and how often?
………………………………………………………………………………………………………………………………………………………………………
c) Any major repairs undertaken/outstanding?
………………………………………………………………………………………………………………………………………………………………………
External Evaluation of District Development Cooperation Programmes in Kalangala District in Uganda/GOPA/June 2018 25
3.9 a) Are the latrines in regular use?
………………………………………………………………………………………………………………………………………………………………………
b) Who clean the latrines?
……………………………………………………………………………………………………………………………………………………………………
c) Do people still use open defecation (land or lake)?
……………………………………………………………………………………………………………………………………………………………………
3.10 a) Has there been a reduction of water / sanitation-related diseases since 2010?
………………………………………………………………………………………………………………………………………………………………………
b) What about since 2014?
……………………………………………………………………………………………………………………………………………………………………
3.11 Has there been any capacity building or refreshment training at the landing site since the project ended in 2015?
………………………………………………………………………………………………………………………………………………………………………
3.12 Has the illegal fishing been reduced the last years and especially since the army started to control?
……………………………………………………………………………………………………………………………………………………………………………………………………………………
3.13 To the interviewer: From the list of infrastructure and materials provided by the project (found in Annex 5 in the Completion Report), visibly inspect and verify the operational condition of latrines or toilets and domestic and process water supply systems as much as possible. Especially inspect the cleanliness of the latrines and the functioning of the water supply.
Note: If there are army officers on site controlling the illegal fishing, it would be useful to interview them, if allowed, especially related to the number of reported / caught illegal fishermen, confiscated boats and illegal fishing gear, etc.
THANK YOU SO MUCH FOR TAKING TIME TO ANSWER THE QUESTIONS. YOUR RESPONSES HAVE PROVIDED VERY USEFUL FEEDBACK.
External Evaluation of District Development Cooperation Programmes in Kalangala District in Uganda/GOPA/June 2018 26
General Issues (Largely taken from the Consultant’s Terms of Reference.
Most of these general questions will be discussed with the staff at the District Administration only, and/or answer will be taken from/cross-checked with the written reports.
The International Key Expert will in general undertake such interviews.)
1. PROGRAMME RELEVANCE
1.1 Did the interventions address the critical needs and priorities of the District, Sub- County and Communities?
1.2 Did the programme address important issues in relation to priorities in the respective district and LLGs development plans?
1.3 Which assistance or services from the progamme have you been most satisfied with, and why?
1.4 Which assistance or services from the programme are you least satisfied with and why?
2. PROGRAMME EFFECTIVENESS
(Ref. also to outputs/ results listed in the Completion Report).
2.1 To what degree have the planned immediate results / outputs been delivered in accordance with the plans, at the appropriate quality and quantity and at planned cost?
2.2 Have the intended/expected effects / outcomes, following some time after programme ended, been achieved or are they likely to be achieved– and to what degree?
2.3 To what extent has the programme contributed to:
a) Efficient and effective leadership in the district together with quality administration and management of public services, along with strong private sector and civil society organisations?
b) Improved quality fisheries production and marketing in the Kalangala district.
c) Equitable access to quality education in Kalangala district.
d) Equitable access for the citizens to quality health services at district level (2006-2010).
e) Improved exploitation of Kalangala District tourism potential (2010-2013).
ASK FOR STATISTICS (preferably in advance of meeting).
2.4 What are the main challenges you have met during implementation of the programme?
3. PROGRAMME EFFICIENCY
3.1 Was the programme approach and design the most cost-effective way of spending the funds in order to achieve the planned results? Are there other ways as good or better? (ET’s assessment).
3.2 How has the sharing of responsibility and accountability been between the various key partners and stakeholders during implementation?
External Evaluation of District Development Cooperation Programmes in Kalangala District in Uganda/GOPA/June 2018 27
3.3 To what degree has the use of inputs in implementation been efficient (money, manpower, equipment)? (ET’s assessment).
a) Construction and procurement of goods and equipment
b) Arrangement of training
c) Monitoring and Evaluation (related to the M&E plans)
3.4 a) How did the following organs function and perform during the implementation of the project:
b) “Project Supervisory Committees”,
d) “Project Management Team”
e) “Project Implementation Team”
f) Was there a clear line of responsibilities?
3.5 Do you think the District Council had the absorption capacity to effectively manage and administer the funding and activities?
3.6 a)How transparent were the financial management aspects of the programme? (ET’s assessment. Describe the system).
b) How were the procurement procedures?
3.7 Was there community participation in the planning and implementation process?
3.8 What lessons can be learned from the efficiency aspects of this programme?
4. PROGRAMME IMPACT
4.1 Has the programme and its implementation had an impact, including and beyond the defined / planned results, on benefitting communities / schools / health services / fishing sector activities?
4.2 Do you think that the programme has changed the individual lives of the beneficiaries to the better (improved livelihoods, standard of living, etc.), measurable and perceived (including indicators from the key sectors of health, education, fisheries and water and sanitation, as defined in the respective project documents and government strategies in Uganda)?
[Ask for concrete examples for various groups: women, men, elderly and people with disabilities, the chronically ill, children and any other beneficiary category]
4.3 What have been the major changes in the wider community?
4.4 Are there any un-intended positive changes that the programme has achieved?
4.5 Are there any negative changes?
4.6 What challenges have you faced during the programme implementation?
4.7 How have you addressed the above challenges?
External Evaluation of District Development Cooperation Programmes in Kalangala District in Uganda/GOPA/June 2018 28
5. PROGRAMME SUSTAINABILITY
5.1 Has the capacity of the district local governments improved in terms of delivering basic services to the population, including health, water and sanitation and education?
5.2 Is it likely that the results can be maintained and operated for the benefit of the population without further external programme support? (This should in particular address matters concerning operations and maintenance of infrastructure.) IF NOT, what further support will be needed?
5.3 Has the contribution from the programme been within limits of the absorption capacity of the district?
5.4 To what extent has capacity building of the district governments been sustainable, for instance with regard to retention of qualified/trained district staff, and has it contributed to improved sustainability of project results?
5.5 What factors influence or challenge sustainability of the programme?
5.6 What will motivate beneficiaries to continue implementing the programme -activities and outputs?
5.7 Was any “Exit Strategy” developed (to meet the challenges when the funding from Iceland phased out)? (If yes, the interviewer must ask to see it).
5.8 Any other external financial support in the district since the end of the programme?
6. CROSSCUTTING ISSUES
6.1 GENDER:
a) Have both genders benefited from the programmes on equal terms?
b) To what extent did the programme create equal opportunities for men and women; and boys and girls to participate in implementation?
c) Have the programmes contributed to increased gender equality in the longer term?
d) Has the programme promoted the protection of vulnerable populations – especially children and women – from exploitation and abuse?
e) Has the programme addressed the needs of people with disabilities?
6.2 ENVIRONMENT:
a) Have the programmes caused any significant environmental impact, positive or negative? Examples?
b) Were proper environmental considerations followed during implementation of activities where applicable?
c) To what extent have the programmes encouraged improved and sustainable use and management of natural resources here also continuing after project implementation (land, forest, wetlands, etc.)?
External Evaluation of District Development Cooperation Programmes in Kalangala District in Uganda/GOPA/June 2018 29
7. LESSONS LEARNED
7.1 How were program assessment and design processes conducted?
7.2 Who participated?
7.3 To what extent did the partners, stakeholders and communities participate in the programme design and implementation strategies?
7.4. To what extent did the programme integrate / advocate strategies to address the root causes of poor sanitation and hygiene among the fishing communities?
7.5 What policy implications can be drawn from this Program performance?
7.6 To what extent did the program strategy outline clear roles and responsibilities of key partners (especially District Health and Education sector)?
7.7 To what extent were communities, government and other partners involved in the planning, implementation and accountability of Project core activities?
7.8 a) What can be learned from the program’s M&E system?
b) Which tools were used?
c) Who was involved in setting and implementing the M&E system?
d) What role did communities and other partners (e.g. government / CBOs) play?
7.9 How was information generated by the program M&E system used in decision-making?
7.10 What were its major strengths?
7.11 What were its weaknesses?
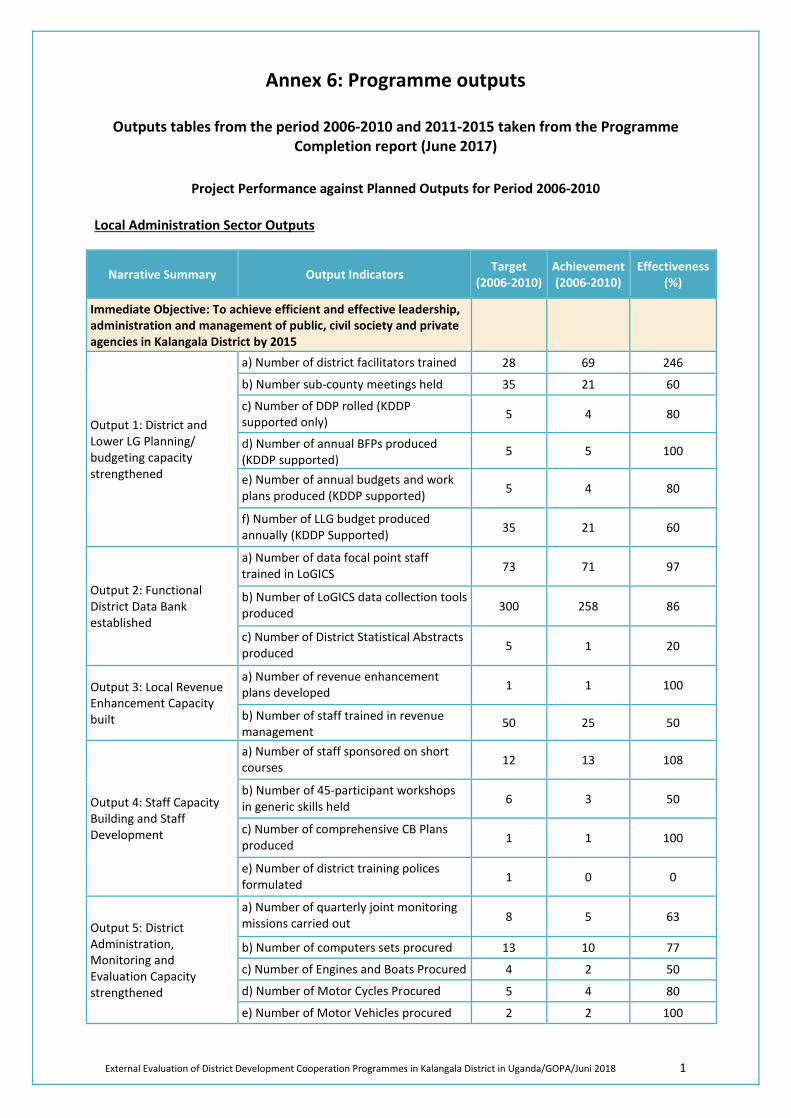
External Evaluation of District Development Cooperation Programmes in Kalangala District in Uganda/GOPA/Juni 2018 1
Annex 6: Programme outputs
Outputs tables from the period 2006-2010 and 2011-2015 taken from the Programme Completion report (June 2017)
Project Performance against Planned Outputs for Period 2006-2010
Local Administration Sector Outputs
Narrative Summary Output Indicators Target (2006-2010)
Achievement (2006-2010)
Effectiveness (%)
Immediate Objective: To achieve efficient and effective leadership, administration and management of public, civil society and private agencies in Kalangala District by 2015
Output 1: District and Lower LG Planning/ budgeting capacity strengthened
a) Number of district facilitators trained 28 69 246
b) Number sub-county meetings held 35 21 60
c) Number of DDP rolled (KDDP supported only) 5 4 80
d) Number of annual BFPs produced (KDDP supported)
5 5 100
e) Number of annual budgets and work plans produced (KDDP supported) 5 4 80
f) Number of LLG budget produced annually (KDDP Supported) 35 21 60
Output 2: Functional District Data Bank established
a) Number of data focal point staff trained in LoGICS 73 71 97
b) Number of LoGICS data collection tools produced 300 258 86
c) Number of District Statistical Abstracts produced 5 1 20
Output 3: Local Revenue Enhancement Capacity built
a) Number of revenue enhancement plans developed 1 1 100
b) Number of staff trained in revenue management
50 25 50
Output 4: Staff Capacity Building and Staff Development
a) Number of staff sponsored on short courses 12 13 108
b) Number of 45-participant workshops in generic skills held 6 3 50
c) Number of comprehensive CB Plans produced 1 1 100
e) Number of district training polices formulated 1 0 0
Output 5: District Administration, Monitoring and Evaluation Capacity strengthened
a) Number of quarterly joint monitoring missions carried out 8 5 63
b) Number of computers sets procured 13 10 77
c) Number of Engines and Boats Procured 4 2 50
d) Number of Motor Cycles Procured 5 4 80
e) Number of Motor Vehicles procured 2 2 100
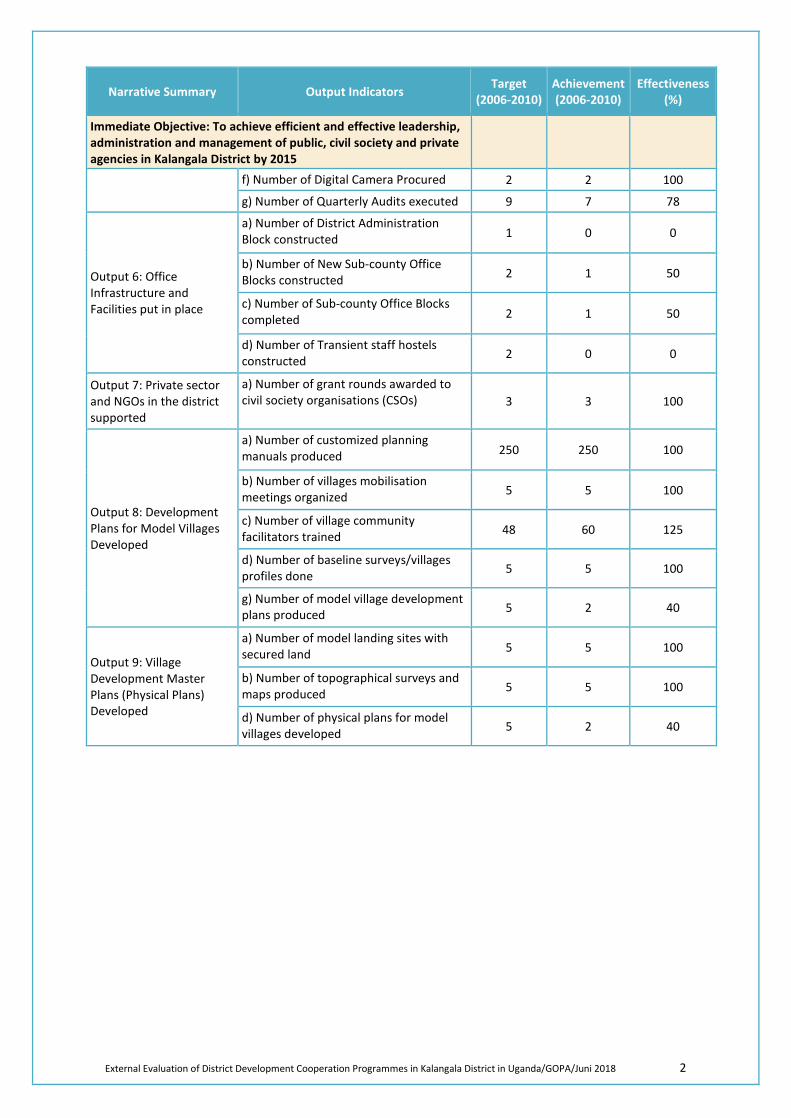
External Evaluation of District Development Cooperation Programmes in Kalangala District in Uganda/GOPA/Juni 2018 2
Narrative Summary Output Indicators Target (2006-2010)
Achievement (2006-2010)
Effectiveness (%)
Immediate Objective: To achieve efficient and effective leadership, administration and management of public, civil society and private agencies in Kalangala District by 2015
f) Number of Digital Camera Procured 2 2 100
g) Number of Quarterly Audits executed 9 7 78
Output 6: Office Infrastructure and Facilities put in place
a) Number of District Administration Block constructed 1 0 0
b) Number of New Sub-county Office Blocks constructed 2 1 50
c) Number of Sub-county Office Blocks completed 2 1 50
d) Number of Transient staff hostels constructed 2 0 0
Output 7: Private sector and NGOs in the district supported
a) Number of grant rounds awarded to civil society organisations (CSOs) 3 3 100
Output 8: Development Plans for Model Villages Developed
a) Number of customized planning manuals produced 250 250 100
b) Number of villages mobilisation meetings organized 5 5 100
c) Number of village community facilitators trained 48 60 125
d) Number of baseline surveys/villages profiles done 5 5 100
g) Number of model village development plans produced 5 2 40
Output 9: Village Development Master Plans (Physical Plans) Developed
a) Number of model landing sites with secured land 5 5 100
b) Number of topographical surveys and maps produced 5 5 100
d) Number of physical plans for model villages developed 5 2 40
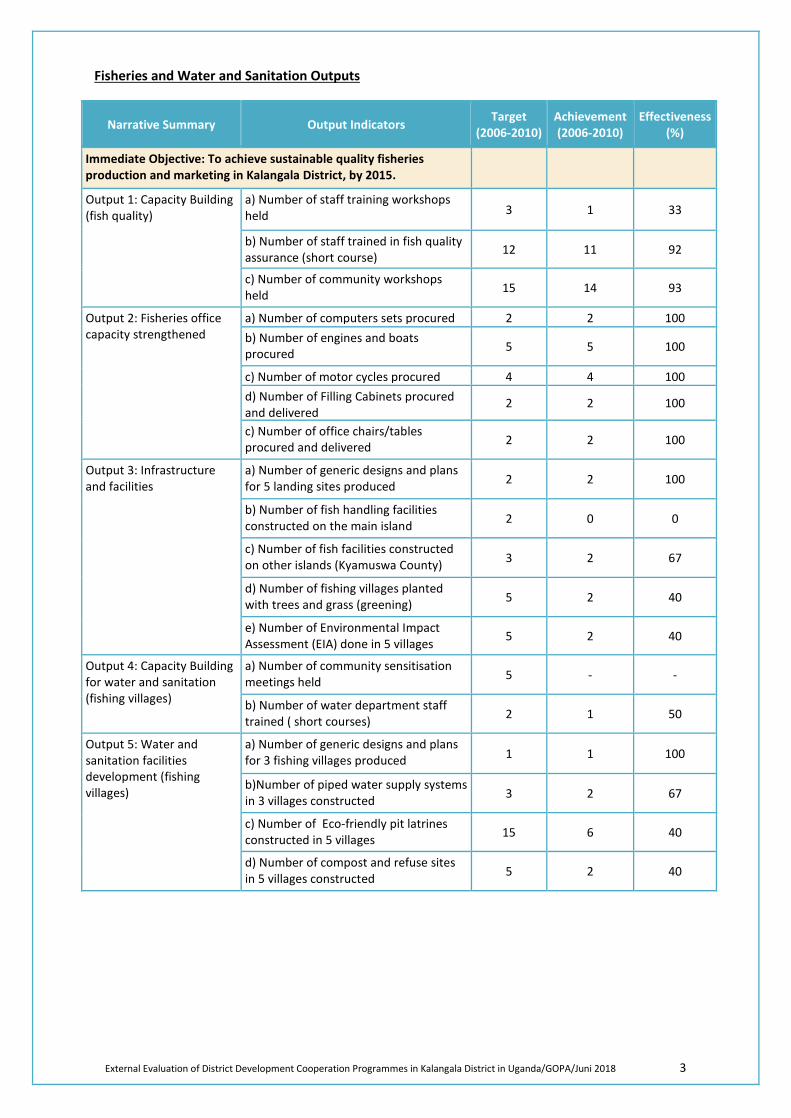
External Evaluation of District Development Cooperation Programmes in Kalangala District in Uganda/GOPA/Juni 2018 3
Fisheries and Water and Sanitation Outputs
Narrative Summary Output Indicators Target (2006-2010)
Achievement (2006-2010)
Effectiveness (%)
Immediate Objective: To achieve sustainable quality fisheries production and marketing in Kalangala District, by 2015.
Output 1: Capacity Building (fish quality)
a) Number of staff training workshops held 3 1 33
b) Number of staff trained in fish quality assurance (short course) 12 11 92
c) Number of community workshops held 15 14 93
Output 2: Fisheries office capacity strengthened
a) Number of computers sets procured 2 2 100 b) Number of engines and boats procured 5 5 100
c) Number of motor cycles procured 4 4 100 d) Number of Filling Cabinets procured and delivered
2 2 100
c) Number of office chairs/tables procured and delivered 2 2 100
Output 3: Infrastructure and facilities
a) Number of generic designs and plans for 5 landing sites produced 2 2 100
b) Number of fish handling facilities constructed on the main island 2 0 0
c) Number of fish facilities constructed on other islands (Kyamuswa County) 3 2 67
d) Number of fishing villages planted with trees and grass (greening) 5 2 40
e) Number of Environmental Impact Assessment (EIA) done in 5 villages 5 2 40
Output 4: Capacity Building for water and sanitation (fishing villages)
a) Number of community sensitisation meetings held 5 - -
b) Number of water department staff trained ( short courses) 2 1 50
Output 5: Water and sanitation facilities development (fishing villages)
a) Number of generic designs and plans for 3 fishing villages produced 1 1 100
b)Number of piped water supply systems in 3 villages constructed 3 2 67
c) Number of Eco-friendly pit latrines constructed in 5 villages 15 6 40
d) Number of compost and refuse sites in 5 villages constructed 5 2 40
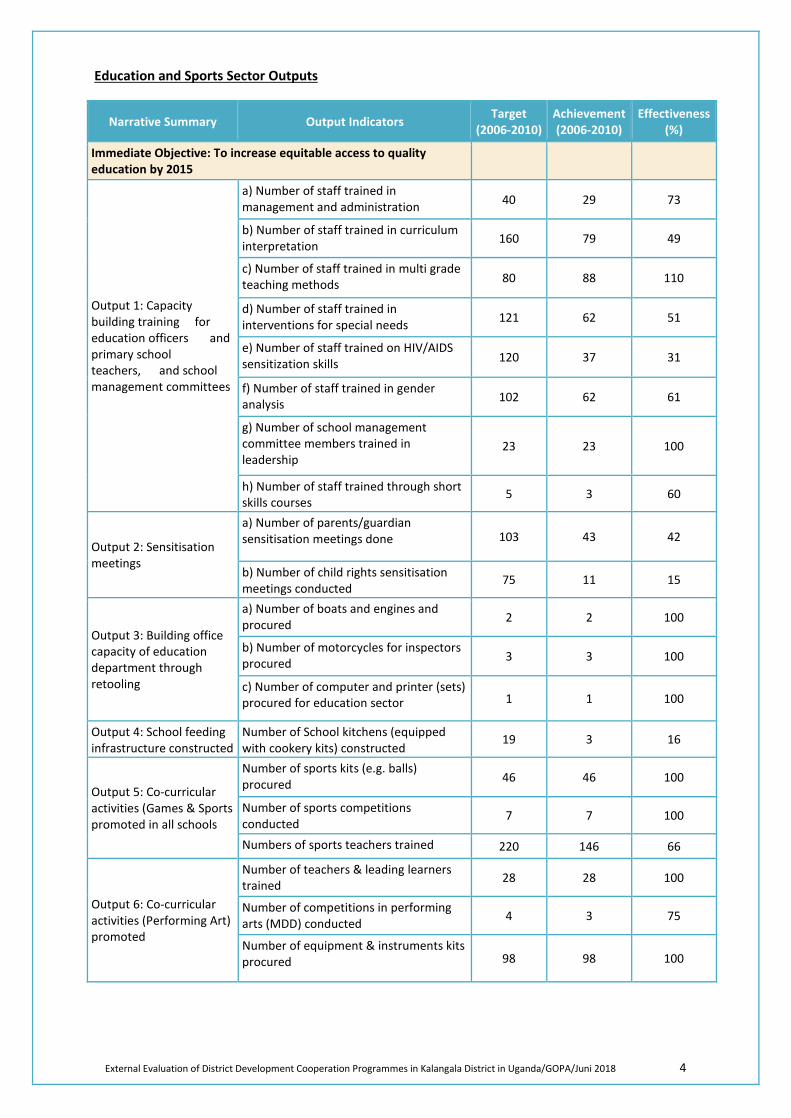
External Evaluation of District Development Cooperation Programmes in Kalangala District in Uganda/GOPA/Juni 2018 4
Education and Sports Sector Outputs
Narrative Summary Output Indicators Target (2006-2010)
Achievement (2006-2010)
Effectiveness (%)
Immediate Objective: To increase equitable access to quality education by 2015
Output 1: Capacity building training for education officers and primary school teachers, and school management committees
a) Number of staff trained in management and administration 40 29 73
b) Number of staff trained in curriculum interpretation 160 79 49
c) Number of staff trained in multi grade teaching methods 80 88 110
d) Number of staff trained in interventions for special needs 121 62 51
e) Number of staff trained on HIV/AIDS sensitization skills 120 37 31
f) Number of staff trained in gender analysis 102 62 61
g) Number of school management committee members trained in leadership
23 23 100
h) Number of staff trained through short skills courses
5 3 60
Output 2: Sensitisation meetings
a) Number of parents/guardian sensitisation meetings done 103 43 42
b) Number of child rights sensitisation meetings conducted
75 11 15
Output 3: Building office capacity of education department through retooling
a) Number of boats and engines and procured 2 2 100
b) Number of motorcycles for inspectors procured 3 3 100
c) Number of computer and printer (sets) procured for education sector 1 1 100
Output 4: School feeding infrastructure constructed
Number of School kitchens (equipped with cookery kits) constructed
19 3 16
Output 5: Co-curricular activities (Games & Sports promoted in all schools
Number of sports kits (e.g. balls) procured 46 46 100
Number of sports competitions conducted
7 7 100
Numbers of sports teachers trained 220 146 66
Output 6: Co-curricular activities (Performing Art) promoted
Number of teachers & leading learners trained 28 28 100
Number of competitions in performing arts (MDD) conducted 4 3 75
Number of equipment & instruments kits procured 98 98 100
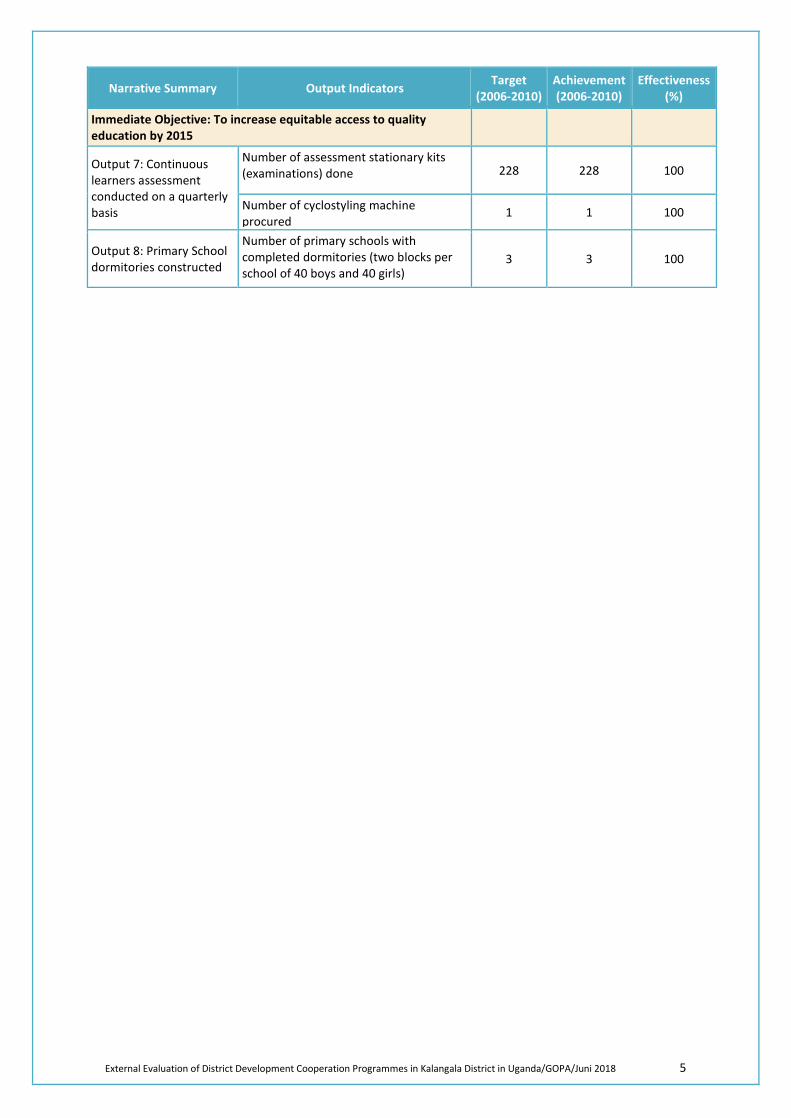
External Evaluation of District Development Cooperation Programmes in Kalangala District in Uganda/GOPA/Juni 2018 5
Narrative Summary Output Indicators Target (2006-2010)
Achievement (2006-2010)
Effectiveness (%)
Immediate Objective: To increase equitable access to quality education by 2015
Output 7: Continuous learners assessment conducted on a quarterly basis
Number of assessment stationary kits (examinations) done 228 228 100
Number of cyclostyling machine procured
1 1 100
Output 8: Primary School dormitories constructed
Number of primary schools with completed dormitories (two blocks per school of 40 boys and 40 girls)
3 3 100
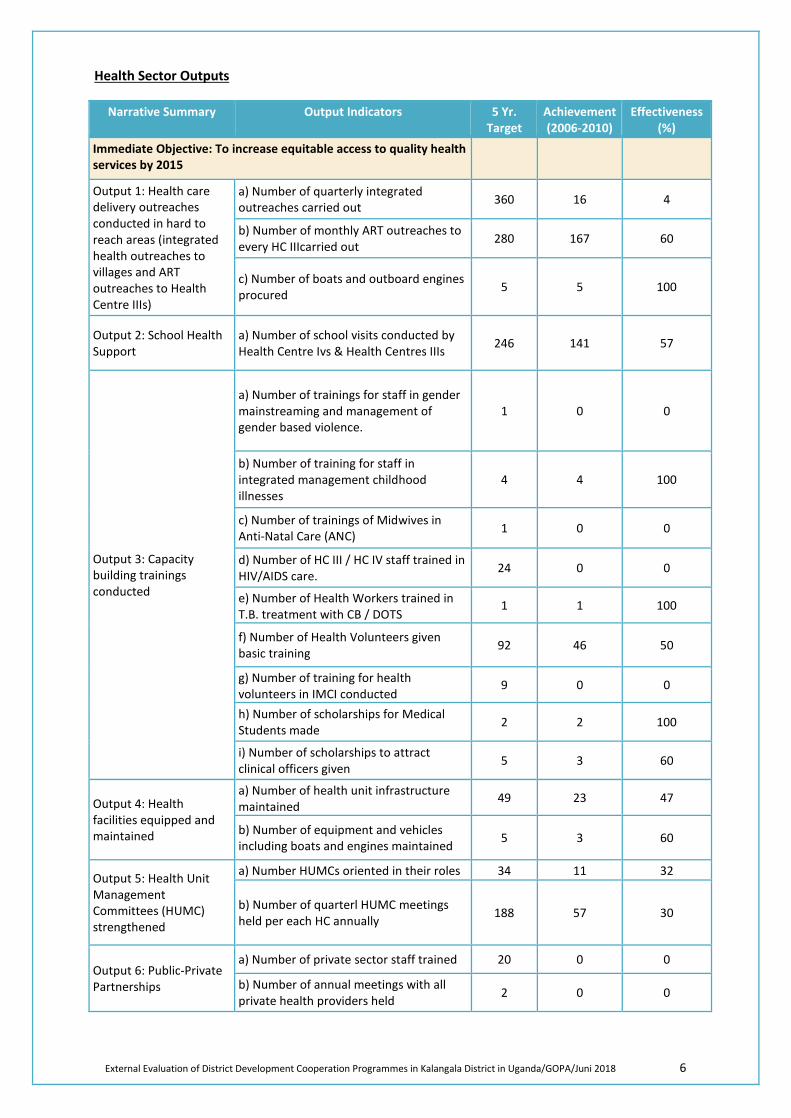
External Evaluation of District Development Cooperation Programmes in Kalangala District in Uganda/GOPA/Juni 2018 6
Health Sector Outputs
Narrative Summary Output Indicators 5 Yr. Target
Achievement (2006-2010)
Effectiveness (%)
Immediate Objective: To increase equitable access to quality health services by 2015
Output 1: Health care delivery outreaches conducted in hard to reach areas (integrated health outreaches to villages and ART outreaches to Health Centre IIIs)
a) Number of quarterly integrated outreaches carried out 360 16 4
b) Number of monthly ART outreaches to every HC IIIcarried out 280 167 60
c) Number of boats and outboard engines procured 5 5 100
Output 2: School Health Support
a) Number of school visits conducted by Health Centre Ivs & Health Centres IIIs 246 141 57
Output 3: Capacity building trainings conducted
a) Number of trainings for staff in gender mainstreaming and management of gender based violence.
1 0 0
b) Number of training for staff in integrated management childhood illnesses
4 4 100
c) Number of trainings of Midwives in Anti-Natal Care (ANC) 1 0 0
d) Number of HC III / HC IV staff trained in HIV/AIDS care. 24 0 0
e) Number of Health Workers trained in T.B. treatment with CB / DOTS
1 1 100
f) Number of Health Volunteers given basic training 92 46 50
g) Number of training for health volunteers in IMCI conducted
9 0 0
h) Number of scholarships for Medical Students made 2 2 100
i) Number of scholarships to attract clinical officers given 5 3 60
Output 4: Health facilities equipped and maintained
a) Number of health unit infrastructure maintained
49 23 47
b) Number of equipment and vehicles including boats and engines maintained 5 3 60
Output 5: Health Unit Management Committees (HUMC) strengthened
a) Number HUMCs oriented in their roles 34 11 32
b) Number of quarterl HUMC meetings held per each HC annually 188 57 30
Output 6: Public-Private Partnerships
a) Number of private sector staff trained 20 0 0
b) Number of annual meetings with all private health providers held 2 0 0
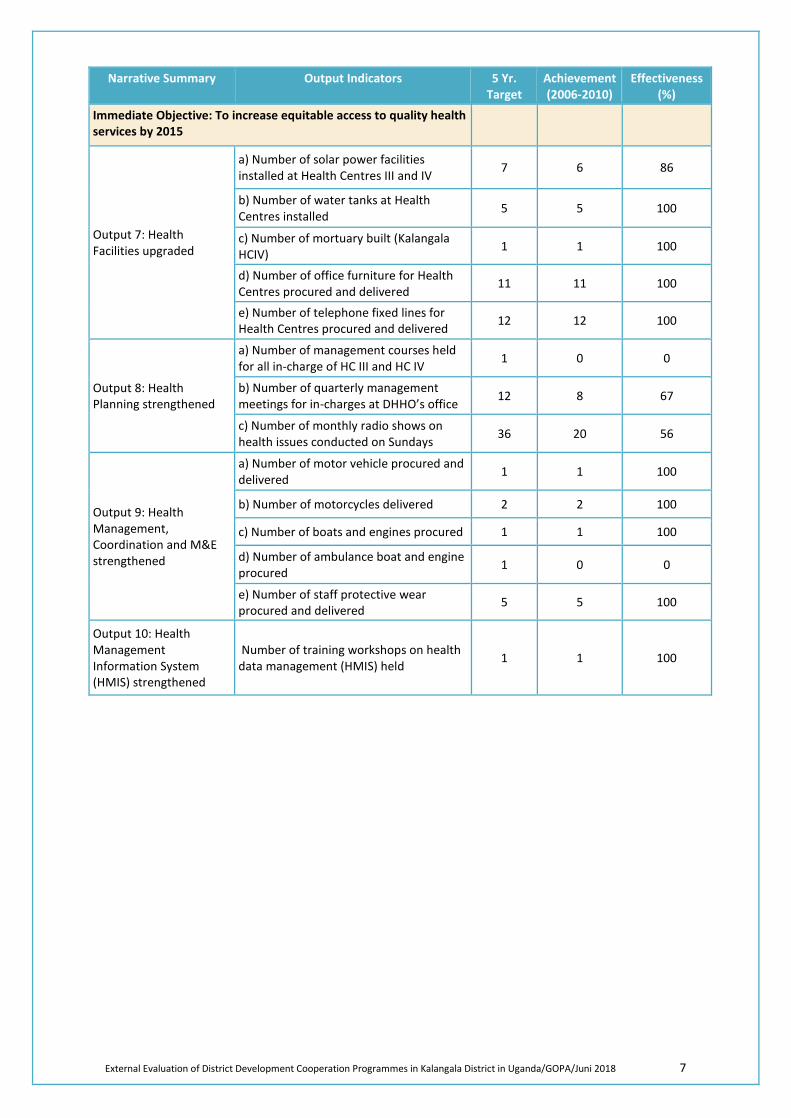
External Evaluation of District Development Cooperation Programmes in Kalangala District in Uganda/GOPA/Juni 2018 7
Narrative Summary Output Indicators 5 Yr. Target
Achievement (2006-2010)
Effectiveness (%)
Immediate Objective: To increase equitable access to quality health services by 2015
Output 7: Health Facilities upgraded
a) Number of solar power facilities installed at Health Centres III and IV 7 6 86
b) Number of water tanks at Health Centres installed 5 5 100
c) Number of mortuary built (Kalangala HCIV) 1 1 100
d) Number of office furniture for Health Centres procured and delivered 11 11 100
e) Number of telephone fixed lines for Health Centres procured and delivered 12 12 100
Output 8: Health Planning strengthened
a) Number of management courses held for all in-charge of HC III and HC IV 1 0 0
b) Number of quarterly management meetings for in-charges at DHHO’s office 12 8 67
c) Number of monthly radio shows on health issues conducted on Sundays 36 20 56
Output 9: Health Management, Coordination and M&E strengthened
a) Number of motor vehicle procured and delivered 1 1 100
b) Number of motorcycles delivered 2 2 100
c) Number of boats and engines procured 1 1 100
d) Number of ambulance boat and engine procured 1 0 0
e) Number of staff protective wear procured and delivered
5 5 100
Output 10: Health Management Information System (HMIS) strengthened
Number of training workshops on health data management (HMIS) held 1 1 100
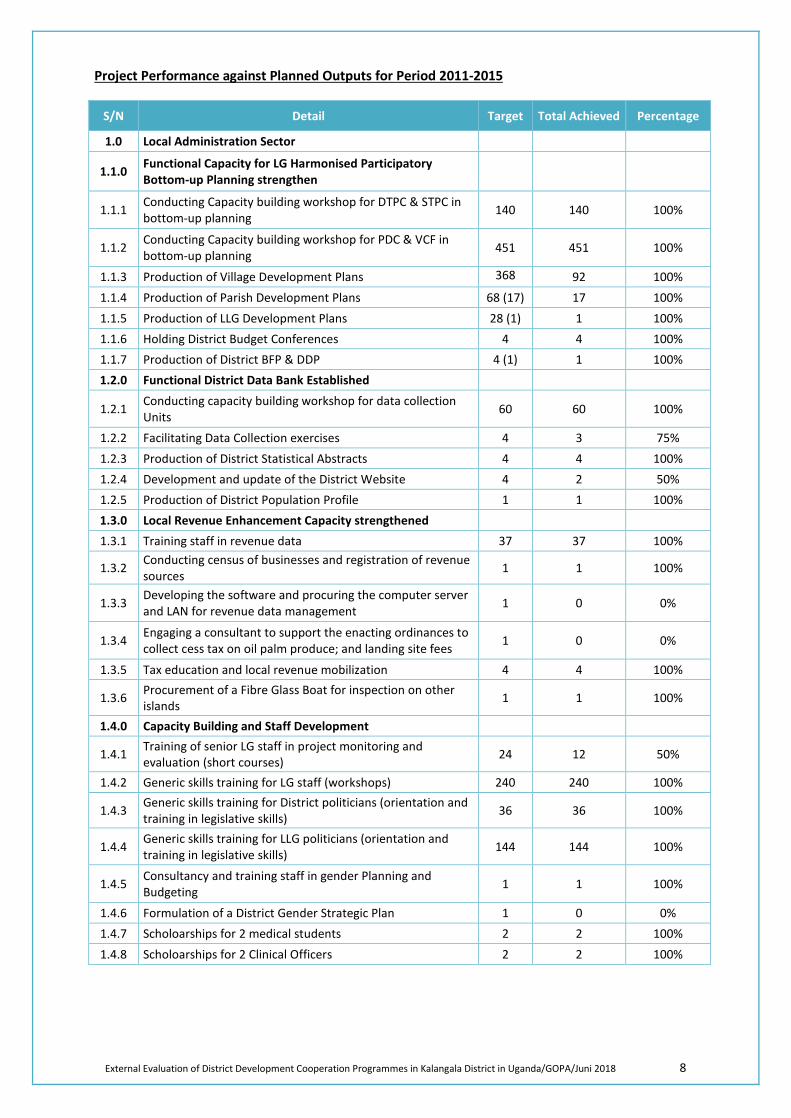
External Evaluation of District Development Cooperation Programmes in Kalangala District in Uganda/GOPA/Juni 2018 8
Project Performance against Planned Outputs for Period 2011-2015
S/N Detail Target Total Achieved Percentage
1.0 Local Administration Sector
1.1.0 Functional Capacity for LG Harmonised Participatory Bottom-up Planning strengthen
1.1.1 Conducting Capacity building workshop for DTPC & STPC in bottom-up planning 140 140 100%
1.1.2 Conducting Capacity building workshop for PDC & VCF in bottom-up planning 451 451 100%
1.1.3 Production of Village Development Plans 368 ( )
92 100% 1.1.4 Production of Parish Development Plans 68 (17) 17 100% 1.1.5 Production of LLG Development Plans 28 (1) 1 100% 1.1.6 Holding District Budget Conferences 4 4 100% 1.1.7 Production of District BFP & DDP 4 (1) 1 100% 1.2.0 Functional District Data Bank Established
1.2.1 Conducting capacity building workshop for data collection Units 60 60 100%
1.2.2 Facilitating Data Collection exercises 4 3 75% 1.2.3 Production of District Statistical Abstracts 4 4 100% 1.2.4 Development and update of the District Website 4 2 50% 1.2.5 Production of District Population Profile 1 1 100% 1.3.0 Local Revenue Enhancement Capacity strengthened 1.3.1 Training staff in revenue data 37 37 100%
1.3.2 Conducting census of businesses and registration of revenue sources 1 1 100%
1.3.3 Developing the software and procuring the computer server and LAN for revenue data management 1 0 0%
1.3.4 Engaging a consultant to support the enacting ordinances to collect cess tax on oil palm produce; and landing site fees 1 0 0%
1.3.5 Tax education and local revenue mobilization 4 4 100%
1.3.6 Procurement of a Fibre Glass Boat for inspection on other islands 1 1 100%
1.4.0 Capacity Building and Staff Development
1.4.1 Training of senior LG staff in project monitoring and evaluation (short courses) 24 12 50%
1.4.2 Generic skills training for LG staff (workshops) 240 240 100%
1.4.3 Generic skills training for District politicians (orientation and training in legislative skills) 36 36 100%
1.4.4 Generic skills training for LLG politicians (orientation and training in legislative skills) 144 144 100%
1.4.5 Consultancy and training staff in gender Planning and Budgeting 1 1 100%
1.4.6 Formulation of a District Gender Strategic Plan 1 0 0% 1.4.7 Scholoarships for 2 medical students 2 2 100% 1.4.8 Scholoarships for 2 Clinical Officers 2 2 100%
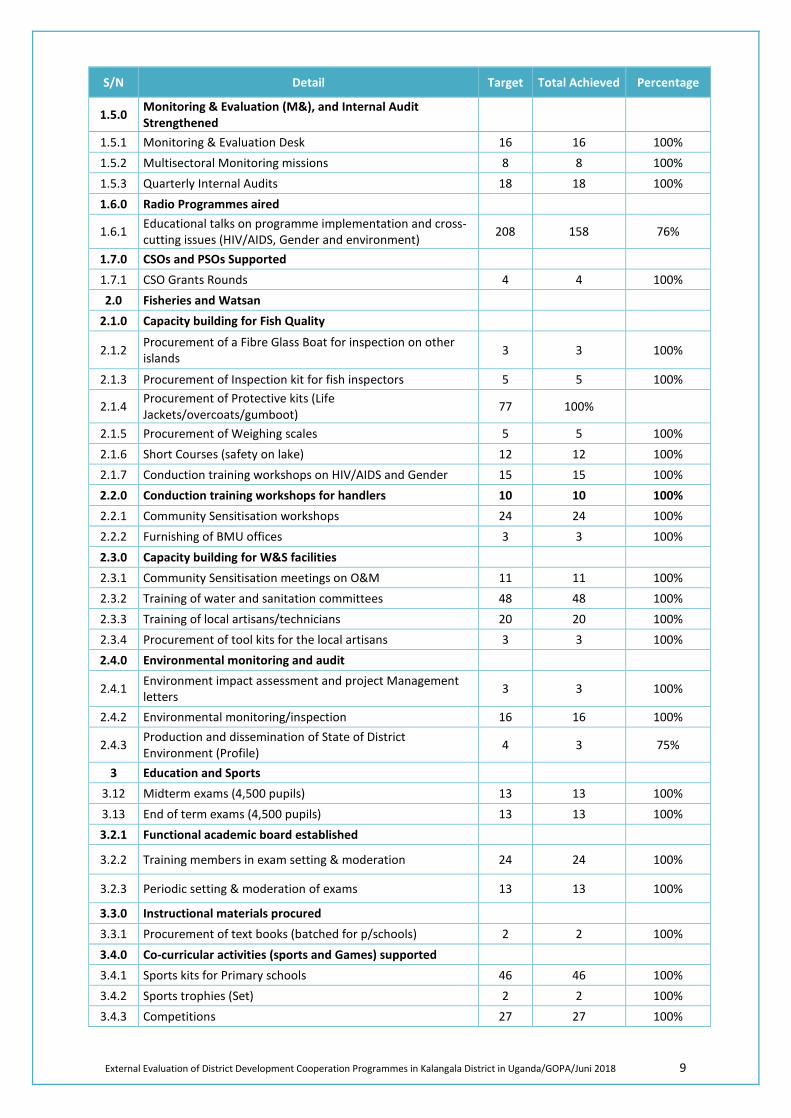
External Evaluation of District Development Cooperation Programmes in Kalangala District in Uganda/GOPA/Juni 2018 9
S/N Detail Target Total Achieved Percentage
1.5.0 Monitoring & Evaluation (M&), and Internal Audit Strengthened
1.5.1 Monitoring & Evaluation Desk 16 16 100% 1.5.2 Multisectoral Monitoring missions 8 8 100% 1.5.3 Quarterly Internal Audits 18 18 100% 1.6.0 Radio Programmes aired
1.6.1 Educational talks on programme implementation and cross-cutting issues (HIV/AIDS, Gender and environment) 208 158 76%
1.7.0 CSOs and PSOs Supported 1.7.1 CSO Grants Rounds 4 4 100% 2.0 Fisheries and Watsan
2.1.0 Capacity building for Fish Quality
2.1.2 Procurement of a Fibre Glass Boat for inspection on other islands 3 3 100%
2.1.3 Procurement of Inspection kit for fish inspectors 5 5 100%
2.1.4 Procurement of Protective kits (Life Jackets/overcoats/gumboot) 77 100%
2.1.5 Procurement of Weighing scales 5 5 100% 2.1.6 Short Courses (safety on lake) 12 12 100% 2.1.7 Conduction training workshops on HIV/AIDS and Gender 15 15 100% 2.2.0 Conduction training workshops for handlers 10 10 100% 2.2.1 Community Sensitisation workshops 24 24 100% 2.2.2 Furnishing of BMU offices 3 3 100% 2.3.0 Capacity building for W&S facilities 2.3.1 Community Sensitisation meetings on O&M 11 11 100% 2.3.2 Training of water and sanitation committees 48 48 100% 2.3.3 Training of local artisans/technicians 20 20 100% 2.3.4 Procurement of tool kits for the local artisans 3 3 100% 2.4.0 Environmental monitoring and audit
2.4.1 Environment impact assessment and project Management letters 3 3 100%
2.4.2 Environmental monitoring/inspection 16 16 100%
2.4.3 Production and dissemination of State of District Environment (Profile) 4 3 75%
3 Education and Sports 3.12 Midterm exams (4,500 pupils) 13 13 100% 3.13 End of term exams (4,500 pupils) 13 13 100% 3.2.1 Functional academic board established
3.2.2 Training members in exam setting & moderation 24 24 100%
3.2.3 Periodic setting & moderation of exams 13 13 100%
3.3.0 Instructional materials procured 3.3.1 Procurement of text books (batched for p/schools) 2 2 100% 3.4.0 Co-curricular activities (sports and Games) supported 3.4.1 Sports kits for Primary schools 46 46 100% 3.4.2 Sports trophies (Set) 2 2 100% 3.4.3 Competitions 27 27 100%
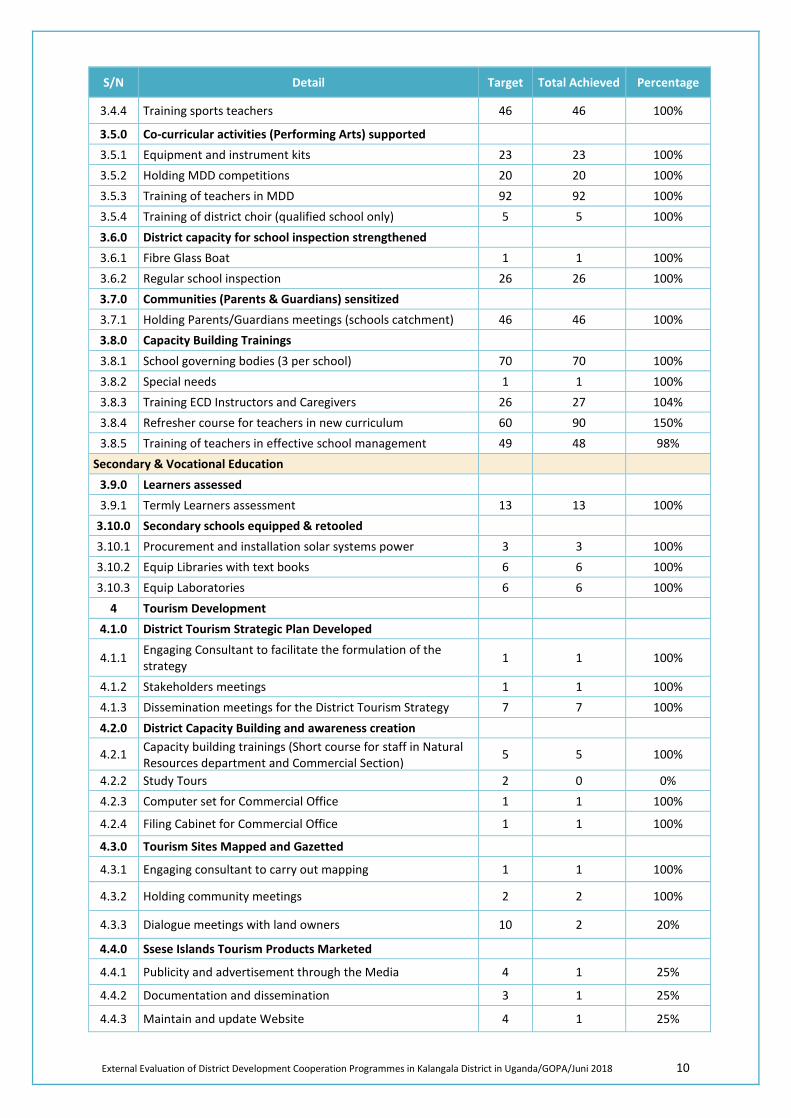
External Evaluation of District Development Cooperation Programmes in Kalangala District in Uganda/GOPA/Juni 2018 10
S/N Detail Target Total Achieved Percentage
3.4.4 Training sports teachers 46 46 100%
3.5.0 Co-curricular activities (Performing Arts) supported 3.5.1 Equipment and instrument kits 23 23 100% 3.5.2 Holding MDD competitions 20 20 100% 3.5.3 Training of teachers in MDD 92 92 100% 3.5.4 Training of district choir (qualified school only) 5 5 100% 3.6.0 District capacity for school inspection strengthened 3.6.1 Fibre Glass Boat 1 1 100% 3.6.2 Regular school inspection 26 26 100% 3.7.0 Communities (Parents & Guardians) sensitized 3.7.1 Holding Parents/Guardians meetings (schools catchment) 46 46 100% 3.8.0 Capacity Building Trainings 3.8.1 School governing bodies (3 per school) 70 70 100% 3.8.2 Special needs 1 1 100% 3.8.3 Training ECD Instructors and Caregivers 26 27 104% 3.8.4 Refresher course for teachers in new curriculum 60 90 150% 3.8.5 Training of teachers in effective school management 49 48 98%
Secondary & Vocational Education 3.9.0 Learners assessed 3.9.1 Termly Learners assessment 13 13 100%
3.10.0 Secondary schools equipped & retooled 3.10.1 Procurement and installation solar systems power 3 3 100% 3.10.2 Equip Libraries with text books 6 6 100% 3.10.3 Equip Laboratories 6 6 100%
4 Tourism Development 4.1.0 District Tourism Strategic Plan Developed
4.1.1 Engaging Consultant to facilitate the formulation of the strategy 1 1 100%
4.1.2 Stakeholders meetings 1 1 100% 4.1.3 Dissemination meetings for the District Tourism Strategy 7 7 100% 4.2.0 District Capacity Building and awareness creation
4.2.1 Capacity building trainings (Short course for staff in Natural Resources department and Commercial Section)
5 5 100%
4.2.2 Study Tours 2 0 0% 4.2.3 Computer set for Commercial Office 1 1 100%
4.2.4 Filing Cabinet for Commercial Office 1 1 100%
4.3.0 Tourism Sites Mapped and Gazetted
4.3.1 Engaging consultant to carry out mapping 1 1 100%
4.3.2 Holding community meetings 2 2 100%
4.3.3 Dialogue meetings with land owners 10 2 20%
4.4.0 Ssese Islands Tourism Products Marketed
4.4.1 Publicity and advertisement through the Media 4 1 25%
4.4.2 Documentation and dissemination 3 1 25%
4.4.3 Maintain and update Website 4 1 25%
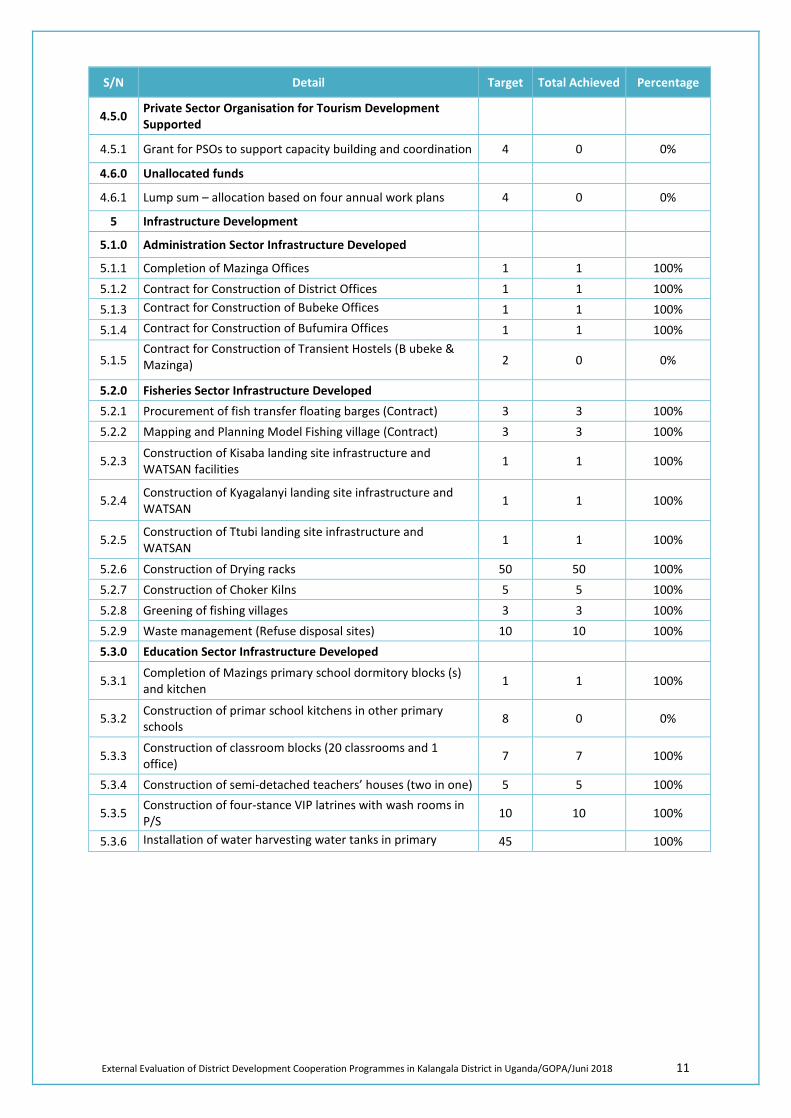
External Evaluation of District Development Cooperation Programmes in Kalangala District in Uganda/GOPA/Juni 2018 11
S/N Detail Target Total Achieved Percentage
4.5.0 Private Sector Organisation for Tourism Development Supported
4.5.1 Grant for PSOs to support capacity building and coordination 4 0 0%
4.6.0 Unallocated funds
4.6.1 Lump sum – allocation based on four annual work plans 4 0 0%
5 Infrastructure Development
5.1.0 Administration Sector Infrastructure Developed
5.1.1 Completion of Mazinga Offices 1 1 100% 5.1.2 Contract for Construction of District Offices 1 1 100% 5.1.3 Contract for Construction of Bubeke Offices 1 1 100% 5.1.4 Contract for Construction of Bufumira Offices 1 1 100%
5.1.5 Contract for Construction of Transient Hostels (B ubeke & Mazinga) 2 0 0%
5.2.0 Fisheries Sector Infrastructure Developed 5.2.1 Procurement of fish transfer floating barges (Contract) 3 3 100% 5.2.2 Mapping and Planning Model Fishing village (Contract) 3 3 100%
5.2.3 Construction of Kisaba landing site infrastructure and WATSAN facilities 1 1 100%
5.2.4 Construction of Kyagalanyi landing site infrastructure and WATSAN 1 1 100%
5.2.5 Construction of Ttubi landing site infrastructure and WATSAN 1 1 100%
5.2.6 Construction of Drying racks 50 50 100% 5.2.7 Construction of Choker Kilns 5 5 100% 5.2.8 Greening of fishing villages 3 3 100% 5.2.9 Waste management (Refuse disposal sites) 10 10 100% 5.3.0 Education Sector Infrastructure Developed
5.3.1 Completion of Mazings primary school dormitory blocks (s) and kitchen 1 1 100%
5.3.2 Construction of primar school kitchens in other primary schools 8 0 0%
5.3.3 Construction of classroom blocks (20 classrooms and 1 office) 7 7 100%
5.3.4 Construction of semi-detached teachers’ houses (two in one) 5 5 100%
5.3.5 Construction of four-stance VIP latrines with wash rooms in P/S 10 10 100%
5.3.6 Installation of water harvesting water tanks in primary h l
45 100%
External Evaluation of District Development Cooperation Programmes in Kalangala District in Uganda/GOPA/June 2018 1
Annex 7: Programme Outcome Achievements
List of outcome as defined in the renewed logframe from 2011
The achievements listed in red colour were reported upon in the Programme Completion Report (CR) by ICEIDA. With the Latter’s comment in yellow shading. Notably some indicator formulations have been changed from the agreed logframe to the CR, which is not according to the “book”, as semantics really prevail in logframe formulations. (It is fair to mention that the Icelandic Embassy does not agree with this statement and says in their comments to the Draft Evaluation Report: ”It fails to capture the essence of the improvement in the report – mean to address the weakness in the construction of the outcome indicators. Minimum conditions are defined in detail in the report as covering minimum functional capacity requirements, which does not change the meaning of the indicator. The change from “number” to “percentage” is an improved construct. Moreover, both the percentage and numbers are given e.g. 100% (8/8) of LGs met minimum conditions in 2014. (Expected result achieved).”
The other indicators were reported upon verbally by the Kalangala District Local Government staff, to the degree possible, during the Evaluation, and were never reported upon in writing. Some statistics were also handed over to the Consultant illustrating the outcome/impact of interventions, but in a not-consistent manner.
The Icelandic Embassy also emphasised in their comments to the below table that “there is reporting on leverage indicators for the outcomes (the indicators that were considered more of outputs, …, were not reported on in the project completion report. Regarding the partners self-assessment (highlighted in yellow) against lack of pre-set targets, the clarification was made that comparisons were made with baseline which was reconstructed largely based on quantitative data that is verifiable, and in comparison, with national benchmarks and in some cases international benchmarks like MDG targets”.
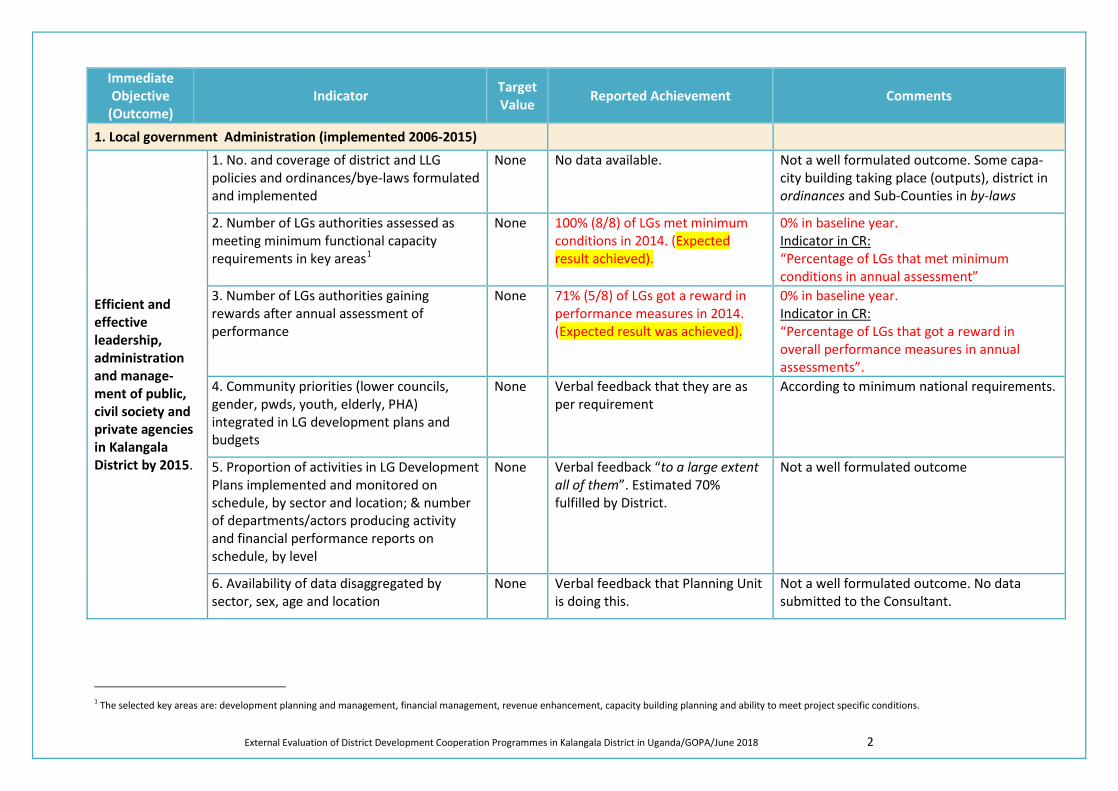
External Evaluation of District Development Cooperation Programmes in Kalangala District in Uganda/GOPA/June 2018 2
Immediate Objective
(Outcome) Indicator Target
Value Reported Achievement Comments
1. Local government Administration (implemented 2006-2015)
Efficient and effective leadership, administration and manage-ment of public, civil society and private agencies in Kalangala District by 2015.
1. No. and coverage of district and LLG policies and ordinances/bye-laws formulated and implemented
None No data available. Not a well formulated outcome. Some capa-city building taking place (outputs), district in ordinances and Sub-Counties in by-laws
2. Number of LGs authorities assessed as meeting minimum functional capacity requirements in key areas1
None 100% (8/8) of LGs met minimum conditions in 2014. (Expected result achieved).
0% in baseline year. Indicator in CR: “Percentage of LGs that met minimum conditions in annual assessment”
3. Number of LGs authorities gaining rewards after annual assessment of performance
None 71% (5/8) of LGs got a reward in performance measures in 2014. (Expected result was achieved).
0% in baseline year. Indicator in CR: “Percentage of LGs that got a reward in overall performance measures in annual assessments”.
4. Community priorities (lower councils, gender, pwds, youth, elderly, PHA) integrated in LG development plans and budgets
None Verbal feedback that they are as per requirement
According to minimum national requirements.
5. Proportion of activities in LG Development Plans implemented and monitored on schedule, by sector and location; & number of departments/actors producing activity and financial performance reports on schedule, by level
None Verbal feedback “to a large extent all of them”. Estimated 70% fulfilled by District.
Not a well formulated outcome
6. Availability of data disaggregated by sector, sex, age and location
None Verbal feedback that Planning Unit is doing this.
Not a well formulated outcome. No data submitted to the Consultant.
1 The selected key areas are: development planning and management, financial management, revenue enhancement, capacity building planning and ability to meet project specific conditions.
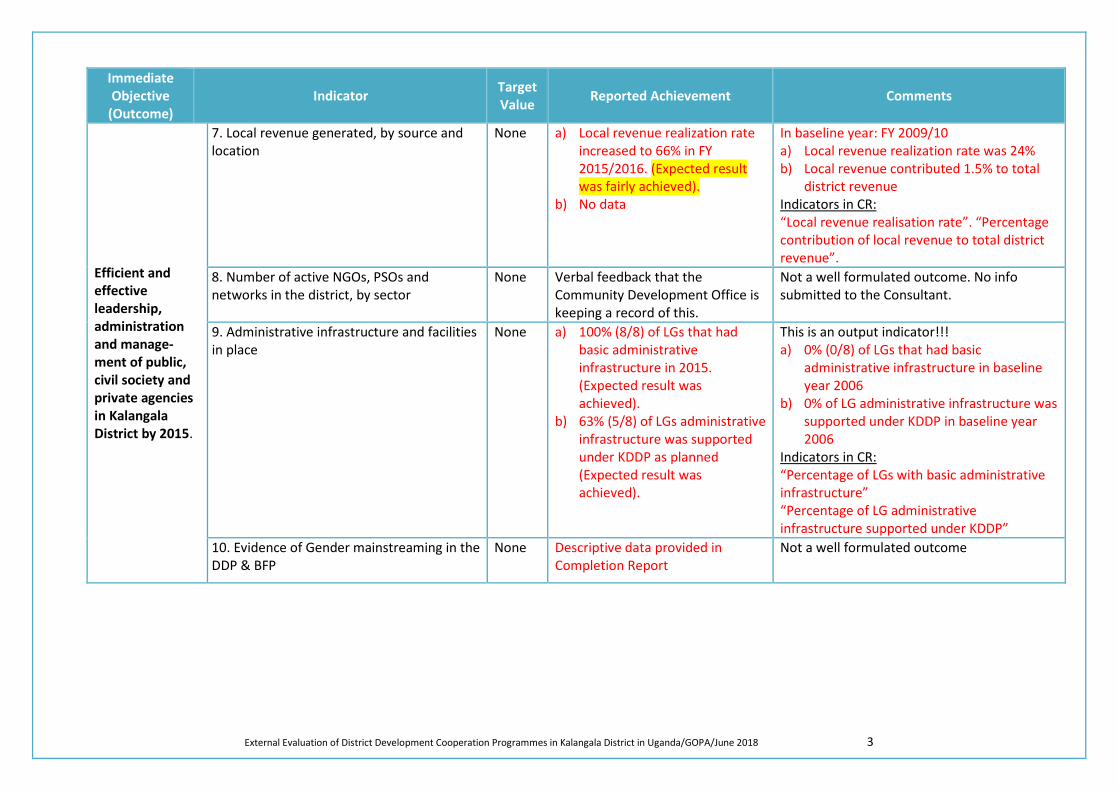
External Evaluation of District Development Cooperation Programmes in Kalangala District in Uganda/GOPA/June 2018 3
Immediate Objective
(Outcome) Indicator Target
Value Reported Achievement Comments
Efficient and effective leadership, administration and manage-ment of public, civil society and private agencies in Kalangala District by 2015.
7. Local revenue generated, by source and location
None a) Local revenue realization rate increased to 66% in FY 2015/2016. (Expected result was fairly achieved).
b) No data
In baseline year: FY 2009/10 a) Local revenue realization rate was 24% b) Local revenue contributed 1.5% to total
district revenue Indicators in CR: “Local revenue realisation rate”. “Percentage contribution of local revenue to total district revenue”.
8. Number of active NGOs, PSOs and networks in the district, by sector
None Verbal feedback that the Community Development Office is keeping a record of this.
Not a well formulated outcome. No info submitted to the Consultant.
9. Administrative infrastructure and facilities in place
None a) 100% (8/8) of LGs that had basic administrative infrastructure in 2015. (Expected result was achieved).
b) 63% (5/8) of LGs administrative infrastructure was supported under KDDP as planned (Expected result was achieved).
This is an output indicator!!! a) 0% (0/8) of LGs that had basic
administrative infrastructure in baseline year 2006
b) 0% of LG administrative infrastructure was supported under KDDP in baseline year 2006
Indicators in CR: “Percentage of LGs with basic administrative infrastructure” “Percentage of LG administrative infrastructure supported under KDDP”
10. Evidence of Gender mainstreaming in the DDP & BFP
None Descriptive data provided in Completion Report
Not a well formulated outcome
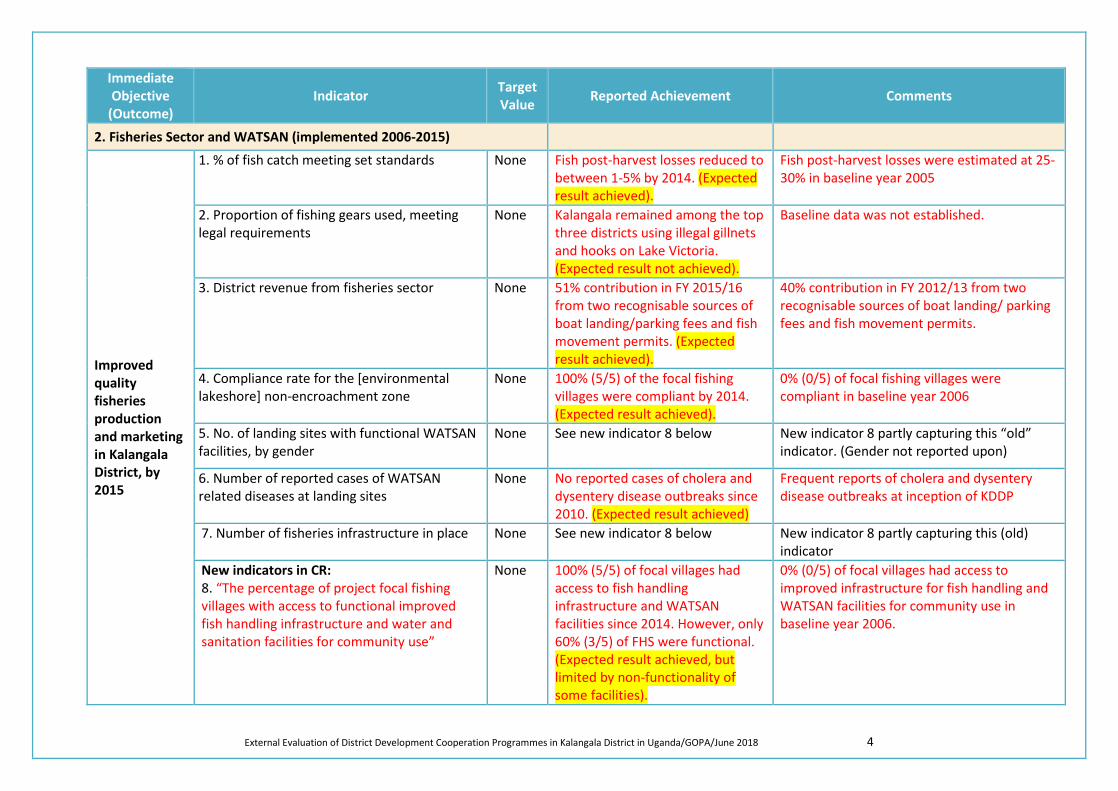
External Evaluation of District Development Cooperation Programmes in Kalangala District in Uganda/GOPA/June 2018 4
Immediate Objective
(Outcome) Indicator Target
Value Reported Achievement Comments
2. Fisheries Sector and WATSAN (implemented 2006-2015)
Improved quality fisheries production and marketing in Kalangala District, by 2015
1. % of fish catch meeting set standards None Fish post-harvest losses reduced to between 1-5% by 2014. (Expected result achieved).
Fish post-harvest losses were estimated at 25-30% in baseline year 2005
2. Proportion of fishing gears used, meeting legal requirements
None Kalangala remained among the top three districts using illegal gillnets and hooks on Lake Victoria. (Expected result not achieved).
Baseline data was not established.
3. District revenue from fisheries sector None 51% contribution in FY 2015/16 from two recognisable sources of boat landing/parking fees and fish movement permits. (Expected result achieved).
40% contribution in FY 2012/13 from two recognisable sources of boat landing/ parking fees and fish movement permits.
4. Compliance rate for the [environmental lakeshore] non-encroachment zone
None 100% (5/5) of the focal fishing villages were compliant by 2014. (Expected result achieved).
0% (0/5) of focal fishing villages were compliant in baseline year 2006
5. No. of landing sites with functional WATSAN facilities, by gender
None See new indicator 8 below New indicator 8 partly capturing this “old” indicator. (Gender not reported upon)
6. Number of reported cases of WATSAN related diseases at landing sites
None No reported cases of cholera and dysentery disease outbreaks since 2010. (Expected result achieved)
Frequent reports of cholera and dysentery disease outbreaks at inception of KDDP
7. Number of fisheries infrastructure in place None See new indicator 8 below New indicator 8 partly capturing this (old) indicator
New indicators in CR: 8. “The percentage of project focal fishing villages with access to functional improved fish handling infrastructure and water and sanitation facilities for community use”
None 100% (5/5) of focal villages had access to fish handling infrastructure and WATSAN facilities since 2014. However, only 60% (3/5) of FHS were functional. (Expected result achieved, but limited by non-functionality of some facilities).
0% (0/5) of focal villages had access to improved infrastructure for fish handling and WATSAN facilities for community use in baseline year 2006.
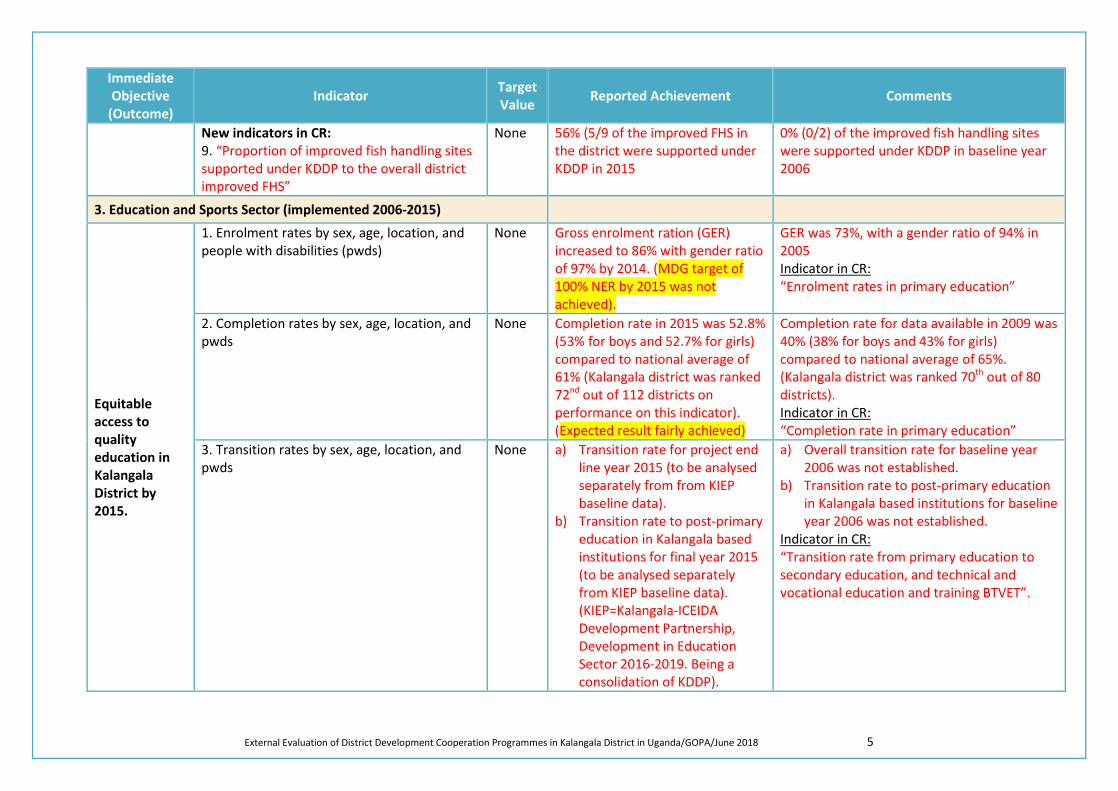
External Evaluation of District Development Cooperation Programmes in Kalangala District in Uganda/GOPA/June 2018 5
Immediate Objective
(Outcome) Indicator Target
Value Reported Achievement Comments
New indicators in CR: 9. “Proportion of improved fish handling sites supported under KDDP to the overall district improved FHS”
None 56% (5/9 of the improved FHS in the district were supported under KDDP in 2015
0% (0/2) of the improved fish handling sites were supported under KDDP in baseline year 2006
3. Education and Sports Sector (implemented 2006-2015)
Equitable access to quality education in Kalangala District by 2015.
1. Enrolment rates by sex, age, location, and people with disabilities (pwds)
None Gross enrolment ration (GER) increased to 86% with gender ratio of 97% by 2014. (MDG target of 100% NER by 2015 was not achieved).
GER was 73%, with a gender ratio of 94% in 2005 Indicator in CR: “Enrolment rates in primary education”
2. Completion rates by sex, age, location, and pwds
None Completion rate in 2015 was 52.8% (53% for boys and 52.7% for girls) compared to national average of 61% (Kalangala district was ranked 72nd out of 112 districts on performance on this indicator). (Expected result fairly achieved)
Completion rate for data available in 2009 was 40% (38% for boys and 43% for girls) compared to national average of 65%. (Kalangala district was ranked 70th out of 80 districts). Indicator in CR: “Completion rate in primary education”
3. Transition rates by sex, age, location, and pwds
None a) Transition rate for project end line year 2015 (to be analysed separately from from KIEP baseline data).
b) Transition rate to post-primary education in Kalangala based institutions for final year 2015 (to be analysed separately from KIEP baseline data). (KIEP=Kalangala-ICEIDA Development Partnership, Development in Education Sector 2016-2019. Being a consolidation of KDDP).
a) Overall transition rate for baseline year 2006 was not established.
b) Transition rate to post-primary education in Kalangala based institutions for baseline year 2006 was not established.
Indicator in CR: “Transition rate from primary education to secondary education, and technical and vocational education and training BTVET”.
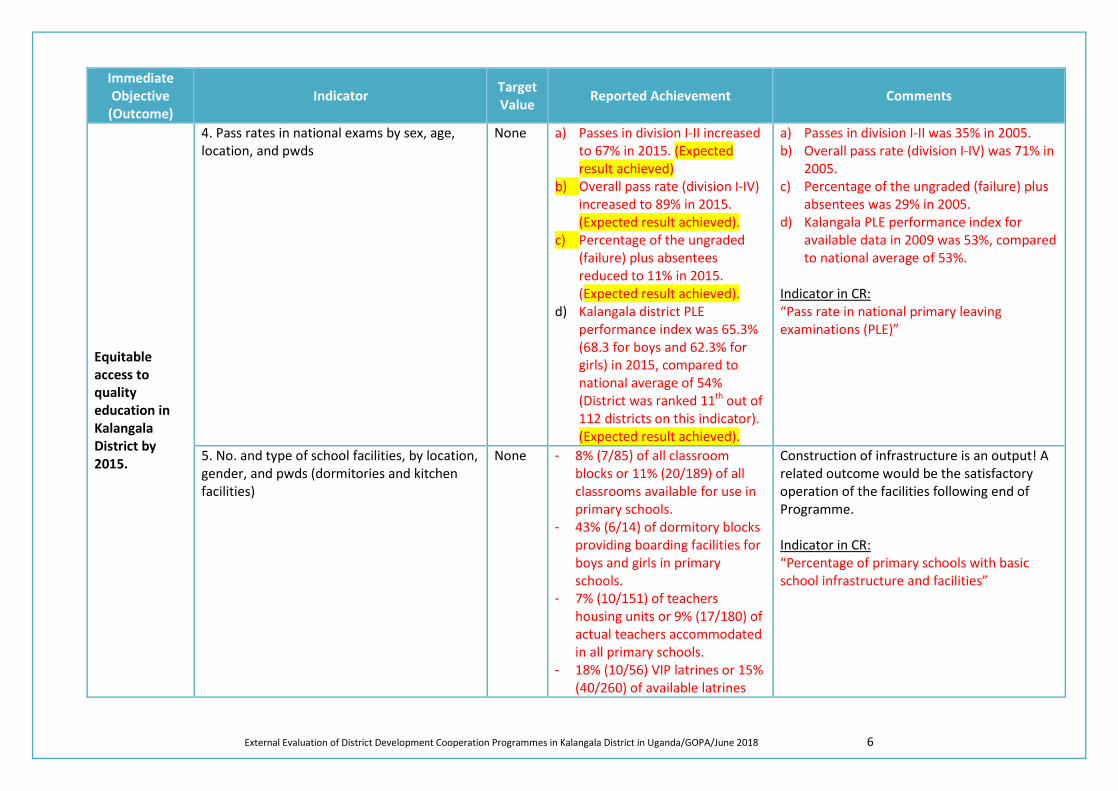
External Evaluation of District Development Cooperation Programmes in Kalangala District in Uganda/GOPA/June 2018 6
Immediate Objective
(Outcome) Indicator Target
Value Reported Achievement Comments
Equitable access to quality education in Kalangala District by 2015.
4. Pass rates in national exams by sex, age, location, and pwds
None a) Passes in division I-II increased to 67% in 2015. (Expected result achieved)
b) Overall pass rate (division I-IV) increased to 89% in 2015. (Expected result achieved).
c) Percentage of the ungraded (failure) plus absentees reduced to 11% in 2015. (Expected result achieved).
d) Kalangala district PLE performance index was 65.3% (68.3 for boys and 62.3% for girls) in 2015, compared to national average of 54% (District was ranked 11th out of 112 districts on this indicator). (Expected result achieved).
a) Passes in division I-II was 35% in 2005. b) Overall pass rate (division I-IV) was 71% in
2005. c) Percentage of the ungraded (failure) plus
absentees was 29% in 2005. d) Kalangala PLE performance index for
available data in 2009 was 53%, compared to national average of 53%.
Indicator in CR: “Pass rate in national primary leaving examinations (PLE)”
5. No. and type of school facilities, by location, gender, and pwds (dormitories and kitchen facilities)
None - 8% (7/85) of all classroom blocks or 11% (20/189) of all classrooms available for use in primary schools.
- 43% (6/14) of dormitory blocks providing boarding facilities for boys and girls in primary schools.
- 7% (10/151) of teachers housing units or 9% (17/180) of actual teachers accommodated in all primary schools.
- 18% (10/56) VIP latrines or 15% (40/260) of available latrines
Construction of infrastructure is an output! A related outcome would be the satisfactory operation of the facilities following end of Programme. Indicator in CR: “Percentage of primary schools with basic school infrastructure and facilities”
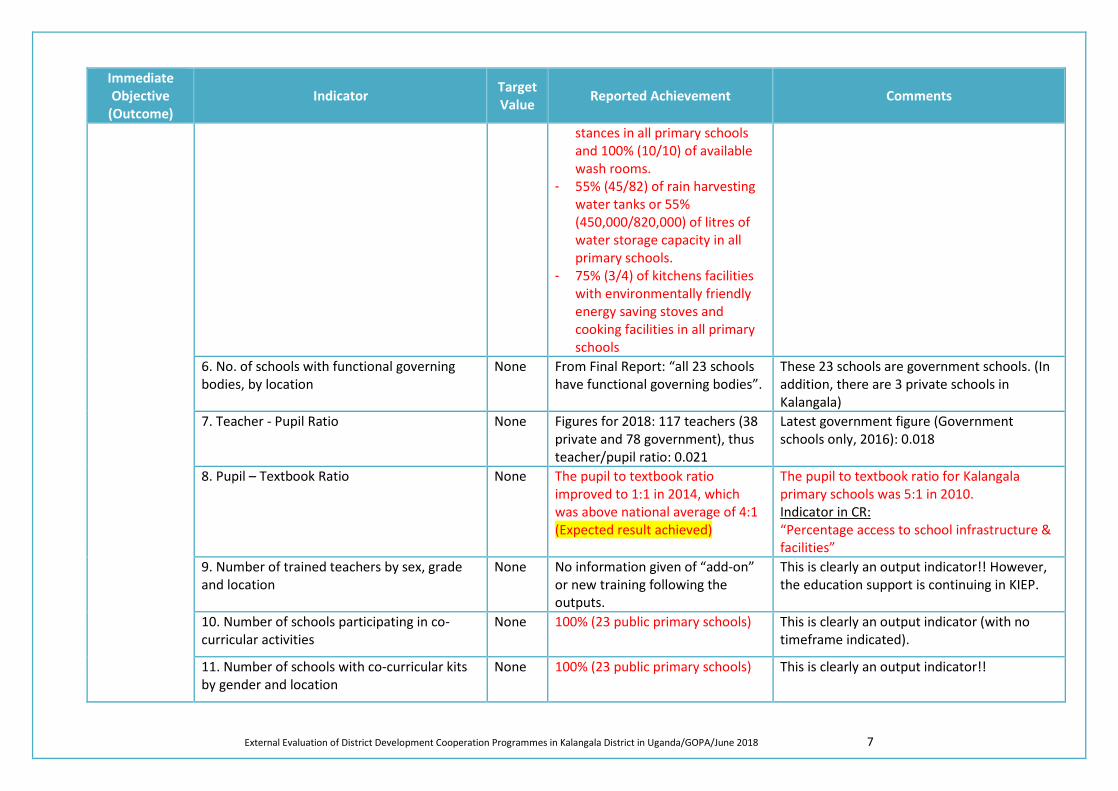
External Evaluation of District Development Cooperation Programmes in Kalangala District in Uganda/GOPA/June 2018 7
Immediate Objective
(Outcome) Indicator Target
Value Reported Achievement Comments
stances in all primary schools and 100% (10/10) of available wash rooms.
- 55% (45/82) of rain harvesting water tanks or 55% (450,000/820,000) of litres of water storage capacity in all primary schools.
- 75% (3/4) of kitchens facilities with environmentally friendly energy saving stoves and cooking facilities in all primary schools
6. No. of schools with functional governing bodies, by location
None From Final Report: “all 23 schools have functional governing bodies”.
These 23 schools are government schools. (In addition, there are 3 private schools in Kalangala)
7. Teacher - Pupil Ratio None Figures for 2018: 117 teachers (38 private and 78 government), thus teacher/pupil ratio: 0.021
Latest government figure (Government schools only, 2016): 0.018
8. Pupil – Textbook Ratio None The pupil to textbook ratio improved to 1:1 in 2014, which was above national average of 4:1 (Expected result achieved)
The pupil to textbook ratio for Kalangala primary schools was 5:1 in 2010. Indicator in CR: “Percentage access to school infrastructure & facilities”
9. Number of trained teachers by sex, grade and location
None No information given of “add-on” or new training following the outputs.
This is clearly an output indicator!! However, the education support is continuing in KIEP.
10. Number of schools participating in co-curricular activities
None 100% (23 public primary schools) This is clearly an output indicator (with no timeframe indicated).
11. Number of schools with co-curricular kits by gender and location
None 100% (23 public primary schools) This is clearly an output indicator!!
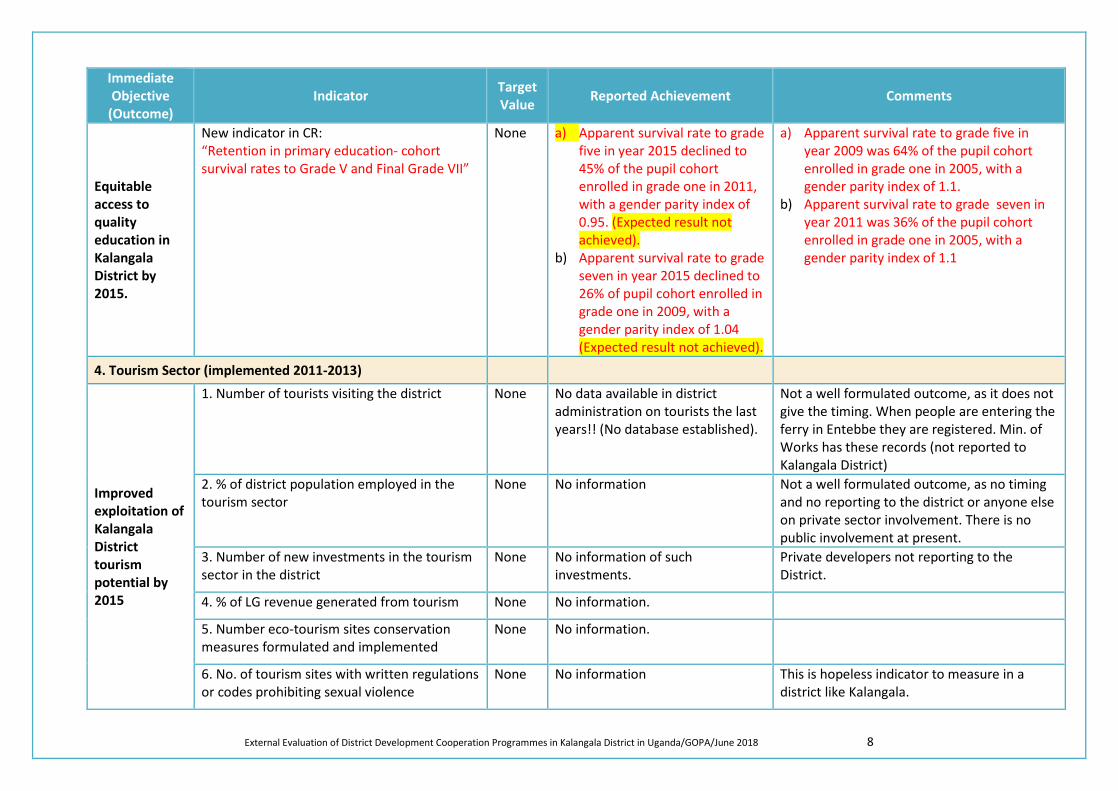
External Evaluation of District Development Cooperation Programmes in Kalangala District in Uganda/GOPA/June 2018 8
Immediate Objective
(Outcome) Indicator Target
Value Reported Achievement Comments
Equitable access to quality education in Kalangala District by 2015.
New indicator in CR: “Retention in primary education- cohort survival rates to Grade V and Final Grade VII”
None a) Apparent survival rate to grade five in year 2015 declined to 45% of the pupil cohort enrolled in grade one in 2011, with a gender parity index of 0.95. (Expected result not achieved).
b) Apparent survival rate to grade seven in year 2015 declined to 26% of pupil cohort enrolled in grade one in 2009, with a gender parity index of 1.04 (Expected result not achieved).
a) Apparent survival rate to grade five in year 2009 was 64% of the pupil cohort enrolled in grade one in 2005, with a gender parity index of 1.1.
b) Apparent survival rate to grade seven in year 2011 was 36% of the pupil cohort enrolled in grade one in 2005, with a gender parity index of 1.1
4. Tourism Sector (implemented 2011-2013)
Improved exploitation of Kalangala District tourism potential by 2015
1. Number of tourists visiting the district None No data available in district administration on tourists the last years!! (No database established).
Not a well formulated outcome, as it does not give the timing. When people are entering the ferry in Entebbe they are registered. Min. of Works has these records (not reported to Kalangala District)
2. % of district population employed in the tourism sector
None No information Not a well formulated outcome, as no timing and no reporting to the district or anyone else on private sector involvement. There is no public involvement at present.
3. Number of new investments in the tourism sector in the district
None No information of such investments.
Private developers not reporting to the District.
4. % of LG revenue generated from tourism None No information.
5. Number eco-tourism sites conservation measures formulated and implemented
None No information.
6. No. of tourism sites with written regulations or codes prohibiting sexual violence
None No information This is hopeless indicator to measure in a district like Kalangala.
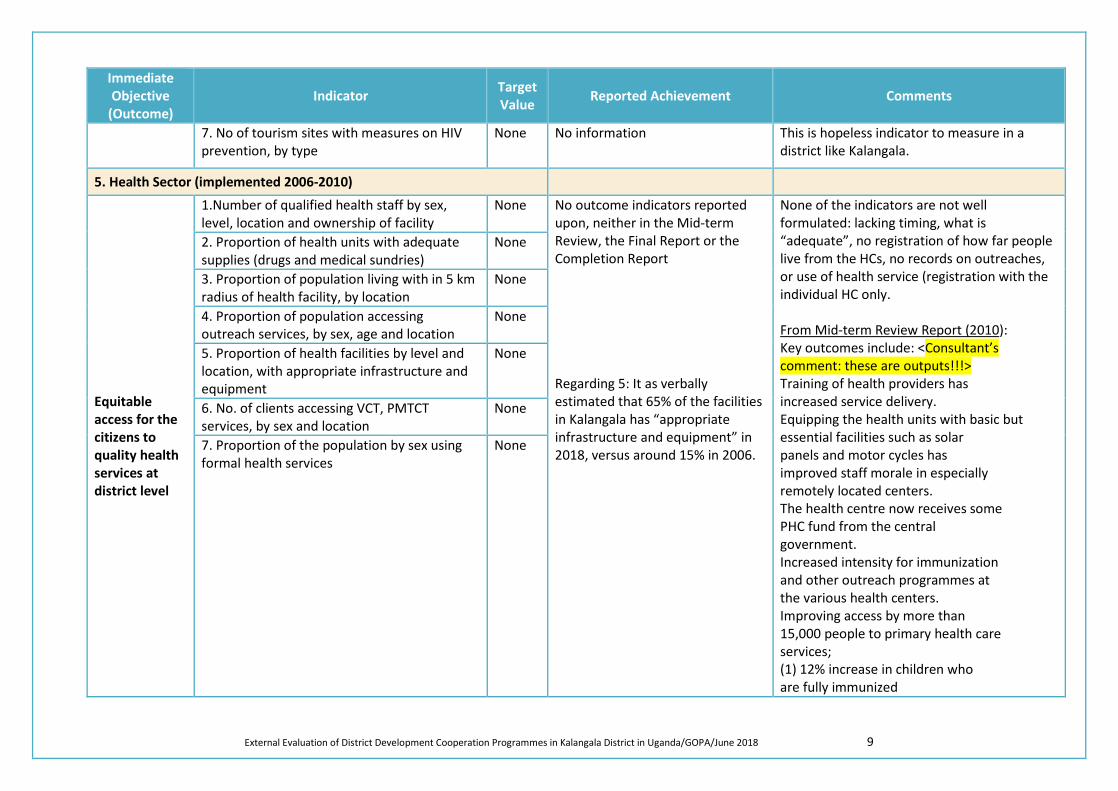
External Evaluation of District Development Cooperation Programmes in Kalangala District in Uganda/GOPA/June 2018 9
Immediate Objective
(Outcome) Indicator Target
Value Reported Achievement Comments
7. No of tourism sites with measures on HIV prevention, by type
None No information This is hopeless indicator to measure in a district like Kalangala.
5. Health Sector (implemented 2006-2010)
Equitable access for the citizens to quality health services at district level
1.Number of qualified health staff by sex, level, location and ownership of facility
None No outcome indicators reported upon, neither in the Mid-term Review, the Final Report or the Completion Report Regarding 5: It as verbally estimated that 65% of the facilities in Kalangala has “appropriate infrastructure and equipment” in 2018, versus around 15% in 2006.
None of the indicators are not well formulated: lacking timing, what is “adequate”, no registration of how far people live from the HCs, no records on outreaches, or use of health service (registration with the individual HC only. From Mid-term Review Report (2010): Key outcomes include: <Consultant’s comment: these are outputs!!!> Training of health providers has increased service delivery. Equipping the health units with basic but essential facilities such as solar panels and motor cycles has improved staff morale in especially remotely located centers. The health centre now receives some PHC fund from the central government. Increased intensity for immunization and other outreach programmes at the various health centers. Improving access by more than 15,000 people to primary health care services; (1) 12% increase in children who are fully immunized
2. Proportion of health units with adequate supplies (drugs and medical sundries)
None
3. Proportion of population living with in 5 km radius of health facility, by location
None
4. Proportion of population accessing outreach services, by sex, age and location
None
5. Proportion of health facilities by level and location, with appropriate infrastructure and equipment
None
6. No. of clients accessing VCT, PMTCT services, by sex and location
None
7. Proportion of the population by sex using formal health services
None
External Evaluation of District Development Cooperation Programmes in Kalangala District in Uganda/GOPA/June 2018 10
External Evaluation of District Development Cooperation Programmes in Kalangala District in Uganda/GOPA/June 2018 1
Annex 8: Infrastructure, materials and equipment supplied under the programme
KDDP Assets Register 2006-2015 (The KDDP Completion Report June 2017)
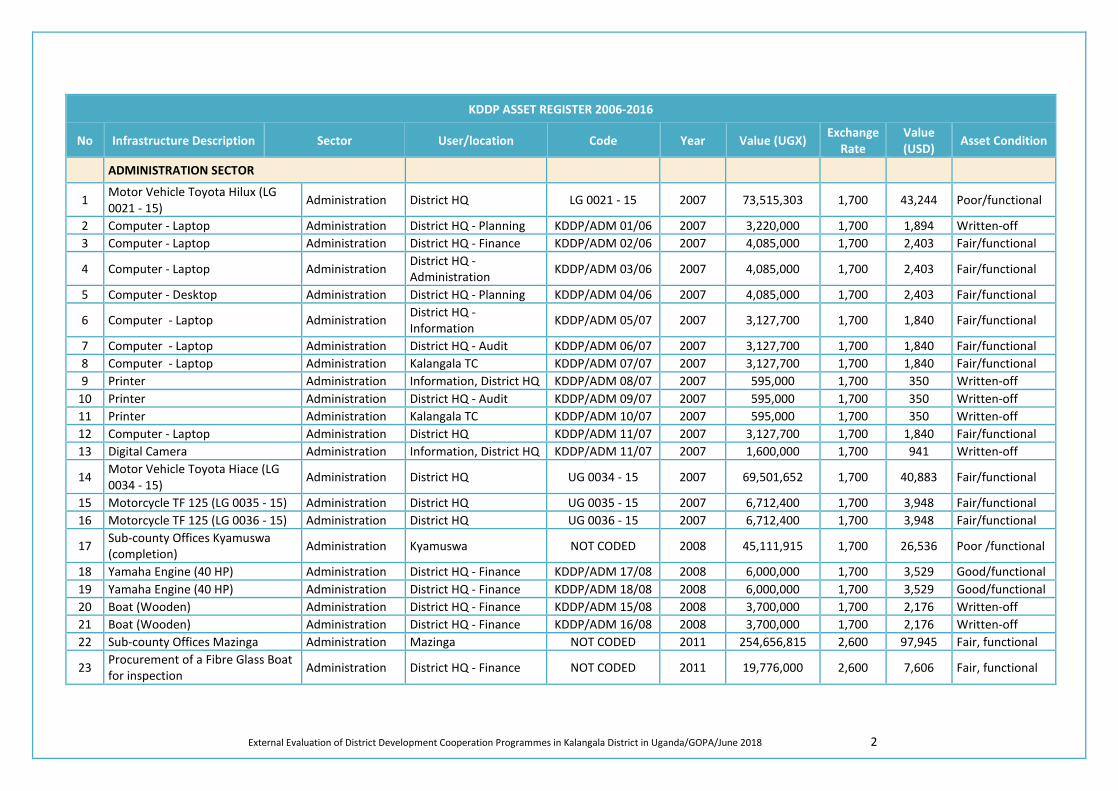
External Evaluation of District Development Cooperation Programmes in Kalangala District in Uganda/GOPA/June 2018 2
KDDP ASSET REGISTER 2006-2016
No Infrastructure Description Sector User/location Code Year Value (UGX) Exchange Rate
Value (USD) Asset Condition
ADMINISTRATION SECTOR
1 Motor Vehicle Toyota Hilux (LG 0021 - 15) Administration District HQ LG 0021 - 15 2007 73,515,303 1,700 43,244 Poor/functional
2 Computer - Laptop Administration District HQ - Planning KDDP/ADM 01/06 2007 3,220,000 1,700 1,894 Written-off 3 Computer - Laptop Administration District HQ - Finance KDDP/ADM 02/06 2007 4,085,000 1,700 2,403 Fair/functional
4 Computer - Laptop Administration District HQ - Administration KDDP/ADM 03/06 2007 4,085,000 1,700 2,403 Fair/functional
5 Computer - Desktop Administration District HQ - Planning KDDP/ADM 04/06 2007 4,085,000 1,700 2,403 Fair/functional
6 Computer - Laptop Administration District HQ - Information KDDP/ADM 05/07 2007 3,127,700 1,700 1,840 Fair/functional
7 Computer - Laptop Administration District HQ - Audit KDDP/ADM 06/07 2007 3,127,700 1,700 1,840 Fair/functional 8 Computer - Laptop Administration Kalangala TC KDDP/ADM 07/07 2007 3,127,700 1,700 1,840 Fair/functional 9 Printer Administration Information, District HQ KDDP/ADM 08/07 2007 595,000 1,700 350 Written-off
10 Printer Administration District HQ - Audit KDDP/ADM 09/07 2007 595,000 1,700 350 Written-off 11 Printer Administration Kalangala TC KDDP/ADM 10/07 2007 595,000 1,700 350 Written-off 12 Computer - Laptop Administration District HQ KDDP/ADM 11/07 2007 3,127,700 1,700 1,840 Fair/functional 13 Digital Camera Administration Information, District HQ KDDP/ADM 11/07 2007 1,600,000 1,700 941 Written-off
14 Motor Vehicle Toyota Hiace (LG 0034 - 15) Administration District HQ UG 0034 - 15 2007 69,501,652 1,700 40,883 Fair/functional
15 Motorcycle TF 125 (LG 0035 - 15) Administration District HQ UG 0035 - 15 2007 6,712,400 1,700 3,948 Fair/functional 16 Motorcycle TF 125 (LG 0036 - 15) Administration District HQ UG 0036 - 15 2007 6,712,400 1,700 3,948 Fair/functional
17 Sub-county Offices Kyamuswa (completion) Administration Kyamuswa NOT CODED 2008 45,111,915 1,700 26,536 Poor /functional
18 Yamaha Engine (40 HP) Administration District HQ - Finance KDDP/ADM 17/08 2008 6,000,000 1,700 3,529 Good/functional 19 Yamaha Engine (40 HP) Administration District HQ - Finance KDDP/ADM 18/08 2008 6,000,000 1,700 3,529 Good/functional 20 Boat (Wooden) Administration District HQ - Finance KDDP/ADM 15/08 2008 3,700,000 1,700 2,176 Written-off 21 Boat (Wooden) Administration District HQ - Finance KDDP/ADM 16/08 2008 3,700,000 1,700 2,176 Written-off 22 Sub-county Offices Mazinga Administration Mazinga NOT CODED 2011 254,656,815 2,600 97,945 Fair, functional
23 Procurement of a Fibre Glass Boat for inspection Administration District HQ - Finance NOT CODED 2011 19,776,000 2,600 7,606 Fair, functional
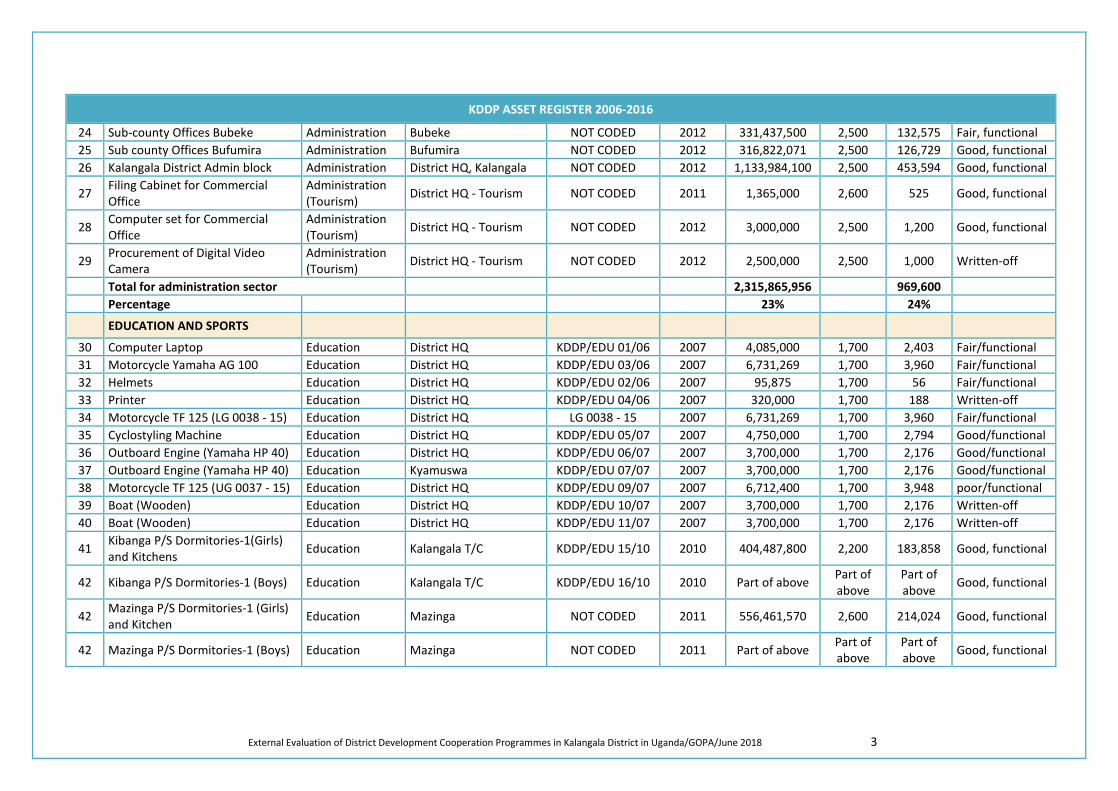
External Evaluation of District Development Cooperation Programmes in Kalangala District in Uganda/GOPA/June 2018 3
KDDP ASSET REGISTER 2006-2016
24 Sub-county Offices Bubeke Administration Bubeke NOT CODED 2012 331,437,500 2,500 132,575 Fair, functional 25 Sub county Offices Bufumira Administration Bufumira NOT CODED 2012 316,822,071 2,500 126,729 Good, functional 26 Kalangala District Admin block Administration District HQ, Kalangala NOT CODED 2012 1,133,984,100 2,500 453,594 Good, functional
27 Filing Cabinet for Commercial Office
Administration (Tourism) District HQ - Tourism NOT CODED 2011 1,365,000 2,600 525 Good, functional
28 Computer set for Commercial Office
Administration (Tourism) District HQ - Tourism NOT CODED 2012 3,000,000 2,500 1,200 Good, functional
29 Procurement of Digital Video Camera
Administration (Tourism) District HQ - Tourism NOT CODED 2012 2,500,000 2,500 1,000 Written-off
Total for administration sector 2,315,865,956 969,600 Percentage 23% 24%
EDUCATION AND SPORTS
30 Computer Laptop Education District HQ KDDP/EDU 01/06 2007 4,085,000 1,700 2,403 Fair/functional 31 Motorcycle Yamaha AG 100 Education District HQ KDDP/EDU 03/06 2007 6,731,269 1,700 3,960 Fair/functional 32 Helmets Education District HQ KDDP/EDU 02/06 2007 95,875 1,700 56 Fair/functional 33 Printer Education District HQ KDDP/EDU 04/06 2007 320,000 1,700 188 Written-off 34 Motorcycle TF 125 (LG 0038 - 15) Education District HQ LG 0038 - 15 2007 6,731,269 1,700 3,960 Fair/functional 35 Cyclostyling Machine Education District HQ KDDP/EDU 05/07 2007 4,750,000 1,700 2,794 Good/functional 36 Outboard Engine (Yamaha HP 40) Education District HQ KDDP/EDU 06/07 2007 3,700,000 1,700 2,176 Good/functional 37 Outboard Engine (Yamaha HP 40) Education Kyamuswa KDDP/EDU 07/07 2007 3,700,000 1,700 2,176 Good/functional 38 Motorcycle TF 125 (UG 0037 - 15) Education District HQ KDDP/EDU 09/07 2007 6,712,400 1,700 3,948 poor/functional 39 Boat (Wooden) Education District HQ KDDP/EDU 10/07 2007 3,700,000 1,700 2,176 Written-off 40 Boat (Wooden) Education District HQ KDDP/EDU 11/07 2007 3,700,000 1,700 2,176 Written-off
41 Kibanga P/S Dormitories-1(Girls) and Kitchens Education Kalangala T/C KDDP/EDU 15/10 2010 404,487,800 2,200 183,858 Good, functional
42 Kibanga P/S Dormitories-1 (Boys) Education Kalangala T/C KDDP/EDU 16/10 2010 Part of above Part of above
Part of above Good, functional
42 Mazinga P/S Dormitories-1 (Girls) and Kitchen Education Mazinga NOT CODED 2011 556,461,570 2,600 214,024 Good, functional
42 Mazinga P/S Dormitories-1 (Boys) Education Mazinga NOT CODED 2011 Part of above Part of above
Part of above Good, functional
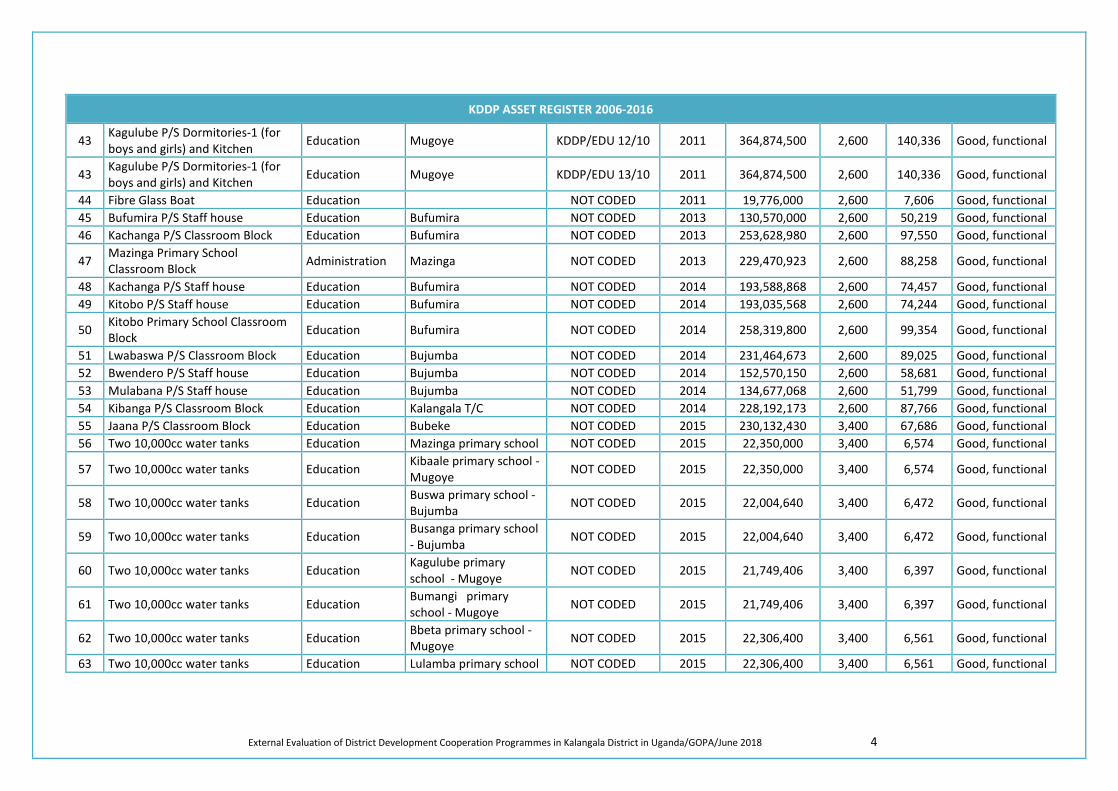
External Evaluation of District Development Cooperation Programmes in Kalangala District in Uganda/GOPA/June 2018 4
KDDP ASSET REGISTER 2006-2016
43 Kagulube P/S Dormitories-1 (for boys and girls) and Kitchen Education Mugoye KDDP/EDU 12/10 2011 364,874,500 2,600 140,336 Good, functional
43 Kagulube P/S Dormitories-1 (for boys and girls) and Kitchen Education Mugoye KDDP/EDU 13/10 2011 364,874,500 2,600 140,336 Good, functional
44 Fibre Glass Boat Education NOT CODED 2011 19,776,000 2,600 7,606 Good, functional 45 Bufumira P/S Staff house Education Bufumira NOT CODED 2013 130,570,000 2,600 50,219 Good, functional 46 Kachanga P/S Classroom Block Education Bufumira NOT CODED 2013 253,628,980 2,600 97,550 Good, functional
47 Mazinga Primary School Classroom Block Administration Mazinga NOT CODED 2013 229,470,923 2,600 88,258 Good, functional
48 Kachanga P/S Staff house Education Bufumira NOT CODED 2014 193,588,868 2,600 74,457 Good, functional 49 Kitobo P/S Staff house Education Bufumira NOT CODED 2014 193,035,568 2,600 74,244 Good, functional
50 Kitobo Primary School Classroom Block Education Bufumira NOT CODED 2014 258,319,800 2,600 99,354 Good, functional
51 Lwabaswa P/S Classroom Block Education Bujumba NOT CODED 2014 231,464,673 2,600 89,025 Good, functional 52 Bwendero P/S Staff house Education Bujumba NOT CODED 2014 152,570,150 2,600 58,681 Good, functional 53 Mulabana P/S Staff house Education Bujumba NOT CODED 2014 134,677,068 2,600 51,799 Good, functional 54 Kibanga P/S Classroom Block Education Kalangala T/C NOT CODED 2014 228,192,173 2,600 87,766 Good, functional 55 Jaana P/S Classroom Block Education Bubeke NOT CODED 2015 230,132,430 3,400 67,686 Good, functional 56 Two 10,000cc water tanks Education Mazinga primary school NOT CODED 2015 22,350,000 3,400 6,574 Good, functional
57 Two 10,000cc water tanks Education Kibaale primary school - Mugoye NOT CODED 2015 22,350,000 3,400 6,574 Good, functional
58 Two 10,000cc water tanks Education Buswa primary school - Bujumba NOT CODED 2015 22,004,640 3,400 6,472 Good, functional
59 Two 10,000cc water tanks Education Busanga primary school - Bujumba NOT CODED 2015 22,004,640 3,400 6,472 Good, functional
60 Two 10,000cc water tanks Education Kagulube primary school - Mugoye NOT CODED 2015 21,749,406 3,400 6,397 Good, functional
61 Two 10,000cc water tanks Education Bumangi primary school - Mugoye NOT CODED 2015 21,749,406 3,400 6,397 Good, functional
62 Two 10,000cc water tanks Education Bbeta primary school - Mugoye NOT CODED 2015 22,306,400 3,400 6,561 Good, functional
63 Two 10,000cc water tanks Education Lulamba primary school NOT CODED 2015 22,306,400 3,400 6,561 Good, functional
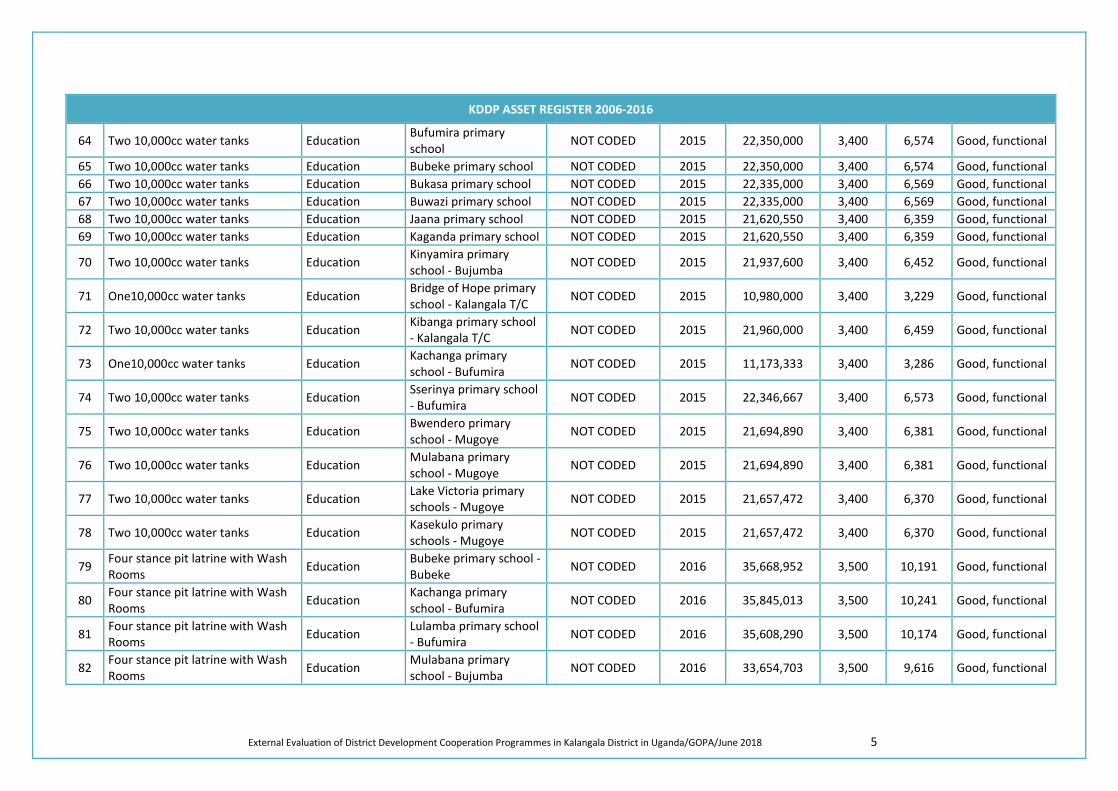
External Evaluation of District Development Cooperation Programmes in Kalangala District in Uganda/GOPA/June 2018 5
KDDP ASSET REGISTER 2006-2016
64 Two 10,000cc water tanks Education Bufumira primary school NOT CODED 2015 22,350,000 3,400 6,574 Good, functional
65 Two 10,000cc water tanks Education Bubeke primary school NOT CODED 2015 22,350,000 3,400 6,574 Good, functional 66 Two 10,000cc water tanks Education Bukasa primary school NOT CODED 2015 22,335,000 3,400 6,569 Good, functional 67 Two 10,000cc water tanks Education Buwazi primary school NOT CODED 2015 22,335,000 3,400 6,569 Good, functional 68 Two 10,000cc water tanks Education Jaana primary school NOT CODED 2015 21,620,550 3,400 6,359 Good, functional 69 Two 10,000cc water tanks Education Kaganda primary school NOT CODED 2015 21,620,550 3,400 6,359 Good, functional
70 Two 10,000cc water tanks Education Kinyamira primary school - Bujumba NOT CODED 2015 21,937,600 3,400 6,452 Good, functional
71 One10,000cc water tanks Education Bridge of Hope primary school - Kalangala T/C NOT CODED 2015 10,980,000 3,400 3,229 Good, functional
72 Two 10,000cc water tanks Education Kibanga primary school - Kalangala T/C NOT CODED 2015 21,960,000 3,400 6,459 Good, functional
73 One10,000cc water tanks Education Kachanga primary school - Bufumira NOT CODED 2015 11,173,333 3,400 3,286 Good, functional
74 Two 10,000cc water tanks Education Sserinya primary school - Bufumira NOT CODED 2015 22,346,667 3,400 6,573 Good, functional
75 Two 10,000cc water tanks Education Bwendero primary school - Mugoye NOT CODED 2015 21,694,890 3,400 6,381 Good, functional
76 Two 10,000cc water tanks Education Mulabana primary school - Mugoye NOT CODED 2015 21,694,890 3,400 6,381 Good, functional
77 Two 10,000cc water tanks Education Lake Victoria primary schools - Mugoye NOT CODED 2015 21,657,472 3,400 6,370 Good, functional
78 Two 10,000cc water tanks Education Kasekulo primary schools - Mugoye NOT CODED 2015 21,657,472 3,400 6,370 Good, functional
79 Four stance pit latrine with Wash Rooms Education Bubeke primary school -
Bubeke NOT CODED 2016 35,668,952 3,500 10,191 Good, functional
80 Four stance pit latrine with Wash Rooms Education Kachanga primary
school - Bufumira NOT CODED 2016 35,845,013 3,500 10,241 Good, functional
81 Four stance pit latrine with Wash Rooms Education Lulamba primary school
- Bufumira NOT CODED 2016 35,608,290 3,500 10,174 Good, functional
82 Four stance pit latrine with Wash Rooms Education Mulabana primary
school - Bujumba NOT CODED 2016 33,654,703 3,500 9,616 Good, functional
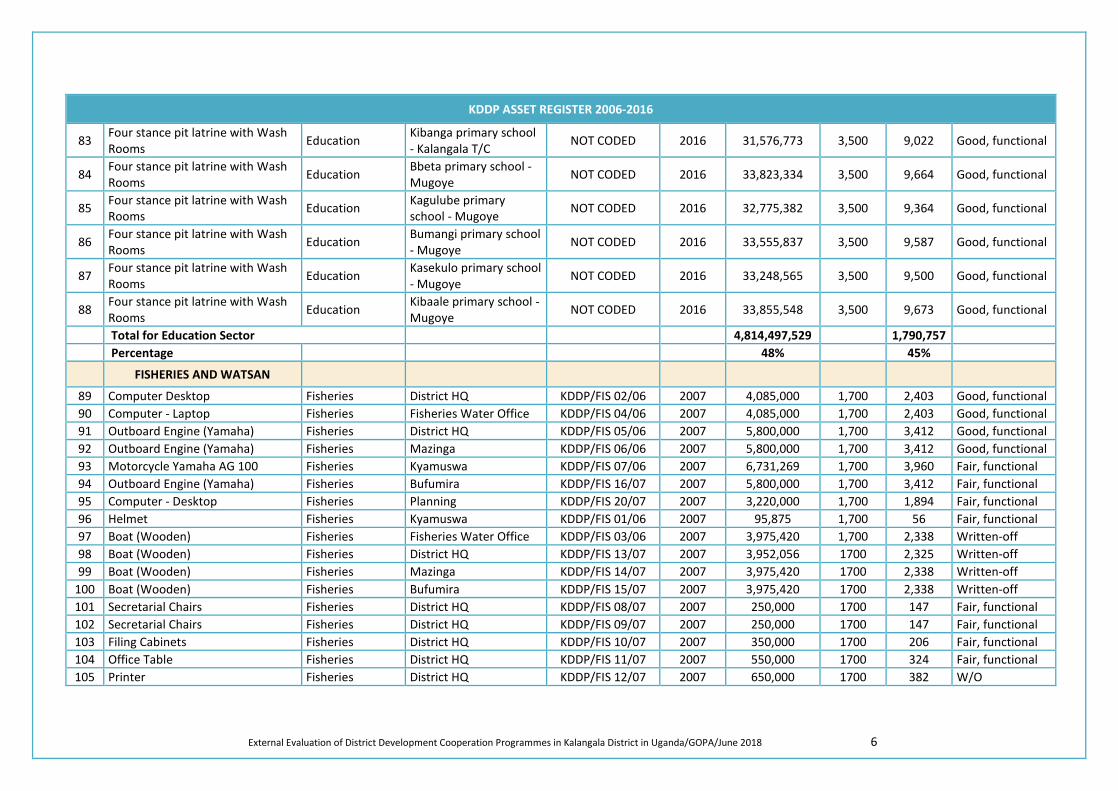
External Evaluation of District Development Cooperation Programmes in Kalangala District in Uganda/GOPA/June 2018 6
KDDP ASSET REGISTER 2006-2016
83 Four stance pit latrine with Wash Rooms Education Kibanga primary school
- Kalangala T/C NOT CODED 2016 31,576,773 3,500 9,022 Good, functional
84 Four stance pit latrine with Wash Rooms Education Bbeta primary school -
Mugoye NOT CODED 2016 33,823,334 3,500 9,664 Good, functional
85 Four stance pit latrine with Wash Rooms Education Kagulube primary
school - Mugoye NOT CODED 2016 32,775,382 3,500 9,364 Good, functional
86 Four stance pit latrine with Wash Rooms Education Bumangi primary school
- Mugoye NOT CODED 2016 33,555,837 3,500 9,587 Good, functional
87 Four stance pit latrine with Wash Rooms Education Kasekulo primary school
- Mugoye NOT CODED 2016 33,248,565 3,500 9,500 Good, functional
88 Four stance pit latrine with Wash Rooms Education Kibaale primary school -
Mugoye NOT CODED 2016 33,855,548 3,500 9,673 Good, functional
Total for Education Sector 4,814,497,529 1,790,757 Percentage 48% 45%
FISHERIES AND WATSAN
89 Computer Desktop Fisheries District HQ KDDP/FIS 02/06 2007 4,085,000 1,700 2,403 Good, functional 90 Computer - Laptop Fisheries Fisheries Water Office KDDP/FIS 04/06 2007 4,085,000 1,700 2,403 Good, functional 91 Outboard Engine (Yamaha) Fisheries District HQ KDDP/FIS 05/06 2007 5,800,000 1,700 3,412 Good, functional 92 Outboard Engine (Yamaha) Fisheries Mazinga KDDP/FIS 06/06 2007 5,800,000 1,700 3,412 Good, functional 93 Motorcycle Yamaha AG 100 Fisheries Kyamuswa KDDP/FIS 07/06 2007 6,731,269 1,700 3,960 Fair, functional 94 Outboard Engine (Yamaha) Fisheries Bufumira KDDP/FIS 16/07 2007 5,800,000 1,700 3,412 Fair, functional 95 Computer - Desktop Fisheries Planning KDDP/FIS 20/07 2007 3,220,000 1,700 1,894 Fair, functional 96 Helmet Fisheries Kyamuswa KDDP/FIS 01/06 2007 95,875 1,700 56 Fair, functional 97 Boat (Wooden) Fisheries Fisheries Water Office KDDP/FIS 03/06 2007 3,975,420 1,700 2,338 Written-off 98 Boat (Wooden) Fisheries District HQ KDDP/FIS 13/07 2007 3,952,056 1700 2,325 Written-off 99 Boat (Wooden) Fisheries Mazinga KDDP/FIS 14/07 2007 3,975,420 1700 2,338 Written-off
100 Boat (Wooden) Fisheries Bufumira KDDP/FIS 15/07 2007 3,975,420 1700 2,338 Written-off 101 Secretarial Chairs Fisheries District HQ KDDP/FIS 08/07 2007 250,000 1700 147 Fair, functional 102 Secretarial Chairs Fisheries District HQ KDDP/FIS 09/07 2007 250,000 1700 147 Fair, functional 103 Filing Cabinets Fisheries District HQ KDDP/FIS 10/07 2007 350,000 1700 206 Fair, functional 104 Office Table Fisheries District HQ KDDP/FIS 11/07 2007 550,000 1700 324 Fair, functional 105 Printer Fisheries District HQ KDDP/FIS 12/07 2007 650,000 1700 382 W/O
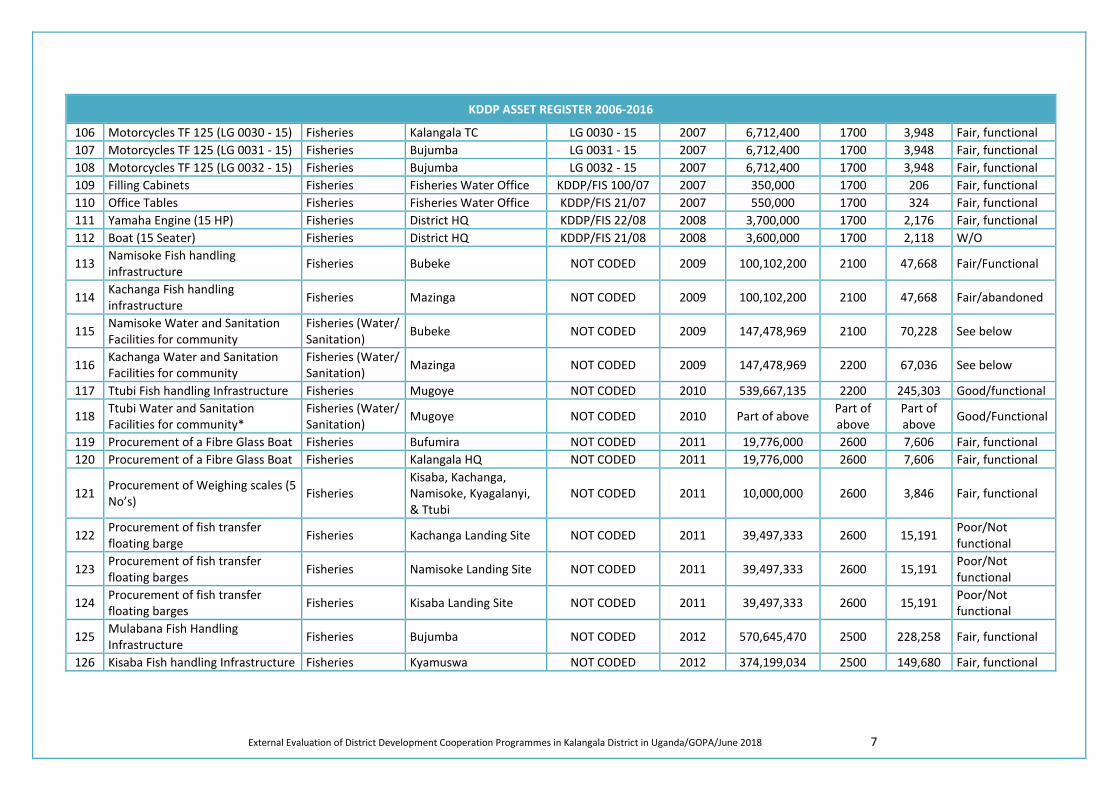
External Evaluation of District Development Cooperation Programmes in Kalangala District in Uganda/GOPA/June 2018 7
KDDP ASSET REGISTER 2006-2016
106 Motorcycles TF 125 (LG 0030 - 15) Fisheries Kalangala TC LG 0030 - 15 2007 6,712,400 1700 3,948 Fair, functional 107 Motorcycles TF 125 (LG 0031 - 15) Fisheries Bujumba LG 0031 - 15 2007 6,712,400 1700 3,948 Fair, functional 108 Motorcycles TF 125 (LG 0032 - 15) Fisheries Bujumba LG 0032 - 15 2007 6,712,400 1700 3,948 Fair, functional 109 Filling Cabinets Fisheries Fisheries Water Office KDDP/FIS 100/07 2007 350,000 1700 206 Fair, functional 110 Office Tables Fisheries Fisheries Water Office KDDP/FIS 21/07 2007 550,000 1700 324 Fair, functional 111 Yamaha Engine (15 HP) Fisheries District HQ KDDP/FIS 22/08 2008 3,700,000 1700 2,176 Fair, functional 112 Boat (15 Seater) Fisheries District HQ KDDP/FIS 21/08 2008 3,600,000 1700 2,118 W/O
113 Namisoke Fish handling infrastructure Fisheries Bubeke NOT CODED 2009 100,102,200 2100 47,668 Fair/Functional
114 Kachanga Fish handling infrastructure Fisheries Mazinga NOT CODED 2009 100,102,200 2100 47,668 Fair/abandoned
115 Namisoke Water and Sanitation Facilities for community
Fisheries (Water/ Sanitation) Bubeke NOT CODED 2009 147,478,969 2100 70,228 See below
116 Kachanga Water and Sanitation Facilities for community
Fisheries (Water/ Sanitation) Mazinga NOT CODED 2009 147,478,969 2200 67,036 See below
117 Ttubi Fish handling Infrastructure Fisheries Mugoye NOT CODED 2010 539,667,135 2200 245,303 Good/functional
118 Ttubi Water and Sanitation Facilities for community*
Fisheries (Water/ Sanitation) Mugoye NOT CODED 2010 Part of above Part of
above Part of above Good/Functional
119 Procurement of a Fibre Glass Boat Fisheries Bufumira NOT CODED 2011 19,776,000 2600 7,606 Fair, functional 120 Procurement of a Fibre Glass Boat Fisheries Kalangala HQ NOT CODED 2011 19,776,000 2600 7,606 Fair, functional
121 Procurement of Weighing scales (5 No’s) Fisheries
Kisaba, Kachanga, Namisoke, Kyagalanyi, & Ttubi
NOT CODED 2011 10,000,000 2600 3,846 Fair, functional
122 Procurement of fish transfer floating barge Fisheries Kachanga Landing Site NOT CODED 2011 39,497,333 2600 15,191 Poor/Not
functional
123 Procurement of fish transfer floating barges Fisheries Namisoke Landing Site NOT CODED 2011 39,497,333 2600 15,191 Poor/Not
functional
124 Procurement of fish transfer floating barges Fisheries Kisaba Landing Site NOT CODED 2011 39,497,333 2600 15,191 Poor/Not
functional
125 Mulabana Fish Handling Infrastructure Fisheries Bujumba NOT CODED 2012 570,645,470 2500 228,258 Fair, functional
126 Kisaba Fish handling Infrastructure Fisheries Kyamuswa NOT CODED 2012 374,199,034 2500 149,680 Fair, functional
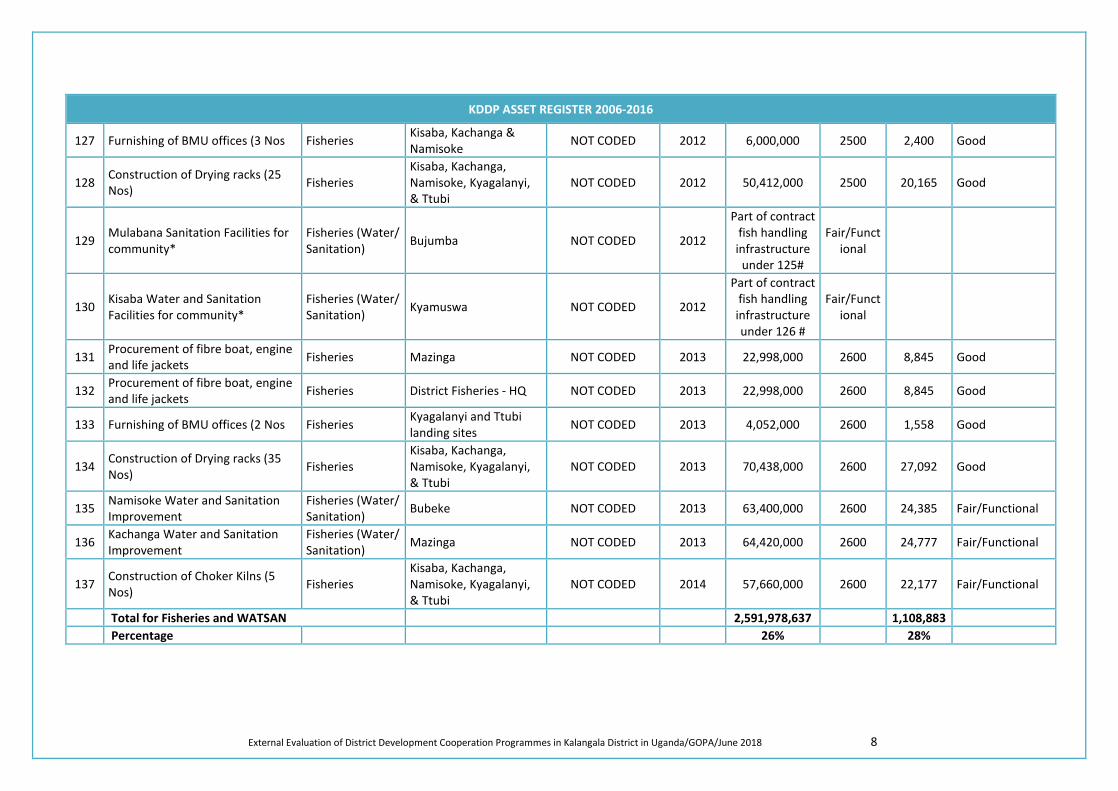
External Evaluation of District Development Cooperation Programmes in Kalangala District in Uganda/GOPA/June 2018 8
KDDP ASSET REGISTER 2006-2016
127 Furnishing of BMU offices (3 Nos Fisheries Kisaba, Kachanga & Namisoke NOT CODED 2012 6,000,000 2500 2,400 Good
128 Construction of Drying racks (25 Nos) Fisheries
Kisaba, Kachanga, Namisoke, Kyagalanyi, & Ttubi
NOT CODED 2012 50,412,000 2500 20,165 Good
129 Mulabana Sanitation Facilities for community*
Fisheries (Water/ Sanitation) Bujumba NOT CODED 2012
Part of contract fish handling infrastructure
under 125#
Fair/Functional
130 Kisaba Water and Sanitation Facilities for community*
Fisheries (Water/ Sanitation) Kyamuswa NOT CODED 2012
Part of contract fish handling infrastructure under 126 #
Fair/Functional
131 Procurement of fibre boat, engine and life jackets Fisheries Mazinga NOT CODED 2013 22,998,000 2600 8,845 Good
132 Procurement of fibre boat, engine and life jackets Fisheries District Fisheries - HQ NOT CODED 2013 22,998,000 2600 8,845 Good
133 Furnishing of BMU offices (2 Nos Fisheries Kyagalanyi and Ttubi landing sites NOT CODED 2013 4,052,000 2600 1,558 Good
134 Construction of Drying racks (35 Nos) Fisheries
Kisaba, Kachanga, Namisoke, Kyagalanyi, & Ttubi
NOT CODED 2013 70,438,000 2600 27,092 Good
135 Namisoke Water and Sanitation Improvement
Fisheries (Water/ Sanitation) Bubeke NOT CODED 2013 63,400,000 2600 24,385 Fair/Functional
136 Kachanga Water and Sanitation Improvement
Fisheries (Water/ Sanitation) Mazinga NOT CODED 2013 64,420,000 2600 24,777 Fair/Functional
137 Construction of Choker Kilns (5 Nos) Fisheries
Kisaba, Kachanga, Namisoke, Kyagalanyi, & Ttubi
NOT CODED 2014 57,660,000 2600 22,177 Fair/Functional
Total for Fisheries and WATSAN 2,591,978,637 1,108,883 Percentage 26% 28%
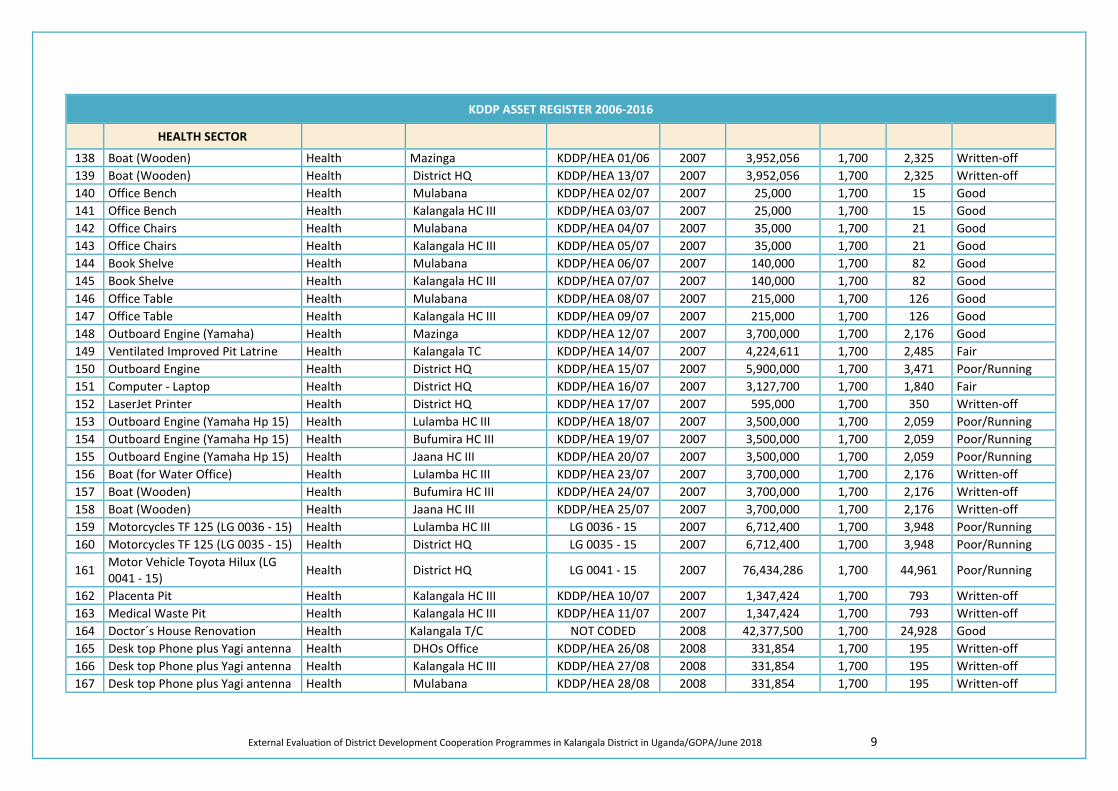
External Evaluation of District Development Cooperation Programmes in Kalangala District in Uganda/GOPA/June 2018 9
KDDP ASSET REGISTER 2006-2016
HEALTH SECTOR
138 Boat (Wooden) Health Mazinga KDDP/HEA 01/06 2007 3,952,056 1,700 2,325 Written-off 139 Boat (Wooden) Health District HQ KDDP/HEA 13/07 2007 3,952,056 1,700 2,325 Written-off 140 Office Bench Health Mulabana KDDP/HEA 02/07 2007 25,000 1,700 15 Good 141 Office Bench Health Kalangala HC III KDDP/HEA 03/07 2007 25,000 1,700 15 Good 142 Office Chairs Health Mulabana KDDP/HEA 04/07 2007 35,000 1,700 21 Good 143 Office Chairs Health Kalangala HC III KDDP/HEA 05/07 2007 35,000 1,700 21 Good 144 Book Shelve Health Mulabana KDDP/HEA 06/07 2007 140,000 1,700 82 Good 145 Book Shelve Health Kalangala HC III KDDP/HEA 07/07 2007 140,000 1,700 82 Good 146 Office Table Health Mulabana KDDP/HEA 08/07 2007 215,000 1,700 126 Good 147 Office Table Health Kalangala HC III KDDP/HEA 09/07 2007 215,000 1,700 126 Good 148 Outboard Engine (Yamaha) Health Mazinga KDDP/HEA 12/07 2007 3,700,000 1,700 2,176 Good 149 Ventilated Improved Pit Latrine Health Kalangala TC KDDP/HEA 14/07 2007 4,224,611 1,700 2,485 Fair 150 Outboard Engine Health District HQ KDDP/HEA 15/07 2007 5,900,000 1,700 3,471 Poor/Running 151 Computer - Laptop Health District HQ KDDP/HEA 16/07 2007 3,127,700 1,700 1,840 Fair 152 LaserJet Printer Health District HQ KDDP/HEA 17/07 2007 595,000 1,700 350 Written-off 153 Outboard Engine (Yamaha Hp 15) Health Lulamba HC III KDDP/HEA 18/07 2007 3,500,000 1,700 2,059 Poor/Running 154 Outboard Engine (Yamaha Hp 15) Health Bufumira HC III KDDP/HEA 19/07 2007 3,500,000 1,700 2,059 Poor/Running 155 Outboard Engine (Yamaha Hp 15) Health Jaana HC III KDDP/HEA 20/07 2007 3,500,000 1,700 2,059 Poor/Running 156 Boat (for Water Office) Health Lulamba HC III KDDP/HEA 23/07 2007 3,700,000 1,700 2,176 Written-off 157 Boat (Wooden) Health Bufumira HC III KDDP/HEA 24/07 2007 3,700,000 1,700 2,176 Written-off 158 Boat (Wooden) Health Jaana HC III KDDP/HEA 25/07 2007 3,700,000 1,700 2,176 Written-off 159 Motorcycles TF 125 (LG 0036 - 15) Health Lulamba HC III LG 0036 - 15 2007 6,712,400 1,700 3,948 Poor/Running 160 Motorcycles TF 125 (LG 0035 - 15) Health District HQ LG 0035 - 15 2007 6,712,400 1,700 3,948 Poor/Running
161 Motor Vehicle Toyota Hilux (LG 0041 - 15) Health District HQ LG 0041 - 15 2007 76,434,286 1,700 44,961 Poor/Running
162 Placenta Pit Health Kalangala HC III KDDP/HEA 10/07 2007 1,347,424 1,700 793 Written-off 163 Medical Waste Pit Health Kalangala HC III KDDP/HEA 11/07 2007 1,347,424 1,700 793 Written-off 164 Doctor´s House Renovation Health Kalangala T/C NOT CODED 2008 42,377,500 1,700 24,928 Good 165 Desk top Phone plus Yagi antenna Health DHOs Office KDDP/HEA 26/08 2008 331,854 1,700 195 Written-off 166 Desk top Phone plus Yagi antenna Health Kalangala HC III KDDP/HEA 27/08 2008 331,854 1,700 195 Written-off 167 Desk top Phone plus Yagi antenna Health Mulabana KDDP/HEA 28/08 2008 331,854 1,700 195 Written-off
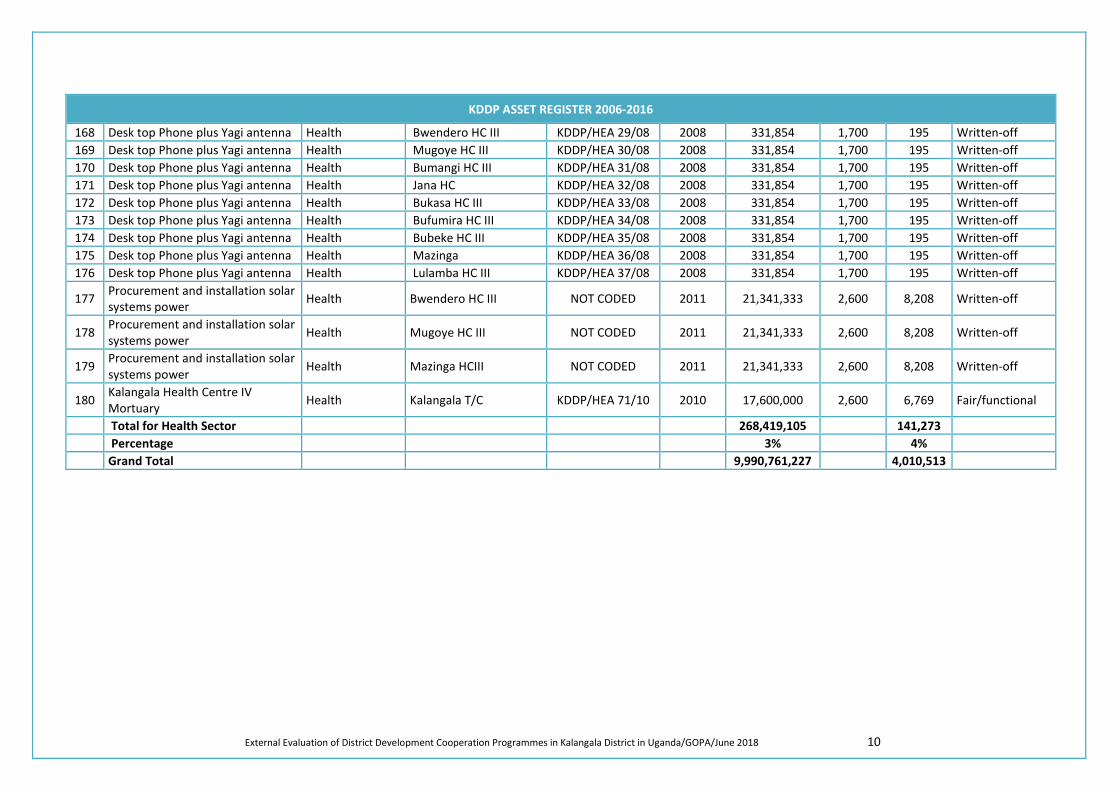
External Evaluation of District Development Cooperation Programmes in Kalangala District in Uganda/GOPA/June 2018 10
KDDP ASSET REGISTER 2006-2016
168 Desk top Phone plus Yagi antenna Health Bwendero HC III KDDP/HEA 29/08 2008 331,854 1,700 195 Written-off 169 Desk top Phone plus Yagi antenna Health Mugoye HC III KDDP/HEA 30/08 2008 331,854 1,700 195 Written-off 170 Desk top Phone plus Yagi antenna Health Bumangi HC III KDDP/HEA 31/08 2008 331,854 1,700 195 Written-off 171 Desk top Phone plus Yagi antenna Health Jana HC KDDP/HEA 32/08 2008 331,854 1,700 195 Written-off 172 Desk top Phone plus Yagi antenna Health Bukasa HC III KDDP/HEA 33/08 2008 331,854 1,700 195 Written-off 173 Desk top Phone plus Yagi antenna Health Bufumira HC III KDDP/HEA 34/08 2008 331,854 1,700 195 Written-off 174 Desk top Phone plus Yagi antenna Health Bubeke HC III KDDP/HEA 35/08 2008 331,854 1,700 195 Written-off 175 Desk top Phone plus Yagi antenna Health Mazinga KDDP/HEA 36/08 2008 331,854 1,700 195 Written-off 176 Desk top Phone plus Yagi antenna Health Lulamba HC III KDDP/HEA 37/08 2008 331,854 1,700 195 Written-off
177 Procurement and installation solar systems power Health Bwendero HC III NOT CODED 2011 21,341,333 2,600 8,208 Written-off
178 Procurement and installation solar systems power Health Mugoye HC III NOT CODED 2011 21,341,333 2,600 8,208 Written-off
179 Procurement and installation solar systems power Health Mazinga HCIII NOT CODED 2011 21,341,333 2,600 8,208 Written-off
180 Kalangala Health Centre IV Mortuary Health Kalangala T/C KDDP/HEA 71/10 2010 17,600,000 2,600 6,769 Fair/functional
Total for Health Sector 268,419,105 141,273 Percentage 3% 4% Grand Total 9,990,761,227 4,010,513
External Evaluation of District Development Cooperation Programmes in Kalangala District in Uganda/GOPA/August 2018
Annex 9: Household Survey Analyses
KALANGALA DISTRICT DEVELOPMENT PROGRAMME END OF PROGRAMME EVALUATION
HOUSEHOLD SURVEY REPORT
Conducted
23rd April – 8th May 2018
Prepared by: GOPA Consultants
August 2018
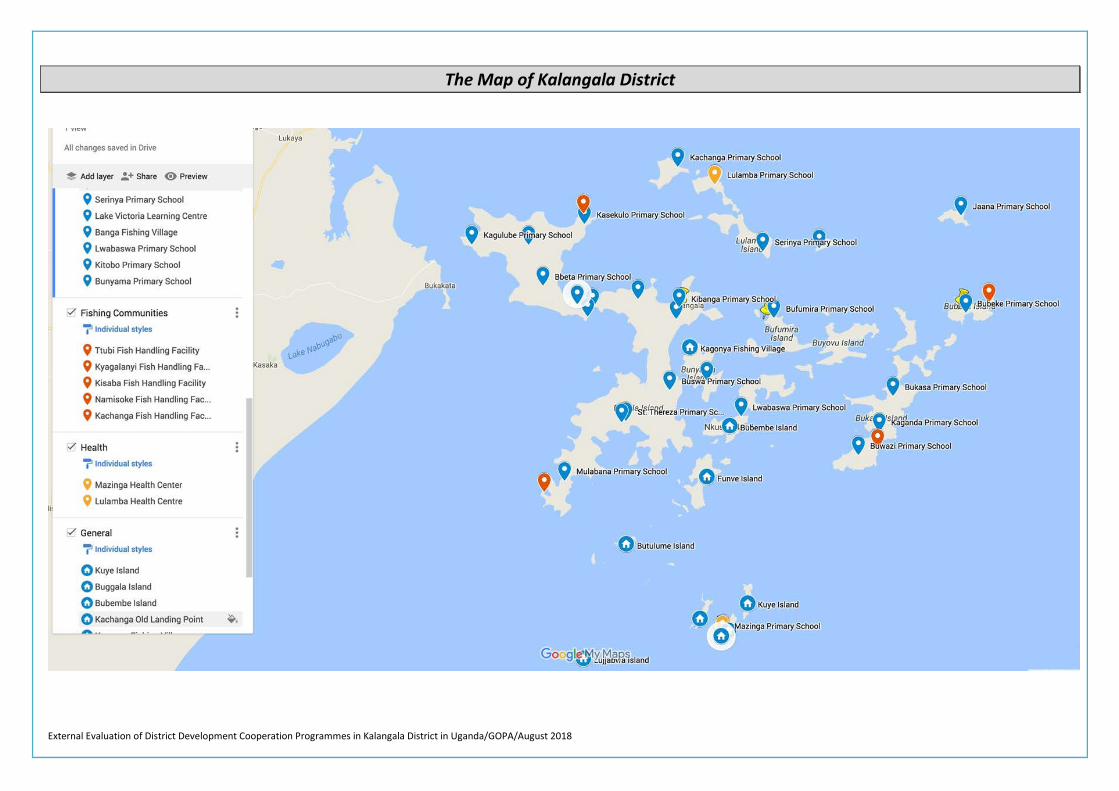
External Evaluation of District Development Cooperation Programmes in Kalangala District in Uganda/GOPA/August 2018
The Map of Kalangala District

External Evaluation of District Development Cooperation Programmes in Kalangala District in Uganda/GOPA/August 2018 i
TABLE OF CONTENTS THE MAP OF KALANGALA DISTRICT ............................................................................................... I
TABLE OF CONTENTS ..................................................................................................................... I
LIST OF TABLES ...........................................................................................................................VI
LIST OF FIGURES .......................................................................................................................... XI
LIST OF ACRONYMS .................................................................................................................... XII
CHAPTER ONE: INTRODUCTION ............................................................................................... 1
1.1 BACKGROUND ................................................................................................................. 1
1.2 KALANGALA DISTRICT HOUSEHOLD SURVEY ..................................................................... 1 1.2.1 SAMPLED VILLAGES AND HOUSEHOLDS .......................................................................................... 2
Table 1.1: Household Sample Size by County ............................................................................................... 2 1.2.2 TRAINING OF ENUMERATORS AND DATA COLLECTION ...................................................................... 3 1.2.2.1 TRAINING OF ENUMERATORS ........................................................................................................ 3 1.2.2.2 DATA COLLECTION ....................................................................................................................... 3 1.2.3 DATA ENTRY, ANALYSIS, AND REPORT WRITING .............................................................................. 4 1.2.4 CHALLENGES ............................................................................................................................. 4 1.2.5 LOGISTICAL SUPPORT FROM KALANGALA DISTRICT LOCAL GOVERNMENT AND EMBASSY OF ICELAND - UGANDA ............................................................................................................................................... 4
CHAPTER TWO: HOUSEHOLD CHARACTERISTICS ........................................................................ 6
2.1 HOUSEHOLDS .................................................................................................................. 6 Table 2.1: Number of Households Covered by Sub-County / Town Council by Gender .............................. 6
2.1.1 DURATION OF STAY .................................................................................................................... 6 Table 2.2: Households by Duration of Stay in the Village by Gender ........................................................ 6
2.1.2 PREVIOUS RESIDENCE OF RESPONDENTS ........................................................................................ 7 Table 2.3: Respondents by Previous Residence by Gender ....................................................................... 7
2.1.3 PLACE OF ORIGIN ....................................................................................................................... 7 Table 2.4: Heads of Household by District or Country of Origin by Gender .............................................. 7
2.2 HOUSEHOLD POPULATION ............................................................................................... 7 2.2.1 HOUSEHOLD SIZE ....................................................................................................................... 8
Table 2.5: Household Size by Gender of Head of Household ........................................................................ 8 2.2.2 HOUSEHOLD POPULATION BY AGE GROUP ..................................................................................... 8
Table 2.6: Number of People by Age Group by Gender ................................................................................. 8 2.2.3 HOUSEHOLD POPULATION BY MARITAL STATUS .............................................................................. 9
Table 2.7: Number of People by Marital Status by Gender ...................................................................... 9 2.2.4 HOUSEHOLD POPULATION BY MAJOR OCCUPATION ......................................................................... 9
Table 2.8: Population by Category of Main Occupation in the Last 30 Days by Age Category ................... 10
CHAPTER THREE: EDUCATION ............................................................................................... 11
3.1 LITERACY ....................................................................................................................... 11 3.1.1 POPULATION BY HIGHEST LEVEL ATTAINED ................................................................................... 11
Table 3.1: Distribution of Population by Highest Level of Education Completed ...................................... 11 Table 3.2: Distribution of the Population Aged 6 - 13 Years by Highest Level of Education Completed .... 12
3.1.2 READING AND/OR WRITING ABILITY OF HOUSEHOLD POPULATION ................................................... 12 Table 3.3: Population (Aged 10 years and above) by Literacy Level by Gender.......................................... 12
3.2 DISTANCE TO OR TIME TAKEN (TO REACH) THE NEAREST GOVERNMENT PRIMARY SCHOOL ...................................................................................................................................... 13
Table 3.4 (a): Distance (Km) to the Nearest Government Primary School by Number of Households ...... 13
External Evaluation of District Development Cooperation Programmes in Kalangala District in Uganda/GOPA/August 2018 ii
Table 3.4 (b): Time Taken (Hours) to Reach the Nearest Government Primary School by Number of Households ................................................................................................................................................... 13
3.3 DISTANCE TO OR TIME TAKEN (TO REACH) THE NEAREST FUNCTIONAL ADULT LITERACY CLASS ...................................................................................................................................... 14
Table 3.5 (a): Distance (Km) to the FAL Class by Number of Households ................................................... 14 Table 3.5 (b): Time Taken (Hours) to Reach the Nearest FAL Class by Number of Households .................. 14
3.4 PRIMARY SCHOOL ATTENDANCE AND DROP OUT ........................................................... 15 3.4.1 PRIMARY SCHOOL ATTENDANCE ................................................................................................ 15
Table 3.6: Primary School Attendance by Number of Households .............................................................. 15 Table 3.7 (a): Major Reasons for Missing Attending Primary School (in the Last 30 Days) by Number of Households ................................................................................................................................................... 15 Table 3.7 (b): Major Reasons for Missing Attending Primary School (in the Last 30 Days) by Number of Households by County .................................................................................................................................. 16
3.4.2 PRIMARY SCHOOL DROP OUT .................................................................................................... 16 Table 3.8: Major Reasons for Dropping out of Primary School by Number of Households (for Children Aged 6 – 13 years) ......................................................................................................................................... 16
3.4.3 NEVER ATTENDED SCHOOL ........................................................................................................ 17 Table 3.9: Major Reasons for Never Attending Primary School by Number of Households (for People Aged 6 – 18 years) ......................................................................................................................................... 17
3.5 VIEWS ON THE QUALITY OF EDUCATION PROVIDED ........................................................ 17 Table 3.10: Views of Respondent on the Quality of Education Children were Receiving at School .......... 17 Figure 1: Perceptions of Household Respondents on the Quality of Education Provided by Government-Aided Primary Schools .................................................................................................................................. 18 Table 3.11: Major Reasons for the Perceptions of Respondents on the Quality of Education ................... 19
CHAPTER FOUR: HEALTH...................................................................................................... 21
4.1 DISTANCE TO OR TIME TAKEN (TO REACH) THE NEAREST GOVERNMENT HEALTH UNIT ... 21 Table 4.1 (a): Distance (Km) to the Government Health Unit by Number of Households .......................... 21 Table 4.1 (b): Time Taken (Hours) to Reach the Nearest Government Health Unit by Number of Households ................................................................................................................................................... 21 Table 4.2 (a): Distance (Km) to the Nearest Government Health Unit by Type by Number of Households ....................................................................................................................................................................... 22 Table 4.2 (b): Distance (Km) to the Nearest Government Health Unit by Type by Number of Households (see also Figure 2) ......................................................................................................................................... 22 Figure 2: Distance to the Nearest Government Health Unit by Type of Unit by Total Number of Households ................................................................................................................................................... 23 Table 4.2 (c): Time Taken (Hours) to Reach the Nearest Government Health Unit by Type by Total Number of Households ................................................................................................................................. 24 Table 4.2 (d): Time Taken (Hours) to Reach the Nearest Government Health Unit by Type by Total Number of Households ................................................................................................................................. 24
4.2 HEALTH SERVICE EXPERIENCE ENCOUNTER .................................................................... 25 Table 4.3 (a): Distribution of Households that Reported Having Persons Who Fell Sick in the Last 30 Days by Type of Illness and Location .................................................................................................................... 25 Table 4.3 (b): Distribution of Persons Who Fell Sick in the Last 30 Days by Type of Illness and Location . 25 Table 4.3 (c): Distribution of Persons Who Fell Sick and Sought Treatment in the Last 30 Days by Type of Illness and Type of Facility Accessed – ALL Sampled Villages ...................................................................... 27 Table 4.4: Distribution of Persons Who Sought Treatment in the Last 30 Days by Type of Illness Who Got to Know their Illnesses, Availed with Drugs, Treated, and/or Referred to Other Facilities ....................... 27
4.3 VIEWS ON THE QUALITY OF SERVICES PROVIDED BY THE NEAREST GOVERNMENT HEALTH UNIT ...................................................................................................................................... 28
Table 4.5 (a): Views of Respondents on the Quality of Health Services provided by the Nearest Government Health Unit .............................................................................................................................. 28 Table 4.5 (b): Views of Respondents on the Quality of Health Services provided by the Nearest Government Health Unit .............................................................................................................................. 28 Figure 3: Perception of Household Respondents on the Quality of Health Services Provided by Government Health Facilities in Kalangala District ...................................................................................... 29 Table 4.5 (c): Views of Respondents on the Quality of Health Services provided by the Nearest Government Health Unit Correlated With Distance .................................................................................... 29
External Evaluation of District Development Cooperation Programmes in Kalangala District in Uganda/GOPA/August 2018 iii
Table 4.6: Major Reasons for the Perceptions of Respondents on the Quality of Health Services Provided by Government Health Units ........................................................................................................................ 30
CHAPTER FIVE: INCOME, EXPENDITURE, ASSETS, AND WELFARE ............................................. 32
5.1 MAJOR SOURCES OF INCOME FOR HOUSEHOLDS ............................................................ 32 Table 5.1 (a): Major Sources of Income for Households by Intervention Location and Control Villages .. ............................................................................................................................................ 32 Table 5.1 (b): Major Sources of Income for Households by County ........................................................ 33
5.2 FISHING – INFRASTRUCTURE, FACILITIES, AND AMENITIES .............................................. 33 5.2.1 CATEGORY OF FISHING ACTIVITIES HOUSEHOLDS ARE INVOLVED IN .................................................. 33
Table 5.2: Number of Households With Fishing as Major Source of Income by Category of Fishing Activity .................................................................................................................................................. 33
5.2.2 FISHING INFRASTRUCTURE ......................................................................................................... 34 Table 5.3 (a): Type of Fishing Facilities / Infrastructure Reported by Households at ALL Landing Sites 34 Table 5.3(b): Fishing Facilities / Infrastructure Reported by Households at Other Villages / Landing Sites ............................................................................................................................................. 35
5.2.3 ACCESS TO FISHING FACILITIES AND AMENITIES ............................................................................ 36 Table 5.4 (a): Access to Fishing Facilities – Intervention Location Landing Sites ....................................... 36 Table 5.4 (b): Access to Fishing Facilities – Other Landing Sites / Villages .................................................. 37 Table 5.4 (c): Distance (Km) or Time Taken (Hours) to Reach Specific Fishing Facilities ............................. 38 Table 5.4 (d): Access to other Facilities and Amenities ............................................................................... 39 Table 5.4 (e): Management of Solid Waste at Landing Sites ....................................................................... 40
5.3 CHANGES IN HOUSEHOLD WELFARE ............................................................................... 40 Table 5.5 (a): Status of Welfare in Households since 2011 .......................................................................... 40 Table 5.5 (b): Status of Welfare in Households since 2011 by County ........................................................ 41
5.3.1 IMPROVEMENT IN HOUSEHOLD WELFARE .................................................................................... 41 Table 5.6: Reasons for Improved Household Welfare ................................................................................. 41 Figure 4: Reasons for Improved Household Welfare ................................................................................... 42
5.3.2 LACK OF IMPROVEMENT IN HOUSEHOLD WELFARE ........................................................................ 42 Table 5.7 (a): Current Poverty Status - Perception of Households that Reported Lack of Improvement in Household Welfare Since 2011 ..................................................................................................................... 42 Table 5.7 (b): Current Poverty Status - Perception of Households that Reported Lack of Improvement in Household Welfare Since 2011 by County ................................................................................................... 43 Table 5.8: Major Causes of Poverty .............................................................................................................. 43
5.4 SAVINGS BY HOUSEHOLDS ............................................................................................. 43 Table 5.9: Income Saving Status of Households........................................................................................... 43 Table 5.10 (a): Proportion of Income Saved by Households ........................................................................ 44 Table 5.10 (b): Type of ‘Institutions or Location’ Where Savings are kept by Number of Households ...... 44 Table 5.11: Major Reasons for Failure to Save by Households .................................................................... 44 Figure 5: Major Reasons Given by Households for Failure to Save ............................................................. 45
5.5 HOUSEHOLD EXPENDITURES .......................................................................................... 45 Table 5.12 (a): Range of Household Expenditure by Number of Households ............................................. 45 Figure 6: Ranges of Household Expenditures on Selected Items ................................................................. 46 Table 5.12 (b): Reported Change in Household Expenditure since 2011 by Number of Households ......... 46
5.6 HOUSEHOLD AND ENTERPRISE ASSETS ........................................................................... 47 Table 5.13: Reported Change in Household and Enterprise Assets since 2011 by Number of Households ....................................................................................................................................................................... 47 Table 5.14: Reasons for Reported Change in Household and Enterprise Assets ......................................... 48 Table 5.15: Available Number of Mobile Telephones by Number of Households ...................................... 48
CHAPTER SIX: WATER, SANITATION, AND HOUSING CONDITIONS ......................................... 49
6.1 WATER ......................................................................................................................... 49 6.1.1 SOURCES OF WATER ................................................................................................................ 49
Table 6.1 (a): Households’ Main Sources of Water by Number of Households .......................................... 49 Table 6.1 (b): Households’ Secondary Sources of Water by Number of Households ................................. 50
6.1.2 TIME TAKEN TO COLLECT WATER ................................................................................................ 51 Table 6.2 (a): Time Taken to Collect Water from the Main Source by Households .................................... 51

External Evaluation of District Development Cooperation Programmes in Kalangala District in Uganda/GOPA/August 2018 iv
Table 6.2 (b): Time Taken to Collect Water from the Secondary Source by Households ........................... 51 6.1.3 QUANTITY OF WATER CONSUMED BY HOUSEHOLDS ON DAILY BASIS ................................................ 52
Table 6.3: Quantity of Water Utilised Daily from the Main Source by Households .................................... 52 6.1.4 QUALITY OF WATER FROM THE MAIN WATER SOURCES ................................................................. 52
Table 6.4: Perception of Households on the Quality of Water from their Main Sources ........................... 52 6.1.5 METHODS USED BY HOUSEHOLDS TO TREAT WATER ..................................................................... 53
Table 6.5: Methods Used by Households to Treat Water from their Main Source ..................................... 53 6.1.6 DURATION OF AVAILABILITY OF WATER FROM THE MAIN SOURCES ................................................. 53
Table 6.6 (a): Duration of Availability of Water from the Main Source – ALL Sampled Villages ................ 53 Table 6.6 (b-1): Duration of Availability of Water from the Main Source – Bujumba County .................... 54 Table 6.6 (b-2): Duration of Availability of Water from the Main Source – Kyamuswa County ................. 54
6.1.7 UTILISATION OF TIME ............................................................................................................... 54 Table 6.7: Utilisation of Time by Households Spending below 30 minutes to Collect Water from Source 54
6.1.8 MAJOR REASONS FOR USING WATER FROM UNSAFE SOURCES ....................................................... 55 Table 6.8: Major Reasons Given by Households for Using Water from UNSAFE Sources ........................... 55
6.1.9 PAYMENT FOR WATER ............................................................................................................. 55 Table 6.9: Water Cost Status by Households ............................................................................................... 55
6.1.10 MONTHLY COST OF WATER .................................................................................................. 56 Table 6.10: Monthly Amount (UGX) Paid for Water Used by Households .................................................. 56
6.1.11 PERCEPTION OF HOUSEHOLDS ON THE COST OF WATER ............................................................ 56 Table 6.11: Perception of Households on the Monthly Cost of Water ........................................................ 56
6.1.12 REASONS FOR PAYMENT FOR WATER ..................................................................................... 57 Table 6.12: Reasons Given for Payment for Water by Households ............................................................. 57
6.1.13 MAINTENANCE OF WATER SOURCES ...................................................................................... 57 Table 6.13: Views of Households on How Water Sources are maintained ................................................. 57
6.2 SANITATION .................................................................................................................. 58 6.2.1 SANITATION FACILITIES USED BY HOUSEHOLDS ............................................................................. 58
Table 6.14: Category of Sanitation Facility Utilised by Households ............................................................ 58 6.2.2 TYPE OF PRIVATE SANITATION FACILITIES UTILISED BY HOUSEHOLDS ................................................ 58
Table 6.15 (a): Type of Private Sanitation Facility Utilised by Households ................................................. 58 Table 6.15 (b): Availability of Water and Soap at the Private Sanitation Facilities..................................... 59
6.2.3 LEVEL OF CLEANLINESS OF PUBLIC SANITATION FACILITIES UTILISED BY HOUSEHOLDS ......................... 59 Table 6.16: Level of Cleanliness of Public Sanitation Facilities Utilised by Some Households and Availability of Water and Soap ..................................................................................................................... 59
6.2.4 KNOWLEDGE LEVELS OF RESPONDENTS ON THE MOST IMPORTANT HYGIENE BEHAVIOURS .................. 60 Table 6.17: Most Important Hygiene Behaviours to Retain Healthy Families ............................................ 60 Table 6.18: Consequences of Failure to Practice the Most Important Hygiene Behaviours ....................... 60
6.2.5 SENSITISATION OF HOUSEHOLDS AND VILLAGE COMMUNITIES ON HYGIENE AND SANITATION .............. 61 Table 6.19: Sensitisation of Individual Households on Hygiene and Sanitation ......................................... 61 Table 6.20 (a-1): Holding of Sensitisation Meetings in the Villages on Hygiene and Sanitation ................ 61 Table 6.20 (a-2): Holding of Sensitisation Meetings in the Villages on Hygiene and Sanitation by County ....................................................................................................................................................................... 61 Table 6.21 (a): Responses on Application of knowledge Acquired from Village Meetings on Hygiene and Sanitation ...................................................................................................................................................... 62 Table 6.21 (b): Responses on Application of knowledge Acquired from Village Meetings on Hygiene and Sanitation by County .................................................................................................................................... 62 Table 6.22: Aspects on Which Households Applied the Knowledge Obtained from Village Sensitisation Meetings on Hygiene and Sanitation ........................................................................................................... 62
6.3 HOUSING CONDITIONS .................................................................................................. 63 Table 6.23: Category of Houses ................................................................................................................... 63 Table 6.24: Respondents who Reported ‘No Improvement in Household Welfare’ Correlated With Category of Housing Structure ..................................................................................................................... 63
CHAPTER SEVEN: DEVELOPMENT INTERVENTIONS AND SUSTAINABILITY ..................................... 64
7.1 DEVELOPMENT INTERVENTIONS UNDERTAKEN AND BENEFITS ........................................ 64 7.1.1 KNOWLEDGE OF SECTOR DEVELOPMENT INTERVENTIONS ............................................................... 64
External Evaluation of District Development Cooperation Programmes in Kalangala District in Uganda/GOPA/August 2018 v
Table 7.1: Knowledge of Sector Development Interventions in the Village Since 2011 and Organisations Responsible ................................................................................................................................................... 64
7.1.2 VIEWS ON BENEFITS FROM SECTOR DEVELOPMENT INTERVENTIONS ................................................ 65 Table 7.2: Views on Whether the Village Communities Benefitted from the Sector Development Interventions ................................................................................................................................................. 65
7.1.3 CATEGORIES OF BENEFICIARIES FROM SECTOR DEVELOPMENT INTERVENTIONS .................................. 65 Table 7.3: Category of Beneficiaries from the Sector Development Interventions in the Villages Since 2011 ............................................................................................................................................................... 65
7.1.4 PARTICIPATION OF VILLAGE COMMUNITY MEMBERS IN PLANNING MEETINGS AND IMPLEMENTATION OF ACTIVITIES ........................................................................................................................................... 66
Table 7.4 (a): Participation of Community Members in the Planning of Programmes / Activities in the Villages since 2011 ........................................................................................................................................ 66 Table 7.4 (b): Participation of Community Members in the Implementation of Programmes / Activities in the Villages since 2011 .............................................................................................................................. 66
7.2 SUSTAINABILITY DEVELOPMENT INTERVENTIONS UNDERTAKEN AND BENEFITS .............. 66 Table 7.5 (a): Perceptions of Households on the Changes in the Provision of Public Facilities and Services Since 2011 ..................................................................................................................................................... 67 Table 7.5(b-1): Perceptions of Households on the Changes in the Provision of Public Facilities and Services Since 2011 – Bujumba County ........................................................................................................ 68 Table 7.5(b-2): Perceptions of Households on the Changes in the Provision of Public Facilities and Services Since 2011 – Kyamuswa County ..................................................................................................... 68 Table 7.6: Reasons Given by Respondents for the Perceptions on the Changes in the Provision of Public Facilities and Services Since 2011 ................................................................................................................. 70
APPENDIX 1: SAMPLED VILLAGES AND NUMBER OF HOUSEHOLDS BY COUNTY, SUB-COUNTY / TOWN COUNCIL, AND PARISH ................................................................................................................................................ 74
External Evaluation of District Development Cooperation Programmes in Kalangala District in Uganda/GOPA/August 2018 vi
LIST OF TABLES THE MAP OF KALANGALA DISTRICT ............................................................................................... I
TABLE OF CONTENTS ..................................................................................................................... I
LIST OF TABLES ...........................................................................................................................VI
LIST OF FIGURES .......................................................................................................................... XI
LIST OF ACRONYMS .................................................................................................................... XII
CHAPTER ONE: INTRODUCTION ............................................................................................... 1
1.1 BACKGROUND ................................................................................................................. 1
1.2 KALANGALA DISTRICT HOUSEHOLD SURVEY ..................................................................... 1 1.2.1 SAMPLED VILLAGES AND HOUSEHOLDS .......................................................................................... 2
Table 1.1: Household Sample Size by County ............................................................................................... 2 1.2.2 TRAINING OF ENUMERATORS AND DATA COLLECTION ...................................................................... 3 1.2.2.1 TRAINING OF ENUMERATORS ........................................................................................................ 3 1.2.2.2 DATA COLLECTION ....................................................................................................................... 3 1.2.3 DATA ENTRY, ANALYSIS, AND REPORT WRITING .............................................................................. 4 1.2.4 CHALLENGES ............................................................................................................................. 4 1.2.5 LOGISTICAL SUPPORT FROM KALANGALA DISTRICT LOCAL GOVERNMENT AND EMBASSY OF ICELAND - UGANDA ............................................................................................................................................... 4
CHAPTER TWO: HOUSEHOLD CHARACTERISTICS ........................................................................ 6
2.1 HOUSEHOLDS .................................................................................................................. 6 Table 2.1: Number of Households Covered by Sub-County / Town Council by Gender .............................. 6
2.1.1 DURATION OF STAY .................................................................................................................... 6 Table 2.2: Households by Duration of Stay in the Village by Gender ........................................................ 6
2.1.2 PREVIOUS RESIDENCE OF RESPONDENTS ........................................................................................ 7 Table 2.3: Respondents by Previous Residence by Gender ....................................................................... 7
2.1.3 PLACE OF ORIGIN ....................................................................................................................... 7 Table 2.4: Heads of Household by District or Country of Origin by Gender .............................................. 7
2.2 HOUSEHOLD POPULATION ............................................................................................... 7 2.2.1 HOUSEHOLD SIZE ....................................................................................................................... 8
Table 2.5: Household Size by Gender of Head of Household ........................................................................ 8 2.2.2 HOUSEHOLD POPULATION BY AGE GROUP ..................................................................................... 8
Table 2.6: Number of People by Age Group by Gender ................................................................................. 8 2.2.3 HOUSEHOLD POPULATION BY MARITAL STATUS .............................................................................. 9
Table 2.7: Number of People by Marital Status by Gender ...................................................................... 9 2.2.4 HOUSEHOLD POPULATION BY MAJOR OCCUPATION ......................................................................... 9
Table 2.8: Population by Category of Main Occupation in the Last 30 Days by Age Category ................... 10
CHAPTER THREE: EDUCATION ............................................................................................... 11
3.1 LITERACY ....................................................................................................................... 11 3.1.1 POPULATION BY HIGHEST LEVEL ATTAINED ................................................................................... 11
Table 3.1: Distribution of Population by Highest Level of Education Completed ...................................... 11 Table 3.2: Distribution of the Population Aged 6 - 13 Years by Highest Level of Education Completed .... 12
3.1.2 READING AND/OR WRITING ABILITY OF HOUSEHOLD POPULATION ................................................... 12 Table 3.3: Population (Aged 10 years and above) by Literacy Level by Gender.......................................... 12
3.2 DISTANCE TO OR TIME TAKEN (TO REACH) THE NEAREST GOVERNMENT PRIMARY SCHOOL ...................................................................................................................................... 13
Table 3.4 (a): Distance (Km) to the Nearest Government Primary School by Number of Households ...... 13
External Evaluation of District Development Cooperation Programmes in Kalangala District in Uganda/GOPA/August 2018 vii
Table 3.4 (b): Time Taken (Hours) to Reach the Nearest Government Primary School by Number of Households ................................................................................................................................................... 13
3.3 DISTANCE TO OR TIME TAKEN (TO REACH) THE NEAREST FUNCTIONAL ADULT LITERACY CLASS ...................................................................................................................................... 14
Table 3.5 (a): Distance (Km) to the FAL Class by Number of Households ................................................... 14 Table 3.5 (b): Time Taken (Hours) to Reach the Nearest FAL Class by Number of Households .................. 14
3.4 PRIMARY SCHOOL ATTENDANCE AND DROP OUT ........................................................... 15 3.4.1 PRIMARY SCHOOL ATTENDANCE ................................................................................................ 15
Table 3.6: Primary School Attendance by Number of Households .............................................................. 15 Table 3.7 (a): Major Reasons for Missing Attending Primary School (in the Last 30 Days) by Number of Households ................................................................................................................................................... 15 Table 3.7 (b): Major Reasons for Missing Attending Primary School (in the Last 30 Days) by Number of Households by County .................................................................................................................................. 16
3.4.2 PRIMARY SCHOOL DROP OUT .................................................................................................... 16 Table 3.8: Major Reasons for Dropping out of Primary School by Number of Households (for Children Aged 6 – 13 years) ......................................................................................................................................... 16
3.4.3 NEVER ATTENDED SCHOOL ........................................................................................................ 17 Table 3.9: Major Reasons for Never Attending Primary School by Number of Households (for People Aged 6 – 18 years) ......................................................................................................................................... 17
3.5 VIEWS ON THE QUALITY OF EDUCATION PROVIDED ........................................................ 17 Table 3.10: Views of Respondent on the Quality of Education Children were Receiving at School .......... 17 Figure 1: Perceptions of Household Respondents on the Quality of Education Provided by Government-Aided Primary Schools .................................................................................................................................. 18 Table 3.11: Major Reasons for the Perceptions of Respondents on the Quality of Education ................... 19
CHAPTER FOUR: HEALTH...................................................................................................... 21
4.1 DISTANCE TO OR TIME TAKEN (TO REACH) THE NEAREST GOVERNMENT HEALTH UNIT ... 21 Table 4.1 (a): Distance (Km) to the Government Health Unit by Number of Households .......................... 21 Table 4.1 (b): Time Taken (Hours) to Reach the Nearest Government Health Unit by Number of Households ................................................................................................................................................... 21 Table 4.2 (a): Distance (Km) to the Nearest Government Health Unit by Type by Number of Households ....................................................................................................................................................................... 22 Table 4.2 (b): Distance (Km) to the Nearest Government Health Unit by Type by Number of Households (see also Figure 2) ......................................................................................................................................... 22 Figure 2: Distance to the Nearest Government Health Unit by Type of Unit by Total Number of Households ................................................................................................................................................... 23 Table 4.2 (c): Time Taken (Hours) to Reach the Nearest Government Health Unit by Type by Total Number of Households ................................................................................................................................. 24 Table 4.2 (d): Time Taken (Hours) to Reach the Nearest Government Health Unit by Type by Total Number of Households ................................................................................................................................. 24
4.2 HEALTH SERVICE EXPERIENCE ENCOUNTER .................................................................... 25 Table 4.3 (a): Distribution of Households that Reported Having Persons Who Fell Sick in the Last 30 Days by Type of Illness and Location .................................................................................................................... 25 Table 4.3 (b): Distribution of Persons Who Fell Sick in the Last 30 Days by Type of Illness and Location . 25 Table 4.3 (c): Distribution of Persons Who Fell Sick and Sought Treatment in the Last 30 Days by Type of Illness and Type of Facility Accessed – ALL Sampled Villages ...................................................................... 27 Table 4.4: Distribution of Persons Who Sought Treatment in the Last 30 Days by Type of Illness Who Got to Know their Illnesses, Availed with Drugs, Treated, and/or Referred to Other Facilities ....................... 27
4.3 VIEWS ON THE QUALITY OF SERVICES PROVIDED BY THE NEAREST GOVERNMENT HEALTH UNIT ...................................................................................................................................... 28
Table 4.5 (a): Views of Respondents on the Quality of Health Services provided by the Nearest Government Health Unit .............................................................................................................................. 28 Table 4.5 (b): Views of Respondents on the Quality of Health Services provided by the Nearest Government Health Unit .............................................................................................................................. 28 Figure 3: Perception of Household Respondents on the Quality of Health Services Provided by Government Health Facilities in Kalangala District ...................................................................................... 29 Table 4.5 (c): Views of Respondents on the Quality of Health Services provided by the Nearest Government Health Unit Correlated With Distance .................................................................................... 29

External Evaluation of District Development Cooperation Programmes in Kalangala District in Uganda/GOPA/August 2018 viii
Table 4.6: Major Reasons for the Perceptions of Respondents on the Quality of Health Services Provided by Government Health Units ........................................................................................................................ 30
CHAPTER FIVE: INCOME, EXPENDITURE, ASSETS, AND WELFARE ............................................. 32
5.1 MAJOR SOURCES OF INCOME FOR HOUSEHOLDS ............................................................ 32 Table 5.1 (a): Major Sources of Income for Households by Intervention Location and Control Villages .. ............................................................................................................................................ 32 Table 5.1 (b): Major Sources of Income for Households by County ........................................................ 33
5.2 FISHING – INFRASTRUCTURE, FACILITIES, AND AMENITIES .............................................. 33 5.2.1 CATEGORY OF FISHING ACTIVITIES HOUSEHOLDS ARE INVOLVED IN .................................................. 33
Table 5.2: Number of Households With Fishing as Major Source of Income by Category of Fishing Activity .................................................................................................................................................. 33
5.2.2 FISHING INFRASTRUCTURE ......................................................................................................... 34 Table 5.3 (a): Type of Fishing Facilities / Infrastructure Reported by Households at ALL Landing Sites 34 Table 5.3(b): Fishing Facilities / Infrastructure Reported by Households at Other Villages / Landing Sites ............................................................................................................................................. 35
5.2.3 ACCESS TO FISHING FACILITIES AND AMENITIES ............................................................................ 36 Table 5.4 (a): Access to Fishing Facilities – Intervention Location Landing Sites ....................................... 36 Table 5.4 (b): Access to Fishing Facilities – Other Landing Sites / Villages .................................................. 37 Table 5.4 (c): Distance (Km) or Time Taken (Hours) to Reach Specific Fishing Facilities ............................. 38 Table 5.4 (d): Access to other Facilities and Amenities ............................................................................... 39 Table 5.4 (e): Management of Solid Waste at Landing Sites ....................................................................... 40
5.3 CHANGES IN HOUSEHOLD WELFARE ............................................................................... 40 Table 5.5 (a): Status of Welfare in Households since 2011 .......................................................................... 40 Table 5.5 (b): Status of Welfare in Households since 2011 by County ........................................................ 41
5.3.1 IMPROVEMENT IN HOUSEHOLD WELFARE .................................................................................... 41 Table 5.6: Reasons for Improved Household Welfare ................................................................................. 41 Figure 4: Reasons for Improved Household Welfare ................................................................................... 42
5.3.2 LACK OF IMPROVEMENT IN HOUSEHOLD WELFARE ........................................................................ 42 Table 5.7 (a): Current Poverty Status - Perception of Households that Reported Lack of Improvement in Household Welfare Since 2011 ..................................................................................................................... 42 Table 5.7 (b): Current Poverty Status - Perception of Households that Reported Lack of Improvement in Household Welfare Since 2011 by County ................................................................................................... 43 Table 5.8: Major Causes of Poverty .............................................................................................................. 43
5.4 SAVINGS BY HOUSEHOLDS ............................................................................................. 43 Table 5.9: Income Saving Status of Households........................................................................................... 43 Table 5.10 (a): Proportion of Income Saved by Households ........................................................................ 44 Table 5.10 (b): Type of ‘Institutions or Location’ Where Savings are kept by Number of Households ...... 44 Table 5.11: Major Reasons for Failure to Save by Households .................................................................... 44 Figure 5: Major Reasons Given by Households for Failure to Save ............................................................. 45
5.5 HOUSEHOLD EXPENDITURES .......................................................................................... 45 Table 5.12 (a): Range of Household Expenditure by Number of Households ............................................. 45 Figure 6: Ranges of Household Expenditures on Selected Items ................................................................. 46 Table 5.12 (b): Reported Change in Household Expenditure since 2011 by Number of Households ......... 46
5.6 HOUSEHOLD AND ENTERPRISE ASSETS ........................................................................... 47 Table 5.13: Reported Change in Household and Enterprise Assets since 2011 by Number of Households ....................................................................................................................................................................... 47 Table 5.14: Reasons for Reported Change in Household and Enterprise Assets ......................................... 48 Table 5.15: Available Number of Mobile Telephones by Number of Households ...................................... 48
CHAPTER SIX: WATER, SANITATION, AND HOUSING CONDITIONS ......................................... 49
6.1 WATER ......................................................................................................................... 49 6.1.1 SOURCES OF WATER ................................................................................................................ 49
Table 6.1 (a): Households’ Main Sources of Water by Number of Households .......................................... 49 Table 6.1 (b): Households’ Secondary Sources of Water by Number of Households ................................. 50
6.1.2 TIME TAKEN TO COLLECT WATER ................................................................................................ 51 Table 6.2 (a): Time Taken to Collect Water from the Main Source by Households .................................... 51
External Evaluation of District Development Cooperation Programmes in Kalangala District in Uganda/GOPA/August 2018 ix
Table 6.2 (b): Time Taken to Collect Water from the Secondary Source by Households ........................... 51 6.1.3 QUANTITY OF WATER CONSUMED BY HOUSEHOLDS ON DAILY BASIS ................................................ 52
Table 6.3: Quantity of Water Utilised Daily from the Main Source by Households .................................... 52 6.1.4 QUALITY OF WATER FROM THE MAIN WATER SOURCES ................................................................. 52
Table 6.4: Perception of Households on the Quality of Water from their Main Sources ........................... 52 6.1.5 METHODS USED BY HOUSEHOLDS TO TREAT WATER ..................................................................... 53
Table 6.5: Methods Used by Households to Treat Water from their Main Source ..................................... 53 6.1.6 DURATION OF AVAILABILITY OF WATER FROM THE MAIN SOURCES ................................................. 53
Table 6.6 (a): Duration of Availability of Water from the Main Source – ALL Sampled Villages ................ 53 Table 6.6 (b-1): Duration of Availability of Water from the Main Source – Bujumba County .................... 54 Table 6.6 (b-2): Duration of Availability of Water from the Main Source – Kyamuswa County ................. 54
6.1.7 UTILISATION OF TIME ............................................................................................................... 54 Table 6.7: Utilisation of Time by Households Spending below 30 minutes to Collect Water from Source 54
6.1.8 MAJOR REASONS FOR USING WATER FROM UNSAFE SOURCES ....................................................... 55 Table 6.8: Major Reasons Given by Households for Using Water from UNSAFE Sources ........................... 55
6.1.9 PAYMENT FOR WATER ............................................................................................................. 55 Table 6.9: Water Cost Status by Households ............................................................................................... 55
6.1.10 MONTHLY COST OF WATER .................................................................................................. 56 Table 6.10: Monthly Amount (UGX) Paid for Water Used by Households .................................................. 56
6.1.11 PERCEPTION OF HOUSEHOLDS ON THE COST OF WATER ............................................................ 56 Table 6.11: Perception of Households on the Monthly Cost of Water ........................................................ 56
6.1.12 REASONS FOR PAYMENT FOR WATER ..................................................................................... 57 Table 6.12: Reasons Given for Payment for Water by Households ............................................................. 57
6.1.13 MAINTENANCE OF WATER SOURCES ...................................................................................... 57 Table 6.13: Views of Households on How Water Sources are maintained ................................................. 57
6.2 SANITATION .................................................................................................................. 58 6.2.1 SANITATION FACILITIES USED BY HOUSEHOLDS ............................................................................. 58
Table 6.14: Category of Sanitation Facility Utilised by Households ............................................................ 58 6.2.2 TYPE OF PRIVATE SANITATION FACILITIES UTILISED BY HOUSEHOLDS ................................................ 58
Table 6.15 (a): Type of Private Sanitation Facility Utilised by Households ................................................. 58 Table 6.15 (b): Availability of Water and Soap at the Private Sanitation Facilities..................................... 59
6.2.3 LEVEL OF CLEANLINESS OF PUBLIC SANITATION FACILITIES UTILISED BY HOUSEHOLDS ......................... 59 Table 6.16: Level of Cleanliness of Public Sanitation Facilities Utilised by Some Households and Availability of Water and Soap ..................................................................................................................... 59
6.2.4 KNOWLEDGE LEVELS OF RESPONDENTS ON THE MOST IMPORTANT HYGIENE BEHAVIOURS .................. 60 Table 6.17: Most Important Hygiene Behaviours to Retain Healthy Families ............................................ 60 Table 6.18: Consequences of Failure to Practice the Most Important Hygiene Behaviours ....................... 60
6.2.5 SENSITISATION OF HOUSEHOLDS AND VILLAGE COMMUNITIES ON HYGIENE AND SANITATION .............. 61 Table 6.19: Sensitisation of Individual Households on Hygiene and Sanitation ......................................... 61 Table 6.20 (a-1): Holding of Sensitisation Meetings in the Villages on Hygiene and Sanitation ................ 61 Table 6.20 (a-2): Holding of Sensitisation Meetings in the Villages on Hygiene and Sanitation by County ....................................................................................................................................................................... 61 Table 6.21 (a): Responses on Application of knowledge Acquired from Village Meetings on Hygiene and Sanitation ...................................................................................................................................................... 62 Table 6.21 (b): Responses on Application of knowledge Acquired from Village Meetings on Hygiene and Sanitation by County .................................................................................................................................... 62 Table 6.22: Aspects on Which Households Applied the Knowledge Obtained from Village Sensitisation Meetings on Hygiene and Sanitation ........................................................................................................... 62
6.3 HOUSING CONDITIONS .................................................................................................. 63 Table 6.23: Category of Houses ................................................................................................................... 63 Table 6.24: Respondents who Reported ‘No Improvement in Household Welfare’ Correlated With Category of Housing Structure ..................................................................................................................... 63
CHAPTER SEVEN: DEVELOPMENT INTERVENTIONS AND SUSTAINABILITY ..................................... 64
7.1 DEVELOPMENT INTERVENTIONS UNDERTAKEN AND BENEFITS ........................................ 64 7.1.1 KNOWLEDGE OF SECTOR DEVELOPMENT INTERVENTIONS ............................................................... 64

External Evaluation of District Development Cooperation Programmes in Kalangala District in Uganda/GOPA/August 2018 x
Table 7.1: Knowledge of Sector Development Interventions in the Village Since 2011 and Organisations Responsible ................................................................................................................................................... 64
7.1.2 VIEWS ON BENEFITS FROM SECTOR DEVELOPMENT INTERVENTIONS ................................................ 65 Table 7.2: Views on Whether the Village Communities Benefitted from the Sector Development Interventions ................................................................................................................................................. 65
7.1.3 CATEGORIES OF BENEFICIARIES FROM SECTOR DEVELOPMENT INTERVENTIONS .................................. 65 Table 7.3: Category of Beneficiaries from the Sector Development Interventions in the Villages Since 2011 ............................................................................................................................................................... 65
7.1.4 PARTICIPATION OF VILLAGE COMMUNITY MEMBERS IN PLANNING MEETINGS AND IMPLEMENTATION OF ACTIVITIES ........................................................................................................................................... 66
Table 7.4 (a): Participation of Community Members in the Planning of Programmes / Activities in the Villages since 2011 ........................................................................................................................................ 66 Table 7.4 (b): Participation of Community Members in the Implementation of Programmes / Activities in the Villages since 2011 .............................................................................................................................. 66
7.2 SUSTAINABILITY DEVELOPMENT INTERVENTIONS UNDERTAKEN AND BENEFITS .............. 66 Table 7.5 (a): Perceptions of Households on the Changes in the Provision of Public Facilities and Services Since 2011 ..................................................................................................................................................... 67 Table 7.5(b-1): Perceptions of Households on the Changes in the Provision of Public Facilities and Services Since 2011 – Bujumba County ........................................................................................................ 68 Table 7.5(b-2): Perceptions of Households on the Changes in the Provision of Public Facilities and Services Since 2011 – Kyamuswa County ..................................................................................................... 68 Table 7.6: Reasons Given by Respondents for the Perceptions on the Changes in the Provision of Public Facilities and Services Since 2011 ................................................................................................................. 70
APPENDIX 1: SAMPLED VILLAGES AND NUMBER OF HOUSEHOLDS BY COUNTY, SUB-COUNTY / TOWN COUNCIL, AND PARISH ................................................................................................................................................ 74
External Evaluation of District Development Cooperation Programmes in Kalangala District in Uganda/GOPA/August 2018 xi
LIST OF FIGURES FIGURE 1: PERCEPTIONS OF HOUSEHOLD RESPONDENTS ON THE QUALITY OF EDUCATION PROVIDED BY GOVERNMENT-AIDED
PRIMARY SCHOOLS .......................................................................................................................................... 18 FIGURE 2: DISTANCE TO THE NEAREST GOVERNMENT HEALTH UNIT BY TYPE OF UNIT BY TOTAL NUMBER OF HOUSEHOLDS ....... 23 FIGURE 3: PERCEPTION OF HOUSEHOLD RESPONDENTS ON THE QUALITY OF HEALTH SERVICES PROVIDED BY GOVERNMENT
HEALTH FACILITIES IN KALANGALA DISTRICT ......................................................................................................... 29 FIGURE 4: REASONS FOR IMPROVED HOUSEHOLD WELFARE ............................................................................................. 42 FIGURE 5: MAJOR REASONS GIVEN BY HOUSEHOLDS FOR FAILURE TO SAVE ....................................................................... 45 FIGURE 6: RANGES OF HOUSEHOLD EXPENDITURES ON SELECTED ITEMS ............................................................................. 46
External Evaluation of District Development Cooperation Programmes in Kalangala District in Uganda/GOPA/August 2018 xii
LIST OF ACRONYMS AIDS Acquired Immune Deficiency Syndrome CBO Community Based Organisation CG Central Government FAL Functional Adult Literacy HC Health Centre HF Health Facility HH Household HIV Human Immunodeficiency Virus HU Health Unit ICEIDA Iceland International Development Agency KCHSP Kalangala Comprehensive Health Services Project KDDP Kalangala District Development Programme KDLG Kalangala District Local Government MDD Music, Dance, and Drama MTR Mid-Term Review NAADS National Agricultural Advisory Services NGO Non-Government Organisation O&M Operation And Maintenance OVC Orphans and Other Vulnerable Children OWC Operation Wealth Creation PLE Primary Leaving Examinations PLWAs People Living With AIDS PWDs People With Disabilities SACCOs Saving and Credit Cooperative Organisations UGX Uganda Shillings VHTs Village Health Teams VIP Ventilated Improved Pit (latrine) VSLS Village Savings and Loans Society WATSAN Water and Sanitation WUC Water User Committee
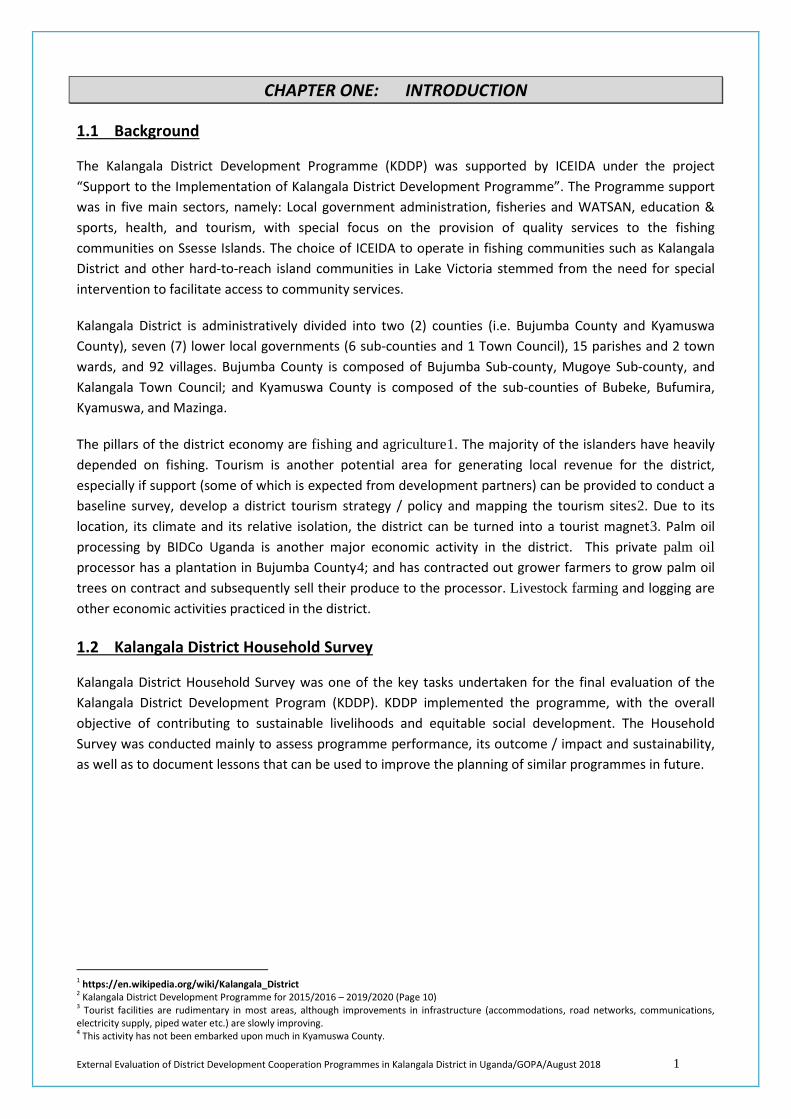
External Evaluation of District Development Cooperation Programmes in Kalangala District in Uganda/GOPA/August 2018 1
CHAPTER ONE: INTRODUCTION
1.1 Background
The Kalangala District Development Programme (KDDP) was supported by ICEIDA under the project “Support to the Implementation of Kalangala District Development Programme”. The Programme support was in five main sectors, namely: Local government administration, fisheries and WATSAN, education & sports, health, and tourism, with special focus on the provision of quality services to the fishing communities on Ssesse Islands. The choice of ICEIDA to operate in fishing communities such as Kalangala District and other hard-to-reach island communities in Lake Victoria stemmed from the need for special intervention to facilitate access to community services.
Kalangala District is administratively divided into two (2) counties (i.e. Bujumba County and Kyamuswa County), seven (7) lower local governments (6 sub-counties and 1 Town Council), 15 parishes and 2 town wards, and 92 villages. Bujumba County is composed of Bujumba Sub-county, Mugoye Sub-county, and Kalangala Town Council; and Kyamuswa County is composed of the sub-counties of Bubeke, Bufumira, Kyamuswa, and Mazinga.
The pillars of the district economy are fishing and agriculture1. The majority of the islanders have heavily depended on fishing. Tourism is another potential area for generating local revenue for the district, especially if support (some of which is expected from development partners) can be provided to conduct a baseline survey, develop a district tourism strategy / policy and mapping the tourism sites2. Due to its location, its climate and its relative isolation, the district can be turned into a tourist magnet3. Palm oil processing by BIDCo Uganda is another major economic activity in the district. This private palm oil processor has a plantation in Bujumba County4; and has contracted out grower farmers to grow palm oil trees on contract and subsequently sell their produce to the processor. Livestock farming and logging are other economic activities practiced in the district.
1.2 Kalangala District Household Survey
Kalangala District Household Survey was one of the key tasks undertaken for the final evaluation of the Kalangala District Development Program (KDDP). KDDP implemented the programme, with the overall objective of contributing to sustainable livelihoods and equitable social development. The Household Survey was conducted mainly to assess programme performance, its outcome / impact and sustainability, as well as to document lessons that can be used to improve the planning of similar programmes in future.
1 https://en.wikipedia.org/wiki/Kalangala_District 2 Kalangala District Development Programme for 2015/2016 – 2019/2020 (Page 10) 3 Tourist facilities are rudimentary in most areas, although improvements in infrastructure (accommodations, road networks, communications, electricity supply, piped water etc.) are slowly improving. 4 This activity has not been embarked upon much in Kyamuswa County.

External Evaluation of District Development Cooperation Programmes in Kalangala District in Uganda/GOPA/August 2018 2
1.2.1 Sampled Villages and Households
For the Household Survey, 34 villages were sampled in the whole district – 22 were “intervention location”5 villages (11 from each of the two counties) and 12 were ‘control’ villages (5 from Bujumba County and 7 from Kyamuswa County). The control villages were included to see whether there is any significant development improvement brought about by KDDP in ‘intervention location’ villages, meaning geographical locations in which physical structures / infrastructures related to fisheries and water and sanitation (WATSAN) sectors have been rehabilitated / constructed, but also to some degree schools and health centres. However, with respect to the education and health interventions, it should be noted that the "control villages" do not carry the usual meaning of control groups (i.e. groups that received no benefit or a “neutral” benefit), because virtually all villages in Kalangala District benefited from KDDP interventions in varying degrees depending on the sectors, though the ‘intervention location’ villages may have benefited to a greater extent. It is therefore apparent that the distinction between the intervention and control villages is the degree of access to the service facilities (e.g. schools, health centres, improved fish handling facilities, water and sanitation facilities), mainly defined by physical distance. For example, in the education sector one primary school may serve several villages in a parish6 and since all schools in the district were supported, the distinction between the intervention and control villages by default becomes ”blurred”, whereas for sectors like fisheries and WATSAN, a clear distinction can be made between intervention and so-called control villages.
Basing on the number of households as per the 2014 Population and Housing Census – Uganda, the proportion of households was 0.49 for Bujumba County and 0.51 Kyamuswa County. Considering that the household survey planned to cover 350 households, the proportionate share for Bujumba County was 172 households, and 178 for Kyamuswa County. However, due to rounding off to the nearest digit, the number of households in Bujumba County totalled to 173 and Kyamuswa County totalled to 182. Thus, the total sample size of households was adjusted to 355. Refer to Table 1.1 for the summary and Appendix 3 for details.
Table 1.1: Household Sample Size by County
Category Number of Households in County:
Total Bujumba Kyamuswa
‘Intervention Location’ Village 126 114 240
‘Control’ Village 47 68 115 Total 173 182 355
5 For purposes of the HH Survey “ intervention Location” villages were the villages and/or landing sites where KDDP supported projects / interventions were located. Control villages were those villages where there were no KDDP supported projects / interventions. The interventions considered exclude administrative infrastructure e.g. sub-county offices and district headquarters. 6 Government of Uganda policy is to have at least one Government-aided primary school per parish.
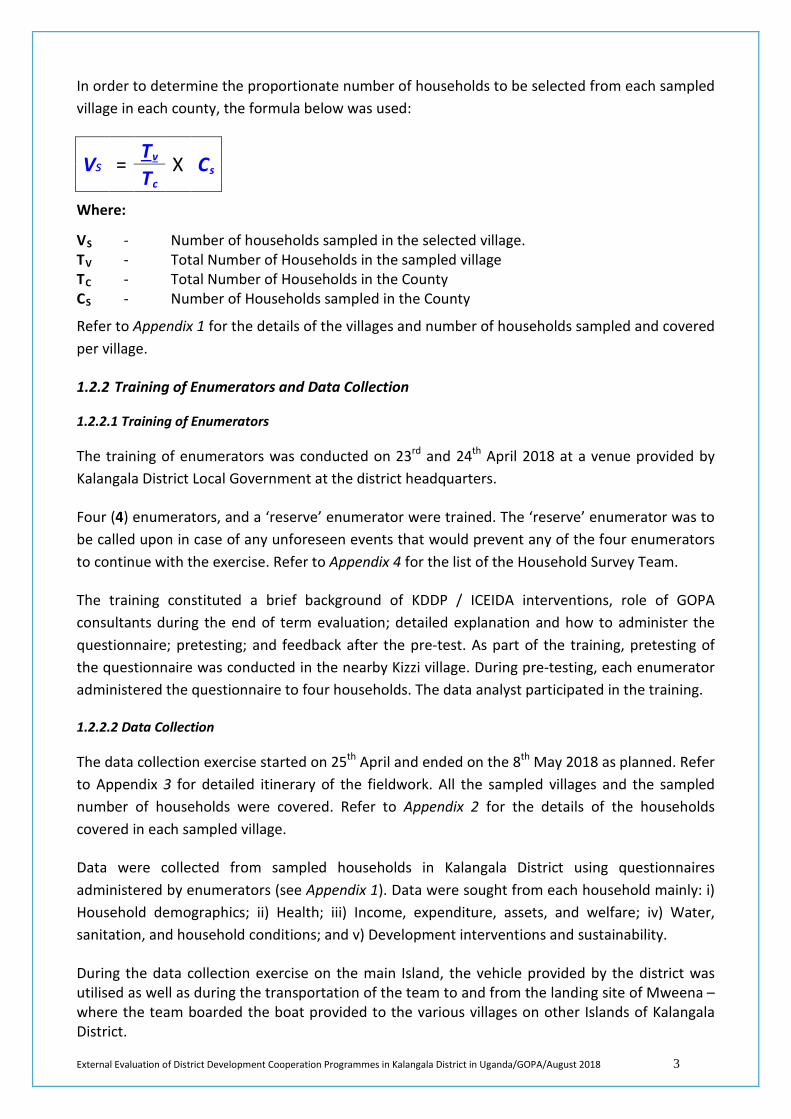
External Evaluation of District Development Cooperation Programmes in Kalangala District in Uganda/GOPA/August 2018 3
In order to determine the proportionate number of households to be selected from each sampled village in each county, the formula below was used:
Vs = Tv X Cs Tc
Where:
VS - Number of households sampled in the selected village. TV - Total Number of Households in the sampled village TC - Total Number of Households in the County CS - Number of Households sampled in the County
Refer to Appendix 1 for the details of the villages and number of households sampled and covered per village.
1.2.2 Training of Enumerators and Data Collection
1.2.2.1 Training of Enumerators
The training of enumerators was conducted on 23rd and 24th April 2018 at a venue provided by Kalangala District Local Government at the district headquarters.
Four (4) enumerators, and a ‘reserve’ enumerator were trained. The ‘reserve’ enumerator was to be called upon in case of any unforeseen events that would prevent any of the four enumerators to continue with the exercise. Refer to Appendix 4 for the list of the Household Survey Team.
The training constituted a brief background of KDDP / ICEIDA interventions, role of GOPA consultants during the end of term evaluation; detailed explanation and how to administer the questionnaire; pretesting; and feedback after the pre-test. As part of the training, pretesting of the questionnaire was conducted in the nearby Kizzi village. During pre-testing, each enumerator administered the questionnaire to four households. The data analyst participated in the training.
1.2.2.2 Data Collection
The data collection exercise started on 25th April and ended on the 8th May 2018 as planned. Refer to Appendix 3 for detailed itinerary of the fieldwork. All the sampled villages and the sampled number of households were covered. Refer to Appendix 2 for the details of the households covered in each sampled village.
Data were collected from sampled households in Kalangala District using questionnaires administered by enumerators (see Appendix 1). Data were sought from each household mainly: i) Household demographics; ii) Health; iii) Income, expenditure, assets, and welfare; iv) Water, sanitation, and household conditions; and v) Development interventions and sustainability.
During the data collection exercise on the main Island, the vehicle provided by the district was utilised as well as during the transportation of the team to and from the landing site of Mweena – where the team boarded the boat provided to the various villages on other Islands of Kalangala District.
External Evaluation of District Development Cooperation Programmes in Kalangala District in Uganda/GOPA/August 2018 4
Also, due to the stormy weather on the lake, the speedboat provided by the Embassy of Iceland was utilised by the survey team to travel to Mazinga Sub-county on 8th May 2018.
1.2.3 Data Entry, Analysis, and Report Writing
Data entry was embarked upon in Kalangala, but could not be completed, and was thus completed in Kampala. With the help of extra manpower (i.e. 3 more people), the work was completed on 19th May 2018. Thereafter data analysis and report writing were embarked upon.
1.2.4 Challenges
The major challenges faced by the team during the household survey were the following:
i) The weather was not good most of the time, due to heavy rains, which forced the team to travel and work during the rain much as none of the team members had a raincoat. Furthermore, the stormy weather, at times led to long travel durations on the lake resulting in late arrival in the villages on other islands. This called for the participation of the National Expert and Data Analyst in the interviewing of household respondents to ensure completion of the sampled households.
ii) Unavailability of complete household lists in many of the villages sampled, which necessitated on-spot sampling with the help of respective village leaders.
iii) The distances between the sampled villages on some of the islands, were rather long and required transporting the team using motorcycles (locally referred to as Boda-Boda). This was especially on Bukasa Island7 and Bubeke Island8.
1.2.5 Logistical Support from Kalangala District Local Government and Embassy of Iceland - Uganda
The district provided the survey team with the following:
i) One (1) Fibre Boat with a Coxswain.
ii) One (1) vehicle with a driver.
The Embassy of Iceland – Uganda provided the survey team with a Speed Boat.
This chapter broadly outlined the background to the household survey, its organisation, and major challenges faced by the survey team. The subsequent chapters (2 - 7) provide the summary of findings during the survey.
Chapter Two provides the results on the household characteristics.
Chapter Three contains the results on education characteristics of the members of households including highest level of education completed, and literacy. The other aspects include distance or time taken to reach the nearest Government-Aided Primary School, and FAL class, attendance of school by children of school-going age, and views of respondents on the quality of education provided by Government-Aided primary schools.
7 The team landed at Namirembe landing site, and was transported on Boda-boda from Buzingo through Buwanga to Lwanabatya and returned to Kisaba landing site. The team spent the night in Kisaba. On the second day, the team was transported to the villages of Buwazi and Nakibanga. 8 The team landed at Lwaazi-Bubeke and some team members travelled on Boda-boda from Bubeke to Kande village.
External Evaluation of District Development Cooperation Programmes in Kalangala District in Uganda/GOPA/August 2018 5
Chapter Four has results on health, which include distance or time taken to reach the nearest Government health unit, health service experience encountered, and views of respondents on the quality of health services provided by Government health units.
Chapter Five summarises the findings on the major sources of income for households; changes in the welfare of households; savings; expenditure; and assets.
Chapter Six gives the results on water, sanitation, and housing conditions. On water the aspects results include the main sources of water used by households; the time taken to collect the water; whether the water is clean and safe; whether the water is free or paid for; and maintenance status of the water source. Sanitation covered sanitation facilities used by household members; state of cleanliness; sanitation practices and knowledge; and participation of household members in sanitation meetings in their villages. Housing conditions provides results on the materials used for the roof, walls, and floor for the households covered.
Chapter Seven summarises results on the development interventions undertaken whether by Government or development partners under the various sectors; benefits for the village communities: category of beneficiaries and how they benefitted; and participation of members of the household in the planning meetings and subsequent participation in the implementation of activities. The chapter also provides, under sustainability, results on any perceived change in the provision of public facilities and services in the various sectors.
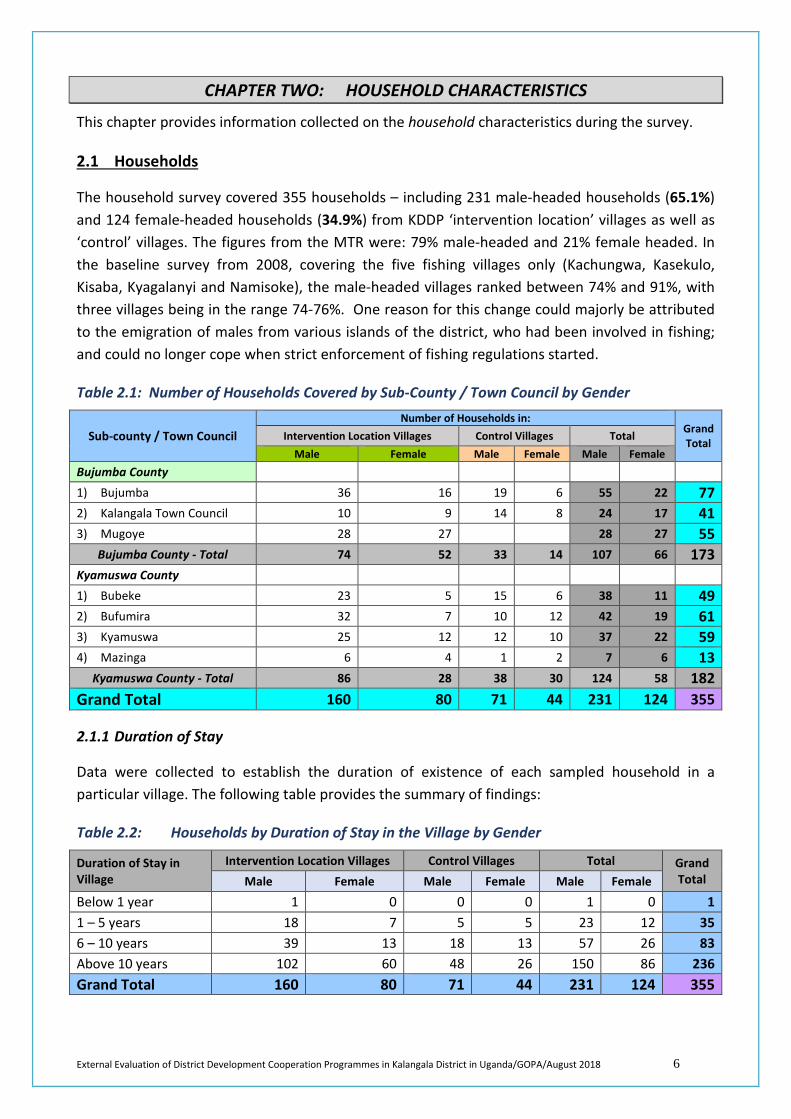
External Evaluation of District Development Cooperation Programmes in Kalangala District in Uganda/GOPA/August 2018 6
CHAPTER TWO: HOUSEHOLD CHARACTERISTICS
This chapter provides information collected on the household characteristics during the survey.
2.1 Households
The household survey covered 355 households – including 231 male-headed households (65.1%) and 124 female-headed households (34.9%) from KDDP ‘intervention location’ villages as well as ‘control’ villages. The figures from the MTR were: 79% male-headed and 21% female headed. In the baseline survey from 2008, covering the five fishing villages only (Kachungwa, Kasekulo, Kisaba, Kyagalanyi and Namisoke), the male-headed villages ranked between 74% and 91%, with three villages being in the range 74-76%. One reason for this change could majorly be attributed to the emigration of males from various islands of the district, who had been involved in fishing; and could no longer cope when strict enforcement of fishing regulations started.
Table 2.1: Number of Households Covered by Sub-County / Town Council by Gender
Sub-county / Town Council Number of Households in:
Grand Total Intervention Location Villages Control Villages Total
Male Female Male Female Male Female Bujumba County 1) Bujumba 36 16 19 6 55 22 77 2) Kalangala Town Council 10 9 14 8 24 17 41 3) Mugoye 28 27 28 27 55
Bujumba County - Total 74 52 33 14 107 66 173 Kyamuswa County 1) Bubeke 23 5 15 6 38 11 49 2) Bufumira 32 7 10 12 42 19 61 3) Kyamuswa 25 12 12 10 37 22 59 4) Mazinga 6 4 1 2 7 6 13
Kyamuswa County - Total 86 28 38 30 124 58 182 Grand Total 160 80 71 44 231 124 355
2.1.1 Duration of Stay
Data were collected to establish the duration of existence of each sampled household in a particular village. The following table provides the summary of findings:
Table 2.2: Households by Duration of Stay in the Village by Gender
Duration of Stay in Village
Intervention Location Villages Control Villages Total Grand Total Male Female Male Female Male Female
Below 1 year 1 0 0 0 1 0 1 1 – 5 years 18 7 5 5 23 12 35 6 – 10 years 39 13 18 13 57 26 83 Above 10 years 102 60 48 26 150 86 236 Grand Total 160 80 71 44 231 124 355
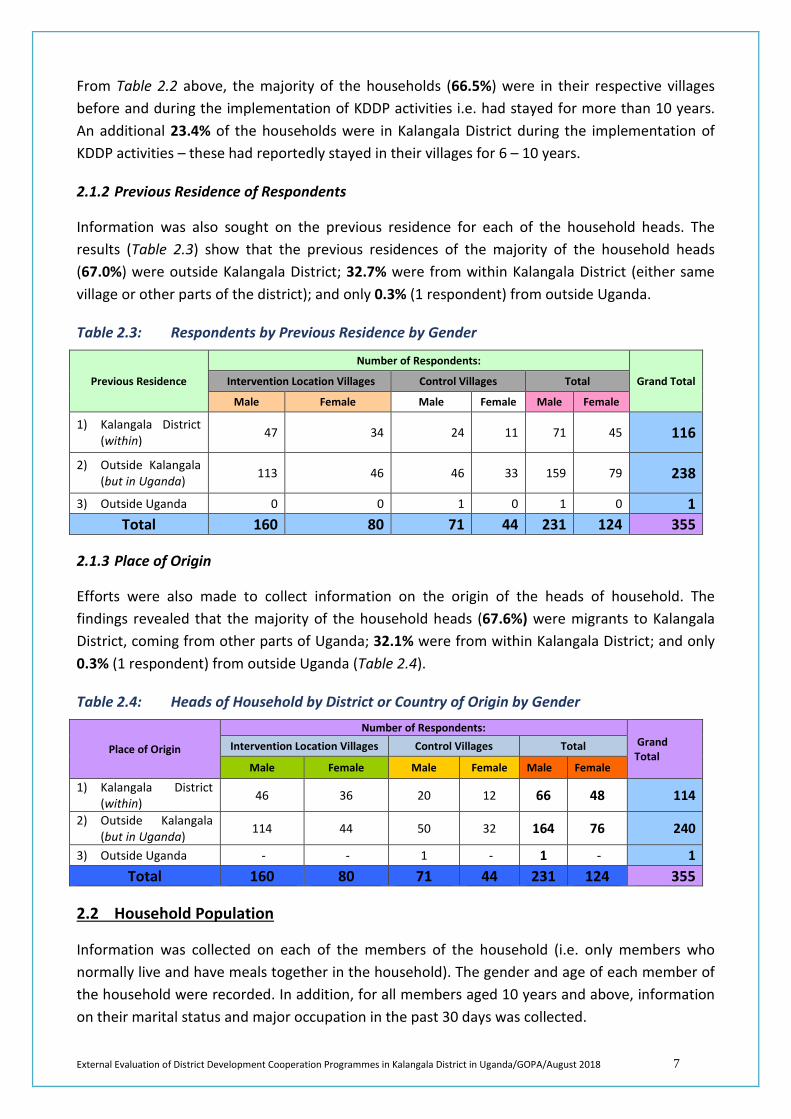
External Evaluation of District Development Cooperation Programmes in Kalangala District in Uganda/GOPA/August 2018 7
From Table 2.2 above, the majority of the households (66.5%) were in their respective villages before and during the implementation of KDDP activities i.e. had stayed for more than 10 years. An additional 23.4% of the households were in Kalangala District during the implementation of KDDP activities – these had reportedly stayed in their villages for 6 – 10 years.
2.1.2 Previous Residence of Respondents
Information was also sought on the previous residence for each of the household heads. The results (Table 2.3) show that the previous residences of the majority of the household heads (67.0%) were outside Kalangala District; 32.7% were from within Kalangala District (either same village or other parts of the district); and only 0.3% (1 respondent) from outside Uganda.
Table 2.3: Respondents by Previous Residence by Gender
Previous Residence
Number of Respondents:
Grand Total Intervention Location Villages Control Villages Total
Male Female Male Female Male Female
1) Kalangala District (within) 47 34 24 11 71 45 116
2) Outside Kalangala (but in Uganda) 113 46 46 33 159 79 238
3) Outside Uganda 0 0 1 0 1 0 1 Total 160 80 71 44 231 124 355
2.1.3 Place of Origin
Efforts were also made to collect information on the origin of the heads of household. The findings revealed that the majority of the household heads (67.6%) were migrants to Kalangala District, coming from other parts of Uganda; 32.1% were from within Kalangala District; and only 0.3% (1 respondent) from outside Uganda (Table 2.4).
Table 2.4: Heads of Household by District or Country of Origin by Gender
Place of Origin
Number of Respondents: Grand Total
Intervention Location Villages Control Villages Total
Male Female Male Female Male Female
1) Kalangala District (within) 46 36 20 12 66 48 114
2) Outside Kalangala (but in Uganda) 114 44 50 32 164 76 240
3) Outside Uganda - - 1 - 1 - 1 Total 160 80 71 44 231 124 355
2.2 Household Population
Information was collected on each of the members of the household (i.e. only members who normally live and have meals together in the household). The gender and age of each member of the household were recorded. In addition, for all members aged 10 years and above, information on their marital status and major occupation in the past 30 days was collected.
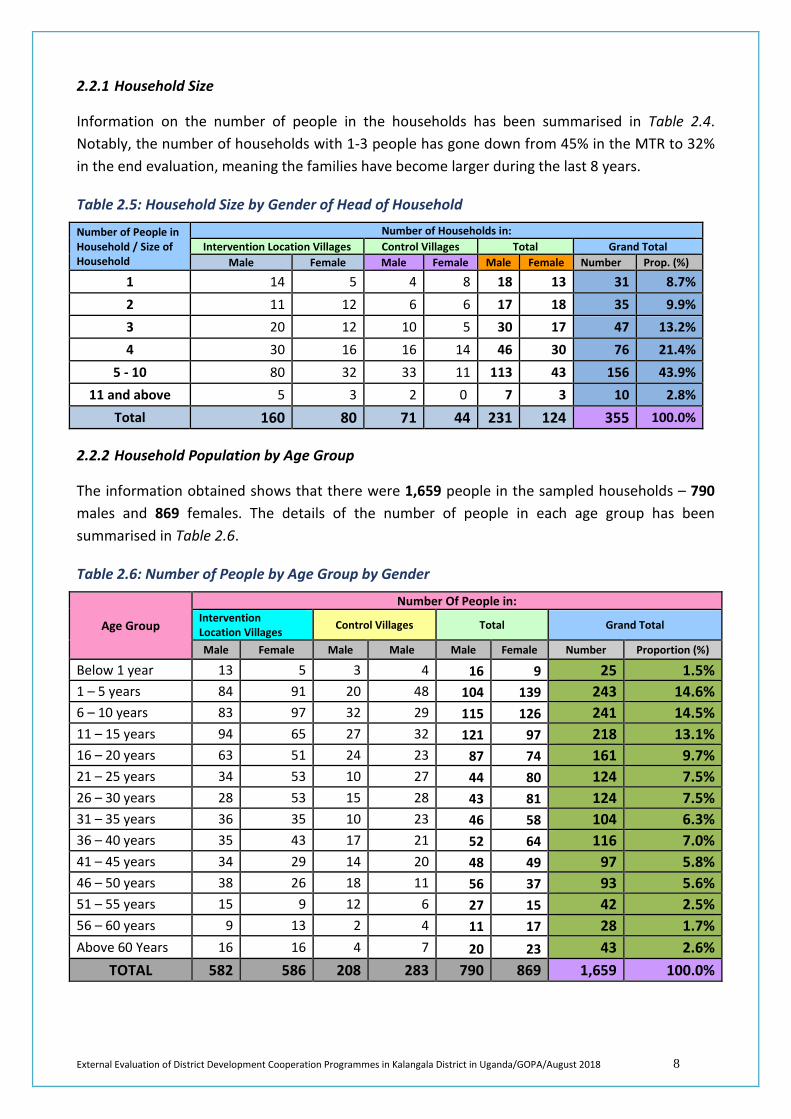
External Evaluation of District Development Cooperation Programmes in Kalangala District in Uganda/GOPA/August 2018 8
2.2.1 Household Size
Information on the number of people in the households has been summarised in Table 2.4. Notably, the number of households with 1-3 people has gone down from 45% in the MTR to 32% in the end evaluation, meaning the families have become larger during the last 8 years.
Table 2.5: Household Size by Gender of Head of Household
Number of People in Household / Size of Household
Number of Households in: Intervention Location Villages Control Villages Total Grand Total
Male Female Male Female Male Female Number Prop. (%)
1 14 5 4 8 18 13 31 8.7% 2 11 12 6 6 17 18 35 9.9% 3 20 12 10 5 30 17 47 13.2% 4 30 16 16 14 46 30 76 21.4%
5 - 10 80 32 33 11 113 43 156 43.9% 11 and above 5 3 2 0 7 3 10 2.8%
Total 160 80 71 44 231 124 355 100.0%
2.2.2 Household Population by Age Group
The information obtained shows that there were 1,659 people in the sampled households – 790 males and 869 females. The details of the number of people in each age group has been summarised in Table 2.6.
Table 2.6: Number of People by Age Group by Gender
Age Group
Number Of People in: Intervention Location Villages Control Villages Total Grand Total
Male Female Male Male Male Female Number Proportion (%)
Below 1 year 13 5 3 4 16 9 25 1.5% 1 – 5 years 84 91 20 48 104 139 243 14.6% 6 – 10 years 83 97 32 29 115 126 241 14.5% 11 – 15 years 94 65 27 32 121 97 218 13.1% 16 – 20 years 63 51 24 23 87 74 161 9.7% 21 – 25 years 34 53 10 27 44 80 124 7.5% 26 – 30 years 28 53 15 28 43 81 124 7.5% 31 – 35 years 36 35 10 23 46 58 104 6.3% 36 – 40 years 35 43 17 21 52 64 116 7.0% 41 – 45 years 34 29 14 20 48 49 97 5.8% 46 – 50 years 38 26 18 11 56 37 93 5.6% 51 – 55 years 15 9 12 6 27 15 42 2.5% 56 – 60 years 9 13 2 4 11 17 28 1.7% Above 60 Years 16 16 4 7 20 23 43 2.6%
TOTAL 582 586 208 283 790 869 1,659 100.0%
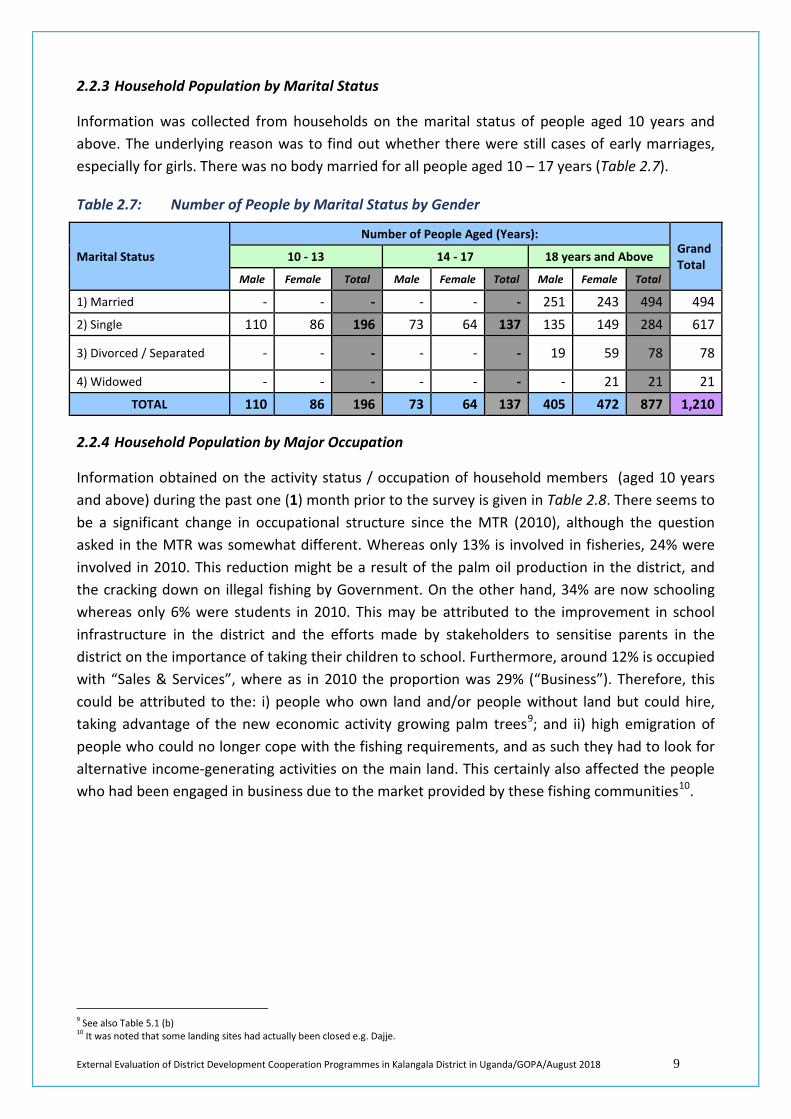
External Evaluation of District Development Cooperation Programmes in Kalangala District in Uganda/GOPA/August 2018 9
2.2.3 Household Population by Marital Status
Information was collected from households on the marital status of people aged 10 years and above. The underlying reason was to find out whether there were still cases of early marriages, especially for girls. There was no body married for all people aged 10 – 17 years (Table 2.7).
Table 2.7: Number of People by Marital Status by Gender
Marital Status
Number of People Aged (Years): Grand Total 10 - 13 14 - 17 18 years and Above
Male Female Total Male Female Total Male Female Total
1) Married - - - - - - 251 243 494 494 2) Single 110 86 196 73 64 137 135 149 284 617
3) Divorced / Separated - - - - - - 19 59 78 78
4) Widowed - - - - - - - 21 21 21 TOTAL 110 86 196 73 64 137 405 472 877 1,210
2.2.4 Household Population by Major Occupation
Information obtained on the activity status / occupation of household members (aged 10 years and above) during the past one (1) month prior to the survey is given in Table 2.8. There seems to be a significant change in occupational structure since the MTR (2010), although the question asked in the MTR was somewhat different. Whereas only 13% is involved in fisheries, 24% were involved in 2010. This reduction might be a result of the palm oil production in the district, and the cracking down on illegal fishing by Government. On the other hand, 34% are now schooling whereas only 6% were students in 2010. This may be attributed to the improvement in school infrastructure in the district and the efforts made by stakeholders to sensitise parents in the district on the importance of taking their children to school. Furthermore, around 12% is occupied with “Sales & Services”, where as in 2010 the proportion was 29% (“Business”). Therefore, this could be attributed to the: i) people who own land and/or people without land but could hire, taking advantage of the new economic activity growing palm trees9; and ii) high emigration of people who could no longer cope with the fishing requirements, and as such they had to look for alternative income-generating activities on the main land. This certainly also affected the people who had been engaged in business due to the market provided by these fishing communities10.
9 See also Table 5.1 (b) 10 It was noted that some landing sites had actually been closed e.g. Dajje.
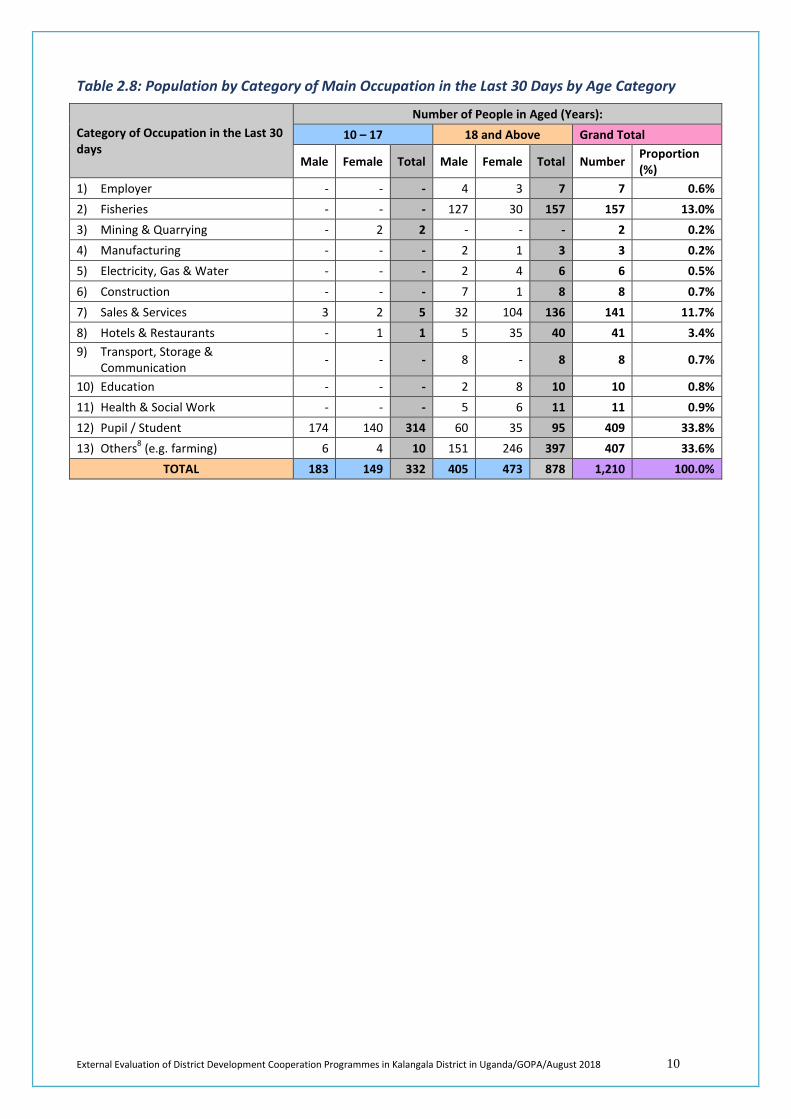
External Evaluation of District Development Cooperation Programmes in Kalangala District in Uganda/GOPA/August 2018 10
Table 2.8: Population by Category of Main Occupation in the Last 30 Days by Age Category
Category of Occupation in the Last 30 days
Number of People in Aged (Years): 10 – 17 18 and Above Grand Total
Male Female Total Male Female Total Number Proportion (%)
1) Employer - - - 4 3 7 7 0.6% 2) Fisheries - - - 127 30 157 157 13.0% 3) Mining & Quarrying - 2 2 - - - 2 0.2% 4) Manufacturing - - - 2 1 3 3 0.2% 5) Electricity, Gas & Water - - - 2 4 6 6 0.5% 6) Construction - - - 7 1 8 8 0.7% 7) Sales & Services 3 2 5 32 104 136 141 11.7% 8) Hotels & Restaurants - 1 1 5 35 40 41 3.4% 9) Transport, Storage &
Communication - - - 8 - 8 8 0.7%
10) Education - - - 2 8 10 10 0.8% 11) Health & Social Work - - - 5 6 11 11 0.9% 12) Pupil / Student 174 140 314 60 35 95 409 33.8% 13) Others8 (e.g. farming) 6 4 10 151 246 397 407 33.6%
TOTAL 183 149 332 405 473 878 1,210 100.0%
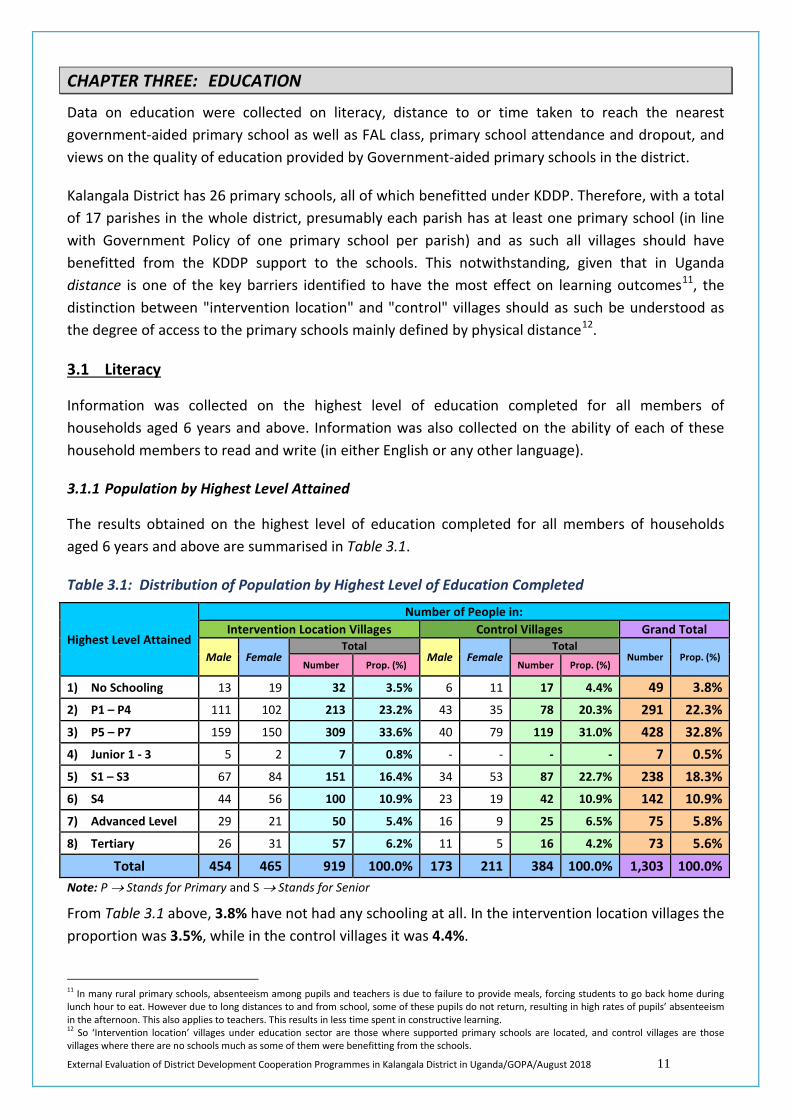
External Evaluation of District Development Cooperation Programmes in Kalangala District in Uganda/GOPA/August 2018 11
CHAPTER THREE: EDUCATION
Data on education were collected on literacy, distance to or time taken to reach the nearest government-aided primary school as well as FAL class, primary school attendance and dropout, and views on the quality of education provided by Government-aided primary schools in the district.
Kalangala District has 26 primary schools, all of which benefitted under KDDP. Therefore, with a total of 17 parishes in the whole district, presumably each parish has at least one primary school (in line with Government Policy of one primary school per parish) and as such all villages should have benefitted from the KDDP support to the schools. This notwithstanding, given that in Uganda distance is one of the key barriers identified to have the most effect on learning outcomes11, the distinction between "intervention location" and "control" villages should as such be understood as the degree of access to the primary schools mainly defined by physical distance12.
3.1 Literacy
Information was collected on the highest level of education completed for all members of households aged 6 years and above. Information was also collected on the ability of each of these household members to read and write (in either English or any other language).
3.1.1 Population by Highest Level Attained
The results obtained on the highest level of education completed for all members of households aged 6 years and above are summarised in Table 3.1.
Table 3.1: Distribution of Population by Highest Level of Education Completed
Highest Level Attained
Number of People in: Intervention Location Villages Control Villages Grand Total
Male Female Total
Male Female Total
Number Prop. (%) Number Prop. (%) Number Prop. (%)
1) No Schooling 13 19 32 3.5% 6 11 17 4.4% 49 3.8% 2) P1 – P4 111 102 213 23.2% 43 35 78 20.3% 291 22.3% 3) P5 – P7 159 150 309 33.6% 40 79 119 31.0% 428 32.8% 4) Junior 1 - 3 5 2 7 0.8% - - - - 7 0.5% 5) S1 – S3 67 84 151 16.4% 34 53 87 22.7% 238 18.3% 6) S4 44 56 100 10.9% 23 19 42 10.9% 142 10.9% 7) Advanced Level 29 21 50 5.4% 16 9 25 6.5% 75 5.8% 8) Tertiary 26 31 57 6.2% 11 5 16 4.2% 73 5.6%
Total 454 465 919 100.0% 173 211 384 100.0% 1,303 100.0% Note: P → Stands for Primary and S → Stands for Senior
From Table 3.1 above, 3.8% have not had any schooling at all. In the intervention location villages the proportion was 3.5%, while in the control villages it was 4.4%.
11 In many rural primary schools, absenteeism among pupils and teachers is due to failure to provide meals, forcing students to go back home during lunch hour to eat. However due to long distances to and from school, some of these pupils do not return, resulting in high rates of pupils’ absenteeism in the afternoon. This also applies to teachers. This results in less time spent in constructive learning. 12 So ‘Intervention location’ villages under education sector are those where supported primary schools are located, and control villages are those villages where there are no schools much as some of them were benefitting from the schools.
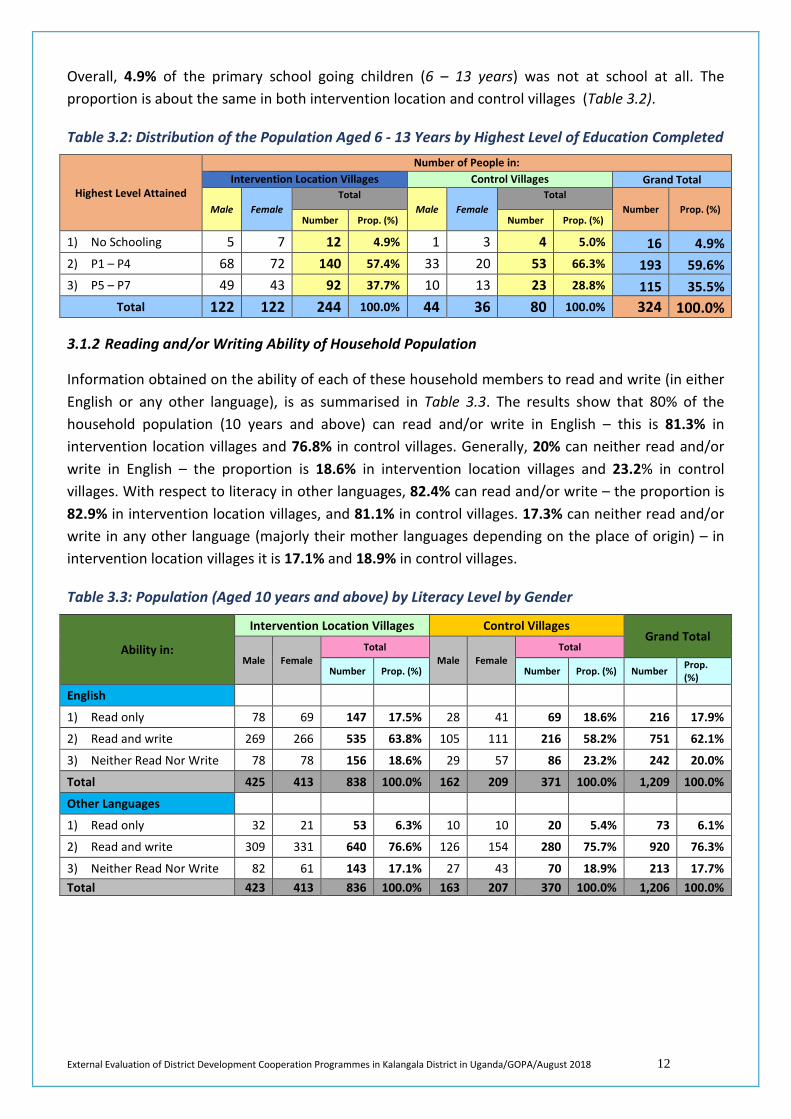
External Evaluation of District Development Cooperation Programmes in Kalangala District in Uganda/GOPA/August 2018 12
Overall, 4.9% of the primary school going children (6 – 13 years) was not at school at all. The proportion is about the same in both intervention location and control villages (Table 3.2).
Table 3.2: Distribution of the Population Aged 6 - 13 Years by Highest Level of Education Completed
Highest Level Attained
Number of People in: Intervention Location Villages Control Villages Grand Total
Male Female Total
Male Female Total
Number Prop. (%) Number Prop. (%) Number Prop. (%)
1) No Schooling 5 7 12 4.9% 1 3 4 5.0% 16 4.9% 2) P1 – P4 68 72 140 57.4% 33 20 53 66.3% 193 59.6% 3) P5 – P7 49 43 92 37.7% 10 13 23 28.8% 115 35.5%
Total 122 122 244 100.0% 44 36 80 100.0% 324 100.0%
3.1.2 Reading and/or Writing Ability of Household Population
Information obtained on the ability of each of these household members to read and write (in either English or any other language), is as summarised in Table 3.3. The results show that 80% of the household population (10 years and above) can read and/or write in English – this is 81.3% in intervention location villages and 76.8% in control villages. Generally, 20% can neither read and/or write in English – the proportion is 18.6% in intervention location villages and 23.2% in control villages. With respect to literacy in other languages, 82.4% can read and/or write – the proportion is 82.9% in intervention location villages, and 81.1% in control villages. 17.3% can neither read and/or write in any other language (majorly their mother languages depending on the place of origin) – in intervention location villages it is 17.1% and 18.9% in control villages.
Table 3.3: Population (Aged 10 years and above) by Literacy Level by Gender
Ability in:
Intervention Location Villages Control Villages Grand Total
Male Female Total
Male Female Total
Number Prop. (%) Number Prop. (%) Number Prop. (%)
English
1) Read only 78 69 147 17.5% 28 41 69 18.6% 216 17.9%
2) Read and write 269 266 535 63.8% 105 111 216 58.2% 751 62.1%
3) Neither Read Nor Write 78 78 156 18.6% 29 57 86 23.2% 242 20.0%
Total 425 413 838 100.0% 162 209 371 100.0% 1,209 100.0%
Other Languages
1) Read only 32 21 53 6.3% 10 10 20 5.4% 73 6.1%
2) Read and write 309 331 640 76.6% 126 154 280 75.7% 920 76.3%
3) Neither Read Nor Write 82 61 143 17.1% 27 43 70 18.9% 213 17.7% Total 423 413 836 100.0% 163 207 370 100.0% 1,206 100.0%
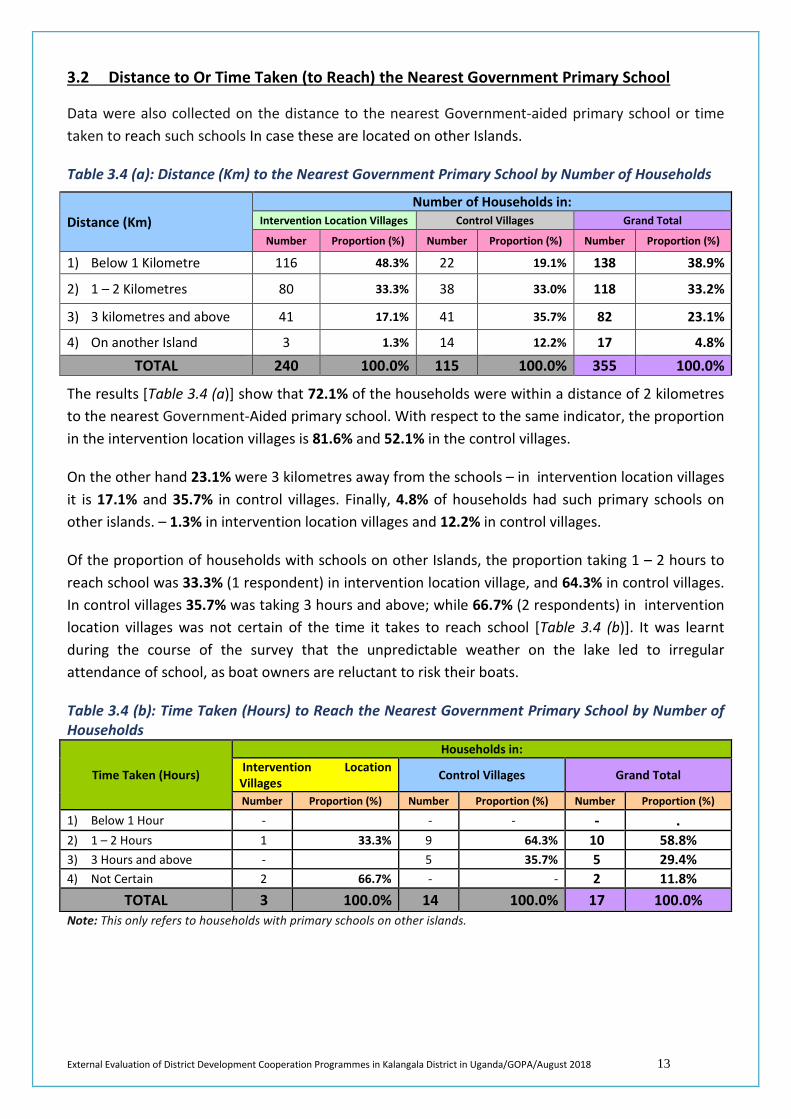
External Evaluation of District Development Cooperation Programmes in Kalangala District in Uganda/GOPA/August 2018 13
3.2 Distance to Or Time Taken (to Reach) the Nearest Government Primary School
Data were also collected on the distance to the nearest Government-aided primary school or time taken to reach such schools In case these are located on other Islands.
Table 3.4 (a): Distance (Km) to the Nearest Government Primary School by Number of Households
Distance (Km) Number of Households in:
Intervention Location Villages Control Villages Grand Total
Number Proportion (%) Number Proportion (%) Number Proportion (%)
1) Below 1 Kilometre 116 48.3% 22 19.1% 138 38.9%
2) 1 – 2 Kilometres 80 33.3% 38 33.0% 118 33.2%
3) 3 kilometres and above 41 17.1% 41 35.7% 82 23.1%
4) On another Island 3 1.3% 14 12.2% 17 4.8%
TOTAL 240 100.0% 115 100.0% 355 100.0%
The results [Table 3.4 (a)] show that 72.1% of the households were within a distance of 2 kilometres to the nearest Government-Aided primary school. With respect to the same indicator, the proportion in the intervention location villages is 81.6% and 52.1% in the control villages.
On the other hand 23.1% were 3 kilometres away from the schools – in intervention location villages it is 17.1% and 35.7% in control villages. Finally, 4.8% of households had such primary schools on other islands. – 1.3% in intervention location villages and 12.2% in control villages.
Of the proportion of households with schools on other Islands, the proportion taking 1 – 2 hours to reach school was 33.3% (1 respondent) in intervention location village, and 64.3% in control villages. In control villages 35.7% was taking 3 hours and above; while 66.7% (2 respondents) in intervention location villages was not certain of the time it takes to reach school [Table 3.4 (b)]. It was learnt during the course of the survey that the unpredictable weather on the lake led to irregular attendance of school, as boat owners are reluctant to risk their boats.
Table 3.4 (b): Time Taken (Hours) to Reach the Nearest Government Primary School by Number of Households
Time Taken (Hours)
Households in: Intervention Location Villages Control Villages Grand Total
Number Proportion (%) Number Proportion (%) Number Proportion (%)
1) Below 1 Hour - - - - . 2) 1 – 2 Hours 1 33.3% 9 64.3% 10 58.8% 3) 3 Hours and above - 5 35.7% 5 29.4% 4) Not Certain 2 66.7% - - 2 11.8%
TOTAL 3 100.0% 14 100.0% 17 100.0% Note: This only refers to households with primary schools on other islands.
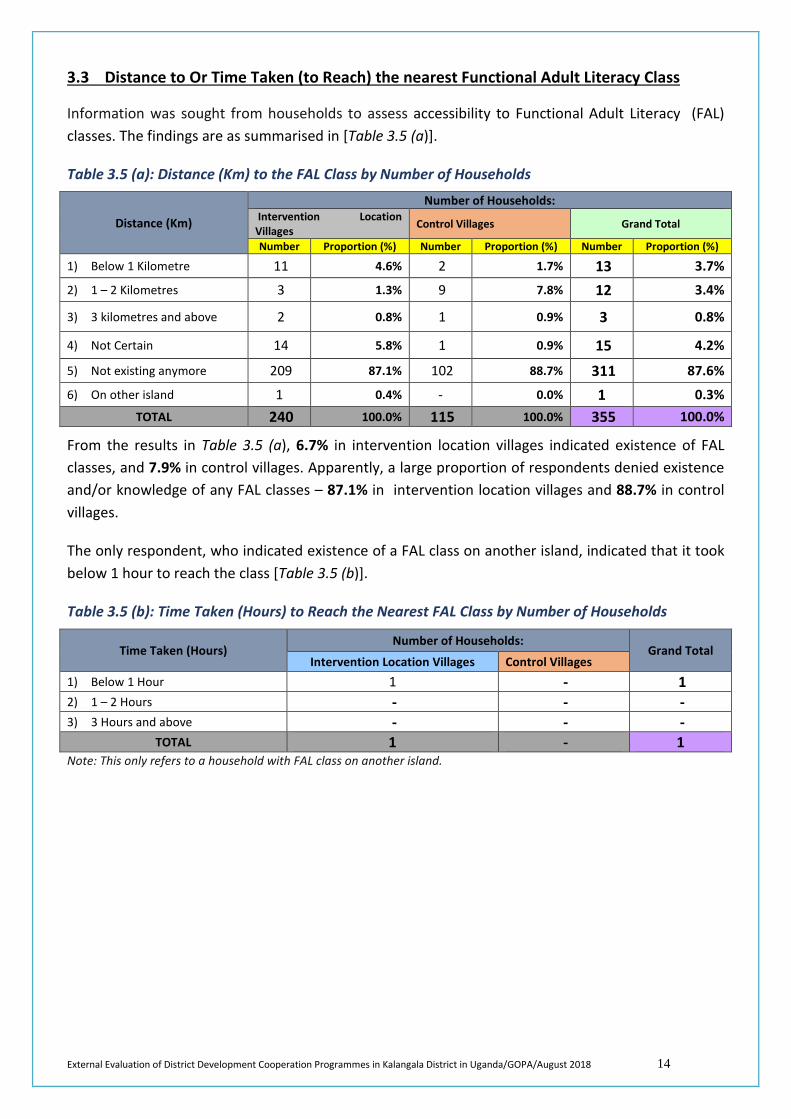
External Evaluation of District Development Cooperation Programmes in Kalangala District in Uganda/GOPA/August 2018 14
3.3 Distance to Or Time Taken (to Reach) the nearest Functional Adult Literacy Class
Information was sought from households to assess accessibility to Functional Adult Literacy (FAL) classes. The findings are as summarised in [Table 3.5 (a)].
Table 3.5 (a): Distance (Km) to the FAL Class by Number of Households
Distance (Km)
Number of Households: Intervention Location Villages Control Villages Grand Total
Number Proportion (%) Number Proportion (%) Number Proportion (%) 1) Below 1 Kilometre 11 4.6% 2 1.7% 13 3.7%
2) 1 – 2 Kilometres 3 1.3% 9 7.8% 12 3.4%
3) 3 kilometres and above 2 0.8% 1 0.9% 3 0.8%
4) Not Certain 14 5.8% 1 0.9% 15 4.2%
5) Not existing anymore 209 87.1% 102 88.7% 311 87.6%
6) On other island 1 0.4% - 0.0% 1 0.3% TOTAL 240 100.0% 115 100.0% 355 100.0%
From the results in Table 3.5 (a), 6.7% in intervention location villages indicated existence of FAL classes, and 7.9% in control villages. Apparently, a large proportion of respondents denied existence and/or knowledge of any FAL classes – 87.1% in intervention location villages and 88.7% in control villages.
The only respondent, who indicated existence of a FAL class on another island, indicated that it took below 1 hour to reach the class [Table 3.5 (b)].
Table 3.5 (b): Time Taken (Hours) to Reach the Nearest FAL Class by Number of Households
Time Taken (Hours) Number of Households:
Grand Total Intervention Location Villages Control Villages
1) Below 1 Hour 1 - 1 2) 1 – 2 Hours - - - 3) 3 Hours and above - - -
TOTAL 1 - 1 Note: This only refers to a household with FAL class on another island.
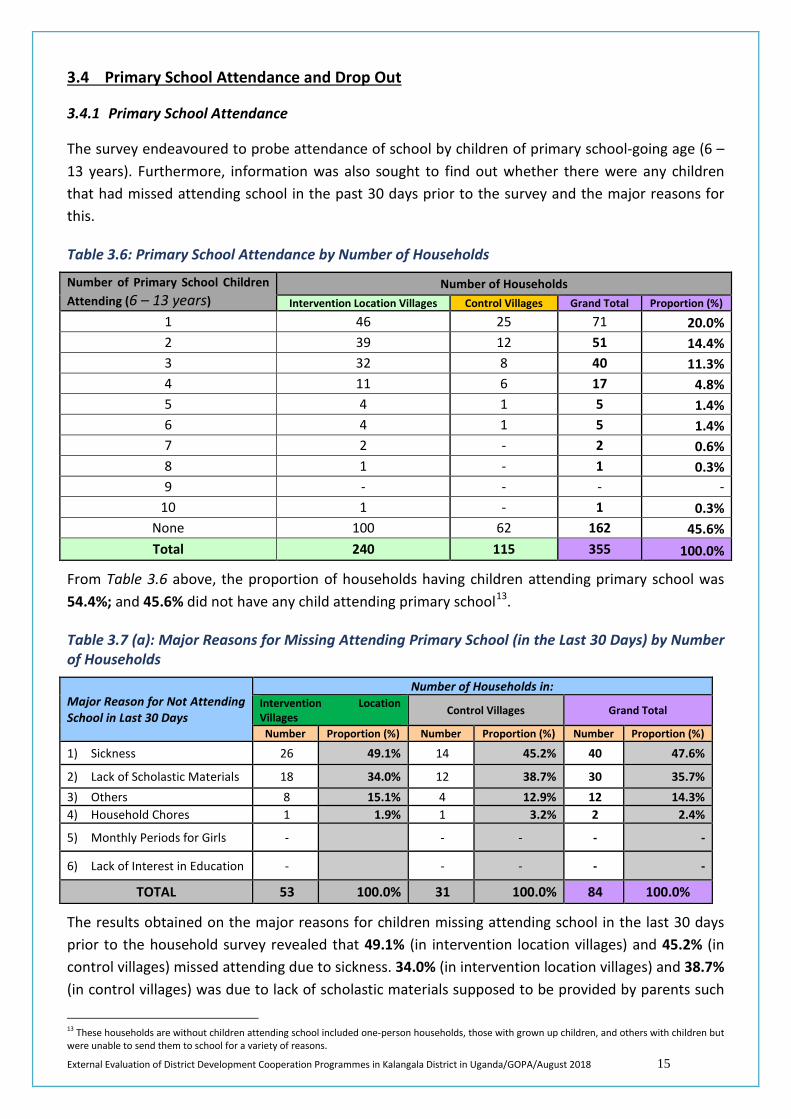
External Evaluation of District Development Cooperation Programmes in Kalangala District in Uganda/GOPA/August 2018 15
3.4 Primary School Attendance and Drop Out
3.4.1 Primary School Attendance
The survey endeavoured to probe attendance of school by children of primary school-going age (6 – 13 years). Furthermore, information was also sought to find out whether there were any children that had missed attending school in the past 30 days prior to the survey and the major reasons for this.
Table 3.6: Primary School Attendance by Number of Households
Number of Primary School Children Attending (6 – 13 years)
Number of Households Intervention Location Villages Control Villages Grand Total Proportion (%)
1 46 25 71 20.0% 2 39 12 51 14.4% 3 32 8 40 11.3% 4 11 6 17 4.8% 5 4 1 5 1.4% 6 4 1 5 1.4% 7 2 - 2 0.6% 8 1 - 1 0.3% 9 - - - -
10 1 - 1 0.3% None 100 62 162 45.6% Total 240 115 355 100.0%
From Table 3.6 above, the proportion of households having children attending primary school was 54.4%; and 45.6% did not have any child attending primary school13.
Table 3.7 (a): Major Reasons for Missing Attending Primary School (in the Last 30 Days) by Number of Households
Major Reason for Not Attending School in Last 30 Days
Number of Households in: Intervention Location Villages Control Villages Grand Total
Number Proportion (%) Number Proportion (%) Number Proportion (%)
1) Sickness 26 49.1% 14 45.2% 40 47.6%
2) Lack of Scholastic Materials 18 34.0% 12 38.7% 30 35.7% 3) Others 8 15.1% 4 12.9% 12 14.3% 4) Household Chores 1 1.9% 1 3.2% 2 2.4%
5) Monthly Periods for Girls - - - - -
6) Lack of Interest in Education - - - - -
TOTAL 53 100.0% 31 100.0% 84 100.0%
The results obtained on the major reasons for children missing attending school in the last 30 days prior to the household survey revealed that 49.1% (in intervention location villages) and 45.2% (in control villages) missed attending due to sickness. 34.0% (in intervention location villages) and 38.7% (in control villages) was due to lack of scholastic materials supposed to be provided by parents such
13 These households are without children attending school included one-person households, those with grown up children, and others with children but were unable to send them to school for a variety of reasons.
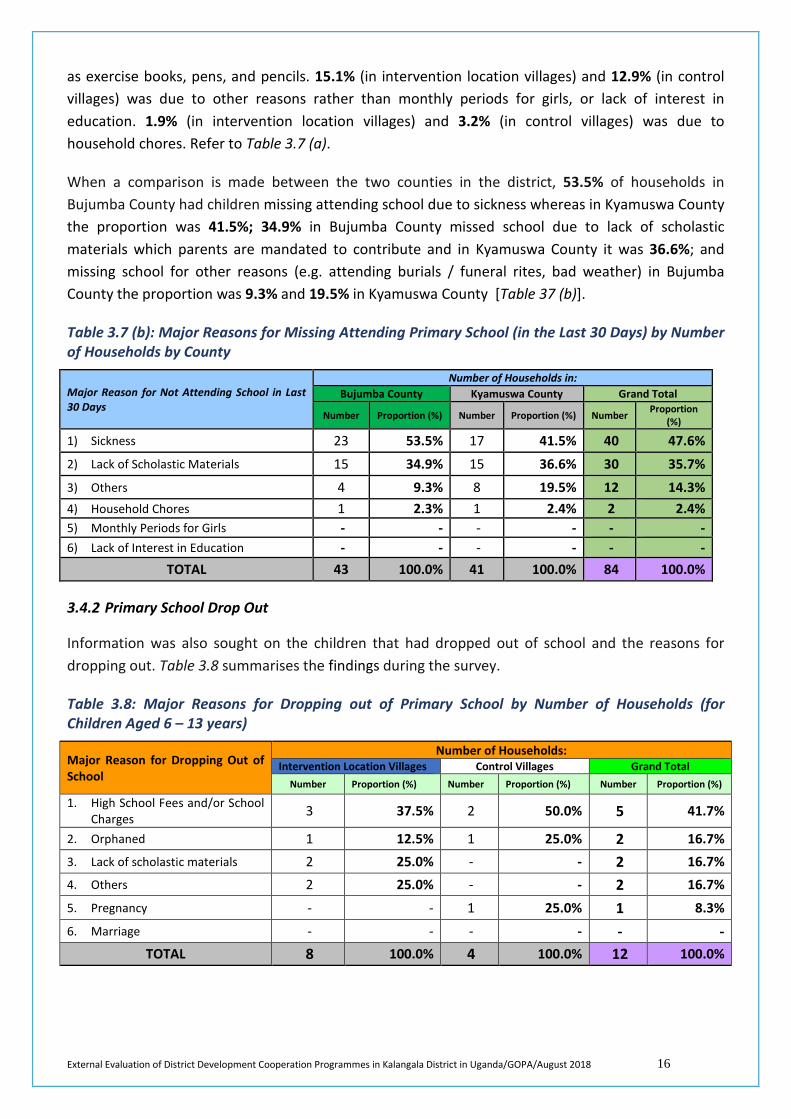
External Evaluation of District Development Cooperation Programmes in Kalangala District in Uganda/GOPA/August 2018 16
as exercise books, pens, and pencils. 15.1% (in intervention location villages) and 12.9% (in control villages) was due to other reasons rather than monthly periods for girls, or lack of interest in education. 1.9% (in intervention location villages) and 3.2% (in control villages) was due to household chores. Refer to Table 3.7 (a).
When a comparison is made between the two counties in the district, 53.5% of households in Bujumba County had children missing attending school due to sickness whereas in Kyamuswa County the proportion was 41.5%; 34.9% in Bujumba County missed school due to lack of scholastic materials which parents are mandated to contribute and in Kyamuswa County it was 36.6%; and missing school for other reasons (e.g. attending burials / funeral rites, bad weather) in Bujumba County the proportion was 9.3% and 19.5% in Kyamuswa County [Table 37 (b)].
Table 3.7 (b): Major Reasons for Missing Attending Primary School (in the Last 30 Days) by Number of Households by County
Major Reason for Not Attending School in Last 30 Days
Number of Households in: Bujumba County Kyamuswa County Grand Total
Number Proportion (%) Number Proportion (%) Number Proportion (%)
1) Sickness 23 53.5% 17 41.5% 40 47.6% 2) Lack of Scholastic Materials 15 34.9% 15 36.6% 30 35.7% 3) Others 4 9.3% 8 19.5% 12 14.3% 4) Household Chores 1 2.3% 1 2.4% 2 2.4% 5) Monthly Periods for Girls - - - - - - 6) Lack of Interest in Education - - - - - -
TOTAL 43 100.0% 41 100.0% 84 100.0%
3.4.2 Primary School Drop Out
Information was also sought on the children that had dropped out of school and the reasons for dropping out. Table 3.8 summarises the findings during the survey.
Table 3.8: Major Reasons for Dropping out of Primary School by Number of Households (for Children Aged 6 – 13 years)
Major Reason for Dropping Out of School
Number of Households: Intervention Location Villages Control Villages Grand Total
Number Proportion (%) Number Proportion (%) Number Proportion (%)
1. High School Fees and/or School Charges 3 37.5% 2 50.0% 5 41.7%
2. Orphaned 1 12.5% 1 25.0% 2 16.7% 3. Lack of scholastic materials 2 25.0% - - 2 16.7% 4. Others 2 25.0% - - 2 16.7% 5. Pregnancy - - 1 25.0% 1 8.3% 6. Marriage - - - - - -
TOTAL 8 100.0% 4 100.0% 12 100.0%
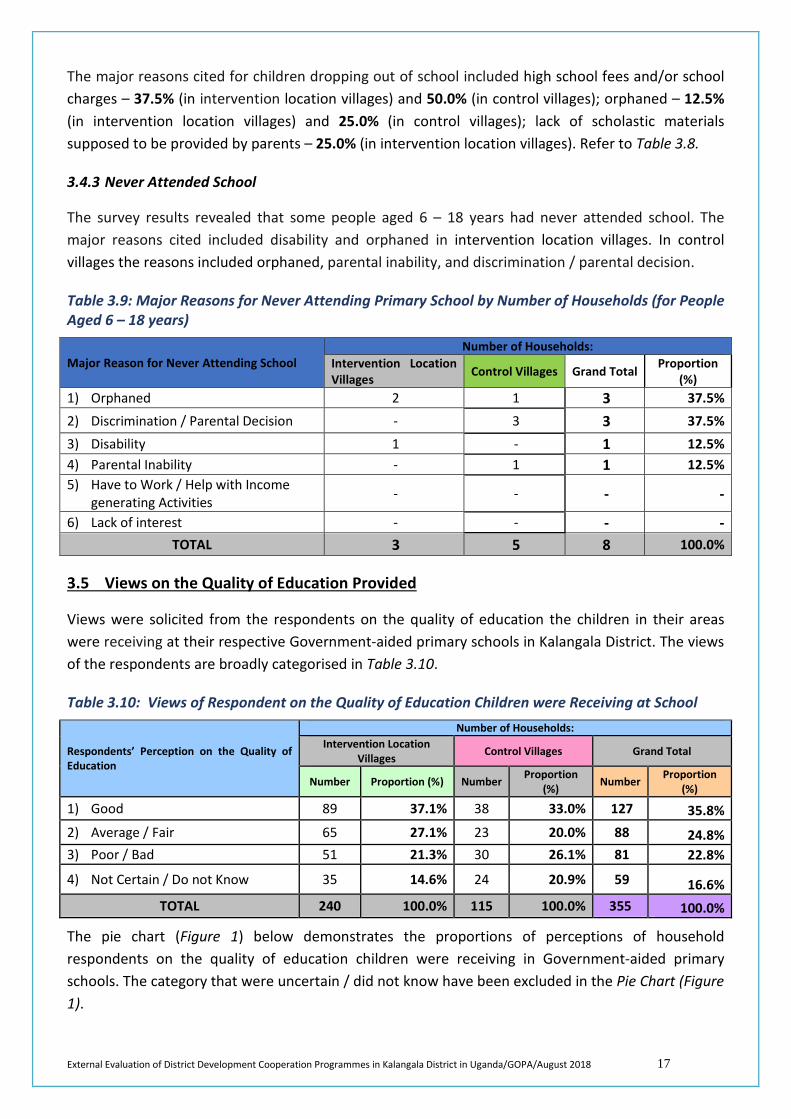
External Evaluation of District Development Cooperation Programmes in Kalangala District in Uganda/GOPA/August 2018 17
The major reasons cited for children dropping out of school included high school fees and/or school charges – 37.5% (in intervention location villages) and 50.0% (in control villages); orphaned – 12.5% (in intervention location villages) and 25.0% (in control villages); lack of scholastic materials supposed to be provided by parents – 25.0% (in intervention location villages). Refer to Table 3.8.
3.4.3 Never Attended School
The survey results revealed that some people aged 6 – 18 years had never attended school. The major reasons cited included disability and orphaned in intervention location villages. In control villages the reasons included orphaned, parental inability, and discrimination / parental decision.
Table 3.9: Major Reasons for Never Attending Primary School by Number of Households (for People Aged 6 – 18 years)
Major Reason for Never Attending School Number of Households:
Intervention Location Villages Control Villages Grand Total Proportion
(%) 1) Orphaned 2 1 3 37.5% 2) Discrimination / Parental Decision - 3 3 37.5% 3) Disability 1 - 1 12.5% 4) Parental Inability - 1 1 12.5% 5) Have to Work / Help with Income
generating Activities - - - -
6) Lack of interest - - - - TOTAL 3 5 8 100.0%
3.5 Views on the Quality of Education Provided
Views were solicited from the respondents on the quality of education the children in their areas were receiving at their respective Government-aided primary schools in Kalangala District. The views of the respondents are broadly categorised in Table 3.10.
Table 3.10: Views of Respondent on the Quality of Education Children were Receiving at School
Respondents’ Perception on the Quality of Education
Number of Households: Intervention Location
Villages Control Villages Grand Total
Number Proportion (%) Number Proportion (%) Number Proportion
(%)
1) Good 89 37.1% 38 33.0% 127 35.8% 2) Average / Fair 65 27.1% 23 20.0% 88 24.8% 3) Poor / Bad 51 21.3% 30 26.1% 81 22.8%
4) Not Certain / Do not Know 35 14.6% 24 20.9% 59 16.6% TOTAL 240 100.0% 115 100.0% 355 100.0%
The pie chart (Figure 1) below demonstrates the proportions of perceptions of household respondents on the quality of education children were receiving in Government-aided primary schools. The category that were uncertain / did not know have been excluded in the Pie Chart (Figure 1).
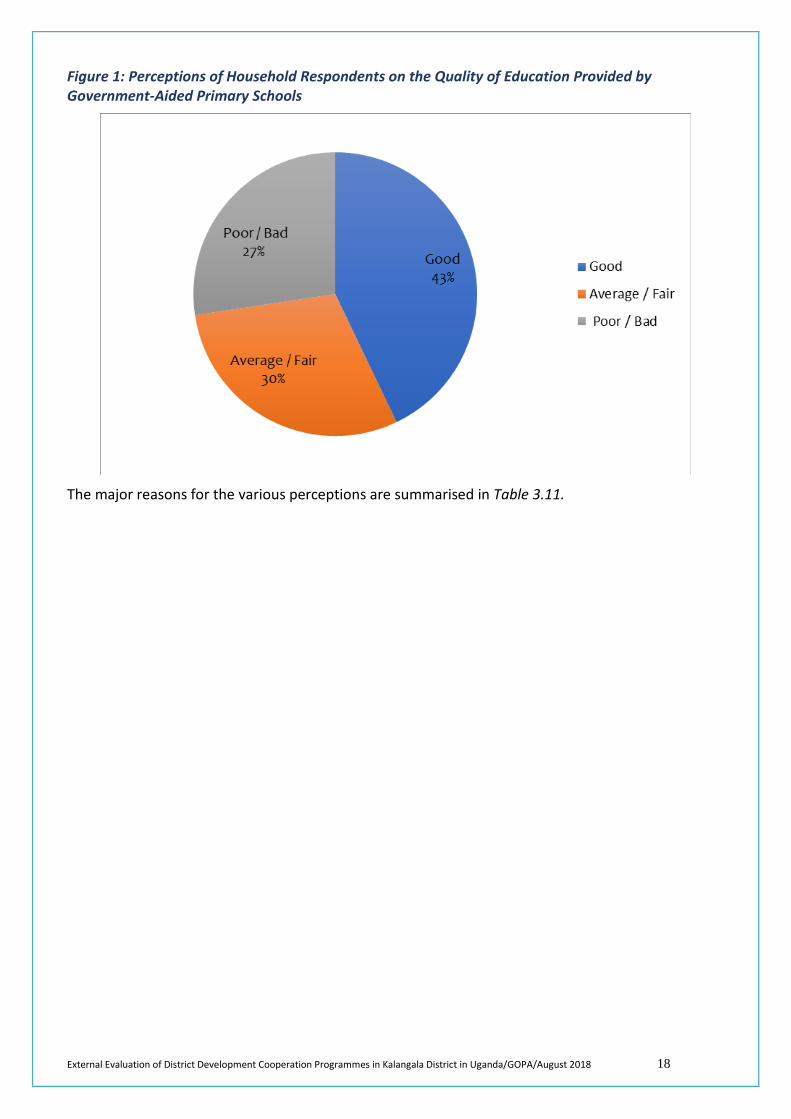
External Evaluation of District Development Cooperation Programmes in Kalangala District in Uganda/GOPA/August 2018 18
Figure 1: Perceptions of Household Respondents on the Quality of Education Provided by Government-Aided Primary Schools
The major reasons for the various perceptions are summarised in Table 3.11.
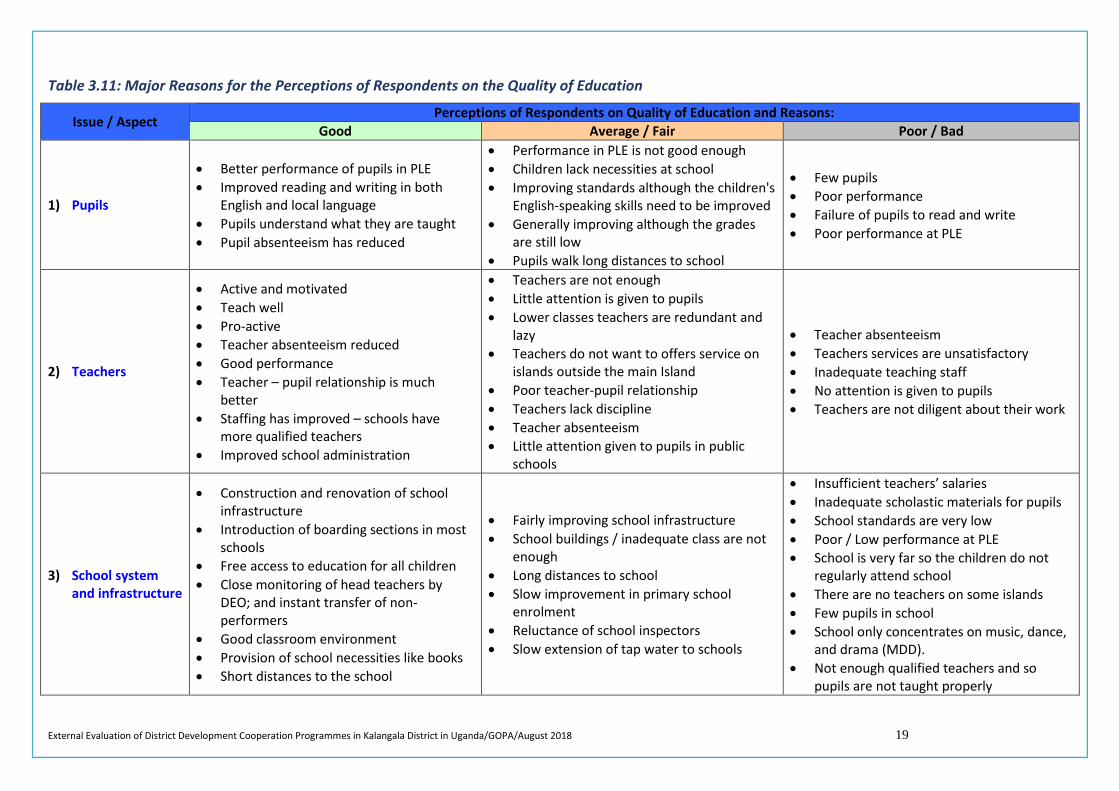
External Evaluation of District Development Cooperation Programmes in Kalangala District in Uganda/GOPA/August 2018 19
Table 3.11: Major Reasons for the Perceptions of Respondents on the Quality of Education
Issue / Aspect Perceptions of Respondents on Quality of Education and Reasons: Good Average / Fair Poor / Bad
1) Pupils
• Better performance of pupils in PLE • Improved reading and writing in both
English and local language • Pupils understand what they are taught • Pupil absenteeism has reduced
• Performance in PLE is not good enough • Children lack necessities at school • Improving standards although the children's
English-speaking skills need to be improved • Generally improving although the grades
are still low • Pupils walk long distances to school
• Few pupils • Poor performance • Failure of pupils to read and write • Poor performance at PLE
2) Teachers
• Active and motivated • Teach well • Pro-active • Teacher absenteeism reduced • Good performance • Teacher – pupil relationship is much
better • Staffing has improved – schools have
more qualified teachers • Improved school administration
• Teachers are not enough • Little attention is given to pupils • Lower classes teachers are redundant and
lazy • Teachers do not want to offers service on
islands outside the main Island • Poor teacher-pupil relationship • Teachers lack discipline • Teacher absenteeism • Little attention given to pupils in public
schools
• Teacher absenteeism • Teachers services are unsatisfactory • Inadequate teaching staff • No attention is given to pupils • Teachers are not diligent about their work
3) School system and infrastructure
• Construction and renovation of school infrastructure
• Introduction of boarding sections in most schools
• Free access to education for all children • Close monitoring of head teachers by
DEO; and instant transfer of non-performers
• Good classroom environment • Provision of school necessities like books • Short distances to the school
• Fairly improving school infrastructure • School buildings / inadequate class are not
enough • Long distances to school • Slow improvement in primary school
enrolment • Reluctance of school inspectors • Slow extension of tap water to schools
• Insufficient teachers’ salaries • Inadequate scholastic materials for pupils • School standards are very low • Poor / Low performance at PLE • School is very far so the children do not
regularly attend school • There are no teachers on some islands • Few pupils in school • School only concentrates on music, dance,
and drama (MDD). • Not enough qualified teachers and so
pupils are not taught properly
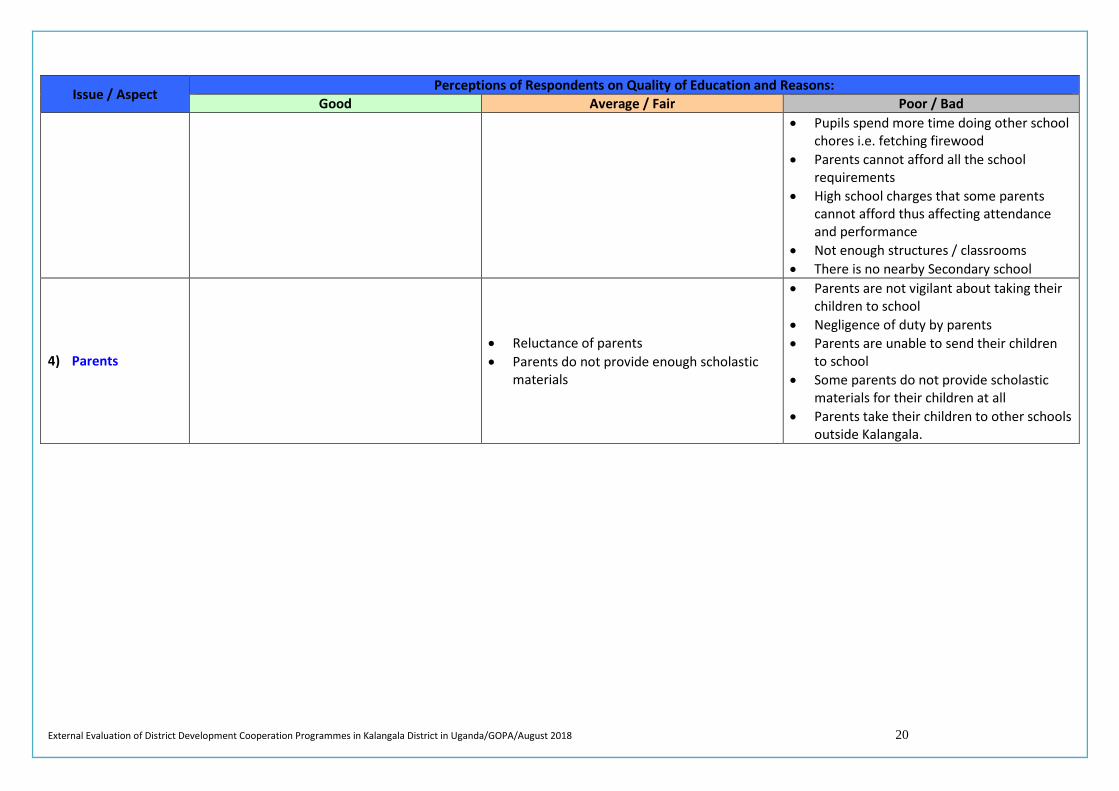
External Evaluation of District Development Cooperation Programmes in Kalangala District in Uganda/GOPA/August 2018 20
Issue / Aspect Perceptions of Respondents on Quality of Education and Reasons: Good Average / Fair Poor / Bad
• Pupils spend more time doing other school chores i.e. fetching firewood
• Parents cannot afford all the school requirements
• High school charges that some parents cannot afford thus affecting attendance and performance
• Not enough structures / classrooms • There is no nearby Secondary school
4) Parents • Reluctance of parents • Parents do not provide enough scholastic
materials
• Parents are not vigilant about taking their children to school
• Negligence of duty by parents • Parents are unable to send their children
to school • Some parents do not provide scholastic
materials for their children at all • Parents take their children to other schools
outside Kalangala.
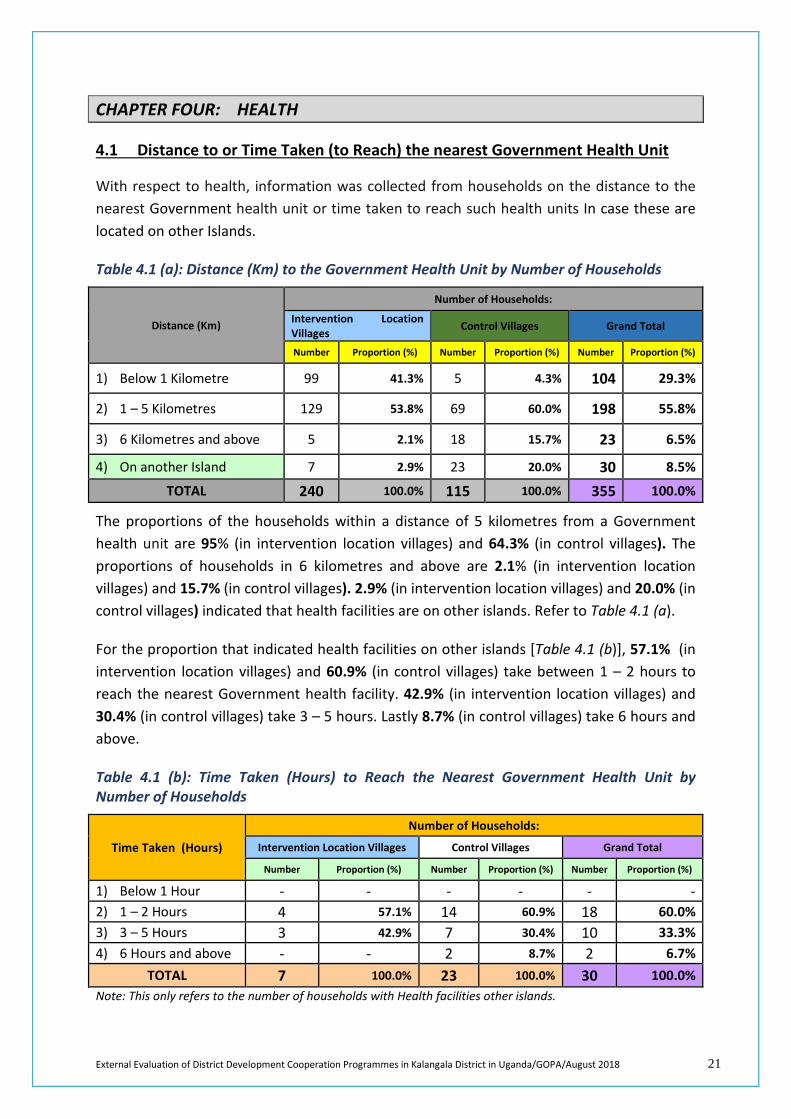
External Evaluation of District Development Cooperation Programmes in Kalangala District in Uganda/GOPA/August 2018 21
CHAPTER FOUR: HEALTH
4.1 Distance to or Time Taken (to Reach) the nearest Government Health Unit
With respect to health, information was collected from households on the distance to the nearest Government health unit or time taken to reach such health units In case these are located on other Islands.
Table 4.1 (a): Distance (Km) to the Government Health Unit by Number of Households
Distance (Km)
Number of Households:
Intervention Location Villages Control Villages Grand Total
Number Proportion (%) Number Proportion (%) Number Proportion (%)
1) Below 1 Kilometre 99 41.3% 5 4.3% 104 29.3%
2) 1 – 5 Kilometres 129 53.8% 69 60.0% 198 55.8%
3) 6 Kilometres and above 5 2.1% 18 15.7% 23 6.5%
4) On another Island 7 2.9% 23 20.0% 30 8.5%
TOTAL 240 100.0% 115 100.0% 355 100.0%
The proportions of the households within a distance of 5 kilometres from a Government health unit are 95% (in intervention location villages) and 64.3% (in control villages). The proportions of households in 6 kilometres and above are 2.1% (in intervention location villages) and 15.7% (in control villages). 2.9% (in intervention location villages) and 20.0% (in control villages) indicated that health facilities are on other islands. Refer to Table 4.1 (a).
For the proportion that indicated health facilities on other islands [Table 4.1 (b)], 57.1% (in intervention location villages) and 60.9% (in control villages) take between 1 – 2 hours to reach the nearest Government health facility. 42.9% (in intervention location villages) and 30.4% (in control villages) take 3 – 5 hours. Lastly 8.7% (in control villages) take 6 hours and above.
Table 4.1 (b): Time Taken (Hours) to Reach the Nearest Government Health Unit by Number of Households
Time Taken (Hours)
Number of Households:
Intervention Location Villages Control Villages Grand Total
Number Proportion (%) Number Proportion (%) Number Proportion (%)
1) Below 1 Hour - - - - - - 2) 1 – 2 Hours 4 57.1% 14 60.9% 18 60.0% 3) 3 – 5 Hours 3 42.9% 7 30.4% 10 33.3% 4) 6 Hours and above - - 2 8.7% 2 6.7%
TOTAL 7 100.0% 23 100.0% 30 100.0% Note: This only refers to the number of households with Health facilities other islands.
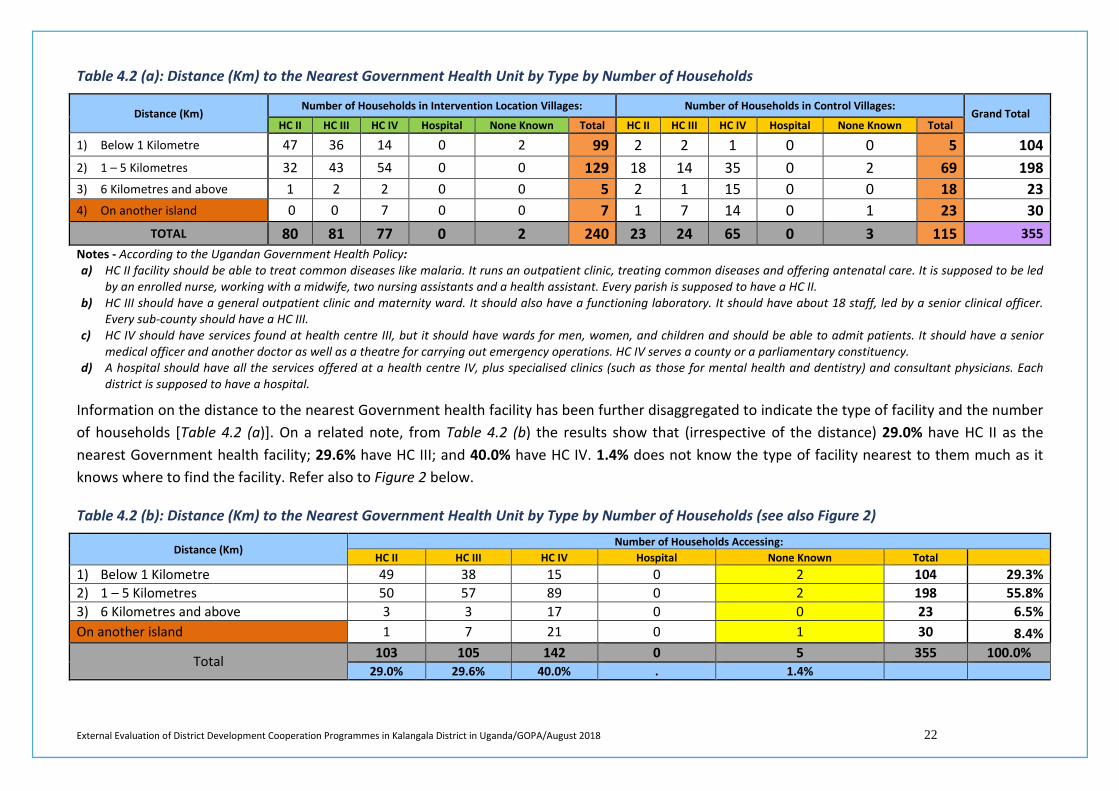
External Evaluation of District Development Cooperation Programmes in Kalangala District in Uganda/GOPA/August 2018 22
Table 4.2 (a): Distance (Km) to the Nearest Government Health Unit by Type by Number of Households
Distance (Km) Number of Households in Intervention Location Villages: Number of Households in Control Villages:
Grand Total HC II HC III HC IV Hospital None Known Total HC II HC III HC IV Hospital None Known Total
1) Below 1 Kilometre 47 36 14 0 2 99 2 2 1 0 0 5 104 2) 1 – 5 Kilometres 32 43 54 0 0 129 18 14 35 0 2 69 198 3) 6 Kilometres and above 1 2 2 0 0 5 2 1 15 0 0 18 23 4) On another island 0 0 7 0 0 7 1 7 14 0 1 23 30
TOTAL 80 81 77 0 2 240 23 24 65 0 3 115 355 Notes - According to the Ugandan Government Health Policy: a) HC II facility should be able to treat common diseases like malaria. It runs an outpatient clinic, treating common diseases and offering antenatal care. It is supposed to be led
by an enrolled nurse, working with a midwife, two nursing assistants and a health assistant. Every parish is supposed to have a HC II. b) HC III should have a general outpatient clinic and maternity ward. It should also have a functioning laboratory. It should have about 18 staff, led by a senior clinical officer.
Every sub-county should have a HC III. c) HC IV should have services found at health centre III, but it should have wards for men, women, and children and should be able to admit patients. It should have a senior
medical officer and another doctor as well as a theatre for carrying out emergency operations. HC IV serves a county or a parliamentary constituency. d) A hospital should have all the services offered at a health centre IV, plus specialised clinics (such as those for mental health and dentistry) and consultant physicians. Each
district is supposed to have a hospital.
Information on the distance to the nearest Government health facility has been further disaggregated to indicate the type of facility and the number of households [Table 4.2 (a)]. On a related note, from Table 4.2 (b) the results show that (irrespective of the distance) 29.0% have HC II as the nearest Government health facility; 29.6% have HC III; and 40.0% have HC IV. 1.4% does not know the type of facility nearest to them much as it knows where to find the facility. Refer also to Figure 2 below.
Table 4.2 (b): Distance (Km) to the Nearest Government Health Unit by Type by Number of Households (see also Figure 2)
Distance (Km) Number of Households Accessing:
HC II HC III HC IV Hospital None Known Total 1) Below 1 Kilometre 49 38 15 0 2 104 29.3% 2) 1 – 5 Kilometres 50 57 89 0 2 198 55.8% 3) 6 Kilometres and above 3 3 17 0 0 23 6.5% On another island 1 7 21 0 1 30 8.4%
Total 103 105 142 0 5 355 100.0% 29.0% 29.6% 40.0% . 1.4%
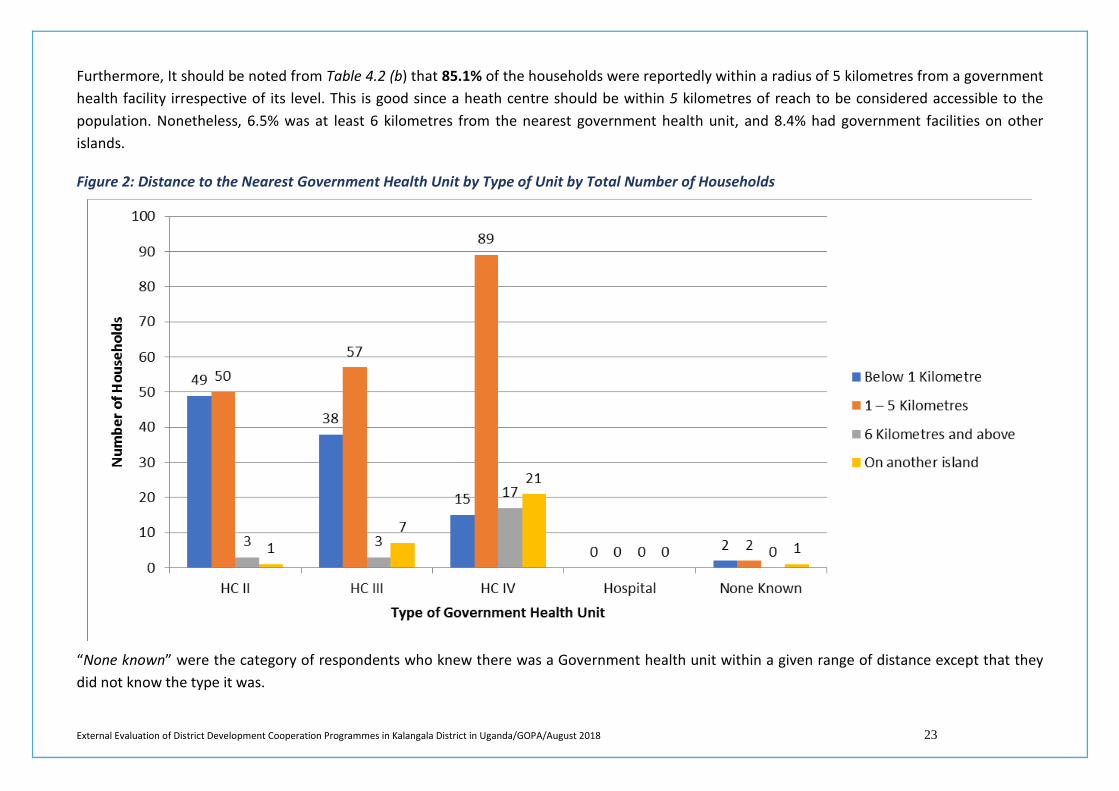
External Evaluation of District Development Cooperation Programmes in Kalangala District in Uganda/GOPA/August 2018 23
Furthermore, It should be noted from Table 4.2 (b) that 85.1% of the households were reportedly within a radius of 5 kilometres from a government health facility irrespective of its level. This is good since a heath centre should be within 5 kilometres of reach to be considered accessible to the population. Nonetheless, 6.5% was at least 6 kilometres from the nearest government health unit, and 8.4% had government facilities on other islands.
Figure 2: Distance to the Nearest Government Health Unit by Type of Unit by Total Number of Households
“None known” were the category of respondents who knew there was a Government health unit within a given range of distance except that they did not know the type it was.
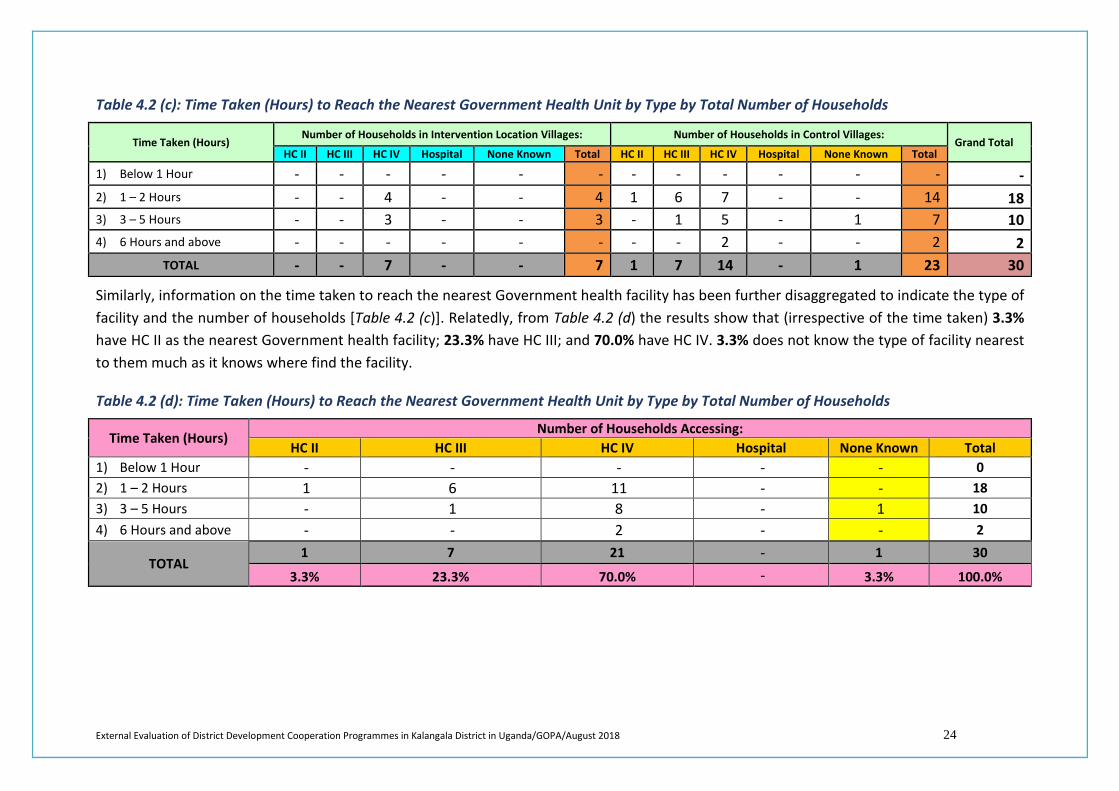
External Evaluation of District Development Cooperation Programmes in Kalangala District in Uganda/GOPA/August 2018 24
Table 4.2 (c): Time Taken (Hours) to Reach the Nearest Government Health Unit by Type by Total Number of Households
Time Taken (Hours) Number of Households in Intervention Location Villages: Number of Households in Control Villages:
Grand Total HC II HC III HC IV Hospital None Known Total HC II HC III HC IV Hospital None Known Total
1) Below 1 Hour - - - - - - - - - - - - - 2) 1 – 2 Hours - - 4 - - 4 1 6 7 - - 14 18 3) 3 – 5 Hours - - 3 - - 3 - 1 5 - 1 7 10 4) 6 Hours and above - - - - - - - - 2 - - 2 2
TOTAL - - 7 - - 7 1 7 14 - 1 23 30
Similarly, information on the time taken to reach the nearest Government health facility has been further disaggregated to indicate the type of facility and the number of households [Table 4.2 (c)]. Relatedly, from Table 4.2 (d) the results show that (irrespective of the time taken) 3.3% have HC II as the nearest Government health facility; 23.3% have HC III; and 70.0% have HC IV. 3.3% does not know the type of facility nearest to them much as it knows where find the facility.
Table 4.2 (d): Time Taken (Hours) to Reach the Nearest Government Health Unit by Type by Total Number of Households
Time Taken (Hours) Number of Households Accessing:
HC II HC III HC IV Hospital None Known Total 1) Below 1 Hour - - - - - 0 2) 1 – 2 Hours 1 6 11 - - 18 3) 3 – 5 Hours - 1 8 - 1 10 4) 6 Hours and above - - 2 - - 2
TOTAL 1 7 21 - 1 30
3.3% 23.3% 70.0% - 3.3% 100.0%
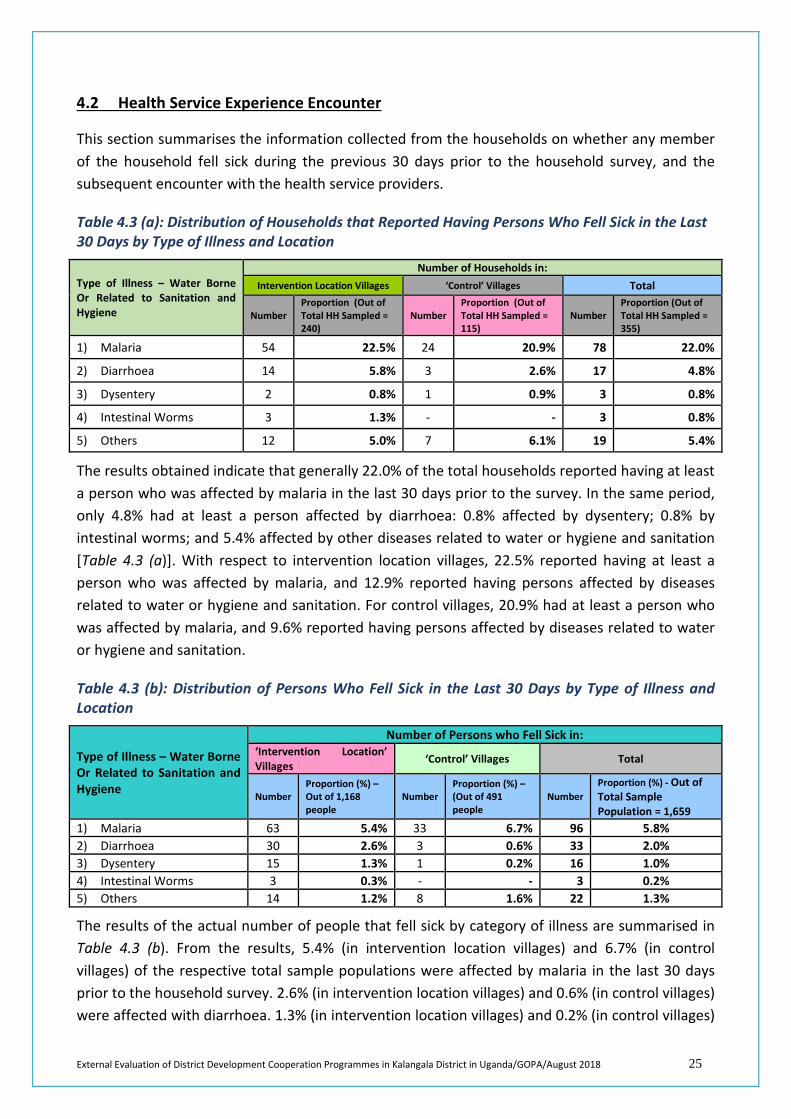
External Evaluation of District Development Cooperation Programmes in Kalangala District in Uganda/GOPA/August 2018 25
4.2 Health Service Experience Encounter
This section summarises the information collected from the households on whether any member of the household fell sick during the previous 30 days prior to the household survey, and the subsequent encounter with the health service providers.
Table 4.3 (a): Distribution of Households that Reported Having Persons Who Fell Sick in the Last 30 Days by Type of Illness and Location
Type of Illness – Water Borne Or Related to Sanitation and Hygiene
Number of Households in: Intervention Location Villages ‘Control’ Villages Total
Number Proportion (Out of Total HH Sampled = 240)
Number Proportion (Out of Total HH Sampled = 115)
Number Proportion (Out of Total HH Sampled = 355)
1) Malaria 54 22.5% 24 20.9% 78 22.0%
2) Diarrhoea 14 5.8% 3 2.6% 17 4.8%
3) Dysentery 2 0.8% 1 0.9% 3 0.8%
4) Intestinal Worms 3 1.3% - - 3 0.8%
5) Others 12 5.0% 7 6.1% 19 5.4%
The results obtained indicate that generally 22.0% of the total households reported having at least a person who was affected by malaria in the last 30 days prior to the survey. In the same period, only 4.8% had at least a person affected by diarrhoea: 0.8% affected by dysentery; 0.8% by intestinal worms; and 5.4% affected by other diseases related to water or hygiene and sanitation [Table 4.3 (a)]. With respect to intervention location villages, 22.5% reported having at least a person who was affected by malaria, and 12.9% reported having persons affected by diseases related to water or hygiene and sanitation. For control villages, 20.9% had at least a person who was affected by malaria, and 9.6% reported having persons affected by diseases related to water or hygiene and sanitation.
Table 4.3 (b): Distribution of Persons Who Fell Sick in the Last 30 Days by Type of Illness and Location
Type of Illness – Water Borne Or Related to Sanitation and Hygiene
Number of Persons who Fell Sick in: ‘Intervention Location’ Villages ‘Control’ Villages Total
Number Proportion (%) – Out of 1,168 people
Number Proportion (%) – (Out of 491 people
Number Proportion (%) - Out of Total Sample Population = 1,659
1) Malaria 63 5.4% 33 6.7% 96 5.8% 2) Diarrhoea 30 2.6% 3 0.6% 33 2.0% 3) Dysentery 15 1.3% 1 0.2% 16 1.0% 4) Intestinal Worms 3 0.3% - - 3 0.2% 5) Others 14 1.2% 8 1.6% 22 1.3%
The results of the actual number of people that fell sick by category of illness are summarised in Table 4.3 (b). From the results, 5.4% (in intervention location villages) and 6.7% (in control villages) of the respective total sample populations were affected by malaria in the last 30 days prior to the household survey. 2.6% (in intervention location villages) and 0.6% (in control villages) were affected with diarrhoea. 1.3% (in intervention location villages) and 0.2% (in control villages)
External Evaluation of District Development Cooperation Programmes in Kalangala District in Uganda/GOPA/August 2018 26
were affected with dysentery. 0.3% (in intervention location villages only) was affected with intestinal worms. Lastly, 1.2% (in intervention location villages) and 1.6% (in control villages) were affected with other diseases related to water or hygiene and sanitation.
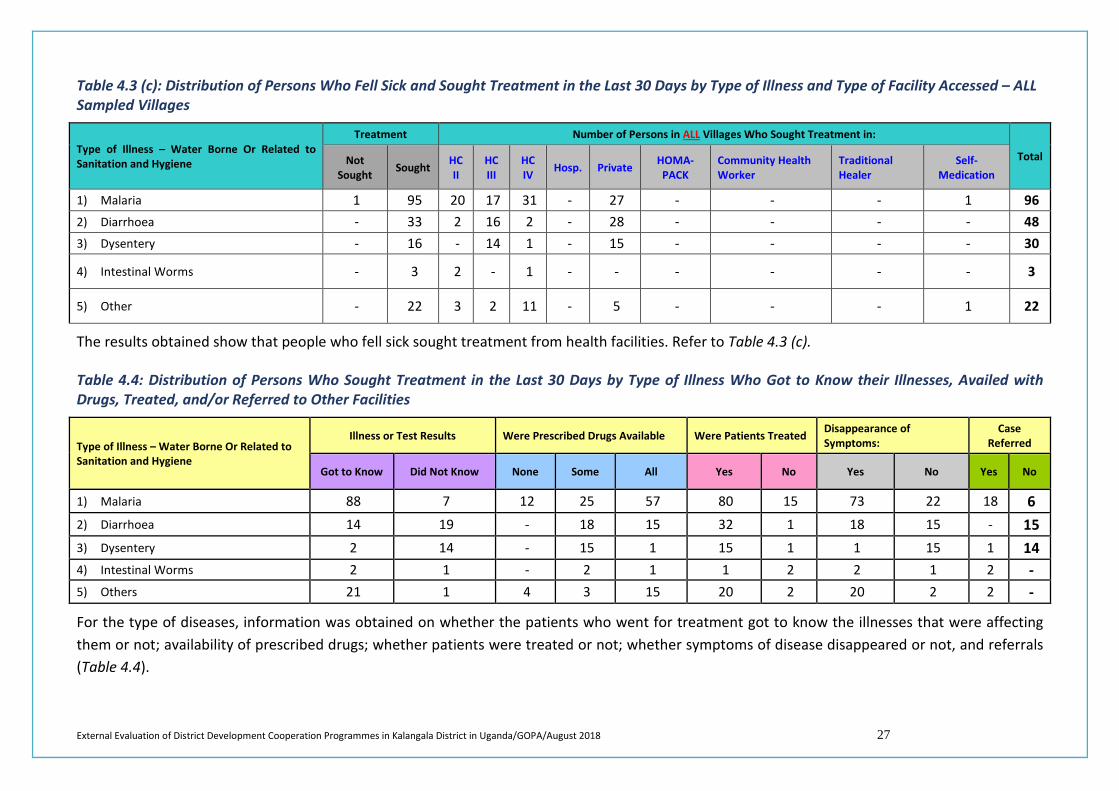
External Evaluation of District Development Cooperation Programmes in Kalangala District in Uganda/GOPA/August 2018 27
Table 4.3 (c): Distribution of Persons Who Fell Sick and Sought Treatment in the Last 30 Days by Type of Illness and Type of Facility Accessed – ALL Sampled Villages
Type of Illness – Water Borne Or Related to Sanitation and Hygiene
Treatment Number of Persons in ALL Villages Who Sought Treatment in:
Total Not Sought Sought HC
II HC III
HC IV Hosp. Private HOMA-
PACK Community Health Worker
Traditional Healer
Self-Medication
1) Malaria 1 95 20 17 31 - 27 - - - 1 96 2) Diarrhoea - 33 2 16 2 - 28 - - - - 48 3) Dysentery - 16 - 14 1 - 15 - - - - 30
4) Intestinal Worms - 3 2 - 1 - - - - - - 3
5) Other - 22 3 2 11 - 5 - - - 1 22
The results obtained show that people who fell sick sought treatment from health facilities. Refer to Table 4.3 (c).
Table 4.4: Distribution of Persons Who Sought Treatment in the Last 30 Days by Type of Illness Who Got to Know their Illnesses, Availed with Drugs, Treated, and/or Referred to Other Facilities
Type of Illness – Water Borne Or Related to Sanitation and Hygiene
Illness or Test Results Were Prescribed Drugs Available Were Patients Treated Disappearance of Symptoms:
Case Referred
Got to Know Did Not Know None Some All Yes No Yes No Yes No
1) Malaria 88 7 12 25 57 80 15 73 22 18 6 2) Diarrhoea 14 19 - 18 15 32 1 18 15 - 15 3) Dysentery 2 14 - 15 1 15 1 1 15 1 14 4) Intestinal Worms 2 1 - 2 1 1 2 2 1 2 - 5) Others 21 1 4 3 15 20 2 20 2 2 -
For the type of diseases, information was obtained on whether the patients who went for treatment got to know the illnesses that were affecting them or not; availability of prescribed drugs; whether patients were treated or not; whether symptoms of disease disappeared or not, and referrals (Table 4.4).
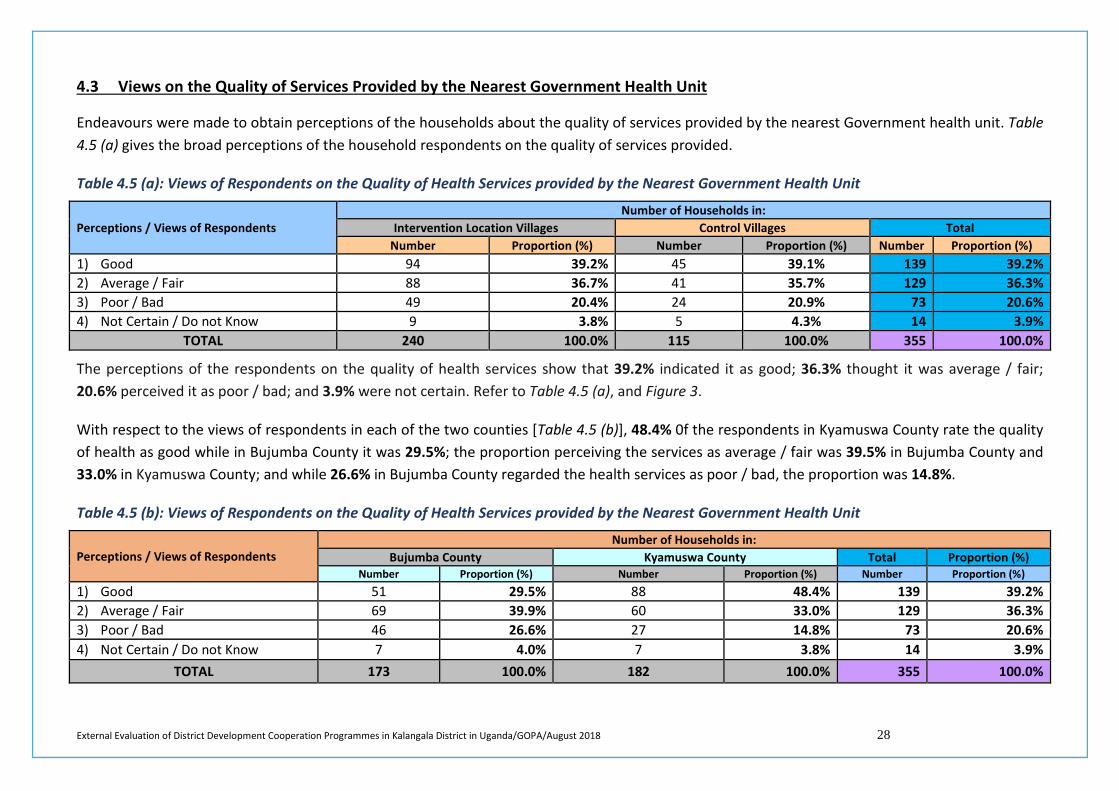
External Evaluation of District Development Cooperation Programmes in Kalangala District in Uganda/GOPA/August 2018 28
4.3 Views on the Quality of Services Provided by the Nearest Government Health Unit
Endeavours were made to obtain perceptions of the households about the quality of services provided by the nearest Government health unit. Table 4.5 (a) gives the broad perceptions of the household respondents on the quality of services provided.
Table 4.5 (a): Views of Respondents on the Quality of Health Services provided by the Nearest Government Health Unit
Perceptions / Views of Respondents Number of Households in:
Intervention Location Villages Control Villages Total Number Proportion (%) Number Proportion (%) Number Proportion (%)
1) Good 94 39.2% 45 39.1% 139 39.2% 2) Average / Fair 88 36.7% 41 35.7% 129 36.3% 3) Poor / Bad 49 20.4% 24 20.9% 73 20.6% 4) Not Certain / Do not Know 9 3.8% 5 4.3% 14 3.9%
TOTAL 240 100.0% 115 100.0% 355 100.0%
The perceptions of the respondents on the quality of health services show that 39.2% indicated it as good; 36.3% thought it was average / fair; 20.6% perceived it as poor / bad; and 3.9% were not certain. Refer to Table 4.5 (a), and Figure 3.
With respect to the views of respondents in each of the two counties [Table 4.5 (b)], 48.4% 0f the respondents in Kyamuswa County rate the quality of health as good while in Bujumba County it was 29.5%; the proportion perceiving the services as average / fair was 39.5% in Bujumba County and 33.0% in Kyamuswa County; and while 26.6% in Bujumba County regarded the health services as poor / bad, the proportion was 14.8%.
Table 4.5 (b): Views of Respondents on the Quality of Health Services provided by the Nearest Government Health Unit
Perceptions / Views of Respondents Number of Households in:
Bujumba County Kyamuswa County Total Proportion (%) Number Proportion (%) Number Proportion (%) Number Proportion (%)
1) Good 51 29.5% 88 48.4% 139 39.2% 2) Average / Fair 69 39.9% 60 33.0% 129 36.3% 3) Poor / Bad 46 26.6% 27 14.8% 73 20.6% 4) Not Certain / Do not Know 7 4.0% 7 3.8% 14 3.9%
TOTAL 173 100.0% 182 100.0% 355 100.0%
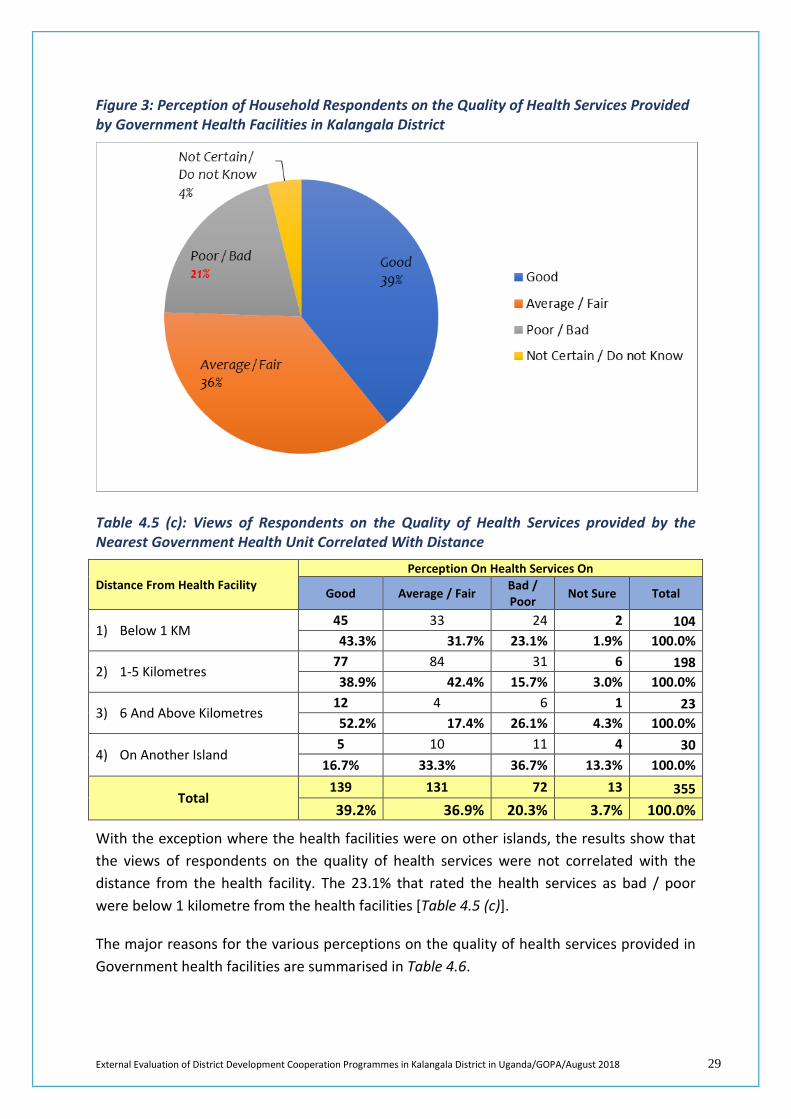
External Evaluation of District Development Cooperation Programmes in Kalangala District in Uganda/GOPA/August 2018 29
Figure 3: Perception of Household Respondents on the Quality of Health Services Provided by Government Health Facilities in Kalangala District
Table 4.5 (c): Views of Respondents on the Quality of Health Services provided by the Nearest Government Health Unit Correlated With Distance
Distance From Health Facility Perception On Health Services On
Good Average / Fair Bad / Poor Not Sure Total
1) Below 1 KM 45 33 24 2 104 43.3% 31.7% 23.1% 1.9% 100.0%
2) 1-5 Kilometres 77 84 31 6 198 38.9% 42.4% 15.7% 3.0% 100.0%
3) 6 And Above Kilometres 12 4 6 1 23 52.2% 17.4% 26.1% 4.3% 100.0%
4) On Another Island 5 10 11 4 30
16.7% 33.3% 36.7% 13.3% 100.0%
Total 139 131 72 13 355 39.2% 36.9% 20.3% 3.7% 100.0%
With the exception where the health facilities were on other islands, the results show that the views of respondents on the quality of health services were not correlated with the distance from the health facility. The 23.1% that rated the health services as bad / poor were below 1 kilometre from the health facilities [Table 4.5 (c)].
The major reasons for the various perceptions on the quality of health services provided in Government health facilities are summarised in Table 4.6.
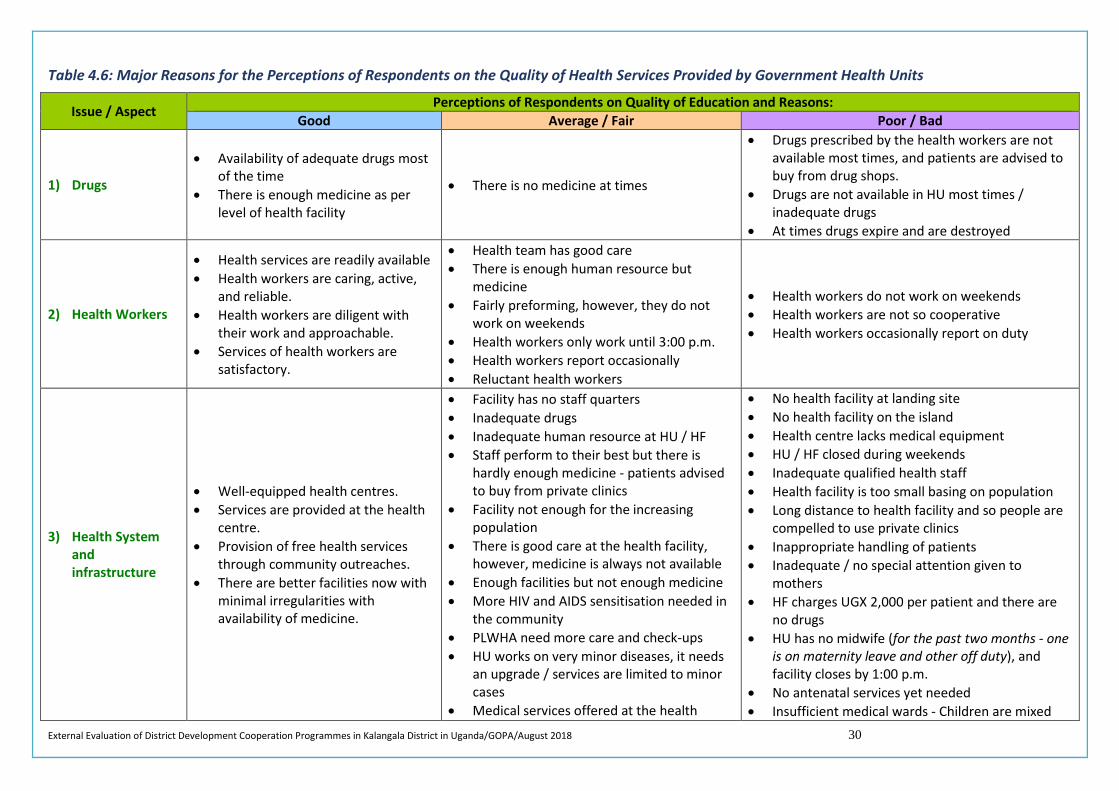
External Evaluation of District Development Cooperation Programmes in Kalangala District in Uganda/GOPA/August 2018 30
Table 4.6: Major Reasons for the Perceptions of Respondents on the Quality of Health Services Provided by Government Health Units
Issue / Aspect Perceptions of Respondents on Quality of Education and Reasons: Good Average / Fair Poor / Bad
1) Drugs
• Availability of adequate drugs most of the time
• There is enough medicine as per level of health facility
• There is no medicine at times
• Drugs prescribed by the health workers are not available most times, and patients are advised to buy from drug shops.
• Drugs are not available in HU most times / inadequate drugs
• At times drugs expire and are destroyed
2) Health Workers
• Health services are readily available • Health workers are caring, active,
and reliable. • Health workers are diligent with
their work and approachable. • Services of health workers are
satisfactory.
• Health team has good care • There is enough human resource but
medicine • Fairly preforming, however, they do not
work on weekends • Health workers only work until 3:00 p.m. • Health workers report occasionally • Reluctant health workers
• Health workers do not work on weekends • Health workers are not so cooperative • Health workers occasionally report on duty
3) Health System and infrastructure
• Well-equipped health centres. • Services are provided at the health
centre. • Provision of free health services
through community outreaches. • There are better facilities now with
minimal irregularities with availability of medicine.
• Facility has no staff quarters • Inadequate drugs • Inadequate human resource at HU / HF • Staff perform to their best but there is
hardly enough medicine - patients advised to buy from private clinics
• Facility not enough for the increasing population
• There is good care at the health facility, however, medicine is always not available
• Enough facilities but not enough medicine • More HIV and AIDS sensitisation needed in
the community • PLWHA need more care and check-ups • HU works on very minor diseases, it needs
an upgrade / services are limited to minor cases
• Medical services offered at the health
• No health facility at landing site • No health facility on the island • Health centre lacks medical equipment • HU / HF closed during weekends • Inadequate qualified health staff • Health facility is too small basing on population • Long distance to health facility and so people are
compelled to use private clinics • Inappropriate handling of patients • Inadequate / no special attention given to
mothers • HF charges UGX 2,000 per patient and there are
no drugs • HU has no midwife (for the past two months - one
is on maternity leave and other off duty), and facility closes by 1:00 p.m.
• No antenatal services yet needed • Insufficient medical wards - Children are mixed
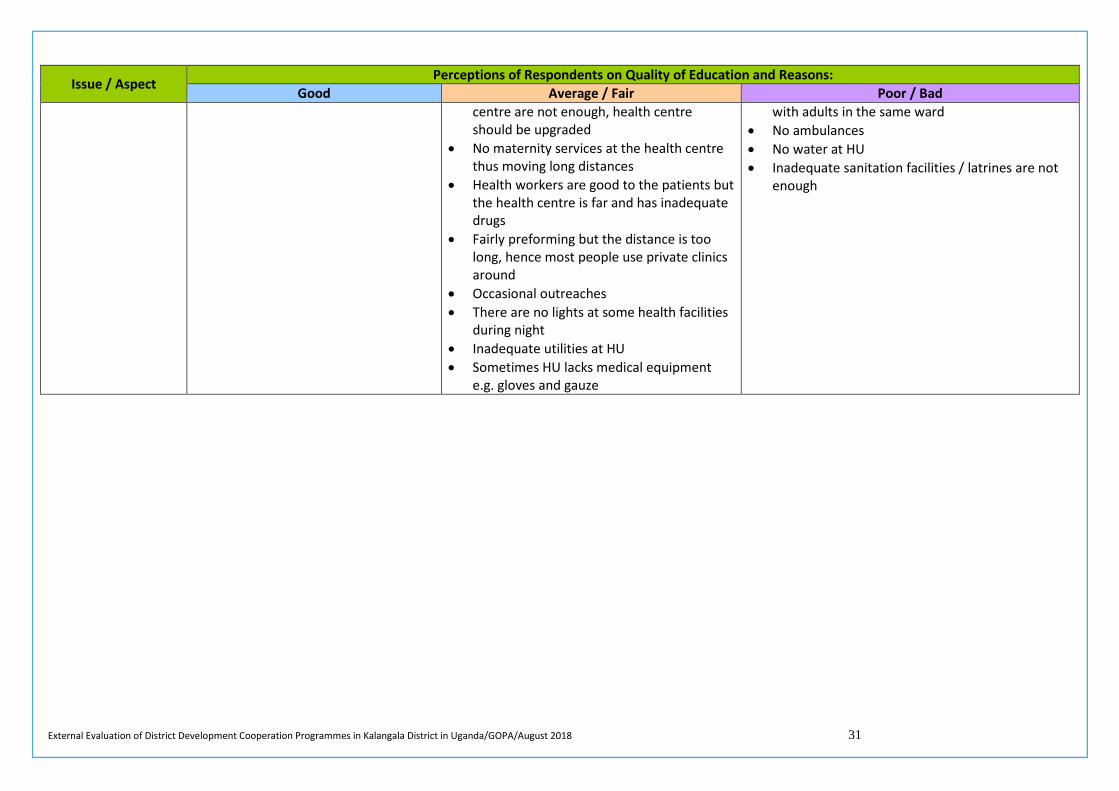
External Evaluation of District Development Cooperation Programmes in Kalangala District in Uganda/GOPA/August 2018 31
Issue / Aspect Perceptions of Respondents on Quality of Education and Reasons: Good Average / Fair Poor / Bad
centre are not enough, health centre should be upgraded
• No maternity services at the health centre thus moving long distances
• Health workers are good to the patients but the health centre is far and has inadequate drugs
• Fairly preforming but the distance is too long, hence most people use private clinics around
• Occasional outreaches • There are no lights at some health facilities
during night • Inadequate utilities at HU • Sometimes HU lacks medical equipment
e.g. gloves and gauze
with adults in the same ward • No ambulances • No water at HU • Inadequate sanitation facilities / latrines are not
enough
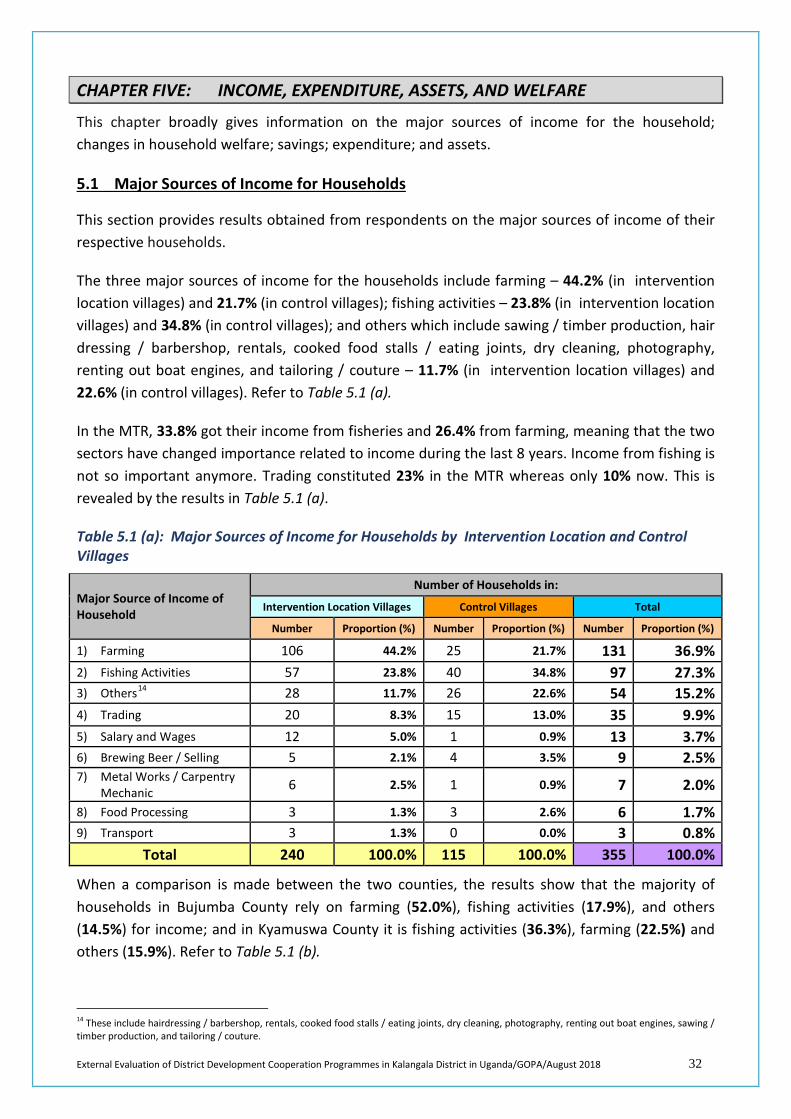
External Evaluation of District Development Cooperation Programmes in Kalangala District in Uganda/GOPA/August 2018 32
CHAPTER FIVE: INCOME, EXPENDITURE, ASSETS, AND WELFARE
This chapter broadly gives information on the major sources of income for the household; changes in household welfare; savings; expenditure; and assets.
5.1 Major Sources of Income for Households
This section provides results obtained from respondents on the major sources of income of their respective households.
The three major sources of income for the households include farming – 44.2% (in intervention location villages) and 21.7% (in control villages); fishing activities – 23.8% (in intervention location villages) and 34.8% (in control villages); and others which include sawing / timber production, hair dressing / barbershop, rentals, cooked food stalls / eating joints, dry cleaning, photography, renting out boat engines, and tailoring / couture – 11.7% (in intervention location villages) and 22.6% (in control villages). Refer to Table 5.1 (a).
In the MTR, 33.8% got their income from fisheries and 26.4% from farming, meaning that the two sectors have changed importance related to income during the last 8 years. Income from fishing is not so important anymore. Trading constituted 23% in the MTR whereas only 10% now. This is revealed by the results in Table 5.1 (a).
Table 5.1 (a): Major Sources of Income for Households by Intervention Location and Control Villages
Major Source of Income of Household
Number of Households in:
Intervention Location Villages Control Villages Total
Number Proportion (%) Number Proportion (%) Number Proportion (%)
1) Farming 106 44.2% 25 21.7% 131 36.9% 2) Fishing Activities 57 23.8% 40 34.8% 97 27.3% 3) Others14 28 11.7% 26 22.6% 54 15.2% 4) Trading 20 8.3% 15 13.0% 35 9.9% 5) Salary and Wages 12 5.0% 1 0.9% 13 3.7% 6) Brewing Beer / Selling 5 2.1% 4 3.5% 9 2.5% 7) Metal Works / Carpentry
Mechanic 6 2.5% 1 0.9% 7 2.0%
8) Food Processing 3 1.3% 3 2.6% 6 1.7% 9) Transport 3 1.3% 0 0.0% 3 0.8%
Total 240 100.0% 115 100.0% 355 100.0%
When a comparison is made between the two counties, the results show that the majority of households in Bujumba County rely on farming (52.0%), fishing activities (17.9%), and others (14.5%) for income; and in Kyamuswa County it is fishing activities (36.3%), farming (22.5%) and others (15.9%). Refer to Table 5.1 (b).
14 These include hairdressing / barbershop, rentals, cooked food stalls / eating joints, dry cleaning, photography, renting out boat engines, sawing / timber production, and tailoring / couture.
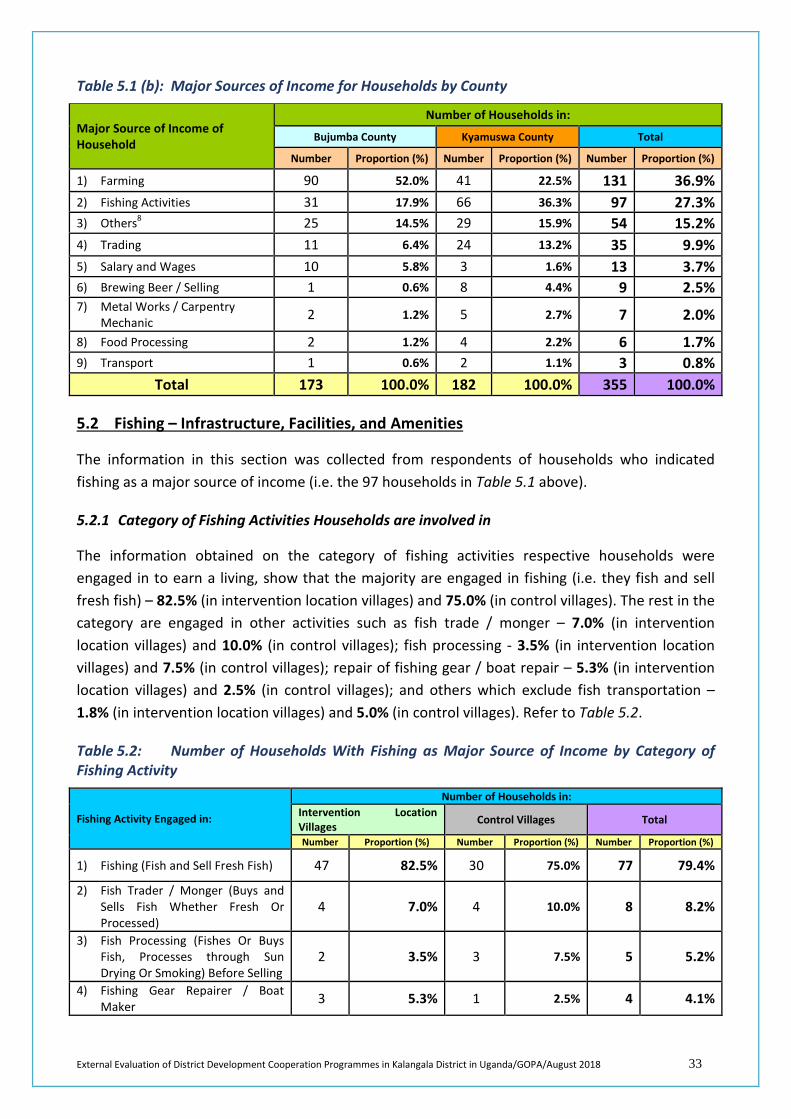
External Evaluation of District Development Cooperation Programmes in Kalangala District in Uganda/GOPA/August 2018 33
Table 5.1 (b): Major Sources of Income for Households by County
Major Source of Income of Household
Number of Households in:
Bujumba County Kyamuswa County Total
Number Proportion (%) Number Proportion (%) Number Proportion (%)
1) Farming 90 52.0% 41 22.5% 131 36.9% 2) Fishing Activities 31 17.9% 66 36.3% 97 27.3% 3) Others8 25 14.5% 29 15.9% 54 15.2% 4) Trading 11 6.4% 24 13.2% 35 9.9% 5) Salary and Wages 10 5.8% 3 1.6% 13 3.7% 6) Brewing Beer / Selling 1 0.6% 8 4.4% 9 2.5% 7) Metal Works / Carpentry
Mechanic 2 1.2% 5 2.7% 7 2.0%
8) Food Processing 2 1.2% 4 2.2% 6 1.7% 9) Transport 1 0.6% 2 1.1% 3 0.8%
Total 173 100.0% 182 100.0% 355 100.0%
5.2 Fishing – Infrastructure, Facilities, and Amenities
The information in this section was collected from respondents of households who indicated fishing as a major source of income (i.e. the 97 households in Table 5.1 above).
5.2.1 Category of Fishing Activities Households are involved in
The information obtained on the category of fishing activities respective households were engaged in to earn a living, show that the majority are engaged in fishing (i.e. they fish and sell fresh fish) – 82.5% (in intervention location villages) and 75.0% (in control villages). The rest in the category are engaged in other activities such as fish trade / monger – 7.0% (in intervention location villages) and 10.0% (in control villages); fish processing - 3.5% (in intervention location villages) and 7.5% (in control villages); repair of fishing gear / boat repair – 5.3% (in intervention location villages) and 2.5% (in control villages); and others which exclude fish transportation – 1.8% (in intervention location villages) and 5.0% (in control villages). Refer to Table 5.2.
Table 5.2: Number of Households With Fishing as Major Source of Income by Category of Fishing Activity
Fishing Activity Engaged in:
Number of Households in: Intervention Location Villages Control Villages Total
Number Proportion (%) Number Proportion (%) Number Proportion (%)
1) Fishing (Fish and Sell Fresh Fish) 47 82.5% 30 75.0% 77 79.4%
2) Fish Trader / Monger (Buys and Sells Fish Whether Fresh Or Processed)
4 7.0% 4 10.0% 8 8.2%
3) Fish Processing (Fishes Or Buys Fish, Processes through Sun Drying Or Smoking) Before Selling
2 3.5% 3 7.5% 5 5.2%
4) Fishing Gear Repairer / Boat Maker 3 5.3% 1 2.5% 4 4.1%
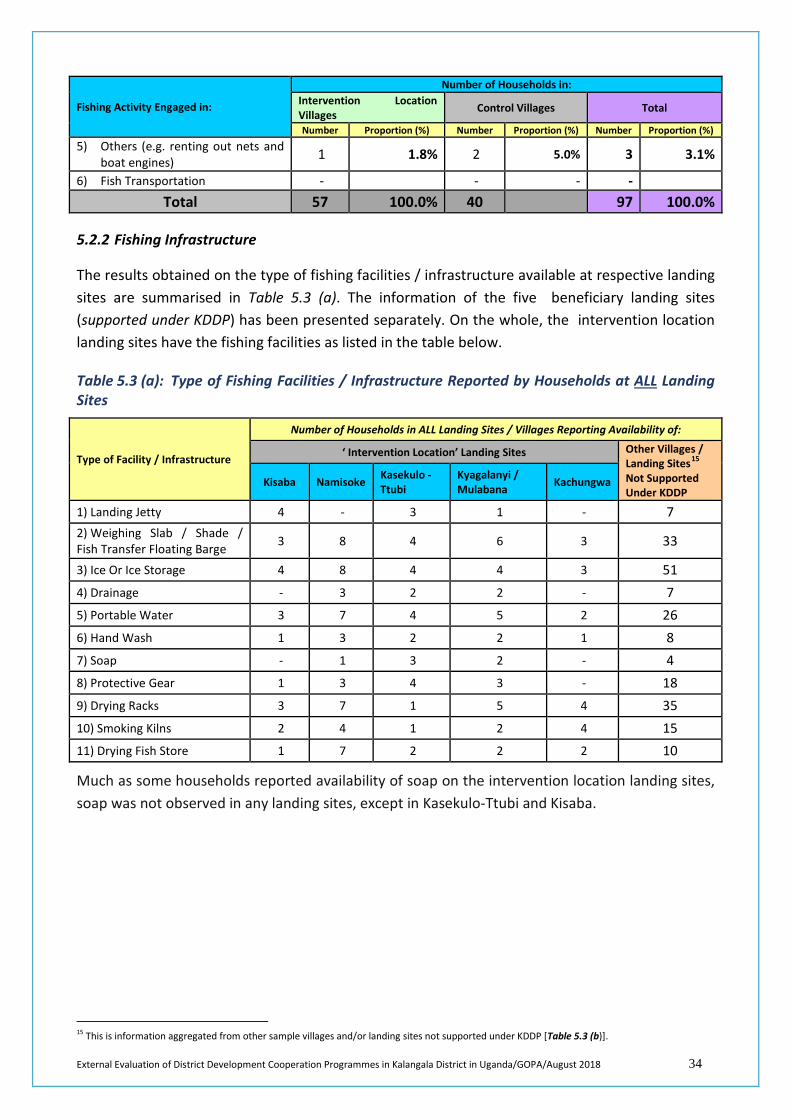
External Evaluation of District Development Cooperation Programmes in Kalangala District in Uganda/GOPA/August 2018 34
Fishing Activity Engaged in:
Number of Households in: Intervention Location Villages Control Villages Total
Number Proportion (%) Number Proportion (%) Number Proportion (%) 5) Others (e.g. renting out nets and
boat engines) 1 1.8% 2 5.0% 3 3.1%
6) Fish Transportation - - - - Total 57 100.0% 40 97 100.0%
5.2.2 Fishing Infrastructure
The results obtained on the type of fishing facilities / infrastructure available at respective landing sites are summarised in Table 5.3 (a). The information of the five beneficiary landing sites (supported under KDDP) has been presented separately. On the whole, the intervention location landing sites have the fishing facilities as listed in the table below.
Table 5.3 (a): Type of Fishing Facilities / Infrastructure Reported by Households at ALL Landing Sites
Type of Facility / Infrastructure
Number of Households in ALL Landing Sites / Villages Reporting Availability of:
‘ Intervention Location’ Landing Sites Other Villages / Landing Sites15 Not Supported Under KDDP
Kisaba Namisoke Kasekulo - Ttubi
Kyagalanyi / Mulabana Kachungwa
1) Landing Jetty 4 - 3 1 - 7 2) Weighing Slab / Shade / Fish Transfer Floating Barge 3 8 4 6 3 33
3) Ice Or Ice Storage 4 8 4 4 3 51 4) Drainage - 3 2 2 - 7 5) Portable Water 3 7 4 5 2 26 6) Hand Wash 1 3 2 2 1 8 7) Soap - 1 3 2 - 4 8) Protective Gear 1 3 4 3 - 18 9) Drying Racks 3 7 1 5 4 35 10) Smoking Kilns 2 4 1 2 4 15 11) Drying Fish Store 1 7 2 2 2 10
Much as some households reported availability of soap on the intervention location landing sites, soap was not observed in any landing sites, except in Kasekulo-Ttubi and Kisaba.
15 This is information aggregated from other sample villages and/or landing sites not supported under KDDP [Table 5.3 (b)].
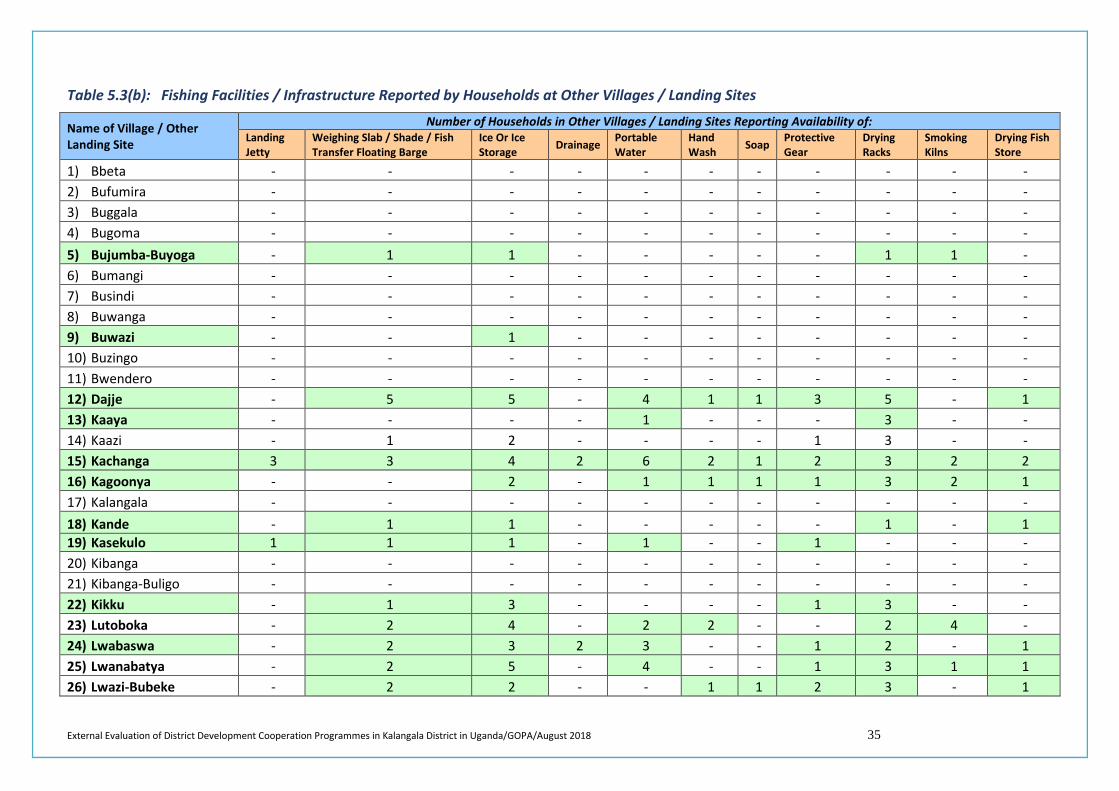
External Evaluation of District Development Cooperation Programmes in Kalangala District in Uganda/GOPA/August 2018 35
Table 5.3(b): Fishing Facilities / Infrastructure Reported by Households at Other Villages / Landing Sites
Name of Village / Other Landing Site
Number of Households in Other Villages / Landing Sites Reporting Availability of: Landing Jetty
Weighing Slab / Shade / Fish Transfer Floating Barge
Ice Or Ice Storage Drainage Portable
Water Hand Wash Soap Protective
Gear Drying Racks
Smoking Kilns
Drying Fish Store
1) Bbeta - - - - - - - - - - - 2) Bufumira - - - - - - - - - - - 3) Buggala - - - - - - - - - - - 4) Bugoma - - - - - - - - - - - 5) Bujumba-Buyoga - 1 1 - - - - - 1 1 - 6) Bumangi - - - - - - - - - - - 7) Busindi - - - - - - - - - - - 8) Buwanga - - - - - - - - - - - 9) Buwazi - - 1 - - - - - - - - 10) Buzingo - - - - - - - - - - - 11) Bwendero - - - - - - - - - - - 12) Dajje - 5 5 - 4 1 1 3 5 - 1 13) Kaaya - - - - 1 - - - 3 - - 14) Kaazi - 1 2 - - - - 1 3 - - 15) Kachanga 3 3 4 2 6 2 1 2 3 2 2 16) Kagoonya - - 2 - 1 1 1 1 3 2 1 17) Kalangala - - - - - - - - - - - 18) Kande - 1 1 - - - - - 1 - 1 19) Kasekulo 1 1 1 - 1 - - 1 - - - 20) Kibanga - - - - - - - - - - - 21) Kibanga-Buligo - - - - - - - - - - - 22) Kikku - 1 3 - - - - 1 3 - - 23) Lutoboka - 2 4 - 2 2 - - 2 4 - 24) Lwabaswa - 2 3 2 3 - - 1 2 - 1 25) Lwanabatya - 2 5 - 4 - - 1 3 1 1 26) Lwazi-Bubeke - 2 2 - - 1 1 2 3 - 1
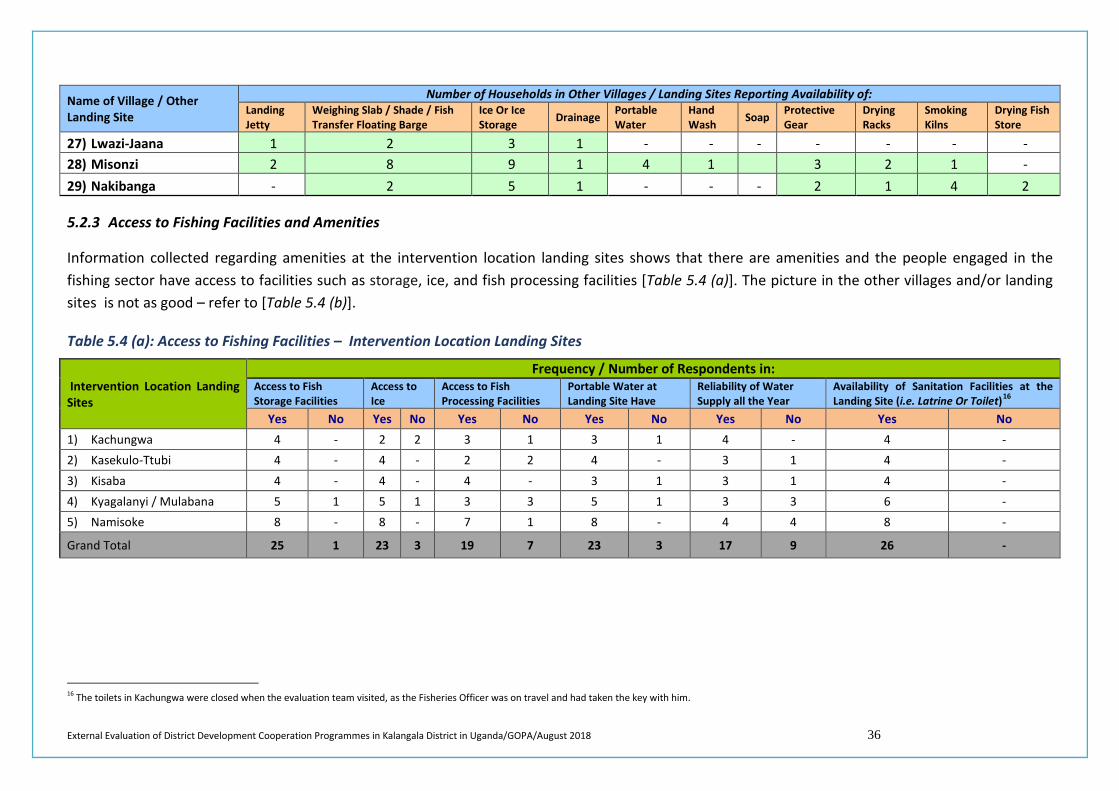
External Evaluation of District Development Cooperation Programmes in Kalangala District in Uganda/GOPA/August 2018 36
Name of Village / Other Landing Site
Number of Households in Other Villages / Landing Sites Reporting Availability of: Landing Jetty
Weighing Slab / Shade / Fish Transfer Floating Barge
Ice Or Ice Storage Drainage Portable
Water Hand Wash Soap Protective
Gear Drying Racks
Smoking Kilns
Drying Fish Store
27) Lwazi-Jaana 1 2 3 1 - - - - - - - 28) Misonzi 2 8 9 1 4 1 3 2 1 - 29) Nakibanga - 2 5 1 - - - 2 1 4 2
5.2.3 Access to Fishing Facilities and Amenities
Information collected regarding amenities at the intervention location landing sites shows that there are amenities and the people engaged in the fishing sector have access to facilities such as storage, ice, and fish processing facilities [Table 5.4 (a)]. The picture in the other villages and/or landing sites is not as good – refer to [Table 5.4 (b)].
Table 5.4 (a): Access to Fishing Facilities – Intervention Location Landing Sites
Intervention Location Landing Sites
Frequency / Number of Respondents in: Access to Fish Storage Facilities
Access to Ice
Access to Fish Processing Facilities
Portable Water at Landing Site Have
Reliability of Water Supply all the Year
Availability of Sanitation Facilities at the Landing Site (i.e. Latrine Or Toilet)16
Yes No Yes No Yes No Yes No Yes No Yes No 1) Kachungwa 4 - 2 2 3 1 3 1 4 - 4 - 2) Kasekulo-Ttubi 4 - 4 - 2 2 4 - 3 1 4 - 3) Kisaba 4 - 4 - 4 - 3 1 3 1 4 - 4) Kyagalanyi / Mulabana 5 1 5 1 3 3 5 1 3 3 6 - 5) Namisoke 8 - 8 - 7 1 8 - 4 4 8 -
Grand Total 25 1 23 3 19 7 23 3 17 9 26 -
16 The toilets in Kachungwa were closed when the evaluation team visited, as the Fisheries Officer was on travel and had taken the key with him.
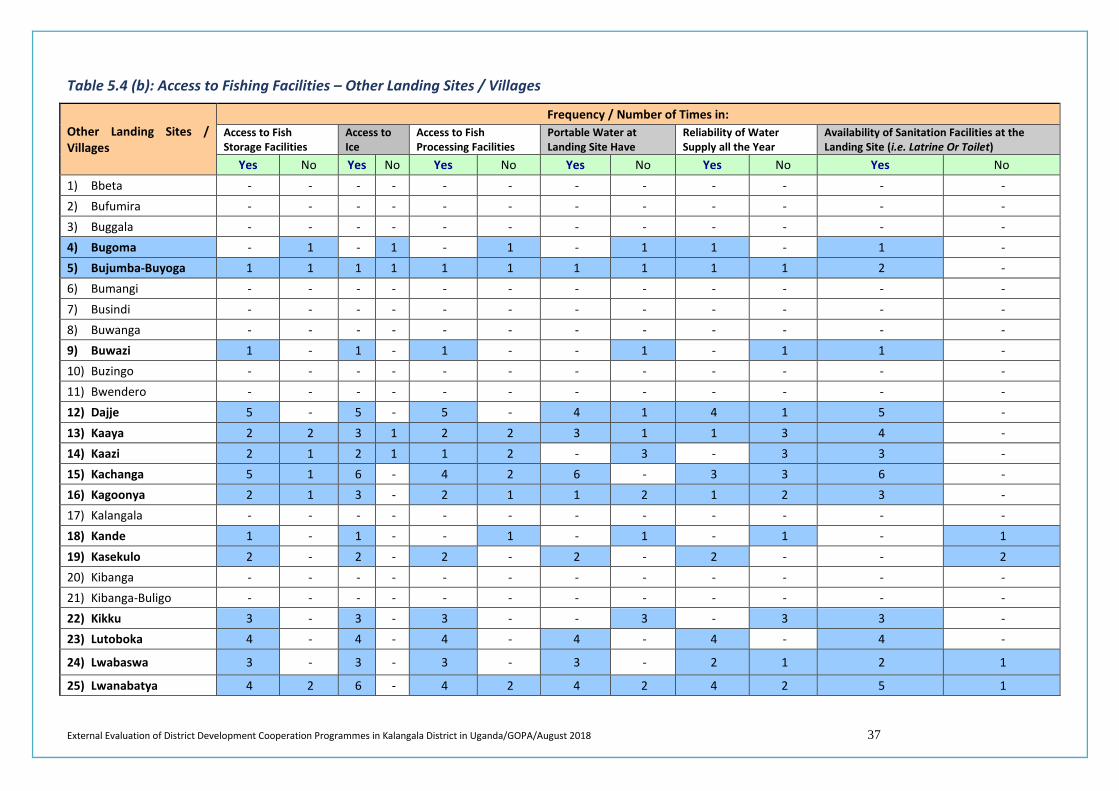
External Evaluation of District Development Cooperation Programmes in Kalangala District in Uganda/GOPA/August 2018 37
Table 5.4 (b): Access to Fishing Facilities – Other Landing Sites / Villages
Other Landing Sites / Villages
Frequency / Number of Times in: Access to Fish Storage Facilities
Access to Ice
Access to Fish Processing Facilities
Portable Water at Landing Site Have
Reliability of Water Supply all the Year
Availability of Sanitation Facilities at the Landing Site (i.e. Latrine Or Toilet)
Yes No Yes No Yes No Yes No Yes No Yes No 1) Bbeta - - - - - - - - - - - - 2) Bufumira - - - - - - - - - - - - 3) Buggala - - - - - - - - - - - - 4) Bugoma - 1 - 1 - 1 - 1 1 - 1 - 5) Bujumba-Buyoga 1 1 1 1 1 1 1 1 1 1 2 - 6) Bumangi - - - - - - - - - - - - 7) Busindi - - - - - - - - - - - - 8) Buwanga - - - - - - - - - - - - 9) Buwazi 1 - 1 - 1 - - 1 - 1 1 - 10) Buzingo - - - - - - - - - - - - 11) Bwendero - - - - - - - - - - - - 12) Dajje 5 - 5 - 5 - 4 1 4 1 5 - 13) Kaaya 2 2 3 1 2 2 3 1 1 3 4 - 14) Kaazi 2 1 2 1 1 2 - 3 - 3 3 - 15) Kachanga 5 1 6 - 4 2 6 - 3 3 6 - 16) Kagoonya 2 1 3 - 2 1 1 2 1 2 3 - 17) Kalangala - - - - - - - - - - - - 18) Kande 1 - 1 - - 1 - 1 - 1 - 1 19) Kasekulo 2 - 2 - 2 - 2 - 2 - - 2 20) Kibanga - - - - - - - - - - - - 21) Kibanga-Buligo - - - - - - - - - - - - 22) Kikku 3 - 3 - 3 - - 3 - 3 3 - 23) Lutoboka 4 - 4 - 4 - 4 - 4 - 4 -
24) Lwabaswa 3 - 3 - 3 - 3 - 2 1 2 1
25) Lwanabatya 4 2 6 - 4 2 4 2 4 2 5 1
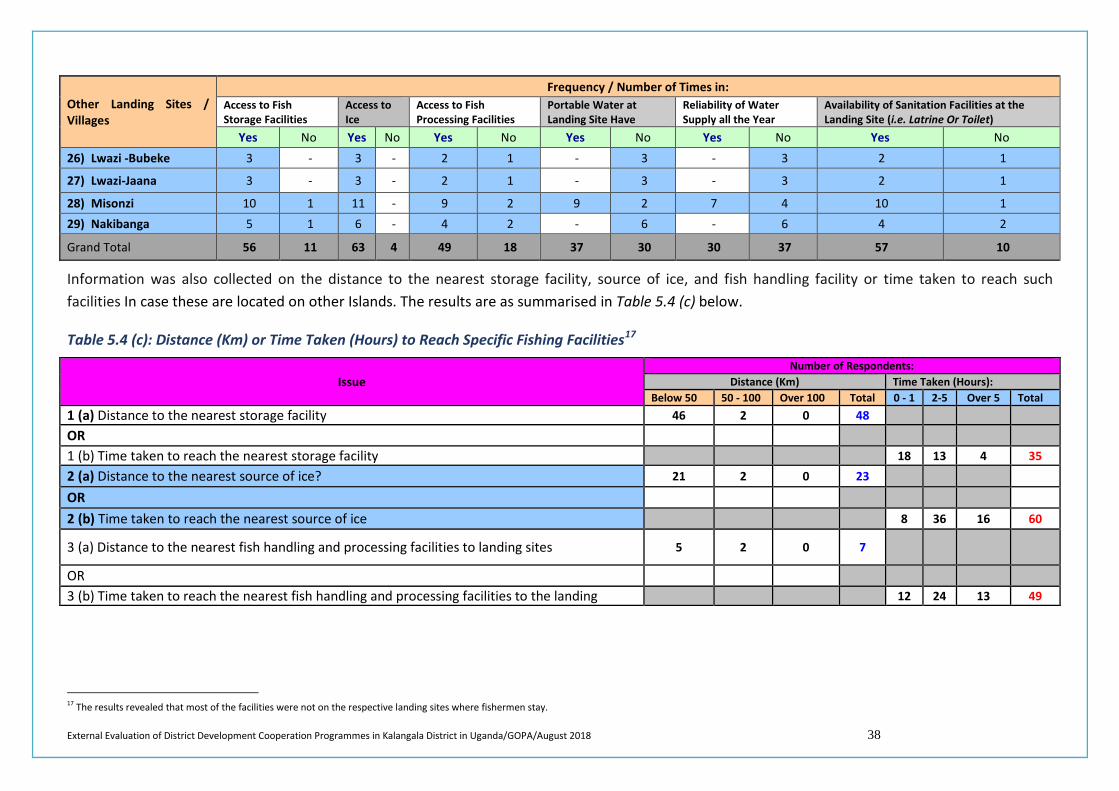
External Evaluation of District Development Cooperation Programmes in Kalangala District in Uganda/GOPA/August 2018 38
Other Landing Sites / Villages
Frequency / Number of Times in: Access to Fish Storage Facilities
Access to Ice
Access to Fish Processing Facilities
Portable Water at Landing Site Have
Reliability of Water Supply all the Year
Availability of Sanitation Facilities at the Landing Site (i.e. Latrine Or Toilet)
Yes No Yes No Yes No Yes No Yes No Yes No 26) Lwazi -Bubeke 3 - 3 - 2 1 - 3 - 3 2 1
27) Lwazi-Jaana 3 - 3 - 2 1 - 3 - 3 2 1
28) Misonzi 10 1 11 - 9 2 9 2 7 4 10 1 29) Nakibanga 5 1 6 - 4 2 - 6 - 6 4 2
Grand Total 56 11 63 4 49 18 37 30 30 37 57 10
Information was also collected on the distance to the nearest storage facility, source of ice, and fish handling facility or time taken to reach such facilities In case these are located on other Islands. The results are as summarised in Table 5.4 (c) below.
Table 5.4 (c): Distance (Km) or Time Taken (Hours) to Reach Specific Fishing Facilities17
Issue Number of Respondents:
Distance (Km) Time Taken (Hours): Below 50 50 - 100 Over 100 Total 0 - 1 2-5 Over 5 Total
1 (a) Distance to the nearest storage facility 46 2 0 48 OR 1 (b) Time taken to reach the nearest storage facility 18 13 4 35 2 (a) Distance to the nearest source of ice? 21 2 0 23
OR
2 (b) Time taken to reach the nearest source of ice 8 36 16 60
3 (a) Distance to the nearest fish handling and processing facilities to landing sites 5 2 0 7
OR 3 (b) Time taken to reach the nearest fish handling and processing facilities to the landing 12 24 13 49
17 The results revealed that most of the facilities were not on the respective landing sites where fishermen stay.
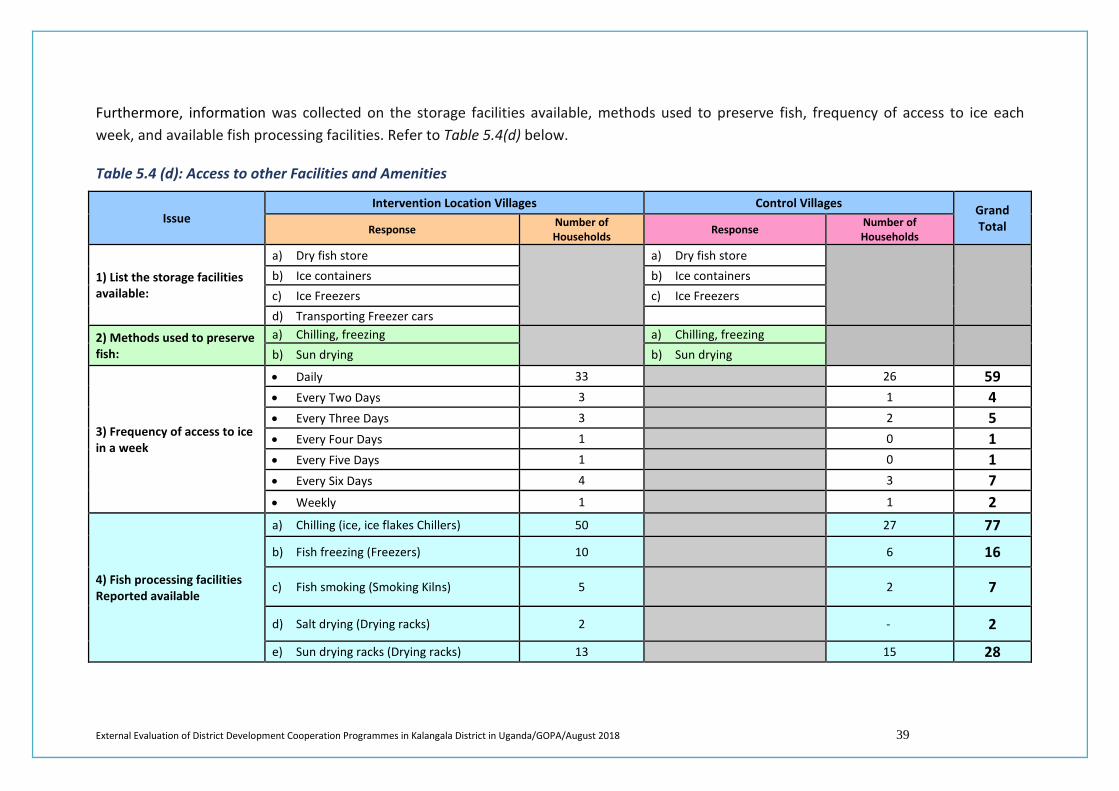
External Evaluation of District Development Cooperation Programmes in Kalangala District in Uganda/GOPA/August 2018 39
Furthermore, information was collected on the storage facilities available, methods used to preserve fish, frequency of access to ice each week, and available fish processing facilities. Refer to Table 5.4(d) below.
Table 5.4 (d): Access to other Facilities and Amenities
Issue Intervention Location Villages Control Villages Grand
Total Response Number of Households Response Number of
Households
1) List the storage facilities available:
a) Dry fish store
a) Dry fish store
b) Ice containers b) Ice containers c) Ice Freezers c) Ice Freezers d) Transporting Freezer cars
2) Methods used to preserve fish:
a) Chilling, freezing
a) Chilling, freezing b) Sun drying b) Sun drying
3) Frequency of access to ice in a week
• Daily 33 26 59 • Every Two Days 3 1 4 • Every Three Days 3 2 5 • Every Four Days 1 0 1 • Every Five Days 1 0 1 • Every Six Days 4 3 7 • Weekly 1 1 2
4) Fish processing facilities Reported available
a) Chilling (ice, ice flakes Chillers) 50 27 77
b) Fish freezing (Freezers) 10 6 16
c) Fish smoking (Smoking Kilns) 5 2 7
d) Salt drying (Drying racks) 2 - 2
e) Sun drying racks (Drying racks) 13 15 28
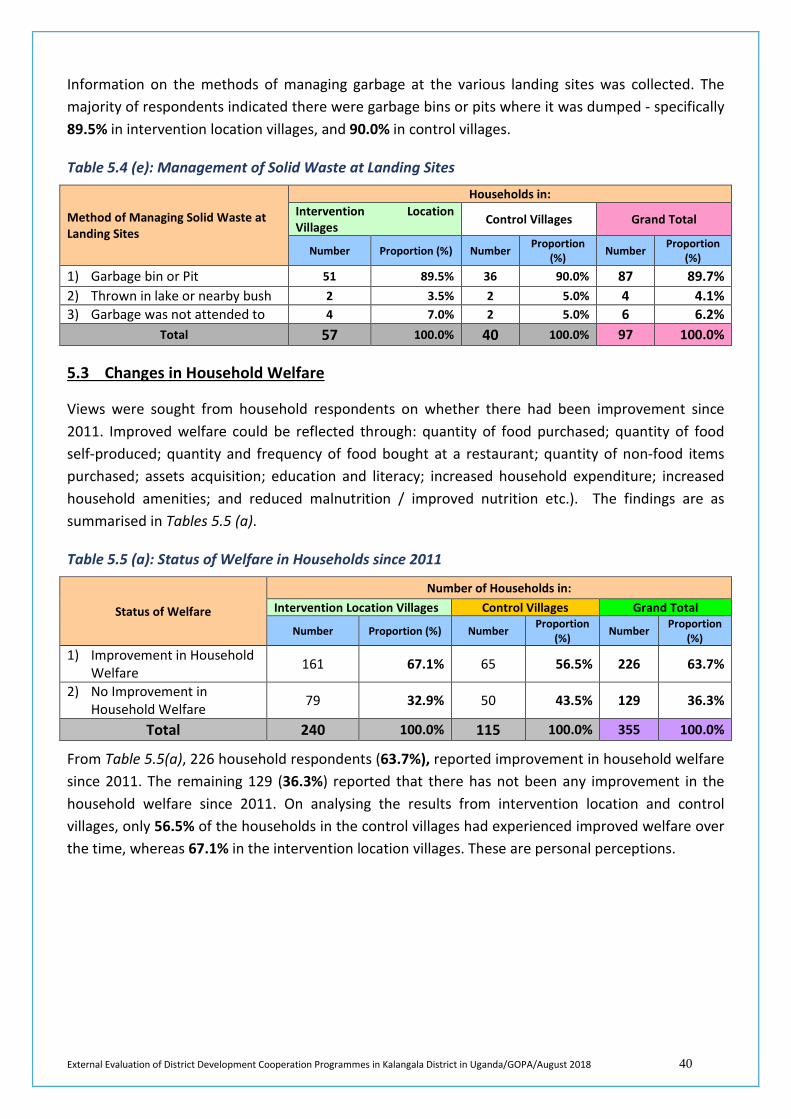
External Evaluation of District Development Cooperation Programmes in Kalangala District in Uganda/GOPA/August 2018 40
Information on the methods of managing garbage at the various landing sites was collected. The majority of respondents indicated there were garbage bins or pits where it was dumped - specifically 89.5% in intervention location villages, and 90.0% in control villages.
Table 5.4 (e): Management of Solid Waste at Landing Sites
Method of Managing Solid Waste at Landing Sites
Households in: Intervention Location Villages Control Villages Grand Total
Number Proportion (%) Number Proportion (%) Number Proportion
(%)
1) Garbage bin or Pit 51 89.5% 36 90.0% 87 89.7% 2) Thrown in lake or nearby bush 2 3.5% 2 5.0% 4 4.1% 3) Garbage was not attended to 4 7.0% 2 5.0% 6 6.2%
Total 57 100.0% 40 100.0% 97 100.0%
5.3 Changes in Household Welfare
Views were sought from household respondents on whether there had been improvement since 2011. Improved welfare could be reflected through: quantity of food purchased; quantity of food self-produced; quantity and frequency of food bought at a restaurant; quantity of non-food items purchased; assets acquisition; education and literacy; increased household expenditure; increased household amenities; and reduced malnutrition / improved nutrition etc.). The findings are as summarised in Tables 5.5 (a).
Table 5.5 (a): Status of Welfare in Households since 2011
Status of Welfare
Number of Households in: Intervention Location Villages Control Villages Grand Total
Number Proportion (%) Number Proportion (%) Number Proportion
(%) 1) Improvement in Household
Welfare 161 67.1% 65 56.5% 226 63.7%
2) No Improvement in Household Welfare 79 32.9% 50 43.5% 129 36.3%
Total 240 100.0% 115 100.0% 355 100.0%
From Table 5.5(a), 226 household respondents (63.7%), reported improvement in household welfare since 2011. The remaining 129 (36.3%) reported that there has not been any improvement in the household welfare since 2011. On analysing the results from intervention location and control villages, only 56.5% of the households in the control villages had experienced improved welfare over the time, whereas 67.1% in the intervention location villages. These are personal perceptions.
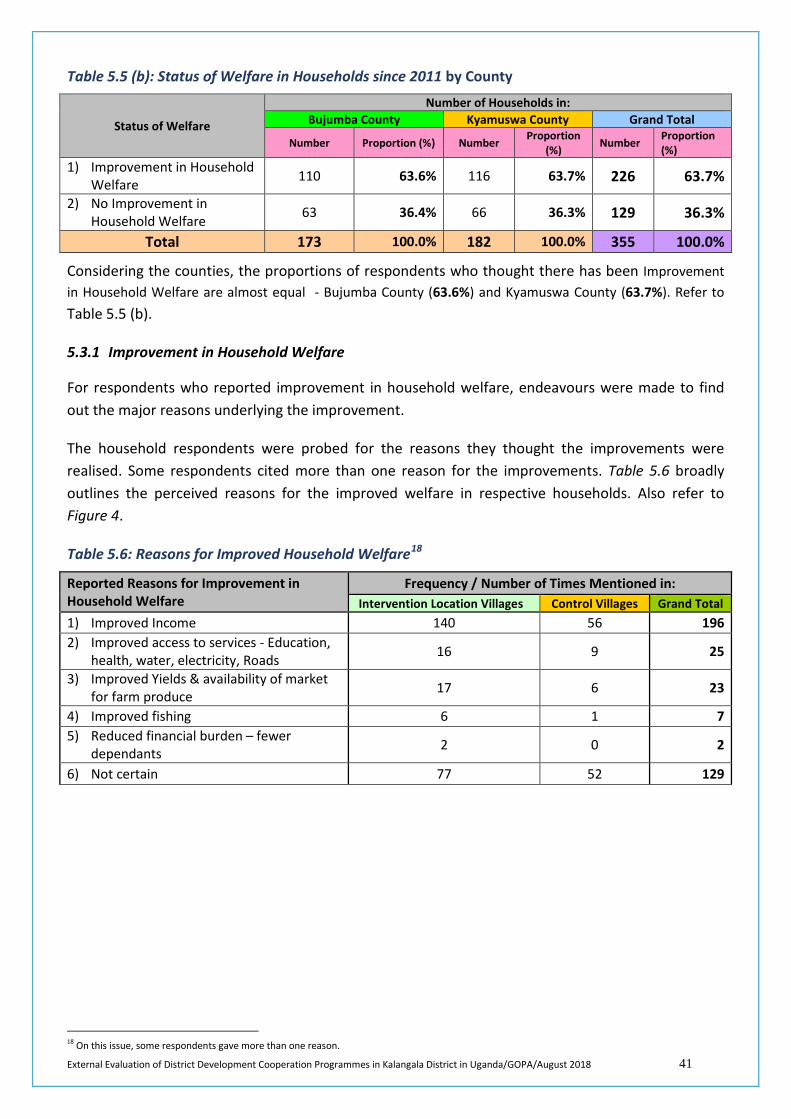
External Evaluation of District Development Cooperation Programmes in Kalangala District in Uganda/GOPA/August 2018 41
Table 5.5 (b): Status of Welfare in Households since 2011 by County
Status of Welfare
Number of Households in: Bujumba County Kyamuswa County Grand Total
Number Proportion (%) Number Proportion (%) Number Proportion
(%) 1) Improvement in Household
Welfare 110 63.6% 116 63.7% 226 63.7%
2) No Improvement in Household Welfare 63 36.4% 66 36.3% 129 36.3%
Total 173 100.0% 182 100.0% 355 100.0%
Considering the counties, the proportions of respondents who thought there has been Improvement in Household Welfare are almost equal - Bujumba County (63.6%) and Kyamuswa County (63.7%). Refer to Table 5.5 (b).
5.3.1 Improvement in Household Welfare
For respondents who reported improvement in household welfare, endeavours were made to find out the major reasons underlying the improvement.
The household respondents were probed for the reasons they thought the improvements were realised. Some respondents cited more than one reason for the improvements. Table 5.6 broadly outlines the perceived reasons for the improved welfare in respective households. Also refer to Figure 4.
Table 5.6: Reasons for Improved Household Welfare18
Reported Reasons for Improvement in Household Welfare
Frequency / Number of Times Mentioned in: Intervention Location Villages Control Villages Grand Total
1) Improved Income 140 56 196 2) Improved access to services - Education,
health, water, electricity, Roads 16 9 25
3) Improved Yields & availability of market for farm produce 17 6 23
4) Improved fishing 6 1 7 5) Reduced financial burden – fewer
dependants 2 0 2
6) Not certain 77 52 129
18 On this issue, some respondents gave more than one reason.
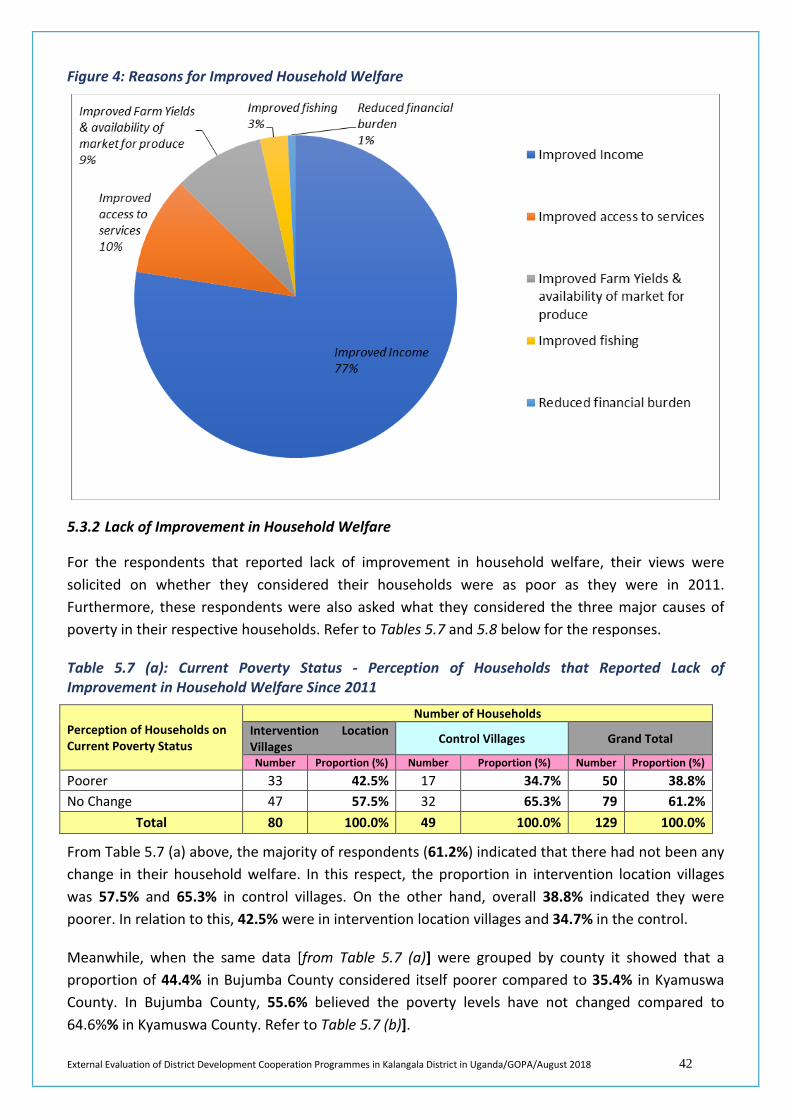
External Evaluation of District Development Cooperation Programmes in Kalangala District in Uganda/GOPA/August 2018 42
Figure 4: Reasons for Improved Household Welfare
5.3.2 Lack of Improvement in Household Welfare
For the respondents that reported lack of improvement in household welfare, their views were solicited on whether they considered their households were as poor as they were in 2011. Furthermore, these respondents were also asked what they considered the three major causes of poverty in their respective households. Refer to Tables 5.7 and 5.8 below for the responses.
Table 5.7 (a): Current Poverty Status - Perception of Households that Reported Lack of Improvement in Household Welfare Since 2011
Perception of Households on Current Poverty Status
Number of Households Intervention Location Villages Control Villages Grand Total
Number Proportion (%) Number Proportion (%) Number Proportion (%) Poorer 33 42.5% 17 34.7% 50 38.8% No Change 47 57.5% 32 65.3% 79 61.2%
Total 80 100.0% 49 100.0% 129 100.0%
From Table 5.7 (a) above, the majority of respondents (61.2%) indicated that there had not been any change in their household welfare. In this respect, the proportion in intervention location villages was 57.5% and 65.3% in control villages. On the other hand, overall 38.8% indicated they were poorer. In relation to this, 42.5% were in intervention location villages and 34.7% in the control.
Meanwhile, when the same data [from Table 5.7 (a)] were grouped by county it showed that a proportion of 44.4% in Bujumba County considered itself poorer compared to 35.4% in Kyamuswa County. In Bujumba County, 55.6% believed the poverty levels have not changed compared to 64.6%% in Kyamuswa County. Refer to Table 5.7 (b)].
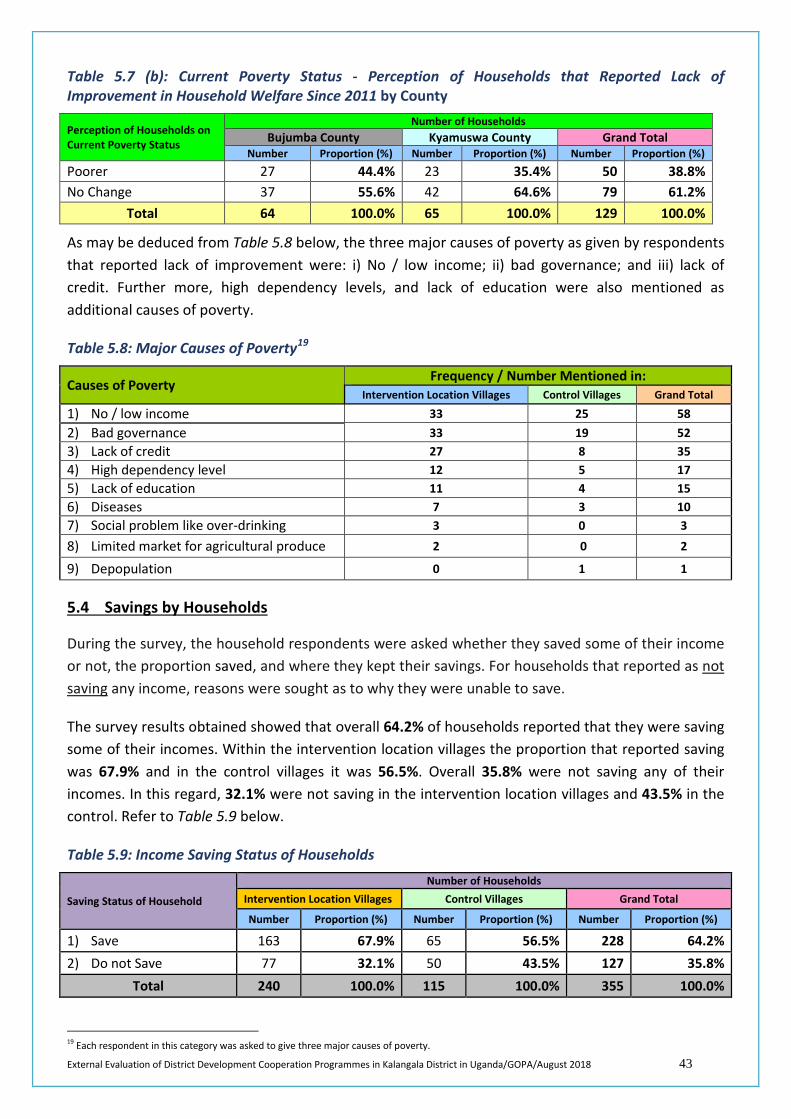
External Evaluation of District Development Cooperation Programmes in Kalangala District in Uganda/GOPA/August 2018 43
Table 5.7 (b): Current Poverty Status - Perception of Households that Reported Lack of Improvement in Household Welfare Since 2011 by County
Perception of Households on Current Poverty Status
Number of Households Bujumba County Kyamuswa County Grand Total
Number Proportion (%) Number Proportion (%) Number Proportion (%) Poorer 27 44.4% 23 35.4% 50 38.8% No Change 37 55.6% 42 64.6% 79 61.2%
Total 64 100.0% 65 100.0% 129 100.0%
As may be deduced from Table 5.8 below, the three major causes of poverty as given by respondents that reported lack of improvement were: i) No / low income; ii) bad governance; and iii) lack of credit. Further more, high dependency levels, and lack of education were also mentioned as additional causes of poverty.
Table 5.8: Major Causes of Poverty19
Causes of Poverty Frequency / Number Mentioned in:
Intervention Location Villages Control Villages Grand Total
1) No / low income 33 25 58 2) Bad governance 33 19 52 3) Lack of credit 27 8 35 4) High dependency level 12 5 17 5) Lack of education 11 4 15 6) Diseases 7 3 10 7) Social problem like over-drinking 3 0 3 8) Limited market for agricultural produce 2 0 2 9) Depopulation 0 1 1
5.4 Savings by Households
During the survey, the household respondents were asked whether they saved some of their income or not, the proportion saved, and where they kept their savings. For households that reported as not saving any income, reasons were sought as to why they were unable to save.
The survey results obtained showed that overall 64.2% of households reported that they were saving some of their incomes. Within the intervention location villages the proportion that reported saving was 67.9% and in the control villages it was 56.5%. Overall 35.8% were not saving any of their incomes. In this regard, 32.1% were not saving in the intervention location villages and 43.5% in the control. Refer to Table 5.9 below.
Table 5.9: Income Saving Status of Households
Saving Status of Household
Number of Households Intervention Location Villages Control Villages Grand Total
Number Proportion (%) Number Proportion (%) Number Proportion (%)
1) Save 163 67.9% 65 56.5% 228 64.2% 2) Do not Save 77 32.1% 50 43.5% 127 35.8%
Total 240 100.0% 115 100.0% 355 100.0%
19 Each respondent in this category was asked to give three major causes of poverty.
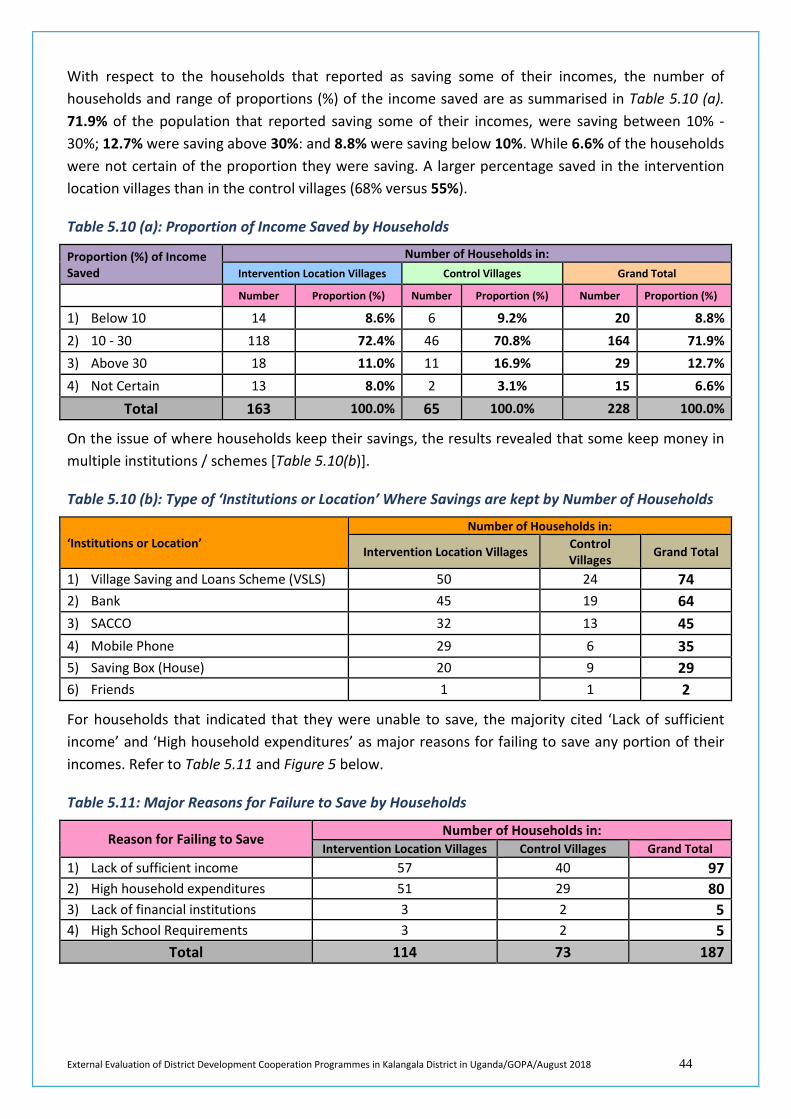
External Evaluation of District Development Cooperation Programmes in Kalangala District in Uganda/GOPA/August 2018 44
With respect to the households that reported as saving some of their incomes, the number of households and range of proportions (%) of the income saved are as summarised in Table 5.10 (a). 71.9% of the population that reported saving some of their incomes, were saving between 10% - 30%; 12.7% were saving above 30%: and 8.8% were saving below 10%. While 6.6% of the households were not certain of the proportion they were saving. A larger percentage saved in the intervention location villages than in the control villages (68% versus 55%).
Table 5.10 (a): Proportion of Income Saved by Households
Proportion (%) of Income Saved
Number of Households in: Intervention Location Villages Control Villages Grand Total
Number Proportion (%) Number Proportion (%) Number Proportion (%)
1) Below 10 14 8.6% 6 9.2% 20 8.8% 2) 10 - 30 118 72.4% 46 70.8% 164 71.9% 3) Above 30 18 11.0% 11 16.9% 29 12.7% 4) Not Certain 13 8.0% 2 3.1% 15 6.6%
Total 163 100.0% 65 100.0% 228 100.0%
On the issue of where households keep their savings, the results revealed that some keep money in multiple institutions / schemes [Table 5.10(b)].
Table 5.10 (b): Type of ‘Institutions or Location’ Where Savings are kept by Number of Households
‘Institutions or Location’ Number of Households in:
Intervention Location Villages Control Villages Grand Total
1) Village Saving and Loans Scheme (VSLS) 50 24 74 2) Bank 45 19 64 3) SACCO 32 13 45 4) Mobile Phone 29 6 35 5) Saving Box (House) 20 9 29 6) Friends 1 1 2
For households that indicated that they were unable to save, the majority cited ‘Lack of sufficient income’ and ‘High household expenditures’ as major reasons for failing to save any portion of their incomes. Refer to Table 5.11 and Figure 5 below.
Table 5.11: Major Reasons for Failure to Save by Households
Reason for Failing to Save Number of Households in: Intervention Location Villages Control Villages Grand Total
1) Lack of sufficient income 57 40 97 2) High household expenditures 51 29 80 3) Lack of financial institutions 3 2 5 4) High School Requirements 3 2 5
Total 114 73 187
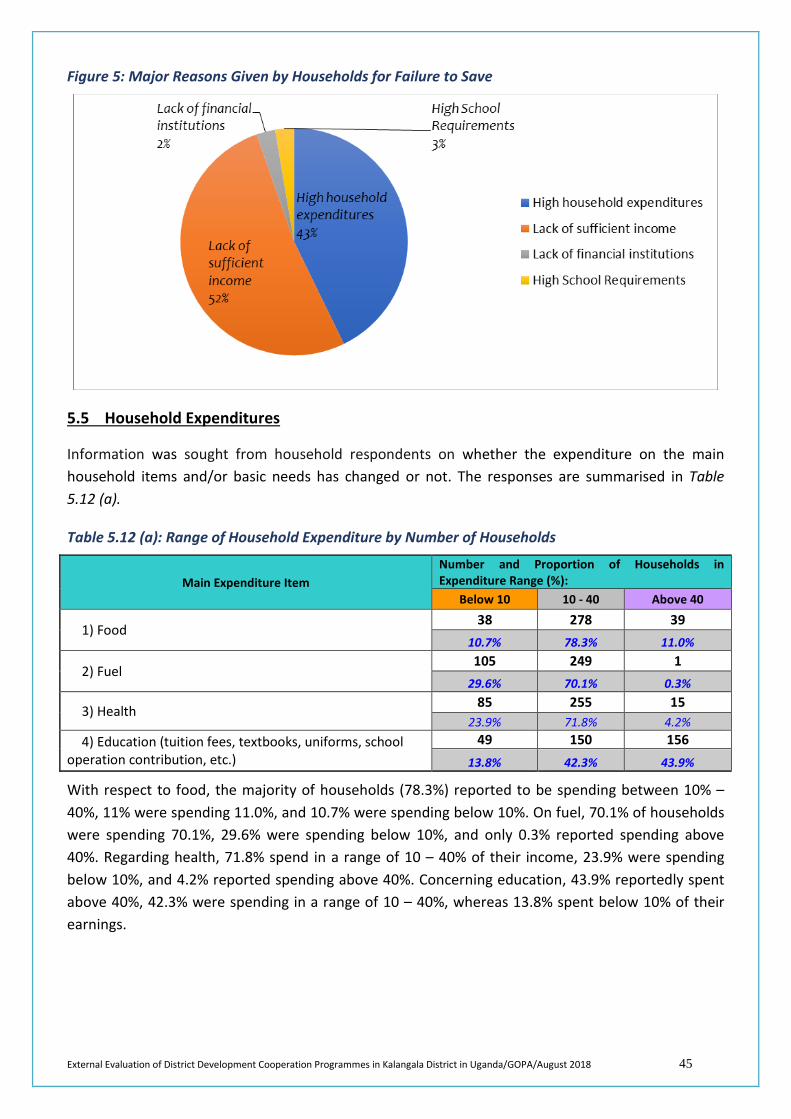
External Evaluation of District Development Cooperation Programmes in Kalangala District in Uganda/GOPA/August 2018 45
Figure 5: Major Reasons Given by Households for Failure to Save
5.5 Household Expenditures
Information was sought from household respondents on whether the expenditure on the main household items and/or basic needs has changed or not. The responses are summarised in Table 5.12 (a).
Table 5.12 (a): Range of Household Expenditure by Number of Households
Main Expenditure Item Number and Proportion of Households in Expenditure Range (%):
Below 10 10 - 40 Above 40
1) Food 38 278 39
10.7% 78.3% 11.0%
2) Fuel 105 249 1
29.6% 70.1% 0.3%
3) Health 85 255 15 23.9% 71.8% 4.2%
4) Education (tuition fees, textbooks, uniforms, school operation contribution, etc.)
49 150 156 13.8% 42.3% 43.9%
With respect to food, the majority of households (78.3%) reported to be spending between 10% – 40%, 11% were spending 11.0%, and 10.7% were spending below 10%. On fuel, 70.1% of households were spending 70.1%, 29.6% were spending below 10%, and only 0.3% reported spending above 40%. Regarding health, 71.8% spend in a range of 10 – 40% of their income, 23.9% were spending below 10%, and 4.2% reported spending above 40%. Concerning education, 43.9% reportedly spent above 40%, 42.3% were spending in a range of 10 – 40%, whereas 13.8% spent below 10% of their earnings.
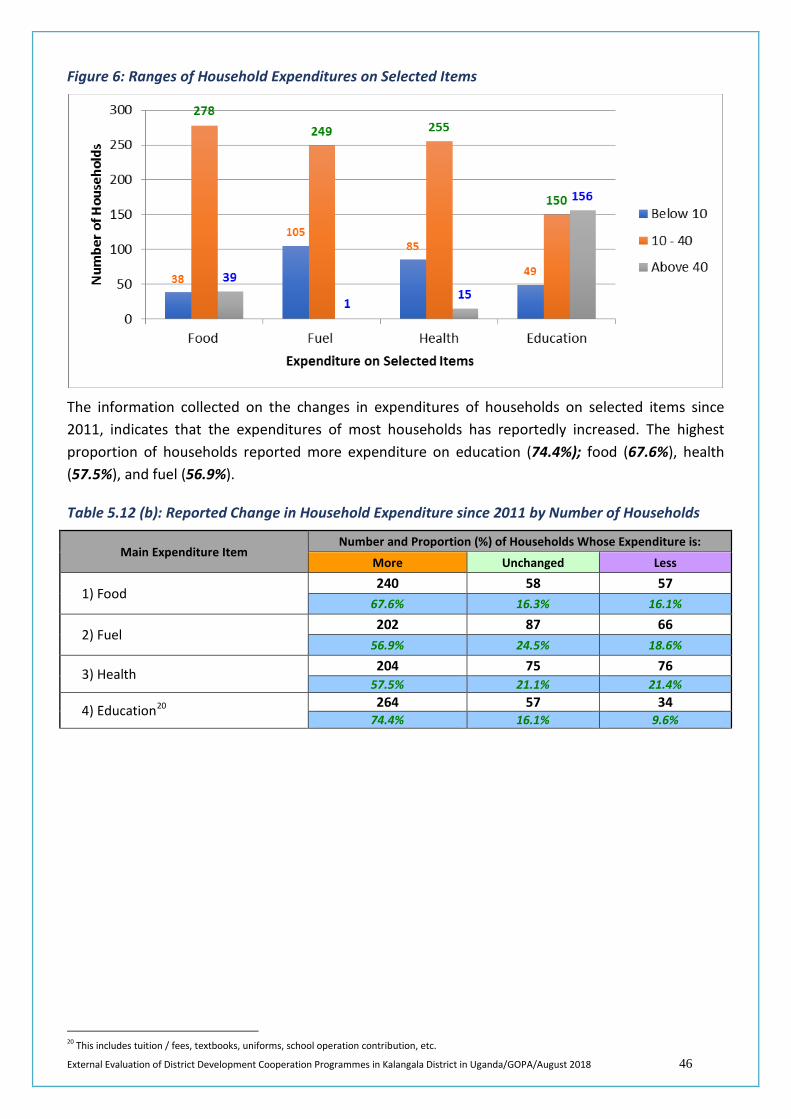
External Evaluation of District Development Cooperation Programmes in Kalangala District in Uganda/GOPA/August 2018 46
Figure 6: Ranges of Household Expenditures on Selected Items
The information collected on the changes in expenditures of households on selected items since 2011, indicates that the expenditures of most households has reportedly increased. The highest proportion of households reported more expenditure on education (74.4%); food (67.6%), health (57.5%), and fuel (56.9%).
Table 5.12 (b): Reported Change in Household Expenditure since 2011 by Number of Households
Main Expenditure Item Number and Proportion (%) of Households Whose Expenditure is:
More Unchanged Less
1) Food 240 58 57
67.6% 16.3% 16.1%
2) Fuel 202 87 66
56.9% 24.5% 18.6%
3) Health 204 75 76 57.5% 21.1% 21.4%
4) Education20 264 57 34 74.4% 16.1% 9.6%
20 This includes tuition / fees, textbooks, uniforms, school operation contribution, etc.
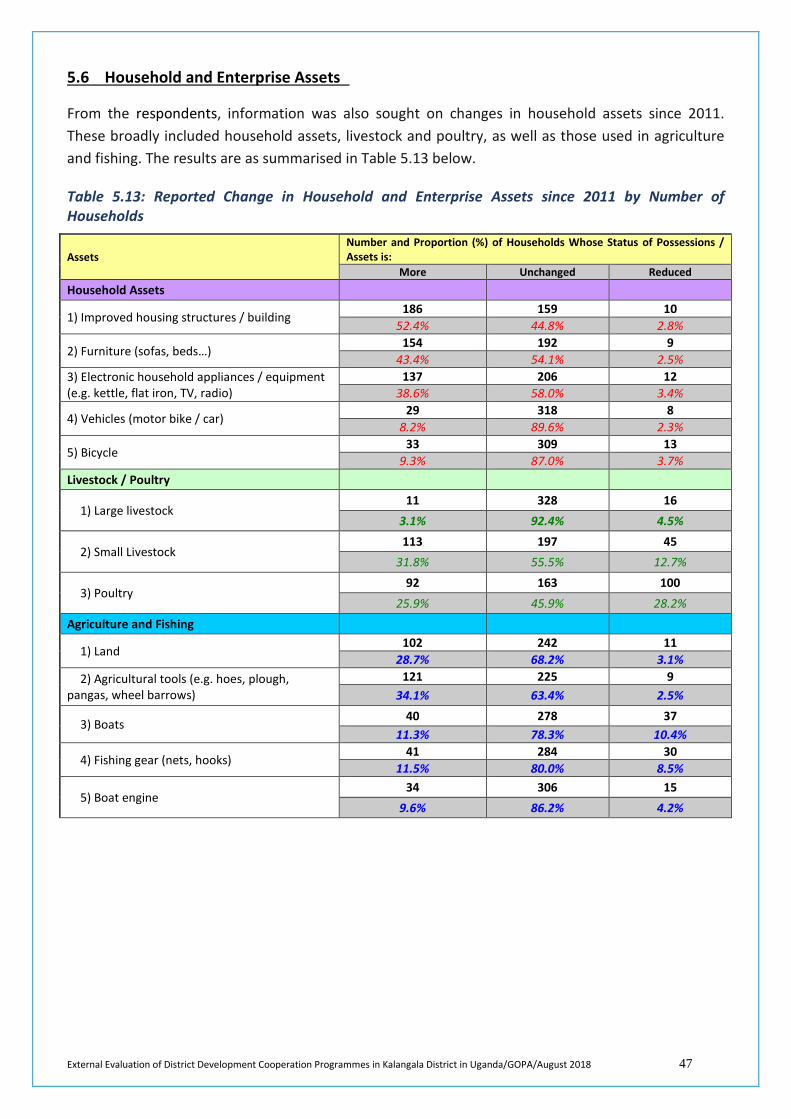
External Evaluation of District Development Cooperation Programmes in Kalangala District in Uganda/GOPA/August 2018 47
5.6 Household and Enterprise Assets
From the respondents, information was also sought on changes in household assets since 2011. These broadly included household assets, livestock and poultry, as well as those used in agriculture and fishing. The results are as summarised in Table 5.13 below.
Table 5.13: Reported Change in Household and Enterprise Assets since 2011 by Number of Households
Assets Number and Proportion (%) of Households Whose Status of Possessions / Assets is:
More Unchanged Reduced Household Assets
1) Improved housing structures / building 186 159 10
52.4% 44.8% 2.8%
2) Furniture (sofas, beds…) 154 192 9
43.4% 54.1% 2.5% 3) Electronic household appliances / equipment (e.g. kettle, flat iron, TV, radio)
137 206 12 38.6% 58.0% 3.4%
4) Vehicles (motor bike / car) 29 318 8
8.2% 89.6% 2.3%
5) Bicycle 33 309 13
9.3% 87.0% 3.7% Livestock / Poultry
1) Large livestock 11 328 16
3.1% 92.4% 4.5%
2) Small Livestock 113 197 45
31.8% 55.5% 12.7%
3) Poultry 92 163 100
25.9% 45.9% 28.2% Agriculture and Fishing
1) Land 102 242 11
28.7% 68.2% 3.1% 2) Agricultural tools (e.g. hoes, plough,
pangas, wheel barrows) 121 225 9
34.1% 63.4% 2.5%
3) Boats 40 278 37
11.3% 78.3% 10.4%
4) Fishing gear (nets, hooks) 41 284 30
11.5% 80.0% 8.5%
5) Boat engine 34 306 15
9.6% 86.2% 4.2%
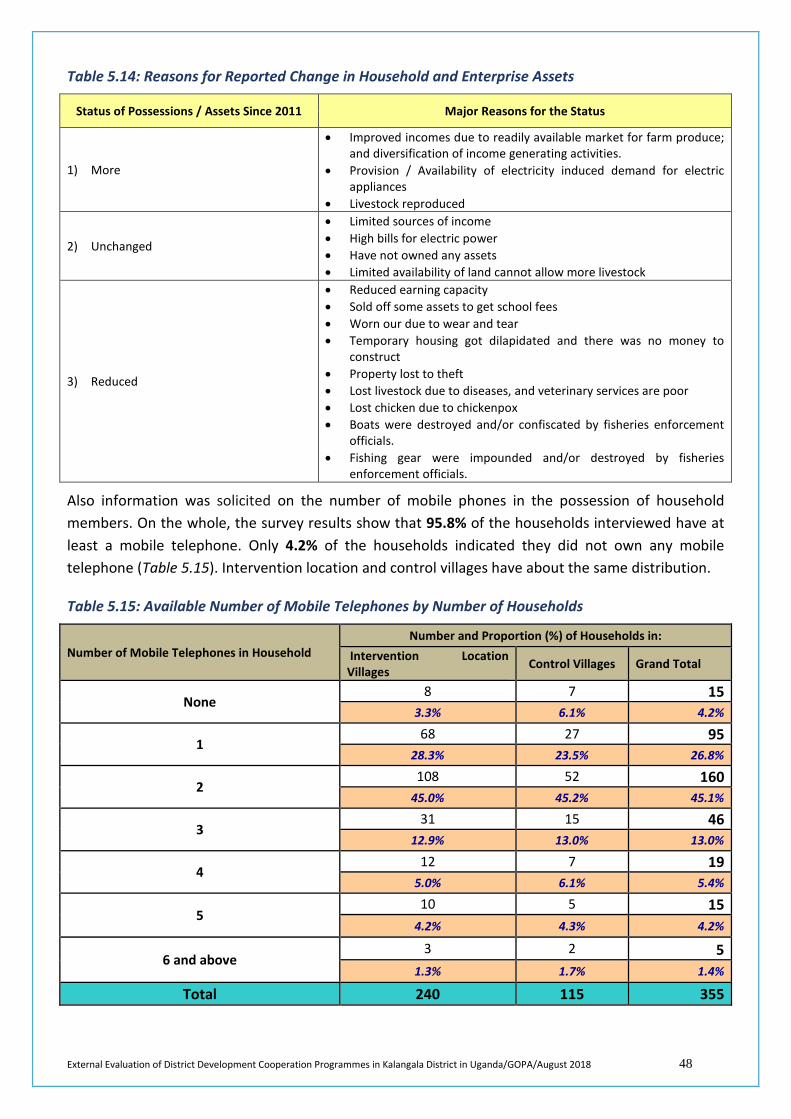
External Evaluation of District Development Cooperation Programmes in Kalangala District in Uganda/GOPA/August 2018 48
Table 5.14: Reasons for Reported Change in Household and Enterprise Assets
Status of Possessions / Assets Since 2011 Major Reasons for the Status
1) More
• Improved incomes due to readily available market for farm produce; and diversification of income generating activities.
• Provision / Availability of electricity induced demand for electric appliances
• Livestock reproduced
2) Unchanged
• Limited sources of income • High bills for electric power • Have not owned any assets • Limited availability of land cannot allow more livestock
3) Reduced
• Reduced earning capacity • Sold off some assets to get school fees • Worn our due to wear and tear • Temporary housing got dilapidated and there was no money to
construct • Property lost to theft • Lost livestock due to diseases, and veterinary services are poor • Lost chicken due to chickenpox • Boats were destroyed and/or confiscated by fisheries enforcement
officials. • Fishing gear were impounded and/or destroyed by fisheries
enforcement officials.
Also information was solicited on the number of mobile phones in the possession of household members. On the whole, the survey results show that 95.8% of the households interviewed have at least a mobile telephone. Only 4.2% of the households indicated they did not own any mobile telephone (Table 5.15). Intervention location and control villages have about the same distribution.
Table 5.15: Available Number of Mobile Telephones by Number of Households
Number of Mobile Telephones in Household Number and Proportion (%) of Households in:
Intervention Location Villages Control Villages Grand Total
None 8 7 15
3.3% 6.1% 4.2%
1 68 27 95
28.3% 23.5% 26.8%
2 108 52 160
45.0% 45.2% 45.1%
3 31 15 46
12.9% 13.0% 13.0%
4 12 7 19
5.0% 6.1% 5.4%
5 10 5 15
4.2% 4.3% 4.2%
6 and above 3 2 5
1.3% 1.7% 1.4% Total 240 115 355
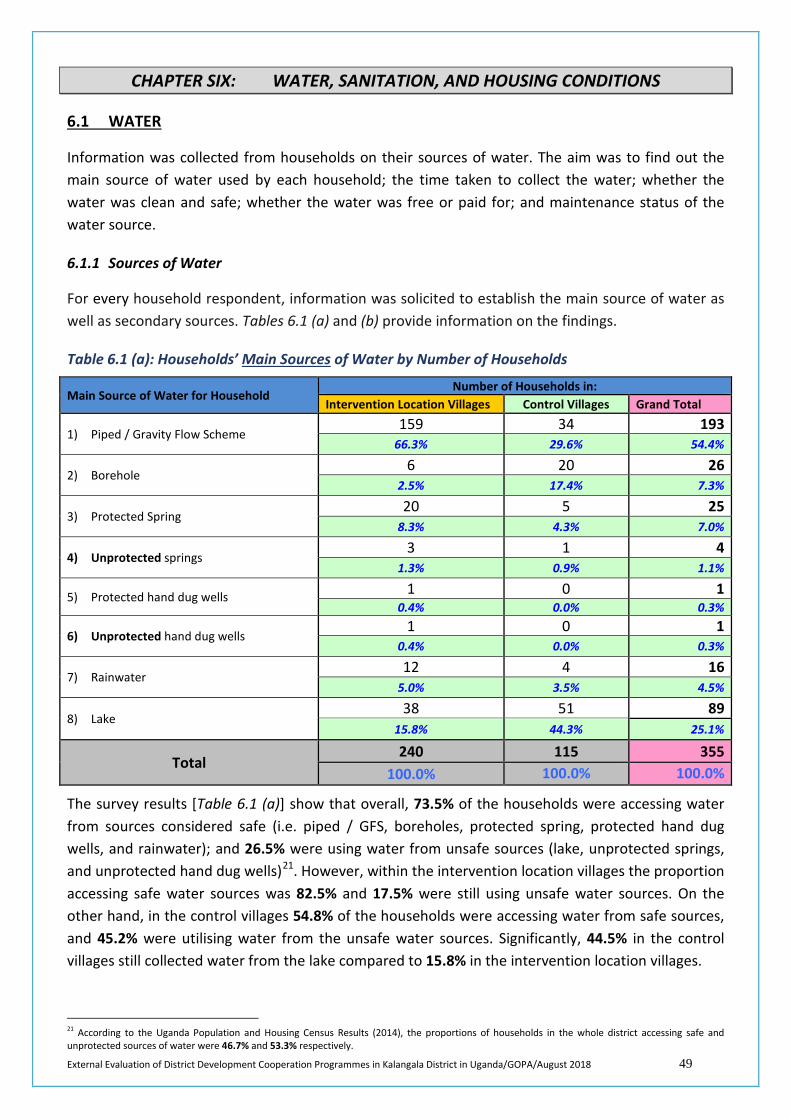
External Evaluation of District Development Cooperation Programmes in Kalangala District in Uganda/GOPA/August 2018 49
CHAPTER SIX: WATER, SANITATION, AND HOUSING CONDITIONS
6.1 WATER
Information was collected from households on their sources of water. The aim was to find out the main source of water used by each household; the time taken to collect the water; whether the water was clean and safe; whether the water was free or paid for; and maintenance status of the water source.
6.1.1 Sources of Water
For every household respondent, information was solicited to establish the main source of water as well as secondary sources. Tables 6.1 (a) and (b) provide information on the findings.
Table 6.1 (a): Households’ Main Sources of Water by Number of Households
Main Source of Water for Household Number of Households in:
Intervention Location Villages Control Villages Grand Total
1) Piped / Gravity Flow Scheme 159 34 193
66.3% 29.6% 54.4%
2) Borehole 6 20 26
2.5% 17.4% 7.3%
3) Protected Spring 20 5 25
8.3% 4.3% 7.0%
4) Unprotected springs 3 1 4
1.3% 0.9% 1.1%
5) Protected hand dug wells 1 0 1 0.4% 0.0% 0.3%
6) Unprotected hand dug wells 1 0 1
0.4% 0.0% 0.3%
7) Rainwater 12 4 16
5.0% 3.5% 4.5%
8) Lake 38 51 89
15.8% 44.3% 25.1%
Total 240 115 355
100.0% 100.0% 100.0%
The survey results [Table 6.1 (a)] show that overall, 73.5% of the households were accessing water from sources considered safe (i.e. piped / GFS, boreholes, protected spring, protected hand dug wells, and rainwater); and 26.5% were using water from unsafe sources (lake, unprotected springs, and unprotected hand dug wells)21. However, within the intervention location villages the proportion accessing safe water sources was 82.5% and 17.5% were still using unsafe water sources. On the other hand, in the control villages 54.8% of the households were accessing water from safe sources, and 45.2% were utilising water from the unsafe water sources. Significantly, 44.5% in the control villages still collected water from the lake compared to 15.8% in the intervention location villages.
21 According to the Uganda Population and Housing Census Results (2014), the proportions of households in the whole district accessing safe and unprotected sources of water were 46.7% and 53.3% respectively.
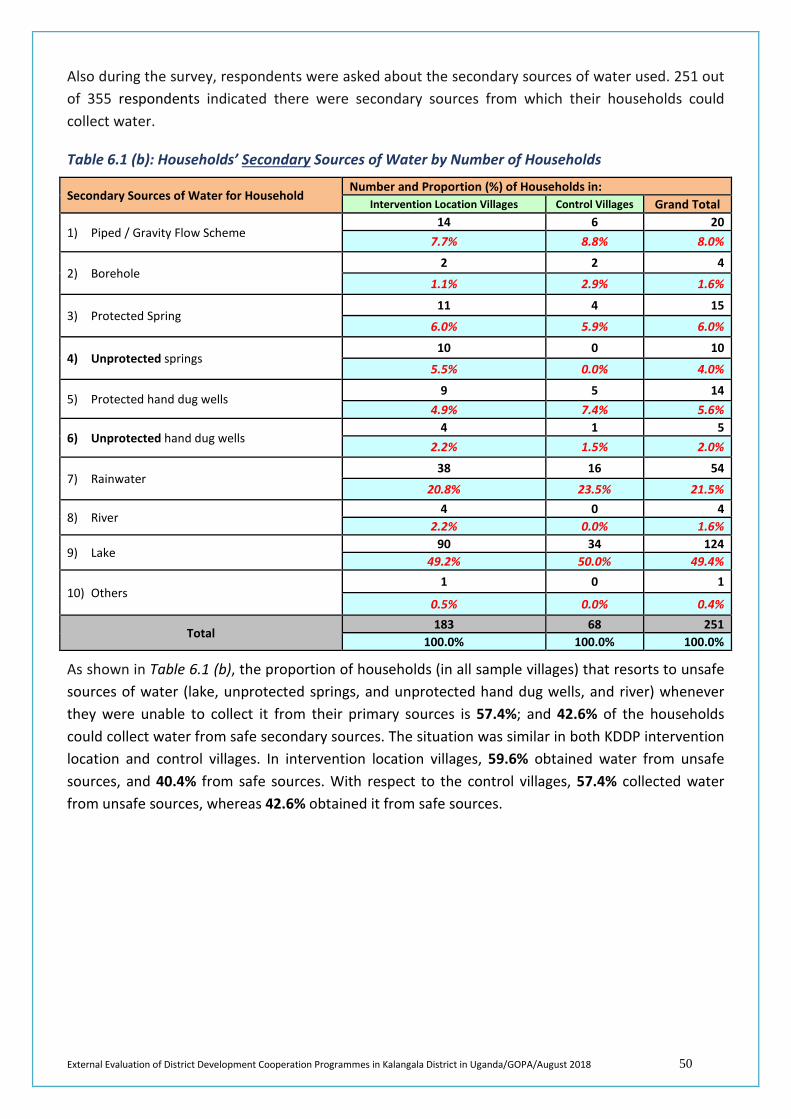
External Evaluation of District Development Cooperation Programmes in Kalangala District in Uganda/GOPA/August 2018 50
Also during the survey, respondents were asked about the secondary sources of water used. 251 out of 355 respondents indicated there were secondary sources from which their households could collect water.
Table 6.1 (b): Households’ Secondary Sources of Water by Number of Households
Secondary Sources of Water for Household Number and Proportion (%) of Households in:
Intervention Location Villages Control Villages Grand Total
1) Piped / Gravity Flow Scheme 14 6 20
7.7% 8.8% 8.0%
2) Borehole 2 2 4
1.1% 2.9% 1.6%
3) Protected Spring 11 4 15
6.0% 5.9% 6.0%
4) Unprotected springs 10 0 10
5.5% 0.0% 4.0%
5) Protected hand dug wells 9 5 14
4.9% 7.4% 5.6%
6) Unprotected hand dug wells 4 1 5
2.2% 1.5% 2.0%
7) Rainwater 38 16 54
20.8% 23.5% 21.5%
8) River 4 0 4
2.2% 0.0% 1.6%
9) Lake 90 34 124
49.2% 50.0% 49.4%
10) Others 1 0 1
0.5% 0.0% 0.4%
Total 183 68 251
100.0% 100.0% 100.0%
As shown in Table 6.1 (b), the proportion of households (in all sample villages) that resorts to unsafe sources of water (lake, unprotected springs, and unprotected hand dug wells, and river) whenever they were unable to collect it from their primary sources is 57.4%; and 42.6% of the households could collect water from safe secondary sources. The situation was similar in both KDDP intervention location and control villages. In intervention location villages, 59.6% obtained water from unsafe sources, and 40.4% from safe sources. With respect to the control villages, 57.4% collected water from unsafe sources, whereas 42.6% obtained it from safe sources.
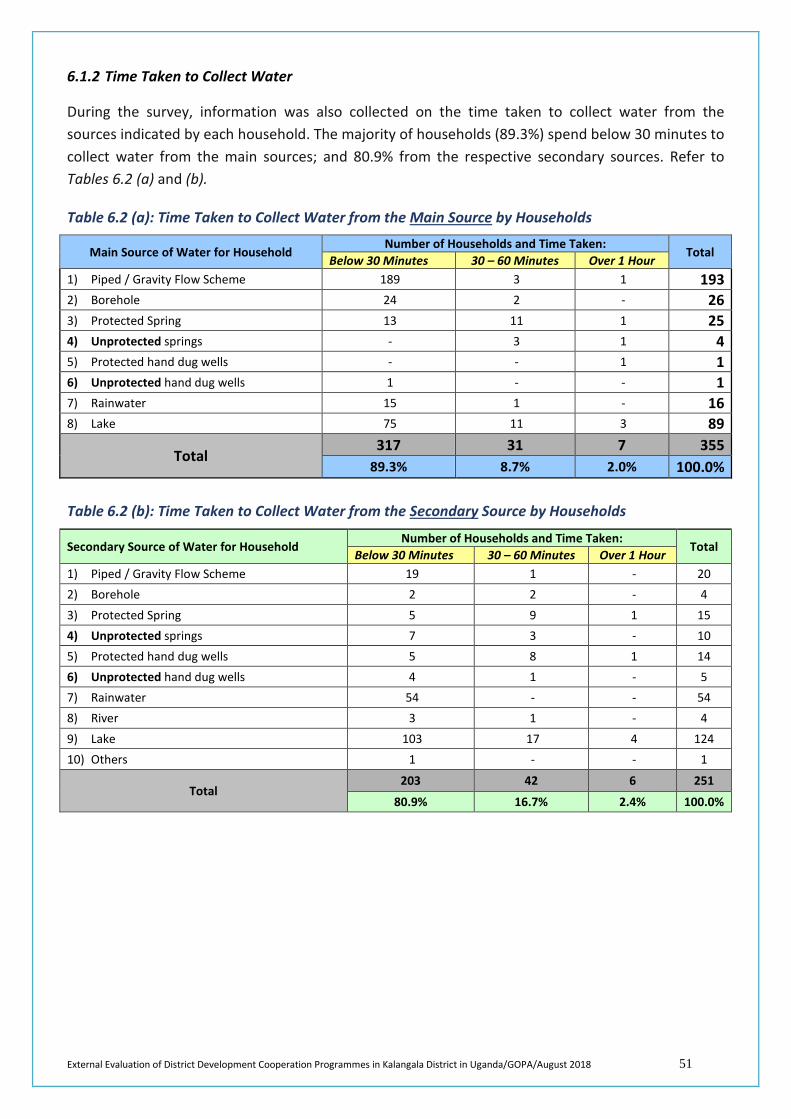
External Evaluation of District Development Cooperation Programmes in Kalangala District in Uganda/GOPA/August 2018 51
6.1.2 Time Taken to Collect Water
During the survey, information was also collected on the time taken to collect water from the sources indicated by each household. The majority of households (89.3%) spend below 30 minutes to collect water from the main sources; and 80.9% from the respective secondary sources. Refer to Tables 6.2 (a) and (b).
Table 6.2 (a): Time Taken to Collect Water from the Main Source by Households
Main Source of Water for Household Number of Households and Time Taken:
Total Below 30 Minutes 30 – 60 Minutes Over 1 Hour
1) Piped / Gravity Flow Scheme 189 3 1 193 2) Borehole 24 2 - 26 3) Protected Spring 13 11 1 25 4) Unprotected springs - 3 1 4 5) Protected hand dug wells - - 1 1 6) Unprotected hand dug wells 1 - - 1 7) Rainwater 15 1 - 16 8) Lake 75 11 3 89
Total 317 31 7 355
89.3% 8.7% 2.0% 100.0% Table 6.2 (b): Time Taken to Collect Water from the Secondary Source by Households
Secondary Source of Water for Household Number of Households and Time Taken:
Total Below 30 Minutes 30 – 60 Minutes Over 1 Hour
1) Piped / Gravity Flow Scheme 19 1 - 20 2) Borehole 2 2 - 4 3) Protected Spring 5 9 1 15 4) Unprotected springs 7 3 - 10 5) Protected hand dug wells 5 8 1 14 6) Unprotected hand dug wells 4 1 - 5 7) Rainwater 54 - - 54 8) River 3 1 - 4 9) Lake 103 17 4 124 10) Others 1 - - 1
Total 203 42 6 251
80.9% 16.7% 2.4% 100.0%
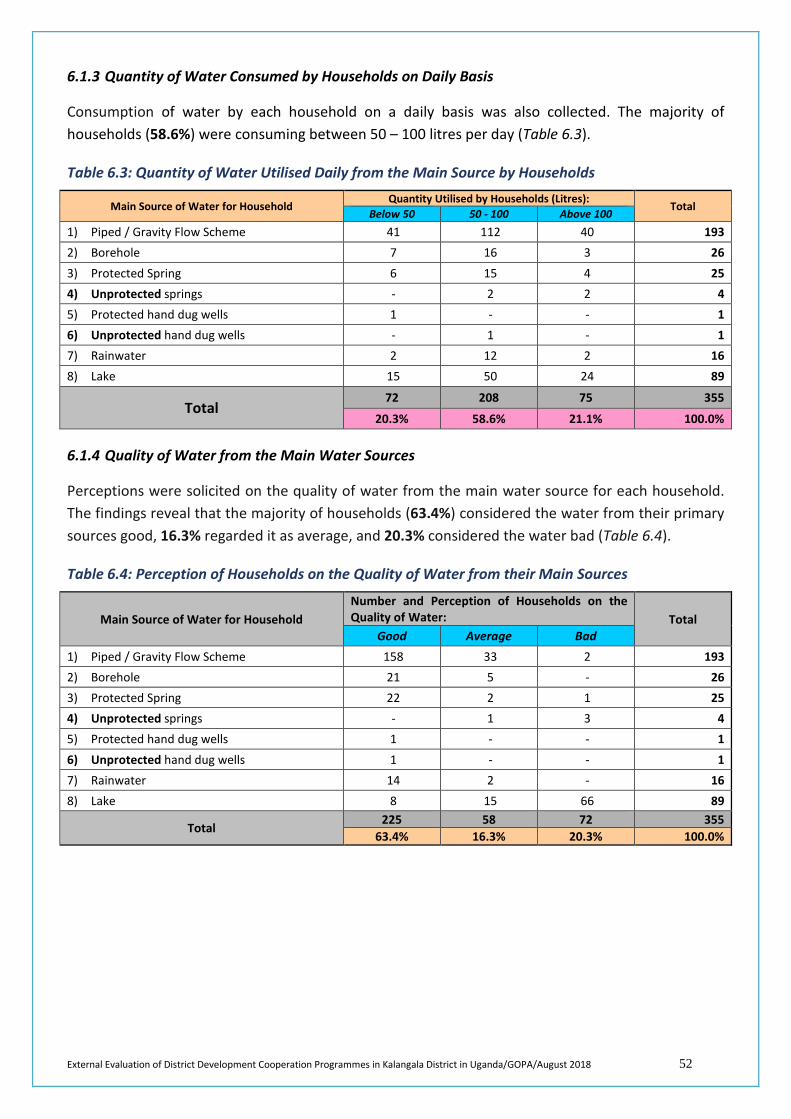
External Evaluation of District Development Cooperation Programmes in Kalangala District in Uganda/GOPA/August 2018 52
6.1.3 Quantity of Water Consumed by Households on Daily Basis
Consumption of water by each household on a daily basis was also collected. The majority of households (58.6%) were consuming between 50 – 100 litres per day (Table 6.3).
Table 6.3: Quantity of Water Utilised Daily from the Main Source by Households
Main Source of Water for Household Quantity Utilised by Households (Litres):
Total Below 50 50 - 100 Above 100
1) Piped / Gravity Flow Scheme 41 112 40 193 2) Borehole 7 16 3 26 3) Protected Spring 6 15 4 25 4) Unprotected springs - 2 2 4 5) Protected hand dug wells 1 - - 1 6) Unprotected hand dug wells - 1 - 1 7) Rainwater 2 12 2 16 8) Lake 15 50 24 89
Total 72 208 75 355
20.3% 58.6% 21.1% 100.0%
6.1.4 Quality of Water from the Main Water Sources
Perceptions were solicited on the quality of water from the main water source for each household. The findings reveal that the majority of households (63.4%) considered the water from their primary sources good, 16.3% regarded it as average, and 20.3% considered the water bad (Table 6.4).
Table 6.4: Perception of Households on the Quality of Water from their Main Sources
Main Source of Water for Household Number and Perception of Households on the Quality of Water: Total
Good Average Bad 1) Piped / Gravity Flow Scheme 158 33 2 193 2) Borehole 21 5 - 26 3) Protected Spring 22 2 1 25 4) Unprotected springs - 1 3 4 5) Protected hand dug wells 1 - - 1 6) Unprotected hand dug wells 1 - - 1 7) Rainwater 14 2 - 16 8) Lake 8 15 66 89
Total 225 58 72 355
63.4% 16.3% 20.3% 100.0%
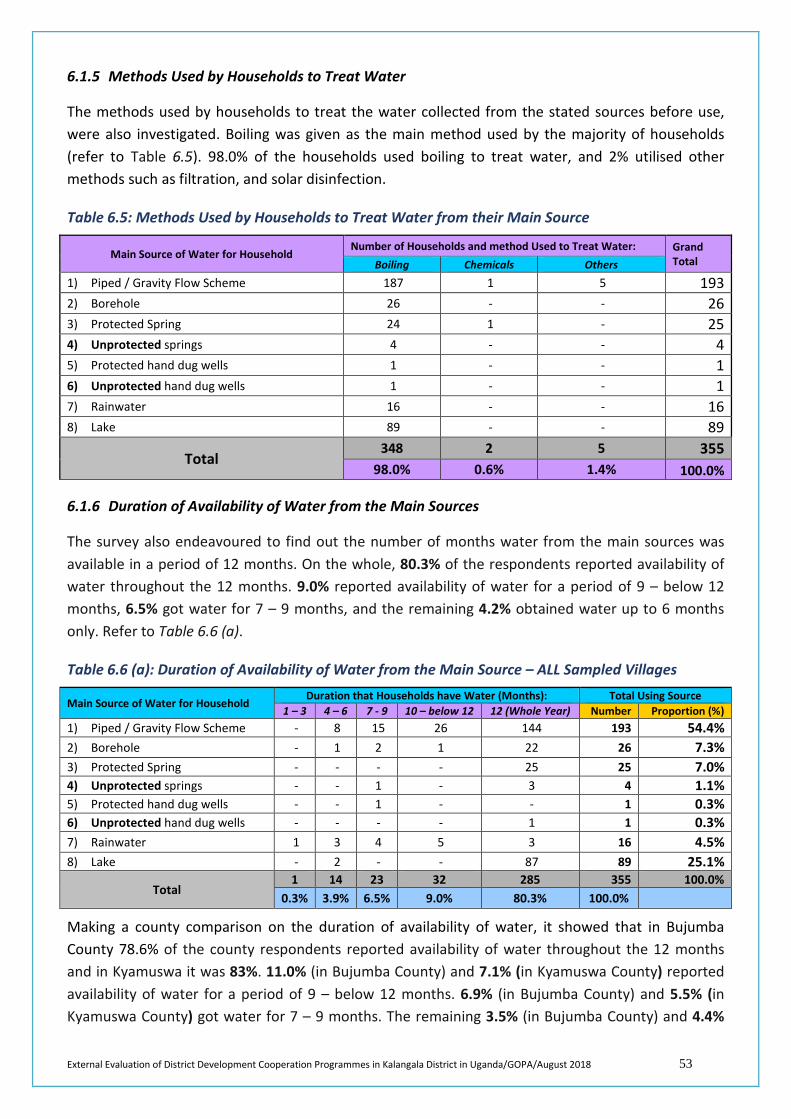
External Evaluation of District Development Cooperation Programmes in Kalangala District in Uganda/GOPA/August 2018 53
6.1.5 Methods Used by Households to Treat Water
The methods used by households to treat the water collected from the stated sources before use, were also investigated. Boiling was given as the main method used by the majority of households (refer to Table 6.5). 98.0% of the households used boiling to treat water, and 2% utilised other methods such as filtration, and solar disinfection.
Table 6.5: Methods Used by Households to Treat Water from their Main Source
Main Source of Water for Household Number of Households and method Used to Treat Water: Grand
Total Boiling Chemicals Others 1) Piped / Gravity Flow Scheme 187 1 5 193 2) Borehole 26 - - 26 3) Protected Spring 24 1 - 25 4) Unprotected springs 4 - - 4 5) Protected hand dug wells 1 - - 1 6) Unprotected hand dug wells 1 - - 1 7) Rainwater 16 - - 16 8) Lake 89 - - 89
Total 348 2 5 355
98.0% 0.6% 1.4% 100.0%
6.1.6 Duration of Availability of Water from the Main Sources
The survey also endeavoured to find out the number of months water from the main sources was available in a period of 12 months. On the whole, 80.3% of the respondents reported availability of water throughout the 12 months. 9.0% reported availability of water for a period of 9 – below 12 months, 6.5% got water for 7 – 9 months, and the remaining 4.2% obtained water up to 6 months only. Refer to Table 6.6 (a).
Table 6.6 (a): Duration of Availability of Water from the Main Source – ALL Sampled Villages
Main Source of Water for Household Duration that Households have Water (Months): Total Using Source 1 – 3 4 – 6 7 - 9 10 – below 12 12 (Whole Year) Number Proportion (%)
1) Piped / Gravity Flow Scheme - 8 15 26 144 193 54.4% 2) Borehole - 1 2 1 22 26 7.3% 3) Protected Spring - - - - 25 25 7.0% 4) Unprotected springs - - 1 - 3 4 1.1% 5) Protected hand dug wells - - 1 - - 1 0.3% 6) Unprotected hand dug wells - - - - 1 1 0.3% 7) Rainwater 1 3 4 5 3 16 4.5% 8) Lake - 2 - - 87 89 25.1%
Total 1 14 23 32 285 355 100.0%
0.3% 3.9% 6.5% 9.0% 80.3% 100.0%
Making a county comparison on the duration of availability of water, it showed that in Bujumba County 78.6% of the county respondents reported availability of water throughout the 12 months and in Kyamuswa it was 83%. 11.0% (in Bujumba County) and 7.1% (in Kyamuswa County) reported availability of water for a period of 9 – below 12 months. 6.9% (in Bujumba County) and 5.5% (in Kyamuswa County) got water for 7 – 9 months. The remaining 3.5% (in Bujumba County) and 4.4%
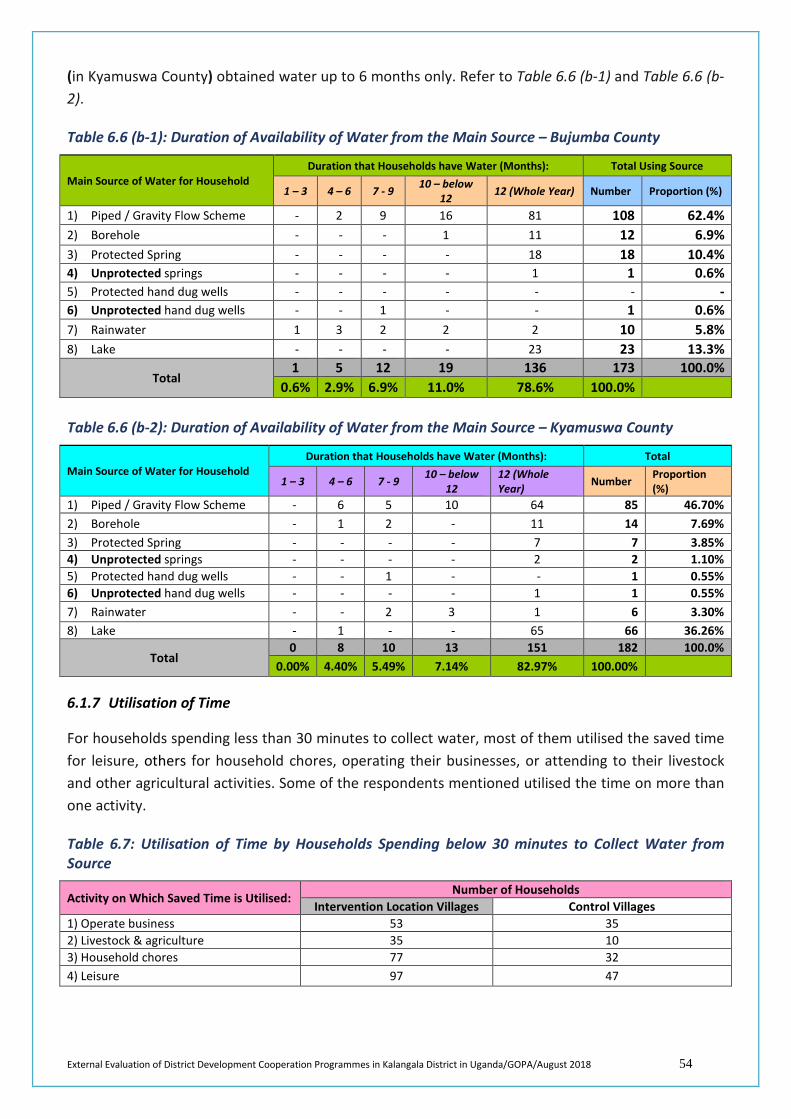
External Evaluation of District Development Cooperation Programmes in Kalangala District in Uganda/GOPA/August 2018 54
(in Kyamuswa County) obtained water up to 6 months only. Refer to Table 6.6 (b-1) and Table 6.6 (b-2).
Table 6.6 (b-1): Duration of Availability of Water from the Main Source – Bujumba County
Main Source of Water for Household Duration that Households have Water (Months): Total Using Source
1 – 3 4 – 6 7 - 9 10 – below 12 12 (Whole Year) Number Proportion (%)
1) Piped / Gravity Flow Scheme - 2 9 16 81 108 62.4% 2) Borehole - - - 1 11 12 6.9% 3) Protected Spring - - - - 18 18 10.4% 4) Unprotected springs - - - - 1 1 0.6% 5) Protected hand dug wells - - - - - - - 6) Unprotected hand dug wells - - 1 - - 1 0.6% 7) Rainwater 1 3 2 2 2 10 5.8% 8) Lake - - - - 23 23 13.3%
Total 1 5 12 19 136 173 100.0%
0.6% 2.9% 6.9% 11.0% 78.6% 100.0%
Table 6.6 (b-2): Duration of Availability of Water from the Main Source – Kyamuswa County
Main Source of Water for Household Duration that Households have Water (Months): Total
1 – 3 4 – 6 7 - 9 10 – below 12
12 (Whole Year) Number Proportion
(%) 1) Piped / Gravity Flow Scheme - 6 5 10 64 85 46.70% 2) Borehole - 1 2 - 11 14 7.69% 3) Protected Spring - - - - 7 7 3.85% 4) Unprotected springs - - - - 2 2 1.10% 5) Protected hand dug wells - - 1 - - 1 0.55% 6) Unprotected hand dug wells - - - - 1 1 0.55% 7) Rainwater - - 2 3 1 6 3.30% 8) Lake - 1 - - 65 66 36.26%
Total 0 8 10 13 151 182 100.0%
0.00% 4.40% 5.49% 7.14% 82.97% 100.00%
6.1.7 Utilisation of Time
For households spending less than 30 minutes to collect water, most of them utilised the saved time for leisure, others for household chores, operating their businesses, or attending to their livestock and other agricultural activities. Some of the respondents mentioned utilised the time on more than one activity.
Table 6.7: Utilisation of Time by Households Spending below 30 minutes to Collect Water from Source
Activity on Which Saved Time is Utilised: Number of Households
Intervention Location Villages Control Villages 1) Operate business 53 35 2) Livestock & agriculture 35 10 3) Household chores 77 32 4) Leisure 97 47
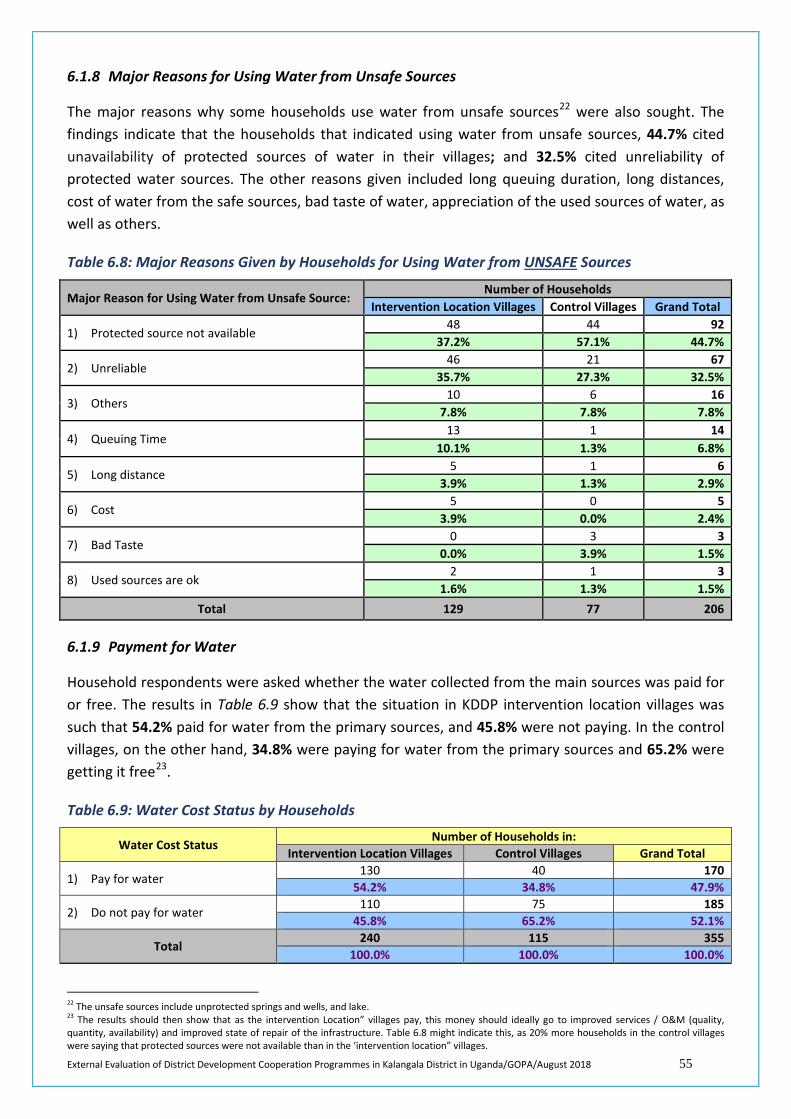
External Evaluation of District Development Cooperation Programmes in Kalangala District in Uganda/GOPA/August 2018 55
6.1.8 Major Reasons for Using Water from Unsafe Sources
The major reasons why some households use water from unsafe sources22 were also sought. The findings indicate that the households that indicated using water from unsafe sources, 44.7% cited unavailability of protected sources of water in their villages; and 32.5% cited unreliability of protected water sources. The other reasons given included long queuing duration, long distances, cost of water from the safe sources, bad taste of water, appreciation of the used sources of water, as well as others.
Table 6.8: Major Reasons Given by Households for Using Water from UNSAFE Sources
Major Reason for Using Water from Unsafe Source: Number of Households
Intervention Location Villages Control Villages Grand Total
1) Protected source not available 48 44 92
37.2% 57.1% 44.7%
2) Unreliable 46 21 67
35.7% 27.3% 32.5%
3) Others 10 6 16
7.8% 7.8% 7.8%
4) Queuing Time 13 1 14
10.1% 1.3% 6.8%
5) Long distance 5 1 6
3.9% 1.3% 2.9%
6) Cost 5 0 5
3.9% 0.0% 2.4%
7) Bad Taste 0 3 3
0.0% 3.9% 1.5%
8) Used sources are ok 2 1 3
1.6% 1.3% 1.5% Total 129 77 206
6.1.9 Payment for Water
Household respondents were asked whether the water collected from the main sources was paid for or free. The results in Table 6.9 show that the situation in KDDP intervention location villages was such that 54.2% paid for water from the primary sources, and 45.8% were not paying. In the control villages, on the other hand, 34.8% were paying for water from the primary sources and 65.2% were getting it free23.
Table 6.9: Water Cost Status by Households
Water Cost Status Number of Households in:
Intervention Location Villages Control Villages Grand Total
1) Pay for water 130 40 170
54.2% 34.8% 47.9%
2) Do not pay for water 110 75 185
45.8% 65.2% 52.1%
Total 240 115 355
100.0% 100.0% 100.0%
22 The unsafe sources include unprotected springs and wells, and lake. 23 The results should then show that as the intervention Location” villages pay, this money should ideally go to improved services / O&M (quality, quantity, availability) and improved state of repair of the infrastructure. Table 6.8 might indicate this, as 20% more households in the control villages were saying that protected sources were not available than in the ‘intervention location” villages.
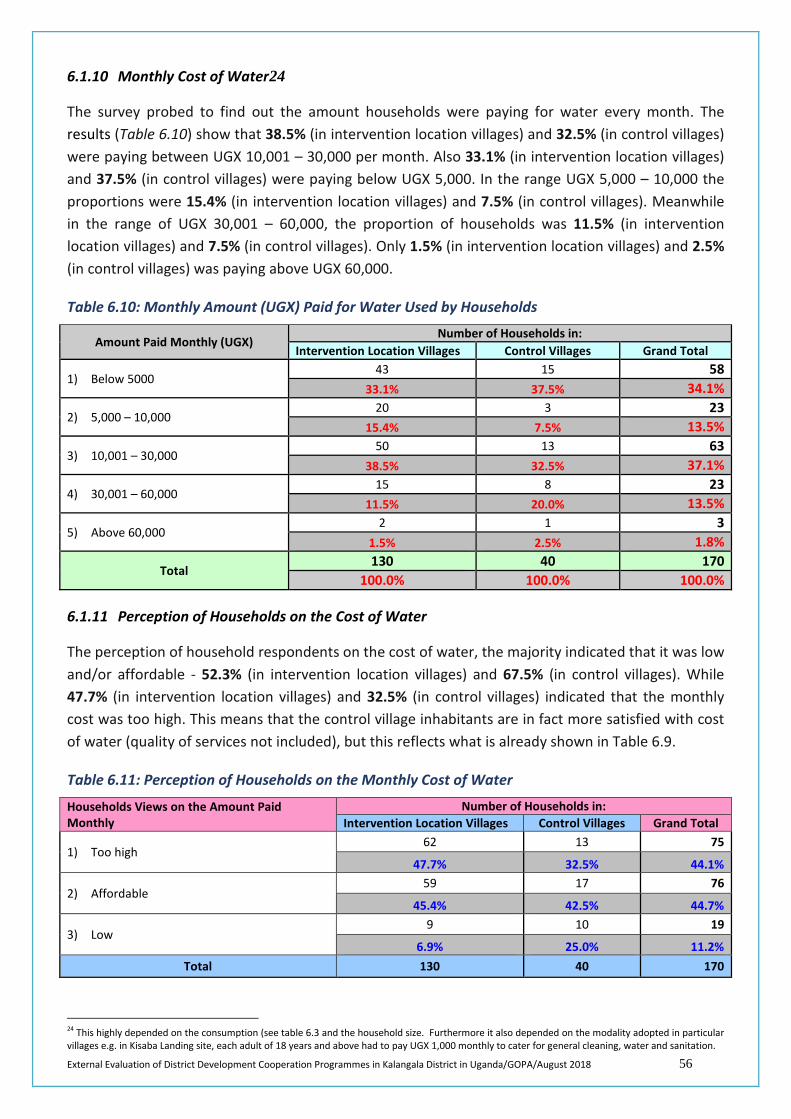
External Evaluation of District Development Cooperation Programmes in Kalangala District in Uganda/GOPA/August 2018 56
6.1.10 Monthly Cost of Water24
The survey probed to find out the amount households were paying for water every month. The results (Table 6.10) show that 38.5% (in intervention location villages) and 32.5% (in control villages) were paying between UGX 10,001 – 30,000 per month. Also 33.1% (in intervention location villages) and 37.5% (in control villages) were paying below UGX 5,000. In the range UGX 5,000 – 10,000 the proportions were 15.4% (in intervention location villages) and 7.5% (in control villages). Meanwhile in the range of UGX 30,001 – 60,000, the proportion of households was 11.5% (in intervention location villages) and 7.5% (in control villages). Only 1.5% (in intervention location villages) and 2.5% (in control villages) was paying above UGX 60,000.
Table 6.10: Monthly Amount (UGX) Paid for Water Used by Households
Amount Paid Monthly (UGX) Number of Households in:
Intervention Location Villages Control Villages Grand Total
1) Below 5000 43 15 58
33.1% 37.5% 34.1%
2) 5,000 – 10,000 20 3 23
15.4% 7.5% 13.5%
3) 10,001 – 30,000 50 13 63
38.5% 32.5% 37.1%
4) 30,001 – 60,000 15 8 23
11.5% 20.0% 13.5%
5) Above 60,000 2 1 3
1.5% 2.5% 1.8%
Total 130 40 170
100.0% 100.0% 100.0%
6.1.11 Perception of Households on the Cost of Water
The perception of household respondents on the cost of water, the majority indicated that it was low and/or affordable - 52.3% (in intervention location villages) and 67.5% (in control villages). While 47.7% (in intervention location villages) and 32.5% (in control villages) indicated that the monthly cost was too high. This means that the control village inhabitants are in fact more satisfied with cost of water (quality of services not included), but this reflects what is already shown in Table 6.9.
Table 6.11: Perception of Households on the Monthly Cost of Water
Households Views on the Amount Paid Monthly
Number of Households in: Intervention Location Villages Control Villages Grand Total
1) Too high 62 13 75
47.7% 32.5% 44.1%
2) Affordable 59 17 76
45.4% 42.5% 44.7%
3) Low 9 10 19
6.9% 25.0% 11.2% Total 130 40 170
24 This highly depended on the consumption (see table 6.3 and the household size. Furthermore it also depended on the modality adopted in particular villages e.g. in Kisaba Landing site, each adult of 18 years and above had to pay UGX 1,000 monthly to cater for general cleaning, water and sanitation.
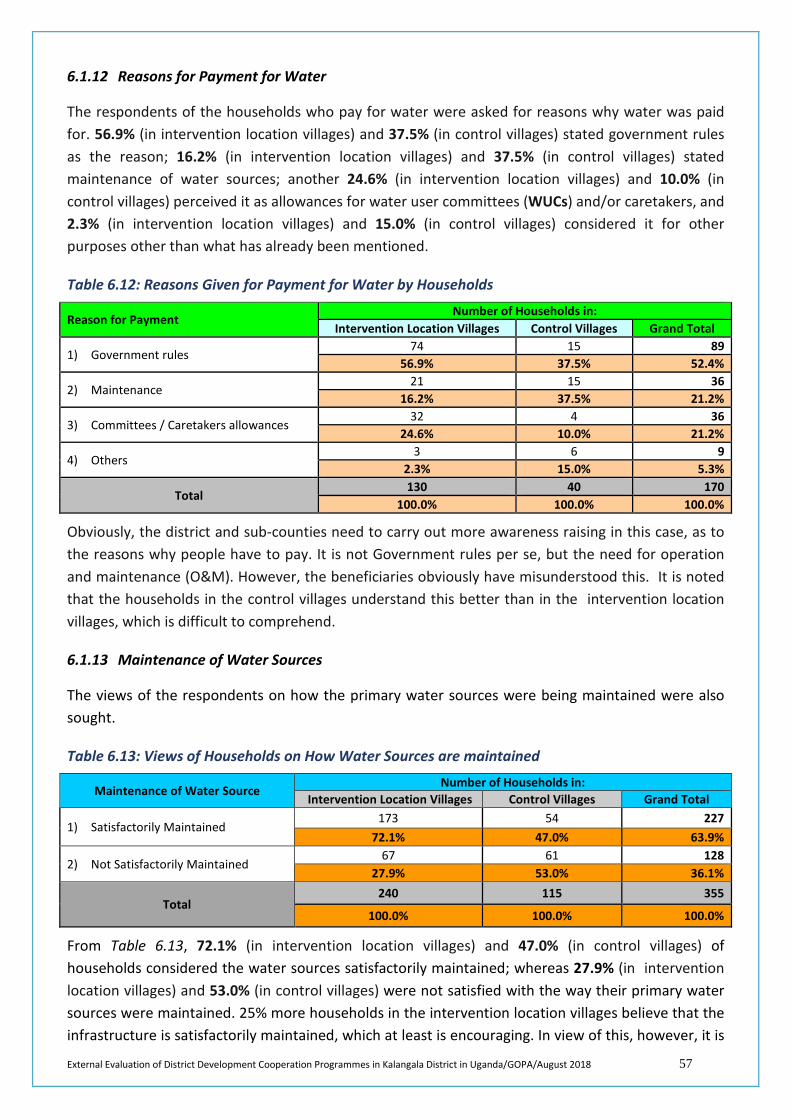
External Evaluation of District Development Cooperation Programmes in Kalangala District in Uganda/GOPA/August 2018 57
6.1.12 Reasons for Payment for Water
The respondents of the households who pay for water were asked for reasons why water was paid for. 56.9% (in intervention location villages) and 37.5% (in control villages) stated government rules as the reason; 16.2% (in intervention location villages) and 37.5% (in control villages) stated maintenance of water sources; another 24.6% (in intervention location villages) and 10.0% (in control villages) perceived it as allowances for water user committees (WUCs) and/or caretakers, and 2.3% (in intervention location villages) and 15.0% (in control villages) considered it for other purposes other than what has already been mentioned.
Table 6.12: Reasons Given for Payment for Water by Households
Reason for Payment Number of Households in:
Intervention Location Villages Control Villages Grand Total
1) Government rules 74 15 89
56.9% 37.5% 52.4%
2) Maintenance 21 15 36
16.2% 37.5% 21.2%
3) Committees / Caretakers allowances 32 4 36
24.6% 10.0% 21.2%
4) Others 3 6 9
2.3% 15.0% 5.3%
Total 130 40 170
100.0% 100.0% 100.0%
Obviously, the district and sub-counties need to carry out more awareness raising in this case, as to the reasons why people have to pay. It is not Government rules per se, but the need for operation and maintenance (O&M). However, the beneficiaries obviously have misunderstood this. It is noted that the households in the control villages understand this better than in the intervention location villages, which is difficult to comprehend.
6.1.13 Maintenance of Water Sources
The views of the respondents on how the primary water sources were being maintained were also sought.
Table 6.13: Views of Households on How Water Sources are maintained
Maintenance of Water Source Number of Households in:
Intervention Location Villages Control Villages Grand Total
1) Satisfactorily Maintained 173 54 227
72.1% 47.0% 63.9%
2) Not Satisfactorily Maintained 67 61 128
27.9% 53.0% 36.1%
Total 240 115 355
100.0% 100.0% 100.0%
From Table 6.13, 72.1% (in intervention location villages) and 47.0% (in control villages) of households considered the water sources satisfactorily maintained; whereas 27.9% (in intervention location villages) and 53.0% (in control villages) were not satisfied with the way their primary water sources were maintained. 25% more households in the intervention location villages believe that the infrastructure is satisfactorily maintained, which at least is encouraging. In view of this, however, it is
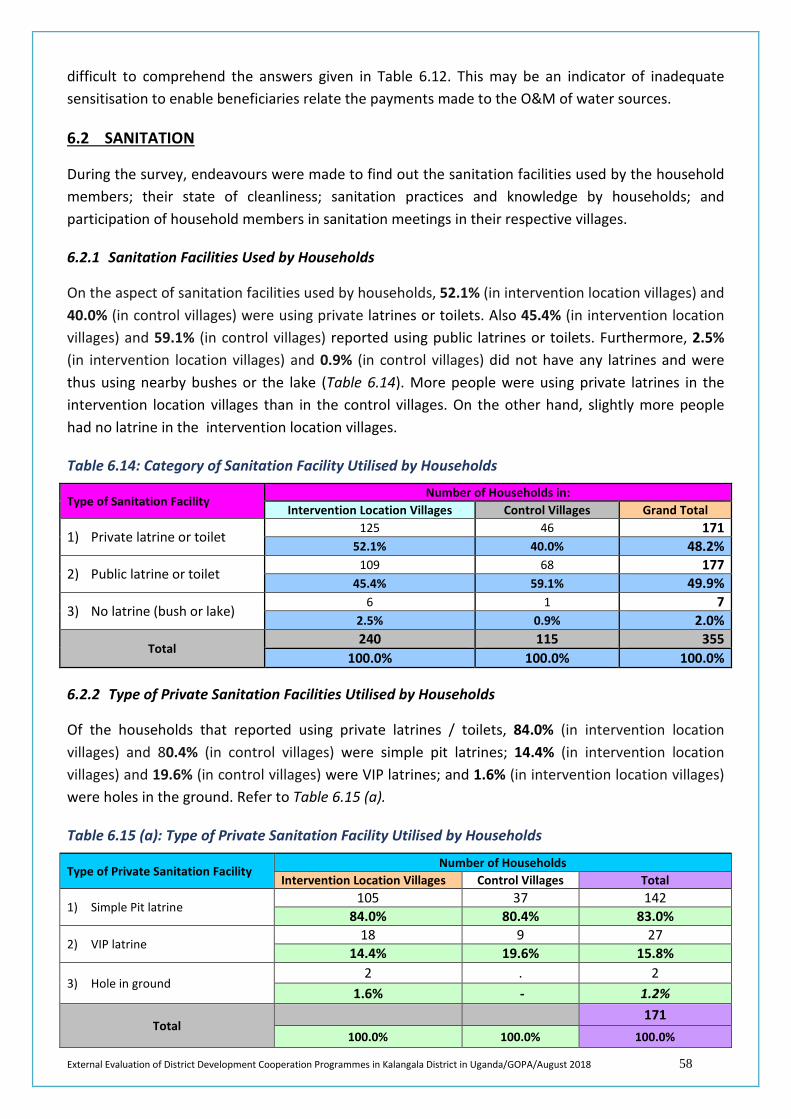
External Evaluation of District Development Cooperation Programmes in Kalangala District in Uganda/GOPA/August 2018 58
difficult to comprehend the answers given in Table 6.12. This may be an indicator of inadequate sensitisation to enable beneficiaries relate the payments made to the O&M of water sources.
6.2 SANITATION
During the survey, endeavours were made to find out the sanitation facilities used by the household members; their state of cleanliness; sanitation practices and knowledge by households; and participation of household members in sanitation meetings in their respective villages.
6.2.1 Sanitation Facilities Used by Households
On the aspect of sanitation facilities used by households, 52.1% (in intervention location villages) and 40.0% (in control villages) were using private latrines or toilets. Also 45.4% (in intervention location villages) and 59.1% (in control villages) reported using public latrines or toilets. Furthermore, 2.5% (in intervention location villages) and 0.9% (in control villages) did not have any latrines and were thus using nearby bushes or the lake (Table 6.14). More people were using private latrines in the intervention location villages than in the control villages. On the other hand, slightly more people had no latrine in the intervention location villages.
Table 6.14: Category of Sanitation Facility Utilised by Households
Type of Sanitation Facility Number of Households in:
Intervention Location Villages Control Villages Grand Total
1) Private latrine or toilet 125 46 171
52.1% 40.0% 48.2%
2) Public latrine or toilet 109 68 177
45.4% 59.1% 49.9%
3) No latrine (bush or lake) 6 1 7
2.5% 0.9% 2.0%
Total 240 115 355
100.0% 100.0% 100.0%
6.2.2 Type of Private Sanitation Facilities Utilised by Households
Of the households that reported using private latrines / toilets, 84.0% (in intervention location villages) and 80.4% (in control villages) were simple pit latrines; 14.4% (in intervention location villages) and 19.6% (in control villages) were VIP latrines; and 1.6% (in intervention location villages) were holes in the ground. Refer to Table 6.15 (a).
Table 6.15 (a): Type of Private Sanitation Facility Utilised by Households
Type of Private Sanitation Facility Number of Households
Intervention Location Villages Control Villages Total
1) Simple Pit latrine 105 37 142
84.0% 80.4% 83.0%
2) VIP latrine 18 9 27
14.4% 19.6% 15.8%
3) Hole in ground 2 . 2
1.6% - 1.2%
Total 171
100.0% 100.0% 100.0%
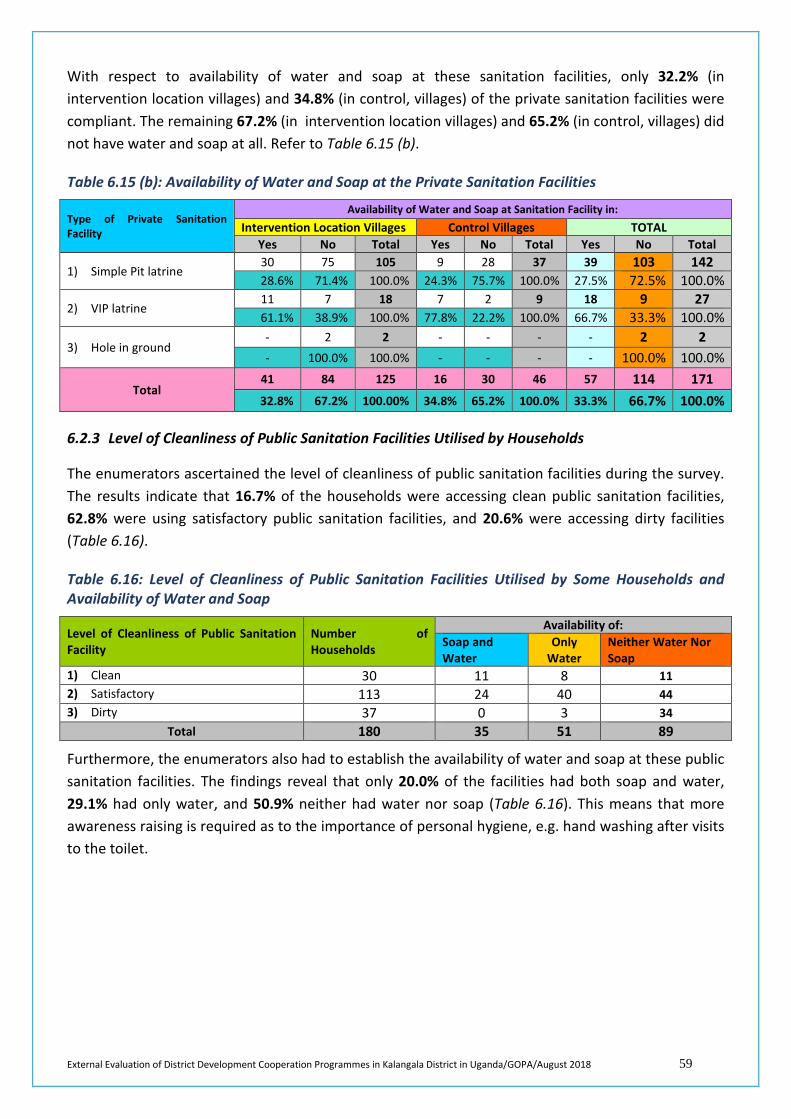
External Evaluation of District Development Cooperation Programmes in Kalangala District in Uganda/GOPA/August 2018 59
With respect to availability of water and soap at these sanitation facilities, only 32.2% (in intervention location villages) and 34.8% (in control, villages) of the private sanitation facilities were compliant. The remaining 67.2% (in intervention location villages) and 65.2% (in control, villages) did not have water and soap at all. Refer to Table 6.15 (b).
Table 6.15 (b): Availability of Water and Soap at the Private Sanitation Facilities
Type of Private Sanitation Facility
Availability of Water and Soap at Sanitation Facility in: Intervention Location Villages Control Villages TOTAL
Yes No Total Yes No Total Yes No Total
1) Simple Pit latrine 30 75 105 9 28 37 39 103 142 28.6% 71.4% 100.0% 24.3% 75.7% 100.0% 27.5% 72.5% 100.0%
2) VIP latrine 11 7 18 7 2 9 18 9 27 61.1% 38.9% 100.0% 77.8% 22.2% 100.0% 66.7% 33.3% 100.0%
3) Hole in ground - 2 2 - - - - 2 2 - 100.0% 100.0% - - - - 100.0% 100.0%
Total 41 84 125 16 30 46 57 114 171 32.8% 67.2% 100.00% 34.8% 65.2% 100.0% 33.3% 66.7% 100.0%
6.2.3 Level of Cleanliness of Public Sanitation Facilities Utilised by Households
The enumerators ascertained the level of cleanliness of public sanitation facilities during the survey. The results indicate that 16.7% of the households were accessing clean public sanitation facilities, 62.8% were using satisfactory public sanitation facilities, and 20.6% were accessing dirty facilities (Table 6.16).
Table 6.16: Level of Cleanliness of Public Sanitation Facilities Utilised by Some Households and Availability of Water and Soap
Level of Cleanliness of Public Sanitation Facility
Number of Households
Availability of: Soap and Water
Only Water
Neither Water Nor Soap
1) Clean 30 11 8 11 2) Satisfactory 113 24 40 44 3) Dirty 37 0 3 34
Total 180 35 51 89
Furthermore, the enumerators also had to establish the availability of water and soap at these public sanitation facilities. The findings reveal that only 20.0% of the facilities had both soap and water, 29.1% had only water, and 50.9% neither had water nor soap (Table 6.16). This means that more awareness raising is required as to the importance of personal hygiene, e.g. hand washing after visits to the toilet.
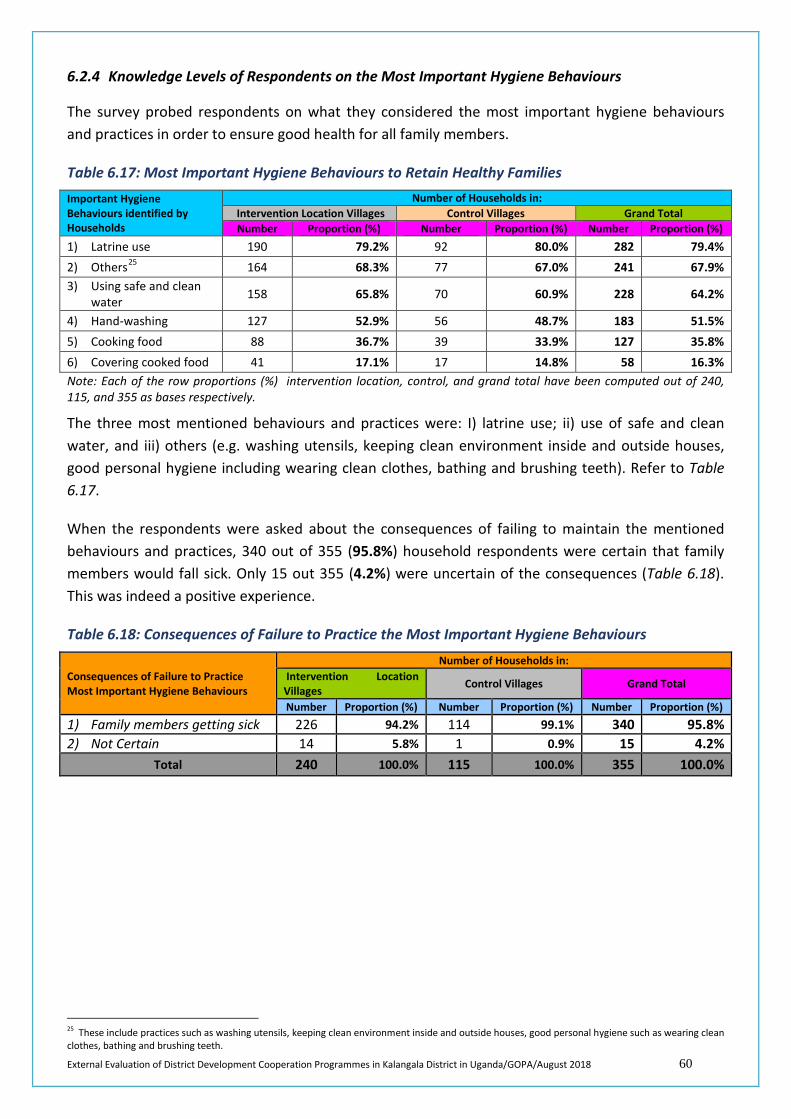
External Evaluation of District Development Cooperation Programmes in Kalangala District in Uganda/GOPA/August 2018 60
6.2.4 Knowledge Levels of Respondents on the Most Important Hygiene Behaviours
The survey probed respondents on what they considered the most important hygiene behaviours and practices in order to ensure good health for all family members.
Table 6.17: Most Important Hygiene Behaviours to Retain Healthy Families Important Hygiene Behaviours identified by Households
Number of Households in: Intervention Location Villages Control Villages Grand Total Number Proportion (%) Number Proportion (%) Number Proportion (%)
1) Latrine use 190 79.2% 92 80.0% 282 79.4% 2) Others25 164 68.3% 77 67.0% 241 67.9% 3) Using safe and clean
water 158 65.8% 70 60.9% 228 64.2%
4) Hand-washing 127 52.9% 56 48.7% 183 51.5% 5) Cooking food 88 36.7% 39 33.9% 127 35.8% 6) Covering cooked food 41 17.1% 17 14.8% 58 16.3% Note: Each of the row proportions (%) intervention location, control, and grand total have been computed out of 240, 115, and 355 as bases respectively.
The three most mentioned behaviours and practices were: I) latrine use; ii) use of safe and clean water, and iii) others (e.g. washing utensils, keeping clean environment inside and outside houses, good personal hygiene including wearing clean clothes, bathing and brushing teeth). Refer to Table 6.17.
When the respondents were asked about the consequences of failing to maintain the mentioned behaviours and practices, 340 out of 355 (95.8%) household respondents were certain that family members would fall sick. Only 15 out 355 (4.2%) were uncertain of the consequences (Table 6.18). This was indeed a positive experience.
Table 6.18: Consequences of Failure to Practice the Most Important Hygiene Behaviours
Consequences of Failure to Practice Most Important Hygiene Behaviours
Number of Households in: Intervention Location Villages Control Villages Grand Total
Number Proportion (%) Number Proportion (%) Number Proportion (%) 1) Family members getting sick 226 94.2% 114 99.1% 340 95.8% 2) Not Certain 14 5.8% 1 0.9% 15 4.2%
Total 240 100.0% 115 100.0% 355 100.0%
25 These include practices such as washing utensils, keeping clean environment inside and outside houses, good personal hygiene such as wearing clean clothes, bathing and brushing teeth.
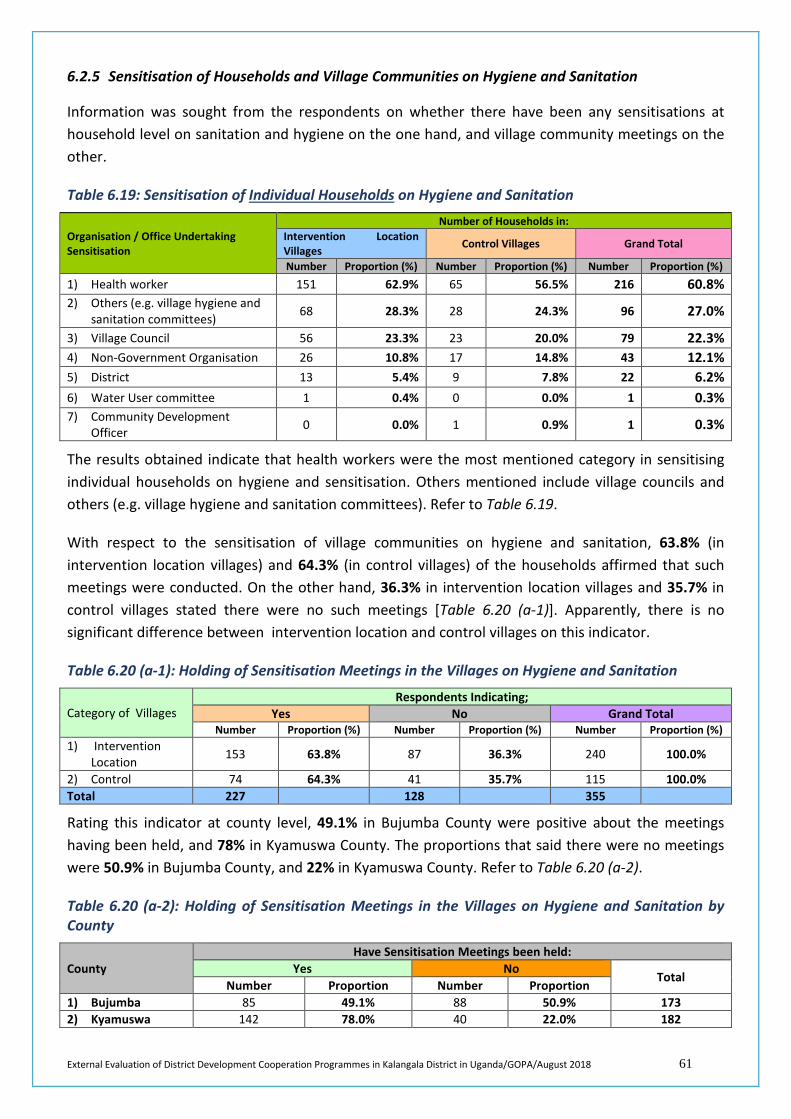
External Evaluation of District Development Cooperation Programmes in Kalangala District in Uganda/GOPA/August 2018 61
6.2.5 Sensitisation of Households and Village Communities on Hygiene and Sanitation
Information was sought from the respondents on whether there have been any sensitisations at household level on sanitation and hygiene on the one hand, and village community meetings on the other.
Table 6.19: Sensitisation of Individual Households on Hygiene and Sanitation
Organisation / Office Undertaking Sensitisation
Number of Households in: Intervention Location Villages Control Villages Grand Total
Number Proportion (%) Number Proportion (%) Number Proportion (%) 1) Health worker 151 62.9% 65 56.5% 216 60.8% 2) Others (e.g. village hygiene and
sanitation committees) 68 28.3% 28 24.3% 96 27.0%
3) Village Council 56 23.3% 23 20.0% 79 22.3% 4) Non-Government Organisation 26 10.8% 17 14.8% 43 12.1% 5) District 13 5.4% 9 7.8% 22 6.2% 6) Water User committee 1 0.4% 0 0.0% 1 0.3% 7) Community Development
Officer 0 0.0% 1 0.9% 1 0.3%
The results obtained indicate that health workers were the most mentioned category in sensitising individual households on hygiene and sensitisation. Others mentioned include village councils and others (e.g. village hygiene and sanitation committees). Refer to Table 6.19.
With respect to the sensitisation of village communities on hygiene and sanitation, 63.8% (in intervention location villages) and 64.3% (in control villages) of the households affirmed that such meetings were conducted. On the other hand, 36.3% in intervention location villages and 35.7% in control villages stated there were no such meetings [Table 6.20 (a-1)]. Apparently, there is no significant difference between intervention location and control villages on this indicator.
Table 6.20 (a-1): Holding of Sensitisation Meetings in the Villages on Hygiene and Sanitation
Category of Villages Respondents Indicating;
Yes No Grand Total Number Proportion (%) Number Proportion (%) Number Proportion (%)
1) Intervention Location 153 63.8% 87 36.3% 240 100.0%
2) Control 74 64.3% 41 35.7% 115 100.0% Total 227 128 355
Rating this indicator at county level, 49.1% in Bujumba County were positive about the meetings having been held, and 78% in Kyamuswa County. The proportions that said there were no meetings were 50.9% in Bujumba County, and 22% in Kyamuswa County. Refer to Table 6.20 (a-2).
Table 6.20 (a-2): Holding of Sensitisation Meetings in the Villages on Hygiene and Sanitation by County
County Have Sensitisation Meetings been held:
Yes No Total
Number Proportion Number Proportion 1) Bujumba 85 49.1% 88 50.9% 173 2) Kyamuswa 142 78.0% 40 22.0% 182
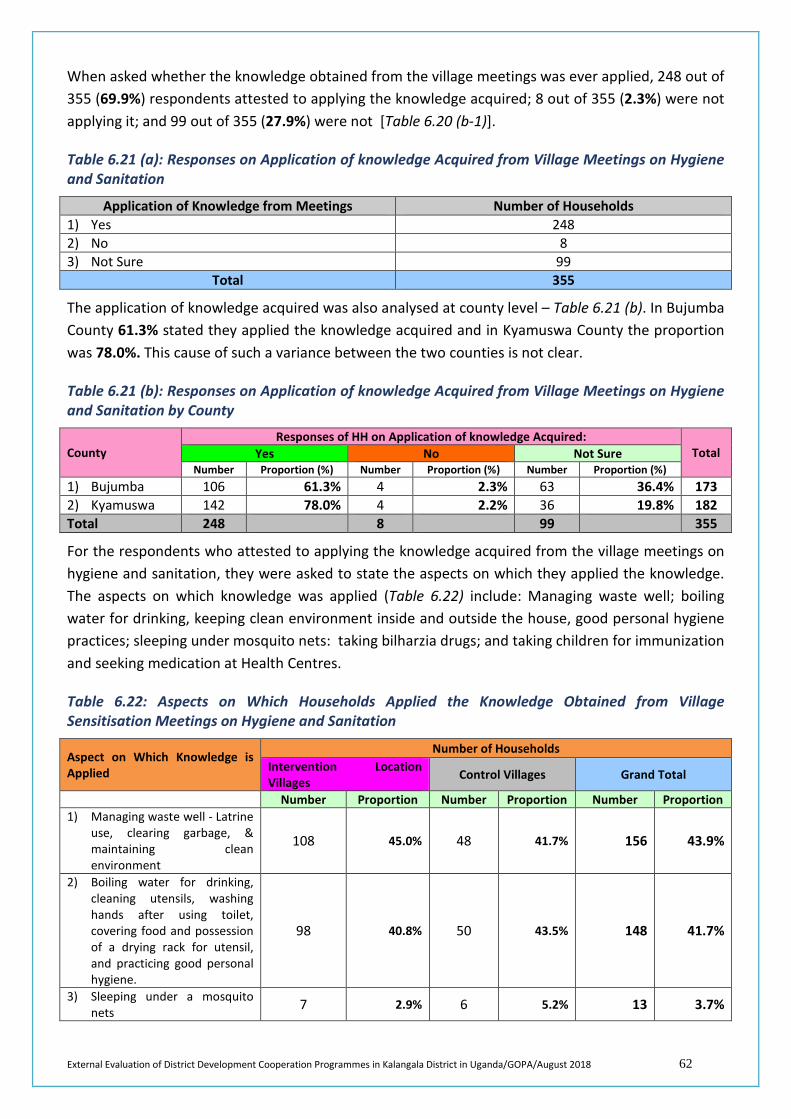
External Evaluation of District Development Cooperation Programmes in Kalangala District in Uganda/GOPA/August 2018 62
When asked whether the knowledge obtained from the village meetings was ever applied, 248 out of 355 (69.9%) respondents attested to applying the knowledge acquired; 8 out of 355 (2.3%) were not applying it; and 99 out of 355 (27.9%) were not [Table 6.20 (b-1)].
Table 6.21 (a): Responses on Application of knowledge Acquired from Village Meetings on Hygiene and Sanitation
Application of Knowledge from Meetings Number of Households 1) Yes 248 2) No 8 3) Not Sure 99
Total 355
The application of knowledge acquired was also analysed at county level – Table 6.21 (b). In Bujumba County 61.3% stated they applied the knowledge acquired and in Kyamuswa County the proportion was 78.0%. This cause of such a variance between the two counties is not clear.
Table 6.21 (b): Responses on Application of knowledge Acquired from Village Meetings on Hygiene and Sanitation by County
County Responses of HH on Application of knowledge Acquired:
Total Yes No Not Sure Number Proportion (%) Number Proportion (%) Number Proportion (%)
1) Bujumba 106 61.3% 4 2.3% 63 36.4% 173 2) Kyamuswa 142 78.0% 4 2.2% 36 19.8% 182 Total 248 8 99 355
For the respondents who attested to applying the knowledge acquired from the village meetings on hygiene and sanitation, they were asked to state the aspects on which they applied the knowledge. The aspects on which knowledge was applied (Table 6.22) include: Managing waste well; boiling water for drinking, keeping clean environment inside and outside the house, good personal hygiene practices; sleeping under mosquito nets: taking bilharzia drugs; and taking children for immunization and seeking medication at Health Centres.
Table 6.22: Aspects on Which Households Applied the Knowledge Obtained from Village Sensitisation Meetings on Hygiene and Sanitation
Aspect on Which Knowledge is Applied
Number of Households Intervention Location Villages Control Villages Grand Total
Number Proportion Number Proportion Number Proportion 1) Managing waste well - Latrine
use, clearing garbage, & maintaining clean environment
108 45.0% 48 41.7% 156 43.9%
2) Boiling water for drinking, cleaning utensils, washing hands after using toilet, covering food and possession of a drying rack for utensil, and practicing good personal hygiene.
98 40.8% 50 43.5% 148 41.7%
3) Sleeping under a mosquito nets 7 2.9% 6 5.2% 13 3.7%
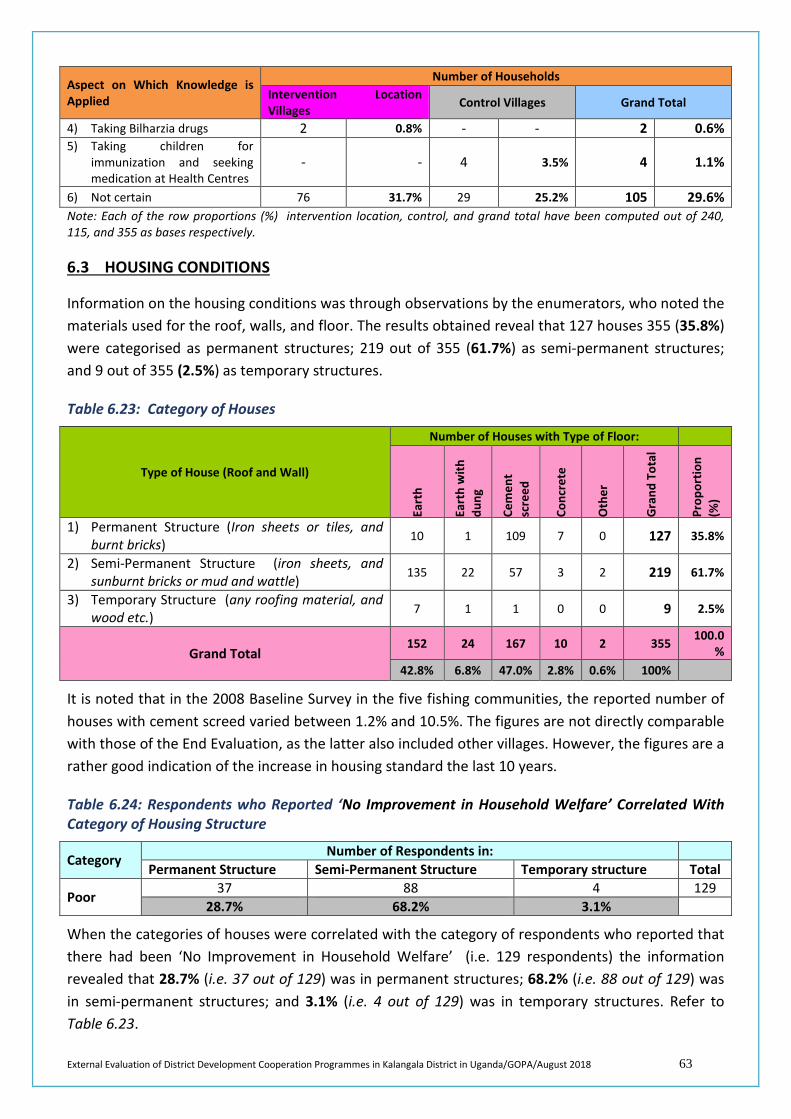
External Evaluation of District Development Cooperation Programmes in Kalangala District in Uganda/GOPA/August 2018 63
Aspect on Which Knowledge is Applied
Number of Households Intervention Location Villages Control Villages Grand Total
4) Taking Bilharzia drugs 2 0.8% - - 2 0.6% 5) Taking children for
immunization and seeking medication at Health Centres
- - 4 3.5% 4 1.1%
6) Not certain 76 31.7% 29 25.2% 105 29.6% Note: Each of the row proportions (%) intervention location, control, and grand total have been computed out of 240, 115, and 355 as bases respectively.
6.3 HOUSING CONDITIONS
Information on the housing conditions was through observations by the enumerators, who noted the materials used for the roof, walls, and floor. The results obtained reveal that 127 houses 355 (35.8%) were categorised as permanent structures; 219 out of 355 (61.7%) as semi-permanent structures; and 9 out of 355 (2.5%) as temporary structures.
Table 6.23: Category of Houses
Type of House (Roof and Wall)
Number of Houses with Type of Floor: Ea
rth
Eart
h w
ith
dung
Cem
ent
scre
ed
Conc
rete
Oth
er
Gra
nd T
otal
Prop
ortio
n (%
)
1) Permanent Structure (Iron sheets or tiles, and burnt bricks) 10 1 109 7 0 127 35.8%
2) Semi-Permanent Structure (iron sheets, and sunburnt bricks or mud and wattle) 135 22 57 3 2 219 61.7%
3) Temporary Structure (any roofing material, and wood etc.) 7 1 1 0 0 9 2.5%
Grand Total 152 24 167 10 2 355 100.0
% 42.8% 6.8% 47.0% 2.8% 0.6% 100%
It is noted that in the 2008 Baseline Survey in the five fishing communities, the reported number of houses with cement screed varied between 1.2% and 10.5%. The figures are not directly comparable with those of the End Evaluation, as the latter also included other villages. However, the figures are a rather good indication of the increase in housing standard the last 10 years.
Table 6.24: Respondents who Reported ‘No Improvement in Household Welfare’ Correlated With Category of Housing Structure
Category Number of Respondents in: Permanent Structure Semi-Permanent Structure Temporary structure Total
Poor 37 88 4 129 28.7% 68.2% 3.1%
When the categories of houses were correlated with the category of respondents who reported that there had been ‘No Improvement in Household Welfare’ (i.e. 129 respondents) the information revealed that 28.7% (i.e. 37 out of 129) was in permanent structures; 68.2% (i.e. 88 out of 129) was in semi-permanent structures; and 3.1% (i.e. 4 out of 129) was in temporary structures. Refer to Table 6.23.
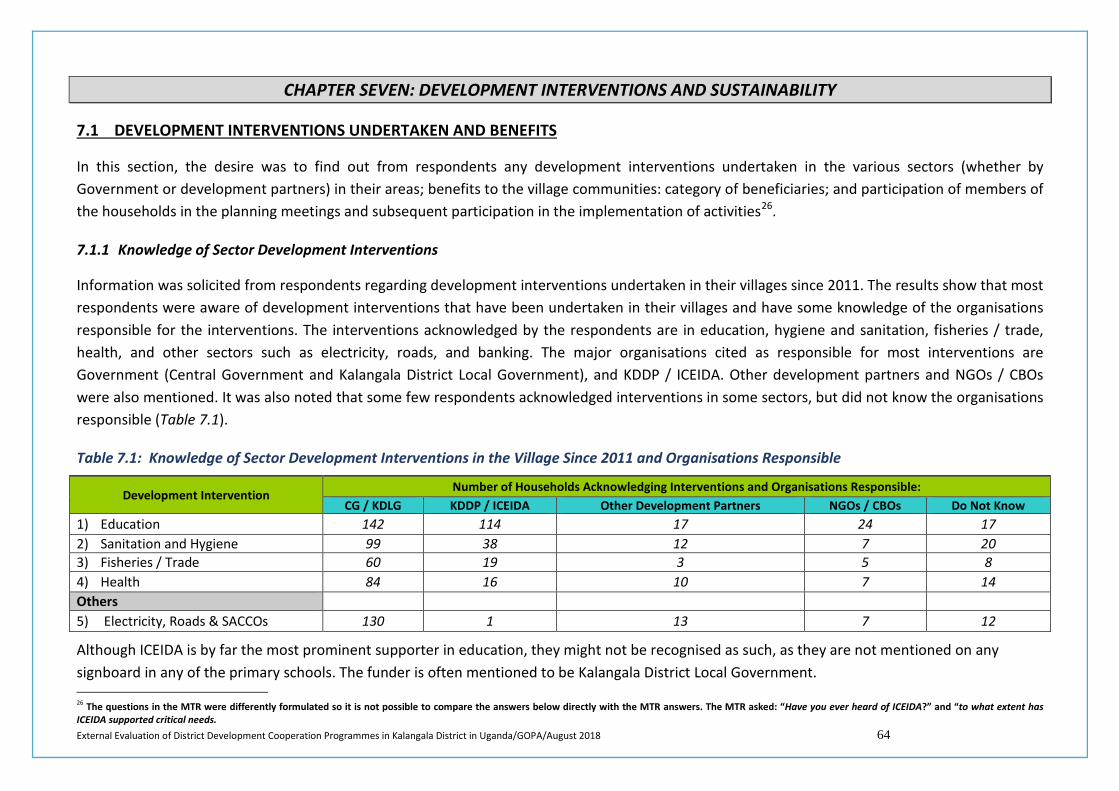
External Evaluation of District Development Cooperation Programmes in Kalangala District in Uganda/GOPA/August 2018 64
CHAPTER SEVEN: DEVELOPMENT INTERVENTIONS AND SUSTAINABILITY
7.1 DEVELOPMENT INTERVENTIONS UNDERTAKEN AND BENEFITS
In this section, the desire was to find out from respondents any development interventions undertaken in the various sectors (whether by Government or development partners) in their areas; benefits to the village communities: category of beneficiaries; and participation of members of the households in the planning meetings and subsequent participation in the implementation of activities26.
7.1.1 Knowledge of Sector Development Interventions
Information was solicited from respondents regarding development interventions undertaken in their villages since 2011. The results show that most respondents were aware of development interventions that have been undertaken in their villages and have some knowledge of the organisations responsible for the interventions. The interventions acknowledged by the respondents are in education, hygiene and sanitation, fisheries / trade, health, and other sectors such as electricity, roads, and banking. The major organisations cited as responsible for most interventions are Government (Central Government and Kalangala District Local Government), and KDDP / ICEIDA. Other development partners and NGOs / CBOs were also mentioned. It was also noted that some few respondents acknowledged interventions in some sectors, but did not know the organisations responsible (Table 7.1).
Table 7.1: Knowledge of Sector Development Interventions in the Village Since 2011 and Organisations Responsible
Development Intervention Number of Households Acknowledging Interventions and Organisations Responsible:
CG / KDLG KDDP / ICEIDA Other Development Partners NGOs / CBOs Do Not Know 1) Education 142 114 17 24 17 2) Sanitation and Hygiene 99 38 12 7 20 3) Fisheries / Trade 60 19 3 5 8 4) Health 84 16 10 7 14 Others 5) Electricity, Roads & SACCOs 130 1 13 7 12
Although ICEIDA is by far the most prominent supporter in education, they might not be recognised as such, as they are not mentioned on any signboard in any of the primary schools. The funder is often mentioned to be Kalangala District Local Government. 26 The questions in the MTR were differently formulated so it is not possible to compare the answers below directly with the MTR answers. The MTR asked: “Have you ever heard of ICEIDA?” and “to what extent has ICEIDA supported critical needs.
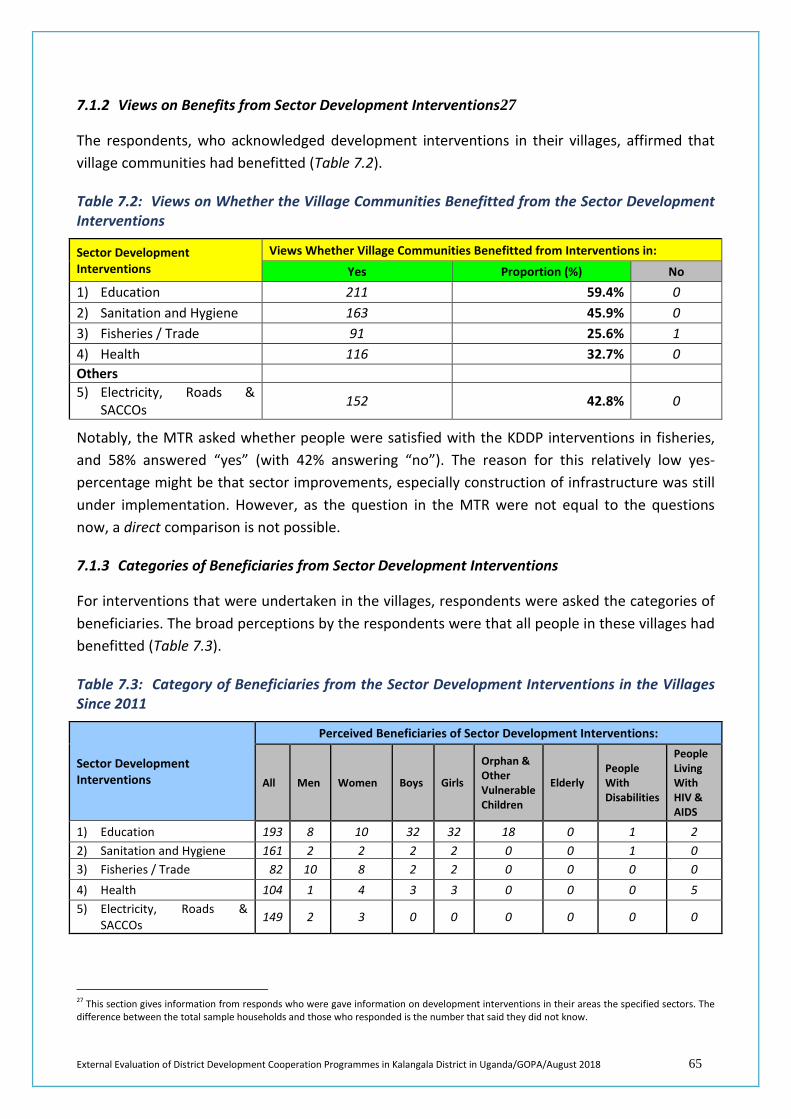
External Evaluation of District Development Cooperation Programmes in Kalangala District in Uganda/GOPA/August 2018 65
7.1.2 Views on Benefits from Sector Development Interventions27
The respondents, who acknowledged development interventions in their villages, affirmed that village communities had benefitted (Table 7.2).
Table 7.2: Views on Whether the Village Communities Benefitted from the Sector Development Interventions
Sector Development Interventions
Views Whether Village Communities Benefitted from Interventions in:
Yes Proportion (%) No 1) Education 211 59.4% 0 2) Sanitation and Hygiene 163 45.9% 0 3) Fisheries / Trade 91 25.6% 1 4) Health 116 32.7% 0 Others 5) Electricity, Roads &
SACCOs 152 42.8% 0
Notably, the MTR asked whether people were satisfied with the KDDP interventions in fisheries, and 58% answered “yes” (with 42% answering “no”). The reason for this relatively low yes-percentage might be that sector improvements, especially construction of infrastructure was still under implementation. However, as the question in the MTR were not equal to the questions now, a direct comparison is not possible.
7.1.3 Categories of Beneficiaries from Sector Development Interventions
For interventions that were undertaken in the villages, respondents were asked the categories of beneficiaries. The broad perceptions by the respondents were that all people in these villages had benefitted (Table 7.3).
Table 7.3: Category of Beneficiaries from the Sector Development Interventions in the Villages Since 2011
Sector Development Interventions
Perceived Beneficiaries of Sector Development Interventions:
All Men Women Boys Girls
Orphan & Other Vulnerable Children
Elderly People With Disabilities
People Living With HIV & AIDS
1) Education 193 8 10 32 32 18 0 1 2 2) Sanitation and Hygiene 161 2 2 2 2 0 0 1 0 3) Fisheries / Trade 82 10 8 2 2 0 0 0 0 4) Health 104 1 4 3 3 0 0 0 5 5) Electricity, Roads &
SACCOs 149 2 3 0 0 0 0 0 0
27 This section gives information from responds who were gave information on development interventions in their areas the specified sectors. The difference between the total sample households and those who responded is the number that said they did not know.
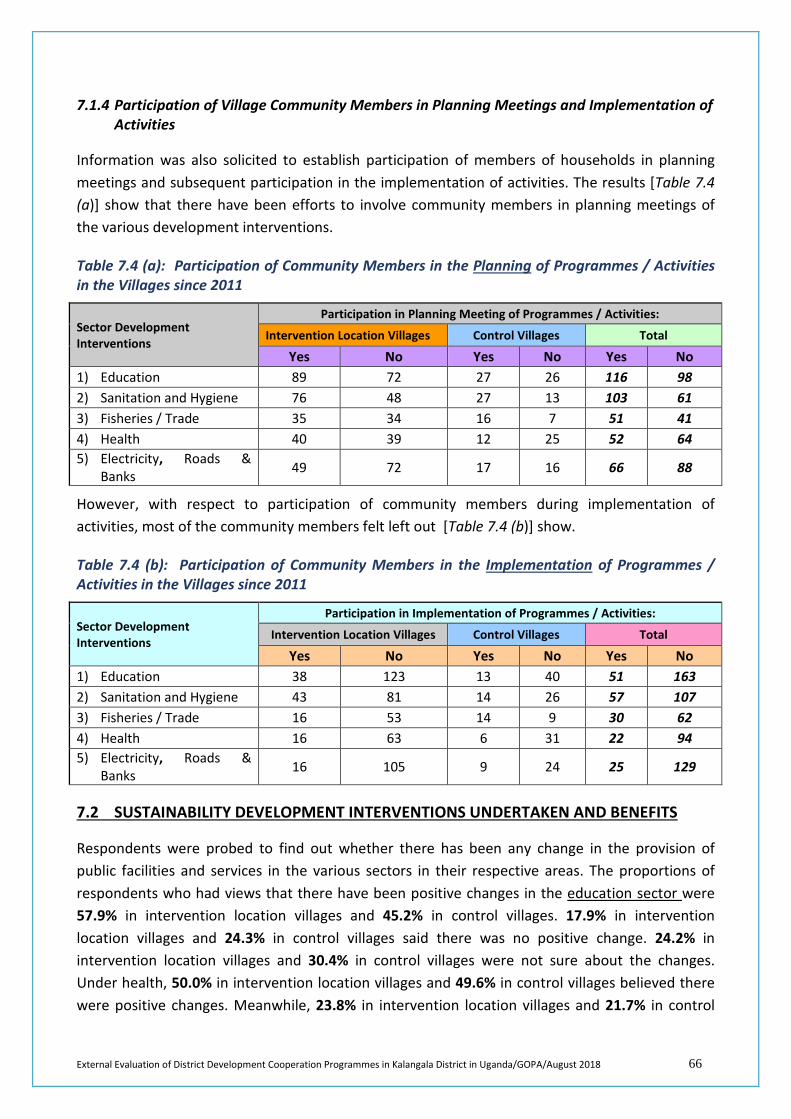
External Evaluation of District Development Cooperation Programmes in Kalangala District in Uganda/GOPA/August 2018 66
7.1.4 Participation of Village Community Members in Planning Meetings and Implementation of Activities
Information was also solicited to establish participation of members of households in planning meetings and subsequent participation in the implementation of activities. The results [Table 7.4 (a)] show that there have been efforts to involve community members in planning meetings of the various development interventions.
Table 7.4 (a): Participation of Community Members in the Planning of Programmes / Activities in the Villages since 2011
Sector Development Interventions
Participation in Planning Meeting of Programmes / Activities:
Intervention Location Villages Control Villages Total
Yes No Yes No Yes No 1) Education 89 72 27 26 116 98 2) Sanitation and Hygiene 76 48 27 13 103 61 3) Fisheries / Trade 35 34 16 7 51 41 4) Health 40 39 12 25 52 64 5) Electricity, Roads &
Banks 49 72 17 16 66 88
However, with respect to participation of community members during implementation of activities, most of the community members felt left out [Table 7.4 (b)] show.
Table 7.4 (b): Participation of Community Members in the Implementation of Programmes / Activities in the Villages since 2011
Sector Development Interventions
Participation in Implementation of Programmes / Activities:
Intervention Location Villages Control Villages Total
Yes No Yes No Yes No 1) Education 38 123 13 40 51 163 2) Sanitation and Hygiene 43 81 14 26 57 107 3) Fisheries / Trade 16 53 14 9 30 62 4) Health 16 63 6 31 22 94 5) Electricity, Roads &
Banks 16 105 9 24 25 129
7.2 SUSTAINABILITY DEVELOPMENT INTERVENTIONS UNDERTAKEN AND BENEFITS
Respondents were probed to find out whether there has been any change in the provision of public facilities and services in the various sectors in their respective areas. The proportions of respondents who had views that there have been positive changes in the education sector were 57.9% in intervention location villages and 45.2% in control villages. 17.9% in intervention location villages and 24.3% in control villages said there was no positive change. 24.2% in intervention location villages and 30.4% in control villages were not sure about the changes. Under health, 50.0% in intervention location villages and 49.6% in control villages believed there were positive changes. Meanwhile, 23.8% in intervention location villages and 21.7% in control
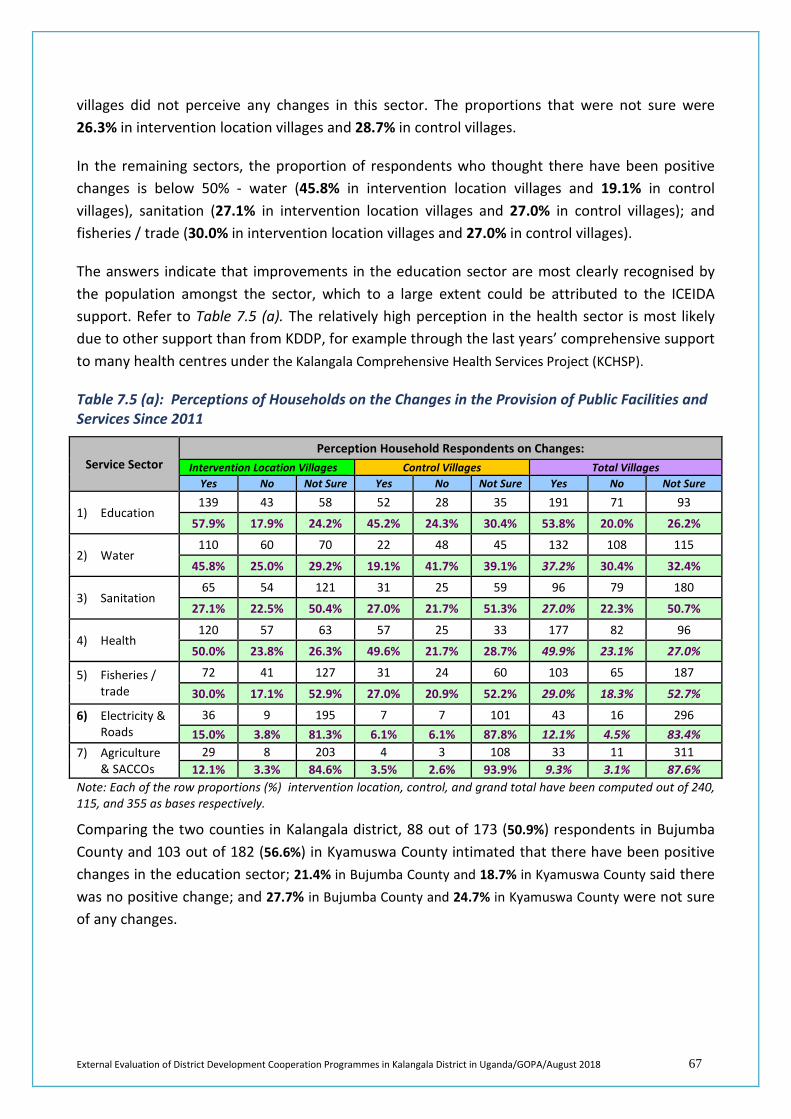
External Evaluation of District Development Cooperation Programmes in Kalangala District in Uganda/GOPA/August 2018 67
villages did not perceive any changes in this sector. The proportions that were not sure were 26.3% in intervention location villages and 28.7% in control villages.
In the remaining sectors, the proportion of respondents who thought there have been positive changes is below 50% - water (45.8% in intervention location villages and 19.1% in control villages), sanitation (27.1% in intervention location villages and 27.0% in control villages); and fisheries / trade (30.0% in intervention location villages and 27.0% in control villages).
The answers indicate that improvements in the education sector are most clearly recognised by the population amongst the sector, which to a large extent could be attributed to the ICEIDA support. Refer to Table 7.5 (a). The relatively high perception in the health sector is most likely due to other support than from KDDP, for example through the last years’ comprehensive support to many health centres under the Kalangala Comprehensive Health Services Project (KCHSP).
Table 7.5 (a): Perceptions of Households on the Changes in the Provision of Public Facilities and Services Since 2011
Service Sector Perception Household Respondents on Changes:
Intervention Location Villages Control Villages Total Villages Yes No Not Sure Yes No Not Sure Yes No Not Sure
1) Education 139 43 58 52 28 35 191 71 93
57.9% 17.9% 24.2% 45.2% 24.3% 30.4% 53.8% 20.0% 26.2%
2) Water 110 60 70 22 48 45 132 108 115
45.8% 25.0% 29.2% 19.1% 41.7% 39.1% 37.2% 30.4% 32.4%
3) Sanitation 65 54 121 31 25 59 96 79 180
27.1% 22.5% 50.4% 27.0% 21.7% 51.3% 27.0% 22.3% 50.7%
4) Health 120 57 63 57 25 33 177 82 96
50.0% 23.8% 26.3% 49.6% 21.7% 28.7% 49.9% 23.1% 27.0%
5) Fisheries / trade
72 41 127 31 24 60 103 65 187
30.0% 17.1% 52.9% 27.0% 20.9% 52.2% 29.0% 18.3% 52.7%
6) Electricity & Roads
36 9 195 7 7 101 43 16 296 15.0% 3.8% 81.3% 6.1% 6.1% 87.8% 12.1% 4.5% 83.4%
7) Agriculture & SACCOs
29 8 203 4 3 108 33 11 311 12.1% 3.3% 84.6% 3.5% 2.6% 93.9% 9.3% 3.1% 87.6%
Note: Each of the row proportions (%) intervention location, control, and grand total have been computed out of 240, 115, and 355 as bases respectively.
Comparing the two counties in Kalangala district, 88 out of 173 (50.9%) respondents in Bujumba County and 103 out of 182 (56.6%) in Kyamuswa County intimated that there have been positive changes in the education sector; 21.4% in Bujumba County and 18.7% in Kyamuswa County said there was no positive change; and 27.7% in Bujumba County and 24.7% in Kyamuswa County were not sure of any changes.
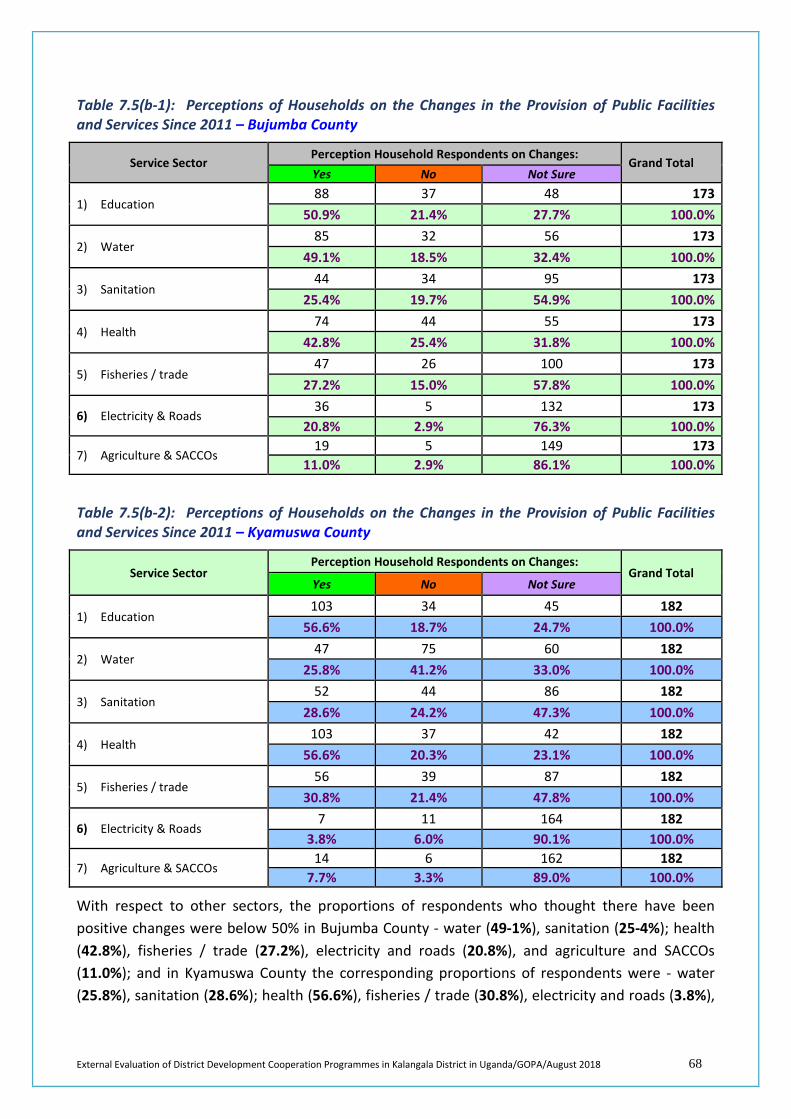
External Evaluation of District Development Cooperation Programmes in Kalangala District in Uganda/GOPA/August 2018 68
Table 7.5(b-1): Perceptions of Households on the Changes in the Provision of Public Facilities and Services Since 2011 – Bujumba County
Service Sector Perception Household Respondents on Changes:
Grand Total Yes No Not Sure
1) Education 88 37 48 173
50.9% 21.4% 27.7% 100.0%
2) Water 85 32 56 173
49.1% 18.5% 32.4% 100.0%
3) Sanitation 44 34 95 173
25.4% 19.7% 54.9% 100.0%
4) Health 74 44 55 173
42.8% 25.4% 31.8% 100.0%
5) Fisheries / trade 47 26 100 173
27.2% 15.0% 57.8% 100.0%
6) Electricity & Roads 36 5 132 173
20.8% 2.9% 76.3% 100.0%
7) Agriculture & SACCOs 19 5 149 173
11.0% 2.9% 86.1% 100.0%
Table 7.5(b-2): Perceptions of Households on the Changes in the Provision of Public Facilities and Services Since 2011 – Kyamuswa County
Service Sector Perception Household Respondents on Changes:
Grand Total Yes No Not Sure
1) Education 103 34 45 182
56.6% 18.7% 24.7% 100.0%
2) Water 47 75 60 182
25.8% 41.2% 33.0% 100.0%
3) Sanitation 52 44 86 182
28.6% 24.2% 47.3% 100.0%
4) Health 103 37 42 182
56.6% 20.3% 23.1% 100.0%
5) Fisheries / trade 56 39 87 182
30.8% 21.4% 47.8% 100.0%
6) Electricity & Roads 7 11 164 182
3.8% 6.0% 90.1% 100.0%
7) Agriculture & SACCOs 14 6 162 182
7.7% 3.3% 89.0% 100.0%
With respect to other sectors, the proportions of respondents who thought there have been positive changes were below 50% in Bujumba County - water (49-1%), sanitation (25-4%); health (42.8%), fisheries / trade (27.2%), electricity and roads (20.8%), and agriculture and SACCOs (11.0%); and in Kyamuswa County the corresponding proportions of respondents were - water (25.8%), sanitation (28.6%); health (56.6%), fisheries / trade (30.8%), electricity and roads (3.8%),
External Evaluation of District Development Cooperation Programmes in Kalangala District in Uganda/GOPA/August 2018 69
and agriculture and SACCOs (7.7%). Notably in Kyamuswa County positive changes have been recognised in the health sector.
The answers indicate that improvements in the education sector are most clearly recognised by the population amongst the sector, which to a large extent could be attributed to the ICEIDA support. Notably also positive changes have been recognised in the health sector in Kyamuswa County.
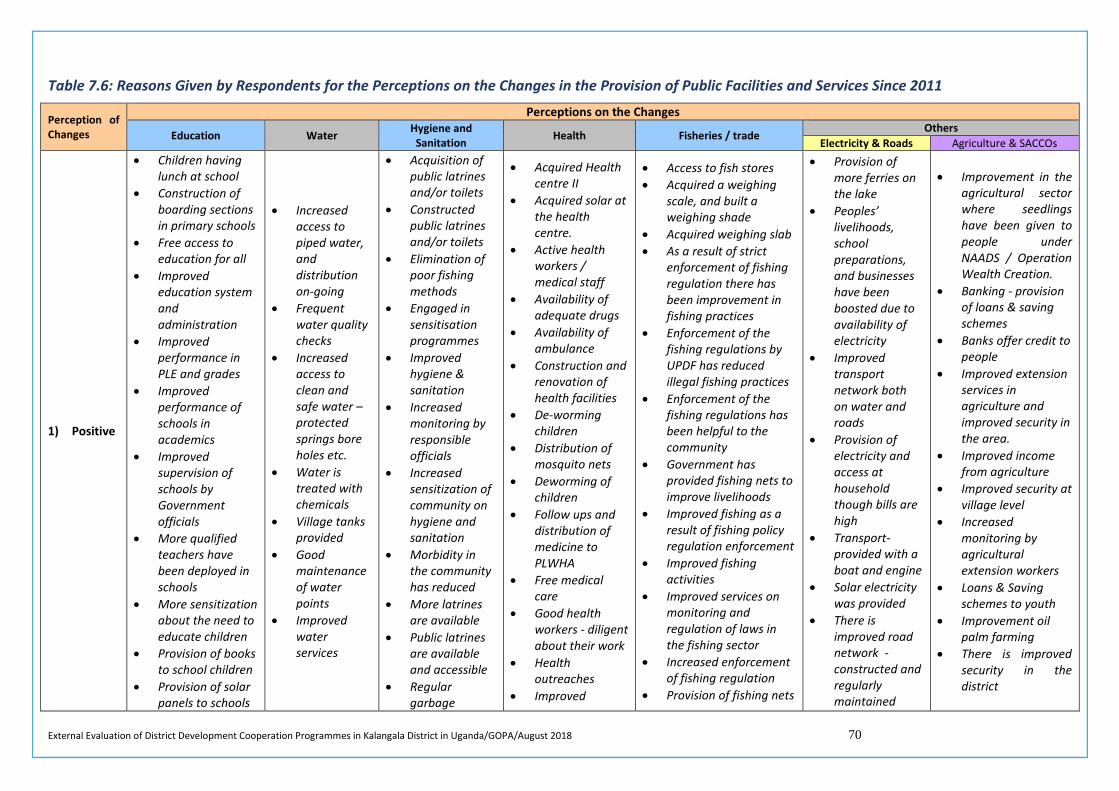
External Evaluation of District Development Cooperation Programmes in Kalangala District in Uganda/GOPA/August 2018 70
Table 7.6: Reasons Given by Respondents for the Perceptions on the Changes in the Provision of Public Facilities and Services Since 2011
Perception of Changes
Perceptions on the Changes
Education Water Hygiene and Sanitation Health Fisheries / trade
Others Electricity & Roads Agriculture & SACCOs
1) Positive
• Children having lunch at school
• Construction of boarding sections in primary schools
• Free access to education for all
• Improved education system and administration
• Improved performance in PLE and grades
• Improved performance of schools in academics
• Improved supervision of schools by Government officials
• More qualified teachers have been deployed in schools
• More sensitization about the need to educate children
• Provision of books to school children
• Provision of solar panels to schools
• Increased access to piped water, and distribution on-going
• Frequent water quality checks
• Increased access to clean and safe water – protected springs bore holes etc.
• Water is treated with chemicals
• Village tanks provided
• Good maintenance of water points
• Improved water services
• Acquisition of public latrines and/or toilets
• Constructed public latrines and/or toilets
• Elimination of poor fishing methods
• Engaged in sensitisation programmes
• Improved hygiene & sanitation
• Increased monitoring by responsible officials
• Increased sensitization of community on hygiene and sanitation
• Morbidity in the community has reduced
• More latrines are available
• Public latrines are available and accessible
• Regular garbage
• Acquired Health centre II
• Acquired solar at the health centre.
• Active health workers / medical staff
• Availability of adequate drugs
• Availability of ambulance
• Construction and renovation of health facilities
• De-worming children
• Distribution of mosquito nets
• Deworming of children
• Follow ups and distribution of medicine to PLWHA
• Free medical care
• Good health workers - diligent about their work
• Health outreaches
• Improved
• Access to fish stores • Acquired a weighing
scale, and built a weighing shade
• Acquired weighing slab • As a result of strict
enforcement of fishing regulation there has been improvement in fishing practices
• Enforcement of the fishing regulations by UPDF has reduced illegal fishing practices
• Enforcement of the fishing regulations has been helpful to the community
• Government has provided fishing nets to improve livelihoods
• Improved fishing as a result of fishing policy regulation enforcement
• Improved fishing activities
• Improved services on monitoring and regulation of laws in the fishing sector
• Increased enforcement of fishing regulation
• Provision of fishing nets
• Provision of more ferries on the lake
• Peoples’ livelihoods, school preparations, and businesses have been boosted due to availability of electricity
• Improved transport network both on water and roads
• Provision of electricity and access at household though bills are high
• Transport- provided with a boat and engine
• Solar electricity was provided
• There is improved road network - constructed and regularly maintained
• Improvement in the agricultural sector where seedlings have been given to people under NAADS / Operation Wealth Creation.
• Banking - provision of loans & saving schemes
• Banks offer credit to people
• Improved extension services in agriculture and improved security in the area.
• Improved income from agriculture
• Improved security at village level
• Increased monitoring by agricultural extension workers
• Loans & Saving schemes to youth
• Improvement oil palm farming
• There is improved security in the district
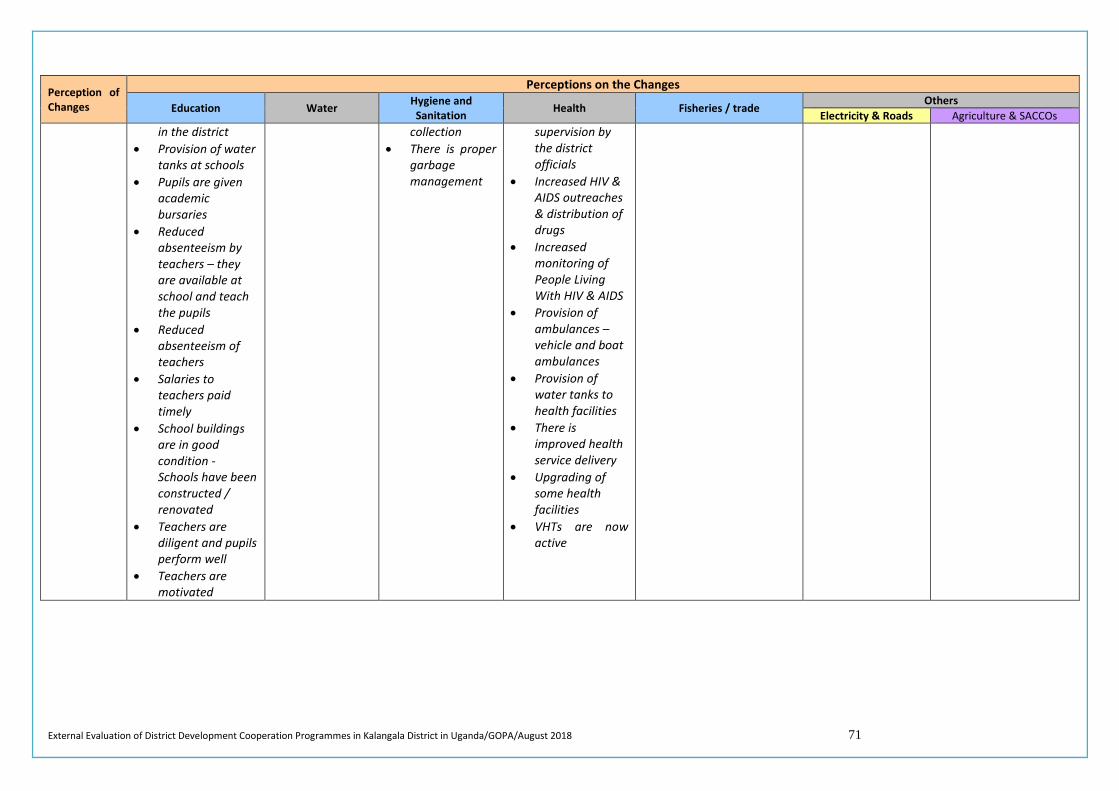
External Evaluation of District Development Cooperation Programmes in Kalangala District in Uganda/GOPA/August 2018 71
Perception of Changes
Perceptions on the Changes
Education Water Hygiene and Sanitation Health Fisheries / trade
Others Electricity & Roads Agriculture & SACCOs
in the district • Provision of water
tanks at schools • Pupils are given
academic bursaries
• Reduced absenteeism by teachers – they are available at school and teach the pupils
• Reduced absenteeism of teachers
• Salaries to teachers paid timely
• School buildings are in good condition - Schools have been constructed / renovated
• Teachers are diligent and pupils perform well
• Teachers are motivated
collection • There is proper
garbage management
supervision by the district officials
• Increased HIV & AIDS outreaches & distribution of drugs
• Increased monitoring of People Living With HIV & AIDS
• Provision of ambulances – vehicle and boat ambulances
• Provision of water tanks to health facilities
• There is improved health service delivery
• Upgrading of some health facilities
• VHTs are now active
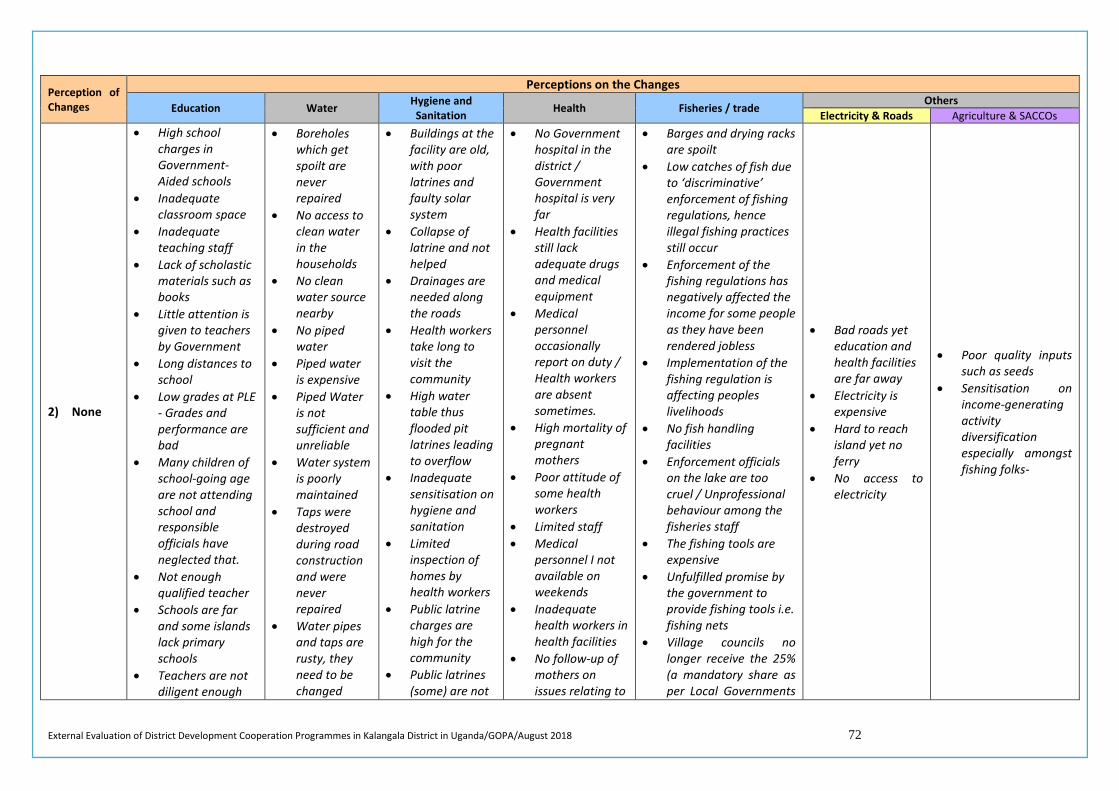
External Evaluation of District Development Cooperation Programmes in Kalangala District in Uganda/GOPA/August 2018 72
Perception of Changes
Perceptions on the Changes
Education Water Hygiene and Sanitation Health Fisheries / trade
Others Electricity & Roads Agriculture & SACCOs
2) None
• High school charges in Government-Aided schools
• Inadequate classroom space
• Inadequate teaching staff
• Lack of scholastic materials such as books
• Little attention is given to teachers by Government
• Long distances to school
• Low grades at PLE - Grades and performance are bad
• Many children of school-going age are not attending school and responsible officials have neglected that.
• Not enough qualified teacher
• Schools are far and some islands lack primary schools
• Teachers are not diligent enough
• Boreholes which get spoilt are never repaired
• No access to clean water in the households
• No clean water source nearby
• No piped water
• Piped water is expensive
• Piped Water is not sufficient and unreliable
• Water system is poorly maintained
• Taps were destroyed during road construction and were never repaired
• Water pipes and taps are rusty, they need to be changed
• Buildings at the facility are old, with poor latrines and faulty solar system
• Collapse of latrine and not helped
• Drainages are needed along the roads
• Health workers take long to visit the community
• High water table thus flooded pit latrines leading to overflow
• Inadequate sensitisation on hygiene and sanitation
• Limited inspection of homes by health workers
• Public latrine charges are high for the community
• Public latrines (some) are not
• No Government hospital in the district / Government hospital is very far
• Health facilities still lack adequate drugs and medical equipment
• Medical personnel occasionally report on duty / Health workers are absent sometimes.
• High mortality of pregnant mothers
• Poor attitude of some health workers
• Limited staff • Medical
personnel I not available on weekends
• Inadequate health workers in health facilities
• No follow-up of mothers on issues relating to
• Barges and drying racks are spoilt
• Low catches of fish due to ‘discriminative’ enforcement of fishing regulations, hence illegal fishing practices still occur
• Enforcement of the fishing regulations has negatively affected the income for some people as they have been rendered jobless
• Implementation of the fishing regulation is affecting peoples livelihoods
• No fish handling facilities
• Enforcement officials on the lake are too cruel / Unprofessional behaviour among the fisheries staff
• The fishing tools are expensive
• Unfulfilled promise by the government to provide fishing tools i.e. fishing nets
• Village councils no longer receive the 25% (a mandatory share as per Local Governments
• Bad roads yet education and health facilities are far away
• Electricity is expensive
• Hard to reach island yet no ferry
• No access to electricity
• Poor quality inputs such as seeds
• Sensitisation on income-generating activity diversification especially amongst fishing folks-
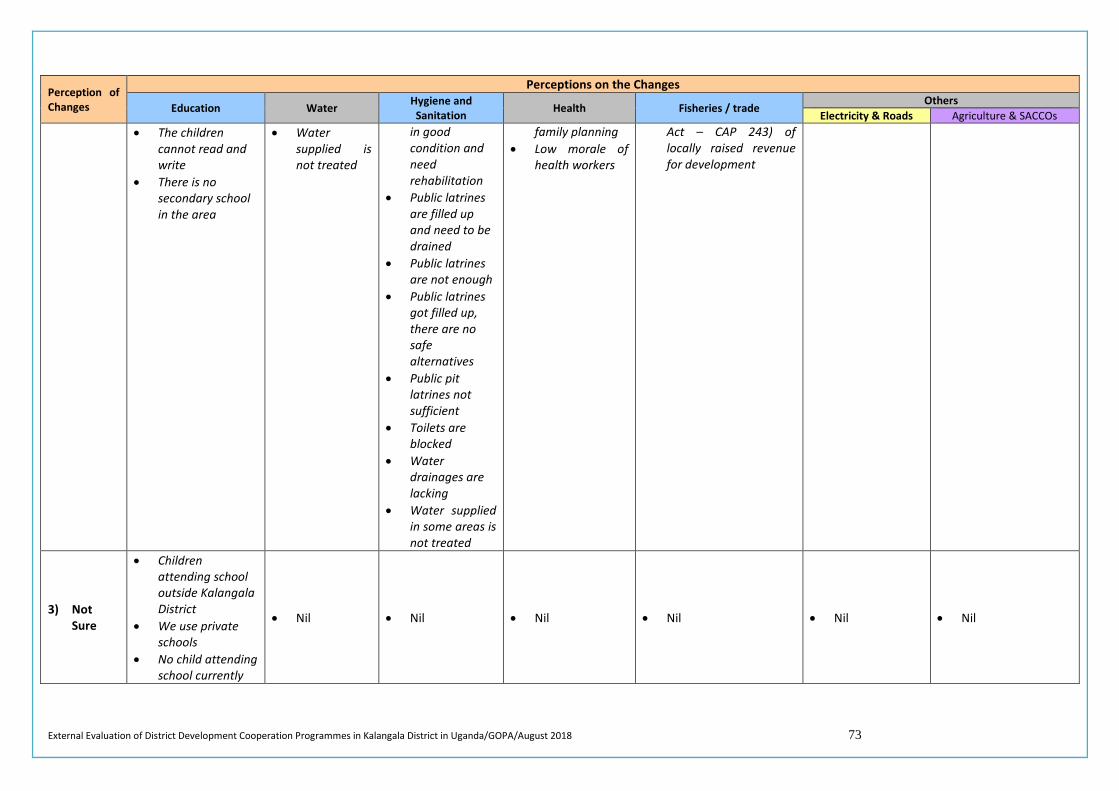
External Evaluation of District Development Cooperation Programmes in Kalangala District in Uganda/GOPA/August 2018 73
Perception of Changes
Perceptions on the Changes
Education Water Hygiene and Sanitation Health Fisheries / trade
Others Electricity & Roads Agriculture & SACCOs
• The children cannot read and write
• There is no secondary school in the area
• Water supplied is not treated
in good condition and need rehabilitation
• Public latrines are filled up and need to be drained
• Public latrines are not enough
• Public latrines got filled up, there are no safe alternatives
• Public pit latrines not sufficient
• Toilets are blocked
• Water drainages are lacking
• Water supplied in some areas is not treated
family planning • Low morale of
health workers
Act – CAP 243) of locally raised revenue for development
3) Not Sure
• Children attending school outside Kalangala District
• We use private schools
• No child attending school currently
• Nil • Nil • Nil • Nil • Nil • Nil
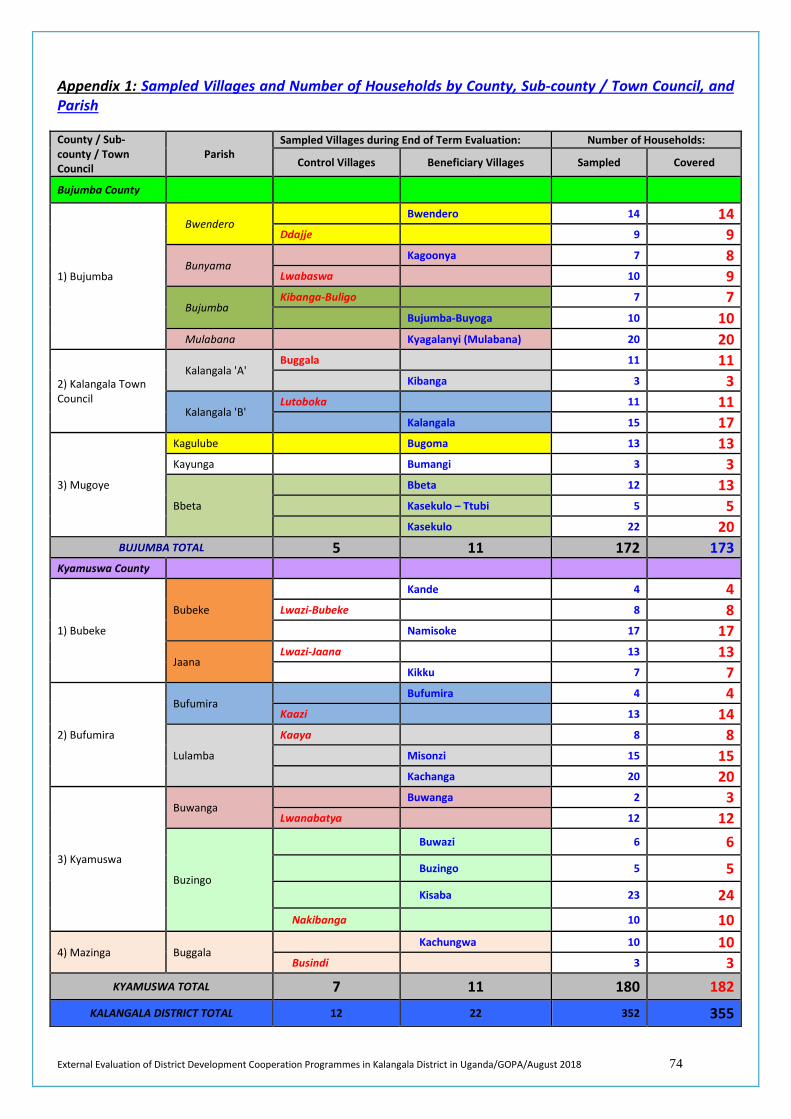
External Evaluation of District Development Cooperation Programmes in Kalangala District in Uganda/GOPA/August 2018 74
Appendix 1: Sampled Villages and Number of Households by County, Sub-county / Town Council, and Parish
County / Sub-county / Town Council
Parish Sampled Villages during End of Term Evaluation: Number of Households:
Control Villages Beneficiary Villages Sampled Covered
Bujumba County
1) Bujumba
Bwendero Bwendero 14 14
Ddajje 9 9
Bunyama Kagoonya 7 8
Lwabaswa 10 9
Bujumba Kibanga-Buligo 7 7
Bujumba-Buyoga 10 10 Mulabana Kyagalanyi (Mulabana) 20 20
2) Kalangala Town Council
Kalangala 'A' Buggala 11 11
Kibanga 3 3
Kalangala 'B' Lutoboka 11 11
Kalangala 15 17
3) Mugoye
Kagulube Bugoma 13 13 Kayunga Bumangi 3 3
Bbeta
Bbeta 12 13 Kasekulo – Ttubi 5 5 Kasekulo 22 20
BUJUMBA TOTAL 5 11 172 173 Kyamuswa County
1) Bubeke
Bubeke
Kande 4 4 Lwazi-Bubeke 8 8
Namisoke 17 17
Jaana Lwazi-Jaana 13 13
Kikku 7 7
2) Bufumira
Bufumira Bufumira 4 4
Kaazi 13 14
Lulamba
Kaaya 8 8 Misonzi 15 15 Kachanga 20 20
3) Kyamuswa
Buwanga Buwanga 2 3
Lwanabatya 12 12
Buzingo
Buwazi 6 6
Buzingo 5 5 Kisaba 23 24 Nakibanga 10 10
4) Mazinga Buggala Kachungwa 10 10 Busindi 3 3
KYAMUSWA TOTAL 7 11 180 182
KALANGALA DISTRICT TOTAL 12 22 352 355
External Evaluation of District Development Cooperation Programmes in Kalangala District in Uganda/GOPA/August 2018 1
Annex 8: Illustration Photos
Local Administration (and Tourism) Component
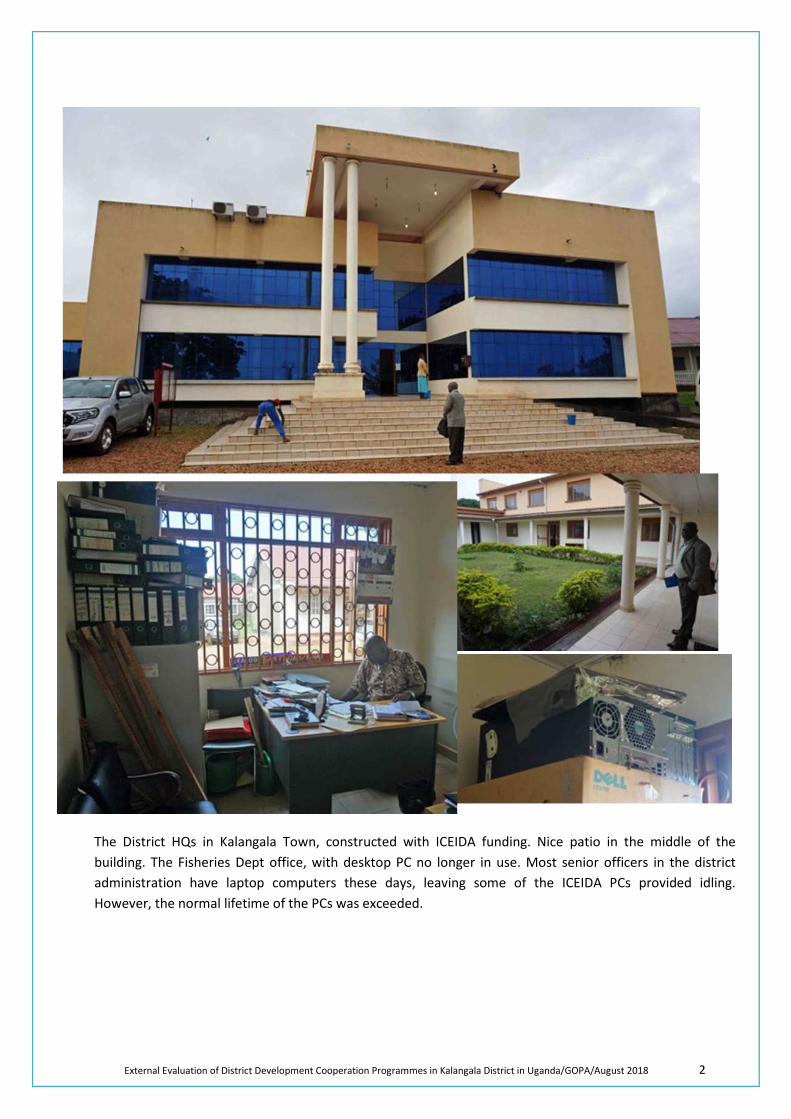
External Evaluation of District Development Cooperation Programmes in Kalangala District in Uganda/GOPA/August 2018 2
The District HQs in Kalangala Town, constructed with ICEIDA funding. Nice patio in the middle of the building. The Fisheries Dept office, with desktop PC no longer in use. Most senior officers in the district administration have laptop computers these days, leaving some of the ICEIDA PCs provided idling. However, the normal lifetime of the PCs was exceeded.
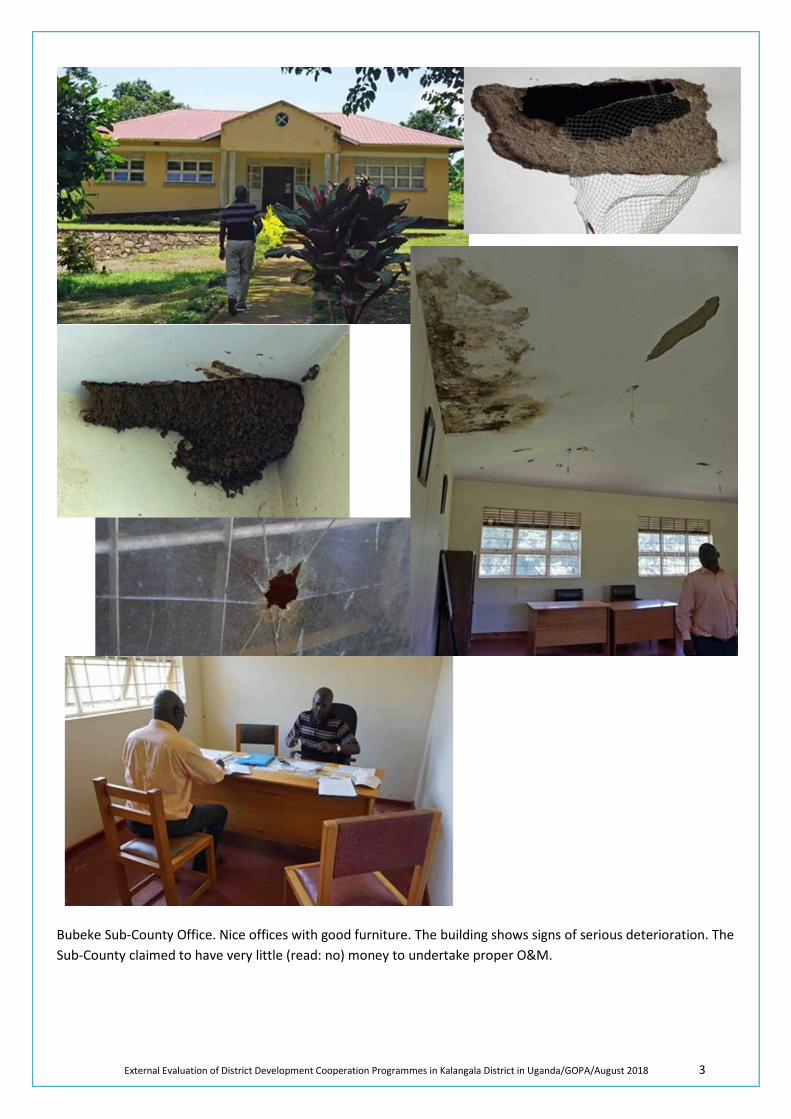
External Evaluation of District Development Cooperation Programmes in Kalangala District in Uganda/GOPA/August 2018 3
Bubeke Sub-County Office. Nice offices with good furniture. The building shows signs of serious deterioration. The Sub-County claimed to have very little (read: no) money to undertake proper O&M.
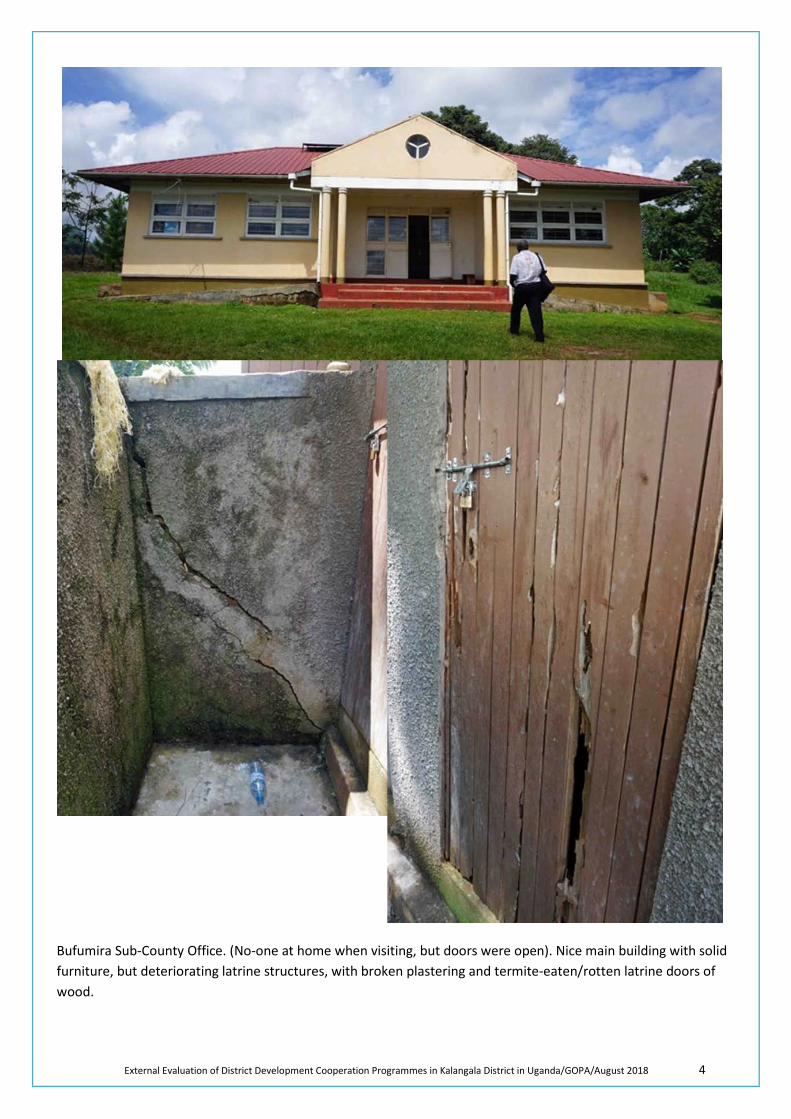
External Evaluation of District Development Cooperation Programmes in Kalangala District in Uganda/GOPA/August 2018 4
Bufumira Sub-County Office. (No-one at home when visiting, but doors were open). Nice main building with solid furniture, but deteriorating latrine structures, with broken plastering and termite-eaten/rotten latrine doors of wood.
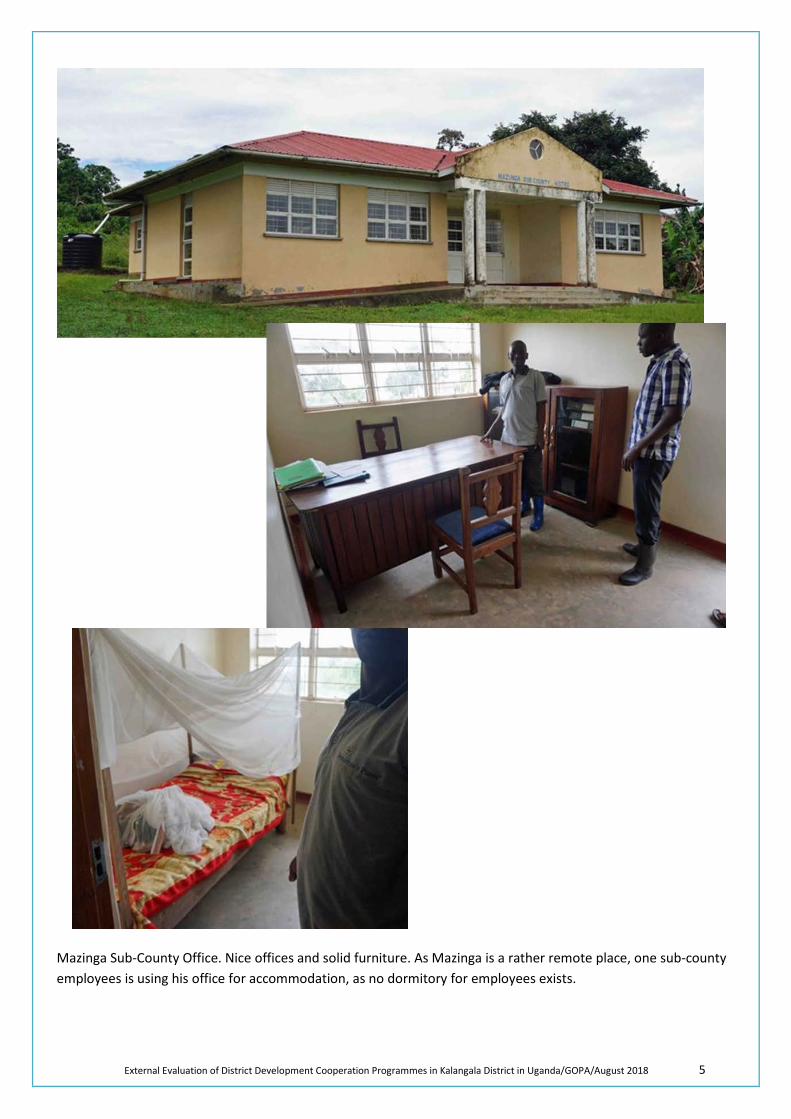
External Evaluation of District Development Cooperation Programmes in Kalangala District in Uganda/GOPA/August 2018 5
Mazinga Sub-County Office. Nice offices and solid furniture. As Mazinga is a rather remote place, one sub-county employees is using his office for accommodation, as no dormitory for employees exists.
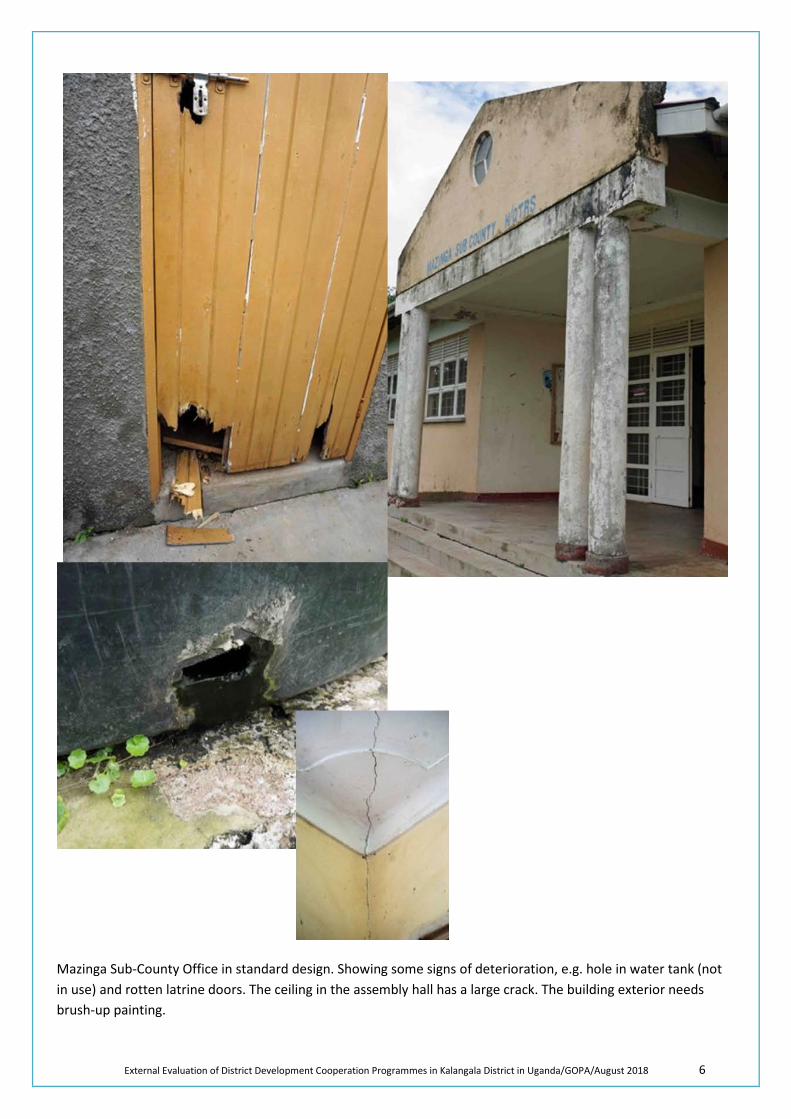
External Evaluation of District Development Cooperation Programmes in Kalangala District in Uganda/GOPA/August 2018 6
Mazinga Sub-County Office in standard design. Showing some signs of deterioration, e.g. hole in water tank (not in use) and rotten latrine doors. The ceiling in the assembly hall has a large crack. The building exterior needs brush-up painting.
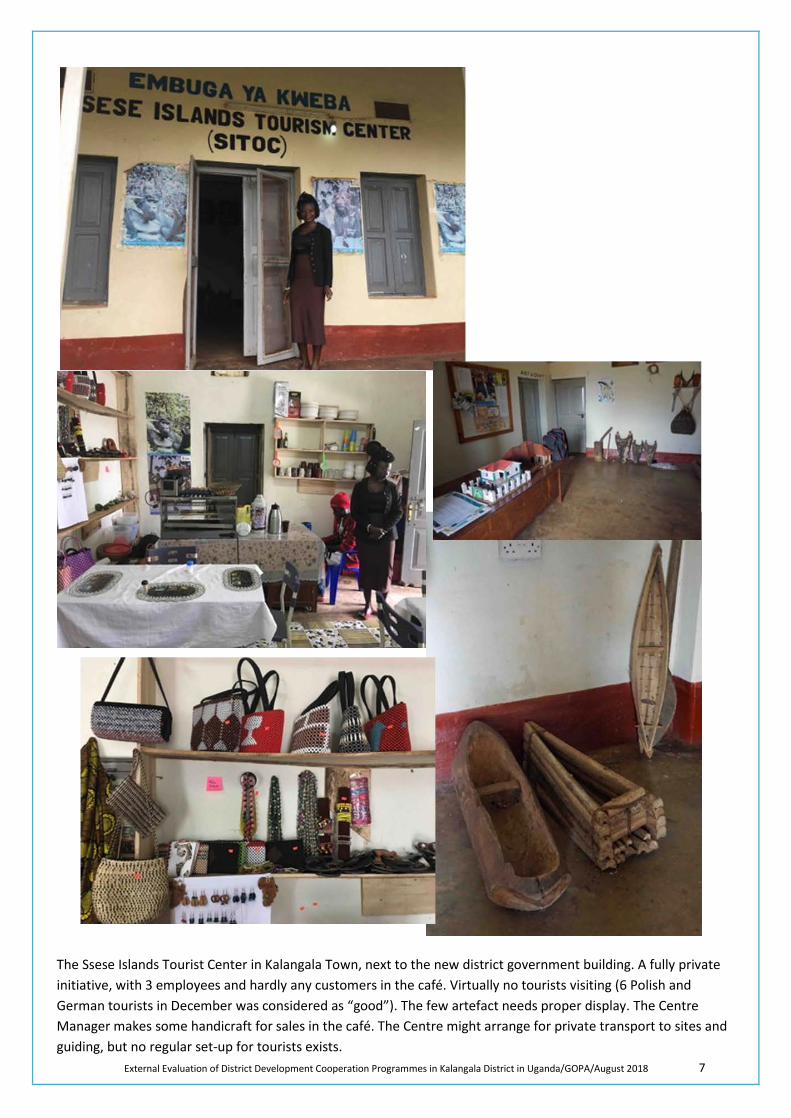
External Evaluation of District Development Cooperation Programmes in Kalangala District in Uganda/GOPA/August 2018 7
The Ssese Islands Tourist Center in Kalangala Town, next to the new district government building. A fully private initiative, with 3 employees and hardly any customers in the café. Virtually no tourists visiting (6 Polish and German tourists in December was considered as “good”). The few artefact needs proper display. The Centre Manager makes some handicraft for sales in the café. The Centre might arrange for private transport to sites and guiding, but no regular set-up for tourists exists.
External Evaluation of District Development Cooperation Programmes in Kalangala District in Uganda/GOPA/August 2018 8
Fisheries and WATSAN Component
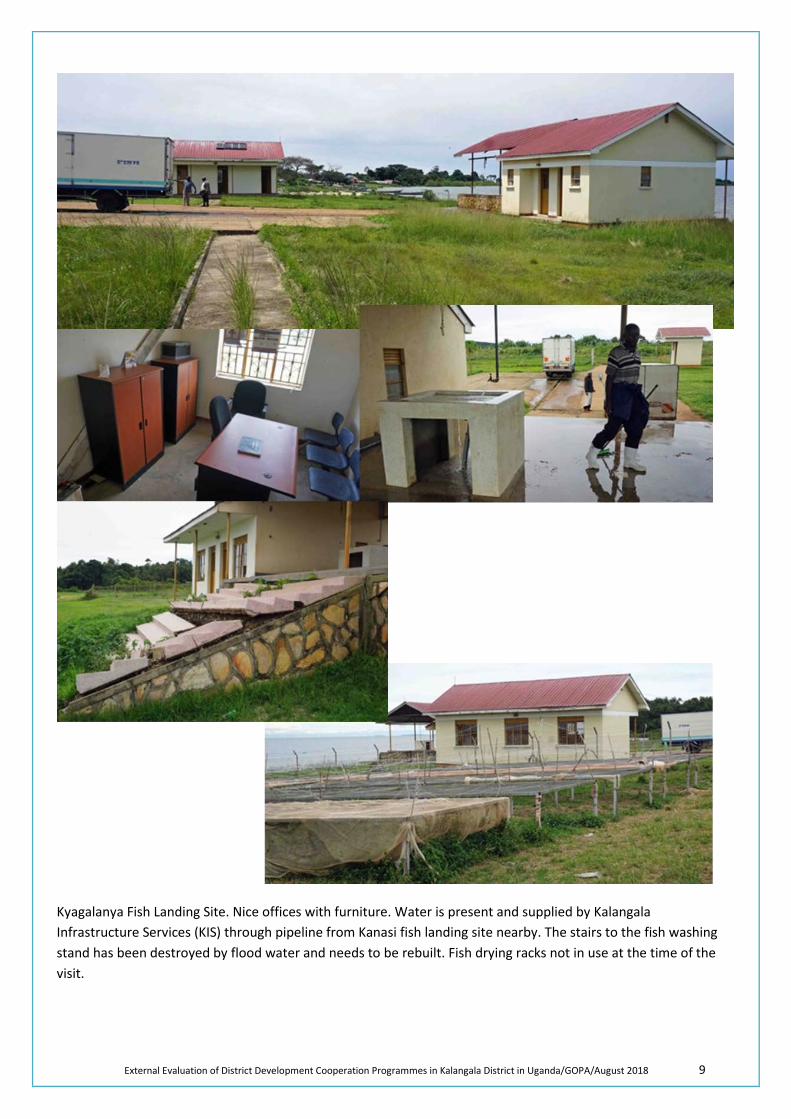
External Evaluation of District Development Cooperation Programmes in Kalangala District in Uganda/GOPA/August 2018 9
Kyagalanya Fish Landing Site. Nice offices with furniture. Water is present and supplied by Kalangala Infrastructure Services (KIS) through pipeline from Kanasi fish landing site nearby. The stairs to the fish washing stand has been destroyed by flood water and needs to be rebuilt. Fish drying racks not in use at the time of the visit.
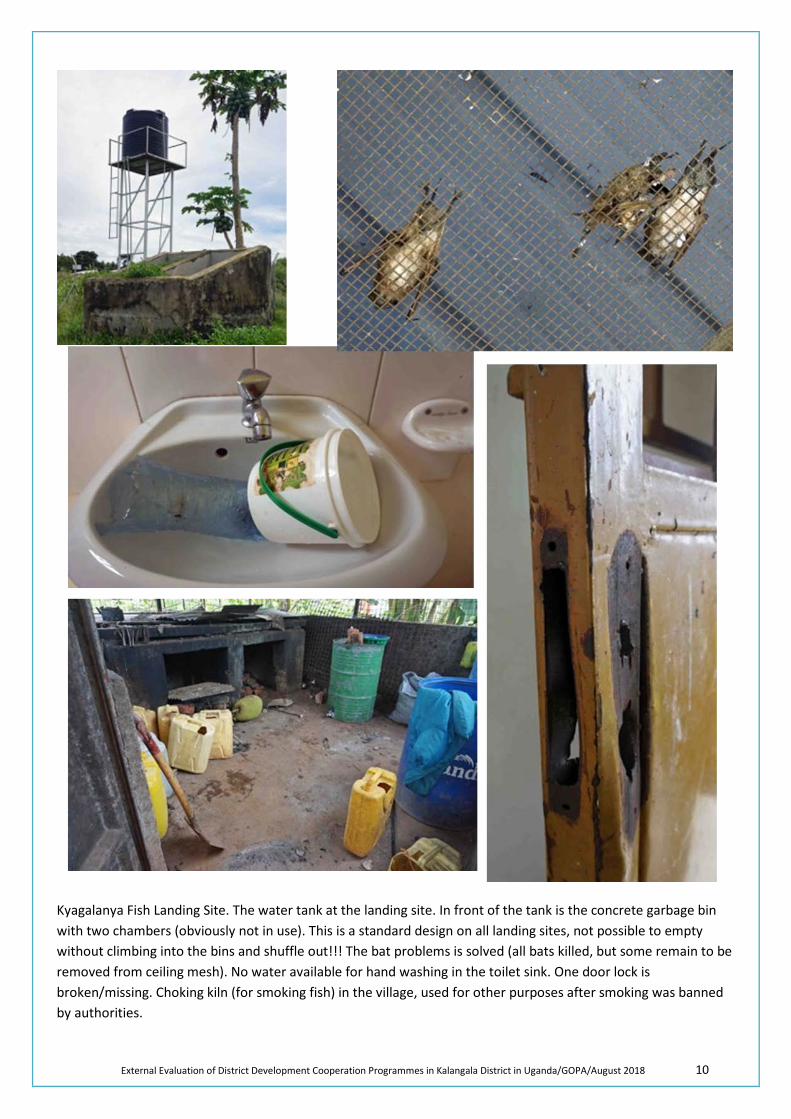
External Evaluation of District Development Cooperation Programmes in Kalangala District in Uganda/GOPA/August 2018 10
Kyagalanya Fish Landing Site. The water tank at the landing site. In front of the tank is the concrete garbage bin with two chambers (obviously not in use). This is a standard design on all landing sites, not possible to empty without climbing into the bins and shuffle out!!! The bat problems is solved (all bats killed, but some remain to be removed from ceiling mesh). No water available for hand washing in the toilet sink. One door lock is broken/missing. Choking kiln (for smoking fish) in the village, used for other purposes after smoking was banned by authorities.
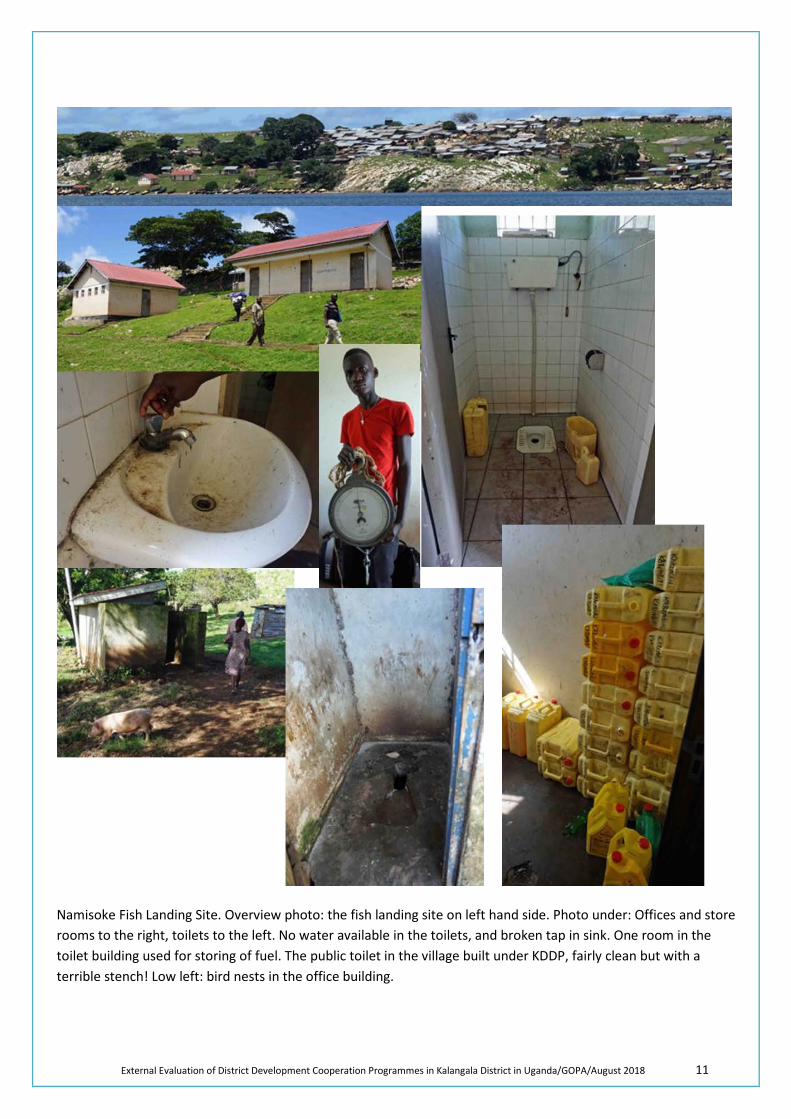
External Evaluation of District Development Cooperation Programmes in Kalangala District in Uganda/GOPA/August 2018 11
Namisoke Fish Landing Site. Overview photo: the fish landing site on left hand side. Photo under: Offices and store rooms to the right, toilets to the left. No water available in the toilets, and broken tap in sink. One room in the toilet building used for storing of fuel. The public toilet in the village built under KDDP, fairly clean but with a terrible stench! Low left: bird nests in the office building.
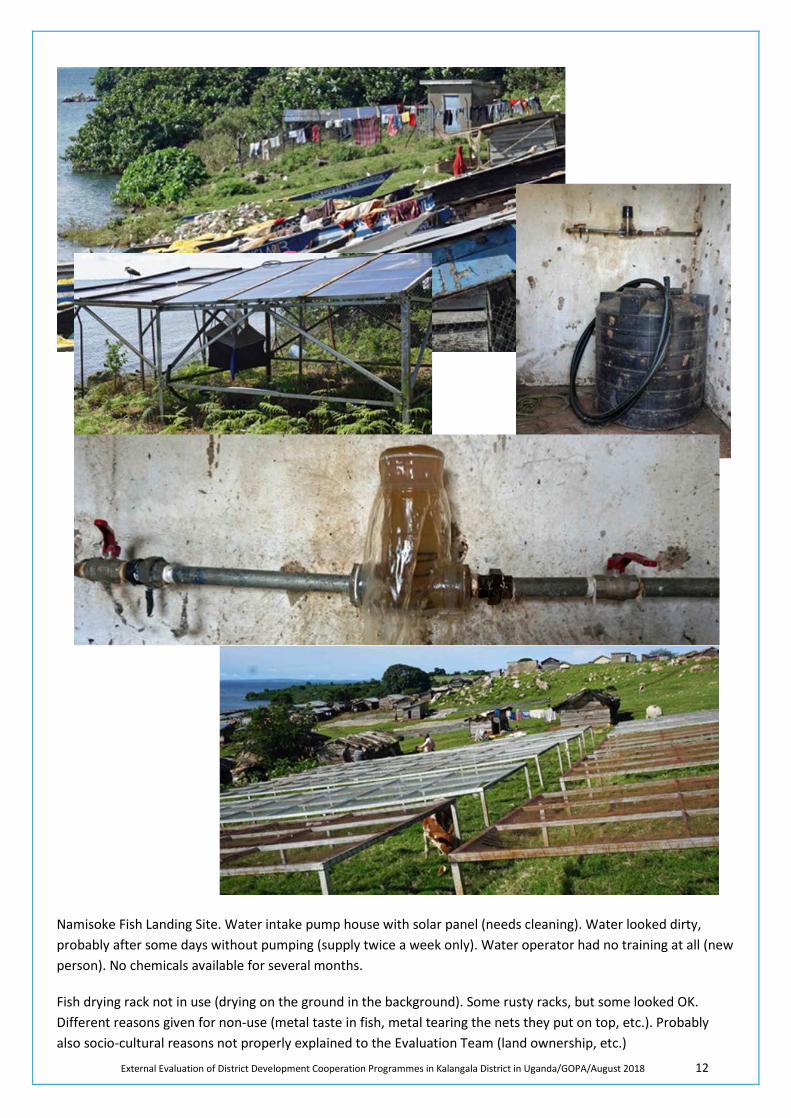
External Evaluation of District Development Cooperation Programmes in Kalangala District in Uganda/GOPA/August 2018 12
Namisoke Fish Landing Site. Water intake pump house with solar panel (needs cleaning). Water looked dirty, probably after some days without pumping (supply twice a week only). Water operator had no training at all (new person). No chemicals available for several months.
Fish drying rack not in use (drying on the ground in the background). Some rusty racks, but some looked OK. Different reasons given for non-use (metal taste in fish, metal tearing the nets they put on top, etc.). Probably also socio-cultural reasons not properly explained to the Evaluation Team (land ownership, etc.)
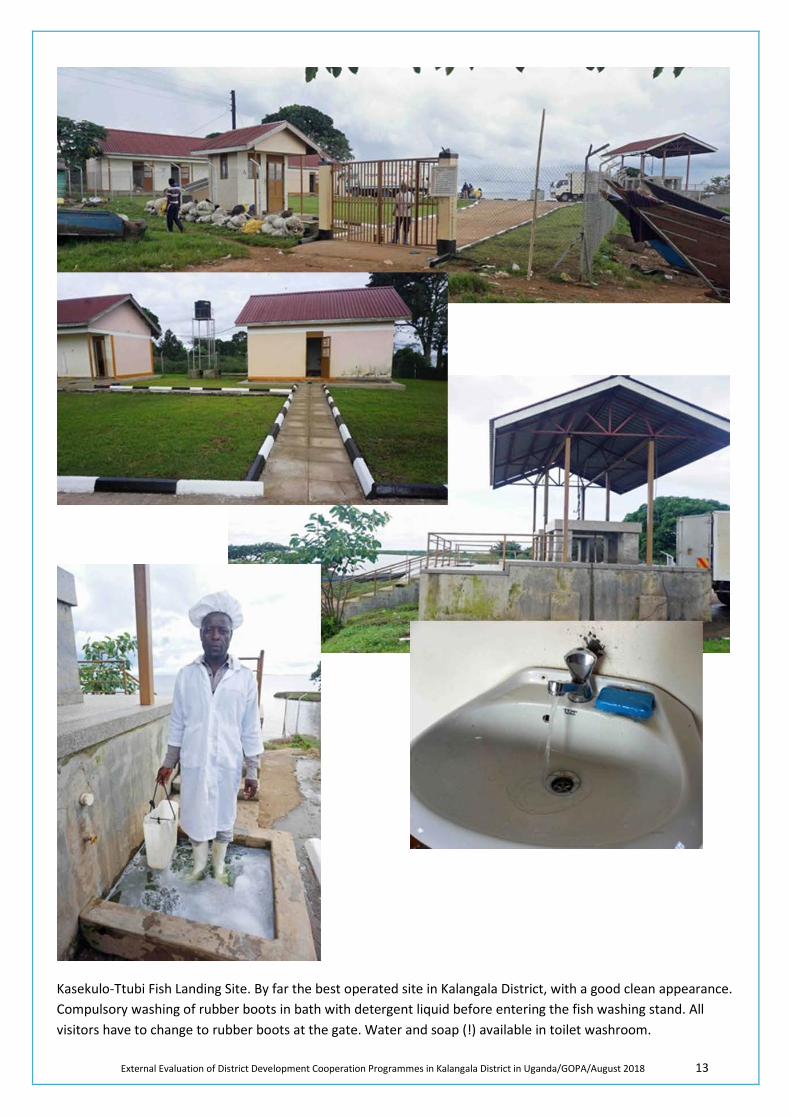
External Evaluation of District Development Cooperation Programmes in Kalangala District in Uganda/GOPA/August 2018 13
Kasekulo-Ttubi Fish Landing Site. By far the best operated site in Kalangala District, with a good clean appearance. Compulsory washing of rubber boots in bath with detergent liquid before entering the fish washing stand. All visitors have to change to rubber boots at the gate. Water and soap (!) available in toilet washroom.
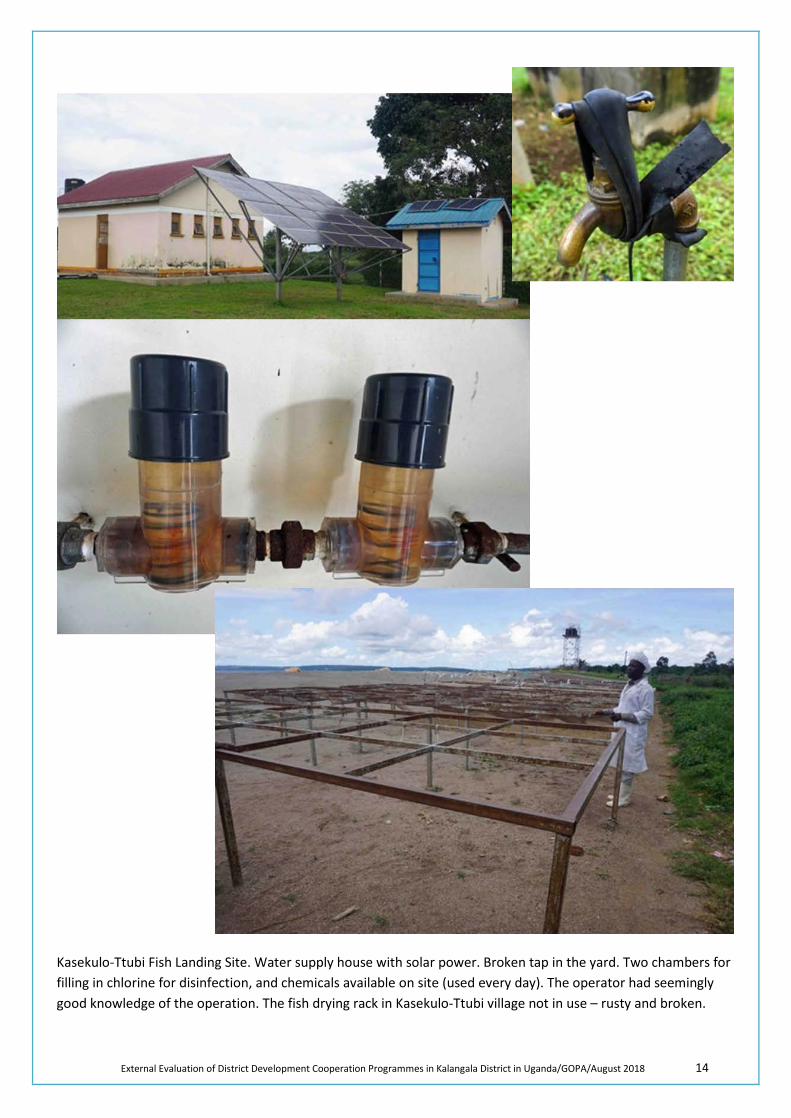
External Evaluation of District Development Cooperation Programmes in Kalangala District in Uganda/GOPA/August 2018 14
Kasekulo-Ttubi Fish Landing Site. Water supply house with solar power. Broken tap in the yard. Two chambers for filling in chlorine for disinfection, and chemicals available on site (used every day). The operator had seemingly good knowledge of the operation. The fish drying rack in Kasekulo-Ttubi village not in use – rusty and broken.
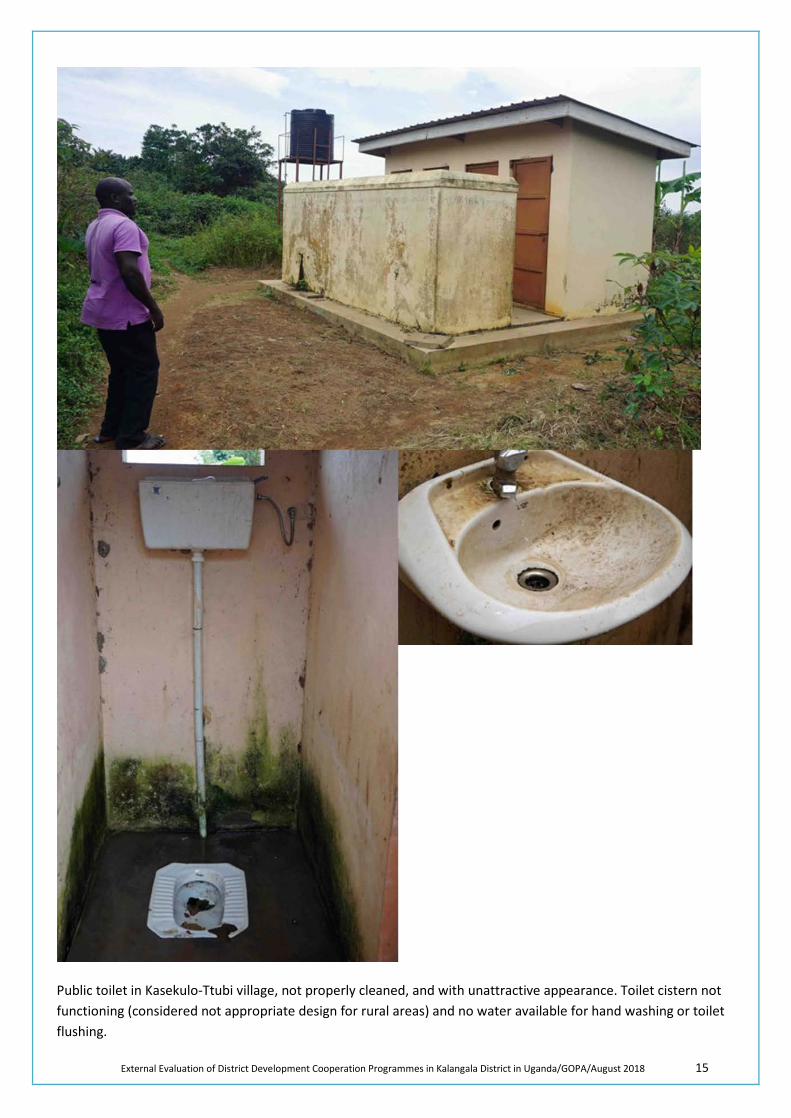
External Evaluation of District Development Cooperation Programmes in Kalangala District in Uganda/GOPA/August 2018 15
Public toilet in Kasekulo-Ttubi village, not properly cleaned, and with unattractive appearance. Toilet cistern not functioning (considered not appropriate design for rural areas) and no water available for hand washing or toilet flushing.
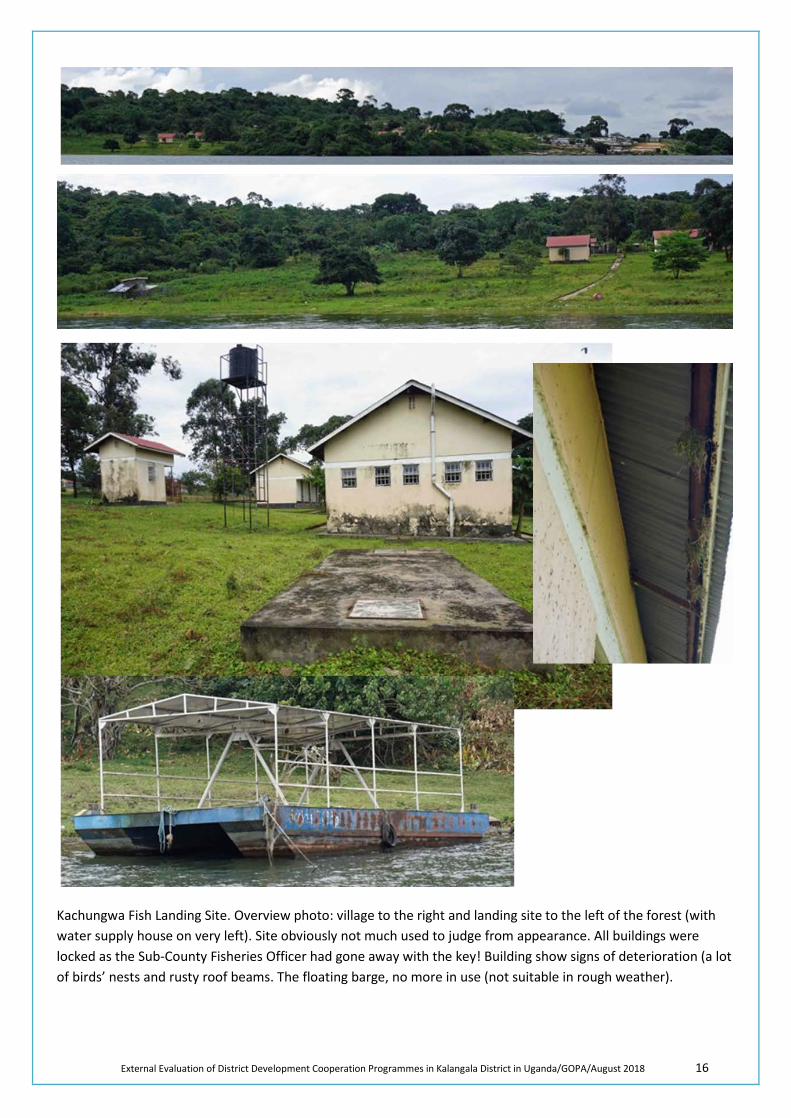
External Evaluation of District Development Cooperation Programmes in Kalangala District in Uganda/GOPA/August 2018 16
Kachungwa Fish Landing Site. Overview photo: village to the right and landing site to the left of the forest (with water supply house on very left). Site obviously not much used to judge from appearance. All buildings were locked as the Sub-County Fisheries Officer had gone away with the key! Building show signs of deterioration (a lot of birds’ nests and rusty roof beams. The floating barge, no more in use (not suitable in rough weather).
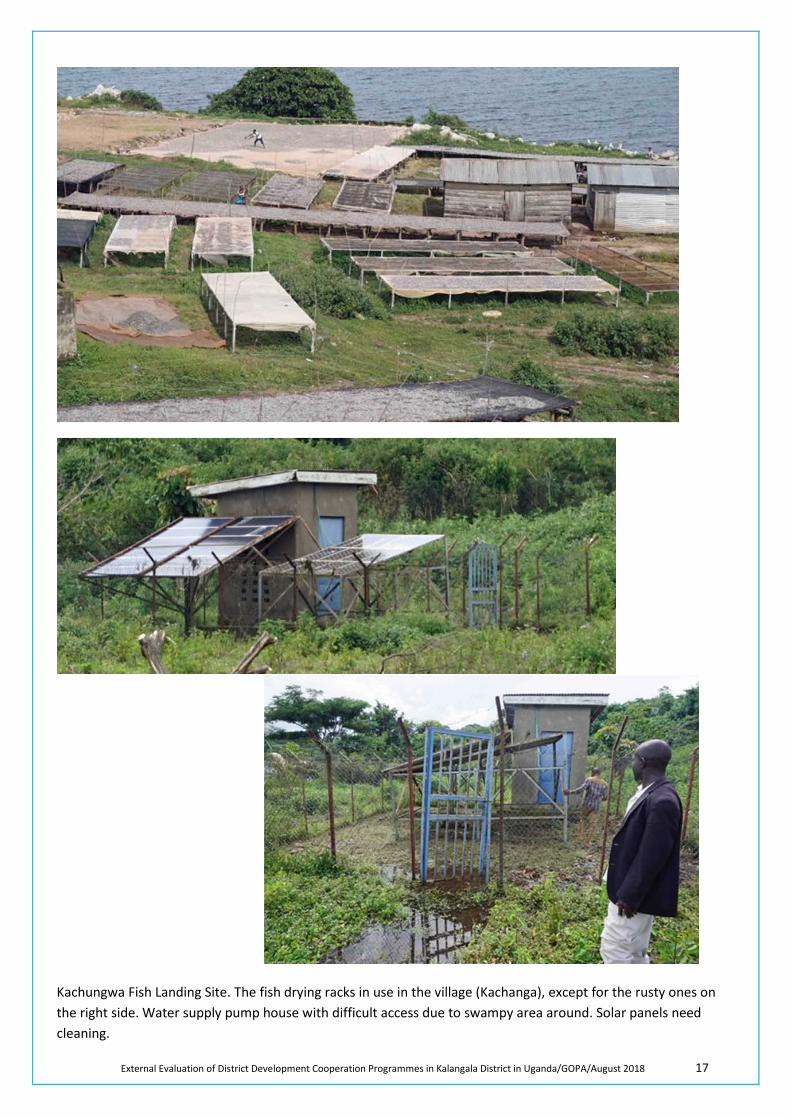
External Evaluation of District Development Cooperation Programmes in Kalangala District in Uganda/GOPA/August 2018 17
Kachungwa Fish Landing Site. The fish drying racks in use in the village (Kachanga), except for the rusty ones on the right side. Water supply pump house with difficult access due to swampy area around. Solar panels need cleaning.
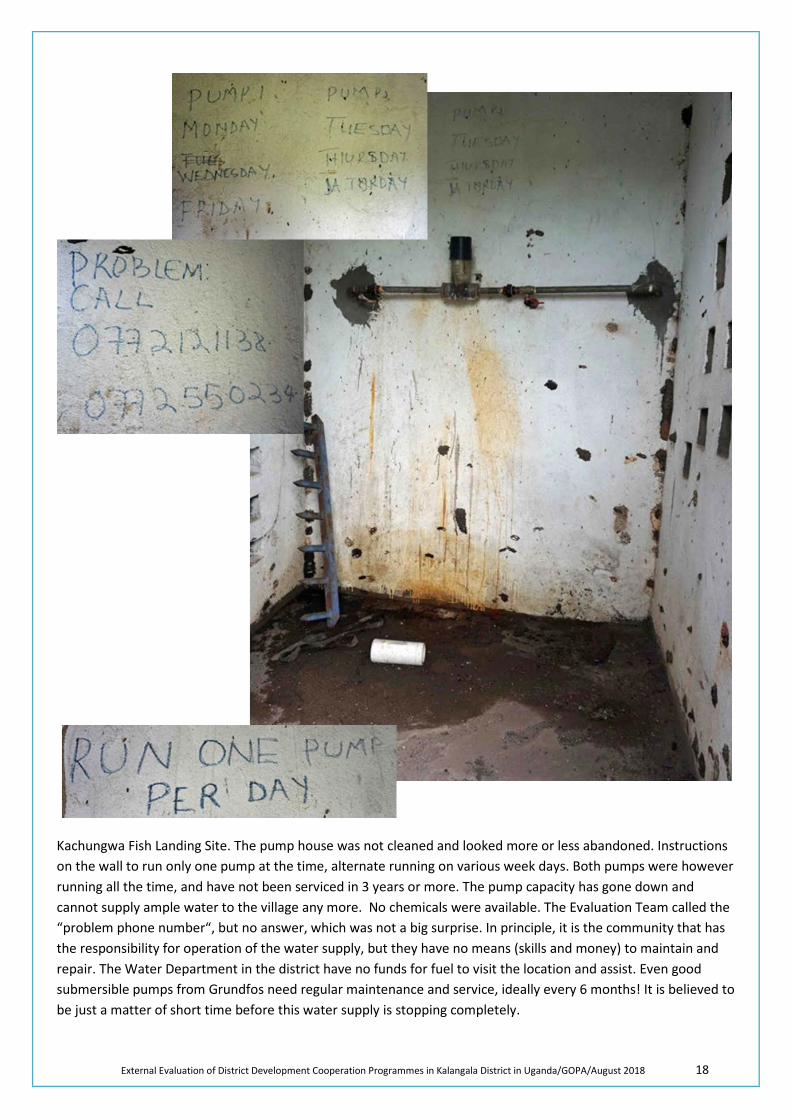
External Evaluation of District Development Cooperation Programmes in Kalangala District in Uganda/GOPA/August 2018 18
Kachungwa Fish Landing Site. The pump house was not cleaned and looked more or less abandoned. Instructions on the wall to run only one pump at the time, alternate running on various week days. Both pumps were however running all the time, and have not been serviced in 3 years or more. The pump capacity has gone down and cannot supply ample water to the village any more. No chemicals were available. The Evaluation Team called the “problem phone number“, but no answer, which was not a big surprise. In principle, it is the community that has the responsibility for operation of the water supply, but they have no means (skills and money) to maintain and repair. The Water Department in the district have no funds for fuel to visit the location and assist. Even good submersible pumps from Grundfos need regular maintenance and service, ideally every 6 months! It is believed to be just a matter of short time before this water supply is stopping completely.
External Evaluation of District Development Cooperation Programmes in Kalangala District in Uganda/GOPA/August 2018 19
Education and Sports Component
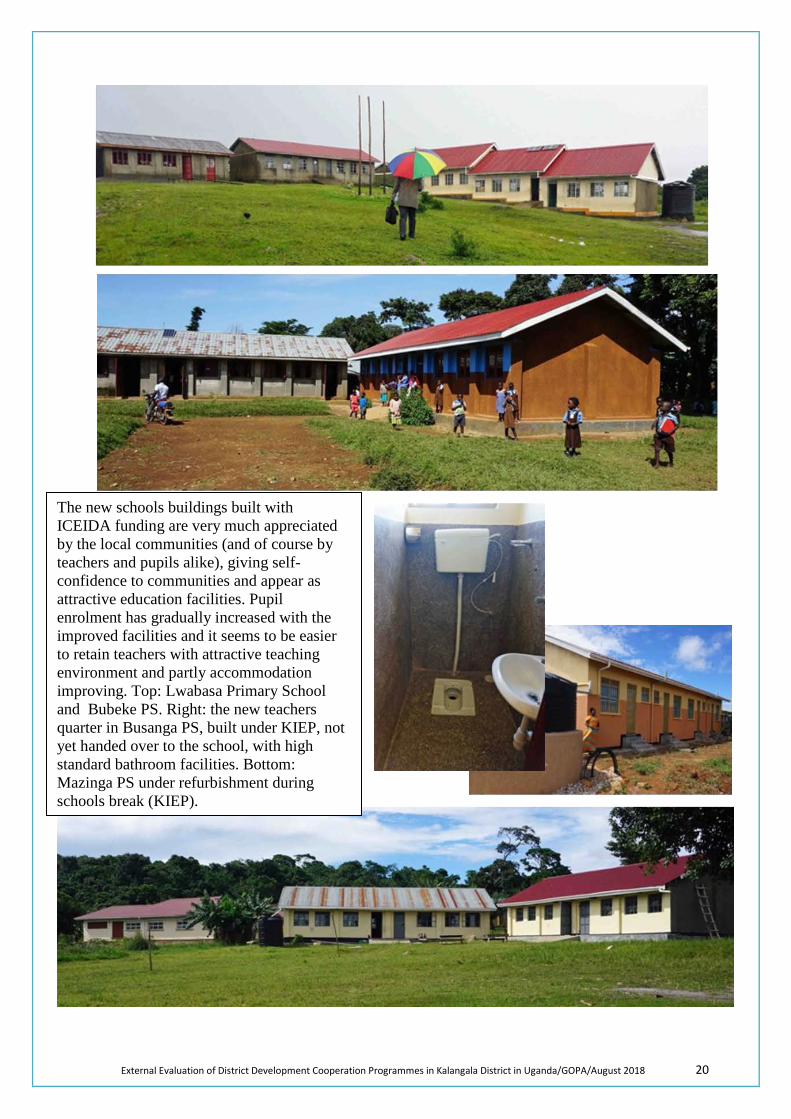
External Evaluation of District Development Cooperation Programmes in Kalangala District in Uganda/GOPA/August 2018 20
The new schools buildings built with ICEIDA funding are very much appreciated by the local communities (and of course by teachers and pupils alike), giving self-confidence to communities and appear as attractive education facilities. Pupil enrolment has gradually increased with the improved facilities and it seems to be easier to retain teachers with attractive teaching environment and partly accommodation improving. Top: Lwabasa Primary School and Bubeke PS. Right: the new teachers quarter in Busanga PS, built under KIEP, not yet handed over to the school, with high standard bathroom facilities. Bottom: Mazinga PS under refurbishment during schools break (KIEP).
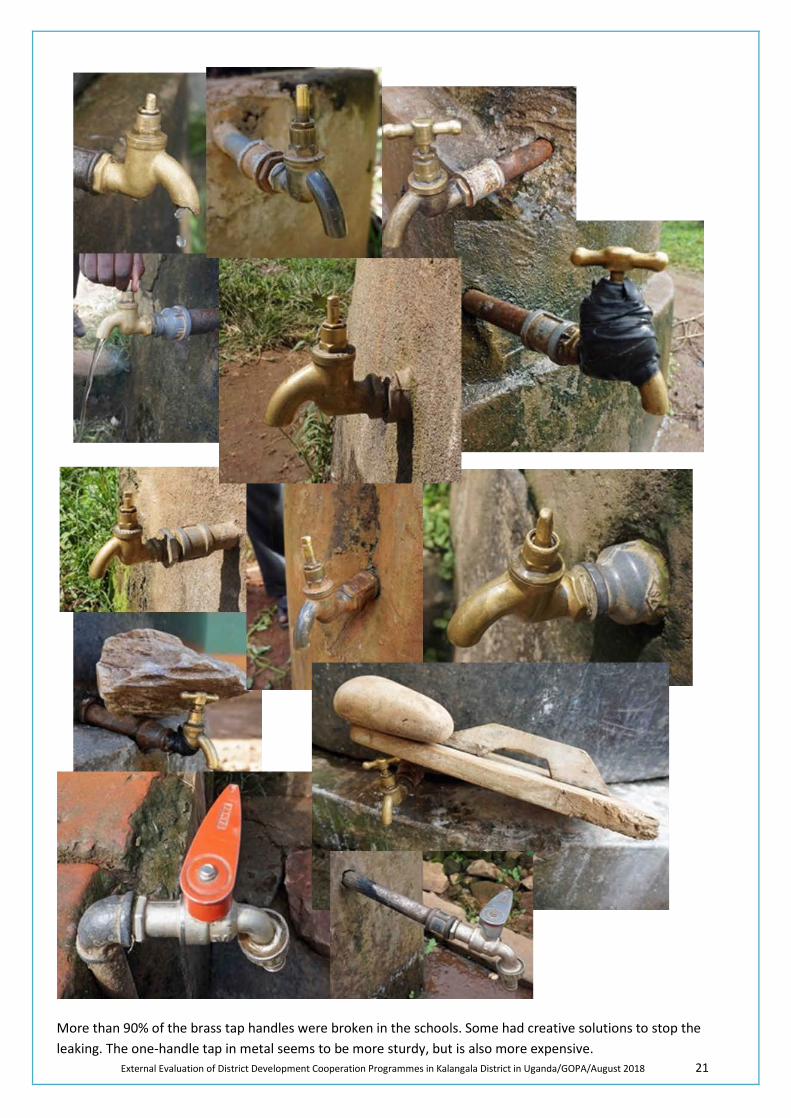
External Evaluation of District Development Cooperation Programmes in Kalangala District in Uganda/GOPA/August 2018 21
More than 90% of the brass tap handles were broken in the schools. Some had creative solutions to stop the leaking. The one-handle tap in metal seems to be more sturdy, but is also more expensive.
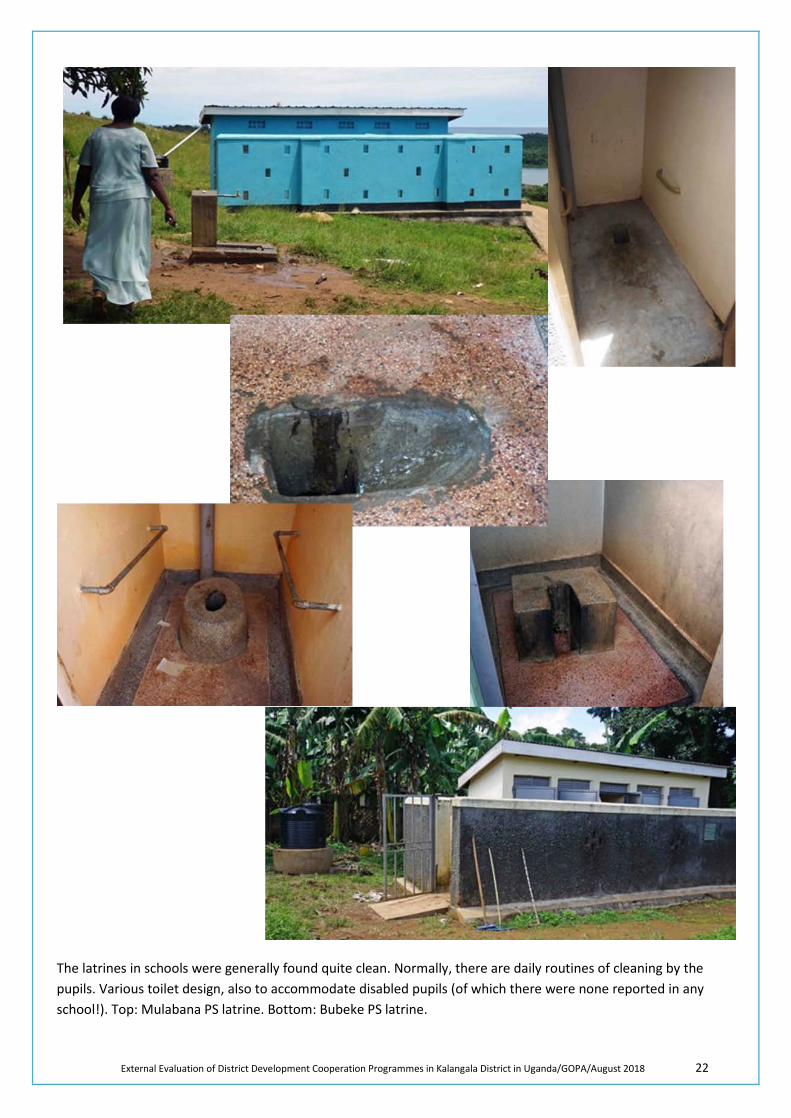
External Evaluation of District Development Cooperation Programmes in Kalangala District in Uganda/GOPA/August 2018 22
The latrines in schools were generally found quite clean. Normally, there are daily routines of cleaning by the pupils. Various toilet design, also to accommodate disabled pupils (of which there were none reported in any school!). Top: Mulabana PS latrine. Bottom: Bubeke PS latrine.
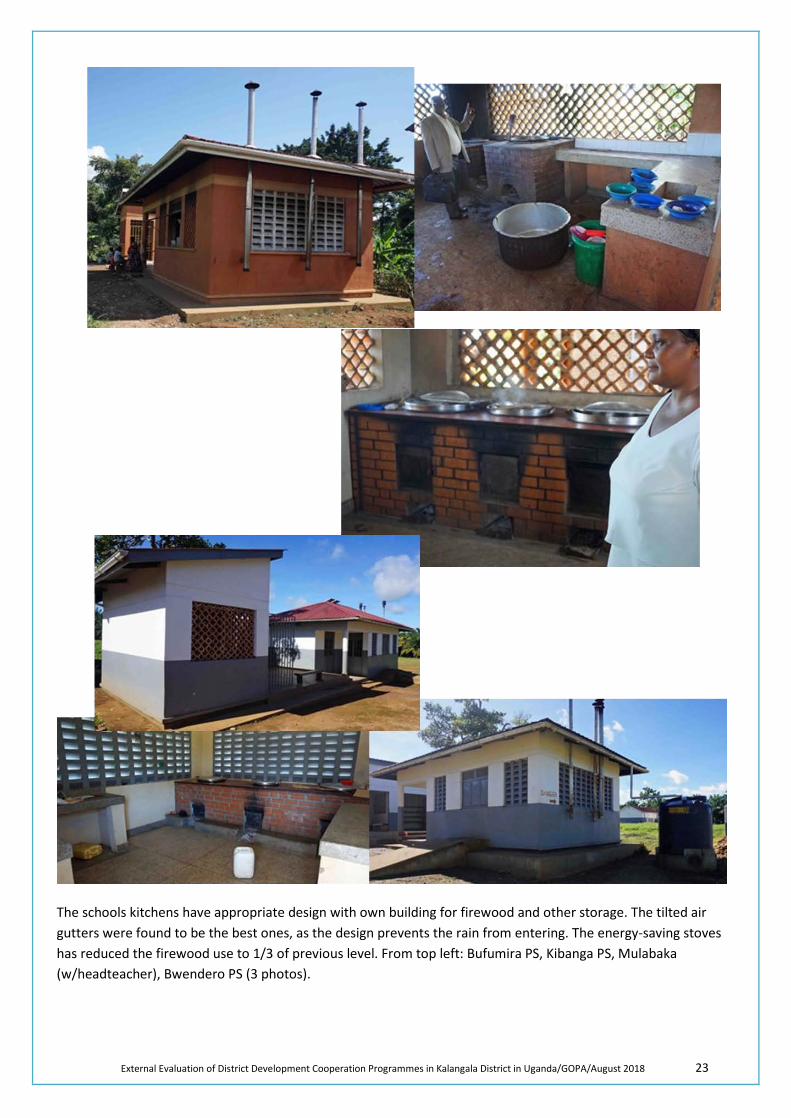
External Evaluation of District Development Cooperation Programmes in Kalangala District in Uganda/GOPA/August 2018 23
The schools kitchens have appropriate design with own building for firewood and other storage. The tilted air gutters were found to be the best ones, as the design prevents the rain from entering. The energy-saving stoves has reduced the firewood use to 1/3 of previous level. From top left: Bufumira PS, Kibanga PS, Mulabaka (w/headteacher), Bwendero PS (3 photos).
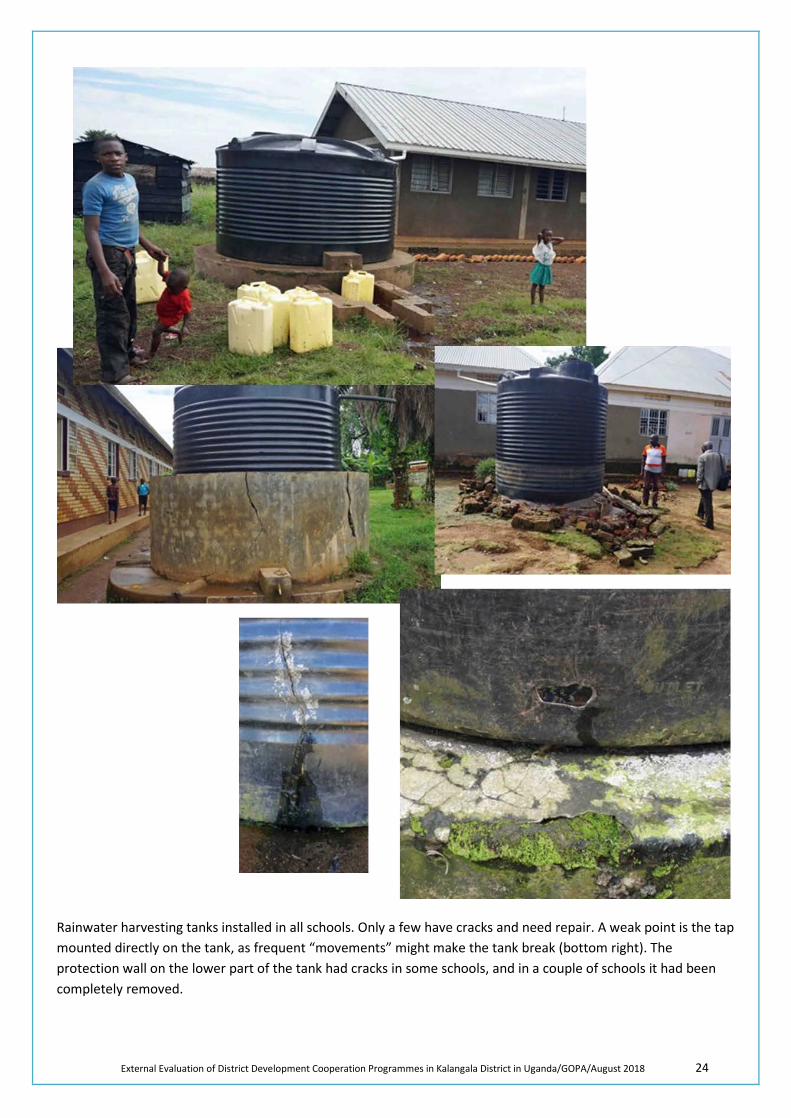
External Evaluation of District Development Cooperation Programmes in Kalangala District in Uganda/GOPA/August 2018 24
Rainwater harvesting tanks installed in all schools. Only a few have cracks and need repair. A weak point is the tap mounted directly on the tank, as frequent “movements” might make the tank break (bottom right). The protection wall on the lower part of the tank had cracks in some schools, and in a couple of schools it had been completely removed.
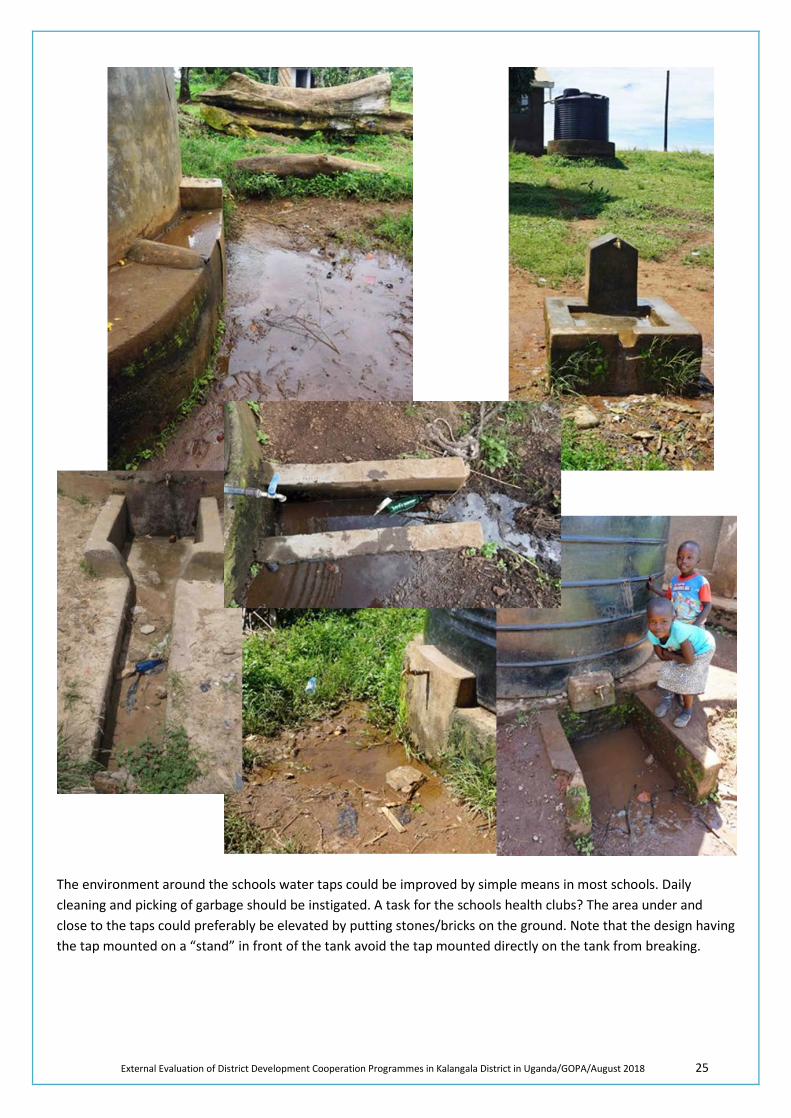
External Evaluation of District Development Cooperation Programmes in Kalangala District in Uganda/GOPA/August 2018 25
The environment around the schools water taps could be improved by simple means in most schools. Daily cleaning and picking of garbage should be instigated. A task for the schools health clubs? The area under and close to the taps could preferably be elevated by putting stones/bricks on the ground. Note that the design having the tap mounted on a “stand” in front of the tank avoid the tap mounted directly on the tank from breaking.
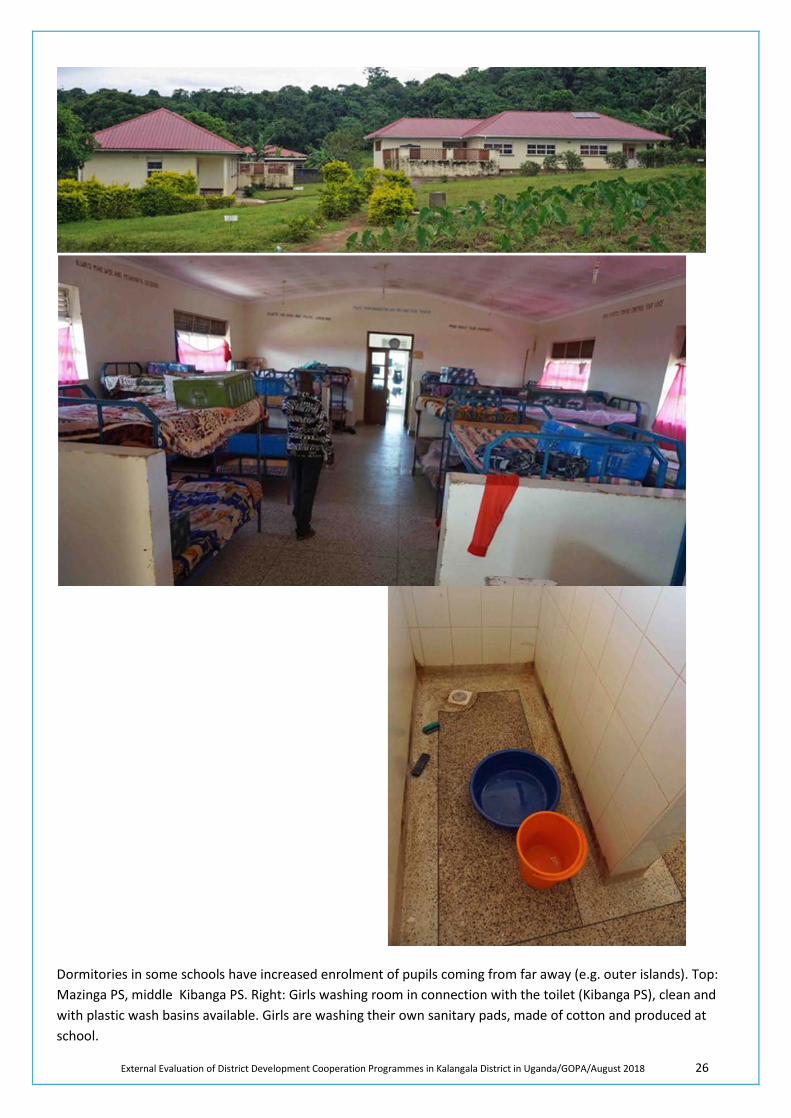
External Evaluation of District Development Cooperation Programmes in Kalangala District in Uganda/GOPA/August 2018 26
Dormitories in some schools have increased enrolment of pupils coming from far away (e.g. outer islands). Top: Mazinga PS, middle Kibanga PS. Right: Girls washing room in connection with the toilet (Kibanga PS), clean and with plastic wash basins available. Girls are washing their own sanitary pads, made of cotton and produced at school.
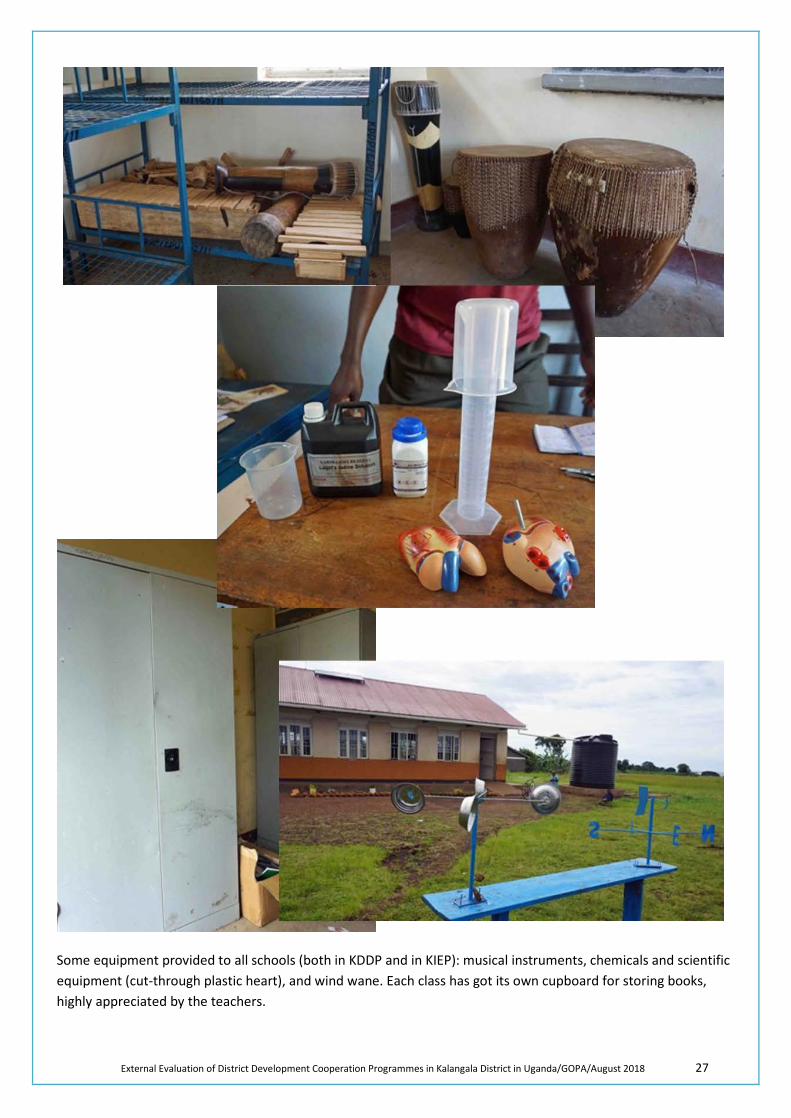
External Evaluation of District Development Cooperation Programmes in Kalangala District in Uganda/GOPA/August 2018 27
Some equipment provided to all schools (both in KDDP and in KIEP): musical instruments, chemicals and scientific equipment (cut-through plastic heart), and wind wane. Each class has got its own cupboard for storing books, highly appreciated by the teachers.
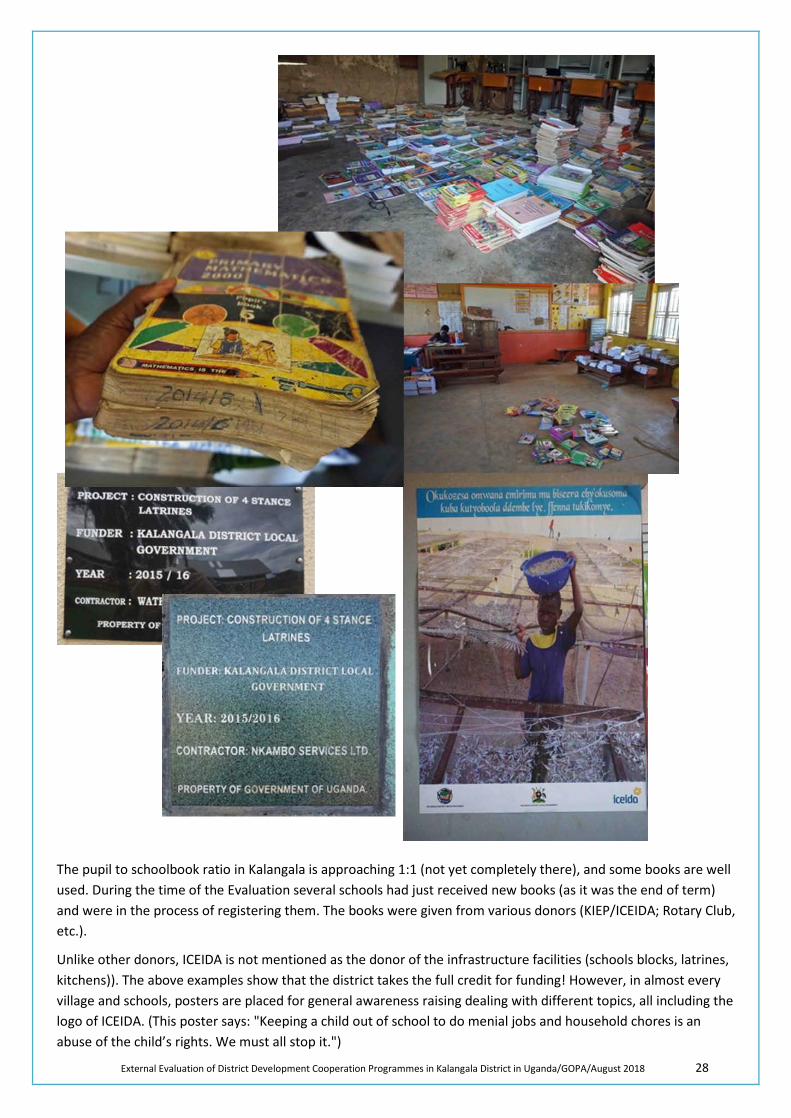
External Evaluation of District Development Cooperation Programmes in Kalangala District in Uganda/GOPA/August 2018 28
The pupil to schoolbook ratio in Kalangala is approaching 1:1 (not yet completely there), and some books are well used. During the time of the Evaluation several schools had just received new books (as it was the end of term) and were in the process of registering them. The books were given from various donors (KIEP/ICEIDA; Rotary Club, etc.).
Unlike other donors, ICEIDA is not mentioned as the donor of the infrastructure facilities (schools blocks, latrines, kitchens)). The above examples show that the district takes the full credit for funding! However, in almost every village and schools, posters are placed for general awareness raising dealing with different topics, all including the logo of ICEIDA. (This poster says: "Keeping a child out of school to do menial jobs and household chores is an abuse of the child’s rights. We must all stop it.")
External Evaluation of District Development Cooperation Programmes in Kalangala District in Uganda/GOPA/August 2018 29
Health Component
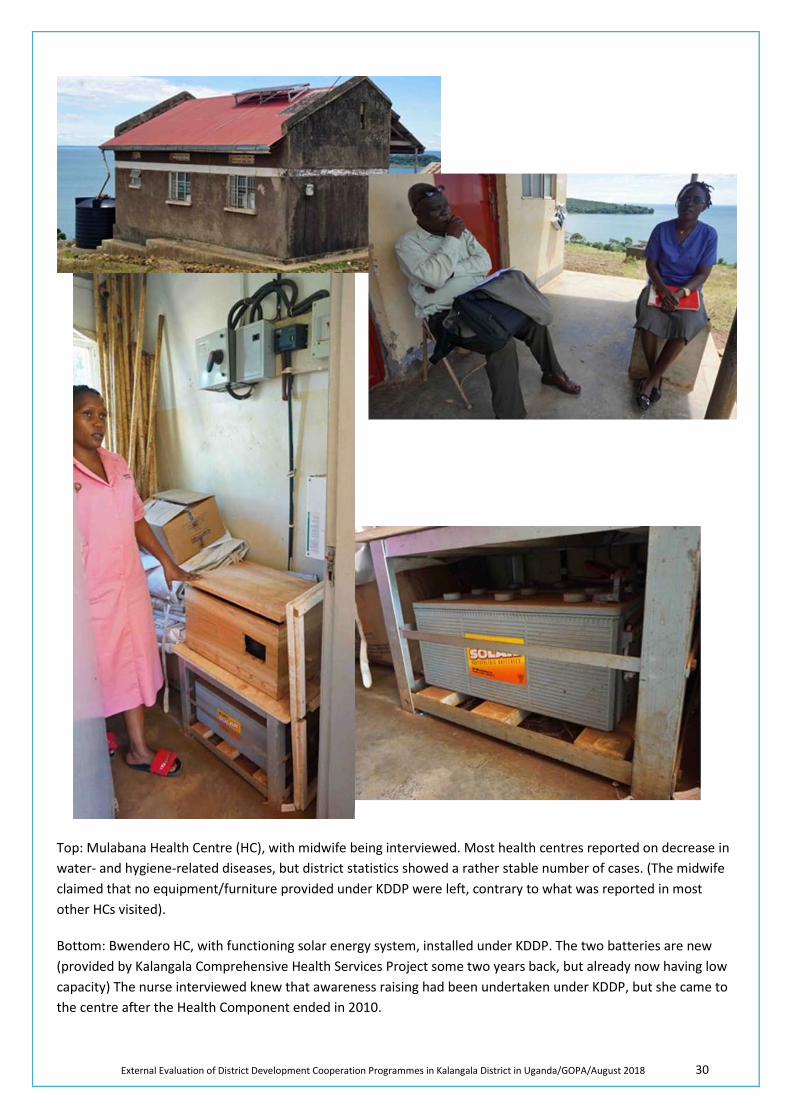
External Evaluation of District Development Cooperation Programmes in Kalangala District in Uganda/GOPA/August 2018 30
Top: Mulabana Health Centre (HC), with midwife being interviewed. Most health centres reported on decrease in water- and hygiene-related diseases, but district statistics showed a rather stable number of cases. (The midwife claimed that no equipment/furniture provided under KDDP were left, contrary to what was reported in most other HCs visited).
Bottom: Bwendero HC, with functioning solar energy system, installed under KDDP. The two batteries are new (provided by Kalangala Comprehensive Health Services Project some two years back, but already now having low capacity) The nurse interviewed knew that awareness raising had been undertaken under KDDP, but she came to the centre after the Health Component ended in 2010.
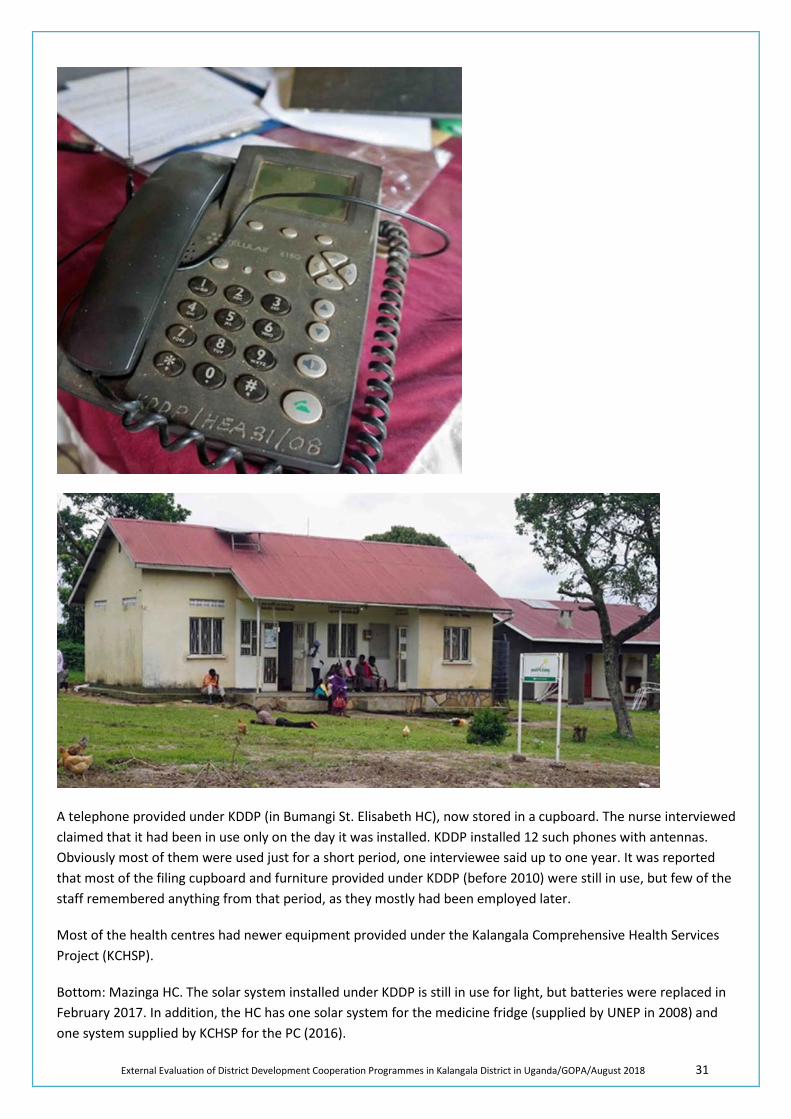
External Evaluation of District Development Cooperation Programmes in Kalangala District in Uganda/GOPA/August 2018 31
A telephone provided under KDDP (in Bumangi St. Elisabeth HC), now stored in a cupboard. The nurse interviewed claimed that it had been in use only on the day it was installed. KDDP installed 12 such phones with antennas. Obviously most of them were used just for a short period, one interviewee said up to one year. It was reported that most of the filing cupboard and furniture provided under KDDP (before 2010) were still in use, but few of the staff remembered anything from that period, as they mostly had been employed later.
Most of the health centres had newer equipment provided under the Kalangala Comprehensive Health Services Project (KCHSP).
Bottom: Mazinga HC. The solar system installed under KDDP is still in use for light, but batteries were replaced in February 2017. In addition, the HC has one solar system for the medicine fridge (supplied by UNEP in 2008) and one system supplied by KCHSP for the PC (2016).
External Evaluation of District Development Cooperation Programmes in Kalangala District in Uganda/GOPA/August 2018 32
Household Survey (Sample photos showing enumerators at work in various villages)
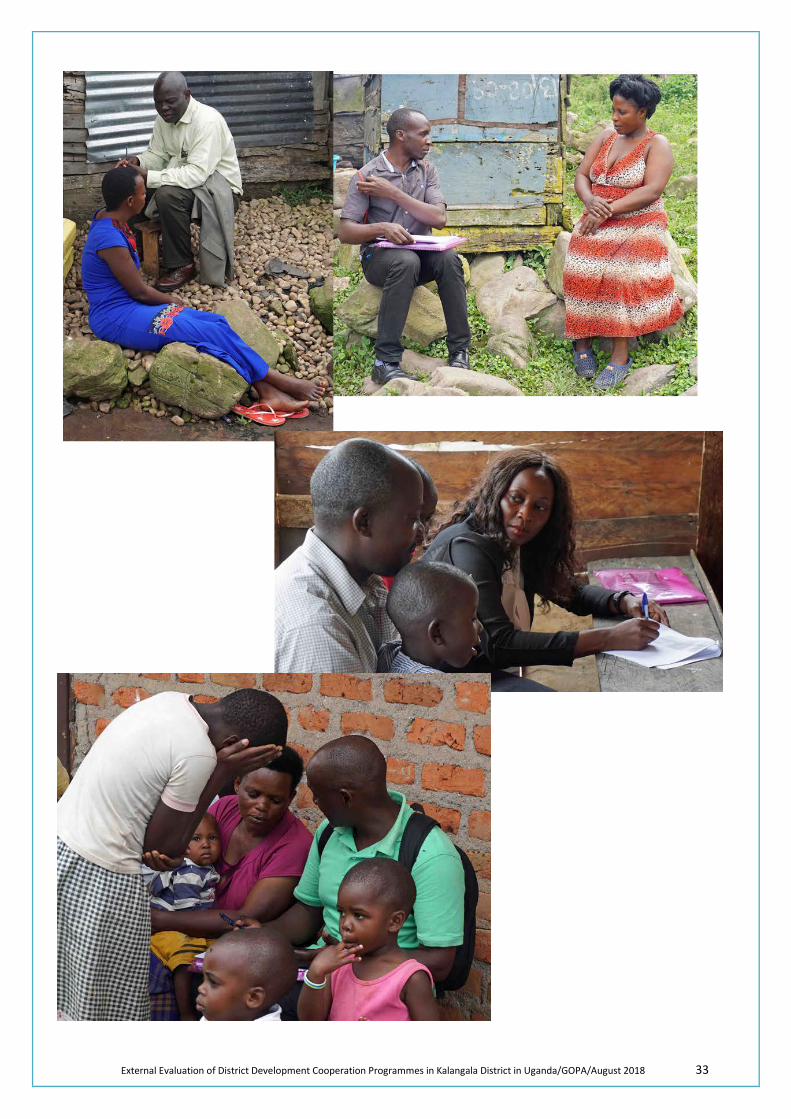
External Evaluation of District Development Cooperation Programmes in Kalangala District in Uganda/GOPA/August 2018 33
External Evaluation of District Development Cooperation Programmes in Kalangala District in Uganda/GOPA/August 2018 34
External Evaluation of District Development Cooperation Programmes in Kalangala District in Uganda/GOPA/August 2018 35
External Evaluation of District Development Cooperation Programmes in Kalangala District in Uganda/GOPA/August 2018 36
External Evaluation of Kalangala District Development Programme (KDDP) 2006-15, Uganda 1
Annex 11: Comments to the Draft Evaluation Report
Comments to the Draft Evaluation Report of 28 June was only made by the Icelandic Embassy In Kampala.
It is noted with some surpise that the Kalangala District Local Government, who was overall responsible for KDDP and the main implementer, did not submit comments and neither did the Ministry of Local Government.
General Comments
by
Icelandic Embassy (ICEMB) Kampala
(Dated July 2018)
on
DRAFT FINAL REPORT
“External Evaluation of District Development Cooperation Programmes in Kalangala District in Uganda”
28 June 2018
Draft, V1
The Consultant’s Team: Tore Laugerud Godfrey Mukwaya Andrew Arinaitwe
External Evaluation of Kalangala District Development Programme (KDDP) 2006-15, Uganda 2
No Comment
GENERAL These are general comments intended to supplement comments tracked in the main document (draft vi). Hence the two should be read together
1
CHAPTER 1. INTRODUCTION There are a few comments tracked in the main document as follows: • Under section 1.1.3 (d) Other studies and milestones: KDDP Internal Review by partners was
omitted (see tracked comment in the main document). Under section 1.2.2 The Household Survey: There is a need to define “beneficiary” villages and “control” villages (see tracked comment in the main document
2
CHAPTER 2. DESIGN AND RELEVANCE There are a few comments tracked in the main document as follows: Under section 2.2 ---- Immediate Objective (outcome/purpose: The clarification is made that KDDP had four immediate objectives (indicating that it was a multi-sector project or “programme”. The three immediate objectives under fisheries and WATSAN sector, education sector and Health sector were not conceived as subsidiary to the immediate objective under administration sector, as presented in the report. It is a different matter if the consultant interpreted it as the most important immediate objective among the four.
3
CHAPTER 3. EFFECTIVENESS A couple of comments are made on this chapter as follows: 3.1 Clarification on progress reports The finding that the progress reports were produced up to 2009 needs to be corrected as the records available show progress reports were produced up to the end of project: • Up to end of 2010, KDDP progress reports were prepared by PIT at sector level, processed
by PMT and presented to PSC. So KDDP progress reports for this period are available up to the end of 2010 (including the KDDP Five Year Report produced in 2010, which is cited by the consultant).
• After 2010, KDDP progress reports were prepared by the district (coordinated by District Planning Unit, processed at district level by District Technical Planning Committee (DTPC) and submitted to the PSC. All reports from 2011 onwards were submitted by the District including the KDDP Completion Report (See attached copies, owing to the bulk of reports only Annual progress reports for 2011-2013, and a copy of biannual report for 2014 have been attached)
KDDP Progress Reports.zip
3.2 The finding that the reports did not include reporting on outcomes needs to be put into context:
The outcomes are at higher results level and as such cannot be reported on in every quarterly progress report. Besides, reporting on outcomes requires evidence in form of data collected over periodic intervals, either through studies or national/sub-national statistical systems. Nevertheless, reporting on some outcome indicators was done based on available data as evidenced by the reports provided: • KDDP Five Year Report covered reporting on outcome indicators under administration
sector, fisheries and WATSAN sector and education sector. Where reporting on outcomes was not comprehensive, it was because data was not available at that material time.
• KDDP MTR covered qualitative reporting on satisfaction levels with the quality of services
External Evaluation of Kalangala District Development Programme (KDDP) 2006-15, Uganda 3
No Comment
• The KDDP Progress report for 2011 comprehensively covered reporting on outcome indicators, while reports for 2012 on words covered some reporting on outcomes for education.
• Finally, the KDDP Internal Review by partners, Detailed Review of KDDP Education Component, and KDDP Completion report all reported on outcome indicators. The completion report highlighted areas where data was not readily available.
3.4 The findings on the Monitoring Plan and Monitoring Reports need to be put into context, and some corrections made:
The development and application of M&E as management tool in development projects has evolved overtime and based on knowledge accumulated overtime the current projects have better designs than the previous ones. Uganda developed the first M&E policy in 2011 and it was approved in 2013. Similarly, the OECD-DAC Evaluation standards were developed in 2010. Notwithstanding the weaknesses the consultant found in the document, the efforts of the partners to develop the M&E Plan that early merits some recognition. • As admitted by the consultant, the M&E Plan which was part of the development of the
Logframes for 2011-2015 refined the immediate objective for the support to the fisheries and WATSAN sector and added a timeframe of 2015.
• The plan added measurable indicators for support to administration sector (especially performance on minimum capacity requirement and performance quality attracting rewards (minimum conditions and performance measures).
• The plan emphasized the need for putting in place key structures and personnel – leading to a functional planning unit.
The finding that the “M&E plan was not at all followed” is not entirely correct; on the contrary the plan was implemented, to some extent: • A functional District Planning Unit was established with 100% staffing (District Planner,
Senior Economist, Statistician and Population Officer)– this was set as precondition for funding the second five phases of KDDP implementation
• District Technical Planning Committee Members and the entire district planning unit staff (total of 13 officials) were sponsored to undertake training in monitoring and evaluation at Uganda Management Institute (UMI).
• The District Planning Unit was equipped with basic equipment and tools e.g. computers • The M&E Unit based in the District Planning Unit headed by the Senior Economist
coordinated reporting activities of KDDP involving collection, analysis and integration of sector reports into cumulative quarterly reports for the period 2011-2014 – culminating into the KDDP project completion report.
• Joint monitoring missions (ICEIDA, MoLG and KDLG) and multi-sector monitoring mission (District level sectors) were conducted to validate reports and get feedback from beneficiaries and mission reports were prepared by District Planning Unit.
The finding that District Planning Unit did not produce reports needs to be corrected: • It is important to note that the monitoring activities and reports were of three types-
Routine monitoring covering financial and physical implementation (done by individual sector departments and secretaries– leading to sector activity reports and monthly reports; multi-sector monitoring missions conducted by a team comprised of members of District Technical Planning Committee and District Executive Committee members – coordinated by CAO through the District Planning Unit; and Joint monitoring mission by partners (ICEIDA, MoLG and KDLG)
• The District Planning Unit- M&E Desk produced all the multi-sector monitoring reports and prepared all the KDDP progress reports for the period 2011-2015 culminating into the KDDP Completion Report (Check carefully the authors for the progress reports and monitoring report provided)
External Evaluation of Kalangala District Development Programme (KDDP) 2006-15, Uganda 4
No Comment
• It is true that a separate computerized database for KDDP was not established. All reports are backed by source paper records filed in the District Central Registry. The copies of paper files were further filed by ICEIDA in the Gopro database/filing system. Some sectors supported have operational databases at district level linked to the sector Ministries (education, health, water and sanitation and local government) but some are under upgrades, especially the LoGICS database under the Ministry of Local Government.
3.5 Grants to CSOs and PSOs: It is admitted there was a filing problem between the district and ICEIDA, but this was a successful intervention with verifiable impact. The organizations supported have sustained their operations up to now. See the initial reports on this folder; Example are including, among other, the following:
• Kalangala District Education Forum (KADEFO) – Is currently engaged to implement community sensitization under KIEP
• SHED has won a grant from USAID to sensitize parents and their role in promoting earl grade learning
• KAFOPHAN is an active network for people living with HIV/AIDS The initial reports are included here: More reports will be sent under a separate email cover.
Grants to CSOs.zip
4
CHAPTER 4: EFFICIENCE Two comments are made in respect to this chapter (a) Contribution by Government/Kalangala district was mainly in form of salaries. Treating contribution by Kalangala as a project management cost is misleading. (see details in tracked comments).
5 CHAPTER 5: IMPACT The general comments are made: (a) Operational definition of the project beneficiary villages and control villages needs to be
elaborated (see details in the tracked comments) (b) Findings related to fisheries which show that contribution of the sector to household
incomes and employment (which the consultant claims he could not understand why) should be analyzed considering the effect of the intervention by government, using the army, to control illegal fishing and regulate the fishing activities on Lake Victoria. At the time of the evaluation, fishing activities had been on standstill and this could account for the responses the household made.
(c) Last but important: The evaluation should directly answer the key evaluation question (More reflected in conclusion)– To what extent has the KDDP had an impact among the population in the project area (intended or not intended, positive or negative)? ▪ Clear comparison of the situation before and after KDDP intervention; and comparison
of “beneficiary” and “non-beneficiary” villages for attribution (definition of villages matters).
▪ A summary table highlighting the comparisons of quantitative and qualitative data on measurable and perceive impacts should be included in the main report to make it a complete and stand-alone document and make the narrative clearer (As the consultant mentions the details in Annex 9: Household Survey Analysis can be a stand-alone document for reference by those that need more details).
Triangulation of results: e.g. it may be necessary to make comparisons with indicators in the Population and Census Report (2014) on Kalangala District available on this site: (https://www.ubos.org/wp-content/uploads/publications/03_2018NPHC_2014-_Subcounty_Indicators_Report_-_Central_Region.pdf)
External Evaluation of Kalangala District Development Programme (KDDP) 2006-15, Uganda 5
No Comment 6 SUSTAINABILITY – No comment 7 CONCLUSION AND RECOMMENDATIONS
The recommendation on appropriate technology - simple technology option for water and sanitation solutions for communities, should recognize the policy context: • The Uganda Vision 2040 aims to increase percentage of the population with access to safe
piped water from 15% (2010) to 100% (2040) – http://npa.ug/wp-content/themes/npatheme/documents/vision2040.pdf
• To that effect, Government issued a circular to all districts (Letter Ref. No. ADM/107/01, dated 14th March 2016- by Permanent Secretary of Ministry of Water and Environment to all Chief Administrative Officers) which guided that with effect from the financial year 2016/2017the priority for Water Development would be as follows -: ▪ First, extension of National Water and Sewerage Water System ▪ Second, Construction of solar Mini piped water systems
Construction of point water sources should be developed in areas where it is not possible to develop the first and 2nd option.