Extent and Nature of the Sexual Victimization of College Women
327
The author(s) shown below used Federal funds provided by the U.S. Department of Justice and prepared the following final report: Document Title: Extent and Nature of the Sexual Victimization of College Women: A National-Level Analysis Author(s): Bonnie S. Fisher Ph.D. ; Francis T. Cullen Ph.D. ; Michael G. Turner M.S. Document No.: 179977 Date Received: December 28, 1999 Award Number: 95-WT-NX-0001 This report has not been published by the U.S. Department of Justice. To provide better customer service, NCJRS has made this Federally- funded grant final report available electronically in addition to traditional paper copies. Opinions or points of view expressed are those of the author(s) and do not necessarily reflect the official position or policies of the U.S. Department of Justice.
-
Upload
khangminh22 -
Category
Documents
-
view
0 -
download
0
Transcript of Extent and Nature of the Sexual Victimization of College Women
The author(s) shown below used Federal funds provided by the U.S.Department of Justice and prepared the following final report:
Document Title: Extent and Nature of the Sexual Victimization ofCollege Women: A National-Level Analysis
Author(s): Bonnie S. Fisher Ph.D. ; Francis T. Cullen Ph.D. ;Michael G. Turner M.S.
Document No.: 179977
Date Received: December 28, 1999
Award Number: 95-WT-NX-0001
This report has not been published by the U.S. Department of Justice.To provide better customer service, NCJRS has made this Federally-funded grant final report available electronically in addition totraditional paper copies.
Opinions or points of view expressed are thoseof the author(s) and do not necessarily reflect
the official position or policies of the U.S.Department of Justice.

THE EXTENT AND NATURE OFTHE SEXUALVICTIMIZATION OF COLLEGE WOMEN:
A NATIONAL-LEVEL ANALYSIS
Submitted to: The National Institute of Justice
Section Ill Other VAW and Family Violence Evaluation and Research
Research Team:
Principal Investigators
Bonnie S. Fisher, Ph.D.
and
Francis T. Cullen, Ph.D.
Division of Criminal Justice University of Cincinnati
Cincinnati, OH 45221 -0389
Graduate Assistant
Michael G. Turner, M.S. College of Criminal Justice
Northeastern University 360 Huntington Avenue Boston, MA 021 15-5005
This study was supp rted under award 95-WT-NX-0001 from the National Institute of Justice, U.S. Depa R' ment of Justice. Points of view in this document are those of the authors and do not necessarily represent the official position of the U.S. Department of Justice. Professor Fisher, who was a faculty membar in the Department of Political Science during the grant period, also thanks the Charles P. Taft Memorial Fund at the University of Cincinnati for their support throughout her tenure in McMicken College of Arts and Science. Joanne Belknap Ph.D. worked with Professors Fisher and Cullen in developing and revising the surveys, and led the focus groups with Professor Fisher.
This document is a research report submitted to the U.S. Department of Justice. This reporthas not been published by the Department. Opinions or points of view expressed are thoseof the author(s) and do not necessarily reflect the official position or policies of theU.S. Department of Justice.
TABLE OF CONTENTS Page
. . . . . . . . . . . . . . . . . . . . . . . . . . . . . . . . . . . . . . . . . . . . . . . . . TABLE OF CONTENTS i
LIST OF TABLES AND FIGURES . . . . . . . . . . . . . . . . . . . . . . . . . . . . . . . . . . . . . . . . iv
EXECUTIVE SUMMARY . . . . . . . . . . . . . . . . . . . . . . . . . . . . . . . . . . . . . . . . . . . . . . viii
CHAPTER 1 : INTRODUCTION . . . . . . . . . . . . . . . . . . . . . . . . . . . . . . . . . . . . . . . . . . 1
ResearchQuestions . . . . . . . . . . . . . . . . . . . . . . . . . . . . . . . . . . . . . . . . . . . . . . . . 7 Objectives of the Study . . . . . . . . . . . . . . . . . . . . . . . . . . . . . . . . . . . . . . . . . . . . . . 8 Statement of the Problem . . . . . . . . . . . . . . . . . . . . . . . . . . . . . . . . . . . . . . . . . . . 12
Researching the Sexual Victimization of College Women . . . . . . . . . . . . . . . . 12 Extending Previous Research . . . . . . . . . . . . . . . . . . . . . . . . . . . . . . . . . . . . . 13
The Need for National-Level Data . . . . . . . . . . . . . . . . . . . . . . . . . . . . . . . 13 The Measurement of Sexual Victimization . . . . . . . . . . . . . . . . . . . . . . . . . 17 The Analytical Framework . . . . . . . . . . . . . . . . . . . . . . . . . . . . . . . . . . . . . 19
Summary . . . . . . . . . . . . . . . . . . . . . . . . . . . . . . . . . . . . . . . . . . . . . . . . . . . . . 27 Plan for this Report . . . . . . . . . . . . . . . . . . . . . . . . . . . . . . . . . . . . . . . . . . . . . . . . 27
CHAPTER 2: RESEARCH METHODS . . . . . . . . . . . . . . . . . . . . . . . . . . . . . . . . . . . . 29
Implementing the Proposed Research Plan . . . . . . . . . . . . . . . . . . . . . . . . . . . . . 30 The FocusGroupDiscussions 31 The Pretest . . . . . . . . . . . . . . . . . . . . . . . . . . . . . . . . . . . . . . . . . . . . . . . . . . . 33 Sampling Design . . . . . . . . . . . . . . . . . . . . . . . . . . . . . . . . . . . . . . . . . . . . . . . 35
Selection of Schools . . . . . . . . . . . . . . . . . . . . . . . . . . . . . . . . . . . . . . . . . . 36 . Selection of Students . . . . . . . . . . . . . . . . . . . . . . . . . . . . . . . . . . . . . . . . . 38 TheCoverLetter 38
The Survey Instruments . . . . . . . . . . . . . . . . . . . . . . . . . . . . . . . . . . . . . . . . . . 39 The Individual-level Instrument . . . . . . . . . . . . . . . . . . . . . . . . . . . . . . . . . 39 The Sexual Victimization Incident-level Instrument . . . . . . . . . . . . . . . . . . 43 The Stalking Incident-level Instrument . . . . . . . . . . . . . . . . . . . . . . . . . . . . 46
Our Adoption of Behaviorally Specific Screen Questions and Incident Report Format . . . . . . . . . . . . . . . . . . . . . . . . . . . . . . . . . . . . . . . . . . 48
Use of Telephone Surveys . . . . . . . . . . . . . . . . . . . . . . . . . . . . . . . . . . . . . . . 52 ResponseRate . . . . . . . . . . . . . . . . . . . . . . . . . . . . . . . . . . . . . . . . . . . . . . . . 53 Population Characteristics and Sample Characteristics . . . . . . . . . . . . . . . . . 54 Secondary Data Sources . . . . . . . . . . . . . . . . . . . . . . . . . . . . . . . . . . . . . . . . . 56
. . . . . . . . . . . . . . . . . . . . . . . . . . . . . . . . . . . . .
. . . . . . . . . . . . . . . . . . . . . . . . . . . . . . . . . . . . . . . . . . . .
Field Period and Training of the Interviewers . . . . . . . . . . . . . . . . . . . . . . . . . 50
Variables Used in the Multivariate Analysis . . . . . . . . . . . . . . . . . . . . . . . . . . . 57
This document is a research report submitted to the U.S. Department of Justice. This reporthas not been published by the Department. Opinions or points of view expressed are thoseof the author(s) and do not necessarily reflect the official position or policies of theU.S. Department of Justice.

Page
Exposure to Crime Measures . . . . . . . . . . . . . . . . . . . . . . . . . . . . . . . . . . . 58 Guardianship Measure . . . . . . . . . . . . . . . . . . . . . . . . . . . . . . . . . . . . . . . . 60 Proximity to Motivated Offenders . . . . . . . . . . . . . . . . . . . . . . . . . . . . . . . . 60 Prior Victimization . . . . . . . . . . . . . . . . . . . . . . . . . . . . . . . . . . . . . . . . . . . . 61 Demographics . . . . . . . . . . . . . . . . . . . . . . . . . . . . . . . . . . . . . . . . . . . . . . 61 Institution-level Characteristics . . . . . . . . . . . . . . . . . . . . . . . . . . . . . . . . . 62
Organization of the Data Analysis . . . . . . . . . . . . . . . . . . . . . . . . . . . . . . . . . . 64
CHAPTER 3: SEXUAL VICTIMIZATION AMONG FEMALE COLLEGE STUDENTS . 69 i
The Extent of Sexual Victimization . . . . . . . . . . . . . . . . . . . . . . . . . . . . . . . . . . . . 73 Rape . . . . . . . . . . . . . . . . . . . . . . . . . . . . . . . . . . . . . . . . . . . . . . . . . . . . . . . . 73 Other Forms of Sexual Victimization 82 Overall Levels of Sexual Victimization . . . . . . . . . . . . . . . . . . . . . . . . . . . . . . . 83 Comparison to Previous Studies . . . . . . . . . . . . . . . . . . . . . . . . . . . . . . . . . . . 84 Prior Sexual Victimization . . . . . . . . . . . . . . . . . . . . . . . . . . . . . . . . . . . . . . . . 87
Victim-Offender Relationship . . . . . . . . . . . . . . . . . . . . . . . . . . . . . . . . . . . . . . . . 89 The Location ana Time of Victimization . . . . . . . . . . . . . . . . . . . . . . . . . . . . . . . . 92 Victim Reactions: Protection. impact. Reporting . . . . . . . . . . . . . . . . . . . . . . . . . . 95 Explaining the Risks of Victimization . . . . . . . . . . . . . . . . . . . . . . . . . . . . . . . . . . 100 Discussion . . . . . . . . . . . . . . . . . . . . . . . . . . . . . . . . . . . . . . . . . . . . . . . . . . . . . . 105
. . . . . . . . . . . . . . . . . . . . . . . . . . . . . . . .
CHAPTER 4: STALKING . . . . . . . . . . . . . . . . . . . . . . . . . . . . . . . . . . . . . . . . . . . . . 171
The Victimization of Female College Students . . . . . . . . . . . . . . . . . . . . . . . . . . 173 Research on the Extent of Stalking . . . . . . . . . . . . . . . . . . . . . . . . . . . . . . . . . . . 176 Results . . . . . . . . . . . . . . . . . . . . . . . . . . . . . . . . . . . . . . . . . . . . . . . . . . . . . . . . 181
Extent and Characteristics of Stalking Events . . . . . . . . . . . . . . . . . . . . . . . . 181 Extent . . . . . . . . . . . . . . . . . . . . . . . . . . . . . . . . . . . . . . . . . . . . . . . . . . . . 181 Victim-Stalker Relationship . . . . . . . . . . . . . . . . . . . . . . . . . . . . . . . . . . . 182 Nature of Stalking: Forms. Duration. and Intensity . . . . . . . . . . . . . . . . . . 182 Location of Stalking . . . . . . . . . . . . . . . . . . . . . . . . . . . . . . . . . . . . . . . . . 183 Harm to Victims . . . . . . . . . . . . . . . . . . . . . . . . . . . . . . . . . . . . . . . . . . . . 184 Actions Taken by the Victim . . . . . . . . . . . . . . . . . . . . . . . . . . . . . . . . . . . 184
Reporting Stalking Victimization . . . . . . . . . . . . . . . . . . . . . . . . . . . . . . . . . . . 185 Risk Factors for Stalking Victimization . . . . . . . . . . . . . . . . . . . . . . . . . . . . . . 186
Discussion . . . . . . . . . . . . . . . . . . . . . . . . . . . . . . . . . . . . . . . . . . . . . . . . . . . . . . 188
.. II
This document is a research report submitted to the U.S. Department of Justice. This reporthas not been published by the Department. Opinions or points of view expressed are thoseof the author(s) and do not necessarily reflect the official position or policies of theU.S. Department of Justice.

Page
CHAPTER 5: VERBAL AND VISUAL FORMS OF SEXUAL VICTIMIZATION . . . . . 208
Verbal Forms of Sexual Victimization . . . . . . . . . . . . . . . . . . . . . . . . . . . . . . . . . 209 Visual Forms of Sexual Victimization . . . . . . . . . . . . . . . . . . . . . . . . . . . . . . . . . 210 Discussion . . . . . . . . . . . . . . . . . . . . . . . . . . . . . . . . . . . . . . . . . . . . . . . . . . . . . . 211
CHAPTER 6: CONCLUSIONS . . . . . . . . . . . . . . . . . . . . . . . . . . . . . . . . . . . . . . . . . 215
REFERENCES . . . . . . . . . . . . . . . . . . . . . . . . . . . . . . . . . . . . . . . . . . . . . . . . . . . . . 226
APPENDIX1 . . . . . . . . . . . . . . . . . . . . . . . . . . . . . . . . . . . . . . . . . . . . . . . . . . . . . . . 238
APPENDIX2 . . . . . . . . . . . . . . . . . . . . . . . . . . . . . . . . . . . . . . . . . . . . . . . . . . . . . . . 240
APPENDIX3 . . . . . . . . . . . . . . . . . . . . . . . . . . . . . . . . . . . . . . . . . . . . . . . . . . . . . . . 242
APPENDIX4 . . . . . . . . . . . . . . . . . . . . . . . . . . . . . . . . . . . . . . . . . . . . . . . . . . . . . . . 292
APPENDIX5 . . . . . . . . . . . . . . . . . . . . . . . . . . . . . . . . . . . . . . . . . . . . . . . . . . . . . . . 294
APPENDIX6 . . . . . . . . . . . . . . . . . . . . . . . . . . . . . . . . . . . . . . . . . . . . . . . . . . . . . . . 296
APPENDIX7 . . . . . . . . . . . . . . . . . . . . . . . . . . . . . . . . . . . . . . . . . . . . . . . . . . . . . . . 299
APPENDIX8 . . . . . . . . . . . . . . . . . . . . . . . . . . . . . . . . . . . . . . . . . . . . . . . . . . . . . . . 303
... Ill
This document is a research report submitted to the U.S. Department of Justice. This reporthas not been published by the Department. Opinions or points of view expressed are thoseof the author(s) and do not necessarily reflect the official position or policies of theU.S. Department of Justice.

LIST OF TABLES AND FIGURES Page
Figure 1 .I Sources of College Women’s Sexual Victimization . . . . . . . . . . . . . . . 28a
Table 2.1 Type of Victimizations Measured . . . . . . . . . . . . . . . . . . . . . . . . . . . . . 65
Table 2.2 Pretest Results: The Nature and Extent of Sexual Victimization “Since School Began in September 1995” Among a Sample of CollegeWomen . . . . . . . . . . . . . . . . . . . . . . . . . . . . . . . . . . . . . . . . . . 67 .
Table 2.3 Size of Student Enrollment by Location of School . . . . . . . . . . . . . . . . 68
Table 3.1
Table 3.2
Table 3.3
Table 3.4
Table 3.5
Table 3.6
Table 3.7
Table 3.8
Table 3.9
Table 3.10
Table 3.1 1
Extent of Rape by Number of Victims and Number of Incidents by Type of Victimization Incident . . . . . . . . . . . . . . . . . . . . . . . . . . . . 1 13
The Relationship Between the Coding of Rape Victimizations by Screen Questions and Incident Reports for Victims and Incidents . . . . . . . . . . . . . . . . . . . . . . . . . . .... - . . . . - . . . . . . . . . 114
Number of Incidents and Victims Who Defined Incident as a Rape by Type of Victimization Incident . . . . . . . . . . . . . . . . . . . . 11 5
Extent of Sexual Coercion by Number of Victims and Number of Incidents . . . . . . . . . . . . . . . . . . . . . . . . . . . . . . . . . . . 116
Extent of Sexual Contact with and without Force by Type of Crime . . 117
Extent of Threatened Crimes by Number of Victims and Number of Incidents . . . . . . . . . . . . . . . . . . . . . . . . . . . . . . . . . . . 11 8
Summary of Incidents and Victimizations by Type of Victimization Incident . . . . . . . . . . . . . . . . . . . . . . . . . . . . . . . 1 19
Percent of Sample Having at Least One Incident . . . . . . . . . . . . . . . . 120
Percent of Sample Who Were Sexually Victimized Before the Start of the 1996 School Year . . . . . . . . . . . . . . . . . . . . . . . . . . . . 121
Number of Persons Committing the Incident by Type of Crime . . . . . 122
Percentage of Victims Who Knew Offender@) by Single Offender and Multiple Offenders by Type of Crime . . . . . . . . . . . . . . . . . . . . . . 123
iv
This document is a research report submitted to the U.S. Department of Justice. This reporthas not been published by the Department. Opinions or points of view expressed are thoseof the author(s) and do not necessarily reflect the official position or policies of theU.S. Department of Justice.
Page
Table 3.12 Victim-Offender Relationship for Single Offender Victimization byTypeofCrime . . . . . . . . . . . . . . . . . . . . . . . . . . . . . . . . . . . . . . . . . 124
Table 3.13 Victim-Offender Relationship by Dating and Romantic Status by iypeofcr ime . . . . . . . . . . . . . . . . . . . . . . . . . . . . . . . . . . . . . . . . . 126
Table 3.14 Victim's and Offender's Use of AlcohoVDrugs by Type of Crime . . . . 127
Table 3.15 Characteristics of Single Offenders by Type of Crime . . . . . . . . . . . . 128
Table 3.16 The Location of Victimization by On-Campus and Off-Campus LocationbyTypeofCrime . . . . . . . . . . . . . . . . . . . . . . . . . . . . . . . . . 129
Table 3 . 77 Location of On-Campus Incidents by Type of Crime . . . . . . . . . . . . . . 130
Table 3.18 Location of Off-Campus Incidents by Type of Crime . . . . . . . . . . . . . . 132
Table 3.19 Type of Crime by Time of Incident . . . . . . . . . . . . . . . . . . . . . . . . . . . 134
Table 3.20 Type of Crime by Month of Incident . . . . . . . . . . . . . . . . . . . . . . . . . . 135
Table 3.21 Incidents During Academic Break by Type of Victimization Incident . . . . . . . . . . . . . . . . . . . . . . . . . . . . . . . . . . . . . . . . . . . . . . . . 136
Table 3.22 Extent of Protection Used by Victims by Type of Protection byTypeofCrime . . . . . . . . . . . . . . . . . . . . . . . . . . . . . . . . . . . . . . . . . 137
Table 3.23 Type of Injuries Suffered by Type of Crime . . . . . . . . . . . . . . . . . . . . . 139
Table 3.24 Presence of Weapon by Type of Crime . . . . . . . . . . . . . . . . . . . . . . . 140
Table 3.25 Reporting of Incident to the Police by Type of Crime . . . . . . . . . . . . . 141
Table 3.26 Reported Incident to Someone Besides the Police byTypeofCrime . . . . . . . . . . . . . . . . . . . . . . . . . . . . . . . . . . . . . . . . . 142
Table 3.27 Reasons for Not Reporting Incident to the Police byTypeofCrime . . . . . . . . . . . . . . . . . . . . . . . . . . . . . . . . . . . . . . . . . 144
Table 3.28 Crime Prevention Activities by Victim Status . . . . . . . . . . . . . . . . . . . 145
This document is a research report submitted to the U.S. Department of Justice. This reporthas not been published by the Department. Opinions or points of view expressed are thoseof the author(s) and do not necessarily reflect the official position or policies of theU.S. Department of Justice.
Page
Table 3.29 Demographic Characteristics of Sexual Vir;fimizations by Victim Characteristics . . . . . . . . . . . . . . . . . . . . . . . . . . . . . . . . . . . 146
Table 3.30 Multivariate Model Identifying Risk Factors of Sexual Victimization . . 147
Table 3.31 Multivariate Model Identifying Risk Factors of Rape . . . . . . . . . . . . . . 149
Table 3.32 Multivariate Model Identifying Risk Factors of Sexual Coercion . . . . . 151
Table 3.33 Multivariate Model Identifying Risk Factors of Sexual Contact . . . . . . 153
Table 3.34 Multivariate Model Identifying Risk Factors of Receiving SexualThreats . . . . . . . . . . . . . . . . . . . . . . . . . . . . . . . . . . . . . . . . . . 155
Table 3.35 Multivariate Model Identifying Risk Factors of Sexual Victimization With Force . . . . . . . . . . . . . . . . . . . . . . . . . . . . . . . . . . . . . . . . . . . . . 157
Table 3.36 Multivariate Model Identifying Risk Factors of Sexual Victimization OnCampus . . . . . . . . . . . . . . . . . . . . . . . . . . . . . . . . . . . . . . . . . . . . . 159
Table 3.37 Multivariate Model Identifying Risk Factors of Rape Occurring OnCampus . . . . . . . . . . . . . . . . . . . . . . . . . . . . . . . . . . . . . . . . . . . . . 161
Table 3.38 Multivariate Model Identifying Risk Factors of Sexual Coercion Occurring On Campus . . . . . . . . . . . . . . . . . . . . . . . . . . . . . . . . . . . . 163
Table 3.39 Multivariate Model Identifying Risk Factors of Sexual Contact Occurring On Campus . . . . . . . . . . . . . . . . . . . . . . . . . . . . . . . . . . . . 165
Table 3.40 Multivariate Model Identifying Risk Factors of Sexual Threats Occurring On Campus . . . . . . . . . . . . . . . . . . . . . . . . . . . . . . . . . . . . 167
Table 3.41 Multivariate Model Identifying Risk Factors of Sexual Victimization With Force Occurring On Campus . . . . . . . . . . . . . . . . . . . . . . . . . . . 169
Table 4.1 Relationship of Victim to Stalker . . . . . . . . . . . . . . . . . . . . . . . . . . . . . 200
Table 4.2 Forms of Stalking . . . . . . . . . . . . . . . . . . . . . . . . . . . . . . . . . . . . . . . . 201
Table 4.3 Frequency of Stalking lncident(s) . . . . . . . . . . . . . . . . . . . . . . . . . . . . 202
Table 4.4 Location of Stalking Incident(s) . . . . . . . . . . . . . . . . . . . . . . . . . . . . . . 203
vi
This document is a research report submitted to the U.S. Department of Justice. This reporthas not been published by the Department. Opinions or points of view expressed are thoseof the author(s) and do not necessarily reflect the official position or policies of theU.S. Department of Justice.

Page
Table 4.5 Actions Taken by Victim Following Stalking Incident(s) . . . . . . . . . . . 204
Table 4.6 Reporting of Stalking Incident(s) . . . . . . . . . . . . . . . . . . . . . . . . . . . . . 205
Table 4.7 Multivariate Model Identifying Risk Factors of Being Stalked . . . . . . . 206
Table 5.1 The Extent of Verbal Victimization by Number of Victims and Number of Victimizations . . . . . . . . . . . . . . . . . . . . . . . . . . . . . . . 214
Table 5.2 The Extent of Visual Victimization by Number of Victims and Number of Victimizations . . . . . . . . . . . . . . . . . . . . . . . . . . . . . . 21 4a
vii
This document is a research report submitted to the U.S. Department of Justice. This reporthas not been published by the Department. Opinions or points of view expressed are thoseof the author(s) and do not necessarily reflect the official position or policies of theU.S. Department of Justice.

THE EXTENT AND NATURE OF THE SEXUAL VICTIMIZATION OF
COLLEGE WOMEN: A NATIONAL-LEVEL ANALYSIS
EXECUTIVE SUMMARY
Statement of the Problem
Over the past twddecades, there has been a growing concern with the sexual
victimization of women. With large concentrations of younger women on college
campuses, it is perhaps not surprising that researchers have shown a special interest in
the extent and types of sexual victimization experienced by female students. The resulting
empirical research has prompted a number of insights that have advanced our
understanding of this phenomenon. The goal of the current project is to build on existing
studies and thus to demarcate more clearly the dimensions and nature of the sexual
victimization of college women.
Although valuable, previous college and university women studies have typically
been limited in one of five ways. First, a majority have not used national-level samples.
Instead, sexual victimization surveys have been conducted on female students attending
one college or university or attending a limited number of institutions of higher education.
The generalizability of the results thus is open to question. Second, many studies have
employed measures that assess only a limited range of sexual victimization (e.g., rape or
sexual harassment), even though women can be victimized in various other forms (e.g,
stalking). Third, the measures used to assess whether a victimization had taken place
viii
This document is a research report submitted to the U.S. Department of Justice. This reporthas not been published by the Department. Opinions or points of view expressed are thoseof the author(s) and do not necessarily reflect the official position or policies of theU.S. Department of Justice.
often are based on a single-item question. Because responses to these questions are not
explored luifher in more detail on the survey (e.g., in an “incident report”), using a
response to a singbitern question can potentially inflate or deflate estimates of the extent
of sexual victimization. Fourth, many studies have not included detailed questions on what
occurred in the incident, thus restricting our knowledge of the nature or characteristics of
sexual victimization. Fifth, in attempting to explain what factors increase the risk of being
victimized, previous studies typically have included only a restricted range of independent
variables .
In response to these limitations, the current project employed a nationally
representative sample of college women, assessed a range of potential sexual
victimizations, measured sexual victimization using specifically worded questions, acquired
detailed information about each victimization incident, and examined how the risk of being
victimized was affected by a range of variables including demographic characteristics,
lifestyles or routine activities, and characteristics of the college or university a student
attended. Again, the goal was to furnish the most systematic information possible on the
extent and nature of the sexual victimization experienced by female students attending the
nation’s colleges and universities.
Methodology
Sample. The sample was chosen using a two-staged process. First, colleges or
universities with enrollments of over 1,000 students were stratified according to the total
student enrollment and location. Relying on the American Student List Company, we
initially determined whether we could obtain the names and telephone numbers of female
ix
This document is a research report submitted to the U.S. Department of Justice. This reporthas not been published by the Department. Opinions or points of view expressed are thoseof the author(s) and do not necessarily reflect the official position or policies of theU.S. Department of Justice.

students from these institutions. From this pool, we then selected randomly institutions
using a probability proportionald to the size of the female enrollment. Second, female
students were then selected randomly from each chosen institution to be interviewed. In
all, 4,446 female college students were interviewed. The response rate for the study was
85.6 percent.
Measure of Victimization. Two considerations guided our efforts to develop an
improved measure of sexual victimization. First, previous research indicates that
respondents may not report instances of sexual victimization if survey questions do not
specifically describe the behavior in question. That is, simply asking a woman if she was
"raped" may not result in all incidents of forcible, unwanted sexual penetration being
counted as rapes because respondents may not interpret such acts as "rape." Second,
even if a respondent might answer "yes" to a question asking if she had been victimized,
confirming what actually took place is not possible unless a series of subsequent
questions are asked about the incident.
In light of these considerations, we asked the respondents a series of behaviorally
specific screen questions that used detailed, graphic language to describe various types
of sexual victimization. If a respondent answered "yes" to a screen question, she was then
asked (for every incident indicated) to complete an "incident-level report." This report
contained detailed questions about what occurred in the incident, including the types of
penetration and sexual contact experienced, and the means of coercion, if any, that were
used by the perpetrator. Further, the incident-level report asked a range of other
questions, such as whether the victim knew the offender, whether the victim suffered any
X
This document is a research report submitted to the U.S. Department of Justice. This reporthas not been published by the Department. Opinions or points of view expressed are thoseof the author(s) and do not necessarily reflect the official position or policies of theU.S. Department of Justice.
harm, whether protective actions were taken during the incident, where and when the
victimization occurred, and whether the victimizatioiI (Nas reported and, if so, to whom.
Note that the two-stage measurement design of using screen questions and an incident-
level report was largely borrowed from the National Crime Victimization Survey. However,
we used behaviorally specific screen questions and a modified incident-level report.
Similar to the National Crime Victimization Survey, responses to incident-level questions
were used to hierarchically classify the type of victimization from most severe to less
severe).
Using this approach, we were able to measure twelve types of sexual victimization:
completed rape, attempted rape, com.pleted sexual coercion, attempted sexual coercion,
completed sexual contact with force or threat of force, completed sexual contact without
force, attempted sexual contact with force or threat of force, attempted sexual contact
without force, threat of rape, threat of contact with force or threat of force, threat of
penetration without force, and threat of contact without force. In another section of the
survey, we also developed a separate screen question and incident-level report for
stalking. Finally, we developed general measures (but not incident-level reports) to secure
counts of "visual" victimization (e.g. , exposed involuritarily to pornography, victim of
voyeurism) and of "verbal" victimization (e.g. , sexually tinged cat calls, obscene telephone
cat Is).
In responding to the survey, the female college students in the sample were asked
to state if they had experienced a sexual victimization within a fixed reference period:
"since school began in Fail of 1996." The survey was conducted between February 21 ,
xi
This document is a research report submitted to the U.S. Department of Justice. This reporthas not been published by the Department. Opinions or points of view expressed are thoseof the author(s) and do not necessarily reflect the official position or policies of theU.S. Department of Justice.
1997 and May 5, 1997, with students who started their academic years earlier (e.g., in
August as opposed to September) being interviewed first. On average, rne reference
period for the victimization survey was at least six months.
The survey instrument was developed using focus groups and was pre-tested. The
final survey was conducted by the survey firm of Schulman, Ronca, and Bucuvalas, Inc.
(SRBI). Before being contacted by SRBI, the respondents were sent a letter describing
the nature of the study and asking for their voluntary cooperation. Only trained, female
interviewers were used to conduct the survey. On average, the survey, conducted via a
telephone interview, lasted 25.9 minutes.
lndependenf Variables. Finally, the survey instrument contained questions that
secured information on the respondents' demographic characteristics, living arrangements,
lifestyle, sexual orientation, and sexual victimization prior to the start of the current school
year. Secondary date sources were used to code institution-level data for the
respondents, such as the size of the enrollment, location, and crime rate for the college
or university they attended. Again, these variables were used to examine the factors that
might place college women more at risk for being sexually victimized.
Major Findings
The complexity of the survey had the advantage of obtaining a large amount of
information about the extent and nature of the sexual victimization of college women.
Here, we attempt to present the most salient findings.
xi i
This document is a research report submitted to the U.S. Department of Justice. This reporthas not been published by the Department. Opinions or points of view expressed are thoseof the author(s) and do not necessarily reflect the official position or policies of theU.S. Department of Justice.

During the six-month reference period, 1.7 percent of the college women sampled
figure for attempted rape was 1 .I percent. reported that they had experienced a completed rape, while the corresponding
-
The percent of the respondents who experienced a completed rape or attempted rape was 2.8 percent.
a Across the twelve types of sexual victimization, 15.5 percent of the women experienced at least one victimization.
When analyzed by the presence or absence of force, almost 8 percent of the sample were sexually victimized in an incident that involved force or the threat of force, while 11 percent were subjected to an unwanted sexual victimization that did not involve the use of force or threat of force.
13.1 percent of the respondents indicated that they had been stalked. The average stalking incidant lasted 60 days.
. A majority of the female students experienced "verbal" sexual victimizations. About half the respondents witnessed sexist remarks and were subjected to cat calls or whistles with sexual overtones. One in five received an obscene telephone call and were asked intrusive questions about their sex or romantic life. One in ten had false rumors spread about their sex life.
. "Visual" sexual victimizations were less common. Still, 6.1 percent of the sample had pornographic pictures involuntarily shown to them, almost 5 percent had someone expose their sexual organs to them, and 2.4 percent were observed naked without their consent.
. Most victims knew the person who sexually victimized them. For example, for both completed and attempted rapes, about nine in 10 offenders were known to the victim. Similarly, in four in five stalking incidents, victims knew or had seen the offender; in over half the cases, the stalker was "well known" to the victim.
. Most often, women were sexually victimized by a boyfriendlex-boyfriend, classmate, friend, acquaintance, or coworker. College professors/teachers were not identified
xiii
This document is a research report submitted to the U.S. Department of Justice. This reporthas not been published by the Department. Opinions or points of view expressed are thoseof the author(s) and do not necessarily reflect the official position or policies of theU.S. Department of Justice.
as committing any rapes or sexual coercions, but were cited as the offender in a low percentage of cases involving unwanted sexual contact.
0 A number of sexual victimizations occurred when the victim was on a date with the offender. With regard to "date rape," 12.8 percent of completed rapes, 35.0 percent of attempted rapes, and 22.9 of threatened rapes took place on a date.
a The majority of sexual victimizations, especially rapes and physically coerced sexual contact, occurred in a living quarters. For example, for completed rapes that occurred on campus, almost 60 percent of the incidents took place in the victim's residence, 31 perdent took place in another living quarters on campus, and 10.3 percent took place in a fraternity.
The vast majority of sexual victimizations occurred in the evening hours (after 6 p.m.). For example, for completed rapes, 51.8 percent took place after midnight, 36.5 percent took place between 6 p.m. and midnight, and only 1 I .8 percent took place between 6 a.m. and 6 p.m.
. College women in the sample were victimized both on campus and off campus. For nearly all types of victimization, however, off-campus victimization was more common. This conclusion must be placed in a larger context because off-campus sexual victimizations may take place in bars/nightclubs or in student residences close to campus.
. The risk of being sexually victimized was increased by a number of factors. In our analyses, four factors, however, had the most consistent, statistically significant effect across the various types of sexual victimization: (1) frequently drinking enough alcohol to get drunk; (2) being unmarried; (3) having been a victim of a sexual assault before the current school year began; and (4) for on-campus victimization, living on campus.
. In a majority of sexual victimizations, victims reported taking some type of protective action. Thus, in two-thirds of completed rape incidents, victims attempted to protect themselves, while this figure for attempted rape was 91.5 percent. The most common form of protective action taken in these rape incidents was the use of physical force against the assailant.
xiv
This document is a research report submitted to the U.S. Department of Justice. This reporthas not been published by the Department. Opinions or points of view expressed are thoseof the author(s) and do not necessarily reflect the official position or policies of theU.S. Department of Justice.

b Few sexual victimizations were reported to the police on or off campus. Thus, fewer than 5 percent of completed and attempted rape incidents were reported to the police. In about one-thd of rape incidents, however, the victim did tell another person about the incident. Most often, this person was a friend and not a family member or campus official.
b The decision not to report being victimized appeared to involve a number of reasons. On one hand, the victims cited that they did not think the incident was serious enough to report (the most common reason given), that they were not clear that a crime or h a m was intended, and that they didn't want to be bothered. Other reasons cited, however, included that victims did not want their family or other people to know about the incident, that they feared a reprisal by the offender, that they lacked proof that the incident happened, and that they feared being treated hostilely by the police.
b About nine in ten womer, reported engaging in some form of crime prevention behavior. Common prevention behavior included attending crime prevention educational seminars, using campus-sponsored crime prevention services (e.9. , escorts, lighted pathways), carrying mace or pepper-spray, and walking with other people to one's destination after dark.
. Victims engaged in more crime prevention behaviors than non-victims. We do not know, however, whether this occurred in response to their sexual victimization during the current school year.
Conclusion
Extent. We should emphasize that the victimization statistics presented in our
research are only for a reference period of about half a year (since school began in the
current academic year). If these figures were extended to cover a year's time or to cover
a student's entire time in college, the extent of victimization would be commensurately
increased. With this perspective in mind, our national-level study suggests that many
college women will encounter sexist and harassing comments, will likely receive an
This document is a research report submitted to the U.S. Department of Justice. This reporthas not been published by the Department. Opinions or points of view expressed are thoseof the author(s) and do not necessarily reflect the official position or policies of theU.S. Department of Justice.
obscene phone call, and will have a good chance of being stalked and of enduring some
form of coerced sexual contact.
Whether the risk of rape for college women is considered high or low may reside
in the eye of the beholder. As noted, a total of 2.8 percent of the women in our sample
experienced a completed or attempted rape. Some commentators might suggest that this
is a "low" level of victimization risk. However, even though, a crude estimate, over the
course of an entire year, this 2.8 percent figure might be about 5.6 percent. Over the five
or more years women now spend in college, we might estimate that this victimization figure
might rise to a fourth or quarter of any cohort of females who enter college and complete
their degree. Such projections admittedly are risky and are based on a number of untested
assumptions. Still, they are worthwhile to the extent they show that the annual levels of
Victimization reported in our study might, over time, produce rape rates that are
disquieting.
Nature. Beyond the extent of sexual victimization, our research furnishes insights
into the "nature" or characteristics of this phenomenon. Although exceptions exist, most
sexual victimizations occur when college women are alone with a man they know, at night,
and in the privacy of a residence. Only a minority of these incidents are said to occur "on
a date." Most women attempt to resist their assailants, often with physical force, but then
are reluctant to report their victimization to the police.
The risk of victimization, however, is not even across all women but rather is
affected by several factors. As might be expected, living on campus increases the
chances of experiencing a victimization on campus. Being in a marriage apparently
xvi
This document is a research report submitted to the U.S. Department of Justice. This reporthas not been published by the Department. Opinions or points of view expressed are thoseof the author(s) and do not necessarily reflect the official position or policies of theU.S. Department of Justice.
insulates against encountering potential offenders and/or situations in which sexual
victimizations take place. College females who frequently drink to get urunk have an
elevated victimization risk, perhaps because alcohol renders them vulnerable to
Victimization. It also is possible that their drinking only means that they are in situations
where they encounter males who are also drinking and thus more likely to victimize them.
Finally, the current risk of sexual victimization is increased by having been sexually
victimized before the start of the current school year.
Future Research. The breadth of our national-level victimization study is both a
strength and a weakness. The study's strength is that it provides national estimates for
various types of the sexual victimization and a wealth of information about the nature of
the victimization experience. The study's weakness, however, is that what is gained in
breadth is lost in depth. Thus, our research project provides important findings but, on the
other hand, cannot always investigate in sufficient detail to explain why these findings
obtain. For example, it is salient that women who often "get drunk" and who have been
previously sexually victimized are more at risk of being victims of a range of sexual
victimizations. But why is this the case? Similarly, why do women experience a sexual
assault, including rape, but then fail to report it to the police? Is this because our research
design-even though carefully implemented-counts incidents as rapes that really are
not? Is it because female students are socialized to believe that sexual aggression-even
to the point of unwanted, forced sexual penetration-is somehow "normal" or "not a police
matter"? If so, why is this the case? Clearly, then, many additional research projects are
needed to focus in detail on the issues raised by the data reported here.
xvii
This document is a research report submitted to the U.S. Department of Justice. This reporthas not been published by the Department. Opinions or points of view expressed are thoseof the author(s) and do not necessarily reflect the official position or policies of theU.S. Department of Justice.

Finally, another challenge awaits: taking the information conveyed in this report
and developing programs and policies that have the potential to reduce the risk of
victimization female college students experience. More minor forms of
victimization-sexist statements, harassing cat calls, sexually tainted whistles-appear to
be commonplace not only off but also on college campuses. How can a more civil
environment be achieved without compromising "free speech"? We also know much about
the circumstances in which sexual victimization, including rape, most often takes place
(i.e., alone, with someone a woman knows, at night, in a residence, and with alcohol
present). How can this information be used in crime prevention programs, including "rape
awareness" seminars, designed for college women? Further, the relatively high
prevalence of stalking--a victimization often ignored by researchers and college
officials-is a cause for concern. What strategies can women use to end stalking? What
programs might colleges and universities implement to control and/or counsel men who
stalk? More generally, how can the lives of college women--on, close to, and off campus-
be made safer and thus free from the costs imposed by the experience of sexual
victimization?
xviii
This document is a research report submitted to the U.S. Department of Justice. This reporthas not been published by the Department. Opinions or points of view expressed are thoseof the author(s) and do not necessarily reflect the official position or policies of theU.S. Department of Justice.

CHAPTER 1
INTROD UCTlON
Although research investigations of the sexual victimization of college women began
nearly four decades ago (see Kanin, 1957), only recently has a substantial literature
examining the rubric of "sexual victimization" developed. However, for some forms of
sexual victimization, such as stalking and visual and verbal insults, little empirical research
has been conducted (see Coleman, 1997; Tjaden and Thoennes, 1998).
The 1970s and 1980s saw many inquiries into the incidence and prevalence of
sexual victimization of college women, including studies on date and acquaintance rape,
sexual assault, and sexual harassment (e.g., MacKinnon, 1979; Koss and Oros, 1982;
Koss, Gidycz, and Wisniewski, 1987). Evidence indicates that between 8 percent and 15
percent of college women have been the victims of forced sexual intercourse (i.e., rape)
during their college tenure (Koss et al., 1987; Rivera and Regoli, 1987; Ward, Chapman,
Cohn, White, and Williams, 1991; DeKeseredy and Kelly, 1993a). Research on less
serious forms of sexual assault-ranging from unwanted touching to attempted
rape-report somewhat higher victimization levels-up to 35 percent (Koss et al., 1987;
Muehlenhard and Linton, 1987; DeKeseredy and Kelly, 1993a). Some of these studies
report that one in three women students have experienced sexual harassment by faculty
members at least once during their college tenure (e.g., McKinney, Olson, and Satterfield,
1988). Finally, a recent national-level study of women 18 years of age or older reported
that 8 percent of them had been stalked at some point in their lives and that 1 percent had
been stalked in the previous 12 months (Tjaden and Thoennes, 1998).
-1 -
This document is a research report submitted to the U.S. Department of Justice. This reporthas not been published by the Department. Opinions or points of view expressed are thoseof the author(s) and do not necessarily reflect the official position or policies of theU.S. Department of Justice.
This research clearly shows that women face a substantial risk of sexual
victimization during their lifetil;e and that college women may face an even greater risk
(see Fisher, Sloan, Cullen, and Lu, 1998). However, given our specific interest in the
sexual victimization of college women, there are five limitations with these studies: (1)
many tend to focus on narrow types of sexual victimization (e.g., rape or date rape) or
group sexual victimization within the broad category of "violence" (Koss, et al., 1987;
Muehlenhard and Linton, $987); (2) they tend to use a single-item or a limited number of
items (e.g., Koss's Sexual Experiences Survey) to measure types of sexual victimization
and do not "verify" the initial responses to this question(s) with an incident report; (3) most
tend to use a broad reference frame (e.g., "ever happened to you") (see Koss et al.,
1987); (4) the majority of the studies survey women on only one campus or in a restricted
geographical area (see Bromley and Sellers, 1996); and (5) they employ a sample of
women who may or may not be college women (e.g., Tjaden and Thoennes, 1998). As a
result, little is known about the extent and nature of different forms of sexual victimization
(including stalking) college women experience during a specific bounded time period (e.g.,
a school year or during their college tenure). Additionally, because the majority of these
studies use limited or nonrandom samples, they cannot provide national-level baseline
estimates of sexual victimization among college women. Therefore, we examined multiple
forms of sexual victimization, ranging from rape to stalking and visual and verbal insults,
experienced by college women in the United States; we use a clearly defined reference
period, "since school began in the Fall of 1996"- a time period that is comparable in
length to the reference period used in the National Crime Victimization Survey; and we
-2-
This document is a research report submitted to the U.S. Department of Justice. This reporthas not been published by the Department. Opinions or points of view expressed are thoseof the author(s) and do not necessarily reflect the official position or policies of theU.S. Department of Justice.

employed a nationally representative sample of women who were currently enrolled in
either two-year and four-year colleges and universities.
A new national-level study is needed because of the many social and legislative
changes that have occurred in the United States in the decade since the last national
study was completed by Koss et ai. (1987). These changes could affect the nature,
prevalence, and incidence of sexual victimization of college women and affect the risk
factors associated with sexual victimization. First, in the time since Koss's research, the
number of women attending post-secondary educational institutions has increased.
According to Department of Education (DOE) figures, between 1982 and 1995, the number
of women attending two-year and four-year post-secondary institutions in this country
increased by over one million and a half (e.g., 1,524,846) (US Department of Education,
1 997). Additionally, the proportion of women enrolled in post-secondary schools increased
during this time, from 52 percent of all post-secondary students in 1982 to about 56
percent of all post-secondary students in 1995. Because more women are enrolled in
colleges and universities today, the number of possible "targets" for sexual victimization
has commensurately increased, which may have affected victimization rates.
Second, in 1990 Congress passed the Sfudenf-Right-to-Know and Campus Secunfy
Act (20 USC 1001 ). This legislation requires all post-secondary institutions receiving
federal funds to publicly distribute annual campus crime statistics, including figures on
sexual assaults (prior to August 1 , 1992 only rape and after August 1, 1992, both forcible
and non-forcible sex offenses), known to campus police or to campus authorities who have
significant counseling responsibilities. Prior to the passage of the Act (but only since
-3-
This document is a research report submitted to the U.S. Department of Justice. This reporthas not been published by the Department. Opinions or points of view expressed are thoseof the author(s) and do not necessarily reflect the official position or policies of theU.S. Department of Justice.
1972), post-secondary schools had voluntarily reported their crime statistics to the FBI's
Uniform Crime Reports. However, the overall reporting pattern for schools was sporadic
and, on average, less than 20 percent of all the post-secondary institutions reported their
crime statistics to the FBI (Seng and Koehler, 1993). Even data from the National Incident-
Based Reporting System (NIBRIS), with an incident location entry for "school/college
(includes university)," cannot distinguish among elementary, junior high, secondary school
or post-secondary school locations of incidents. Unfortunately, these three "official"
sources of statistics limit our understanding of the prevalence and incidence of sexual
victimization by only requiring the reporting of serious sexual assaults (including rape).
Additionally, the reliability of these statistics is highly suspect. Many college women who
have been sexually assaulted are unwilling to report their experiences to the authorities
(DeKersedy, Schwartz, and Tait, 1993; Benson, Charlton, and Goodhart, 1992; Ward et
al., 1991; Warshaw, 1988). One nationwide poll in 1987 of undergraduate students re-
vealed that only 31 percent of all on-campus sexual assaults were reported to campus
police or security (Siegal and Raymond, 1992). A more recent study (1 993-1 994 academic
year) reported that 78 percent of rapes and 83 percent of sexual assaults which happened
on campus went unreported to campus law enforcement and other campus officials (Sloan,
Fisher, and Cullen, 1997). Further, because most forms of sexual harassment (e.g.,
leering, sexually tinged staring, verbal comments) are not crimes, official statistics fail to
include this type of behavior in their figures, which also creates gaps in estimating the
extent and nature of sexual victimization of college women.
This document is a research report submitted to the U.S. Department of Justice. This reporthas not been published by the Department. Opinions or points of view expressed are thoseof the author(s) and do not necessarily reflect the official position or policies of theU.S. Department of Justice.

Finally, on many college and university campuses, there has been increased
concern with, awareness of, and responses to the sexual victimization of college women
and the risk factors associated with such victimization due to social, legal, and legislative
factors. First, the brutal rape and murder of Jeanne Ann Clery, a freshman at Lehigh
University in Pennsylvania, by a fellow student while she slept in her dormitory room in the
spring of 1986, catapulted the issue of campus sexual victimization and lax campus
security to national attention. Since then, the grassroots efforts by Ms. Clery's parents has
helped to organize many groups on campus that are actively addressing issues of
'
women's safety. Second, a growing number of legal cases exist in which campus rape
victims have successfully sued post-secondary institutions and collected monetary
damages for institutional breach of its duty to foresee dangers and provide a reasonably
safe environment (see Fisher, 1995; Smith and Fossey, 1995). Third, as part of the
Student Right-to-Know and Campus Security Act, schools are required to disseminate
information on their security policies, including crime prevention programs currently used.
Currently, Congress is considering the Accuracy in Campus Crime Reporting Act of 1997
(H .R 715) which expands the categories of crime that schools would have to report (e.g.,
simple assault and theft), opens campus police logs and campus disciplinary proceedings
to the public, and provides sanctions for school found to be in noncompliance to the
Student Right-to-Know and Campus Security Act. Further interest by Congress ir, the
spring 1998 includes the introduction of The Campus Crime Disclosure Act of 1998, which
expands the definition of campus, the categories of crime that must be reported and
-5-
This document is a research report submitted to the U.S. Department of Justice. This reporthas not been published by the Department. Opinions or points of view expressed are thoseof the author(s) and do not necessarily reflect the official position or policies of theU.S. Department of Justice.
provides for a fine for schools violating campus security disclosure laws
(http://w.soconline.org/LEGIS/newindex. html#l , 1998).
In combination, these three factors have resulted in college and university
administrators creating various rape, sexual assault, or sexual harassment awareness
programs that address the problem of sexual victimization of college women. Thus, since
the completion of the sexual victimization studies in the 1980s, many post-secondary
institutions have developed programs to educate students (both male and female) and
employees (faculty members and staff) on preventing rape, sexual assault, and sexual
harassment. These efforts have clear implications for reducing sexual victimization of
college women; however, whether this has happened remains an empirical question.
In summary, the existing literature on the sexual victimization of college women
does not allow researchers or policy makers: (1) to examine the scope of different forms
of sexual victimization among college women; (2) to assess national-level baseline
estimates of the prevalence or incidence of these victimizations; or (3) to examine the
effectiveness of institutional and legal policies in addressing these crimes and protecting
the victims. Thus, a national-level study is needed for three reasons: (1) the last national-
level study in the United States was completed during the 1980s, and since then various
social, legislative, and legal changes have happened that may have affected the incidence
and prevalence of the sexual victimization of college women; (2) Congress has routinely
scheduled hearings to examine campus crime in general and to examine the impact of the
Student Right-to-Know and Campus Security Act on campus crime and has introduced new
-6-
This document is a research report submitted to the U.S. Department of Justice. This reporthas not been published by the Department. Opinions or points of view expressed are thoseof the author(s) and do not necessarily reflect the official position or policies of theU.S. Department of Justice.
legislation to address campus crime issues; and (3) the inclusion of campus sexual
assaults in the Violent Crime control and Law Enforcement Act of 1994.
RESEARCH QUESTIONS
We collected data from a national-level sample of female college and university
students. Included in these data are information on the victimization incident, the victim
and her lifestyle, and the institutional context in which the incident occurred. Using these
data, we answered a basic set of research questions about the sexual victimization of
college women:
1. What is the extent of sexual victimization of college women in the United States? To the degree that comparisons with existing research are possible, how do the victimization rates in the current study compare with those found in previous studies of sexual victimization among college women?
2. What are the characteristics or nature of the sexual victimizations that college women experience? Thus, what is the relationship between victims and offenders (e.g., stranger, acquaintance, intimate partner)? Where are victimizations most likely to occur (e.g., in public or private settings, on or off campus)? When are victimizations most likely to occur (e.g., during the day, in the evening hours)?
3. What factors increase the risk of the sexual victimization of college women? Thus, how is the risk of victimization affected by personal characteristics, by lifestyles or routine activities, and by the characteristics of the institution that a woman attends?
4. How do college women who experience sexual victimization react to victimization incidents? Thus, during the victimization, do they take steps to prevent the incident and, if so, what specific actions do they employ? How are they affected, physically and psychologically, by the victimization? Do they report their victimization experience and, if so, to whom?
-7-
This document is a research report submitted to the U.S. Department of Justice. This reporthas not been published by the Department. Opinions or points of view expressed are thoseof the author(s) and do not necessarily reflect the official position or policies of theU.S. Department of Justice.

We believe that answers to these questions will achieve the major objectives that
we have set for this study, including: (1) determiningthe extent and the nature of various
forms of sexual victimization of college women; (2) helping post-secondary institutions
identify and assess experiences that come under the rubric of sexual victimization; (3)
developing a better understanding of the dynamics associated with various forms of sexual
victimization by examining the contributions of several different categories of variables;
and (4) making a contribdion to the theoretical study of sexual victimization.
OBJECTIVES OF THE STUDY
Our first objective is to estimate the extent and the nature of sexual victimization of
women on college campuses. This objective is based on four considerations: (1) previous
national-level studies of sexual victimization of college students are nearly ten years old;
(2) due to victim underreporting and the limited types of sexual victimization that are
measured, official data sources (e.g., UCR or NIBRS) underreport the extent, and may
misrepresent the nature, of the sexual victimization of college women; (3) the most recent
studies of sexual victimization of college students have been done in Canada, which is a
different social domain than the United States (DeKeseredy and Kelly, 1993a, 1993b;
DeKeseredy et al., 1993); and (4) the existing literature generally fails to conceptualize
sexual victimization in its full complexity.
Our second objective is to help post-secondary institutions identify and assess the
problem of sexual victimization of college women. Based on the results of our study, post-
secondary institutions could assess the extent and nature of their programs and make
-0-
This document is a research report submitted to the U.S. Department of Justice. This reporthas not been published by the Department. Opinions or points of view expressed are thoseof the author(s) and do not necessarily reflect the official position or policies of theU.S. Department of Justice.

changes as needed. From an institutional policy standpoint, it is not enough to know that
large numbers of college women are the victims of various forms of sexual victimization.
For post-secondary institutions to adequately address the problem, it is more
advantageous for them to know bofh the nature and extent of victimization and the
dynamics associated with sexual victimization. For example, if we find that sexual
harassment of college women is not only confined to faculty members but is also
perpetrated by students and staff, institutions can develop programs to address the
multiple dynamics associated with this behavior.
Our third objective is to develop an understanding of the dynamics of sexual
victimization. This objective will be accomplished by: (1 ) conceptualizing sexual
victimization to include a wide variety of behaviors ranging from "minor" forms of
victimization such as visual and verbal insults to more "serious" forms such as rape, sexual
assault, and stalking; (2) collecting detailed individual-level and incident-level information
using a structured telephone interview that (a) is based on the methodology of the National
Crime Victimization Survey (NCVS) (Bureau of Justice Statistics, 1994) and (b) has been
used successfully by Fisher, Sloan, Cullen, and Nasar (1995) in our general study of
college student victimization; and (3) collecting detailed information about the context in
which the event occurred, using secondary data sources including commercially available
"guides" to colleges and universities, and the Department of Education statistics. Thus,
we collected data on the "who," "what," "where," "when," and "how" of many forms of
sexual victimization of college women. Using these data, we will assess a theoretical
model of sexual victimization using multivariate data analytic techniques.
-9-
This document is a research report submitted to the U.S. Department of Justice. This reporthas not been published by the Department. Opinions or points of view expressed are thoseof the author(s) and do not necessarily reflect the official position or policies of theU.S. Department of Justice.
Our fourth objective is to make a contribution to the theoretical study of sexual
victimization. In part, we hope to advance our understanding of these victimization by
exploring the etiological influence of individual and contextual factors. In particular, we are
interested in examining the utility of "routine activities theory" (Cohen and Felson, 1979)
and "lifestyle models of criminal victimization" (Garofalo, 1987; Hindelang, Gottfredson,
and Garofalo, 1978) for explaining sexual victimization of college women.
,
Our last objective is to extend the general study of college student victimization
(mentioned above in objective three) in which two of the current authors participated
(Professors Fisher and Cullen) (Fisher et. al., 1998). Funded by the National Institute of
Justice (#93-l J-CX-O049), this project explored levels of victimization for various forms of
crime among college students on 12 randomly selected campuses (response rate = 71
percent; n = 3,472). The Final Report submitted attempted to furnish the most
comprehensive data and analysis of campus crime victimization (Fisher et al., 1998; Fisher
et al., 1995). At the same time, this project was limited in the data it could provide on
sexual victimization. Accordingly, a project devoted specifically to the sexual victimization
of female college students appeared warranted-a realization that prompted the current
study.
There are three specific limits of the general study of campus victimization that our
study attempts to move beyond. First and most important, in our general campus
victimization survey, we measured victimization in large part by using the victimization
questions in the National Crime Victimization Survey. The NCVS asks a series of "screen
questions" that attempt to discern whether a victimization has occurred; if so, a second set
-1 0-
This document is a research report submitted to the U.S. Department of Justice. This reporthas not been published by the Department. Opinions or points of view expressed are thoseof the author(s) and do not necessarily reflect the official position or policies of theU.S. Department of Justice.
of questions, "incident-level" questions, are asked that probe the circumstances around
each victimization recorded in the screen questions. We followed the NCVS's
methodology because it has been extensively assessed and is viewed in the field of
criminology as an acceptable means for measuring victimization.
Despite this advantage, a persistent criticism of the NCVS is that its measure of
rape and sexual assault is inadequate. Even in its revisedform, which includes a question
that asks specifically about whether a respondent "has been forced or coerced to engage
in unwanted sexual activity," the NCVS screen questions are potentially too limited in
number and in content to measure accurately the various types of sexual victimization that
women potentially experience. As we explain below, consistent with literature in the area,
the current project conceives of sexual victimization as a multi-faceted phenomenon. We
developed screen questions that were capable of measuring the extent of different types
of sexual victimization (see methods section). Our goal was to achieve a more accurate
assessment of the extent of sexual victimization among college women than previous
research, including our own, has been able to provide.
A second limitation of the previous project was that it did not allow for accurate
estimates of national rates of victimization on campuses. Because we sampled students
on 12 randomly selected institutions, the data were only suggestive of likely victimization
rates across all college students. In our current project, however, we employed a sampling
design that furnishes estimates of national rates of sexual victimization of female college
students.
-1 1-
This document is a research report submitted to the U.S. Department of Justice. This reporthas not been published by the Department. Opinions or points of view expressed are thoseof the author(s) and do not necessarily reflect the official position or policies of theU.S. Department of Justice.

Third, because the previous study attempted to explain campus victimization across
a variety of property and violent offenses for males and females, questions dealing with
aspects of students' lives were often broadly phrased. In the current study, however, we
tailored questions about students' lifestyles and past experiences to assess those aspects
of female students' lives that research suggests are most likely to place them at risk for
sexual victimization (e.g. , parties attended, dating practices, past sexual assaults).
STATEMENT OF THE PROBLEM
Researching the Sexual Victimization of College Women
The existing literature on the sexual victimization of college women indicates the
following. First, many college women are "at risk" for victimization from behaviors ranging
from sexual harassment (Adams, Kottke, and Padgitt, 1983; Benson and Thomson, 1982;
Crowell and Burgess, 1996; Dziech and Wiener, 1984; McKinney et al., 1988; Paludi,
1990), sexual assaults (Koss et al., 1987; DeKeseredy et al., 1993) and rape (Barrett,
1982; DeKeseredy and Kelly, 1993a; Fisher et al., 1998; Kanin, 1957; Koss et al., 1987;
Koss and Oros, 1982; Lane and Gwartney-Gibbs, 1985; Lott, Reilly, and Howard, 1982;
Muehlenhard and Linton, 1987). Research suggests that college women commonly
encounter sexual victimizations such as coercive sexual pressure at parties, acquaintance
and date rapes, and unethical sexual advances by male professors (Leidig, 1992; Crowell
and Burgess, 1996; Belknap and Erez, 1995). Second, it appears that most rapes of
college women are perpetrated by an acquaintance, including boyfriends and husbands
(Koss et al., 1987). Third, in cases of sexual assault involving acquaintances, the incident
-1 2-
This document is a research report submitted to the U.S. Department of Justice. This reporthas not been published by the Department. Opinions or points of view expressed are thoseof the author(s) and do not necessarily reflect the official position or policies of theU.S. Department of Justice.
is likely to have occurred in the living quarters of the victim (Belknap, 1989). Finally, the
sexual victimization of college women involves bel ,aviors that are not necessady mutually
exclusive. For example, in addition to leering and making sexual comments and
committing sexual bribery against a student, a professor could sexually assault a student
in his (or her) office. In fact, one study on sexual harassment in the workplace reported
that 17 percent of the women had experienced a completed or attempted rape by someone
with whom they worked (Schneider, 1993). Moreover, the National Advisory Council of
Women's Education Program specified five levels of sexual harassment ranging from
generalized sexist remarks (level one) to outright sexual assaults (level five) (Till, 1980).
This project attempts to draw on and the extend existing research on the sexual
victimization of college women. Although previous studies have significantly advanced
knowledge on the sexual victimization of college women, we believe that this research can
be extended in three ways: (1) the use of national-level data; (2) enhanced measurement
of sexual victimization; and (3) the use of a broader analytical framework to assess the
potential effects of a wider range of factors on sexual victimization. In the following
section, we address these three areas.
Extending Previous Research
The Need for National-Level Data. Although a number of studies have been
conducted, these have typically used samples of college women drawn from a single
campus or from a limited geographical area (e.g., Schwartz and Pitts, 1995). An exception
is DeKeseredy and Kelly's (1993a) recent survey of sexual aggression at Canadian
-1 3-
This document is a research report submitted to the U.S. Department of Justice. This reporthas not been published by the Department. Opinions or points of view expressed are thoseof the author(s) and do not necessarily reflect the official position or policies of theU.S. Department of Justice.

universities. It is not known, of course, whether estimates from this study would generalize
to college women in this country, given that the United States has higher rates of violent
crime (Messner and Rosenfield, 1994). I
To date, Koss et al.'s (1987) national survey remains the state-of-the-art study of
college sexual assault. In 1985, Koss administered a survey to 6,159 male and female
students at 32 post-secondary institutions in the United States. However, several
considerations suggest Kdss's study should not be viewed as the Yinal word" on estimates
of sexual victimization of college women, and thus that there is a need for a new national
victimization survey.
First, Koss's data are almost a decade "old"; in the intervening years, changes in
post-secondary education have occurred that may influence the measurement of sexual
victimization. As noted previously, while the number of males enrolled in higher education
remained stable over the last decade, the number and percentage of women enrolled at
post-secondary institutions has increased significantly (US Department of Education,
1993). Perhaps more important, however, is how the changing social context at many
post-secondary institutions has potentially altered awareness of sexual victimization and,
in turn, the likelihood that women will report their victimizations on surveys. For example,
since the term "date rape" was originally coined in the early 1980s, most colleges and
universities have implemented some type of programming to educate both female and
male students about what behaviors constitute rape. Similarly, institutions have become
more concerned about sexual harassment and have taken steps to educate faculty and
students about this behavior.
,
-1 4-
This document is a research report submitted to the U.S. Department of Justice. This reporthas not been published by the Department. Opinions or points of view expressed are thoseof the author(s) and do not necessarily reflect the official position or policies of theU.S. Department of Justice.

Second, Koss employed a potentially flawed sampling framework. Because she
administered questionnaires in classrooms, she depended on securing the approval of
campus administrators to gain access to her subjects; only 32 of the 92 universities she
contacted allowed the survey to be administered. By having access only to those
campuses receptive to the research, the possibility that there is selection bias in the study
cannot be discounted.
Third, Koss's "Sexual Experiences Survey" and modified versions (see, for example,
DeKeseredy and Kelly, 1993a) employed 10 different questions to measure 4 types of
sexual victimization. To prompt respondents to report their victimization, Koss did not use
broadly worded questions or questions that asked women if they had been "raped" or
"sexually assaulted" (see Koss and Oros, 1982). Instead, she used what have become
known as "behaviorally specific question": questions that used simple language to
describe in detail the type of behavior that the respondent may have experienced. For
.example, question 4 reads: "Have you had a man attempt sexual intercourse (get on top
of you, attempt to insert his penis) when you didn't want to by threatening or using some
degree of force (twisting your arm, holding you down, etc.) but intercourse did not occur?"
(Koss et at., 1987, p. 167). Koss and others have maintained that behaviorally specific
questions are more likely to elicit reports of victimization from respondents than traditional
questions that use terms, such as rape, that are open to divergent interpretations by
women (see Fisher and Cullen, 2000). Despite this major advance, Koss's approach
suffered from a potential limitation: unlike the National crime Victimization Survey, Koss's
SES did not follow up the behaviorally specific (screen) questions with a detailed incident
-1 5-
This document is a research report submitted to the U.S. Department of Justice. This reporthas not been published by the Department. Opinions or points of view expressed are thoseof the author(s) and do not necessarily reflect the official position or policies of theU.S. Department of Justice.
report. Again, the NCVS uses the questions in the incident report not only to collect
detalld information on the incident but also to I) verify that a victimization actually took
place and, if so, 2) to classify the incident into a specific type of victimization. In the
NCVS's approach, then, the screen questions are used to prompt a respondent's memory
of a possible victimization, but the actual recording of this event as a victimization incident
depends on the respondent answering a series of follow-up questions in the incident
report. By not employing a similar two-stage measurement process-screen questions
followed by an incident report-Koss's SES risks introducing measurement error into the
estimates of sexual victimization (Dodge, 1984; Fisher and Cullen, 2000).
Fourth, because the Koss study used self-administered questionnaires, it was
limited in its ability to gain detailed information on all incidents of sexual victimization
experienced by respondents. Instead, in the case of multiple victimizations, respondents
were instructed to answer questions about the victimization "you remember most."
Accordingly, the national-level information on victimization-incidents is potentially biased
because it focuses only on those events most salient to the respondents.
Fifth, many studies of college females have attempted to measure only a limited
range of the sexual victimization behaviors that women can experience (see Schwartz and
Pitts, 1995). As is also true of the numerous others who have adopted or modified here
"Sexual Experiences Survey," Koss's work is largely limited to measuring four types of
sexual victimization: (1) sexual contact; (2) sexual coercion, (3) attempted rape, and (4)
completed rape (see also DeKeseredy and Kelly, 1993a). In contrast, studies of the sexual
harassment of college women generally fail to include questions about sexual assaults and
-1 6-
This document is a research report submitted to the U.S. Department of Justice. This reporthas not been published by the Department. Opinions or points of view expressed are thoseof the author(s) and do not necessarily reflect the official position or policies of theU.S. Department of Justice.
rapes (for an exception, see Fitzgerald, Schullman, Bailey, Richards, Swecker, Gild,
Ormerod, and Weitzman, 1598). The majority of studies of sexual harassment on campus
also have focused mainly on professors as potential perpetrators (neglecting students and
staff). Further, sexual victimization research on college women has virtually ignored
stalking (e.g., it is not included in Koss et al.'s study). To date, research on the stalking
of students has been infrequent and has used only limited samples (Coleman, 1997;
Mustaine and Tewksbury, 1999).
In short, due to the methodological limitations in the existing research, there are no
current national-level estimates on the extent and the nature of the sexual victimization,
including stalking, of college women. To attempt to fill this void in the existing literature,
we conducted a national survey that: (1) provides incidence and prevalence estimates of
several types of sexual victimization (ranging from sexual harassment to rape, including
completed acts, attempts, and threats and stalking); (2) collects detailed incident-level
information on each victimization; and (3) uses a two-stage approach-screen questions
followed by an incident report-to measure and classify victimization incidents.
The Measurement of Sexual Victimization. Measures of sexual victimization in
existing studies possess two limitations. First, we developed measures of sexual victim-
ization that cover a wider range of behaviors than is found in much of the literature. As
noted, past studies have conceptualized, or at least examined, the problem of sexual
victimization narrowly. The typical design has been to ask questions on one type of sexual
victimization (e.g., "forced sexual intercourse against the woman's will"). Some studies
have explored more than one form of sexual victimization, but still have not considered as
-1 7-
This document is a research report submitted to the U.S. Department of Justice. This reporthas not been published by the Department. Opinions or points of view expressed are thoseof the author(s) and do not necessarily reflect the official position or policies of theU.S. Department of Justice.

wide a range of behaviors as possible (e.g., Koss's work examined sexual assaults and
rape but did not examine sexual harassment). In untrast, we employ measures of multiple
forms of sexual victimization, which enhances our ability to estimate the full extent of
victimization experienced by college women.
,
Second, the past research includes limited information on the characteristics of the
victimization incident and characteristics of the school. For example, they rarely contain
detailed information concerning the victimization experience (such as whether the assault
was perpetrated by a stranger or acquaintance, and if the latter, whether the acquaintance
was a fellow student, member of a fraternity, athletic team member, faculty member, staff
member, non-university friend, or dating partner). The studies rarely ask whether the
victimization occurred while the student was on campus-and if so, where on campus-or
if the incident occurred while she was a college student (e.g., a study might ask whether
the respondent had experienced a certain form of victimization "since she was 14"). And,
as noted above, the research fails to include detailed information on all sexual vic-
timizations experienced by the respondent. Our current study attempts to overcome these
limitations by collecting detailed incident-level information for each completed, attempted
and threatened victimization that occurred.
To capture the effects of the broader environment we collected school-level data.
We collected information about the characteristics of the school because campus crime
rates studies show a relationship between certain school-level characteristics (e.g.,
student demographics) and rates of violence (see Sloan 1992, 1994; Volkwein, Szelest,
and Lizotte, 1995). We did not collect information about the characteristics of the adjacent
-1 8-
This document is a research report submitted to the U.S. Department of Justice. This reporthas not been published by the Department. Opinions or points of view expressed are thoseof the author(s) and do not necessarily reflect the official position or policies of theU.S. Department of Justice.

community because the campus crime research shows no relationship between such
characteristics and campus violence rates (Fernandez and Lizotte, 1935). Note also that l
a recent study reported that campus-level and community-level characteristics do not
significantly predict the probability of being an on-campus victim of violence (Fisher et al.,
1998). To our knowledge, the effect(s) of campus-level characteristics on sexual
victimization has not been examined.
In summary, we conceptualized sexual victimization as a multi-dimensional
phenomenon which includes varied but related acts like sexual harassment, stalking, and
rape. The advantage of this conceptualization is that it is sensitive to various forms and
degrees of sexual victimization that respondents might otherwise not report or might
confound with other types of victimization. In short, it should allow for a systematic
operationalization of sexual victimizations that disentangles the behaviors and thus
provide estimates on many distinct forms of sexual victimization. We also collected data
on each incident. With these data, we were able to examine different characteristics of the
victimization experience. In addition, we collected school-level characteristics to examine
their contextual effects on the risk of on-campus sexual victimization.
I The Analytical Framework. As noted, the existing literature on the dynamics of
the sexual victimization of college women is relatively limited by the types of variables that
have been considered. Prior studies have largely focused on the individual characteristics
and attitudes of women that may increase their vulnerability to sexual victimization (Lott
et al., 1982; Muehlenhard and Linton, 1987; Ward et al., 1991 ). This approach also tends
-1 9-
This document is a research report submitted to the U.S. Department of Justice. This reporthas not been published by the Department. Opinions or points of view expressed are thoseof the author(s) and do not necessarily reflect the official position or policies of theU.S. Department of Justice.

to inform the more general literature on college student victimization (for exception see
Fisher et al., 1998; Schwartz and Pitts, 1995).
To help move beyond this narrow focus, this study examines variables that could
be related to the sexual victimization of women in two contexts. First, we examine how
different types of sexual victimization are related to two categories of variables: (1)
lifestylelroutine activity characteristics; and (2) individual demographics. Second, we
examine how different types of on-campus sexual victimization are related to three broad
categories of variables: (1 ) lifestylelroutine acitvity characteristics; (2) individual
demographics; and (3) institutional characteristics. By focusing on these categories of
variables, we hope to provide important data on the relative causal significance of a range
of factors that may increase or decrease the risk of sexual victimization. These data
should be important in understanding the sources of women's sexual victimization and in
providing the possibility of constructing a more adequate theory of such victimization.
Further, knowledge on the causes of sexual victimization should provide a firmer basis for
developing prevention programs on college campuses.
Figure 1.1 outlines the analytical framework employed in the study. The first
category of variables, lifestyle and individual characteristics, consists of factors that have
implications for the extent women are exposed to sexual victimization: (1) exposure to
crime; (2) guardianship; (3) proximity to motivated offenders; (4) previous sexual
victimizations; and (5) demographic characteristics. First, drawing on the insights found
in "routine activities theory" (Cohen and Felson, 1979) or the "lifestyles model of criminal
victimization" (Garofalo, 1987; Hindelang et al., 1978), we measured the daily
-20-
This document is a research report submitted to the U.S. Department of Justice. This reporthas not been published by the Department. Opinions or points of view expressed are thoseof the author(s) and do not necessarily reflect the official position or policies of theU.S. Department of Justice.

activities/lifestyles of the respondent in terms of her exposure to crime. Several general
victlmization studies have consistently found that the most vulnerable groups for violent
victimization are those who engage in public activities at night, such as frequenting bars
or going to movies (Felson, 1997; Kennedy and Forde, 1990; Miethe and Meier, 1994;
Sampson and Lauritsen, 1990; Sampson and Wooldredge, 1987). Sampson and Lauritsen
(1 990) reported that a “deviant lifestyle” (e.g., extensive drinking, drug use, and “partying”)
is a significant predictor of violent victimization. Additionally, Miethe and Meier (1 990)
reported that indicators of night activity (e.g., the average number of nights spent outside
the home in leisure and social activities and the average number of hours spent walking
alone outside the home) were significantly related to the odds of assault. Such (ifestyfes
may lead to situations in which different factors coincide in presenting offenders with
situations where guardianship is lacking, resulting in increased risk for victimization
(Sampson and Lauritsen, 1990).
,
The campus rape research suggests that women’s activities which put them at
higher risk of victimization include attending dormitory and fraternity parties as well as their
alcohol and drug consumption (Lott et al., 1982; Muehlenhard and Linton, 1987; Warshaw,
1988; Sanday, 1990; Ward et al., 1991). There is some evidence that alcohol
consumption is associated with sexual victimization (see Testa and Parks, 1996). In
contrast, several studies have found that after controlling for the effects of other variables,
alcohol was not a significant predictor of sexual assault (e.g.,Himelein, 1995). Other
researchers, however, have reported that alcohol consumption by either the man, the
women, or both predicted sexual assault (Abbey, Ross, McDuffie, and McAuslan, 1996;
-21 -
This document is a research report submitted to the U.S. Department of Justice. This reporthas not been published by the Department. Opinions or points of view expressed are thoseof the author(s) and do not necessarily reflect the official position or policies of theU.S. Department of Justice.
Frinter and Rubinson, 1993; Koss and Dinero, 1989; Schwartz and Pitts, 1995). The
current state of this resedrch does not allow us to determine conclusively that alcohol
causes sexual victimization; it does allow us to conclude that alcohol may play a role in
such victimization.
There is an abundance of research reporting that the majority of sexual
victimizations of women are perpetrated by men with whom the victim is acquainted, even
well-acquainted (including friends, boyfriends, lovers, and husbands; see Russell, 1984).
Some of these studies reported that sexually assaultive men often plan how to get their
victims in a chemically altered state or into a room with loud music to increase their
chances of completing a rape. There has been speculation that women's risk of
rape-especially by an acquaintance-is related to activities such as frequenting parties,
bars, and men's residences (Warshaw, 1988). To our knowledge, there is no empirical
analysis of these speculations (see Schwartz and Pitts, 1995). Thus, for the purposes of
the study, the lifestyle measures included activities that may increase the risks of sexual
victimization (e.g., frequency of going to bars and parties where alcohol is served, places
where many men are at, and getting drunk).
We also included another type of social situation that may increase sexual
victimization risks: sorority membership . The research has shown that sorority members
experience higher levels of sexual victimization than non-sorority members.
Second, as part of the lifestyle/routine activities framework, we examined the
possible effects of of guardianship-the ability of persons or objects to prevent the
occurrence of crime by social (interpersonal) and/or physical (target-hardening devices)
-22-
This document is a research report submitted to the U.S. Department of Justice. This reporthas not been published by the Department. Opinions or points of view expressed are thoseof the author(s) and do not necessarily reflect the official position or policies of theU.S. Department of Justice.
means (Cohen and Felson, 1979; Miethe and Meier, 1994). Results from the general
victimization literature are mixed with respect LU the deterrent effect of social or physical
guardianship on individual victimization; several studies have reported that lower
victimization rates are associated with social and physical guardianship while other studies
did not find such associations (see Miethe and Meier, 1994; Rosenbaum, 1987). To our
knowledge, within the sexual victimization literature no one has examined the effects of
guardianship on the risk of sexual victimization. Since many types of sexual victimization
occur in a residence, the lack of capable guardians may influence the risk of being
victimized. For example, if a student has a roommate, suitemate, or housemate, he or she
may act as a potential guardian. However, a roommate suitemate or housemate may also
be a potential offenaer and thereby increase the victims' proximity to an offender.
I
Third, we also investigated the potential impact of measures of proximity to
motivated offenders-closeness to a pool of would-be perpetrators. Students' proximity
to motivated offenders can occur in their living arrangements or on campus given the
amount of time they spend there. For example, students living on campus typically reside
in multiple-unit, high-density residence halls or dormitories; some also live in a coed dorm.
Both types of situations may increase risks of sexual victimization by bringing women close
to would-be offenders on a daily basis. Analyzing these variables should provide clues
on whether certain living arrangements are "hot spots" for sexual victimization or,
alternatively, limit exposure to risks. Similarly, being on campus as a full-time student may
also expose students to more would-be offenders over a longer time period than part-time
students.
-23-
This document is a research report submitted to the U.S. Department of Justice. This reporthas not been published by the Department. Opinions or points of view expressed are thoseof the author(s) and do not necessarily reflect the official position or policies of theU.S. Department of Justice.

As we previously noted, the sexual victimization research has consistently reported
that the majority of sexual victimizations are committed by men with whom the victim is
involved with in a relationship such as a date, a nonromantic acquaintance, or an intimate
partner. Researchers examining relationship factors influencing the risk of rape have
suggested that the likelihood of rape increases with the amount of exposure a woman has
to potential perpetrators (see Harney and Muehlenhard, 1991 ; Koss and Dinero, 1989).
Studies of courtship violence have found that about one in five students have experienced
violence in a dating relationship (see Crowell and Burgess, 1996; Harney and
Muehlenhard, 1991). Studies of college women have found that cohabitating couples
(unmarried heterosexual couples living together) report more violence than heterosexual
couples who date but do not live together or are married (see, Belknap and Erez, 1995).
Researchers have also documented the incidence of date rape, forced intercourse, and
coerced intercourse among college women (Fisher et al., 1998; Harney and Muehlenhard,
1991; Koss and Oros, 1982; Miller and Marshall, 1987; Rivera and Regoli, 1987;
Warshaw, 1988). For example, Koss et al. (1988) found that most rapes occurred
between dating partners and that more women were raped by steady dates than casual
dates. Other researchers have reported that sexually victimized women have had a
greater number of dating partners and sexual partners than nonvictimized women (Koss,
1985; Koss and Dinero, 1989).
, I
I
Fourth, research has shown, on a fairly consistent basis, that a sexual victimization
occurring in childhood or adolescence increases the likelihood of a future sexual victimiza-
tion by another perpetrator or perpetrators (Aizenman and Kelley, 1988; Browne and
-24-
This document is a research report submitted to the U.S. Department of Justice. This reporthas not been published by the Department. Opinions or points of view expressed are thoseof the author(s) and do not necessarily reflect the official position or policies of theU.S. Department of Justice.
Finkelhor, 1986; Harney and Muehlenhard, 1991 ; Himelein, 1995; Russell, 1984). For
example, Himelein (1 995) reported that pre-college sexual victimization in dating was
positively correlated with sexual victimization during college. Similarly, Koss and Dinero
(1 989) reported findings from their multivariate models which indicate that sexual abuse
in childhood was one of the strongest predictors of rape victimization in adulthood.
Fifth, we also included the personal demographic characteristics (e.g. ,
race/ethnicity, age, year in school) of the respondents as relevant factors in sexual
victimization incidents for several reasons. First, previous studies suggest that in society
generally, there aredinks between personal characteFistics and victimization (e.g., Miethe
and Meier, 1 994; Sampson and Lauritsen, 1990). Second, some sexual victimization
researchers have reported that certain types of college women experience high levels of
certain forms of sexual victimizations while other researchers have reported no difference.
For example, Abbey et al. (1 996) reported that African-American women are more likely
to experience a sexual assault than Caucasian women. Koss et al. (1987) and Russell
(1 984), however, reported that the rates of rape between black women and white women
were not significantly different. Both researchers also found a high prevalence of
victimization among Native American women and a low prevalence among Asian-American
women. Tjaden and Thoennes (1 998) reported similar results with respect to stalking:
Asian and Pacific Islander women were less at risk of being stalked compared with women
of other racial and ethnic backgrounds. Notably, American Indian/Alaska Native women
1 were most at risk. And last, we included these characteristics because the literature on
-25-
This document is a research report submitted to the U.S. Department of Justice. This reporthas not been published by the Department. Opinions or points of view expressed are thoseof the author(s) and do not necessarily reflect the official position or policies of theU.S. Department of Justice.

campus crime (based on official measures) identifies links between student characteristics
and campus crime (Sloan, 1992, 1994; Sloan and Mansour, 1992).
The second general category of variables-insfjfutiona~ontains characteristics
of the institution. These variables, however, were only used when we examined the risks
associated with on-campus sexual victimization. Although not explored systematically in
the campus sexual victimization literature, the on-campus crime research generally
indicates clear links between institutional characteristics and campus crime. For example,
in a study of crime at over 500 four-year colleges and universities nationwide, Sloan
(1 992,1994) found that the percent of students who were minorities and the location of the
school (e.g., urban setting) were positively related to on-campus rates of violence. Other
studies have found similar relationships consistent with, and in the same direction, as
those described by Sloan (see Bromley, 1994; Fox and Hellman, 1985; McPheters, 1978;
Volkwein et al., 1995). Each of these studies, however, used official crime statistics and
not data from victimization surveys. Further, although this research shows a relationship
of macro-level characteristics to campus crime, we do not know if these institutional
conditions also are related to individual-level sexual victimizations. Fisher and her
associates (1 998) produced the only study, to our knowledge, that examined the
relationship between institution-level characteristics and on-campus victimization. In
particular, they reported that campus-level characteristics did not have a significant impact
on the probability of experiencing an on-campus act of violence. In light of the inconsistent
results between the crime rate and victimization studies, we have included measures of
the characteristics of the school in our models.
-26-
This document is a research report submitted to the U.S. Department of Justice. This reporthas not been published by the Department. Opinions or points of view expressed are thoseof the author(s) and do not necessarily reflect the official position or policies of theU.S. Department of Justice.

The dependent variables in the models include various forms of "sexual
victimization." As n o t q we developed measures capturing various types of sexual
victimization described in the extant literature. These victimizations range from minor
forms (e.g., visual and verbal insults) to more serious forms of sexual victimization (e.g.,
rape, stalking). With the exception of stalking, the more serious forms of sexual
victimization included completed, attempted, and threatened victimizations.
I
Summary
In summary, the analytical framework directs the empirical investigation toconsider
the relationship between different types of sexual victimization and both individual-level
and institution-level variables. The individual-level variables are largely oriented to
assessing the extent to which women lead lives that expose them to risks of sexual
victimization. The institutional variables assess how the external environment creates or
mitigates chances of sexual victimization. This approach, we hope, will provide
unprecedented data that will permit more detailed basic knowledge about the sources of
and risks associated with different types of sexual victimization and, in turn, knowledge
that will inform the more adequate formulation of prevention programs.
PLAN FOR THIS REPORT
In this introductory chapter, we have endeavored to show the importance of
conducting a national study of the sexual victimization offemale college students. We also
have conveyed our research strategy and how it is rooted in, and hopefully extends,
-27-
This document is a research report submitted to the U.S. Department of Justice. This reporthas not been published by the Department. Opinions or points of view expressed are thoseof the author(s) and do not necessarily reflect the official position or policies of theU.S. Department of Justice.

existing research. In Chapter 2, we present in detail the research methods used to
undertake our national sexual victimization survey of female students. In the following
three chapters, we present data on different types of victimization. Thus, Chapter 3
reports the results for twelve forms of sexual victimization, including rape and various
forms of sexual assault and sexually coercive behavior. Chapter 4 conveys the analysis
of the extent and nature of stalking victimization. Chapter 5 presents the findings on forms
of verbal and visual sexual victimization, such as sexist remarks, harassing comments,
obscene telephone calls, and unwanted exposure to pornography. In each of the three
“data” chapters, the results not only are reported but also are discussed in light of the
existing research. Finally, Chapter 6, the concluding section of the report, relates the
survey results to the four sets of research questions stated above on pages 4 and 5 of
Chapter 1.
-20-
This document is a research report submitted to the U.S. Department of Justice. This reporthas not been published by the Department. Opinions or points of view expressed are thoseof the author(s) and do not necessarily reflect the official position or policies of theU.S. Department of Justice.

Figure 1.1 Sources of College Women’s Sexual Victimization
INDIVIDUAL LIFESTYLE II
h Exposure to Crime Guardians hip
Proximity to Motivated Offenders Prior Sexual Victimization
Demographic Characteristics 1 \
I i
I Victim-Nonvictim I Type of Victimization
I NSTlTUTl ONAL CHARACTER ISTICS
Demographic Composition of Students
Presence of Fraternities Location of Institution
Enrollment Size Campus Crime Rate
-28a-
This document is a research report submitted to the U.S. Department of Justice. This reporthas not been published by the Department. Opinions or points of view expressed are thoseof the author(s) and do not necessarily reflect the official position or policies of theU.S. Department of Justice.
CHAPTER 2
RESEARCH METHODS
This study attempts to overcome the noted limitations in previous studies by
improving several aspects of the research design and methods. First, we collected sexual
victimization data from a random sample of female undergraduate and graduate college
students enrolled in two-year andfour-year colleges and universities throughout the United
States during the 1996-1 997 academic term. Second, we collected data for 23 different
forms of sexual victimization, including rape, sexual coercion, unwanted sexual contact,
stalking, sexual harassment, and verbal and visual insults, since school began in the Fall
of 1996. Third, the data were collected using a structured-telephone interview with screen
questions and an incident report process modeled after the redesigned National Crime
Victimization Survey (NCVS). In particular, we developed 1 1 sexual victimization screen
questions for 12 different forms of sexual victimization and designed an incident-level
instrument to collect detailed information about each of these forms of sexual victimization
that included questions about its characteristics (e.g., its location, time of day it occurred,
what actually happened, characteristics of the offender[s], and reporting behavior). For
stalking, we developed one screen question and an incident-level instrument to collect
detailed information about the stalking experience (e.g., type of stalking, duration, location,
characteristics of the offender(s), and reporting behavior). With the other 10 forms of
sexual victimization, we developed a truncated set of questions (e.g., the location of the
incident-on or off campus-and the number of times experienced). Fourth, we collected
detailed information concerning prior sexual victimization experiences, lifestyle, fear of
-29-
This document is a research report submitted to the U.S. Department of Justice. This reporthas not been published by the Department. Opinions or points of view expressed are thoseof the author(s) and do not necessarily reflect the official position or policies of theU.S. Department of Justice.
sexual assault, crime prevention behavior, and demographic information (e.g. , housing
inlormation, living arrangements, age, race, class rank, full-time or part-time student
status) on both victims and nonvictims. Fifth, to conduct the interviews, we secured the
services of an experienced survey firm, Schulman, Ronca, and Bucuvalas (SRBI). This firm
hired and professionally trained female interviewers. They used a computer-aided
telephone interviewing (CATl) system to collect the individual-level and incident-level data.
Sixth, we collected contextual information, including crime statistics and sociodemographic
data at the institutional (i.e., campus) level. Using this information, we can present afairly
complete picture of the extent and nature of sexual victimizations, both on-campus and off-
campus, by individual-level and institutional-level characteristics for the 233 randomly
selected schools.
I
This section describes: ( I ) our efforts to implement the proposed research plan
including the use of the focus group discussions and a pretest; (2) the sampling design;
(3) the survey instruments; (4) the field period and training of the interviewers; (5) the
response rate; (6) the population characteristics and sample characteristics; (7) the
secondary data sources; (8) the variables used in the multivariate analyses; and (9) the
organization of the data analyses.
IMPLEMENTING THE PROPOSED RESEARCH PLAN
Beginning in the late Fall of 1995, the research team met weekly to develop the
survey instruments. We began this process by reviewing the sexual victimization
research, especially the work of Koss and her collaborators (1 982, 1987, 1996). After an
-30-
This document is a research report submitted to the U.S. Department of Justice. This reporthas not been published by the Department. Opinions or points of view expressed are thoseof the author(s) and do not necessarily reflect the official position or policies of theU.S. Department of Justice.
extensive review Qf the research and of other instruments widely used to measure various
forms of sexual victimirdtion (e.g., Koss’s SES scale, NCVS, Rape in America report to
the nation), we decided to develop instruments that would measure 23 different forms of
sexual victimization (see Table 2. I) and to follow the screen question and incident report
process of the NCVS. We finished this task in mid-February in anticipation of the planned
focus groups and pretesting of the instruments.
..
The Focus Group Discussions
Before the pretest in early March 1996, Professors Fisher and Belknap led two
focus groups in a private meetin,g room in the student center at the University of Cincinnati
(hereafter UC). We recruited female students from three sources: (1) their respective
classes; (2) currently enrolled graduate students in their respective departments; and (3)
majors in Women’s Studies.
Each focus group lasted approximately one hour or longer. Professors Fisher and
Belknap started the discussion by explaining the nature of the study to the participants, the
sponsor, and the processes used to develop the instruments and to collect data.
Professors Fisher and Belknap told the participants that what they said during the hour
would be recorded for methodological reasons but that their names or any other identifying
characteristics would not be recorded. We also told them that we were soliciting their
ideas and suggestions into our cover letter and sexual victimization screen questions.
They were informed that they did not have to answer the questions; we wanted them to
comment on the content and flow of the cover letter and questions.
-31 -
This document is a research report submitted to the U.S. Department of Justice. This reporthas not been published by the Department. Opinions or points of view expressed are thoseof the author(s) and do not necessarily reflect the official position or policies of theU.S. Department of Justice.
The participants read the cover letter as if they were respondents in the sample.
Following this, the participants then openly bmussed their reactions to the content of the
letter. Professor Fisher then read each of the screen questions as if she were the
interviewer. Each question was discussed after it was read.
The focus groups proved very valuable. The students were helpful in suggesting
where (1 ) wording in the cover letter needed to be clearer, (2) question length was too long
to comprehend fully, and (3) question wording was ambiguous or terse. They also
provided contemporary examples of extortion and nonphysical punishment that could be
used in the sexual victimization screen questions- For example, the students provided
examples of how peers can coerce sex by threatening to hurt someone's reputation or
defame her character. The example given was a threat to one's social status, such as
excluding them from a social group, a club, or a sorority, if the female student did not
engage in some form of sexual activity with a group or club member.
The students did not experience any problems with what some might consider
graphic language used in the questions. They did suggest, however, that we include a
brief statement at the beginning of the survey to remind the respondent that graphic
language will be used. Overall, they were extremely interested in the subject matter of the
survey and felt that results from our study were long overdue and much needed by both
school representatives (e.g., presidents, provosts, deans) and college women and men.
-32-
This document is a research report submitted to the U.S. Department of Justice. This reporthas not been published by the Department. Opinions or points of view expressed are thoseof the author(s) and do not necessarily reflect the official position or policies of theU.S. Department of Justice.

The Pretest
Following changes made as a result of the focus group discussions, we pretested
the instruments. The purpose of the pretest was threefold: (1) to monitor the flow of the
instrument (e.g., wording of questions, response categories, and skip patterns); (2) to
obtain a rough estimate of the nature and extent of sexual victimization; and (3) to time the
length of the instruments. The individual-level and incident-level instruments were
pretested by trained female interviewers at the Institute of Policy Research (IPR) at the
University of Cincinnati (UC) between 11 April and 17 April 1996. Before pretesting,
Professors Fisher and Belknap spent six hours educating the interviewers as to the results
of the most recent sexual victimization research and possible respondent reactions to
questions asked. In addition, the interviewers were trained how to administer the
questionnaires.
I
Four hundred randomly selected female undergraduate and graduate students at
UC comprised the pretest sample. UC was picked as the pretest site to minimize
telephone costs. Students' names, addresses, and telephone numbers were taken from
the most recent student telephone directory (1 995-1 996 academic term). Two weeks
before the field period, we sent each student a cover letter that described the nature and
importance of the study, identified the National Institute of Justice as the funding agency,
guaranteed confidentiality and anonymity, stated the period when a trained female
interviewer from the IPR at UC might call her, and provided Dr. Fisher's office telephone
number and her E-mail address to contact if she did not want to participate in the study or
wanted more information about the study (see Appendix 1).
-33-
This document is a research report submitted to the U.S. Department of Justice. This reporthas not been published by the Department. Opinions or points of view expressed are thoseof the author(s) and do not necessarily reflect the official position or policies of theU.S. Department of Justice.
Of the 400 cover letters mailed via the U.S. Postal Service, 4.3 percent (n=l7) were
out of range, that is, their address was not in the Cincinnati area; 2.0 percent (n=8) weia
returned by the U.S. postal service because they were unable to deliver the letter (e.g., a
student moved and left no forwarding address, no such person at the address). Of the 375
remaining sample members, 62.1 percent (n=233) students were not eligible to participate
in the study or the listed telephone number was not operable.’ Of the 142 remaining
eligible students, 108 participated in the pretest and 34 refused,* for a response rate of
76.1 percent.
During our one-week field period, twelve trained female interviewers administered
the surveys over the telephone starting around 1O:OO a.m. and making the last call around
9:00 p.m. The interviewers were equipped with the telephone numbers of both on-campus
and off-campus women’s medical and psychological service centers and hot lines that
addressed sexual victimization should any respondent request such information; no
respondent requested such information.
Professor Fisher monitored the pretesting by randomly listening in on several
interviews during the pretest period. These calls were monitored on different days and at
various times during the day and at night.
Of those not eligible (n=l13), 75.2 percent (n=85) were not available during the field period, 23.0 percent (n=26) were no longer enrolled at UC, and 1.8 percent (n=2) were full-time employees. Of the telephone numbers that we could not use (n=l20), there was no answer for 49.1 percent (n=59) of them, 27.5 percent (n=33) were the wrong number (the selected student did not live there), 20.8 percent (n=25) were not in service, and 2.5 percent (n=3) were fax machine or business numbers.
This number included the three students who contacted Professor Fisher and asked not to be
1
2
called by the IPR interviewers.
-34-
This document is a research report submitted to the U.S. Department of Justice. This reporthas not been published by the Department. Opinions or points of view expressed are thoseof the author(s) and do not necessarily reflect the official position or policies of theU.S. Department of Justice.

Professors Fisher, Belknap, and Cullen debriefed with the IPR staff and interviewers
ror more than five hours after the field period. The pretest provided high quality feedback
about the flow and content of the instruments. The results of the pretest were very helpful
in detecting awkward or inappropriate wording, out of sequence question ordering and
inadequate response choices. Discussions with the interviewers following the pretest were
also helpful in determining students' time availability and reactions to questions. The
interviewers reported that the respondents were very cooperative and interested in the
survey and its results. The average length for an interview was 45 to 50 minutes. Based
on information provided in the debriefing, the instruments were tailored to stay within our
budget. Table 22 reports our preliminary estimates of the nature and extent of sexual
victimization among college women during the reference period "since school began in
September 1995."
Sampling Design
The sampling design was a two-stage process. First, two-year and four-year
schools were stratified by the size of the total student enrollment and location of the
school, and then were selected into the sample using a probability proportionate to the
total size of the female student enrollment. Second, female students who were currently
enrolled at the selected schools were randomly selected into the sample. Each stage of
the sampling process is described below.
-35-
This document is a research report submitted to the U.S. Department of Justice. This reporthas not been published by the Department. Opinions or points of view expressed are thoseof the author(s) and do not necessarily reflect the official position or policies of theU.S. Department of Justice.

I
Selecfion ofSchools. To begin, we limited the selection of our schools to those
institutions with an enrollment of over 1,000 students3 The complexity of our sampling
design, however, posed some difficulties in obtaining a list of the population of two-year
and four-year schools who had an enrollment of at least 1,000 students and a list of the
names, school address, and telephone number of the females currently enrolled at each
respective school. Obtaining a list from the Department of Education (DOE) of all two-year
and four-year institutions having an enrollment of 1,000 or more was not fea~ib le .~ We
were, however, able to obtain a count of the number of these institutions from The Digest
of Education Statistics. In 1995, there were 924 two-year institutions and 1,351 four-year
institutions with an enrollment greater than 1,000 students.
We contracted with the American Student List Company (ASLC), a private
organization that directly purchases enrollment listings every term (e.g. , quarter, semester)
from academic institutions. ASLC was unique in that they could provide each of the two
parts of our sampling design: (1) a sampling frame of institutions; and (2) the names,
school addresses, and phone numbers of the female students in the second stage.’ The
We did not include institutions with less than 1,000 students because most of these schools were religious schools (e.g., Bible colleges or Yeshivas) or were speciality medical schools. In addition, though institutions enrolling less than 1,000 students represent 32.6 percent (N = 447) of all two-year institutions and 37.9 percent (N = 823) of all four-year institutions, only 3.8 percent (N = 537,685) of post- secondary students in the United States are enrolled in these institutions (Department of Education, 1997). Because students were our main focus, we decided not to include these small institutions in the study (see also Koss, et al., 1987).
their recent campus security publication. We were told that the institution information was not available to the public.
3
We made numerous calls to staff at the Department of Education, including the contact for 4
Although purchasing enrollment listings from every institution would be ideal, it was not 5
practical. In a previous research study of victimization on 12 campuses, we discovered that universities were unable or unwilling to supply an updated list of students. We realize that ASLC has limitations. Specifically, ASLC claims to have approximately 6,000,000 names of students attending more than
-36-
This document is a research report submitted to the U.S. Department of Justice. This reporthas not been published by the Department. Opinions or points of view expressed are thoseof the author(s) and do not necessarily reflect the official position or policies of theU.S. Department of Justice.
507 institutions with enrollments greater than 1,000 that ASLC had students' names,
school mailing address, and telephone number served as our sampling frame.
We stratified these institutions on two variables: (1) total student enrollment; and
(2) location of the school. The enrollment size was divided into four categories: 1,000 to
4,999; 5,000 to 9,999; 10,000 to 19,999; and 20,000 or more (Department of Education,
1997). The location designation for the institution was divided into three categories: urban,
suburban, and small townlrwal (Peterson's Guide to Four Year Colleges, 1998; Peterson's
Guide to Two Year Colleges, 1998).'
Using the formula for a stratified random sample, we determined how many
institutions we needed from each of the 12 strata. Because of the substantial within-strata
variation of female enrollments, we selected institutions using a probability proportionate
to the size (PPS) of the female enrollment. Using this methodological approach ensured
us that there were enough female students at each institution from which to randomly
select our needed sample size. In addition, using the PPS design assured us that each
institution was given a chance of selection into the sample proportionate to the size of its
female enrollment. A total of 233 two-year and four-year institutions were selected: 39
two-year schools and 194 four-year schools.'
1,200 colleges and universities in all 50 states. This equals 31.7 percent (n = 428) of the total number of four-year institutions and 8.5 percent (n = 79) of the total number of two-year institutions.
Unfortunately, the DOE does not collect a "location" measure like we needed. They have city, 6
state, and zip code information but no measure that we could use in our proposed stratification design.
Five schools selected during the first stage of the sampling design were randomly replaced using the PPS design because the number of female students required to meet the institutional quota exceeded the number of currently enrolled females available from which we would draw our sample of students. Therefore, including these five schools would have meant that a greater number of students would be selected from schools within the same cell. This procedure would have violated our initial
7
-37-
This document is a research report submitted to the U.S. Department of Justice. This reporthas not been published by the Department. Opinions or points of view expressed are thoseof the author(s) and do not necessarily reflect the official position or policies of theU.S. Department of Justice.

Selection of Students. Using the PPS design additionally provided us the
opportunity to calculate the number of students to be selected from each institution.
Following the selection of our 233 institutions, ASLC randomly selected female students
three times the size that we needed for our sampling purposes to take into account for
such things as disconnected telephone numbers and refusals. They provided us with a
list of students' names, current school address and telephone numbers on floppy disks.
Table 2.3 provides a breakdown of the number of schools and number of female students
selected from each stratum.
The Cover Letfer. Each sample member was senta cover letter via the U.S. Postal
Service to her school address approximately two weeks before she was called by a SRBI
interviewer (see Appendix 2). This cover letter was a revised version of the one used
during the pretest.
The purpose of the cover letter was fivefold: (1) to provide respondents with
knowledge of the increasing concern about unwanted sexual experiences occurring on
college campuses; (2) to indicate that a nationally funded research project is currently
under way to address some of the identified concerns and that they have been randomly
selected to participate in the study; (3) to identify the National Institute of Justice as the
sponsor; (4) to indicate that participation in the study was voluntary, but that it was
important to gain an understanding of the extent and nature of the sexual victimization
experiences of this population, and; (5) to provide information on whom to contact if the
respondent had questions regarding the legitimacy of the study and/or wanted a copy of
sampling design.
-38-
This document is a research report submitted to the U.S. Department of Justice. This reporthas not been published by the Department. Opinions or points of view expressed are thoseof the author(s) and do not necessarily reflect the official position or policies of theU.S. Department of Justice.

the results. This last point included Professor Fisher's collect telephone number and her
E-mail address. To date, 88 students contacted her requesting results, and 52 wanted to
know more about the specifics of the research (e.g., how was I picked, how did you know?)
or to comment on the high quality of the survey or the professionalism of the interviewers.
The Survey Instruments
The research team developed and revised three surveys to measure the extent and
nature of 23 different forms of sexual victimization. In addition, these instruments were
used to collect information on other relevant variables: an indivldual-level one .and two
incident-level ones (one for the 12 forms of sexual victimization and one for the stalking).
As previously noted, the individual-level and incident-level instruments were modeled after
the NCVS Redesign Phase 111 (see Appendix 3). Each of these instruments is discussed
below
I
The individual-level Instrument. Each student was asked to verify her name,
telephone number, and address so that the interviewer was assured that the selected
sample member had been contacted. If the correct person had been contacted, the
interviewer then read a short summary of the purpose of the study to the respondent,
asked if the cover letter had arrived and if another should be sent, provided an 800
number should the respondent have any questions about the authenticity of the study or
any follow-up questions, and asked if she (the interviewer) could begin the interview. If
the respondent did not agree to continue, the interviewer either terminated the interview
or arranged to call back after the student had received a new cover letter. If the student
-39-
This document is a research report submitted to the U.S. Department of Justice. This reporthas not been published by the Department. Opinions or points of view expressed are thoseof the author(s) and do not necessarily reflect the official position or policies of theU.S. Department of Justice.

agreed to continue, then she was asked a set of screen questions to determine eligibility
(e.g., currently enrolled at the respective school, enrolled since the 1996 fall term at the
respective school, full-time employment status at the respective school). For example, if
the respondent was a student who also worked full-time for the respective school, she was
excluded from the study. Similarly, a student who had enrolled in January of 1997 or was
not currently enrolled was excluded. These students were excluded because our
reference period for experiencing a sexual victimization was "since school began in Fall
of 1996."
I
Prior to administering the screen questions, the interviewer read an introduction to
each respondent that clarified the nature of the survey questions and the contexts under
which the respondent should think about an experience as she answered the survey
questions (see Appendix 3). The respondent was cued as to the wide range of unwanted
sexual experiences that the survey covered and cued that these experiences may not have
been reported to the police or discussed with friends or family. She was also cued as to
whom potential perpetrators might include (e.g, fellow student, professor, family member)
and to possible locations where the victimization had occurred (e.g, on-campus, off-
campus, place of employment). So that the respondent also understood that we were
including incidents where she might be unable to resist an unwanted sexual advance or
give consent, we included the following statement: "You could be awake, or you could be
asleep, unconscious, drunk, or otherwise incapacitated." We believed that this statement
was needed so that our screen questions would "catch" victimizations, especially rape, that
occurred when a woman was unable to give consent to the sexual advance. We did not
-40-
This document is a research report submitted to the U.S. Department of Justice. This reporthas not been published by the Department. Opinions or points of view expressed are thoseof the author(s) and do not necessarily reflect the official position or policies of theU.S. Department of Justice.
want to explicitly ask the respondent this type of consent question because we did not
‘I want her to interpret our intentions as blaming the victim.
Each eligible respondent was then asked a series of 11 sexual victimization screen
questions and one stalking screen question within our reference period. With these
questions, we screened for five forms of sexual victimizations: (1) rape; (2) sexual
coercion; (3) sexual contact; (4) sexual harassment; and (5) stalking. Included in these
screen questions were: (1) the definition of the sexual victimization; and (2) if it was
completed, attempted, and threatened. For example, to screen for completed rape, we
asked the following four questions (see questions 7 through 10 in Appendix 3):
1. “Since school began in the Fall 1996, has anyone made you have intercourse by using force or threatening to harm you or someone close to you? Just so there is no mistake, by intercourse I mean putting a penis in your vagina.”
2. “Since school began in the Fall 1996, has anyone made you have oral sex by force or threat of harm? By oral sex, I mean did someone’s mouth or tongue make contact with your vagina or anus or did your mouth or tongue make contact with someone else’s genitals or anus.”
3. “Since school began in the Fall 1996, has anyone made you have anal sex by force or threat of harm? By anal sex, I mean putting a penis in your anus or rectum.”
4. “Since school began in the Fall 1996, has anyone ever used force or threat of harm to sexually penetrate you with a foreign object? By this, I mean for example, placing a bottle or finger in your vagina or anus.”
, I I
If the respondent said yes to any of the 11 sexual victimization screen questions, she was
incidents of forced ... have happened to you since school began in Fall 1996?” (see
-41 -
This document is a research report submitted to the U.S. Department of Justice. This reporthas not been published by the Department. Opinions or points of view expressed are thoseof the author(s) and do not necessarily reflect the official position or policies of theU.S. Department of Justice.

question 11 in Appendix 3). An incident report was completed for each of the number of
times the respondent said a different incident had happeneu. In short, two incident reports
were developed: (1) one for the measures of rape, sexual coercion, sexual contact, and
sexual harassment; and (2) one for stalking (see discussion of specific instruments below).
All of the respondents were then asked about their experiences with 10 other forms
of sexual victimizations. These included: (1) received obscene phone calls or have such
messages left on an answering machine; (2) had someone make cat calls, whistles, etc.
with sexual overtones; (3) have false rumors spread about one’s sex life; (4) been asked
questions about sex life or romantic life when clearly.it was none of theperson’s business;
(5) had someone make general sexist remarks in front of you; (6) been exposed to
pornographic pictures or materials when you did not agree to see them; (7) had someone
expose their sexual organs when you did not agree to see them; (8) had someone without
your consent observe or try to observe you when you were undressing, nude, or in a
sexual act; (9) had someone photograph, videotape or audio tape you having sex, or in a
nude or semi-nude state without your consent; and (1 0) had someone without your consent
show other people photographs or played videotapes or audio tapes of you having sex or
in a nude or seminude state. For each of these forms of sexual victimization, the
respondent was asked if she had experienced the form “since school began in the Fall of
1996.” If s h e said yes, the interviewer then followed up by asking how many times it had
occurred on campus and how many times it had occurred off campus.
I
Regardless of whether they had been victimized, all respondents were asked a
series of questions relating to four forms of prior sexual victimization (completed rape,
-42-
This document is a research report submitted to the U.S. Department of Justice. This reporthas not been published by the Department. Opinions or points of view expressed are thoseof the author(s) and do not necessarily reflect the official position or policies of theU.S. Department of Justice.

attempted or threatened rape, unwanted touching of a sexual nature, and sexual
intercourse or contact from threats of nonphysical punishment or promise of reward). The
respondents were asked whether these events occurred at three separate periods of time:
(1 ) prior to school starting in the Fall of 1996; (2) between the ages of 14 and 18 years old;
and (3) before the age of 14. They were also asked about their knowledge of vicarious
sexual victimization and offending, fear of sexual assault on campus, crime prevention
behaviors (e.g., carry dace, carry a gun, use campus-sponsored crime prevention
services, taken a self-defense class), lifestyle characteristics (e.g., since the Fall of 1996:
how often been inside a fraternity house., gone to a party sponsored by a fraternity house,
gone io a bar, pub, or club, frequency of alcohol consumption in terms o'f getting drunk,
frequency of illegal drug consumption), and demographic characteristics. The
demographic characteristics included: college class rank, year born, family status (e.g.,
upper class, upper middle class, middle class, working class, and poor), racelethnicity,
marital status, where living (on or off campus), type of housing (e.g., a traditional dorm, a
sorority house, an apartment), how far the respondent lived from campus (on campus to
more than one mile away), tenure at school, part-time or full-time student status, member
of or pledge to a social sorority, foreign student, current relationship (e.g., living with an
intimate partner), current relationship status (e.g., more than 1 year, less than 1 year,
dating but not serious, rarely date, or never date), and sexual orientation (e.g.,
heterosexual, lesbian, or bisexual).
t
The Sexual Victimization Incident-level Instrument. We had three objectives
when we developed the sexual victimization incident-level instrument. We wanted to
-43-
This document is a research report submitted to the U.S. Department of Justice. This reporthas not been published by the Department. Opinions or points of view expressed are thoseof the author(s) and do not necessarily reflect the official position or policies of theU.S. Department of Justice.

obtain information (1) to determine exactly what type@) of sexual victimization occurred
and to what degree (completed, attempted, or threatened); (2) to collect detailed
information about the characteristics of the incident; and (3) to understand the reporting
behaviors of the victim.
To determine what fom(s) of sexual victimization the respondent had experienced
and its degree, we developed a series of questions. First, the interviewer asked the
respondent if the incident were threatened, attempted, or completed. Depending on her
response, the interviewer then asked the respondent which sexual act(s) was completed,
which act(s) was attempted, and/or which act(s) was threatened [four se,parate questions,
see questions 'I 3 through 16 in Appendix 3).
A respondent could answer one of the three responses or all three responses
because it was possible that a single incident resulted in more than one victimization,
either of the same type or of a different type. For example, if a respondent reported that
there was attempted vaginal-penile penetration with force and completed unwanted sexual
contact (e.g., touching of her breasts or buttocks) with the threat of force, then there were
two victimizations during this one incident: an attempted rape and completed sexual
coercion. Another incident could have included the same type of victimizations: a
completed penile-vaginal penetration with force and an oral-genital penetration with force
(both are completed rapes). Information was collected on all victimizations for that
respondent arising from a single incident.
i I
I I
I I
The respondent was then asked five questions about the use of coercion or threat
of coercion. These questions included: (1) if physical force was used; (2) if there was a
-44-
This document is a research report submitted to the U.S. Department of Justice. This reporthas not been published by the Department. Opinions or points of view expressed are thoseof the author(s) and do not necessarily reflect the official position or policies of theU.S. Department of Justice.

both, or neither), and victimization reporting behavior (e.g., was the incident reported to
the police, was it told to someone else and to whom). For example, we asked students
where the incident occurred-on or off campus-and if they reported the incident to the
-45-
b
authorities If they reported the incident, we then followed up by asking to which
This document is a research report submitted to the U.S. Department of Justice. This reporthas not been published by the Department. Opinions or points of view expressed are thoseof the author(s) and do not necessarily reflect the official position or policies of theU.S. Department of Justice.

student population was different from the general population, we designed our questions
exhibited this type of behavior; (2) to obtain information about the characteristics of the
experience; (3) to determine if the incident had been reported and to whom; and (4) the
actions taken as a result of the stalking. I
I To determine what the respondent had experienced, we developed questions
concerning what the person did that seemed obsessive or frightening. These behaviors
so that they would be appropriate lor a student sample. For example, to determine to
which authority the victimization was reported, we included “campus police” in the
response set. We also asked the respondent if they had told anyone else other than the
police about the incident. If she had told someone else, the interviewer followed up by
asking whom that person was (e.g., a parent@], a friend[s], a roommate[s], dean, a victim
service hotline).
I
The Stalking Incident-level Instrument. Given that stalking involves a repeated
behavior(s), we created a separate incident-level instrument. We defined stalking to
include repeated: (1) fo’llowing; (2) waiting outside a classroom, residence, workplace, or
other buildings, or car; (3) watching; (4) telephoning; (5) writing letters, cards, etc.; (6)
electronic mailing (i.e., E-mail); and/or (7) communicating with the respondent in other
ways that seemed obsessive and made the respondent afraid or concerned for her safety.
Again the reference period was “since school began in the Fall of 1996.”
We had four objectives when we developed the stalking incident-level instrument:
(1) to determine the type of stalking experienced and the number of people who had
included: following, waiting outside or inside places, watching from afar, telephoning,
-46-
This document is a research report submitted to the U.S. Department of Justice. This reporthas not been published by the Department. Opinions or points of view expressed are thoseof the author(s) and do not necessarily reflect the official position or policies of theU.S. Department of Justice.

sending unwanted cards, letters or email, or other unwanted contact such as showing up
uninvited. The respondent could answer with more tnan one type of stalking. For
example, the stalker may have followed the respondent and waited for her. We also asked
the respondent if the behavior(s) had stopped or was continuing, how long the behavior(s)
had occurred (e.g., number of years, months, weeks, or days), and how often the behavior
occurred (e.g., less than twice a week, once a week, more than once daily). We also
asked where the stalking took place-on or off campus-and where specifically it took
place (e.g., at a social activity, at a classroom building).
Other questions included: if the offender made any threats of harm or attempts h
harm €he victim, and if the respondent suffered any injuries [e.g., physical ones, including
stab wounds, internal injuries, bruises, and/or emotional and psychological ones). The
characteristics of the offender included: relationship to victim and sex.
Finally, we asked the respondent about her reporting behavior in terms of reporting
the stalking to the police. If the incident was reported to the police, the interviewer asked
the respondent to identify the police authority. If the incident was not reported to the
police, the interviewer asked the respondent why the incident had not been reported to the
police. We also asked if the respondent had told someone else about the incident and
who that person was (e.g., a family member, a roommate, a friend, a victim service
hot I ine).
I
I
I Last, we asked the respondent if she had taken any other actions as a result of the
stalking. These included such actions as: avoided the person who had stalked her,
-47-
This document is a research report submitted to the U.S. Department of Justice. This reporthas not been published by the Department. Opinions or points of view expressed are thoseof the author(s) and do not necessarily reflect the official position or policies of theU.S. Department of Justice.

dropped a class the person was enrolled in, sought psychological counseling, filed civil
charges, and/or bought a weapon.
Our Adoption of Behaviorally Specific Screen Questions and Incident Report Format
As we previously noted, Koss’s SES and modified versions of it use behaviorally
specific questions to cue respondents to report their sexual victimizations, and if so, to
classify victims as to the type of victimization experienced (e.9, completed rape, attempted
rape). Kilpatrick and his associates (1 992) in the National Women’s Study and Tjaden and
Thoennes (1998) in the Nationai Violence Against Women Study also adopted
behaviorally specific questions to cue respondents as to rape incidents. The strength of
these questions is that they employed wording that described the specific behavior in
question (e.g., rape) in graphic detail (e.g., “by oral sex, we mean that a man or a boy put
his penis in your mouth or somebody penetrated your vagina or anus with his mouth or
tongue” ) .
The National Crime Victimization Survey (NCVS) employs another approach to
measuring the extent of different types of victimization: the broad screen question and
incident-report format. With respect to sexual victimization, the NCVS now explicitly cues
respondents in two screen questions as to 1) rape, attempted rape and any other type of
sexual attack, and 2) forced or unwanted sexual assault. Unlike the Koss’s SES, the
NCVS follows up each incident with a detailed incident report; it is the responses to
incident-report questions that ask what happened during the incident that are the basis for
This document is a research report submitted to the U.S. Department of Justice. This reporthas not been published by the Department. Opinions or points of view expressed are thoseof the author(s) and do not necessarily reflect the official position or policies of theU.S. Department of Justice.

classifying the type of crime. The strength of the NCVS is that it does not reply on its
screen questions to classify an incident but rather uses responses to detailed incident-
level questions to classify an incident. This format allows for incidents to screen in on any
question to be classified as a rape or sexual assault (note that these are the two types of
sexual victimization that the NCVS measures).
Both Koss’s SES and the NCVS’s question wording have been criticized for
introducing measuremenferror into their respective sexual victimization estimates (see
Fisher and Cullen, 2000). ‘Taking these criticisms into account, we decided to draw on the
strengths of each instrument-the SES’s behaviorally specific screen questions and .the
NCVS’s detailed incident report-to classTfy type of crime. Our behaviorally specific screen
questions were modeled after those used by Koss et ai. (1987), Kilpatrick and his
associates (1 992), and Tjaden and Thoennes (1 998) (see Appendix 3). The sexual
victimization incident-level report format was modeled after the NCVS. Note, however, that
our “what happened” questions differed from the NCVS questions (see Appendix 3). We
explicitly asked what behavior was completed, attempted, and/or threatened and about
different means of coercion (see Appendix 3, questions R12 through R21). These
questions were used to operationalize all the forms of sexual victimization except stalking
as it had its own incident report. We used the responses to these questions to classify
incidents as to the type of crime experienced. I -49-
This document is a research report submitted to the U.S. Department of Justice. This reporthas not been published by the Department. Opinions or points of view expressed are thoseof the author(s) and do not necessarily reflect the official position or policies of theU.S. Department of Justice.
Field Period and Training of the Interviewers
Due 10 their previous experience in conducting sexual victimization surveys (see
Tjaden and Thoennes, 1998), we contracted with Schulman, Ronca, and Bucuvalas, Inc.
(hereafter SRBI) in Silver Spring, Maryland to administer the surveys using a CAT1 system.
The telephone calls were made by professionally trained female interviewers from SRBl’s
office in Ft Meyers, Florida which has 100 CAT1 stations. Professor Fisher toured the
facilities in January 1997 and met with the SRBl personal that eventually oversaw the
administration of the surveys. Our field period lasted approximately 2.5 months; it began
February 21 , 1997 and ended May 5, 1997. The interviews lasted, on average, 25.9
m‘i nut e s .
At the study’s inception, a project training session was held that included all
assigned field staff. The training session was divided into two interrelated segments. The
first phase of training required review of the general principles of survey research and
interviewing. The second phase of training dealt specifically with the requirements and
complexities of our sexual victimization study. Operationally, both sets of information were
covered simultaneously in the training sessions. In these sessions, the specific
requirements of the study to be performed were used to demonstrate the general principles
of survey research.
All interviewers followed a general manual on interviewing procedures developed
by the SRBl operations staff. A few of the areas which were considered important in the
general background training of interviewers included: (1 ) an understanding of sampling
procedures and the importance of rigorous adherence to sampling procedures in the field;
-50-
This document is a research report submitted to the U.S. Department of Justice. This reporthas not been published by the Department. Opinions or points of view expressed are thoseof the author(s) and do not necessarily reflect the official position or policies of theU.S. Department of Justice.
(2) an understanding of respondent selection procedures and the importance of following
~
The project director developed the training manual. Additional training materials J
these procedures rigorously; (3) the role of the interviewer in the survey process; (4)
I recommended methods for contacting potential respondents and procedures for setting
appointments; and, (5) effective methods for gaining initial agreement to be interviewed.
Other areas related to survey research were additionally covered at length.'
probability of obtaining sensitive information from respondents; (3) proper CAT1 recording
procedures; and, (43 additional reporting and quality control requirements for this effort.
Training sessions not on'ly allowed the review of general 'interview principles and unique
study procedures and requirements but also enabled the use of the CAT1 equipment; both
to gain familiarity with the survey instrument and to conduct interviews.
The most critical issue in the training sessions was to ensure that sensitive
questions were asked properly and that responses were recorded correctly
Consequently, much of the training period was devoted to question by question
specifications for the interview. Time was also spent reviewing initial contact and
screening procedures, call-back protocol, sample record-keeping, and other administrative
The remaining areas covered in the training sessions were: methods for overcoming initial reluctance to schedule or agree to be interviewed, interviewer behavior in the interview setting (Le., how to be courteous, neutral, and nonintmsive), how to avoid biasing responses by verbal and nonverbal cues, how to ask and record close-ended questions, how to probe and record open-ended questions, how to control irrelevancies and digressions without offending the respondent, how to reassure respondents about the confidentiality of the information collected and the anonymity of survey respondents, the general standards of completion, comprehensibility, and legibility required for recording, general recording conventions, and field reporting standards.
F
-51 -
This document is a research report submitted to the U.S. Department of Justice. This reporthas not been published by the Department. Opinions or points of view expressed are thoseof the author(s) and do not necessarily reflect the official position or policies of theU.S. Department of Justice.
matters. After the first formal training session, interviewer performance was monitored and
individual instructions were provided.
Interviewers were also instructed how to handle respondents who became
emotionally upset as a result of the questions and/or memories provoked by the past
experiences. This included providing the lead author's telephone number and/or E-mail
address, who then would provide an 800 number for a crisis services hotline or send local-
level and national-level victim services or counseling information via the overnight mail to
the respondent. We received no requests for either types of information.
Use of Telephone Sunreys
Similar to the NCVS and to other recent studies (Kilpatrick, et al., 1992; Tjaden and
Thoennes, 1998), we chose to conduct this study through telephone interviews. In-person
interviews would have been prohibitively expensive. Mail surveys would have been
impractical because the screen question-incident report measurement approach potentially
requires numerous "skips" into different parts of the survey depending on whether a
victimization incident is reported. It is possible that different methods of surveying could
affect responses (see Fisher and Cullen, 2000). As noted, we attempted to take every
precaution to place respondents in a position in which they would be comfortable in
relaying any victimizations that may have occurred. Again, however, we cannot rule out
the possibility that the results reported might have been inflated or deflated by the use of
telephone interviewing to collect the data.
-52-
This document is a research report submitted to the U.S. Department of Justice. This reporthas not been published by the Department. Opinions or points of view expressed are thoseof the author(s) and do not necessarily reflect the official position or policies of theU.S. Department of Justice.

Response Rate
Potential respondents were not included in the survey for a number of reasons that
are discussed below. Of the 10,527 telephone numbers dialed, 47.1 percent (n = 4,957)
were phone numbers in which a potential respondent was not eligible.g Of the remaining
52.9 percent (n = 5,570) active numbers in which a potential respondent was eligible, 8.9
percent (n = 496) were screened out because 89.5 percent (n = 444) were not currently
enrolled and 11.5 percent (n = 52) were part-time students. The remaining 90.0 percent I
(n = 4,461) of the active numbers were considered qualified to complete the interview,
however, 0.3 percent In = 15) were terminated while 99.7 percent (n = 4,446) completed
the interview.
We calculated the response rate using two different formulas; each revealed high
rates of response. First, we summed the total number of respondents completing the
survey (n = 4,446) and the total number of respondents that were screened out (n = 496)
and divided this figure by the total number of potential respondents contacted by SRBl (n
= 5,769). Using this first formula generated a response rate of 85.6 percent. Second, we
divided the total number of respondents completing the survey (n = 4,446) by the sum of
Of the 5,570 telephone numbers not eligible, 53.5 percent (n = 2,979) were phone numbers 9
that were wrong, changed, or not in service; 6.7 percent (n = 369) exceeded the 10-call limit; 5.5 percent (n = 307) were in "callback" status at the termination of the study period; 4.2 percent (n = 236) were numbers where only answering machines were present; 2.6 percent (n = 146) were business telephone numbers; 2.5 percent (n = 142) were terminated for reasons not specified; 1.9 percent (n = 109) wanted another letter sent but the was completed before the letter was received; 1.9 percent (n = 107) were never available (no answer); 1.9 percent (n = 105) were numbers of fax machines; 0.7 percent (n = 41) had returned home prior to the completion of the study; 0.6 percent (n = 36) were terminated because of language barriers, and; 0.5 percent (n = 29) were deaf or deceased or busy. In addition, 9.4 percent (n = 526) initially refused; 4.5 percent (n = 249) were second refusals; 2.7 percent (n = 152) were away for the duration, and; 0.7 percent (n = 37) were classified as "refusal eligibility unknown."
-53-
This document is a research report submitted to the U.S. Department of Justice. This reporthas not been published by the Department. Opinions or points of view expressed are thoseof the author(s) and do not necessarily reflect the official position or policies of theU.S. Department of Justice.

the total number of respondents completing the survey and the total number of
respondents who refused to participate ([n = 4,4461 + [n = 8121). Using this second
formula generated a response rate of 84.6 percent.
Population Characteristics and Sample Characteristics I We were not able to directly compare how representative our sample was to the
population of female students who were enrolled at two-year and four-year colleges and I universities with enrollments of at least 1,000 students for two reasons. First, while
demographic information (e.g. , racelethnicity, mean age) for all students is published by
the Department of Education (hereafter DOE), information for institutions with 1,000 or
more students is not published.'0 Second, the DOE does not break down student
demographic information by sex. We can, however, provide the demographic
characteristics of our sample, which appear to be similar to the characteristics of students
in institutions of all sizes (compare the following with information provided in footnote 10).
Most of our sample (n = 4,446) were full-time students (90 percent) and
undergraduates (86 percent). Freshmen comprised 24 percent of the sample, sophomores
Institutions with less than 1,000 students, comprise only 3.8 percent (N = 537,685) of all students in post-secondary education. As such, it is expected that the characteristics presented closely represent the population from which our sample was drawn. While the majority (87.6 percent) of all students were undergraduates, a significant portion (12.4 percent) were graduate students. Assessing class status reveals that 32.7 percent were freshman or other first-time students, 19.8 percent were sophomores, 10.0 percent were juniors, and 12.3 percent were seniors (Department of Education, 1997). The remaining were unclassified (1 .O percent) or were classified only as taking credit courses (1 1.5 percent). A slight majority (56.9 percent) of them were full-time students and female (55.6 percent). A substantial percentage (40.0 percent) were under the age of 22. Most (74.7 percent) of all students were white, non-Hispanic followed by African-American, non-Hispanic (I 0.7 percent), Hispanic (7.9 percent), Asian or Pacific Islander (5.8 percent) and American Indian or Alaskan Native (1 .O percent) (Department of Education, 1997).
1 0
I I
-54-
This document is a research report submitted to the U.S. Department of Justice. This reporthas not been published by the Department. Opinions or points of view expressed are thoseof the author(s) and do not necessarily reflect the official position or policies of theU.S. Department of Justice.
22 percent, juniors 18 percent, seniors 22 percent, graduate students 12 percent, and
others (posi-doctorate, continuing education, certification programs) 1.7 percent. As
expected, the sample was youthful: Just over 76 percent of the sample were between the
ages of 17 and 22 years old (mean = 21.54, std. dev. = 4.25). Most of the sample were
White/Caucasian, non-HispanidLatino (80.6 percent), followed by African-American, non-
HispanidLatino (7.0 percent), HispanidLatino (6.2 percent), AsianIPacific Islander, non-
HispanidLatino (3.4 percht), American IndiadAlaska Native, non-HispanidLatino (0.8
percent), and mixed or other (1.5 percent). Less than 1 percent (0.54) refused or did not
know their race or ethnicity. Forty-four percent described their family when they were
growing up as “middle class,” followed by 38 percent who reported their family as “upper
middle class,” 12 percent as “working poor,” 4 percent as “upper class,” and 2 percent as
‘‘ poor. ”
I
Almost all the respondents were not married (91 percent). Of those not married, 7
percent are currently living with an intimate partner. Of those not living with an intimate
partner, 31 percent were in a relationship that had lasted a year of more, 19 percent were
in a relationship that has lasted less than a year, 26 percent dated, but not anyone
seriously, 20 percent rarely dated, and 5 percent never dated. Almost all were
heterosexual (97.5 percent); less than 2 percent were bisexual (1.7 percent) and less than
one percent were lesbian (0.8 percent). Most respondents (just over 87 percent) were not
a member of or a pledge to a social sorority. Fifty-one percent of the students lived on
campus, and the majority of those students (close to 88 percent) lived in traditional dorms.
-55-
This document is a research report submitted to the U.S. Department of Justice. This reporthas not been published by the Department. Opinions or points of view expressed are thoseof the author(s) and do not necessarily reflect the official position or policies of theU.S. Department of Justice.

Of those who lived off campus (49 percent), the majority (63 percent) lived more than
three-fourths of a mile away fro1 11 campus.
We used three sources of secondary data to obtain institution-level data. These
data were used to assess if institutional characteristics had any effect on the probability
of experiencing an on-campus sexual victimization. First, we used the Peterson's Guide I
to Four Year Colleges and Universities (1998) and the Peterson's Guide to Two-Year
Colleges (1998) data sources because they provide information on various types of
characteristics of an institution. This informalion included: Yhe composition of fhe student
body (e.g. , total student enrollment, gender and racial distributions of the student body,
and percentage of students that are full time, and the percentage of students that are
freshmen), the physical characteristics (e.g., number of acres, location), and the type of
institution (i.e., four-year school or two-year school).
Second, we used four sources of secondary data to obtain the number of on-
campus rapes known to the campus law enforcement. First, during the summer of 1997,
we sent a letter requesting the annual security report from every school in our sample (see
Appendix 4). According to the Campus Security Act of 1990, every school that receives I
I federal financial aid must publish this report and make it available to prospective students.
I
~
By law, it should contain statistics for the specific crimes, including forcible and non-
forcible rape, and liquor, alcohol and weapons violations for the previous three calendar
years. Of our 233 schools, 12 percent (n = 28) sent us their respective campus security
-56-
This document is a research report submitted to the U.S. Department of Justice. This reporthas not been published by the Department. Opinions or points of view expressed are thoseof the author(s) and do not necessarily reflect the official position or policies of theU.S. Department of Justice.

report. Some sent nothing while others sent us materials that we could not use for our
study. Second, because of the small percentage ui schools that answered our initial
request, we developed another survey (see Appendix 5) that we then sent to the campus
law enforcement/public safety office in mid-November 1997. This survey asked specifically
for crime and violation statistics for the years we needed. Of all our schools, 42.2 percent
(n = 98) responded to our survey. Third, in an attempt to obtain crime and violation
statistics from those schools that did not respond to our initial request for their respective
annual security report or to our follow-up survey, we used the Internet to look at the home
pages of those schools to see if someone had posted their school's security report or crime
statistics. Just over 7 percent (7.3 percent) In = 17) had these statistics on Yhe'ir school's
home page. Finally, 17.6 percent (n = 41) of the schools had our needed crime
information published in The Chronicle of Higher Education (March, 1997).
And third, we collected information concerning the number of fraternities on campus
from the National Interfraternity Conference. We used their 1997-?998 Directory of
Chapters as a source of the number of fraternities officially registered at the respective
school.
Variables Used in the Multivariate Analyses I We used lifestyle/routine activities theory to guide the selection of variables that we
included in the mulitvariate models of sexual victimization risk. Researchers have used
these theories extensively to explain different types of victimization in several domains:
(1) violent victimization in the general population (see Miethe and Meier, 1994; Sampson
-57-
This document is a research report submitted to the U.S. Department of Justice. This reporthas not been published by the Department. Opinions or points of view expressed are thoseof the author(s) and do not necessarily reflect the official position or policies of theU.S. Department of Justice.

and Lauritsen, 1990); (2) violent college student victimization on campus (see Fisher et
al., 1998); (3) sexual victimization among college women (see Schwartz anu ?itts, 1995);
and (4) stalking among college women (see Mustaine and Tewksbury, 1999).
I We estimated three sets of models for: (1 ) victimization categories associated with
the 12 forms of sexual victimization; (2) victimization categories associated with the 12
forms of sexual victimization that occurred only on campus; and (3) stalking. Note that for
some of the dummy variables we created (e.g., status of relationship, race/ethnicity, and
class standing), we collapsed categories differently across the sets of models. In the text,
we described the most general forms of the dummy variables and we noted any changes
in the footnotes.
Exposure to Crime Measures. Researchers have shown that exposure to certain
types of situations at particular times, under particular circumstances, and with particular
kinds of persons plays a role in victimization risk (Cohen and Felson, 1979; Hindelang et
al , 1978; Miethe and Meier, 1994). The routine activities/lifestyle theory and sexual
victimization research consistently has shown that certain routines/lifestyles-such as
partaking in high alcohol and drug consumption and frequenting bars, clubs, and
parties-increase the risks of victimization (see Belknap and Erez, 1995; Crowell and
Burgess, 1996; Fisher et ai., 1998; Miethe and Meier, 1994; Sampson and Lauritsen, 1990;
Schwartz and Pitts, 1995). As we discussed in Chapter 1 , the campus rape research
suggests that women’s activities which put them at higher risk of victimization include
attending dormitory and fraternity parties as well as their frequency of alcohol and drug
I
I
I I
I
-58-
This document is a research report submitted to the U.S. Department of Justice. This reporthas not been published by the Department. Opinions or points of view expressed are thoseof the author(s) and do not necessarily reflect the official position or policies of theU.S. Department of Justice.
consumption (see Hamey and Muehlenhard, 1991 ; Koss and Dinero, 1989; Mustaine and
Tewksbury, 1999; Testa and Parks, 1996; for exception see Himelein, 1995).
We used five variables to measure exposure to crime: (1 ) propensity to be at places
where there may be men exclusively; (2) propensity to be at places where alcohol is I served; (3) frequency of drinking enough alcohol to get drunk; (4) frequency of smoking t pot or hashish; and (5) member of or pledge to a social sorority. The first two measures,
propensity to be at places where there may be men exclusively and propensity to be at c
places where alcohol is served, are multi-item scales (see Appendices 6, 7 , and 8 for a
description of the measurement of all the variables we used and their respective statistics).
For each respondent we calculated her respective mean value for each scale." We
created these scales because, as we noted in Chapter 1 , researchers have documented
that males are most often the perpetrator in sexual victimizations against women and the
consumption of alcohol has been linked to the occurrence of such victimizations.
In light of their significance in previous college student sexual victimization and
stalking studies, we included two measures of a respondent's substance use since school
began in the Fall of 1996: (1 ) how often she drinks alcohol to get drunk; and (2) how often
she smokes pot or hashish (see Fisher, et al., 1998; Mustaine and Tewksbury, 1999;
Schwartz and Pitts, 1 995). Finally, similar to other college student victimization research,
we employed membership in (either member of or pledge to) a social sorority as a measure f We calculated a mean based on the total number of valid responses that a respondent gave
to the questions used in the respective scale. A scale score was given only to those respondents who answered a majority of the questions used in the respective scale,
-59-
This document is a research report submitted to the U.S. Department of Justice. This reporthas not been published by the Department. Opinions or points of view expressed are thoseof the author(s) and do not necessarily reflect the official position or policies of theU.S. Department of Justice.

I
I
I
of exposure to risk because researchers have reported that sorority members have a high
prevalence rate of sexual victimization (Rivera and Regoli, 1987).
Guardianship Measure. Guardianship involves the ability of persons or objects
to prevent the occurrence of crime by
hardening devices) means (Cohen and
developed one measure of guardianship:
social (interpersonal) and/or physical (target
Felson, 1979; Miethe and Meier, 1994). We
living alone. The sexual victimization research
has found that many of these victimizations occurred in private places; for example, a
residence, by someone the victim knew (see Belknap and Erez, 1995; Harney and
Muehlenhard, 1991). Living alone may contribute to the risk of victimization because no
one, other than the offender, is present to act as a suitable guardian.
Proximity to Motivated Offenders. Research has suggested that the likelihood
of victimization increases with the amount of exposure a person has to potential
perpetrators (see Koss and Dinero, 1989; Miethe and Meier, 1994). In support of this
proposition, recent work reports that victimized women tend to have a greater number of
dating and sexual partners (see Harney and Muehlenhard, 1991). Violence within a
relationship, especially those who are involved in a college dating relationship or in an
intimate relationship, is also well documented in the sexual victimization research
(Himelein, 1995; Koss and Dinero, 1989; Muehlenhard and Linton, 1987). To capture the
extent of a person being in physical proximity to potential student offenders, we employed
four measures: (1) the current enrollment status (Le., part-time student or full-time
student); (2) the sex of the individuals who live in the respondent's dormitory (i.e., coed
dormitory or all-female dormitory); (3) the location of respondent's residence (on campus
-60-
This document is a research report submitted to the U.S. Department of Justice. This reporthas not been published by the Department. Opinions or points of view expressed are thoseof the author(s) and do not necessarily reflect the official position or policies of theU.S. Department of Justice.
in a dormitory or off campus);‘’ and (4) the respondent’s current relationship status. We
I
created three dummy variables to measure the student‘s current relationship status: (1)
involved in a relationship; (2) dating some people, but no one seriously or rarely date; and
(3) never date.13 I
Koss and Dinero, 1989). 7’0 control for previous sexual experiences, we created a count
measure of four different types of sexual victimizations (rape, attempted rape, unwanted
or uninvited touching, and attempted unwanted sexual intercourse or sexual contact
because someone made threats of physical punishment or promises of reward if you
sexually complied) that had occurred prior to school beginning in the Fall of 1996.
Demographics. Some past victimization research and sexual victimization
research has reported that victimization varies by certain sociodemographic
characteristics, while other work has reported no differences (Fisher et al., 1998; Harney
and Muehlenhard, 1991; Koss et al., 1987; Miethe and Meier, 1994; Sampson and
Lauritsen, 1990). For example, Koss et al. (1987) reported that the prevalence of sexual
victimization did not vary significantly by family income but did differ significantly by
race/ethnicity-Native Americans had the highest prevalence of rape and Asian-Americans
Of the 1,986 women who lived in a dormitory, 99.7 percent (n=l,980) reported living on campus.
For the on-campus models, dummy variables for dating some people but no one seriously or 1 3
rarely date and never date were used. For the other two sets of models (Le., sexual victimization and stalking models), we used the dummy relationship variables described in the text.
-61 -
This document is a research report submitted to the U.S. Department of Justice. This reporthas not been published by the Department. Opinions or points of view expressed are thoseof the author(s) and do not necessarily reflect the official position or policies of theU.S. Department of Justice.
had the lowest. Tjaden and Thoennes (1 998) reported a similar result with respect to the
relationship between stalking and racelethnicity; American Indian/Alaska Native women
had the highest lifetime prevalence of stalking and Asian/Pacific Islander women had the ‘I lowest.
Following in this research tradition, we included the following demographic
characteristics: age, race/ ethnicity, sexual orientation, family class, and academic class
standing. The age of the respondent was measured in years at the time the survey was t
administered. Race/ethnicity was measured using five dummy variables: (1 ) African-
American, non-HispanicILatino; (2) Asian/Pacific Islander, non-Hispanidlatino; (3)
HispanidLatino; (4) American Indian/ Alaska Native, non-HispanicLatino; and (5) Other,
non-HispanidLatino (i.e. , mixed and ~ t h e r ) . ‘ ~ Sexual orientation was measured as
heterosexual and nonhetersexual (lesbian and bisexual). Family class was measured
ranging from poor, working class, middle class, upper-middle class to upper class. Class
standing was measured using two dummy variables: (1 ) freshman or sophomore; and (2)
junior or senior.’’
lnsfifufion-level Characferisfics. Researchers have reported that institutional-
level characteristics are significantly related to violent campus crime rates (see Sloan,
1992, 1994). Koss and her colleagues (1987), however, reported that size of the total f enrollment of the institution and the size of the city where the institution was located was
These five dummy variables were used in the stalking model. The sexual victimization 14
models and on-campus models used the following dummy variables: African-American, non- HispanidLatino, HispanidLatino, and Other, Non-HispanidLatino.
models. The on-campus models used only one class standing variable: freshman/sophomore status. These two class standing dummy variables were used in the sexual victimization and stalking
-62-
This document is a research report submitted to the U.S. Department of Justice. This reporthas not been published by the Department. Opinions or points of view expressed are thoseof the author(s) and do not necessarily reflect the official position or policies of theU.S. Department of Justice.
not significantly related to the prevalence of sexual victimization. To control for these
factors, we included measures of exposure to crime which included: (1) tile percent of
freshmen enrolled, (2) type of institution (four year or two year), (3) size of student
enrollment, and (4) institutional rape rate per 1,000 female students. We created three
dummy variables to measure the effects of the size of the student enrollment: small (1,000
to 4,999), medium (5,000 to 9,999), and large (10,000 to 19,999).
We used the number of rapes reported to the campus police as a measure of
institution-level exposure to crime. There were some difficulties in creating this measure
because some schools provided their rape statistics in calendar years while others
provided them in academic years. Still, others did not provide these statistics or we could
not obtain them from our other sources. We used a method described by Greene (1 997)
to statistically control for the number of reported on-campus rapes and to address the
missing data problem. We created four variables: (1) rate of rape for calendar year (0 if
missing on this variable or true zero); (2) rate of rape for academic year (0 if missing on
this variable or true zero); (3) missing on academic year; and (4) missing on calendar year.
The latter two variables are dummy variables: those schools that have valid values on the
respective type of year (Le., calendar or academic) are coded as a zero and those schools
that are missing on both academic year and calendar year or have missing values on the
respective type of year are coded as one.
We also included three institution-level measures of proximity to crime: (1) the
percent of full-time students; (2) the percent of male students; and (3) the number of
-63-
This document is a research report submitted to the U.S. Department of Justice. This reporthas not been published by the Department. Opinions or points of view expressed are thoseof the author(s) and do not necessarily reflect the official position or policies of theU.S. Department of Justice.

fraternities registered at the respective school. Institution-level guardianship was
measured by one variable: student density-the number of students per acre.
Organization of the Data Analysis
The data analysis is composed of three parts: (1) a series of descriptive statistics;
(2) a series of bivariate analyses; and (3) a multivariate multi-level analysis of the different
forms of sexual victimization. First, we used descriptive statistics to report information
~ f about the nature and extent of the 12 different forms of sexual victimization, stalking, and
visual and verbal insults. Second, we performed bivariate analyses to provide an overview
of the relationships between sexual victimization and other variables of interest to our
initial research questions. Finally, we estimated a series of multivariate models to test the
relationships expressed in Figure 1.1 for the forms of sexual victimization and stalking.
Our results are presented in Chapters 3, 4, and 5.
-64-
This document is a research report submitted to the U.S. Department of Justice. This reporthas not been published by the Department. Opinions or points of view expressed are thoseof the author(s) and do not necessarily reflect the official position or policies of theU.S. Department of Justice.
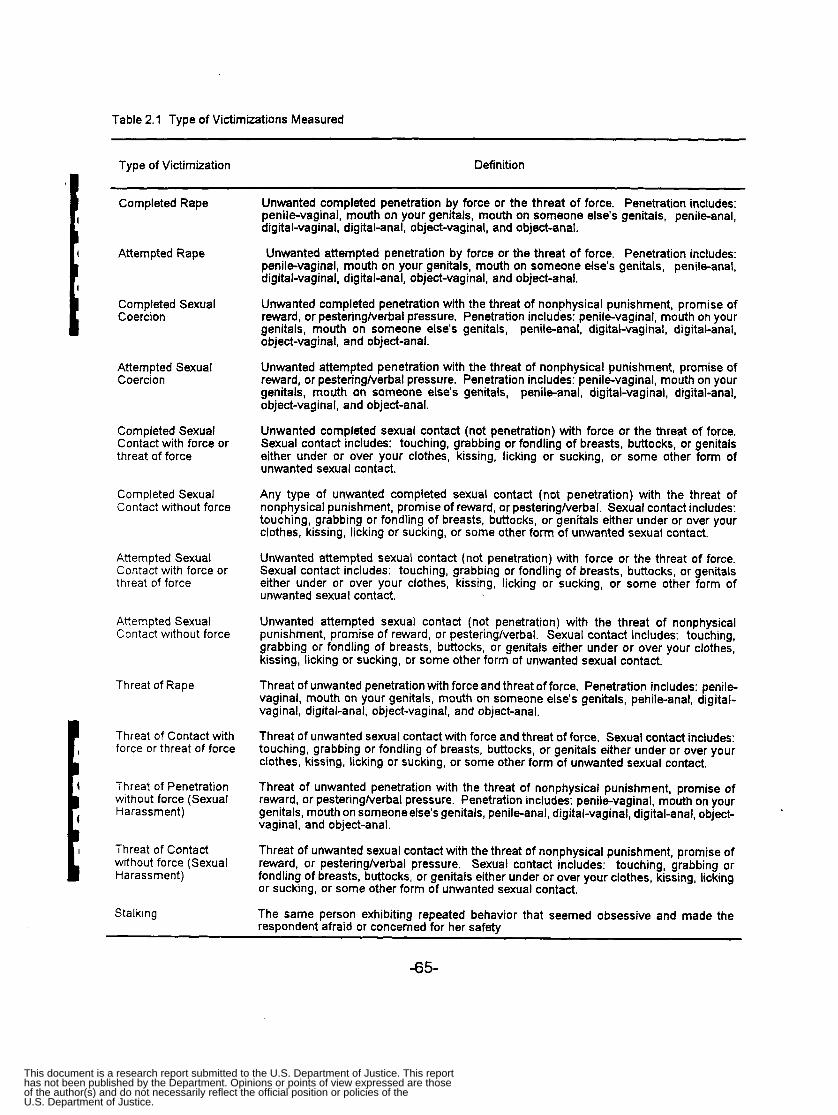
Table 2.1 Type of Victimizations Measured
Type of Victimization Definition
Completed Rape
Attempted Rape
Completed Sexual Coercion
Attempted Sexual Coercion
Completed Sexual Contact with force or threat of force
Completed Sexual Contact without force
Attempted Sexual Contact with force or threat of force
Attempted Sexual Contact without force
Threat of Rape
Threat of Contact with force or threat of force
Threat of Penetration without force (Sexual Harassment)
Threat of Contact without force (Sexual Harassment)
Stalking
Unwanted completed penetration by force or the threat of force. Penetration includes: penile-vaginal, mouth on your genitals, mouth on someone else's genitals, penile-anal, digital-vaginal, digital-anal, object-vaginal, and object-anal.
Unwanted attempted penetration by force or the threat of force. Penetration includes: penile-vaginal, mouth on your genitals, mouth on someone else's genitals, penile-anal, digital-vaginal, digital-anal, object-vaginal, and object-anal.
Unwanted completed penetration with the threat of nonphysical punishment, promise of reward, or pestering/verbal pressure. Penetration includes: penile-vaginal, mouth on your genitals, mouth on someone else's genitals, penile-anal, digital-vaginal, digital-anal, object-vaginal, and object-anal.
Unwanted attempted penetration with the threat of nonphysical punishment, promise of reward, or pesteringlverbal pressure. Penetration includes: penile-vaginal, mouth on your genitals, mouth on someone else's genitals, penile-anal, digital-vaginal, digital-anal, object-vaginal, and object-anal.
Unwanted completed sexual contact (not penetration) with force or the threat of force. Sexual contact includes: touching, grabbing or fondling of breasts, buttocks, or genitals either under or over your clothes, kissing, licking or sucking, or some other form of unwanted sexual contact.
Any type of unwanted completed sexual contact (not penetration) with the threat of nonphysical punishment, promise of reward, or pesteringherbal. Sexual contact includes: touching, grabbing or fondling of breasts, buttocks, or genitals either under or over your clothes, kissing, licking or sucking, or some other form of unwanted sexual contact.
Unwanted attempted sexual contact (not penetration) with force or the threat of force. Sexual contact includes: touching, grabbing or fondling of breasts, buttocks, or genitals either under or over your clothes, kissing, licking or sucking, or some other form of unwanted sexual contact.
Unwanted attempted sexual contact (not penetration) with the threat of nonphysical punishment, promise of reward, or pesteringlverbal. Sexual contad includes: touching, grabbing or fondling of breasts, buttocks, or genitals either under or over your clothes, kissing, licking or sucking, or some other form of unwanted sexual contact.
Threat of unwanted penetration with force and threat of force. Penetration includes: penile- vaginal, mouth on your genitals, mouth on someone else's genitals, pehile-anal, digital- vaginal, digital-anal, object-vaginal, and object-anal.
Threat of unwanted sexual contact with force and threat of force. Sexual contact includes: touching, grabbing or fondling of breasts, buttocks, or genitals either under or over your clothes, kissing, licking or sucking, or some other form of unwanted sexual contact.
Threat of unwanted penetration with the threat of nonphysical punishment, promise of reward, or pesteringlverbal pressure. Penetration includes: penile-vaginal, mouth on your genitals, mouth on someone else's genitals, penile-anal, digital-vaginal, digital-anal, object- vaginal, and object-anal.
Threat of unwanted sexual contact with the threat of nonphysical punishment, promise of reward, or pesteringherbal pressure. Sexual contact includes: touching, grabbing or fondling of breasts, buttocks, or genitals either under or over your clothes, kissing, licking or sucking, or some other form of unwanted sexual contact.
The same person exhibiting repeated behavior that seemed obsessive and made the respondent afraid or concerned for her safetv
-65-
This document is a research report submitted to the U.S. Department of Justice. This reporthas not been published by the Department. Opinions or points of view expressed are thoseof the author(s) and do not necessarily reflect the official position or policies of theU.S. Department of Justice.
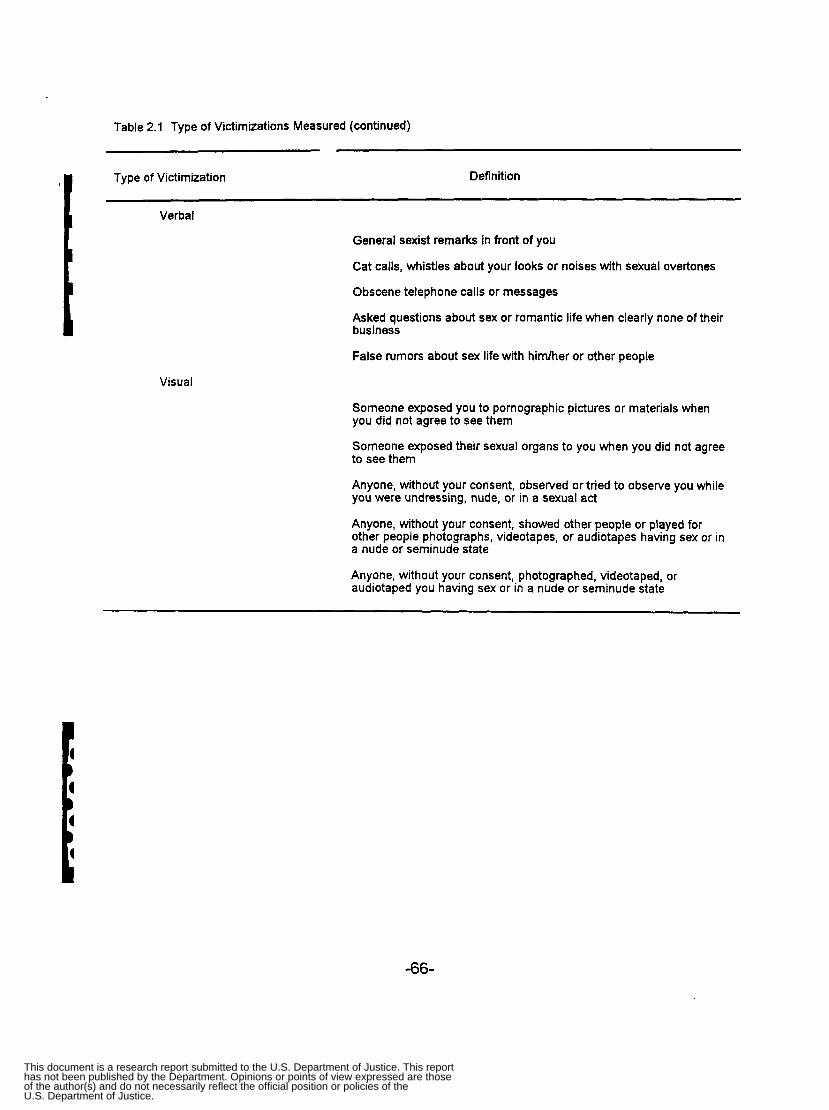
Table 2.1 Type of Victimizations Measured (continued)
Type of Victimization Definition
Verbal
General sexist remarks in front of you
Cat calls, whistles about your looks or noises with sexual overtones
Obscene telephone calls or messages
Asked questions about sex or romantic life when clearly none of their business
False rumors about sex life with himlher or other people
Visual
Someone exposed you to pornographic pictures or materials when you did not agree to see them
Someone exposed their sexual organs to you when you did not agree to see them
Anyone, without your consent, observed or tried to observe you while you were undressing, nude, or in a sexual act
Anyone, without your consent, showed other people or played for other people photographs, videotapes, or audiotapes having sex or in a nude or seminude state
Anyone, without your consent, photographed, videotaped, or audiotaped you having sex or in a nude or seminude state
-66-
This document is a research report submitted to the U.S. Department of Justice. This reporthas not been published by the Department. Opinions or points of view expressed are thoseof the author(s) and do not necessarily reflect the official position or policies of theU.S. Department of Justice.
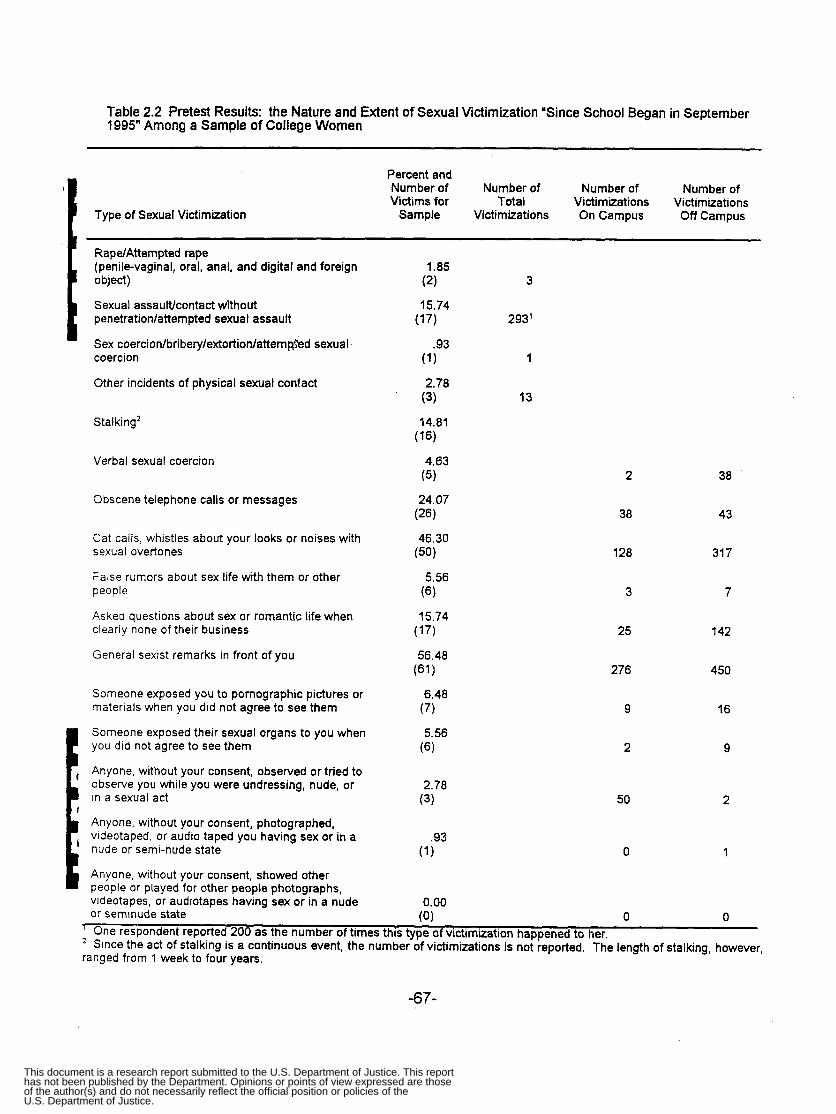
Table 2.2 Pretest Results: the Nature and Extent of Sexual Victimization "Since School Began in September 1995" Among a Sample of College Women
Percent and Number of Number of Number of Number of
Victims for Total Victimizations Victimizations Sample Victimizations On Campus Off Campus
RapelAttempted rape (penile-vaginal, oral, anal, and digital and foreign 1.85 object) (2) 3
Sexual assaultlcontact without 15.74 penetration/attempted sexual assault (77) 293'
Sex coercion/bribery/extortion/attemp$ed sexual .93 coercion (1 1 1
t Other incidents of physical sexual contact
Stalking'
Verbal sexual coercion
Obscene telephone calls or messages
2.78 (3) 13
Cat calls, whistles about your looks or noises with 46.30 sexual overtones (50)
False rumors about sex life with them or other people (6)
Asked questions about sex or romantic life when clearly none of their business (17)
5.56
15.74
General sexist remarks in front of you 56.48 (61 1
Someone exposed you to pornographic pictures or 6.48 materials when you did not agree to see them
Someone exposed their sexual organs to you when you did not agree to see them
Anyone, without your consent, observed or tried to observe you while you were undressing, nude, or
Anyone, without your consent, photographed,
nude or semi-nude state
(7)
(6)
2.78
5.56
in a sexual act (3)
videotaped, or audio taped you having sex or in a .93 (1 1
b Anyone, without your consent, showed other people or played for other people photographs, videotapes, or audiotapes having sex or in a nude or serninude state 10)
0.00
2
38
128
3
25
276
9
2
50
0
38
43
317
7
142
450
16
9
2
1
0 n I ,
- ' One respondent reported 200 as the number of times this type of victimization happened to her. ' Since the act of stalking is a continuous event, the number of victimizations is not reported. The length of stalking, however, ranged from 1 week to four years.
-67-
This document is a research report submitted to the U.S. Department of Justice. This reporthas not been published by the Department. Opinions or points of view expressed are thoseof the author(s) and do not necessarily reflect the official position or policies of theU.S. Department of Justice.

Table 2.3 Size of Student Enrollment by Location of School
Location of School: Number of Schools Selected
(Number of Female Students Interviewed)
Small Town/ Size of Student Enrollment Urban Suburban Rural TOTALS
1,0004,999
5,000-9,999
1 0,000-1 9,999
20,000 and more
21 (378)
(364)
(364)
(372)
14
14
12
TOTALS
-68-
This document is a research report submitted to the U.S. Department of Justice. This reporthas not been published by the Department. Opinions or points of view expressed are thoseof the author(s) and do not necessarily reflect the official position or policies of theU.S. Department of Justice.
CHAPTER 3
SEXUAL VICTIMIZATION AMONG FEMALE COLLEGE STUDENTS
A central goal of this research is to provide data on the extent to which college
women experience a range of different types of sexual victimization. In this chapter, we
present the results from our national survey of college women for completed and
attempted rape-the most serious forms of sexual victimization-and then convey the data
relevant to sexual coercion, sexual contact, and threatened victimizations. We also
present information on the extent to which the respondents experienced sexual
victimizations prior to the current academic year.
As reviewed in Chapter 1, the measurement of sexual victimization is a complicated
and, to a degree, imperfect enterprise. The challenges are especially daunting when
attempting to discern when, in an intimate encounter, a sexual advance crosses the line
from imprudence to criminal behavior. But the salience of the methodology of measuring
sexual victimization is intensified even further because the "findings" are integral to the
ongoing debate between feminist and conservative scholars overwhether women's sexual
victimization is a true social problem or a misguided social construction of reality.
For feminist scholars, the victimization of women by men remained, until recently,
largely invisible (Belknap 1995). Traditionally, the sexual victimization of females only
surfaced-or received attention from law enforcement officials-when women were
attacked by strangers and could not hide physical injuries. Using the term "real rapes" to
refer to rape victimizations that fit this pattern. Estrich (19871 observed that manv other
-69-
This document is a research report submitted to the U.S. Department of Justice. This reporthas not been published by the Department. Opinions or points of view expressed are thoseof the author(s) and do not necessarily reflect the official position or policies of theU.S. Department of Justice.
rapes-those involving acquaintances or partners, those that did not leave bruises-were
not accorded the status of a legitimate, criminal victimization.
But why were so many sexual victimizations-from sexual assault to sexual
harassment-rendered invisible? Why were they not considered "real"? One ready culprit
cited by feminists was "patriarchy." The gender inequity inherent in patriarchy, argued
feminists, produced cultural beliefs that reduced women to sex objects, legitimated men's
dominance of females, and rendered women powerless to redefine their ill-treatment by
men as criminal. Only with the advent of the Women's Movement-a movement that has
challenged the hegemony of patriarchal structures and culture-have women been able
to make their sexual victimization visible
These claims might have been dismissed as just a bunch of feminist rhetoric if they
had not ostensibly been backed up by hard data. Thus, victimization surveys of women
revealed high prevalence rates for rape and other forms of sexual assault (see, for
example, Koss et ai., 1987; Russell, 1984). As reviewed in Chapter 1, it is noteworthy for
our purposes that a number of these studies were conducted with samples of college
women and showed that, in particular, sexual assaults by acquaintances or dates were
commonplace (see, for example, DeKeseredy and Kelly, 1993b; Koss et al., 1987).
In contrast, conservative commentators argue that the supposed epidemic of sexual E victimization is an invention of feminist scholars (see, for example, Gilbert, 1997; Roiphe,
1993). But what about the data showing that sexual victimization is widespread? The t conservatives' main rebuttal is to contend that, in essence, feminists find what they set out
to find; their methodology is biased and artificially inflates-many times over-prevalence
-70-
This document is a research report submitted to the U.S. Department of Justice. This reporthas not been published by the Department. Opinions or points of view expressed are thoseof the author(s) and do not necessarily reflect the official position or policies of theU.S. Department of Justice.

rates. In particular, contend conservatives, the survey questions used to measure offenses
such as rape are so broadly phrased that they "pick up" and count as sexual victimizations
a wide diversity of conduct, most of which could hardly be considered criminal. This is why
many women who answer "yes" to questionnaire items do not, when asked, believe that
they have been "raped" (Gilbert, 1997; compare with Koss, 1992, 1993, 19%).
No single study, including ours, can hope fully to resolve this debate. Even so, no
study, again including ours, can ignore the contentiousness between feminists and
conservatives, for it is within the context of their debate that empirical findings on the
extent of sexual victimization will be scrutinized methodologically and be given broader
social meaning.
In approaching this sensitive topic, therefore, we developed a measurement
strategy that would minimize potential sources of measurement error or bias. As described
in the methods section in Chapter 2, the initial step in the process was to include detailed
screen questions that fully described the act of rape and other forms of sexual assaults.
If a respondent answered "yes" to any of the sexual victimization screen questions,
however, she was not necessarily counted as having been a victim of that specific type of
sexual victimization (e.g. , completed rape, completed sexual contact, attempted sexual
coercion). Instead, the screen question only allowed the interview to continue to the next
stage: the incident report. In the incident report, the respondent was then asked a series
of questions that inquired about the degree of unwanted sexual contact that happened
(Le., was it threatened, attempted, or completed), what specifically had happened (i.e.,
type of unwanted penetration and/or physical contact), whether physical force was used
-71 -
This document is a research report submitted to the U.S. Department of Justice. This reporthas not been published by the Department. Opinions or points of view expressed are thoseof the author(s) and do not necessarily reflect the official position or policies of theU.S. Department of Justice.
or threatened or if other means of coercion were used or threatened (i.e., non-physical
punishment, promised a reward, or continual pestering or verbal pressure). For example,
for completed rape, only if all elements of this offense were present-completed unwanted
penetration by force or threat of force-would it be included in our count of victimization.
Finally, as noted, the reference period for the study was "since the school year began in
the Fall of 1996," a period of about six months for the respondents. By using a relatively
short reference period with a clear and socially meaningful boundary (the beginning of the
academic year), problems introduced by a lack of recall and telescoping should be
reduced (see Skogan, 1981).
Again, this methodological strategy limits, but does not eliminate, potential
measurement error. Further, whether the victimization figures we report are "high" or"low"
will, to a degree, rest in the eye of the beholder. Even low victimization statistics, when
extrapolated to a full college career of four or more years and/or to the larger population
of college women, can take on new meaning.
In all, twelve forms of "serious" sexual victimization were measured and are reported
below. Again, the definition of each form is contained in Table 2.1 of the Methods chapter.
We should note that in Chapter 4 of this report we report the data on the extent to which
the women in the sample were stalked. Chapter 5 presents the data on forms of verbal
and visual sexual victimizatior? (e.g., sexist remarks, harassing comments, obscene
telephone calls, unwanted exposure to pornography).
Beyond the extent to which the women in the sample were sexually victimized, we
also present data on a variety of related issues. First, we explore the nature of the
-72-
This document is a research report submitted to the U.S. Department of Justice. This reporthas not been published by the Department. Opinions or points of view expressed are thoseof the author(s) and do not necessarily reflect the official position or policies of theU.S. Department of Justice.
victim-offender relationship, including whether the victimization occurred on a date.
Second, we report on whether alcohol and/or drugs had been used by victims and
offenders involved in victimization incidents. Third, we relay information on the
characteristics of the offender. Fourth, we examine the location and timing of the
victimizations that occurred, with a special focus on victimizations that occurred on-campus
and off-campus. Fifth, we present data on the extent to which women attempted to protect
themselves during the vicfimization. Sixth, we assess whether the victimizations were
reported and, if so, to whom-and if not, why not. Finally, we explore characteristics of the
victims and, in a multivariate model, what characteristics and other factors potentially
increase the risk of sexual victimization. In this latter analysis, our work is guided by and
has implications for routine activities theory.
THE EXTENT OF SEXUAL VICTIMIZATION
Rape
Table 3.1 reports the percentage of the respondents who experienced a completed
or attempted rape. These estimates are based on our hierarchical scoring procedure and,
therefore, reflect the most severe type of sexual victimization. As can be seen, 1.7 percent E of the sample indicated that they had been raped, while the corresponding figure for
attempted rape was 1.1 percent. The percent of the respondents who experienced a rape
was 2.8 percent. Note that in the NCVS (1997), this pattern of the number of completed E rapes being higher
rate of victims per
than attempted rapes is also found. As also shown in Table 3.1 , the
1,000 was 16.6 for rape and 11.0 for attempted rape. Since some
-73-
This document is a research report submitted to the U.S. Department of Justice. This reporthas not been published by the Department. Opinions or points of view expressed are thoseof the author(s) and do not necessarily reflect the official position or policies of theU.S. Department of Justice.

victims suffered more than one completed or attempted rape, the incident rate per 1,000
female students is 19.3 for rape and 16.0 for attempted rape.
We recognize that a hierarchical scoring procedure is not the only way to count
victims and incidents, especially since we have multiple victims. Another estimation
procedure is to count the total number of completed rape victims and the total number of
attempted rape victims separately. For example, let us say that there were two incident
records for respondent 00: 1 incident was classified as a completed rape and the other
was classified as an attempted rape (recall that using a hierarchical scoring procedure,
respondent 00 would be counted as a completed rape victim). Respondent 00 would now
count as a completed rape victim and as an attempted rape victim. Using this “separate”
counting procedure, there were 57 attempted rape victims, or 1.3 percent of the sample
(results not reported in a table).
Did a larger percentage of undergraduate respondents experience a completed
rape or attempted rape as compared to the percentage of nonundergraduate respondents
who experienced such victimizations? Using a hierarchical scoring procedure, the
percentage of undergraduates who experienced a completed rape (n= 69/3,823) was 2.3
times larger than nonundergraduates (n = 5/61 3) (1.8 percent compared to .8 percent,
respectively). For attempted rape, 1.3 percent of the undergraduates (n = 49/3,823)
reported experiencing an attempted rape whereas 0 percent of the nonundergraduates
reported experiencing an attempted rape. A total of 3.09 percent of the undergraduates
(n = 1 18) experienced a rape compared to .8 percent of the nonundergraduate students
(results not reported in a table).
-74-
This document is a research report submitted to the U.S. Department of Justice. This reporthas not been published by the Department. Opinions or points of view expressed are thoseof the author(s) and do not necessarily reflect the official position or policies of theU.S. Department of Justice.

Do these victimization figures show that rape is extensive or rare? There is a range
of interpretations for these rape estimates. On one side of the range is the conservative
perspective which could conclude that our results support their position: the vast majority
of all college females will not experience a completed or attempted rape in any given
academic year. On the other side of the range is the feminist perspective which could
provide at least two less sanguinary conclusions could be drawn. First, the combined
completed rapelattempted rape figure for the sample indicates that 2.8 percent of the
women in the sample were victimized. Although computing an annual figure by doubling
the six-month estimate is risky (for example, rates of victimization may be lower or higher
during the summer months), if we do so the rate is 5.6 percent. This figure means that for
the women in our sample, they had approximately a one-in-twenty chance of a completed
rape/attempted rape victimization during a given year.
Second, from a policy perspective, the results should be of concern to college and
university authorities and policy makers. Assuming that a university has 1,000 female
students, these students are likely to have experienced at least 19 completed rapes and
16 attempted rapes (that is, based on the number of incidents per 1,000 students; see
Table 3.1 ). Calculating the figures for large institutions-say, having 10,000 female
students-is perhaps more disquieting: 190 completed rapes and 160 attempted rapes.
Given the seriousness of the victimization, these statistics would be of concern to virtually
any academic administration.
As we will see below, many completed rapes and attempted rapes occur not on the
campus per se but away from campus. University authorities, it might be argued, are not
-75-
This document is a research report submitted to the U.S. Department of Justice. This reporthas not been published by the Department. Opinions or points of view expressed are thoseof the author(s) and do not necessarily reflect the official position or policies of theU.S. Department of Justice.

legally responsible in a direct way for off-campus sexual assaults. Even so, if scores of
an institution's female students are being raped each year-an event that researchers
have shown event negatively affects their lives in serious ways-this certainly is a problem
1 that these authorities cannot ignore (see Pitts and Schwartz, 1993).
It also is instructive that the figures for our study are not dissimilar to those reported E . by Koss et al. (1 987) in their classic research on the "scope of rape." In Table 5 of their t
study (p. 168), they report that for their sample of 3,187, 63 women reported "intercourse
by threat or force" and 53 women stated that they had "oral or anal penetration by threat
or force." (We exclude their "intercourse by alcohol or drugs," since this was not defined
as rape in our study.) Taken together, these figures mean that 116 women experienced
a completed rape for the one-year reference period used in the Koss et al. study; the
half-year rate would be 58. When calculated as the percent of the sample, the figure
would be 1.8 percent of the sample. Again, in our study, the comparable figure was 1.7
percent.
Further, it seems likely that the methodology employed in our study yields a
statistically conservative or low estimate of the extent of rape victimization. As Table 3.2
shows, of the 59 women who answered "yes" to a rape screen question, only 47.5 (n = 28)
percent were eventually categorized as completed rape victims. Ideally, our use of the
screen question-incident report methodology meant that only those completed rapes that f occurred were actually categorized in that way. It also is possible, however, that response
bias accounts for some of the loss of cases between the response to the screen question
and the coding we did from the responses to questions in the incident report. For example,
-76-
This document is a research report submitted to the U.S. Department of Justice. This reporthas not been published by the Department. Opinions or points of view expressed are thoseof the author(s) and do not necessarily reflect the official position or policies of theU.S. Department of Justice.

respondents who were embarrassed by or fearful of revealing the intimate details of their
victimization experience may have refused to answer all or some of the questions (e.g.,
the questions that asked about the use of physical force or threat of physical force) that
would have allowed us to code the incident as a completed rape. Thus, in 68 incident
reports respondents had screened into an incident report because they had answered
“yes” to one of the four completed rape questions and gave a number greater than or equal
to 1 for the number of different incidents questions (n = 59 respondents). Of these 68,
42.6 percent of the incidents (n = 29) were coded as completed rapes, and 10.3 percent
(n = 7) as attempted rapes. Of the remaining incidents, 33.8 percent (n = 23) were coded
as other types of sexual victimization (for example, completed sexual coercion, attempted
sexual coercion, threat of rape). Further, 13.2 percent (n = 9) could not be coded because
the respondent did not fully answer the questions in the incident report that would have
allowed us to code the incident. For example, in 4 of the 9 incidents, the respondent said
that there was completed penetration but then said “no” to the physical force question,
threat of force question, and the other means of coercion questions.
It is also noteworthy that a number of incidents eventually coded as a “rape”
screened into the incident report on other sexual victimization screen questions were
coded as completed rapes. Of the 86 incidents that we coded as completed rapes, 14.0
percent (n = 12) screened in on the attempted or threatened forced penetration screen
question (see question 12 in Appendix 3), 24.4 percent (n = 21) on the unwanted or
uninvited touching of a sexual nature question (question 14), 9.3 percent (n = 8) on the
attempted or threatened unwanted or uninvited touching of a sexual nature question
-77-
This document is a research report submitted to the U.S. Department of Justice. This reporthas not been published by the Department. Opinions or points of view expressed are thoseof the author(s) and do not necessarily reflect the official position or policies of theU.S. Department of Justice.

‘I
completed sexual contact without force or threat of force.
1
(question 16), 1 5.1 (n = 13) on the sexual coercion or pressure question (questions 18 and
20), and 3.5 percent (n = 3) the catchall unwanted or uninvited sexual contact question
(question 22). These results show the importance of both a range of screen questions and
detailed incident reports using in the measurement of sexual Victimization.
it also is relevant that even though a victimization incident is defined as a completed
rape, it does not mean that women experienced no other incidents. Only 27 percent (n
= 20) of the rape victims experienced only rape. Experiencing more than one incident was
common among rape victims. Seventy three percent of the completed rape victims were
victims of another incident; 28.4 percent (n = 21) experienced 2 incidents, 20.3 percent (n
= 15) experienced 3 incidents, and 24.4 percent experienced 4 or more incidents (n = 18).
For example, one respondent experienced a total of four different incidents: (1) a
completed rape, and (2) three attempted sexual coercions.
Repeat victimization was relatively common among completed rape victims: 16.2
percent of these victims (n = 12) reported experiencing another completed rape incident
within the reference period. No respondent reported experiencing 3 or more completed
rapes during this period.
During the course of the rape incident, other types of sexual victimization occurred.
In 10.5 percent (n = 9) of the incidents the victim reported that another type of sexual
victimization occurred. As an example, let us take one case. In this instance, the
respondent reported that within a completed rape incident, she also experienced
-78-
This document is a research report submitted to the U.S. Department of Justice. This reporthas not been published by the Department. Opinions or points of view expressed are thoseof the author(s) and do not necessarily reflect the official position or policies of theU.S. Department of Justice.
Further, within a completed rape incident, different types of forced penetration
occurred. In 27.5 percent of these incidents, victims reported only form of penetration
occurred, in 20.2 percent two forms of penetration occurred, in 37.5 percent 3 forms of
penetration occurred, and in 15.0 percent four forms of penetration occurred during the f Interpreting these data on repeat rape incidents and multiple victimization during
the course of a rape inciddnt is difficult. For the latter type of incident, the incident report
was not structured to record, step by step, what occurred during the victim-offender
interaction. It seems feasible to suggest, however, that the incident was, in many cases,
not a brief victimization. Instead, it is likely that victims experienced a series of sexual
assaults that culminated in the use of force or threat of rape to rape them. Future research
should focus on whether rape incidents involving college women-especially when the
victim is acquainted with the offender-are patterned in such a way that they escalate from
less serious forms of sexual victimization (e.g., forced sexual contact) to rape.
Finally, in each incident of rape, we asked victims, "Do you consider this incident
to be rape?" For the 86 incidents categorized by our definition of completed rape, in 46.5
percent (n = 40) of the incidents women answered "yes" to this question, in 48.8 percent
(n = 42) of the incidents they answered "no," and in 4.7 percent (n = 4) of the incidents
they answered "don't know." For attempted rape incidents, in only 2.8 percent of the c' incidents (n = 2) did the respondents defined their victimization as rape, in 95.8 percent
(n = 68) of the incidents women answered "no," and 1.4 percent (n = 1) of the incidents a
women answered "don't know" (see Table 3.3). Our results are supportive of Koss et a1.k
-79-
This document is a research report submitted to the U.S. Department of Justice. This reporthas not been published by the Department. Opinions or points of view expressed are thoseof the author(s) and do not necessarily reflect the official position or policies of theU.S. Department of Justice.

(I 987) and Pitts and Schwartz's (1 993) findings that rape victims often do not perceive
their experience as a rape. Note, however, that we found that a higher percent of our
classified completed rape victims considered the incident to be rape (46.5 percent) as
compared to the percentages reported by Koss (1 988) and Pitts and Schwartz (27 percent
and 27 percent, respectively).
How should we interpret these data? The attempted rape data are problematic
because we did not ask specifically whether the respondents believed a rape had been
attempted. Putting this issue aside, what, again, should be made of the data showing that
only about half of the women who qualified as completed rape victims in our study defined
their victimization in this way?
At best, we can present two competing perspectives. First, skeptical of victimization
survey data, conservative commentators are reluctant to count any event that the victims
themselves do not label as "rape" (Gilbert, 1997). After all, these commentators have
argued, adult women know when a rape has occurred. In contrast, feminist commentators
count any event that conforms to the legal standard for rape: unwanted sexual penetration
by force or threat of force, or where consent had not been given (Koss, 1992, 1996). In
their view, female victims may manifest a lack of knowledge of the law or false
consciousness when they define forced sexual penetration as something other than a
rape. Accordingly, which of these two interpretations is more or less correct cannot be
definitively substantiated because little systematic research has examined why women do
or do not define an incident that has met the researcher's criteria for a rape as a rape. A
case study by Pitts and Schwartz (1 993) sheds some insight into why these women do not
-80-
This document is a research report submitted to the U.S. Department of Justice. This reporthas not been published by the Department. Opinions or points of view expressed are thoseof the author(s) and do not necessarily reflect the official position or policies of theU.S. Department of Justice.
define the incident as a rape when asked if they had been raped. They reported that all
of the rape victims in their sample (n = 16) who told "the most helpful person"about their
experience and then had this person blame the victim or encourage her own self-blame
did not define her experience as a rape. From this result, Pitts and Schwartz draw the
tentative conclusion that "women who are blamed by confidants, who this accept self-
blame, do not accept that they have been raped (p. 393). This line of research clearly
needs more rigorous examination if we are to understand more fully (1) why this
discrepancy characterizes the measurement of rape, and (2) the discrepancy between
survey responses that led to the classification of other forms of sexual victimization and
to the perception that a rape has occurred (see Table 3.3).
Other data in Table 3.3, however, complicate this issue still further. The question
of "Do you consider this incident to be rape?" was asked not only of those categorized as
rape victims but also for every respondent who indicated some form of sexual victimization.
Beyond the rape and attempted rape victims, 40 women in the sample defined their sexual
victimization as a rape (see Table 3.3). Of these victims, 28 fell into the categories of
"completed sexual coercion," "attempted sexual coercion," and "threat of rape."The sexual
coercion incidents involved "unwanted completed/attempted penetration with the threat of
nonphysical punishment, promise of reward, or pesteringherbal pressures"; threat of rape E was defined as the "threat of unwanted penetration with force or threat of force." k
It IS possible, of course, that these female students who defined themselves as rape
victims did not know the legal requirements of rape and thus mischaracterized what
happened to them. An alternative possibility, however, is that surveys on sexual
-81 -
This document is a research report submitted to the U.S. Department of Justice. This reporthas not been published by the Department. Opinions or points of view expressed are thoseof the author(s) and do not necessarily reflect the official position or policies of theU.S. Department of Justice.

victimization-even when using carefully worded screen and incident-report
questions-fail to capture rapes that actually take place. For example, the line between
a "threat" and an "attempt" may, in real circumstances, be a thin one that only be
ascertained by more probing questions. It also may be that forms of "pesteringlverbal
pressures" may escalate to the point where they become Yorce or threat of force."
Again, issues such as these can only be clarified by further research that uses
follow-up questions to ask respondents why they did or did not define an act as a rape.
At this stage, we must admit that victimization surveys leave significant methodological
questions unanswered and thus can provide only "ballpark" estimates of how much rape
and sexual victimization occurs. It is important to realize, however, that response biases
on these surveys may not, as conservative commentators contend, only be in the direction
of inflating estimates of the extent of rape. As the data in Table 3.3 suggest, there also is
the possibility of underestimating how much rape victimization actually takes place.
Other Forms of Sexual Victimization
As noted in Chapter 2, our survey attempted to measure, in additional to rape and
attempted rape, ten forms of sexual victimization (for definitions, see Table 2.1). Tables
3.4, 3.5, and 3.6 report the results for these victimizations.
Table 3.4 reports the results for completed and attempted sexual coercion, with the
percent of victims in the sample being 1.7 and 1.3 for these victimizations, respectively.
The 134 victims experienced a total of 221 victimization incidents, a ratio of 1.65 incidents
to victims.
-82-
This document is a research report submitted to the U.S. Department of Justice. This reporthas not been published by the Department. Opinions or points of view expressed are thoseof the author(s) and do not necessarily reflect the official position or policies of theU.S. Department of Justice.
Table 3.5 focuses on unwanted completed and attempted sexual contact, which
used and did not use force. For the two types of sexual contact with force, about 2.0
percent of the sample reported being victimized by each type (3.9 percent overall). These
174 victims reported 297 incidents; a 1.7 ratio of incidents to victims. For sexual contact f without force, 1.8 percent of the sample reported a completed sexual contact and 3.0
percent reported an attempted sexual contact. These 21 3 victims reported a total of 427
incidents; a 2 to 1 ratio of incidents to victims. The incidence rate per 1,000 female
students ranged from 29.2 for completed sexual contact to 66.4 for attempted sexual
contact.
As seen in Table 3.6, threats of sexual victimization were relatively rare (0.3 percent
or lower for each of the four different types of victimization). The number of incidents is
higher, suggesting that a small number of victims in the sample experienced multiple
victimizations (a ratio of 3.0 to 6.25 incidents to victims).
Overall Levels of Sexual Victimization
Disaggregating the data is useful in showing how the extent of victimization by
varies by specificforms of sexual victimization. It also is useful, however, to aggregate the
data to assess the overall level of sexual victimization in the sample. Tables 3.7 and 3.8
present data on this issue.
First, Table 3.7 summarizes the number of victimization incidents reported by our e national sample of female college students. The incidents totaled 1,318-an incident
victimization rate of 296.4 per 1,000 female students. Second, Table 3.8 reports how
-83-
This document is a research report submitted to the U.S. Department of Justice. This reporthas not been published by the Department. Opinions or points of view expressed are thoseof the author(s) and do not necessarily reflect the official position or policies of theU.S. Department of Justice.
‘I many women in the sample experienced some type of victimization. As can be seen, 7.7
percent (n = 319) of the sample experienced a sexual victimization that involved either
force or the threat of force, while 11 .O percent (n = 372) experienced an unwanted sexual
victimization that did not involve force. Across both categories, 15.5 percent (n= 691) of
the woman stated that they had experienced at least one of the twelve victimizations we
assessed. The rate of victimization per 1,000 female students was 155.4. Thus, of every
10 female students, about one and one-half students will be a victim in a six-month period.
Again, the meaning given to these data will be conditioned in part by the ideological
lens through which they are viewed. Conservatives, for example, might suggest that most
college women are not victimized and that only a small percentage are raped. In contrast,
feminists are likely to remind us that the percentages reported are only for a relatively
limited reference period, that over 15 percent of the sample experience a sexual
victimization, and that nearly 3 percent of the sample are either raped or faced of
attempted rape.
Comparison to Previous Studies
For several reasons, caution must be exercised when comparing our results with
the results from previous studies. First, the definition of different types of sexual
victimization (e.g., completed rape, attempted rape, sexual coercion, sexual contact,
sexual harassment) differ across studies. Even researchers who have used Koss’s SES
scale modify it for their purposes (see DeKeseredy and Kelly, 1993a, 1993b; Schwartz and
Pitts, 1995). Second, the reference period varies across studies from “ever experienced”
-84-
This document is a research report submitted to the U.S. Department of Justice. This reporthas not been published by the Department. Opinions or points of view expressed are thoseof the author(s) and do not necessarily reflect the official position or policies of theU.S. Department of Justice.

to “previous academic year.” For example, Koss and her colleagues (1 987) used a one-
year reference period (Le., from September to September), whereas Schwartz and Pitts
(1 995) used “since enrolling at the University” as their reference period. The latter’s time
frame could range from part of a single year to several years. Third, not all studies use
a sample of female college students. Many studies of sexual victimization employ an adult
female sample (see Tjaden and Thoennes, 1998; Crowell and Burgess, 1996; Randall and
Haskell, 1995). Fourth, rhisearchers have used different research designs and sampling
designs of female college students to examine the extent of their sexual victimization.
Schwartz and Pitts (1 995), for example, distributed their questionnaires to students
enrolled in selected classes at Ohio University. Koss (1 987) administered her surveys at
32 four-year and two-year schools selected using a stratified sampling design. Her
surveys were administered to students enrolled in randomly selected classes. Fifth, some
studies only sampled undergraduate students or a certain rank of students. In a study of
sexual harassment, for example, McCormack (1995) only sampled seniors at a single
school. Last, some studies only examined sexual victimization within the context of dating
relationships (see Abbey et al., 1996; Himelein, 1995).
With these differences noted, we can provide a limited comparison of our results
to comparable studies in terms of similar definitions of sexual victimization. To our
knowledge, no published studies used a similar reference period and employed a national
sample of randomly selected women who were currently enrolled in either two-year or four-
year schools. As noted earlier, Koss’s study comes the closest to ours in terms of
methods. As we previously suggested, if we take her one-year estimates and divide them
-85-
This document is a research report submitted to the U.S. Department of Justice. This reporthas not been published by the Department. Opinions or points of view expressed are thoseof the author(s) and do not necessarily reflect the official position or policies of theU.S. Department of Justice.

in half so that we can roughly compare our results to her results, we see that our estimate
of completed rape is similar to her estimate (1.7 compared with 1.8, respectively).16 Our
estimate of completed sexual contact with force or threat of force are slightly higher than
her estimate (2.3 compared to 1.7, respectively). Our estimates of attempted rape,
completed sexual coercion with verbal coercion, and completed sexual contact with verbal
coercion are lower than her estimates (1.4 compared to 2.8, 2.0 compared with 5.5, and
2.5 compared with 11.4, respectively).
Again, making comparisons across studies is, at best, an inexact enterprise. Still,
it appears that although differences exist, our results are not fully dissimilar to those
reported by Koss. This convergence in findings lends at least a measure of confidence
that the data we report here are not idiosyncratic or somehow inflated or deflated by
unsuspected methodological biases.
Another national-level sexual victimization study was conducted during the summer
of 1992 in Canada by DeKeseredy and Kelly (1 993a). Bear in mind, like Koss’s study,
their research is methodologically different than our project. For example, they distributed
their surveys at 44 randomly selected universities and colleges in 96 randomly selected
classec to women and men attending the chosen class. They also adopted a modified
version of Koss’s SES and used the past year as one of their reference periods.
In subsequent analyses, we calculated a more precise estimate of the average reference 16
period. We summed the total number of days from September 1, 1996 to the date of the interview across all the respondents and divided this sum by the total number of respondents (average number of days= 209.43). We then summed the total number of days from September 1, 1996 to May 31, 1997 (273 days). This sum was then divided by the total number of months (30.33). The average reference period was 6.91 months (209.43130.33). Using this more precise estimate did not change any of our substantive results reported in the final report.
-86-
This document is a research report submitted to the U.S. Department of Justice. This reporthas not been published by the Department. Opinions or points of view expressed are thoseof the author(s) and do not necessarily reflect the official position or policies of theU.S. Department of Justice.
As we did with Koss’s estimates to make them more comparable with our estimates,
we divide DeKeseredy and Kelly’s estimates in half to reflect a crude six-month reference
period. We also used a comparable definition for completed rape and attempted rape.
Our estimates of completed rape are identical to their estimate (1.7 percent), and our
estimate of attempted rape is slightly lower (I .4 compared to 1.8, respectively). Our other
sexual victimization estimates vary in comparison to their estimates. For example, our
estimate of completed sexual contact with verbal coercion is the same as their estimate
(2.5 percent). Our estimate of completed sexual contact with force or threat of force is
higher than their estimate (2.3 compared to 1.5, respectively). Our estimate of completed
sexual coercion with verbal coercion are lower than their estimates (2.0 compared with 5.4,
respect ive~y). ”
Prior Sexual Victimization
Although peripheral to our main attempts to measure sexual victimization, we did
include questions on the survey regarding the sexual victimization that members of the
sample might have experienced prior to the reference period (start of the academic year
in the Fall of 1996). Five questions were asked; they were not followed by an incident
report. In the absence of incident-level data, it is difficult to assess the accuracy of these
self-reports. Still, they do provide a broad estimate of the extent of sexual victimization
experienced by women before the school year began.
The DeKeseredy and Kelly estimates that we calculated are based on the number of victims 17
that they reported in Table 6 (p. 149). We did not base our reported estimates on their reported percentages in Table 6.
-87-
This document is a research report submitted to the U.S. Department of Justice. This reporthas not been published by the Department. Opinions or points of view expressed are thoseof the author(s) and do not necessarily reflect the official position or policies of theU.S. Department of Justice.

As Table 3.9 reveals, sexual victimization in the sample appears to be widespread.
About one in ten women reported having been raped, and the same proportion reported
having a rape attempted against them. More than one-third of the sample reported
experiencing a sexual contact (Le. , assault) that was attempted, threatened, or completed.
Almost one in ten women also stated that they had suffered unwanted sexual contact that
. was accompanied by non-physical threats. A catch-all category that asked about any
other types of unwanted sexual intercourse or contact revealed an additional prevalence L
rate of 3.9 percent of the sample. Across all five types of victimization, 40 percent (n =
1,778) of the sample had experienced at least one sexual victimization.
Bearing in mind the differences across sexual victimization studies previously
noted, we can offer a crude comparison of our" lifetime" estimates and those estimates
from other studies. Our lifetime estimates of completed rape are 10.1 percent of the
sample (n = 486) and 10.9 percent for attempted rape (n = 483). Koss et ai. (1987)
reported a prevalence rate since age 14 years old of 15 percent for completed rape and
13 percent for attempted rape (using definitions comparable to ours).
The completed rape and attempted rape are not mutually exclusive categories;
hence, they should not be summed. Summing them would result in some respondents
being counted twice because they had experienced both a completed rape and an
I: attempted rape before school had started in the Fall of 1996. Fifteen percent (n = 673)
of the respondents had experienced either a completed rape, attempted rape, or both prior
to school starting in the Fall of 1996. Of these victims, 62 percent had been victimized by
either a completed rape or attempted rape (9.4 percent of the total sample), and 38
-88-
This document is a research report submitted to the U.S. Department of Justice. This reporthas not been published by the Department. Opinions or points of view expressed are thoseof the author(s) and do not necessarily reflect the official position or policies of theU.S. Department of Justice.

percent (n = 256) had been victimized by both a completed rape and an attempted rape
(5.8 percent of the total sample)
We can also take account both the completed and attempted rape prior to school
starting in the Fall of 1996 and since school began in the Fall of 1996. Using both time
frames as criteria, 16.8 percent of the respondents (n = 748), or 1 out of 6 college women, 1 had experienced a completed rape, an attempted rape, or both by the time that they were
attending college. Koss et al. (1 987) reported that 27.5 percent of college women in their c
sample reported experiencing rape since the age of 14 years old.
Again, it would be risky to contend that these data yield precise estimates of
victimization. Even so, the findings in Table 3.9 are at least suggestive that by the time
women reach college age, a sizable number have experienced rape or sexual assault.
VICTIM-0 FFEN DER RELATION SH I P
In this section, we explore the nature of the relationship between the victim and the
offender. These data are presented in Tables 3.10 to 3.15.
As can be seen from Table 3.10, the vast majority of sexual victimizations were
committed by a single offender. Across the twelve forms of sexual victimization, the c E percent of incidents committed by one person-as opposed to multiple offenders-ranged
from 93.9 percent to 98.0 percent. When multiple offenders were involved, most often the E victimization was committed by two persons. ti
Tables 3.1 1 reveals that across the types of victimization, victims most often "knew
or had seen before" the offender. This pattern did not hold when multiple offenders were
-89-
This document is a research report submitted to the U.S. Department of Justice. This reporthas not been published by the Department. Opinions or points of view expressed are thoseof the author(s) and do not necessarily reflect the official position or policies of theU.S. Department of Justice.
involved. The number of these incidents is too small to allow for firm conclusions, but
there is some tendency in the data far multiple offender victimization to include one or
more strangers.
It is noteworthy that for single-offender victimizations, rape victims were acquainted
with 93.8 percent of their offenders, while this figure for attempted rape victims was 89.9
percent. This finding is consistent with past research (see Belknap, 1995; Crowell and
Burgess, 1996). For the other types of victimization, the percent of known offenders is
generally not as high, although in every case a substantial majority of incidents involved
known offenders. Note, however, that the percent of strangers was higher for the sexual
contact victimizations.
Table 3.12 explores the precise nature of the relationship between victims and
offenders. Across the types of victimization in the single-offender incidents, three
relationship categories predominate: boyfriendlex-boyfriend, friend, and classmate. For
example, in the case of rape, 93.4 percent of the offenders fell into one of these cases.
For attempted rape incidents, the figure was 82.2 percent, with another 9.7 percent of
incidents involving acquaintances. Similar patterns are found for the other victimization
types, although coworkers emerge as another group of potential offenders. In general,
college professors and graduate assistants were not cited as being extensively involved
in sexually victimizing the college women in our sample. Finally, the number of
victimizations for multiple-offender victimizations was too small to allow for a meaningful
analysis the victim-offender link by the type of relationship involved.
-90-
This document is a research report submitted to the U.S. Department of Justice. This reporthas not been published by the Department. Opinions or points of view expressed are thoseof the author(s) and do not necessarily reflect the official position or policies of theU.S. Department of Justice.
As Table 3.1 3 shows, most victims in the sample were not victimized while on a date
with the offender. For rape, only 12.8 percent of the incidents occurred on a date; the
comparable statistic for attempted rape was 35.0 percent. Further, in none of these cases
is the victim still romantically involved with the offender. For the other forms of
victimization, the same general patters of results obtain, although for sexual
coercion-victimizations that do not involve physical force-there is some tendency for I: victims to continue in theit relationship with offenders.
From Table 3.14, it appears that the use of alcohol and or drugs by victims before
a victimization incident is not uncommon. For rape, victims had used alcohol and/or drugs
before ;he incident in about half the incidents (54.6 percent). For attempted rape, the
percent was slightly less, in 43.6 percent of the incidents. For attempted sexual contact
and threatened victimizations, the likelihood of using a substance was lower. It is
noteworthy that the percent of offenders using alcohol, drugs, both, or "something else"
was even more pronounced. For example, for rape and attempted rape, in only 26.2
percent and 32.4 percent of the incidents, respectively, did the respondents report that the
offender was not using some mind-altering substance. The proportion not using any
substance is higher for other types of victimization, but for all types a majority of offenders
were seen as not being completely sober.
We cannot determine from these data if alcohol and/or drugs were causally related
to being sexually victimized. We do not know if substances make women more vulnerable L: to victimization or make men more likely to sexually assault. It is possible, for example,
that the findings in Table 3.14 simply indicate that when college men and women socialize,
-91 -
This document is a research report submitted to the U.S. Department of Justice. This reporthas not been published by the Department. Opinions or points of view expressed are thoseof the author(s) and do not necessarily reflect the official position or policies of theU.S. Department of Justice.
alcohol and drugs are present in that environment. Alternatively, however, we cannot
- dismiss the possibility that alcohol and drugs may affect judgments and conduct in
victimization incidents. 'E Finally, Table 3.15 reports on the characteristics of the offender. First, note that all
of the single-offender sexual victimizations reported by our sample of college women were
by males. The number of incidents for multiple offenders is too small to interpret
meaningful or to report in a table; however, we can note that in only two incidents was it
reported that the offenders included "both male and female" offenders. Second, consistent
with the composition of the sample (see Chapter 2), most sexual victimizations were
committed by White males. Third, for most victimization types, about a fifth to a third of
the single-offense incidents involved an offender who was a member of a fraternity; similar
proportions were reported for those seen by victims with being an athlete ("sports club
member"). Previous research suggests that members of fraternities and athletes are
disproportionately involved in the sexual victimization of women (see Belknap, 1995;
Boswell and Spade, 1996). Our data, however, do not allow us to test this proposition.
THE LOCATION AND TIME OF VICTIMIZATION
Tables 3.16 to 3.21 report the data collected on the "where and when" of sexual E victimization. As Table 3.16 reports, for nearly all types of victimization, a majority of the k victimizations occurred off campus; the only exception is threat of contact without force,
where 54.1 percent of the incidents took place on campus.
-92-
This document is a research report submitted to the U.S. Department of Justice. This reporthas not been published by the Department. Opinions or points of view expressed are thoseof the author(s) and do not necessarily reflect the official position or policies of theU.S. Department of Justice.
'his finding, however, can be somewhat misleading, as an examination of the
completed rape incidents shows. Again, in Table 3.16, one-third of completed rapes (n =
29) happened on-campus. From Table 3.18, however, it can be seen that another ten
rapes occurred "in an off-campus student housing area." Thirteen took place in or around c' the victims' "living quarters." Further, one rape was in a fraternity house, two in "the
off-campus business district," and three "at a party." In contrast, the victims stated that
20 incidents-35.1 percent-occurred "away from campus," such as while a victim was on E
vacation or at her parents' home (see Table 3.18). It also was reported that only 13
rapes-5.8 percent of the incidents-occurred during an academic break (Table 3.21 ).
These statistics suggest that while two-thirds of rapes do not occur specifically on
campus, a clear majority of rapes take place in either on-campus or in the course of
activities that are integral to attending college (such as having a residence) or are integral
to college life (going to parties, seeing classmates/friends in off-campus housing). Thus,
to the extent that, as a result of going to college, students lives "spill over" into related
social domains, the distinction between on-campus and off-campus sexual assaults
becomes less meaningful. From a policy perspective, these findings mean that campus
authorities may legitimately be concerned not only with rape and other types of sexual
victimization within the geographical boundaries of their campus, but also with what may
occur to their students who live and recreate near the campus.
From Table 3.17, it is clear that the rapes and attempted rapes that the victims
experienced occurred almost exclusively in or close to their own or someone else's "living
quarters." These data suggest that virtually all of the on-campus rapes in our sample did
-93-
This document is a research report submitted to the U.S. Department of Justice. This reporthas not been published by the Department. Opinions or points of view expressed are thoseof the author(s) and do not necessarily reflect the official position or policies of theU.S. Department of Justice.
not take place in a public place but a more private location. A similar pattern-although
not as clear-cut-obtains for off-campus rapes. We cannot categorize the specific location
of rapes that occurred "on another college or university campus" or while a respondent
was "avlay from campus.'' Of the remaining 34 rape incidents, however, 22 occurred either
in a living quarters area (n = 1 I ) , in an off-campus student housing area (n = IO), or at a
fraternity (n= 1 ); three other incidents took place "at a party."
For the other types of victimization, those occurring on campus also tend-although
not as strongly-to be concentrated in living quarters. This pattern is present, but less
clear, off campus. Here, the data show victimizations also taking place in motor vehicles,
in bars or dancehight clubs, and at work (see Tables 3.17 and 3.18).
Relatedly, Table 3.19 shows that a substantial majority of all types of sexual
victimization occurred in the evening hours (after 6 p.m.). For both rape and attempted
rape, a majority of the victimizations took place after midnight. It thus appears that most
rape incidents involved single offenders who assaulted women in private living areas, late
at night, and often with alcohol and/or drugs present.
Finally, Table 3.20 reveals the distribution of victimizations by month. The lower
number of victimizations in August, March, and April is likely a methodological artifact:
most universities either were not in session in August or were in session only part of that
month; as March and April progressed, the sample size was decreasing as respondents
were interviewed. The lower rate for December is likely due to time spent on vacation
during this month. Otherwise, the distribution of victimization appears fairly constant
-94-
This document is a research report submitted to the U.S. Department of Justice. This reporthas not been published by the Department. Opinions or points of view expressed are thoseof the author(s) and do not necessarily reflect the official position or policies of theU.S. Department of Justice.

across months. Finally, Table 3.21 reports that most victimizations occurred while
students were in school and not while they were on an academic break.
VICTIM REACTIONS: PROTECTION, IMPACT, REPORTING
As Table 3.22 reveals, for nearly all types of victimization, a majority of the victims
reported taking steps to protect themselves during the course of the victimization. Only
with completed sexual coercion did the percent of the victims using protection drop below
50 percent. The most common protective actions employed included: using physical force
and removing the offender's hand; a verbal response, such as telling the offender to stop,
pleading for the person to stop, and screaming; and avoidance, such as running away or
trying to avoid the offender.
These protective actions have implications for the issue of whether victims
evidenced a clear sign to their assailants that consent was not being given in the sexual
encounter that was occurring. Let us hasten to say, however, that these data do not
provide a direct test of whether consent was not given, since we did not ask specifically
if the victim communicated to the offender that the sexual encounter was against her will
and, if this was done, how the communication transpired.
In any event, the data on attempted and completed rape are instructive. The victims
were asked, "Did you do anything with the idea of protecting yourself or stopping the
behavior while the incident was going on?" In more than nine in ten incidents of attempted
rape (91.5 percent), some form of protection was used. Of those using protection, nearly
-95-
This document is a research report submitted to the U.S. Department of Justice. This reporthas not been published by the Department. Opinions or points of view expressed are thoseof the author(s) and do not necessarily reflect the official position or policies of theU.S. Department of Justice.

seven in ten reported that they had "used physical force against the person." Although
- only sujgestive, it is plausible that the willingness or ability to use physical resistance is
why the attempted rapes of these women were not successful. '1 In rape incidents, two-thirds of the victims reported attempting to protect r(
themselves. This finding can be interpreted in two ways. First, the failure of women to E report making an effort to protect themselves or to stop the behavior-physically or c verbally-in one-third of the incidents raises the issue of whether these incidents can be
seen as rape. Although force may have been used by the man and consent may not have
been given, is there any evidence that the women explicitly communicated that the sexual
penetration was unwanted?
Second, in these incidents where women ostensibly took no action to stop their
victimization, we do not know if the victim "said no" before the incident began, possiblywas
overwhelmed by physical force, was too fearful to resist, was too incapacitated by alcohol
or drugs to resist, and/or communicated through clear physical facial reactions that the
sexual advances were unwelcomed. The fact that the man had to use physical force to
complete the penetration is, in the least, suggestive that a "message" was sent that the
sexual encounter was not consensual. Further, even if the criminality of these incidents
are ambiguous, these penetrations are clear cases of sexual aggression that rightly are
p( considered victimizing.
The larger point, however, is that in 121 of the 157 rapelattempted rape
incidents-77.1 percent of the cases-the victims reported taking an action to protect
themselves or to stop the victimizing behavior while the incident was going on. Although
-96-
This document is a research report submitted to the U.S. Department of Justice. This reporthas not been published by the Department. Opinions or points of view expressed are thoseof the author(s) and do not necessarily reflect the official position or policies of theU.S. Department of Justice.

not definitive, these data suggest that these incidents are correctly classified as crimes of
rape.
As Table 3.23 shows, the victims in the sample generally did not state that their
victimization resulted in injuries. About one in five completed rape and attempted rape
victims reported being injured, most often citing "bruises, black-eye, cuts, scratches,
swelling or chipped teeth." Of those completed rape victims who reported experiencing
an injury, 41 percent cited;'emotional or psychological" injuries. Note, as well, that six of
the seven threat of rape cases stated that they had been physically bruised or hurt. For
most other types of victimization, few victims said that they were hurt.
We should note that the question used to measure incident-related injuries was not
designed in a way that it was able to detect non-physical injuries. The victims were asked
first, "Did you suffer any injuries during the incident?" Only if they answered "yes" what
injuries they suffered was a list of injuries that included "emotional or psychological" read
to the respondents. On reflection, it seems likely that many victims would have responded
"yes" to the injury question only if clear physical harm had been inflicted upon them.
Accordingly, those who had experienced temporary or enduring emotional distress would
have been unlikely to have had the opportunity to express this type of harm to the
interviewers.
As seen in Table 3.24, the victims rarely reported that the offender either had or
claimed to have had a weapon during the incident. In the case of rape, however, twelve
incidents involved a weapon: this was also true in seven cases of threats of raDe
-97-
This document is a research report submitted to the U.S. Department of Justice. This reporthas not been published by the Department. Opinions or points of view expressed are thoseof the author(s) and do not necessarily reflect the official position or policies of theU.S. Department of Justice.

Table 3.25 shows that almost none of the sexual victimizations were reported to
campus police or to other law enforcement agencies. Most notewul thy, 95 percent of all
rapes and attempted rapes were not reported. Table 3.26 reports that in about one-third
of rape and attempted rape incidents, victims "told someone besides the police about the
incident"; similar percentages obtained for the other forms of victimization. Most often,
rape and attempted rape victims disclosed the incident to a friend. Other persons at times
told about the incident were roommates, parents, and family members.
Table 3.27 explores why victims did not report incidents to the police. We should
note that victims were not asked an open-ended question but rather were read a list of
possible reasons for not responding. Victims were asked to indicate all those that were
"important reasons why it [the incident] was not reported to the police." These reasons
are listed across the top of Table 3.27.
As can be seen, the most often-cited reason for all types of victimization was that
the victim did not think that the incident "was serious enough to report." Relatedly, victims
also no(ed, although in lesser numbers, that "it was not clear that harm was intended" and
that the "police wouldn't think it was serious enough."
The results regarding rape and attempted rape show the need to develop more
probing questions on this issue. Two-thirds of rape victims and three-fourths of attempted
rape victims stated that the victimization incident was not "serious enough" to report to the
police. For these two victimizations, 44.4 percent and 39.7 percent of the victims also said
that it was not clear that a crime had been committed or that harm was intended. What is
not clear, however, is why they gave these reasons. One interpretation is that many of the
-98-
This document is a research report submitted to the U.S. Department of Justice. This reporthas not been published by the Department. Opinions or points of view expressed are thoseof the author(s) and do not necessarily reflect the official position or policies of theU.S. Department of Justice.
incidents were relatively minor and should not be classified as a rape. Another
interpretation is that victims are not well-educated about what constitutes a crime OT
rape-even when the victimization involves force and lack of consent. Further, although
they may see the victimization incident as serious, turning in the offender-many of whom
they know-to the police is a major undertaking that would exact high costs on both the
offender and them personally.
In making the decision not to report an incident to the police, victims might best be
seen as making a "rational choice." Is it "worth it" to call in the police? The other
responses in Table 3.27 reveal some of the potential costs to reporting identified by
victims It is noteworthy that in nearly half of the rape incidents, victims cited as their
reason for not reporting that they did not want their family to know (44.4 percent) or other
people to know (46.9); the figures for attempted rape were about one-third of the victims.
Another common answer was that they lacked proof that the incident happened. About
one-fourth of the rape victims feared a negative reaction from the police: either they would
be treated hostilely by the police and/or the police would not think the incident was serious
enough Further, two in five rape victims and one-fourth of attempted rape victims stated
that they were afraid of a reprisal by the person who victimized them.
Finally, Table 3.28 shows the crime prevention activities taken by victims and
non-victims Nine in ten students reported being involved in some crime prevention activity
since school began in the Fall of 1996. The most common form of crime prevention activity
was to increase one's "guardianship" by being in the presence of other people as a student
travels after dark Campus-sponsored crime prevention services (e.g., escort service,
-99-
This document is a research report submitted to the U.S. Department of Justice. This reporthas not been published by the Department. Opinions or points of view expressed are thoseof the author(s) and do not necessarily reflect the official position or policies of theU.S. Department of Justice.
emergency phones) were used by a sizable minority of the sample. It also was not
uncommon for students to attend crime prevention educational activities, including
"awareness" seminars. Less than one in ten students reported taking a self-defense
course or canying a weapon; few students carried afirearm. Notably, however, more than
one-quarter of the sample said that they carried "mace, pepper-spray, or a screamer."
Because we cannot establish the precise causal order between victimization
incidents and when students used crime prevention behaviors, we cannot discern whether
being victimized results in students engaging in crime prevention. Note, however, that for
virtually every crime prevention activity, victims had a higher level of participation. It is at
least plausible, therefore, that one reaction to victimization is to become more involved in
crime prevention.
EXPLAINING THE RISKS OF VICTIMIZATION
Based on the data in Table 3.29, it is possible to derive a profile of the "typical"
victim of sexual victimization. Thus, in our sample, victims tend to be white, middle-class,
undergraduates, who are under age 22, unmarried, and heterosexual; they are likely to live
off campus and to have experienced a prior sexual victimization.
From this profile alone, it is not possible to determine if any of these characteristics E increase the risk of victimization; the other possibility is that these are simply the
characteristics of students in our sample generally. Even so, we can note that while 61.5 L percent of the victims had been victimized previously, the comparable figure for
non-victims is 36.1 percent. Compared to the sample as a whole, there also is a tendency
-1 00-
This document is a research report submitted to the U.S. Department of Justice. This reporthas not been published by the Department. Opinions or points of view expressed are thoseof the author(s) and do not necessarily reflect the official position or policies of theU.S. Department of Justice.

for victims in our sample to be younger, to be freshmen, to be white, to be unmarried, to
be higher in social class, to be a member of a sorority, to live off campus, and to be
bisexual. A multivariate analysis, however, is needed to establish whether any of these
characteristics have independent effects on the likelihood of being sexually victimized.
As a prelude to this analysis, we will again note that feminist scholars generally
have downplayed the view that characteristics of women decidedly differentiate victims
from non-victimsfor two reasons. First, given that they believe that sexual victimization
is widespread, it is seen as reaching all sectors of society. Second, they are skeptical of
analyses that, if only implicitly, "blame the victim" by stating that characteristics of women
or of their lifestyles are "responsible" forfemales' victimization by men. There is, however,
a notable exception to this tendency to argue against sexual victimization "risk factors":
feminist scholars often note the connection between sexual victimization in childhood and
sexual victimization at other points in the life course. In contrast, a routine activities
perspective would contend that regardless of the domain of crime-whether sexual
assaults or other street crimesfactors that expose women to "motivated offenders" will
increase the risk of victimization.
Although we take no a priori stance on whetherfeminist scholars' views on the risks
of victimization are correct, our analysis is informed by, and has implications for, routine
activities theory. Thus, our multivariate analysis includes not only demographic variables
but also variables that can be see as measuring exposure to crime, proximity to motivated
offenders, and guardianship. We also incorporate into the analysis a measure of prior
-1 01 -
This document is a research report submitted to the U.S. Department of Justice. This reporthas not been published by the Department. Opinions or points of view expressed are thoseof the author(s) and do not necessarily reflect the official position or policies of theU.S. Department of Justice.

sexual victimization and sexual orientation. The measures for the independent variables
used in the multivariate analyses are presented in Appendices 6 and 7.
We begin the analysis by presenting data on an overall measure of
victimization-that is across all 12 types of victimization we measured (for a listing, see
Table 2.1 ). We then conduct five separate analysis: for attemptedkompleted rape;
attemptedkompleted coercion; for attemptedkompleted sexual contact; for threatened
sexual victimization (rape, penetration, contact with and without force); and for all forms
of victimization involving force. Further, we also then assess these six models (one for
overal I sexual victimization, five for types of victimization) for sexual victimizations that
occurred on-campus. The on-campus models also include independent variables for
institution-level characteristics. We confine the use of institution-level characteristics to
the on-Tampus analyses because off-campus victimizations could have taken place far
away from campus (e.g., while a student was at home in another community, visiting
another city or campus, or on vacation). As a result, any effects of institutional variables
on off-campus victimization would not be easily interpreted.
The data for all victimizations (on-campus and off-campus) are presented in Tables
3.30 to 3.35. The analysis of the overall sexual victimization measure set forth in Table
3.30 lends some support to routine activities theory. Thus, the risk of victimization is
significantly increased by freqilenting places with men and with alcohol, by drinking
alcohol to get drunk, by living alone, and by not being married. Victimization risk is also
increased by prior sexual victimization, a high class status, being African-American, being
young, not being a graduate student, and not being heterosexual.
-1 02-
This document is a research report submitted to the U.S. Department of Justice. This reporthas not been published by the Department. Opinions or points of view expressed are thoseof the author(s) and do not necessarily reflect the official position or policies of theU.S. Department of Justice.
When the .analyses are conducted for separate types of sexual victimizations
(Tables 3.31 to 3.35), there is a tendency for the results found for the overall victimization
measure to also obtain in these analyses. One notable exception, however, is the analysis
1 of sexual threats, where virtually no independent variable was found to exert a statistically
significant effect (see Table 3.34).
In any case, across the six analyses for types of sexual victimization, routine
activities theory received general support. Thus, some statistically significant effects were
E found for the propensity [o be at places with men and alcohol. The guardianship
measure-living alone-was significantly related to sexual contact and sexual violence
with force. Compared to other relationship statuses, being married generally insulated
women against sexual victimization. Most important, however, the frequency of drinking
enough alcohol to get drunk has a consistent effect of types of sexual victimization. In
contrast, the other two exposure to crime variables-smoking pot or hashish and being a
member or pledge of a social sorority-did not exert any statistically significant effects.
Similarly, no statistically significant results were found for three measures of proximity to
motivated offenders (being a part-time versus full-time student, living in a coed dorm, living
on campus).
With regard to the other variables in the analyses, perhaps the most striking finding
is that with the exception of sexual threats, having had a prior sexual victimization
increases the risk of all forms of sexual victimization. The other results are more t inconsistent, but some tendencies can be noted. Although not significant for all forms
analyzed, there is a tendency for the risk of victimization to be increased if a respondent
-1 03-
This document is a research report submitted to the U.S. Department of Justice. This reporthas not been published by the Department. Opinions or points of view expressed are thoseof the author(s) and do not necessarily reflect the official position or policies of theU.S. Department of Justice.
was of a higher family class status, a minority, younger, not a graduate student, and not
a heterosexual.
The results for the on-campus analyses, which include the institution-level
characteristics, are presented in Tables 3.36 to 3.41. Across all six equations, the
institutional variables have few and inconsistent effects. For example, the aggregate rate
of rape for an institution is significantly related to a respondent's risk of rape victimization,
but is not related to any other form of sexual victimization. Similarly, the overall risk of
sexual victimization is positively related to the percent of male students and negatively
related to the percent of full-time students, but these variables have few effects on the five
types of sexual victimization examined. These results thus suggest that for the most part,
institutim-level characteristics are not strong predictors of sexual victimization.
Three variables, however, do appear to be consistent predictors of on-campus
victimization. First, as might be expected, students who live on campus are more likely to
experience an on-campus sexual victimization. Second, as with the general models,
female students who frequently drink enough alcohol to get drunk are more at risk of
victimization. There are some effects for the propensity to be a place with men and places
with alcohol, but these are not found across all forms of victimization. Third, women who
had a prior sexual victimization are more at risk of a current sexual victimization. It is
noteworthy, then, that regardless of whether an overall or on-campus measure of
victimization is used, drinking alcohol and prior sexual victimization seed to consistently
elevate the risk of sexual victimization among female students.
-1 04-
This document is a research report submitted to the U.S. Department of Justice. This reporthas not been published by the Department. Opinions or points of view expressed are thoseof the author(s) and do not necessarily reflect the official position or policies of theU.S. Department of Justice.

DISCUSSION
As noted previously, the measurement of rape and other forms of sexual
victimization not only is methodologically complicated but also is at the nexus of a debate
between conservative and feminist scholars over whether the sexual assault of women by
men is a small or extensive problem. Any empirical analysis thus potentially has divergent
theoret'cal, policy, and political implications. Thus, if sexual victimization is found to be
widespread, the data lend credence to the view that such victimization is caused by
patriarchy and its cultural hegemony, is in need of vigorous crime prevention by campus
authorities, and is another manifestation of entrenched sexism that is in need of
fundamental reform. If sexual victimization is non-serious and relatively infrequent, then
it would seem that such victimization is not inherent in the system of patriarchy but-like
other crimes-is confined to a tiny minority of men; that "rape awareness" seminars on
campus are misguided and likely to foster unwarranted fear of men by women; and that the
existing political system is not inherently unfair to women.
What, then, would conservatives and feminists make of the data presented in this
chapter? We would anticipate that, informed by radically different ideological lenses, they
would create from the data divergent narratives of sexual victimization on college
campuses .
Thus, a conservative narrative might be as follows: The study shows that only a tiny
percentage of college women experience rape (1.1 percent) or attempted rape (1.7
percent). Nearly all of these incidents arise in private sexual encounters where alcohol
is present and where the line between normal and excessive aggressive sex is not clear.
-1 05-
This document is a research report submitted to the U.S. Department of Justice. This reporthas not been published by the Department. Opinions or points of view expressed are thoseof the author(s) and do not necessarily reflect the official position or policies of theU.S. Department of Justice.

In the majority of these cases, supposed rape victims do not even define themselves as
- having been raped. Not surprisingly, they almost never report the incident to the police,
and when asked why not, they say that the event was not serious enough to do so. More
than four in ten rape victims even say that they are not certain that a crime was committed
or that the "offender" intended any harm. Although some of these incidents may qualify
legally as a rape, most would not. At most, actual rapes and attempted rapes on college
campuses are a rare event-serious when they occur, but not something the typical coed
.
will ever experience.
In contrast, a feminist narrative might be as follows: The study shows that in only
a six-month period, about 2.8 percent of women on college campuses will be raped or
have a rape attempted against them. The annual rate for rape of young, college women
is thus likely to be over 5 percent. If this rate holds over the four or five years women are
in college, then it is not an exaggeration to say that one in four to five women will
experience a rape assault in her college career. It is not clear, moreover, that this study
has captured all rapes that took place in the sample. Many women answered "yes" to the
rape screen question only to be discounted in the incident report, and forty other women
stated that they had been raped even though they had "screened in" on another question.
The data show, moreover, that women are vulnerable to sexual assault in situations when
0 they are alone with a man, at night, and in a private space. It is noteworthy that two-thirds
of all rape victims and nine-tenths of attempted rape victims tried to protect
themselves-figures that belie any claims that most incidents were not forced but
f consensual. And none of these victims continue to be involved with the men who
-1 06-
This document is a research report submitted to the U.S. Department of Justice. This reporthas not been published by the Department. Opinions or points of view expressed are thoseof the author(s) and do not necessarily reflect the official position or policies of theU.S. Department of Justice.
assaulted them. Further, the failure to report sexual victimizations is not surprising given
- the continued hostility of the criminal justice system, the difficulty of proving that a crime
has occurred, the public embarrassment victims experience, and failure to educate men
and women about what legally constitutes rape. Finally, the data reveal a shocking k E amount of sexual victimization beyond the crime of rape. In a relatively short period of
time, over 15 percent of the women reported having been sexually victimized at least once.
To a degree, we are not in a position to settle this debate. Even though we used t
a fairly detailed measurement strategy-explicitly worded screen question followed by an
extensive incident report-it is difficult in a structured, time constrained interview to probe
key issues that would establish precisely what occurred in a victimization incident. Thus,
future research would benefit from detailed interviews that probed what victims mean when
they say "force" was used or that "consent" was or was not given. Similarly, we need to
probe why women see forced, unwanted sex as a rape or not as a rape, and why they see
such acts as serious or not as serious. Using survey data such as ours to reconstruct and
capture the complexities of a victimization incident that may have culminated after several
hours of interaction is not feasible.
Even so, our data provide useful estimates of the extent of sexual victimization rn college women experience. It is clear that there is no epidemic of rape on college ti campuses, that most rapes do not involve brutal violence, and that most arise out of men
and women being in situations where sexual advances are commonplace. At the same
time, our methodological strategy was careful not to count as rapes or attempted rapes
sexual penetrations that were not unwanted and forced. Although proving in court that
-1 07-
This document is a research report submitted to the U.S. Department of Justice. This reporthas not been published by the Department. Opinions or points of view expressed are thoseof the author(s) and do not necessarily reflect the official position or policies of theU.S. Department of Justice.

these sncounters were criminal undoubtedly would be difficult-most do not have the
characteristics of the "real rapes" that Estrich (1987) talks abouf-they would meet the
legal standard for rape. At the very least, these are serious cases of sexual victimization:
a woman being violated against her will.
In a broader picture, college women are at risk for some form of sexual victimization.
Although the prevalence rate for any given form is low for the bounding period in the
sample, taken together these various victimizations mean that about 1.5 of ten women are
sexually victimized in some way. Extrapolating to annual rates and rates over a college
career can only be done cautiously, but the implications are clear: many, if not most,
women will be sexually victimized during her time in college. Further, when small
percentages are calculated over a large population base, the magnitude of a problem
takes on a new focus. Thus, a 15 percent sexual victimization rate for a college of any
size would be of concern to campus authorities interested in ensuring the safety and
quality of educational experiences for their female students.
The results also have implications for explaining who is at risk for being sexually
victimized. First, a consistent finding was that female respondents who frequently drink
enough alcohol to get drunk had a higher risk of sexual victimization, including rape.
There are at least three possible explanation for this finding. First, it may be that when
women drink they become more vulnerable to victimizationfor example, by being less
able to resist an assault or by being more easily led into places (e.g., private rooms) where
victimization is more easily accomplished. Second, "drunk" women may be see as more
"attractive targets" for "motivated offenders," and thus they may be selected for attempted
-1 08-
This document is a research report submitted to the U.S. Department of Justice. This reporthas not been published by the Department. Opinions or points of view expressed are thoseof the author(s) and do not necessarily reflect the official position or policies of theU.S. Department of Justice.

sexual advances (see also, Finkelhor and Asdigian, 1996). Third, women who "get drunk''
may be more likely to be in the company of "drunk men" who, in turn, may have a higher
propensity to victimize (see Crowell and Burgess, 1996). Note, however, that the effect
of drinking holds even controlling for the respondents' propensity to be at places with men
and at places with alcohol.
Second, although the effects were not always consistent, various findings lent
support to the contention df routine activities theory that victimization is linked to lifestyles
and, more specifically, to exposure to crime/motivated offenders and guardianship (Cohen
and Felson, 1979). As noted already, a "drinking lifestyle" was associated with being
sexually victimized. For some of the analyses, the risk of victimization was also
heightened by frequenting places with men and with alcohol. Living alone, but especially
being married (or cohabitating), decreased sexual victimization. Further, although not
conceptualized as lifestyle variable, graduate students were less likely to be sexually
victimized than undergraduates. Given the academic demands placed on graduate
students' time, however, it is likely that they may lead lifestyles that are less risky than
those led by undergraduate students. Finally, although only "common sense," students
who live on campus were more at risk of on-campus sexual victimizations. Still, a failure
to detect a significant finding for this variable would have been troubling for routine
activities theory, given that a central premise of the theory is the exposure to victimization
opportunities should predict victimization experiences. Accordingly, the finding for living
on campus, while perhaps not substantively surprising, is theoretically salient.
-1 09-
This document is a research report submitted to the U.S. Department of Justice. This reporthas not been published by the Department. Opinions or points of view expressed are thoseof the author(s) and do not necessarily reflect the official position or policies of theU.S. Department of Justice.

Third, the analysis revealed that heterosexual women were less likely to experience
a sexual victimization generally and, specifically, to be raped or victimized with force. Why
might lesbian students be more at risk of victimization? Two possibilities can be
suggested. First, gay women may be more likely to spurn the sexual advances of men,
which in turn may result in increased efforts by male victimizers to use force in an attempt
to accomplish their goals. Second, lesbian college students may be "attractive targets" for
hate crimes.
Fourth, the effects of demographic characteristics were inconsistent. There was
some tendency, however, for sexual victimization to be higher among affluent students,
among African-American students, among HispanicILatino students, and among younger
students.
Fifth, few institution-level characteristics had effects on the risk of victimization,
suggesting that being a sexual victim is not strongly contingent of a college's or university's
context. One finding, however, may be worth considering: the risk of being a rape victim
was significantly related to the aggregate-level of rape for the students' institution. This
variable affected no other outcome measure, so it may be ill-advised to give its significant
influence on rape much credence. Still, if one were to consider the institutional rate of
rape as a broad indicator of the cultural climate of a college or university, then this finding
may be of relevance: the risk of victimization is higher where a "culture of rape" is present.
Again, this interpretation is clearly speculative, but it does open up a line of inquiry that
future research may wish to consider.
-1 10-
This document is a research report submitted to the U.S. Department of Justice. This reporthas not been published by the Department. Opinions or points of view expressed are thoseof the author(s) and do not necessarily reflect the official position or policies of theU.S. Department of Justice.
Sixth, consistent with the results from several sexual victimization studies (see
Crowell and Burgess, 1996), women who were previously sexually victimized were more
likely to be sexually victimized. This finding held for the analyses conducted for all
victimization and for the analyses conducted only for on-campus victimizations. This
finding also obtained for the overall sexual victimization measure (across all 12 types), for
the measure of rape, for the measure of sexual victimization with force, and for most other
measures of sexual victimization used in the analyses. Further, as will be noted in Chapter
4, prior sexual victimization also was significantly related to the risk of being a stalking
victim.
Without the benefit of additional information, however, interpreting this finding is a
daunting challenge (an issue we explore again in Chapter 4). We can offer three
speculations that may play some role in accounting for the consistent relationship between
prior and current victimization. The first possibility is that the relationship is spurious and
IS due to a "reporting bias" that could operate in one of two ways. On the one hand,
women victimized in the past may be more likely to define sexual advances by men in the
present as "victimizing." On the other hand, it may be that some respondents who are
currently victimized may retrospectively overreport past victimizations.
-ihe other two possibilities reflect concepts developed by criminologists studying E: crime over the life-course (see, e.g., Sampson and Laub, 1993): "state dependence,"
which refers how the experience of crime affects later behavior; and "heterogeneity," which
emphasizes how enduring individual characteristics produce stability of behavior across
time In this regard, a "state dependence" argument would be that early victimization
-111-
This document is a research report submitted to the U.S. Department of Justice. This reporthas not been published by the Department. Opinions or points of view expressed are thoseof the author(s) and do not necessarily reflect the official position or policies of theU.S. Department of Justice.

experiences change women in ways that make their future victimization more likely (e.g.,
- by creating feelings of self-blame that reduce their ability to resist attempts to victimize
them). A "heterogeneity" argument would propose that female victims have underlying
personal traits or orientations that make their continued victimization more likely (e.g.,
personal vulnerabilities that make them more attractive targets, a risk-taking orientation
that lezds them into associations and situations in which victimizations are more likely).
Of course, both these processes could be operating simultaneously and be mutually
reinforcing.
-1 12-
This document is a research report submitted to the U.S. Department of Justice. This reporthas not been published by the Department. Opinions or points of view expressed are thoseof the author(s) and do not necessarily reflect the official position or policies of theU.S. Department of Justice.
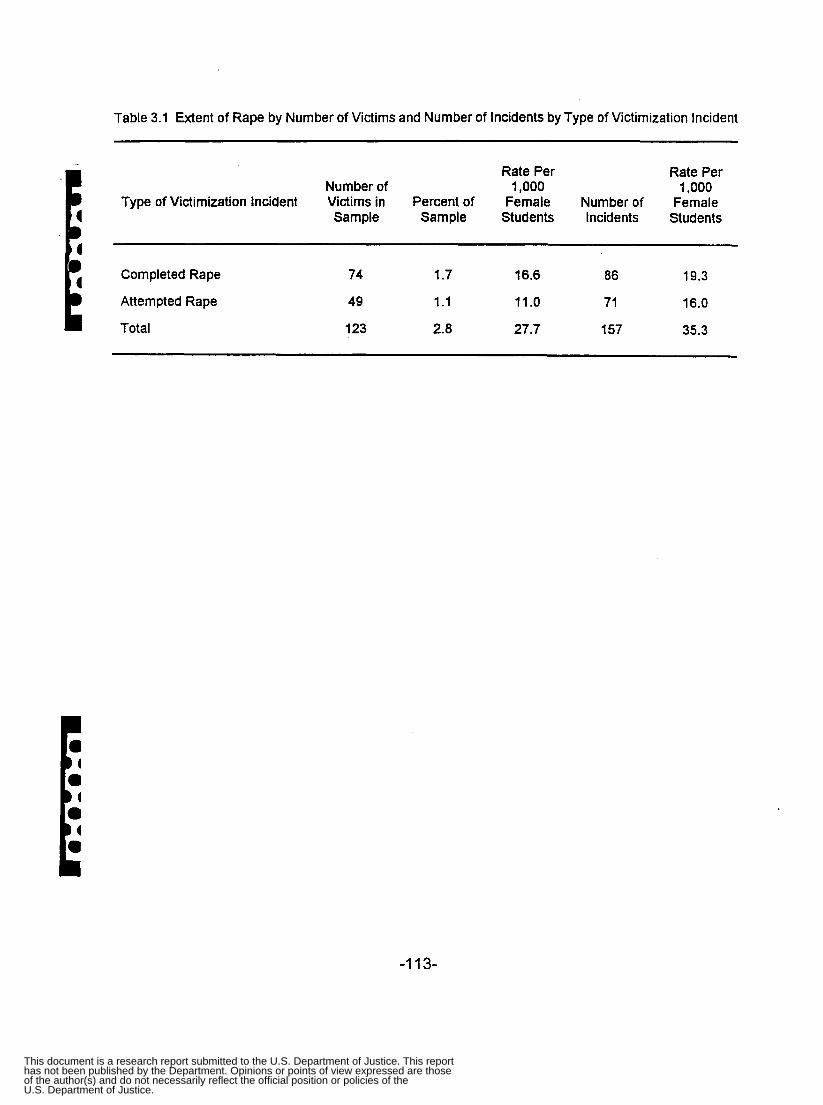
Table 3.1 Extent of Rape by Number of Victims and Number of Incidents by Type of Victimization Incident
Rate Per Rate Per
Type of Victimization Incident Victims in Percent of Female Number of Female Sample Sample Students Incidents Students
Number of 1,000 1,000
Completed Rape
Attempted Rape
Total
74 1.7 16.6 86 19.3
49 1.1 11.0 71 16.0
123 2.8 27.7 1 57 35.3
-1 13-
This document is a research report submitted to the U.S. Department of Justice. This reporthas not been published by the Department. Opinions or points of view expressed are thoseof the author(s) and do not necessarily reflect the official position or policies of theU.S. Department of Justice.

Table 3.2 The Relationship Between the Coding of Rape Victimizations by Screen Questions and Incident Reports for Victims and Incidents
Qualify as Rape Based Qualify as Rape Based Unit of Measurement on Screen Questions on incident Report
59
68’
28 (47.5)
29 (42.6)
This is the number of incidents that screened into an incident report and the respondent then completed the incident report so that we were able to classify.
-1 14-
This document is a research report submitted to the U.S. Department of Justice. This reporthas not been published by the Department. Opinions or points of view expressed are thoseof the author(s) and do not necessarily reflect the official position or policies of theU.S. Department of Justice.
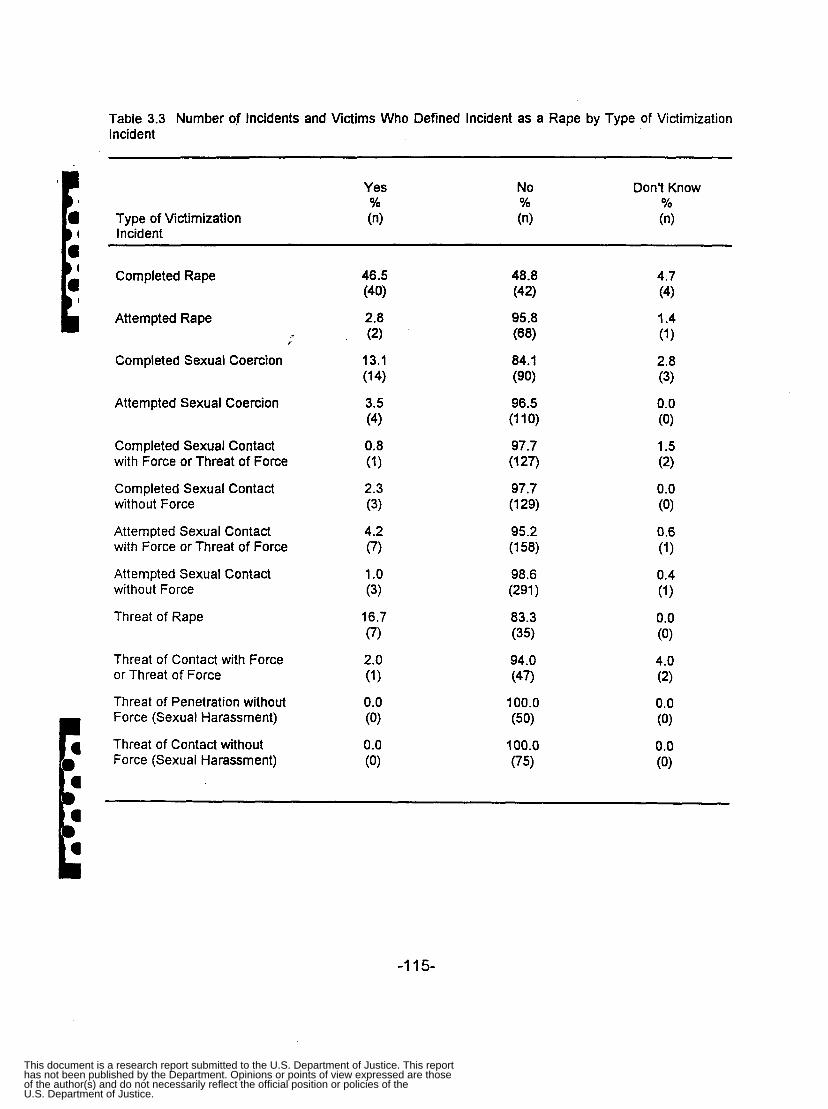
Table 3.3 Number of Incidents and Victims Who Defined Incident as a Rape by Type of Victimization Incident
Type of Victimization Incident
Yes % (n)
No Don’t Know YO % (n) (n)
Completed Rape
Attempted Rape
Completed Sexual Coercion 6
Attempted Sexual Coercion
Completed Sexual Contact with Force or Threat of Force
Completed Sexual Contact without Force
Attempted Sexual Contact with Force or Threat of Force
Attempted Sexual Contact without Force
Threat of Rape
Threat of Contact with Force or Threat of Force
Threat of Penetration without Force (Sexual Harassment)
Threat of Contact without Force (Sexual Harassment)
-1 15-
This document is a research report submitted to the U.S. Department of Justice. This reporthas not been published by the Department. Opinions or points of view expressed are thoseof the author(s) and do not necessarily reflect the official position or policies of theU.S. Department of Justice.
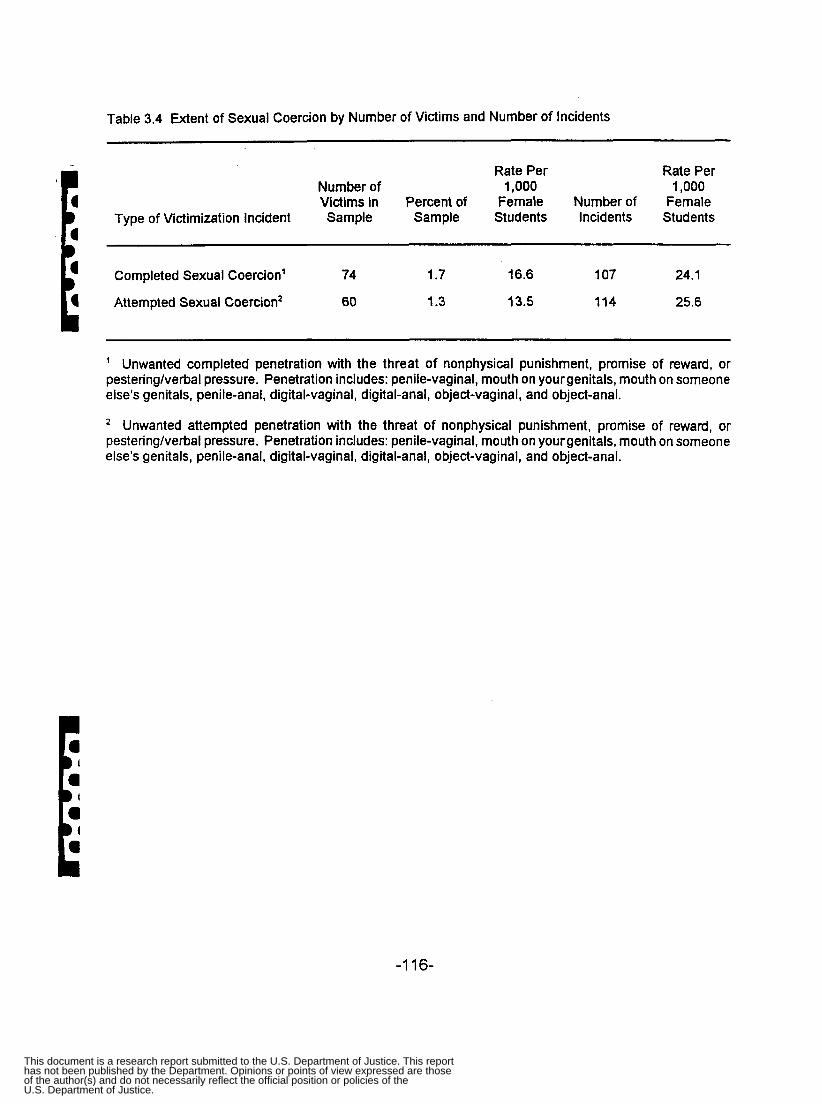
Table 3.4 Extent of Sexual Coercion by Number of Victims and Number of Incidents
Rate Per Rate Per Number of 1,000 1,000 Victims in Percent of Female Number of Female
Type of Victimization Incident Sample Sample Students Incidents Students
Completed Sexual Coercion’ 74 1.7 16.6 107 24.1
Attempted Sexual Coercion‘ 60 1.3 13.5 114 25.6
’ Unwanted completed penetration with the threat of nonphysical punishment, promise of reward, or pesteringherbal pressure. Penetration includes: penile-vaginal, mouth on yourgenitals, mouth on someone else’s genitals, penile-anal, digital-vaginal, digital-anal, object-vaginal, and object-anal.
Unwanted attempted penetration with the threat of nonphysical punishment, promise of reward, or pesteringherbal pressure. Penetration includes: penile-vaginal, mouth on yourgenitals, mouth on someone else’s genitals, penile-anal, digital-vaginal, digital-anal, object-vaginal, and object-anal.
-1 16-
This document is a research report submitted to the U.S. Department of Justice. This reporthas not been published by the Department. Opinions or points of view expressed are thoseof the author(s) and do not necessarily reflect the official position or policies of theU.S. Department of Justice.

Table 3.5 Extent of Sexual Contact with and without Force by Type of Crime
Rate Per Rate Per Number of 1,000 1,000 Victims in Percent of Female . Number of Female
Type of Victimization Incident Sample Sample Students Incidents Students
With Force
Completed Sexual Contact' 85 1.9 19.1 130 29.2
Attempted Sexual Contact' 89 2.0 20.0 167 37.6
Without Force
Completed Sexual Contact3 80 1.8 18.0 132 29.7
Attempted Sexual Contact4 133 3.0 29.9 295 66.4
' Unwanted completed sexual contact (not penetration) with force or the threat of force. Sexual contact includes: touching, grabbing or fondling of breasts, buttocks, or genitals either under or over your clothes, kissing, licking or sucking, or some other form of unwanted sexual contact.
' Unwanted attempted sexual contact (not penetration) with force or the threat of force. Sexual contact includes: touching, grabbing or fondling of breasts, buttocks, or genitals either under or over your clothes, kissing, licking or sucking, or some other form of unwanted sexual contact.
Any type of unwanted completed sexual contact (not penetration) with the threat of nonphysical punishment, promise of reward, or pestering/verbal. Sexual contact includes: touching, grabbing or fondling of breasts, buttocks, or genitals either under or over your clothes, kissing, licking or sucking, or some other form of unwanted sexual contact.
Unwanted attempted sexual contact (not penetration) with the threat of nonphysical punishment, promise of reward, or pestering/verbal. Sexual contact includes: touching, grabbing or fondling of breasts, buttocks, or genitals either under or over your clothes, kissing, licking or sucking, or some other form of unwanted sexual contact.
-1 17-
This document is a research report submitted to the U.S. Department of Justice. This reporthas not been published by the Department. Opinions or points of view expressed are thoseof the author(s) and do not necessarily reflect the official position or policies of theU.S. Department of Justice.

Table 3.6 Extent of Threatened Crimes by Number of Victims and Number of Incidents
', . - Rate Per Rate Per
Number of 1,000 1,000 Victims in Percent of Female Number of Female
Type of Victimization Incident Sample Sample Students Incidents Students
Threat of Rape' 14 0.3 3.2 42 9 .s
Threat of Contact with Force'
Threat of Penetration without Force3
Threat of Contact without Force4
8 0.2 1.8 50 11.3
10 0.2 2.3 50 11.3
15 0.3 3.4 75 16.9
Threat of unwanted penetration with force and threat of force. Penetration includes: penile-vaginal, mouth on your genitals, mouth on someone else's genitals, penile-anal, digital-vaginal, digital-anal, object-vaginal, and object-anal.
Threat of unwanted sexual contact with force and threat of force. Sexual contact includes: touching, grabbing or fondling of breasts, buttocks, or genitals either under or over your clothes, kissing, licking or sucking, or some other form of unwanted sexual contact.
Threat of unwanted penetration with the threat of nonphysical punishment, promise of reward, or pesteringherbal pressure. Penetration includes: penile-vaginal, mouth on your genitals, mouth on someone else's genitals, penile-anal, digital-vaginal, digital-anal, object-vaginal, and object-anal.
Threat of unwanted sexual contact with the threat of nonphysical punishment, promise of reward, or pestering/verbal pressure. Sexual contact includes: touching, grabbing or fondling of breasts, buttocks, or genitals either under or over your clothes, kissing, licking or sucking, or some other form of unwanted sexual contact.
-1 18-
This document is a research report submitted to the U.S. Department of Justice. This reporthas not been published by the Department. Opinions or points of view expressed are thoseof the author(s) and do not necessarily reflect the official position or policies of theU.S. Department of Justice.

Table 3.7 Summary of Incidents and Victimizations by Type of Victimization Incident
Type of Victimization Incident Number of
Number of Incidents Victimizations
Completed Rape
Attempted Rape
Completed Sexual Coercion
Attempted Sexual Coercion
Completed Sexual Contact with Force or Threat of Force
Completed Sexual Contact without Force
Attempted Sexual Contact with Force or Threat of Force
Attempted Sexual Contact without Force
Threat of Rape
Threat of Contact with Force or Threat of Force
Threat of Penetration without Force (Sexual Harassment)
Threat of Contact without Force (Sexual Harassment)
86
71
107
114
130
132
166
295
42
50
50
75
86
75
107
119
131
133
185
31 7
50
59
54
81
TOTAL 1,318 1,397
Victimization Rate Per 1,000 Female Students 296.4 314.2
Incident to Victimization Ratio 1.06
-1 19-
This document is a research report submitted to the U.S. Department of Justice. This reporthas not been published by the Department. Opinions or points of view expressed are thoseof the author(s) and do not necessarily reflect the official position or policies of theU.S. Department of Justice.
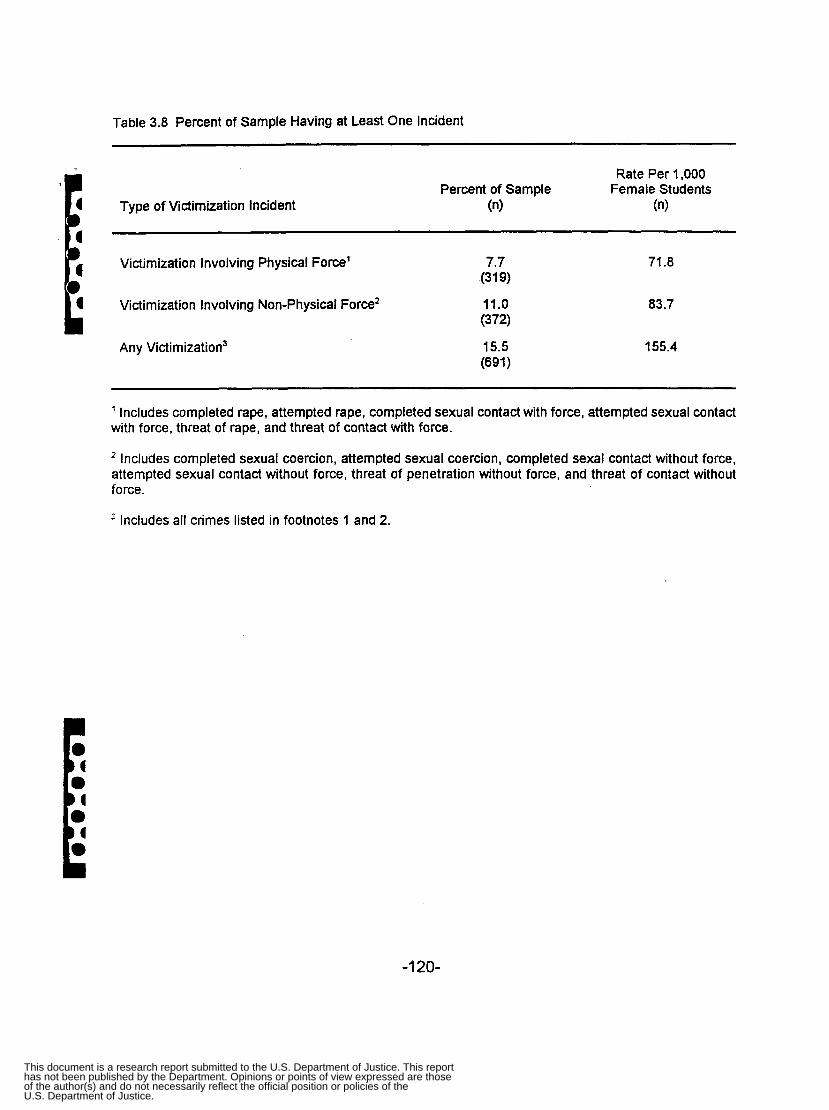
Table 3.8 Percent of Sample Having at Least One Incident
Type of Victimization Incident
Rate Per 1,000 Percent of Sample Female Students
(n) (n>
Victimization Involving Physical Force’ 7.7 (31 9)
Victimization Involving Non-Physical Force’ 11.0 (372)
Any Victimization’ 15.5 (691)
71.8
83.7
155.4
’ Includes completed rape, attempted rape, completed sexual contact with force, attempted sexual contact with force, threat of rape, and threat of contact with force.
Includes completed sexual coercion, attempted sexual coercion, completed sexal contact without force, attempted sexual contact without force, threat of penetration without force, and threat of contact without force.
’ Includes all crimes listed in footnotes 1 and 2.
-1 20-
This document is a research report submitted to the U.S. Department of Justice. This reporthas not been published by the Department. Opinions or points of view expressed are thoseof the author(s) and do not necessarily reflect the official position or policies of theU.S. Department of Justice.
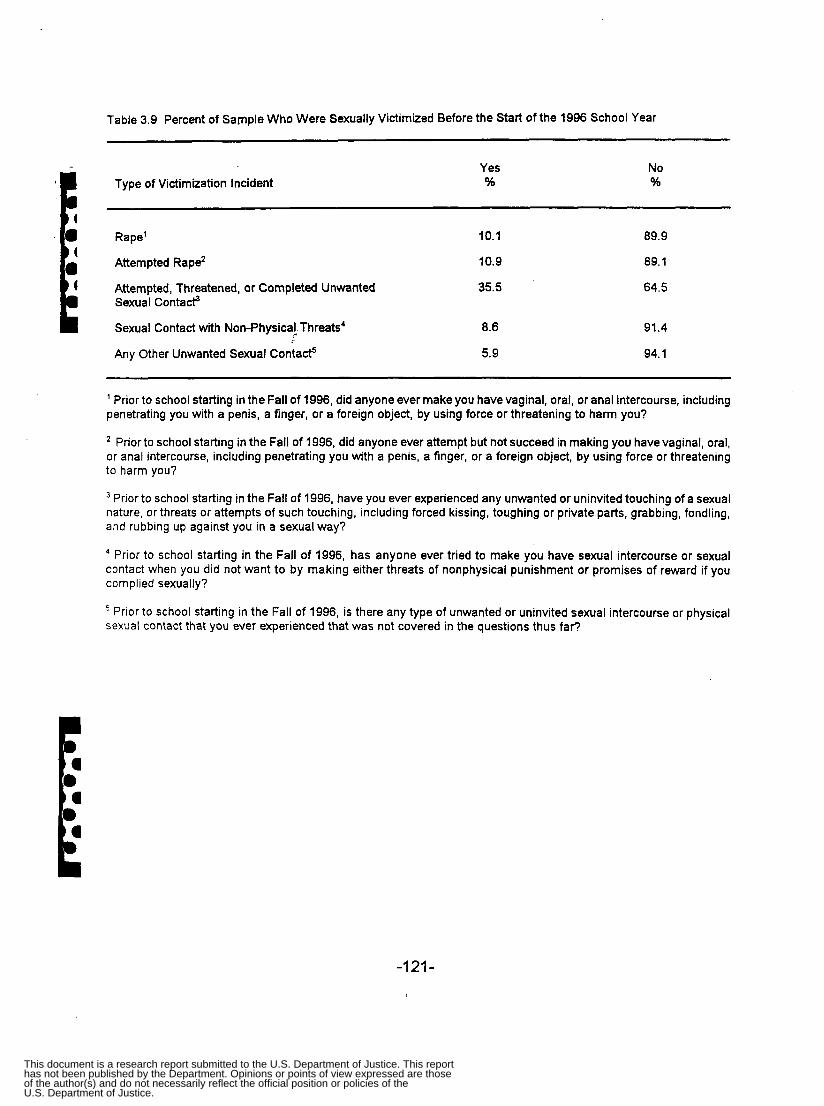
Table 3.9 Percent of Sample Who Were Sexually Victimized Before the Start of the 1996 School Year
Type of Victimization Incident Yes %
No %
Rape’ 10.1 89.9
Attempted Rape’ 10.9 89.1
Attempted, Threatened, or Completed Unwanted Sexual Contat9
Sexual Contact with Non-Physica! Threats‘
Any Other Unwanted Sexual Contad t
35.5 64.5
8.6
5.9
91.4
94.1
’ Prior to school starting in the Fall of 1996, did anyone ever make you have vaginal, oral, or anal intercourse, including penetrating you with a penis, a finger, or a foreign object, by using force or threatening to harm you?
Prior to school starting in the Fall of 1996, did anyone ever attempt but not succeed in making you havevaginal, oral, or anal intercourse, including penetrating you with a penis, a finger, or a foreign object, by using force or threatening to harm you?
Prior to school starting in the Fall of 1996, have you ever experienced any unwanted or uninvited touching of a sexual nature, or threats or attempts of such touching, including forced kissing, toughing or private parts, grabbing, fondling, and rubbing up against you in a sexual way?
Prior to school starting in the Fall of 1996, has anyone ever tried to make you have sexual intercourse or sexual contact when you did not want to by making either threats of nonphysical punishment or promises of reward if you complied sexually?
Prior to school starting in the Fall of 1996, is there any type of unwanted or uninvited sexual intercourse or physical sexual contact that you ever experienced that was not covered in the questions thus far?
-121-
This document is a research report submitted to the U.S. Department of Justice. This reporthas not been published by the Department. Opinions or points of view expressed are thoseof the author(s) and do not necessarily reflect the official position or policies of theU.S. Department of Justice.
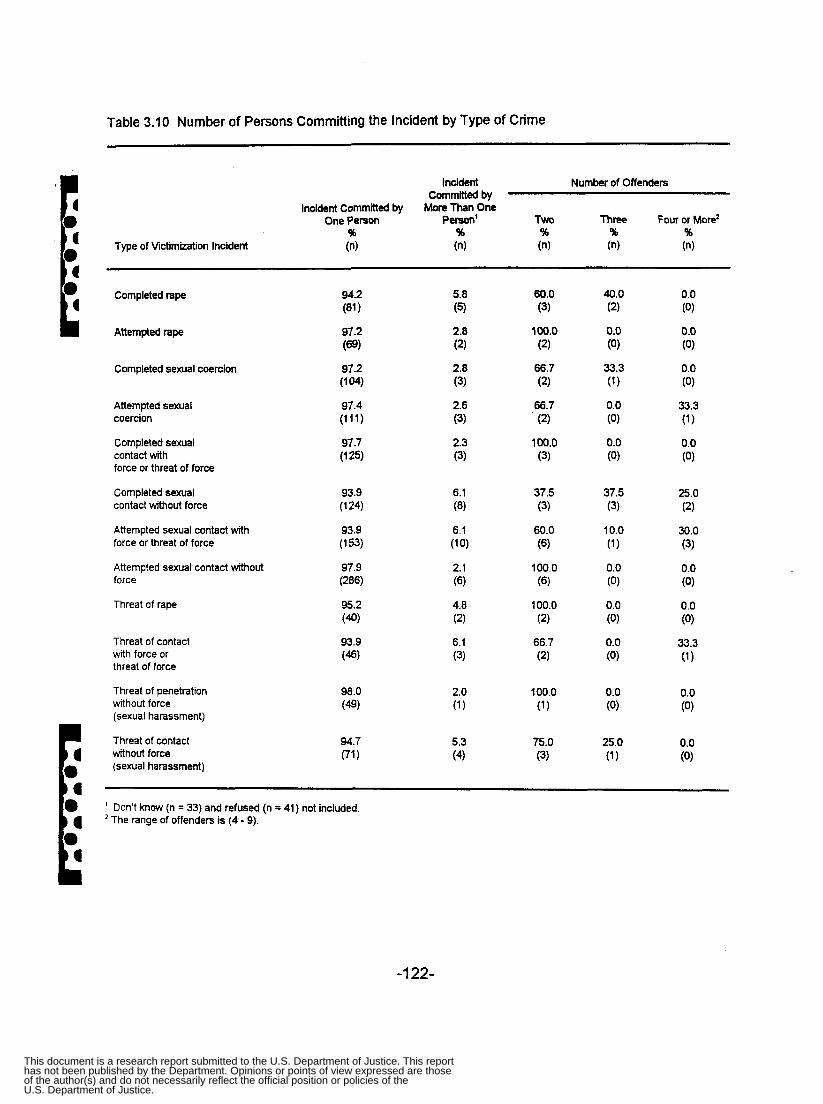
Table 3.10 Number of Persons Committing the Incident by Type of Crime
Incident Number of Offenders Committed by
More Than One Incident Committed by One Person Person‘ TWO Three Four or More’
% 96 % % % Type of Victimization Incident 0-0 (4 (n) (n) (n)
Completed rape
Attempted rape
Completed sexual coercion
Attempted sexual coercion
Completed sexual contact with force or threat of force
Completed sexual contact without force
Attempted sexual contact with force or threat of force
Attempted sexual contact without force
Threat of rape
Threat of contact with force or threat of force
Threat of penetration without force (sexual harassment)
Threat of contact without force (sexual harassment)
’ Don’t know (n = 33) and refused (n = 41) not included. The range of offenders is (4 - 9).
-1 22-
This document is a research report submitted to the U.S. Department of Justice. This reporthas not been published by the Department. Opinions or points of view expressed are thoseof the author(s) and do not necessarily reflect the official position or policies of theU.S. Department of Justice.
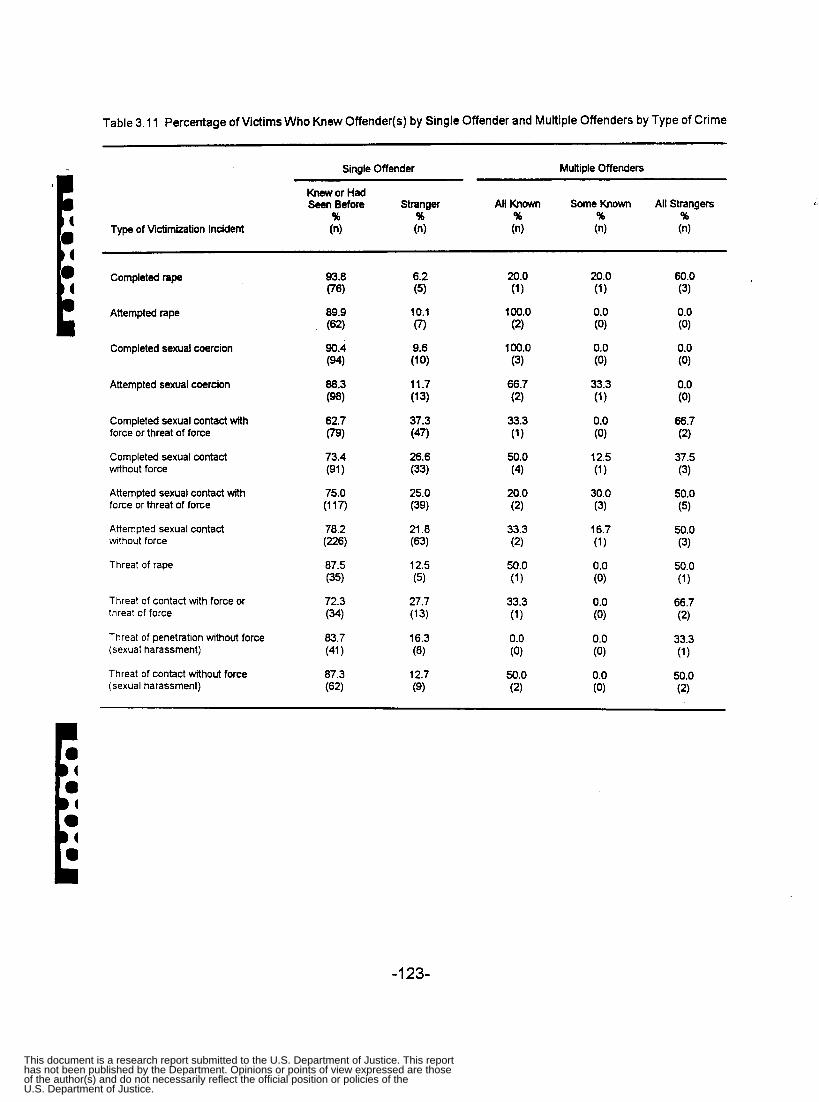
Table 3.11 Percentage of Victims Who Knew Offender(s) by Single Offender and Multiple Offenders by Type of Crime
Single Offender Multiple Offenders
Knew or Had Seen Before Stranger All Known Some Known All Strangers
% % 96 % % Type of Wctimization Incident (n) (n) (n) (n) (n)
Completed rape
Attempted rape
Completed sexual coercion
Attempted sexual coercion
Completed sexual contact with force or threat of force
Completed sexual contact wthout force
Attempted sexual contact with force or threat of force
Attempted sexual contact wthout force
Threat of rape
Threat of contact with force or threat of force
Threat of penetration without force (sexual harassment)
Threat of contact without force (sexual harassment)
6.2 (5)
0
(1 0)
(1 3)
(47)
26.6 (33)
(39)
(63)
(5)
27.7 (13)
(8)
12.7 (9)
10.1
9.6
11.7
37.3
25.0
21.8
12.5
16.3
-1 23-
This document is a research report submitted to the U.S. Department of Justice. This reporthas not been published by the Department. Opinions or points of view expressed are thoseof the author(s) and do not necessarily reflect the official position or policies of theU.S. Department of Justice.

Relationship to Offender'
Single Boyfriend/ Professor/ Male Non- Employer/ Offender Classmate Friend Ex-boyfriend Acquaintance Coworker Teacher Relative Supenrisor
% % % % % % % % 0
Type of Victimization Incident (n) (n) (n) 0-4 (n) (n) (n) (n) (nJ
Completed rape
Attempted rape
Completed sexual coercion
Attempted sexual coerclon
Completed sexual contact with force or threat of force
Completed sexual contact without force
Attempted sexual contact with force or threat of force
Altempted sexual contact without force
Threat of rape
Threat of contact with force or threat of force
Threat of penetratlon without force (sexual harassment)
Threat of contact without force (sexual harassment)
100.0 (76)
(62)
(94)
(98)
100.0 (79)
(91 1
(117)
(226)
(35)
(W
(41 1
(62)
100.0
100.0
100.0
100.0
100.0
100.0
100.0
100.0
100.0
100.0
35.5 (27)
43.5 (27)
(1 9)
25.5 (25)
34.2 (27)
(30)
41.9 (49)
41.1 (92)
(1 2)
(7)
(1 5)
(25)
20.2
33.0
34.3
20.6
36.6
40.3
13.2 (12)
-1 24-
This document is a research report submitted to the U.S. Department of Justice. This reporthas not been published by the Department. Opinions or points of view expressed are thoseof the author(s) and do not necessarily reflect the official position or policies of theU.S. Department of Justice.

rrT. I, e ~r 1
Single Offender Victirnization by Type of Crime (continued)
~
Relationship to Offender'
KnOWll Other Single Other Male Husband/ FatherlStep- Graduate BrotherlStcp Relative Female
% % % % % % % % % Offender Roommate Relative Ex-husband father Asslstant brother Uncle
Type of Victimization Incident (n) (n) (n) (n) ( 4 (n) (n) (n) (n)
Completed rape
Attempted rape
Completed sexual coercion 100.0 0.0 0.0 0.0 0.0 0.0 0.0 0.0 C 3 (94) (0) (0) (0) (0) (0) (0) (b) ((1)
Attempted sexual coercion 100.0 0.0 1 .o 0.0 0.0 0.0 0.0 0.0 0.0 (98) (0) (1) (0) (0) (0) (0) (0) (0)
Completed sexual contact with 100.0 1.3 0.0 0.0 0.0 0.0 0.0 0.0 0.0 force or threat of force (79) (1 1 (0) (0) (0) (0) (0) (0) (0)
Completed sexual contact 100.0 0.0 0.0 0.0 0.0 0.0 0.0 0.0 0.0 without force (91 1 (0) (0) (0) (0) (0) (0) (0) (0)
Attempted sexual contact with 100.0 0.0 0.0 0.9 0.0 0.0 0.0 0.0 0.0 force or threat of force (1 17) (0) (0) (1 1 (0) (0) (0) (0) (0)
Attempted sexual contact 100.0 0.4 0.0 0.0 0.0 0.4 0.0 0.0 0.0 without force (226) (1 1 (0) (0) (0) (1 1 (0) (0) (0)
Threat of rape
Threat of contact with force or 100.0 8.8 0.0 0.0 0.0 0.0 0.0 0.0 0.0 threat of force (3) (3) (0) (0) (0) (0) (0) (0) (0)
Threat of penetratlon without force 100.0 0.0 0.0 0.0 0.0 0.0 0.0 0.0 0.0 (sexual harassment) (41 1 (0) (0) (0) (0) (0) (0) (0) (0)
Threat of contact without force 100.0 0.0 0.0 0.0 0.0 0.0 0.0 0.0 0.0 (sexual harassment) (62) (0) (0) (0) (0) (0) (0) (0) (0)
' Don't know (n = 3) not Included.
-1 25-
This document is a research report submitted to the U.S. Department of Justice. This reporthas not been published by the Department. Opinions or points of view expressed are thoseof the author(s) and do not necessarily reflect the official position or policies of theU.S. Department of Justice.

Table 3.13 Victim-Offender Relationship by Dating and Romantic Status by Type of Crime
Length of Dating Relationship' Nature of Relatlonshlp'
Victim was on a Date Less Than Six Six to Twelve More Than One Victim Currently Romantically Wlth the Offender' First Date Months Months Year Involved With Offender
% % % % % % Type of Victimization Incident (n) (n) (n) (n) ( 4 (n)
Completed rape
Attempted rape
Completed sexual coercion
Attempted sexual coercion
Completed sexual contact with force or threat of force
Completed sexual contact without force
Attempted sexual contact with force or threat of force
Attempted sexual contact without force
Threat of rape
Threat of contact with force or threat of force
Threat of penetration without force (sexual harassment)
Threat of contact without force (sexual harassment)
21.2 (7)
21.2 (7)
' Don't know (n = 2) not included. ' Refused (n = 1) not included. ' Asked only of those respondents who were on a date when the Incident occurred.
-1 26-
This document is a research report submitted to the U.S. Department of Justice. This reporthas not been published by the Department. Opinions or points of view expressed are thoseof the author(s) and do not necessarily reflect the official position or policies of theU.S. Department of Justice.
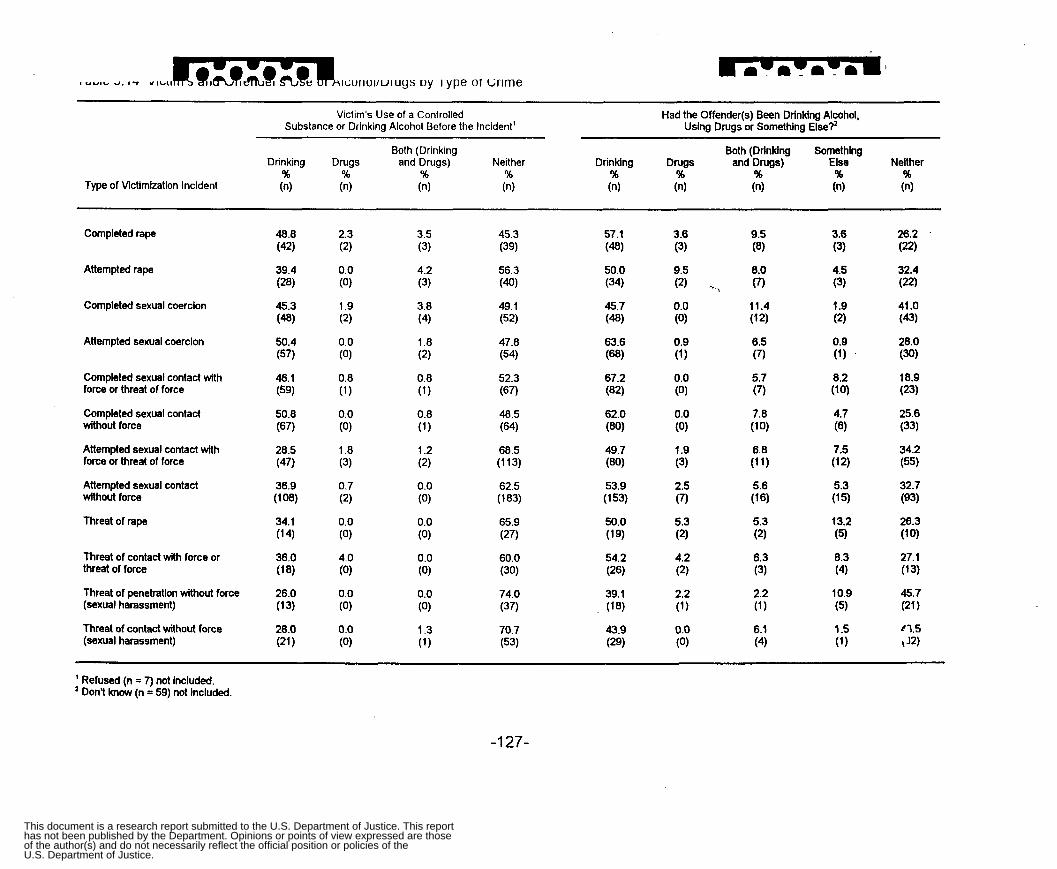
Victim's Use of a Controlled Substance or Drinking Alcohol Before the incident'
~ ~~ ~ ~ _ _ _ _
Had the Offender@) Been Drinking Alcohol, Using Drugs or Something Else?'
Both (Drinking Both (Drinking Somethlng Drinking Drugs and Drugs) Neither Drinking DNgS and Drugs) Else Nelther
% % % % % % % % % Type of Victimization Incident (n) ( 4 (n) (n) (n) (n) (n) (n) (n)
Completed rape
Attempted rape
Completed sexual coercion 45.3 1.9 3.8 49.1 (48) (2) (4) (52)
Attempted sexual coercion 50.4 0.0 1.8 47.8 63.6 0.9 6.5 0.9 28.0 (57) (0) (2) (54) (68) (1 1 (7) (1) . (30)
Completed sexual contact with 46.1 0.8 0.8 52.3 force or threat of force (59) (1 1 (1) (67)
Completed sexual contact 50.8 0.0 0.8 48.5 without force (67) (0) (1 1 (64)
force or threat of force (47) (3) (2) (113) Attempted sexual contact with 28.5 1.8 1.2 68.5
Attempted sexual contact 36.9 0.7 0.0 62.5 53.9 2.5 5.6 5.3 32.7 without force (108) (2) (0) (183) (1 53) (7) (1 6) (15) (93)
Threat of rape
Threat of contact with force or 36.0 4.0 0.0 60.0 threat of force (1 8) (0) (0) (30)
(sexual harassment) (1 3) (0 ) (0) (37)
(sexual harassment) (21 1 (0) (1) (53)
Threat of penetration without force 26.0 0.0 0.0 74.0
Threat of contact without force 28.0 0.0 I .3 70.7
' Refused (n = 7) not included. ' Don't know (n = 59) not included.
-1 27-
This document is a research report submitted to the U.S. Department of Justice. This reporthas not been published by the Department. Opinions or points of view expressed are thoseof the author(s) and do not necessarily reflect the official position or policies of theU.S. Department of Justice.

Table 3.15 Characteristics of Single Offenders by Type of Crime
Sex of Offender RacdEthnicity of Offender' Status of Offendef
Hispanic White/ African- or Latin- AsladPacific Native American/ Fraternity Sports Club
Male Caucasian American American Islander Eskimo/Alaska Native Other Member Member % % % % % % % % % (n) (n) (n) (n) (4 (n) (n) (n) (n)
Type of Victimization Incident
Completed rape
Attempted r a p
Completed sexual coercion
Attempted sexual coerclon
Completed sexual contact with force or threat of force
Completed sexual contact without force
Attempted sexual contact with force or threat of force
Attempted sexual contact without force
Threat of rape
Threat of contact with force or threat of force
Threat of penetration without force (sexual harassment)
Threat of contact without force (sexual harassment)
86.4 (70)
76.8 (53)
89.4 (93)
(92)
(94)
79.8 (99)
73.9 (113)
(239)
(29)
(36)
69.4 (34)
(57)
82.9
75.2
83.6
72.5
78.3
80.3
6.7 (7)
5.4 (6)
13.6 (17)
5.6 (4)
0.0 (0)
0.0 (0)
22.2 (20)
32.8 (22)
36.7 (33)
(47) 26.0
25.0 m
25.0 (11)
' Don't know (n = 4) and refused (n = 4) not Included. Only asked of those respondents who knew or had seen the offender before.
-1 28-
This document is a research report submitted to the U.S. Department of Justice. This reporthas not been published by the Department. Opinions or points of view expressed are thoseof the author(s) and do not necessarily reflect the official position or policies of theU.S. Department of Justice.

Table 3.16 The Location of Victimization by On-Campus and Off-Campus Location by Type of Crime
Location of victimization’
Type of Victimization Incident
On Campus Off Campus % % (n) (n)
Completed rape
Attempted rape
Completed sexual coercion
Attempted sexual coercion
Completed sexual contact with force or threat of force
Completed sexual contact without force
Attempted sexual contact with force or threat of force
Attempted sexual contact without force
Threat of rape
Threat of contact with force or threat of force
Threat of penetration without force (sexual harassment)
Threat of contact without force (sexual harassment)
33.7 (29)
(32)
(31)
(53)
(45)
38.6 (51 1
(56)
35.9 (1 06)
(1 9)
44.0 (22)
(24)
(40)
45.1
29.0
46.5
34.6
33.9
45.2
48.0
54.1
’ Don’t know (n = 2 ) not included.
-1 29-
This document is a research report submitted to the U.S. Department of Justice. This reporthas not been published by the Department. Opinions or points of view expressed are thoseof the author(s) and do not necessarily reflect the official position or policies of theU.S. Department of Justice.
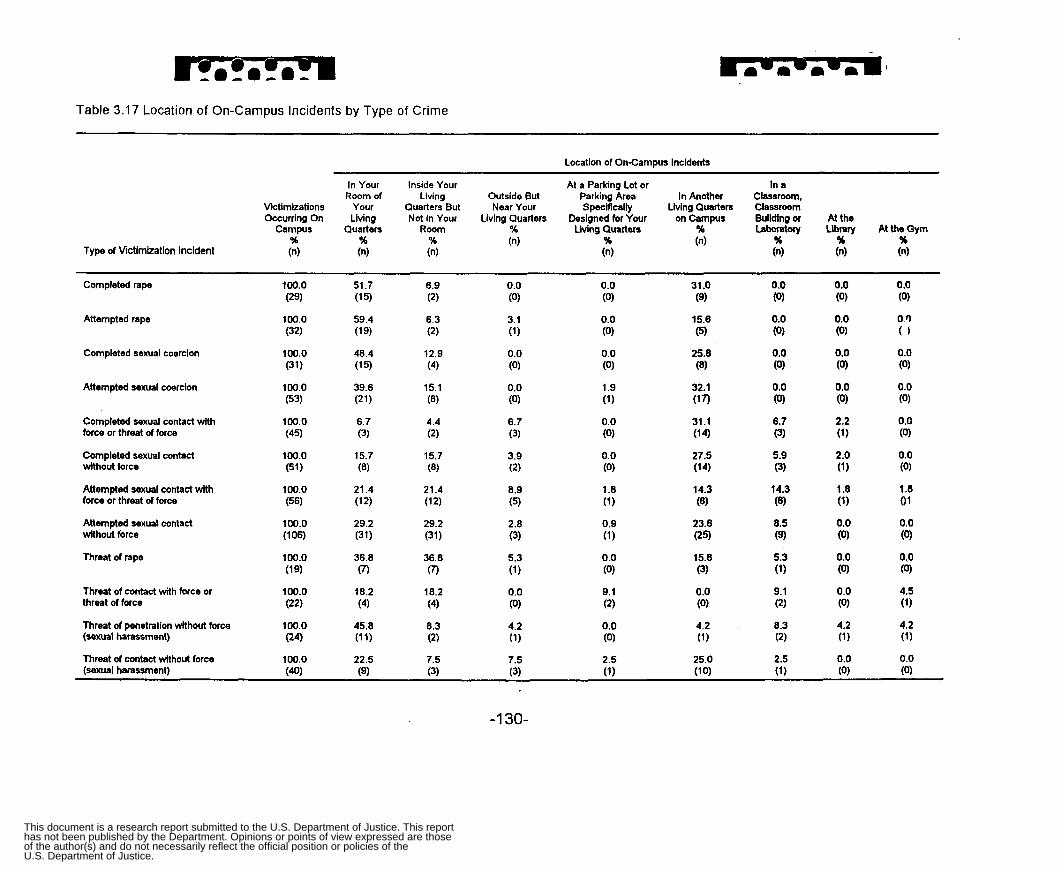
Table 3.17 Location of On-Campus Incidents by Type of Crime
Location of On-Campus Incidents
In Your Inside Your At a Parking Lot or In a Room of Living Outside But Parking Area In Another Classroom,
Victimizations Your Quarters But Near Your Specifically Living Quarters Classroom Occurring On Living Not in Your Living Quarters Designed for Your on Campus Building or At the
Campus Quarters Room % Living Quarters % Labomtory Llbmry At the Gym % % % (n) % (n) % % %
Type of Victimization incident (n) (n) (n) (n) (n) (n) (n)
Completed rape
Attempted rape
Completed sexual coercion
Attempted sexual coercion
Completed sexual contact with 100.0 6.7 4.4 6.7 0.0 31.1 6.7 2.2 0.0 force or threat of force (45) (3) (2) (3) (0) (1 4) (3) (1) (0)
Completed sexual contad without force
Attempted sexual contact with 100.0 21.4 21.4 8.9 1.8 14.3 14.3 1.8 1.8 force or threat of force (56) (1 2) (1 2) (5) (1 1 (8) (8) (1) 01
Attempted sexual contact without force
Threat of rape
Threat of contact with force or 100.0 18.2 18.2 0.0 9.1 0.0 9.1 0.0 4.5 threat d force (22) (4) (4) (0) (2) (0) (2) (0) (1)
Threat of penetration without force 100.0 45.8 8.3 4.2 0.0 4.2 8.3 4.2 4.2 (sexual harassment) (24) (1 1) (2) (1) (0) (1) 12) (1) (1)
Threat of contad without force 100.0 22.5 7.5 7.5 2.5 25.0 2.5 0.0 0.0 (sexual harassment) (40) (9) (3) (3) (1) (10) (1) (0) (0)
-1 30-
This document is a research report submitted to the U.S. Department of Justice. This reporthas not been published by the Department. Opinions or points of view expressed are thoseof the author(s) and do not necessarily reflect the official position or policies of theU.S. Department of Justice.

Table 3.17 Location of On-Campus Incidents by Type of Crime (continued)
Location of On-Campus Incidents
Outside or In a Campus Near
Victlmkations At the Parking Classroom In a Occurring On Student In a Dining DecklGaragd In an Open Area of Building, At a Motor Somewhere
Campus Union Commons Lot Campus Library or Gym Fraternlty Vehicle Else % I 56 56 % % % % %
Type of Victirnlzation Incident (n) (n) (n) (n) (n) (n) (n) (n) (n)
Completed rape
Attempted rape
Completed sexual coercion
Attempted sexual coercion
Completed sexual contact with force or threat of force
Completed sexual contact without force
Attempted sexual contact with force or threat of force
Attempted sexual contact without force
Threat of rape
Threat of contact with force or threat of force
Threat of penetration without force (sexual harassment)
100.0 (29)
100.0 (32)
(31) 100.0
100.0 (53)
(45)
100.0 (51)
(56)
100.0 (1 06)
100.0 (1 9)
100.0 (22)
100.0
100.0
100.0 (24)
Threat of contact without force 100.0 5.0 2.5 0.0 2.5 2.5 2.5 (sexual harassment) (40) (2) (1) (0) (1) (1 1 (1) . .
-1 31 -
This document is a research report submitted to the U.S. Department of Justice. This reporthas not been published by the Department. Opinions or points of view expressed are thoseof the author(s) and do not necessarily reflect the official position or policies of theU.S. Department of Justice.

Location of Ofi-Campus incidents'
inside Your Outside At a Parking Lot or At a Public In an Off- Living But Near Parking Area Street or Alley Campus
Victimizations In Your Room Quarters But Your Specitically Next to Your In a Student Occurring Off of Your Living Not in Your Living Designed for Your Living At a Motor Houslng
Campus Quarters Room Quarters Living Quarters Quarters Fraternity Vehicle Area % w x w % I % % %
Type of Victimization lncldent (n) (n) (n) (n) (n) (n) (n) (n) (n)
Completed rape
AttemRted rape
Completed sexual coercion
Attempted sexual coercion
Completed sexual contact with force or threat of force
Completed sexual contact without force
Attempted sexual contact with force or threat of force
Attempted sexual contact without force
Threat of rape
Threat d contact WHh force or threat of force
Threat of penetration without force (sexual harassment)
Threat of contact without force (sexual harassment)
-1 32-
This document is a research report submitted to the U.S. Department of Justice. This reporthas not been published by the Department. Opinions or points of view expressed are thoseof the author(s) and do not necessarily reflect the official position or policies of theU.S. Department of Justice.
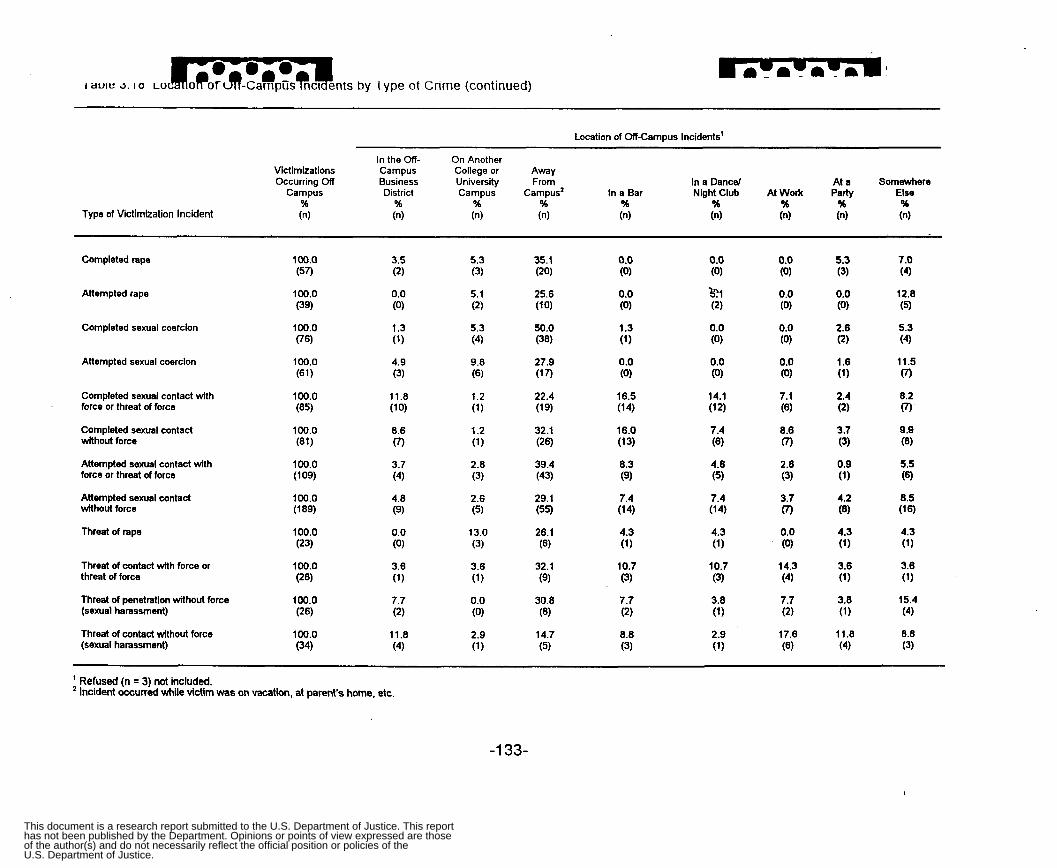
by 1 ype ot Crime (continued)
Location of Off-Campus Incidents'
In the OR- On Another Victimizations Campus College or Away Occurring Off Business University From In a Dancel At a Somewhere
Campus District Campus Campus' In a Bar Nightclub AtWork Patty Else 56 % % % % % % % %
Type of Victimization Incident (n) (n) (n) (n) (n) (n) (n) (n) (n)
Completed rape
Attempted rape
Completed sexual coercion
Attempted sexual coercion
Completed sexual contact with force or threat of force -
Completed sexual contact without force
Attempted sexual contact with force or threat of force
Attempted sexual contact without force
Threat of rape
Threat of contact with force or threat of force
Threat of penetration without force (sexual harassment)
Threat of contact without force (sexual harassment)
' Refused (n = 3) not Included. * Incident occurred while victim was on vacation, at parent's home, etc.
-1 33-
This document is a research report submitted to the U.S. Department of Justice. This reporthas not been published by the Department. Opinions or points of view expressed are thoseof the author(s) and do not necessarily reflect the official position or policies of theU.S. Department of Justice.
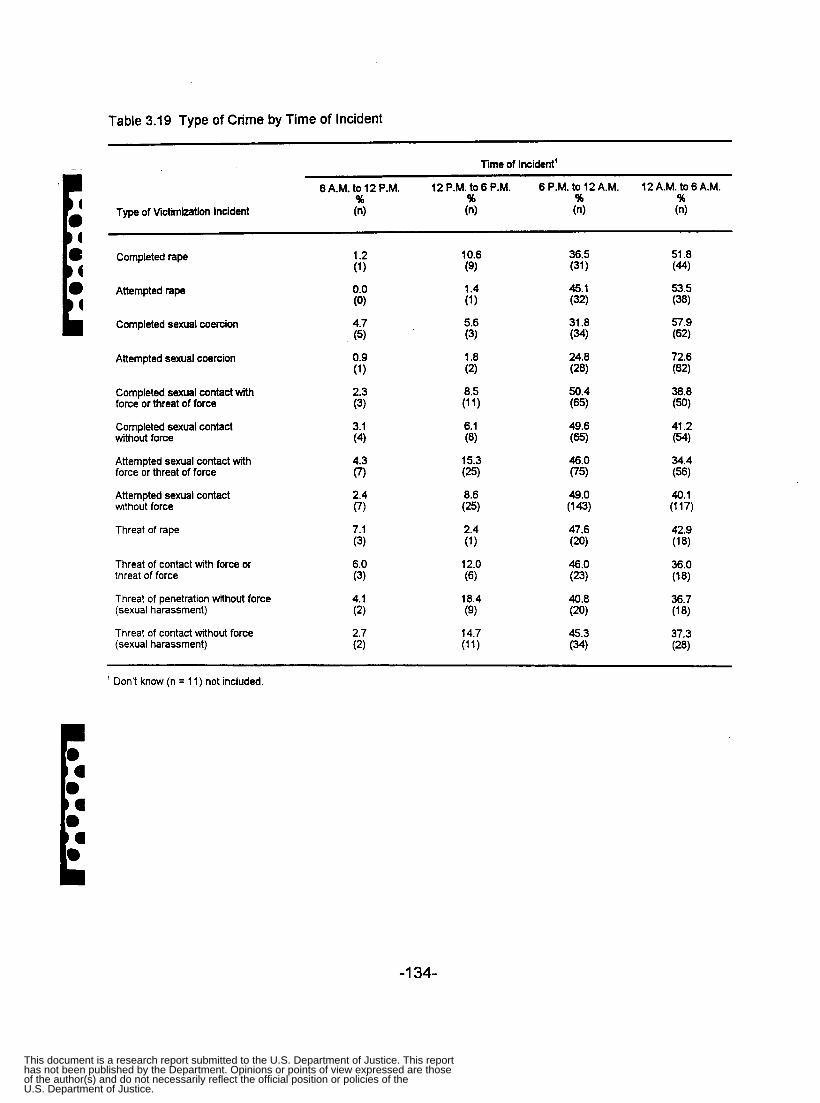
Table 3.19 Type of Crime by Time of incident
Time of Incident'
6A.M.to12P.M. 12P.M.to6P.M. 6P.M.to12A.M. 12A.M.to6A.M. % % % 96
Type of Victimization Incident (n) (n) (n) (n)
Completed rape
Attempted rape
Completed sexual coercion
Attempted sexual coercion
Completed sexual contact wiul force or threat of force
Completed sexual contact without force
Attempted sexual contact with force or threat of force
Attempted sexual contact without force
Threat of rape
Threat of contact with force or threat of force
Threat of penetration without force (sexual harassment)
Threat of contact without force (sexual harassment)
10.6 (9)
1.4 (1)
5.6 (3)
1.8 (2)
6.1 (8)
15.3 (25)
8.6 (25)
' Don't know (n = 11) not included.
-1 34-
This document is a research report submitted to the U.S. Department of Justice. This reporthas not been published by the Department. Opinions or points of view expressed are thoseof the author(s) and do not necessarily reflect the official position or policies of theU.S. Department of Justice.
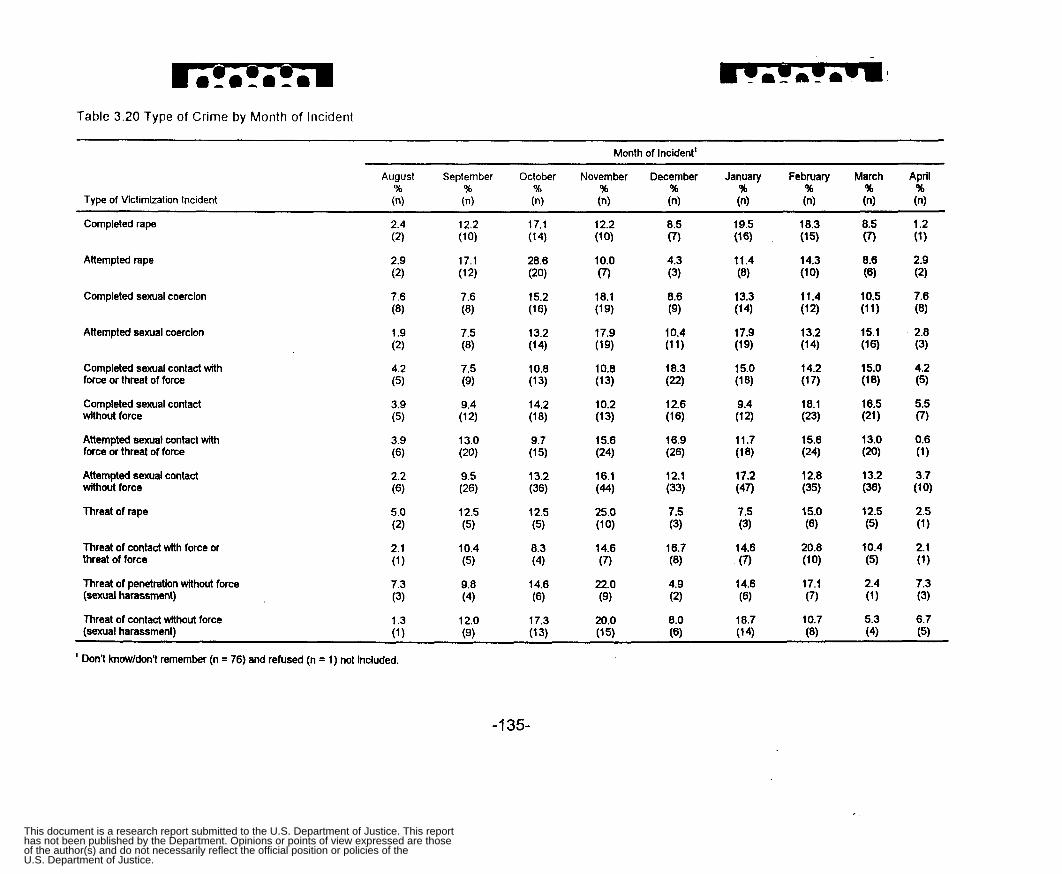
Table 3.20 Type of Crime by Month of Incident
Month of Incident' ~ ~ ~ ~
August September October November December January February March April % % % % % % % % %
Completed rape
Attempted rape
Completed sexual coercion
Attempted sexual coercion
Completed sexual contact with force or threat of force
Completed sexual contact without force
Attempted sexual contact with force or threat of force
Attempted sexual contact without force
Threat of rape
Threat of contact with force or threat of force
Threat of penetration without force (sexual harassment)
Threat of contact without force
12.2 (1 0)
10.0 0
(1 9)
17.9 (1 9)
10.8 (13)
(1 3)
(24)
(44)
(1 0)
(7)
22.0 (9)
18.1
10.2
15.6
16.1
25.0
14.6
20.0 (sexual harassment) (1 1 (1 5)
' Don't knawldont remember (n = 76) and refused (n = 1) not Included.
-1 35-
This document is a research report submitted to the U.S. Department of Justice. This reporthas not been published by the Department. Opinions or points of view expressed are thoseof the author(s) and do not necessarily reflect the official position or policies of theU.S. Department of Justice.

Table 3.21 Incidents During Academic Break by Type of Victimization Incident
Type of Victimization Incident
Incident Occurred On Academic Break‘ % (n)
Completed rape
Attempted rape
Completed sexual coercion
Attempted sexual coercion
Completed sexual contact with force or threat of force
Completed sexual contact without force
Attempted sexual contact with force or threat of force
Attempted sexual contact without force
Threat of rape
Threat of contact with force or threat of force
Threat of penetration without force (sexual harassment)
Threat of contact without force (sexual harassment)
’ Don’t know (n = 12) not included.
-1 36-
This document is a research report submitted to the U.S. Department of Justice. This reporthas not been published by the Department. Opinions or points of view expressed are thoseof the author(s) and do not necessarily reflect the official position or policies of theU.S. Department of Justice.
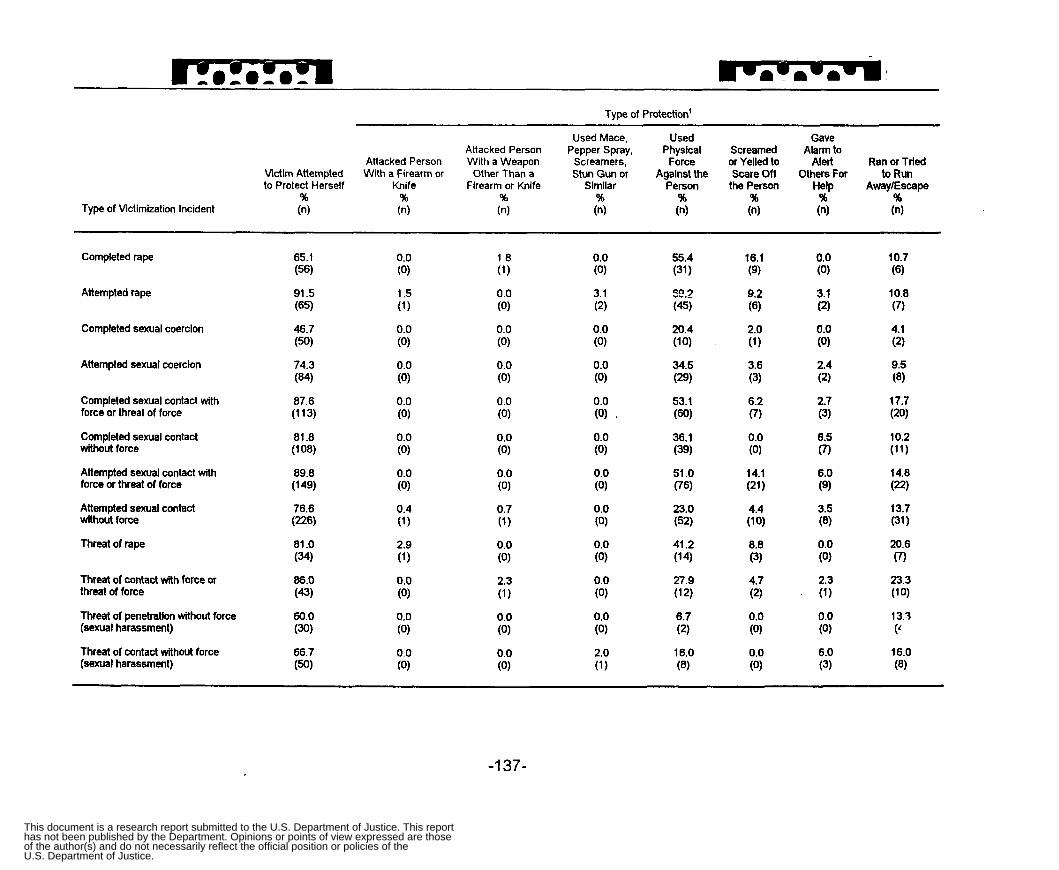
Type of Protection' ~~~ ~~
Used Mace, Attacked Person Pepper Spray,
Attacked Person With a Weapon Screamers, Vlctim Attempted With a Firearm or Other Than a Stun Gun or to Protect Herself Knife Firearm or Knife Similar
% % % % Type of Victimization Incident (4 (n) (4 (4
used Physical
Force Against the
Person % (n)
~ ~~
Gave Screamed Alarm to
Ran or Trled or Yelled to Alert Scare Off Others For to Run
the Person Help Away/Escape % % % (n) (n) (n)
Completed rape
Attempted rape
Completed sexual coerclon
Attempted sexual coercion
Completed sexual contact with force or threat of force
Completed sexual contact without force
Attempted sexual contact with force or threat of force
Attempted sexual contact without force
Threat of tape
Threat of contact with force or threat of force
Threat of penehtlon without force (sexual harassment)
Threat of contact without force (sexual harassment)
-1 37-
This document is a research report submitted to the U.S. Department of Justice. This reporthas not been published by the Department. Opinions or points of view expressed are thoseof the author(s) and do not necessarily reflect the official position or policies of theU.S. Department of Justice.

Type of Protection'
Tried to Pleaded With or Reason1 Told the Tried to Removed
Victim Attempted Begged Person Chased, Held or Negotiate With Person to Avoid Person's to Protect Herself to stop Captured Person the Person Stop Person Hand Other
% % % % % % % % Type of Victimization Incident (n) (n) ( 4 (n) (n) (n) (n) (n)
Completed rape
Attempted rape
Completed sexual coercion
Attempted sexual coercion
Completed sexual contact with force or threat of force
Completed sexual contact without force
Attempted sexual contact with force or threat of force
Attempted sexual contact without force
Threat of rape
Threat of contact with force or threat of force
Threat of penetration without force (sexual harassment)
Threat of contact without force (sexual harassment)
' Percentages may be greater than 100.0 because a respondent could give more than one response.
-1 38-
This document is a research report submitted to the U.S. Department of Justice. This reporthas not been published by the Department. Opinions or points of view expressed are thoseof the author(s) and do not necessarily reflect the official position or policies of theU.S. Department of Justice.

Table 3.23 Type of Injuries Suffered by Type of Crime
Nature of Injuries Suffered'
Injury From Sexual Brulses, the Assault Black-Eye.
the Sexual Sexual the Sexual Gun Bonesor Scratches, Wctlm Intercourse lntercoune Intercourse Knife or Shot or Teeth Swelling or
Injury From Allempled Other Than Broken cuts,
Suffered or Sexual or Sexual or Sexual Stab Bullet Knocked Internal Knocked Emotlonalor - an Injury' Contact Contad Contact Wound Wounds Out lnjurles Unconsclous c:gr Psychological Other
% % % % % % % % % % % % Type of Victimization Incident (n) (n) (n) (n) (n) (n) (n) (n) (n) (n) (n) @)
Completed rape
Allempled rape
Completed sexual coercion
Allempled sexual coerclon
Completed hsxual contad with force or threat of force
Completed sexual contad without force
Anempted sexual conlad with force or threat of force
Allempled sexual contad wllhout force
Threat of rape
Threat of contact with force or threat of force
Threat of penetration without force (sexual harassment)
Threat of contad w i th4 force (sexual harassment)
0.0 (0) '
0.0 (0)
88.2 41 2 (15) (7)
' Don1 h o w (n = 1) not included. ' Percentages may be greater than 100.0 bemuse a respondent could give more than one response.
-1 39-
This document is a research report submitted to the U.S. Department of Justice. This reporthas not been published by the Department. Opinions or points of view expressed are thoseof the author(s) and do not necessarily reflect the official position or policies of theU.S. Department of Justice.
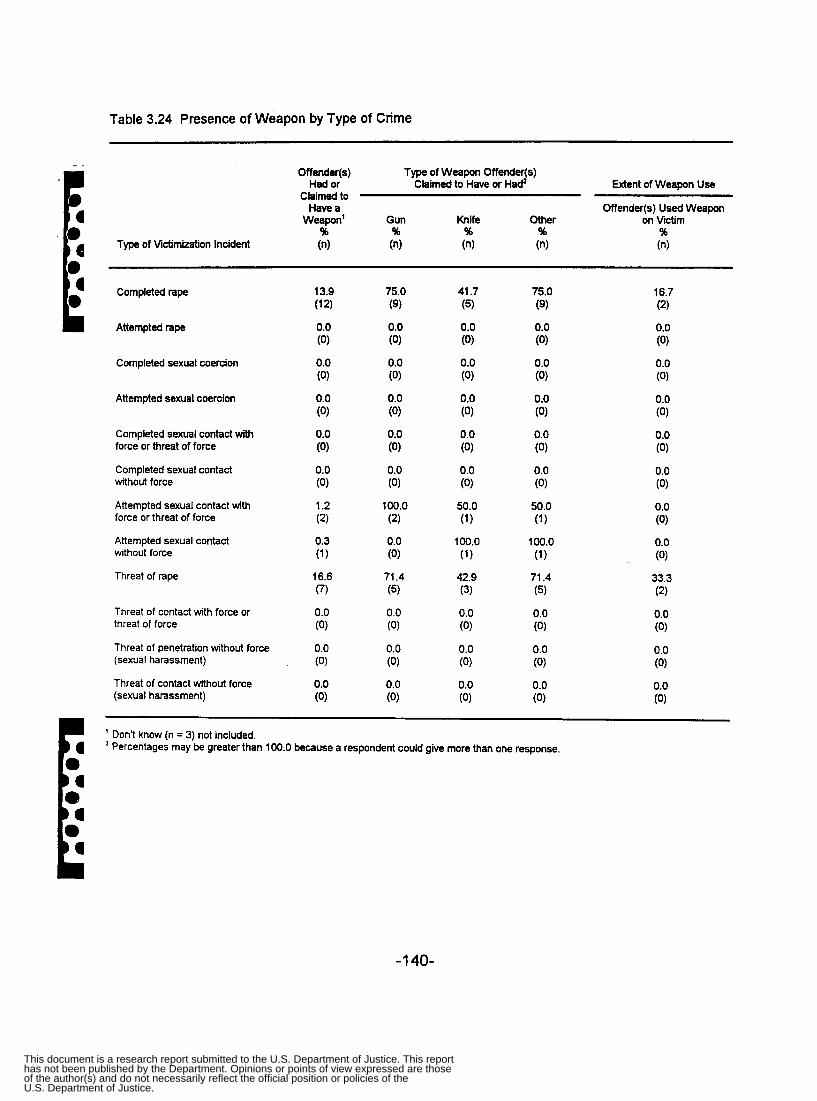
Table 3.24 Presence of Weapon by Type of Crime
Offender(s) Type of Weapon Offender@) Had or
Chimed to Have a Offender@) Used Weapon
Weapon‘ Gun Knife Other on Victim % % % % %
Claimed to Have or Had’ Extent of Weapon Use
Type of Victimization Incident (n) (n) (n) (n) (n)
Completed rape
Attempted rape
Completed sexual coercion
Attempted sexual coercion
Completed sexual contact with force or threat of force
Completed sexual contact without force
Attempted sexual contact with force or threat of force
Attempted sexual contact without force
Threat of rape
Threat of contact with force or threat of force
Threat of penetration without force (sexual harassment)
Threat of contact without force (sexual harassment)
’ Don’t know (n = 3) not included. Percentages may be greater than 100.0 because a respondent could give more than one response.
-1 40-
This document is a research report submitted to the U.S. Department of Justice. This reporthas not been published by the Department. Opinions or points of view expressed are thoseof the author(s) and do not necessarily reflect the official position or policies of theU.S. Department of Justice.
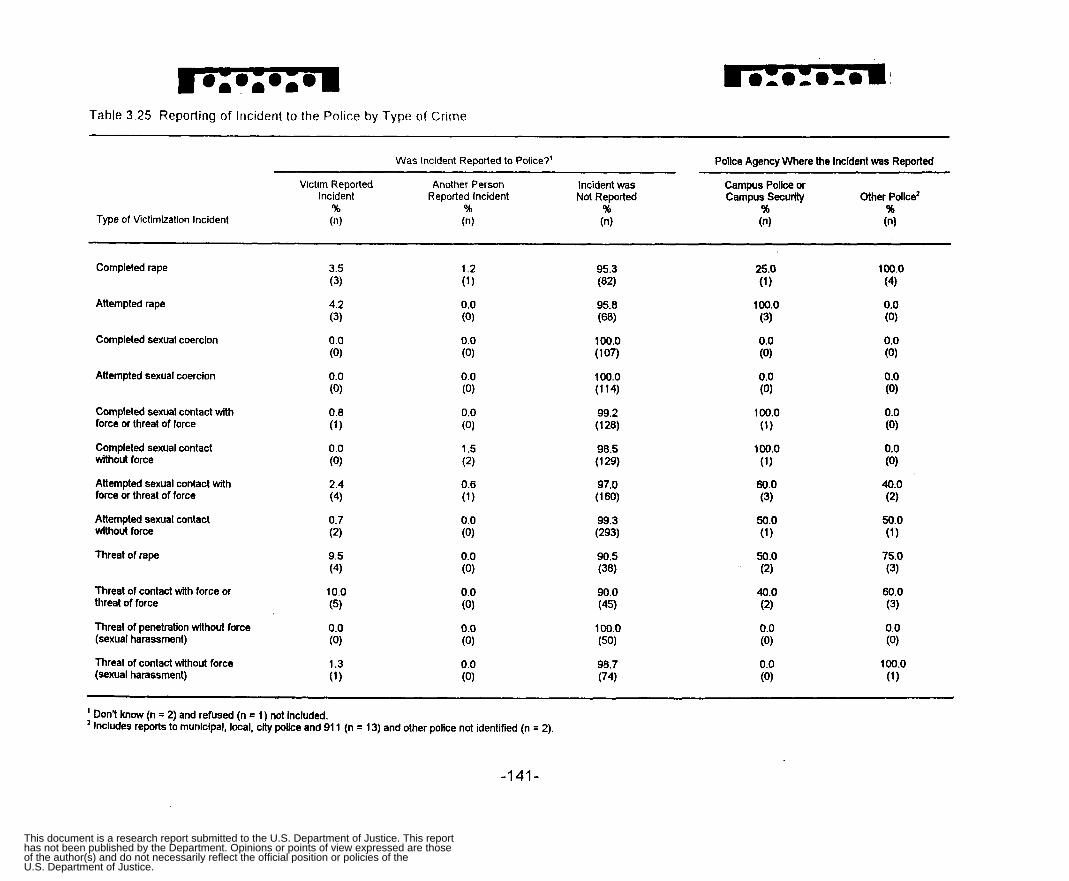
Table 3.25 Reporting of Incident to the Police by Type of Crime
Was incident Reported to Police?' Pollce Agency Where the Incident was Reported
Victim Reported Another Person Incident was Campus Police or Incident Reported Incident Not Reported Campus Security Other Police'
% ?& % % % Type of Victimization Incident (n) (n) (n) (n) (n)
Completed rape
Attempted rape
Completed sexual coercion
Attempted sexual coercion
Completed sexual contact with force or threat of force
Completed sexual contact without force
Attempted sexual contact with force or threat of force
Attempted sexual contact without force
Threat of rape
Threat of contact with force or threat of force
Threat of penetration without force (sexual harassment)
Threat of contact without force (sexual harassment)
' Don't know (n = 2) and refused (n = 1) not Included. ' Includes reports to municipal, local, city police and 91 1 (n = 13) and other police not identified (n = 2)
-1 41 -
This document is a research report submitted to the U.S. Department of Justice. This reporthas not been published by the Department. Opinions or points of view expressed are thoseof the author(s) and do not necessarily reflect the official position or policies of theU.S. Department of Justice.

Table 3.26 Reported Incident to Someone Besides the Police by Type of Crime
Other Person(s) That Were Told of Incident' Victim Told
Someone Besides Roommate, the Police About Parents or a Husband, Boyfriend Family Member Suitemete 01 Residence
the Incident' Parent or Partner Other Than Parents Friend Housemate Hall Advisor % I % % % % %
Type of Victimization Incident (4 (n) (n) (n) (n) (n) (n)
Completed rape
Attempted rape
Completed sexual coercion
Attempted sexual coercion
Completed sexual contact with force or threat of force
Completed sexual contact without force
Attempted sexual contact with force or threat of force
Attempted sexual contact without force
Threat of rape
Threat of contact with force or threat of force
Threat of penetration without force (sexual harassment)
Threat of contact without force (sexual harassment)
2.7 (1)
7.1 (4)
6.3 (3)
6.2 (4)
0.0 (0)
(9)
1.9 (2)
5.6 0 1.5 (3)
(3)
10.8 (4)
(1)
(2)
9.3
10.3
3.4
4.2
76.8 (43)
64.6 (31 )
69.2 (45)
79.7 (59)
83.5 (81)
(84)
72.8 (91)
(153)
(1 7)
79.2
75.0
58.6
64.9 (24)
(1 9) 65.5
54.2 (26)
-1 42-
This document is a research report submitted to the U.S. Department of Justice. This reporthas not been published by the Department. Opinions or points of view expressed are thoseof the author(s) and do not necessarily reflect the official position or policies of theU.S. Department of Justice.
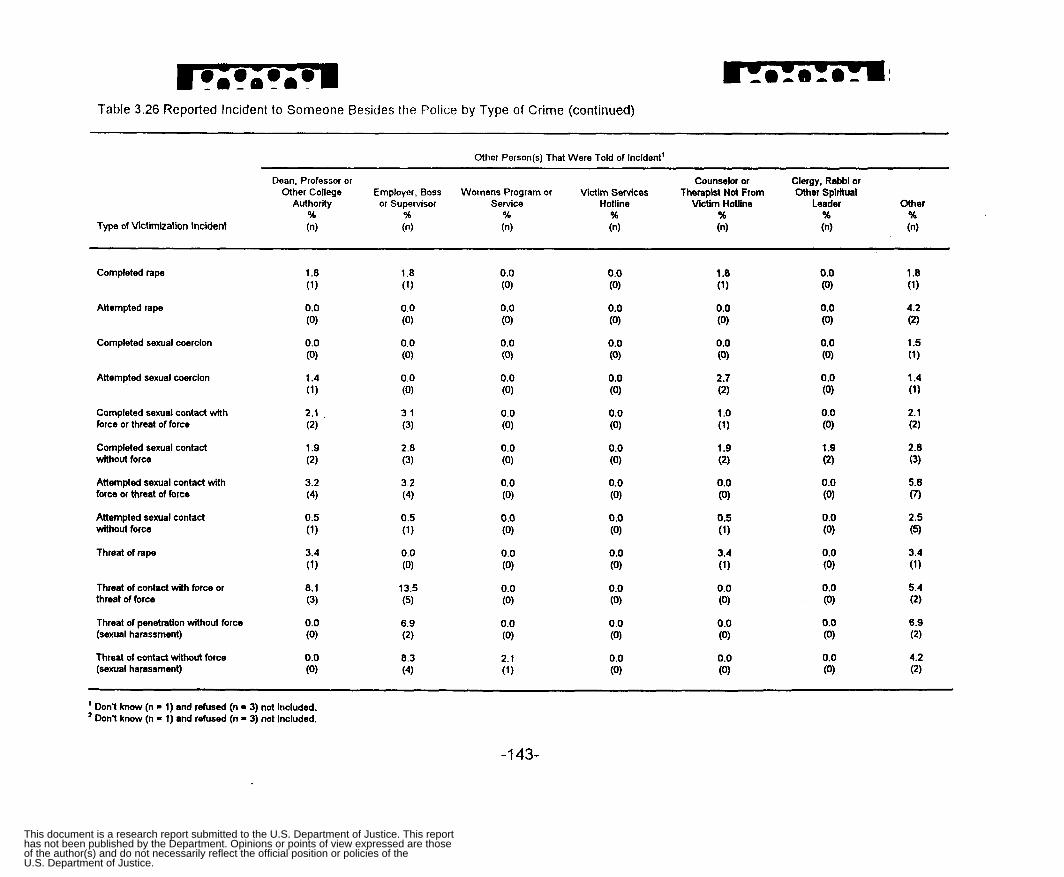
Table 3.26 Reported Incident to Someone Besides the Police by Type of Crime (continued) ~~ _ _ _ ~ ~ _ _ _ ~ -
Other Person(s1 That Were Told of Incident'
Dean, Professor or Counselor or Clergy. Rabbi or Other College Employer, Boss Wornens Program or Victim Services Therapist Not From Other Spiritual
Authority or Supervisor Service Hotline Victim Hotline Leader Other 56 I w % % % %
Type of Victimization Incident (n) (n) (n) (n) (n) (n) (n)
Completed rape
Attempted rape
Completed sexual coerclon
Attempted sexual coerclon
Completed sexual contact with force or threat of force
Completed sexual contact without force
Attempted sexual contact with force or threat of force
Attempted sexual contact without force
Threat of rape
Threat of contact with force or threat of force
Threat of penetration without force (sexual harassment)
Threat of contact without force (sexual harassment)
' Don't know (n = 1) and refused (n - 3) not included. Don't know (n = 1) end refused (n = 3) not included.
-1 43-
This document is a research report submitted to the U.S. Department of Justice. This reporthas not been published by the Department. Opinions or points of view expressed are thoseof the author(s) and do not necessarily reflect the official position or policies of theU.S. Department of Justice.
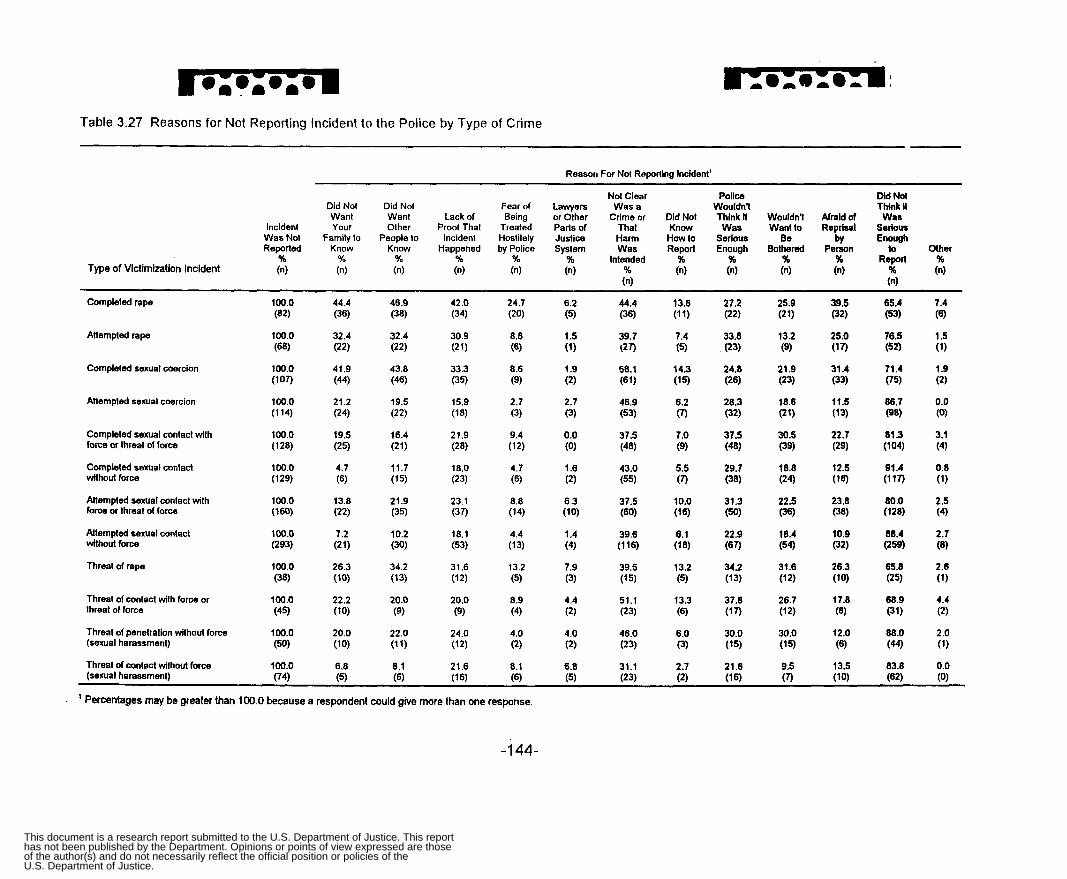
Table 3.27 Reasons for Not Reporting Incident to the Police by Type of Crime
~ ~~~ ~ -~~
Reason For Not Reporllng Incident'
Not Clear Police Did Not Did Not Did Not Fearof Lawyers Wasa WoutdnY Thhk H Want Want Lackof Being orother Crimeor DidNot Thinkh WoutdnY Afraidof Was
Incident Your OIher Proof That Treated Pads of That Know Was Wanlto Reprisal Serious Was Not Family to People to Incident Hostilely Justice Harm How to Serious Be by Enough Reporled Know Know Happened byPolice System Was Report Enough Bothered Person to Other
% % % Yo % % intended % % % % Reporl % Type of Victimization Incident (n) (n) (n) (0 ) (n) (n) 96 (n) (n) (n) (n) 96 (n)
(n) (n)
Completed rape
Attempted rape
Completed sexual coercion
AHempted sexual coercion
Completed sexual contact with force or threat of force
Completed sexual contact without force
Anempled sexual contact with force or threat of force
Atlempted sexual contact without force
Threat of rape
Threat of contact with force or threat of force
Threat of penetration without force (sexual harassment)
Threat of contact without force lsexual harassment)
42 .O (34)
(21)
(35)
15.9 (18)
21.9 (28)
18.0 (23)
23.1 (37)
18.1 (53)
(12)
(9)
(12)
21.6 (16)
30.9
33.3
31.6
20.0
24.0
44.4 (36)
1227)
(61)
(53)
(48)
(55)
37.5 (60)
(116)
39.5 (1 5)
51.1 (23)
39.7
58.1
46.9
37.5
43.0
39.6
46.0 (23)
31.1 (23)
27.2 (22)
33.8 (23)
24.0 (26)
28.3 (32)
37.5 (48)
29.7 (38)
31.3 (so)
22.9 (627)
34.2 (13)
37.8 (1 7)
(15)
21.6 (16)
30.0
25.9 (21)
(9) 13.2
21.9 (23)
18.6 (21)
30.5 (19)
18.8 (24)
22.5 (36)
18.4 (54)
(12)
(12)
(15)
9.5
31.6
26.7
30.0
(n
39.5 (32)
(17)
(33)
(13)
(29)
(16)
23.8 (38)
10.9 (32)
(10)
(8)
12.0 (6)
13.5 (10)
25.0
31.4
11.5
22.7
12.5
26.3
17.0
. . . . . . . . . . . . . . . . ~ -I ~~
' Percentages may be greater than 100.0 because a respondent could give more than one response.
-1 44-
This document is a research report submitted to the U.S. Department of Justice. This reporthas not been published by the Department. Opinions or points of view expressed are thoseof the author(s) and do not necessarily reflect the official position or policies of theU.S. Department of Justice.

Table 3.28 Crime Prevention Activities by Victim Status
Crime Prevention Behaviors' Crime Prevention ActMtles Completed Since
School Began In the Fall of 1996'
Percent That Engaged in
at Least One Carry Mace, Carry a Crime Pepper- Gun or
Prevention Spray, or a Other Behavior Screamer Firearm
% % % Status (n) (n) (n)
Carry a Knife or Other
Weapon Not
Including a Firearm
% ( 4
Use Any Campus- Sponsored Crime
Prevention Services, Such as Campus Escort
Service, Paths With Blue Light
Emergency Phones or Something Else
% ( 4
Ask Someone to Walk or Drive
You to Your Dormitory, the Library, Your Car, or Some
Other Destination After Dark
% (n)
Walk In a Group WRh
Others to Your Dormitory, the Library, Your Car, or Some
Other Destination After Dark
% (n)
Percent Who
Attended at Least One
Crime Taken a Attended a Crime Prevention Self- Prevention or Educational Defense Rape AW. eness
Activity Course Semlnar % % % (n) (n) (n)
Not a 88.1 26.6 1 .o 6.0 29.8 63.5 76.3 23.8 7.8 19.3 victim (3,307) (997) (39) (227) (1,117) (2,385) (2,863) (892) (294) (724)
(627) (206) (2) (59) (273) (507) (567) (222) (65) (1 87) Wctirn 90.7 29.8 0.3 8.5 39.5 73.4 82.1 32.1 9.4 27.1
' Percentages may be greater than 100.0 because a respondent could give more than one response.
-1 45-
This document is a research report submitted to the U.S. Department of Justice. This reporthas not been published by the Department. Opinions or points of view expressed are thoseof the author(s) and do not necessarily reflect the official position or policies of theU.S. Department of Justice.
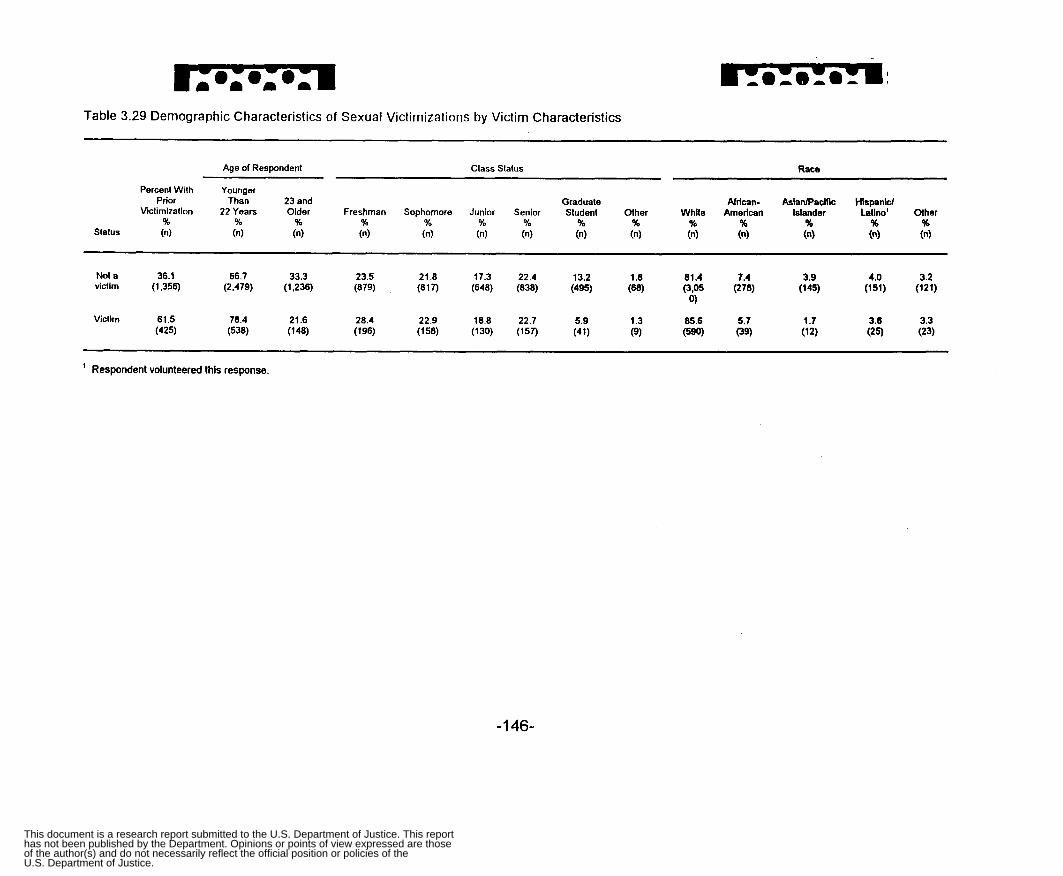
Table 3.29 Demographic Characteristics of Sexual Victimizations by Victim Characteristics
Age of Respondent Class Stalus Race
Percent With Younger
Wctimization 22 Years Older Freshman Sophomore Junior Senior Student Other WhHe American Islander Latino' Other Prior Than 23 and Graduate African- AsianlpacHic Hispanid
% % % % 96 % % YO % % % % % % Stalus (n) (n) (n) (n) (n) (n) (n) (n) (n) (n) (n) (n) (n) (n)
No! a 36.1 66.7 33.3 23.5 21.8 17.3 22.4 13.2 1.8 81.4 7.4 3.9 4.0 3.2 victim (1,356) (2,479) (1,236) (879) (817) (648) (838) (495) (68) w 5 (278) (1 45) (151) (121)
0)
Victim 61.5 78.4 21.6 28.4 22.9 18.8 22.7 5.9 1.3 85.6 5.7 1.7 3.6 3.3 (425) (538) (148) (196) (158) (130) (157) (41) (9) (590) (39) (12) (2s) (23)
~~
' Respondent volunteered this response.
-1 46-
This document is a research report submitted to the U.S. Department of Justice. This reporthas not been published by the Department. Opinions or points of view expressed are thoseof the author(s) and do not necessarily reflect the official position or policies of theU.S. Department of Justice.

Table 3.30 Multivariate Model Identifying Risk Factors of Sexual Victimization
Factors
Exposure to Crime
Propensity to be at Places with Men 193" 1.21 3 i.077)
Propensity to be at Places with Alcohol .209" 1.233
Frequency of Drinking Enough Alcohol to Get Drunk .196" 1.216
Frequency of Smoking Pot or Hashish .025 1.026
(.069)
(.039)
(.034)
(.129) Member of or Pledge to Social Sorority .lo5 1.111
Guardianship Measure
Live Alone .274" (.122)
Proximity to Motivated Offenders
Part-time Student
Live in a Coed Dorm
Live On Campus
Relationship Status
Involved in a Relationship
Some Dating
Never Date
Prior Victimization
Prior Sexual Victimization
Demographic Characteristics
Family Class
.157 (.193)
-. 028 (.125)
-.OB9 (.142)
.879" (.208)
1.178"
1.159" (.317)
(.208)
,528" (. 042)
,148" (.060)
1.315
1.170
0.973
0.915
2.409
3.249
3.188
1.695
1.159
Race/Ethniclty
.325' 1.384 African-American, non-HispanidLatino (.199)
Hispanic/Latino
Other, Non-HispanicILatino
.307 (.191)
-. 197 (223)
1.359
0.821
Age -.040" 0.961 (.019)
-1 47-
This document is a research report submitted to the U.S. Department of Justice. This reporthas not been published by the Department. Opinions or points of view expressed are thoseof the author(s) and do not necessarily reflect the official position or policies of theU.S. Department of Justice.

Table 3.30 Multivariate Model Identifying Risk Factors of Sexual Victimization (continued)
Factors
Class Standing
FreshmenlSophomore
JuniorKenior
Sexual Orientation
Heterosexual
Constant
-2 log-likelihood = 3273.871
df = 21
Model x2 = 469.570
Significance of model Y' = .OOOO
.520" (.212)
1.682
.497" 1.643 (.lea)
-.440' (.256)
-4.446" (.693)
0.644
' Significance levels: p s . I O , ... p 5 .05, " p 2 .01.
-1 48-
This document is a research report submitted to the U.S. Department of Justice. This reporthas not been published by the Department. Opinions or points of view expressed are thoseof the author(s) and do not necessarily reflect the official position or policies of theU.S. Department of Justice.
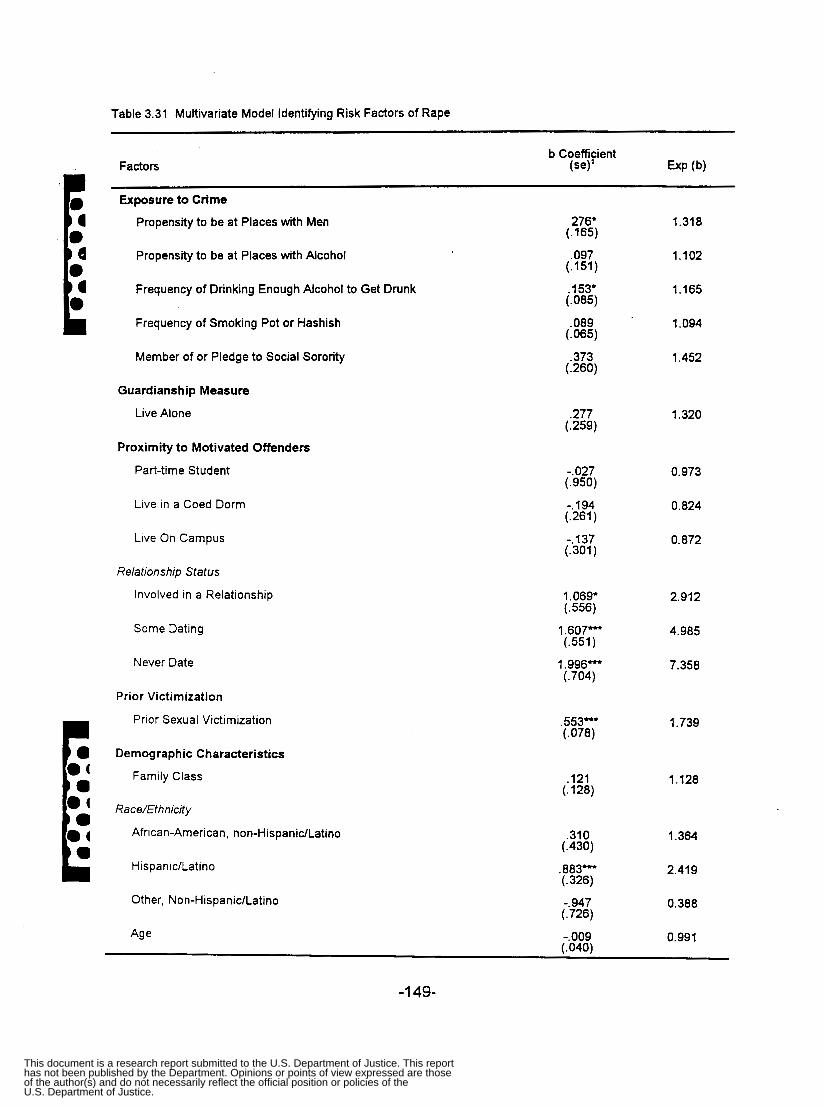
Table 3.31 Multivariate Model Identifying Risk Factors of Rape
Factors
Exposure to Crime
Propenslty to be at Places with Men
Propensity to be at Places with Alcohol
Frequency of Drinking Enough Alcohol to Get Drunk
Frequency of Smoking Pot or Hashish
Member of or Pledge to Social Sorority
Guardianship Measure
Live Alone
Proximity to Motivated Offenders
Part-time Student
Live in a Coed Dorm
Live On Campus
Relationship Status
Involved in a Relationship
Some Dating
Never Date
Prior Victimization
Prior Sexual Victimization
Demographic Characteristics
Family Class
Race/Ethnicity
African-American, non-HispanidLatino
His paniclLat ino
Other, Non-Hispanic/Latino
276' (.165)
,097 (.151)
.153' (. 085)
.089 (. 065)
.373 (.260)
.277 (.259)
-.027 (. 950)
(.26l) - 194
- 137 (.301)
1.069* (.556)
1.607" (.551)
1.996" (. 704)
.553- (. 078)
,121 (.128)
,310 (.430)
.883" (. 326)
-. 947 (.726)
1.318
1.102
1.165
1.094
1.452
1.320
0.973
0.824
0.872
2.912
4.985
7.358
1.739
1.128
1.364
2.419
0.388
0.991 Age -.009 (. 040)
-1 49-
This document is a research report submitted to the U.S. Department of Justice. This reporthas not been published by the Department. Opinions or points of view expressed are thoseof the author(s) and do not necessarily reflect the official position or policies of theU.S. Department of Justice.
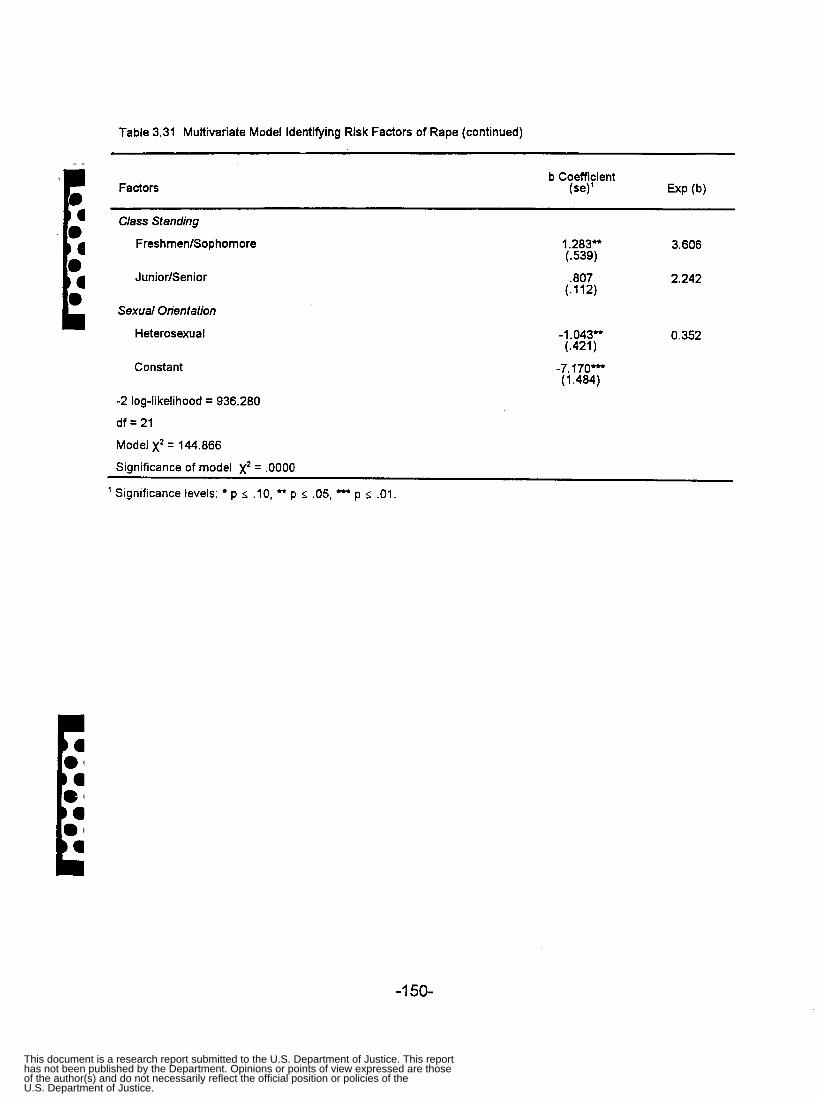
Table 3.31 Multivariate Model Identifying Risk Factors of Rape (continued)
Factors
Class Standing
FreshmenlSophornore 1.283" 3.606 (. 539)
Junior/Senior
Sexual Orientation
Heterosexual
Constant
.e07 2.242 (.112)
,l .043" (.421)
-7.170" (1.484)
0.352
-2 log-likelihood = 936.280 df = 21 Model x2 = 144.866 Significance of model x2 = .OOOO
' Significance levels: p i . lo , * p < .05, - p 5 .01.
-1 50-
This document is a research report submitted to the U.S. Department of Justice. This reporthas not been published by the Department. Opinions or points of view expressed are thoseof the author(s) and do not necessarily reflect the official position or policies of theU.S. Department of Justice.
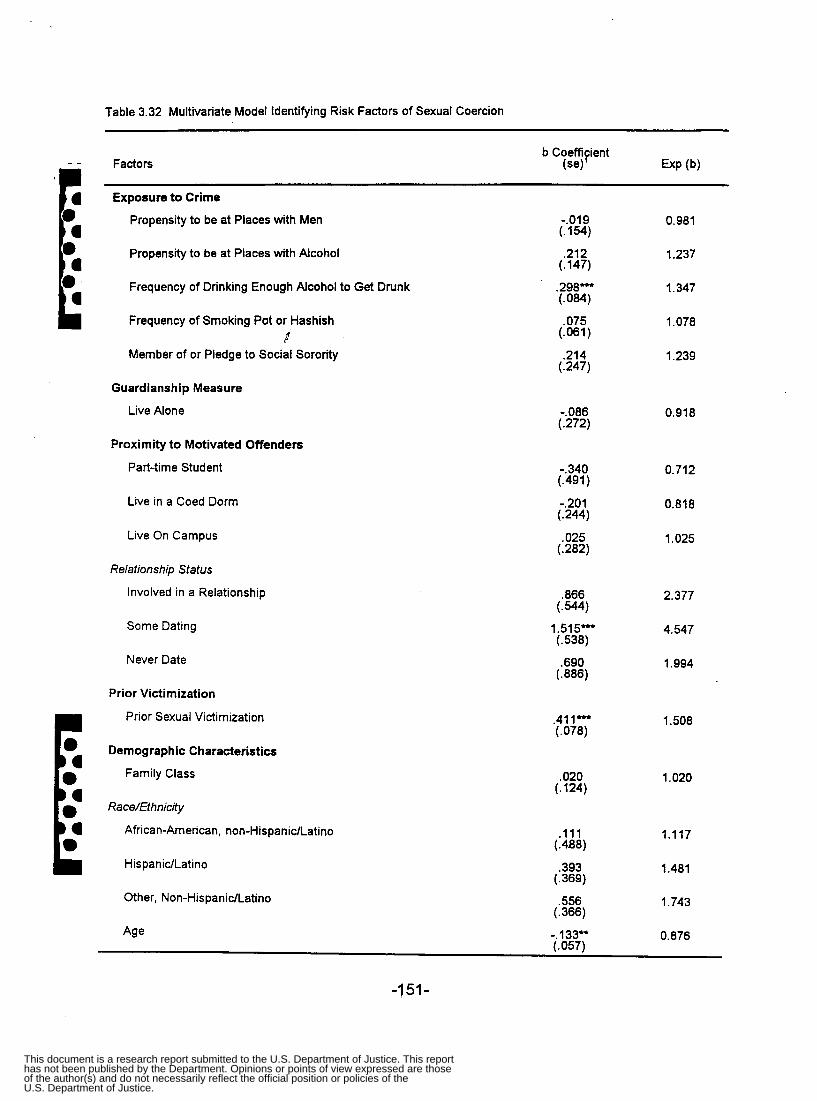
Table 3.32 Multivariate Model Identifying Risk Factors of Sexual Coercion
Factors
Exposure to Crime
Propensity to be at Places with Men
Propenstty to be at Places with Alcohol
Frequency of Drinking Enough Alcohol to Get Drunk
Frequency of Smoking Pot or Hashish
Member of or Pledge to Social Sorority r"
Guardianship Measure
Live Alone
Proximity to Motivated Offenders
Part-time Student
Live in a Coed Dorm
Live On Campus
Relationship Status
Involved in a Relationship
Some Dating
Never Date
Prior Victimization
Prior Sexual Victimization
Demographic Characteristics
Family Class
RaceIEthnicity
African-American, non-HispanidLatino
His panidLatino
Other, Non-HispanidLatino
-.019 (.1%)
.212 (.147)
.298" (. 084)
.075 (.061)
.214 (.247)
-.086 (.272)
-.340 (.491)
-.201 (.244)
.025 (.282)
.866
1.515" (.538)
.690 (.886)
(. 544)
.411" (. 078)
.020 (.124)
.ill (.488)
.393 (. 369)
.556 (.366)
0.981
1.237
1.347
1.078
1.239
0.918
0.712
0.818
1.025
2.377
4.547
1.994
1.508
1.020
1.117
1.481
1.743
0.876
-1 51 -
This document is a research report submitted to the U.S. Department of Justice. This reporthas not been published by the Department. Opinions or points of view expressed are thoseof the author(s) and do not necessarily reflect the official position or policies of theU.S. Department of Justice.
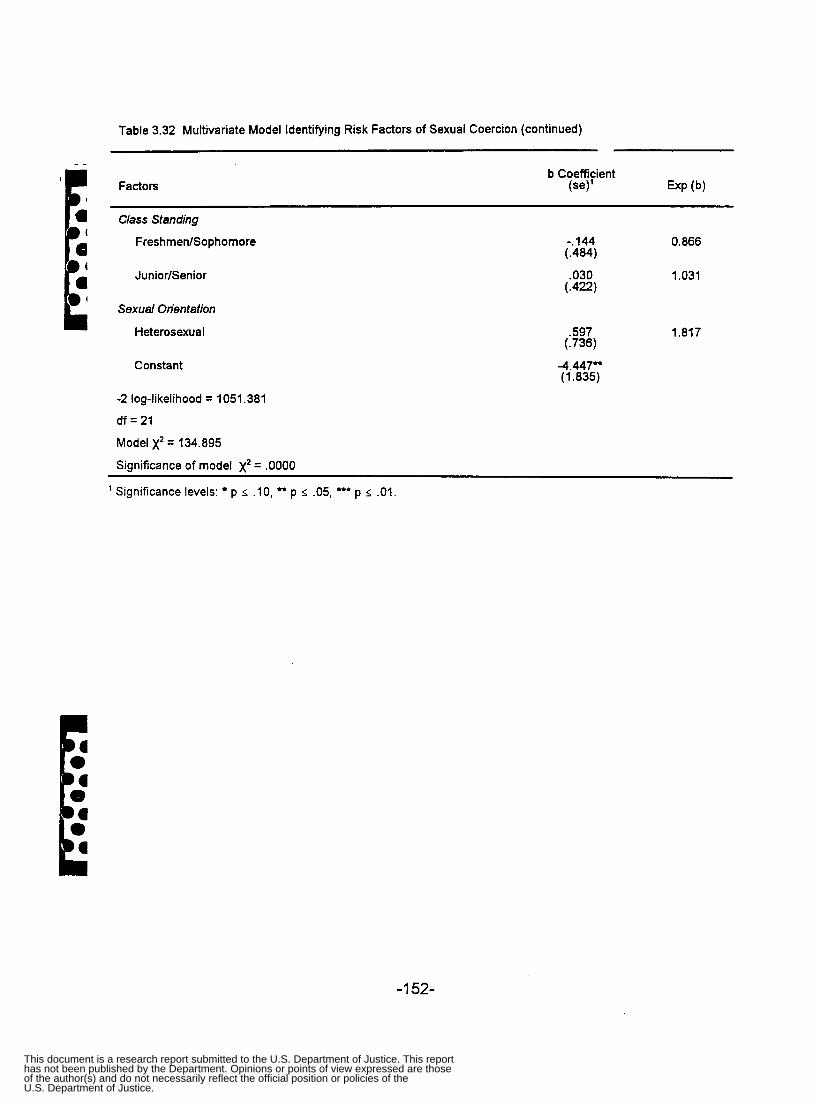
Table 3.32 Multivariate Model Identifying Risk Factors of Sexual Coercion (continued)
Factors
Class Standing
Freshmen/Sophomore -.144 0.866
JuniorlSenior .030 1.031
(.484)
(.4W Sexual Orientation
Heterosexual .597 1.817 (.736)
Constant
-2 log-likelihood = 1051.381
-4.447" (1.835)
df = 21
Model x2 = 134.895 Significance of model xz = .OOOO
' Significance levels: p < . lo, " p 5 .05, "+ p < .01.
-1 52-
This document is a research report submitted to the U.S. Department of Justice. This reporthas not been published by the Department. Opinions or points of view expressed are thoseof the author(s) and do not necessarily reflect the official position or policies of theU.S. Department of Justice.

Table 3.33 Multivariate Model Identifying Risk Factors of Sexual Contact
Factors
Exposure to Crime
Propensity to be at Places with Men 1.21 0
1.254
1.146
0.953
0.915
1.414
1.146
1.169
0.855
2.256
2.315
2.642
1.454
1.154
1.149
0.820
0.741
0.979
.191- (.095)
Propensity to be at Places with Alcohol 226" (.086)
Frequency of Drinking Enough Alcohol to Get Drunk .137"
-. 048 ( .044)
Frequency of Smoking Pot or Hashish
Member of or Pledge to Social Sorority -.OB9 (.164)
Guardianship Measure
Live Alone ,346" (.145)
Proximity to Motivated Offenders
Part-time Student .136 (.235)
Live in a Coed Dorm .156 (.158)
Live On Campus
Relationship Status
Involved in a Relationship
-. 157 (.180)
.813" (.255)
Some Dating .840" (.257)
Never Date
Prior Victimization
Prior Sexual Victimization
.972" (. 387)
.375- (. 050)
Demographic Characteristics
Family Class 143' i.074)
Race/Ethniuty
African-American, non-HispanidLatino
His pan ic/Latino
.139 (.250)
- 199 (.267)
Other, Non-HispanidLatino -.300 (.287)
Age -.021 (. 023)
-1 53-
This document is a research report submitted to the U.S. Department of Justice. This reporthas not been published by the Department. Opinions or points of view expressed are thoseof the author(s) and do not necessarily reflect the official position or policies of theU.S. Department of Justice.

Table 3.33 Multivariate Model Identifying Risk Factors of Sexual Contact (continued)
b Coefficient Factors W’ ExP (b)
Class Standing
Freshrnen/Sophornore .332 1.393
JuniorlSenior .373’ 1.452
(.257)
(.225)
Sexual Orientation
Heterosexual -.247 (.319)
0.781
Constant
-2 log-likelihood = 2382.535
df = 21
Model x z = 181.536
Significance of model x2 = .OOOO
-4.930” (.861)
’ Significance levels: p < . lo, p .05, - p < .01.
-1 54-
This document is a research report submitted to the U.S. Department of Justice. This reporthas not been published by the Department. Opinions or points of view expressed are thoseof the author(s) and do not necessarily reflect the official position or policies of theU.S. Department of Justice.
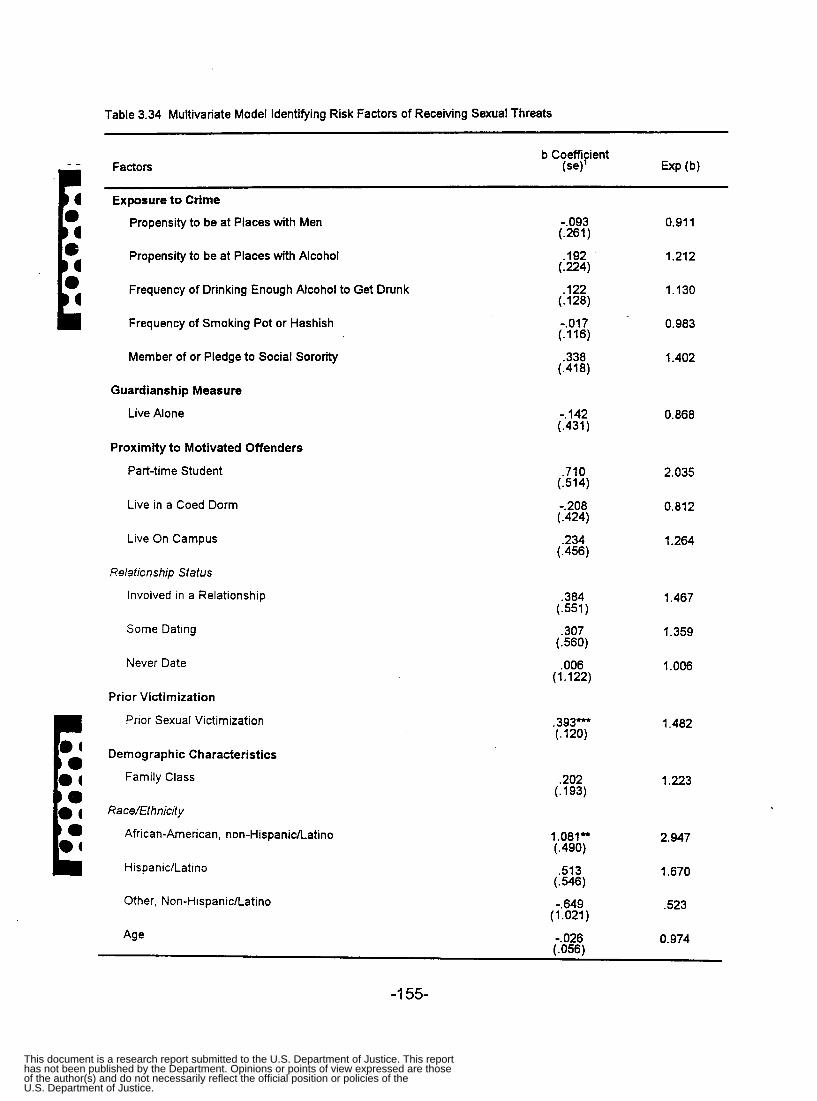
Table 3.34 Multivariate Model Identifying Risk Factors of Receiving Sexual Threats
Factors
Exposure to Crime
Propensity to be at Places with Men
Propensity to be at Places with Alcohol
Frequency of Drinking Enough Alcohol to Get Drunk
Frequency of Smoking Pot or Hashish
Member of or Pledge to Social Soronty
Guardianship Measure
Live Alone
Proximity to Motivated Offenders
Part-time Student
Live in a Coed Dorm
Live On Campus
Relationship Status
involved in a Relationship
Some Dating
Never Date
Prior victimization
Prior Sexual Victimization
Demographic Characteristics
Family Class
Ra cdEthnicity
African-American, non-HispanidLatino
His p a n i clLat I no
Other, Non-HispanidLatino
-.093 (.261)
.192
.122 (.128)
-.017 (.116)
.338 (.418)
(-224)
-. 142 (.431)
.710 (.514)
(.424)
.234 (.456)
-.208
.384 (.551)
.307 (560)
.006 (1.122)
.393- (.120)
.202 (.193)
1.081” (.490)
.513 (. 546)
-.649 (1.021)
0.91 1
1.21 2
1.130
0.983
1.402
0.868
2.035
0.812
1.264
1.467
1.359
1.006
1.482
1.223
2.947
1.670
.523
0.974 Age -.026 (.056)
-1 55-
This document is a research report submitted to the U.S. Department of Justice. This reporthas not been published by the Department. Opinions or points of view expressed are thoseof the author(s) and do not necessarily reflect the official position or policies of theU.S. Department of Justice.

Table 3.34 Multivariate Model Identifying Risk Factors of Receiving Sexual Threats (continued)
Factors b Coefficient
(se)'
Class Standing
FreshmedSophomore .741 (.716)
2.097
JuniorlSenior .967 2.630 (.654)
Sexual Orientation
Heterosexual
Constant
-.866 0.421 (.640)
-6.215" (2.066)
-2 log-likelihood = 489.061
df = 21
Model x2 = 28.882
Significance of model x2 = .1169
' Significance levels: * p s . I O , tt p 2 .05, - p 2 .01
-1 56-
This document is a research report submitted to the U.S. Department of Justice. This reporthas not been published by the Department. Opinions or points of view expressed are thoseof the author(s) and do not necessarily reflect the official position or policies of theU.S. Department of Justice.
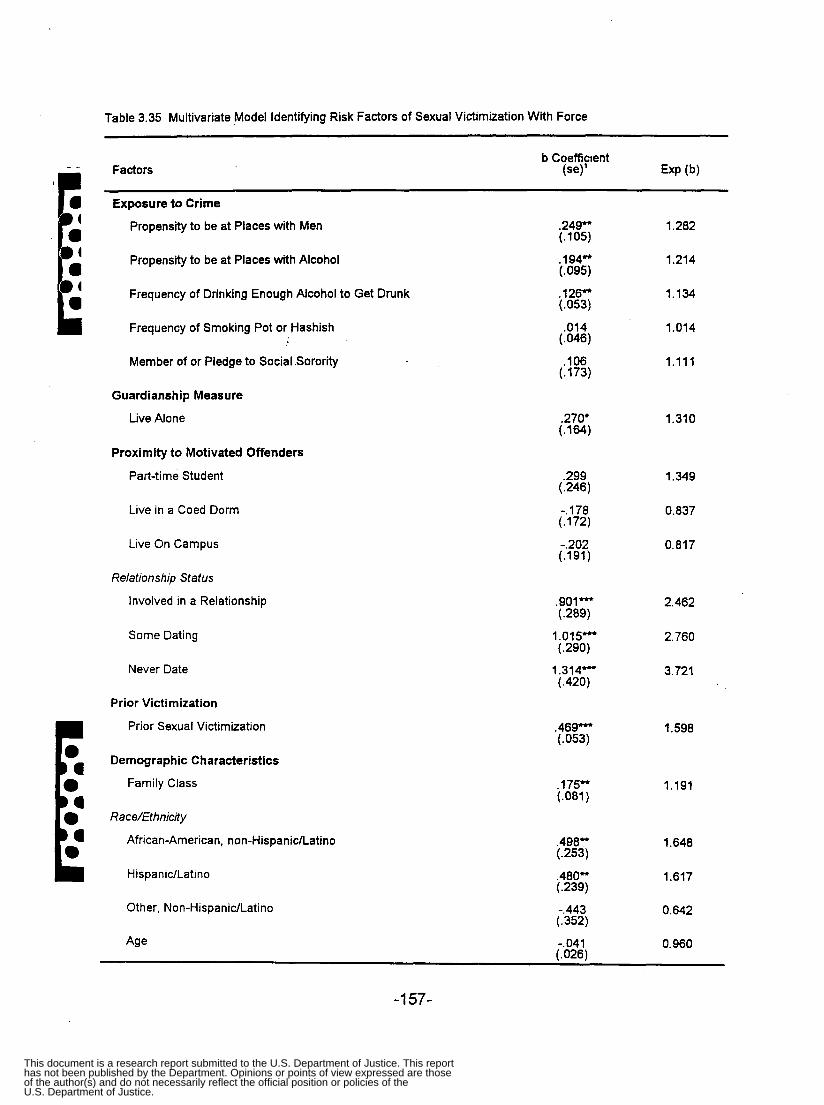
Table 3.35 Multivariate Model Identifying Risk Factors of Sexual Victimization With Force ~~ ~
b Coeffifient Factors (se) ExP (b)
Exposure to Crime
Propensrty to be at Places with Men .249" 1.282 (.105)
(.095) Propensrty to be at Places with Alcohol .194* 1.214
Frequency of Drinking Enough Alcohol to Get Drunk
Frequency of Smoking Pot or Hashish
.126* (.053)
1.134
.014 1.014
Member of or Pledge to Social Sorority . lo6 1.111 (.173)
Guardianship Measure
Live Alone
Proximity to Motivated Offenders
Part-time Student
Live in a Coed Dorm
.270* (.164)
.299 (.246)
-. 178 (.172)
Live On Campus -.202 (.191)
Relationship Status
Involved in a Relationship
Some Dating
Never Date
Prior Victimization
Prior Sexual Victimization
Demographic Characteristics
Family Class
.901" (.289)
1.015" (.290)
1.314- (.420)
.469- (. 053)
.175- (.081)
1.310
1.349
0.837
0.817
2.462
2.760
3.721
1.598
1.191
Race/Ethnicity
African-American, non-Hispanic/Latino .498" 1.648 (.253)
Hispanic/Latino ,480" (.239)
1.617
Other, Non-HispanidLatino -.443 0.642 (.352)
Age -.041 0.960 (. 026)
-1 57-
This document is a research report submitted to the U.S. Department of Justice. This reporthas not been published by the Department. Opinions or points of view expressed are thoseof the author(s) and do not necessarily reflect the official position or policies of theU.S. Department of Justice.

Table 3.35 Multivariate Model Identifying Risk Factors of Sexual Victimization With Force (continued)
Factors
Class Standing
FreshmenlSophomore
JuniorlSenior
Sexual Orientation
Heterosexual
Constant
-2 log-likelihood = 2015.728
df = 21
Model x2 = 21 1.392
Significance of model x2 = .OOOO
.557" (.284)
.363 (.255)
-.682" (.311)
-4.795- (. 927)
1.746
1.438
0.506
' Significance levels: p 5 .lo, " p s .05, * p s .01.
-1 58-
This document is a research report submitted to the U.S. Department of Justice. This reporthas not been published by the Department. Opinions or points of view expressed are thoseof the author(s) and do not necessarily reflect the official position or policies of theU.S. Department of Justice.

Table 3.36 Multivariate Model Identifying Risk Factors of Sexual Victimization On Campus
Factors
Exposure to Crime
Propensity to be at Places with Men
Propensity to be at Places with Alcohol
Frequency of Drinking Enough Alcohol to Get Drunk
Frequency of Smoking Pot or Hashish
Member of or Pledge to Social Soronty
Guardianship Measure
Live Alone
Proximity to Motivated Offenders
Part-time Student
Live in a Coed Dorm
Live On Campus
Relationship Status
Some Dating
Never Date
Prior Victimization
Prior Sexual Victimization
Demographic Characteristics
Family Class
RacdEthnicity
African-American, non-HispanidLatino
His pan i c/Lati no
Other, No n-His pan idLatino
Age
Class Standing
Freshmen/Sophomore
,191' (.115)
.153 (.106)
.151" (.057)
.093" (.047)
-. 062 (.186)
.160 (.177)
-.664 (. 560)
.025
1.041" (.242)
(.159)
.208 (.133)
-.242 (.447)
,459" (.061)
.114 (. 090)
,568" (.285)
,147 (. 323)
.184 (.298)
(. 047) -.064
. lo5
1.210
1.165
1.163
1.097
0.938
1.174
0.515
1.025
2.831
1.231
0.785
1.583
1.121
1.765
1.158
1.203
0.938
1.111
-1 59-
This document is a research report submitted to the U.S. Department of Justice. This reporthas not been published by the Department. Opinions or points of view expressed are thoseof the author(s) and do not necessarily reflect the official position or policies of theU.S. Department of Justice.
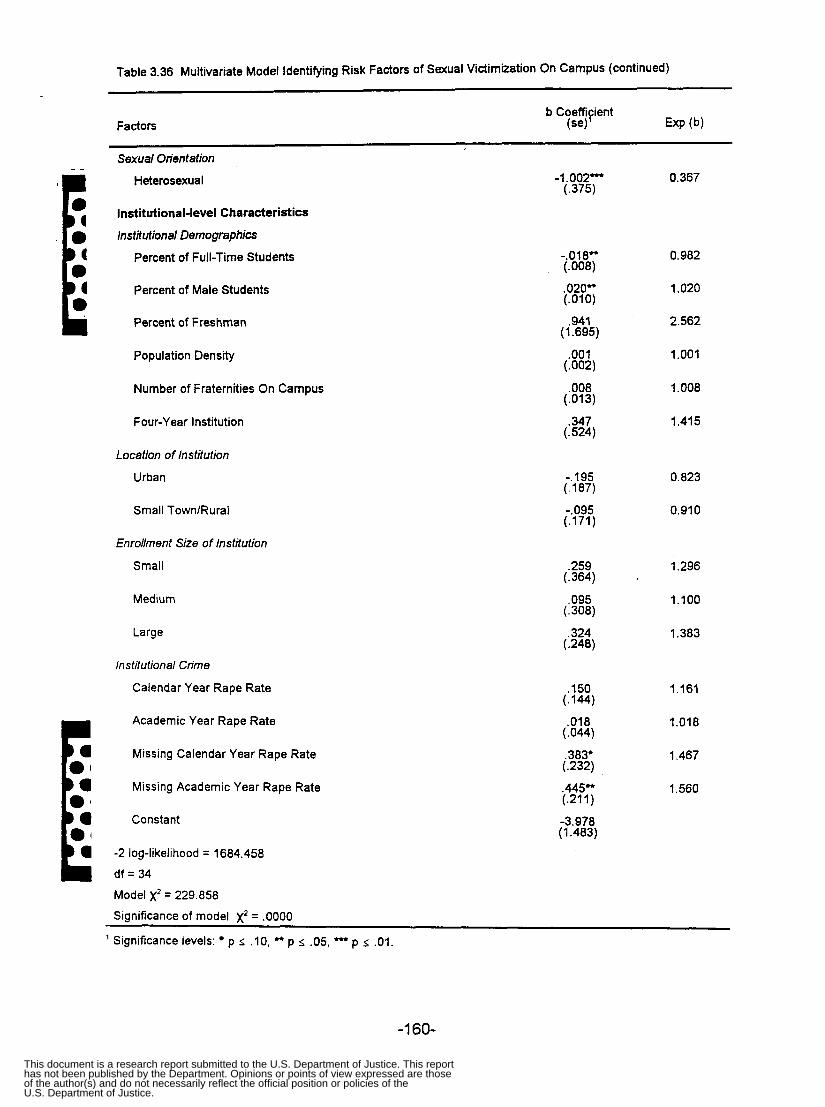
Table 3.36 Multivariate Model Identifying Risk Factors of Sexual Victimization On Campus (continued)
Factors
Sexual Orientation Heterosexual -1.002- 0.367
(.375)
Institutional-level Characteristics
tnsfitutional Demographics
Percent of Full-Time Students
Percent of Male Students
Percent of Freshman
Population Densrty
Number of Fraternities On Campus
Four-Year Institution
Location of lnstifufion Urban
Small TownlRural
Enrollment Size of lnsfitufion Small
Medium
Large
lnstifutional Crime Calendar Year Rape Rate
Academic Year Rape Rate
Missing Calendar Year Rape Rate
Missing Academic Year Rape Rate
Constant
-2 log-likelihood = 1684.458
df = 34
Model x2 = 229.858 Significance of model x' = .OOOO
-.018" (.008)
.020* (.010)
.941 (1.695)
.001 (.002)
.008 (.013)
.347 (. 524)
- 195 (.'187)
-.095 (.171)
.259 (.364)
.095 (. 308)
.324 (.248)
.I50 (.144)
.018 (.044)
.383* (.232)
,445" (211)
-3.978 (1.483)
0.982
1.020
2.562
1.001
1.008
1.415
0.823
0.910
1.296
1.100
1.383
1.161
1.018
1.467
1.560
' Significance levels: p 2 . lo, p 5 .05, - p 5 . O l .
-1 60-
This document is a research report submitted to the U.S. Department of Justice. This reporthas not been published by the Department. Opinions or points of view expressed are thoseof the author(s) and do not necessarily reflect the official position or policies of theU.S. Department of Justice.
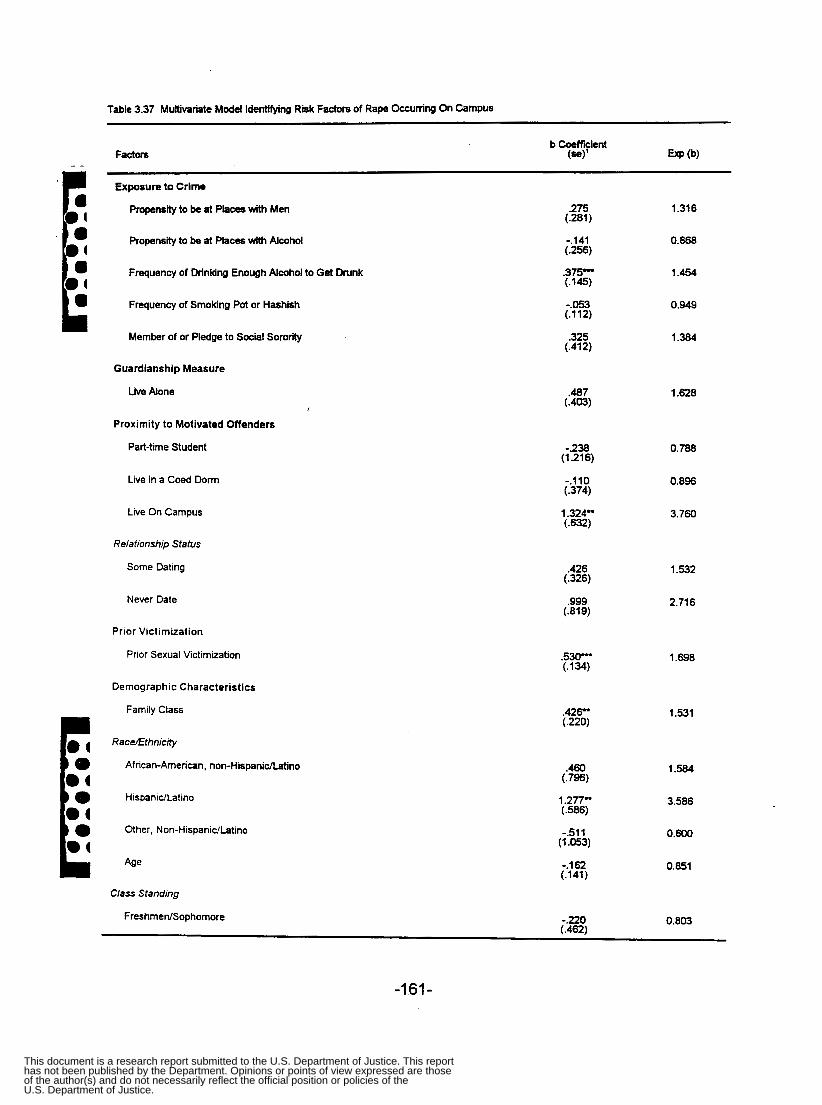
Table 3.37 Multivariate Model Identifying Risk Factors of Rape Occurring On Campus
Factors
Expo8ure to Crime
Propensity to be at Places with Men .275 1.316 (.281)
Propensity to be at Places with Alcohol -.141 0.868
Frequency of Drinking Enough Alcohol to Get Drunk .375- 1.454
(.256)
( . l a )
Frequency of Smoking Pot or Hashish -.053 0.949
Member of or Pledge to Social Sorority .325 1.384
(.112)
(.412)
Guardianship Measure
Live Alone I
Proximity to Motivated Offenders
Part-time Student
Live in a Coed Dorm
.487 1.628 (.a)
-.238 (1.21 6)
-.110 (.374)
Live On Campus 1 .324n (.632)
Relationship Status
Some Dating
Never Date
Prior Victimization
Prior Sexual Victimization
Demographic Characteristics
Family Class
.426 (.326)
.999 (.619)
0.788
0.896
3.760
1.532
2.716
1.698
1.531
RacdEfhnicrty
.460 1.584 (.796)
African-American, non-Hispanidlatino
HispanidLatino
Other, Non-Hispanidlatino
Class Standing
1.277- (.586)
-.511 (1 .om - . l a (.141)
3.586
0.600
0.851
FreshmerVSophomore 0.803
-161-
This document is a research report submitted to the U.S. Department of Justice. This reporthas not been published by the Department. Opinions or points of view expressed are thoseof the author(s) and do not necessarily reflect the official position or policies of theU.S. Department of Justice.
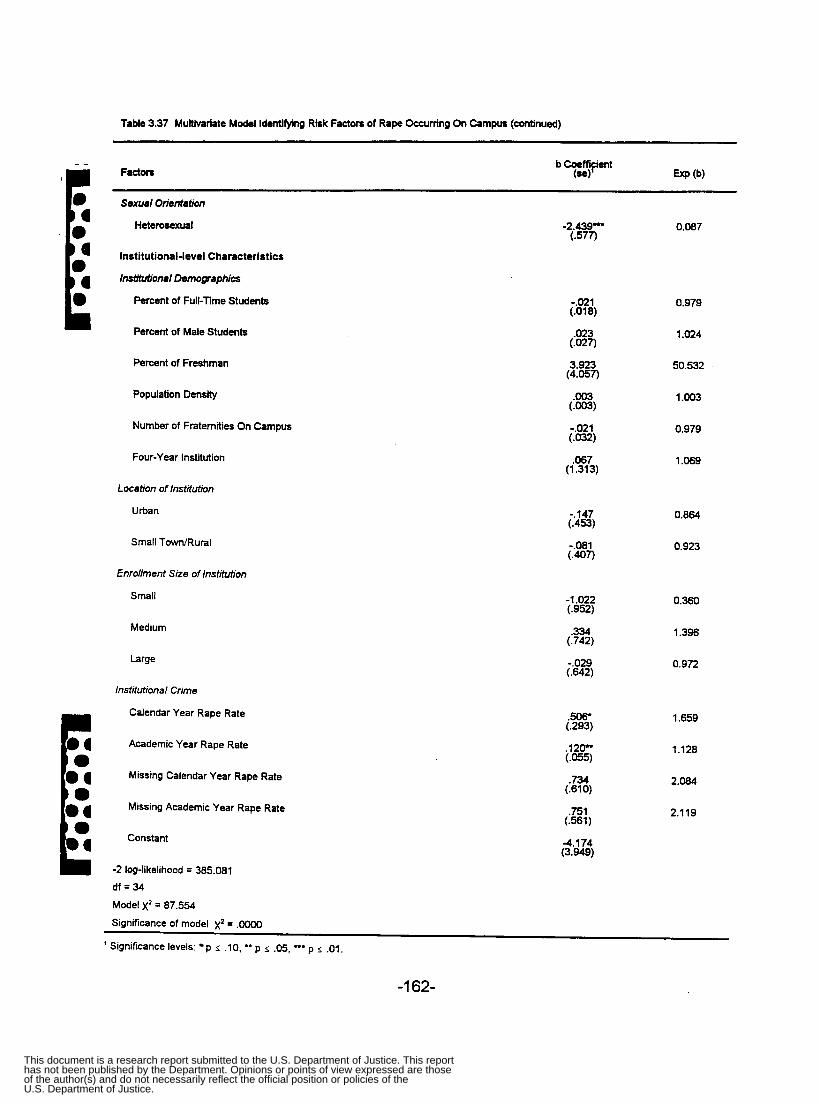
Table 3.37 Multivariate Model ldentnylng Risk Factors of Rape Occurring On Campus (continued)
Factors
Sexual Onentation
Heterosexual -2.439" 0.087 (.577)
Institutional-level Characteristics
InstiMional Demographics
Percent of Full-Time Students
Percent of Male Students
Percent of Freshman
Population Density
Number of Fraternities On Campus
Four-Year Institution
Location of Institution
Urban
Small Town/Rural
Enrollment Size of Institution
Small
Medium
Large
Institutional Crime
Calendar Year Rape Rate
Academic Year Rape Rate
Missing Calendar Year Rape Rate
Missing Academic Year Rape Rate
Constant
-2 log-likelihood = 385.081 df = 34 Model x' = 87.554 Significance of model xz = .oooO
-.Mi (.018)
(:E) 3.923 (4.057)
.003 (.a)
$3) .067 (1.313)
-.147 (.453)
(..E)
-1.022 (.952)
.334 (.742)
iE)
.734 (.610)
.751 (561)
-4.174 (3.949)
0.979
1 .M4
50.532
1.003
0.979
1.069
0.864
0.923
0.360
1.396
0.972
1.659
1.128
2.084
2.119
' Significance levels: p I. .lo, .* p s ,135, - p 6 .01.
-1 62-
This document is a research report submitted to the U.S. Department of Justice. This reporthas not been published by the Department. Opinions or points of view expressed are thoseof the author(s) and do not necessarily reflect the official position or policies of theU.S. Department of Justice.
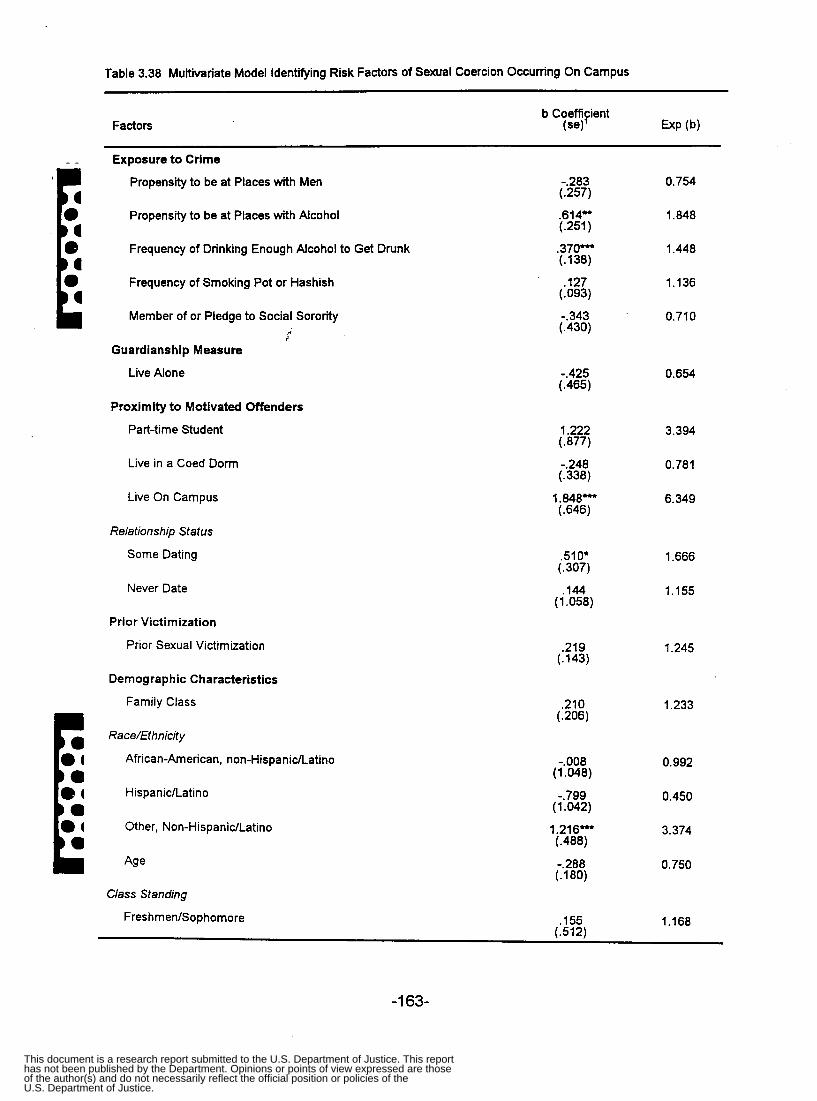
Table 3.38 Multivariate Model ldentifylng Risk Factors of Sexual Coercion Occurring On Campus
Factors ~~
Exposure to Crime
Propensity to be at Places with Men -.283 (.257)
0.754
Propensty to be at Places with Alcohol .614" 1.848 (.251)
.370" 1.448 (.138)
Frequency of Drinking Enough Alcohol to Get Drunk
Frequency of Smoking Pot or Hashish .127 1.136 (.093)
Member of or Pledge to Social Soronty
c -.343 (.430)
0.710
Guardianship Measure
Live Alone -.425 (.465)
0.654
Proximity to Motivated Offenders
Part-time Student 1.222 ( .877)
3.394
0.781
6.349
Live in a Coed Dorm -.248 (. 338)
Live On Campus
Relationship Status
Some Dating
1.848" (.646)
,510. (.307)
1.666
1.155 Never Date
Prior Victimization
Prior Sexual Victimization
144 (1.058)
.219 (.143)
1.245
Demographic Characteristics
Family Class .210 1.233 (.206)
Race/Ethnicity
African-American, non-HispanidLatino -.008 (1.048)
-.799 (1.042)
0.992
HispaniclLatino 0.450
Other, Non-HispaniclLatino 1.216" 3.374 (.488)
-.288 (.180)
0.750
Class Standing
FreshmenlSophomore .155 1.168 (.512)
-1 63-
This document is a research report submitted to the U.S. Department of Justice. This reporthas not been published by the Department. Opinions or points of view expressed are thoseof the author(s) and do not necessarily reflect the official position or policies of theU.S. Department of Justice.
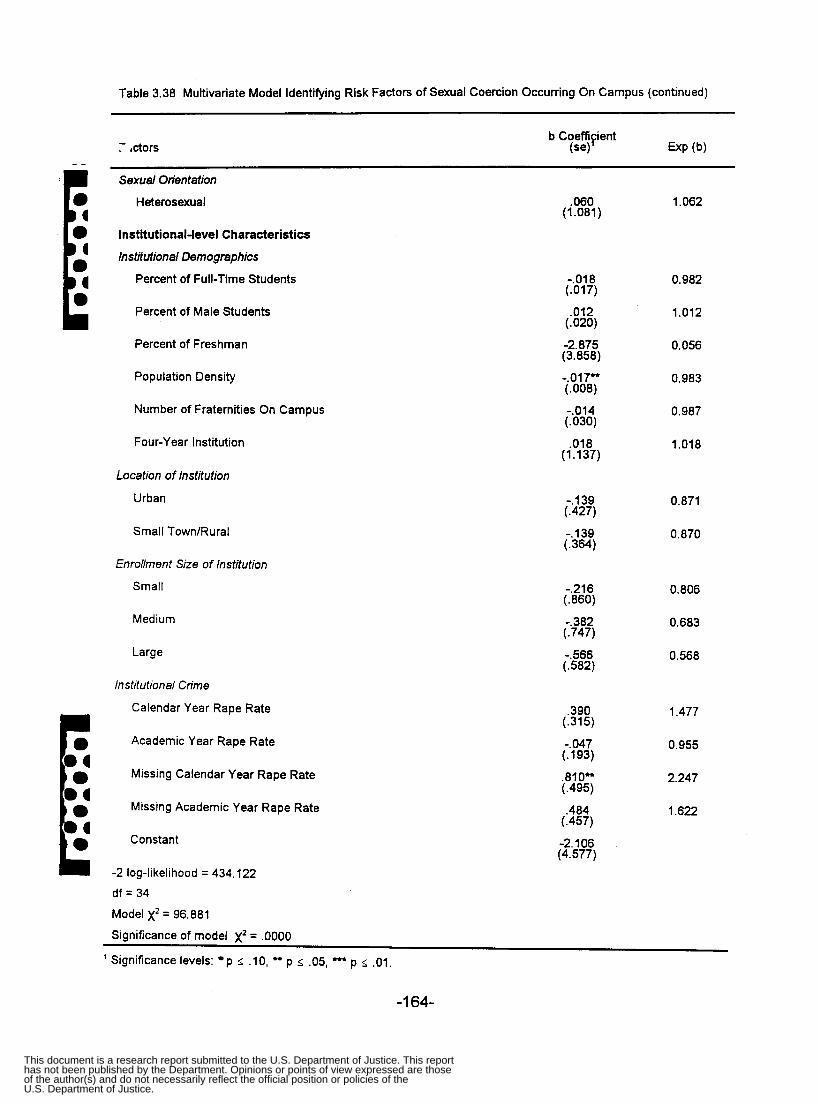
Table 3.38 Multivariate Model Identifying Risk Factors of Sexual Coercion Occurring On Campus (continued)
: &ton
Sexual Orientation
Heterosexual .060 1.062 (1.081)
Institutional-level Characteristics
Institutional Demographics
Percent of Full-Time Students
Percent of Male Students
-.ole (.017)
.012 (.020)
0.982
1.012
Percent of Freshman -2.875 0.056 (3.858)
Population Density -.017" 0.983 (.008)
Number of Fraternities On Campus -.014 0.987 (.030)
Four-Year lnstitution
Location of lnstitution
Urban
Small Town/Rural
.018 (1.137)
- 139 (.427)
(.;E) Enrollment Size of lnstitution
Small -.216 ( ,860)
Medium
Large
lnstitutional Crime
Calendar Year Rape Rate
Academic Year Rape Rate
Missing Calendar Year Rape Rate
Missing Academic Year Rape Rate
Constant
-.382 (.747)
-.566 (.582)
.390 (.315)
-.047 (.193)
.810" (.495)
.484 (.457)
-2.106 (4.577)
1.018
0.871
0.870
0.806
0.683
0.568
1.477
0.955
2.247
1.622
-2 log-likelihood = 434.122 df = 34
Model x2 = 96.881
Significance of model x2 = .OOOO
' Significance levels: p < .IO, " p .05, - p 5 .01.
-1 64-
This document is a research report submitted to the U.S. Department of Justice. This reporthas not been published by the Department. Opinions or points of view expressed are thoseof the author(s) and do not necessarily reflect the official position or policies of theU.S. Department of Justice.

Table 3.39 MuMriate Model Identifying Risk Factors of Sexual Contact Occurring On Campus
b Coefficient Factors (e)' EXP (b)
Exposure to Crime
Propensity to be at Places with Men .293* 1.340 (.I&)
Propensity to be at Places with Alcohol .013 1.013 (.138)
(.075) Frequency of Drinking Enough Alcohol to Get Drunk .084 1.088
Frequency of Smoking Pot or Hashish .086 1.090
Member of or Pledge to Social Soronty
Guardianship Measure
-.017 0.983 (.241)
Live Alone .334 (.220)
Proximity to Motivated Offenders
Part-time Student -5.687 (7.897)
Live in a Coed Dorm .319 (215)
Live On Campus
Relationship Status
Some Dating
.533' (.319)
,018 (.173)
Never Date -.917 (.736)
Prior Victimization
Pnor Sexual Victimization
Demographic Characteristics
Family Class
RaceEthnicrty
Afncan-Amencan, non-Hispanidlatino
-.008 (.116)
.441 (.355)
1.397
0.003
1.375
1.704
1.018
0.400
1.478
0.993
1.555
HispanidLatino .056 1.058 (.419)
Other, Non-HispanidLatino -.150 (.416)
0.861
-.025 0.976
Class Standing
FreshmenSophomore .136 1.233)
1.146
-1 65-
This document is a research report submitted to the U.S. Department of Justice. This reporthas not been published by the Department. Opinions or points of view expressed are thoseof the author(s) and do not necessarily reflect the official position or policies of theU.S. Department of Justice.
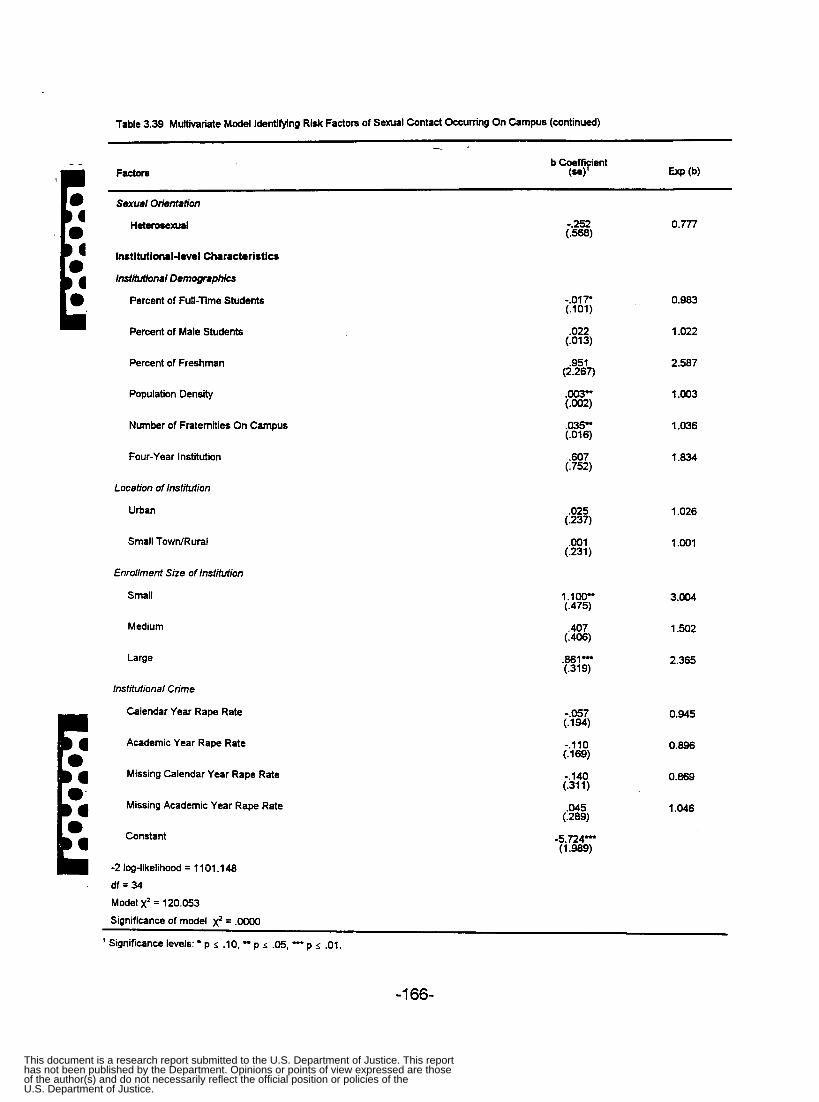
Table 3.39 Mut i r i a te Model ldentifylng Rdc Factors of Sexual Contact Occurring On Campus (continued)
- - '
Facton ~ ~~ ~
Sexual Orientation
H&errwexual
Institutional-level Characteristics
lnstihrtional Demographics
Percent of Full-Time Students
Percent of Male Students
Percent of Freshman
Population Density
Number of Fraternities On Campus
Four-Year Institution
Location of Institution
Urban
Small Town/Rural
Enrollment Size of Institution
Small
Medium
Large
lnstitutional Crime
Calendar Year Rape Rate
Academic Year Rape Rate
Missing Calendar Year Rape Rate
Missing Academic Year Rape Rate
Constant
-2 log-likelihood = 1101.148 df = 34 Model x2 = 120.053
-.017 (.101)
.022 (.013)
.951 (2.267)
.035" (.016)
.607 (.752)
.025 (.237)
.001 (.231)
1.100- (.475)
,407 (.4W
.861- (.319)
i:Z) -.110 (.169)
-.140 (.311)
.045 (.289)
-5.724" (1.989)
0.777
0.983
1.022
2.587
1.003
1.036
1.834
1.026
1.001
3.004
1.502
2.365
0.945
0.896
0.869
1.046
Significance of model x2 = .o000
' significance levels: p s .IO, - p 5 .05, p I .Oi
-1 66-
This document is a research report submitted to the U.S. Department of Justice. This reporthas not been published by the Department. Opinions or points of view expressed are thoseof the author(s) and do not necessarily reflect the official position or policies of theU.S. Department of Justice.
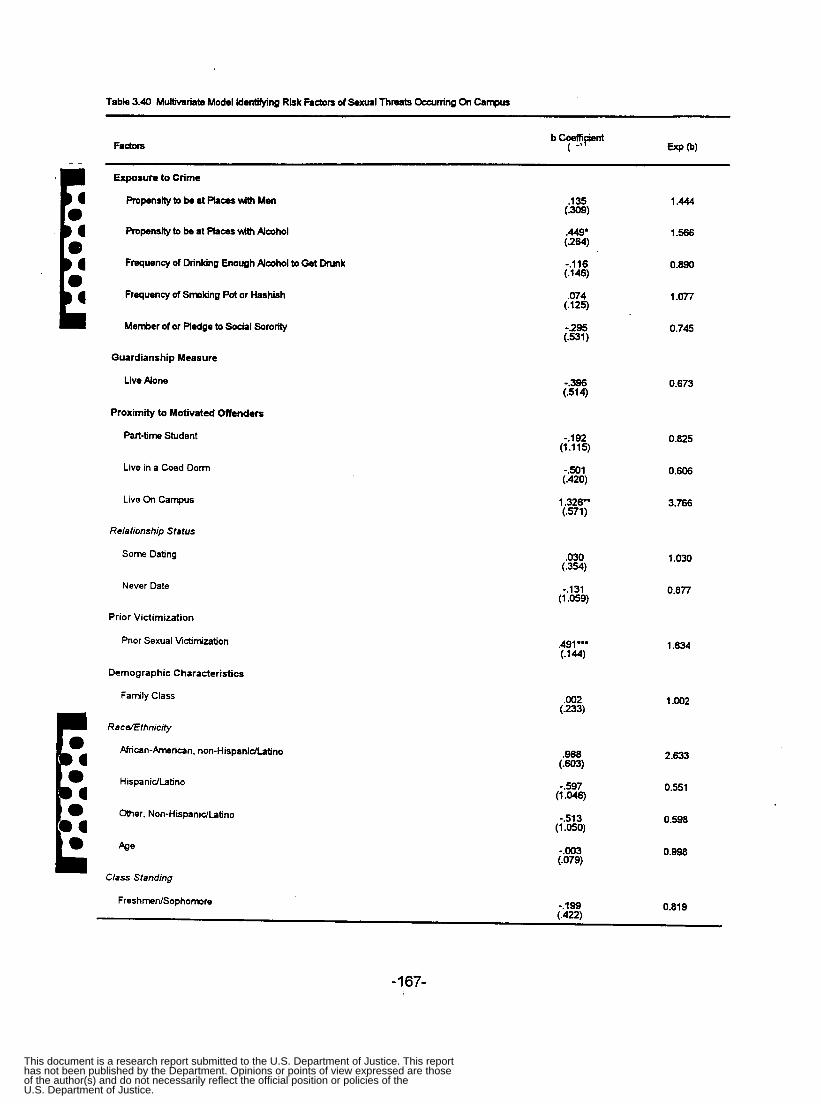
Table 3.40 Multivariate Model identifying Risk R&rs of Sexual Threats Occurring On Carpus
Exposure to Crime
Propensity to be at h a t s w4tJI Men
Propnsity to be at ha ts HAth Alcohol
Fmquency of Drinking Enough Alcohol to Get Drunk
Frequency of Smoking Pot or HashBh
Member of or Pledge to Social Sorority
Guardianship Measure
Live Alone
Proximity to Motivated Offenders
Part-time Student
Live in a Coed Dorm
Live On Campus
Relationship Status
Some Dating
Never Date
Prior Victimization
Pnor Sexual Victimization
Demographic Characteristics
Family Class
RacdEthnicrty
African-American, non-HispanidLatino
Hispanidlatino
Other. Non-HispanidLatino
Aee
Class Standing
.135 1.444
.a' 1 .E66 (.=v -.116 0.890 (.146)
1 .on
-.295 (.%1)
-3% (.514)
-.192 (1.115)
-SO1 (.420)
1.326" (.571)
.030 (.354)
(1.059) -.131
.491*.* (.144)
.002 (.233)
368 (.603)
-.597 (1 .W6)
(1 . B O )
- .w3 (.079)
-.513
0.745
0.673
0.825
0.606
3.766
1.030
0.877
1.634
1.002
2.633
0.551
0.598
0.998
-.199 0.819 FreshmenlSophomore (.4W
-1 67-
This document is a research report submitted to the U.S. Department of Justice. This reporthas not been published by the Department. Opinions or points of view expressed are thoseof the author(s) and do not necessarily reflect the official position or policies of theU.S. Department of Justice.
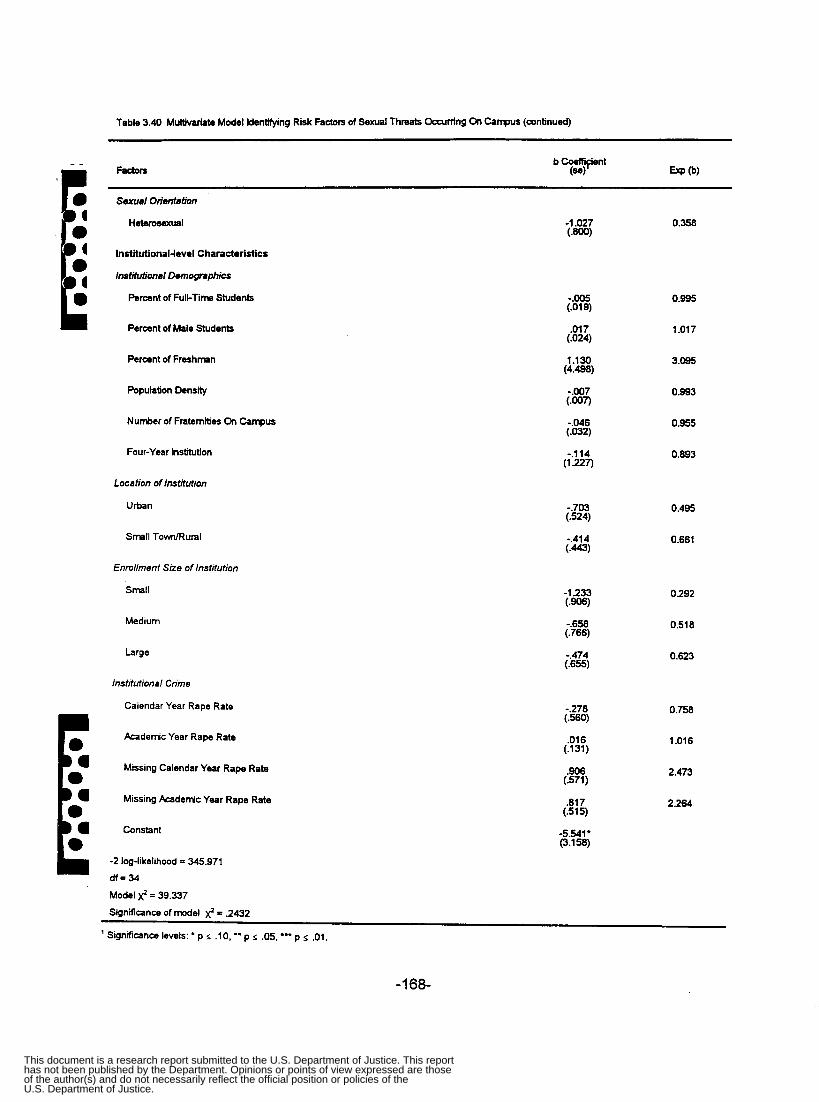
Table 3.40 M u M b Model Identifying Risk Factors d Sexual Threats Occurring On Canpus (continued)
Fadon ~
Sexual orientation
-1.027 (.800)
0.358
Instiutional-lcvcl Characteristics
Instilulional Demographics
Percent of Full-Time Shrdents
Percent of Male Students
Percent of Freshman
Population Density
Number of Fraternities On Campus
Four-Year InsMution
Location of lnsfitution
Urban
Small T o ~ R u m l
Enrollment Size of Institution
Small
Medium
Large
Institutional Crime
Calendar Year Rape Rate
Academic Year Rape Rate
Missing Calendar Year Rape Rate
Missing Academic Year Rape Rate
-.m (.019)
(35)
;%)
(12$
1.130 (4.498)
-.046 (.032)
-.703 (.524)
-.414 (.a)
-1 933 (.%I -.658 (.766)
-.474 (.655)
-.278 (560)
.016 (.131)
.817 (.515)
0.995
1.017
3.095
0.993
0.955
0.893
0.495
0.661
0.292
0.518
0.623
0.758
1.016
2.473
2.264
-5.541. (3.1 58)
Constant
-2 log-likelihwd = 345.971
dta34
Model $ = 39.337
Significance of model $ = .2432
’ Significance ievels: * p i .lo. .. p s .=. *** p s .OI.
-168-
This document is a research report submitted to the U.S. Department of Justice. This reporthas not been published by the Department. Opinions or points of view expressed are thoseof the author(s) and do not necessarily reflect the official position or policies of theU.S. Department of Justice.
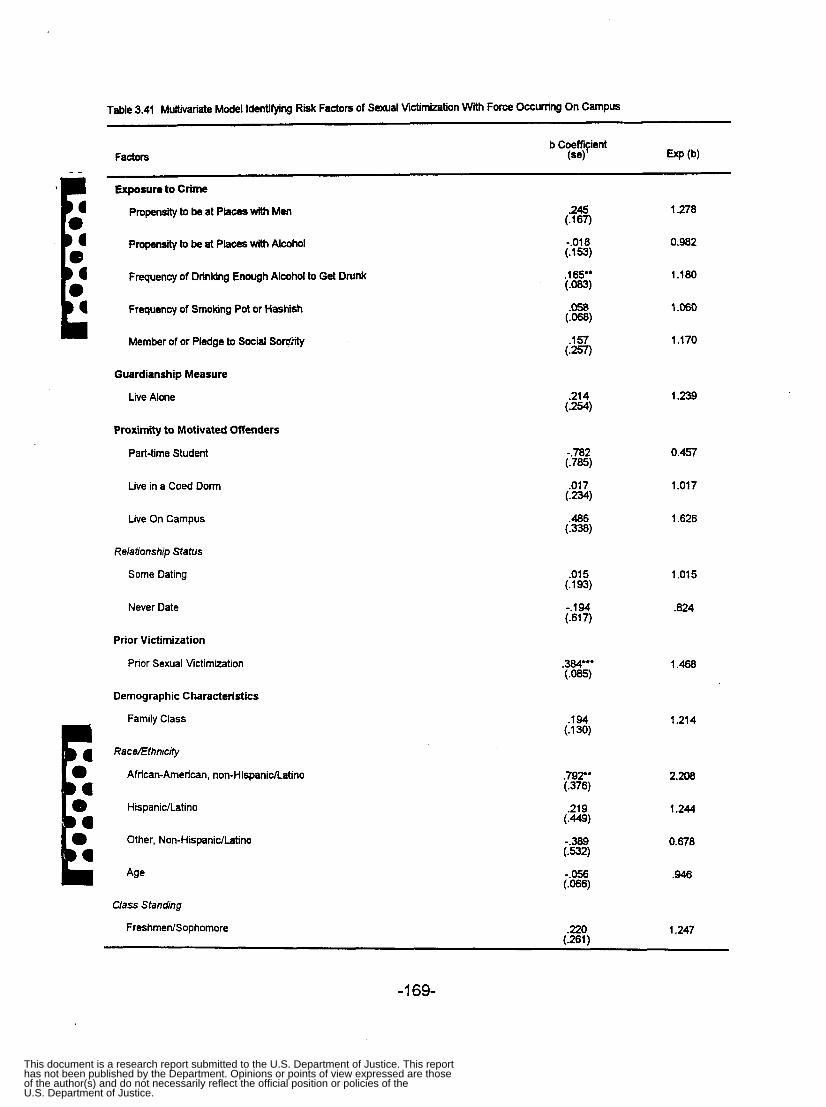
Table 3.41 Multivariate Model Identifying Risk Factors of Sexual Victimization Wlth Force Occurring On Campus
Exposure to Crime
Propensity to be at P l a m with Mtn
Propensrty to be at Places with Alcohol
Frequency of Drinking Enough Alcohol to Get Drunk
Frequency of Smohng Pot or Hashkh
Member of or Pledge to Social S o w
Guardianship Measure
Live Alone
Proximity to Motivated Offenders
Part-time Student
Live in a Coed Dorm
Live On Campus
Relationship Status
Some Dating
Never Date
Prior Victimization
Prior Sexual Victimization
Demographic Characteristics
Family Class
RaceEthnicty
African-American, non-HispanicLatino
HispanidLatino
Other, Non-HispanidLatino
Age
Class Standing
245 (.167)
-.018 (.W
(.W
(.ow
.165-
.058
(4%
.214 (.254)
-.782 (.785)
(.=+I .017
.486 (.338)
.015 (.193)
-.194 (.617)
.384**' (.085)
.194 (.130)
.792' (.376)
.219
-.389 (.=4
-.056
1.278
0.982
1.180
1.060
1.170
1.239
0.457
1.017
1.626
1 . O S
.E24
1.468
1.214
2.208
1.244
0.678
.946
1.247 FreshmenlSophomore 220 (.261)
-1 69-
This document is a research report submitted to the U.S. Department of Justice. This reporthas not been published by the Department. Opinions or points of view expressed are thoseof the author(s) and do not necessarily reflect the official position or policies of theU.S. Department of Justice.

Table 3.41 Multivariate Model ldentifytng Risk Factors of Sexual Victimization Wth Force Occurring On Campus (continued)
Sexual Orientation
Heterosexual
Institutional-level Characteristics
I n M o n a 1 Demogmphics
Percent of Full-lime Students
Percent of Male Students
Percent of Freshman
Population Density
Number of Fraternities On Campus
Four-Year Institution
Location of lnsbtution
Urban
Small Town/Rural
Enrollment Size of Institution
Small
Medium
Large
Institutional Crime
Calendar Year Rape Rate
Academic Year Rape Rate
Missing Calendar Year Rape Rate
Missing Academic Year Rape Rate
Constant
-2 log-likelihood = 944.649 df = 34 Model x’ = 83.903 Significance of model x’ = .oooO
-.936 (.518)
-.m9
.019
(.011)
(.015)
(5%) (:E;) .012 (.018)
-232 (.698)
$2) -.lo2 (.249)
.698 (.527)
(:E) (%?
. E 1 (.209)
(2%) (:G) (2;)
-4.751 ** (2.065)
0.392
0.992
1.020
0.907
1.002
1.012
0.793
0.929
0.903
2.01 0
1.543
1.822
1.063
1.052
1.189
1.368
’ Significance levels: p i .lo, ** p i .E, *** p i .Ol .
-1 70-
This document is a research report submitted to the U.S. Department of Justice. This reporthas not been published by the Department. Opinions or points of view expressed are thoseof the author(s) and do not necessarily reflect the official position or policies of theU.S. Department of Justice.
CHAPTER 4
STALKING
Over the past two decades, the victimization of women has emerged as a salient
social and policy concern in the private and public sectors. Within criminology and related
social sciences, research in this area has grown remarkably (for a summary, see Belknap,
1996; Belknap and Erez, 1995; Crowell and Burgess, 1996). Even so, compared to other
types of victimization and with a few notable exceptions (d. Coleman, 1997; Mustaine
E and Tewksbury, 1999; Tjaden and Thoennes, 1998), one victimization stands out in the
lack of research attention it has received: the stalking of women.
In marked contrast, "claimsmakers" have succeeded in defining stalking as a social
problem-so much so that the word "stalking" is now part of the public's lexicon (Lowney
and Best, 1995). Thus, several educational and victim service organizations, such as
National Victim Center and Survivors of StalkingTM, have heightened the public's
awareness of the problem of stalking (see Monaghan, 1998). The media continues to
publicize stalking cases involving Hollywood stars, public officials, and fatal outcomes.
Perhaps most noteworthy, legislatures across the nation have criminalized stalking
E behavior (Marks, 1997; McAnaney, Curliss, and Abeyta-Price, 1993).
0 The first anti-stalking law was passed in 1990 in California in response to both the p murder of Rebecca Shaeffer, a young actress who was shot to death in 1989 by an 0
4 obsessed fan who stalked her for two years, and to the murders of five women in Orange
County who had been stalked by former boyfriends or spouses (see McAnaney et al., h
'
1993). These cases galvanized national and state attention as to the seriousness of
-1 71 -
This document is a research report submitted to the U.S. Department of Justice. This reporthas not been published by the Department. Opinions or points of view expressed are thoseof the author(s) and do not necessarily reflect the official position or policies of theU.S. Department of Justice.

stalking. Thus, by 1992, legislatures had initiated a "torrent" of anti-stalking statutes
(McAnaney et ai., 1993). Today, all 50 states and the Di,:.-ict of Columbia have
implemented anti-stalking laws (Marks, 1997). Although legal scholars continue to
address the constitutionality of state anti-stalking statutes and numerous constitutional
challenges to these statutes have been waged (by January 1996, 53 in 19 states),
generally the courts have upheld the laws (U.S. Department of Justice, 1996).
In addition to state-level interest in anti-stalking statutes, a substantial investment
in the passage of anti-stalking legislation has occurred at the federal level. In fact, the
U.S. Congress was prompted to pass (1) legislation in 1992 that charged the Attorney
General, through the National Institute, to develop and distribute a constitutional and
enforceable anti-stalking law to serve as a model for the states; (2) the Violence Against
Women Act (VAWA) Title IV of the Violent Crime Control and Enforcement Act of 7994
(Public Law 103-322), which includes subtitle F that directs the Attorney General to submit
an annual report to Congress providing information about the incidence of stalking and the
effectiveness of anti-stalking efforts and legislation; and (3) a law prohibiting interstate
stalking and stalking on federal property and other places within federal jurisdictions
(passed as part of the National Defense Authorization Act of Fiscal Year 7997, Public Law
104-201 , Section 1069, codified at 18 U.S.C. 2261 , 2261A, and 2262) (see National Victim
Center, 1997; Marks, 1997; Monaghan, 1998; U.S. Department of Justice, 1996).
Despite this public attention, our understanding of the extent, nature, and risk
factors of stalking remains limited. As Coleman (1997:421) observes, "the majority of
information is anecdotal because little empirical research has been conducted on stalking."
-1 72-
This document is a research report submitted to the U.S. Department of Justice. This reporthas not been published by the Department. Opinions or points of view expressed are thoseof the author(s) and do not necessarily reflect the official position or policies of theU.S. Department of Justice.
Echoing this view, NIJ Director Jeremy Travis (U.S. Department of Justice, 1993:91) notes
that "little hard data exist on the incidence of stalking"-an omission that hinders C-.>
development of prevention strategies to combat stalking. Although studies are beginning
to appear (see Coleman, 1997; Mustaine and Tewksbury, 1999; Tjaden and Thoennes,
1998), stalking victimization remains an underresearched area.
To help fill this void in the literature, we furnish data on the extent and nature of
stalking victimization. Because thesurvey included detailed questions on each stalking
incident, we are able to explore the context in which stalking occurred-that is the form,
duration, intensity, and location of the stalking, the victim-offender relationship, victim
injuries and reactions to the stalking, whether the stalking was reported, and to whom. To
further our understanding of the risk factors associated with being a stalking victim, we
developed a multivariate model of stalking that examines whether victimization varies by
demographic and lifestyle factors. We consider the implications of these findings for
routine activities theory.
THE VICTIMIZATION OF FEMALE COLLEGE STUDENTS
As we have previously noted, the existing sexual victimization research suggests
that college students, especially women, may be more at-risk for one type of victimization:
sexual victimization (see Belknap, 1996; Crowell and Burgess, 1996). This finding is
4 consistent with a routine activities/lifestyle perspective (see Cohen and Felson, 1979;
Fisher, et al., 1998; Hindelang, Gottfredson, and Garofalo, 1978; Schwartz and Pitts,
1995). College students converge regularly in time and space, often with minimal adult
-1 73-
This document is a research report submitted to the U.S. Department of Justice. This reporthas not been published by the Department. Opinions or points of view expressed are thoseof the author(s) and do not necessarily reflect the official position or policies of theU.S. Department of Justice.

supervision, both on and off campus. Male and female students also often cohabitate in
the same building (e.g. , coed dormitories, cooperatives, or apartments), socially interact
in the evening hours (e.g., studying, dating, attending a party or fraternity-sorority event),
consume alcohol and/or partake in drugs together, and retreat to private settings (e.g.,
residence hall rooms, apartments) where there is an absence of guardianship (see Fisher,
Sloan, Cullen, and Lu, 1997). To the extent that men are "motivated offenders," college
women will be in numerous situations on and off campus where they are exposed to the
risk of victimization (see Fisher, 1998; Mustaine and Tewksbury, 1999; Schwartzand Pitts,
1995). One contention of feminist scholars is that such motivated offenders are not in
short supply: the hegemony of patriarchy ensures that the propensity of males to pursue
sexual relationships and, if necessary, to use force against women in this pursuit is
widespread (Gilbert, 1997; Messerschmidt, 1993).
As we previously discussed, assessing the extent to which female college students
are in fact sexually victimized is a daunting challenge, since estimates of victimization
often hinge on a variety of methodological choices (compare Gilbert, 1997 with Koss,
1992, 1993, 1996; see also Crowell and Burgess, 1996; Lynch, 1995). Even so, there is
evidence that a substantial proportion of college women experience minor forms of sexual
harassment such as sexist comments (Adams, Kottke, and Padgitt, 1983; Lott, Reilly, and
Howard, 1 982). Research on sexual assaults-ranging from unwanted touching to
attempted rape-report victimization levels of upwards of 30 percent (DeKeseredy and
Kelly, 1993a; Koss, Gidycz, and Wisniewski, 1987). And studies reveal that during their
time in college, between 8 and 15 percent of women are victims of forced sexual
-1 74-
This document is a research report submitted to the U.S. Department of Justice. This reporthas not been published by the Department. Opinions or points of view expressed are thoseof the author(s) and do not necessarily reflect the official position or policies of theU.S. Department of Justice.

_ - I intercourse (DeKeseredy and Kelly, 1993a; Koss et al., 1987; Rivera and Regoli, 1987;
Ward, White, and -.AAliams, 1991; cf. Gilbert, 1997). It also is instructive that using
National Crime Victimization Survey methodology in a survey of college students, Fisher
et al. (1998) found that the rate of rape victimization in their sample of college students
was approximately three times higher than that reported for the 1993 NCVS general
population of the same age; the rate of sexual assault in their sample was nine times
higher. Much of this victimization, moreover, occurs in the process of dating relationships
(Aizenman and Kelley, 1988; DeKeseredy and Kelly, 1993a, 1993b; Muehlenhard and
Linton, 1987).
These observations would suggest that similar to other forms of sexual or gender-
based victimization, female college students would experience comparatively high rates
of stalking." Again, to the extent that college campuses provide a domain in which young
women interact extensively with young men, it is plausible to expect that female students
would be at risk to become objects of stalking by men. Unfortunately, the major studies
of sexual victimization among college students have not measured and thus have been
unable to present data on the prevalence of stalking (see, for example, DeKeseredy and
Kelly, 1993a; Koss et al., 1987), in part, perhaps, because sustained interest in stalking
is a relatively recent occurrence.
We categorize stalking as a form of 'sexual" victimization because it is largely conduct that involves the obsessive behavior of men toward women on the basis oftheir gender. We also suspect
that a variety of motives can underlay stalking (see, for example, Holmes, 1993; Meloy, 1996). Of course, this can also be said of other forms of behavior typically categorized as sexual Victimization, such as sexual harassment and rape (e.g., the desire to control or exert power over women). Finally, because the definition of stalking usually includes either being physically threatened or fearing for one's safety, stalking has been conceived as a crime of violence against women (Tjaden and Thoennes, 1998).
17
that stalking involves a desire for contact, intimacy, and/or sexual relations. We recognize, however,
-1 75-
This document is a research report submitted to the U.S. Department of Justice. This reporthas not been published by the Department. Opinions or points of view expressed are thoseof the author(s) and do not necessarily reflect the official position or policies of theU.S. Department of Justice.

RESEARCH ON THE EXTENT OF STALKING
Statistics on the number of stalking victims as well as on the number of stalkers are
limited at best. At the national-level, neither the Federal Bureau of Investigation nor the
National Crime Victimization Survey collect information about stalking incidents. Likewise,
_ _
state-level statistics on the number of people charged, prosecuted, or convicted of stalking
are not readily available. According to the NIJ's 1996 VAWA report to Congress, however,
estimates of the number of stalkers in the United States vary widely from 20,000 to
200,000. Assuming that a perpetrator stalks only one female victim, a rough estimate of
the number of women stalked would range from 19.78 per 100,000 women 18 years and
older to 197.79 per 100,000 women 18 years and older. Researchers also have examined
the behavioral patterns of stalkers and have attempted to create typologies based on the
offenders' motives, psychopathy, and symptoms (see, for example, Geberth, 1992;
Holmes, 1993; Wright, Burgess, Burgess, Laszlo, McCrary, and Douglas, 1996) and have
attempted to summarize clinical studies of stalkers (see Meloy, 1996). Although useful,
these studies, as well as the research cited above estimating the number of stalkers,
furnish only preliminary insights on the extent and nature of stalking and no information r, on who is most at risk of being a stalking victim.
A small body of research, however, has recently appeared that provides more data
on these issues. Based on a survey of 141 female students in undergraduate psychology
classes, Coleman (1997) reports that 29.1 percent of the sample answered "yes" to the
question, "Have you ever ended a relationship that resulted in your former partner giving
you repeated, unwanted attention following the breakup?" Further, 9.2 percent of the
-1 76-
This document is a research report submitted to the U.S. Department of Justice. This reporthas not been published by the Department. Opinions or points of view expressed are thoseof the author(s) and do not necessarily reflect the official position or policies of theU.S. Department of Justice.

students stated that this repeated attention was either malicious, physically threatening,
or fear-inducing. The limitations of this study are c l e r the use of a small,
unrepresentative sample; the lack of a reference period on the response; and the failure _ _
to measure stalking by men other than former boyfriends or partners. Still, the general
finding that almost three in ten women have received “repeated, unwanted attention” and
almost one in ten have experienced attention that threatens their safety is, at the very
least, suggestive that stalking is not uncommon. Coleman’s results also provide
information about the demographic profile of the stalking victim: white, early twenties
(mean age 23 years old), a father whose level of education is “some college or more,” and
a mother whose level of education is “high school or less.”
In an important advance, Mustaine and Tewksbury (1 999) present the results from
a victimization survey, conducted in the Fall of 1996, of 861 women drawn from
introductory sociology and criminal justice courses at nine post-secondary institutions.
Using a six-month reference period, they report that 10.5 percent of the females in their
sample said that they had been a victim of behavior which the women defined as
“stalking.” In a multivariate analysis, they also found that the risk of stalking was related
to several measures of lifestyle/ routine activities. Thus, stalking was higher for women I 0 who shopped often at the mall, lived off campus, were employed, bought illegal drugs, and
L a were drunk in public. Women who carried mace and pocket knives also were stalked more
often-behaviors that may have been in response to having experienced this victimization.
LT Mustaine and Tewksbury’s findings are important-especially in showing that one
in ten women were stalked in a six-month period-but they can potentially be criticized on
-1 77-
This document is a research report submitted to the U.S. Department of Justice. This reporthas not been published by the Department. Opinions or points of view expressed are thoseof the author(s) and do not necessarily reflect the official position or policies of theU.S. Department of Justice.

two interrelated grounds. First, the respondents were allowed to define for themselves
whether they had been a victim of "stalking." Without a Clear behavioral Or ;,gal
description of what constitutes stalking (cf. Tjaden and Thoennes, 1998), it is possible that
respondents might have differentially interpreted when a stalking incident has actually
taken place. Conservative critics, in particular, argue that the use of imprecise offense
definitions and measures artificially inflate sexual victimization rates (Gilbert, 1 997).
Second, this study provides no information on the nature of the stalking incident, such as
who did the stalking, how long it lasted, what kinds of stalking behaviors were involved,
and whether the stalking was reported to the police. Accordingly, it is not clear whether
the stalking incidents in this study were brief and trivial obsessions or were enduring and
consequential.
To date, the most rigorous study of stalking remains Tjaden and Thoennes's ( I 998)
survey on 1995-1 996 of 8,000 women ages 18 and over. They report that 8 percent of the
women had been stalked at least once in their lives. The prevalence for the preceding 12
months was 1 .O percent.
These results, however, were conditioned by how stalking was defined in the study.
To count as a stalking victim, a respondent had to: (I) answer "yes" to one of eight
"screen" questions that described stalking behavior, such as a person spying on or making
unsolicited phone calls to the respondent; (2) answer that these behaviors had happened
more than once; and (3) answer that the behavior caused the respondent to feel "very
frightened" or to "fear bodily harm." This restrictive definition has an important advantage:
the incidents qualifying as stalking under this definition would be crimes under the stalking
-1 78-
This document is a research report submitted to the U.S. Department of Justice. This reporthas not been published by the Department. Opinions or points of view expressed are thoseof the author(s) and do not necessarily reflect the official position or policies of theU.S. Department of Justice.
statutes that states passed in the 1990's. The disadvantage is that much of the stalking
that women experience is excluded from consideration. Thus, when Tjaden and Thoennes _ _
' E relaxed the definition to include women who felt only "somewhat" or a "little" frightened, the
lifetime prevalence figure jumped from 8 to 12 percent, while the annual prevalence figure
jumped from 1 to 6 percent. These results suggest that serious incidents of stalking are
relatively rare, but that less serious incidents are far more common.
The disparity between annual (1 percent) and lifetime (8 percent) figures for the
prevalence of stalking also warrants attention. Even taking into account that some women
will be victimized more than once and that a single stalking incident can last a lengthy
period, it is difficult to see how an annual rate of 1 percent could result in only 8 percent
of the women being stalked in their lifetime. In part, this can be explained by the
concentration of stalking among younger women: 52 percent of all female stalking victims
were ages 18 to 29, with another 22 percent of the victims being ages 30 to 39. That is,
women tend to be victimized while relatively young and then not again. It also is possible
that a cohort effect is in place: changes in the status and lifestyle of women have made
younger cohorts more susceptible to stalking victimization (see Cohen and Felson, 1979).
Still, response bias cannot be discounted: over the course of a lifetime, victims may have
recall errors. In particular, they may be most likely to filter out incidents that "did not
amount to much" and only report the more serious stalkings that occurred.
Tjaden and Thoennes present additional data on the victimization incidents that met
their restrictive definition of stalking (and thus are more likely to be serious in nature).
Thus, they found that only 23 percent of the victims were stalked by strangers; that less
-1 79-
This document is a research report submitted to the U.S. Department of Justice. This reporthas not been published by the Department. Opinions or points of view expressed are thoseof the author(s) and do not necessarily reflect the official position or policies of theU.S. Department of Justice.

than half the victims were threatened with physical harm; that women stalked by former
husbands or partners were especially likely to be physically and sexually assaulted; that
55 percent ofthe women reported the stalking incidents to the police; that stalking victims
were more likely than non-victims to be concerned for their safety and to carry something
for self-defense; and that 30 percent of the women suffered negative psychological and
social consequences as a result of their stalking. Their results support those reported in
a study of 100 stalking victims from a self-selected clinical sample in Australia: in 58
percent of the cases the stalker made overt threats to the victim; 7 percent of the victims
reported being sexually and 34 percent physically assaulted by their stalker; and the
stalking experience had social (e.g., lifestyle changes) and psychological tolls (e.g., post-
traumatic stress symptoms) on the victims (see Pathe and Mullen, 1997).
Finally, Tjaden and Thoennes present only a limited analysis of the factors that
might increase the risk of stalking victimization. They do note that stalking was more
common for younger women and for American IndianIAlaska Natives and was less
common for Asian women. They do not, however, report multivariate models identifying
how lifestyle factors potentially affect the risk of being stalked (cf. Mustaine and
Tewksbury, 1999).
Our study attempts to build on the stalking research that has only recently
appeared. Similar to Tjaden and Thoennes (1998), we present data from a nationally
representative sample to explore the prevalence and nature of stalking victimization.
Following Mustaine and Tewksbury (1 999) and consistent with calls to do domain-specific
research (Fisher et al., 1998; Lynch, 1987; Mustaine, 1997), we focus on a social
-1 80-
This document is a research report submitted to the U.S. Department of Justice. This reporthas not been published by the Department. Opinions or points of view expressed are thoseof the author(s) and do not necessarily reflect the official position or policies of theU.S. Department of Justice.

domain-females attending college-that is likely to have more pronounced levels of
stalkir la victimization. In so doing, we explore the demographic, lifestyle, and institution-
level factors that might affect the risk of victimization. This analysis attempts to contribute
to the individual-level empirical literature assessing routine activities theory, especially as
that perspective applies to the victimization of college students (see Fisher et al., 1997,
- _
c
RESULTS
Extent and Characteristics of Stalking Events
Exfenf. The sample of 4,446 female students experienced 696 incidents of stalking
(156.5 per 1,000 female students). The number of victims was 581 (130.7 per 1,000
female students)-a figure which is lower than the count of incidents because a
considerable proportion, 15 percent of the women (n = 88), experienced more than one
stalking. These results thus indicate that 13.1 percent of the women in the sample had
been stalked at least once since the academic year had begun-a period that averaged
six months. Of those who had been stalked, 12.7 percent experienced two stalkings and
2.3 percent experienced three or more stalkings. Although our percentage of stalking
victimization appears high (compare with Tjaden and Thoennes, 1998), we should '
p: re-emphasize that our screen question asked the respondents to include as stalking only
0 those incidents in which the attention they received was repeated and done in a way that
seemed obsessive and made you afraid or concerned for your safety. Stalking victims
tend to be young (see Tjaden and Thoennes, 1998) which may also explain our higher
-1 81 -
This document is a research report submitted to the U.S. Department of Justice. This reporthas not been published by the Department. Opinions or points of view expressed are thoseof the author(s) and do not necessarily reflect the official position or policies of theU.S. Department of Justice.

- - E 0
E .a ma
estimate. Finally, consistent with the stalker characteristics research (see Meloy, 1996),
nearly all (97.6 percent) -<the stalkers were male.
Victim-Stalker Relationship. As Table 4.1 shows, four in five victims reported
knowing their stalker. In half of those incidents where the stalkers were known, the
respondent stated that the stalker was "well known" to them. As Table 1 also reveals,
when stalkers were known, there was a link to an established or previously established
relationship; more than four in ten were a boyfriend or ex-boyfriend. Almost a quarter of
the known stalkers were classmates, about two in ten were either a friend or an
acquaintance (9.3 percent and 10.3 percent, respectively), and 1 in 20 was a co-worker.
College women generally were not stalked by college professors or graduate assistants,
by employerslsupervisors, or by relatives.
Nafure of Stalking: Forms, Duration, and htensity. Table 4.2 lists the patterns
of pursuit used by the perpetrator(s) to stalk the women in the sample. As Table 4.2
reports, stalkers used nonphysically visible means to attract the attention of the victim (i.e.,
means in which they were not physically present). Thus, more than three-fourths of the
stalking incidents involved telephone calls, three in ten involved letters, and a quarter
involved E-mail messages. Moreover, stalkers were often physically visible to victims.
Thus, in half the incidents, they were seen waiting for the victim, while in more than four
in ten cases apiece they followed the victim or watched the victim from afar. Stalkers also
typically had multiple contacts with the victim (see Meloy, 1996). On average, each
stalking incident involved 2.9 forms of stalking.
-1 82-
This document is a research report submitted to the U.S. Department of Justice. This reporthas not been published by the Department. Opinions or points of view expressed are thoseof the author(s) and do not necessarily reflect the official position or policies of theU.S. Department of Justice.

Computing how long the average stalking incident lasted is complicated by outliers
in the data (e.g., seven victims reported being -*alked for 1 day and one victim reported
being stalked for ten years). The mean duration for the stalking incident, which is affected
by the outlier cases, was 146.6 days; in contrast, the median duration for an incident was
60 days.'' In any event, the typical stalking incident experienced by college students is
not brief but rather persists for about two months. Finally, at the time of the survey, in 18.1
percent (n=120) of the incidents, the stalking behavior was still ongoing.
The intensity of the stalking also can be assessed by how frequently the forms of
stalking transpired (see Table 4.3). Thus, in response to the question, "During this period,
how often did these events occur?", four in ten respondents reported two to six times a
week, while almost another fourth of the sample stated that the incident occurred either
daily (1 3.3 percent) or more than once daily (9.7 percent). Taken together, these results
indicate that almost two-thirds of the victims experienced stalking that was not only
repeated but consistently present in their lives. In contrast, only one-third of the sample
stated that the stalking incidents took place once a week or less, and of these victims, less
than 4 percent reported the stalking incidents as being less than twice a month.
Location of Stalking. As seen in Table 4.4, more than two-thirds of the incidents
happened either on campus or both on and off campus; 31.4 percent of the stalking
incidents occurred exclusively off campus. Most often, victims were stalked at their
The median number of days did not change when we excluded outliers at both ends of the 18
distribution (less than or equal to 2 days and more than 4 years). The mean, however, was reduced slightly to 137.2 days.
-1 83-
This document is a research report submitted to the U.S. Department of Justice. This reporthas not been published by the Department. Opinions or points of view expressed are thoseof the author(s) and do not necessarily reflect the official position or policies of theU.S. Department of Justice.
residence. Other common locations of stalking were over the telephone or through e-mail,
in a classroom, at work, or going to and from someplace. _ _
Harm to Victims. The majority of the stalking incidents did not appear to have
involved explicit physical threats or lasting injuries. Still, in 15.3 percent of the incidents,
the victim reported that the stalker either threatened or attempted to harm them. With
regard to injuries, in 30.3 percent of the incidents (n=203), stalking victims suffered some
type of injury. Thus, 1.5 percent (n=3) of the incidents involved a "knife or stab wound";
1 percent (n=2) had "broken bones or had teeth knocked out"; 1.5 percent (n=3) involved
the victim being "knocked unconscious"; and 14.8 percent (n=30) involved "bruises,
black-eye, cuts, scratches, swelling, or chipped teeth."'g Further, in 95.1 percent (n=l93)
of the incidents, the respondents stated that they were "injured emotionally or
psychologically." We also should note that in 10.3 percent (n=69) of the incidents, the
victim reported that the stalker "forced or attempted sexual contact."
Actions Taken by the Victim. In nearly three-fourths of the incidents (73.1
percent), victims reported that they had taken "actions as a result of their stalking" (see
Table 4.5). The most common response was to avoid or to try to avoid the stalker (43.2
percent), while another 0.8 percent stated that they did not acknowledge messages from
I the offender. Notably, in 16.3 percent of the incidents, the victim had confronted the
0 stalker. In 5.6 percent of the incidents, respondents indicated that as the result of stalking, ID. ' they became less trusting of others. Although not high percentages (under 5 percent of
the incidents), victims stated that they had taken such actions as getting caller ID,
Percentage may be greater than 100.0 percent because a respondent could give more than i 9
once response.
-1 84-
This document is a research report submitted to the U.S. Department of Justice. This reporthas not been published by the Department. Opinions or points of view expressed are thoseof the author(s) and do not necessarily reflect the official position or policies of theU.S. Department of Justice.

improving the security on their residence, moving their residence, andlor dropping a class.
Respondents were very unlikely to use the legal system to address the stalker(s); in a little
less than 4 percent of the incidents a respondent sought a restraining order, in only 2
percent of the incidents did the respondent file criminal charges, and in a little over 1
percent of the incidents did the respondent file civil charges. They were also not likely to
p L': use formal disciplinary processes available at the respective institution; only 3.3 percent
of the incidents involved a respondent filing a grievance or initiating disciplinary action. b
Reporting Stalking Victimization
The survey also explored whether stalking victims reported being stalked to the
authorities and, if so, to whom. Overall, 83.1 percent of the incidents were not reported
to police or campus law enforcement officials. As Table 4.6 shows, of those incidents that
were reported, on-campus stalking was most often reported to campus police or security,
while stalking that occurred off campus (wholly or in part) was most often reported to the
police.
Similar to other victimization surveys, common answers for not reporting an incident
included not thinking the incident was serious enough to report (72 percent), not being E clear that the incident was a crime or that harm was intended (44.6 percent), and not
p i believing that the police would think it was serious enough (33.6 percent). The victims,
however, also noted that they did not report the stalking because of lack of proof
(one-quarter), because they did not want their family (9.0 percent) or other people (8.5
-1 85-
This document is a research report submitted to the U.S. Department of Justice. This reporthas not been published by the Department. Opinions or points of view expressed are thoseof the author(s) and do not necessarily reflect the official position or policies of theU.S. Department of Justice.
percent) to know, because they did not know how to report the incident (1 0.8 percent), and
becb,se they were afraid of reprisals (1 5.3 percent). _ _
Further, in nearly all the incidents (93.4 percent), the respondents in the survey
confided in someone that they were being stalked. Most often, they reported their
L7 victimization to a friend (69.5 percent of the incidents), to a parent (32.1 percent) or other
1; family member (1 5.2 percent), or to a roommate (21.9 percent). A small number of stalking
victims reported that they were being stalked to resident hall advisors (3.2 percent) or to m
college professors or other university officials (3.5 percent).
Risk Factors for Stalking Victimization
Table 4.7 reports the results of the multivariate logit model that estimates which risk
factors and demographic characteristics contribute to the likelihood of a woman being
stalked. Consistent with a routine activities/lifestyle perspective, measures of exposure
to certain situations, lack of available guardianship, and their proximity to motivated
offenders each placed women at an increased risk of being a stalking victim. In particular,
women with a higher propensity to be at places with alcohol had a higher odds (1.139) of
being stalked than women who did not frequent such places. Lower means of
guardianship also placed women at an increased risk of being stalked; women living alone
had a 1.444 higher odds of being victimized by a stalker than those who did not live alone.
Notably, however, respondents who were dating, whether in a relationship for more than
a year or only dating occasionally, but were not married or living with an inmate partner
also were at an increased likelihood of being stalked. In particular, women who were in
-1 86-
This document is a research report submitted to the U.S. Department of Justice. This reporthas not been published by the Department. Opinions or points of view expressed are thoseof the author(s) and do not necessarily reflect the official position or policies of theU.S. Department of Justice.

shorter relationships-dating less than a year or only occasionally-were at a higher odds
(compare "involved in a cmmitted relationship" = 2.054 higher and "some date" = 2.036)
of being stalked. This finding suggests that women are at their greatest risk of being
stalked ean'y on in a potential relationship; commitment in a marital or cohabiting
relationship lowered women's odds of becoming a stalking victim. Women who were
sexually victimized prior to the start of the academic year were also more likely to be
stalked (1 543 higher thapl those who were not victimized).
Despite research suggesting that the demographic characteristics of the victim are
not significantly influential in explaining stalking victimizations (Coleman, 1 997; Mustaine
and Tewksbury, 1 999; but see Tjaden and Thoennes, 1998), some factors emerge that are
notable in challenging this finding. Specifically, Table 4.7 indicates that in comparison to
White, non-Hispanidlatinos, Asians or Pacific Islanders were significantly less likely to
be stalked while other, non-Hispanic/Latinos and American Indians or Alaska Natives were
significantly more likely to be victimized. Notably, American Indians or Alaska Natives had
the highest likelihood (4.082) of any raciallethnic group to experience a stalking. This
finding is consistent with the sexual victimization research suggesting that American Indian
or Alaska Natives are at greatest risk of being raped (Koss et al., 1987) and stalked
(Tjaden and Thoennes, 1998). Finally, stalking victims were more likely to come from a
wealthy family background and be undergraduates versus graduate students or other
students.
-1 87-
This document is a research report submitted to the U.S. Department of Justice. This reporthas not been published by the Department. Opinions or points of view expressed are thoseof the author(s) and do not necessarily reflect the official position or policies of theU.S. Department of Justice.

DISCUSSION
This chapter's most noteworthy finding is that among college women, stalking
appears to be a common form of victimization. As reported, 13.1 percent of the women in
our national sample indicated that they had been stalked since the academic year had
begun. It is instructive that the reference period for reporting this victimization covered a
relatively short period, approximately six months. We cannot conclude that the prevalence
of stalking would be twice as high for the entire calendar year, because we do not know
if stalking becomes less common during the summer months when many students do not
attend class and thus reside in and/or frequent other social locations and domains (e.g,
work, leisure). Even so, it seems virtually certain that the annual prevalence of stalking
would exceed the 13.1 percent figure in our sample. Further, we recognize that using a
six-month statistic to estimate victimization across an entire college career is problematic
(e.g., the risk of stalking may decline as college students gain seniority on campus; some
students may be multiple victims). Nonetheless, based on our findings, it is plausible to
suggest that a substantial minority, if not a majority, of women will experience stalking
during their college careers, which today average nearly 6.29 years (U.S. Department of
Census, 1997).
The proposal that stalking is a common form of victimization that college women
endure will undoubtedly be subject to scrutiny by more conservative commentators who
view claims of high prevalence rates for sexual victimization as an ideologically inspired
social construction of reality. Calling feminist investigations in this area "advocacy
research," Gilbert (1 997:123) contends that ostensibly high rates of sexual victimization
-1 08-
This document is a research report submitted to the U.S. Department of Justice. This reporthas not been published by the Department. Opinions or points of view expressed are thoseof the author(s) and do not necessarily reflect the official position or policies of theU.S. Department of Justice.

are an artifact of measurement strategies that, among other things, define "a problem so
broadly that it forms a vessel into which almost any human difficulty PI be poured." The
feminists' goal, he argues, is to show that sexual victimization is so pervasive that it must
reflect structures of inequality in society-inequality which, in turn, is in need of
fundamental social change. "They tend not only to see their client group's problems as
_ -
approaching epidemic proportions but to attribute the underlying causes to oppressive
social conditions-such as sexism," observes Gilbert (1 997: 112-1 13). "If 5 percent of
females are sexually abused as children, the offenders are sick deviants; if 50 percent of
females are sexually abused as children, the problem is the way that males are regularly
socialized to take advantage of females."
Leaving aside the accuracy of Gilbert's critique relevant to research on other forms
of sexual victimization (compare with Koss 1992, 1993, 1996), it is incumbent upon us to
address the issue of whether the 13.1 percent figure we report is artificially inflated. To
an extent, Gilbert's perspective is useful in warning against grouping all forms of stalking
together. Our data reveal that, like other forms of victimization (see Bureau of Justice
Statistics, 1997), stalking incidents with less serious consequences are far more
widespread. About 85 percent of the incidents resulted in no threatened or attempted
0 4 physical harm to victims. Further, over eight in ten incidents were not reported to the
police, with the main reason being given that the stalking "was not serious enough to
a report." Taken together, these findings could be used to suggest that many of the
stalkings in the sample may not qualify as crimes, since most states require either an
-1 89-
This document is a research report submitted to the U.S. Department of Justice. This reporthas not been published by the Department. Opinions or points of view expressed are thoseof the author(s) and do not necessarily reflect the official position or policies of theU.S. Department of Justice.

explicit threat or the requirement that a "reasonable person" would interpret the behavior
of the stalker as threatening (U.S. Department of Justice, 1993). - -
'E While disaggregating the data may be useful in guarding against the conclusion that
an epidemic of life-threatening criminal stalking grips the nation's ivory towers, other
findings in our study caution against seeing the high rate of stalking as inconsequential.
Thus, in designing our study, we endeavored to avoid Gilbert's (1 997) concern that bias
is introduced when researchers use an overly broad definition of what counts as a sexual
victimization. Instead, we employed a screen question that specifically asked if the
stalking behavior had been "repeated," "obsessive," and "made you afraid or concerned
for your safety." We relied on this definition to rule out truly petty forms of attentive
behavior which, though rude or bothersome, were not repeated and salient enough to
induce fear or concern. Although response errors are possible, it seems likely that our
measure detected mainly patterns of behavior that would be widely regarded as "stalking."
This conclusion gains credence when the nature of the stalking incidents are
examined. As reported, victims were typically stalked for two months, with two-thirds
indicating that offenders contacted them in some way at least two to six times a week.
Again, we cannot say what proportion of these stalking itxidents formally crossed the line mil 0 4 into criminal behavior or, more pragmatically, would be prosecuted by a district attorney l o
as criminal. More detailed information would have to be collected to discern whether the
nature of the stalking would be reasonably seen as "threatening'l-even if it did inspire fear
or concern for safety in the victims. Regardless, the duration of and the frequency of E
-1 90-
This document is a research report submitted to the U.S. Department of Justice. This reporthas not been published by the Department. Opinions or points of view expressed are thoseof the author(s) and do not necessarily reflect the official position or policies of theU.S. Department of Justice.

whether a "risk" is seen as normal and inevitable or as unacceptable and changeable
varies overtime. In this cc.-text-and independent of its objective consequences-stalking
may only now be emerging as a "risk" that is perceived as being worthy of invoking legal
intervention (see McAnaney et al., 1993). As noted, stalking laws are a creation of this
decade (Marks, 1997). It is unclear, moreover, whether on college campuses, prevention
programs dealing with the sexual victimization of women move beyond important issues
such as date rape to include stalking. In short, assessments of seriousness may not be
tied only to what occurs in a stalking incident but also to whether the larger culture defines
stalking as a "crime" and whether the local campus "raises consciousness" about this form
of victimization.
Second, stating that a stalking incident is not serious enough to call in the police
is not identical to saying that the incident is not serious or otherwise consequential.
Reporting a victimization to the police or to campus authorities must be balanced against
the costs that such action incurs (e.g., time, anticipated anxiety over going to court,
publicity). On college campuses, victims would also have to overcome norms against
"turning in" or "snitching on" one's fellow students. Most salient perhaps is that in four in
five cases, the victims knew their stalkers. It may very well be that stalking would have to
pass a high threshold-to have imminent or completed physical harm-before it would be
seen as serious enough to warrant having a classmate and/or ex-boyfriend arrested.
Consistent with this view, the victims in our sample were less likely to report a stalker if
they knew the person and were more likely to report their victimization if the stalking
-1 92-
This document is a research report submitted to the U.S. Department of Justice. This reporthas not been published by the Department. Opinions or points of view expressed are thoseof the author(s) and do not necessarily reflect the official position or policies of theU.S. Department of Justice.
contact in these incidents obviate any claim that the offenders' conduct somehow was
misI. kerpreted or misunderstood by our female respondents. _ _
In fact, the measurement of stalking may be less open to methodological bias than
that of other sexual victimizations precisely because stalking is a repeated pattern of
Lea behavior. For example, in assessing whether a rape occurred in an intimate relationship
4 (e.g., on a date), measuring the key components of whether consent was given and force
was used is a daunting enterprise-especially when respondents may not share the
researchers' interpretation of these terms or, more holistically, may not see the event as
a "rape" even when consent was absent and force was used (compare Gilbert, 1997 with
Koss, 1992, 1993). These same challenges might be present if we were to ask a
respondent if the single act of a person following her was obsessive and made her
concerned for her safety. Was the behavior really stalking or just an awkward attempt to
get the attention of a female student? However, when the acts continue again and again
over time-that is, when victims have numerous "empirical observations" of the offender's
conduct-it is unlikely that female victims do not know what is occurring in their lives and
are erroneously reporting that they have been stalked. Accordingly, we can have a
commensurate level of confidence that the prevalence of stalking reported in our study is
not somehow widely inflated by the wording of the screen question we have used. 0
We would also be cautious about assuming that stalking incidents are merely petty
simply because the respondents justify not reporting their victimization with the reasoning
that the stalking was "not serious enough." First, the concept of "seriousness" is socially
constructed and dynamic (see Lowney and Best, 1995). As Friedman (1985) notes,
-1 91 -
This document is a research report submitted to the U.S. Department of Justice. This reporthas not been published by the Department. Opinions or points of view expressed are thoseof the author(s) and do not necessarily reflect the official position or policies of theU.S. Department of Justice.
persisted for a longer period of time, if they were followed by the stalker, and if they were
injured.*' _ _
Relatedly, although victims did not often summon authorities to exercise formal
social control, the data suggest that they did engage in "self-help" to cope with their
victimization (see, more broadly, Black, 1983; Smith and Uchida, 1988). There is no
evidence, for example, that the victims perceived their stalking to be so minor that they
dealt with it as a purely pripate matter. Instead, more than nine in ten respondents stated
that they confided in sorrreone they knew-most often friends, family members, and
roommates-about their being stalked. In turning to those close to them, it is likely that
they were seeking social support to help them cope with their stalking. Further, in nearly
three-fourths of the incidents, victims took some action in response to their victimization.
Most often this involved avoiding the stalker or, in a smaller but not insignificant number
of cases, confronting the stalker directly.
Taken together, this discussion suggests that the prevalence of stalking in our study
is not due to methodological artifacts and that most stalking incidents-even if not
physically harmful-result in victims exercising coping responses. But let us assume for
the moment that conservative critics are correct and that most of what our respondents
report is relatively minor-certainly not life-threatening or criminal, mostly just aggravating
male behavior-and thus is not deserving of sustained social intervention. The danger in
this reasoning is that in their contentious efforts to deconstruct supposed feminist claims
The results from our estimated multivariate logit model predicting reporting to the police or 20
campus law enforcement are not presented in this paper. The results, however, are available upon request from the first author.
-1 93-
This document is a research report submitted to the U.S. Department of Justice. This reporthas not been published by the Department. Opinions or points of view expressed are thoseof the author(s) and do not necessarily reflect the official position or policies of theU.S. Department of Justice.

that sexual victimization occurs in epidemic proportions, these critics make the opposite
error of "normalizing" the unwanted intrusion of males into the live; &women in private
and in public. That is, why should women have to endure the persistent, if not obsessive,
violation of their lives? Even if only mildly and episodically unnerving-only enough to
cause a female to avoid the stalker and to seek out of friend's ear-why should this level 04
4 of victimization be minimized? Why the sympathy for "men acting badly"? 'E We recognize, of course, that constitutional rights may expose citizens of any
_ _
gender to a certain level of uncivil behavior. It may also be a reality that the criminal law
will have a role in controlling only the more extreme forms of stalking. Still, on college
campuses, administrators will have to wrestle with the question of the extent to which
stalking is a problem that diminishes the quality of female students' lives. The relatively
high prevalence of stalking found in our data would seemingly suggest that this form of
sexual victimization should not be ignored. Instead, whether through support services for
victims, counseling programs for stalkers, or disciplinary codes, it is perhaps time for
colleges and universities to design comprehensive strategies to protect women whose
days are punctuated by the obsessive intrusions of male stalkers.
Beyond the issue of the prevalence and consequences of stalking, the results have m 0 4 implications for routine activities theory-in two respects. First, Lynch (1987) notes the L.
importance of assessing how victimization varies across different social domains (see also LO L.2 Fisher et al., 1998; Mustaine, 1997). To the extent that college campuses are distinctive
domains, routine activities theory would predict that the nature of victimization would differ
from that of other social domains-at least to the extent that features of campus life
-1 94-
This document is a research report submitted to the U.S. Department of Justice. This reporthas not been published by the Department. Opinions or points of view expressed are thoseof the author(s) and do not necessarily reflect the official position or policies of theU.S. Department of Justice.
influence the intersection in time and space of motivated offenders, attractive targets, and
_ _ capable guardianship.
Contrary to much rhetoric in the media, research suggests that institutions of higher
education may insulate students from most serious forms of "street" crime (see Fisher et
1; al., 1998). Coterminously, however, colleges and universities likely expose
1; students-especially female students-to a higher risk of sexual victimization by people '
they know (see also Fisher et al., 1998; Koss et al., 1987). The typical lifestyle of college rn
women is such that they come into regular contact with young men-men seeking social
and sexual relationships-both in class and in recreational settings, during the day and
at night, in public and in private locations, and often without much guardianship. Routine
activities theory would predict that these routines would inevitably produce a high rate of
sexual victimization among people who know one another. Consistent with this view, the
analysis revealed that most victims knew their stalkers. Further, we found that the
prevalence of stalking victimization among our national sample of college women to be
much higher than that reported for the general female population (see Tjaden and
Thoennes, 1998) and more similar to that reported in a comparable study of female
students (see Mustaine and Tewksbury, (1 999).
Second, routine activities theory would also predict that the risk of stalking
victimization would vary among college women according to the lifestyles of these women.
This contention is not a case of "blaming the victim," but rather a statement that lifestyle to
factors affect the level of exposure to victimization. In contrast, feminist researchers tend
to reject the idea that sexual victimization differs among females, instead claiming that
-1 95-
This document is a research report submitted to the U.S. Department of Justice. This reporthas not been published by the Department. Opinions or points of view expressed are thoseof the author(s) and do not necessarily reflect the official position or policies of theU.S. Department of Justice.
such victimization is spread across women in all parts of society (see Gilbert, 1997). It is
at lI,nes suggested that the most important risk factor for women being victimized is “simply _ _
being a woman” (Crowell and Burgess, 1996: 70-73).
The results from our study lend support to routine activities/lifestyle theory.
p2 Women’s risk of stalking was significantly enhanced for those who frequented places
where alcohol was served (Le., exposure to crime), lived alone (i.e., absence of
guardianship), and were involved in dating relationships (i.e., close proximity to motivated h
offender). Women who frequently go to parties, bars, or clubs where alcohol is served
may come in contact with sexually predatory people (see Schwartz and Pitts, 1995).
Women who live alone may be more vulnerable to stalkers because they are suitable
targets; namely, there are fewer barriers for the stalker, including someone other than the
victim to witness the obsessive behavior (see Mustaine and Tewksbury, 1999). Dating
provides a means to meet and over time to become intimate with a person who is or may
become obsessive with regards to the person he or she is or was dating (see Meloy,
1996). Although the statistical prevalence of former or current intimate stalking is not
known, the literature on the characteristics of stalkers and stalking victims both suggest
that there is a link between stalking and intimate relationships (see Meloy, 1996; Tjaden
and Thoennes, 1998).
Consistent with the results from several sexual victimization studies (see Crowell 0
4 and Burgess, 1996), women who were previously sexually victimization were more likely La
to be a stalking victim. We have no firm data on why this relationship exists but some
insight might be drawn from Finkelhor and Asdigian’s (1996:6) work on “target
-1 96-
This document is a research report submitted to the U.S. Department of Justice. This reporthas not been published by the Department. Opinions or points of view expressed are thoseof the author(s) and do not necessarily reflect the official position or policies of theU.S. Department of Justice.

congruence.” In an extension of the routine activities concept of target attractiveness,
Finkelhor and Asdigian , ,de that “personal characteristics” might “increase vulnerability
to victimization, independent of routine activities, because these characteristics have some
congruence with the needs, motives or reactivities of offenders” (1 996:6: emphasis in the
original). Such congruence may be exacerbated by a victim’s target vulnerability”-a
situation in which a personal characteristic“may compromise the potential victim’s capacity
to resist or deter victimization . . . the prototypical risk factors . . . would be attributes like
small size, physical weakness, emotional deprivation, or psychological problems’
(1 996:67). In this context, prior sexual victimization may increase a woman’s vulnerability
in relationships with men and decrease her capacity to deter men with propensities to
engage in stalking. These, speculations, of course, warrant further empirical investigation.
We also found significant that the risk of stalking varied among different types of
women. Undergraduates also may place themselves in a wider diversity of social
situations and then increase their exposure to the types of people who sexually prey on
women. Further, undergraduate women may have schedules that are more predictable
and routine (e.g., a political science class three days a week at 11:OO a.m., followed by a
criminal justice class at 12:20 p.m., a daily work-study job that begins at 3:30 p.m, dinner
between 5 p.m. and 6:30 p.m., and studying in library from 7 p.m. to midnight) than
graduate students or other adult students and thus they are easier to stalk.
Undergraduates may also frequently attend parties and bars and date more than other
students and as a result, increase their risk of being stalked because they put themselves
in different types of vulnerable situations and increase their exposure to those who
-1 97-
This document is a research report submitted to the U.S. Department of Justice. This reporthas not been published by the Department. Opinions or points of view expressed are thoseof the author(s) and do not necessarily reflect the official position or policies of theU.S. Department of Justice.
sexually prey on women. Further, Native American and Alaska Native women were more
likely to be stalked than women of other rack; and ethnic backgrounds, and Asian and
Pacific Islander women were less likely to be stalked. Caution should be exercised when
interpreting these results because of the small number women in these two groups in the
sample. It should be noted that these results support those presented by Tjaden and
_ _
Thoennes (1 997). Finally, women who attended schools located in small towns or rural
areas were more likely to be stalked than those who did not attend schools located in small
towns or rural areas. One plausible explanation is that women who attended schools in
a small townhral area physically live and socialize in a confined geographical area that
makes them easier to stalk.
In closing, we recognize that even with the empirical results reported here and
elsewhere (see, especially, Mustaine and Tewksbury, 1999; Tjaden and Thoennes, 1998),
research on the extent and nature of stalking remains in its preliminary stages. Many gaps
in our knowledge remain to be filled in: What is the best way to measure whether stalking
has occurred? How do victims interpret the obsessive behavior of stalkers and come to
decide that it constitutes a "crime"? In what social domains is stalking more or less likely
to occur? Is stalking a psychological disorder or rooted in the cultural and structural
hegemony of patriarchy? Under what circumstances does stalking escalate into violence?
1; What social controls-criminal, civil, or informal-should be used to reduce stalking and
0 4 protect potential victims in different social domains? These questions, and many more, L m
beg systematic attention. At this point, however, we can say at a minimum that stalking
is not a rare event but a form of victimization that many women, especially on college
-1 98-
This document is a research report submitted to the U.S. Department of Justice. This reporthas not been published by the Department. Opinions or points of view expressed are thoseof the author(s) and do not necessarily reflect the official position or policies of theU.S. Department of Justice.
campuses, will be forced to endure. It is an issue, in short, that warrants far more
illumination and intervention than it has thus far received. _ _
-1 99-
This document is a research report submitted to the U.S. Department of Justice. This reporthas not been published by the Department. Opinions or points of view expressed are thoseof the author(s) and do not necessarily reflect the official position or policies of theU.S. Department of Justice.

Table 4.1 Relationship of Victim to Stalker
Extent of Relationship Wdh Known Stalkers’
Knew Stalker Stalker Was a Casual Stalker Was Slig htiy Acquaintance Well Known
Percent % % % 6 Relationship to Staike? (n) (n) (n) (n)
4 Knew or Had Seen Stalker Before 80.3 24.3 22.7 53.0 (535) (1 30) (1 21 1 (283)
Stalker Was a Stranger 17.7 (1 18)
2.0 (1 3)
Never Saw or Heard the Stalker
Relationship to Stalker if Respondent Knew or Had Seen the Stalker
Relationship to Stalker % n
Boyfriend or Ex-Boyfriend
Classmate
Acquaintance
Friend
Co-worker
Male Non-Relative
Husband or Ex-Husband
Professor
Graduate Teaching Assistant
Male Relative
Female Relative
Female Non-Relative
42.4
24.5
10.3
9.3
5.6
1.9
1.7
0.7
0.6
0.4
0.0
0.0
227
131
55
50
30
10
9
4
3
2
0
0
’ Question only asked of respondents who knew or had seen stalker(s) before. One respondent did not answer the question.
Don’t know (n = 10) and refused (n = 9) not included.
-200-
This document is a research report submitted to the U.S. Department of Justice. This reporthas not been published by the Department. Opinions or points of view expressed are thoseof the author(s) and do not necessarily reflect the official position or policies of theU.S. Department of Justice.

Table 4.2 Forms of Stalking
Form of Stalking’
Total Number of Stalking Waited Outside Watched Sent Sent Showed Up Incidents Followed or Inside Places From Afar Telephoned Letters E-Mailed Gifts Uninvited Other
YO YO % Y O % % % YO YO %
100.0 42.0 52.1 44.0 77.7 30.7 24.7 3.3 4.9 10.9 (696)2 (282) (350) (296) (522) (206) (1 66) (22) (33) (73)
Total will not sum to 100.0 percent because a stalking incident could involved more than one form of stalking. For example, the stalker followed the respondent and E-mailed her.
In 13 stalking incidents, we did not know what form(s) of stalking happened because the respondent refused to answer this question. In 11 stalking incidents, the respondent refused to discuss the incident and did not complete an incident report.
-201 -
This document is a research report submitted to the U.S. Department of Justice. This reporthas not been published by the Department. Opinions or points of view expressed are thoseof the author(s) and do not necessarily reflect the official position or policies of theU.S. Department of Justice.
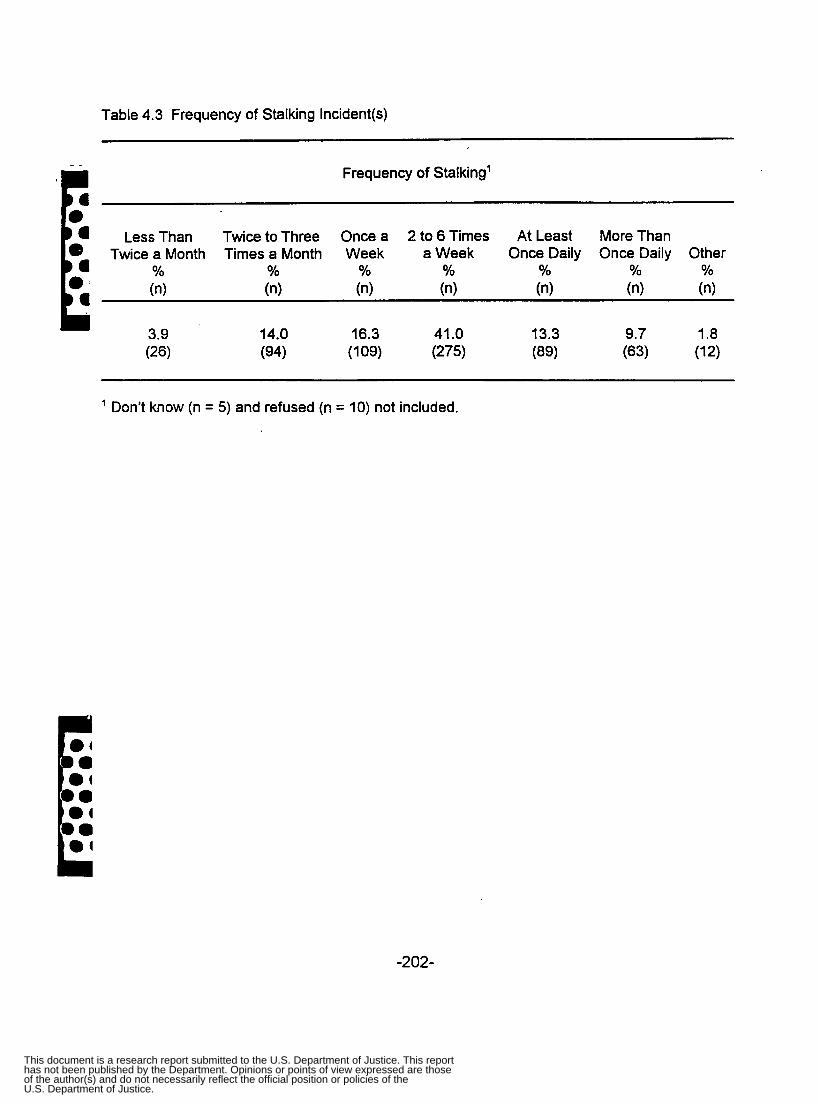
Table 4.3 Frequency of Stalking Incident@)
_ _ Frequency of Stalking’
Less Than Twice to Three Once a 2 to 6 Times At Least More Than Twice a Month Times a Month Week a Week Once Daily Once Daily Other
% YO % YO YO % YO
(n) (n) (n) (n) (n) (n) (n)
3.9 14.0 16.3 41 .O 13.3 9.7 1.8 (26) (94) (1 09) (275) (89) (63) (12)
’ Don’t know (n = 5) and refused (n = I O ) not included.
-202-
This document is a research report submitted to the U.S. Department of Justice. This reporthas not been published by the Department. Opinions or points of view expressed are thoseof the author(s) and do not necessarily reflect the official position or policies of theU.S. Department of Justice.

Table 4.4 Location of Stalking Incident(s)
Exact Location of Stalking
Library or Telephone or On the Way Other Answering Through Through to and From
Location Percent Party Classroom Building Residence Work Machine the Mail E-Mail Someplace Other of % % % % % % % % % % %
Stalking (n) (n) (n) (n) (n) (n) (n) (n) (n) ( 4 (n)
On 45.6 6.9 23.9 17.6 52.3 5.6 35.9 7.5 16.7 9.5 7.8 Campus (306) (21) (73) (54) (160) (17) (110) (23) (51 1 (29) (24)
Campus (211) (17) ( 5 ) (4) (144) (43) (59) (13) (8) (18) (32)
(154) (38) (62) (30) (1 15) (44) (57) (17) (18) (43) (20)
Off 31.4 8.1 2.4 1.9 68.2 20.4 28.0 6.2 3.8 8.5 15.2
Both 23.0 24.7 40.3 19.5 74.7 28.6 37.0 11.0 11.7 27.9 13.0
-203-
This document is a research report submitted to the U.S. Department of Justice. This reporthas not been published by the Department. Opinions or points of view expressed are thoseof the author(s) and do not necessarily reflect the official position or policies of theU.S. Department of Justice.
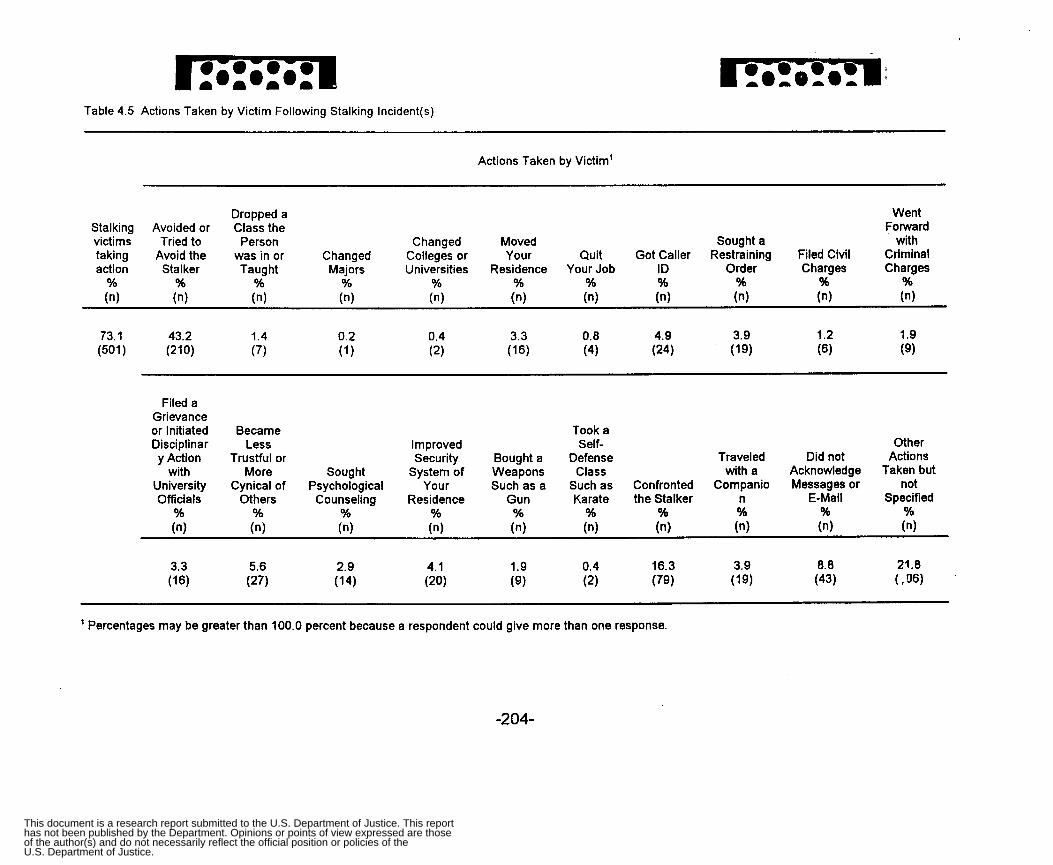
Table 4.5 Actions Taken by Victim Following Stalking Incident(s)
Actions Taken by Victim'
Dropped a Went Stalking Avoided or Class the Fotward victims Tried to Person Changed Moved Sought a with
Criminal taking Avoid the was in or Changed Colleges or Your Quit Got Caller Restraining Filed Civil action Stalker Taught Majors Universities Residence Your Job ID Order Charges Charges
% % % % % YO % % % % % ( 4 (n) (n) (n) (n) (n) (n) (n) ( 4 (n) (n)
Filed a Grievance or Initiated Became Disciplinar Less Improved Self- Other y Action Trustful or Security Bought a Defense Traveled Did not Actions
with More Sought System of Weapons Class with a Acknowledge Taken but University Cynical of Psychological Your Such as a Such as Confronted Cornpanio Messages or not Officials Others Counseling Residence Gun Karate the Stalker n E-Mail Specified
% % % % % % % % % %
Took a
(n) (n) (n) (n) (n) (n) (n) (n) (n) (n)
' Percentages may be greater than 100.0 percent because a respondent could give more than one response.
-204-
This document is a research report submitted to the U.S. Department of Justice. This reporthas not been published by the Department. Opinions or points of view expressed are thoseof the author(s) and do not necessarily reflect the official position or policies of theU.S. Department of Justice.
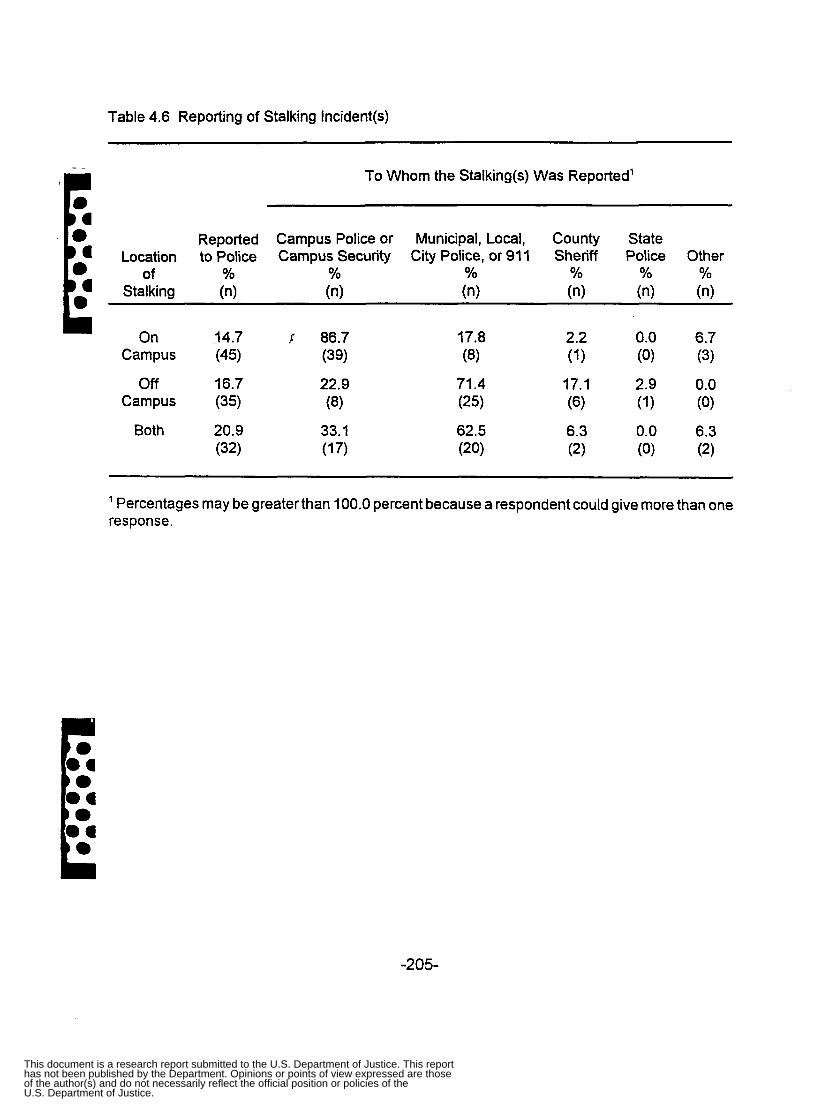
Table 4.6 Reporting of Stalking Incident(s)
To Whom the Stalking@) Was Reported’
Reported Campus Police or Municipal, Local, County State Location to Police Campus Security City Police, or 91 1 Sheriff Police Other
of YO % YO YO % % Stalking (n) (n) (n) (n) (n) (n)
On 14.7 .s 86.7 17.8 2.2 0.0 6.7 Campus (45) (39) (8) (1) (0) (3)
Off 16.7 22.9 Campus (35) (8)
’ Percentages may be greater than 100.0 percent because a respondent could give more than one response.
-205-
This document is a research report submitted to the U.S. Department of Justice. This reporthas not been published by the Department. Opinions or points of view expressed are thoseof the author(s) and do not necessarily reflect the official position or policies of theU.S. Department of Justice.

Table 4.7 Multivariate Model Identifying Risk Factors of Being Stalked
b Coefficient' Factors (se) ExP (b)
Exposure to Crime
Propensity to be at Places with Men
Propensity to be at Places with Alcohol
Frequency of Drinking Enough Alcohol to Get Drunk
Frequency of Smoking Pot or Hashish
Member of or Pledge to Social Sorority
Guardianship Measure
Live Alone
Proximity to Motivated Offenders
Part-time Student
Live in a Coed Dorm
Live On Campus
Relationship Status
involved in a Committed Relationship
Some Dating
Never Date
Prior Victimization
.125 1.133 (.083)
.130+ 1.139 (. 070)
-.003 0.997 (.040)
.051 (.037)
1 .OS2
-.169 0.844 (.148)
.368- (.124)
.037 (.192)
.025 (.135)
-.207 (.150)
,720'" (.190)
.711" (.192)
1.444
1.037
1.025
0.813
2.054
2.036
.296 1.344 (.341)
Prior Sexual Victimization .434+" 1.543 (. 042)
Demographic Characteristics
Family Class .222- 1.249 (. 063)
RaceEthnicity
African-American, non-Hispanicllatino
AsianlPacific Islander
Other, Non-HispaniclLatino
HispaniclLatino
-.OB6 0.917
-1.202- 0.301
(.212)
(.460)
,829- (.296)
. loo (.201)
2.291
1.105
4.082 American IndianlAlaska Native 1.407" (. 396)
-206-
This document is a research report submitted to the U.S. Department of Justice. This reporthas not been published by the Department. Opinions or points of view expressed are thoseof the author(s) and do not necessarily reflect the official position or policies of theU.S. Department of Justice.
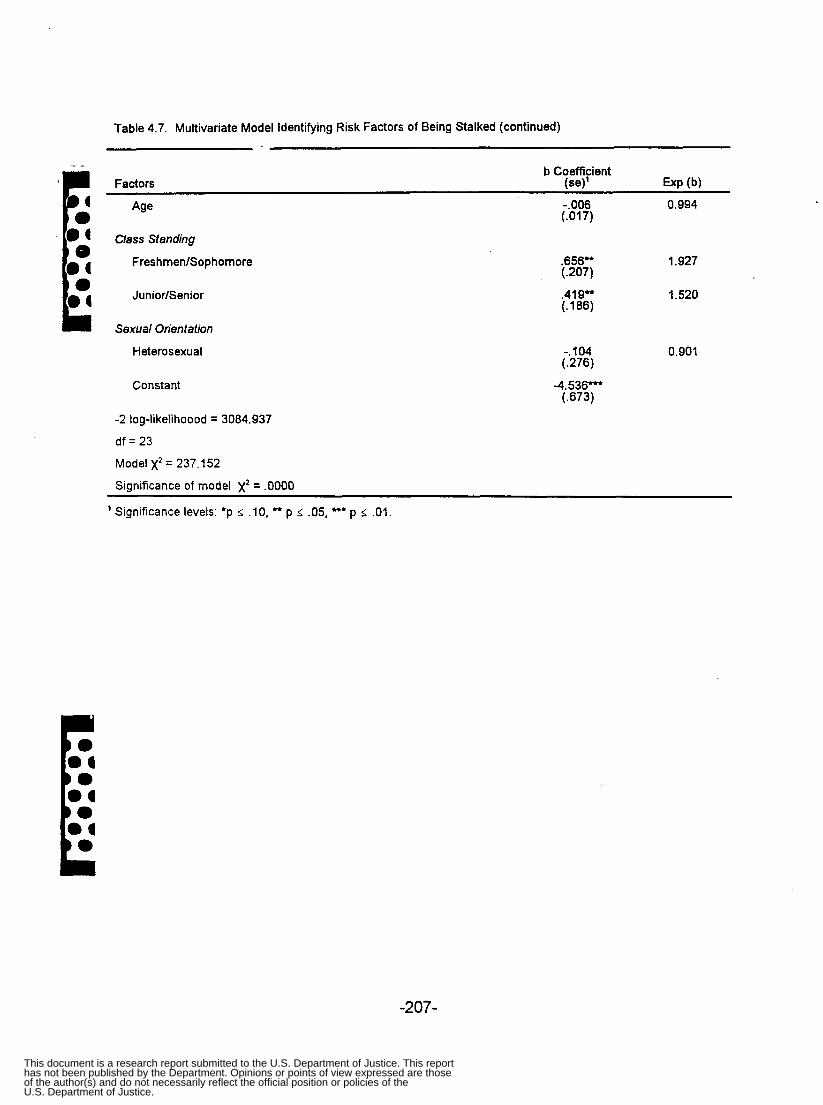
_ _
04 0 'E 0 4
Table 4.7. Multivariate Model Identifying Risk Factors of Being Stalked (continued)
b Coefficient Factors W' ExP (b)
-.006 0.994 (.017)
Age
Class Standing
FreshmenlSophomore .656" 1.927 (.207)
JuniorlSenior
Sexual Orientation
Heterosexual
Constant
-2 log-likelihoood = 3084.937
df = 23
Model x2 = 237.152
Significance of model x2 = .OD00
.419* (.l86)
-. 104 (.276)
-4.536" (.673)
1.520
0.901
I Significance levels: 'p r; . I O , c. p 5 .05, ** p s .01.
-207-
This document is a research report submitted to the U.S. Department of Justice. This reporthas not been published by the Department. Opinions or points of view expressed are thoseof the author(s) and do not necessarily reflect the official position or policies of theU.S. Department of Justice.
CHAPTER 5
VERBAL AND VISUAL FORMa OF SEXUAL VICTIMIZATION
As noted in Chapter 1 , the sexual victimization of women can take many forms.
1.'1 Previous research suggests that beyond victimization involving force or threats of force,
0 4 females are subjected to a range of sexually harassing comments including, for example, E sexist remarks, cat calls, insults, and unwelcomed statements tinged with sexual innuendo
or sexually explicit content. Although not plentiful, there is some evidence that the
supposed civility of the ivory tower life on college campuses does not insulate female
students from such verbal sexual victimization (Adams, Kottke, and Padgitt, 1983; Benson
and Thomson, 1982; Fitzgerald, Shullman, Bailey, Richards, Swecker, Gold, Ormerod, and
Weitzman, 1988; Lott, Reilly, and Howard, 1982).
In our attempt to furnish a more complete portrait of the sexual victimization that
college women experience, therefore, we included five questions that attempted to assess
harassing verbal comments. Although not typically found in research studies, we also
incorporated five questions that assessed the "visual" victimization of women. Thus, we
focused on instances in which the respondents were involuntarily exposed to sexually- r, related content and instances in which their sexual privacy was violated.
As explained in the methods section, for verbal and visual victimization, we did not
follow a screen question with an incident report. From our pre-test, it seemed likely that
' some of these victimizations would be so numerous that the study's interviewers would
have to complete thousands of incident reports. The time and resource limits of the survey
precluded undertaking this enormous task. Instead, we asked only whether a victimization
-208-
This document is a research report submitted to the U.S. Department of Justice. This reporthas not been published by the Department. Opinions or points of view expressed are thoseof the author(s) and do not necessarily reflect the official position or policies of theU.S. Department of Justice.

had occurred. If the respondent answered "yes," then the person was asked "how many
times this happened to you" both "on campus" and "off campus." We recognize that this
approach-although not unlike that employed in past research-is less precise than using
a methodology that uses an incident report to confirm that a victimization indicated on a
- _
b7 screen question has actually taken place. Even so, the results reported here are
suggestive of the extent to which different types of verbal and visual victimization are e: experienced by college women.
Finally, we should reemphasize that the bounding period for this survey was
approximately six months. As noted previously, extrapolating from six-month figures to
year-long figures is difficult. Nevertheless, the extent of. sexual victimization reported
here-which is particularly high for verbal victimization-does suggest that only a minority
of women on college campuses escape some type of sexual victimization.
VERBAL FORMS OF SEXUAL VICTIMIZATION
As the data in Table 5.1 show, verbal sexual victimization appears to be a common
experience for the female college students in our national sample. Since the beginning
of the academic school year, more than half the women had experienced "general sexist
remarks" voiced in their presence, while almost half reported hearing "cat calls, whistles
about your looks, or noises with sexual overtones." Moreover, the number of victimizations p 0
per victim for these two offenses was 13.0 and 13.9, respectively. p' About one in five women also stated that they had received "obscene telephone
calls or messages." Here the mean number of victimization incidents per victim was 5.0.
-209-
This document is a research report submitted to the U.S. Department of Justice. This reporthas not been published by the Department. Opinions or points of view expressed are thoseof the author(s) and do not necessarily reflect the official position or policies of theU.S. Department of Justice.

Almost one in five women reported that they had been "asked questions about your sex
- - or romantic life" when such inquiries were clearly none of someone's business. The meon '
for this item was 5.6. Finally, almost one in ten women said that "false rumors" had been
0 spread about their sex lives (mean = 2.7 incidents).
It is not clear, however, how much of this sexual verbal victimization was specifically E related to being a college student and how much was simply a burden that young women k in society generally experience. Although there was variation across the five types of
victimization (see Table 5.1), verbal victimization appeared to take place both on campus
and off campus. Thus, while it cannot be stated that verbal sexual victimization is unique
to college campuses, the data do suggest that campuses do not insulate college-aged
females from sexism, lewd remarks, obscene phone calls, and unwanted inquires into and
rumors about their sex lives.
VISUAL FORMS OF SEXUAL VICTIMIZATION
Table 5.2 reports the results for five forms of visual sexual victimization. As can be
readily seen, visual victimization occurs far less often than verbal victimizations. Even so, m
it is instructive that 6.1 percent of the respondents reported that they had been shown to ;
0 pornographic materials that they did not wish to see. Almost 5 percent of the sample re 4
indicated that, in approximately a six-month period, they had someone expose their sexual
organs to them when they did not give their consent. Further, 2.4 percent stated that, also
without their consent, someone had tried to observe them while "undressing, nude, or in
a sexual act."
-21 0-
This document is a research report submitted to the U.S. Department of Justice. This reporthas not been published by the Department. Opinions or points of view expressed are thoseof the author(s) and do not necessarily reflect the official position or policies of theU.S. Department of Justice.
The other two forms of victimization were very rare-under 1 percent-but were not
_ _ non-existent. Notably, fifteen women in the sample reported that, without their consent,
I E someone had shown "photographs, videotapes, or audiotapes" of them "having sex or in
a nude or seminude state." Further, eight women indicated that they had been K photographed or taped "having sex or in a nude or semi-nude state" without their consent. t:
As with verbal sexual victimizations, these victimizations occurred both on and off
campus. However, therehas a tendency for exposure to pornographic materials to occur
on campus (60.0 percent) and for exposure to sexual organs and being observed without
consent to occur off campus (66.0 percent and 56.0 percent, respectively). The number
of cases for photographs of the victim being taken or shown was too small to allow for a
mean i ngf u I ana I ysi s.
DISCUSSION
The statistics on verbal and visual sexual victimization are best seen not as precise
counts but as estimates of the extent of these forms of victimization. As noted above,
without an incident report in which the specifics of a victimization are confirmed and
E recorded, answers to (essentially) screen questions are open to response error. Further, 0
0 4
for some questions, the victimization may, to an extent, lie in the eye of the beholder.
Thus, what one woman might define as a sexist remark, another woman might see as a E 0 I.' more or less successful attempt at humor
With these caveats stated, however, the pattern of results reported above suggest
that few woman in the sample were free from one or more of these forms of victimization.
-21 1-
This document is a research report submitted to the U.S. Department of Justice. This reporthas not been published by the Department. Opinions or points of view expressed are thoseof the author(s) and do not necessarily reflect the official position or policies of theU.S. Department of Justice.
Indeed, a clear majority of the respondents indicated that they had experienced at least
_ _ one verbal or visud sexual victimization. Even with some response bias, the
pervasiveness of the reported sexual victimization argues against this phenomenon being
a construction of the respondents' imagination or an artifact of our methodology. 4
Instead, it appears that both on campus and off campus, female college students e
often confront sexist remarks and are subjected to cat calls signifying some male's interest c in them sexually. They also are subject, if in smaller proportions, to rude inquiries into,
and false rumors about, their sex lives. It is noteworthy, moreover, that one in five of the
respondents received an obscene telephone call or message; indeed, victims averaged
five such calls in the six-month bounding period. Although we do not have a comparative
male sample, it seems likely that these forms of victimization are not experienced in similar
proportions by men (see, for example, Fitzgerald et al. 1988).
On one level, of course, these victimizations seem relatively minor. And in a social
domain in which younger men and women students often attempt to initiate or interact
about intimate relationships, one might anticipate that some sexually tinged remarks will
be made. But given the prevalence of victimization, the data suggest that the verbal
harassment of women goes beyond playful exchanges, harmless off-color humor, and
unintentional affronts. Instead, many female respondents reported repeatedly having to
4 cope with having their gender-especially their role as sexual objects-made salient
against their consent. Further, in an era in which political correctness supposedly has E chilled what can be said in the ivory tower, our data did not support the conclusion that
-212-
This document is a research report submitted to the U.S. Department of Justice. This reporthas not been published by the Department. Opinions or points of view expressed are thoseof the author(s) and do not necessarily reflect the official position or policies of theU.S. Department of Justice.

college campuses provide a safe haven from verbal victimization. Instead, such
- - victimization was as prevalent on campus bsoff campus.
In contrast, visual victimization did not appear to be ubiquitous in the lives of female
I': students. Even so, considering that the statistics were only for six months of the students'
lives, the prevalence of both involuntary exposure both to pornographic materials (6.1
percent) and to sexual organs (4.8 percent) are not inconsequential. Future research CE focusing on the details of these victimization incidents, however, is needed to clarify what
they entail. For example, "exposure to sexual organs" could be the result of a stranger
"flashing" a victim or it could occur on a date where a male lowers his trousers and
underpants in an inappropriate attempt to initiate a sexual encounter.
Finally, it does not appear that the non-consensual videotaping of women having
sex or in the nude is a problem of any magnitude. Although a rare event, however, it is
instructive that there were seven cases in which women were involuntarily taped on
campus (and eight other cases in which taped material, voluntarily obtained, was
involuntarily shown to others). These are serious violations of the victims' privacy, and,
if publicized, a single incident can have a scandalous effect on the individuals involved
and on a university's reputation. Further, it is at least conceivable to anticipate that these
incidents-although never likely to become widespread-will become more prevalent as
the general public has access to increasingly sophisticated surveillance technology.
-21 3-
This document is a research report submitted to the U.S. Department of Justice. This reporthas not been published by the Department. Opinions or points of view expressed are thoseof the author(s) and do not necessarily reflect the official position or policies of theU.S. Department of Justice.
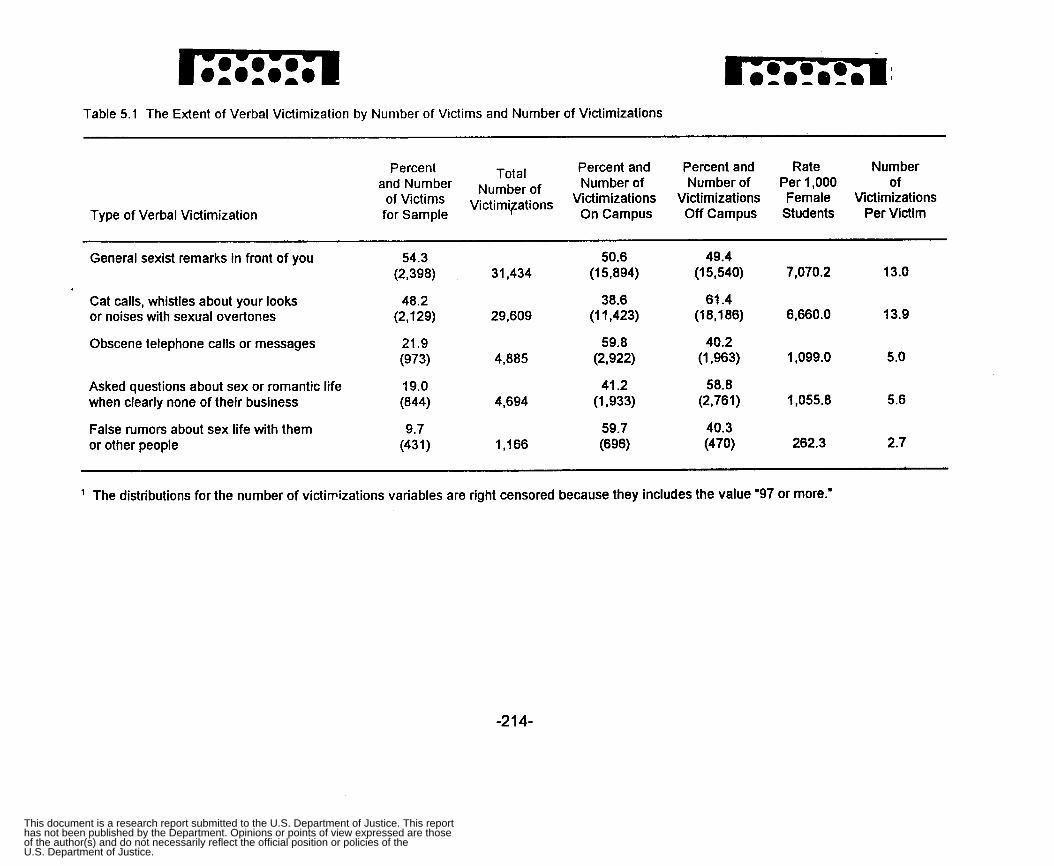
Table 5.1 The Extent of Verbal Victimization by Number of Victims and Number of victimizations
Type of Verbal Victimization
Number Percent and Percent and Rate Number of
Victimizations Victimizations Female Victimizations On Campus Off Campus Students Per Victim
Number of Per 1,000 of Total
vict i m iFa t ions
Percent and Number Number of of Victims for Sample
General sexist remarks in front of you 54.3 50.6 49.4 (2,398) 31,434 (1 5,894) (1 5,540) 7,070.2 13.0
Cat calls, whistles about your looks 48.2 38.6 61.4 or noises with sexual overtones (2,129) 29,609 (1 1,423) (1 8,186) 6,660.0 13.9
Obscene telephone calls or messages 21.9 59.8 40.2 (973) 4,885 (2,922) (1,963) 1,099.0 5.0
Asked questions about sex or romantic life 19.0 41.2 58.8 when clearly none of their business (844) 4,694 (1,933) (2,76 1) 1,055.8 5.6
False rumors about sex life with them or other people
9.7 59.7 40.3 (431) 1,166 (696) (470) 262.3 2.7
' The distributions for the number of victirizations variables are right censored because they includes the value '97 or more.'
-2 1 4-
This document is a research report submitted to the U.S. Department of Justice. This reporthas not been published by the Department. Opinions or points of view expressed are thoseof the author(s) and do not necessarily reflect the official position or policies of theU.S. Department of Justice.

Table 5.2 The Extent of Visual Victimization by Number of Victims and Number of Victimizations
Percent
Number Total Number of Number of 1,000 Number of of Victims Number of Victimizations Victimizations Female Victimizations
Type of Visual Victimization for Sample Victimizations’ On Campus Off Campus Students Per Victim
and Percent and Percent and Rate Per
Someone exposed you to pornographic pictures or materials when you did not agree 6.1 59.9 40.1 to see them (272) 865 (51 8) (347) 194.6 3.2
Someone exposed their sexual organs to you 4.8 34.0 66.0 when you did not agree to see them (214) 568 (1 93) (375) 127.8 2.7
Anyone, without your consent, observed or tried to observe you while you were 2.4 44.0 56.0 undressing, nude, or in a sexual act (1 05) 302 (1 33) (1 69) 67.9 2.9
Anyone, without your consent, showed other people or played for other people photographs, videotapes, or audiotapes having sex or in a nude or seminude state
0.3 (1 5 ) 18
44.4 (8) 1.2
Anyone, without your consent, photographed, videotaped, or audio taped you having sex or in a nude 0.2 77.8 22.2 or seminude state (8) 9 0 (2) 2.0 1 .l
’ The distributions for the number of victimizations variables are right censored because they includes the value ‘97 or more.”
-21 4a-
This document is a research report submitted to the U.S. Department of Justice. This reporthas not been published by the Department. Opinions or points of view expressed are thoseof the author(s) and do not necessarily reflect the official position or policies of theU.S. Department of Justice.

CHAPTER 6
CONCLUSIONS
In the previous three chapters, we presented and discussed the major findings of
this research project. We will not repeat this material here by presenting, once again, an
extended discussion of the data. Rather, to conclude this report, we will return to the four
sets of research questions identified in Chapter I. In this way, we hope to provide a
parsimonious review of the central conclusions of the project.
7. What is the extent of sexual victimization of college women in the United States? To the degree that comparisons with existing research are possible, how do the victimization rates in the current study compare with those found in previous studies of sexual victimization among college women?
Measuring sexual victimization presents daunting challenges, which make precisely
calibrated estimates beyond the reach of conventional social science methods. Still, our
goal was to improve on previous attempts to measure sexual victimization by using a
methodology that combined a wide range of screen questions with detailed incident-level
reports. Further, we endeavored to measure a variety of types of sexual victimization so
as to ensure that the potential breadth of this phenomenon might be captured. Several
important conclusions, we believe, can be derived from this approach.
First, the analysis revealed that during the six-month reference period (since the
start of the academic year), 1.7 percent of the college women sampled reported that they
had experienced a completed rape, while the corresponding figure for attempted rape was
1.1 percent. The percent of the respondents experiencing either completed rape or
-21 5-
This document is a research report submitted to the U.S. Department of Justice. This reporthas not been published by the Department. Opinions or points of view expressed are thoseof the author(s) and do not necessarily reflect the official position or policies of theU.S. Department of Justice.
attempted rape was 2.8 percent. These statistics suggest that, on an absolute level, the
risk of rapelattempted rape victimization during any given academic year is about 1 in 40
l female students. Still, taken by itself, this one finding can be misleading. Indeed, the risk 14 of rape victimization may be seen as disquieting when it is calculated over a longer period
La. of time and/or over a larger population.
Thus, if, essentially, the half-year victimization figure is extended to cover a year's
time, it would appear that, in a crude estimate, about one in twenty college women
experience an attempted 0: completed rape in this period. If this figure is in turn extended
over the time women typically spend securing a college degree, then it would appear that
perhaps a fifth to a quarter of these women will experience a rape victimization. Relatedly,
if these yearly and college-career figures are calculated over the population base at a
given college or university, it can be seen that tens, if not hundreds, of female students will
experience rape during a year or over several years. From this vantage point, our rates
of victimization can pose important policy concerns for university administrators seeking
to ensure an educational experience that is nurturing of growth and physically safe.
Second, beyond rape, college women are likely to experience other forms of sexual
victimization. Across the twelve types of victimization measured in the main part of our mi
survey (and reported in Chapter 3), 15.5 percent of the women experienced at least one
victimization during the reference period. When analyzed by the presence or absence of
' force, almost 8 percent of the sample were sexually victimized in an incident that involved
force or the threat of force, while 11 percent were subjected to an unwanted sexual
victimization that did not involve the threat or use of force.
-2 1 6-
This document is a research report submitted to the U.S. Department of Justice. This reporthas not been published by the Department. Opinions or points of view expressed are thoseof the author(s) and do not necessarily reflect the official position or policies of theU.S. Department of Justice.
_ - E 0
The data on verbal and visual forms of sexual victimization are further instructive
(see Chapter 5). In general, visual victi-ization was not widespread, although instances
of being exposed involuntarily to pornographic pictures and to sexual organs and of being
viewed naked without one's consent did occur (with victimizations figures ranging from 6.1
to 2.4 percent). In contrast, verbal victimizations were commonplace. Half of the women
experienced sexist comments and sexually tinged cat calls and whistles; about one in five
experienced obscene telephone calls and intrusive questions about their sex lives; and
about one in ten had false rumors spread about their sex lives. Although some observers
may consider these acts mainly to be "minor" and often as reflecting merely "bad taste"
that must be tolerated in a democratic society, the extensiveness of these experiences in
a relatively short reference period raises the question of how these victimizations impact
the quality of life female students have on a college campus. Again, how to achieve more
civility and to spare women students such harassment are issues that campus
administrators arguably, in light of these data, should be addressed.
Third, it appears that stalking-a form of victimization that only recently has
received public recognition and empirical research-is relatively widespread (see Chapter
4). Thus, in the current academic year, 13.1 percent of the female college students
indicated that they had been stalked. Again, when this figure is projected over time and
across a college's entire female student population, the dimension of the stalking problem E would seem to warrant attention from officials in higher educational institutions.
As noted previously, making comparisons to previous research is complicated by
the wide diversity of methods used in these studies to assess various forms of sexual
-21 7-
This document is a research report submitted to the U.S. Department of Justice. This reporthas not been published by the Department. Opinions or points of view expressed are thoseof the author(s) and do not necessarily reflect the official position or policies of theU.S. Department of Justice.
victimization. Precise comparisons are generally not possible or are, at best, risky
business. Even so, we can offer three general conclusions Jn how the results of the _ -
' E current national survey compare to those in existing studies.
First, consistent with previous research, it is clear that female college students do
not exist in an ivory tower that insulates them from sexual victimization. Instead, there
0 4 appears to be mounting evidence-added to by our researchthat college women E commonly experience minor forms of sexual victimization (e.g. , verbal harassment) and,
though less frequent, are targets for sexual aggression.
Second, the extent of rape victimization reported in this study appears to coincide
fairly closely with figures for comparable forms of victimization found in the most extensive
previous study of college women in the United States (Koss et al., 1987) and Canada
(DeKeseredy and Kelly, 1993a, 1993b). As noted above, the rate of victimization over a
limited time span is not extensive (1.7 percent of the women raped; 1.1 percent of the
women experiencing an attempted rape), but this is generally the case with serious forms
of criminal victimization. We should also note that some critics of previous attempts to
measure rape might argue that the figures we report include incidents that might not
qualify legally as a "rape" (e.g., those that victims did not themselves define as a rape)
0 (see Gilbert, 1997); our study is not capable of settling this issue. In any case, the data
we report on the extent of rape do not appear to be wildly inflated or so inconsistent with 6 lao. previous research as to question the general validity of the findings.
Third, the results for stalking in our study-13.1 percent of the women L victimized-appear to be higher, but not decidedly so, compared to the best previous study
-21 8-
This document is a research report submitted to the U.S. Department of Justice. This reporthas not been published by the Department. Opinions or points of view expressed are thoseof the author(s) and do not necessarily reflect the official position or policies of theU.S. Department of Justice.
of stalking conducted on sample of college women. Thus, Mustaine and Tewksbury (1 999)
found that over a six-month period, 10.5 percent of the 861 women in their samL'-. of _ _
' college students had been stalked.
It noteworthy, however, that the figures presented in our study far exceed the
prevalence of stalking reported by Tjaden and Thoennes (1998) in their national
victimization survey of 8,000 women: merely 1 percent over the previous twelve months.
The large gap between our results and those reported by Tjaden and Thoennes may seem m
less insurmountable when two considerations are taken into account. First, when Tjaden
and Thoennes use a less restrictive definition of stalking, the prevalence figure rose
markedly to 6 percent. Second, Tjaden and Thoennes surveyed women across the life
course and, even among younger women, did not restrict their survey to females attending
college. It may very well be that the college setting-and the lifestyles that college women
lead-are factors that elevate the risk of stalking. In short, it appears that research on
specific social domains are likely to reach different conclusions than research conducted
on the general population (see Lynch, 1987).
2. What are the characteristics ornature of the sexual victimizations that college women experience? Thus, what is the relationship between victims and offenders (e.g., stranger, acquaintance, intimate partner)? Where are victimizations most likely to occur(e.g., in public orprivate settings, on or off campus)? When are victimizations most likely to occur (e.g., during the day, in the evening hours)?
The vast majority of sexual victimizations are committed by a single offender who
knows the victim. For example, for both attempted and completed rapes, about nine in ten
offenders were known to the victim. Most often, offenders were a boyfriend/ex-boyfriend,
-21 9-
This document is a research report submitted to the U.S. Department of Justice. This reporthas not been published by the Department. Opinions or points of view expressed are thoseof the author(s) and do not necessarily reflect the official position or policies of theU.S. Department of Justice.

a friend, a classmate, or an acquaintance. For the most part, these trends obtain for other
types of sexual victimization. Furthermore, sexual victimizations tend to take place in or
near a living quarter. Sexual contacts and threatened sexual victimizations, however, also
are commonly experienced in bars and in dancehight clubs. Finally, women students
generally are sexually victimized in the evening hours; in fact, a majority of
completed/attempted rapes and sexual coercions take place after midnight.
College women are sexually victimized both on campus and off campus. The data
revealed, however, that for nearly all types of victimization, women are more often
victimized off campus. In the case of rape, for example, two-thirds of completed rapes and
55.9 percent of attempted rapes occurred off campus. Even so, defining a rape or other
sexual victimization as taking place "off campus" can be deceiving. A certain proportion
of off-campus victimizations appear to be connected to a woman's status of being a
student. Thus, when a victimization occurs in a student's or friend's residence close to
campus or in a bar frequented by college students, the line between an "on-campus" and
"off-campus" victimization becomes fuzzy. In this regard, future research may wish to
explore more carefully not only the location of the victimization but also whether a
victimization occurred as part of a woman's life as a sfudentversus that part of her life that
is distinct from her status as a student.
To an extent, the victim-offender relationship for stalking victimization mirrored that
for the other types of sexual victimization. Thus, four in five victims reported that they
knew their stalker, who was often a boyfriendlex-boyfriend, classmate, friend, or
acquaintance. Further, stalking occurred both on and off campus. Only about one-third
-220-
This document is a research report submitted to the U.S. Department of Justice. This reporthas not been published by the Department. Opinions or points of view expressed are thoseof the author(s) and do not necessarily reflect the official position or policies of theU.S. Department of Justice.
of stalkings were confined to an off-campus location, while two-thirds occurred either on
campus or both on and off campus. - _
In summary, our data suggest that women college students are most often
victimized when they are alone with a man, at night, and in a private space. Students are
a victimized off campus, but college campuses are not ivory towers: they are domains in
which women can, to varying degrees, be raped, sexually assaulted, and stalked. Lf 3. What factors increase the risk of the sexual victimization of college women?
Thus, how is the risk of victimization affected by the personal characteristics, by lifestyles or routine activities, and by the characteristics of the institution that a woman attends?
Beyond the issue of the extent of sexual victimization across the entire sample, we
explored whether the risk of victimization varied by a range of individual and institution-
level characteristics. That is, are some women more at-risk of sexual victimization than
other women?
A number of variables had statistically significant effects on one or more measure
of sexual victimization: Thus being a victim tended to be more likely if a female student
frequented places with men present and alcohol present, lived alone, was affluent, was
p, African-American, was young, was an undergraduate, and was not heterosexual.
However, four factors most consistently increased the risk of being victimized: frequently
drinking enough alcohol to get drunk, being married, prior sexual victimization, and-for
i on-campus victimization-living on campus. L The challenge is to interpret these latter findings. To some extent, they can be seen
as being consistent with the predictions of routine activities theory. Thus, the excessive
-221 -
This document is a research report submitted to the U.S. Department of Justice. This reporthas not been published by the Department. Opinions or points of view expressed are thoseof the author(s) and do not necessarily reflect the official position or policies of theU.S. Department of Justice.
use of alcohol may make a person more vulnerable to victimization or bring her into the
company of potentially motivated offenLrs; marriage provides guardianship from one's
partner and a lifestyle that is likely more confined to the home; and living on campus
increases exposure to on-campus victimization (see Schwartz and Pitts, 1995). Why prior
4 sexual victimization should increase current sexual victimization, however, is less clear. 0
- -
It is possible to speculate that being victimized might change a woman and make her more
vulnerable or may reflect ah underlying personal characteristic that has increased her risk
of victimization across her life-course. Regardless, this issue is clearly deserving of
further, systematic research.
It is noteworthy that being a sexual victim prior to the current academic year also
increased the risk of being a stalking victim. We also found that the risk of stalking is
heightened by factors such as frequenting places where alcohol is served, living alone,
being involved in dating relationships, and being undergraduates. These findings can be
interpreted as being consistent with routine activities theory, since each of these factors
may be seen as assessing a lifestyle that may increase exposure to, and reduce
guardianship against, potential motivated offenders.
4. How do college women who experience sexual victimization reacf to victimization incidents? Thus, during the victimization, do they take steps to prevent the incident and, if so, what specific actions do they employ? How are they affected, physically and psychologically, by the victimization? Do they report their victimization experience and, if so, to whom?
To a degree, information on how sexual assault victims react to their victimizations
has implications for assessing the seriousness of the incidents that have occurred. If
-222-
This document is a research report submitted to the U.S. Department of Justice. This reporthas not been published by the Department. Opinions or points of view expressed are thoseof the author(s) and do not necessarily reflect the official position or policies of theU.S. Department of Justice.
victims report experiencing extensive harm and taking vigorous steps to avoid
victimization, such data might be used to show that the incidr's reported here are clearly _ _
criminal victimizations. This line of reasoning, however, should not be taken too far, for
reasons previously discussed: In sexual victimization cases, victim reactions are
potentially shaped not only by the nature or seriousness of the act but also by range of
factors that could affect how victimizations are interpreted (for example, embarrassment,
self-blame, false-consciousness). b In any event, the data on victim reactions paint a mixed portrait on how victims react
to their victimization. Thus, in the majority of incidents, victims report taking some
protective action against assailants. For example, in over three-fourths of
attemptedlcompleted rape incidents, victims attempted to protect themselves-usually by
physically resisting offenders. Similarly, in three-fourths of stalking incidents, victims were
prompted to react, with two common responses being avoiding the stalker or directly
confronting the stalker. In contrast, most victims did not state that their victimization
resulted in injuries or in serious psychological discomfort. However, in two-fifths of the
completed rape where any injury occurred, victims reported emotional or psychological
injuries. Further, most incidents were not reported to the police. This was true even in
4 attemptedlcompleted rape cases, where more than nine in ten incidents were not reported
I, ' to authorities. When asked why they did not report victimizations, victims most often said E Lo; that the event "was not serious enough" (although the meaning of this answer was not
explored to confirm what precisely victims were communicating). It also seems, however, Lt;: that victims failed to contact officials because they wished to keep the event a private
-223-
This document is a research report submitted to the U.S. Department of Justice. This reporthas not been published by the Department. Opinions or points of view expressed are thoseof the author(s) and do not necessarily reflect the official position or policies of theU.S. Department of Justice.

matter. In rape cases, about half of the respondents noted that they did not report the
incident because they did not want their family or other people to know about it.
In summary, our data allow us, if only in broad strokes, to paint a portrait of sexual
victimization among college women. Beyond the sexist and harassing comments women
experience in their daily surroundings and the undesired sexual contacts which occur at
bars and parties, sexual victimizations tend to take place when a woman, who has been
drinking and has been victimized in the past, is alone at night in a residence with someone
she knows. Although sexual contacts and penetrations are unwanted and occasionally are
forcibly attempted or accomplished, most often violence to the point of physical injury is
not used. Women frequently try to protect themselves from these victimizations, but they
also are reluctant to report them to authorities.
Much like viewing artwork, this portrait is open to different interpretations, especially
as it relates to the criminality of the incidents. For feminists, the careful wording of our
questions to assess the use of force and the unwanted nature of the offenses will be
enough to persuade them that many of these sexual victimizations qualify as criminal
sexual assaults. For conservatives, the lack of physical harm to victims and the low
reporting rates to the police will convince them that most of these incidents are imprudent
sexual acts that would never be prosecuted in court. As noted previously, our data cannot
settle this debate.
Still, we would suggest that a balanced approach would reach two general
conclusrons Despite the limitations of our study and the differential interpretations that
our data might inspire, we believe that the following conclusion is warranted: There is little
-224-
This document is a research report submitted to the U.S. Department of Justice. This reporthas not been published by the Department. Opinions or points of view expressed are thoseof the author(s) and do not necessarily reflect the official position or policies of theU.S. Department of Justice.
doubt that sexual victimization is sufficiently pervasive that college women will repeatedly
encounter sexist and harassing comments, will likely receive an obscene phone call, will
have a good chance of being stalked and of enduring some type of coerced sexual
contact, and will be at some risk-especially over the course of a college career-of
experiencing an incident in which someone she knows will attempt to use force, against
her will, in the pursuit of sexual intercourse. Taken together, these observations suggest
that sexual victimization-in its minor and more serious forms-is a "cost" that, compared
to their male counterparts, is endured disproportionately by college women and that may
diminish the quality of their lives on and off campus. Accordingly, it is an issue that
deserves both further study and, in the interim, systematic attention from campus officials.
-225-
This document is a research report submitted to the U.S. Department of Justice. This reporthas not been published by the Department. Opinions or points of view expressed are thoseof the author(s) and do not necessarily reflect the official position or policies of theU.S. Department of Justice.

REFERENCES
4 f 4 _ - E 0
Abbey, A., L. Thompson Ross, D. McDuffie, and P. McAuslan 1996 Alcohol and Dating Risk Factors for Sexual Assault Among College
Women. Psychology of Women Quarterly 20: 147-1 69.
Adams, J. W., J. L. Kottke, and J. S. Padgitt 1983 Sexual Harassment of University Students. Journal of College Student
Personnel 24:484-90.
Aizenman, M. and G. Kelley 1988 The Incidence of Violence and Acquaintance Rape in Dating
Relationships Among College Men and Women. Journal of College Student Development 29:305-11.
Bachman, R. and B. Taylor 1993 The Measurement of Rape and Family Violence by Redesigned NCVS:
Facts and Fallacies. Paper presented at the annual meeting of American Society of Criminology, Phoenix, AZ.
Barrett, K. 1982 Date Rape: A Campus Epidemic? Ms. , September, 49-51 , 130.
Belknap, J. 1989 The Sexual Victimization of Unmarried Women by Nonrelative
Acquaintances. In M.A. Pirog-Goodland and J.E. Stets (eds.), Violence and Dating Relationships: Emerging Social Issues. New York: Praeger.
1996 The Invisible Woman: Gender, Crime, and Justice. Belmont, CA: Wadsworth.
Belknap, J. and E. Erez 1995 The Victimization of Women on College Campuses: Courtship Violence,
Date Rape, and Sexual Harassment. In John J. Sloan, 111 and Bonnie S. Fisher (eds.), Campus Crime: Legal, Social, and Policy Perspectives. Springfield, IL: Charles C. Thomas.
0 4 Benson, D., C. Charlton, and F. Goodhart
a 1992 Acquaintance Rape on Campus. Journal of American College Health E 40: 157-65.
-226-
This document is a research report submitted to the U.S. Department of Justice. This reporthas not been published by the Department. Opinions or points of view expressed are thoseof the author(s) and do not necessarily reflect the official position or policies of theU.S. Department of Justice.

Benson, D. J. and G. Thomson 1982 Sexual Harassment on a University Campus: The Confluence of Authority
Relations, Sexual Interest in Academia and the Workplace. S L a l Problems 29:236-251.
Best, J. 1990 Threatened Children: Rhetoric and Concern About Child-Victims.
Chicago, IL: University of Chicago Press.
Black, D. 1983 Crime as Social Control. American Sociological Review 48:34-45.
Bromley, M. 1992 Campus and Community Crime Rate Comparisons: A Statewide Study.
Journal of Security Administration 15(2):49-64.
Bromley M. and C. S. Sellers 1996 Violent Behavior in College Student Dating Relationships: Implications
for Campus Service Providers. University of South Florida. Working Paper.
Browne, A. and D. Finkelhor 1986 The Impact of Child Sexual Abuse: A Review of the Research.
Psychological Bulletin 99: 1-12.
Bureau of Justice Statistics 1994 Criminal Victimization in the United States, 1992. Washington, DC: U.S.
Department of Justice.
1997 Criminal Victimization in the United States, 1994. Washington, DC: U.S. Department of Justice.
Cohen, L. E. and M. Felson Social Change and Crime Rate Trends: A Routine Activity Approach. American Sociological Review 445884508.
Coleman, F. L. ( 1997 Stalking Behavior and the Cycle of Domestic Violence. Journal of
Interpersonal Violence 12:420-32.
Crowell, N. A., and A. W. Burgess 1996 Understanding Violence Against Women. Washington, DC: National
Academy Press.
-227-
This document is a research report submitted to the U.S. Department of Justice. This reporthas not been published by the Department. Opinions or points of view expressed are thoseof the author(s) and do not necessarily reflect the official position or policies of theU.S. Department of Justice.

DeKeseredy, W. and K. Kelly 1993a The Incidence and Prevalence of Women Abuse in Canadian University
and College Dating Relationships. Canadian Journal of Sociology 1 8: 1 37-59.
Woman Abuse in University and College Dating Relationships. Human Justice 2:25-52.
4 DeKeseredy, W., M. D. Schwartz, and K. Tait. 1993 Sexual Assault and Stranger Aggression on a Canadian Campus. Sex
Roles 28:263-77.
Dziech, B. W. and L. Weider m
1984 The Lecherous Professor: Sexual Harassment on Campus. Boston: Beacon Press.
Federal Bureau of Investigation 1997 Uniform Crime Reports: Crime in the United States, 1996. Washington,
DC: U.S. Government Printing Office.
Fenstermaker, S. 1989 Acquaintance Rape on Campus: Responsibility and Attributions of Crime.
In M.A. Pirog-Goodland and J.E. Stets (eds.), Violence and Dating Relationships: Emerging Social Issues. New York, Praeger.
Fernandez, A. and A. J. Lizotte 1995 An Analysis of the Relationship Between Campus Crime and Community
Crime: Reciprocal Effects? In John J. Sloan, 111 and Bonnie S. Fisher (eds.), Campus Crime: Legal, Social, and Policy Perspectives. Springfield, IL: Charles C. Thomas.
Finklehor, D. and N. L. Asdigian Risk Factors for Youth Victimization: Beyond a Lifestyles/Routine Activities Theory Approach. Violence and Victims 1 1 :3-19. Frn: Fisher, B. S.
1995 Crime and Fear on Campus. Annals of the American Academy Political and Social Science May:85-101.
of
Fisher, 6. S., J. J. Sloan, F. T. Cullen, and J. L. Nasar 1993 Understanding Crime Victimization on College Campuses: Implications
for Crime Prevention. Grant Proposal, National institute of Justice.
-228-
This document is a research report submitted to the U.S. Department of Justice. This reporthas not been published by the Department. Opinions or points of view expressed are thoseof the author(s) and do not necessarily reflect the official position or policies of theU.S. Department of Justice.

1994 Understanding Crime Victimization on College Campuses: Implications for Crime Prevention. Working draft of final report to National Institute of Justice
Fisher, 6. S., J. J. Sloan, F. T. Cullen, and C. Lu 1997 The On Campus Victimization Patterns of Students: Implications for
Crime Prevention By Students and Post-secondary Institutions. In Steven P. Lab (Ed.), Crime Prevention at a Crossroads Cincinnati, OH: Anderson Publishing Co.
1998 Crime in the Ivory Tower: The Level and Sources of Student Victimization. Criminology. In Press.
Fisher, B. S., J. J. Sloan, F. T. Cullen, C. Lu and J. L. Nasar 1995 Understanding Crime Victimization Among College Students: Implications
For Crime Prevention. Final Report, National Institute of Justice.
Fitzgerald, L. F., L. M. Weitzman, Y. Gold, and M. Ormerod 1988 Academic Harassment: Sex and Denial in the Scholarly Garb.
Psychology of Women Quarterly 12:32940.
Fitzgerald, L. F., S. L. Schullman, N. Bailey, M. Richards, J. Swecker, Y. Glld, M. Ormerod, and L. Weitzman.
The Incidence and Dimensions of Sexual Harassment in Academia and the Workplace. Journal of Vocational Behavior 32:152-175.
1988
Fox, J. A. and D. A. Hellman 1985 Location and Other Correlates of Campus Crime. Journal of Criminal
Justice 13(4):429-444.
Friedman, L. M. 1985 Total Justice. New York, NY: Russell Sage Foundation
Acquaintance Rape: The Influence of Alcohol, Fraternity Membership, and Sports Team Membership. Journal of Sex Education and Therapy
Frinter, M. P. and L. Rubinson 1993
ma 19(4):272-284.
ma Garafolo, J.
1907 Reassessing the Lifestyle Model of Criminal Victimization. In M.R. Gottfredson and Travis Hirschi (eds.), Positive Criminology. Newbury Park, CA: Sage
E -229-
This document is a research report submitted to the U.S. Department of Justice. This reporthas not been published by the Department. Opinions or points of view expressed are thoseof the author(s) and do not necessarily reflect the official position or policies of theU.S. Department of Justice.

Geberth, V. J. 1992 Stalkers. Law and Order 40:138-143.
Gilbert, N. 1997
- -
Advocacy Research and Social Policy. In Michael Tonry (ed.), Crime and Justice: A Review of Research, Volume 22. Chicago, IL: University of Chicago Press.
Hanushek, E. A. and J. Jackson Statistical Methods for Social Scientists. New York: Academic Press.
Harney, P. A. and C. L. Muehlenhard 1991 Factors that Increase the Likelihood of Victimization. In Andrea Parrot
and Laurie Bechhofer (eds.), Acquaintance Rape: The Hidden Crime. New York, NY: John Wiley & Sons, Inc.
Himelein, M. J. 1995 Risk Factors for Sexual Victimization in Dating: A Longitudinal Study of
College Women. Psychology of Women Quarterly 13:3148.
Hindelang, M. J., M. R. Gottfredson, and J. Garofalo 1978 Victims of Personal Crime: An Empirical Foundation for a Theory of
Personal Victimization. Cambridge, MA: Ballinger.
Holmes, R. M. 1993 Stalking in America: Types and Methods of Criminal Stalkers. Journal of
Contemporary Criminal Justice 9(4):317-327.
Httw/lwww.soconline.orcr/LEGIS/newindex. html#l 1998
Jansen, G. F. and M. Karpos 1993 Managing Rape: Exploratory Research on the Behavior of Rape
Statistics. Criminology 31 (3):363-385.
Kanin, E. J. 1957 Male Aggression in Dating-Courtship Relations. American Journal of
Sociology 63: 197-204.
4 KOSS, M. P. 1990 Changed Lives: The Psychological Impact of Sexual Harassment. In
M.A. Paludi (ed.), Ivory Power: Sexual Harassment on Campus. Albany: State University of New York Press.
-230-
This document is a research report submitted to the U.S. Department of Justice. This reporthas not been published by the Department. Opinions or points of view expressed are thoseof the author(s) and do not necessarily reflect the official position or policies of theU.S. Department of Justice.
1992 The Underdetection of Rape: Methodological Choices Influence Incidence Estimates. Journal of Social Issues 48:61-75.
1993 Detecting the Scope of Rape: A Review of Prevalence Research Methods. Journal of Interpersonal Violence 8: 198-222.
1996 The Measurement of Rape Victimization in Crime Surveys. Criminal Justice and Behavior 23(1):55-69.
Koss, M. P. and T. E. Dinero 1989 Discriminant Analysis of Risk Factors for Sexual Victimization Among a
National Sample of College Women. Journal of Consulting and Clinical Psychology 57(2):242-250.
Koss, M. P. and C. Oros 1982 Sexual Experiences Survey: A Research Instrument Investigating Sexual
Aggression and Victimization. Journal of Consulting and Clinical Psychology 50(3):455-457.
Koss, M. P., C. A. Gidycz, and N. Wisniewski The Scope of Rape: Incidence and Prevalence of Sexual Aggression and Victimization in a National Sample of Higher Education Students. Journal of Counseling and Clinical Psychology 55: 162-70.
1987
Koss, M. PI K.E. Leonard, D.A. Beezley, and C. J. Oros 1985 Nonstranger Sexual Aggression: A Discriminant Analysis of
Psycho1 og ical Characteristics of Undetected Offenders. Sex Roles 1 2: 981 -992.
Lab, S. P. 1988 Crime Prevention Approaches, Practices and Evaluations. Cincinnati,
OH: Anderson Publishing.
Lane, K.E. and P.A. Gwartney-Gibbs 1985
Leidig, M W. 1992 .a E Lett, B., M E Reilly, and D. R. Howard
Violence in the Context of Dating and Sex. Journal of Family Issues 6:4549.
Continuum of Violence Against Women: Psychological and Physical Consequences. Journal of American College Health 40: 149-55.
1982 Sexual Assault and Harassment: A Campus Community Case Study. Journal of Women in Culture and Society 8:296-319.
-231 -
This document is a research report submitted to the U.S. Department of Justice. This reporthas not been published by the Department. Opinions or points of view expressed are thoseof the author(s) and do not necessarily reflect the official position or policies of theU.S. Department of Justice.

Lowney K. S. and J. Best 1995 Stalking Strangers and Lovers: Changing Media Typifications of a New
Crime Problem. In Joel Best (ed.), Images of Issues: Typifying Contemporary Social Problems, Second Edition. New York, NY: Aldine De Gruyter.
Lynch, J. P. 1987 Routine Activities and Victimization at Work. Journal of Quantitative
Criminology 3(4):283-300.
Campus Sexual Assault: A Review and Assessment of the Literature. Report to the Bureau of Justice Statistics. Washington, DC.
MacKinnon, C.A. 1979 Sexual Harassment of Working Women. New Haven, CT: Yale
University Press.
Maddala, G. S. 1987 Limited-Dependent and Qualitative Variables in Econometrics. New
York: Cambridge University Press.
Marks, C. A. 1997 The Kansas Stalking Law: A'ICredible Threat" to Victims. Washburn Law
Journal 36:468-498.
Matthews, A. D. 1993 The Ivory Tower Becomes an Armed Camp. The New York Times
Sunday Magazine, March 7, pp. 38-47.
McAnaney, K. G., L. A. Curliss, and C. E. Abeyta-Price 1993 From Imprudence to Crime: Anti-Stalking Laws. Notre Dame Law Review
68(4):819-909.
McCormack, A.S. 1995 Revisiting Sexual Harassment of Undergraduate Women: 1989 and
1993. Violence Against Women 1 :254-265.
McKinney, K., C.V. Olson, and A. Satterfield Graduate Students Experiences with and Responses to Sexual Harassment. Journal of Interpersonal Violence 3:319-25.
-232-
This document is a research report submitted to the U.S. Department of Justice. This reporthas not been published by the Department. Opinions or points of view expressed are thoseof the author(s) and do not necessarily reflect the official position or policies of theU.S. Department of Justice.

McPheters, L. R. 1978 Econometric Analysis of Factors Influencing Crime and Campus. Journal
of Criminal Justice 6( 1 ):47-51.
Meloy, J. R. 1996 Stalking (Obsessional Following): A Review of Some Preliminary Studies.
Aggression and Violent Behavior l(2): 147-1 62.
Messerschmidt, J. W. 1993 Masculinities and Crime: Critique and Reconceptualization of Theory.
Lanham, MD: R o m a n & Littlefield.
Messner, S. F. And R. Rosenfeld. 1994 Crime and the American Dream. Belmost, CA:
Wadsworth.
Miethe, T. D. and R. F. Meier 1994 Crime and Its Social Context: Toward an Integrated Theory of Offenders,
Victims, and Situations. Albany, NY: State University of New York Press.
Monaghan, P. 1998 Beyond the Hollywood Myths: Researchers Examine Stalkers and Their
Victims. The Chronicle of Higher Education, March 6, pp. Al7, A20.
Mustaine, E. E. 1997 Victimization Risks and Routine Activities: A Theoretical Examination
Using a Gender-Specific and Domain-Specific Model. American Journal of Criminal Justice 22( 1 ): 41 -70.
Mustaine, E. E. and R. Tewksbury 1999 A Routine Activity Theory Explanation for Women’s Stalking
Victimizations. Violence Against Women. 543-62.
Muehlenhard, C. L. and M. A. Linton 1987 Date Rape and Sexual Aggression in Dating Situations: Incidence and
Risk Factors. Journal of Consulting Psychology 34:186-96. E N;tiFl Victim Center Stalking and the Law. Arlington, VA: National Victim Center.
Paludi, M. A. 1990 ivory Tower: Sexual Harassment on Campus. Albany, NY: State
University of New York Press.
-233-
This document is a research report submitted to the U.S. Department of Justice. This reporthas not been published by the Department. Opinions or points of view expressed are thoseof the author(s) and do not necessarily reflect the official position or policies of theU.S. Department of Justice.

Pathe, M. and P. E. Mullen 1997 The Impact of Stalkers on Their Victims. British Journal of Psychiatry
170: 12-1 7.
Peterson’s Guide to Four Year Colleges p: 1997 Princeton, NJ: Peterson’s.
Peterson’s Guide to Two Year Colleges Princeton, NJ: Peterson’s.
4 Pitts, Victoria L. and Martin D. Schwartz 1993 Promoting Self-Blame in Hidden Rape Cases.” Humanity and Society.
171383-398.
Rivera, G. F. Jr. and R. M. Regoli 1987 Sexual Victimization Experiences of Sorority Women. Sociology and
Social Research 72:39-42.
Russell, D. E. H. 1984 Sexual Exploitation: Rape, Child Sexual Abuse, and Workplace
Harassment. Beverly Hills, CA: Sage.
Sampson, R. J. and J. H. Laub 1993 Crime In the Making: Pathways and Turning Points Through Life.
Cambridge, MA: Harvard University Press.
Sampson, R. J. and J. L. Lauritsen 1990 Deviant Lifestyles, Proximity to Crime, and the Offender-Victim Link in
Personal Victimization. Journal of Research in Crime and Delinquency 27(2):110-139.
Sanday, P.R. 1990 Fraternity Gang Rape: Sex, Brotherhood, and Privilege on Campus. New
York, The Free Press.
Schaffer, R., W. Mendenhall, and L. Ott 1990 Elementary Survey Sampling. Belmont, CA: Duxbury Press.
Put Up and Shut Up: Workplace Sexual Assaults. In P.B. Bart and E.G. Moran (eds.), Violence Against Women. Newbury Park, CA: Sage.
Schneider, B.E. 1993
-234-
This document is a research report submitted to the U.S. Department of Justice. This reporthas not been published by the Department. Opinions or points of view expressed are thoseof the author(s) and do not necessarily reflect the official position or policies of theU.S. Department of Justice.
Schwartz, M. D. and V. L. Pitts 1995 Exploring a Feminist Routine Activities Approach to Explaining Sexual
Assault. Justice Quarterly 12(1):9-31.
Shulman, Ronca, and Bucuvalas, Inc. 1998 Survey of College Women: Methods Report. Silver Spring, MD: SRBI.
Seng, M. J. and N.S. Koehler 1993 The Crime Awareness and Campus Security Act: A Critical Analysis.
Journal of Crime and Justice 16( 1 ):97-110.
Siegel, D. G. and C. Raymond 1992 An Ecological Approach to Violent Crime on Campus. Journal of Security
Administration 15(2):19-29.
Skogan, W. G. 1990 The Polls-A Review: The National Crime Survey Redesign. Public
Opinion Quarterly 54:256-272.
Sloan, J. J. 1992 Campus Crime and Campus Communities. Journal of Security
Administration 15(2):31-47.
1994 The Correlates of Campus Crime: An Analysis of Reported Crimes on College and University Campuses. Journal of Criminal Justice 22( 1 ):51- 61.
Sloan, J. J. and N. Mansour 1992 Campus Crime and Campus Communities: Theoretical and Empirical
Linkages. Paper presented at the 1992 Annual Meetings of the Academy of Criminal Justice Sciences.
k Sloan, J. J., B. S. Fisher, and F. T. Cullen 1997 Assessing the Student Right-to-Know and Campus Security Act of 1990:
An Analysis of the Victim Reporting Practices of College and University Students. Crime and Delinquency 43(2): 148-1 68. .-a
0 Smith, M.C. 1988 Coping with Campus Crime. New York, MacMillan. t:.
Smith, M. R. and R. Fossey 1995 Crime on Campus: Legal Issues and Campus Administration. Phoenix,
AZ: The Oryx Press.
-235-
This document is a research report submitted to the U.S. Department of Justice. This reporthas not been published by the Department. Opinions or points of view expressed are thoseof the author(s) and do not necessarily reflect the official position or policies of theU.S. Department of Justice.

Smith, D. A. and C. C. Uchida 1988 The Social Organization of Self-Help: A Study Defensive Weapon
Ownership. American Sociological Review 53:94-102.
Student Right-to-Know and Campus Security Act of 1990. 20 USC 1001.
Testa, M. and K. A. Parks 1996 The Role of Women's Alcohol Consumption in Sexual Victimization.
Aggression and Violent Behavior 1 (3):217-234.
Till, F. J. 1980 Sexual Harassment: A Report on the Sexual Harassment of Students.
Report of the National Advisory Council on Women's Educational Programs. Washington, D.C.
Tjaden, P. 1997 The Crime of Stalking: How Big Is the Problem? National Institute of
Justice, Research Preview. Washington, DC: National Institute of Justice.
Tjaden, P. and N. Thoennes 1996 Stalking In America: How Big is the Problem? Paper Presented at the
Annual Meetings of the American Society of Criminology, Chicago, Illinois.
1998 Stalking In America: Findings from the National Violence Against Women Survey. U.S. Department of Justice, Office of Justice Programs. Washington, DC: U.S. Government Printing Office.
U.S. Bureau of Census 1995 Statistical Abstract of the United States: 1997 (1 17th edition).
Washington, DC: U.S. Government Printing Office.
U S Department of Education 1993 Fall Enrollment Statistics, 1991. Washington, DC: Government Printing
Office.
National Center for Education Statistics, Integrated Postsecondary Education Data System.
1997
0 4 E e4
-236-
This document is a research report submitted to the U.S. Department of Justice. This reporthas not been published by the Department. Opinions or points of view expressed are thoseof the author(s) and do not necessarily reflect the official position or policies of theU.S. Department of Justice.
U.S. Department of Justice 1996 Domestic Violence, Stalking, and Antistalking Legislation: An Annual
Report to C o n g r ~ s Under the Violence Against Women Act. Washington, DC: U.S. Government Printing Office.
Violent Crime Control and Law Enforcement Act of 1994. H.R. 3355, Report 103-71 1.
Volkwein, J. F., B. P. Szelest, and A. J. Lizotte
- -
1995 The Relationship of Campus Crime to Campus and Student Characteristics. Research in Higher Education 36(6):647-670.
Ward, S. K., K. Chapman, E. Cohn, S. White, and K. Williams 1991 Acquaintance Rape and the College Social Scene. Family Relations
40165-71.
Warshaw, R. 1988 I Never Called It Rape: The Ms. Report on Recognizing, Fighting, and
Surviving Date Rape. New York: Harper and Row.
Wright, J. A., A. G. Burgess, A. W. Burgess, A. T. Laszlo, G. 0. McCrary, and J. E. Douglas
1996 A Typology of Interpersonal Stalking. Journal of Interpersonal Violence 11 (4):487-502.
-237-
This document is a research report submitted to the U.S. Department of Justice. This reporthas not been published by the Department. Opinions or points of view expressed are thoseof the author(s) and do not necessarily reflect the official position or policies of theU.S. Department of Justice.
APPENDIX 1
-238-
This document is a research report submitted to the U.S. Department of Justice. This reporthas not been published by the Department. Opinions or points of view expressed are thoseof the author(s) and do not necessarily reflect the official position or policies of theU.S. Department of Justice.
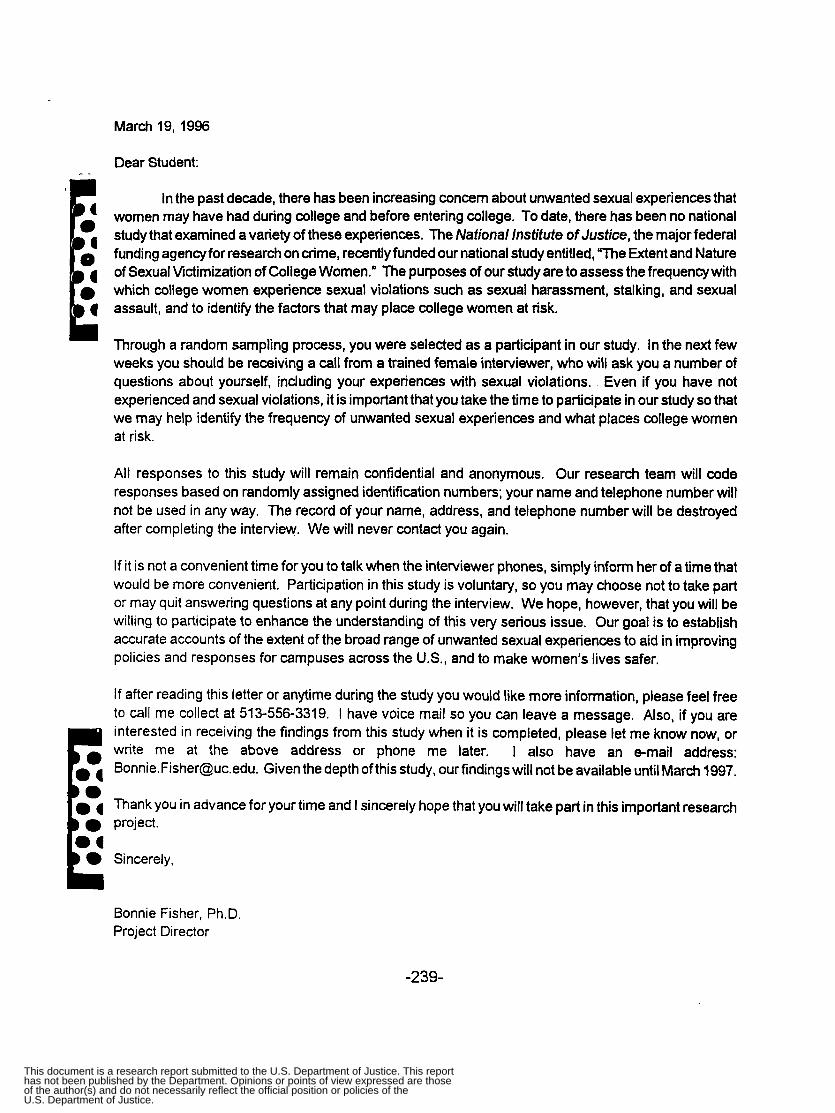
March 19,1996
Dear Student: - -
In the past decade, there has been increasing concern about unwanted sexual experiences that women may have had during college and before entering college. To date, there has been no national study that examined a variety of these experiences. The National lnsfifufe of Justice, the major federal funding agency for research on crime, recently funded our national study entitled, The Extent and Nature of Sexual Victimization of College Women.” The purposes of our study are to assess the frequency with
assault, and to identify the factors that may place college women at risk.
Through a random sampling process, you were selected as a participant in our study. In the next few weeks you should be receiving a call from a trained female interviewer, who will ask you a number of questions about yourself, including your experiences with sexual violations. Even if you have not experienced and sexual violations, it is important that you take the time to participate in our study so that we may help identify the frequency of unwanted sexual experiences and what places college women at risk.
which college women experience sexual violations such as sexual harassment, stalking, and sexual
All responses to this study will remain confidential and anonymous. Our research team will code responses based on randomly assigned identification numbers; your name and telephone number will not be used in any way. The record of your name, address, and telephone number will be destroyed after completing the interview. We will never contact you again.
If it is not a convenient time for you to talk when the interviewer phones, simply inform her of a time that would be more convenient. Participation in this study is voluntary, so you may choose not to take part or may quit answering questions at any point during the interview. We hope, however, that you will be willing to participate to enhance the understanding of this very serious issue. Our goal is to establish accurate accounts of the extent of the broad range of unwanted sexual experiences to aid in improving policies and responses for campuses across the U.S., and to make women’s lives safer.
If after reading this letter or anytime during the study you would like more information, please feel free to call me collect at 513-556-3319. I have voice mail so you can leave a message. Also, if you are interested in receiving the findings from this study when it is completed, please let me know now, or write me at the above address or phone me later. I also have an e-mail address: [email protected]. Given the depth of this study, our findings will not be available until March 1997.
r.7 Thank you in advance for your time and I sincerely hope that you will take part in this important research
Bonnie Fisher, Ph.D. Project Director
-239-
This document is a research report submitted to the U.S. Department of Justice. This reporthas not been published by the Department. Opinions or points of view expressed are thoseof the author(s) and do not necessarily reflect the official position or policies of theU.S. Department of Justice.

P
APPENDIX 2
-240-
This document is a research report submitted to the U.S. Department of Justice. This reporthas not been published by the Department. Opinions or points of view expressed are thoseof the author(s) and do not necessarily reflect the official position or policies of theU.S. Department of Justice.

February 1997
Dear Student:
There has been increasing concern over the past decade about unwanted sexual experiences that women may experience during college. This includes problems of sexual harassment, stalking, and sexual assaults. Although there has been a lot of talk about these issues, no one really knows the incidence, nature, or risk factors for these problems among college women.
The National Institute of Justice, the federal agency responsible for research on crime, has funded a national study - ‘The Extent and Nature of Sexual Victimization of College Women” - to answer these questions. The study is being directed by a research team from the University of Cincinnati, who will report the findings to the U.S. Department of Justice. We have drawn a national sample of college women whom we hope to interview by telephone about their experiences and opinions. The interviews, which average about 20 minutes, will be conducted by professional, women interviewers from Schulman, Ronca, & Bucuvalas, Inc. (SRBI), a national survey research organization. SRBI specializes in public policy surveys on sensitive issues including crime, violence, harassment, and abuse.
As a randomly selected member of this national sample of students, we hope that you will be willing to participate in the study. One of SRBl’s interviewers will call in the next few weeks to schedule a telephone interview at your convenience. Alternatively, you can call SRBl’s toll free number (1-800-772-9287) and ask for the College Women’s Study coordinator to schedule or conduct an interview at your convenience.
Your participation in this study is voluntary. Although we hope that you will answer each question candidly, you don’t have to answer any question that you don’t want to answer. All of your answers will be anonymous and confidential. They will not be disclosed to anyone. No identifying information, such as name, address, or telephone number will be retained after we complete interviewing. After finishing the survey, you will not be contacted again.
Let me stress that we need the participation of every student sampled, regardless of your personal experiences related to unwanted sexual experiences in college. Our goal is to establish an accurate account of the extent of these experiences among college women so that students, universities, and public agencies can plan the appropriate steps to make women’s lives safer in the future. We hope that you will spend twenty minutes of your time to help make this possible.
If you have any questions about this project, please feel free to call me collect at 513-556- 3319 or contact me by e-mail at [email protected]. When the study is completed in the Fall of 1997, we will make results of the study available to any participants who request them. Thank you in advance for your time. I sincerely hope that you will take part in this important project.
Sincerely
Bonnie Fisher, Ph.D. Project Director
-241 -
This document is a research report submitted to the U.S. Department of Justice. This reporthas not been published by the Department. Opinions or points of view expressed are thoseof the author(s) and do not necessarily reflect the official position or policies of theU.S. Department of Justice.

APPENDIX 3
-242-
This document is a research report submitted to the U.S. Department of Justice. This reporthas not been published by the Department. Opinions or points of view expressed are thoseof the author(s) and do not necessarily reflect the official position or policies of theU.S. Department of Justice.

SURVEY OF COLLEGE WOMEN SCHULMAN, RONCA AND BUCUVALAS, INC. 145 E. 32ND STREET, NEW YORK, NEW YORK 10016
STUDY NO. 7232 February 20, 1997 Final
SAMPLE READ IN RESP. ID. RESPONDENT NAME: RESPONDENT ADDRESS: RESPONDENT SCHOOL: SCHOOL ZIP CODE:
- --- ---- RESP. TELEPHONE NUMBER: -
Interviewer:
Interview Date: / / 1997 Time Interview Began: : AM/PM
QUOTA CELL ENROLLMENT (1 000-4,999)
URBAN LOCATION ....................... 1 SUB URBAN LOCATION.. ............... .2 SMALL TOWN/RURAL ................. .3
URBAN LOCATION ......................... 4 SUBURBAN LOCATION. ............. .5 SMALL TO WN/RU RAL.. ................. .6
URBAN LOCATION ...................... .7 SUBURBAN LOCATION .................. 8 SMALL TOWNIRURAL.. ................ 9
URBAN LOCATION ......................... I O SUBURBAN LOCATION ............... 11 SMALL TOWN/RURAL .................... 12
ENROLLMENT (5,000-9,999)
ENROLLMENT (1 0,000-1 9,999)
ENROLLMENT (20,000 OR MORE)
N =378 N=364 N=360
N=364 N=364 N=378
N =364 N=369 N=368
N=372 N=370 N=371
-243-
This document is a research report submitted to the U.S. Department of Justice. This reporthas not been published by the Department. Opinions or points of view expressed are thoseof the author(s) and do not necessarily reflect the official position or policies of theU.S. Department of Justice.
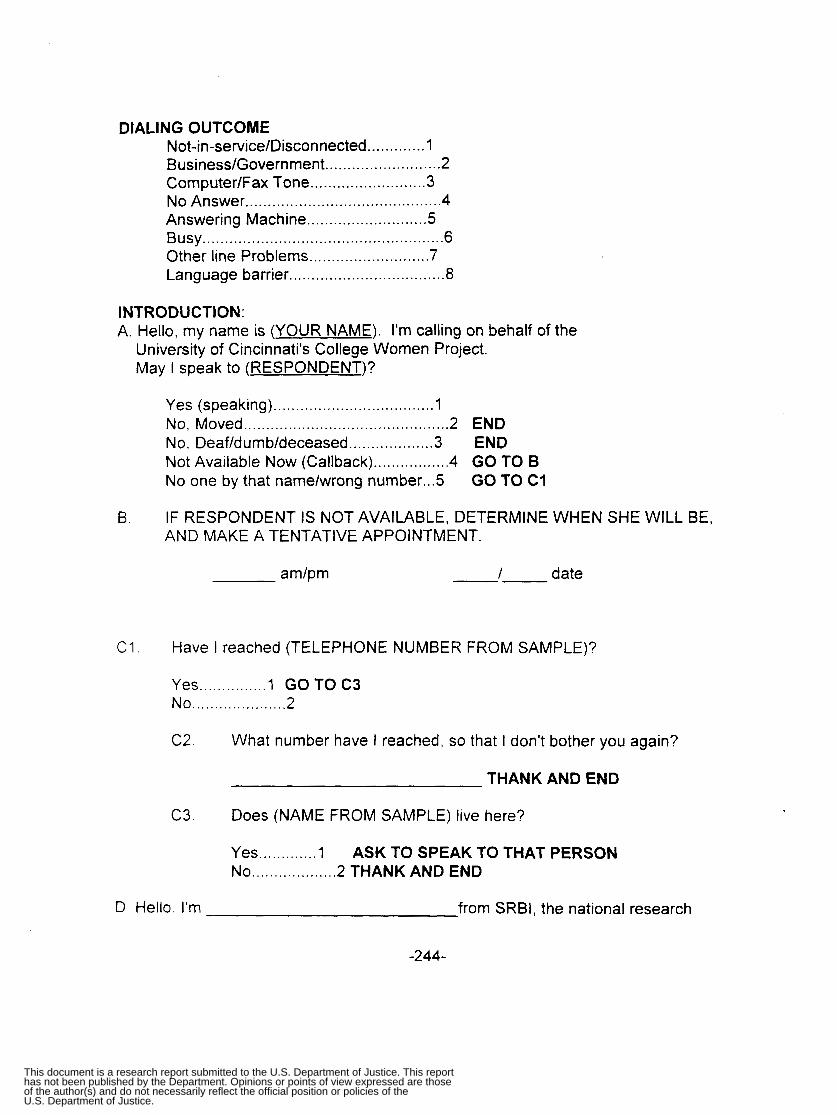
DIALING OUTCOME Not-in-service/Disconnected.. .......... .1 Business/Government.. ....................... .2 Computer/Fax Tone.. ....................... .3 No Answer ............................................ 4 Answering Machine.. ........................ .5 Busy ...................................................... 6 Other line Problems ........................... 7 Language barrier ................................... 8
INTRODUCTION: A. Hello, my name is (YOUR NAME). I'm calling on behalf of the
University of Cincinnati's College Women Project. May I speak to (RESPONDENT)?
Yes (speaking) .................................... 1
Not Available Now (Callback) ................. 4 GO TO B GO TO C1
No, Moved .............................................. 2 END No, Deafldumb/deceased ................... 3 END
No one by that namelwrong number ... 5
B.
c1
IF RESPONDENT IS NOT AVAILABLE, DETERMINE WHEN SHE WILL BE, AND MAKE A TENTATIVE APPOINTMENT.
I date -- arnlpm
Have I reached (TELEPHONE NUMBER FROM SAMPLE)?
Yes ... . . . . . . . . . . . . 1 GO TO C3 No ..................... 2
C2. What number have I reached, so that I don't bother you again?
THANK AND END
C3. Does (NAME FROM SAMPLE) live here?
Yes ............. 1 No ................... 2 THANK AND END
ASK TO SPEAK TO THAT PERSON
D. Hello, I'm from SRBI, the national research
-244-
This document is a research report submitted to the U.S. Department of Justice. This reporthas not been published by the Department. Opinions or points of view expressed are thoseof the author(s) and do not necessarily reflect the official position or policies of theU.S. Department of Justice.
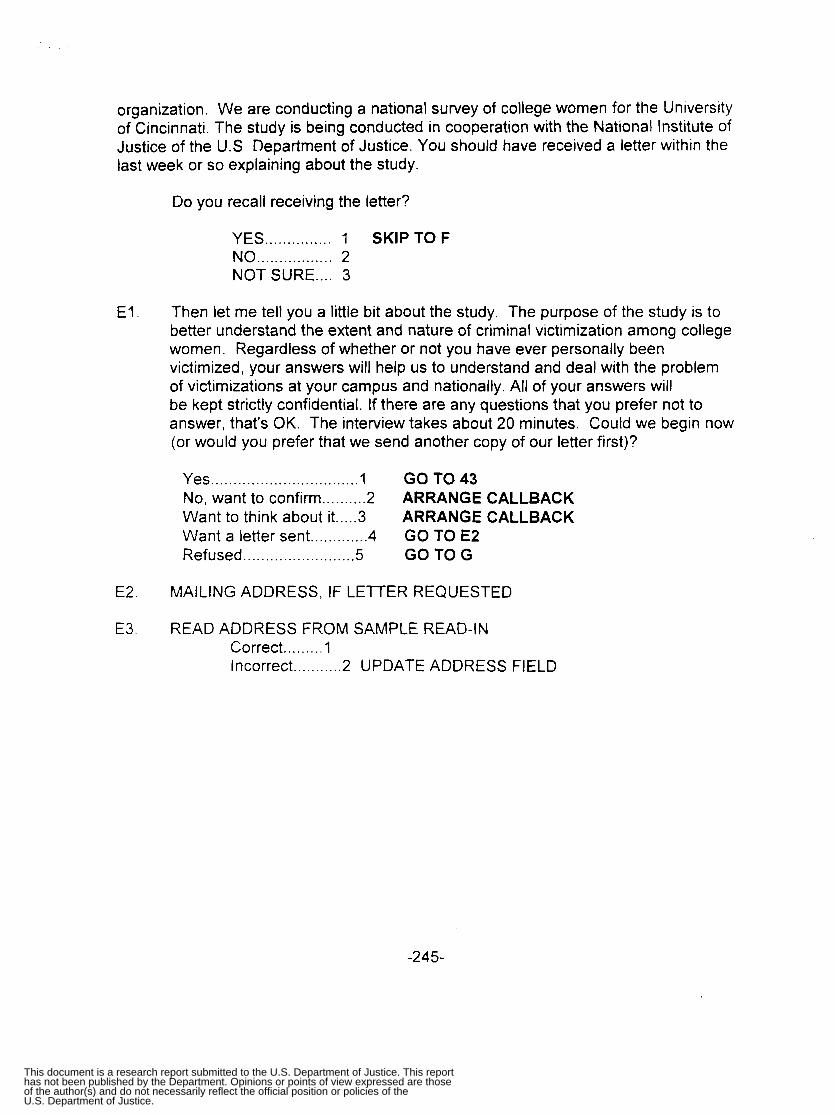
organization. We are conducting a national survey of college women for the University of Cincinnati. The study is being conducted in cooperation with the National Institute of Justice of the U.S Department of Justice. You should have received a letter within the last week or so explaining about the study.
Do you recall receiving the letter?
YES ............... 1 SKIP TO F NO ................. 2 NOT SURE .... 3
E l . Then let me tell you a little bit about the study. The purpose of the study is to better understand the extent and nature of criminal victimization among college women. Regardless of whether or not you have ever personally been victimized, your answers will help us to understand and deal with the problem of victimizations at your campus and nationally. All of your answers will be kept strictly confidential. If there are any questions that you prefer not to answer, that's OK. The interview takes about 20 minutes. Could we begin now (or would you prefer that we send another copy of our letter first)?
Yes ................................. 1 No, want to confirm .......... 2 Want to think about it ..... 3 Want a letter sent ............. 4 Refused.. ...................... .5
GO TO 43 ARRANGE CALLBACK ARRANGE CALLBACK GO TO E2 GO TO G
E2. MAILING ADDRESS, IF LETTER REQUESTED
E3 READ ADDRESS FROM SAMPLE READ-IN Correct ......... 1 Incorrect ........... 2 UPDATE ADDRESS FIELD
-245-
This document is a research report submitted to the U.S. Department of Justice. This reporthas not been published by the Department. Opinions or points of view expressed are thoseof the author(s) and do not necessarily reflect the official position or policies of theU.S. Department of Justice.
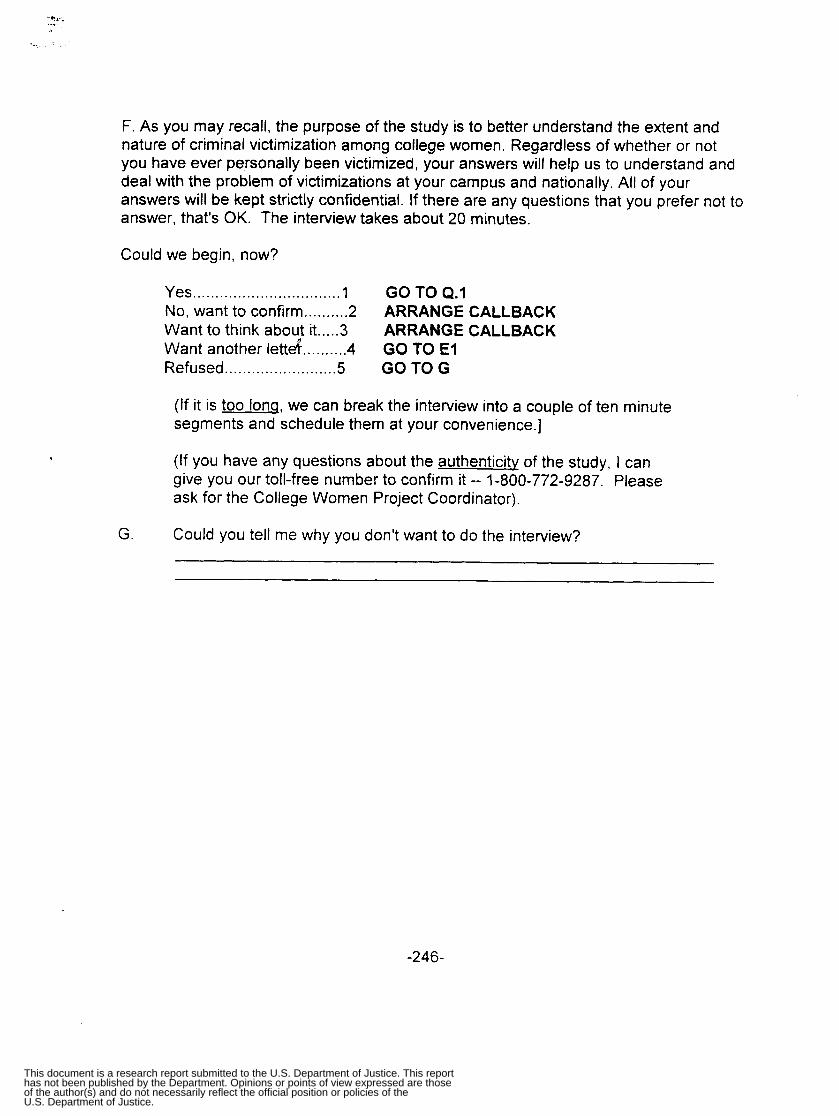
"e'; .-.
F. As you may recall, the purpose of the study is to better understand the extent and nature of criminal victimization among college women. Regardless of whether or not you have ever personally been victimized, your answers will help us to understand and deal with the problem of victimizations at your campus and nationally. All of your answers will be kept strictly confidential. If there are any questions that you prefer not to answer, that's OK. The interview takes about 20 minutes.
Could we begin, now?
Yes ................................. 1 No, want to confirm .......... 2 Want to think about it ..... 3 Want another lettef .......... 4 Refused.. ...................... .5
GO TO Q.l ARRANGE CALLBACK ARRANGE CALLBACK GO TO E l GO TO G
(If it is too long, we can break the interview into a couple of ten minute segments and schedule them at your convenience.]
(If you have any questions about the authenticitv of the study, I can give you our toll-free number to confirm it -- 1-800-772-9287. Please ask for the College Women Project Coordinator).
G. Could you tell me why you don't want to do the interview?
-246-
This document is a research report submitted to the U.S. Department of Justice. This reporthas not been published by the Department. Opinions or points of view expressed are thoseof the author(s) and do not necessarily reflect the official position or policies of theU.S. Department of Justice.

1A. Are you CURRENTLY enrolled and attending classes at (COLLEGE}? :
YES ... 1 NO ........ 2 SCREEN OUT I am sorry, we are only interviewing students who are currently enrolled and attending classes. Thank you for your time.
CONTINUE WITH Q2
1B. Were you enrolled at (COLLEGE) in the Fall Semester or Quarter of this academic year, that is the term that began in August or September 1996.
YES ... 1 NO ........ 2 SCREEN OUT I am sorry, we are only interviewing students who were enrolled DURING the Fall 1996. Thank you for your time.
CONTINUE WITH Q2
2. In what year did you first enroll at {name of college or university}? :
19 1997.. .............................. 97 SCREEN OUT
3. During which academic term did you first enroll at {COLLEGE}?
FA L L/A U TU M N ..................... .I WINTER ................................... 2 SPRING, OR .......................... 3 SUMMER.. ............................... .4
4. Are you currently a (READ LIST AND SINGLE RECORD):
Full-Time Student (12 Credit Hours or More) ........... 1 Part-Time Student (Less than 12 Credit Hours) .............. 2
5. Are you currently employed by {COLLEGE}?:
Yes ............ 1 No .................. 2 (SKIP TO VICTIMIZATION SCREEN QUESTIONS)
-247-
This document is a research report submitted to the U.S. Department of Justice. This reporthas not been published by the Department. Opinions or points of view expressed are thoseof the author(s) and do not necessarily reflect the official position or policies of theU.S. Department of Justice.

CONDITIONAL: IF YES IN Q5 AND PART-TIME STUDENT IN Q4, ASK Q6: 6. Do you work FULL-TIME (at least 35 hours per week) for (COLLEGE}?
No .................... 1 Yes ........................... 2 SCREEN OUT
GO TO VICTIMIZATION SCREEN
I am sorry, we are only interviewing full-time students. Thank you for your time.
-248-
This document is a research report submitted to the U.S. Department of Justice. This reporthas not been published by the Department. Opinions or points of view expressed are thoseof the author(s) and do not necessarily reflect the official position or policies of theU.S. Department of Justice.

SEXUAL VICTIMIZATION SCREEN QUESTIONS Women may experience a wide range of unwanted sexual experiences in college. Women do not always report unwanted sexual experiences to the police or discuss them with family or friends. The person making the advances is not always a stranger, but can be a friend , boyfriend, fellow student, professor, teaching assistant, supervisor, co-worker, somebody you met off campus, or even a family member. The experience could occur anywhere: on- or off-campus, in your residence, in your place of employment, or in a public place. You could be awake, or you could be asleep, unconscious, drunk, or otherwise incapacitated. Please keep this in mind as you answer the questions.
Now, I’ m going to ask you about different types of unwanted sexual experiences you may have experienced since school began in the Fall 1996. Because of the nature of unwanted sexual experience, the language may seem graphic to you. However, this is the only way to assess accurately whether or not the women in this study have had such experiences. You only have to answer “yes“ or “no“.
7. Since school began in the Fall 1996, has anyone made you have sexual intercourse by using force or threatening to harm you or someone close to you? Just so there is no mistake, by intercourse I mean putting a penis in your vagina.
Yes ............... 1 No .................... 2
Not sure ..... 3 Refused.. ..... .4
8.Since school began in the Fall 1996, has anyone made you have oral sex by force or threat of harm? By oral sex, I mean did someone‘s mouth or tongue make contact with your vagina or anus or did your mouth or tongue make contact with someone else’s genitals or anus.
Yes ............. 1 No.. ............... .2
Not sure ... 3 Refused.. ... .4
9.Since school began in the Fall 1996, has anyone made you have anal sex by force or threat of harm? By anal sex, I mean putting a penis in your anus or rectum.
Yes ............. 1 No ................. 2
Not sure ... 3 Refused.. ... .4
-249-
This document is a research report submitted to the U.S. Department of Justice. This reporthas not been published by the Department. Opinions or points of view expressed are thoseof the author(s) and do not necessarily reflect the official position or policies of theU.S. Department of Justice.
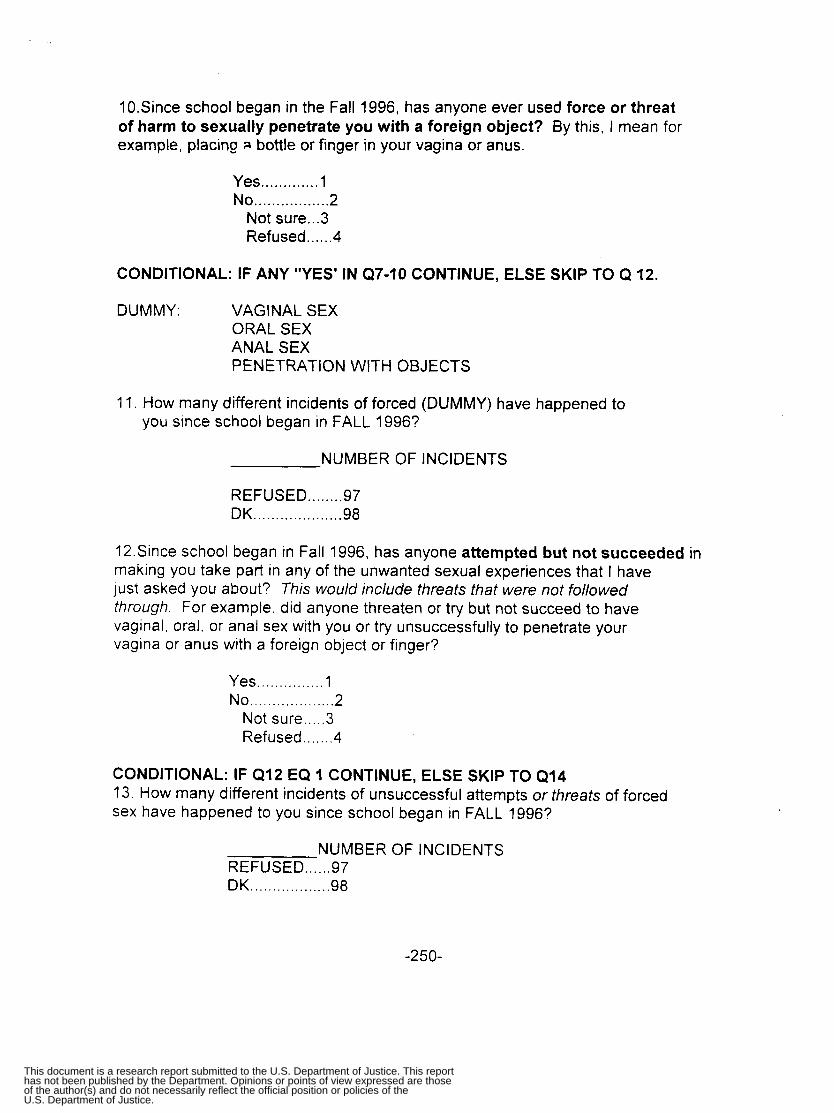
10.Since school began in the Fall 1996, has anyone ever used force or threat of harm to sexually penetrate you with a foreign object? By this, I mean for example, placing 3 bottle or finger in your vagina or anus.
Yes ............. 1 No ................. 2
Not sure ... 3 Refused.. ... .4
CONDITIONAL: IF ANY "YES' IN Q7-10 CONTINUE, ELSE SKIP TO Q 12.
DUMMY: VAGINAL SEX ORAL SEX ANAL SEX PENETRATION WITH OBJECTS
11. How many different incidents of forced (DUMMY) have happened to you since school began in FALL 1996?
NUMBER OF INCIDENTS
REFUSED ........ 97 DK .................... 98
12 Since school began in Fall 1996, has anyone attempted but not succeeded in making you take part in any of the unwanted sexual experiences that I have just asked you about7 This would include threats that were not followed through For example, did anyone threaten or try but not succeed to have vaginal, oral or anal sex with you or try unsuccessfully to penetrate your vagina or anus with a foreign object or finger?
Yes ............... 1 No ................... 2
Not sure ..... 3 Refused.. .... .4
CONDITIONAL: IF 412 EQ I CONTINUE, ELSE SKIP TO 414 13. How many different incidents of unsuccessful attempts or threats of forced sex have happened to you since school began in FALL 1996?
NUMBER OF INCIDENTS REFUSED ...... 97 DK .................. 98
-250-
This document is a research report submitted to the U.S. Department of Justice. This reporthas not been published by the Department. Opinions or points of view expressed are thoseof the author(s) and do not necessarily reflect the official position or policies of theU.S. Department of Justice.

14. Not counting the types of sexual contact already mentioned, have you experienced any unwanted or uninvited touching of a sexual nature since school began in the Fall 1996? This includes forced kissing, touching of private parts, grabbing, and fondling, even it is over your clothes. Remember this could include anyone from strangers to people you know well. Have any incidents of unwanted or uninvited touching of a sexual nature happened to you since school began in the Fall 1996?
Yes ............. I No ................. .2
Not sure ... 3 Refused.. .... .4
CONDITIONAL: IF Q14 EQ I CONTINUE, ELSE SKIP TO Q16 15. How many different incidents of unwanted or uninvited touching of a
sexual nature have happened to you since school began in FALL 1996?
NUMBER OF INCIDENTS REFUSED ........ 97 DK ................... .98
16.Since school began in Fall 1996, has anyone attempted or threatened but not succeeded in unwanted or uninvited touching of a sexual nature?
Yes ............... 1 No .................. .2
Not sure ..... 3 Refused.. ..... .4
CONDITIONAL: IF Q16 EQ 1 CONTINUE, ELSE SKIP TO Q18 17. How many different incidents of unwanted or uninvited attempts or threats at touching of a sexual nature have happened to you since school began in FALL 1996?
NUMBER OF INCIDENTS REFUSED ........ 97 DK ................... .98
-251-
This document is a research report submitted to the U.S. Department of Justice. This reporthas not been published by the Department. Opinions or points of view expressed are thoseof the author(s) and do not necessarily reflect the official position or policies of theU.S. Department of Justice.

18. I have been asking you about unwanted sexual contact that involved force or threats of force against you or someone else. Sometimes unwanted sexual contact may be attempted using threats of nonphvsical punishment, promises of rewards if you complied sexually, or simply continual verbal pressure.
Since school began in Fall 1996, has anyone made or tried to make you have sexual intercourse or sexual contact when you did not want to by making threats of non-physical punishment such as lowering a grade, being demoted or fired from a job, damaging your reputation or being excluded from a group for failure to comply with requests for any type of sexual activity.
Yes ............... 1 No ................... 2
Not s u k ..... 3 Refused.. ..... .4
19. Since school began in the Fall 1996, has anyone made or tried to make you have sexual intercourse or sexual contact when you did not want to by making promises of rewards such as raising a grade, being hired or promoted, being given a ride or class notes, or getting help with coarse work from a fellow student if you complied sexually.
Yes ............... 1 No ................... 2
Not sure ..... 3 Refused.. ..... .4
20. Since school began in the Fall 1996, has anyone made or tried to make you have sexual intercourse or sexual contact when you did not want to by simply being overwhelmed by someone’ s continual pestering and verbal pressure?
Yes ............... 1 No ................... 2
Not sure ..... 3 Refused.. ..... .4
CONDITIONAL: IF YES IN (218, Q19 or Q20 ASK (221, ELSE SKIP TO 422 21. How many different incidents of non-physical threats, rewards or continual verbal pressure to make you have sexual intercourse or contact have happened to you since school began in FALL 1996?
NUMBER OF INCIDENTS REFUSED ................. 97 DK ........................... ..98
-252-
This document is a research report submitted to the U.S. Department of Justice. This reporthas not been published by the Department. Opinions or points of view expressed are thoseof the author(s) and do not necessarily reflect the official position or policies of theU.S. Department of Justice.

22. Not counting any incidents we have already discussed, have you experienced any other type of unwanted or uninvited sexual contact since school began in the Fall? Remember, this could include sexual experiences that may or may not have been reported to the police or other officials, which were with strangers or people you know, in variety of locations both on- and off-campus, and while you were awake, or when you were asleep, drunk, or othetwise incapacitated
Yes ............... 1 No ................... 2
Not sure ..... 3 Refused., ..... .4
CONDITIONAL: IF YES IN Q22 ASK Q23, ELSE SKIP TO Q24 23. How many different incidents of these other types of unwanted or uninvited sexual contact have happened to you since school began in Fall 1996?
NUMBER OF INCIDENTS REFUSED ........ 97 DK .................... 98
SEXUAL INCIDENT COUNTER: A. B.
C D
E. F
NUMBER OF FORCED SEXUAL PENETRATIONS FROM Q11 NUMBER OF ATTEMPTEDnHREATENED FORCED SEXUAL PENETRATIONS FROM Q13 NUMBER OF SEXUAL TOUCHINGS OR ASSAULTS FROM Q15 NUMBER OF ATTEMPTEDlTHREATENED SEXUAL TOUCHING OR ASSAULT FROM Q17 NUMBER OF SEXUAL COERCION OR PRESSURE FROM Q21 NUMBER OF OTHER UNWANTED SEXUAL CONTACTS FROM Q23
COMPUTE TOTAL INCIDENTS A-F. IF COUNTER EQ 0, SKIP TO Q24 IF SEXUAL INCIDENT COUNTER IS GREATER THAN ZERO, GO TO INCIDENT REPORT LOOP. INCIDENT REPORT WILL BE COMPLETED FOR EACH REPORTED INCIDENT BY CATEGORY BEGINNING WITH THE MOST RECENT INCIDENT IN THAT CATEGORY. THERE IS A MAXIMUM OF FIVE LOOPS PER CATEGORY.
-253-
This document is a research report submitted to the U.S. Department of Justice. This reporthas not been published by the Department. Opinions or points of view expressed are thoseof the author(s) and do not necessarily reflect the official position or policies of theU.S. Department of Justice.

24. Since school begin in the Fall 1996 has anyone --from a stranger to an ex-boyfriend -- repeatedly followed you, watched you, phoned, written, e-mailed, or communicated with you in other ways in a wav that seemed obsessive and made YOU afraid or concerned for vour safetv. [This includes waiting outside your class, residence, workplace, other buildings, or car] .
Yes ............... 1 No ................... 2
Not sure ..... 3 Refused.. .... .4
25. How many people exhibited this type of behavior towards you since school began in the Fall?
NUMBER OF PERSONS
REFUSED ........ 97 DK .................. ..98
CONDITIONAL: A stalking incident report will be completed for each person indicated in Q25. If none, go to Q26A.
26A. Since school began in Fall 1996, have you received any obscene phone call or had an obscene message left on your answering machine or e-mail?
Yes ............... I No ................... 2 SKIP TO 27A
Not sure ..... 3 SKIP TO 27A Refused ....... 4 SKIP TO 27A
266. How many times has this happened to you on campus?
TIMES
REFUSED. .. .98 DK.. ............. .99
26C. How many times has this happened to you off campus?
TIMES REFUSED.. . .98 DK.. ............. .99
-254-
This document is a research report submitted to the U.S. Department of Justice. This reporthas not been published by the Department. Opinions or points of view expressed are thoseof the author(s) and do not necessarily reflect the official position or policies of theU.S. Department of Justice.

27a. Since school began in Fall 1996, have you experienced any cat calls, whistles about your looks, or noises with sexual overtones?
Yes ............... I No ................... 2 SKIP TO 28A
Not sure ..... 3 SKIP TO 28A Refused ....... 4 SKIP TO 28A
278. How many times has this happened to you on campus?
TIMES
REFUSED .... 98 DK ............... .99
27C. How many times has this happened to you off campus?
TIMES
REFUSED.. ..98 DK ................ 99
28a.Since school began in Fall 1996, has anyone spread false rumors about your sex life with them or others?
Yes ............... I No ................... 2 SKIP TO 29A
Not sure ..... 3 SKIP TO 29A Refused ....... 4 SKIP TO 29A
28B. How many times has this happened to you on campus?
TIMES
REFUSED.. . .98 DK.. ............. .99
28C. How many times has this happened to you off campus?
TIMES
REFUSED.. . .98 DK.. ............. .99
-255-
This document is a research report submitted to the U.S. Department of Justice. This reporthas not been published by the Department. Opinions or points of view expressed are thoseof the author(s) and do not necessarily reflect the official position or policies of theU.S. Department of Justice.
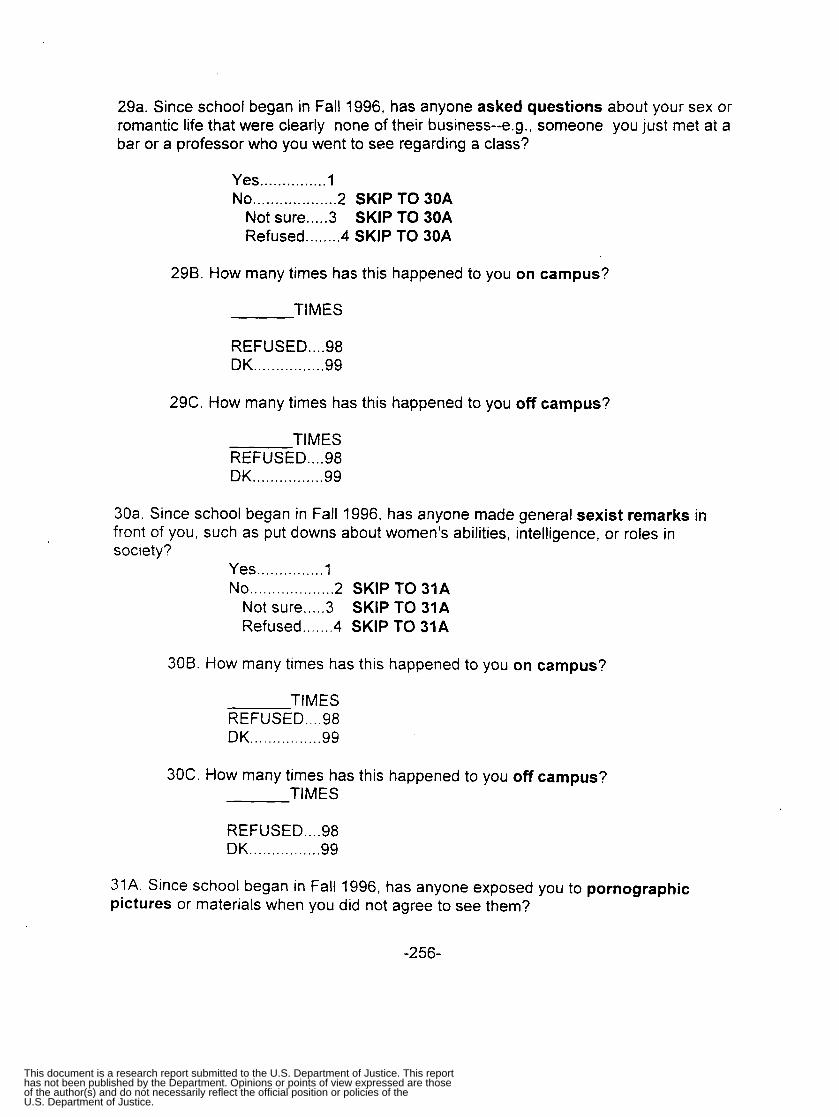
29a. Since school began in Fall 1996, has anyone asked questions about your sex or romantic life that were clearly none of their business--e.g., someone you just met at a bar or a professor who you went to see regarding a class?
Yes ............... 1 No ................... 2 SKIP TO 30A
Not sure ..... 3 SKIP TO 30A Refused ........ 4 SKIP TO 30A
29B. How many times has this happened to you on campus?
TIMES
REFUSED.. . .98 DK ................ 99
29C. How many times has this happened to you off campus?
TIMES REFUSED.. . .98 DK ............... .99
30a. Since school began in Fall 1996, has anyone made general sexist remarks in front of you, such as put downs about women's abilities, intelligence, or roles in society?
Yes .............. .1 No ................... 2 SKIP TO 31A
Not sure ..... 3 SKIP TO 31A Refused ....... 4 SKIP TO 31A
30B. How many times has this happened to you on campus?
TIMES REFUSED ... .98 DK ................ 99
30C. How many times has this happened to you off campus? TIMES
REFUSED .... 98 DK ............... .99
31A. Since school began in Fall 1996, has anyone exposed you to pornographic pictures or materials when you did not agree to see them?
-256-
This document is a research report submitted to the U.S. Department of Justice. This reporthas not been published by the Department. Opinions or points of view expressed are thoseof the author(s) and do not necessarily reflect the official position or policies of theU.S. Department of Justice.
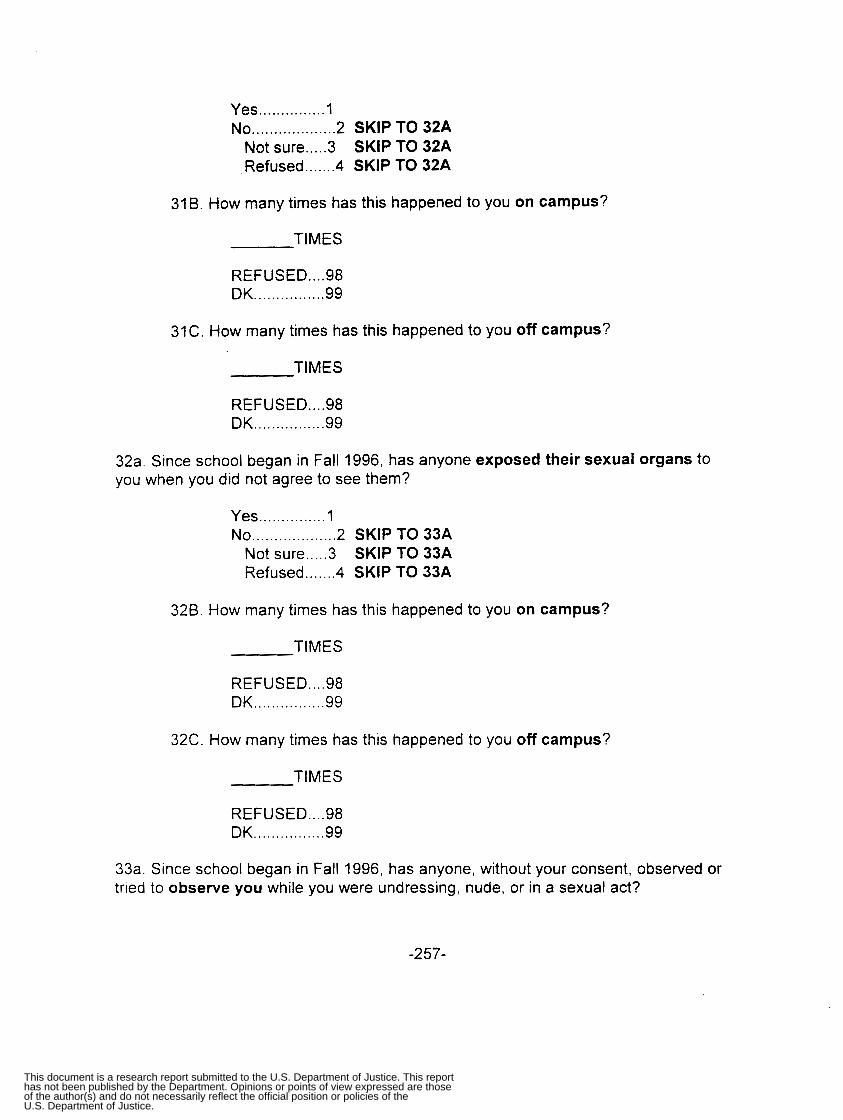
Yes ............... 1 No ................... 2 3 2 A SKIP TO
Not sure ..... 3 3 2 A SKIP TO Refused ....... 4 3 2 A SKIP TO
31B . How many times has this happened to you on campus?
TIMES
REFUSED .... 98 DK ................ 99
31C . How many times has this happened to you off campus?
TIMES
REFUSED .... 98 DK ................ 99
32a . Since school began in Fall 1996. has anyone exposed their sexual organs to you when you did not agree to see them?
Yes ............... 1 No ................... 2 3 3 A SKIP TO
Not sure ..... 3 3 3 A SKIP TO Refused ....... 4 3 3 A SKIP TO
326 . How many times has this happened to you on campus?
TIMES
REFUSED .... 98 DK ................ 99
32C . How many times has this happened to you off campus?
TIMES
REFUSED .... 98 DK ................ 99
33a . Since school began in Fall 1996. has anyone. without your consent. observed or tried to observe you while you were undressing. nude. or in a sexual act?
-257-
This document is a research report submitted to the U.S. Department of Justice. This reporthas not been published by the Department. Opinions or points of view expressed are thoseof the author(s) and do not necessarily reflect the official position or policies of theU.S. Department of Justice.

Yes ............... I No ................... 2 SKIP TO 34A
Not sure ..... 3 SKIP TO 34A Refused ....... 4 SKIP TO 34A
33B. How many times has this happened to you on campus?
TIMES
REFUSED.. . .98 DK.. ............ ..99
33C. How many times has this happened to you off campus? 0’
TIMES
REFUSED.. . .98 DK ............... .99
34a. Since school began in Fall 1996, has anyone photographed, videotaped, or audio taped you having sex or in a nude or semi-nude state without your consent?
Yes ............... I No ................... 2 SKIP TO 35A
Not sure ..... 3 SKIP TO 35A Refused ....... 4 SKIP TO 35A
34B. How many times has this happened to you on campus?
TIMES
REFUSED .... 98 DK.. ............. .99
34C. How many times has this happened to you off campus?
TIMES
REFUSED.. . .98 DK ............... .99
35a. Since school began in Fall 1996, has anyone, without your consent, shown other people photographs, or played videotapes, or audiotapes in which you were having sex or in a nude or seminude state?
-258-
This document is a research report submitted to the U.S. Department of Justice. This reporthas not been published by the Department. Opinions or points of view expressed are thoseof the author(s) and do not necessarily reflect the official position or policies of theU.S. Department of Justice.
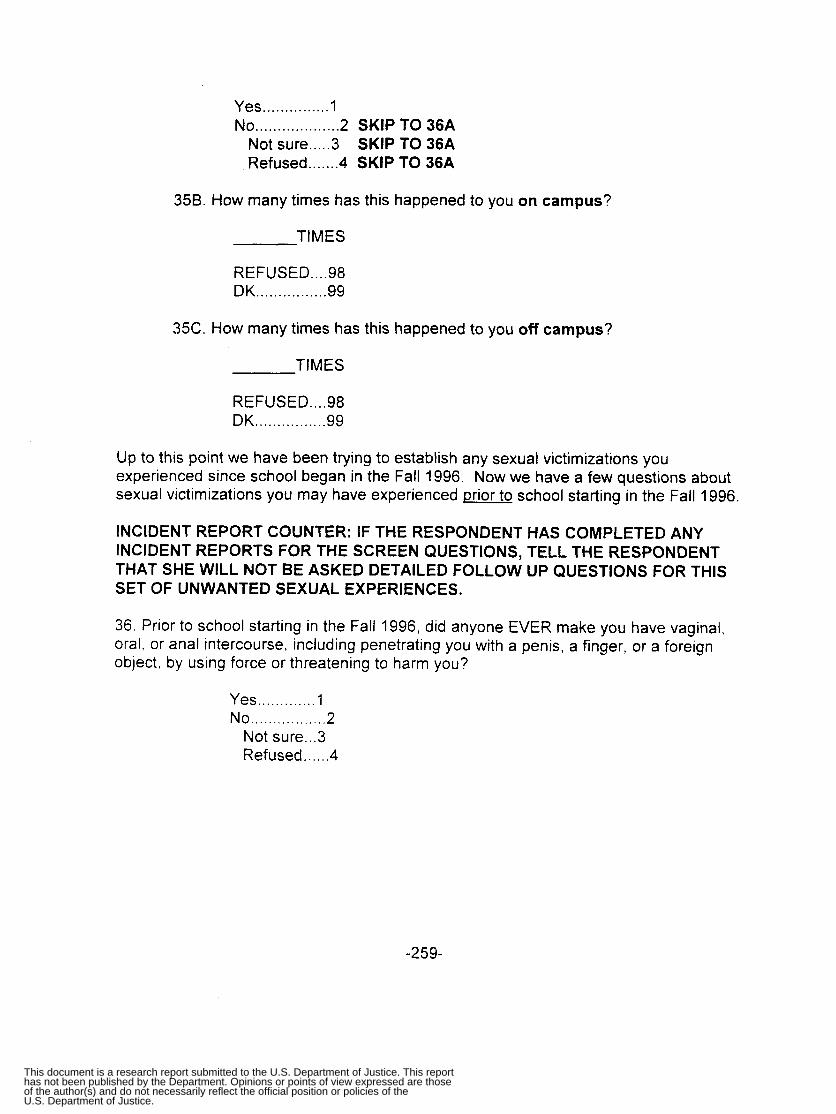
Yes .............. . l No ................... 2 SKIP TO 36A
Not sure ..... 3 SKIP TO 36A Refused ....... 4 SKIP TO 36A
35B. How many times has this happened to you on campus?
TIMES
REFUSED .... 98 DK ............... .99
35C. How many times has this happened to you off campus?
TIMES
REFUSED.. . .98 DK ................ 99
Up to this point we have been trying to establish any sexual victimizations you experienced since school began in the Fall 1996. Now we have a few questions about sexual victimizations you may have experienced prior to school starting in the Fall 1996.
INCIDENT REPORT COUNTER: IF THE RESPONDENT HAS COMPLETED ANY INCIDENT REPORTS FOR THE SCREEN QUESTIONS, TELL THE RESPONDENT THAT SHE WILL NOT BE ASKED DETAILED FOLLOW UP QUESTIONS FOR THIS SET OF UNWANTED SEXUAL EXPERIENCES.
36. Prior to school starting in the Fall 1996, did anyone EVER make you have vaginal, oral, or anal intercourse, including penetrating you with a penis, a finger, or a foreign object, by using force or threatening to harm you?
Yes ............. 1 No ................. 2
Not sure ... 3 Refused.. ... .4
-259-
This document is a research report submitted to the U.S. Department of Justice. This reporthas not been published by the Department. Opinions or points of view expressed are thoseof the author(s) and do not necessarily reflect the official position or policies of theU.S. Department of Justice.
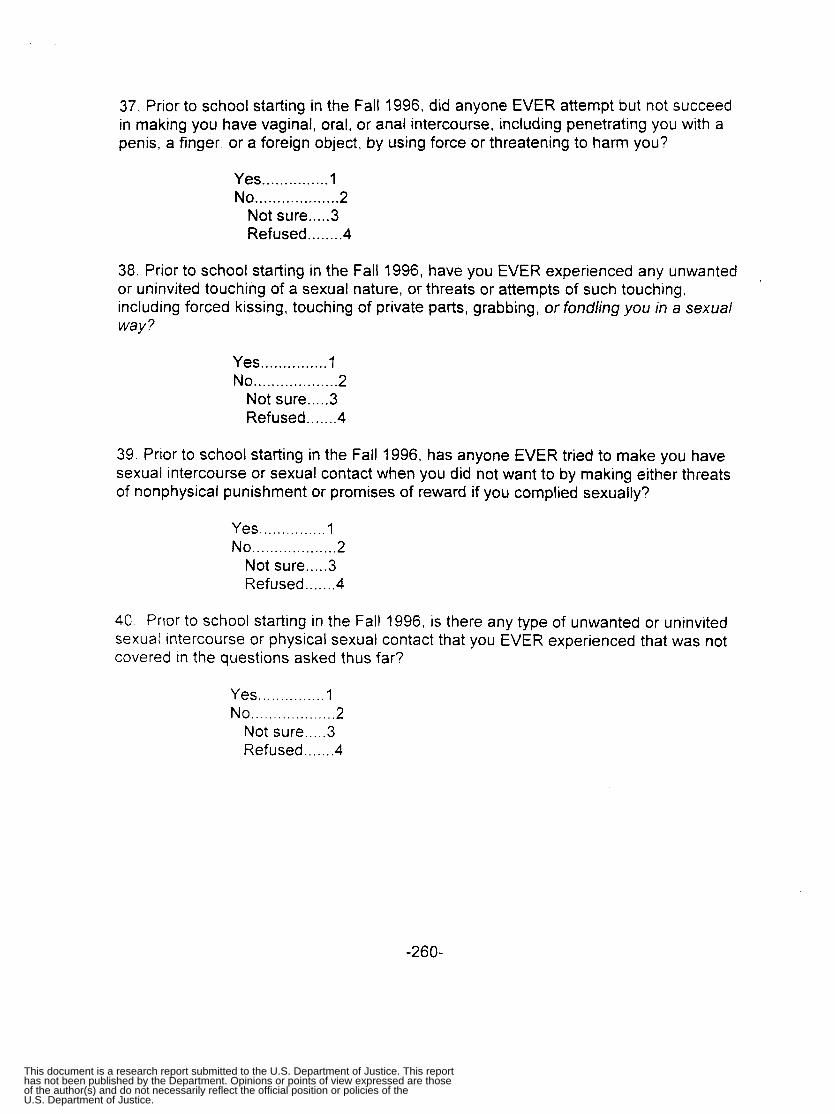
37. Prior to school starting in the Fall 1996, did anyone EVER attempt but not succeed in making you have vaginal, oral, or anal intercourse, including penetrating you with a penis, a finger. or a foreign object, by using force or threatening to harm you?
Yes ............... 1 No ................... 2
Not sure ..... 3 Refused.. ..... .4
38. Prior to school starting in the Fall 1996, have you EVER experienced any unwanted or uninvited touching of a sexual nature, or threats or attempts of such touching, including forced kissing, touching of private parts, grabbing, or fondling you in a sexual way?
Yes ............... 1 No ................... 2
Not sure ..... 3 Refused.. .... .4
39. Prior to school starting in the Fall 1996, has anyone EVER tried to make you have sexual intercourse or sexual contact when you did not want to by making either threats of nonphysical punishment or promises of reward if you complied sexually?
Yes ............... I No ................... 2
Not sure ..... 3 Refused.. .... .4
40 Prior to school starting in the Fall 1996, is there any type of unwanted or uninvited sexual intercourse or physical sexual contact that you EVER experienced that was not covered in the questions asked thus far?
Yes ............... I No. .................. 2
Not sure ..... 3 Refused.. .... .4
-260-
This document is a research report submitted to the U.S. Department of Justice. This reporthas not been published by the Department. Opinions or points of view expressed are thoseof the author(s) and do not necessarily reflect the official position or policies of theU.S. Department of Justice.
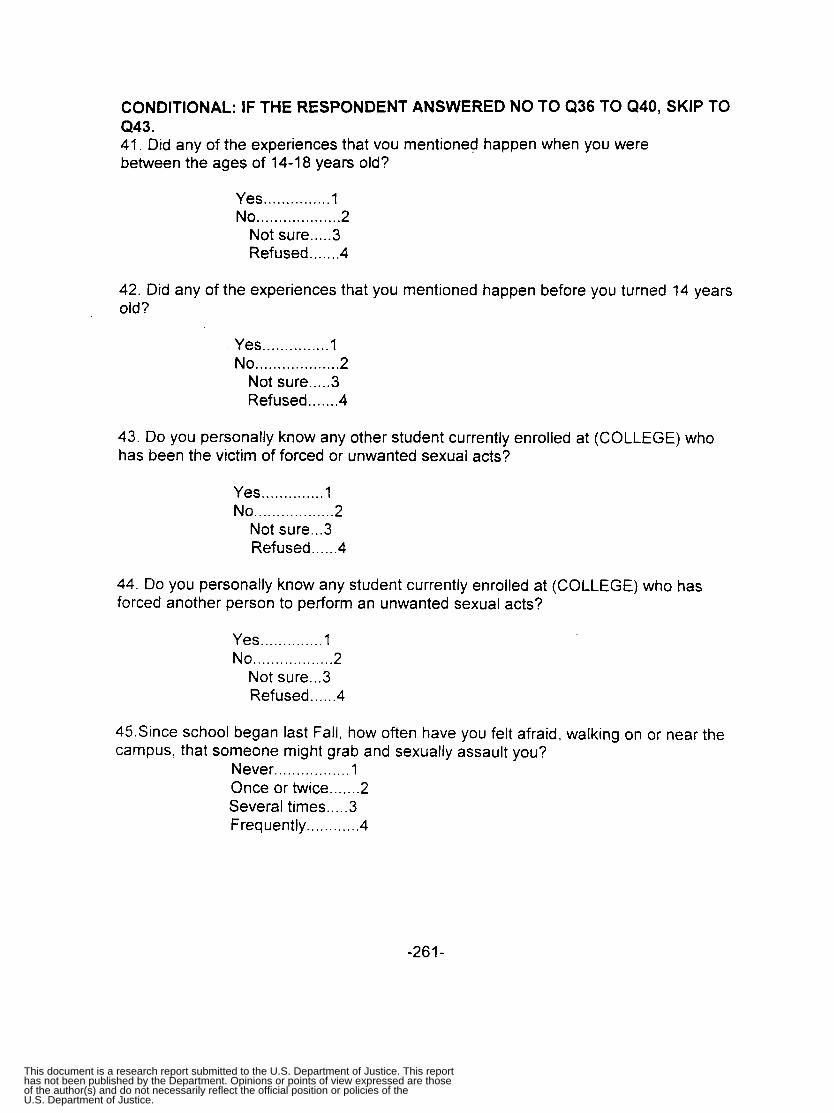
CONDITIONAL: IF THE RESPONDENT ANSWERED NO TO Q36 TO Q40. SKIP TO Q43 . 41 . Did any of the experiences that vou mentioned happen when you were between the ages of 14-18 years old?
Yes ............... 1 No ................... 2
Not sure ..... 3 Refused ....... 4
42 . Did any of the experiences that you mentioned happen before you turned 14 years old?
Yes ............... 1 No ................... 2
Not sure ..... 3 Refused ....... 4
43 . Do you personally know any other student currently enrolled at (COLLEGE) who has been the victim of forced or unwanted sexual acts?
Yes .............. 1 No .................. 2
Not sure ... 3 Refused ...... 4
44 . Do you personally know any student currently enrolled at (COLLEGE) who has forced another person to perform an unwanted sexual acts?
Yes .............. 1 No .................. 2
Not sure ... 3 Refused ...... 4
45.Since school began last Fall. how often have you felt afraid. walking on or near the campus. that someone might grab and sexually assault you?
Never ................. 1 Once or twice ....... 2 Several times ..... 3 Frequently ............ 4
-261-
This document is a research report submitted to the U.S. Department of Justice. This reporthas not been published by the Department. Opinions or points of view expressed are thoseof the author(s) and do not necessarily reflect the official position or policies of theU.S. Department of Justice.

46 . Since school began last Fall. how often have you avoided areas of campus because you were afraid that someone might grab and sexually assault you?
Never ................. 1 Once or twice ....... 2 Several times ..... 3 Frequently ............ 4
47 . Since school began last Fall. how often have you felt afraid in a social situation. like a date or party. that someone might grab and sexually assault you?
Never ................. 1 Once or twice ....... 2 Several times ..... 3 Frequently ............ 4
48 . Now. I' d like to ask you a few questions about how you protect yourself from potential victimization . Do you typically ... READ LIST AND CODE ALL THAT APPLY
Carry mace. pepper-spray. or a screamer ............................... 1 Carry a gun or other firearm ........................................................... 2 Carry a knife. or other weapon not including a firearm ............ 3 Use any campus-sponsored crime prevention services.
such as campus escort service. paths with blue light emergency phones. or something else ....................................... 4
Ask someone to walk or drive you to your dormitory. the
Walk in a group with others to your dormitory. the library. library. your car or some other destination after dark ............. 5
your car or some other destination after dark .............................. 6
49 . Since school began in Fall 1996. have you ... . .
Taken a self-defense course ............................................... 1 Attended a crime prevention or rape awareness seminar ....... 2
Now. I'd like to ask you some questions about how you spend your time. and activities you may engage in while you are on or off campus .
-262-
This document is a research report submitted to the U.S. Department of Justice. This reporthas not been published by the Department. Opinions or points of view expressed are thoseof the author(s) and do not necessarily reflect the official position or policies of theU.S. Department of Justice.
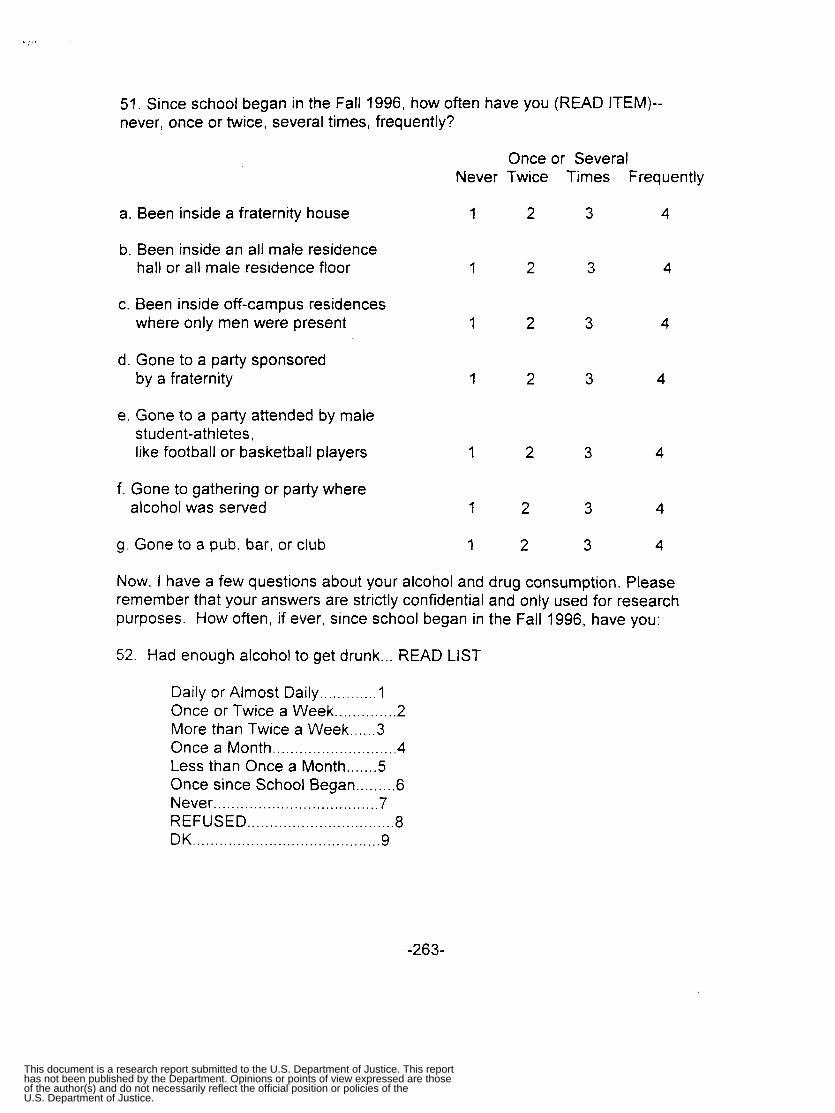
. I .
51. Since school began in the Fall 1996, how often have you (READ ITEM)-- never, once or twice, several times, frequently?
Never
a. Been inside a fraternity house 1
b. Been inside an all male residence hall or all male residence floor 1
c. Been inside off-campus residences where only men were present
d. Gone to a party sponsored by a fraternity
1
1
e. Gone to a party attended by male student-athletes, like football or basketball players 1
f. Gone to gathering or party where alcohol was served 1
g. Gone to a pub, bar, or club 1
Once or Several Twice
2
2
2
2
2
2
2
Times Frequently
3 4
3 4
3 4
3 4
3 4
3 4
3 4
Now, i have a few questions about your alcohol and drug consumption. Please remember that your answers are strictly confidential and only used for research purposes. How often, if ever, since school began in the Fall 1996, have you:
52. Had enough alcohol to get drunk ... READ LIST
Daily or Almost Daily ...... . . . .... 1 Once or Twice a Week .............. 2 More than Twice a Week ...... 3 Once a Month ............................ 4 Less than Once a Month ....... 5 Once since School Began ......... 6 Never ..................................... 7 REFUSED ................................. 8 DK .......................................... 9
-263-
This document is a research report submitted to the U.S. Department of Justice. This reporthas not been published by the Department. Opinions or points of view expressed are thoseof the author(s) and do not necessarily reflect the official position or policies of theU.S. Department of Justice.
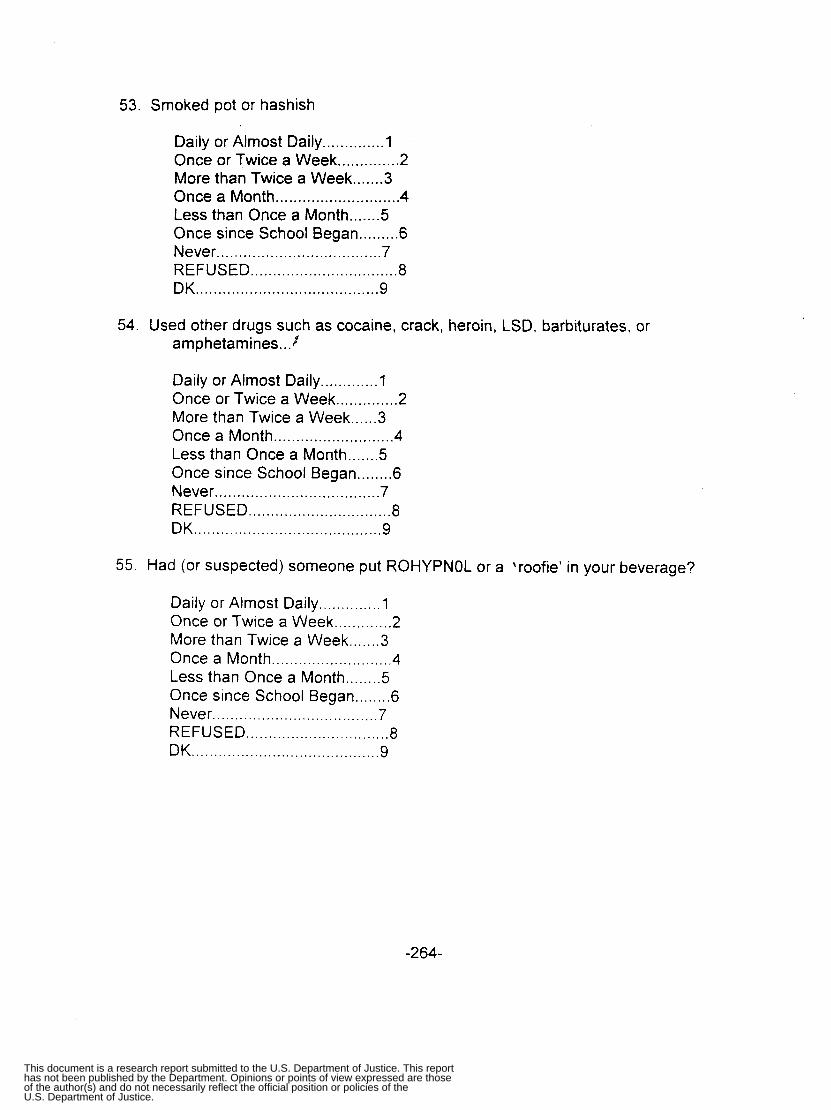
53 . Smoked pot or hashish
Daily or Almost Daily .............. 1 Once or Twice a Week .............. 2 More than Twice a Week ....... 3 Once a Month ............................ 4 Less than Once a Month ....... 5 Once since School Began ......... 6 Never ..................................... 7 REFUSED ................................. 8 DK ......................................... 9
54 . Used other drugs such as cocaine. crack. heroin. LSD. barbiturates. or amphetamines ... 8
Daily or Almost Daily ............. 1 Once or Twice a Week .............. 2 More than Twice a Week ...... 3 Once a Month ........................... 4 Less than Once a Month ....... 5 Once since School Began ........ 6 Never ..................................... 7 REFUSED ................................ 8 DK .......................................... 9
55 . Had (or suspected) someone put ROHYPNOL or a ‘roofie’ in your beverage?
Daily or Almost Daily .............. 1 Once or Twice a Week ............. 2 More than Twice a Week ....... 3 Once a Month ........................... 4 Less than Once a Month ........ 5 Once since School Began ........ 6 Never ..................................... 7 REFUSED ................................ 8 DK .......................................... 9
-264-
This document is a research report submitted to the U.S. Department of Justice. This reporthas not been published by the Department. Opinions or points of view expressed are thoseof the author(s) and do not necessarily reflect the official position or policies of theU.S. Department of Justice.
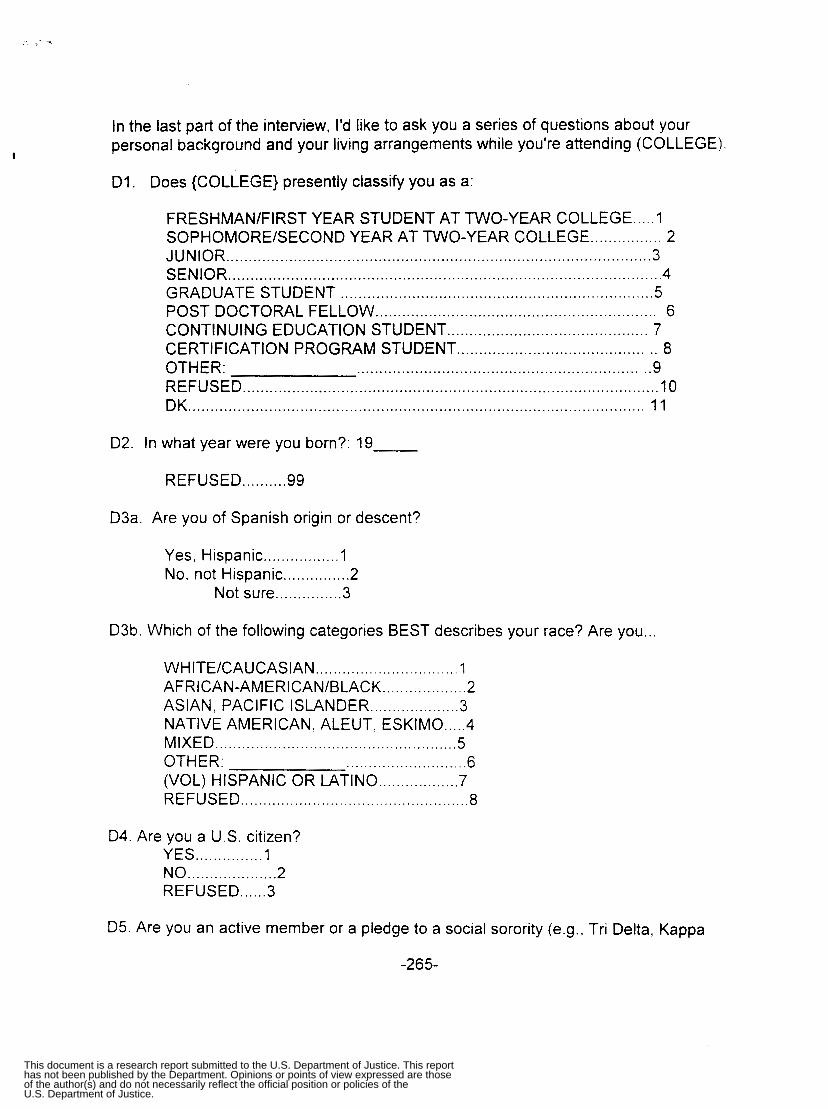
; . . .
I
In the last part of the interview. I'd like to ask you a series of questions about your personal background and your living arrangements while you're attending (COLLEGE)
D1 . Does {COLLEGE} presently classify you as a:
FRESHMANIFIRST YEAR STUDENT AT TWO-YEAR COLLEGE .. . . . 1 SOPHOMORE/SECOND YEAR AT TWO-YEAR COLLEGE ................ 2 JUNIOR ............................................................................................... 3 SENIOR ................................................................................................. 4 GRADUATE STUDENT ...................................................................... 5
CONTINUING EDUCATION STUDENT ............................................. 7 CERTIFICATION PROGRAM STUDENT ............................................ 8
POST DOCTORAL FELLOW ............................................................... 6
OTHER: ................................................................. 9 REFUSED ............................................................................................. 10 DK ...................................................................................................... 11
D2 . In what year were you born?: 19
REFUSED .......... 99
D3a . Are you of Spanish origin or descent?
Yes. Hispanic ................. 1 No. not Hispanic ............... 2
Not sure ............... 3
D3b . Which of the following categories BEST describes your race? Are you . . .
WHITE/CAUCASIAN ................................ 1
ASIAN, PACIFIC ISLANDER .................... 3 NATIVE AMERICAN, ALEUT. ESKIMO ..... 4 MIXED ...................................................... 5
AFRICAN-AMERICANIBLACK ................... 2
OTHER: ........................... 6 (VOL) HISPANIC OR LATINO .................. 7 REFUSED ................................................... 8
D4 . Are you a U.S. citizen? YES ............... 1 NO .................... 2 REFUSED ...... 3
D 5 . Are you an active member or a pledge to a social sorority (e.g., Tri Delta. Kappa
-265-
This document is a research report submitted to the U.S. Department of Justice. This reporthas not been published by the Department. Opinions or points of view expressed are thoseof the author(s) and do not necessarily reflect the official position or policies of theU.S. Department of Justice.

Delta. NOT a honor sorority)?
YES .................. 1 NO ....................... 2 REFUSED ........ 3
D6 . Do you currently live on or off campus?:
ON CAMPUS ................ 1 OFF CAMPUS .................... 2 REFUSED ..................... 3
(SKIP TO D8)
(SKIP TO D17)
D7 . About how far from campus would you say you currently live?:
LESS THAN TWO BLOCKS FROM CAMPUS ..... 1 114 MILE OR LESS FROM CAMPUS ..................... 2 1/2 MILE OR LESS FROM CAMPUS ................... 3 314 MILE OR LESS FROM CAMPUS ..................... 4 MORE THAN 3/4 OF A MILE FROM CAMPUS ... 5 REFUSED ............................................................... 6
CONDITIONAL: IF D6 EQ 2. SKIP TO D14
D8 . Do you currently live in (a):
TRADITIONAL DORMITORY ................................. 1 SORORITY ............................................................... 2 (SKIP TO D12) STUDENT COOPERATIVE (CO-OP) ..................... 3 GRADUATE OR MARRIED STUDENT HOUSING ... 4 (SKIP TO 013) OTHER: ..................... 5 REFUSED ................................................................. 6
D9 How many roommates do you have?:
REFUSED .... 99
D10 . Is your dorm or co-op:
ALL FEMALE ......................... 1
REFUSED ............................. 3 DK ........................................... 4
(SKIP TO D17)
(SKIP TO D17) CO-ED ..................................... 2
D11 Is your floor:
-266-
This document is a research report submitted to the U.S. Department of Justice. This reporthas not been published by the Department. Opinions or points of view expressed are thoseof the author(s) and do not necessarily reflect the official position or policies of theU.S. Department of Justice.

ALL FEMALE ...................... 1
REFUSED ........................... 3 DK.. .. . .. . . . . . . .. ..... ... . . . . . . .. . . . . .. .. . .4
CO-ED ....... .. .......................... 2
(ALL RESPONSES SKIP TO D17)
D12. How many roommates do you have?:
REFUSED ....... 9 (ALL RESPONSES SKIP TO D17)
D13. How many people (adults and children) live with you in your dwelling?
REF USED.. . . . .9 (ALL RESPONSES SKIP TO D17)
D14. Which of the following best describes the type of housing in which you live?:
TRADITIONAL DORMITORY ....................... ............ 1 SORORITY.. . . . . . . . . . . . . . . . . . . . . . . . . . . . . . . . . . . . . . . . . . . . . . . . . . . . . . . . . . . . . . . .2 GRADUATE OR MARRIED STUDENT HOUSING..3 (SKIP TO D16) STUDENT CO-OP ...................................................... 4 SINGLE-FAMILY DWELLING (E.G., HOUSE) ......... 5 (SKIP TO D16) APARTMENT.. . . . . . . . . . . . . . TOWNHOUSE.. . . . . . . . . . . . . . . . . . . . . . . . . . . . . . . . . . . . . . . . CONDO ......... .. . .. .. ... ....... . . . . . . .. ...... ... ... ... ...
............................................ (SKIP TO DIG) .......... 7 (SKIP TO D16) ............8 (SKIP TO DIG)
(SKIP TO D16) OTHER: . . . . . . . . . . . . . . . . . . . . . . . . . . . . . . . . . . . lo (SKIP TO D16) REFUSED ........................ ................................... 1 (SKIP TO END)
SING LE-FAM I LY D WELL1 NG DlVl DED INTO APARTMENTS OR ROOMS ................................. 9
D15. How many roommates do you have?:
REFUSED ...... 9 (ALL RESPONSES SKIP TO D17)
D16. How many people (adults and children) live with you in your specific dwelling (e.g., room, apartment, condo, townhouse, etc.)?
REFUSED ...... 99
D17. How would you describe your family when you were growing up. Would you say there were ......... READ LIST AND SINGLE RECORD
-267-
This document is a research report submitted to the U.S. Department of Justice. This reporthas not been published by the Department. Opinions or points of view expressed are thoseof the author(s) and do not necessarily reflect the official position or policies of theU.S. Department of Justice.

Upper class ................... 1
Working class ................... 4
Upper-middle class .......... 2 Middle class ................... 3
Poor ............................... 5
D18 . Which of the following best describes your current marital status? NEVER MARRIED ............ 1 MARRIED ........................... 2 (SKIP TO D21) SEPARATED .................... 3 DIVORCED ......................... 4 WIDOWED ........................ 5 REFUSED .......................... 6 DK ..................................... 7
D19 . Are you currently living with an intimate partner?
YES ............... 1 NO ................... 2 REFUSED ..... 3
(SKIP TO D21)
D20 . Are you:
IN A COMMITTED DATING RELATIONSHIP OF 1 YEAR OR MORE ...... 1 IN A COMMITTED DATING RELATIONSHIP OF LESS THAN 1 YEAR ......... 2 DATING SOME PEOPLE. BUT NO ONE SERIOUSLY. or do you ............ 3 RARELY DATE. or ........................................................................................... 4 NEVER DATE ............................................................................................ 5 REFUSED ........................................................................................................ 6
D21 . You don’t have to answer this last question if you would prefer . Which of the following best describes your sexual orientation?
HETEROSEXUAL/STRAIGHT ........ 1 LESBIANIGAY ................................... 2 BISEXUAL ...................................... 3 REFUSED ......................................... 4 DK .................................................. 5
We appreciate your cooperation with our study . Thank you for your time . Should you want a copy of the results. please call Dr . Fisher at 513 556 3319 .
INCIDENT REPORT LOOP: ASK FOR EACH INCIDENT WITHIN CONDITION. BEGINNING WITH MOST RECENT
-268-
This document is a research report submitted to the U.S. Department of Justice. This reporthas not been published by the Department. Opinions or points of view expressed are thoseof the author(s) and do not necessarily reflect the official position or policies of theU.S. Department of Justice.
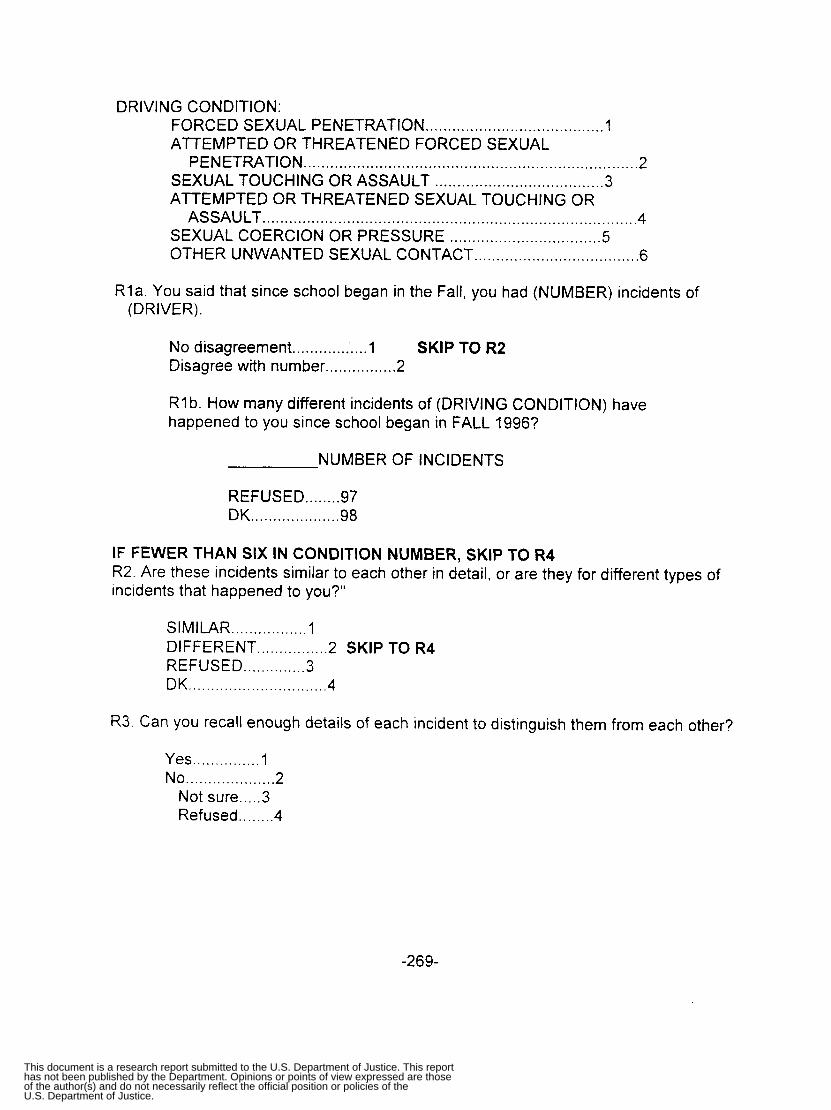
DRIVING CONDITION: FORCED SEXUAL PENETRATION ........................................ 1 ATTEMPTED OR THREATENED FORCED SEXUAL
SEXUAL TOUCHING OR ASSAULT ...................................... 3 ATTEMPTED OR THREATENED SEXUAL TOUCHING OR
ASSAULT .................................................................................... 4 SEXUAL COERCION OR PRESSURE .................................. 5 OTHER UNWANTED SEXUAL CONTACT ..................................... 6
PENETRATION ........................................................................... 2
R l a . You said that since school began in the Fall. you had (NUMBER) incidents of (DRIVER) .
................. No disagreement 1 SKIP TO R2 Disagree with number ................ 2
R1 b . How many different incidents of (DRIVING CONDITION) have happened to you since school began in FALL 1996?
NUMBER OF INCIDENTS
REFUSED ........ 97 DK .................... 98
IF FEWER THAN SIX IN CONDITION NUMBER. SKIP TO R4 R2 . Are these incidents similar to each other in detail. or are they for different types of incidents that happened to you?"
SIMILAR ................. 1 DIFFERENT ................ 2 R 4 SKIP TO REFUSED .............. 3 DK ............................... 4
R 3 . Can you recall enough details of each incident to distinguish them from each other?
Yes ............... 1 No .................... 2
Not sure ..... 3 Refused ........ 4
-269-
This document is a research report submitted to the U.S. Department of Justice. This reporthas not been published by the Department. Opinions or points of view expressed are thoseof the author(s) and do not necessarily reflect the official position or policies of theU.S. Department of Justice.

. . ......
R4 . Thinking about (that incidenvthe most recent of those incidents). in what month .did that incident happen?
AUGUST ............................. 1 SEPTEMBER .......................... 2 OCTOBER .......................... 3 NOVEMBER ........................... 4 DECEMBER ....................... 5 JANUARY ............................... 6 FEBRUARY ........................ 7 MARCH ................................... 8 APRIL ................................. 9 MAY ........................................ 10 JUNE .................................. P 11 REFUSED ............................... 12 DWDON'T REMEMBER ..... 13
R5 . Did [this/most recent] incident occur during an academic break (e.g., Thanksgiving. Christmas. or Spring break?:
Yes .................. I No ...................... 2
Not sure ........ 3 Refused .......... 4
R7 . Did [this/most recent] incident happen ..... ? READ LIST
After 6 :OO AM Before 12:OO Noon ...................... 1 After 12:OO Noon and Before 6:OO PM ................... 2
After 12:OO Midnight and Before 6:OO AM .............. 4 Don't Know 5 Refused 6
After 6:OO PM and Before 12:OO Midnight ........... 3
.......................................................... ..................................................................
R8 . Did [thisithe most recent] incident happen while you were on or off the campus of {name of college or university}?
On Campus ............ 1 (SKIP TO R10) Off Campus ................ 2 (SKIP TO R11) Both ........................ 3 Refused .................... 4 (SKIP TO R12) DK ........................ 5 (SKIP TO R12)
-270-
This document is a research report submitted to the U.S. Department of Justice. This reporthas not been published by the Department. Opinions or points of view expressed are thoseof the author(s) and do not necessarily reflect the official position or policies of theU.S. Department of Justice.
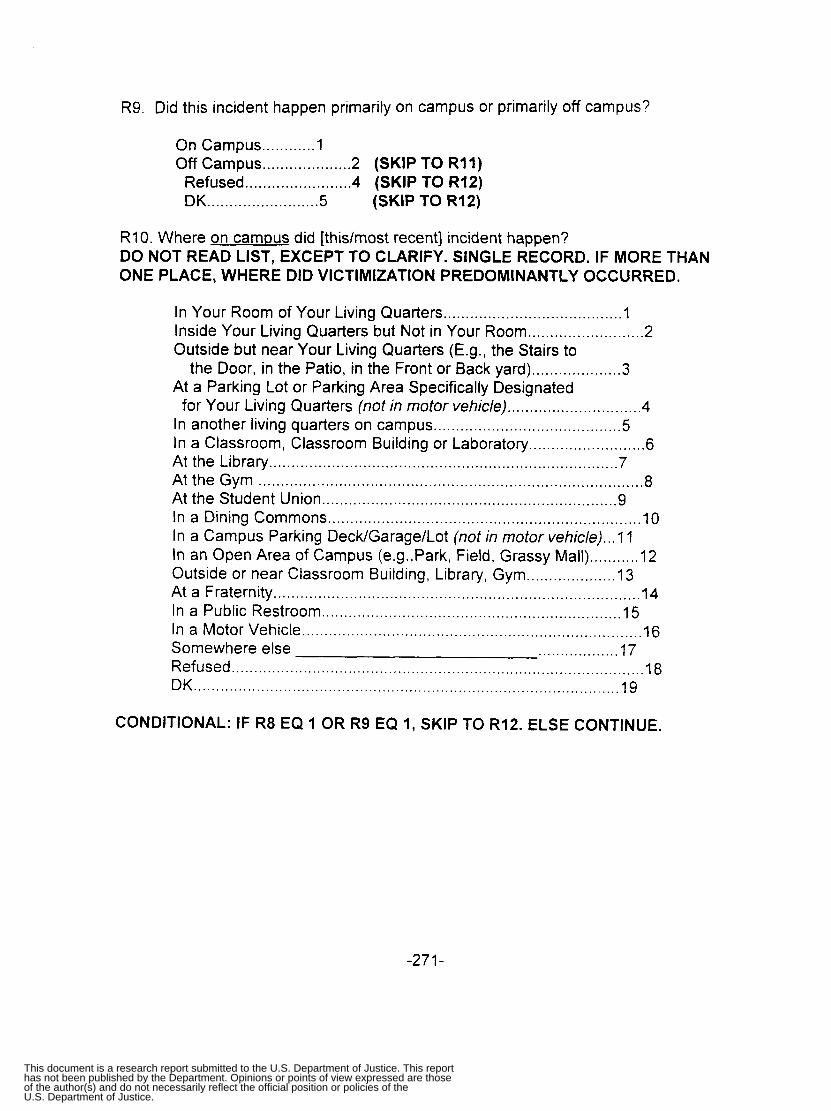
R9 . Did this incident happen primarily on campus or primarily off campus?
On Campus ............ 1 Off Campus .................... 2 (SKIP TO R11)
Refused ........................ 4 (SKIP TO R12) DK ......................... 5 (SKIP TO R12)
R10 . Where on camws did [this/most recent] incident happen? DO NOT READ LIST. EXCEPT TO CLARIFY . SINGLE RECORD . IF MORE THAN ONE PLACE. WHERE DID VICTIMIZATION PREDOMINANTLY OCCURRED .
In Your Room of Your Living Quarters ........................................ 1 Inside Your Living Quarters but Not in Your Room .......................... 2 Outside but near Your Living Quarters (E.g., the Stairs to
At a Parking Lot or Parking Area Specifically Designated the Door. in the Patio. in the Front or Back yard) .................... 3
for Your Living Quarters (not in motor vehicle) .............................. 4 In another living quarters on campus .......................................... 5 In a Classroom. Classroom Building or Laboratory .......................... 6 At the Library .............................................................................. 7 At the Gym ...................................................................................... 8 At the Student Union .................................................................. 9 In a Dining Commons ...................................................................... 10 In a Campus Parking DecWGaragelLot (not in motor vehicle) ... 11 In an Open Area of Campus (e.g.,Park, Field. Grassy Mall) ........... 12 Outside or near Classroom Building. Library. Gym .................... 13 At a Fraternity .................................................................................. 14 In a Public Restroom ................................. .............................. 15 In a Motor Vehicle ...................................... ................................... 16 Somewhere else .................. 17 Refused ................................ 18 DK .............................. ...................................................... 19
........................................................
CONDITIONAL: IF R8 EQ 1 OR R9 EQ 1. SKIP TO R12 . ELSE CONTINUE .
-271-
This document is a research report submitted to the U.S. Department of Justice. This reporthas not been published by the Department. Opinions or points of view expressed are thoseof the author(s) and do not necessarily reflect the official position or policies of theU.S. Department of Justice.

R11 . Where off the campus of {name of collegeluniversity} did [this/most recent] incident happen? DO NOT READ LIST. EXCEPT TO CLARIFY . SINGLE RECORD . IF MORE THAN ONE PLACE. WHERE DID VICTIMIZATION PREDOMINANTLY OCCURRED .
In Your Room of Your Living Quarters ........................................ 1 Inside Your Living Quarters but Not in Your Room .......................... 2 Outside but near Your Living Quarters (E.g., the Stairs to
At a Parking Lot or Parking Area Specifically Designated the Door. in the Patio. in the Front or Back yard) ..................... 3
for Your Living Quarters (not in motor vehicle) ............................ 4 At a Public Street or Alley next to Your Living Quarters .............. 5 At a Fraternity .................................................................................. 14 In a Motor Vehicle ....................................................................... 16 In an Off-Campus Student Housing Area ......................................... 21 In the Off-Campus Business District ........................................... 22 On Another College or University Campus ...................................... 23 Away from Campus (Vacation. at Parent's Home. Etc.) .............. 24 Somewhere else ....................... 25 Refused ....................................................................................... 26 DK .................................................................................................... 27
R12 . Was the sexual contact in this incident threatened. attempted or completed (at least some sexual contact actually happened)? MULTIPLE RECORD IF NECESSARY
Threatened .......... 1 Attempted ................ 2 Completed ........... 3
ASK R13 IF R12=1. ELSE SKIP TO R15 R 1 3 Tell me which of the following actually occurred to you during this incident . Just say yes or no . Did you experience ........ READ LIST AND MULTIPLE RECORD
Penis in your vagina ..................................... 1
Your mouth on someone else's genitals ....... 3
Finger in your vagina ................................... 5
A mouth on your genitals ................................. 2
Penis in your anus or rectum ........................... 4
Finger in your anus or rectum ......................... 6 Another object in your vagina ...................... 7 Another object in your anus or rectum ............ 8 None of these ............................................... 9
CONDITIONAL: IF YES TO ANY IN R13. 1.8. SKIP TO R15 R 14 During the incidence did you experience unwanted ......
-272-
This document is a research report submitted to the U.S. Department of Justice. This reporthas not been published by the Department. Opinions or points of view expressed are thoseof the author(s) and do not necessarily reflect the official position or policies of theU.S. Department of Justice.
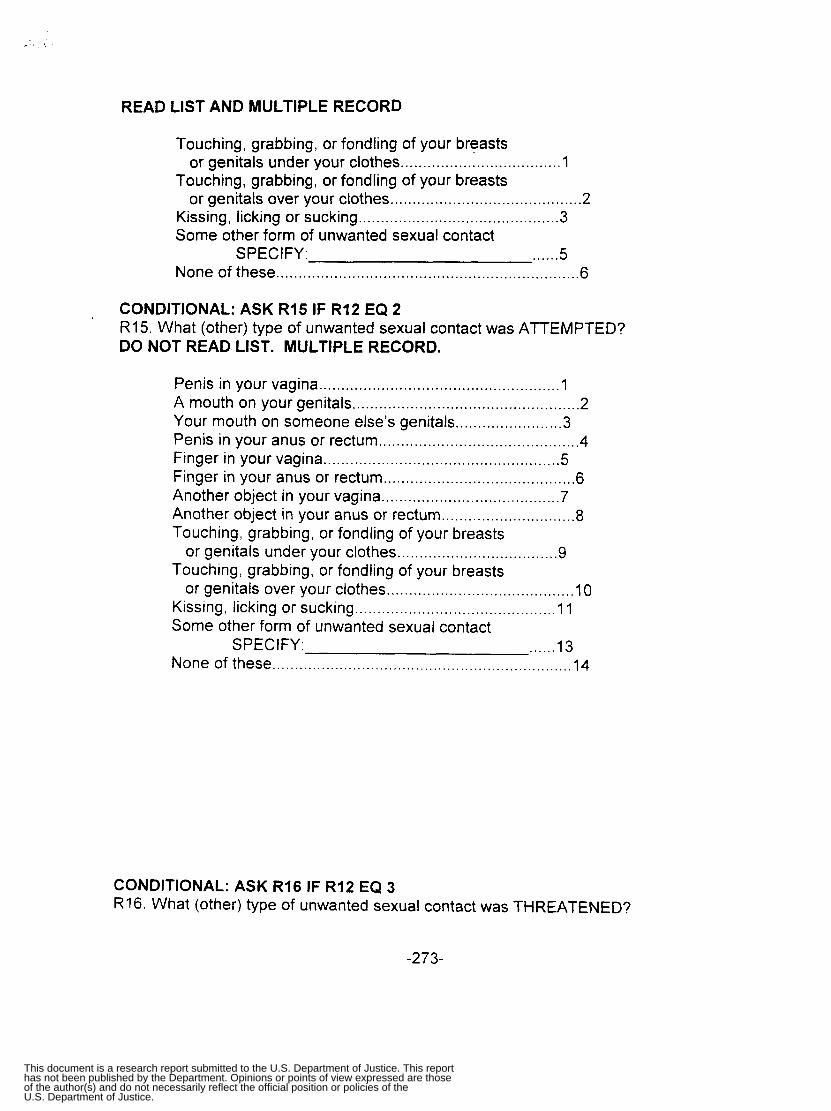
READ LIST AND MULTIPLE RECORD
Touching, grabbing, or fondling of your breasts
Touching, grabbing, or fondling of your breasts
Kissing, licking or sucking ..... . . . . . . . . . . . . . ... . . . . . . ._. . . . . . . . . . . . . . . .3 Some other form of unwanted sexual contact
SPECIFY: ...... 5 None of these .................................................................... 6
or genitals under your clothes .................................... 1
or genitals over your clothes ..................................... ...... 2
CONDITIONAL: ASK R15 IF R12 EQ 2 R15. What (other) type of unwanted sexual contact was ATTEMPTED? DO NOT READ LIST. MULTIPLE RECORD.
Penis in your vagina ...................................................... 1 A mouth on your genitals ................................................... 2 Your mouth on someone else’s genitals ........................ 3 Penis in your anus or rectum ............................................. 4 Finger in your vagina ..................................................... 5 Finger in your anus or rectum ........................................... 6 Another object in your vagina ........................................ 7 Another object in your anus or rectum .............................. 8 Touching, grabbing, or fondling of your breasts
or genitals under your clothes .................................... 9 Touching, grabbing, or fondling of your breasts
or genitals over your clothes .......................................... 10 Kissing, licking or sucking ............................................. 11 Some other form of unwanted sexual contact
SPEC I FY: ...... 13 None of these ................................................................... 14
CONDITIONAL: ASK R16 IF R12 EQ 3 R16. What (other) type of unwanted sexual contact was THREATENED?
-273-
This document is a research report submitted to the U.S. Department of Justice. This reporthas not been published by the Department. Opinions or points of view expressed are thoseof the author(s) and do not necessarily reflect the official position or policies of theU.S. Department of Justice.

DO NOT READ LIST . MULTIPLE RECORD . Penis in your vagina ...................................................... 1 A mouth on your genitals ................................................... 2 Your mouth on someone else's genitals ........................ 3 Penis in your anus or rectum ............................................. 4 Finger in your vagina ..................................................... 5
Another object in your vagina ........................................ 7 Another object in your anus or rectum .............................. 8
Finger in your anus or rectum ........................................... 6
Touching, grabbing, or fondling of your breasts
Touching, grabbing, or fondling of your breasts
Kissing, licking or sucking ............................................. 11 Some other form of unwanted sexual contact
SPEC1 FY: ...... 13 None of these ................................................................... 14
or genitals under your clothes .................................... 9
or genitals over your clothes .......................................... 10
R17 . Was physical force actually used against you in this incident?
Yes ................. 1 No ...................... 2
Not sure ....... 3 Refused .......... 4
SKIP TO R22
R18 . Were you threatened with physical force in this incident?
Yes ................. 1 No ...................... 2
Not sure ... ' .. 3 Refused ......... 4
SKIP TO R22
R19 . Were you threatened with non-physical punishment. such as lowering a grade. being fired. or exclusion from a study group. if you did not comply with this act or these acts?"
Yes ................. 1 No ...................... 2
Not sure ...... 3 Refused ......... 4
-274-
This document is a research report submitted to the U.S. Department of Justice. This reporthas not been published by the Department. Opinions or points of view expressed are thoseof the author(s) and do not necessarily reflect the official position or policies of theU.S. Department of Justice.

R20 . Were you promised any reward. such as money. getting a better grade . being promoted at work. or sharing class notes. if you complied with this act or these acts?
Yes ................. 1 No ...................... 2
Not sure ...... 3 Refused ......... 4
R21 . Were continual pestering or verbal pressures used in an attempt to get you to engage in this act or these acts?
Yes ................. 1 No ...................... 2
Not sure ...... 3 Refused ......... 4
R22 . Do you consider this incident to be rape?
Yes ................. 1 No ...................... 2
Not sure ...... 3 Refused ......... 4
R23 . Was the incident committed by one person or by more than one person?"
.................... ONLY ONE 1 (SKIP TO R29) MORE THAN ONE ............ 2 REFUSED ..................... 3 DO NOT KNOW ................ 4
(SKIP TO R46) (SKIP TO R46)
R24 . How many persons? DK ......... 9
R25 . Were they male or female?
ALL MALE ........................................... 1 ALL FEMALE .......................................... 2 BOTH MALE AND FEMALE ................ 3 DO NOT KNOW SEX OF PERSONS ...... 4
-275-
This document is a research report submitted to the U.S. Department of Justice. This reporthas not been published by the Department. Opinions or points of view expressed are thoseof the author(s) and do not necessarily reflect the official position or policies of theU.S. Department of Justice.

. .
R26.Which category BEST describes the race or ethnicity of these persons? MULTIPLE RECORD
WH ITE/CAUCASIAN .................................. 1 B LAC WAF R I CAN -AM E R I CAN ...................... 2 HISPANIC OR LATINO .............................. 3 ASIAN. PACIFIC ISLANDER. OR ................. 4 NATIVE AMERICAN. ALEUT. ESKIMO ..... 5 OTHER: SPECIFY ................. 6 UNKNOWN ................................................. 7 REFUSED ..................................................... 8
R27 . Were any of the pekons known to you or were they all strangers you had never seen before?:
ALL KNOWN ..................... 1 SOME KNOWN ..................... 2 ALL STRANGERS ............ 3 REFUSED ............................. 4 DO NOT KNOW ................ 5
SKIP TO R38
-276-
This document is a research report submitted to the U.S. Department of Justice. This reporthas not been published by the Department. Opinions or points of view expressed are thoseof the author(s) and do not necessarily reflect the official position or policies of theU.S. Department of Justice.
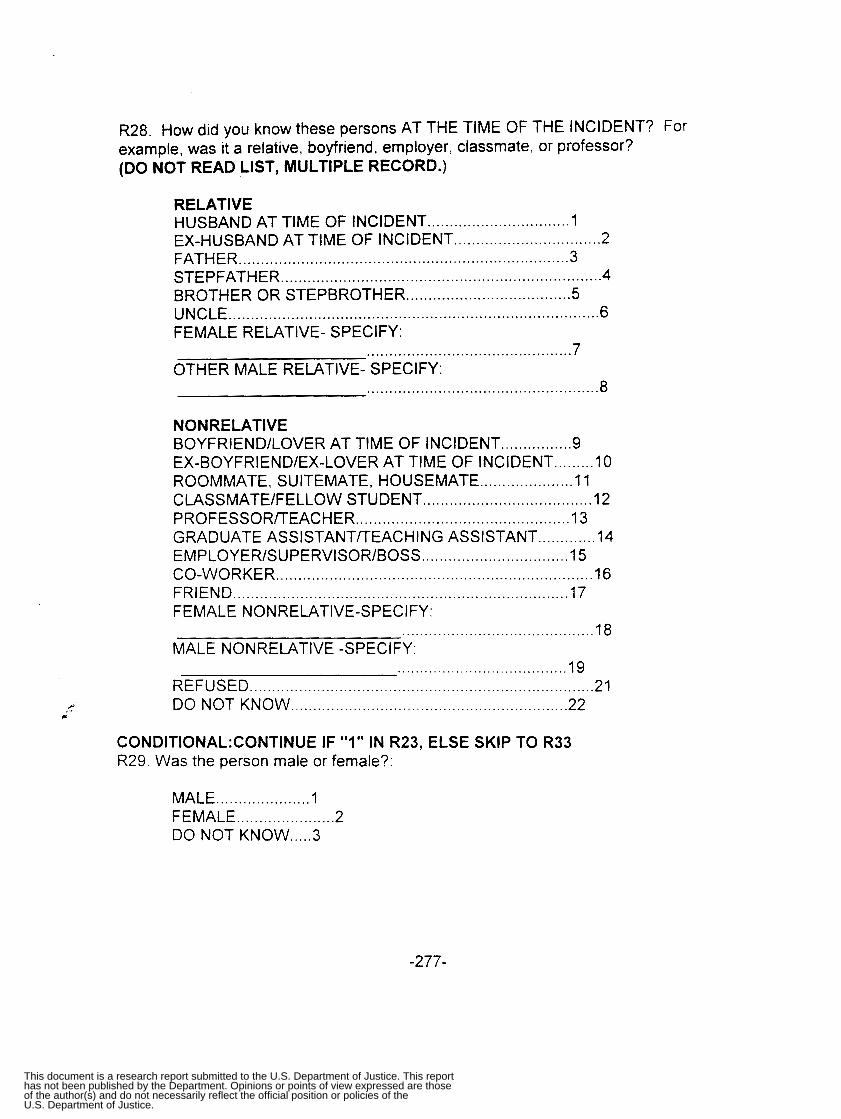
r' .. P
R28 . How did you know these persons AT THE TIME OF THE INCIDENT? For example. was it a relative. boyfriend. employer. classmate. or professor? (DO NOT READ LIST. MULTIPLE RECORD.)
RELATIVE HUSBAND AT TIME OF INCIDENT ................................ 1 EX-HUSBAND AT TIME OF INCIDENT ................................. 2 FATHER .......................................................................... 3 STEPFATHER ........................................................................ 4 BROTHER OR STEPBROTHER ..................................... 5 UNCLE ................................................................................... 6 FEMALE RELATIVE- SPECIFY:
.............................................. 7 OTHER MALE RELATIVE- SPECIFY:
8 ....................................................
NONRELATIVE BOYFRIEND/LOVER AT TIME OF INCIDENT ................ 9 EX-BOYFRIENDIEX-LOVER AT TIME OF INCIDENT ......... 10 ROOMMATE, S U ITEMATE, HOUSE MATE ..................... 11 CLASSMATE/FELLOW STUDENT ...................................... 12 PROFESSORmEAC H E R ................................................ 13 GRADUATE ASSlSTANTmEACHlNG ASSISTANT ............. 14 EMPLOY E R/S U PERVl SOR/BOSS ................................. 15
FRIEND ........................................................................... 17 CO-WORKER ....................................................................... 16
FEMALE NONRELATIVE-SPECIFY:
MALE NONRELATIVE -SPECIFY: ........................................... 18
...................................... 19
22 REFUSED ............................................................................. 21 DO NOT KNOW ..............................................................
CONDITI0NAL:CONTINUE IF "1" IN R23. ELSE SKIP TO R33 R29 . Was the person male or female?:
MALE ..................... 1 FEMALE ...................... 2 DO NOT KNOW ..... 3
-277-
This document is a research report submitted to the U.S. Department of Justice. This reporthas not been published by the Department. Opinions or points of view expressed are thoseof the author(s) and do not necessarily reflect the official position or policies of theU.S. Department of Justice.

R30 . Which category BEST describes the race or ethnicity of this person? SINGLE RECORD
WHITE/CAUCASIAN ............................................ i BLACKlAFRICAN-AMERICAN ................................. 2 HISPANIC ............................................................ 3 ASIAN. PACIFIC ISLANDER. OR ............................ 4 NATIVE AMERICAN. ALEUT. ESKIMO ............... 5 OTHER: SPECIFY ............................ 6 UNKNOWN .......................................................... 7 REFUSED ................................................................ 8
R31 . Was the person someone you knew or had seen before or a stranger you had never seen before?
KNEW OR HAD SEEN BEFORE .............. 1 STRANGER .................................................. 2 (SKIP TO R38) REFUSED ................................................. 3 DO NOT KNOW ............................................ 4
-278-
This document is a research report submitted to the U.S. Department of Justice. This reporthas not been published by the Department. Opinions or points of view expressed are thoseof the author(s) and do not necessarily reflect the official position or policies of theU.S. Department of Justice.

R32. How did you know the person AT THE TIME OF THE INCIDENT? For example, was the person a relative, boyfriend, employer, classmate, or professor?
ENDED AND CODE APPROPRIATELY, UNLESS RESPONDENT NEEDS PROMPTS.)
(MARK FIRST CATEGORY THAT APPLIES. DON'T READ 1-20, LET THIS BE OPEN-
RELATIVE HUSBAND AT TIME OF INCIDENT ............................... 1
FATHER ......................................................................... 3
BROTHER OR STEPBROTHER ................................... 5 UNCLE . . . . . . . . . . . . . . . . . . . . . . I ............................................................ 6
EX-HUSBAND AT TIME OF INCIDENT ................................ 2
STEPFATHER ....................................................................... 4
FEMALE RELATIVE- SPECIFY: ................. ... .................... . .. .7
OTHER MALE RELATIVE- SPECIFY: ................................................... 8
NONRELATIVE BOYFRIEND/LOVER AT TIME OF INCIDENT .............. 9
ROOMMATE, SUITEMATE, HOUSEMATE ......... ... ...... .I 1 CLASSMATE/FELLOW STUDENT.. . . . . . . . . . . . . . . . . . . . . . . . . . . . . . . . . . . . . .12 PRO FES SOR/TEAC H ER. . . . . . . . . . . . . . . . . . . . . . . . . . . . . . . . . . . . . , . . . . . . . .I 3 GRADUATE ASSlSTANT/TEACHlNG ASSISTANT ............. 14 EMPLOY ER/S U PERVISO RIBOSS.. . . . . . . . . . . . . . . . . . . . . . . . . . . . . . 1 5 CO-WORKER ... . .. . . .. ... ... ... ... . ..... ....,.... .. . . .. . . . . . . . . ......... .... . .. . .. .16 FRIEND ......................... ..................................... 17 FEMALE NONRELATIV CIFY:
EX-BOYFRIEND/EX-LOVER AT TIME OF INCIDENT.. .... . . .10
. . . . . . . . . . . . . . . . . , . . . . . . . . . , . . . . MALE NONRELATIVE -SPECIFY:
REFUSED ................... ...................................... DO NOT KNOW .................................. . . . . . . . . . .__.._.. . . .
. . . . . . . . . . . . . . . . . . . . . . . . 21
CONDITIONAL: IF R28 OR R32 EQ 9-12,17 OR 19 CONTINUE, ELSE SKIP TO R38 R33. Was the person a member of a fraternity at the time of the incident or don't you know?
Yes .............. 1 No.. . ... . ...... ....... 2 Refused.. . . . . .3 DK.. .................. 4
-279-
This document is a research report submitted to the U.S. Department of Justice. This reporthas not been published by the Department. Opinions or points of view expressed are thoseof the author(s) and do not necessarily reflect the official position or policies of theU.S. Department of Justice.

R34. Was the person a member of a sports team or club such as the football, basketball, or rugby team, at the time of the incident or don't you know?
Yes .............. 1 No .................... 2 Refused.. .... .3 DK.. .................. 4
CONDITIONAL: IF R28 OR R32 EQ 9-20 CONTINUE, ELSE SKIP TO R38 R35. Were you on a date with that person when the incident occurred?"
Yes .............. 1 No .................... 2 SKIP TO R34 Refused.. .... .3 DK ................... .4
R36. Approximately how long had you been dating this person?
1. FIRSTDATE 2. LESS THAN 6 MONTHS
4. MORE THAN 1 YEAR 7. REFUSED 8 DK
3. 6 -12 MONTHS
R37. Are you currently romantically involved with this person?
Yes .............. 1 No ................... .2 Refused.. .... .3 DK. ................. . .4
R38. Was (the personlany of the persons) drinking alcohol or on drugs or couldn't you tell which one?
DRINKING ................................................................. I DRUGS .......................................................................... 2 BOTH (DRINKING AND ON DRUGS) ....................... 3 DRINKING OR DRUGS COULD NOT TELL WHICH ..... 4 NEITHER .................... REFUSED ..... .................................... DK.. ......................................
-280-
This document is a research report submitted to the U.S. Department of Justice. This reporthas not been published by the Department. Opinions or points of view expressed are thoseof the author(s) and do not necessarily reflect the official position or policies of theU.S. Department of Justice.
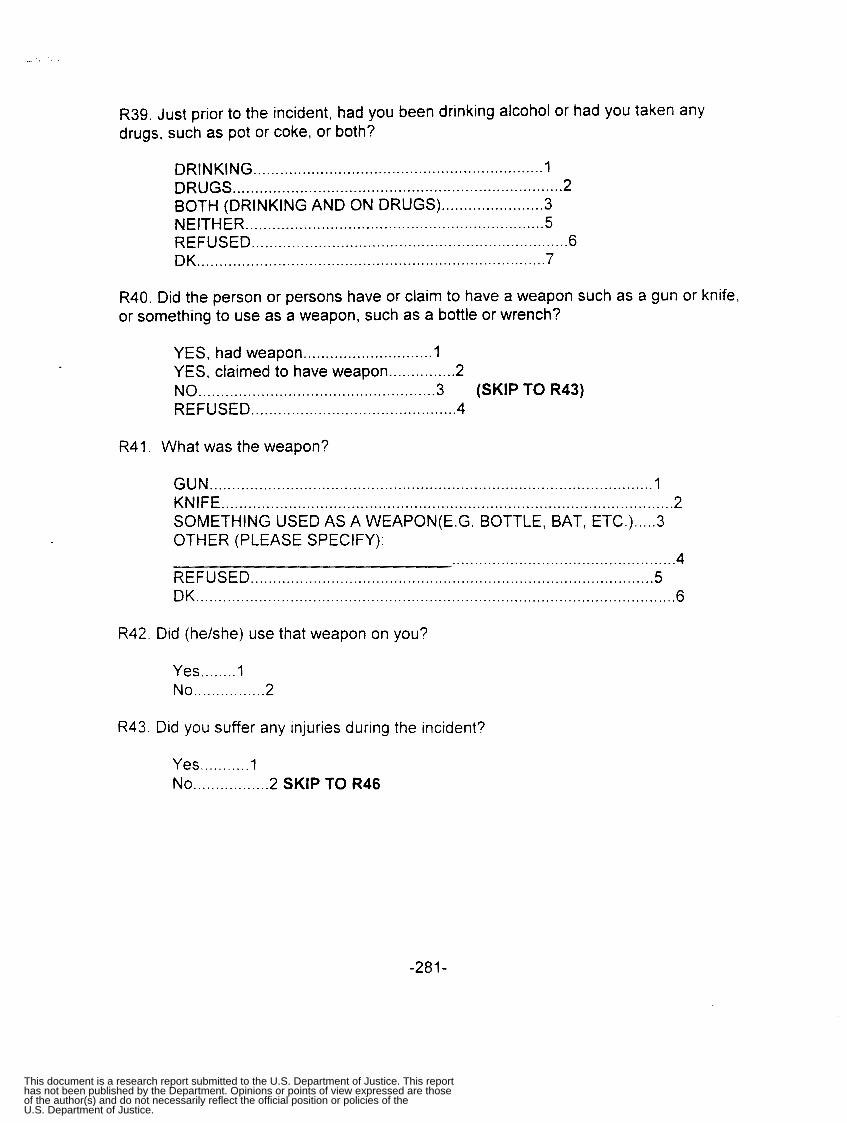
R39 . Just prior to the incident. had you been drinking alcohol or had you taken any drugs. such as pot or coke. or both?
DRINKING ................................................................. 1 DRUGS
NEITHER ................................................................... 5 REFUSED DK 7
......................................................................... BOTH (DRINKING AND ON DRUGS) ....................... 3
..................................................................... ..............................................................................
..2
..6
R40 . Did the person or persons have or claim to have a weapon such as a gun or knife. or something to use as a weapon. such as a bottle or wrench?
YES. had weapon ............................. I YES, claimed to have weapon ............... 2 . I-
NU ..................................................... 3 (SKIP TO R43) REFUSED .............................................. 4
R41 . What was the weapon?
GUN ........................................................................... ........................ 1 KNIFE ..................................................................................................... 2
SOMETHING USED AS A WEAPON(E.G. BOTTLE, BAT, ETc.) ..... 3 OTHER (PLEASE SPECIFY): 4
DK ........................................................................... ................................ 6
.................................................. REFUSED .................................................. ........................................ 5
R42 . Did (hekhe) use that weapon on you?
Yes ........ 1 No ................ 2
R43 . Did you suffer any injuries during the incident?
Yes ........... 1 NO ................. 2 SKIP TO R46
-281-
This document is a research report submitted to the U.S. Department of Justice. This reporthas not been published by the Department. Opinions or points of view expressed are thoseof the author(s) and do not necessarily reflect the official position or policies of theU.S. Department of Justice.

R44 . What were the injuries you suffered? DO NOT READ LIST UNLESS NECESSARY AS PROMPTS . MULTIPLE RECORD .
NONE .......................................................................... 1 (SKIP TO R46) INJURY FROM THE SEXUAL INTERCOURSE OR
SEXUAL CONTACT (E.G., VAGINAL OR ANAL TEARING) ....................................................................... 2
INJURY FROM THE ATTEMPTED SEXUAL INTERCOURSE OR SEXUAL CONTACT ............... 3
SEXUAL ASSAULT OTHER THAN THE SEXUAL INTERCOURSE OR SEXUAL CONTACT ....................... 4
KNIFE OR STAB WOUNDS ........................................ 5 GUN SHOT, BULLET WOUNDS ........................................ 6 BROKEN BONES OR TEETH KNOCKED OUT .......... 7 INTERNAL INJURIES ......................................................... 8 KNOCKED UNCONSCIOUS ....................................... 9 BRUISES, BLACK-EYE, CUTS, SCRATCHES,
SWELLING, CHIPPED TEETH ...................................... 10 EMOTIONAL OR PSYCHOLOGICAL .......................... 11 OTHER: SPECIFY ................................ 12 REFUSED ................................................................... 13 (SKIP TO R46) DK ...................................................................................... 14
R45 . Did you receive medical attention (e.g., campus infirmary or emergency room) for these injuries?
Yes ............... 1 No ..................... 2 Refused ........ 3 DK ..................... 4
R46 . Did you do anything with the idea of protecting yourself or stopping the behavior while the incident was going on?
YES ............................................................ 1 NOlTOOK NO ACTION/KEPT STILL ............ 2 SKIP TO R48 REFUSED .................................................. 3 SKIP TO R48 DO NOT KNOW ............................................. 4 SKIP TO R48
-282-
This document is a research report submitted to the U.S. Department of Justice. This reporthas not been published by the Department. Opinions or points of view expressed are thoseof the author(s) and do not necessarily reflect the official position or policies of theU.S. Department of Justice.

R47 . What did you do? DO NOT READ RESPONSES EXCEPT IF NEEDED AS PROMPT . MULTIPLE RECORD . ATTACKED PERSON WITH FIREARM OR KNIFE .................................................. 1 ATTACKED PERSON WITH A WEAPON OTHER THAN A FIREARM OR KNIFE ... . . . . . 2 USED MACE. PEPPER SPRAY. SCREAMERS. STUN GUN. OR SIMILAR USED PHYSICAL FORCE AGAINST THE PERSON (HIT. KICKED. ETC.). SCREAMED OR YELLED TO SCARE OFF THE PERSON ..................................... 5 VERBALLY THREATENED TO HARM PERSON ...................................... GAVE ALARM TO ALERT OTHERS FOR HELP ....................................... RAN OR TRIED TO RUN AWAY/ESCAPE .................................................................... 8 PLEADED WITH OR BEGGED PERSON TO STOP ............................................... 9 CHASED. HELD. OR CAPTURED PERSON ................................................................ 10 TRIED TO REASONINEGOTIATE WITH PERSON ............................................... 11 TOLD THE PERSON TO STOP .................................................................................... 12 TRIED TO AVOID PERSON ..................................................................................... 13 REMOVED PERSON'S HAND ...................................................................................... 14 OTHER:
R48 . Did you or someone else report the incident to the police. or was it not reported to the police?
YOU REPORTED ............................ 1 SOMEONE ELSE REPORTED ............... 2 NO ................................................... 3 REFUSED ............................................... 4 DK .................................................... 5
(SKIP TO R50)
(SKIP TO R50) (SKIP TO R50)
R49 . To which police agency was the incident reported?: (MULTIPLE RECORD)
CAMPUS POLICE OR CAMPUS SECURITY ... . . . . . . . . . . . . 1 MUNICIPAL/LOCAL/CITY POLICE/91 1 .............................. 2 COUNTY SHERIFF ....................................................... 3 STATE POLICE ................................................................... 4 OTHER: ...................................... 5 REFUSED .......................................................................... 6 DK ................................................................................. 7
-283-
This document is a research report submitted to the U.S. Department of Justice. This reporthas not been published by the Department. Opinions or points of view expressed are thoseof the author(s) and do not necessarily reflect the official position or policies of theU.S. Department of Justice.
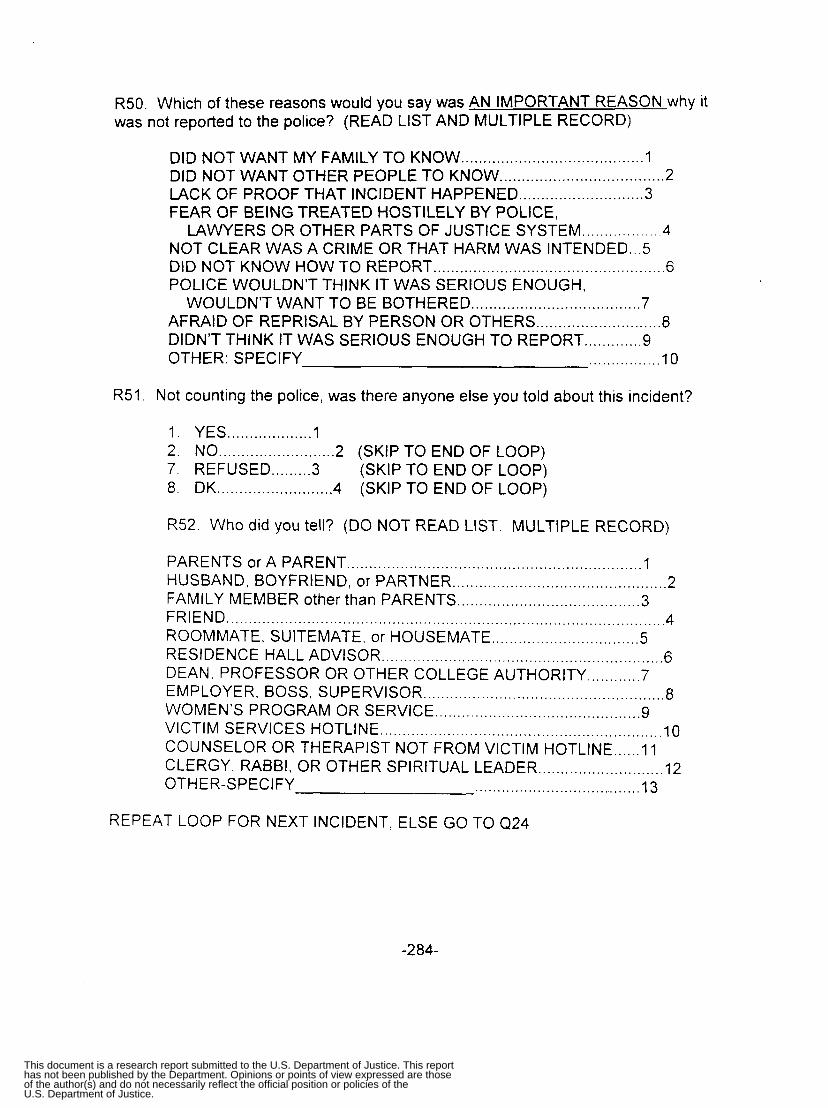
R50. Which of these reasons would you say was AN IMPORTANT REASON why it was not reported to the police? (READ LIST AND MULTIPLE RECORD)
DID NOT WANT MY FAMILY TO KNOW ......................................... 1 DID NOT WANT OTHER PEOPLE TO KNOW ..................................... 2 LACK OF PROOF THAT INCIDENT HAPPENED ............................ 3 FEAR OF BEING TREATED HOSTILELY BY POLICE,
LAWYERS OR OTHER PARTS OF JUSTICE SYSTEM ................. 4 NOT CLEAR WAS A CRIME OR THAT HARM WAS INTENDED ... 5 DID NOT KNOW HOW TO REPORT .................................................... 6 POLICE WOULDN'T THINK IT WAS SERIOUS ENOUGH,
WOULDN'T WANT TO BE BOTHERED ...................................... 7 AFRAID OF REPRISAL BY PERSON OR OTHERS ............................ 8 DIDN'T THINK IT WAS SERIOUS ENOUGH TO REPORT ............. 9 OTHER: SPECIFY ................ 10
R51. Not counting the police, was there anyone else you told about this incident?
1. YES ................... 1 2. NO .......................... 2 (SKIP TO END OF LOOP)
8. DK .......................... 4 (SKIP TO END OF LOOP) 7. REFUSED ......... 3 (SKIP TO END OF LOOP)
R52. Who did you tell? (DO NOT READ LIST. MULTIPLE RECORD)
PARENTS or A PARENT .................................................................. I HUSBAND, BOYFRIEND, or PARTNER ................................................ 2 FAMILY MEMBER other than PARENTS .............................. FRIEND .................................... ROOMMATE, SUITEMATE, or HOUS RESIDENCE HALL ADVISOR. DEAN. PROFESSOR OR OTH EMPLOYER, BOSS, SUPERVI WOMEN'S PROGRAM OR SE VICTIM SERVICES HOTLINE .... ................................................. 10 COUNSELOR OR THERAPIST ROM VICTIM HOTLINE ...... 11 CLERGY, RABBI, OR OTHER SPIRITUAL LEADER ............................ 12
, , , . , . , , . , , . , . . , , , , . , , , , ...................... 9
OTHER-SPECIFY ................................. 13
REPEAT LOOP FOR NEXT INCIDENT, ELSE GO TO Q24
-284-
This document is a research report submitted to the U.S. Department of Justice. This reporthas not been published by the Department. Opinions or points of view expressed are thoseof the author(s) and do not necessarily reflect the official position or policies of theU.S. Department of Justice.

STALKING LOOP
DUMMY: I F Q25 EQ 1 ............. stalked you IF Q25 GT 1 ............. stalked you most recently
S1 . I would like to ask you a few more questions about the person(s) who exhibited the obsessive behaviors towards you . For simplicity. I’ II refer to this behavior as stalking .
Was the person who stalked you (most recently) someone you knew or had seen before or was it a stranger you had never seen before?
KNEW OR HAD SEEN BEFORE ............. 1 STRANGER .................................................. 2 NEVER SAW OR HEARD PERSON ....... 3 REFUSED .................................................... 4 DK ........................................................... 5
(SKIP TO S3)
(SKIP TO S6)
S2 . Would you be able to recognize the person if you saw or heard himlher?
YES. DEFINITELY .................. 1 MAYBE ........................................ 2 (SKIP TO 55) NO .......................................... 3 REFUSED ................................... 4 (SKIP TO 55)
(SKIP TO 55)
(SKIP TO 55)
S3 . How well did you know the person.. slightly only, casual acquaintance. or well known?
SLIGHTLY ONLY ................................ 1 CASUAL ACQUAINTANCE ...................... 2 WELL KNOWN .................................... 3 REFUSED ................................................ 4 DK ....................................................... 5
-285-
This document is a research report submitted to the U.S. Department of Justice. This reporthas not been published by the Department. Opinions or points of view expressed are thoseof the author(s) and do not necessarily reflect the official position or policies of theU.S. Department of Justice.

S4 . How did you know the person AT THE TIME THE STALKING WAS GOING ON7 For example. was the person a relative. boyfriend. employer. classmate. or professor7 (MARK FIRST CATEGORY THAT APPLIES)
RELATIVE HUSBAND AT TIME OF INCIDENT ............................... 1 EX-HUSBAND AT TIME OF INCIDENT ................................ 2 FATHER ......................................................................... 3 STEPFATHER ...................................................................... 4 BROTHER OR STEPBROTHER ................................... 5 UNCLE .................................................................................. 6 FEMALE RELATIVE- SPECIFY:
............................................ 7 OTHER MALE RELATIVE- SPECIFY:
8 ...................................................
NONRELATIVE BOYFRIEND/LOVER AT TIME OF INCIDENT .............. 9 EX-BOYFRIEND/EX-LOVER AT TIME OF INCIDENT ......... 10 ROOMMATE. SUITEMATE. HOUSEMATE ................... 11 CLASSMATE/FELLOW STUDENT ....................................... 12 PROFESSORmEACHER .............................................. 13 GRADUATE ASSlSTANTmEACHING ASSISTANT ............. 14 EM PLOY ER/SUPERVISOR/BOSS ............................... 15
FRIEND ......................................................................... 17 CO-WORKER ....................................................................... 16
FEMALE N 0 N R E LATIVE-S P E C I FY: ................................. 18
MALE NONRELATIVE -SPECIFY: .. 19
OTHER-SPECIFY: .....
................................... .................................... 22
S5 . Was the person a male or female?
MALE ..................... 1 FEMALE .................... 2 REFUSED .............. 3 DK ............................. 4
-286-
This document is a research report submitted to the U.S. Department of Justice. This reporthas not been published by the Department. Opinions or points of view expressed are thoseof the author(s) and do not necessarily reflect the official position or policies of theU.S. Department of Justice.

S6 . What did this person do that seemed obsessive or frightening to you? Did he/she (READ LIST AND MULTIPLE RECORD)
FOLLOW YOU ......................................................................... 1 WAIT OUTSIDE OR INSIDE PLACES FOR YOU ........................ 2 WATCH YOU FROM AFAR ..................................................... 3 TELEPHONED WHEN YOU DID NOT WANTTHEM TO ............ 4 SENT UNWANTED LEiTERS OR CARDS ............................. 5 SENT UNWANTED ELECTRONIC MAIL MESSAGES ............... 6 OTHER UNWANTED CONTACT (BRIEFLY DESCRIBE)
.................. 7 REFUSED .................................................................................... 8 DK ........................................................................................... 9
S7 . Has this person stopped bothering you or is the behavior continuing?
CURRENTLY BEING STALKING ................. 1 STALKING HAS STOPPED ................................. 2 REFUSED ..................................................... 3 DO NOT KNOW ................................................... 4
S8 . For how long a period of time did type of behavior occur? (If still continuing: How long to date?)
DAYS WEEKS MONTHS YEARS
REFUSED .... . 98 DON'T KNOW ...... 99
S9 . During this period. how often did these events occur?
LESS THAN TWICE A MONTH ............................... 1 TWICE TO THREE TIMES A MONTH ONCE A WEEK ....................................................... 3 2-6 TIMES A WEEK AT LEAST ONCE DAILY-7 DAYS A WEEK ........... 5 MORE THAN ONCE A DAY ......................... OTHER (SPEC1 FY): REFUSED .................................................................... 8 DK ................................................... ................... 9
................ ... 2
..... 4 .......................................
S10 . Did the stalking happen while you were on or off the campus of {name of college
-287-
This document is a research report submitted to the U.S. Department of Justice. This reporthas not been published by the Department. Opinions or points of view expressed are thoseof the author(s) and do not necessarily reflect the official position or policies of theU.S. Department of Justice.
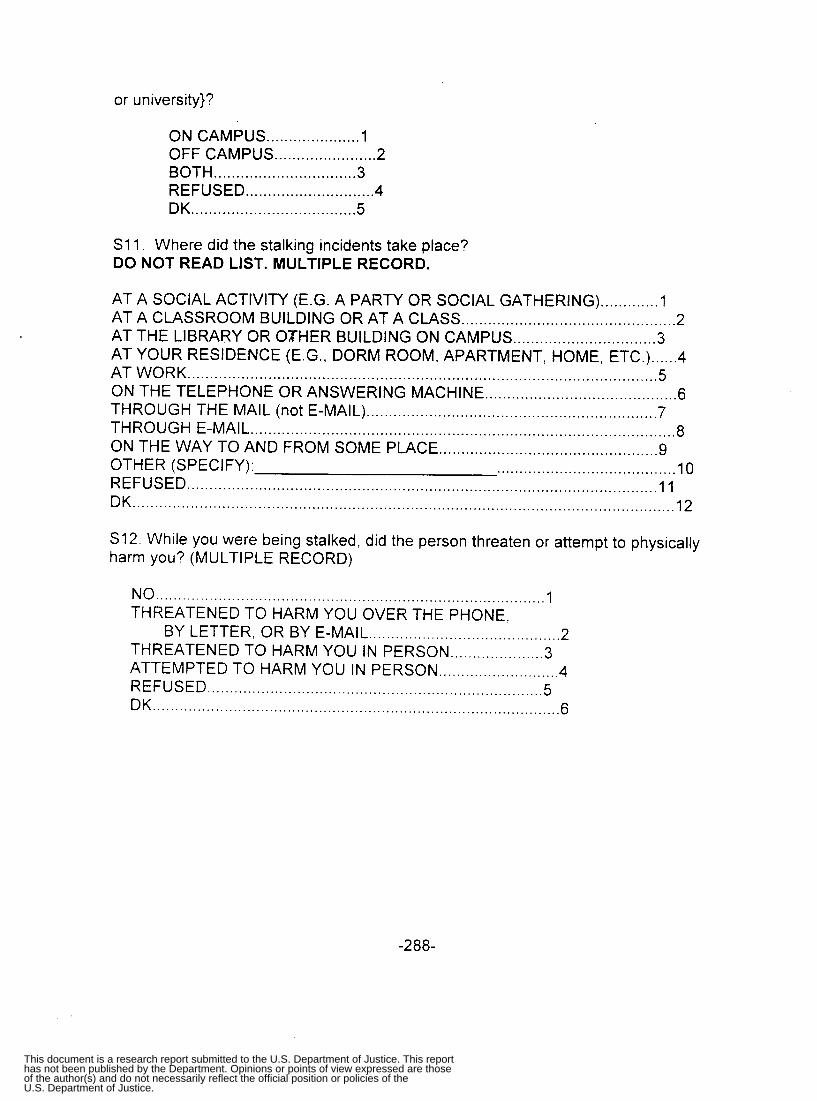
or u n i ve rs it y } ?
ON CAMPUS ..................... 1 OFF CAMPUS ....................... 2 BOTH ................................ 3 REFUSED ............................. 4 DK ..................................... 5
S1 1 . Where did the stalking incidents take place? DO NOT READ LIST . MULTIPLE RECORD .
AT A SOCIAL ACTIVITY (E.G. A PARTY OR SOCIAL GATHERING) ............. 1 AT A CLASSROOM BUILDING OR AT A CLASS ................................................ 2 AT THE LIBRARY OR OTHER BUILDING ON CAMPUS ................................ 3 AT YOUR RESIDENCE (E.G., DORM ROOM. APARTMENT. HOME. ETC.) ...... 4 AT WORK ......................................................................................................... 5 ON THE TELEPHONE OR ANSWERING MACHINE ........................................... 6 THROUGH THE MAIL (not E-MAIL) ................................................................. 7 THROUGH E-MAIL ............................................................................................... 8 ON THE WAY TO AND FROM SOME PLACE ................................................. 9 OTHER (SPECIFY): ........................................ 10 REFUSED ......................................................................................................... 11 DK ......................................................................................................................... 12
S I 2 . While you were being stalked. did the person threaten or attempt to physically harm you? (MULTIPLE RECORD)
.............................. .................................. 1 THREATENED TO HARM YOU
BY LETTER. OR BY E-MA1 THREATENED TO HARM YOU ATTEMPTED TO HARM YOU IN PERSON REFUSED ................................................ ..................... 5
THE PHONE. ..................
............ ....... 4
........................... ....................................... 6
-288-
This document is a research report submitted to the U.S. Department of Justice. This reporthas not been published by the Department. Opinions or points of view expressed are thoseof the author(s) and do not necessarily reflect the official position or policies of theU.S. Department of Justice.

SI3 . While you were being stalked. did the person injure you in any way of the following ways? (MARK ALL THAT APPLY)
NO.. NO INJURIES ................................................. i KNIFE OR STAB WOUND .......................................... 2 GUN SHOT. BULLET WOUND .............................. 3 BROKEN BONES OR TEETH KNOCKED OUT ......... 4 INTERNAL INJURIES ............................................. 5 KNOCKED UNCONSCIOUS ....................................... 6 BRUISES. BLACK.EYE. CUTS. SCRATCHES.
S WELL1 N G . C H I PPED TEETH ....................... 7 EMOTIONALLY OR PSYCHOLOGICALLY ................ 8 OTHER: SPECIFY ........................ 9 REFUSED ................................................................... IO DK ........................................................................... 1 1
SI4 . Did the person stalking you make or attempt to make you have sexual contact with him or her that you did not want? This would include using force or the threat of force to make you have vaginal. oral. or anal sex; physical sexual contact that was uninvited; or any other type of unwanted or uninvited sexual intercourse or physical sexual contact that occurred since school began in Fall 1996 .
YES ............... 1 NO ..................... 2 (SKIP TO S16) REFUSED ..... 3 (SKIP TO S16) DK ..................... 4 (SKIP TO S16)
SI5 . Did you remember to mention this incident or incidents when asked about unwanted sexual intercourse or contact earlier in this survey?
YES ... . . . . . . . . . . . . . 1 NO ........................ 2 REFUSED ...... 3 DK ........................ 4
(SKIP TO S16) (FILL OUT A MAIN INCIDENT REPORT) (SKIP TO S16) (SKIP TO S16)
S16 . Did you or someone else report the stalker to the police. or was this not reported?
YOU ........................................... 1 SOMEONE ELSE .......................... 2 YOU AND SOMEONE ELSE ..... 3 NOT REPORTED .......................... 4 (SKIP TO Q16) REFUSED ................................. 5 (SKIP TO q16) DK ................................................. 6 (SKIP TO (216)
-289-
This document is a research report submitted to the U.S. Department of Justice. This reporthas not been published by the Department. Opinions or points of view expressed are thoseof the author(s) and do not necessarily reflect the official position or policies of theU.S. Department of Justice.
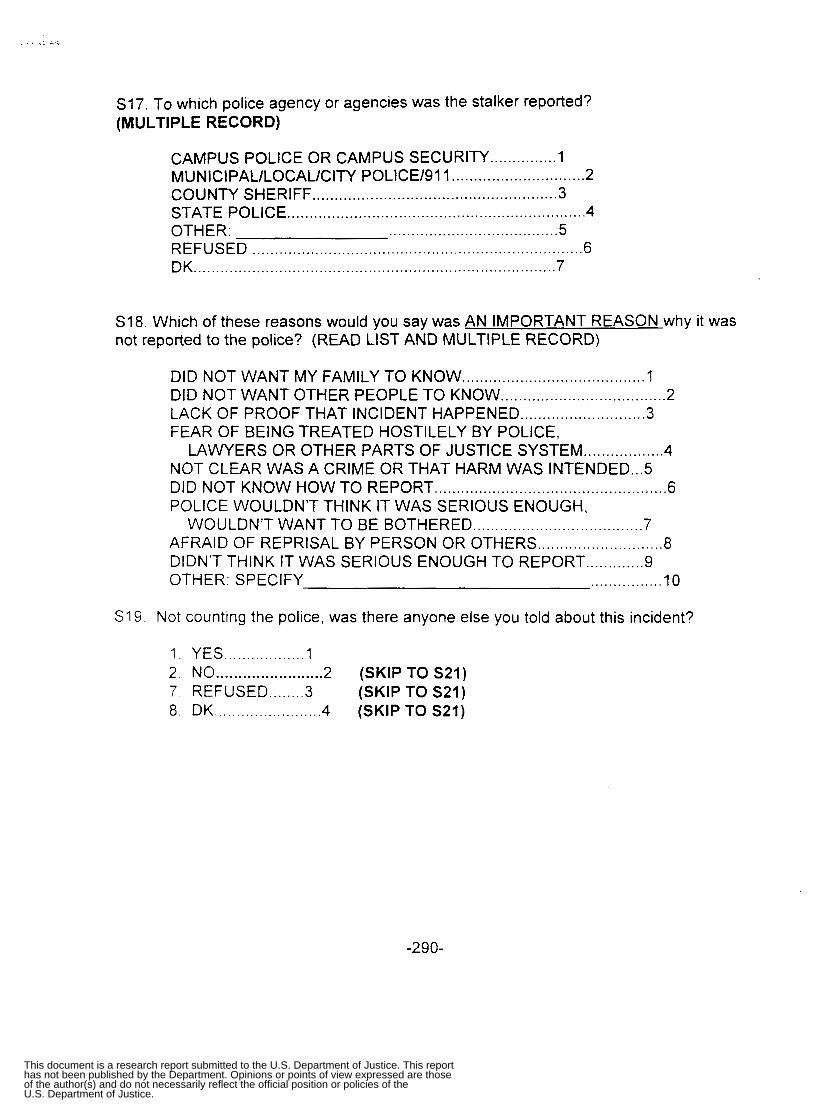
.... ; ...
S17 . To which police agency or agencies was the stalker reported? (MULTIPLE RECORD)
CAMPUS POLICE OR CAMPUS SECURITY ............... 1 MUN IC1 PAULOCAUCITY POLICE/S 1 I .............................. 2 COUNTY SHERIFF ....................................................... 3 STATE POLICE ................................................................... 4 OTHER: ...................................... 5 REFUSED .......................................................................... 6 DK ................................................................................. 7
S I 8 . Which of these reasons would you say was AN IMPORTANT REASON why it was not reported to the police? (READ LIST AND MULTIPLE RECORD)
DID NOT WANT MY FAMILY TO KNOW ......................................... 1 DID NOT WANT OTHER PEOPLE TO KNOW ..................................... 2 LACK OF PROOF THAT INCIDENT HAPPENED ............................ 3 FEAR OF BEING TREATED HOSTILELY BY POLICE.
LAWYERS OR OTHER PARTS OF JUSTICE SYSTEM .................. 4 NOT CLEAR WAS A CRIME OR THAT HARM WAS INTENDED ... 5 DID NOT KNOW HOW TO REPORT .................................................... 6 POLICE WOULDN’T THINK IT WAS SERIOUS ENOUGH.
WOULDN’T WANT TO BE BOTHERED ...................................... 7 AFRAID OF REPRISAL BY PERSON OR OTHERS ............................ 8 DIDN’T THINK IT WAS SERIOUS ENOUGH TO REPORT ............. 9 OTHER: SPECIFY ................ 10
S19 Not counting the police. was there anyone else you told about this incident?
1 . YES .. . . . . . . . . . . . . . . . . 1 2 . NO ........................ 2 (SKIP TO S21) 7 . REFUSED ........ 3 (SKIP TO S21) 8 . DK ........................ 4 (SKIP TO S21)
-290-
This document is a research report submitted to the U.S. Department of Justice. This reporthas not been published by the Department. Opinions or points of view expressed are thoseof the author(s) and do not necessarily reflect the official position or policies of theU.S. Department of Justice.
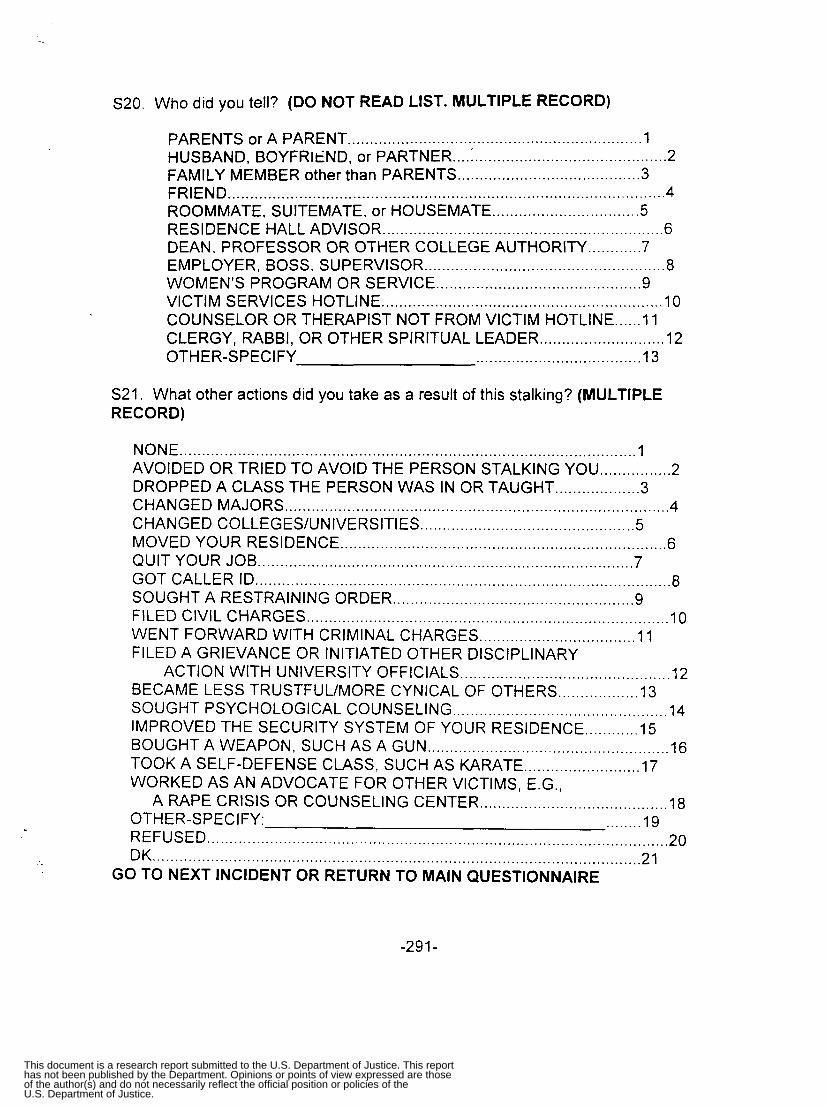
..
S20 . Who did you tell? (DO NOT READ LIST . MULTIPLE RECORD)
PARENTS or A PARENT .................................................................. i HUSBAND. BOYFRltND. or PARTNER ................................................ 2 FAMILY MEMBER other than PARENTS ......................................... 3 FRIEND .................................................................................................. 4 ROOMMATE, SUITEMATE, or HOUSEMATE ................................. 5 RESIDENCE HALL ADVISOR ............................................................... 6 DEAN, PROFESSOR OR OTHER COLLEGE AUTHORITY ............ 7 EMPLOYER, BOSS, SUPERVISOR ...................................................... 8 WOMEN'S PROGRAM OR SERVICE .............................................. 9 VICTIM SERVICES HOTLINE ............................................................... IO COUNSELOR OR THERAPIST NOT FROM VICTIM HOTLINE ...... 1 1 CLERGY, RABBI, OR OTHER SPIRITUAL LEADER ............................ 12 OTH ER-SPEC I FY ..................................... 13
S21 . What other actions did you take as a result of this stalking? (MULTIPLE RECORD)
NONE ...................................................................................................... 1 AVOIDED OR TRIED TO AVOID THE PERSON STALKING YOU ................ 2 DROPPED A CLASS THE PERSON WAS IN OR TAUGHT ................... 3 CHANGED MAJORS ...................................................................................... 4 CHANGED COLLEGES/UNlVERSlTlES ............................................ 5 MOVED YOUR RESIDENCE ......................................................................... 6 QUIT YOUR JOB ........................ ........................................................ 7 GOT CALLER ID ......................... ............................................ 8 SOUGHT A RESTRAINING ORDER ...................................................... 9 FILED CIVIL CHARGES ................................................................................. IO WENT FORWARD WITH CRIMINAL CHARGES ................................... 1 1 FILED A GRIEVANCE OR INITIATED OTHER DISCIPLINARY
ACTION WITH UNIVERSITY OFFICIALS ............................................... ? 2 BECAME LESS TRUSTFULIMORE CYNICAL OF OTHERS .................. 13 SOUGHT PSYCHOLOGICAL COUNSELING ... 14 IMPROVED THE SECURITY SYSTEM OF YOUR RESIDENCE ............ 15 BOUGHT A WEAPON, SUCH AS A GUN ................................................ 16 TOOK A SELF-DEFENSE CLASS, SUCH AS KARATE .......................... 17 WORKED AS AN ADVOCATE FOR OTHER VICTIMS, E.G.,
......................................
A RAPE CRISIS OR COUNSELING CENTER .......................................... 18 OTHER-SPECIFY: REFUSED ........................... ..........................................................
GO TO NEXT INCIDENT OR RETURN TO MAIN QUESTIONNAIRE DK ...................................... 21 ...................................................................
-291-
This document is a research report submitted to the U.S. Department of Justice. This reporthas not been published by the Department. Opinions or points of view expressed are thoseof the author(s) and do not necessarily reflect the official position or policies of theU.S. Department of Justice.

APPENDIX 4
-292-
This document is a research report submitted to the U.S. Department of Justice. This reporthas not been published by the Department. Opinions or points of view expressed are thoseof the author(s) and do not necessarily reflect the official position or policies of theU.S. Department of Justice.
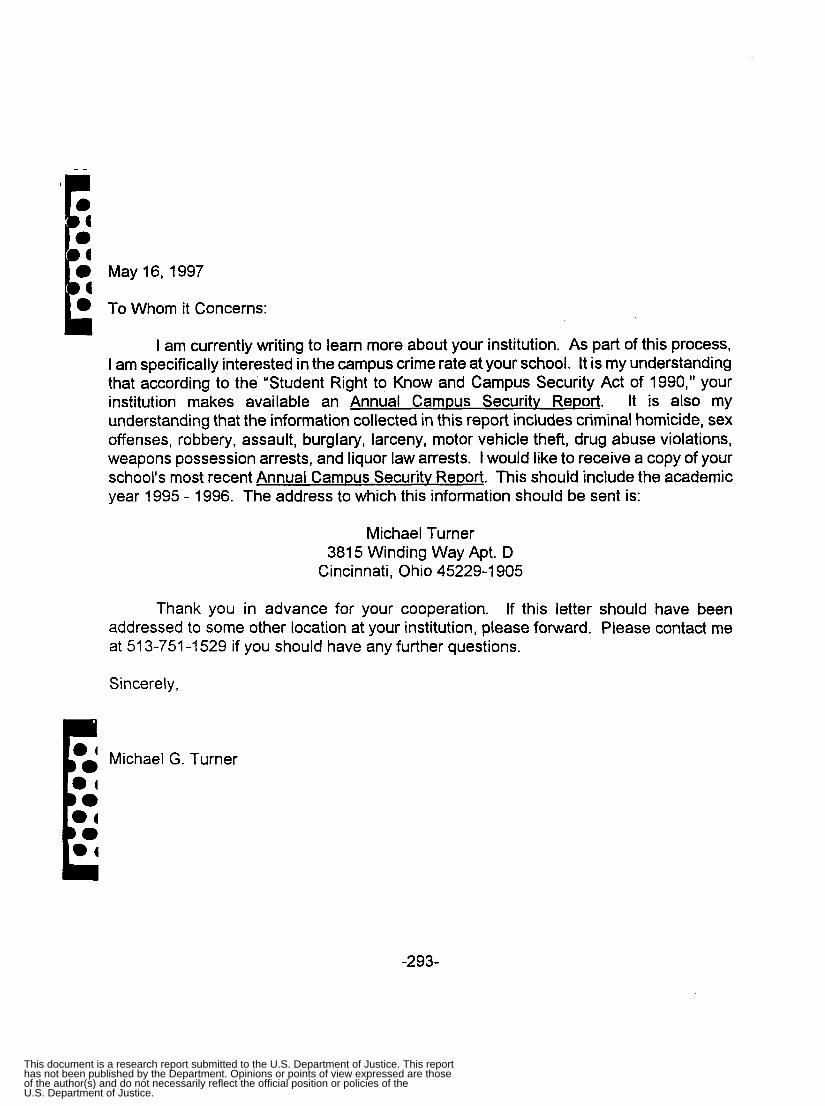
May 16, 1997
To Whom it Concerns:
I am currently writing to learn more about your institution. As part of this process, I am specifically interested in the campus crime rate at your school. It is my understanding that according to the "Student Right to Know and Campus Security Act of 1990," your institution makes available an Annual Campus Securitv Report. It is also my understanding that the information collected in this report includes criminal homicide, sex offenses, robbery, assault, burglary, larceny, motor vehicle theft, drug abuse violations, weapons possession arrests, and liquor law arrests. I would like to receive a copy of your school's most recent Annual Campus Securitv Report. This should include the academic year 1995 - 1996. The address to which this information should be sent is:
Michael Turner 3815 Winding Way Apt. D
Cincinnati, Ohio 45229-1 905
Thank you in advance for your cooperation. If this letter should have been addressed to some other location at your institution, please forward. Please contact me at 51 3-751 -1 529 if you should have any further questions.
Sincerely,
E Michael G. Turner
-293-
This document is a research report submitted to the U.S. Department of Justice. This reporthas not been published by the Department. Opinions or points of view expressed are thoseof the author(s) and do not necessarily reflect the official position or policies of theU.S. Department of Justice.

APPENDIX 5
-294-
This document is a research report submitted to the U.S. Department of Justice. This reporthas not been published by the Department. Opinions or points of view expressed are thoseof the author(s) and do not necessarily reflect the official position or policies of theU.S. Department of Justice.
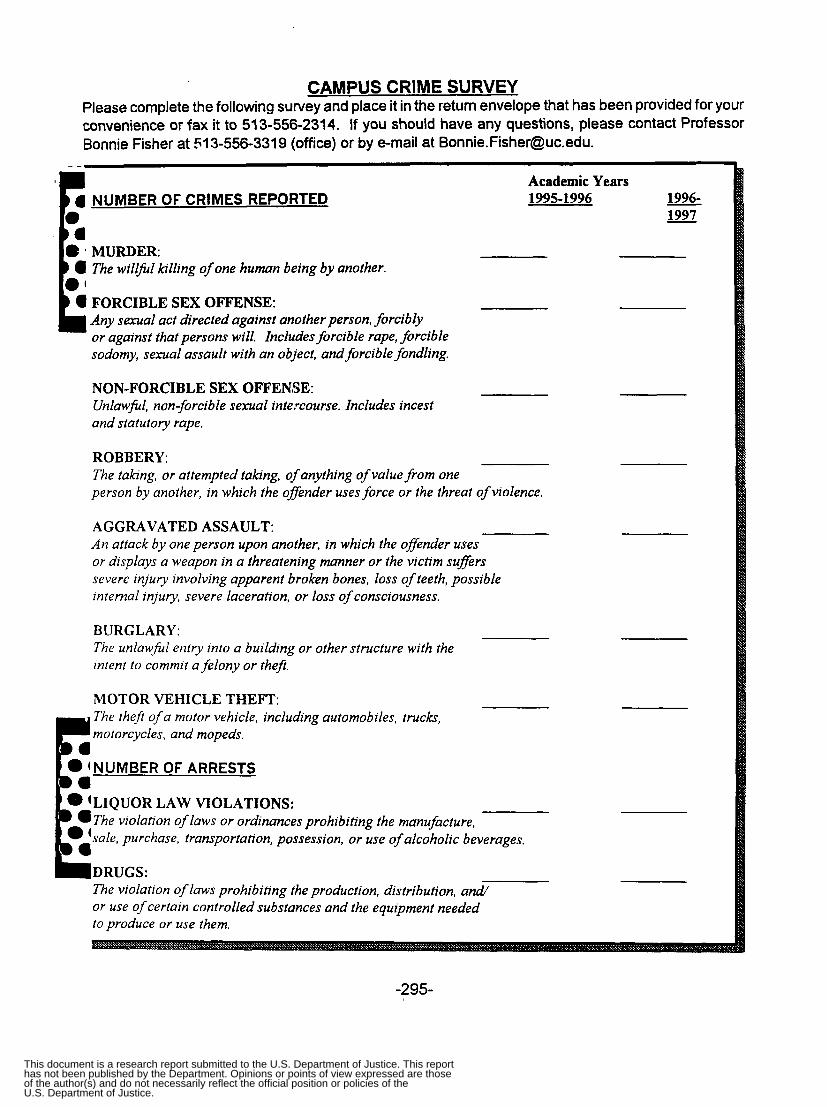
CAMPUS CRIME SURVEY Please complete the following survey and place it in the return envelope that has been provided for your convenience or fax it to 513-556-2314. If you should have any questions, please contact Professor Bonnie Fisher at 513-556-331 9 (office) or by e-rnail at [email protected].
Academic Years b 4 NUMBER OF CRIMES REPORTED 1995-1996
The willfkl killing of one human being by another.
(I FORCIBLE SEX OFFENSE: Any sexual act directed against another person, forcibly or against that persons will. Includes forcible rape, forcible sodomy, sexual assault with an object, and forcible fondling.
NON-FORCIBLE SEX OFFENSE: Unlawfil, non-forcible sexual intexourse. Includes incest and statutory rape.
ROBBERY: The tabng, or attempted taking, of anything of value from one person by another, in which the offender uses force or the threat of violence.
AGGRAVATED ASSAULT: An attack by one person upon another, in which the offender uses or displays a weapon in a threatening manner or the victim suffers severe injury involving apparent broken bones, loss of teeth, possible internal injury, severe laceration, or loss of consciousness.
BURGLARY: The unlawfitl entry into a building or other structure with the intent to commit a felony or the).
MOTOR VEHICLE THEFT: The theft of a motor vehicle, including automobiles, trucks, motorcycles, and mopeds.
0 (NUMBER OF ARRESTS E LAW VIOLATIONS:
The violation of laws or ordinances prohibiting the manufacture, 'sale, purchase, transportation, possession, or use of alcoholic beverages.
DRUGS: The violation of laws prohibiting the production, distribution, and/ or use of certain controlled subitances and the equipment needed to produce or use them.
1996- 1997
-295-
This document is a research report submitted to the U.S. Department of Justice. This reporthas not been published by the Department. Opinions or points of view expressed are thoseof the author(s) and do not necessarily reflect the official position or policies of theU.S. Department of Justice.

APPENDIX 6
-296-
This document is a research report submitted to the U.S. Department of Justice. This reporthas not been published by the Department. Opinions or points of view expressed are thoseof the author(s) and do not necessarily reflect the official position or policies of theU.S. Department of Justice.

Appendix 6. Measurement of Variables and Descriptive Statistics: Total Victimization Models (n = 4,446)
Description Standard Variables (type of variable, code, and range) Mean Deviation
Victimization Variables
Victim of Any Type of Sexual Crime
Victim of Rape
Victim of Sexual Coercion
Victim of Sexual Contact
Victim of Sexual Threat
Victim of Sexual Crime With Force
Exposure to Crime
Propensity to be at Places with Men
Propensity to be at Places with Alcohol
Frequency of Drinking Enough Alcohol to Get Drunk
Frequency of Smoking Pot or Hashish
Member/Pledge of Social Sorority
Guardianship Measure
Live Alone
e Proximity to Motivated Offenders L . Part-time Student
Live in a Coed Dorm
E Live On Campus
Dichotomous variable, 1 = victim of rape, sexual coercion, sexual contact, or sexual threat
Dichotomous variable, 1 = victim of rape
Dichotomous variable, 1 = victim of sexual coercion
Dichotomous variable, 1 = victim of sexual contact
Dichotomous variable, 1 = victim of sexual threat
Dichotomous variable, 1 = victim of sexual crime that included forcible means
Continuous variable, scale ranging from 1 (low propensity) to 4 (high propensity); a = .62
Continuous variable, scale ranging from 1 (low propensity) to 4 (high propensity); a = .41
Ordinal variable, 1 = Never; 7 = daily or almost daily
Ordinal variable, 1 = Never; 7 = daily or almost daily
Dichotomous variable, 1 = member of or pledge to a social sorority
Dichotomous variable, 1 = student living alone
Dichotomous variable, 1 = student enrolled part time
Dichotomous variable, 1 = student living in coed dorm
Dichotomous variable, 1 = student living on campus in a dorm
0.16
0.03
0.03
0.09
0.01
0.07
1.99
2.47
2.95
1.54
0.13
0.16
0.10
0.32
0.51
0.36
0.16
0.17
0.28
0.10
0.26
0.75
0.78
1.61
1.23
0.33
0.36
0.30
0.47
0.50
-297-
This document is a research report submitted to the U.S. Department of Justice. This reporthas not been published by the Department. Opinions or points of view expressed are thoseof the author(s) and do not necessarily reflect the official position or policies of theU.S. Department of Justice.
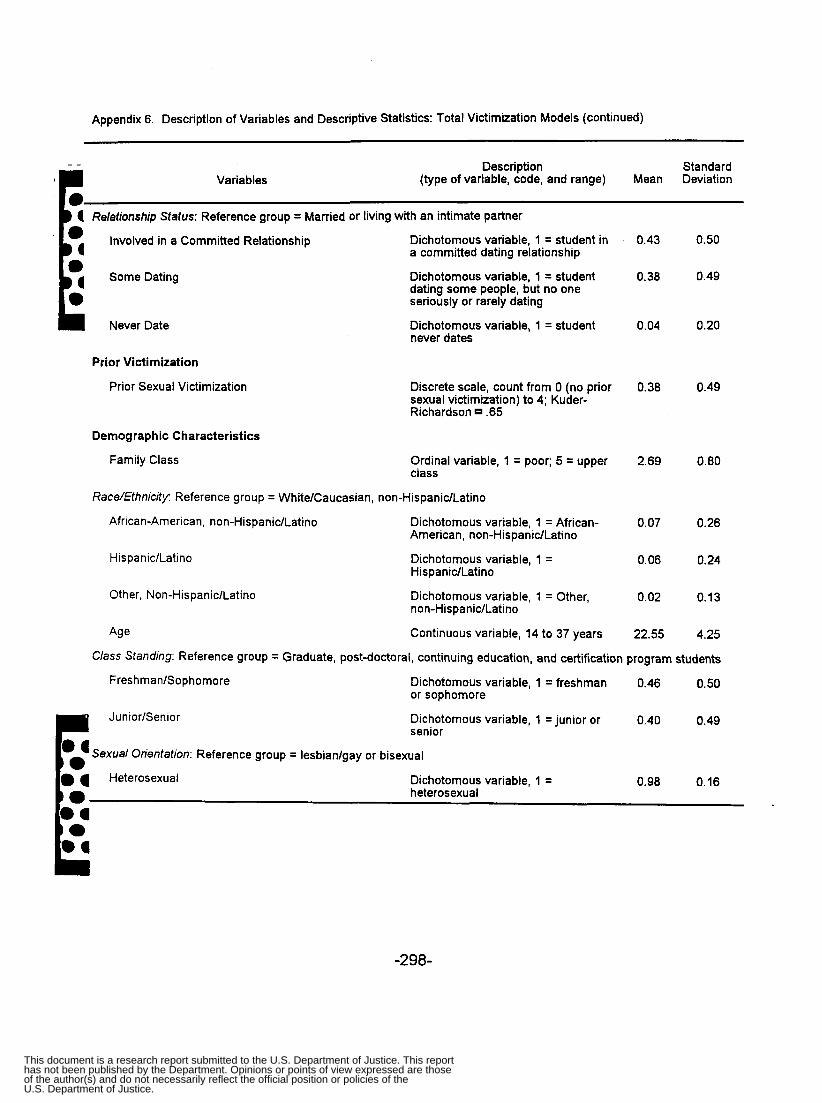
Appendix 6. Description of Variables and Descriptive Statistics: Total Victimization Models (continued)
Description Standard Variables (type of variable, code, and range) Mean Deviation
4 Rdationship Status: Reference group = Married or living with an intimate partner
Involved in a Committed Relationship .L'I L: Some Dating
Never Date
Prior Victimization
Prior Sexual Victimization
Demographic Characteristics
Family Class
Dichotomous variable, 1 = student in a committed dating relationship
Dichotomous variable, 1 = student dating some people, but no one seriously or rarely dating
Dichotomous variable, I = student never dates
Discrete scale, count from 0 (no prior sexual victimization) to 4; Kuder- Richardson .65
Ordinal variable, 1 = poor; 5 = upper class
Race/Ethnicity: Reference group = WhitelCaucasian, non-HispaniclLatino
African-American, non-Hispanicllatino
His pan i clLati no
Other, Non-HispanidLatino
Dichotomous variable, 1 = African- American, non-HispanitYLatino
Dichotomous variable, I = HispaniclLatino
Dichotomous variable, 1 = Other, non-Hispanicllatino
Age Continuous variable, 14 to 37 years
0.43
0.38
0.04
0.38
2.69
0.07
0.06
0.02
22.55
0.50
0.49
0.20
0.49
0.80
0.26
0.24
0.13
4.25
Class Standing: Reference group = Graduate, post-doctoral, continuing education, and certification program students
FreshmanlSophomore Dichotomous variable, 1 = freshman 0.46 0.50 or sophomore
0.40 0.49 J u n iorlSen i o r Dichotomous variable, 1 =junior or senior
Orientation: Reference group = lesbianlgay or bisexual
0.98 0.16 eterosexual Dichotomous variable, I = heterosexual Lo.
-298-
This document is a research report submitted to the U.S. Department of Justice. This reporthas not been published by the Department. Opinions or points of view expressed are thoseof the author(s) and do not necessarily reflect the official position or policies of theU.S. Department of Justice.
_ - ‘E .( APPENDIX 7
-299-
This document is a research report submitted to the U.S. Department of Justice. This reporthas not been published by the Department. Opinions or points of view expressed are thoseof the author(s) and do not necessarily reflect the official position or policies of theU.S. Department of Justice.
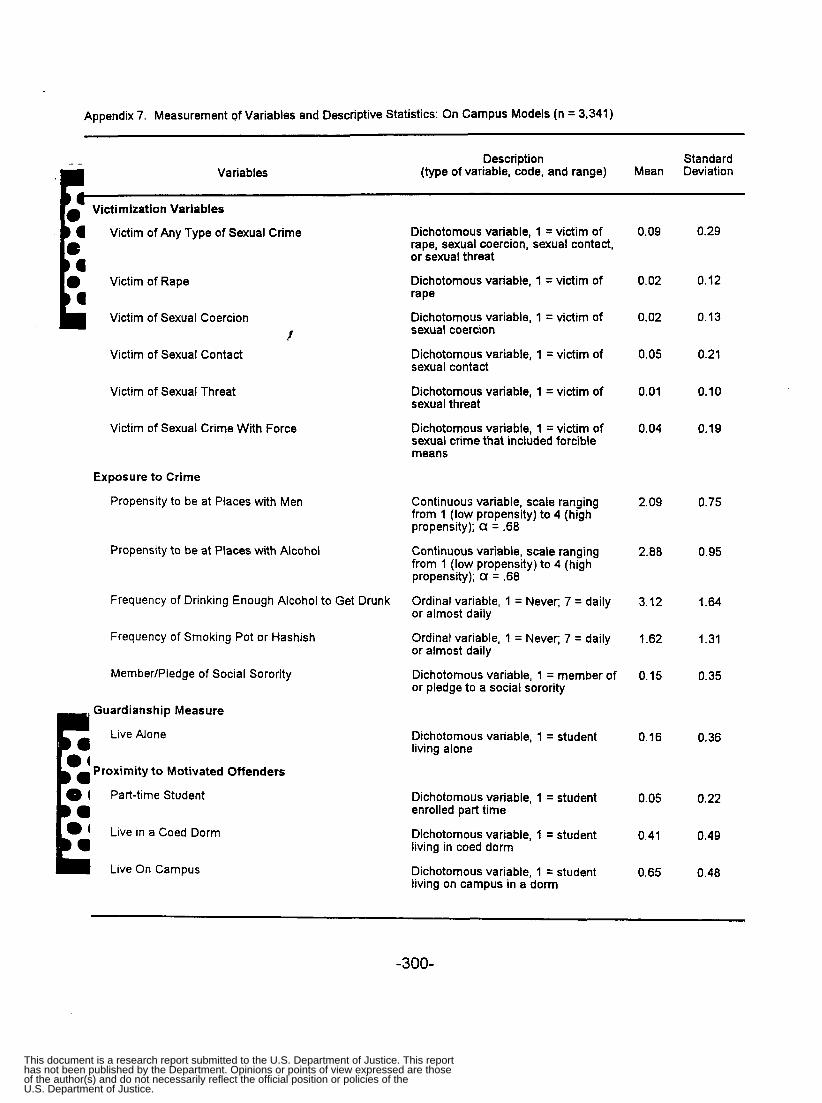
Appendix 7. Measurement of Variables and Descriptive Statistics: On Campus Models (n = 3,341)
_ _ Description Standard Variables (type of variable, code, and range) Mean Deviation
Victimization Variables
4 Victim of Any Type of Sexual Crime
Victim of Rape
Victim of Sexual Coercion ?
Victim of Sexual Contact
Victim of Sexual Threat
Victim of Sexual Crime With Force
Exposure to Crime
Propensity to be at Places with Men
Propensity to be at Places with Alcohol
Frequency of Drinking Enough Alcohol to Get Drunk
Frequency of Smoking Pot or Hashish
Member/Pledge of Social Sorority
Guardians hip Measure
Live Alone
Proximity to Motivated Offenders Lo; Lo. Part-time Student
Lm. Live in a Coed Dorm
h Live On Campus
Dichotomous variable, 1 = victim of rape, sexual coercion, sexual contact, or sexual threat
Dichotomous variable, 1 = victim of rape
Dichotomous variable, 1 = victim of sexual coercion
Dichotomous variable, 1 = victim of sexual contact
Dichotomous variable, 1 = victim of sexual threat
Dichotomous variable, 1 = victim of sexual crime that included forcible means
Continuous variable, scale ranging from 1 (low propensity) to 4 (high propensity); a = .68
Continuous variable, scale ranging from 1 (low propensity) to 4 (high propensity); a = .68
Ordinal variable, 1 = Never; 7 = daily or almost daily
Ordinal variable, 1 = Never; 7 = daily or almost daily
Dichotomous variable, 1 = member of or pledge to a social sorority
Dichotomous variable, I = student living alone
Dichotomous variable, 1 = student enrolled part time
Dichotomous variable, 1 = student living in coed dorm
Dichotomous variable, 1 = student living on campus in a dorm
0.09
0.02
0.02
0.05
0.01
0.04
2.09
2.88
3.12
1.62
0.15
0.16
0.05
0.41
0.65
0.29
0.12
0.13
0.21
0.10
0.19
0.75
0.95
1.64
1.31
0.35
0.36
0.22
0.49
0.48
-300-
This document is a research report submitted to the U.S. Department of Justice. This reporthas not been published by the Department. Opinions or points of view expressed are thoseof the author(s) and do not necessarily reflect the official position or policies of theU.S. Department of Justice.
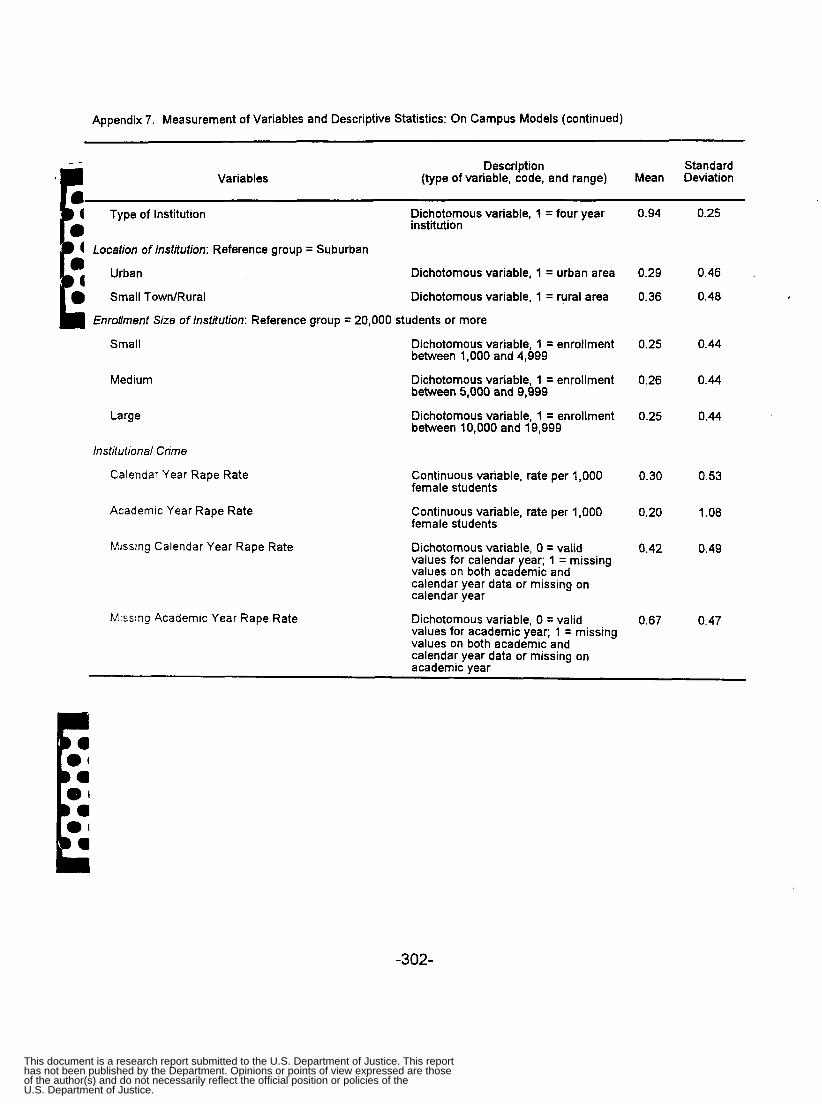
Appendix 7. Measurement of Variables and Descriptive Statistics: On Campus Models (continued)
_ -
Variables Description Standard
(type of variable, code, and range) Mean Deviation
4 Type of Institution Dichotomous variable, 1 = four year 0.94 0.25
4 Location of Institution: Reference group = Suburban
institution
Dichotomous variable, 1 = urban area 0.29 0.46 ,
Dichotomous variable, 1 = rural area 0.36 0.48
Enrollment Size of Institution: Reference group = 20,000 students or more
Small
Medium
Large
In stit ution a/ Crirn e
Calendar Year Rape Rate
Academic Year Rape Rate
Miss ing Calendar Year Rape Rate
Miss ing Academic Year Rape Rate
Dichotomous variable, 1 = enrollment 0.25 0.44 between 1,000 and 4,999
Dichotomous variable, 1 = enrollment 0.26 0.44 between 5,000 and 9,999
Dichotomous variable, I = enrollment 0.25 0.44 between 10,000 and 19,999
Continuous variable, rate per 1,000 0.30 0.53 female students
Continuous variable, rate per 1,000 0.20 1.08 female students
Dichotomous variable, 0 = valid 0.42 0.49 values for calendar ear; 1 = missing values on both acady,mic and calendar year data or missing on calendar year
Dichotomous variable, 0 = valid 0.67 0.47 values for academic year; 1 = missing values on both academic and calendar year data or missing on academic vear
-302-
This document is a research report submitted to the U.S. Department of Justice. This reporthas not been published by the Department. Opinions or points of view expressed are thoseof the author(s) and do not necessarily reflect the official position or policies of theU.S. Department of Justice.
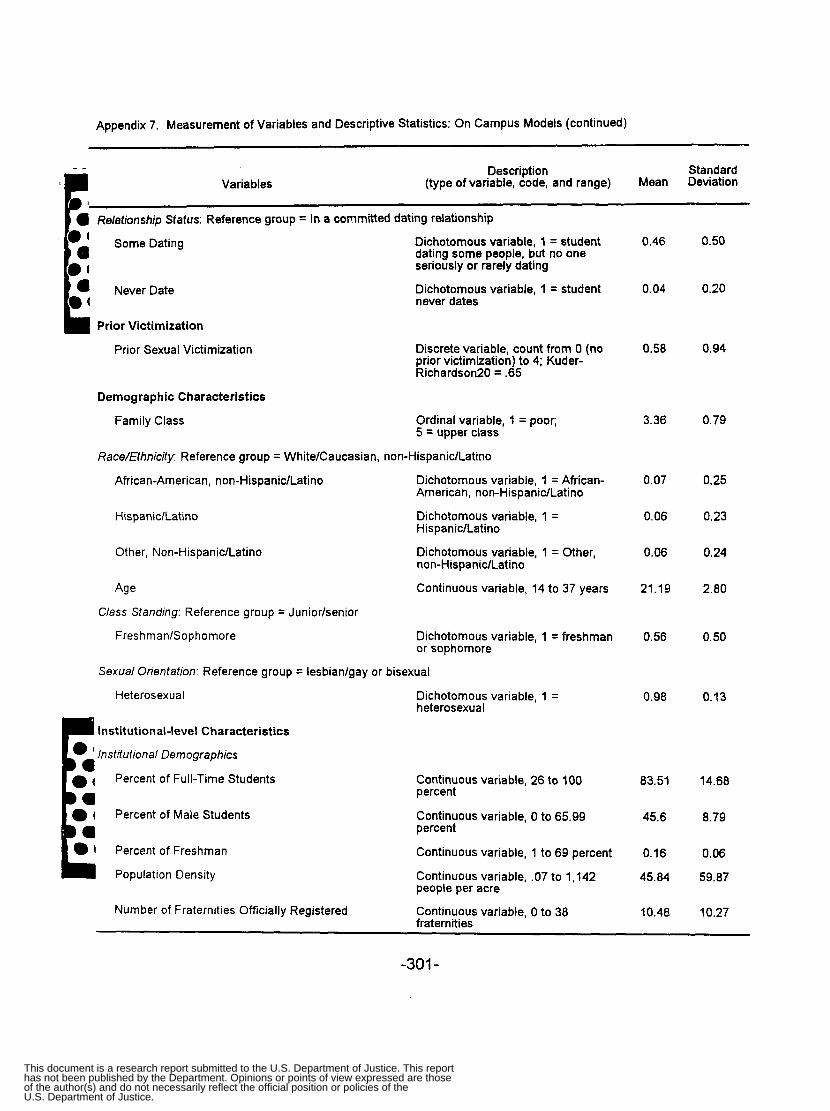
Appendix 7. Measurement of Variables and Descriptive Statistics: On Campus Models (continued)
- - Variables
Description Standard (type of variable, code, and range) Mean Deviation
P ' Relationship Status: Reference group = In a committed dating relationship pi Some Dating
Never Date
Prior Victimization
Prior Sexual Victimization
Demographic Characteristics
Family Class
Dichotomous variable, I = student 0.46 0.50 dating some people, but no one seriously or rarely dating
Dichotomous variable, 1 = student 0.04 0.20 never dates
Discrete variable, count from 0 (no 0.58 0.94 prior victimization) to 4; Kuder- Richardson20 = .65
Ordinal variable, I = poor; 5 = upper class
3.36 0.79
RaceEthnicjty Reference group = White/Caucasian, non-HispanidLatino
African-American, non-Hispanidlatino
His panidLatino
Other, Non-Hispanidlatino
Age
Class Standing: Reference group = Junior/senior
FreshmanlSophomore
Dichotomous variable, 1 = African- 0.07 0.25 American, non-Hispanidlatino
Dichotomous variable, 1 = 0.06 0.23 HispanidLatino
Dichotomous variable, 1 = Other, 0.06 0.24 non-Hispanicllatino
Continuous variable, 14 to 37 years 21.19 2.80
Dichotomous variable, 1 = freshman 0.56 0.50 or sophomore
Sexual Orientation: Reference group = lesbian/gay or bisexual
Heterosexual
Institutional-level Characteristics
i Institutional Demographics
Percent of Full-Time Students
Percent of Male Students
Percent of Freshman
Population Density
Dichotomous variable, 1 = heterosexual
0.90 0.13
Continuous variable, 26 to 100 83.51 14.68 percent
percent
Continuous variable, 1 to 69 percent 0.16 0.06
Continuous variable, .07 to 1,142 45.04 59.87 people per acre
Continuous variable, 0 to 65.99 45.6 8.79
Number of Fraternities Officially Registered Continuous variable, 0 to 38 10.48 10.27 fraternities
-301 -
This document is a research report submitted to the U.S. Department of Justice. This reporthas not been published by the Department. Opinions or points of view expressed are thoseof the author(s) and do not necessarily reflect the official position or policies of theU.S. Department of Justice.
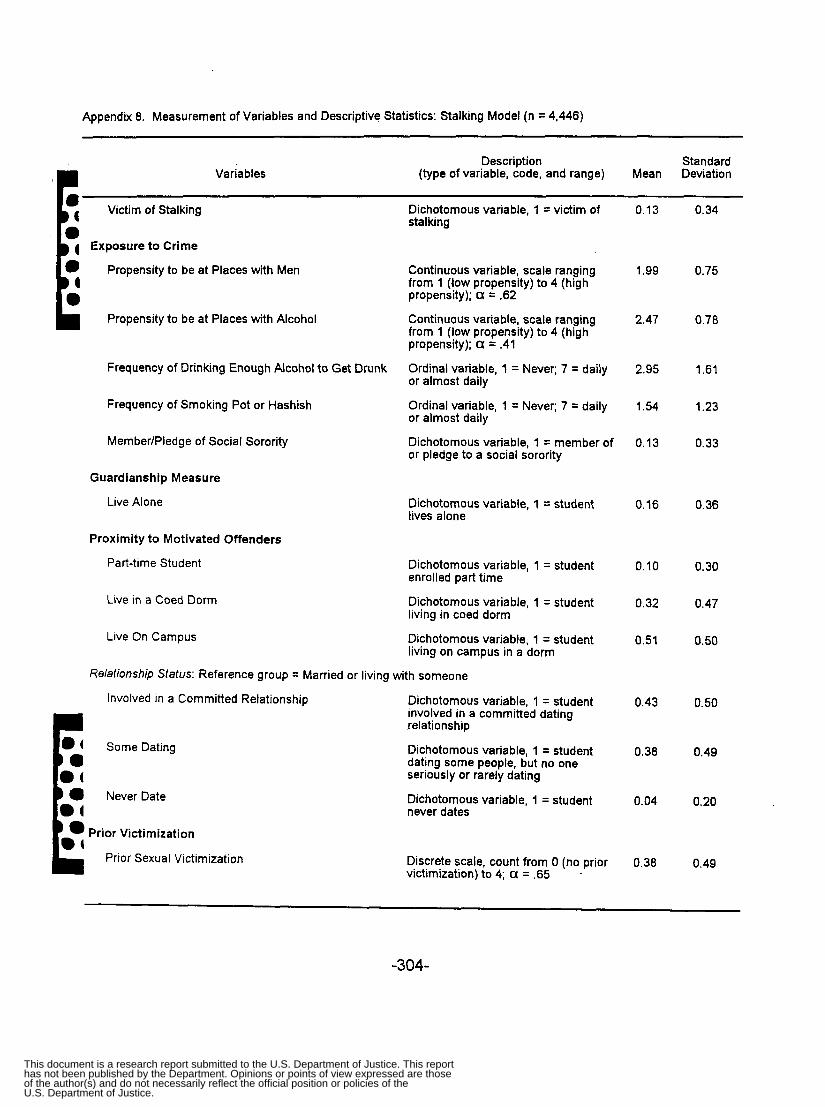
Appendix 8. Measurement of Variables and Descriptive Statistics: Stalking Model (n = 4,446)
Standard Deviation
_ . Description Variables (type of variable, code, and range)
Dichotomous variable, 1 = victim of stalking
Victim of Stalking
Exposure to Crime
Mean - 0.13 0.34
Propensity to be at Places with Men L': Continuous variable, scale ranging from 1 (low propensity) to 4 (high propensity); a = .62
Continuous variable, scale ranging from I (low propensity) to 4 (high propensity); a = .41
0.75 1.99
Propensity to be at Places with Alcohol L: 0.78 2.47
Frequency of Drinking Enough Alcohol to Get Drunk Ordinal variable, 1 = Never; 7 = daily or almost daily
1.61
1.23
0.33
2.95
1.54
0.13
Frequency of Smoking Pot or Hashish Ordinal variable, 1 = Never; 7 = daily or almost daily
Dichotomous variable, 1 = member of or pledge to a social sorority
Member/Pledge of Social Sorority
Guardianship Measure
Live Alone Dichotomous variable, 1 = student lives alone
0.36 0.16
Proximity to Motivated Offenders
Part-time Student
Live in a Coed Dorm
Dichotomous variable, 1 = student enrolled part time
Dichotomous variable, 1 = student living in coed dorm
Dichotomous variable, 1 = student living on campus in a dorm
0.30
0.47
0.50
0.10
0.32
0.51 Live On Campus
Relationship Status: Reference group = Married or living with someone
Involved in a Committed Relationship Dichotomous variable, 1 = student involved in a committed dating relationship
Dichotomous variable, 1 = student dating some people, but no one seriously or rarely dating
Dichotomous variable, 1 = student never dates
0.43
0.38
0.04
0.50
0.49
0.20 r: NeverDate Prior Victimization
Prior Sexual Victimization Discrete scale, count from 0 (no prior victimization) to 4; a = .65 . 0.38 0.49
-304-
This document is a research report submitted to the U.S. Department of Justice. This reporthas not been published by the Department. Opinions or points of view expressed are thoseof the author(s) and do not necessarily reflect the official position or policies of theU.S. Department of Justice.
APPENDIX 8
-303-
This document is a research report submitted to the U.S. Department of Justice. This reporthas not been published by the Department. Opinions or points of view expressed are thoseof the author(s) and do not necessarily reflect the official position or policies of theU.S. Department of Justice.

Appendix 8. Description of Measures and Descriptive Statistics: Stalking Model (continued)
Variables Description Standard
(type of variable, code, and range) Mean Deviation
Demographic Characteristics
Family Class Ordinal variable, 1 = poor, 2.69 0.80 5 = upper class
RaceEthnicity: Reference group = WhiteKaucasian, non-Hispanidlatino
African-American, non-Hispanidlatino Dichotomous variable, 1 = African- 0.07 0.26
AsianlPacific Islander, non-Hispanidlatino Dichotomous variable, 1 = Asian, 0.03 0.18
American, non-Hispanicllatino
non-Hispanidlatino
Other, Non-Hispanicllatino
HispanidLatino
Native American, non-his panidlatino
Dichotomous variable, 1 = Other, 0.02 0.13 non-Hispanidlatino
Dichotomous variable, 1 = Hispanicllatino
0.06 0.24
Dichotomous variable, 1 = Native 0.01 0.09 American, non-Hispanic
Age Continuous variable, 14 to 37 years 22.55 4.25
Class Standing: Reference group = Graduate, post-doctoral, continuing education, and certification program students
FreshmanlSophomore
J u n ior/Sen ior
Dichotomous variable, 1 = freshman 0.46 0.50 or sophomore
Dichotomous variable, 1 =junior or 0.40 0.49 senior
Sexual Orientation: Reference group = lesbianlgay or bisexual
Heterosexual Dichotomous variable, 1 = heterosexual
0.98 0.16
-305-
This document is a research report submitted to the U.S. Department of Justice. This reporthas not been published by the Department. Opinions or points of view expressed are thoseof the author(s) and do not necessarily reflect the official position or policies of theU.S. Department of Justice.