The Extensive Reading Foundation , s Guide to Extensive Reading
Extensive Evolutionary Changes in Regulatory ElementActivity during Human Origins Are Associated withAltered Gene Expression and Positive SelectionYoichiro Shibata1., Nathan C. Sheffield1., Olivier Fedrigo1,2, Courtney C. Babbitt1,2, Matthew Wortham1,
Alok K. Tewari1, Darin London1, Lingyun Song1, Bum-Kyu Lee3, Vishwanath R. Iyer3, Stephen C. J. Parker4,
Elliott H. Margulies4, Gregory A. Wray1,2*, Terrence S. Furey5,6*, Gregory E. Crawford1,7*
1 Institute for Genome Sciences and Policy, Duke University, Durham, North Carolina, United States of America, 2 Biology Department, Duke University, Durham, North
Carolina, United States of America, 3 Center for Systems and Synthetic Biology, Institute for Cellular and Molecular Biology, Section of Molecular Genetics and
Microbiology, University of Texas at Austin, Austin, Texas, United States of America, 4 Genome Technology Branch, National Human Genome Research Institute, National
Institutes of Health, Bethesda, Maryland, United States of America, 5 Department of Genetics, Carolina Center for Genome Sciences, The University of North Carolina at
Chapel Hill, Chapel Hill, North Carolina, United States of America, 6 Department of Biology, Carolina Center for Genome Sciences, and Lineberger Comprehensive Cancer
Center, The University of North Carolina at Chapel Hill, Chapel Hill, North Carolina, United States of America, 7 Department of Pediatrics, Division of Medical Genetics, Duke
University, Durham, North Carolina, United States of America
Abstract
Understanding the molecular basis for phenotypic differences between humans and other primates remains an outstandingchallenge. Mutations in non-coding regulatory DNA that alter gene expression have been hypothesized as a key driver ofthese phenotypic differences. This has been supported by differential gene expression analyses in general, but not by theidentification of specific regulatory elements responsible for changes in transcription and phenotype. To identify thegenetic source of regulatory differences, we mapped DNaseI hypersensitive (DHS) sites, which mark all types of active generegulatory elements, genome-wide in the same cell type isolated from human, chimpanzee, and macaque. Most DHS siteswere conserved among all three species, as expected based on their central role in regulating transcription. However, wefound evidence that several hundred DHS sites were gained or lost on the lineages leading to modern human andchimpanzee. Species-specific DHS site gains are enriched near differentially expressed genes, are positively correlated withincreased transcription, show evidence of branch-specific positive selection, and overlap with active chromatin marks.Species-specific sequence differences in transcription factor motifs found within these DHS sites are linked with species-specific changes in chromatin accessibility. Together, these indicate that the regulatory elements identified here are geneticcontributors to transcriptional and phenotypic differences among primate species.
Citation: Shibata Y, Sheffield NC, Fedrigo O, Babbitt CC, Wortham M, et al. (2012) Extensive Evolutionary Changes in Regulatory Element Activity during HumanOrigins Are Associated with Altered Gene Expression and Positive Selection. PLoS Genet 8(6): e1002789. doi:10.1371/journal.pgen.1002789
Editor: Joshua M. Akey, University of Washington, United States of America
Received December 1, 2011; Accepted May 7, 2012; Published June 28, 2012
This is an open-access article, free of all copyright, and may be freely reproduced, distributed, transmitted, modified, built upon, or otherwise used by anyone forany lawful purpose. The work is made available under the Creative Commons CC0 public domain dedication.
Funding: This work was supported by the Duke Primate Genomics Initiative to YS and NCS, a National Science Foundation Graduate Research Fellowship to NCS,and the National Human Genome Research Institute K22HG003169 to GEC. The funders had no role in study design, data collection and analysis, decision topublish, or preparation of the manuscript.
Competing Interests: The authors have declared that no competing interests exist.
* E-mail: [email protected] (GAW); [email protected] (TSF); [email protected] (GEC)
. These authors contributed equally to this work.
Introduction
Understanding the molecular basis of phenotypic differences
between humans and other primates has been a priority in
medicine, behavior, and evolution research [1–3]. The genetic
basis for these differences can now be explored genome-wide due
in part to the rising number of completely sequenced primate
genomes. However, finding genotype-phenotype connections is
difficult since the vast majority of sequence changes do not
contribute to phenotypic differences across species. It was
hypothesized over 40 years ago that phenotypic differences
between humans and our closest primate relatives are shaped
largely by changes in non-coding regulatory elements [4].
Variation in gene regulation have been indirectly confirmed by
studying gene expression differences across matched cell or tissue
types isolated from different primates [5–12], but these studies
have failed to pinpoint the regulatory elements responsible for
these changes [13]. Genome-wide scans of non-coding DNA
sequences under branch-specific positive selection have identified
putative regulatory elements that have undergone functional
changes [14–16]. These studies identified hundreds of regulatory
regions with evidence of accelerated sequence substitution during
human origins, possibly reflecting adaptive changes in gene
regulation. Scans for selection do not, however, provide informa-
tion about the functional or trait consequences of these evolution-
ary changes.
Understanding the relationship between mutation, natural
selection, and variation in gene regulation is an important goal
in evolutionary genomics. Heritable differences in gene expression
must have a genetic basis, but exactly what sequence variants have
PLoS Genetics | www.plosgenetics.org 1 June 2012 | Volume 8 | Issue 6 | e1002789
led to these differences are largely unknown. In this study, we used
changes in chromatin configuration to better understand this
genotype-phenotype relationship. We identified evolutionary con-
served and altered regulatory element activity by performing
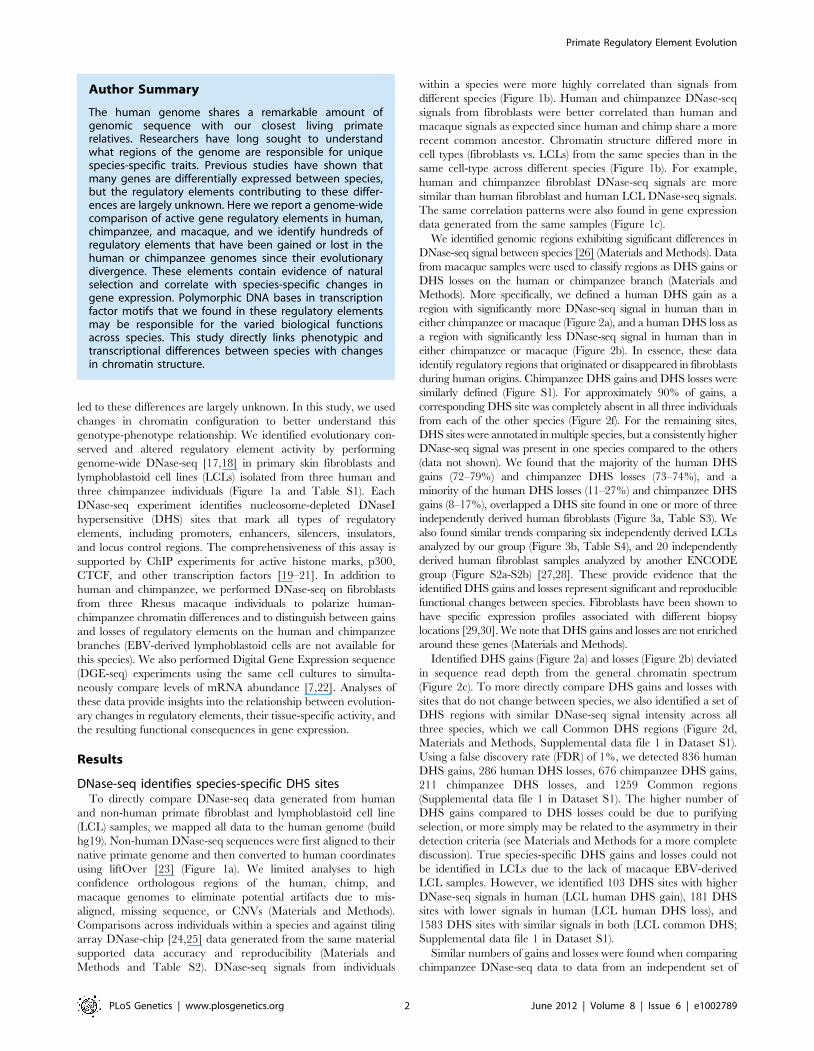
genome-wide DNase-seq [17,18] in primary skin fibroblasts and
lymphoblastoid cell lines (LCLs) isolated from three human and
three chimpanzee individuals (Figure 1a and Table S1). Each
DNase-seq experiment identifies nucleosome-depleted DNaseI
hypersensitive (DHS) sites that mark all types of regulatory
elements, including promoters, enhancers, silencers, insulators,
and locus control regions. The comprehensiveness of this assay is
supported by ChIP experiments for active histone marks, p300,
CTCF, and other transcription factors [19–21]. In addition to
human and chimpanzee, we performed DNase-seq on fibroblasts
from three Rhesus macaque individuals to polarize human-
chimpanzee chromatin differences and to distinguish between gains
and losses of regulatory elements on the human and chimpanzee
branches (EBV-derived lymphoblastoid cells are not available for
this species). We also performed Digital Gene Expression sequence
(DGE-seq) experiments using the same cell cultures to simulta-
neously compare levels of mRNA abundance [7,22]. Analyses of
these data provide insights into the relationship between evolution-
ary changes in regulatory elements, their tissue-specific activity, and
the resulting functional consequences in gene expression.
Results
DNase-seq identifies species-specific DHS sitesTo directly compare DNase-seq data generated from human
and non-human primate fibroblast and lymphoblastoid cell line
(LCL) samples, we mapped all data to the human genome (build
hg19). Non-human DNase-seq sequences were first aligned to their
native primate genome and then converted to human coordinates
using liftOver [23] (Figure 1a). We limited analyses to high
confidence orthologous regions of the human, chimp, and
macaque genomes to eliminate potential artifacts due to mis-
aligned, missing sequence, or CNVs (Materials and Methods).
Comparisons across individuals within a species and against tiling
array DNase-chip [24,25] data generated from the same material
supported data accuracy and reproducibility (Materials and
Methods and Table S2). DNase-seq signals from individuals
within a species were more highly correlated than signals from
different species (Figure 1b). Human and chimpanzee DNase-seq
signals from fibroblasts were better correlated than human and
macaque signals as expected since human and chimp share a more
recent common ancestor. Chromatin structure differed more in
cell types (fibroblasts vs. LCLs) from the same species than in the
same cell-type across different species (Figure 1b). For example,
human and chimpanzee fibroblast DNase-seq signals are more
similar than human fibroblast and human LCL DNase-seq signals.
The same correlation patterns were also found in gene expression
data generated from the same samples (Figure 1c).
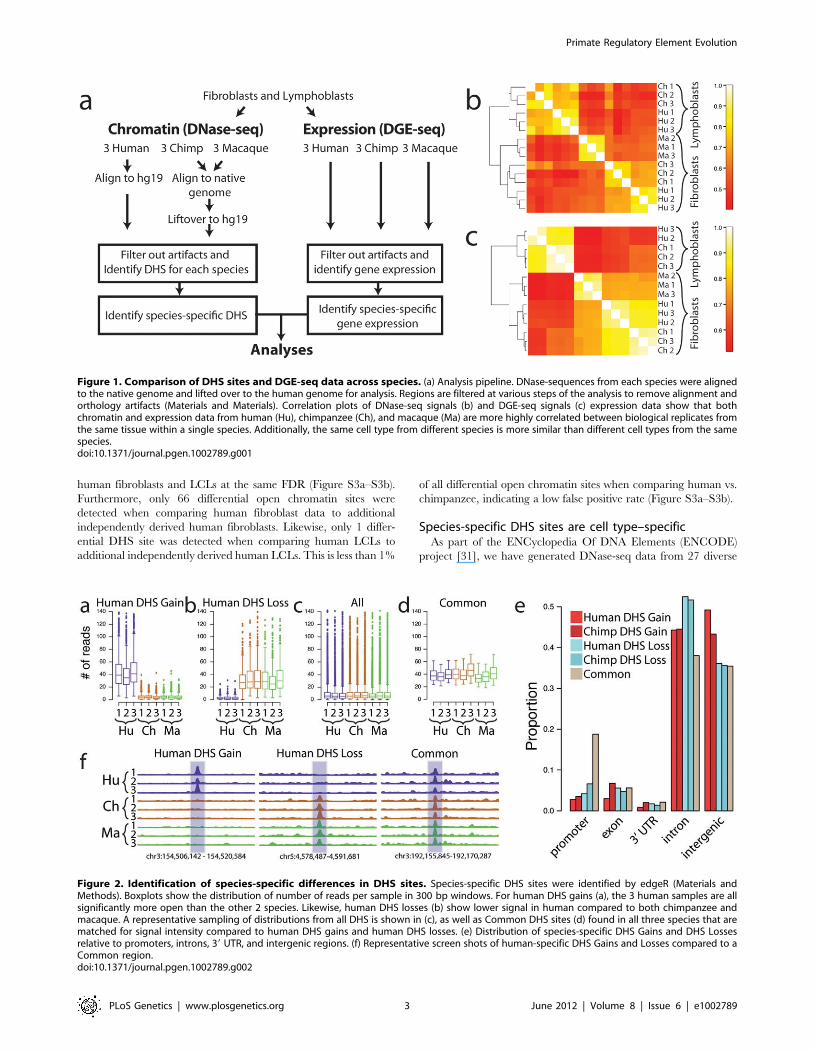
We identified genomic regions exhibiting significant differences in
DNase-seq signal between species [26] (Materials and Methods). Data
from macaque samples were used to classify regions as DHS gains or
DHS losses on the human or chimpanzee branch (Materials and
Methods). More specifically, we defined a human DHS gain as a
region with significantly more DNase-seq signal in human than in
either chimpanzee or macaque (Figure 2a), and a human DHS loss as
a region with significantly less DNase-seq signal in human than in
either chimpanzee or macaque (Figure 2b). In essence, these data
identify regulatory regions that originated or disappeared in fibroblasts
during human origins. Chimpanzee DHS gains and DHS losses were
similarly defined (Figure S1). For approximately 90% of gains, a
corresponding DHS site was completely absent in all three individuals
from each of the other species (Figure 2f). For the remaining sites,
DHS sites were annotated in multiple species, but a consistently higher
DNase-seq signal was present in one species compared to the others
(data not shown). We found that the majority of the human DHS
gains (72–79%) and chimpanzee DHS losses (73–74%), and a
minority of the human DHS losses (11–27%) and chimpanzee DHS
gains (8–17%), overlapped a DHS site found in one or more of three
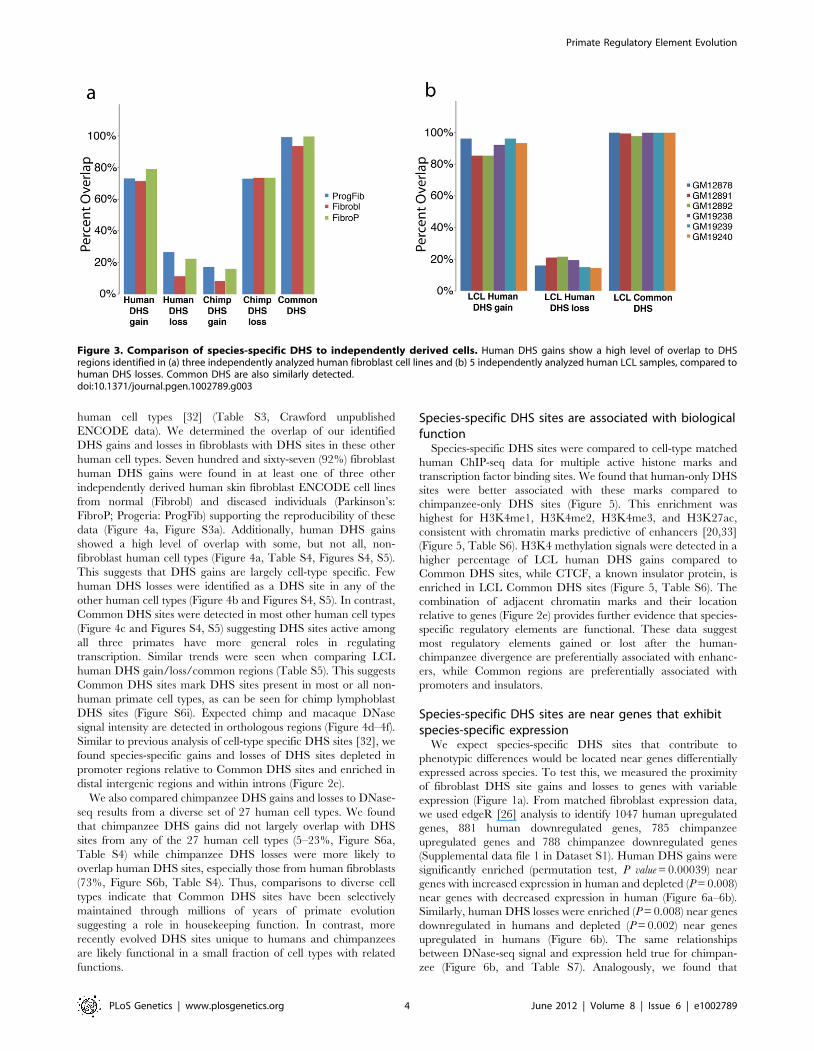
independently derived human fibroblasts (Figure 3a, Table S3). We
also found similar trends comparing six independently derived LCLs
analyzed by our group (Figure 3b, Table S4), and 20 independently
derived human fibroblast samples analyzed by another ENCODE
group (Figure S2a-S2b) [27,28]. These provide evidence that the
identified DHS gains and losses represent significant and reproducible
functional changes between species. Fibroblasts have been shown to
have specific expression profiles associated with different biopsy
locations [29,30]. We note that DHS gains and losses are not enriched
around these genes (Materials and Methods).
Identified DHS gains (Figure 2a) and losses (Figure 2b) deviated
in sequence read depth from the general chromatin spectrum
(Figure 2c). To more directly compare DHS gains and losses with
sites that do not change between species, we also identified a set of
DHS regions with similar DNase-seq signal intensity across all
three species, which we call Common DHS regions (Figure 2d,
Materials and Methods, Supplemental data file 1 in Dataset S1).
Using a false discovery rate (FDR) of 1%, we detected 836 human
DHS gains, 286 human DHS losses, 676 chimpanzee DHS gains,
211 chimpanzee DHS losses, and 1259 Common regions
(Supplemental data file 1 in Dataset S1). The higher number of
DHS gains compared to DHS losses could be due to purifying
selection, or more simply may be related to the asymmetry in their
detection criteria (see Materials and Methods for a more complete
discussion). True species-specific DHS gains and losses could not
be identified in LCLs due to the lack of macaque EBV-derived
LCL samples. However, we identified 103 DHS sites with higher
DNase-seq signals in human (LCL human DHS gain), 181 DHS
sites with lower signals in human (LCL human DHS loss), and
1583 DHS sites with similar signals in both (LCL common DHS;
Supplemental data file 1 in Dataset S1).
Similar numbers of gains and losses were found when comparing
chimpanzee DNase-seq data to data from an independent set of
Author Summary
The human genome shares a remarkable amount ofgenomic sequence with our closest living primaterelatives. Researchers have long sought to understandwhat regions of the genome are responsible for uniquespecies-specific traits. Previous studies have shown thatmany genes are differentially expressed between species,but the regulatory elements contributing to these differ-ences are largely unknown. Here we report a genome-widecomparison of active gene regulatory elements in human,chimpanzee, and macaque, and we identify hundreds ofregulatory elements that have been gained or lost in thehuman or chimpanzee genomes since their evolutionarydivergence. These elements contain evidence of naturalselection and correlate with species-specific changes ingene expression. Polymorphic DNA bases in transcriptionfactor motifs that we found in these regulatory elementsmay be responsible for the varied biological functionsacross species. This study directly links phenotypic andtranscriptional differences between species with changesin chromatin structure.
Primate Regulatory Element Evolution
PLoS Genetics | www.plosgenetics.org 2 June 2012 | Volume 8 | Issue 6 | e1002789
human fibroblasts and LCLs at the same FDR (Figure S3a–S3b).
Furthermore, only 66 differential open chromatin sites were
detected when comparing human fibroblast data to additional
independently derived human fibroblasts. Likewise, only 1 differ-
ential DHS site was detected when comparing human LCLs to
additional independently derived human LCLs. This is less than 1%
of all differential open chromatin sites when comparing human vs.
chimpanzee, indicating a low false positive rate (Figure S3a–S3b).
Species-specific DHS sites are cell type–specificAs part of the ENCyclopedia Of DNA Elements (ENCODE)
project [31], we have generated DNase-seq data from 27 diverse
Figure 1. Comparison of DHS sites and DGE-seq data across species. (a) Analysis pipeline. DNase-sequences from each species were alignedto the native genome and lifted over to the human genome for analysis. Regions are filtered at various steps of the analysis to remove alignment andorthology artifacts (Materials and Materials). Correlation plots of DNase-seq signals (b) and DGE-seq signals (c) expression data show that bothchromatin and expression data from human (Hu), chimpanzee (Ch), and macaque (Ma) are more highly correlated between biological replicates fromthe same tissue within a single species. Additionally, the same cell type from different species is more similar than different cell types from the samespecies.doi:10.1371/journal.pgen.1002789.g001
Figure 2. Identification of species-specific differences in DHS sites. Species-specific DHS sites were identified by edgeR (Materials andMethods). Boxplots show the distribution of number of reads per sample in 300 bp windows. For human DHS gains (a), the 3 human samples are allsignificantly more open than the other 2 species. Likewise, human DHS losses (b) show lower signal in human compared to both chimpanzee andmacaque. A representative sampling of distributions from all DHS is shown in (c), as well as Common DHS sites (d) found in all three species that arematched for signal intensity compared to human DHS gains and human DHS losses. (e) Distribution of species-specific DHS Gains and DHS Lossesrelative to promoters, introns, 39 UTR, and intergenic regions. (f) Representative screen shots of human-specific DHS Gains and Losses compared to aCommon region.doi:10.1371/journal.pgen.1002789.g002
Primate Regulatory Element Evolution
PLoS Genetics | www.plosgenetics.org 3 June 2012 | Volume 8 | Issue 6 | e1002789
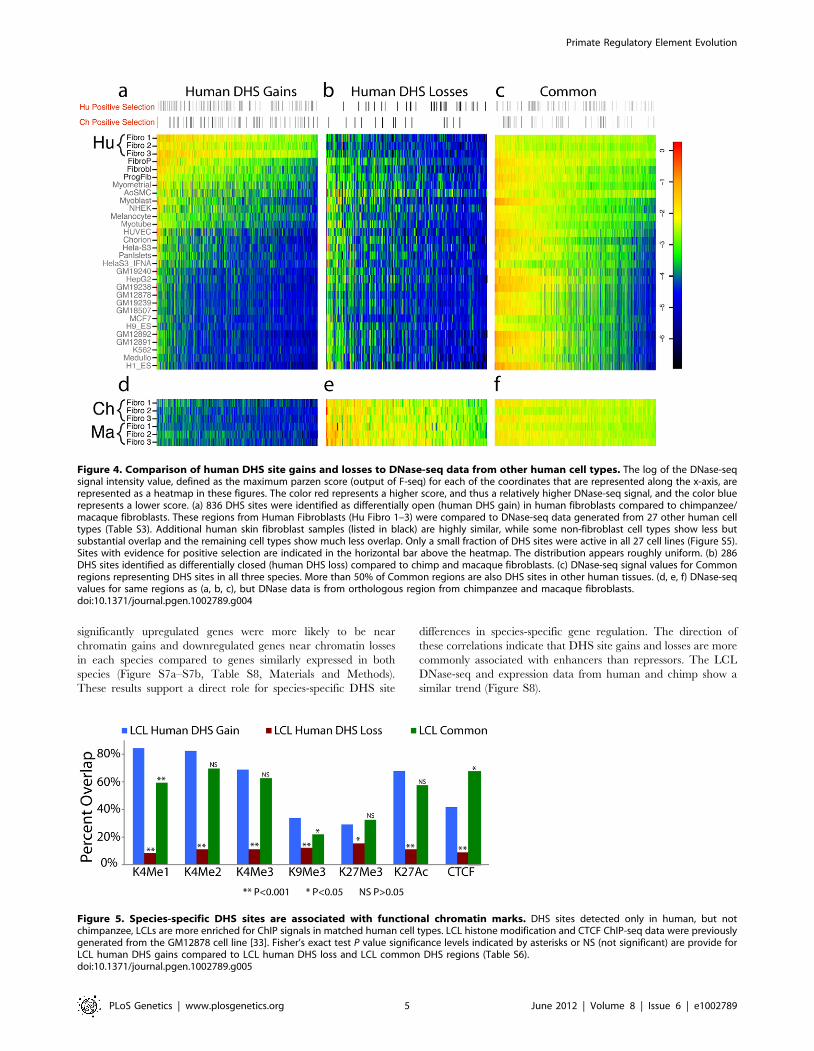
human cell types [32] (Table S3, Crawford unpublished
ENCODE data). We determined the overlap of our identified
DHS gains and losses in fibroblasts with DHS sites in these other
human cell types. Seven hundred and sixty-seven (92%) fibroblast
human DHS gains were found in at least one of three other
independently derived human skin fibroblast ENCODE cell lines
from normal (Fibrobl) and diseased individuals (Parkinson’s:
FibroP; Progeria: ProgFib) supporting the reproducibility of these
data (Figure 4a, Figure S3a). Additionally, human DHS gains
showed a high level of overlap with some, but not all, non-
fibroblast human cell types (Figure 4a, Table S4, Figures S4, S5).
This suggests that DHS gains are largely cell-type specific. Few
human DHS losses were identified as a DHS site in any of the
other human cell types (Figure 4b and Figures S4, S5). In contrast,
Common DHS sites were detected in most other human cell types
(Figure 4c and Figures S4, S5) suggesting DHS sites active among
all three primates have more general roles in regulating
transcription. Similar trends were seen when comparing LCL
human DHS gain/loss/common regions (Table S5). This suggests
Common DHS sites mark DHS sites present in most or all non-
human primate cell types, as can be seen for chimp lymphoblast
DHS sites (Figure S6i). Expected chimp and macaque DNase
signal intensity are detected in orthologous regions (Figure 4d–4f).
Similar to previous analysis of cell-type specific DHS sites [32], we
found species-specific gains and losses of DHS sites depleted in
promoter regions relative to Common DHS sites and enriched in
distal intergenic regions and within introns (Figure 2e).
We also compared chimpanzee DHS gains and losses to DNase-
seq results from a diverse set of 27 human cell types. We found
that chimpanzee DHS gains did not largely overlap with DHS
sites from any of the 27 human cell types (5–23%, Figure S6a,
Table S4) while chimpanzee DHS losses were more likely to
overlap human DHS sites, especially those from human fibroblasts
(73%, Figure S6b, Table S4). Thus, comparisons to diverse cell
types indicate that Common DHS sites have been selectively
maintained through millions of years of primate evolution
suggesting a role in housekeeping function. In contrast, more
recently evolved DHS sites unique to humans and chimpanzees
are likely functional in a small fraction of cell types with related
functions.
Species-specific DHS sites are associated with biologicalfunction
Species-specific DHS sites were compared to cell-type matched
human ChIP-seq data for multiple active histone marks and
transcription factor binding sites. We found that human-only DHS
sites were better associated with these marks compared to
chimpanzee-only DHS sites (Figure 5). This enrichment was
highest for H3K4me1, H3K4me2, H3K4me3, and H3K27ac,
consistent with chromatin marks predictive of enhancers [20,33]
(Figure 5, Table S6). H3K4 methylation signals were detected in a
higher percentage of LCL human DHS gains compared to
Common DHS sites, while CTCF, a known insulator protein, is
enriched in LCL Common DHS sites (Figure 5, Table S6). The
combination of adjacent chromatin marks and their location
relative to genes (Figure 2e) provides further evidence that species-
specific regulatory elements are functional. These data suggest
most regulatory elements gained or lost after the human-
chimpanzee divergence are preferentially associated with enhanc-
ers, while Common regions are preferentially associated with
promoters and insulators.
Species-specific DHS sites are near genes that exhibitspecies-specific expression
We expect species-specific DHS sites that contribute to
phenotypic differences would be located near genes differentially
expressed across species. To test this, we measured the proximity
of fibroblast DHS site gains and losses to genes with variable
expression (Figure 1a). From matched fibroblast expression data,
we used edgeR [26] analysis to identify 1047 human upregulated
genes, 881 human downregulated genes, 785 chimpanzee
upregulated genes and 788 chimpanzee downregulated genes
(Supplemental data file 1 in Dataset S1). Human DHS gains were
significantly enriched (permutation test, P value = 0.00039) near
genes with increased expression in human and depleted (P = 0.008)
near genes with decreased expression in human (Figure 6a–6b).
Similarly, human DHS losses were enriched (P = 0.008) near genes
downregulated in humans and depleted (P = 0.002) near genes
upregulated in humans (Figure 6b). The same relationships
between DNase-seq signal and expression held true for chimpan-
zee (Figure 6b, and Table S7). Analogously, we found that
Figure 3. Comparison of species-specific DHS to independently derived cells. Human DHS gains show a high level of overlap to DHSregions identified in (a) three independently analyzed human fibroblast cell lines and (b) 5 independently analyzed human LCL samples, compared tohuman DHS losses. Common DHS are also similarly detected.doi:10.1371/journal.pgen.1002789.g003
Primate Regulatory Element Evolution
PLoS Genetics | www.plosgenetics.org 4 June 2012 | Volume 8 | Issue 6 | e1002789
significantly upregulated genes were more likely to be near
chromatin gains and downregulated genes near chromatin losses
in each species compared to genes similarly expressed in both
species (Figure S7a–S7b, Table S8, Materials and Methods).
These results support a direct role for species-specific DHS site
differences in species-specific gene regulation. The direction of
these correlations indicate that DHS site gains and losses are more
commonly associated with enhancers than repressors. The LCL
DNase-seq and expression data from human and chimp show a
similar trend (Figure S8).
Figure 4. Comparison of human DHS site gains and losses to DNase-seq data from other human cell types. The log of the DNase-seqsignal intensity value, defined as the maximum parzen score (output of F-seq) for each of the coordinates that are represented along the x-axis, arerepresented as a heatmap in these figures. The color red represents a higher score, and thus a relatively higher DNase-seq signal, and the color bluerepresents a lower score. (a) 836 DHS sites were identified as differentially open (human DHS gain) in human fibroblasts compared to chimpanzee/macaque fibroblasts. These regions from Human Fibroblasts (Hu Fibro 1–3) were compared to DNase-seq data generated from 27 other human celltypes (Table S3). Additional human skin fibroblast samples (listed in black) are highly similar, while some non-fibroblast cell types show less butsubstantial overlap and the remaining cell types show much less overlap. Only a small fraction of DHS sites were active in all 27 cell lines (Figure S5).Sites with evidence for positive selection are indicated in the horizontal bar above the heatmap. The distribution appears roughly uniform. (b) 286DHS sites identified as differentially closed (human DHS loss) compared to chimp and macaque fibroblasts. (c) DNase-seq signal values for Commonregions representing DHS sites in all three species. More than 50% of Common regions are also DHS sites in other human tissues. (d, e, f) DNase-seqvalues for same regions as (a, b, c), but DNase data is from orthologous region from chimpanzee and macaque fibroblasts.doi:10.1371/journal.pgen.1002789.g004
Figure 5. Species-specific DHS sites are associated with functional chromatin marks. DHS sites detected only in human, but notchimpanzee, LCLs are more enriched for ChIP signals in matched human cell types. LCL histone modification and CTCF ChIP-seq data were previouslygenerated from the GM12878 cell line [33]. Fisher’s exact test P value significance levels indicated by asterisks or NS (not significant) are provide forLCL human DHS gains compared to LCL human DHS loss and LCL common DHS regions (Table S6).doi:10.1371/journal.pgen.1002789.g005
Primate Regulatory Element Evolution
PLoS Genetics | www.plosgenetics.org 5 June 2012 | Volume 8 | Issue 6 | e1002789
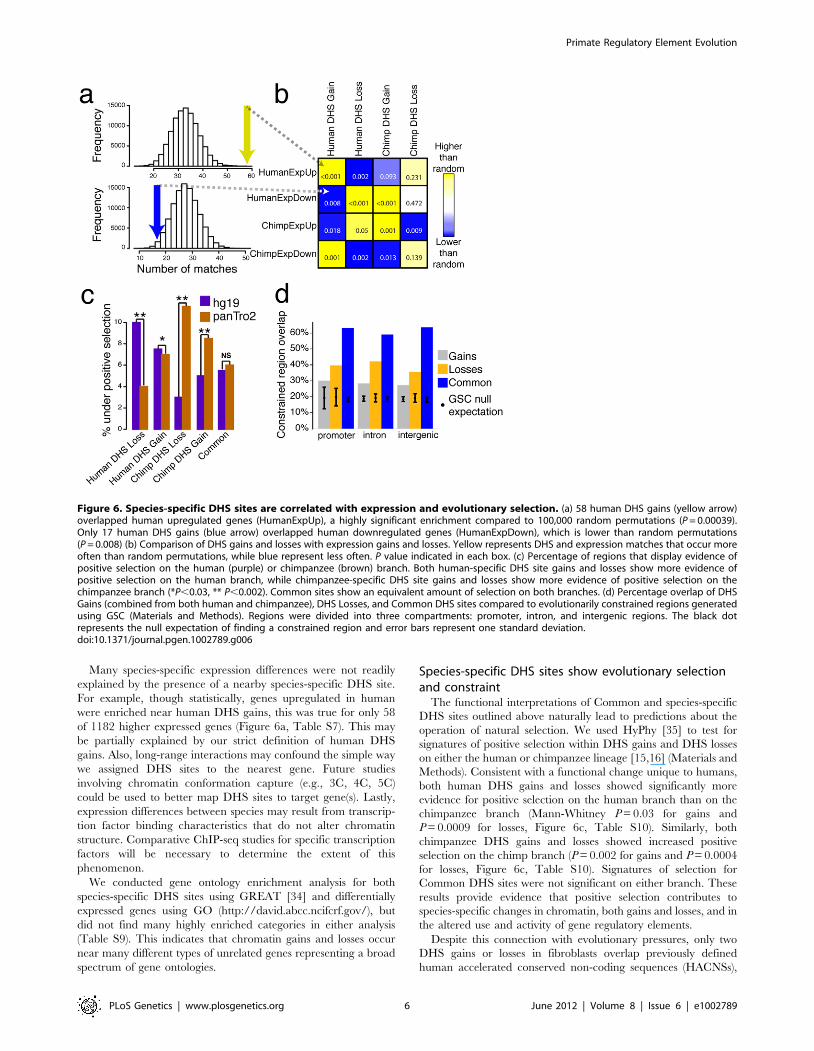
Many species-specific expression differences were not readily
explained by the presence of a nearby species-specific DHS site.
For example, though statistically, genes upregulated in human
were enriched near human DHS gains, this was true for only 58
of 1182 higher expressed genes (Figure 6a, Table S7). This may
be partially explained by our strict definition of human DHS
gains. Also, long-range interactions may confound the simple way
we assigned DHS sites to the nearest gene. Future studies
involving chromatin conformation capture (e.g., 3C, 4C, 5C)
could be used to better map DHS sites to target gene(s). Lastly,
expression differences between species may result from transcrip-
tion factor binding characteristics that do not alter chromatin
structure. Comparative ChIP-seq studies for specific transcription
factors will be necessary to determine the extent of this
phenomenon.
We conducted gene ontology enrichment analysis for both
species-specific DHS sites using GREAT [34] and differentially
expressed genes using GO (http://david.abcc.ncifcrf.gov/), but
did not find many highly enriched categories in either analysis
(Table S9). This indicates that chromatin gains and losses occur
near many different types of unrelated genes representing a broad
spectrum of gene ontologies.
Species-specific DHS sites show evolutionary selectionand constraint
The functional interpretations of Common and species-specific
DHS sites outlined above naturally lead to predictions about the
operation of natural selection. We used HyPhy [35] to test for
signatures of positive selection within DHS gains and DHS losses
on either the human or chimpanzee lineage [15,16] (Materials and
Methods). Consistent with a functional change unique to humans,
both human DHS gains and losses showed significantly more
evidence for positive selection on the human branch than on the
chimpanzee branch (Mann-Whitney P = 0.03 for gains and
P = 0.0009 for losses, Figure 6c, Table S10). Similarly, both
chimpanzee DHS gains and losses showed increased positive
selection on the chimp branch (P = 0.002 for gains and P = 0.0004
for losses, Figure 6c, Table S10). Signatures of selection for
Common DHS sites were not significant on either branch. These
results provide evidence that positive selection contributes to
species-specific changes in chromatin, both gains and losses, and in
the altered use and activity of gene regulatory elements.
Despite this connection with evolutionary pressures, only two
DHS gains or losses in fibroblasts overlap previously defined
human accelerated conserved non-coding sequences (HACNSs),
Figure 6. Species-specific DHS sites are correlated with expression and evolutionary selection. (a) 58 human DHS gains (yellow arrow)overlapped human upregulated genes (HumanExpUp), a highly significant enrichment compared to 100,000 random permutations (P = 0.00039).Only 17 human DHS gains (blue arrow) overlapped human downregulated genes (HumanExpDown), which is lower than random permutations(P = 0.008) (b) Comparison of DHS gains and losses with expression gains and losses. Yellow represents DHS and expression matches that occur moreoften than random permutations, while blue represent less often. P value indicated in each box. (c) Percentage of regions that display evidence ofpositive selection on the human (purple) or chimpanzee (brown) branch. Both human-specific DHS site gains and losses show more evidence ofpositive selection on the human branch, while chimpanzee-specific DHS site gains and losses show more evidence of positive selection on thechimpanzee branch (*P,0.03, ** P,0.002). Common sites show an equivalent amount of selection on both branches. (d) Percentage overlap of DHSGains (combined from both human and chimpanzee), DHS Losses, and Common DHS sites compared to evolutionarily constrained regions generatedusing GSC (Materials and Methods). Regions were divided into three compartments: promoter, intron, and intergenic regions. The black dotrepresents the null expectation of finding a constrained region and error bars represent one standard deviation.doi:10.1371/journal.pgen.1002789.g006
Primate Regulatory Element Evolution
PLoS Genetics | www.plosgenetics.org 6 June 2012 | Volume 8 | Issue 6 | e1002789
chimpanzee accelerated conserved non-coding sequences
(CACNSs), or human accelerated regions (HARs; Table S11)
[14,36–38]. More generally, few DHS sites from any human cell
type we have analyzed, including embryonic stem cells, corre-
spond to genomic regions of accelerated turnover (Table S11e).
This lack of overlap may be due to the absence of DNase-seq data
from specific developmental cell types since HACNSs, CACNSs,
and HARs have been associated with developmental gene
regulation, or to regions of accelerated turnover representing a
different type of genetic element not detected by DNase mapping.
We examined sequence conservation in DHS gains, losses, and
Common sites using evolutionarily constrained regions defined by
PhastCons [14,39] and GERP [40] algorithms with Genome
Structure Correction (GSC) overlap test statistic [19,41,42]. By
PhastCons analysis, we found that Common DHS sites were the
most conserved, a characteristic of regions under negative
selection (Figure S9). Common regions also had the greatest
overlap with evolutionarily conserved elements, as defined by
GERP (Figure 6d; Materials and Methods). The presence of
Common DHS sites in most human cell types (Figure 4c) with
presumably greater functional demands may contribute to their
higher conservation levels relative to gains and losses. Additionally,
losses in both species were more conserved and overlapped more
with conserved elements than gains (Figure S9) suggestive of
relaxed selection and positive selection, respectively. These trends
held true even when noncoding genomic regions were partitioned
based on their relationship to genes (promoter, intron, intergenic;
Figure 6d). In general, higher degree of conservation within
specific regions of the genome can result from local differences
either in mutation rate or selection [43]. Given that localized
decreases in mutation rate below background are unusual, our
data suggest that sequence conservation within Common DHS
sites is primarily driven by negative selection to maintain function.
A large fraction of DHS gains (,70%), losses (,60%), and
Common (,40%) sites did not overlap any highly conserved
elements (Figure 6d). Thus, many DHS sites present in all three
species, and possibly many or all of 27 human cell types, are not
highly conserved. Understanding how these regions function in all
species and cell types without high sequence conservation poses an
interesting challenge for evolutionary genomics.
DHS gains near DHS losses are potential binding siteturn-over regions
Previous studies have shown that individual transcription factor
binding sites (TFBS) ‘‘turn over’’ rapidly during evolution [44–46].
Transposon-mediated shifts in the position of enhancers have also
been documented between mouse and human [47]. While these
showed evidence of TFBS positional change, the turnover of entire
DHS sites have not been shown previously. We identified ten
possible instances of regulatory-element shuffling where a human
DHS gain maps near (,50 kb) a human DHS loss (Figure S10).
These regions were found near genes associated with obesity
(MCR4, Figure S11), imprinting (GNAS, Figure S12), and glial
cell formation (METRNL, Figure S13). We also found cases of
nearby (,50 kb) human and chimpanzee DHS sites that were
independently gained (Figure S14, Figure S10). One region
mapped within an intron of the SRGAP2 gene (Figure S14),
which is involved in neuronal guidance during brain development.
Overall, the number of DHS gains and losses that mapped within
close proximity to each other was not largely enriched or depleted
based on randomized permutation tests, thus we cannot disprove
that these findings are due to chance observations. Further
detailed functional analyses are needed to determine the biological
significance, if any, of these closely mapped regulatory changes.
DHS sites are found in genomic segments deleted in thehuman or chimp lineage
Our analyses above focused exclusively on DHS sites mapped to
genome sequences shared between all three primate species.
Recently, segments of DNA broadly conserved among mammals
were found deleted specifically in the human (hCONDELs) or
chimpanzee (cCONDELs) genome [48]. It has been proposed that
these largely gene-desert regions contain regulatory elements that
contribute to species-specific phenotypes [41]. We found human
and chimp DHS sites mapped to 6% of cCONDELs and 11% of
hCONDELs supporting their role in species-specific gene expres-
sion (Table S11). Many human fibroblast DHS sites that overlap
cCONDELs were also present in other human cell types (Figure
S15) indicating that some CONDELs contain regulatory elements
with pleiotropic consequences.
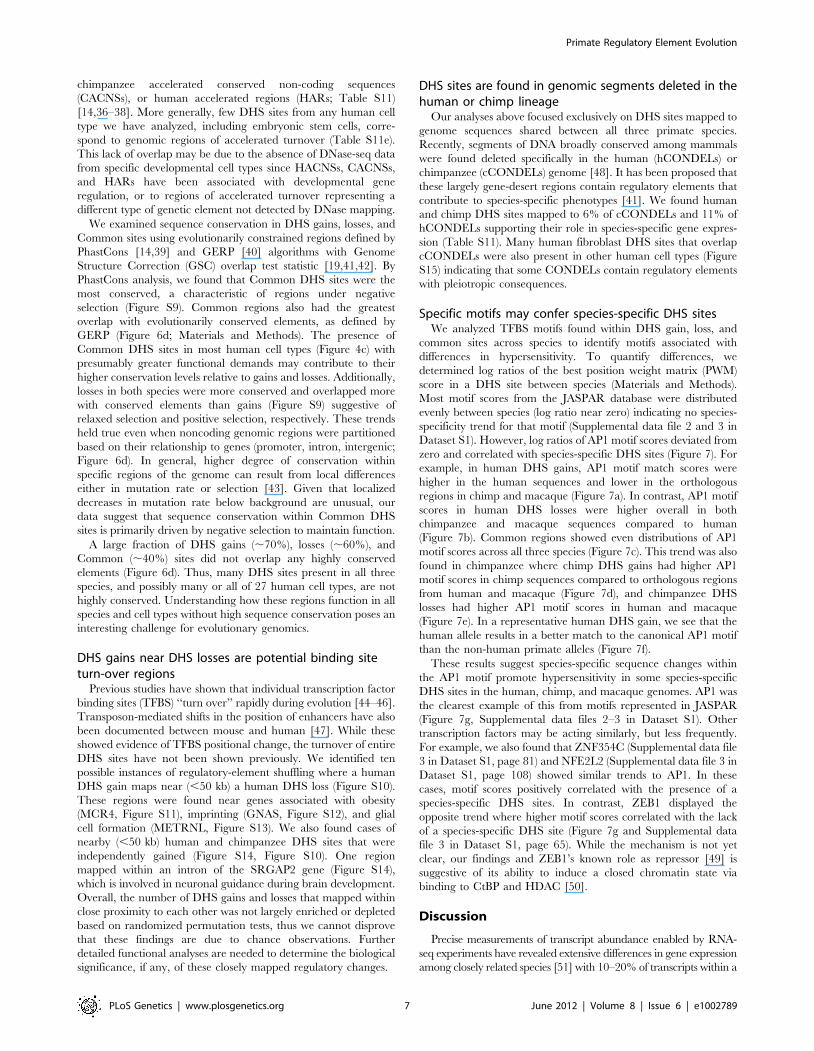
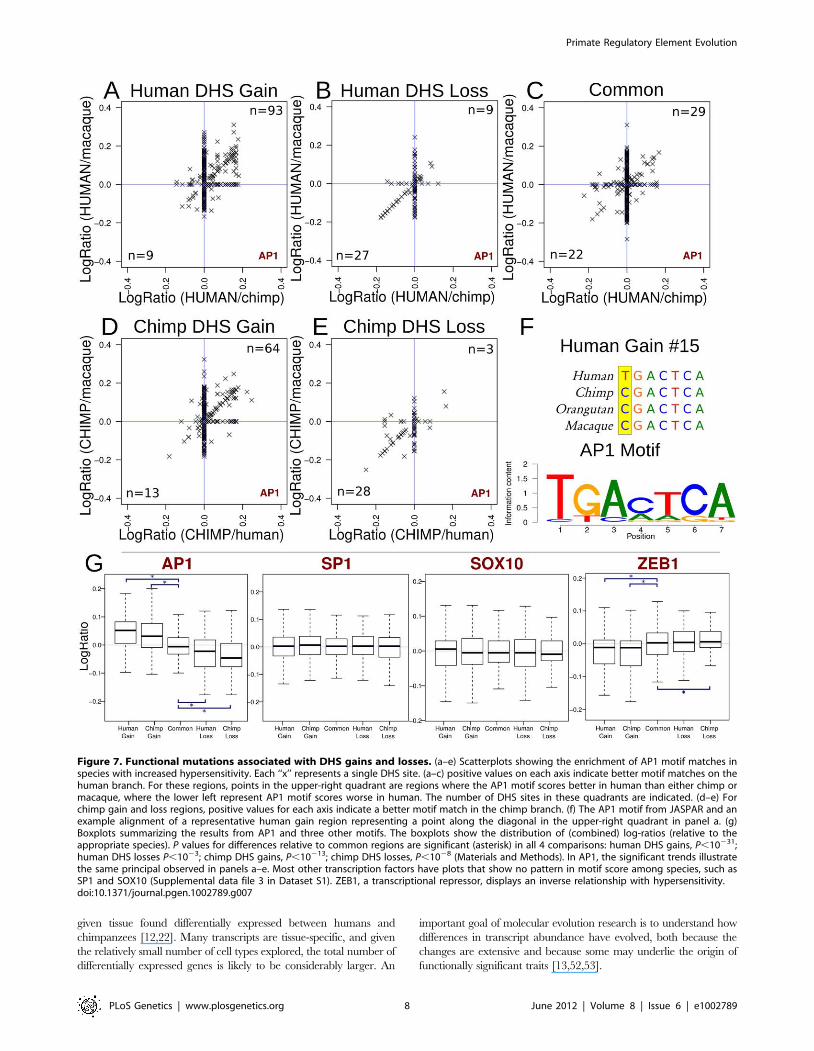
Specific motifs may confer species-specific DHS sitesWe analyzed TFBS motifs found within DHS gain, loss, and
common sites across species to identify motifs associated with
differences in hypersensitivity. To quantify differences, we
determined log ratios of the best position weight matrix (PWM)
score in a DHS site between species (Materials and Methods).
Most motif scores from the JASPAR database were distributed
evenly between species (log ratio near zero) indicating no species-
specificity trend for that motif (Supplemental data file 2 and 3 in
Dataset S1). However, log ratios of AP1 motif scores deviated from
zero and correlated with species-specific DHS sites (Figure 7). For
example, in human DHS gains, AP1 motif match scores were
higher in the human sequences and lower in the orthologous
regions in chimp and macaque (Figure 7a). In contrast, AP1 motif
scores in human DHS losses were higher overall in both
chimpanzee and macaque sequences compared to human
(Figure 7b). Common regions showed even distributions of AP1
motif scores across all three species (Figure 7c). This trend was also
found in chimpanzee where chimp DHS gains had higher AP1
motif scores in chimp sequences compared to orthologous regions
from human and macaque (Figure 7d), and chimpanzee DHS
losses had higher AP1 motif scores in human and macaque
(Figure 7e). In a representative human DHS gain, we see that the
human allele results in a better match to the canonical AP1 motif
than the non-human primate alleles (Figure 7f).
These results suggest species-specific sequence changes within
the AP1 motif promote hypersensitivity in some species-specific
DHS sites in the human, chimp, and macaque genomes. AP1 was
the clearest example of this from motifs represented in JASPAR
(Figure 7g, Supplemental data files 2–3 in Dataset S1). Other
transcription factors may be acting similarly, but less frequently.
For example, we also found that ZNF354C (Supplemental data file
3 in Dataset S1, page 81) and NFE2L2 (Supplemental data file 3 in
Dataset S1, page 108) showed similar trends to AP1. In these
cases, motif scores positively correlated with the presence of a
species-specific DHS sites. In contrast, ZEB1 displayed the
opposite trend where higher motif scores correlated with the lack
of a species-specific DHS site (Figure 7g and Supplemental data
file 3 in Dataset S1, page 65). While the mechanism is not yet
clear, our findings and ZEB1’s known role as repressor [49] is
suggestive of its ability to induce a closed chromatin state via
binding to CtBP and HDAC [50].
Discussion
Precise measurements of transcript abundance enabled by RNA-
seq experiments have revealed extensive differences in gene expression
among closely related species [51] with 10–20% of transcripts within a
Primate Regulatory Element Evolution
PLoS Genetics | www.plosgenetics.org 7 June 2012 | Volume 8 | Issue 6 | e1002789
given tissue found differentially expressed between humans and
chimpanzees [12,22]. Many transcripts are tissue-specific, and given
the relatively small number of cell types explored, the total number of
differentially expressed genes is likely to be considerably larger. An
important goal of molecular evolution research is to understand how
differences in transcript abundance have evolved, both because the
changes are extensive and because some may underlie the origin of
functionally significant traits [13,52,53].
Figure 7. Functional mutations associated with DHS gains and losses. (a–e) Scatterplots showing the enrichment of AP1 motif matches inspecies with increased hypersensitivity. Each ‘‘x’’ represents a single DHS site. (a–c) positive values on each axis indicate better motif matches on thehuman branch. For these regions, points in the upper-right quadrant are regions where the AP1 motif scores better in human than either chimp ormacaque, where the lower left represent AP1 motif scores worse in human. The number of DHS sites in these quadrants are indicated. (d–e) Forchimp gain and loss regions, positive values for each axis indicate a better motif match in the chimp branch. (f) The AP1 motif from JASPAR and anexample alignment of a representative human gain region representing a point along the diagonal in the upper-right quadrant in panel a. (g)Boxplots summarizing the results from AP1 and three other motifs. The boxplots show the distribution of (combined) log-ratios (relative to theappropriate species). P values for differences relative to common regions are significant (asterisk) in all 4 comparisons: human DHS gains, P,10231;human DHS losses P,1023; chimp DHS gains, P,10213; chimp DHS losses, P,1028 (Materials and Methods). In AP1, the significant trends illustratethe same principal observed in panels a–e. Most other transcription factors have plots that show no pattern in motif score among species, such asSP1 and SOX10 (Supplemental data file 3 in Dataset S1). ZEB1, a transcriptional repressor, displays an inverse relationship with hypersensitivity.doi:10.1371/journal.pgen.1002789.g007
Primate Regulatory Element Evolution
PLoS Genetics | www.plosgenetics.org 8 June 2012 | Volume 8 | Issue 6 | e1002789
Most gene expression differences across species likely have a
genetic basis, but it is difficult to relate expression changes to
variation in genome sequences. While many non-coding sequence
differences are unlikely to impact transcription, for the subset that
do, it is often not clear what genes are directly affected. In
addition, a non-coding regulatory mutation may only affect gene
expression in a subset of tissues or developmental stages, so many
functional consequences have gone unrecognized given the limited
number of studies performed thus far. Further complicating
analysis, transcription is influenced by environmental factors and
by epigenetic modifications. But the lack of a complete regulatory
element map across species and tissues is perhaps the most
important impediment to understanding gene expression differ-
ences in terms of genome sequence evolution. Changes in
transcript abundance may be caused by genetic differences within
individual regulatory elements in cis that affect transcription factor
binding affinity [54], or within transcription factors that affect
binding to many regulatory elements in trans. Even when the
genetic basis is known to be in cis, there is no reliable method for
identifying the causal mutations from sequence comparisons. As a
result, distributions of positive and negative selection genome-wide
correlate poorly with changes in transcript abundance [12,55,56].
In this study, we showed that analyzing chromatin accessibility
using DNase-seq provides a powerful approach to link genome
sequence changes to species- and tissue-specific differences in gene
expression. Chromatin accessible DHS sites have three properties
that make them especially valuable for evolutionary analyses of
gene expression [17,18]. First, DHS sites identify all known
functional classes of regulatory elements, including core promot-
ers, enhancers, repressors, boundary elements, and locus control
regions, thus revealing all cis components of transcription through
a single genome-wide assay. Second, DHS sites are only found
when a regulatory element is active or poised, which means that
DNase-seq can be used to identify evolutionary changes in tissue-
and developmental stage-specific regulatory elements. And third,
DHS sites represent only ,2% of the genome, making it possible
to focus analyses on regions that are involved in transcriptional
regulation and ignore regions that are not.
We performed DNase-seq on fibroblasts from three primate
species and identified more than two thousand regulatory elements
apparently gained or lost since the divergence of humans and
chimpanzees. Turnover of regulatory elements was enriched near
genes that display species-specific expression differences, indicating
that gains and losses in DHS sites have functional consequences on
transcript abundance. To our knowledge, this is the first evidence
correlating changes in DNase chromatin accessibility and gene
expression across species at a genome-wide scale. We found most
expression differences occurred without a detectable change in a
nearby regulatory element. One possibility is that mutations within
DHS sites affect transcription factor binding without causing large
changes in overall chromatin accessibility. Future experiments are
needed to identify the specific sequence changes that regulate
expression at long distances and/or via post-transcriptional
mRNA stability mechanisms.
Most regulatory element changes occurred within intergenic
regions and introns and were predominantly associated with cell
type-specific DHS sites. These results are consistent with expected
differences in the extent of pleiotropy: loss of core promoter
elements will more likely affect transcription in many tissues and
stages of development, while loss of distal enhancers will more likely
affect transcription in a subset of tissues. Lower rates of change in
core promoter elements and in regulatory elements actively utilized
in multiple tissues suggest negative selection is operating to maintain
regulatory elements with more critical functions.
Analysis of the DNA sequences within regulatory elements
provides evidence for the operation of natural selection within these
elements. Sequence within DHS sites utilized across all three species
show lower rates of substitution than surrounding DNA, which is a
proxy for neutral evolution by drift, consistent with negative
selection operating to maintain their function. In contrast,
regulatory element gains on the human and chimpanzee branches
have significantly elevated rates of substitution, consistent with
positive selection for altered function, while regulatory element
losses show slightly elevated rates, perhaps due to relaxed selection.
Explicit tests for positive selection using branch-specific likelihood
ratio tests [16] reveal that the highest association is with regulatory
element gains and the lowest with common regulatory elements
utilized in all three species. Thus, the genome-wide distribution of
both negative and positive selection within regulatory elements
correlates in predicted ways with the evolutionary conservation and
change in their function. Although we are not aware of any previous
evidence for such a relationship, it seems likely in principle that the
operation of natural selection is often tied to gains, losses, and
conservation of regulatory elements. Most instances of inferred
positive selection we identified do not overlap previously described
HARs [14] or HACNs [36] highlighting that our DHS gains and
losses represent a novel set of differential regulatory elements may
have played a role in adaptation during human evolution.
Many studies have documented evolutionary gains and losses of
individual transcription factor binding sites or H3K4me3 histone
marks among related species [44–46,57], but this is the first
evidence showing gains and losses of entire DHS sites. Since we
only examined two cell types and applied conservative identifica-
tion criteria, the full extent of regulatory element changes between
humans and chimpanzees is likely to be considerably greater than
we report. Nonetheless, the instances of turnover we identified
suggest regulatory element gains and losses are a common class of
functional change within evolving genomes.
We show that sequence differences among species within
particular motifs may result in species-specific DHS sites, which
suggests one way non-coding regulatory variants can alter
chromatin structure. In particular, mutations that produce better
matches to the activator protein 1 (AP1) motif on either the human
or chimpanzee genome correlate with the presence of species-
specific DHS sites, a result detected in human DHS gains and losses
as well as chimpanzee gains and losses. Sequence changes increasing
the affinity for AP1 motif more likely drive species-specific changes
in chromatin structure rather than species-specific coding mutations
within the AP1 components, FOS and JUN proteins, altering the
sequence-binding preference of AP1. Since only a minority of
species-specific DHS gains and losses has differential AP1 motif
scores (Figure 7), this indicates the majority of factors that govern
species-specific DHS sites remain to be discovered. AP1 has been
implicated in many aspects of cellular function ranging from
proliferation, transformation, differentiation, oncogenesis, apopto-
sis, hormone activation, to tumor suppression [58–61]. We provide
evidence that other factors act similarly to AP1 or in the opposite
direction as repressors, such as ZEB1. Mapping DHS sites across a
more diverse set of primate samples, as well as using additional de
novo motif discovery and performing ChIP-seq to reveal binding
sites, will be an important part of identifying additional factors that
confer changes in chromatin structure across species.
Materials and Methods
Cell types and tissue cultureWe obtained two cell types from Coriell for this study: skin
fibroblast cells and lymphoblastoid cell lines (LCLs). Primary skin
Primate Regulatory Element Evolution
PLoS Genetics | www.plosgenetics.org 9 June 2012 | Volume 8 | Issue 6 | e1002789
fibroblast cells from three human, three chimpanzee, and three
macaque individuals. LCLs, which are B cells immortalized with
Epstein-Barr Virus, were obtained from the same three human
and three chimpanzee individuals that fibroblasts were isolated
from (Table S1). EBV does not reliably transfect macaque
lymphocyte cells, so matched macaque LCLs cells were not
available for this study. Importantly, other recent genome-wide
studies that used macaque LCLs were of B-Lymphocyte cells
transformed with rhesus herpes papio virus, a close relative of
human EBV [57]. Cells from all species were grown in standard
growth media. Fibroblast growth media consisted of Gibco’s
MEM (10370-021), L-Glutamine (25030-081), Pen/Strep (15140-
122), and 10% FBS (Hyclone SH30070). LCLs growth media
consisted of Gibco’s RPMI (21870) media with L-Glutamine, Pen/
Strep, and 15% FBS. We harvested fifty million cells for each
individual biological replicate and allocated 35 million cells for
DNase assays (DNase-seq and DNase-chip), 10 million for
genomic DNA (used as control for DNase-chip array hybridiza-
tion), and 5 million for RNA DGE-seq expression analysis.
DNaseI HS library preparationDNase-seq libraries we generated as previously described
[17,18] and sequenced via Illumina’s GAII sequencer. DNase-
chip library preparations, used for validation of our DNase-seq
results were performed as previously described [24,25] and were
hybridized to 1% ENCODE Nimblegen arrays [19]. Custom
arrays were designed to cover the orthologous regions from
chimpanzee and macaque. DNase-chip array intensities were
compiled and significant DHS sites were called using ChIPOTle
[62] (P,0.000001 peak cutoff).
DNase-seq aligned to native genomes and lifted to hg19DNase-seq data generated from each species was aligned to the
native genome (human hg19, chimpanzee panTro2, and macaque
rheMac2) using BWA [63]. To directly compare three different
primate species requires that they be aligned to a single reference
sequence. Because both the chimpanzee (panTro2) and macaque
(rheMac2) reference sequences were built from the existing human
reference, we converted all sequences to human coordinates. To
do this, we converted each 20-mer DNase-seq sequence from
panTro2 or rheMac2 to hg19 with liftOver [23], using a match
setting of 80 percent. After conversion to hg19 coordinates, we
used F-seq [64] to identify DNaseI hypersensitive (DHS) sites. The
F-seq scores from the top 100,000 peaks from each sample were
used to determine how well chromatin openness correlates among
all 15 samples (Figure 1). This analysis uses a pairwise Pearson
correlation to compare the similarity among samples.
Identifying species-specific hypersensitive sites and filtersto eliminate liftOver artifacts and CNVs
We used the bioconductor edgeR package to define species-
specific hypersensitive regions [26]. EdgeR is designed to detect
differences in count data among groups of samples. Briefly, it
compares within-group variances to between-group variances
using a negative binomial model, and selects entries with
significant between-group differences. It was designed for differ-
ential expression data such as DGE-seq or RNA-seq, but it is
similarly applicable to read counts generated by DNase-seq. One
key advantage of edgeR is a normalization procedure specifically
designed for high-throughput sequencing studies [26].
To locate significant differences in DNase-seq signal between
species, we first identified the union set of the top 100,000 DHS
sites (as scored by F-seq) from all 15 samples (9 fibroblasts and 6
LCLs). We used bx-python (https://bitbucket.org/james_taylor/
bx-python) to analyze the data. We divided these regions into
windows, attempting to maximize the resolution of the windows
while minimizing the number of windows required:
Defining windows. We divided the union set into overlapping
windows of 300 bp. DHS sites smaller than 300 bp were expanded to
300 bp. Regions larger than 300 bp were tiled with overlapping
windows; the overlap varies depending on the size of the
hypersensitive region to tile. We start by finding the number of
windows that would fit completely inside the defined HS site using the
default overlap (100 bp). If these windows discard fewer than 10% of
the bases on each edge of the HS site, we tile the site using these
windows, because the initial peak calls tend to run a bit wide. If using
the default overlap would cause us to lose more than this edge
threshold (10%), we add another window and adjust the overlap so
the windows exactly cover the entire HS region. These windows
cover almost all of the HS bases in the original, while minimizing the
number of non-HS bases considered for the downstream analysis.
After defining the windows, we liftOver each window back to chimp
and macaque and discard any windows that don’t map. We also
eliminated any windows mapping to the Y chromosome, because we
have female samples. This resulted in ,1.2 million windows across all
DHS sites (Supplemental data file 4 in Dataset S1).
Zero counts filter. We next counted the number of reads
(DNase cuts) that mapped within each window for each sample. To
be certain to compare only regions that are actually found in all 3
primates, we omitted any windows that did not have at least one
read count in at least one individual from each species. We believe
this is a reasonable filter since there is a basal level of DNase
digestion throughout the genome, and regions without any mapping
reads in one species are likely caused by alignment ambiguities (such
reads are lost in the liftOver process) or reference problems.
Significant differences. We then used edgeR to call
windows with significantly different counts in each pairwise
comparison at a false discovery rate of 1%. This defined species-
specific HS windows. For example, to define human-fibroblast-
specific (human DHS gain) regions, we selected any windows with
significantly more counts in humans compared (pairwise) to both
chimp and macaque fibroblasts. We then merged any significant
neighboring windows.
Reciprocal liftOver filter. To confirm that DNase sites
detected in only a single species were not due to a liftOver artifact or
copy-number variation (CNV), we performed a reciprocal liftOver.
Reciprocal liftOver discards regions that do not map 1:1 between
species assemblies. After defining a species-specific or Common
DHS sites (Common DHS described below) in human coordinates,
we the lifted these windows back to panTro2 or rheMac2. We then
compared number of reads from the original native genome
alignment to the read count on the lifted (hg19) reference. We found
that, in general, these scores correlate well. However, some windows
differ in counts on each reference, indicates liftOver artifacts or
CNVs. Windows with native counts exceeding the reference counts
could result from counts from the native assembly being lifted to
multiple places on hg19. Likewise, windows with more reads on
hg19 than on the equivalent native assembly could be caused by
several regions from the native genome lifting to a single location on
hg19. Since these may possibly artificially appear as chromatin gains
or losses, we filter out these scenarios by requiring that the number
of reads on hg19 for chimp/macaque data be within 10% of the
number of reads on the native assembly.
Sharp peaks and assembly filters. Some regions mapped to
areas in the genome that are clear artifacts, most likely CNVs. These
artifacts are expanses where one of the species has much higher levels
of hypersensitivity than the others, and are often located near
Primate Regulatory Element Evolution
PLoS Genetics | www.plosgenetics.org 10 June 2012 | Volume 8 | Issue 6 | e1002789
centromeres or telomeres. A DHS resulting from a massive expansion
in one of our samples compared to reference genome appears as a
large (kb to Mb-scale) DHS site encompassing the entire CNV and/
or DHS sites that cluster closely together. We manually curated a list
of such areas and filtered data mapping within these regions
(Assembly filter). We also eliminate abnormally sharp peaks, which
are likely caused by PCR artifacts, reference assembly inaccuracies,
or small differences in copy number between our samples and the
reference genomes. If any 30 bp window within a region contains
75% or more of the reads in the entire region, these regions are
filtered out as ‘‘sharp peaks’’. Ultimately, we confirmed the regions by
visually inspecting many using both the Integrative Genomics Viewer
(IGV) [65] and the UCSC Genome Browser [23]. These filters apply
to DHS gains, losses, and common regions.
Addressing the confounding effects of skin biopsylocation and Fibroblast heterogeneity
Chang et al. (2002) showed that human skin- and non-skin-
fibroblast samples collected from different locations along the body
plane showed notable differences in transcriptional profiles [29].
Aware of this issue, we made an effort to use fibroblast cultures
made from only skin samples and from the same region of the
upper arm. All 3 replicates of macaque Fibroblasts and one human
Fibroblast were confirmed from Coriell to be from skin biopsies
from the upper arm (the other two locations were unknown). Since
our analysis poses a strict requirement of DHS sites to be present
in all three human individuals to be called a human DHS gain,
having at least one human sample with the biopsy site confirmed
to be from the upper arm ensures that the human gains are not a
result of human DHS gains being a result of, for example, all
human fibroblasts isolated from lower leg. Likewise, to be called a
human chromatin loss, DHS sites have to be absent in all three
human samples (but present in all chimp and macaque samples);
this biopsy location bias is again mitigated by at least one human
sample being from the upper arm.
The Yerkes National Primate Center, from where the chim-
panzee skin fibroblasts were obtained from, unfortunately do not
document the exact location of biopsy. While the standardized
skin punch protocol calls for the location of the skin biopsies to be
from the ear pinna (personal communication with Fawn Conner-
Stroud from Yerkes), we cannot be 100% sure that the samples
were isolated from this location. As described above, human DHS
losses are a result of signal being present in all three chimpanzee
and macaque samples, supporting that these regions are not due to
chimp biopsy location. We also want to reiterate that our skin
fibroblast results are highly similar in LCL lines that are all
uniformly derived from blood samples.
We find that none of our chromatin gains and losses overlap the
Hox genes described in the Chang et al., 2002 paper [29]. In
addition, a more recent analysis by Rinn et al. [30], using more
comprehensive microarrays and more biopsy sites, identified 337
expression array probes (299 unique genes) that were shown to be
highly associated with five different general biopsy site locations.
We have compared this list of genes to both species-specific
chromatin gains/losses, as well as species-specific gene expression,
and find ,3% of the species-specific and common DHS overlap
with the 299 position specific genes. Similarly, species-specific and
commonly expressed genes also show ,3% overlap (Table S12).
Identifying DNaseI hypersensitive sites in all species(‘‘Common’’ sites)
In order ensure that our tests for selection were meaningful, we
wanted to compare chromatin gains and losses with a set of regions
that were open in all species. Rather than simply choose DHS sites
that have the highest scores, we wanted to mirror the level of
hypersensitivity to that of the species-specific regions. This is
important because species-specific DHS sites are not necessarily
the strongest DHS sites. We also wanted to select a set of regions
similar in size to our sets of gains and losses to retain
computational tractability.
To select a set of matched Common DHS sites, we required
that each window be similarly open in all 9 samples from all 3
species. To be considered ‘‘similarly open’’ in a given sample, the
number of counts must lie between the 20% and 80% quantiles for
that sample in the corresponding species-specific regions. For
example, we used the human DHS gains identified by edgeR to
define the distribution for each of the three human samples, and
similarly for chimp and macaque. As such, our set of Common
regions is the set of all windows with DNase counts within this
range for each of the 9 samples (Figure 2d). To reduce the number
of Common regions we found to the most representative set (those
that most closely match the average signal intensity of the differential
DHS sites), we narrowed the quantiles until we found a set of
around one thousand Common regions, which we reasoned would
be a sufficient number to examine summary statistics. To ensure
that our results are not biased for a specific set of Common
regions, we repeated our experiments on a significantly larger set
(,11,000) of Common DHS sites using less stringent criteria
(10%–90% quantile). This larger set is even more enriched for
promoter regions but does not change our conclusions (data not
shown).
After identifying an initial set of potential Common DHS sites,
we filtered out any that appeared to be ‘‘appendages’’ to other
hypersensitive sites. Without this step, many Common DHS sites
would map to the edge of a strong hypersensitive sites. To ensure
that a Common DHS site is a standalone DHS site, we examined
the neighboring windows surrounding the initial set of Common
DHS sites. If a Common DHS site window contained fewer than
80% of the number of reads in the adjacent window on either side,
we filtered it out as most likely an ‘‘appendage’’ to a stronger DHS
site. This resulted in a final list of 1259 Common DHS sites
matched in intensity to the species-specific DHS sites. We also ran
this filter on DHS gains and losses, and found that very few of the
gains (3–5%) and losses (3–8%) get flagged as ‘‘appendages.’’ Of
these, many of them are flagged as a result of FDR threshold issues
that simply didn’t quite highlight a neighboring window, and we
would actually still consider this a legitimate gain region. Because
gain/loss appendages are relatively rare and are largely due to
threshold issues, we elected to retain them in our final list.
Why are there more species-specific increases thandecreases?
In every comparison, we reported more species-specific gains
than losses. The most important factor in determining the size of
these lists is the level of significance we set by choosing a FDR. To
obtain lists that match in length, we could simply adjust the FDR
value for the lists to yield about the same number of regions.
Instead, we decided to keep the FDR constant and select varying
numbers of DHS sites for each category.
However, it is still constructive to consider the disparity. In
other words, ‘‘at a constant FDR (1%), why are there more
species-specific increases than decreases?’’ This is possibly a result
of purifying selection. Because DHS sites are regulatory (and
therefore tend to be conserved), a loss of a DHS site probably
confers a fitness disadvantage. In this case, we would expect to see
more gains than losses.
Primate Regulatory Element Evolution
PLoS Genetics | www.plosgenetics.org 11 June 2012 | Volume 8 | Issue 6 | e1002789
It is also possible that the prevalence of increases is simply a
result of the way we constructed the significance test. A DHS site is
a sparse signal (there are more ‘‘closed’’ regions than ‘‘open’’
regions). Combined this with the asymmetry of the evolutionary
tree: the chimp and human are more similar to each other than
either is to the macaque. A human-specific increase requires both
macaque and chimp to be closed (the default), while a human-
specific decrease requires both macaque and chimp to be open.
This latter scenario will happen less often because the relationship
between chimp and human is closer than either to the macaque.
In short, the greater number of gains than losses in our analysis
may reflect purifying selection on DHS sites; however, it may also
simply be a result of the way we constructed the test, particularly
due to using an outgroup species to polarize the chromatin
structure changes.
Testing for selectionWe tested for evidence of positive selection using the DHS sites
indicated as DHS gains, losses, and commons defined by edgeR
and common analyses (see above). A branch model test [66] in
HYPHY [35] was used to assess evidence for positive selection on
each the human and chimp branches. HYPHY uses a likelihood
ratio test to compare two opposing models. For the null
hypothesis, we specified a composite model that allowed for
negative selection, neutral evolution, or relaxed constraint
specifically on the branch of interest (i.e. the human branch), with
negative or neutral evolution across the rest of the tree. The
alternative hypothesis modeled positive selection only on the
branch of interest, with negative or neutral evolution on the rest of
the tree. For each region, HYPHY performed a likelihood ratio
test comparing these hypotheses and output a P value that can be
interpreted as a level of evidence for positive selection. In order to
test the likelihood of either the null or alternative hypothesis, we
specify both the alignment of the region of interest, as well as a
background sequence alignment assumed to be evolving neutrally
[67]. For the alignment of the region of interest, we used
alignments of human, chimp, macaque, and orangutan precom-
puted at UCSC. For the background sequence, we collected a
separate set of local introns for each region to test, following
Haygood et al. [16]. To define these background alignments, we
started with the UCSC knownGene definition of intron annota-
tions, and then filtered out all first introns, splice junctions, and
hypersensitive sites (in any of the 15 samples in this study). In this
way, we aimed to select sequences that are evolving neutrally.
After defining this set of neutral introns, we used an expanding
window centered on the region of interest to collect introns in a
region up to 100 kb surrounding the center. We added introns to
this collection sequentially as the window expanded until we
reached an alignment of 2000 nucleotides. If we were unable to
find 2 kb of background introns within 100 kb of sequence, we
discarded these regions (this happens rarely). Introns are
commonly assumed to be evolving neutrally [43,68], particularly
when our filtering steps are taken into account; however, there are
still likely to be regulatory sequences present in our background
model, either due to sequences containing DNaseI HS sites in
other cell types not tested or due to unannotated or mis-annotated
transcripts. In order to further correct for this possibility, we
performed each likelihood-ratio test 50 times, using 50 different
bootstrapped versions of the background model. We then
averaged these P values to assign a final P value for each region.
This method has the effect of possibly discarding any elements
under selection in some of the bootstrap replicates, increasing our
ability to detect positive selection even if we inadvertently chose
some background regions under selection. To test significance, for
a given set of regions (e.g. human DHS gains) we ordered the P
values for selection on both hg19 and panTro2, then did a Mann-
Whitney test to see if one branch has higher P values than the
other (Table S10).
The fibroblast DHS sites where we can polarize the differences
using macaque all have significant differences in the direction we
expect, while the Common regions do not have significant
differences. In the LCLs, where we are unable to polarize (no
macaque LCLs were available), we do not detect a significant
difference. This is likely due to a combination of two categories
(gains and losses) that have competing selection (i.e. LCL human
DHS loss = human DHS loss+chimpanzee DHS gain).
Testing for evolutionary constraintWe calculated the observed fraction of overlaps between DHS
sites and evolutionarily constrained regions using constrained
regions defined by the Genome Evolutionary Rate Profiling
(GERP) method [40] executed on Enredo, Pecan, Ortheus (EPO)
[69,70] 33-way alignments. EPO alignments and GERP regions
are available for download at the Ensembl browser (http://
ensembl.org). We then constructed a null distribution of the
fraction of expected overlaps by using the conservative Genome
Structure Correction (GSC) methodology described previously
[19,41,42]. We performed 1000 randomizations and calculated
the mean and standard deviation from the null distribution to
assess the statistical significance of the observed overlap (Figure 6d).
We also used PhastCons to explore degree of sequence
conservation. For each region, we extracted the mean and max
PhastCons score from the primate PhastCons table at UCSC. We
then compared the distribution of these scores across the regions to
see how sequence conservation is related to hypersensitivity
conservation (Figure S9).
Expression analysis using digital gene expression (DGE-seq)
Total RNA purified from 5–10 million cells harvested from the
same cell culture used for DNase-seq were also used to generate
DGE-seq expression libraries as previously described [12,71].
Polyadenylated RNA is captured for enrichment of mRNA and
the oligo dT primer is used to make cDNA. Briefly, DGE-seq is
similar to Serial Analysis of Gene Expression (SAGE) where
mRNA abundance is assessed via counting short sequences of their
cDNA at specific restriction site locations. These DGE-seq
libraries were sequenced using Illumina’s GAII sequencer, and
averaged 10 million 20mer sequences for each sample, which were
then aligned to the samples’ native reference sequence using BWA.
We used EdgeR to detect differences in tag counts across species
by comparing intra-species variances to inter-species variances
using a negative binomial model, and selects expressed genes with
significant between-species differences [26].
Cross-species correlation of genome-wide expressionUnlike the analysis performed for comparing cross-species DHS
sites, we did not liftOver any non-human expression sequences to
human. Instead, we simply compared the DGE-seq sequence
counts that aligned to exonic regions within each species’ native
sequence alignment (Supplemental data file 5 in Dataset S1).
Because of the high level of homology of the exonic regions
between the 3 primate species, we directly compared tag count
numbers between each of the orthologous genes. For the genome-
wide expression correlation comparison (Figure 1), we normalized
tag counts using edgeR to calculate the total library size for each
sample and adjusting the tag counts accordingly so that relative
Primate Regulatory Element Evolution
PLoS Genetics | www.plosgenetics.org 12 June 2012 | Volume 8 | Issue 6 | e1002789
differences between the depth of the sequencing reads did not
influence the results. Next, we filtered out genes that did not have
at least 10 combined tag counts between all of the samples to
decrease the noise associated with genes that fall below the
meaningful level as recommended for edgeR. Following these
filters, we compared the Spearman correlation values between all
of the samples and plotted the results as a heatmap with
hierarchical clustering to show similarities within and between
species and tissue types.
Identification of differentially expressed genes betweenspecies
Using edgeR, we identified genes that were significantly
differentially expressed between the 3 primate species. Compar-
isons between species were performed on a pairwise manner
comparing 3 individuals of one species against 3 individuals from a
second species. The same normalization method and filters used in
the expression correlation analysis was also used prior to defining
the differentially expressed genes. Differential gene expression was
defined as genes having a P value cutoff of 0.05. Using the
Macaque expression result as an outgroup, we identified genes that
displayed high or low expression specifically on the human and
chimp branch. For example, genes we defined as highly expressed
in human (human upregulated genes) are differentially expressed
in both human/chimp and human/macaque comparisons, but not
differentially expressed in the chimp/macaque comparison.
Similar criteria were used to identify genes that display low
expression in human compared to chimp and macaque (human
downregulated genes).
Correlation of species-specific DHS site gains and losseswith species-specific gene expression gains and losses
To firmly establish the connection between differential chro-
matin and differential expression, we tested for significance in
overlap in both directions: First, we tested if differential DHS sites
tend to be located near differentially expressed genes, and second,
we tested if differentially expressed genes tend to have differential
DHS sites nearby.Comparing differential DNase-seq signal to differential
gene expression. We compared human DHS gain, human
DHS loss, chimpanzee DHS gain, and chimpanzee DHS loss
regions to species-specific genes (e.g., human upregulated/
downregulated genes, etc.). We first assigned each DHS site its
nearest gene, then intersected these with each differential
expression set. The number of overlaps for every pairwise
combination of DHS sites vs. differentially expressed genes are
shown in Table S5a. We calculated P values by permuting
(100,000 times) the set of all expressed Fibroblast genes, randomly
selecting the number of genes for each comparison, and
intersecting those random sets with the genes nearest species-
specific DHS sites (Table S7b–S7c). This established a null
distribution of overlaps in random intersects.Comparing differential gene expression to differential
DHS sites. To establish the connection in the opposite
direction, we did a similar analysis in the reverse direction. Using
the UCSC knownGene table, we merged all isoform coordinates
for each gene and found all DHS sites within a surrounding 20 kb
window. We calculated pairwise overlaps of DHS sites between
each differential DHS site list and these lists of all nearby DHS
sites. If a gene contained a differential DHS site within 20 kb, it
was counted as a match. The number of overlaps for every
pairwise combination of sites near differentially expressed genes vs.
differential DHS sites are shown in Table S6a. We then permuted
genes similar to above (1,000 times), located all nearby DHS sites,
and tested for overlap to create a null distribution of overlap count
(Table S8b–S8c).
Identification of mutations in motifs associated withspecies-specific DHS sites
To connect sequence changes to species-specific DHS sites, we
compared JASPAR motif scores across species. We first extracted
the orthologous DNA sequences for human, chimpanzee, and
macaque for each of our DHS gain, loss, and common sites. We
scanned and scored each of these sequences for all the position
weight matrices (PWMs) in the JASPAR database. We scored a
sequence for a given PWM as the highest motif score anywhere in
that sequence. This resulted in a region-by-motif matrix of scores;
each score is the highest score for each motif/sequence
combination. To compare species, we took the log ratio of scores
(human/chimp, human/macaque, and chimp/macaque). Where
this score is 0, the highest score does not differ between species.
Deviations from 0 indicate the direction of improvement in motif
match (in a human/chimp comparison, a positive number means
the best match in the human sequence scored higher than the best
match in the chimp sequence). After calculating these scores and
each pairwise log-ratio, we plotted the log-ratios (Supplemental
data files 2–3 in Dataset S1 and Figure 7) to examine trends. We
calculated the pairwise log-ratios for multiple species comparisons
and plotted these on different axis to check whether increases over
one species correlate with increases over the other. In these two-
dimensional plots, each axis quantifies a different pairwise species
relationship. Points that cluster in the upper-right quadrant have
higher scores than either of the other species; points that cluster in
the lower-left have lower scores. The most interesting variation in
these plots is whether the points congregate in the upper-right or
lower left. To assess significance, we project each data point onto
the y = x line to reduce the dimensionality to 1. We then used the
Wilcoxson rank-sum test to compare each distribution to the
distribution of the common regions (Figure 7g and Supplemental
data file 3 in Dataset S1).
Supporting Information
Dataset S1 Supplemental data file 1. Species-specific DHS
Gains, Losses, and Common regions. Excel file containing
coordinates (hg19) of differential DHS gains, DHS losses, DHS
common regions, as well as a list of upregulated, downregulated,
and commonly expressed genes (UCSC gene symbols). A BED
format (non-Excel) version of the same datasets are also included
(SupplementalDataFile1.zip). Supplemental data file 2. Motif
analysis boxplots. Boxplots showing pairwise comparisons of log
ratios of the best position weight matrix (PWM) in a DHS Gain/
Loss/Common site between each species. Motifs for 130
transcription factors are represented on the X-axis. The Y-axis
shows the ratio of the PWM score change for all DHS sites in the
set of regions (DHS Gains/Losses/Common) being compared for
each TF. Supplemental data file 3. Motif analysis scatterplots.
Scatterplots showing the level of enrichment of a transcription
factor motif in each species to the level of DNase hypersensitivity.
One hundred and thirty TFs were analyzed separately. Supple-
mental data file 4. BED file containing sequence counts for all
DHS regions used for differential DHS analysis. Supplemental
data file 5. Excel file containing sequence counts for all genes
captured by DGE-seq used for differential Expression analysis.
(GZ)
Figure S1 Representative examples of chimpanzee DHS gain
and chimpanzee DHS loss.
(PDF)
Primate Regulatory Element Evolution
PLoS Genetics | www.plosgenetics.org 13 June 2012 | Volume 8 | Issue 6 | e1002789
Figure S2 Species-specific gains and common DHS sites are
highly reproducible in independently isolated matched cell types.
(a) Human DHS gains/losses, Chimp DHS gains/losses, and
Common DHS sites detected in fibroblast cells were compared to
independently derived ENCODE Fibroblast DNase-seq data
generated by the University of Washington ENCODE group. (b)
LCL human DHS gains/losses/common compared to 4 indepen-
dently derived ENCODE lymphoblastoid samples also identified
by the University of Washington ENCODE group.
(PDF)
Figure S3 Differential edgeR analysis of original human and
chimpanzee samples to independently analyzed cell samples.
Similar numbers of human gains and losses are identified when
comparing independently derived human fibroblasts (a) and LCLs
(b) to chimpanzee fibroblasts and LCLs. Very few differentially
open chromatin regions were identified by edgeR when comparing
the 3 original human samples to 3 independently derived human
fibroblast and LCL samples.
(PDF)
Figure S4 Box plot showing DNase intensity of human DHS
gains/losses and common regions across 27 human cell types
shown in Figure 4 heatmaps.
(PDF)
Figure S5 Boxplot of the binary comparison of human DHS
gain/loss, chimpanzee DHS gain/loss, and Common regions to
the DHS peak calls from the 27 other human cell types.
(PDF)
Figure S6 Comparison of chimpanzee DHS gains and DHS
losses to DNase-seq data from other human cell types. These
regions were compared to DNase-seq data generated from 27
other human cell types (Table S3). Heatmap signal intensities are
of maximum DNase-seq parzen scores in log scale, where red
indicates a higher DNase-seq score and blue indicates lower
DNase-seq scores. (a) Chimpanzee DHS sites were identified as
differentially open (chimpanzee DHS gain) in chimpanzee
fibroblasts compared to human/macaque fibroblasts. (b) Chim-
panzee DHS sites identified as differentially closed (Chimpanzee
DHS loss) compared to human and macaque fibroblasts. (c)
DNase-seq signal values for Common regions representing DHS
sites in all three species. Note that more than 50% of Common
regions are also DHS sites in other human tissues. (d, e, f) DNase-
seq signal values for same regions as (a, b, c), but DNase-seq data is
from orthologous region from human and macaque fibroblasts. (g,
h, i) DNase-seq values for same regions as (a, b, c), but from
human and chimpanzee LCLs. (bottom) Box plot shows intensity
values shown in heatmaps.
(TIF)
Figure S7 Species-specific upregulated/downregulated gene
expression levels are correlated with species-specific DHS gains/
losses, respectively. (a) 48 Human upregulated genes (Huma-
nExpUp) intersect genes that were located closest to human DHS
gains (yellow arrow), which is higher than random permutations. 6
Human upregulated genes (HumanExpUp) overlap with genes
located closest to human DHS losses (blue arrow), which is less
than random permutations. (b) Comparison of upregulated genes
(expression gains) and downregulated genes (expression losses) to
genes located nearest to DHS gains and losses. P values were
derived from 1000 random permutations (Materials and Methods).
(PDF)
Figure S8 Comparison of chromatin DHS gains and DHS losses
with genes that are upregulated and downregulated in human vs.
chimpanzee lymphoblastoid cell lines (LCLs). Yellow represents
chromatin and expression matches that occur more often than
random permutations, while blue represent less often. P value
indicated in each box.
(PDF)
Figure S9 Phastcons figure showing sequence conservation.
Histograms comparing the distribution of maximum PhastCons
scores for pooled DHS gains (both human- and chimp-specific
increases), pooled DHS losses (both human- and chimp-specific
decreases), and Common regions. We pooled regions because the
distributions look similar when divided (data not shown). Common
regions have higher PhastCons scores. Average PhastCons scores
show similar trends (data not shown).
(PDF)
Figure S10 Potential regulatory element shuffling: Number of
instances (within 50 k) where fibroblast human DHS gain, human
DHS loss, chimpanzee DHS gain, chimpanzee DHS loss, or
Common regions map other nearby species-specific gains, losses,
or common regions. This plot shows the number of DHS sites that
fall within 50 kb of each other for each pairwise comparison. It
also shows a P value for the significance of the overlap. To
calculate the P values (upper number in each box), we used a
permutation test to compare the number of true overlaps (lower
number in each box) to the number of expected overlaps with a
random set of DHS sites of matching size. Significant enrichments
are bright yellow and depletions bright blue, with both significance
and count shown in the appropriate box. The significance levels
are limited by the number of permutations (1000), so a 0 indicates
a permutation P value ,10‘-3. We find insignificant or only
marginally significant overlaps in most comparisons; for example,
comparing human DHS gains to human DHS losses: human DHS
gains are not located near human DHS losses more often than
expected by chance. The same is true for chimp gains and losses.
However, we do see more significance when comparing human
DHS gains to chimp DHS losses, and chimp DHS gains to human
DHS losses. This indicates that these regions tend to be located
near one another more often than expected by chance.
(PDF)
Figure S11 Potential regulatory element shuffling associated
with obesity. Shown is a human DHS gain nearby a human DHS
loss between the PMAIP1 and melanocortin 4 receptor (MC4R).
MC4R is a gene shown to cause autosomal dominant obesity.
(PDF)
Figure S12 Potential regulatory element shuffling associated
with an imprinted gene. GNAS is an imprinted gene that is
regulated by the GNAS1 antisense transcript. A human DHS gain
is located at the 39 end of the GNAS1 gene, and human DHS loss
in the intron of GNAS1 (upstream of GNAS).
(PDF)
Figure S13 Potential regulatory element shuffling associated
with alternative promoter and glial cell formation. Human DHS
loss associated with meteorin-like (METRNL), a gene associated
with glial cell formation. Nearby is a human DHS gain near an
alternative promoter of the BG3NTL1, a gene with putative
glycosyltransferase activity. Also note a great ape specific DHS
between METRNL/BG2NTL1 genes (present in chimpanzee/
human, but absent in macaque).
(PDF)
Figure S14 Potential case of an independently gained human
and chimpanzee DHS sites associated with neuronal guidance.
Human DHS gain found nearby (,50 kb) a chimpanzee DHS
Primate Regulatory Element Evolution
PLoS Genetics | www.plosgenetics.org 14 June 2012 | Volume 8 | Issue 6 | e1002789
gain. Both mapped within an intron of the SRGAP2, a gene
associated with neuronal guidance during brain development.
(PDF)
Figure S15 Chimp Condel (cCondel) regions heatmap. Shown
are DNase-seq signal intensities (maximum parzen scores) of the
344 cCONDEL regions. The color scale (log) ranges from red,
representing the highest signal intensities, down to black,
representing little/no signal intensity. All 15 primate samples
(fibroblasts and LCLs) used in our DNase-seq analysis and 27
different ENCODE cell lines are represented. Ubiquitous DHS
sites that overlap cCONDELs are clustered on the right, and more
common DHS sites are found in the middle. Note that these
regions are do not have signal in chimpanzee data (C_L or C_F
samples), and a small number also do not contain signal in
macaque data (Q_F samples).
(PDF)
Table S1 Samples used for DNase-seq and DGE-seq analyses.
Basic sequence count statistics are provided with each sample.
(PDF)
Table S2 DNase-seq data is validated by DNase-chip. DNase-chip
libraries from the 15 samples were hybridized to 1% ENCODE DNA
arrays of the corresponding species type. Probes consisted of segments
of DNA sequences matching reference sequence builds hg18
(human), panTro2 (chimpanzee), and rheMac2 (macaque), respec-
tively. The array intensities were compiled and significant DHS sites
were called using ChIPotle (P,0.000001 peak cutoff). We intersected
the DNase-chip sites from each of the 3 individuals samples for each
species and determined the amount that overlap DNase-seq data.
The top 100,000 F-seq called sites were used from each DNase-seq
sample for this comparison.
(PDF)
Table S3 Human cell types analyzed by DNase-seq for the
ENCODE project by our group. All data is available on the
UCSC genome browser (http://genome.ucsc.edu/) and more
specifically at: http://genome.ucsc.edu/cgi-bin/hgTrackUi?hg
sid = 246298273&c = chr21&g = wgEncodeOpenChromDnase
(PDF)
Table S4 Percent overlap of human- and chimpanzee- DHS
gains/losses/common detected in fibroblasts with DHS sites
identified in ENCODE human cell types. FibroP, Fibrobl, and
ProgFib cells were independently derived fibroblasts samples.
(PDF)
Table S5 Percent overlap of human-DHS gains/losses/common
detected in lymphoblasts with DHS sites identified in ENCODE
human cell types. Note high degree of overlap with independently
derived LCLs (GM).
(PDF)
Table S6 Fisher’s exact test for Histone modification and CTCF
ChIP-seq peaks that intersect LCL Human DHS gains/losses/
commons.
(PDF)
Table S7 Relationship between species-specific DHS sites and
differentially expressed genes. Species-specific DHS sites (Human
DHS gain/loss and Chimpanzee DHS gain/loss regions) for the
fibroblast cell type were compared to the expression state of the
closest gene (human up/down and chimp up/down expressed
genes).
(PDF)
Table S8 Relationship between differentially expressed species-
specific genes (human DHS gains/losses, chimpanzee DHS gains/
losses) and the likelihood of finding a species-specific DHS site
within a 20 kb window surrounding those genes.
(PDF)
Table S9 Gene Ontology enrichments associated with species-
specific DHS gain/loss and common regions and human up- and
down- regulated genes. (a) Gene ontology analysis tool, GREAT,
was used to look for any enrichments of biological process or
disease ontologies of genes associated with human and chimpanzee
DHS gain/loss/common regions. (b) Genes identified as differen-
tially expressed in human or chimpanzee fibroblast samples were
analyzed for GO biological process enrichments using DAVID. A
P value threshold of 0.001 was set as the minimum.
(PDF)
Table S10 Testing for selection, P values (Two-tailed Mann-
Whitney test). To test significance, for a given set of regions
(Fibroblast: human DHS gain, human DHS loss, chimpanzee DHS
gain, chimpanzee DHS loss, Common; LCLs: LCL human DHS
gain, LCL human DHS loss, Common) we ordered the P values for
selection on both hg19 and panTro2, then did a Mann-Whitney test
to see if one branch has higher P values than the other.
(PDF)
Table S11 The most rapidly evolving Conserved Non-coding
Sequences (CNSs) minimally overlap species-specific DHS gains
and losses. Human Accelerated Regions (HARs) and Chimpanzee
CONDELs (cCONDELs) did not overlap any species-specific
DHS gains, losses, or common regions. (a) Genome coordinates of
Human Accelerated Conserved Non-coding Sequences (HACNSs)
that overlapped 1 human-specific DHS loss and 1 common DHS
region identified in fibroblasts. (b) Genome coordinates of Chimp
Accelerated Conserved Non-coding Sequences (CACNSs) that
overlapped 1 chimp-specific DHS losses and 1 common DHS
region. (c) Percent of HACNSs, CACNSs, HARs, and cCON-
DELs that overlap the top 100 k DHS peaks (defined by p-value)
from fibroblast and LCL samples in hg19 space. (d) Percent of
Human CONDELs (hCONDELs) that overlap the top 100 k
DHS peaks (defined by P value) from fibroblast and LCL samples
in panTro2 space. (e) The number of HACNSs, CACNSs, HARs,
and cCONDELs that overlap DHS sites identified in 27 diverse
cell lines is consistently low.
(PDF)
Table S12 Genes located closest to human-specific DHS gain/
loss and common regions as well as genes identified as
differentially expressed among the 3 primate species are not
highly associated with genes used to identify Fibroblast biopsy
locations in Rinn et al. 2006 PLoS Genetics [30].
(PDF)
Acknowledgments
We would like to thank two groups for next generation sequencing: Simon
Gregory and Sheetal Ghelani at the David H. Murdock Research Institute,
and Lisa Bukovnik and Fangfei Ye at Duke’s Genome Sequencing and
Analysis core facility.
Author Contributions
Conceived and designed the experiments: YS NCS GAW TSF GEC.
Performed the experiments: YS NCS MW. Analyzed the data: YS NCS
SCJP. Contributed reagents/materials/analysis tools: OF CCB AKT DL
LS B-KL VRI EHM TSF. Wrote the paper: YS NCS GAW TSF GEC.
Primate Regulatory Element Evolution
PLoS Genetics | www.plosgenetics.org 15 June 2012 | Volume 8 | Issue 6 | e1002789
References
1. Robertson M (2010) The evolution of gene regulation, the RNA universe, and
the vexed questions of artefact and noise. BMC Biol 8: 97.
2. Olson MV, Varki A (2003) Sequencing the chimpanzee genome: insights into
human evolution and disease. Nat Rev Genet 4: 20–28.
3. Sholtis SJ, Noonan JP (2010) Gene regulation and the origins of human
biological uniqueness. Trends Genet 26: 110–118.
4. King MC, Wilson AC (1975) Evolution at two levels in humans and
chimpanzees. Science 188: 107–116.
5. Caceres M, Lachuer J, Zapala MA, Redmond JC, Kudo L, et al. (2003) Elevated
gene expression levels distinguish human from non-human primate brains. Proc
Natl Acad Sci U S A 100: 13030–13035.
6. Khaitovich P, Hellmann I, Enard W, Nowick K, Leinweber M, et al. (2005)
Parallel patterns of evolution in the genomes and transcriptomes of humans and
chimpanzees. Science 309: 1850–1854.
7. Gilad Y, Oshlack A, Smyth GK, Speed TP, White KP (2006) Expression profiling in
primates reveals a rapid evolution of human transcription factors. Nature 440: 242–245.
8. Enard W, Khaitovich P, Klose J, Zollner S, Heissig F, et al. (2002) Intra- and
interspecific variation in primate gene expression patterns. Science 296: 340–343.
9. Blekhman R, Marioni JC, Zumbo P, Stephens M, Gilad Y (2010) Sex-specific
and lineage-specific alternative splicing in primates. Genome Res 20: 180–189.
10. Somel M, Franz H, Yan Z, Lorenc A, Guo S, et al. (2009) Transcriptional
neoteny in the human brain. Proc Natl Acad Sci U S A 106: 5743–5748.
11. Xu AG, He L, Li Z, Xu Y, Li M, et al. (2010) Intergenic and repeat transcription
in human, chimpanzee and macaque brains measured by RNA-Seq. PLoS
Comput Biol 6: e1000843. doi:10.1371/journal.pcbi.1000843
12. Babbitt CC, Fedrigo O, Pfefferle AD, Boyle AP, Horvath JE, et al. (2010) Both
noncoding and protein-coding RNAs contribute to gene expression evolution in
the primate brain. Genome Biol Evol 2: 67–79.
13. Carroll SB (2008) Evo-devo and an expanding evolutionary synthesis: a genetic
theory of morphological evolution. Cell 134: 25–36.
14. Pollard KS, Salama SR, King B, Kern AD, Dreszer T, et al. (2006) Forces
shaping the fastest evolving regions in the human genome. PLoS Genet 2: e168.
doi:10.1371/journal.pgen.0020168
15. Prabhakar S, Poulin F, Shoukry M, Afzal V, Rubin EM, et al. (2006) Close
sequence comparisons are sufficient to identify human cis-regulatory elements.
Genome Res 16: 855–863.
16. Haygood R, Fedrigo O, Hanson B, Yokoyama KD, Wray GA (2007) Promoter
regions of many neural- and nutrition-related genes have experienced positive
selection during human evolution. Nat Genet 39: 1140–1144.
17. Boyle AP, Davis S, Shulha HP, Meltzer P, Margulies EH, et al. (2008) High-
Resolution Mapping and Characterization of Open Chromatin across the
Genome. Cell 132: 311–322.
18. Song L, Crawford GE (2010) DNase-seq: a high-resolution technique for
mapping active gene regulatory elements across the genome from mammalian
cells. Cold Spring Harb Protoc 2010: pdb prot5384.
19. Consortium E (2007) Identification and analysis of functional elements in 1% of
the human genome by the ENCODE pilot project. Nature 447: 799–816.
20. Heintzman ND, Stuart RK, Hon G, Fu Y, Ching CW, et al. (2007) Distinct and
predictive chromatin signatures of transcriptional promoters and enhancers in
the human genome. Nat Genet 39: 311–318.
21. Xi H, Shulha HP, Lin JM, Vales TR, Fu Y, et al. (2007) Identification and
characterization of cell type-specific and ubiquitous chromatin regulatory structures in
the human genome. PLoS Genet 3: e136. doi:10.1371/journal.pgen.0030136
22. Blekhman R, Oshlack A, Chabot AE, Smyth GK, Gilad Y (2008) Gene
regulation in primates evolves under tissue-specific selection pressures. PLoS
Genet 4: e1000271. doi:10.1371/journal.pgen.1000271
23. Hinrichs AS, Karolchik D, Baertsch R, Barber GP, Bejerano G, et al. (2006) The
UCSC Genome Browser Database: update 2006. Nucleic Acids Res 34: D590–598.
24. Crawford GE, Davis S, Scacheri PC, Renaud G, Halawi MJ, et al. (2006)
DNase-chip: a high-resolution method to identify DNase I hypersensitive sites
using tiled microarrays. Nat Meth 3: 503–509.
25. Shibata Y, Crawford GE (2009) Mapping regulatory elements by DNaseI
hypersensitivity chip (DNase-Chip). Methods Mol Biol 556: 177–190.
26. Robinson MD, McCarthy DJ, Smyth GK (2010) edgeR: a Bioconductor
package for differential expression analysis of digital gene expression data.
Bioinformatics 26: 139–140.
27. Sabo PJ, Hawrylycz M, Wallace JC, Humbert R, Yu M, et al. (2004) Discovery
of functional noncoding elements by digital analysis of chromatin structure. Proc
Natl Acad Sci U S A 101: 16837–16842.
28. Sabo PJ, Kuehn MS, Thurman R, Johnson BE, Johnson EM, et al. (2006)
Genome-scale mapping of DNase I sensitivity in vivo using tiling DNA
microarrays. Nat Methods 3: 511–518.
29. Chang HY, Chi JT, Dudoit S, Bondre C, van de Rijn M, et al. (2002) Diversity,
topographic differentiation, and positional memory in human fibroblasts. Proc
Natl Acad Sci U S A 99: 12877–12882.
30. Rinn JL, Bondre C, Gladstone HB, Brown PO, Chang HY (2006) Anatomic
demarcation by positional variation in fibroblast gene expression programs.
PLoS Genet 2: e119. doi:10.1371/journal.pgen.0020119
31. Consortium E (2011) A User’s Guide to the Encyclopedia of DNA Elements
(ENCODE). PLoS Biol 9: e1001046. doi:10.1371/journal.pbio.1001046
32. Song L, Zhang Z, Grasfeder LL, Boyle AP, Giresi PG, et al. (2011) Open
chromatin defined by DNaseI and FAIRE identifies regulatory elements that
shape cell-type identity. Genome Res 21: 1757–1767.
33. Ernst J, Kheradpour P, Mikkelsen TS, Shoresh N, Ward LD, et al. (2011)Mapping and analysis of chromatin state dynamics in nine human cell types.
Nature 473: 43–49.
34. McLean CY, Bristor D, Hiller M, Clarke SL, Schaar BT, et al. (2010) GREAT
improves functional interpretation of cis-regulatory regions. Nat Biotechnol 28: 495–501.
35. Pond SL, Frost SD, Muse SV (2005) HyPhy: hypothesis testing using
phylogenies. Bioinformatics 21: 676–679.
36. Prabhakar S, Noonan JP, Paabo S, Rubin EM (2006) Accelerated evolution of
conserved noncoding sequences in humans. Science 314: 786.
37. Prabhakar S, Visel A, Akiyama JA, Shoukry M, Lewis KD, et al. (2008) Human-
specific gain of function in a developmental enhancer. Science 321: 1346–1350.
38. Pollard KS, Salama SR, Lambert N, Lambot MA, Coppens S, et al. (2006) An
RNA gene expressed during cortical development evolved rapidly in humans.Nature 443: 167–172.
39. Siepel A, Bejerano G, Pedersen JS, Hinrichs AS, Hou M, et al. (2005)
Evolutionarily conserved elements in vertebrate, insect, worm, and yeast
genomes. Genome Res 15: 1034–1050.
40. Cooper GM, Stone EA, Asimenos G, Green ED, Batzoglou S, et al. (2005)Distribution and intensity of constraint in mammalian genomic sequence.
Genome Res 15: 901–913.
41. Parker SC, Hansen L, Abaan HO, Tullius TD, Margulies EH (2009) Local
DNA topography correlates with functional noncoding regions of the human
genome. Science 324: 389–392.
42. Bickel PJ, Boley N, Brown JB, Huang H, Zhang NR (2010) Subsamplingmethods for genomic inference. The Annals of Applied Statistics 4: 1660–1697.
43. Graur D, Li W-H (2000) Fundamentals of molecular evolution. Sunderland,Mass.: Sinauer Associates. xiv, 481 p.
44. Bradley RK, Li XY, Trapnell C, Davidson S, Pachter L, et al. (2010) Bindingsite turnover produces pervasive quantitative changes in transcription factor
binding between closely related Drosophila species. PLoS Biol 8: e1000343.doi:10.1371/journal.pbio.1000343
45. Schmidt D, Wilson MD, Ballester B, Schwalie PC, Brown GD, et al. (2010) Five-vertebrate ChIP-seq reveals the evolutionary dynamics of transcription factor
binding. Science 328: 1036–1040.
46. Odom DT, Dowell RD, Jacobsen ES, Gordon W, Danford TW, et al. (2007)
Tissue-specific transcriptional regulation has diverged significantly betweenhuman and mouse. Nat Genet 39: 730–732.
47. Mikkelsen TS, Xu Z, Zhang X, Wang L, Gimble JM, et al. (2010) Comparativeepigenomic analysis of murine and human adipogenesis. Cell 143: 156–169.
48. McLean CY, Reno PL, Pollen AA, Bassan AI, Capellini TD, et al. (2011)Human-specific loss of regulatory DNA and the evolution of human-specific
traits. Nature 471: 216–219.
49. Papadopoulou V, Postigo A, Sanchez-Tillo E, Porter AC, Wagner SD (2010)
ZEB1 and CtBP form a repressive complex at a distal promoter element of theBCL6 locus. Biochem J 427: 541–550.
50. Zhang CL, McKinsey TA, Lu JR, Olson EN (2001) Association of COOH-
terminal-binding protein (CtBP) and MEF2-interacting transcription repressor
(MITR) contributes to transcriptional repression of the MEF2 transcriptionfactor. J Biol Chem 276: 35–39.
51. Brawand D, Soumillon M, Necsulea A, Julien P, Csardi G, et al. (2011) Theevolution of gene expression levels in mammalian organs. Nature 478: 343–348.
52. Wray GA (2006) The evolution of embryonic gene expression in sea urchins.
Integr Comp Biol 46: 233–242.
53. Orgogozo V, Muro NM, Stern DL (2007) Variation in fiber number of a male-
specific muscle between Drosophila species: a genetic and developmentalanalysis. Evol Dev 9: 368–377.
54. Degner JF, Pai AA, Pique-Regi R, Veyrieras JB, Gaffney DJ, et al. (2012) DNaseI sensitivity QTLs are a major determinant of human expression variation.
Nature 482: 390–394.
55. Holloway AK, Lawniczak MK, Mezey JG, Begun DJ, Jones CD (2007) Adaptive
gene expression divergence inferred from population genomics. PLoS Genet 3:e187. doi:10.1371/journal.pgen.0030187
56. Good JM, Hayden CA, Wheeler TJ (2006) Adaptive protein evolution andregulatory divergence in Drosophila. Mol Biol Evol 23: 1101–1103.
57. Cain CE, Blekhman R, Marioni JC, Gilad Y (2011) Gene expression differencesamong primates are associated with changes in a histone epigenetic
modification. Genetics 187: 1225–1234.
58. Shaulian E, Karin M (2002) AP-1 as a regulator of cell life and death. Nat Cell
Biol 4: E131–136.
59. Karamouzis MV, Konstantinopoulos PA, Papavassiliou AG (2007) The
activator protein-1 transcription factor in respiratory epithelium carcinogenesis.Mol Cancer Res 5: 109–120.
60. Eferl R, Wagner EF (2003) AP-1: a double-edged sword in tumorigenesis. Nat
Rev Cancer 3: 859–868.
61. Biddie SC, John S, Sabo PJ, Thurman RE, Johnson TA, et al. (2011)
Transcription factor AP1 potentiates chromatin accessibility and glucocorticoid
receptor binding. Mol Cell 43: 145–155.
62. Buck MJ, Nobel AB, Lieb JD (2005) ChIPOTle: a user-friendly tool for theanalysis of ChIP-chip data. Genome Biol 6: R97.
Primate Regulatory Element Evolution
PLoS Genetics | www.plosgenetics.org 16 June 2012 | Volume 8 | Issue 6 | e1002789
63. Li H, Durbin R (2009) Fast and accurate short read alignment with Burrows-
Wheeler transform. Bioinformatics 25: 1754–1760.64. Boyle AP, Guinney J, Crawford GE, Furey TS (2008) F-Seq: a feature density
estimator for high-throughput sequence tags. Bioinformatics 24: 2537–2538.
65. Robinson JT, Thorvaldsdottir H, Winckler W, Guttman M, Lander ES, et al.(2011) Integrative genomics viewer. Nat Biotechnol 29: 24–26.
66. Zhang J, Nielsen R, Yang Z (2005) Evaluation of an improved branch-sitelikelihood method for detecting positive selection at the molecular level. Mol Biol
Evol 22: 2472–2479.
67. Wong WS, Nielsen R (2004) Detecting selection in noncoding regions ofnucleotide sequences. Genetics 167: 949–958.
68. Gilbert W (1978) Why genes in pieces? Nature 271: 501.
69. Paten B, Herrero J, Beal K, Fitzgerald S, Birney E (2008) Enredo and Pecan:genome-wide mammalian consistency-based multiple alignment with paralogs.
Genome Res 18: 1814–1828.
70. Paten B, Herrero J, Fitzgerald S, Beal K, Flicek P, et al. (2008) Genome-widenucleotide-level mammalian ancestor reconstruction. Genome Res 18: 1829–
1843.71. t Hoen PA, Ariyurek Y, Thygesen HH, Vreugdenhil E, Vossen RH, et al. (2008)
Deep sequencing-based expression analysis shows major advances in robustness,
resolution and inter-lab portability over five microarray platforms. Nucleic AcidsRes 36: e141.
Primate Regulatory Element Evolution
PLoS Genetics | www.plosgenetics.org 17 June 2012 | Volume 8 | Issue 6 | e1002789
Copyright © 2022 FDOKUMEN