Expression profiling of cell cycle genes reveals key facilitators of cell production during carpel...
15
Journal of Experimental Botany, Vol. 62, No. 1, pp. 205–219, 2011 doi:10.1093/jxb/erq258 Advance Access publication 22 August, 2010 This paper is available online free of all access charges (see http://jxb.oxfordjournals.org/open_access.html for further details) RESEARCH PAPER Expression profiling of cell cycle genes reveals key facilitators of cell production during carpel development, fruit set, and fruit growth in apple (Malus3domestica Borkh.) Anish Malladi* and Lisa Klima Johnson Department of Horticulture, 1111 Miller Plant Sciences, University of Georgia, Athens, GA 30602, USA * To whom correspondence should be addressed. E-mail: [email protected] Received 7 June 2010; Revised 1 August 2010; Accepted 2 August 2010 Abstract Cell production is an essential facilitator of fruit growth and development. Cell production during carpel/floral-tube growth, fruit set, and fruit growth, and its regulation by cell cycle genes were investigated in apple (Malus3domes- tica Borkh.). Cell production was inhibited during late carpel/floral-tube development, resulting in growth arrest before bloom. Fruit set re-activated cell production between 8 d and 11 d after full bloom (DAFB) and triggered fruit growth. The early phase of fruit growth involved rapid cell production followed by exit from cell proliferation at ;24 DAFB. Seventy-one cell cycle genes were identified, and expression of 59 genes was investigated using quantitative RT-PCR. Changes in expression of 19 genes were consistently associated with transitions in cell production during carpel/floral-tube growth, fruit set, and fruit growth. Fourteen genes, including B-type cyclin-dependent kinases (CDKs) and A2-, B1-, and B2-type cyclins, were positively associated with cell production, suggesting that availability of G2/M phase regulators of the cell cycle is limiting for cell proliferation. Enhanced expression of five genes including that of the putative CDK inhibitors, MdKRP4 and MdKRP5, was associated with reduced cell production. Exit from cell proliferation at G0/G1 during fruit growth was facilitated by multiple mechanisms including down-regulation of putative regulators of G1/S and G2/M phase progression and up-regulation of KRP genes. Interestingly, two CDKA genes and several CDK-activating factors were up-regulated during this period, suggesting functions for these genes in mediating exit from cell proliferation at G0/G1. Together, the data indicate that cell cycle genes are important facilitators of cell production during apple fruit development. Key words: Cell division, cell expansion, fruit development, fruit size, pollination. Introduction Fruit development in apple (Malus3domestica Borkh.) involves multiple phases of growth: carpel/floral-tube growth, fruit set, and early and later stages of fruit growth, similar to that in other fruits (Gillaspy et al., 1993). Transitions in cell production are closely associated with the above phases of growth. Growth of the carpel/floral-tube following bud break is probably mediated by changes in cell production. Pollina- tion and fertilization, which typically occur several days after bloom in apple, result in seed set and generate signals that initiate fruit growth. Stimulation of growth during fruit set is facilitated by re-activation of cell production (Malladi and Hirst, 2010). Fruit set is followed by an early phase of fruit growth which is largely driven by multiple rounds of cell production (Denne, 1960; Malladi and Hirst, 2010). Transi- tion from cell production-mediated to cell expansion-mediated fruit growth occurs at ;3–8 weeks after bloom, and is associated with exit from mitotic cell production (Denne, 1960; Harada et al., 2005; Malladi and Hirst, 2010). Key questions regarding the regulation of cell production during these growth phases remain unanswered. For example: How is cell production in the carpel/floral-tube prior to bloom regulated? What are the factors involved in the re-activation of cell production during fruit set? How is regulation of the rate and duration of cell production during early fruit growth ª 2010 The Author(s). This is an Open Access article distributed under the terms of the Creative Commons Attribution Non-Commercial License (http://creativecommons.org/licenses/by- nc/2.5), which permits unrestricted non-commercial use, distribution, and reproduction in any medium, provided the original work is properly cited.
-
Upload
independent -
Category
Documents
-
view
2 -
download
0
Transcript of Expression profiling of cell cycle genes reveals key facilitators of cell production during carpel...

Journal of Experimental Botany, Vol. 62, No. 1, pp. 205–219, 2011doi:10.1093/jxb/erq258 Advance Access publication 22 August, 2010This paper is available online free of all access charges (see http://jxb.oxfordjournals.org/open_access.html for further details)
RESEARCH PAPER
Expression profiling of cell cycle genes reveals keyfacilitators of cell production during carpel development, fruitset, and fruit growth in apple (Malus3domestica Borkh.)
Anish Malladi* and Lisa Klima Johnson
Department of Horticulture, 1111 Miller Plant Sciences, University of Georgia, Athens, GA 30602, USA
* To whom correspondence should be addressed. E-mail: [email protected]
Received 7 June 2010; Revised 1 August 2010; Accepted 2 August 2010
Abstract
Cell production is an essential facilitator of fruit growth and development. Cell production during carpel/floral-tube
growth, fruit set, and fruit growth, and its regulation by cell cycle genes were investigated in apple (Malus3domes-
tica Borkh.). Cell production was inhibited during late carpel/floral-tube development, resulting in growth arrest
before bloom. Fruit set re-activated cell production between 8 d and 11 d after full bloom (DAFB) and triggered fruit
growth. The early phase of fruit growth involved rapid cell production followed by exit from cell proliferation at ;24
DAFB. Seventy-one cell cycle genes were identified, and expression of 59 genes was investigated using quantitative
RT-PCR. Changes in expression of 19 genes were consistently associated with transitions in cell production during
carpel/floral-tube growth, fruit set, and fruit growth. Fourteen genes, including B-type cyclin-dependent kinases(CDKs) and A2-, B1-, and B2-type cyclins, were positively associated with cell production, suggesting that
availability of G2/M phase regulators of the cell cycle is limiting for cell proliferation. Enhanced expression of five
genes including that of the putative CDK inhibitors, MdKRP4 and MdKRP5, was associated with reduced cell
production. Exit from cell proliferation at G0/G1 during fruit growth was facilitated by multiple mechanisms including
down-regulation of putative regulators of G1/S and G2/M phase progression and up-regulation of KRP genes.
Interestingly, two CDKA genes and several CDK-activating factors were up-regulated during this period, suggesting
functions for these genes in mediating exit from cell proliferation at G0/G1. Together, the data indicate that cell cycle
genes are important facilitators of cell production during apple fruit development.
Key words: Cell division, cell expansion, fruit development, fruit size, pollination.
Introduction
Fruit development in apple (Malus3domestica Borkh.)
involves multiple phases of growth: carpel/floral-tube growth,
fruit set, and early and later stages of fruit growth, similar to
that in other fruits (Gillaspy et al., 1993). Transitions in cell
production are closely associated with the above phases of
growth. Growth of the carpel/floral-tube following bud break
is probably mediated by changes in cell production. Pollina-tion and fertilization, which typically occur several days after
bloom in apple, result in seed set and generate signals that
initiate fruit growth. Stimulation of growth during fruit set is
facilitated by re-activation of cell production (Malladi and
Hirst, 2010). Fruit set is followed by an early phase of fruit
growth which is largely driven by multiple rounds of cell
production (Denne, 1960; Malladi and Hirst, 2010). Transi-
tion from cell production-mediated to cell expansion-mediated
fruit growth occurs at ;3–8 weeks after bloom, and is
associated with exit from mitotic cell production (Denne,
1960; Harada et al., 2005; Malladi and Hirst, 2010). Key
questions regarding the regulation of cell production duringthese growth phases remain unanswered. For example: How is
cell production in the carpel/floral-tube prior to bloom
regulated? What are the factors involved in the re-activation
of cell production during fruit set? How is regulation of the
rate and duration of cell production during early fruit growth
ª 2010 The Author(s).
This is an Open Access article distributed under the terms of the Creative Commons Attribution Non-Commercial License (http://creativecommons.org/licenses/by-nc/2.5), which permits unrestricted non-commercial use, distribution, and reproduction in any medium, provided the original work is properly cited.
achieved? Additionally, in apple, exit from the mitotic cell
cycle during fruit growth occurs at G0/G1 and does not
involve the onset of endoreduplication, an alternative form of
the cell cycle commonly seen in plants such as Arabidopsis and
tomato (Melaragno et al., 1993; Joubes et al., 2000; Harada
et al., 2005; Malladi and Hirst, 2010). Mechanisms associated
with exit from the mitotic cell cycle at G0/G1 are not well
understood. To address these questions, a clear understandingof mechanisms regulating cell production during fruit de-
velopment is essential.
Cell production is regulated by the sequential progression
of a cell through different phases of the cell cycle. The plant
mitotic cell cycle consists of G1, S, G2, and M phases, where
cell growth, DNA replication, DNA repair, and mitosis
occur, respectively (Inze and De Veylder, 2006). Regulation
of the plant cell cycle is facilitated by a core group of cellcycle genes such as cyclin-dependent kinases (CDKs),
cyclins, CDK inhibitors [Kip-related proteins (KRPs)],
CDK subunits, E2F transcription factors, retinoblastoma-
related genes (RBRs), WEE kinases, and CDC25 phospha-
tases. More than 80 genes constitute the core cell cycle
machinery in Arabidopsis (Vandepoele et al., 2002; Menges
et al., 2005). Similarly, core cell cycle genes have been
identified in maize, tomato, and rice (Chevalier, 2007; Guoet al., 2007; Rymen et al., 2007). While A-type CDKs are
constitutively expressed during the cell cycle, B-type CDKs
are plant specific and are involved in regulating G2/M phase
progression (Menges et al., 2005). CDKs facilitate pro-
gression through the cell cycle in association with specific
cyclin partners. A-type cyclins typically facilitate S and/or
G2/M phase progression, and B-type cyclins regulate pro-
gression of cells through the G2/M phase. D-type cyclinsfacilitate phosphorylation of RBRs, thereby releasing their
inhibitory binding to E2F transcription factors, subse-
quently leading to the activation of S phase progression
(Inze and De Veylder, 2006). Regulation of CDK activity is
facilitated by their association with CDK-activating
kinases, such as CDKF, and with CDK subunits. KRPs
are CDK inhibitors that bind to and inactivate CDKs,
thereby facilitating negative regulation of the cell cycle (DeVeylder et al., 2001; Verkest et al., 2005b). An additional
level of regulation of CDK activity is facilitated by WEE
kinase and a putative CDC25 phosphatase, although the
role of CDC25 in regulating CDK activity may be limited
(De Schutter et al., 2007; Dissmeyer et al., 2009).
Changes in expression of cell cycle genes are often closely
associated with transitions in cell production during organ
growth. A set of 131 cell proliferation-related genes, includingmany cell cycle genes, was identified in Arabidopsis based on
their expression during leaf and root growth (Beemster et al.,
2005). Additionally, activation of cell production in emerging
roots during seed germination is dependent on changes in the
expression of A- and D-type cyclins, as well as other cell cycle
genes (Masubelele et al., 2005). Expression of several cell cycle
genes is associated with cell production during fruit growth in
tomato (Joubes et al., 1999, 2000; Baldet et al., 2006;Chevalier, 2007). Additionally, ovary growth and fruit set in
tomato involve extensive alterations in the cell cycle tran-
scriptome (Vriezen et al., 2008; Pascual et al., 2009; Wang
et al., 2009). It may be hypothesized that transitions in cell
production during carpel/floral-tube growth, fruit set, and
fruit growth in apple are similarly facilitated by extensive
changes in the expression of cell cycle genes.
Cell cycle genes also play important roles in facilitating
exit from the mitotic cell cycle (Buttitta and Edgar, 2007; Lee
et al., 2009). The role of cell cycle genes in regulating mitoticexit through the onset of endoreduplication is well character-
ized in plants (Cebolla et al., 1999; Verkest et al., 2005b;
Lammens et al., 2008; Boudolf et al., 2009). However, regul-
ation of exit from the mitotic cell cycle at G0/G1 by the cell
cycle genes has not been sufficiently explored. Absence of
endoreduplication during fruit growth in apple allows in-
vestigation of the role of cell cycle genes in mediating cell
cycle exit at G0/G1 in the context of organ development.Several studies have previously addressed genome-wide
changes in gene expression during fruit development in apple
(Park et al., 2006; Lee et al., 2007; Janssen et al., 2008).
However, association of quantitative changes in gene expres-
sion with changes in cell production and growth was not
achieved in these studies. The primary goals of this study
were: to identify key potential regulators (among cell cycle
genes) of cell production during different phases of fruitgrowth and development in apple; to understand how these
regulators facilitate transitions in cell production during fruit
growth and development; and to explore the role of these
genes in regulating exit from the mitotic cell cycle at G0/G1
during fruit growth. Kinematic analysis of cell production
and growth, and quantitative analysis of the expression of 59
cell cycle genes were performed to achieve these objectives.
Materials and methods
Plant materials
Mature ‘Gala’ apple (Malus3domestica Borkh.) trees growing onM.7 rootstocks at the Georgia Mountain Research and Experi-ment Station in Blairsville, GA, USA, were used for analysis ofcarpel/floral-tube growth prior to bloom (n¼4). Carpel/floral-tubediameter at the widest part was measured on 10 king flowers pertree. King flowers were collected at 26, 17, 7, and 0 days before fullbloom (DBB), stages roughly corresponding to ‘tight cluster’,‘pink’, ‘open cluster’, and ‘bloom’ stages of apple flower de-velopment, respectively. The carpel/floral-tube region was excisedfrom the flowers and used for histology and gene expressionanalyses. For histology, tissues were fixed in Histochoice (AmrescoInc., Solon, OH, USA). For gene expression analyses, tissues werefrozen in liquid N2 and stored at –80 �C.For analysis of fruit set, mature ‘Gala’ trees on M.7 rootstocks
at the above location were used (n¼4). At 6 DBB (‘open cluster’stage of flower development), flower clusters were manuallythinned to one king flower per cluster and randomly assigned to‘Pollinated’ or ‘Unpollinated’ treatments. To prevent pollinationand fertilization in the ‘Unpollinated’ treatment, flowers wereopened by separating the petals and the styles were clipped withscissors at 6 DBB. For the ‘Pollinated’ treatment, pollen collectedfrom various apple varieties grown at the Horticulture ResearchFarm in Athens, GA, USA, was applied to the stigmatic surface ofopen flowers after bloom. Additionally, flowers in the ‘Pollinated’treatment were allowed to be open-pollinated. The carpel/floral-tube diameter was measured at regular intervals and samples werecollected for histology and gene expression analyses at 0, 8, and
206 | Malladi and Johnson

11 days after full bloom (DAFB). For histology, tissues were fixedin CRAF III fixative (Berlyn and Miksche, 1976). For geneexpression analyses, tissues were frozen as described above.Mature ‘Gala’ trees on M.7 rootstocks at the above location
were used for fruit growth analyses (n¼5). Trees were maintainedaccording to commercial production practices except that nochemical thinning agents were applied. Clusters were manuallythinned to one king fruit per cluster at 11 DAFB. Fruit diameterwas measured at the widest part of the fruit (10 fruits per tree).Fruits from each tree were sampled at different stages duringdevelopment for histology (four fruits per tree) or for geneexpression analyses (4–20 fruits per tree), as described above forthe fruit set study.
Cell number and cell area measurement
Carpel/floral-tube and fruit tissues were sectioned using a vibra-tome. To facilitate efficient sectioning, carpel/floral-tube tissueswere embedded in 6% agarose prior to sectioning. Cell number wasdetermined by counting the number of cell layers between the petalvascular trace and the peel. The relative cell production rate(RCPR) was determined from the cell number data as: [Ln(C2)–Ln(C1)]/T2–T1], where C1 and C2 are the cell numbers at timepoints T1 and T2, respectively. Cell area was determined bycounting the number of cells within a defined area, at threelocations between the epidermis and the petal vascular trace.
Identification of cell cycle genes from apple
Apple expressed sequence tags (ESTs) coding for cell cycle genes wereidentified from publicly available EST databases (NCBI and theApple EST Project: http://titan.biotec.uiuc.edu/apple/). Core cell cyclegenes from Arabidopsis (Menges et al., 2005) were initially used forsimilarity searches in the apple databases, which resulted in theidentification of several cell cycle genes. Additionally, queries forpreviously annotated cell cycle genes (cyclins, CDKs, KRPs, E2Ftranscription factors, RBR genes, WEE kinase, and CDC25) in theApple EST Project database yielded genes with homology to knownplant cell cycle genes. Sequences obtained by the above methods werefurther used to mine the NCBI apple unigene database. Sequenceswithin the unigene sets were analysed to identify putative homeo-logues. Typically, the longest EST within the unigene was used forblastx analysis and a putative function was assigned to the gene basedon its similarity to the Arabidopsis homologue (e-value <1e-05).
RNA extraction and cDNA synthesis
RNA was extracted from carpel/floral-tube and fruit tissues for thefruit set and fruit growth studies as described in Malladi and Hirst(2010). For extraction of RNA from developing carpel/floral-tubetissues, the EZ-RNA extraction kit (Omega Bio-Tek, Norcross, GA,USA) was used following the manufacturer’s instructions. TotalRNA (1 lg) was treated with DNase (Promega Corporation,Madison, WI, USA) prior to cDNA synthesis. ImPromII reversetranscriptase and oligo(dT) (Promega Corporation, Madison, WI,USA) were used for cDNA synthesis following the manufacturer’sinstructions (20 ll reaction volume). Samples without the reversetranscriptase were used to test for genomic DNA contamination.The cDNA was diluted 5-fold for the fruit growth study and 8-foldfor carpel/floral-tube growth and fruit set studies.
Quantitative RT-PCR
Gene-specific primers for quantitative RT-PCR were designed aftermultiple alignment of related genes using Clustal W. In the case ofclosely related genes, primers were designed specifically in non-conserved regions. All primers were validated using a cDNAdilution series. A list of the validated primers used in this study ispresented in Supplementary Table S1 available at JXB online.Primer efficiency ranged from 1.85 to 2.0, and ;80% of the primer
pairs had an efficiency >95%. The specificity of the primer pairs wasverified by melting curve analysis at the end of the RT-PCR. Allprimer pairs used in this study displayed a distinct, single peak inthe melting curve analysis. Quantitative RT-PCR analyses wereperformed on the Stratagene Mx3005P real-time PCR system.Reaction volumes were 14/15 ll using the 2X SYBR-Green MasterMix (Applied Biosystems Inc., Foster City, CA, USA). Reactionparameters were: 95 �C for 10 min; 95 �C for 30 s followed by 60 �Cfor 1 min (40 cycles); and melting curve analysis. Relative expressionof cell cycle genes was calculated according to Pfaffl (2001). Tworeference genes were used for normalization of gene expression datafor the carpel/floral-tube growth and fruit growth studies: MdAC-TIN (accession no. EB127077) and MdGAPDH (accession no.EB146750). The geometric mean of expression of the two referencegenes (normalization factor) was used for normalization of expres-sion of cell cycle genes. For the fruit set study, only MdGAPDH wasused as a reference gene, as expression of MdACTIN decreasedconsiderably at later stages in ‘Unpollinated’ flowers. Representativechanges in the expression of the normalization factor during carpel/floral-tube growth and fruit growth, and of MdGAPDH during fruitset are shown in Supplementary Fig. S1 at JXB online. Expressionof the normalization factor (or MdGAPDH) was generally alteredby <2-fold. Hence, a cut-off value of 2-fold change in expression ofcell cycle genes was used for analysing all quantitative geneexpression data. Expression of a gene relative to its expression atbloom is presented for the fruit set and fruit growth experiments.For the carpel/floral-tube growth study, expression of a gene relativeto its expression at 26 DBB is presented. Three CKLs, five P-typecyclins, and two T-type cyclins were excluded from analysis of geneexpression as little is known regarding their function in plants.Additionally, expression of MdCYCD1 and MdCYCD3;3 could notbe determined as primer pairs did not result in the unequivocalamplification of a single product.
Statistical analyses
Statistical analyses were performed using Minitab-15 (Minitab Inc.,State College, PA, USA) and SigmaPlot 11 (Systat Software Inc.,San Jose, CA, USA). All statistical analyses of gene expression wereperformed on log2-transformed data. Analysis of variance (ANOVA)was used to identify genes that exhibited significantly differentexpression during carpel/floral-tube growth (P <0.05; n¼4). Two-way ANOVA with the general linear model: time, treatment, andtime3treatment (three levels of time, 0, 8, and 11 DAFB; and twolevels of treatment, ‘Pollinated’ and ‘Unpollinated’) was used foranalysing gene expression data for the fruit set study (n¼4), and wasfollowed by Tukey’s multiple comparison test for mean separation(a¼0.05). Carpel/floral-tube diameter, cell layers, and cell area datawere compared between the ‘Pollinated’ and ‘Unpollinated’ treat-ments using a paired t-test (n¼4). ANOVA was used to determine ifexpression of a given cell cycle gene was significantly different acrossvarious stages of fruit development (P <0.05; n¼5). Pearson productmoment correlation analysis was used to analyse the associationbetween RCPR and expression of cell cycle genes (P <0.05). RCPRdata were normalized to the value at bloom prior to correlationanalyses. Clustering of cell cycle genes based on expression profileswas performed using Cluster 3.0 (Eisen et al., 1998), and visualizedin Java TreeView (http://jtreeview.sourceforge.net/manual.html). Hi-erarchical clustering using centred, Pearson correlation with completelinkage was adopted for all clustering analyses.
Results
Identification of core cell cycle genes
Seventy-one genes with homology to known core cell cycle
genes in plants were identified in apple (Table 1). Core cell
cycle-related genes from apple were also compared with
Apple fruit development and the cell cycle transcriptome | 207

predicted genes from Vitis vinifera (Supplementary Table S2
at JXB online). Overall, 14 CDKs representing seven classes
(A, B, C, D, E, F, and G) were identified. The apple trans-
criptome contains two CDKA genes with the ‘PSTAIRE’motif. Two B1- and two B2-type CDKs were identified,
indicating the presence of multiple plant-specific, G2/M
phase-regulating CDKs in apple. Two members each of
C-, E-, and G-type CDKs, a D-type CDK, and a CDK-
activating kinase (MdCDKF1;1) were also identified. Addi-
tionally, six genes with homology to Arabidopsis CDK-like
(CKL) genes are present in the apple transcriptome.
Cyclins constituted the largest class of cell cycle genes inapple (34 genes; A, B, C, D, H, L, P, Q, and T classes). All
three A-type cyclins identified here were classified within the
A2 subclass. Seven B-type cyclins constituted the G2/M
phase-specific group of cyclins. Ten genes representing puta-
tive D-type cyclins, of which five belonged to the D3 sub-
class, were identified. The apple transcriptome also contains
six P-type and three T-type cyclins, the functions of which
in plants are not yet clear.
Four genes with limited homology to Arabidopsis KRPs
and one with similarity to a KRP from Poplar wereidentified in apple. The apple KRP genes were named in the
order of increasing numbers as limited sequence homology
exists among KRPs. Two ESTs with homology to the
Arabidopsis CDK subunit gene (CKS) shared >90% identity
between them and were grouped within the same unigene.
However, sequence analysis of ESTs within the unigene
allowed their classification into two putative homeologous
genes (MdCKS1;1 and MdCKS1;2). Three members be-longing to the E2F-type and related transcription factors
(MdE2F, MdDEL1, and MdDPb) and two genes with simil-
arity to the retinoblastoma genes (MdRBR1 and MdRBR2)
were identified in the apple transcriptome. A single EST
with similarity to the WEE kinase of Arabidopsis and
a putative CDC25 homologue were also identified.
Table 1. List of core cell cycle genes in Malus3domestica
Genename
Accessionno.
Arabidopsishomologue
Genename
Accessionno.
Arabidopsishomologue
MdCDKA1 CN909892 At3g48750 MdCYCD3;1 CV631290 At5g67260
MdCDKA2 CN579054 At3g48750 MdCYCD3;2 CO899912 At4g34160
MdCDKB1;1 CV085424 At3g54180 MdCYCD3;3 CN881828 At4g34160
MdCDKB1;2 EB138473 At2g38620 MdCYCD3;4 CV656302 At5g67260
MdCDKB2;1 CV129014 At1g20930 MdCYCD3;5 GU357629 At4g34160
MdCDKB2;2 CV086331 At1g20930 MdCYCD6 CN997769 At4g03270
MdCDKC1 CV826145 At5g64960 MdCYCH1 CN897477 At5g27620
MdCDKC2 CN997352 At5g64960 MdCYCL1 CN892991 At2g26430
MdCDKD1 CO723214 At1g73690 MdCYCP1 CV149804 At3g63120
MdCDKE1 EB136175 At5g63610 MdCYCP4;1 CX025340 At2g44740
MdCDKE2 CO901481 At5g63610 MdCYCP4;2 CO416200 At2g44740
MdCDKF1;1 CO414989 At4g28980 MdCYCP4;3 CN993644 At2g44740
MdCDKG1 CO901434 At1g67580 MdCYCP4;4 CV883264 At2g44740
MdCDKG2 EH034576 At1g67580 MdCYCP4;5 CN496561 At2g44740
MdCKL1 EB134331 At5g50860 MdCYCQ1 CN581554 At2g01905
MdCKL2 EB155053 At1g54610 MdCYCT1;1 EB137708 At5g45190
MdCKL3 CO723491 At1g57700 MdCYCT1;2 CO723472 At5g45190
MdCKL4 CN901693 At5g50860 MdCYCT1;3 CO865616 At5g45190
MdCKL5 CO416773 At5g50860 MdCYL1 CV882910 At4g34090
MdCKL6 CN926840 At1g53050 MdCYL2 CN948872 At3g19650
MdCYCA2;1 CO416185 At5g11300 MdKRP1 CN495867
MdCYCA2;2 CO722204 At5g11300 MdKRP2 CO723015 At5g48820
MdCYCA2;3 CO415585 At1g15570 MdKRP3 CO066613 At2g32710
MdCYCB1;1 CN579062 At5g06150 MdKRP4 CV084380 At1g49620
MdCYCB1;2 CV084069 At3g11520 MdKRP5 CN912198 At1g49620
MdCYCB1;3 CN993377 At3g11520 MdCKS1;1 CO868566 At2g27960
MdCYCB1;4 CO052588 At3g11520 MdCKS1;2 CV466287 At2g27960
MdCYCB2;1 GU357628 At1g20610 MdCAKF1 CO867265 At4g30820
MdCYCB2;2 CV628904 At1g76310 MdDEL1 CV631574 At3g48160
MdCYCB3;1 CN582078 At1g16330 MdE2F CN493661 At2g36010
MdCYCC1;1 CN444354 At5g48630 MdDPb CN493041 At5g03415
MdCYCC1;2 CV081989 At5g48630 MdRBR1 EB124314 At3g12280
MdCYCD1 CO866008 At1g70210 MdRBR2 CN995924 At3g12280
MdCYCD2;1 CO756480 At2g22490 MdWEE1 CO904973 At1g02970
MdCYCD2;2 CO901089 At2g22490 MdCDC25 CN938816 At5g03455
MdCYCD2;3 CN864744 At2g22490
208 | Malladi and Johnson
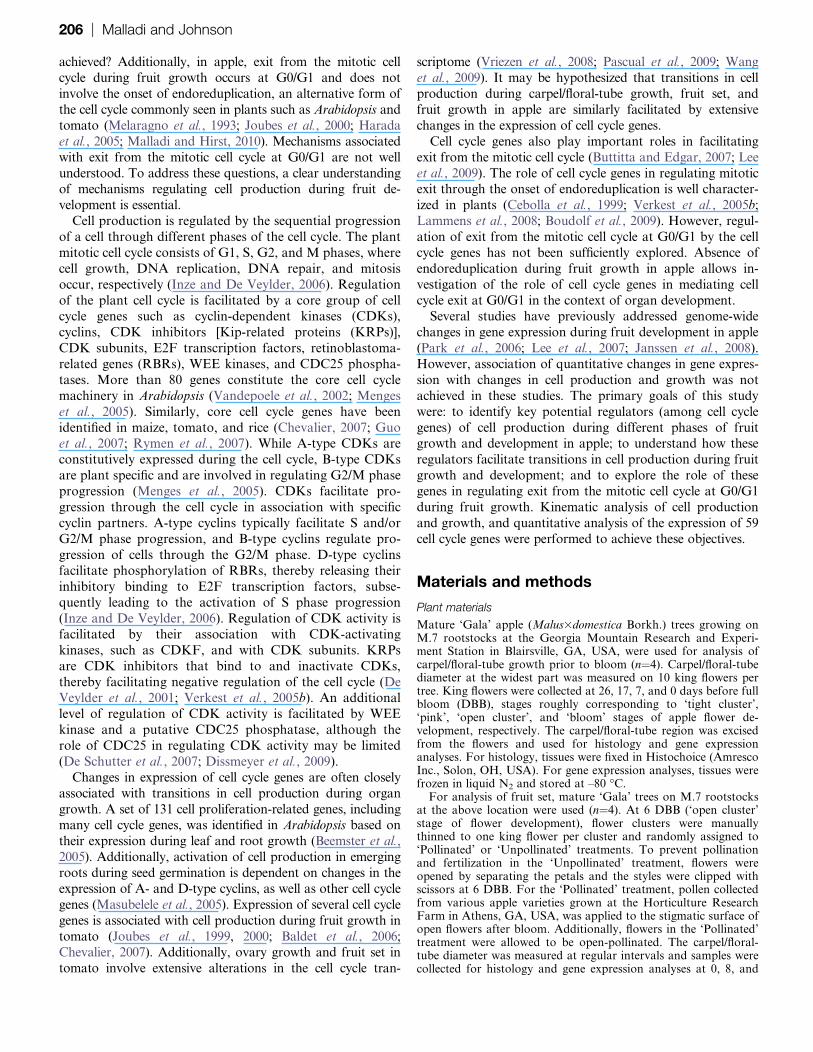
Carpel/floral-tube growth, cell production, and cellexpansion before bloom
Carpel/floral-tube diameter increased by 32% between 17
DBB and 7 DBB, but was not significantly altered between
7 DBB and 0 DBB, indicating that growth of the carpel/
floral-tube ceased around a week before bloom (Fig. 1). Cell
number in the floral-tube increased between 26 DBB and 7DBB by 56% (Fig. 1). However, cell number was not signi-
ficantly different between 7 DBB and 0 DBB, indicating
cessation of cell production concomitant with the arrest in
growth. Between 26 DBB and 0 DBB, cell area increased by
only 13% (Fig. 1). Hence, the majority of carpel/floral-tube
growth prior to bloom is facilitated by cell production.
These data also indicate that arrest in carpel/floral-tube
growth prior to bloom is primarily facilitated by a reductionin cell production.
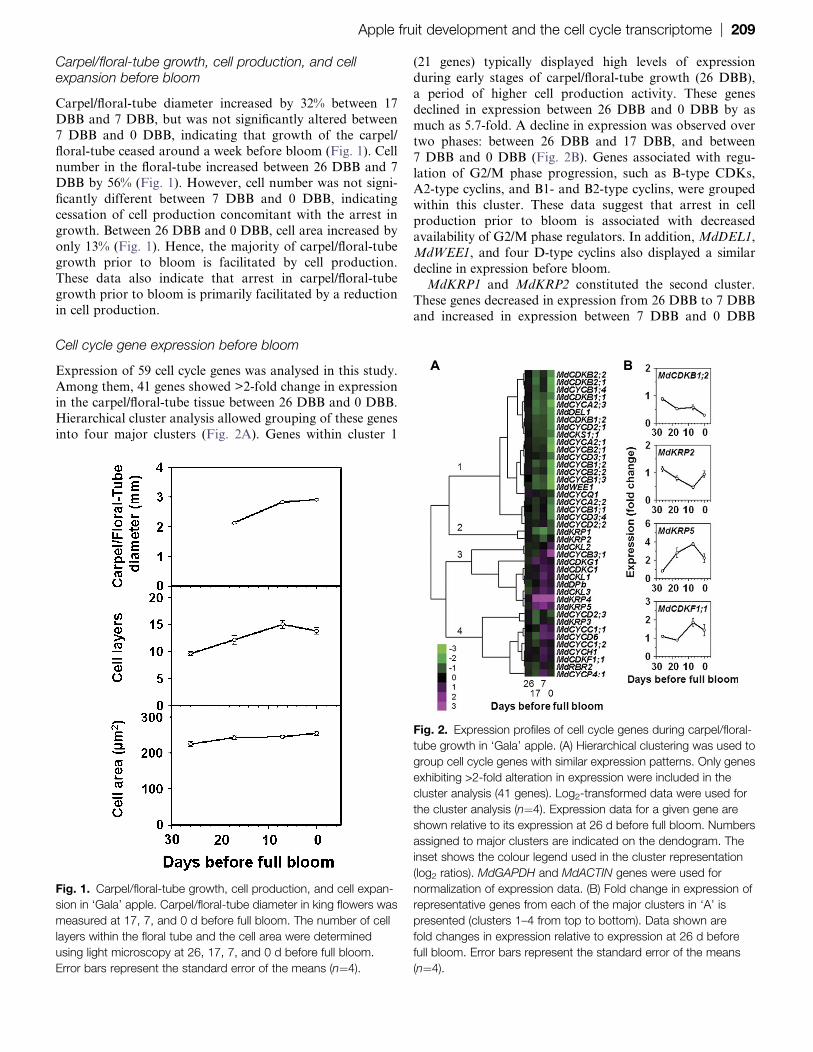
Cell cycle gene expression before bloom
Expression of 59 cell cycle genes was analysed in this study.
Among them, 41 genes showed >2-fold change in expressionin the carpel/floral-tube tissue between 26 DBB and 0 DBB.
Hierarchical cluster analysis allowed grouping of these genes
into four major clusters (Fig. 2A). Genes within cluster 1
(21 genes) typically displayed high levels of expression
during early stages of carpel/floral-tube growth (26 DBB),
a period of higher cell production activity. These genes
declined in expression between 26 DBB and 0 DBB by as
much as 5.7-fold. A decline in expression was observed over
two phases: between 26 DBB and 17 DBB, and between
7 DBB and 0 DBB (Fig. 2B). Genes associated with regu-
lation of G2/M phase progression, such as B-type CDKs,A2-type cyclins, and B1- and B2-type cyclins, were grouped
within this cluster. These data suggest that arrest in cell
production prior to bloom is associated with decreased
availability of G2/M phase regulators. In addition, MdDEL1,
MdWEE1, and four D-type cyclins also displayed a similar
decline in expression before bloom.
MdKRP1 and MdKRP2 constituted the second cluster.
These genes decreased in expression from 26 DBB to 7 DBBand increased in expression between 7 DBB and 0 DBB
Fig. 2. Expression profiles of cell cycle genes during carpel/floral-
tube growth in ‘Gala’ apple. (A) Hierarchical clustering was used to
group cell cycle genes with similar expression patterns. Only genes
exhibiting >2-fold alteration in expression were included in the
cluster analysis (41 genes). Log2-transformed data were used for
the cluster analysis (n¼4). Expression data for a given gene are
shown relative to its expression at 26 d before full bloom. Numbers
assigned to major clusters are indicated on the dendogram. The
inset shows the colour legend used in the cluster representation
(log2 ratios). MdGAPDH and MdACTIN genes were used for
normalization of expression data. (B) Fold change in expression of
representative genes from each of the major clusters in ‘A’ is
presented (clusters 1–4 from top to bottom). Data shown are
fold changes in expression relative to expression at 26 d before
full bloom. Error bars represent the standard error of the means
(n¼4).
Fig. 1. Carpel/floral-tube growth, cell production, and cell expan-
sion in ‘Gala’ apple. Carpel/floral-tube diameter in king flowers was
measured at 17, 7, and 0 d before full bloom. The number of cell
layers within the floral tube and the cell area were determined
using light microscopy at 26, 17, 7, and 0 d before full bloom.
Error bars represent the standard error of the means (n¼4).
Apple fruit development and the cell cycle transcriptome | 209
(Fig. 2B). Cluster 3 included nine genes which increased in
expression from 26 DBB to 7 DBB, and either remained
constant or slightly declined thereafter (Fig. 2B). Two puta-
tive CDK inhibitors, MdKRP4 and MdKRP5, were included
within this cluster. Interestingly, expression of MdKRP4
increased by >25-fold between 26 DBB and 7 DBB (Sup-
plementary Fig. S2 at JXB online). Nine genes were included
in cluster 4 which typically displayed a slight decrease inexpression between 26 DBB and 17 DBB, followed by a sharp
increase in expression between 17 DBB and 7 DBB. Ex-
pression of these genes either remained constant or decreased
slightly between 7 DBB and 0 DBB (Fig. 2B). MdCDKF1;1,
MdRBR2, and several cyclins exhibited this pattern of
expression.
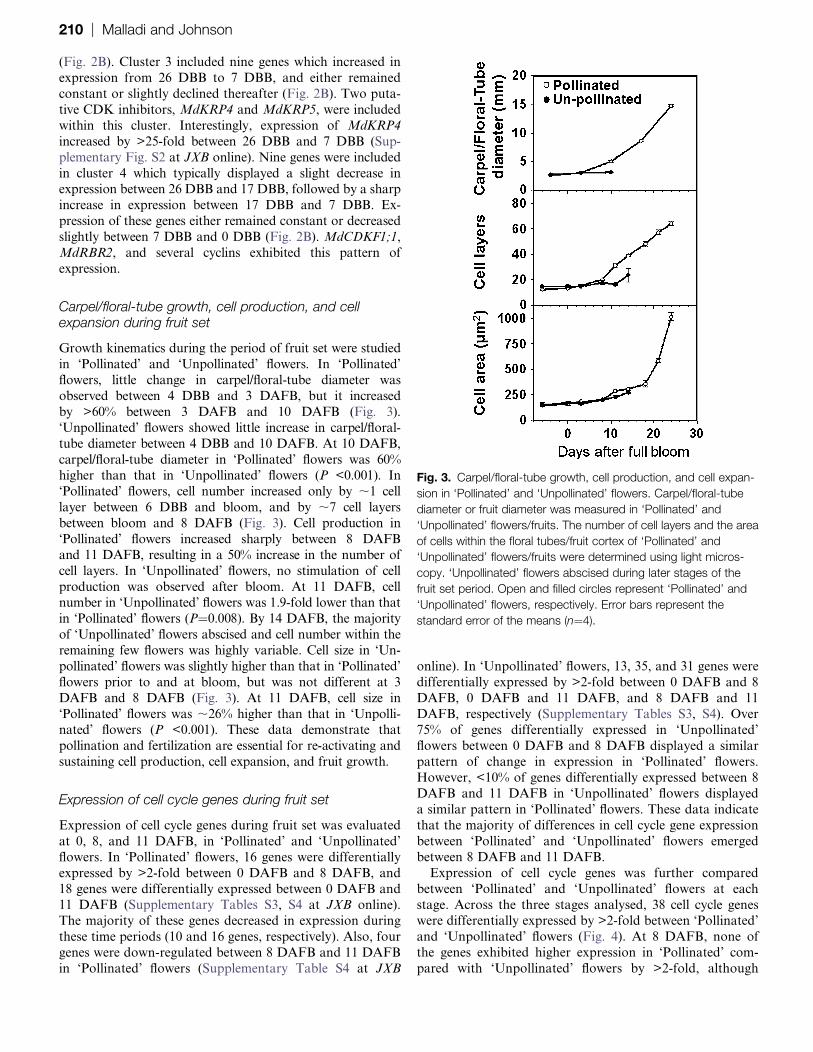
Carpel/floral-tube growth, cell production, and cellexpansion during fruit set
Growth kinematics during the period of fruit set were studied
in ‘Pollinated’ and ‘Unpollinated’ flowers. In ‘Pollinated’
flowers, little change in carpel/floral-tube diameter was
observed between 4 DBB and 3 DAFB, but it increased
by >60% between 3 DAFB and 10 DAFB (Fig. 3).
‘Unpollinated’ flowers showed little increase in carpel/floral-
tube diameter between 4 DBB and 10 DAFB. At 10 DAFB,
carpel/floral-tube diameter in ‘Pollinated’ flowers was 60%higher than that in ‘Unpollinated’ flowers (P <0.001). In
‘Pollinated’ flowers, cell number increased only by ;1 cell
layer between 6 DBB and bloom, and by ;7 cell layers
between bloom and 8 DAFB (Fig. 3). Cell production in
‘Pollinated’ flowers increased sharply between 8 DAFB
and 11 DAFB, resulting in a 50% increase in the number of
cell layers. In ‘Unpollinated’ flowers, no stimulation of cell
production was observed after bloom. At 11 DAFB, cellnumber in ‘Unpollinated’ flowers was 1.9-fold lower than that
in ‘Pollinated’ flowers (P¼0.008). By 14 DAFB, the majority
of ‘Unpollinated’ flowers abscised and cell number within the
remaining few flowers was highly variable. Cell size in ‘Un-
pollinated’ flowers was slightly higher than that in ‘Pollinated’
flowers prior to and at bloom, but was not different at 3
DAFB and 8 DAFB (Fig. 3). At 11 DAFB, cell size in
‘Pollinated’ flowers was ;26% higher than that in ‘Unpolli-nated’ flowers (P <0.001). These data demonstrate that
pollination and fertilization are essential for re-activating and
sustaining cell production, cell expansion, and fruit growth.
Expression of cell cycle genes during fruit set
Expression of cell cycle genes during fruit set was evaluated
at 0, 8, and 11 DAFB, in ‘Pollinated’ and ‘Unpollinated’
flowers. In ‘Pollinated’ flowers, 16 genes were differentially
expressed by >2-fold between 0 DAFB and 8 DAFB, and
18 genes were differentially expressed between 0 DAFB and11 DAFB (Supplementary Tables S3, S4 at JXB online).
The majority of these genes decreased in expression during
these time periods (10 and 16 genes, respectively). Also, four
genes were down-regulated between 8 DAFB and 11 DAFB
in ‘Pollinated’ flowers (Supplementary Table S4 at JXB
online). In ‘Unpollinated’ flowers, 13, 35, and 31 genes were
differentially expressed by >2-fold between 0 DAFB and 8
DAFB, 0 DAFB and 11 DAFB, and 8 DAFB and 11
DAFB, respectively (Supplementary Tables S3, S4). Over
75% of genes differentially expressed in ‘Unpollinated’
flowers between 0 DAFB and 8 DAFB displayed a similar
pattern of change in expression in ‘Pollinated’ flowers.
However, <10% of genes differentially expressed between 8DAFB and 11 DAFB in ‘Unpollinated’ flowers displayed
a similar pattern in ‘Pollinated’ flowers. These data indicate
that the majority of differences in cell cycle gene expression
between ‘Pollinated’ and ‘Unpollinated’ flowers emerged
between 8 DAFB and 11 DAFB.
Expression of cell cycle genes was further compared
between ‘Pollinated’ and ‘Unpollinated’ flowers at each
stage. Across the three stages analysed, 38 cell cycle geneswere differentially expressed by >2-fold between ‘Pollinated’
and ‘Unpollinated’ flowers (Fig. 4). At 8 DAFB, none of
the genes exhibited higher expression in ‘Pollinated’ com-
pared with ‘Unpollinated’ flowers by >2-fold, although
Fig. 3. Carpel/floral-tube growth, cell production, and cell expan-
sion in ‘Pollinated’ and ‘Unpollinated’ flowers. Carpel/floral-tube
diameter or fruit diameter was measured in ‘Pollinated’ and
‘Unpollinated’ flowers/fruits. The number of cell layers and the area
of cells within the floral tubes/fruit cortex of ‘Pollinated’ and
‘Unpollinated’ flowers/fruits were determined using light micros-
copy. ‘Unpollinated’ flowers abscised during later stages of the
fruit set period. Open and filled circles represent ‘Pollinated’ and
‘Unpollinated’ flowers, respectively. Error bars represent the
standard error of the means (n¼4).
210 | Malladi and Johnson

Fig. 4. Expression of cell cycle genes during the period of fruit set in ‘Pollinated’ and ‘Unpollinated’ flowers. (A) Genes exhibiting higher
expression (>2-fold) in ‘Pollinated’ flowers in comparison with ‘Unpollinated’ flowers during the fruit set period are shown. MdCYCD3;4
was the only gene that displayed a >2-fold increase in expression in ‘Pollinated’ flowers at 0d after full bloom. (B) Genes exhibiting higher
expression (>2-fold) in ‘Unpollinated’ flowers in comparison with ‘Pollinated’ flowers during the fruit set period are shown. Gene
expression was determined by quantitative RT-PCR using MdGAPDH for normalization. Fold change in expression of a gene relative to
its expression in ‘Pollinated’ flowers at 0d after full bloom is presented. White bars represent ‘Pollinated’ flowers and black bars represent
‘Unpollinated’ flowers. Error bars indicate the standard error of the means (n¼4).
Apple fruit development and the cell cycle transcriptome | 211

several genes were significantly different. By 11 DAFB, 19
genes displayed higher expression in ‘Pollinated’ flowers
compared with that in ‘Unpollinated’ flowers (Fig. 4A; all
genes except MdCYCD3;4). Changes in expression ranged
from 2.4-fold (MdCDKB1;1) to >93-fold (MdCYCB2;2;
Fig. 4A). The majority of these genes were putative G2/M
phase regulators (13 genes), suggesting that these genes are
essential for re-activating and sustaining cell productionduring fruit set. Additionally, several D-type cyclins also
displayed higher expression in ‘Pollinated’ flowers during
fruit set.
At 8 DAFB, five genes (MdCDKF1;1, MdCKL3,
MdCYCB3;1, MdKRP4, and MdKRP5) exhibited higher
expression (>2-fold) in ‘Unpollinated’ flowers in compari-
son with that in ‘Pollinated’ flowers (Fig. 4B). By 11 DAFB,
18 genes showed higher expression in ‘Unpollinated’ flowersin comparison with that in ‘Pollinated’ flowers, with differ-
ences in expression ranging from 2.1-fold (MdCYCC1;2)
to >21-fold (MdCYCB3;1; Fig. 4B). Interestingly, expres-
sion of several KRP genes was higher by 2- to 4-fold in
‘Unpollinated’ flowers at 11 DAFB. The data suggest that
these genes facilitate inhibition of cell production in the
absence of pollination.
Analysis of growth, cell production, and cell expansionduring fruit development
Carpel/floral-tube diameter changed little between 4 DBB
and 3 DAFB. The increase in fruit diameter was initiated
between 3 DAFB and 10 DAFB (Fig. 5A). Fruit diameter
increased almost exponentially during the early stages (until
32 DAFB) and linearly during later stages of fruit de-
velopment (Fig. 5A). While cell number within the floral-
tube increased by <5 cell layers between 0 DAFB and 8DAFB, a rapid increase in cell number by >50% was
observed between 8 DAFB and 11 DAFB, coincident with
initiation of fruit growth (Fig. 5B). Cell number continued
to increase rapidly until ;24 DAFB. This was followed by
exit from mitotic cell production in the majority of fruit
cortex cells (Fig. 5B). An increase in cell number between 8
DAFB and 11 DAFB was associated with a sharp increase
in the RCPR (Fig. 5C). RCPR subsequently decreasedfrom ;14 DAFB and reached basal levels by 32 DAFB.
Although cell number within the fruit cortex continued to
increase during subsequent stages of fruit development, this
occurred at a lower rate than during early fruit growth
(Fig. 5B, C). Cell area increased by >3-fold from bloom
until 21 DAFB (Fig. 5D). However, the majority of increase
in cell size (>24-fold) occurred during later stages of fruit
growth (24–123 DAFB), following exit from cell produc-tion. The above data indicate that early fruit growth was
closely associated with cell production while later stages of
fruit growth were primarily driven by cell expansion.
Expression of cell cycle genes during fruit development
Expression of cell cycle genes was evaluated at 13 stages of
fruit development. All core cell cycle genes analysed here
showed a significant change in expression by at least 2-fold
among different stages of development while 58 of them
were altered by >3-fold. Hierarchical clustering was used to
identify related groups of cell cycle genes based on their
expression profiles during fruit development (Fig. 6A).
Representative genes from major clusters are shown in
Fig. 6B. Genes within the first cluster (17 genes) exhibitedpeak expression at bloom or immediately after bloom, and
displayed a decrease in expression during the period of
cell production. Expression of some of these genes sub-
sequently increased slightly at ;56 DAFB (Fig. 6B, and
Fig. 5. Fruit growth, cell production kinematics, and cell expan-
sion during fruit development in ‘Gala’ apple. (A) Fruit diameter
was measured from before full bloom until maturity. (B) The
number of cell layers in the fruit cortex was determined at different
stages of fruit development. (C) The relative cell production rate
(RCPR) was determined during the period of fruit development.
(D) The cell area of fruit cortex cells was measured during fruit
development using light microscopy. Error bars represent the
standard error of the means (n¼5).
212 | Malladi and Johnson
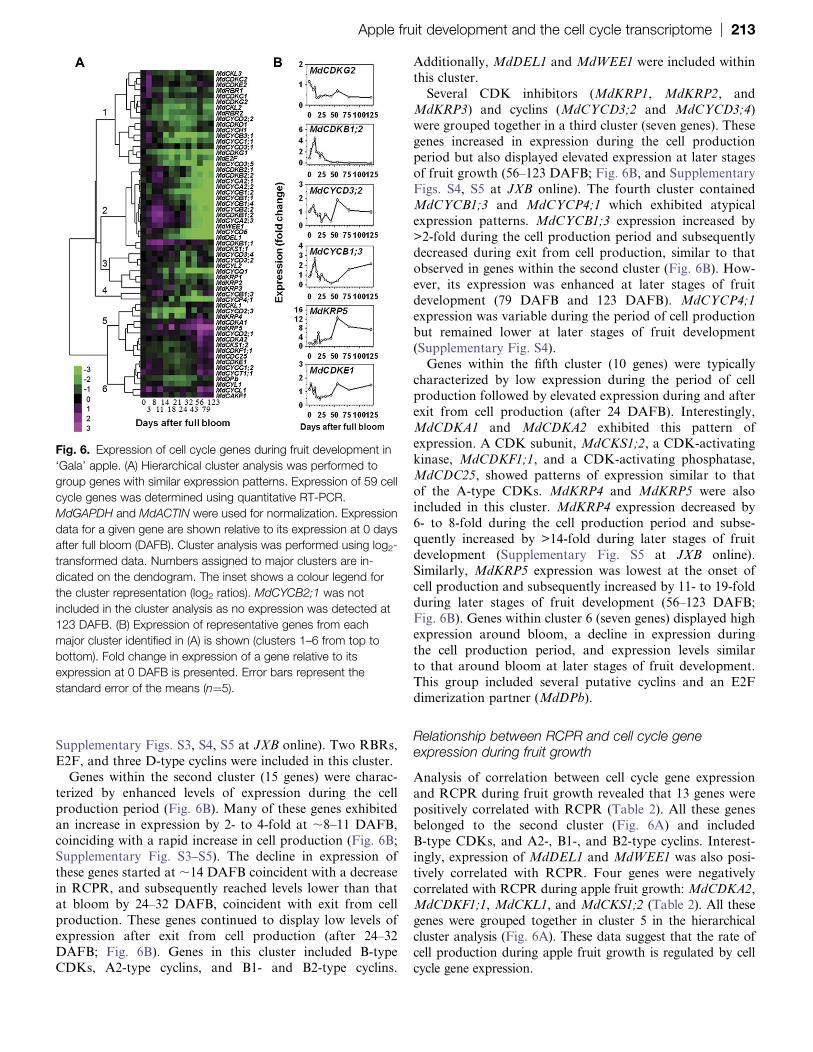
Supplementary Figs. S3, S4, S5 at JXB online). Two RBRs,
E2F, and three D-type cyclins were included in this cluster.
Genes within the second cluster (15 genes) were charac-
terized by enhanced levels of expression during the cell
production period (Fig. 6B). Many of these genes exhibited
an increase in expression by 2- to 4-fold at ;8–11 DAFB,coinciding with a rapid increase in cell production (Fig. 6B;
Supplementary Fig. S3–S5). The decline in expression of
these genes started at ;14 DAFB coincident with a decrease
in RCPR, and subsequently reached levels lower than that
at bloom by 24–32 DAFB, coincident with exit from cell
production. These genes continued to display low levels of
expression after exit from cell production (after 24–32
DAFB; Fig. 6B). Genes in this cluster included B-typeCDKs, A2-type cyclins, and B1- and B2-type cyclins.
Additionally, MdDEL1 and MdWEE1 were included within
this cluster.
Several CDK inhibitors (MdKRP1, MdKRP2, and
MdKRP3) and cyclins (MdCYCD3;2 and MdCYCD3;4)
were grouped together in a third cluster (seven genes). These
genes increased in expression during the cell production
period but also displayed elevated expression at later stages
of fruit growth (56–123 DAFB; Fig. 6B, and SupplementaryFigs. S4, S5 at JXB online). The fourth cluster contained
MdCYCB1;3 and MdCYCP4;1 which exhibited atypical
expression patterns. MdCYCB1;3 expression increased by
>2-fold during the cell production period and subsequently
decreased during exit from cell production, similar to that
observed in genes within the second cluster (Fig. 6B). How-
ever, its expression was enhanced at later stages of fruit
development (79 DAFB and 123 DAFB). MdCYCP4;1
expression was variable during the period of cell production
but remained lower at later stages of fruit development
(Supplementary Fig. S4).
Genes within the fifth cluster (10 genes) were typically
characterized by low expression during the period of cell
production followed by elevated expression during and after
exit from cell production (after 24 DAFB). Interestingly,
MdCDKA1 and MdCDKA2 exhibited this pattern ofexpression. A CDK subunit, MdCKS1;2, a CDK-activating
kinase, MdCDKF1;1, and a CDK-activating phosphatase,
MdCDC25, showed patterns of expression similar to that
of the A-type CDKs. MdKRP4 and MdKRP5 were also
included in this cluster. MdKRP4 expression decreased by
6- to 8-fold during the cell production period and subse-
quently increased by >14-fold during later stages of fruit
development (Supplementary Fig. S5 at JXB online).Similarly, MdKRP5 expression was lowest at the onset of
cell production and subsequently increased by 11- to 19-fold
during later stages of fruit development (56–123 DAFB;
Fig. 6B). Genes within cluster 6 (seven genes) displayed high
expression around bloom, a decline in expression during
the cell production period, and expression levels similar
to that around bloom at later stages of fruit development.
This group included several putative cyclins and an E2Fdimerization partner (MdDPb).
Relationship between RCPR and cell cycle geneexpression during fruit growth
Analysis of correlation between cell cycle gene expression
and RCPR during fruit growth revealed that 13 genes were
positively correlated with RCPR (Table 2). All these genes
belonged to the second cluster (Fig. 6A) and included
B-type CDKs, and A2-, B1-, and B2-type cyclins. Interest-
ingly, expression of MdDEL1 and MdWEE1 was also posi-
tively correlated with RCPR. Four genes were negatively
correlated with RCPR during apple fruit growth: MdCDKA2,MdCDKF1;1, MdCKL1, and MdCKS1;2 (Table 2). All these
genes were grouped together in cluster 5 in the hierarchical
cluster analysis (Fig. 6A). These data suggest that the rate of
cell production during apple fruit growth is regulated by cell
cycle gene expression.
Fig. 6. Expression of cell cycle genes during fruit development in
‘Gala’ apple. (A) Hierarchical cluster analysis was performed to
group genes with similar expression patterns. Expression of 59 cell
cycle genes was determined using quantitative RT-PCR.
MdGAPDH and MdACTIN were used for normalization. Expression
data for a given gene are shown relative to its expression at 0 days
after full bloom (DAFB). Cluster analysis was performed using log2-
transformed data. Numbers assigned to major clusters are in-
dicated on the dendogram. The inset shows a colour legend for
the cluster representation (log2 ratios). MdCYCB2;1 was not
included in the cluster analysis as no expression was detected at
123 DAFB. (B) Expression of representative genes from each
major cluster identified in (A) is shown (clusters 1–6 from top to
bottom). Fold change in expression of a gene relative to its
expression at 0 DAFB is presented. Error bars represent the
standard error of the means (n¼5).
Apple fruit development and the cell cycle transcriptome | 213

Identification of genes consistently associated withchanges in cell production
Cell cycle gene expression data from carpel/floral-tube
growth, fruit set, and fruit growth analyses were used to
identify genes consistently associated with alterations in cell
production. Genes positively associated with cell production
were identified by: high expression during the initial stagesof carpel/floral-tube growth followed by low expression
during later stages (cluster 1 of Fig. 2A); higher expression
in ‘Pollinated’ flowers during fruit set (Fig. 4A and
Supplementary Table S3 at JXB online); and high expres-
sion during the cell production phase of fruit growth
followed by low expression at later stages (cluster 2 of Fig.
6A and genes positively correlated with RCPR). Fourteen
genes were positively associated with cell production acrossall three data sets (Table 3). Putative G2/M phase-specific
regulators of the cell cycle were over-represented within this
group (12 genes). Genes negatively associated with changes
in cell production were identified by: low expression during
early carpel/floral-tube growth followed by peak expression
around bloom (clusters 3 and 4 of Fig. 2A); lower expres-
sion in ‘Pollinated’ flowers during fruit set (Fig. 4B, and
Supplementary Table S4 at JXB online); and low expression
during the cell production phase followed by enhanced
expression at later stages of fruit growth (clusters 5 and 6 ofFig. 6A, and genes negatively correlated with RCPR). Five
genes, MdCDKF1;1, MdCYCC1;2, MdCYCD2;3, MdKRP4,
and MdKRP5, were negatively associated with cell produc-
tion across all data sets (Table 3). Together, the data allowed
the identification of key potential regulators of cell pro-
duction during fruit development.
Discussion
All cell cycle genes analysed in this study exhibited a >2-
fold change in expression during at least one growth phase
of carpel/floral-tube or fruit development, suggesting im-
portant roles for the cell cycle gene family in facilitating cellproduction and growth in apple. A previous microarray
study indicated that only three cell cycle genes were
significantly altered in expression during apple fruit de-
velopment (Janssen et al., 2008). However, in that study
fewer cell cycle genes and only two stages within the cell
production period of fruit growth were analysed. In the
current study, a quantitative method for analysis of gene
expression along with higher temporal resolution, particu-larly during the cell production phase of early fruit growth,
enabled better comprehension of the roles of these genes in
regulating fruit growth. In addition to temporal regulation,
spatial regulation of gene expression may contribute
significantly to fruit development (Lemaire-Chamley et al.,
2005; Mounet et al., 2009). Also, regulation of cell pro-
duction by the cell cycle genes is facilitated through post-
transcriptional mechanisms. Analysis of spatial regulationof cell production in fruits and functional analysis of key
cell production regulators are required to define further the
roles of these genes in apple fruit growth control.
Key facilitators of cell production during fruitdevelopment
Genes positively associated with cell production werelargely constituted by B-type CDKs, and A2-, B1-, and
B2-type cyclins, suggesting that cell proliferation during
different growth phases of fruit development is limited by
the availability of putative G2/M phase regulators of the
cell cycle. A majority of genes associated with cell pro-
liferation during leaf and root growth in Arabidopsis were
M phase-specific factors (Beemster et al., 2005). G2/M
phase-regulating cell cycle genes were also associated withhigh mitotic activity during seed germination in Arabidopsis
and during fruit growth in tomato (Joubes et al., 2000;
Masubelele et al., 2005). Additionally, altered expression of
these genes in Arabidopsis is often associated with changes
in cell production and, in certain cases, with organ growth
Table 3. List of genes consistently associated with cell production
Positively associated genes Negatively associated genes
MdCDKB1;1 MdCDKF1;1
MdCDKB1;2 MdCYCC1;2
MdCDKB2;1 MdCYCD2;3
MdCDKB2;2 MdKRP4
MdCYCA2;1 MdKRP5
MdCYCA2;2
MdCYCA2;3
MdCYCB1;1
MdCYCB1;2
MdCYCB1;4
MdCYCB2;1
MdCYCB2;2
MdDEL1
MdWEE1
Genes were identified from data on expression of cell cycle genesduring carpel/floral-tube growth, fruit set, and fruit growth.
Table 2. Correlation between the relative cell production rate and
cell cycle gene expression during fruit growth
Gene name Correlationcoefficient(r)a
Gene name Correlationcoefficient(r)a
MdCDKB1;1 0.64 MdCDKA2 –0.57
MdCDKB1;2 0.62 MdCDKF1;1 –0.56
MdCDKB2;1 0.59 MdCKL1 –0.56
MdCDKB2;2 0.65 MdCKS1;2 –0.55
MdCYCA2;1 0.58
MdCYCA2;3 0.61
MdCYCB1;1 0.59
MdCYCB1;2 0.55
MdCYCB1;4 0.61
MdCYCB2;1 0.58
MdCYCB2;2 0.64
MdDEL1 0.57
MdWEE1 0.62
a P < 0.05 using Pearson product moment correlation analysis.
214 | Malladi and Johnson

(Doerner et al., 1996; Lee et al., 2003; Li et al., 2005;
Boudolf et al., 2009). Promotion of cell proliferation by G2/
M phase-specific regulators may therefore constitute a con-
served mechanism for facilitating organ growth in plants.
MdDEL1 and MdWEE1 were also positively associated
with cell production in apple. In Arabidopsis, DEL1 is
expressed mostly in actively dividing cell types and is
a negative regulator of exit from the mitotic cell cycle andonset of endoreduplication (Vlieghe et al., 2005; Lammens
et al., 2008). MdDEL1 may similarly prevent exit from cell
proliferation as a decline in its expression was consistently
associated with a reduction in cell production. In addition,
positive correlation of MdDEL1 with RPCR suggests that it
may directly promote cell production during apple fruit
growth. WEE1 is expressed in tissues undergoing rapid cell
proliferation during growth in tomato fruits and Arabidop-
sis leaves, although its expression peaks during the onset of
endoreduplication (Gonzalez et al., 2004, 2007; Beemster
et al., 2005). In Arabidopsis, WEE1 is essential for
checkpoint control during G2/M to allow repair of DNA
damage (De Schutter et al., 2007). Similarly, in apple,
MdWEE1 may trigger checkpoint control mechanisms in
replicating cells in the event of DNA damage, a role
supported by its expression specifically in dividing cells.Alternatively, MdWEE1 may directly promote cell pro-
duction in apple through as yet undefined mechanisms.
Such a function is supported by the positive correlation
between MdWEE1 and RCPR during fruit growth.
KRPs function as negative regulators of the mitotic cell
cycle (Schnittger et al., 2003; Verkest et al., 2005a, b; Weinl
et al., 2005). In apple, MdKRP4 and MdKRP5 were
negatively associated with cell production, suggesting thatinhibition of CDK activity by these KRP genes limits cell
production. In Arabidopsis, CDKF;1 is a positive regulator
of cell proliferation as loss of its function reduces cell
production and endoreduplication (Takatsuka et al., 2009).
Expression of at least one Arabidopsis C-type cyclin is
associated with cell proliferation during leaf growth and
seed germination (Beemster et al., 2005; Masubelele et al.,
2005). D2-type cyclins enhance cell production in responseto mitogenic signals (Riou-Khamlichi et al., 2000; Qi and
John, 2007). Negative association of the above three genes
with cell production in apple is inconsistent with their
putative roles in Arabidopsis, and suggests novel functions
for these genes in regulating apple carpel/floral-tube and
fruit development.
Arrest in cell production and growth during late carpel/floral-tube development
Growth arrest in the carpel/floral-tube tissue from ;7 DBB
until at least 3 DAFB was primarily due to reduced cell
production. Reduction in cell production at this stageappears to be facilitated by a block in G1 progression as at
least some cells retain competence for re-activation of cell
production after fruit set. This indicates an arrest in cell
production or quiescence prior to bloom. An arrest in ovary
growth is also observed prior to anthesis in tomato
(Gillaspy et al., 1993; Pascual et al., 2009), indicating that
cell production arrest prior to anthesis/bloom is a conserved
mechanism to prevent fruit growth in the absence of seed
set. Down-regulation of several D3-type cyclins and en-
hanced expression of MdRBR2 during late carpel/floral-
tube growth suggest a block in G1/S phase progression,
while down-regulation of all putative G2/M phase regula-
tors during this period suggests a block in G2/M pro-gression, thereby facilitating the arrest in cell production.
Similar to data reported here, expression of several cell cycle
genes was found to decrease during pre-anthesis in tomato
(Wang et al., 2009). Conversely, their expression is
enhanced around anthesis in parthenocarpic tomato fruits
which do not exhibit an arrest in ovary growth (Mazzucato
et al., 1998; Pascual et al., 2009). Arrest in cell production
was also associated with enhanced expression of MdKRP4
and MdKRP5. Enhanced KRP activity associated with
these genes may result in the inactivation of G1/S phase-
specific CDK–cyclin complexes as the cell cycle block
occurs at G1 during this period. Together, these data
indicate coordinated down-regulation of cell cycle activity
during late carpel/floral-tube growth.
Several upstream inhibitory mechanisms may constrain
cell production and growth prior to bloom/anthesis. De-creased auxin levels, and/or enhanced activity of negative
regulators of auxin signalling, such as IAA9 and ARF7, may
constitute one such mechanism (Wang et al., 2005, 2009; de
Jong et al., 2009a, b). Alternatively, changes in gibberellic
acid (GA) signalling through enhanced DELLA activity
may facilitate the reduction in cell production. Prominent
roles of GAs in regulating late ovary development and fruit
set, and the recent discovery of the role of GAs inregulating cell proliferation support this hypothesis (Marti
et al., 2007; Achard et al., 2009; de Jong et al., 2009a).
Analyses of changes in the above hormone levels and the
expression/activity of genes associated with their signalling
are essential to better define these mechanisms.
Re-activation of cell production and growth duringfruit set
Pollination and fertilization released the arrest of cell pro-
duction and initiated fruit growth. Impaired progression
of the above events resulted in a sharp decrease and
enhancement of expression of genes positively and negativelyssociated with cell production, respectively. These data clearly
indicate that pollination/fertilization-derived cues, possibly
originating from the seeds, are essential for sustaining
changes in cell cycle gene expression and for re-activating cell
production during fruit set. Some of the early changes in
expression (0–8 DAFB) in ‘Unpollinated’ flowers were similar
to those in ‘Pollinated’ flowers, suggesting that these changes
are at least initially driven by developmental signals. Alter-ation in hormone levels/signalling, either in a developmental
context or as a result of pollination and fertilization, may
facilitate re-activation of cell cycle activity and growth during
fruit set. Interestingly, fruit set in tomato is also associated
with extensive changes in the transcriptome, particularly that
Apple fruit development and the cell cycle transcriptome | 215

of cell cycle genes and hormone biosynthesis- and signalling-
related genes (Vriezen et al., 2008; Wang et al., 2009).
Analysis of genome-wide changes in the transcriptome during
fruit set in apple may provide insights into the molecular
nature of developmental and pollination/fertilization-derived
signals that trigger cell production.
Regulation of the rate and duration of cell productionduring fruit growth
Early fruit growth in apple was characterized by a rapid but
short period of cell production (8–24 DAFB). Several
D-type cyclins displayed enhanced expression during this
period, while the expression of RBR genes was reduced,
suggesting the activation of mechanisms required for pro-
gression through the G1/S phase of the cell cycle. During
this period, many putative G2/M phase regulators of the
cell cycle exhibited expression patterns correlated withRCPR, suggesting that progression through the G2/M
phase may determine the cell cycle duration and thereby
the rate of cell proliferation in apple fruit cells. Negative
correlation of the expression of MdCDKA2, MdCKL1, and
two putative CDK-activating genes with RCPR during this
period is surprising as reduction in CDKA activity in
Arabidopsis is usually associated with decreased cell pro-
duction (Dissmeyer et al., 2009). Analysis of CDKA activityis required to understand the significance of this relation-
ship. Coordinated changes in cell cycle gene expression may
also influence the duration of the cell production phase
during fruit growth as the expression of all genes positively
associated with cell production declined, while that of genes
within clusters 5 and 6 (Fig. 6A) increased prior to the exit
from cell production. Upstream factors controlling final cell
number may facilitate such coordination of cell cycle geneexpression.
Exit from the mitotic cell cycle during fruit growth
Transition from cell production and subsequent differentia-
tion during apple fruit growth may be facilitated by cell
cycle exit at G0 or an arrest in G1, as the majority of fruit
cells exhibit a 2C DNA content during later stages of fruit
development (Harada et al., 2005; Malladi and Hirst, 2010).
Multiple mechanisms appear to facilitate exit from cell
proliferation at G0/G1. A dramatic reduction in expressionof many putative G2/M phase-specific regulators to levels
lower than that during the quiescent stage at bloom was
observed during exit from the cell production phase of fruit
growth. Down-regulation of mitosis-promoting factors such
as the G2/M phase regulators is also required in endoredu-
plicating plants to facilitate exit from the mitotic cell cycle
and to trigger the onset of endoreduplication (Edgar and
Orr-Weaver, 2001; Larkins et al., 2001; Lee et al., 2009).Hence, down-regulation of mitosis-promoting activity may
constitute an essential component of all mechanisms
mediating exit from the mitotic cell cycle.
In addition to reduced mitosis-promoting activity, other
mechanisms such as down-regulation of G1/S phase-
promoting factors also govern exit from cell proliferation
at G0/G1 (Buttitta and Edgar, 2007). E2F transcription
factors are essential for entry and progression through the
S phase during the mitotic cell cycle (De Veylder et al.,
2002). Reduction in MdE2F, and possibly MdDEL1,
expression at later stages of fruit growth in apple may
prevent transcription of genes required for S phase entry
subsequently aiding in exit from cell proliferation at G0/G1.S phase entry and progression are also negatively regulated
by RBR genes as loss of RBR function in tobacco leaves
enhances cell production in mitotically competent cells and
promotes endoreduplication in differentiated cell types
(Park et al., 2005). Expression of MdRBR1 and MdRBR2
was slightly enhanced after exit from cell production in
apple fruits. Together these data suggest that S phase entry
and progression may be down-regulated in apple fruit cellsduring exit from cell proliferation at G0/G1.
CDK inhibitors are important regulators of cell cycle exit
(Buttitta and Edgar, 2007). While moderate overexpression
of KRP genes induces precocious entry into endoreduplica-
tion, strong overexpression leads to complete exit from cell
cycle activity in Arabidopsis (Verkest et al., 2005a, b; Weinl
et al., 2005). Expression of MdKRP4 and MdKRP5 was
greatly enhanced during exit from the cell proliferationphase of fruit growth, suggesting that these genes facilitate
exit from the mitotic cell cycle in apple. However, enhanced
expression of these genes during late carpel/floral-tube
growth was associated with only a quiescent state. Hence,
an increase in expression of these KRP genes may primarily
aid in blocking progression of the cell cycle through G1,
thereby facilitating exit from cell proliferation in apple fruit
cells. Alternatively, a threshold level of KRPs may beessential to trigger exit at G0/G1. High KRP expression at
later stages of fruit growth may aid in overcoming such
a threshold, thereby triggering exit from cell proliferation.
Interestingly in apple, both A-type CDKs displayed
enhanced expression specifically during and following exit
from the cell production phase of fruit growth, suggesting
an increase in CDKA levels and activity during this period.
This is in contrast to mechanisms in endoreduplicatingplant systems where mitotic cell cycle exit, and onset and
progression of endoreduplication are often associated with
a reduction in CDKA activity (Joubes et al., 1999; Verkest
et al., 2005b; Inze and De Veylder, 2006; Vlieghe et al.,
2007). During mitotic cell cycles, lower CDK activity during
the G1 phase is essential to allow assembly of pre-replicative
complexes (pre-RCs) required for DNA replication (Edgar
and Orr Weaver, 2001; Arias and Walter, 2007; Lee et al.,2009). Even within endoreduplication cycles, oscillation in
CDK activity is required to license multiple rounds of DNA
replication (Edgar and Orr Weaver, 2001; Larkins et al.,
2001). Exit from the mitotic cell cycle at G0/G1 may
presumably require the inactivation of mechanisms involved
in DNA replication licensing. Enhanced expression/activity
of CDKA during later stages of apple fruit growth may
reflect a mechanism which prevents pre-RC assemblythereby blocking DNA replication licensing and facilitating
exit at G0/G1. Analysis of CDK activity and identification
216 | Malladi and Johnson

of its partners during exit from cell proliferation at G0/G1
may help in better defining such mechanisms.
Supplementary data
Supplementary data are available at JXB online.Table S1. List of primer sequences used for quantitative
RT-PCR analyses.
Table S2. List of genes with similarity to apple cell cycle
genes in Vitis vinifera.
Table S3. List of up-regulated genes in ‘Pollinated’ and
‘Unpollinated’ flowers across three stages during fruit set.
Table S4. List of down-regulated genes in ‘Pollinated’ and
‘Unpollinated’ flowers across three stages during fruit set.Figure S1. Representative expression patterns of reference
genes/normalization factors used for normalization of cell
cycle gene expression.
Figure S2. Expression of cell cycle genes in the carpel/
floral-tube.
Figure S3. Expression of cyclin-dependent kinases (CDKs)
and CDK-like genes during fruit development in ‘Gala’
apple.Figure S4. Expression of cyclins during fruit development
in ‘Gala’ apple.
Figure S5. Expression of other cell cycle genes during
fruit development in ‘Gala’ apple.
Acknowledgements
The authors thank the staff of the Georgia Mountain
Research and Experiment Station, Blairsville, GA, for their
help with field experiments and tree maintenance.
References
Achard P, Gusti A, Cheminant S, Alioua M, Dhondt S,
Coppens F, Beemster GTS, Genschik P. 2009. Gibberellin
signaling controls cell proliferation rate in Arabidopsis. Current Biology
19, 1188–1193.
Arias EE, Walter JC. 2007. Strength in numbers: preventing
rereplication via multiple mechanisms in eukaryotic cells. Genes and
Development 21, 497–518.
Baldet P, Hernould M, Laporte F, Mounet F, Just D, Mouras A,
Chevalier C, Rothan C. 2006. The expression of cell proliferation-
related genes in early developing flowers is affected by a fruit load
reduction in tomato plants. Journal of Experimental Botany 57,
961–970.
Beemster GTS, De Veylder L, Vercruysse S, West G,
Rombaut D, Van Hummelen P, Galichet A, Gruissem W, Inze D,
Vuylsteke M. 2005. Genome-wide analysis of gene expression
profiles associated with cell cycle transitions in growing organs of
Arabidopsis. Plant Physiology 138, 734–743.
Berlyn GP, Miksche JP. 1976. Fixation and storage. In: Botanical
microtechnique and cytochemistry. Ames, IA: Iowa State University
Press, 24–34.
Boudolf V, Lammens T, Boruc J, et al. 2009. CDKB1;1 forms
a functional complex with CYCA2;3 to suppress endocycle onset.
Plant Physiology 150, 1482–1493.
Buttitta LA, Edgar BA. 2007. Mechanisms controlling cell cycle exit
upon terminal differentiation. Current Opinion in Cell Biology 19,
697–704.
Cebolla A, Vinardell JM, Kiss E, Olah B, Roudier F, Kondorosi A,
Kondorosi E. 1999. The mitotic inhibitor ccs52 is required for
endoreduplication and ploidy-dependent cell enlargement in plants.
EMBO Journal 18, 101–109.
Chevalier C. 2007. Cell cycle control and fruit development. In: Inze
D, ed. Cell cycle control and plant development. Ames, IA: Blackwell
Publishing, 269–293.
Denne P. 1960. The growth of apple fruitlet and the effect of early
thinning on fruit development. Annals of Botany 24, 397–406.
de Jong M, Mariani C, Vriezen WH. 2009a. The role of auxin and
gibberellin in tomato fruit set. Journal of Experimental Botany 60,
1523–1532.
de Jong M, Wolters-Arts M, Feron R, Mariani C, Vriezen WH.
2009b. The Solanum lycopersicum auxin response factor 7 (SlARF7)
regulates auxin signaling during tomato fruit set and development. The
Plant Journal 57, 160–170.
De Schutter K, Joubes J, Cools T, et al. 2007. Arabidopsis WEE1
kinase controls cell cycle arrest in response to activation of the DNA
integrity checkpoint. The Plant Cell 19, 211–225.
De Veylder L, Beeckman T, Beemster GTS, et al. 2002. Control of
proliferation, endoreduplication and differentiation by the Arabidopsis
E2Fa-DPa transcription factor. EMBO Journal 21, 1360–1368.
De Veylder L, Beeckman T, Beemster GTS, Krols L, Terras P,
Landrieu I, Van der Schueren E, Maes S, Naudts M, Inze D.
2001. Functional analysis of cyclin-dependent kinase inhibitors of
Arabidopsis. The Plant Cell 13, 1653–1667.
Dissmeyer N, Weimer AK, Pusch S, et al. 2009. Control of cell
proliferation, organ growth, and DNA damage response operate
independently of dephosphorylation of the Arabidopsis Cdk1 homolog
CDKA;1. The Plant Cell 21, 3641–3654.
Doerner P, Jorgensen JE, You R, Steppuhn J, Lamb C. 1996.
Control of root growth and development by cyclin expression. Nature
380, 520–523.
Edgar BA, Orr-Weaver TL. 2001. Endoreplication cell cycles: more
for less. Cell 105, 297–306.
Eisen MB, Spellman PT, Brown PO, Botstein D. 1998. Cluster
analysis and display of genome-wide expression patterns. Proceedings
of the National Academy of Sciences, USA 95, 14863–14868.
Gillaspy G, Bendavid H, Gruissem W. 1993. Fruits:
a developmental perspective. The Plant Cell 5, 1439–1451.
Gonzalez N, Gevaudant F, Hernould M, Chevalier C, Mouras A.
2007. The cell cycle-associated protein kinase WEE1 regulates cell
size in relation to endoreduplication in developing tomato fruit. The
Plant Journal 51, 642–655.
Gonzalez N, Hernould M, Delmas F, Gevaudant F, Duffe P,
Causse M, Mouras A, Chevalier C. 2004. Molecular
characterization of a WEE1 gene homologue in tomato (Lycopersicon
esculentum Mill.). Plant Molecular Biology 56, 849–861.
Apple fruit development and the cell cycle transcriptome | 217

Guo J, Song J, Wang F, Zhang XS. 2007. Genome-wide
identification and expression analysis of rice cell cycle genes. Plant
Molecular Biology 64, 349–360.
Harada T, Kurahashi W, Yanai M, Wakasa Y, Satoh T. 2005.
Involvement of cell proliferation and cell enlargement in increasing the
fruit size of Malus species. Scientia Horticulturae 105, 447–456.
Inze D, De Veylder L. 2006. Cell cycle regulation in plant
development. Annual Review of Genetics 40, 77–105.
Janssen BJ, Thodey K, Schaffer RJ, et al. 2008. Global gene
expression analysis of apple fruit development from the floral bud to
ripe fruit. BMC Plant Biology 8, 16.
Joubes J, Phan TH, Just D, Rothan C, Bergounioux C,
Raymond P, Chevalier C. 1999. Molecular and biochemical
characterization of the involvement of cyclin-dependent kinase A
during the early development of tomato fruit. Plant Physiology 121,
857–869.
Joubes J, Walsh D, Raymond P, Chevalier C. 2000. Molecular
characterization of the expression of distinct classes of cyclins during
the early development of tomato fruit. Planta 211, 430–439.
Lammens T, Boudolf V, Kheibarshekan L, et al. 2008. Atypical
E2F activity restrains APC/CCCS52A2 function obligatory for endocycle
onset. Proceedings of the National Academy of Sciences, USA 105,
14721–14726.
Larkins BA, Dilkes BP, Dante RA, Coelho CM, Woo YM, Liu Y.
2001. Investigating the hows and whys of DNA endoreduplication.
Journal of Experimental Botany 52, 183–192.
Lee HO, Davidson JM, Duronio RJ. 2009. Endoreplication:
polyploidy with purpose. Genes and Development 23, 2461–2477.
Lee J, Das A, Yamaguchi M, Hashimoto J, Tsutsumi N,
Uchimiya H, Umeda M. 2003. Cell cycle function of a rice B2-type
cyclin interacting with a B-type cyclin-dependent kinase. The Plant
Journal 34, 417–425.
Lee YP, Yu GH, Seo YS, Han SE, Choi YO, Kim D, Mok IG,
Kim WT, Sung SK. 2007. Microarray analysis of apple gene
expression engaged in early fruit development. Plant Cell Reports 26,
917–926.
Lemaire-Chamley M, Petit J, Garcia V, Just D, Baldet P,
Germain V, Fagard M, Mouassite M, Cheniclet C, Rothan C.
2005. Changes in transcriptional profiles are associated with early fruit
tissue specialization in tomato. Plant Physiology 139, 750–769.
Li CX, Potuschak T, Colon-Carmona A, Gutierrez RA,
Doerner P. 2005. Arabidopsis TCP20 links regulation of growth and
cell division control pathways. Proceedings of the National Academy of
Sciences, USA 102, 12978–12983.
Malladi A, Hirst PM. 2010. Increase in fruit size of a spontaneous
mutant of ‘Gala’ apple (Malus3 domestica Borkh.) is facilitated by
altered cell production and enhanced cell size. Journal of Experimental
Botany 61, 3003–3013.
Marti C, Orzaez D, Ellul P, Moreno V, Carbonell J, Granell A.
2007. Silencing of DELLA induces facultative parthenocarpy in tomato
fruits. The Plant Journal 52, 865–876.
Masubelele NH, Dewitte W, Menges M, Maughan S, Collins C,
Huntley R, Nieuwland J, Scofield S, Murray JAH. 2005. D-type
cyclins activate division in the root apex to promote seed germination
in Arabidopsis. Proceedings of the National Academy of Sciences,
USA 102, 15694–15699.
Mazzucato A, Taddei AR, Soressi GP. 1998. The parthenocarpic
fruit (pat) mutant of tomato (Lycopersicon esculentum Mill.) sets
seedless fruits and has aberrant anther and ovule development.
Development 125, 107–114.
Melaragno JE, Mehrotra B, Coleman AW. 1993. Relationship
between endopolyploidy and cell-size in epidermal tissue of
Arabidopsis. The Plant Cell 5, 1661–1668.
Menges M, de Jager SM, Gruissem W, Murray JAH. 2005. Global
analysis of the core cell cycle regulators of Arabidopsis identifies novel
genes, reveals multiple and highly specific profiles of expression and
provides a coherent model for plant cell cycle control. The Plant
Journal 41, 546–566.
Mounet F, Moing A, Garcia V, et al. 2009. Gene and metabolite
regulatory network analysis of early developing fruit tissues highlights
new candidate genes for the control of tomato fruit composition and
development. Plant Physiology 149, 1505–1528.
Park JA, Ahn JW, Kim YK, Kim SJ, Kim JK, Kim WT, Pai HS.
2005. Retinoblastoma protein regulates cell proliferation, differentiation,
and endoreduplication in plants. The Plant Journal 42, 153–163.
Park S, Sugimoto N, Larson MD, Beaudry R, van Nocker S.
2006. Identification of genes with potential roles in apple fruit
development and biochemistry through large-scale statistical analysis
of expressed sequence tags. Plant Physiology 141, 811–824.
Pascual L, Blanca JM, Canizares J, Nuez F. 2009. Transcriptomic
analysis of tomato carpel development reveals alterations in ethylene
and gibberellin synthesis during pat3/pat4 parthenocarpic fruit set.
BMC Plant Biology 9, 67.
Pfaffl MW. 2001. A new mathematical model for relative quantification
in real-time RT-PCR. Nucleic Acids Research 29, 2002–2007.
Qi RH, John PCL. 2007. Expression of genomic AtCYCD2;1 in
Arabidopsis induces cell division at smaller cell sizes: implications for
the control of plant growth. Plant Physiology 144, 1587–1597.
Riou-Khamlichi C, Menges M, Healy JMS, Murray JAH. 2000.
Sugar control of the plant cell cycle: differential regulation of
Arabidopsis D-type cyclin gene expression. Molecular and Cellular
Biology 20, 4513–4521.
Rymen B, Fiorani F, Kartal F, Vandepoele K, Inze D,
Beemster GTS. 2007. Cold nights impair leaf growth and cell cycle
progression in maize through transcriptional changes of cell cycle
genes. Plant Physiology 143, 1429–1438.
Schnittger A, Weinl C, Bouyer D, Schobinger U, Hulskamp M.
2003. Misexpression of the cyclin-dependent kinase inhibitor ICK1/
KRP1 in single-celled Arabidopsis trichomes reduces
endoreduplication and cell size and induces cell death. The Plant Cell
15, 303–315.
Takatsuka H, Ohno R, Umeda M. 2009. The Arabidopsis cyclin-
dependent kinase-activating kinase CDKF;1 is a major regulator of cell
proliferation and cell expansion but is dispensable for CDKA activation.
The Plant Journal 59, 475–487.
Vandepoele K, Raes J, De Veylder L, Rouze P, Rombauts S,
Inze D. 2002. Genome-wide analysis of core cell cycle genes in
Arabidopsis. The Plant Cell 14, 903–916.
218 | Malladi and Johnson

Verkest A, Manes CLD, Vercruysse S, Maes S, Van der
Schueren E, Beeckman T, Genschik P, Kuiper M, Inze D, De
Veylder L. 2005a. The cyclin-dependent kinase inhibitor KRP2
controls the onset of the endoreduplication cycle during Arabidopsis
leaf development through inhibition of mitotic CDKA;1 kinase
complexes. The Plant Cell 17, 1723–1736.
Verkest A, Weinl C, Inze D, De Veylder L, Schnittger A. 2005b.
Switching the cell cycle. Kip-related proteins in plant cell cycle control.
Plant Physiology 139, 1099–1106.
Vlieghe K, Boudolf V, Beemster GTS, Maes S, Magyar Z,
Atanassova A, Engler JD, De Groodt R, Inze D, De Veylder L.
2005. The DP-E2F-like gene DEL1 controls the endocycle in
Arabidopsis thaliana. Current Biology 15, 59–63.
Vlieghe K, Inze D, De Veylder L. 2007. Physiological relevance and
molecular control of the endocycle in plants. In: Inze D, ed. Cell cycle
control and plant development. Ames, IA: Blackwell Publishing, 227–248.
Vriezen WH, Feron R, Maretto F, Keijman J, Mariani C. 2008.
Changes in tomato ovary transcriptome demonstrate complex
hormonal regulation of fruit set. New Phytologist 177, 60–76.
Wang H, Jones B, Li ZG, Frasse P, Delalande C, Regad F,
Chaabouni S, Latche A, Pech JC, Bouzayen M. 2005. The tomato
Aux/IAA transcription factor IAA9 is involved in fruit development and
leaf morphogenesis. The Plant Cell 17, 2676–2692.
Wang H, Schauer N, Usadel B, Frasse P, Zouine M, Hernould M,
Latche A, Pech JC, Fernie AR, Bouzayen M. 2009. Regulatory
features underlying pollination-dependent and -independent tomato
fruit set revealed by transcript and primary metabolite profiling. The
Plant Cell 21, 1428–1452.
Weinl C, Marquardt S, Kuijt SJH, Nowack MK, Jakoby MJ,
Hulskamp M, Schnittger A. 2005. Novel functions of plant cyclin-
dependent kinase inhibitors, ICK1/KRP1, can act non-cell-autonomously
and inhibit entry into mitosis. The Plant Cell 17, 1704–1722.
Apple fruit development and the cell cycle transcriptome | 219