Export of Russian Software Development Industry
168
2016 Export of Russian Software Development Industry With support from APKIT Association RUSSOFT Association 2016 13-th Annual Survey
-
Upload
khangminh22 -
Category
Documents
-
view
3 -
download
0
Transcript of Export of Russian Software Development Industry

2016Export of Russian Software Development Industry
With support fromAPKIT Association
RUSSOFT Association2016
13-th Annual Survey

Dear readers!
Best regards,Valentin Makarov
Executive EditorRUSSOFT Association President
Let me bring to your notice the results of the annual (this time already 13th) survey of the software development export industry in Russia. The research was conducted by RUSSOFT Association from February to April, 2016.
More than 130 market players were interrogated within the research, additionally a wide range of sources of information were studied, expert judgments were received from dozens of presidents of software development companies.
Last year passed in the rather complicated situation: political tension between Russia and the United States, low petrol prices, corresponding stagnation of Russian economy and a sharp drop in the value of the country’s currency. All these factors had a negative impact on the Russian software development industry.
Although in dollar terms the ICT market in Russia reduced by 39%, the results of software development industry proved to be not that pessimistic. The essential market disruption was related to software supplied by foreign vendors. At the same time, a sales growth of Russian software took shape at domestic market (it was as much as 9% in ruble terms) demonstrating the commencement of the process of natural import substitution.
Devaluation of ruble added to marketability of Russian industry in the global market. The volume of foreign sales of software and development services by Russian companies increased by 12% and reached 6.7 billion dollars. At the same time, to be sure, that due to geopolitics our companies have a hard time selling software and development services from Russia. As a result, the disparity between the total volume of foreign sales of Russian companies and the volume of sales from the standpoint of their Russian o�ces (amounting to 4.5 billion dollars) increased.
Service companies have built up their foreign sales more quickly than software vendors, which re�ected the e�ect of ruble devaluation. Nevertheless, an important de�ning feature of last year was the clear-cut ascendancy of a group of Russian software vendors in the so called Magic Quadrants of Gartner (four new companies joined the ranks of those in quadrants). Particularly it is worthwhile noting successes of our solution producers in the �eld of information security.
Taking the opportunity, I would like to thank Toy Opinion company for their e�ective support of source information collection, and PROMT for their excellent translation of our report into English, as well as recruiting agencies for submission of their extended analytical �ndings of labor market situation in the IT area.
Also I would like to express gratitude to prof.Andrey Terekhov from St. Petersburg State University for his traditional friendly assistance and advice. And certainly, I wish to give best kind words of gratitude to our analyst Dmitry Zhelvitsky for his arduous e�orts for collection of complementary information, report writing and preparation of ratings of leading Russian software companies and universities.
We are very grateful to the Association of Computer and Information Technology Companies (APKIT) and to our sponsors for �nancial and moral support in conductance of research.
Many thanks to all survey participants who provided information on their companies.

Contents
. . . . . . . . . . . . . . . . . . . . . . . . . . . . . . . . . . . . . . . . . . . . . . . . . . . . . . . . . . . . . . . . . . . . . . . . . . .
. . . . . . . . . . . . . . . . . . . . . . . . . . . .. . . . . . . . . . . . . . . . . . . . . . . . . . . . . . .
. . . . . . . . . . . . . . . . . . . . . . . . . . . . . . . . . . . . . . . . . . . . . . . . . . . . . . . . . . . . . . . . . . . . . . . . . . . . . . . . . . . . . . . . . . . .
. . . . . . . . . . . . . . . . . . . . . . . . . . . . . . . . . . . . . . . . . . . . . . . . . . . . . . . . . . . . . . . . . . . . . . . . . . . . . . . . .
. . . . . . . . . . . . . . . . . . . . . . . . . . . . . . . . . . . . . . . . . . . . . . . . . . . . . . . . . . . . . . . . . . . . . . . . . . . . . . . . .
. . . . . . . . . . . . . . . . . . . . . . . . . . . . . . . . . . . . . . . . . . . . . . . . . . . . . . . . . . . . . . . . . . . . . . . . . . . . . . . . . . . .
. . . . . . . . . . . . . . . . . . . . . . . . . . . . . . . . . . . . . . . . . . . . . . . . . . . . . . . . . . . . . . . . . . . . . . . . . . . . . . . . . . . . . . . .
. . . . . . . . . . . . . . . . . . . . . . . . . . . . . . . . . . . . . . . . . . . . . . . . . . . . . . . . . . . . . . . . . . . . . . . . . . . . . . . .
. . . . . . . . . . . . . . . . . . . . . . . . . . . . . . . . . . . . . . . . . . . . . . . . . . . . . . . . . . . . . . . . . . . . . . . .
. . . . . . . . . . . . . . . .. . . . . . . . . . . . . . . . . . . . . . . . . . . . . . . . . . . .
. . . . . . . . . . . . . . . . . . . . . . . . . .
. . . . . . . . . . . . . . . . . . . . . . . . . . . . . . . . . . . . . . . . . . . . . . . . . . . . . . . . . . . . . . . . . . . . . . . . . . . . . . . . . . .
. . . . . . . . . . . . . . . . . . . . . . . . . . . . . . . . . . . . . . . . . . . . . . . . . . . . . . . . . . . . . . . . . . . . . . . . . . . .
. . . . . . . . . . . . . . . . . . . . . . . . . . . . . . . . . . . . . . . . . . . . . . . . . . . . . . . . . . . . . . . . . . . . . . . . . . . . .
. . . . . . . . . . . . . . . . . . . . . . . . . . . . . . . . . . . . . . . . . . . . . . . . . . . . . . . . . . . . . . . . . . . . . . . .. . . . . . . . . . . . . . . . . . . . . . . . . . . . . . . . . . . . . . . . . . . . . . . . . . . . . . . . . . . . . . . . . . . . . . . . . . .
. . . . . . . . . . . . . . . . . . . . . . . . . . . . . . . . . . . . . . . . . . . . . . . . . . . . . . . . . . . . . . .
. . . . . . . . . . . . . . . . . . .
. . . . . . . . . . . . . . . . . . . . . . . . . . . . . . . . . . . . . . . . . . . . . . . . . . . . . . . . . .
. . . . . . . . . . . . . . . . . . . . . . . . . . . . . . . . . . . . . . . . . . . .
. . . . . . . . . . . . . . . . . . . . . . . . . . . . . . . . . . . . . . . . . . . . . . . . . . . . .. . . . . . . . . . . . . . . . . . . . . . . . . . . . . . . . . .
. . . . . . . . . . . . . . . . . . . . . . . . . . . . . . . . . . . . . . . . . .. . . . . . . . . . . . . . . . . . . . . . . . . .
. . . . . . . . . . . . . . . . . . . . . . . . . . . . . . . . . . . . . . . . . . . . . . . . . . .
. . . . . . . . . . . . . . . . . . . . . . . . . . . . . . . . . . . . . . . . . . . . . . . . . . . . . . . . . . . . . . . . . . . . . . . . . . .
. . . . . . . . . . . . . . . . . . . . . . . . . . . . . . . . . . . .
. . . . . . . . . . . . . . . . . . . . . . . . . . . . . . . . . . . . . . . . . . . . . . . . . . . . . . . . . . . . .
. . . . . . . . . . . . . . . . . . . . . . . . . . . . . . . . . . . . . . . . . . . . . . . . . . . . . . . . . . . . . . . . . . . . . . . . . .
. . . . . . . . . . . . . . . . . . . . . . . . . . . . . . . . . . . . . . . . . . . . . . . . . . . . . . . . . . . . . . . . . . . . . . . . . . . . . .
. . . . . . . . . . . . . . . . . . . . . . . . . . . . . . . . . . . . . . . . . . . . . . . . . . . . . . . . . . . . . . . . . . . . . . . . . . . . . . . . . . . . . . . . .
. . . . . . . . . . . . . . . . . . . . . . . . . . . . . . . . . . . . . . . . . . . . . . . . . . . . . . . . . . . . . . . . . . . . . . . . . . . . . .
CHAPTER1. Russian positions on the world IT marketIntroduction1.1. Russia in world IT ratings1.2. Achievements of individual Russian companies in the world IT ratings1.3. Publications on High Technologies in Russia in Foreign Mass Media 1.4. Russian ICT market
CHAPTER 2. Volume and structure of sales by Russian software companies in domestic market and abroad
2.1. Sales volume of Russian software development industry2.2. Distribution of software sales abroad depending on the business model2.3. Service companies2.4. Software products and ready-to-use solutions2.5. Software development centers of foreign corporations in Russia2.6. RUSSOFT rating of largest Russian software companies
CHAPTER 3. Views of Russian IT-companies on business development directionsand Major Trends in the Russian Software Development Industry
3.1. General analysis3.2. Quality management system certi�cation3.3. Investments3.4. Import substitution3.5. The global software market and the ways to increase sales of Russian suppliers
CHAPTER 4. Geographical Reach and Vertical Markets of Russian Software Developer Companies
4.1. Main Geographical Markets4.2. Geographical Distribution of Marketing and Sales O�ces of Russian Companies4.3. Geographical Distribution of Software Development Centers4.4. Vertical Markets
CHAPTER 5. Human resources5.1. Assessment of general situation with human resources in the industry5.2. Labor force migration5.3. Rotation and personnel de�ciency5.4. Labor compensation5.5. Sta� training. Universities5.6. Foreign language skills
CHAPTER 6. TechnologiesKey conclusionsParticipants of the Survey
455
111626
38395051566063
666770728185
9091
101102107109110113118124128144149156160

Chapter 1
Russian positionson the world IT market

Chapter 1. Russian positions on the world IT market 5
The situation in the world and within Russia for Russian software companies over the past year has somewhat changed for the worse. First and foremost, it is related to the growth of barriers on the way of Russian software and development services to the West due to anti-Russian sanctions. Secondly, it was due to the negative media coverage created by western mass media. Weakening ruble caused contraction of ruble equivalent of the turnover of companies which are primarily oriented toward Russian market. Thereby the positions of these companies lowered in a number of international ratings, also there is observed a reduction in their pro�ts (or they were not growing at all as in previous years), which could be used for business development and promotion of goods and services on international markets.
However, neither weakening ruble no negative media coverage resulted in consequences which could be expected. Notwithstanding a big amount of negative information toward Russia in foreign media, over the past year Russian positions in ratings which rank countries and cities in terms of development and innovation, IT and business environment much more improved than changed for the worse. This fact re�ects real successes of the industry (admittedly, media stories exert a strong in�uence over compilers of ratings, the same as over ordinary people). All the more is revealing the positive trend of improvement of Russian position in the international ratings.
At the same time, from the standpoint of impacting upon IT export, the negative in�uence of economic recession, declining of oil prices and anti-Russian sanctions was fully o�set by the positive e�ect of depreciation of national currency which contributed the growth of competitiveness of Russian software development industry on the global market.
Introduction
In the last 2 years, in the various ratings which characterize business environment and the degree of development and application of information technologies, Russia as a rule took higher places than in prior years. In the business environment rating it rose even by 30 positions. If and when there was a decline in a number of ratings, it happened within limit of �uctuations typical for last few years.
Such �ndings are somewhat unexpected since the place of Russia in the majority of other world ratings under consideration is determined by personal assessments which largely depend on an image generated by politicians and mass media. This image in 2014-2016 was worse than in several prior years. From all appearances, the media coverage already less impacts on rating compilers: they view Russia less according to publications and pieces in media, but more according to emerging positive information about the country. Such information is partly provided by the RF governmental structures, by Russian experts whom foreigners begin to tune in to, and by branch associations.
Nevertheless, this year the signs of a marginal impact of the negative media coverage in some foreign mass media were revealed. Probably, the compilers of the ratings overestimate importance of one or another factor. For example, it is clearly overestimated the in�uence of events in Ukraine on competitiveness of Russian cities from the point of view of clients of custom software developers.
Throughout ten recent years, Russia improved its positions in the majority of various global ratings. However, this upward movement was, as a rule, slow. Only in two cases there was observed a sharp upturn in 1-2 years. In 2012 in the world rating of the Electronic government development (E-Government Survey 2012: E-Government for the People), Russia rose by 32 places at one stroke - from the 59th to the 27th place. This rating was published by the United Nations; it re�ects the readiness and the feasibility of the state agencies from 193 countries to use ICT to provide the state services.
1.1. Russia in world IT ratings

6 Chapter 1. Russian positions on the world IT market
In reality, Russia jumped from one category of the rating to another – from countries with emerging economics to the economically developed countries – in a year. Moreover, in this rating the countries are ranged based on the weighted index of estimates on three main components (the scale and the quality of online services, the level of ICT-infrastructure development and the human capital) and it is hard to change them in a year to overtake about thirty countries.
Another breakthrough was found out at the same time in the Doing business rating, created by the World Bank experts, Russia �ew up 41 positions higher — from the 92nd to the 51st place.
Apparently, these breakthroughs were caused by e�orts on the E-government development and improvement of business climate that were undertaken in Russia within several years, as well as the active work with the rating compilers.
There is a rule of thumb that the �nal place of one or another country in the international ratings generally depends on the availability of information which the analysts can trust. The movements of Russia and Russian cities up in the global ratings are often associated not so much with real changes as with the active work of the Russian side to inform the rating’s authors about a real situation in Russia.
Long-term observations of Russia’s positions in various global ratings allow for bringing to light the following pattern: the better is the place the fewer is the impact of subjective expert judgments on country ranking. In di�erent ratings where ranking is based on such simple indicators as a number of users of the Internet and cellular networks, Russia take a place that more or less corresponds to its population size (9th place) and the size of economy (8th place). As a rule, even a little bit higher.
At the end of 2011, Vladimir Putin, the incumbent president of Russia (then, he held the position of the prime minister) demanded that by 2020 Russia should move up in the Doing Business rating from the 120th place to the 20th place. The ascension began straight away. In the next rating Russia turned to be by 8 places higher. A year after, Russia managed to outclass 19 countries more. As a result, Russia by the end of 2013 rose to the 92nd place among 189 countries and the next year run the table by 30 places upward.
It should be noted that the Doing Business rating is created by the World Bank experts that traditionally estimate the situation in Russia shade worse than other international organizations. In some instances its experts held �rm to pessimistic and not realistic forecasts concerning Russia’s economic development. Perhaps, this particular attitude toward Russia might be the reason of such low place in the Doing business rating.
Yet the compilers of this rating cannot but express the current progress of Russia in creation of the favorable business environment. It may be assumed that such progress is not only in place but is also owing to submission by Russian o�cials all necessary information to international experts. For this purpose, sometimes it is necessary to invite World Bank experts to visit Russia in order to conduct required experiments on-the-spot (for example, registration of a new enterprise). Due in large part to such work with rating compilers one can explain the rise by 30 positions in one year only (it is even theoretically impossible to carry out real changes within such short period).
In the last 2 years, the compilers of the new Doing Business rating analyze the situation not only in Moscow but in St. Petersburg as well. At the same time, it looks a regular oddity when Russia, Tunisia, Moldova and problem-plagued Greece are viewed along similar lines from the standpoint of business environment. Certain mistrust is also aroused by placement of several countries higher than Russia in this rating while business not so much gravitates to these countries in spite of the low-paid manpower.
As far back as four years ago, the RF Ministry of Economic Development and Trade on the basis of their data determined that Russia should have taken 44th place in this rating. This agency also can be under delusion but in this case its version is more realistic than that of the World Bank. At least one should notice that a lot of leading world corporations work actively and successfully in Russia. It is worth noting that even the World Bank’s experts acknowledge in the interview the serious drawbacks of their rating. First, it estimates business environment just in the chief seat of commerce (in Russia it is Moscow and St. Petersburg) and not country-wide. Secondly, it informs about a level of administrative control, but cannot
Doing business — 51st place

7 Chapter 1. Russian positions on the world IT market
serve as a direct indicator of business climate and quality of institutional environment. In essence, it presents only opinions of the World Bank’s experts about the level of administrative control.
Anyway business environment in the country should be improved regardless of the country’s place in the Doing business rating. All the more so, that even the 44th place (according to the RF Ministry of Economic Development and Trade) is by no means high.
However, in this case the most important is not a position taken but the current progress re�ected in the rating. The last version of the Doing business informs that Russia has risen three positions more and takes now the 51st place, but the similar report shows not the 54th place but the 62nd place. Therefore, we have a new big surge by 11 positions. Whether there is an error in the last version of the World Bank report, or their experts changed the position of Russia in the previous rating. The latter is more probable because in the Doing business website there is information on revision of previous report data. The point is that the current progress is again re�ected, and the 20th place became even closer. It is to be noted that the upward movement in the rating occurred against media coverage not very favorable for Russia.
In the Doing business rating Russia takes leading positions in the following indices: Property registration (the 8th place) and Enforcing contracts (the 5th place). The biggest progress has been achieved over the past year in Getting electricity (rise from the 53rd to the 29th place) and Getting credits (from the 61st to the 42nd place). The worst places are for the following indices: Trading across borders (the 170th place) and Dealing with construction permits (the 117th place). Here are problems, but it may be assumed that in countries which are higher than Russia in the rating there is almost no cross-border trade and new facilities are almost not built.
The E-Government development rating, prepared by the UN experts, is updated every other year. After movement up from the 59th place in 2010 by 32 positions in 2012 the Russia’s position has remained unchanged. In 2014, it retained the su�ciently high 27th place. In 2016, a small lowering was observed – up to the 35th, however, a level of development still is thought to be high. The worst estimate of the rating authors concerns the Russian telecommunication infrastructure. Probably, due to the unique country size and the signi�cant number of inhabited localities separated from the nearest metropolitan cities by the hundreds and thousands kilometers. In the E-Participation Index (EPI) rating Russia takes the 32nd place.
E-Government Survey 2016:E-Government Development Index (EGDI) — 35th place
In the Global Competitiveness rating created by experts of the World Economic Forum who assess the performance of economy of 144 countries, following the results of 2014-2015 Russia rose by 11 positions bur still takes a very low — the 53rd place. Following the results of 2015-2016, the next rise occurred – up to the 45th place. A number of countries under consideration reduced to 140, but those ruled out hardly were among the leaders
The general rating of The Global Competitiveness considers 12 criteria: Institutional environment, Infrastructure, Macroeconomic situation, Health and basic education, Business knowledge, Higher education, E�ciency of goods market, Labor market e�ciency, Financial market maturity, Level of technological development, Size of market, Innovations. Each of them has its own individual rating. The worst positions of Russia are Financial market maturity (rise from the 110th place to the 95th), E�ciency of goods market (from the 99th to the 92nd place), Institutional environment (fall from the 97th to the 100th
place) and Business knowledge (from the 86th to 80th place). The best positions are Size of market (from the 7th to the 6th place), Macroeconomic situation (fall from the 31st to the 40th place) and Infrastructure (from the 39th to the 35th place). It should be noted that the relatively high places are taken by Russia according to more objective indicators. At the same time, the improvement along almost all directions is observed.
The Global Competitiveness — 45th place

8 Chapter 1. Russian positions on the world IT market
Russia went down by two lines (from the 26th to the 28th place) in the new Human Capital Index compiled by the World Economics Forum (WEF). The countries are ranked according to 46 indicators in two groups. The rating considers employment (arranged by skill level, unemployment rate, availability of skilled employees, life expectancy) and education (shares of population with secondary-level and higher education). In terms of people having higher education, the USA, China and India have comparable �gures (66-77 million, in RF - 29 million – however, a number of graduates from technical universities is greater precisely in China and India (4.6 million and 2.6 million people). In Russia they are 561 thousand and in the USA - 568 thousand.
Human Capital Index 2016 — 28th place
In another competitiveness rating, prepared by the International Institute for Management Development, Switzerland (IMD), Russia takes a similar to the World Economic Forum’s rating place. However if The Global Competitiveness demonstrates the growth of the Russian rating, IMD considers that the positions became worse —in 2015 the country moved from the 38th to the 45th place (and not even among 144 countries but among 61). In the previous 5 years the Swiss institute regularly indicated that competitiveness of Russia was rising against other countries. Lowering of the rating in 2015, according to explanations by the IMD experts, stems from the Ukrainian con�ict and market volatility due to the negative geopolitical factors. In 2016, Russia did not return to the 38th place in the IMD rating nevertheless it rose one point up (to the 44th place).
World Competitiveness Yearbook (IMD) — 44th place
In the new rating published in early, Russia turned to be among 12 most innovative countries. In 2015, in this rating Russia returned to the 14th place which it took in 2013 after dropping to the 18th place in 2014. Ranking covered only 33 countries, but at the same time the information of more than 200 countries was analyzed (most of them are not included in the basic rating). The authors of the Bloomberg Innovation Index considered the following seven factors: R&D expenses, High-tech Companies Intensity, Productiveness, Value-Added Manufacturing as percent of GDP, Patents, Education, Research Personnel per 1 million inhabitants. The highest position is related to the higher education rate: in terms of universities and colleges attendance and a share of graduates Russia takes pride of the 3rd place. In terms of R&D expenses as percent of GDP Russia retains the 31st place. In terms of high-tech companies intensity and activities in the area of patent record Russia takes the 8th and the 15th place, correspondingly. The information was provided by the World Bank, the World Intellectual Property Organization, and the Conference Board organization, the Organization for Economic Cooperation and Development, and UNESCO.
Global Innovation Index (Bloomberg) — 12th place
Aside from Bloomberg, the Global Innovation Index rating is prepared by the Cornell University jointly with the INSEAD business school and the World Intellectual Property Organization. In 2014, Russia rose by 13 positions in this rating and took 49th place. In 2012, it dropped from the 51st to the 62nd place, and in 2015 rose by one step – to the 48th place.
Between the 14th -18th places in the Bloomberg rating and the 50th -60th places in the Cornell University rating there is a whale of di�erence that may be explained by the fact that Bloomberg basically relies upon quantitative values whereas the Cornell University experts (and their partners) — for the most part, on judgmental estimates. They valued at a very low rate the use of innovations in households and production facilities notwithstanding that the indicators of Internet penetration and computers in Russian society are high enough and almost all enterprises have introduced the basic corporate ERP systems.
Global Innovation Index (Cornell University) — 48th place

9 Chapter 1. Russian positions on the world IT market
As per the 2015 results, Russia rose from the 46th place in 2010 in the ICT Development Index of the International Telecommunication Union and took the 45th place.
Global ICT Development Index – 45th place
According to the World Economic Forum, in 2015 Russia rose from the 50th to the 41st place among countries all over the world in terms of networked readiness. Besides objective scoring (for example, by the number of Internet users), the place of a country in this rating is determined by such judgmental estimates as country’s business climate, state policy in the IT area, practical regulation of IT industry as well as economic and social in�uence of information technologies on commonwealth .
By the middle of 2016, there have been no updated versions of this index yet.
Networked Readiness Index
The World Wide Web Foundation slightly improved the Russian position in their global rating of countries in terms of level of development and Internet usage “The Web Index”. In the 2012 survey it took the 31st place, then in 2013 – the 41st, and in the last version 2014 our country rose to the 35th place.
A drop by 10 places, most likely, is caused by very low scores that the country received for Freedom and openness – 26.5. In all appearances, the drumbeat of adopted laws regulating activity on the Internet came into play. If they are looked at objectively, it will turn out that Russian segment of the Internet is no less free from state regulation than American or German segments. Some restrictions are imposed in Russia with a longer delay than in the West. However, the US estimate for Freedom and openness in the Web Index is almost 50 points higher — 71.
The media frenzy over adopted laws re�ected also on the positions in the rating of the international nongovernmental organization Freedom House. Russia got there the 41st place among 60 countries. Some Russian political leaders expressed their reasonable amazement at this case because among leaders of the rating there are countries (for example, the USA, Germany, France) where global Internet is cracked down much stronger than in Russia.
In 2014, the rating of Russia rose owing to correction of the too low score for Freedom and openness (it increased from 26.5 to 39.6).
By the middle of 2016, there have been no updated versions of this index yet as the authors decided to take a break.
The Web Index — 35th place
In the A.T. Kearney global retail e-commerce rating Russia took the su�ciently high 8th place among 30 developed and developing countries (a year ago it took the 13th place). In their ranking the A.T. Kearney experts used generally objective indicators: market size and growth, condition of infrastructure, consumption in global Internet. The list is headed by China with the world biggest number of Internet users. But for instance India with more than 1.2 billion people was not included in the rating owing to infrastructure problems.
In opinion of rating’s authors, the population of developing countries faster tune themselves to current changes than people from developed countries. The inhabitants of developing countries use telephones for search for goods, price comparison and information sharing with their friends in social networks.
Russia with 18% of forecasted annual average growth rate by 2018 and online business volume of $10 billion is transformed in one of the e-retail markets appealing to both domestic and foreign retailers. Among all European countries, it enjoys the most numerous Internet users’ community (over 70 million people). 33 million of Russian people buy goods online. At the same time, the experts forecast that Russian online business will grow at the average rate of 18% by 2018.
In the �rst half of 2016, there have been no updated versions of this index yet.
The 2015 Global Retail E-Commerce Index — 8th place

10 Chapter 1. Russian positions on the world IT market
In the GfK Connected Consumer Index which demonstrates a level of availability and usage of technical devices (including those with internet connection) by consumers of di�erent countries, Russia in 2016 took the 43rd place among 78 countries having risen by 1 line as compared to the previous rating.
GfK Connected Consumer Index — 43rd place
In the rating of the world's most innovative cities in 2015 Moscow moved up in a year from the 74th to the 45th place, and St. Petersburg —to the 48th (two years ago it was only the 84th). The other Russian cities get far behind the two Russian capitals: Yekaterinburg took the 220th place (previously the 213th), Kazan – 223rd (222), Novosibirsk – 244th (253), Samara - 282nd (266), Nizhny Novgorod – 273rd (282), Krasnoyarsk – 280th (303), Kaliningrad – 303rd (314), Rostov-on-Don – 289th (317), Tomsk – 339th (343), Perm – 340th (354), Saratov – 341st (355), Omsk – 362nd (371), Volgograd – 365th (378), Vladivostok – 367th (381), Izhevsk – 400th (394), Barnaul 404th (405), Orenburg – 406th (407), Togliatti – 407th (408). It is questionable that the rating compilers managed to collect objective information on all cities of the world. For instance, Minsk retains the 435th place where it was a year before alongside Kabul. Such adjacency is hardly justi�ed. It was changed within a year – Kabul is no longer among 442 cities covered by the rating. It seems that the authors of this rating also had insu�cient information about Kazan. In Russia this city is considered to be among the most innovative (it is second only to Moscow and St. Petersburg and not by much). However the most important thing is that in the rating almost all Russian cities are slightly higher and some of them rose at once by many places.
Innovation Cities Global Index
In the quadrant Data-driven city built by the research company PricewaterhouseCoopers (PwC) Moscow was among the leaders. Only New York and London were slightly ahead. Under this research there was studied the experience of 28 main world metropolitan cities in implementation of the DDC (Data driven city) concept.
Data-driven city
In terms of level of development of national policies concerning cloud computing Russia took the 17th place among 24 major countries. In 2013 that position was higher — the 14th place. Such lowering is associated with the fact that the Russian legal and regulatory framework hinders development of cloud-based computing. At the same time, just in the last 3 years cloud technologies began to be actively entrenched in Russia with tens of percent rate of growth, and it is hardly possible to talk about any restraint policy having such rate. Apparently, this information has not reached the rating authors yet.
2016 BSA Global Cloud Computing — 17th place
The Russian national segment of Internet (according to Qrator Labs specialized in DDoS attack countermeasures) has become the 3rd in terms of stability among national segments of Internet worldwide. The stability of one or another national segment is determined depending on a share of operator which experiences the biggest impact in case of failure. Just so, Runet according to Qrator Labs calculations is mainly conditional on the company Rostelecom which malfunction would cause the global unreachability of no more than 5.5% of the Russian segment networks.
Stability of Internet national segments — 3rd place
In the rating of 100 cities with the best options for the software development outsourcing in 2016 all four Russian metropolitan cities included in the previous versions have decreased indices. As compared to the last year version, only Novosibirsk moved from the 91st to the 92nd place. St. Petersburg dropped from the 34th place to the 37th, Nizhny Novgorod from the 59th to the 60th, Moscow from the 56th to the 64th.
The Top 100 Outsourcing Cities

11 Chapter 1. Russian positions on the world IT market
Novosibirsk from the previous 92nd place left the Top 100 at all. Such changes look a regular oddity because in the last 2 years owing to weakening of the national currency the labor costs of Russian outsourcing companies considerably decreased whereas other assessment parameters could not show any reduction in attractiveness. Probably, some subjective ideas took a toll on, for example, connected with the con�ict in neighboring Ukraine. It is worthy of note that two Ukrainian cities (Kiev and Lvov), included in this rating in 2014 did not enter the rating this year.
In this rating the leading positions are taken by Indian cities as well as by other Southeast Asian cities. It should be noted, however, that the rating’s authors include in the concept of outsourcing both services for high tech software engineering and for simplest business processes (for example, window cleaning). Since companies from Russian metropolitan cities are exclusively specialized in high tech services, they would have got much higher places if ratings were made for narrower service segments.
The large Russian software exporters actively participate in various ratings created by the globally authoritative analyst teams. However their presence in these ratings is still insigni�cant. The main reason is the requirement of the rating authors to disclose their turnover and pro�t data. A lot of Russian companies for a variety of reasons refrain from disclosing it.
Moreover, software vendors frequently do not wish to demonstrate their Russian origin as they introduce themselves at the corresponding markets as local resident companies (in order to use the status of these countries' national manufacturers).
Due to these reasons and because of the information protection generally not alien to many Russian middle-aged businessmen (who embarked upon a career in the time of perestroika) the representation of Russian companies in a number of world software vendor ratings is much lower than it can be expected in the present context.
First of all, it concerns the ratings which assume providing of the �nancial statements veri�ed by auditors as ranking is made by the turnover (or its growth) indicator. However, Russian companies are gradually becoming more open and their representation is growing even in those ratings for which the turnover data has to be disclosed.
The Russian service companies have a very di�erent attitude towards the participation in the international ratings. Among the most well known ratings, we can note two versions of the Top-100 world's IT outsourcing companies: Global Services and IAOP (International Association of Outsourcing Professionals). In these ratings, which are mainly based on the quality of rendered services than on the company size, a signi�cant number of companies represent Russia (only India and the USA have more companies in the ratings). At the time of publication of the latest Global Services rating in 2013 the number of Russian customized software development companies looked very close to the maximum extent possible, and it could be even more increased due to the progress in other Russian companies' information transparency and activity. Totally, 10 Russian companies have been included at least once in the Top-100 outsourcing companies according to Global Services and IAOP.
In recent years, the share of Russian companies in these ratings has kept at the level of 5-8%. Thus, not only IT service providers but business process outsourcing service providers are also included into the Top-100 outsourcing companies in the world. Excluding such companies from the ratings above, the proportion of Russia will be much higher than 10%.
1.2. Achievements of individual Russiancompanies in the world IT ratings

12 Chapter 1. Russian positions on the world IT market
The Global Services and IAOP analysts not only identi�ed the global top-100 leading outsourcing companies but also de�ned the best ones in various categories that allows for judging the more important strengths of the Russian software developers. In 2015, the Russian companies (with their main development centers in Russia) are considered to be the leaders in the following areas: Product Engineering, Software/Hardware, Information and Communication Technology Services, Entertainment & Media, Automotive, Financial Services, Health Care, Government and Industry-Speci�c Services.
Unfortunately, we have to speak about certain ratings in the past tense. Even of those which were baselines for the most world customers. Thus, for example, The Global Services 100 has not been updated since 2013. Looks like the disappearance of the Global Services rating was due to the drop of interest of outsourcing service providers to participate in ratings. The reason thereof may be related to an obvious maturation of the service market where service providing became almost a routine (like commodity) and where customers do not need any more indicators produced by ratings.
Over the past year, in the ratings which directly or indirectly account for the turnover in dollar terms, positions of Russian companies either lowered or remain unaltered which is to be expected as earnings in dollars in the last 2 years either lowered or lost steam (to be sure, if we take into account the total sales dip due to decrease of currency equivalent of sale of services in Russia).
Presence of Russian companies has considerably grown just in Magic Quadrants of Gartner which primarily account for the software quality.
The Russian representation in the IAOP rating in recent years changed insigni�cantly after the gradual increase for over a decade. In recent years it increased and stabilized. Good performance in this rating, in experts’ opinion, testi�es that to the highest technical level of Russian engineers the Russian companies added perception of market requirements and skills of doing business. Some companies from time to time come out of the best 100 as well as from category leaders. However they are replaced by others. So the total number remains almost the same. In assessment of inclusion of the Russian companies in the IAOP rating it should be remembered that this Association is interested in attraction of new members that may impact on the rating of companies which are not the IAOP members.
In 2016, �ve Russian companies were in the Top-100 according to IAOP, the same as a year earlier, however their composition changed. Three companies (Auriga, Luxoft, MAYKOR) retained their positions but Artezio and MERA left the list (the last 10 years they are included in the Global Outsourcing 100 on a non-continuous basis).
A newcomer in world ratings is ICL Services. For years we assessed this company as a main Russian contender for the place in Top-100 of the world service companies, and it came up to our expectations. In 2013 the company left Fujitsu Group and started to work in Russia under the brand name ICL Services. It is located in Kazan, the capital of Tatarstan, which enjoys good environment for start-up and development of IT companies. ICL Services has over 50 global customers in 26 countries and its sta� exceeds 1 thousand people.
MAYKOR provides IT services. Two year ago the company was a �st timer in this rating largely owing to the vigorous activity in Russia and in IAOP Association. In the last 3 years experts distinguished amongst leaders two Russian companies more - Reksoft and First Line Software. Reksoft in a greater degree crossed over implementation of large public projects in Russia after joining Technoserv group and making away with business dimensions not related to IT services. As a result of such rigorous specialization the company’s turnover kind of reduced, in compensation there were created conditions for strengthening positions of the company within Russia on the basis of specialization in development of complex projects at the national level.
First Line Software instead of the IAOP rating was marked in spring 2015 by the analytical agency Gartner through inclusion in the report Cool Vendors in Application Serviсes 2015 for its expertise in the area of IT application development for Digital marketing.
The 2016 Global Outsourcing 100

13 Chapter 1. Russian positions on the world IT market
Thus, in 2016 the IAOP rating includes the following Russian companies - Auriga, ICL Services, Luxoft and MAYKOR.
Apart from Russia, neighboring Ukraine and Belarus are also represented in the global IAOP rating (in various years such companies were there as IBA Group, Intetics, Itransition, Oxagile, TEAM International, Miratech, SaM Softjourn, SoftServe). All three countries are culturally and economically close in spite of existing big and small problems. So we can quite reasonably mention the so-called "Russian-speaking community" of the service IT companies. The strengths of companies from these three states are approximately identical. First of all, they have high quality of education in the �eld of physical and mathematical sciences, creativity and experience in performing complex projects. All what is to be done now is to smooth relations with Ukraine so that all sides will take full advantages.
This rating has been keeping up since 2013 and it looks like it will never be updated. In the last published version among the global 100 service companies there were 9 Russian companies: Auriga, DataArt, EPAM Systems, First Line Software, Luxoft, MERA, Reksoft and Return on Intelligence (before 2013 - Exigen Services). There are no �rst-timers. Some of them temporarily leave the list but afterwards return back. It depends on the major customers they had over the period under investigation by rating’s authors.
From all appearances, the period of service industry development when the international structuring of upstream market has been taking place draws to a close. The segments with acknowledged leaders have been established. Foremost, it concerns the segment of high-end solutions where companies of Russian origin took the highest places having gained solid reputation and secured an entire pool of international customers. Above all else it refers to two recognized leaders of service industry from East and Central Europe — EPAM Systems and Luxoft – which happily took advantage of the window of opportunities and held an IPO on the New York Stock Exchange in 2012 and 2013, respectively.
In the IOAP Global Outsourcing 100, historically, there were less Russian companies than in The Global Services 100. It is explained by the fact that IAOP covers with its rating a larger range of outsourcing �elds of application (including the business process outsourcing sector, where Russian export companies are not represented). On completion of publication of the Global Services rating one expects that the presence of Russian service companies will remain with a slight ascending trend connecting with the observed entry into the global market from other outsourcing sectors (including IT outsourcing). Currently, high-tech service companies see no rationale for inclusion in the IOAP rating and look for other e�ective marketing tools.
The 2013 Global Services 100
In 2015 and 2016, the quarterly reports of Information Services Group which forms the ISG Outsourcing Index included Russian companies MAYKOR and Luxoft. They are marked in Top-10 in category Breakthrough 10 Sourcing Standouts of EMEA region. At the same time, Luxoft gained the same positions in America.
ISG Outsourcing Index
According to PwC, Kaspersky Lab slightly gave ground in the top-100 software companies. If by results of 2012, it took the 54th place (with the sales result of $628 million and the turnover of $750 million), by results of 2014, (there was no ranking by results of 2013) �nished up in the 65th place due to a slightly reduced turnover in dollar terms.
By the results of 2011, there was compiled a separate rating for the EMEA region and the emerging markets. Here Kaspersky Lab took the 12th place and the second place in the emerging markets (Emerging Markets 100), being slightly behind the Brazilian TOTVS company. In the EMEA region the 1С company also
PwC Global 100 Software Leaders

14 Chapter 1. Russian positions on the world IT market
entered in the �rst hundred of major companies (30th place, software sales revenue was $360 million). In the category Emerging Markets 100, besides Kaspersky Lab and 1С (8th place) there were three Russian companies more – Dr. Web (42th place, $38 million), ABBYY (51st place, $31 million), Positive Technologies (68th place, $25 million).
According to Deloitte, among 500 most fast-growing high-technology companies in the EMEA region, as a rule, there have not been major Russian software developers, however, the rating from time to time included other Russian fast-growing high-technology companies. For example, the previous version included one Russian company - CTI (459th place). In the last version there are not Russian companies at all. The reason is not so much that Russia lacks fast-growing high-technology companies worthy of getting into Deloitte Technology Fast 500 EMEA but in their unwillingness to provide the authors of rating with audited accounts which is an indispensable condition for participation.
Deloitte Technology Fast 500 EMEA
In 2015, six Russian software development companies were present in the rating of 500 world best software companies (a year before there were 7). Business volumes permit several tens Russian software development companies to be present in this rating because the last 500th place is given to a company with turnover less than $3 million (according to our estimates, Russia has at least 60 companies with turnover more than $20 million) however few of them provided their turnover information. This may be the reason why Kaspersky Lab, Russian leader top software seller, was excluded from the list of 500 major vendors. In 2014 they took the 121st place ($667 million). In addition, Kaspersky Lab discloses turnover information on its website. The company’s income lowered by 9%, but by no means it could impact upon the loss of a place in the Top-200. Probably, in 2015, the turnover data of Kaspersky Lab was not submitted to the rating authors. For this very reason may be explained the absence of the Perm company Prognoz which in spite of the great reduction in turnover in dollar terms all the same should have come in the list of 300-400 biggest companies. In 2014 they took the 237th place ($149 million).
All other companies representing Russia lost their positions (if any) in the rating due to reduction in turnover in dollars (or slower growth rate as compared to that of neighbors in the rating). A �rst-timer is the outsourcing company from Ulyanovsk — SimbirSoft. In the last two years it was intensely developing and with the turnover of $3.15 took the 497th place.
It bears mentioning the achievement of EPAM Systems which in turnover approached the �rst hundred by 9 positions taking the 112th place ($730 million). CFT Group, more gearing to the contracting Russian market, is still high in the rating — the 188th place ($337 million), but a year ago it was on the 151st place. The weakening ruble also lowered positions of Diasoft which receives the most part of proceeding on the contracted Russian market too. It dropped from the 306th place to the 344th ($60.8 million). The outsourcing company Artezio took on the 436th place ($16.4 million) descending by 20 positions.
Software 500
In 2010 and 2011 only one Russian company (Luxoft) was included in the FinTech 100 (the rating of the global leading providers of technologies and services for the �nancial industry). In subsequent years it was added by Diasoft. In the last version compared to 2012 Luxoft ranks 57th, and Diasoft —86th. However in the latest 2015 rating we could �nd neither these companies nor other Russian representatives. No obvious reasons are noticeable. Luxoft and Diasoft demonstrated the importance of coming into FinTech 100, and they do not have any really serious problems. Perhaps, the authors of the rating were a�ected by the decrease in proceeding of Diasoft in dollar terms, although it is only associated with the activities on the company mainly on Russian market where income is measured in weakening ruble. Throughout recent years Luxoft is augmenting the turnover, at the same time it has rearranged the structure through business separation. It might be that the compilers of the rating began to look at individual structures and not at Luxoft as a whole. Other factors of absence in the FinTech 100 also may be of consequence.
FinTech 100

15Chapter 1. Russian positions on the world IT market
The Gartner Group analytical agency ratings are one of the most prestigious ratings of product companies (software vendors). This agency year over year publishes so-called Magic Quadrants of Gartner, which include products and companies that are among the leaders in certain software segments. Since 2012, three new players were added to the Russian software leaders, which are traditionally present in their "quadrants" (Kaspersky Lab, ABBYY, Parallels, Acronis, and some others). These companies are PROGNOZ – in the Business Intellegence quadrant, Diasoft – in the Core Banking Software quadrant, and InfoWatch – in the new Data Loss Prevention quadrant.
In the summer 2013, Gartner included Kaspersky Lab in the new "magic quadrant", which is comprised of the global vendors of mobile device management solutions, Mobile Device Management (MDM).
In 2015 Gartner included the Positive Technologies specialized in the �eld of cyber security in the “magic quadrant” uniting 14 world producers of solutions for protection of web applications (2015 Magic Quadrant for Web Application Firewalls).
In 2016 there appeared three more Russian newcomers to Magic Quadrants of Gartner. In summer Veeam Software, supplier of innovative solutions for provision of data accessibility in corporate segment, found itself among the leaders of Magic Quadrant for Data Center Backup and Recovery Software).
In the end of January 2016 a new version of Magic Quadrant for Data Leak Prevention was issued. As a result, the list of the best producers of DLP systems was added by another Russian company — Zecurion. Earlier InfoWatch took its place herein. Both companies are in the leading group of niche players.
In June 2016 the only Russian vendor included in the global report Magic Quadrant for Contact Center Infrastructure was NAUMEN.
Magic Quadrants of Gartner
According to the American INTERNET TELEPHONY periodical, VideoMost of SPIRIT became the Product of 2012. SPIRIT software products integrated in various telecommunication devices are used by over 1 billion people in more than 100 countries.
In the summer 2014, their solution called TeamSpirit Voice and Video received the 2014 Uni�ed Communications Product of the Year Award of INTERNET TELEPHONY magazine.
In early 2016, VideoMost, software for videoconferences, was included in Top 10 of world suppliers of VoIP solutions prepared by the reputed American periodical Enterprise Networking.
In April 2013, two Russian companies – Softkey and Next Media Group – were included in the top-100 innovative and technological Internet projects according to Red Herring, one of the largest media holdings.
The chat bot Eugene Goostman developed by Vladimir Veselov team on the basis of arti�cial intelligence technology and promoted by the Russian i-Free company, became the world’s �rst program that successfully passed the famous Turing test: over 30% mistook “Eugene Goostman” for a human being.
The voice biometrics of the Speech Technology Center took the �rst place at the competition NIST SRE 2014– uno�cial Speaker Recognition Evaluation world championship. Over the 18-year period this biennial competition is held by National Institute of Standards and Technology by order of the U.S. Government.
Parallels was included in the top-50 leading suppliers of cloud virtualization 2014 according to the American CRN Magazine. This magazine selects the most successful suppliers of virtualization solutions aimed at channel sales.
The solution Parallels Mac Management for Microsoft System Con�guration Manager took a prize Best of TechEd 2014.
Some Other Achievements of Russian Software Developers:

16 Chapter 1. Russian positions on the world IT market
Kaspersky Lab with its solutions continuously is among the best companies by the independent test results. Eventually it became one of the leaders in number of certi�cates Advanced+ and received in 2015 the certi�cate Top Rated from the testing company AV-Comparatives.
As a result of trials conducted by the research institute AV-TEST, business solutions Kaspersky Internet Security and Kaspersky Security received certi�cates AV-TEST Certi�ed and AV-TEST Approved.
The solution Hard Disk Manager 15 Professional of Paragon was awarded Editors Choice from PCMAG.COM.
In March 2016 at the exhibition СeBIT in Hannover Paragon Software Group was awarded by the professional community Initiative Mittelstand in nomination Best of IT Innovation 2016. Paragon Camptune and Paragon NTFS for Mac were named as the best solutions in Data Management category.
Diasoft joined the ranks of the world largest suppliers of �nancial technologies according to American Banker and BAI.
The software management product of NAUMEN hit top 5 of the leaders of the world rating ITSM Tool Universe, in particular, it became the best among all solutions in the estimation of customers. The rating was prepared by the British industry portal The ITSM Review in 2014.
The solution Intellij IDEA 14 of JetBrains took the prize Dr. Dobbs Jolt Productivity Award 2015 as the best integrated development environment for platform Java and JVM.
In the autumn of 2015 the teams from Moscow and St. Petersburg turned in a good performance in Qatar at the 12th WRO. They captured four sets of awards: two “gold” in the basic category (middle age group) and the creative category (senior age group), as well as two silver medals in the creative category (junior age group) and in the student category.
Analysis of publication in foreign mass media in 2015 allows for two principal conclusions. First, Russian companies, associations, government entities continue to demonstrate that they do not have skillfulness and even aspiration to work with foreign pressmen. Arguably, only two companies have established a continious work with media outside Russia - Kaspersky Lab and Yandex. Presumably, 2-3 companies more also keep liaisons with foreign media, but their turnovers are next smaller, so they generate news content a great deal less frequently. Besides, the facilities of a relatively small PR sta� of these companies are anything but comprehensive. Generally, other software developers are mentioned in foreign media on a case-to-case basis.
The second basic premise may seem a bit unusual for an outside observer — in countries which are priority markets for Russian software companies (in the �rst place, North America and Western Europe) local media most obstinately form the negative image of Russia and Russian developers. It is as if this media ful�ll an order to drive out Russian business from the major markets of geopolitical competitors of Russia. One cannot help but compare this campaign with squeezing Russian sportsmen out the Olympic Games in Brazil. By killing o� strong competitors, the same advanced Western countries (USA and Great Britain) prepare the way to medals (in our case – to the market).
1.3. Publications on High Technologiesin Russia in Foreign Mass Media

Chapter 1. Russian positions on the world IT market 17
If a local media can be called absolutely loyal, than in these countries the sales of software developed in Russia are of small account — just 5-10% of receipts outside the former Soviet Union (about 40% accrue to EU and USA). It may seem that Russian developers obstinately reach out to the markets where they are less waited. However, loyalty of press is just one of many factors in�uencing geographical priorities of Russian companies (for more on distribution of foreign sales see Chapter 4). Moreover, this factor is not the most signi�cant. We can do no more than mention that practically it is not accounted for by companies in development of foreign trade expansion strategy.
If we look not only at the share of articles which express loyal or disloyal attitude toward Russia, but at the total amount of publications about Russian IT industry and its achievements, then the situation will look rather di�erent. Indeed, in western media a share of publications aimed at formation of the negative image of Russia (often enemy image), is light years greater than, for example, in media of Southeast Asia (SEA). However, Asian media are side with Russia where according to beliefs of pressmen of this region the creation of high-tech products is technically feasible. We cannot state the same about Russian software industry. The attitude to it cannot be characterized by such words as “loyalty” or “disloyalty”. In SEA the information about it is thin.
At the same time, in western media on the back of predominance of publications which hardly promote Russian software abroad there is a good many articles creating a positive image of Russian developers. This indicator outside EU and USA is next smaller. Just an absolute amount of articles positive for Russian software companies has to be primarily connected with sales on certain markets and not with a share of these publications.
One way or another, there is a need to work with mass media. It is especially important to establish connections on the markets which are important for Russian developers.
If you take a look at di�erent �gures characterizing the attitude to Russian software industry in foreign media, you will arrive to a conclusion that over the past year there was no profound changes. In the previous survey we noted that the �are-up between Russia, on the one hand, and the USA and EU, on the other hand, would have a negative impact on the tone of publications mentioning Russian high tech economy sector. A number of publications that negatively in�uence the image of Russia, and therefore, potentialities of the Russian software companies in promotion of their products and services on the world market drastically increased (twice precisely). If over the period 01.05.2013-30.04.2014 there were 85 such articles, then since 01.05.2014 till 30.04.2015 they were 170.
In 2016, we selected other periods for reference - 01.08.2014-31.07.2015 and 01.08.2015-31.07.2016, but a certain time shift gives loose reign to draw the conclusion that a share of negative publications has not increased markedly.
The analysis was only performed based on publications describing the hi-tech economy sector and, �rst of all, the software development industry. The search within a number of specialized editions and in the media resources most popular in the world and in separate continents was performed hunting for two keywords – Russia and Software. In prior years the similar methods were used but with small modi�cations (for example, comparison was made for other timeframes).
The list of monitored mass media included the following 21 resources: Asia Times, BВC, BusinessWeek, CNET, Computerworld, eWeek (PC Week), Financial Times, Forbes, The Hindu, IT Europa, InfoWorld, Linux Magazine, MacWorld, Network World, The New York Times, PC World, REUTERS, TechNewsWorld, The Washington Post, The Wall Street Journal, and ZDnet. Validation on the basis of foreign news aggregators (such as Yahoo.news) showed that the selected publications re�ected the climate of opinion of the majority of foreign mass media.
For reference:

18 Chapter 1. Russian positions on the world IT market
Messages and reviews not directly related to the high technologies were peeled apart. Of primary concern were publications where information technologies were mentioned. However, if some publications were met which were related to other high-technology industries (such as space or aircraft manufacture) they were accounted for as well. All in all, almost 500 articles were analyzed published from August 1, 2014 to July 31, 2016.
Before we present the �ndings of analysis of publication for the last 2 years, let us remind the transition of attitude to Russia and Russian developers in foreign mass media over the past decade.
Following a long period of manifest bias and prejudice expressed in negative presentation of the state of high technologies in Russia in 2010-2011 the tide was turned. At that time a share of publications with positive information about, in a varying degree, for the �rst time exceeded 50% and reached 66% (the highest-ever in our investigations) with an upsurge in interest of foreign mass media in the high-tech sector of Russian economy. The revulsion of mood of foreign media to Russia was primarily connected with a more active PR politics of our companies in foreign mass media. The Russian export companies, government men, close-to-the-state structures and trade associations deserve some credit for this change.
In 2014, a real regression to old times happened. First, the indicator of mass media loyalty lowered up to 48% (over the period 01.05.2013-30.04.2014), further to 35% (01.05.2014-30.04.2015) and remained at that level till August 2016. Before 2010 it consistently hovered around 30-40%, and changes had a random nature or were within the measurement accuracy. In other words, it was a throw back to the situation of the past decade.
However, even before the middle of 2015 with the increasing proportion of negative publications a total number of mentions of Russia (as regards activities of high-tech companies) were signi�cantly growing. A year ago we noted that although a share of publications with the positive tone decreased from 48% to 35%, their number increased by 14%. The last analysis showed that a total number of mentions during the year did not merely increased but even seriously decreased - from 273 to 221 (by 21%). Roughly speaking, the same goes for the number of publications with the positive tone — by 24% (from 88 to 67).
Noteworthy is that the tone of foreign mass media (one ought to speak primarily about American media) switched sides after �are-up between Russia and the USA. First the displeasure of the US government was incurred by non-extradition of the former CIA and NSA o�cer Edward Snowden who after disclosure of large-scale intelligent surveillance over citizens of di�erent countries (including heads of states – allies of the USA) in the summer of 2013 was granted the asylum in Russia. Even a greater �are-up occurred due to reuni�cation with Crimea in March 2014.
From the point of view of topics with the greatest changes it will become clear that the growth of negative attitude was provided by the messages about cyber-threats and cyber-attacks on the part of Russia (the proportion of this news increased for the last 2 years from 39% to 56%). In this case, a source of
Character of publications in foreign mass media(analysis results for two periods: 01.08.2014-31.07.2015 and 01.08.2015-31.07.2016)
Period Amount of negative Amount of positive Amount of positive
and ambiguous Total
01.08.2014-31.07.2015 157 (64%) 88 (36%) 116 (42%) 273
01.08.2015-31.07.2016 135 (61%) 67 (33%) 86 (39%) 221
For 2 years 292 (59%) 155 (31%) 202 (41%) 494

19 Chapter 1. Russian positions on the world IT market
news in most cases was either American authorities or structures close to them, or politicians of other states that are considered as American sponsored regimes. Besides, it should be pointed out that guess-work of certain experts and their words to be taken on hearsay su�ced for the most accusations against Russia.
The publications selected for investigation are divided into two groups: specialized print press dedicated to IT and general political papers. Before 2010, there was a consistent pattern: positive publications favorable for Russian software companies' export appeared mainly in the specialized editions that were far from participation in political games, as well as in mass media of the countries that assumed, at least, a neutral attitude to Russia. In 2010-2011, there are almost no di�erences between specialized press and general political papers, and since 2013 the attitude of specialized print press toward Russia became more negative than that of general political press.
From August 1, 2015 to July 31, 2016, the numerical superiority of specialized press in terms of publications with negative tone was somewhat reduced, however, it is still obvious (that is it cannot be explained simply by a margin of error). Analysis of content of articles over the last year allows for the �rm conclusion on political engagement of IT editions. It manifests itself when they no longer con�ne themselves to their subject matter but take the liberty of politically assessing the ongoing events. It even came to accusations of crackdown on gay rights which allegedly take place in Russia, moreover such assessments often are not supported by facts but at the same time they are very emotional not providing foundation for doubts. Such change in practice of IT editions comes as a surprise even for some readers who leave the relevant comments under articles.
However it must be taken into account that the information war and creation of an image of enemy take shape mainly through news about hacker attacks and malicious software, and this subject is of interest of specialized press in the �rst place. General political press probably placed a bet on other topics unrelated to IT. Publications on these subjects were not evaluated within the scope of our survey but it is safe to say that the articles which do not regard high-tech at all (or even business as such) also color Russia and promotion of Russian software in the USA and European countries. The in�amed negative attitude to the whole country may have a negative impact on decision to buy software or on selection of a custom software developer. Russian outsourcing companies came across the facts when due to intolerance to the policy of Russia such as it was presented in press the managers of major western companies refused to sign contracts already prepared by their subordinates.
A year ago, we were skeptical about the chance that the changed tone of publications in foreign media during the last year could have a de�nitely negative impact on opportunities of Russian companies as regards sales of their solutions and services on the world market. The same doubts remain on the basis of analysis of publications for the last 2 years. However, it must be admitted that the situation has deteriorated. First and foremost, it happened due to the signi�cant reduction of a total amount of publications about Russian IT industry. The interest for software industry and high-tech sector of Russian economy has recognizably decreased.
Correlation between late changes in the tone of media andthe volume of overseas IT sales
58
67
Attitude of specialized and general-political mass media to Russia
01.08.2014-31.07.2015
63
69
01.08.2015-31.07.2016
specialized general-political
share of publications with negative tone
period

20 Chapter 1. Russian positions on the world IT market
Nevertheless, we again call for not being melodramatic. The interest has lowered bit it is still higher than even 2 years ago. A signi�cant increase in the last 2 years of proportion of articles with negative tone in the total number of publications is neither something disastrous.
First, a lot of readers take a huge amount of chills about Russian threats in their stride and do not put much trust in them. They (particularly, well-educated) guess that not so much the Russian threats have increased as the activity aimed to present Russia as an image of the enemy has enhanced. Moreover, reading publications about cyber-threats any educated person will shake head at inevitable connection of these attacks with Russian hackers or security services because the individual criminal hacker groups only in exceptional circumstances are formed on account of ethnic descent if what is the issue here is not big-league politics but just a malicious software and breaking of a core banking system. Because of it, �nding only Russia guilty in these cases is inappropriate. Even some journalists write that there are not issues for concern about any special Russian cyber-threats reasoning that “we come into attack and they come into attack”.
The information security experts know full well that there is no such thing as a special Russian threat that many western media inform about. And indeed, every now and again readers may �nd there information that Russia is far behind other countries when it comes to hacker attacks (for example, in the context of sources of DdoS attack where the leaders by miles are Americans).
Second, the regular mention of some sophisticated cyber attacks on the part of Russia or creation by Russian programmers of a complicated scumware is a re�ection of the high level of specialization training. In some articles supposedly focused on the Russian threat one may see fairly direct advertising of Russian education. For instance, an expert from Trend Micro (Tom Kellermann) responds to the question “Why Russian hackers are beating us”. He thinks that Russians are cleverer than Americans (more skilled) – “Russians are more intelligent than Americans. They're more intelligent because they think through every action they take to a point where it's incredibly strategic”.
It appears that even the USA with a vast budget cannot stand out against Russian hackers. Admittedly, owing to numerous publications about “dreadful Russian hackers” people in many countries know that Russia is among world leaders in the information security area. It may be no accident that out of 7 Russian companies most frequently mentioned in foreign media 3 o�er solutions and services just in this area.
It is important to bear in mind that our attribution of articles to positive or negative category is judgmental (to identify trends one has to obey the certain standing rules). For example, the news that Edward Snowden publicly voiced criticism about “Yarovaya Law” aimed at terrorism resistance implying a more severe control over online networking we labeled as those negatively in�uencing the image of Russia, because in these publications the law was presented as crackdown on civil liberties. Nevertheless, a reader of quick observation may note that Snowden criticizes the law endorsed by the RF President who granted him the asylum. A similar situation in western countries is hard to imagine — for example, the Russians who in the native country are charged with treachery dare not criticize American laws if they have been granted asylum in the USA.
If in contrast a reader is not a nice observer, he can be helped if the decision is made to work with foreign media actively and on a regular basis. Many evidence-free accusations may be pleaded in a well-argued manner with reference to independent sources. For example, against the statement of the Head of the US Cyber Command, Director of the National Security Agency and Director of the Central Security Service Admiral Michael Rogers who in his report presented Russia as a main threat in cyberspace one may present the results of the research of Akamai State of the Internet Security Report. According to it, in QIV 2016 the USA stand �rst in terms of tra�c of DDoS attacks well ahead of the second place taken by China. The USA is accounted for by 31.54% of total tra�c, China (17.61%). Further Germany (12%), Mexico (11.69%), France (7.64%), India (4.31%), Spain (4.12%), UK (3.8%), South Korea (3.65%) and only after them, actually among worst, Russia (3.64%). There is a host of similar examples of discrepancy of statements of western politicians and high-level public o�cials with research data of independent companies.

21 Chapter 1. Russian positions on the world IT market
In many articles western journalists refer to data of independent analysts but, as a rule, as a matter of choice. For example, they truthfully write that the Japanese-American company Trend Micro calls Russia and China the main computer crime hubs. However, in the reports of this company “Below the Surface: Exploring the Deep Web” (2015) and “Cybercrime and the Deep Web” (2016) on an equal basis with Russia and China are called North America, Brazil, Japan and Germany.
A vast number of publications appeared in relation of accusations against Russia that it intervened into the US elections. The main accusation states that the hackers allegedly working for the RF authorities gained access to the computer system of the National Committee of the US Democratic Party and stole information on candidates for presidency and the database on the political opponent – the representative of the Republican Party, billionaire Donald Trump. As usual, no proofs were produced. However, in this case the accusations look extra ridiculous if it is remembered that the Democratic candidate Hillary Clinton was earlier accused that while being the head of the US State Department she used her private email address for conveyance of con�dential restricted information. Therefore, it may be assumed that in the Democratic Party they simply do not know how to prevent information leakage whereas in this situation such leakage is inevitable. In other words, the problem of security of the US Democratic Party is primarily associated with Hillary Clinton and her team. But for �nger-pointing there were needed artful hackers �nanced by the Russian government.
In some articles not only the USA and its allies accuse Russia and China of cyber attacks but vice versa. But much less frequently. Perhaps, the American attacks are not always spoken about even in Russian mass media. Either these attacks are not recorded or are not perceived as attacks.
In conclusion, one more argument for not dramatizing the situation: China is presented as an even more non-democratic state and no less “aggressive” than Russia but it does not disturb very successful promotion of Chinese goods in the US and European markets. The western consumers and customers are pragmatic and mostly evaluate quality and price instead of an exporting country's "democratic character" and "friendliness" in the mass media representation. Nevertheless, it is known that in foreign companies, which are or plan to become customers of software development in Russia, polemics are carried as to whether it is justi�ed to cooperate with Russians in the current political circumstances. The existing events of refusal to work with Russian software suppliers are mostly related to nascent anxieties as to become prohibited entities due to possible relations of Russian suppliers with the RF Ministry of Defense or Crimean organizations and companies. However this problem is primarily related to sanctions and not to media stories.
Some Russian companies also take the leading positions in developed markets irrespective of the content of western mass media publications about Russia. The Kaspersky Lab company manages to dominate not only in the US corporate market but even in the retail one. In Germany, the Russian antivirus developer steadily heads the list, having beaten the local G-Data company to the second place.
Over half of publications are steadily related to cyber threats and cyber attacks which at the slightest provocation (for example, by location of one of the servers or presence of Russian words in code), and infrequently without cause at all are associated with Russian hackers. Some articles call German Klimenko, the RF President Internet adviser, as Kremlin Internet tsar that shows complete ignorance of what is going on in Russia. Klimenko rather presents Russian Internet industry in Kremlin and not the reverse. This is not to say that he is a Kremlin representative because he publicly criticizes laws endorsed by the President which are unfavorable for Internet companies.
If earlier Kaspersky Lab was mentioned in foreign media as a successful company tackling some problems in the area of information security, in the last 2 years it was accused, for example, for closeness to Kremlin and Russian secret services (Bloomberg), and also that it carries out assault against a competitor. Such assault, for example, was described by Reuters, but according to oral information provided by a
Review of reasons to publications

22 Chapter 1. Russian positions on the world IT market
company which considered itself to be the victim. In that case the author quotes a contradiction by the head of Kaspersky Lab Eugeny Kaspersky. Accusations of Kaspersky Lab are probably another demonstration of information warfare and creation of an enemy image. However it should be pointed out that most publications mentioning Kaspersky Lab still create a positive image of this company. Its experts and managers are constantly asked to make comments of news related to cyber crimes. There and then, media often refer to Kaspersky Lab when inform about detection of a new malicious software.
The second place in the number of negative publications took the subject “High-tech business environment in Russia” - 21%. Three parts of the whole have negative tonality. Most publications here are primarily related to the lack of stability of Russian economy (particularly, the weakening ruble). However in this case the negative attitude is even more conditional than with regard to the “Information security”. For instance, fall in the exchange rate of national currency a�ects adversely the sales of foreign vendors in Russia, at the same time it promotes the competitiveness of Russian software development industry products and services on the world market.
Several articles were dedicated to the trial of the Federal Antimonopoly Service of Russia against Google charged with breach of antimonopoly legislation. The initiator of this trial was Yandex. Such articles rather make positive impact upon image of Russia as a country that develops environment for high-tech business. Nevertheless, similar proceedings began also in the EU. At that, complaints against Google in both cases look quite reasonable.
At the same time, a piece of news that Google plans to close its Russian development center due to the passage of the law on storing of all personal data in Russia hardly can be considered among those creating a positive image of the country. That’s good to know that other foreign companies having Russian R&D centers did not follow suit though they also worry about entering of this law into force since September 1, 2015.
The western pressmen also write about the subject of the IT import substitution in Russia — in that Russia gives up on the USA and Europe trying to make its own alternative solutions. However, these articles are rare and appear at the discretion of individual journalists and not relating to any apparent news piece.
One of the articles writes that the American company Cisco manages to skirt a ban in relation to sanctions already in place in order not to leave Russian market by a quite legal way.
The US and EU sanctions against Russia are mentioned due to their impact on high-tech business in Russia but in very rare publications. Together with articles related to political situation without mention of sanctions these two topics are re�ected just in 5% of publications. A year ago they were 7%. Apparently, the e�ciency of sanctions fell short of expectations and they began to recede from the readers’ mind.
Publications by subject area, % of all publications for the period 01.05.2013-30.04.2014
01.08.2014-31.07.2015
01.08.2015-31.07.2016
Investment attraction, merge and takeovers, cooperation 1% 2% 1%
Space 5% 3% 2%
Conditions for hi-tech business in Russia 20% 14% 21%
Activities of Russian developers and scientists 15% 11% 9%
Information security 39% 55% 56%
Edward Snowden 16% 7% 6%
Sanctions, political situation 2% 7% 5%
Other 3% 2% 1%

23 Chapter 1. Russian positions on the world IT market
We established a separate category with messages about Edward Snowden. One part of western readers appreciated the fact that Russia granted him temporary asylum as an unfriendly act towards the USA. Another part took Snowden as a hero and developed respect for the country that sheltered him and secured from persecution. Many did not come to a decision how to perceive granting of asylum to the fugitive NSA o�cer, but they cared for Russia to say the least of it.
The interest of mass media in Snowden over the past 2 years has been dropping (or anyway the pressmen less frequently remind that he is still in Russia), though he is not, of course, forgotten. A peak of interest to him is over as compared to times when the whole world kept a wary eye on his movements and wondered whether Russia would deliver him to the USA.
For the �rst time the articles about Russian microelectronics start to appear in foreign media. Journalists write that earlier the existence of this industry in Russia was completely unknown. They mention development of processors by companies MCST (Elbrus) and T-Platforms (Baikal). Of course, it is said that these processors are slow and in terms of functionality correspond to devices produced in the USA in 1999 (Russian specialists think that a gap does not exceed 5 years). An important point is that media are bound to acknowledge that the competitive electronics has emerged in Russia (and previously nowhere in evidence), therefore publications on the subject of Russian processors are indicative of progress at hand.
Reuters informed that the company WayRay in Moscow created the world �rst holographic navigation system. No other media caught up the news.
Reuters also published an article that Yandex planned to promote its own solution for Big Data analysis.
Several articles were dedicated to the fact that Sberbank, which was called the longest-standing Russian bank, was mainstreaming information technologies. Generally, a quite positive image is created of both the bank and Russia.
In the last 2 years in articles under consideration we could not �nd any mention of Skolkovo (foundation and a city under construction alike). Foreign journalists neither expressed interest in a similar large-scale project in Tatarstan — construction of Innopolis city though it is a quite world-class project.
Mass media also stopped to mention the Russian global navigation system Glonass – many hopes of promotion of di�erent applications in foreign countries were rested upon this venture. Several years ago there were published some articles on this subject though they were few.
Two previous years the most loyal to high-tech Russia edition for two consecutive years was the American Forbes. This leadership was determined by the share of positive articles as a result of analysis of publications of the previous 2 years. Forbes quite well re�ected the situation in Russia from 2012 till 2015 though in terms of the number of positive articles was far behind the leaders (after all, the specialized press much more frequently writes about software developers than general political papers).
Based on analysis of publications in 2014-2016 Forbes has left our rating of the most loyal editions. The same is the case for BusinessWeek and BBC. It should come as no surprise that it is related to the �are-up between the US and the UK, on the one hand, and Russia, on the other hand. On the plus side, the escalation of geopolitics in no way touches on the tonality of articles in the Indian newspaper The Hindu — from the second place among the most loyal editions it headed the list however with a very small number of articles impacting upon the image of Russian software industry. The IT edition MacWorld retains its third place, but it also mentions Russia and Russian developers not often. The same is the case for IT Europa (the 2nd place in the rating according to the share of positive publications). Among 5 mass media most loyal to Russia only Reuters and eWeek (PC Week) have a good many publications.
Ratings of publications loyalty

24 Chapter 1. Russian positions on the world IT market
Top 5 most loyal editions in amountof positive articles for last 2 years(01.08.2014-31.07.2016)
* - Only editions with at least 4 publications per yearare included in the table
Top 5 most loyal editions not by a share but by amount of positive articles includes only specialized press (which was expected). However, it is di�cult to designate Network World at the 5th place as a loyal edition because a good deal more publications in its columns present Russia as a threat source.
As a year before, The Washington Post and InfoWorld are found to be the most disloyal editions. The high place in this rating was retained by Network World, although it yielded the third position to the seemingly respectful Computerworld.
The biggest increase in number of publications with negative tonality for the last year (when comparing data of 2014-2015 and 2015-2016) was shown by The Washington Post and CNET.
Top-5 most loyal editions by numberof positive publications for last 2 years(01.08.2014-31.07.2016)
%
All positive publications*
1 The Hindu 100% 6
2 IT Europa 75% 4
3 MacWorld 60% 7
4 eWeek (PC Week) 59% 26
5 Reuters 52% 21
Top-10 most disloyal editions by numberof negative publications for last 2 years(01.08.2014-31.07.2016)
Number of positive % of positive
1 PC World 18 34%
2 CNET 16 43%
3 ZDnet 16 36%
4 eWeek (PC Week) 13 59%
5 Network World 12 23%
1 InfoWorld 94%
2 The Washington Post 94%
3 Computerworld 79%
4 Network World 77%
5 The Wall Street Journal 75%
6 TechNewsWorld 74%
7 The New York Times 67%
8 PC World 66%
9 ZDnet 64%
10 Bloomberg (BusinessWeek) 61%
1 PC World
2 Network World
3 ZDnet
Rating of editions by number of publication for last 2 years (01.08.2014-31.07.2016)
59
57
53
4 Computerworld
5 CNET
49
43
All publications
8 BCC
9 InfoWorld
10 TechNewsWorld
24
22
21
11 REUTERS
12-13 Financial Times
21
16
6 Forbes
7 eWeek (PC Week)
28
26
12-13 The Washington Post
14 The New York Times
16
15
15 The Wall Street Journal 9
All publications

25 Chapter 1. Russian positions on the world IT market
We have not found any publications satisfying the search query in Asia Times and Linux Magazine however we keep on looking after them. The Chinese paper Asia Times gives a fair view of the Chinese market – one of the largest software markets worldwide. Linux Magazine is also important in the light of a more active trend of conversion to free software in Russia. This edition prior to 2010 had publications mentioning Russia. Due to some reasons they later lost interest in our country. Probably, some contacts between journalists and representatives of Russian companies were lost.
All in all, in the publications selected for analysis (for 2 years) 25 Russian companies and organizations are mentioned, but only 9 of them more than twice. A year ago the number of such companies was 29, and two years ago 36. Though some newcomers have appeared but a total number of mentioned companies are reducing.
Several companies more can also boast of certain PR achievements but even they can learn from Kaspersky Lab how to work with foreign mass media. There is room for much better presentation of Russian software industry in foreign media, and it is well-placed to do it.
Other mentioned companies:
ROSA Software, FSUE Research and development establishment Quant (Intelligence Kvant Research), Softline, Elbrus MCST (twice), VimpelCom, Sberbank, T-Platforms (2 раза), Promobot, RosEnergoAtom, Prisma, MTS, WayRay, Rostelecom, RAIDIX, MegaFon, Summa Group, CardsMobile (i-Free), Parallels.
Most mentioned Russian companies
1 Kaspersky Lab
2 Yandex
3 Yota
Russian companies most mentioned in foreignmass media publications for 2 last years (the number of publications with reference)
40
20
7
4 Group IB
5 Mail.ru
6
6
6 vKontakte
7 Elcomsoft
8
5
47
31
6
4
5
15
4
For some years, Kaspersky Lab expectedly leads by far the rating of the most mentioned companies. This company is the largest Russian software product exporter and dominates at the markets of many economically developed countries including the US and Germany. Besides, its managers established a permanent contact with many journalists of foreign print press. Such contact, probably, is at disposal of the PR department of Yandex which takes the second place in this rating. Yandex is a public company and because of it is bound to work with foreign mass media.

26 Chapter 1. Russian positions on the world IT market
The Russian IT market in 2015 predictably decreased by tens of percent as measured in dollars. A year ago we predicted the 40% fall. That forecast was based on assumption of a minor alteration of the aggregate ruble IT budget of companies, government entities and households with a signi�cant devaluation of the national currency (the biggest spike took place in early months of 2015 while the further drop was not anticipated). According to IDC, the calculation of the expected market size turned to be very accurate — the market decline was 39%. An absolute value of the Russian IT market capacity at year-end 2015 was $17.8 billion. Total losses of vendors and suppliers exceeded $10 billion which allowed for using in headlines such words as “crash”, “wreck” and “going 10 years back”.
Such alarming de�nitions are scarcely correct that very moment because measurements are made by IDC not in the Russian currency but in dollars.
Indeed, determination of market capacity in dollar terms is also necessary but in the �rst place it is of importance for foreign IT companies concerning themselves with the Russian market and measuring their earnings and gains in the U.S. currency.
For another thing, these measurements in dollars are interesting for those Russian software exporters who have competitive solutions but for promotion in foreign countries they need the marketing budget in dollars, euro and other currencies. At year-end 2015, the national currencies of majority of countries strengthened against the ruble meaning that the resources of the Russian companies (which mostly gain income from sales in Russia) for promotion of solutions abroad lowered. However to these companies is more important the information on growth/drop in a speci�c segment of the market. At the same time, some segments even in dollar terms either were not diminished or even more so were increased.
It is also important to bear in mind that much of exporter expenses accrues to Russia and still is determined by prices in rubles. And indeed, they strike annual balance providing pro�t performance in rubles (rarely if ever in dollars and for foreign shareholders only). Therefore even for exporters is more important the market information in ruble terms. For IT users (both businesses and individuals) is of no concern at all how the market is changing in dollars.
In this regard, there exist results of the IT market measuring also in rubles. For example, according to the RF Ministry of Economic Development and Trade, the volume of the Russian IT market in 2015 amounted to 740 billion rubles that is by 9% less than in the year-earlier period if calculated in comparable prices.
It is an easy task to convert the IDC data in rubles. As a result, stemming from the IDC estimate in dollars, the volume of the Russian IT market in 2015 is as much as 1.08 trillion rubles - by 3% less than in 2014, however unadjusted for in�ation.
The gap in data for the IT market between IDC and the RF Ministry of Economic Development and Trade is considerable but it is accounted for by di�erent methods used. Particularly, the ministry, contrary to IDC, does not include smart phones and tablets with the IT market. At the same time, we see an almost absolute agreement between IDC and the Ministry of Economic Development and Trade regarding the estimates of the Russian software market. Neither the Ministry of Economic Development and Trade nor IDC disclose their methodologies in full. There are doubts that authorities address themselves to the market investigation on their own account. As a rule, they use the government statistical data but in Russia for Rosstat the IT sector does not exist at all. Besides, the activity of Rosstat in investigation of this new market has not changed since socialist times. It may be seen in the presented statistical information which appears with a long time lag (sometimes within 1.5-2 years when the situation in economy and di�erent branches can be quite di�erent) and in the same form that was prepared many years ago for the state-controlled economy.
The Ministry of Communications and Mass Media as far back as in July 2014 made a statement: “At the moment in Russia there is no o�cial uniform statistical indicators for the IT industry, so from viewpoint of formal statistics such industry is non-existent”. The regulator proposed to develop a uniform procedure of performance evaluation of the Russian IT industry which resulted in the draft order prepared by the ministry. However any information about the results of this proposal is lacking.
1.4. Russian ICT market

27Chapter 1. Russian positions on the world IT market
With a signi�cant reduction in PC sales, the sales of tablet computers increased (in 2015 such events are absent — sales of tablets also signi�cantly decreased).
The slumping sales of servers and a decrease in the growth rate of software market takes place against the background of the signi�cant cloud service market growth.
Smart phones squeeze out normal mobile phones (in 2015 the process gets going again but the share of smart phones is growing due to a lower falling-o� in sales).
Sales of printers and multifunctional devices are reduced with the mass change-over of companies and governmental structures to the e-document �ow.
Reduction of the market of infrastructural video conferencing products is compensated for increased sales of video conferencing software systems.
The Ministry of Communications and Mass Media as far back as in July 2014 made a statement: “At the moment in Russia there is no o�cial uniform statistical indicators for the IT industry, so from viewpoint of formal statistics such industry is non-existent”. The regulator proposed to develop a uniform procedure of performance evaluation of the Russian IT industry which resulted in the draft order prepared by the ministry. However any information about the results of this proposal is lacking.
RUSSOFT made an attempt to obtain from Rosstat the information on total revenues of St. Petersburg software companies with explanation about the source of data. The attempts were unsuccessful — in a point of fact, the statisticians ignored our request though it was made on a paid basis.
It is fair to assume that not having an opportunity to take measurements in the IT industry the public servants of the Ministry of Economic Development and Trade can only process market data provided by specialized research companies — IDC, Gartner and others. They just present the obtained data in a slightly di�erent way and convert into rubles.
Therefore, in an attempt to evaluate the volume of the IT market one has to found upon IDC data (another leading international analytical agency Gartner does not publish the �ndings of investigations of the Russian IT market).
Two years ago, for the �rst time we suggested to look at the Russian IT market not only from the standpoint of foreign corporations as it is done by most industry-speci�c analysts but also from the standpoint of perspective Russian users (both individual and corporate), and domestic IT producers. The glance through the spectacle of users allows for identifying the impact of information technologies upon life of citizens and national economy.
Because of the fact that we looked at the IT market from di�erent standpoints in the last two years we have received di�erent results. They have made possible to conclude that we have to tell not only about contraction of the IT market in dollar terms but also about its development. If for the foreign companies a drastic market decline is obvious (the income in foreign currency was seriously diminished for the vast majority although not for all companies), for the domestic developers which costs and income are measured exclusively in rubles the market was growing, yet with minor growth rates. Moreover, many Russian developers had the opportunity to augment turnover due to take-over of the share of their foreign competitors. Hence the market for them (that is a part which they could lay claim to) could grow even in dollar terms though as a whole its volume was diminishing.
In�uence of IT over economy and society also was increasing. It manifested itself in the growing number of users of Internet and electronic government, computer and server population. There and then we observe that some technologies are replaced by the other ones. In this case, the squeezing technologies were those which were considered to be less expensive and more e�cient. Thus, the users could have greater functionalities even with contraction of the IT market.
Here are just a few examples of such replacement over recent years:
Therefore, a decrease in a certain segment is compensated by a growth of another (partially or fully alternative) segment. It is accompanied by the drop of turnover of certain companies that focus on conventional segments and the sales growth of other companies (more often smaller ones currently not ranking among the leaders) which guessed the market tendency.

28 Chapter 1. Russian positions on the world IT market
In our opinion, there is still no collapsing situation on the Russian IT market, although the IT development in Russia still has not come up to that of the most economically developed countries meaning that the growth of the IT market still is a must, but following the results of the year it is missing even in ruble terms.
As a main reason of the Russian IT market standstill (from the standpoint of foreign vendors), or its recession (from the standpoint of users) the analysts most frequently cite the perturbed macroeconomic situation. The economy does not grow (at least, at a previous rate), so the IT market is at a stop too.
Indeed, economic climate in�uences the IT market. However if we do not consider other equally important factors, we can get to a somehow warped and simpli�ed conception about what is going on at the Russian information technology market.
The factors in�uencing the Russian IT market (apart from low GDP growth rate):
Inhibition factors
Improvement of the e�ectiveness of investment in IT. After 2009 crisis in expectation of new shocks, business is learning to use in an e�ective way the available IT budget. Selection of parties responsible for projects and decisions as well as service providers becomes more careful. It is not inconceivable that the companies will improve the investment performance as regards information technologies, so to solve IT problems they don’t need to increase the IT budget even though there is room to do it. It may be assumed that retail buyers and business customers went for their expenses in a more down-to-earth manner. Now purchases of computer equipment and investments in information systems to a lesser extent are pegged to certain dates (New Year or yearly closure) but are made as and when necessary.
Emergence of alternative technologies. It should not go without mention that both cloud technologies and e-document �ow allow for signi�cantly saving expenditures on primary inputs in IT at least. Purchase of servers, workstations, printers and multifunctional devices could grow down not only by reason that there was not su�cient money to buy them but also owing to the existing alternative which allowed getting the same or even greater functionalities with reduced expenditures on IT. The transition to “free software” is bringing out, that results in reduction of the Russian software market since now there is no need to pay for licenses while expenses on software support are relatively similar.
Saturation in some segments. It is hard to deny the impact of such factor as market (certain segments) saturation upon Russian IT market volume. For example, a vast majority of Russians have personal computers. From year to year notebooks and desktops are bought not for the �rst time but in order to replace old devices. On the enterprise IT market saturation is also felt. For example, according to Doc�ow, only 2% of companies do not use and not plan to use IT solutions in the �eld of enterprise content management. In 2012 they were 23%. Introduction of e-document systems (EDS) by the middle of 2014 is completed already by 56% of companies that is by 15% more than in the last year. 40% of companies are under introduction of EDS. A similar situation is observed on the ERP market and in other segments of IT market.
Price-cutting. Price reduction of di�erent devices is another factor slowing down the spending spree connected with information technologies on a nationwide scale. It is telling that, for instance, the Russian data storage system market in 2013 reduced in monetary terms by 5%, at the same time it increased in petabytes (total amount of delivered systems) by 11.4%. In all likelihood this tendency remained in 2014-2015 as well.
Lack of sensational specialties. Finally, in recent years the Russian market did not face any essential novelties (devices, technologies or products) that could have driven demand. This factor is less signi�cant compared to those above mentioned, anyway it is worth mentioning.

Chapter 1. Russian positions on the world IT market 29
All these factors are mentioned by the experts and representatives of IT companies but far and away less often than aggravation of the macroeconomic situation.
Considering that the market can be viewed di�erently, in the recent years we suggested to measure its size both in rubles and dollars. However from the standpoint of IT impact upon economy and society both measures do not give an answer about the general trend of the IT market, because this impact depends on both dollar prices and ruble prices.
We have developed a measurement methodology which allows for accounting for prices in di�erent currencies. The point is as follows. The market is divided into imported and domestic solutions, and the growth in a respective currency is determined for each segment. Afterwards, the weight of each segment is accounted for. A share of Russian companies during the year increased just slightly, so we may ignore its change in our calculations.
As a result, we obtained that the IT market in 2015 contracted approximately by 25% (this indicator was called RUSSOFT “bi-currency index”). This contraction is serious but it is far less than the value of IDC — 39%, however greater than that of the Ministry of Communications and Mass Media which stated the contraction of market by 9% in comparable prices.
Is highly questionable the way the authorities de�ned “comparable prices” given that for Rosstat which monitors growth in prices IT industry is actually non-existent. Probably, statisticians determine a price index for a certain category of consumer commodities and services classed with IT — software, PC, access to the Internet. However the whole IT market is much greater than the sales of goods and services paid for by households.
In our calculations we did not take into account price changes at all because in this context there are only expert judgments and just for small segments. Our procedure requires separate measurement of prices in dollars and rubles. And yet, if a price of any imported product, solution, equipment is set in dollars, in recent years these prices were not growing. Even more so, a total index of dollar prices for imported equipment was negative. Thus, for example, new servers and computers are more powerful and e�cient than previous ones, at the same time they are less expensive.
In the event that a price of the imported part of sold solution in dollars remained stable, the ruble component of such solution’s price hardly increased in proportion to changes of national currency exchange rate. For this reason, a price in dollars for end users had to be reduced even slightly.
No information on revision of ruble prices for IT services and software was observed in 2015. For the �rst time such news appeared in early 2016. Here this refers also to Microsoft which basically is geared to income in dollars, but set their prices on software products in Russia in rubles. From time to time the company revises the prices depending on exchange rate �uctuations, however with a certain delay. For our part, we assumed that such companies set prices in dollars.
Three views of the change of size of the Russian IT market at year-end 2015 Change Comment
From the standpoint of global companies ($) -39% IDC version
From the standpoint of Russian companies (rubles inflation-adjusted)
-9%
Version of the Ministry of Economic Development and Trade
-14% Calculated according to IDC with allowance for official inflation 12.9%
RUSSOFT bi-currency index (from the standpoint of IT users)
-25%
-10-15% With allowance for change-over to free software, more active use of cloud technologies and reduced prices in dollars and rubles

30 Chapter 1. Russian positions on the world IT market
The conditions for increase on prices for IT services in 2015 were not favorable. According to suppliers, customers requested more services for the same money. And there were no two ways about it.
Therefore, it may be assumed that, on average, both dollar and ruble prices have rather reduced than increased. It means that the downturn by 25%, that we obtained, should be revised downward.
Apart from the negative price index, there are other factors requiring the same revision. This is change-over to free software. A scope of such process cannot be evaluated even by developers of Linux distributive. They only note an increase in downloading of the free operating system. How is it used, who downloads (individuals, small businesses or medium-sized companies), how many computers it is installed on with one downloading — such information is lacking. This phenomenon is new in Russia. That is why it is hard even to make assumptions. It is known that major Russian corporations (for example, plane makers) shift to free software however this change-over lasts for 2-3 years. Anyway, at the Annual IT Summit APKIT in April 2016 the change-over of corporate customers to free software was named as one of the most important market trends in 2015.
Another factor is the explosive development of cloud technologies allowing for obtaining the same or greater economy-sized functionalities.
In�uence of these factors is very di�cult to assess. At present, there is no even required initial data to do it. It may be only assumed that every one of them allows for adjusting only by several percent points while the resulting indicator will nevertheless be negative. For this reason, even taking into account the above mentioned factors, the IT market disruption hardly was less than 10-15%.
At the same time, it means that the positive impact upon economy and society has been reduced as compared to 2014, though the IT market with changed structure is still developing even with such contraction. Accordingly, broadly speaking there is no sense to tell about any return of the IT market to the past. In 2005 it was quite di�erent — both in terms of sales structure and sold equipment and solutions. In those times nobody could imagine the saturation of market in any segment. Over recent years it is already possible to mention the approaching market saturation. It is fair enough to state that sales of foreign vendors measured in dollars returned to the level of 2005. Primarily such contraction is a matter of concern of these companies.
In our calculations we based ourselves upon IDC data (Association RUSSOFT did not measure the IT market and just analyzed and revised information about it from di�erent sources).
In the context of segments where foreign vendors predominate, the experts and participants of the Russian IT market (for example, major distributors) have no occasion not to trust the estimates of IDC analysts. But when what is meant here is segments of software market where Russian developers prevail, or the IT service market (also with prevailing domestic companies), experts often have serious reservations about correctness of foreign analysts’ approaches. For example, according to Uniscan GS1 Rus, the segment of business-to-business electronic document �ow was twofold underestimated by IDC because the company does not take into account some sectors and individual market players.
RUSSOFT in the annual inquiry determines a volume of cumulative income, export and sales of Russian software companies on internal market. That’s why we have benchmarks for determination of the domestic software market size. According to our estimates, the size of this market should be not $2.1 billion, as that of IDC, but not less than $4-4.5 billion (more details in the pertinent subsection below). More than likely that IT services are also underestimated.
It must be noted that the major IT companies from 2013 Rating earned in 2014 far less than in 2013. Therefore, it is fair to assume that a share of major companies in the total IT sales volume has reduced in 2 years, which con�rms the version about a more signi�cant growth of medium-sized IT companies not classed with the largest ones.
However even in the Top-100 Rating, 50% of companies by estimate have not shown any signi�cant ruble revenue contraction in comparable prices. According to Tadviser, out of 100 major companies only 19 showed a negative increment in revenue, another 17 closed last year with the 5% growth and less. And other companies were growing faster. This goes to prove that a fundamental change of market structure is taking place, not only in technologies in use but also in company shares.

31 Chapter 1. Russian positions on the world IT market
The following pieces of information allow for drawing conclusion on what is going on the Russian ICT market:
Russian federal public authorities, according to Cnews, spent in 2015 on departmental information support on average by 9% less than in 2014. This conclusion was drawn on the basis of analysis of ICT budgets of more than 90 federal government establishments.
Volume of IT budget of the entire Russian defense industry complex in 2015 amounted to 21 billion rubles that is by 10% more than in 2014 (TAdviser estimate).
In 2015, Russian regions spent on ICT around 72.5 billion rubles — by 15.4% more than in 2014. Leading positions in the rating prepared by CNewsAnalytics are gained by Moscow, St. Petersburg, Moscow, Tyumen and Samara regions.
At year-end 2015, a total revenue of 20 major IT suppliers in the retail segment increased by 11.6% up to 35.8 billion rubles.
Volume of the Moscow ICT market at year-end 2015 reduced by 6.8% as compared to 2014 and ran at 646.2 billion rubles (Moscow Information Technologies Department).
Basic indicators which characterize the Russian ICT market in 201 5
Indicators Absolute value
following the results of 2015
Drop (-)/Growth (+) following the
results of 2015
Drop (-)/Growth (+) following the
results of 2015
Source
Russian IT market 740 billion rubles
($12.2 billion) -9%
prices) (in comparable
+2.2% (in comparable
prices)
The Ministry of Economic Development and Trade
$17.8 billion(1.08 trillion rubles)
-39% (-2.9%) - 16% (+0,25%) Calculated according to IDC
Cumulative income amount of 60 major Russian IT companies
658.7 billion rubles +6% +3% Rating of major Russian IT
companies (RIA Rating)
Cumulative business volume of 100 l majorRussian IT companies
876.3 billion rubles ($23 billion)
+8.6% (-9%) - Rating TAdviser100
Cumulative business volume of 100 major Russian IT companies
928 billion rubles ($24.4 billion)
+1.09% (-15.32%)
Rating CNews100
Cumulative business volume of major Russian IT companies (51 organizations) in rating Expert RA
404.8 billion rubles +8% +2% Expert RA
Communication services by enterprises of all economic activity
1711.3 billion rubles -0.4% (in comparable
prices)
+0.5% (in comparable
prices)
The Ministry of Economic Development and Trade
(flash estimate)
Telecommunication market (volume)
1.674 trillion rubles ($27.6 billion)
+1% (-37%) +3% (-13%) TMT Consulting

32 Chapter 1. Russian positions on the world IT market
Concerning the IT market structure according to IDC it is apparent that a share of IT services over the last couple of years has signi�cantly increased — 20% - 25%. This change demonstrates that the market has become more mature, though it is primarily connected with signi�cant growing prices of imported equipment resulting in falling-o� in sales thereof.
The system integrator System Soft showed a growth in 2015 by 45% driven by development of service sector. This is one of case studies which demonstrate that the growth may seriously increase even on the falling market.
In 2015, the turnover of cloud activity area of KROK (one of the largest Russian IT companies) increased by 59%, and in 2016 an even higher growth ratio is anticipated. In opinion of the company management, the reason is that a weak ruble made purchasing of equipment which price rose twofold appreciably less attractive to Russian customers. A share of IaaS in the turnover of cloud service department is about 80%, SaaS — 20%. But as a whole the total KROK business increased only by 4.2% (turnover 27.5 billion rubles).
The IBM revenue in Russia in 2015 was reduced by 32.2% in dollar terms. The drop-down was more signi�cant than in 2014 when the company revenue decreased by 22.7%. An even higher revenue drop than in Russia is shown in the IBM annual report only for the Chinese market – where it amounted to 34.4%.
Structure of the Russian IT market
Structure of the Russian ITmarket at year-end 2013 (IDC)
Structure of the Russian IT marketat year-end 2015 (IDC version)
2013 2015
IT services IT services
Software
Software
telecommunication andnetwork equipment
other equipment
IT equipmentPC
mobilephones
2019
15
1818
10
25
1362
Structure of the Russian IT market at year-end 2015
IDC version absolute value
IT equipment $11.1 billion
IT services $4.4 billion
Software $2.3 billion
Total: $17.8 billion
version of the Ministry of Economic Development and Trade) share
hardware 56,4%
software 19,3 %
services 24,3%
Total: 100%
Р
417,4 billion
142,8 billion
179,8 billion
740 billion
$
6,9 billion
2,4 billion
3 billion
12,2 billion

33 Chapter 1. Russian positions on the world IT market
Individual segments of the Russian IT market Information by segments
Indicator 2015 Drop (-)/Growth (+) at year-end 2015
Source
Monitors 2.1 million pcs($350 million)
-38% (-36%) ITResearch
Printing devices 2.27 million pcs ($441 million)
-36.4% (-46.5%) IDC
Traditional retail sale of antivirus software (Q 1-3 2015)
-18% (in pcs) GfK
Servers 106.7 thousand pcs ($669 million)
-25.4% (-27,8%) IDC
External data storage systems
total capacity 480 petabytes ($381 million)
+1.6% (-32,6%) IDC
Tablet computers 6.11 million pcs -25.2% (-53.5% volume of sales in dollar terms)
IDC
Projection devices 93 thousand pcs ($88 million)
-40% (-45%) ITResearch
Number of SIM cards M2M/IoT
8 million pcs (preliminary data)
+20% iKS-Consulting
Volume of Russian digitizer market
3.6 billion rubles +60% Company ELAR
PC 4.87 million pcs ($ 2,07 billion)
-38.4% (-46.8%) IDC
Desktops 1.88 million pcs -38% IDC
Share of households – desktop users
53% - Json&PartnersConsulting
Share of households – notebook users
63% - Json&PartnersConsulting
ERP systems 60-80 billion rubles (depending on calculation methods)
-20-40% EnergyConsulting, TAdviser
Commercial data center market
Income in rubles (in $) +16% (-18%) iKS-Consulting
EDMS/ECM system market 37.8 billion rubles (preliminary data)
+9-10% TAdviser
34 Chapter 1. Russian positions on the world IT market
According to TMT Consulting, telecommunications market in ruble terms unadjusted for in�ation increased in 2013 by 5% and in 2014 and 2015 – only by 3% with a much higher in�ation. Same deal with the broadband access market. Nevertheless, it is in this area that the in�ation is very low — a cost of services of telecommunications companies almost does not grow. As a rule, the available contraction is due to the approaching or already manifested market saturation. At that, as a whole, the use of telecommunications technologies is expanding just the same.
Judging from the change of the size of telecommunications service market, we may see there a stagnation (as measured in rubles, the growth is purely symbolic) or a serious crisis (as measured in dollars). According to the analytical company iKS-Consulting, in 2015 the volume of the Russian business communication service market was 148 billion rubles, for the �rst time lowering — approximately by 1.5-2% as compared to the previous year. In 2014, the growth was 1.4%.
However concerning the telecommunications market we can state neither stagnation nor crisis. The existing cost e�ectiveness of telecommunications operators de�nitely permits to introduce new technologies, to enlarge the coverage area. In recent years, in di�erent regions LTE networks have been put into operation, data transmission rate has been increased with stable tari�s. A number of Internet users keep growing. Indeed, growth rates are o�, but it is already possible to speak about approaching market saturation, which is one of the important factors in�uencing the dynamics of new user connection.
A �at path of sales of business communications services can be attributed not only to the tough economic environment in Russia but also to transfer to less expensive technologies. For example, telephone communication is shifting to VoIP telephony.
Communications market
According to IDC, the environment on the Russian software market is going down year to year: in 2012 there was observed the growth in dollar terms by 10%, in 2013 it decreased up to 4%, and in 2014 the disruption began — the contraction was 20%. Finally, at year-end 2015, the meltdown occurred — the market lost 43.1% reaching the point of $2.3 billion. The situation in ruble terms looks quite di�erent — over the last two years no serious disruption was observed. Actually, the contraction is primarily governed by devaluation of the ruble: the Russian national currency has dropped in round numbers by the same value as the software market (IDC version).
One may speculate about the best way of measuring the Russian software market — in rubles or in dollars (we will propose an alternative method below), but the slowdown indicators look quite lifelike. This cannot be said about the absolute value obtained by IDC. $2.3 billion is too little with allowance for our data on sales of Russian software companies on internal market, expert judgments of individual segments of software market, sales of western software companies in Russia.
Just the ERP system market is by conservative estimates over $1 billion. Almost the same is accounted for by o�ce software. The market of mobile applications, in all likelihood, has also reached or approached to $1 billion (according to J’son&PartnersConsulting forecast). That is at the �rst approximation something around $3 billion. At least, not less than $2.3 billion, but there also is a lot of types of the other software — CAD, navigation systems, billing systems, engineering software and a host of other things.
On the other hand, according to our estimates, the total sales of Russian software companies on internal market amounted to about $5 billion. In this case we deal with a double count (but only for hundreds of million dollars), and there also the sales of software development services and di�erent revenues of companies are accounted for, which are not related to the software sales. From this sum 35-40% falls within the sales of proper program products giving about $2 billion. Note that this �gure does not account for sales of foreign software which volumes of only three companies SAP, IBM, Microsoft exceed $1 billion.
In order to understand the reason of such inconsistency one has to carefully analyze the methodologies which are used in measurement of the whole software market and individual segments (though these methodologies, as a rule, are not disclosed).
Software market

35 Chapter 1. Russian positions on the world IT market
It may be assumed that IDC included in the concept of the software market only license selling (with no innovation costs) and only in those segments where a signi�cant share belonged to foreign corporations. The segments where Russian companies prevail still are not accessible to foreign researchers. To a large extent it occurs due to the fact that these segments are measured with great di�culty. In this event, IDC in all appearances does not include in the concept of the software market the custom development and mobile applications.
Indeed, there may be a great amount of methods to measure the software market. Hence there are serious discrepancies in research �ndings. Shall we include custom software in the concept of “the software market” or not? Shall we count SaaS as IT services or as software? Shall we account for revenues of software companies from introduction and support or not? If a company develops custom software for a speci�c customer, but on its own replicated platform, is it a service or a standard solution? If a software company sells mass-produced software-hardware complexes on the basis of its standard software, does it present sales of equipment or software? There are plenty of such questions. In majority of cases methodological di�culties are still related to the issue whether a certain segment is included with the IT services market or the software market.
However if one takes into account actual data of IDC about the IT services market, then the software market, according to our estimates, shall be no less than $4-4.5 billion, not accounting for custom software development services.
Sales (without software-hardware complexes, SaaS and custom software) reduced approximately by 7%. In this event, change-over to free software is not considered, besides it is assumed that western vendors set license values in dollars (if in rubles then adjusted depending on exchange rates), which is not quite correct. It is di�cult to make quantitative estimate of e�ect of changes of prices and change-over to free software upon market, however these factors are quite meaningful for this market. Thus it may be assumed that if we take them into account then the disruption will be by a negligible margin.
If we take into account custom software, there is no disruption of the software market at all — the growth is 2% at least.
Development of the Russian Internet industry has slackened in the last 2 years. It manifests itself in the reduction of growth rate of some indicators (particularly, Internet audience).
Use of Internet technologies
Three views of the change of size of the Russian software market at year-end 2015
Change Comment
From the standpoint of global companies ($) -43.1% IDC version
From the standpoint of Russian companies (rubles inflation-adjusted)
-19% Calculated according to IDC with allowance for official inflation 12.9%
RUSSOFT bi-currency index (from the standpoint of IT users)
-7% Only replicated software solutions
+2% Together with custom software development services
-1-3% Only replicated software solutions, but with allowance for change-over to free software and more active use of cloud technologies
Sales of Russian software companies on internal market
+29% (+14%) Nominal income in rubles. Within brackets — with allowance for official inflation.

36 Chapter 1. Russian positions on the world IT market
In experts’ opinion, the number of Russian Internet users will grow by 2020 but the growth rate will be slower. In Moscow, St. Petersburg and other big Russian cities Internet penetration has already reached or come near the sky line (80-85%). The growth in Internet audience occurs at the expense of small towns and settlements.
The digital gap is almost redressed because Internet penetration in villages and small towns has exceeded 50%.
Use of Internet technologies in Russia
Absolutevalue
Indicatorchange
Penetrationindicator
Source
Runet audience(used at least once a month)
Internal e-commercemarket size
Site sessions frommobile devices
Runet audience (16+)
Number of stationarybroadband access users
Number of registeredG2C users
Cross-border saleson e-commerce market
Number of purchasersof online legal content
Cellular communication and mobile phones Russian market of cellular communication and mobile phones
Indicator Time Absolute value Change Source
SP sale
at year-end 2015 25.3 million -3% (+6% in monetary terms)
J'son&PartnersConsulting
at year-end 2015 26 million(260 billion rubles)
-8% (+6%) MTS
LTE phone sale at year-end 2015 6.7 million Over all preceding periods 6.1 million devices sold
MTS
Cellular communication spreading factor
2015 151 active subscribers per 100 people
+1.2% during the year Higher Schoolof Economics
Indicator Time
end of 2015 83 million people +4% 68% TNS Russia
end of 2015 84 million people +5% 70.4% GfK
end of 2015 29% of all users - - Yandex metrica
at year-end 2015
650 billion rubles ($10.5 billion)
+16% (-28%) - East-WestDigitalNews
at year-end 2015
$3.4 billion +55% East-WestDigitalNews
by end of 2015
30.3 million people
+2% - J’son&PartnersConsulting
at year-end 2015
18 million people +50% - The Ministry of Communications and Mass Media
by end of January 2015
23.4 million people
growth ~ one million monthly

37 Chapter 1. Russian positions on the world IT market
In all likelihood, the volume of the ICT market at year-end 2016 in ruble terms will change insigni�cantly. Drop or growth will be 2-3%, anyway the growth is more probable; it cannot be excluded that it will exceed 3%. First, because the prices for software, communications services, IT services (including custom development) after standstill at a certain level after all will creep upward catching up the o�cial in�ation. According to estimates, a cost of communications landline services will increase in 2016 by 5.5%. Several major software companies reported to RBC about the planned enhancement of prices for software in 2016. What is meant here is the rise in the cost of software by 10–25% depending on type – for users or for business software. For example, Microsoft will adjust prices for software for private customers by 19%, for commercial structures – up to 25%. In Kaspersky Laboratory the planned enhancement of prices will average 10% for personal solutions, 10–20% - for corporate solutions. The antivirus company Eset states that the products will increase if and when no more than by 10%.
Second, the scheduled IT budgets of government entities have increased. For example, a basic budget of the Ministry of Communications and Mass Media on IT penetration in 2016 increased almost by 150% and was about 9.023 billion rubles, though in some measure such growth was probably conditioned by redistribution of �nancial resources between entities. According to the report of Gartner RUS disclosed at the December meeting of APKIT Commission on monitoring of IT industry development, in 2016 IT expenses in ruble terms of 39% major Russian enterprises compared to 2015 will increase (on average by 31%), and those of 37% will stay static. And only among 24% respondents IT expenses in 2016 will decrease (compared to 2015, on average by 26%). On consumer market the put-up demand should manifest itself, because the situation in economy is stabilizing, in some sectors the previously frozen (sometimes reduced) salaries have been increased.
According to the basic scenario prepared by analysts of the IT Department of Moscow Government, the volume of the Moscow ICT market shall increase in 2016 by 3.9% up to 671 billion rubles (about $10 billion).
With a slight change of market in ruble terms its size in dollars will be determined (as in 2015) by the foreign exchange market. In the �rst months, the average ruble rate decreased against dollar by about 13%. That’s s just the decline of the IT market by IDC forecast. Preconditions for the further ruble fall are still unsight. Even a slight strengthening of the ruble is possible if oil prices increase as predicted by some experts.
All trends observed in 2015 will also be typical for 2016. It refers to change-over to free software, more active use of cloud technologies, mobile application sale uplift, introduction of navigation systems. One expects that the results of import phase-out will be more obvious than in 2015. A lot of experts and specialists are actively working toward this common goal upon di�erent directions.
ICT market in the nearest future

Chapter 2
Volume and structure ofsales by Russian softwarecompanies in domesticmarket and abroad

Chapter 2. Volume and structure of sales by Russian software companies indomestic market and abroad
39
The total sales of the Russian software companies as per the results of 2015 amounted to RUR 630 billion that is 40% higher than those of the past year. Such a high amount of growth was produced mostly due to a Ruble exchange rate fall that caused a growth in Ruble equivalent of export earnings generating now more than half of the total revenues of Russian software developers. If the in�ation rate is taken into account (which was 12.9% in 2015 as per the o�cial data) then the growth of sales in Ruble amounted to 23%. However, if we measure the sales of software products and development services in US dollar, then for the �rst time for several years a reduction in the total sales volume by 10% was observed. The primary reason for the reduction (as well as the high growth in Ruble) was the depreciation of the national currency against US dollar, which resulted in a substantial contraction of the domestic market volume equivalent in USD.
Sales in the domestic market dropped by 3% down to ruble 235 billion. However, if those are converted in USD, then a decline by 39% from $6 to $3.86 billion will result.
The question about the best currency to measure the industry’s sales, in our opinion, is not appropriate. Everything depends on what we want to determine. If we estimate the share of Russian software industry in the global software market, then USD must be used. If we want to determine the movements in development of the domestic companies, then it is better to use ruble still as they operate in the ruble zone. In this case, one can estimate the sales either without or with regard to the in�ation rates.
On the one part, the prices of software development services and of the packaged software were not growing in 2015 (price revisions appeared early in 2016 only) or were almost not growing. On the other part, the ruble was nevertheless depreciating as such and not only against any foreign currency.
As we try to show the industry’s evolution in various aspects, then we provide the total sales variations in di�erent measurement units. In addition, we have introduced our own bi-currency index to be calculated as an average growth of revenues in foreign currency and Ruble considering the weight of earnings from exports and domestic market sales. As per the results of 2015 the index amounted to 1.1 (i.e., the corporate sales increased integrally by 10% on the average for the year).
2.1. Sales volume of Russian softwaredevelopment industry
Basic indicators of Russian software industryThe number of Russian software companies and consolidatednumbers of core employees
Basic figures characterizing the Russian software industry (growth/decline compared to similar indicator in 2015)
Number of Russian stable software companies at least 3200
Number of companies with export receipts at least 2000
Total number of software developers in Russia at least 450 thousand persons
Consolidated staff numbers of software companies at least 140 thousand persons
in US dollar in ruble in ruble with regard to inflation rates (in prices 2014)
Cumulative turnover of Russian software companies
$10.34 billion (-10%) Р 630 billion (+40%) +23%
Volume of foreign sales $6.7 billion (+12%) Р 405 billion (+77%) +57%
Volume of sales in domestic market
$3.64 billion (-39%) Р 235 billion (-3%) -14%

40 Chapter 2. Volume and structure of sales by Russian software companies indomestic market and abroad
The growth rates of sales of software products and development services have been falling steadily during 13 most recent years. Under the current environment, a recovery towards the growth rates of exports at 40–50%, which were observed under a low baseline, is unlikely. However, the industry o�ers yet a potential to increase exports by 15–20% at the least during several forthcoming years. In particular, a potential is based on the fact that the promising market of developing countries is almost underserved still (see details in Chapter 5). In this case, a growth of the foreign sales can be predicted for software products as well as for software development services, while a growth of the foreign companies’ development center services above 10% in Russia cannot be expected in every respect.
All those more or less optimistic forecasts of foreign sales growth rates can materialize provided only that the social payments exemptions for the software developers will be also maintained in future. Besides those exemptions, the government provided support to IT through the venture capital �nancing to startups and the subsidies to promising research developments as well as through the �nancing for construction of technology parks. The support has already contributed to the growing export growth rates and can be a good growth factor during forthcoming years.
Another important export growth reserve of the industry is a governmental support such as elimination of administrative barriers, �rst and foremost those relating to the customs and foreign exchange regulation.
It is worth noting, however, that the current achievements have been obtained without signi�cant governmental support to the IT exports. All the existing �nancial measures of governmental support to the exports in Russia are almost not applicable to IT due to the governmental unwillingness to appreciate the speci�c features of intangible software production. Non-�nancial export support measures (�rst of all, subsidization of international marketing) in Russia are almost not applied.
The export e�ects cannot be considered only from the standpoint of tax revenues and employment growth. An expansion of the software exports permits to diversify the Russian economy and to reduce its dependence on the global commodity price �uctuations. The software exporters obtain the competences and knowledge from abroad, which they use to operate in the Russian market. Renovation of the Russian traditional economy sectors is not possible without information technology. It is also necessary to keep in mind that all the modern businesses of the high-tech economy sectors depend on the software. The more the high-class developers o�ering successful global competition experiences in Russia, the higher the chances to develop competitive solutions in any segment of the global innovative economy.
Due to a confusion that often occurs when the software companies’ exports mentioned by us compared with the net foreign currency in�ow into Russia, we have elected to use the term «foreign sales». The point is that foreign sales of the software companies are not always leading to a direct foreign currency �ow to Russia. A percentage of cash is left in other countries when sales are made by the legal entities established by Russian companies in accordance with the global practices to be closer to the customer in order to mitigate its risks of dealing with foreign companies (this is much more relevant under the current geopolitical environment). Those funds are spent partially for supporting foreign development centers and sales o�ces, including the marketing costs. In addition, some funds are left in the accounts with foreign banks where the owners of Russian companies deposit their cash (the more so as many major Russian companies feature foreign co-owners).
It is quite di�cult to determine exactly the net foreign currency in�ow from the Russian software industry to Russia; however, based on the data we have obtained in the course of survey 2016 it is possible to suggest that it amounts to about $4.5-$4.6 billion (most likely, $4.5 billion at the least). At the same time, the total foreign sales amounted to $6.7 billion as per results of 2015.
Foreign sales and net foreign currency in�ow

41 Chapter 2. Volume and structure of sales by Russian software companies indomestic market and abroad
The estimated net foreign currency in�ow due to foreign sales by Russian IT companies is based, for instance, on the formal data of the Russian Central Bank, according to which the volume of cross-boundary computer services provided in 2015 amounted to $2.455 billion that is almost the same with the Central Bank’s data on foreign currency in�ow for rendering of such services in 2014 (the di�erence is within the measurement accuracy). For the �rst time during the most recent years, no growth of foreign currency proceeds for cross-boundary computer services was observed, given that the foreign sales by IT Companies increased by 12% as per our estimates. It is most likely that the di�erence resulted from the growing pressures on the Russian export IT industry due to geopolitical factors. The anti-Russian sanctions and threats relating to imposition of the same on foreign customers of Russian companies have compelled our companies to partly relocate their sales and support centers (and sometimes, their headquarters) abroad under the jurisdiction of countries that o�er much less risks of being subject to the anti-Russian sanctions in the eyes of our customers.
It is possible that one more factor a�ecting the decreasing foreign currency proceeds as shown by the Central Bank’s statistical data relates to the fact that the activity of using various schemes of cash transfer to Russia has changed. According to our survey, the importance of Internet sales has grown. In this case, it has been yet growing for major companies (previously, sales on the Net were more intensely practiced by small companies). Such sales are most likely not shown by the Central Bank’s statistical data.
It is necessary to put some clarity into the fairness of presentation of the real foreign sales by IT companies according to the Central Bank’s data on the foreign currency proceeds for the provision of trans-boundary services. The statistical foreign trade data on the services is generated pursuant to an international methodology set forth in the UN Manualon Statisticsof International Tradein Services 2010. Computer services are classi�ed as the transactions relating to the production and integration of software: engineering, development, delivery, and supply of documentation for customized software; purchase of ready-to-use software supplied electronically; acquisition of the licenses for software without an entitlement to duplicate and distribute the same.
In addition, that class of services includes the work relating to data processing, generation, recovery, hosting, storage of and operations with databases; services relating to production, design, and hosting of web-pages; those relating to installation, repair, and maintenance of hardware and software; provision of consulting services relating to software and operation of computers as well as training within a consulting framework. The primary information sources to generate the statistical data on foreign trade in services of the Russian Federation are the details contained in the reporting of lending institutions to be adopted by the Bank of Russia.
However, it is known that a lot of small companies sell their solutions via Internet, including through Application Stores. They cannot know themselves at all times, who exactly has purchased their mobile application. There are various schemes of cash transfer from abroad, which are not meant to be part of the
0.345
2002
0.53
2003
Volume of software exports in 2002-2016, $ billion
* - forecast as per the survey results
+55%
0.74
2004
+39%
0.95
2005
+28%
1.41
2006
+49%
2.15
2007
+52%
2.6
2008
+21%
2.75
2009
+5%
3.3
2010
+20%
4
2011
+22%
4.6
2012
+13%
5.4
2013
+17%
6
2014
+11%
6.7
2015
+12%
7.6
2016*
+13%

42 Chapter 2. Volume and structure of sales by Russian software companies indomestic market and abroad
lending institutions’ reporting as the computer service sales. Moreover, a percentage of sales by software companies is provided by hardware and software packages, various equipment and devices operating on the proprietary software basis.
There are business models suggesting collection of cash for the services other than computer-related ones. For example, the user may earn from advertising on a mobile application installed free of charge.
The sales of foreign o�ces run by Russian companies can be estimated only based on the data on the numbers of employees working in Russia and abroad with the companies that we classify as Russian ones. In this case, the foreign employee numbers are an expert estimate rather than a calculation result. Calculations require more source data. It is also necessary to consider that the foreign employees may be employed with the head o�ce in Russia, while they do not deal with their own sales. That’s why a contribution of foreign development centers is estimated from the employee numbers as a better measurement method is missing.
The foreign sales of software products and development services increased by 12% in 2015 that is a bit less than the forecast made a year ago. Almost the same growth is expected also as per the results of 2016 (14%). In 2014, the foreign sales increased by 11%, and this means that it is possible to say that the software development industry has not regained the growth rates of foreign sales following the geopolitical shocks of 2014 and a subsequent deteriorating environment of exports from Russia, which relates to the anti-Russian sanctions and anti-Russian propaganda in our primary foreign markets.
The share of Russian software foreign sales in the total export income of Russian enterprises and organizations has been growing during the most recent years. Basically, it has happened due to higher growth rates as compared with those of the total exports of goods and services. As per the results of 2014, the foreign software sales accounted for 1.1% of the total exports from Russia (1% in 2013, 0.88% in 2012, and 0.8% in 2011). In 2015, the share increased instantly by the factor of one and a half to achieve 1.7%. Such a rush was predetermined not so much by the growth of foreign sales (this amounted to 14%) as by the reduction in the total exports from Russia by 30% (from $561 billion in 2014 down to $392 billion in 2015) due to a fall of global oil prices.
Whatever be the reasons, but an indisputable fact is that foreign software sales have become much more important to the foreign economic activities of Russia. For comparison: the share of foodstu� exports is 4% of the total Russian exports (cereals – 1.4%), that of chemical industry – 6.5%, that of machinery and equipment is 6%, the share of nonferrous metals and articles made therefrom is 3.7%, that of arms – 4.4%, that of timber and pulp and paper products – 2.7%.The indicators of the industries can serveas a closest and quite achievable target for the Russian software industry. However, their shares have also grown due to the decreased share of crude oil and oil products that have marked down considerably.
The year before we forecasted that the software foreign sales could reach the crops export volume as soon as at year-end 2015. This had just happened — foreign software sales increased and those of grains decreased. Notwithstanding the peak crops and grain export levels in 2016, one can suggest that the ratio between software and grain exports will be the same in 2016 as the growth of grain crops in Russia coincides with those throughout the world and, consequently, will be followed by global grain price reductions.
Moscow and St. Petersburg saw a higher share of foreign software sales than that in Russia on the average — about 2% and 5%, respectively. In this case, it is necessary to keep in mind that both Russian capitals accommodate the head o�ces for exporters of energy, timber, and other natural resources, which are produced and processed in other regions. If we eliminate such unreasonable things, then the share of software and development service exports from the above cities will achieve quite signi�cant values.
It is important to note that when the software export volume is determined, we do not consider the income of the Internet companies at all, which commercial success is mainly assured by software developers.Earlier, they were mostly oriented towards the Russian market and on a second-priority basis – towards the former Soviet Union market.However, since 2012 following the successful IPO, Yandex and Mail.ru Group, Russian Internet giants, have begun their expansion into the foreign markets.Aside fromthem, there are a great number of others that are also oriented towards the foreign audience. For example, the aggregate turnover of Yandex and Mail.Ru Group amounted to about $1.5 billion as per the

43 Chapter 2. Volume and structure of sales by Russian software companies indomestic market and abroad
results of 2015, i.e. decreased by approximately $0.5 billion resulting from a foreign currency equivalent reduction of the domestic market due to ruble devaluation. Some of the earnings could be classi�ed as export ones (probably, 10-15%).
It is not groundless to consider Internet companies as software ones, but their successful promotion in the global market is primarily determined by new software solutions that are created by them independently.Therefore, their export income should be considered.
As these companies can be considered neither as standard software developers nor as customized software developers, their export revenue shall be accounted separately.There are serious problems concerning determination of this value.First of all, it is di�cult to identify the export revenue in the cumulative income if an Internet company mainly earns at the expense of advertising.Such advertising may be oriented towards both the Russian audience and the audience of Internet users in the near- and far-abroad countries.Besides, it is incorrect to sum up the revenues (such as the export ones) from advertising and e-commerce.It is more correct to identify as an online store income not an entire turnover but only the margin which is not as great for e-commerce as for o�ine commerce.It is essential to decide whether we can consider the revenues that were gained by Mail.Ru Group from purchase and sale of foreign hi-tech companies' shares as the export revenue.In 2012-2013, these revenues were $1.85billion.
There are a lot of methodical di�culties but some estimates still can be made if more complete information about Internet companies is available.For example, the export share can be calculated taking into account the proportion of the Russian and foreign audience.Presently, about a half of Russian-speaking Internet users are citizens of other states.
Based on the available data, we can assume that the export volume of the Internet companies that use their own software and therefore can be accounted for in investigation of software development export industry exceeds $1.5 billion.
It is not improbable that Internet companies may sell abroad their own solutions or services based thereon as well. For example, Yandex has already established a new segment based on its own Big Data analysis development.
When comparing the economic performance of companies o�ering a di�erent turnover, it is safe to say that small companies face much di�culty to grow (or often just to maintain the previous income levels and survive) than major companies. The larger the company, the better their turnover movements and foreign sales. Such regularity has been identi�ed almost throughout all the years of surveying. It was only once (in 2013) when small companies made a contribution comparable with that of major companies into the growth of exports. In this context, small businesses became much more vulnerable during the crisis periods (in 2009 and 2014-2015) than major companies.
On the one part, the situation is normal when a high number of new small businesses emerge in the country as a result of considerable market situation changes and, following a certain general rise, some begin to lag behind the competitors and cease to exist. In economically and technologically developed countries, a signi�cant percentage of startups also undergo di�culty and most of them fail to survive. Some entrepreneurs start their business several times, and a success comes to them following that only (although not at all times). However, the survivors must join medium and then major businesses very soon.
Among Russian companies established during 10-15 most recent years, there are very few ones with a turnover of at least $10 million or approaching this �gure. Even though judging by Russian standards, those are not very large companies. Besides, some of them are spino�s of major businesses (where IT is either core or noncore segment) and, consequently, have belonged to a major entity from the very beginning.
It is worth noting that small businesses had di�erent performance during the past years, depending on their age. For example, the market old-timers grew slowly or reduced their turnover, while the newcomers developed quite dynamically.
Foreign sales di�erences due to the size of companies

44 Chapter 2. Volume and structure of sales by Russian software companies indomestic market and abroad
In the GfK Connected Consumer Index which demonstrates a level of availability and usage of technical devices (including those with internet connection) by consumers of di�erent countries, Russia in 2016 took the 43rd place among 78 countries having risen by 1 line as compared to the previous rating.
As per the results of 2015, such regularity was not identi�ed. Companies with a turnover below $5 million, which had been established during 10 past years, reduced their turnover by 29% (in US Dollar), while increased their foreign sales by 4%. The same companies operating in the market for more than 10 years showed a similar turnover reduction by 29%, but the foreign sales were the same.
It is possible to state that 10 most recent years have seen better stimulation towards the establishment of startups on the governmental part, which has resulted in a corresponding boom of startups in 2010-2013. However, the numbers of established IT companies have decreased during 2 most recent years. This can be explained in part with a worsening geopolitical situation, economic crisis in Russia and a contraction of the domestic IT market. In addition, no integrated support to the industry’s businesses is observed on the governmental part, which could not only help starting a business but also become a medium or then major business.
As per the survey 2016, a trend has been validated, according to which the key performance indicators of companies depend on their size. The bigger the companies, the higher the growth of exports and turnover. However, the indicators of large and small enterprises in the previous three years became more or less similar thanks largely to a reduction of threshold sta� numbers which allow for pretending to get State privileges in social taxation (in 2010 from 50 persons to 30 persons and since January 2014 - to 7 persons). In some cases, it is small enterprises that enjoy a higher growth.
Since 2010, only large and medium-sized enterprises (with sta� number 50 people at least) have had premium exemptions that gave them additional competitive advantages at the labor market. As a result, they demonstrated growth of turnover and export above all others.
At year-end 2013, the growth of exported products and replicated solutions to a large extent was provided just by small companies (primarily, startups with export receipts no more than $1 million), and not by large enterprises as it happened in previous years. Small product companies had a higher value of export and turnover growth. In addition, the number of small companies was also rapidly growing in recent years.
It is possible to suggest that the growth rates of small IT enterprises were in�uenced by the created Development Institutes (RVC, Skolkovo, FRII) and improved by appearance of technological clusters in some Russian cities. Several such clusters provided the preferential rent rates and services of business incubators and accelerators. Experience shows that good conditions of employment and correct organizational management can considerably raise labor productivity of software developers and as a consequence provide a certain increase of turnover without hiring new employees.
In 2014, better indicators of small software vendors retained only partially. The indicator of growth of cumulative business volume of small companies engaged in development of software and replicated solutions was higher than that of 35 major companies (with the turnover of $20 million at least) of the same pro�le — 10% against 6%. However, small companies’ export increased only by 4% and that of major companies — by 11%.
Dependence of turnover changes and foreign sales on the size of respondent companies
Company classes by turnover amount
below $1 million $1 to $5 million $5 to $20 million over $20 million
Total revenue change in US dollar
-24% -31% -8% +21%
Foreign sales change in US dollar
+5% +1% +16% +24%

45 Chapter 2. Volume and structure of sales by Russian software companies indomestic market and abroad
In 2015, dependence of the performance on the turnover levels of product companies enhanced signi�cantly. For example, the di�erence between variations in the sales of companies with a turnover below $5 million and those with a turnover exceeding $20 million amounted to 20 percentage point in 2014, and 48 in 2015.
Such apparently lower exports of small companies as compared with medium and large ones should upset the Russian Government. It means that they have few chances to become medium and large companies. However, once upon a time all current leaders of the world software market were small companies and in due time received the state support in one form or another. According to the Stanford University professor Henry Etzkowitz, well-known by his concept of the innovation development of society Triple Helix, a cornerstone of all high-tech companies of Silicon Valley was the results of governmental research projects many of which were implemented by orders of Pentagon. There are also a lot of tools for supporting exporters (including tools of marketing support of small companies), which are widely used in many countries with developed or rapidly developing economy.
Geography of Russian exporters
Change of export and of turnover of softwareservice development companies at year-end2015 depending on size
Company size Turnover growth /fall fall
Export growth /
Turnover below $5 million
-31% +1%
Turnover of $5 to $20 million
-8% +16%
Turnover exceeding $20 million
+17% +27%
Out of small companies with a turnover below $5 million, the service companies su�ered from the crisis most of all (�rst of all, due to an anti-Russian campaign abroad and to the economic crisis in the Russian market). Their turnover reduced by 30%, while the foreign sales increased by as low as 1%. The software vendors of the same size reduced their turnover as well, though to a bit lesser extent — by 27%, while the growth of foreign sales appeared to be quite remarkable — 7% in US dollar. Thanks to the growth of exports, their turnover reduced to a lesser extent than that of the small service companies.
Moscow and St. Petersburg companies showed better �gures of the total sales and exports than the regional businesses. The primary reason is that most large and medium software companies of Russia concentrate in the two Russian capitals. As we have already mentioned, it was their size, thanks to which they have been growing, although the head o�ce locations were also of importance. Moscow and St. Petersburg feature an important advantage in terms of transportation lines, that has turned out to be very important to retain the loyal customers and search for new ones under the environment of anti-Russian sanctions and a negative PR campaign in foreign mass media.
Dependence of turnover changes andforeign sales on the head officelocation of respondent companies
Moscow St. Petersburg Other cities
Head office location
119 9
-8
2423
Overall revenuechange in USD
Foreign saleschange in USD

46 Chapter 2. Volume and structure of sales by Russian software companies indomestic market and abroad
During the crisis years 2014-2015, it was obvious that companies with a high export share were much more resistant to the manifestations of crisis than companies more oriented towards the domestic market. As per the results of 2015, the companies o�ering a share of foreign sales in excess of 50%, reduced their turnover generally by 21% in USD, that have not been observed throughout the years of surveying.
Random �uctuations of optimal ratio of export income and sales in the domestic market are quite possible however the evaluation over the past few years shows that if the software development companies intend to provide the stable turnover growth, the export share in their consolidated revenues must be at least 50%. It is especially true with the existing contraction of Russian software market in dollar terms as well as state budget curtailment for information system development.
Income growth of companies offering a different share of foreign sales
less than 10% less than 50% over 50% over 75%
3634
1711
24,520,622,1
28,525
24
7
5
2625
14
2522
Income growth in 2011 Income growth in 2012 Income growth in 2013 Income growth in 2014
Income growth/reduction in 2015
-21-34
Addition of a new question about the company’s specialization in 2015 has permitted to assess the most growing business segments as well as the structure of respondent companies depending on their segments of activity. In many aspects, the structure shows the share of companies across the industry for each dedication. In this case, an error is quite high, but it is just possible to obtain a general understanding.
As we have the data on specialization of companies for two years still, it is possible to make initial comparisons. However, it will be only possible to judge quite unambiguously the trends (for example, those concerning a growth in the numbers and shares of companies under speci�c specialization), when the results for 3-5 years are compared.
The most frequently mentioned business segment of companies is “Custom software development”. However, one should not consider that companies indicating the segment are service ones. As much as 41% companies deal with custom software development among companies gaining their primary income from the sales of their own generic solutions.
Specialization of software companies
Specialization of respondent companies
Core business segments Survey 2015
Survey 2016
1 Custom software development 73% 53%
2 Mobile applications 37% 40%
3 Replicated enterprise (institution) management, document flow automation, design and production process systems (ERP, CRM, ECM, EDMS, CAD, APCS and other)
30% 40%
4 Site designing 13% 24%

47 Chapter 2. Volume and structure of sales by Russian software companies indomestic market and abroad
Specialization of respondent companies
Core business segments Survey 2015
Survey 2016
5 Basic software development (DBCS, OS, office applications, virtualization tools, programming languages and tools)
25% 22%
6 Embedded software (equipment, devices) 19% 20%
7 Scientific researching 14% 20%
8 Information security solutions 11% 15%
9 Geographic information systems (GIS) 7% 14%
10 Computer games 7% 6%
11 Navigation systems 4% 5%
Other 16% 33%
Priority business segments(survey 2016)
1 Custom software development 21%
2 Enterprise Resource Plannig, document flow automation, design and production process systems (ERP, CRM, ECM, EDMS, CAD, APCS and other)
14%
3 Basic software development (DBCS, OS, office applications, virtualization and programming languages and tools)
9%
4 Mobile applications 5%
5 Scientific researching 4%
6 Information security solutions 4%
7 Site designing 2%
8 Embedded software (equipment, devices) 1%
9 Navigation systems 1%
10 Geographic information systems (GIS) 1%
11 Computer games 1%
Other 24%
I hesitate to respond 13%

48 Chapter 2. Volume and structure of sales by Russian software companies indomestic market and abroad
Turnover and foreign sales changes depending on the business segment Business segment existence
Totalturnover changein 2014
Total foreign sales change in 2014
Total turnover change in2015
Forecast turnover change in 2016
Total foreign sales change in2015
Share of exports
Highest contingence upon another segment*
Custom development
+22% +23% +17% +24% +27% 84% Mobile applications
Mobile applications +22% +24% +16% +24% +26% 82% Custom engineering
Site designing +26% +27% +23% +24% +29% 88% Mobile applications
Computer games +4% +2% -21% +8% +11% 57% Mobile applications
Embedded software (equipment, devices)
+24% +27% +15% +15% +21% 68% Custom engineering
Navigation systems +24% +26% +19% +14% +25% 71% Embedded software (equipment, devices)and Custom development **
Geographic information systems (GIS)
+24% +25% +4% +15% +17% 70% Custom development
Enterprise document flow automation, design and production management systems (ERP, CRM, ECM, EDMS, CAD, APCS and other)
+24% +27% -9% +12% +15% 48% Custom development
Information security solutions
+20% +26% -1% +13% +21% 54% Custom development
Basic software development (DBCS, OS, office applications, virtualization and programming languages and tools)
+6% +5% +10% +16% +19% 68% Custom development
Scientific researching
- 1% -23% +6% +14% +22% 65% Custom development
Other +26% +25% -28% +8% +11% 27% Replicated enterprise management systems
* - the segment indicated most often by the respondents as supplementary ones** - navigation systems show coincidence with two supplementary segments at 100%

49Chapter 2. Volume and structure of sales by Russian software companies indomestic market and abroad
As per the results of 2015, it appeared to be di�cult to identify the segments providing the highest growth rate of turnover and foreign sales. The relationship between business segments and a share of foreign sales turned out to be much apparent. If the share of exports is high, then the performance of companies appeared to be better due to a drastic ruble depreciation across the segments supposing a focus not on the contracted domestic market but on the foreign customers and purchasers. It can be seen from the obtained data, which specialization is most suitable for an expansion abroad.
It is only possible to note quite low �gures of the dependence on a share of exports under “Computer games” as well as those specializations falling under “Other”. A reduction in the segment “Replicated enterprise management systems” amounted to 9% and that in the segment “Information security solutions” - 1%. However, a reduction exists only in US dollar. It is known that the Russian enterprise management systems are implemented mostly in Russia (and some 10-15% more in the former USSR countries, where the local national currencies have also depreciated against US dollar). It is better to calculate the turnover concerning such systems in ruble.
“Information security solutions” are promoted successfully abroad. However, the respondent companies developing the segment are better focused on the Russian market. A number of major companies beyond the survey may have other �gures. It is known nevertheless that the Russian leader of the segment, Kasperfsky Lab, with a turnover in excess of $600 million, which most part falls on foreign sales, reduced its turnover by 9%. That is why it can be suggested that the total turnover of all Russian companies dedicated to information security solutions has reduced by several per cent in USD. Previously, the growth rates of such companies were either the highest or among the highest ones. However, the segment is a most promising one to develop new markets. There is a persistent and quite popular opinion abroad (in any case, among the professionals) about high skills of the Russian information security professionals. The developers under appropriate dedication may build their business in the Brazilian market yet, which is limited for the entry of foreign companies with high protective barriers. For example, while the Russians are not awaited there with 1С programs, then they are quite tolerant towards Russian information security solutions.
In theory, a high potential for the expansion of sales is speci�c to navigation systems (both in Russia and abroad). Quite high turnover growth rates of companies with such specialization (second position from the top as per the results of 2015 after “Site designing”) support the existence of such a potential.
As per the data of CNews Analitics, notwithstanding an economic recession, the development of mobile services is a priority segment still from the standpoint of business owners. The overall revenue of companies engaged in a rating list of CnewsMobile corporate mobile application developers increased by 27% to achieve Р2.65 billion ($ 44 million) at year-end 2015. As per our data, the segment provides also a highest turnover growth rate.
Turnover change's nature Share of respondent companies withdifferent turnover changes
No changeIncrease
DecreaseI hesitate to respond
715
51
26
14
71
25
4
Year-end 2014 Year-end 2015
In 2015, the share of respondent companies to reduce drastically the turnover in the past year increased substantially. This is explained �rst and foremost with a signi�cant ruble depreciation and the related domestic market contraction in dollars. If the turnover is measured in ruble, then there will be no substantial di�erence in the shares of companies showing a lower turnover.

2.2. Distribution of software sales abroad depending onthe business model
50 Chapter 2. Volume and structure of sales by Russian software companies indomestic market and abroad
However, foreign exchange �uctuations caused shocks across the industry. The shocks are well shown by an average deviation from the change of overall revenues of all the respondent companies. While it was 6.4% at year-end 2014, then it achieved 20.4% at year-end 2015. It means that while the overall revenues of all the respondent companies increased by 8%, the turnover change �gure by company deviated from the above value by 20.4% on the average both up and down. Such an increase in the average deviation can relate to the fact that some companies promoting novel and more advanced technology started replacing extensively the other companies failing to rearrange. The process takes place in Russia as well. However, such a high growth of the average deviation in 2015 is explained mostly with the fact that a ruble exchange rate fall impacted the Russian software companies in quite di�erent ways. The companies focused mostly on foreign markets appeared to be in a much better position that is another evidence of an intense entry to the foreign markets being of critical importance. If a company pays equal attention just to several di�erent markets, this will warrant its stability and protection against external impacts.
The highest growth of foreign sales in 2015 appeared to be with the companies dedicated to project-based development (custom software engineering). Therefore, their share increased in the total IT exports. The reasons for the share reduction in the sales of products and ready-to-use solutions will be stated in detail under the appropriate section dealing with the product model.
During most recent years, the service and product models have warranted alternately the bulk of an increase in the aggregate income of Russian software companies from foreign sales. Therefore, those complement each other. The division of companies to product and service ones is arti�cial in many aspects. As regards service companies, 30% of the domestic market sales fall on the sales of software products. In case of foreign sales, the �gure is much lower — 2%, although it is not zero.
At the same time, 41% of responding software vendors indicated that a core segment of their business was custom engineering. And they gain 29% of foreign sales earnings as a result of various services provided (in case of the domestic market, the �gure amounts to as much as 46%). Indeed, the services of product companies are most often related to the sales of their solutions – either a solution is developed on their own platform for a particular customer or the services are required to integrate and support the replicated solutions and �rmware packages being sold. However, the service companies have also ready-to-use units that are used regularly in various projects.
Distribution of foreign software sales by business activity
Software developmentservices provided byDevelopment Centers of foreigncompanies, universities, andresearch institutes
Sale ofsoftwareproducts andready-to-use solutions
Softwaredevelopment services
55
30
15
2008
51
37
12
2009
4841
11 11
2010
50,5 50,5
40
9,5
2011
45,543,5
2012
46,443,4 43,2
10,2
2013
48,2
8,6 +8
2014
42
7,2
2015
+18
-2
$510M
$2,8B
$3,4B
Absolute valuein 2015
(growth per year)

Chapter 2. Volume and structure of sales by Russian software companies indomestic market and abroad
51
A percentage of companies (about 20%) could be hardly classi�ed at all under a business model (product or service) as the sales of software and earnings from the provision of services were almost not di�ering in value.
The two models will complement each other to a greater extent, if the product companies start cooperating extensively with Russian service companies. Then it will be quite incorrect to distinguish them.
The share of R&D centers of foreign companies in Russia was decreasing during three consecutive years, which relates most likely to the worsening geopolitical situation and to enhancing of import substitution philosophy as a kind of isolationism. One can hardly expect that forthcoming years will stabilize it at the current level as the campaign to isolate the Russian IT industry from the global IT community (which is pursued simultaneously both by foreign geopoliticians ang by domestic passionate advocates of the Russian market protection against foreign competitors) is just gathering pace and it will take a couple of years more to prove its failure.
Major service companies may receive more bene�cial orders and, consequently, pay better salaries to their employees than small businesses. This has been a reason for a �ow of professionals to major companies from small ones.
Major companies feature one more advantage: an existing chain of sales o�ces and development centers throughout the world. As a result, they may compensate for the problems of anti-Russian propaganda and anti-Russian sanctions as well as expand their sta� through the establishment of remote development centers in Russian various towns and abroad or through the acquisition of foreign and Russian companies.
2.3. Service companies The bulk of the increment in foreign sales of
software development services during several most recent years has been provided by major companies. Until and including 2012, the foreign sales of companies with a turnover below $4 million were not growing almost at all. As per the results of 2013, such companies increased their foreign sales by 8%. However, small companies (including currently those with the turnover below $5 million) recorded a reduction by 6% in 2014. At the same time, the foreign sales of companies with a turnover over $5 million increased by 27-29%.
As per the results of 2015, the bulk of the increase in foreign sales of service companies was also provided by the largest development companies. Service companies with turnover below $5 million reduced their total proceeds in USD by 30%, while their foreign sales increased by 1% only. When considering companies with turnover over $20 million, then the �gures are much better — the turnover increased by 16% and the foreign sales — by 25%.
in USD in rubles in ruble inflation adjusted
Turnover $4.4 billion Р 267 billion
Turnover increase
-12% +41% +25%
Foreign sales $3.4 billion - -
Foreign sales increase
+17% - -
Domestic market sales
$1 billion Р 61 billion
Domestic market sales increase / decrease
-52% -25% -32%

52 Chapter 2. Volume and structure of sales by Russian software companies indomestic market and abroad
Small software development service providers and, moreover, private developers operating as unincorporated entities have also a chance to receive foreign orders for software development as major service companies often ignore low-budget customers. However, they found it di�cult to look for new customers abroad given their low turnover �gures. Some are successful to maintain their turnover at USD 1-3 million, but the average growth of small companies’ exports was either minute or negative.
The lion’s share of the increase in software services export (as a year before) was provided by Luxoft which (together with EPAM Systems from Belarus) are leaders in their sphere not only in Russia but also in the whole Central and Eastern Europe.
EPAM Systems, though being a Belarussian company, has been viewed historically in our survey as the largest software development center employing over 2000 developers in Russia. From the very beginning it was developing largely by acquisition of service companies and the growth of their own development centers in Russia. EPAM Systems was the �rst to undertake IPO,following in steps of �rst Russian companies of IT sector Mail.ru and Yandex. They held successfully an initial public o�ering at the New-York stock exchange. EPAM Systemshas retained a high rate of growth over all previous 4 years. As per the results of 2015, its turnover increased by 25% to achieve $914 million. At the beginning of 2012 EPAM Systems capitalization during IPO at NYSE was $490 million, and in June 2014 itwas already evaluated at $2.14 billion.
In June 2013 Luxoft held a successful initial public o�ering at the New York stock exchange.During the last years before the IPO, Luxoft's growth rates have exceeded 20% that was quite su�cient along with the high rating position for increasing its capitalization thanks to the IPO up to $555 million (by February 2015, it increased to $1.6 billion). By the time of IPO holding, Luxoft already had the extended geography of its development center locations worldwide with the main development centers in Ukraine (almost 3,000 employees), in Russia (1,000 people in Moscow, St Petersburg and Omsk) as well as in Bulgaria, Romania, Vietnam, and even in England (altogether 18 remote development centers). The Ukrainian events posed before both leaders the issue of resource relocation to the countries adjacent to Ukraine, and this was urgently done.
Almost all largest service companies were formed before 2000, and their number almost did not change during the last decade.Among new market players that recently came into the world elite (in the Global Services and IAOP ratings) we can mention MERA of Nizhny Novgorod and ICL Services, the sta� numbers thereof exceeded a level of 1000 persons and, according to their turnover, are the third and fourth largest exporters of software development services from Russia, respectively. One should also distinguish Artezio from Moscow, which showed persistently high growth rates over the years, specializing mainly in such vertical market segments as telecommunications and health care. We should also mention ReturnOnIntelligence, as well as FirstLine Software and Reksoft from St. Petersburg that successfully combine operations at the Russian and global market.
It is also worth notingDataArt, which considerably increased its sta� through the contracts in the USA in 2012-2015and Auriga which quite regularly appears in the global rating list of the leading service companies for about 10 years. On the rating list of the leading world engineering companies (Data Monitor, 2011) Auriga, which accommodates the main development resources in Moscow, Nizhny Novgorod and Kazan took the absolute �rst place in the category of "software engineering", having outstripped such giants as IBM, Dell, HP, HCL, Wipro and Siemens.
As many as 5-6 companies of Russia are found persistently on the leading global rating list of IT outsourcing, The Global Outsourcing 100 (IAOP). In general, there is some rotation resulting from di�erent causes (these are not always related to the achievements of particular companies during a year). In 2016, the IAOP rating list contained 4 Russian companies as follows - Auriga, ICL Services, Luxoft and MAYKOR.
The range of companies that have been ever shown among the Top-100 of leading outsourcing companies of the world have not been modi�ed for many years yet. This contains about 10 companies representing Russia. Therefore, it is important to emphasize a newcomer of the Rating List 2016, i.e. ICL Services of Kazan (the Republic of Tatarstan) that is growing vigorously. It has over 50 global customers in 26 countries, and its sta� numbers exceeded 1 thousand employees one year ago yet. It is known that the company has hired 200-300 new employees per annum during most recent years.

53 Chapter 2. Volume and structure of sales by Russian software companies indomestic market and abroad
On the contrary, some service companies that have gained or are still gaining the better part of income from export, currently are increasing the share of sales in Russia. In particular, it is associated with participation in major public projects. For example, Reksoft is developing a sophisticated information system for the Federal Migration Service, Luxoft in the end of 2013 announced the successful completion of the full range of services of developing commercial software for the navigation information platform ERA-GLONASS, and Lanit-Tercom is carrying out maintenance and elaboration of the municipal system “Tenant” that calculates payment for housing and utilities services for 70% of St. Petersburg residential areas.
The expertise, competences, and experiences gained under the implementation of foreign projects appear to be useful in Russia.On the other hand, the implementation of unique projects of federal importance allows for obtaining funding as well as new competences and experience by service companies. All this may come useful for successful participation in complicated foreign tenders. The experience gained in recent years shows that for sustained growth and development it is essential to have customers in di�erent countries and to consider risks connected with special factors of one or another region. If sales from one part of the planet are reduced due to circumstances beyond company’s control (as a result of economic crisis or aggravation of political relations), the wide business geography makes it possible to quickly cross over to resources in other destinations.
The structure of total exports by service companies has been changing within the range of random �uctuations during 4 most recent years.
While Russian service companies always gain 85-95% of income from sales of custom software development services including deployment and support in the foreign markets, then in Russia this proportion is much smaller — about 70-80%. In the Russian IT-market they successfully sell and support software products that provided 19% of income in 2013, and 6% in 2014. There is almost no relevant export income.
Income structure and resources of service companies
Structure of respondent service companies’ total exports in2012-2015
Development and support of software solutions and products
Custom software development
Deployment and support
IT outsourcing Other
2012 1% 63% 25% 10% 1%
2013 1% 91% 3% 5% 0%
2014 0% 78% 6% 3% 12%
2015 2% 90% 2% 5% 1%
Structure of total salesof respondent service companies in the domesticmarket in 2013-2015
Development and support of software solutions and products
Custom software development
Deployment and support
IT outsourcing Other
2013 19% 48% 23% 10% 0%
2014 6% 58% 22% 6% 8%
2015 30% 52% 10% 5% 3%

by 6% of the companies, and 5% were not able to respond to the appropriate question. The primary reason for the changing responses to a question about the business model is most likely a drastic reduction in the number of companies hesitating to respond. Probably, that relates to a survey method improvement.
54 Chapter 2. Volume and structure of sales by Russian software companies indomestic market and abroad
During 2 most recent years, it has been di�cult to forecast future earnings of service companies due to the great existing (primarily, political) uncertainty. After all, they focus on the US and EU markets which relationships with Russia have aggravated critically, and this has resulted in a negative image of the country in western mass media. However, the forecast for 2014 turned out to be quite correct. Based on the survey, under which every company was invited to indicate a potential growth in the next year, we suggested that the volume of foreign sales will increase by 10-20% in 2014. This increased by 13%, though the growth would be about 2 times as low (approximately 7-8%) without the largest company (Luxoft) operating in the foreign jurisdiction and running development centers in various countries.
Services to establish remote development centers are provided (using a cooperation model “O�shore development center”) by 18% of the companies. This �gure has been decreasing during all the previous years – since the corresponding question appeared in the questionnaire 4 years ago. The share of companies using the alternative model “Development of software to customer’s requirement” amounted to 83% (52% previously). The both models are used
The main clients of Russian service companies are end-users (82% of respondents indicated them under the survey 2015). 36% of companies are engaged in activities under subcontracts, and the least number of respondents render services to system integrators, i.e. 27%.
Forecast of turnover and foreign sales changesof service companies
Contract types used, %of respondent companies
2013 2014 2015
Payment on timeconsumed
44,% 27% 48%
Payment on fixed price 50% 40% 63%
Both types 9% 5% 8%
Type of offered services, % of respondent companies
Softwaredevelopment
Testing Technical supportof IT systems
IT consulting other
2013 80% 57% 49% 44% 6%
2014 60% 44% 49% 40% 11%
2015 88% 52% 57% 51% 11%
Major customers, % of respondent companies
System integrator End user
Software developer Other
1 1 1
36
88
29 33
72
24
2
27 27
55
20
36
82
2012 2013 2014 2015

55 Chapter 2. Volume and structure of sales by Russian software companies indomestic market and abroad
A continued growth of foreign sales at least at the same pace was anticipated by respondents in 2015 as well. Those anticipations also proved true — the service companies increased their foreign sales by 17%. Again, the bulk of the increment was provided by Luxoft, while the growth of small companies, if any, was symbolic.
As regards the total turnover of companies, however, the forecast was incorrect. Instead of an expected turnover growth in foreign currency by 11%, a decline by 6% resulted. The reason was that our calculations relied only on the expectations of respondent companies, and they were likely to disregard that the ruble exchange rate change would a�ect so heavily the size of domestic market denominated in USD.
It is necessary to note also that the Russian labor market faced an increased o�er resulting from the corporate IT sta� reductions across various industries due to the population growth from the accession of the Crimea and an expansion of the professional migration �ow from the former USSR countries (�rst of all, from Ukraine, Belorussia, and Kazakhstan).
The armed con�ict in Ukraine has already seriously a�ected placement of forces at the market of IT outsourcing providers in the Eastern Europe. Before the Ukrainian crisis started, the sta� of development centers of Russian service companies amounted to about 10 thousand people. It was thought that by some criteria Ukraine was a better place for development of custom software than Russia (lesser tax burden and labor costs).
In 2014 the situation changed fundamentally. On the one hand, business environment in Russia somehow improved. On the other hand, Ukraine fell into profound economic and political crisis, the country hardly will �nd escape from it in the next years, and in these circumstances almost any business will entail risk. The civil war in the east of the country by the middle of 2015 was fought not so actively as before. However, there are no symptoms of an improved situation in Ukraine still — many problems have been suspended rather than settled.
Aggravation of relations between Russia and the US and EU, where a greater percentage of customers of Russian service companies are based as well as the Ukrainian events appeared to be serious considerations a�ecting Russian outsourcing companies. For example, Luxoft’s customers already in May 2014 were passed about growing animosity between Russia and Ukraine and demanded that the company would take measures to protect them against political risks. The matter was that at that time out of 7 thousand employees of Luxoft 2.75 thousand were working in Ukraine. Under coercion of customers already in the spring 2014 Luxoft stated that formally it was no longer a Russian company and re-registered its main o�ce in Switzerland. Besides, it was announced that the management would go from Moscow to Switzerland, Germany, UK and US, and also 500 programmers from Russia and Ukraine would come over to the company’s development centers in other countries. In the wake of risk rising for business operations in Ukraine, Luxoft had urgently to move its development division from Ukraine to the adjacent Eastern European countries.
Based on the above, a number of conclusions can be made:Expectations of respondents show mostly the real processes occurring during a stable market evolution phase. However, they cannot predict the course of events under an impact of strong external forces (�rst of all, political ones),Considering all the importance of an impact produced by the geopolitical forces on the foreign sales (these are both anti-Russian sanctions as well as total anti-Russian propaganda in western mass media), a much stronger impact on the sales was generated by a labor cost reduction of Russian developers in dollars which occurred due to the national currency devaluation as against the major world currencies,Those companies were most resistant against all the �uctuations of the global politics and economics, which di�erentiated their resources and sales markets as well as took advantage from their access to external investing sources.

56 Chapter 2. Volume and structure of sales by Russian software companies indomestic market and abroad
The accession of Crimea to Russia provided potential increase of the total number of programmers by 4-5 thousand people. After the accession of Crimea to Russia, the Ukrainian software companies due to political pressure had to close their development centers in Crimea. On the basis of such center of SoftServe (one of the major software developers in Ukraine) in Sevastopol a new company Alvion Europ was founded. In the past it operated till 2002, but as a result of a merger became a part of SoftServe. Unfortunately, software development companies in Crimea cannot independently operate at the world market owing to sanctions imposed by the US and EU on Russia. However, the experiences gained by the most successful companies of Crimea permits to believe that a solution can be found through reincorporation of companies in Russia.
When relying on the expectations of respondent companies, then the growth of foreign sales by Russian service companies will amount to 15% in 2016. As we have mentioned, such high growth expectations during an instability phase are most likely to be justi�ed in respect of the largest companies pursuing reasonable policies, running a distributed system of development and sales centers. As regards the service industry at large, then one can expect that the growth rate will be maintained at 8-10%.
As the ruble exchange rate has stabilized (the average exchange rate against USD is most likely to reduce at the year-end, though by about 10%) the total turnover in USD will increase as well. The expectations were generally optimistic: 60% of respondents believed that the turnover at year-end 2016 would increase, 12% - that it would not change, 9.5% thought that it would decrease, and 19% of respondents hesitated to respond to the appropriate question.
At the same time, 39% of the respondent companies anticipated an increase in the total turnover by not more than 10%, and 24% of them anticipated a growth by more than 20%. On the average, the expected growth of the total turnover in rubles amounted to 26%.
Thus, one can suggest that the service industry’s foreign sales will increase by about 15%, while the turnover growth will be a bit lower as the domestic market of software development services will hardly grow in USD (most likely, it will contract slightly due to the stagnation of the Russian economy).
The results of 2017 and subsequent years can be a�ected by the procedure for granting the social tax incentives for IT companies as discussed now by the RF Government, according to which it is supposed that the repeal of bene�ts will a�ect �rst and foremost the service companies. Although the social tax is supposed to increase gradually since 2018, such plans will a�ect the service companies’ turnover and foreign sales earlier as the developers will respond in advance through closing down their development centers in Russia, dismissing the sta� and relocating their resources from Russia to countries o�ering more favorable business environment.
2.4. Software products andready-to-use solutions
in USD in rubles in ruble inflation adjusted
Forecast for 2016
Turnover $5.46 billion Р 331 billion $5.9 billion
Turnover growth / reduction
-16% +34% +19% +8%
Foreign sales $2.8 billion - - $3.1 billion
Foreign sales growth +8% - - +11%
Domestic market sales $2.66 billion Р 161 billion - $2.8 billion
Domestic market sales growth / reduction
-32% +9% -4% +5%

57 Chapter 2. Volume and structure of sales by Russian software companies indomestic market and abroad
Until and including 2010, the foreign sales of Russian software products were growing much faster than those of software development services. In 2011, those increased for the �rst time a bit lower than the custom software development. In 2012, an apparent advance of the growth rates was observed, though the 2 next years the share of software products stabilized at about 43%. As per the results of 2015, the primary growth of foreign sales by software companies was provided by the custom software engineering services, while the share of software products reduced to 41%.
Given that software product companies should expand their sales easier as they depend on availability of the vacant professionals in the labor market to a lower extent, their growth rates appeared to be less than those of service companies, whose sales are almost proportionately governed by the sta� expansions. Such a lag, that is not logical at the �rst sight, is explained by several reasons. First, new large exporters fail to appear among Russian software vendors, while the existing ones have exhausted their growth potential in the market segments.
For example, Kaspersky Lab contributed to 20-30% of the increment in total foreign sales of Russian developers from time to time several years ago, though now it cannot grow at the previous pace as they hold currently the global 4th position from the top in their segment. It is almost impossible for a Russian company to be the global leader under the current geopolitical situation, even though they have the apparently best solution. Therefore, the 3-4th position from the top is the ceiling that it may be a�orded, especially in such area as information security. The price and functionality of the software is not the entire story in the segment. For instance, there are trivial prohibitions on the use of Russian software for the public authorities, and these produce a great e�ect on the global IT market.
Other Russian major exporters of software products face the same situation. If they have not yet reached the ceiling, then they approach the same and so diminish the growth rates.
If we look at the next tier — medium-size companies according to Russian standards – then they fail permanently to make a breakthrough when trying to establish themselves in foreign markets. There are local success stories, though a shift towards new quality with the exponential growth of foreign sales has not resulted anyhow. One of the reasons is lack of a marketing budget that is adequate for active promotion of software. They replenish their marketing budget at the account of earnings in the Russian market, and it has shrunk considerably during 2 most recent years.
Probably a mistake is to prioritize the Western Europe and USA markets (for example, the market of German-speaking countries) that are almost not growing. It is very di�cult to urge the users to change over to another solution in those markets for political reasons, notwithstanding that the solution is cheaper and better. Therefore, it is necessary to size up (and examine intensely still) new and rapidly growing geographical markets where there is no prevailing preferences towards vendors and where quite loyal attitudes exist towards Russian companies.
There is certain repeatability in development of software industry. New software companies were most actively created in certain time periods (for 3-4 years) during economic crises or just after them. A number of successful software exporters appeared during the Soviet economy collapse in 1991-1992. The next startup boom took place in the late 1990s and early 2000s (in 1998, there was a default and economic crisis in Russia).The third wave is connected with the world crisis 2008, which also a�ected the Russian economy.
Development of individual product companies also has certain cycles. For a few years (probably, decades) they can increase export by 30-50% per year.In occasional years, the growth even may exceed 50%.However, deceleration inevitably takes place when companies reach a certain size and their market segment saturation.In the last 2-3 years leading Russian software exporters reached this size, and fast-growing younger companies still have not achieved such large turnovers to compensate the reduction of leaders' growth rates.
Small companies (for example, mobile application developers) sometimes achieve a many-fold growth of turnover, though the cases are singular rather than frequent. The entry of small companies to the international markets has not been adjusted yet as a system. However, what is reassuring is that the growth of foreign sales by companies with a turnover below $5 million amounts to 7% - i.e. almost the same as that of larger companies (whose sales growth is 8%). Yet, the turnover of small companies diminished (in USD) after all to a greater extent than that of large companies, i.e. by 20% against 11%.

58 Chapter 2. Volume and structure of sales by Russian software companies indomestic market and abroad
The losses of service companies in the domestic market relate to the fact that they have no chance to get better due to substitution for the services of foreign competitors that are almost missing in Russia. Foreign companies are almost not involved in the development of customized software in the Russian market, if this is not development on their own platform. The service company depends totally on how the Russian market is changing; if this contracts, then their turnover �gures reduce also to the same extent on the average.
On the other hand, the performance of service companies appeared to be better as they found themselves in a better situation than during the previous years due to lower labor costs in Russia in dollars, which governs directly the cost of services and the competitive ability in the global market. Also of a positive e�ect is the migration of professionals from the former USSR countries and other industries featuring the corporate IT sta� reductions across many economy segments, which are not too extensive but e�ective.
While the product companies started to lag behind the service ones under the growth of foreign sales, then their domestic market positions appeared to be better that those of the service industry’s peers. Or, to say correct, not so bad. While the service companies lost 43% of the domestic market turnover in USD and 8.5% in ruble, then the product companies reduced their sales in USD by a lower amount (32%) and increased those in rubles by 9% at all. At the same time, they did not revise the prices in Russia during 2015.
As per our estimates, the sales of Russian software companies in the domestic market in foreign currency appeared to be just a bit higher than the market itself when measured by IDC - $2.6 billion against $2.3 billion. At the same time, at least $1.5 billion is still held by foreign vendors (such as Microsoft, SAP, Oracle, IBM, and many others). To escape a situation when the readers play o� our survey data and the IDC market research results once again, it is necessary to explain that the aggregate proceeds of the software companies (both Russian and foreign) of sales in Russia and the Russian software market volume measured by the analysts of reputable global research companies are far from being the same. Generally foreign analysis consider only the sales of licenses with the integration costs as part of the software sales, though they do not take account of software companies’ earnings resulting from the provision of IT services and sales of hardware that their proprietary software is embedded in.
In addition, the data on total sales by Russian software companies contains a double count. For example, some developers create their own solutions on the platform of a Russian or foreign vendor (such as 1С or Microsoft) and sell those to the customer, including the required contributions to the vendor. Those contributions become part of the Russian proceeds of both the vendors as well as their partners, i.e. count twice.
If we rely �rst and foremost on the expectations of respondent companies then not only the growth of foreign sales of software vendors (by 11%) but also their total turnover in USD (by 8%) should be seen in 2016. A growth is also expected in the domestic market (by 5% in USD). Foreign vendors are most likely not to see such growth. It means that the process of imported software substitution, especially of basic software, will continue, which has been launched by the government’s calls for import substitution and enhanced by the national currency devaluation e�ect.
In this case, it is necessary to note that the devaluation impact got to be stronger than any governmental decision which is demonstrated by the fact that a shift from the imported to Open Software is observed in 2015 �rst and foremost across the commercial sector that shows the real market situation much adequately. However, it is better to measure the actual import substitution extent in the number of integrations, licenses, jobs embraced by the projects rather than in dollars or rubles.
The expectations of small companies (with a turnover below $5 million) appear to be better than under the general class of product companies. They anticipate that the turnover and foreign sales will increase by 18% (in USD). As we have already mentioned, such companies can be mistaken quite often. However, there
Forecast of software vendors' sales

59 Chapter 2. Volume and structure of sales by Russian software companies indomestic market and abroad
are actual reasons for those to grow faster than larger companies. First of all, the growth opportunities relate to availability of their promising dedication. For example, the developers of navigation systems and mobile applications thereunder feature apparently a growth prospect, notwithstanding that they generally have quite small size at present.
Certain hopes have been pinned on development of the Global Navigation Satellite System GLONASS for a long time (it is worth mentioning that the similar functioning system is only available in the USA).Thanks to the availability of the system, Russian companies exporting terminals and applications that ensure monitoring of moving targets on Earth and processing of relevant information have gained some advantage over foreign competitors.This concerns medium companies as well (major companies of the same dedication, which o�er a turnover above $100 million, have been missing in Russia so far). For example, the NIS GLONASS company plans to occupy about 20% of the Indian professional navigation equipment market in the short run; and in the long term, the company intends to capture 20–30% of the global market in this segment with the estimated current capacity of $60–90 billion.
In 2013, the GLONASS navigation satellite system for the �rst time was considered as the one capable to pay back the huge investments and to bring a notable economic e�ect.However, the failures to launch rockets with communication satellites that would allow the system full use in the near future create some uncertainty concerning the perspectives of the system commercial use.Most likely, an increase in the volume of services involving tra�c and cargo tracking based on the GLONASS system will remain, but it will be not as high as it could be on condition of planned implementation of the global project on GLONASS satellite group in the redundant operation mode.
Some companies involved in development of systems and applications for satellite navigation also undergo di�culties. For example, Russian Navigation Technologies after explosive growth and successful initial public o�ering in 2010 took a bad knock in 2012. As a result, the company was recognized as a bankrupt. It has not gone into liquidation however the external management is being conducted and the turnover has drastically declined.Nevertheless, other companies successfully work in the �eld related to GLONASS. In particular, TRANZAS intends to become a system integrator in the pilot project on installation of monitoring and correcting stations GLONASS/BeiDou/GPS in China.
In order to realize the available potential in the satellite navigation area there was created a State owned company GLONASS. Its main objective is the provision of reliable operation and competitive development of the ERA-GLONASS system. It will allow for unlocking the high commercial potential of the existing high-tech infrastructure, securing investment in its development, decreasing burden on the state budget.
Just a year ago we believed that an additional gain of export may be ensured by su�ciently large Russian software companies that were previously oriented towards the Russian and CIS market.Many of them had and probably have plans to work more actively in far-abroad countries.Among them we need to notice 1C with the turnover of about $1 billion(including the income from software distribution and franchising) which decreased drastically in USD following the national currency exchange rate reduction in 2015.
There are a few other smaller companies that hold promises of promoting their solutions in foreign countries after they have successfully approved them in the Russian market.This promotion is, in particular, supported by their inclusion in the so-called Gartner Magic Quadrants.During most recent years, the list was added by such companies as Diasoft (Core Banking Software), PROGNOZ (Business Intelligence) and InfoWatch (Data Loss Prevention). In 2012, IntelTech from Moscow headed the Gartner's Cool Vendors list of the most progressive product companies. 2015 was marked by the appearance of another Russian company in Gartner Magic Quadrants. Positive Technologies was included in the quadrant uniting 14 world producers of solutions for web application protection (2015 Magic Quadrant for Web Application Firewalls).
2016 Saw the addition of three more Russian newcomers to Gartner Magic Quadrants: Veeam Software (2016 Magic Quadrant for Data Center Backup and Recovery Software), Zecurion (under Data Loss Prevention), NAUMEN (Magic Quadrant for Contact Center Infrastructure, Worldwide), Group IB (Security Threat Intelligence Services).

60 Chapter 2. Volume and structure of sales by Russian software companies indomestic market and abroad
2.5. Software development centersof foreign corporations in Russia
Diasoft, which until recently has mainly produced solutions for Russian banks, has good prospects thanks to the agreement for global cooperation with the IBM company (Global Alliance Attachment) signed in 2011.This agreement provides the joint development and promotion in the global markets of the Russian company's banking solutions based on the Service Oriented Architecture (SOA).As part of this agreement IBM will provide its partner with technological expertise, support of Diasoft projects on optimization and introduction of banking systems, will assist with implementation of marketing initiatives and worldwide promotion of the Diasoft products.The Russian company management expected at year-end 2015 about 30% of the company's income to be received from international markets. However, the company has not yet reported any successful large-scale promotion of its solutions abroad.
ABBYY in 2014 yielded �rst products for enterprise search and data acquisition on the basis of technology of text understanding, analysis and translation (Compreno). R&D in this �eld have been performed by ABBYY for 19 years, their own investment in this line for the whole period of work amounted to over $80 million. The company does not disclose the revenue target but considering such serious investments it must count on tens of millions per year if not by the results of 2014 or 2015 then on a mid-term horizon.
We believe still that in terms of applicable technology and market decision, those companies o�er good prospects, but the last year has brought about a less favorable background for the promotion of Russian companies in the western markets. Under such an environment they may elect other foreign markets as a priority. NAUMEN has already focused mostly on the South-East Asia region, and Diasoft runs its foreign representative o�ces not only in London, but also in Shanghai.
The state support of international marketing activity could signi�cantly facilitate faster promotion of young companies' development at o�shore markets but this support is so insigni�cant that cannot exert noticeable in�uence on the volume of software product export.
The prevailing geopolitical situation renders our task to forecast a change in the amount of investments in the software development centers of foreign corporations and their exports much more problematic. There are various considerations that a�ect substantially, though di�erently, the �gures. First of all, this is the ruble exchange rate depreciation. On the one part, the national currency devaluation contributes to an in�ow of foreign investments in the development centers as the Russian labor market appears to be more appealing in terms of engineering resource costs. On the other part, most of those centers belong to the companies of the US and Western Europe the relations therewith were deteriorated recently. The information background in foreign mass media misrepresents often risks of operations in Russia. For that reason, top managers of foreign corporations, if they have not elected to reduce the investments in Russian business units, then are not at least bent on an expansion of the same. At the same time, Russia has taken a number of measures complicating the operations of foreign corporations’ development centers. In particular, foreign R&D centers have responded adversely to adoption of the Law on personal data protection as well as to the plans to repeal the social tax incentives for software developing companies which do not have their software in the Register of domestic software.
Volume of services provided to parent companies
Volume at year-end 2015 in USD
Change at year-end 2015, $
Volume at year-end 2015 in rubles
Change at year-end 2015, Р
Forecast for 2016, $
$510 million -2% Р 31 billion +57% +5%

61Chapter 2. Volume and structure of sales by Russian software companies indomestic market and abroad
One more consideration a�ecting the development centers of foreign corporations in Russia is a di�cult situation around the income and pro�t of some major global corporations in relation to a world economy slowdown. Thereby they reduce headcount worldwide. This includes in some cases the sta� numbers that are either reduced or do not increase in Russia as well. In addition, under the global economy slowdown environment, global companies decrease their expenditure for research. This is stated, for example, by spokespersons of the US universities that lose their earnings for the reason of that reduction.
At that negative background, companies of South-East Asia (China, South Korea) are operating more intensely in Russia as well as quite small western companies. In 2015, some examples of intensi�ed activity in Russia by very large companies of Europe and USA were reported, though these were solitary instances.
A review of all the data available (results of the questioning that involved some development centers for the �rst time as well as those of private interviews with chief o�cers of other development centers) permits to suggest that, at year-end 2015, the total amount of export of software development services from Russia produced by the R&D centers of foreign corporations decreased by 2%. In this case, an error is within 3 percentage points. It means that a reduction could be a bit more and, at the same time, a symbolic growth is probable.
For the �rst time throughout the years of our surveying, 2014 saw a reduction in the service exports by international software development centers and the cost of projects they implement with Russian universities and academic institutions. While the export of such services was increasing steadily by 8-12% during the past years, then it declined by about 5% at year-end 2014. If we rely on the declared plans (these were especially numerous late in 2015 and �rst half-year 2016) then a growth of the �gure can be predicted by 5-7% at year-end 2016. In 2017 the movements of exports by the development centers of foreign corporations may be a�ected by the adoption of a law extending the social tax incentives for software companies. If the centers are deprived of the bene�t (the law provides for a gradual increase of the social tax rate from 14% to 30% during 3 years), then they can revise the strategy of their evolution in Russia in advance. It cannot be ruled out that a number of such centers will be closed down. The total reduction in the volume of their foreign sales can achieve 50%.
Since 2012 and through �rst-half 2014, some international companies started implementing the earlier declared plans for creation of new R&D centers in Russia or for expansion of the existing ones.Generally, those centers appeared thanks to the Skolkovo Foundation and the innovation center under the same name (construction is in progress), where the residents have already received the same social tax incentives.A possibility of obtaining incentives (�rst of all, tax ones) supported an increase in the volume of foreign corporations' investment into R&D in the territory of the Russia.
Such powerful corporations as IBM, Cisco Systems, Microsoft and SAP were among the active investors in implementation of R&D in the territory of Russia in the last 3 years.SAP planned to bring its research division sta� up to 250 people, and its R&D investment volume – up to 45 million euro. Microsoft in Skolkovo planned to develop software for face and speech recognition in video as well as software for multimedia data broadcasting.
The R&D centers of EMC and Samsung have been operating for a long time in St. Petersburg and Moscow, respectively, but they established additional centers at Skolkovo in 2012 as well.
T-Systems, Deutsche Telekom' subsidiary, while expanding the number of developers in its St. Petersburg o�ce, entered the labor market of Voronezh, expanded considerably its o�ce in Voronezh in cooperation with the Voronezh State University.
Chinese Huawei Technologies declared its plans to increase investments into R&D in the territory of the Russian Federation.Qualcomm, US mobile microelectronics vendor, last year started sourcing a team that can form the basis of creation of its Russian development center.The company is interested in the experts who have experience in application programming and digital signal processing. Facebook has also considered the establishment of its R&D center at Skolkovo.
In August 2013, Cisco Corporation stated that it was going to put into e�ect a long-term research program aimed at introduction of innovations in the course of R&D in Russia. This initiative will allow Russian educational and research establishments to participate in the Cisco Research international

62 Chapter 2. Volume and structure of sales by Russian software companies indomestic market and abroad
program. The project envisages the �nancial support of Cisco and will be implemented by the company for purposes of new technology development, promotion of innovations and involvement of ambitious engineers in mutual R&D activities.
In August 2014, The EMC R&D Center in St. Petersburg signed an agreement with the Academic University of the Russian Academy of Sciences aimed at joining e�orts to develop a simple and easy-to-use cloud platform for genomic variant analysis in clinical medicine. It will be helpful in revealing the so called “hybrid genes” that often are sources of malignant neoplasm.
In April 2014, the R&D division of Microsoft Research announced the conclusion of 3-year cooperation agreement with the Moscow State University in the area of the newest IT solutions including opening of the joint research center. The cooperation will cover joint research projects on Big Data processing and visualization as well as computer vision. It also envisages organization of scienti�c and practical incentives for students.
Symantec in the end of 2013 began to contemplate possible opening of its development center in Russia.
However, such activity in the second half of 2014 drastically reduced, and in 2015 it was not seen at all. Some companies are waiting for completion of construction of the innovation center Skolkovo to allocate there the development centers and start workforce recruiting more actively. So one should not expect a signi�cant increase in investment into such centers at year-end 2015. Perhaps, Chinese and South Korean companies will be more active. But they are even more closed in information terms (they almost never disclose any �gures of the enlargement of their Russian R&D centers).
A primary and unsolved issue for international R&D centers of foreign corporations in Russia is serious administrative barriers for importing to Russia the so-called “engineering prototypes” brought to Russia for software development and testing.The customs duties and VAT are charged, a security deposit need to be paid when importing the equipment and business also has problems around an inde�nite duration of the permitting procedure.
Since late 2015, a number of new market players have announced their development plans in Russia. ESET, a Slovak company, producing an antivirus NOD32 known in the world, informed early in 2016 about the investments in expansion of its own development center in Russia. Since the time of entry to the Russian market, they pursued a policy of as much business localization as possible. The center was opened in 2015 to participate in analytical studies, development of business models to meet the requirements of Russian customers. The company implements several joint technology projects with the Russian producers of information security solutions.
SAP announced the plans to open an Internet of Things Solution Center in Russia in 2016 on the premises of the Joint Innovation Laboratory. The purpose of the Center is to make their customers and partners familiar with the Internet of Things capabilities. In addition, support will be rendered to the SAP customers to optimize their business processes. Above all, SAP is intended to establish a joint venture with the Russian gas giant Gazprom to localize software for automation of the enterprise management business processes. An appropriate agreement was signed in June 2016 at the St. Petersburg International Economic Forum.
Late in 2015, Cisco Corporation informed about an intention to expand the range of their products made in Russia. It is quite possible that the business unit dealing with software development will be expanded.
D-Link, a Taiwan manufacturer of network and telecommunication equipment, opened another Research and Development Center of the company in Ryazan in May 2016. It will focus on the development of engineering solutions and mobile applications for prospective telecommunication equipment.
Late in May 2016, an agreement was signed to set up a Russian-Chinese research and engineering innovation center at Strogino Tech Park in Moscow. The Center’s goals are to develop Chinese-Russian cooperation concerning high technology and knowledge-intensive deliverables; establish an environment for emergence of joint projects and companies and entry to the Chinese market; enhance international cooperation; promote information exchanges. The Center is most likely to be �nanced also by the Chinese party.

Chapter 2. Volume and structure of sales by Russian software companies indomestic market and abroad
63
In 2015, it became known about the recruitment of software developers by the Moscow development center of Lazada online store with its headquarters in Singapore. Lazada Group deals with e-commerce in Vietnam, Indonesia, Malaysia, Singapore, Thailand, and Philippines.
The data of the Central Bank of Russia on the volume of cross-boundary computing services in the R&D �eld was useful for clari�cation of information on volume of sales by the foreign development centers in Russia. Their export in 2014 was $454 million (by 19% more than a year before).Taking into consideration that the statistics of the Central Bank of Russia concerns not only services in the IT area (by estimates of RUSSOFT analysts this share is about 20% of total amount of cross-boundary R&D services), it is possible to assess the export volume of IT services generated by Russian scienti�c and educational establishments at a level of $80 million. In this case, with the total volume of R&D export services of $510 million the export volume of software development services by the foreign development centers in Russia will make up $430 million.
However, the volume of cross-boundary services related to research and development reduced to $320 million at year-end 2015 as per the data of the RF Central Bank (by 30% that is well comparable with devaluation of the national currency, in which the contracts of Russian educational and research institutions were denominated). It is not possible yet to measure, how much were those IT services down (maybe, these were not down at all). It is necessary to look at the same data at year-end 2016. However, the above data provide some guides to support a trend towards a decline of activities by the R&D centers and software development centers of foreign companies in Russia.
The foreign companies which have their own R&D centers in Russia:
Alcatel-Lucent, Allied Testing, AVIcode, Cadence, Design Systems, Chrysler, Cisco Systems, Columbus IT, Dell, Deutsche Bank, Digia, Edisoft, EGAR Technology, EMC, EMS, Ericsson, Hewlett-Packard, Huawei, IBM, Intel, InterSystems, Jensen Technologies, LG Softlab, Motorola, NEC, NetCracker, Nival Interactive, Microsoft, Netwrix, Nokia, Nokia Siemens, Quest Software, RD-Software, Samsung Research Center, SAP, Scala CIS, SmartPhoneLabs, Oracle (Sun Microsystems), Tagrem Studio, Teleca, T-Systems.
Within the framework of the past survey undertaken in 2015 we ranked Russian software development companies for the �rst time. Essentially, it is a list of the major software companies divided into categories (divisions) depending on size and on growth rate (including predicted indicators during 2 years to come). No similar complete rating list of Russian software developers has ever been done.
Our objective was rather not ranking companies by size but covering all Russian largest software companies. Perhaps, we do not have yet information of some companies worth looking at to be included in our rating list. However, it is arguable that there are only a very few such companies, and they have the turnover no more than $50 million.
Certain mass media made broader rating lists of IT companies where software development companies were ranked separately. But their ratings were obviously incomplete (at most, they covered 50% of major software companies) and included also system integrators, hardware makers as well as foreign software companies which informed about sales in the Russian market.
The main reason of non-coverage of software companies by available ratings is the lack of any veri�able information about consolidated revenues of participating companies. We intrinsically withdrew concrete data from the ranking, although we had collected information on the turnover of all largest Russian software companies. The point is that a substantial part of this information was obtained as a result of annual polling of software developers on non-disclosure terms, and we keep this rule inviolate (we also used data of other ratings such as CNews, Tadviser100, RIA Rating and Expert RA subject to strong veri�cation. However, the central source of information is our survey of the market actors on a non-disclosure basis).
2.6. RUSSOFT rating of largest Russiansoftware companies

64 Chapter 2. Volume and structure of sales by Russian software companies indomestic market and abroad
Furthermore, we think unacceptable comparing the indicators taken from audited �nancial statements of some companies with the past year results presented by employees of companies in the course of polling, or obtained by expert judgment.
It would not be exactly correct to rank strictly and compare companies with di�erent business models.
Nevertheless, we compiled our own rating list with a primary focus on a company size. For fear of disclosing con�dential information and avoiding rigorous ranking, all the companies were grouped and posted in alphabetic order without giving information about their turnover.
For each division, a su�ciently wide range of consolidated revenues was de�ned; however, the companies were grouped out not only by existing volumes but also with consideration for their development trends. First of all, we focused on the turnover, but in some cases a company was shifted upward if it had high development trends and growth rate.
The Top division consists of companies which already have capitalization in billions of dollars. This total revenue has never been gained by any Russian software companies, but at least 3 companies have the billion values (capitalization). Kaspersky Lab is surely there. We have included Luxoft into this division as it is historically a Russian company, it made IPO under the Russian �ag, and has changed the jurisdiction of its head o�ce as late as two years ago under the pressures of heavy geopolitical consideration. Most likely, 1С could have had a billion turnover if one takes into account the income not only from sale of own solutions but earnings from distribution of other software as well. However, the economic crisis (primarily, the ruble exchange rate fall) had an extremely unfavorable impact on its turnover in dollar terms as the company’s main income is drawn in Russia.
The Division B also includes su�ciently large companies with the turnover from $100 million to $500 million. Among them we see only one company which in the next years can move to the Top division — Veeam Software. Considering its growth rates (including those during initial six months of 2016), this will happen as soon as at year-end 2016.
The Division C ($50-100 million), there are two contenders for rise to Division B, judging from their turnover close to $100 million. However, in recent years their growth rates have not been very high.
In the Division D, almost all companies have the turnover from $20 million to $50 million. However, it contains several companies with the turnover of about $12 million. In part, those are companies featuring good prospects to rise to Division C as well as the companies that reduced their revenues in USD due to their focus on the Russian market only (and achieved the lower turnover threshold of $20 million). We thought it would be not quite fair to remove them from the rating list, but we shall have to do this if their turnover fails to approach $20 million next year.
Our rating list has undergone some changes for the past year. Generally, those relate to the ruble devaluation e�ect and the relevant turnover reduction in USD. Cognitive Technologies has shifted down slightly from the Top Division. Prognoz and Parus have also shifted down to Divisions C and D, respectively. Peter-Service improved its position through a transfer from Division C to Division B.
In addition, 7 newcomers have been added to the updated rating list, i.e. R-Style Softlab, Elecard, Infotecs, Compass Plus, CryptoPro, Ashmanov and Partners, and “Security Code”. In doing so, Infotecs has found itself just in Division C and “Security Code” is about to enter the same from Division D.
As per the turnover amount, Sberbank-Technologies can be present on our rating list (and it will join immediately Division B). However, it is treated now as IT Department of the Sberbank of Russia, which has been spun o� as a separate legal entity. As soon as it is known that the company operates actively for other customers (it is expected to have foreign customers after all), then we shall add it to the largest software companies.
Once a number of its businesses have been transferred to other companies that constituted previously a common holding, TRANSAS seems to be beyond Division B. However, we have not obtained information still, whether the company maintains a�liation with TRANSAS Holding, and what is the turnover. Until we have obtained such information, we shall treat the TRANSAS Holding’s turnover without regard to the above separation.
In total, our rating list contains 64 companies, whose total turnover is in excess of $6 billion.

65 Chapter 2. Volume and structure of sales by Russian software companies indomestic market and abroad
1 «1С»
2 Kaspersky Lab
3 Luxoft
Top Division (Division A)
1 ABBYY
2 Acronis
3 Cognitive Technologies
4 CBOSS
5 Center of financial technologies
6 EPAM Systems Rus
7 Parallels
8 SKB Kontur
9 Peter-Service
10 TRANSAS
11 Veeam
Division B
1 Diasoft
2 JetBrains
3 Infotecs
4 Prognoz
5 BSS
6 Positive Technologies
7 Dr. Web
8 DataArt
9 GDC Services (ICL-Services)
10 RTSoft
11 Mera
Division C
1 Arcadia
2 Artezio
3 ASCON
4 Ashmanov and Partners
5 Auriga
6 B2B-Center (“Economy Development Center”)
7 BARS Group
8 Bercut
9
BFT (Budgeting and Financial Technology)
10
BIS (“Bank Information Systems”)
11 Compass Plus
12 CryptoPro
13 Devexperts (“Expert-System”)
14 Digital Design
15 Elecard
16 First Line Software
17 Galaktika
18 Garant
19 Group-IB
20 InfoWatch
21 Kodeks
22 Lanit-Tercom
23 Naumen
24 Scientific and Engineering Center SPb ETU – JSC NIC SPb ETU
25 Omnicomm
26 Paragon
27 Parus
28 PROMT
29 SCANEX
30 Security code
31 SIGMA
32 Soft Expert
33 SpeechPRO (“Speech Technology Center”)
SPIRIT34
35 RDTex
36 Reksoft
37 Return on Intelligence
38 R-Style Softlab
39 Zecurion
Дивизион D

Chapter 3
Views of Russian IT-companies on business development directions and Major Trends in the Russian Software Development Industry

67 Chapter 3. Views of Russian IT-companies on business development directions andMajor Trends in the Russian Software Development Industry
The answers to the question about the main directions of Russian IT-companies development not only provide the relevant information of companies’ goals but also serve asa presumptive evidence of a feeling of crisis. If a company mentions a smaller number of directions of development, more often than not it means that it has to scrap plans to complete some tasks. This may be due to the emerged uncertainty on market related to changed conditions, or to the lack of resources for adequate development. Naturally, in a down economy the companies try to concentrate on solving just one task (or two, if there is a way).
Thus, with the evanescence of mentioned areas of activity in answers of a meaningful number of respondents one may talk about crisis at hand. In our case, when income in ruble of majority of companies following the results of 2015 still increased, and the very few were busy surviving, the crisis may be perceived as a very relative concept. It means that the going gets tough for the industry. Judging from the changed average number of company development directions mentioned by respondents these hard times were during the polling in 2014 and 2015. In 2016, this indicator increased even if only slightly though not reaching the 2012-2013 level. This could be understood as making an indirect reference to commencement of recovery from crisis.
The same conclusions may be made as regards a similar indicator of mentioned trends corrected for the fact that it largely re�ects the intensity of current changes which may increase also in a downturn. In common opinion of our respondents this intensity of changes drastically decreased in 2015, but in 2016 increased again. This indicator has not attained the level of 2010-2014, but its growth indicates that today there is less uncertainty and more prospects for future development.
As compared to the previous survey data by each direction, we should note an increase of proportion of companies focused on the more active work at the foreign market. As one of the main areas of activity it is assessed by 57% (a year ago — 50%), and as a priority — 41% (30%). Therefore, today a smaller number of companies believe in long-term bene�ts of Russian market than in 2015. In this case, 77% respondents mentioned the growth of business (no matter, in Russia or abroad) as a priority objective of development in 2 next years. Last year the amount was about the same — 75%.
Another signi�cant change is an increase in the share of companies dealt with creation of remote development centers in the regions. However, as a year before, this direction as a priority was mentioned only by 2%.
3.1. General analysis
Directions Trends
3,19
-
2010
2,73
-
2011
2,96
1,9
2012
3,23
2,06
2013
Year of survey
3,42
1,84
2014
2,28
1,6
2015
2,58
1,82
2016
Number of referred directions of development and trends per respondent company

68 Chapter 3. Views of Russian IT-companies on business development directions andMajor Trends in the Russian Software Development Industry
Among other objectives which were not included in the questionnaire the respondent companies indicated the following ones: certi�cation of produced hardware, expansion of ongoing projects, development of new products, new product line market launch, development of online solutions, development of own box solutions, improvement and optimization of process quality, improvement of recruitment quality and rate, assimilation of new areas of technology, marketing forming up. Only three respondents mentioned objectives not aimed at development — execution of current orders, survival, preservation of market position. Apparently, among other objectives the most important are development and market launch of new products or of box solutions.
66%
Main areas of companies’ development *
2009
68%
2010
77%
2011
73%
2012
81%
2013
73%
2014
63%
2015
65%
2016Year of survey/direction of development
More active work at the domestic market
22% 31% 28% 29% 36% 27% 30% 32%Growth of online sales
- - 47% 52% 59% 56% 50% 57%Work for export/expansion of themarketing network abroad
8% 13% 12% 13% 10% 5% 7% 8%Certification of softwaredevelopment processes
7% 12% 13% 15% 15% 15% 4% 10%Establishment of regional development centers
8% 8% 5% 8% 6% 10%Other
* respondents could choose more than one area
Priority areas of companies’ development
More active work at the domestic market
Growth of online sales
Work for export/expansion of the marketing network abroad
Certification of software development processes
Establishment of regional development centers
Other
Период
45
17
30
1 2 5
2015 2016
36
14
41
0 28
Main directions of companies’ development with different turnover
More active work at the domestic market
Growth of online sales
Work for export/expansion of the marketing network abroad
Certification of software development processes
Establishment of regional development centers
63
28
63
2
13
turnover < $5 million turnover > $5 million
74
27
74
21
12

69 Chapter 3. Views of Russian IT-companies on business development directions andMajor Trends in the Russian Software Development Industry
In comparison of indicated main areas of business development among companies with di�erent turnover it may be noted that an increase of online sales is mentioned equally as often by both large/medium-size and small companies. Previously the latest ones were most targeted on this goal (almost twofold).
If one looks at di�erences in responses depending on location, it will be found out that sales via Internet are less important for Siberia. Previously they indicated this area more often than other companies. At the same time, Siberian companies are focused on work abroad on a more frequent basis. However it should be taken into account that their proportion among respondents is small so these �uctuations may be explained by random factors. In view of such small sample let us wait for the results in the next several years to make any valid conclusions.
The answers of St. Petersburg companies can hardly be explained by random factors because the sample is quite representative. Almost in every direction the �gures of St. Petersburg are inferior to those of regions. It is also consistent with estimates of business environment which in the second capital by all tokens are worse than in many other big Russian cities.
Frequencies of market trend mention are coherent with answers to the question about main directions of development. Export growth as a trend was mentioned 1.5 times more by respondents than a year ago. The same goes for export growth as a main direction for business development.
Main areas of companies’ development with different H.Q. location
Moscow St. Petersburg Other cities Siberia
73
59 61
30
42
28 27
10
54 50
64
90
10 136 6 97
0 0
More active work at the domestic
market
Growth of online sales
Work for export/expansion of the
marketing network abroad
Certification of software development
processes
Establishment of regional
development centers
Modern trends in the Russian software development industry inopinion of enterprises
Year of survey/trend 2008 2009 2010 2011 2012 2013 2014 2015 2016
Domestic market growth 71% 44% 49% 54% 51% 58% 59% 35% 37%
Export growth 56% 19% 35% 35% 23% 37% 33% 32% 48%
IT outsourcing growth (IT infrastructure support)
30% 34% 32% 28% 35% 32% 33% 20% 28%
Growth of direct sales via Internet 31% 27% 39% 38% 39% 47% 48% 37% 42%

70 Chapter 3. Views of Russian IT-companies on business development directions andMajor Trends in the Russian Software Development Industry
In the recent years, such phenomenon as purchase of foreign companies by large Russian software enterprises has become distinct.Judging by media,these transactions are more frequent than before butcommencing from 2015 and the �rst six months of 2016 the number has decreased.
This trend is still more typical for the largest companies.Such purchases pursue di�erent objectives.On the basis of the purchased company, remote development centers may be created (but by no means always).However, acquisition of a new asset is mostly aimed at getting access to a new market and new regional customers.Later in this chapter, in the section dealing with investments, this aspect is addressed in more detail.
The interest in the issue of quality management system certi�cation decreased in the previous years. The share of companies that mentioned obtaining the Certi�cate of Compliance with the international standards (ISO, CMM, and CMMI) as one of the main objectives decreased �rst from 13% to 10% in 2013, and in 2014 from 10% to 5%. In 2015-2016 this value increased to 7%, further to 8%, however it hardly implies any tendency. Most likely, the share of companies setting task of certi�cation has been stabilized.
One of explanations of the decrease in interest in certi�cation is the fact that all large service companies were certi�ed in 2000s on compliance with the CMMI standard highest levels (4 and 5).
Also is signi�cantly lower the share of companies that plan to obtain certi�cates in the next 2 years. If in 2012 among respondents without certi�cates there were 46% of those who mentioned obtaining, in 2013 there were 27%, and in 2014 - 19%. In 2015 this value lowered even more – to 15%. In 2016, such plans are mentioned by 19%. A small increase in this indicator may be another con�rmation that the challenging times are running out (the desire to pass through certi�cation suggests a possibility of the development). Another explanation of this fact is the appearance of new players, particularly service companies seeking fortunes at foreign markets and wishing to acquire the international certi�cate for this purpose.
Modern trends in the Russian software development industry in opinion of enterprises
Year of survey/trend 2008 2009 2010 2011 2012 2013 2014 2015 2016
Market consolidation (mergers, takeovers, creation of holdings)
61% 21% 35% 30% 25% 31% 33% 23% 25%
Increase in product developments (Box/LicensedSoftware)
32% 21% 26% 19% 26% 27% 33% 28% 22%
Growth in development and adoption of software solutions (Services & Solutions)
50% 18% 35% 24% 37% 32% 35% 18% 25%
Increase in custom software development
38% 14% 35% 29% 30% 31% 41% 19% 12%
Adoption of quality management systems
38% 10% 21% 12% 20% 24% 24% 14% 12%
Other - - 12% 4% 10% 4% 3% 2% 7%
3.2. Quality management system certi�cation

71Chapter 3. Views of Russian IT-companies on business development directions andMajor Trends in the Russian Software Development Industry
According to the interviewed experts, the issue of establishing a quality management system in the software development companies in Russia lost its urgency approximately in the middle of 2000s because to a varying degree practically all companies have their own quality management systems.For those service companies, which participate in the international tenders with formal requirements for availability of CMMI certi�cates, this problem is resolved by the regulatory certi�cation.All product companies and small service providers content themselves with ISO and implement their own quality management systems based on ISO and CMMI, but not requiring expensive procedure of certi�cation and its con�rmation.
As the problem of availability of certi�cates becomes less pressing, the respondents don’t pay attention any more as to whether there is the state support of certi�cation (though essentially such support is almost zero). Most of the respondent companies are not even aware that in the competing countries the state is interested in the quality management system certi�cation of domestic companies.
In the last two years mass media almost did not mention caes of certi�cation to CMMI or ISO. Probably, the companies themselves ceased to consider it as an achievement or an important piece of news, however, all large service companies have previously gone through all required procedures. The only one relevant piece of news refers not to a service company but to Kaspersky Lab, the solution developer in the
In 2007 the �rst authorized (and later – certi�ed) CMMI Appraiser appeared in Russia and in 2009 – the �rst Russian-speaking Lead Appraiser (that still remains the only one).This fact only led to a short-term and small increase in the number of certi�ed companies as the share of the Russian experts' services cost in the total assessment and certi�cation cost is not great enough to have a serious bearing on the certi�cation cost.
In 2014, we for the �rst time included the question about use of SCRUM or another kind of Agile Programming however early on we could not obtain any representative results. It seems that many respondents misunderstood the question. The problem was solved already next year. In 2015 and 2016, the �ndings on the share of companies which use SCRUM or its analog were identical -13%.
Share of companies certified to international standards
* the CMM was not included in the 2014 questionnaire as it was recognized as obsolete and completely replaced by CMMI
2009 2010 2011 2012 2013 2014 2015 2016
Not certified 65% 61% 69% 64% 74% 71% 61% 61%
ISO 31% 31% 29% 35% 24% 24% 33% 30%
CMM* 0% 7% 3% 3% 1% - - 0%
CMMI 4% 7% 2% 6% 6% 5% 4% 4%
Evaluation of the state support for international certification
Low Satisfactory Good
2010 56% 40% 4%
2011 78% 21% 2%
2012 57% 41% 1%
2013 57% 39% 4%
2014 46% 44% 9%
2015 38% 59% 4%
2016 45% 48% 8%

72 Chapter 3. Views of Russian IT-companies on business development directions andMajor Trends in the Russian Software Development Industry
3.3. Investments
information security area. This company successfully underwent certi�cation audit for compliance with requirements of the new version of the international standard ISO 9001:2015. As it is stated in the Kaspersky Lab press release, the company has become the �rst among competitors which customer relationship principles and processes meet the universally accepted requirements in the management quality area. In particular, the scope of certi�cation covers management of single and multiple safety incidents, client request processing, knowledge management and internal support of Kaspersky Lab customers. Certi�cate validity extends to technical support desks working with corporate and family users of company’s products and services in Russia, Europe, North and South America.
Software developers mention the availability of any certi�cate almost just as often as service companies (36% and 40%, correspondingly).
In the situation of decrease in volume of venture investments in Russia, referred to by analysts, and in the total national situation that does not very much play in favor of growth of investments, our survey shows that a share of companies which managed to attract external �nancing in 2015 has increased up to 10% (a year ago it was 7%). Admittedly, more software companies could receive investments.
Compliance of our �ndings with data from reports dedicated to venture market is unessential. Firstly, software companies have been accounted for a large part of venture investments, but Internet projects in previous years were more appealing. The economic crisis lowered their popularity (they were adversely a�ected by the decrease in risk-related investments in Russia), while IT companies with their interest in foreign markets retained attractiveness. Secondly, respondent companies for the most part are not startups and can attract investments in circumvention of venture market.
Situation at hand in this country due to decrease of foreign investments, though is re�ected on software companies but to a lesser degree than on enterprises of most other branches. Decrease in expenses in dollar terms in Russia makes more appealing the investments in software developers which are mainly oriented toward foreign markets. Besides, the expected large-size import phase-out on software market allows for counting on increase in revenues of companies which are mainly oriented toward Russian software market. If, as a whole, Russian economy showed a small decrease, software companies even in the most di�cult for them 2015, on average, were growing. It may be expected that their sales in the next 2 years will increase both on Russian and foreign markets.
Since 2011, when the question about investments was included in the questionnaire for the �rst time, in the next 2 years the ful�llment of intentions of investments' attraction amounted only to 30-50 %. As a rule, expectations were met by no more than one third of companies which counted upon attraction of investments. Therefore, the needs of software companies in external �nancing are satis�ed only in part. This is not to say that these needs always comply with companies’ capabilities to return money invested. A lot of applications to venture funds are known to look lame.
Share of companies that attracted (or plan to attract) investments
Last year This year Next year
9 9
1618
2426
12
25 25
7
18
27
7
2224
10
19
23
2011 2012 2013 2014 2015 2016

Chapter 3. Views of Russian IT-companies on business development directions andMajor Trends in the Russian Software Development Industry
73
Venture funds begin their operation in the Russian market mainly in Moscow. Though they have begun to express an active interest in investment in the regions (the Russian Venture Company even arranges the tours across the country to put the investors in touch with regional high-tech businessmen), still it is much easier to �nd investments in the capital. Such is the opinion of promoters of building rapport between startups and venture capitalists.
The results of our polling in the last 3 years show that there is no any signi�cant di�erence between Moscow and regions by a share of companies that attracted investments. In 2014 Moscow has lost any advantage in this sense: in regions (it does not apply to St. Petersburg) investments were attracted by 13% of respondent companies, whereas in the capital – the same 6%, as a year before. In 2015, in regions investments were received by 11% of respondents, in Moscow by 10%. Following the results of survey in the last three years one may already conclude that the regional companies even more often attract external �nancing than those in the capital (or at least not less).
However, this data does not counter argument that it is easier to �nd investments in Moscow, because many regional companies �nd it just in the capital. The accessibility of resources of the metropolitan venture funds for regions in recent years has grown to a large extent thanks to above mentioned di�erent regional events arranged by funds.
Share of companies that attracted (or plan to attract) investments, by categories
Year of survey Last year This year Next year
Business model
Software developers 11% 26% 32%
Service companies 10% 16% 18%
Company size
Turnover less than $5 million 4% 16% 20%
Turnover more than $5 million. 21% 21% 18%
Turnover from $5 million to $20 million 26% 26% 22%
Turnover more than $20 million 10% 10% 10%
Share of foreign sales
More than 50% 17% 17% 11%
Less than 50% 7% 20% 27%
Age of company
Older than 10 years 9% 15% 19%
Younger than 10 years 12% 29% 31%
H.Q. location
Moscow 10% 17% 19%
St. Petersburg 7% 20% 23%
Siberia 30% 30% 40%
Ural 33% 33% 33%
Other cities 5% 18% 23%
All regions 11% 21% 27%

74 Chapter 3. Views of Russian IT-companies on business development directions andMajor Trends in the Russian Software Development Industry
A declared need in investments does not depend on location of head o�ces of companies. In recent years the need of investment is expressed by 20-30% of companies (sometimes a little bit higher than 30%). Taking into account that Moscow has nothing going for itself on that score, an assumption that Moscow companies are less interested in investments due to availability of internal funds is groundless. Nevertheless, the data of 2015 allows for suggesting that Moscow companies still much less frequently are in need of outside �nancing.
None of St. Petersburg companies attracted investments in 2013-2014. In 2015, they were 7%, but this �gure is still lower than countrywide. A sample of St. Petersburg companies is very decent. So it makes no sense to refer to any random factors. The results of our polling make someone sit up and take notice of investment appeal of St. Petersburg in the area of software development. Such appeal exists (particularly, implicitly), but in this indicator the second Russian capital is inferior to other major Russian cities
There are solid grounds for supposing that the attempts to create the investment climate favorable for activities of venture investors in St. Petersburg have failed in comparison not even with Finland or American Silicon Valley, but with other Russian cities. It should be noted that in St. Petersburg the training in the IT area is tuned, a lot of international high-tech conferences and forums are held here. Judging from the number of software companies and technical higher education institutions with a very high degree of training, the second Russian capital should be among the leaders in attraction of investments in IT.
For three consecutive years now a leader by the share of companies that have attracted investments is Ural (17% in 2013 and 2014, 33% in 2015). This region is represented by not so many respondents, and in the case of a small sample the random facts may dominate.That is why years ago we assumed that it was a small size of sample that brought leadership to Ural. However, the recurrence of a high indicator in 2014 and in 2015 suggests that Ural region does have a su�ciently high indicator of investment appeal.
A reasonably good �gure of investment attraction in 2015 was also shown by Siberia though in the last 2 years none of respondent Siberian companies attracted investments. At the same time, most often Ural and Siberian are in want of investments in the next two years. Perhaps, they a have a better view of opportunities for growth.
As before, indicators of growth of turnover and export of “other cities” companies are lower than in two largest Russian cities. We suppose that the relatively low growth rates at large are related to the shortage in investments in the previous 10 years. Probably, this problem has got o� the ground, and in the next years regions will be able to gather themselves up. We will be able to make conclusions depending on the speed at which their companies increase business volume and export.
Small companies more often needed external �nancing and they also more often managed to attract investments (in 2014, it was achieved by 6% of companies with the turnover less than $5 million, and 8% - with the turnover more than $5 million). We have not found by 2015 any great di�erence in successful investment promotion as a function of company size. Nevertheless, in 2015 most frequently external �nancing was accessible for medium-size companies (investments were obtained by 25% of companies with the turnover from $5 to $20 million).
If none of companies with the turnover over $20 million attracted investments in 2014, in 2015 – 10% of companies in this category did. As a rule, large companies tell nothing about plans to attract investments in the next 2 years. It does not mean that they have no such need. As a rule, they have, and the amounts in question are interesting for serious venture and investment funds (tens of millions US dollars). However large companies not always want to declare publicly their activities for attraction of investments, considering this to be a private matter however they do not hide the fact of receiving funds in the previous period.
The fact that an average size of companies attracting investments has grown allows us to suggest with certainty that the total growth of investments to software industry is underway. In addition, a share of companies which received investments has also increased.
As in the recent years, young companies attract investments more often. The same advantage software vendors have over service companies.
In 2012 and 2013 companies that are mainly oriented to the Russian market have managed to attract investments more often than those that gain the most part of their income from export (in 2012 attracted investments 13% and 10%, in 2013 - 8% and 3%, respectively). Probably, it is related to the assumption that the

75 Chapter 3. Views of Russian IT-companies on business development directions andMajor Trends in the Russian Software Development Industry
prospects of further development in the Russian market are for them more obvious than possibilities of strengthening in foreign markets.In 2014 the situation was changing: 11% of respondent companies with no less than 50% earnings derived from export could attract investments. For companies that are mainly oriented to the Russian market this �gure is just 6%. In 2105, this huge di�erence not only remained, but increased – 17% and 7%, respectively.
It seems that the policy of venture funds (other development institutions), which implies encouraging startups to operate at the world market and not only in Russia, yields fruit. When external �nancing is provided to a company that is fundamentally oriented toward foreign markets, the investment e�ciency can be far greater than if a similar amount is given to developers interested only in the domestic market. At the same time, it must be noted that anyway the receipt of investments in the next 2 years is built upon by those companies which gain the most part of income from sales in Russia.
It is impossible to identify what sources of funding are the most important for software developers only on the basis of negative and positive answers in our survey. It is fair to assume that the investment activity in software industry was mostly stimulated by the government and state corporations. There is no knowing about large public investments made in 2015 directly in software development, but the focus on import phase-out in many high-tech areas and ongoing �nancing of large-scale state programs form expectation of demand growth in future. Even if public investments are intended for other areas, something from public spending reach software companies without fail because without custom software development or software products (or hardware and software packages) can exist not a single economy sector (particularly, high-tech sectors).
Government programs and projects associated with high-tech development in Russia were implemented in 2015 with no serious reduction as compared to 2014. For example, ROSNANO Corporation, which is a development institution in the area of nanoscale technologies, invested in development of portfolio companies 15.8 billion rubles. The World Intellectual Property Organization (WIPO) in early 2016 even labeled Russia as one of the world leaders in terms of credit exposure in nanoscale technologies (along with the USA and China).
According to various published analytical reports, Russian venture market greatly declined in 2015 as compared to the previous year. The decline exists both in dollar and ruble terms, but in ruble terms it is not very signi�cant. The slump in volume of the venture market in dollar terms is caused mainly by ruble devaluation, but it is not the only factor of importance. Russian venture market began declining since 2013 (even before ruble depreciation). But in the beginning the drop of venture market was expressed only in volume of investments while in terms of number of transactions the growth still was at hand. In 2014, not only the volume but the number of transactions also lowered.
There are several reasons of contraction of venture market in the last three years. First and foremost, it is the devaluation of national currency which depreciated Russian venture funds which are formed in rubles, mainly from internal sources of �nancing. In addition, the ruble fall resulted in a situation where incomes of companies oriented toward domestic market greatly declined in dollar terms. Therefore, these companies became much less interesting for foreign private investors (and Russian too, as they have an opportunity to invest in foreign projects which became more pro�table). The second important factor of the declining interest in venture projects is a general economic situation in this country leading to decline in earnings of many enterprises even in ruble terms and causing budget problems at di�erent levels. Thus, government investments in di�erent venture funds reduced also.
Another reason of contraction of venture market is a more severe selection of projects for �nancing. Looking back on the year 2013, experts stated that although the volume of investment had reduced, but the quality of projects supported by funds on the average had increased. PwC and RVC were comfortable with it, even looked at the future with optimism as this reduction primarily was indicative of coming-of-age — the average transaction volume was aligned with similar indicators of mature markets of other countries.
Russian venture market

76 Chapter 3. Views of Russian IT-companies on business development directions andMajor Trends in the Russian Software Development Industry
However, following the results of 2014 there was nothing to be heard about any coming-of-age. Perhaps, it happened but it was di�cult to uncover it against the background of other factors. In opinion of the J’son & Partners Consulting, PWC and RVC analysts, the decrease of venture market was caused by the deterioration of macroeconomic and foreign-policy situation in the RF as well as a natural completion of venture funds’ investment cycles. Perhaps, the quality of projects had taken place that year but to recognize it amidst explosive changes was di�cult. Anyway, the number of transactions decreased mostly due to external factors and not enhancement of project selection quality.
According to J’son & Partners Consulting, the volume of the Russian venture market continues to decrease for two consecutive years now and has reached at year-end 2014 $447.5 million covering, 319 transactions. The amount of �nancing dropped by 26% in comparison with 2013, up to $258.2 million; while a number of investors’ exits increased 5-fold and amounted to $189.3 million.
As J’son & Partners Consulting have adjusted the methodology of venture market measuring, the direct comparison with above mentioned data would be scarcely correct. More speci�cally, the estimate of the venture investment market now does not include grants, transactions and exits with participation of startup founders, strategic investors as well as venture and investment companies which are not funds.
According to the new methodology of J’son & Partners Consulting, the volume of venture investment with participation of funds and business angels amounted in 2015 to $135 million having reduced during the year by 55.3%. The analytical company report informs about reduction of the number of transactions to 187, but in percentage terms it can be determined only by size of histogram bars in this report. It seems that this reduction is too very signi�cant but it apparently turned to be less than the value of investment volume contraction (meaning that a transaction value has slightly reduced).
A similar lowering of investments was also found out by RMG Partners. According to this company, the volume of venture investments decreased at year-end 2015 by 51% up to $383 million and the number of transactions from 436 to 297 (by 32%). This data also speaks for lowered average transaction cost.
At the same time, the RMG Partners analysts found out the same signi�cant reduction not in all segments of venture market. In some of them there was even the growth. For example, in the area of Software & Internet B2B the volume of investments reduced only by 11% from $148 million in 2014 to $132 million in 2015 (meaning a signi�cant growth in ruble terms). At that, the shares of investments in framework and ERP systems in this segment signi�cantly increased from 12.7% to 29.2% and from 10.7% to 34.3%, respectively. Therefore, these investments increased also in absolute dollar terms. It is important to notice that the growth is observed in the segments of economy which are closest to software industry. This data con�rms our version about increase in volume of investments attracted by software companies.
According to J’son & Partners Consulting, the top investor in IT in 2015 (as a year before) was the Internet Initiatives Development Fund (IIDF). ICT is accounted for by 85% of all �nanced projects. Among ICT sub-industries in 2015 lead the pack “aggregators and directories” and “business solutions”. It appears that a share of business solutions has appreciably increased.
A large part of investments, as in 2014, accrued to the seeding stage though the amount of seed transactions reduced by 26.7% as compared to 2014. In 2015, the reduction of the share of transactions in volume from $1 to $5 million was observed with the increased share of transactions in volume up to $1 million.
In 2015, there were 11 exits of venture funds from Russian projects to the amount of $1202.3 million.
The analysts of J’son & Partners Consulting identi�ed the following barriers on the way of Russian venture market development: reduction of speed of transaction completion; increase in period of exits; drop of company valuation; crisis of bank industry; drawbacks of Russian law; low R&D budgets; sluggish demand of major customers; scarcity of teachers in fundamental industries. Among basic drivers one may distinguish the following: improvement of venture project quality; impact of a decline in the ruble upon reduction of R&D volumes; propping-up of demand for investments into some directions due to import phase-out; positive moves in Russian law, active participation of IIDF in ICT project �nancing.
According to the report of the Internet Initiatives Development Fund, Russian market of direct and venture investment in segment “Internet and information technologies” in 2015 reduced by 43% in volume of

investments in ruble terms and by 20% in amount of transactions. A total volume of investment was 34 billion rubles, and an amount of transactions — 225. An average transaction value in 2015 was 152 million rubles versus 210 million in 2014 (by 29% less).
According to IIDF, in 2015 a number of regional startups were growing resulting in reduction of a share of Moscow in the total amount of investment transactions from 71% to 56% and reduction of a share of the whole central federal district by 11% — from 73% to 62%. A share of Moscow out of transactions of the central federal district was 91% in 2015. Among cities, St. Petersburg (12% of total number of transactions in Russia), Yekaterinburg (4%) and Kazan (3%) keep leading positions. A large part of investment in 2015 accrued to regions — 61%. Reduction of a share of Moscow indicated by IIDF is in line with our �ndings.
In 2015, according to IIDF, the biggest investments were observed in the following segments: business solutions (31%), e-commerce and recommendation services (19%). An interest arose in investments into segment IoT (if in 2014 the share of this segment was 1%, then in 2015 — 7%) and medicine (growth from 1% to 4%, respectively). The IIDF analysts expect that these segments will promote market growth in 2016.
The venture fund LETA Capital looked at the situation of venture investments the other way round carrying out analysis of the existing requests for investments. A total cost of all requests in 2015 from startups at the seeding stage and in round A amounted to $2.48 billion. On a more frequent basis as in the 2 previous years the investments were requested by aggregators and classi�edes of all sorts. They are accounted for by 10% of all requests. Approximately the same share have di�erent projects related to development of equipment, hardware and software packages (so called “iron” projects).
A share of market o�ers in B2B-Analytics/Optimization/Engagement tools (di�erent frameworks and applications to improve business e�ciency and transparency) decreased in 2015 almost twofold as compared to 2014 (6%). There are also less of projects aimed at health, life style and habits. Previously this direction was very popular.
Financing and technological projects are proposed in 5% of requests for two consecutive years.
According to LETA Capital, the most promising directions are Big Data analysis, Internet of Things, robotic technology related to software solutions for arti�cial vision and control, virtual reality.
Compared to Russia, the share of venture capital versus GDP in US is 13% or 4.25 times higher in absolute terms. By this relative ratio, Russia is at the same level with China and Europe.
Whereas the US market of venture investments is one of the most promising, the number of venture funds there has been substantially reduced in the last 10 years. It is worth noting that the similar trend is observed also in Western European countries – in the last 12 years the number of funds decreased by 63%. Experts even sometimes speak about Silicon Valley as a large footprint on the sands of time long gone by.
1. The RF President signed the venture amendments to the Tax Code of the Russian Federation developed by IIDF and by the Private Law Research Center (PLRC). The main objective of amendments is introduction therein some analogs of foreign statutory concepts due to the lack of which Russian Internet companies are forced to go under foreign jurisdictions.
2. In 2015, GVA LaunchGurus Fund 1, L.P. was set up. The volume of fund is $10–11 million.
3. The Skolkovo Foundation and Singapore accelerator HaxAsia launched the joint acceleration program for hardware projects in Moscow and Singapore.
4. In April, the fund StarNet Venture for investment in IoT was founded. Gennady Medetsky was appointed the head. Previously he headed the funds Ruventu and Sinergy Innovations. The fund volume is about $50 million.
77 Chapter 3. Views of Russian IT-companies on business development directions andMajor Trends in the Russian Software Development Industry
Some most important events at venture market in 2015 inexpert opinions J’son & Partners Consulting

78 Chapter 3. Views of Russian IT-companies on business development directions andMajor Trends in the Russian Software Development Industry
5. In Moscow the international �ntech cluster Future Fintech was opened. Its goal is development of innovative technologies in �nancial sector and attraction of foreign investments into Russian startup market.
6. In April 2015, Da Vinci PE Fund II L.P. and RVC announced fund creation with a volume of 5 billion rubles for investments into Russian high-tech companies with international potential for development and further holding an IPO on the Moscow stock exchange.
7. In June 2015, the crowd investing �oor was launched for o�ine and online business Itinvest.su.
8. In June 2015, Accelerator.ru got started. It deals with IT projects in the area of uber-mechanics (o�ine conversion to online), payment solutions as well as startups in mobile �eld.
9. In August 2015, Russian book service Bookmate entered Indonesian market under the brand CipikaBookmate. In September, Russian startup RetailRocket entered European market.
10. In September 2015, the Russian medical startup UNIM entered the international market. The company deals with the problem of remote oncologic diagnostics.
11. Silicon Valley business accelerator and seed fund 500 Startups entered Russian market. However, the company does not plan to open the o�ce in Russia yet, startups will undergo training in the USA.
12. In September 2015, the RF Ministry of Economic Development and Trade endorsed the bill with amendments to the Tax Code which will grant bene�ts to the investors of high-tech companies. The bill concerns zeroing of income tax on sale of securities circulating in the sector of innovation and investment market (IIM) of the Moscow stock exchange.
13. In September 2015, Intel and RVC completed strategic agreement to support the technical promotion community (Do-It-Yourself) in Russia.
14. The Commission on legislative drafting activities endorsed the bill on regulations of conferment of Russian citizenship with foreign citizens – individual entrepreneurs and investors.
15. The RF President signed the order on foundation of the National center of development of robotics technologies and basic elements.
16. In December 2015, the Skolkovo foundation approved the establishment of representation in Beijing aimed at commercialization of technologies, attraction of investments in companies and infrastructure, formation of a range of commercial services for companies – members of the foundation for relationship with Chinese partners.
Some most important events related to invest promotion byRussian companies and establishment of new investment funds
In the spring of 2015, the American corporation Net Element purchased the Russian processing system PayOnline. A transaction amount will be up to $8.48 million from which assets of PayOnline frozen in a Cyprus bank will be subtracted.
In February 2015, RoboCV, a developer of intellectual auto piloting systems for transportation, completed the new round of venture investments totaling $3 million. A lead investor was a fund controlled by I2BF Global Ventures and VTB Capital Investment Management. Other participants were international venture market players — Columbus Nova, Almaz Capital, as well as Leta Capital which had already invested in the company.
In April 2016, one of the �rst robotics venture investors Grishin Robotics (called after the name of the founder – the manager and co-owner of the Internet giant Mail.ru) announced the establishment of its new $100 million fund. It is four times bigger that the fund previously established by the same investor and is one of the world’s biggest. Capital will be used for expansion of geographic and investment focus on IoT, private space, etc. in addition to the traditional robotics as well as participation in bigger rounds. In all likelihood, the fund will not be limited to investments in Russia.

79 Chapter 3. Views of Russian IT-companies on business development directions andMajor Trends in the Russian Software Development Industry
In the beginning of 2016, the American investment fund BlackRock consolidated 5.2% of shares of the o�shore developer EPAM Systems. Earlier BlackRock purchased a similar block of Luxoft – the competitor of EPAM Systems. The market value of the EPAM Systems holding of shares collected by BlackRock was $195 million. Another American fund - Vanguard Group – also early in the year informed about purchase of 5.9% of EPAM Systems shares. The market value of this block was $170 million.
In February 2016, it got about the �rst investment of the venture fund of the telecommunications giant Rostelecom – KommIT capital. It purchased 30% Raidix for 100 million rubles ($1.5 million) setting a value of the whole company at 333 million rubles.
In March 2016, the venture fund of Rostelecom and the fund Leta Capital jointly invested $1.75 million in the Russian developer of data transmission systems Brain4net. The investors obtained 25% of company stock.
In February 2016, the service of Russian developers Appnow permitting to develop a multi-platform mobile business application for customer engagement via social networks received $2 million of investments on project development from the Dutch company Maxforсing ВV.
In May 2016, the Russian free of charge service for vacant parking space search in the online mode ParkApp attracted investment to the amount of $500 thousand and expanded presence from Moscow and Rostov-on-Don to Great Britain.
In June 2016, the group Lanit invested $2.5 million in the Russian company CardsMobile — developer of platforms for contactless payment by smart phone, user identi�cation by pressing the phone against the terminal, as well as the mobile application Purse.
In February 2016, the Hon Kong fund Sylebra HK bought up 8% of shares of the Russian payment systemQiwi. It happened on the back of declining company stock prices. In the light of the current bid prices of Qiwi at the stock exchange NASDAQ at the moment of purchase, the cost of the purchased holding of shares is $50 million.
In February 2016, Russian company Comfortway received foreign investment to the amount of €6 million on development of its general purpose virtual SIM card which allows for direct connecting to di�erent cellular providers all over the world without roaming service brokers.
In February 2016, the Russian company Lesif attracted 32 million from the company Leader which administers funds of the closed-end venture fund Leader-Innovations established with participation of RVC capital. Using these funds, Lesif by the end of 2016 plans to complete development of a new generation hardware-independent video codec which will outperform by its parameters all current video coding technologies on the market.
In October 2015, it got about that it was expected that within a new package of the IIDF acceleration program would appear some ten projects related to information security which would receive the standard upfront investment but increased by the amount from 1.4 to 2 million rubles. Total 2-year investment of IIDF into this direction could reach 1 billion rubles and more.
In February 2016, the US fund Oppenheimer which just a year ago owned 11% of Yandex shares fully exits from the Russian company. A reason could be the unceasing fall of Yandex shares quotation. In the same month, the Scottish investment company Baillie Gi�ord & Co bought up 6% of Yandex shares.

80 Chapter 3. Views of Russian IT-companies on business development directions andMajor Trends in the Russian Software Development Industry
In several recent years, there was also a growth of investments of the Russian individuals, Russian companies and funds in the hi-tech sector of foreign countries' economies.According toJ’son & Partners Consulting, in H1 2014 the number of investments into foreign projects with participation of Russian investors increased both in quantitative and monetary terms. At the same time, the share of syndications changed insigni�cantly: in quantitative transactions with participation terms increased from 28% to 35%, in monetary terms decreased from 53% to 48%. Compared to H1 2013, the number of Russian capital increased from 18 to 23.
At year-end 2014, investments of Russian investors into foreign projects (exclusive of syndications) in monetary terms decreased by 1.4% amounting to $92.2 million. At the same time, the number of transactions kept growing (increasing in comparison with 2013 by 7.5%).
In 2015, the growth of foreign investments was shown again. According to J’son & Partners Consulting, a number of transactions with participation of Russian foundations and business angels increased by 34.2%, and in monetary terms the growth was 21.7% (98 transactions with integrated value of $1.27 billion). Over the same period there were seven exits of Russian foundations from foreign projects versus nine exits a year before.
Russian investors can pursue di�erent purposes when investing abroad (establishment of their remote development centers, access to new signi�cant clients in the markets concerned, receipt of pro�t from subsequent resale, as well as getting an opportunity to exert in�uence upon decision-making process as the company's shareholders).
Foreign investments allow particular individuals or companies to enjoy their pro�t.However, they are also important from the viewpoint of Russian economy integration into the world economy.Acquisition of large holdings of shares in successful foreign companies is a way to adopt executive experience and to �nd opportunities for cooperation between these enterprises and the Russian IT companies, as well as to provide Russian companies' entrance into new markets.In certain cases, the Russians obtain ready-to-use technologies that may be elaborated and used in their own business in Russia.In this regard, in the spring 2014 the US FBI warned high-tech companies and research institutes in Boston and its neighborhood about ulterior motives of Russian venture investors showing interest in the US startups. The true motive of Russian investors’ interest to American solutions, in opinion of FBI representatives, is in gaining access to new promising technologies and stealing them.
Besides, the money earned from purchase and sale of shares may return to the Russian IT sector.Judging by the successful transactions, this process is already in progress.
First, it should be mentioned that after the Facebook's IPO, the Russian shareholders of this company (Mail.ru Group, AlisherUsmanov, Yury Milner, Mikhail Frolkin, and others) became the owners of holdings of shares worth a total of several billion dollars.
In late 2013, the group of funds DST of Yuri Milner and AlisherUsmanov began actively unloading stock in foreign Internet projects: Facebook, Groupon and Zynga. For the sold shares they gained about $300 million.
In early 2014, �rst exit as a consequence of sale of the US mobile bank Simple to the Spanish bank group BBVA for $117 million made the Russian venture fund Life. Sreda. According to this fund, by way of transaction it earned 180% per annum out of investments.
Investments of Russian companies and funds to other countries

81 Chapter 3. Views of Russian IT-companies on business development directions andMajor Trends in the Russian Software Development Industry
The import substitution of software has been on the tongues of men for a long time bringing solution to this problem into the public eye on-and-o�. The substitution has been successfully carried out in some segments of software market. For example, the relevant changes took place on the ERP system market where domestic developers predominate if we assess their share not in monetary terms but in a number of projects and established solutions.
In 2014 with the advent of sanctions assuming restraint on alienation of western software to a certain range of Russian enterprises, the issue came up in conversations that the import phase-out process should be speeded up and brought into action in some segments. Decisions were made on the governmental level, but within almost two years they had little e�ect. First and foremost, it was necessary to resolve what was the very thing to encourage what should be called as “import phase-out”. It emerged that for the good reason it was di�cult to give a de�nition of a domestic developer (almost one year was spent on wording and introduction of relevant amendments to legislation). It was desirable to decide whether import
3.4. Import substitution
Some examples of Russian investments in foreign high-tech companies in the last 2 years
In the summer of 2015 it got about that Russian Group Otkritie would become the largest shareholder of Italian provider Tiscali after its merger with WiMAX operator Aria belonging to Russian owners. Shares of the company are listed on Italian stock exchange; in the summer of 2015 its capitalization amounted to €104 million.
In the spring of 2016, it was announced that the former shareholder of Qiwi, president of fund Parus Capital Andrey Muraviev and the managing partner of Parus Capital Boris Sinegubko invested several million dollars in Iranian Internet resources DigiKala, Divar and Sheypoor.
In May 2016, the Russian developer First Line Software purchased the American consulting company in the area of medical IT solutions Solaris Development. The reason of acquisition is explained by First Line as a desire to come into possession of new competences and to enlarge footprint in the USA.
In August 2016 it was announced that EPAM Systems would pay $26.7 million for the US digital strategy developer NavigationArts.
In April 2016 it was announced that the Russian billionaire Yury Milner invested in the Chinese company Horizon Robotics, which developed arti�cial intelligence frameworks. Volume of investments is con�dential.
In February 2016 the cofounder and the head of Yandex Group ArkadyVolozh invested in two startups. The �rst deals with the development of a framework for interpretation of brain activity signals, the second deals with the food fast delivery.
In the summer of 2016 Luxoft purchased the American IT consultant Insys Group. Main areas of activity: development of IT solutions for pharmaceuticals and medicine as well as telecommunications sector. According to information in media, Luxoft is ready to pay for Insys Group up to $71.4 million.
In March 2016 EPAM Systems purchased for $51 million the American-Indian developer Alliance Global Services. It is the biggest acquisition in the history of EPAM Systems.
In January 2016 Sberbank president Herman Gref informed that his bank would buy a block of shares of GridGain based in the USA. The company was founded by Russian programmers Nikita Ivanov and Dmitry Setrakian in 2005. It also has a development center in St. Petersburg.

82 Chapter 3. Views of Russian IT-companies on business development directions andMajor Trends in the Russian Software Development Industry
phase-out was the replacement of one import solution by another if the alternative developer looked more reliable. Actually, in many instances one has to recourse to such import phase-out though it is not recognized by law, however, to a greater extent it concerns not software market but electronic components and equipment.
The necessary decisions at the domestic level were taken but it took very long time while the monitoring and enforcement mechanism by the middle of 2016 was developed. As a result, in opinion of domestic developers despite restriction foreign solutions are still supplied to government agencies (either it was justi�ed by lack of a domestic analog, or under trademarks of Russian companies which use for this purpose ОЕМ model).
Due to the open-ended discussion of the way to encourage import phase-out in 2014, no large-scale replacement of western development by Russian one in public sector was observed (though with domestic alternative at hand it is very convenient to do this just in public sector by executive decisions). The process has been going on but very slowly — more or less at the same rate as before exacerbation of relations with the USA and imposed sanctions. It may be assumed that Chinese companies increased their market share owing to elimination of American manufacturers of electronic equipment.
While the state worked over the approaches to import phase-out and tried to form �nancial support instruments of software substitution, Russian IT companies as far back as 2014 began to push for preparation of alternative solutions of import software replacement. In 2014 the establishment of several companies’ consortiums was initiated aiming at creation of comprehensive solutions on the basis of developments of some companies or at jointly promoting the systems on Russian market (in particular, in public sector including the state-owned enterprises). Among other things, there were established consortiums such as: BETA for formation of the full stack of domestic software (or free software) and replacement of system and application software for banking sector) and SOYUZ – for substitution of not only system and application software for oil and gas sector but also for replacement of import servers by domestic hardware on the basis of Elbrus processors. Looking at these actions of domestic companies one may univocally state that preparation for alteration of market structure (positive from the view of IT users and domestic developers) is underway.
In 2015 this process somewhat quickened. However, it was caused not so much by decisions of the Russian government and changes in legislation as by anti-Russian sanctions and ruble devaluation. A wide range of enterprises were faced with situation where foreign vendors ceased to support previously purchased equipment, and they had to look for an alternative without any governmental stimulation of import phase-out. Several corporations which took a chance of being included in the sanctioned companies' list did not wait for denial of service by western vendors. For example, JSC Russian Helicopters set up a project of change-over to free basic software (primarily, the operating system Linux of domestic assembly).
How actively the import phase-out process was going in the last 2 years and how intense was its acceleration in 2015 – nobody determined it in any quantitative indices. And indeed, it was di�cult to do it as the methodology was absent too. The traditional method of measurement procedure when market shares are measured in dollars in this case is out of place. The fact is that the Russian solutions which often are no worse than foreign analogs, as a rule, are much cheaper. Owing to substitution of import solutions, IT companies managed to increase in 2015 the sales by 30% in rubles, while western vendors had to decrease their sales by 10% in dollars, but their shares on the market measured in dollars remained almost unchanged. In the event of change-over to free software that allows not to depend on loyalty of foreign countries, this is not always about software sales. As a matter of fact, small businesses download such software from free websites not requesting support and installation services.
The foregoing example with di�erent rates of sales in rubles and dollars is not completely hypothetical as similar indices are really typical for certain segments of Russian software market.
According to our estimates, all Russian software developers 2015 increased their aggregate sales on the internal market by 9%. At the same time, the market itself contracted in dollar terms by 43% (along similar lines the foreign vendors lowered their revenues in Russia).

83Chapter 3. Views of Russian IT-companies on business development directions andMajor Trends in the Russian Software Development Industry
In this case it is more accurate to measure the indices of western and Russian developers in di�erent currencies (in which they settle charges). If one compares the alteration of volume of sales in this fashion, it may be stated that the import phase-out process was on fast-forward. Still this statement will not be quite correct as it must be taken into account that import phase-out has taken place basically in segments dominated by foreign vendors. Besides, it would not be quite right to assume that all western software companies strictly locked their ruble prices to dollar prices. As a rule, ruble prices were changing with a certain lag in relation to a change in ruble exchange rate.
The rate and the volume of import phase-out should be measured for each segment separately, with due allowance for pricing policy of main solution suppliers. To calculate afterwards an aggregated indicator is basically possible, but it hardly can be an absolute necessity as the importance of each segment (for national information security and technological independence) is widely di�erent.
The RF Ministry of Communications and Mass Media in the import substitution program has already established the existing import shares for each software segment (at year-end 2014), as well as guidelines for lowering it by 2020 and by 2025. For example, for the direction Business Applications including ERP, CRM, BI, EDMS and other systems which are used in company management, a share of import is 75%. By 2020, it should decrease 50%, and within next �ve years — up to 25%. However, it is unclear how these shares were calculated — in dollars or in installed systems. At the same time, there are reservations about accuracy of calculations. For example, according to IDC – the company that will hardly overestimate a share of Russian companies - at ERP market domestic developers already occupy almost 50% of Russian market (and in amount of installed systems resume a dominant position). Therefore, it is possible to talk about plan ful�llment ahead of schedule, although the import phase-out process in this segment thus far was going all by itself — unin�uenced by government authorities.
There are also doubts about the statement that a share of import in the area Antivirus software and information security software in 2014 was 60%. In this area domestic companies also dominate.
Anyway, the name of the game is not a take-over of a share of Russian market but the provision of national information security and technological independence, as well as creation of competitive domestic solutions in all key software segments (in some segments such solutions are already in place). In our opinion, the purpose of import substitution is not the shake-out of foreign software suppliers from Russian market (in some instances it shall be done by non-market methods), but the advancement of Russian developers who have to create solutions for taking on markets including foreign ones. Some software companies made it their mission — within the framework of the import substitution process they develop such solutions and prepare for successful commercialization abroad.
Thanks to the fact that a number of important government decisions has been already done (among other things, the Register of domestic software is established, the programs of import phase-out adopted at the level of some ministries, constituent entities and state corporations), whereas developer communities are widely involved in the process of software import phase-out, one may expect the process acceleration in 2016-2017.
1. At year-end 2015, Business Logic, a member of IT Group, which specializes in development and introduction of ECM solutions, reached the turnover of 1.4 billion rubles ($23 billion). The company’s sales for three consecutive years grow by almost 30%. According to Tadviser, it is about 3-fold more than the growth of Russian ECM market which demonstrates the growth against the universal crisis.
2. The Moscow IT department informed that in little less than a year and a half since early 2015 over 1.5 thousand budget-funded municipal enterprises (in di�erent forms of business ownership) were changed over to the municipal form of cloud book-keeping on 1С:Enterprise platform. In order to complete the project of total conversion of metropolitan taxpayer-funded sector to this solution, within the next year
News directly related to import phase-out

84 Chapter 3. Views of Russian IT-companies on business development directions andMajor Trends in the Russian Software Development Industry
this indicator must reach 2.5 thousand. However, from this information it is incomprehensible what foreign solutions are refused by the capital. It is only said that previously there was a “Zoo” – a great number of di�erent con�icting solutions. We can do no more than assume that among these solutions there are also import ones.
3. In June 2016 the largest Russian airline company Aero�ot announced call for open competition for rendering services on migration from the antivirus solution Symantec Endpoint Protection to the solution Kaspersky Total Security for business. According to speci�ed requirements, the project works should be completed by the end of 2016.
4. The Russian company Bulat, jointly owned by Rostelecom and OPK, informed in the summer of 2016 that it had developed its own hardware and software solution of data storage system (DSS). Due to sanctions, in this segment the Asian components are used.
5. June 2, 2016 Panasonic and RAIDIX (Russian DSS developer) signed the Memorandum on Intent under which with the assistance of Skolkovo Foundation it is planned to develop a unique hardware-software solution operated under the control of Russian software. The parties intend to develop a new product to provide highly-e�cient storage of “hot” data and reliable and cost-e�cient storage of “cold” data for up to 100 years. The product under development is intended for the global market. According to current plans, the sales will start in the last quarter of 2016.
6. The Russian independent information and analytical center Anti-Malware.ru in June 2016 published the �ndings of the latest analysis of DLP (data loss prevention) market in Russia. Following the results it became clear that in volume of sales on Russian DLP market in 2015 Russian producers lead the pack while foreign manufacturers signi�cantly weakened their positions.
7. The Center of Competence (CC) Internet plus Sovereignty established at the Institute for Internet Development (IRI) at the order of the Russian President started in June 2016 the �eld audit of IT infrastructure in administrative buildings of two cities and two settlements of Vladimir region. This region will be a pilot project, afterwards it is planned to carry out the same audit in all Russian regions. After that, the CC specialists will prepare a budget oriented to import phase-out in IT area (primarily, software), as well as present several options of software packages of Russian developers that, in opinion of CC, will help to save budget money.
8. In February 2016, it got about that Rosneft which until later gave precedence to DBMS of Oracle and MS SQL, had tested a number of solutions which use did not depend on foreign sanctions. The winner was PostgreSQL (free object-relational database management system). Adoption of this DBMS in Rosneft has already begun.
9. According to IDC, SAP and 1С in 2015 reinforced positions on ERP software market in Russia. In dollar terms, the market decreased by 30.6%, in ruble terms – increased by 10.5%. In dollar terms, the volume of market amounted to $639.5 million. The top �ve suppliers of ERP systems maintain positions, but the shares have been slightly redistributed. The German SAP increased the share from 48.4% to 48.9%, 1С — from 30.9% to 32.7%. The shares of Oracle and Microsoft reduced (a share of Oracle — from 4.9% to 4.4%, a share of Microsoft — from 9.4% to 8.7%). TheshareofGalaxyremainedat 2.1%. Thus, even in dollar terms the share of less expensive and more adapted to Russian market domestic systems (1С and Galaxy) increased. In number of roll-outs their growth is much more intense.
10. In May 2016, the RF Ministry of Economic development and Trade proposed to make the use of domestic software binding on governmental agencies in document, accounting data and HR management.
11. In June 2016, the United Industrial Corporation (OPK, the member of the state corporation Rostech) presented a number of novelties for the domestic computer architectureElbrus. In particular, the �rst porting for Elbrus of the engineering computations system Flowvision was implemented.
12. In 2016it was announced that 5 billion rubles were allocated from the federal budget on �nancing of Russian software. The Ministry of Communications and Mass Media has to select no less than eight Russian software projects which will be promoted on markets (including foreign markets) and will earn in

Chapter 3. Views of Russian IT-companies on business development directions andMajor Trends in the Russian Software Development Industry
85
2017 $30 million (and later $40 million in 2018). At the same time, on internal market the state sector thanks to them must save 2 billion rubles in 2017 (3 billion rubles in 2018).
13. The Association of Software Developers (ARPP) “Patrimonial Soft” (unites tens of major Russian software developers including 1C, Kaspersky Lab, InfoWatch and others) announced in May 2016 about dozens of violations revealed in a�ording preferences to domestic software. According to it, governmental bodies regularly trespass against the law on priority procurements of Russian software in force in Russia since January 1, 2016.
14. According to Tadviser, in 2014-2015 demand for open source software signi�cantly increased in Russia. One of growth drivers is western sanctions in relation to Russia and state policy of reducing dependence on decisions of major global IT suppliers. Demand also drives the economic crisis and the growth of cost of solutions of global vendors due to rise in the main currencies against the ruble. Experiencing �nancial problems, customers view the free software as an opportunity for IT cost optimization.
In some major organizations in 2014-2015 projects were launched on free software testing and replacement of proprietary products. For example, Sberbank plans to change-over some systems from Oracle to PostrgeSQL, for which cause in the autumn it began testing of this DBMS. A possibility for using PostgreSQL is under consideration also by VTB where Bank of Moscow presented its experimental framework. On plans to change-over non-critical systems to PostgreSQL was also informed by Bank Otkrytiye.
The Rosatom structures are also interested in open source solutions. In RfYaC-VNIIEF the development of a platform based on free software is underway to replace Microsoft, VMware and Oracle products. Besides, in September the organization started change-over of application systems to DBMS PostgreSQL.
In 2015 a number of projects on using free software were launched at a regional level. Among regions which are changing over to open source solutions are Tula region and Moscow region. On a basis of the open source software PostgreSQL and Unix the Crimean electronic government is being created.
15. Under the aegis of Association Russoft, in the last 2 years there were established consortiums which develop branch-wise comprehensive solutions (BETA — for banking sector and SOYUZ — for oil and gas sector).
Experience has shown that even small contractions of major world markets have a negative impact on the scope of software export from Russia. So it was during the dot-com crash (companies with business models fully based on activities in the Internet) in 2000 and it was repeated during the global economic crisis in 2009. The sales of Russian developers did not drop but the growth rate was reduced signi�cantly.
According to IDC and Gartner, the situation on the world IT market in 2015 was not the most favorable for expansion of Russian export. According to Gartner, total world ICT expenses in 2015 lowered by 6%. In this event, reduction a�ected such important for Russian developers segments as Software and IT services (by 1.9% and 4.7%, accordingly). The market has never declined so much in dollar terms over the period Gartner has kept watch over it. However, in analysts’ opinion, ICT market decline won’t take long whereas individual segments will enjoy a comfortable growth according to international standards already in 2016.
3.5. The global software market and the ways to increase sales of Russian suppliers

86 Chapter 3. Views of Russian IT-companies on business development directions andMajor Trends in the Russian Software Development Industry
Early in the year, the Gartner analysts predicted a decline by 0.5% of the world ICT expenses at year-end 2016, but in the heart of summer they revised the forecast. According to the new version, expenses will remain at the previous year level. Essentially, the change is inside the margin of error, but anyway some reasons (certain positive changes) have appeared for revision. Analysts were forced to change the forecast due to a certain stabilization of currency market. Besides, in the beginning of the year the impact of the possible exit of the UK from the European Union was not taken into account. Apparently, the Gartner analysts think that Brexit will promote the growth of the world ICT expenses.
More serious amendments refer to individual segments. In particular, expenses on software will increase not by 4.2%, but by 5.8%, IT services — not by 2.1% but by 3.7%.
On the IT services market the growth above the average world indicator will be seen in Japan and India, and below – in Brazil, China and South Korea (owing to degradation of the economic and political situation in Brazil as well as government actions and degradation of business climate in China and South Korea).
With the assumption that total expenses on software (according to Gartner) in 2015 declined by 1.9%, the consolidated revenues of 500 major world software companies (according to Software Magazine) over the same year increased by 4.3% and reached $748.7 billion. The companies included in Top-500 also work on IT services market, but it decreased even more — by 4.7%. It seems that the major companies altogether entrench their positions.
Gartner does not publish its forecast for a longer period. It may be related to the fact that under conditions of great uncertainty it is very di�cult to build upon an acceptable departure of predicted indicators from real ones. In the last few years one is forced to seriously adjust the forecast of current year within this year.
IDC, although acknowledging that a new and inde�nite stage of global economy development is in progress, and in the next �ve years the total world IT expenses will depend on economic cycles and the imponderables of future events, nevertheless gives an outlook for the next 4 years: expenses on IT worldwide will increase from $2.46 trillion in 2015 to $2.8 trillion in 2019. I.e., the growth is predicted almost by 14% over all these years and about by 3.3% annually.
As before, in terms of the value of aggregate expenditure North America (the USA and Canada) will lead the world with IT expenses exceeding $1 trillion. In 2017, the EMEA region (Europe, the Middle East and Africa) will retain the second place; Asia Paci�c region will follow the tracks with a slight margin. The biggest growth rate is expected in Latin America — 4.3%. However, among all world macroregions it is at the bottom by volume of total IT expenses. In North America the growth will be as much as 3.8%, and in EMEA and Asia Paci�c region — 3.3%.
Source: Gartner
Global IT budgets
Segment 2015,
$ billion Growth/fall in 2015
2016, $billion
Growth/fall in 2016 (forecast of early 2016)
Growth/fall in 2016 г. (forecast of middle of 2016)
Devices 650 -6.4% 626 -3.7% -5.3%
DC systems 171 +2.9% 175 +2.1% +2%
Software 308 -1.9% 321 +4.2% +5.8%
IT services 910 -4.7% 929 +2.1% +3.7%
Telecom services 1470 -8.4% 1441 -2% -1.4%
Total 3509 -6% 3492 -0.5% 0%

87 Chapter 3. Views of Russian IT-companies on business development directions andMajor Trends in the Russian Software Development Industry
IT expenses in China provided the highest income increment for IT vendors in the recent years. In 2015, they grew by 11% (primarily, at the expense of sales of smart phones and development of cloud infrastructure), but in 2016 for the �rst time their decrease is anticipated (by 0.3%). Though the deceleration of smart phone sales is more related to market maturity than to weakness of economy, IDC also forecasts the delay in PC sales and decrease of growth of expenses on purchase of servers, DSS and hardware peripherals as compared to the last year.
Software market in China is still relatively stable but it amounts to just 5% of total IT expenses (versus 30% in the US). That is why China is subject to temporary �uctuations of capital spending as equipment markets are more sensitive to economic problems.
IDC expects that IT expenses in the USA will as a whole remain stable provided that there will be no signi�cant violations in economy at large. It is expected that IT market in the USA will grow by 4% for the fourth year in a row in spite of the anticipated recession on PC market and slowdown in growth rates of server and DSS sales.
Western Europe will show a weaker growth in 2016 than in 2015 (1% against 5%). However, a �gure for IT services and software will be higher.
Asia Paci�c region will demonstrate a growth less than 2% in 2016 versus 7% in 2015. According to estimates, IT market in Japan will stabilize returning to the growth by 1.5% after a slight decline in 2015. IT expenses in India will increase by 13% owing to PC market which growth is promoted by government-sanctioned programs and education projects. IDC think that India will provide a decent earnings gain of global IT companies in the next �ve years.
IT market in Brazil will increase by 3% this (2016) year. If smart phones are not accounted for, IT expenses in Brazil will show a slight decline with the signi�cant reduction of server and PC sales. Total IT expenses in BRIC countries (Brazil, Russia, India and China) will increase only by 1%.
According to IDC analysts, the highest IT expenses are expected in digital, banking and telecom sectors with more than 8% of IT expenses accounted for by each of them. They are followed by round-the-clock operation, federal and central government entities and professional services.
IT expenses will be increased by the most rapid leaps in public health service — by 5.5% per year. Insurance and banking sectors, raw materials industry, show business and mass media rank second with the 4.6% growth rate.
The greatest contribution in IT expenses will be made by very large companies (over one thousand employees), and small companies (1-9 employees) up to 70 million will account for hardly more than one quarter of total IT expenses. IT expenses will be increased by the most rapid leaps among medium-size (100-499 employees) and large companies (500-999 employees) — by 4.4% and 4.8%, respectively.
According to IDC, expenses on software and business services will increase at the quickest rate — annually by 6.7% and 6.2%, accordingly. In software segment, the biggest share of expenses will be accounted for by applications which support enterprise activities and simplify IT operations (ERP systems, engineering and production applications). The high growth segments will be networking software, collaboration, data access and analytical applications.
Similar changes take place in almost all segments of IT market in the world and in Russia. Only in Russia the �gures of market growth and disruption, as a rule, are much bigger. According to Gartner, total sales of computers, notebooks, mobile phones, tablets and printers decreased in 2015 by 6.4% and amounted to $650 billion. In Russia they reduced about 40%.
Data centers were the only growing segment of the world IT industry in 2015 (increasing by 1.8%).
According to IDC, PC supply to the world market in Q1 2016 declined by 11.5% as compared to the same period in 2015. Gartner con�rmed this dynamics and stated that this market declined by 9.6%. Altogether, over this period, according to IDC, there were supplied 60.6 million PCs (64.8 million, according to Gartner).

88 Chapter 3. Views of Russian IT-companies on business development directions andMajor Trends in the Russian Software Development Industry
According to the forecast of Gartner, in 2016 the business intelligence market will increase by 5.2% as compared to the previous year and reach $16.9 billion. Therefore, the BI segment will signi�cantly beat in growth rate the IT market which as a whole will increase by 0.6%, according to expectations of Gartner.
According to IDC, the Big Data and BI market will increase from $122 billion in 2015 up to $187 billion in 2019 (by about 50%). The main increment will be provided by large (over 500 employees) and very large companies. However, medium and small-size business will also make their contribution — about one quarter of the market.
Volume of the world market of cloud services in 2016 will reach $204 billion that is by 16.5% more than in 2015 ($175 billion). This is Gartner data. IDC expects an even more rapid growth — by 19.4% up to $141 billion.
Volume of the entire CRM software market in 2015 increased by 12.3% and attained $26.3 billion (Gartner). At large, the growth was promoted by cloud services, namely SaaS (software as a service). Operating income in SaaS segment in 2015 increased by 27%, that is twice as big as the growth rate of the whole CRM market.
Volume of the world market of cloud infrastructure, according to IDC, increased in 2015 by 22% up to $29 billion. Analysts expect that in 2016 the volume of the global market of cloud infrastructure will increase by 19% more and reach $38.2 billion. In 2020 it will increase to $57.8 billion at the annual average growth rate 12.5%.
Gartner expects that expenditures on security in development of IoT solutions in 2016 will be as much as $348 million (by 23.7% more than a year before). By 2018 they will reach $547 million. Altogether in 2016 in the world 6.4 billion online units will be in operation, i.e. by 30% more than in 2015, and in 2018 their number will reach 11.4 billion.
According to App Annie, in 2016 the global mobile application market will increase by 24%. Gross receipt of all app shops will reach $51 billion and by 2020 will exceed $100 billion. China will overrun the USA in terms of aggregate income of app shops in H1 2016.
For Russian custom software developers must be of interest to learn that Indian outsourcing IT companies plan to lift service prices. In December 2015, the Congress of the USA passed the bill on doubling the expenditures on payment for short-stay visas H1B and L1 for foreign workers. With due consideration for new legal developments in American immigrant policy, Indian IT companies will lose $400 million (information of the National Association of Software and Services Companies, Nasscom). In order to compensate for losses, Indian companies intend to increase service prices.
The sweeping changes of the world IT market are associated not only with a new phase of technology development but also with political scandals. According to the report of the research company Forrester Research, the scandal with illegal control of information belonging to citizens of various countries by NSA will cost American cloud providers and IT service suppliers $47 billion of lost pro�t for three years — between 2014 and 2016. It may happen that this scandal will adversely a�ect business of the world largest American software vendors.
According to all indications, in the world IT market things are drawing to the age of serious shocks with the substantial redistribution of spheres of in�uence. Such distribution may result both in collapse of speci�c companies and tremendous growth of others. Russian software companies have chances of both growth and threat. It will be important to �nd the right way or direction which not necessarily is straightforward. Most probably, the majority of companies will have to continuously adjust the route to get ahead in foreign markets.
The spying scandal produced by Snowden’s disclosures gives Russian software companies a certain chance to win back a market share from the US competitors. However, this chance is merely theoretical if the name of the game is not the Russian or the CIS markets. Russian and the US software companies in rare occasions are direct competitors outside Russia. It is di�cult to believe that due to a spying scandal the ERP systems of 1С, for instance, will be adopted in the USA or Europe. Chances are also slim for Kaspersky Lab to put competitive pressure on Symantec or Eset at western markets. Most likely, this scandal will remake markets of some big countries in favor of local developers, even if the quality of their solutions is apparently worse than American or Russian counterparts. Besides, transfer to free software will speed up. However, Russian companies have a chance to occupy the loose niches, but to a greater degree it is true for emerging markets rather than in the USA and Europe.

The conditions of operation in the US and European markets for Russian product companies not only became worse, but new threats have emerged. A good many time Kaspersky Lab had to �ght against accusations in western media. For example, in early 2015 Bloomberg published an article impeaching the head of the company EugenyKasperky for relations with Russian security service (later other editions from time to time published other materials discrediting the Russian company). In addition, all sources were anonymous. According to Kaspersky Lab, this article was published as a response to the company’s investigation of activities of the cybergroup Equation, which in opinion of some experts was related to National Security Agency. As for accusations of relations with security service, EugenyKasperky answered that the company cooperated not only with the Russian Federal Agency of security but also with similar bodies of other countries, including the USA. The struggle against cybercrime without such cooperation is impossible. However, similar retraction may escape observation.
Another case of using political arguments in competitive struggle is related to Diasoft that is still beginning to develop foreign markets with solutions for banks with which it had taken leadership of foreign competitors in Russia. In the autumn of 2014 a large US company refused to conclude contract with Diasoft in spite of very good indicators shown in testing following the results of the year. The refusal is explained by the existing political tension between Russia and the United States.
Such cases bring Russian software companies to pay greater attention to non-conventional markets— Southeast Asia, Latin America, Africa and the Middle East. Some of these markets have volumes comparable to those of European countries and enjoy high growth rate. Some developers have already built their business there (for example, Kaspersky Lab, TRANSAS and SPB TV in China, Naumen in Indonesia, InfoWatch in Arab states, SpeechPRO in Latin America, PROGNOZ in Africa) and are ready to give the bene�t of experience. Association RUSSOFT regularly holds events (including webinars) to spread knowledge about markets which are not generally known among Russian software developers.
The entrance to Asian markets is not fast. It takes 3-4 years. Needless to say that Russian software companies will be able in the shortest time to cross over to the East, anyway it must be done.
Russian developers are able to work successfully in all high-growth segments of the world software market. They enjoy well-deserved recognition especially in the �eld of information security. Unfortunately, the politically motivated decision to go back from Russian software may have a major negative impact on the sale of respective solutions in the Western (and not exclusively) countries.
Availability of the GLONASS system can provide certain advantages toRussian developers in the �eld of creation ofgeo information systems. But contrary to expectation, its full-size commercial use in 2013 did not start yet. In the summer of 2014, theRussian Government approved “the Road Map” for creation of JSC GLONASS, development of the state automatic information system ERA-GLONASS and its use in the interest of other information navigation complexes and systems established by federal executive authorities and organizations.
After all previous years of our survey Russian software companies have gradually increased their presence in the global software market - this share has been increasing by approximately 0.1% per year irrespective of the global market growth deceleration or acceleration. So this �gure serves only as a general idea about the changes in relative importance of Russian software industry. At year-end 2015, for the �rst time during our study the share of Russia at the world software market decreased because the cumulative business volume of Russian software companies reduced in dollar terms more than the world market. Primarily it is related to the steep fall of exchange-value of ruble.
89 Chapter 3. Views of Russian IT-companies on business development directions andMajor Trends in the Russian Software Development Industry

Chapter 4
Geographical Reach and Vertical Markets of Russian Software Developer Companies

91 Chapter 4. Geographical Reach and Vertical Markets of Russian Software Developer Companies
As per the most recent survey, each of the Russian software developer companies is present in 3-4 geographical markets on the average (the precise �gure is 3.6). At the same time, 1-2 markets are mentioned as key ones (on the average, the number of key markets per company amounts to 1.5, while the respondents mentioned 13 markets as key ones in total). Those markets have established under the geographical, linguistic, and cultural attributes.
Any variation in the number of markets per company can hardly be signi�cant as the share of small companies is high among the respondents, who face di�culties to operate in more than two markets. However, a stepwise growth can be expected due to a growing number of companies promoting their solutions or services on a global basis.
Monitoring of the geographical market distribution �gures of Russian IT companies has been carried out for about 10 years. Therefore, the existence of their signi�cant growth since early 1990s, when the pioneer companies exporting software products just emerged, can be only ascertained logically (at the outset, these should be close to one).
During 10 most recent years, a signi�cant reduction in the number of markets per company was only identi�ed in 2012. At that time following the world economic crisis 2008-2009, the companies elected to focus their business to a greater extent on certain geographical markets so as to eliminatedispersion of the resources. During 4 most recent years, the average number of markets per company varied within themeasurement accuracy. However, refocusing of the product companies from some markets to other ones has been observed since 2014.
Historically, the markets of Europe and North America as well as those of Russia and former USSR countries have been conventional ones of the Russian developers. The penetration into the markets of developed countries was due to numerous former compatriots, who relocated extensively during the perestroika years to the countries featuring a higher life standard. The especially extensive migration to those countries from the post-Soviet area took place during 1990s. The former Soviet countries (Republics of the USSR) have been often considered by the Russian developers as the domestic market as it is well known to them, while the clients and customers have a good command of Russian language.
Overall, the service companies focused initially only onnon-CIS countries as both Russia and neighboring countries were missing a solvent customer. However, the situation changed in time and, having gained serious experiences of work for a foreign customer, they became involved in major projects of the domestic market.
Looking at the picture of changes in the shares of one or another geographic market since 2007, we can see that the share of non-CIS countries in some years decreased, in other years increased but as a whole it showed a downward trend at the background of growing activities in the markets of the countries established after the USSR collapse. It re�ects the actual refocusing of Russian companies on the markets of Russia and CIS countries which attractiveness has improved greatly over recent years.
But it is true only to a certain degree. The fact is that over recent years a number of new software (mainly product) companies have greatly increased, which most often started their business in Russia and CIS countries. At the same time, a total number of Russian software companies present in the markets of non-CIS countries have not even decreased and, on the contrary, increased. Similar to the period after the 2009 crisis, with contraction of the domestic market and the factor of devaluation of ruble, the companies have intensi�ed their e�orts in the markets of non-CIS countries — in the USA and Western Europe.
Since 2007, the share of respondent companies operating in the U.S. market has been decreasing in relation to a business activity reduction in the United States due to the economic crisis. Mainly it concerns small-sized companies (though large companies to a lesser degree also reduced their performance in the USA). Years 2013-2014 saw a recovery of interest towards the U.S. market, though the interest decreased again in 2015 due to geopolitical risks and appeared to be just a bit higher than that in 2012. One should not make an unambiguous conclusion concerning a long-term reduction of interest by the Russian IT companies towards the U.S. market, because �rstly: the market is the largest one of the world and it would be silly to reject the same, and secondly: the market is the most competitive one, and therefore it will call for high-tech solutions notwithstanding the political climate and geography of the vendors.
4.1. Main Geographical Markets

92 Chapter 4. Geographical Reach and Vertical Markets of Russian Software Developer Companies
In terms of sales, the U.S. market is most likely to hold the second position from the top (following Russia) for all the years of our surveying. It is known that a share of the sales by Russian major exporters to the U.S.A. in their total proceeds is often measured as tens per cent to achieve sometimes 50% and as much as 80%. Service companies are leaders in dealing with the developed markets (the USA and EU), with the share of their segment’s companies operating in these markets being almost twice as much as that of the product companies. However, the U.S. market warrants a high amount of export proceeds for major product companies. For example, Kaspersky Lab, a Russian major developer of information security solutions, earns up to $200 million in the U.S. market.
Tworecent years have seen certain risks in the conventional markets of Russian developers. Those relate to the countries of European Union, USA, Canada, and Ukraine, where mass media maintain a campaign to generate an adverse image of Russia. The governmental structures have been prohibited to purchase any type of Russian software at all. Business companies have been recommended to avoid purchases of Russian software products or to engage Russian companies to develop software in case this is used to the bene�t of Departments of Defense. A sanction regime is valid, which has been imposed against the supply of software to the Crimea or the purchase of services to develop the same from the Crimean companies. In case of any violation, a penalty follows in a judicial procedure. For instance, the U.S. Department of Justice obligated two U.S. companies to pay multimillion �nes in autumn 2015 on the engagement of Russian programmers to create source codes for the U.S. defense systems.
In Ukraine, where the government attempts to present the situation around the relations with Russia as a state of war, the President Petr Poroshenko signed an addendum to the decree prohibiting the governmental purchases from several tens of Russian companies.
However, 2015 saw a signi�cant reduction in the presence of Russian companies only in the markets of USA/Canada. An out�ow from the Ukrainian market was observed in 2014 though the process stalled during the past year (judging upon a number of symptoms). About one third of the companies we have surveyed continued to operate in Ukraine (they both supply their solutions as well as bene�t from the skilled local sta� of engineers). Some new players are intended to enter the market during 2 forthcoming years (about 2% of the surveyed companies). In 2014, such willing of companies was missing at all, although the survey 2015 indicated that notwithstanding all the political declarations it is possible to do business in Ukraine. A business environment deterioration and the Ukrainian currency devaluation have resulted in the fact that a price/qualityration of the services o�ered by the software developers inUkraine turns out to be much more attractive. And the competitive advantage overcomes the barriers relating to the anti-Russian rhetoric, to criminal risks and to an out�ow of developers from Ukraine to the neighboring countries of Europe.
The problems around Ukraine relate not only to the political situation. Its IT market is shrinking rapidly. As a result, the IT market of Belarus featuring the population 4 times as low as that of Ukraine is of interest to the same number of Russian IT companies as the IT market of Ukraine.
However, the notable escapes of Russian companies from the Ukrainian market have taken place. For example, Infowatch attempting intensely to assimilate new geographical markets has closed its sales o�ce in Ukraine. It does not mean the sales have ceased at all, but the signi�cance of the Ukrainian market has become apparently lower.
A decreasing appeal of some conventional markets pushes the companies to look more actively for the opportunities of sales in the South-East Asia, Latin America, Middle East and as far as in Africa. According to the mass media, a high number of companies (mostly, large ones with their turnover exceeding $10 million) open representative o�ces and implement projects in the countries where Russian software developers had almost no interest as long as 5-10 years ago (see a selection of news below). Russian software vendors have become interested in the markets of Latin America’s countries, Vietnam, Mongolia, Philippines, Zimbabwe, Nigeria, China, Nepal and other countries.
Emergency of ‘Problematic Markets’ Relating to Intensi�cation of Political Tension
New Markets

93Chapter 4. Geographical Reach and Vertical Markets of Russian Software Developer Companies
Unfortunately, it was as late as in 2013 when we added such a region as «Countries of the Middle East» to the questionnaire. It has turned out that we had to do it a bit earlier as the market appeared to be more signi�cant than those present on the questionnaire long ago. About one tenth of Russian software companies are present in the IT market of the Middle East. At the same time, 7% of respondent companies are intended to enter the market during 2 forthcoming years.
Some 7-8 years ago we advised Russian companies to look at the prospects in the markets which were new for them; although these are smaller than the North American and European markets, they are big enough and fast growing. We also associated the interest in these markets with the fact that the competition in developing countries is not so strong and there is an opportunity to overtake a higher market share than that in the USA and Western Europe. In addition, those countries show generally good attitudes towards Russia and Russian developments.
It seems that a stepwise sweep towards the new markets has been taken at long last. It can be only stepwise yet, because the entry to, say, Asian markets calls for a comprehensive understanding of the local speci�c features and intricate establishment of contacts. Sales appear generally 3-4 years after the start in promotion.
Our �ndings have not yet shown any clear growth in the share of companies operating in Asia, Africa, and Latin America. It is more likely that there are occasional entries of quite large and prominent companies in the markets. However, as time goes by, they can bring about other Russian companies. RUSSOFT Association contributed greatly to this through arranging road shows together with RVC at new markets and holding webinars where managers shared their experiences of operations in the markets that were poorly know for Russian software developers still.
Presence of Russian companies in the world markets, % of respondent companies
2007 2011 2012 2013 2014 2015 Those who are not present in 2015 and not intended to enter in 2016-2017
Russia 55% 93% 89% 93% 94% 92% 6%
USA and Canada 55% 45% 31% 41% 48% 36% 56%
Ukraine 17% 35% 34% 39% 30% 32% 66%
Other countries of Western Europe
35% 40% 25% 34% 37% 32% 55%
Other countries of the former USSR
39% 50% 36% 31% 45% 40% 54%
Belarus 32% 29% 31% 33% 27% 33% 61%
Germany 25% 34% 26% 22% 24% 27% 61%
Scandinavia (with Finland)
28% 27% 19% 17% 17% 18% 77%
South East Asia 19% 23% 15% 8% 12% 15% 73%
Australia, Africa, South America
25% 15% 15% 14% 12%
South and Central America
8% 86%
Africa 9% 89%
Australia 8% 88%
Middle East - - 10% 8% 6% 9% 84%

94 Chapter 4. Geographical Reach and Vertical Markets of Russian Software Developer Companies
Presence of Russian software vendors and software development service providers in world markets, % of respondent companies
9394
Russia
product service
52
23
Belarus
3929
Ukraine
54
34
Other countriesof the former
USSR
22
43
USA and Canada
2230
Germany
9
24
Scandinavia(with Finland)
15 147 8
South EastAsia
11 7
South America
0
13
Africa
7 10
Australia
2,38 1,8
Middle East
0,81 1,31
Russia andformer USSR
countries
Europe andNorth
America
New marketsfor Russia*
2834
Othercountries
of WesternEurope
0,4 0,52
Key markets, % of respondent companies
* - It is incorrect to compare new markets by year.
2007 2010 2011 2012 2013 2014 2015
Russia 42% 86% 79% 24% 69% 62% 78%
USA and Canada 43% 15% 30% 14% 10% 18% 21%
Ukraine 12% 12% 17% 13% 15% 14% 11%
Other countries of Western Europe 6% 10% 9% 22% 8% 5% 7%
Other countries of the former USSR 12% 6% 11% 24% 7% 8% 10%
Belarus 24% 12% 8% 20% 6% 6% 9%
Germany 11% 12% 14% 18% 8% 7% 6%
Scandinavia (with Finland) 13% 6% 8% 8% 8% 7% 4%
South East Asia 6% 3% 7% 6% 1% 4% 3%
Australia, Africa, South America 9% 1% 4% 3% 3% 6%
South and Central America 1%
Africa 0%
Australia 0%
Middle East - - - 3% 1% 3% 0%

Chapter 4. Geographical Reach and Vertical Markets of Russian Software Developer Companies 95
Moscow has kept long-standing leadership in the share of exporters present in the markets of Russian and the former Soviet republics.
St. Petersburg has retained the leadership under the same �gure in «Scandinavia and Finland» for many years owing to the geographical vicinity and numerous business contacts in various sectors.
Several years ago, St. Petersburg companies were more often (as compared with companies of other cities of Russia) focusing on global market rather than on the former USSR republics. The only exception was the markets of Asia and Australia. St. Petersburg was also leading in the share of exports in the corporate proceeds. In general, St. Petersburg IT companies were focusing on exports to a greater extent than Russian other software businesses. In 2-3 most recent years, St. Petersburg has ceased to be the leader in the share of companies operating in the countries other than the former USSR republics in terms of total proceeds (an only exception is Scandinavia).
As per the 2015 results, regional companies (based outside St. Petersburg and Moscow) are most often focusing on the markets «USA and Canada», «Germany and German-Speaking Countries», «Other Countries of Western Europe»). Moscow features a high share of companies present in the markets that are not quite conventional for Russia («South-East Asia», «South and Central America», «Africa», «Australia», «Countries of Middle East»).
At the same time, the share of exports in the total proceeds of regional companies is 60%, while the same �gures for Moscow and St. Petersburg are 76% and 72%, respectively. It is possible to conclude from the presented data that regional companies have begun to operate more intensely abroad than companies of St. Petersburg, although they earn less from exports than the St. Petersburg companies. It is worth noting that the higher share of exports is warranted for the two capitals by several major companies. If those are disregarded then there will be no much di�erence between the sales patterns of the capital-based and regional companies.
Priorities of Companies Based in Moscow, St. Petersburgand Other Cities
Share of Companies Present in Various Geographical Markets in 2015
9690
RussiaAll respondents 92%
91
Moscow-based St. Petersburg-based
44
19
BelarusAll respondents 33%
30
53
16
UkraineAll respondents 32%
23
44
32
Other former USSR countries
All respondents 40%
4133
29
USA and CanadaAll respondents 36%
41
27
19
Germany andGerman-Speaking
Countries
All respondents 27%
30
1823
Scandinavia and Finland
All respondents 18%
16
31
16
Other countries of Western EuropeAll respondents 32%
18
41
6
South-East AsiaAll respondents 15%
189
3
South and Central AmericaAll respondents 8%
11
113
Countries of Middle EastAll respondents 9%
11113
AfricaAll respondents 9%
11 116
AustraliaAll respondents 8%
7
Regional

96 Chapter 4. Geographical Reach and Vertical Markets of Russian Software Developer Companies
Software vendors as compared to software development service providers to a greater extent are oriented toward markets of Russia and CIS countries. Not all of them have a required marketing budget to operate in the non-CIS countries. If the state provided support to IT companies in the foreign marketing, it would have been possible to increase exports of Russian companies far and away. This is particularly so with emerging markets which are loyal enough to Russia but almost lack information about Russian software companies. It should be noted that in the Western European and US markets there also is room for expansion of Russian software exports.
During 5-6 most recent years, the opening of sales and local customer technical support o�ces was declared by several Russian companies: Group-IB in the USA, Softline in Peru, ABBYY in Kazakhstan and UAE, Yandex in Switzerland and Belarus, Kaspersky Lab and Parallels in the Republic of South Africa, Acronis in Singapore, InfoWatch in the Middle East, DataArt in Germany and Poland, and Terrasoftin Australia and Singapore.
Service Providers and Software Vendors
Facts Relating to Expansion of Russian Companies inForeign Markets during 5-6 Most Recent Years:
2010
1. Playnatic Entertainment announced the signature of an agreement with Sina Data Coin, the �rst Russian-Iranian agreement in the IT sector.
2011
1. The NIS GLONASS has registered the NIS GLONASS Pvt Ltd subsidiary in India, which will be engaged in the large projects requiring system integration as well as develop a distribution network for its solutions in the consumer market.It is supposed that incorporation of the subsidiary will help to promote the GLONASS navigation technologies in the Indian market.
2012
1.ABBYY, acquired 100% of the Connective Language Services American shares for the solutions localization and implementation in the US market.
2013
1.i-Free and China Telecom, a Chinese mobile network operator represented by the Dazzle Interactive Network Technologies subsidiary, signed the agreement on strategic cooperation in the �eld of mobile games.
2. The integrated automated security management system (KASUB) developed by the RTEC was presented at LAAD-2013, the leading armament exhibition in Latin America.
3.Mail.Ru launched the Spanish version of its mail service interface.According to the Internet World Stats, Spanish is one of the top-3 languages spoken by Internet users globally.
4.Naumen from Yekaterinburg reported that Magellan Solutions, a Philippine outsourcing call center, began operations based on the company's software. Naumen expects to start expansion in the region with automation of 100 workplaces of this center. According to developers, the size of the Philippine call-center service market is considerably larger than the similar Indian market and is measured in billions of dollars.
5. The commissioning center Domino Soft automated the largest Mongolian network of drugstores and pharmaceutical wholesale centers Asia-Pharma. (The solution "1С: Commerce management 8" was introduced in the main o�ce, wholesale stores and retail outlets of the network).
6. JSC NIS concluded in 2013 the cooperation agreement on implementation of the project “Safe tracker - India” with NII C-DAC (the department of the Indian Ministry of Communications responsible for development of IT solutions.

97 Chapter 4. Geographical Reach and Vertical Markets of Russian Software Developer Companies
7. Omnicomm – one of the leading domestic manufacturers of tra�c monitoring and control systems based on satellite technologies GLONASS/GPS, presented their solutions on fuel control and tra�c monitoring at the conference Telematics Brazil & LATAM 2013 in September in San Paulo (Brazil). This company has been solidifying at the Latin American market for several years.
8. PROGNOZ, developer of solutions in the Business Intelligence area, in the end of 2013 completed deployment of solutions for statistical services under the initiative “African Development Bank” (AfDB).
9. The partner relationship was established between the Turkish integrator NGN and the Russian company Krok. The partnership is intended for increasing technical expertise of the Turkish party in development of comprehensive IT solutions and joint implementation of large IT infrastructural projects within the territory of Turkey.
10. The Nepalese police in 2013 purchased the package for forensic processing of speech phonograms ICAR LAB of Speech Technology Center for their crime investigation department.
11. BPC Bank Technologies won the tender for development of a processing center for interbank payment transfer between 15 �nancial organizations in Palestine.
12. On the basis of its o�ce in the Hague and with the support of the Agency of investment promotion in West Holland (WFIA), RUSSOFT organized a visit of Russian IT companies to the major technology forum - The Hague Tech.
2014
1. Epam Systems acquired Jointech, the Chinese developer of software for global investment banks and organizations dealing with administration of assets. By this merger the company is going to expand its presence in Asia.
2. NAUMEN completed the project of automation of the outsourcing contact center Positive-Contact in the capital of the Kyrgyz Republic.
3. JSCKazakhtelecom (Kazakhstan) switched to the system of management accounting formation based on the BI platform Prognoz Platform developed by PROGNOZ.
4. Kaspersky Lab announced relocation of its Western European head quarters to Paddington, London. Previously its Western European o�ce was located in Ingolstadt, Germany.
5. Macroscop, the Russian developer of software and hardware for IP video surveillance systems, declared June 2014 on the entry to the Middle East market.
6. InfoWatch reported about acquisition of the department of German Secude that develops a full disk encryption technology. It is already the third acquisition in Germany. Similar actions help to expand the presence at the German market.
7. The Speech Technology Center (STC) at the partner conference in June 2014 stated that promotion in the American market became their priority. The implementation of a project with the world’s largest bank Wells Fargowas announced for operation of a biometric control system developed by STC to identify the customer when addressing the bank’s division via mobile communications.
8. TRANZAS declared in July 2014 that the company would become a system integrator of the pilot project on installation of monitoring and correcting stations GLONASS/BeiDou/GPS in China.
9. The main o�ce of TRANZAS in St. Petersburg was visited by representatives of the companies-members of GIFAS (The Groupement des Industries FrançaisesAéronautiques et Spatiales) to familiarize themselves with the state-of-the-art solutions and products for aircraft industry. The foreign colleagues got acquainted with the newest solutions and stock-produced items of the TRANZAS Group in the area of avionics, training simulators and systems, unmanned aerial vehicles and other modern high-tech solutions for aviation. The delegation consisted of the representatives of European companies – leaders in the market of modern solutions for aircraft industry – Thales, Elvia, IFAERO, Dassault Systems, Cassidian, Airbus Defense and Space.

98 Chapter 4. Geographical Reach and Vertical Markets of Russian Software Developer Companies
10. Bell Integrator, specializing in telecom and bank projects, opened in the spring of 2014 their o�ce in California. The company is going to carry out their principal activities in the USA.
11. A young Russian company VOCORD (developer and manufacturer of intelligent video surveillance and audio registration systems) and the Indian company TAL Secure Systems specialized in deployment of IT solutions in the public security �eld, in summer of 2014 entered into the cooperation agreement. The Russian management expects that this agreement will assist promotion of their solutions in international market. The active promotion outside Russia is a part of a new strategy of the company adopted in early 2014.
12. An American corporation R. Christopher Goodwin & Associates introduced a Russian product TrueConf Server for holding video conferences between their o�ces in the USA. The project did not cause any sanction problems.
13. Omnicomm – the Russian producer of tra�c and fuel �ow monitor systems, at the international conference Smart Mobility World transferred its equipment for test integration with the solution Web Fleet of the Italian division of Tom Tom Telematics, the world biggest supplier of cartographic services and devices for vehicle and personal GPS navigation. At the �rst stage of cooperation, the Omnicomm equipment in the test mode will be integrated in B2B solution of TomTom that will provide not only vehicle tracking but also fuel rate control. The active promotion of Omnicomm in the Italian market is contingent on a growing demand for equipment allowing for e�cient monitoring of fuel rate and optimizing the car �eet operation.
14. PROGNOZ concluded a contract with the Statistical center of the Cooperation Counsil for the Arab States of the Gulf (GCC Stat). Under this project the Russian company implements for the bene�t of Arab states a large-scale project on development of data portals and statistics acquisition, processing and management systems. As a whole, this project will allow to create a consolidated information area for six countries: the United Arab Emirates, Bahrain, Saudi Arabia, Oman, Qatar, and Kuwait.
15. Mango Telecom opened an o�ce in Germany intended for sales of their cloud products for European business clients. The company received �nancial resources for international expansion from Intel Capital.
16. In autumn of 2014, six out of 38 agreements, signed as a result of the meeting of Russian and Chinese heads of governments, directly concern IT and telecommunication technologies. A half of agreements pertain to supply of Huawei equipment to Russia. However, there are also decisions on joint developments. For example, one agreement contemplates development of civil technologies based on GLONASS and BeiDou systems. The �rst project will be co-developing of a navigation chipset GLONASS /BeiDou in 40 nm topology. On the basis of this chipset there will be developed an equipment line GLONASS /BeiDou for various civil applications. The users of equipment including this chipset will also need programming applications.
17. PROGNOZ in the end of 2014 introduced its mobile solution in the European Central Bank. The project was preceded by a restricted tender the year before.
2015-2016
1. Yota Devices commenced sales of YotaPhone 2 in China and Latin America. According to the YotaDevices’s plan, 50% of total sales of smart phone will fall on China. By the end of the year, the company plans to come also to the markets of Indonesia, Turkey, India, South America and the USA. Yota Devices is regarded as a producer of user equipment. But the core of equipment is a complicated and unique in-house software.
2. Ascon in early 2015 undertook beta testing as a part of preparation for launching a new design package of civil and architectural CAD oriented toward primary activities not with drawings but with 3D building models. In the spring of 2015, Ascon, the developer of Compass-3D software, presented its core to the Swedish IT company to use in a product intended for wooden stairs design.

3. The well-known company DataArt announced opening of o�ces in Munich (Germany) and Wroclaw (Poland). Now the company is presented in 15 cities worldwide.
4. ABBYY announced an expansion of the market presentation in the Middle East. It opened an o�ce in Dubai (UAE) to provide consulting and marketing support to partners and customers of ABBYY in that region.
5. TheSkolkovo Foundation, judging by their statements in early 2015, considers as one of priorities the support of projects implying promotion of solutions in the markets of Asia-Paci�c region.According to Skolkovo experts, the Russian innovation companies under development should from the very beginning be oriented to the global market. At the same time, collaboration with Asia-Paci�c region has always been essential, and nowadays it becomes much more important with regards to the geopolitical changes.
6. InfoWatch began the active development of a new international market – Latin America. By that time, InfoWatch had over 10 partners and systems integrators in this region, cooperation with the ministries of communications of several Latin American countries, pilot projects in the companies of �nancial sector in Colombia and Peru.
7. In the spring of 2015 T-platforms announced an agreement for supplying its own supercomputer to the German Julich computer center. A sum of transaction will amount to 17 million Euro.
8. Deputy Minister of Communications and Mass Media Alexey Volin held a working meeting with the Minister of Information and IT of Uganda NyombiTembo. In the course of the talks the parties agreed to intensify cooperation in the area of IT, e-government, communications and information.
9. The Minister of Communications and Mass Media of the Russian Federation Nikolai Niki�rov held a meeting with the Ambassador Extraordinary and Plenipotentiary of the Republic of Iraq in the RF Ismail Muhsin. The parties agreed to conduct more active relations in the sphere of telecommunications, mass communications, postal service and information technology.
10. The representatives of Chinese IT business discussed with the Russian Prime Minister Dmitry Medvedev their involvement in Russian projects. The Russian companies are supposed to access the Chinese market as well.
11. In March 2016, Russia achieved a preliminary agreement with Iran concerning supply of Elbrus domestic processors to the Middle East state once the international sanctions have been lifted from the state.
12. Group of Companies Terrasoft, the developer of a platform to manage marketing, sales, and service, opened an o�ce in Singapore and Australia in the �rst half of 2016.
13. In November 2015, Docsvisionset up a representative o�ce in Belarus.
14. In2016, Promobot, a Russian startup of Perm, sold its �ve humanoid consultants to Keysi Microelectronics, a Chinese companyof Hangzhou, received the payment for four other ones, and also entered into two agreements with them to expand the cooperation.
15. Early in 2016 the Speech Technology Center (STC) entered into an agreement with HYPR, a company of New Yourk, that is dealing with major corporate customers, providing them with customized solutions for user identi�cation based on various combinations of biometric attributes such as voice, face, retina, and �ngerprints. In cooperation with HYPR, STC will promote their own biometric solutions in the U.S. market.
16. In 2016, the UN Economic and Social Commission for Western Asia commenced cooperation with PROGNOZ that will implement a project to develop and integrate an ESCWA Online Statistical Information System (EOSIS) designed for the statistical data processing and analysis under various development segments of the Arab region.
17. Eidos-medicine, a company from Kazan, supplied 15 humanoid simulators of its own manufacture for newcomer surgeons of the Juntendo University of Tokyo for an amount of $1.5 million.
99 Chapter 4. Geographical Reach and Vertical Markets of Russian Software Developer Companies

100 Chapter 4. Geographical Reach and Vertical Markets of Russian Software Developer Companies
18. Vladimir Potanin, co-founder of Winter Capital Partners (with a capital stock exceeding $300 million, mostly funds of Interros) became the �rst Russian billionaire who transacted the real deals in Iran opened after the sanctions Thus he became a co-owner of a wide range of Iranian Internet companies, including the country’s largest Internet retailer Digikala.
19. PROMT, a developer of automated translation solutions, concluded a strategic partnership agreement with Chuanhow Technologies — a distributor and provider of process solutions in the Asia Paci�c market. Owing to the new cooperation, PROMT will be able to o�er their most recent solutions in Taiwan, China, and Hong Kong: PROMT Translation Server 11 for corporate customers and PROMT Professional 11 for private users.
Judging upon a varying number of news, the intensi�cation of marketing e�orts by Russian companies in the foreign markets started in 2013. In doing so, those markets were �rst and foremost of interest, which have not yet been conventional for the Russian software companies.
As per the data of our survey of IT companies, it is not possible to specify the pattern of foreign sales by country and region of the world without a very high margin of error. Based on the share of the companies present in certain markets and on the share of the companies treating a market as the key one, it is only possible to evaluate the sales falling on Russia, on the USA with EU and on the rest of the world. Considering the known sales in the domestic market and the total turnover of the software developer companies, it is possible to suppose that Russia accounts for about 45% of the total sales. Other income within 10-15% is warranted by the sales in the former USSR republics.
As mentioned above, the largest markets where Russian companies are present beyond the former USSR republics are those of USA and EU countries. Then the South-East Asia market follows, where 15% of our respondents are present, then all other markets come (10% of the companies at most). However, few companies treat those markets as the key ones. The South-East Asia market is considered as the key one by as low as 3% of the respondents (though 6% of the companies with a turnover exceeding $5 million) and, in case of South and Central America, only 1% of companies believe this is the key one. None of the respondent companies have classi�ed quite large markets of Africa, Australia, and Middle East as the key ones. Following the above data, one can suggest that the total sales of the Russian software developer companies in the «Rest of the World» account for 2-4% of the Russian software exports and development services. Therefore, 36%-43% is left for USA and EU (this �gure is most likely to exceed 40%).
If the sales beyond the former USSR republics are only considered, then the following pattern will result: 90-95% of all Russian software sales are e�ected to the USA and EU, and 5%-10% to other countries beyond the former USSR republics.
Such a proportion does not meet the geographical pattern of the global market. If we rely upon the data of Gartner andIDC, then the USA and EU account for about 60% of the global IT expenditure (including communications services). Consequently 40% of the globalICT market accounts for as low as 5-10% of foreign sales by the Russian software developer companies (most likely closer to 5% thanto 10%).
The above disaccord contains a great potential for expansion of sales in the developing markets. At the same time, Russian companies can expand their sales in the U.S. and European markets, where they have had a low share still.
Distribution of Sales by Country/Region

Service Providers and Software Vendors
101 Chapter 4. Geographical Reach and Vertical Markets of Russian Software Developer Companies
The activity in and the interest towards various markets on the part of Russian software development companies is indicated by the presence of marketing and sales' o�ces both within and beyond Russia as well as by plans to establish the same. Such o�ces were operated in 2015 by 38% of the respondent companies. The �gure a year before was 44%, though the reduction of number is related to the change in the pattern of respondents: the survey involved less companies focused on exports and, in addition, the share of large and medium companiesdecreased, which can a�ord themselves to open sales o�ces abroad (the share of respondents with the turnover exceeding $5 million decreased from 38% to 34%).
Given such occasional �uctuations, a trend can be actually traced during 5-7 years. A conclusion concerning a gradual increase in the share of companies o�ering sales o�ces can be based on the fact that it was 34% and 33% in 2011 and 2012, while 44% and 38% in 2014 and 2015, respectively.
Judging upon the plans to open sales o�ces during 2 forthcoming years, the desire to enter new markets is shown by a growing number of respondents. Before 2013, the share of such companies had never exceeded 20%. As per the results of survey 2016 and that of the past year, the �gure achieved 37% and 34% respectively. The interest towards foreign countries other than the former USSR republics is growing: in 2015, the desire to open new sales o�ces there was stated by 14% and in 2016 by as much as 18% of respondents.
The trade o�ces abroad are run by 59% of the companies with a turnover exceeding $5 million (47% beyond the former USSR republics). Among smaller companies the o�-shore sales o�ces are run by 24% and those in the non-former USSR countries - by 13% of respondents.
While the software vendors operated their sales o�ces abroad more often during the previous years, then as per the results of survey 2016, the service providers have caught up and are now ahead of them (sales o�ces abroad are run by 39% of service companies and by 36% of the software vendors). The plans to open new o�ces during 2 forthcoming years are more often announced by the service companies, i.e. 37% against 32% of the software vendors. The environment for an expansion of the foreign sales of customized software has appeared to be favorable due to the ruble exchange rate reduction and to the decrease in the average developer's remenuration equivalent in US Dollar.
4.2. Geographical Distribution ofMarketing and Sales O�ces ofRussian Companies
Availability of sales offices (the share of respondents who specified a country or a region)
2011 2012 2013 2014 2015 Those planning in 2015 to open
at least one sales office during 2015-
2016
Those planning to
open at least one sales office in
2016
Those planning to open at
least one sales office in 2017
Those running and planning no
offices
Somewhere 34% 33% 40% 44% 38% 36% 27% 25% 49%
in Russia 19% 21% 34% 27% 29% 20% 16% 15% 68%
abroad 27% 26% 29% 24% 32% 19% 25% 24% 57%
non-CIS countries - 17% 19% - 21% 14% 16% 18% 69%

102 Chapter 4. Geographical Reach and Vertical Markets of Russian Software Developer Companies
Remote software development centers are being established by Russian companies in order to achieve two goals: either to have their developers closer to the customer so that they can handle all the issues arising with them on a 24/24 basis; however, a decision to open a remote center is more often taken based on the consideration of the labor market rather than on the sales market.
Most often, the required professionals are found by Russian companies in another city of Russia (36% of respondents). 22% of the respondent companies have their operating development centers abroad, 11% of them in the non-former USSR republics. At the same time, the development centers are run in the USA/Canada by 8% of respondents, and those in Western Europe by 7% of them. This is just the case when the development centers are required so as to be closer to the main customers. Sometimes the costs of them, however, did not di�er substantially from those at the similar production sites in Moscow and St. Petersburg. In some countries of Western Europe the average salary of programmers was not much higher than that in Russia, though the higher costs of employees were compensated by a lower cost of the o�ce leases. Such a situation existed when the US Dollar exchange rate was less than Ruble 40.
During the two most recent years, the di�erence between the salary levels in Russia and in the developed countries has increased, and the o�ce lease costs have evened out. However, an appeal of the USA and Western Europe for opening development centers is high still (5-7% of respondents are intended to open American and Western European business units).
4.3. Geographical Distribution of Software Development Centers
Availability of sales offices (the share of respondents who specified a country or a region)
2011 2012 2013 2014 2015 Those planning in 2015 to open
at least one sales office during 2015-
2016
Those planning to
open at least one sales office in
2016
Those planning to open at
least one sales office in 2017
Those running and planning no
offices
in Belarus 2% 6% 11% 5% 7% 2% 5% 6% 90%
in Ukraine 3% 6% 14% 5% 8% 3% 4% 2% 92%
in other CIS countries
6% 6% 13% 7% 8% 7% 6% 6% 86%
in Western European countries
16% 5% 10% 14% 11% 13% 5% 5% 84%
in Central and Eastern European countries
3% 2% 2% 3% 5% 4% 1% 3% 92%
in USA and Canada
19% 15% 14% 16% 12% 11% 8% 7% 81%
in South East Asia 6% 3% 3% 2% 5% 2% 2% 5% 89%
in Africa 3% 2% 0% 1% 2% 2% 0% 3% 95%
in South America 2% 0% 1% 97%
in Middle East 3% 1% 1% 2% 2% 2% 2% 2% 96%

Development Centers in Ukraine and inFormer USSR Republics
103 Chapter 4. Geographical Reach and Vertical Markets of Russian Software Developer Companies
Among the EU countries the lowest average salary levels are observed in the countries of Southern Europe. As long as two years ago the salaries there were comparable with the Russian ones. At the same time, those countries o�er available resources, while their own development capability in the EU area permits to be closer to the customers in Western and Central Europe.
In total, 40% of respondents run their development centers in Russia or abroad. The �gure has not almost changed during the year. Notably, almost all the companies are running their development centers in Russia as well. Only 4% of respondents prefer to grow the personnel numbers through foreign professionals, failing to �nd s in other cities of Russia.
Among the countries/regions (except for Russia), where Russian software development companies run their development centers, Ukraine is on the top of the list. While the country’s software market has lost its signi�cance for Russian developers, then the labor market has appeared to bemore attractive yet, when judging only upon the personnel maintenance costs (the Ukrainian national currency has dropped lower than the Russian one). The risks have increased, though not so much as to reject the Ukrainian cheaper workforce. While 2% of respondent companies only intended to open a development center in Ukraine during 2 forthcoming years in 2015, then at least 5% of such companies were identi�ed in 2016.
Quite many Russian companies operate remote development centers also in Belarus and in other CIS countries.However, Ukraine has a special place as it is the second largest post-Soviet state (after Russia).According to Luxoft, there are about 38 thousand skilled programmers in Ukraine.Every year, Ukrainian universities graduate 18 thousand IT professionals, who know English generally better than Russians.
The majority of Ukrainian software development centers of Russian companies are located in Kiev.The following Ukrainian cities are also mentioned by respondents: Kharkov, Dnepropetrovsk, Odessa, Kherson, Lvov, Vinnytsa, Lugansk Region, Anthracite, and Cherkassy.
In Belarus, the majority of software development centers are also located in the capital city of Minsk. There are also development centers in Gomel, Vitebsk, Mogilev, Alekseyevka, and Brest.
Among other CIS countries, Kazakhstan is an attractive place for creation of remote development centers.The Baltic countries (the cities of Riga, Vilnius, and Liepaja) were also mentioned in our survey.
Plans for 2 Forthcoming YearsIt is necessary to note that as per the market survey results in 2016, the share of companies planning to
open new remote software development centers during 2 forthcoming years increased. In 2015, such plans were declared by 30% and, in 2016 - by 32% of respondents. The share of companies planning to open their development centers in a short run has either not changed or increased..
Availability of remote development centers, the share of respondent companies
At least one remote
development center is available in
Russia or abroad
Those planning to open centers in
Russia or abroad in 2016-2017
Those running centers abroad
Those planning to open offices abroad
in 2016-2017
Those running offices in non-former USSR
republics
Those planning to open offices in non-
former USSR republics in2016-2017
40% 32% 22% 22% 11% 15%

104 Chapter 4. Geographical Reach and Vertical Markets of Russian Software Developer Companies
Availability of Development Centers due toDi�erent-Size of Companies
Among large and medium size companies, the numbers of remote development centers are conventionally much higher than those of small companies. At least one remote development center is run by 71% of companies with the turnover exceeding $5 million. The previous year saw 64% of such companies.
Availability of remote development centers(the share of respondents who specified a country or region)
2011 2012 2013 2014 2015 Those who planned in 2015 to
open a development center during 2015-2016
Those planning to open a
development center in 2016
to open a development
center in 2017
Those running
and planning
no offices
in Russia 28% 24% 34% 32% 36% 16% 18% 16% 60%
in Belarus 7% 8% 11% 7% 6% 4% 5% 4% 92%
in Ukraine 7% 10% 14% 9% 12% 2% 5% 2% 88%
in other CIS countries
3% 6% 12% 4% 7% 4% 5% 4% 89%
in Western European countries
5% 5% 10% 7% 7% 8% 5% 6% 89%
in Central and Eastern European countries
3% 1% 2% 3% 5% 5% 3% 4% 93%
in USA and Canada
3% 4% 14% 9% 8% 7% 5% 7% 88%
in South East Asia
5% 1% 3% 3% 4% 2% 4% 6% 93%
in Africa 0% 0% 2% 1% 1% 2% 1% 1% 98%
in South America 0% 0% 0% 2% 2% 0% 1% 2% 97%
in Middle East 0% 1% 1% 0% 1% 0% 1% 1% 99%
in Australia 1% 1% 1% 99%
Share of export companies running remote development centers in 2015
operating planning to open a development center during 2015-2016
turnover less than $1 million 23% 23%
turnoverof $1 million to $5 million 37% 35%
turnover of $5 million to $20 million 63% 42%
turnover of $20 million to $100 million 89% 56%
turnover exceeding $100 million 100% 0%
* - this is not 100% as the specific plans were most likely not defined or disclosed

105Chapter 4. Geographical Reach and Vertical Markets of Russian Software Developer Companies
The respondent companies have head o�ces and remote development centers in 50 Russian cities at least. In questionnaires in di�erent years from 30 to almost 50 cities were mentioned but every year their composition is somewhat changed. Judging from the number of mentioned head o�ces or remote development centers in the surveys in the last 3 years (summing was made to lessen in�uence of random factors), the distribution of leading cities turned to be quite logical and generally met the rating of cities on the basis of the number of IT companies in these cities accredited at the Ministry of Communications.
Anyway, there must be a certain discrepancy as in our survey participate those software companies which have export earnings whereas the Ministry of Communications can be applied for accreditation by all Russian IT companies (not only software ones and not only exporters). However correlation with distribution of these companies by cities does exist. So the di�erence cannot be too big.
In the rating made on the basis of 3-year survey the �rst two places are naturally taken by Moscow and St. Petersburg. The same places two cities have in the rating by the number of IT companies accredited at the Ministry of Communications. However, the third place in the rating of software exporters took Novosibirsk, and in the rating of all IT companies — Yekaterinburg which by the number of exporters took not so high 7th-9th places (which it shares with Omsk and small Taganrog). Such di�erence is quite understandable: Yekaterinburg companies are historically oriented toward Russian market whereas Novosibirsk for a long time has been promoting products and services abroad.
In the Top-10 cities with the greatest number of software exporters almost all are million-plus cities. However there is also a relatively small Taganrog with population of about 250 thousand people (in the metropolitan area with neighboring settlements - 325 thousand people.). The second city in the exporters rating not being a million-plus city is Izhevsk. Its population is 640 thousand people and in the Izhevsk metropolitan area — 950 thousand people. In other cities townspeople are estimated at 1 million people at least. It appears that Taganrog (and also Izhevsk) have a rather favorable business environment and community encouraging creation and development of software companies — world market players.
Among cities not included in the Top-10 cities with the greatest number of software exporters we should also mention the following: Samara, Penza, Ulyanovsk, Belgorod, Perm, Vladimir, Rostov-on-Don, Saratov and Yaroslavl. Noteworthy is that this group of twenty does not include such big Russian educational center as Tomsk which is well-known by its universities.
Development Centers in Russia
Top-10 Russian cities mentioned most frequently by Russian companies as thelocation of a head office or remote development center
city mentioning frequency
1 Moscow 191
2 St. Petersburg 150
3 Novosibirsk 41
4 Nizhny Novgorod 19
5-6 Kazan 16
5-6 Voronezh 16
7-8 Taganrog 14
7-8 Izhevsk 14
9 Omsk 13
10 Yekaterinburg 12

106 Chapter 4. Geographical Reach and Vertical Markets of Russian Software Developer Companies
In Moscow and in economically developed countries with a high programmers' salary level, development centers are opened by Russian IT companies either to access the sources of high competence or to support customers' projects through the e�ort of local engineers.Foreign companies are most often acquired for this purpose. For example, in April 2013 Luxoft declared its acquisition of Freedom OSS, a U.S. developer of corporate open source software using the RedHat products.The acquisition was made in order to obtain new customers from the U.S. �nancial sector.
Investments towards Countries and Cities O�ering Higher Salaries
Distribution of companies accredited with the Ministry of Communications by city of location
Source: calculated according to the data of the Ministry of Communications
1 Moscow 2061 35.3%
2 St. Petersburg 713 12.2%
3 Yekaterinburg 199 3.4%
4 Novosibirsk 173 3.0%
5 Moscow Region 168 2.9%
6 Kazan 147 2.5%
7 Omsk 107 1.8%
8 Nizhny Novgorod 104 1.8%
9 Samara 101 1.7%
10 Perm 95 1.6%
11 Rostov-on-Don 76 1.3%
12 Izhevsk 75 1.3%
13 Krasnodar 70 1.2%
14 Ulyanovsk 68 1.2%
15 Ufa 65 1.1%
16 Tomsk 59 1.0%
17 Voronezh 54 0.9%
18 Belgorod 53 0.9%
19 Tula 51 0.9%
20 Saratov 48 0.8%
21 Volgograd 48 0.8%
22 Yaroslavl 47 0.8%
23 Tver 46 0.8%
24 Chelyabinsk 44 0.8%
25 Krasnoyarsk 40 0.7%

Chapter 4. Geographical Reach and Vertical Markets of Russian Software Developer Companies 107
Earlier, in spring 2012 EPAM Systems expanded its presence in the market of North America, having acquired for $17.4 million Thoughtcorp, a Canadian software developer dealing with the customers in retail, telecommunications and �nance.Early in 2013, one more deal involving EPAM was closed: the company purchased Empathy Lab, an American consulting company specializing in the development of digital strategies and UX design.
In November 2015 the authorities of Poland announced that they would grant subsidies to Luxoft for an expansion of the company’s sta� in the country. Late in September 2015, the company’s sta� in Poland exceeded 1200 persons, while the previous year saw the personnel numbers of 600 employees. The share of Luxoft software programmers in the country as against the company’s personnel numbers increased during the period from 5.5% to 15.5%.
Throughout the period of our survey no regular change in the importance of particular vertical markets for Russian software developers have been revealed.Most �uctuations of the �gure are of a random or temporary nature. In general, it can be concluded that Russian exporter companies' industry priorities have not changed principally for the decade.
The only regularity revealed clearly that was connected with vertical markets, was drastic reduction in their mentioning frequency during a period of the Global economic crisis in 2009-2010. The software developers were forced then to focus their e�orts on the areas where they were most competitive or which were a�ected by the global crisis to the least extent. A similar signi�cant reduction in the �gure was identi�ed in in 2015.
4.4. Vertical Markets
Mentioning frequency of vertical markets in 2007-2016 (% of respondents)
Year of survey/vertical markets
2007 2009 2011 2013 2015 2016
Information Technology 89% 69% 74% 74% 68% 70%
Banking* 35% 36% 23% 26% 34% 29%
Telecom 34% 33% 26% 31% 27% 27%
Industries 31% 31% 27% 38% 37% 33%
Hospitality, Travel & Transportation
24% 31% 28% 29% 31% 27%
Government 28% 25% 21% 24% 28% 24%
Powersupply, Gas&Oil 18% 24% 17% 22% 29% 21%
Healthcare&Pharmaceuticals 23% 24% 23% 28% 28% 24%
Retail&Distribution 35% 24% 26% 29% 24% 26%
Education 36% 23% 21% 28% 24% 25%
Science&Research - - 18% 26% 20% 20%
Gambling & Entertainment 20% 11% 9% 15% 17% 15%

108 Chapter 4. Geographical Reach and Vertical Markets of Russian Software Developer Companies
* prior to 2011 - Banking & Financial Services
Mentioning frequency of vertical markets in 2007-2016 (% of respondents)
Year of survey/vertical markets
2007 2009 2011 2013 2015 2016
Media - - 13% 18% 18% 13%
Sport&Travel - - 10% 17% 11% 15%
Insurance - - 13% 15% 15% 13%
Building&Realestate - - 12% 17% 28% 17%
Services - - 27% 35% 26% 22%
Finance - - 25% 26% 21% 19%
Energy - - 17% 21% 24% 22%

Chapter 5
Human resources

110 Chapter 5. Human resources
The data on the numbers of software developers of the respondent companies as well as of major companies that are not involved in the survey but post the information on the professional sta� in the public space (either at their web-site or in mass media) permit us to calculate the total numbers of employed software developers and then adjust the �gure on an annual basis. The calculation is made with regard to the weight of those companies across the software industry, which data is available. The weight is determined per the share of companies in the total quantity of Russian software companies under every category, which are constituted depending on the enterprise size and business model (service or product-based). In doing so, information on all major companies with the turnover above $50 million is available. For this category of companies, the data on the numbers are only summed up. In case of the other categories, the total number of companies and the share of those, which data on the employee numbersis available, are taken into account.
At the same time we suppose that Russia has 3200 software companies (most likely, their number has already increased, especially if those employing several persons are counted). The Ministry for Communications and Media has already accredited over 6 thousand IT companies, that are essentially software ones. One can �nd among them legal entities that are actually business units of their parent companies. We record such companies as business units rather than separate companies. However, those hardly can make up 2-3 thousand.
Therefore, under any source of data which we use to measure the number of companies in a particular interval, we have always used the least number of software developers within the interval. Consequently, all our calculation results concerning the total numbers of software developers employed in Russia can be supplemented with «at the least».
Every year we have had an opportunity to calculate the data on software developers numbers in two ways — both as mentioned above and through multiplying the past year’s �gure by the weighted average sta� growth value of our respondent companies. Moreover, opportunities to verify our calculations against the data from various sourceshave emerged from time to time. For example, recruiting agencies measure also the average sta� growth �gures. They have data on the distribution of vacancies by city and other source information for the calculations. In spring 2015 we got another opportunity to verify our calculations of the total programmer numbers in Russia. The IT Department of Moscow published the data on Muscovites employed with the IT segment. As per the data based on the regional statistics of the Rosstat, over 140 thousand programmers are working in the capital. As it is known from various sources that Moscow accounts for over one-third of the Russian software development professionals, then the total programmers' numbers in Russia can be assessed at 430-440 thousand people. Our calculation in 2015 produced almost the same �gure. We had also undertaken similar veri�cations of the industry’s sta� numbers previously. An error can achieve several ten thousand people, though it is most unlikely that the total number of programmers employed in Russia is beyond 400-500 thousand persons.
5.1. Assessment of general situationwith human resources in the industry
Data on core professionals (software developers) employed with Russian softwarecompanies at year-end 2015
Total number, thousand persons
Software developers employed in Russia 450-460
Core employees with Russian software companies (total) 170-180
- with foreign development centers 40-50
- in Russia 125-130
with service companies (for foreign customers) 70-75 (25-26)
with product companies ≈50
with Russian R&D centers of foreign companies >5

111 Chapter 5. Human resources
During 2015, the total numbers of software developers employed with the Russian software companies increased by about 12-15%, and those employed in Russia — by 8-9%. Consequently, Russian companies hired employees more intensely for their foreign development centers than in Russia. In any case, however, the increment of the employee numbers in Russia is quite considerable and stable. This is expected at the same level at year-end 2016. In either event, the respondent companies anticipate that their sta� numbers will increase by 9% on the average.
In Moscow, the software companies employ about 45-50 thousand persons (core professionals only) and those in St. Petersburg — 23-25 thousand. An indicative distribution pattern across other cities can be determined from the data of recruiting agencies and the share of software or IT companies in the total numbers of the industry. They correlate well with each other. In all cases, the share of Moscow amounts to 32-35% and that of St. Petersburg — 12-17%. The fact that the shares of two capitals under the vacancies of young IT professionals are below the above values is explained by the concentration of high number of major companies in the cities, which can a�ord themselves to invite experienced professionals from regions and abroad.
Approximate distribution ofsoftware developers by the argest cities of Russia
Source: ANCHOR High Technologies
Distribution of vacancies of IT engineers bycities in 2015 (% of all correspondingvacancies in Russia)
Source: HeadHunter
Moscow 35%
St. Petersburg 15%
Yekaterinburg 5.2%
Novosibirsk 5%
Nizhny Novgorod 2.5%
Kazan 2.4%
Voronezh 1.2%
Moscow 32%
St. Petersburg 11%
Voronezh region 5%
Moscow region 4%
Nizhniy Novgorod region 3%
Republic of Tatarstan 3%
Novosibirsk region 3%
Rostov region 3%
Krasnodar Territory 2%
Samara region 2%
Distribution of vacancies of young ITengineers by cities in 2015(% оf all corresponding vacanciesin Russia)
Distribution of companies accredited bythe Ministry for Communications and Media by cities of RF
Source: calculated as per data of Ministry for Communications and Media Source: HeadHunter
Moscow 22%
Moscow region 12%
St. Petersburg 7%
Nizhniy Novgorod region 4%
Republic of Tatarstan 4%
Krasnodar Territory 3%
Rostov region 2%
Perm Territory 2%
Sverdlovsk region 2%
Voronezh region 2%
quantity share
Moscow 1754 35%
St. Petersburg 629 12%
Novosibirsk 158 3,1%
Nizhny Novgorod 95 1.9%
Kazan 128 2.5%
Izhevsk 69 1.4%
Yekaterinburg 171 3.4%
Tomsk 56 1.1%
Omsk 56 1.1%
Perm 79 1.6%
Saratov 51 1%
Rostov-on-Don 71 1.4%
Other 1765 36%
Total 5082 100%

112 Chapter 5. Human resources
In 2015, the employee numbers were augmented faster by large service companies. The respondent companies with turnover below $5 million increased their sta� by as low as 3%, those with turnover from $5 million to $20 million – by 11%, and those with turnover over $20 million – by 25%, though the sta� growth was mostly due to the expansion of foreign development centers. If we count only the employees in Russia, then the service companies increased their sta� by about 11%.
As regards the software product developers, such dependence on the company size was not identi�ed: companies with a turnover below $5 million and those with turnover above $5 million increased their sta� by 7% on the average.
There were a bit more companies intending to increase their employee numbers in 2016 than those expanding their sta� in 2015. At the same time, 11% of respondents could not respond to the appropriate question. Probably, they were not sure whether they would increase the employee numbers at the time of the survey.
As per the data of hh.ru portal, 57% of Russian companies in the «IT, Internet, telecom» segment are planning to increase the employee numbers in 2016, while about 40% are intended to maintain the existing sta�.
The primary sources of increasing the total numbers of software developers in Russia are universities as well as migration from neighboring countries (see details under the relevant sections of this chapter). Another source of human resources for the software companies are other industries employing over 70% of the Russian programmers.
It is possible to suggest that 2 most recent years, due to the crisis as well as to the development of cloud technology and outsourcing (permitting to have lower IT o�ce sta� numbers) have seen a �ow of software developers from various industries to the software companies. We have failed to �nd the data on a magnitude of the inter-industry migration, but according to the available information one can suggest that it has taken place. It is necessary to note that, at �rst sight, some reports testify to the opposite. However, closer inspection reveals that this is not the case. For example, according to the o�cial statistical data cited by Moscow o�cials, the number of ICT employees decreased by 22.1 thousand persons in Moscow during nine months of 2015. Most of them (58%) went to be employed under their occupation to other industries, and only 15% found themselves unemployed for some time. However, the software companies employ programmers accounting for a small percentage of all the professionals in the ICT industry. According to our survey data, the average numbers of software development companies increased by 2015 both in Moscow as well as throughout the country.
The sta� reductions across the ICT industry in Moscowseemed to take place on account of telecommunications companies, system integrators, distributors, and communications stores, which are also classi�ed as the ICT industry. As per the data of Superjob.ru portal, at the background of a general reduction of vacancies in the IT sector of Russia from January 2015 through January 2016 by 24%, it was the demand for professionals relating to cellular, wireless and network technology, which decreased by the factor of two. At the same time, the demand for professionals dealing with CRM-systems, however, increased by 39% (not only operation, but also development are implied), that for mobile application developers – by 29%, and that for project managers – by 10%. Given that, almost half the demand for sta� in the information technology sector is for software developers, while engineering support accounts for as low as 21% of all the vacancies. It means that the growing demand for sta� is where software development is implied.
How respondent companies change the staff numbers
at year-end 2015 forecast 2016
Increase by 47% 50.5%
Reduction by 11% 7%
No change by 42% 31.5%
Those hesitating to respond - 11%

113 Chapter 5. Human resources
As per the survey bythe Russian Association for Electronic Communications (RAEC, Runet Economics 2014-2015), the demand for IT professionals reduced by 15% in 2015 (by 20-40% in other industries). And in total, this sector employs 2 million persons according to the RAEC data. Therefore, the software companies employ 9% or less of all the IT professionals.
Notwithstanding the reductions, the general IT sector situation is recognized by recruiting agencies as quite stable. A slumping demand in 2015 just mitigated the existing de�cit of human resources, while the activity of employers looking for IT professionals recovered at the pre-crisis level in 2016. As per the data of HeadHunter, the increment of relevant o�ers as against the past year amounted to 57% in March 2016. Following that, a slight monthly reduction in the number of vacancies commenced. However, the year-on-year growth of o�ers in July 2016 appeared to be quite comfortable — 38%. The situation around CVs is di�erent. In March 2015, an increment against the past year amounted to 42% - this was the highest �gure for two most recent years. However, the activity of job-seekers has been declining since May 2016 on a regular basis. A year-on-year increment amounted to as low as 4% by July. This is explained in part by a seasonale�ect, though the employers reduce commonly their activity in summer. So the reduction in hh.index (the number of CVs per vacancy) rather indicates the recovery of the pre-crisis demand/o�er ratio concerning IT professionals than a seasonal �uctuation.
According to an anonymous survey at hh.ru portal as undertaken in December 2015 among 33526 job-seekers, more than one-third of the respondents confessed that they felt no threat of dismissal in 2016. Those holding the opposite viewpoint accounted for as low as 8%. According to 16% of the respondents, a probability of being subject to sta� reductions existed still. Since that time, the situation for the job-seekers has improved remarkably. At the same time it is necessary to keep in mind that those, who were satis�ed with their job and not going to change it, were not involved in the survey.
According to a survey conducted in January-February 2016 by Unity recruitment agency, 56.1% of respondents representing IT companies, saw no changes in the incentive system applied by their employers in 2015. An increase of salary was noted by 23.2% and addition of bonuses – by 12.2%. Much less adverse changes were noted in the responses (bonuses were removed — 7.2%, salary was decreased — 3.7%, voluntary medical insurance was eliminated — 1.2%).
A survey conducted by HeadHunter in April 2016 among 225 respondents indicated that high salaries were the prime driver of a job appeal to IT professionals. They mentioned more often an interesting job (86%) and a prospective and dynamically evolving segment (58%). The salary was mentioned by 39% of the respondents only. 23% appreciated a �exible work schedule, while 23% appreciated that IT professionals were demanded and protected against sta� reductions.
Based on a survey conducted in May-July 2016, HeadHunter made a pro�le of an IT job-seeker. Those were mostly men (88%) at an age of 26-35 (54%), who had over 6 years of work experience (62%). The fewest of the segment were professionals at an age of 46-55 (4%) as well as inexperienced job-seekers (3%). At the background of a widespread opinion concerning an intention of IT professionals to go abroad, only 15% of them were reading professional literature in, and as low as 3% of them were speaking �uently foreign languages. A bit more than one-fourth (26%) of the job-seekers were not knowing any foreign language, while 24% noted availability of basic knowledge in their CV.
2 most recent years have generated a reason for a discussion of migration �ows once again. Historically, the largest migration of software developers was observed from 90-s to the middle of 2000-s years approximately. From the beginning of 90-s of the last century for 15 years the out�ow of human resources to countries outside the CIS was a serious problem for Russian software companies. Just about 2005-2007 the salary increase in Russia was so signi�cant that for many developers there was not much sense to go for earnings to another country. Some engineers who had left before came back to Russia. At the same time a steady �ow to Russia of software developers from Belarus and Ukraine was observed (including those who came to Russia to get education and found a job after graduation).
5.2. Labor force migration

114 Chapter 5. Human resources
After 2007 (up to the Ukrainian crisis onset) migration to both sides reduced. The out�ow of human resources fell short to be a problem. At the same time, the invitation of developers from former Soviet republics also ceased to be a signi�cant source of recruitment. Russian companies more frequently wended the way of opening the development centers in Belarus and Ukraine. Especially since the tax legislation in these countries was more favorable for software development than in Russia.
As a result of events of the last 2 years (the con�ict in Ukraine, crude oil price decline, weakening ruble, and the economic crisis in Russia) one can no longer state the insigni�cant impact of migration on Russian labor market.
Any o�cial data on the migration �ows of programmers is missing. However, there are grounds for believing that those �ows expanded in 2015. One of the reasons to think so is that in 2014 and �rst months of 2015 a number of responses by Ukrainian applicants to vacancies in IT industry in Russia substantially increased. According to the recruiting company HeadHunter experts, this �gure was increasing drastically during certain periods of time due to escalation in Ukraine. After the events on Maidan in February-March 2014, the number of responses from Ukrainian IT engineers in the same period increased almost 4-fold (by 277%) against the same period of the past year. A next spurt in applications for employment in Russia was in the summer of 2014 – after tragic events in Odessa on the May 2nd.
According to publications in Ukrainian media, a problem of mass emigration of IT engineers is really serious. However, these publications, as a rule, write about the West as a destination of migration �ow. From the standpoint of wages, relocation for a new job in western countries is a better choice compared to Russia where salaries in dollars also decreased during the last year and a half. However, many Ukrainian IT engineers do not speak foreign languages. So it is much easier to �nd job outside Ukraine just in Russia, as the Russian language, as a rule, is their native one.
In summer 2016, the Ministry of Education and Science of Ukraine recognized a problem relating to an out�ow of educated professionals to Russia and to Western countries o�ering better conditions of remuneration. At the same time Ukraine has seen a catastrophic reduction of the governmental funding during �ve recent years.
One year ago, we suggested that, based on various data (on the total migration, numbers of vacancies in neighboring countries featuring a willingness to relocate to Russia, the share of the jobseekers, who not only declare an ability to relocate but also decide so) another 5-10 thousand software development professionals should appear in the Russian labor market from the former USSR (and other) countries since 2014 through mid-2015 (as per estimates of HeadHunter, 5-7 thousand or less relocated to Russia). Such an in�ow could not but a�ect the labor market. Another evidence of the impact is the increasing average number of applicant CVs per vacancy as recorded by the recruiting agencies.
The out�ow of software developers from Russia is most likely to expand, though much less than the in�ow. As per our estimates, it was unlikely to exceed 1-2 thousand professionals for the same period. However, such a quite low out�ow turned out to be a problem for a number of companies as most competent developers knowing foreign languages left the country.
The survey 2016 included our questions permitting to determine the impact of migration �ows on the software industry. As a result, we found out that the migration of employees abroad was a problem for 14% of the respondent companies. The �gure is totally independent on the share of foreign sales and almost independent of the business model (13% for the software product developers and 14% for the service companies). Regional companies face the problem of migration abroad a bit more often (16%). In Moscow and St. Petersburg, 13% answered «yes» to the appropriate question. The problem was noted by 15% of companies with a turnover below $5 million and 12% of those with a turnover above $5 million. It is most likely that they go abroad from the companies where the standard of salaries is lower (these are regions and small companies). However, quite large deviations from the average �gure under the company classes were not identi�ed.
As the question about the migration problem has been added to our questionnaire as late as in 2016, it is still impossible to determine trends from answers to the question. However, it is possible to suggest that the share of companies a�ected by the departure of employees from the country was close to zero before 2014. The chief executives of software companies have probably forgotten such a problem since 2007.

115 Chapter 5. Human resources
One more question added to the questionnaire had to assist in counting the number of programmers, who arrived to Russia from the former USSR republics. In their answers, the respondent companies indicated the share of employees, who had arrived from the former USSR, in the total number of persons employed in 2015. It appeared that the �gure was not high, i.e. 2.4%. In case of the software industry, the in�ow is not more than 300-400 persons. All the programmers employed across all the industries (and not only the software one) will produce 700 or less. However, a share other than zero was indicated by as low as 20% of the respondent companies. It is possible to suggest that not all the respondents had the appropriate correct information. It means that the data obtained must be complemented with words «at least», and then the trends must be monitored. Foreign professionals go more often just to Moscow (2.7% if the new employees, 1.8% to regions, and 1.7% to St. Petersburg).
According to the studies undertaken by recruiting agencies, one can judge only the intentions of IT professionals to relocate either to or from Russia. Such studies are carried out through an analysis of CVs as these state their willingness (or unwillingness) to leave the town of residence as well as an analysis of the survey results. One year ago, various surveys provided similar results — in total, about 60% of the IT professionals agreed to relocate abroad. It seems to be a lot. However, almost 3 times as low persons thought about a search for a job abroad, and those who not only though but tried to �nd a job abroad were few per cent. At the same time, not all but just a few of them appreciated adequately their chances to �nd a satisfactory job abroad.
In summer 2016, HeadHunter presented the following data: 36% of the job-seekers o�ering an IT occupation were ready to relocate for the sake of job, and an opportunity of relocation to another country was considered by 22% of them.
Similar �gures were observed in Ukraine. However, the reasons urging to think about the departure to another country di�ered dramatically. Most Ukrainians (52.6%) wanted to leave the country for the sake of a high life standard, 45.2% mentioned social guarantees, 40% - high salaries, and as low as 36.9% - a chance to gain new knowledge. In case of the Russians, the top priority was foreign experiences (44.6% of the respondents), and then a high life standard (44.4%), social guarantees (42.1%), and high salaries (26.5%) followed.
According to the surveys undertaken, the prime driver complicating the preparedness for relocation is the hesitation. Because of that, about 80% of persons desiring to work abroad abstain from attempts to leave. Another 16% is restrained by an inadequate standard of second-language skills, and 8% - by lack of engineering knowledge. The importance of drivers was almost the same both for the Ukrainian as well as Russian programmers, but economic and political events have a�ected the resoluteness in the Ukraine during 2 most recent years, while poor knowledge of foreign languages has not prevented their relocation to Russia. A combination of the two drivers pushed the Ukrainian developers to relocate to Russia.
As per the data of Parallels (that has gained experiences in the inter-state relocation of professionals) software developers leave Russia - though not in a quantity that could be imagined when judging upon wild speculation. At the most, 10-15% of all the programmers have appeared to be ready to relocate abroad.
Judging from the fact that the past year saw no outburst of the persons desiring to work abroad, the out�ow of software developers did not change in 2015 and �rst half 2016. It seems that the out�ow is not more than 2 thousand persons. However, the departure of just one key employee to another country turns out to be a problem for a particular company as the most competent developers knowing foreign languages leave. That is why the number of companies looking at the migration of professionals abroad as a problem is quite high under such a relatively small size of «brain drain» — 14% (orabout450).
According to the o�cial statistical data of the Federal Migration Service, the number of persons, who went abroad to the non-CIS countries in 2015, increased by 6% from 51.3 to 54.4 thousand. If we suppose that the share of programmers herein was the same (that is quite admissible), then the growth of their out�ow abroad appeared to be actually low.

116Chapter 5. Human resources
It is important to note that the desire to leave Russia is prevented mostly by the fact that Russian professionals may work for foreign companies at their rates, though without leaving this country. It is probable that with the entry of Crossover, a US company that established a platform to search for part-time IT professionals for foreign companies in early 2016, there will be more opportunities to �nd an employer in another country. In 2016, Crossover is planning to employ 200 Russian professionals, and another 1 thousand in 2017.
A year ago we (together with experts of HeadHunter) supposed that about 5-7 thousand software developers arrived to work in Russia for the year and a half (in 2014 and �rst half 2015). Since mid-2015 until mid-2016, the �ow was most likely to decrease, though it exceeded the out�ow of Russian IT-sta� to foreign countries. This is evidenced with various data.
The primary donor of IT professionals to Russia in 2015 was Ukraine, although Kazakhstan and Belorussia were not far behind in terms of persons willing to relocate to Russia. We suggested that a considerable in�ow was provided by the Ukrainian refugees (i.e. the persons requesting an appropriate status (of refugee, temporary refuge), about 270 thousand of whom arrived to Russia in 2014 even as per the o�cial data. Together with those arriving to Russia from Ukraine, who failed to request for an o�cial status, the total in�ow of refugees from Ukraine to Russia achieved 1 million persons as per some estimates. Generally, they did not post CVs indicating their willingness to relocate to Russia as they had already been in Russia. When relying upon the share of IT professionals in the total population of Ukraine (this is about 0.5%), then all the refugees included 1.3 to 5 thousand professionals who o�er the programming skills.
As estimated by the State Agency of Science, Innovations and Computerization of Ukraine, in late 2012 a total number of IT engineers in Ukraine was 215 thousand people.
Those respondents which have development centers in Ukraine say that they did not close nor decrease their Ukrainian branches. As a rule, these are companies oriented toward western markets and engaged in customized software development in Ukraine. Most likely, the same relatively stable position is typical for Ukrainian outsourcing companies which speci�cally work for export. For them a decline in the exchange rate of national currency is even a blessing. The employees of Russian development centers and Ukrainian software export companies hardly aspire to leave for Russia by the score. First, they have not lost job. Second, on the whole they have a good command of English at least meaning that can count on successful job hunting in western countries.
The situation in Ukraine stabilized in 2015, although it is of strain still. Therefore, the in�ow of refugees and of those looking for a temporary refuge reduced from there by 45% (to 149 thousand persons). The number of CVs indicating the willingness to relocate to Russia is most likely to reduce as well. Ukraine ceased to be the leader in the share of all foreign IT professionals willing to be employed with Russian companies. Now it laggs behind Belorussia and Kazakhstan. One can suggest that the absolute quantity of jobseekers in other countries have not changed considerably, and that in Ukraine decreased.
Source: hh.ru
Desirable countries for relocation of IT professionals from Russia(based on CVs posted from May through April 2016)
USA 8.2%
Germany 5.9%
Great Britain 5.2%
Canada 4.7%
Australia 3.8%
Belarus 3.4%
Switzerland 3.4%
Czech Republic 3.3%
Spain 2.9%
The Netherlands 2.8%
Austria 2.7%
Sweden 2.7%
France 2.7%
Finland 2.6%

In compliance with the Russian law, refugees from the former USSR may submit a simpli�ed package of documents under the “Governmental compatriots' relocation program” and obtain quite quickly the Russian citizenship. This also contributes to the relocation of professionals to Russia.
The Russian Government had adopted a number of resolutions promoting an in�ow of foreign professionals. Those resolutions are supposed to attract up to 200 thousand skilled professionals from abroad during several years to 2020.
For instance, to achieve the projected targets, in Autumn 2013 the Ministry for Communications and Media proposed to reduce the minimal remuneration threshold for a foreign professional from 2 to 1 million rubles per annum. This will permit to invite not only very «expensive» professionals from abroad, but also those pretending to a moderate salary of IT professional (or a bit higher). Experts believe that the highest in�ow of human resources can be expected from the former USSR countries (Ukraine, Belarus, and other CIS countries). However, the terms and conditions o�ered by the employers in Russia to the programmers are quite appealing also for those from South-East Asia and Southern Europe, where high unemployment rates are recorded. However, a considerable increase in the in�ow of professionals was only provided by the crisis in Ukraine.
In this case 5 thousand professionals (10 thousand at the most) relocating to Russia every year is a too low �gure to achieve the set goal of attracting 200 thousand skilled professionals. In fact, the program is not operational. Probably, the reason is that there is no active international promotion of Russia as a country where one can relocate to look for a job.
The migration of IT professionals takes place also within Russia. As per the study undertaken by the Mayor’s O�ce of Innopolis (a new town in Tatarstan) and HeadHunter, 48% of the Russian IT professionals are ready to relocate to another region of the country, while 16% of them have already gained such experiences. The most preferable destinations for relocation are: Moscow (29.2%), St. Petersburg (27.7%) and Krasnodar area (11.3%). The TOP-10 included also Moscow region, Novosibirsk, Nizhny Novgorod, Kaliningrad, Leningrad region, Samara Region and the Republic of Tatarstan. If we speak about relocation to technology' and IT parks of Russia, then the TOP-5 which the respondents have heard about, include Skolkovo Innovation Center (Moscow), Academpark (Novosibirsk), Phystechpark (Moscow), IT Park and Innopolis (Tatarstan). At the same time, it would be interesting for over 60% of professionals to work at a technology park, 20% of them have not thought about such an opportunity, 10% reject such an option and 10% have already worked or work there. A central advantage of technology parks is de�ned by the IT professionals as a chance to exchange their experiences or to learn something new, advanced technology, and also higher salaries.
Managers of IT-projects and those dealing with database administration think about relocation most often. The relocation to other regions of Russia is least appealing to mobile application developers (18%), who would rather prefer to relocate abroad (25%). Both test engineers (21%) and programmers (16%) tend to the latter as well.
As per the data of HeadHunter, �rst half 2015 saw a rapid growth of CVs from IT professionals of the Crimea. Those were ready to relocate to other regions of Russia. During a year following the accession of the Crimea to Russia, the o�ces of Ukrainian software companies were closing. The economic situation was di�cult that also contributed to the sta� reductions. In total, about 4 thousand persons were looking for a job (this is a signi�cant percentage of IT professionals in the peninsula, if not a majority). All
117 Chapter 5. Human resources
Countries being potential donors for relocation of IT professionals to Russia(citizenship of the jobseekers who indicated a possibility to relocate to Russia inCVs posted from May through July 2016)
Kazakhstan 38%
Belarus 22%
Ukraine 18%
Uzbekistan 3%
Kyrgyzstan 3%
Azerbaijan 2%
Moldavia 2%
Other 6%

Chapter 5. Human resources 118
indications are that the situation has changed drastically in 2016. According to the statistical data of hh.ru web-site, there are as low as 1-2 jobseekers per job in the Crimea’s IT segment against a standard of 5-6. Therefore, it is possible to state that the excessive o�er has changed over to the de�cit of human resources. IT professionals desiring to relocate to the Crimea from other regions have already appeared. However, desirable salaries of jobseekers from other regions as indicated in their CV at hh.ru, are Ruble 55 thousand on the average in the IT segment, while those o�ered by the employers in the peninsula are much lower, i.e. Ruble 36 thousand.
Information from di�erent sources permits to state with certainty that the �gures describing the de�cit of human resources across the IT segment and, in particular, the software industry, have stabilized. Early in 2016, the vacancy numbers in the IT, Internet, and telecom segments was growing faster than that of CVs, according to the HeadHunter Index labor monitoring system. In May 2016, the vacancy numbers in the above segment exceeded that of May 2015 by 46%, while the CV numbers increased by 15% only. In general, hh.index (the number of CVs per vacancy) decreased in the IT segment. While this varied within a range of 3.7-4.7 in 2015, then it appeared to be within a range of 3.0-3.6 since January through August 2016. It means that the IT segment personnel de�ciency has increased.
However, the situation di�ers in the software development area –hh.index has increased considerably since the beginning of 2015 (from 1.7 to 4.6). That is to say, it has almost achieved a level that is comfortable for the employers, which is 5-6 in the opinion of HeadHunter experts.
5.3. Rotation and personnel de�ciency
hh.index in IT, Internet, telecom professional segment (number of CVs per vacancy in Russia
hh.index for Software Developer occupation (number of CVs per vacancy in Russia)
Janua
ry 2
015
Febr
uary
201
5M
arch
201
5Ap
ril 2
015
May
201
5Ju
ne 2
015
July
2015
Augu
st 2
015
Sept
embe
r 201
5Oct
ober
201
5No
vem
ber 2
015
Dece
mbe
r 201
5Jan
uary
201
6Fe
brua
ry 2
016
Mar
ch 2
016
April
201
6M
ay 2
016
June
201
6Ju
ly 20
16Au
gust
201
6
Janua
ry 2
015
Febr
uary
201
5M
arch
201
5Ap
ril 2
015
May
201
5Ju
ne 2
015
July
2015
Augu
st 2
015
Sept
embe
r 201
5Oct
ober
201
5No
vem
ber 2
015
Dece
mbe
r 201
5Jan
uary
201
6Fe
brua
ry 2
016
Mar
ch 2
016
April
201
6M
ay 2
016
June
201
6Ju
ly 20
16Au
gust
201
6
Source: hh.ru
Source: hh.ru
4.04.1
4.7
4.44.3
4.14.0
3.7 3.8 3.7
4.2 4.2
3.6
3.2 3.33.2
3.4
3.1 3.03.2
1.7 1.7 1.71.9 1.91.8
2.1 2.0 2.1
2.62.9
3.2 3.2 3.22.8
4.23.9
4.1
4.6 4.6

119 Chapter 5. Human resources
Such di�erent trends of index for all IT professionals and for software developers look illogical. As per our data, the Russian software industry must continue its growth in 2016, and the Russian IT market size is most likely to remain at the level of 2015 or reduce, if measured in US Dollar. The demand for human resources depends mostly on the industry situation. When the sales grow, the companies are more active in the labor market, while no symptoms of the growth have been seen throughout the IT industry in 2016.
We had no su�cient information late in summer 2016 to explain the above illogical variation of the �gures. It is possible to suggest that, at the background of IT market failure in 2015, the IT industry situation appeared to be much better in 2016, although without growth symptoms. The software industry saw no dramatic changes that would in�uence the labor market demand. At the same time, the IT companies, telecommunication companies, and IT departments su�ered from quite extensive sta� reductions (due to the economic crisis and to the changeover to cloud technology). For example, the ICT industry employment in Moscow decreased by 22.1 thousand persons during nine months 2015. All those professionals could apply for jobs of the software companies that had not changed drastically their activities in the labor market. It will be possible to either prove or disprove those suggestions, once the totals of 2016 are summarized.
According to our survey, the share of companies that showed no activity in the labor market in 2015 increased to 26% (in 2014– 22%), though the �gure decreased for the companies with a turnover below$5 million.
During a time interval between the crises 2009-2010 and 2014, the share of companies compelled to reject the employment of new sta� was decreasing regularly; initially, from 28% in 2010 to 15-16% in 2011-2012, and 11% in 2013, then the �gure varied within a range of 5-10% until 2009. It is possible to suggest that the next peak of the �gure was passed in 2015 and the share of companies that failed to hire at least one employee will start to decrease as per the totals of 2016, although the decrease will hardly be signi�cant initially.
The indicator of turnover of sta� has varied insigni�cantly during most recent years, while being at a su�ciently low level if compared with other countries (for example India), which is a competitive advantage of Russia. During 2011-2012 the sta� turnover was observed at the level of 6% while at year-end 2013 it somewhat increased (to 7.7%) along with the growing activity of employers, and in 2014 the sta� turnover decreased again — to 5.7% in the context of decreasing vacancies and absence of large-scale dismissals. In 2015 this increased again to 6.3%. However, while the sta� turnover was generally higher with small companies, then now companies with turnover of $5 million to $20 million are su�ering from the phenomenon to a bit higher extent.
Share of companies which did not hire new employees in 2012-2015,depending on company turnover
* - until and including 2014, “from $0.5 million to $5 million”** - until and including 2014, “less than $0.5 million”
year over $100 million over $100 million from $20 million to $100 million
from $5 million to $20 million*
from $0.5million to $5 million**
2012 0% 9% 11% 8% 59%
2013 0% 14% 0% 10% 26%
2014 0% 0% 10% 20% 50%
2015 0% 22% 12% 13% 43%

120 Chapter 5. Human resources
Annual turnover of staff depending on company size
* - until and including 2014, “from $0.5 million to $5 million”** - until and including 2014, “less than $0.5 million”
year over $100 million from $20 million to $100 million
from $5 million to $20 million
from $0.5million to $5 million
less than $0.5 million
2012 4.56% 8.29% 9.02% 8.41% 4.76%
2013 7.7% 7.4% 7.8% 8.2% 13.1%
2014 5% 6.5% 7.4% 6.6% 7.7%
2015 6% 6.1% 8.1% 6.1% 6.2%
Due to the crisis and to decline of the average growth rate of sta� number, the share of graduates in company sta� signi�cantly decreased. If over the period of obvious technical rally in the market it increased at year-end 2013 from 4.6% to 8.4%, then in 2014 this indicator dropped to the all-time low — 0.8%. However, the �gure increased to 8.1% to achieve the level of 2013 at year-end 2015.
Let’s try to understand what was happening. The revival of the labor market continued in 2013 after the crisis of 2008-2009. Large companies joined in a campaign of attracting the graduates, not only in IT sphere but in other branches of Russian economy as well. The inquiry of the recruiting portal Superjob.ru in the middle of June 2013 demonstrated that 72% of Russian enterprises and organizations hired graduates without record of service. Two years ago there were 66% of such employers, and in 2009 - 54%.
In 2014, the interest in graduates by large software companies decreased. First, the needs in expansion of o�ces in Russia lessened. Second, due to the economic crisis and thereto related drop of IT market, a su�cient amount of engineers with high experience appeared in the labor market.
Large companies may o�er higher salaries to their employees. This permits them to hire employees featuring work experiences. Small companies are compelled more often to invite university graduates. The share of inexperienced employees for the companies with a turnover below $5 million amounts to 13% and that for the large companies — 7.6%.
The sta� turnover is a bit higher with the companies to a greater extent focused on exports. Their �gure amounts to 6.4%, the companies with a share of foreign sales below 50% show 6%.
If companies gain a major percentage of income abroad, they prefer (and are able) most often to hire experienced employees. If exports exceed 50% of the turnover, the share of graduates amounts to 6.9%, and if it is less than 50%, then it is 10.9%.
As low as 14% of the companies with a share of exports below 50% and 28% of the companies with a share of exports above 50% failed to hire at least one employee in 2015.
During all years under investigation, more active in the labor market were companies geared to foreign markets than those more active in the Russian market. During most recent years, the �gures have equalized from time to time, but the next year reinstates a great di�erence between them.
The sta� turnover �gure is more than twice as much with the service companies as compared with the software vendors (6.6% against 3.2%). As much as 74% of the service companies and 51% of the software vendors faced employee withdrawals in 2015 (65% on the average across all the companies).
The share of employed graduates in the total sta� numbers depends on the business model to a lower extent. The �gure of software vendors is 6.9%, and that of service providers — 7.9%. In 2015, 53% of the software vendors and 63% of service companies hired recent students in 2015 (60% on the average throughout).

121 Chapter 5. Human resources
New companies at an age below 10 years show higher sta� turnover �gures as compared with companies older than 10 years (8.2% against 6.1%). The share of graduates in the total sta� numbers is also higher with new companies (10.5% against 7.8%).
Among the companies at an age below 10 years, 11% has hired no employees in 2015. Among the companies older than 10 years, those make 30%.
The technical rally in labor market during almost all years under investigation has been noted in St Petersburg. This city leads in indicators of sta� turnover and of the share of hired university graduates. In addition, St. Petersburg traditionally has the least number of companies that employed nobody. Though in these three indicators, St. Petersburg can be compared only to Moscow and the whole Russia. The coverage of other cities in our survey is too scarce.
Generally, the metropolitan companies reduce sta� less than the companies from other towns and more often hire new employees.
As a whole, the situation in the labor market in various cities and regions year after year has smoothened. However, a year ago we assumed that adjustment of indicators characterizing the activity of the Russian software companies in the labor market can be disturbed due to a mass in�ow of IT professionals from abroad as anticipated in 2014-2015 (primarily from Ukraine). In all appearances, that was the case in 2014, but the dispersion of the �gures went down at year-end 2015.
Since 2008, the demand for engineers with di�erent specialisations among all respondent companies has been changing modestly. The top three of the most demanded categories throughout these years stably includes only developers of C/C++, Java and C#.
Among other most demanded specialisations beyond the Table are 1С, Python (3 mentions), Delphi (3), Objective-C (2), Java Script (2), ABAP, SQL programmers. Business analysts, bank software integration project managers, marketing experts, sales managers, operators, 1C analysts, IC consultants, development managers, data protection professionals, engineering support professionals, and multimedia professionals are also demanded.
Activity of respondent companies in the labor market depending on location
Местоположение компании
at year-end 2013 at year-end 2014 at year-end 2015
Hiredgraduates
Hiredgraduates
Hiredgraduates
Hirednobody
Hirednobody
Hirednobody
Staffturnover
Staffturnover
Staffturnover
Moscow 2,4% 15% 7,2% 8,20% 25% 5,2% 0,4% 25% 6,1%
St. Petersburg 9% 4% 9,5% 9,3% 10% 9,2% 1,2% 25% 7,5%
Regions 7,6% 11% 7,4% 8,2% 21% 5,4% 1,9% 23% 6,5%
Most popular specialists that were employed by respondent companies in 2008-2015
2008 2009 2010 2011 2012 2013 2014 2015
Developer (C/C++)
42% 30% 25% 29% 26% 28% 24% 24%
Developer (Java) 29% 29% 21% 30% 17% 26% 23% 27%
Developer (C#) 20% 19% 18% 28% 23% 27% 24% 24%
Developer (DB) 4% 5% 2% 4% 4% 4% 3% 1%

122 Chapter 5. Human resources
For work at the foreign markets in 2014 the Java and C# developers were demanded much more often (these specialists were hired by 34% and 39% companies with more than 50% export turnover, and with a smaller share - 18% and 16%, respectively, when it comes to work more at the Russian market). For work in the Russian market the demand for Web programmers PHP/MySQL is the highest (21% versus 8% in 2014). Similar di�erences in demand for speci�c engineers were also observed following the results of 2012-2013. In 2015, the respondent companies hired most often test engineers and web-programmers for foreign sales.
Most popular specialists that were employed by respondent companies in 2008-2015
2008 2009 2010 2011 2012 2013 2014 2015
Test engineer 9% 14% 13% 22% 16% 15% 11% 18%
Web programmer(PHP/MySQL)
21% 11% 13% 13% 18% 20% 17% 15%
Web programmer(ASP.Net/MS SQL)
16% 7% 4% 15% 13% 10% 9% 8%
Systemadministrator (Win)
2% 4% 7% 8% 6% 6% 2% 5%
System administrator (UNIX)
2% 4% 2% 5% 2% 3% 1% 2%
Others 8% 16% 11% 19% 15% 16% 13% 15%
Average number of mentioned categories
1,53 1,39 1,16 1,73 1,4 1,55 1,26 1,39
Most popular specialisations of engineers that were employed by respondentcompanies in 2008-2015
companies with a share of exports below 50%
companies with a share of exports above 50%
Developer (C/C++) 22% 27%
Developer (Java) 25% 32%
Developer (C#) 23% 27%
Developer (DB) 2% 0%
Test engineer 14% 30%
Web programmer (PHP/MySQL) 15% 14%
Web programmer (ASP.Net/MS SQL) 5% 16%
System administrator (Win) 5% 5%
System administrator (UNIX) 2% 3%

123 Chapter 5. Human resources
St. Petersburg companies employ Java developers Java developers more then all others. It is possible to suggest that their share among all the developers in the second capital is higher than that in any other city of Russia as Java as the programming language (its �rst versions) had been developed in St. Petersburg R&D Center of Sun Microsystems (now Oracle).
In 2014 HeadHunter evaluated personal qualities most frequently mentioned in CVs by job applicants to attract employer’s notice. It was found out that di�erences between Moscow, St. Petersburg and other cities are very big. In St. Petersburg and in regions the reliability took the �rst place (35% and 54%, respectively). In Moscow this characteristic was not included even in the �rst three qualities. In the capital the most frequently mentioned qualities were communicability (31.5%), ability to handle stress (18%) and commitment (13%).
According to HeadHunter’s survey, in the recent years the most promising and popular professions in the IT area were: tra�c arbitration expert, computer graphics designer, data scientist, UX designer, mobile game programmer, information system architect, cloud solution developer/programmer (cloud technologies). Other promising jobs that appeared in Russia before 2011 were as follows: GUI designer, usability expert, Ruby on Rails developer, iOS developer.
With due account for perspectives for development in Russian higher education institutions, new specialized departments have been established, as a rule, with participation of a Russian or a foreign company. Thus, for example, “Big Data Analytics” department was established in the Ural Federal University. The required equipment and software for studies in Big Data in this university was supplied by Teradata in the end of 2014.
Distribution of specialists that were employed by respondent companies in 2015depending on location of respondents
Moscow St. Petersburg Regions
2014 2015 2014 2015 2014 2015
Developer (C/C++) 19% 29% 26% 28% 27% 16%
Developer (Java) 17% 23% 39% 44% 18% 21%
Developer (C#) 19% 21% 26% 19% 25% 30%
Developer (DB) 0% 2% 10% 0% 2% 2%
Test engineer 14% 19% 19% 19% 4% 18%
Web programmer (PHP/MySQL)
19% 13% 16% 9% 16% 20%
Web programmer (ASP.Net/MS SQL)
11% 4% 10% 16% 7% 7%
System administrator (Win)
0% 4% 0% 3% 4% 7%
System administrator(UNIX)
0% 2% 0% 3% 2% 2%

124 Chapter 5. Human resources
Few IT-professionals have been able to claim an increase in salaries in Russia during most recent years. Among those were the software developers. However, they also have a grievance. First, their salaries were revised in Ruble only, and decreased signi�cantly in US Dollar. Second, software developers had witnessed previously an increase in their salaries by 10-20% every year. The growth was almost warranted above the o�cial in�ation rates. During 2-3 most recent years, this has been either at or below the in�ation rates.
While the salary growth of software developers was somehow in conformity with the o�cial in�ation rates in 2013—2014, then it was apparently strongly lower in 2015. According to our survey and to the data of recruiting agencies, the salaries increased by 4.5-7% in 2013, while the in�ation rates amounted to 6.6%. In 2014, the average salary growth rate of the respondent companies amounted to 11.6% against the in�ation rate of 11.2%. However, the �gure took account of labor compensation at the foreign development centers as well (for instance, in Ukraine where the national currency depreciated much more than in Russia). If we eliminate the data of companies with a turnover above $20 million, which have considerable (sometimes, majority) percentage of the employees is based in other countries (�rst and foremost, in Ukraine and Belorussia), then the salary growth amounted to 8.4%, which is likely to correspond to the increase in average salaries in Russia. It is necessary to keep in mind that our survey involves only companies o�ering foreign sales, and the exporters had more opportunities to increase salaries in Ruble at the cost of proceeds in foreign currency.
In 2015, the average salary growth of respondent companies (excluding major ones with a high number of development centers abroad) amounted to 8% at the background of the o�cial in�ation rate of 12.9%.
The average salary growth we calculate is well corresponding to the data from various sources. Korn Ferry Hay Group, a management consulting company, indicates that people engaged in the IT segment have increased their compensation by 7.9%. The researchers of HeadHunter have recorded a salary growth by 9%. The salary index of Superjob (SJI) which is concerning IT increased for the year (January 2015 to January 2016) by 6.4%, and added another 4% before June against the year beginning. In this case, a di�erence of 1-2 percentage points is totally insigni�cant as di�erent methodologies are used to collect the data and to calculate. Recruiting companies focus generally on the vacancies — i.e., the salaries o�ered to new employees. Our survey shows, how the salaries of the employed professionals vary.
Under certain software development specialisations, a dispersion of the �gure is quite high; however, it is quite admissible that the average �gure is in a range of 7-9%. For example, Superjob Index indicates that the PHP programmer’s salary increased by 11.6% in the calendar year, while that of the Java programmer —by 1.3%. In return, the salary of the Java programmer increased faster during the following half-year (since January 2016) —by 12.8% against a 5.3% increment of the PHP programmer.
5.4. Labor compensation
Average salary growth under different classes of respondent companies
All respondent companies +8%
Head office location
Moscow +7%
St. Petersburg +8%
Other cities of Russia +10%
Company size
turnover below$5 million +9%
turnover above$5 million +7.8%
Share of exports
less than 50% +6.6%
more than 50% +10%
Business model
replicated solution developers +4%
customized software developers +9%
Age
companies older than 10 years +10%
companies younger than 10 years +8%

125 Chapter 5. Human resources
The salary growth below the in�ation rates is an attribute of the industry’s crisis. However, the crisis is a special type. At the background of the situation around other industries, it is missing at all (compare –as per the data of HeadHunter, the average salary throughout Russia decreased by 1.06% in 2015).
As Ruble has depreciated against US Dollar by the factor of 1.9 during three most recent years, then the average salary of a software developer in US Dollar decreased by 31%-35% during the same period. At the same time, the purchasing capacity for the employees with IT companies reduced insigni�cantly within Russia, though the competitive ability of Russian software companies improved in the global market (�rst of all, this concerns the customized software development).
None of the respondent companies revised the salaries downwards in 2015. As much as 41% of companies maintained the previous salaries, 45% — increased the same, and 14% hesitated to respond to the appropriate question in 2015. The salaries were increased by more than 10% by 16% of the respondent companies.
Most of all, the average salary increased with the service companies developing customized software. In addition, the growth is higher with the companies focused on foreign markets (with a share of exports in their proceeds above 50%).
As per the data on the salary growth in the two capitals and regions in 2015, it is possible to suggest that the di�erence between the salary levels equalized to some extent, but only by quite an insigni�cant amount. The di�erence is high still – under some occupations, the average salary in Moscow is almost twice as much as that in any other metropolis of Russia.
When comparing the data on the salary levels of programmers in di�erent cities for a period from August 2015 through August 2016 (as per the data of Yandex.Job), it is clear that the salary growth rates are almost the same everywhere— about 10%. However, those turned out to be higher in two cities. One can note apparent equalization of salaries outside Moscow and St. Petersburg. It is most likely that the internal migration tells on.
Average offered wage at vacancies of programmer in different Russian cities,thousand rubles
Source: “Yandex.Job”
August 2014 August 2015 August 2016 Growth for the last year (August 2015
against August 2016)
Relative to Moscow average in August
2016
Moscow 82 87 97 +11% 100%
St. Petersburg 64 74 85 +15% 88%
Novosibirsk 52 59 65 +10% 67%
Nizhniy Novgorod 47 48 59 +23% 61%
Yekaterinburg 47 51 56 +10% 58%
Voronezh 46 55 60 +9% 62%
Saratov 45 50 55 +10% 57%
Perm 39 52 57 +10% 59%
Rostov-on-Don 39 45 52 +16% 54%

126 Chapter 5. Human resources
On the average, a programmer earned Ruble 75-76 thousand in Russia late in 2015. By August 2016, the �gure increased to Ruble 79-80 thousand.
According to a survey undertaken by Mail.Ru Technology Park jointly with SmartStart recruiting agency, students would like to earn 43% more at the starting position in the software development segment than now is paid by the employers (Ruble 50.5 thousand against 35 thousand). The survey involved 548 students at IT Departments of the Bauman Moscow State Technical University, Lomonosov Moscow State University, St. Petersburg State University, etc. Therefore, this refers �rst and foremost to Moscow and St. Petersburg.
Although students evaluate inadequately their future value in the labor market, the survey data indicated that the most important criterion when choosing the employer is «interesting tasks» as judged by a prevailing majority of the current IT students (70%). This demonstrates that the attitudes of young people towards their own career become much conscious. This is also evidenced by the fact that 43% of respondents have gained work experiences in the occupation obtained at the university and 33% feature traineeship experiences. Information on the actual salary levels for the study was provided by HeadHunter Company.
Source: Research Center of superjob.ru portal
Source: Research Center of superjob.ru portal
Average wage of C++ programmer with at least 2 years of experience in differentRussian cities (December 2015), thousand rubles
110
120
98
64 66
82
66 6674 71 71
78
6472 72 72
94
61
76 7568 68 68
5869
6168 66
61 61
Mos
cow
St. P
eter
sbur
gVo
rone
zhYe
kate
rinbu
rg
Kaza
nKr
asno
yars
kNi
zhny
Nov
goro
dNo
vosib
irsk
Omsk
Perm
Rost
ov-o
n-Do
nSa
mar
a
Ufa
Chely
abins
kVo
lgogr
ad
Mos
cow
St. P
eter
sbur
g
Voro
nezh
Yeka
terin
burg
Kaza
nKr
asno
yars
kNi
zhny
Nov
goro
dNo
vosib
irsk
Omsk
Perm
Rost
ov-o
n-Do
nSa
mar
a
Ufa
Chely
abins
k
Volgo
grad
Average wage of iOS application developer in different Russian cities (March 2016),thousand rubles

127 Chapter 5. Human resources
As per the data of the Ministry of Education and Science, the average salary of Russian university graduates in the initial employment year increased during the past year (since mid-2015) from Ruble 28 thousand to Ruble 30.6 thousand. This applies to all the occupations rather than IT only.
The number of Russians agreeing with «under-table» or «illegal» salaries (i.e., which are informal in full or in part) strongly decreased. According to a survey of the Research Center of Superjob portal, the share of them has decreased by 19 percentage points during 6 most recent years. At year-end 2015, 41% of Russians at an employable age agreed with “enveloped salaries”, 35% would not agree with such a compensation scheme. Another 24% of respondents hesitated to respond. It is possible to suggest that much more than 35% of the IT professionals would not agree with “black” salaries.
Recruiting agencies expect that the IT professional’s IT salary will have to increase by about 7-10% at year-end 2016. It means that the growth will be somewhat at or a bit higher than o�cial in�ation rates. In US Dollar, the average salary is most likely to change by 2-3% at the most. Judging upon 8 initial months, the average Ruble exchange rate against US Dollar will amount to about Ruble 65-66 in 2016 that shows the national currency depreciation by 8-9%. The data on 8 initial months has proved the forecast. The salary growth of software developers has not di�ered much from the same �gure of the IT segment as a whole.
The past years saw some problems relating to the averaging of a programmer’s man-hour cost. The point is that the respondent companies were reluctant to answer the appropriate question. As a result, we had quite an insu�cient sample to calculate the average �gure within an acceptable error. In addition, it was suspected that a percentage of the companies indicated the cost that was unreal for them. In order to improve the averaging accuracy, we changed the wording of a question about the man-hour cost, and requested that both the minimal and maximal rather than average value should be indicated. The results of all the companies and distributed by class appeared to be more realistic.
Man-hour cost, $ (survey undertaken in spring 2016)
Software development Testing
Project managers
All respondent companies 28-44 26-36 38-50
Depending on head office location
Moscow 30-47 32-37 46-55
St. Petersburg 25-43 21-37 31-48
Regions 21-64 20-30 23-33
Depending on size
turnover below$5 million 19-30 15-23 23-39
turnover above $5 million 30-46 27-35 39-49
Depending on share of exports in turnover
less than 50% 29-43 29-36 43-53
more than 50% 30-60 23-36 32-46

128Chapter 5. Human resources
In the sphere of sta� training for IT industry we observe an obvious though rather small progress during last 10 years. Some governmental decisions concerning the educational system look belated as the appropriate proposals were expressed by representatives of IT companies and trade associations already about 15 years ago.
In particular, the progress is observed as a better funding of universities. The changes were well characterized by an ITMO professor: “We have moved to another category. Before we were beggars, now we are poor, and there is a fundamental di�erence between beggars and poor persons. Today we have an opportunity to make progress”.
The material and technical resources of many universities are already at a good level and the lack of �nancing concerns primarily a salary level of the academic teaching sta�. There are very rich higher education institutions (�rst of all, in Moscow with very expensive fee-paying education and powerful sponsors). Some lecturers have good wages. Nowadays young people also go to work at higher education institutions improving the indicator of teaching sta� mean age. But for young teachers the �nancial incentives are not of paramount importance.
At the same time, by no means all higher education institutions deserve an increase in �nancing by the state. Over 50% of university graduates do not work within the chosen IT specialty largely because their level of competence does not satisfy the employers. For the leading higher education institutions this indicator is more than 70%, but the national average is about 50%. Not all problems can be solved with money. Sometimes the change of management of a higher education institution is needed or merger of underperforming universities into leading ones. The process has begun, but it is still di�cult to predict future results of these changes.
Financing of the universities has been unlikely to improve during 2 most recent years, if we consider all the sources, i.e. budgetary injections, fee-paying education, partner investments, pro�t-based projects. It is most likely to be at the previous level in ruble. However, it is possible to suggest that the e�ciency of governmental �nancing in the higher education segment has improved. This could happen as a result of involvement of Russian universities in the enhancement of their positions on various rating lists. Indeed, those rating lists are not perfect, they do not provide for an adequate comparison (�rst of all, between the universities of di�erent countries), though they operate still as some evaluation of the way the university evolves. While �nancing of universities was chaotic, and many things were dependent on the rector’s ability to wheedle money out of the budget, then the rating system has given a chance to identify at least those universities that have no grounds for additional �nancing.
It is essential to improve level of education and a share of graduates who work within their specialisation, but anyway it is also necessary to increase the total number of students in de�cit technical areas. Thanks to activity of the umbrella Association of computer and IT companies (APKIT) in recent years this increase had a rather regular nature. In 2016 the Ministry of Communications and Mass Media reported that the growth of student spaces paid by the State in IT subject matter will be as much as 31%. As a result, in the two last years, the government order for IT engineers increased by more than 70%, from 25 thousand to more than 42.5 thousand State-funded student spaces. In 2017, a further expansion by about 30% is expected at the cost of reduction in the State-funded spaces under other occupations that are not in the demand corresponding to the graduate numbers.
Out of 2607 Russian universities, information technology professionals are educated in 951. The information is obtained from a study “Runet Economics 2014-2015, RAEC, Superjob.ru”.
Unfortunately, there is no correct statistical data on the education of IT professionals at universities with a breakdown by occupation and with data on the employment of graduates in the public domain. We can only estimate them approximately, relying upon the data obtained from various sources. As per the data of the Federal State Statistics Service, there are 4 766 thousand students. Out of them, 2 269 thousand are educated on a full-time basis. The graduates are about 5 times as low, while the IT occupations account
5.5. Sta� training. Universities

for 14% of all the education programs. Thus, Russia annually o�ers about 60 thousand graduates who have been educated on a full time bases and graduated with an information technology profession (if we assume that the share of programs corresponds to that of students). Along with other education types, this will result in about 130 thousand. Almost all IT professionals o�er programming skills, though half or less of them can be employed as programmers. The graduate numbers must be divided by half still, if we need to identify those intended to work under the occupation. As a result, about 30 thousand of 60-65 thousand university graduates, who have been trained in programming, are going to work as programmers. The software companies obtain 8-10 thousand, the other are employed with enterprises and institutions of various economy sectors. Generally, this corresponds to our data on the software developer numbers employed throughout the country’s economy and those employed in the software industry. Moreover, it is known that about 65 thousand persons pass a Uni�ed State Examination in computer science. This is about the same number with those admitted to the universities under IT occupations on a full-time basis.
However, a comprehensive study of the IT segment sta� training system is required, starting from the occupational guidance of schoolchildren and ending with the monitoring of graduate employment. The Russian Government made a decision to monitore graduate employment. The corresponding system was developed by the Ministry of Education and Science, the Federal Education and Science Supervision Service, and the Pension Fund. The heads of these agencies signed an agreement about information interaction and data exchange. The analysis of graduate employment will help to forecast the needs of the Russian economy in quali�ed human resources in the course of distribution of state-funded student spaces by categories and lines of training within higher education programs. The monitoring results are important for decision making in the future.
Currently, the Russian Government still has no correct information about the quantity of IT engineers and, in particular, programmers in the country. Public servants refer to data of di�erent surveys but do not know which of them must be trusted in case of signi�cant discrepancies in computational results. How the state monitors the employment, and whether it is the case — any information on this was available still at the end of August 2016.
The Internet Development Institution (IRI) announced in May 2016 that it was planning to undertake a Russian-wide survey of the IT-educational programs at Russian universities. However, it is most likely that this implies a study of the process only without an o�er-demand analysis.
Nevertheless, based on these results the Ministry of Communications determined that for accelerated development of IT industry during several years since 2014 till 2018 at least 350 thousand IT engineers should be trained. The increase of state-funded places in educational institutions in IT subject matter is one of measures to achieve this objective. It is thought that the educational system (including postgraduate and sta� retraining courses) will prepare by 2018 up to 150 thousand IT engineers. It is supposed to attract the de�cient engineers from other countries (for further information, see chapter “Labor migration”). However, there is no accurate and reliable information on how many professionals are educated, and what share of them will work under the occupation. The guides have been set, though it is not possible to check how much these have been approached and set correctly.
The growth of state-funded spaces under IT occupations can be welcomed, though it is also necessary to agree upon the plans to expand the same with the number of prospective students who are ready to elect the occupations.
The education quality of engineers has been also a�ected during most recent years by the so-called demographic downturn caused by a drastic reduction in the school graduate numbers due to the birth-rate falling during a period of “perestroika” in 1990s (a growth in the school graduate numbers is only expected after 2018).
This has resulted in a lower competition for technical universities from year to year. Entrance to universities became easier and the threat of expel after the entrance decreased. Therefore, both higher education institutions and young people have fewer stimuli to improve the quality of training. By 2010, the fall of the graduate and of students' educational level (who start working in the companies even before the graduation) became obvious almost for all employers. Of course, the point was only the average education
129 Chapter 5. Human resources

Chapter 5. Human resources 130
standard that had been declining, though slowly, at the time when the education quality at some educational institutions could improve during the past years.
Besides, the teaching sta� began to note that nowadays students ceased to read not only �ction but even professional literature. Consequently they have a limited intelligence in comparison with the time when open mindedness was one of competitive advantages of Russian developers. It is essential for understanding the requirements of customers who present di�erent spheres of human activities. Besides, lack of knowledge that cannot be gained by a narrow technical specialization hinders development of high-tech business whereas a low level of culture prevents adherence to their country. For this reason a lot of young engineers are ready to leave Russia, and consequently other countries will take advantage of contributions made by Russian educational system. The teaching sta� of leading universities already feels anxious about a limited students’ intelligence and values that they share these days.
At the same time, there are some positive changes. Universities received grants, which allow them to invite well-known professors from abroad. Furthermore, judging by achievements of the Russian students and graduates in the international programmer competitions, signi�cant deterioration in comparison to foreign universities is not observed. This can be partly explained by the fact that the level of IT major training is gradually decreasing in most countries (especially in the developed ones).
However, an increase in the state �nancing support still does not allow involving young talented teachers in the quantity necessary to retain the existing quality of training. The salary of university faculty remains rather low, and many things stay up thanks to the enthusiasts who retire over time or switch to a better-paid job by family circumstances.
At the background of a general reduction in the school graduate numbers, the popularization of IT occupations gains special importance. In an e�ort to encourage youngsters to go to higher education institutions in IT subject matter, in Russia in December 2014 a large-scale event “Code Hour” took place within which over 7 million children from more than 35 thousand schools in all federal districts of Russia got familiarized with programming fundamentals. This event during a week covered 70% Russian school children. In 2015, over 8 million children became involved in the same event.
It was supported by the Ministry of Education and Science, the Ministry of Communications, as well as leading companies of Russian IT industry. The campaign allowed children and their parents to assess the importance of such subject as informatics and, probably, to specify IT as an area for subsequent training and career building.
Moreover, for popularization of IT and for initial training in the information technology �eld the Ministry of Communications and Moscow Education Department jointly with 1С, ABBYY, Mail.ru Group and Yandex on the basis of competition selected some �fty Moscow schools to arrange elective IT courses and classes. In opinion of the ministry, this experiment can be extended to other Russian cities.
All indications say that the popularization yields its fruit. According to a survey undertaken by Levada Center in mid-2016, 17% of parents desire to see their children as programmers. This is the highest �gure among all the occupations along with physicians. Lawyers, economists and �nanciers gained 13% each.
A survey undertaken by the VCIOM (all-Russia sociological agency) almost at the same time shows also a great di�erence in the popularity of engineering and humanitarian professions. As much as 40% of respondent Russians would like to see their children and grandchildren engaged in the engineering segment, while as low as 16% - as humanitarians. The admission to universities in summer 2016 is another evidence that the engineering professions are appealing young people to a growing extent.
A new higher education institution has been established with the State participation to train exclusively IT engineers. Innopolis University in а town of the same name dedicated for high-tech business will be built near Kazan, the capital of the Republic of Tatarstan. State budget committed therefore 4.7 billion rubles (from both federal and regional budgets). Financing of business operations including paying salaries to teachers, selected on results of the competition, was imposed on sponsors. In the middle of 2014 the consent to participate in �nancing of the Innopolis University gave a large Russian communications

131 Chapter 5. Human resources
service provider MegaFon and several Tatarstan IT companies. In 2015, 20 thousand young people expressed their desire to get into the university, though the applications were satis�ed for 322 of them only. The training is carried out by Innopolis under the following categories: Software Engineering, Cyber Security, Data Sciences, Robotics, and Computer Science.
In 2014 the Russian Government launched the program called “Global education” which envisaged awarding scholarships to students to the amount of 1.38 million rubles per person. Then the limit was increased to 2.763 million rubles (about $40 thousand) due to the ruble devaluation. This sum can be spent on training of Russian students in the prominent foreign universities in IT sphere (particularly, Information Technologies, Computer Science and Information Security). The scholarship also may be spent on transportation to the place of education, on health insurance, accommodation and food, study materials and scholarly literature, etc.
The government speci�ed a list of foreign higher education institutions and lines of training under the program. It includes 219 higher education institutions from 27 countries including American Harvard University, Massachusetts Institute of Technology, Californian universities in Berkeley and Santa Cruz, Columbia University etc.
The state program will act in 2014-2016 covering 1.5 thousand citizens.
The state scholarship is granted to persons who have advanced degree and commit to work three years according to educational quali�cation in a Russian company, higher education institution, scienti�c or medical institution. Those who violate the last condition may face obligation to return the amount received and to pay the penalty at twice the amount thereof.
By December 2015, the requests for participation in the «Global education» program were submitted by 700 persons, 153 persons were approved as winners of all the competitive selection rounds undergone, 97 winners signed agreements. By now 6 participants completed their education at a foreign university (all of them have been employed).
In Russia since the middle of 2012 the process of development of new professional standards in IT area is underway. It was initiated by the order of the President dated 7 May 2012 No. 597 “On measures in implementation of state social policy”. It is assumed that by 2015 there will be developed and approved no less than 800 professional standards for di�erent branches. In the autumn of 2013 there were released to the public �rst versions of twelve new standards in IT area developed under the auspices of APKIT: Database administrator; Software architect; IT manager; IT product manager; Programmer; IT project manager; Software development manager; System analyst; Information resource engineer; Information system engineer; IT test engineer; Technical writer in IT area.
The postgraduate education system (the career development and sta� retraining system) created by the organized business may also ensure an increase in the Russian labor market supply. For example, in June 2013 RUSSOFT, supported by the American Chamber of Commerce, established St. Petersburg Academy of Postgraduate IT Education (SPb ITAPO). Here about ten chairs o�ering modular programs for retraining of engineers in various IT areas – from programming and software testing to application programs of the city/enterprise level – are established on the basis of commercial companies' training centers.
Besides, the Ministry of Education approved the three-year refresher course program for technical specialists, within which at least 15 thousand people are supposed to be trained. This program will be implemented based on the private and state partnership principle. The Ministry of Education is ready to �nance up to 50% of the employers' expenses on engineer training. Up to $10 million are supposed to be annually allowed for these purposes in the Ministry federal budget. This program provides professional development in Russia, as well training abroad. Similar support measures are taken and prepared at the regional level.
Unfortunately, the proposed program is intended for sta� retraining based on the existing chairs of universities and does not provide involvement of medium and large Russian companies' training centers, as well as of foreign corporations' training centers in Russia. Experience shows that, in terms of professional

132 Chapter 5. Human resources
development and retraining of active IT engineers, the e�ciency of higher education institutions is lower than that of companies' training centers as the majority of university professors are not involved in commercial projects on a regular basis.
Considering all aforesaid, it can be stated that the existing education system is only capable to partially reduce the de�cit of IT specialists and, in particular, of software developers.
Private companies the same as the Russian government began to implement the increased focus on sta� training. Large IT enterprises, which have actively cooperated with higher education institution for a long time, announced launching new educational programs or broadening of existing cooperation. Currently there is much more news about similar incentives than in several prior years.
Judging upon the results of our survey, the activity of software companies in this area reduced slightly in 2014 as against the past year, though recovered again in 2015. Moreover, 60% of the respondent companies cooperated with universities. This is the highest �gure of our survey since 2008. The preliminary data indicates that companies will not curtail their cooperation with universities during 2016.
The share of companies cooperating with universities has varied mostly due to companies with a turnover below $5 million. While 40-50% of such companies indicated under the survey 2016 that they had not cooperated with universities during the past year, then the share was higher by 20-30 percentage points in 2015.
Cooperation
Main types of cooperation between companies and universities in 2008-2015
2008 2009 2010 2011 2012 2013 2014 2015
Students training 42% 41% 41% 37% 39% 45% 38% 43%
Graduates employment 34% 23% 26% 32% 31% 32% 24% 39%
Courses for employees 24% 21% 18% 17% 19% 14% 12% 23%
Other 1% 14% 10% 17% 12% 19% 37% 11%
Do not cooperate 42% 48% 48% 48% 53% 46% 53% 40%
Cooperation between companies and universities, depending oncompanies’ turnover in 2015
over $100 million from $20 million to $100 million
from $5 million to $20 million
from $1 million to $5 million
less than $1 million
Students training
100% 67% 63% 43% 30%
Graduates employment
100% 67% 75% 37% 20%
Courses for employees
0% 67% 25% 24% 14%
Other 0% 22% 25% 9% 5%
Do not cooperate (a year before)
0%(%) 22% (%) 17% (%) 41% (%) 52% (%)

133 Chapter 5. Human resources
Among the large and medium software and IT companies (both Russian as well as foreign companies operating in the Russian market), those companies failing to cooperate with universities were very few for many years. Such companies have launched new programs supposing a support to the education system during most recent years.
The Higher School of Economics (HSE) reported that at the computer science department of the higher education institution created by HSE jointly with Yandex a number of prospective university students who have won di�erent Academic Olympics in the 2014-2015 academic year would exceed the number of state-funded student spaces (216 versus 180). Exactly half of the Olympics winners enrolled at this faculty are graduates from regional schools. In cooperation with Yandex, the Higher School of Economics plans to train skilled engineers who will build up сomputer science in Russia.
The EMC development center in St. Petersburg reported that in 2012-2013 spent about $1.15 million on educational incentives and training of young engineers. In Russia this company starts training new generation of engineers already in the upper secondary school. In 2013 EMC launched the Student STAR Program which included visits of the development center as well as intensive educational courses. In the freshman year the best students of these higher education institutions may lay claim to the “Successful freshman scholarship” to the amount of 7 thousand rubles per month. In this fashion in 2012-2013, the company subsidized 60 students.
The EMC Academic Alliance program is in a league of its own. Under this program the company does not provide any �nancial inducement. It is aimed at development of a portfolio of educational courses to be included in the training agenda of higher education institutions. In Russia and the CIS countries more than 80 higher education institution – partners joined this program.
In early 2014, Mail.Ru Group and IT Innopolis University signed a memorandum of understanding. The university’s courses plan will be improved to account for market’s challenges and include the latest IT trends. Whereas, Mail.Ru will lend assistance in training of young Russian IT engineers. The university students will be able to practice problem solving on the basis of cases prepared by the Mail.Ru engineers. Moreover, the successfully interviewed students will reinforce the skills by working on probation at the company, and the employees of Mail.Ru are invited to conduct research and practice classes in the university.
In summer 2014 Kaspersky Lab reported that it would participate in training of students of the Moscow State University (MGU) and of other leading Russian higher education institutions. The company and the department of computational mathematics and cybernetics of MGU concluded an agreement on cooperation and joint educational activity in the information security �eld. In partnership with the university the Kaspersky Lab engineers will hold a course on di�erent aspects of software development as well as actively participate in development of the “cyber security” area of focus at the department.
Yandex decided to open its new master's program of engineer training in data processing and storage in the St. Petersburg State University. The would-be masters will learn in the department “Information analytical systems”. Most of the time students will dedicate to studies of mathematical statistics, parallel programming, data processing and computer-aided learning. All subjects will be taught not only by lecturers of the department but also by the Yandex employees.
A combined master’s program implies close cooperation of students and the company. Training is arranged in such a way that some courses will be taken in the university, and another courses — at the company’s Computer Science Center. Besides, the Yandex employees not only will deliver lectures but also take upon themselves tutoring in preparation of research papers and master’s thesis. Studies are planned to start on 1 September 2014.
Yandex.Money arranged in St. Petersburg a school for web developers in May-June 2014. The session implied assimilation of XML, XPath and XSLT languages.
Yandex is not a pioneer of business cooperation with the St. Petersburg State University. Over 10 years, the System Programming Chair of the St. Petersburg State University in cooperation with Russian companies such as Lanit-Tercom, JetBrains, Digital Design, MacroGroup, and St. Petersburg Development

134 Chapter 5. Human resources
Center of EMC has conducted student projects and managed summer schools, which involve over 100 students per annum. As a result of such additional industrial training, students gain collective work skills, learn new technology and being trained in such operational aspects as scheduling, quality control, software version management, etc.
Since the middle of 2014 such examples of cooperation between universities and large business have been much fewer. According to our survey, in 2013 a share of companies cooperating with higher education institutions increased from 47% to 54%. At year-end 2014 due to the di�cult economic situation this �gure decreased to the 2012 level - to 47%. Closing cooperation up is typical both for small and su�ciently large companies (with the turnover up to $100 million). The previous increase in the share of companies cooperating with higher education institutions in 2013 was due to small companies which in those times enjoyed somewhat redressed situation.
The indicator of cooperation with higher education institutions has been increasing until 2014, notwithstanding that in recent years for middle-sized Russian and su�ciently large foreign companies it has been much more di�cult time to bring the leading universities in contact. The latter are more and more aware of themselves as producers of tight human resources. According to a survey of Career.ru (portal belongs to HeadHunter) performed some three years ago, 30% of companies cooperating with higher education institutions and colleges have a hard time because higher education institutions engage with reluctance. 49% of respondents confess that the process itself is very hard to organize, and 38% of the companies undergo di�culties in looking for resources such as mentors for inexperienced graduates.
In 2015, there were almost no reports on the new types of cooperation between business and universities. Those appeared again in 2016. It can be noted that new projects are launched by various foreign companies (excluding those of USA). This is not an occasion and relates to the aggravated relations between Russia and USA.
In July 2016 Huawei reported the launch of second enhanced training program for young ICT and information security professionals employed with the public authorities of Russia. The program involves professionals of the federal executive authorities and subordinate entities, including the Ministry of Finance, Ministry of Education and Science, the Ministry of Interior, the Radio Research Institution, the Central Bank, RZHD, etc. During 10 days, the program members undergo training in such segments as e-government, smart and safe city, information security, and modern ICT trends. The program includes visits to the exhibition centers as well as examination of the Chinese cultural heritage.
The program has been established jointly by Huawei and The Fund for Information and Technology Independence “Infofond” and with support of the State Duma Committee for security and corruption control. The program is implemented under an educational initiative of Huawei “Seeds for the Future” and under the cooperation agreement concerning educational information security projects signed by Huawei and Infofond in April 2015. The training for the �rst team young professionals of the Russian public authorities was provided in November 2015.
In April 2016, SAP CIS opened a new training center for Russian developers, creation of joint innovations and knowledge exchanges. The investments to the new training center amounted to €1 million. The SAP training center has set up 150 jobs and 12 classes, presented over 400 for 30 solutions, including 25 unique courses adapted to the Russian speci�cs; interactive demo stands are operating. The training process can proceed in di�erent formats — from individual to group ones. The partners involved in setting-up the center have not been reported. However, it will hardly exist without extensive interactions with Russian universities.
The share of respondent companies practicing other types of cooperation increased substantially in 2014 (except for traineeship, employment and courses for their own employees). While 10-20% of respondents mentioned those types of cooperation in the past years, then as much as 37% did so in 2014. After all, the businesses began to look during the crisis year for opportunities to establish interactions with universities, which are of interest to the educational institutions and imply a�ordable �nancing even for the companies that are not too large. In 2015, the share of companies practicing other types of cooperation decreased to a level that was speci�c to 2014.

135 Chapter 5. Human resources
Ratings
In the last 3 years respondents mentioned other forms of cooperation (except for traineeship, employment, and courses for their own employees) as follows:
A vast list of various cooperation programs has been presented traditionally by EMC (in particular: successful freshman’s scholarships, a mentorship program, a joint research program, joint student educational projects, excursion programs for students and schoolchildren, an academic partnership program). Other foreign corporations o�er an extended list of cooperation programs as well. They are involved intensely in training of human resources.
As a rule, the Russian universities are placed far outside the �rst hundred of the international rating lists of universities though in some lines can be considered to be among the world best. One of the main reasons is a small volume of R&D works performed by higher education institutions by orders of business. Historically, Russian universities have never focused on this kind of research which was dealt with by other organizations (sector research institutes and institutions at the Russian Academy of Sciences). However in recent years universities turned upon R&D, the government encouraged emergence of universities with the status of the “national research universities”.
In addition, of great importance to the position of higher education institutions on the rating list is the lack of knowledge as to how to work with rating agencies, which do not have enough information on higher education in Russia. In the future, the situation may change and Russian educational institutions will break into the lists of the world's leading universities in international ratings. To implement the measures permitting to achieve this result, 40 billion rubles were supposed to be assigned during 4 years (later, the amount increased to about 60 billion rubles). As a result of the �rst tender, a percentage of this money has been already allocated to 15 Russian universities. In 2013, each of them received about 600 million rubles ($20 million) for those purposes. In October 2015, another tender was held, as a result of which the number of higher educational institutions increased to 21.
creation of a basic sub-department and laboratories;
summer intern;
holding of subject matter conferences;
free provision of software (or at preferential prices);
free training center for students;
mentoring programs;
development of stands for universities;
training courses for local university students;
implementation of joint educational projects;
provision of training materials;
conductance of carrier days and vacancy fairs;
competitions of degree works;
programming competitions, organization of Academic Olympics;
student projects under guidance of company’s employees;
free training center for students;
involvement in advanced training programs;
participation in a quali�cations commission;
lectureship, research work;
joint research and development e�orts;
student center for software development.

136 Chapter 5. Human resources
The goal of 5-100 Program is not to break Russian universities into Top-100 on any international rating list in any way. The central point is to improve quality of the university operations through as much enhancement of a competitive position for a group of Russian major universities in the global market of educational services and research programs. It is quite possible that the quality can improve without any upward movement on the rating lists.
As regards some parameters, it is incorrect to compare the Russian educational institutions and foreign universities at all. For example, the USA and Great Britain as well as other English-speaking countries have had an initial advantage of making lecturing in English that is actually an international language. Therefore, the universities of these counties can attract easier foreign students who under all other equal conditions will still desire to learn English rather than Russian (the number of foreign student in�uences signi�cantly a university’s position on the most known international rating lists). Some Russian universities launch their educational programs in English, though the basic language must be the national and native one of the most citizens.
It is also di�cult to attract foreign students due to a negative information background towards Russian in western mass media. Of high importance could be just the climate of this country — many young people would prefer to live, say, in warm California rather than under a severe environment of Siberia.
That is why one should not lament a fact that a number of the Russian best universities are beyond Top-100 of the international rating lists. The only thing that matters is to have an improvement in quality of the university activities. This process is shown in part through an upward movement on international rating lists, and this promotion has been observed during most recent years.
At year-end 2013, one of the best known international ratings QS World University Rankings included in the 500 best 8 Russian universities. Next year almost all of them improved their places.
In 2015 Russia was presented better among Top-500 of QS World University Rankings to achieve 9 positions, while a total of 21 Russian universities entered Top-800. However, when compared with 2014, 7 universities went up and 6 ones went down in terms of their ratings. The other maintained their positions. The Moscow State University that was on 120th positions from the top in 2013 climbed to 108 during the two years. This is the best position of Russian educational institutions in QS World University Rankings. Then the St. Petersburg State University (SPbGU) lags far behind. Initially, it reached 233rd after 240th position from the top, but dropped down to 256th position in 2015.
Russian universities on rating lists of QS World University Rankings in 2015 and 2014
Position in 2015 Position in 2014
108(↑) 114 Lomonosov Moscow State University
256(↓) 233 Saint-Petersburg State University
317(↑) 328 Novosibirsk State University
338(↓) 322 Bauman Moscow State Technical University
397(↑) 399 Moscow State Institute of International Relations (MGIMO University)
431-440(↓) 411-420 Moscow Institute of Physics and Technology State University
471-480(↑) 481-490 Peter the Great Saint-Petersburg Polytechnic University
481-490(↑) 501-550 National Research Tomsk Polytechnic University
481-490(↑) 491-500 Tomsk State University
501-550(↓) 481-490 National Research Nuclear University MEPhI (Moscow Engineering Physics Institute)
501-550(=) 501-550 Higher School of Economics (HSE)

137 Chapter 5. Human resources
The global reputation rating list of universities ТНЕ – 2016 (The Times Higher Education World Reputation Rankings - 2016) is based on an expert poll of the global academic community members. The most recent version of the rating list was published in May 2016. When making the most recent version, the opinions of 10323 scientists from 133 countries were taken into account.
A Russian university appeared on the World Reputation Rankings for the �rst time in 2013, when the Moscow State University (MGU) occupied 50th position from the top. In 2015, the SPb State University (SPbGU) also joined Top-100 (among 71st – 80th positions), while the MGU climbed to 25th position from the top. In 2016, Top-100 showed three Russian universities — the MGU found itself on 30th position, the SPbGU shared 81st – 90th positions, and the Moscow Institute of Physics and Technology shared 91st -100th positions from the top.
In 2016 Russian universities demonstrated a remarkable progress on the international rating list Round University Ranking (RUR). This presents 700 universities of 74 countries of the world, including 23 ones of Russia. However, the best position of the MGU on the general rating list is found towards the bottom of the second hundred (172nd position from the top). The next university of Russia (271st position from the top) is the National Research Nuclear University “MIFI”, and then comes the Tomsk State University (TGU) — 327th position from the top.
As regards engineering science, the MGU position is much poorer (the most recent version of RUR in the sector was issued in 2015). It occupies as low as 207th position from the top. The TGU holds 265th position, the N.E.Bauman Moscow State Technical University — 291st, and the MIFI — 328th position from the top.
The RUR rating list shows that Russian universities are strongest in the lecturing standard. Based on the lecturing quality, as much as 9 Russian universities have entered the global Top-200. Moreover, the MGU entered Top-50, having occupied 46th position on the global list based on the lecturing quality, as against 67th position from the top a year before. The TGU held 100th position from the top.
There are Russian di�erent rating lists of the universities that show some strong points of the country’s universities. For example, Superjob has presented a rating list of Russian technical universities in 2016 based on the salaries of the graduates employed with the IT industry. The MGU being treated on the international rating lists as the best university of the country has found itself there on 4 – 5th positions shared with the Perm State National Research University.
Russian universities on rating lists of QS World University Rankings in 2015 and 2014
Position in 2015 Position in 2014
551-600(=) 551-600 Kazan (Volga region) Federal University
601-650(=) 601-650 National Research Saratov State University
601-650(↓) 471-480 Peoples' Friendship University of Russia
601-650(=) 601-650 Southern Federal University
601-650(↓) 551-600 Ural Federal University named after Boris Yeltsin
651-700(↑) 701 Far Eastern Federal University
701+(=) 701+ Lobachevsky State University of Nizhni Novgorod
701+(=) 701+ The National University of Science and Technology “MISiS”
701+(=) 701+ Plekhanov Russian University of Economics
701+(=) 701+ Voronezh State University
Note: ↑ - rating up, ↓ - rating down, = - position has not changed

138 Chapter 5. Human resources
The rating list was made by the Superjob Research Center based on a comparison of the average income levels of the Russian university graduates 2010—2015. The salaries of the university graduates residing beyond Moscow have been adjusted by the regional index to the Moscow labor market standards. The regional index is a ratio between the average salary level in the particular city and the average salary level in Moscow.
Superjob rating list of Russian technical universities in 2016 based in salaries ofgraduates employed with IT industry, Ruble thousand
1 Moscow Institute of Physics and Technology (State University) 130
2 National Research Nuclear University «MIFI» 100
3 Moscow Bauman State Technical University 96
4 St Petersburg National Research University of Information Technologies, Mechanics and Optics 87
5-7 Novosibirsk State Technical University 85
5-7 Lomonosov MoscowState University 85
5-7 Perm State National Research University 85
8-9 National Research University – Moscow Institute of Electronic Engineering 80
8-9 St. Petersburg State University of Aerospace Instrumentation Engineering 80
10 National Research University – Moscow Energy Institute 78
11-17 Novosibirsk State Technical University 75
11-17 N.I. Lobachevsky Nizhny Novgorod State University (National Research University) 75
11-17 Ural Federal University named after the First Russian President B.N. Yeltsin 75
11-17 St. Petersburg State University 75
11-17 Moscow Institute of Electronics and Mathematics – National Research University Higher School of
75
11-17 National Research Technology University “MISiS” 75
11-17 D.F. Ustinov Baltic State Technical University “Voenmekh” 75
18 Tomsk National State Research University 74
19-21 Moscow Aviation Institute (National Research University) 73
19-21 Yu.A. Gagarin Saratov State Technical University 73
19-21 Ufa State Technical Aviation University 73
22-27 Moscow State University of Railroads 72
22-27 South Ural National State Research University 72
22-27 UlyanovskStateTechnicalUniversity 72
22-27 M.I. Platov South Russian State Polytechnic University (NPI) 72
22-27 Far Eastern Federal University 72
22-27 D.I. Mendeleyev University of Chemistry and Technology 72
28-32 F.M. Dostoyevsky Omsk State University 71
28-32 Irkutsk State University 71
28-32 Irkutsk National Technical Research University 71

139 Chapter 5. Human resources
RUSSOFT as an association of software developers issues its own rating list of universities based on results of the regular survey of Russian software companies. This considers the number of time that the university has been mentioned under the RUSSOFT’s surveys during 5 most recent years. The respondents indicate universities, which are in their opinion in the highest demand on the part of business.
Superjob rating list of Russian technical universities in 2016 based in salaries ofgraduates employed with IT industry, Ruble thousand
28-32 Tyumen StateUniversity 71
28-32 Peter The Great St. Petersburg Polytechnic University 71
33-36 V.I. Lenin Ivanovo State Energy University 70
33-36 Omsk State Technical University 70
33-36 R.E. Alexeyev Nizhny Novgorod State Technical University 70
33-36 Kazan (Volga Region) Federal University 70
37-39 Penza State University 68
37-39 Orenburg State University 68
37-39 Altai State Technical University 68
40-42 Volgograd State Technical University 67
40-42 Tula State University 67
40-42 Far Eastern State University of Railroads 67
43-46 Izhevsk State Technical University 66
43-46 Astrakhan State Technical University 66
43-46 Ulyanovsk State University 66
43-46 Pacific State University 66
47-53 AstrakhanStateUniversity 65
47-53 Vladimir StateUniversity 65
47-53 Ryazan State Radio Technical University 65
47-53 Moscow State University of Economics, Statistics and Informatics* 65
47-53 Altai State University 65
47-53 Voronezh State University 65
47-53 Kuban State Technology University 65
54-56 Don State Technical University 63
54-56 Russian University of People’s Friendship 63
54-56 Petrozavodsk State University 63
57-58 Kazan National Research Technical University 62
57-58 Volgograd State University 62
59-60 Siberian Federal University 61
59-60 St. Petersburg State Electric University 61

140Chapter 5. Human resources
The rating list has been available for several years. It has been updated every year to take account of the most recent survey data, though it cannot show critical variations per year as the data for 5 most recent years are summed up as a result.
In 2016, the top position on the list is held by the St. Petersburg National Research University of Information Technologies, Mechanics and Optics (ITMO). However, the Bauman Moscow State Technical University (MGTU) has approached almost neck and neck as the respondents have been mentioning it increasingly during 2 most recent years. The MGTU may take the top position in the next year.
The closest to TOP-10 are the Southern Federal University. It has been mentioned by 22 respondents during 5 most recent years. Then the St. Petersburg State University of Aerospace Instrumentation Engineering, Voronezh State University, Omsk State Technical University (9 mentions each), Izhevsk State Technical University (8), Ural Federal University and Penza State University (6 each), Belgorod State University, Tomsk Polytechnic University, Ulyanovsk State Technical University (5 each) are lagging far behind.
The rating of RUSSOFT Association is created based on the poll of software exporters and, therefore, re�ects how successfully universities prepare personnel for the software industry. However, it is also not beyond reproach.
Since the position of the higher education institution in this rating depends to a great extent on the number of companies representing speci�c city, �rst places were occupied by universities from Moscow and St. Petersburg. In this regard, it is more appropriate to compare universities located in one city; however, su�cient sample for this comparison presents only in Moscow and St. Petersburg higher education institutions.
Source: Association RUSSOFT
TOP-10 Russian universities by the results of polling among software companies overthe last 5 years
Place(a year ago)
Name/year of survey number of references over the last 5 years
1 (1) St. Petersburg National Research University of Information Technologies, Mechanics and Optics
91
2 (2) Bauman Moscow State Technical University 89
3 (3) St. Petersburg State University 86
4(5) Moscow State University 74
5(4) St. Petersburg State Polytechnic University 71
6 (6) Moscow Institute of Physics and Technology 59
7 (7) St. Petersburg State Electric University 48
8 (9) Moscow Institute of Engineering and Physics 36
9 (8) Novosibirsk State University 32
10 (10) Novosibirsk State Technical University 27

141 Chapter 5. Human resources
Nevertheless, even taking aforesaid note into account, universities ranking re�ects the level of programmers training especially when taking into consideration the range containing speci�c higher education institution (3 to 5 places).
In total, in 5 recent years respondents have mentioned about 100 universities (in 2015 - 79) graduates of which are in the greatest demand among IT companies in the region. In this number we may �nd higher education institutions which - if judged by their names - should not train software developers. They are the Higher School of Economics, the Samara State Architectural and Construction University, the Siberian State Motor-Road Academy, the Russian University of Chemical Technology and some others. However, it should be noted that the Higher School of Economics jointly with Yandex created a department of computer science the students thereof already managed to achieve success at the ACM ICPC world championship in June 2014.
For students and employers, of interest is the rating of universities bythe proportion of the graduates who found a job according to their university major. The leader of this rating is St. Petersburg ITMO University with is 76%.In the vast majority of higher education institutions which train specialists in the software development area, this share is much less – about 50%.Employers consider that 15-20% of university graduates are ready to work for software companies right after the graduation.Other 30-35% of graduates need to continue their studies in training centers of some companies.Thus, a half of the graduates who got degree of a software developer are unable to work for software companies, although there is a huge sta� shortage.
An important conclusion is that the system of higher education o�ers a great potential for an increase in the number of graduates who are capable to satisfy employers.For this purpose, �rst of all, it is necessary to create stimuli to encourage young and perspective people to work in the education system, creating the competition for university professor and school informatics teacher job positions.
It is di�cult to compare Russian and foreign universities as they have had historically di�erent goals.Nevertheless, higher education institutions in Russia take the highest positions in some speci�c ratings.For example, the St. Petersburg National Research University of Information Technologies, Mechanics and Optics (SPNRU ITMO) is the best in the world by ACM International Collegiate Programming Contest results during the whole period when these competitions have been running.Some other Russian higher education institutions are in the top twenty in the rating prepared by the organizers of this competition. SPNRU ITMO is the six-fold world champion.No other team has won so many times for the entire 38-year history of this competition.
The team of the St. Petersburg State University four times was a world champion, which is also a World record. Saratov State University was also once the World champion. Noteworthy, Russian students started to participate in the International Programming Contest only about 20 years ago.
Some more Russian universities also take high places in this main programmer competition on a regular basis. In the last 5 years, there have usually been at least 4 Russian teams among 12-13 prize-winners of the contest. All together, 14 Russian universities were prizewinners of the ACM ICPC world championship.
In June 2014, ACM ICPC world championship for the second time in its 40-year history was held in Russia — in Yekaterinburg. A year before this prestige competition was hosted by St. Petersburg. The performance of Russian students in 2014 was again triumphant. The team of the St. Petersburg State University became an all-round champion. The second place was taken by the Moscow State University, which the same as SPSU was awarded a gold medal (gold is captured by 4 �rst places). A bronze medal and the 9th absolute place were taken by the St. Petersburg University ITMO. Another medal place (in this contest there are 12 of them) won the National research university Higher School of Economics (a bronze medal and the 10th place).
Programming Olympics

Chapter 5. Human resources 142
In 2015, only two Russian teams were ACM-ICPC prizewinners, but again they occupied two �rst places. The team of the St. Petersburg University ITMO for the 6th time became the all-round champion, and the 2nd place was taken by the Moscow State University.
In 2016, 5 Russian teams have been again among 12 prizewinners. The SPbGU students have become the champions (for the fourth time during their history), the Moscow Institute of Physics and Technology has taken 4th position, the ITMO University — 7th, the Ural Federal University — 8th, the Nizhny Novgorod State University — 10th position from the top. Some more Russian universities have found themselves not far from the prize positions. Those are the Moscow Aviation Institute, Moscow State University, Saratov State University, and St. Petersburg Academic University. All of them have shared 14th position from the top with about ten universities of other countries. Top-50 of the competition have included Innopolis University from the new town of the same name in Tatarstan (given that the University welcomed the �rst students as late as in 2015 (a bit more than 300)).
Such competitions in many respects re�ect the quality of programmer training.Judging by their results, programmer training in Russia is the best in the world, although in the last decade, Chinese universities achieved the similar great progress.Among the leaders and prize-winners, there have been teams from Poland, Belarus, and Ukraine, but these countries do not have as many strong teams as Russia and China.Individual representatives of Western Europe and the USA sometimes appear among the top teams.
Not always champions and prizewinners on sports programming reach the outstanding results in commercial and state organizations.However, they can usually meet the most complex challenges in their labor activities, as well, that is con�rmed by the fact that many Russian ACM contest champions and prize-winners established successful software companies or work as the key experts for these companies (DevExperts, SPb Software, Yota, VKontakte).
The �nal round of ACM-ICPC 2016 involved 128 winner teams of the regional tournaments. Initially, the quali�cation embraced 300 thousand students of the information technology departments.
Medal places of the Russian universities teams at the Student World Cup inProgramming (ACM International Collegiate Programming Contest) from 1999 to 2016*
1999-2011 2012 2013 2014 2015 2016
1 St. Petersburg State University of Information Technologies, Mechanics and Optics
3, 5, 3, 3, 1, 3, 3, 1, 1 1 1 9 1 7
2 St. Petersburg State University
9, 1, 1, 6, 11, 3, 9, 4 5 1 1
3 Moscow State University 9, 2, 2, 9, 10, 5, 2, 10 10 10 2 2
4 Saratov State University 6, 7, 1, 6, 4, 7, 6
5 Izhevsk State University 8, 9, 3
6 Altai State Technical University
3, 8
7 Moscow Institute of Physics and Technology
3 4

143 Chapter 5. Human resources
Russians individuals also win in other competitions in programming and informatics.In the last three years, they steadily became winners of the Facebook Hacker Cup contest.In 2013, as well as two years earlier, PyotrMitrichev won these competitions, and last year, Roman Andreyev from St. Petersburg State University was the winner. In 2014, this contest won Belorussian Gennady Korotkevich who became a student of the St. Petersburg State University of Information Technologies, Mechanics and Optics. He again won in 2015, in this year Gennady Korotkevich also became a world champion within the SPNRU ITMO team at the ACM ICPC championship.
In addition, in summer 2016 Gennady Korotkevich has won his third running prestigious prize in the annual programming contest, Google Code Jam.
The Top-15 of the contest have included other ITMO University graduates: Evgeny Kaplun has held the fourth position, and Pavel Mavrin – thirteenth position from the top.
In November 2015, the teams of Moscow and St. Petersburg won four sets of prizes – gold and silver medals – in Qatar at 12th World Robot Olympiad — WRO). Two gold medals were obtained in the basic class (medium age division) and creative class (senior age division), two silver medals in the creative class (junior age group) and in student class. Another Russian team (of St. Petersburg) gained the fourth position without any prize at a robot football competition after it had given the third position from the top to their rivals from Hong Kong. In addition, the Russian schoolchildren won the sixth through eighth positions in the creative class and the ninth position in the basic class of junior age division.
The projects of Russian upper-form pupils on mathematics, chemistry, programming, materials science and engineering were awarded by 6 basic and 3 special prizes at the 66th World Festival of scienti�c achievements of secondary school students Intel ISEF (International Science and Engineering Fair). The �nal of the contest was held in Pittsburg, USA, and lasted for almost a week, since 10 till 15 May 2015.
Medal places of the Russian universities teams at the Student World Cup inProgramming (ACM International Collegiate Programming Contest) from 1999 to 2016*
1999-2011 2012 2013 2014 2015 2016
8 Perm State University 4 13
9 Petrozavodsk State University
13, 10, 5
10 Novosibirsk State University
5
11 Nizhny Novgorod State University
5 10
12 National Research University Higher School of Economics
10
13 Ufa State Aviation Technical University
10
14 Ural State University 13,11 8
Total prizewinners от 2 до 5 3 4 4 2
Source: ACM International Collegiate Programming Contest, the rating is compiled by the RUSSOFT Association
* the quantity of medal places varied from 10 to 13 during this period

144 Chapter 5. Human resources
In November 2013, in the �nal of programmer competition PayPal Battle Hack the �rst place was won by the team of four Russian programmers with application DonateNow which facilitates a collection of donations.
In late 2013, the picked team of the department of computational mathematics and cybernetics of the Moscow State University won in the international hacker competition iCTF 2013. Russian hackers were the �rst to �nd out vulnerabilities of services and protected them as well as built a virtual nuclear missile and �red it to counterpart virtual objects.
At the International Informatics Olympics in summer 2014 in Taiwan, Russian secondary school students won four medals. The �rst of gold medals was awarded to the graduate of the vocational school No.40 of Nizhniy Novgorod Nikolai Kalinin. The second gold medal was awarded to the graduate of the special academic center at the Ural Federal University (SAC UrFU) in Yekaterinburg Nikita Sivukhin. The silver medals were awarded to a graduate of the vocational school No.41 in Izhevsk Konstantin Semenov and to a graduate of the vocational school “Moscow Second School” Nikita Uvarov.
It becomes trendy to hold in Russia di�erent competitions in programming and informatics, as well as various international contests in the �eld of innovations.In several days after ACM ICPC contest 2013, the world �nal of the Imagine Cup, an international contest of student's innovative projects, which was organized by the Microsoft corporation, took place in St. Petersburg.This competition was also held in Russia for the �rst time.In 2014, ACM ICPC took place in Yekaterinburg.Similar competitions held in Russian cities promote the 'Russia' brand in the world market of high technologies, as well as contributes to the very important purpose - popularity of IT professions within the country.
The results of students' performance in this programming contest give an idea of the quality of training at Russian universities.However, it is more important to estimate this quality by the degree of employer satisfaction.The university rating by this indicator would not be completely objective, as well, but comparison of higher education institutions by di�erent ratings and ranking by di�erent criteria allows drawing more reasonable conclusions concerning the output of di�erent educational institutions.
However, if the employees with foreign development centers are not taken into account, then the share of those speaking English will be much lower. As per the results of survey 2016, those make 55-57%. The same applies to German and other languages (these will make 2-3% without foreign centers).
As a rule, knowledge of English is su�cient for communication with foreign colleagues, while localization and promotion of solutions can be performed by the agency of local partners.
A share of employees of software development companies �uent in English in the last 2-3 years consistently averages about 70%. Most likely, after increase in previous years this value is stabilized. A share of German-speaking professionals of the respondent exporter companies is stuck at 8-10%. The share of employees speaking other foreign languages is almost the same.
5.6. Foreign language skills
Share of employees knowing foreign languages well(of total staff numbers of respondent companies)
2008 2009 2010 2011 2012 2013 2014 2015
English 65% 65% 68% 68% 72% 67% 75% 74%
German 10% 11% 5% 8% 8.5% 9% 8% 11.5%
Others 3% 11% 4% 8% 9.5% 11% 10% 13.5%

145 Chapter 5. Human resources
Among other languages, French was mentioned 9 times by the respondents, Spanish – 6 times, and Dutch, Italian, Korean, Latvian, Lithuanian, Finnish, Czech were mentioned once each.
Languages of the former USSR countries and Russian national republics were also mentioned, though these would hardly assist in promotion of their services and solutions abroad. It is natural that almost all the employees with foreign development centers are speaking excellent the language that is the national one in the countries where the centers operate.
Despite an obvious progress in foreign language acquisition by companies' sta�, many problems remain unresolved.There are not enough English-speaking employees in small and regional companies.An increase in the number of such employees is provided by the largest companies located in Moscow and St. Petersburg.
In Russia, skilled English teachers, as a rule, do not tend to work at schools and universities because of the low salary level in the state educational institutions.This problem should be solved by the government.Otherwise, the business achievements of high-technology sector of economy will not fully enjoy the potential of engineers' training level available in Russia.
It is especially important to improve the language training level in regional universities and schools because many of these institutions provide a high level of education in the �eld of mathematical and technical sciences, but cannot provide their graduates with competitive positions with respect to foreign languages skills.
Russia is not at the bottom of the English pro�ciency level list, but it is in the second half of the world ratings.
For example, according to GlobalEnglish research, where the level of pro�ciency in business English was de�ned, Russia received 3.6 points.That is higher than in Colombia (2.75), Brazil (2.95), and Turkey (2.97), but it is much lower than in the Philippines (7.11), India (5.57), and some other large countries.
Share of the staff with good knowledge of foreign languages,depending on company location
English German Others
Moscow 76% 14% 17%
St. Petersburg 76% 3% 2%
Siberia 72% 7% 6%
Ural 93% 0% 6%
Other cities 54% 4,5% 0,2%
Beyond Moscow and St. Petersburg 62% 4% 1,7%
Share of staff with good knowledgeof foreign languages, depending on company turnover
less than $5 million over $5 million
English 50% 77%
German 4% 12%
Others 1,8% 15%
Partly, this happens because they pay for their employees' foreign language training.However, this growth is mainly connected to the fact that companies from the two capitals have an opportunity to poach the best specialists from regions and small companies.
The growth of the share of English-speaking employees in IT companies is not caused by improvements in the Russian state educational system.People often study foreign languages at their own expense or at their employers' expense, attending language courses and engaging teachers.

146 Chapter 5. Human resources
On the global rating list of English language skills, The EF English Pro�ciency Index 2015, Russia holds 39th position from the top, lagging a bit behind the Ukraine, Peru, Chile, France, and Ecuador, and being ahead of Mexico and Brazil.
Sweden and Finland, which take the top positions in the world English knowledge ratings, should be a reference point for Russia.In many respects, the high percentage of English-speaking population in these countries is ensured by the countries' integration in the world economy and their considerable achievements in the �eld of high technologies.
An insu�ciently high level of pro�ciency in English interferes with creation of competitive solutions and services by Russian companies, and furthermore, with their promotion in the global market.The unwillingness to monitor the global trends can be mainly caused by weak competence in languages.
According to superjob.ru portal, 84% of jobseekers specify knowledge of English in CVs. However, in reality among them there are much less programmers with a good command of this language (most likely, less than 70%, because roughly the same amount of English-speaking employees work at companies which predominantly work for export).
A more fundamental analysis of CVs made bythe Superjob research centershows that only 15% of software developers specify the '�uent' or 'conversational' level of English in their CVs, 50% declare knowledge of language at the level of technical documentation reading, 28% admit that they have basic skills only and 7% do not specify their level of pro�ciency in English.
According to ANCHOR High Technologies, the situation with knowledge of English is much better: 64% of all developers (included in the recruiting agency's database) have a good command of English or are �uent in English.
Considerable di�erences in the data of two companies can be explained by the fact that they cover absolutely di�erent audiences.ANCHOR is more oriented towards recruiting of personnel for international companies and for Russian exporters that implies more strict requirements to knowledge of foreign languages while SuperJob focuses on a wider audience.
A shortage of software developers and of IT professionals is a global problem. For that reason, the salary of programmers is growing almost everywhere. However, notwithstanding the global sta� shortage, some countries can o�er an excess of professionals. This occurs due to a low export potential at the background of domestic IT market contraction. For example, low quotations are speci�c to software companies of South Europe. At the same time, their customized engineering services are quite high as compared with outsourcing companies of East Europe and Asia.
In 2015, ZDNet publication reported that in the last 5 years thousands of software developers were forced to leave Greece. In fact, over this period about 200 thousand people under 35 years of age left the country. Mostly they represent three sectors of economy — medicine, �nances and IT. While a programmer can �nd in Greece job in “software development”, the payment will hardly satisfy this person.
As evidenced by enquiry of MarketWatch, the problem of skilled manpower drain exists not only in Greece, but also in Spain, Italy and Portugal. Thus, for example, in 2013 82 thousand people of able-bodied population left Italy, 30% of them were graduates of higher education institutions.
Even three years ago we thought about South Europe as a potential donor concerning IT engineers. The programmer salaries in the region were comparable to Russian wages, at the same time many young engineers were unemployed. In EU, the situation in software development looks paradoxical — a high level of unemployment along with a huge manpower shortage.
Quite a number of engineers from Western European countries work in Russia, but not enough to appreciably impact on the local labor market. As a rule, such specialists hold key positions for which is di�cult to �nd job candidates within Russia. However, no mass �ow of migrants from EU and the USA to
Global labor market

147 Chapter 5. Human resources
Nonetheless, it makes sense for Russian software development companies to consider a possibility of opening development centers in Southern Europe — there are free human resources at a modest price. Besides, such o�ces make companies closer to European customers. Such center in Italy was opened 2 years ago by the St. Petersburg outsourcing company Lanit-Tercom.
According to the research of the international recruiting company Kelly Services conducted in February-March 2014, the indicator of loyalty to the employer in Russia is one of the world-highest. One of the key factors in�uencing personnel loyalty level is “a feeling that employer appreciates their contribution to the development of organization”. The satisfaction of employers by Russians by this criterion is comparable to that in the countries of the Asia-Paci�c region, where the most respondents answer that their management “values highly” or “thinks no end” of them. The highest percentage of these employees is noted in Russia (62%), Thailand (58%) and Indonesia (57%), and the lowest – in Italy, Portugal and France. However, the migration of professionals is not a�ected by the research results in any way.
While the numbers of university graduates under IT occupations have grown or at least have not reduced during 10 most recent years, then they have been diminishing in the EU. According to the report of the European Commission, the numbers of IT graduates had decreased 13% from 2006 through 2013. As a result, it has been forecasted that within �ve years the number of vacant positions in the IT segment can grow to 825 thousand. To solve this problem, in EU several educational projects were set up. In 2013, the program Grand Coalition for Digital Jobs began with training in IT specialization in Bulgaria, Greece, Italy, Malta, Lithuania, Latvia, Poland and Romania. Later they were joined by Belgium, the Netherlands, Cyprus, and the UK. In the UK, an objective is set to train 1 million of IT engineers.
Due to a continuing growth of threats to security throughout the world, the demand for skilled information security (IS) professionals had achieved such a magnitude that it is far in excess of the o�er. In order to evaluate the scope and the expected e�ect of a shortage of IS professionals around the world, Intel Security, jointly with the Center for Strategic and International Studies (CSIS) prepared a report “Hacking the Skills Shortage”». To estimate the shortage of IS professionals and its potential consequences, the IT decision-makers were interviewed in Australia, France, Germany, Israel, Japan, Mexico, Great Britain, and USA. In total, 82% of respondents told that their entities were currently feeling a lack of IS professionals. The shortage was expected to continue at least until 2020. By that time, 15% of the
Russia is observed. Some countries showed an extensive out�ow of professionals, though they destined to the USA or to other countries of the European Union. In addition, the appeal of Russian vacancies for Europeans started declining dramatically after 2014 due to the Ruble exchange rate fall. As a result, the average salary of a Russian experienced IT professional denominated in Euro reduced for a half-year (starting from summer 2014) by about 60%. The following year and a half saw a continued reduction, though it was not so substantial.
At the same time, the USA shows a quite considerable growth of salaries in US Dollar. For example, according to the data of Glassdoor, a US recruitment site, the median aggregate remuneration in Google amounted to $143.5 thousand in summer 2015, and a year later this increased to $153.7 thousand. As the struggle for human resources is in progress, then a similar growth is observed for other major IT companies of the USA. A survey by Glassdoor has indicated that in mid-2016 Juniper Networks o�ered the aggregate remuneration of $157 thousand, Lab126 - $150.1 thousand, Facebook - $150 thousand, Twitter - $150 thousand, Walmart eCommerce - $149 thousand, LinkedIn - $145 thousand, Microsoft - $141 thousand, and Adobe - $140 thousand.
Source: CNews, HayGroup
Average fixed monthly wages of an experienced IT professional in somecountries, €
USA 6821
Germany 5192
Great Britain 4484
Finland 4112
Singapore 4090
Turkey 3190
Beijing 2620
Russia (June 2014) 2546
Shanghai 2528
Czech Republic 2148
Russia (January 2015) 1634

148 Chapter 5. Human resources
appropriate vacancies will not be �lled yet. One of the consequences of such shortage will be higher salaries of the IS department employees.
According to a human potential rating list of World Economic Forum (WEF) – Human Capital Index 2016 - the world will lack 50 million engineers and researchers during 10 forthcoming years. At present, the USA, China and India have comparable �gures in terms of people with a university degree (66-77 million each). Russia has 29 million people with such a degree. However, the graduates under engineering occupations are most of all just in China and India (4.6 million and 2.6 million persons). Russia o�ers 561 thousand and the USA – 568 thousand persons.
According to a publication of Forbes, Russia features quite a low average age of the employed software developer. This is 26.6 years. This is a bit higher than in India — 25 years, though much lower than in the USA (31.6 years).

Chapter 6
Technologies

150Chapter 6. Technologies
As judged by the answers to the question about mainly used operating systems (see Table Commonly used operating systems) it may be concluded that the popularity of almost all included OSs has not signi�cantly changed since 2009. Fluctuations of this value are attributable to a su�ciently poor, in this case, accuracy. An exception to this is only OSs RIM Blackberry and Symbian OS which usage in the last 7 years obviously reduced due to the problems of their developers - RIM and Nokia. As their audience rating has slimmed to none, this year we excluded them from the table of main operating systems. Instead of Blackberry and Symbian there emerged a relatively new OS Tizen which �rst version was issued in 2012. This system has a version tailored to Russia for devices that can be used in government entities and companies aiming at elimination of the risk of unauthorized access to transmitted sensitive information.
In summer 2016, in Russia there was presented the �rst implementation of the free operating system Tizen for the Russian processor — 1892VM14Ya. A major feature of the Russian Tizen distributive is the implementation of built-in safety pro�le allowing for attaining a higher level of con�dence in compliance with requirements of Russian regulators (1892VM14Y is a new-generation signaling multicore chip for communications, navigation, multimedia, built-in and mobile systems, for example: tablets, intelligent video cameras, telephones).
At present, it seems that nothing puts in question the leadership of two leading operating systems Windows and Linux. Though the distance between them is signi�cantly changing year by year, these changes are bidirectional: sometimes they come closer together, some other time the gap increases. Fluctuations are attributable to a su�ciently big error (primarily, due to composition of respondents). As before, ОС Android �rmly ranks #3. If in 2010-2011 only 4-6% of respondent companies operatedthis system then in 2014 there were already43%. The same indicator was demonstrated by Android in 2016 after lowering to 36% a year earlier.
It would not be exactly correct to match Android against Linux. Linux means a whole family of single core operating systems (GNU Linux family). Android was also developed on the basis of Linux, but it is intended for mobile devices, so it apparently stands out against the background of closely related systems (both in terms of popularity and devices where it is installed). That is why this operating system is separately mentioned in the questionnaire. If we consider Android together with the GNU Linux family it will emerge that both open systems are used not less frequently than Windows. That’s for sure.
Thecompanies that are oriented towards the Russian market much less frequently mention the operating systems for mobile devices than those developers whogain over 50% of their income from export. It also concerns Mac OS, which in Russia is not so popular as in the western countries. Such distinction of OS popularity depending on the companies’ export sharemeans that the applications for mobile devices and Apple tablets are mainly created for sale abroad.
Considering an increase in the share of smart phones and tablets in Russia, it is possible to assume that the indicator of these systems’ popularity will be aligned among the companies with orientation towards the Russian market and among exporters. However this forecast which we already made several years ago has not come true yet. Therefore it is quite reasonable to assume that mobile applications developed by Russian companies are meant for the whole global market including the Russian market.
OPERATING SYSTEMS (OS)

151 Chapter 6. Technologies
Compared to other cities, in previous years the percentage of the companies that use mobile operating systems — Android, iOS, Windows Phone was signi�cantly higher in St. Petersburg. Besides, about 70% of respondents from St. Petersburg companies indicated GNU Linux family as the commonly used operating system. It is much more than a year ago and countrywide. As regards OS Android, St. Petersburg maintains leadership also according to 2016 survey �ndings. The same goes for GNU Linux family (72%). However with respect to iOS, MS Windows MobileOS and MS Windows Phone (OS for mobile devices) St. Petersburg has lost its advantage. iOS is more frequently used by Moscow companies. In regions, OS Oracle (Sun) Solaris and Open/Free/NetBSD are used much less often than in Moscow and St. Petersburg. Among Moscow companies it may be noted that MS Windows Phone is mentioned with a slightly increasing frequency than countrywide. This leadership of Moscow companies was shown also a year before.
Among other operating systems (not included in Table of commonly used ones) there is none mentioned more than once. It may be noted the presence of real-time OSs QNX and VxWorks. They were also mentioned last year, moreover QNX was twice mentioned. Another 4 respondents mentioned unnamed real-time systems. Last year we concluded that the real-time operating systems were increasingly mentioned from year to year, this observation is consistent with the global trends. According to 2016 poll results, such growth of the real-time OSs is not observed. That is why, for example, it is still too early to include QNX in the number of commonly used operating systems. It must be noted that OS for IBM mainframe for three consecutive years now is not mentioned at all by respondents though previously it was mentioned 1-2 times at least.
Moscow St. Petersburg Other 2016
1 MS Windows 98% 91.00% 91.00% 93%
2 GNU Linux family 52% 72.00% 59.00% 60%
3 Android 42% 47.00% 41.00% 43%
4 Mac OS 33% 31.00% 34.00% 33%
5 iOS 38% 34.00% 32.00% 35%
6 MS Windows Mobile 15% 19.00% 23.00% 19%
7 MS Windows Phone 19% 22.00% 21.00% 21%
8 Oracle (Sun) Solaris 25% 22.00% 5.00% 16%
9 Open/Free/NetBSD 15% 16.00% 5.00% 11%
10 Tizen 4% 6.00% 2.00% 4%
Commonly used operating systems 2008 2009 2010 2011 2012 2013 2014 2015 2016
1 MS Windows 97% 94% 93% 96% 94% 88% 92% 87% 93%
2 GNU Linux family 64% 54% 54% 59% 60% 65% 51% 59% 60%
3 Android - - 6% 4% 37% 33% 43% 36% 43%
4 Mac OS 26% 9% 15% 19% 32% 31% 33% 32% 33%
5 iOS - - - - 28% 24% 34% 29% 35%
6 MS Windows Mobile 41% 17% 16% 15% 23% 17% 15% 23% 19%
7 MS Windows Phone - - - - 19% 19% 22% 23% 21%
8 Oracle (Sun) Solaris 26% 16% 15% 19% 19% 14% 15% 11% 16%
9 Open/Free/NetBSD 25% 7% 9% 9% 13% 10% 14% 13% 11%
10 Tizen - - - - - - - - 4%
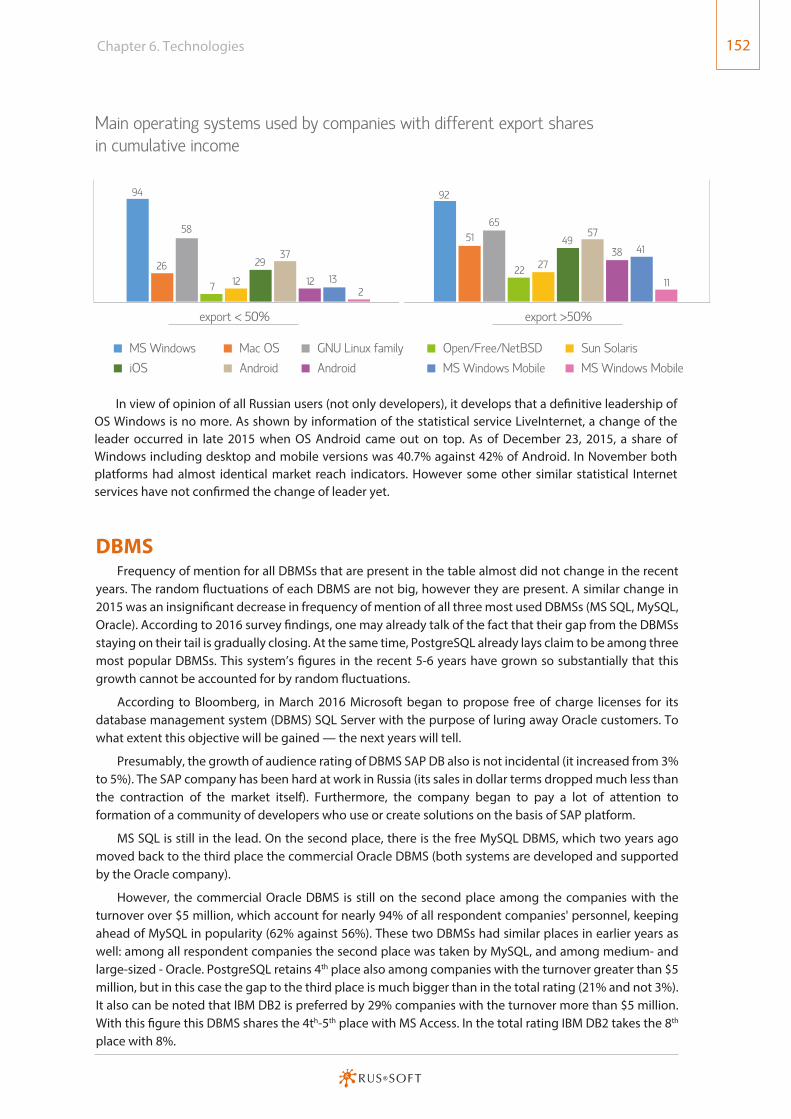
Chapter 6. Technologies 152
In view of opinion of all Russian users (not only developers), it develops that a de�nitive leadership of OS Windows is no more. As shown by information of the statistical service LiveInternet, a change of the leader occurred in late 2015 when OS Android came out on top. As of December 23, 2015, a share of Windows including desktop and mobile versions was 40.7% against 42% of Android. In November both platforms had almost identical market reach indicators. However some other similar statistical Internet services have not con�rmed the change of leader yet.
MS Windows Mac OS GNU Linux family
iOS Android Android
Open/Free/NetBSD
MS Windows Mobile
Sun Solaris
MS Windows Mobile
Main operating systems used by companies with different export sharesin cumulative income
export < 50% export >50%
94
26 2937
12 12 137 2
58
92
65
22 27
4957
38
11
4151
Frequency of mention for all DBMSs that are present in the table almost did not change in the recent years. The random �uctuations of each DBMS are not big, however they are present. A similar change in 2015 was an insigni�cant decrease in frequency of mention of all three most used DBMSs (MS SQL, MySQL, Oracle). According to 2016 survey �ndings, one may already talk of the fact that their gap from the DBMSs staying on their tail is gradually closing. At the same time, PostgreSQL already lays claim to be among three most popular DBMSs. This system’s �gures in the recent 5-6 years have grown so substantially that this growth cannot be accounted for by random �uctuations.
According to Bloomberg, in March 2016 Microsoft began to propose free of charge licenses for its database management system (DBMS) SQL Server with the purpose of luring away Oracle customers. To what extent this objective will be gained — the next years will tell.
Presumably, the growth of audience rating of DBMS SAP DB also is not incidental (it increased from 3% to 5%). The SAP company has been hard at work in Russia (its sales in dollar terms dropped much less than the contraction of the market itself). Furthermore, the company began to pay a lot of attention to formation of a community of developers who use or create solutions on the basis of SAP platform.
MS SQL is still in the lead. On the second place, there is the free MySQL DBMS, which two years ago moved back to the third place the commercial Oracle DBMS (both systems are developed and supported by the Oracle company).
However, the commercial Oracle DBMS is still on the second place among the companies with the turnover over $5 million, which account for nearly 94% of all respondent companies' personnel, keeping ahead of MySQL in popularity (62% against 56%). These two DBMSs had similar places in earlier years as well: among all respondent companies the second place was taken by MySQL, and among medium- and large-sized - Oracle. PostgreSQL retains 4th place also among companies with the turnover greater than $5 million, but in this case the gap to the third place is much bigger than in the total rating (21% and not 3%). It also can be noted that IBM DB2 is preferred by 29% companies with the turnover more than $5 million. With this �gure this DBMS shares the 4th-5th place with MS Access. In the total rating IBM DB2 takes the 8th place with 8%.
DBMS

153 Chapter 6. Technologies
A little bit more than ten DBMSs mentioned in the questionnaires are absent in the table.OnlyMongoDB was mentioned two times among them. A year earlier it also was in the lead among DBMSs not classed with the basic ones.
In the questionnaire 2014 we modi�ed the groups of programming languages. More exactly, we distinguished individual languages in certain group. In this context, we also restated the question — instead of specifying the main programming language, respondents were o�ered to select one from the list (in previous years, not one but several programming languages were put into the relevant box). Because of it, the direct comparison with the last year outcomes now presents di�culties.
Nonetheless, it is fair to say that popularity of one or another programming language did not greatly change amongrespondents. If stemming from the results of previous survey 2014 it follows that, for example, �rst four places with identical indicator were justi�ably taken by C#, C, C/C++ and Java/J2EE while
LANGUAGES AND PROGRAMMING TOOLS
Commonly used DBMSs, % of respondent companies
Year of survey/DBMS
20 10 2011 2012 2013 2014 2015 2016
MS SQL 63% 74% 70% 66% 70% 67% 59%
MySQL 47% 40% 59% 56% 56% 54% 42%
Oracle 49% 55% 51% 47% 45% 39% 36%
PostgreSQL 17% 15% 26% 30% 28% 28% 33%
SQLite 9% 5% 12% 10% 19% 12% 10%
MS Access 19% 9% 19% 17% 18% 19% 17%
Firebird 11% 9% 10% 13% 16% 15% 11%
IBM DB2 13% 14% 9% 10% 12% 12% 8%
Sybase ASE 6% 3% 3% 6% 8% 6% 2%
MSDE 7% 5% 5% 5% 7% 2% 2%
InterBase 9% 7% 7% 10% 6% 6% 3%
Sybase ASA 6% 6% 5% 6% 6% 3% 2%
IBM Informix 7% 5% 7% 7% 6% 4% 1%
SAP DB 6% 5% 7% 5% 5% 3% 5%
Paradox 4% 3% 3% 2% 4% 3% 1%
Other 13% 8% 7% 8% 10% 9% 5%

154 Chapter 6. Technologies
in 2015 the growth of C++ and Java/J2EE popularity is noted with the lowered popularity of С and C# languages. The 2016 survey showed that the audience rating of C language kept lowering, but C# recaptured the second place. It can also be noted that the audience rating of Delphi has grown, however, this change could have been caused by random factors.
Among the above mentioned programming languages that are not listed in Table of our questionnaire, respondents twice mentioned only Python and 1С.
Frequency of mention of the programming languages specified as main tools,% of respondent companies
Year of survey/programming language
survey 2014
survey 2015
survey 2016
C# 17% 16% 20%
C 17% 12% 8%
C/C++ 17% 26% 26%
Java/J2EE 17% 22% 17%
.NET 9% 6% 8%
PHP 9% 6% 5%
Delphi 8% 7% 11%
Usage of programming languages which are not considered as main tools,but are applied by the companies in a number of projects, % of respondent companies
survey 2014 survey 2015 survey 2016
1 Java 39% 44% 40%
2 С++ 30% 25% 34%
3 HTML5 - - 29%
4 С# 25% 21% 26%
5 PHP 23% 18% 26%
6 .Net 14% 24% 24%
7 С 10% 16% 19%
8 Delphi 7% 4% 10%
9 Python 3% 8% 5%
10-11 Javascript 5% 7% 4%
10-11 SQL 3% 4% 4%
12-13 Perl 4% 4% 3%
12-13 Ruby 4% 4% 3%
14 Objective C 5% 5% 2%
15 Visual Basic 3% 6% 1%

155 Chapter 6. Technologies
The results of 2014 survey as regards the used programming tools di�er markedly from the 2013 results by a considerable increase in frequency of mention of practically all tools (by 5-19 percentage points). Assumedly, this growth is related to the modi�ed phrasing in the questionnaire as well as to changes in composition of respondents. In 2015, this indicator returned to the values of the 2013 survey. These �uctuations convey little to us.
There is no doubt that MS Visual Studio remains the most popular building tool among Russian companies.It is fair to assume thatthe free of charge Eclipse and Intellij IDEA of St. Petersburg companyJetBrains, that took 2nd and 3rd place, respectively, in 5-10 years increased their shares anyway. Their positions are also remained unchallenged.
Among the most popular programming tools not included in Table Delphi (4%) and Android Studio (2%) are mentioned most often.
In early 2016, JetBrains presented a new integrated development environment in C# under the name of Project Rider. Contrary to Microsoft Visual Studio which is formally similar in terms of functionality, the new environment is x-plat — it operates both with Windows, and OS X and Linux. A �nal version is planned to launch in the end of 2016.
Most popular development tools
Year of survey/development tool
2008 2009 2010 2011 2012 2013 2014 2015 2016
MS Visual Studio 46% 64% 60% 62% 45% 36% 53% 49% 57%
Eclipse 19% 25% 19% 6% 16% 15% 34% 12% 25%
Intellij IDEA 10% 5% 3% 8% 9% 4% 14% 9% 21%
Xcode - - - - - 2% 14% 6% 15%
NetBeans - - - - - 3% 8% 0% 7%
WebStorm 2% 10%
not used - - - - - - 15% 24% 20%

156
The total sales of the Russian software companies as per the results of 2015 amounted to RUR 630 billion that is 40% higher than those of the past year. However, if we measure the sales of software products and development services in US dollar, then for the �rst time for several years of our studies a reduction in the total sales volume by 10% was observed. The primary reason for the reduction (as well as the high growth in the ruble) was the depreciation of national currency against USD, which resulted in a substantial contraction of the domestic market volume equivalent in USD.
Sales in the domestic market dropped by 3% down to 235 billion rubles. However, if those are converted in USD, then a decline by 39% from $6 to $.3.86 billion will result.
The bi-currency RUSSOFT index which is calculated as an average growth of revenues in foreign currency and in rubles considering the weight of earnings from exports and domestic market sales per the results of 2015, amounted to 1.1 (i.e., the corporate sales increased integrally by 10% on the average for the year).
When comparing the economic performance of companies o�ering a di�erent turnover, it is safe to say that small companies face much di�culty to grow (or often just to maintain the previous income levels and survive) than major companies.
The 2015 results once again con�rmed the importance of foreign sales for the stability of business. All principal indicators of companies with the export share in the cumulative income over 50% were much better than those of companies focused on the Russian market to a greater extent. It appears that companies' managers start to understand it.
In comparison with the �ndings of the previous survey for each direction of business development, it is worthwhile noting an increase in the share of companies which focus on a more active work at foreign markets. As one of the core business areas, this activity is contemplated by 57% (a year ago — 50%), and as a priority area — 41% (30%).
The foreign sales of service companies increased more than those of software vendors. At the domestic market the opposite is true — the sales' indicators of product companies are higher. While service companies lost 43% of the domestic market turnover in USD and 8.5% in rubles, then the software vendors reduced their sales in USD by a lower amount (32%) and increased those in rubles by 9% at all. At the same time, they did not revise the prices in Russia during 2015.
According to IDC, the Russian software market contracted down in dollar terms by 43%. First and foremost, it concerns foreign vendors who are always trying to keep their sales in dollars. It would be more correct to measure the income of Russian software vendors at domestic market in rubles unadjusted for in�ation. As their increase was as much as 9%, a good case can be made that it is one of the �rst signs of a natural import substitution process.
Over the past year, the situation worldwide and in Russia for Russian software companies generally took a turn for the worse nonetheless. In the �rst place, it is related to economic stagnation in Russia, to the weakening ruble and to the negative publicity created by western media.
In 2014, with regard to impact of foreign media on the attitude of readers toward the Russian high-tech sector a real regression to old times happened. First, the indicator of mass media loyalty lowered down to 48% (over the period 01.05.2013-30.04.2014), further on to 35% (01.05.2014-30.04.2015) and remained at that level till August 2016. Before 2010 it consistently hovered around 30-40% while changes had a random nature or were within the measurement accuracy.
The tone of foreign mass media (one ought to speak primarily about American media) switched sides after �are-up between Russia and the USA. Analysis of content of articles over the last year allows for the �rm conclusion on political engagement of many IT editions which was not seen before.
Key conclusions

157 Key conclusions
In western media a share of publications aimed at formation of a negative image of Russia (often enemy image) is light years greater than, for example, in media of Southeast Asia (SEA). However, Asian media are side with Russia where according to beliefs of their pressmen the creation of high-tech products is technically feasible. We cannot state the same about Russian software industry. The attitude hereto cannot be characterized by such words as “loyalty” or “disloyalty”. In South-East Asia the information about Russian software industry is thin.
Analysis of publications in foreign mass media in 2015 allows for the conclusion that Russian companies, associations and government entities continue to demonstrate that they do not have skillfulness and even aspiration to work with foreign pressmen. Arguably, that the work with media outside Russia is established on a regular basis by two companies only - Kaspersky Lab and Yandex.
Analysis of various ratings in the last years which characterize business environment and the degree of development and application of information technologies showed that Russia as a rule took higher places than in prior years. If and when there was a decline in a number of ratings, it happened within limit of �uctuations typical for last few years.
Such �ndings are somewhat unexpected since a place of Russia in the majority of other world ratings under consideration is determined by personal assessments which largely depend on an image generated by politicians and mass media. One could have expected a greater in�uence of this negative factor.
Over the past year, in the ratings, which directly or indirectly account for the turnover in dollar terms, the positions of Russian companies either lowered or remain unaltered which is to be expected as earnings in dollars in the last 2 years either lowered or lost steam. Presence of Russian companies has considerably grown just in Magic Quadrants of Gartner which primarily account for the software quality.
In early 2016 the Gartner analysts predicted a decline by 0.5% of the world ICT expenses at year-end 2016, but in the heart of summer they revised the forecast. According to the new version, expenses will remain at the previous year level. Essentially, the change is inside the margin of error, but anyway some reasons (certain positive changes) have appeared for revision. More serious amendments refer to individual segments. In particular, expenses on software will increase not by 4.2%, but by 5.8%, IT services — not by 2.1% but by 3.7%.
According to all indications, in the world IT market things are drawing to the age of serious shocks with the substantial redistribution of spheres of in�uence. Such distribution may result both in collapse of speci�c companies and tremendous growth of others. Russian software companies have chances of both growth and threat.
At year-end 2015 for the �rst time (since we began to measure it) the ICT market in Russia decreased, no matter what measurement procedure is used — in dollars, in rubles, adjusted or unadjusted for in�ation. A decrease was shown even by the RUSSOFT bi-currency index which allows to look at the market from the point of view of IT buyers. However, it means that the positive impact of IT upon economy and society has been reduced as compared to 2014, though the IT market with changed structure is still developing even with such contraction. In 2016 a small increase in ruble terms is the most probable.
A lot of indicators make it clear that if the crisis has not passed yet, we are over the worst. Such conclusion may be drawn in particular because the respondent companies begin to demonstrate their dedicated innovation more often.
In the situation of decrease in volume of venture investments in Russia (referred to by analysts) and the total national situation that does not very much play in favor of growth of investments, our survey shows that a share of companies which managed to attract external �nancing in 2015 has increased up to 10% (a year ago it was 7%). Admittedly, more software companies could receive investments in the next future. Although the venture market has reduced, some data tell that the reduction concerned the IT sphere as a whole but not the software industry.
In 2015 the growth of investments produced by Russian software companies abroad was shown again. According to J’son & Partners Consulting, the number of transactions with participation of Russian foundations and business angels increased by 34.2% and in monetary terms the growth was 21.7% (98 transactions with integrated value of $1.27 billion). Over the same period there were seven exits of Russian foundations from foreign projects versus nine exits a year before.

158 Key conclusions
This year the introduction of a new question about the structure of spending permitted to determine the signi�cance of one or another item of expenditure. As a result, it has been found that software companies spend the most (exclusive of payroll budget) on R&D and on o�ce rental fees. Supposedly, they underestimate the meaning of marketing.
Due to the decline of the national currency with a low growth of business activity, already there is no great di�erence by comparison with other European countries in terms of the o�ce rental in rubles. Over the last couple of years the rental rates in Russia decreased in dollar terms more than by 40%. It has a signi�cant positive impact on competitive performance of Russian companies in the world market.
Admittedly, the activity in the area of protection of intellectual property rights is in place though it is not very much in evidence. That is why it may be no accident that a proportion of respondents who have seen improvements in this area in the last 2 years have increased — from 13% to 18%.
If the sales beyond the former USSR republics are only considered, then the following pattern will result: 90-95% of Russian software sales is e�ected to the USA and EU, and 5-10% to the other countries beyond the former USSR republics.
Such a proportion disaccords to the geographical pattern of the global market. If we rely upon the data of Gartner and IDC, then the USA and EU account for about 60% of the global IT expenditure (including communications services). This disaccord contains a great potential for expansion of Russian software in the developing markets. At the same time, Russian companies can expand their sales in the U.S. and European markets, where they have had a low share still.
Judging upon the plans to open trade o�ces during 2 forthcoming years, a desire to enter new markets is shown by a growing number of respondents. Before 2013, the share of such companies had never exceeded 20%. As per the results of survey 2016 and that of the past year, the �gure achieved 37% and 34%, respectively. The interest towards foreign countries other than the former USSR republics is growing: in 2015 the desire to open new trade o�ces there was stated by 14% and in 2016 by as much as 18% of respondents.
During 2015 the total numbers of software developers employed with Russian software companies increased by about 12-15%, and those employed in Russia — by 8-9%. Consequently, Russian companies hired employees more intensely for their foreign development centers than in Russia.
Judging from the fact that the past year saw no outburst of the persons desiring to work abroad, the out�ow of software developers did not change in 2015 and �rst half 2016. It seems that the out�ow is not more than 2 thousand persons. However, the departure of just one key employee to another country turns out to be a problem for a particular company as the most competent developers knowing foreign languages leave. That is why the number of companies looking at the migration of professionals abroad as a problem is quite high under such a relatively small size of “brain drain” — 14%.
A considerable increase in the in�ow of professionals was only provided by the crisis in the Ukraine. In this case, 5 000 professionals (10 000 at the most) relocating to Russia every year is a too low �gure to achieve the set goal of attracting 200 thousand skilled professionals. In fact the program is not operational. Probably, the reason is that there is no active international promotion of Russia as a country where one can relocate to look for a job.
In general, hh.index (the number of CVs per vacancy) decreased in the IT segment. While this varied within a range of 3.7-4.7 in 2015, then it appeared to be within a range of 3.0-3.6 since January through August 2016. It means that the IT segment personnel de�ciency has increased.
However, the situation di�ers in the software development area – hh.index has increased considerably since the beginning of 2015 (from 1.7 to 4.6). That is to say, it has almost achieved a level that is comfortable for the employers, which is 5-6 in the opinion of HeadHunter experts. That very fact may be explained by the growing number of the sta� cut-o� in software development departments in traditional economy.

159 Key conclusions
In 2015 the average salary growth of respondent companies (excluding major ones with a high number of foreign centers) amounted to 8% in ruble at the background of the o�cial in�ation rate of 12.9%.
The average salary growth is well corresponding to the data from various sources.As the ruble has depreciated against US dollar by the factor of 1.9 during three most recent years, then the average salary of a software developer in USD decreased by 31%-35% during the same period.
The salary growth below the in�ation rates is an attribute of the industry’s crisis. However the crisis has a special type. At the background of the situation around other industries, it is di�cult to see any crisis there (compare – as per the data of HeadHunter, the average salary throughout Russia in ruble decreased by 1.06%).
On the average a programmer earned 75-76 thousand rubles in Russia late in 2015. By August 2016, the �gure increased to 79-80 thousand rubles.
Private companies the same as the Russian government began to implement the increased focus on sta� training. Large IT enterprises, which have actively cooperated with higher education institution for a long time, in 2013 and in the �rst half of 2014 announced launching new educational programs or broadening of existing cooperation. Currently there is much more news about similar incentives than in several prior years.
Judging upon the results of our survey, the activity of software companies in this area reduced slightly in 2014 as against the past year, though recovered again in 2015. Moreover, 60% of respondent companies cooperated with universities. This is the highest �gure of our survey since 2008.

Participants of the Survey

161 Participants of the Survey
First Line Software is a premier provider of custom software development, technology enablement services and value-add consulting in big data engineering, digitalization, intellectual integration, industrial Internet and IoT, digital media and marketing, and enterprise content management as well as healthcare IT.
Headquartered in the US, First Line employs 400+ sta� globally. First Line team and company culture is centered around subject matter expertise, technical excellence, consulting capabilities and proven methodologies, with a strong focus on Agile and Intellectual Integration.
The company has been recognized with multiple annual rankings and awards by the International Association of Outsourcing Professionals (IAOP), Global Services, CorporateLiveWire, Insights Success and CNews. We were the frst to be awarded with the Scrum Capability Medallion by Scrum, Inc. Most recently, research frm Gartner included FirstLine in their frst ever Market Guide for Technology Integrators (2014) and the Cool Vendor in Applications Services 2015 Report. We are active members in Object Management Group and Industrial Internet Consortium. FLS is also an EPiServer Premium Solutions Partner.
First Line ran over 400 projects in 15 countries in 14 di�erent industries. We have global clients across North America, Europe and Australia, including Accenture, Bonnier Group, Clinic to Cloud, Dell Software, InnerWorkings, Partners HealthCare, Odysseus Data Services, Solita, Viastore, and others.
Industry RecognitionRecognized in the Global Services 100 ranking, 2012Included in the 2013 Global Outsourcing 100 ranking by the International Association of Outsourcing Professionals (IAOP®) in 2012 and 2013. Recognized as a Rising Star and as a Top 20 software R&D provider in the world In 2012, First Line became the �rst software company in the world to receive the o�cial Scrum Capability Сerti�cation by Scrum Inc., the company founded by Dr. Je� Sutherland, co-inventor of ScrumListed as a representative vendor in Gartner’s 2014 �rst-ever Market Guide for Marketing Technology IntegratorsListed in Gartner’s Cool Vendors in Application Services Report, 2015
Listed in Multiple Categories of CNews100 Rankings for 2015: Largest IT companies, Largest IT developers, Fastest growing IT companiesListed in 50 Most Valuable Microsoft Solution Provider Companies 2016Recognized as a Top Company for: Customer References & Programs for Innovation in the Rising Star Size Group (IAOP®, 2016)First Line is Corporate LiveWire’s Global Awards’ Winner, 2016Certi�ed as Episerver Solution Partner, 2016Listed in 10 Fastest Growing Software Companies 2016 of The Silicon Review
Services (R&D/Development)Product development
Technology research and selectionPorting and migrationFull SDLC servicesPerformance engineeringCustomization, deployment, support and maintenance
Custom software developmentHistory of innovation and technical excellenceExpertise in globally distributed project managementCompetent business analystsRobust software development lifecycle
QA and testingTest process audit / Outsourcing readiness assessmentTest strategy developmentTest automationTest execution: Functional / Regression, Integration testing, Load / Stress, Failover / Recovery, Performance, Compatibility, Security
Clients:Bonnier Group, Dell, RW3, P�zer, ClickSquared, Episerver, InnerWorkings, Tupperware, Solaris Development, Web2print, Geotraq, Viastore
Technical expertise.NET technologies
Azure Services, LINQ, Windows Forms, WPF, WWF, Entity Framework, SOAP WebServices, WCF, Quartz.net
Content managementAlfresco, EpiServer, Drupal, Jumla, MS SharePoint, Orchard
Application Servers/ContainersApache Tomcat, Jetty, Oracle Weblogic, IBM Websphere, JBoss AS
Java SE/EEEJB, JPA-based ORM, JSF, JSP, JTA, Servlets, Spring, Struts, Swing
Windows technologiesCOM/DCOM/COM+, GDI+/DirectX, General Win32 API, MFC, MS Installer
Load/Stress/Performance testingGrinder, HP PerformanceCenter/LoadRunner, MS VS LoadTesting, OpenSTA, JMeter
Security testingApplication Security testing, Penetration testing, Fortify360, WebInspect
Test AutomationAutomatedQATestComplete, HP QuickTestPro, Selenium, WatiN, SpecFlow, FitNesse
Full-Text Search EnginesApache Solr and others Lucene-based engines
USA / Worldwide Sales 1 Broadway, 14th FloorCambridge MA 02142, +1 (877) 737 7178 Europe Louis Couperusplein 2, 2514HP The Hague, The Netherlands, +31 (70) 512 1899 Na Havránce 1508/14, 143 00 Praha 12, +420 (2) 28884855, The Czech RepublicEmail: sales@�rstlinesoftware.сom, info@�rstlinesoftware.сomfirstlinesoftware.сom
Contacts:

162Participants of the Survey
CompanyOverview:Artezio is an ISO 9001:2015 certi�ed software development and consulting company. Over the last sixteen years, Artezio has completed more than 1000 projects for its international clients.Since 2005, Artezio is a member and a major o�shore division of LANIT group, which is an IT Services vendor with 8000+ employees. From its development centers Artezio delivers cost e�ective, high quality IT services to clients in North America, Europe, Middle East and Japan thus being one of the leading East European o�shore software developers.
Developmentcenters: Moscow, Saratov, Nizhny Novgorod (Russia); Minsk, Vitebsk, Mogilev (Belarus); Riga (Latvia)
Certi�cation: ISO 9001:2015, Microsoft Gold Certi�ed.
Industry awards: IAOP Global Outsourcing 100 2006, 2010-2015; Global Services 100 2011,2013,
Software 500 2010-2016.
Industry focus:Core: Finance/Banking, Logistics&Retail, Governmental, IT&Hi-tech, Telecommunications, Healthcare/Pharmaceuticals/Bio-tech.Emerging: Media, Education&E-Learning, Construction, Gas and Oil.
Corporate solutionsDatabase analysis and BI (Activiti BPM, jBPM) High loaded SOA systems development based on JEE stackand frameworks (Spring, Seam), and .Net technologiesPortal Solutions(Liferay Portal, Sharepoint WSS/MOSS, WebLogic Portal, WebSphere Portal)ESB integration (OSB, Oracle ESB, IBM WebSphere ESB, JBoss ESB), Spring integration, MSMQ, eMule)Reporting systems(Jasper, BIRT, Pentaho, SQL Server Reporting Services)Cloud Solutions (Azure, Amazon)
Technological pro�le:
Services: Custom Software DevelopmentBusiness Software IntegrationSoftware quality assurance and controlSupport and maintenance
Founded: 2000Sta�: 400+
Dedicated development centers setup and operateDevelopment and integration of intellectual interfaces Technology consulting Business Analysis and Consulting
WEBdevelopment Development of Rich Internet Applications (RIA)based on Java, ASP.NET, PHP, JavaScript,Python Development of WEB-Interfaces withAngular.JS, React.JS, GWT\GXT, ExtJSframeworksMobile WEB-applicationsSingle Page Applications (SPA)
BigDatarelated technologiesDatabase analysis and BI (Pentaho, Oracle BI) NoSQLdatabases (Cassandra, MongoDB, Couchdb) Search engines (Elastic search, Apache Solr, Sphinx) Intellectual data processing (ApacheLucene, Mahout, Spark, NiFi) Distributed compilations (ApacheHadoop, ZooKeeper, Kafka) Image recognition (ConvolutionalNeural Networks, OpenCV)Natural language processing (Watson, YodaQA, LSTM, Apache UIMA, Word2Vec)
Contacts:ArtezioUSAhttp://[email protected]+1 609 786-2435
ArtezioHQhttp://[email protected]+7 495 981 0531
Mobile software developmentAll development services onAndroid, iOSandWin8\10 platformsCross-platform software development (ApacheCordova, Xamarin, React Native, AlphaSoft) Sophisticated geotracking apps developmentHigh loaded based SOA system development

163 Participants of the Survey
Engineering Locations6 development centers in Russia (2 in Moscow, N. Novgorod, Rostov-on-Don, St. Petersburg), + 1 in EU (Vilnius, Lithuania)
Services• Software Product Engineering and ADM• Custom Software Development• Product Maintenance• Re-engineering and Porting• Customization and Integration• Software Testing and QA• Product Support• Technology Research and Consulting
Domain VerticalsHigh-tech, Telecom, Mobile, Healthcare, Finance and Banking, Information security, Enterprise, Computer SW, Education, Government, Automotive, Media & Entertainment, Robotics, Avionics, Logistics and more.
Major ClientsIBM, Draeger Medical, Chrysler, Sberbank Russia, LynuxWorks, Pigeon Point Systems, Digital Guardian, Conservation Services Group, HomeCredit, IBM, CROC, iMind, onMobile, etc.
Technologies & Platforms• Embedded devices (ARM, PowerPC, Intel, FPGA…)• Real-time systems (VxWorks, QNX, ThreadX, pSOS, eCos, LynxOS)• Linux (server, desktop and embedded), UNIX, Windows internals.• Mobile (Android, iOS, Windows Phone, Tizen) and Connectivity (GSM, 3G, 4G, LTE, GLONASS, Bluetooth, WiFi, WiMax)• Enterprise applications: Work�ow, document and content management (EMC Documentum and other), CRM systems.• Web services, high loaded distributed applications, Big data• Net and Java platforms for portals (SharePoint, Liferay, IBM WebSphere), web and desktops application development• Databases (MS SQL, Oracle, DB2, Sybase, MySQL)• Multimedia streaming: multiplexing/de-multiplexing, real-time transcoding, optimization for mobile devices, face recognition• Geolocation and Geopositioning (LBS, GPS, GSM, NFC, SS7)• Social networks, Web 2.0, Internet of Things, wearables• Robot locomotion, sensors, computer vision
Awards- In Global Outsourcing 100 (rating by IAOP) since 2008. In 2015 Auriga received top marks in Customer References, Delivery Excellence and Corporate Social Responsibility categories.- In Global Services 100 (by Global Services Media and neoIT) since 2006. The company is ranked among the “Top 10 Service Providers: Eastern Europe”.
- In The Black Book of Outsourcing (by Datamonitor) с 2006. In 2011 Auriga is ranked the No. 1 Engineering Services Outsourcing (ESO) provider worldwide. In 2010 Auriga was named #15 in the prestigious “Global Top 50 Vendors” list. In previous years the company is named No. 3 in the list of IT Outsourcing Vendors in Central/Eastern Europe and No. 6 in the list of Global Software QA & Testing.- Auriga is included in overall Top 20 of software R&D service providers and in Top 10 among the companies serving Software industry, in a 2009 ranking of service providers in India, China, Russia, Ukraine & CEE by Zinnov Management Consulting, a leading management consulting �rm- Microsoft Silver Partner in Software Application Development since 2010
Industry StandardsCMMI Level 4, ISO 9001, SPICE, DO-178B, ISO 13485
About AurigaFounded in 1990, Auriga (www.auriga.com) was the �rst Russian company to provide software R&D o�shore/nearshore services to EU/US customers. Auriga o�ers the full range of software engineering services – managed teams and projects – for high-tech and software vendors, allowing them to quickly build and scale teams, access required skills and expertise, focus on strategic tasks. Auriga services cover all aspects of software RnD either as an all-in-one full-cycle outsourced product development engagement, or as a set of sub-services including conceptualization, development, testing, maintenance, support, porting, etc.In addition to technical expertise, Auriga pays special attention to soft skills - transparent communications, �exibility, engineering mindset, cultural compatibility, building trust. In 2011 Auriga was named world’s #1 engineering services provider based on customer satisfaction survey by Datamonitor, ahead of such names as Wipro, Siemens, Capgemini, IBM, and others. Auriga client list consists of both established industry leaders and fast-growing start-ups, including IBM, Draeger Medical, Chrysler, Sberbank Russia, Yandex, LynuxWorks, Pigeon Point Systems, and many others.
Contacts:Auriga, USA400 Trade Center, Ste 5900,Woburn, MA 01801, USAPhone: +1 (866) 645-1119Fax: +1 (603) 386-6097
Auriga, Russia125 Varshavskoe Shosse, Unit 16AMoscow, Russia, 117587Phone: +7 (495) 713-9900Fax: +7 (495) 939-0300
Web site: http://www.auriga.comE-mail: [email protected]
Founded: 1999Number of Employees: 500+
Elite Software R&D ServicesSince 1990

About EPAM EPAM Systems, Inc. (NYSE: EPAM) delivers product development and platform engineeringservices to Global 2000 companies by solving complex business challengeswith breakthrough technical innovations.EPAM specializes in digital transformation, business intelligence, big dataand analytics, testing, next-gen architecture, digital engagement, servicedesign and business consulting; all supported by over 23 years of softwareengineering expertise.
We are among the fastest growing technology �rms globally, with over 200clients and o�ces in over 25 countries. We have successfully helped our clientsachieve measurable business results through best-in-class software engineering,combined with innovative strategy, consulting and design capabilities.
Global Reach Armenia, Austria, Australia, Belarus, Bulgaria, Canada, China, Czech Republic,Germany, Hong Kong, Hungary, India, Ireland, Kazakhstan, Mexico, Netherlands,Poland, Russia, Singapore, Sweden, Switzerland, Ukraine, United Kingdom,United States
Recent Awards and Recognitions Named #8 on Forbes 2015 ‘America’s 25 Fastest Growing TechCompanies’ ListNamed ‘Top Information Technology Services Company’ onFortune’s 100 Fastest Growing Companies 2015 ListRecognized as the leader in Digital Platform Engineering in theForrester WaveTM: Digital Platform Engineering Services, Q2 2016Named in the Forbes’ List ‘The 100 Most Trustworthy Companies inAmerica 2016’Ranked in the Leadership Zone across all service lines in ZinnovZones for Digital Ratings 2015Ranked as 2015 Best Software Development Company by EuropeanCEO MagazineWon the Red Dot Award for service and industrial design for MissionAero wireless speaker
Vertical FocusFinancial ServicesTravel & HospitalitySoftware & High-TechRetail & DistributionMedia & EntertainmentLife Sciences & HealthcareEnergyOil & GasAutomotive
• Formed in 1993• Headquarter: Newtown, PA, USA• Number of employees: 18000+• Fortune Global 2000 Customers: 120
Service FocusSoftware & Platform EngineeringProduct DevelopmentNext-Gen ArchitectureAgilityIoTApplication & Cloud ManagementBig Data & AnalyticsConsulting ServicesDigital EngagementMobilityStrategy & Experience
Contacts:
CIS Headquarters 9th Radialnaya Street, Building 2, 115404, Moscow, RussiaP: +7-495-730-6362F: +7-495-730-6361
www.epam.com
Global Headquarters 41 University Drive, Suite 202,Newtown, PA 18940, USAP: +1-267-759-9000F: +1-267-759-8989
Results. Relentlessly.EPAM
164Participants of the Survey

165 Participants of the Survey
Aquarius Software 2000 Kostroma www.aqua-soft.ru [email protected] 910-660-46-18
OKTET Labs. 2003 Saint-Petersburg www.oktetlabs.ru [email protected] 921-332-08-05
Geosis 2009Dubna (Moscow region)
www.geosis.ru [email protected] 495-633-71-54
Internet-Frigate 2000 Novocherkassk www.ifrigate.ru [email protected] 863-522-41-10
RTSoft 1992 Moscow www.rtsoft.ru [email protected] 495-967-15-05
ALTINNTECH 2008 Saint-Petersburg www.altinntech.com [email protected] 812-994-31-77
AndSoft 2006 Saint-Petersburg www.andsoft.ru [email protected] 921-301-20-85
Aplana 1999 Moscowwww.aplana.com, www.aplana.ru, www.aplanadc.ru
[email protected]; 916-525-15-08
Arcadia 1993 Saint-Petersburgwww.softwarecountry.com; www.arcadia.spb.ru
[email protected] 812-610-59-55
Auriga 1990 Moscowwww.auriga.com; www.auriga.ru
[email protected] 495-713-99-00
Centrobit 2010 Moscow www.centrobit.ru [email protected] 495-927-02-78
Crossinform 2009 Moscow www.crossinform.ru [email protected] 495-760-43-24
Darout Service 2001 Saint-Petersburg www.darout.ru [email protected] 812-346-85-30
DataArt 1997 Saint-Petersburgwww.dataart.com, www.dataart.ru
[email protected] 812-333-44-40
Devpark 2009Zhukovsky (Moscow region)
www.devpark.ru [email protected] 499-999-01-85
Elecard (The Tomsk Development Team) 1988 Tomsk www.elecard.com [email protected] 382-270-14-55
Enterra 2001 Barnaul www.enterra.ru [email protected] 385-256-72-95
EPAM Systems 1993 Moscowwww.epam-group.ru, www.epam.com
[email protected] 495-730-63-62
eVelopers 1999 Saint-Petersburg www.evelopers.com [email protected] 812-324-32-11
First Line Software 2010 Saint-Petersburg www.�rstlinesoftware.ru sales@�rstlinesoftware.com 812-336-55-33
High Technologies Center 2000 Izhevsk www.htc-cs.ru o�[email protected] 3412-93-88-61
Inreco LAN 1994 Vladimirwww.inrecolan.ru; www.inrecolan.com
[email protected] 4922-444-090
Lanit-Tercom 1991 Saint-Petersburg www.lanit-tercom.com [email protected] 911-982-10-21
Luxoft Professional 2000 Moscow www.luxoft.com [email protected] (# 4683)
MMTR 2000 Kosrtoma www.mmtr.ru [email protected] 962-186-55-55
Monolit-Info 1991 Saint-Petersburg www.monolit.com [email protected] 812-334-95-95
Nicotech International 1991 Moscow www.nicotech.ru [email protected] 499-500-38-29
PiterSoft 2015 Saint-Petersburg www.piter-soft.ru [email protected] 812-333-08-60
Reksoft 1991 Saint-Petersburg www.reksoft.com/ru [email protected] 812-325-21-00
Rosberry 2010 Omsk www.rosberry.com [email protected] 381-266-13-12
Rubius 2008 Tomsk www.rubius.com [email protected] 382-297-77-72
SimbirSoft 2001 Ulyanovsk www.simbirsoft.com [email protected] 8422-44-66-71
Softoria 1997 Moscow www.softoria.ru [email protected] 495-682-42-07
Titan Information Service JSC 1998 Saint-Petersburg www.speereo.com [email protected] 950-000-88-22
Play hard 1993 Moscow www.akella.com [email protected] 495-729-53-91
Advanced Software Development 2008 Ulyanovsk www.asdevel.com [email protected] 842-227-04-99
BioRainbow Group 2004 Novosibirsk www.biorainbow.com [email protected] 952-947-12-43
Сuberto 2010 Saint-Petersburg www.cuberto.ru [email protected] 812-384-24-34
Intelligent Network Technologies 2005 Moscow www.int-corporation.com [email protected] 903-206-96-66
Inexika 2001 Novosibirsk www.inexika.ru [email protected] 383-332-15-41
Network Media 2013 Saint-Petersburg www.network-media.ru [email protected] 812-670-07-32
Perpetuum Software Russia 2006 Barnaul www.perpetuumsoft.com [email protected] 385-256-72-95
Embedded software (equipment, devices)
Geographic information systems (GIS)
Custom software development
Computer games
Mobile applications

166Participants of the Survey
SCOUT Group of companies 2005 Saint-Petersburg www.scout-gps.ru [email protected] 800-250-60-77
3DreamTeam 2008 Moscow www.vizerra.ru [email protected] 916-190-76-49
Alfa-Transit 2000 Moscow www.alfatran.com [email protected] 495-232-60-91
CISLink 2000 Moscow www.cislink.com [email protected] 495-587-42-33
Geomix 1959 Belgorod www.geomix.ru [email protected] 472-231-14-18
Navigation systems
Scienti�c researching
Integrated Biometrical Solutions & Systems 2011 Moscow www.ibrislab.com [email protected] 495-762-52-38
Fast Reports 1998 Rostov-on-Don www.fastreport.ru [email protected] 863-227-07-40
FIORD 1992 Saint-Petersburg www.�ord.com info@�ord.com 812-323-62-12
Giasoft 2002 Kazan www.giasoft.ru [email protected] 843-258-27-24
HyperMethod 1991 Saint-Petersburg www.learnware.ru [email protected] 812-380-88-77
InterSystems 1998 Moscow www.intersystems.ru [email protected] 495-967-00-88
Lira 2005 Moscow www.liraland.ru manager@r�ira.ru 495-672-17-16
Open Solutions 2009 Penza www.osinit.com [email protected] 8412-20-06-03
Oracle Development SPB 2004 Saint-Petersburg www.oracle.com [email protected] 812-334-64-51
Potok 1998 Korolev www.potok.ru [email protected] 498-600-27-60
Quality Solution 2008 Saint-Petersburg www.qsolution.ru [email protected] 812-575-79-44
TS Soft 2010 Ryazan www.ts-soft.ru [email protected] 491-251-04-77
VeeRoute 2014 Saint-Petersburg www.veeroute.com [email protected] 911-967-77-31
BINN 2001 Moscow www.binn.ru [email protected] 495-969-27-74
Business-Leader 2008 Ulyanovsk www.b-leader.ru [email protected] 951-096-48-81
Compass Plus 1992 Magnitogorsk www.compassplus.ru [email protected] 351-926-00-00
ALTEX-SOFT 2008 Korolev www.altex-soft.ru [email protected] 495-543-31-01
CryptoPro 1999 Moscow www.cryptopro.ru [email protected] 495-984-07-90
InfoWatch 2003 Moscow www.infowatch.ru [email protected] 495-229-00-22
MASCOM 1991 Moscow www.mascom.ru [email protected] 495-740-43-40
SearchInform 1995 Moscow www.searchinform.ru [email protected] 495-721-84-06
Star-Force 2000 Moscow www.star-force.ru [email protected] 495-967-14-51
Altec 2000 Saint-Petersburg www.altec.ru [email protected] 812-320-08-88ASKsoft 2004 Penza www.asksoft.net [email protected] 960-326-53-48Automatika-plus 1998 Penza www.automatikaplus.ru [email protected] 841-248-70-12BACUP IT 1990 Novosibirsk www.rabis.biz [email protected] 383-325-07-71BandMaster 2007 Saint-Petersburg www.bandmaster.ru [email protected] 812-329-38-56BaseRide Technologies
2006Nizhny Novgorod
www.baseride.com [email protected] 920-259-92-36
Bercut 1995 Saint-Petersburg www.bercut.com [email protected] 812-327-32-33Best 1999 Moscow www.bestnet.ru [email protected] 495-775-66-76Borlas 2001 Moscow www.borlasretail.ru [email protected] 495-740-49-73Compas 1991 Saint-Petersburg www.compas.ru [email protected] 812-327-74-28Comtec 1990 Moscow www.comtec.ru [email protected] 495-544-25-52CSoft Development (earlier - Consistent Software)
1989 Moscow www.csdev.ru [email protected] 495-913-22-22
Doc�ow Best Practice 2006 Moscow www.sapdoc�ow.ru sapdoc�ow@sapdoc�ow.ru 499-762-07-71ETNA 2003 Saint-Petersburg www.etnasoft.com [email protected] 1-855-779-7171Etton 2010 Kazan www.etton.ru [email protected] 843-221-72-46Guru-soft 2005 Izhevsk www.guru-soft.ru [email protected] 341-291-66-26Krug 1992 Penza www.krug2000.ru [email protected] 841-249-97-75LeaderTask 2005 Yaroslavl www.leadertask.com [email protected] 485-268-17-01Smart solutions 2010 Samara www.smartsolutions-123.ru [email protected] 846-279-37-79SOLVO 1995 Saint-Petersburg www.solvo.ru [email protected] 812-606-05-55
Basic software development (DBCS, OS, o�ce applications, virtualization tools, programming languages and tools)
Site designing
Information security solutions
Replicated enterprise (institution) management, document �ow automation, design and production process systems (ERP, CRM, ECM, EDMS, CAD, APCS and other)

167 Participants of the Survey
AGG Software Vladimir www.aggsoft.ru [email protected] 910-180-78-33
AGIMA.mobile Moscow www.mobile.agima.ru [email protected] 495-981-01-85
Aktive Systems Moscow www.aktivsystems.ru [email protected] 903-810-57-47
Alt-Soft Saint-Petersburg www.altsoft.spb.ru [email protected] 921-956-79-61
APM Research and Development Centre Korolev www.apm.ru [email protected] 495-514-84-19
Art-Media Kirov www.allnetwork.ru [email protected] 833-278-11-89
ASV Perm www.asv.ru [email protected] 342-222-44-44
AXIOMA Moscow www.axiomadev.ru [email protected] 495-215-51-18
BaseGroup Labs Ryazan www.basegroup.ru [email protected] 491-224-09-77
CPS Belgorod www.1cps.ru [email protected] 472-224-04-26
Other
CHTD Moscow www.chtd.ru [email protected] 8-800-555-92-54
CMA Small Systems AB Moscow www.cma.ru [email protected] 495-745-84-84
Competentum Moscow www.competentum.ru [email protected] 495-514-11-00 #3
Cryptex Samara www.cryprex.pro [email protected] 987-932-05-35
Elma Izhevsk www.elma-bpm.ru [email protected] 341-293-66-93
EMC, St.Petersburg Development Centre Saint-Petersburg www.russia.emc.com [email protected] 812-325-46-33
Engineering Centre Energoservice Moscow www.ens.ru [email protected] 818-265-75-65
EULER Moscow www.euler.ru [email protected] 499-429-01-20
Fundamental Systems of Analysis Astrakhan www.fsa3d.com [email protected] 851-252-33-33
Garant Moscow www.garant.ru [email protected] 495-647-62-38
GDC Services Kazan www.icl-services.com [email protected] 843-567-15-88
Genery Software Novosibirsk www.genery.com [email protected] 913-743-17-99
GKC ElectroSoft Ivanovo www.gkclab.com [email protected] 493-237-06-31
Glolime Saint-Petersburg www.glolime.ru [email protected] 812-334-93-84
Improve IT Novosibirsk www.improve-group.ru [email protected] 383-239-48-26
InduSoft Moscow www.indusoft.ru [email protected] 495-580-70-20
Inostudio Solutions Taganrog www.inostudio.com [email protected] 495-640-45-00
Integral Saint-Petersburg www.integral.ru [email protected] 812-740-11-00
IntegrIT Mytishchi www.integrit.ru [email protected] 926-258-30-19
InSAT Moscow www.insat.ru [email protected] 495-989-22-49 #204
Iron Water Studio Rostov-on-Don www.ironwaterstudio.com [email protected] 863-303-10-63
IVT Belgorod www.ivt.su o�[email protected] 472-258-00-80
Measuring Technologies Sarov www.mtels.ru [email protected]; 831-307-87-95
MTG Moscow www.logistical.ru [email protected] 495-662-73-50
NEXT TECHNIQUES Vladivostok www.nexttehnika.ru [email protected] 423-260-01-12
Opensoft Saratov www.opensoftdev.ru [email protected] 8452-39-19-89
Palitra-System Moscow www.palitra-system.ru [email protected] 499-754-10-04
Papillon Miass www.papillon.ru [email protected] 912-310-51-45
R-Style Softlab Moscow www.softlab.ru 495-796-93-15
Rus Wizards Taganrog www.ruswizards.com [email protected] 863-431-91-00
SCAD Soft Moscow www.scadsoft.com [email protected] 499-267-40-76
Sigma Moscow www.iosotech.com [email protected] 495-761-24-87
Soft-Impact Saint-Petersburg www.softimpact.ru [email protected] 812-320-43-90
Softpoint Moscow www.softpoint.ru [email protected] 495-543-74-02
Tech-soft Moscow www.tech-soft.ru [email protected] 495-960-22-83
Ultimeta Moscow www.ultimeta.ru [email protected] 495-287-46-09

RUSSOFT AssociationBirzhevaya line 16, suite 411,St. Petersburg, 199034, [email protected]