Exploring the Potential of Social Marketing to Encourage ...
501
Exploring the Potential of Social Marketing to Encourage Sustainable Tourist Behaviour in South West England Submitted by Julie Wooler, to the University of Exeter as a thesis for the degree of Doctor of Philosophy in Human Geography in February 2014. This thesis is available for library use on the understanding that it is copyright material and that no quotation from the thesis may be published without proper acknowledgement. I certify that all the material in this thesis which is not my own work has been identified and that no material has previously been submitted and approved for the award of a degree by this or any other University. Signature…………………………………………………………………….
-
Upload
khangminh22 -
Category
Documents
-
view
3 -
download
0
Transcript of Exploring the Potential of Social Marketing to Encourage ...

Exploring the Potential of Social Marketing to Encourage Sustainable Tourist
Behaviour in South West England
Submitted by Julie Wooler, to the University of Exeter as a thesis for the degree
of Doctor of Philosophy in Human Geography in February 2014.
This thesis is available for library use on the understanding that it is copyright
material and that no quotation from the thesis may be published without proper
acknowledgement.
I certify that all the material in this thesis which is not my own work has been
identified and that no material has previously been submitted and approved for
the award of a degree by this or any other University.
Signature…………………………………………………………………….
ACKNOWLEDGEMENTS
In the first instance, I would like to express my sincere gratitude to Peter Roach
of Dartmouth Steam Railway and David McCubbin of West Somerset Steam
Railway, who provided me with access to their passengers and enabled me to
undertake my data collection during the summer of 2011, which was perhaps
one of the most challenging aspects of this research project, as who wants to
answer a four page questionnaire when they are on holiday? Their help, along
with the staff and volunteers at both railways was invaluable, as were the
visitors who agreed to complete my questionnaire during their holiday.
I would also like to thank my supervisors, Dr Stewart Barr and Professor Gareth
Shaw, who have provided me with excellent guidance throughout the duration
of my research. Their level of ‘support’ has been balanced at exactly at the
right level, as the last four years have been particularly difficult for me on a
personal level, with my husband being seriously ill, which forced me to take
several ‘breaks’ during the course of my studies. Their support and confidence
in my research has been instrumental in the completion my research.

On a personal level, I would also like to express my thanks to John, my
husband, who even throughout his illness, was of immense help to me,
accompanying me on all those data collection runs, on the steam train, proof
reading and making copious cups of tea, I could not have done it without you,
and to Amber my daughter, thank you for your motivational messages, which I
would find placed in random places in my notes, it did help and make me smile.
Abstract
In the South West of England tourism provides an extremely important form of
economic revenue, with 92 million nights spent in the region, generating over £9
billion in visitor spending and 11% of the total workforce employed either
directly or indirectly in the sector. However this additional seasonal influx of
visitors inevitably places a strain on the natural environment, built resources,
infrastructure and communities. In order to readdress the balance tourism as a
sector needs to be more sustainable and the emphasis for change is now
placed on the individual. Social marketing has been used successfully to
encourage behaviour change in the health sector, and is beginning to be
recognised for its potential in encouraging sustainable behaviour, but has never
been specifically applied in a tourism context. Therefore this research
evaluates the potential of applying a social marketing methodology to
encourage sustainable behaviour amongst tourists in two case study areas in
South West England.
Social marketing focusses on changing behaviour by understanding individual
perceptions of the barriers to and motivations for behaviour. A social
methodology then works to segment individuals into groups that share similar
attitudes and beliefs, those groups identified as most likely to respond, are
targeted with an intervention to encourage behaviour change. This research
identified the perceived and actual barriers to (cost, time, convenience), and
motivations for sustainable tourist behaviour among participants from the case
study areas and identified three distinct clusters of tourists, one of which was
identified as suitable for targeting with a social marketing intervention. This
research also revealed that even those most committed to range of sustainable
behaviours in the home environment do not continue this behaviour when in the
holiday environment. A further dimension was added to this research by
exploring the use of an ecological footprint calculator (REAP for Tourism) to
quantify the environmental impact of individual tourists and to explore whether
pro-environmental attitudes and behaviour equate to lower environmental
impact.
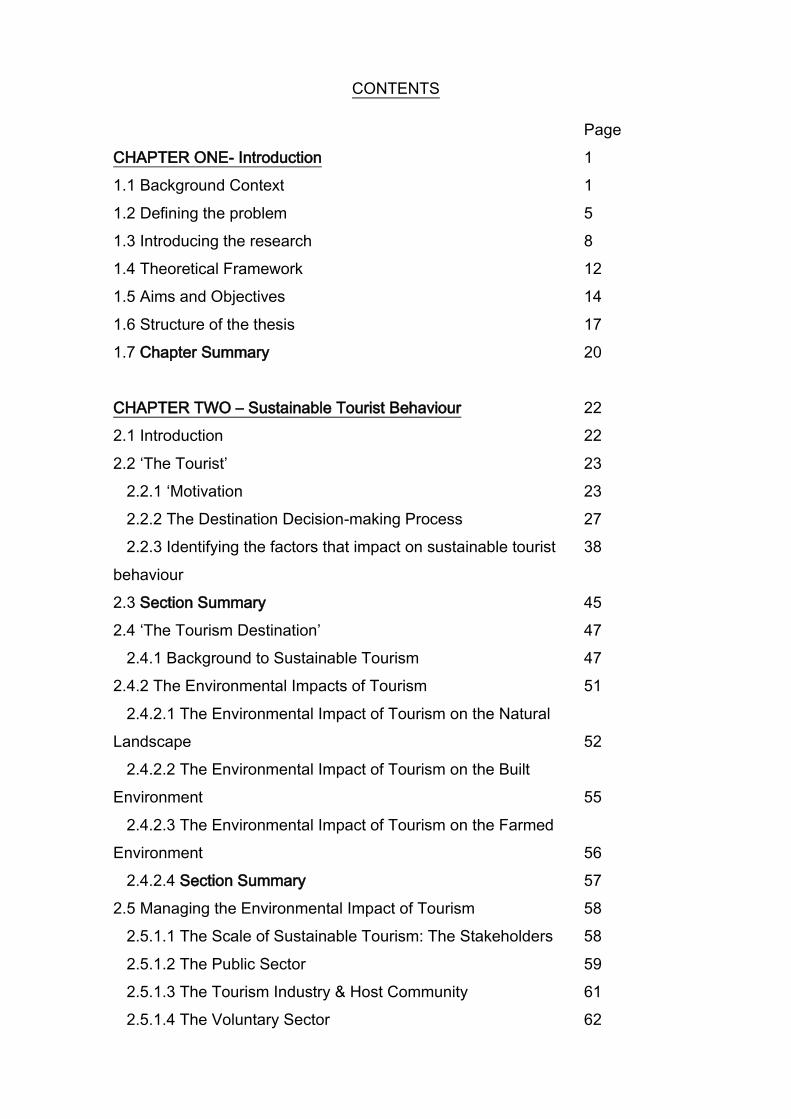
CONTENTS
Page
CHAPTER ONE- Introduction 1
1.1 Background Context 1
1.2 Defining the problem 5
1.3 Introducing the research 8
1.4 Theoretical Framework 12
1.5 Aims and Objectives 14
1.6 Structure of the thesis 17
1.7 Chapter Summary 20
CHAPTER TWO – Sustainable Tourist Behaviour 22
2.1 Introduction 22
2.2 ‘The Tourist’ 23
2.2.1 ‘Motivation 23
2.2.2 The Destination Decision-making Process 27
2.2.3 Identifying the factors that impact on sustainable tourist
behaviour
38
2.3 Section Summary 45
2.4 ‘The Tourism Destination’ 47
2.4.1 Background to Sustainable Tourism 47
2.4.2 The Environmental Impacts of Tourism 51
2.4.2.1 The Environmental Impact of Tourism on the Natural
Landscape
52
2.4.2.2 The Environmental Impact of Tourism on the Built
Environment
55
2.4.2.3 The Environmental Impact of Tourism on the Farmed
Environment
56
2.4.2.4 Section Summary 57
2.5 Managing the Environmental Impact of Tourism 58
2.5.1.1 The Scale of Sustainable Tourism: The Stakeholders 58
2.5.1.2 The Public Sector 59
2.5.1.3 The Tourism Industry & Host Community 61
2.5.1.4 The Voluntary Sector 62
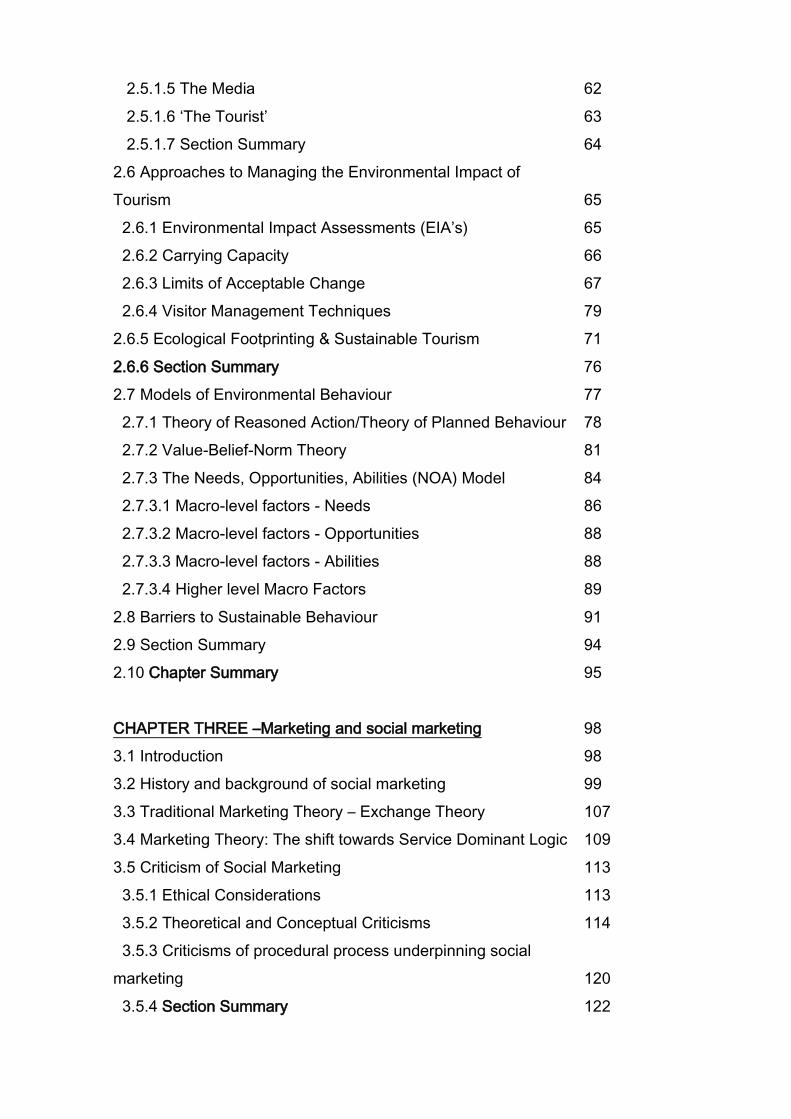
2.5.1.5 The Media 62
2.5.1.6 ‘The Tourist’ 63
2.5.1.7 Section Summary 64
2.6 Approaches to Managing the Environmental Impact of
Tourism
65
2.6.1 Environmental Impact Assessments (EIA’s) 65
2.6.2 Carrying Capacity 66
2.6.3 Limits of Acceptable Change 67
2.6.4 Visitor Management Techniques 79
2.6.5 Ecological Footprinting & Sustainable Tourism 71
2.6.6 Section Summary 76
2.7 Models of Environmental Behaviour 77
2.7.1 Theory of Reasoned Action/Theory of Planned Behaviour 78
2.7.2 Value-Belief-Norm Theory 81
2.7.3 The Needs, Opportunities, Abilities (NOA) Model 84
2.7.3.1 Macro-level factors - Needs 86
2.7.3.2 Macro-level factors - Opportunities 88
2.7.3.3 Macro-level factors - Abilities 88
2.7.3.4 Higher level Macro Factors 89
2.8 Barriers to Sustainable Behaviour 91
2.9 Section Summary 94
2.10 Chapter Summary 95
CHAPTER THREE –Marketing and social marketing 98
3.1 Introduction 98
3.2 History and background of social marketing 99
3.3 Traditional Marketing Theory – Exchange Theory 107
3.4 Marketing Theory: The shift towards Service Dominant Logic 109
3.5 Criticism of Social Marketing 113
3.5.1 Ethical Considerations 113
3.5.2 Theoretical and Conceptual Criticisms 114
3.5.3 Criticisms of procedural process underpinning social
marketing
120
3.5.4 Section Summary 122
3.6 Undertaking a social marketing campaign 124
3.6.1 Identifying the social problem 125
3.6.2 The Process of social marketing 125
3.6.3 Scoping 128
3.6.4 Development 131
3.6.5 Implementation 135
3.6.5.1 Phase 1 – Planning to launch the intervention 135
3.6.5.2 Phase 2 – Identifying Opportunities and Problems 136
3.6.5.3 Phase 3 – Evaluating, monitoring and modification 137
3.6.6 Evaluation 139
3.6.7 Follow-up 143
3.7 Section Summary 144
3.8 Chapter Summary 145
CHAPTER FOUR - Methodology 146
4.1 Introduction 147
4.2 Research Design 147
4.3 Selection of Case Study Areas 152
4.3.1 Case Study Area 1 – Minehead, West Somerset 153
4.3.2 Case Study Area 2 – Paignton, Devon 158
4.4 Description of Survey Design 162
4.4.1 Questionnaire Design 162
4.4.2 Survey Delivery and Data Collection 166
4.4.3 Data Input and Analysis 176
4.5 Description of the REAP for Tourism Model Design 178
4.5.2 Data Input 183
4.5.3 Inputting Procedure 189
4.5.4 REAP Output 189
4.6 Description of Interview Design 190
4.6.1 Interview Schedule 191
4.6.2 Semi-structured Interview Delivery 193
4.6.3 Interview Analysis 196
4.7 Ethical Considerations 199
4.8 Chapter Summary 202
CHAPTER FIVE – Results of the Questionnaire Survey 204
5.1 Introduction 204
5.2 Descriptive Characteristics of the Sample 206
5.2.1 Characteristics of the Minehead Case Study Area
Participants
207
5.2.2 Characteristics of the Paignton Case Study Area
Participants
209
5.3 Motivating Factors – Information Sources 211
5.4 Motivating Factors – Destination Characteristics 213
5.5 Attitudes to the environment and climate change 216
5.6 Comparing general attitudes towards the environment
between case study areas
222
5.7 Measuring attitudes towards the environmental impact of
holidays, travel and transport
225
5.7.1 Case Study comparison between attitudes towards
holiday, travel and transport
230
5.8 Home and Holiday Sustainable Behaviour 236
5.8.1 Recycling Behaviour 237
5.8.2 Composting of Food Waste 239
5.8.3 Use of Energy Efficient Appliances 240
5.8.4 Ensuring all electrical appliances are turned off 242
5.8.5 Use of Water Saving Devices 244
5.8.6 Energy Efficient Light Bulbs 246
5.8.7 Purchasing of Eco-Friendly Goods 247
5.8.8 Purchasing of Organic or Locally Produced Food 249
5.8.9 Re-use of plastic carrier bags 252
5.8.10 Transport Behaviour 254
5.9 Comparing the full range of sustainable behaviour at home
and on holiday
255
5.10 Comparison of sustainable behaviours between genders 256
5.11 Comparison of sustainable behaviours between age groups 257
5.11.1 Reported sustainable behaviours at home by age group 257
5.11.2 Reported sustainable behaviour on holiday by age
group 258
5.12 Comparison of reported sustainable behaviour at home and
on holiday by case study area
258
5.12.1 Case Study Area Comparison – Recycling 258
5.12.2 Summary comparison of recycling behaviour by Case
Study area
261
5.13 Case Study Comparison – Composting 262
5.13.1 Summary comparison of composting behaviour by case
study area
265
5.14 Comparison of Conservation Behaviours by Case Study
Area
265
5.14.1 Summary of Energy Conservation Behaviour 272
5.15 Pro Environmental Consumer Behaviour 273
5.15.1 Summary of Pro Environmental Consumer Behaviour
5.16 Carrier Bag Re-use
5.17 Transport Behaviour
279
279
281
5.18 Summary Results- Pro Environmental Behaviour
Comparison Between Case study areas
273
283
5.19 Quantifying the environmental impact of tourist on-site
behaviour using REAP for Tourism Ecological Footprint
Software
285
5.19.1 Introduction 285
5.19.2 Describing the ecological footprint by accommodation
type for each case study area
286
5.19.3 Total Ecological Footprint For All Participants 288
5.20 Comparing Total Ecological Footprint between case study
areas
5.20.1 Comparing Average Daily Ecological Footprint Between
Case study areas
289
289
5.21 Comparing Ecological Footprint by Accommodation Type 290
5.21.1 Exploring the Ecological Footprint of Serviced
Accommodation
293
5.21.2 Exploring the Ecological Footprint of VFR’s 296

5.21.3 Exploring the Ecological Footprint of Self Catering
Accommodation
297
5.21.4 Exploring the Ecological Footprint of Holiday Park
Accommodation
299
5.21.5 Exploring the Ecological Footprint of Camping 302
5.22 Exploring Travel and Transport EF 304
5.23 Exploring the EF of shopping behaviour 309
5.24 Exploring the EF of activities 309
5.25 Section Summary 310
5.26 Segmentation Analysis 311
5.26.1 Comparing Reported Sustainable Behaviours Between
Clusters
320
5.26.2 Section Summary 323
5.27 Exploring environmental impact of the Clusters using REAP 324
5.27.1 Cluster One – EF 325
5.27.2 Cluster Two – EF 327
5.27.3 Cluster Three – EF 328
5.28 Exploring the average daily EF between Clusters 330
5.29 Chapter Summary 332
CHAPTER SIX – Results of The Semi-Structured Interviews 334
6.1 Introduction 334
6.2 Profile of participants 335
6.3 Interview analysis 337
6.4 Psychological and Physical Benefits of a Holiday 337
6.5 Holiday Decision-making 341
6.6 Important factors in holiday decision-making process 342
6.7 Sustainable Behaviour 346
6.7.1 Sustainable Behaviour at Home 346
6.7.2 Sustainable Behaviour on Holiday 349
6.7.3 Holiday Travel and Transport 350
6.7.4 Food purchase and ‘eating out’ 355
6.8 After the holiday 361
6.9 Integration of the categories 365

6.10 Model showing barriers to sustainable tourist behaviour 366
6.11 Pre-holiday – Benefits 369
6.12 Pre-holiday – Decision-making 370
6.13 Pre-holiday – Destination Selection 370
6.14 Perceived Benefits 371
6.16 Barriers to sustainable tourist behaviour 372
6.17 During holiday – behaviour 373
6.18 Barriers to sustainable tourist behaviour 374
6.19 After holiday phase – experiences 375
6.20 After holiday phase –suggested improvements to the
holiday
375
6.21 After holiday phase – Re-visit 376
6.22 Barriers to sustainable tourist behaviour 377
6.23 Motivations to sustainable behaviour 379
6.24 Chapter Conclusion 382
CHAPTER SEVEN – Discussion & Conclusion 386
7.1 Introduction 386
7.2 Meeting the Objectives of this thesis 388
7.2.1 Objective One 388
7.2.2 Objective Two 393
7.2.3 Objective Three 399
7.2.4 Objective Four 403
7.2.5 Section Summary 406
7.3 Practical application of results to a social marketing
campaign
409
7.3.1 Customer Orientation 411
7.3.2 Behaviour & Behavioural Goals 412
7.3.3 Theory Based 413
7.3.4 Insight 416
7.3.5 Exchange 416
7.3.6 Competition 417
7.3.7 Segmentation 418
7.3.8 Methods Mix 421

7.4 The Total Planning Process 423
7.4.1. Scoping 423
7.4.1.1 Phase 1 424
7.4.1.2 Phase 2 424
7.4.1.3 Phase 3 425
7.4.2 Developing 425
7.4.3 Implementation 426
7.4. 4 Evaluation
7.4.5 Follow-up
427
428
7.4.6 Section Summary
7.5 Limitations and suggestions for further research 429
7.6 Concluding Remarks – Setting the research in a wider
context
431
7.6.1 Sustainable Tourism; Encouraging Sustainable Tourist
Behaviour
432
7.6.2 Concluding remarks 434
References
Table of Acronyms
437
459
Appendices 460
1
CHAPTER ONE – Introduction
1.1 Background context
One of the most important challenges for society is balancing the need for
continued and sustainable economic development whilst protecting and
preserving natural resources. The predicted rise in global population over the
following decades will place a greater pressure on the environment, and
coupled with the threats associated with climate change threatens the long term
viability of the planet’s resources. The influential Brundtland Report (1987)
recognised the need to balance the needs of developed and developing
countries continued economic development whilst preventing the exploitation
and depletion of natural resources. The report suggested that the most
appropriate way to achieve this was through building the principles of
sustainable development (SD) into all areas of development. Thus
consideration must be given to the potential environmental impact of human
activity. The need to consider the impact of human behaviour on the
environment was brought further into focus by the scientific evidence which
suggests that changes in the earth’s climate can be directly linked with human
behaviour. (IPCC, 2007)
The Intergovernmental Panel on Climate Change (IPCC) recognised the direct
links between human behaviour and climate change. The panel report every six
years and assess the earth’s response to current climatic conditions and predict
2
the future impact of a further change in global temperatures. Current
predictions forecast that global temperature will rise between 2.5 – 10 degrees
Fahrenheit over the next century. This predicted rise in temperature will have
regionally significant impacts around the world, in Europe the anticipated
impacts are likely to be increased flash flooding, coastal flooding leading to
erosion, glacial retreat in mountainous areas, reduced snow cover, extensive
loss of species and reduction in crop production for areas of southern Europe.
(IPCC, 2007) Mc Michael, Woodruff and Hales (2006) predict that the
anticipated impacts of climate change on human life are likely to be experienced
both directly and in-directly. The direct effects of a change in climate, such as
an increase temperature are predicted to have implications for health by
increasing levels of air pollution and increasing the likelihood of the spread of
infectious diseases. In-direct effects on human life by a change in climate are
predicted to impact negatively on food production, crop yields, decrease marine
productivity and these pressures are anticipated to cause displacement of
vulnerable populations creating conflicts over natural resources, such as water.
Therefore, the global community must respond to the challenges associated
with global climate change and sustainable management of natural resources
whilst also trying to maintain and maximise economic development initiatives.
The tourism sector represents an area of economic development that it has
been argued can be meet the challenge of a sustainable future whilst
3
maintaining economic stability. (Williams and Shaw, 1991; Sinclair, 1998;
Michalic, 2002) Tourism is perceived as an important tool for developed
countries to diversify and generate additional income and for developing
countries to boost their revenues. The provision of tourism services
encompasses many different sectors thus supporting a wide range of
employment and generating a welcome income boost, enabling essential
infrastructure improvements to the host community, (Sinclair, 1998) However
the provision of tourism infrastructure and services inevitably has consequences
for resort areas and host communities. (Sharma, 2004) The environmental
consequences of tourist activity can lead to degradation of important eco-
systems, pollution, and erosion whilst the impact of tourism on socio-cultural
aspects of a resort area can cause irreparable change to traditional ways of life.
(Mathieson and Wall, 1982) Tourism therefore faces the same challenge as the
rest of society, the need to balance the needs for economic development, whilst
recognising, and mitigating the environmental and socio-cultural impacts of the
activity. (Mathieson and Wall, 2007)
The next question for the global community is with whom does the responsibility
lie in terms of mitigating the effects of climate change and ensuring a
sustainable future? There is obviously a need for change in the way natural
resources are consumed with greater emphasis given to the environmental
consequences of behaviour. The change required to ensure an environmentally
4
sustainable future requires a combination of technological advances through
innovation to cleaner technologies that have a less detrimental impact on the
environment (Penner et al, 1999); market-based changes such as imposing
taxes and levies on more environmentally damaging activity (Mayor and Tol,
2007); and the third solution, and the one perhaps perceived to play the most
important role in mitigating environmental damage is individual behaviour
change. (Gössling and Peeters, 2007). The importance of the ‘individual’ in the
process of changing to more environmentally sound forms of behaviour has
come to the forefront in the policy arena, as Owens (2000) suggests there has
been a move from ‘passive to active politics’ in recent years whereby the
‘individual’ is expected to take responsibility in order to collectively mitigate the
impact of environmental damage (Barr, 2008).
This shift in political policy towards ‘individual responsibility’ for behaviour has
change created a further challenge for policy makers especially in the UK, what
is the most effective way to encourage behaviour change? In the UK The
Department for the Environment, Food and Rural Affairs (DEFRA) developed a
framework of Environmental Behaviour based on segmentation of individuals
based on their and attitudes towards and behaviour in respect of a range of pro-
environmental behaviours (recycling, energy saving, water conservation, ‘green’
consumer choices and transport decisions). (DEFRA, 2008) By focussing on
the ‘individual’ and segmenting groups of individual according to their attitudes
5
and behaviours towards a range of environmental issues it is perceived that any
‘intervention’ to encourage behaviour change is thus targeted at those most
likely to respond, thus ensuring a more effective targeting of resources. This
concept of targeting ‘segmented’ groups of individuals to encourage a change in
behaviour is derived directly from social marketing. Social marketing utilises the
tools and techniques of traditional marketing alongside other theories to
encourage changes in attitudes and behaviour for social good. (French and
Blair-Stevens, 2010) Social marketing has traditionally been utilised in public
health and safety campaigns where a change in attitude and behaviour to a
social issue has been required (e.g. anti-smoking campaign, road safety etc.).
Social marketing is now being utilised successfully to encourage higher levels of
pro-environmental and sustainable behaviour through addressing the barriers
and motivations for the behaviour(McKenzie-Mohr & Smith, 2008).
1.2 Defining the problem
As stated in the previous section, society faces the challenge of mitigating the
impacts of human activity whilst maintaining economic stability. Tourism is an
important sector for maintaining economic stability but must also ensure that its
impacts are minimalized. With the focus of change now firmly sited on
‘individual’ behavioural change then the challenge is how best to encourage
individuals to behave in a sustainable manner whilst on their holiday. Social
marketing with its guiding principles based on understanding ‘social problems’
from an ‘individual’ standpoint offers the opportunity to assess whether these
6
principles can be applied in the tourist setting. The originality of this thesis is
that is the first study to explore the potential of a social marketing methodology
to encourage greater levels of sustainable behaviour amongst tourists.
Previous studies have being very much focussed on behaviour change in and
around the home environment, through exploring green consumer choices,
sustainable travel and transport options. (Thorgersen, 1999; DeYoung, 2000,
Barr & Gilg, 2006; Hobson, 2002; Shove, 2003) Research studying the range of
sustainable behaviours practiced in the home environment suggests that for
those individuals who routinely engage that sustainable behaviour is a ‘lifestyle
choice’ one that should be reflected throughout all spheres of life, from home,
work environments through to the holiday environment. Research shows that
the ‘holiday’ represents a sphere of life for which pro-environmental attitudes
and behaviour do not persist (Barr, Shaw, Coles and Prillwitz, 2009; Gössling &
Peeters, 2007). Therefore this suggests that there is something ‘special’ about
the holiday environment and that the ‘attitude ‘behaviour’ gap is even wider
when an individual transcends from the ‘home’ environment to the holiday
environment. (Miller, 2003; Dolnicar & Leisch, 2008; Rathouse, Scarles, Holmes
& Tribe, 2010) By applying a social marketing methodology to the ‘problem’ of
sustainable tourist behaviour, this will address the difference in attitude and
behaviour between the home and holiday environments. One of the most
important components of a social marketing methodology is the emphasis
placed on understanding individual behaviour in the context with which it
occurs, in this instance the ‘holiday’. This process enables the barriers to
7
behaviour change to be addressed, and motivational factors also be identified
and acted upon. Therefore the social marketing process is a ‘bottom up’
process driven by the experience of the individual rather than a ‘top down’
process driven by regulatory authorities and eventually perceived to be more
successful in driving behaviour change. (Andreasen, 1994)
Another challenge facing those addressing the need to change attitudes and
behaviour towards more sustainable options is the need to ensure that the
behaviour undertaken actually has less of an environmental impact. This is
particularly problematic due to individuals being so far ‘removed’ from the actual
impact of their behaviour and the long term nature of sustainable practices, for
example the benefits accrued to the environment by individuals walking instead
of driving cannot physically be perceived by those concerned but in the long
term do have a positive impact on the environment. Ecological footprinting
offers the opportunity to represent the impact of behaviour on the earth’s
resources and by so doing demonstrates that natural resources have finite
limits. (Wackernagel & Rees, 1996; Chambers, Simmons & Wackernagel, 2000)
Ecologicaland carbon footprint calculations take into consideration the full
impact of a specific behaviour has upon natural resources and assigns it a
value. Once assigned a value this allows for identification of those behaviours
which incur the highest environmental impact. This thesis will utilise ecological
footprinting to explore the impact of individual tourist on-site behaviour, and is
8
innovative in that it will seek to make direct links between pro-environmental
attitudes, behaviour and actual environmental impact within a tourist
destination.
This thesis is unique in that it is the first study to explore the potential of a social
marketing methodology to encourage greater levels of sustainable behaviour
amongst tourists. Furthermore the ecological footprint calculations will add a
further novel dimension by exploring the link between attitudes, behaviour and
their environmental impact within the destination case study areas.
1.3 Introducing the research
Tourism as an activity is usually defined as the short-term (less than 12 months)
movement of people away from their usual home environment. (Hall, 2008).
Most commonly tourism is associated with travel for leisure and recreation
purposes, however, tourism covers a multitude of other types of short-term
voluntary travel, for the purposes of business, religion, health, visiting friends
and relatives and for education purposes to name but a few. Tourism is also
extremely important as a generator of economic income contributing £115billion
to the United Kingdom’s economy, employing over 2.6 million people and is the
third largest employer accounting for 9% of total employment. (Office for
National Statistics, 2011) The current research is sited in the South West of
9
England where tourism is a significant contributor to the economy where it
generates over £9billion of revenue, with a higher than the national average
employment rate of 11% of the region’s population being employed in tourism or
tourism related businesses (South West Tourism Alliance, 2008). Whilst the
South West of England is very much dependent on tourism and tourism related
activity for economic reasons, the influx of visitors over a relatively short tourism
season inevitably places a strain on resorts, in terms of services, infrastructure,
the environment and relations between the visitors and the host community. So
encouraging sustainable behaviour amongst its visitors is extremely important
to the long term future of the region.
This thesis will therefore focus on exploring the best way to encourage
sustainable leisure and tourist behaviour within two traditional seaside holiday
resorts in the South West of England. The main thrust of this thesis will be
devoted to understanding the motivations and barriers to sustainable behaviour
experienced by those on holiday in the two case study areas, utilising a social
marketing methodology. The thesis will consider the link between
environmental attitudes and behaviour and the on-site environmental impact
through the use of ecological footprinting calculations.
One of the most important aspects of a social marketing campaign rests with
segmentation and targeting of specific lifestyle groups. An example of
10
segmentation was undertaken by Defra (2008) in respect of Pro-environmental
Behaviour; to identify 7 distinct population segments, each segment sharing a
distinct set of values, beliefs and behaviours towards the environment and
environmental issues. These distinct segments were defined by their
willingness and ability to act on a range of environmental issues. The rationale
behind using segmentation analysis is that information and resources can be
more effectively targeted in a way that directly responds to the motivations of
each lifestyle segment thus meaning the intervention is likely to be more
effective in encouraging a change in attitudes and behaviour. However
utilisation of social marketing methodology to encourage sustainable leisure and
tourist behaviour has not been established and will form an important part of
this thesis. In order to achieve this, this research will examine the full cycle of
tourist behaviour from the decision-making stage through to ‘on holiday’
behaviour, including travel to and from the home environment, with the intention
of understanding the motivations and barriers to sustainable tourists behaviour.
It could be proposed that the ‘holiday’ environment is somewhat special and
different from the home environment especially in terms of sustainable
behaviours as these tend to be disregarded in a tourist setting (Miller, 2003;
Dolnicar & Leisch, 2008;Rathouse, Scarles & Holmes Tribe, 2010). Therefore it
is the intention of this thesis to explore the psychological and situational
variables that impact on behaviour in a tourist setting.
11
The Climate Change Act of 2008 recognised the need to address the threats
offered by climate change. This set binding targets for the lowering of
Greenhouse Gas Emissions and suggested a system for carbon budgeting for
England and Wales. Regulation and restriction of heavy industry emissions and
the need to develop technologies to adapt to these threats has already been
recognised, resulting in a push for cleaner and more energy efficient
technologies. However ‘service’ industries such as tourism cannot be
overlooked in their contribution to climate change the way tourism and the
leisure industry operates currently, will have to adapt and innovate in response
to the challenges of climate change (Becken & Patterson, 2006). Tourism as a
sector might be perceived to be less obviously ‘dirty’ than manufacturing or the
industrial sectors, rather tourism trades in less tangible ‘experience’ based
activity but provision of these ‘experiences’ still contribute considerably to
greenhouse gas emissions. One of the ways that industry has sought to
quantify the environmental impact is through the use of ‘footprint’ calculators.
Ecological and carbon ‘footprinting’ offer the opportunity to represent the impact
of behaviour on the earth’s resources and by so doing illustrate the Earth’s finite
resources (Wackernagel & Rees, 1996; Chambers, Simmons & Wackernagel,
2000). Ecological and carbon footprint calculations take into consideration the
full impact a specific behaviour has upon resource use and assigns it a value.
Once assigned a numeric value this allows for identification of those behaviours
that use the most resources, thus making it possible to either discourage certain
behaviours or develop technologies to combat resource use. In order to

12
quantify the impact of tourist behaviour on the environment this research will
include ecological footprinting (EF) analysis to understand the environmental
impact of different tourist types. An important aspect of understanding tourist
behaviour, is appreciating the environmental impact such behaviours are having
on a destination. Therefore this thesis will include analysis, using the Resource
Energy Analysis Program for Tourism (REAP) software program developed by
South West Tourism and the Stockholm Environment Institute to calculate
estimated ecological footprints for tourists. This will add a further dimension to
the research and will be useful when considering which lifestyle segments will
be most likely to change their behaviour. The use of the EF of on-site tourist
behaviour will provide a benchmark of the estimated environmental impact and
also give scope for calculating how a change in behaviour might alter the overall
environmental impact.
1.4 Theoretical/conceptual framework
This thesis covers three broad fields of research – marketing, sustainability and
tourist behaviour drawing together a multi-dimensional knowledge base from
across three sub-disciplines in order to encourage sustainable tourist behaviour.
The originality of this research is focussed on the fact that social marketing as a
derivative of traditional marketing has been successful at encouraging change
in attitudes and behaviour in health and social welfare campaigns, and is
beginning to be applied in encouraging sustainable behaviour in the ‘home’
13
environment but it has not been specifically applied to a tourist environment.
(Gordon et al, 2006; El-Ansary and Kramer, 1973). In terms of environmental
behaviour, research has tended to focus on behaviour in the home, how best to
encourage recycling, energy conservation and the use of public transport but
this has not been extended to the holiday environment (Peattie & Peattie,
2009). One of the areas of interest for this thesis is the exploration of whether
those people committed to a range of sustainable behaviours in and around the
home environment continue this commitment when on holiday. In terms of
tourism, the consensus of opinion suggests that tourism needs to be more
sustainable but how this is best achieved in the light of the need to protect vital
visitor revenue is one of the biggest issues facing destination management
organisations. It is readily accepted that the seasonal influx of tourists to
destinations has an impact on the host community but quantifying the impact is
problematic. The explorative use of ecological footprinting of individual visitors
adds a further dimension to the research by providing a quantifiable
environmental impact.
The following sections of this introduction will briefly consider the main bodies of
literature that underpin this thesis. The main thrust of this research is focussed
on exploring the potential of a social marketing methodology, therefore the main
conceptual framework rests in this sphere, however, the process acknowledges
the need to draw on evidence across a broad discipline base, therefore
14
knowledge gained through tourist behaviour and pro-environmental behaviour
will be influential in directing this research.
1.5 Aims and Objectives of this thesis
This research at its most basic seeks to explore the potential of utilising a social
marketing methodology to encourage sustainable behaviour amongst tourists.
However tourist behaviour covers a myriad of behaviours including actual
behaviour and the motivations and decision-making behind the behaviour.
Social marketing seeks to change behaviour using a ‘bottom-up’ approach by
understanding behaviour from the standpoint of the individual rather than
imposing change from above in a ‘top down’ manner. This thesis focusses on
the exploration of tourist behaviour within the selected case study areas in the
South West of England. Social marketing also acknowledges that individuals
are likely to experience any number of external barriers to behaviour change; to
this end this research also includes an evaluation of these effects.
Aim: the aim of this research is to explore the potential of employing a social
marketing methodology to encourage greater levels of sustainable
behaviour amongst tourists.
Objectives:
The specific objectives of this research are as follows:-
15
1. To describe and explain the behaviour of tourists within a destination, to
include travel to, from and within the destination and also include all
consumer behaviour undertaken during the holiday. The data gathered
here is focussed on the reported behaviour of tourists whilst on holiday in
their chosen destination. Data gathered includes information regarding
activities undertaken, purchases made, distances travelled and modes of
transport. The psychological aspects of tourist behaviour will also be
explored in terms of motivations and decision-making processes involved
in the pre-holiday period.
2. To identify, the barriers to and motivations for adopting more sustainable
tourist behaviour. A social marketing methodology dictates that one of
the most important aspects to changing attitudes and behaviours is
understanding the perceived and actual barriers to behaviour change,
whilst also considering what individuals perceive might motivate them to
change. Therefore this thesis considers how people understand notions
of sustainability, what behaviours they undertake whilst in their home
environment and what sustainable behaviours they might already take
part in whilst on holiday and what motivates this behaviour. Further
consideration is also given to what might encourage people to behave
more sustainably whilst in the resort and what they perceive the barriers
to be in this context.
16
3. To identify using segmentation analysis, specific lifestyle groups that
could be targeted with a social marketing intervention to encourage
sustainable tourist behaviour. The data gathered identifies sub-groups
of individuals that share similar psychological and behavioural
characteristics in respect of their attitudes towards holidays, transport
and travel. Where behavioural and psychological characteristics indicate
that a particular group of individuals may be amenable to behaving more
sustainably whilst on holiday, this group would be considered suitable for
targeting with a social marketing intervention.
4. To measure the environmental impact, using REAP for Tourism
Ecological Footprinting Software, of visitors on the two destination case
study areas. This objective will be fulfilled by collecting data regarding
the reported consumption behaviour of tourists whilst on holiday in the
case study area. The information collected will consist of all the activities
undertaken during the stay, spending on a range of items,
accommodation, travel and transport choices. The results generated will
provide an individual ecological footprint for each of the tourists which
demonstrate the environmental impact of their on-site holiday behaviour.
This information will linked directly back to the segmentation analysis
gathered for objective 3 in order explore the link between pro-
environmental attitudes, behaviour and environmental impact.
17
1.6 Structure of the thesis
Following this introductory chapter this thesis comprises a further seven
chapters:
Chapter 2 – Sustainable Tourist Behaviour
This chapter will comprise a full and extensive review of the relevant
literature within the field of tourist behaviour. Consideration will be given to
the literature pertaining to tourist motivation and decision-making, tourist
typologies and on-site tourist behaviour. The impact of this behaviour on
the host community and environment will be an important component part of
the literature review. Pro-environmental behaviour, sustainable tourism and
behaviour will form an essential part of the discussion. A review of the
literature pertaining to measurement and quantification of the environmental
impact of behaviour will also be an integral part of this chapter.
Chapter 3 – Marketing and Social Marketing
This chapter will review the literature and history of marketing and the
emergence of social marketing as a distinct discipline. Consideration and
description will be provided on the process and theory underpinning any
social marketing intervention. A discussion of recent uses of social
marketing to encourage pro-environmental behaviour will also be included
as this will be particularly influential in directing this thesis. Consideration of

18
the limitations of such an approach to encouraging attitude and behaviour
change will also be an intrinsic element of this chapter.
Chapter 4 – Methodology
This chapter will explain and describe the research and analysis used to
fulfil the aim and objectives of this thesis. The chapter will discuss the
selection of the case study area used in this thesis. A full description of the
quantitative and qualitative methods and analysis will be explained and
justified. A full description, rationale and limitations of the Resource Energy
Analysis Program for Tourism (REAP) ecological footprinting software will
also be considered within this chapter.
Chapter 5 – Results of the Questionnaire Survey
The content of this chapter will be divided into two sections; the first section
will be dedicated to describing the descriptive results of the large scale
questionnaire survey completed in the two case study areas; the second
section will explore the results of the segmentation analysis.
The ‘descriptive’ section of the chapter will include the demographics of
those who completed the survey, as well as details relating to holiday
motivations, decision-making, accommodation choices, transport and travel,
19
holiday activities and shopping behaviour. Further information regarding
reported commitment to a range of sustainable behaviours at home and on
holiday will be described, as will attitudes towards the environment.
Included in this section will be a description of the results of REAP for
Tourism ecological footprint calculations.
The second part of the chapter will detail results of the segmentation
analysis. The segmentation analysis will describe in full the characteristics
of each of the segments and link these directly with their personal ecological
footprint profiles.
Chapter 6 – Results of the qualitative interviews
This chapter will explore the analysis and results of the qualitative research
stage. The discussion will focus on describing the semi-structured
interviews undertaken in order to explore the barriers and motivations to
sustainable tourist behaviour. Furthermore the chapter will reveal how the
participants of this research perceived the barriers to sustainable behaviour
whilst on holiday and what they perceived might encourage them to behave
in a more sustainable manner when on holiday.
20
Chapter 7 – Discussion of the results and conclusion
This chapter focusses on drawing together the results gathered in the
previous chapters and discussing them in terms of a social marketing
methodology. Specific consideration will be given to whether the results
obtained during the research meet the criteria of a social marketing
campaign and whether they could be instrumental in developing a social
marketing intervention to encourage sustainable tourist behaviour. This
chapter will, provide a series of recommendations regarding increasing
levels of sustainable behaviour amongst tourists. Further consideration will
also be given to the policy context within which tourism rests and consider
the best way to encourage sustainable tourist behaviour. Consideration will
be given to both the limitations of the research and suggestions for further
research in this area.
The final section of the chapter will formulate a definitive conclusion and
guidance based on the results derived herein for encouraging greater levels
of sustainable behaviour amongst tourists.
1.7 Chapter Summary
This introductory chapter has set out the basic premise of this thesis. This
thesis and research contained herein is of a broad nature and aims to utilise a
social marketing methodology to understand and enable increasing levels of
21
sustainable behaviour amongst tourists and exploring the link between pro-
environmental attitudes, behaviour and tourist on-site behaviour through the use
of Ecological Footprinting software calculations.
Social marketing by its very nature seeks to utilise knowledge and research
techniques from a broad academic base. This thesis accordingly acknowledges
a broad spectrum of disciplines in order to generate a broader understanding of
the problem and through the use of primary research with tourists formulate
some suggestions for increasing levels of sustainable behaviour amongst
tourists. It is the intention of this thesis to enhance research in the area of
sustainable tourist behaviour through the utilisation of the previously untested
social marketing techniques in order to provide a greater understanding of the
barriers to and motivations for greater levels of sustainable behaviour whilst on
holiday. Additionally by adding the ecological footprinting dimension to the
enquiry this provides a greater depth, by testing whether pro-environmental
attitudes and behaviour are good predictors of low environmental impact.
22
CHAPTER 2 – SUSTAINABLE TOURIST BEHAVIOUR
2.1 Introduction
Social marketing acknowledges the need to review the existing literature
pertaining to the social ‘issue’ that requires action, in the case of this research
the relevant literatures naturally flow from research investigating tourist
behaviour, pro-environmental behaviour and how this might translate into
sustainable tourist behaviour.
This chapter will provide a critical overview of the existing literature in these
areas with the prospect of extracting and identifying the possible barriers to and
motivations for greater engagement in a range of sustainable behaviours whilst
on holiday. In essence this chapter will argue that it is the very nature of the
‘holiday’ and all that the notion entails which makes sustainable forms of
behaviour particularly difficult to encourage. In order to achieve this, the
chapter will explore the factors, both internal and external which individuals
experience and act as barriers to sustainable on-site tourist behaviour and will
be drawn from the literatures relating specifically to tourist behaviour but also
from research related to pro-environmental behaviour.
In pursuance of meeting the objectives of this literature review the chapter will
be divided into three sections; the first section will focus on ‘the tourist’ and
explore motivations, decision-making, and on site holiday behaviour with a view
to identifying the barriers to and motivations for sustainable holiday behaviour;
23
the second section will explore ‘the destination’ identifying the environmental
impacts of tourist behaviour, who is responsible and ways of managing the
impact; the final section will explore some of the behavioural models that may
be effective in encouraging sustainable behaviour.
2.2 ‘The Tourist’
The process of becoming a ‘tourist’ infers that some sort of transition or change
takes places within the individual. This change is not only related to the
physical move from the home environment to the holiday environment, but a
psychological process of change as a result of a freeing from routineness of
everyday life. This section of the chapter will argue that it is this ‘change’ or
‘transition’ from the home to holiday environment and all of the complexities
involved that makes tourist behaviour particularly resistant to changing to more
sustainable forms of behaviour.
2.2.1 Motivation
The ‘holiday’ is defined as an extended period of leisure and recreation,
especially one spent away from home or in travelling; however this definition
does not fully encompass the deeper motivations behind the touristic
experience. What is it is that individuals are seeking when they plan their next
holiday? What motivates holiday destination selection? And what are the crucial
factors that impact directly on motivation?

24
Cohen (1972) believed that motivation to travel was as a direct response to the
need to escape from the ordinariness of everyday life, however this need for
‘escape’ was often tempered by the need to maintain some facets of familiarity.
Furthermore Cohen (1972) believed that individuals could be differentiated by
the type of ‘escapism’ and the amount of ‘familiarity’ they required from their
holiday destination. Thus those individuals motivated to travel further afield and
experience ‘different’ destinations and cultures were strongly motivated by the
need for escapism but did not need to retain any facets of familiarity. However
those motivated to travel to mass tourist destinations, whilst also seeking to
‘escape’ from their everyday lives need to retain the familiarity associated with
holidaying with their compatriots. Where Cohen (1979) focussed on the notion
of ‘escapism’ as the motivating force behind specific destination selection, Plog
(1972; 1987) contended that motivation was as result of particular psychological
characteristics and these characteristics were reflected in the types of
destination selected. The personality types identified by Plog (1972), range on a
continuum from psychocentric to allocentric, with midcentrics taking the central
position. Thus those individuals who with more reserved and inhibited
characteristics might select destinations with which they are familiar and that
are considered established holiday resorts (psychocentrics), Allocentrics on the
other end of the continuum are perceived to be more outgoing and seek out
greater differentiation and this is reflected by travel to unusual and unheard of
holiday destinations. Midcentrics are motivated to seek out newly fashionable
destinations, meeting the need for discovery without the requirement to
25
immerse themselves wholeheartedly in the host culture. Interestingly Plog
(1991) developed this concept further suggesting that these tourist motivation
typologies could explain the development of destinations over time.
Allocentrics would be the first group to discover new destinations, once the area
becomes more popular and the infrastructure and services improve, the
midcentrics move in, and the allocentrics move on to previously undiscovered
destinations. Finally once a destination is fully developed and has become a
fully functioning tourist resort the psychocentrics arrive.
Whilst both Plog’s (1972; 1991) and Cohen’s (1977) interpretation of tourist
motivation are extremely intuitive, they suggest that ‘motivation’ remains fairly
static throughout the lifetime of the individual. Plog’s (1972: 1991) model links
tourist motivation with psychological characteristics, these characteristics define
and guide lifestyle decisions throughout life, this suggests that holiday
destination selection will always be centred around whether the individual is
extroverted, introverted or somewhere between the two. However whilst
psychological traits do remain fairly stable throughout life, destination selection
will influenced by other factors outside of the individual, factors such as age,
gender, lifecycle stage, physical ability, financial constraints to name but a few.
Pearce’s travel career ladder (1982) emphasized the dynamic nature of tourist
decision making, by integrating psychological motivations with the concept of
experience, so that motivations alter with travel and holiday experience. Pearce
26
(1982) based his ideas on those of Maslow’s (1970) heirachy of needs, as a
way of explaining how people develop different needs for travel as they become
more experienced thus progressing up the ‘travel career ladder’ as each of the
psychological needs are satisfied and new ones develop (Ryan, 1998). Another
area of criticism centres on the notion of ‘escapism’ that individuals are
motivated by wanting to ‘escape’ from the constraints of everyday life, however
as several authors have pointed out, whilst holidays are motivated by the need
for a break from routine, often once on holiday tourists tend to behave very
much as they do at home (Krippendorf 1987; Cohen 1977). In so much as they
seek out familiar cuisines, try to find places to watch their favourite television
programmes and mix with the same types of people that they would encounter
in their home environment. So by saying that tourists are motivated by the need
to ‘escape’ from the routines of everyday life, this suggests that all routine
behaviour is disregarded when the individual transcends from the home to the
holiday environment, however some commentators suggest that elements of
the ‘home routine’ are retained when on holiday. This is particularly important
to the current research, if ‘escapism’ from everyday routine behaviour is an
important motivation for holidaying, then this could help explain one of the
barriers to sustainable tourist behaviour. On the other hand, if some elements
of routine everyday behaviour continue into the holiday environment, then
routine everyday sustainable behaviour should also be found in those
individuals who are committed to and engaged in the home environment. The
suggestion that sustainable behaviour remains consistent and permanent

27
across different contexts implies that sustainable behaviour might be a ‘lifestyle
choice’. (Barr and Gilg, 2006) However Barr et al, (2010) found that even
individuals who were environmentally active in the home environment did not
continue this conscientiousness when in the holiday environment. Cohen et al,
(2013) confirm these findings suggesting that the ‘tourism space’ is perceived
somewhat differently to the home environment, and subject to lower levels of
environmental concern. Their research demonstrated that the majority of
individuals reduced, suppressed or abandoned their ‘normal’ level of
environmental concern and behaviour whilst in the holiday environment.
Having identified one of the potential barriers to sustainable tourist behaviour,
the next section will explore the decisions individuals make once they are
motivated to take a holiday. The holiday decision-making process in a highly
complex in nature, involving many components, travel and transport,
accommodation, destination amenities and activities and these need to match
the requirements of the individuals taking the holiday (Dallaert, 1998).
2.2.2 The Destination Decision-making Process
Once motivated to travel for the purpose of a holiday, the destination decision-
making process goes into action. Understanding the influential factors behind
destination selection is important to destinations as it is essential, in a
28
competitive market to provide the services and infrastructure to attract visitors
and reflect this in promotional materials. (Crompton, 1979) In the context of this
research it is important to explore the factors that influence the decision-making
process in order to assess whether these factors compete with issues of
sustainability in order to create further barriers to sustainable tourist behaviour.
In order to provide a better understanding of the process which underlies the
selection of a holiday destination many researchers have conceptualised it as a
‘funnel like’ process whereby choices are narrowed until a final decision and
selection has been made. (Sirakaya & Woodside, 2005) Others have sought to
conceptualise the ‘funnelling’ process into a sequence of destination choice-
sets which are reduced and eliminated until the final destination selection is
made. (Um and Crompton, 1990; Goodall, 1988; Crompton and Ankomah,
1992: Decrop, 2010) Gartner (1993) suggests that destination decision-making
is highly dependent on personally held images of possible holiday destinations
and it is this that initiates the process. The selection process then proceeds by
funnelling all of the destinations available (total opportunity set) narrowing down
options until a final destination is settled upon. Narrowing and reducing of
possible destinations is based upon matching possible destinations with
personal needs and constraints until the final stage where the destinations are
narrowed down to the ‘decision set’, this according to Gartner will not exceed
29
three and destination image is an essential element of the final decision and
selection.
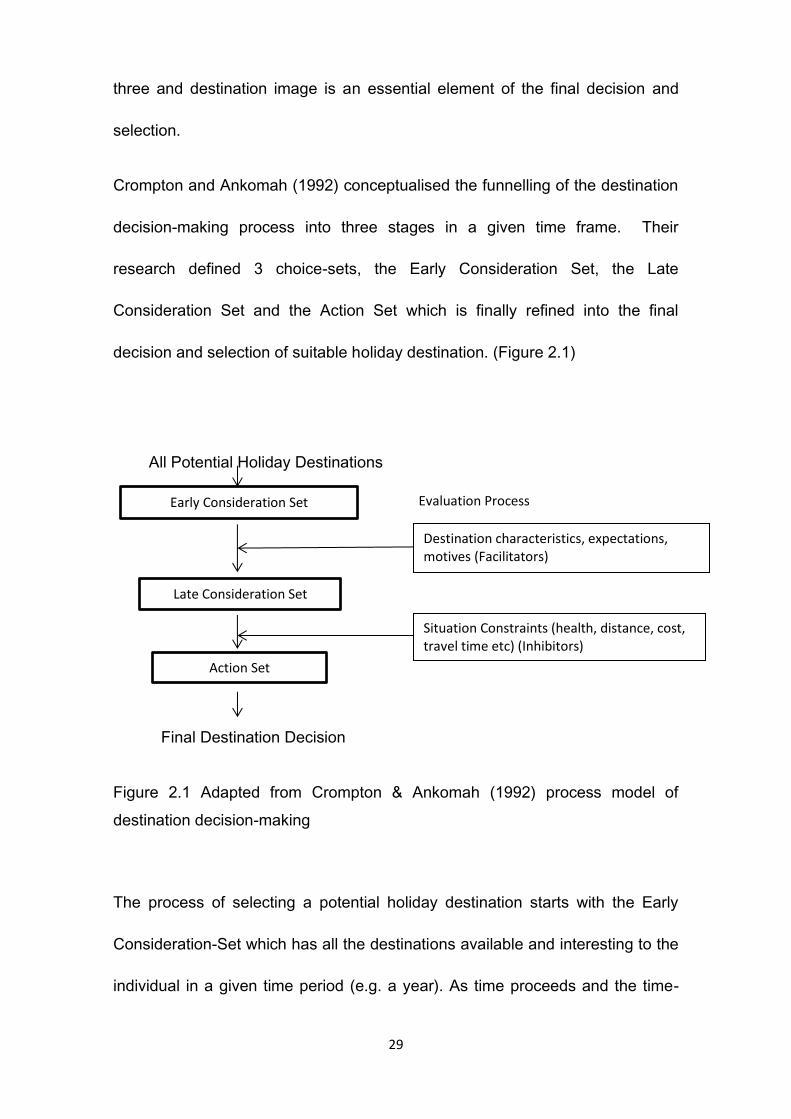
Crompton and Ankomah (1992) conceptualised the funnelling of the destination
decision-making process into three stages in a given time frame. Their
research defined 3 choice-sets, the Early Consideration Set, the Late
Consideration Set and the Action Set which is finally refined into the final
decision and selection of suitable holiday destination. (Figure 2.1)
All Potential Holiday Destinations
Final Destination Decision
Figure 2.1 Adapted from Crompton & Ankomah (1992) process model of
destination decision-making
The process of selecting a potential holiday destination starts with the Early
Consideration-Set which has all the destinations available and interesting to the
individual in a given time period (e.g. a year). As time proceeds and the time-
Early Consideration Set
Late Consideration Set
Action Set
Evaluation Process
Destination characteristics, expectations, motives (Facilitators)
Situation Constraints (health, distance, cost, travel time etc) (Inhibitors)
30
frame for destination selection shortens the process refines and reduces until it
reaches the Late Consideration-Set, this set comprises all the probable and
most likely to be selected holiday destinations. The final choice-set is the
Action-set and this set of destination choices contains those destinations
seriously under consideration and for which actual information has been sought
and contact made with various tourist services (travel agent etc) in order to
refine the selection and enable the final decision to be made. Crompton and
Ankomah (1992) further defined how destinations were evaluated in order to
move them through the selection process. In terms of destinations being
moved from the Early Consideration-set to the Late Consideration-set
individuals evaluated the specific characteristics of the potential destination in
terms of how likely they were to satisfy the expectations and motives of the
holiday group these evaluation criteria the authors termed facilitators. Once this
group of choices had been refined and reduced and moved to the Late
Consideration-set then the process of re-evaluation of potential destinations
were undertaken in terms of the situational constraints of each destination (e.g.
distance, cost, travel mode, health, safety etc.) and these criteria were termed
inhibitors, again destinations are filtered out before moving to the Action-set. By
exploring this model of tourist destination decision-making it may be possible to
identify further barriers to the selection of more sustainable choices. The very
nature of more sustainable choices of transport, accommodation and services
means that they are often more financially expensive, take more time, and are
31
more inconvenient and this acts as barrier to their selection thus eliminating
these options from the final destination decision set.
Where the previous review discussed the process of destination decision-
making, Decrop and Snelders (2005) chose to explore the way individuals
select their holiday. The concept behind this was to generate tourist typologies
based upon segmentation of individuals based upon their socio-psychological
and socio-demographic characteristics coupled with facets of the decision-
making process as reviewed previously. In essence, their research sought to
generate tourist typologies based upon their holiday decision-making style
whilst taking into account other factors that shape the process. Their research
was initiated by recognizing that holiday decision-making is not necessarily an
active deliberative decision to take a holiday but may more often that be a result
of incidental information processing or opportunities arising that had not been
previously recognised. For example, it might be that be there they become
aware of a discounted holiday opportunity, or that a new resort has opened or
friend offers them the opportunity to visit. Thus these decisions are initiated by
a ‘trigger’ rather than sequential pre-planned decision-making and execution
(Decrop & Snelders, 2005).
The research undertaken by Decrop and Snelders (2005) took place over a
year long period and segmented individuals according to the way they selected
32
their holiday destination and combined this with psychological and demographic
characteristics. They defined six tourist typologies based on these
characteristics:
Habitual – those individuals characterised as ‘habitual’ holiday decision-
makers routinely visit the same destination year after year, this can be
due to structural factors such as owning a holiday home. They are
characterised as being risk adverse, as they prefer knowing where they
are going and what is available for them whilst on holiday. Due to the
habitual nature of the holidaying they tend to optimise their holiday time
as they are familiar with the environment, undertaking many activities
and maximising their use of destination facilities. In terms of holiday
decision-making those in the ‘habitual’ typology tend to apply the same
rules each year in a routine manner.
Rational – The ‘rational’ holiday decision-maker is also risk adverse, but
this is more in recognition of constraining factors such as financial
circumstances rather than the psychological need for familiarity
associated with ‘habitual’ decision-makers. The process of selecting a
potential holiday destination tends to be undertaken in a careful and
realistic way, as they are not prepared to take a holiday at any cost.
Therefore holidays are planned a long time in advance, taking facilitating
and constraining factors into account from the start.
33
Hedonic – Members of this group particularly enjoy thinking, dreaming
and talking about potential holiday destinations, this process enhances
the anticipated arousal of experiencing a new destination. This group
tend to collect a lot of information from any sources regarding potential
destinations in order to generate even more pleasurable anticipation.
This daydreaming and thinking about potential destinations leads to
members of this group being particularly optimistic, so much so, that they
often overlook potential constraining factors.
Whilst members of this group immerse themselves in daydreaming about
potential holiday destinations their actual holiday destination tend to be
substituted by a much more realistic destination choice. This group
derive as more pleasure from the ‘daydreaming phase’ of the destination
selection process than they do from being on holiday.
Opportunistic – Members of this group of holiday decision-makers
minimise the process of thinking and planning a holiday, instead they are
willingly waiting for the correct financial or situational opportunity to arise
in order for them to take a holiday. This group comprises individuals who
experience a lack of leisure time due to factors such as professional
commitments. When holiday destination decisions are made they tend to
be the results of a co-occurrence of ‘need’ and the opportunity for fulfil
that need.
34
Constrained – Members of this group tend to be those individuals who
undergo destination decision-making rather than controlling it. Members
of this group are constrained by factors outside of their control for which
their destination selection will be influenced, for example, health and or
financial issues would influence the viability of certain destinations.
Members of this group tend to be individuals who do not have control
over the holiday destination selection process and therefore the resulting
holiday is not necessarily somewhere they would choose.
Adaptable – Members of this group like holidays and travel and always
have potential holiday projects in mind. By their very nature they are
adaptable and are willing to adapt their plans in order to suit any given
situation. Due to the adaptability of this group decisions tend to be taken
later in order to accommodate new information which may improve the
holiday experience.
Decop and Snelders (2005) results illustrate that the decision-making process is
often ongoing, with various holiday options running simultaneously with a lot of
contextual influences and that it is possible to segment individual depending on
the way they select their holiday destination. This has important ramifications
for tourist destination marketing organisations as it offers the potential for
marketing last minute deals to ‘opportunistic ‘decision-makers whilst selling the
35
flexibility and adaptive virtues of a destination to ‘adaptable’ decision-makers.
In the context of the debate regarding possible barriers to adoption of more
sustainable choices in the holiday environment, each of the segments here
experience particular barriers to selection of sustainability for example the
‘rational’ ‘opportunistic’ and ‘constrained’ segments destination decision-making
is impacted on by financial and health considerations, and as stated previously,
sustainable options tend to be time and financially expensive, thus the resultant
selection would be even less likely to be of a sustainable nature. In terms of the
‘hedonic’ segment their motivation is centred firmly on the ‘pleasure’ and
‘escapism’ of their holiday and thus sustainable alternatives would not even
feature as a consideration. The ‘adaptable’ and ‘habitual’ segments may
however, offer some opportunity to encourage more sustainable behaviour,
particularly the ‘adaptable’ segment who appear to be more amenable to
adapting their holiday selection if given enough incentive to do so. The
‘habitual’ segment on the other hand may already be using more sustainable
options during their holidays as they become familiar with the environment and
possible sustainable alternatives.
The rationale for including so much detail relating to tourist decision-making is
that social marketing dictates that behaviour needs to be understood on many
levels, therefore for this thesis it is important to understand the types of
facilitating and inhibitory factors that impact on holiday destination decision-
36
making. It could be suggested that the inhibitory factors which influence
destination decision-making share the characteristics as sustainable choices
meaning that barriers to sustainable behaviour are even more unassailable. In
order to assess the credence of this assumption, it is essential to review the
factors that have been identified as important to the destination decision-making
process and cross reference with the factors that have been identified as
significant predictors of, or barriers to sustainable behaviour. Where factors
which constrain destination selection match those factors which influence
sustainable behaviour it could be argued that this has a ‘multiplier’ effect
meaning that sustainable holiday choices are even less likely to be made.
The selection of a holiday destination and the component parts, travel and
transport to, from and during, accommodation, entertainment, food and drink
and activities involves a significant financial investment. These decisions are
likely to be impacted upon and constrained by the availability of financial
resources. Sustainable alternatives, such as opting for train travel over use of
the private car and selecting accommodation with ‘green accreditation’ often
incur a higher financial tariff and therefore are less likely to be selected. The
amount of money available to a household and budgeted for holiday expenses
will always have a direct impact on decisions-making regardless of attitudes
towards the environment (Swarbrooke & Horner, 2001).
37
Households will also be constrained by the amount of time available to them to
take their holiday and this impact’s on destination decision-making but will also
have a direct bearing on selection of sustainable alternatives. When in the
holiday destination the amount of time available is limited for undertaking
holiday activities so convenience is of utmost importance, so tourists work hard
to maximise their enjoyment whilst minimising travel time and inconvenience.
(Mill & Morrison, 1985) As stated previously in order for tourism to be more
sustainable, holidays need to be longer in duration but taken less often and
alternatives to air travel need to be selected in order to lessen the
environmental impact. However the time available to holidaymakers in terms of
annual leave from the workplace or school holidays restrict the amount of time
available for taking slower forms of transport or taking holidays of a longer
duration. (Cooper, 1981) Thus ‘time constraints’ are important factors for those
selecting when and where to take their holiday and having school age children
or employment regulations reduce available holiday options, especially for those
groups with school age children who are restricted to designated peak holiday
periods and financial costs are already higher than normal. Thus sustainable
options being more expensive and time heavy in nature could be said to be
lessening their chance of selection, therefore ‘time’ could be considered as a
further barrier to sustainable tourist behaviour especially for those individuals
who are restricted by financial and time constraints (Thornton, et al, 1997).
38
Another crucial element of whether tourists will engage in sustainable behaviour
whilst on holiday is the provision of suitable facilities and infrastructure that
meet the requirements of tourists. Research has demonstrated (in the home
environment) that access and ease of use were good predictors of engagement
in a range of sustainable behaviours. (Derksen & Gartrell, 1993; Berger, 1997)
The concept of ‘ease of use’ and ‘convenience’ is especially important in the
holiday environment where time is constrained and holiday group requirements
need to be met in the most effective and pleasurable manner (Aberg, 2000).
Time constraints and availability of facilities have a direct impact on tourist
decision-making and also impact on the likelihood of sustainable alternatives
being considered. However attitudes and beliefs regarding the environment will
also impact on home and holiday sustainable behaviour and can act as
motivating or inhibiting factors. Individuals experience both structural barriers
(place attributes, money and time) and interpersonal and intrapersonal barriers
and these interact to inhibit behaviour (Jackson & Rucks, 1995; Walker,
Jackson & Jinyang, 2007).
2.2.3 Identifying the factors that impact on sustainable tourist behaviour
As suggested previously those engaging in sustainable behaviours in a routine
manner, may make a conscious decision to ensure that their behaviour is as
39
considerate of the environment as possible. Thus behaving in a sustainable
manner could be said to be their ‘primary motive’ which guides their intentions,
however another type of motive operates which can override these guiding
principles and these are known as ‘selective motives’. (Mosiander, 2007)
These selective motives tend to occur on a day-to-day basis and tend to reflect
immediate needs and as a response to changing and conflicting contexts.
Hence an individual’s guiding motivations might be to behave in a sustainable
manner, but if the weather is inclement when leaving for work, then the decision
to take the car, instead of walking or cycling would override the guiding motives
and ‘selective motives’ that guide behaviour (Mosiander, 2007). If this principle
of guiding ‘primary motives’ versus ‘selective motives’ is applied in the context
of this research this might help explain why individuals who engage in a range
of behaviours in the home environment cease to do so when on holiday. It
could be that the change of context, from home to holiday, empowers the
individual to abandon their ‘guiding motives’ in favour of ‘selective motives’
which better match the requirements of the group in the holiday environment.
It would be sensible to presume that environmental knowledge and awareness
would be good predictors of sustainable behaviour. However research
demonstrates that only a small percentage of pro-environmental behaviour
occurs as a response to concrete and accurate knowledge. (Kempton, et al,
1995) In terms of environmental awareness this is a less concrete concept, but

40
is related to individuals being able to perceive the environmental impact of their
behaviour. However an awareness of the environmental impact of behaviour
has little effect on actual behaviour, this it has been suggested is due to the fact
that environmental impact is intangible and lacks immediacy. (Kempton et al,
1995) Closely related to the concept of environmental awareness and
perception of the impact of behaviour is the idea of ‘locus of control’ and
‘personal responsibility’. Locus of control is defined by the extent by which an
individual perceives their actions can impact on a given situation. Individuals
can either perceive that their ‘locus of control’ is either ‘internal’, or ‘external’,
those with an ‘internal’ locus of control will perceive that they can have an
impact on situation, however those with an ‘external’ locus of control will
perceive their actions will be ineffectual. In respect of pro-environmental
behaviour, locus of control pertains to whether an individual feels that, they
personally, can through their own behaviour, reduce environmental problems.
Those individuals who have a strong internal locus of control believe that their
actions can be significant in mitigating environmental degradation. On the other
hand, those individuals with an external locus of control believe that their own
behaviour will not be significant enough to effectively impact on the situation
and believe that change is the responsibility of others, especially government
and industry, thus control lies externally. (Owens, 2000) Whilst perceived locus
of control has an impact on an individual’s intention to take pro-environmental
action, other variables can further impinge on the decision to act. Trust is an
area that can impact directly on decisions to behave environmentally, if
41
individuals do not trust the information sources that they receive, they are less
likely to perceive that they are personally responsible for changing their
behaviour. This can be evidenced in respect of conflicting media reports
regarding the speed and extent of climate change. Once the public begin to
mistrust the sources of information advising the need for behavioural change
then they are much less likely to engage and act on these messages (Van Liere
& Dunlap; Hines Hungerford & Tomera, 1987).
As suggested previously, locus of control and personal responsibility for
impacting on a given situation are inextricably linked (Shultz, 2001).
Responsibility is a complex issue, as individuals can have any number of
personal responsibilities and these tend to compete for attention and are thus
prioritised in order of importance. (Stern & Dietz, 1994) Responsibility for the
welfare and wellbeing of one’s immediate family is likely to be the most
important, even when there is acknowledgement that they bear some
responsibility for the environment, other personal responsibilities that are of a
higher priority compete and conflict making pro-environmental behaviour less
likely. It is only when personal responsibilities and priorities have been met, or
when they are in alignment with needs and values of the family that pro-
environmental choices will be made. (Kollmus & Agyeman, 2002). In terms of
holiday decision-making and behaviour, and perceptions of personal control and
responsibility for environmental impact, it would appear from the literature that

42
this is a barrier to adopting more sustainable holiday behaviours. (Hares et al,
2010) This is especially true in the case of air travel, where there is an
awareness of the environmental consequences, but this awareness does not
translate into either attitude or behaviour change even for those committed to
reducing their impact at home (Barr et al, 2010; Barr, Gilg and Shaw, 2011).
their individual responsibility for the environmental impact of air travel and enter
a ‘psychology of denial’. The authors contend this is due to the way the air
industry portrays its relationship to environmental degradation. They suggest
there are four discourses used by the air industry to justify its position; that the
air industry is energy efficient and only has a marginal impact on carbon dioxide
emissions; air travel is too economically and socially important to be restricted;
that fuel efficiency is monitored constantly and technological advances will solve
the problem; and finally that air travel is treated unfairly when compared with
other modes of transport. These discourses do not reflect the true
environmental impact of flying but do impact on the way individuals perceive
their own responsibilities in relation to air travel and holidays and perpetuates
the idea that ‘holidays’ are so unique, so as to render the individual devoid of all
personal responsibility.
43
The concept of social norms and ‘normative behaviour’ has been used as a way
to explore whether this impacts on routine engagement in sustainable
behaviours. Normative behaviour refers to behaviour that is considered ‘typical’
in a given society, thus most people with conform to the behaviour; this leads to
feelings of belonging and results in societal acceptance. Non-conformity on the
other hand can lead to social sanctions where individuals are excluded from
society. Normative behaviour is usually socially or culturally constructed and
this explains why different societies exhibit different behaviours as a response
to similar situations. Social norms are an important factor to consider when
exploring pro-environmental behaviour, as normative behavioural responses to
environmental concerns will exert influence over individuals in any given
community or group. (Ciadlini, Reno and Kallgren, 1990) Thus in the context of
this research, sustainable behaviour in relation to holidays is not a ‘normative’
behaviour, therefore there is no ‘social’ pressure or sanctions experienced when
individuals make unsustainable choices or behave in an unsustainable manner
when on holiday.
In a research context often demographic characteristics are used to explore
differences in behaviour. Age has been shown to have a slightly negative
relationship with levels of engagement in various sustainable behaviours and
this remains constants across longitudinal studies. (Van Liere and Dunlap,
1980) In terms of gender females have been found to be more emotionally

44
engaged than males, showing more concern for environmental degradation and
being more likely, as a response to change their behaviour. (Lehmann, 1999)
However males report higher levels of knowledge regarding the nature of
environmental damage, but their response to threats tends to be focussed on
technological solutions rather than personal behaviour change (Lehmann,
1999).
Social class, in terms of educational levels has shown that those with higher
attainment show greater levels of environmental concern than those with lower
levels of attainment. (Van Liere and Dunlap, 1980) In terms of the income
component of social class higher incomes do not appear to be consistently
correlated with higher levels of environmentally concern, (Murdock and
Schriner, 1977;) and some studies report a negative relationship (Malkis &
Grasmick, 1977). Economic status can have a limiting influence on
environmental concern and behaviour, as many ‘environmental actions’ require
a financial outlay and those on lower incomes will be restricted in how much
they can achieve. Black, Stern and Elworth (1985) noted using increased
energy prices as a strategy to encourage energy conservation behaviour is
more likely to create financial hardship than to elicit behaviour change. High
energy prices create an inequitable situation, whereby those on low incomes
suffer financial hardship or energy poverty and those on higher incomes are in a
stronger position as they are better able to absorb the costs. Income will
always have a direct impact on the type of pro-environmental behaviours
undertaken, inevitably expensive behaviours such as re-insulation will be not be

45
possible for those on low incomes. (Stern, 2000; Gatersleben, Steg, & Vlek,
2009) If income has a direct impact on sustainable behaviour in and around the
home, then this is especially important in the holiday context. Sustainable
options tend to be more expensive, this would mean that those on lower
incomes would be precluded from selecting them, not because they are not
concerned about the environment, but because the choice is taken out of their
hands.
2.3 Section Summary
It is assumed in much of the literature that as long as the facilities and
infrastructure exist to provide sustainable tourism then tourists will be amenable
to changing their behaviour in favour of the sustainable options. (Dolnicar,
2006) However evidence suggests that even where sustainable choices are in
existence individuals on holiday do not necessarily select them. (Martens and
Spaargaren, 2005) Furthermore, even positively declared attitudes towards the
concept of sustainable tourism, does not ensure their selection and use. (Chafe,
2005) In order that tourism should become a more environmentally conscious
and sustainable product, the desired behavioural patterns for tourists should be
to adopt less environmentally damaging forms of transport, the use of eco-
efficient or environmentally friendly graded accommodation, respectful of
resident cultures and heritage, non-polluting, and purchasing of locally sourced
food, drink and goods. (Budeanu, 2007) In terms of encouraging greater levels
46
of sustainable behaviour amongst tourists it is important that any engagement
process reflects the perceived and actual barriers to change. This review has
attempted to argue that the barriers to sustainable tourist behaviour are
extremely complex and interact and compete with all areas of the tourist
experience. Starting with destination decision-making which involves the
moderation and balancing of many different variables (e.g. cost, time, family,
etc) in order to make the final selection. By adding sustainable alternatives into
the decision-making process this further complicates the selection process
multiplying effect of constraining factors which creates an even larger barrier to
selection. Coupled with these constraining factors, is the nature of the ‘holiday
experience’ which is associated with notions of freedom, hedonism and
happiness where recognition and acknowledgement of environmental impact of
such experiences is denied, suppressed and abandoned in order to fulfil the
psychological and physiological requirements of the holiday (Cohen, Higham &
Reis 2013; Ram, Nawijn & Peeters, 2013).
The next section of the chapter will focus more directly on the ‘destination’ or
supply-side of sustainable tourism and will be more descriptive in nature by
providing the background to the concept of ‘sustainability’ and its application to
the tourism arena. The chapter will define what constitutes sustainable tourism,
explore the impacts of, management of and who is responsible for ensuring the
sustainability of destinations. The final section of the chapter will re-focus on
47
the ‘tourist’ with a review of some of the models which aim to depict pro-
environmental behaviour and conceptualise and address the barriers to
sustainable behaviour. The following chapter (chapter 3) will then focus on
social marketing as a way to address the barriers to sustainable tourist
behaviour.
2.4 ‘The Tourism Destination’
2.4.1 Background to sustainable tourism
The influential Brundtland Report (WCED, 1987) drew attention to the
environmental consequences of continued economic development without
restriction and in turn gave rise to the concept of ‘sustainability’ and ‘sustainable
development’. Thus any economic activity, of which tourism is one, should be
subject to a set of guiding principles where planning should be holistic in nature,
recognising the need to protect and preserve ecological processes, to protect
human heritage and bio-diversity, and development should be undertaken in
such a way as to preserve resources for future generations (WCED, 1987). The
concepts of sustainable development within the tourism sector lead to the
emergence of a distinct sub-discipline, sustainable tourism. (Hall, 2008) The
sustainable tourism movement grew through recognition of the environmental,
social, cultural and economic impacts of mass tourism on host destination
areas. In this context, poor planning and management of resources in tourism
destinations, both natural and cultural were being depleted so greatly by the
48
pressure of tourism and tourist activity it would thus endanger its future
sustainability. (Hall, 2008) Therefore sustainable tourism recognises and
acknowledges the socio-cultural, environmental and economic impacts of all
tourism activity and works to mitigate these effects in order to secure the future
for the industry.
As sustainable tourism was borne out of a realisation that mass tourist
destinations could not continue to develop without some consideration of the
consequences, sustainable tourism became to be seen as an ‘alternative’ form
of tourism rather than guiding principles for all tourism. (Shaw & Williams, 2002)
This notion that sustainable tourism was a different ‘type’ of tourism lead to the
evolution of alternatives which attempted to evoke the notions of ‘good’ ‘non-
mass tourism’ products such as ‘green’ (Dingle, 1995), ‘eco’ (Valentine, 1992),
‘low-impact’ (Lillywhite & Lillywhite, 1991) and ‘responsible’ (Wheeller, 1991) to
name but a few. However these ‘alternative’ forms of tourism and the
subsequent differing interpretations and ways of planning and managing
resources meant that the full consequences were not properly recognised
(Shaw & Williams, 2002). This leads to much debate regarding whether it is
conceivable that an environment hungry economic activity such as tourism
could ever be truly ‘sustainable’ (Bramwell & Lane, 1993; Wheeller, 1994).
Furthermore much of the criticism surrounding sustainable tourism rests on a
lack of a clear definition of what ‘sustainable tourism’ is and how best to
49
operationalise the concept in practical terms, thus as Wall (1996) suggests the
meaning becomes de-valued as it could have multiple meanings and
interpretations and can be perceived as an ideology, a process, a concept and
or a political catchphrase.
In 2005 the World Tourism Organisation (2005) defined sustainable tourism as:
‘Tourism that takes full account of its current and future economic, social
and environmental impacts, addressing the needs of visitors the industry,
the environment and host communities’ (UNWTO, 2005:11)
The WTO proposes that sustainable development guidelines and management
should be applicable to all forms of tourism, from and including mass tourism
and down to the various niche segments. The issue of sustainability refers to
the environmental, economic and socio-cultural aspects of tourism development
and balance needs to be established between the three principles to ensure the
long-term viability of the sector. Therefore sustainable tourism should:
1. Make optimal use of environmental resources, whilst maintaining
essential ecological processes and helping to conserve natural heritage
and biodiversity.
2. Respect the socio-cultural authenticity of host communities, conserve
built and living heritage and contribute to inter-cultural understanding and
tolerance.
3. Ensure viable long term economic operations, providing socio-economic
benefits and opportunities to all stakeholders that are equitably
50
distributed. Including stable employment and income and social services
to host communities therefore contributing to poverty alleviation (WTO,
2005).
The issue of sustainability and its guiding principles has in recent years become
embedded in global and local politics, especially in terms of the scientific
community’s acknowledgement of the problems associated with man-made
climate change and an increasing world population unable to be supported by
the earth’s natural resources. This resulted in the United Kingdom in the 2008
Climate Change Act which set binding targets for greenhouse gas emissions.
One of the main criticisms of sustainability per se, is that whilst there should be
an equal balance between socio-cultural, environmental and economic
requirements, inevitably the balance tends to be in favour of economic
development especially in times of economic recession. Conversely tourism is
often used as a form of economic development and as a way for traditional
industries such as farming to diversify in order to generate additional income.
However the Climate Change Act (2008) placed the emphasis back on
protection and preservation of the environment by attempting to regulate
activities that have a detrimental impact on the environment.
As tourism and associated tourism spending are important generators of
income at global and local levels then balancing the need to maintain and
maximise income whilst mitigating the environmental impact is particularly

51
difficult. The next section will explore in more detail the environmental impact
associated with tourism activity.
2.4.2 The Environmental Impacts of Tourism
The environmental impact of tourism and tourism related activity is far reaching
and not just sited in destination-based impacts. The term ‘environment’
encompasses five different types of environment on which tourism can have an
environmental impact; natural resources, the natural environment, the farmed
environment, wildlife and the built environment. Swarbrooke (1999) suggests
that rather than focussing on the environment rather sustainability should take
an eco-systems approach, whereby the inter-relationship and mutual
dependency of forms of the environment (including man) are taken into
consideration (Mathieson & Wall, 1982; Miller & Spoolman, 2008). For tourism
protecting all facets of the ‘eco-system’ is important as they are mutually
dependent on each other for their continued success (Mowforth and Munt,
1998; Holden, 2000), in so much as, tourism can cause a negative impact on
the quality and quantity of natural and cultural resources and this decline in
quality will have negative impact on tourism demand (Cocossis and Parpairis,
1996; Wall & Mathieson, 2006).
52
The following section will detail a range of impacts that tourism development
and activity can have on each of the five ‘environments’ with which it interacts.
2.4.2.1 The Environmental Impact of Tourism on the Natural Landscape
Natural resources are often related directly to the tourism product on offer such
as, clean and safe bathing waters of the lakes, rivers and the sea or mineral
waters associated with spa treatments, or the clean unpolluted air of
mountainous regions. These natural resources often motivate visitation to a
specific area, however the provision of tourism and tourist services impact
negatively on the very resources on which tourism depends . (Mercher, 1983)
The provision of tourism accommodation bases can divert water supply away
from host communities in order to meet demand for swimming pools, washing
facilities, drainage, watering of lawns for aesthetics and recreation to name but
a few. Furthermore if sewage is not treated properly and is discharged directly
into rivers and the sea, or enters the water course, this will cause pollution and
destruction of plant and marine life (Jenner & Smith, 1992).
In terms of natural resources such as ‘air’ tourist activity in terms of vehicle
traffic to visit a particular landscape will impact on the area through emissions
from a variety of vehicles creating air pollution, which in turn will have an impact
on indigenous flora and fauna (Hunter & Green, 1996).
53
In terms of the natural environment this relates to features such as mountainous
regions, oceans, coastal areas, rivers, lakes, forests and beaches to name but a
few and these features are directly related to natural resources as detailed
previously. The direct and indirect impact of tourism on the natural environment
tends to be specific to the type of destination area. Coastal areas consist of
many natural elements (sea, cliffs, beaches, sand dunes) and each of these is
susceptible to the negative impacts of tourist activity. Water quality and clean
beaches are essential to a successful destination; however discharge of
untreated sewage lowers water quality and has a negative impact on marine
eco-systems(Bercheri, 1991; Pattullo,1996; Davenport & Davenport, 2006). The
use of motorised boats disrupts and important coral reefs and marine habitats
as were experienced by large areas of the Great Barrier Reef in Australia and
areas of the Caribbean (Schoorl & Visser, 1991).
The removal of sand dunes and reclamation of coastal wetland areas in order to
build tourist resorts has destroyed and disrupted breeding grounds of birds and
other species of wildlife and can also have ramifications for host communities
increasing their risk of flooding (Baron-Yelles, 1999; Klemm, 1992).
In terms of mountainous regions and particularly in relation to the provision of
winter holidays such as skiing and snowboarding, the provision of built
infrastructure (hotels, roads, ski lifts, cable cars etc) to support these activities
54
has had a detrimental impact on the natural landscape. In order to provide the
infrastructure to support winter ski holidays it is estimated that in the early
1990’s around 100 km2 of forest was removed in the Alps, this impacted directly
on wildlife populations by reducing their natural habitat but also reduced a
natural barrier thus increasing the likelihood of avalanches in winter and
mudslides in summer. (Williams & Shaw, 2002; Swarbrooke, 2000)
Furthermore the actual skiing or snowboarding activity undertaken during the
holiday has a significant impact on the environment especially with increasing
numbers of visitors skiing off the designated runs which means they are more
likely to come into contact with and damage sensitive vegetation. The provision
of tourism services inevitably leads to more vehicular traffic and thus pollution,
increased waste and litter all of which require disposal and generate the need
for larger landfill sites to accommodate rising levels of waste meaning more of
the natural environment and loss of natural habitat is experienced.
Skiing and winter holidays are not the only activities undertaken by tourists in
mountainous regions, trekking holidays have become increasingly popular in
the last couple of decades. Provision of tourist accommodation and roads has
destroyed forests, vegetation and wildlife habitats. Additionally the action of
thousands of people walking causes compaction of the soil, increased surface
run-off and soil erosion. (Sparrowhawk & Holden, 1999; Pickering, Carrington
and Worboys, 2003) Mowforth and Munt (1998) amongst others comment that
55
even tourism that is purportedly sensitive to the environment, such as some
eco-tourism destinations are in such sensitive fragile landscapes that even a
small number of visitors has an impact on the natural environment and
resources. Through disruption to wildlife breeding sites and patterns, and as in
wildlife reserves in areas such as Kenya where visitors want to spot the ‘big five’
involves vehicles ‘chasing’ animals in order to satisfy these desires which
impacts on the animals naturally feeding and breeding patterns (Roe, Leader-
Williams & Dalal-Clayton, 1997).
2.4.2.2 The Environmental Impact of Tourism on the Built Environment
The impact of tourism on the built environment can be considered in terms of
individual buildings, small scale settlements such as villages up to and including
large scale towns and cities. Tourists are often motivated to visit an area by the
picturesque, historical and cultural nature of the built environment; however this
creates traffic congestion, pollution from exhaust emissions and therefore
greater levels of CO2 causing pollution and acid rain (Hunter & Green, 1996).
This in turn can have a detrimental impact on the buildings and other structures
such as statues which in the case of limestone, marble and sandstone can be
corrosive causing them to crumble. The Taj Mahal in India which is India’s most
important tourist attraction attracting between two to four million visitors per year
banned tourist traffic from the area in order to protect the structure from
pollutants. Instead visitors park outside the area and are bussed into the

56
attraction in an electric bus. (Hunter & Green, 1996) In Venice very high visitor
numbers have placed such an unsustainable pressure on both natural
resources and infrastructure that high prices for services have been introduced
in order to deter visitors (Buhalis, 2000).
2.4.2.3 The Environmental Impact of Tourism on the Farmed Environment
There are a wide range of farm environments that tourism can impact upon,
from large scale intensive crop growing farms, smaller mixed farms growing a
range of small range of crops and animals, cash crops such as vineyards,
timber farms to small scale nomadic farming communities. Where tourist
activity interacts with any scale of farming activity there can be impacts; the
development of new tourist resorts can put pressure on water supplies which
would be needed to support crops and or livestock; tourists may behave
inconsiderately tramping and damaging crops, dog walkers may inadvertently
allow their dogs to cause stress to pregnant livestock which ultimately result in
loss of revenue for the farmer (Archer, Cooper & Ruhanon, 1995). Furthermore
employment in tourism may be attractive to younger generations and they may
leave the farming environment resulting in a loss of future generations farming
potential. (Hunter & Green, 1996)

57
2.4.2.4 Section Summary
In summary this section has noted some of the negative environmental impacts
that tourism and tourist activity has on the environment. The environmental
impacts described here are negative in nature; however tourism and the need to
satisfy tourists can also have positive impacts on the environment. This is due
to the mutually interdependent relationship between tourism and the
environment, as tourism is an important economic activity it is therefore
important to protect areas that draw touristic attention (Dolors, Canoves &
Valdovinos, 1995). An example of this is provided in the European Blue Flag
scheme which measures beach and bathing water quality and awards those
destinations which meet the criteria with a Blue Flag. This scheme is important
for both tourists, tourism and the environment as potential visitors have a
benchmark of how clean and safe the beaches and water is, but the scheme
also, motivates destinations not to neglect the importance of clean water, and
environmentally important marine eco-systems are protected from potential
damaging pollutants (Shaw & Williams, 2008).
The next section will explore the types of techniques employed to manage the
environmental impacts of tourism.

58
2.5 Managing the Environmental Impact of Tourism
The previous section concentrated on describing a range of environmental
impacts on different types of tourism destinations, this section will focus on the
approaches and techniques undertaken in order to manage the environmental
impacts of tourist activity. The aim of these different techniques is to try to
maximise the potential of tourism whilst minimising the environmental impacts in
order to sustain the sector for the long term. The range of techniques used in
order to ensure the environmental sustainability of tourism can be considered in
one of two ways either by managing the tourism environment in a more
environmentally sustainability way, or by utilising a range of techniques directly
targeted at specific aspects of tourism, tourist behaviour, tourism development
processes, or the agencies that link them together (Williams & Shaw, 2002).
2.5.1 The Scale of Sustainable Tourism: The Stakeholders
Tourism is an inherently complex process involving multiple stakeholders with
differing responsibilities which makes implementation of sustainable tourism
techniques even more difficult.
The scale of those stakeholders which is necessary for the implementation of
sustainable tourism is vast from large supra-national governmental bodies and
corporations right down to the individual tourist (Hall, 2008). Each of these
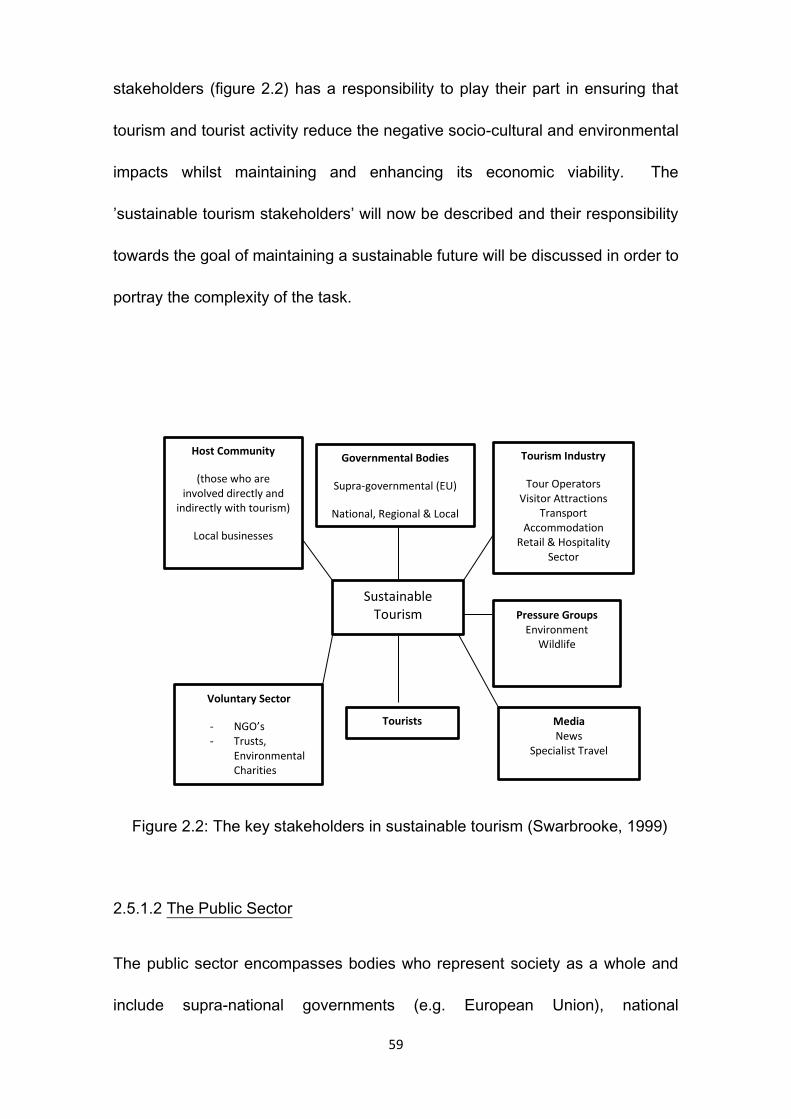
59
stakeholders (figure 2.2) has a responsibility to play their part in ensuring that
tourism and tourist activity reduce the negative socio-cultural and environmental
impacts whilst maintaining and enhancing its economic viability. The
’sustainable tourism stakeholders’ will now be described and their responsibility
towards the goal of maintaining a sustainable future will be discussed in order to
portray the complexity of the task.
Figure 2.2: The key stakeholders in sustainable tourism (Swarbrooke, 1999)
2.5.1.2 The Public Sector
The public sector encompasses bodies who represent society as a whole and
include supra-national governments (e.g. European Union), national
Host Community
(those who are involved directly and
indirectly with tourism)
Local businesses
Tourism Industry
Tour Operators Visitor Attractions
Transport Accommodation
Retail & Hospitality Sector
Tourists
Sustainable Tourism
Governmental Bodies
Supra-governmental (EU)
National, Regional & Local
Pressure Groups Environment
Wildlife
Media News
Specialist Travel
Voluntary Sector
- NGO’s - Trusts,
Environmental Charities
60
government and national government departments, QUANGO’s (quasi non-
governmental organisations) who are publicly funded agencies who work on
behalf of the government but are managed semi-autonomously (such as
VisitBritain) and other public organisations. . The public sector has the
potential to create legislation and regulations to support the principles of
sustainable tourism and provide funding, financial incentives and disincentives
to encourage the ‘public’ to engage in sustainable practices. Planning
regulations are also an important area of responsibility of the public sector and
produce guidelines that ensure that new tourism developments mitigate their
environmental impacts. (Hall, 2008) The provision of official standards and
labelling that endorse sustainable practice is also an area that the public sector
is responsible for, this is especially important so the Public can select services
and trust products that meet the criteria. Public sector bodies are also
responsible for providing the infrastructure to support sustainable tourism
practices; sewerage treatment works to ensure clean safe water, airports, and
roads. The issue of sustainability is a complex political issue especially as
many of the elements require an element of financial commitment which tends
to make elected governments unpopular with the public and business leaders.
(Elliot, 1997) Therefore whilst the public sector can be instrumental in guiding
sustainable practice there needs to be ‘buy in’ from all of the other sectors in
order for it to be fully implemented and successful (Page & Thorn, 2010; Dredge
& Moore, 1992).

61
2.5.1.3 The Tourism Industry & Host Community
There are many different types of organisations directly involved in the provision
of tourism services; in the pre-visit stage there are tour operators, travel agents,
destination management organisations (DMO’s) and the travel media which
includes internet sources who mediate between the tourism industry and
potential visitor (Choi, Lehro & O’Leary, 2007). Also included in tourism
provision are transport providers such as airlines, train operators and bus and
coach services (Swarbrooke, 1999). Once in the holiday destination a range of
tourist organisations large and small are responsible for the holiday experience
– accommodation providers, food and drink, entertainment, visitor attractions
and travel and transport services. Whilst the aforementioned organisations are
directly involved in the provision of tourism services there are many businesses
in the host community indirectly involved in providing tourism related services,
such as local food producers and cleaning services for example (Ritchie &
Crouch, 2005). These different elements of tourism need to work together in
order to encourage and enable sustainable tourism. (Berry, 1997) The types of
influence they can have includes by changing their businesses practices to be
more sustainable by reducing energy and water consumption, reducing waste,
recycling and sourcing from local suppliers; and by encouraging visitors through
the use of voluntary codes of practice to reduce consumption, recycle and
utilise local transport services (Swarbrooke, 1999).
62
2.5.1.4 The Voluntary Sector
The voluntary sector when related to sustainable tourism is comprised of public
sector pressure groups, professional bodies, industry pressure groups and
voluntary trusts. Public sector pressure groups can either be specific tourism
related groups such as Tourism Concern or more general pressure groups such
as Friends of the Earth who use their influence to lobby governments regarding
the importance of sustainable tourism. Professional bodies to which members
of the tourism industry belong can influence their members to adhere to and
embed the principles of sustainability into their business practices. Industry
pressure groups made up specifically by members of the tourism industry lobby
government on behalf of the best interests of the sector and therefore can
campaign in favour of the principles of encouraging sustainable and responsible
tourism practices. Finally voluntary trusts are comprised of a group of like-
minded individuals who work together for a mutual goal where no-one expects
to profit, one such organisation in the UK would be the National Trust which
works to protect and conserve natural landscapes and historic buildings (Post,
Lawrence et al, 1999; Swarbrooke, 1999).
2.5.1.5 The Media
The media influences and shapes visitors motivation to visit holiday
destinations. The type of influence can be direct through the use of brochures
and holiday destination television programmes promoting specific areas to visit
63
and points of interest. To indirect promotion of destinations through film and
television that feature attractive destinations that thus motivate travel. Whilst
the exposure of destinations through mass media communication can be
beneficial it can also place pressure on destinations cultural heritage,
infrastructure and environment. Therefore the ‘media’ has a responsibility to
raise awareness of the impact of tourism on destination areas, particularly
remote areas of the world and educate potential visitors on the best ways to
mitigate these impacts (Middleton, 1998, Swarbrooke, 1999).
2.5.1.6 The ‘Tourist’
The tourist is the central element of sustainable tourism, as all of the other
stakeholders are involved in the provision of tourism services either directly or
indirectly, however the tourist is the receiver of the provision and must therefore
utilise the services provided. Much of the research focusses on the ‘supply
side’ of sustainable tourism whilst the ‘demand side’, the tourist it is assumed
will be a passive receptor of any sustainable tourism initiatives (Chafe, 2005).
The tourist and their on-site behaviour are especially important to this thesis as
the focus is on trying to encourage greater levels of sustainable behaviour
whilst on holiday. Therefore tourists must take some responsibility for their own

64
behaviour, in terms of protecting and conserving natural resources, and being
respectful of the host community.
The concepts and behaviours involved in securing a sustainable tourism
industry do not necessarily fit well with how individual’s perceive their holiday, in
that sustainable choices are often inconvenient such as public transport over
private, are both financially and ‘time’ expensive. Therefore the ‘supply-side’ of
tourism stakeholders need to respond to this and encourage tourists to see
sustainable tourism as attractive and that it in fact it could enhance their holiday
experience rather than be a negative experience.
2.5.1.7 Section Summary
In summary the first part of this section focussed on describing the scale and
complexity of the sustainable tourism problem, in terms of the differing levels of
responsibility from supra-governmental bodies’ down to the individual tourist
(Swarbrooke, 1999; Hall, 2008). The second part of this section will focus on
some on the approaches used to control the negative impacts of tourism on the
environment and finally the chapter will conclude with a section which focusses
directly on the research undertaken to identify the sustainable tourist.
65
2.6 Approaches to Managing the Environmental Impact of Tourism
There are broadly two approaches to managing the effects of tourism on the
environment, the first is focussed on managing an area in its entirety, the
second utilises a raft of different techniques focussed on particular aspects of
tourism and tourist activity in order to mitigate the particularly harmful effects.
2.6.1 Environmental Impact Assessments (EIA’s)
Environmental Impact Assessments (EIA’s) are used primarily in the planning
stage of new tourism developments to enable the potential environmental risks
to be assessed and addressed before the development goes ahead (Middleton
& Hawkins, 1998). The assessment takes into account a range of factors that
could potentially be impacted upon by the development (e.g. air quality, surface
and groundwater quality, noise levels, natural vegetation wildlife etc.), these are
then ranked in accordance with how much impact they could have upon certain
aspects of the environment. There a number of different ways the EIA is
undertaken using a number of different techniques from simple mapping of the
potential impacts to more complex mathematical input-output cost benefit
analysis. The results of EIA thus informs planning decisions and means that the
environmental consequences of a tourism development have been considered
and can be provisions can be made to mitigate these effects prior to
commencement of any development (Swarbrooke, 2002).
66
One of the criticisms of EIA’s is that many tourism developments are relatively
small and are therefore are not required to undertake the assessment. For
those developments which require an assessment it is an expensive part of the
pre-planning stage and one for which the developer has to bear the expense. .
This means that the results of the assessment might not be as impartial as if
undertaken by a third party not commissioned by the developer (Holden, 2000).
2.6.2 Carrying Capacity
The concept of carrying capacity measures the amount of tourist activity an
area can sustain without having a negative impact on natural resources and
affecting visitor satisfaction or exerting adverse impacts on the host society,
economy and culture (WTO, 1997). This definition suggests that there a
number of ways that carrying capacity can be understood:-
Physical Carrying Capacity – The number of tourists that a destination
can physically accommodate at a given time.
Environmental Capacity – The number of tourists that can visit the
destination before the environmental impact become irreparable.
Economic Capacity – The number of tourists that can be accommodated
by an area before it becomes so popular that demand drives the prices
up and local people are affected and cannot afford the cost of living.
Social Capacity – The number of tourists that can accommodated before
the social and cultural heritage of the host society is impacted upon.

67
Infrastructure Capacity – The number of tourists that the destination’s
infrastructure can support (e.g. roads, public services, local transport,
water provision etc.)
Perceptual Capacity – The number of tourists that the destination can
support before visitor satisfaction is impacted upon negatively.
Although carrying capacity acknowledges that there are limits to which a
destination can withstand the impact of rising visitor numbers, operationalizing
the concept is particularly difficult. Firstly it is difficult to measure the capacity in
terms of actual numbers of visitors that can be accommodated and secondly in
identifying the ‘tipping point’ from where the destination is managing to support
itself to where negative irreparable impacts are being experienced. Furthermore
each destination in terms of its specific location, geography, culture,
infrastructure and facilities is going to be unique and thus the carrying capacity
is likely to be subjective and difficult to regulate (Swarbrooke, 1999, Hall, 2008).
2.6.3 Limits of Acceptable Change
The Limits of Acceptable Change (LAC) is slightly different to ‘carrying capacity’
in that it does not rely on quantifying numbers of acceptable tourists, instead it
works on the principle that tourism activity will have an impact on a destination
and works out what the acceptable limit of change is and thus how manageable
those changes can be (Stankey, Cole, Lucas, Petersen & Frissell, 1985). The
framework rests on utilising a range of indicators to identify changes taking
68
place in the environment (e.g. pollution levels, soil erosion, wildlife habitat loss,
drop in water quality etc.) and then sets in place a range of management
actions to either restore or maintain the current situation and stop further
degradation (Holden, 2000).
The process of Limits of Acceptable Change works as follows:-
1. Identify the area of concern and issues involved.
2. Define opportunities classes and zones, which can be managed in a
number of ways according the issues needing to be addressed (ensuring
environmental issues are addressed whilst maintaining visitor satisfaction
and meeting management obligations)
3. Select the indicators to address the issues identified in the previous step
and measure change.
4. Make an inventory of the current status of the area, and then evaluate
opportunities available to affect change.
5. Identify possible management solutions, then implement those plans most
suitable. This process will be on-going with periods of re-evaluation,
monitoring and implementation (Stankey, Cole, Lucas, Peterson &
Frissell, 1985).
In order that LAC’s work well in tourist destination areas a great deal of planning
and collaboration between tourism stakeholders is required at national, local
and individual levels. (Saarinen, 2006)
69
All of these techniques work by managing the natural resources impacted upon
by the tourism industry, the other techniques utilised focus on managing tourist
based activity within destinations (Saarinen, 2006).
2.6.4 Visitor Management Techniques
Where high volumes of visitors to a destination area are having a negative
impact on both natural and built environments the use of techniques to manage
visitor flows have often been implemented. These techniques tend to focus on
diverting tourist attention away from heavily impacted areas through the use of
techniques to encourage visitation to other sites in the area. Where traffic
congestion is a problem, then roads close to the visitor site can be closed and
parking situated away from the main visitor attraction. These measures both
deter some visitors but those that do come will have to walk or be bussed to the
site thus reducing congestion and pollution levels (Swarbrooke, 2000).
Educating tourists through the use of voluntary codes of conduct is another
technique utilised in order to encourage sustainable behaviour amongst tourists
whilst in the destination. These codes of conduct include education of visitors
regarding sustainable public transport options, the importance of respecting the
natural environment by not littering, keeping to designated footpaths,
encouraging visitors to avoid peak times and ask visitors to respect local

70
cultural traditions (Croall, 1995). The advantage of using voluntary codes of
conduct are that the concept can be applied widely from small tourism
businesses right up to and including large multi-national tourism organisations.
The disadvantages, however rest on the fact the codes are ‘voluntary’ and thus
it is difficult to assess their effectiveness in changing behaviour (Mowforth &
Munt, 1995).
Financial incentives and disincentives through the use of high tourist taxes is
another technique that can be utilised in order to deter high volumes of visitors,
however only lower income groups are more likely to be disadvantaged by such
measures (Buhalis, 2000).
Marketing is another area that is an essential element of the tourism industry
and therefore can be influential in directing sustainable tourist practices. Thus
marketing could be used to draw potential visitors to the importance of
protecting the environment they are visiting by only using accommodation that
meet sustainable criteria or are members of a sustainable grading scheme such
as the Green Tourism Business Scheme (GTBS). Moreover marketing
techniques are important for segmenting customers based on their attitudes,
beliefs and behaviour and these techniques can be applied to tourists
segmenting based on their attitudes towards the environment and pro-
environmental behaviour (Swarbrooke, 2002).

71
Furthermore marketing can play a part in managing visitor impacts through the
process of de-marketing of destinations and visitor attractions that are
experiencing the negative environmental impacts of too many visitors can assist
in reducing numbers to more manageable levels (Kotler & Levy 1971; Beeton &
Benfield, 2002). The types of techniques employed to de-market a negatively
impacted visitor site could be; ticket only system whereby visitor numbers are
restricted to those with a ticket thus creating a limit; a reduction or complete
cease in advertising and promotion of the destination; removal of sign-posting to
deter visitors from visiting by chance (Swarbrooke, 2002).
2.6.5 Ecological Footprinting and Sustainable Tourism
This section has explored some of the techniques utilised to manage the
environmental impacts of tourism and tourist activity. Whilst these measures
are helpful in managing the numbers of visitors to destination areas they do not
necessarily provide a ‘measure’ of the impact of behaviour on the environment.
This is where the concept of ecological footprinting comes to the fore; ecological
footprinting directly links the impact of behaviour on natural environmental
resources. Thus ecological footprinting provides an indicator of environmental
impact by estimating ‘resource consumption and waste assimilation
requirements of a defined human population or economy’ (Wackernagel &
Rees, 1996). The ecological footprint thus assigns impact in units (global
hectares gha) of land space required to support any activity or behaviour. Thus
72
the ecological footprint of a hotel would include the land used to build the hotel
and include the resources required to build, set up and maintain the hotel
(heating, water, cleaning, waste removal, and lighting) If the hotel provided food
for its guests then the land required to grow the food, store, process and
transport would also be included in the calculation. The advantage of ecological
footprint calculations over other sustainability indicators is that the measure
acknowledges the finite nature of natural resources. Furthermore the
calculation is thus able to assign a global fair share of reproductive land space
to the population making comparison between populations and behaviours
possible. This is achieved by the earth’s bio-productive land area divided by the
world population to reveal a fair share of 1.8 gha per person (World Wildlife
Fund, 2006). Thus the ecological footprint reprioritises environmental resources
over economic development, as the conservation of environmental resources is
essential for continued economic success (Stabler, 1997).
Hunter (2002) was the first commentator to suggest that ecological footrprint
analysis could aid the understanding of tourism and tourist behavioural
environmental impacts. Wackernagel and Yount (2000) suggest ecological
footprint analysis could be a useful tool in distinguishing components of the
sector in terms of resource use. As tourism is made up of many components,
travel and transport, accommodation, on-site behaviour, and food and drink
consumption, ecological footprinting would allow for comparison of natural
73
resource use thus providing an indicator of those areas that could be targeted in
order to reduce environmental impact. To this end, Peeters and Schauten
(2006) explored the ecological footprint of inbound visitors to Amsterdam in the
Netherlands, and calculated how the environmental impact was distributed
amongst the component elements of the holiday. Their results showed that
70% of the overall tourist ecological footprint was attributed to transport to and
from the destination, 21% could be attributed to accommodation, 8% to visitor
attractions and 1% to the use of local transport. In terms of transport long haul
air travel only 25% of visitors arrived by air, but their resource use accounted for
70% of the ecological footprint attributed to transport. Therefore the authors
suggest that Amsterdam should increase marketing to visitors from short haul
destinations, who can utilise more environmentally friendly forms of transport
(e.g. train) and decrease marketing to visitors from long haul destinations who
are reliant on air travel to reach the destination thus decreasing the overall
tourist ecological footprint. Becken, Simmons and Frampton (2003) estimate
that tourist travel and transport especially in terms of international visitors
accounts for 65 – 70% of their overall environmental impact. Whilst inbound
long-haul air travel is the largest contributors to the tourist ecological footprint it
is also important to consider the contribution of transport used whilst in the
holiday destination. Martin-Ceras and Sanchez (2010) used ecological
footprinting calculations to examine the use of private cars by tourists on the
island of Lanzarote. Their results demonstrated that the geography and
infrastructure is such on the island that tourists tend to rely heavily on the use of
74
private cars to visit places of interest during their holiday, and the ecological
footprint associated with this activity is a significant component of the overall
tourist footprint and is projected to rise in the future. The ecological footprint
data thus provides justification and motivation for the Island to plan a more
sustainable tourist transport infrastructure. This could be achieved by providing
and promoting local public transport services for tourists use the concept of the
ecological footprint to educate tourists regarding their personal contribution to
resource use and ban the use of private cars in town centres.
Cole and Sinclair (2002) used ecological footprint analysis to assess the long
term sustainability of Manali, a rapidly expanding tourist centre in the
Himalayas. Using the available data sources regarding land use, goods and
services the analysis found that the overall ecological footprint of the town
increased by 450% between 1971 and 1995 thus the footprint is now 25 times
larger than the town itself. The results suggest that the pressure of increasing
numbers of visitors is forcing the town to rely on outside ecosystems to support
its tourism industry and is thus not sustainable in the long term. The authors
suggest that in order to mitigate these impacts the area needs to focus on
planning to manage waste, decrease reliance on fossil fuels and raise
environmental awareness amongst residents and tourists to the area.
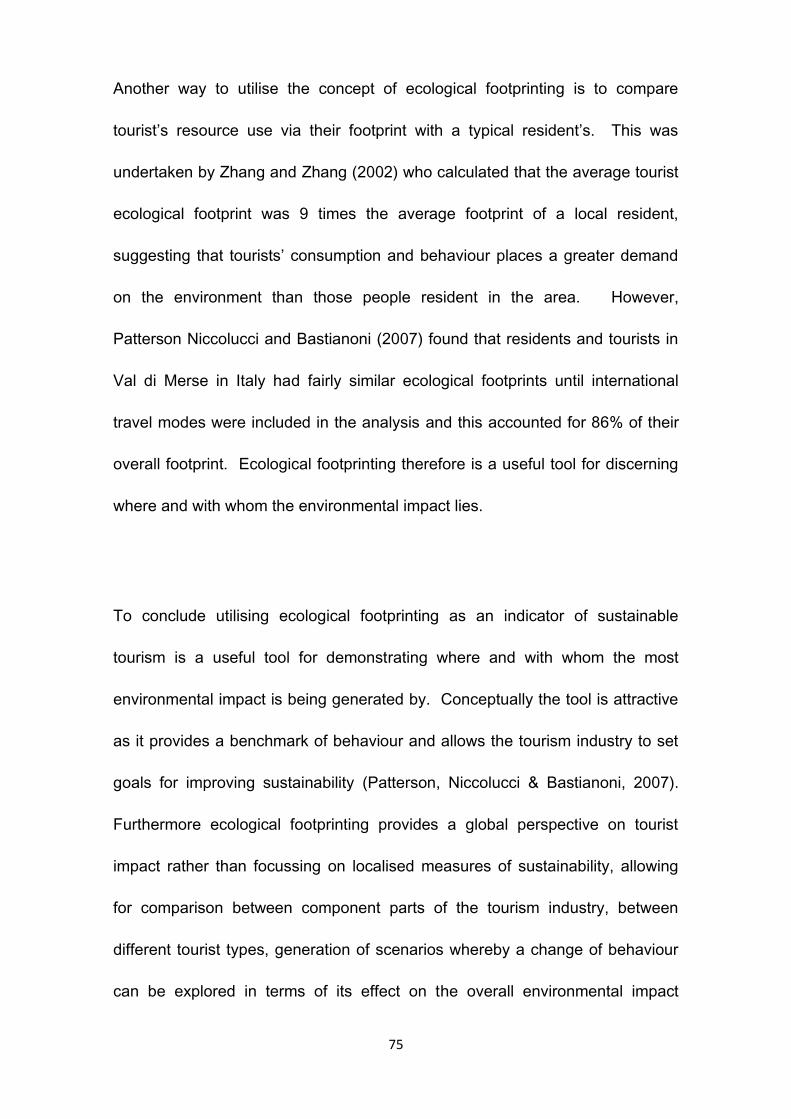
75
Another way to utilise the concept of ecological footprinting is to compare
tourist’s resource use via their footprint with a typical resident’s. This was
undertaken by Zhang and Zhang (2002) who calculated that the average tourist
ecological footprint was 9 times the average footprint of a local resident,
suggesting that tourists’ consumption and behaviour places a greater demand
on the environment than those people resident in the area. However,
Patterson Niccolucci and Bastianoni (2007) found that residents and tourists in
Val di Merse in Italy had fairly similar ecological footprints until international
travel modes were included in the analysis and this accounted for 86% of their
overall footprint. Ecological footprinting therefore is a useful tool for discerning
where and with whom the environmental impact lies.
To conclude utilising ecological footprinting as an indicator of sustainable
tourism is a useful tool for demonstrating where and with whom the most
environmental impact is being generated by. Conceptually the tool is attractive
as it provides a benchmark of behaviour and allows the tourism industry to set
goals for improving sustainability (Patterson, Niccolucci & Bastianoni, 2007).
Furthermore ecological footprinting provides a global perspective on tourist
impact rather than focussing on localised measures of sustainability, allowing
for comparison between component parts of the tourism industry, between
different tourist types, generation of scenarios whereby a change of behaviour
can be explored in terms of its effect on the overall environmental impact
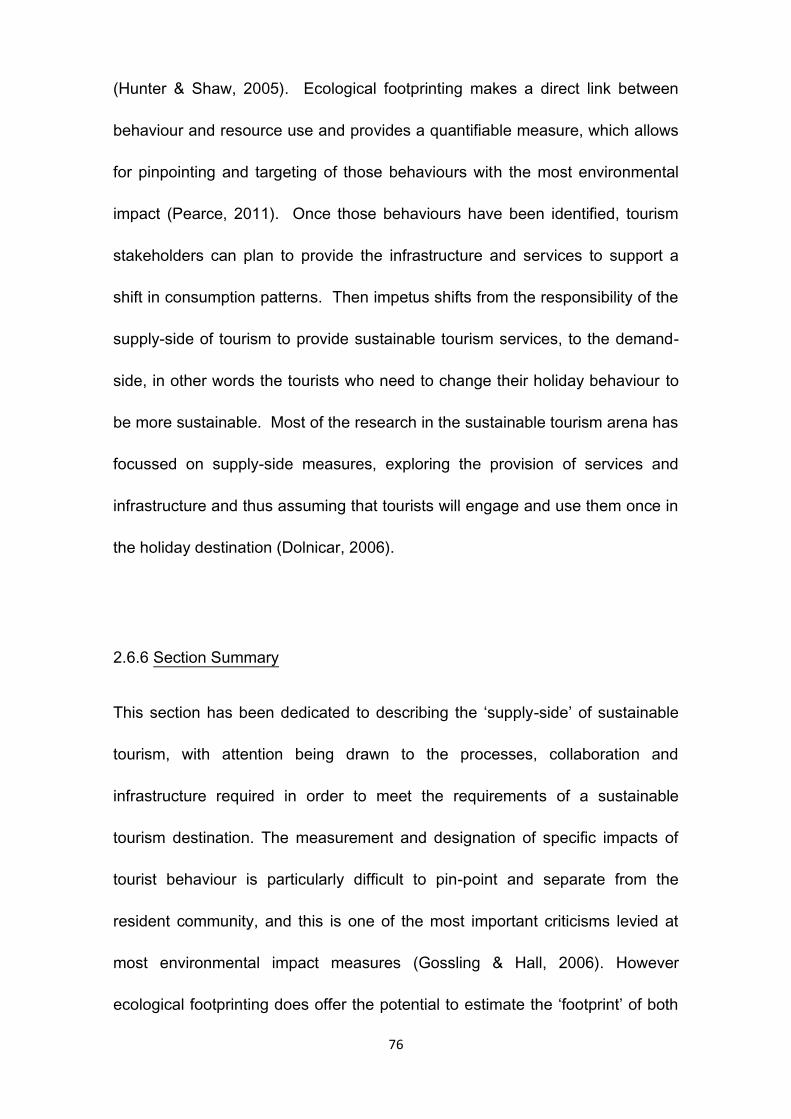
76
(Hunter & Shaw, 2005). Ecological footprinting makes a direct link between
behaviour and resource use and provides a quantifiable measure, which allows
for pinpointing and targeting of those behaviours with the most environmental
impact (Pearce, 2011). Once those behaviours have been identified, tourism
stakeholders can plan to provide the infrastructure and services to support a
shift in consumption patterns. Then impetus shifts from the responsibility of the
supply-side of tourism to provide sustainable tourism services, to the demand-
side, in other words the tourists who need to change their holiday behaviour to
be more sustainable. Most of the research in the sustainable tourism arena has
focussed on supply-side measures, exploring the provision of services and
infrastructure and thus assuming that tourists will engage and use them once in
the holiday destination (Dolnicar, 2006).
2.6.6 Section Summary
This section has been dedicated to describing the ‘supply-side’ of sustainable
tourism, with attention being drawn to the processes, collaboration and
infrastructure required in order to meet the requirements of a sustainable
tourism destination. The measurement and designation of specific impacts of
tourist behaviour is particularly difficult to pin-point and separate from the
resident community, and this is one of the most important criticisms levied at
most environmental impact measures (Gossling & Hall, 2006). However
ecological footprinting does offer the potential to estimate the ‘footprint’ of both
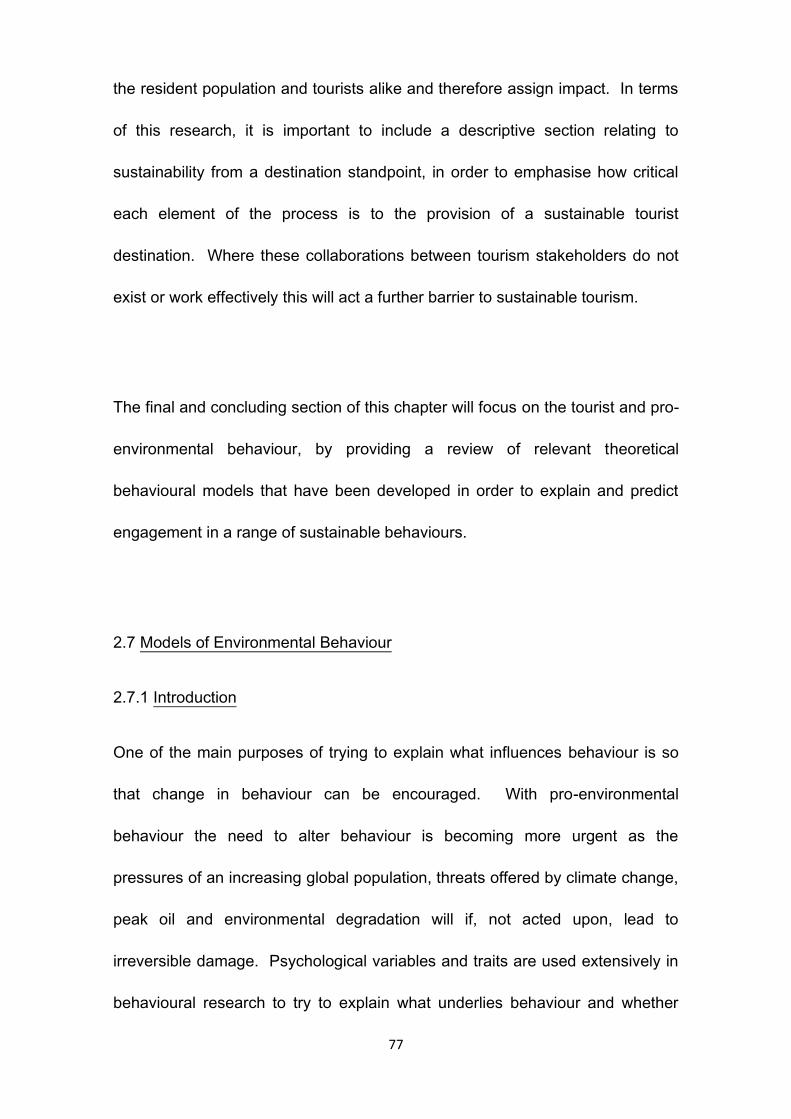
77
the resident population and tourists alike and therefore assign impact. In terms
of this research, it is important to include a descriptive section relating to
sustainability from a destination standpoint, in order to emphasise how critical
each element of the process is to the provision of a sustainable tourist
destination. Where these collaborations between tourism stakeholders do not
exist or work effectively this will act a further barrier to sustainable tourism.
The final and concluding section of this chapter will focus on the tourist and pro-
environmental behaviour, by providing a review of relevant theoretical
behavioural models that have been developed in order to explain and predict
engagement in a range of sustainable behaviours.
2.7 Models of Environmental Behaviour
2.7.1 Introduction
One of the main purposes of trying to explain what influences behaviour is so
that change in behaviour can be encouraged. With pro-environmental
behaviour the need to alter behaviour is becoming more urgent as the
pressures of an increasing global population, threats offered by climate change,
peak oil and environmental degradation will if, not acted upon, lead to
irreversible damage. Psychological variables and traits are used extensively in
behavioural research to try to explain what underlies behaviour and whether
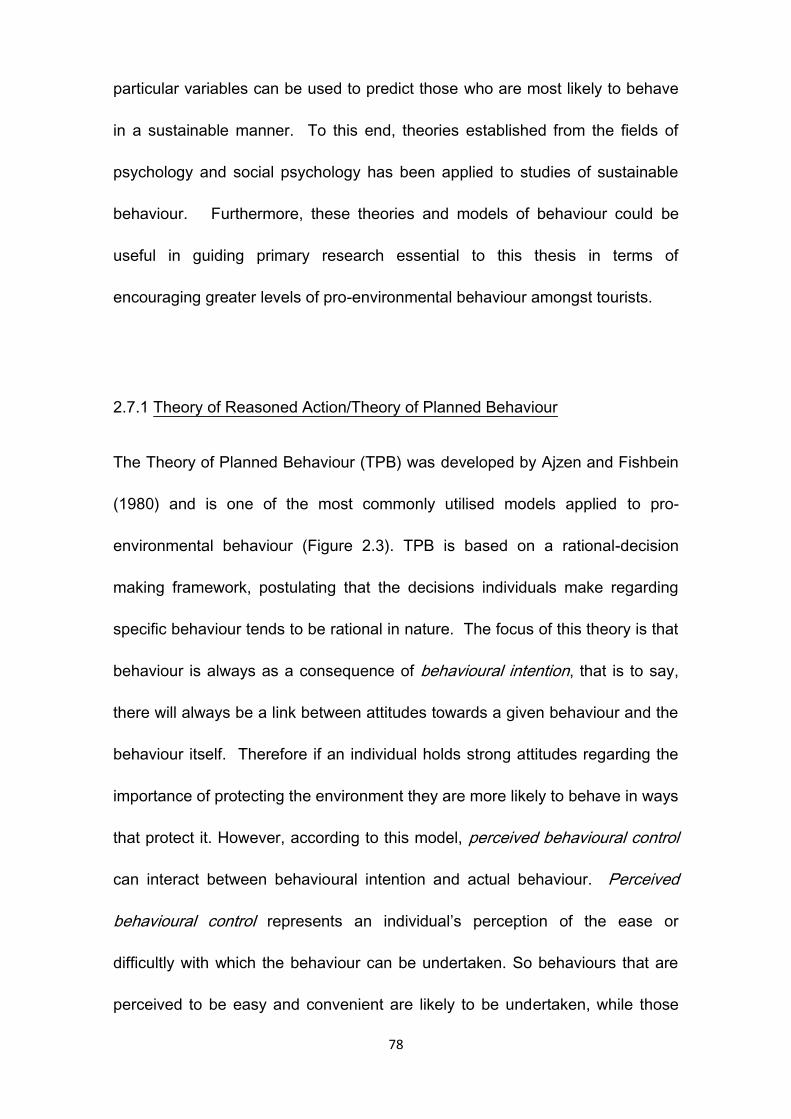
78
particular variables can be used to predict those who are most likely to behave
in a sustainable manner. To this end, theories established from the fields of
psychology and social psychology has been applied to studies of sustainable
behaviour. Furthermore, these theories and models of behaviour could be
useful in guiding primary research essential to this thesis in terms of
encouraging greater levels of pro-environmental behaviour amongst tourists.
2.7.1 Theory of Reasoned Action/Theory of Planned Behaviour
The Theory of Planned Behaviour (TPB) was developed by Ajzen and Fishbein
(1980) and is one of the most commonly utilised models applied to pro-
environmental behaviour (Figure 2.3). TPB is based on a rational-decision
making framework, postulating that the decisions individuals make regarding
specific behaviour tends to be rational in nature. The focus of this theory is that
behaviour is always as a consequence of behavioural intention, that is to say,
there will always be a link between attitudes towards a given behaviour and the
behaviour itself. Therefore if an individual holds strong attitudes regarding the
importance of protecting the environment they are more likely to behave in ways
that protect it. However, according to this model, perceived behavioural control
can interact between behavioural intention and actual behaviour. Perceived
behavioural control represents an individual’s perception of the ease or
difficultly with which the behaviour can be undertaken. So behaviours that are
perceived to be easy and convenient are likely to be undertaken, while those
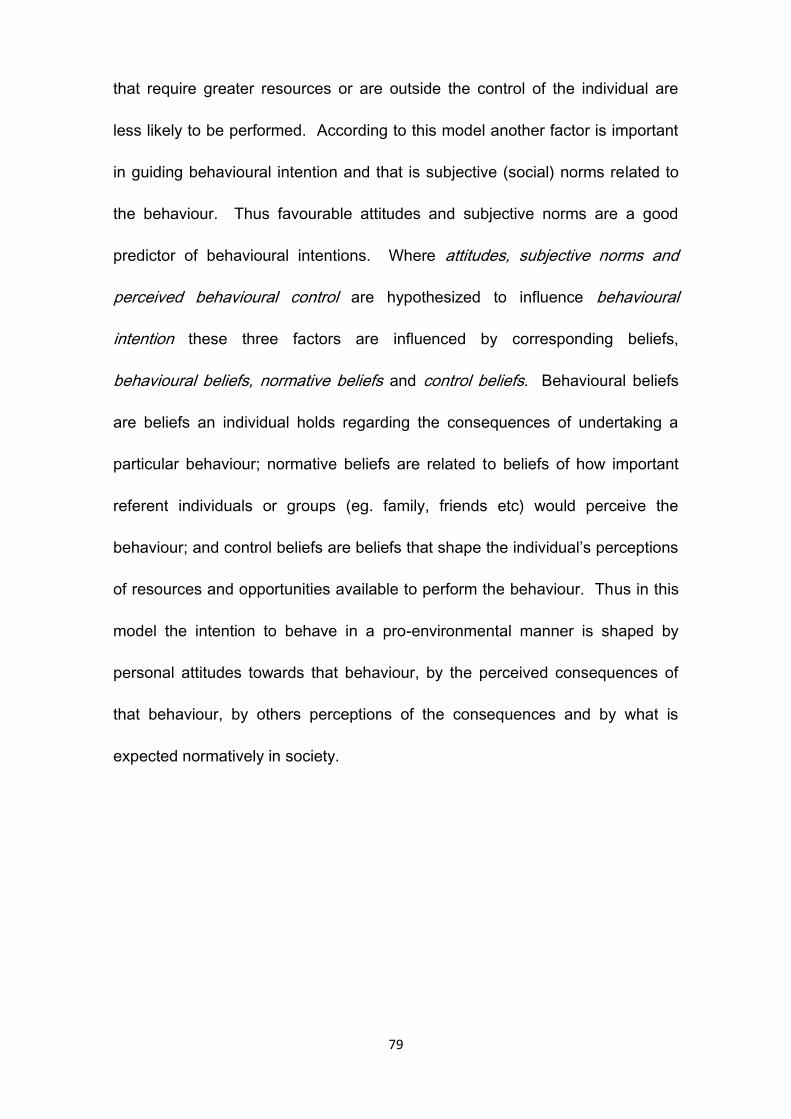
79
that require greater resources or are outside the control of the individual are
less likely to be performed. According to this model another factor is important
in guiding behavioural intention and that is subjective (social) norms related to
the behaviour. Thus favourable attitudes and subjective norms are a good
predictor of behavioural intentions. Where attitudes, subjective norms and
perceived behavioural control are hypothesized to influence behavioural
intention these three factors are influenced by corresponding beliefs,
behavioural beliefs, normative beliefs and control beliefs. Behavioural beliefs
are beliefs an individual holds regarding the consequences of undertaking a
particular behaviour; normative beliefs are related to beliefs of how important
referent individuals or groups (eg. family, friends etc) would perceive the
behaviour; and control beliefs are beliefs that shape the individual’s perceptions
of resources and opportunities available to perform the behaviour. Thus in this
model the intention to behave in a pro-environmental manner is shaped by
personal attitudes towards that behaviour, by the perceived consequences of
that behaviour, by others perceptions of the consequences and by what is
expected normatively in society.
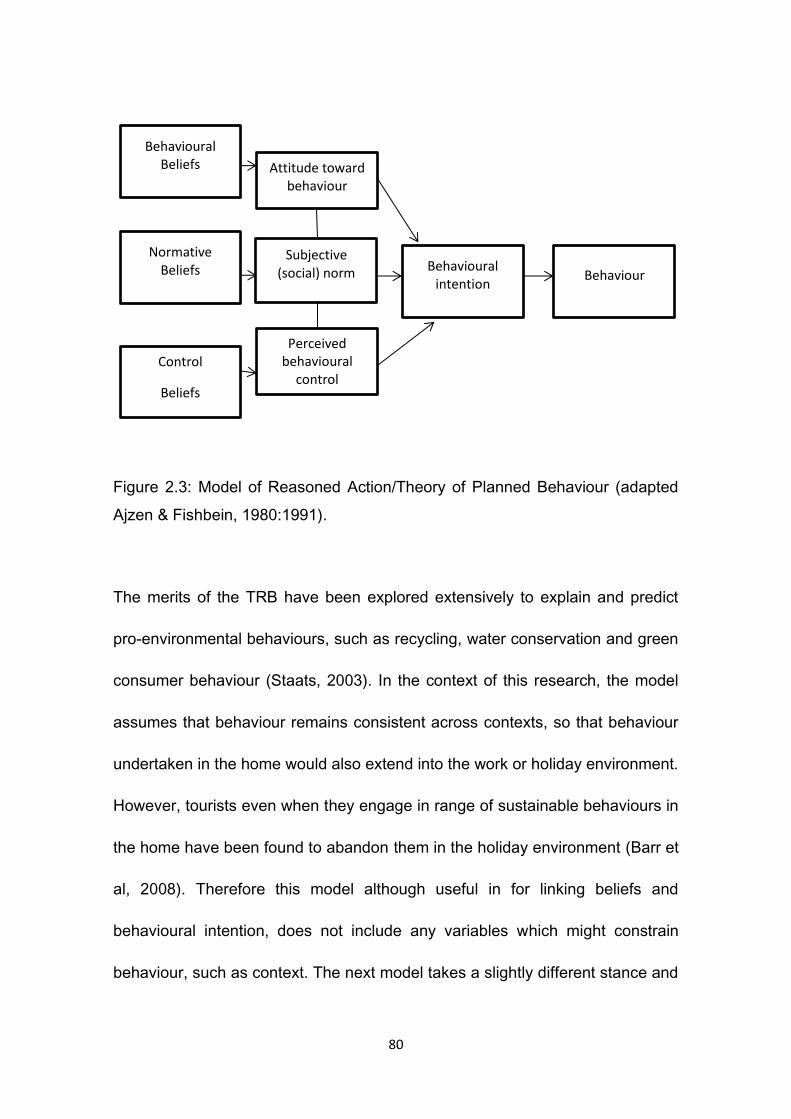
80
Figure 2.3: Model of Reasoned Action/Theory of Planned Behaviour (adapted
Ajzen & Fishbein, 1980:1991).
The merits of the TRB have been explored extensively to explain and predict
pro-environmental behaviours, such as recycling, water conservation and green
consumer behaviour (Staats, 2003). In the context of this research, the model
assumes that behaviour remains consistent across contexts, so that behaviour
undertaken in the home would also extend into the work or holiday environment.
However, tourists even when they engage in range of sustainable behaviours in
the home have been found to abandon them in the holiday environment (Barr et
al, 2008). Therefore this model although useful in for linking beliefs and
behavioural intention, does not include any variables which might constrain
behaviour, such as context. The next model takes a slightly different stance and
Behavioural Beliefs
Normative Beliefs
Control
Beliefs
Attitude toward behaviour
Subjective (social) norm
Perceived behavioural
control
Behavioural intention
Behaviour
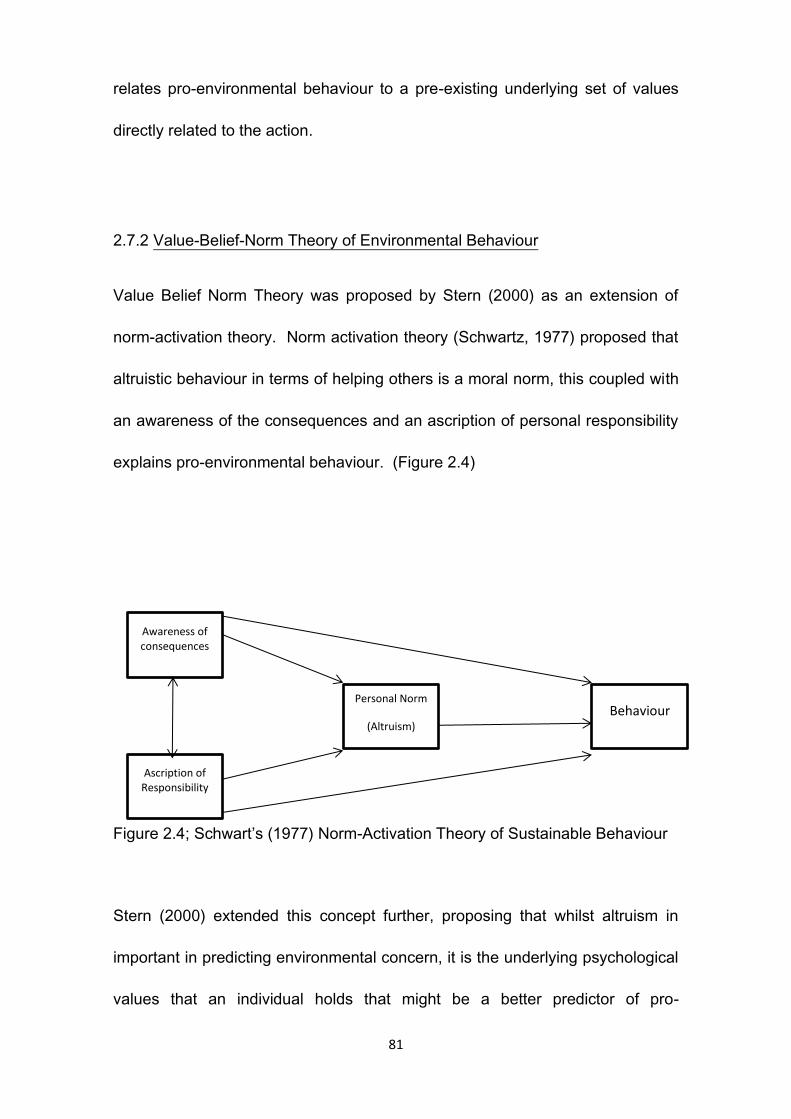
81
relates pro-environmental behaviour to a pre-existing underlying set of values
directly related to the action.
2.7.2 Value-Belief-Norm Theory of Environmental Behaviour
Value Belief Norm Theory was proposed by Stern (2000) as an extension of
norm-activation theory. Norm activation theory (Schwartz, 1977) proposed that
altruistic behaviour in terms of helping others is a moral norm, this coupled with
an awareness of the consequences and an ascription of personal responsibility
explains pro-environmental behaviour. (Figure 2.4)
Figure 2.4; Schwart’s (1977) Norm-Activation Theory of Sustainable Behaviour
Stern (2000) extended this concept further, proposing that whilst altruism in
important in predicting environmental concern, it is the underlying psychological
values that an individual holds that might be a better predictor of pro-
Awareness of consequences
Ascription of Responsibility
Personal Norm
(Altruism)
Behaviour
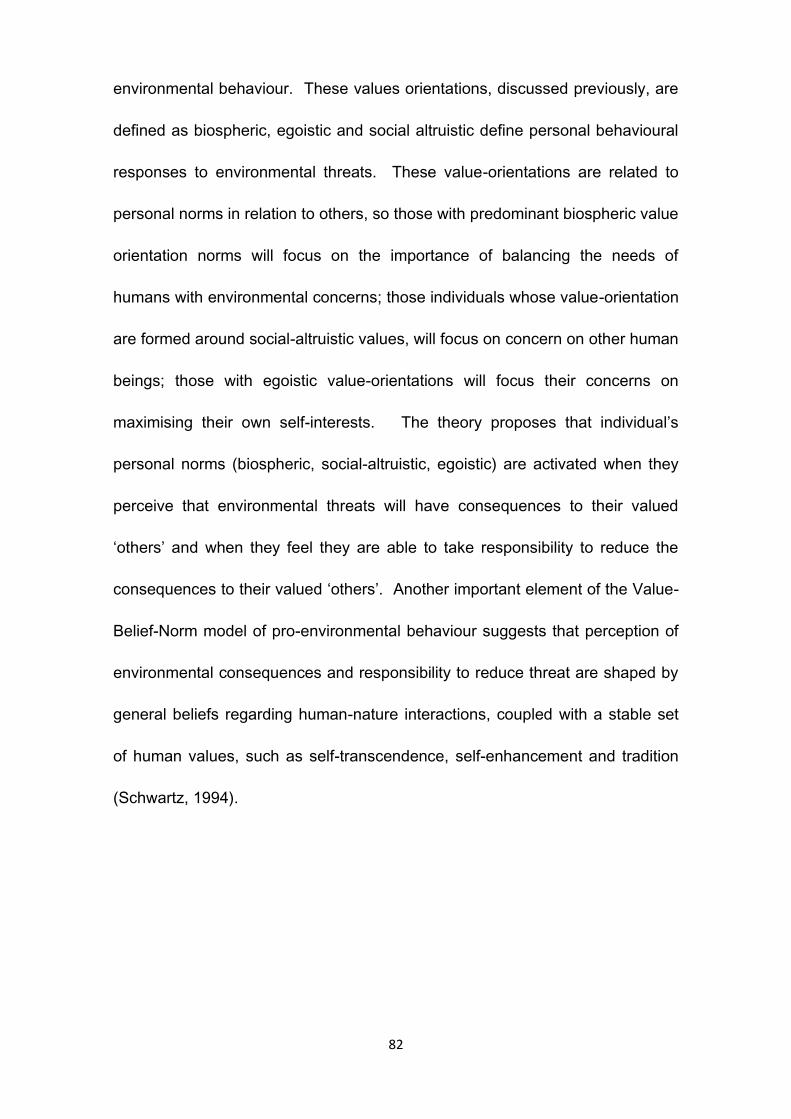
82
environmental behaviour. These values orientations, discussed previously, are
defined as biospheric, egoistic and social altruistic define personal behavioural
responses to environmental threats. These value-orientations are related to
personal norms in relation to others, so those with predominant biospheric value
orientation norms will focus on the importance of balancing the needs of
humans with environmental concerns; those individuals whose value-orientation
are formed around social-altruistic values, will focus on concern on other human
beings; those with egoistic value-orientations will focus their concerns on
maximising their own self-interests. The theory proposes that individual’s
personal norms (biospheric, social-altruistic, egoistic) are activated when they
perceive that environmental threats will have consequences to their valued
‘others’ and when they feel they are able to take responsibility to reduce the
consequences to their valued ‘others’. Another important element of the Value-
Belief-Norm model of pro-environmental behaviour suggests that perception of
environmental consequences and responsibility to reduce threat are shaped by
general beliefs regarding human-nature interactions, coupled with a stable set
of human values, such as self-transcendence, self-enhancement and tradition
(Schwartz, 1994).
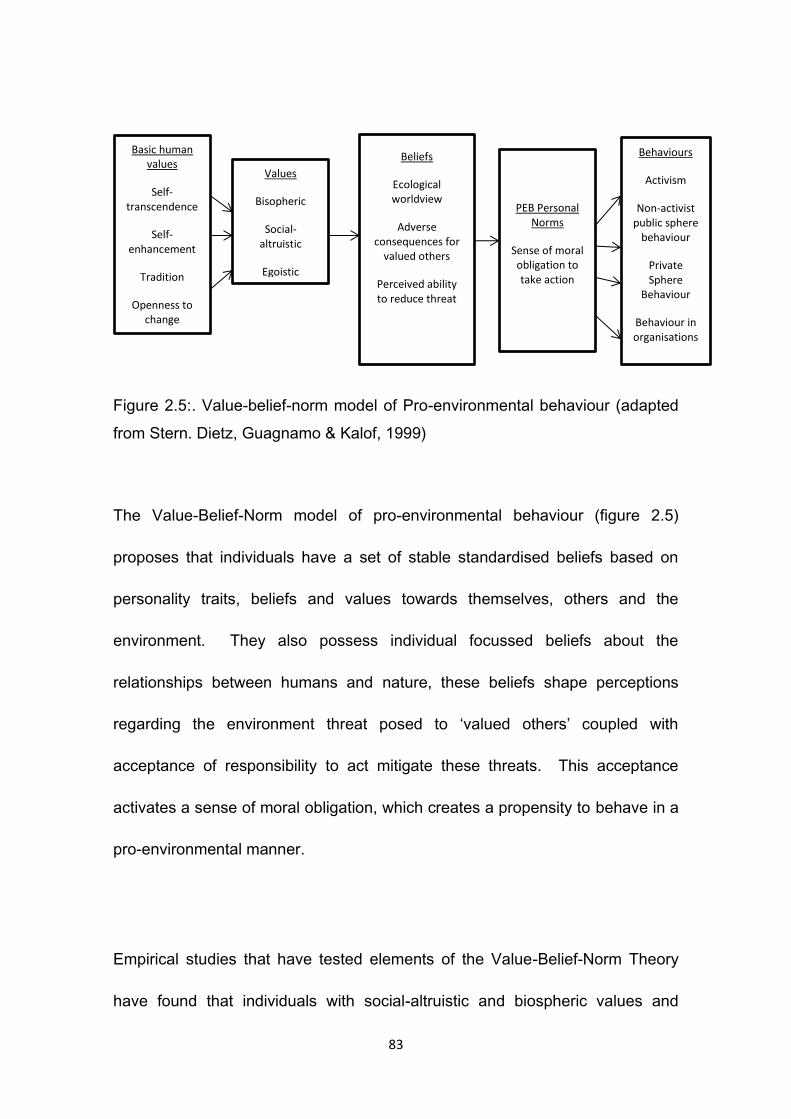
83
Figure 2.5:. Value-belief-norm model of Pro-environmental behaviour (adapted
from Stern. Dietz, Guagnamo & Kalof, 1999)
The Value-Belief-Norm model of pro-environmental behaviour (figure 2.5)
proposes that individuals have a set of stable standardised beliefs based on
personality traits, beliefs and values towards themselves, others and the
environment. They also possess individual focussed beliefs about the
relationships between humans and nature, these beliefs shape perceptions
regarding the environment threat posed to ‘valued others’ coupled with
acceptance of responsibility to act mitigate these threats. This acceptance
activates a sense of moral obligation, which creates a propensity to behave in a
pro-environmental manner.
Empirical studies that have tested elements of the Value-Belief-Norm Theory
have found that individuals with social-altruistic and biospheric values and
Basic human values
Self-transcendence
Self- enhancement
Tradition
Openness to change
Values
Bisopheric
Social-altruistic
Egoistic
Beliefs
Ecological worldview
Adverse consequences for
valued others
Perceived ability to reduce threat
PEB Personal Norms
Sense of moral obligation to take action
Behaviours
Activism
Non-activist public sphere
behaviour
Private Sphere
Behaviour
Behaviour in organisations
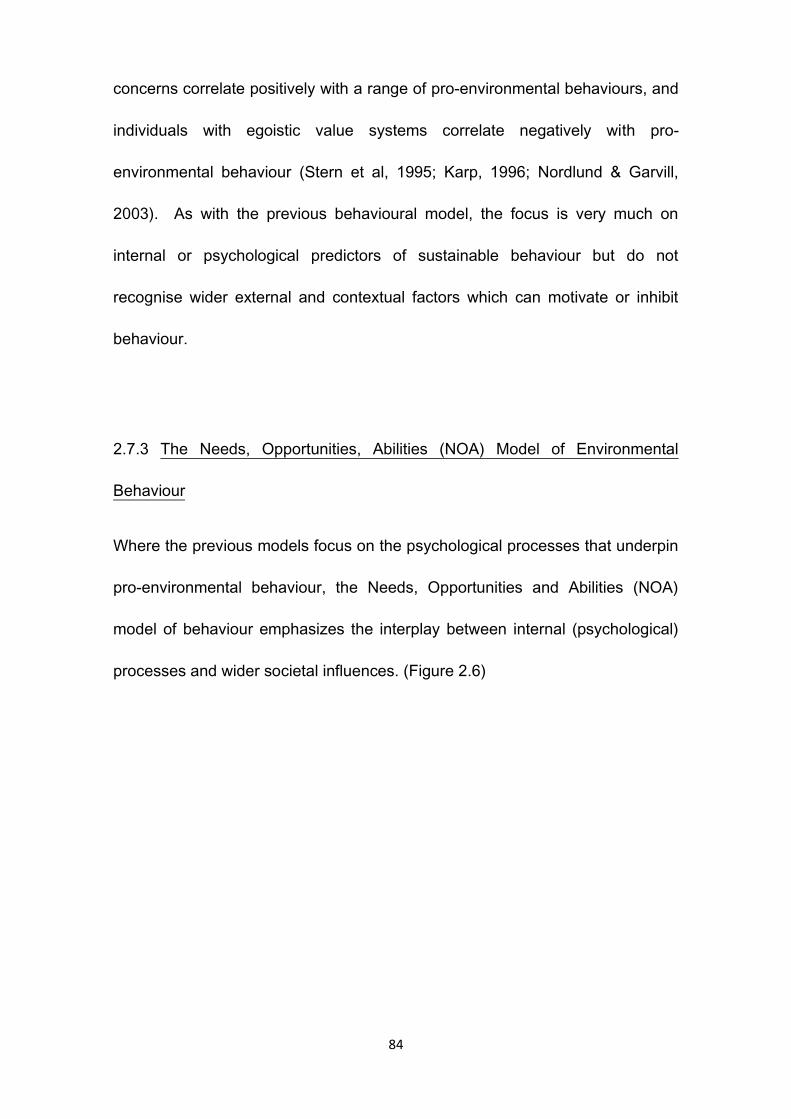
84
concerns correlate positively with a range of pro-environmental behaviours, and
individuals with egoistic value systems correlate negatively with pro-
environmental behaviour (Stern et al, 1995; Karp, 1996; Nordlund & Garvill,
2003). As with the previous behavioural model, the focus is very much on
internal or psychological predictors of sustainable behaviour but do not
recognise wider external and contextual factors which can motivate or inhibit
behaviour.
2.7.3 The Needs, Opportunities, Abilities (NOA) Model of Environmental
Behaviour
Where the previous models focus on the psychological processes that underpin
pro-environmental behaviour, the Needs, Opportunities and Abilities (NOA)
model of behaviour emphasizes the interplay between internal (psychological)
processes and wider societal influences. (Figure 2.6)
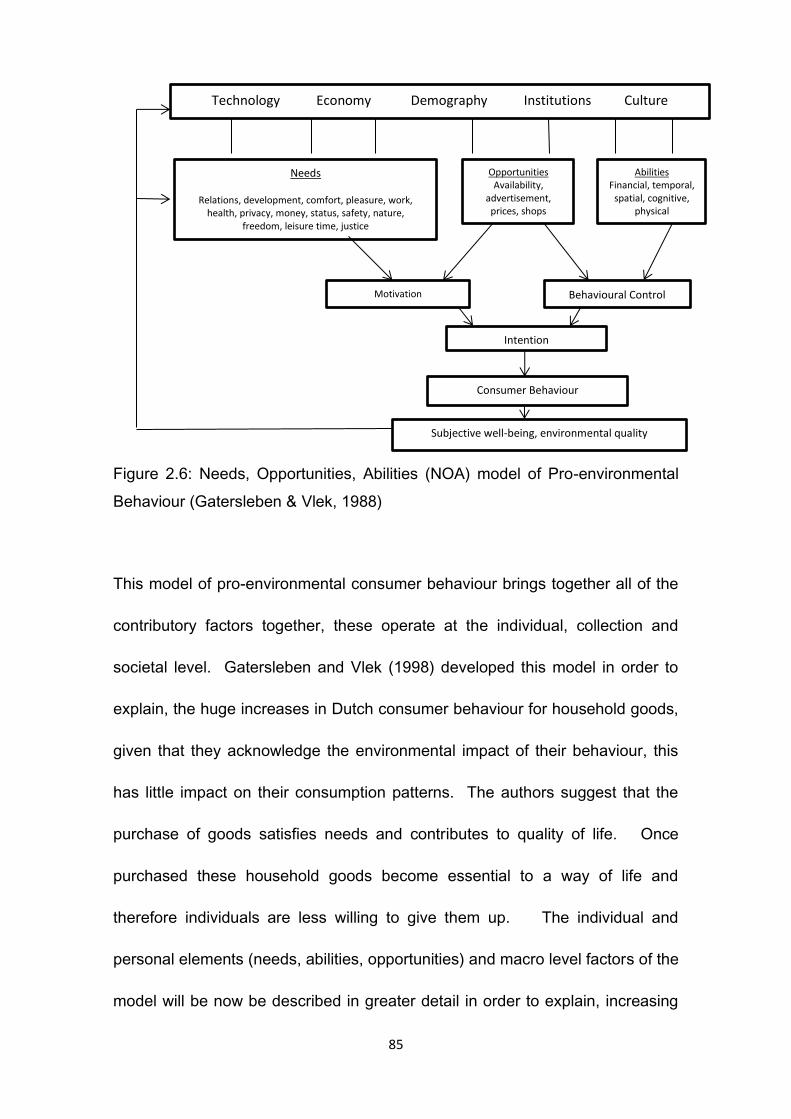
85
Figure 2.6: Needs, Opportunities, Abilities (NOA) model of Pro-environmental
Behaviour (Gatersleben & Vlek, 1988)
This model of pro-environmental consumer behaviour brings together all of the
contributory factors together, these operate at the individual, collection and
societal level. Gatersleben and Vlek (1998) developed this model in order to
explain, the huge increases in Dutch consumer behaviour for household goods,
given that they acknowledge the environmental impact of their behaviour, this
has little impact on their consumption patterns. The authors suggest that the
purchase of goods satisfies needs and contributes to quality of life. Once
purchased these household goods become essential to a way of life and
therefore individuals are less willing to give them up. The individual and
personal elements (needs, abilities, opportunities) and macro level factors of the
model will be now be described in greater detail in order to explain, increasing
Technology Economy Demography Institutions Culture
Needs
Relations, development, comfort, pleasure, work, health, privacy, money, status, safety, nature,
freedom, leisure time, justice
Opportunities Availability,
advertisement, prices, shops
Abilities Financial, temporal,
spatial, cognitive, physical
Motivation Behavioural Control
Intention
Consumer Behaviour
Subjective well-being, environmental quality
86
consumer behaviour in spite of the threat this behaviour has on the
sustainability of natural resources.
2.7.3.1 Macro-level factors – Needs
The model postulates that individuals seek to fulfil a series of personal ‘needs’
in order to achieve a good ‘quality of life’ or psychological ‘well-being’.
Gatersleben and Vlek (1998) defined 15 ‘quality of life’ factors that influence
and motivate consumer behaviour. (Table 2.1)
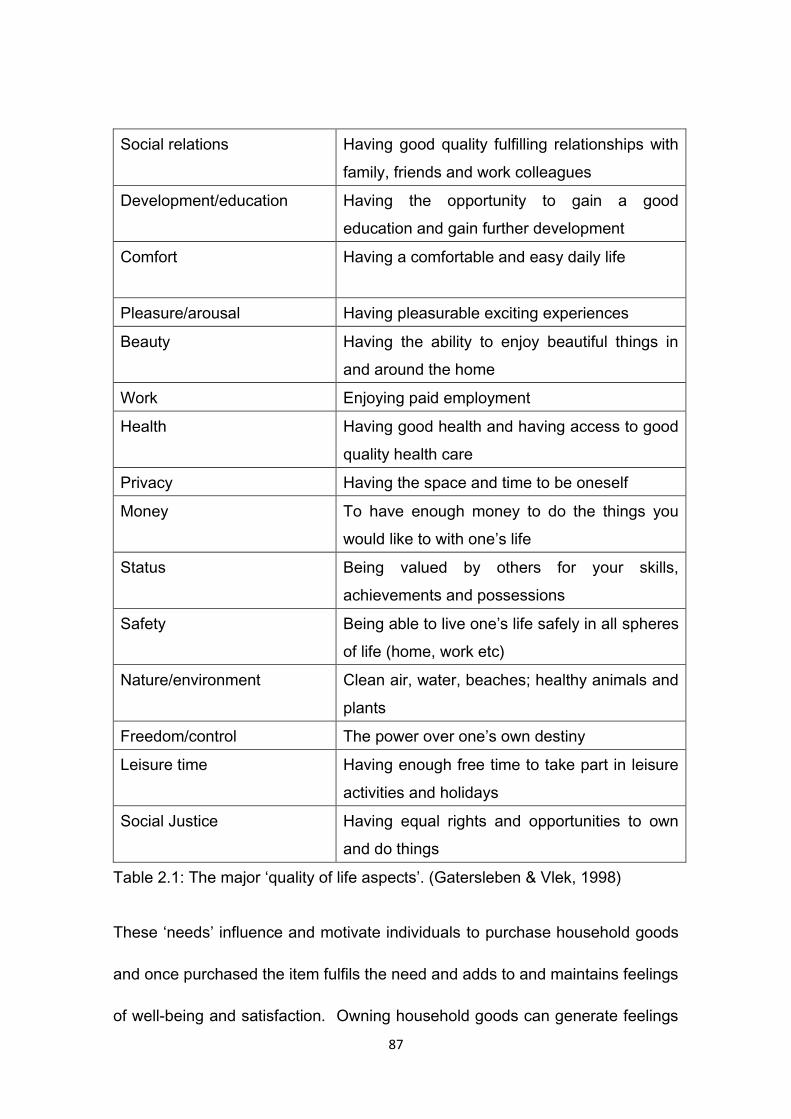
87
Social relations Having good quality fulfilling relationships with
family, friends and work colleagues
Development/education Having the opportunity to gain a good
education and gain further development
Comfort Having a comfortable and easy daily life
Pleasure/arousal Having pleasurable exciting experiences
Beauty Having the ability to enjoy beautiful things in
and around the home
Work Enjoying paid employment
Health Having good health and having access to good
quality health care
Privacy Having the space and time to be oneself
Money To have enough money to do the things you
would like to with one’s life
Status Being valued by others for your skills,
achievements and possessions
Safety Being able to live one’s life safely in all spheres
of life (home, work etc)
Nature/environment Clean air, water, beaches; healthy animals and
plants
Freedom/control The power over one’s own destiny
Leisure time Having enough free time to take part in leisure
activities and holidays
Social Justice Having equal rights and opportunities to own
and do things
Table 2.1: The major ‘quality of life aspects’. (Gatersleben & Vlek, 1998)
These ‘needs’ influence and motivate individuals to purchase household goods
and once purchased the item fulfils the need and adds to and maintains feelings
of well-being and satisfaction. Owning household goods can generate feelings

88
of self-worth, status, freedom, control and labour saving devices can increase
‘free time’ to undertake leisure activities.
2.7.3.2 Macro-level factors – Opportunities
Where ‘needs’ motivate the desire for consumer goods ‘opportunities’ exist as
facilitating external factors that enable consumption. The ease with which
household consumer goods are available, the services they provide, access to
information, advertising, marketing coupled with increased access to financial
credit all facilitate consumption.
2.7.3.3 Macro-level factors – Abilities
Gatersleben and Vlek (1998) describe ‘ability’ as the internal capacitiy to
procure goods and services. These ‘abilities’ can refer to the financial ability to
purchase a product, to have the means to generate income to secure purchase,
the ability to apply for loans, instalment options and credit. Other abilities relate
to having the time and space to utilise and accommodate new goods. Physical
capacity refers to having the health, fitness and strength required to install and
use the products and includes the capacity to apply for licences and permits
should they be required.
89
2.7.3.3 Higher level Macro-factors
Developments in technology, economy, demography, institutions and culture all
influence consumer behaviour by altering consumer needs, abilities and
opportunities. Technological advances and development and economic
services have increased individuals’, opportunities because there is more of a
choice for consumers than 60 years ago. Mass production has led to falling
prices which have increased opportunities and generated need.
At a societal level, production and consumption of low price household goods
have yielded better standards of living even for those on lower incomes. Thus
as society strives for greater technological development and economic growth
this perpetuates the situation whereby consumption of the latest goods and
services becomes incorporated into society’s cultural norms and values
(Gatersleben & Vlek, 1998). Thus consumer goods and the ability to purchase
new possessions generate a sense of well-being, enhance status and
perception of others. As a consequence, nature and care for the environment,
are reduced in importance, and are only perceived in terms of the services it
can provide to humans (Gatersleben & Vlek, 1997).
In this model the motivation to purchase a product results from certain
consumer needs and the opportunity to fulfil these needs. Consumer needs
90
can only be fulfilled when the opportunity and abilities to do so are present. The
model stresses the importance of consumer need, that consumers do not want
goods for the sake of owning them, they want them for the service they provide
to the consumer. Consumers must be motivated to purchase a product, but it is
the opportunity (availability, shop, etc.) and ability (financial costs) that
determine behavioural control. Purchase of the goods then leads to subjective-
well-being and environmental quality which link directly back to the five macro-
level influences (societal) influences on consumer behaviour.
The NOA model focusses on the consumer behaviour element of pro-
environmental behaviour, which is important as the manufacture, production
and transit of goods worldwide has a significant environmental impact.
Therefore it is essential to consider consumer behaviour and decision-making in
terms of its impact on the environment. Furthermore this model incorporates
decisions made regarding the use of leisure time and holidays, establishing that
holidaying is an important ‘need’ that leads to a sense of well-being, status and
enhanced self-perception. Thus the natural environment is perceived positively
as it satisfies the psychological need for a holiday; however behaviour to protect
the same environment is downgraded.
The model is particularly efficient in describing the interaction between the
individual and society, as any intervention to change behaviour will need to
91
work on multiple levels and take into account a multiplicity of factors. The
strength of this model is that it incorporates how important and distinct the
holiday is to individual’s well-being rather than assuming that sustainable
behaviour generalizable across all contexts.
Whilst this section has been devoted to explaining the internal and external
factors influencing pro-environmental behaviour, the next section will explore
two models that focus their attention on the barriers to pro-environmental
behaviour.
2.8 Barriers to Sustainable Behaviour
Blake (1999) was concerned that many pro-environmental models of behaviour
often failed to include personal, social and institutional constraints experienced
by individuals and assumed that individuals make rational choices based on the
information available to them (Figure 2.7). However Blake (1999) contests that
much of human behaviour is irrational and therefore encouraging informing
individuals to change their behaviour for the sake of the environment will not be
enough.
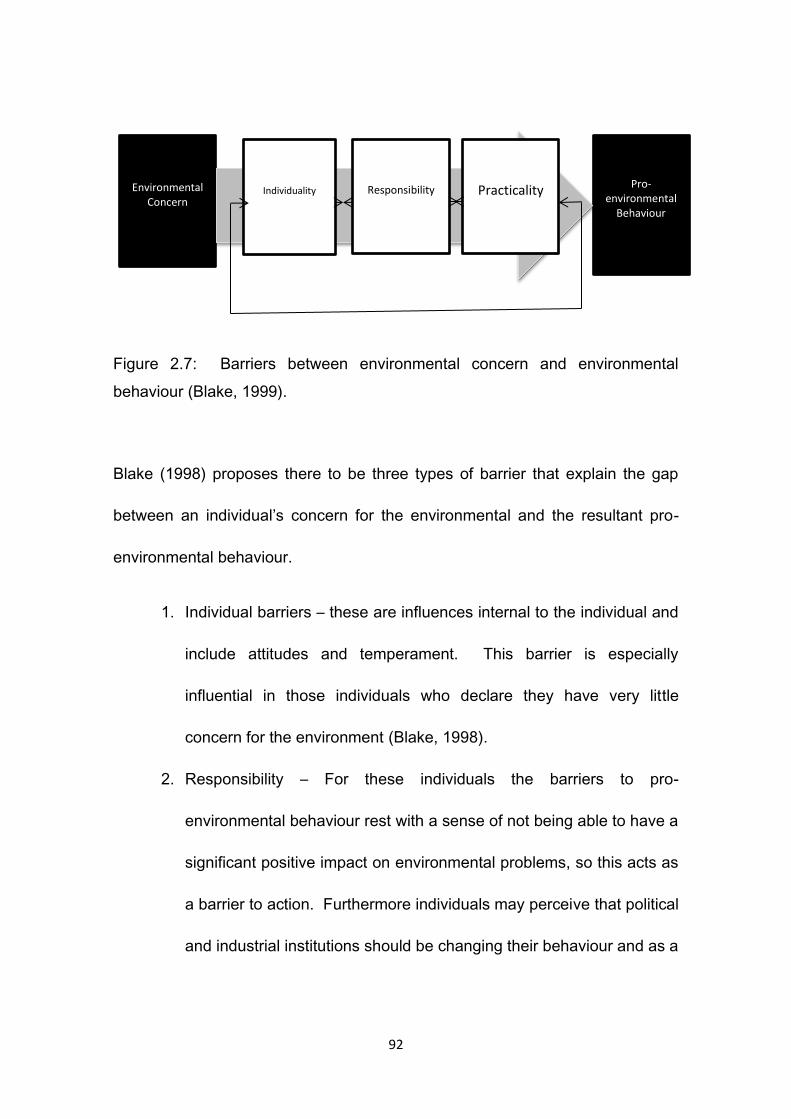
92
Figure 2.7: Barriers between environmental concern and environmental
behaviour (Blake, 1999).
Blake (1998) proposes there to be three types of barrier that explain the gap
between an individual’s concern for the environmental and the resultant pro-
environmental behaviour.
1. Individual barriers – these are influences internal to the individual and
include attitudes and temperament. This barrier is especially
influential in those individuals who declare they have very little
concern for the environment (Blake, 1998).
2. Responsibility – For these individuals the barriers to pro-
environmental behaviour rest with a sense of not being able to have a
significant positive impact on environmental problems, so this acts as
a barrier to action. Furthermore individuals may perceive that political
and industrial institutions should be changing their behaviour and as a
Environmental Concern
Pro-environmental
Behaviour
Individuality Responsibility Practicality
93
result a sense of mistrust prevents them from behaving in a more
sustainable manner.
3. Practicality – These barriers are the institutional constraints that
inhibit individuals from behaving in pro-environmental ways
regardless of their personal concerns and intentions.
Blake’s (1999) model (figure 2.7) is useful in describing the types of influences
both internal and external interact to constrain behaviour, and seems to suggest
that a change in behaviour would require addressing these barriers in order for
behaviour change to be successful. However Kollmus and Agyeman (2000)
suggest that this model does not adequately address all of the barriers to pro-
environmental behaviour, they suggest social factors, familial pressures and
cultural norms should be included in order to provide a more complete model.
Kollmus and Agyeman’s (2002) model of pro-environmental behaviour attempts
to take into account both external and internal influences on behaviour and
focuses on trying to explain the barriers to pro-environmental behaviour. The
authors suggest that models are often over simplistic and do not take into
consideration deeper psychological needs for comfort and convenience and the
powerful influence of habits and pre-existing behavioural routines. They
suggest that often individuals hold high levels of pro-environmental knowledge
and concern but the convenience of older more established behaviour patterns
94
inhibit behaviour change. They stress that in order for a behaviour to become
the ‘norm’ it must be practiced repeatedly until it replaces the old behaviour and
that some pro-environmental behaviours are particularly resistant to change,
due to their less convenient and comfortable nature (eg. walking instead of
driving to work is much less appealing when the weather is cold or wet, or when
running late).
2.9 Section Summary
This section has been focussed on describing some of behavioural models
which are most relevant to the current research. The emphasis of most
behavioural models rests on identification of underlying psychological traits or
characteristics which best predict behaviour with little consideration of factors
outside of the control on the individual. The models tend to assume that as long
as the individual displays the ‘correct’ combination of recognised traits then it
can be assumed that they will behave in a particular way. However sustainable
behaviour appears to be particularly difficult to define in terms of psychological
traits and positively held attitudes toward the environment is not a good
predictor of behaviour (Kollmus & Agyeman, 2002). This ‘attitude-behaviour
gap’ appears to be even more resilient when the holiday context comes into
play. (Barr, 2008) This would suggest that the barriers to sustainable tourist
behaviour are even higher than for home behaviour. The models described in
this section will therefore be useful in guiding the primary research needed to
95
fulfil the objectives, in so much as, it will be important to ensure that data
collected reflects both attitudes and beliefs but also recognises the barriers
individuals experience when making decisions regarding their holiday
behaviour.
2.10 Chapter Summary
The focus of this chapter was to review the pertinent literature surrounding
sustainable tourism behaviour, with a view to identifying the barriers to said
behaviour. The review incorporated literature from the fields of tourist
behaviour, sustainable tourism and pro-environmental behaviour in order to
garner a better understanding of the complexities of the problem at hand. The
very notion of the ‘holiday’ and all that this entails in terms of decision-making
regarding, destination, accommodation, travel and transport, activities,
entertainment and food is a complex process. This process is dependent on
the interaction of many factors, some which constrain choice and others which
motivate. It appears that the addition of sustainable choices into the decision-
making mix, which by their very nature conflict with perceptions relating to
holiday expectation, results in denial and suppression and choices made that
are focussed on achieving a pleasurable holiday for all.
96
In terms of the ‘destination’ it is essential to include the services and
infrastructure needs to be in place to enable sustainability. Thus a detailed
description of the collaborative relationship required between tourism
stakeholders in order to achieve a sustainable tourist destination was discussed
at length. Further consideration was given to the most effective way to monitor
and measure the environmental impact of tourist behaviour. The ecological
footprint was suggested as a way to test whether pro-environmental attitudes
and behaviour results in lower environmental impact.
The premise of this thesis is to utilise a social marketing methodology to
encourage greater levels of sustainable behaviour amongst tourists. One of the
most important elements of employing a social marketing methodology is the
identification of the barriers to behaviour change. In the context of this research
this means identifying individual perceptions of the barriers to sustainable tourist
behaviour as well as what individual’s perceive might motivate them to change
their behaviour. This chapter therefore has explored some of the barriers to
behaviour change and will utilise the tenets of social marketing to gain a greater
understanding of the perceived and actual barriers to sustainable tourist
behaviour.

97
The following chapter (Chapter 3) will be centred on social marketing, exploring
the background, its application and processes before proceeding to application
of the methodology in Chapter 4.
98
CHAPTER THREE – Marketing and social marketing
3.1 Introduction
It is the intention of this chapter to provide a starting point in relation to the
application of a social marketing methodology to trying to encourage greater
levels of sustainable behaviour amongst tourists. Particularly as the focus of
responsibility for ‘change’ is now directed specifically at the individual and social
marketing’s premise focusses its attention directly on individual and their
personal perceptions. Therefore this chapter will seek to explain the evolution
of social marketing as a derivative of traditional marketing and how elements of
traditional marketing are applied, alongside knowledge and expertise from many
other disciplines to encourage attitude and behaviour change.
The chapter will explore the literature regarding the theoretical and conceptual
frameworks underpinning marketing and social marketing. Exploration of the
process of applying a social marketing methodology to encourage a change in
attitudes and behaviour to a range of social problems will be described.
Consideration will also be given to limitations and criticism of social marketing
and explore the future direction of the discipline.
99
Finally the chapter will discuss why social marketing has been selected as a
potential way to encourage greater levels of sustainable behaviour amongst
tourists.
3.2 History and background of social marketing
Social marketing has been actively employed as a technique to encourage
attitude and behaviour change for over 50 years and is defined as:-
The systematic application of marketing alongside other concepts and
techniques to achieve specific behavioural goals for social good’ (French
& Blair-Stevens, 2010:1).
The concept of social marketing is a direct combination of two elements,
traditional commercial marketing and inputs from the social sciences which
have always studied the best ways to understand human behaviour.
Traditional commercial marketing developed as a result of mass production and
mass consumerism. Goods were produced on a massive scale and available
for purchase to a broad spectrum of people, therefore marketing developed as
an activity, to bridge the gap between producer and potential purchaser.
Marketing as a process informed the potential purchaser about the benefits of
buying the product, not only could marketing match product to purchaser and it
was able create a need for a particular product where none previously existed.
100
Marketing as an activity is essentially about influencing and changing
individual’s behaviour, most usually consumer behaviour. Changing an
individual’s consumer behaviour requires a huge amount of skill and knowledge
but if undertaken carefully can be hugely successful, creating a desire for a
product or service where none previously existed. Consumers will often quite
easily swap from a product they have been loyal to for years for one that is
marketed in such a way as to induce feelings of desire for the new product. As
mentioned previously, Weibe (1950) was the first commentator to recognise that
this ability to alter behaviour could be utilised to change behaviour in relation to
social problems. A social problem is a condition that undermines some or all
members of a society and is usually a matter of public controversy (Macionis,
2002:4). Therefore a ‘social problem’ is something that occurs within a society
and that has a detrimental effect on both the society and those that it impacts
upon. One such example might be, rising levels of obesity, which impacts
directly on those with the condition and also places a strain on health and social
services. This strain inevitably, as Macionis states, causes some sort of
controversy within society, in terms of the cost of providing for the extra
healthcare requirements for those people who are suffering with obesity,
amongst food producers, government departments and those directly impacted
by the problem. The important element in any social problem is the ‘social’
element, that is, the problem is a result of human attitudes, perceptions and
behaviour. Therefore any resolution to the ‘social problem’ must be social in
nature, this is where, as Wiebe (1950) suggested, marketing techniques could
101
be applied to encourage a change in behaviour – hence the term ‘social
marketing’. Any benefits, experienced, as a result of a social marketing
intervention, say a healthy eating campaign could be experienced by the
individual, due to increased energy levels and loss of body weight, their family,
but also by wider society, in terms of the health service and healthy food
producers. Understanding human attitudes and behaviour is an intrinsic part of
social marketing, Truss et al, (2009) suggest that those involved in social
marketing should look to the social sciences (sociology, psychology and the
political sciences) to assist in explaining and understanding the ‘social’ aspect
of social marketing. Understanding and influencing human behaviour means
that there should be consideration given to the meanings behind behaviour at
an individual level, however, individuals do not exist in a vacuum therefore it is
important that external societal influences should also be explored in order to
gain a fuller appreciation of the problem under exploration. This is where the
social science literature can be invaluable by guiding any social marketing
intervention to encourage a change in behaviour. Thus social marketing is
really dependent on understanding the best ways of promoting attitude and
behaviour change for any number of social problems. Behavioural sciences
have a lot to offer in terms of the research undertaken with regards to existing
behaviour and the best ways to influence and motivate a change in behaviour.
What follows are some of the theories that are useful in understanding
behaviour and behaviour change:-
102
Cognitive Dissonance Theory – Festinger (1957) introduced this theory as an
attempt to explain the uncomfortable tension individuals experience when their
attitude to an issue does not match their actual behaviour. Festinger (1957)
states that there is a tendency to try and reduce this tension by justifying and
rationalizing the behaviour, for example, someone might acknowledge that their
smoking is an unhealthy behaviour and know that they should not be doing it,
but to reduce the ‘dissonance’ they justify their behaviour by saying they only
smoke occasionally, or that they do not have the willpower to stop, or that they
have tried to stop but been unsuccessful.
Attribution Theory – looks at how individuals explain their behaviour, in terms of
whether they attribute internal or external factors as being the root of their
behaviour (Heider, 1958 as cited in Blair-Stevens, Reynolds & Christopouls,
2009). Their research showed that people tend to attribute negative behaviour
to external sources and positive behaviour to internal factors. For instances, in
the example above, individuals who still smoke regardless of the negative
health implications might attribute this to external factors, such as a lack of
support from the health profession, or lack of support from family members.
Whereas, if someone had managed to stop smoking they might attribute this
positive behaviour, to their own strong willpower and motivation, rather than the
assistance they received from a health care clinic.
103
Social Learning Theory – where the previous theories concentrated on
individual determinants of behaviour some theorists have concentrated on the
societal determinants of behaviour. Akers (1973) in his Social Learning Theory
looked at how behaviour is ‘learned’ from social interaction with others. This
theory of behaviour suggests that individuals tend to imitate behaviour that they
see rewarded by others in their social group. Akers (1973) contended that when
individuals learn a behaviour, they initially imitate behaviour by a valued
member of their social group. Successful imitation generates an initial internal
reward, which leads to further repetition of the behaviour, however over time, as
repetition and competency increase, individuals experience less and less
internal gratification, until the behaviour becomes routine. Bandura (1986)
believed that the experience of reward for successful imitating behaviour leads
individuals to set higher and higher goals in order to repeat the internal
satisfaction of learning a new behaviour. The internal reward experienced also
increase self-efficacy and self-belief which also increases motivation to continue
to change or learn new behaviours. Bandura (1986) went on examine how
personal, environmental and behavioural factors interact constantly to influence
behaviour. These interactions vary constantly depending on the time and
context of behaviour and previous experience, with behaviours in different
contexts having an impact on individual’s likelihood of repeating or changing
behaviour.
104
Theory of Planned Behaviour – Ajzen (1991) explored ‘planned behaviour’ and
asserted that an individual’s intention to perform behaviour is influenced by
what they perceived their peers or significant others would perceive by their
actions. Therefore, if an individual believed that their peers would perceive their
behaviour as a positive act, then they would be more likely to undertake the
behaviour. However researchers in this area also acknowledged that other
environmental factors would also influence an individual’s intention, as would
social norms. This lead to the development of The Theory of Planned
Behaviour – which focusses on the attitudes an individual may hold regarding a
particular behaviour, the social norms relating to that behaviour and the
‘perceived behavioural control’ as key influences of the intention to behave in a
particular way. In respect of the notion of ‘perceived behavioural control’, an
individual’s intention to behave in a particular way will be directly affected by the
level of skill they possess, opportunities to behave, and perceptions of how
important it is to them in terms of results to behave in a certain way.
In the application of social marketing to a social problem, the concepts identified
by the ‘Theory of Reasoned Action’ and the ‘Theory of Planned Behaviour’ can
assist in identifying the many different types of influences that individuals are
likely to experience. In particular these theories highlight how important it is to
consider how social norms, attitudes and ‘perceived behavioural ability’
intermesh and directly influence behavioural intention.
105
Transtheoretical (stages of change) model – This theory is particularly useful
when planning a social marketing intervention to encourage a change in
behaviour, as it proposes that individuals move through a series of stages when
adopting new behaviours (Prochasta & DiClemente,1983). The theory also
accepts that individuals have differing levels of motivation and readiness to
change behaviour. The theory maintains there are five main stages that
individuals pass through when adopting a new behaviour:-
1 – Pre-contemplation: in this stage the individual is unaware of the
behaviour and therefore is not considering undertaking the behaviour.
2 – Contemplation: in this stage the individual is aware of behaviour and
maybe considering undertaking the behaviour, during this contemplation
stage the individual may seek further information regarding the
practicalities of the behaviour.
3 – Preparation: In this stage the individual is actively considering
undertaking the behaviour, and preparing to make the commitment to
adopting a new behaviour.
4 – Action: The individual starts to undertake the behaviour.
5 – Maintenance: During this stage the person either sustains and
consolidates the new behaviour or reverts to the previous behaviour.
The theory recognises that individuals do not move through the stages at the
same speed, some may remain at a particular stage for some time, whilst
106
others adopt and sustain a new behaviour much more quickly. In order to assist
an individual move through the stages and maintain a new behaviour the theory
suggests that individual needs to understand the balance of positives and
negatives in terms of the consequences of a change of behaviour. They also
need to recognise the importance of self-efficacy in terms of whether the
individual believes that they are able to move to a new behaviour.
This theory is particularly useful for those planning a social marketing
intervention as it appreciates that individuals move through a series of stages
when contemplating a change in behaviour, and that change and adoption of
behaviour will be swift for some, but much slower for others. This allows for any
social marketing intervention to be tailor-made according to the stage that the
individual is at. So for instance, someone at the ‘pre-contemplation stage’ will
not even be aware of the behaviour and its consequences so the first action
would be to inform the need to change, what the change behaviour would mean
to individuals and then finally what the outcome would mean. Someone at the
‘action stage’ would already be undertaking the behaviour, so the intervention
might be tailored to encourage and sustain the behaviour, so the intervention
might emphasize the positives of the behaviour, praise the behaviour, but also
focus on what a relapse might mean for the individual.
107
Whilst this is not an exhaustive review of all of the possible behavioural theories
that social marketing practitioners may utilise to gain a fuller appreciation of,
behaviour and behaviour change, it does illustrate how knowledge gained from
other disciplines contributes to the application of a social marketing
methodology.
3.3 Traditional Marketing theory: Exchange Theory
Marketing as a professional activity evolved and has become recognised as an
academic discipline due to the complicated and sophisticated processes
involved in the process. Processes such as value creation, innovation, market
research, advertising and communication are all integral to the process of
marketing. Sophisticated information and intelligence gathering techniques
regarding customer needs, buyer behaviour and brand loyalty mesh together in
order to provider the marketer with the tools to segment and target audiences
with specific goods and services. As a discipline marketing is inspired by the
concept of ‘Exchange Theory’ which has its conceptual base in the fields of
economics and psychology. Exchange theory postulates that marketing is
essentially centred on the ‘exchange’ of tangible and intangible entities between
two or more parties. The basic prerequisites of marketing are:-
- There are at least two parties
- Each party has something that might be of value to the other
- Each party is capable of communication and delivery
108
- Each party is free to accept or reject the offer
- Each party feels it is appropriate and desirable to deal with the other
(Bagozzi, 1975; Hastings & Saren, 2003)/
Bagozzi (1975) proposes that there are 3 different types of exchange
relationships involved in marketing activity – restricted exchange, generalised
exchange and complex exchange. Restricted exchange exists between 2
parties (consumer and wholesaler or wholesaler and retailer) here the exchange
is direct and the relationship attempts to remain equal, so that something of
value is exchanged for something else of value. Generalised exchange
relationships exist between 3 or more parties, but where the parties do not
necessarily benefit each other directly. Complex exchange relationships in
marketing exist where there is a system of interconnected mutual relationships,
each party is involved in one direct exchange but benefits are realised as a
result of the exchanges between all parties (Bagozzi, 1975). The benefits
accrued as a result of these relationships can be either tangible, in terms of
purchased goods or payment, or intangible in terms of a service received or a
mutually beneficial contact. Furthermore Bagozzi (1975) suggests that social
marketing rests within the Complex Exhange Theory, where, more often than
not, the benefits tend to be symbolic or intangible in nature. Thus the benefits
gained through social marketing campaign, say a change of behaviour, will be
less tangible than that of a commercial campaign where the ‘company’ gains
109
value through the customer’s purchase, and the customer gains through receipt
of the product.
3.4 Marketing Theory: The shift towards Service-dominant Logic
The emphasis on the creation of value through marketing activity is reflected in
the development of Service Dominant Logic(Vargo & Lusch, 2000). Here the
focus rests on the ‘customer’ and the value created in this relationship (Peattie
& Peattie, 2003). The premise of Service Dominant Logic lies in the value
created in the exchange of services rather than the exchange of goods, these
‘services’ are defined as the knowledge and skills provided by firms in the
creation of goods and services. Thus the ‘value’ of a purchased product is not
in the physical product but in the service it provides to the consumer. For the
firm that developed and sold the product the ‘value’ lies in the knowledge and
expertise by all of the actors who played a part in the development, production,
marketing and selling of the product (Vargo & Lusch, 2006). This theoretical and
conceptual construct was generated in response to the changing nature of
commercial trading, traditional marketing bridged the gap between producer
and customer however this was related directly to physical products and the
value embedded in the product. However, as the service industry developed
and became more important ‘value’ was no longer embedded in a tangible
products, ‘value’ was derived through the service received, and the related skills
and knowledge involved in generating the service. Furthermore, firms begun to
110
realise, that even when tangible products were involved the ‘value’ of the
product was derived as a result of the service provided by that product to the
consumer. This evolution and change in the concept of ‘value’ had implications
for the theory of marketing which still tied to traditional economic models of
exchange (Webster, 1992; Day & Montgomery, 1999; Parvatiyar, 2000). The
recognition that value was embedded in intangibles led to the emergence of
‘services marketing’ as a sub-discipline of marketing’ (Shostack, 1997) However
Vargo and Lusch (2004) did not perceive a need for distinct sub-disciplines of
marketing theory they argued that the marketing of both tangible and intangibles
was reliant on the ‘value’ of the service they provide to the consumer and called
for a new dominant logic for marketing. They proposed ten foundational
premises for the new evolution of marketing theory which they termed Service
Dominant Logic:-
FP 1 - Service is the fundamental unit of exchange, this means that the
application of knowledge and skills is the basis for all exchange, thus service
is exchanged for service.
FP 2 – Indirect exchange masks the fundamental basis of exchange,
sometimes it is not always clear where service is provided due to the
complex combination of goods, money and institutions, however service is
still the basis of exchange.
FP 3 – Goods are a distribution mechanism for service provision, goods
derive value through use and thus the service they provide to the customer.

111
FP 4 – Operant resources are the fundamental source of competitive
advantage, thus the ability to create a desired change in purchasing
behaviour drives competition, rather than the product as a physical entity.
FP 5 – All economies are service economies, the service industry in terms of
knowledge and expertise is very important especially in terms of increased
specialization and outsourcing of these skills.
FP 6 – The customer is always co-creator of value, ‘value’ is only created
when the customer perceives it, which implies that value is interactional in
nature and can only be achieved through interaction thus creating value.
FP 7 – The enterprise cannot deliver value, but only offer value proposition,
this suggests that delivery of value cannot occur as a result of a singular
company, value is only generated through interaction and collaboration.
FP8 – A service-centred view is inherently customer orientated and related,
because the nature of value is determined through the benefits accrued on
behalf of the customer, therefore the process is inherently customer
orientated.
FP9 – All social and economic actors are resource integrators, suggests that
value creation is the result of networks of networks that integrate resources.
FP10 – Value is always uniquely and phenomenologically determined by the
beneficiary, value as a concept is experiential and contextual and the
meaning behind the value derived is individual in nature.
112
These ten ‘Foundational Premises’ defined by Vargo and Lusch in 2008 fit in
well with the processes and concepts associated with social marketing. Social
marketing is based around generating social benefits, through behaviour
change, and the value derived is experienced by both the individual and society.
Undoubtedly behaviour change and value are generated through a process that
utilises skills and knowledge from all those involved, including those individuals
being targeted to change behaviour. Further suggesting that behaviour change
for societal good is the result of a co-creational process which fits well with the
tenants of Service Dominant Logic.
With this in mind, Dann, Harris, Sullivan-Mort, Fry and Binney (2007:294)
suggest that social marketing should redefine itself in terms of ‘social marketing
dominant logic’. Co-creation of value is central to the theory of Service
Dominant Logic, in social marketing ‘value’ is created through behaviour
change, which in turn is created and aided through multiple channels of
knowledge, expertise and insight within society. Dann et al, (2007) believe that
further evolution of social marketing as a discipline requires the development of
a distinct theory that embraces the tenants of Service Dominant Logic, and to
this end, they call for more research into the area to increase understanding
and applicability. Likewise, Peattie and Peattie (2003) believe that it is time for
social marketing to ‘fly solo’ and reduce its dependence on commercial
marketing theory.
113
3.5 Criticism of social marketing
As stated in the previous section social marketing as a process lacks a distinct
theoretical and conceptual framework and has relied on adapting methods and
processes from traditional marketing in order to frame itself (Bloom & Novelli;
Andreasen, 2002; Peattie & Peattie, 2003; Dann, Harris, Sullivan-Mort, Fry and
Binney, 2007).
The major criticisms of social marketing as a discipline are focussed around
three areas, the ethical considerations of changing behaviour, the procedural
processes underlying social marketing and the theoretical and conceptual
framework underpinning social marketing. These three areas of controversy will
be discussed in the following section.
3.5.1 Ethical considerations of social marketing – The aim of many social
marketing initiatives is to encourage individuals to change pre-established
comfortable behaviour for another set of behaviours defined by another group.
Laczniak, et al, (1979) perceive that it is the process of one group being given
the power to influence another group to change opinion and behaviour that is
unethical especially when promoting changes in behaviour to contested issues
such as family planning and abortion. Furthermore, it is suggested that social
marketing is ‘self-serving’ in so much as, in the process of promoting a social
114
cause proponents could also be making a profit (Fox & Kotler, 1980). Fox and
Kotler (1980) provide the following examples to back up this argument; seat belt
manufacturers are often strong supporters of legislation and campaigns to
encourage car safety; life insurance companies encouraging people to
undertake changes in the consumption of alcohol, salt, sugar, fat, cigarettes and
increase exercise which in turn reduces premature deaths, thus cutting claims
and increasing profits.
3.5.2 Theoretical and conceptual criticisms of social marketing – As described
previously in this chapter traditional marketing theory has centred on the
concept of ‘exchange’, the idea being that customer satisfaction is exchanged
for company profit, however social marketing interventions are rarely measured
in terms of economic profit or customer satisfaction (Peattie & Peattie, 2003).
Furthermore Peattie and Peattie (2003) suggest that the nature of exchange
theory needs to be reassessed in order to appreciate whether it can be applied
directly to social marketing. Exchange theory states that;
- Exchange takes place between two or more parties
- Each party desires the attributes that the other has
- Each party is willing to exchange
However it is the value that each party attributes to the exchange process which
sets it apart from social marketing. Generally there are no tangible or monetary
benefits from changing to a desired new behaviour, where information is
115
provided this is not the basis of a commitment to change behaviour rather it is
exchanged as an incentive, which may, or may not result in a change of
behaviour. Furthermore traditional marketing measures its success on the
basis of this exchange relationship, so successful exchange in terms of
customer satisfaction leads to increased sales. However social marketing
cannot measure its success based on customer satisfaction or profit, instead
success is gained through a change in behaviour, this could be an increased
level of participation in a desired behaviour, a decrease in levels of a particular
behaviour or even a stabilising of the behaviour. Measuring a change in
behaviour in social marketing campaigns is difficult, as is ascertaining its
success as changes could be subtle, short-term or build with longer term
interventions.
To summarise, exchange theory which has its foundations in economics and
psychology translates well into commercial theory, but not so well for social
marketing where the processes and applications are more subtle and less
dependent on customer satisfaction and maximisation of profit.
Many of the criticisms regarding social marketing rest on the discipline’s
reliance on transposing ideas and processes directly from traditional marketing.
Whilst some aspects of traditional marketing campaigns translate quite well
from traditional marketing others do not. Peattie and Peattie (2003) draw
116
attention to the four P’s taken from traditional marketing (product, price, place
and promotion) and often utilised in social marketing campaigns. In terms of
‘product’ in traditional marketing the ‘product’ is quite obvious, it is the item
being marketed to potential customers, however, in social marketing the
‘product’ is quite often less tangible. In a social marketing campaign, the
‘product’ could be conceived in one of two ways, either the ‘product’ is
perceived as the resultant behaviour change, or, the ‘product’ is the
technologies or information used in the campaign to encourage change. Peattie
and Peattie (2008) suggest there are problems with both conceptualisations of
the ‘product’ in a social marketing intervention, in so much as, a change in
behaviour is not produced by the social marketer, neither is the information or
technologies used to facilitate change as product of social marketing. The
change in behaviour is solely a product of the individual electing to change the
way they behave. Andreasen (1995) suggests that in some social marketing
campaigns there is a strong similarity between traditional marketing, but this
tends to be dependent on the context and benefits accrued as a result of the
social marketing campaign. So for example those social marketing campaigns
where the benefits are experienced immediately are more akin to a traditional
marketing campaign. Andreasen (1995) uses the example of a social marketing
campaign to encourage smoking cessation, the benefits to the individual of
stopping smoking are economic and physiological and are likely to be
experienced immediately, there is also a high degree of societal consensus
regarding the value of the behaviour. In contrast a social marketing campaign
117
to encourage pro-environmental behaviour where the benefits are likely to be
less tangible and less immediate, are less similar to traditional marketing’s
concept of ‘product’.
In terms of ‘price’ the translation from traditional marketing is more obvious than
for ‘product’, as monetary price is usually absent in social marketing campaigns.
Therefore in social marketing, the concept of ‘price’ is translated as the cost to
the individual of changing behaviour. There are as, Bloom and Novelli (1981),
inherent difficulties and directly translating the notion of ‘price’ from traditional
marketing, which is associated with the price of a product to the consumer and
maximising of profit for the provider. In social marketing, this process is almost
the opposite, as the provider is almost certainly aiming to reduce the ‘cost’ of
changing the behaviour, in order to increase the likelihood of behaviour change.
A further problem with direct translation of ‘price’ from traditional marketing to
social marketing is that monetary price is universally understood, however the
‘price’ of behaviour change will be inherently individual.
The next of the four P’s is ‘place’ and in a commercial marketing campaign this
is usually related to the location and distribution of the products being marketed.
The concept of ‘place’ transposes itself quite well into a social marketing
campaign as this could involve the distribution of physical objects in a targeted
region (eg, birth control in areas of high teenage pregnancy) or ‘place’ could
118
also mean the placing of an intervention to encourage behaviour change in or at
a strategic area or group of individuals.
‘Promotion’ is the final of the four P’s transposed from traditional marketing into
social marketing, and probably has the strongest parallels to the processes
undertaken during a marketing campaign. The process involves designing,
planning, testing and implementing a promotional campaign, however the
transmission of messages designed to change social behaviours are much
more complicated and could be received and interpreted in a multitude of
different ways compared to promotional campaign designed to encourage the
purchase of a specific brand of soft drink. It is the ‘social’ in social marketing
campaigns that makes them inherently different from traditional promotional
campaigns. Communication of behavioural change messages must be more
subtle and fully understand the external and internal demands of the target
audience.
Peattie and Peattie (2003) argue that over reliance on transposing theory and
practice directly from commercial marketing into social marketing could be
hindering to development as a discipline. They suggest that social marketing
should develop its own vocabulary so;
- Products should become – social propositions
119
- Price becomes - cost of involvement
- Place becomes – accessibility
- Promotion becomes – social communication
- Exchange becomes – interaction
- Competition is associated with understanding the types of influences that
compete for the attention of the target audience/
-
In summary Peattie and Peattie (2003) are suggesting that social marketing
needs to reduce its dependence on the traditions, theories and conceptual
framework of traditional marketing and develop its own vocabulary and
theoretical base focussed on the ‘social’ aspect of the discipline and all that this
entails. They caution that over reliance on traditional marketing could mean
that social marketing may inherit some of the negative connotations associated
with traditional marketing in that it is perceived as manipulative and profiteering
due to its success being dependent on creating desire for goods not necessarily
needed by the public. Social marketing in contrast aims to change behaviour
and its success is measured by the positive effects it has in society. If the
public perceive social marketing negatively and believe they are being
manipulated then interventions are likely to be unsuccessful (Fox & Kotler,
1980).
120
3.5.3 Criticism of procedural processes underpinning social marketing - The
differences between undertaking a social marketing intervention and that of a
commercial marketing campaign have been explored by several commentators
(Bloom & Novelli, 1979, 1980; Fox & Kotler, 1980; Hastings & Haywood, 1991).
The following section discusses the key differences between undertaking a
commercial marketing campaign compared to undertaking a social marketing
campaign.
Market analysis problems for social marketing – those undertaking a
commercial marketing campaign are likely to have access to a lot of
secondary data regarding their potential customers’ wants, needs,
desires, attitudes and satisfaction levels. However social marketing, by
the very nature, of the causes it deals with, will have difficulty obtaining
accurate and valid measurement of perceptions, attitudes and reported
behaviour. Individuals whilst willing to be surveyed on a wide range of
issues do not necessarily provide accurate and truthful responses
particularly to sensitive issues, which is exactly the area that social
marketing operates in (Bloom & Novelli, 1980; Fox & Kotler, 1980).
Market segmentation problems for social marketing – Commercial
marketing uses segmentation techniques to target their products and
services at distinct sectors of the population, those that have expressed
a need or desire for a product with particular attributes, this then
increases likelihood of purchase and profit. However social marketing
121
can experience difficulties when trying to segment its target audience,
this can be due to unreliable data gathering as alluded to previously, or
to the nature of the group to be targeted. In certain situations, groups of
individuals are selected to be targeted with a social marketing
intervention, based upon the risk that continuance of the behaviour has
to them, rather than willingness to change behaviour. Bloom and Novelli
(1980) use the example of ‘drivers who tend to avoid using seat belts’ or
‘sexually active teenagers who do not tend to use contraceptives’ and
‘heavy smokers’ to name but a few. These segments are selected due to
the risk their behaviour poses however these groups are the least likely
to respond to a behaviour change intervention, because they are already
behaving in a ‘risky’ manner and any intervention to change this
behaviour will be not as a response for change emanating from the group
rather change is being imposed on them by societal pressure, this differs
from commercial market segmentation where products and services are
directed at groups in response to their needs and desires which
increases likelihood of a change in behaviour.
Product strategy problems for social marketing – As discussed previously
‘product’ is a problematic construct for social marketing. In commercial
marketing there is usually a tangible product to be marketed that can be
adjusted in order to suit the requirements of the customer. However
‘product’ for social marketers tends to be less tangible, and as such is
less able to be adjusted to suit the needs of the target audience. The
122
‘product’ or the change in behaviour tends to be directed by community
or government organisations that require a change in behaviour to meet
a societal goal (eg, reduction in drug abuse, increase in use of recycling
facilities). This does not leave any room for adjustment of the ‘product’.
Another difference between social marketing and commercial marketing
lies in the limited amount of funding available to encourage behaviour
change and this therefore restricts ‘product’ development. For example, a
campaign to encourage recycling behaviour might be more effective if
the local authority could provide enhanced facilities, but limited budgets
are likely to restrict provision, so the campaign will be only be focussed
on encouraging greater use of existing facilities.
3.5.4 Section Summary
In conclusion, this section of the chapter has addressed the main criticisms
levied at social marketing, these criticisms are mainly centred on an over
reliance by academics and practitioners on translating traditional marketing
practices and theories directly into the social marketing domain. Whilst there
are parallels to commercial marketing theories and practices, in fact social
marketing is much more complicated, as it deals with the uniqueness of human
experience and understanding. All relatively new disciplines, such as social
marketing, experience problems with establishing their academic credentials,
thus establishing a robust and credible theoretical base is a significant part of
123
this process. However, as suggested previously, an over reliance on ‘exchange
theory’ in order to explain the types of transactions undertaken during a social
marketing campaign are not adequate in describing the process. Traditional
commercial marketing is heavily dependent on ‘down streaming’ of products
and goods and generating interest in and desire in consumers for new products.
However Andreasen (2002) argues that the process of social marketing should
be undertaken through the process of ‘up-streaming’ whereby the target
audience is clearly understood in terms of how they perceive their environment
and what they understand by behaviour change. Furthermore greater
consideration needs to be levied at understanding all of the competing
determinants of behaviour. Therefore service dominant logic perhaps provides
a more accurate base with which social marketing could rest, where emphasis
is placed on co-creation of value, so that the target audience becomes central
to the process, and where value is in the relationships between all parties which
is what determines success (Dann, Harris, Sullivan-Mort, Fry & Binney, 2007).
As always there is a difference in opinions between academics and practitioners
and social marketing is no different. For those undertaking and utilising the
principles of a social marketing methodology to encourage behaviour change
the theoretical and conceptual basis is less important than the effectiveness of
the intervention itself. The following section will describe in detail the process of
undertaking a social marketing campaign.
124
3.6 Undertaking a social marketing campaign
3.6.1 Identifying the social problem
Before the process of undertaking a social marketing campaign is initiated there
needs to some recognition that a social problem exists. Macionis (2002:4)
defined a social problem as ‘a condition that undermines the well-being of some
or all members of society and that is usually a matter of public controversy’.
Social problems can be relatively minor affecting a small group of people or
major affecting the majority of the population. These issues tend to evolve as
society changes, so problems that were of consequence a few years ago,
change their status and are superseded by other social problems. Issues move
up the agenda, when the public perceive the issue to be important as shown in
public opinion polls, when the media provides coverage of the issue and when
the issue becomes important to those with political power (Lang & Lang, 1983).
Andreasen (2006) proposes an eight stage Life Cycle of Social Change
process; stage one - the social problem exists, but there is no recognition or
data to draw the problem to attention; stage two – the problem is discovered
and organisations such as the media begin to take notice; stage three –
activists, lobbyists, politicians, journalists begin to acknowledge the issue, start
to uncover the victims of the social injustice and draw attention to the issue;
stage four – advocates start to examine the issue with reference to the causes
and gather evidence regarding the likely outcomes; stage five – in this stage

125
solutions to the social problem start to be sought, the costs and the benefits of
addressing the social problem are undertaken; stage six – governmental
organisations start fund interventions to tackle the problem, at this stage social
marketing comes into play; stage seven – reassessment of the problem, re-
organisation of efforts to address the problem are instigated; stage eight – this
final stage occurs a considerable time after the social problem was first
recognised, and either the problem has been solved, stayed the same, or been
replaced by another social problem (Andreasen, 2006)
So the process of social marketing is initiated when there is acknowledgement
that there is a problem within society which needs to be corrected, these
problems may be identified in a number of ways through analysis of data trends,
one-time surveys, uncovered evidence and issues uncovered by advocate
pressure groups. Once the problem has been identified recognition is sought
by those people with the finance and power to initiate a social marketing
campaign (Adreasen, 1995; Andreasen, 2006).
3.6.2 The process of social marketing
This section of thesis will be dedicated to explaining the practical process of
undertaking a social marketing intervention to encourage behaviour change.

126
French and Blair-Stevens (2010) developed eight-point benchmark criteria to
differentiate social marketing from other types of intervention and to aid
understanding of what social marketing could offer a programme for social
change. These criteria are:-
1. Customer Orientation – the customer/client must be at the centre of the
process and as a part of this there must be full understanding of the
target audience based on sound and reliable research utilising evidence
from various sources.
2. Behaviour and Behavioural Goals – the campaign must focus on
achieving an impact on problem behaviour – thus closing the gap
between ‘problem behaviour’ and ‘desired behaviour’. Wth this in mind
the intervention needs to be designed to focus directly on specific
behaviour and there needs to be actionable and measurable behavioural
goals.
3. Theory based – as mentioned previously all interventions need to draw
on knowledge from human behaviour theorists.
4. Insight – the intervention must incorporate an understanding of what
motivates people and identify specific factors that will influence people to
change their behaviour.
5. Exchange – the intervention will also have to acknowledge what the
costs are going to be to the individual when they change their behaviour
and whether these costs are likely to impinge on the success of the
campaign. (Costs could be financial, time and or energy)
127
6. Competition – competition relates to other factors which compete for the
attention of the target audience, by understanding the audience it should
be possible to mediate the effects that competing sources may have on
the effectiveness of the intervention.
7. Segmentation – There should be a segmentation of the target audience,
and this should be based on a deep understanding of motivations and
attitudes thus allowing specific actions to be targeted specific audience
segments.
8. Methods – Intervention or marketing mix, all social marketing
interventions are likely to employ a variety of methods, these should be a
mix of altering the environment, communication, regulation and
enforcement, personal enablement, empowerment and support services
(French & Blair-Stevens, 2010).
These benchmark criteria were not designed to describe the practical process
of implementing a social marketing campaign; rather they were designed to
provide an information base for those considering initiating a campaign directed
at social problems.
Blair-Stevens and French (2005) developed a framework to support social
marketing interventions, through the processes of planning, development and
delivery of the intervention, this they termed ‘The Total Planning (TPP)

128
Framework’. This framework was developed through a review of two important
areas of learning, project planning methodologies and best practice principles
coupled with knowledge gained through behavioural interventions. The
knowledge gained through the review extracted best practice and from project
management and behavioural intervention methodologies was combined to
create the Total Process Planning framework (Blair-Stevens & French, 2005).
There are five primary stages to the framework:-
1. Scoping
2. Developing
3. Implementing
4. Evaluating
5. Following-up
Each stage of the TPP framework will now be described in some detail to
enable a better understanding of the processes and stages involved in a social
marketing intervention to encourage behaviour change.
3.6.3 Scoping
The overarching aim of the scoping phase is to consider which interventions to
progress and the objectives of this phase are to consider the issue or challenge,
to gain an understanding of the target audience and their behaviour and to
identify the resources required to tackle the issue. Once all the issues have
been considered the final output is a scoping report in which key challenges are

129
identified and addressed (Reynolds & Merrit, 2010 in French, Blair-Stevens,
McVey & Merrit, 2010).
The scoping stage is undertaken in three main stages and these stages are
fundamental for gleaning the information required to implement a social
marketing campaign.
Phase 1 – The first phase involves forming a steering group, this steering
group’s function will be to collect data pertaining to the behaviour that is being
addressed, the locality that this behaviour is taking place in and finally the
people that the intervention is intended to influence.
The utilisation of secondary data pertaining to the social problem under
examination is undertaken during this initial stage. The objectives of this phase
are to define clearly the behaviour to be addressed, who and, where the
behaviour is taking place, and the causes of the behaviour need to be clearly
defined. These causes could be psychological, biological or genetic, factors in
the physical environment, or social factors. From the information gleaned in the
review and analysis of pre-existing data it will be possible to identify potential
target audiences, although this may change further along in the process.
Finally, in this phase consideration will be given to research or interventions that
have already taken place, with a view to assessing levels of success, funding
130
and budget, challenges faced selection of target audience and behaviour to be
addressed.
An important element of phase one is identification of key stakeholders in the
area so that they can be engaged in the project. These key stakeholders will
provide insight and knowledge regarding the target audience, help deliver the
intervention and provide essential contacts and authority which will be essential
to the successful delivery of the intervention.
Phase 2 – This phase is dedicated to conducting primary research, the objective
of this research is to fill the gaps in knowledge identified in the previously
analysed data. The final outcome of this phase will be a written research report
in which the primary research will acknowledge the results from phase one
and add to the knowledge base. An important element of this research report is
an analysis of competition and a review of assets. Analysis of competition
pertains to factors that compete for the target audience’s attention such as the
current behaviour or preferred behaviour rather than the desired behaviour. In
terms of reviewing assets this section of the report is related to mapping the
resources and services that are already in existence which could support an
intervention in order to avoid duplicating services or resources.
131
Phase 3 – This phase is centred on understanding the audience, segmentation
and tailoring a social marketing strategy that reflects the specific characteristics
of that segment. Audience segmentation is an essential element of a social
marketing intervention, as it clusters individuals according to attitudes, abilities,
and behaviour, thus allowing for development of an intervention that reflects
these unique attributes, that in turn, increases the effectiveness of the social
marketing message.
Finally, after all three phases of the scoping stage are completed; a scoping
report is drawn up that reflects the findings of all three phases. The research
generated in phases 1 and 2 are combined with the audience segmentation
detail and the desired changes in behaviour that have been identified are
moved forward to the ‘development’ phase (Reynolds & Merrit, 2010).
3.6.4 Development
This phase of the framework is dedicated to the development of the social
marketing intervention, this is achieved by building initial behaviour change
goals in order to develop and design the intervention. The ideas generated in
this phase are then pre-tested on the target audience and refined as necessary.
The primary output for the development stage is a marketing plan (Merritt,
2010).
132
This is the phase where the 4P’s (product, price, place, promotion) are put into
action. As stated previously, extensive use of the 4P’s has been criticised by
academics as being too over reliant on theories directly transposed from
marketing (Peattie & Peattie, 2003). However, in reality social marketing
campaigns rely heavily translating the concepts of product, price, place and
promotion as a way to develop a social marketing intervention. This dichotomy
between academia and ‘real world’ experiences demonstrates the reality of
working in an area without an established theoretical base.
In terms of social marketing’s use of the concept of ‘product’, product is
intended to be selling the benefits of a change in behaviour to the target
audience. Therefore the intervention has to be carefully designed to encourage
behavioural change by promoting the benefits; these benefits could be tangible
or intangible and are less easy to induce within a social marketing context
compared to commercial marketing.
Product in a social marketing sense has three levels, the core product, the
actual product and the augmented product (Kotler, 1988). The core product
relates directly to the benefits accrued by the individual as a result of a change
in behaviour, for example, if an individual gives up smoking, then they will
experience the benefits of reduced risk to cardiovascular health, improvement in
finances and a sense of personal achievement. The actual product relates to a
133
product or service that has been developed in order to product the core
product’s benefits, so in relation to the example above this could be the
introduction of a support service to assist in stopping smoking. In terms of the
augmented product, this relates to the services and infrastructure created in
order to increase uptake of the actual product or service. In example supplied
previously, this might mean ensuring that the support service is a mobile service
located within walking distance of those needing it.
So for social marketers the ‘product’ is the desired behaviour change and
ensuring its effectiveness is dependent on providing a product that is perceived
to be beneficial to the recipient, that is accessible, and that has the services and
infrastructure to encourage participation by the target audience.
For social marketing ‘price’ relates to the cost to the target audience of a
change in behaviour. Therefore a social marketing campaign must consider
what the ‘costs’ of changing from the existing behaviour to the desired
behaviour will be, and aim to mitigate these costs in order to encourage
participation.
In terms of the ‘place’ component of a social marketing campaign, this relates to
the locality that the behavioural change intervention will be undertaken in;
134
therefore the campaign must ensure that the related support structures and
infrastructure are in place to facilitate and enable the desired behaviour change.
The ‘promotion’ element of the social marketing mix is used to communicate the
benefits of the desired behaviour change to the target audience, the value of
changing behaviour and where the product or service is available. The task of
the promotion element of the campaign is to ensure that the target audience are
aware of the campaign, how it will benefit them, what is required of them in
terms of effort and ultimately be inspired to act. Branding is an important
element of the campaign as it provides the campaign with a recognizable
‘personality’ with which the audience can associate with a defined set of
attributes and trusted outcomes. Developing a brand identity in the context of a
social marketing campaign requires pre-testing, revising and testing again with
the target audience in order for it be effective.
Pre-testing is an essential element of the development stage of the social
marketing process, as the target audience should always be central to the
intervention. Pre-testing of materials, services and messages allows the target
audience to feedback which of the options has most effect on their attitudes and
perceptions. Pre-testing in the development stage of the process will be
undertaken with the target audience via focus groups or individual interviews.
The process of evaluation of the nature of what is trying to be achieved by the
135
social marketing intervention is undertaken repeatedly throughout the process
in order to ensure that the target audience’s perceptions and attitudes are fully
recognised and reflected in the campaign (Merritt, 2010).
3.6.5 – Implementation
The third phase of the TPP framework is the implementation stage, the overall
aim of this stage is to actively implement the marketing campaign as defined
during the scoping and development stages. This implementation phase is
undertaken in a step-like sequence, first the launch is planned, followed by
execution of the intervention, monitoring of progress, identifying and modifying
as needed. The final output from the implementation stage is documentation of
the activities undertaken and feedback received which will be used in the
‘evaluation stage’.
3.6.5.1 Phase 1 – Planning to launch the intervention
The first phase of the implementation stage involves ensuring that the
intervention is implemented as efficiently as possible. The key relevant
stakeholders are important at this stage as they will be influential in supporting
the intervention through the implementation stage. Therefore they will need to
be fully informed regarding the content, context and delivery of the intervention

136
and any suggestions that they make will need to be allowed for in
implementation of the intervention.
Training of staff who will be in the frontline of the intervention is also vitally
important, as they will be delivering the ‘service’ or ‘product’ to the target
audience so will need to be fully aware of the expectations of the behaviour
change programme.
Prior to the launch data, the resources required to implement the intervention
must be in the areas where the target audience can access them.
The final stage of planning the launch, is to decide the timings, here
consideration needs to be given to the most effective time to attract the
attention of the target audience. Evidence from the scoping and development
phases will be instrumental in directing this decision.
3.6.5.2 Phase 2 – Identifying Opportunities and Problems
When the intervention has been launched and is running, it is important to
monitor the effectiveness of the program and respond to any opportunities to
fine tune the intervention. Furthermore, correcting any problems that occur
137
during the implementation stage is also very important to the effectiveness and
efficiency of the program.
Budgets for social marketing interventions are usually quite small, so the budget
needs to be monitored throughout the process and adjusted accordingly.
3.6.5.3 Phase 3 – Evaluating, monitoring and modification
During phase 3 of the implementation stage, monitoring the progress of the
actual intervention against the planned progress of the intervention in order to
evaluate the effectiveness of the programme and any adjustments made to it.
In order to evaluate the implementation phase of the intervention a variety of
methods are employed such as:-
- Media analysis, monitoring of reports regarding the intervention in mass
media communications
- Event monitoring, monitoring via short feedback questionnaires after
events
- Postcard questionnaires sent to the target regarding the intervention,
whether are aware of the intervention, have acted upon it and their
general response to it.
138
- Inventory tracking whereby products are monitored in terms of those that
are most popular, where they are being used and which members of the
target audience.
- Coupons, if coupons are being used to reduce the cost of a product and
to encourage uptake, then monitoring of who is using them and where,
will allow proponents to gage which channels are the most effective in
terms of distribution.
- Website, often a social marketing intervention will have a website
supporting the intervention providing information and guides to support
services. Monitoring of website statistics given an indication of the pages
that are most often visited, monitor length of time spent on specific pages
and where the interest has come from.
-
These evaluation techniques provide an indication of how well the
implementation phase is proceeding and also may provide information
regarding issues that need to be refined or adjusted in order to meet the target
audience more effectively.
Once the implementation phase is underway and monitoring and evaluation has
taken place then the findings need to be disseminated to a wider audience. The
reviewing process will show the positives and possibly the negatives of the
intervention and these need to be shared with as wide an audience as possible
139
in order that others working in the same field can learn from the experience.
The communication channels chosen to disseminate the findings need to reflect
the needs and interests of the key stakeholders (Merritt, 2010).
After the implementation stage, where the intervention is launched, monitored
and adjusted the next stage is a formal evaluation of whether the intervention
has been successful in directing behavioural change (Merritt, 2010)/
3.6.6 Evaluation
The main aim of the evaluation stage of the TPP framework is to assess the
strengths and weaknesses of the intervention and to evaluate whether the
intervention is affecting behaviour change (McVey, Crosier & Christopoulus,
2010).
The main output from the evaluation stage is a report detailing whether the aims
and objectives of the intervention have been met, the positives and negatives of
the intervention, whether there have been any expected consequences and
what has been learned in terms of the future direction of any subsequent
interventions.
140
There are three stages in the evaluation process, a formative evaluation,
process evaluation and finally outcome evaluations. These stages of the
evaluation process will now be described in more detail.
Formative evaluation – In this stage of the evaluation process a baseline of data
is gathered regarding knowledge, attitudes and behaviour of the target
audience. This allows for assessment of the steps required to meet the
objectives of the behaviour change programme. The process involves pre-
testing of the intervention which in turn allows for a re-assessment of the aims
and objectives of the programme of behavioural change. This stage is
undertaken utilising a range of qualitative research techniques such as
interviewing, participant observation and focus groups.
Process evaluation – This stage of the evaluation process focusses on how the
intervention was implemented and functioned. The process will examine the
context in which the intervention was implemented so will explore the wider
cultural, political and economic environment as this will have been likely to have
had some impact on the effectiveness of the intervention. During this phase of
the evaluation process there will be an assessment of how effective the
intervention was in generating awareness amongst target audience members.
141
Outcome evaluation – In this stage the evaluation looks at assessing the
effectiveness of the intervention in terms of the original aims and objectives of
the project. So the effectiveness of the intervention will be assessed in terms
of short term, mid-term and long term outcomes. Short-term evaluation will
focus on levels of awareness amongst the target audience, mid-term evaluation
will assess which determinants of behaviour were changed and long-term
outcomes will assess the intended (and unintended) outcomes of the
intervention in terms of significant behaviour change.
The types of data employed during the outcome stage of the evaluation process
are:-
- Direct indicators of the effectiveness of the intervention are statistically
reported changes in behaviour, self-reported behaviour change,
increased levels of usage of a related service or product and increased
levels of ‘footfall’ to particular services that are an intrinsic part of the
intervention.
- Intermediary indicators are those that happen before a change in
behaviour, but suggest there is a change in perception amongst the target
audience, so there could be increasing levels of awareness, knowledge
and a change in attitudes and beliefs regarding the issue. Media analysis
is also used to explore how the intervention is being communicated, so
column inches and campaign mentions would be regarded as indicator of
142
the effectiveness of the intervention. Further assessment of the views of
those delivering the services, who is using the services and what their
opinions are of the service or product.
- Indirect indicators are not directly related to the intervention but may
provide evidence that the intervention is having an effect. So the process,
could examine whether the intervention is having an effect on policy in the
area under consideration, or whether the law is considering the impact of
suggested change. Whether the intervention is having an effect on key
opinion makers in society, whether social opinion is changing in relation to
social problem would also suggest that the intervention is having an
effect.
-
In conclusion the evaluation phase of the TPP uses a wide range of quantitative
and qualitative which are triangulated against existing data sources to assess
the effectiveness of the social marketing intervention. The data generated in
this phase provides an unbiased assessment of the effectiveness of the social
marketing intervention, by consistently measuring the aims and objectives of the
programme against a variety of behavioural change measures (McVey, Croiser
& Christopoulus, 2010).
143
3.6.7 Follow-up
The final phase of the TPP framework for social marketing involves focussing
on reflecting and disseminating what has been achieved throughout the
implementation of the behavioural change intervention.
The overall aim is to share the findings of the evaluation phase to enable future
development of the intervention, with the objective building on the successes of
the intervention and learning and avoiding any of the unsuccessful elements of
the intervention.
The final output from the follow-up stage should be a clear plan for the future
direction of the intervention with a view to maintaining the desired behaviour
change, building on and improving the effectiveness of the intervention and
publishing information regarding the successes and failures to a wider audience
that could benefit from what has been achieved by the intervention.
Much of the follow-up stage of the TPP framework is dedicated to
communicating, both the successes and the failures, to as wider audience as
possible. The findings of the intervention should be reported to those
stakeholder groups that assisted in all phases of the intervention, to the target
audience and to other interested or related parties.
144
The content of the follow-up report should provide detailed information
regarding the behaviour targeted, the target audience, how and what behaviour
was altered, the obstacles encountered during the intervention and how these
were overcome. Furthermore the report should discuss the relevance of the
findings in terms of how they could be utilised by others to influence further
programmes of behavioural change.
3.7 Section Summary
In summary, the follow-up stage of the TPP framework centres on
disseminating the findings of the intervention with a view to consolidating the
information gained in order to generate a future plan to sustain, maintain and
enhance the effectiveness of the social marketing intervention. Effective and
successful communication strategies such as targeted journal articles, one-to-
one briefings to stakeholders, press releases, media interviews, and seminar
and conference presentations are an important facet in securing funding to
sustain the intervention for the long term. Continual feeding back of results is
an essential element in maintaining funding streams for social marketing
interventions (Christopoulus, Blair-Stevens & French, 2010).
145
3.8 Chapter Summary
This main objective of this chapter was to explain and describe the background
to social marketing as a concept, explore the theoretical underpinnings of the
discipline, and examine the ethical implications of undertaking a programme of
behaviour change. The next section of the chapter was devoted to describing
the practical processes undertaken during a social marketing campaign. The
rationale for including so much detail relating to applying a social marketing
methodology to a social problem was that this thesis, will be applying these
techniques to understand and explore the most effective ways to encourage
sustainable behaviour amongst tourists. Therefore the following sections of this
thesis will be apply the techniques suggested in phases 1, 2 and 3 of the
Scoping section of the Total Planning Process model in order to gather all the
relevant data to explore whether a social marketing methodology could be
successful in encouraging tourists to behave in more sustainable ways whilst on
holiday.
The next chapter will be focussed on the research methodology and analysis in
order to identify the barriers to sustainable tourist behaviour and distinguish a
potential cluster of individuals who may respond positively to an intervention to
encourage a greater range of sustainable behaviours whilst on holiday.
146
CHAPTER FOUR – Methodology
4.1 Introduction
It is the intention of this thesis to explore the effectiveness of employing a social
marketing methodology to encourage greater levels of engagement in
sustainable behaviours amongst tourists and explore the link between
environmental attitudes, behaviour and impact through the use of Ecological
Footprinting software. The contents of this chapter will provide a detailed
discussion of the research methods selected and how these meet and fulfil the
requirements of both a social marketing perspective and the wider objectives of
academic enquiry. Further discussion will detail the various stages of the
process from survey design and implementation, sampling method, survey
design, data collection and analysis. Full consideration will be given to
exploring the relationship between the theoretical framework of social marketing
and the methodological strategy employed to fulfil the objectives of the
research. Additionally the research method and tools used to estimate the
environmental impact of tourist on-site behaviour will be defined and explored in
detail.
The structure and format for this chapter will be as follows:-
- Discussion of theoretical framework and methodological strategy
- Research design
147
- Selection of case study sites
- Description of survey design
- Description of REAP model design
- Description of interview design
- Ethical considerations
4.2 Research design
This research is centred on utilising a social marketing methodology to
understand behaviour with a view to encouraging a change in behaviour. With
this in mind the research design must focus on capturing relevant data relating
to tourist on-site behaviour and an assessment of how individual’s perceive their
holiday, what their motivations are and how they perceive their holiday and
decisions made in relation to environmental issues.
In the ‘scoping’ section of the social marketing process, where the primary
research is undertaken with the target audience, the process dictates that great
consideration should be given to the design of the research. The investigation
of human behaviour is extremely complex, therefore, a combination of both
quantitative and qualitative research methods offer the best opportunity to
gather the data required to represent the problem under scrutiny (Zaltman,
2003).
148
Quantitative research methods focus heavily on gathering data via
questionnaire surveys. These questionnaire surveys consist of mostly
structured closed-ended questions measuring knowledge, attitudes and
behaviour in which participants are forced to select answer that most closely
represents their experiences (Donovan and Henley, 2003). The responses
provided allow for numerical coding of individual responses which allows for
statistical analysis and generation of sub-groups of individuals based on shared
attitudes, beliefs and behaviours which is an essential element of a social
marketing methodology. These questionnaire surveys can be delivered in a
variety of ways via the telephone, mail, on-line and face-to-face. The
advantages of quantitative research methods are that they allow an overall
assessment of the social issue whilst enabling comparisons to be made
between various subgroups (Donovan and Henley, 2003).
The methods associated with qualitative enquiry produces rich descriptive data
which is more exploratory in nature and less constrained that data gathered by
quantitative research techniques. The research instruments employed by
qualitative research include in-depth and semi-structured interviews, focus
groups, observation, and ethnography. These techniques are designed to allow
participants to represent their experiences in the way they perceive them,
leading to reach detailed information with which the researcher must interpret in
149
order to identify recurrent themes and establish the important determinants of
behaviour.
The research design utilised by those employing a social marketing
methodology combines both quantitative and qualitative research techniques to
gain the most representative picture of the target audiences’ perceptions of the
issue under investigation (Zaltman, 2003). In the context of this research, and
in order to follow closely the methods utilised by social marketeers, both
quantitative and qualitative research methods will be used. The quantitative
technique will involve the design of a questionnaire survey consisting of both
open and closed-ended questions. The rationale for utilising the questionnaire
method of enquiry is that the survey can be distributed to a large number of
tourists and the data gathered can be statistically analysed, and will provide
enough data to enable segmentation analysis to be undertaken. The
segmentation analysis will enable identification of sub-groups of individuals
within the dataset based on their attitudes towards holidays and the
environment. Whilst quantitative methods such as questionnaires provide an
important statistical element to the research, the method does not allow, due to
the closed nature of the questions, for individual perceptions and understanding
of behaviour to be explored. However, qualitative techniques will allow for
deeper exploration of the perceived and actual barriers to sustainable tourist
behaviour to be analysed.
150
In terms of the qualitative element of the research plan, consideration was given
to the most appropriate method to investigate individual perceptions of the
barriers to and motivations for on-site sustainable tourist behaviour. The use of
researcher led focus groups to discuss the issue was considered as a potential
way to investigate the issue. However upon consideration, this concept was
considered to be particularly difficult to organize and recruit participants, as the
research process was to be undertaken whilst the participants were on their
holiday. In terms of observation techniques, this was not considered as a
potential technique as this would not aid exploration of individual perceptions of
the barriers to sustainable behaviour. Semi-structured interviewing was
perceived to be the most effective way to explore the issues surrounding
sustainable tourist behaviour. These could then be scheduled with the
participants after their holiday so as not to intrude upon the holiday experience.
In-depth interviews were not felt to be necessary in this instance as the
questionnaire would be designed to gather detailed information relating to on-
site tourist behaviour, so a shorter more structured interview, related specifically
to the exploration of the barriers to, and motivations for, sustainable tourist
behaviour were deemed to be more appropriate.
In terms of the collection of data relating specifically to the ecological
footprinting element of this research, the data required to enter into the REAP
for Tourism software would need to be quantitative in nature. Therefore
151
consideration was given to what would be the most effective approach to data
design and collection. There were two main ways that this data required could
be collected, through diary-based collection method, whereby participants
would record their activities and associated spending on a daily basis for the
duration of the holiday; or the information could be condensed and be gathered
from participants from the questionnaire survey. It was decided that the latter
option would be most advantageous for this research, due to various reasons;
by condensing the information into the questionnaire survey more participants
could be expected to complete it and thus greater levels of data could be
gathered offering more validity; diary-based method is time consuming and
intrusive for participants especially when they are on holiday and this may make
recruitment of participants difficult. A review of the diary-based methodology
employed by South West Tourism to collect information regarding behaviour
patterns suggested that a condensed version applied to the questionnaire would
be most effective in this case. Therefore this research added a self-report
section to the questionnaire survey which detailed activities and spending
behaviour for the duration of the holiday.
An important element of the overall research design was the selection of
suitable case study sites in which roll out the research. The next section of the
chapter will detail how and why the particular case study areas were deemed to
be suitably representative of tourist destinations in the South West of England.
152
4.3 Selection of case study areas
The case study approach in tourist behaviour research is an important way to
compare whether locations have specific characteristics, that make them unique
and thus attract a particular type of visitor, or whether tourist behaviour is fairly
similar regardless of location (Beeton, 2005). In the case of this research the
case study approach was utilised in order to assess whether sustainable on-site
attitudes and behaviours differed between the two resorts, that is whether
visitors to each of the destination areas behaved more sustainably because the
destination had different characteristics, whether the case study areas attract
different visitor types, or whether behaviour and attitudes were consistent
between visitors to the two case study sites.
The two case study areas selected for this research to be undertaken are
Minehead in Somerset and Paignton in Devon, both case study areas are
traditional family coastal resorts. The next section will provide a detailed over
view of each of the case study sites and justification for their selection.
153
4.3.1 – Case study site 1 – Minehead, West Somerset
The town of Minehead is located on Somerset’s coast within the district of West
Somerset. West Somerset covers an area of 720 km and comprises of two
distinct areas the Quantock Hills Area of Outstanding Natural Beauty (AONB)
and Exmoor National Park, the area also comprises coastline with established
sea-side resorts of which Minehead is the largest. In 2008 West Somerset
received 1.3 million staying visitors with an associated visitor spend of over £59
million whilst there were nearly 1.3 million day trips to the region associated
generated over £47 million for the economy (South West Tourism, 2008).
The town of Minehead is the area’s principal settlement with a population of
12,500 which nearly triples to 35,000 in the peak tourist season months. The
resort comprises a promenade, sandy beach and harbour, the South West
Coast path also begins on the promenade at Minehead. Minehead is also
home to Butlins, an extensive holiday and day visitor resort. Butlins Minehead
is the largest employer in the region. The town also comprises a wide range of
catered accommodation (hotels, bed and breakfasts etc) and self-catering
accommodation. Transport links to the resort is heavily reliant on road
transport, with the only access via the M5 motorway at exit J25 at Taunton.
access being via the A39 or A358 for approximately 11 miles. There is no
mainline railway station, visitors alight at Taunton and catch a connecting local
bus service to Minehead. There are currently 27 local bus services to

154
Minehead and 3 coach services. The nearest international airports are either
Exeter or Bristol.
The principal responsibility for tourism strategy in Minehead falls under the remit
of West Somerset District Council. West Somerset District Council released
their proposed Tourism Delivery Plan for 2010 (West Somerset District Council,
2010). The vision for area is to create a ‘high quality visitor experience,
economically successful sustainable tourism industry which brings benefits to
local communities’ (2010:4). The strategic objectives for tourism are ‘to ensure
effective, integrated industry focussed marketing of the tourism offer across
Exmoor and West Somerset’ (2010:5). There is acknowledgement that the area
of West Somerset does not have a strong brand identity with the public and
therefore the strategy suggests that West Somerset is uniquely placed to take
advantage of increased demand for an offer that is both based on high quality
local environment and reduces local environmental impacts. The strategy
therefore suggests the destination’s marketing should be focussed on
promoting a ‘green’ location within short travel times of major markets and
potentially accessible by sustainable forms of transport. The second strategic
objective outlined by the tourism delivery plan is to ‘develop the quality of the
tourism offer within the district, maximising its existing assets and linking this to
the inherent environmental quality of the area’. The plan recognises the need to
develop a strong brand identity to allow the area to compete nationally and
155
internationally. Minehead is recognised as a resort that should be aiming for
year round tourism and the plan suggests that the resort would be ideally suited
to the short breaks and activity holiday focussed markets.
Marketing of the area is achieved through partnership working with public and
private sector groups, and comes under the remit of the Exmoor Tourism
Partnership (ETP). The ETP comprises members from Exmoor Tourism
Association, Active Exmoor, West Somerset Council and the Exmoor National
Park Association key partners are North Devon+ and Somerset Tourism
Partnership. Together the partnership aims to enhance the ‘quality of the visitor
experience, to improve the viability, sustainability and performance of tourism
enterprises and to develop, promote and champion Exmoor and West Somerset
brand in appropriate markets’ (2010:8).
Minehead as a potential case study area is a small resort that, according to
West Somerset District Council lacks a strong brand identity. The Tourism
Delivery Plan (2010) also acknowledges the importance of sustainability,
environmental quality and the environmental impact of tourism. Tourism
delivery in the area suffers from a lack of funding and there is no dedicated
Tourism Officer which means there is little reliable data regarding tourist
behaviour in and around the resort. Visitor profiling in terms of behaviour and
consumption patterns is an important component of this research and therefore
156
it will be necessary to survey in some detail tourist behaviour, Minehead will be
useful case study area in that it has some unique features such as the Butlins
Resort and West Somerset Steam Railway. (West Somerset Steam Railway is
a very popular attraction that thousands of day visitors to the town)
The Butlins resort is extremely important to the resort in terms of bed spaces
and employment. In terms of environmental impact the resort’s 380,000 staying
visitors and 80,000 day visitors per year must have an impact on the resort both
environmentally, economically and socially. It could be proposed that visitors
who choose stay in resorts such as Butlins tend to spend most of their leisure
time in the resort and do not travel much farther afield. In terms of
environmental impact in the form of eco-foot printing this might mean that
Butlins visitors have a smaller footprint than a visitor that self-caters and visits
local attractions by car. This could be one area where eco-footprinting analysis
could be advantageous. Day visitors to Butlins could on the other hand be
having greater impact on the environment depending on how far they have
travelled and by what means?
In terms of sustainable transport options, Minehead has limited access to public
transport particularly with regards to rail transport, local buses do operate but
the journey time is over an hour and a half from the nearest mainline station.
This limited accessibility will undoubtedly be a barrier to visitors opting to use
157
public transport to access the resort. Staying visitors on the other hand do have
the option to utilise the local bus routes to nearby attractions such as Dunster,
Watchet and Dulverton.
In relation to the DMO and its responsibility for marketing and promotion of the
resort there appears to be a desire to re-brand the resort and a direct
acknowledgement of the importance of sustainability – however translation into
a direct strategy is missing. Therefore the case study area could be amenable
to the development of a social marketing campaign to encourage sustainable
tourist behaviour.
In conclusion, Minehead as a case study area should enable the research to
meet each of the research objectives. In so much as Minehead is a medium-
sized resort with a stable day and staying visitor profile. The resort itself is
beset with barriers regarding issues of sustainability particularly with regard to
sustainable transport options and this research has the potential to show how
important this might be to visitor motivation and decision-making processes.
Minehead also has 2 major day visitor attraction Butlins and West Somerset
Steam Railway.

158
4.3.2 – Case study site 2 – Paignton, Devon
The second case study area selected to conduct this research is Paignton
which is part of the wider area known as Torbay which comprises three main
resorts Torquay, Paignton and Brixham plus the smaller areas of Babbacombe
and Cockington. This area has a long history as a holiday destination branding
itself as ‘The English Riviera’ due its climate and attractive scenery. The
English Riviera is made up of 22 miles of coastline with 18 sandy beaches and
positions itself as a traditional seaside destination (Torbay Development
Agency, 2010).
Of the three tourist resorts Paignton has the most established history as a
family holiday destination due to its long sandy beach and Victorian Pier. In
2007 the area of Torbay had over 1.1 million staying visitors and 2.3 million day
visitors with an associated visitor spend in excess of £438 million, 21% of the
resident population are employed in tourism or tourism related businesses.
(South West Tourism, 2007) In terms of holiday accommodation Paignton has
18,070 bed spaces with over 50% being in holiday park or touring park
accommodation. Transport links to the area are extremely good with direct road
access from the South East of England and the Midlands via the M5 motorway,
Paignton is also at an advantage as it has its own mainline railway station
meaning the resort can be fairly easily from London and the North of the
country. It is this ‘sustainable’ transport option that defines the resort as distinct

159
from the Minehead case study which is very much reliant on road access and
therefore personal car use. There are also plenty in resort public bus routes
connecting Paignton to the rest of the Torbay area so that visitors have the
opportunity to select sustainable options whilst on holiday. The nearest
international airport is Exeter.
In terms of visitor attractions, Paignton has the Dartmouth Steam Railway which
starts and terminates at Paignton and travels for 30 minutes through to
Kingswear where passengers can take the ferry across to Dartmouth. As an
added advantage the steam railway is adjacent to Paignton’s mainline railway
station which provides a sustainable travel option for visitors. The other large
attraction is Paignton Zoo which attracts over 400,000 visitors per year. Along
with these major visitor attractions many visitors come to the area to experience
the natural landscape or to walk the South West Coast Path which traverses the
Torbay coastline.
Tourism management of the Torbay area including Paignton is overseen by
Torbay Council, with responsibility for strategic tourism being undertaken by the
Torbay Development Agency and visitor services, marketing being the remit of
Torbay Council. Additionally there are 13 smaller organisations either directly
or indirectly involved in promotion of the area, leading to fragmented
management and marketing of the destination. The current tourism strategy for
160
the area ‘Turning The Tide for Tourism in Torbay, 2010 – 2015’ is focussed on
arresting the decline in visitor numbers experienced in the previous years,
increasing the value of tourism and reposition the ‘English Riviera’ brand as an
inspirational and interesting area to visit (Torbay Development Agency, 2010;5).
Current visitors to the area are dominated by families with pre-school or school
aged children, the over 50’s and coach groups. In order to sustain holiday
bookings throughout the year the objectives is to focus on promotion to groups
who are more flexible and can holiday outside of the school holiday period.
In terms of ‘sustainability’ the tourism strategy recognises the importance of
high environmental standards with many of the beaches holding Blue Flag
accreditation for cleanliness and high water quality. The tourism strategy
recognises the need to embrace the tenets of sustainability. GTBS accreditation
is held by 28 businesses in the Torbay area and 15 David Bellamy
Conservation Awards which demonstrates there is acknowledgement of the
importance of sustainability amongst tourism sector businesses. However the
tourism strategy in itself does not have any objectives directly linked to
providing and enabling sustainable behaviour amongst its visitors.
In conclusion, Paignton as the second case study was deemed to be a suitable
study area as it would allow the objectives of this research to be met. The
selection of the second case study area is important as the research needs to
161
compare tourist behaviour between the two resorts in order to test whether
behaviour is generalizable between areas, or specific to the area and its
visitors. Therefore Paignton and Minehead are suitable due to their similarities,
in so much as, they are both established medium-sized traditional seaside
resorts attracting similar visitor groups. Both case study areas are home to
large visitor attractions and both have a Steam Railway which was selected as
suitable sites for the questionnaire distribution. Whilst the areas share these
characteristics, the two areas can also be differentiated by transport options;
Minehead is heavily reliant on access by car and has no mainline railway
station, whereas Paignton is easily accessible by public transport. The issue of
accessibility could be an important determinant is decision-making and
motivation of those visiting the area and also has ramifications for those wishing
to make sustainable travel decisions. It should be noted that different case
study options were considered before the two used in this research were
selected, the justification for selecting Minehead and Paignton was to explore
whether tourist behaviour within traditional seaside resorts can be generalised
or are specific to the resort.
The next section will describe the design of the questionnaire survey which was
delivered to visitors in the two case study area described.

162
4.4 Description of Survey Design
This research is in its simplest terms seeks to change tourist behaviour through
the use of social marketing techniques. However tourist behaviour covers a
myriad of behaviours including actual behaviour and the motivations and
decision-making behind the behaviour. Social marketing seeks to change
behaviour using a ‘bottom-up’ approach by understanding behaviour from the
standpoint of the individual rather than imposing change from above in a ‘top-
down’ manner. Therefore the research needs to focus on exploring tourist
behaviour within the chosen case study areas. Therefore the specific objectives
of the research are outlined below and will be met through the following
research objectives:-
1. To describe and explain the behaviour of tourists within a destination, to
include travel to, from and within the destination also to include consumer
behaviour whilst on holiday. The data gathered here is focussed on the
reported behaviour of tourists whilst on holiday in their chosen destination.
Data gathered includes information regarding activities undertaken, purchases
made, distances travelled and modes of transport. The psychological aspects
of tourist behaviour will also be explored in terms of motivations and decision-
making processes involved in the pre-holiday period.
Method – Questionnaire survey of convenience sample of tourists within
each case study area, the data required to meet this objective would
include:-

163
Demographic information (age, gender, socio-economic
status, group composition)
Type of visitor (day, VFR, staying)
Transportation information (including distance travelled and
mode of travel)
Location and type of accommodation
Activities undertaken
Purchases made (consumer behaviour)
Information on pro-environmental behaviour at home and
holiday
Measurement of general attitudes towards the environment
and related to leisure travel and transport.
2. To identify, the barriers and motivations for adopting more sustainable tourist
behaviour. A social marketing methodology dictates that one of the most
important aspects to changing attitudes and behaviours is understanding the
perceived and actual barriers to behaviour change, whilst also considering what
individuals perceive might motivate them to change. Therefore this thesis
considers how people understand notions of sustainability, what behaviours
they undertake whilst in their home environment and what sustainable
behaviours they might already take part in whilst on holiday and what motivates
this behaviour. Further consideration is also given to what might encourage
people to behave more sustainably whilst in the resort and what they perceive
the barriers to be in this context.
164
Method – Utilising the quantitative data gathered in the previous objective
undertake semi-structured interviews with selected respondents to
identify the internal and external motivations and barriers to sustainable
tourist behaviour. The interview transcripts will then be analysed and
coded to reveal underlying themes of behaviour.
Outcome – the qualitative data gathered will enable greater
understanding of how tourists understand the decisions they make
regarding their behaviour. Further the information gained here, will
enable greater understanding of the psychological and external barriers
to sustainable tourist behaviour.
3. Based on the data derived in the previous objectives, this thesis will identify
using segmentation analysis, specific lifestyle groups that could be targeted
with a social marketing intervention to encourage sustainable tourist behaviour.
The data gathered identifies sub-groups of individuals that share similar
psychological and behavioural characteristics in respect of their attitudes
towards holidays, transport and travel. Where behavioural and psychological
characteristics indicate that a particular group of individuals may be amenable
to behaving more sustainably whilst on holiday, this group would be considered
suitable for targeting with a social marketing intervention.
Method – Use statistical package SPSS to undertake multivariate
analysis of data to generate lifestyle segments of visitors to the
destinations.
165
Outcome - Analysis of this data should allow for lifestyle profiles to be
ascertained and from this those groups that are more amenable to
change can be identified and targeted with a social marketing campaign.
4. To measure the environmental impact, using REAP for Tourism Ecological
Footprinting Software, of visitors to the two destination case study areas. This
objective will be fulfilled by collecting data regarding the reported consumption
behaviour of tourists whilst on holiday in the case study area. The information
collected will consist of all the activities undertaken during the stay, spending on
a range of items, accommodation, travel and transport choices. The results
generated will provide an individual ecological footprint for each of the tourists
which demonstrate the environmental impact of their on-site holiday behaviour.
This information will be linked directly back to the segmentation analysis
gathered for objective 3 in to order explore the link between pro-environmental
attitudes, behaviour and environmental impact.
Method - Design a section of the survey instrument to gather data
relating to the purchases made or intending to be made during the
holiday, activities undertaken during the holiday, transport and travel
options and distances travelled.
Outcome – The data collected will be inputted into the REAP for Tourism
Software program and used to generate an individual ecological footprint
of visitor behaviour. The ecological footprint generated can then be
tested between case study area, visitor type, accommodation, type in
166
order to examine the link between environmental attitudes and
behaviour.
4.4.1 – Questionnaire Survey
The questionnaire survey was designed and developed to provide a
comprehensive baseline of behaviour amongst visitors whilst in the holiday
destination case study areas. Table 4.4 details the sections of the
questionnaire survey and how the information was broken down into eight
sections to gain a fuller understanding of both pre-holiday decision-making and
motivations and on-site holiday behaviour (Appendix 1 & 2).
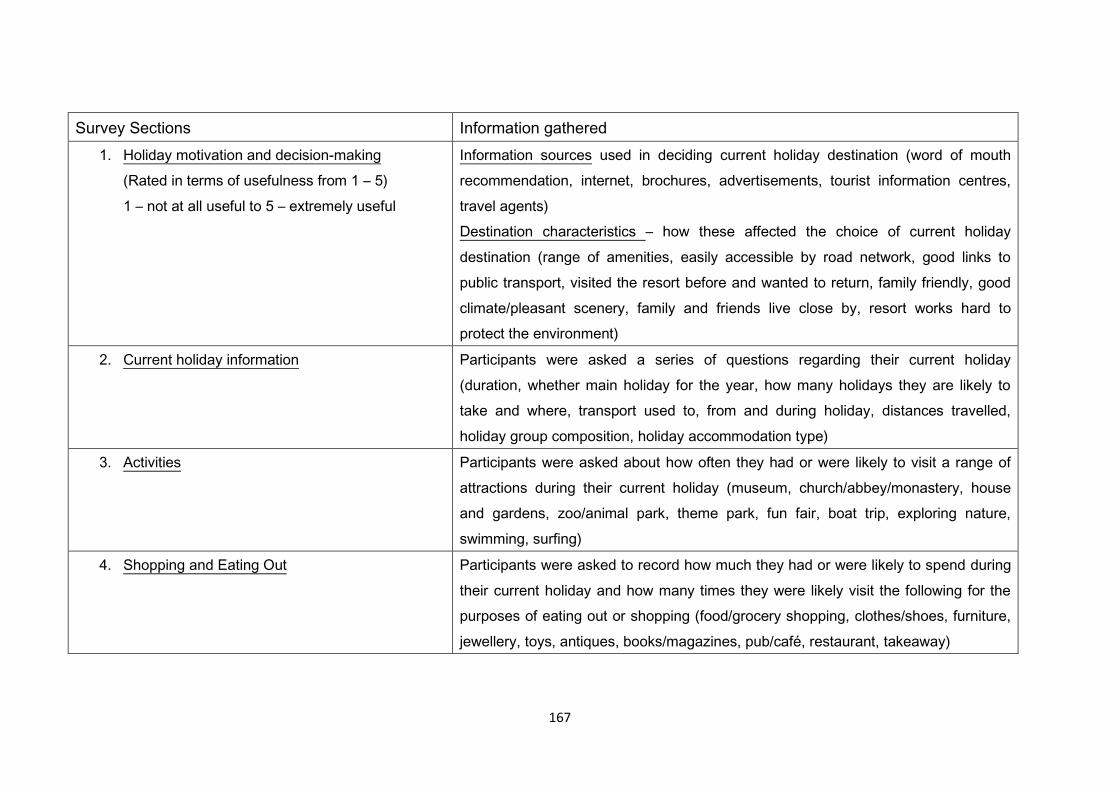
167
Survey Sections Information gathered
1. Holiday motivation and decision-making
(Rated in terms of usefulness from 1 – 5)
1 – not at all useful to 5 – extremely useful
Information sources used in deciding current holiday destination (word of mouth
recommendation, internet, brochures, advertisements, tourist information centres,
travel agents)
Destination characteristics – how these affected the choice of current holiday
destination (range of amenities, easily accessible by road network, good links to
public transport, visited the resort before and wanted to return, family friendly, good
climate/pleasant scenery, family and friends live close by, resort works hard to
protect the environment)
2. Current holiday information Participants were asked a series of questions regarding their current holiday
(duration, whether main holiday for the year, how many holidays they are likely to
take and where, transport used to, from and during holiday, distances travelled,
holiday group composition, holiday accommodation type)
3. Activities Participants were asked about how often they had or were likely to visit a range of
attractions during their current holiday (museum, church/abbey/monastery, house
and gardens, zoo/animal park, theme park, fun fair, boat trip, exploring nature,
swimming, surfing)
4. Shopping and Eating Out Participants were asked to record how much they had or were likely to spend during
their current holiday and how many times they were likely visit the following for the
purposes of eating out or shopping (food/grocery shopping, clothes/shoes, furniture,
jewellery, toys, antiques, books/magazines, pub/café, restaurant, takeaway)

168
5. Attitudes towards the environment and climate
change – rated level of agreement 1 – 5 (1 –
strongly disagree, 2 – disagree, 3 – neither agree
nor disagree, 4 – agree, 5 – strongly agree)
Participants were asked to rate their level of agreement to range of statements
regarding the environment and climate change
6. Attitudes towards travel and transport for short
breaks and holidays - rated level of agreement 1
– 5 (1 – strongly disagree, 2 – disagree, 3 –
neither agree nor disagree, 4 – agree, 5 –
strongly agree)
Participants were asked to rate their level of agreement to range of statements
regarding travel and transport in relation to short breaks and holidays
7. Home and holiday sustainable behaviours –
recorded often they undertook behaviours (1 –
always, 2 – usually, 3 – sometimes, 4 – rarely, 5 –
never)
Participants were asked to record how often they undertook a range of sustainable
behaviours when in the home environment and when on holiday (recycling,
composting of food waste, use of energy efficient appliances, turning appliances off
from ‘standby’, water saving devices, energy efficient light bulbs, purchase of eco-
friendly goods, organic food, food from local farmers markets, re-use plastic carrier
bags, use public transport or walk or cycle)
8. Personal details Participants recorded the gender and age of each person on their current holiday,
bicycle ownership, car ownership, concessionary travel passes, and membership of
environmental organisations, disability, and occupation.
9. Contact details & Opt in Participants were asked if they would like to participate in a short telephone interview
if they opted to they were asked to provide contact details
Table 4.1 – Sections of the questionnaire survey
169
The rationale for the use of each of the sections of the questionnaire will be
explained in the following sections.
Section 1 – Holiday motivations and decision making: The first part of the
survey explored the period before a decision was reached on the participant’s
final holiday destination and the types of information that were perceived to be
instrumental in forming the final decision. The rationale for including this
information within the survey was that a conventional social marketing strategy
might design an intervention that could be applied before a decision on a
holiday destination was made, therefore it would be important to understand
what types of information people find especially useful when choosing a holiday
destination. Thus any intervention would be more effective if placed via the
most used information channel.
The second part of this section explored which of the resort’s attributes were
most important to the participant’s when selecting their current holiday. The
rationale for including this kind of information would be to gain a better
understanding of what makes a holiday destination desirable and whether pro-
environmental attributes such as a resort having ‘good links to public transport’
or the ‘resort works hard to protect and preserve the environment’ are important
aspects of the motivation for selecting a particular destination or whether less
170
environmentally important characteristics play a greater role in holiday decision-
making.
Section 2 – Current holiday information: This section was devoted to gathering
information regarding the participant’s current holiday with a view to
understanding the nature of the current holiday experience. So the information
gathered included the length of stay, accommodation type, composition of
holiday group, transport type to, from and during vacation and mileage
undertaken for the complete holiday. The rationale for including such detail was
to establish the types of holidays undertaken, who the participants were
travelling with, how far they had travelled and what means, and the travel they
undertook whilst on holiday. The travel and transport aspect of this part of
questionnaire is important in terms of sustainability as car travel is used to
primarily to reach tourist resorts in the South West of England.
This section of the questionnaire also collected data regarding about the
number of holidays and short breaks likely to be taken during the following 12
months and the location of these holidays (in the UK, Europe or further afield).
The significance of collecting this information lies in the fact that shorter breaks
taken more frequently are becoming the norm but the future of tourism in terms
of sustainability is perceived to be longer holidays taken less frequently.

171
Section 3 – Activities: This section of the questionnaire focussed on the
frequency of visits to different types of visitor attractions during the participant’s
current holiday. The rationale for gathering this data was that it could be
inputted as part of the eco-foot printing software program which will enable an
individual footprint to be calculated for each participant.
Section 4 – Shopping and eating out: This section gathered information
regarding how many times participants had been or were likely to purchase
items during their holiday (groceries, clothes and shoes, furniture, jewellery,
toys, antiques, books and magazines) and how much they had or were likely to
spend. Information regarding ‘eating out’ activities was also part of the survey
so participants were requested to report how many times they ate out in
restaurants, pubs and cafes and from takeaway food outlets, they were also
asked to report how much they had spent or were likely to spend during their
holiday. The rationale for inclusion of this information was the same as the
previous section in so much as the information gathered was entered into the
REAP for Tourism ecological footprinting software.
Section 5 – Attitudes towards the environment and climate change: This section
required participants to give their level of agreement with a series of statements
related towards the environment and climate change. The statements
consisted of three different types, knowledge and understanding regarding the
172
threats of climate change to the environment, personal responsibility towards
the environment and willingness to change behaviour as a result of threats
associated with climate change. The statements accessed participants’
attitudes to and understanding of the threats associated with a change in
climate and five of the statements were linked to a BBC Climate Change Poll
that was undertaken November 2009 and then repeated in February 2010.
These statements were specifically aimed at participants perceptions of whether
climate change and the environmental threats associated with it are established
scientific facts, whether these threats were perceived to be exaggerated, and
whether climate change is occurring as a direct result of man-made activity.
The statements relating to personal responsibility examined participants’
attitudes towards how their own behaviour might impact on the environment and
whether this responsibility should be individual or collective in nature. The final
set of statements explored participants’ willingness to change their behaviour as
a response to the environmental threats associated with climate change. The
basis for including these statements was to explore participant’s general
attitudes towards the environment and climate change in order to gauge how
seriously they perceive the threats to be and whether in the light of this they
would be willing to adapt their behaviour.
Section 6 – Attitudes towards travel and transport for short breaks and holidays:
This section comprised of 8 statements in which participants were required to
173
rate their level of agreement with a series of statements relating to holiday
transport and travel. The first four statements related directly to transport
decisions made for travelling to the destination and during the holiday.
Participants were asked whether choosing the fastest transport option when
going on holiday was important to them, whether they enjoyed using public
transport when on holiday, whether they actively avoid highly polluting forms of
transport such as air travel when going on holiday and whether they actively
avoid using public transport when away. The motivation for using these
statements was to understand participant’s attitudes towards the choices they
make regarding holiday transport and travel. In terms of sustainability longer
slower journey’s utilising public transport services tend to be more sustainable
then quicker journey’s using air travel or the car and therefore it is important to
evaluate whether people consider sustainable travel options viable in a holiday
context.
The next statements were centred on attitudes towards the environment
specifically in relation to holiday decision making. Here the statements centred
on whether participants’ attitudes regarding how they might reduce their
environmental impact whilst on holiday and whether they might change their
holiday plans in response to issues such as global change. The participants
were also asked to rate their level of agreement in respect of how important
taking short breaks are to them. The rationale for including these statements
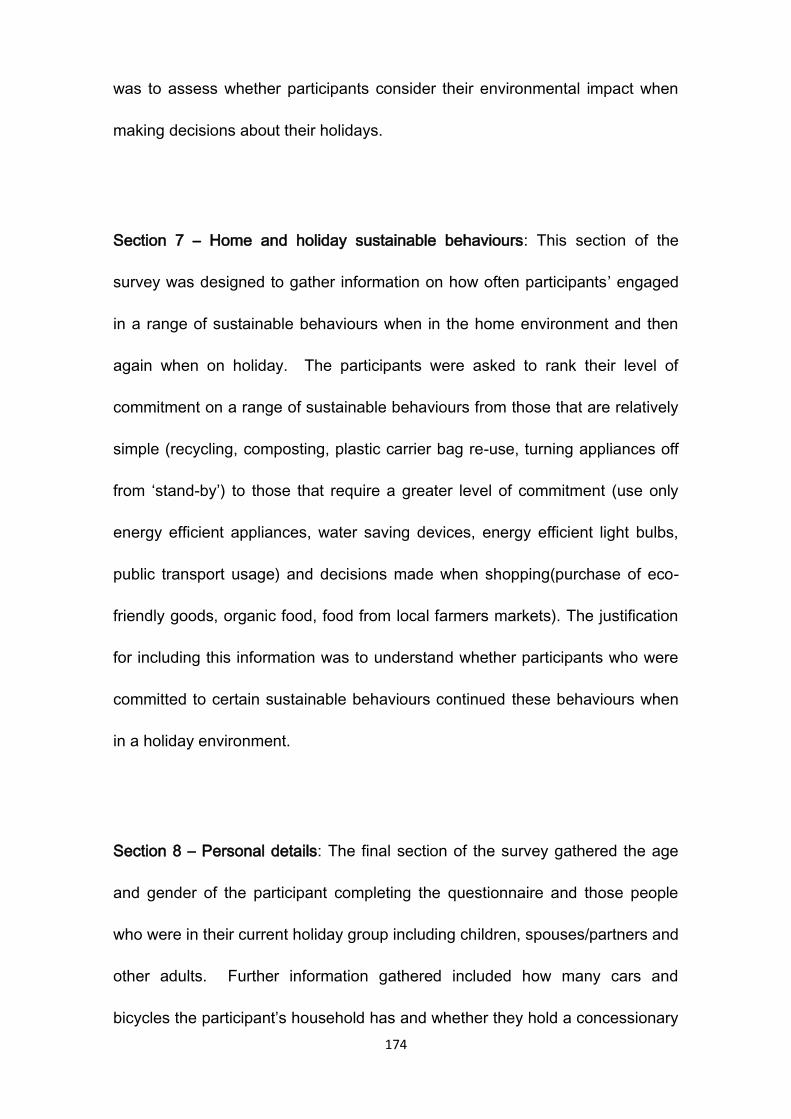
174
was to assess whether participants consider their environmental impact when
making decisions about their holidays.
Section 7 – Home and holiday sustainable behaviours: This section of the
survey was designed to gather information on how often participants’ engaged
in a range of sustainable behaviours when in the home environment and then
again when on holiday. The participants were asked to rank their level of
commitment on a range of sustainable behaviours from those that are relatively
simple (recycling, composting, plastic carrier bag re-use, turning appliances off
from ‘stand-by’) to those that require a greater level of commitment (use only
energy efficient appliances, water saving devices, energy efficient light bulbs,
public transport usage) and decisions made when shopping(purchase of eco-
friendly goods, organic food, food from local farmers markets). The justification
for including this information was to understand whether participants who were
committed to certain sustainable behaviours continued these behaviours when
in a holiday environment.
Section 8 – Personal details: The final section of the survey gathered the age
and gender of the participant completing the questionnaire and those people
who were in their current holiday group including children, spouses/partners and
other adults. Further information gathered included how many cars and
bicycles the participant’s household has and whether they hold a concessionary

175
travel pass (National bus pass/railcard), and whether they are a member of any
environmental organisation (World Wildlife Fund, National Trust, Greenpeace,
RSPB, Natural England, Woodland Trust). Information regarding disability and
professional status of the participant was also collected. Information regarding
membership of environmental organisations was included in order to establish
whether membership of these organisations correlates with sustainable
attitudes and behaviours.
Section 9 – Contact details and opt in: Participants were asked if they would be
prepared to take part in a short telephone interview if so they were asked to
provide contact details (interviewees were incentivised by £10 Amazon
voucher). Furthermore participants were asked if they wished to be entered into
prize draw to win £100 of Marks and Spencers vouchers for completing the
questionnaire which would be drawn after the survey period had ended at the
end of September 2011.
It should be noted that two versions of the questionnaire survey were developed
one for participants who were staying visitors and one for participants who were
day visitors and would therefore be returning to their home at the end of the
visit.
176
4.4.2 Survey delivery and data collection
A small pilot study was undertaken to establish if a) the questions worked as
designed and b) to establish what would be the most effective delivery method.
Initially the survey was trialled by the researcher on the seafront in the
Minehead case study area. Here potential participants were approached and
asked if they were on holiday or day visitors and then asked if they would be
willing to complete the questionnaire. Hotels and guesthouses and Tourist
Information Centres were also contacted and asked if they would be willing to
have copies of the questionnaire survey for their guests to complete. After a
short trial the questionnaire was reviewed and shortened slightly and the
success of the collection methods were reviewed. The results showed that
although the survey instrument was functioning as designed the delivery
method was not so effective with only 12 successfully completed questionnaires
being obtained during the trial period of three weeks. Additionally the Tourist
Information Centre in the Minehead case study area was unwilling to continue
keeping copies of the survey as they were conducting their own survey and
therefore wished to prioritise this.
A second method of survey delivery was therefore deemed to be necessary,
contact and permission was sought to distribute the survey amongst visitors,
with West Somerset Steam Railway which serves the Minehead case study
area and Dartmouth Steam Railway which operates in the Paignton case study
177
area. Both of these steam railways are extremely popular visitor attractions in
the case study areas attracting all types of visitors. The steam railways were
selected as suitable points for survey distribution as there is a period of
‘turnaround’ time before the steam railway journey is undertaken where visitors
are waiting and would be available to complete the surveys without disrupting
their experience of the steam train.
The surveys were distributed at the start of the journey before visitors were
boarded the train. A survey on a clipboard and pen were placed on each seat.
Whilst the visitors were waiting to depart the researcher walked through the
train and invited participants to complete the questionnaire and provide
background information regarding the nature of the research. Participants were
informed that the completed questionnaires would be collected at the end of the
journey. Surveys were collected at the end of the journey and stored securely;
the clipboards were then replenished for the return journey. This process was
undertaken during July, August and September of 2011 and undertaken on
different days (one weekday, one weekend day) in order to capture as many
visitor types as possible. The surveys were distributed in the Minehead area on
the second Tuesday of July, August and September and in the Paignton case
study area on the second Thursday of each month. In terms of weekend
distribution this was undertaken in the Minehead on the first Sunday of July,
August and September and in Paignton on the third Sunday of each month
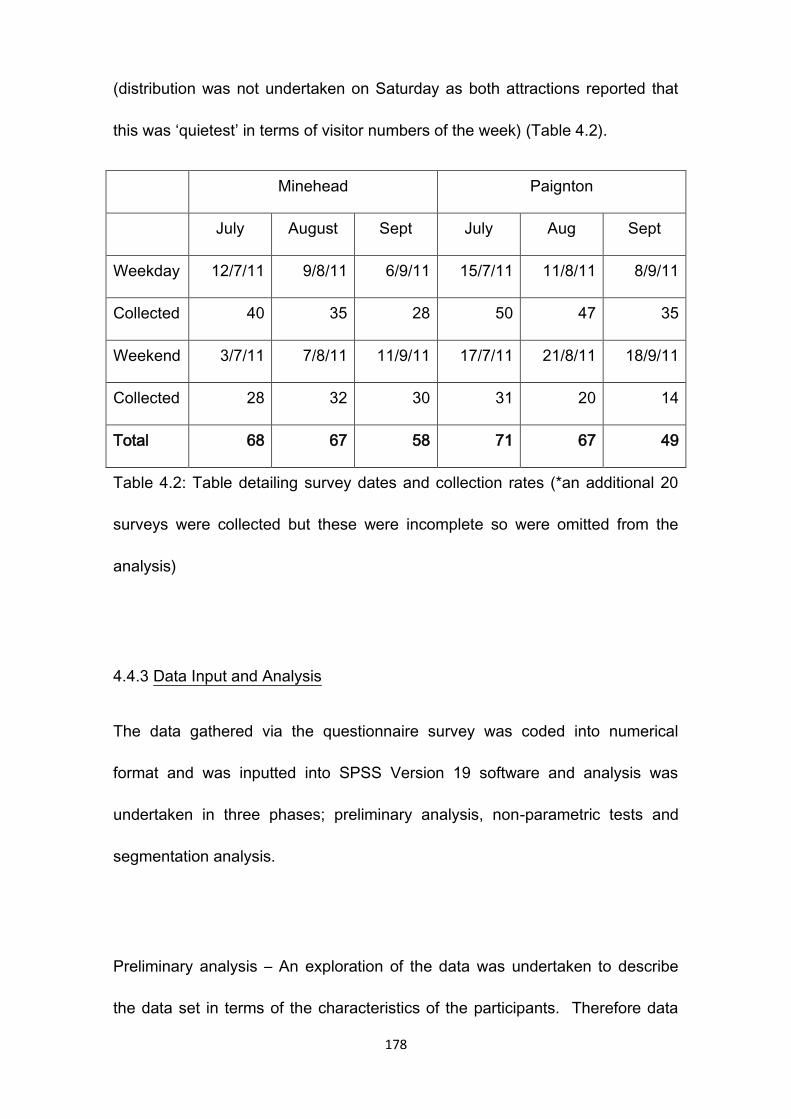
178
(distribution was not undertaken on Saturday as both attractions reported that
this was ‘quietest’ in terms of visitor numbers of the week) (Table 4.2).
Minehead Paignton
July August Sept July Aug Sept
Weekday 12/7/11 9/8/11 6/9/11 15/7/11 11/8/11 8/9/11
Collected 40 35 28 50 47 35
Weekend 3/7/11 7/8/11 11/9/11 17/7/11 21/8/11 18/9/11
Collected 28 32 30 31 20 14
Total 68 67 58 71 67 49
Table 4.2: Table detailing survey dates and collection rates (*an additional 20
surveys were collected but these were incomplete so were omitted from the
analysis)
4.4.3 Data Input and Analysis
The data gathered via the questionnaire survey was coded into numerical
format and was inputted into SPSS Version 19 software and analysis was
undertaken in three phases; preliminary analysis, non-parametric tests and
segmentation analysis.
Preliminary analysis – An exploration of the data was undertaken to describe
the data set in terms of the characteristics of the participants. Therefore data
179
was gathered regarding age, gender, holiday type, holiday group composition,
accommodation type, length of stay, and transport type.
Further analysis was undertaken to manipulate the data in order to ensure the
results were more meaningful; therefore recoding of variables and reversing of
negatively worded items were carried out in order to generate a total score for a
particular set of variables. This was carried for Sections 5 and 6 of the survey
(general attitudes towards the environment and climate change and attitudes
towards holidays and short breaks). These variables contained ordinal ranked
data where each variable had a total possible score of 5; a score of 5 would
suggest high environmental attitude and a score of 1 would suggest a that a
participant was not particularly interested in environmental problems such as
climate change. In order to generate a total score for general environmental
attitudes that could be used for comparisons between groups it was important to
reverse negatively worded variables this was undertaken for two variables
‘Climate change is happening but not yet proven to be largely man made’ and
‘The threats of climate change have been exaggerated’ which in turn allowed for
a total score for general attitudes towards the environment to be generated.
The total maximum score for attitudes towards the environment was 45 and the
lowest score would total 9. For section 6 Attitudes toward holidays and short
breaks there were five negatively worded variables that required reverse
180
coding. A high total score for this set of variables would suggest a participant
considers the environmental impact of their holiday behaviour.
Finally in section 7 where participants were asked to record how often they
engaged in a range of sustainable behaviours both at home and in the holiday
environment the scores were reversed so that a high score would mean a
greater commitment to sustainable behaviours. This also enabled a total score
for sustainable behaviour at home and on holiday to be calculated thus allowing
for comparison at a later stage.
Non-parametric tests – a series of non-parametric statistical tests were carried
out in order to make statistically significant comparisons between groups of
participants. Whilst parametric statistical tests have a higher level of sensitivity
to differences between groups they do require a more stringent set of
assumptions usually regarding the shape of the sample population in so much
as they require the data set to be normally distributed. It is for this reason that
non-parametric tests were used in this research project.
Mann-Whitney U Tests were used to test for differences between two
independent groups on a continuous measure, in the case of this research the
test was applied to test whether gender differed in terms of total scores for
181
sustainable behaviour at home and then in the holiday environment. Similarly
the sample was separated by case study area and differences in levels of
commitment to a range of sustainable behaviours were tested. Total scores on
environmental attitudes and attitudes to holiday transport and travel were tested
across a range of independent variables (gender, case study area etc).
Kruskal-Wallis Tests were used to compare scores on a continuous measure
when there were three or more groups. In the case of this research the test
was used to compare age groups on a range of continuous measures (general
attitudes towards the environment, commitment to a range of sustainable
behaviours at home and on holiday).
Wilcoxon-Signed Rank Tests were to test whether there are statistically
significant differences between scores in two separate conditions. In the case
of this research the tests were used test whether there was a statistically
significant difference in levels of commitment to a range of sustainable
behaviours between the home environment and the holiday one.
Cluster Analysis – An essential component of a social marketing methodology is
the segmentation of participants into homogenous groups in order to eventually
target the most receptive kind of behavioural intervention. Cluster analysis is
182
therefore utilised to group individuals, based on their responses into meaningful
segments whereby members of each clustered segment share similar
characteristics but are also distinct from members of other clusters.
There are a number of clustering techniques available, this research utilised the
Two-Step Clustering technique in SPSS V19. The Two-Step technique
revolves around a two stage algorithm; the first stage uses within cluster
variation to form homogenous clusters and aims to segment the data so that
within set variation is minimised. This is achieved by randomly assigning
objects to clusters which are then successively reassigned to other clusters in
such as a way as to minimise the variation between objects in the same cluster.
In the second stage of the process the program conducts a hierarchal
agglomerative clustering procedure combining the objects sequentially to form
the final homogenous clusters. The advantage of using the Two-Step
procedure is that it can hand both categorical and continuous variables and also
indicates each variable’s importance in the construction of that cluster (Mooin &
Sarstedt, 2011).
An important part of the clustering process lies in the selection of variables to be
clustered, segments can be chosen based upon observable and therefore
directly measurable variables (demographics, socio-economic status) or
unobservable and therefore not directly measurable (attitudes, values and
183
beliefs) Mooin & Sarstedt, 2011). In the case of this research the variables
selecting for the clustering procedure were those relating to participants
attitudes towards holidays, transport and travel. The five variables used in the
Two-Step clustering process were:-
1. I don’t worry about the environment when I make choices concerning
my holiday travel.
2. I am unlikely to change my holiday plans in response to issues like
global climate change.
3. Taking short breaks is important to me.
4. I prefer to avoid air travel when I go on holiday
5. I like to use public transport when I am on holiday.
Another crucial aspect of the Two-Step Clustering technique is that it allows the
researcher to define the minimum and maximum number of clusters generated.
Therefore a number of clustering procedures were undertaken around the
variables and the most successful outcome generated three distinct clusters.
4.5 Description of the REAP for Tourism Model Design
An important part of this research was to explore the environmental impact of
reported tourist behaviour and to establish if there was a link between attitudes
towards the environment and reported behaviour. In order to achieve this, an
Ecological Footprint was calculated for each of the participants who accurately
completed the required sections of the questionnaire survey. The data
184
collected was inputted into the REAP (Resource Energy Analysis Program) for
Tourism software.
The REAP for Tourism footprinting software was developed by the Stockholm
Environment Institute (SEI) at the University of York in conjunction with South
West Tourism specifically to provide a way to estimate the environmental
impact of tourist behaviour. In 2006 the SEI launched the original REAP
software program to track the materials, carbon dioxide emissions and
Ecological Footprint through the UK economy by industrial sector, geographical
area and socio-economic group. Data on consumer spending on travel and
energy was further incorporated into the model; this data came from the Family
Expenditure Survey and the National Travel Survey. The SEI then tested the
model to see if it could be modified in order that tourism specific footprints could
be generated. Thus data gathered for South West England residents in respect
of their consumer spending and energy use was replaced by data gathered
from tourists. The model went through a series of refinements and testing and
baseline data for tourists in 2006 was added to the tool. Eventually an interface
was designed so that the tool could be to calculate an estimate of tourist
environmental impact in the South West of England.
The methodology of the REAP for tourism tool was established to take account
the full consequences of tourism. The Ecological Footprint (EF) is one indicator
185
which works to achieve this by estimating “the full resource consumption and
waste assimilation requirements of a defined human population” (Wakernagel &
Rees, 1996:9) The EF is measured in terms of the resources and therefore the
corresponding land mass area required to provide the goods or services. The
advantage of using EF is that it gives a finite limit to resources and is therefore
able to illustrate when consumption becomes unsustainable. The SEI state that
their methodology uses ‘conversion factors’ which enable the impact in tonnes
of carbon dioxide to be calculated for each pound (sterling) spent on any
consumption category. Therefore it is possible to calculate the impact of
different products and services per pound spent using a series of input-out
tables that convert spend to a measure of carbon dioxide. The extensive input-
output tables that the SEI have generated show purchases in each sector of the
economy and include imported commodities as well as the consumption of
products by services in other sectors. The conversion factors then reveal the
full environmental impact associated with each product along the whole supply
chain.
The REAP for Tourism tool was designed as a tool to inform those responsible
for regional tourism strategy and activity. The program has baseline data for
the whole of the South West of England which is further broken down into
individual counties, unitary authorities and districts. In order to generate a
footprint data needs to be gathered along the themes of accommodation, food
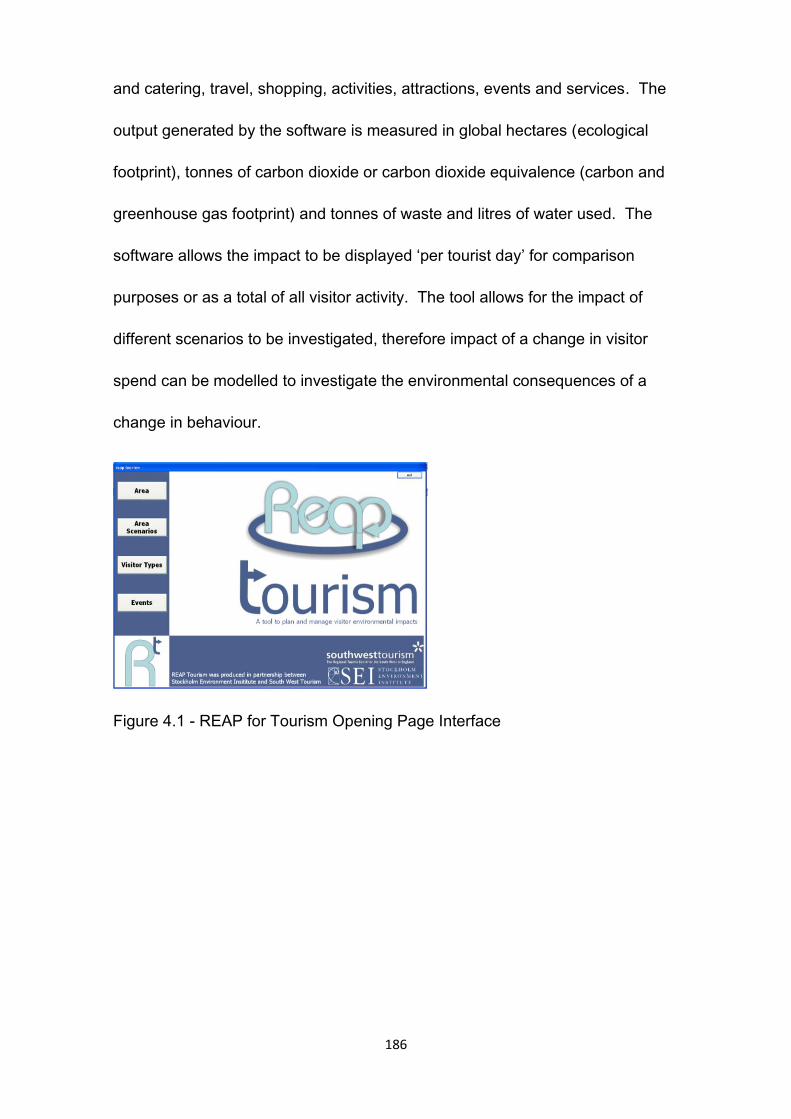
186
and catering, travel, shopping, activities, attractions, events and services. The
output generated by the software is measured in global hectares (ecological
footprint), tonnes of carbon dioxide or carbon dioxide equivalence (carbon and
greenhouse gas footprint) and tonnes of waste and litres of water used. The
software allows the impact to be displayed ‘per tourist day’ for comparison
purposes or as a total of all visitor activity. The tool allows for the impact of
different scenarios to be investigated, therefore impact of a change in visitor
spend can be modelled to investigate the environmental consequences of a
change in behaviour.
Figure 4.1 - REAP for Tourism Opening Page Interface
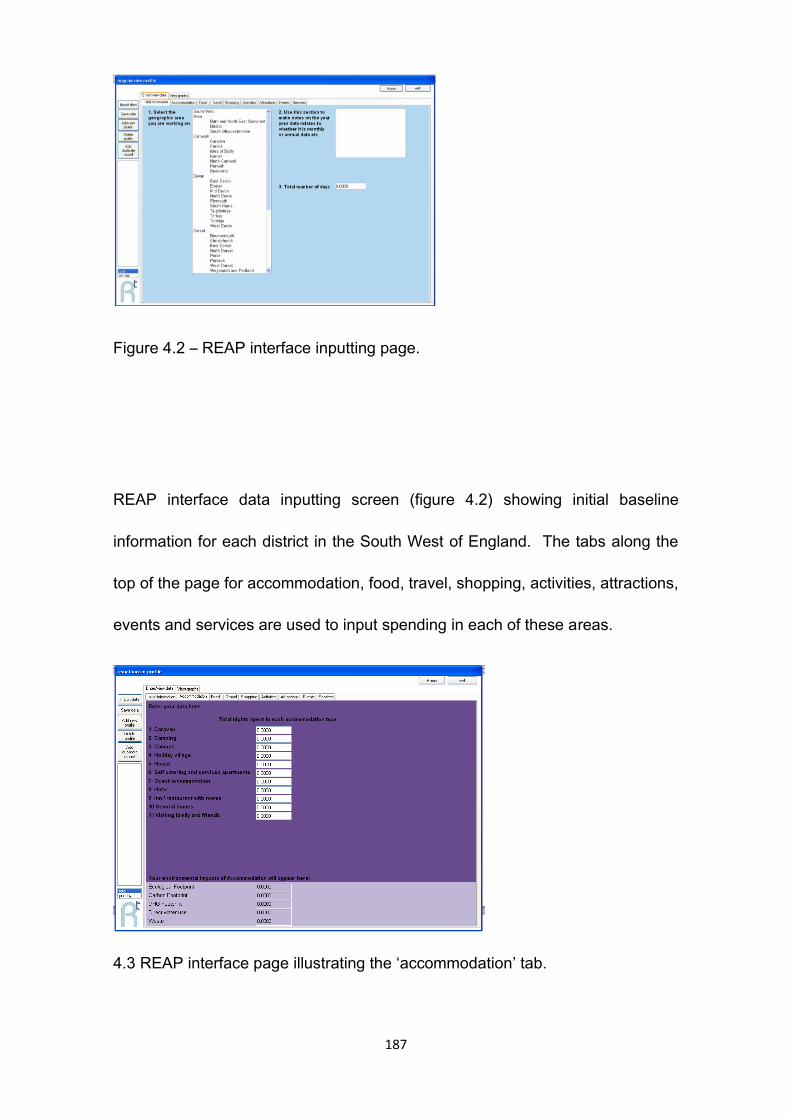
187
Figure 4.2 – REAP interface inputting page.
REAP interface data inputting screen (figure 4.2) showing initial baseline
information for each district in the South West of England. The tabs along the
top of the page for accommodation, food, travel, shopping, activities, attractions,
events and services are used to input spending in each of these areas.
4.3 REAP interface page illustrating the ‘accommodation’ tab.
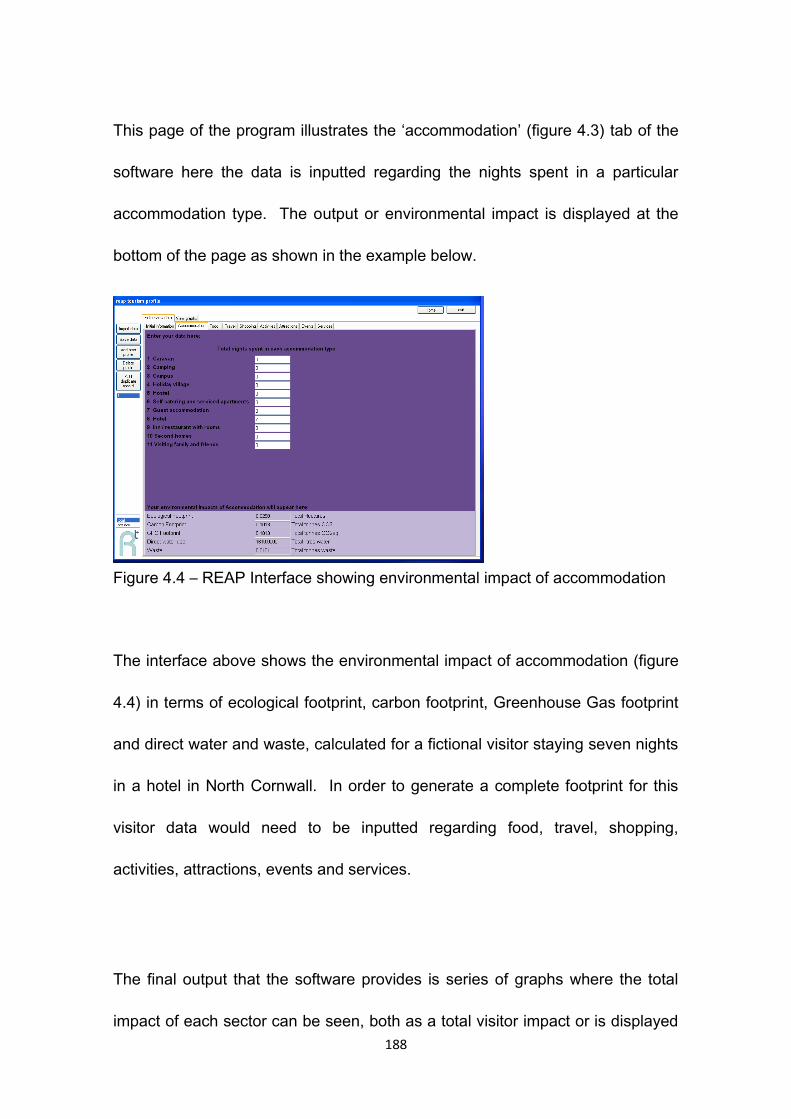
188
This page of the program illustrates the ‘accommodation’ (figure 4.3) tab of the
software here the data is inputted regarding the nights spent in a particular
accommodation type. The output or environmental impact is displayed at the
bottom of the page as shown in the example below.
Figure 4.4 – REAP Interface showing environmental impact of accommodation
The interface above shows the environmental impact of accommodation (figure
4.4) in terms of ecological footprint, carbon footprint, Greenhouse Gas footprint
and direct water and waste, calculated for a fictional visitor staying seven nights
in a hotel in North Cornwall. In order to generate a complete footprint for this
visitor data would need to be inputted regarding food, travel, shopping,
activities, attractions, events and services.
The final output that the software provides is series of graphs where the total
impact of each sector can be seen, both as a total visitor impact or is displayed
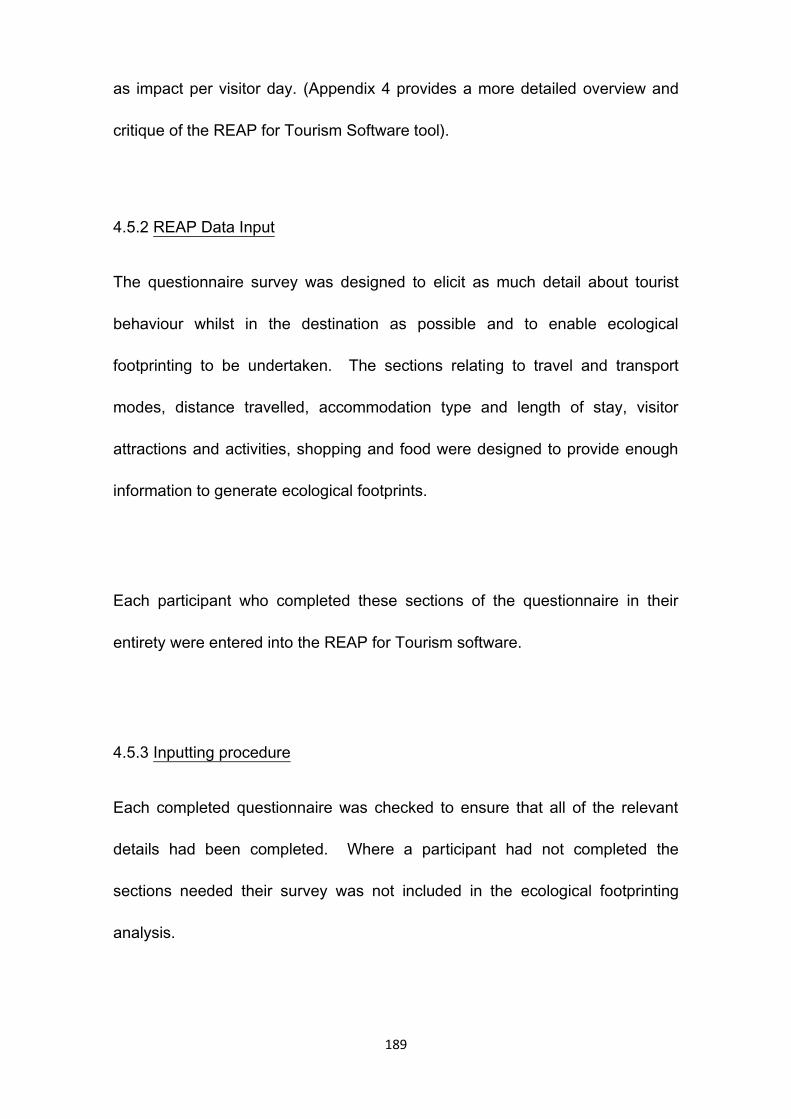
189
as impact per visitor day. (Appendix 4 provides a more detailed overview and
critique of the REAP for Tourism Software tool).
4.5.2 REAP Data Input
The questionnaire survey was designed to elicit as much detail about tourist
behaviour whilst in the destination as possible and to enable ecological
footprinting to be undertaken. The sections relating to travel and transport
modes, distance travelled, accommodation type and length of stay, visitor
attractions and activities, shopping and food were designed to provide enough
information to generate ecological footprints.
Each participant who completed these sections of the questionnaire in their
entirety were entered into the REAP for Tourism software.
4.5.3 Inputting procedure
Each completed questionnaire was checked to ensure that all of the relevant
details had been completed. Where a participant had not completed the
sections needed their survey was not included in the ecological footprinting
analysis.
190
Each completed survey was inputted into the software completing all of the
relevant tabs as mentioned above, the completed questionnaire was also
allocated a number which was the same as the number for data inputted into
the SPSS software. Once an ecological footprint had been generated by the
software this was transferred to a Microsoft Excel spread sheet. The spread
sheet recorded the ecological footprint in terms of the land required to support
that activity for each of the sectors of tourist behaviour. So for each participant
an accommodation footprint, travel footprint, food, shopping, and activities
generated, as well as a total visitor footprint and the average per day footprint.
Once the footprint for each participant had been generated and added to the
Excel spread sheet the data was transferred to the SPSS data set via the cross
referencing method mentioned previously.
4.5.4 REAP Output
The output from the REAP software generated a total ecological footprint for
each participant entered as well as a per day visitor footprint. This total was
further broken down into the component parts so that it was possible to see
where most of the footprint was generated. This data was then transferred to
the Excel spread sheet this allowed comparisons between participants staying
191
in different accommodation types, case study areas and once the cluster
analysis had been undertaken by cluster membership.
4.6 Description of Interview Design
An essential element of this research was to uncover the perceived and actual
barriers to, and motivations for encouraging sustainable tourist behaviour. This
was achieved through a series of short semi-structured telephone interviews
from self-selecting questionnaire participants. The interviews were undertaken
when the participants had returned from their holiday and an appointment was
made with them to undertake the interview at time convenient to them.
Where the main focus of the questionnaire survey was to detail tourist
behaviour in the destination area and to gather general attitudes towards the
environment, travel and transport and sustainable behaviour at home and on
holiday the interviews focussed on trying to uncover what the barriers and
motivating factors to behaving more sustainably on holiday might be.
The strengths of including a qualitative element to the research lies in the ‘emic’
element of the process of enquiry, in so much as the data gathered gives the
participants the opportunity to ‘drive’ the responses in the direction of their own
perceptions and experiences rather than being forced into the restricted choices
of a questionnaire survey. This is especially true of this research that chose to
192
utilise a semi-structured interview technique whereby target issues were
discussed but responses were very much driven by the participant. Thus the
participant becomes a ‘co-researcher’ and uncovers the meanings and
experiences behind particular decisions and behaviours, in the case of this
research participants would be revealing the reasons for particular holiday
decisions and behaviours (Jennings, 2005).
In the process of undertaking semi-structured interviews, in order that
information gained is informative and valuable and thus meets the objectives of
the research, the researcher must adopt a position of actively listening,
interpretation and reflexivity (Jennings, 2005).
Further consideration should be given regarding the ethical implications of the
process of interviewing participants, especially as in order for the interview to be
successful, rapport between interviewee and interviewer must be established.
Therefore identification of personal information and perceptions should be
guarded against and in process of engagement and personal rapport the
researcher must try not to influence the direction of discussion too heavily thus
invalidating the process of discovery.
193
4.6.1 Interview schedule
The interview schedule was developed based on responses from the
quantitative questionnaire survey, whereby more detailed information might
explain particular ‘gaps’ in the information provided, or to provide greater
explanation of particular decisions and behaviour. Therefore the interview
schedule was developed to understand the barriers and motivations to
sustainable tourist behaviour as identified by the questionnaire survey. The
questionnaire survey was worked through section by section to identify which
areas could be identified as possible ‘gaps’ in knowledge or required further
explanation (Appendix 3).
The first section of the questionnaire assessed the types of information
participants used when choosing their holiday destination and what destination
attributes were important in this process. The first part of the interview schedule
focussed on asking participants to think back to before they selected their
holiday destination in terms of the ‘search’ process and what information was
most important to them in this process. The concept behind this section was to
establish whether pro-environmental issues featured anywhere in this decision
process. So for example were participants actively seeking accommodation
providers with ‘green accreditation’? Was it important that their destination had
good public transport links? If this was important how were they finding this
information? Did they notice any information regarding protection of the
194
environment in any of the information they used in their search and selection
process?
As transport and travel are intrinsic to the holiday, an important part of the
interview schedule was establishing the barriers and motivations to utilising
more sustainable forms of transport when in the holiday destination. The
results of the questionnaire survey showed that the majority of respondents
travelled to and from their chosen holiday destinations using a car, and that the
majority of journeys undertaken whilst on holiday were also undertaken in their
car. So the interview schedule included questions relating to decisions made
regarding transport modes and what the participants might perceive to
encourage them to make less car journeys whilst on holiday. Discussion also
focussed on identification of factors that made using public transport more
difficult, such as a member of the holiday group having a disability, or travelling
with very young children.
The next area of discussion followed on from the results of the questionnaire
survey which showed that there to be a ‘drop off’ in commitment to sustainable
behaviours between the home and holiday environments. Here participants
were asked whether their accommodation provider provided facilities and
encouraged recycling, had energy saving devices installed, encouraged the
turning off of electrical devices and provided information regarding ‘car free’
195
days out? If so, did the participants use these services and what was their
experience of them? If these services were not provided would the participants
like to see them? If they did not use them, what factors would encourage them
to use them?
The final section of interview was related to participants’ general feelings about
the purpose of a holiday, and how they felt in general about air travel and
matters regarding protection of the environment.
4.6.2 Semi-structured interview delivery
The questionnaire survey asked participants to ‘opt in’ if they were interested in
taking part in an interview after their holiday. 36 participants opted to take part
in the interviews and were contacted via email after they had returned home in
order to arrange a suitable and convenient time for interview. In the end 20
participants agreed to participation in the interviews and had their details
gathered and appointments were made to undertake the interviews at a time
convenient to them (this represents 5% of participants). The participants were
informed that interviews would be short in duration between 10 and 15 minutes
and would be undertaken on the telephone.
196
The participants were also informed that their interview would be recorded to
allow for transcription and analysis but that their details and responses would
remain completely confidential and be stored separately from their contact
details.
The interviews were recorded using an Olympus Digital Voice Recorder (model
no WS-200S) with Telephone Pickup T7 Microphone. Each interview was then
transcribed into Microsoft Office Word 2010 ready for analysis.
4.6.3 Interview analysis
The method of analysis selected for the transcribed interviews was based on
the principles of Grounded Theory Analysis which was developed and
established by Glaser and Strauss (1967). Grounded Theory analysis works on
the premise that the ‘theory’ behind social phenomena is grounded in the way
people perceive and experience their lives (Pidgeon, 1996). Therefore in order
to fully understand social phenomena the researcher has to fully appreciate how
individuals understand and experience their lives. Grounded Theory analysis
also fully recognises that as a researcher it is impossible to be completely
unbiased in the direction the research takes and that undoubtedly the
researcher will impact on the results. The analysis and further theory
construction is therefore ‘grounded’ in the interview transcripts and is a direct

197
reflection of the way the participants experience their world (Pidgeon &
Henwood, 1996).
The analysis process is undertaken in a series of stages, the interview
transcripts are prepared by breaking down the chunks of text into a series of
manageable and meaningful utterances these are then labelled. The whole of
the transcript is worked through in the same way, so that each chunk or
utterance is labelled numerically, labelling identifies the participant with a
number that runs through the whole transcript and each utterance is numbered
in numeric sequence to allow for cross referencing at a later date.
Once all of the data has been prepared initial analysis is undertaken, this
involves moving through labelled chunks of interview transcript and identifying
themes that represent what has been said by the participant. So that the
researcher creates a theme and the part of the interview script that represents
that is then cut and pasted under that theme, the numerical coding of the
participant and line number are also recorded under the theme. This allows the
researcher at a later stage to review the script and judge whether the theme
created does indeed represent what the participant said.
The rest of interview script is worked through in the same fashion and text
relevant to the research question are identified and pasted under themes until
the whole script has been coded. In the case of the research the interviews

198
were designed to identify the barriers and motivations of sustainable tourist
behaviour, so the interview scripts and emergent themes centred on answering
that question.
The remaining interview transcripts are worked through in the same way with
constant comparisons made between what has been recorded by participants
and many new codes created to represent themes and concepts running
through the scripts. The researcher moves through the scripts looking for
similarities and differences in participant’s experiences and responses and
constantly reviewing the themes and concepts identified.
In parallel to the process of coding and theme development the researcher
writes ‘memos’ recording any ‘hunches’ they develop regarding participant’s
experiences of the phenomena under investigation. This process of constant
internal re-evaluation allows the researcher to make modifications to the themes
developed and become increasingly familiarised with themes that repeat
themselves throughout the interview transcripts.
As the process of coding continues the concepts and themes developed
become ‘saturated’ with utterances that all pertain to a similar theme, at this
point the researcher writes a definition that summarises the information under

199
that concept in order to make in meaningful in relation to the research question.
At this point the researcher also looks for links between concepts, splitting
themes and concepts into categories. Once this stage has been completed for
the entire set of interview scripts and definitions have been written that
encompasses all the relevant themes and categories the researcher attempts
integrate the categories in order to fully understand how everything fits together
in relation to the research question often this is achieved by diagrammatic
representation, through flow charts for example. The use of diagrams enables
the researcher to represent the most salient parts of their findings and how they
link to other factors uncovered in the research process. The final diagrammatic
representation then allows the researcher to fully understand how participants
understand their experiences in relation to the research question and as a
consequence develop a ‘theory’ that answers the question at hand that is
grounded directly in the data collected.
4.7 Ethical Considerations
As this research project is centred on the use of a social marketing
methodology, and because the very nature of social marketing depends on
‘behavioural change for social good’ there are at least two ethical dilemmas that
require consideration, a. changing people’s behaviour and b. the notion of
‘social good’. The idea that changing people’s behaviour in relation to a social

200
problem is a complex notion, especially if individual’s within a given society do
not perceive there to be a ‘problem’ that needs fixing, therefore a change in
behaviour is likely to be perceived as intrusion into their life. Combine this with
the complexity of defining a ‘social good’ in terms of how individuals will
perceive the outcome of a change in behaviour and whether in fact there will be
a benefit either to them or to society as a whole. Therefore the whole concept
of social marketing is littered with ethical issues from which participants must be
protected from (Kotler and Lee, 2008; Laczinzk, Luscha and Murphy, 1979).
The process of undertaking a piece of research must always consider its ethical
and moral obligations to those who participate in the research and those that
might be influenced as a result of the findings. An important element of
research is that a certain amount of deception is implied between researcher
and participant in order to extricate valid information regarding attitudes and
behaviours without influencing the participant’s responses. Therefore ethically
the researcher should ensure that any deception is carefully considered so as
not to cause distress to participants especially with regards to sensitive issues
such as sexuality, finances, ethnicity etc.
In the case of this research project there two stages of investigation a
quantitative section which will be undertaken using a questionnaire survey and
secondary qualitative stage undertaken via semi structured interviews. In the
201
quantitative stage of investigation there are several ethical issues under
consideration:-
- Deception will be required in order to not reveal the true nature of the
research for fear of influencing participant’s responses. Therefore the
survey will gather information regarding holiday behaviour and
attitudes before and during the holiday without informing the
participant that research is aiming to change tourist behaviour.
- There is a second area of deception as the survey has an element
that includes information regarding holiday expenditure this is
information that might be considered sensitive or personal to
participants. The data gathered within this section will be used to
generate personal ecological footprints and should therefore be used
for those who consume the most resources whilst on holiday. The
questionnaire will not reveal the purpose of this section so as not to
influence participant’s responses and to protect participants that may
feel uncomfortable with their responses.
- Further potentially sensitive information will be gathered regarding
professional status, environmental behaviour in and around the home
and attitudes and beliefs regarding the environment and climate
change.
- The survey will be administered to tourists whilst they are on holiday
as this could therefore be considered as an intrusion into a ‘sacred’
time for many. In order to counteract this intrusion the research will
202
aim to keep this intrusion to minimum by keeping the questionnaire as
concise as possible and by administering the questionnaire at a time
when participants are not on an active part of their holiday.
- The qualitative section of the research is centred around short semi-
structured interviews with self-selected questionnaire participants
here further details regarding the motivations and barriers to
sustainable tourist behaviour will be discussed in more detail.
-
In conclusion, the areas of ethical and moral consideration are fairly low risk in
this section as levels of deception are minimal however protection of privacy in
terms of recording and transcription was ensured by storing contact details and
transcribed data separately.
4.8 Chapter Summary
This chapter has focussed on explaining the process of undertaking research
based upon a social marketing methodology. The whole guiding premise of
social marketing is that behaviour change is not possible without a full
recognition of individual perceptions of the problem. Therefore employing a
social marketing methodology utilises behavioural theories in order to better
understand the barriers to and motivations for a change in behaviour. This
chapter therefore draws together these concepts to explain how the aim and
objectives of this research will be met, through a thorough description of the

203
research design, selection of case study sites, survey and interview design and
distribution and a consideration of any potential ethical issues in order to meet
the required academic standards for rigour and validity.
The following chapters will provide a detailed analysis and description of the
data gathered as a result of employing this methodology to explore the
problems associated with encouraging sustainable behaviour amongst tourists.
204
CHAPTER FIVE – Results of the Questionnaire Survey
5.1 Introduction
The aim of this chapter is to provide a comprehensive analysis of the
quantitative gathered via questionnaire survey. The questionnaire survey was
designed to capture detailed on-site visitor data, relating to all characteristics of
their holiday, including travel and transport, accommodation, activities and
demographics in order to meet the first objective of this thesis. Thus this results
chapter will be divided into three sections;
1. Descriptive statistics relating to visitor characteristics, to include data
relating to reported on-site holiday behaviour, including information
relating to travel, transport and accommodation selection.
2. Measurement and analysis of environmental attitudes and
sustainable behaviours at home and whilst on holiday. Including the
results of the ecological footprinting undertaken using the REAP for
Tourism Software.
3. Report of segmentation analysis undertaken in order to identify
specific lifestyle group(s) which could be targeted with a social
marketing intervention to encourage greater levels of sustainable
tourist behaviour.
205
The chapter is divided into three parts; the first part concentrates on analysis of
the quantitative descriptive data gathered from the questionnaire, including all
the information pertaining to the participant’s holiday behaviour, sustainable
behaviour at home and on holiday and demographic information.
The second section of chapter will explore the results gathered in relation to the
participants’ general attitudes towards the environment and the threats
associated with climate change. Before going on the explore responses in
relation to attitudes relating to the environmental impact of holidays, travel and
transport. This section will also contain a detailed analysis of reported levels of
commitment to a range of sustainable behaviours in both the home and holiday
environments. The final part of this section will provide the results of the
analysis undertaken using the REAP for Tourism ecological footprinting
software which explores and quantifies the environmental impact of tourist
behaviour.
The final section of the chapter will demonstrate the results of the segmentation
analysis which was undertaken in order to identify specific lifestyle group(s)
which could be would be most likely to respond to a social marketing
intervention to encourage greater levels of sustainable behaviour whilst on
holiday.
206
5.2 Descriptive Characteristics of the Sample
The first section will concentrate on describing the data gathered by the
questionnaires distributed amongst staying and day visitors to the respective
case study areas (Appendix 5) There were 380 completed questionnaires
gathered in total from both case study areas (n = 380). There were 193
completed questionnaires gathered from Minehead case study area and 187
completed questionnaires gathered from Paignton case study area. In
Minehead 118 of these visitors were staying visitors and 75 were day visitors.
In Paignton 160 of the completed questionnaires came from staying visitors
whilst 27 were collected from day visitors (Full descriptive data and frequency
data in relation to survey participants is provided in Appendix 5).
The following section focuses on the results gathered regarding the dynamics of
the tourists surveyed, holiday type, length of stay and holiday plans for following
12 months. (Appendix 9) The rationale for including details relating to future
holiday plans to explore how many holidays individuals plan to take as has
ramifications for environmental impact and issues of sustainability as the trend
for frequent short breaks are especially damaging the environment and should
be discouraged.
207
5.2.1 Describing Visitors to the Minehead Case Study Area
In order to describe the demographic information gathered by the survey the
data will be described separately by case study area. (Appendix 9)
In the Minehead case study area 92 (51.9%) participants were staying for more
than 4 nights, 17 (9.6%) were on a short break staying between one and three
nights. Of those staying in Minehead 52 (44.8%) this was their main holiday for
the year, although 29 (58.0%) admitted that they would be taking further
holidays or short breaks in the next 12 months. When asked the destination for
further holidays 33 (71.1%) were planning further breaks in the United Kingdom,
10 (21.7%) were planning to holiday in Europe and 3 (6.5%) were planning long
haul destination holidays. For the participants that reported that their current
holiday was not their main holiday, they were asked where they were most likely
to go, 29 (58.0%) were planning their main holiday in the UK, a further 5 (10.%)
were planning to holiday in Europe while 16 (32.0%) were planning to holiday in
long haul destination areas. When participants were asked to estimate how
many holidays or short breaks they are likely to take in the coming 12 months,
45 (43.7%) were planning between 1 and 2 holidays, 45 (43.7%) were planning
to take between 3 and 5 further holidays, whilst 13 (12.6%) were planning to
take more than 5 holidays in the coming 12 months.

208
The composition of the holiday group (Appendix 9) was also assessed with 15
(7.8%) of Minehead staying visitors were visiting the resort alone, 60 (31.6%)
were in a family group that included children, 65 (34.2%) were in family groups
that did not include children, 17 (8.9%) were part of an organised tour group
while 33 (17.4%) were holidaying with friends.
In terms of accommodation type (Appendix 9) 35 (29.9%) were staying in
serviced accommodation, with 13 (11.1%) reporting to staying in a holiday park,
26 (22.2%) were staying in self-catering accommodation, 20 (17.1%) staying
with friends and relatives, a further 21 (17.9%) were camping with 2 (1.7%)
people reporting to staying in another form of accommodation.
Transport to the resort area (Appendix 9) was mainly undertaken by car with
165(85.9%) reporting that this was the main mode of transport used to reach
the destination, 16 (8.3%) participants reported to using a bus/coach service to
reach the resort, 5 (2.6%) reported the train as their main mode of transport with
1 (0.5%) person reporting using a combination of walking and cycling as their
main mode of transport a further 5 (2.6%) reported that air travel constituted
their main mode of transport to the destination.
209
The main mode of transport used during the holiday was the car with 87
(81.4%) reporting that this was the transport they used most regularly whilst
holidaying in the destination, 16 (9.3%) reported to utilising local bus services,
11 (6.4%) used train services and 5 (2.9%) used a combination of walking and
cycling as transport during their visit. (Appendix 9)
5.2.2 Describing Visitors to Paignton Case Study Area
In Paignton 135 (72.2%) of the participants were staying more than 4 nights, 22
(11.8%) participants were on a short break staying less than 3 nights in the
destination, with 3 (1.6%) participants reporting to staying with friends and
relatives. (Appendix 9)
For those participants holidaying (Appendix 9) in Paignton 97 (60.2%) their
current holiday was their main holiday for the year, 64 (39.8%) participants
reported that their current stay was not their main holiday for the year. For those
participants that reported that their current holiday was their main holiday they
were asked whether they would be likely to take any further vacations, 57
(58.8%) reported they were intending to take further holidays during the coming
year, 18 (8.6%) were not intending to take any further holidays while 22 (22.7%)
were unsure whether they would go on holiday again. Further information was
gathered regarding the likely destinations for further holidays, 51 (69.9%)
reported that would be likely to take further holidays in the United Kingdom, 17
210
(23.3%) would be travelling to Europe with 5 (6.8%) travelling further afield to
long haul destinations. For those participants that the current holiday was not
their main holiday information was gathered regarding their main holiday
destination, 57 (58.8%) reported their main holiday would be taken within the
United Kingdom, 18 (18.6%) reported they would holiday in Europe and 22
(22.7%) reported that they would be travelling further afield to long- haul
destinations. (Appendix 2)
The next series of questions were related to details of the participant’s current
holiday, including accommodation type, transport, and holiday group
composition (Appendix 9). In the Paignton case study area 10 (5.4%) of
participants were holidaying alone, 88 (47.8%) were holidaying in a family group
that included children, a further 70 (38.0%) were also holidaying in a family
group but without children, 4 (2.2%) were part of an organised tour group and
12 (6.5%) were holidaying with friends. In terms of accommodation 59 (31.6%)
were staying in serviced accommodation 23 (14.3%), 23 (12.3%) in a holiday
park, 40 (21.4%) were in staying in self-catering accommodation, 6 (3.2%) were
staying friends and relatives resident in the area and 33 (17.6%) were camping
in the destination area.
Consideration was given to main modes of transport (Appendix 9) used to travel
to the destination, 156 (84.8%) travelled to Paignton by car, 6 (3.3%) travelled
211
by bus or coach, 13 (7.1%) travelled by train, 1 (0.5%) participant reported to
walking/cycling to the destination and 5 (2.7%) arrived in the destination by air
travel. When asked about the main mode of transport (Appendix 9) used during
in the holiday, 1115 (65.3%) reported the car was their main mode of transport
used during their holiday, 33 (16.8%) used a combination of local bus and
coach services, 12 (6.8%) utilised train services while 16 (9.1%) reported to
walking and cycling during their holiday.
5.3 Motivating Factors – Influential Information Sources
In order to understand what information and destination features are important
in destination choice a range of information sources and amenities were rated
by the participants in terms of how influential they were in this choice these
results are the overall results for both case study areas combined(Table 5.1)
(Appendix 6 describes the results by case study area, however upon scrutiny of
the data it appeared that scores were dispersed fairly equally and consistently
between participants from both case study areas therefore only the overall
results are described here.

212
Information Source Not at
all
useful
(%)
Slightly
useful
(%)
Useful
(%)
Quite useful
(%)
Extremely
useful (%)
Word of mouth
recommendation
177
(46.6)
18 (4.7) 39
(10.3)
49 (12.9) 97 (25.5)
Internet search engines 127
(33.4)
14 (3.7) 36
(9.5)
66 (17.4) 137 (36.1)
Printed brochure 209 (55) 27 (27) 36
(9.5)
45 (11.8) 63 (16.6)
Advertisement in
newspaper/magazine
300
(78.9)
30 (7.9) 27
(7.1)
11 (2.9) 12 (3.2)
TV advertisement 326
(85.8)
19 (5) 16
(4.2)
12 (3.2) 7 (1.8)
Tourist Information
Centre
280
(73.7)
20 (5.3) 27
(7.1)
28 (7.4) 25 (6.6)
Table 5.1: Information sources used to motivate destination choice.
In terms of information sources internet search engines was the most useful in
guiding destination choice with 137 (36.1%), 66 (17.4%), 36 (9.5%) reporting
they found the internet extremely useful, quite useful and useful in their
destination choice. Information provided by TV advertisements proved to be the
least influential of the information sources, 326 (85.6%) stating that this source
of information was least useful in destination choice. Of the remaining
information sources ‘word of mouth recommendation’ was also deemed to be
useful in destination selection with 97 (25.5%), 49 (12.9%) and 39 (10.3%)
reporting they found personal recommendation as extremely useful, quite useful
and useful in their choice of destination. Printed brochures were also perceived
213
to be useful sources of information when selecting a holiday destination with 63
(16.67%) finding the source extremely useful in selecting a holiday destination.
Tourist Information Centre’s were perceived by 280 (78.7%) of respondents
stating that information provided by this source was not at all useful in
destination selection.
5.4 Motivating Factors – Destination Characteristics
The survey also accessed the motivating factors, in terms of resort amenities,
transport, climate, scenery and previous visitation which influenced decisions.
Appendix 6 describes the results obtained by case study area, however upon
scrutiny of the data the motivating factors in terms of destination characteristics
appeared consistent across both case study areas and did warrant further
investigation. These results could be explained due to the similarity of the
destination areas in that they are both family orientated seaside resorts sharing
many similarities and this may explain the consistency of results.
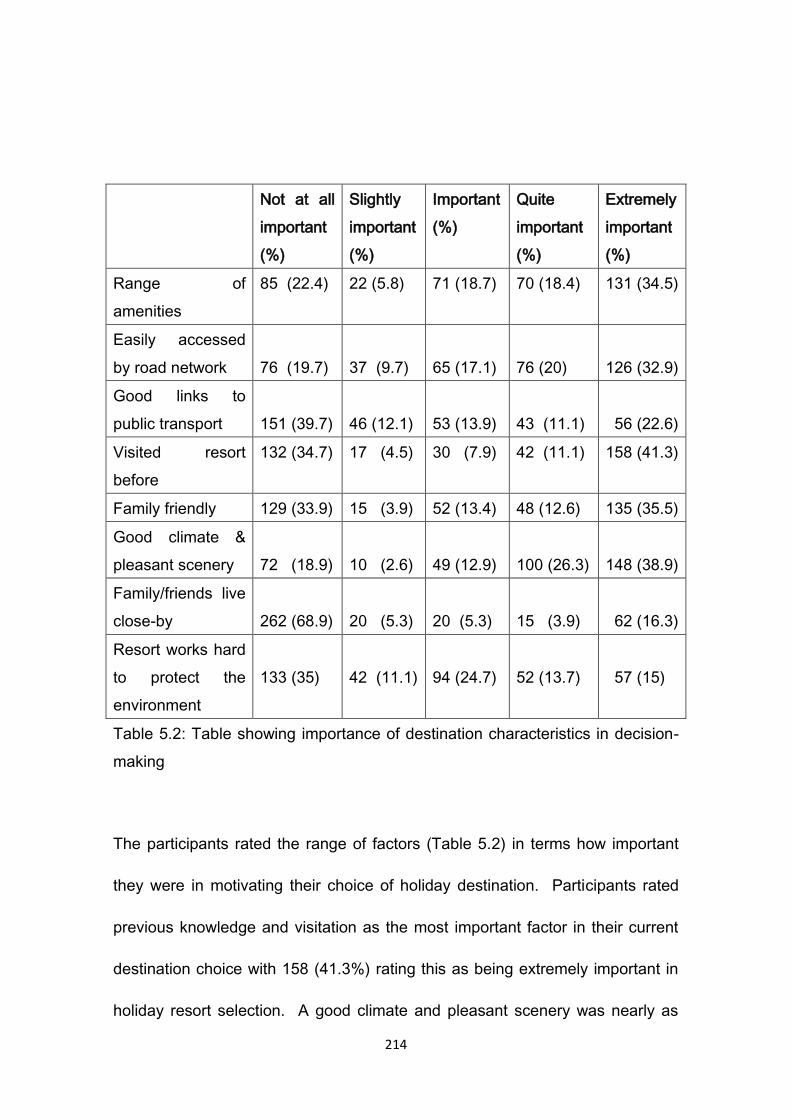
214
Not at all
important
(%)
Slightly
important
(%)
Important
(%)
Quite
important
(%)
Extremely
important
(%)
Range of
amenities
85 (22.4) 22 (5.8) 71 (18.7) 70 (18.4) 131 (34.5)
Easily accessed
by road network
76 (19.7)
37 (9.7)
65 (17.1)
76 (20)
126 (32.9)
Good links to
public transport
151 (39.7)
46 (12.1)
53 (13.9)
43 (11.1)
56 (22.6)
Visited resort
before
132 (34.7) 17 (4.5) 30 (7.9) 42 (11.1) 158 (41.3)
Family friendly 129 (33.9) 15 (3.9) 52 (13.4) 48 (12.6) 135 (35.5)
Good climate &
pleasant scenery
72 (18.9)
10 (2.6)
49 (12.9)
100 (26.3)
148 (38.9)
Family/friends live
close-by
262 (68.9)
20 (5.3)
20 (5.3)
15 (3.9)
62 (16.3)
Resort works hard
to protect the
environment
133 (35)
42 (11.1)
94 (24.7)
52 (13.7)
57 (15)
Table 5.2: Table showing importance of destination characteristics in decision-
making
The participants rated the range of factors (Table 5.2) in terms how important
they were in motivating their choice of holiday destination. Participants rated
previous knowledge and visitation as the most important factor in their current
destination choice with 158 (41.3%) rating this as being extremely important in
holiday resort selection. A good climate and pleasant scenery was nearly as
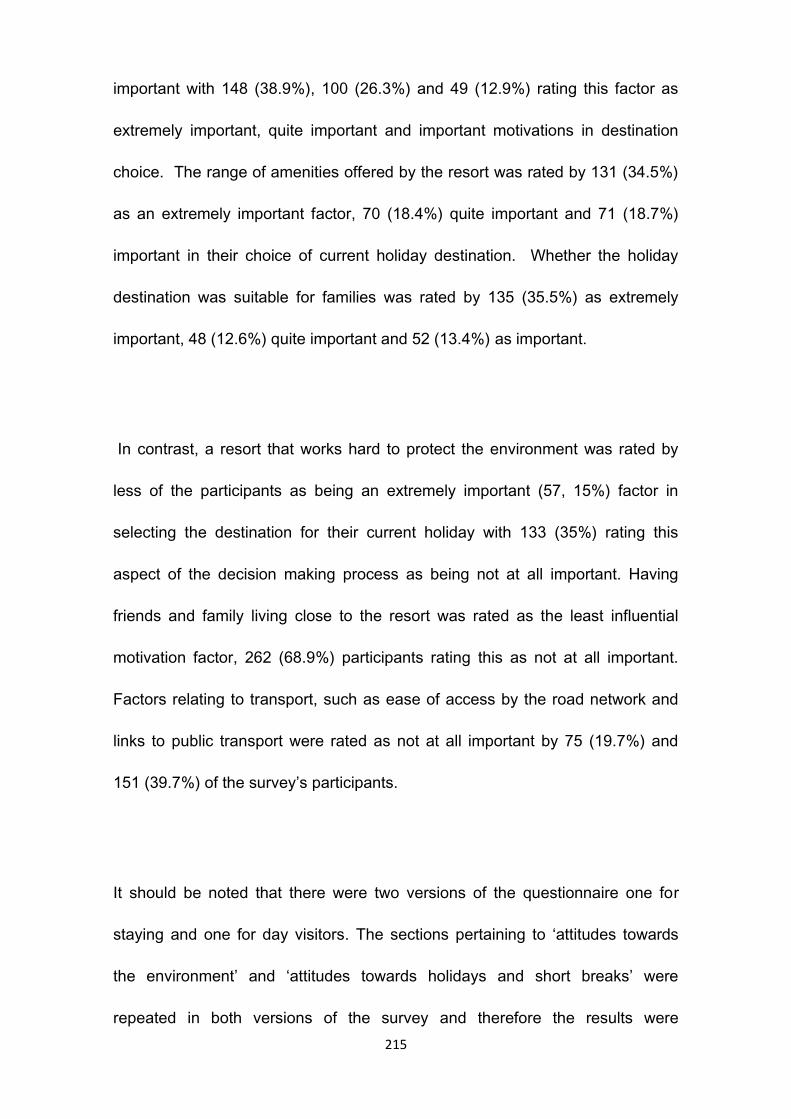
215
important with 148 (38.9%), 100 (26.3%) and 49 (12.9%) rating this factor as
extremely important, quite important and important motivations in destination
choice. The range of amenities offered by the resort was rated by 131 (34.5%)
as an extremely important factor, 70 (18.4%) quite important and 71 (18.7%)
important in their choice of current holiday destination. Whether the holiday
destination was suitable for families was rated by 135 (35.5%) as extremely
important, 48 (12.6%) quite important and 52 (13.4%) as important.
In contrast, a resort that works hard to protect the environment was rated by
less of the participants as being an extremely important (57, 15%) factor in
selecting the destination for their current holiday with 133 (35%) rating this
aspect of the decision making process as being not at all important. Having
friends and family living close to the resort was rated as the least influential
motivation factor, 262 (68.9%) participants rating this as not at all important.
Factors relating to transport, such as ease of access by the road network and
links to public transport were rated as not at all important by 75 (19.7%) and
151 (39.7%) of the survey’s participants.
It should be noted that there were two versions of the questionnaire one for
staying and one for day visitors. The sections pertaining to ‘attitudes towards
the environment’ and ‘attitudes towards holidays and short breaks’ were
repeated in both versions of the survey and therefore the results were
216
combined. The following section relates to all of the surveys completed as part
of this research.
5.5 Attitudes to the environment and climate change
In order to gain a broad understanding of what participants’ perceptions of
environmental issues and climate change, participants’, were asked to rate their
level of agreement to a range of statements relating to the environment and
climate change (Table 5.3)
When participants were asked their level of agreement with the statement ‘the
earth’s climate is changing and global warming is taking place’ 121 (31.8%) and
97 (25.5%) agreed and strongly agreed with the proposition, While 15 (3.9%)
and 23 (6.1%) strongly disagreed and disagreed with the statement.
Furthermore a large proportion of responses remained neutral neither agreeing
nor disagreeing with the proposition 117 (30.8%). (Table 5.3).
Participants were asked to rate their level of concern in terms of the impact of
their behaviour on the environment, 98 (25.8%) agreed and 26 (6.8%) strongly
agreed that they were concerned that their behaviour was having an adverse
effect on the environment. Whilst 126 (33.2%) remained neutral, with 73
(18.2%) disagreeing and 48 (12.6%) strongly disagreeing with the statement.
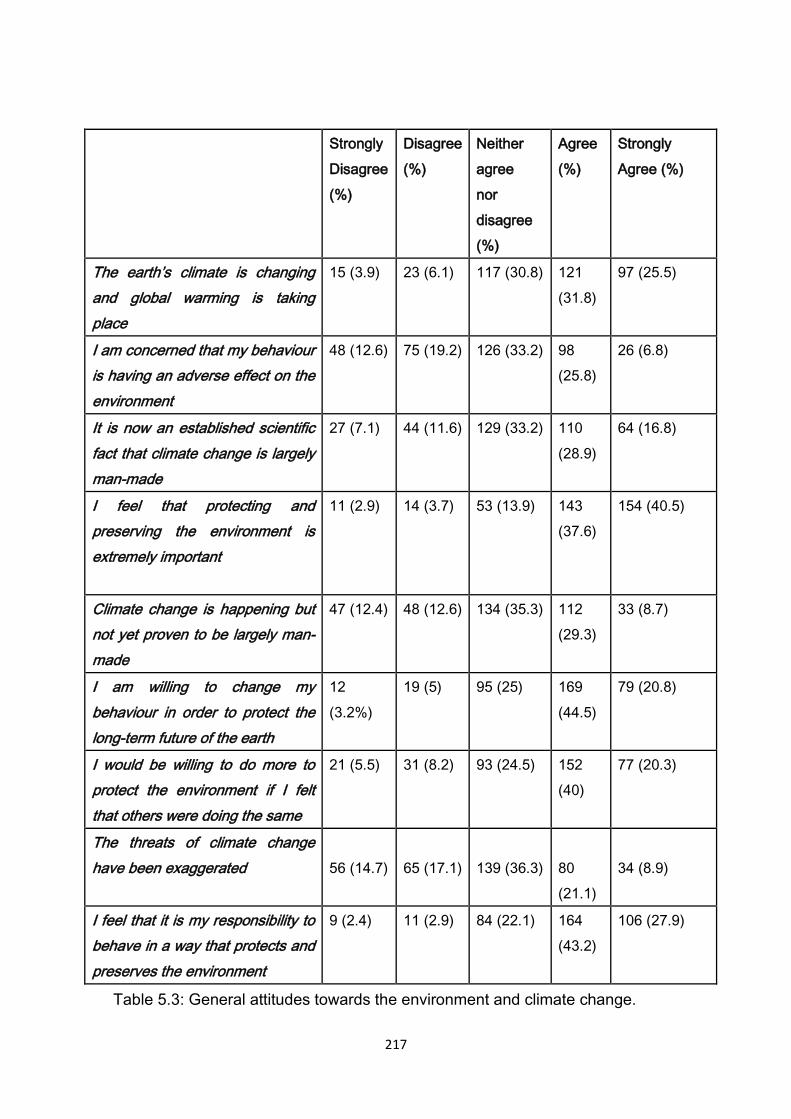
217
Strongly
Disagree
(%)
Disagree
(%)
Neither
agree
nor
disagree
(%)
Agree
(%)
Strongly
Agree (%)
The earth’s climate is changing
and global warming is taking
place
15 (3.9) 23 (6.1) 117 (30.8) 121
(31.8)
97 (25.5)
I am concerned that my behaviour
is having an adverse effect on the
environment
48 (12.6) 75 (19.2) 126 (33.2) 98
(25.8)
26 (6.8)
It is now an established scientific
fact that climate change is largely
man-made
27 (7.1) 44 (11.6) 129 (33.2) 110
(28.9)
64 (16.8)
I feel that protecting and
preserving the environment is
extremely important
11 (2.9) 14 (3.7) 53 (13.9) 143
(37.6)
154 (40.5)
Climate change is happening but
not yet proven to be largely man-
made
47 (12.4) 48 (12.6) 134 (35.3) 112
(29.3)
33 (8.7)
I am willing to change my
behaviour in order to protect the
long-term future of the earth
12
(3.2%)
19 (5) 95 (25) 169
(44.5)
79 (20.8)
I would be willing to do more to
protect the environment if I felt
that others were doing the same
21 (5.5) 31 (8.2) 93 (24.5) 152
(40)
77 (20.3)
The threats of climate change
have been exaggerated
56 (14.7)
65 (17.1)
139 (36.3)
80
(21.1)
34 (8.9)
I feel that it is my responsibility to
behave in a way that protects and
preserves the environment
9 (2.4) 11 (2.9) 84 (22.1) 164
(43.2)
106 (27.9)
Table 5.3: General attitudes towards the environment and climate change.
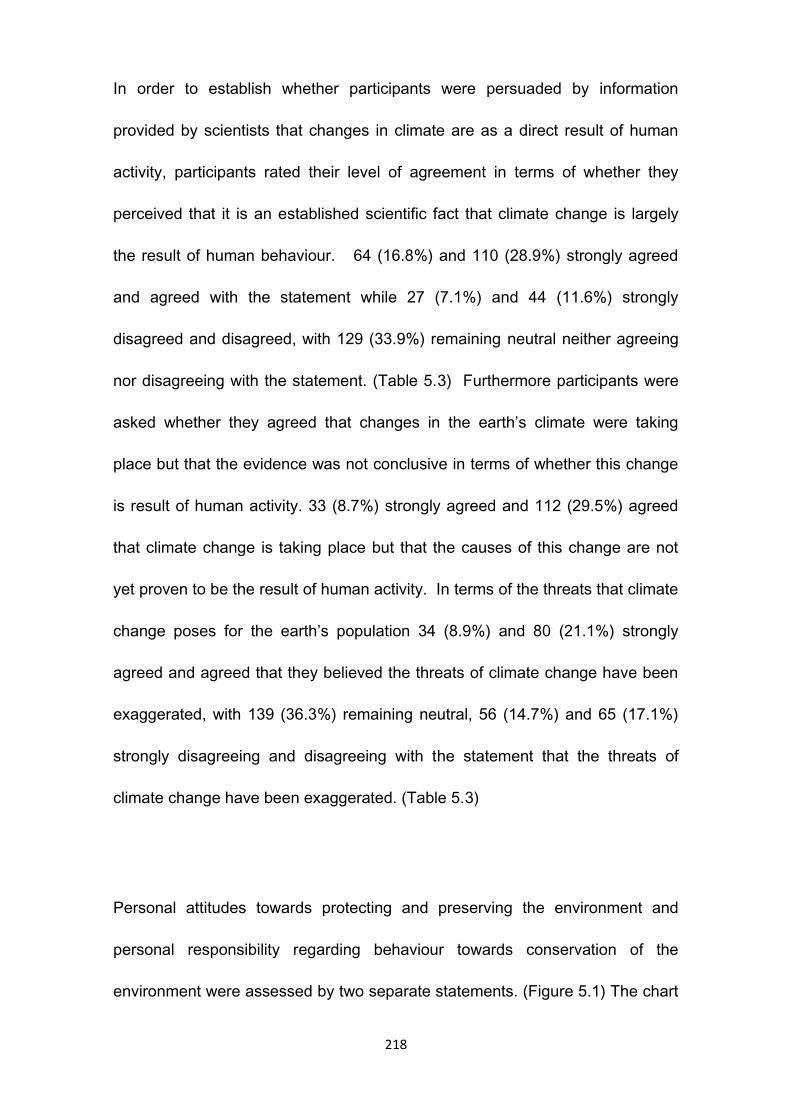
218
In order to establish whether participants were persuaded by information
provided by scientists that changes in climate are as a direct result of human
activity, participants rated their level of agreement in terms of whether they
perceived that it is an established scientific fact that climate change is largely
the result of human behaviour. 64 (16.8%) and 110 (28.9%) strongly agreed
and agreed with the statement while 27 (7.1%) and 44 (11.6%) strongly
disagreed and disagreed, with 129 (33.9%) remaining neutral neither agreeing
nor disagreeing with the statement. (Table 5.3) Furthermore participants were
asked whether they agreed that changes in the earth’s climate were taking
place but that the evidence was not conclusive in terms of whether this change
is result of human activity. 33 (8.7%) strongly agreed and 112 (29.5%) agreed
that climate change is taking place but that the causes of this change are not
yet proven to be the result of human activity. In terms of the threats that climate
change poses for the earth’s population 34 (8.9%) and 80 (21.1%) strongly
agreed and agreed that they believed the threats of climate change have been
exaggerated, with 139 (36.3%) remaining neutral, 56 (14.7%) and 65 (17.1%)
strongly disagreeing and disagreeing with the statement that the threats of
climate change have been exaggerated. (Table 5.3)
Personal attitudes towards protecting and preserving the environment and
personal responsibility regarding behaviour towards conservation of the
environment were assessed by two separate statements. (Figure 5.1) The chart
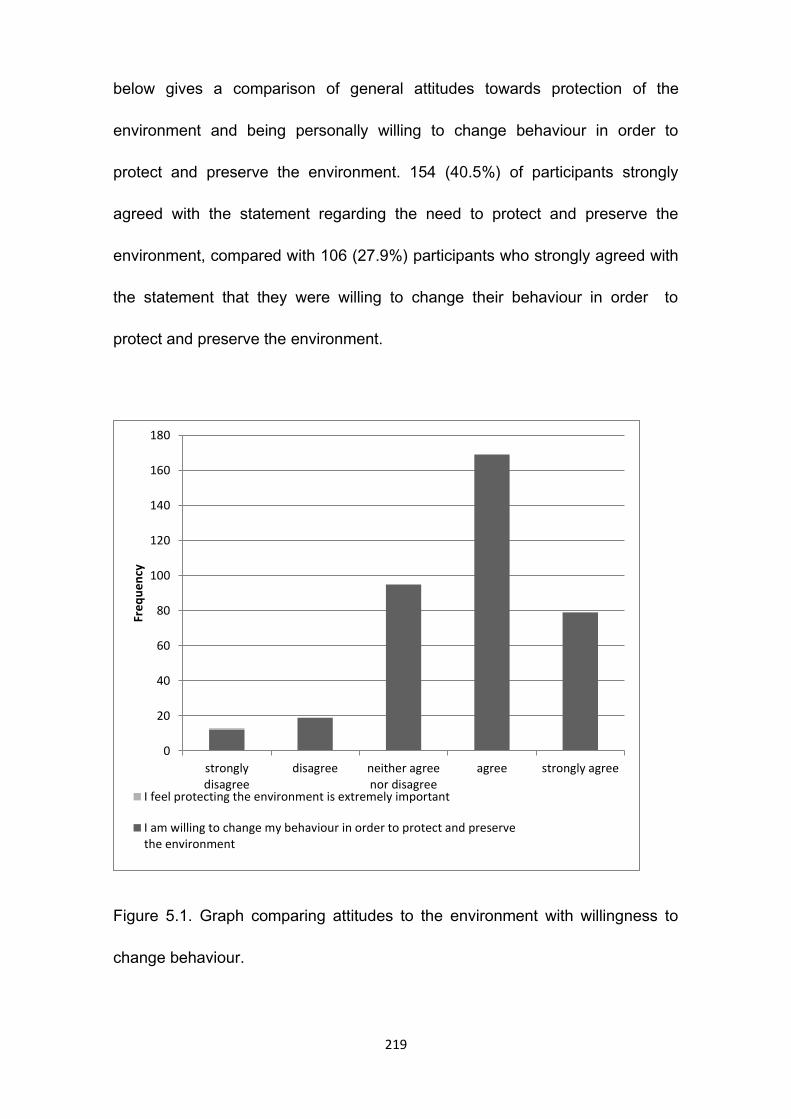
219
below gives a comparison of general attitudes towards protection of the
environment and being personally willing to change behaviour in order to
protect and preserve the environment. 154 (40.5%) of participants strongly
agreed with the statement regarding the need to protect and preserve the
environment, compared with 106 (27.9%) participants who strongly agreed with
the statement that they were willing to change their behaviour in order to
protect and preserve the environment.
Figure 5.1. Graph comparing attitudes to the environment with willingness to
change behaviour.
0
20
40
60
80
100
120
140
160
180
stronglydisagree
disagree neither agreenor disagree
agree strongly agree
Fre
qu
en
cy
I feel protecting the environment is extremely important
I am willing to change my behaviour in order to protect and preservethe environment
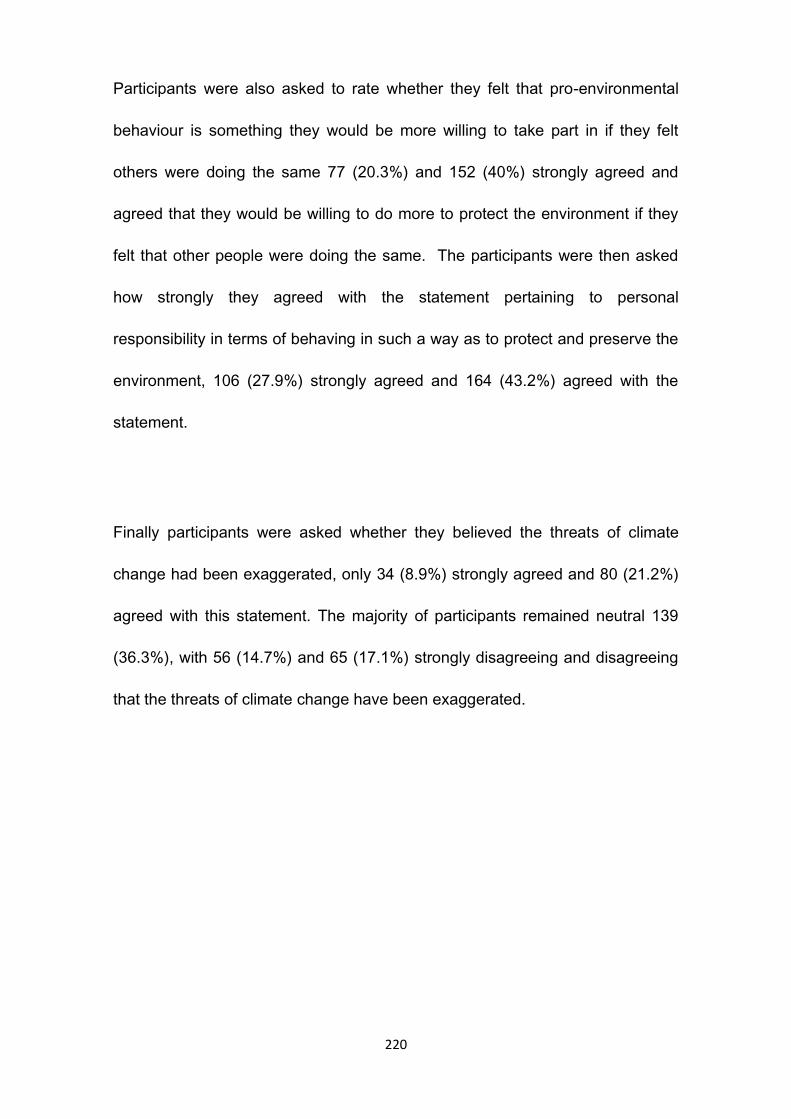
220
Participants were also asked to rate whether they felt that pro-environmental
behaviour is something they would be more willing to take part in if they felt
others were doing the same 77 (20.3%) and 152 (40%) strongly agreed and
agreed that they would be willing to do more to protect the environment if they
felt that other people were doing the same. The participants were then asked
how strongly they agreed with the statement pertaining to personal
responsibility in terms of behaving in such a way as to protect and preserve the
environment, 106 (27.9%) strongly agreed and 164 (43.2%) agreed with the
statement.
Finally participants were asked whether they believed the threats of climate
change had been exaggerated, only 34 (8.9%) strongly agreed and 80 (21.2%)
agreed with this statement. The majority of participants remained neutral 139
(36.3%), with 56 (14.7%) and 65 (17.1%) strongly disagreeing and disagreeing
that the threats of climate change have been exaggerated.
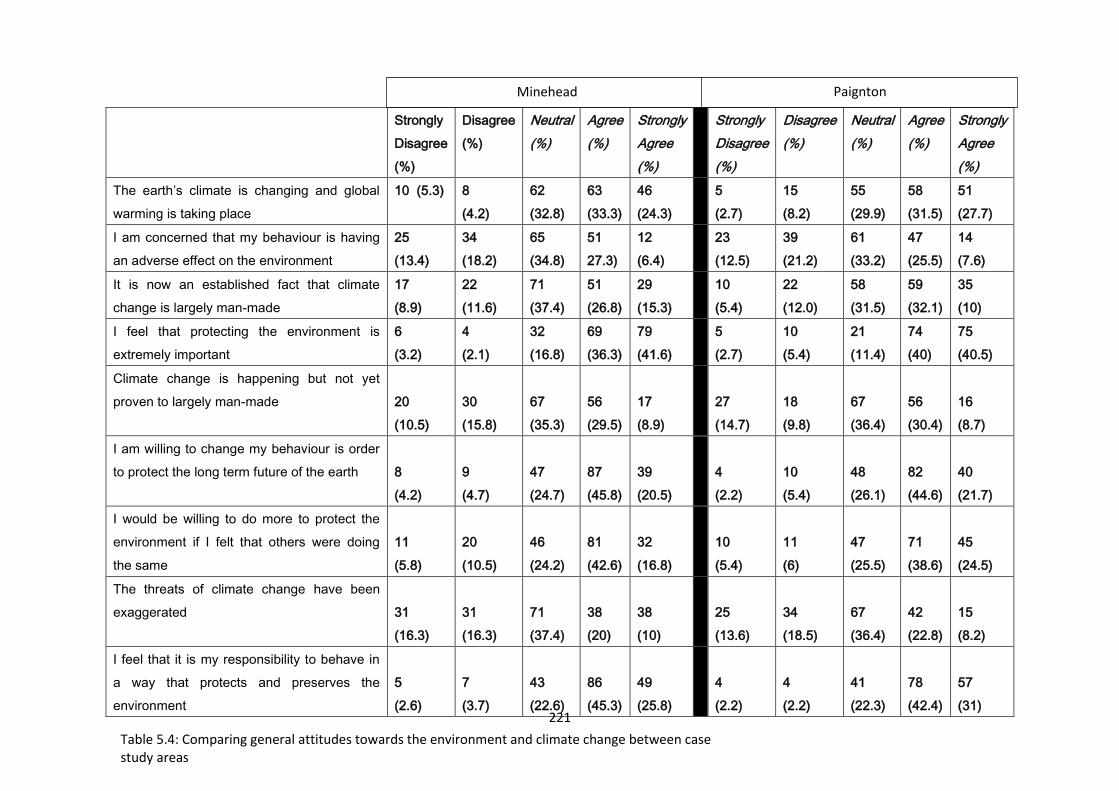
221
Strongly
Disagree
(%)
Disagree
(%)
Neutral
(%)
Agree
(%)
Strongly
Agree
(%)
Strongly
Disagree
(%)
Disagree
(%)
Neutral
(%)
Agree
(%)
Strongly
Agree
(%)
The earth’s climate is changing and global
warming is taking place
10 (5.3) 8
(4.2)
62
(32.8)
63
(33.3)
46
(24.3)
5
(2.7)
15
(8.2)
55
(29.9)
58
(31.5)
51
(27.7)
I am concerned that my behaviour is having
an adverse effect on the environment
25
(13.4)
34
(18.2)
65
(34.8)
51
27.3)
12
(6.4)
23
(12.5)
39
(21.2)
61
(33.2)
47
(25.5)
14
(7.6)
It is now an established fact that climate
change is largely man-made
17
(8.9)
22
(11.6)
71
(37.4)
51
(26.8)
29
(15.3)
10
(5.4)
22
(12.0)
58
(31.5)
59
(32.1)
35
(10)
I feel that protecting the environment is
extremely important
6
(3.2)
4
(2.1)
32
(16.8)
69
(36.3)
79
(41.6)
5
(2.7)
10
(5.4)
21
(11.4)
74
(40)
75
(40.5)
Climate change is happening but not yet
proven to largely man-made
20
(10.5)
30
(15.8)
67
(35.3)
56
(29.5)
17
(8.9)
27
(14.7)
18
(9.8)
67
(36.4)
56
(30.4)
16
(8.7)
I am willing to change my behaviour is order
to protect the long term future of the earth
8
(4.2)
9
(4.7)
47
(24.7)
87
(45.8)
39
(20.5)
4
(2.2)
10
(5.4)
48
(26.1)
82
(44.6)
40
(21.7)
I would be willing to do more to protect the
environment if I felt that others were doing
the same
11
(5.8)
20
(10.5)
46
(24.2)
81
(42.6)
32
(16.8)
10
(5.4)
11
(6)
47
(25.5)
71
(38.6)
45
(24.5)
The threats of climate change have been
exaggerated
31
(16.3)
31
(16.3)
71
(37.4)
38
(20)
38
(10)
25
(13.6)
34
(18.5)
67
(36.4)
42
(22.8)
15
(8.2)
I feel that it is my responsibility to behave in
a way that protects and preserves the
environment
5
(2.6)
7
(3.7)
43
(22.6)
86
(45.3)
49
(25.8)
4
(2.2)
4
(2.2)
41
(22.3)
78
(42.4)
57
(31)
Minehead Paignton
Table 5.4: Comparing general attitudes towards the environment and climate change between case study areas
222
5.6 Comparing general attitudes towards the environment between case study
areas
This research is seeking to understand visitor behaviour at destination level
therefore it is important to assess whether visitors to the chosen case study
areas differ significantly in their attitudes towards the environment and climate
change. Table 5.4 provides a breakdown of responses provided by
respondents in each case study area. Careful consideration of the data would
suggest that there is very little difference between environmental attitudes and
beliefs between visitors in each of the case study areas. For example when
asked their level of agreement with the statement
‘The earth’s climate is changing and global warming is taking place’
57.6% of Minehead case study visitors and 59.2% of Paignton case study
visitors agreed or strongly agreed with the proposition, similarly 9.5% of
Minehead and 10.9% of Paignton’s visitors strongly disagreed and disagreed
with this statement. The remaining 32.8% (Minehead) and 29.9% (Paignton)
remained neutral by neither agreeing nor disagreeing with the statement.
In terms of whether visitors to either case study area were concerned that their
behaviour might be having an adverse effect on the environment the most
frequent response from both case study areas was to remain neutral Minehead
34.8% and Paignton 33.2%. The next most frequent response was to ‘agree’

223
with the statement Minehead 27.3% and Paington 25.5%.. However 31.6% of
Minehead visitors and 33.7% of Paignton visitors ‘disagreed’ or ‘strongly
disagreed’ with the statement.
The survey then attempted to assess whether the participants were convinced
by the information produced by the scientific community that climate change is a
result of man’s behaviour. The majority of visitors to the Minehead case study
area remained neutral 37.4%, (Paignton 31.5%). The most frequent response
from Paignton visitors was to ‘agree’ with the statement (32.1%) compared to
26.8% of Minehead visitors. In terms of ‘strongly disagreeing’ and ‘disagreeing’
with the proposition 20.4% of Minehead visitors ‘disagreed’ or ‘strongly
disagreed’ compared with Paignton at 17.4%. The survey then attempted to
assess whether participants accepted that climate change is occurring but that
the scientific facts did not prove that it was result of human activity through the
following statement ‘climate change is happening but it is not yet proven to be
man-made’. There was little divergence in results between participants from
either case study area with the most frequent response being to remain neutral
(Minehead 35.3% and Paignton 36.4%). 29.5% of Minehead and 30.4% of
Paignton case study participants agreed that climate change is occurring but
that it had not yet been proven to be as a result of human activity. Further
consideration was given to whether participants feel that the threats associated
with a change in climate have been exaggerated, the results of the analysis
224
show that participants in both case study areas have fairly consistent opinions.
Just over 32% in each area ‘strongly disagreed’ or ‘disagreed’, 37.4%
(Minehead) and 36.4% (Paignton) remained ‘neutral’ by neither agreeing or
disagreeing and 30% (Minehead) 31% (Paignton) ‘agreed’ or strongly agreed’
that the threats associated with climate change had been exaggerated.
The participants were then asked to rate their level of agreement with the
following statement
‘I feel that protecting and preserving the environment is extremely important’
Visitors from both case study areas vehemently agreed with this statement,
80.5% of visitors to the Paignton case study area ‘agreed’ or ‘strongly agreed’
with statement which is slightly higher percentage than visitors from the
Minehead case study area (77.5%). 16.8% of Minehead visitors remained
neutral by neither agreeing nor disagreeing to the statement (Paignton 11.4%).
In terms of ‘disagreeing’ and ‘strongly disagreeing’ with the statement only 5.3%
of Minehead disagreed or strongly disagreed compared with 8.1% of Paignton
visitors.
The next statements looked at willingness to change behaviour, personal
responsibility to behave a pro-environmental manner and whether majority
action is important in encouraging wider participation in sustainable behaviour.
225
The majority of participants from both case study areas report to be willing to
change their behaviour in order to protect the long term future of the earth with
66.3% in each area ‘agreeing’ or ‘strongly agreeing’ with the proposition. 59.4%
of Minehead participants and 63.3% of Paignton participants ‘agreed’ or
‘strongly agreed’ that they would be willing to do more if they felt that others
were doing the same. In terms of personal responsibility to behave in manner
that protects and preserves the environment over 70% in both case study areas
‘agreed’ or ‘strongly agreed’ that they felt it is their responsibility to behave in a
way that protects the long term future of the environment.
5.7 Measuring attitudes towards the environmental impact of holidays, travel
and transport
The next section of the survey asked participants to rate their level of
agreement with a series of statements relating to holidays and the environment.

226
Figure 5.2: Graph showing attitudes towards holiday transport
Decisions made in relation to travel mode and transport is an important aspect
of sustainability as this element is often associated with heaviest environmental
impact. Often the fastest modes of transport have the greatest environmental
impact and this is especially true for air travel therefore participants were asked
to state their level of agreement with the following statement ‘when I go on
holiday I try to use the fastest mode of transport possible’, 57 (15%) ‘strongly
agreed’, 80 (20.9%) ‘ agreed’, with 83 (21.8%) ‘disagreeing’ and 47 (17.4%)
‘strongly disagreeing’ and 107 (28.2%) remaining ‘neutral’, neither agreeing nor
disagreeing with the statement. (Figure 5.2)
In order to assess whether participants actively choose to utilise public transport
whilst on holiday they were asked to rate their level of agreement with the
following statement;
0
20
40
60
80
100
120
Stronglydisagree
Disagree Neither agreenor disagree
Agree Strongly agree
Fre
qu
en
cy
When I go on holiday I try to use the fastest mode of transport possible

227
‘I like to use public transport when I am on holiday’
Figure 5.3. Graph showing attitudes to the use of public transport when on
holiday
The chart shows the frequency of responses to the above statement, 72
(18.9%) strongly agreed 111 (26.2%) agreed that they liked to utilise local public
transport whilst in their holiday destination. 105 (37.6%) of participants chose
not to rate either in favour or against the proposition with 54 (14.2%) and 32
(6.4%) actively disagreeing or strongly disagreeing.
Further assessment was made regarding highly polluting forms of travel such as
air travel, whether participants actively chose to avoid this when travelling.
0
20
40
60
80
100
120
Stronglydisagree
Disagree Neither agreenor disagree
Agree Strongly agree
Fre
qu
en
cy
I like to use public transport when I am on holiday

228
Figure 5.4: Attitudes towards highly polluting forms of transport when going on
holiday
The majority of participants chose to disagree with this statement (12.6%
strongly disagreed, 24.7% disagreed) while 134 (35.3%) preferred to remain
neutral, only 52 (13.7%) and 46 (12.1%) agreed and strongly agreed that they
preferred to avoid highly polluting forms of travel when they went on holiday.
Another option open to participants when travelling to destinations is the use of
public transport which is less polluting per capita than air travel, to this end the
participants were asked whether they actively chose to avoid public transport
options when going on holiday. The majority of responses disagreed (113,
29.7%) and strongly disagreed (110, 28.8%) with this statement. Only 52
(13.7%) agreed and 48 (12.1%) strongly agreed with the statement that they try
to avoid public transport when going on holiday, 101 (26.6%) remained neutral.
0
20
40
60
80
100
120
140
160
Stronglydisagree
Disagree Neither agreenor disagree
Agree Strongly agree
Fre
qu
en
cy
I prefer to avoid highly polluting forms of transport like air travel when I goaway
229
An important aspect of trying to encourage sustainable tourist behaviour is
trying to establish whether holidaymakers actively try to reduce their
environmental impact whilst on holiday. Participants were asked to rate their
agreement with this statement, the majority of participants 162 (42.6%)
remained neutral, neither agreeing nor disagreeing that they thought about how
they could reduce environmental damage whilst on holiday, the lowest
responses came from the strongly agree rating with 31 (8.2%) stating that they
think how they can reduce environmental damage when on holiday, 53 (13.9%)
agreed, with 88 (23.2%) disagreeing and 40 (10.5%) strongly disagreeing.
Another factor that will be important in establishing sustainable tourism is
discouraging shorter more frequent holidays that have become the norm in
recent years. Therefore participants were asked to rate whether ‘taking short
breaks is important to me’. The majority of responses to this statement fell in
the agree 128 (33.7%) and strongly agree 110 (28.9%) rating categories with
only 16 (4.2%) and 26 (6.7%) disagreeing and strongly disagreeing with the
proposition, 94 (24.7%) remained neutral.
Changing holiday plans as a response to issues such as climate change were
explored by the survey. Participants were asked to rate the likelihood that
would change their holiday through the following statement ‘I am unlikely to
change my holiday plans in response to issues like climate change’ The
230
majority agreed 111 (29.2%) and 65 (17.1%) strongly agreed that were unlikely
to change their holiday plans as a response to global issues such as climate
change. 125 (32.9%) remained neutral neither agreeing nor disagreeing with
statement, only 22 (5.8%) and 51 (13.4%) strongly disagreed and disagreed
with the statement suggesting that would be more likely to change their holiday
plans in response to the threats of climate change.
In order to assess whether participants think and incorporate environmental and
sustainability issues into their holiday decision-making, participants rated the
following statement ‘I don’t worry about the environment when I make choices
concerning my holiday travel’. The majority of responses agreed that they were
unlikely to worry about the environment when making decisions concerning
holiday travel – 109 (28.7%) agreed, 56 (14.7%) strongly agreed with the
statement, 124 (32.4%) preferred to remain neutral, whilst 33 (8.7%) strongly
disagreed and 52 (13.7%) disagreed.
5.7.1 Case study comparison between attitudes towards holiday transport and
travel
In this section a brief analysis was undertaken to determine whether there was
any reported difference in attitudes towards holiday transport and travel
between participants from each of the selected case study areas. (Table 5.5)
231
The first statement assessed how important it was for participants to travel to
their holiday destination by the fastest means possible. The rationale behind
this question was that often the fastest modes of transport are least sustainable.
When the results were compared between participants from the case study
areas there was very little difference in attitudes towards this statement 34.2%
of Minehead case study area participants ‘disagreed or strongly disagreed’ that
using the fastest mode of transport was important to them compared to 35.5%
of Paignton case study area. In terms of agreeing with the statement which
would suggest that the fastest mode of transport was important when travelling
to their holiday destination. 37.9% of Minehead participants’ ‘strongly disagreed
and disagreed’ compared to 34.8% of Paignton case study area participants
(Table 5.5).
‘I like to use public transport when I am on holiday’ was then explored to see if
participants actively selected to use public transport when in the holiday
destination, 25.3% of participants staying in the Minehead case study area
‘strongly disagreed and disagreed’ with the statement compared to 20.7% of
participants staying in Paignton case study area. More than half (56.5%) of the
participants staying in the Paignton case study area ‘agreed or strongly agreed’
with the statement compared to 41.1% of participants staying in the Minehead
case study area, suggesting that those staying in Paignton were more in favour
of utilising public transport services when on holiday compared to their
Minehead counterparts. When participants were asked to rate the statement ‘I
try to avoid public transport when I go on holiday’ more participants from both
232
case study areas ‘strongly disagreed’ and ‘disagreed’ with this proposition
(56.6%, Minehead and 61.06%, Paignton) which suggests that participants from
both case study areas do not actively seek to avoid using public transport when
going on holiday. A further statement assessed whether participants ’try to
avoid highly polluting forms of travel such as air travel when going on holiday’
there was no discernible difference between levels of agreement of this
statement between participants of either case study area (Minehead 27.9%,
‘agreed’ or ‘strongly agreed’ and Paignton 24.5%), levels of disagreement with
the statement showed slightly different results between participants from both
case study areas (Minehead 37.9% % ‘strongly disagreed’ or ‘disagreed’
compared to 24.5% of Paignton participants) (Table 5.5).
The next statement aimed to measure participants’ attitudes regarding reducing
the effects of their holiday behaviour on the environment. (Table 5.5) There was
no significant difference in agreement across participants in either case study
area (21.6% of Minehead participants ‘strongly agreed’ and ‘agreed’ with the
statement compared to 23.3% of Paignton’s participants). Over 40% of
participants from both case study areas chose to remain neutral in respect of
this statement, while 34.7% of Minehead participants and 33.7% of Paignton
case study participants ‘strongly disagreed’ or ‘disagreed’ with the statement.
In a similar vein the participants were also asked to rate their agreement with
the following statement:-

233
’I don’t worry about the environment when I make choices regarding my holiday
travel’
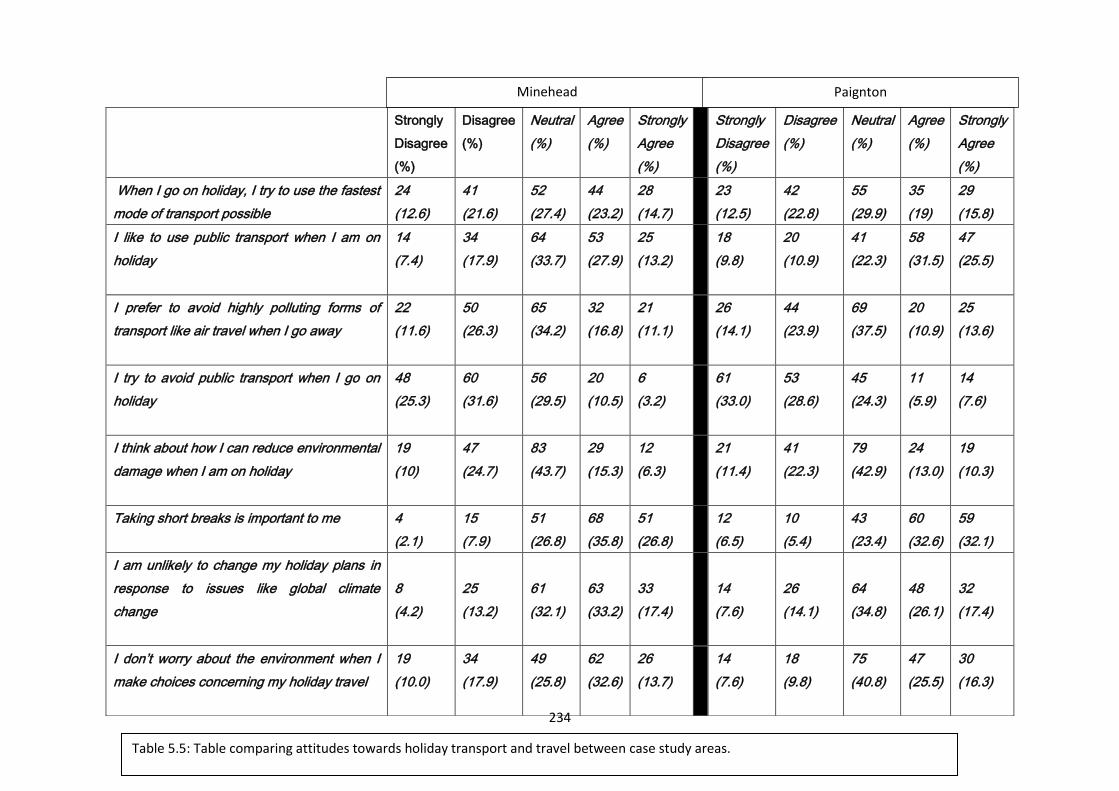
234
Strongly
Disagree
(%)
Disagree
(%)
Neutral
(%)
Agree
(%)
Strongly
Agree
(%)
Strongly
Disagree
(%)
Disagree
(%)
Neutral
(%)
Agree
(%)
Strongly
Agree
(%)
When I go on holiday, I try to use the fastest
mode of transport possible
24
(12.6)
41
(21.6)
52
(27.4)
44
(23.2)
28
(14.7)
23
(12.5)
42
(22.8)
55
(29.9)
35
(19)
29
(15.8)
I like to use public transport when I am on
holiday
14
(7.4)
34
(17.9)
64
(33.7)
53
(27.9)
25
(13.2)
18
(9.8)
20
(10.9)
41
(22.3)
58
(31.5)
47
(25.5)
I prefer to avoid highly polluting forms of
transport like air travel when I go away
22
(11.6)
50
(26.3)
65
(34.2)
32
(16.8)
21
(11.1)
26
(14.1)
44
(23.9)
69
(37.5)
20
(10.9)
25
(13.6)
I try to avoid public transport when I go on
holiday
48
(25.3)
60
(31.6)
56
(29.5)
20
(10.5)
6
(3.2)
61
(33.0)
53
(28.6)
45
(24.3)
11
(5.9)
14
(7.6)
I think about how I can reduce environmental
damage when I am on holiday
19
(10)
47
(24.7)
83
(43.7)
29
(15.3)
12
(6.3)
21
(11.4)
41
(22.3)
79
(42.9)
24
(13.0)
19
(10.3)
Taking short breaks is important to me 4
(2.1)
15
(7.9)
51
(26.8)
68
(35.8)
51
(26.8)
12
(6.5)
10
(5.4)
43
(23.4)
60
(32.6)
59
(32.1)
I am unlikely to change my holiday plans in
response to issues like global climate
change
8
(4.2)
25
(13.2)
61
(32.1)
63
(33.2)
33
(17.4)
14
(7.6)
26
(14.1)
64
(34.8)
48
(26.1)
32
(17.4)
I don’t worry about the environment when I
make choices concerning my holiday travel
19
(10.0)
34
(17.9)
49
(25.8)
62
(32.6)
26
(13.7)
14
(7.6)
18
(9.8)
75
(40.8)
47
(25.5)
30
(16.3)
Minehead Paignton
Table 5.5: Table comparing attitudes towards holiday transport and travel between case study areas.
235
The next statement aimed to measure participants’ attitudes regarding reducing the
effects of their holiday behaviour on the environment, there was no significant
difference in agreement across participants in either case study area (21.6% of
Minehead participants ‘strongly agreed’ and ‘agreed’ with the statement compared to
23.3% of Paignton’s participants). Over 40% of participants from both case study
areas chose to remain neutral in respect of this statement, while 34.7% of Minehead
participants and 33.7% of Paignton case study participants ‘strongly disagreed’ or
‘disagreed’ with the statement. In a similar vein the participants were also asked to
rate their agreement with the following statement:-
’I don’t worry about the environment when I make choices regarding my holiday
travel’
Comparison across participants from both case study areas showed very little
variation in responses, 46.3% of Minehead case study participants ‘agreed’ or
‘strongly agreed’ with the statement compared to 41.8% of Paignton’s participants.
The only difference was between levels of disagreement with the statement where
27.9% of Minehead’s participants ‘disagreed’ or ‘strongly disagreed’ with the
statement compared to 17.4% of Paignton’s case study participants. 40.8% of
Paignton’s case study participants chose to remain ‘neutral’ with regards to this
statement compared to 25.8% of Minehead’s participants. (Table 5.5)
236
A comparison of scores on whether participants perceived ‘short breaks and
holidays as important’ revealed very little difference between participants from either
case study area, 62.6% and 64.5% of Minehead and Paignton case study area
participants believed that ‘taking short breaks is important to them’, only 10% of
Minehead and 11.9% of Paignton’s participants ‘strongly disagreed’ and ‘disagreed’
with the statement. The remaining 26.8% (Minehead) and 23.4% (Paignton) chose
to remain ‘neutral’ by neither agreeing nor disagreeing with the statement. (Table
5.5)
The participants from each case study area were compared on their scores in
relation to the likelihood that they ‘would be prepared to change their holiday plans in
response to issues such as global climate change’, again there appeared to be no
difference in attitudes between participants of either case study area, with over 40%
of participants from both areas ‘agreeing’ or ‘strongly agreeing’ that they were
unlikely to change their plans (Minehead, 40.6%, Paignton, 43.5%).
5.8 Home and holiday sustainable behaviour
An important element of this research argued that the ‘holiday’ is a special context,
and that even those who are committed to a range of sustainable behaviours in the
home environment abandon these behaviours when on holiday. (Barr, 2008, Tudor
et al, 2006) Therefore it was important to measure whether there was a ‘drop off’ in
reported sustainable behaviours between the home and holiday environment. The
237
next results report the frequency with which participants undertook sustainable
behaviours both in the home environment and in the holiday environment. The
survey explored a number of sustainable behaviours that are encouraged in the
home environment and measured against the same behaviour in the holiday context.
Sustainable behaviours for which many local authorities provide services such as
recycling of cardboard, paper, tin cans, plastic, and composting of food waste were
measured. Other behaviours involve longer term commitment in the form of energy
efficient appliances and water saving devices. Consumer behaviour in terms of
choice of energy efficient light bulbs, eco-friendly goods, plastic bag re-use and
organic and locally produced food were measured in both home and holiday
environments. The final question examined transport choices and the regularity with
which sustainable choices were made.
5.8.1 Recycling behaviour
The participants were asked to rate how often they took park in regular recycling
behaviour at home and when on holiday. They were provided with a five-point Likert
scale, ranging from ‘always, usually, sometimes, rarely never’ to record how often
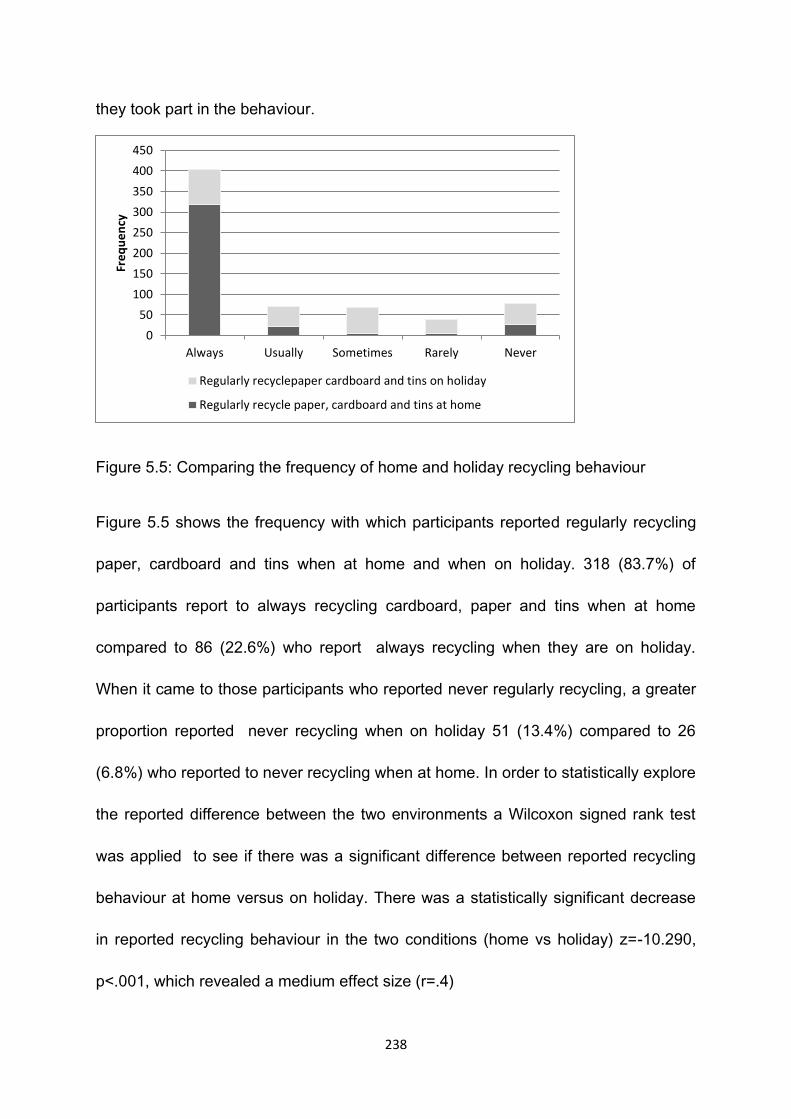
238
they took part in the behaviour.
Figure 5.5: Comparing the frequency of home and holiday recycling behaviour
Figure 5.5 shows the frequency with which participants reported regularly recycling
paper, cardboard and tins when at home and when on holiday. 318 (83.7%) of
participants report to always recycling cardboard, paper and tins when at home
compared to 86 (22.6%) who report always recycling when they are on holiday.
When it came to those participants who reported never regularly recycling, a greater
proportion reported never recycling when on holiday 51 (13.4%) compared to 26
(6.8%) who reported to never recycling when at home. In order to statistically explore
the reported difference between the two environments a Wilcoxon signed rank test
was applied to see if there was a significant difference between reported recycling
behaviour at home versus on holiday. There was a statistically significant decrease
in reported recycling behaviour in the two conditions (home vs holiday) z=-10.290,
p<.001, which revealed a medium effect size (r=.4)
0
50
100
150
200
250
300
350
400
450
Always Usually Sometimes Rarely Never
Fre
qu
en
cy
Regularly recyclepaper cardboard and tins on holiday
Regularly recycle paper, cardboard and tins at home
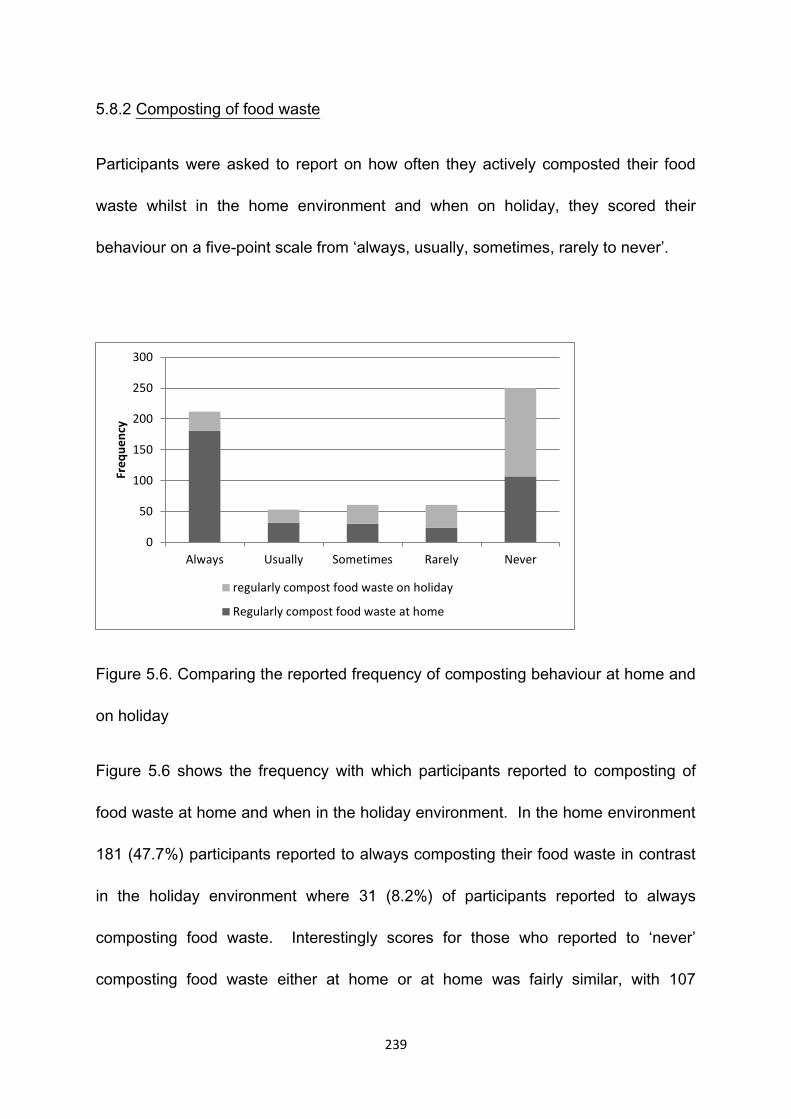
239
5.8.2 Composting of food waste
Participants were asked to report on how often they actively composted their food
waste whilst in the home environment and when on holiday, they scored their
behaviour on a five-point scale from ‘always, usually, sometimes, rarely to never’.
Figure 5.6. Comparing the reported frequency of composting behaviour at home and
on holiday
Figure 5.6 shows the frequency with which participants reported to composting of
food waste at home and when in the holiday environment. In the home environment
181 (47.7%) participants reported to always composting their food waste in contrast
in the holiday environment where 31 (8.2%) of participants reported to always
composting food waste. Interestingly scores for those who reported to ‘never’
composting food waste either at home or at home was fairly similar, with 107
0
50
100
150
200
250
300
Always Usually Sometimes Rarely Never
Fre
qu
en
cy
regularly compost food waste on holiday
Regularly compost food waste at home
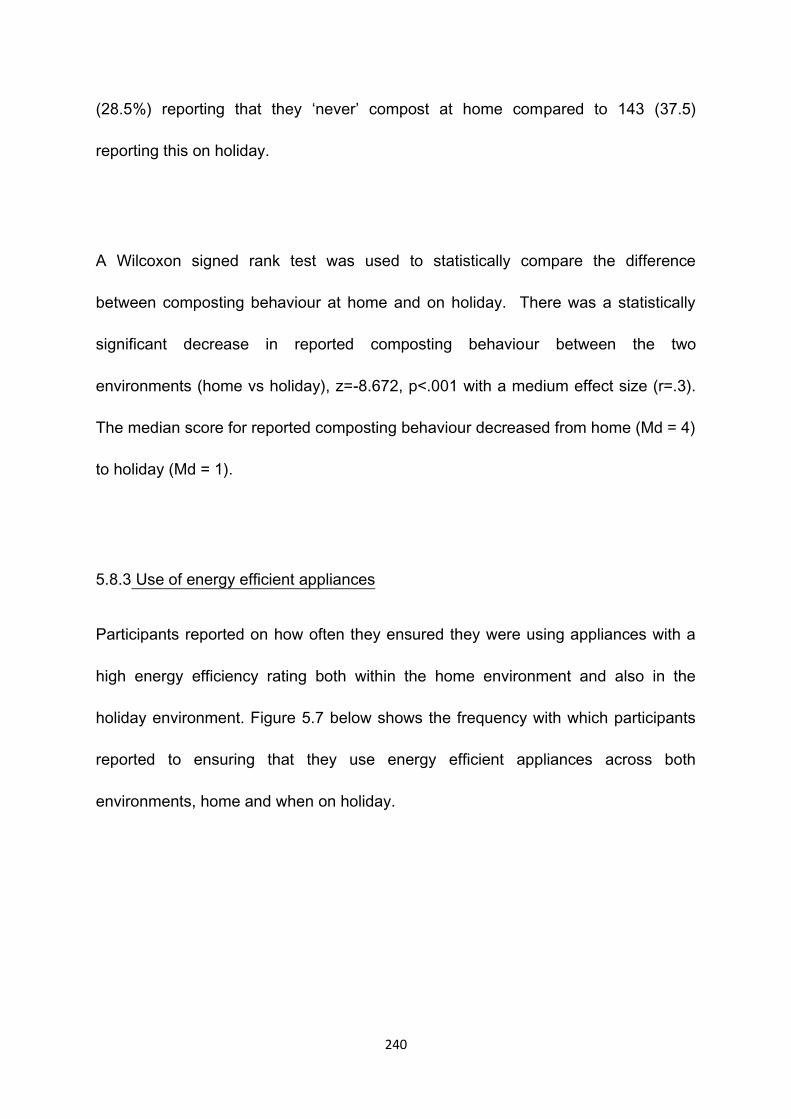
240
(28.5%) reporting that they ‘never’ compost at home compared to 143 (37.5)
reporting this on holiday.
A Wilcoxon signed rank test was used to statistically compare the difference
between composting behaviour at home and on holiday. There was a statistically
significant decrease in reported composting behaviour between the two
environments (home vs holiday), z=-8.672, p<.001 with a medium effect size (r=.3).
The median score for reported composting behaviour decreased from home (Md = 4)
to holiday (Md = 1).
5.8.3 Use of energy efficient appliances
Participants reported on how often they ensured they were using appliances with a
high energy efficiency rating both within the home environment and also in the
holiday environment. Figure 5.7 below shows the frequency with which participants
reported to ensuring that they use energy efficient appliances across both
environments, home and when on holiday.
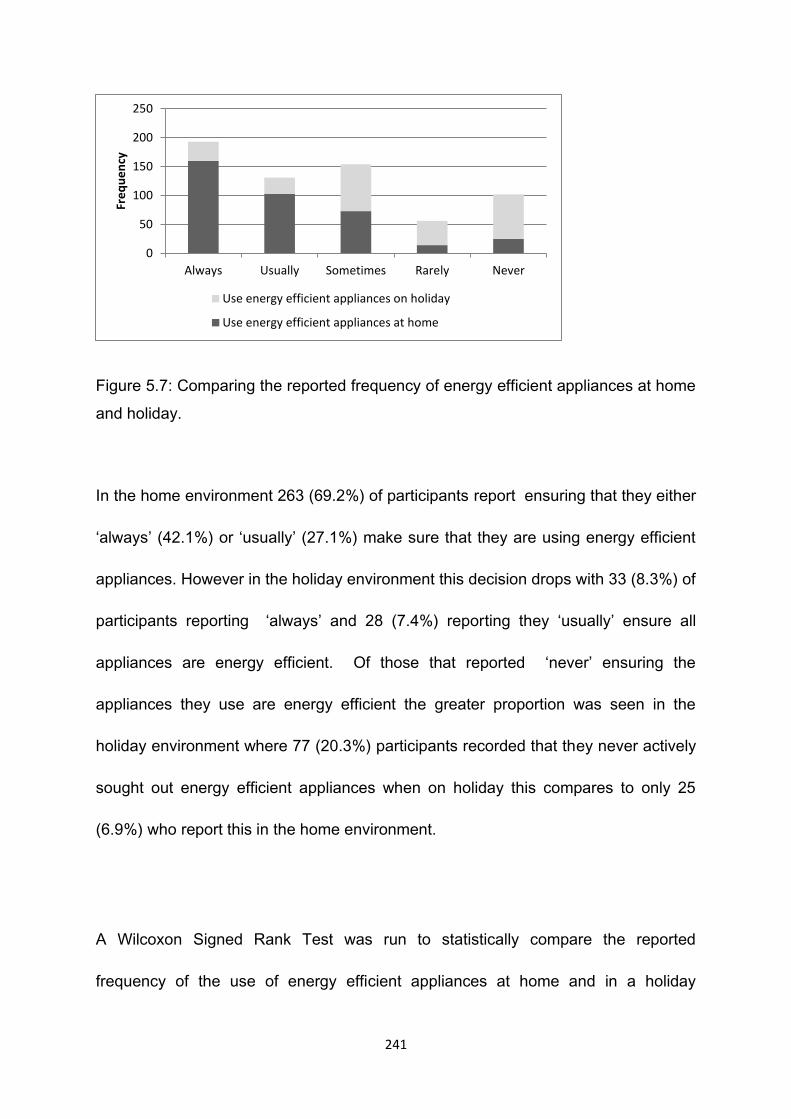
241
Figure 5.7: Comparing the reported frequency of energy efficient appliances at home
and holiday.
In the home environment 263 (69.2%) of participants report ensuring that they either
‘always’ (42.1%) or ‘usually’ (27.1%) make sure that they are using energy efficient
appliances. However in the holiday environment this decision drops with 33 (8.3%) of
participants reporting ‘always’ and 28 (7.4%) reporting they ‘usually’ ensure all
appliances are energy efficient. Of those that reported ‘never’ ensuring the
appliances they use are energy efficient the greater proportion was seen in the
holiday environment where 77 (20.3%) participants recorded that they never actively
sought out energy efficient appliances when on holiday this compares to only 25
(6.9%) who report this in the home environment.
A Wilcoxon Signed Rank Test was run to statistically compare the reported
frequency of the use of energy efficient appliances at home and in a holiday
0
50
100
150
200
250
Always Usually Sometimes Rarely Never
Fre
qu
en
cy
Use energy efficient appliances on holiday
Use energy efficient appliances at home
242
environment. There was a statistically significant reduction in reported use of energy
efficient appliances at home versus on holiday, z=-9.786, p<.001 with a medium
effect size (r=.3). The median score for reported use of energy efficient appliances
at home (Md=4) and when on holiday (Md=3).
5.8.4 Sustainable behaviour – ensuring all electrical appliances are turned off from
‘stand-by’
Recognised and standard forms of sustainable behaviour in the home environment
were measured in terms of how often participants reported to undertaking them.
(Figure 5.8) Ensuring that electrical appliances are switched to the ‘off’ position
rather than being left in ‘stand by’ mode which still uses electricity is part of most
people’s home routine. Participants in this study were asked to report how routinely
they engaged in this behaviour when on their holiday.
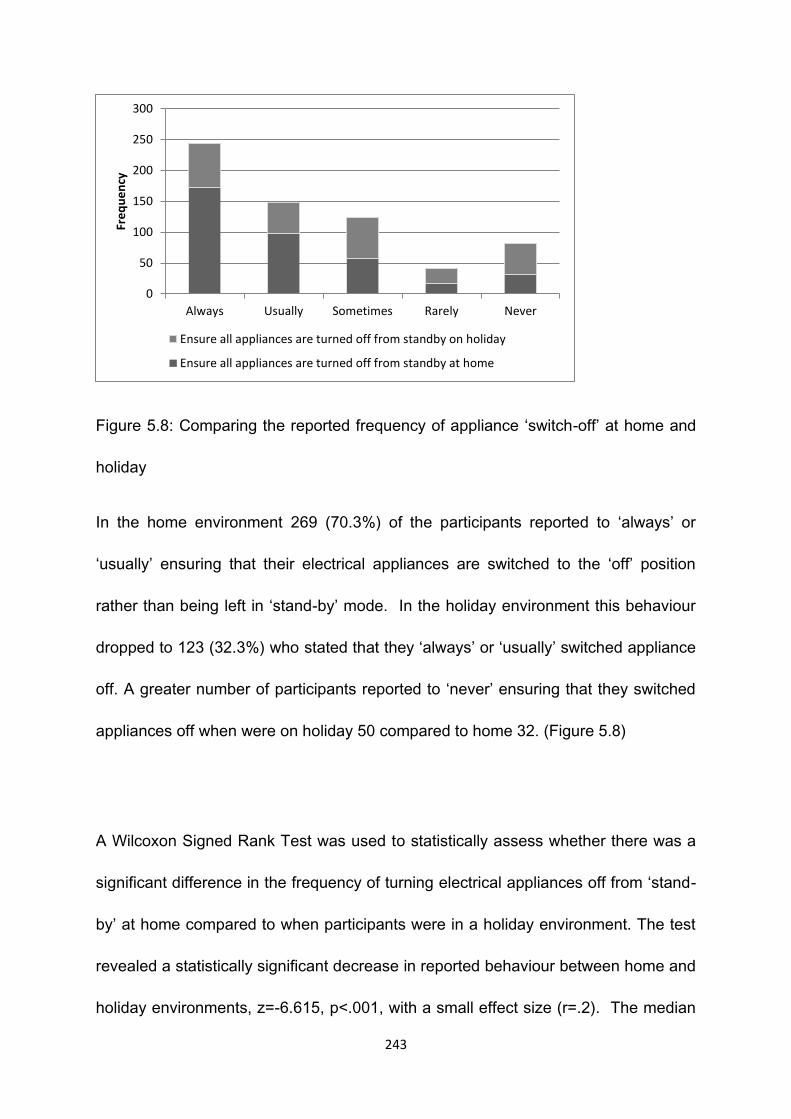
243
Figure 5.8: Comparing the reported frequency of appliance ‘switch-off’ at home and
holiday
In the home environment 269 (70.3%) of the participants reported to ‘always’ or
‘usually’ ensuring that their electrical appliances are switched to the ‘off’ position
rather than being left in ‘stand-by’ mode. In the holiday environment this behaviour
dropped to 123 (32.3%) who stated that they ‘always’ or ‘usually’ switched appliance
off. A greater number of participants reported to ‘never’ ensuring that they switched
appliances off when were on holiday 50 compared to home 32. (Figure 5.8)
A Wilcoxon Signed Rank Test was used to statistically assess whether there was a
significant difference in the frequency of turning electrical appliances off from ‘stand-
by’ at home compared to when participants were in a holiday environment. The test
revealed a statistically significant decrease in reported behaviour between home and
holiday environments, z=-6.615, p<.001, with a small effect size (r=.2). The median
0
50
100
150
200
250
300
Always Usually Sometimes Rarely Never
Fre
qu
en
cy
Ensure all appliances are turned off from standby on holiday
Ensure all appliances are turned off from standby at home
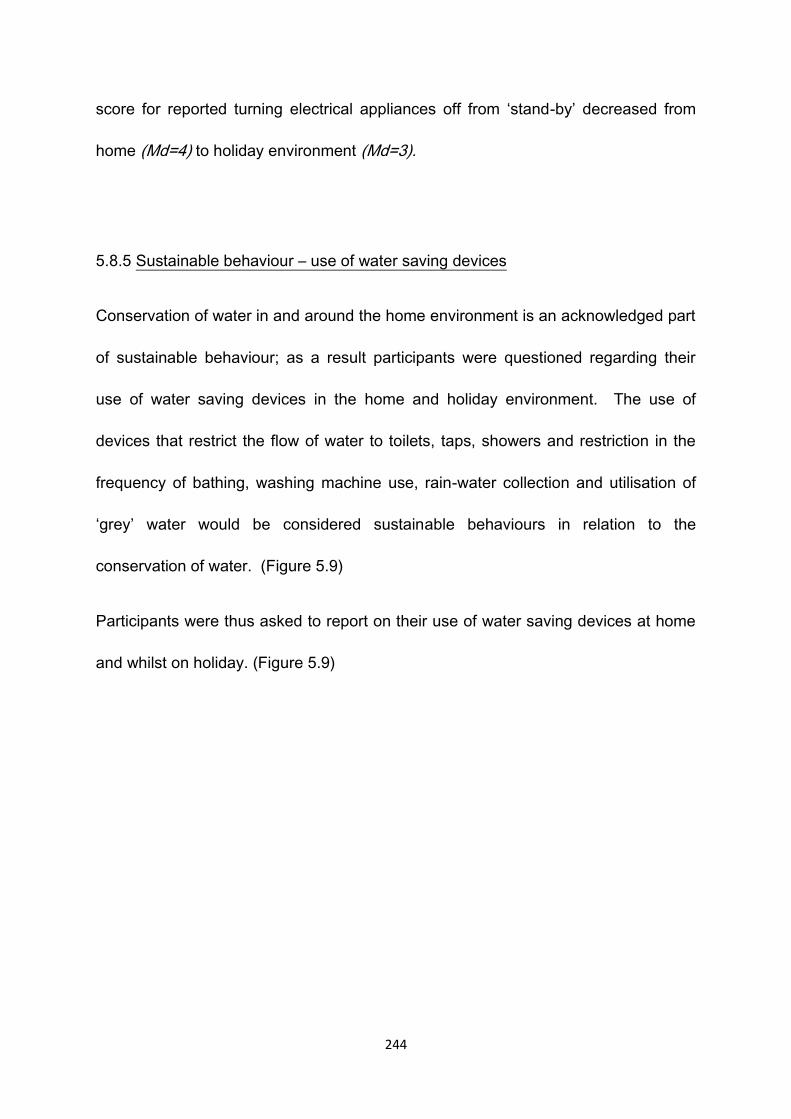
244
score for reported turning electrical appliances off from ‘stand-by’ decreased from
home (Md=4) to holiday environment (Md=3).
5.8.5 Sustainable behaviour – use of water saving devices
Conservation of water in and around the home environment is an acknowledged part
of sustainable behaviour; as a result participants were questioned regarding their
use of water saving devices in the home and holiday environment. The use of
devices that restrict the flow of water to toilets, taps, showers and restriction in the
frequency of bathing, washing machine use, rain-water collection and utilisation of
‘grey’ water would be considered sustainable behaviours in relation to the
conservation of water. (Figure 5.9)
Participants were thus asked to report on their use of water saving devices at home
and whilst on holiday. (Figure 5.9)
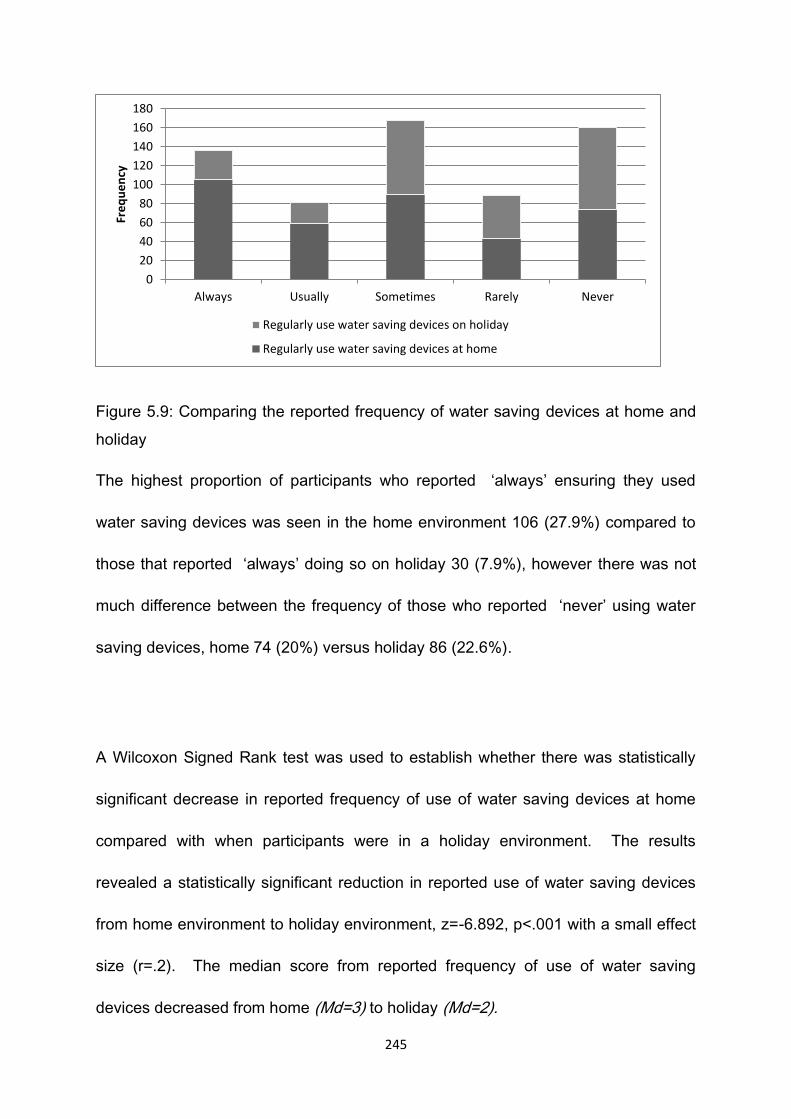
245
Figure 5.9: Comparing the reported frequency of water saving devices at home and
holiday
The highest proportion of participants who reported ‘always’ ensuring they used
water saving devices was seen in the home environment 106 (27.9%) compared to
those that reported ‘always’ doing so on holiday 30 (7.9%), however there was not
much difference between the frequency of those who reported ‘never’ using water
saving devices, home 74 (20%) versus holiday 86 (22.6%).
A Wilcoxon Signed Rank test was used to establish whether there was statistically
significant decrease in reported frequency of use of water saving devices at home
compared with when participants were in a holiday environment. The results
revealed a statistically significant reduction in reported use of water saving devices
from home environment to holiday environment, z=-6.892, p<.001 with a small effect
size (r=.2). The median score from reported frequency of use of water saving
devices decreased from home (Md=3) to holiday (Md=2).
0
20
40
60
80
100
120
140
160
180
Always Usually Sometimes Rarely Never
Fre
qu
en
cy
Regularly use water saving devices on holiday
Regularly use water saving devices at home
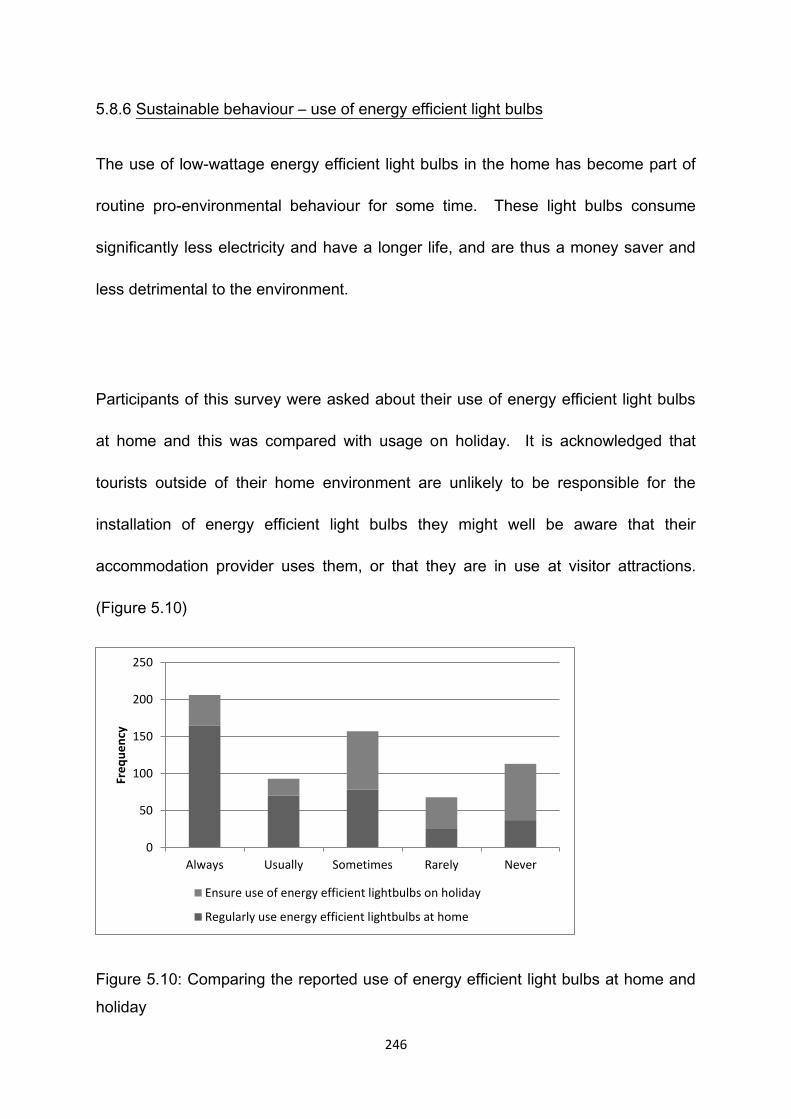
246
5.8.6 Sustainable behaviour – use of energy efficient light bulbs
The use of low-wattage energy efficient light bulbs in the home has become part of
routine pro-environmental behaviour for some time. These light bulbs consume
significantly less electricity and have a longer life, and are thus a money saver and
less detrimental to the environment.
Participants of this survey were asked about their use of energy efficient light bulbs
at home and this was compared with usage on holiday. It is acknowledged that
tourists outside of their home environment are unlikely to be responsible for the
installation of energy efficient light bulbs they might well be aware that their
accommodation provider uses them, or that they are in use at visitor attractions.
(Figure 5.10)
Figure 5.10: Comparing the reported use of energy efficient light bulbs at home and
holiday
0
50
100
150
200
250
Always Usually Sometimes Rarely Never
Fre
qu
en
cy
Ensure use of energy efficient lightbulbs on holiday
Regularly use energy efficient lightbulbs at home
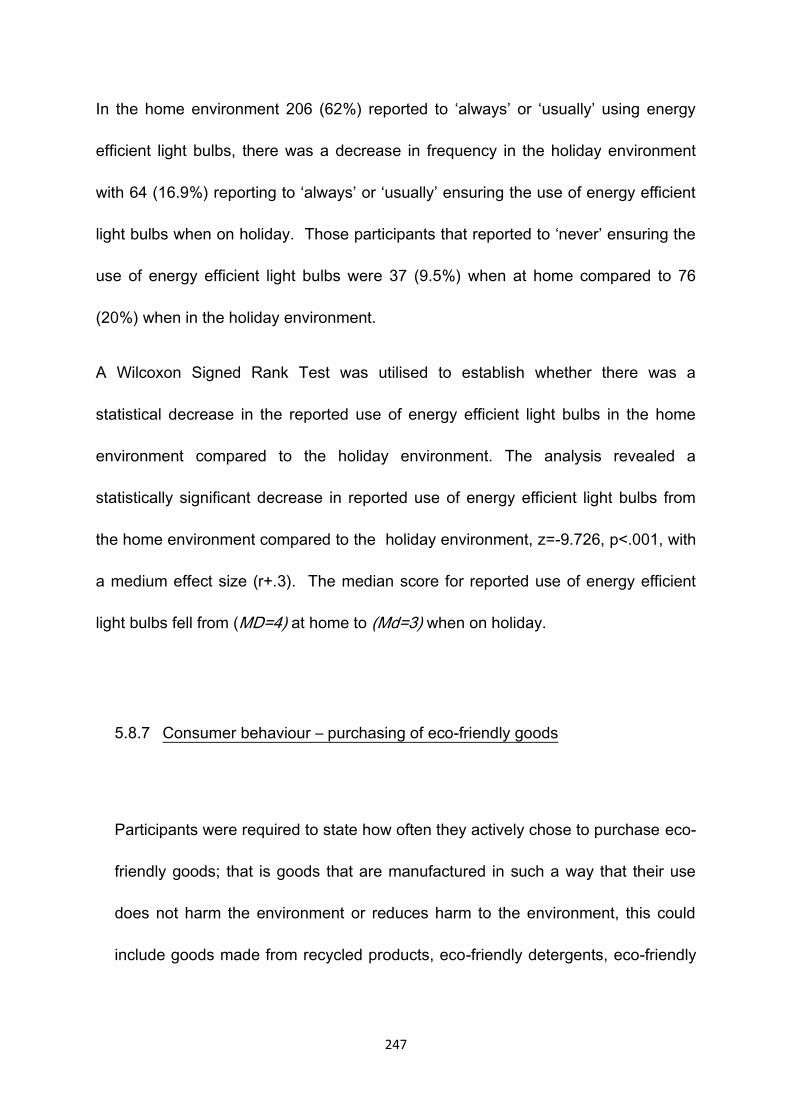
247
In the home environment 206 (62%) reported to ‘always’ or ‘usually’ using energy
efficient light bulbs, there was a decrease in frequency in the holiday environment
with 64 (16.9%) reporting to ‘always’ or ‘usually’ ensuring the use of energy efficient
light bulbs when on holiday. Those participants that reported to ‘never’ ensuring the
use of energy efficient light bulbs were 37 (9.5%) when at home compared to 76
(20%) when in the holiday environment.
A Wilcoxon Signed Rank Test was utilised to establish whether there was a
statistical decrease in the reported use of energy efficient light bulbs in the home
environment compared to the holiday environment. The analysis revealed a
statistically significant decrease in reported use of energy efficient light bulbs from
the home environment compared to the holiday environment, z=-9.726, p<.001, with
a medium effect size (r+.3). The median score for reported use of energy efficient
light bulbs fell from (MD=4) at home to (Md=3) when on holiday.
5.8.7 Consumer behaviour – purchasing of eco-friendly goods
Participants were required to state how often they actively chose to purchase eco-
friendly goods; that is goods that are manufactured in such a way that their use
does not harm the environment or reduces harm to the environment, this could
include goods made from recycled products, eco-friendly detergents, eco-friendly
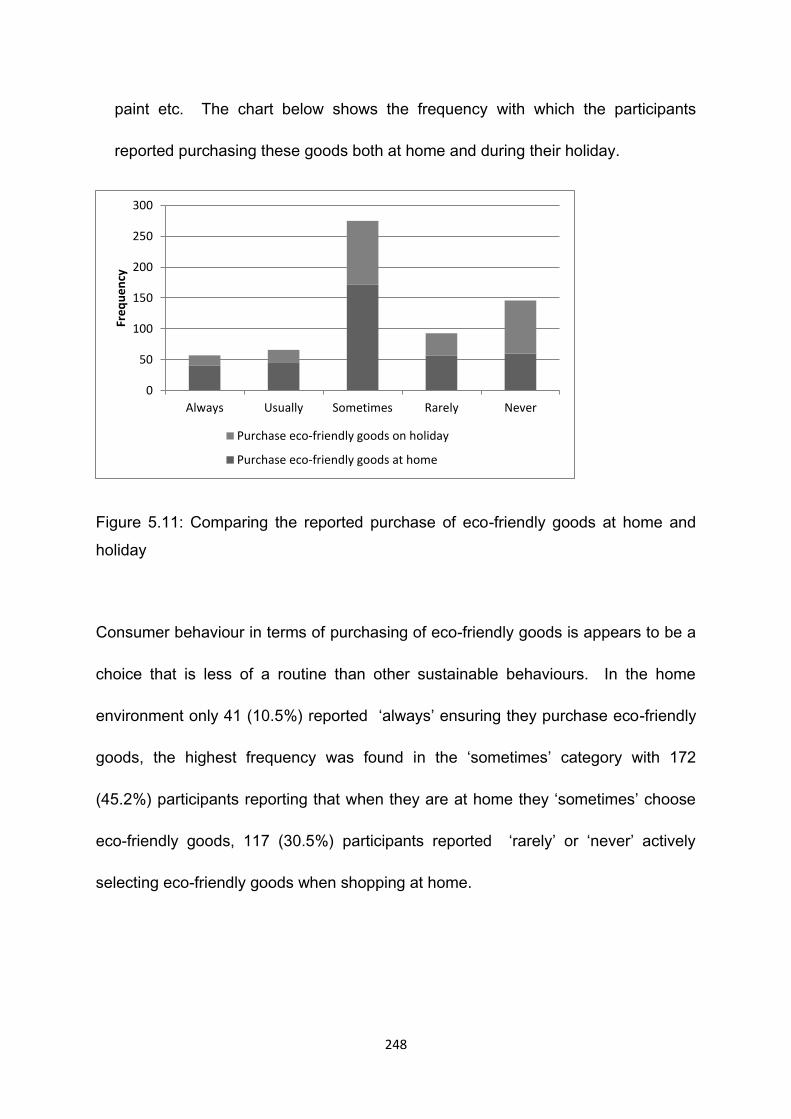
248
paint etc. The chart below shows the frequency with which the participants
reported purchasing these goods both at home and during their holiday.
Figure 5.11: Comparing the reported purchase of eco-friendly goods at home and
holiday
Consumer behaviour in terms of purchasing of eco-friendly goods is appears to be a
choice that is less of a routine than other sustainable behaviours. In the home
environment only 41 (10.5%) reported ‘always’ ensuring they purchase eco-friendly
goods, the highest frequency was found in the ‘sometimes’ category with 172
(45.2%) participants reporting that when they are at home they ‘sometimes’ choose
eco-friendly goods, 117 (30.5%) participants reported ‘rarely’ or ‘never’ actively
selecting eco-friendly goods when shopping at home.
0
50
100
150
200
250
300
Always Usually Sometimes Rarely Never
Fre
qu
en
cy
Purchase eco-friendly goods on holiday
Purchase eco-friendly goods at home
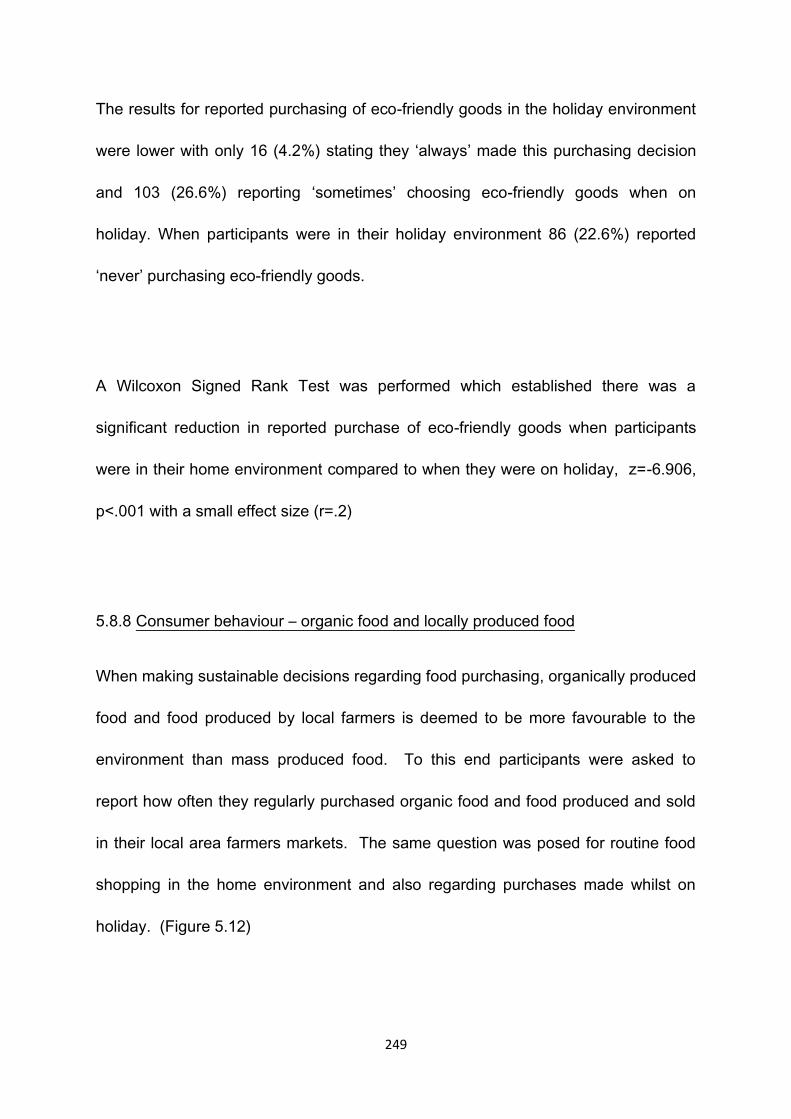
249
The results for reported purchasing of eco-friendly goods in the holiday environment
were lower with only 16 (4.2%) stating they ‘always’ made this purchasing decision
and 103 (26.6%) reporting ‘sometimes’ choosing eco-friendly goods when on
holiday. When participants were in their holiday environment 86 (22.6%) reported
‘never’ purchasing eco-friendly goods.
A Wilcoxon Signed Rank Test was performed which established there was a
significant reduction in reported purchase of eco-friendly goods when participants
were in their home environment compared to when they were on holiday, z=-6.906,
p<.001 with a small effect size (r=.2)
5.8.8 Consumer behaviour – organic food and locally produced food
When making sustainable decisions regarding food purchasing, organically produced
food and food produced by local farmers is deemed to be more favourable to the
environment than mass produced food. To this end participants were asked to
report how often they regularly purchased organic food and food produced and sold
in their local area farmers markets. The same question was posed for routine food
shopping in the home environment and also regarding purchases made whilst on
holiday. (Figure 5.12)
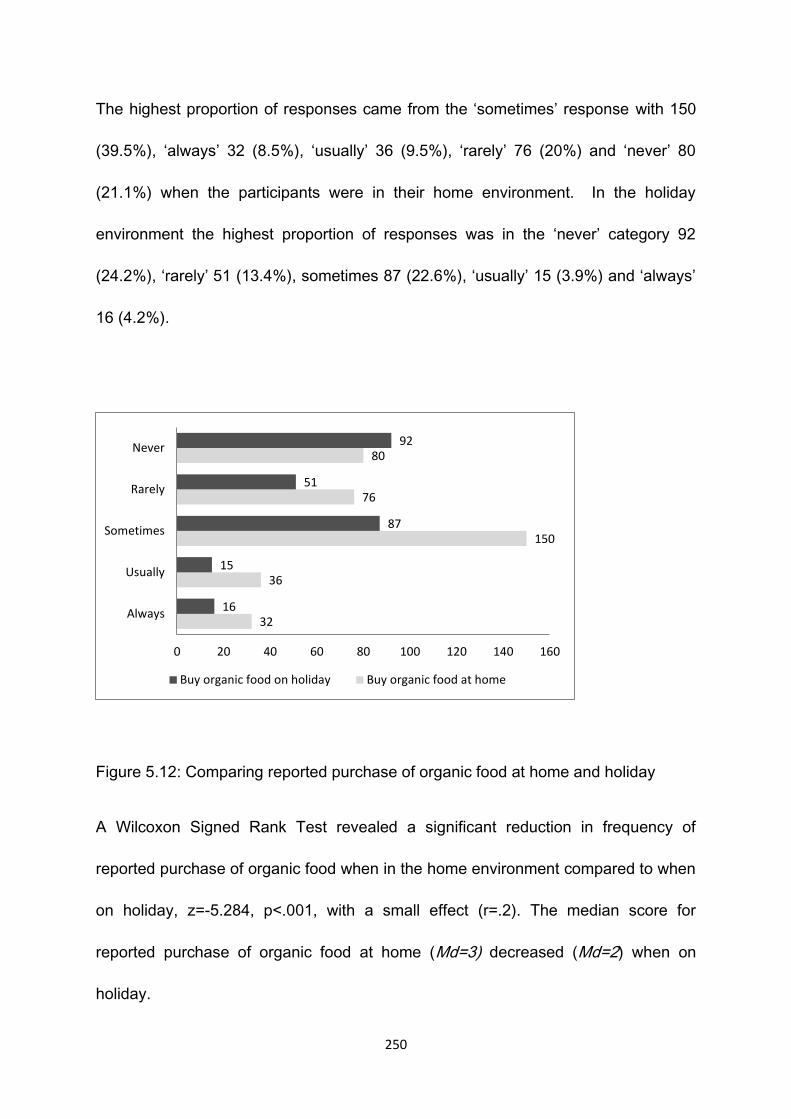
250
The highest proportion of responses came from the ‘sometimes’ response with 150
(39.5%), ‘always’ 32 (8.5%), ‘usually’ 36 (9.5%), ‘rarely’ 76 (20%) and ‘never’ 80
(21.1%) when the participants were in their home environment. In the holiday
environment the highest proportion of responses was in the ‘never’ category 92
(24.2%), ‘rarely’ 51 (13.4%), sometimes 87 (22.6%), ‘usually’ 15 (3.9%) and ‘always’
16 (4.2%).
Figure 5.12: Comparing reported purchase of organic food at home and holiday
A Wilcoxon Signed Rank Test revealed a significant reduction in frequency of
reported purchase of organic food when in the home environment compared to when
on holiday, z=-5.284, p<.001, with a small effect (r=.2). The median score for
reported purchase of organic food at home (Md=3) decreased (Md=2) when on
holiday.
32
36
150
76
80
16
15
87
51
92
0 20 40 60 80 100 120 140 160
Always
Usually
Sometimes
Rarely
Never
Buy organic food on holiday Buy organic food at home
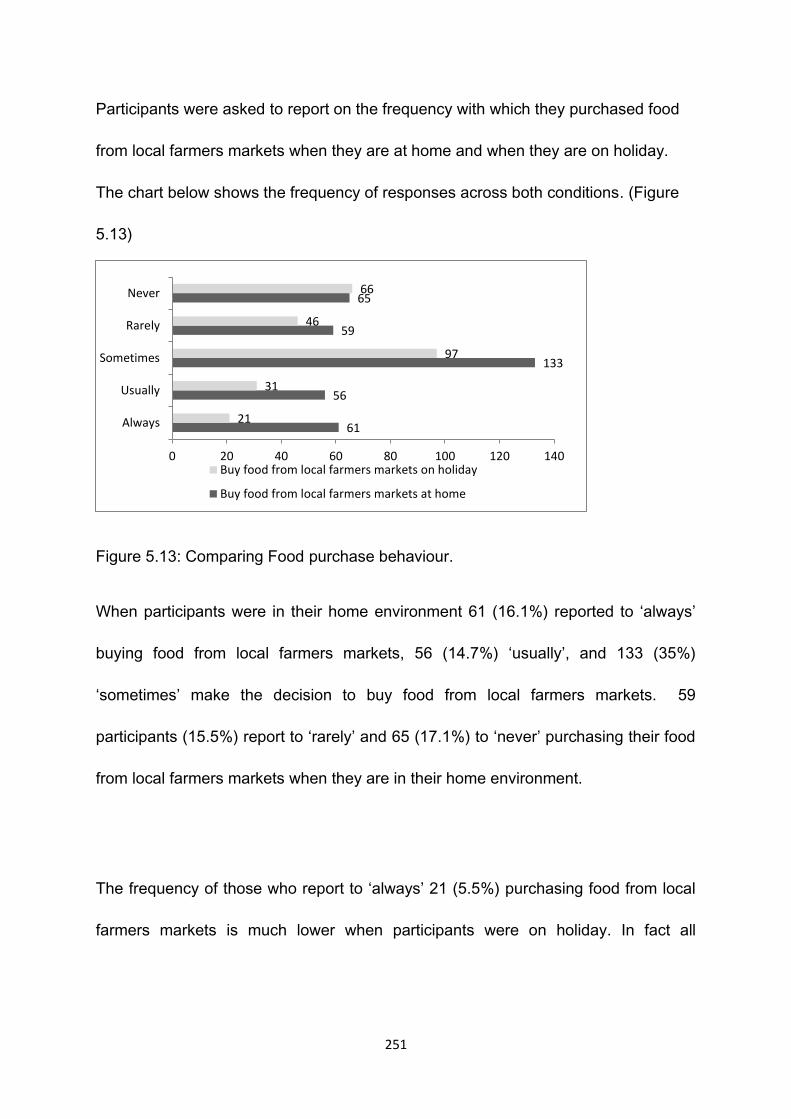
251
Participants were asked to report on the frequency with which they purchased food
from local farmers markets when they are at home and when they are on holiday.
The chart below shows the frequency of responses across both conditions. (Figure
5.13)
Figure 5.13: Comparing Food purchase behaviour.
When participants were in their home environment 61 (16.1%) reported to ‘always’
buying food from local farmers markets, 56 (14.7%) ‘usually’, and 133 (35%)
‘sometimes’ make the decision to buy food from local farmers markets. 59
participants (15.5%) report to ‘rarely’ and 65 (17.1%) to ‘never’ purchasing their food
from local farmers markets when they are in their home environment.
The frequency of those who report to ‘always’ 21 (5.5%) purchasing food from local
farmers markets is much lower when participants were on holiday. In fact all
61
56
133
59
65
21
31
97
46
66
0 20 40 60 80 100 120 140
Always
Usually
Sometimes
Rarely
Never
Buy food from local farmers markets on holiday
Buy food from local farmers markets at home
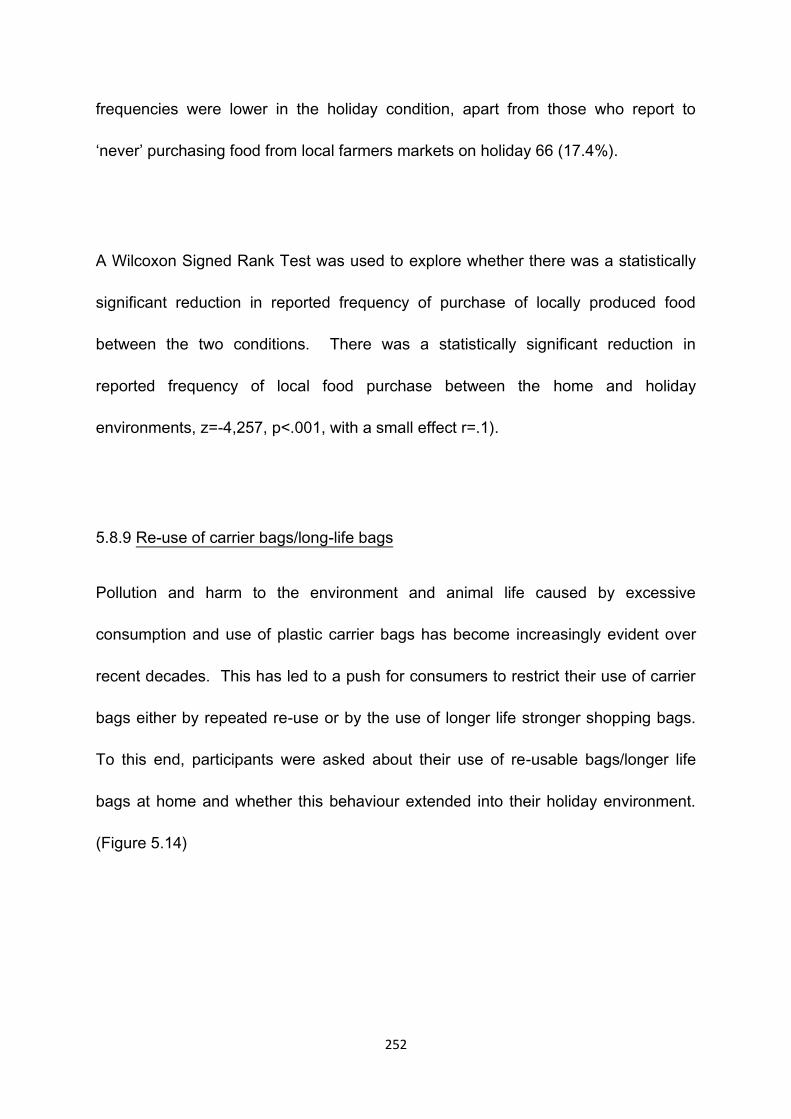
252
frequencies were lower in the holiday condition, apart from those who report to
‘never’ purchasing food from local farmers markets on holiday 66 (17.4%).
A Wilcoxon Signed Rank Test was used to explore whether there was a statistically
significant reduction in reported frequency of purchase of locally produced food
between the two conditions. There was a statistically significant reduction in
reported frequency of local food purchase between the home and holiday
environments, z=-4,257, p<.001, with a small effect r=.1).
5.8.9 Re-use of carrier bags/long-life bags
Pollution and harm to the environment and animal life caused by excessive
consumption and use of plastic carrier bags has become increasingly evident over
recent decades. This has led to a push for consumers to restrict their use of carrier
bags either by repeated re-use or by the use of longer life stronger shopping bags.
To this end, participants were asked about their use of re-usable bags/longer life
bags at home and whether this behaviour extended into their holiday environment.
(Figure 5.14)
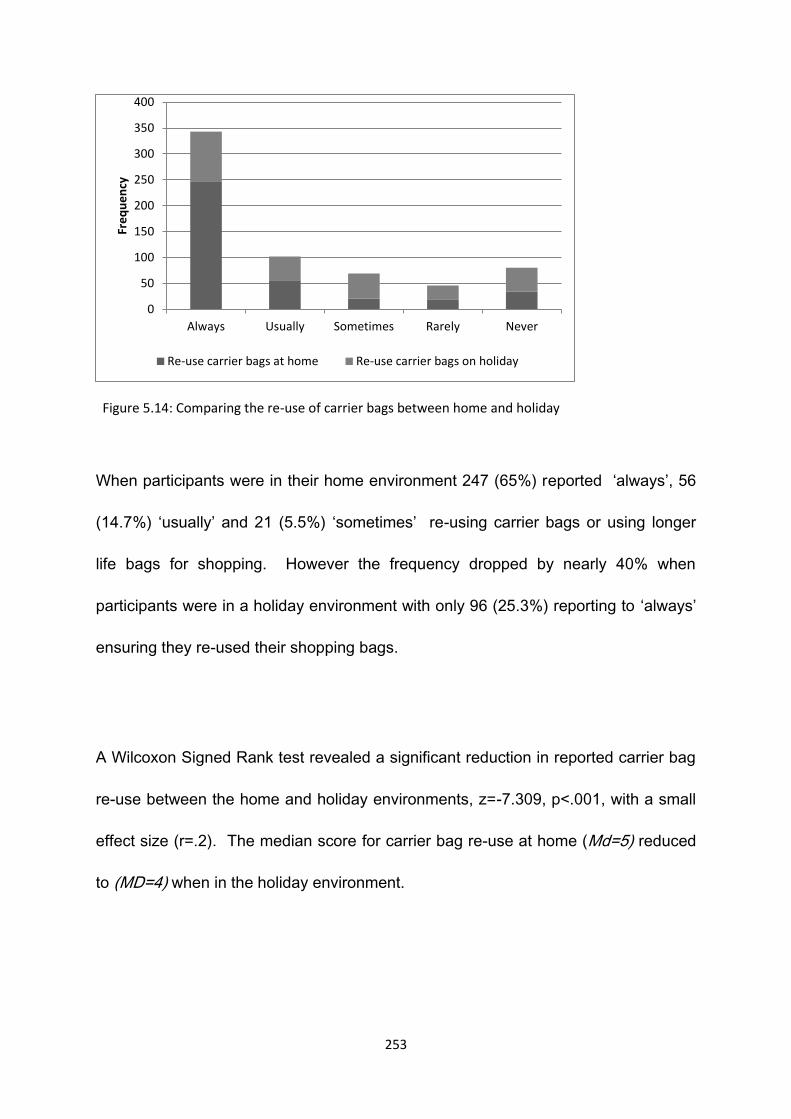
253
When participants were in their home environment 247 (65%) reported ‘always’, 56
(14.7%) ‘usually’ and 21 (5.5%) ‘sometimes’ re-using carrier bags or using longer
life bags for shopping. However the frequency dropped by nearly 40% when
participants were in a holiday environment with only 96 (25.3%) reporting to ‘always’
ensuring they re-used their shopping bags.
A Wilcoxon Signed Rank test revealed a significant reduction in reported carrier bag
re-use between the home and holiday environments, z=-7.309, p<.001, with a small
effect size (r=.2). The median score for carrier bag re-use at home (Md=5) reduced
to (MD=4) when in the holiday environment.
0
50
100
150
200
250
300
350
400
Always Usually Sometimes Rarely Never
Fre
qu
en
cy
Re-use carrier bags at home Re-use carrier bags on holiday
Figure 5.14: Comparing the re-use of carrier bags between home and holiday
254
5.8.10 Transport behaviour – use of public transport/walking/cycling
An important aspect of personal sustainable behaviour relates to choices made
regarding transport, utilisation of public transport services, walking or cycling are
more sustainable than use of the car. Therefore participants were asked to report
how often they regularly use public transport or walked or cycled both at home and
when on holiday. (Figure 5.15)
When participants were in their home environment 99 (26.1%) reported to ‘always’
either using public transport or walking/cycling where possible, compared to 61
(16.1%) in the holiday environment. The highest frequency came in the ‘sometimes’
category with 118 (31.1%) reporting this behaviour at home and 83 (21.8%) when on
holiday. Those that report to ‘never’ using public transport were highest in the home
environment 52 (13.7%) compared to 37 (9.7%) when on holiday. (Figure 5.15)
0
50
100
150
200
250
Always Usually Sometimes Rarely Never
Fre
qu
en
cy
Use public transport/walk/cycle where possible
Use public transport/walk/cycle where possible at home
Figure 5.15: Comparing reported frequency of public transport at home and on holiday
255
A Wilcoxon Signed Rank test revealed there was a statistically significant reduction
in reported use of public transport/walking/cycling between home and holiday
conditions, z=-1.824, p<.001, with a very small effect size (r=.07).
5.9 Comparing the full range of sustainable behaviours at home and on holiday
In the previous section, results for each type of sustainable behaviour were
compared individually across the home and holiday conditions. As was shown in the
previous section there was a statistically significant decrease in behaviour from the
home environment to the holiday in all sustainable behaviours except for the use of
public transport which showed a relatively small reduction in behaviour between the
two conditions.
In order to determine whether there is a more general decrease in reported
sustainable behaviours across the two conditions scores were recoded and totalled
to give a score for sustainable behaviour at home and on holiday. Each response
was coded from 1 to 5; 1 was never, 2 rarely, 3 sometimes, 4 usually and 5 always.
Therefore, each behaviour had a maximum score of 5 and a minimum score of 1,
those participants with the highest score were thus engaging more frequently in
sustainable behaviours. In each condition (home versus holiday) it was possible to
obtain a maximum of 55 points and minimum of 11.

256
A Wilcoxon Signed Rank Test was undertaken to establish whether there was a
statistically significant decrease in total scores for reported sustainable behaviour at
home versus holiday. There was a significant decrease between scores for reported
total sustainable behaviours at home, z=-11.089, p<.001 with a medium to large
effect size (r=.4). The median score decreased from (Md=37) at home to (Md=27)
on holiday for total scores reported sustainable behaviour.
5.10 Comparison of sustainable behaviours between genders
It has been suggested by previous research that there is a difference in commitment
to sustainable behaviours between males and females, therefore this research
tested this hypotheses. (Van Liere & Dunlap, 1980) A Mann-Whitney U Test was
conducted to compare total scores for sustainable behaviour for males and females
in the home environment. There was no significant difference between in reported
sustainable behaviours in the home environment between genders, males (Md=36.5,
n=158) and females (Md=37.00, n=187), U=13777.5, z=-1.080, p=.28, r=.05.
In order to establish whether males and females differ in terms of reported
sustainable behaviours in the holiday environment a further Mann-Whitney U Test
was run, there was no statistically significant difference in reported sustainable
257
behaviours on holiday between males (Md=27, n=107) and females (Md=27, n=137),
U=7297.5, z=-.059, p=.95, r=.003.
5.11 Comparison of sustainable behaviours between age groups
5.11.1 Reported sustainable behaviour at home between age groups
Van Liere and Dunlap (1980) review of sustainable behaviours demonstrated a
slightly negative relationship between age and sustainable behaviour. So a Kruskai-
Wallis Test was undertaken to compare total scores for sustainable behaviour across
participants’ age groups. The participants’ ages were divided into three groups,
<29years, 30 – 50 years and 60+years in order to ascertain whether the frequency of
reported total scores for sustainable behaviours at home differed across the three
age groups. The test revealed a statistically significant difference in total sustainable
behaviour scores in the home environment across the three age groups. (Gp1, n=37:
<29years, Gp2, n=177: 30 – 59 years, Gp3, n = 116: 60+years), X2 (2, n = 330) =
8.96, p = .01. The older age group, 60+years recorded the highest median score
(Md=38) than the other two age groups <29years (Md=34) and 30 -59 years
(Md=37).
A Mann Whitney-U Test was undertaken to assess whether there was a statistically
significant difference in reported frequency of sustainable behaviours between the

258
youngest group <29yrs and the oldest age group 60+yrs. The test revealed there is
a statistically significant difference in reported sustainable behaviour at home
between the youngest (Md=34, n= 34) and oldest age groups (Md=38, n = 116), U =
1447.5, z=-2.980, p=.003, r=.2 indicating a small/medium effect size.
5.11.2 Reported sustainable behaviour on holiday between age groups
A Kruskal-Wallis Test was applied to establish whether there was a statistical
difference in scores for total sustainable behaviour when on holiday across the three
age groups. The Kruskal-Wallis Test revealed no statistically significant difference in
frequency of reported sustainable behaviour whilst on holiday across the three age
groups (Gp1, n=25: <29yrs, Gp2, n=129: 30-59yrs, Gp3, n=78: 60yrs+), X2 (2,
n=232) = 1.211, p=.54. The median scores for the Group 1 the youngest age group
<29yrs (Md=27) both Group 2 (30-59yrs) and Group 3 (60yrs+) had the same
median scores for sustainable behaviour whilst on holiday (Md=28).
5.12 Comparison of reported sustainable behaviour at home and holiday by case
study area
5.12.1 Regular recycling of paper, cardboard, tins and glass
This research has focussed on two specific case study locations in the South West
of England in order to ascertain whether reported behaviour differs amongst
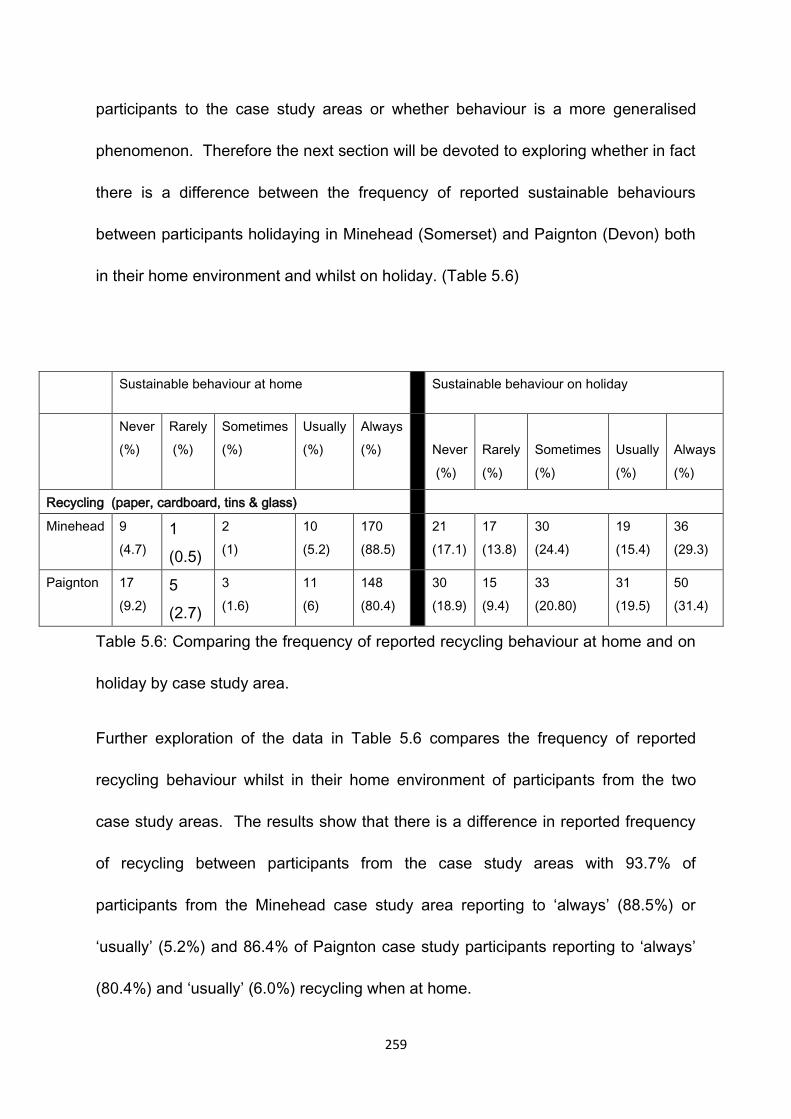
259
participants to the case study areas or whether behaviour is a more generalised
phenomenon. Therefore the next section will be devoted to exploring whether in fact
there is a difference between the frequency of reported sustainable behaviours
between participants holidaying in Minehead (Somerset) and Paignton (Devon) both
in their home environment and whilst on holiday. (Table 5.6)
Sustainable behaviour at home Sustainable behaviour on holiday
Never
(%)
Rarely
(%)
Sometimes
(%)
Usually
(%)
Always
(%)
Never
(%)
Rarely
(%)
Sometimes
(%)
Usually
(%)
Always
(%)
Recycling (paper, cardboard, tins & glass)
Minehead 9
(4.7)
1
(0.5)
2
(1)
10
(5.2)
170
(88.5)
21
(17.1)
17
(13.8)
30
(24.4)
19
(15.4)
36
(29.3)
Paignton 17
(9.2)
5
(2.7)
3
(1.6)
11
(6)
148
(80.4)
30
(18.9)
15
(9.4)
33
(20.80)
31
(19.5)
50
(31.4)
Table 5.6: Comparing the frequency of reported recycling behaviour at home and on
holiday by case study area.
Further exploration of the data in Table 5.6 compares the frequency of reported
recycling behaviour whilst in their home environment of participants from the two
case study areas. The results show that there is a difference in reported frequency
of recycling between participants from the case study areas with 93.7% of
participants from the Minehead case study area reporting to ‘always’ (88.5%) or
‘usually’ (5.2%) and 86.4% of Paignton case study participants reporting to ‘always’
(80.4%) and ‘usually’ (6.0%) recycling when at home.
260
A Mann-Whitney U test was undertaken to explore whether there was a statistical
difference in the frequency of reported recycling in the two case study areas. The
test revealed a statistically significant difference in reported frequency of recycling in
the home environment from participants in the Minehead case study area (Md=5, n =
192) and Paignton case study area (Md=5, n=184), U = 16180, z=-2.243, p=.02,
r=.1, indicating a small effect.
When reported recycling behaviour is compared in the holiday environment amongst
case study participants there is a ‘drop off’ in the reported frequency of recycling
behaviour amongst all participants. A Wilcoxon Signed Rank Test was applied
separately to each case study area to establish whether there was a statistically
significant ‘drop off’ in reported recycling behaviour between home and holiday
environments. The test revealed that there was a statistically significant ‘drop off’ in
commitment to the frequency of reported recycling between the home environment
and the holiday environment, z=-7.452, p<.001 with a medium sized effect (r = .4).
The median score for Minehead case study area participants recycling behaviour
(Md = 5) at home decreased (Md = 3) when on holiday. The same test was applied
to Paignton case study area participants, here there was also a statistically
significant reduction in frequency of reported recycling behaviour between home and
holiday conditions, z = -7.096, p < .001, with a medium effect size (r = .3). The
median score for recycling at home (Md = 5) and whilst on holiday (Md = 4). The
261
results show a statistically significant ‘drop off’ in reported frequency in recycling
behaviour between the home and holiday environment however the biggest
decrease in behaviour is seen in the participants from the Minehead case study
area.
Comparison of recycling behaviour between the two case study areas levels of
commitment to recycling when on holiday shows that 50.9% of Paignton case study
area participants report to ‘always’ (31.4%) or ‘usually’ (19.5%) recycling when on
holiday compared to Minehead where 44.47% report to ‘always’ (30.5%) or ‘usually’
(15.4%) regularly recycle whilst on holiday.
A Mann-Whitney U Test was undertaken to explore whether the difference in
frequency of reported recycling behaviour is statistically different. The test revealed
that there is no statistical difference in reported recycling behaviour by case study
participants when in a holiday environment, Minehead (Md=3, n=123) and Paignton
(Md=4, n=159), U = 9398, z = -.576, p = .56, r = .03.
5.12.2 Summary comparison of recycling behaviour between case study areas
In summary the results show there to be a greater commitment amongst those
participants staying in the Minehead case study area to recycling in the home
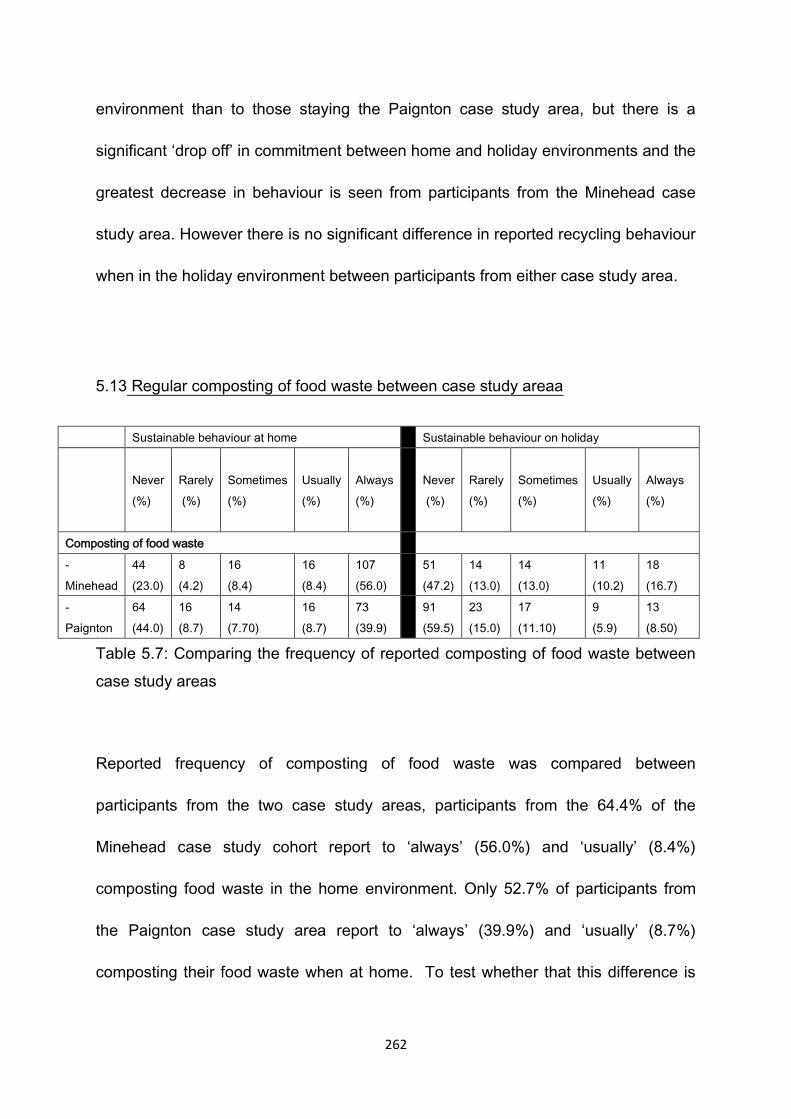
262
environment than to those staying the Paignton case study area, but there is a
significant ‘drop off’ in commitment between home and holiday environments and the
greatest decrease in behaviour is seen from participants from the Minehead case
study area. However there is no significant difference in reported recycling behaviour
when in the holiday environment between participants from either case study area.
5.13 Regular composting of food waste between case study areaa
Sustainable behaviour at home Sustainable behaviour on holiday
Never
(%)
Rarely
(%)
Sometimes
(%)
Usually
(%)
Always
(%)
Never
(%)
Rarely
(%)
Sometimes
(%)
Usually
(%)
Always
(%)
Composting of food waste
-
Minehead
44
(23.0)
8
(4.2)
16
(8.4)
16
(8.4)
107
(56.0)
51
(47.2)
14
(13.0)
14
(13.0)
11
(10.2)
18
(16.7)
-
Paignton
64
(44.0)
16
(8.7)
14
(7.70)
16
(8.7)
73
(39.9)
91
(59.5)
23
(15.0)
17
(11.10)
9
(5.9)
13
(8.50)
Table 5.7: Comparing the frequency of reported composting of food waste between
case study areas
Reported frequency of composting of food waste was compared between
participants from the two case study areas, participants from the 64.4% of the
Minehead case study cohort report to ‘always’ (56.0%) and ‘usually’ (8.4%)
composting food waste in the home environment. Only 52.7% of participants from
the Paignton case study area report to ‘always’ (39.9%) and ‘usually’ (8.7%)
composting their food waste when at home. To test whether that this difference is
263
statistically significant a Mann-Whitney U Test was applied. The results of the test
revealed that the difference in reported frequency of composting of food waste when
in the home environment, Minehead case study area (Md = 5, n = 191) and Paignton
case study area (Md = 3, n = 183), U = 14269.5, z = -3.30, p = .001, r = .1 indicating
a small effect. (Table 5.7)
It should be acknowledged that commitment to food composting behaviour whilst in a
holiday environment is likely be fairly difficult to undertake due to lack of facilities if
staying in self-catering accommodation or lack of control over what happens to
personal food waste if in catered accommodation. However a comparison between
commitments to food composting was undertaken between participants from the two
case study areas. The most frequent response in both case study areas was ‘never’
regularly composting food waste when on holiday (Minehead 47.2%) and (Paignton
59.5%). A Mann-Whitney U Test was run to establish whether there was a
significant difference in frequency of food composting behaviour between
participants from the two case study areas. The results of the test revealed a
statistically significant difference in behaviour between participants from the two case
study areas, Minehead (Md = 2, n = 108) and Paignton (Md = 1, n = 153), U = 6926,
z = -2.438, p = .01, r = .1 indicating a small effect. The median results suggest that
there are a higher proportion of participants from the Paignton case study area who
report ‘never’ composting food waste when in the holiday environment. A review of
facilities and infrastructure to support recycling and food composting in both case
study areas was undertaken and showed that weekly collections of recyclable
264
material and foodwaste was available for residents in both case study areas and
therefore should be available to visitors (West Somerst District Council, 2014(online);
Torbay Council, 2014 (online).
As with the recycling behaviour there was a general ‘drop off’ in frequency of
reported food composting between home and holiday environments, in the Minehead
case study area 56% reported ‘always’ composting food waste when at home this
dropped to 16.7% when on holiday; similarly 39.5% of participants from the Paignton
case study reported ‘always’ composting food waste at home and this fell to 8.5%
when on holiday. Therefore the data was analysed using a Wilcoxon Signed Rank
Test to see if there was a statistically significant ‘drop off’ in behaviour in both case
study areas between home and holiday conditions. The test revealed a statistically
significant reduction in reported frequency of food composting for participants from
the Minehead case study area between the home and holiday environment, z = -
.5.905, p<.001, with a medium-sized effect (r = .3). The median score for reported
frequency for food composting at home (Md = 5) decreased to (Md = 2) when in the
holiday environment. The test was applied to data provided by the Paignton case
study participants the results revealed a statistically significant reduction in reported
frequency of food waste composting between home and holiday environment, z = -
6.382, p<.001, with a medium-sized effect (r = .3). The median scores in the home
environment (Md = 3) decreased to (Md = 1) when on holiday.
265
5.13.1 Summary comparison of composting behaviour between case study areas
To summarise Minehead case study area participants report a greater commitment
to composting of food waste when in their home environment compared to Paignton
case study area participants. In the holiday environment there is a large drop in
commitment in both case study areas probably due to the reason listed above, but
Paignton case study area participants are less likely than their Minehead
counterparts to compost their food waste when on holiday.
5.14 Conservation behaviours between case study areas
The next section will group the conservation behaviours assessed in the
questionnaire into together, these behaviours include the use of energy efficient
appliances, turning electrical appliances off from ‘stand by’, use of water saving
devices and using energy efficient light bulbs. A comparison will be made between
participants from the case study areas to see if there is a greater commitment to
these behaviours whilst in the home compared to the home environment. (Table 5.8)
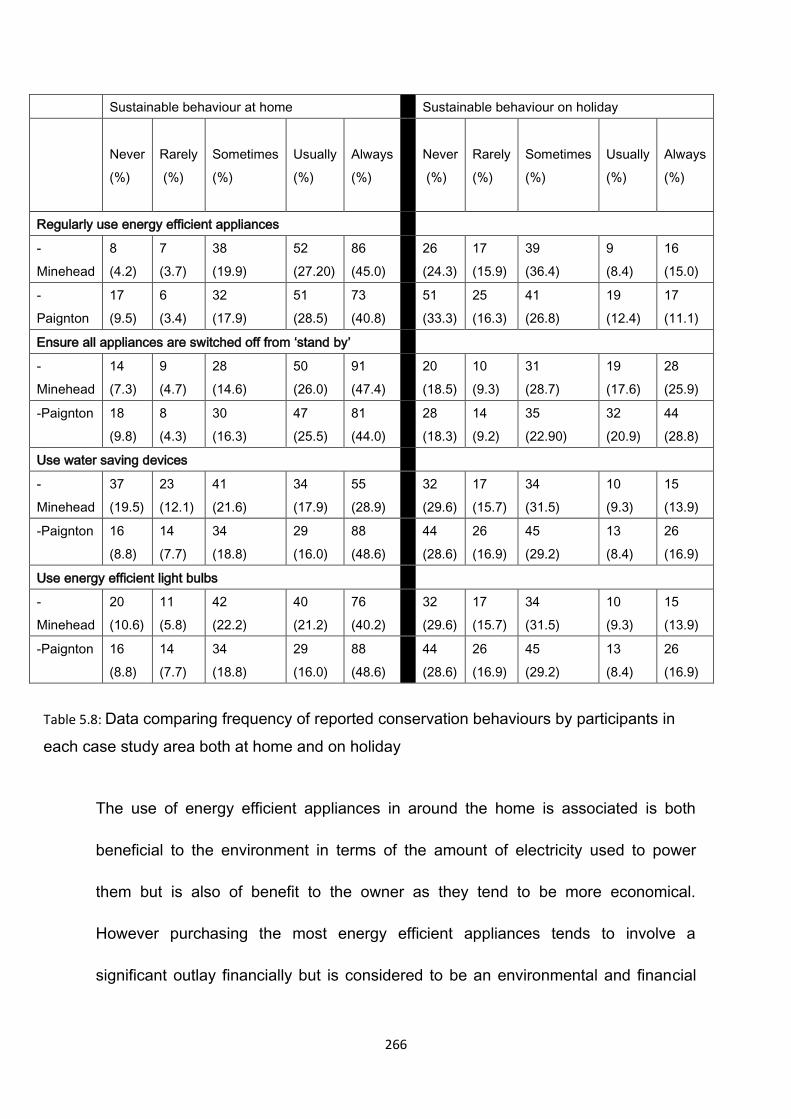
266
Sustainable behaviour at home Sustainable behaviour on holiday
Never
(%)
Rarely
(%)
Sometimes
(%)
Usually
(%)
Always
(%)
Never
(%)
Rarely
(%)
Sometimes
(%)
Usually
(%)
Always
(%)
Regularly use energy efficient appliances
-
Minehead
8
(4.2)
7
(3.7)
38
(19.9)
52
(27.20)
86
(45.0)
26
(24.3)
17
(15.9)
39
(36.4)
9
(8.4)
16
(15.0)
-
Paignton
17
(9.5)
6
(3.4)
32
(17.9)
51
(28.5)
73
(40.8)
51
(33.3)
25
(16.3)
41
(26.8)
19
(12.4)
17
(11.1)
Ensure all appliances are switched off from ‘stand by’
-
Minehead
14
(7.3)
9
(4.7)
28
(14.6)
50
(26.0)
91
(47.4)
20
(18.5)
10
(9.3)
31
(28.7)
19
(17.6)
28
(25.9)
-Paignton 18
(9.8)
8
(4.3)
30
(16.3)
47
(25.5)
81
(44.0)
28
(18.3)
14
(9.2)
35
(22.90)
32
(20.9)
44
(28.8)
Use water saving devices
-
Minehead
37
(19.5)
23
(12.1)
41
(21.6)
34
(17.9)
55
(28.9)
32
(29.6)
17
(15.7)
34
(31.5)
10
(9.3)
15
(13.9)
-Paignton 16
(8.8)
14
(7.7)
34
(18.8)
29
(16.0)
88
(48.6)
44
(28.6)
26
(16.9)
45
(29.2)
13
(8.4)
26
(16.9)
Use energy efficient light bulbs
-
Minehead
20
(10.6)
11
(5.8)
42
(22.2)
40
(21.2)
76
(40.2)
32
(29.6)
17
(15.7)
34
(31.5)
10
(9.3)
15
(13.9)
-Paignton 16
(8.8)
14
(7.7)
34
(18.8)
29
(16.0)
88
(48.6)
44
(28.6)
26
(16.9)
45
(29.2)
13
(8.4)
26
(16.9)
The use of energy efficient appliances in around the home is associated is both
beneficial to the environment in terms of the amount of electricity used to power
them but is also of benefit to the owner as they tend to be more economical.
However purchasing the most energy efficient appliances tends to involve a
significant outlay financially but is considered to be an environmental and financial
Table 5.8: Data comparing frequency of reported conservation behaviours by participants in
each case study area both at home and on holiday
267
investment. The current survey was interested in whether the participants were
committed in their use of energy efficient appliances at home and whether this
commitment extended into the holiday environment. Commitment in the holiday
environment, is of course, somewhat limited by what is provided by tourism
businesses but it could be argued that if ‘one’ is committed to the virtues of energy
efficient appliances then they might specifically seek out tourism providers that do
the same. The results show that 72.2% of Minehead case study area participants
‘usually’ (27.2%) or ‘always’ (45%) chose to use energy efficient appliances when in
their home environment whereas 69.3% of Paignton case study area participants
‘usually’ (28.5%) and ’always’ (40.8%) chose to use energy efficient appliances at
home. A Mann-Whitney U Test revealed there was no statistical difference in
reported frequency of the use of energy efficient appliances at home between
participants of either case study area Minehead (Md = 4, n =191) and Paignton (Md
= 4, n=179), U = 16058, z = -1.067, p = .28, r = .05.
In the holiday environment there is a definite ‘drop off’ in commitment to the use of
energy efficient appliances however the results for participants from both case study
areas were similar. Only 23.4% of Minehead case study participants and 23.5% of
Paignton case study participants reported to ‘usually’ or ‘always’ using energy
efficient appliances when on holiday. A Mann Whitney U Test further confirmed that
there was no statistical difference in reported use of energy efficient appliances
268
when on holiday in either case study area, Minehead (Md = 3, n = 107) and Paignton
(Md = 3, n = 153), U = 7414.5, z = -1.335, p = .18, r = .08).
A Wilcoxon Signed Rank test was performed to establish if there was a statistically
significant decrease in reported use of energy efficient appliances between home
and holiday environments for participants from each case study area. The test
revealed a statistically significant decrease in reported use of energy efficient
appliances from the home to the holiday environment in both case study areas,
Minehead, z =-6.767, p<.001, with a medium effect size (r= .3). The median score at
home for reported use of energy efficient appliances (Md = 4) decreased to (Md = 3)
when on holiday. Similar results were found for participants from the Paignton case
study area, the test revealed a statistically significant decrease in reported use of
energy efficient appliances between the home and holiday environment, z = 7.164,
p<.001, with a medium effect (r = .3). The median score for use of energy efficient
appliances at home (Md = 4) decreased to (Md = 3) when in the holiday
environment.
A further, but much simpler form of sustainable behaviour is the turning ‘off’ from
‘stand by’ of electrical appliances; the results of such behaviour have benefits for the
owner in terms of a reduction in power usage and thus cost but also in environmental
terms as the power is not wasted and thus conserved. 73.7% of participants from
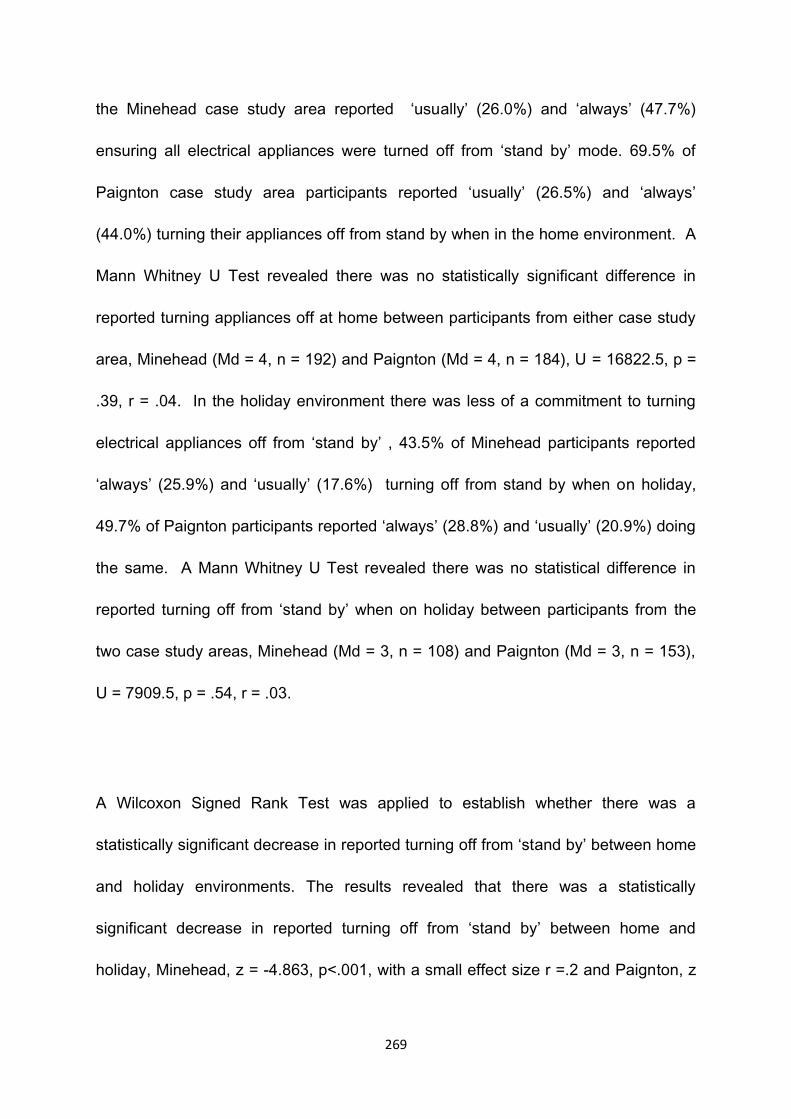
269
the Minehead case study area reported ‘usually’ (26.0%) and ‘always’ (47.7%)
ensuring all electrical appliances were turned off from ‘stand by’ mode. 69.5% of
Paignton case study area participants reported ‘usually’ (26.5%) and ‘always’
(44.0%) turning their appliances off from stand by when in the home environment. A
Mann Whitney U Test revealed there was no statistically significant difference in
reported turning appliances off at home between participants from either case study
area, Minehead (Md = 4, n = 192) and Paignton (Md = 4, n = 184), U = 16822.5, p =
.39, r = .04. In the holiday environment there was less of a commitment to turning
electrical appliances off from ‘stand by’ , 43.5% of Minehead participants reported
‘always’ (25.9%) and ‘usually’ (17.6%) turning off from stand by when on holiday,
49.7% of Paignton participants reported ‘always’ (28.8%) and ‘usually’ (20.9%) doing
the same. A Mann Whitney U Test revealed there was no statistical difference in
reported turning off from ‘stand by’ when on holiday between participants from the
two case study areas, Minehead (Md = 3, n = 108) and Paignton (Md = 3, n = 153),
U = 7909.5, p = .54, r = .03.
A Wilcoxon Signed Rank Test was applied to establish whether there was a
statistically significant decrease in reported turning off from ‘stand by’ between home
and holiday environments. The results revealed that there was a statistically
significant decrease in reported turning off from ‘stand by’ between home and
holiday, Minehead, z = -4.863, p<.001, with a small effect size r =.2 and Paignton, z
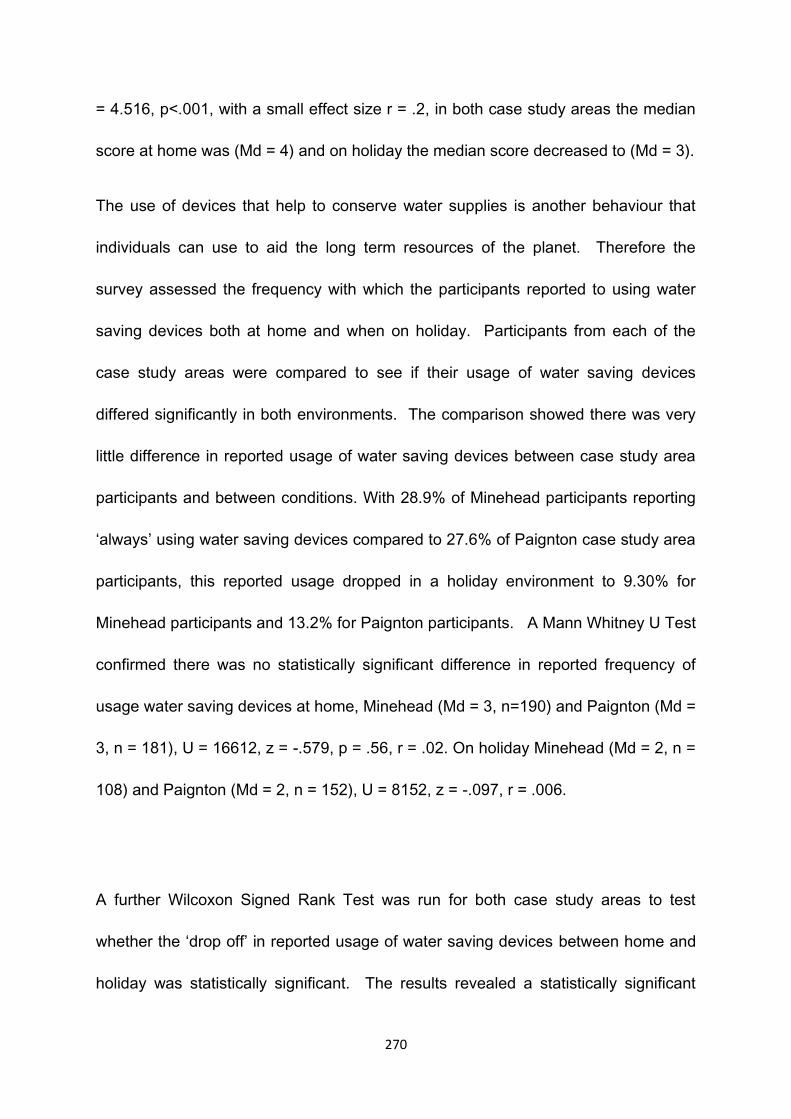
270
= 4.516, p<.001, with a small effect size r = .2, in both case study areas the median
score at home was (Md = 4) and on holiday the median score decreased to (Md = 3).
The use of devices that help to conserve water supplies is another behaviour that
individuals can use to aid the long term resources of the planet. Therefore the
survey assessed the frequency with which the participants reported to using water
saving devices both at home and when on holiday. Participants from each of the
case study areas were compared to see if their usage of water saving devices
differed significantly in both environments. The comparison showed there was very
little difference in reported usage of water saving devices between case study area
participants and between conditions. With 28.9% of Minehead participants reporting
‘always’ using water saving devices compared to 27.6% of Paignton case study area
participants, this reported usage dropped in a holiday environment to 9.30% for
Minehead participants and 13.2% for Paignton participants. A Mann Whitney U Test
confirmed there was no statistically significant difference in reported frequency of
usage water saving devices at home, Minehead (Md = 3, n=190) and Paignton (Md =
3, n = 181), U = 16612, z = -.579, p = .56, r = .02. On holiday Minehead (Md = 2, n =
108) and Paignton (Md = 2, n = 152), U = 8152, z = -.097, r = .006.
A further Wilcoxon Signed Rank Test was run for both case study areas to test
whether the ‘drop off’ in reported usage of water saving devices between home and
holiday was statistically significant. The results revealed a statistically significant
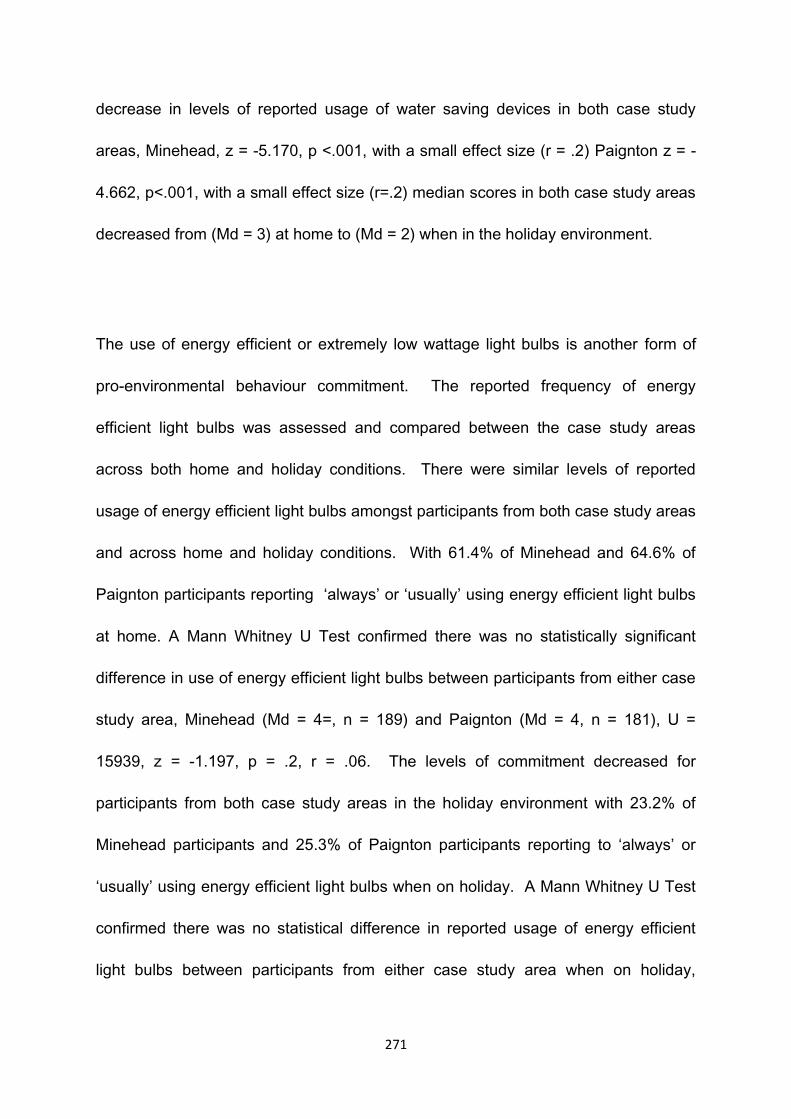
271
decrease in levels of reported usage of water saving devices in both case study
areas, Minehead, z = -5.170, p <.001, with a small effect size (r = .2) Paignton z = -
4.662, p<.001, with a small effect size (r=.2) median scores in both case study areas
decreased from (Md = 3) at home to (Md = 2) when in the holiday environment.
The use of energy efficient or extremely low wattage light bulbs is another form of
pro-environmental behaviour commitment. The reported frequency of energy
efficient light bulbs was assessed and compared between the case study areas
across both home and holiday conditions. There were similar levels of reported
usage of energy efficient light bulbs amongst participants from both case study areas
and across home and holiday conditions. With 61.4% of Minehead and 64.6% of
Paignton participants reporting ‘always’ or ‘usually’ using energy efficient light bulbs
at home. A Mann Whitney U Test confirmed there was no statistically significant
difference in use of energy efficient light bulbs between participants from either case
study area, Minehead (Md = 4=, n = 189) and Paignton (Md = 4, n = 181), U =
15939, z = -1.197, p = .2, r = .06. The levels of commitment decreased for
participants from both case study areas in the holiday environment with 23.2% of
Minehead participants and 25.3% of Paignton participants reporting to ‘always’ or
‘usually’ using energy efficient light bulbs when on holiday. A Mann Whitney U Test
confirmed there was no statistical difference in reported usage of energy efficient
light bulbs between participants from either case study area when on holiday,

272
Minehead (Md = 3, n = 108), and Paignton (Md = 3, n = 154), U = 8148, z = -.287, p
= .774, r = .01.
A Wilcoxon Signed Rank Test was performed to establish whether there was
statistically significant decrease in reported frequency of use energy efficient light
bulbs between home and holiday environments for participants from both case study
areas. The results revealed there was a statistically significant decrease in reported
usage of energy efficient light bulbs between home and holiday for participants from
both case study areas. Minehead, z = -6.692, p<.001, with a medium sized effect
(r=.3), Paignton, z =-7.097, p<.001, with a medium sized effect (r=.3) the median
scores for usage of energy efficient light bulbs was the same for participants from
both case study areas at home(Md = 4) this decreased to (Md = 3) when on holiday.
5.14.1 Summary of energy conservation behaviours between case study areas
In summary levels of commitment in the use of energy efficient appliances, switching
electrical appliances off from ‘stand by’, use of water saving devices and use of
energy efficient light bulbs did not significantly differ between participants from either
case study area or across home and holiday conditions. However there was
statistically significant decrease in all behaviours for participants from both case
study areas between home and holiday environments.
273
5.15 Pro-environmental Consumer Behaviour
Choices made when purchasing goods and services also reflects an individual’s
commitment to sustainable or pro-environmental causes. (Table 5.15) To this end
the survey gathered data regarding how frequently participants purchased eco-
friendly goods, organic food and food produced and sold locally via local farmers
markets this was assessed both in the home environment and when the participants
were on holiday. (Table 5.9)

274
The selection and purchase of goods that have less of a detrimental effect on the
environment to traditional products is another way of individuals showing their
commitment to pro-environmental issues.
Table 5.9: Comparing commitment to a range of pro-environmental consumer
behaviours between case study areas
Sustainable behaviour at home Sustainable behaviour on holiday
Never
(%)
Rarely
(%)
Sometimes
(%)
Usually
(%)
Always
(%)
Never
(%)
Rarely
(%)
Sometimes
(%)
Usually
(%)
Always
(%)
Purchase eco-friendly goods
-Minehead 30
(15.8)
29
(15.3)
84
(44.2)
25
(13.2)
22
(11.6)
33
(30.6)
15
(13.9)
42
(38.9)
11
(10.2)
7
(6.5)
- Paignton 30
(16.8)
24
(13.4)
86
(48.0)
21
(11.7)
18
(10.1)
53
(35.3)
21
(14.0)
58
(38.7)
9
(6.0)
9
(6.0)
Purchase organic food
-Minehead 33
(17.3)
38
(19.9)
80
(41.9)
24
(12.6)
16
(8.4)
29
(27.1)
25
(23.4)
35
(32.7)
11
(10.3)
7
(6.5)
-Paignton 47
(25.8)
38
(20.9)
70
(38.5)
12
(6.6)
15
(8.2)
63
(41.2)
26
(17.0)
51
(33.3)
4
(2.6)
9
(5.9)
Purchase food from local farmers markets
-Minehead 37
(19.3)
21
(10.9)
66
(34.4)
30
(15.6)
38
(19.8)
20
(18.3)
19
(17.4)
42
(38.5)
17
(15.6)
11
(10.1)
-Paignton 27
(14.9)
38
(21.0)
67
(37.0)
26
(14.4)
23
(12.7)
46
(30.5)
27
(17.9)
54
(35.8)
14
(9.3)
10
(6.6)

275
To this end the survey assessed how frequently the participants purchased eco-
friendly goods whilst in their home environment and whether this commitment
extended into the holiday environment and this behaviour was further compared
between participants from each of the case study areas. By far the most common
response from both case study areas in terms of frequency was that eco-goods
tended to be purchased ‘sometimes’ (44.2% - Minehead) and (48% - Paignton), just
over 30% of participants from both case study areas reported to ‘rarely’ or ‘never’
purchasing eco-goods when at home and only just over 10% in each case study
area reporting to ‘always’ purchasing eco-goods. A Mann Whitney U Test was
employed to establish whether there was a statistically significant difference in
purchasing of eco-goods amongst participants from each case study area. The test
revealed no statistical difference in levels of reported purchasing of eco-goods,
Minehead (Md = 3, n =190) and Paignton (Md = 3, n = 179), U = 16691.5, z = -.324,
p = .7, r = .01.
The reported frequency of purchasing eco-friendly goods decreased between the
home and holiday conditions for participants from both case study areas. A
Wilcoxon Signed Rank Test revealed that there was a statistically significant
reduction in reported purchasing eco-friendly goods between home and holiday,
Minehead, z = -4.741, p<.001, with a small effect (r = .2), Paignton, z = -5.026,
p<.001, with a small effect (r = .2). The median score for frequency of reported
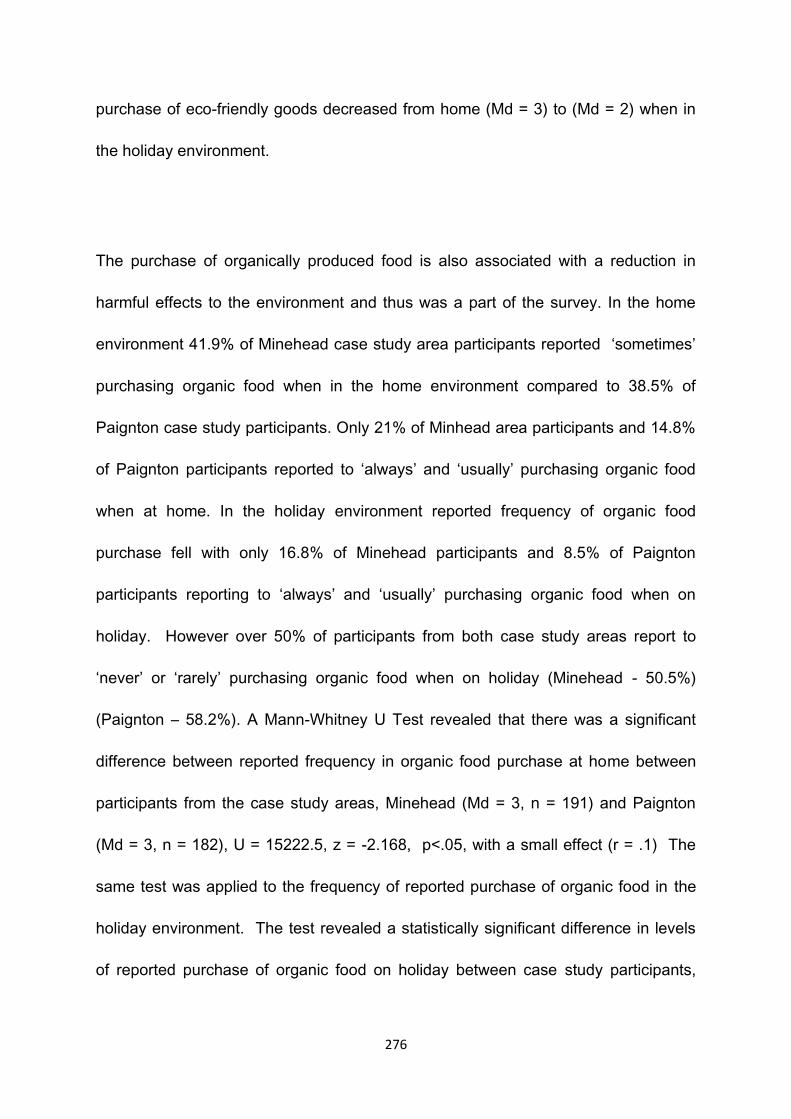
276
purchase of eco-friendly goods decreased from home (Md = 3) to (Md = 2) when in
the holiday environment.
The purchase of organically produced food is also associated with a reduction in
harmful effects to the environment and thus was a part of the survey. In the home
environment 41.9% of Minehead case study area participants reported ‘sometimes’
purchasing organic food when in the home environment compared to 38.5% of
Paignton case study participants. Only 21% of Minhead area participants and 14.8%
of Paignton participants reported to ‘always’ and ‘usually’ purchasing organic food
when at home. In the holiday environment reported frequency of organic food
purchase fell with only 16.8% of Minehead participants and 8.5% of Paignton
participants reporting to ‘always’ and ‘usually’ purchasing organic food when on
holiday. However over 50% of participants from both case study areas report to
‘never’ or ‘rarely’ purchasing organic food when on holiday (Minehead - 50.5%)
(Paignton – 58.2%). A Mann-Whitney U Test revealed that there was a significant
difference between reported frequency in organic food purchase at home between
participants from the case study areas, Minehead (Md = 3, n = 191) and Paignton
(Md = 3, n = 182), U = 15222.5, z = -2.168, p<.05, with a small effect (r = .1) The
same test was applied to the frequency of reported purchase of organic food in the
holiday environment. The test revealed a statistically significant difference in levels
of reported purchase of organic food on holiday between case study participants,
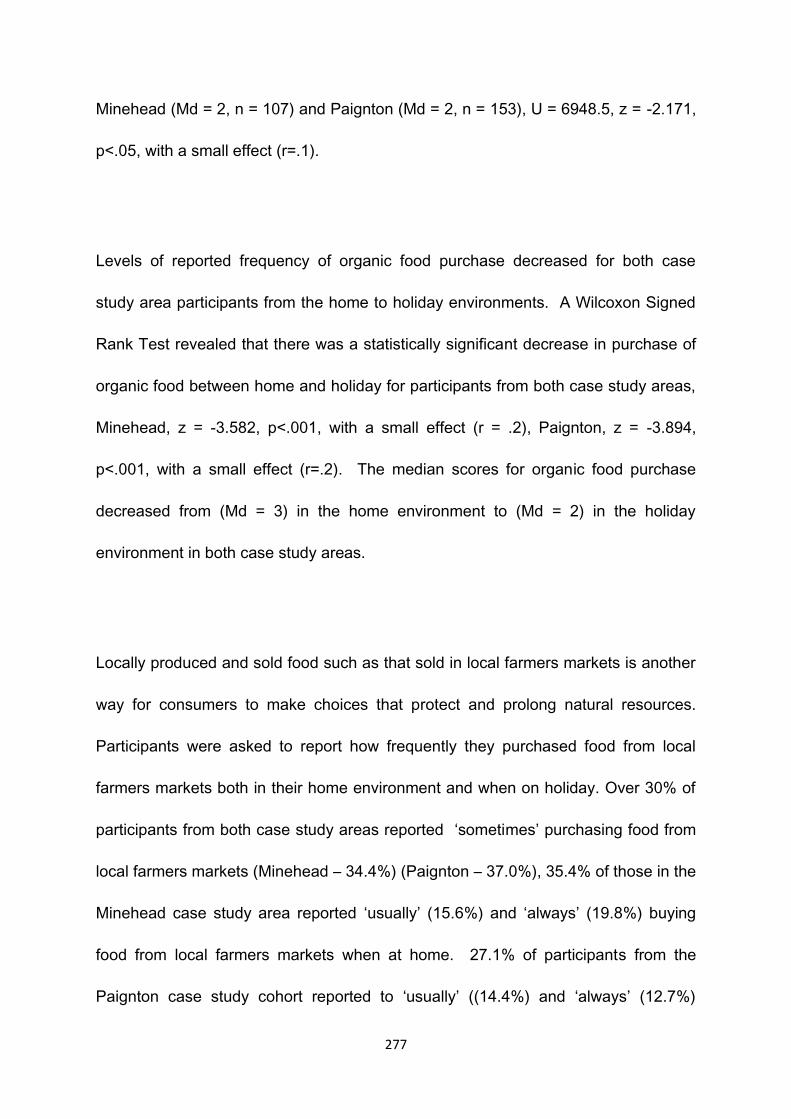
277
Minehead (Md = 2, n = 107) and Paignton (Md = 2, n = 153), U = 6948.5, z = -2.171,
p<.05, with a small effect (r=.1).
Levels of reported frequency of organic food purchase decreased for both case
study area participants from the home to holiday environments. A Wilcoxon Signed
Rank Test revealed that there was a statistically significant decrease in purchase of
organic food between home and holiday for participants from both case study areas,
Minehead, z = -3.582, p<.001, with a small effect (r = .2), Paignton, z = -3.894,
p<.001, with a small effect (r=.2). The median scores for organic food purchase
decreased from (Md = 3) in the home environment to (Md = 2) in the holiday
environment in both case study areas.
Locally produced and sold food such as that sold in local farmers markets is another
way for consumers to make choices that protect and prolong natural resources.
Participants were asked to report how frequently they purchased food from local
farmers markets both in their home environment and when on holiday. Over 30% of
participants from both case study areas reported ‘sometimes’ purchasing food from
local farmers markets (Minehead – 34.4%) (Paignton – 37.0%), 35.4% of those in the
Minehead case study area reported ‘usually’ (15.6%) and ‘always’ (19.8%) buying
food from local farmers markets when at home. 27.1% of participants from the
Paignton case study cohort reported to ‘usually’ ((14.4%) and ‘always’ (12.7%)
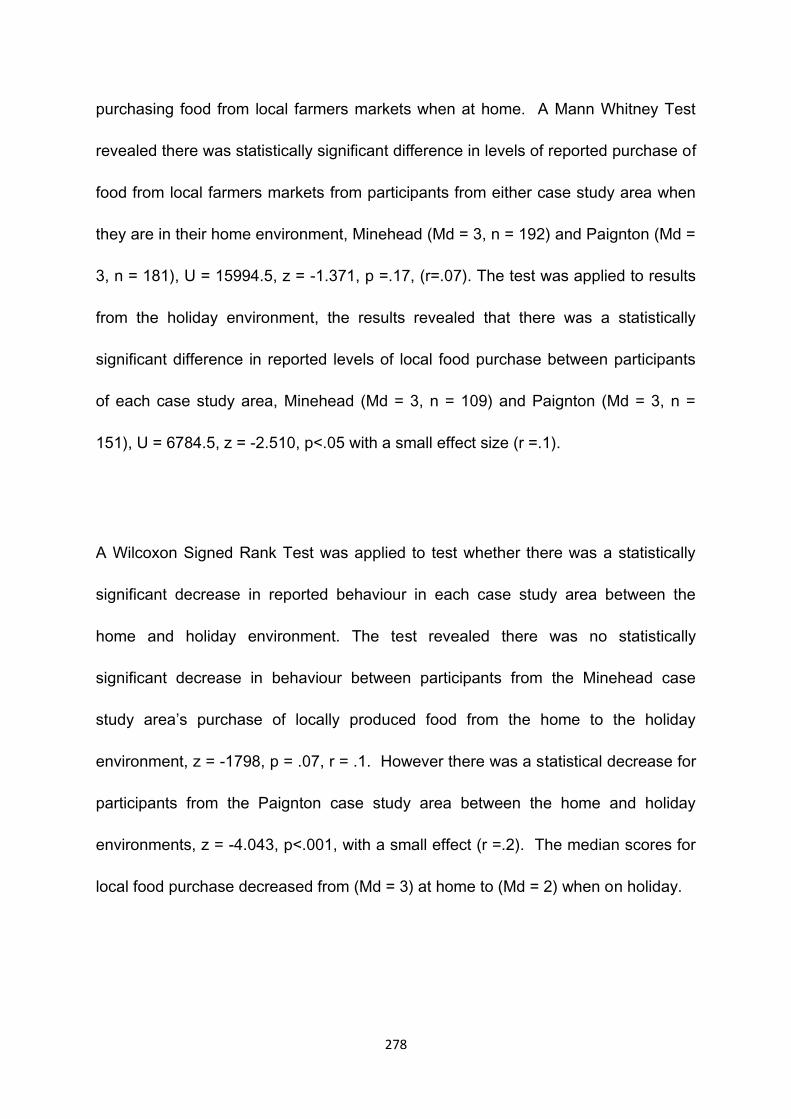
278
purchasing food from local farmers markets when at home. A Mann Whitney Test
revealed there was statistically significant difference in levels of reported purchase of
food from local farmers markets from participants from either case study area when
they are in their home environment, Minehead (Md = 3, n = 192) and Paignton (Md =
3, n = 181), U = 15994.5, z = -1.371, p =.17, (r=.07). The test was applied to results
from the holiday environment, the results revealed that there was a statistically
significant difference in reported levels of local food purchase between participants
of each case study area, Minehead (Md = 3, n = 109) and Paignton (Md = 3, n =
151), U = 6784.5, z = -2.510, p<.05 with a small effect size (r =.1).
A Wilcoxon Signed Rank Test was applied to test whether there was a statistically
significant decrease in reported behaviour in each case study area between the
home and holiday environment. The test revealed there was no statistically
significant decrease in behaviour between participants from the Minehead case
study area’s purchase of locally produced food from the home to the holiday
environment, z = -1798, p = .07, r = .1. However there was a statistical decrease for
participants from the Paignton case study area between the home and holiday
environments, z = -4.043, p<.001, with a small effect (r =.2). The median scores for
local food purchase decreased from (Md = 3) at home to (Md = 2) when on holiday.
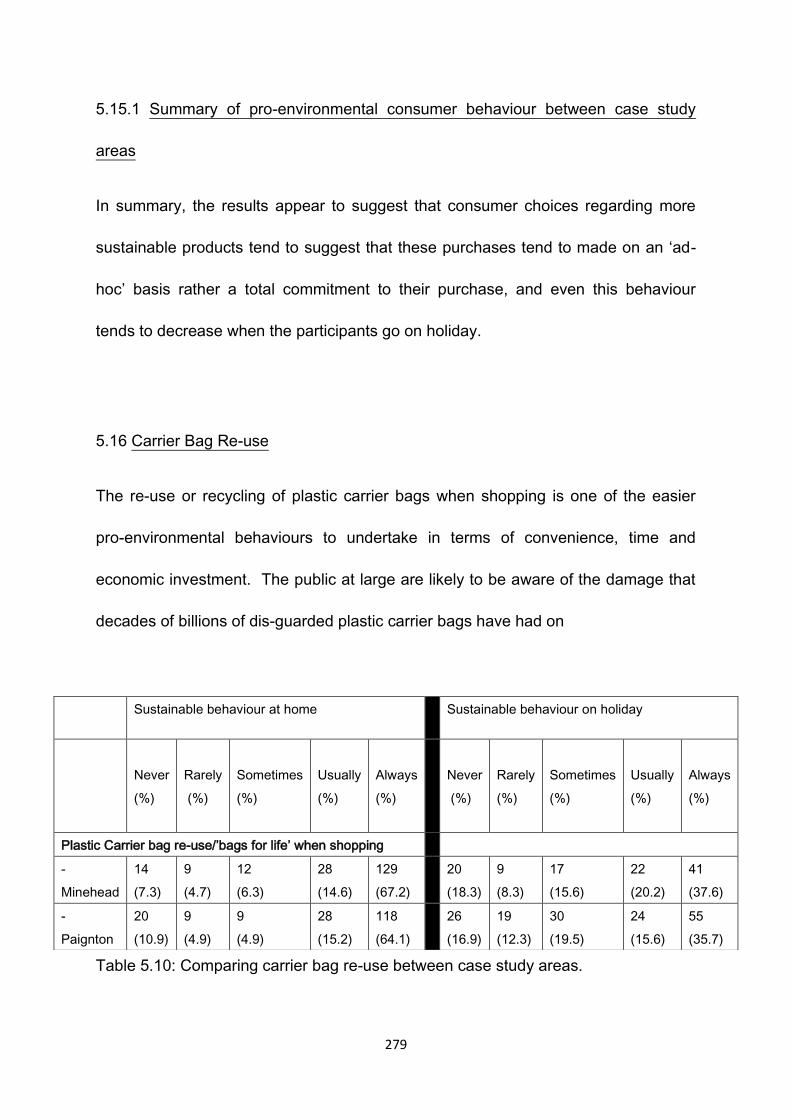
279
5.15.1 Summary of pro-environmental consumer behaviour between case study
areas
In summary, the results appear to suggest that consumer choices regarding more
sustainable products tend to suggest that these purchases tend to made on an ‘ad-
hoc’ basis rather a total commitment to their purchase, and even this behaviour
tends to decrease when the participants go on holiday.
5.16 Carrier Bag Re-use
The re-use or recycling of plastic carrier bags when shopping is one of the easier
pro-environmental behaviours to undertake in terms of convenience, time and
economic investment. The public at large are likely to be aware of the damage that
decades of billions of dis-guarded plastic carrier bags have had on
Table 5.10: Comparing carrier bag re-use between case study areas.
Sustainable behaviour at home Sustainable behaviour on holiday
Never
(%)
Rarely
(%)
Sometimes
(%)
Usually
(%)
Always
(%)
Never
(%)
Rarely
(%)
Sometimes
(%)
Usually
(%)
Always
(%)
Plastic Carrier bag re-use/’bags for life’ when shopping
-
Minehead
14
(7.3)
9
(4.7)
12
(6.3)
28
(14.6)
129
(67.2)
20
(18.3)
9
(8.3)
17
(15.6)
22
(20.2)
41
(37.6)
-
Paignton
20
(10.9)
9
(4.9)
9
(4.9)
28
(15.2)
118
(64.1)
26
(16.9)
19
(12.3)
30
(19.5)
24
(15.6)
55
(35.7)
280
the environment (Ritch, Brennan & Macleod, 2009). Therefore the survey gathered
information regarding the commitment participants made to limiting their use of
plastic carrier bags either by re-using or purchase of stronger longer life
bags(Convery, McDonnell & Ferreira, 2007) (Table 5.10).
The results showed there was a fairly strong commitment to the re-use of carrier
bags across participants from both case study areas, with 81.8% of Minehead case
study area participants reporting either ‘usually’ (14.6%) or ‘always’ (67.2%) re-using
carrier bags or using longer life bags when shopping in the home environment.
Similar commitment was seen amongst Paignton participants where 79.3% reported
‘usually’ (15.2%) or ‘always’ (64.1%) re-using their carrier bags when at home. A
Mann Whitney U Test revealed there was no statistical significant difference in
reported re-use of carrier bags at home between case study area participants,
Minehead (Md = 5, n = 192) and Paignton (Md = 5, n = 184), U = 16984.5, z = -.764,
p = .44, (r = .03).
Reported carrier bag re-use was measured in the holiday environment, and has
been recorded for the previous behaviours there was a decrease in the frequency of
the behaviour. In both case study area just over 37% of participants reported to
‘always’ re-using their carrier bags when in the holiday environment. A Mann
Whitney U Test revealed there was no statistically significant difference in reported
281
re-use of carrier bags between either case study area participants when they were in
the holiday environment, Minehead (Md = 4, n = 109) and Paignton (Md = 4, n =
154), U = 8086, z = -.523, p =.6, (r = .03).
A Wilcoxon Signed Rank Test applied to both data gathered from both case study
areas revealed there was a statistically significant decrease in reported re-use of
carrier bags from the home to the holiday environments, Minehead, z = -4.355, p
<.001, r =.2 (small effect) and Paignton z = -5.918, p<.001, (r =.2). The median
scores for carrier bag re-use for participants from each case study area decreased
from (Md = 5) in the home environment to (Md = 4) when in the holiday environment.
15.7 Transport behaviour
One of the most important aspects of pro-environmental behaviour rests upon
decisions made regarding transport; therefore the survey gathered data regarding
how frequently the participants chose to use public transport, walk or cycle where
conditions made it possible. (Table 5.11)
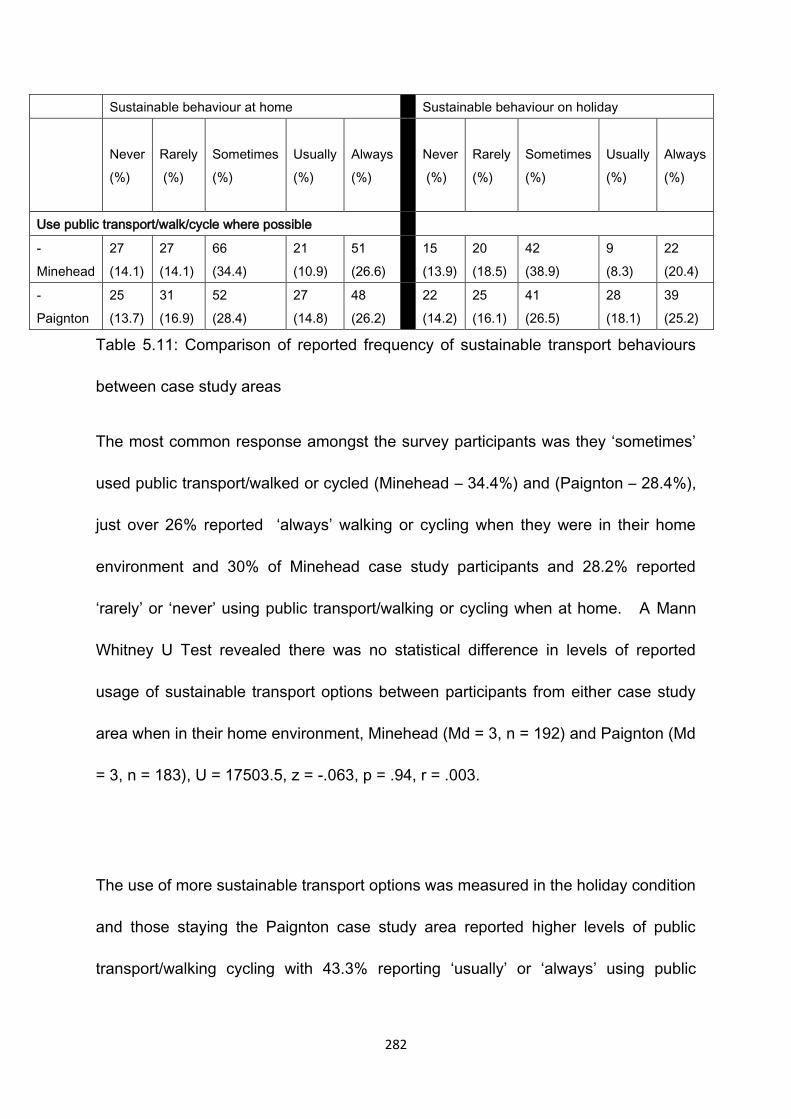
282
Sustainable behaviour at home Sustainable behaviour on holiday
Never
(%)
Rarely
(%)
Sometimes
(%)
Usually
(%)
Always
(%)
Never
(%)
Rarely
(%)
Sometimes
(%)
Usually
(%)
Always
(%)
Use public transport/walk/cycle where possible
-
Minehead
27
(14.1)
27
(14.1)
66
(34.4)
21
(10.9)
51
(26.6)
15
(13.9)
20
(18.5)
42
(38.9)
9
(8.3)
22
(20.4)
-
Paignton
25
(13.7)
31
(16.9)
52
(28.4)
27
(14.8)
48
(26.2)
22
(14.2)
25
(16.1)
41
(26.5)
28
(18.1)
39
(25.2)
Table 5.11: Comparison of reported frequency of sustainable transport behaviours
between case study areas
The most common response amongst the survey participants was they ‘sometimes’
used public transport/walked or cycled (Minehead – 34.4%) and (Paignton – 28.4%),
just over 26% reported ‘always’ walking or cycling when they were in their home
environment and 30% of Minehead case study participants and 28.2% reported
‘rarely’ or ‘never’ using public transport/walking or cycling when at home. A Mann
Whitney U Test revealed there was no statistical difference in levels of reported
usage of sustainable transport options between participants from either case study
area when in their home environment, Minehead (Md = 3, n = 192) and Paignton (Md
= 3, n = 183), U = 17503.5, z = -.063, p = .94, r = .003.
The use of more sustainable transport options was measured in the holiday condition
and those staying the Paignton case study area reported higher levels of public
transport/walking cycling with 43.3% reporting ‘usually’ or ‘always’ using public
283
transport/walking or cycling when on holiday compared to 28.7% of Minehead
participants. Just over 30% of participants from both case study areas reported to
‘never’ or ‘rarely’ using sustainable transport options when on holiday. A Mann
Whitney U test revealed there was statistically significant difference in reported
levels of sustainable transport between participants from either case study area
when on holiday, Minehead (Md = 3, n = 108) and Paignton (Md = 3, n = 155), U =
7589, z = -1.324, p = .18, (r = .08).
The results from both case study areas were compared between home and holiday
condition using a Wilcoxon Signed Rank Test, the results revealed there was a
statistically significant difference between reported use of sustainable transport
options between home and holiday for participants from the Minehead case study
area, z = -2.614, p <.05, r = -1. However there was no statistical difference between
home and holiday conditions for participants from the Paignton case study area, z =
-.049, p = .96, r = .002.
5.18 Summary results – pro-environmental behaviour comparison between case
study areas
The results of the comparison of levels of reported pro-environmental behaviour
between participants from both case study areas at home and on holiday are fairly
284
consistent, in so much as there appears to be very little difference in the levels of
reported behaviours across the participants regardless of which case study area they
were a member of. Some behaviours, particularly the easier, less economical or
time heavy behaviours show the greatest levels of commitment, such as recycling,
switching electrical appliances off from ‘stand by’ mode, use of energy efficient light
bulbs and re-use of plastic carrier bags. On the other hand, use of water saving
devices, consumer behaviour and food choices appear to be behaviours that are
‘sometimes’ undertaken. Sustainable transport options are another area where
participants showed consistently low levels of commitment both at home and when
on holiday.
Participants from both case study areas all reported a ‘drop off’ in sustainable
behaviours between the home and holiday environment suggesting that even
behaviours that are routine in the home environment do not continue to be so when
the participants were on holiday.
The next section of the chapter will be devoted to exploration of the data collected in
order to quantify the environmental impact of tourist behaviour using the REAP for
Tourism ecological footprinting software program.
285
5.19 Quantifying the environmental impact of tourist onsite behaviour using REAP for
Tourism Ecological Footprint Software.
5.19.1 Introduction
The survey contained a section designed to collect data pertaining to quantifying the
impact of tourist behaviour on the environment. The data contained information
regarding destination, accommodation choices, distance travelled, transport to, from
and during holiday, consumer spend and activities undertaken during the holiday.
This data was inputted to the REAP for Tourism computer software and Ecological
Footprint, Carbon Footprint and Greenhouse Gas Emissions were calculated for
each participant who supplied complete information for each of the above sections.
The questionnaire provided 142 useable datasets which were inputted into the REAP
for Tourism computer software. The results provided total ecological footprint,
carbon footprint and greenhouse gas emissions associated with the data provided by
each of the participants. The REAP calculator also allows impact to be calculated by
day as well as for the complete holiday. This enables comparisons to be made
between those undertaking longer holidays and those on shorter vacations.
286
15.9.2 Describing the ecological footprint by accommodation type for each case
study area
The data gathered from the questionnaire was inputted into the REAP for Tourism
software and generated an individual ecological footprint for each participant. 142
participants successfully completed the section of the questionnaire dedicated to
gathering ecological footprinting data, 49 participants were staying in Minehead and
93 were staying in the Paignton case study area. (Table 5.12) (There was a
relatively low respondent rate for this particular section of the survey, this is probably
due to the nature and type of information required. In order to provide usable data
the survey required detailed estimation of spending in multiple categories and
quantification of activities undertaken or expected to be undertaken during the
holiday. Many of the participants may have found this information difficult to provide,
either because was perceived as too intrusive or because they found it difficult to
know in advance what their monetary outlay might be or what activities they would
be likely to undertake).

287
Nights spent in the region
All Paignton Minehead
Hotels 240 161 79
VFR 70 27 43
Self-catering 202 136 66
Holiday Parks 119 91 28
Camping 241 154 87
Total 872 569 303
Table 5.12: Nights spent in the South West by case study area used in the REAP
Tourism analysis.
872 nights were spent in the South West of England by the participants of this
survey. 569 of these nights were spent in the Paignton case study area and 303
were spent in the Minehead case study area. 240 nights were spent in hotel
accommodation, 161 of these were spent in Paignton case study area and 79 were
spent in Minehead. 70 in total were spent visiting friends and relatives, 27 in
Paignton and 43 in Minehead. 202 nights were spent in self-catering
accommodation, 136 of these were spent in Paignton and 66 nights were spent in
Minehead. 119 nights were spent in holiday park accommodation, 91 of these nights
were in Paignton and 28 in Minehead. In total 241 nights were spent camping, 154
were staying in the Paignton case study area and 87 nights in the MInehead case
study area.
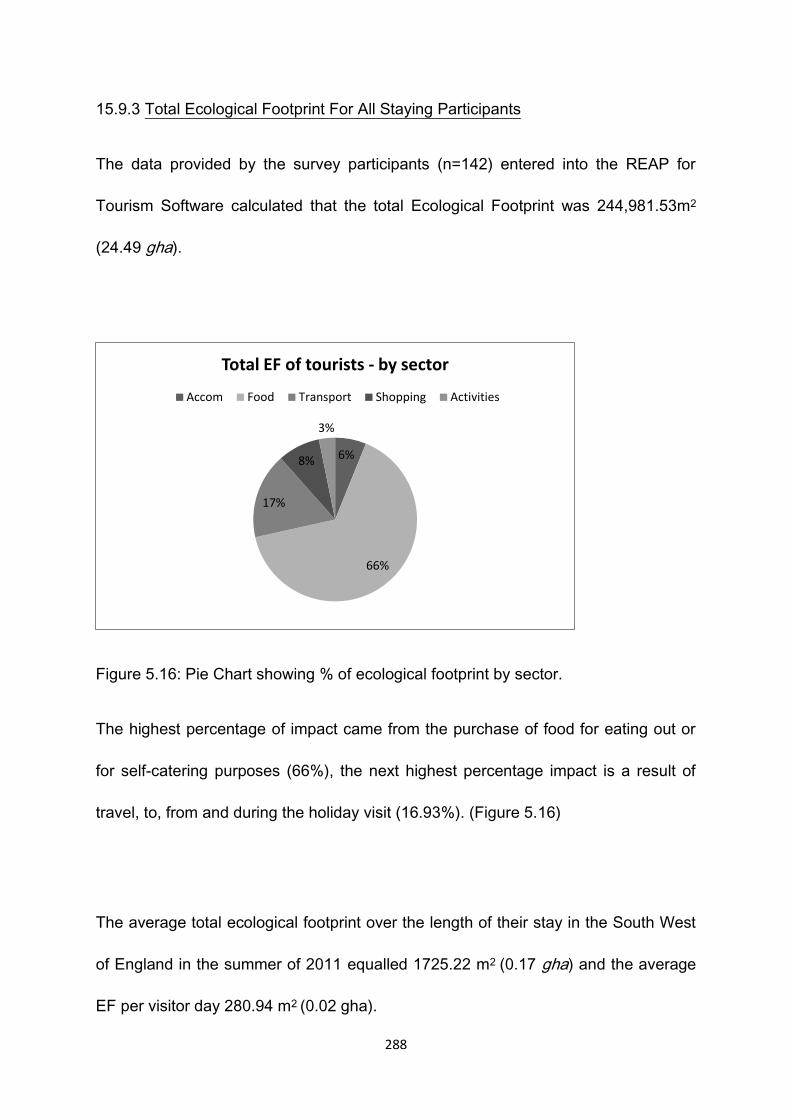
288
15.9.3 Total Ecological Footprint For All Staying Participants
The data provided by the survey participants (n=142) entered into the REAP for
Tourism Software calculated that the total Ecological Footprint was 244,981.53m2
(24.49 gha).
Figure 5.16: Pie Chart showing % of ecological footprint by sector.
The highest percentage of impact came from the purchase of food for eating out or
for self-catering purposes (66%), the next highest percentage impact is a result of
travel, to, from and during the holiday visit (16.93%). (Figure 5.16)
The average total ecological footprint over the length of their stay in the South West
of England in the summer of 2011 equalled 1725.22 m2 (0.17 gha) and the average
EF per visitor day 280.94 m2 (0.02 gha).
6%
66%
17%
8%
3%
Total EF of tourists - by sector
Accom Food Transport Shopping Activities

289
5.20 Comparing total ecological footprint between case study areas
An analysis was run using the REAP for Tourism software to calculate the ecological
impact of those participants staying in the two case study areas. (Table 5.13)
Participants from the Paignton case study area had the highest total impact with EF
totalling 147264.35m2 (14.73gha) and participants from the Minehead case study
area had a total EF of 97717.18m2 (9.77 gha). Food in both case study areas
created the greatest ecological footprint (96400.93 m2 – Paignton and Minehead –
63802.12 m2).
5.20.1 Comparing average daily ecological footprint between case study areas
Minehead (n=49) Paignton (n=93)
Average EF
per visitor
(m2)
Average EF
Per visitor day
(m2)
Average EF
per visitor
(m2)
Average EF
Per visitor day
(m2)
Accommodation 108.40 17.53 104.19 17.03
Food 1302.08 210.57 1036.57 169.42
Travel 337.20 54.53 268.26 43.85
Shopping 188.52 30.49 120.96 19.77
Activities 58.02 9.38 53.51 8.75
Total 1994.23 322.50 1583.49 258.81
Average EF impact (Table 5.13) were calculated by case study area to establish Table 5.13: Comparison average daily EF between case study areas
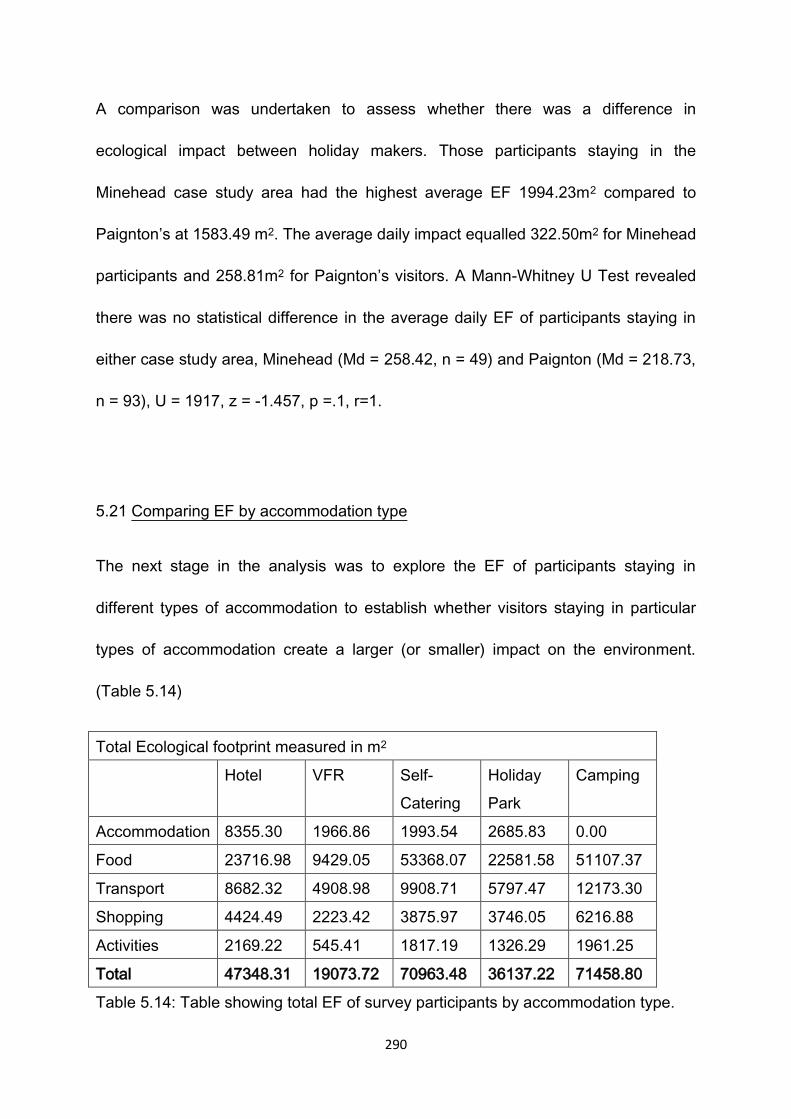
290
A comparison was undertaken to assess whether there was a difference in
ecological impact between holiday makers. Those participants staying in the
Minehead case study area had the highest average EF 1994.23m2 compared to
Paignton’s at 1583.49 m2. The average daily impact equalled 322.50m2 for Minehead
participants and 258.81m2 for Paignton’s visitors. A Mann-Whitney U Test revealed
there was no statistical difference in the average daily EF of participants staying in
either case study area, Minehead (Md = 258.42, n = 49) and Paignton (Md = 218.73,
n = 93), U = 1917, z = -1.457, p =.1, r=1.
5.21 Comparing EF by accommodation type
The next stage in the analysis was to explore the EF of participants staying in
different types of accommodation to establish whether visitors staying in particular
types of accommodation create a larger (or smaller) impact on the environment.
(Table 5.14)
Total Ecological footprint measured in m2
Hotel VFR Self-
Catering
Holiday
Park
Camping
Accommodation 8355.30 1966.86 1993.54 2685.83 0.00
Food 23716.98 9429.05 53368.07 22581.58 51107.37
Transport 8682.32 4908.98 9908.71 5797.47 12173.30
Shopping 4424.49 2223.42 3875.97 3746.05 6216.88
Activities 2169.22 545.41 1817.19 1326.29 1961.25
Total 47348.31 19073.72 70963.48 36137.22 71458.80
Table 5.14: Table showing total EF of survey participants by accommodation type.
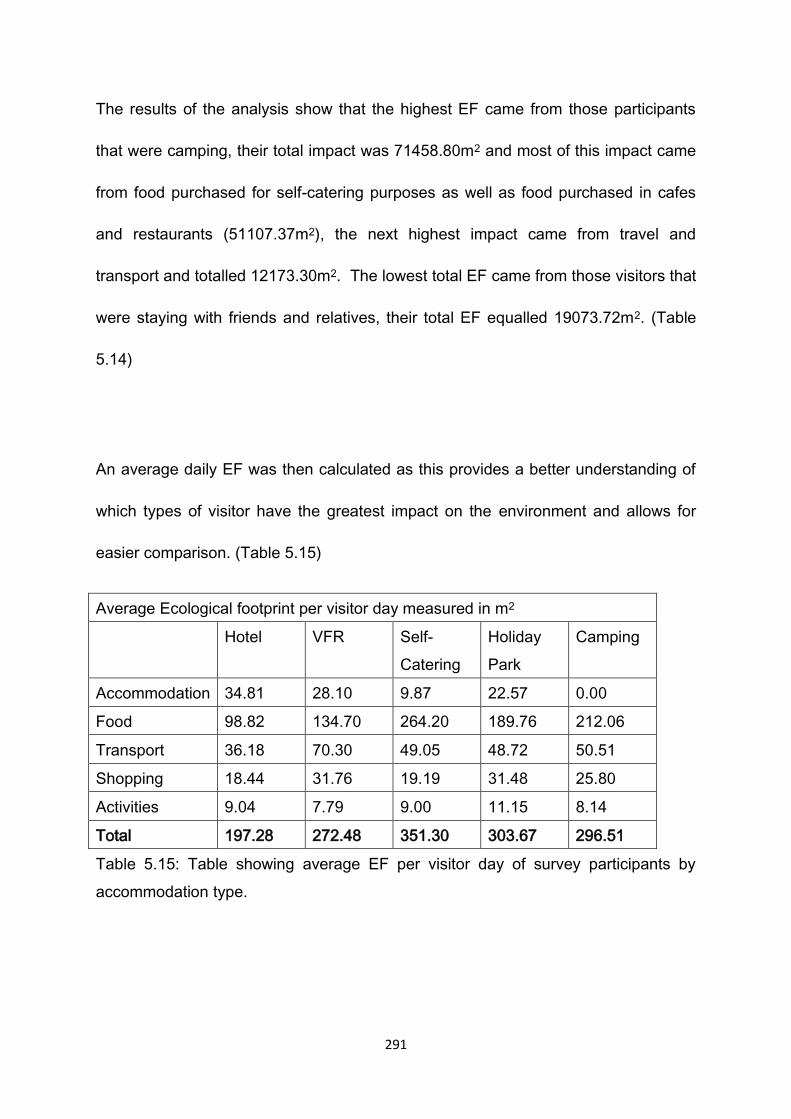
291
The results of the analysis show that the highest EF came from those participants
that were camping, their total impact was 71458.80m2 and most of this impact came
from food purchased for self-catering purposes as well as food purchased in cafes
and restaurants (51107.37m2), the next highest impact came from travel and
transport and totalled 12173.30m2. The lowest total EF came from those visitors that
were staying with friends and relatives, their total EF equalled 19073.72m2. (Table
5.14)
An average daily EF was then calculated as this provides a better understanding of
which types of visitor have the greatest impact on the environment and allows for
easier comparison. (Table 5.15)
Average Ecological footprint per visitor day measured in m2
Hotel VFR Self-
Catering
Holiday
Park
Camping
Accommodation 34.81 28.10 9.87 22.57 0.00
Food 98.82 134.70 264.20 189.76 212.06
Transport 36.18 70.30 49.05 48.72 50.51
Shopping 18.44 31.76 19.19 31.48 25.80
Activities 9.04 7.79 9.00 11.15 8.14
Total 197.28 272.48 351.30 303.67 296.51
Table 5.15: Table showing average EF per visitor day of survey participants by
accommodation type.
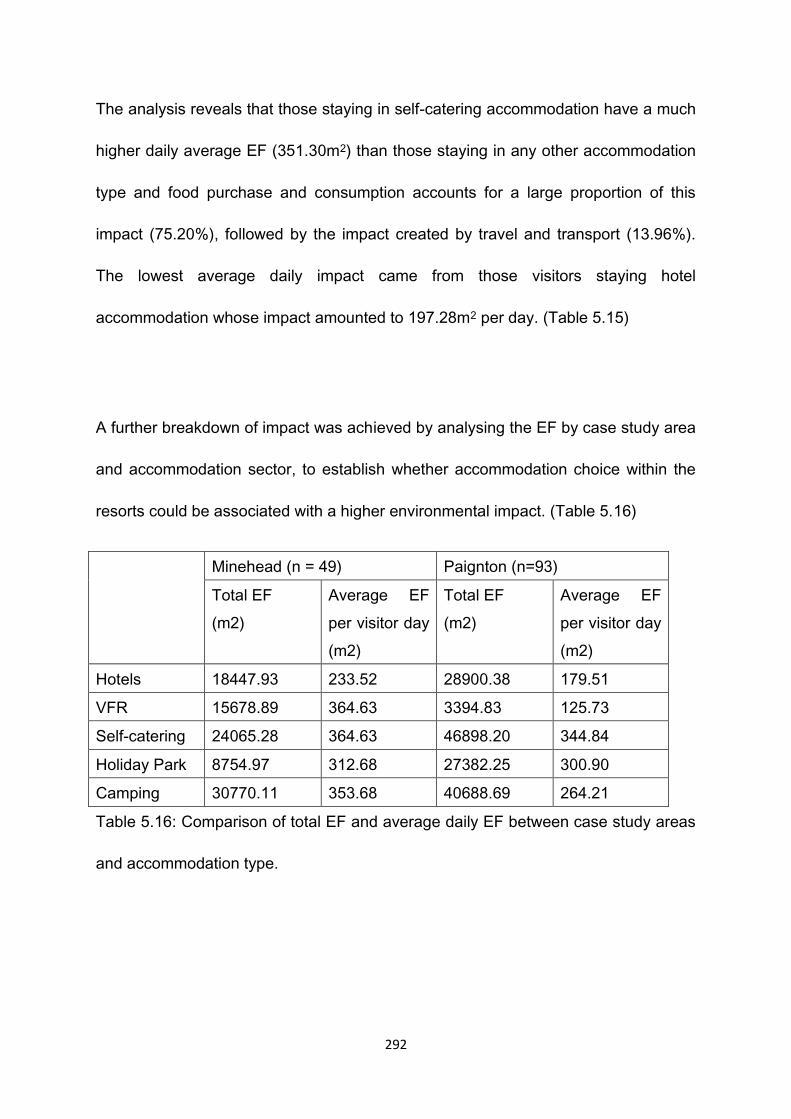
292
The analysis reveals that those staying in self-catering accommodation have a much
higher daily average EF (351.30m2) than those staying in any other accommodation
type and food purchase and consumption accounts for a large proportion of this
impact (75.20%), followed by the impact created by travel and transport (13.96%).
The lowest average daily impact came from those visitors staying hotel
accommodation whose impact amounted to 197.28m2 per day. (Table 5.15)
A further breakdown of impact was achieved by analysing the EF by case study area
and accommodation sector, to establish whether accommodation choice within the
resorts could be associated with a higher environmental impact. (Table 5.16)
Minehead (n = 49) Paignton (n=93)
Total EF
(m2)
Average EF
per visitor day
(m2)
Total EF
(m2)
Average EF
per visitor day
(m2)
Hotels 18447.93 233.52 28900.38 179.51
VFR 15678.89 364.63 3394.83 125.73
Self-catering 24065.28 364.63 46898.20 344.84
Holiday Park 8754.97 312.68 27382.25 300.90
Camping 30770.11 353.68 40688.69 264.21
Table 5.16: Comparison of total EF and average daily EF between case study areas
and accommodation type.
293
Upon review of the results it is possible to illustrate that participants staying in the
Minehead case study area had a higher average EF per visitor day across all
accommodation types. Those participants staying with friends and relatives and
those staying in self-catering accommodation in the Minehead case study area had
the highest average daily EF at 364.63m2. The next highest average daily EF was
found to be those participants camping in the Minehead case study area their impact
totalled 353.68m2. In the Paignton case study area the highest average daily EF
was found in those participants who were staying in self-catering accommodation
344.84m2. The lowest daily EF was for the participants who were staying with friends
and relatives in the Paignton case study area their footprint totalled 125.73m2.
5.21.1 Exploring the EF of those staying in ‘serviced’ accommodation
The next stage of the process was to drill down further to see where the majority of
the impact was generated for each case study area by specific accommodation type.
The rationale being – does the type of accommodation selected for a holiday have
an effect on ecological impact?
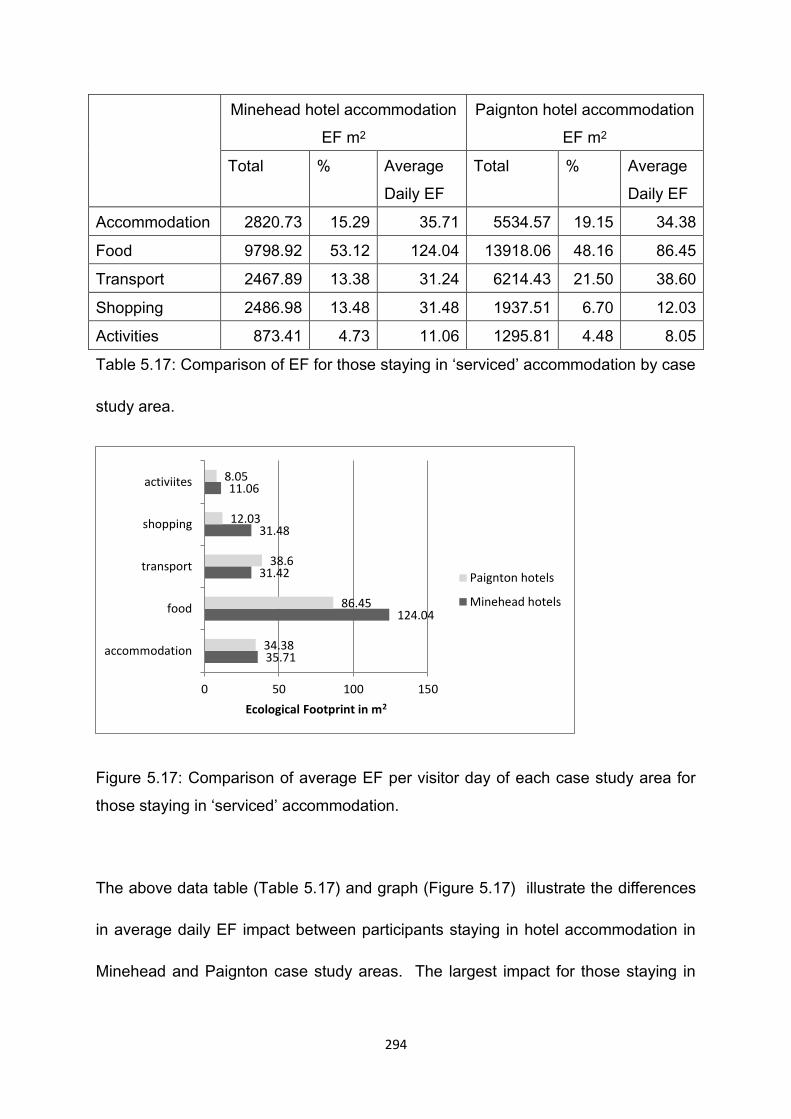
294
Minehead hotel accommodation
EF m2
Paignton hotel accommodation
EF m2
Total % Average
Daily EF
Total % Average
Daily EF
Accommodation 2820.73 15.29 35.71 5534.57 19.15 34.38
Food 9798.92 53.12 124.04 13918.06 48.16 86.45
Transport 2467.89 13.38 31.24 6214.43 21.50 38.60
Shopping 2486.98 13.48 31.48 1937.51 6.70 12.03
Activities 873.41 4.73 11.06 1295.81 4.48 8.05
Table 5.17: Comparison of EF for those staying in ‘serviced’ accommodation by case
study area.
Figure 5.17: Comparison of average EF per visitor day of each case study area for
those staying in ‘serviced’ accommodation.
The above data table (Table 5.17) and graph (Figure 5.17) illustrate the differences
in average daily EF impact between participants staying in hotel accommodation in
Minehead and Paignton case study areas. The largest impact for those staying in
35.71
124.04
31.42
31.48
11.06
34.38
86.45
38.6
12.03
8.05
0 50 100 150
accommodation
food
transport
shopping
activiites
Ecological Footprint in m2
Paignton hotels
Minehead hotels
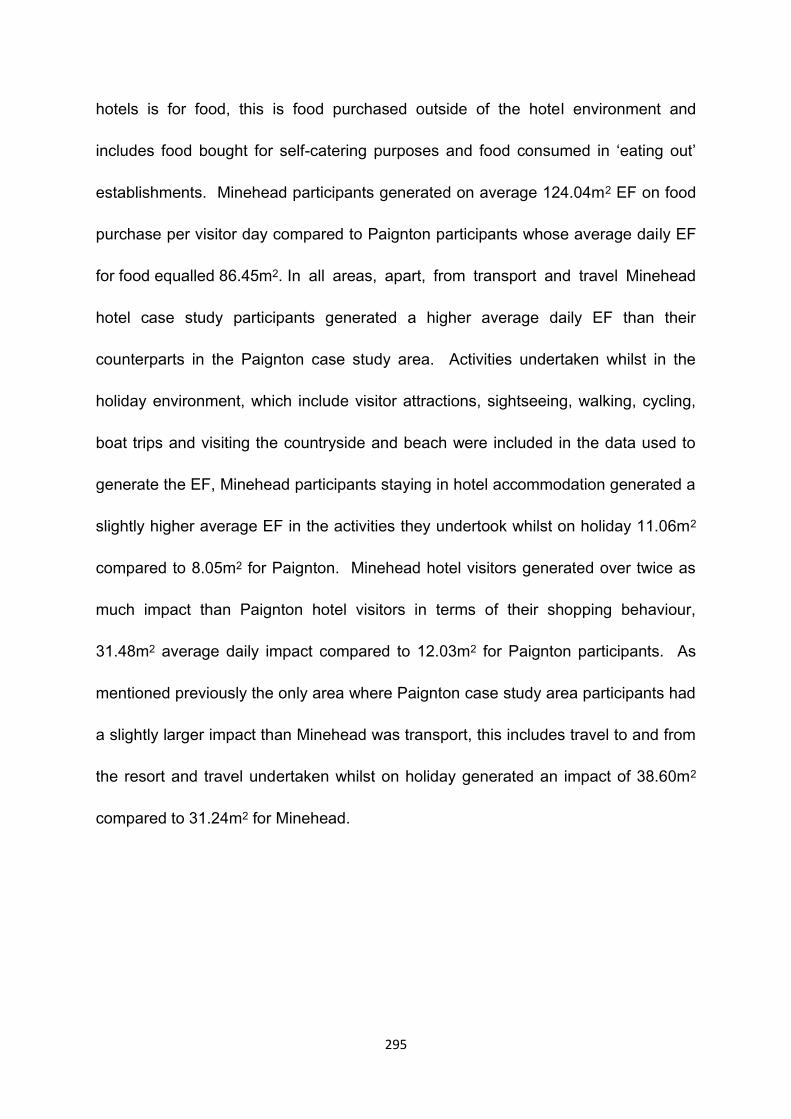
295
hotels is for food, this is food purchased outside of the hotel environment and
includes food bought for self-catering purposes and food consumed in ‘eating out’
establishments. Minehead participants generated on average 124.04m2 EF on food
purchase per visitor day compared to Paignton participants whose average daily EF
for food equalled 86.45m2. In all areas, apart, from transport and travel Minehead
hotel case study participants generated a higher average daily EF than their
counterparts in the Paignton case study area. Activities undertaken whilst in the
holiday environment, which include visitor attractions, sightseeing, walking, cycling,
boat trips and visiting the countryside and beach were included in the data used to
generate the EF, Minehead participants staying in hotel accommodation generated a
slightly higher average EF in the activities they undertook whilst on holiday 11.06m2
compared to 8.05m2 for Paignton. Minehead hotel visitors generated over twice as
much impact than Paignton hotel visitors in terms of their shopping behaviour,
31.48m2 average daily impact compared to 12.03m2 for Paignton participants. As
mentioned previously the only area where Paignton case study area participants had
a slightly larger impact than Minehead was transport, this includes travel to and from
the resort and travel undertaken whilst on holiday generated an impact of 38.60m2
compared to 31.24m2 for Minehead.
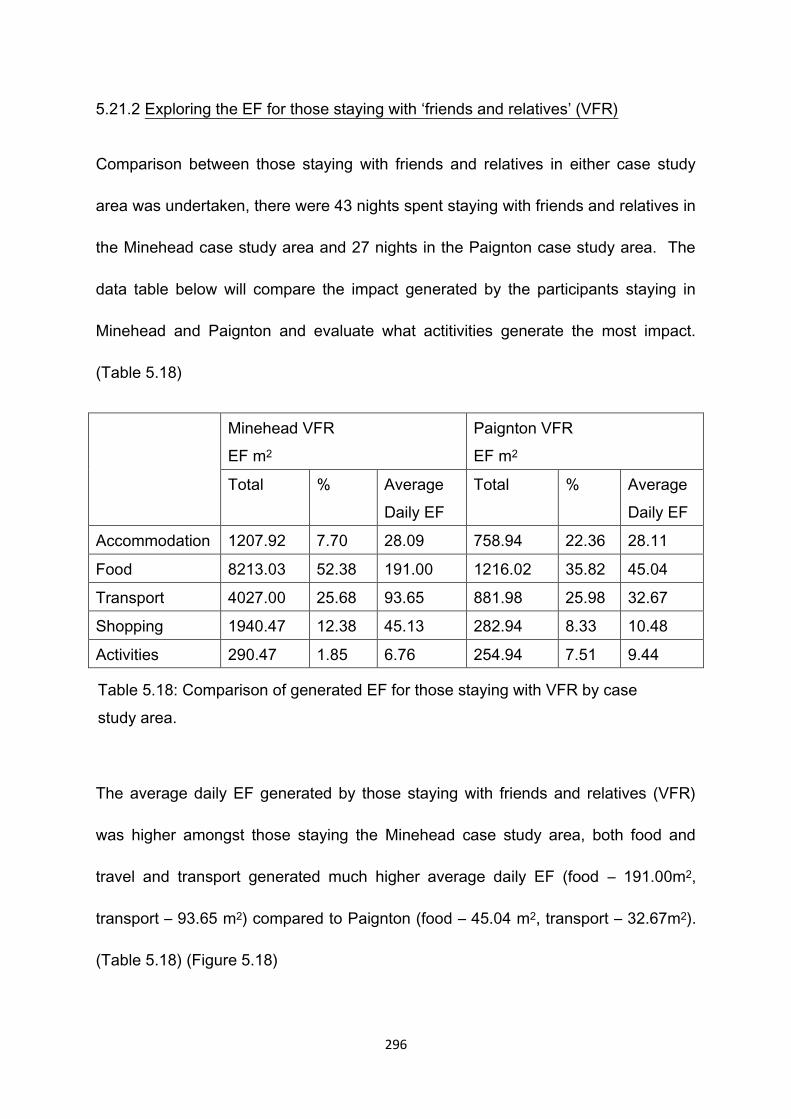
296
5.21.2 Exploring the EF for those staying with ‘friends and relatives’ (VFR)
Comparison between those staying with friends and relatives in either case study
area was undertaken, there were 43 nights spent staying with friends and relatives in
the Minehead case study area and 27 nights in the Paignton case study area. The
data table below will compare the impact generated by the participants staying in
Minehead and Paignton and evaluate what actitivities generate the most impact.
(Table 5.18)
Minehead VFR
EF m2
Paignton VFR
EF m2
Total % Average
Daily EF
Total % Average
Daily EF
Accommodation 1207.92 7.70 28.09 758.94 22.36 28.11
Food 8213.03 52.38 191.00 1216.02 35.82 45.04
Transport 4027.00 25.68 93.65 881.98 25.98 32.67
Shopping 1940.47 12.38 45.13 282.94 8.33 10.48
Activities 290.47 1.85 6.76 254.94 7.51 9.44
The average daily EF generated by those staying with friends and relatives (VFR)
was higher amongst those staying the Minehead case study area, both food and
travel and transport generated much higher average daily EF (food – 191.00m2,
transport – 93.65 m2) compared to Paignton (food – 45.04 m2, transport – 32.67m2).
(Table 5.18) (Figure 5.18)
Table 5.18: Comparison of generated EF for those staying with VFR by case
study area.
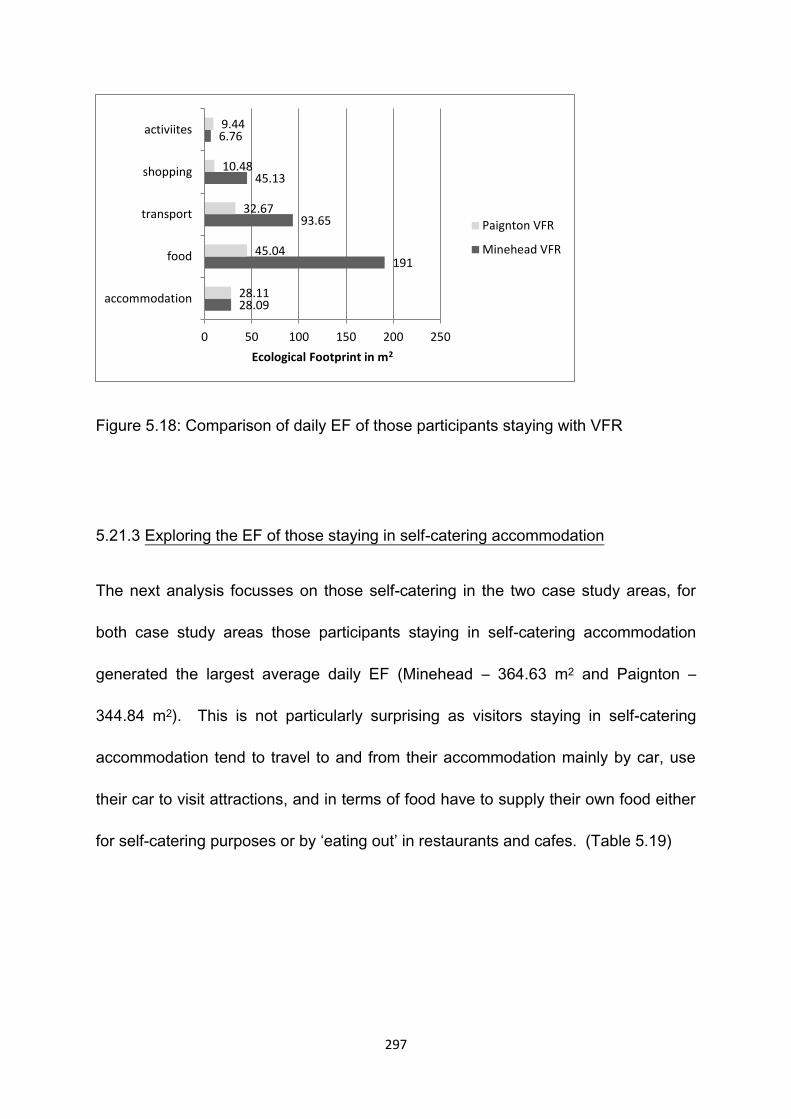
297
Figure 5.18: Comparison of daily EF of those participants staying with VFR
5.21.3 Exploring the EF of those staying in self-catering accommodation
The next analysis focusses on those self-catering in the two case study areas, for
both case study areas those participants staying in self-catering accommodation
generated the largest average daily EF (Minehead – 364.63 m2 and Paignton –
344.84 m2). This is not particularly surprising as visitors staying in self-catering
accommodation tend to travel to and from their accommodation mainly by car, use
their car to visit attractions, and in terms of food have to supply their own food either
for self-catering purposes or by ‘eating out’ in restaurants and cafes. (Table 5.19)
28.09
191
93.65
45.13
6.76
28.11
45.04
32.67
10.48
9.44
0 50 100 150 200 250
accommodation
food
transport
shopping
activiites
Ecological Footprint in m2
Paignton VFR
Minehead VFR
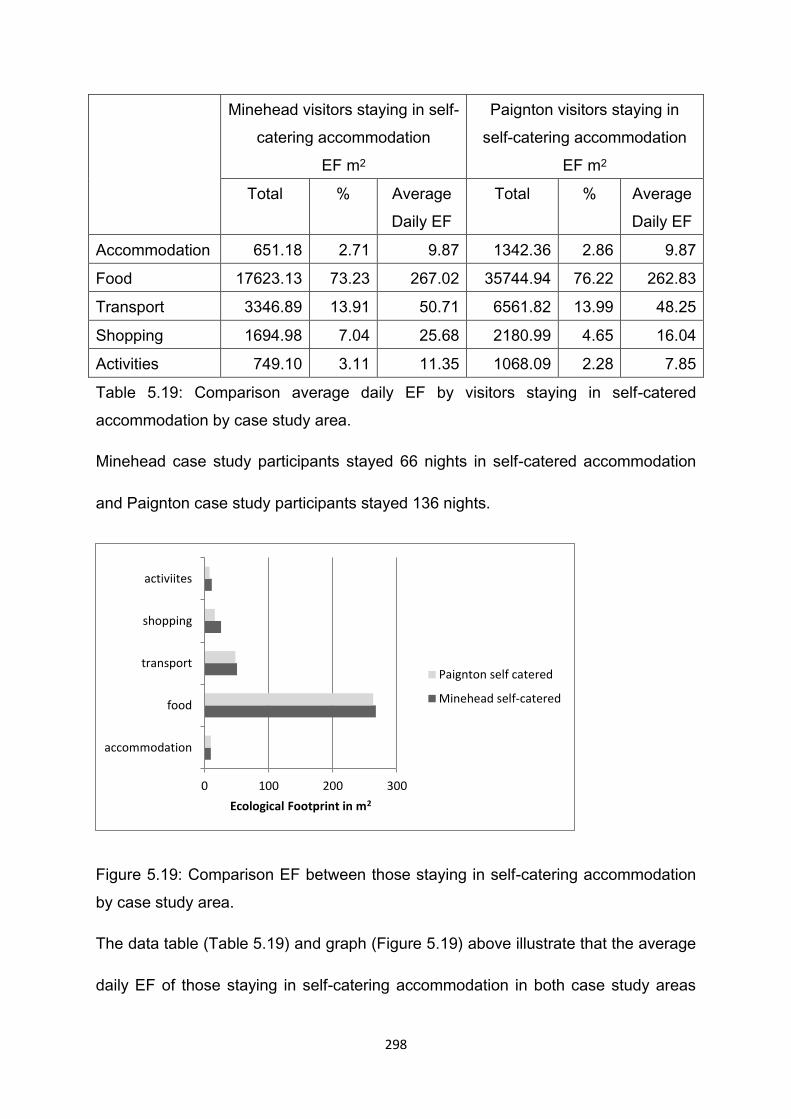
298
Minehead visitors staying in self-
catering accommodation
EF m2
Paignton visitors staying in
self-catering accommodation
EF m2
Total % Average
Daily EF
Total % Average
Daily EF
Accommodation 651.18 2.71 9.87 1342.36 2.86 9.87
Food 17623.13 73.23 267.02 35744.94 76.22 262.83
Transport 3346.89 13.91 50.71 6561.82 13.99 48.25
Shopping 1694.98 7.04 25.68 2180.99 4.65 16.04
Activities 749.10 3.11 11.35 1068.09 2.28 7.85
Table 5.19: Comparison average daily EF by visitors staying in self-catered
accommodation by case study area.
Minehead case study participants stayed 66 nights in self-catered accommodation
and Paignton case study participants stayed 136 nights.
Figure 5.19: Comparison EF between those staying in self-catering accommodation
by case study area.
The data table (Table 5.19) and graph (Figure 5.19) above illustrate that the average
daily EF of those staying in self-catering accommodation in both case study areas
0 100 200 300
accommodation
food
transport
shopping
activiites
Ecological Footprint in m2
Paignton self catered
Minehead self-catered
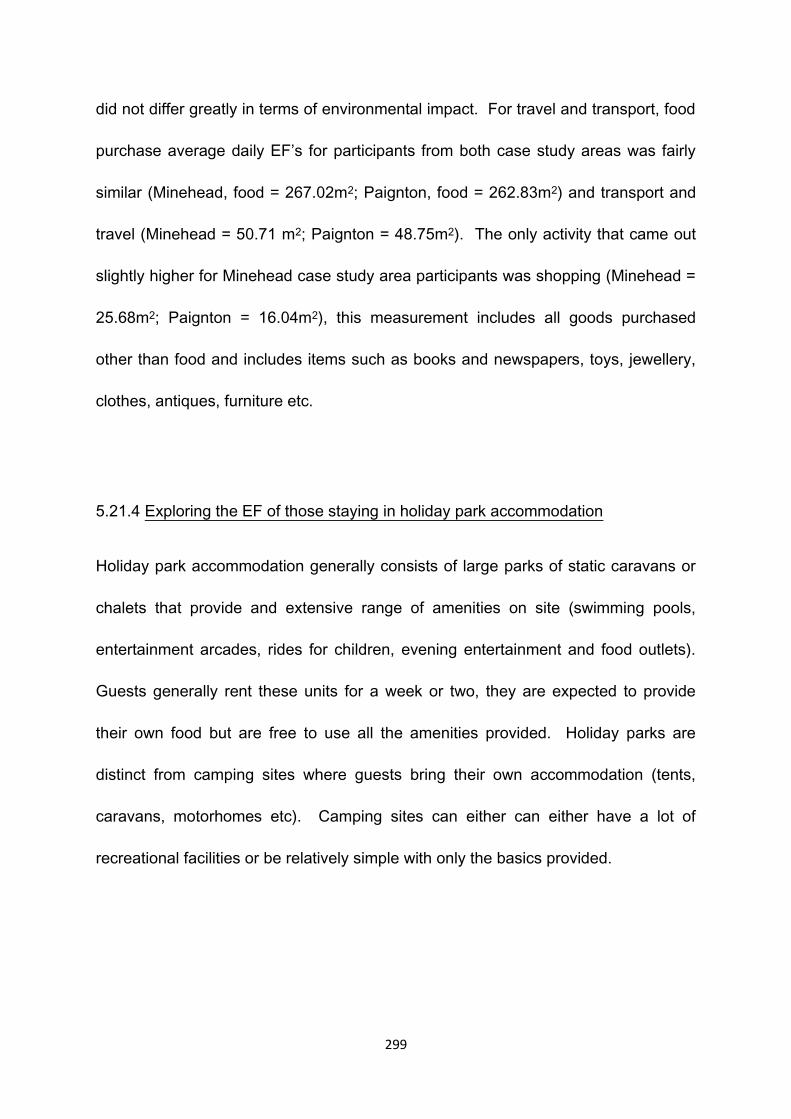
299
did not differ greatly in terms of environmental impact. For travel and transport, food
purchase average daily EF’s for participants from both case study areas was fairly
similar (Minehead, food = 267.02m2; Paignton, food = 262.83m2) and transport and
travel (Minehead = 50.71 m2; Paignton = 48.75m2). The only activity that came out
slightly higher for Minehead case study area participants was shopping (Minehead =
25.68m2; Paignton = 16.04m2), this measurement includes all goods purchased
other than food and includes items such as books and newspapers, toys, jewellery,
clothes, antiques, furniture etc.
5.21.4 Exploring the EF of those staying in holiday park accommodation
Holiday park accommodation generally consists of large parks of static caravans or
chalets that provide and extensive range of amenities on site (swimming pools,
entertainment arcades, rides for children, evening entertainment and food outlets).
Guests generally rent these units for a week or two, they are expected to provide
their own food but are free to use all the amenities provided. Holiday parks are
distinct from camping sites where guests bring their own accommodation (tents,
caravans, motorhomes etc). Camping sites can either can either have a lot of
recreational facilities or be relatively simple with only the basics provided.
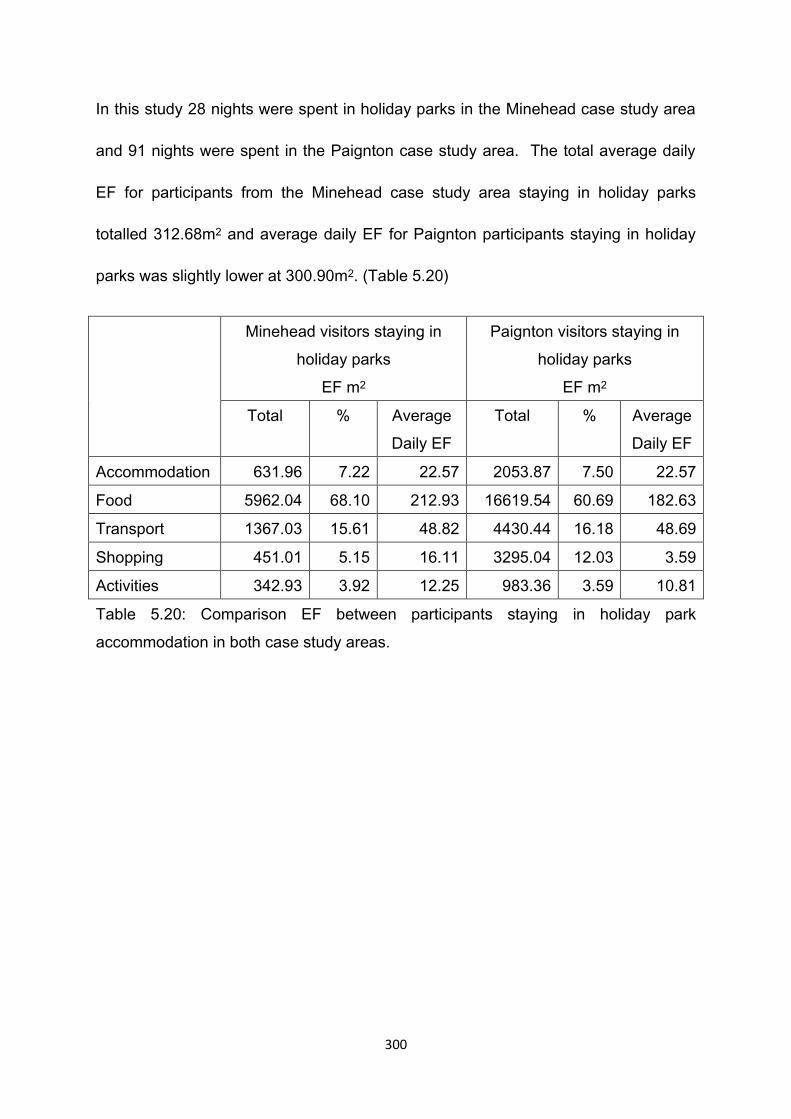
300
In this study 28 nights were spent in holiday parks in the Minehead case study area
and 91 nights were spent in the Paignton case study area. The total average daily
EF for participants from the Minehead case study area staying in holiday parks
totalled 312.68m2 and average daily EF for Paignton participants staying in holiday
parks was slightly lower at 300.90m2. (Table 5.20)
Minehead visitors staying in
holiday parks
EF m2
Paignton visitors staying in
holiday parks
EF m2
Total % Average
Daily EF
Total % Average
Daily EF
Accommodation 631.96 7.22 22.57 2053.87 7.50 22.57
Food 5962.04 68.10 212.93 16619.54 60.69 182.63
Transport 1367.03 15.61 48.82 4430.44 16.18 48.69
Shopping 451.01 5.15 16.11 3295.04 12.03 3.59
Activities 342.93 3.92 12.25 983.36 3.59 10.81
Table 5.20: Comparison EF between participants staying in holiday park
accommodation in both case study areas.
301
Figure 5.20: Comparison of average daily EF for participants staying holiday park
accommodation
As was the case with those staying in self-catering accommodation, participants
staying in both case study areas did not vary greatly in terms of their average daily
EF, the only slight difference can be seen in the food purchase section where
Minehead case study participants had a slightly higher daily average at 212.93m2
compared to Paignton’s of 182.63m2 average per day. (Figure 5.20)
22.57
212.93
48.82
16.11
12.25
22.57
182.63
48.69
3.59
10.81
0 50 100 150 200 250
accommodation
food
transport
shopping
activiites
Ecological footprint in m2
Paignton holiday park
Minehead holiday park
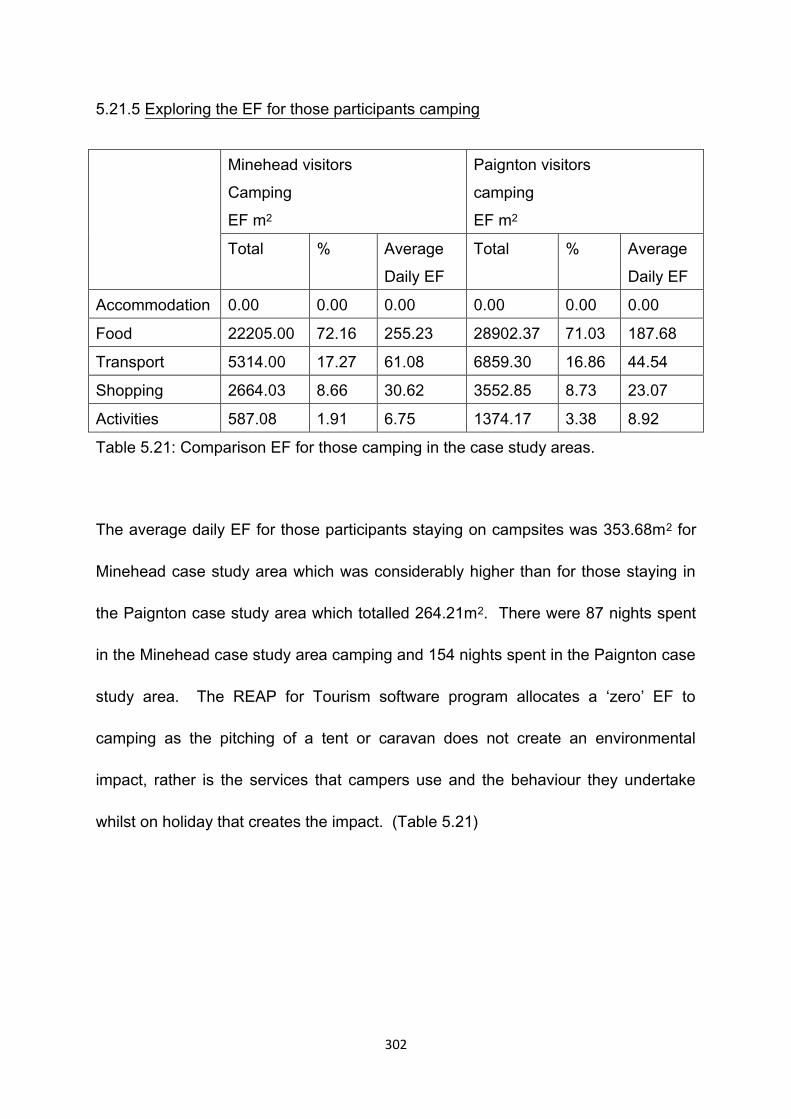
302
5.21.5 Exploring the EF for those participants camping
Minehead visitors
Camping
EF m2
Paignton visitors
camping
EF m2
Total % Average
Daily EF
Total % Average
Daily EF
Accommodation 0.00 0.00 0.00 0.00 0.00 0.00
Food 22205.00 72.16 255.23 28902.37 71.03 187.68
Transport 5314.00 17.27 61.08 6859.30 16.86 44.54
Shopping 2664.03 8.66 30.62 3552.85 8.73 23.07
Activities 587.08 1.91 6.75 1374.17 3.38 8.92
Table 5.21: Comparison EF for those camping in the case study areas.
The average daily EF for those participants staying on campsites was 353.68m2 for
Minehead case study area which was considerably higher than for those staying in
the Paignton case study area which totalled 264.21m2. There were 87 nights spent
in the Minehead case study area camping and 154 nights spent in the Paignton case
study area. The REAP for Tourism software program allocates a ‘zero’ EF to
camping as the pitching of a tent or caravan does not create an environmental
impact, rather is the services that campers use and the behaviour they undertake
whilst on holiday that creates the impact. (Table 5.21)
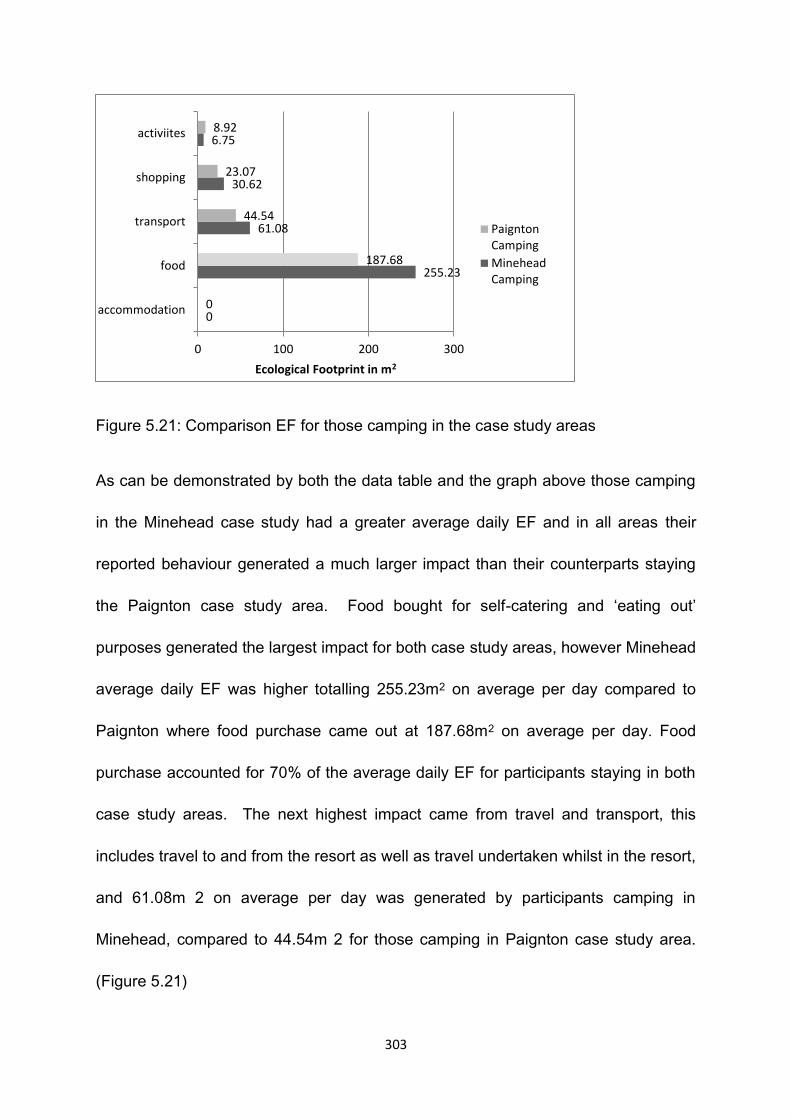
303
Figure 5.21: Comparison EF for those camping in the case study areas
As can be demonstrated by both the data table and the graph above those camping
in the Minehead case study had a greater average daily EF and in all areas their
reported behaviour generated a much larger impact than their counterparts staying
the Paignton case study area. Food bought for self-catering and ‘eating out’
purposes generated the largest impact for both case study areas, however Minehead
average daily EF was higher totalling 255.23m2 on average per day compared to
Paignton where food purchase came out at 187.68m2 on average per day. Food
purchase accounted for 70% of the average daily EF for participants staying in both
case study areas. The next highest impact came from travel and transport, this
includes travel to and from the resort as well as travel undertaken whilst in the resort,
and 61.08m 2 on average per day was generated by participants camping in
Minehead, compared to 44.54m 2 for those camping in Paignton case study area.
(Figure 5.21)
0
255.23
61.08
30.62
6.75
0
187.68
44.54
23.07
8.92
0 100 200 300
accommodation
food
transport
shopping
activiites
Ecological Footprint in m2
PaigntonCamping
MineheadCamping
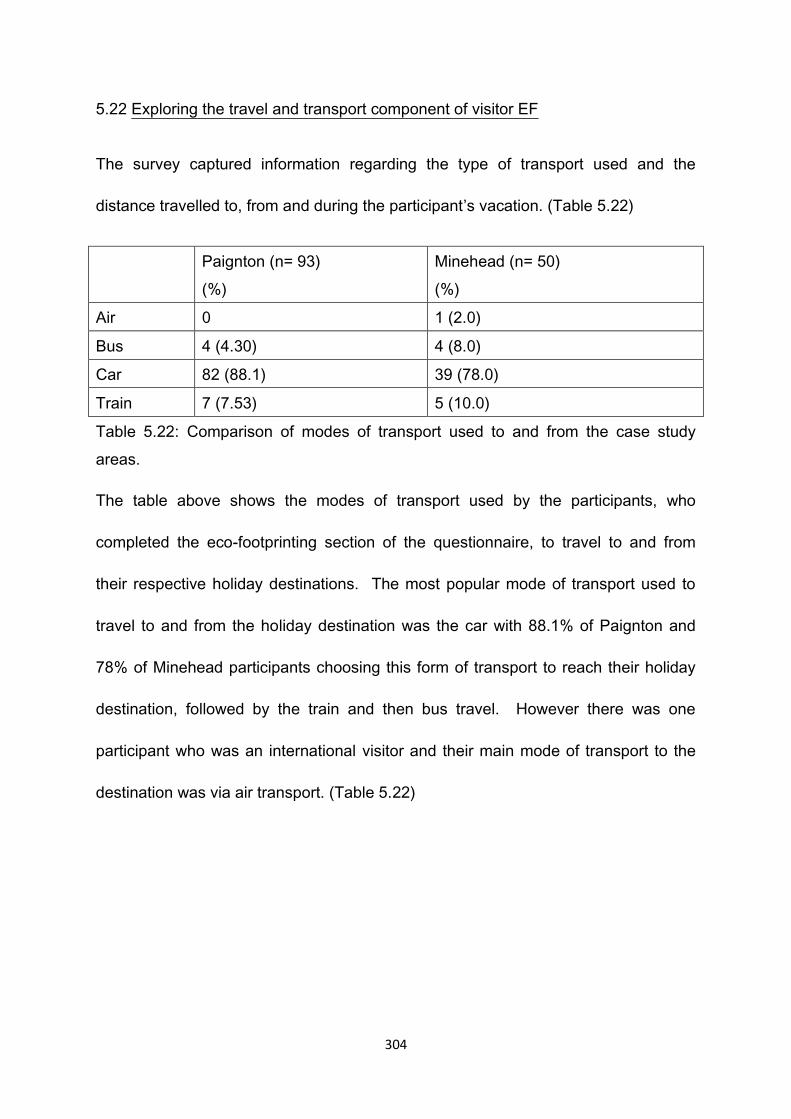
304
5.22 Exploring the travel and transport component of visitor EF
The survey captured information regarding the type of transport used and the
distance travelled to, from and during the participant’s vacation. (Table 5.22)
Paignton (n= 93)
(%)
Minehead (n= 50)
(%)
Air 0 1 (2.0)
Bus 4 (4.30) 4 (8.0)
Car 82 (88.1) 39 (78.0)
Train 7 (7.53) 5 (10.0)
Table 5.22: Comparison of modes of transport used to and from the case study
areas.
The table above shows the modes of transport used by the participants, who
completed the eco-footprinting section of the questionnaire, to travel to and from
their respective holiday destinations. The most popular mode of transport used to
travel to and from the holiday destination was the car with 88.1% of Paignton and
78% of Minehead participants choosing this form of transport to reach their holiday
destination, followed by the train and then bus travel. However there was one
participant who was an international visitor and their main mode of transport to the
destination was via air transport. (Table 5.22)
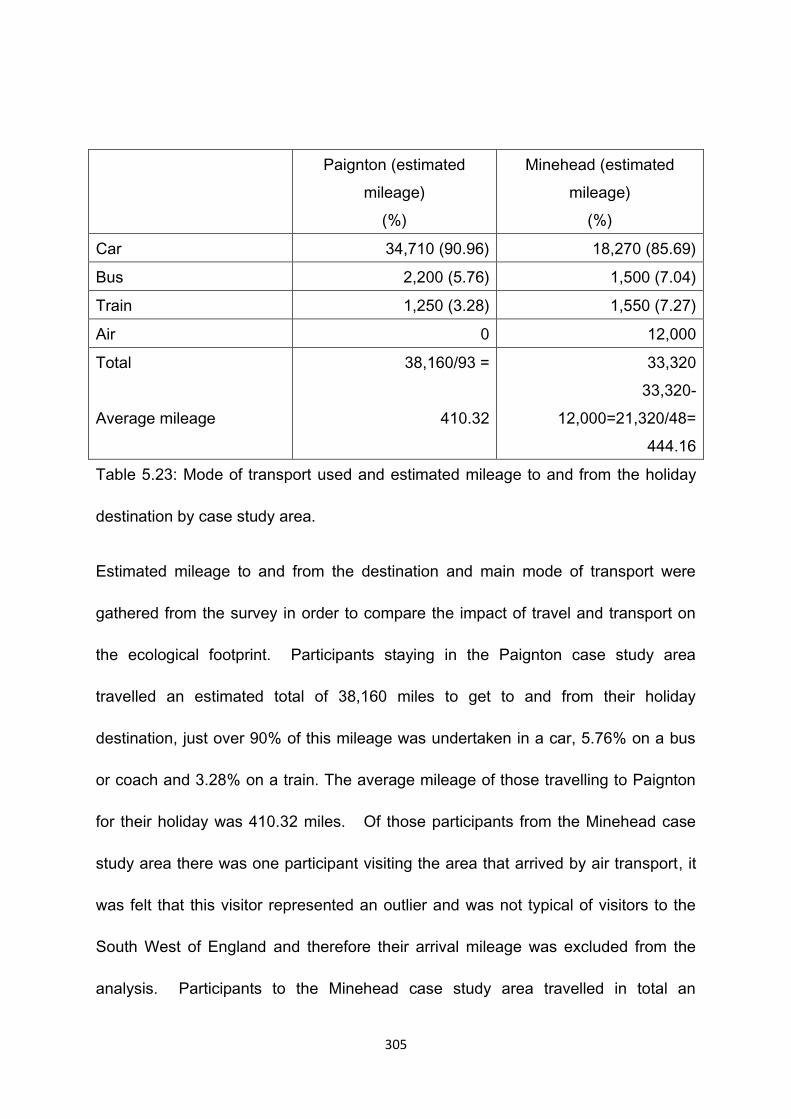
305
Paignton (estimated
mileage)
(%)
Minehead (estimated
mileage)
(%)
Car 34,710 (90.96) 18,270 (85.69)
Bus 2,200 (5.76) 1,500 (7.04)
Train 1,250 (3.28) 1,550 (7.27)
Air 0 12,000
Total
Average mileage
38,160/93 =
410.32
33,320
33,320-
12,000=21,320/48=
444.16
Table 5.23: Mode of transport used and estimated mileage to and from the holiday
destination by case study area.
Estimated mileage to and from the destination and main mode of transport were
gathered from the survey in order to compare the impact of travel and transport on
the ecological footprint. Participants staying in the Paignton case study area
travelled an estimated total of 38,160 miles to get to and from their holiday
destination, just over 90% of this mileage was undertaken in a car, 5.76% on a bus
or coach and 3.28% on a train. The average mileage of those travelling to Paignton
for their holiday was 410.32 miles. Of those participants from the Minehead case
study area there was one participant visiting the area that arrived by air transport, it
was felt that this visitor represented an outlier and was not typical of visitors to the
South West of England and therefore their arrival mileage was excluded from the
analysis. Participants to the Minehead case study area travelled in total an
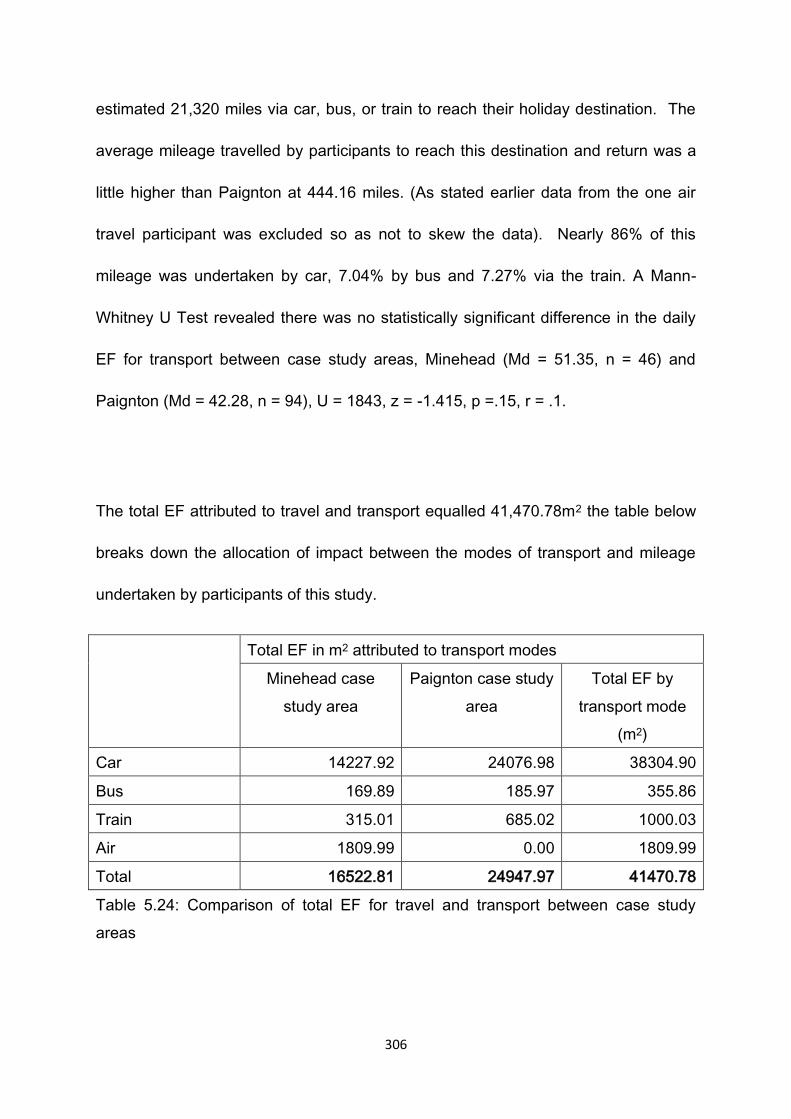
306
estimated 21,320 miles via car, bus, or train to reach their holiday destination. The
average mileage travelled by participants to reach this destination and return was a
little higher than Paignton at 444.16 miles. (As stated earlier data from the one air
travel participant was excluded so as not to skew the data). Nearly 86% of this
mileage was undertaken by car, 7.04% by bus and 7.27% via the train. A Mann-
Whitney U Test revealed there was no statistically significant difference in the daily
EF for transport between case study areas, Minehead (Md = 51.35, n = 46) and
Paignton (Md = 42.28, n = 94), U = 1843, z = -1.415, p =.15, r = .1.
The total EF attributed to travel and transport equalled 41,470.78m2 the table below
breaks down the allocation of impact between the modes of transport and mileage
undertaken by participants of this study.
Total EF in m2 attributed to transport modes
Minehead case
study area
Paignton case study
area
Total EF by
transport mode
(m2)
Car 14227.92 24076.98 38304.90
Bus 169.89 185.97 355.86
Train 315.01 685.02 1000.03
Air 1809.99 0.00 1809.99
Total 16522.81 24947.97 41470.78
Table 5.24: Comparison of total EF for travel and transport between case study
areas
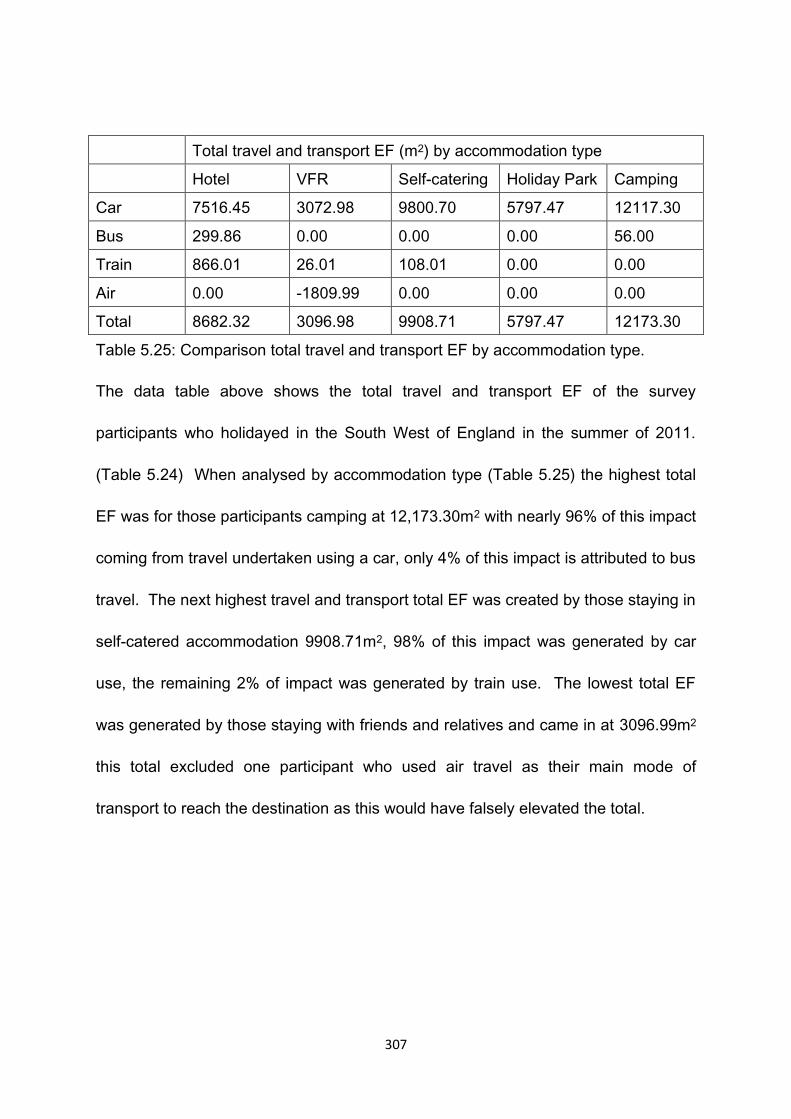
307
Total travel and transport EF (m2) by accommodation type
Hotel VFR Self-catering Holiday Park Camping
Car 7516.45 3072.98 9800.70 5797.47 12117.30
Bus 299.86 0.00 0.00 0.00 56.00
Train 866.01 26.01 108.01 0.00 0.00
Air 0.00 -1809.99 0.00 0.00 0.00
Total 8682.32 3096.98 9908.71 5797.47 12173.30
Table 5.25: Comparison total travel and transport EF by accommodation type.
The data table above shows the total travel and transport EF of the survey
participants who holidayed in the South West of England in the summer of 2011.
(Table 5.24) When analysed by accommodation type (Table 5.25) the highest total
EF was for those participants camping at 12,173.30m2 with nearly 96% of this impact
coming from travel undertaken using a car, only 4% of this impact is attributed to bus
travel. The next highest travel and transport total EF was created by those staying in
self-catered accommodation 9908.71m2, 98% of this impact was generated by car
use, the remaining 2% of impact was generated by train use. The lowest total EF
was generated by those staying with friends and relatives and came in at 3096.99m2
this total excluded one participant who used air travel as their main mode of
transport to reach the destination as this would have falsely elevated the total.
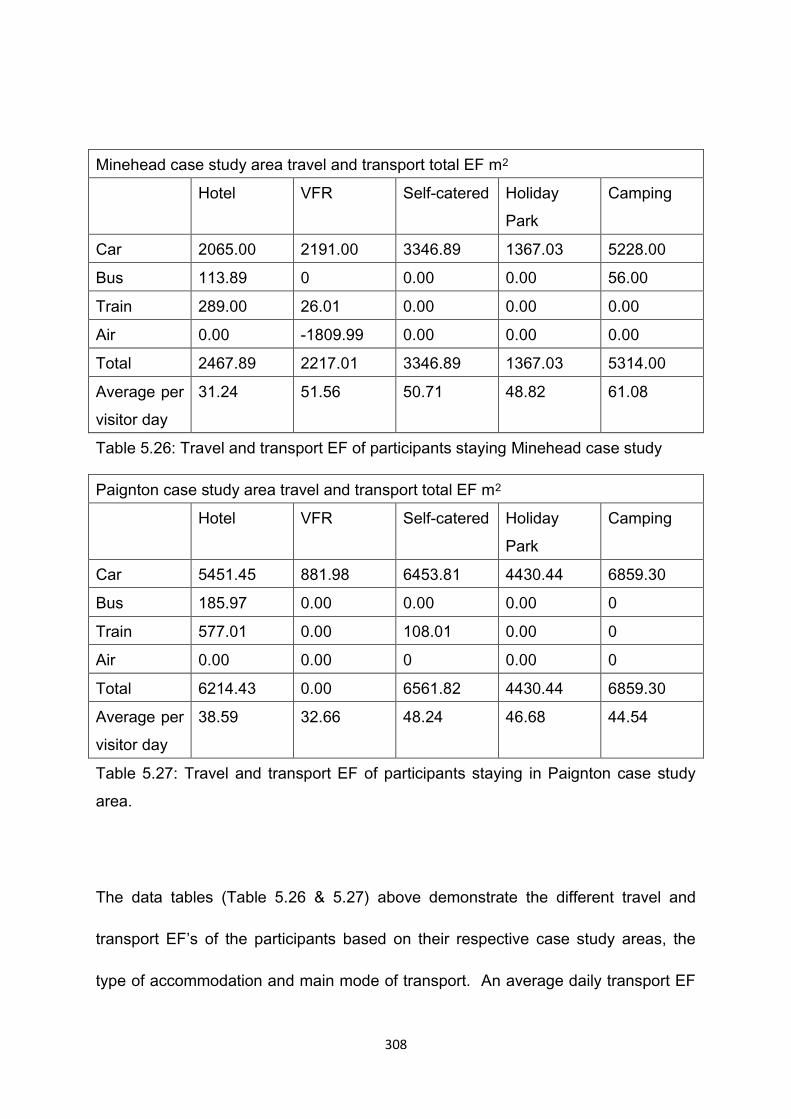
308
Minehead case study area travel and transport total EF m2
Hotel VFR Self-catered Holiday
Park
Camping
Car 2065.00 2191.00 3346.89 1367.03 5228.00
Bus 113.89 0 0.00 0.00 56.00
Train 289.00 26.01 0.00 0.00 0.00
Air 0.00 -1809.99 0.00 0.00 0.00
Total 2467.89 2217.01 3346.89 1367.03 5314.00
Average per
visitor day
31.24 51.56 50.71 48.82 61.08
Table 5.26: Travel and transport EF of participants staying Minehead case study
Paignton case study area travel and transport total EF m2
Hotel VFR Self-catered Holiday
Park
Camping
Car 5451.45 881.98 6453.81 4430.44 6859.30
Bus 185.97 0.00 0.00 0.00 0
Train 577.01 0.00 108.01 0.00 0
Air 0.00 0.00 0 0.00 0
Total 6214.43 0.00 6561.82 4430.44 6859.30
Average per
visitor day
38.59 32.66 48.24 46.68 44.54
Table 5.27: Travel and transport EF of participants staying in Paignton case study
area.
The data tables (Table 5.26 & 5.27) above demonstrate the different travel and
transport EF’s of the participants based on their respective case study areas, the
type of accommodation and main mode of transport. An average daily transport EF
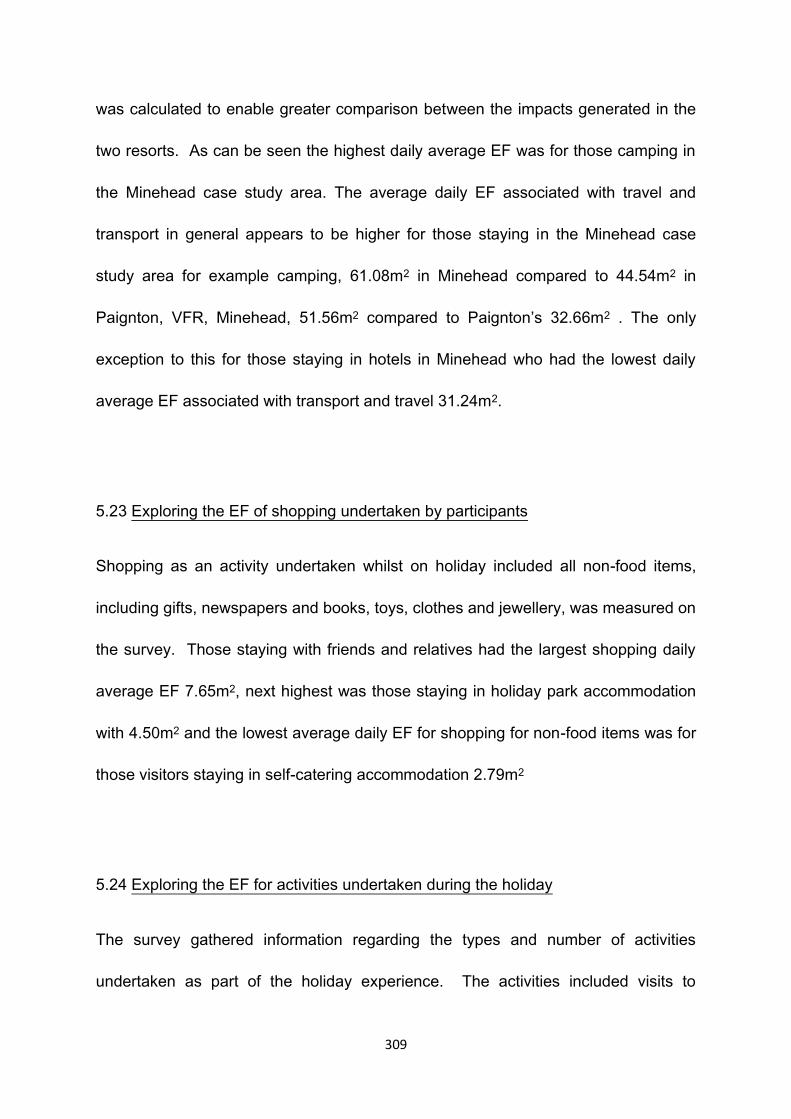
309
was calculated to enable greater comparison between the impacts generated in the
two resorts. As can be seen the highest daily average EF was for those camping in
the Minehead case study area. The average daily EF associated with travel and
transport in general appears to be higher for those staying in the Minehead case
study area for example camping, 61.08m2 in Minehead compared to 44.54m2 in
Paignton, VFR, Minehead, 51.56m2 compared to Paignton’s 32.66m2 . The only
exception to this for those staying in hotels in Minehead who had the lowest daily
average EF associated with transport and travel 31.24m2.
5.23 Exploring the EF of shopping undertaken by participants
Shopping as an activity undertaken whilst on holiday included all non-food items,
including gifts, newspapers and books, toys, clothes and jewellery, was measured on
the survey. Those staying with friends and relatives had the largest shopping daily
average EF 7.65m2, next highest was those staying in holiday park accommodation
with 4.50m2 and the lowest average daily EF for shopping for non-food items was for
those visitors staying in self-catering accommodation 2.79m2
5.24 Exploring the EF for activities undertaken during the holiday
The survey gathered information regarding the types and number of activities
undertaken as part of the holiday experience. The activities included visits to

310
permanent visitor attractions such as theme parks, zoos, historic houses and
museums as well as trips to enjoy the scenery, beach trips and swimming and non-
permanent events such as fetes, concerts and fun fairs.
There was no great variation in the average daily EF between each of the
accommodation however the highest daily average EF for activities by
accommodation type was for those staying in hotels 1.19m2, the next highest were
for VFR 1.65m2 the lowest daily average was for those camping 1.17m2.
5.25 Section Summary
The results of the ecological footprinting analysis provide some interesting results in
that it is clear that most of the environmental impact is located in food purchasing
behaviour and travel and transport. Thus these are areas that could be targeted
specifically with a social marketing intervention to change on-site tourist behaviour.
(Please see appendix 4 for detailed information on the limitations of the REAP for
Tourism Software Program).
The really influential results occur when individual ecological footprints are linked
with the segmentation analysis, which will be discussed in the following section.
311
5.26 Segmentation Analysis
In line with a social marketing methodology a segmentation analysis of the data
gathered must be undertaken in order to define the group(s) that would be most
amenable to targeting with a social marketing intervention. Segmentation or cluster
analysis groups participants in terms of shared and distinct characteristics,
participants within in these groups must be similar to each other but distinct from
members of other groups or clusters. The characteristics used to define clusters or
segments can be demographic (age, gender, income etc) or more commonly
psychographic centred around shared attitudes, beliefs, values and behaviours.
(French, J, Blair-Stevens, C., McVey, D., and Merritt, R. 2010). Within the tourism
research literature segmentation is frequently used to describe and differentiate
visitor motivation, behaviour and attitudes (e.g. Dallen 2007; Frochot 2005;
McKercher, B., Ho, P.S.Y. du Cros, H., and Chow Mong, B. (2002).
In terms of the current research where the impetus is on understanding the barriers
and motivations to encouraging sustainable tourist behaviour, the cluster or
segmentation analysis should focus on trying to define sub-groups of participants
who are most likely to respond to a social marketing initiative focussed on
encouraging sustainable tourist behaviour. Hence the cluster analysis focussed on
the variables related to attitudes towards holidays and holiday travel. (Table 5.28) A
series of cluster analyses were run using SPSS V19 utilising the Two-Step analysis
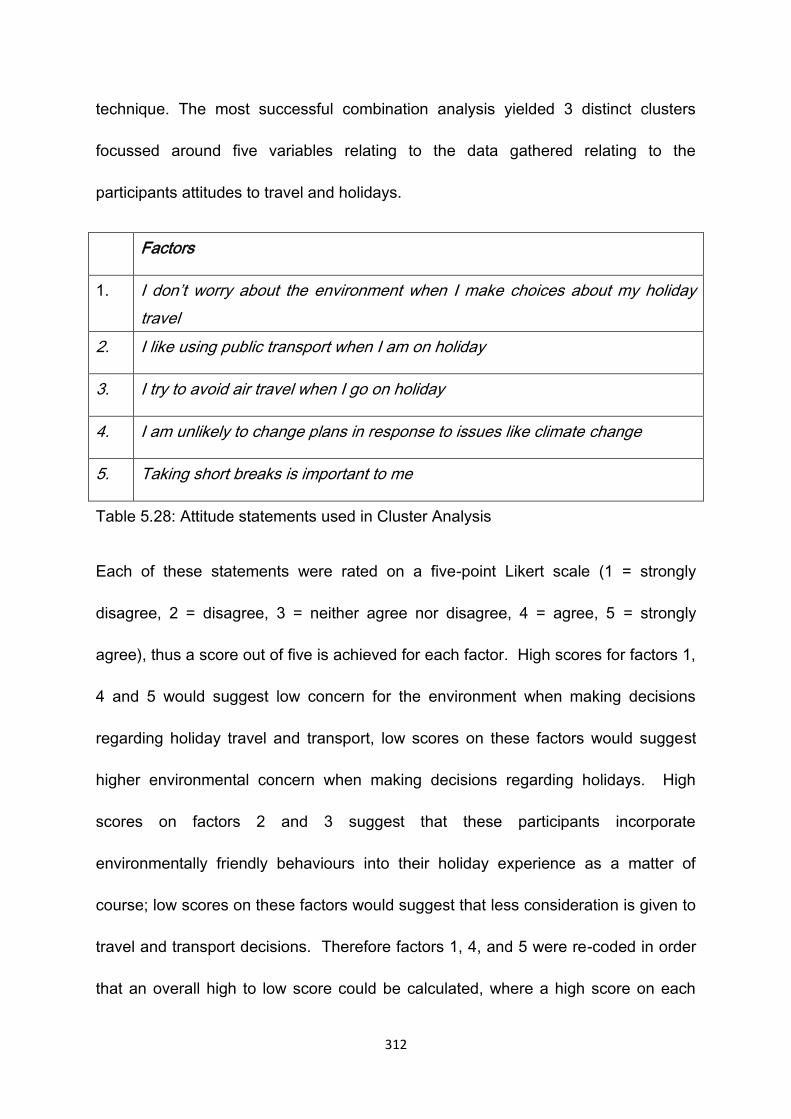
312
technique. The most successful combination analysis yielded 3 distinct clusters
focussed around five variables relating to the data gathered relating to the
participants attitudes to travel and holidays.
Factors
1. I don’t worry about the environment when I make choices about my holiday
travel
2. I like using public transport when I am on holiday
3. I try to avoid air travel when I go on holiday
4. I am unlikely to change plans in response to issues like climate change
5. Taking short breaks is important to me
Table 5.28: Attitude statements used in Cluster Analysis
Each of these statements were rated on a five-point Likert scale (1 = strongly
disagree, 2 = disagree, 3 = neither agree nor disagree, 4 = agree, 5 = strongly
agree), thus a score out of five is achieved for each factor. High scores for factors 1,
4 and 5 would suggest low concern for the environment when making decisions
regarding holiday travel and transport, low scores on these factors would suggest
higher environmental concern when making decisions regarding holidays. High
scores on factors 2 and 3 suggest that these participants incorporate
environmentally friendly behaviours into their holiday experience as a matter of
course; low scores on these factors would suggest that less consideration is given to
travel and transport decisions. Therefore factors 1, 4, and 5 were re-coded in order
that an overall high to low score could be calculated, where a high score on each
313
factor would mean more positive attitudes and behaviour towards the environment
when in a holiday setting. Each cluster was evaluated in terms of its scores on the
cluster variables and in terms of mediating factor titled ‘total environmental attitudes’
– this variable was not used in the factoring analysis but the developed clusters were
measured against this factor. Similarly the higher the score on this variable the
greater the stated concern for the environment.
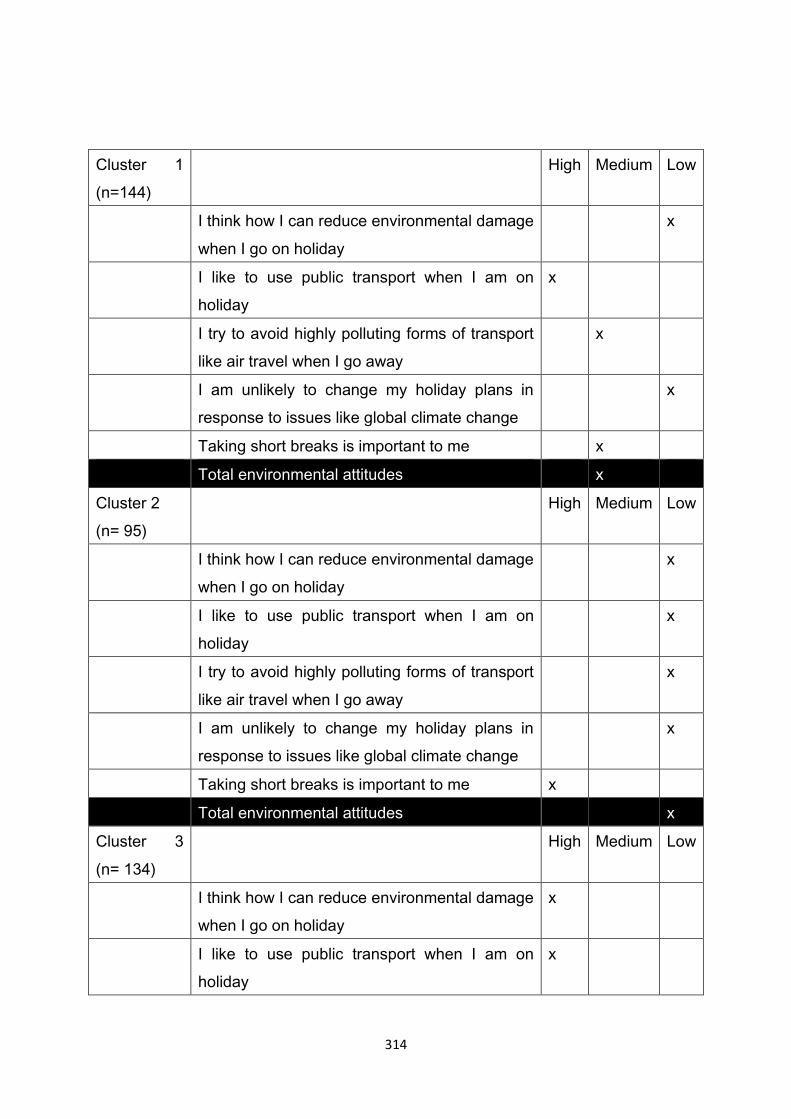
314
Cluster 1
(n=144)
High Medium Low
I think how I can reduce environmental damage
when I go on holiday
x
I like to use public transport when I am on
holiday
x
I try to avoid highly polluting forms of transport
like air travel when I go away
x
I am unlikely to change my holiday plans in
response to issues like global climate change
x
Taking short breaks is important to me x
Total environmental attitudes x
Cluster 2
(n= 95)
High Medium Low
I think how I can reduce environmental damage
when I go on holiday
x
I like to use public transport when I am on
holiday
x
I try to avoid highly polluting forms of transport
like air travel when I go away
x
I am unlikely to change my holiday plans in
response to issues like global climate change
x
Taking short breaks is important to me x
Total environmental attitudes x
Cluster 3
(n= 134)
High Medium Low
I think how I can reduce environmental damage
when I go on holiday
x
I like to use public transport when I am on
holiday
x
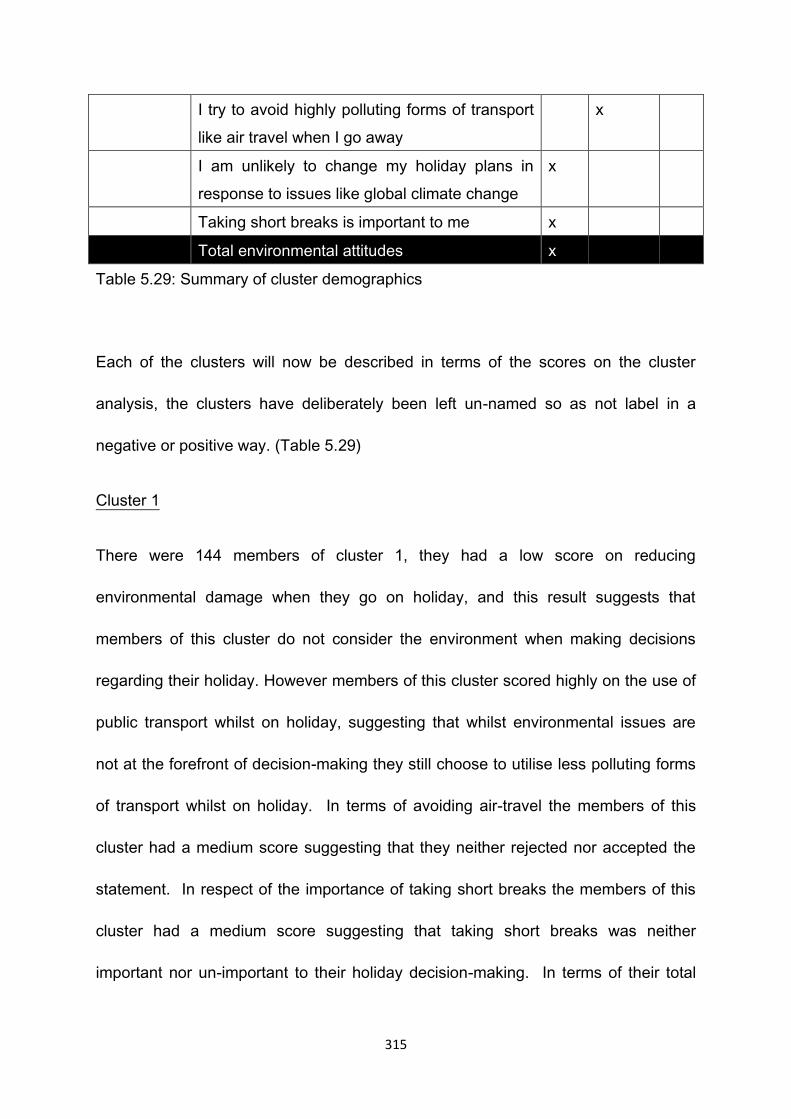
315
I try to avoid highly polluting forms of transport
like air travel when I go away
x
I am unlikely to change my holiday plans in
response to issues like global climate change
x
Taking short breaks is important to me x
Total environmental attitudes x
Table 5.29: Summary of cluster demographics
Each of the clusters will now be described in terms of the scores on the cluster
analysis, the clusters have deliberately been left un-named so as not label in a
negative or positive way. (Table 5.29)
Cluster 1
There were 144 members of cluster 1, they had a low score on reducing
environmental damage when they go on holiday, and this result suggests that
members of this cluster do not consider the environment when making decisions
regarding their holiday. However members of this cluster scored highly on the use of
public transport whilst on holiday, suggesting that whilst environmental issues are
not at the forefront of decision-making they still choose to utilise less polluting forms
of transport whilst on holiday. In terms of avoiding air-travel the members of this
cluster had a medium score suggesting that they neither rejected nor accepted the
statement. In respect of the importance of taking short breaks the members of this
cluster had a medium score suggesting that taking short breaks was neither
important nor un-important to their holiday decision-making. In terms of their total
316
scores on attitudes towards the environment this cluster scored just below the
median. (Table 5.29)
Cluster 1 – Profile
The members of cluster 1 were mainly female and aged over 60 years and retired
from work, 50% of the segment owned a concessionary travel card. 42% of this
cluster have two cars per household, 7% have no car and 5% report to having 4+
cars in their household (Appendix 6.3) In terms of holidays 50% of the cluster take
up to 2 holidays per year and are most likely to be travelling in a family group without
children (43%) or with friends (14%) and most likely to be staying in serviced
accommodation (39%) and least likely to be staying in a holiday park (11%).
(Appendix 8.2)
In terms of membership of environmental organisations this cluster is the least likely
to have a membership with 40% reporting to being a member of any organisation. In
terms of disability 18% of this cluster reported either they or someone is their
household was registered with a disability. (Appendix 8.1)
The analysis returned to the original data gathered in the questionnaire survey and
explored the reported levels of home and holiday pro-environmental behaviours
amongst cluster members. In terms of pro-environmental behaviours in and around
the home, cluster 1 reported the lowest score in terms of ‘always’ recycling of the
three clusters with 10% admitting ‘rarely’ or ‘never’ recycling at home. In a holiday
environment 30% reported they either ‘always or usually’ recycled when on holiday
317
compared to 18% reporting to ‘rarely or never’ recycling whilst on holiday. (Appendix
7.1) The use of energy efficient appliances in this cluster was the lowest of the three
clusters with 55% reporting ‘always or usually’ using them when at home, only 20%
reported to ensuring using them when on holiday and 11% stating they ‘never’
ensure appliances are turned off when at home which is higher than either Cluster 2
or 3. (Appendix 7.2)
In terms food purchasing 48% of Cluster 1 ‘sometimes’ purchase organic food but
are the least likely of the three clusters to source food from local farmers markets.
(Appendix 7.7, 7.8) Interestingly Cluster 1 report the highest commitment of the
three clusters in re-using plastic carrier bags, with 67% reporting to ‘always’ ensure
their re-use. (Appendix 7.9)
Cluster 2
There were 95 members of cluster 2, they had a low score on concern about
reducing environmental damage when on holiday, and furthermore this cluster had a
low score on using public transport whilst on holiday and on avoiding air travel and
scored very lowly on willingness to change behaviour. In terms of taking short breaks
this cluster scored very highly meaning that this aspect of holidaying is extremely
important to them. These results suggest that this cluster is particularly unsinterested

318
in environmental concerns and pro-environmental behaviour and this is reflected in a
low total score for environmental attitudes. (Table 5.30)
Cluster 2 - Profile
Members of Cluster 2 tended to be male under 30yrs of age. In terms of car
ownership 50% of this cluster have 2 cars per household and take up to 2 holidays
or short breaks per year. In terms of holidays Cluster 2 were most likely to be
holidaying in a family group that includes children (48%), the most common
accommodation choices of this Cluster was camping (24%) and self-catering (28%).
(Appendix 8.2) Interestingly 48% of this cluster had a membership of an
environmental organisation such as English Heritage or the National Trust.
(Appendix 8.1)
In terms of reported frequency of pro-environmental behaviours this cluster were
committed recyclers with 94% reporting ‘always or usually’ recycling when in the
home environment, this dropped to 44% when on holiday and was the lowest of the
three clusters. (Appendix 7.1) However, on all other pro-environmental behaviours
this cluster were the least committed of the three clusters (water saving, energy
efficient appliances; turn off from stand-by etc.). They were also the least likely
cluster to utilise public transport options at home and on holiday. (Appendix 7.10)
319
Cluster 3
There were 134 members of cluster 3, they scored highly on reducing environmental
damage when making decisions regarding their holiday, and they also scored highly
on using public transport whilst on holiday. In terms of avoiding highly polluting forms
of transport such as air travel when going on holiday this cluster had achieved a
medium score suggesting they still consider air travel as a vital component of their
holiday. However members of this cluster scored highly on willingness to change
behaviour in the light of the threats associated with issues such as global climate
change, but short breaks were still perceived to be an important part of holidaying.
In terms of total scores on environmental attitudes this cluster had the highest of the
three clusters (Table 5.29).
Cluster 3 – Profile
Members of cluster 3 were more likely to be female and professional or working in an
unskilled work and be aged between 30 – 60 years. (Appendix 6.1) In terms of car
ownership 54% of Cluster 3 had 2 or more cars per household. This Cluster
reported to taking the most holidays per year with 14% reporting to taking more than
5 holidays or short breaks per year. Appendix 8.2) In terms of accommodation
members of Cluster 3 tend to stay in either serviced accommodation (32%) or self-
catering accommodation (25%) and tend to be holidaying in a family group that
includes children (44%). (Appendix 8.2)
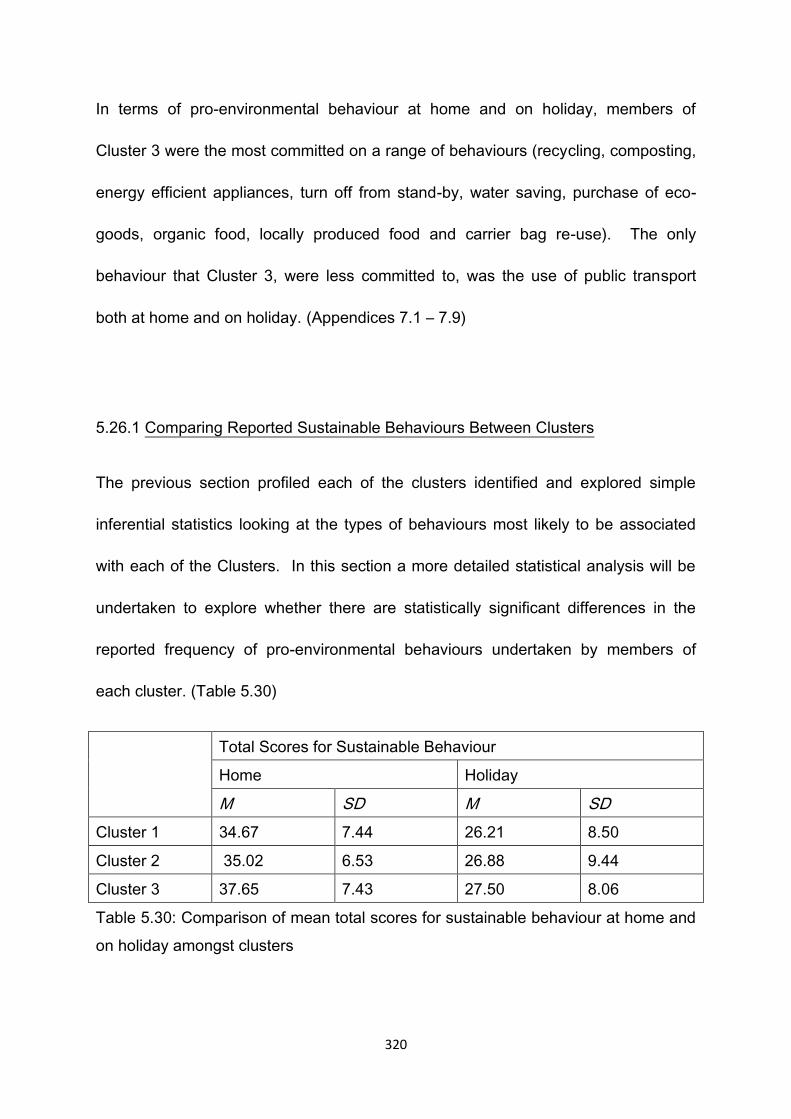
320
In terms of pro-environmental behaviour at home and on holiday, members of
Cluster 3 were the most committed on a range of behaviours (recycling, composting,
energy efficient appliances, turn off from stand-by, water saving, purchase of eco-
goods, organic food, locally produced food and carrier bag re-use). The only
behaviour that Cluster 3, were less committed to, was the use of public transport
both at home and on holiday. (Appendices 7.1 – 7.9)
5.26.1 Comparing Reported Sustainable Behaviours Between Clusters
The previous section profiled each of the clusters identified and explored simple
inferential statistics looking at the types of behaviours most likely to be associated
with each of the Clusters. In this section a more detailed statistical analysis will be
undertaken to explore whether there are statistically significant differences in the
reported frequency of pro-environmental behaviours undertaken by members of
each cluster. (Table 5.30)
Total Scores for Sustainable Behaviour
Home Holiday
M SD M SD
Cluster 1 34.67 7.44 26.21 8.50
Cluster 2 35.02 6.53 26.88 9.44
Cluster 3 37.65 7.43 27.50 8.06
Table 5.30: Comparison of mean total scores for sustainable behaviour at home and
on holiday amongst clusters
321
The scores for each of the sustainable home and holiday behaviours measured were
combined to create a maximum score of 55 for both home and holiday conditions. A
high score would indicate a high level of commitment to sustainable or pro-
environmental behaviour. Of the three clusters identified by the research Cluster 3
had the highest mean score for sustainable behaviour at home (M = 37.65, SD =
7.44), both Cluster’s 1 (M = 34.67, SD = 7.44) and Cluster 2 (M = 35.02, SD = 6.53)
mean scores for sustainable behaviour on holiday did not vary greatly. A Kruskal-
Wallis Test was applied to the results to test whether there was a statistically
significant difference in reported frequency of pro-environmental behaviour at home
amongst members of the three Clusters. The test revealed there was a statistically
significant difference in total reported sustainable behaviour at home between the
three Clusters,(Cluster 1, n = 135: Cluster 2, n = 85: Cluster 3, n = 123), X2 = (2, n =
343) = 15.62, p<.001. Cluster 3 had the highest median score for reported
sustainable behaviour at home (Md = 39), Cluster 2 had the lowest median score
(Md = 35) with Cluster 1 (Md = 36).
The results Kruskal-Wallis Test reveals that there is a statistical difference between
total scores for sustainable behaviour but it is not able to show where the statistical
differences are. Therefore a series of Mann-Whitney U Tests were carried out
between pairs of Clusters to show where the difference lie. The first two clusters
tested were Cluster 1 and Cluster 2, the results of the Mann-Whitney U Test

322
revealed there was no statistical difference in total scores for sustainable behaviour
at home, Cluster 1 (Md = 36, n = 135) and Cluster 2 (Md 35, n = 85), U = 5678.5, z =
-.129, p = .8, r = .008.
When Cluster’s 1 and 3 were tested, the analysis revealed there was a statistically
significant difference in total scores for sustainable behaviour at home between the
two clusters, Cluster 1 (Md = 36, n = 135) and Cluster 3 (Md = 39, n = 123), U =
6234.2, z = -3.456, p = .001, r =.2 indicating a small effect. The final test was
between Cluster 2 and Cluster 3, the results revealed there was a statistically
significant difference in levels of reported sustainable behaviour at home between
the two clusters, Cluster 2 (Md = 35, n = 85) and Cluster 3 (Md = 39, n = 123), U =
3821.5, z = -3.299, p = .001, r = .2 indicating a small effect. Hence the significant
differences in reported levels of sustainable behaviour at home are between Cluster
1 and Cluster 3 and Cluster 2 and Cluster 3 however there is no statistical difference
in reported behaviour between Clusters 1 and 2.
There was a ‘drop off’ in reported sustainable behaviour in the holiday condition for
all three of the clusters there was no statistically significant difference in total scores
for reported sustainable behaviour between members of the three clusters, (Cluster
1, n = 98: Cluster 2, n = 60: Cluster 3, n = 82), X2 = (2, n = 240) = 1.59, p = .45.
Cluster 3 had the highest median score for sustainable behaviour on holiday (Md =

323
29), Cluster 2 and Cluster 1 had the same median scores for sustainable behaviour
on holiday (Md = 26). However a Wilcoxon Signed Rank Test revealed that each of
the Clusters showed a statistically significant decrease in total reported sustainable
behaviour between the home and holiday conditions, Cluster 1 at home (Md = 36, n
= 135) and on holiday (MD = 26, n = 98), z = -6.938, p <.001: Cluster 2 scores for
total sustainable behaviour at home (Md = 35, n = 85) and on holiday (Md = 26, n =
60), z = -5.351, p<.001: Cluster 3 at home (Md = 39, n =123) and on holiday (Md =
29, n = 82), z = -6.953, p<.001 each cluster showed a medium effect r =.4.
5.26.2 Section Summary
In summary the three clusters were distinctively different, in terms of their attitudes
towards holiday transport and travel, Clusters 2 and 3 had the most extreme
differences, with Cluster 2 being the least pro-environmental and Cluster 3 being the
most especially in terms of attitudes towards holidays and the environment. Profiling
of the cluster members further identified the traits that each segment was
differentiated by, and that the profile tended to match reported pro-environmental
behaviour. Cluster 2 was identified as showing the least concern for the environment
when making decisions regarding their holidays also were the lowest scorers on a
range of pro-environmental or sustainable behaviours at home and on holiday.
Furthermore Cluster 3 were identified as having the most concern for the
environment when making decisions regarding their holidays and also reported a
324
higher commitment to the environment via sustainable behaviours in the home
environment and whilst on holiday. The next section will explore the link between
environmental attitudes; behaviour and environmental impact through the use of
ecological footprinting using REAP for each of the Clusters.
5.27 Exploring the environmental impact of Clusters using REAP for Tourism
ecological footprinting software
The data gathered via the survey to generate ecological footprint using the REAP for
Tourism software was amalgamated with the results of the segmentation analysis.
The premise of this was to test whether there is difference in the environmental
impact of the three clusters, so that a cluster that represented a group of people with
less concern for the environment might be expected to have greater environmental
impact than members of a cluster who expressed greater concern for the
environment and reported more commitment to pro-environmental behaviours. This
is important for testing whether attitudes, behaviour and environmental impact
match.
Each participant that completed the survey data pertaining to ecological footprinting
was assigned their cluster number from the analysis and a total EF and an average
daily EF were generated and assigned to each the holiday components. (Table 5.31)
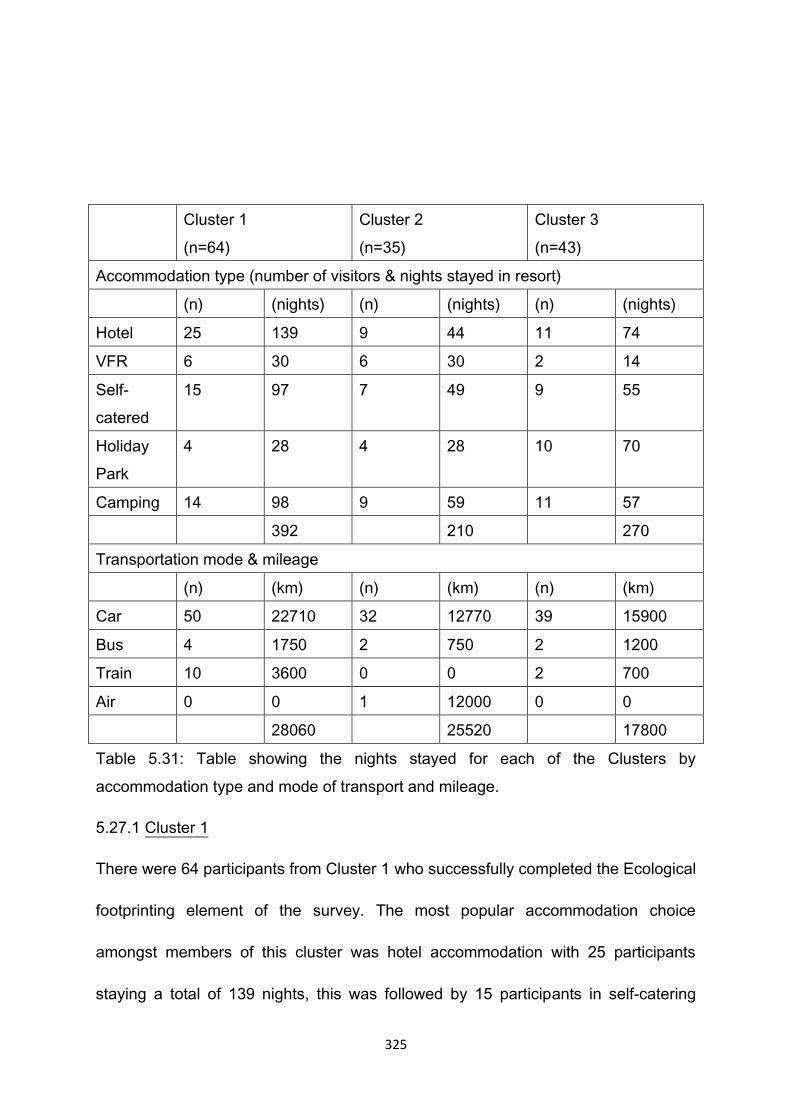
325
Cluster 1
(n=64)
Cluster 2
(n=35)
Cluster 3
(n=43)
Accommodation type (number of visitors & nights stayed in resort)
(n) (nights) (n) (nights) (n) (nights)
Hotel 25 139 9 44 11 74
VFR 6 30 6 30 2 14
Self-
catered
15 97 7 49 9 55
Holiday
Park
4 28 4 28 10 70
Camping 14 98 9 59 11 57
392 210 270
Transportation mode & mileage
(n) (km) (n) (km) (n) (km)
Car 50 22710 32 12770 39 15900
Bus 4 1750 2 750 2 1200
Train 10 3600 0 0 2 700
Air 0 0 1 12000 0 0
28060 25520 17800
Table 5.31: Table showing the nights stayed for each of the Clusters by
accommodation type and mode of transport and mileage.
5.27.1 Cluster 1
There were 64 participants from Cluster 1 who successfully completed the Ecological
footprinting element of the survey. The most popular accommodation choice
amongst members of this cluster was hotel accommodation with 25 participants
staying a total of 139 nights, this was followed by 15 participants in self-catering
326
accommodation staying 97 nights, 14 participants camping for 98 nights, 6 staying
with friends and relatives for a total of 30 nights and finally 4 participants staying 28
nights in holiday park accommodation. 41 participants were staying in the Paington
case study area and 24 were staying in the Minehead case study area (Table 5.31).
In terms of modes of transport 50 (78.1%) of Cluster 1 participants’ main mode of
transport was the car with which they travelled a total of 22710 kilometres to and
from their holiday resort. 10 participants travelled 3600 kilometres by train, 4
travelled a total of 1750 kilometres by bus.
The table shows the total EF generated by Cluster 1 to be 96583.92m2, the largest
impact came from the purchase of food either for self-catering purposes or via
’eating out’ in cafes and restaurants and totalled 60364.26m2 (62.4%), the next
highest impact came from travel and transport, this included travelling to and from
the destination as well as travel undertaken during the holiday the total EF generated
18442m2 (19.0%). Accommodation accounted for 7181.83m2 of the total EF,
shopping 6995.67m2 and activities 3600.16m2. (Table 5.31)
327
5.27.2 Cluster 2
There were 35 members of Cluster 2 who successfully completed the ecological
footprinting section of the questionnaire. In terms of holiday accommodation 9
Cluster 2 participants camped a total of 59 nights, 7 participants stayed a total of 49
nights in self-catering accommodation, 9 participants stayed 44 nights in hotel
accommodation, 6 visited friends and relatives for a total of 30 nights and 4
participants stayed a total of 28 nights in holiday park accommodation. 20
participants were staying in the Paignton case study area and 15 were staying in
Minehead case study area. (Table 5.31)
In terms of transport the majority of Cluster 2 participants used the car as their main
mode of transport with 32 (91.4%) travelling a total of 12770 kilometres to and from
their holiday destination, 2 travelled by bus for a total of 750 kilometres and 1
member of Cluster was an international visitor and used air travel as their main mode
of reaching their holiday destination they travelled approximately 12000 kilometres to
and from their holiday destination.
The table shows the total EF generated by members of Cluster 2 which totalled
78590.69m2. Once again the highest impact came from food purchase and total
53967.16m2, the next highest was generated by travel and transport which totalled
328
11348.73m2, shopping for goods other than food generated the next highest impact
for Cluster 2 members at 7929.11m2, followed by accommodation at 3528.96m2 and
activities at 1816.73m2. (Table 5.32)
5.27.3 Cluster 3
There were 43 members of Cluster 3 that successfully completed the EF section of
the questionnaire and where therefore included in the analysis. 11 participants
stayed a total 74 nights in hotel accommodation, another 11 participants stayed a
total of 57 nights camping, 10 participants stayed 70 nights in holiday park
accommodation, 9 participants spent 55 nights in self-catered accommodation and 2
participants stayed a total of 14 nights with friends and relatives. 31 participants
were staying in the Paignton case study area and 11 were staying in Minehead.
(Table 5.31)
The car was the most widely used most of transport for members of Cluster 3 with 39
(90.6%) travelling a total of 15900 kilometres to and from their holiday destination, 2
travelled 1200 kilometres by bus and a further 2 travelled 700 kilometres by train.
The total EF generated by members of Cluster 3 was 69806.92m2 (table below).
The highest impact was generated by food purchase and totalled 45871.63m2,
followed by travel and transport at 11680.05m2, shopping at 5562.03m2,
accommodation 4290.74m2 and activities at 2402.47m2. (Table 5.32)
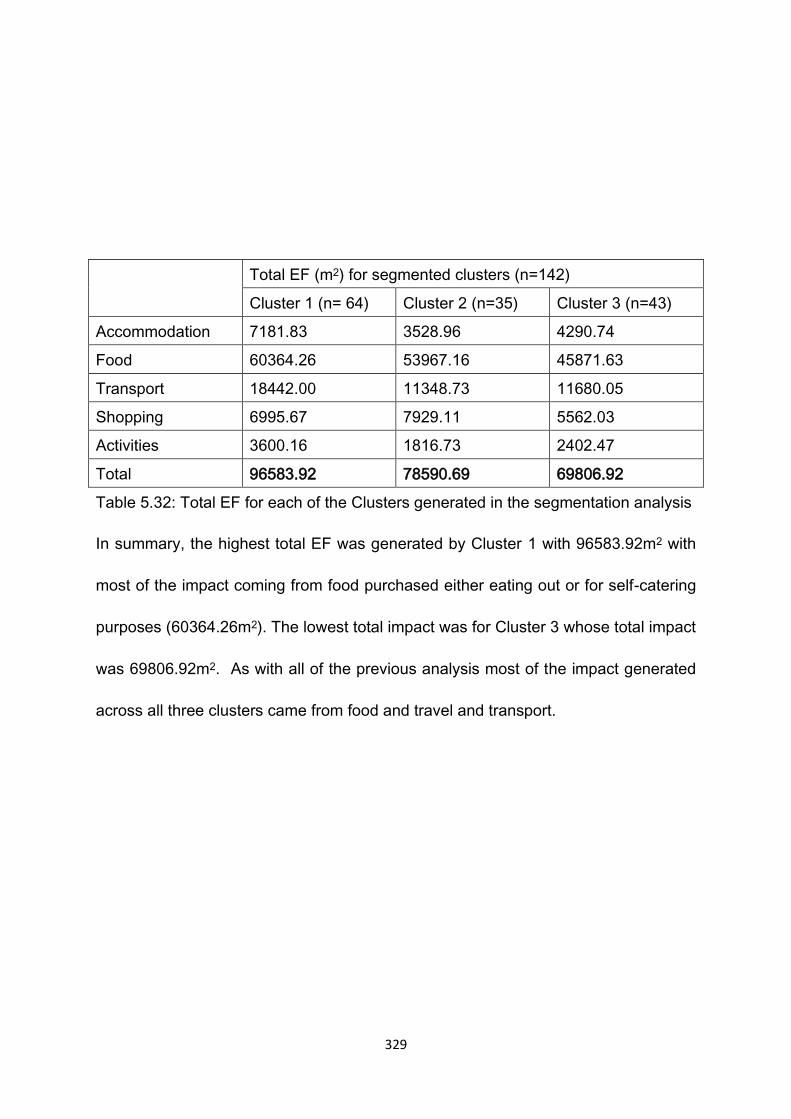
329
Total EF (m2) for segmented clusters (n=142)
Cluster 1 (n= 64) Cluster 2 (n=35) Cluster 3 (n=43)
Accommodation 7181.83 3528.96 4290.74
Food 60364.26 53967.16 45871.63
Transport 18442.00 11348.73 11680.05
Shopping 6995.67 7929.11 5562.03
Activities 3600.16 1816.73 2402.47
Total 96583.92 78590.69 69806.92
Table 5.32: Total EF for each of the Clusters generated in the segmentation analysis
In summary, the highest total EF was generated by Cluster 1 with 96583.92m2 with
most of the impact coming from food purchased either eating out or for self-catering
purposes (60364.26m2). The lowest total impact was for Cluster 3 whose total impact
was 69806.92m2. As with all of the previous analysis most of the impact generated
across all three clusters came from food and travel and transport.
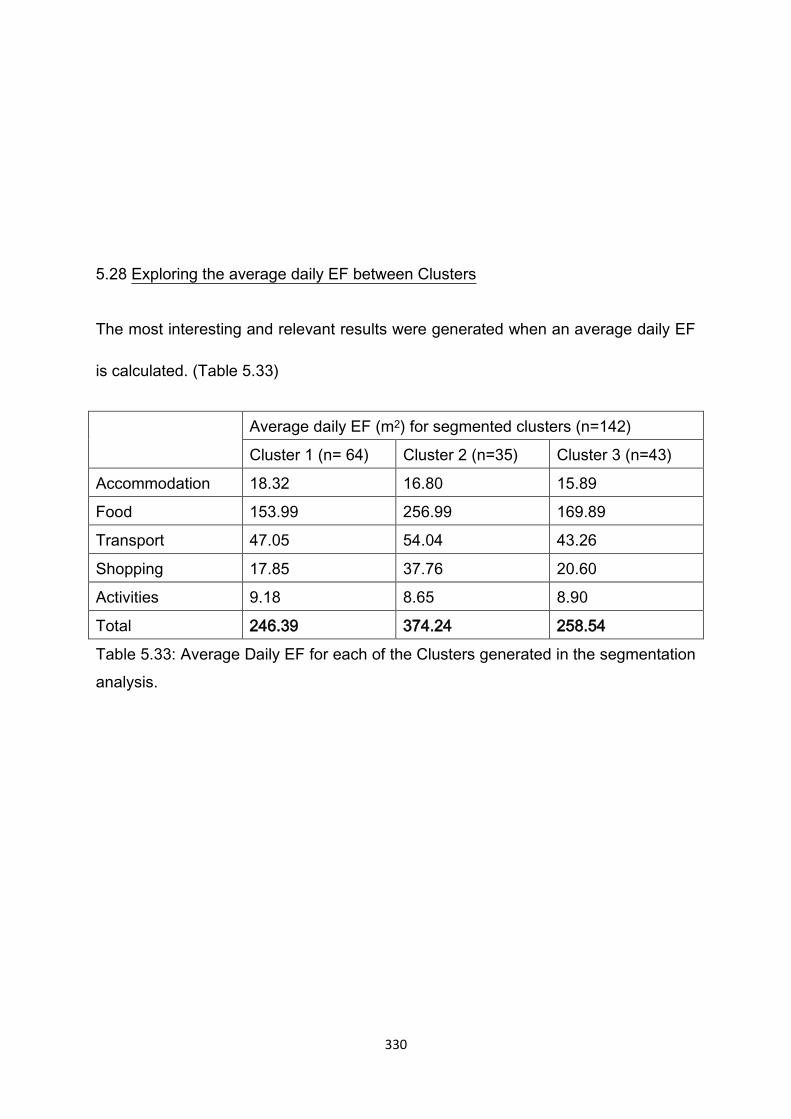
330
5.28 Exploring the average daily EF between Clusters
The most interesting and relevant results were generated when an average daily EF
is calculated. (Table 5.33)
Average daily EF (m2) for segmented clusters (n=142)
Cluster 1 (n= 64) Cluster 2 (n=35) Cluster 3 (n=43)
Accommodation 18.32 16.80 15.89
Food 153.99 256.99 169.89
Transport 47.05 54.04 43.26
Shopping 17.85 37.76 20.60
Activities 9.18 8.65 8.90
Total 246.39 374.24 258.54
Table 5.33: Average Daily EF for each of the Clusters generated in the segmentation
analysis.
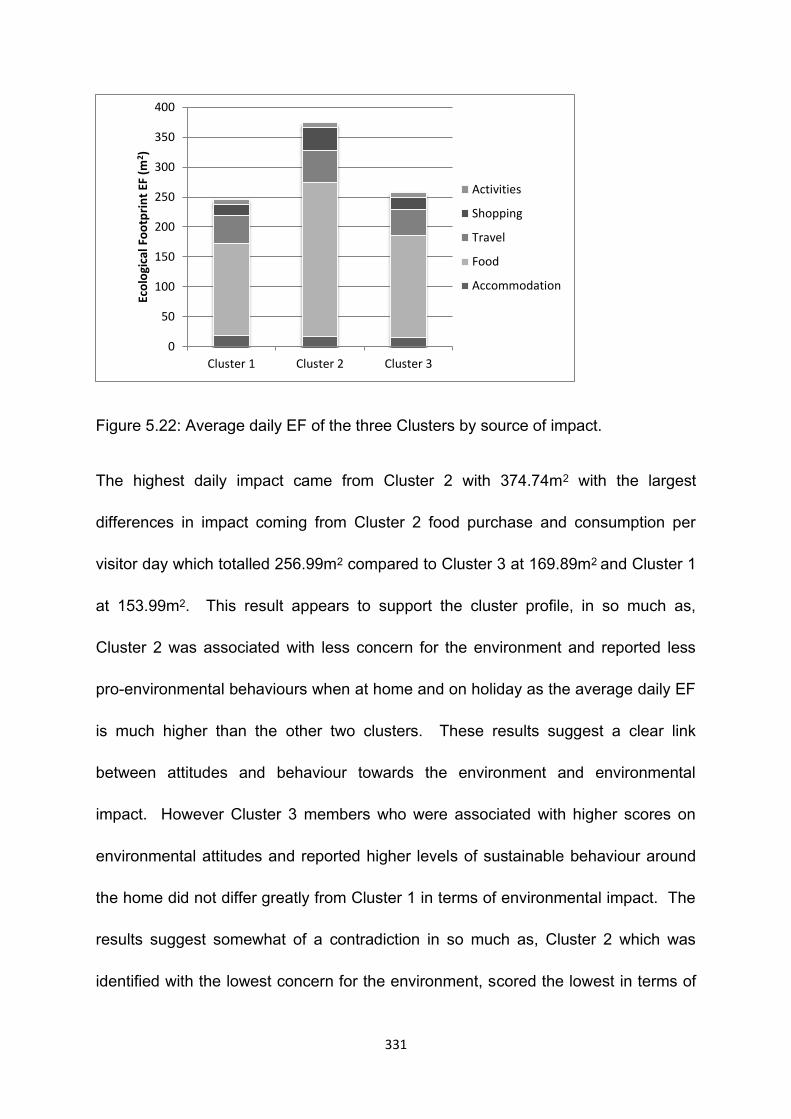
331
Figure 5.22: Average daily EF of the three Clusters by source of impact.
The highest daily impact came from Cluster 2 with 374.74m2 with the largest
differences in impact coming from Cluster 2 food purchase and consumption per
visitor day which totalled 256.99m2 compared to Cluster 3 at 169.89m2 and Cluster 1
at 153.99m2. This result appears to support the cluster profile, in so much as,
Cluster 2 was associated with less concern for the environment and reported less
pro-environmental behaviours when at home and on holiday as the average daily EF
is much higher than the other two clusters. These results suggest a clear link
between attitudes and behaviour towards the environment and environmental
impact. However Cluster 3 members who were associated with higher scores on
environmental attitudes and reported higher levels of sustainable behaviour around
the home did not differ greatly from Cluster 1 in terms of environmental impact. The
results suggest somewhat of a contradiction in so much as, Cluster 2 which was
identified with the lowest concern for the environment, scored the lowest in terms of
0
50
100
150
200
250
300
350
400
Cluster 1 Cluster 2 Cluster 3
Eco
logi
cal F
oo
tpri
nt
EF (
m2 )
Activities
Shopping
Travel
Food
Accommodation
332
reported sustainable behaviour and had the largest environmental impact. However
Cluster 3 which was identified with the greatest concern for the environment and
reported the highest levels of sustainable behaviour does not appear to have much
less of an environmental impact than Cluster 1. A Kruskal-Wallis test did not detect
a statistically significant difference in average daily EF for each of the Clusters,
(Cluster 1, n = 67; Cluster 2, n = 35; Cluster 3, n = 41), X2 (2, n = 143) = 4.32, p =.1.
Cluster 2 had the highest median score (Md = 296.09) and Cluster 1 (Md = 218.87)
and Cluster 2 (Md = 218.58) median scores. A Mann Whitney U Test was applied to
pairs of Clusters to further test any statistically significant difference in average daily
EF specifically Cluster 1 and 2, and Cluster 2 and 3 were tested. To control for type
1 errors a Bonferroni adjustment was made to the Alpha level, therefore the Alpha
level for this test was 0.25. The results revealed there was no statistical difference in
average daily EF between Cluster 1 (Md = 218.66, n = 66) and Cluster 2 (Md =
296.10, n = 35), U = 891, z = -1.984, p =.04, r =.1. The results for Cluster 2 and 3
revealed there was statistically significant difference in average daily EF between the
clusters, Cluster 2 (Md = 291.10, n = 35) and Cluster 3 (Md = 218.58, n = 41), U =
556, z = -1.683, p =.09, r =.1
5.29 Chapter Summary
This chapter has provided a comprehensive analysis of the data gathered via the
large scale questionnaire survey undertaken during the summer of 2011. The data
333
gathered has produced a comprehensive picture of holidaying behaviour amongst
tourists in both case study areas. Furthermore data relating to environmental
attitudes, holiday, travel and transport have also been assessed along with
exploration of home and holiday sustainable behaviours. Another novel aspect of
this analysis rests on the use of REAP for Tourism ecological footprint analysis
which were used to generate individual environmental impact footprints. Finally, as
dictated by a social marketing methodology, a segmentation analysis was
undertaken which identified three distinct Clusters of which one would be suitable for
targeting with a social marketing intervention to encourage behaviour change.
The next chapter will explore the qualitative side of data collection and analysis
which is focussed on identifying the barriers to, and motivations for greater levels of
sustainable on site tourist behaviour.
334
CHAPTER SIX - Results of The Semi-structured interviews
6.1 Introduction
This research is centred on using a social marketing methodology to investigate the
most appropriate way to encourage sustainable behaviour amongst tourists. Social
marketing works on the principle that in order to fully understand behaviour and
therefore encourage change the researcher must fully appreciate how people
understand and experience their world. In this case the research needs to fully
explore how ‘tourists’ perceive their holiday behaviour and establish what factors
they perceive to be barriers to behaving in a more sustainable way when on holiday,
what might motivate them to change their behaviour in future.
The use of semi-structured interviews allows the participant to articulate more freely
their opinions and how they perceive their behaviour and is therefore lead by the
participant, whereas quantitative research is much more led by the researcher and
responses as a result are somewhat restricted and do not allow for the uniqueness
of human understanding and experience to be demonstrated. Thus once the
quantitative survey had been administered and the results recorded a semi-
structured interview schedule was developed. This was based around a combination
of gathering further details regarding certain aspects of the survey, and around
generating more specific information regarding factors that participants perceive
inhibit sustainable tourist behaviour and what they perceive might motivate them.
More specifically this chapter aims to achieve the following objectives:

335
To explore how participants perceive the nature of their holiday, what it
means to them on a personal level.
To establish what participants perceive to be the barriers to sustainable
tourist behaviour.
To establish what participants perceive might motivate them to behave
in a more sustainable manner whilst on holiday.
The results were gathered over 2 months in the summer season of 2011 after
participants had returned from their holiday. Participants were selected from
questionnaire survey participants who supplied their details on the survey. They
were then contacted by e-mail after they returned to their home and an interview
date and time was set up at a time convenient them. Twenty participants took part in
the interviews which were conducted via the telephone and were recorded for
transcription purposes. The interviews were fairly short, lasting between 8 and 13
minutes depending on how much detail was provided by the participants.
6.2 Profile of participants
There were 20 participants in the interview stage of the research, 10 from each of
the two case study areas. Fifteen of the participants were female and five were male
their ages ranged from 24 years to 65 years. (Table 6.1)
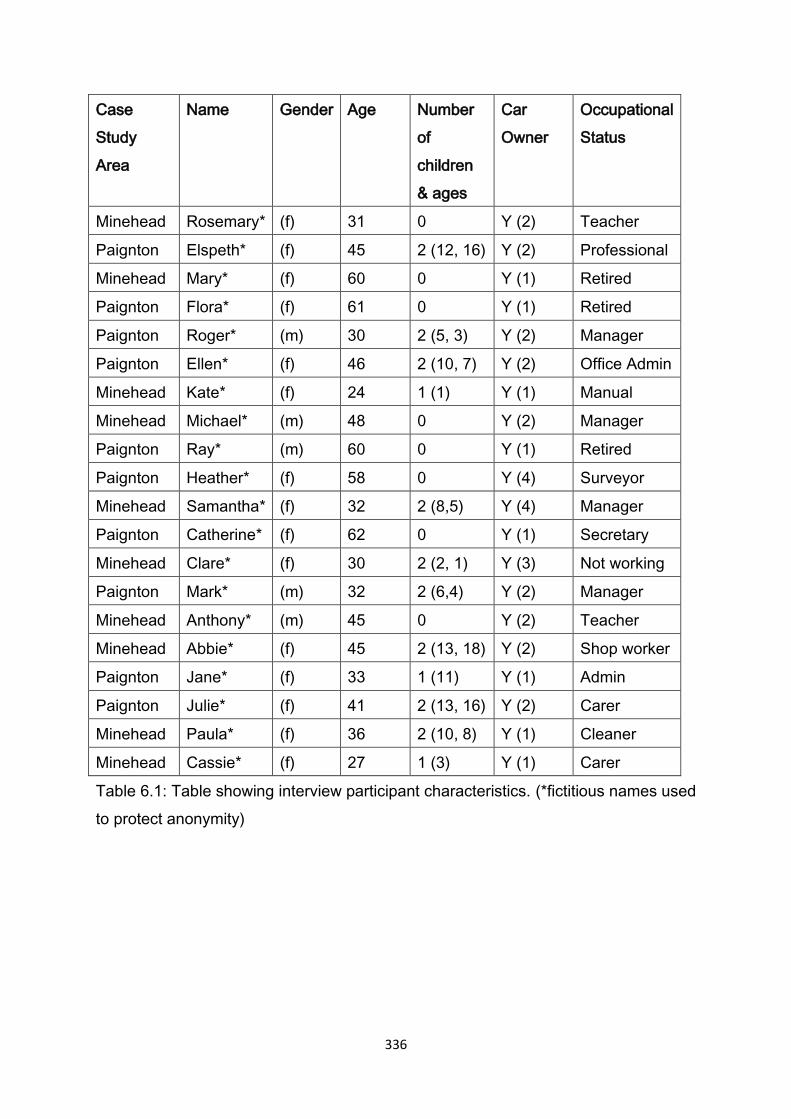
336
Case
Study
Area
Name Gender Age Number
of
children
& ages
Car
Owner
Occupational
Status
Minehead Rosemary* (f) 31 0 Y (2) Teacher
Paignton Elspeth* (f) 45 2 (12, 16) Y (2) Professional
Minehead Mary* (f) 60 0 Y (1) Retired
Paignton Flora* (f) 61 0 Y (1) Retired
Paignton Roger* (m) 30 2 (5, 3) Y (2) Manager
Paignton Ellen* (f) 46 2 (10, 7) Y (2) Office Admin
Minehead Kate* (f) 24 1 (1) Y (1) Manual
Minehead Michael* (m) 48 0 Y (2) Manager
Paignton Ray* (m) 60 0 Y (1) Retired
Paignton Heather* (f) 58 0 Y (4) Surveyor
Minehead Samantha* (f) 32 2 (8,5) Y (4) Manager
Paignton Catherine* (f) 62 0 Y (1) Secretary
Minehead Clare* (f) 30 2 (2, 1) Y (3) Not working
Paignton Mark* (m) 32 2 (6,4) Y (2) Manager
Minehead Anthony* (m) 45 0 Y (2) Teacher
Minehead Abbie* (f) 45 2 (13, 18) Y (2) Shop worker
Paignton Jane* (f) 33 1 (11) Y (1) Admin
Paignton Julie* (f) 41 2 (13, 16) Y (2) Carer
Minehead Paula* (f) 36 2 (10, 8) Y (1) Cleaner
Minehead Cassie* (f) 27 1 (3) Y (1) Carer
Table 6.1: Table showing interview participant characteristics. (*fictitious names used
to protect anonymity)
337
6.3 Interview Analysis
The next section will explore what the interview analysis revealed regarding
sustainable tourist behaviour amongst the participants of this research. Each of the
themes that emerged from the transcripts will be worked through in turn and quotes
from these transcripts will be provided as examples of the themes. Once all of the
themes have been explained the final stage will be to draw the evidence together in
order to answer the research objectives.
In order to establish rapport with the participants and to set the scene regarding the
nature of the interview participants were asked what their holiday meant to them.
Upon analysis of the transcripts it became obvious that there were two common
themes reoccurring throughout, these focussed on the perceived psychological and
physical benefits of taking a holiday away from home. (Appendix 8 details the
interview schedule employed)
6.4 Psychological and Physical Benefits of a ‘Holiday’
A holiday is perceived by the participants of this research to be an important part of
their lives as it offers a chance to relax and recuperate away from the stresses of life
and work at home. In fact the anticipation and planning for the holiday was perceived
to be almost as important as the actual holiday as it gave participants something to
338
focus on and to look forward to. This is perfectly represented by one of the
participants in the following excerpt
‘I really look forward to my holiday, the closer it gets the more excited I get, I
dunno I s’pose it’s the anticipation of being somewhere new, seeing new
things, I really like knowing that even weeks ahead’ (Abbie)
Another comment suggested that anticipation of the upcoming holiday in itself had
personal psychological benefits but that these benefits were also perceived to be
important for the whole family.
‘Going on holiday is really important for me, well for the whole family…I have
a really busy work life, I’m always on the phone, driving, and going away
means I can just switch off’ (Roger)
When the participants were in the holiday environment they identified many common
themes as benefits; time with the family, time off from paid work, enjoyment of
scenery and climate and free time. One of the most common themes running
through the transcripts was how important holidays were perceived to be in terms of
‘family time’. Holiday’s appeared to provide family’s the time to reconnect and re-
establish relationships between members this is especially evident in the following
extract
‘…we don’t get together much when we are at home, you know the kids are
always out or in bed when I come home from work and weekends are hectic,
339
but when we are on holiday I get to see them all day, we get to do things
together’ (Mark)
The following source follows a similar theme but here the participant has drawn
particular attention to how important she feels a holiday for children in terms of
spending time together:-
‘…the kids really love coming away, they know they’ll get our attention all day,
we get to do things together which they really look forward to’ (Ellen)
It appears this reconnection does not just occur between parents and children but
also with other members of the family as seen in the following
‘my parents often come on holiday with us…we like it that way, the children
get to see their grandparents, we get time off to do things alone, it’s a win, win
situation’ (Ellen)
A holiday as part of ‘time away’ from paid work was of course, one of the most
common benefits mentioned by respondents and was perceived as an essential part
of the year.
‘Oh I really, really look forward to going away, even if it’s just for a few days,
just to get away from work is really important to me…’ (Roger)
‘Work has been really hectic over the last few months, so it’s great to come
down to the West Country and get away from it all’ (Michael)
340
Participants who had holidayed in both case study areas were interviewed, and one
of the most commonly cited benefits of their holiday was related to the geographical
location and natural landscape. The scenery in terms of countryside, beaches and
cliff areas of both Minehead in Somerset and Paignton in Devon were both
mentioned repeatedly as benefits of holidaying in the region.
‘We come to Devon every year, we love the area, the coastline is beautiful
and the beaches are amazing and it’s so different from where we live’ (Mary)
‘The beaches are what makes it for us’. (Ellen)
In terms of physical benefits accrued by a holiday, there were several mentions of
the environment of the South West lending itself to being more physically active.
‘We love the area…it gives a chance to be outside a lot more, we do a lot of
walking, even if the weather’s not great we still enjoy it…it’s all that fresh air’
(Mary)
‘The children bring their bikes and because we are on a campsite they tend to
be outside all day playing and riding their bikes’ (Samantha)
‘This year we tried surfing for the first time…it really great, but cold, but it
didn’t really matter’. (Samantha)
Therefore the results suggest that a holiday is perceived as an important and much
anticipated period of time away from the home and work environment. Many of the
perceived benefits centred on re-establishing of family relationships and enjoyment
341
of shared new experiences and activities. There appeared to be a general
appreciation of the natural environment in the South West of England by those
interviewed and it was this was a motivating factor for holidaying in the region. It
was this natural environment that was perceived to be beneficial in terms of
encouraging outdoor activities. All in all, the holiday, according to analysis of the
transcripts appears to be viewed as an intrinsic part of these participants lives, and
as such offers a valuable period of time away from the routine of the home
environment and its inherent stresses and strains.
6.5 Holiday decision-making
The main objective of this qualitative section of the research is to uncover the
barriers and motivations to sustainable tourist behaviour. Therefore it was important
to establish with the participants how they selected their holiday destination, their
accommodation, transport and travel decisions and what factors influenced these
decisions, and further whether pro-environmental factors were included in the
decision making process. The analysis focussed on identifying more obvious
decisions that reflected a concern for the environment such as deliberate selection of
accommodation that had been rated as ‘pro-environmental’ such as those
businesses which are members of the Green Tourism Business Scheme (GTBS) or
businesses or resorts that promote themselves as environmentally friendly in terms
of the facilities that they offer. Decisions made that did not necessarily reflect a
342
concern for the environment but could nonetheless be considered more sustainable,
such as the use of public transport instead of the personal car, or accommodation
selection based on proximity to amenities, so that the car would not be required were
also identified in this section. The following section of the analysis then moved on to
specifically identify what participants perceived to be the barriers to sustainable
tourist behaviour whilst on holiday.
6.6 Important factors in holiday decision-making process
The quantitative survey included information regarding the factors that could be
useful to participants when they were selecting their final holiday destination, these
included what types of information sources were the most helpful and the attributes
of the resort itself. The results suggested that internet search engines were the most
useful source of information regarding the selection of holiday destination and that
having visited the resort before, the resort being family friendly and the area having a
good climate and pleasant scenery were also deciding factors. Whilst this
information gives some idea of what was important to the participants when selecting
their holiday it does not provide enough detail regarding how the search process
operates and which factors are the most influential in the search process. The
interviews therefore provide the participants with much more scope to elaborate on
how the decisions were reached and from this it should be possible to ascertain
whether issues of sustainability featured anywhere in the decision process.
343
Participants were asked how they went about selecting their holiday. It appears from
the transcripts that participants had already selected a geographical location in
which they wished to holiday, as most of the participants gave the name of the
county which they had selected or stated which coast they had planned to take their
holiday.. The knowledge of where the intended holiday was to take place appeared
to be influenced by a number of factors, including the composition and needs of
other holiday group members especially children, the range of amenities available
and the type of holiday experience the participants wanted to have. The following
excerpts demonstrate these concepts
‘…well we chose Devon, it’s got everything really that we like to do, beaches
and lots of things for the kids to do’ (Ellen)
‘We always go to either Devon or Cornwall, mostly for the coast, if the
weather’s good it’s even better’ (Julie)
‘This year we stayed near Minehead, basically we chose it cos we hadn’t
been there before and the family is getting older so we thought we could
explore Exmoor’ (Abbie)
In terms of accommodation selection, the analysis suggested that there were a
number of competing factors which influenced the final choice of accommodation;
these were cost both financial and time costs, suitability of accommodation for the
needs of the holiday group, and geographical location. It appeared from the analysis
that most participants already knew what ‘type’ of accommodation they were looking
344
for i.e. they knew they wanted to self-cater, or would be camping, or required catered
hotel, or bed and breakfast accommodation. Therefore specific accommodation
selection decisions made regarding where to stay were made based on the prior
knowledge of accommodation type and then selected in terms of the other criteria.
The quotes below demonstrate these points:
‘We always look for holiday cottage, because we have a lot of different age
groups with us, it makes it easier to cater for everyone’s needs’ (Samantha)
‘Yes, we go camping, and so we look for campsites that have good facilities,
that are not too expensive but are also near to the beach’ (Paula)
‘This year we went to a holiday park and stayed in one of their caravans, we
thought it would be easier as everything is in one place and they have a pool
and entertainment if the weather isn’t great’ (Ellen)
The participants tended to draw a lot of attention towards the ‘price’ of the
accommodation and it appears that financial cost is the most important criteria when
searching for accommodation, followed by location and amenities, so much so, that if
an accommodation is perceived to be too costly then a less expensive alternative is
sought and a compromise is made on location and amenities.
‘We were looking around and comparing prices…in the end we stayed
somewhere a bit further away cos it was a bit cheaper’ (Jane)
345
‘We knew what week we wanted to go away and where, but we had to be
careful how much it cost so we did a lot of shopping around’ (Clare)
‘We looked at a few places, the one we chose eventually had a deal on, book
for 2 nights and 3rd night free, something like that’ (Ray)
Participants were asked about which information sources they used and which were
most useful when deciding upon accommodation. There were a variety of responses
however the most often cited was the internet, this was utilised in various ways either
as a general ‘search’ for information regarding what activities were available in the
area or as a specific ‘search’ for ‘accommodation’ in the chosen location. In terms of
accommodation searches many participants first started their internet search for
accommodation using their chosen holiday destination, rather than using dedicated
holiday accommodation websites. Again cost, location, facilities and amenities were
the most important factors that the participants used when sifting through possible
holiday accommodation on-line, as is demonstrated in the following;
‘I used the internet quite a lot, it’s really useful, I just typed in where I wanted
to go, and it brought up whole lists of places, from there I chose one that was
at the right price and in the right area’ (Ellen)
‘The holiday cottage we stayed in was in a complex and they had a really
good website, that’s really what made our minds up’ (Catherine)

346
‘We used, I think, the Devon website, and then made a search for places to
stay from there’ (Roger)
In order to assess whether sustainability featured during the holiday decision making
process the transcripts were scrutinised to see if any mention was made for a need
for facilities such as provision for recycling, energy efficiency appliances, car-free
days out, close to public transport links and the use of locally produced or organic
food. However none of the participants explicitly mentioned a requirement for these
facilities therefore it could concluded that sustainability is not a priority when making
a decision regarding a holiday destination or accommodation.
6.7 Sustainable Behaviour
6.7.1 Sustainable Behaviour at Home
The next stage of the interviews were designed to address more directly sustainable
behaviour whilst on holiday, in the first instance respondents were asked about their
behaviour whilst at home and then whether they continue to undertake the same
behaviours when on holiday. The quantitative questionnaire survey suggested a
definite ‘drop off’ in commitment between the two environments but the interview
process should allow participants to elaborate more freely on their perceptions and
behaviours.
347
When asked about their commitment to activities like recycling and using energy
efficient appliances at home the consensus of opinion was that it was routine
behaviour and if the facilities allowed all of the participants were happy to. For
example
‘oh yes, we recycle tins, glass, cardboard and paper every week it’s not hard
cos the local council come and collect it’ (Ellen)
‘Yes we recycle everything we can’ (Clare)
‘…we’ve got used to recycling at home, sorting out all the rubbish, but I
suppose we’re lucky cos our local council collects it from the house, even food
waste, so we don’t have to take it anywhere, that makes it a lot easier’. (Julie)
In terms of the use of energy efficient appliances and undertaking energy saving
behaviour around the home, again the participants made positive comments and
perceived this behaviour as routine. From the analysis it appears that participants
understand that energy saving behaviours and the use of energy efficient appliances
has benefits for themselves, and it is these benefits, motivates them to undertake the
behaviour. Most participants who specifically mentioned the benefits of using energy
efficient appliances and undertaking energy saving behaviours linked it to a personal
financial gain. So by undertaking the behaviour they would be saving money on
energy bills due to either a reduction of electricity used to power the appliances, or
the purchase of energy efficient appliances that use less energy to power them. This
can be demonstrated by the following quotes taken from the transcripts;
348
‘We try to make sure that everything is switched off, especially try to get the
children to turn off TV’s and computers, I know you can save quite a lot by
doing that’ (Ellen)
‘Yes, that is something we do at home [turning off electrical appliances]…it
makes sense really’ (Ray)
‘It’s tempting to leave everything on ‘stand by’ but we do make the effort
especially overnight to turn everything off…even if it only saves a few pence
that adds up over the whole year’ (Clare)
In terms of the use of energy efficient appliances;
‘It makes sense to buy stuff that is energy efficient cos you’ll be making
savings in the longer term’ (Anthony)
‘We always buy energy efficient light bulbs, they’ve got a lot better recently,
not so expensive…so we’ve gradually changed all of them’ (Clare)
‘Yes, we do use them, and if we are buying something new like a washing machine it
makes sense to buy one that is energy efficient, although I would say that it would
depend on the price’ (Paula)
Therefore it appears that participants were committed to energy efficient behaviours
and the use of energy efficient appliances in the home environment. The next stage
of the analysis was to assess their perceptions of these behaviours when on holiday.
349
6.7.2 Sustainable Behaviour on Holiday
The interview proceeded to ask whether participants considered that it was important
for tourism destinations and businesses to offer facilities to enable recycling, energy
efficient appliances and to encourage energy efficient behaviours by their visitors,
and whether they actively sought these facilities when in the destination. Upon
analysis of the transcripts the responses illustrated similar themes, in so much as
there tended to be an acknowledgment that provision of these facilities were
desirable, and that if they were available then participants, if prompted tended to use
them. However the participants did not necessarily actively seek out the facilities, or
feel they were a pre-requisite of the decision-making process.
‘I think the campsite we stayed on had separate recycling bins for tins and
paper and the like’ (Paula)
‘Yes, we stayed in a hotel and there were signs up encouraging guests to turn
off the TV and not to have the towels changed every day I remember that…I
think it’s good when they try to do things’ (Ray)
‘I think there were energy efficient light bulbs in our holiday cottage, bins for
tins, paper and glass so we used them cos it was easy like at home’ (Flora)
It appears therefore, where facilities exist participants used them and perceived their
provision as positive, however when prompted participants acknowledged that these
were not facilities that they would actively seek, and the provision would not directly
350
influence their decision to select a particular destination or accommodation as is
demonstrated in the following quotes;
‘Yes, there were facilities provided, but I didn’t know about them before we
arrived, I don’t think it’s something that would’ve influenced me’ (Paula)
‘It’s good when places provide facilities, but I don’t necessarily look for them’
(Clare)
6.7.3 Holiday Transport and Travel
The next area under discussion was transport and travel decision making and
behaviour, as it is the transport element of the holiday which is generally responsible
for most of visitor environmental impact. In terms of the holidaymakers visiting the
South West of England the majority of journeys made to the destination are
undertaken by car. The results gathered in the quantitative section of this research
revealed just over 85% of the visitors surveyed travelled by car to their respective
holiday destinations. This information however, does not give any further details
regarding the reasons why people choose their car over other forms of transport, and
how they might be persuaded to use other modes of transport.
All of the participants interviewed reported using their car to travel to and from their
holiday destination. The analysis showed that the participants all gave similar
reasons for selecting this mode of transport over the use of public transport, these
351
centred on themes of convenience, time, financial cost and holiday group
composition. Convenience of using their own car was one of the most important
factors stated by participants using their own car, not only as transport to and from
the destination, but also during the holiday in order to visit local attractions and for
shopping purposes. This is demonstrated by the following quotes;
‘Yes, we use our car to go on holiday, it’s easier, it means you can leave
when you want, and when you are there you can get around a lot easier’
(Mark)
‘It’s good to have use of the car, I mean we were self-catering and you have
to do your food shopping like at home, so you need to have it…it wouldn’t be
much of a holiday if you had to go to the supermarket by bus’ (Abbie)
The concepts of ‘time’ and ‘convenience’ appeared to be inextricably linked, in so
much as, time spent travelling by car is perceived to be less than for other modes of
transport and it is this that allows participants to be flexible in planning journey times
to meet the needs of the holiday group.
‘Driving is just easier…you can travel door to door, you can go when you want
to’ (Samantha)
‘We’ve got two young children it’s just not feasible to go any other way than by
car, we have to take so much stuff with us…pushchairs and a travel cot…you
couldn’t take that much on a train’ (Clare)
352
‘I just think going by car is the only option, it’s not just the convenience, it’s the
cost as well, you know it’s so expensive going by train and then you have to
either get a taxi, or bus to where you are staying…it all adds up’ (Mary)
The participants were asked about how they travelled around once in their holiday
destination to assess whether there was scope for encouraging sustainable travel
choices once visitors have arrived in their holiday destination. The participants
identified various ways they travelled around during their holiday and these differing
travel modes tended to reflect the activity being undertaken during that particular
day. Furthermore the travel mode selection also directly corresponded to the location
of the activity and to the requirements of the holiday group as described in the
following excerpts;
‘…well it depends on what we’re doing that day, so if we were going to the
beach and where we were staying was close enough we’d walk, but on other
days we’d need to take the car’ (Paula)
‘…we generally tend to take the car, especially to visit places, it’s just easier,
we’ve got two young children and loads of stuff to take for the day’ (Clare)
‘…we didn’t use the car every day, it’s nice not to have to drive, but if we were
visiting somewhere that was a long way away then we’d usually use the car’
(Catherine)
353
The interview participants were then encouraged to discuss what might encourage
them to use more sustainable forms of transport, both for to travel their holiday
destination and whilst on holiday. Differentiating between travel and transport to and
from the destination and travel during the holiday is important, as the car is likely to
remain the most frequently used form of transport for travel to South West England.
However travel during the holiday is something that holiday destinations and resorts
at a local level can have an influence over and therefore a change in visitor
behaviour would be might more feasible.
The participants identified several factors which they perceived might motivate them
to use more sustainable forms of travel and transport whilst on holiday. Most of the
comments recorded in the interviews mentioned how important it is, whilst on holiday
that any transport services are easy and convenient to use, that services are regular
and reliable, information and access and to these services is straightforward. This
point is illustrated by one of the comments recorded in the interview in relation to the
use of local bus services whilst on their holiday;
‘…we did use the bus when we were there, which was good in some ways
because we got to see the countryside and didn’t have to worry about parking,
but coming back wasn’t so easy as we had to wait a long time and it was
raining so we were hanging around just waiting for bus’ (Flora)
Another area for concern that the participants drew attention to was the financial cost
of using public transport when on holiday, especially if the holiday group was fairly
354
large and the age range and requirements of the holiday group also affected whether
sustainable forms of travel and transport were viable options;
‘…yes, well, it’s the price, it can get quite expensive if there is a lot of you…it’s
not at that easy when you have very young children and older ones’. (Paula)
‘I think we might have considered using the bus if it wasn’t too expensive…it
all adds up’ (Clare)
Information regarding public transport services, or walking and cycling routes was
also perceived by participants to be something that might have encouraged them to
leave the car behind as the following quotes demonstrate;
‘…we weren’t really aware that was any other way to get around, although by
the end of the week we did realise there was a short cut to the beach…that
we could walk to’ (Anthony)
‘…maybe some bus times could be given out when you check in, with maybe
some prices…that would make it easier’ (Jane)
‘…we all take our bikes, but sometimes we don’t know if it’s safe enough for
us all to cycle places so we tend to take the bikes on the car and then use
them there…so it would be good to know where was safe, and how hard it
would be to cycle or walk to places’ (Ellen)
The location of the holiday accommodation was also something that makes
accessing public transport services particularly difficult, especially for those
355
participants who were staying in self-catered accommodation which is often located
in rural areas where public transport services are limited;
‘…well I suppose it depends where you are staying, I mean we were in a
holiday cottage up on Exmoor and there just wasn’t any public transport, so
that makes it difficult’ (Michael)
‘…we were staying on campsite in the middle of nowhere, which was good
‘cos we wanted to do a lot of walking, but in terms of going shopping or
visiting other places, you really do need a car’ (Heather)
‘…it would have been good to have had a regular mini-bus or something into
the nearest town…then we wouldn’t have had to use the car all the time’
(Samantha)
Therefore it appears from the analysis that participants would be willing to take fewer
car journeys whilst on holiday if services were available, were affordable, reliable,
regular and met their individual needs in terms of convenience and ease of use.
6.7.4 Food purchase and ‘eating out’
Another aspect of sustainable behaviour surrounds choices made regarding food;
locally produced and sourced food is perceived to be a more sustainable choice than
mass produced food sourced from a globally distant marketplace. The ecological
356
footprint of food retail is perhaps the best way to understand the impact of bringing
an extensive range of food stuffs from around the world as it takes account of the full
environmental impact in terms of energy required to grow, process and transport
intensively produced food. (Chambers, Simmons & Wackernagel, 2000) This point
is further demonstrated by the results of the ecological footprinting undertaken as
part of this research , the results showed that food purchased as part of ‘eating out’
and/or for self-catering purposes was responsible for just over 65% of the tourists’
surveyed environmental impact. Therefore it is important to recognise that the
choices tourists make regarding food whilst on holiday are also an essential part of
sustainability.
The interview participants were thus invited to explain their food choices whilst they
were on their holiday, discussion took place regarding where they purchased food,
for what purpose and what factors influenced these decisions. From the analysis of
the transcripts it appeared that food purchase and consumption on holiday fell into
several different types, the first type of food purchase was dependent on the type of
accommodation that participants were staying in. Those staying in ‘catered’
accommodation such as hotels, guest houses and bed and breakfasts had food
provided for them as part of their accommodation, the remainder were staying in a
form of ‘self-catered’ accommodation, here food was purchased in order to provide
meals very much like in the home environment. The other type of food purchase
357
was as part of ‘eating out’ in restaurants, cafes and public houses, finally all other
food purchases were made outside of meals and were in the form of snacks, these
purchases tended to made when the participants were visiting attractions or
sightseeing, the following quotes demonstrate the complexity of holiday food
purchase and consumption;
‘we were camping, so the way we did it was to buy food for breakfasts in the
morning and then on daily basis we would decide if we were going out to buy
things for a picnic or buy something like a pasty or sausage roll for
lunch…then generally in the evening we would go to the pub for a bar meal, a
couple of times during the week we had a bar-be-que at the campsite, but
that’s only okay if the weather’s good…and it wasn’t particularly’ (Clare)
‘…we had breakfast in the hotel and then we didn’t usually have anything
again until the evening, then we either ate out in a restaurant or had a
takeaway, sometimes we had a snack in the daytime maybe sandwiches or a
cream tea or something’ (Ray)
‘…we didn’t eat out that much…we pretty much bought the same as at home,
in fact we actually bought quite a lot with us…we did have a couple of
takeaways during the week, fish and chips and pizza but that was it really’
(Abbie)
The participants were then asked more specifically about the sources of their food, in
terms of whether they specifically bought locally produced food, or whether they
358
were served any in an ‘eating out’ establishment, or by their accommodation
provider. Further discussion took place regarding their perceptions of sustainable
food and what might encourage them to purchase more in the future. The
participants tended to associate locally produced food with traditional food types
which are associated with the South West of England, so cream teas, Cornish
pasties and fish and chips were mentioned most frequently in discussions of locally
produced food. It appeared from the transcripts that the participants tended, if
shopping for food for self-catering purposes to behave mostly as they do in their
home environment by shopping in the nearest supermarket. However food
purchased for ‘eating out’ in restaurants/cafes and pubs, or as a takeaway were the
most likely outlets where the participants acknowledged purchasing locally produced
food.
‘…er local food, yes we had a really nice cream tea in Dunster when we
visited the castle, that’s something you only really get when you come to the
West Country’ (Mary)
‘well we were self-catering so we bought most of our food from the
supermarket on the campsite, but we did eat out a bit, we had home-made
pasties in a pub we visited’ (Heather)
359
‘…I think the only real local food we ate was when we went to Kings Wear and
stopped in a pub and they had a ‘specials’ board with mackerel on it, and we
found out that the landlord had fishing boat and it had been caught that
morning…’ (Julie)
‘We stayed in a holiday cottage on a farm and they had their own eggs and
bacon and other types of meat, so we tried the eggs and bacon for breakfast’
(Cassie)
In terms of encouraging the participants to purchase more locally sourced food, other
than in ‘eating out’ establishments, the consensus amongst participants was that this
would be more time consuming, and probably would incur greater financial cost.
However, they were not against the idea of locally produced food, in fact they
perceived it as an essential part of the holiday experience. They felt, that as locally
sourced food was less readily available, especially in terms of daily staples such as
bread and milk, mass produced supermarket food was more convenient when on
holiday. This concept links with the others defined previously, in so much as the
‘holiday’ is a special time where any routine tasks that need to be undertaken, such
as travel or shopping, need to be as convenient and stress free as possible;
‘…I think buying all your food from local shops when you are on holiday would
be quite difficult, you’d have to go to lots of different shops…it would take too
long…and probably be more expensive’ (Mark)
360
‘I would buy more local food if it was easier, but when you are on holiday, you
don’t want to spend your whole time food shopping’ (Catherine)
‘When I’m at home I do try and buy some local stuff from the farm shop but
when you’re on holiday you don’t always know where one is so it’s just easier
to get your food from the supermarket’ (Abbie)
In conclusion it appears from the analysis that locally sourced food was an attractive
proposition to the participants of this research project, but that they perceived local
food when on holiday more in terms of regional specialities, rather than a source of
every day staples. Further, local food or regional specialities appeared to be
deemed as important aspects of the holiday ‘experience’ in so much as, a visit to the
South West of England would not complete without sampling a Devon cream tea or a
Cornish pasty. However when purchasing food for self-catering purposes,
participants, tended to behave very much as they did in their home environment and
relied on mass produced supermarket food. Sustainable food choices were
therefore perceived to be less convenient and more expensive choices when on
holiday and unless the participants were presented with them directly, as in the
previous example where the holiday accommodation produced their own food,
participants were unlikely to seek these sources out.
361
6.8 After the holiday – defining the benefits
The final section of the interview surrounded how the participants felt about their
holiday once they had returned to their home environment, whether they
experienced the benefits they anticipated, how they felt about destination in terms of
the environment, whether they might be likely to holiday there again in the future,
and whether there was anything they would thought could have improved their
experiences. The rationale for including this in the analysis was see whether
participants identified areas that could be linked to issues of sustainability as areas
for improvement, such as travel and transport links, facility and infrastructure
provision, locally produced food being more widely available, if so, this could act as a
motivating force to facilitate change.
In terms of participants’ perceptions of their holiday experience, most identified their
holiday as a positive experience, any negative reflections tended to focus on the
weather conditions during the holiday period, as this had a direct impact on some of
the planned holiday activities. Other themes that developed throughout this section
centred on the financial cost, and whether the facilities and amenities matched the
requirements of the holiday group. In situations where improvements were
suggested these were directly linked to personal needs of those in the holiday group
rather than the characteristics of the destination or the resort as the following quotes
demonstrate;
362
‘…yes we…had a good time, the weather wasn’t great so that meant we
couldn’t go the beach as much as we wanted to’ (Paula)
‘…We did everything we wanted to…but everything seemed to be so
expensive, mainly cos the children needed somewhere to play, we had a lot of
rain so they couldn’t play outside’ (Ellen)
‘…We enjoyed ourselves, but we probably wouldn’t go back there again cos
there wasn’t much for the children to do…the area was nice though, but not
very good if you have young children’ (Mark)
In terms of a repeat visit to the area in the future, all of the participants responded
similarly in that they would most certainly visit the South West of England in future
and many responded that they tended to return yearly. The participants identified
improvements to travel and transport links to the region, as areas that might improve
their holiday experiences. The themes that tended to re-occur throughout the
transcripts in terms of improvements to transport systems were focussed on
upgrades to roads in the region, in terms of motorway access, or major roads to
many rural areas. Other suggestions surrounded public transport systems, within
resort areas, particularly those participants staying the Minehead case study area,
who noted that the closest mainline railway station was 20 miles away which meant
travelling to the area by train was not an option;
363
‘…Well I suppose the only thing that is quite difficult is roads in the area, you
can’t get around very quickly, and at times queues for car parks is a
nightmare, we found that really annoying’ (Roger)
‘…I would have liked to have maybe have used the train to get to Minehead
but I was just too difficult cos there is no train station, so maybe that might be
an improvement’ (Mary)
‘Yes, we enjoyed the holiday, probably the most irritating thing was parking
there never seemed to be enough and the roads were really busy, but I
suppose it was August and the most busy time of the year’ (Abbie)
In terms of whether participants derived the expected benefits from their holiday,
most viewed their experiences in a positive light. However the analysis revealed that
many participants’ specific pre-holiday expectations in terms of benefits were not
explicitly recalled after their holiday. This perhaps suggests that in the period of time
before a holiday the ‘anticipated benefits’ are an important motivational factor and
may even be used to justify decisions made, and the financial costs associated with
taking a holiday. However once the holiday has been taken the benefits appear to
be related more directly to actual experiences, in terms of the resort, facilities, travel
and transport and has less to do with the psychological and physical benefits of a
holiday. The following excerpts illustrate the dichotomy between the previously
stated anticipated benefits and the benefits derived directly from the ‘holiday’

364
‘…Erm, yes it was a good holiday, maybe it was a bit different to what we
expected, but we really did enjoy it, we did most of what we had planned’ (Mark)
‘ Well we probably would have liked to do more stuff outdoors but the weather
kind of let us down, so for a couple of days we were pretty much stuck in the
caravan’ (Roger)
‘…we had a really good time, it was a lot fun, we were in a big group, 2 families
and all the children, so they all played together so it wouldn’t really have
mattered where we were cos they had each other…so we all did as well’ (Ellen)
In terms of whether the participants planned to return to the same area for another
holiday, the responses identified three significantly different types of repeat visitor;
regular repeat visitors – participants that return to the same resort year after year;
exploring visitors – visitors that state they plan to return but intend to explore other
areas within the region; possible repeat visitors – visitors who will most likely return
to the area but do not make a direct commitment. There were other responses but
the likelihood of a repeat visit was due to pre-existing ties to the area such as family
visitation and a friend who owned a holiday home in the region. The following
quotes from the transcripts demonstrate the differing responses;
‘…oh well, we will definitely be back, we come every year, it’s just got
everything we like’ (Kate)
365
‘…I think we will go back…sometime, although probably not to the same
place, we like to try different places’ (Ray)
‘…I expect we would go back, but we don’t have any definite plans’ (Anthony)
‘We come down quite a lot because we visit family’ (Jane)
In conclusion, it appears from the transcripts that the participants were relatively
content with their holiday experiences, although they were able to suggest room for
improvement in terms of transport and travel provision in the region. The climate of
the South West of England is also an area that impacted on participant’s holiday pre-
planned behaviour however this seemed not to necessarily have a negative impact
on their perceptions of the region or impact on their decision to re-visit.
6.9 Integration of categories
The next stage of the analysis involved drawing together the concepts identified in
the interview scripts and creating links between them in order to gain a deeper
understanding of tourist behaviour and the motivations and barriers to sustainable
tourist behaviour. Grounded theory analysis involves creating a diagrammatic
representation of the problem space in order to fully appreciate the dynamics of the
research question. (Glasser & Strauss, 2009) Therefore a flow chart diagram was
developed that represented the analysis of the interview transcripts, each section of
the diagram will be described with the links and impacts as perceived by the
366
participants used to understand the barriers and motivations to sustainable tourist
behaviour.
6.10 Model showing the barriers to sustainable tourist behaviour
The model (figure 6.1) describes the results of the interviews with the participants in
terms of their pre-holiday decision-making and selection, their on holiday behaviour
and their post-holiday experiences and describes their perception of the barriers to
sustainable tourist behaviour. Each section of the model will be described in turn
with emphasis on how and what the participants perceive to be the barriers to
sustainable tourist behaviour.
6.11 Pre-holiday - Benefits
The results from the analysis suggest that there a several different stages that the
participants go through prior to taking their holiday. These stages are all inextricably
linked and impact on the final decision-making and selection process. It appears
from the analysis that the ‘benefits’ that participants hope to gain from their holiday
experience guide the process from the beginning, thus those participants hoping for
a relaxing holiday will therefore include these requirements when searching and
deciding on a particular destination. The benefits that the participants hoped to

367
derive from their holiday tended to be grouped into psychological and physical
benefits.
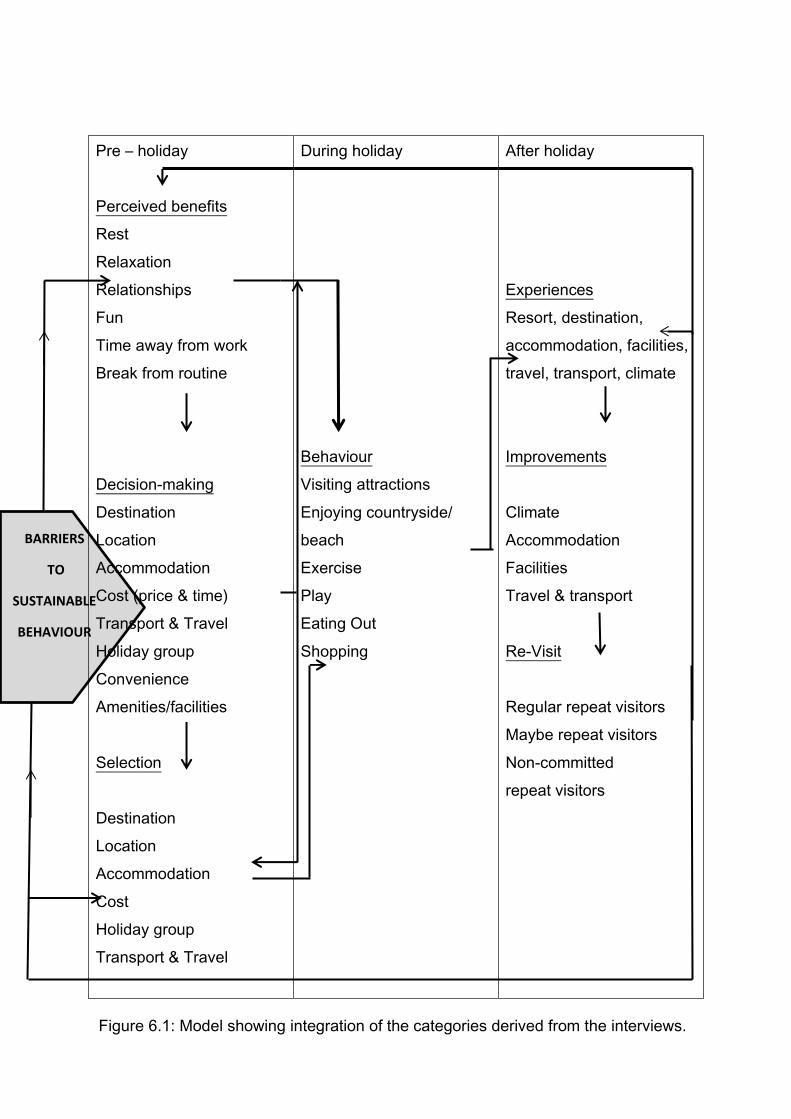
368
BARRIERS
TO
SUSTAINABLE
BEHAVIOUR
Pre – holiday
Perceived benefits
Rest
Relaxation
Relationships
Fun
Time away from work
Break from routine
Decision-making
Destination
Location
Accommodation
Cost (price & time)
Transport & Travel
Holiday group
Convenience
Amenities/facilities
Selection
Destination
Location
Accommodation
Cost
Holiday group
Transport & Travel
During holiday
Behaviour
Visiting attractions
Enjoying countryside/
beach
Exercise
Play
Eating Out
Shopping
After holiday
Experiences
Resort, destination,
accommodation, facilities,
travel, transport, climate
Improvements
Climate
Accommodation
Facilities
Travel & transport
Re-Visit
Regular repeat visitors
Maybe repeat visitors
Non-committed
repeat visitors
Figure 6.1: Model showing integration of the categories derived from the interviews.
369
In terms of psychological benefits, the holiday offered a period of time away from the
routines of the home environment, and benefits included rest, relaxation, and re-
establishing of family/friend relationships. These benefits were linked directly to the
anticipated benefits of the nature of the location, in so much as, the climate, coast
and countryside of the South West of England offered both physical benefits, in
terms of exercise and time spent outdoors and the psychological benefits of time
away from the stresses of everyday life.
6.12 Pre-holiday - Decision-making
The next stage in the process is the decision-making stage; here consideration is
given to the specifics of the holiday in terms of the destination, its location and
accommodation type. These decisions are impacted directly by the requirements of
members of the holiday group, in terms of the facilities and amenities that will enable
them to have a successful holiday. These requirements are weighed up against the
financial, and time costs associated with a particular destination or accommodation
selection. Decisions made regarding destinations and accommodation, tend only to
be impacted on by travel and transport options when participants are using public
transport to reach a destination. Therefore those travelling by personal car to their
holiday destination will be less likely to select their resort based on availability of
public transport routes and links.
370
6.13 Pre-Holiday - Destination Selection
The final destination selection occurs when participants have weighed up the
anticipated benefits of the particular holiday against the requirements of the holiday
group. Selection of specific accommodation is preceded by a desire to visit a
particular geographic location and selection is informed by financial cost, location,
amenities and information provided by the accommodation providers. In the case of
the participants in these interviews, issues regarding transport and travel were less
important than the selection and booking of accommodation as all of the participants
interviewed travelled by car to the region. However should any of the participants
have been travelling to the region by public transport, consideration would have
needed to be given to whether particular resorts and accommodation would be
accessible by public transport, as many areas of the South West of England do not
have adequate public transport links.
6.14 Perceived benefits
Once the decision-making and selection process has been undertaken and bookings
made, and in the period running up to the holiday, participants appear to focus back
on the perceived benefits of the up and coming holiday. The perceived benefits act
to build up anticipation for the holiday, which ensures that participants believe their
holiday will provide respite from the routines of daily life.
371
6.16 Barriers to sustainable tourist behaviour
The flow diagram illustrates that the barriers to sustainable tourist behaviour act
throughout the holiday decision-making and selection process, and continues
through the ‘on holiday’ phase, linking directly to the post-holiday phase. In the pre-
holiday phase participants perceived that making sustainable choices regarding
accommodation, transport and travel would impact negatively on their holiday
experiences. These negative impacts were perceived to threaten the perceived
benefits of the holiday in terms of the effort involved in engaging in activities that are
less damaging to the environment. Furthermore more sustainable forms of
accommodation and transport were perceived to be more costly both in time and
money, further decreasing the benefits of being away from the routines of the home
environment. Whilst participants were willing to undertake sustainable behaviours
such as recycling routinely in the home environment they were less likely to be
concerned about this when on holiday. (Tudor et al, 2007; Barr et al, 2011) Thus the
‘holiday’ is perceived to be a ‘special’ time away from routine behaviours, and
choices made, tend to reflect this, therefore sustainable options are perceived to be
more costly in terms of effort, convenience and financially more expensive.

372
6.17 During holiday - Behaviour
Once on holiday, the focus moves to realising the pre-holiday perceived benefits in
terms of rest, relaxation and time away from the home environment. Thus the
destination, accommodation and visitor attractions in the area are sought out, in
order to meet the expectations of the holiday group. Whilst on holiday travel and
transport are an intrinsic element to the holiday, with access to visitor attractions and
coastal and countryside areas being an essential part of the holiday experience.
Decisions made regarding visiting the surrounding area tend to be dependent on the
characteristics of the holiday group, in so much as those holiday groups with of
young children will have very different requirements in terms of mode of travel and
final destination, when compared to a holiday group of adults only.
In terms of activities undertaken during the holiday these tend to take the form of
visiting visitor attractions or countryside/coastal areas. The activities undertaken in
these locations reflect the needs of specific members of the holiday group, the
weather at the time, the financial costs, and the requirement to meet the anticipated
experiences of the holiday.
The other notable behaviours undertaken whilst on holiday revolve around shopping,
food purchase and consumption. There are two types of food purchase undertaken
373
whilst on holiday; food for self-catering purposes; and food purchased and eaten in
‘eating out’ establishments such as cafes, restaurants and public houses. Those
purchasing food for self-catering purposes, do so as a consequence of their holiday
accommodation selection or to subsidise the meals provided for them in catered
accommodation. Food purchased for self-catering purposes tended to be bought by
participants from the closest supermarket to their holiday accommodation, however
choices made regarding food purchased in ‘eating out’ establishments tended to be
more varied. Participants based their decisions either on cost and convenience, or a
desire to consume food that was traditionally associated with the region, such as
Cornish pasty’s and Devon cream teas. Where locally produced and sourced food
was available, this was viewed positively, but was perceived by participants to be
best suited to food bought as part of an ‘eating out’ experience rather than for self-
catering purposes. Participants perceived making choices regarding sustainable
food purchase for self-catering purposes to be more financially costly, and less
convenient, than food purchased via mass produced food outlets such as
supermarkets.
6.18 Barriers to sustainable tourist behaviour
As stated previously the model demonstrates that the barriers to sustainable tourist
behaviour continue to operate throughout the holiday process. Participants perceive
that making sustainable decisions during the holiday regarding accommodation,
374
activities undertaken, transport and travel, shopping and food purchase and
consumption would have a negative impact on their holiday experience, in so much
as selecting more sustainable options would, they perceive, be more expensive
financially, require more effort and eat into their holiday time. This is particularly the
case with sustainable transport and travel options, where the use of the car is
perceived to be essential when on holiday in the South West of England. The
barriers to more sustainable travel options are perceived to be the suitability of public
transport for differing members of the holiday group and the subsequent financial
cost implications. Furthermore information and service provision was not perceived
adequate enough to enable public transport to be a viable option when on holiday.
The barriers to sustainable tourist behaviour therefore link directly back to the pre-
holiday anticipated benefits of the holiday, suggesting that participants perceive that
behaving sustainably would impact negatively on the benefits they hoped to gain as
a consequence of taking the holiday, as these options are perceived to be
associated with an increase in effort, time and are also associated with being less
convenient.
6.19 After holiday phase - Experiences
In the period following the ‘holiday’ participants recalled their experiences of their
time away. These recollections focussed directly on the specifics of the holiday
experience in terms of whether activities undertaken and accommodation choices
375
matched the requirements of the holiday group. Any negative comments tended to
be related to factors that were outside the decision or selection process, such as
weather conditions which had impacted on the types of activities undertaken during
the holiday period.
In terms of the benefits accrued by the participants during their holiday these were
directly related to the participant’s experiences of the area, the accommodation and
the activities or visits made during the holiday, rather than the benefits anticipated in
the pre-holiday stage of the process.
6.20 After Holiday Phase – Suggested Improvements to the holiday
In terms of whether there should, or could, be anything that would have improved
their holiday experience, participants perceived that transport and travel options, and
facilities could be improved in the areas they visited. Road networks and public
transport options were specific factors which were suggested could improve their
experiences of the location. Other improvements to their holiday reflected more
personal factors, such as being more careful when selecting accommodation, and
ensuring that facilities matched the requirements of the holiday group. As mentioned
previously the weather was an area that participants felt could have improved their
376
holiday, as this had impacted directly on planned activities, and finding additional
activities undercover was also associated with additional financial expenditure.
6.21 After Holiday Phase - Re-visit
Repeat visitation of holiday resorts is an important part of the continued success of
tourism destinations, and therefore it was important to assess whether participants
were, in the light of their holiday experiences, likely to re-visit the area. The
analysis revealed there to be three different types of repeat visitor, those that are
committed regular repeat visitors perhaps returning year after year, those visitors
who state they intend to visit the region again, but are less specific about when and
where the visit will be, and the final type who state they are likely to visit the area in
future but do commit to a specific return.
The diagram shows that post-holiday recollections via immediate experiences and
improvements link directly to the concept of re-visitation. Therefore if past
experiences of the destination are favourable and any improvements can be
facilitated by changing decisions, made regarding accommodation and facilities, the
likelihood of a re-visit is increased, this then links back to the pre-holiday planning
and perceived benefits stage of the model.
377
6.22 Barriers to sustainable tourist behaviour
As indicated by the model, the barriers to sustainable tourist behaviour operate
throughout all phases of the ‘holiday’. Sustainable behaviour whilst on holiday is
perceived to impact negatively on holiday experiences, as the behaviour is perceived
to require more effort, and is therefore less convenient, increases the overall
financial cost of the holiday and might therefore interfere with plans to revisit the
destination in the future. Therefore the barriers to sustainable tourist behaviour can
be defined as follows;
Cost – time and financial
The perceived barriers to sustainable behaviour whilst on holiday are cost,
both in terms of time, and in terms of perceived increased financial cost. Here
participants perceive undertaking more sustainable behaviours whilst on
holiday will mean that they will have to sacrifice time during their holiday as
they believe sustainable options require more effort in order to reach the
same end. This is particularly perceived to be the case with selecting
sustainable travel options such as using public transport services to travel to
and from the holiday destination and during the vacation. The lack of
information regarding services and the increased time and effort associated
with travelling on public transport further adds to these perceptions. There is
also a perception that making sustainable choices whilst on holiday will add a
378
greater financial cost to the holiday. The larger the holiday group, wider the
range of ages, further inhibits the chances of tourists selecting public transport
options. (As public transport services charge per person the cost increases
greatly the larger the group, often holiday group members have a wide age
range requiring differing facilities and this is also perceived to be a barrier to
sustainable travel decision-making). In terms of locally sourced and produced
food, the barriers to selection are again related to increased financial cost and
the perceived time required to source food items.
Convenience
When considering sustainable choices on holiday, along with the concept of
the costs of ‘time’, participants also perceived that these options were less
convenient than their regular choices. Most of the participants stated that it
was important to them that the choices they made on holiday did not intrude
on their enjoyment of the holiday. For the participants the important part of
visiting an attraction is arriving and enjoying the facilities rather than the
journey to the attraction. Therefore they perceive, selecting a sustainable
transport option would impact on this overall enjoyment, as it would inevitably
be less convenient, as the journey would have to be undertaken when the
service ran rather than when the participants were able to travel. This
concept further interacts with the effects of the requirements and

379
characteristics of those in the holiday group. For example those holidaying
with very young children, with disabled group members, or elderly relatives
perceive that sustainable travel options would be less convenient than
travelling by car due to timetabling of services and the characteristics of
vehicles used thus creating a barrier to sustainable tourist behaviour.
6.23 Motivations to sustainable behaviour
One of the objectives of the interview stage of analysis was to identify the
motivations to encouraging sustainable tourist behaviour. The quantitative stage of
this research project demonstrated that there was a distinctive ‘drop off’ in reported
sustainable behaviours between the home and holiday environments. It is important
therefore, to try and explain this difference in behaviour, and to find ways to close the
gap, so that sustainable behaviour on holiday becomes as routine as sustainable
behaviour in the home.
The previous section identified what participants perceived to be the barriers to
behaving more sustainably in the holiday environment. These barriers focussed on
the cost, both financially and in terms of lost holiday time in making sustainable
choices regarding travel, transport and food choices whilst on holiday. It was also
felt that sustainable options were less convenient and would impact negatively on
380
the holiday experience. These barriers act constantly throughout the pre-holiday, on
holiday and post-holiday stages.
A social marketing methodology dictates that in order to fully understand a social
problem and in this case, sustainable tourist behaviour, the research must uncover
from the individual’s standpoint what the barriers and motivations to encouraging that
behaviour are. Therefore the motivations to encouraging sustainable tourist
behaviour lie in addressing the barriers. The perceived barriers act throughout the
process preventing participants from making sustainable decisions.
In order to encourage sustainable behaviour on holiday the issue of ‘costs’ in terms
of time and expenditure need to be addressed. Motivating individuals to behave in a
sustainable manner requires them to perceive their holiday time differently, that time
spent on public transport/walking/cycling is not time lost, but allows for greater
freedom and a chance to experience the scenery without the problems associated
with driving. Furthermore that there are benefits to leaving the car behind, in so
much as it provides an opportunity for a break from the stress of driving, avoiding
traffic congestion as well as saving money on petrol and parking charges. This
needs to be supported by the provision of regular services travelling to destinations
that visitors want rather than incorporating services into normal local bus/train routes.
The vehicles need to be fit for purpose and accessible for those with differing

381
requirements and fares need to be incentivised, so that large groups travel more
cheaply, and tickets can be used as discounted entry to visitor attractions.
Information regarding the services and discounts need to be encouraged at all
stages of the holiday process, so that individuals are aware they exist prior to
booking their holiday, know how to use them once on holiday, remember them when
they return from their holiday. So that they are motivated either to re-visit and utilise
them again, or to search for the same facilities and services on further holidays.
In terms of locally sourced and produced food, participants perceived the notion of
locally produced food in different ways, food for ‘eating out’ in restaurants or other
dining establishments and food purchased for self-catering purposes. When thinking
about locally produced food eaten in dining establishments most participants
associated this with traditional local dishes such as Devon cream teas and Cornish
pasties. When making choices regarding food purchased for self-catering purposes
participants tended to purchase their food very much as they did in their home
environment via the local supermarket. Whilst purchase of locally produced food in
the form of food eaten in restaurants/cafes/pubs was perceived favourably, locally
sourced and produced food for self-catering purposes was perceived to be more
costly and less convenient than mass produced supermarket food. In order to
address this issue and to motivate visitors to purchase locally sourced food it would
be advantageous for supermarkets to stock locally produced food and market it thus,
382
so that visitors would be aware that they were purchasing local food and supporting
local producers. Many accommodation providers already use locally sourced and
produced food in their catered accommodation and use this as a selling point so this
is something could be rolled out to other accommodation types. Self-catering
establishments could provide pre-ordered food packs for use on arrival as a way of
addressing the barriers to purchase of locally sourced and produced food stuffs.
Pre-packed picnic lunches for visitors could be used to showcase local food.
Established routine home behaviours such as recycling of paper, tins and cardboard
needs to be encouraged in the holiday environment, therefore provision of facilities
also needs to be consistent across the whole of the region. This provision needs to
be at all levels from destination level right down to small accommodation providers
and visitors need to aware of the existence of these facilities, there also needs to be
an expectation that visitors are required to use them during their stay.
6.24 Chapter Conclusion
In conclusion the interview section of this research has assisted in exploring and
explaining the results derived in the quantitative data analysis. In so much, as the
quantitative section was able to show that participants reported less commitment to
383
sustainable behaviours when on holiday, the interviews were able to uncover how
the participants perceive their holidays and what they identify as the barriers to
sustainable tourist behaviour. The barriers to sustainable behaviour whilst on
holiday were related to cost in terms of money and time lost undertaking sustainable
tasks and inconvenience. These barriers interacted at all stages of the holiday,
before the holiday in terms of impacting on the perceived anticipated benefits that
the holiday was expected to bring to the participant and the holiday group in general.
During the holiday, sustainable behaviours were perceived to be more financially
expensive and to be more costly in terms of time undertaken to complete them. This
increased expenditure was perceived to have a negative impact on the holiday
impacting directly on the anticipated benefits of the holiday. Finally in the post-
holiday phase where participants would be considering re-visiting, any aspects that
would make the process more expensive, more time consuming and therefore less
enjoyable would impact negatively on the decision to repeat their holiday
experiences. The solution therefore is to convert the perceived barriers of
sustainable tourist behaviour into motivating factors.
The participants of this research demonstrated that they perceive sustainable
behaviour on holiday negatively, in terms of cost and convenience and something
that would impact negatively on their enjoyment. So in order to motivate, or
encourage them to behave more sustainably they would need to believe that
384
sustainable options were more attractive than ‘everyday’ behaviour. The only way
this could be successfully achieved is to create the conditions within the tourism
destination where provision of sustainable services are all that is available and thus
the decision-making process is removed from the process. Furthermore with
sustainability built naturally into the ‘holiday’ visitors would need to appreciate the
different ‘experiences’ created as a result, so for example, a car-free destination
would mean the destination would be quieter, cycling and walking for children and
adults alike would be safer and more attractive. Thus the holiday experience would
be somewhat different with perhaps more activities being undertaken in a smaller
geographical area, which would have benefits for the destination as money would be
spent in local businesses. The change in experiences of both the holiday, and
sustainability would re-conceptualise visitors perceptions of sustainable behaviour by
associating the behaviour with positive experiences thus re-enforcing the behaviour
in the future. By so doing, the holiday environment could lead to increased
sustainability in the home environment as the associations between behaviour and
experiences would be positive.
The insight gained from the interviews suggests that encouraging sustainable
behaviour whilst on holiday needs to be treated differently than sustainable
behaviour undertaken in the home environment, because the ‘holiday’ is a special
environment in terms of what it means to individuals, and the expectations of the
385
benefits accrued as result of the time away from home. Any behaviour that is
perceived to intrude and impact negatively on these anticipated benefits will be
rejected. For this reason attitude and behaviour change cannot be the sole
responsibility of the ‘tourist’, destination and resorts need to change the focus of their
activities in order to create the environment where sustainability exists as the norm.
Destination marketing and endorsement would be central to the success of the
principles of the sustainable tourist resort. As stated previously the tourism
destination should be the leading force in encouraging sustainable tourist behaviour
by providing the resources and environment for all tourism stakeholders to
participate. Thus the ‘tourist’ would only have to make one decision, that is, to stay
in the destination, once there everything else would be taken out of the decision-
making process and would therefore be inevitable in terms of transport, food,
accommodation and entertainment.
386
CHAPTER SEVEN – Discussion & Conclusion
7.1 Introduction
This chapter of the thesis will focus on drawing together the results obtained during
the fieldwork and assessing whether the aims and objectives of the research have
been met. The overarching aim of this research project was to assess the potential
of a social marketing methodology in encouraging sustainable behaviour amongst
tourists. The principles of social marketing rest on changing attitudes and behaviour
for the purpose of improving a social problem. In the case of this research the goal
is to understand the best way to encourage sustainable behaviour when people are
on holiday. Social marketing approaches ‘social problems’ in a ‘bottom up’ way by
aiming to uncover how the target audience, in this case tourists, perceive their
behaviour and what they perceive might encourage them to change their attitudes
and ultimately their behaviour. Whilst a social marketing methodology has been
applied successfully to varying ‘social problems’ related mostly to health and social
welfare (substance misuse, healthy eating and family planning) and is beginning to
be applied in encouraging sustainable behaviour, social marketing has not been
applied specifically in the tourist environment. McKenzie-Mohr, 2010) One of the
most important aspects of a social marketing methodology is the concept of
audience segmentation and targeting. The methodology encourages the use of
segmentation in order that individuals can be grouped together in a ‘segment’, thus
members of the same segment will share similar beliefs, attitudes and behaviours.
387
This allows for pinpointing of the segment or segments that would be most amenable
to targeting with an intervention to encourage attitude and behaviour change.
(French & Blair-Stevens, 2010; Andreasen, 2006) Another unique element of this
thesis is the use of ecological footprinting software to calculate estimated individual
environmental impact of tourists whilst in their holiday destination. This exploratory
technique allows the environmental impact of tourist behaviour to assigned a value
by which it can be compared, and specific particularly impactful behaviour
pinpointed. Furthermore once a calculation of individual footprints has been
undertaken a direct link can be established between the environmental attitudes and
behaviour of that individual and their actual environmental impact – thus testing
whether holding positive attitudes towards the environment and acting upon them
actually leads to a smaller environmental impact.
This chapter will be divided into two sections the first section will provide a detailed
discussion of the results obtained during the fieldwork and how these meet the aim
and objectives of this research. The second will be more pragmatic in nature and
will aim to set the findings within a social marketing process framework, before
discussing the limitations and providing further discussion of suggestions for future
research.
388
7.2 Meeting the Objectives of this thesis
7.2.1 Objective One: To describe and explain the behaviour of tourists within a
destination, to include travel to, from and within the destination and also include all
consumer behaviour undertaken during the holiday.
In order to fully understand tourist behaviour from the standpoint of the individual it
was essential to collect detailed data relating to all areas of the holiday experience,
from the pre-visit planning stage through to the actual holiday, thus providing a
benchmark measurement of holiday behaviour. The following discussion will draw
together the data gathered in both the quantitative (questionnaire survey) and
qualitative (interviews) to provide a complete picture of the behaviour of tourists
within the destination case study areas.
Pre-visit Stage – Much of the literature reviewed in chapter 2 related to tourist
behaviour and established that motivation and decision-making are essential parts of
the process; therefore this research took a similar route, exploring the sources of
information and destination characteristics which motivate destination selection. For
the participants of this study their ‘holiday’ was perceived as an essential element of
their lives and the anticipated psychological and physiological benefits were
389
associated with notions of ‘rest’, ‘relaxation’, and ‘recuperation’ and were important
for re-connecting family relationships.
In terms of the information sources utilised in order to motivate destination selection,
the use of the internet to explore detailed information regarding amenities and
facilities was the most important source of information. However first-hand
experience and word of mouth recommendation from trusted friends and relatives
also facilitated the process. (Crompton & Ankomah, 1992) Selection of component
parts of the holiday such as accommodation were directly influenced by the
requirements of the holiday group, with children being an important determinant in
the selection process, which in consistent with the findings of previous research.
(Thornton, Shaw & Williams, 1997; Kerstetter, 1994) Financial ‘cost’ and ‘time’
expenditure were also important constraining and motivating factors when selecting
suitable accommodation provision and is the geographical location of the
accommodation in relation to various tourist attractions (McKean, Johnson & Walsh,
1995; Nicolou & Mas, 2006; Sirakaya & Woodside, 2005).
The participants were asked to define the specific characteristics of the destination
which were important in the selection of their current holiday. The majority of
respondents rated their own personal experience of visiting the destination on a
previous occasion as an important motivating factor for their current holiday. The
390
attributes of the destination in terms of the natural landscape and climate were
important in motivating destination selection as were the range of amenities on offer.
Destination accessibility in terms of being able to be easily accessed via the road
network also played its part in motivating selection of the final destination.
Visitor Characteristics: In order to meet and fulfil the objective one, it was important
to build a detailed picture of those on holiday in the two case study areas. The
majority of those sampled in this survey were ‘staying-visitors’ with over 80% staying
more than 4 nights in the region, for 65% of those on holiday this was to be their
‘main’ holiday for the year, although the majority of those for whom this was their
main holiday admitted that they were planning to take further short breaks or
holidays in the following twelve months and these ‘breaks’ would most likely to be
taken either in the UK or Europe. For those participants who responded that this
was not their main holiday, the majority cited either somewhere in the UK as their
main holiday or a long-haul destination outside of Europe. The rise in the popularity
of a number of ‘short breaks’ distributed throughout the year is one of the areas of
tourist behaviour that needs to be tackled in order for tourism to be more
sustainable. This is due to the environmental impact related to the travel component
of the holiday, in order to address this issue it is suggested that people should take
less frequent holidays over a longer period.
391
Holiday Group Composition: The majority of those holidaying or visiting the two case
study areas were made up of family groups with and without children, followed by
those visiting in groups of friends. This is not a particularly surprising result as both
case study areas are seaside resorts with a tradition for family holidays due their
close proximity to beaches and coastal areas.
Accommodation: The most popular type of holiday accommodation was serviced
accommodation including hotels, bed and breakfasts or guest houses followed by
self-catering units and then those camping in tents or caravans.
Travel and transport: The car was by far the most commonly used form of transport
used to travel to and from the case study areas, with a tiny majority arriving by bus,
coach or train. This result has significant implications, as it demonstrates the
importance of the car for holidaymakers to the region, even where a destination has
a mainline railway station as is the case for Paignton very few people utilise the
service as their main form of holiday transport. Therefore in terms of increasing
sustainability, sustainable transport options need to be prioritised and the barriers
which constrain their use lowered in order to encourage greater use.
392
In terms of transport used during the holiday, the car was identified as the most
regularly used form of transport used to visit attractions whilst on holiday in the case
study areas. However local bus services, cycling and walking were also used as
ways of getting around whilst in the holiday destination. The car was perceived as
an important way to maximise time usage whilst on holiday, the convenience,
flexibility and which enabled members of the holiday group to visit various attractions
in comfort. However the interviews revealed that the car was not necessarily used
every day and that depending on their specific location many chose to walk or cycle
and this added to their overall holiday experience.
Holiday Activities: The participants undertook a range of activities whilst in their
respective holiday areas, the most frequently undertaken activities were visits made
to Houses and Gardens, followed by boat trips, with exploration of the natural
landscape, coastal walking and beach trips being the top three activities undertaken
in the two case study areas.
In conclusion, the requirements of ‘objective one’ of this research has been met and
fulfilled by both the quantitative and qualitative data collected. The data provides a
clear picture of the visitors to the two case study areas. It demonstrates the sources
of information that are important to the selection process, the factors which constrain
and motivate choice such as ‘holiday group composition’, ‘time’ ‘cost’ and
393
‘convenience’ and that these factors are important as they impact directly on the
anticipated psychological and physiological benefits associated with taking a holiday.
It should be noted however that the ‘consumer behaviour’ element of this objective
involved the gathering of data relating to all purchases made during the holiday and
the data here was used for fulfil Objective Four of this thesis.
7.2.2 Objective Two: To identify, the barriers and motivations for adopting more
sustainable tourist behaviour.
Attitudes towards the environment: A crucial element in the debate regarding pro-
environmental or sustainable behaviour is the whether being environmentally aware
or holding positive attitudes towards the environment is a prerequisite for
engagement in a range of sustainable behaviours. Therefore this research
measured attitudes towards a range of statements relating to the environment and
climate change. The statements were designed to explore levels of concern related
to the imminent threats associated with a change in climate, personal responsibility
for mitigating impact, trust in scientific facts related to the man-made element of
climate change. There were varying levels of agreement in relation to general
attitudes towards the environment amongst participants; whilst there was a general
394
acceptance and belief that the earth’s climate is changing and global warming is
taking place, personal responsibility and trust in scientific knowledge relating to the
‘man-made’ element of impact was either denied or participants remained ‘neutral’ in
their opinions. These results suggest that there are general issues with ‘trusting’
scientific information relating to the threats of climate change and as result this
impacts negatively on intentions to act (Hungerfrod & Tomera, 1986). Attitudes
towards the importance of protecting and preserving the environment were very
positive with nearly 80% supporting the statement, and over 60% stated they were
willing to change their behaviour but would be more likely to do more if they felt
others were doing the same. These results suggest that there is ‘social normative’ is
an element of engagement in sustainable behaviour as suggested by Ciadlini, Reno
and Kallegren (1990).
Attitudes toward holiday transport and travel: The study also explored attitudes
towards the environment specifically in relation to holiday travel and transport. The
statements focussed heavily on attitudes towards transport modes and attitudes
towards short breaks. An important element of sustainable tourist behaviour is
related to the mode of transport used to arrive in the destination, the fastest and
therefore the most convenient modes (air travel, car etc) tend to have the most
impact therefore it is important that these journeys are reduced. Attitudes towards
the importance of selecting the ‘fastest’ mode of transport to reach the holiday
395
destination suggested that for over a third of people this was important but for the
remaining two thirds this was not important or they remained neutral. In terms of
actively avoiding polluting forms of transport when selecting their holiday destination
the majority either disagreed with the statement or chose to remain neutral
suggesting that the environmental impact of travel behaviour is rarely considered
when making decisions relating to holidays.
In terms of ‘short breaks’ these were perceived to be very important to participants,
suggesting that multiple short holiday breaks have become an entrenched part of the
holiday process now, and this may be an important and significant barrier to the
adoption of more sustainable tourist behaviour.
Home and holiday sustainable behaviour: Research has demonstrated a ‘drop off’ in
commitment between sustainable behaviours routinely undertaken in the home
environment and commitment to the same behaviours in a holiday environment.
(Barr et al, 2011; Tudor et al, 2007) Levels of commitment to a range of sustainable
behaviours (recycling, composting, water saving, electrical efficiency, re-used bags,
transport etc.) were measured in the home and holiday environments. The results
supported the work of Barr et al, (2011) and others and demonstrated there was a
significant ‘drop off’ in commitment to all of the sustainable behaviours between the
two environments. The results demonstrated no significant difference between
396
males and females in their levels of commitment to sustainable behaviours
(Lehmann, 1999; Van-Liere & Dunlap, 1980). However when participants were
divided separated into age groups the results showed that the oldest age group,
those over 60 years of age demonstrated a greater level of commitment to a range of
sustainable behaviours in the home environment; however this did not extend into
the holiday environment. Comparison between case study areas showed that
reported sustainable behaviour was consistent between the areas, some behaviours
particularly the easier, less economically or time heavy behaviours show the greatest
levels of commitment (recycling, switching electrical equipment off from ‘stand-by’,
energy efficient light bulbs and carrier bag re-use), on the other hand the use of
water saving devices, consumer behaviour and food choices tend to be occasional.
Sustainable transport options appear to be the most resistant to selection and
consistently show levels of commitment and uptake (Stern 2000, Steg & Vlek, 2002).
Barriers to sustainable tourist behaviour: The quantitative element of the research
process allowed for confirmation of the ‘drop off’ in commitment to a range of
sustainable behaviours between the home and holiday environment. However, the
qualitative interview stage allowed for exploration and identification of the perceived
and actual barriers to sustainable tourist behaviour. The interviewees confirmed the
findings of the quantitative research in that the respondents were committed to a
range of sustainable behaviours at home and were happy to use them if they were
provided in the holiday environment, but these services were not sought out and did
not influence their holiday destination decision-making (Aberg, 2000). In terms of
397
sustainable transport modes the perceived and actual barriers identified by the
participants were related to financial cost, time cost and convenience. (Cooper,
1981; Thornton et al, 1997) These considerations were moderated by the
requirements of the holiday group, particularly the needs of young children who
require additional equipment (pushchairs etc.) and physical needs for sleep and food
which acts as a significant barrier to the selection of sustainable transport options
(Thornton et al, 1997; Swarbrooke & Horner, 2001). The selection of sustainable
options was perceived negatively by participants in terms of cost and convenience
as this would impact the anticipated benefits of a holiday, such as rest, relaxation
and pleasure.
Motivations to encouraging greater levels of sustainable tourist behaviour: In order
to address the barriers to behaviour and motivate a change, sustainable options
need to be perceived more positively. So that the constraints of ‘time lost’ due to
walking or taking public transport is a positive experience whereby the individual is
freed from the stress of driving and parking, enabling a wider experience of the
culture and landscape. Whilst changing perceptions is important, as important is the
provision of adequate and suitable sustainable infrastructure and services.
Especially in the case sustainable of transport options in which vehicles and services
need to accessible and fit for purpose responding directly to the requirements of
holidaymakers specifically rather than being ‘tagged’ onto existing residential
398
services. Incentivising the use of such services by reducing the cost and including
entrance to tourist attraction would motivate uptake to sustainable options.
Adequate information provided at the time of booking to allow for planning of
alternative routes and sustainable options would encourage usage.
In terms of selection of locally produced and sourced food, individuals need to have
access close to their accommodation and catered and self-catered accommodation
could provide an avenue for this.
As established previously routinely engaged in sustainable behaviours such as
recycling, re-using and composting needs to be encouraged in the holiday
environment by the provision of facilities which are consistent across
accommodation types and visitor attractions.
In summary, the data gathered has met the requirements of Objective Two by the
confirmation of ‘drop off’ in routine sustainable behaviours between the home and
holiday environments. Furthermore the research has established the actual and
perceived barriers to sustainable behaviour are linked to the financial cost, time cost,
and convenience acts to constrain selection of sustainable alternatives. Motivation
399
to change in behaviour need to be realised through addressing and lowering these
barriers and suggestions for doing this have been provided above.
7.2.3 Objective Three: Based on the previous objectives, the thesis identifies using
segmentation analysis, specific lifestyle groups that could be targeted with a social
marketing intervention to encourage sustainable tourist behaviour.
Social marketing dictates that targeting of interventions to encourage a change in
attitudes and behaviour works most effectively on segmented groups of individuals
who share similar beliefs and attitudes. (French & Blair-Stevens, 2010) Therefore
this research utilised a statistical clustering technique in which individuals were
grouped according to their attitudes towards holiday travel and transport.
The analysis revealed three distinct clusters of individuals;
Cluster One – Members of this cluster held moderate levels of concern towards the
environmental impact of their holidaying behaviour, however they enjoyed using
public transport whilst in the destination, but were unlikely to change their holiday
plans as a response to issues like climate change. In terms of attitudes towards short
breaks, these were perceived to be moderately important to members of this cluster.
Members of this cluster were predominately female, over 60 years of age and

400
retired. They were the most likely of the three clusters to hold a concessionary travel
card, likely to own up to two cars per household and holiday at least twice a year.
This cluster was the least likely to regularly recycle their waste in the home
environment, purchase locally produced food, eco-friendly household goods but
most likely to re-use carrier bags. However members of this cluster were the most
likely of the three to use public transport both at home and whilst on holiday. The
fact that this cluster is more likely to use public transport means that members could
be specifically targeted with an intervention to encourage wider use of local bus and
train services whilst in their holiday destination.
Cluster Two: Members of this cluster held the lowest scores on all aspects of
environmental concern suggesting very little commitment or interest in sustainability.
Members of this cluster were predominately male and lived in household with at least
three children under 16 years, have 2 cars per household and take between three to
five holidays per year. In terms of accommodation choice, members of this cluster
were most likely to self-cater either by camping or staying on a holiday park or
cottage.
In the home environment members of this cluster reported the high levels of
commitment to recycling but this dropped significantly when they were on holiday, in
fact their drop in commitment was greater than either of the other two clusters. In
401
terms of commitment to the other sustainable behaviours this cluster was least
committed of the three both at home and when in the holiday environment. They
were also the least likely cluster to ever use public transport either at home or on
holiday.
Therefore it could be concluded that Cluster Two show minimal interest or
commitment to sustainable behaviour, this could be due to constraining factors such
as the necessities needed to support families with young children. In terms of
developing a social marketing intervention to encourage behaviour change, lowering
the barriers to behaviour change would be the most problematic and significant for
this cluster and therefore would not be undertaken unless resources were limitless
and heavily incentivised.
Cluster Three: Members of this cluster demonstrated the highest levels of concern
towards the environmental impact of their holidaying behaviour. They scored highly
on the use of public transport on holiday, demonstrated concern in relation to the use
of air travel for holiday purposes. Members of this cluster also scored highly on
willingness to change their behaviour; however they still felt that short breaks were
important to them.
402
Members of Cluster Three were most likely to be professional females aged between
30 and 60 years. This Cluster reported the highest number of holidays per year with
15% reporting to more than five holidays in a year. In terms of accommodation
choices, this Cluster were the most likely of the three clusters to be staying in
serviced accommodation and be holidaying in a family group with children.
In terms of sustainable behaviours at home and on holiday this Cluster were the
most committed to all of the behaviours apart from the use of public transport.
To conclude, Cluster Three is the most environmentally concerned and committed to
a range of sustainable behaviours both at home and on holiday. There is also a
willingness to change behaviour, thus suggesting that this Cluster would be most
appropriate to target with a social marketing intervention.
The results of the segmentation analysis demonstrated three distinct clusters of
respondents differentiated by their attitudes towards the environmental
consequences of their holiday behaviour. Cluster Three were identified, as a result
of the analysis to be the most appropriate cluster to target with a social marketing
intervention to encourage greater levels to sustainable behaviour whilst on holiday
thus fulfilling the requirements of Objective Three.
403
7.2.4 Objective Four: To measure the environmental impact, using REAP for
Tourism Ecological Footprinting Software, of visitors on the two destination case
study areas.
Ecological footprint calculations provide an effective way to quantify the
environmental impact of human behaviour. Hunter (2002) was the first commentator
to recognise that ecological footprint analysis could provide a better understanding of
the impact of tourist behaviour as previously it was notoriously difficult to separate
tourist impact from resident impact. (Hall, 2008)
Therefore this research sought to utilise a specially designed tourist ecological
footprint software program to generate individual environmental footprints of tourists
in the two destination case study areas. This would allow for pinpointing of
behaviours associated with high environmental impact, allow for comparison
between visitors staying in different forms of tourist accommodation and comparison
between case study areas. Furthermore the ecological footprint analysis could test
the link between levels of environmental concern and actual environmental impact by
comparing the individual footprint calculations of members of each of the Clusters
identified in the previous Objective.
404
In order to fulfil the requirements of Objective Four, the data was gathered via the
questionnaire survey, and detailed information regarding purchases made for food,
clothing, books, magazines, toys and other consumer goods were captured in
relation to the duration of the holiday. Further data relating to activities undertaken
and frequency of these activities was also gathered, along with information relating
to accommodation, transport mode and distances travelled. This information was
inputted into the REAP for Tourism software and generated 142 individual tourist
footprints and comparisons made between accommodation type, case study area,
pinpointing particularly heavy areas of environmental impact. Food and travel were
identified as the areas with the highest environmental impact.
The analysis allowed average ecological footprints to be compared between
members of the three clusters. Cluster Two who showed the least environmental
concern and the lowest commitment to a range of sustainable behaviours both at
home and on holiday was found to have the largest average ecological footprint of
the three clusters. Interestingly Cluster Three who demonstrated the greatest
concern for the environment and commitment to sustainable behaviours at home and
on holiday did not differ significantly in terms of their average ecological footprint to
Cluster One. These results appear to show that having little or no environmental
concern and undertaking a minimal amount of sustainable behaviour is in fact linked
to higher environmental impact especially when on holiday. However, Cluster Three

405
who demonstrated the highest levels of concern and were committed to greatest
range of sustainable behaviours both at home and on holiday did not have a
significantly lower holiday ecological footprint. These results may suggest that those
who consider themselves environmentally conscious and undertake what they
perceive to be sustainable behaviours may in fact have ‘hidden’ behaviours which
are contributing to their environmental impact. Another explanation might be in
relation to the change in context between home and holiday environments, Cluster 3
may indeed engage in a greater range of behaviours in both environments, but they
still exhibit a ‘drop off’ in commitment, although less than the other Clusters therefore
their holiday footprint might be higher than could be expected. A social marketing
intervention directed at Cluster Three in order to encourage them to maintain their
levels of environmental behaviours between home and holiday environments might
be enough to lower their ecological footprint to be in-line with their levels of
environmental concern.
In summary, the ecological footprint analysis undertaken utilising the REAP for
Tourism software program yielded some interesting results. The holiday behaviours
associated with the most environmental impact centred on the purchase of food and
in relation to travel and transport. The analysis also demonstrated links between low
levels of environmental concern and behaviour and higher ecological footprints
amongst holidaymakers. Furthermore high levels of environmental concern and
406
commitment do not always translate into significantly lower ecological footprints
especially in a holiday environment. These results support the idea that the ‘holiday’
is special in the sense of freedom and hedonism it imbues and means that even the
most dedicated environmentalists abandon some of their commitment to sustainable
behaviour when on holiday. As this group is the most likely to respond to an
intervention to encourage greater levels of sustainable behaviour, they need to be
encouraged to continue their commitment across all contexts.
7.2.5 Section Summary
This section of the chapter was devoted to a detailed discussion of how each of the
objectives has been fulfilled by the research and analysis undertaken. One of the
most important aspects of any research is that it contributes to knowledge in the
relevant area. This research is focussed on applying a previously never used
methodology, namely social marketing to the challenge of encouraging greater levels
of sustainable behaviour amongst tourists. Social marketing works on the premise of
understanding behaviour from the standpoint of the individual, thus only by exploring
how individuals perceive their own behaviour, is it possible to identify the perceived
and actual barriers to behaviour. Once identified the barriers can be addressed and
lowered in order to encourage greater participation (Andreasen, 2006, French &
Blair-Stevens, 2010). This research utilised a mixed methods approach to
understanding tourist behaviour, firstly by using a large scale questionnaire survey
407
which detailed all aspects of reported on-site tourist behaviour and in the second
stage by the use of semi-structured interviews to hone in on identification of the
barriers to sustainable tourist behaviour. The results demonstrated that the barriers
to sustainable behaviour on holiday are related to notions of cost in terms of time
lost, financial expense, inconvenience and engagement is associated with an
impingement on pleasure and enjoyment levels.
The research was also able to demonstrate and confirm research by others which
suggested that the holiday environment was somewhat special, in that even for
those committed to engagement in multiple sustainable behaviours at home this did
not extend into the holiday environment (Barr et al, 2011; Tudor et al, 2007). The
results of this analysis demonstrated a significant ‘drop off’ of reported commitment
to range of behaviours between home and environment.
Furthermore undertaking a social marketing approach to understanding behaviour
proposes that individuals should be segmented into groups who share similar
attitudes and beliefs in relation to the social problem. This research undertook a
segmentation analysis and identified three distinct clusters of individuals each with
differing attitudes towards the environmental impact of their holiday behaviour. One
Cluster (Cluster Three) were identified to exhibit the highest levels of environmental
concern in relation to their holiday behaviour and were also the most willing to

408
change their behaviour. Therefore Cluster Three would be the group of individuals
for which a social marketing intervention would be developed designed and
implemented for.
The use of ecological footprinting to quantify tourist behaviour is becoming an
increasingly important way to measure environmental impact. (Cole & Sinclair, 2002;
Peeters & Schauten, 2006; Martin-Cerras & Sanchez, 2010) Although most of these
studies focus on a specific component of tourist behaviour, the current research
provided a calculation of individual ecological footprint across the whole holiday
which allowed for comparisons between visitor types and between case study areas.
Furthermore the analysis undertaken in this section allowed for testing of the link
between environmental attitudes, behaviours and environmental impact. The results
suggests that for those with low levels of environmental concern their environmental
impact is consistent, in that it is significantly higher than for those exhibiting
moderate to high levels of environmental concern. On the other hand, those
individuals reporting high levels of environmental concern and the highest
commitment to a range of sustainable behaviours did not differ significantly in their
holiday ecological footprint to those reporting moderate levels of interest and
commitment.

409
To conclude, this research has demonstrated a significant contribution to knowledge
in this area, it has applied social marketing as a methodology, and identified the
barriers to sustainable tourist behaviour. It has identified three distinct clusters one of
which would suitable for targeting with an intervention to encourage greater levels of
sustainable behaviour whilst on holiday. Finally it has successfully utilised ecological
footprint analysis to quantify the environmental impact of on-site tourist behaviour.
Furthermore a direct link has been established between environmental attitudes,
behaviour and holiday environmental impact.
The next section will return explicitly to the applying the current research directly to
the practical process of undertaking a social marketing campaign in order gain a
fuller appreciation of the data in relation to what would be expected during a
campaign.
7.3 Practical application of a social marketing campaign
The main aim of this research is to apply the principles of a social marketing
methodology to the ‘problem’ of encouraging sustainable behaviour amongst
tourists. Therefore in order to test this process, the data gathered during this
research will be applied to the eight-point benchmark criteria as set out by French
and Blair-Stevens (2010). The key concepts and principles are defined below (Table
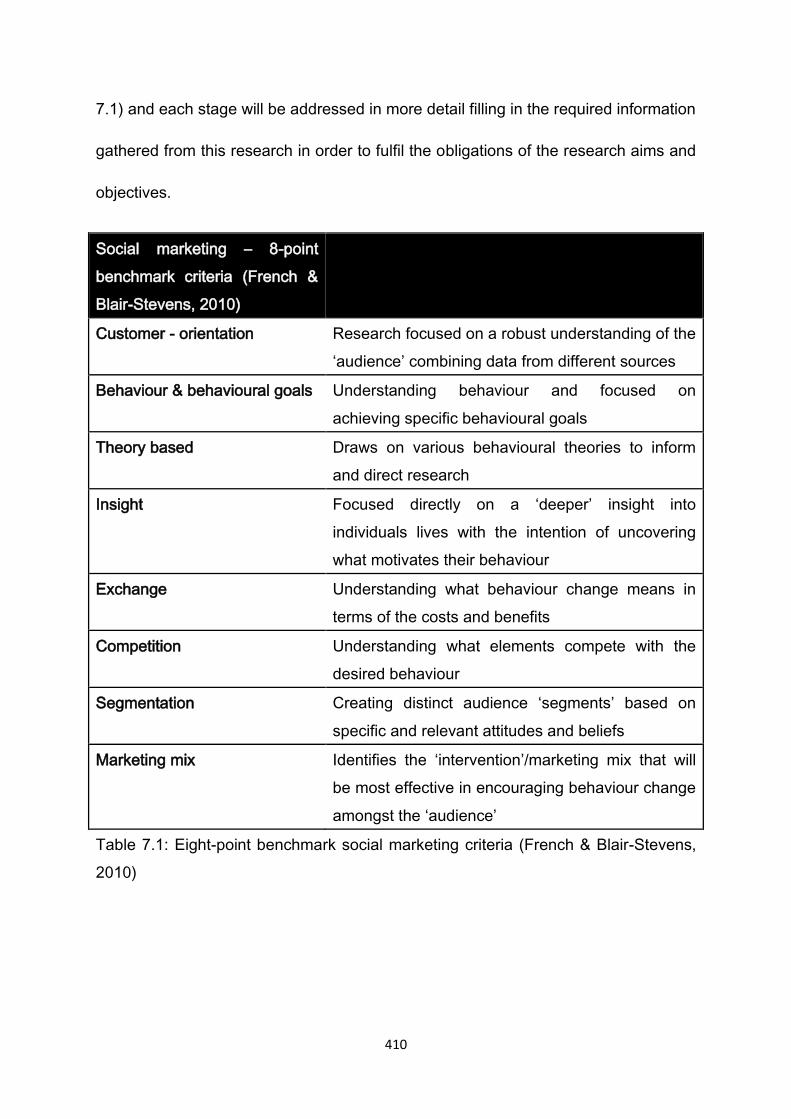
410
7.1) and each stage will be addressed in more detail filling in the required information
gathered from this research in order to fulfil the obligations of the research aims and
objectives.
Social marketing – 8-point
benchmark criteria (French &
Blair-Stevens, 2010)
Customer - orientation Research focused on a robust understanding of the
‘audience’ combining data from different sources
Behaviour & behavioural goals Understanding behaviour and focused on
achieving specific behavioural goals
Theory based Draws on various behavioural theories to inform
and direct research
Insight Focused directly on a ‘deeper’ insight into
individuals lives with the intention of uncovering
what motivates their behaviour
Exchange Understanding what behaviour change means in
terms of the costs and benefits
Competition Understanding what elements compete with the
desired behaviour
Segmentation Creating distinct audience ‘segments’ based on
specific and relevant attitudes and beliefs
Marketing mix Identifies the ‘intervention’/marketing mix that will
be most effective in encouraging behaviour change
amongst the ‘audience’
Table 7.1: Eight-point benchmark social marketing criteria (French & Blair-Stevens,
2010)
411
7.3.1 Customer Orientation
The first element of the 8-point benchmark criteria is the focus on ‘customer
orientation’, this means the focus of enquiry rests on understanding the audience
that is being addressed by the social marketing research. In the case of this
research the target audience are ‘tourists’, the quantitative survey was designed to
meet the first of the criteria by establishing demographics, the nature and type of
holiday being undertaken, travel and transport decisions and behaviour, home and
holiday sustainable behaviour, and holiday activities and expenditure. Knowledge
regarding attitudes towards climate change and the environment and general
attitudes towards holidays, travel and transport were also garnered. This first stage
of the research set the baseline from which the rest of the research process could be
explored.
The research was able to demonstrate that there were significant differences in
levels of commitment to sustainable behaviour between the home and holiday
environments. The qualitative stage focussed further on trying to explain how
participants understood these differences. Further discussion took place regarding
what the participants perceived as the barriers to sustainable behaviour whilst on
holiday and in turn, what might encourage them to behave in a more sustainable
manner when on holiday. The results revealed that participants perceived that
sustainable behaviour whilst on holiday would be costly, both in financial terms but
412
also in terms of time lost undertaking sustainable behaviours. These ‘costs’ it was
perceived, would impact negatively on the anticipated benefits that a holiday is
associated with, such as a time for rest, relaxation and a break from the routines of
the home environment.
The first stage of the process sets the groundwork for fully understanding both the
problem under investigation and how those being investigated perceive the realities
of their behaviour and any potential change in behaviour.
7.3.2 Behaviour and Behavioural Goals
The focus on behaviour and behavioural goals is an essential element of any social
marketing campaign. It is important in the first instance, to focus on explaining and
understanding existing behaviour in terms of the motivations and perceptions of the
said behaviour. In the case of this research a fuller understanding of how
participants perceived their holiday time, what was important for them, what benefits
they hoped to derive from the holiday were as important as the ‘actual behaviour’
undertaken during the holiday. The next essential element of the methodology is to
establish the desired ‘behavioural goals’ of the social marketing campaign. In the
case of this research project the behavioural goal is greater levels of sustainable
behaviour amongst tourists. It should be noted that in a traditional social marketing
413
campaign a number of specific measurable behavioural goals would be established
in order to determine the effectiveness of the social marketing intervention, however
this was beyond the scope of this research project. The timeframe did not allow for
the development and implementation of a social marketing intervention to encourage
sustainable behaviour. Nevertheless this research was able to provide a greater
understanding of the existing sustainable behaviour both in the home and holiday
environments, and also expose what participants perceived to be the barriers to
sustainable behaviour when on holiday. Based on these perceived barriers it is then
possible to define what might motivate and encourage greater commitment to
sustainable behaviour.
7.3.3 Theory Based
Social marketing uses behavioural theories to aid and understand the motivations
and perceptions of the individuals under investigation. In this case the research data
gathered was analysed and suitable behavioural theories were sought that would
provide a fuller explanation of behaviour and further the most appropriate ways to
encourage a change.
In the case of the results of this research ‘Attribution Theory’ would fit the
participants’ perceptions of the barriers to sustainable behaviour. Attribution Theory
414
states that individuals often attribute their behaviour to either internal or external
factors. When an individual explains their behaviour often they will perceive that
their behaviour is a consequence of ‘external factors’ that are outside of their control.
In this case of this research the participants claimed that one of the barriers to
sustainable behaviour whilst in the holiday environment was due to increased
financial cost, the cost of utilising public transport is something that is outside the
control of the individual. In terms of internal factors, these factors exist within the
individual where they perceive they are personally responsible for a particular
behaviour. For example, someone who regularly recycles all of their waste may
attribute this to their own sense of dedication to the cause rather than as a result of
excellent service provision by the local authority (Heider, 1958).
The results gathered during this research project support concepts laid down by
Attribution Theory in that the participants of this project appear to attribute the
barriers to sustainable tourist behaviour to both external and internal sources;
External - The participants explain that they feel that behaving sustainably
whilst on holiday would cost them more money, the services would not suit
the composition of the holiday group and service provision is not adequate to
meet the requirements of the holiday.
415
Internal – The participants explained they perceived sustainable behaviour
whilst on holiday would have a negative impact on the psychological and
physiological benefits they anticipated gaining from their holiday.
An important element of Attribution Theory lies not only in how individuals attribute
their behaviour but also on how they might be motivated to change behaviour.
Attribution Theory proposes that self-efficacy is an important aspect of whether
participants can be motivated to change their behaviour. Therefore if an individual
feels that the conditions exist whereby the behaviour change can be undertaken with
ease they are more likely to be empowered to do so. For example and the purpose
of this research if the conditions existed within the resort to make sustainable
behaviour the only and easiest choice then there would be a greater likelihood of
behaviour change.. Furthermore if perceptions regarding the ‘costs’ in terms of
increased expenditure and decreased benefits could be altered, sustainability might
be viewed more positively and thus seen as less of an intrusion on a significant and
special time of the year.
Attribution Theory therefore assists in explaining how the participants of this
research attribute the perceived barriers to sustainable tourist behaviour to both
external and internal factors. By so doing the theory helps to explain how behaviour
change could be encouraged through the use of techniques to increase and
encourage self-efficacy amongst tourists.
416
7.3.4 Insight
The fourth element of the criteria relates to ensuring that the understanding gained
through the research focusses on gaining a deep understanding of what motivates
individuals. This part of the research goes beyond examining the group as a
collective whole but goes further by attempting to identify key factors that could be
used to actively influence behaviour. In the case of this research the key factors that
were important to the participants was the perceived extra financial cost of
sustainable behaviour and the time lost in undertaking sustainable behaviour which
is turn would have a negative impact on their holiday experience. This insight
illustrates that in order to encourage sustainable tourist behaviour services would
need to be provided that were easier and less expensive to use and perceptions
regarding the nature of sustainable activities would need to be addressed.
7.3.5 Exchange
The concept of ‘exchange’ focusses on understanding and explaining what
individuals would have to ‘give’ up in order to reach the desired behaviour. The
analysis of the data should ensure it provides a full appreciation of the ‘costs’ to the
individual of a change in behaviour and this is balanced against the benefits of a
change in behaviour. This research has clearly demonstrated that the participants
perceived that sustainable behaviours undertaken on holiday would be more
financially expensive and costly in terms of time undertaken to achieve them.
417
Therefore a change in behaviour would have to mitigate these costs and at the same
time provide benefits to the participants. Hence changing behaviour in the holiday
environment could be incentivised by financial discounts on entry to tourist
attractions when arriving by public transport for example. The benefits for the
participants would be a financial reduction, but in order to fully motivate individuals to
undertake the behaviour the services would need to be tailored to the needs of the
holidaymaker rather than as a part of a local resident transport network.
Furthermore a change in the perceptions of public transport needs to be developed,
so that journeys are not perceived to be longer, less convenient and uncomfortable
than travel by personal car. The experience of the journey needs to emphasized
with the benefits of experiencing the countryside, lack of traffic congestion and
parking difficulties being cited as part of a positive holiday experience.
7.3.6 Competition
This element adds to the previous section by recognising all of the elements that
compete for the attention of the target audience are addressed. This criteria
acknowledges that a target behaviour has competition from both ‘internal’
(psychological factors, rest, relaxation, stress etc) and ‘external’ factors (family
pressures, time, behaviour, cost) these factors interact and reinforce established
existing behaviours.
418
In this research the participants identified a number of barriers to sustainable holiday
behaviour, these factors, both internal and external, interact, and compete thus
reducing the likelihood that sustainable choices will be made. Factors such as size
of the holiday group and the age of the holiday group members directly influence
decisions regarding sustainable behaviour options. So if the holiday group
comprises of very young children, disabled or elderly individuals then their personal
requirements will rank higher in importance than sustainable options. Furthermore if
the financial cost of choosing sustainable options interacts with holiday group
requirements then the chance of sustainable decisions being made further
diminishes.
7.3.7 Segmentation
The process of segmentation allows for the data gathered to be grouped into clusters
of individuals who share similar beliefs and attitudes. Thus allowing for groups to be
identified that would be most likely to respond to some type of intervention, the
intervention would be designed to target the group specifically rather than a ‘blanket’
approach covering the entire target audience.
The current research revealed there to be three distinct clusters of individuals each
sharing similar beliefs regarding the environment, climate change and attitudes
419
towards holidays and short breaks. The third cluster was revealed to hold the
strongest commitment to protection of the environment and also reported the highest
levels of sustainable behaviour in the home environment and also while on holiday.
The second cluster showed the least pro-environmental attitudes towards holidays
and travel and transport and would therefore be less receptive to a social marketing
intervention to encourage sustainable tourist behaviour.
As part of this research Cluster 3 was identified to the most pro-environmental of the
segments. In the light of these results a social marketing campaign would need to be
developed that matched the attitudes and profile of members of this cluster. Profiling
suggested that members of this segment were predominately female, middle aged
professionals, they were likely to have two children aged under 16 years and would
be likely to have two or more cars per family. In terms of their attitudes towards
holidays and short breaks this Cluster reported enjoying utilising public transport
whilst on holiday and admits to thinking about reducing the environmental impact of
their holiday behaviour. This Cluster also showed the highest levels of willingness to
change their holidaying behaviour in the light of the threats of climate change;
however they still believe that taking short breaks are important especially as
members of this Cluster reported taking the highest number of holidays or short
breaks of the three clusters. As a consequence of these results any social marketing
intervention would need to reflect the profile membership of the Cluster.
420
In terms of sustainability the desired change in behaviours required to ensure a
tourist destination was more sustainable should be as follows;
- A reduction in the use of personal cars for sightseeing and holiday activities,
increase use of public transport, walking and cycling.
- Longer holidays to be taken over the whole year, rather than lots of short
breaks taken throughout a short season of five to six months.
- An increase in the use of recycling facilities, with greater emphasis on
accommodation providers and attractions providing consistent facilities to
enable and encourage the behaviour.
- Increased use of locally sourced food by both visitors and accommodation
providers, eating out establishments and attractions.
In order to achieve these changes Cluster 3 could be targeted with an intervention
that reflects attitudes towards transport, travel and holidays. This Cluster
demonstrated that it would be willing to change their behaviour but that taking short
breaks was important. Therefore an intervention would need to be designed that
encouraged the benefits of longer holidays with emphasis placed on the greater
breadth of experiences that could be enjoyed as part of a longer slower holiday
rather than short breaks that provide only glimpse of what an tourist destination has
to offer. Furthermore this Cluster also demonstrated that it enjoyed utilising public
421
transport services whilst on holiday which is also something that could be built on, by
encouraging and incentivising the use of public transport, cycling or walking to visitor
attractions. The longer in duration but slower paced holiday would also fit in well
with encouraging the use of more sustainable transport options. Incentivising the
use of Green accredited businesses would also encourage this cluster to utilise more
sustainable holiday options, one suggestion might be to offer a nationwide ‘Green’
membership scheme that allowed points to be gathered that could be collected
throughout the year in the home environment and redeemed at ‘Green’ businesses
when on holiday.
7.3.8 Methods Mix
The final section of the benchmark criteria is focussed on the development of an
intervention designed specifically to address the ‘social problem’ in response to the
data gathered from the target audience. Here a range of different approaches could
be used to encourage a change in behaviour not only focussed on the target
audience but also on the environment within in which the desired behaviour will be
taking place. In the case of this research the intervention should not only focus on
‘tourists’ but also on those providing tourism services: local authorities, tourism
accommodation providers, transport providers and visitor attractions. As stated
previously the development and implementation of a social marketing intervention to
encourage sustainable tourist behaviour is beyond the scope of this research,
422
however the data and analysis provided herein would enable a social marketing
intervention to be developed and implemented and fully test the effectiveness of
social marketing in encouraging sustainable tourist behaviour.
The results gathered throughout the analysis have built a detailed picture of tourist
behaviour within two case study areas in South West England, identified three
distinct clusters of tourists, one of which would be the most amenable to behaviour
change. Therefore the application of a social marketing methodology to the problem
of encouraging sustainable tourist behaviour has been successful. The
implementation of the final stage the ‘intervention’ has not been tested and evaluated
but the evidence exists that would make this possible. French and Blair-Stevens
(2010) state that the eight-point benchmark criteria was never intended to be a
process model, or a ’how to do social marketing’ model, instead it was intended to
act as a checking mechanism to ensure that all of the elements had been utilised
during the process. As a result of this a linear model was developed called the Total
Planning Process (TPP) which was designed to support and inform effective social
marketing interventions, throughout the process from planning and development
through to implementation of the intervention.
423
The TPP has five primary sequential stages;
Scoping
Developing
Implementing
Evaluating
Following-up
7.4 The Total Planning Process
Each of the stages will now be described in more detail and related directly to the
results of this research and suggestions made regarding further work that could be
undertaken to test whether social marketing could be effective in encouraging
sustainable tourist behaviour.
7.4.1 Scoping
This initial stage focusses on building a strong base from which the development of
an intervention can be based and is undertaken in three phases. Therefore the work
undertaken during this stage is based on gaining a wide understanding of the target
audience, through sound research gathering, building relationships between
stakeholders and understanding the specifics of the location the social marketing
intervention will be undertaken in.
424
7.4.4.1 Phase 1
The first phase focusses on the behaviour that is to be influenced; the location in
which the behaviour is taking place, and attention is given to the individuals that the
intervention is hoping to influence. In this stage any pre-existing data regarding the
target behaviour and target audience is collated and any gaps in knowledge are
noted. This stage will also focus on identifying stakeholders that would also need to
be engaged in the project.
7.4.1.2 Phase 2
In this phase the focus in on developing primary research based on the findings of
the first phase with the aim of filling the identified knowledge gaps. In terms of the
current research the data gathered via the survey questionnaire and interviews fulfils
this stage. Detailed data was gathered regarding holiday decision-making and
behaviour, attitudes towards the environment and climate change, attitudes towards
short breaks and holidays and levels of commitment to sustainable behaviour in the
home environment and whilst on holiday. Furthermore the barriers and motivations
to sustainable tourist behaviour were also ascertained and segmentation of groups
were undertaken to establish the most those individuals are likely to be influenced by
an intervention.
425
7.4.1.3 Phase 3
In phase three the information gained in the previous two stages are combined and a
decision is made regarding the specific behaviour to be targeted and the target
audience. In this research project Cluster 3 were identified as the group most likely
to be influenced by a social marketing campaign and by analysing the profile,
attitudes and reported behaviour of this segment suggested that this group actively
enjoyed using public transport whilst on holiday, were willing to change their
behaviour and showed the highest levels of commitment to sustainable behaviour
both in the home environment and whilst on holiday. Therefore if a social marketing
intervention were to be designed it should reflect the findings of the research. One
suggestion could be to focus on targeting members of the segment encouraging
them to utilise more sustainable travel options, this could be achieved through
incentivising joint travel and visitor attraction tickets, focussing on the personal
benefits of leaving the car behind for the whole holiday group, the benefits to the
environment in terms of emissions but also that car free areas are more pleasant for
pedestrians and cyclists.
7.4.2 Developing
This stage of the process works on developing the intervention, working with the
target audience and pre-testing ideas to see if they are viable. In respect of this
research project this is not a stage that could be tested but in theory if the
426
suggestions generated in the previous section were applied then a marketing plan
would be developed and tested on the target audience. A series of focus groups
could be undertaken where the ideas could be trialled with the target audience to
ensure that the insights gained would be actionable and be likely to lead to a change
in behaviour. Work would also need to be undertaken with tourism stakeholders to
gain their support for the plans and ensure that the services exist and that there was
a general ‘buy in’ to the principles of the project.
7.4.3 Implementation
This is the stage where the social marketing intervention is implemented, so in the
case of the ideas proposed by this research an integrated plan for encouraging
increased use of sustainable transport options would be undertaken. This could
involve a targeted marketing campaign focussed on the Cluster identified as most
likely to respond favourably to selecting sustainable transport options. The system of
incentivised travel would also be in place and this would enable tracking and
monitoring of the successfulness of the intervention. Constant monitoring of uptake
would take place during this stage and adjustments would be undertaken if required.

427
7.4.4 Evaluation
The evaluation stage of the process is where the original aims and objectives of the
project are reviewed in order to establish whether the social marketing intervention
has been effective. The evaluation process gathers and reviews the data collected
during the period of the intervention and provides a collated report of whether a
significant change in behaviour has occurred. In the case of the current research,
the data gathered during the implementation stage, regarding uptake of sustainable
travel options would, show whether there was a good uptake of the services and
whether joint incentivised entry to visitor attractions and transport had encouraged
people to change their behaviour. This stage would also assess whether the
process undertaken to encourage a change in behaviour was successful, whether
there had been a significant impact and whether the intervention was cost-effective.
Cost-effectiveness is an important consideration when encouraging changes in
behaviour, for example, in the case of this research if the cost of providing additional
bus/train services, improving cycle paths, creating a joint incentive programme
outweighed the benefits of a small change in behaviour, then the intervention could
not be deemed successful. In this research a change in behaviour should be
beneficial on many levels, to the environment, which could be proven through the
use of ecological footprinting the decrease in emissions, to the destination in terms
of a cleaner less polluted environment, to tourism stakeholders as more visitors
would be drawn to the area because it is more attractive which should in turn

428
increase prosperity, and finally to the ‘tourist’ themselves as they have a different
holiday experience.
7.4.5 Follow-Up
The final stage of the process draws together all those involved in the intervention
and those with an interest in the area to dissect what has been learned through the
intervention program. This stage considers the wider impact of the intervention and
the long term outcomes. This stage is used to disseminate the outcomes and
messages learned throughout the intervention program to a wider audience. The
findings are finally written-up, with the purpose of publishing and promoting learning
in the area, suggesting further proposals for taking the issue further.
In the current research project, the final report would link together the data gathered
in the quantitative and qualitative chapters, describe the three clusters identified by
the research and the associated ecological footprints of the cluster members.
Further information would be given on the intervention and its rate of success in
encouraging sustainable travel decisions amongst tourists and lessons learned for
future initiatives. This information would be useful to other destinations in planning
their visitor transport systems and provide justification for investment in services and
initiatives.
429
7.4.6 Section Summary
This section of the chapter has been devoted to applying the data and analysis
derived in the current research project to the tenets of a social marketing
methodology. The purpose was to reconnect the findings of the current research
with the aim of this project, which was to test the applicability of a social marketing
methodology in encouraging sustainable tourist behaviour. This is particularly
important as the time constraints of this project did not allow for development and
testing of an actual social marketing intervention, therefore the results of the analysis
might have appeared obscure if not related back and applied to the process of social
marketing.
The following section will explore some of the limitations of the current research and
suggestions for further research, before providing some concluding remarks and
viewing the findings in wider context.
7.5 Limitations of this research and suggestions for further research
This research set out to explore the potential of social marketing methodology to
encourage greater levels of sustainable behaviour amongst tourists. The research
generated some interesting findings and fulfilled each of its objectives, however due

430
to the limited time scale for the research was unable to apply the findings and
develop and implementation of a social marketing campaign. Therefore, whilst the
research methodology, in terms of what social marketing expects has been applied,
the full process could not be put into action and the efficiency tested. Thus a
suggested further study could work to complete the stages unmet during this
research; this could involve working with tourism stakeholders to establish their
perceptions of the barriers and motivations for them to provide sustainable options
for visitors. Once completed an intervention could be developed in conjunction with
members of Cluster 3 which would reflect their perceptions of the situation. This
could then be implemented and any change in behaviour could be monitored and
would fully test the potential of utilising social marketing to encourage greater levels
of sustainable behaviour amongst tourists.
In respect of the ecological footprinting aspect of this research, this is the first time
that the REAP for Tourism software has been used on a relatively large sample of
visitors, and the results gained are extremely useful in pinpointing impact. However,
in order to fully capture behaviour, collection of data could be more comprehensive
in nature. A suggestion for achieving this would be to have tourists undertake a
diary-based reporting of all behaviour on a day-to-day basis for the duration of the
holiday. In order not to be too intrusive to the holidaymaker, one suggestion might
the development of an ‘App’ which could be downloaded to mobile devices and
431
details entered each day and then uploaded to a ‘server’ each night. This would
enable a larger and more representative sample to be collected and analysed and
would provide even more accurate information relating to visitor environmental
impact.
To summarise, this research successfully applied the early stages of a social
marketing methodology to the problem of sustainable tourist behaviour, however the
limited time frame restricted full testing of the process, however further research
could utilise these findings and work through the final stages and allow for the full
potential of social marketing as a tool to encourage sustainable tourist behaviour to
be assessed.
7.6 Concluding Remarks – Setting the research in a wider context
This research project had the aim of examining the potential of a social marketing
methodology in encouraging sustainable behaviour amongst tourists. The data
gathered, analysed and presented herein has utilised this methodology and provided
essential information regarding tourist behaviour, motivations, decision-making
coupled with data regarding the environmental impact of tourist behaviour within
destination areas. The following section of this chapter will set the results of this
research project within the wider context of the tourism environment and provide
432
recommendations and suggestions regarding how destinations could encourage
greater levels of sustainable behaviour amongst their visitors.
7.6.1 Sustainable tourism; encouraging sustainable tourist behaviour
The current research has focussed primarily on understanding the behaviour of
tourists within two destination areas, in order to encourage greater levels of
sustainable behaviour, rather than focussing on what constitutes sustainable
tourism. The results demonstrate that there is potential for encouraging behaviour
change by addressing the barriers to sustainable behaviour, however this
information cannot be viewed outside of the policy context. Tourism as an activity is
extremely diverse in its nature involving a multitude of services, resources,
businesses and taking place across a wide geographical area. Therefore
consideration needs to be given to the tourism stakeholders who are responsible for
providing the tourism services. The infrastructure and provision of services, in terms
of accommodation, transport, and visitor attractions amongst others, all need to be
considered in planning any tourism destination’s strategy. One of the important
debates surrounds the issue of how to define the concept of sustainable tourism,
should destinations seek to limit growth through limiting visitors and decreeing a
maximum ‘carrying capacity’ for the destination? (Getz, 1983) Or should the
emphasis lie in using the destination’s natural and cultural resources to secure the
long-term economic success of tourism activity? (Saarinen, 2006) This suggests that

433
tourism destinations are likely to have different interpretations of the notion of
‘sustainability’, and that sustainability is likely to be at odds with how the destination
would prefer to plan its tourism strategy. The nature of tourism activity is very
diverse, but is mostly directed towards maximum revenue generation thus changing
behaviours which could be perceived to have a detrimental effect on income is likely
to be perceived negatively by those involved in the industry. Those in a position to
develop a destination’s tourism strategy are likely to find it particularly difficult to
implement radical sustainability strategies without some resistance from key
stakeholders. Therefore a sustainable tourism strategy would need the ‘buy in’ of all
those involved in the provision of tourism infrastructure and services as well as the
tourists. Changing perceptions of sustainable behaviour amongst tourism
stakeholders is almost as important as encouraging tourists to behave in a more
sustainable manner. In so much as tourism stakeholders are likely to be concerned
that designating a resort as ‘car free’ would be likely to lead to a drop in visitor
numbers and ultimately a loss in profits. Thus it is essential when developing a
sustainable tourism strategy that stakeholders perceive there to be an economic
advantage to a change in behaviour. Any scheme that develops a ‘car free’
destination would require significant economic and community investment, in order
to provide the infrastructure to support such activity, and by those inhabitants
residing in the destination. Marketing activities would need to be of prime importance
in a tourism strategy that introduces a ‘car free’ resort by means of press releases,
434
newsletters, events to promote the concept and a website to support and promote
the uniqueness of the destination.
The previous section hinted that encouraging sustainable tourist behaviour is not
only dependent on ‘tourists’ changing their perceptions and behaviour, but is also
dependent on the facilities and infrastructure to support such activities. One of the
most significant difficulties with tourism provision and strategy is that those with
responsibility for driving its direction operate on so many levels. In England, tourism
strategy is developed by national government which sets out how tourism should
develop over the coming five years, then there is strategy at regional level driven by
destination management organisations operating at county level, and then finally
there is strategy developed at the resort level, plus numerous other organisations
with specific responsibilities for areas such as National Parks. Unless there is
coherence, in terms of encouraging sustainable tourist behaviour amongst all levels
of strategy, there is likely to be significant barriers to changing the way services are
provided.
7.6.2 Concluding Remarks
This research has sought to understand the nature and complexity of tourist
behaviour within two destination case study areas, with the intention of exploring a

435
potential way to encourage greater levels of sustainable behaviour amongst those on
holiday. A social marketing methodology was employed with a view to
understanding how tourists perceive their holidays and what they perceive the
barriers to, and the motivations for, sustainable tourist behaviour. Furthermore
additional information recorded individual environmental impacts using an ecological
footprinting software program. This program generates a personal ecological
footprint which illustrates what types of behaviour and which type of tourist generate
the greatest environmental impact, thus enabling pinpointing of the types of
behaviour and types of tourist that cause the greatest environmental impact in a
holiday destination with a view to targeting this behaviour to reduce environmental
impact. The footprinting tool also allows for scenario testing, whereby a change in
behaviour can be modelled and the resultant change in impact observed.
The results generated within this thesis form a basis for working towards a situation
where tourists could be encouraged to behave more sustainably whilst in the holiday
environment. Those tourists who responded to the survey reported being
significantly less committed to a range of sustainable behaviours in the holiday
environment compared to at home. Further exploration of the participants’
perceptions of the barriers to holiday sustainable behaviour identified a range of both
internal and external factors that interacted to inhibit the selection of sustainable
choices when on holiday. These factors appear to act throughout the holiday, from
436
the pre-holiday decision-making phase, to during the holiday and they also exert
influence in the post-holiday phase impacting on future holiday plans.
A holiday destination or resort wishing to encourage greater levels of sustainable
behaviour amongst its visitors would therefore have to focus not only on providing
the services and infrastructure to make this possible, but also recognise that the
‘holiday’ is psychologically and physiologically a significant experience for its visitors.
The ‘value’ of a holiday in terms of the experiences anticipated prior the holiday,
during the holiday and the memories recalled afterwards are unique and
encouraging sustainable behaviour must reflect this. Monetary value is also an
important consideration when planning an intervention to change behaviour;
therefore any changes made must consider the ‘cost’ for the tourist of the
sustainable option.
437
References:
Ajzen, J. (1991). The theory of planned behaviour, Organizational Behaviour and
Human Decision Processes, 50 (2): 179.211.
Akers. R. L., (1973), Deviant Behaviour; A Social Learning Approach, Belmont, CA:
Wadsworth Publishing Co.
Andreasen, A. R. (1994). Marketing Social Change: Changing Behaviour to Promote
Health, Social Development, and the Environment. Washington: Jossey-Bass
Publishers.
Andreasen, A. R. (2002). Marketing Social Marketing in the Social Change
Marketplace. Journal of Public Policy & Marketing, 21(1), 3-13.
Andreasen, A. R. (2006). Social Marketing in the 21st Century. London: Sage
Publications.
Bagozzi, R. (1975) Marketing as Exchange. Journal of Marketing, 39:32-39.
Bandura, A., (1986), Social Foundations of Thought and Action; A Social Cognitive
Approach, Englewood Cliffs: Prentice Hall.
.
Baron-Yelles, N., (1999), French coastal wetlands: in search of sustainability,
Tourism Geographies, Vol 1, pp 108-120.
Barr, S. (2008). Environment and Society: Sustainability, Policy and the Citizen.
Hampshire: Ashgate Publishing.
438
Barr, S. & Gilg, A. W. (2006), Sustainable Lifestyles; framings environmental actions
in and around the home, Geoforum, 37, Vol 37, (6), pp 906-920.
Barr, S., Gilg, A. W. & Shaw, G. (2011), ‘Helping People Make Better Choices:
Exploring the behaviour change agenda for environmental sustainability, Applied
Geography, Vol 31, (2), pp 712-720.
Barr, S., Shaw, G., Coles, T., & Prillwitz, J. (2010) ‘A holiday is a holiday’: practicing
sustainability, home and away. Journal of Transport Geography, Vol 18, (3). 474-
481.
Becken, S., & Patterson, M. (2006), Measuring National Carbon Dioxide Emissions
from Tourism as a Key Step Towards Achieving Sustainable Tourism, Journal of
Sustainable Tourism, Vol 14, (4), pp 323-338.
Beeton, S., & Benfield, R., (2002), Demand control: The case for de-marketing as a
visitor and environmental management tool, Journal of Sustainable Tourism, Vol 10,
(6), pp 497-806.
Beeton, S. (2005). The Case Study in Tourism Research: a Multi-method Case
Study Approach, in Ritchie, B. W., Burns, P., & Palmer, C.(eds) Tourism Research
Methods: Integrating Theory with Practice, Wallingford: CABI Publishing.
439
Bercheri, E., (1991), Rimini and Co – the end of a legend?: Dealing with the algae
effect. Tourism Management, Vol 12, 229-235.
Beckan, S., Simmons, D. G., & Frampton, C., (2003), Energy use associated with
travel choices, Tourism Management, Vol 24, (3), pp 267-277.
Berger, I. E. (1997), The demographics of recycling and the structure of
environmental behaviour, Environment and Behaviour, Vol 29, (4), pp 515-531.
Berry, S., & Ladkin, A;, (1997), ‘Sustainable tourism: a regional perspective’.
Tourism Management, Vol 18, (7), 433-440.
Black, J. S., Stern, P. C. & Elworth, J. T. (1985). Personal and contextual influences
on household energy adaptations, Journal of Applied Psychology, 70 (1): 3-21.
Blake, J., (1999), Overcoming the ‘value-action gap’ in environmental policy:
Tensions between national policy and local experiences, Local Environment: The
International Journal of Justice and Sustainability, Vol 4, (3), pp 257-278.
Bloom, P. N. & Novelli W. D. (1981). Problems and challenges in social marketing.
Journal of Marketing, 45, 79-88.
Bramwell, B., & Lane, B., (1993), Sustainable Tourism: an evolving global approach,
Journal of Sustainable Tourism, Vol 1, (1), pp 1-5.
440
Budeanu, A., (2007), Sustainable Tourist Behaviour – a discussion of opportunities
for change, International Journal of Consumer Studies, Vol 31, pp 499-506.
Buhalis, D., (2000), Marketing the competitive destination of the future, Tourism
Management, Vol 21, (1), pp 97-116.
Chafe, Z, (2005), Consumer Demand and Operator Support for Socially and
Environmentally Responsible Tourism, (WWW document) http;/.www,ecotourism.org
(accessed September 2012).
Chambers, N., Simmons, C., & Wackernagel, M., (2000), Sharing Nature’s Interest;
Ecological Footprints as an Indicator of Sustainability, London: Earthscan.
Cialdini, R. B., Reno, R. R. & Kallgren C. A. (1990). A Focus Theory of Normative
Conduct: Recycling the Concept of Norms to Reduce Littering in Public Places.
Journal of Personality and Social Psychology, 18 (6): 1015-1026.
Coccossis, H. & Parpairis, A., (1996), Tourism and carrying capacity in coastal
areas: Mykonos, Greece, In Priestly, G. K., Edwards, J. A., and Cocossis, H., (eds.),
Sustainable Tourism: European Experiences, Wallingford: CAB International.
Cohen, E. (1972). Toward a Sociology of International Tourism, Social Research, 39
(1):164-182.
Cohen, E. (1979). A Phenomenology of Tourist Experiences, Sociology, 13 (2): 179-
201.
441
Cohen, S. A., Higham, J. E. S., & Reis, A. (2013), Sociological barriers to developing
sustainable discretionary air travel behaviour, Journal of Sustainable Tourism, Vol
21, (7), 982–998.
Cooper, C. P. (1981), Spatial and temporal patterns of tourist behaviour, Regional
Studies, Vol 15, pp 359-371.
Croall, J., (1995), Preserve or destroy: tourism and the environment, London:
Calouste Glubenkien Foundation.
Crompton, J. L. (1979) Motivations for Pleasure Vacation. Annals of Tourism
Research. 3: 408-424.
Crompton, J. L., & Ankomah, P.K. (1992), Choice set propositions in decision
making, Annals of Tourism Research, Vol 20, (3), 461-476.
Dann, S., Harris, P., Sullivan-Mort, G., Fry, M. & Binney,W. (2007). Reigniting the
fire: a contemporary research agenda for social, political and non-profit marketing.
Journal of Public Affairs, 7: 291-304.
Davenport, J., & Davenport, J. L. (2006), The impact of tourism and personal leisure
transport on coastal environments, Estuarine, Coastal & Shelf Science, Vol 67, (1-
2),pp 280-292.
442
Day, G. S., & Montgomery, D. B., (1999), Charting new directions for marketing, The
Journal of Marketing, Vol 63, pp 3-13.
Decrop, A, (2010), Destination Choice Sets: An Inductive Longitudinal Approach,
Annals of Tourism Research, Vol 37, (1), pp 93-116.
Decrop, A., & Snelders, D., (2005), A grounded typology of vacation decision
making. Tourism Management, Vol 2 (1), pp 121-132.
Derksen, L., & Gertrell, J., (1993), The social context of recycling, American
Sociological Review, Vol 58, (3), pp 434-442.
Delleart, B. D. C., (1998), Multi-faceted travel decisions: a constraint-based
conceptual framework to describe tourists’ sequential choices of travel components.
Tourism Management, Vol 19 (4), 313-320.
Department of the Environment, Food and Rural Affairs (DEFRA), 2008, Framework
for Environmental Behaviours, DEFRA, London.
De Young, K., (2000), Expanding and evaluating motives for environmentally
responsible behaviour. Journal of Social Issues, Vol 56, (3), 509-526.
Dingle, P. (1985), Practical Green Business, Insights, March, London; ETB.

443
Dolnicar, S, & Leisch, F., (2008), Selective marketing for environmentally sustainable
tourism, Tourism Management, Vol 29, (4), pp 672-680.
Dredge, D., (2006), ‘Policy networks and the local organisation of tourism’, Tourism
Management, Vol 27, (2), pp 269-280.
El-Ansary, A. I., & Kramer, Jr, (1973), Social marketing the family planning
experience, Journal of Marketing, Vol 37, (3), pp 1-7.
Elliot, J., (1997), Tourism, Politics and Public Sector Management, London:
Routeledge.
Fox, K. F. A., & Kotler, P., (1980), The marketing of social causes: the first 10 years,
The Journal of Marketing, Vol 44, (4), 24-33.
Festinger., L, (1957), A Theory of Cognitive Dissonance, Stanford, CA: Stanford
University Press.
French, J., Blair-Stevens, C., McVey, D., & Merritt, R. (2010). Social Marketing &
Public Health: Theory and Practice. Oxford: Oxford University Press.
Garcia-Ramon, M. D., Canoves, G., & Valdovinos, N., (1995), Gender and farm
tourism and the environment, Annals of Tourism Research, Vol 22, (2), 267-282.
Gartner, W. C., (1993), Image formation process, Journal of Travel & Tourism
Marketing, Vol 2: 191-215.
444
Glaser, B. G., & Strauss, A. L., (1967), The Discovery of Grounded Theory:
Strategies for Qualitative Research, (7th Ed), Chicago: Transaction Publishers.
Gössling, S, & Peeters, P., (2007), ‘It does not harm the environment’, An Analysis of
Industry Discourses on Tourism, Air Travel and the Environment, Journal of
Sustainable Tourism, 15, (4), pp 402-417.
Great Britain, Climate Change Act (2008), Carbon Target and Carbon Budgeting
2008, Elizabeth II, Chapter 27 (Part 1), (2008), London: The Stationary Office.
Great Britain, Department for Energy and Climate Change, Climate Change Act
(2008), Carbon Target and Carbon Budgeting, (on-line), Available:
http://www.legislation.gov.uk/ukpga/2008/27/contents, (accessed September, 2011).
Green Tourism Business Scheme, Criteria (Online) http://www.green-
business.co.uk/GreenBusiness_Criteria_Introduction.asp (accessed 5 July, 2010).
Hall, C. M. (2008), Tourism Planning; Policies, Processes and Relationships, (2nd
Ed), Harlow: Pearson Education.
Hares, A, Dickinson, J., Wilkes, K. (2010), Climate Change and air travel decisions
of UK tourists, Journal of Transport Geography, Vol 18, (3), pp 466-473.
445
Hastings, G., & Haywood, A., (1994), Social marketing: a critical response, Health
Promotion International, Vol 6, (2), 135-145.
Hastings, G. & Saren, M. (2003). The Critical Contribution of Social Marketing:
Theory and Application. Marketing Theory, 3(3):305-322.
Heider, F., (1958), The Psychology of Interpersonal Relations, New York NY: John
Wiley & Sons.
Hines, J. M., Hungerford,H. R., & Tomera, A. N. (1987), Analysis and Synthesis of
Research on Responsible Environmental Behaviour: A Meta-Analysis. The Journal
of Environmental Education, Vol 18, (2), pp 1-8.
Hobson, K., (2002), Competing discourses of sustainable consumption: does the
‘rationalization of lifestyles’ make sense?, Environmental Politics, Vol 11, pp 95-120.
Holden, A., (2000), Environment and Tourism, London: Routeledge.
Hunter, C., & Green, H., (1995), Tourism and the environment; A sustainable
relationship, London: Routeledge.
Hunter, C., & Shaw, J., (2007), The ecological footprint as a key indicator of
sustainable tourism, Tourism Management, Vol 28, (1), pp 45-57.
446
Intergovernmental Panel on Climate Change (IPCC), 2007, Climate Change
Synthesis Report of the Fourth Assessment, IPCC, Geneva.
Jackson, E. L., & Rucks, V. C. (1995), Negiotation of leisure constraints by junior-
high and high school students: An exploratory study, Journal of Leisure Research,
Vol27, (1), pp 85-195.
Jenner, P., & Smith, C., (1992), The tourism industry and the environment, London:
EIU,
Kempton, W. Boster, J. S., & Hartley, J. A. (1995), Environmental Values in
American Culture, Cambridge, Massachusetts: MET Press.
Klemm, M., (1992), Sustianable tourism development: Languedoc and Roussillon,
Tourism Management, 169-180.
Kollmuss, A. & Agyeman, J. (2002). Mind the Gap: why do people act
environmentally and what are the barriers to pro-environmental behaviour?
Environmental Education Research. 8, (3): 239-260.
Kotler, P. & Zaltman, G. (1971). Social Marketing: An Approach to Planned Social
Change The Journal of Marketing, 35: 3-12.
Krippendorf, I, (1987), The Holiday Makers. London, Heinemann.
447
Lang, G. E., & Lang, G. (1983), The battle for public opinion: The president, the
press and the polls during Watergate, New York: Columbia University Press.
Laczinak, G. R., Lusch, R. F. & Murphy, P. E. (1979). “Social Marketing: Its ethical
dimensions”. Journal of Marketing, 43, (Spring), 29-36.
Lillywhite, M., & Lillywhite, L., (1991), Low impact tourists. In S. Medik, (ed.),
Managing Tourism, London: Butterworth-Heinemann.
Macionis, J. J., (2002), Social Problems, Upper Saddle Back River, NJ: Prenticd-Hall
Malkis, A., & Grasmick, H. G., (1977), ‘Support for the ideology of the environmental
movement: tests of alternative hypothess’, Western Sociological Review, Vol 8, pp
25-47.
Martens, S., & Spaargaren, G. (2005), The politics of sustainable consumption; the
case of the Netherlands, Sustainability, Practice and Policy, Vol 1, (1) pp 1-10.
Mathieson, A., & Wall, G., (1982), Tourism, Economic, Physical and Social Impacts,
London: Longman.
Maslow, A. H., (1970), Motivation and Personality, (2nd Ed), New York: Harper &
Row.
448
Matthews, C. (2010), Appendix A - West Somerset Tourism Delivery Plan – January
2010. (Online),West Somerset District Council.
http://www.westsomersetonline.gov.uk/getattachment/Tourism---
Leisure/Tourism/Tourism-delivery-plan-Jan-10-V4.pdf.aspx (accessed 30 June,
2010)
Mayor, K., & Tol, R. S. J., (2007), The Impact of the UK aviation tax on carbon
dioxide emissions and visitor numbers, Transport Policy, Vol 14, (6), pp 607-613.
McKenzie-Mohr, D. & Smith W. (1999). Fostering Sustainable Behaviour: An
Introduction to Community Based Social Marketing. Canada: New Society.
Mercher, B. (1983), Some fundamental truths about tourism: Understanding
tourism’s social and environmental impacts, Journal of Sustainable Tourism, Vol
1,(1) pp 6-16.
Mc Michael, A. J., Woodruff, R. E., & Hales, S. (2006), Climate Change and Human
Health Present and Future, The Lancet, vol. 367, (9613), pp 859-869.
McVey, D., Crosier, A., & Christopolous, A., (2010) ‘Evaluation’, In French, J., Blair-
Stevens, C., McVey, M., & Merritt, R., (eds.), Social marketing and public health:
Theory and Practice, Oxford: Oxford University Press.
Michalic, T,(2002), Tourism & Economic Development Issues, in Sharpley, R., &
Tefler, D. J., (ed), Tourism and Development, Concepts and Issues, Clevedon:
Channel View Publications.
449
Middleton, V. T. C., & Hawkins, P., (1998), Sustainable Tourism; a marketing
perspective, Oxford: Butterworth-Heinemann.
Mill. R. C., & Morrison, A. M., (1985), The Tourism System, Englewood Cliffs, NJ:
Prentice Hill.
Miller, C. A. (2003), Consumption in sustainable tourism; a survey of UK consumers,
Journal of Sustainable Tourism, Vol 11, (1), pp 17-39.
Miller, G. T., & Spoolman, S. E. (2008), Sustaining the Earth; An Integrative
Approach, Belmont CA: Brooks/Cole.
Mosiander, J. (2007), Motivational Complexity of Green Consumerism, International
Journal of Consumer Studies, Vol 31, (4), pp 404-409.
Mowforth, M., & Munt, I, (1998), Tourism and Sustainability; Development,
globalization and development in the third world, New York: Routeledge.
Murdock, S. H. & Schriner, E. C. (1997), ‘Social determinants of the level of support
for environmental protection and economic growth in rural population’ Paper
presented at the Annual Meeting of Rural Sociological Society, Madison: Wisconsin.
Nordlund, A. M., & Garvill, J., (2003), Effects of values, problem awareness and
personal norm on willingness to reduce personal car use, Journal of Environmental
Psychology, Vol 23, (4), pp 339-347.
450
Office for National Statistics, (2011), Characteristics of Workers in Tourism, (Online);
Available http://www.ons.gov.uk/ons/rel/tourism/tourism-employment-
summaries/characteristics-of-workers-in-tourism--2011/rep-chartour.html (accessed
Nov, 2013)
Owens, S. (2000), ‘Engaging the public’; information and deliberation in
environmental policy’, Environment and Planning A, Vol 32, pp 1141-1148.
Parvatiyar, J., (2000), Handbook of Relationship Marketing, Thousand Oaks, CA:
Sage Publications.
Pattullo, P., (1996), Last Resorts: The cost of tourism in the Caribbean, London:
Cassell.
Pearce, D. G. (1988). Tourist Time-Budgets, Annals of Tourism Research, 15: 106-
121.
Pearce, P. L. (1981). Route Maps: A Study of travellers’ perceptions of a section of
country side, Journal of Environmental Psychology, 141-155.
Pearce, P. L. (1982), The Social Psychology of Tourist Behaviour, Oxford:
Pergamon.
Peattie, S. & Peattie, K. (2003). Ready to fly solo? Reducing social marketing’s
dependence on commercial marketing theory. Marketing Theory, 3(3): 365-385.
Peattie, K., & Peattie, S. (2009), Social marketing: A pathway to consumption
reduction?, Journal of Business Research, Vol 62, (2), pp 260-268.
451
Penner, J. E., Lister, D. H., Griggs, D. J., Dokken, D. J. & McFarland, M.
(eds),(1999), Aviation and the Global Atmosphere; A Special Report of IPPC
Working Groups I & II, Cambridge: Cambridge University Press.
Pidgeon, N., (1996), Grounded theory: theoretical background, In; Richardson, J. T.
E. (ed) Handbook of Qualitative Research Methods for Psychology and the Social
Sciences, (3rd Ed); Leicester: British Psychological Society.
Pidgeon, N., & Henwood N., (1996), Grounded theory: practical implementation, In;
Richardson, J. T. E. (ed) Handbook of Qualitative Research Methods for Psychology
and the Social Sciences, (3rd Ed); Leicester: British Psychological Society.
Plog, S. C. (1972), Why destination areas rise and fall in popularity. Paper presented
at Southern California Chapter of the Travel Research Association.
Plog, S. C. (1987), Understanding psychographics in tourism research. In J. R.
Brent-Ritchie and Goeldner, C. R. (eds.), Travel, Tourism and Hospitality Research:
A Handbook for Managers and Researchers, New York: John Wiley.
Plog, S. C. (1991), Leisure Travel, making it a growth market…again!, New York:
John Wiley.
452
Prochaska, J. O., & DiClementi, C. C., (1983), Stages and processes of self-change
of smoking: towards an integrated model of change, Journal of Consulting and
Clinical Psychology, Vol 51, (3), pp 390-395.
Ram, Y., Nawijn, J, & Peeters, P., (2013), Happiness and limits to sustainable
tourism mobility; a new conceptual model, Journal of Sustainable Tourism, Vol 21,
(7), 1017-1035.
Rathouse, K., Scarles, C., Holmes, K., & Tribe, J. (2010), Public understanding of
sustainable tourism, Annals of Tourism, Vol 37, (3), pp 627-646.
Ritchie, G. I., Ritchie, I, & Brent, J. R. (2005), Application of the Analytic Heirachy
Process to Choice and Decision Making: A Review and Illustration Applied to
Destination Competiveness, Tourism Analysis, Vol 10, (1), pp 17-29.
Roe, N., Leader-Williams, D., & Dalal-Clayton, B., (1997), The environmental
impacts of wildlife tourism, Wildlife & Development Series, 10, IIED.
Reynolds, L., & Merritt, R., (2010), ‘Scoping’ In French, J., Blair-Stevens, C., McVey,
D., & Merritt, R. (eds.). Social Marketing & Public Health: Theory and Practice.
Oxford: Oxford University Press.
Ryan, C., (1998), The travel career ladder: an appraisal. Annals of Tourism
Research, 25 (4), pp 936-957.
453
Saarinen, J., (2006), Traditions of sustainability in tourism studies. Annals of Tourism
Research, Vol 33, (4), pp 1121-1140.
Schultz, W. (2001). The Structure of Environmental Concern: Concern of Self, Other
People, and the Biosphere, Journal of Environmental Psychology, 21:327-339.
Schoorl, J., & Visser, N., (1991), Towards Sustainable Coastal Tourism:
Environmental Impacts pf Tourism on the Kenyan Coast. Discussion Paper,
Netherlands Ministry of Agriculture, Nature, Management and Fisheries.
Sharma, K. K., (2004), Tourism & Socio-cultural Development, New Dehli: Sarup &
Sons.
Shaw, G., & Williams, A. (2002) From Lifestyle Consumption to Lifestyle Production;
Changing Patterns of Tourism Entrepreneurship, In Thomas, R, (ed) Small Firms in
Tourism; International Perspectives, Amsterdam: Elsevere.
Shove, E. (2003), Comfort, Cleanliness and Convenience: The Social Organisation
of Normality, Berg, Oxford.
Shostack, G. L., (1977), Breaking Free From Product Marketing, Journal of
Marketing, Vol 41, pp 73-80.
Sinclair, T., (1998), Tourism & Economic Development: A Survey, The Journal of
Development Studies, Vol 34, (5), pp 1 – 51.
454
Sirakaya, E. & Woodside, A. G. (2005), Building and testing theories of decision
making by travellers, Tourism Management, Vol 26, (6), pp 815-832.
South West Tourism Alliance, (2008), The Value of Tourism 2008; Executive
Summary, South West Tourism.
South West Tourism. Value of Tourism Somerset, (Online)
http://www.swtourism.org.uk/documents/q/category/finance-facts-figures-
documents/value-of-tourism-archive/value-of-tourism-2008/ (Accessed 9 July 2010)
Sparrowhawk, J., & Holden, A,. (1999), Human development: the role of tourism
based NGO’s in Nepal, Tourism Recreation Research, Vol 24, pp 37-44.
Stankey, G. H., Cole, D. N., Lucas, R. C., Petersen, M. E., & Frissell, S.S. (1985),
The limits of acceptable change (LAC) system for wilderness planning, Gen, Tech
Report, INT-176,USDA, Forest Service Intermountain Forest & Range Experiment
Station,Ogden, UT
Steg, L., & Vlek, C., (2009), Encouraging Pro-environmental Behaviour: An
integrative review and research agenda, Journal of Environmental Psychology, Vol
29, (3), pp 309-317.
Stern, P. C. & Dietz, T., (1994), The Value Basis of Environmental Concern, Journal
of Social Issues, Vol 50, (3), 65-84.
455
Stern, P. C., Dietz, T., Abel, T., Gregory, A;, Guagnano, A., & Kalof, L., (1999), A
Value-Belief-Norm of Support for Social Movements, Research in Human Ecology,
Vol 6, (2), pp 81-97.
Stern, P. (2000). Toward a Coherent Theory of Environmentally Coherent Behaviour.
Journal of Social Issues, 56 (3): 407-424.
Swarbrooke, J., (1999), Sustainable Tourism Management, Oxford: CABI Publishing.
Swarbrooke, J., & Horner, S. (2001), Business Travel and Tourism, Oxford:
Butterworth-Heinemann.
Thorgersen, J., (1999), Spillover processes in the development of a sustainable
consumption pattern, Journal of Economic Psychology, Vol 20, (10), 51-81.
Thornton, P. R., Williams, A. M., Shaw, G. (1996). Revisiting time-space diaries: an
exploratory case study of tourist behaviour in Cornwall, England. Environment &
Planning A 29 (10); 1847-1868 .
Thornton, P. R., Shaw, G., & Williams, A. M. (1997), Tourist group holiday decision-
making and behaviour: the influence of children, Tourism Management, Vol 18, (5),
287-297.
Torbay Development Agency, (2010), Turning the tide for tourism in Torbay. Torbay
Council.
456
Torbay Council, (2014) Recycling and Waste, [online] Available at
http://www.torbay.gov.uk/index/yourservices/waste.htm (accessed 6 June 2014)
Truss, A., Marshall, R. & Blair-Stevens, C. (2010) ’A history of social marketing’, In
French, J., Blair-Stevens, C., McVey, D., & Merritt, R (eds). Social Marketing and
Public Health; Theory and Practice. Oxford: Oxford University Press.
Um, S, & Crompton, J. L, (1990), Attitude Determinants in tourism destination
choice, Annals of Tourism Research, Vol 17, (3), 432-438.
UNEP & UNWTO, (2005), Making Tourism More Sustainable – A Guide for Policy
Makers, [online] http://sdt.unwto.org/content/about-us-5 (accessed June 2014)
Valentine, P. S. (1992), Eco-tourism and nature conservation; a definition with some
recent developments in Micronesia, In B. Weiler (ed,), Ecotourism, Canberra Bureau
of Tourism.
Van Liere, K. D. & Dunlap, R. E. (1980) A social bases of environmental concern; A
review of Hypothesis, Explanations and Empirical Evidence, Public Opinion
Quarterly, 44, (2), pp 181-197.
Vargo, S. L. & Lusch, R. F. (2004). Evolving to a new dominant logic for marketing.
Journal of Marketing, 68: pp 1-17.
457
Vargo, S. L. & Lusch R. F. (2006). Service Dominant Logic: What it is, What it is not,
What it might be. In Lusch S. L. & Vargo, S. L. (eds). The Service Dominant Logic of
Marketing: Dialog, Debate & Directions. New York: M. E. Sharpe.
Vargo, S. L. & Lusch, R. F. (2008), Service Dominant Logic; continuing the
evaluation, Journal of the Academy of Marketing Sciences, 36: pp 1-10.
Wackernagel, M., & Rees, W. E., (1996), Our ecological footprints: Reducing Human
Impact on the Earth, Gabriolo Island; New Society Publishers.
Walker, G. J., Jackson, E. L. & Jinyany, D. (2007), Culture and leisure constraints: A
comparison of Canadian & Mainland Chinese University Students, Journal of Leisure
Research, Vol 39, (4), pp 567-590.
Wall, G., (1996), Is ecotourism sustainable? Environmental Management, Vol 2, pp
207-216.
Wall, G., & Mathieson, A., (2006), Tourism Change, Impacts & Opportunities,
Harlow: Pearson.
Walmsley, D. J. & Jenkins, J. M. (1992). Tourism Cognitive Mapping of Unfamiliar
Environments, Annals of Tourism Research, 19: 268-286.
Webster, F., (1992), The changing role of marketing in the corporation, Journal of
Marketing, Vol 56, pp 1 – 17.
458
West Somerset District Council, (2014), Recycling and Waste, [online]; Available at
http://www.westsomersetonline.gov.uk/Recycling---Waste, (accessed 6 June, 2014)
WCED 1987: Our Common Future, The World Commission on Environment and
Development, Oxford: Oxford University Press.
Wheeller, B., (1991), ‘Tourism’s troubled times – Responsible tourism is not the
answer’, Tourism Management, Vol 12, pp 91-96.
Wheeller, B. (1994), Ecotourism: A ruse by any other name, Progress in Tourism,
Recreation and Hospitality Management, Vol 6, pp 3-11.
Wiebe, G. D. (1952). Merchandising Commodities and Citizenship on Television.
Public Opinion Quarterly, Winter: 679-691.
World Tourism Organisation, (1992), Tourism Carrying Capacity: Report on the
Senior-level Expert Group Meeting, June 1990, Madrid: WTO.
World Tourism Organisation, (2005) Making tourism more sustainable – A Guide for
Policy Makers, Madrid: WTO.
Williams, A., & Shaw, G., (1991). Tourism & Economic Development; Western
European Experiences, London: Belhaven Press.
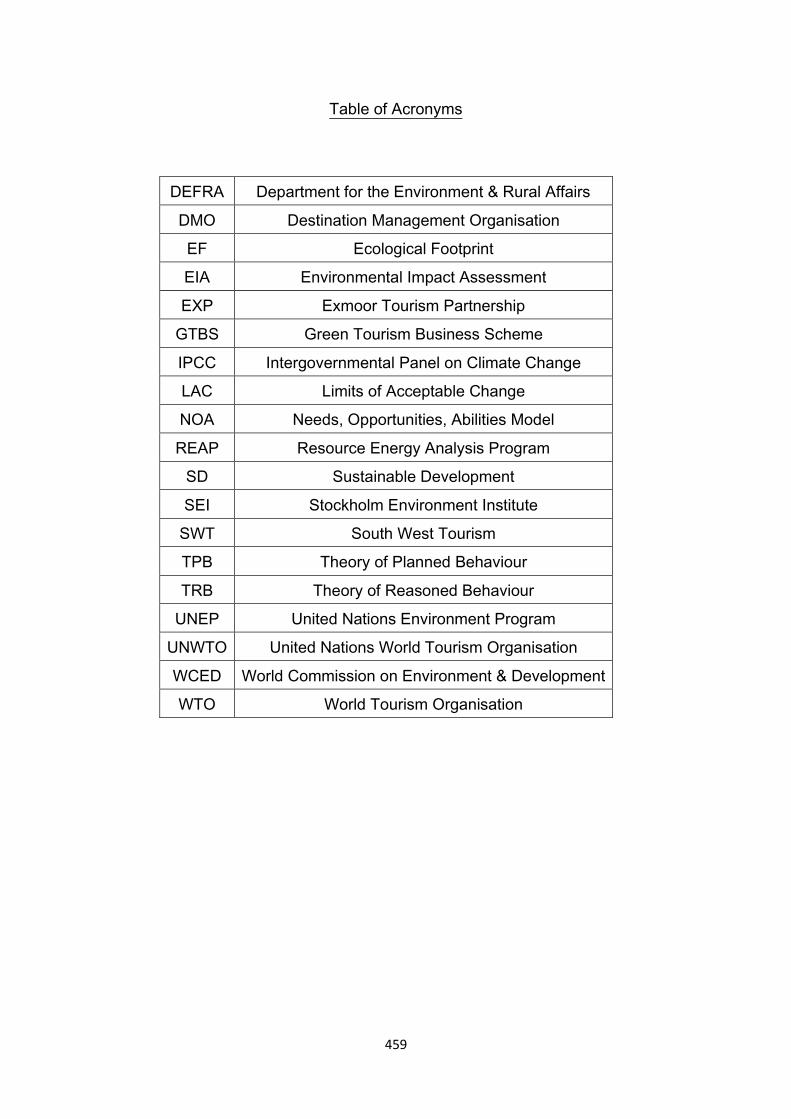
459
Table of Acronyms
DEFRA Department for the Environment & Rural Affairs
DMO Destination Management Organisation
EF Ecological Footprint
EIA Environmental Impact Assessment
EXP Exmoor Tourism Partnership
GTBS Green Tourism Business Scheme
IPCC Intergovernmental Panel on Climate Change
LAC Limits of Acceptable Change
NOA Needs, Opportunities, Abilities Model
REAP Resource Energy Analysis Program
SD Sustainable Development
SEI Stockholm Environment Institute
SWT South West Tourism
TPB Theory of Planned Behaviour
TRB Theory of Reasoned Behaviour
UNEP United Nations Environment Program
UNWTO United Nations World Tourism Organisation
WCED World Commission on Environment & Development
WTO World Tourism Organisation
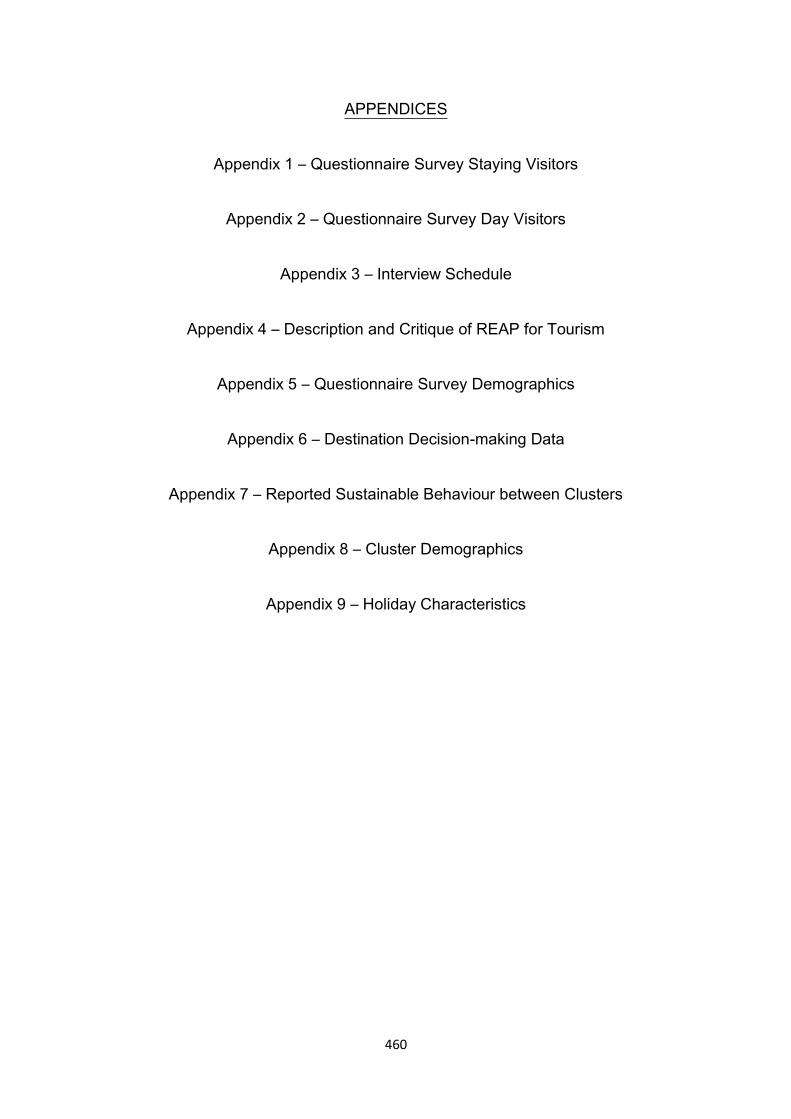
460
APPENDICES
Appendix 1 – Questionnaire Survey Staying Visitors
Appendix 2 – Questionnaire Survey Day Visitors
Appendix 3 – Interview Schedule
Appendix 4 – Description and Critique of REAP for Tourism
Appendix 5 – Questionnaire Survey Demographics
Appendix 6 – Destination Decision-making Data
Appendix 7 – Reported Sustainable Behaviour between Clusters
Appendix 8 – Cluster Demographics
Appendix 9 – Holiday Characteristics
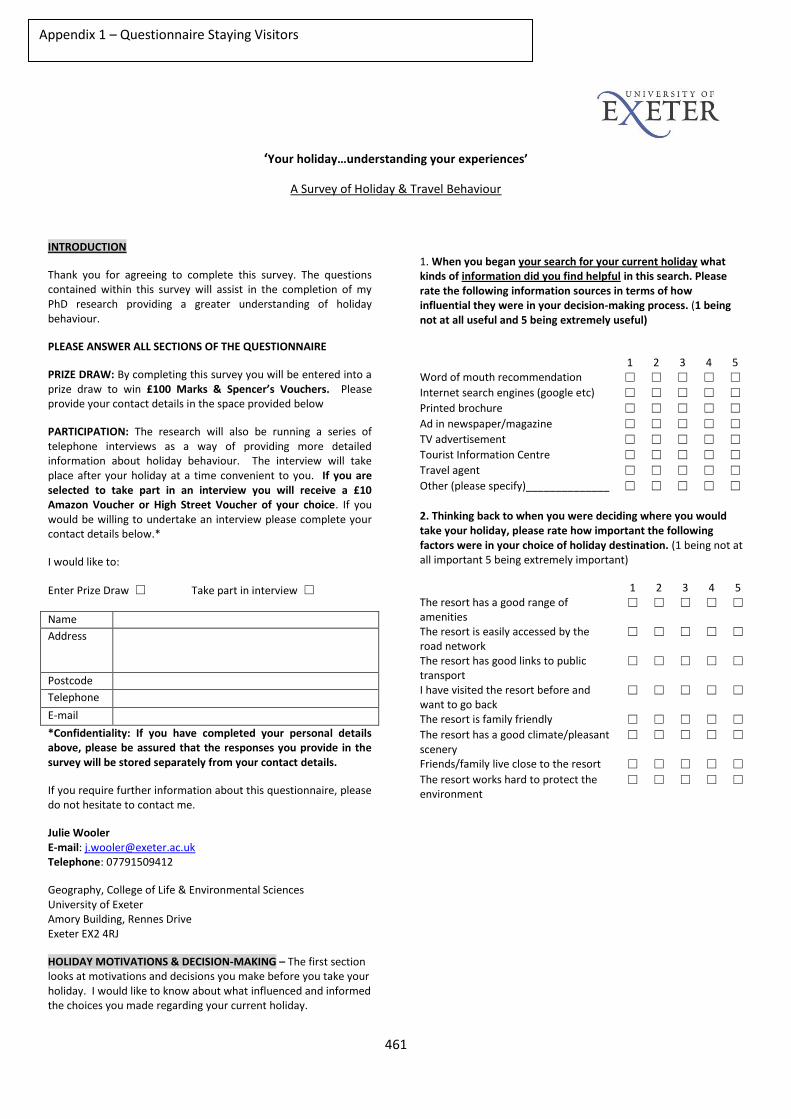
461
‘Your holiday…understanding your experiences’
A Survey of Holiday & Travel Behaviour
INTRODUCTION
Thank you for agreeing to complete this survey. The questions contained within this survey will assist in the completion of my PhD research providing a greater understanding of holiday behaviour.
PLEASE ANSWER ALL SECTIONS OF THE QUESTIONNAIRE
PRIZE DRAW: By completing this survey you will be entered into a prize draw to win £100 Marks & Spencer’s Vouchers. Please provide your contact details in the space provided below
PARTICIPATION: The research will also be running a series of telephone interviews as a way of providing more detailed information about holiday behaviour. The interview will take place after your holiday at a time convenient to you. If you are selected to take part in an interview you will receive a £10 Amazon Voucher or High Street Voucher of your choice. If you would be willing to undertake an interview please complete your contact details below.*
I would like to:
Enter Prize Draw ☐ Take part in interview ☐
Name
Address
Postcode
Telephone
*Confidentiality: If you have completed your personal details above, please be assured that the responses you provide in the survey will be stored separately from your contact details.
If you require further information about this questionnaire, please do not hesitate to contact me.
Julie Wooler E-mail: [email protected] Telephone: 07791509412
Geography, College of Life & Environmental Sciences University of Exeter Amory Building, Rennes Drive Exeter EX2 4RJ
HOLIDAY MOTIVATIONS & DECISION-MAKING – The first section looks at motivations and decisions you make before you take your holiday. I would like to know about what influenced and informed the choices you made regarding your current holiday.
1. When you began your search for your current holiday what kinds of information did you find helpful in this search. Please rate the following information sources in terms of how influential they were in your decision-making process. (1 being not at all useful and 5 being extremely useful)
1 2 3 4 5 Word of mouth recommendation ☐ ☐ ☐ ☐ ☐ Internet search engines (google etc) ☐ ☐ ☐ ☐ ☐ Printed brochure ☐ ☐ ☐ ☐ ☐
Ad in newspaper/magazine ☐ ☐ ☐ ☐ ☐ TV advertisement ☐ ☐ ☐ ☐ ☐ Tourist Information Centre ☐ ☐ ☐ ☐ ☐ Travel agent ☐ ☐ ☐ ☐ ☐
Other (please specify)______________ ☐ ☐ ☐ ☐ ☐ 2. Thinking back to when you were deciding where you would take your holiday, please rate how important the following factors were in your choice of holiday destination. (1 being not at all important 5 being extremely important)
1 2 3 4 5 The resort has a good range of amenities
☐ ☐ ☐ ☐ ☐
The resort is easily accessed by the road network
☐ ☐ ☐ ☐ ☐
The resort has good links to public transport
☐ ☐ ☐ ☐ ☐
I have visited the resort before and want to go back
☐ ☐ ☐ ☐ ☐
The resort is family friendly ☐ ☐ ☐ ☐ ☐ The resort has a good climate/pleasant scenery
☐ ☐ ☐ ☐ ☐
Friends/family live close to the resort ☐ ☐ ☐ ☐ ☐
The resort works hard to protect the environment
☐ ☐ ☐ ☐ ☐
Appendix 1 – Questionnaire Staying Visitors
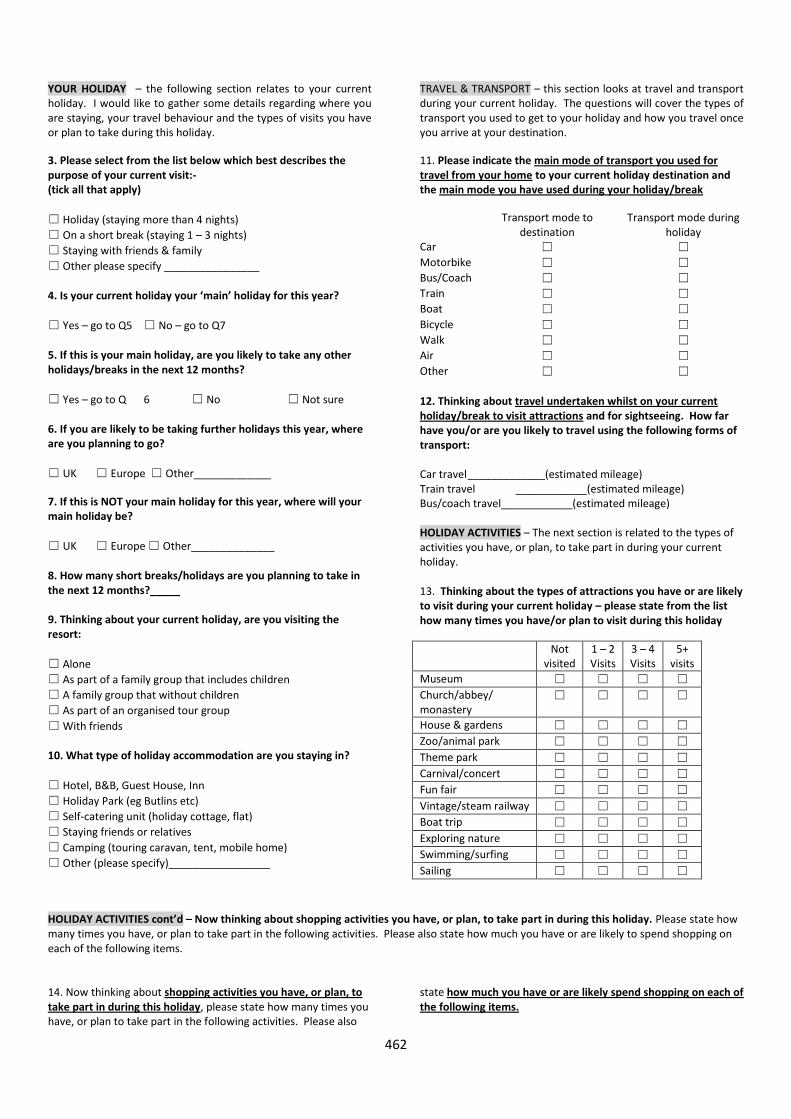
462
YOUR HOLIDAY – the following section relates to your current holiday. I would like to gather some details regarding where you are staying, your travel behaviour and the types of visits you have or plan to take during this holiday.
3. Please select from the list below which best describes the purpose of your current visit:- (tick all that apply)
☐ Holiday (staying more than 4 nights)
☐ On a short break (staying 1 – 3 nights)
☐ Staying with friends & family
☐ Other please specify ________________
4. Is your current holiday your ‘main’ holiday for this year?
☐ Yes – go to Q5 ☐ No – go to Q7
5. If this is your main holiday, are you likely to take any other holidays/breaks in the next 12 months?
☐ Yes – go to Q 6 ☐ No ☐ Not sure 6. If you are likely to be taking further holidays this year, where are you planning to go?
☐ UK ☐ Europe ☐ Other_____________
7. If this is NOT your main holiday for this year, where will your main holiday be?
☐ UK ☐ Europe ☐ Other______________
8. How many short breaks/holidays are you planning to take in the next 12 months?_____ 9. Thinking about your current holiday, are you visiting the resort:
☐ Alone
☐ As part of a family group that includes children
☐ A family group that without children
☐ As part of an organised tour group
☐ With friends 10. What type of holiday accommodation are you staying in?
☐ Hotel, B&B, Guest House, Inn
☐ Holiday Park (eg Butlins etc)
☐ Self-catering unit (holiday cottage, flat)
☐ Staying friends or relatives
☐ Camping (touring caravan, tent, mobile home)
☐ Other (please specify)_________________
TRAVEL & TRANSPORT – this section looks at travel and transport during your current holiday. The questions will cover the types of transport you used to get to your holiday and how you travel once you arrive at your destination.
11. Please indicate the main mode of transport you used for travel from your home to your current holiday destination and the main mode you have used during your holiday/break
Transport mode to destination
Transport mode during holiday
Car ☐ ☐
Motorbike ☐ ☐ Bus/Coach ☐ ☐ Train ☐ ☐ Boat ☐ ☐
Bicycle ☐ ☐ Walk ☐ ☐ Air ☐ ☐
Other ☐ ☐
12. Thinking about travel undertaken whilst on your current holiday/break to visit attractions and for sightseeing. How far have you/or are you likely to travel using the following forms of transport: Car travel _____________(estimated mileage) Train travel ____________(estimated mileage) Bus/coach travel____________(estimated mileage) HOLIDAY ACTIVITIES – The next section is related to the types of activities you have, or plan, to take part in during your current holiday. 13. Thinking about the types of attractions you have or are likely to visit during your current holiday – please state from the list how many times you have/or plan to visit during this holiday
Not visited
1 – 2 Visits
3 – 4 Visits
5+ visits
Museum ☐ ☐ ☐ ☐
Church/abbey/ monastery
☐ ☐ ☐ ☐
House & gardens ☐ ☐ ☐ ☐
Zoo/animal park ☐ ☐ ☐ ☐
Theme park ☐ ☐ ☐ ☐
Carnival/concert ☐ ☐ ☐ ☐
Fun fair ☐ ☐ ☐ ☐
Vintage/steam railway ☐ ☐ ☐ ☐
Boat trip ☐ ☐ ☐ ☐
Exploring nature ☐ ☐ ☐ ☐
Swimming/surfing ☐ ☐ ☐ ☐
Sailing ☐ ☐ ☐ ☐
HOLIDAY ACTIVITIES cont’d – Now thinking about shopping activities you have, or plan, to take part in during this holiday. Please state how many times you have, or plan to take part in the following activities. Please also state how much you have or are likely to spend shopping on each of the following items. 14. Now thinking about shopping activities you have, or plan, to take part in during this holiday, please state how many times you have, or plan to take part in the following activities. Please also
state how much you have or are likely spend shopping on each of the following items.
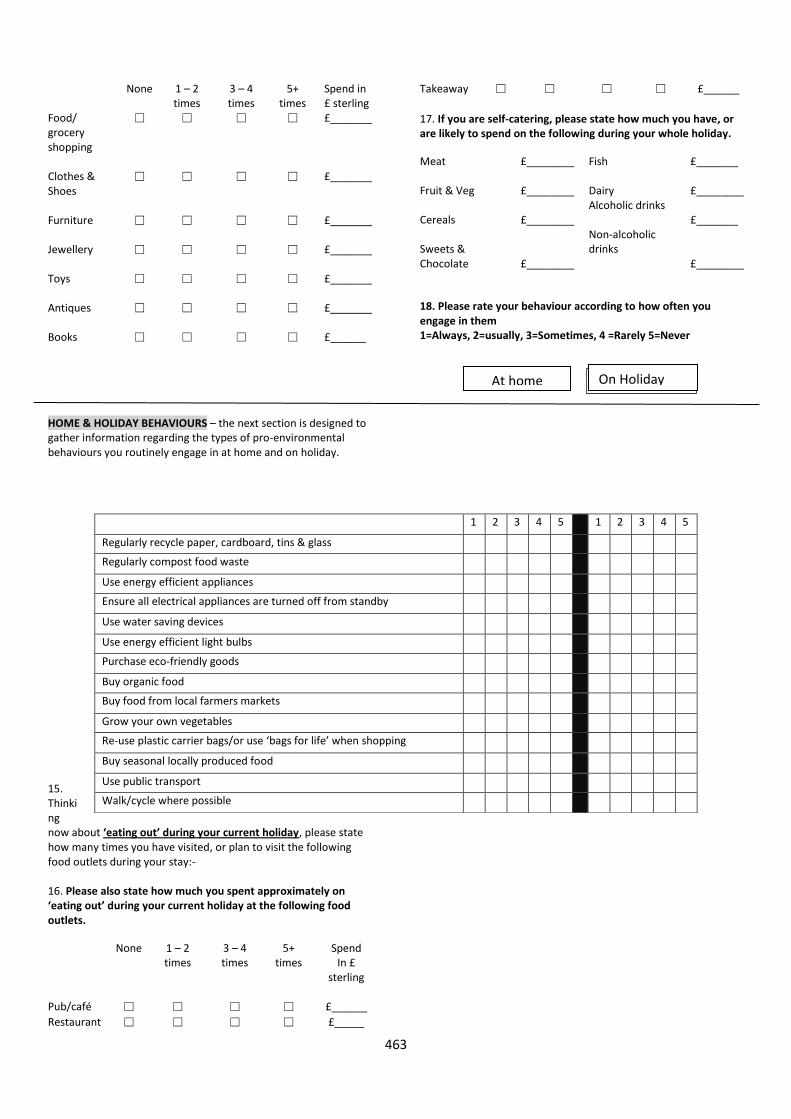
463
None 1 – 2 times
3 – 4 times
5+ times
Spend in £ sterling
Food/ grocery shopping
☐ ☐ ☐ ☐ £_______
Clothes & Shoes
☐ ☐ ☐ ☐ £_______
Furniture ☐ ☐ ☐ ☐ £_______
Jewellery ☐ ☐ ☐ ☐ £_______
Toys ☐ ☐ ☐ ☐ £_______
Antiques ☐ ☐ ☐ ☐ £_______
Books ☐ ☐ ☐ ☐ £______
HOME & HOLIDAY BEHAVIOURS – the next section is designed to gather information regarding the types of pro-environmental behaviours you routinely engage in at home and on holiday.
15. Thinking now about ‘eating out’ during your current holiday, please state how many times you have visited, or plan to visit the following food outlets during your stay:- 16. Please also state how much you spent approximately on ‘eating out’ during your current holiday at the following food outlets.
None 1 – 2 times
3 – 4 times
5+ times
Spend In £
sterling
Pub/café ☐ ☐ ☐ ☐ £______
Restaurant ☐ ☐ ☐ ☐ £_____
Takeaway ☐ ☐ ☐ ☐ £______
17. If you are self-catering, please state how much you have, or are likely to spend on the following during your whole holiday.
Meat £________ Fish £_______ Fruit & Veg
£________
Dairy
£________
Cereals
£________
Alcoholic drinks £_______
Sweets & Chocolate
£________
Non-alcoholic drinks
£________
18. Please rate your behaviour according to how often you engage in them 1=Always, 2=usually, 3=Sometimes, 4 =Rarely 5=Never
1 2 3 4 5 1 2 3 4 5
Regularly recycle paper, cardboard, tins & glass
Regularly compost food waste
Use energy efficient appliances
Ensure all electrical appliances are turned off from standby
Use water saving devices
Use energy efficient light bulbs
Purchase eco-friendly goods
Buy organic food
Buy food from local farmers markets
Grow your own vegetables
Re-use plastic carrier bags/or use ‘bags for life’ when shopping
Buy seasonal locally produced food
Use public transport
Walk/cycle where possible
At home On holiday On Holiday

464
PERSONAL DETAILS
19. Please let us know the gender and age of each person with you on your current holiday by completing the table below. You should tick two boxes per line, one for each person’s gender and one their age group.
Male Female Under 16 yrs
16 – 19 20 – 29 30 – 44 45 – 59 60 – 74 75 and over
You
Spouse/partner
Dependent child 1
2
3
4
5
Other adult 1
2
3
20. How many cars (including motor homes) does your household own or have access to ?_______ How many bicycles does your household have?_________________
21. Do you or does anyone in your household have a concessionary travel pass, such as National Bus Pass/Railcard or Coach Card? ☐
Yes ☐ No
22. Please tick if you, or any member of your household a member of any of the following environmental organisations?
☐ World Wildlife Fund ☐ National Trust ☐ Greenpeace ☐ RSPB
☐ Natural England ☐ Woodland Trust ☐ Other (please specify)_________________
23. Do you or anyone in your household have a disability, (a disability is any physical, sensory or mental impairment which has, or had, substantial and long-term adverse effect on a person’s ability to carry out normal day-to-day activities)?
☐ Yes Continue to Question 24 ☐ No Continue to Question 25
24. Who in your household has a disability (please tick all that apply)?
☐ You ☐ Other members of your household
25. Please state which of the following occupation categories YOU fall into (please tick one only):
Professional (e.g. doctor, dentist, teacher ☐ Skilled manual (eg. Office manager) ☐ Not working for medical reasons ☐
Managerial (e.g. company manager) ☐ Unskilled manual (e.g. cleaner) ☐ Unemployed ☐ Skilled manual (e.g. electrician, plumber ☐ Retired ☐ On maternity/paternity leave ☐ Un-skilled non-manual (e.g. office admin) ☐ Student ☐ Home maker or carer ☐
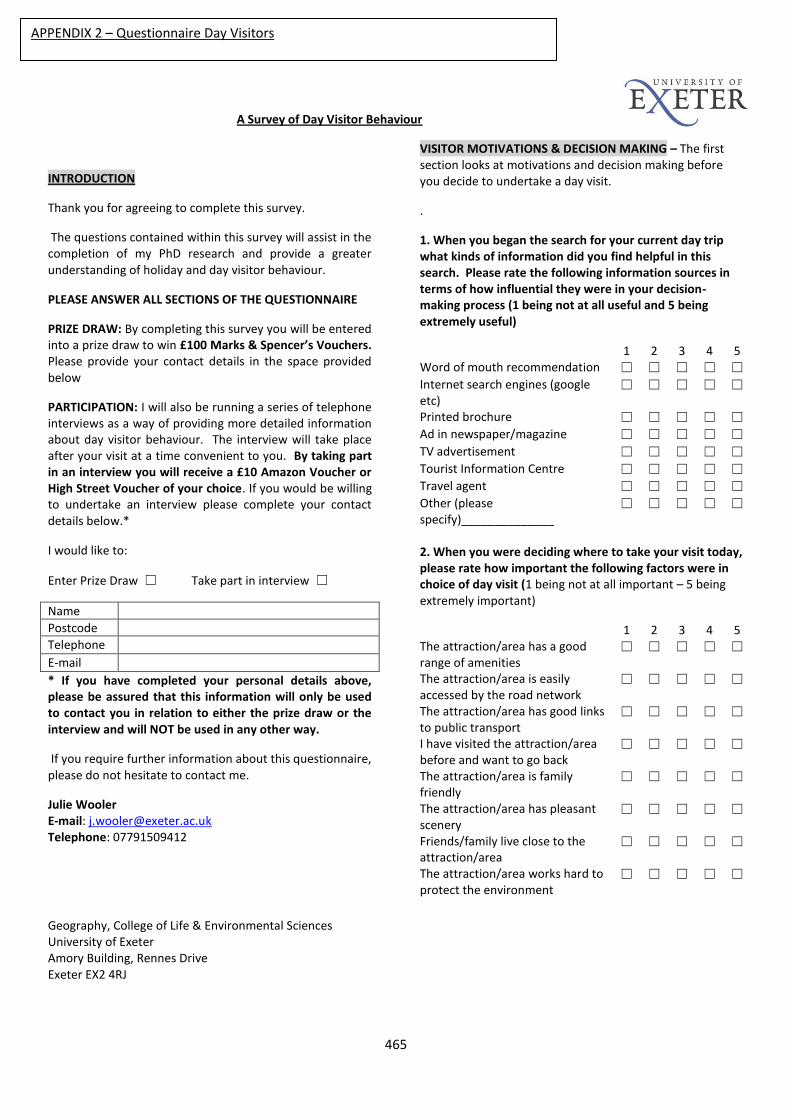
465
A Survey of Day Visitor Behaviour
INTRODUCTION
Thank you for agreeing to complete this survey.
The questions contained within this survey will assist in the completion of my PhD research and provide a greater understanding of holiday and day visitor behaviour.
PLEASE ANSWER ALL SECTIONS OF THE QUESTIONNAIRE
PRIZE DRAW: By completing this survey you will be entered into a prize draw to win £100 Marks & Spencer’s Vouchers. Please provide your contact details in the space provided below
PARTICIPATION: I will also be running a series of telephone interviews as a way of providing more detailed information about day visitor behaviour. The interview will take place after your visit at a time convenient to you. By taking part in an interview you will receive a £10 Amazon Voucher or High Street Voucher of your choice. If you would be willing to undertake an interview please complete your contact details below.*
I would like to:
Enter Prize Draw ☐ Take part in interview ☐
Name
Postcode
Telephone
* If you have completed your personal details above, please be assured that this information will only be used to contact you in relation to either the prize draw or the interview and will NOT be used in any other way.
If you require further information about this questionnaire, please do not hesitate to contact me.
Julie Wooler E-mail: [email protected] Telephone: 07791509412
Geography, College of Life & Environmental Sciences University of Exeter Amory Building, Rennes Drive Exeter EX2 4RJ
VISITOR MOTIVATIONS & DECISION MAKING – The first section looks at motivations and decision making before you decide to undertake a day visit.
.
1. When you began the search for your current day trip what kinds of information did you find helpful in this search. Please rate the following information sources in terms of how influential they were in your decision-making process (1 being not at all useful and 5 being extremely useful)
1 2 3 4 5 Word of mouth recommendation ☐ ☐ ☐ ☐ ☐ Internet search engines (google etc)
☐ ☐ ☐ ☐ ☐
Printed brochure ☐ ☐ ☐ ☐ ☐ Ad in newspaper/magazine ☐ ☐ ☐ ☐ ☐
TV advertisement ☐ ☐ ☐ ☐ ☐ Tourist Information Centre ☐ ☐ ☐ ☐ ☐ Travel agent ☐ ☐ ☐ ☐ ☐ Other (please specify)______________
☐ ☐ ☐ ☐ ☐
2. When you were deciding where to take your visit today, please rate how important the following factors were in choice of day visit (1 being not at all important – 5 being extremely important)
1 2 3 4 5 The attraction/area has a good range of amenities
☐ ☐ ☐ ☐ ☐
The attraction/area is easily accessed by the road network
☐ ☐ ☐ ☐ ☐
The attraction/area has good links to public transport
☐ ☐ ☐ ☐ ☐
I have visited the attraction/area before and want to go back
☐ ☐ ☐ ☐ ☐
The attraction/area is family friendly
☐ ☐ ☐ ☐ ☐
The attraction/area has pleasant scenery
☐ ☐ ☐ ☐ ☐
Friends/family live close to the attraction/area
☐ ☐ ☐ ☐ ☐
The attraction/area works hard to protect the environment
☐ ☐ ☐ ☐ ☐
APPENDIX 2 – Questionnaire Day Visitors
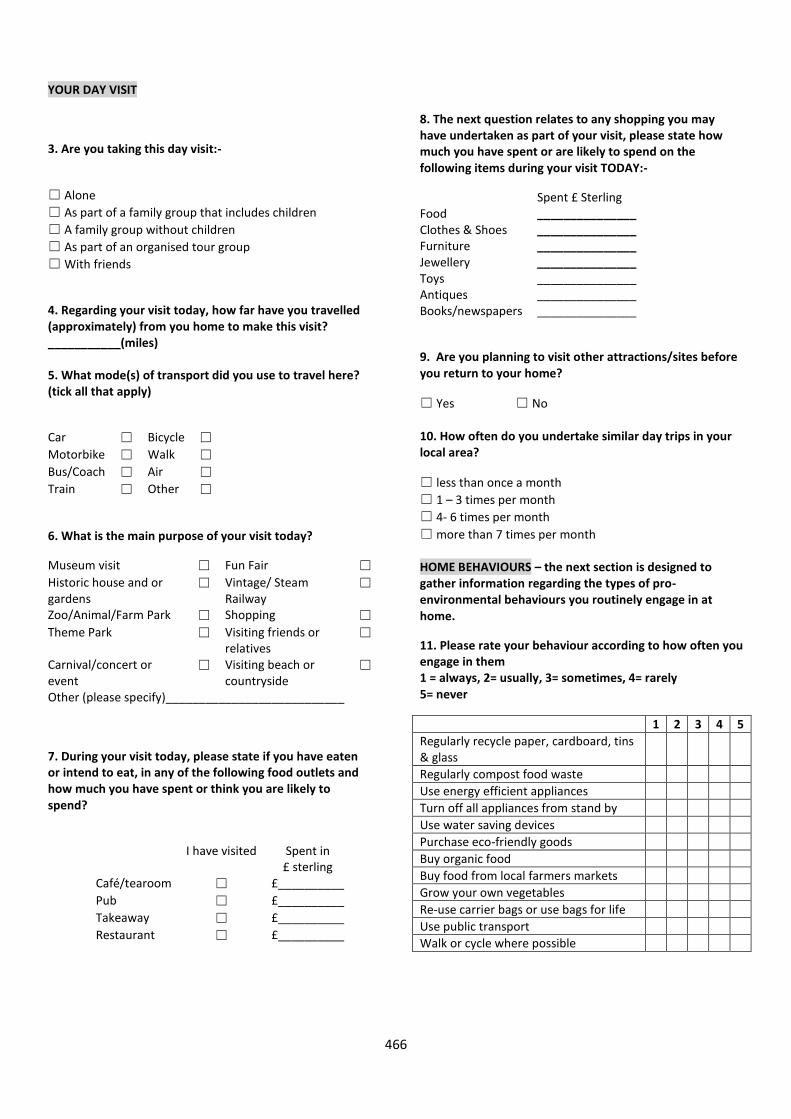
466
YOUR DAY VISIT
3. Are you taking this day visit:-
☐ Alone
☐ As part of a family group that includes children
☐ A family group without children
☐ As part of an organised tour group
☐ With friends
4. Regarding your visit today, how far have you travelled (approximately) from you home to make this visit? ___________(miles) 5. What mode(s) of transport did you use to travel here? (tick all that apply)
Car ☐ Bicycle ☐ Motorbike ☐ Walk ☐ Bus/Coach ☐ Air ☐ Train ☐ Other ☐
6. What is the main purpose of your visit today?
Museum visit ☐ Fun Fair ☐ Historic house and or gardens
☐ Vintage/ Steam Railway
☐
Zoo/Animal/Farm Park ☐ Shopping ☐
Theme Park ☐ Visiting friends or relatives
☐
Carnival/concert or event
☐ Visiting beach or countryside
☐
Other (please specify)___________________________
7. During your visit today, please state if you have eaten or intend to eat, in any of the following food outlets and how much you have spent or think you are likely to spend?
I have visited
Spent in £ sterling
Café/tearoom ☐ £__________
Pub ☐ £__________
Takeaway ☐ £__________
Restaurant ☐ £__________
8. The next question relates to any shopping you may have undertaken as part of your visit, please state how much you have spent or are likely to spend on the following items during your visit TODAY:-
Spent £ Sterling Food _______________ Clothes & Shoes _______________ Furniture _______________ Jewellery _______________ Toys _______________ Antiques _______________ Books/newspapers _______________
9. Are you planning to visit other attractions/sites before you return to your home?
☐ Yes ☐ No 10. How often do you undertake similar day trips in your local area?
☐ less than once a month
☐ 1 – 3 times per month
☐ 4- 6 times per month
☐ more than 7 times per month HOME BEHAVIOURS – the next section is designed to gather information regarding the types of pro-environmental behaviours you routinely engage in at home.
11. Please rate your behaviour according to how often you engage in them 1 = always, 2= usually, 3= sometimes, 4= rarely 5= never
1 2 3 4 5
Regularly recycle paper, cardboard, tins & glass
Regularly compost food waste
Use energy efficient appliances
Turn off all appliances from stand by
Use water saving devices
Purchase eco-friendly goods
Buy organic food
Buy food from local farmers markets
Grow your own vegetables
Re-use carrier bags or use bags for life
Use public transport
Walk or cycle where possible
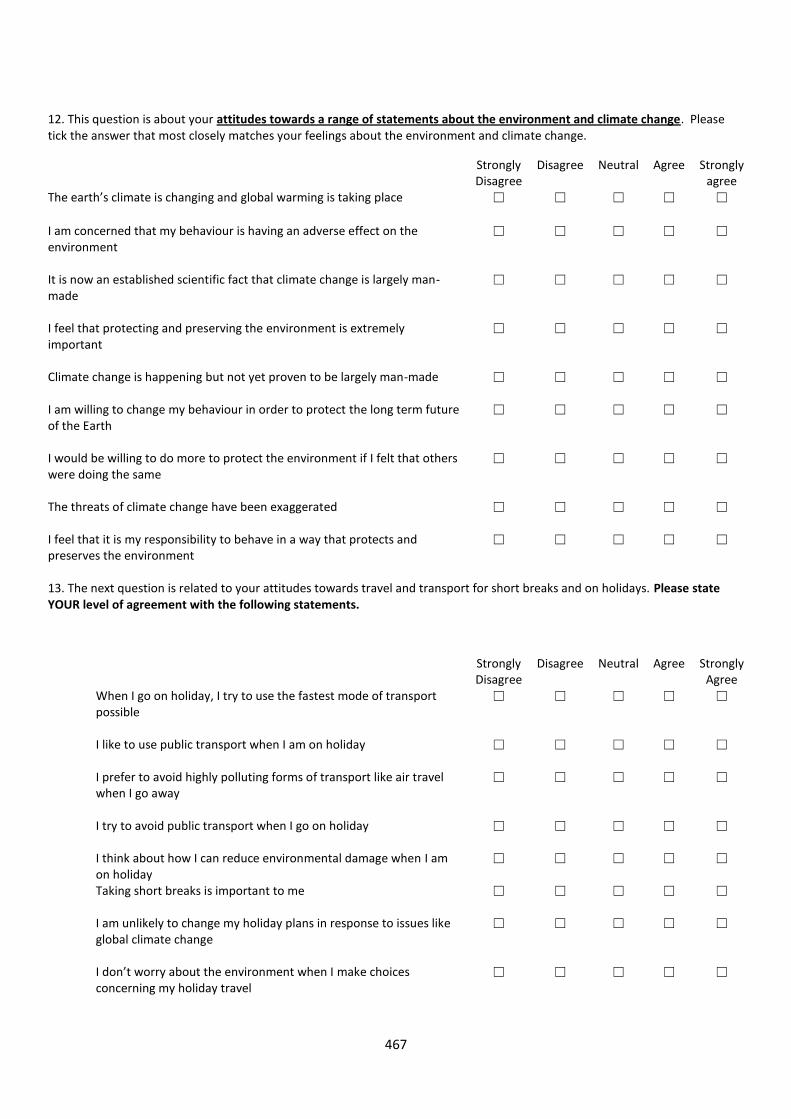
467
12. This question is about your attitudes towards a range of statements about the environment and climate change. Please tick the answer that most closely matches your feelings about the environment and climate change.
Strongly Disagree
Disagree Neutral Agree Strongly agree
The earth’s climate is changing and global warming is taking place ☐ ☐ ☐ ☐ ☐ I am concerned that my behaviour is having an adverse effect on the environment
☐
☐
☐
☐
☐
It is now an established scientific fact that climate change is largely man-made
☐ ☐ ☐ ☐ ☐
I feel that protecting and preserving the environment is extremely important
☐ ☐ ☐ ☐ ☐
Climate change is happening but not yet proven to be largely man-made
☐ ☐ ☐ ☐ ☐
I am willing to change my behaviour in order to protect the long term future of the Earth
☐ ☐ ☐ ☐ ☐
I would be willing to do more to protect the environment if I felt that others were doing the same
☐ ☐ ☐ ☐ ☐
The threats of climate change have been exaggerated
☐ ☐ ☐ ☐ ☐
I feel that it is my responsibility to behave in a way that protects and preserves the environment
☐ ☐ ☐ ☐ ☐
13. The next question is related to your attitudes towards travel and transport for short breaks and on holidays. Please state YOUR level of agreement with the following statements.
Strongly Disagree
Disagree Neutral Agree Strongly Agree
When I go on holiday, I try to use the fastest mode of transport possible
☐ ☐ ☐ ☐ ☐
I like to use public transport when I am on holiday
☐ ☐ ☐ ☐ ☐
I prefer to avoid highly polluting forms of transport like air travel when I go away
☐ ☐ ☐ ☐ ☐
I try to avoid public transport when I go on holiday
☐ ☐ ☐ ☐ ☐
I think about how I can reduce environmental damage when I am on holiday
☐ ☐ ☐ ☐ ☐
Taking short breaks is important to me
☐ ☐ ☐ ☐ ☐
I am unlikely to change my holiday plans in response to issues like global climate change
☐ ☐ ☐ ☐ ☐
I don’t worry about the environment when I make choices concerning my holiday travel
☐
☐
☐
☐
☐
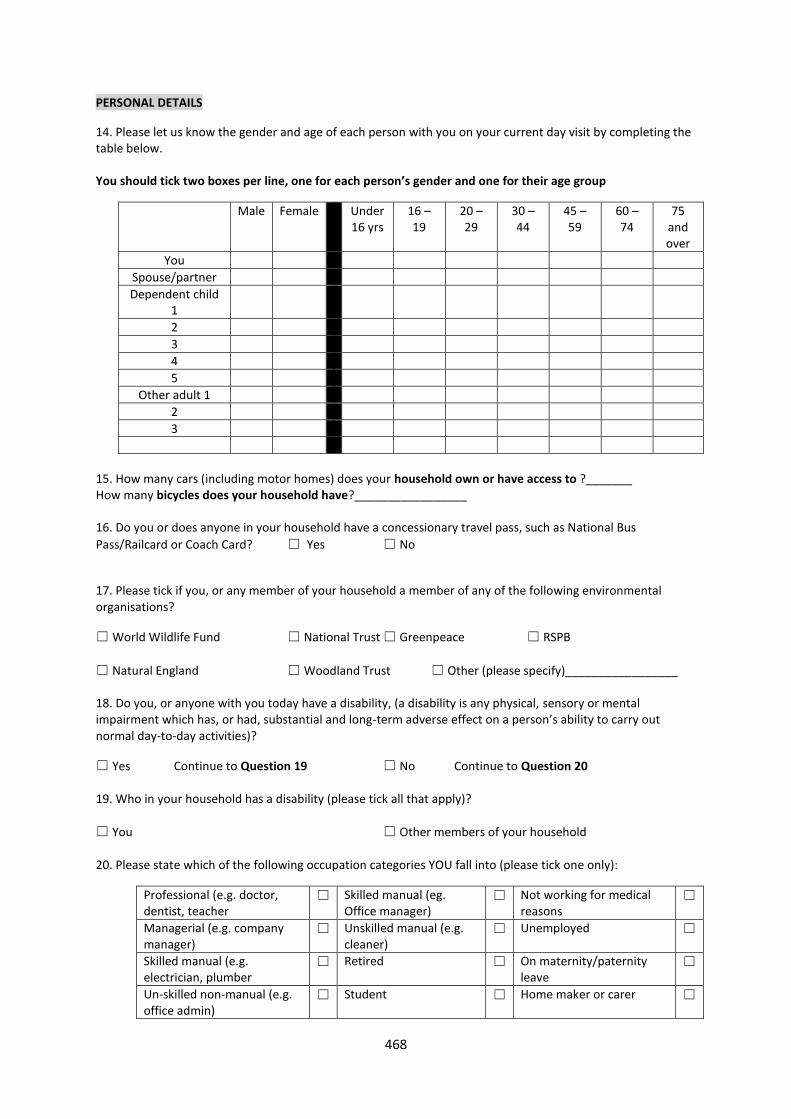
468
PERSONAL DETAILS
14. Please let us know the gender and age of each person with you on your current day visit by completing the table below. You should tick two boxes per line, one for each person’s gender and one for their age group
Male Female Under 16 yrs
16 – 19
20 – 29
30 – 44
45 – 59
60 – 74
75 and over
You
Spouse/partner
Dependent child 1
2
3
4
5
Other adult 1
2
3
15. How many cars (including motor homes) does your household own or have access to ?_______ How many bicycles does your household have?_________________ 16. Do you or does anyone in your household have a concessionary travel pass, such as National Bus
Pass/Railcard or Coach Card? ☐ Yes ☐ No
17. Please tick if you, or any member of your household a member of any of the following environmental organisations?
☐ World Wildlife Fund ☐ National Trust ☐ Greenpeace ☐ RSPB
☐ Natural England ☐ Woodland Trust ☐ Other (please specify)_________________ 18. Do you, or anyone with you today have a disability, (a disability is any physical, sensory or mental impairment which has, or had, substantial and long-term adverse effect on a person’s ability to carry out normal day-to-day activities)?
☐ Yes Continue to Question 19 ☐ No Continue to Question 20 19. Who in your household has a disability (please tick all that apply)?
☐ You ☐ Other members of your household 20. Please state which of the following occupation categories YOU fall into (please tick one only):
Professional (e.g. doctor, dentist, teacher
☐ Skilled manual (eg. Office manager)
☐ Not working for medical reasons
☐
Managerial (e.g. company manager)
☐ Unskilled manual (e.g. cleaner)
☐ Unemployed ☐
Skilled manual (e.g. electrician, plumber
☐ Retired ☐ On maternity/paternity leave
☐
Un-skilled non-manual (e.g. office admin)
☐ Student ☐ Home maker or carer ☐

469
APPENDIX 3 -Semi-structured Interview Schedule
Warm Up Phase:
Introduction
Good morning/afternoon/evening as appropriate, I am calling regarding the appointment I
made in order to undertake a short interview in relation to your recent holiday in the South
West of England. Are you still happy to take part in the interview? And is this still convenient
for you?
As you are already aware I am working on my PhD which is looking at tourism and tourist
behaviour. The questions I am about to ask you relate to your experiences and behaviour on
your recent holiday in the Minehead/Paignton area.
Areas of interest
Anticipated benefits associated with the holiday
1. Please think back to when you were deciding to go holiday, can you tell me what you
hoped the holiday would be like? (Prompt: what you think the benefits might be to
you and your holiday group/family/partner etc)
2. Are there are particular activities you were looking to do while you were on holiday?
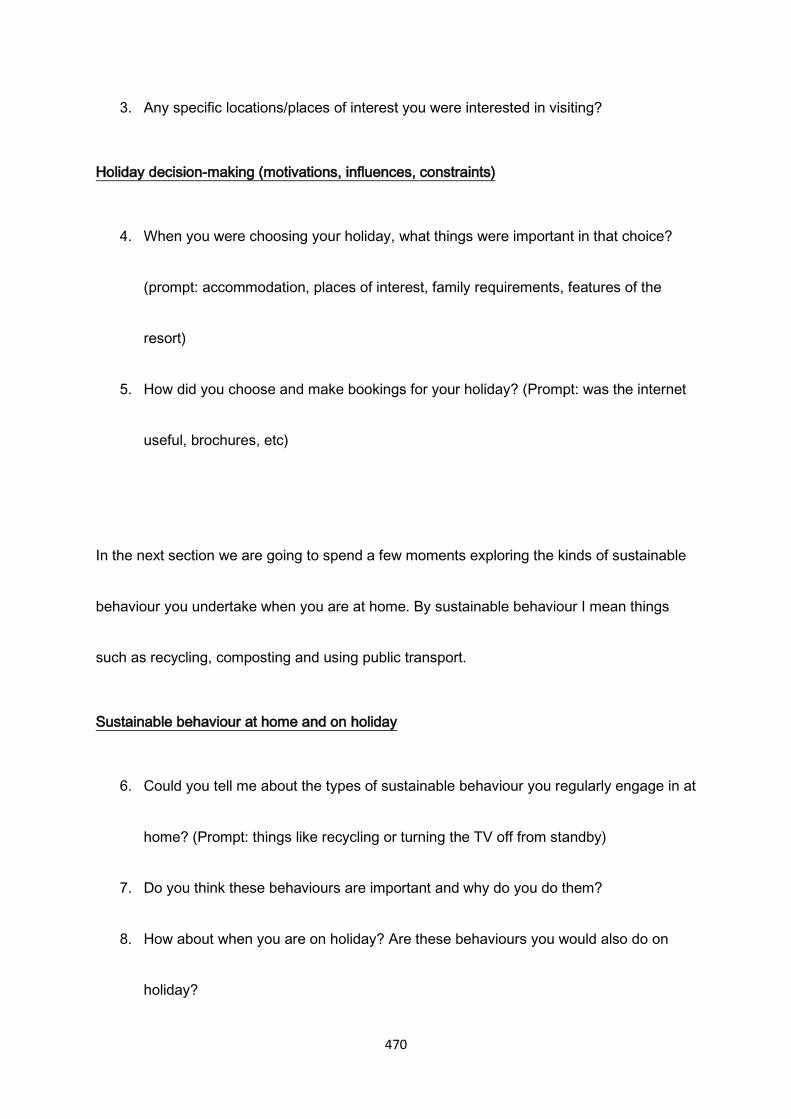
470
3. Any specific locations/places of interest you were interested in visiting?
Holiday decision-making (motivations, influences, constraints)
4. When you were choosing your holiday, what things were important in that choice?
(prompt: accommodation, places of interest, family requirements, features of the
resort)
5. How did you choose and make bookings for your holiday? (Prompt: was the internet
useful, brochures, etc)
In the next section we are going to spend a few moments exploring the kinds of sustainable
behaviour you undertake when you are at home. By sustainable behaviour I mean things
such as recycling, composting and using public transport.
Sustainable behaviour at home and on holiday
6. Could you tell me about the types of sustainable behaviour you regularly engage in at
home? (Prompt: things like recycling or turning the TV off from standby)
7. Do you think these behaviours are important and why do you do them?
8. How about when you are on holiday? Are these behaviours you would also do on
holiday?

471
9. How about transport and travel is public transport something you use regularly?
Transport and travel
10. How did you travel to your holiday destination? (if car move to Q11)
11. Why do you use the car? Did you consider any other ways of travelling to your
holiday destination? If so, can you tell me why you decided against not using them?
12. Can you tell about how you travelled around once in your holiday resort?
13. Did you have any car free days? If so what did you do on those days?
14. Is there anything you feel might encourage you to use public transport when you are
on holiday?
Food and ‘eating out’
15. Could you tell me about food you purchased when you were holiday? (Prompt: eating
out in restaurants, food for self-catering)
16. Can you tell me about any ‘local food’ that you had during your holiday?
Now we are going to move on to how you feel about your holiday since you’ve been home.

472
After the holiday
17. Can you tell me a little about how you feel about your holiday since you’ve come
home?
18. Do you feel that your holiday provided the benefits you hoped for before going?
19. Would you be likely based on your experiences to return to the same destination
again? (If so why?)
We have now come to the end of your interview. I would like to thank you for taking the time
to take part, do you have any other points you feel would be helpful to my research in terms
of understanding tourist behaviour? If not, many thanks once again.
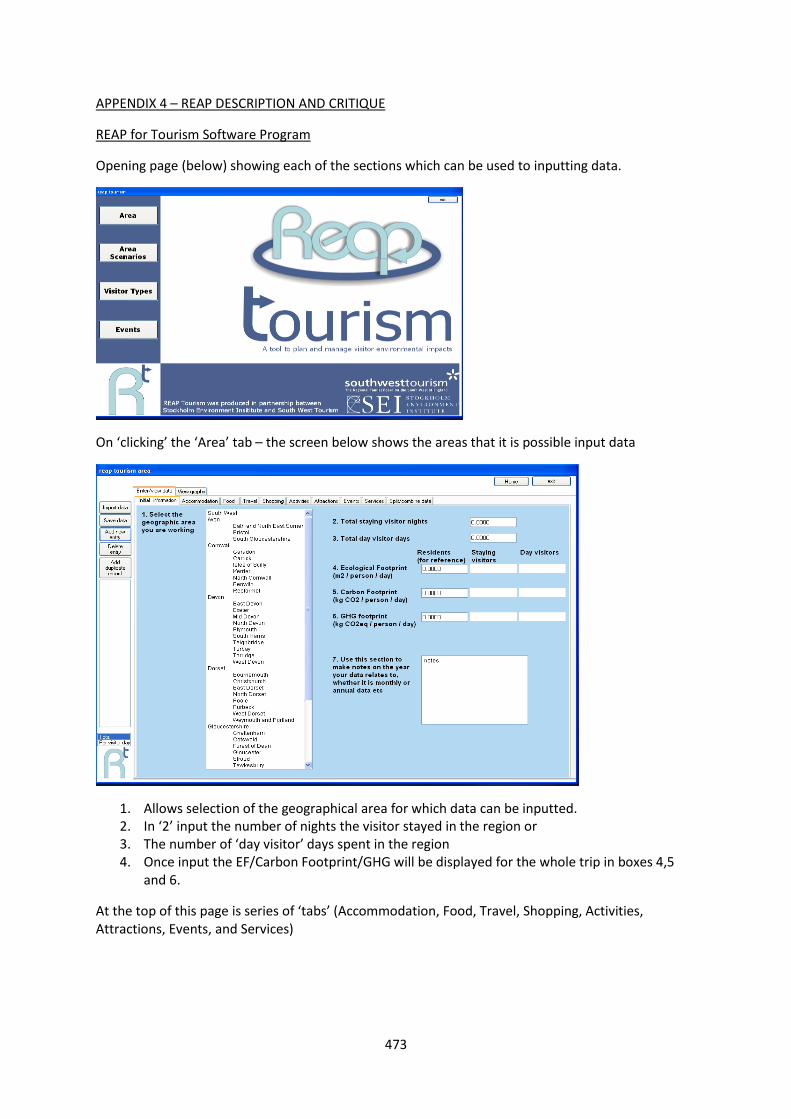
473
APPENDIX 4 – REAP DESCRIPTION AND CRITIQUE
REAP for Tourism Software Program
Opening page (below) showing each of the sections which can be used to inputting data.
On ‘clicking’ the ‘Area’ tab – the screen below shows the areas that it is possible input data
1. Allows selection of the geographical area for which data can be inputted. 2. In ‘2’ input the number of nights the visitor stayed in the region or 3. The number of ‘day visitor’ days spent in the region 4. Once input the EF/Carbon Footprint/GHG will be displayed for the whole trip in boxes 4,5
and 6.
At the top of this page is series of ‘tabs’ (Accommodation, Food, Travel, Shopping, Activities, Attractions, Events, and Services)
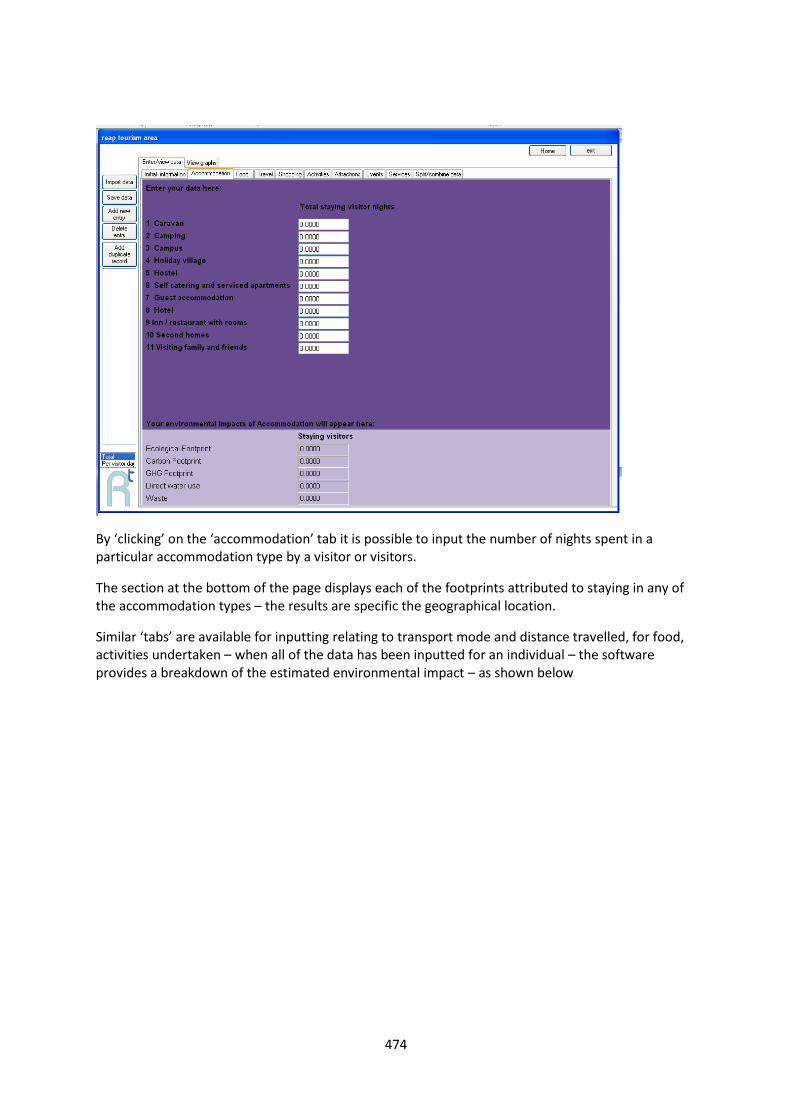
474
By ‘clicking’ on the ‘accommodation’ tab it is possible to input the number of nights spent in a particular accommodation type by a visitor or visitors.
The section at the bottom of the page displays each of the footprints attributed to staying in any of the accommodation types – the results are specific the geographical location.
Similar ‘tabs’ are available for inputting relating to transport mode and distance travelled, for food, activities undertaken – when all of the data has been inputted for an individual – the software provides a breakdown of the estimated environmental impact – as shown below
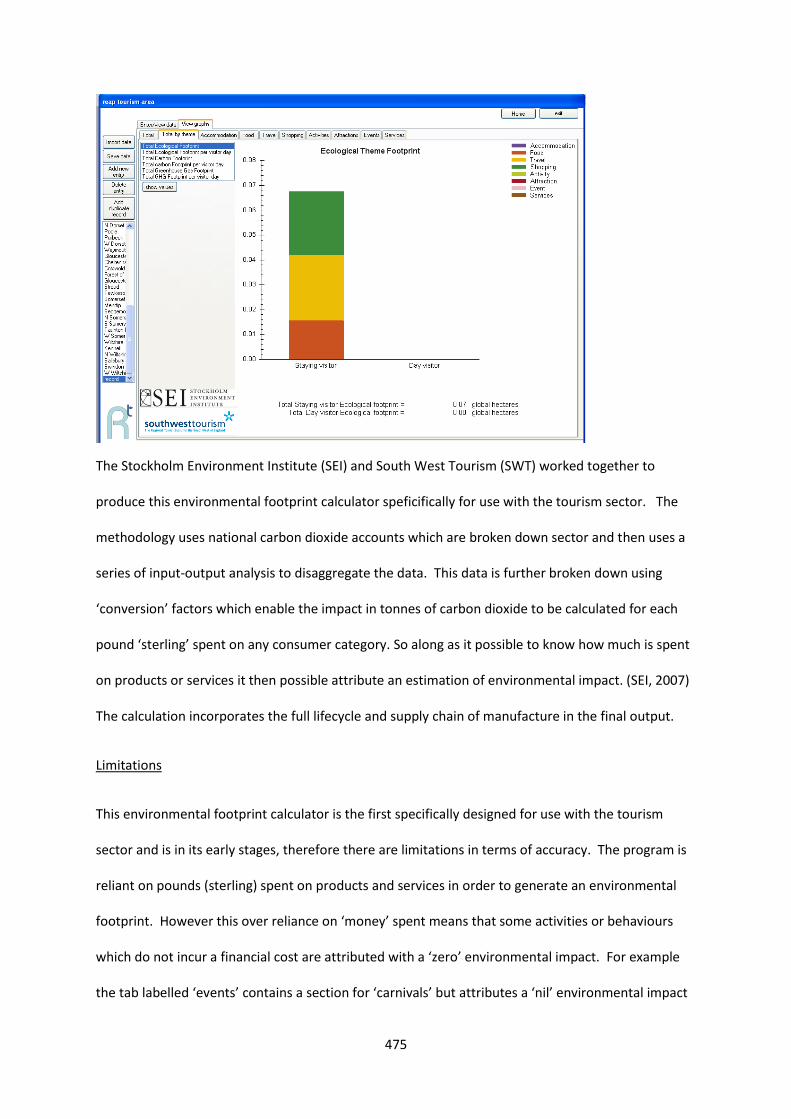
475
The Stockholm Environment Institute (SEI) and South West Tourism (SWT) worked together to
produce this environmental footprint calculator speficifically for use with the tourism sector. The
methodology uses national carbon dioxide accounts which are broken down sector and then uses a
series of input-output analysis to disaggregate the data. This data is further broken down using
‘conversion’ factors which enable the impact in tonnes of carbon dioxide to be calculated for each
pound ‘sterling’ spent on any consumer category. So along as it possible to know how much is spent
on products or services it then possible attribute an estimation of environmental impact. (SEI, 2007)
The calculation incorporates the full lifecycle and supply chain of manufacture in the final output.
Limitations
This environmental footprint calculator is the first specifically designed for use with the tourism
sector and is in its early stages, therefore there are limitations in terms of accuracy. The program is
reliant on pounds (sterling) spent on products and services in order to generate an environmental
footprint. However this over reliance on ‘money’ spent means that some activities or behaviours
which do not incur a financial cost are attributed with a ‘zero’ environmental impact. For example
the tab labelled ‘events’ contains a section for ‘carnivals’ but attributes a ‘nil’ environmental impact
476
to this. However in Somerset the carnival season has a huge environmental impact, as the carnival
floats are lit with hundreds of thousands of electric lightbulbs, generators, huge motorised floats
pulled articulated lorries generating pollution etc. Furthermore accommodation choices such as
‘camping’ can vary dramatically in the type of impact generated, someone ‘backpacking’ carrying a
tent is likely to have much less of an impact compared to someone with a large tent or caravan.
In terms of food purchase, although the calculator allows for inputting of food eaten in commercial
eating out establishments, there is also a section for food purchased for self-catering purposes and
each food type is broken down into sections (meat. Fish, fruit, vegetables, dairy, cereals, pasta,
sweets, alcholic drinks and non-alcholic drinks) and an estimation of locally produced or organic food
percentage needs to be inputted. In reality, the data required to accurately complete this section is
very difficult to capture and means that the ‘food’ element of the calculation may well not be a true
representation of the environmental impact food and catering.
Conclusion
The REAP for Tourism software program is useful tool for calculating and ascribing the
environmental impact of tourist behaviour within a destination area. However the results should be
viewed with a measure of caution as there are still areas of the tool which need to adjusted in order
to provide a more accurate representation of the environmental impact of specific behaviours. The
over reliance on ascribing environmental impact based on ‘spend’ is one of the biggest limitations of
this tool and one with which the developers need to develop additional ways of measuring impact
when there is not an associated spend.
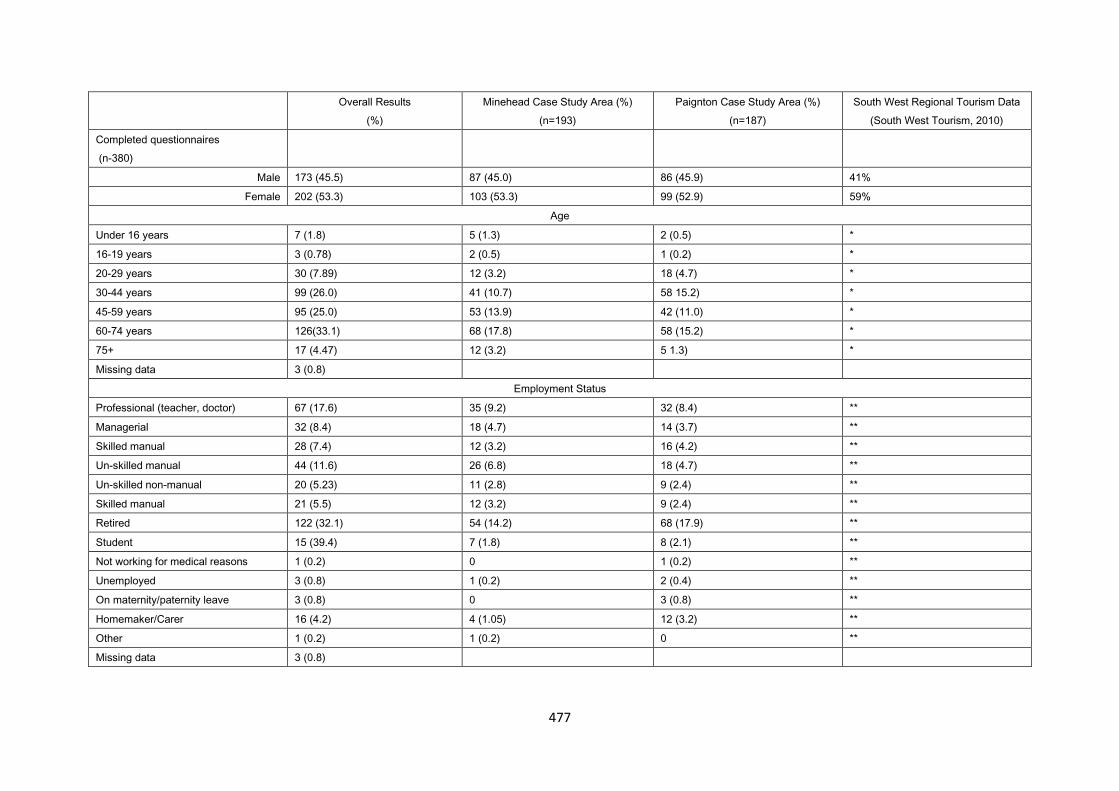
477
Overall Results
(%)
Minehead Case Study Area (%)
(n=193)
Paignton Case Study Area (%)
(n=187)
South West Regional Tourism Data
(South West Tourism, 2010)
Completed questionnaires
(n-380)
Male 173 (45.5) 87 (45.0) 86 (45.9) 41%
Female 202 (53.3) 103 (53.3) 99 (52.9) 59%
Age
Under 16 years 7 (1.8) 5 (1.3) 2 (0.5) *
16-19 years 3 (0.78) 2 (0.5) 1 (0.2) *
20-29 years 30 (7.89) 12 (3.2) 18 (4.7) *
30-44 years 99 (26.0) 41 (10.7) 58 15.2) *
45-59 years 95 (25.0) 53 (13.9) 42 (11.0) *
60-74 years 126(33.1) 68 (17.8) 58 (15.2) *
75+ 17 (4.47) 12 (3.2) 5 1.3) *
Missing data 3 (0.8)
Employment Status
Professional (teacher, doctor) 67 (17.6) 35 (9.2) 32 (8.4) **
Managerial 32 (8.4) 18 (4.7) 14 (3.7) **
Skilled manual 28 (7.4) 12 (3.2) 16 (4.2) **
Un-skilled manual 44 (11.6) 26 (6.8) 18 (4.7) **
Un-skilled non-manual 20 (5.23) 11 (2.8) 9 (2.4) **
Skilled manual 21 (5.5) 12 (3.2) 9 (2.4) **
Retired 122 (32.1) 54 (14.2) 68 (17.9) **
Student 15 (39.4) 7 (1.8) 8 (2.1) **
Not working for medical reasons 1 (0.2) 0 1 (0.2) **
Unemployed 3 (0.8) 1 (0.2) 2 (0.4) **
On maternity/paternity leave 3 (0.8) 0 3 (0.8) **
Homemaker/Carer 16 (4.2) 4 (1.05) 12 (3.2) **
Other 1 (0.2) 1 (0.2) 0 **
Missing data 3 (0.8)
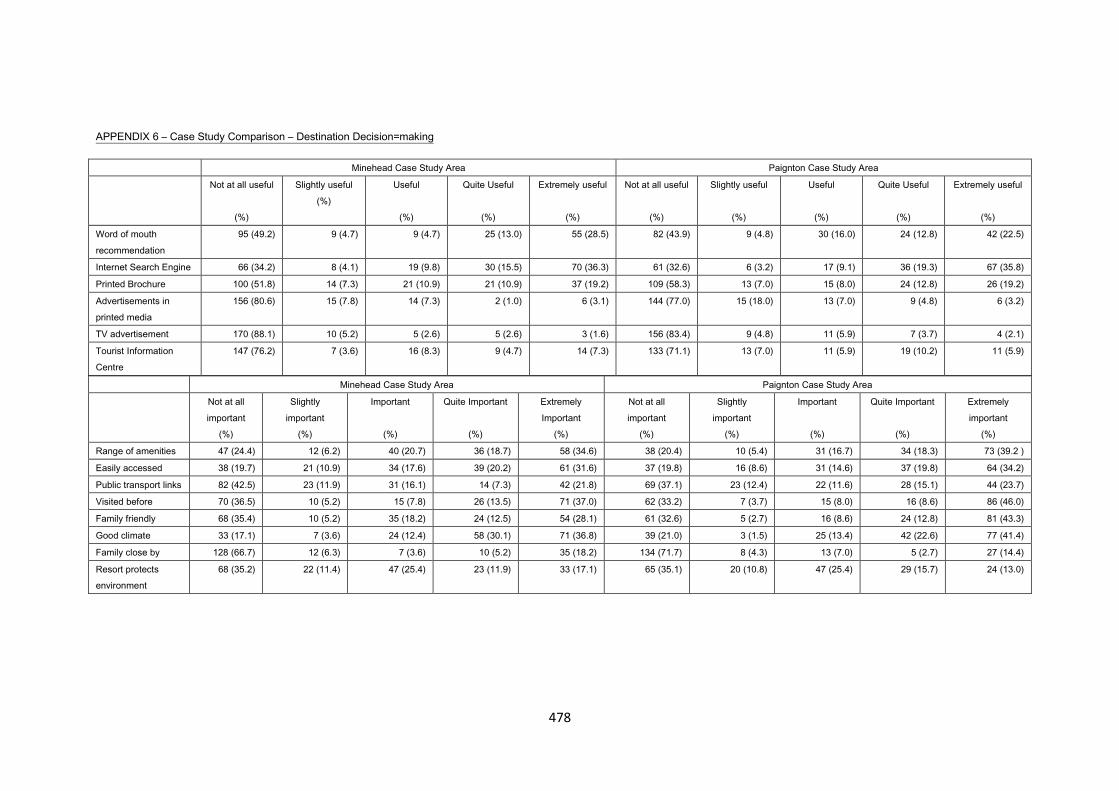
478
APPENDIX 6 – Case Study Comparison – Destination Decision=making
Minehead Case Study Area Paignton Case Study Area
Not at all useful
(%)
Slightly useful
(%)
Useful
(%)
Quite Useful
(%)
Extremely useful
(%)
Not at all useful
(%)
Slightly useful
(%)
Useful
(%)
Quite Useful
(%)
Extremely useful
(%)
Word of mouth
recommendation
95 (49.2) 9 (4.7) 9 (4.7) 25 (13.0) 55 (28.5) 82 (43.9) 9 (4.8) 30 (16.0) 24 (12.8) 42 (22.5)
Internet Search Engine 66 (34.2) 8 (4.1) 19 (9.8) 30 (15.5) 70 (36.3) 61 (32.6) 6 (3.2) 17 (9.1) 36 (19.3) 67 (35.8)
Printed Brochure 100 (51.8) 14 (7.3) 21 (10.9) 21 (10.9) 37 (19.2) 109 (58.3) 13 (7.0) 15 (8.0) 24 (12.8) 26 (19.2)
Advertisements in
printed media
156 (80.6) 15 (7.8) 14 (7.3) 2 (1.0) 6 (3.1) 144 (77.0) 15 (18.0) 13 (7.0) 9 (4.8) 6 (3.2)
TV advertisement 170 (88.1) 10 (5.2) 5 (2.6) 5 (2.6) 3 (1.6) 156 (83.4) 9 (4.8) 11 (5.9) 7 (3.7) 4 (2.1)
Tourist Information
Centre
147 (76.2) 7 (3.6) 16 (8.3) 9 (4.7) 14 (7.3) 133 (71.1) 13 (7.0) 11 (5.9) 19 (10.2) 11 (5.9)
Minehead Case Study Area Paignton Case Study Area
Not at all
important
(%)
Slightly
important
(%)
Important
(%)
Quite Important
(%)
Extremely
Important
(%)
Not at all
important
(%)
Slightly
important
(%)
Important
(%)
Quite Important
(%)
Extremely
important
(%)
Range of amenities 47 (24.4) 12 (6.2) 40 (20.7) 36 (18.7) 58 (34.6) 38 (20.4) 10 (5.4) 31 (16.7) 34 (18.3) 73 (39.2 )
Easily accessed 38 (19.7) 21 (10.9) 34 (17.6) 39 (20.2) 61 (31.6) 37 (19.8) 16 (8.6) 31 (14.6) 37 (19.8) 64 (34.2)
Public transport links 82 (42.5) 23 (11.9) 31 (16.1) 14 (7.3) 42 (21.8) 69 (37.1) 23 (12.4) 22 (11.6) 28 (15.1) 44 (23.7)
Visited before 70 (36.5) 10 (5.2) 15 (7.8) 26 (13.5) 71 (37.0) 62 (33.2) 7 (3.7) 15 (8.0) 16 (8.6) 86 (46.0)
Family friendly 68 (35.4) 10 (5.2) 35 (18.2) 24 (12.5) 54 (28.1) 61 (32.6) 5 (2.7) 16 (8.6) 24 (12.8) 81 (43.3)
Good climate 33 (17.1) 7 (3.6) 24 (12.4) 58 (30.1) 71 (36.8) 39 (21.0) 3 (1.5) 25 (13.4) 42 (22.6) 77 (41.4)
Family close by 128 (66.7) 12 (6.3) 7 (3.6) 10 (5.2) 35 (18.2) 134 (71.7) 8 (4.3) 13 (7.0) 5 (2.7) 27 (14.4)
Resort protects
environment
68 (35.2) 22 (11.4) 47 (25.4) 23 (11.9) 33 (17.1) 65 (35.1) 20 (10.8) 47 (25.4) 29 (15.7) 24 (13.0)

479
Cluster 1 (n = 144) Cluster 2 (n=95) Cluster 3 (n+134)
Home (%)
Holiday (%)
Home (%)
Holiday (%)
Home (%)
Holiday (%)
Recycling
Never 8.4 17.9 5.3 17.6 6.7 19.1
Rarely 2.1 12.0 0 11.8 2.2 9.6
Sometimes 2.1 22.2 1.1 26.5 0.7 19.1
Usually 7.0 17.9 8.5 16.2 2.2 19.1
Always 80.4 29.9 85.1 27.9 88.1 33.0
Appendix 7.1: Levels of reported recycling between Clusters at home and on holiday.
Cluster 1 (n = 144) Cluster 2 (n=95) Cluster 3 (n+134)
Home (%)
Holiday (%)
Home (%)
Holiday (%)
Home (%)
Holiday (%)
Composting
Never 32.2 55.6 35.5 58.7 20.9 49.4
Rarely 7.0 14.8 6.5 12.7 6.0 14.9
Sometimes 5.6 10.2 5.4 15.9 11.9 11.5
Usually 7.7 9.3 11.8 1.6 7.5 9.2
Always 47.6 10.2 40.9 11.1 53.7 14.9
Appendix 7.2: Levels of food composting behaviour between Clusters at home and on holiday
Cluster 1 (n = 144) Cluster 2 (n=95) Cluster 3 (n+134)
Home (%)
Holiday (%)
Home (%)
Holiday (%)
Home (%)
Holiday (%)
Energy Efficient Appliances
Never 6.4 31.8 4.3 28.1 9.1 26.7
Rarely 5.0 16.8 3.2 12.5 2.3 17.4
Sometimes 24.8 29.0 21.5 31.3 10.6 33.7
Usually 24.8 12.1 32.3 10.9 28.8 9.3
Always 39.0 10.3 38.7 17.2 49.2 12.8
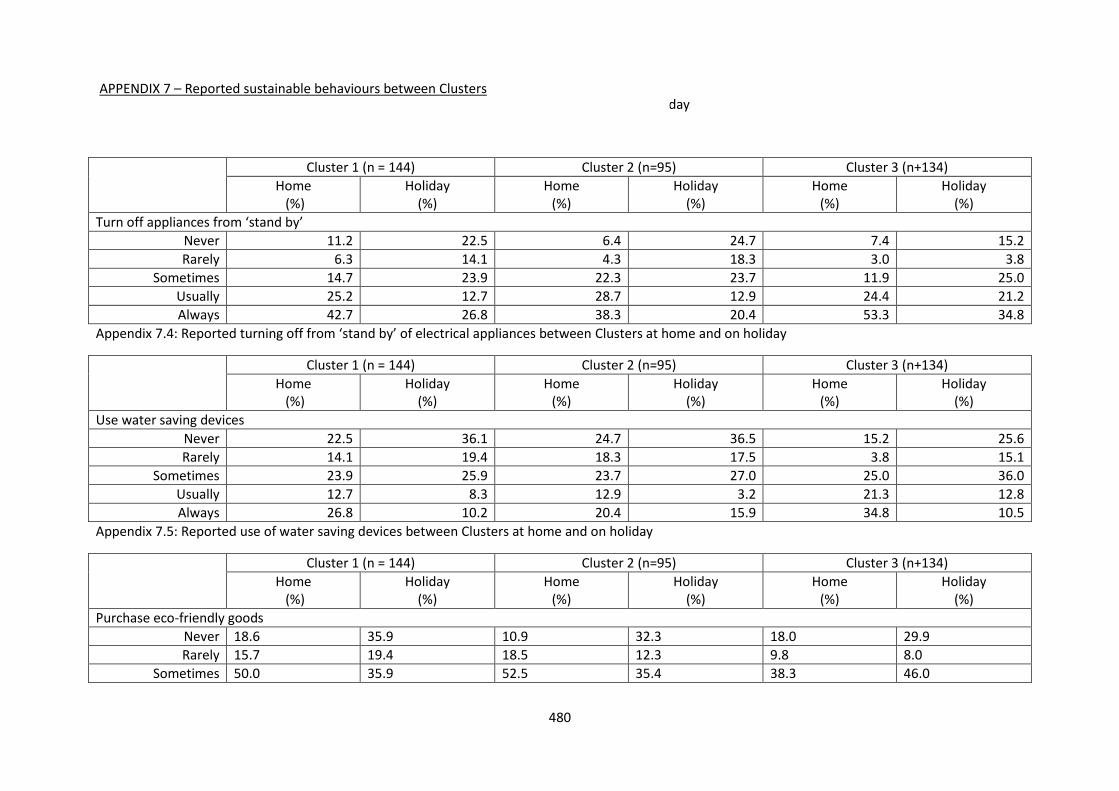
480
Appendix 7.3: Reported use of energy efficient appliances between Clusters at home and on holiday
Cluster 1 (n = 144) Cluster 2 (n=95) Cluster 3 (n+134)
Home (%)
Holiday (%)
Home (%)
Holiday (%)
Home (%)
Holiday (%)
Turn off appliances from ‘stand by’
Never 11.2 22.5 6.4 24.7 7.4 15.2
Rarely 6.3 14.1 4.3 18.3 3.0 3.8
Sometimes 14.7 23.9 22.3 23.7 11.9 25.0
Usually 25.2 12.7 28.7 12.9 24.4 21.2
Always 42.7 26.8 38.3 20.4 53.3 34.8
Appendix 7.4: Reported turning off from ‘stand by’ of electrical appliances between Clusters at home and on holiday
Cluster 1 (n = 144) Cluster 2 (n=95) Cluster 3 (n+134)
Home (%)
Holiday (%)
Home (%)
Holiday (%)
Home (%)
Holiday (%)
Use water saving devices
Never 22.5 36.1 24.7 36.5 15.2 25.6
Rarely 14.1 19.4 18.3 17.5 3.8 15.1
Sometimes 23.9 25.9 23.7 27.0 25.0 36.0
Usually 12.7 8.3 12.9 3.2 21.3 12.8
Always 26.8 10.2 20.4 15.9 34.8 10.5
Appendix 7.5: Reported use of water saving devices between Clusters at home and on holiday
Cluster 1 (n = 144) Cluster 2 (n=95) Cluster 3 (n+134)
Home (%)
Holiday (%)
Home (%)
Holiday (%)
Home (%)
Holiday (%)
Purchase eco-friendly goods
Never 18.6 35.9 10.9 32.3 18.0 29.9
Rarely 15.7 19.4 18.5 12.3 9.8 8.0
Sometimes 50.0 35.9 52.5 35.4 38.3 46.0
APPENDIX 7 – Reported sustainable behaviours between Clusters
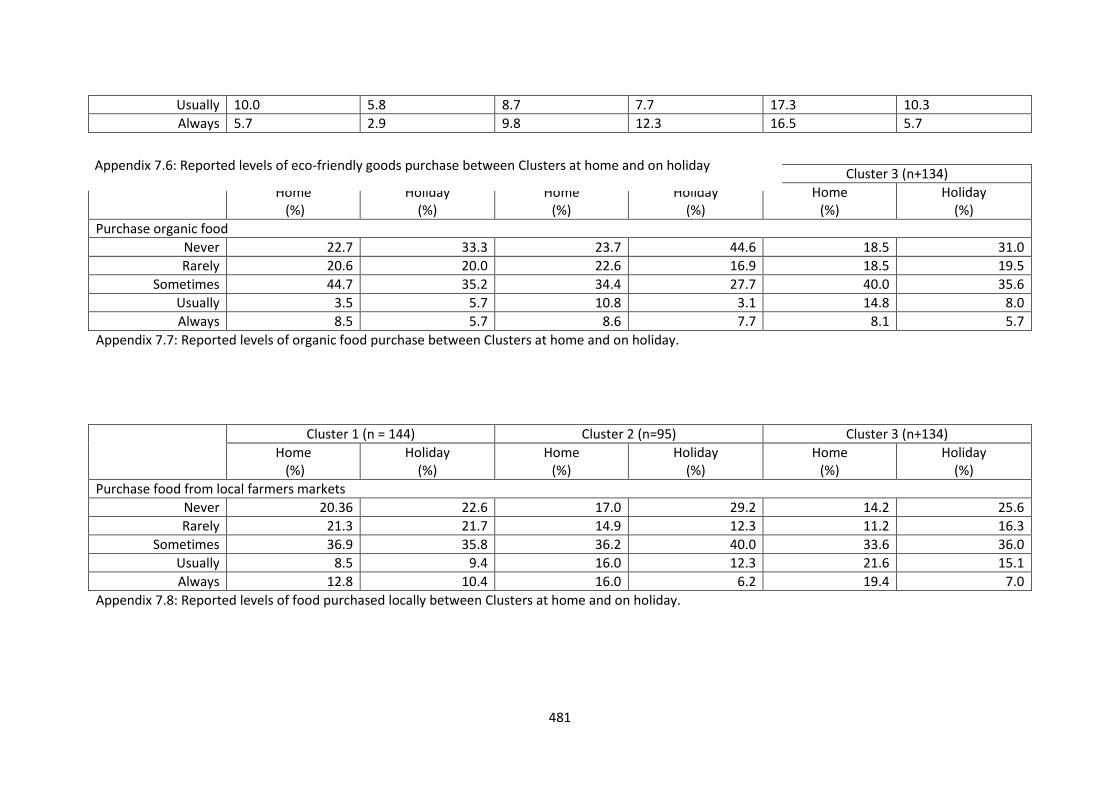
481
Usually 10.0 5.8 8.7 7.7 17.3 10.3
Always 5.7 2.9 9.8 12.3 16.5 5.7
Cluster 1 (n = 144) Cluster 2 (n=95) Cluster 3 (n+134)
Home (%)
Holiday (%)
Home (%)
Holiday (%)
Home (%)
Holiday (%)
Purchase organic food
Never 22.7 33.3 23.7 44.6 18.5 31.0
Rarely 20.6 20.0 22.6 16.9 18.5 19.5
Sometimes 44.7 35.2 34.4 27.7 40.0 35.6
Usually 3.5 5.7 10.8 3.1 14.8 8.0
Always 8.5 5.7 8.6 7.7 8.1 5.7
Appendix 7.7: Reported levels of organic food purchase between Clusters at home and on holiday.
Cluster 1 (n = 144) Cluster 2 (n=95) Cluster 3 (n+134)
Home (%)
Holiday (%)
Home (%)
Holiday (%)
Home (%)
Holiday (%)
Purchase food from local farmers markets
Never 20.36 22.6 17.0 29.2 14.2 25.6
Rarely 21.3 21.7 14.9 12.3 11.2 16.3
Sometimes 36.9 35.8 36.2 40.0 33.6 36.0
Usually 8.5 9.4 16.0 12.3 21.6 15.1
Always 12.8 10.4 16.0 6.2 19.4 7.0
Appendix 7.8: Reported levels of food purchased locally between Clusters at home and on holiday.
Appendix 7.6: Reported levels of eco-friendly goods purchase between Clusters at home and on holiday

482
Cluster 1 (n = 144) Cluster 2 (n=95) Cluster 3 (n+134)
Home (%)
Holiday (%)
Home (%)
Holiday (%)
Home (%)
Holiday (%)
Plastic Carrier bag re-use/’bags for life’ use when shopping
Never 11.2 18.5 7.4 13.8 7.4 18.4
Rarely 4.2 9.3 4.3 10.8 5.2 11.5
Sometimes 5.6 15.7 8.5 24.6 3.7 16.1
Usually 11.9 19.4 16.0 15.4 17.8 16.1
Always 67.1 37.0 63.8 35.4 65.9 37.9
Appendix 7.9: Reported levels of plastic carrier bag re-use between Clusters at home and on holiday.
Cluster 1 (n = 144) Cluster 2 (n=95) Cluster 3 (n+134)
Home (%)
Holiday (%)
Home (%)
Holiday (%)
Home (%)
Holiday (%)
Use public transport/walk/cycle where possible
Never 14.0 12.8 13.8 14.1 13.4 14.9
Rarely 15.4 12.8 21.3 25.0 11.9 14.9
Sometimes 28.0 26.6 37.2 35.9 32.1 35.6
Usually 11.2 16.5 10.6 7.8 16.4 16.1
Always 31.5 31.2 17.0 17.2 26.1 18.4
Appendix 7.10: Reported use of public transport/walking/cycling between Clusters at home and on holiday.
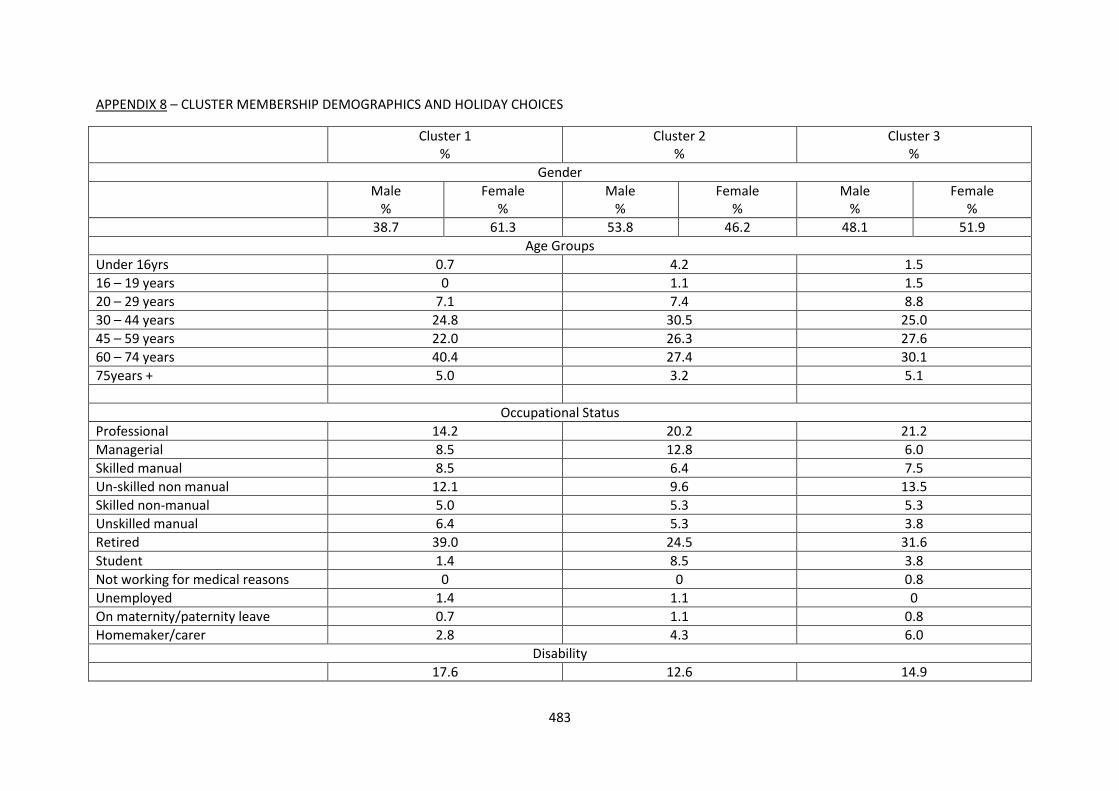
483
APPENDIX 8 – CLUSTER MEMBERSHIP DEMOGRAPHICS AND HOLIDAY CHOICES
Cluster 1 %
Cluster 2 %
Cluster 3 %
Gender
Male %
Female %
Male %
Female %
Male %
Female %
38.7 61.3 53.8 46.2 48.1 51.9
Age Groups
Under 16yrs 0.7 4.2 1.5
16 – 19 years 0 1.1 1.5
20 – 29 years 7.1 7.4 8.8
30 – 44 years 24.8 30.5 25.0
45 – 59 years 22.0 26.3 27.6
60 – 74 years 40.4 27.4 30.1
75years + 5.0 3.2 5.1
Occupational Status
Professional 14.2 20.2 21.2
Managerial 8.5 12.8 6.0
Skilled manual 8.5 6.4 7.5
Un-skilled non manual 12.1 9.6 13.5
Skilled non-manual 5.0 5.3 5.3
Unskilled manual 6.4 5.3 3.8
Retired 39.0 24.5 31.6
Student 1.4 8.5 3.8
Not working for medical reasons 0 0 0.8
Unemployed 1.4 1.1 0
On maternity/paternity leave 0.7 1.1 0.8
Homemaker/carer 2.8 4.3 6.0
Disability
17.6 12.6 14.9
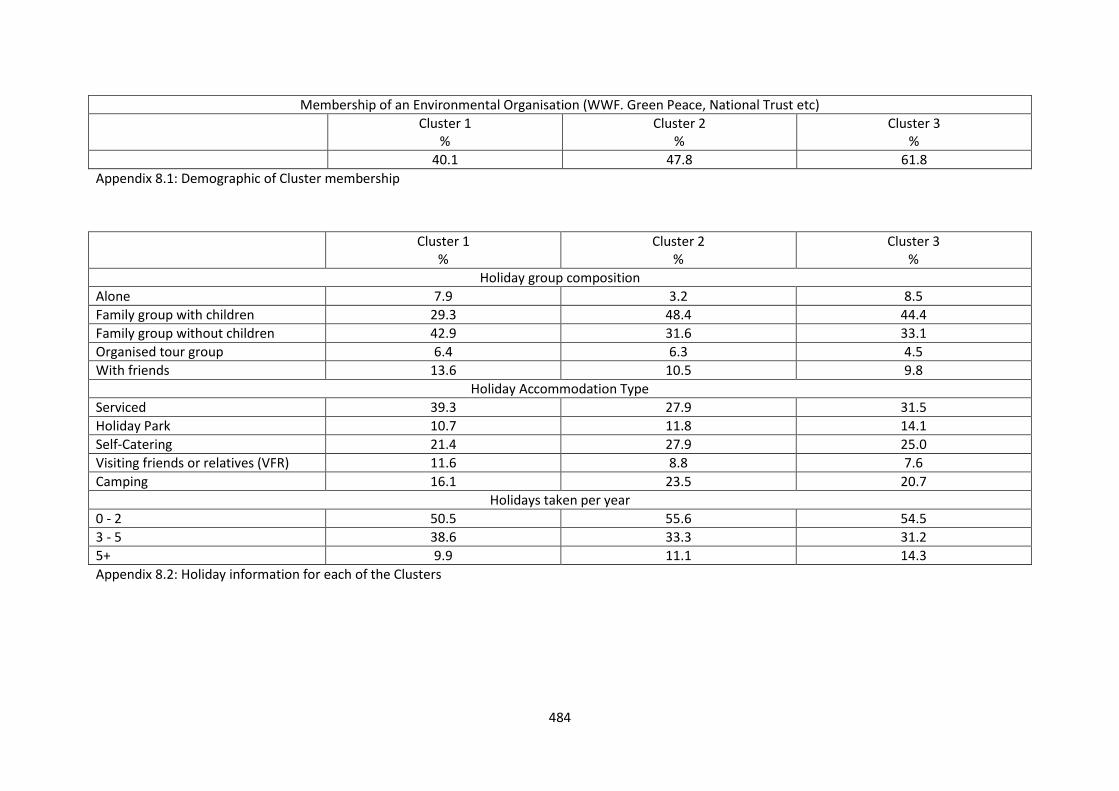
484
Membership of an Environmental Organisation (WWF. Green Peace, National Trust etc)
Cluster 1 %
Cluster 2 %
Cluster 3 %
40.1 47.8 61.8
Appendix 8.1: Demographic of Cluster membership
Cluster 1 %
Cluster 2 %
Cluster 3 %
Holiday group composition
Alone 7.9 3.2 8.5
Family group with children 29.3 48.4 44.4
Family group without children 42.9 31.6 33.1
Organised tour group 6.4 6.3 4.5
With friends 13.6 10.5 9.8
Holiday Accommodation Type
Serviced 39.3 27.9 31.5
Holiday Park 10.7 11.8 14.1
Self-Catering 21.4 27.9 25.0
Visiting friends or relatives (VFR) 11.6 8.8 7.6
Camping 16.1 23.5 20.7
Holidays taken per year
0 - 2 50.5 55.6 54.5
3 - 5 38.6 33.3 31.2
5+ 9.9 11.1 14.3
Appendix 8.2: Holiday information for each of the Clusters
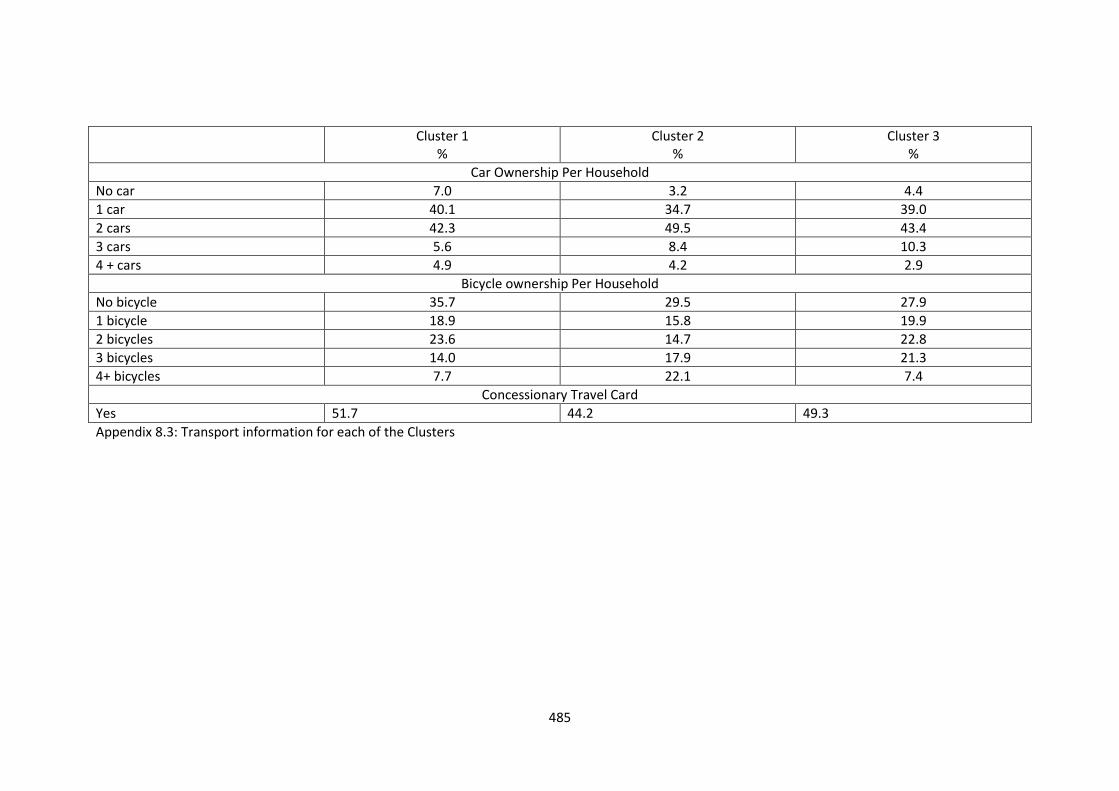
485
Cluster 1 %
Cluster 2 %
Cluster 3 %
Car Ownership Per Household
No car 7.0 3.2 4.4
1 car 40.1 34.7 39.0
2 cars 42.3 49.5 43.4
3 cars 5.6 8.4 10.3
4 + cars 4.9 4.2 2.9
Bicycle ownership Per Household
No bicycle 35.7 29.5 27.9
1 bicycle 18.9 15.8 19.9
2 bicycles 23.6 14.7 22.8
3 bicycles 14.0 17.9 21.3
4+ bicycles 7.7 22.1 7.4
Concessionary Travel Card
Yes 51.7 44.2 49.3
Appendix 8.3: Transport information for each of the Clusters

486
APPENDIX 9 – Holiday Characteristics
Overall Survey Results Minehead Case Study Area (%) Paignton Case Study Area (%) South West Tourism Regional Data
(2010)
Purpose of current visit
- Holiday 4+ nights) 277 (62.2) 92 (51.9) 135 (72.2) 68%
- Short break (< 3 nights) 39 (10.7) 17 (9.6) 22 (11.8)
- Staying with
friends/relatives
12 (3.3) 9 (5.0) 3 (1.6)
- Day Visitor 85 (23.3) 59 (33.3) 26 (13.9)
- Other 2 (0.5) 1 (0.5) 1 (0.5)
- Missing Data 15
Is the current holiday, your main
holiday for this year?
- Yes 149 (53.7) 52 (44.8) 97 (60.2) 50%
- No 128 (46.3) 64 (55.2) 64 (39.8)
If this is your main holiday are you
likely to take any other breaks this
year?
- Yes 86 (58.5) 29 (58.0) 57 (58.8)
- No 23 (15.6) 5 (10.0 18 (18.6)
- Not sure 28 (25.9) 16 (32.0) 22 (22.7)
If yes, where are you likely to go?
- UK 84 (70.5) 33 (71.1) 51 (69.9)
- Europe 27 (22.7) 10 (21.7) 17 (23.3)
- Other 8 (6.7) 3 (6.5) 5 (6.8)
How many holidays/short breaks are
you planning for the next 12 months?
- Up to 2 132 (53.4) 45 (43.7) 87 (60.4)
- Between 3 and 5 87 (35.2 45 (43.7) 42 (29.2)
- More than 5 28 (11.3) 13 (12.6) 15 (10.4)

487
APPENDIX 9 – Holiday Characteristics
Overall Survey Results (%) Minehead Case Study Area (%) Paignton Case Study Area (%) South West Tourism Regional Data
(2010)
Are you visiting the resort:-
- Alone 25 (6.7) 15 (7.8) 10 (5.4)
- As part of a family group
with children
146 (39.6) 60 (31.6) 88 (47.8)
- A family group without
children
135 (36.1) 65 (34.2) 70 (38.0)
- As part of an organised tour
group
21 (5.6) 17 (8.9) 4 (2.2)
- With friends 45 (12.0) 33 (17.4) 12 (6.5)
Type of holiday accommodation:-
- Serviced accommodation 94 (33.8) 35 (29.9) 59 (36.6)
- Holiday Park 36 (12.9) 13 (11.1) 23 (14.3)
- Self-catering unit 66 (23.7) 26 (22.2) 40 (21.4)
- Staying with friends 26 (9.4) 20 (17.1) 6 (3.2)
- Camping 54 (19.4) 21 (17.9) 33 (17.6)
- Other 2 (0.7) 2 (1.7) 0
Transport used to travel to holiday
destination:-
- Car 321 (85.4) 165 (85.9) 156 (84.8) 68% (arrived bycar, van, motorcycle)
- Motorbike 0 0 0
- Bus/coach 22 (5.9) 16 (8.3) 6 (3.3)
- Train 18 (4.8) 5 (2.6) 13 (7.1)
- Walk/cycle 2 (0.5) 1 (0.5) 1 (0.5)
- Air 10 (2.7) 5 (2.6) 5 (2.7)
- Other 2 (0.5) 0 2 (1.1)

488
Overall Survey Results (%) Minehead Case Study Area (%) Paignton Case Study Area (%) South West Tourism Regional Data
(2010)
Transport used during holiday:-
- Car 255 (73.3) 87 (81.4) 115 (65.3)
- Bus/coach 49 (14.1) 16 (9.3) 33 (18.8)
- Train 23 (6.6) 11 (6.4) 12 (6.8)
- Wal/cycle 23 (6.0) 5 (2.9) 16 (9.1)
APPENDIX 9 – Holiday Characteristics