Exploring the impact of interface signs’ interpretation accuracy, design, and evaluation on web...
23
1 Author’s Copy The final version of this article is published in Journal of Systems and Information Technology, 16(4). Islam, M. N. & Tetard, F. (2013). "Exploring the impact of interface signs’ interpretation accuracy, design, and evaluation on web usability: A semiotics perspective", Journal of Systems and Information Technology, Vol. 16 Iss: 4, pp.250 – 276. The final publication is available at http://dx.doi.org/10.1108/JSIT-03-2014-0019
Transcript of Exploring the impact of interface signs’ interpretation accuracy, design, and evaluation on web...

1
Author’s Copy
The final version of this article is published in Journal of Systems and
Information Technology, 16(4).
Islam, M. N. & Tetard, F. (2013). "Exploring the impact of interface signs’
interpretation accuracy, design, and evaluation on web usability: A semiotics
perspective", Journal of Systems and Information Technology, Vol. 16 Iss: 4,
pp.250 – 276.
The final publication is available at http://dx.doi.org/10.1108/JSIT-03-2014-0019

2
Exploring the Impact of Interface Signs’ Interpretation Accuracy, Design,
and Evaluation on Web Usability: A Semiotics Perspective
Structured Abstract:
Purpose: The purpose of this empirical study was to address two important concerns of web usability:
(i) how user-intuitive interface signs affect web usability, and (ii) how applying semiotics (i.e., the
doctrine of signs) in user interface (UI) design and evaluation helps to improve usability.
Methodology: An empirical research approach is followed here to conduct a total of three user tests.
These tests were conducted on a web application with a total of 17 test participants. Data was gathered
through laboratory-based think-aloud usability test, questionnaires, and interviews. Following an
empirical research approach, statistics and user behavior analysis were used to analyze the data.
Findings: This study explores two important concerns of UI design and evaluation. First, users’
interpretation accuracy of interface signs impact on web usability. The study found that (i) users’
interpretation of signs might be accurate, moderate, conflicting, erroneous, or incapable; (ii) user-
intuitive interface signs led participants to interpret signs’ meaning accurately; and (iii) users’
inaccurate interpretation of one or a few task-related interface sign(s) led users to usability problems,
resulting in participants performing tasks with lower task-completion performance. Second,
considering semiotics perception in UI design and evaluation is important to improve web usability.
This study showed that interface signs, when re-designed considering the semiotics guidelines, have
increased the end users’ interpretation accuracy and the interface signs’ intuitiveness. This study also
provides a small set of semiotics guidelines for sign design and evaluation.
Originality/value: This study empirically demonstrated that signs’ intuitiveness impact on web
usability and that considering the semiotics perception in sign design and evaluation is important to
improve web usability. These outcomes are valuable in a number of ways to HCI researchers and
practitioners: (i) the results provide awareness of the importance of user-intuitive interface signs in UI
design; (ii) practitioners can easily adopt the concept of interpretation accuracy classification to
conduct a sign test in order to obtain an ‘overall impression of interface signs’ intuitiveness’; (iii)
practitioners can easily adopt the methodological approach followed in this study to conduct usability
test without additional resources; and (iv) the results raised important fundamental questions for future
research such as ‘what does a practitioner need to be aware of when designing or evaluating interface
signs?’.
Keywords: Web usability, think-aloud usability test, human-computer interaction, semiotics, interface
signs, web user interface, and user experience
Article Classification: Research Paper
1. Introduction
Over the past decades, with the advent of globalization and the rise of information technology, the
competition has increased for not only with the millions of other web applications who produce or
provide the same products or services, but also for the users’ attention, time, happiness, easiness,

3
effectiveness, and satisfaction (Choraria, 2012; Flavian et al, 2009). The most significant measurement
unit of these qualities is usability. Usability is defined as “the effectiveness, efficiency, and satisfaction
with which specified users achieve specified goals in particular environment” (ISO 9241-11, 1998).
Lack of usability contributes to user dissatisfaction, frustration, etc., eventually resulting in application
abandonment. Therefore, usability is considered a key quality for a web application.
The interaction between user and web application is mediated by a web user interface. A web
user interface encompasses a number of navigational links, command buttons, thumbnails, small
images, short texts, images, icons, etc. These small elements of user interfaces are defined in this paper
as interface signs (see figure 1). Interface signs are treated as one of the most crucial elements of user
interfaces since (i) the content and functions of web applications are essentially directed by interface
signs, and (ii) end users obtain the desired information or perform tasks in web applications by
interacting with interface signs. Furthermore, interface design and its usability evaluation are
conducted along a number of dimensions. Bolchini et al. (2009) include content, information
architecture, navigation, layout and interface signs in these dimensions (see figure 1). If two
applications are identical with respect to content, information, navigation and graphical layout but
different in terms of interface signs, then we can assume that the more intuitive interface signs
contribute positively to the usability. Therefore, designers should design the interface signs intuitive
for end users so that end users can easily and accurately understand the referential meaning of the
interface signs in order to perform their desired tasks. Design principles used by designers focus on
sense production and interpretation, and thereby implicate semiotics - the science of signs (Peirce,
1931:58).
Figure 1. Snapshot of Turku Centre for Computer Science homepage (retrieved from www.tucs.fi on
January 2014) shows (i) example interface signs marked by ovals, and (ii) user interface design and
usability evaluation dimensions.
Usability evaluation methods (UEM) are considered as important quality assessment techniques in
website evaluation (Al-Wabil and Al-Khalifa, 2009). Usability evaluation is the process during which
designers and developers test, verify and validate the results of the design process. A number of
usability evaluation methods have been proposed in the last few decades (Insfran and Fernandez,
2008). Evaluation methods are classified into the following four groups by Whitefield et al. (1991):
(i) Analytical methods: these methods are mainly driven by analysis of tasks (Diaper and Stanton,
2003) that need to be done by the end users.

4
(ii) Usability inspection: These methods mainly focus on feedback from experts in HCI or web
application design. Heuristic evaluation (Nielsen, 1999; Nielsen and Mack, 1994), cognitive
walkthrough (Hertzum and Jacobsen, 2003), feature inspection (Nielsen and Mack, 1994) are
more common evaluation methods in this group. Checklists, usability principles or rules are
used as guidelines to direct these kinds of evaluations.
(iii) Observational methods: Co-discovery (Barnum and Dragga, 2001), think-aloud (Hertzum and
Jacobsen, 2003; Nielsen, 1993) are effective example methods of usability testing group. In co-
discovery, two or more users work together in the evaluation. For the think-aloud, a small
number of users are involved individually, users verbalize while using the system and express
their thoughts, feelings, and opinions.
(iv) User reports: this group involves the use of questionnaires and interviews for data collection
(Nielsen, 1993; Usability Net, 2013).
Only a few methods consider semiotic issues when evaluating the usability of web applications,
since most of the methods do not analyze the intrinsic meaning of user interfaces, especially the
interface signs. Although some well-structured usability evaluation methods consider semiotic aspects
as generic criteria to evaluate usability, these are often confusing and blended with other usability
aspects (e.g., aspects related to content, layout design, etc.) (Triacca et al., 2003). Actually, very few
methods give importance to semiotics in user interface design and usability evaluation. The possible
reasons to forego semiotics issues in user interface design and usability evaluation are: (a) lack of
knowledge in semiotics and its theories in general, (b) very limited semiotics theories related to
interface design and evaluation exist in the literature, and (c) lack of awareness on how considering
semiotics aspects in user interface design and usability evaluation affects the usability standard of an
application.
Therefore, the purpose of this research was to explore (i) how user intuitive interface signs affect
web usability. In other words, how users’ inaccurate interpretations of web interface signs lead to
usability problems, and (ii) how applying semiotics in user interface design and evaluation helps to
improve the system’s overall usability. The fundamental research question is “Why is considering
semiotic perception in user interface design and evaluation so important to improve web usability?”
To attain this research goal, an empirical user study was conducted on a web application, the online
Ovi Calendar by Nokia (http://calendar.ovi.com; © 2010 Nokia). It is important to mention here that
an earlier version of this research has been previously published in (Islam, 2011a; 2011b).
This paper is organized as follows. In the following sections, we first introduce the two
fundamental terms, namely semiotics and interface signs, to provide a clear understanding of our main
focus area, and briefly review the literature related to the focus area. Next, we describe the research
methodology, including the study procedure, the participants’ profile, and the data collection process
for each test. The analysis and results are presented in the subsequent section. Following this, we
discuss the study outcomes and their implications for research and practice. The conclusion,
limitations, and ideas for future work are provided in the final section.
2. Research Background
2.1 Semiotics and Interface Sign Interpretation
The study of signs and significations is called semiotics (Liu, 2000). Semiotics is considered an
account of signification and representation of a sign. The central notion of semiotics is the ‘sign’ that
generally takes the form of words, odours, sounds, images, acts, etc. (Chandler, 2002); these are
treated as a sign when they provide a meaning to somebody in some respect or capacity. Thus a sign
becomes a sign only when designers invest them with meaning (Chandler, 2002). A complete
5
definition of semiotics could be presented as “the study of signs, signification, and signifying systems”
(Burgoyne et al., 1992).
A few semiotics models are presented here to provide a concise idea about semiotics, interface
signs and their interpretations. In De Saussure’s (1966) terms, a semiotic model consists of a signifier
(the form that a sign takes) and a signified (the concept in somebody’s mind) in the form of a dyad. As
an example, ‘OPEN’ could be a sign when it is interpreted by someone who encounters it on the
entrance gate of a shopping mall consisting of a signifier (the word Open) and a signified (the mall is
opened for customers to enter inside).
A semiotics model proposed by Peirce (1931-52) consists of a triadic relationship containing the
representamen (the sign itself that stands for something to somebody in some respect or capacity), the
object (actual thing that the sign stands for) and the interpretant (created in the mind of the interpreter,
an equivalent or more developed sign). As an example, consider a panel at the entrance of a company
with “Reception office” written on it. The textual shape of the sign (i.e., the text string “Reception
office”, text font, color, background, and size) is the representamen. The concept that the sign evokes
in the mind of the reader (i.e., the idea of a reception’s office and what it means) is the interpretant.
The actual object in the real world (i.e., the reception’s office) is the object. A sign requires the
existence of these three constituents concurrently.
According to Gottlob Frege (1879), the sign is a logical triad consisting of: Zeichen (sign) for the
symbol, Sinn (sense) for the concept, and Bedeutung (reference) for the object. As an example, Frege
cited the terms ‘morning star’ and ‘evening star’. Both terms refer to the planet Venus as their
meaning, but their senses are very unlike the way in which the planet is presented (one term refers to a
star seen in the morning, and other one refers to a star seen in the evening).
A few important properties of interface signs can be discerned. These are: i) there is no one-to-one
link between the referential object and the sign; various signs may refers to a single meaning in spite
of several meanings, ii) users usually guess signs’ meanings through the interpretation of 'signs', iii)
web user interface encompasses a number of interface signs and users interact with these signs to
perform a specific task or obtain the desired information, iv) designers design interface signs as an
encoded form in order to provide information or functionalities, and users need to decode these signs
in order to obtain the desired information or services. Thus a user can perform a desired task
accurately when the user’s interpretant matches with the designer’s interpretant, and inaccurately
otherwise.
2.2 Related Work
During the last two decades, a limited number of studies has yielded semiotics in human-computer
interaction (HCI) for improving information systems design, development, and evaluation process. We
will give an overview of some studies which are important to this research.
Andersen (1997) provided a methodological framework rooted in semiotics to analyse human-
computer interaction. In his work, Andersen showed that computer-based signs mediated users’
interaction with the computer systems. De Souza (2005a) introduced the theory of semiotic
engineering in HCI. According to semiotic engineering theory a two-fold communicative process
(designer to system communication and system to user interaction) is involved in HCI and both level
of communication need to be successful to achieve effective HCI (de Souza, 2005a; 2005b; 2013; de
Souza et al. 2001). Barr et al. (2004) proposed a semiotic model for user interface metaphor, where
they applied Peirce’s triad (representamen, object, and interpretant) to user interface metaphor. Nadin
(1988, 2001) broadly discussed the elements of user interface and pointed out the importance of
semiotics in HCI. Derboven et al. (2012) presented a semiotic analysis for multi-touch applications to
get the insight of users’ understanding and uses of multi-touch interface. Algebraic semiotics was

6
introduced by Goguen (1999) and was significantly applied to user interface design (Malcolm and
Goguen, 1998). Scolari (2001, 2007, 2009) replicated the applications of semiotics in HCI, especially
to the analysis of user interfaces. An interface analysis method proposed by Scolari (2009) consists of
four levels: plastic (surface analysis), figurative (scene analysis), communicative (receiver’s position
analysis in respect of the interface), meta-communicative (receiver’s position analysis in respect of the
whole situation).
Moreover, to allow the analysis of intrinsic values of interface signs during usability evaluation, a
few approaches have been developed including the following:
(i) Semiotic inspection method (SIM) for interface evaluation (de Souza et al., 2006). The core step
of semiotic inspection method (SIM) includes (de Souza et al., 2006): inspection of the
metalinguistic signs, the static signs, and the dynamic signs; comparison of the designers’
metacommunication message generated in the previous steps; and finally evaluation of the quality
of whole metacommunication (designer-to-user). In another study, Salgado et al. (2009)
demonstrated the applicability of SIM to investigate the communicability of ICDL (International
Children’s Digital Library) application.
(ii) A usability inspection method called MiLE+ (Milano-Lugano Evaluation method) for developing
web applications (Triacca et al., 2005). In MiLE+ (Triacca et al., 2005; Bolchini and Garzotto,
2007), they integrated the concept of semiotics in interface design evaluation in order to analyze
application-independent features of web interface.
(iii) W-SIDE (Web-Semiotic Interface Design Evaluation) framework to evaluate information
intensive web user interfaces (Speroni, 2006). W-SIDE framework mainly focuses on the
semantics of interface signs and their understandings by the end users. In W-SIDE, Speroni
(2006) introduces the term ‘Ontology’ as a set of concepts or knowledge presupposed by users
when interpreting the referential meaning of interface signs such as InterLocutor/Institution
Ontology (concepts related to the owner of the website).
(iv) A set of heuristics to evaluate information intensive web applications (Bolchini et al., 2009; Islam
et al., 2010). Heuristics proposed by Bolchini et al. (2009) are derived from Speroni’s (2006) W-
SIDE framework and suggested to use as an additional toolkit to evaluate web interface signs.
To sum up, the above discussion makes clear that semiotics has a significant role in HCI, although
a limited number of studies are conducted on user interface design and evaluation through semiotic
perception. Moreover, few usability evaluation methods consider semiotics issues in the evaluation of
the usability of web applications. Furthermore, little research explicitly focused on ‘interface signs’ of
web user interface in usability evaluation. Therefore, further empirical research is needed to
demonstrate the importance of considering semiotics in user interface design and evaluation, and to
show the importance of making interface signs intuitive for users through the semiotics perception.
This study aims to fill these research gaps.
3. Study Method
An empirical research approach is followed to conduct three user tests in two phases. These tests were
conducted on an example web application, the online Ovi calendar (http://calendar.ovi.com; © 2010
Nokia) in Finland. An interface sign intuitive test (Test I) and a usability test (Test II) were conducted
in phase I; and an interface sign intuitive test (Test III) was conducted in Phase II.
The methodological overview is presented in figure 2. First, all the interface signs (a total of 104
interface signs) of Ovi calendar were selected, a set of study tasks (see table 1) was prepared, and
participants who might be the users of the studied application were recruited and scheduled. Second,
the interface sign intuitive test (Test I) was conducted for each participant followed by the usability
test (Test II). Third, the test data were analyzed and examined to find out how accurate the users’
7
interpretations were, their impact on web usability, and also to find the possible semiotics guidelines
for designing the user-intuitive interface signs. Fourth, a subset of the interface signs of the studied
application was selected and re-designed according to the deduced (from Test II) semiotics guidelines;
and test participants were recruited and scheduled ahead of Test III. Fifth, another interface sign
intuitive test (Test III) for the original and re-designed interface signs was conducted. Sixth, data from
Test III was analyzed in order to observe any improvements of interface signs’ intuitiveness. Finally,
we discussed the overall study results.
A total of 17 student participants were recruited on a voluntary basis to conduct this empirical
study. Students were recruited as test participants for the following reasons: (a) users who have
internet access facility and are familiar with web browsing could be considered as potential users of
the selected web application, (b) the study was planned to be conducted on a web application (Ovi
calendar), and (c) it was easy to access students as test subjects. Test I and Test II were replicated with
7 participants. Each of the 7 participants performed both Test I and Test II. Participants were aged 21-
30 [M (SD) = 25.14 (2.79)]. Each participant had good experience of real world calendars, internet
browsing, and personal computer use; 3 participants had prior experience of online calendars; and
none of them had experience with Ovi calendar. Test III was conducted with 10 participants. This test
was designed as a ‘within-subject’ user test, i.e., each participant interpreted both original and re-
designed interface signs. Participants were aged 23-32 [M (SD) = 26.30 (3.74)], had good experience
of real world calendars, internet browsing, and personal computer use, 6 participants had prior
experience of online calendar, and none of them had experience of Ovi calendar.
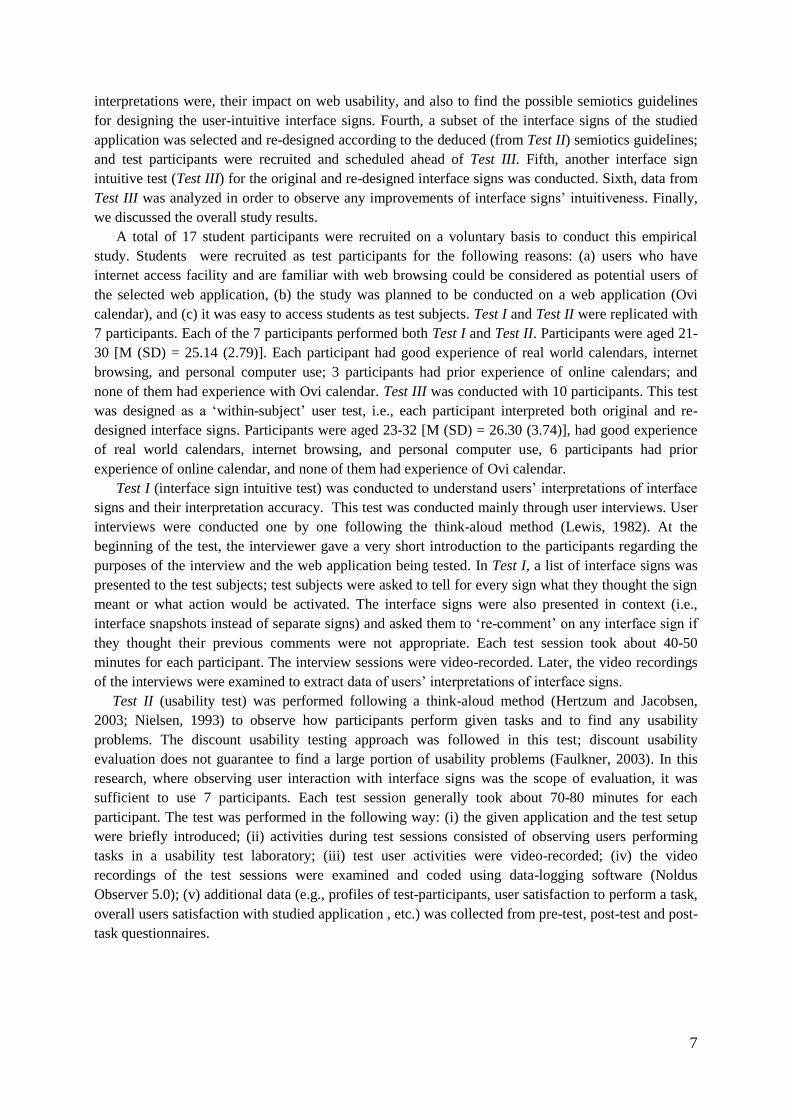
Test I (interface sign intuitive test) was conducted to understand users’ interpretations of interface
signs and their interpretation accuracy. This test was conducted mainly through user interviews. User
interviews were conducted one by one following the think-aloud method (Lewis, 1982). At the
beginning of the test, the interviewer gave a very short introduction to the participants regarding the
purposes of the interview and the web application being tested. In Test I, a list of interface signs was
presented to the test subjects; test subjects were asked to tell for every sign what they thought the sign
meant or what action would be activated. The interface signs were also presented in context (i.e.,
interface snapshots instead of separate signs) and asked them to ‘re-comment’ on any interface sign if
they thought their previous comments were not appropriate. Each test session took about 40-50
minutes for each participant. The interview sessions were video-recorded. Later, the video recordings
of the interviews were examined to extract data of users’ interpretations of interface signs.
Test II (usability test) was performed following a think-aloud method (Hertzum and Jacobsen,
2003; Nielsen, 1993) to observe how participants perform given tasks and to find any usability
problems. The discount usability testing approach was followed in this test; discount usability
evaluation does not guarantee to find a large portion of usability problems (Faulkner, 2003). In this
research, where observing user interaction with interface signs was the scope of evaluation, it was
sufficient to use 7 participants. Each test session generally took about 70-80 minutes for each
participant. The test was performed in the following way: (i) the given application and the test setup
were briefly introduced; (ii) activities during test sessions consisted of observing users performing
tasks in a usability test laboratory; (iii) test user activities were video-recorded; (iv) the video
recordings of the test sessions were examined and coded using data-logging software (Noldus
Observer 5.0); (v) additional data (e.g., profiles of test-participants, user satisfaction to perform a task,
overall users satisfaction with studied application , etc.) was collected from pre-test, post-test and post-
task questionnaires.
8
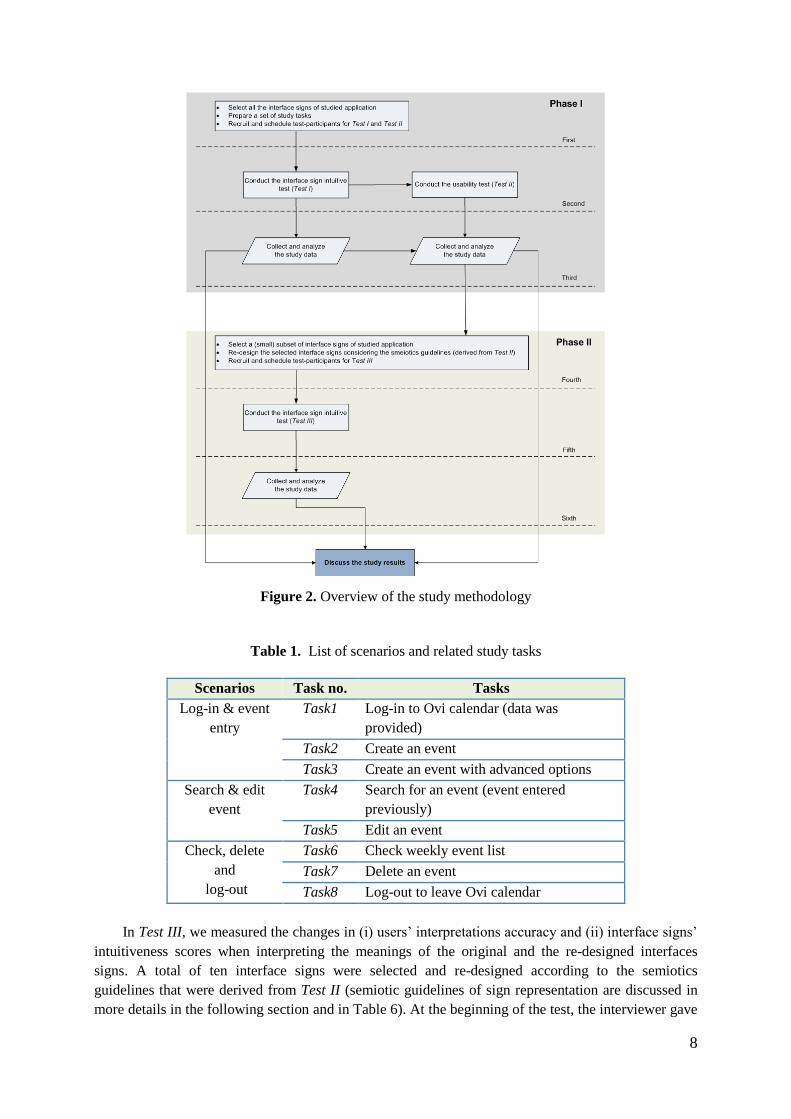
Figure 2. Overview of the study methodology
Table 1. List of scenarios and related study tasks
Scenarios Task no. Tasks
Log-in & event
entry
Task1 Log-in to Ovi calendar (data was
provided)
Task2 Create an event
Task3 Create an event with advanced options
Search & edit
event
Task4 Search for an event (event entered
previously)
Task5 Edit an event
Check, delete
and
log-out
Task6 Check weekly event list
Task7 Delete an event
Task8 Log-out to leave Ovi calendar
In Test III, we measured the changes in (i) users’ interpretations accuracy and (ii) interface signs’
intuitiveness scores when interpreting the meanings of the original and the re-designed interfaces
signs. A total of ten interface signs were selected and re-designed according to the semiotics
guidelines that were derived from Test II (semiotic guidelines of sign representation are discussed in
more details in the following section and in Table 6). At the beginning of the test, the interviewer gave

9
a very short introduction to the participants regarding the purposes of the interview and the web
application being tested. The redesigned signs’ page-snapshots and original signs’ page-snapshots
were randomly presented to test subjects. Participants were asked to interpret the meaning of every
sign (original and re-designed signs were marked by ovals in the presented snapshots - a few example
snapshots are presented in Appendix I). Participants were not informed about which sign was the
original and which sign was re-designed. They were also asked to give an intuitiveness score (1 - 7; 1:
very intuitive, 7: not intuitive) for every sign. Each test session took about 15-20 minutes for each
participant.
4. Analysis and Results
4.1 Data Collection
Both qualitative and quantitate data were collected from the tests. The following data were collected
from Test I:
a) Participants’ interpretations of all interfaces signs (i.e., a total of 104 interface signs), and
b) Participants’ interpretations of each task-related sign (i.e., the signs related to the completion of a
specific task).
The following data were collected from Test II:
a) Task completion time (TCT), and minimum and maximum TCT (see table 2). Here, TCT is
measured as the time interval between the start and end points to execute a task.
b) Number of failures to complete a task (TF).
c) Number of input errors
d) Number of system errors.
e) Number of times participants expressed despair, happiness, and/or anger.
f) Number of times participants asked for help to perform the tasks.
g) Interaction-variation (IV) to perform a task. User should perform a sequence of actions in order to
complete a task. These actions are executed by interacting with interface signs. The Interaction-
variation (IV) refers to the difference between the number of required interaction (i.e., mouse
clicks) to perform a task and the number of interactions needed by a user to perform a task. Figure
3 shows the interaction-variation (IV) to perform task5 by participant P2.
h) Time spent in despaired, happy, or angry state.
i) Time spent in confused & wrong navigation (C&WN) state. Here, C&WN measured as the time
interval between the start and end points to navigate inaccurately and also being confused.
j) Subjective rate of user satisfaction (US) to perform each task, as well as overall user experience
(UX) of using the studied application on the scale of 1-5 [1: not at all satisfied/ very low, 5:
extremely satisfied/very high].
k) Participants’ verbal comments while performing the tasks.
The following data were collected from Test III:
a) Accuracy level of participants’ interpretations of original and re-designed interface signs.
b) Perceived intuitiveness score (i.e., how easy and how intrinsic it is to interpret the meaning of the
interface sign) for the presented original and re-designed interface signs in the scale of 1-7 [1:
very intuitive, 7: not intuitive]

10
Table 2. Task completion time (mm:ss), minimum TCT (bold italic) & maximum TCT (bold)
Participants Task1 Task2 Task3 Task4 Task5 Task6 Task7 Task8 Total
P1 01:28 05:44 08:26 00:44 05:40 02:19 01:10 00:07 25:38
P2 01:00 04:02 18:53 00:55 04:55 02:02 02:59 00:03 34:49
P3 00:38 02:57 06:47 01:44 15:18 00:29 00:36 00:03 28:32
P4 01:15 03:08 02:54 00:59 03:16 05:35 00:44 00:05 17:56
P5 01:24 06:23 07:43 00:54 01:19 06:25 01:01 00:03 25:12
P6 01:03 07:00 02:21 01:35 11:40 05:08 03:22 00:03 32:12
P7 01:12 03:11 14:07 03:04 21:27 04:39 00:14 00:03 47:57
Figure 3. Interaction-variation (IV) to perform task5 by P2
Table 3. Participants’ interpretations’ accuracy levels of all interface signs
Participan
ts
Accurat
e
Inaccurate Accura
cy
(%)
Inaccura
cy (%) Moderat
e
Conflicti
ng
Erroneo
us
Incapabl
e
P1 67 18 3 12 4 64.4
2
35.58
P2 65 13 8 16 2 62.5
0
37.50
P3 79 16 0 8 1 75.9
6
24.04
P4 73 14 5 4 8 70.1
9
29.81
P5 71 14 3 11 5 68.2
7
31.73
P6 77 11 2 9 5 74.0
4
25.96
P7 76 9 4 13 2 73.0
8
26.92
11
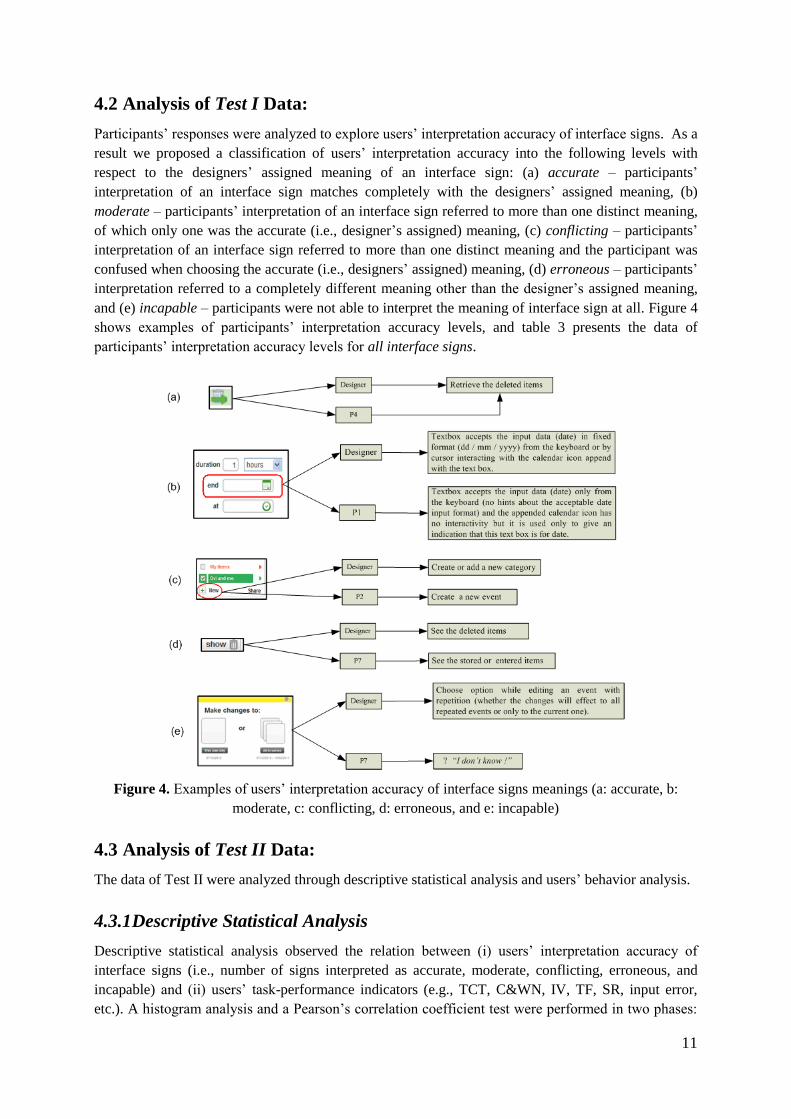
4.2 Analysis of Test I Data:
Participants’ responses were analyzed to explore users’ interpretation accuracy of interface signs. As a
result we proposed a classification of users’ interpretation accuracy into the following levels with
respect to the designers’ assigned meaning of an interface sign: (a) accurate – participants’
interpretation of an interface sign matches completely with the designers’ assigned meaning, (b)
moderate – participants’ interpretation of an interface sign referred to more than one distinct meaning,
of which only one was the accurate (i.e., designer’s assigned) meaning, (c) conflicting – participants’
interpretation of an interface sign referred to more than one distinct meaning and the participant was
confused when choosing the accurate (i.e., designers’ assigned) meaning, (d) erroneous – participants’
interpretation referred to a completely different meaning other than the designer’s assigned meaning,
and (e) incapable – participants were not able to interpret the meaning of interface sign at all. Figure 4
shows examples of participants’ interpretation accuracy levels, and table 3 presents the data of
participants’ interpretation accuracy levels for all interface signs.
Figure 4. Examples of users’ interpretation accuracy of interface signs meanings (a: accurate, b:
moderate, c: conflicting, d: erroneous, and e: incapable)
4.3 Analysis of Test II Data:
The data of Test II were analyzed through descriptive statistical analysis and users’ behavior analysis.
4.3.1 Descriptive Statistical Analysis
Descriptive statistical analysis observed the relation between (i) users’ interpretation accuracy of
interface signs (i.e., number of signs interpreted as accurate, moderate, conflicting, erroneous, and
incapable) and (ii) users’ task-performance indicators (e.g., TCT, C&WN, IV, TF, SR, input error,
etc.). A histogram analysis and a Pearson’s correlation coefficient test were performed in two phases:

12
firstly, taking into account users’ interpretation accuracy of all interface signs and users’ task-
performance indicators for all tasks, and secondly, considering users’ interpretation accuracy of each
task-related interface sign and users’ task-performance indicators for each task.
Both phases of histogram analysis showed that there was no linear relation between the users’
interpretation accuracy of interface signs and the values of task-performance indicators. To illustrate
this, figure 5(a) (first phase analysis) presents three task-performance indicators (i.e., TCT, C&WN,
and US) for all study tasks and interpretation accuracy of all interface signs; and figure 5(b) (second
phase analysis) presents three task-performance indicators (i.e., TCT, C&WN, and US) for Task3 and
interpretation accuracy of Task3-related interface signs. For instance, participant P3 (see figure 5(a))
showed highest interpretation accuracy, whereas P4 completed the study tasks with minimum time
(TCT) and spent shortest time in C&WN state, while P1, P3, P4, and P5 gave highest satisfaction
(US) scores. Again to perform Task3 (see figure 5(b)), P7 showed the highest interpretation accuracy
of the task3-related interface signs but he spent maximum time in C&WN state, and gave the lowest
satisfaction (US) score.
Pearson’s correlation coefficient test showed that there is no significant correlation between the
values of users’ interpretation accuracy of interface sign and the values of tasks-performance
indicators (see table 4).
Figure. 5 Histograms of (a) First phase analysis and (b) Second phase analysis
Table 4. Statistical parameters for all tasks and Task3
First phase analysis Second phase analysis
UIA vs.
TCT
UIA vs.
C&WN
UIA vs.
SR
UIA vs.
TCT
UIA vs.
C&WN
UIA vs.
SR
Correlation (r) 0.176 0.433 -0.36 -0.294 0.186 0.02
P-value (2-
tailed)
0.706 0.332 0.428 0.522 0.689 0.966
Note. UIA: users’ interpretation accuracy; Sample size = 7 (no. of test participants); α Level= 0.05;
4.3.2 Users’ Behavior Analysis Users’ behavior analysis observed participants’ behavior while performing a study task in Test II with
respect to his interpretations’ accuracy of task-related interface signs (observed in Test I). We also
observed the possible reasons for users’ inaccurate interpretations of interface signs, and the usability

13
problems created by users’ inaccurate interpretations of task-related interface signs. To observe these,
the following steps were followed for each participant:
First, we re-viewed the (Test I) data of users’ interpretation of task-related interface signs for a
particular task.
Second, we observed users’ behavior while performing this specific task. Here, we particularly
observed users’ behavior when interacting with each interface sign that was not properly
interpreted in Test I.
Third, we observed how users’ behavior (observed in step two) subsequently led to usability
problems.
Fourth, we observed the possible reasons for users’ inaccurate interpretations of interface signs.
Here, we particularly observed the missing design considerations of sign representation from a
semiotics perspective that led participants to interpret the meaning of a sign inaccurately, and also
led to usability problems.
Moreover, in Test II participants were advised to think aloud while performing study tasks since
participants’ verbal comments are treated as high-quality qualitative user feedback (see table 5). We
also observed users’ behavior while they verbalized during the task completion. To observe this, the
following steps were followed for each participant:
First, we meticulously noted what is verbalized at a certain time during the task completion.
Second, participants activities were observed in order to understand the object of the
verbalization. When it was found that the participants’ verbal comments were related to
interpretations, understanding, or searching for any interface sign, then we proceeded to the next
step.
Third, we observed the consequences, i.e., we observed the relation between the participant’s
interpretation accuracy of task-related interface signs, verbal comments, and values of task-
performance indicators.
Table 5. Examples of verbal comments related to interface sign interpretation
Comments Task - Participant
“Oops!!!” Task3-P3
“….How come I can’t repeat? Why repeat option is off...” Task5-P3
“…Why I am not finding this (entered event)…” Task6-P4
“…I am not finding ‘Delete’. How come I am not getting the ‘Delete’
option…”
Task5-P6
“…I have got this! But I didn’t want to get this in this way…” Task4-P7
“….Oops! So these are deleted items! I am browsing deleted items….” Task5-P7
“….Option is obviously available here but why I am not getting this.
Where is the ‘Delete’ option….”
Task5-P7
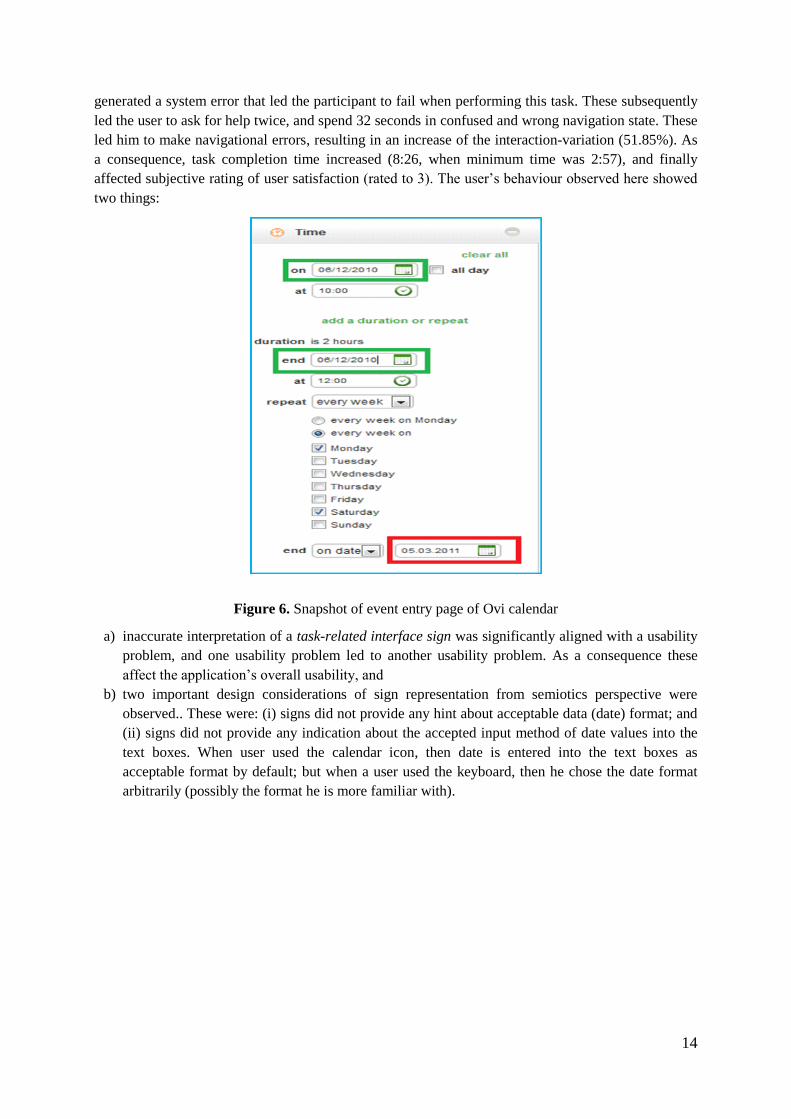
Let us show an example of observation of user behavior. The date input text boxes on event entry page
(see figure 6) accepts data (date) in two ways: (i) by keyboard, and (ii) by cursor via interaction with
the calendar icon appended besides the text boxes. A participant thought that the text boxes accepted
input data (date) only through keyboard. He also thought that the appended calendar icon had no
interactivity but it was used only to give an indication that this text box is for date value. Therefore, he
entered the date value into the text boxes in two different formats. In figure 6, the date values are
shown by rectangles; in which the two top rectangles show the incorrect date format and the bottom
rectangle shows the correct one. When saving incorrect input, an input error occurred; this input error
14
generated a system error that led the participant to fail when performing this task. These subsequently
led the user to ask for help twice, and spend 32 seconds in confused and wrong navigation state. These
led him to make navigational errors, resulting in an increase of the interaction-variation (51.85%). As
a consequence, task completion time increased (8:26, when minimum time was 2:57), and finally
affected subjective rating of user satisfaction (rated to 3). The user’s behaviour observed here showed
two things:
Figure 6. Snapshot of event entry page of Ovi calendar
a) inaccurate interpretation of a task-related interface sign was significantly aligned with a usability
problem, and one usability problem led to another usability problem. As a consequence these
affect the application’s overall usability, and
b) two important design considerations of sign representation from semiotics perspective were
observed.. These were: (i) signs did not provide any hint about acceptable data (date) format; and
(ii) signs did not provide any indication about the accepted input method of date values into the
text boxes. When user used the calendar icon, then date is entered into the text boxes as
acceptable format by default; but when a user used the keyboard, then he chose the date format
arbitrarily (possibly the format he is more familiar with).

15
Table 6. Missing design considerations, usability problems, number of participants faced the
problems, and the derived semiotic guidelines
Missing
Design
Consideration
s
Usability Problems Participant
s facing
problems
(%)
Derived
Semiotic
Guideline
s
UP
1
UP
2
UP
3
UP
4
UP
5
UP
6
UP
7
UP
8
UP
9
A X X X X X X X X 43 G1
B X X X X 57 G2
C X X X X 71 G3
D X X X X 57 G4
E X X X X X X 29 G5
F X X X X X 86 G6
G X X X X X X X X X 14 G7
H X X X X X 43 G8
I X X X X X X X 86 G9
J X X X X X X X X 43 G4
Usability Problems. UP1: Input error UP2: System error UP3: High interact-variation
UP4: Spent longer time at C&WN state UP5: Task failure UP6: Facial expressions
(despaired & angry)
UP7: Comparatively high TCT UP8: Asking help UP9: Poor user satisfaction
ratings
Missing Design Considerations:
A: Identical sign was used for multiple purposes
B: Interface signs of a particular page were not placed consistently
C: Lack of clear indication of interface sign’s interactivity
D: Text boxes were not clearly designed to indicate their purpose of use
E: Dependency relation (where necessary) between interface signs was not presented clearly
F: Did not provide understandable message for wrong interactions with an interface sign
G: Text boxes were not provided with any hint of accepted data formats.
H: Used confusing conjunctional word (e.g., or, and, etc.) in the design of an interactive sign.
I: Lack of good relation with neighboring signs.
J:Lack of clear indication of the specific purpose of use of a sign
Semiotic Design Guidelines:
G1: Avoid using identical signs for multiple purposes.
G2: Place a sign consistently at a particular position in a user interface.
G3: Present clearly the purpose of sign interactivity.
G4: Provide clear indication of the specific purpose of use of a sign (e.g., text boxes).
G5: Maintain dependency relations among interface signs in a user interface, where necessary.
G6: Provide understandable message when wrong interaction occurs.
G7: Provide hints of accepted data format.
G8: Use the conjunctional word (e.g., or, and, etc.) wisely in interface sign design
G9: Retain good relations with neighboring signs.
Let us discuss an example of observation of users’ behaviour while they verbalized during the task
completion. Participant P7 verbalized during task5 “….Oops! So these are deleted items! I am
browsing deleted items….”. We observed that, when P7 failed once to complete task5 due to his

16
misinterpretation of repeated-date-entry sign in event entry page, then he was trying to correct his
entered event and clicked on the ‘ ’ sign to obtain the entered event. But he did not find the
entered event by clicking this sign. He then tried in some other ways to find the entered event. A few
minutes later he again clicked on the ‘ ’ sign and carefully explored the list of events. A few
seconds later he realized that the ‘ ’ sign actually stands for showing the deleted items, and not
for storing the entered events. He was despaired and angry for his misinterpretation, and then used the
search box to find his entered event. At that moment he verbalized the comment mentioned earlier.
Again, data from Test I showed that participant P7 interpreted ‘ ’ sign erroneously
(inaccurately) since the designer’s assigned meaning was ‘providing the list of all deleted items’ but he
interpreted it as ‘show all stored or entered items’ (see figure 5). As a consequence, his inaccurate
interpretation of the ‘ ’ sign led him to spend longer time at C&WN state and fail to perform
the task for the second time, asking for help twice. These ultimately led to an increase of interaction-
variation (IV) and task completion time (TCT), and also affected his facial expression (despaired and
angry). Finally, these subsequently affected his rating of user satisfaction (rated to 1).
The results showed that user inaccurate interpretations of task-related interface signs affect the
overall usability of a web application. From this analysis we also derived a small set of guidelines for
interface sign representation from a semiotics perspective. The missing design considerations observed
from semiotics perspective, the usability problems observed, the number of test participants
experiencing the usability problems, and the derived semiotics guidelines are presented in Table 6. For
instance, due to the lack of design consideration A (i.e., identical signs were used for multiple
purposes), 3 out of 7 test-participants (43%) experienced all the usability problems except system error
(UP2), and semiotic guideline G1 (i.e., avoid using identical signs for multiple purposes) was derived
from this observation.
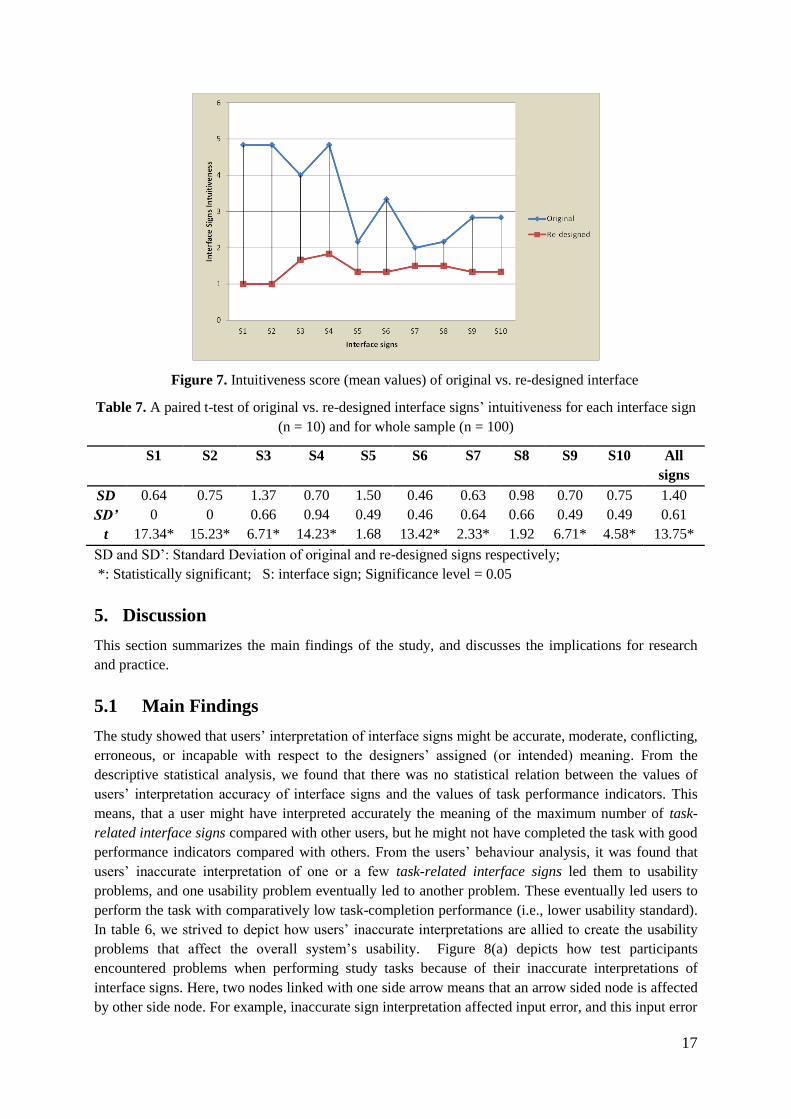
4.4 Analysis of Test III Data
Participants’ responses were analysed in order to observe changes in interpretations’ accuracy level
and perceived intuitiveness when interpreting the meaning of the original and re-designed signs. The
results of this test showed that participants’ interpretation accuracy increased to 88% for re-designed
signs from 37% for original signs, and participants rated the re-designed interface signs as more
intuitive. Figure 7 shows the mean values of users’ intuitiveness score of the original vs. re-designed
interface signs. Here, intuitiveness score is presented in the scale of 1-7 [1: very intuitive, 7: not
intuitive]. A significant difference in interface sign intuitiveness was showed for the whole sample
(i.e., data for all interface signs, n= 100) and also for 80% of the re-designed signs (8 out of 10
redesigned signs) through a paired t-test (see table 7).
17
Figure 7. Intuitiveness score (mean values) of original vs. re-designed interface
Table 7. A paired t-test of original vs. re-designed interface signs’ intuitiveness for each interface sign
(n = 10) and for whole sample (n = 100)
S1 S2 S3 S4 S5 S6 S7 S8 S9 S10 All
signs
SD 0.64 0.75 1.37 0.70 1.50 0.46 0.63 0.98 0.70 0.75 1.40
SD’ 0 0 0.66 0.94 0.49 0.46 0.64 0.66 0.49 0.49 0.61
t 17.34* 15.23* 6.71* 14.23* 1.68 13.42* 2.33* 1.92 6.71* 4.58* 13.75*
SD and SD’: Standard Deviation of original and re-designed signs respectively;
*: Statistically significant; S: interface sign; Significance level = 0.05
5. Discussion
This section summarizes the main findings of the study, and discusses the implications for research
and practice.
5.1 Main Findings
The study showed that users’ interpretation of interface signs might be accurate, moderate, conflicting,
erroneous, or incapable with respect to the designers’ assigned (or intended) meaning. From the
descriptive statistical analysis, we found that there was no statistical relation between the values of
users’ interpretation accuracy of interface signs and the values of task performance indicators. This
means, that a user might have interpreted accurately the meaning of the maximum number of task-
related interface signs compared with other users, but he might not have completed the task with good
performance indicators compared with others. From the users’ behaviour analysis, it was found that
users’ inaccurate interpretation of one or a few task-related interface signs led them to usability
problems, and one usability problem eventually led to another problem. These eventually led users to
perform the task with comparatively low task-completion performance (i.e., lower usability standard).
In table 6, we strived to depict how users’ inaccurate interpretations are allied to create the usability
problems that affect the overall system’s usability. Figure 8(a) depicts how test participants
encountered problems when performing study tasks because of their inaccurate interpretations of
interface signs. Here, two nodes linked with one side arrow means that an arrow sided node is affected
by other side node. For example, inaccurate sign interpretation affected input error, and this input error
18
eventually affected interaction-variation, and this eventually affected task completion time, and so on.
That is, users’ interpretations of interface signs directly as well as indirectly affect usability metrics
(effectiveness, efficiency and satisfaction) thus eventually affecting overall web usability (see figure
8(b)).
The main reasons for getting divergent findings from the descriptive statistical analysis and
users’ behavior analysis were: (i) to perform a study task, user should interact with a sequence of
interface signs; therefore when users failed to interpret the meaning of the entire set of task-related
interface signs accurately, then the mis-interpreted signs created usability problems, and (ii) one
usability problem eventually led to another problem. Figure 9 depicts the example of Task3 performed
by participant P2. Here, circles represent the interface sign in Ovi calendar, and colors represent P2’s
interpretation accuracy levels of these signs. Circles with labels (e.g., S1, S2, etc.) represent Task3-
related interface signs, and labels represent the sequential relation among these signs (e.g., user should
interact with S1 before interacting with S2). We observed that P2 tried to reach the event entry page
due to his inaccurate interpretations of S1 (conflicting), S2 (moderate), and S3 (erroneous), and a
sequential relations among these. At the event entry page, his inaccurate interpretations of S5
(erroneous) and S11 (moderate) also affected proper task completion. Though a maximum numbers of
Task3-related interface signs were interpreted properly, P2 failed to complete Task3 properly. P2 also
gave comparatively lower satisfaction rate for Task3. However, these findings indicated that each and
every interface sign in web user interface is important and needs to be intuitive. In other words, each
interface sign in web user interface needs to be designed to be intuitive so that end users interpret these
signs more easily and accurately.
A small set of semiotics guidelines was also derived from the users’ behaviour analysis. This
small set of semiotics guidelines was not claimed as complete and novel to design and evaluation of
interface signs, since most of them were known to practitioners from literature and a few of them (e.g.,
Guidelines G5: Maintain dependency relations among interface signs in a user interface, where
necessary) were quite new. In fact, this study reports both familiar and unfamiliar guidelines with a
semiotic rationale observed from this study. It is also important to remind here that providing a
complete and novel set of semiotics considerations was not the main concern of this study.
Furthermore, this study also showed that users’ interpretation accuracy as well as the intuitiveness
of interface signs have increased when the interface signs were re-designed considering the semiotics
guidelines (derived from Test II). On the one hand, this study showed that users’ inaccurate
interpretation as well as lack of interface signs’ intuitiveness led participants to usability problems. On
the other hand, this study showed that interface signs, when re-designed considering the semiotics
guidelines, have increased the end users’ interpretation accuracy and the interface signs’ intuitiveness.
Thus, these findings imply that considering semiotic perception in interface design and usability
evaluation eventually improves the overall system usability standard.

19
Figure 8. Users’ inaccurate interpretations of interface signs affect overall web usability
Figure 9. A participant’s (P2) interpretations accuracy with Task3-realted interface signs
5.2 Implications for Practice
The results of this study provide important concerns for web usability and user interface design
grounded in an empirical dataset. These findings have important practical implications as well. First,
these provide practitioners an awareness of the importance of user-intuitive interface signs for
successful web user interfaces. Second, these outcomes empirically showed the importance of
considering semiotics to improve the interface signs’ intuitiveness and system usability standard.
Third, the interpretation accuracy classification (observed in Test I) showed how users’ interpretation
varied comparing to the original (designer’s) assigned meaning. Practitioner can easily adopt this
concept and conduct a sign test to obtain an ‘overall impression of interface signs’ intuitiveness’. The
existing usability evaluation methods do not provide this kind of outcomes though the outcomes
related to the ‘overall intuitiveness of interface signs’ are important to understand the system’s
usability standard. Fourth, a small set of semiotics considerations derived from this study might be
20
used as design guidelines, or as checklists for heuristics evaluation. Fifth, from the methodological
perspective, practitioners might easily adopt the methodology of this study in usability testing to
obtain additional values in usability evaluation in order to obtain an overall idea of interface signs’
intuitiveness, to identify the reasons of usability problems, to derive semiotic considerations of
interface sign representation, and to recommend possible solutions to design user-intuitive interface
signs. Moreover, practitioners can easily design and conduct this kind of study integrating a sign test
within a usability test without needing any additional resources.
5.3 Implications for Research
For researchers, this study showed the importance of user-intuitive interface signs to improve system’s
usability, and the significance of considering semiotics perceptions to design and evaluate user-
intuitive interface signs. The answer of the basic research question (i.e., Why is considering semiotic
perception in user interface design and evaluation so important to improve web usability) reached
from this research raises other important fundamental questions such as “what semiotics
considerations are needed to design user-intuitive web user interface?”, “what does a practitioner
need to be aware of when designing or evaluating web interface signs?” Thus several avenues for
future research remain such as (i) conducting similar studies to other web applications and also to
other web domains in order to provide a complete set of semiotics guidelines to design user-intuitive
interface signs, (ii) studying how semiotics could be integrated in usability testing to improve system’s
usability evaluation, (iii) focusing on mobile web/app interface where signs have an even more
predominant importance, (iv) investigating beyond the cultural issues in order to extend the semiotic
guidelines for culturally adapted user interface design and evaluation, and (v) conducting action
research or an extensive empirical research to validate the complete set of semiotics considerations
observed in this work.
6. Conclusion and Future Work
Designing effective user interface and improving system usability standard has attracted the attention
of HCI researchers for almost five decades. Our main intention has been to explore (i) users’
interpretation accuracy of interface sign meaning, (ii) usability problems created due to users’
inaccurate interpretations of interface signs, and (iii) the importance of considering semiotics
perception in the user interface design and evaluation process. We believe that our rigorous study
approach and our findings have met these objectives. We hope that the findings will be used by
practitioners and taken up by HCI researchers to continue expanding our understanding of the
contribution of these outcomes. We also acknowledge that this study was conducted only on a web
application; and that the number of participants was rather small. While we have no doubt about the
adequacy of this choice, we believe that further research should be based on a larger number of
participants and conducted on other types of web applications. However, our next step is to design and
conduct more user studies to find a complete set of semiotics considerations for designing user-
intuitive interface signs. These findings will be triangulated into different layers (e.g., syntactic,
semantic, pragmatic) of semiotics concepts to propose a semiotic framework for user interface design
and evaluation. In the final phase, practitioners will be involved to validate the proposed semiotic
framework and alleviate the subjectivity of the interface sign assessment method.

21
References Al-Wabil, A., Al-Khalifa, H. (2009), “A framework for integrating usability evaluations methods: The
Mawhiba web portal case study”, in proceedings of the International Conference on the Current
Trends in Information Technology (CTIT), Dubai, UAE, pp. 1–6.
Andersen, P.B.(1997),A theory of computer semiotics: Semiotic approaches to construction and
assessment of computer systems, Cambridge University Press, Cambridge.
Barnum, C.M., Dragga, S. (2001), Usability testing and research, Allyn & Bacon, Inc.
Barr, P., Biddle, R., Noble, J.(2004),“A semiotic model of user-interface metaphor”, in Liu, K. (Ed.),
Virtual, Distributed and Flexible Organisations:Studies in Organisational Semiotics, Kluwer
Academic Publisher, pp. 189–215.
Bolchini, D., Chatterji, R., Speroni, M. (2009),“Developing heuristics for the semiotics inspection of
websites”, in Proceedings of the 27th ACM International Conference on Design of
Communication, ACM Press, pp. 67–72.
Bolchini, D., Garzotto, F.(2007),“Quality of web usability evaluation methods: an empirical study on
MiLE+”, inproceedings of the Web Information Systems Engineering–WISE 2007 Workshops, pp.
481–492.
Burgoyne, R., Flitterman-Lewis, S., Stam, R. (1992),New Vocabularies in Film Semiotics, London:
Routledge.
Flavian, C., Gurrea, R., Orús, C. (2009) "Web design: a key factor for the website success", Journal of
Systems and Information Technology, Vol. 11 Iss: 2, pp.168 – 184
Chandler, D. (2002),The basics: semiotics, Routledge, London.
De Souza, C.S. (2005a),The semiotic engineering of human-computer interaction, The MIT press.
De Souza, C.S.(2005b),“Semiotic engineering: bringing designers and users together at interaction
time”, Interacting with Computers, Vol. 17, pp. 317–341.
De Souza, C.S.(2013),“Semiotics and Human-Computer Interaction”, The Encyclopedia of Human-
Computer Interaction, 2nd Ed.
De Souza, C.S., Barbosa, S.D.J., Prates, R.O. (2001), “A semiotic engineering approach to user
interface design”, Knowledge-Based Systems, Vol. 14, pp. 461–465.
De Souza, C.S., Leitão, C.F., Prates, R.O., da Silva, E.J. (2006), “The semiotic inspection method”, in
Proceedings of VII Brazilian Symposium on Human Factors in Computing Systems, ACM Press,
pp. 148–157.
Derboven, J., De Roeck, D., Verstraete, M., (2012), “Semiotic analysis of multi-touch interface
design: The MuTable case study”, International Journal of Human-Computer Studies, Vol. 70,
pp. 714–728.
Diaper, D., Stanton, N. (2003), The handbook of task analysis for human-computer interaction,
Lawrence Erlbaum Associates.
Faulkner, L. (2003), “Beyond the five-user assumption: Benefits of increased sample sizes in usability
testing”, Behavior Research Methods, Instruments, & Computers, Vol. 35, pp. 379–383.
Frege,G. (1879), “Begriffsschrift ; English Translation”, in van Heijenoort, J. (ed.) From Frege to
Gödel, Harvard University Press, Cambridge, pp. 1-82.
Goguen, J. (1999), “An Introduction to Algebraic Semiotics, with Application to User Interface
Design”, in Nehaniv, C.L. (Ed.), Computation for Metaphors, Analogy, and Agents, LNCS
Springer, pp. 242–291.
22
Hertzum, M., Jacobsen, N.E. (2003), “The evaluator effect: A chilling fact about usability evaluation
methods”, International journal of human-computer interaction, Vol.15, pp. 183–204.
Insfran, E., Fernandez, A. (2008), “A systematic review of usability evaluation in Web development”,
in Proceedings of the Web Information Systems Engineering–WISE 2008 Workshops,Springer,
pp. 81–91.
Islam, M., Ali, M., Al-Mamun, A., Islam, M. (2010), “Semiotics Explorations on Designing the
Information Intensive Web Interfaces”, International Arab Journal of Information Technology,
Vol. 7, pp. 45–54.
Islam, M.N. (2011a), “A Semiotics Perspective to web Usability: An Empirical case Study”,
in Proceedings of the IADIS International Conference on Interfaces and Human Computer Intera
ction (IHCI2011),Rome, Italy, pp. 19-28.
Islam, M.N. (2011b), “Beyond Users’ Inaccurate Interpretations of Web Interface Signs: A Semiotic
Perception”, inProceedings of the IFIP 13thInternational Conference on Informatics and
Semiotics in Organizations (ICISO 2011), Leeuwarden, Netherlands, pp. 31-40.
ISO 9241 -11.(1998), Guidance on usability standards. Available at
http://www.iso.org/iso/iso_catalogue/ Catalogue _tc/catalogue_detail.htm?csnumber=16883
(accessed on September, 2012).
Jacob, N. (1999), Designing Web Usability: the practice of simplicity, News Riders Publising.
Liu, K., (2000), Semiotics in information systems engineering, Cambridge University Press,
Cambridge.
Mack, R.L., Nielsen, J. (1994), Usability inspection methods, Wiley & Sons.
Malcolm, G., Goguen, J.A. (1999), “Signs and representations: Semiotics for user interface design”, in
Visual Representations and Interpretations, Springer, pp. 163–172.
Nadin, M., (1988), “Interface design: A semiotic paradigm”, Semiotica, Vol. 69, pp. 269–302.
Nadin, M., (2001), “One cannot not interact”, Knowledge-Based Systems, Vol. 14, pp. 437–440.
Nielsen, J. (1999), Designing Web Usability: The Practice of Simplicity, New Riders Publishing,
Thousand Oaks, CA, USA.
Nielsen, J., (1993), Usability engineering, Academic Press, London, UK.
Peirce,C.S. (1931:52), Collected Writings (8 Vols.), In: Hartshorne, C., Weiss, P., & Burks,A. (eds.).
Harvard University Press.
Salgado, L.C.C., de Souza, C.S., Leitão, C.F., De Lucena, C.J.P. (2009), “A Semiotic Inspection of
ICDL”, (MonografiasemCiência da Computação). Technical Report 31, Brazil.
Choraria, S. (2012) "Factors determining the flow of information among the online community users",
Journal of Systems and Information Technology, Vol. 14 Iss: 2, pp.105 – 122
Saussure, F. D.(1966),Course in General Linguistics (trans. W. Baskin), McGraw-Hill, New York,
NY.
Scolari, C. (2007), “Limitations in ‘Digital Taylorism’: Applying semiotics to HCI Research”, in
Proceedings of the Fifty-seventh Annual Conference of the International Communication
Association, San Francisco. San Francisco, pp. 24–28.
Scolari, C. (2009), “The sense of the interface: Applying semiotics to HCI research”, Semiotica, pp.
1–27.
Scolari, C.A. (2001), “Towards a semio-cognitive theory of Human-Computer Interaction”, in
Proceedings of the CHI’01 Extended Abstracts on Human Factors in Computing Systems, ACM
Press, New York, pp. 85–86.
23
Speroni, M. (2006), Mastering the semiotics of information-intensive web interfaces, Unpublished
Doctoral dissertation, University of Lugano, Switzerland.
Triacca, L., Bolchini, D., Di Blas, N., Paolini, P. (2003), “Wish you were Usable! How to improve the
Quality of a Museum Web Site”, in Proceedings of the International Conference on Electronic
Imaging and the Visual Arts.
Triacca, L., Inversini, A., Bolchini, D. (2005), “Evaluating web usability with MiLE+”, in
Proceedings of the Seventh IEEE International Symposium on Web Site Evaluation (WSE 2005),
pp. 22–29.
Usability Net, (2011), available at http://usabilitynet.org (accessed 20 November 2011)
Whitefield, A., Wilson, F., Dowell, J. (1991), “A framework for human factors evaluation”, Behaviour
&Information Technology, Vol. 10, pp. 65–79.
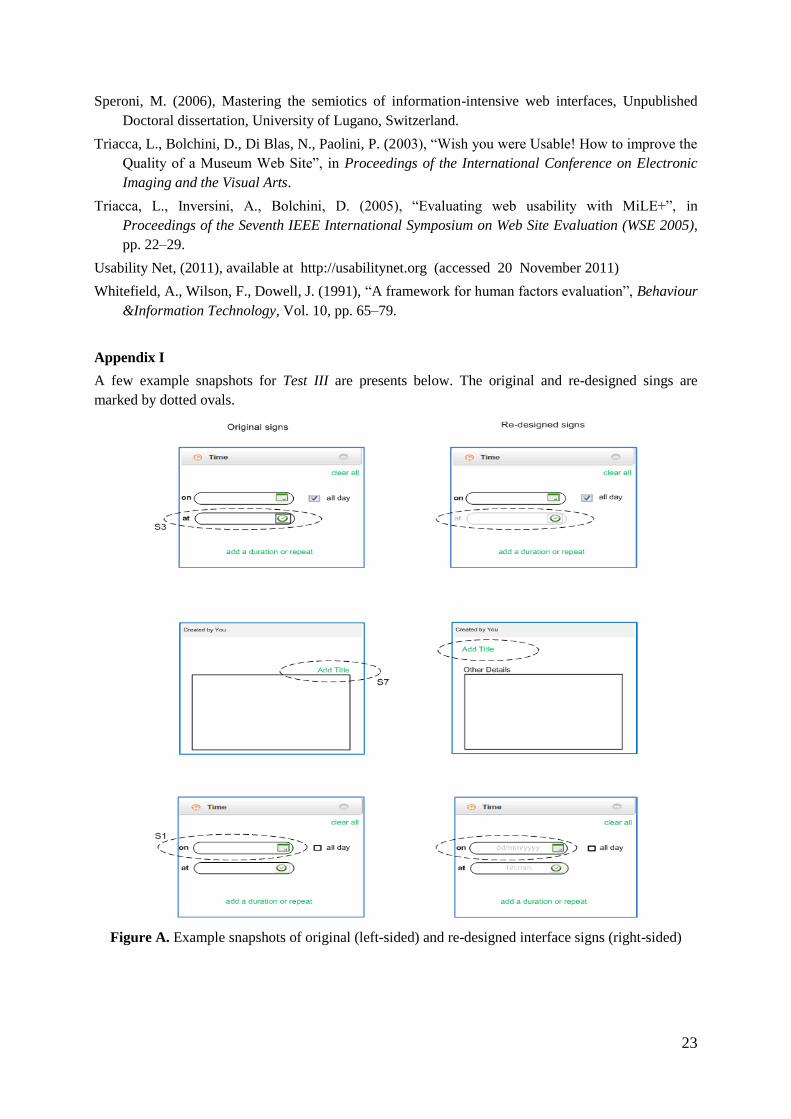
Appendix I
A few example snapshots for Test III are presents below. The original and re-designed sings are
marked by dotted ovals.
Figure A. Example snapshots of original (left-sided) and re-designed interface signs (right-sided)