exploring the effects of ball speed and spin in grand slam
183
EXPLORING THE EFFECTS OF BALL SPEED AND SPIN IN GRAND SLAM TENNIS MATCH-PLAY by OLIVIA JAYNE CANT Bachelor of Exercise and Sports Science (Honours) Institute for Health and Sport, Victoria University Thesis submitted in fulfilment of the requirements for the degree of DOCTOR OF PHILOSOPHY DECEMBER 2020
-
Upload
khangminh22 -
Category
Documents
-
view
3 -
download
0
Transcript of exploring the effects of ball speed and spin in grand slam
EXPLORING THE EFFECTS OF BALL SPEED AND SPIN IN GRAND SLAM
TENNIS MATCH-PLAY
by
OLIVIA JAYNE CANT
Bachelor of Exercise and Sports Science (Honours)
Institute for Health and Sport, Victoria University
Thesis submitted in fulfilment of the requirements for the degree of
DOCTOR OF PHILOSOPHY
DECEMBER 2020
ii
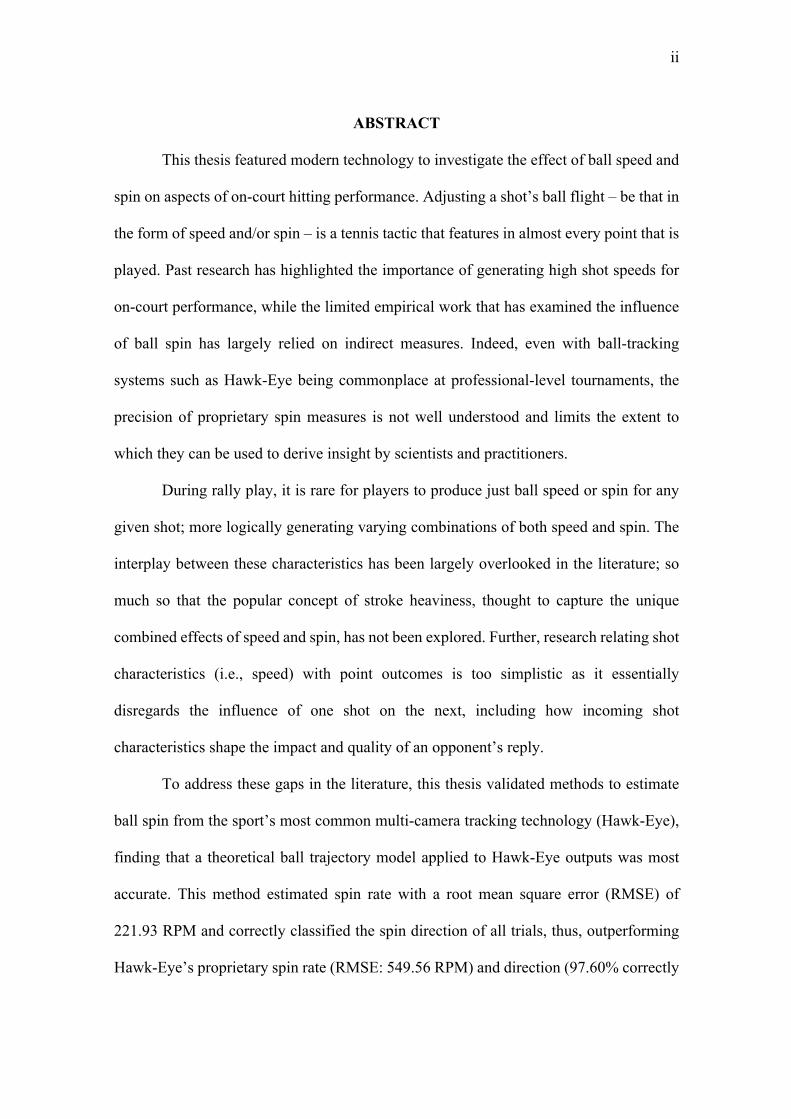
ABSTRACT
This thesis featured modern technology to investigate the effect of ball speed and
spin on aspects of on-court hitting performance. Adjusting a shot’s ball flight – be that in
the form of speed and/or spin – is a tennis tactic that features in almost every point that is
played. Past research has highlighted the importance of generating high shot speeds for
on-court performance, while the limited empirical work that has examined the influence
of ball spin has largely relied on indirect measures. Indeed, even with ball-tracking
systems such as Hawk-Eye being commonplace at professional-level tournaments, the
precision of proprietary spin measures is not well understood and limits the extent to
which they can be used to derive insight by scientists and practitioners.
During rally play, it is rare for players to produce just ball speed or spin for any
given shot; more logically generating varying combinations of both speed and spin. The
interplay between these characteristics has been largely overlooked in the literature; so
much so that the popular concept of stroke heaviness, thought to capture the unique
combined effects of speed and spin, has not been explored. Further, research relating shot
characteristics (i.e., speed) with point outcomes is too simplistic as it essentially
disregards the influence of one shot on the next, including how incoming shot
characteristics shape the impact and quality of an opponent’s reply.
To address these gaps in the literature, this thesis validated methods to estimate
ball spin from the sport’s most common multi-camera tracking technology (Hawk-Eye),
finding that a theoretical ball trajectory model applied to Hawk-Eye outputs was most
accurate. This method estimated spin rate with a root mean square error (RMSE) of
221.93 RPM and correctly classified the spin direction of all trials, thus, outperforming
Hawk-Eye’s proprietary spin rate (RMSE: 549.56 RPM) and direction (97.60% correctly
iii
classified) measure. This has widespread applications given the extent to which Hawk-
Eye is used during professional matches and allowed the thesis’s subsequent studies to
probe spatiotemporal data from Grand Slam matches. This involved the novel exploration
of player and data-driven views of the attributes and effects of stroke heaviness and then
investigation of the effect of incoming shot characteristics (i.e., speed, spin, landing
depth) on aspects of on-court hitting performance (i.e., player impact, return stroke
quality). Investigating the concept of stroke heaviness highlighted the complexity of this
style of shot-making, while further examination of the influence of incoming shot speed
and spin on player impact and ball-striking revealed that producing a consistent contact
point and return stroke was outside of a player’s full control.
To summarise, developing a method to accurately estimate ball spin from ball-
tracking data allowed this thesis to extend current knowledge on the influence of
incoming shot characteristics on aspects of performance during Grand Slam matches.
Accordingly this thesis provides coaches and players with a method to estimate spin in
practice and match contexts and highlights how shot characteristics can be varied to
influence an opponent’s contact point and the quality of their next shot.
iv
STUDENT DECLARATION
I, Olivia Cant, declare that the PhD thesis entitled ‘Exploring the effects of ball speed and
spin in Grand Slam tennis match-play’ is no more than 80,000 words in length including
quotes and exclusive of tables, figures, appendices, bibliography, references and
footnotes. This thesis contains no material that has been submitted previously, in whole
or in part, for the award of any other academic degree or diploma. Except where otherwise
indicated, this thesis is my own work.
I have conducted my research in alignment with the Australian Code for the Responsible
Conduct of Research and Victoria University’s Higher Degree by Research Policy and
Procedures.
Signature: Date: 30th December 2020
v
ACKNOWLEDGEMENTS
What a journey the last four years have been, one that definitely would not have
been possible without the help and support of many people.
Firstly, thank you to my supervisors – Machar, Steph and Damian – without all of
your knowledge and guidance this thesis would not have been completed. Machar, thank
you for allowing me to complete my PhD at Tennis Australia and the numerous
opportunities and experiences you have provided me outside of this thesis. I am so
grateful to have had you as a supervisor and for the endless ideas, feedback and edits you
have provided to make this thesis what it is. Steph, thank you for all of your help
throughout this process, especially with the data analysis. I have learnt so much from you
and I appreciate all of the time you have taken to explain everything to me and your
patience in answering my endless questions, which I am sure were at times repetitive.
Thank you, Damo, for your assistance, especially with everything ethics and Candidature
related. I am grateful for your support over the last few years.
I would also like to acknowledge and thank Rod Cross, without your expertise
and help on the first study in this thesis the others would not have been possible. I
appreciate your willingness to help, your patience and for your quick responses to the
many questions I have had.
Lyndon and Molly, I can’t imagine the last four years without you both and I am
so grateful for your friendship and for making this journey such a memorable one. Thank
you for the endless laughs, dealing with my stress and for all your help along the way.
Thank you to Victoria University and Tennis Australia for providing me the
opportunity to conduct this research and to the staff and players at Tennis Australia who
participated in this research and made it possible. I would also like to thank the many

vi
staff and PhD students at Tennis Australia who I have met along the way for their genuine
interest and willingness to help.
Finally, a massive thank you to my family for your continual encouragement and
support through what was at times a stressful journey. Thank you for always believing in
me and supporting me in whatever I do. I wouldn’t be where I am without you.
vii
LIST OF PUBLICATIONS AND PRESENTATIONS
The following work has been published (or submitted for publication) in peer reviewed
journals and/or presented at relevant scientific and coaching conferences.
THESIS PUBLICATIONS
CHAPTER 3: Cant, O., Kovalchik, S., Cross, R., Reid, M. (2019). Validation of ball
spin estimates in tennis from multi-camera tracking data. Journal of Sports Sciences,
38(3), 296-303, https://doi.org/10.1080/02640414.2019.1697189
CHAPTER 4: Cant, O., Kovalchik, S., Reid, M. (2020). A mixed methods approach to
investigating heaviness in professional tennis. Submitted to PLoS ONE.
CHAPTER 5: Cant, O., Kovalchik, S., Reid, M. (2020). In the battle for time and space,
how early and consistently do professional tennis players intercept the ball. Currently
under review in Journal of Sports Sciences.
CHAPTER 6: Cant, O., Kovalchik, S., Reid, M. (2020). Modelling the effect of
incoming shot trajectories and impact positions on the quality of a player’s ball-striking.
Submitted to PLoS ONE.
viii
CONFERENCE PRESENTATIONS
Cant, O., Kovalchik, S., Cross, R., Reid, M. (2019). Using tracking technology to
estimate ball spin in tennis. Presented at the 37th annual conference of the International
Society of Biomechanics in Sports, Ohio, USA.
Cant, O. (2019). “What is stroke heaviness?”. Presented at the 2019 Grand Slam
Coaches’ Conference, Melbourne, Australia.
Cant, O. (2019). “What is stroke heaviness? And what does it mean for performance and
injury”. Presented at the 2018 Tennis Australia High Performance Workshop, Canberra,
Australia.

ix
TABLE OF CONTENTS
ABSTRACT.. ................................................................................................................... ii
STUDENT DECLARATION ........................................................................................ iv
ACKNOWLEDGEMENTS ........................................................................................... v
LIST OF PUBLICATIONS AND PRESENTATIONS ............................................. vii
TABLE OF CONTENTS .............................................................................................. ix
LIST OF FIGURES ...................................................................................................... xv
LIST OF TABLES ..................................................................................................... xviii
LIST OF ABBREVIATIONS ...................................................................................... xx
CHAPTER 1 INTRODUCTION AND OVERVIEW OF THESIS ............................ 1
1.1 Introduction ............................................................................................................. 2
1.2 Aims of the thesis .................................................................................................... 4
1.2.1 General aim ...................................................................................................... 4
1.2.2 Specific aims .................................................................................................... 4
1.3 Chapter organisation ............................................................................................... 5
CHAPTER 2 REVIEW OF LITERATURE ................................................................ 8
2.1 Introduction ............................................................................................................. 9
2.2 Projectile motion models in sport ......................................................................... 10
2.3 Use of technology to measure ball speed and spin in sport .................................. 13
2.3.1 Radar .............................................................................................................. 13
2.3.2 High-speed vision .......................................................................................... 14
x
2.3.3 Three-dimensional motion analysis ............................................................... 15
2.3.4 Instrumented sports equipment ...................................................................... 16
2.3.5 Computer vision ............................................................................................. 17
2.3.5.1 Hawk-Eye ............................................................................................... 17
2.3.5.2 Hawk-Eye specific application for measuring ball spin ......................... 19
2.4 Why shot speed, and its measurement, is important in tennis .............................. 19
2.4.1 Relationship between serve speed and point or match outcome .................... 20
2.4.2 Relationship between serve-return and groundstroke speed and point outcome
................................................................................................................................. 21
2.4.3 Relationship between ball speed and competition level ................................ 22
2.5 Why shot spin, and its measurement, is important in tennis ................................. 23
2.5.1 Ball spin for tactical variation ........................................................................ 24
2.5.2 Relationship between ball spin and point outcome ........................................ 24
2.5.3 Relationship between ball spin, the post-bounce trajectory and player impact
................................................................................................................................. 25
2.6 The complex interaction and effects of ball speed and spin in tennis .................. 27
2.6.1 Understanding beyond the independent analysis of ball speed and spin ....... 27
2.6.2 The concept of stroke heaviness .................................................................... 28
2.6.3 The effect on contact point: Impact height .................................................... 29
2.6.4 The effect on contact point: Impact depth ..................................................... 31
2.7 Summary ............................................................................................................... 33
CHAPTER 3 VALIDATION OF BALL SPIN ESTIMATES IN TENNIS FROM
MULTI-CAMERA TRACKING DATA .................................................................... 35
xi
3.1 Abstract ................................................................................................................. 36
3.2 Introduction ........................................................................................................... 37
3.3 Methods ................................................................................................................. 39
3.3.1 Experimental setup ......................................................................................... 39
3.3.2 Data collection ............................................................................................... 40
3.3.3 Data processing .............................................................................................. 40
3.3.3.1 Hawk-Eye validation .............................................................................. 41
3.3.3.2 Two-dimensional trajectory model ......................................................... 41
3.3.3.3 Three-dimensional trajectory model ....................................................... 43
3.3.4 Statistical analysis .......................................................................................... 43
3.4 Results ................................................................................................................... 44
3.4.1 Hawk-Eye ball spin validation ....................................................................... 44
3.4.2 Two-dimensional trajectory model ................................................................ 45
3.4.2.1 CD and CL estimation .............................................................................. 45
3.4.2.2 Ball spin estimation ................................................................................. 46
3.4.2.3 Ball trajectory model validation .............................................................. 47
3.4.3 Hawk-Eye vs. ball trajectory model ............................................................... 50
3.4.4 Three-dimensional trajectory model .............................................................. 50
3.5 Discussion ............................................................................................................. 51
3.6 Conclusion ............................................................................................................ 54
CHAPTER 4 A MIXED METHODS APPROACH TO INVESTIGATING
HEAVINESS IN PROFESSIONAL TENNIS ............................................................ 55
4.1 Abstract ................................................................................................................. 56
xii
4.2 Introduction ........................................................................................................... 57
4.3 Methods ................................................................................................................. 59
4.3.1 Survey ............................................................................................................ 59
4.3.2 Development of heaviness measure ............................................................... 61
4.3.2.1 Participants .............................................................................................. 61
4.3.2.2 Pre-processing and feature engineering .................................................. 61
4.3.3 Statistical analysis .......................................................................................... 62
4.4 Results ................................................................................................................... 64
4.4.1 Survey ............................................................................................................ 64
4.4.2 Heaviness measure ......................................................................................... 65
4.5 Discussion ............................................................................................................. 68
4.6 Conclusion ............................................................................................................ 73
CHAPTER 5 HOW TENNIS PLAYERS ADJUST IMPACT CONDITIONS IN
THE BATTLE FOR TIME AND SPACE .................................................................. 74
5.1 Abstract ................................................................................................................. 75
5.2 Introduction ........................................................................................................... 76
5.3 Methods ................................................................................................................. 78
5.3.1 Participants ..................................................................................................... 78
5.3.2 Pre-processing and feature engineering ......................................................... 78
5.3.3 Statistical analysis .......................................................................................... 80
5.4 Results ................................................................................................................... 85
5.4.1 Serve-returns: Effect of incoming shot characteristics .................................. 85
xiii
5.4.2 Groundstrokes: Effect of incoming shot characteristics ................................ 87
5.4.3 Gender comparison ........................................................................................ 89
5.4.4 Player ranking ................................................................................................ 92
5.4.5 Strike zones .................................................................................................... 93
5.4.6 Player-specific impact .................................................................................... 94
5.5 Discussion ............................................................................................................. 94
5.5.1 Serve-return impact ........................................................................................ 95
5.5.2 Groundstroke impact ...................................................................................... 96
5.5.3 Player ranking ................................................................................................ 98
5.5.4 Player-specific impact .................................................................................... 98
5.5.5 Limitations ..................................................................................................... 99
5.6 Conclusion .......................................................................................................... 100
CHAPTER 6 MODELLING THE EFFECT OF INCOMING SHOT
TRAJECTORIES AND IMPACT POSITIONS ON THE QUALITY OF A
PLAYER’S BALL-STRIKING ................................................................................. 102
6.1 Abstract ............................................................................................................... 103
6.2 Introduction ......................................................................................................... 104
6.3 Methods ............................................................................................................... 105
6.3.1 Participants ................................................................................................... 105
6.3.2 Pre-processing and feature engineering ....................................................... 106
6.3.3 Statistical analysis ........................................................................................ 107
6.4 Results ................................................................................................................. 112
6.4.1 Serve-returns: Effect of incoming shot characteristics ................................ 112
xiv
6.4.2 Serve-returns: Effect of impact characteristics ............................................ 114
6.4.3 Groundstrokes: Effect of incoming shot characteristics .............................. 117
6.4.4 Groundstrokes: Effect of impact characteristics .......................................... 119
6.5 Discussion ........................................................................................................... 122
6.5.1 Serve-returns ................................................................................................ 122
6.5.2 Groundstrokes .............................................................................................. 124
6.5.3 Limitations ................................................................................................... 126
6.6 Conclusion .......................................................................................................... 127
CHAPTER 7 GENERAL DISCUSSION .................................................................. 128
7.1 General discussion .............................................................................................. 129
7.2 Main findings ...................................................................................................... 129
7.3 Theoretical and methodological implications ..................................................... 131
7.4 Practical implications .......................................................................................... 134
7.5 Limitations of this thesis ..................................................................................... 136
7.6 Future directions ................................................................................................. 139
7.7 Concluding remark .............................................................................................. 142
CHAPTER 8 REFERENCES .................................................................................... 143
CHAPTER 9 APPENDICES ..................................................................................... 164
xv
LIST OF FIGURES
Figure 2.1. Forces acting on a tennis ball in flight. The drag force (FD) acts in the opposite
direction to the ball’s motion, the lift force (FL) acts at right angles to the ball’s direction
of motion and mg represents the gravitational force. ..................................................... 12
Figure 3.1. Experimental setup: a) setup for collection of topspin and backspin trials
(birds-eye view), b) setup for collection of sidespin trials (side-on view), c) markings
drawn on each ball used to calculate spin rate. ............................................................... 40
Figure 3.2. Bland-Altman plot for high-speed vision spin rates compared to Hawk-Eye
ball spin rate estimates. ................................................................................................... 45
Figure 3.3. Spin parameter as an average to 6.40 m against best fit CL and CD. Influential
data points identified by Cook’s distance and subsequently excluded when fitting a
regression line are circled. .............................................................................................. 46
Figure 3.4. Bland-Altman plot for high-speed vision spin rates compared to estimates
from the best-performing ball trajectory model (nmbk, CL = 0.505*Sp, error = height +
vx + vz). .......................................................................................................................... 48
Figure 4.1. Ratings (mean ± SD) for the perceived characteristics of heavy strokes. ... 65
Figure 4.2. Effect of ball speed and spin on the out-of-bounce angle of a forehand, shaded
areas represent the 95% CI. Spin represents the median value for the 1st, 3rd, 5th, 7th and
9th deciles of spin. ........................................................................................................... 66
Figure 4.3. Effect of ball speed and spin on forehand impact (depth, height and total
change in impact), shaded areas represent the 95% CI. Spin represents the median value
for the 1st, 3rd, 5th, 7th and 9th deciles of spin. .................................................................. 68
xvi
Figure 5.1. Effect of serve speed and spin on the proportion of deuce court topspin
forehand serve-returns impacted on the rise, shading represents the 95% CI. Spin
represents the median value for the 3rd, 5th and 8th deciles of spin. ................................ 86
Figure 5.2. Effect of landing depth and incoming shot on the proportion of deuce court
topspin forehand serve-returns and topspin forehand groundstrokes impacted on the rise
(shading represents the 95% CI). .................................................................................... 87
Figure 5.3. Effect of groundstroke speed and spin on the proportion of forehand and
backhand replies impacted on the rise during topspin rallies, shading represents the 95%
CI. Spin represents the median value for the 3rd, 5th and 8th deciles of spin. .................. 89
Figure 5.4. Effect of gender on six impact characteristics of the topspin forehand serve-
return (shading represents the 95% CI). ......................................................................... 91
Figure 5.5. Effect of gender on six groundstroke impact characteristics (point range
represents the 95% CI). ................................................................................................... 92
Figure 5.6. Player estimates (95% CI) for the proportion of first serve-returns, second
serve-returns and groundstrokes impacted on the rise. ................................................... 94
Figure 6.1. Estimated change in measures of serve-return quality with a 0.5 SD increase
in serve landing depth, speed or spin. ........................................................................... 113
Figure 6.2. Estimated change in measures of return quality with a 0.5 SD increase in
groundstroke landing depth, speed or spin. .................................................................. 119
Figure A.1. Effect of ball speed and spin on the out-of-bounce angle of a backhand,
shaded areas represent the 95% CI. Spin represents the median value for the 1st, 3rd, 5th,
7th and 9th deciles of spin. .............................................................................................. 172
xvii
Figure A.2. Effect of ball speed and spin on backhand impact (depth, height and total
change in impact), shaded areas represent the 95% CI. Spin represents the median value
for the 1st, 3rd, 5th, 7th and 9th deciles of spin. ................................................................ 173
Figure A.3. Effect of serve speed and spin on the proportion of ad court topspin backhand
serve-returns impacted on the rise, shading represents the 95% CI. Spin represents the
median value for the 3rd, 5th and 8th deciles of spin. ..................................................... 175
Figure A.4. Effect of landing depth and incoming shot on the proportion of ad court
topspin backhand serve-returns and topspin backhand groundstrokes impacted on the rise
(shading represents the 95% CI). .................................................................................. 176
Figure A.5. Effect of gender on six impact characteristics of the topspin backhand serve-
return (shading represents the 95% CI). ....................................................................... 177
Figure A.6. Estimated change in measures of serve-return quality with a 0.5 SD increase
in serve landing depth, speed or spin. ........................................................................... 179
Figure A.7. Estimated change in measures of return quality with a 0.5 SD increase in
groundstroke landing depth, speed or spin. ................................................................. 181
xviii
LIST OF TABLES
Table 3.1. Comparison of Hawk-Eye ball spin estimates to high-speed vision. ............ 45
Table 3.2. Errors, optimisers and CL calculations used to estimate spin. ...................... 47
Table 3.3. Comparison of ball trajectory model spin estimates to high-speed vision,
sidespin trials are included in analysis. ........................................................................... 49
Table 3.4. Comparison of ball trajectory model spin estimates to high-speed vision,
sidespin trials are excluded from analysis. ..................................................................... 50
Table 3.5. Example of spin estimates from the three-dimensional model compared to the
high-speed vision spin rate and two-dimensional model estimate. ................................. 51
Table 4.1. List of characteristics and outcomes of heavy shots (left column) and
performance variables derived from Hawk-Eye (right column). .................................... 61
Table 5.1. Variables calculated and extracted from Hawk-Eye ball trajectories and point
level files. ........................................................................................................................ 79
Table 5.2. Horizontal and vertical accuracy of predicted peak height (m) for serve and
groundstroke trajectories. ................................................................................................ 80
Table 5.3. Subgroups excluded from models due to insufficient sample size. .............. 83
Table 5.4. Improvement in Akaike information criterion for interaction compared to
baseline models. .............................................................................................................. 84
Table 6.1. Variables calculated and extracted from Hawk-Eye ball trajectories and point
level files. ...................................................................................................................... 107
Table 6.2. Subgroups excluded from models due to insufficient sample size. Models were
fit separately for each impact measure, thus each row represents one model. ............. 110
Table 6.3. Improvement in Akaike information criterion for interaction compared to
baseline models. ............................................................................................................ 111

xix
Table 6.4. Effect of impact (on the rise, on the drop) on four measures of serve-return
quality. .......................................................................................................................... 116
Table 6.5. Effect of impact (on the rise, on the drop) on four measure of groundstroke
quality. .......................................................................................................................... 121
Table A.1. Effect of impact (on the rise, on the drop) on four measures of serve-return
quality. .......................................................................................................................... 180
xx
LIST OF ABBREVIATIONS
CD Drag coefficient
CL Lift coefficient
CI Confidence interval
OTD On the drop
OTR On the rise
RMSE Root mean square error
RPM Revolutions per minute
SD Standard deviation
Sp Spin parameter

CHAPTER 1 INTRODUCTION AND OVERVIEW OF THESIS 1
CHAPTER 1
INTRODUCTION AND OVERVIEW OF THESIS
CHAPTER 1 INTRODUCTION AND OVERVIEW OF THESIS 2
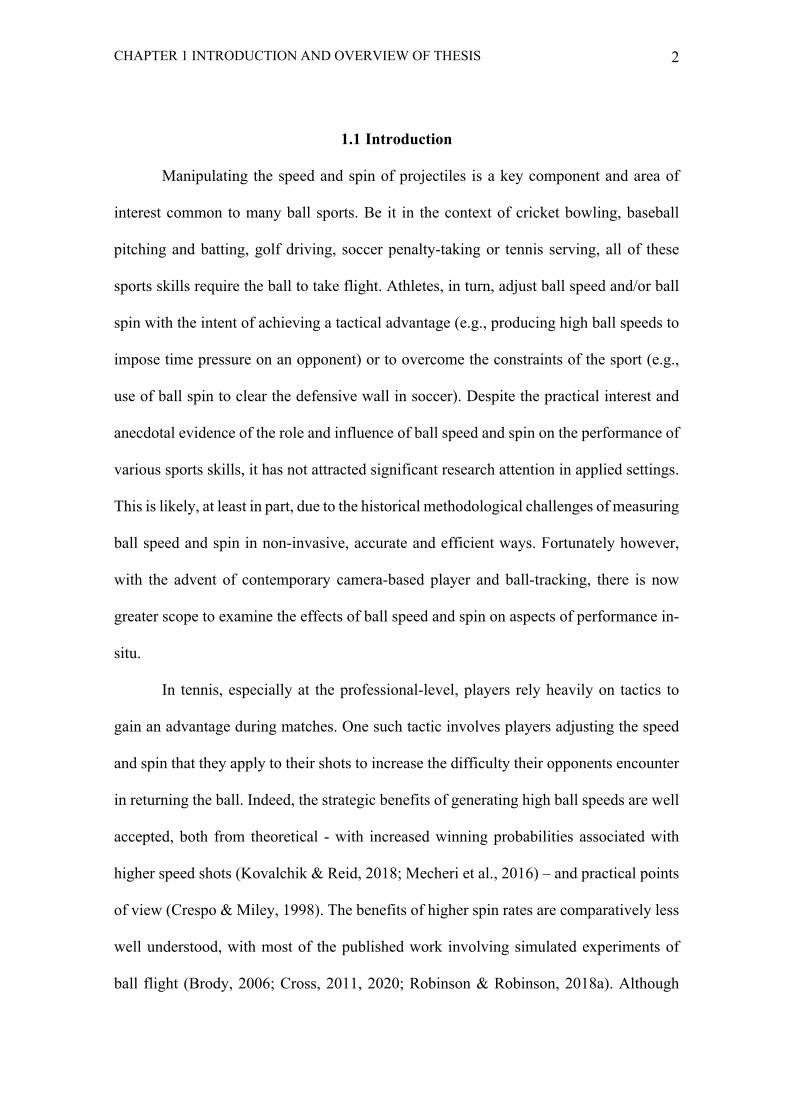
1.1 Introduction
Manipulating the speed and spin of projectiles is a key component and area of
interest common to many ball sports. Be it in the context of cricket bowling, baseball
pitching and batting, golf driving, soccer penalty-taking or tennis serving, all of these
sports skills require the ball to take flight. Athletes, in turn, adjust ball speed and/or ball
spin with the intent of achieving a tactical advantage (e.g., producing high ball speeds to
impose time pressure on an opponent) or to overcome the constraints of the sport (e.g.,
use of ball spin to clear the defensive wall in soccer). Despite the practical interest and
anecdotal evidence of the role and influence of ball speed and spin on the performance of
various sports skills, it has not attracted significant research attention in applied settings.
This is likely, at least in part, due to the historical methodological challenges of measuring
ball speed and spin in non-invasive, accurate and efficient ways. Fortunately however,
with the advent of contemporary camera-based player and ball-tracking, there is now
greater scope to examine the effects of ball speed and spin on aspects of performance in-
situ.
In tennis, especially at the professional-level, players rely heavily on tactics to
gain an advantage during matches. One such tactic involves players adjusting the speed
and spin that they apply to their shots to increase the difficulty their opponents encounter
in returning the ball. Indeed, the strategic benefits of generating high ball speeds are well
accepted, both from theoretical - with increased winning probabilities associated with
higher speed shots (Kovalchik & Reid, 2018; Mecheri et al., 2016) – and practical points
of view (Crespo & Miley, 1998). The benefits of higher spin rates are comparatively less
well understood, with most of the published work involving simulated experiments of
ball flight (Brody, 2006; Cross, 2011, 2020; Robinson & Robinson, 2018a). Although
CHAPTER 1 INTRODUCTION AND OVERVIEW OF THESIS 3
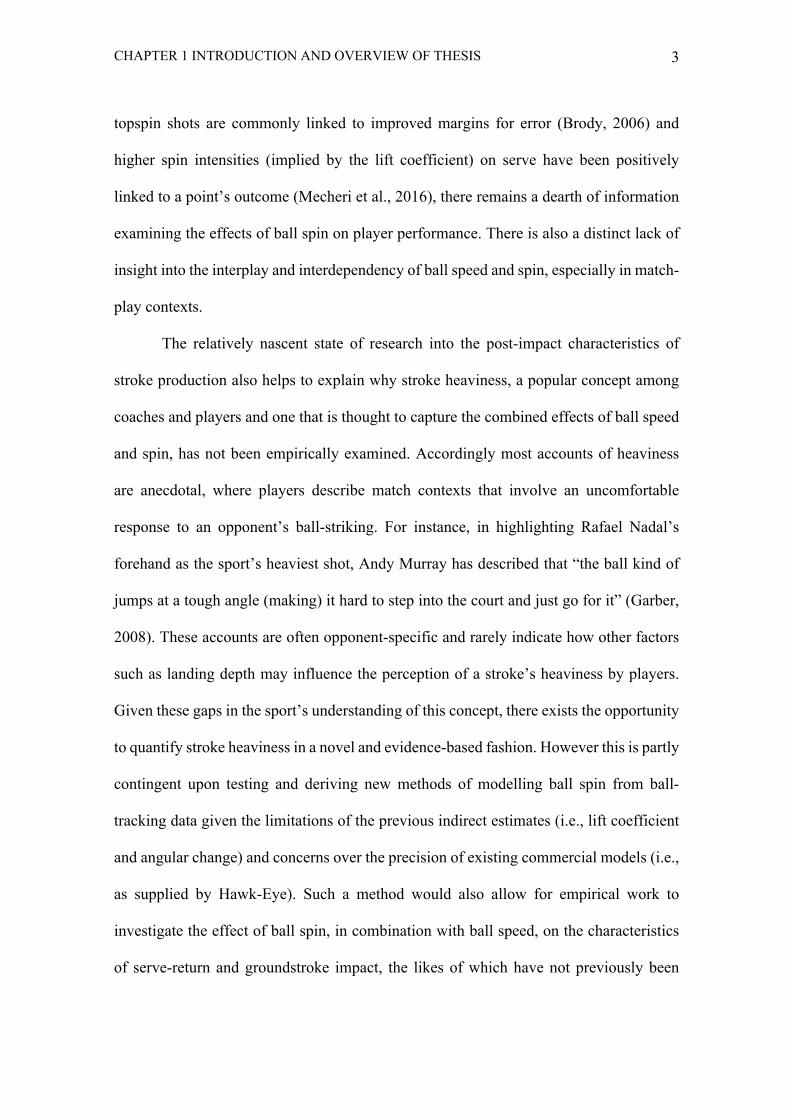
topspin shots are commonly linked to improved margins for error (Brody, 2006) and
higher spin intensities (implied by the lift coefficient) on serve have been positively
linked to a point’s outcome (Mecheri et al., 2016), there remains a dearth of information
examining the effects of ball spin on player performance. There is also a distinct lack of
insight into the interplay and interdependency of ball speed and spin, especially in match-
play contexts.
The relatively nascent state of research into the post-impact characteristics of
stroke production also helps to explain why stroke heaviness, a popular concept among
coaches and players and one that is thought to capture the combined effects of ball speed
and spin, has not been empirically examined. Accordingly most accounts of heaviness
are anecdotal, where players describe match contexts that involve an uncomfortable
response to an opponent’s ball-striking. For instance, in highlighting Rafael Nadal’s
forehand as the sport’s heaviest shot, Andy Murray has described that “the ball kind of
jumps at a tough angle (making) it hard to step into the court and just go for it” (Garber,
2008). These accounts are often opponent-specific and rarely indicate how other factors
such as landing depth may influence the perception of a stroke’s heaviness by players.
Given these gaps in the sport’s understanding of this concept, there exists the opportunity
to quantify stroke heaviness in a novel and evidence-based fashion. However this is partly
contingent upon testing and deriving new methods of modelling ball spin from ball-
tracking data given the limitations of the previous indirect estimates (i.e., lift coefficient
and angular change) and concerns over the precision of existing commercial models (i.e.,
as supplied by Hawk-Eye). Such a method would also allow for empirical work to
investigate the effect of ball spin, in combination with ball speed, on the characteristics
of serve-return and groundstroke impact, the likes of which have not previously been
CHAPTER 1 INTRODUCTION AND OVERVIEW OF THESIS 4
examined despite high levels of practical interest (United States Tennis Association,
2004).
Player and ball-tracking data from professional tennis tournaments present a
unique opportunity to address these previous research gaps, including the effect of ball
speed and spin, along with other contextual factors, on player performance. With this in
mind, this thesis will first validate methods to estimate ball spin from Hawk-Eye tracking
technology before exploring the quantification of heaviness and then investigating the
combined effects of ball speed and spin on aspects of on-court hitting performance.
1.2 Aims of the thesis
1.2.1 General aim
This thesis aims to use data recorded from Hawk-Eye tracking technology to
better understand the effect of ball speed and spin on aspects of on-court hitting
performance.
1.2.2 Specific aims
1. Examine the accuracy of methods to estimate ball spin using multi-camera
tracking technology.
2. Develop a method to measure stroke heaviness utilising available technology that
can be implemented in match-play and practice settings.
3. Describe the impact characteristics relative to peak bounce height and player
stature in a novel way.
CHAPTER 1 INTRODUCTION AND OVERVIEW OF THESIS 5
4. Investigate the effect of the incoming shot characteristics (speed, spin, landing
depth), gender and ranking on a player’s contact point during Grand Slam
matches.
5. Examine the effect of the incoming shot characteristics (speed, spin, landing
depth) and player impact (impact relative to peak height, impact height) on
measures of return stroke quality (where ‘quality’ refers to the speed, spin, time
pressure and error rate of the return).
1.3 Chapter organisation
Chapter 1 provided an introduction to the thesis topic while also detailing the
general and specific aims of the thesis.
Chapter 2 will provide a review of the relevant literature examining the effects of
ball speed and spin on player performance. Additionally, this chapter will review methods
utilised to measure and examine ball trajectory characteristics such as ball speed and spin
in sporting contexts like baseball. These methods will be considered in terms of their
suitability for use during tennis matches.
Chapters 3 to 6 represent the experimental chapters of this thesis. These chapters
have been prepared with the intention of publication in peer-reviewed journals (as per the
list of publications on page vii). Chapters are presented in the form in which they have
been submitted for publication or are published, thus, there is some repetition in the
content of these chapters.
Chapter 3 validates methods to estimate ball spin (rate and direction) from multi-
camera tracking technology (Hawk-Eye). The accuracy of ball spin estimates from Hawk-
Eye’s proprietary measure are compared to an alternate method which applies a
CHAPTER 1 INTRODUCTION AND OVERVIEW OF THESIS 6
theoretical ball trajectory model to recorded ball trajectories. This chapter finds a
theoretical ball trajectory model can estimate spin rate and direction more accurately than
Hawk-Eye’s proprietary measure. This chapter also reveals that both methods tend to
estimate spin rates >4500 RPM with the highest error and shows how the validated
method can be extended to a three-dimensional ball trajectory model to provide spin
estimates more representative of typical tennis shots. These findings inform how ball spin
is estimated from Hawk-Eye data collected during Grand Slam matches in subsequent
chapters.
Despite players, coaches and commentators commonly referencing the heaviness
of a player’s ball-striking, this concept, to our knowledge, had not previously been
empirically examined. Thus, Chapter 4 involved a sample of professional players being
surveyed to identify their perception of heavy strokes, with survey results subsequently
used in combination with ball trajectories from Grand Slam matches to inform a data-
driven approach to quantify heaviness. This chapter provides a consensus view on the
characteristics and outcomes of heavy strokes among a sample of tennis experts and
reports the performance of a variety of models to explain this phenomena using ball-
tracking data. Given the difficulty in deriving a single measure of heaviness, the chapters
that follow consider the interaction of a shot’s speed and spin on features of an opponent’s
ball-striking.
Chapter 5 describes groundstroke and serve-return impact during Grand Slam
matches by examining how a range of factors (i.e., incoming shot characteristics, gender,
player ranking) influence the contact point of players. A number of impact characteristics
are investigated, including, where the ball is impacted relative to peak height, impact
depth and impact height. Shot, gender, ranking and player effects were observed across
CHAPTER 1 INTRODUCTION AND OVERVIEW OF THESIS 7
measures of serve-return and groundstroke impact during Australian Open singles
matches. Results highlighted that the impact point of players may be dictated by a
multitude of factors and outside of their full control.
The effects of the incoming shot’s characteristics and the receiving player’s
impact on the subsequent shot’s quality are examined in Chapter 6. This chapter revealed
that incoming shot characteristics variously effect a player’s serve-return and
groundstroke quality, with effects varying by player gender, return type and impact (on
the rise, on the drop). Results from this chapter also provided insight into how players
can vary their ball-striking to influence the quality of opponents’ returns. Additionally,
this chapter shows players likely vary their contact point based on stylistic preferences.
Chapter 7 provides a summary of key findings from this thesis and then identifies
the theoretical, methodological and practical implications from this body of work. This
chapter culminates by detailing the limitations of the course of studies while also
highlighting areas for future investigation.

CHAPTER 2 REVIEW OF LITERATURE 8
CHAPTER 2
REVIEW OF LITERATURE
CHAPTER 2 REVIEW OF LITERATURE 9
2.1 Introduction
The motion of projectiles has long been a focus in sporting contexts, including,
pitches in baseball, free kicks in soccer, deliveries in cricket, drive length in golf and
strokes in tennis. Related empirical research in many of these sports has largely focused
on the aerodynamic properties of the ball (Alam et al., 2011; Alaways & Hubbard, 2001;
Carré et al., 2002; Cross & Lindsey, 2014; Sayers & Hill, 1999), general performance
characteristics of different skills (pitches, shots, deliveries) (Alcock, Gilleard, Brown, et
al., 2012; Jinji & Sakurai, 2006; Sakurai et al., 2013; Spratford et al., 2018) as well as the
biomechanics that underpin movement in those skills (Alcock, Gilleard, Hunter, et al.,
2012; Chin et al., 2009; Reid et al., 2007; Stodden et al., 2005). Unusually, despite the
interest in and popular commentary on the speed, spin and trajectory of different
projectiles, which essentially represent the outcome of most of these sporting skills,
relatively little is known in an applied sense. While elite athletes manipulate ball speed
and spin relatively routinely, the nature of these effects on performance outcomes or the
opposition remains the source of considerable speculative but not research interest. One
of the barriers to researchers learning more about the characteristics and effects of ball
flight in match-play has been its onerous measurement. However, with the advent of
sophisticated computer vision (tracking technologies) in professional-level sport, in-situ
ball flight is thought to be tracked precisely and at scale, which creates opportunities for
its inter-relationships with player and other contextual factors to be scrutinised.
The interest in shot trajectories is very evident in tennis, where ball speed has been
a prevailing focus (Capel-Davies & Spurr, 2019; Landlinger et al., 2012; Vaverka &
Cernosek, 2013). Ball speed is considered all important in the sport, most notably due to
its association with the sport’s ultimate goal of winning points (Kovalchik & Reid, 2018;
CHAPTER 2 REVIEW OF LITERATURE 10
Mecheri et al., 2016). As such, it has received considerable research attention, including,
the analysis of underpinning stroke mechanics (Elliott et al., 1997; Elliott et al., 1995;
Martin et al., 2013; Reid & Elliott, 2002; Reid et al., 2008) and intrinsic factors (i.e.,
player height, fatigue, gender) (Capel-Davies & Spurr, 2019; Cross, 2014; Maquirriain et
al., 2016; Martin et al., 2016; Reid et al., 2016; Söğüt, 2018; Vaverka & Cernosek, 2013)
related to the production of ball speed. However, ball speed represents only one aspect of
ball-striking, with players directing shots to different parts of the court and also generating
ball spin. Interestingly, investigations into the characteristics and effects of ball spin have
been comparatively sparse, especially during match-play. This is likely the historical
consequence of spin’s measurement being a computational challenge, meaning that the
datasets available for analysis are limited. Fortunately, as abovementioned, with the
advent of modern technologies (i.e., ball-tracking systems), tracking data has become
increasingly accessible, paving the way for heightened understanding of not just the
effects of ball spin but the interplay between ball speed and spin in-situ.
The following review will examine methods which have been used to model or
measure ball flight, including ball speed and spin, in sporting contexts. It then critiques
the literature that has examined the link between ball speed and/or ball spin and sports
performance, specifically in tennis. The review will finally turn to scrutinising the limited
research that has considered the combined effect of ball speed and spin in ball-striking.
2.2 Projectile motion models in sport
Ball trajectory models have previously been utilised to examine the effect of
launch parameters, including ball speed and spin, on aspects of the ball’s flight in
numerous sporting contexts. Specific examples of the application of such models include,
examining the effect of ball speed and/or ball spin on the height and range of batted
CHAPTER 2 REVIEW OF LITERATURE 11
baseballs (Nathan, 2008), the bounce distance and lateral movement in cricket swing
bowling (Robinson & Robinson, 2015) and the free kick in soccer (Carré et al., 2002),
including consideration for the defensive wall (Bray & Kerwin, 2003). Modelled
trajectories have similarly been utilised in tennis, where their application has included
examining the effect of shot speed and/or spin on the ball’s landing point (horizontal and
lateral), landing speed and trajectory shape (e.g., amount of lateral movement) (Cross,
2020; Robinson & Robinson, 2018a).
Trajectory models can simulate a ball’s trajectory based on its initial launch
parameters and by incorporating the gravitational and aerodynamic (drag, lift) forces
acting on it through flight (Figure 2.1). The magnitude of the drag force (FD) is quantified
by FD = !"CD!Av2 and the magnitude of the lift force (FL) by FL =
!"CL!Av2, where ! is
the air density, A is the ball’s cross-sectional area and CD and CL are the drag and lift
coefficients, respectively (Cross & Lindsey, 2014). A ball’s two-dimensional motion (i.e.,
horizontal (x) and vertical (z) plane) can be described as (Cross & Lindsey, 2014):
"#$# #%& = −*$+,-. −*%-/0. (1)
"#$& #%& = *%+,-. −*$-/0. − "1 (2)
which can be written as
#$# #%& = −2$(4$$# + 4%$&) (3)
#$& #%& = 2$(4%$# − 4$$&) − 1 (4)
In equations (3) and (4), 2 = !" !78"/", where 8 and " represent the ball’s
radius and mass, respectively. These equations require the input of CD and CL, with the
measurement of each for a range of sport balls obtained through the use of wind tunnels
(Asai et al., 2007; Goodwill et al., 2004; Štěpánek, 1988; Watts & Ferrer, 1987) as well
CHAPTER 2 REVIEW OF LITERATURE 12
as through identifying the best fit values for trajectories recorded using motion analysis
or high-speed cameras (Alaways & Hubbard, 2001; Cross & Lindsey, 2014; Goff &
Carré, 2009; Nathan, 2008).
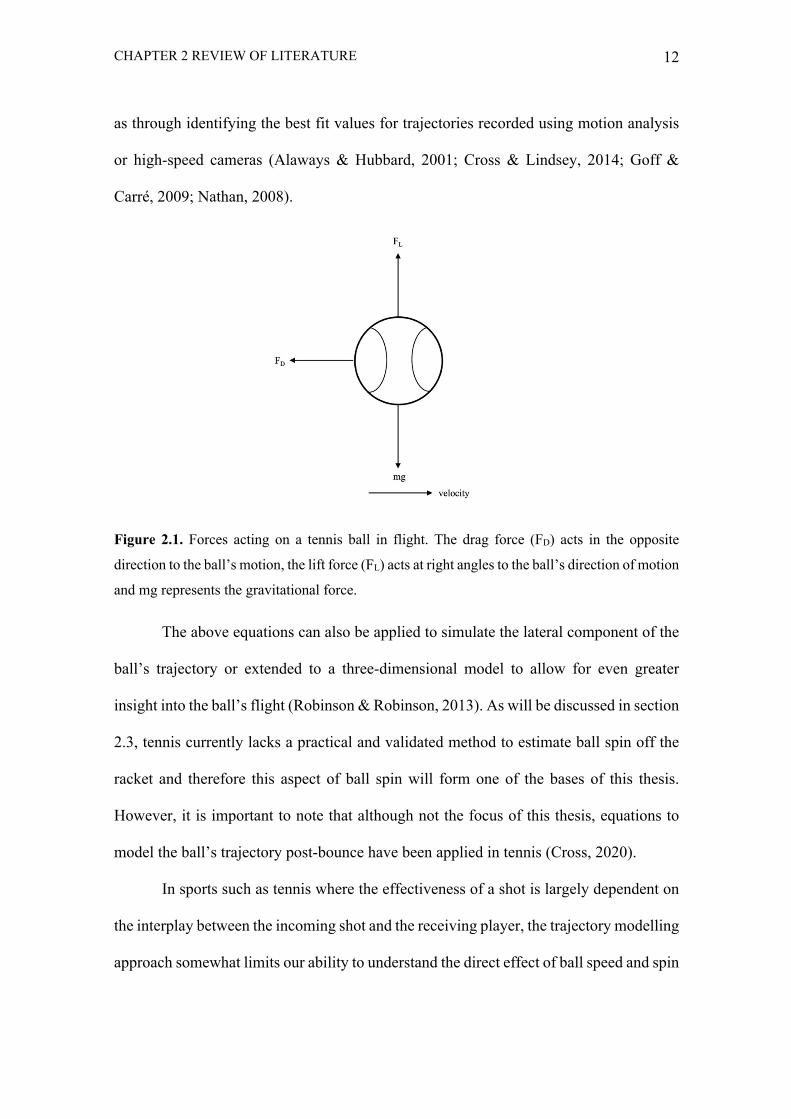
Figure 2.1. Forces acting on a tennis ball in flight. The drag force (FD) acts in the opposite
direction to the ball’s motion, the lift force (FL) acts at right angles to the ball’s direction of motion
and mg represents the gravitational force.
The above equations can also be applied to simulate the lateral component of the
ball’s trajectory or extended to a three-dimensional model to allow for even greater
insight into the ball’s flight (Robinson & Robinson, 2013). As will be discussed in section
2.3, tennis currently lacks a practical and validated method to estimate ball spin off the
racket and therefore this aspect of ball spin will form one of the bases of this thesis.
However, it is important to note that although not the focus of this thesis, equations to
model the ball’s trajectory post-bounce have been applied in tennis (Cross, 2020).
In sports such as tennis where the effectiveness of a shot is largely dependent on
the interplay between the incoming shot and the receiving player, the trajectory modelling
approach somewhat limits our ability to understand the direct effect of ball speed and spin
CHAPTER 2 REVIEW OF LITERATURE 13
on match-play performance. For instance, although ball speed and spin influence the
bounce height of shot trajectories in tennis (Cross, 2011, 2020), the subsequent effects on
the receiving player can only be presumed from these trajectory models.
2.3 Use of technology to measure ball speed and spin in sport
Various methods have been implemented to quantify ball speed and spin in ball
sports. However a number of these are intrusive, historically limiting their use to
controlled testing and/or practice contexts. With advances in modern technology, there is
greater scope to quantify both aspects of the ball’s flight during matches or games. This
section will review approaches to quantify ball speed and spin in sporting contexts, with
a particular focus on their suitability for use during tennis matches.
2.3.1 Radar
Radar speed guns are commonly implemented in both research and applied
sporting contexts to measure ball speed through Doppler radar technology. This
technology is commonplace during professional tennis matches, where it is implemented
to measure serve speed. These speeds are displayed on electronic scoreboards on-court
and reported in summary match statistics available on tournament websites (for an
example see US Open, 2020) which are in turn a common data source for research
purposes (Fernández-García et al., 2019; Fitzpatrick et al., 2019; Katić et al., 2011; Martin
et al., 2018; O’Donoghue, 2002). During tennis matches, this technology does not record
the ball speed for shots other than the serve (e.g., serve-return, groundstrokes) and does
not measure ball spin.
TrackMan is a system that has been utilised in a number of sports, particularly
golf and baseball, where until recently it was the main system installed at Major League
CHAPTER 2 REVIEW OF LITERATURE 14
Baseball stadiums. By utilising Doppler radar technology, the system can derive a number
of metrics concerning the ball’s flight (e.g., ball speed, spin rate). A validation study on
the accuracy of TrackMan’s golf system found a median error of 0.32 km/h (lower
quartile = -0.16, upper quartile = 0.80) in ball speed and -47 revolutions per minute (RPM)
(lower quartile = -73, upper quartile = -26) in ball spin measurement, although spin
measurement error increased for the driver club at lower spin rates (~2500 RPM) (Leach
et al., 2017). Significantly, a metallic dot was added to the ball during validation to
enhance the radar signature and spin rate tracking (Leach et al., 2017). In baseball, with
the exception of a small portion of trajectories, TrackMan has also been reported to
accurately quantify the ball’s spin rate (root mean square error = 35 RPM) (Nathan et al.,
2014). This system can be used in tennis and has been found to display reasonable
agreement with gold standard speed and spin rate measurements, but to poorly estimate
the ball’s spin axis (Murata & Takahashi, 2020; Sato et al., 2017). At this stage, however,
this system is not approved for use during tennis tournaments (International Tennis
Federation, 2020).
2.3.2 High-speed vision
Ball speed and spin are also commonly measured using high-speed cameras and
a variety of related mathematical approaches. Specifically though, for ball spin to be
calculated from this data source, markings are required on the ball’s surface which can
be tracked across frames. Thus, the suitability of this approach in match or game settings
is likely dependent on the availability of markings on the ball’s surface.
In tennis, the ball’s logo serves as a marking which can be tracked in order to
determine ball revolutions. Therefore, high-speed cameras provide a non-intrusive
method to collect ball speed and spin data during tennis practice and match-play. This
CHAPTER 2 REVIEW OF LITERATURE 15
method originally required the manual analysis of vision (Goodwill et al., 2007; Kelley
et al., 2008), however, software has subsequently been developed and validated to
automatically determine ball speed as well as ball revolutions by tracking the ball’s logo
(Kelley et al., 2010). This software was found to calculate the speed of ball’s launched
from a ball machine with a mean error of -0.43 km/h (95% CI = -0.61, 1.51) compared to
light gates and, after the exclusion of an outlier, the ball’s spin rate was estimated with a
mean error of -4.68 RPM (95% CI = -15.28, 6.02) compared to manual analysis (Kelley
et al., 2010). While this method is promising due to its accuracy and non-invasive nature,
it was only validated for trajectories with speeds of 64.37 to 112.65 km/h and spin rates
of 600 to 1600 RPM, which are considerably lower than those commonly reported in
practice and match-play (Choppin et al., 2011; Goodwill et al., 2007; Kelley et al., 2008;
Reid et al., 2016). Further, these approaches to measuring ball spin require the ball’s logo
to be visible to the camera (if no other markings are added) which occurs only
sporadically (Goodwill et al., 2007; Kelley et al., 2010) as well as requiring data to be
collected manually and from specific perspectives. Likely owing to these limitations,
studies utilising this approach to describe typical spin rates during match-play have used
relatively small sample sizes. As such, a more practical and scalable method is required
to evaluate ball speed and spin during match-play.
2.3.3 Three-dimensional motion analysis
Three-dimensional motion analysis technology is utilised to measure both ball
speed and spin in sports, including cricket (Chin et al., 2009; Lindsay & Spratford, 2020;
Spratford et al., 2018), baseball (Jinji et al., 2011) and tennis (Elliott et al., 2013; Murata
& Fujii, 2014; Reid et al., 2013; Sakurai et al., 2013; Whiteside et al., 2013). These
approaches have been used to compute components of ball velocity as well as angular
CHAPTER 2 REVIEW OF LITERATURE 16
velocity vectors. In tennis, for instance, prior work has measured the horizontal velocity,
spin rate, angular velocity components and spin axis characterising different serve types
(i.e., flat, kick, slice) using a VICON motion analysis system (Sakurai et al., 2013). This
method of data collection however is intrusive, requiring a number of cameras to be
positioned around an athlete and markers to be attached to the ball. These markers may
not only affect the production of a given skill (i.e., stroke) but also the subsequent ball
trajectory (Sakurai et al., 2013). Thus, while this approach may provide an accurate
source of ball speed and spin measurements, its use is typically constrained to controlled
laboratory or testing environments.
2.3.4 Instrumented sports equipment
Instrumented sports balls which incorporate sensors (e.g., gyroscopes) have been
developed and utilised for research and training purposes in sports such as baseball
(Diamond Kinetics, n.d.; Doljin et al., 2020), cricket (Doljin & Fuss, 2015; SportCor,
n.d.) and Australian Rules Football (Fuss & Smith, 2011). Despite the addition of a
sensor, these balls have been developed to specified regulations (i.e., ball mass) and with
the same outer casing to mimic regular match and game balls. While likely providing a
useful tool to quantify ball speed and/or ball spin in a number of sports, instrumented
sports balls are not a turn-key solution in tennis and would be unlikely additions to match-
play settings given the regulations on ball specifications (International Tennis Federation,
2019) and the requirement to regularly change balls throughout professional matches (i.e.,
every 7 or 9 games). Such technology has however been incorporated into the design of
rackets/bats and wearables used by athletes more generally. These sensors have been
shown to measure the velocity of implements and balls with varying levels of precision
(Keaney & Reid, 2020; Lückemann et al., 2018; Myers et al., 2019), while the accuracy
CHAPTER 2 REVIEW OF LITERATURE 17
of spin rate estimates from these devices has not been a focus of prior validation work. In
tennis, the widespread implementation of sensors may be constrained by the fact that
sensors are often specific to a racket and/or brand and can change the inertial parameters
of a racket (Keaney & Reid, 2020).
2.3.5 Computer vision
There are a number of commercially available computer vision systems that track
ball flight in sporting contexts. Tracking data from these technologies is increasingly used
for research purposes, with the work of Whiteside et al. (2016) in examining how pitch
characteristics (e.g., ball speed) relate to success in Major League Baseball a case in point.
Such technologies can overcome some of the limitations of historical methods to studying
the effects of ball characteristics such as trajectory models. These contemporary
approaches are non-intrusive and often have multiple use cases (i.e., tracking players),
which can provide helpful additional context. The implementation of such systems in
match or game contexts in professional sport is typically determined by the sport’s
governing body. For instance, in tennis, only a limited number of systems are approved
for use (International Tennis Federation, 2020); the most common of which is Hawk-Eye
which is discussed in detail below.
2.3.5.1 Hawk-Eye
Hawk-Eye (Hawk-Eye Innovations Ltd, Basingstoke, UK), primarily
implemented as an electronic line-calling system, triangulates the position of the ball and
players through up to 10 cameras positioned around the court (Hawk-Eye Innovations,
n.d.) and provides three-dimensional cartesian coordinates of the ball as well as two-
dimensional player coordinates as a function of time. Compared to high-speed vision,
CHAPTER 2 REVIEW OF LITERATURE 18
Hawk-Eye has been reported to estimate the location of the ball’s bounce with a 2.6 mm
mean error (Hawk-Eye Innovations, n.d.). In addition to its use in officiating, Hawk-Eye
tracking data provides a valuable source of match-play information for broadcasters and
research purposes. For example, previous investigations have used player and ball-
tracking data to describe features of match-play (Kovalchik & Reid, 2017; Reid et al.,
2016; Whiteside & Reid, 2017a), predict shot and point outcomes (Wei, Lucey, Morgan,
Reid, & Sridharan, 2016; Wei, Lucey, Morgan, & Sridharan, 2016), examine ball wear
during match-play (Choppin et al., 2018), develop shot dictionaries (Kovalchik & Reid,
2018; Wei et al., 2015) and investigate the effect of serve characteristics on shot success
(Capel-Davies & Spurr, 2019; Mecheri et al., 2016; Whiteside & Reid, 2017b).
The majority of these studies have documented ball speed but few have detailed
the effect of ball spin. Those that have, have used indirect measures (e.g., lift coefficient
(Mecheri et al., 2016), angular change (percentage increase in the ball’s out-of-bounce
compared to into bounce angle) (Kovalchik & Reid, 2018)) or incorporated the effects of
ball spin by interpreting the ball’s trajectory (Wei et al., 2015). Outside of datasets from
tournament play, Krause, Farrow, et al. (2019) and Busuttil et al. (2020) have also
reported ball spin rates (revolutions over time) obtained from Hawk-Eye’s proprietary
spin measure. This measure provides an estimate of a shot’s spin rate and spin direction
(topspin, backspin), however, no information on its validity is publicly available. The
comparatively sparse attention afforded to ball spin in research would seem at least partly
due to the lack of transparency regarding the precision of Hawk-Eye’s current ball spin
measure as well as the overarching complexity of measuring ball spin in-situ. Thus, there
is scope to better understand the accuracy of the current measure as well as to explore
alternate measures to estimate ball spin from this data source.
CHAPTER 2 REVIEW OF LITERATURE 19
2.3.5.2 Hawk-Eye specific application for measuring ball spin
Spin does not directly enter into the equations presented in section 2.2 which can
be used to model the ball’s flight, however, previous research has found CL and the spin
parameter (Sp = ball radius * angular velocity / velocity) share a linear relationship
(Alaways & Hubbard, 2001; Cross & Lindsey, 2014; Goodwill et al., 2004; Nathan,
2008). Thus, if CL, CD and launch parameters are known, an accurate estimate of ball spin
from Hawk-Eye trajectories (the most common tracking technology in tennis) may be
possible.
With this in mind, Mecheri et al. (2016) applied a trajectory model to Hawk-Eye
ball trajectories to measure the CL and axis of rotation of serves to examine the
relationship between serve spin and winning probability. The CL was used as an
indication of the ball’s spin intensity and provides some insight, albeit indirectly, into the
effect of serve spin given the abovementioned relationship between CL and the spin
parameter (Alaways & Hubbard, 2001; Cross & Lindsey, 2014; Goodwill et al., 2004;
Nathan, 2008). However, the use of the CL likely limits the adoption of these findings
among coaches and players who are unfamiliar with the CL and more accustomed to
popular measures of ball spin such as revolutions per minute. Thus, considering alternate
applications of ball trajectory models to Hawk-Eye outputs to quantify ball spin in
revolutions over time may be beneficial.
2.4 Why shot speed, and its measurement, is important in tennis
Shot trajectories in tennis comprise of varying characteristics, such as, speed,
direction and spin; each of which is manipulated according to the tactical intent of players.
As critiqued below, speed has been variously investigated by researchers in different
tennis contexts.
CHAPTER 2 REVIEW OF LITERATURE 20
2.4.1 Relationship between serve speed and point or match outcome
Ball speed is generally considered a key aspect of stroke production, with higher
shot speeds logically thought to be advantageous due to the time pressure they impose on
opponents (Capel-Davies & Spurr, 2019; Crespo & Miley, 1998; Mecheri et al., 2016).
Prior research linking ball speed with performance outcomes during matches has largely
focused on the serve (Capel-Davies & Spurr, 2019; Fernández-García et al., 2019; Katić
et al., 2011; Mecheri et al., 2016; O’Donoghue, 2002), likely owing to it being considered
one of the sport’s most important shots (Elliott & Saviano, 2001; Gillet et al., 2009; Reid
et al., 2013) and the availability of serve speed data. That is, serve speeds recorded during
professional matches have historically been made available via tournament websites,
allowing researchers to examine various, although relatively crude, associations between
match-level summaries of serve speed and match outcome (Fernández-García et al., 2019;
Fitzpatrick et al., 2019; Katić et al., 2011; O’Donoghue, 2002). Ball-tracking data
routinely collected during matches affords researchers with the opportunity to examine
the effect of serve speed at the point-level.
Higher winning probabilities have been associated with faster paced serves in the
men’s and women’s game (Kovalchik & Reid, 2018; Mecheri et al., 2016). For instance,
Mecheri et al. (2016), using a sample of ~260,000 points from professional men’s and
women’s tournaments (2003-2008), found that faster first and second serve speeds were
associated with higher point winning probabilities. Unusually, no measures of statistical
significance (e.g., confidence intervals) were provided, complicating the interpretation of
the exact relationship between each serve speed category and winning probability.
Nevertheless, Kovalchik and Reid (2018) offered support to the importance of fast
serving by revealing that serves associated with the highest winning probability during
CHAPTER 2 REVIEW OF LITERATURE 21
Australian Open main draw singles matches tended to be characterised by higher speeds.
For example, of the 17 different types of ad court serves identified in the women’s game,
serves with a favourable win chance (i.e., >50%) were hit with higher speed (median =
160 km/h) than those associated with a lower probability of winning (median = 130
km/h). Whiteside and Reid (2017b) have also found men’s first serve speeds to be linked
to aces, although, serve placement and angle were found to be the main factors
discriminating aces from serves which were returned into play. The importance of serve
placement and angle, functions of a serve’s trajectory, was also highlighted by Capel-
Davies and Spurr (2019), with the relevance of ball speed further reinforced through its
inverse relationship with the probability of serves being returned into play. From the
above, it is clear that past research has considered the influence of serve speed on point
outcomes, aces and unreturnable serves yet not applied the same scientific lens to its
relationship with the characteristics of successful returns and subsequent rally play.
2.4.2 Relationship between serve-return and groundstroke speed and point
outcome
A link between higher shot speeds and higher winning probabilities has also been
observed for serve-returns and groundstrokes (Kovalchik & Reid, 2018). For instance, of
the 19 men’s forehand serve-returns identified, eight have been associated with a
favourable win chance (i.e., >50%), with each of these being in the fastest speed category
(i.e., median = 120 km/h) for serve-returns (Kovalchik & Reid, 2018). Similarly, eight of
the ten forehand rally shots in the men’s game that have been associated with winning
probabilities of ≥80% belonged to the fastest groundstroke speed category (median = 130
km/h) (Kovalchik & Reid, 2018). While instructive, this work reported the winning
probabilities of shot types characterised by speed categories, which may oversimplify the
CHAPTER 2 REVIEW OF LITERATURE 22
relationship between shot speed and point outcome. The work of Wei et al. (2013) also
provides some insight into how these higher winning probabilities may be achieved.
Using Australian Open (2012) ball-tracking data, the researchers investigated shot-level
characteristics to predict shot outcomes. They found a general trend among the top three
tournament seeds in the men’s game (Novak Djokovic, Rafael Nadal, Roger Federer) for
shots preceding rally errors to be hit faster (and land deeper) than shot’s preceding
winners (Wei et al., 2013).
It is worth noting that analyses linking shot speed with point outcomes are
somewhat blunt and likely oversimplify the role of ball speed by ignoring the influence
of one shot on the next. For instance, with 75% of a shot’s outgoing speed attributed to
racket velocity (Brody, 2003), shots hit with higher speed that reduce a player’s
preparation time may limit their ability to generate racket speed, thus directly affecting
the quality of their outgoing reply. The advent and availability of ball-tracking data during
professional matches makes it increasingly possible to investigate the effects of one shot
on the next.
2.4.3 Relationship between ball speed and competition level
Beyond a link to point and match outcomes, shot speed has also been used to
describe a player’s competitive level. Across serves and groundstrokes, higher shot
speeds have been observed to differentiate players of higher compared to lower skill level
(e.g., professional vs. advanced, elite vs. recreational) (Girard et al., 2005; Hernández-
Davó et al., 2019; Kolman et al., 2017; Landlinger et al., 2012; Martin et al., 2014; Söğüt,
2017). It could be argued that these findings were a product of controlled laboratory test
conditions and failed to satisfactorily mimic match-play contexts where incoming ball
trajectories differ with a player’s competitive level, although similar differences have
CHAPTER 2 REVIEW OF LITERATURE 23
been observed between professional and junior players at the Australian Open (Kovalchik
& Reid, 2017). Furthermore, a number of the abovementioned studies compared players
of varying skill level as well as age groups (Girard et al., 2005; Kovalchik & Reid, 2017;
Landlinger et al., 2012), thus, differences in ball speed may also be linked to physical
maturity and the mechanics underpinning stroke production (Whiteside et al., 2013). It
then stands to reason that there is scope to better understand differences in stroke
production during match-play among more homogenous groups of professional players.
In this vein, Whiteside et al. (2015) described shot-specific differences in ball speed
among higher (ranking ≤53) and lower (ranking ≥73) ranked males at the Australian
Open. Higher-ranked males generated significantly faster average first serve-return
speeds and likely higher maximum serve speeds (Whiteside et al., 2015). No meaningful
differences were observed in the average shot speed for first and second serves, second
serve-returns or groundstrokes (Whiteside et al., 2015). The analysis failed to consider
other contextual factors presumably linked to shot speed such as the pace of the incoming
shot, while the female game was not considered at all. These omissions underline the
opportunity for further research in this area.
2.5 Why shot spin, and its measurement, is important in tennis
It is worth noting that the above synthesis of the literature highlights the value of
high ball speeds, yet it’s logical for players to choose not to simply execute every stroke
at maximal speed. Indeed, in applying equations describing the physics of ball flight,
Brody (2006) showed that for a given set of launch conditions, an increase in ball speed
reduces a shot’s window of acceptance and therefore increases the chances of players
committing an error. In comparison, topspin acts to increase a shot’s window of
CHAPTER 2 REVIEW OF LITERATURE 24
acceptance, and thus margin for error (Brody, 2006). For this reason, among others
discussed below, (top)spin is imparted to shots.
2.5.1 Ball spin for tactical variation
As alluded to above, ball spin can be used by players for tactical variation by
adjusting the ball’s trajectory. Slice or backspin groundstrokes are characterised by a
high-to-low racket trajectory and low out-of-bounce angle (Elliott & Marsh, 1989).
Topspin groundstrokes, on the other hand, often feature steeper post-bounce trajectories
produced by high vertical racket velocities and a low-to-high racket trajectory (Elliott &
Marsh, 1989; Genevois et al., 2020; Takahashi et al., 1996). In serving, similar effects are
observed with topspin or kick serves known for their “kick” off the court and subsequent
bounce height, while slice serves produce lateral ball movement, allowing the ball to be
moved away from returners (Crespo & Miley, 1998; Robinson & Robinson, 2018a). The
effect of these trajectories on a player’s on-court performance is an important
consideration to determine the usefulness of these variations in stroke production.
2.5.2 Relationship between ball spin and point outcome
The effect of ball spin on point outcome during match-play has been examined
using ball-tracking data, albeit, through indirect measures of spin. For instance,
Kovalchik and Reid (2018) used the angular change (percentage increase in the ball’s
out-of-bounce compared to into bounce angle) and Mecheri et al. (2016) relied on the lift
coefficient as a measure of spin intensity. While there was no clear association between
the ball’s angular change and winning probability (Kovalchik & Reid, 2018), Mecheri et
al. (2016) reported that serves characterised by high and low lift coefficients were
associated with more positive point outcomes. Given the speed-spin trade-off previously
CHAPTER 2 REVIEW OF LITERATURE 25
observed on serve (Sakurai et al., 2013), the authors concluded that serves characterised
by high spin intensities were as effective as those characterised by lower spin intensities
but high velocity (Mecheri et al., 2016). However, the strength of these conclusions
should be tempered given the relatively small change in winning probability across the
categories of lift coefficient examined as well as the paper’s omission of a measure of
significance. Interestingly, the work of Gillet et al. (2009) reported contrasting findings
with males observed to win more points from flat first serves (57.60%) than serves
typically hit with higher spin rates (topspin; 24.1%, slice; 18.30%). These differences
may be attributed to a combination of the variation in court surfaces examined and the
categorical and indirect classification of serve spin by Gillet et al. (2009). Additionally,
as with investigating the effect of shot speed on winning probability, these studies provide
limited insight into the interplay between successive shot’s in the point.
2.5.3 Relationship between ball spin, the post-bounce trajectory and player impact
Partly motivated by popular commentary around heavily spun topspin shots
challenging player impact (United States Tennis Association, 2004), research involving
trajectory simulations has examined the effect of initial launch conditions (e.g., speed,
spin, angle) on aspects of a shot’s post-bounce trajectory (e.g., out-of-bounce angle,
bounce height) (Cross, 2011, 2020). For instance, the work of Cross (2011) and Cross
(2020) has revealed that the bounce height of kick serves and topspin groundstrokes
generally increases with ball spin but tends to decrease with ball speed off the racket.
Similarly, Kolbinger and Lames (2013) have highlighted the influence of spin on serve
bounce height by revealing that men’s second serves (>88% were >1.22 m from the
ground at a point three-feet inside the opponent’s baseline), which are characterised by
higher spin rates (Kelley, 2011), bounced higher than first serves (>80% were <1.22 m
CHAPTER 2 REVIEW OF LITERATURE 26
from the ground) during Grand Slam matches. Limited empirical attention has been paid
to quantifying the practical effect of these bounce conditions on the opponent beyond
Cross (2020) suggesting that topspin groundstrokes with moderate-to-high ball speed and
heavy spin would still only bounce to knee-to-waist height and thus be comfortable for
players to counter. This seems at odds with the perception of players and coaches and
warrants further investigation.
It is evident from the above research that examination of bounce height alone
discounts the interplay between the incoming ball’s spin (and trajectory) and a player’s
court positioning in determining impact height. In a practical sense, experts commonly
espouse the value of consistent and comfortable contact points in providing players with
maximum tactical choice (Giles et al., 2019). Some coaching resources are even more
explicit, referencing how players can counterattack heavily spun topspin shots by taking
balls early and on the rise or shifting deeper in the court to meet the ball at an equally
comfortable height (Crespo & Miley, 1998; United States Tennis Association, 2004).
Indeed, only one study has previously examined where in the post-bounce trajectory
professional players make contact (Choppin et al., 2007). By examining the ball’s vertical
velocity out of the bounce as an indication for how early or late contact occurred, the
researchers found that players predominantly made contact near the top of the ball’s
bounce during practice at Wimbledon Qualifying (Choppin et al., 2007). Limited detail
was provided in relation to the study’s sample, including player gender, which is
problematic given the observed gender-based differences in shot speed, spin and shape
as well as court positioning (Kelley, 2011; Kovalchik & Reid, 2017; Mecheri et al., 2016;
Reid et al., 2016). Additionally, the generalisability of the findings is limited owing to
the small sample size (106 shots from 13 players), the unique coefficients of friction and
CHAPTER 2 REVIEW OF LITERATURE 27
restitution of grass courts (Cross, 2003) and lack of detail describing the characteristics
of the inbound (e.g., landing location, spin rate, spin direction) and outbound (e.g., spin
direction) shots. Against this backdrop, it is clear that even though the inter-relationships
between ball trajectory, impact point and the player’s court position continue to be the
source of considerable practical interest in tennis, they remain largely unexplored in
research settings.
2.6 The complex interaction and effects of ball speed and spin in tennis
Logically, players do not produce shots with speed or spin alone, rather varying
magnitudes of both are generated across stroke types. Thus, considering their combined
effects, such as through a stroke’s heaviness, may allow a more comprehensive
understanding of how shot characteristics effect player performance.
2.6.1 Understanding beyond the independent analysis of ball speed and spin
While studies are increasingly exploring clustering techniques to build out shot
dictionaries in an effort to better understand the types of shots played and player style
(Kovalchik & Reid, 2018; Wei et al., 2015), these studies have not specifically looked at
the interplay between ball speed and spin. Indeed, past research has largely considered
the effects of ball speed and spin independently and/or incorporated the effect of ball spin
through indirect measures (Kovalchik & Reid, 2018) or as a by-product of examining
trajectory shape (Wei et al., 2015). For instance, Kovalchik and Reid (2018) developed a
dictionary of serves, serve-returns and groundstrokes using a number of characteristics
describing where the shot was impacted and the ball’s flight (e.g., ball speed, height over
net, landing location). Such an approach allowed for common features across shots to be
identified and for the frequency and effectiveness of distinct shots to be analysed. For
CHAPTER 2 REVIEW OF LITERATURE 28
example, 17 unique ad court serve trajectories were identified in the women’s game, with
the most common serve being a fast paced wide serve with a low net clearance that
accounted for 15% of all women’s ad court serves (Kovalchik & Reid, 2018).
More classical approaches to understanding the dynamic between ball speed and
spin in tennis have involved theoretical trajectory modelling work. Such work has
provided insight into how varying combinations of ball speed and spin can influence
various outcome measures (e.g., margin for error, bounce height, rebound angle) (Brody,
2006; Cross, 2011, 2020). For instance, across the ranges of ball speed and spin examined
by Cross (2020), it was found that the out-of-bounce angle of a topspin groundstroke
generally increased with the spin of faster but not slower paced groundstrokes. Such
insight provides some sense of how players might adjust their stroke production to obtain
a specific outcome, but this work remains largely theoretical and fails to consider the way
in which players deal with the varying characteristics of incoming shots.
2.6.2 The concept of stroke heaviness
From a practical point of view, coaches and players refer to the unique combined
effects of a shot’s speed and spin as a stroke’s heaviness, where a “heavy” stroke has
historically been described as one characterised by higher speed and spin (Elliott, 2003).
Player descriptions of this style of ball-striking offer some insight into its effects. For
instance, in describing Rafael Nadal’s forehand as the sport’s heaviest shot, Andy Murray
noted that “the ball kind of jumps at a tough angle (making) it hard to step into the court
and just go for it” (Garber, 2008), while Richard Gasquet has similarly described having
“to be deeply entrenched in order to hold up against it and return it well” (Fest, 2016).
Additionally, facing the heavy ball-striking of Dominic Thiem, Novak Djokovic has
described that, “it’s very hard to dictate the play and stay close to the line” (Mutua Madrid
CHAPTER 2 REVIEW OF LITERATURE 29
Open, 2019). While these quotes offer some insight into the perceived challenge posed
by heavy ball-striking, only Elliott (2003) and Elliott et al. (2009a) has offered a scientific
way of quantifying the measure. Indeed, the simplicity of their proposed measure (an
equal contribution of ball speed and spin: ball speed x ball spin) highlights the nascent
state of the sport’s understanding into heaviness and the gap between research and this
aspect of practice.
2.6.3 The effect on contact point: Impact height
With the combination of a shot’s ball speed and spin affecting the characteristics
of the ball bounce, including bounce height (Cross, 2011, 2020), it seems intuitive that
they would directly influence a player’s contact point. Although there exists a coaching
maxim that players could dynamically adjust to these changes in ball flight (speed and
spin) to make contact with all shots in the same position, this is not physically possible
and variation in contact points has not been investigated. Rather previous work has
reported the average height at which professional players make contact during match-
play, including how contact is affected by gender, ranking and shot type (i.e., 1st vs. 2nd
serves) (Reid et al., 2016; Whiteside et al., 2015). However, even these researchers have
emphasised that a focus on average contact points risks oversimplifying stroke production
given the wide variety of factors that likely influence player contact (Reid et al., 2016).
The impact point of players can also be expressed relative to stature (i.e., their
standing height or the height of their hips). Coaching texts commonly reference player
impact in this way and make links to other aspects of stroke production such as grip
position, where there is some suggestion that the natural contact point of players will be
dictated by their grip (Crespo & Higueras, 2001). For example, it is proposed that the use
of a semi-western forehand grip by players favours contact points around the mid chest,
CHAPTER 2 REVIEW OF LITERATURE 30
while the eastern grip is better suited to lower and the western grip to higher (e.g., above
shoulder) contact points (Crespo & Higueras, 2001).
Prior research has also variously described the location of impact height relative
to the hip and waist (Elliott & Christmass, 1995; Lin et al., 2011; Reid & Elliott, 2002).
That is, Reid and Elliott (2002) reported the impact height of different single and double
handed backhands relative to the hip, while Elliott and Christmass (1995) compared the
kinematics of slice backhands hit at approximately hip (mean 5.4 cm below hip height)
and shoulder (mean 41.6 cm above hip height) height, revealing bounce height affected
some aspects of stroke production (i.e., shoulder height impacts were associated with a
more upright trunk and larger front knee angle), yet players were able to generate similar
post-impact ball speeds. It is instructive that this collection of studies required players to
respond to pre-determined trajectories from a ball machine, thus, the extent to which each
impact occurs during match-play remains poorly understood. In examining the effect of
equipment scaling, Kachel et al. (2015) have reported the proportion of shots taken at low
(below hip height), comfortable (hip-shoulder height) and high (above shoulder height)
contact points by a sample of elite juniors (10 and under) in a match-play context. The
work of Timmerman et al. (2015) derived similar insight, although through a different
classification of contact point (i.e., comfortable = knee-shoulder). To the author’s
knowledge such insight is not available from the professional game.
With reference to players having a preferred and most effective hitting zone (Giles
et al., 2019; United States Tennis Association, 2004), it then follows that the height at
which players contact the ball may directly affect the physical attributes of the outgoing
shot. This thought has been explored by Lin et al. (2011), who compared the post-impact
ball speed of forehands executed above and below waist height by intermediate and
CHAPTER 2 REVIEW OF LITERATURE 31
advanced players. While the researchers observed no significant differences in shot speed,
there was a trend for the advanced group to generate higher average shot speeds
(6.80km/h) when making contact above compared to below waist height (Lin et al., 2011).
However, it is worth noting that these data were collected during controlled testing and
no detail was provided on how far above or below waist height impact occurred, where
data was collected (i.e., on a tennis court) or what determined a successful stroke (i.e.,
landing in a target). Additionally, advanced players in this study were below professional
level, classified as level three and four based on the International Tennis Number
(ATP/WTA ranking = level one). Further, impact height has been suggested to
theoretically influence other aspects of stroke quality (Cross, 2011; Kwon et al., 2017),
although as much has not been confirmed through research in match-play.
2.6.4 The effect on contact point: Impact depth
A player’s court positioning and the incoming shot’s trajectory, partly influenced
by the shot’s combination of speed and spin, combine to determine the height at which
the ball is impacted. This interplay may explain the gender differential in impact observed
during Australian Open singles matches, where males were found to contact first serve-
returns from deeper in the court, with a similar trend observed for second serves (Reid et
al., 2016). This deeper return positioning, in combination with the high spin rates
observed for men’s serves (Kelley, 2011), may in turn explain the higher average height
at which males contacted returns. In that sense, it becomes clear that deeper impact
positions do not always correspond with lower impact heights.
Players may also vary their court positioning to manipulate the spatiotemporal
aspect of the game. For instance, the deeper first serve-return position adopted by males
(Reid et al., 2016), may reflect an attempt to ease the time pressure imposed by the serve,
CHAPTER 2 REVIEW OF LITERATURE 32
providing them more time to respond. While this is effective in a relative sense (versus
attempting to return from further up the court), male players in the Reid et al. (2016) study
were still found to be under greater time pressure than females despite their deeper return
positions. Nevertheless, the ability of players to ease the time pressure they are under may
offer some strategic advantage as it might enable them to generate higher horizontal
and/or vertical racket velocities to produce higher ball speeds and/or ball spins (Genevois
et al., 2020; Kwon et al., 2017). In this sense, court positioning may indeed link to a
player’s game style (e.g., deeper court positioning may be associated with heavily spun
shots).
Conversely, players may tactically choose to adopt positions further up the court.
In principle, these court positions can allow players to contact the ball on the rise and/or
earlier in its post-bounce trajectory. This tactic is commonly described in coaching texts
as a means to impose time pressure on opponents (Antoun, 2007; Crespo & Miley, 1998;
United States Tennis Association, 2004), with higher time pressure (measured as time to
net), in turn linked with positive point outcomes during Grand Slam matches (Mlakar &
Kovalchik, 2020). While the assumption that higher time pressure would be imposed
through earlier impacts is seemingly logical, in practice this relationship may be more
complicated. For instance, with 75% of a shot’s speed attributed to racket velocity (Brody,
2003), earlier impacts may limit a player’s ability to generate racket and consequently
ball speed, which in turn could have implications on the creation of time pressure. In a
similar vein, the incoming shot’s characteristics (e.g., higher ball speed) may effect this
aspect of stroke production. However, the interplay between time pressure, impact and/or
the incoming shot has not been a focus of prior work.
CHAPTER 2 REVIEW OF LITERATURE 33
Players have also been suggested to obtain a positional advantage when, relative
to the opponent, they are positioned closer to the net and/or the midline of the court
(Carvalho et al., 2013). Similarly point losers in men’s matches have been found to spend
less time in offensive and more time in defensive zones compared to point winners
(Martínez-Gallego et al., 2019). The assumption might then be that when players are in
control of points, they adopt more central court positions, while their opponents are more
likely to be forced behind or wider on the baseline, although Whiteside et al. (2015) have
presented some evidence to the contrary. Regardless, players may benefit from insight
into how their ball-striking can be used to influence an opponent’s court position.
2.7 Summary
Players can adjust the ball speed and spin they produce when hitting, which may
be done with the aim of achieving a tactical advantage during matches. Indeed, previous
research generally supports the notion of producing higher shot speeds, yet, the efficacy
of spin is less clear, exacerbated by a reliance on the use of indirect measures of ball spin
in published work (Kovalchik & Reid, 2018; Mecheri et al., 2016). Furthermore, studies
linking a shot’s speed or spin to a point’s outcome are too reductionistic and ignore the
effect of one shot on the next, while an understanding of the interplay and combined
effects of ball speed and spin during match-play remains overlooked. A barrier to
advancing the sport’s understanding in this regard has historically been the inaccessibility
and complex measurement of ball spin information.
Although the use of large-scale spatiotemporal data describing ball and player
position has become more commonplace in research, few studies have examined the
ball’s trajectory in detail. Attempts to rely on Hawk-Eye’s proprietary measure of ball
spin to examine this aspect of ball flight are also confounded by the lack of information

CHAPTER 2 REVIEW OF LITERATURE 34
on its precision. The development and validation of accurate estimates of ball spin from
the available tracking data for subsequent use to more comprehensively understand the
effects of ball speed and spin in match-play represents a valuable addition to the analysis
of professional tennis.
CHAPTER 3 VALIDATION OF BALL SPIN ESTIMATES 35
CHAPTER 3
VALIDATION OF BALL SPIN ESTIMATES IN TENNIS FROM MULTI-
CAMERA TRACKING DATA

Validation of ball spin estimates in tennis from multi-camera tracking data by O. Cant, S. Kovalchik, R. Cross, M. Reid was published in the peer review journal, Journal of Sports Sciences, 38/3, 296-303, 2020. The full-text of this article is subject to copyright restrictions, and cannot be included in the online version of the thesis. The published version is available from: https://doi.org/10.1080/02640414.2019.1697189
CHAPTER 4 INVESTIGATING STROKE HEAVINESS 55
CHAPTER 4
A MIXED METHODS APPROACH TO INVESTIGATING HEAVINESS IN
PROFESSIONAL TENNIS
CHAPTER 4 INVESTIGATING STROKE HEAVINESS 56
4.1 Abstract
Professional tennis players rely on tactics to gain an advantage during matches,
with the heaviness of a player’s ball-striking one such tactic. While players, coaches and
commentators commonly refer to the concept of heaviness, it has not been empirically
examined, with no consensus on its measurement. Therefore, this study adopted a mixed
methods approach to derive the attributes, effects and a definition of heaviness in tennis.
Professional players (median peak rank = 53 males, 48 females) were surveyed to identify
the perceived characteristics of heavy shots (e.g., effect on impact). Generalised additive
models were then fit to ball trajectories recorded by Hawk-Eye during Grand Slam
matches to determine the contribution of ball speed and spin to these characteristics and
therefore heaviness. Survey responses from experts identified heavy strokes to; (1) rear
off the court, (2) effect a player’s court position (push them further back), (3) compromise
a player’s impact height. Using survey results and ball-tracking data, we developed
models explaining 53-72% of the variance in stroke heaviness. Our findings highlight the
complex nature of stroke heaviness and propose a significant first attempt at quantifying
the phenomena in tennis.
CHAPTER 4 INVESTIGATING STROKE HEAVINESS 57
4.2 Introduction
Tennis players commonly manipulate their tactics by adjusting the speed and spin
of their shots to assert control over a match. Directly related to the horizontal and vertical
velocity of the racket (Genevois et al., 2020; Takahashi et al., 1996), high ball speeds are
a feature of professional players’ arsenals and increase the probability of winning the
point (Kovalchik & Reid, 2018; Mecheri et al., 2016), while higher spin intensities are
considered advantageous to performance (Mecheri et al., 2016) and higher topspin rates
can increase a shot’s margin for error (Brody, 2006). Strangely though, beyond the
occasional application of clustering algorithms to inform shot taxonomies (Kovalchik &
Reid, 2018) and trajectory modelling work (Cross, 2011, 2020), past research has
independently considered ball speed and spin. This contrasts with their interplay in a
practical sense as coaches or players rarely consider one independent of the other; indeed
it is almost physically impossible for players to do so. This oversight in the literature also
helps to explain why so little is known about stroke heaviness, a concept thought to
capture the unique combined effect of speed-spin and which is discussed on a daily basis
in commentary booths and practice courts the world over. Players are lauded for their
heavy ball-striking and coaches constantly tinker with ideal ratios of ball speed and spin
to produce heavy shots, yet there is no consensus around how the concept is best
quantified.
Players have commonly referenced the effects of heavy shots or better put, how
they adapt and respond to this type of ball-striking. For instance, Andy Murray describes
Rafael Nadal’s forehand as the sport’s heaviest shot, lamenting that “the ball kind of
jumps at a tough angle (making) it hard to step into the court and just go for it” (Garber,
2008). Richard Gasquet has similarly suggested that heavy shots force players “to be
CHAPTER 4 INVESTIGATING STROKE HEAVINESS 58
deeply entrenched in order to hold up against it and return it well” (Fest, 2016), while
Novak Djokovic has recounted that “it’s very hard to dictate the play and stay close to
the line” against the heavy ball-striking of Dominic Thiem (Mutua Madrid Open, 2019).
Through the above, we can begin to appreciate the challenge posed by heavy ball-striking
among elite male players but are unclear whether these effects are experienced by female
players in the same way and/or influenced by factors like landing depth. Accordingly,
there is a need to establish a consensus view on the effects of heaviness across a range of
expert coaches and players in the male and female game.
High topspin rates are thought to differentiate heavy shots from others (i.e., flat
shots), and likely contributed to the aforementioned effect of the ball leaving the court at
a tough angle, as higher bounces and rebound angles are associated with heavily spun
groundstrokes (Cross, 2020). Equally though, heavy shots are unlikely the product of high
spin alone as this may coincide with players producing very little horizontal or forward
racket movement (and therefore, ball velocity), presumably making for a relatively
comfortable shot for professional players to counter. In this way, and as abovementioned,
very little is known about how ball speed and spin combine to create the heaviness
perceived or described by players. The only previous documented attempt at quantifying
the contribution of ball speed and spin to heaviness inferred an equal weighting (i.e., ball
speed x ball spin) (Elliott, 2003; Elliott et al., 2009a). While arguably intuitive as a
starting point, the researchers offered no justification or evidence for this approach.
Indeed, using the crudest possible application of this uniform weighting, it seems unlikely
that a forehand hit at 50 km/h with 4000 RPM would be as heavy as another hit at 100
km/h with 2000 RPM.
CHAPTER 4 INVESTIGATING STROKE HEAVINESS 59
This study had two aims. Firstly, to identify the perceived characteristics (landing
location, post-bounce trajectory, effect of shot on impact behaviour and shot quality) of
a heavy shot from experts using a structured survey of elite tennis players. Secondly, to
derive a new measure of stroke heaviness using ball-tracking data from Grand Slam
match-play that reflected the perceived characteristics of a heavy shot.
4.3 Methods
Part one of this study surveyed professional players to understand how they
responded when receiving heavy strokes as well as the shot characteristics (e.g., landing
location) which may have contributed to this response. Part two of the study aimed to use
these outcomes and characteristics to develop a measure of stroke heaviness from ball-
tracking data.
4.3.1 Survey
Eighteen professional players who currently or have previously held a ranking on
the men’s (ATP) or women’s (WTA) tour consented to participate in the study (Appendix
B). The six females and twelve males included seven current and eleven former
professional players. The peak career WTA rankings (doubles or singles) of females
ranged from 1 to 189 (median peak rank = 48). For males, the range in ATP peak rankings
was 2 to 722 (median peak rank = 53). This sample of participants included three top ten
players, ten top 100 players and eight Grand Slam tournament quarterfinalists. An
Institutional Review Board approved this study.
Experts were asked to rate on a scale of 1 to 5 (1 - not at all; 5 - always) the extent
to which playing against an opponent hitting heavy strokes resulted in nine different
outcomes (listed in Table 4.1). The survey focused on groundstroke heaviness to gain a
CHAPTER 4 INVESTIGATING STROKE HEAVINESS 60
consensus view on the abovementioned player descriptions, although experts were also
asked to rate its relationship with serving. The outcomes rated were informed by coaching
texts (Elliott et al., 2003), player descriptions (Draper, 2016; Fest, 2016; Garber, 2008;
Mutua Madrid Open, 2019), conversations with players and coaches as well as from the
experience and expertise of researchers. Shot characteristics and outcomes were rated
separately for groundstrokes, first serves and second serves. Respondents were provided
the opportunity to describe additional effects of playing against a heavy ball striker
through an open-ended question. Additionally, experts were asked to indicate in which
part of the court they perceived heavy strokes to land so that the interaction between
landing depth and the perceived heaviness could be probed. For groundstrokes, this
required players to nominate the landing depth (using one metre intervals from the
baseline) of heavy strokes, while the direction (wide, body, T) and depth (using one metre
intervals from the service line) of heavy serves was also indicated.
An average rating was calculated for each of the nine shot characteristics and
outcomes. Themes emerging from the qualitative comments of the experts (in response
to the open-ended question) were codified and recorded. The frequency at which each
court zone was identified as the landing location of heavy strokes was also calculated.
Summaries of mean ratings and frequency counts were used to prioritise the
characteristics of heavy strokes to be investigated in part two of this study, where the
objective was to develop a measure of stroke heaviness. This involved exploring the
contribution of ball speed and spin to stroke characteristics using ball-tracking data
collected during Australian Open Grand Slam matches. This process aimed to identify
the contribution of ball speed and spin (components of stroke heaviness) to the
CHAPTER 4 INVESTIGATING STROKE HEAVINESS 61
characteristics of a heavy stroke and thus the combination of ball speed and spin which
best explain stroke heaviness.
Table 4.1. List of characteristics and outcomes of heavy shots (left column) and performance
variables derived from Hawk-Eye (right column).
4.3.2 Development of heaviness measure
4.3.2.1 Participants
A dataset containing ball-tracking data collected during 296 men’s and 308
women’s Australian Open main draw singles matches played between 2017 and 2019
was utilised. This shot-level dataset was made up of 174 unique male and 173 unique
female players.
4.3.2.2 Pre-processing and feature engineering
All tracking data was recorded by Hawk-Eye (Hawk-Eye Innovations Ltd,
Basingstoke, UK), a ball and player tracking technology utilised during professional
tennis matches to assist in adjudication. The system is comprised of cameras positioned
around the court which continuously track the three-dimensional position of the ball as a
To what extent does a heavy stroke:
Ball-tracking variables:
Make you more likely to hit an error Shot type: serve, serve-return, groundstroke
Force you to change direction of your outgoing shot Stroke type: forehand, backhand
Reduce the speed of your outgoing shot Spin direction: topspin, backspin
Decrease the amount of time you have to play your shot Ball spin: ball spin rate (combined topspin/backspin and sidespin) off the racket (RPM)
Force you to contact the ball outside of your preferred contact zone Ball speed: ball speed off the racket (km/h)
Make you contact the ball higher Landing depth: horizontal distance the ball lands from the net (m)
Force you further back in the court Out-of-bounce angle: angle of the ball out of the bounce (°)
Cause the ball to skid off the court Impact height: vertical height the ball is impacted from the ground (m)
Cause the ball to jump, climb or rear off the court Impact depth: horizontal distance the ball is impacted from the net (m). The baseline is 11.89 m from the net
CHAPTER 4 INVESTIGATING STROKE HEAVINESS 62
function of time. Hawk-Eye enables players to challenge line calls during matches, with
the system reported to determine the location of the ball’s bounce with a 2.6 mm mean
error (Hawk-Eye Innovations, n.d.).
Hawk-Eye point-level files containing meta and raw trajectory data were
processed using a custom R script to calculate and extract variables of interest (Table
4.1). Metadata (i.e., shot type, player names, shot number) added context, while the
reconstructed trajectories allowed positions, velocities and angles at any point in the ball’s
trajectory to be calculated. Ball spin rates off the racket were calculated using previously
published methods (Cant, Kovalchik, Cross, & Reid, 2020). The accuracy of this method
was observed to deteriorate at spin rates >4500 revolutions per minute (RPM), thus shots
incoming with a component of spin (topspin/backspin or sidespin) greater than this were
excluded (<0.51% of shots excluded).
4.3.3 Statistical analysis
Following the removal of outliers (any value more than six standard deviations
(SD) from the median), a shot-level dataset containing ~180,000 groundstrokes was
available for analysis. A groundstroke was defined as any impact that occurred from
beyond the service line and at a height of less than 2 m. Further, shots that ended wide of
the court boundaries and did not pass the net were excluded from analysis. This was done
in an effort to remove shots not representative of typical impact.
Regression models were initially used to identify and exclude the top 1% of
influential data points based on Cook’s distance (Cook, 1979). Following this, the effect
of ball speed and spin on (1) the out-of-bounce angle of topspin shots, and (2) opponent
return position (depth and height) during topspin rally exchanges were modelled. All
analysis was performed using Generalised Additive Models (GAMs), fit using the mgcv
CHAPTER 4 INVESTIGATING STROKE HEAVINESS 63
package in R (R Core Team, 2017). GAMs were selected for their ability to handle
complex and non-linear associations which may arise. Models were fit by stroke type.
Ball speed, ball spin and landing depth were standardised by gender and included in
models as thin-plate smooths. Ball speed and spin were represented as a bivariate smooth
to capture their interaction, with gender incorporated as a further interaction term.
Landing depth was included in the models to control for the effect of shot depth on
outcome variables, with the effect of speed and spin for an average landing depth (to
represent a typical shot) analysed. Separate models of return position were fitted to
examine the distinct effects of ball speed and spin on impact height and depth, while
controlling for landing depth and gender. In order to determine the overall influence of
ball speed and spin on impact, the impact height and depth outcomes were standardised
so that the estimated speed and spin effects would have a common scale and could be
combined to determine a total change in impact due to incoming shot characteristics. Out-
of-bounce angle and impact depth outcomes were log-transformed to improve the
normality of the model’s residuals. Models also included a random effect for impact
player to eliminate potential bias associated with player performance and imbalances in
the observed shots for each player. Approximate 95% confidence intervals (CI) were
calculated. Additionally, the adjusted r-squared value from models will be reported to
indicate the proportion of variance in heaviness explained by ball speed and spin while
controlling for landing depth and gender.
The effects of ball speed and spin were summarised over their observed range
using the subsample of shots within ±0.25 SD of the average landing depth. In order to
account for the joint distribution of ball speed and spin, that is, that the range of speed
may differ for lower compared to higher values of spin and vice versa, the variable of
CHAPTER 4 INVESTIGATING STROKE HEAVINESS 64
primary interest (speed or spin) for the summary was divided into ventiles (quantiles in
5% steps) within each decile of the variable of secondary interest. The outcome (impact,
out-of-bounce angle) was then predicted for the median of each decile and ventile.
4.4 Results
4.4.1 Survey
Average ratings for the perceived characteristics of heavy strokes are summarised
in Figure 4.1. On average, heavy strokes were most commonly characterised by the ball
jumping, climbing or rearing off the court according to the experts. For heavy
groundstrokes and second serves, experts identified the effect on their impact (height,
depth and strike zone) as the next most obvious, especially among the female respondents.
The effect of heavy strokes on player impact was supported through qualitative
survey responses. Twelve survey respondents provided descriptions on the effects of
playing against an opponent hitting heavy first or second serves, with the following
commonly referenced effects; forced back in the court (n = 5), impact height is challenged
(n = 3) and less time on the ball (n = 3). Additionally, three respondents described taking
heavy serves on the rise to counter the trajectories’ effect on impact height. Of the 13
respondents providing descriptions on the effects of heavy groundstrokes, seven experts
made reference to their court position being affected, with five experts describing being
forced back in the court and four indicating that their contact point was challenged.
It was identified that landing depth is important to the heaviness of a shot, with
heavy groundstrokes thought to be most effective when landing one to three meters inside
the baseline. Of the 18 survey respondents, 16 suggested one of zones 1 (baseline to 1 m
inside baseline), 2 (1 to 2 m inside baseline) or 3 (2 to 3 m inside baseline), while zone 2
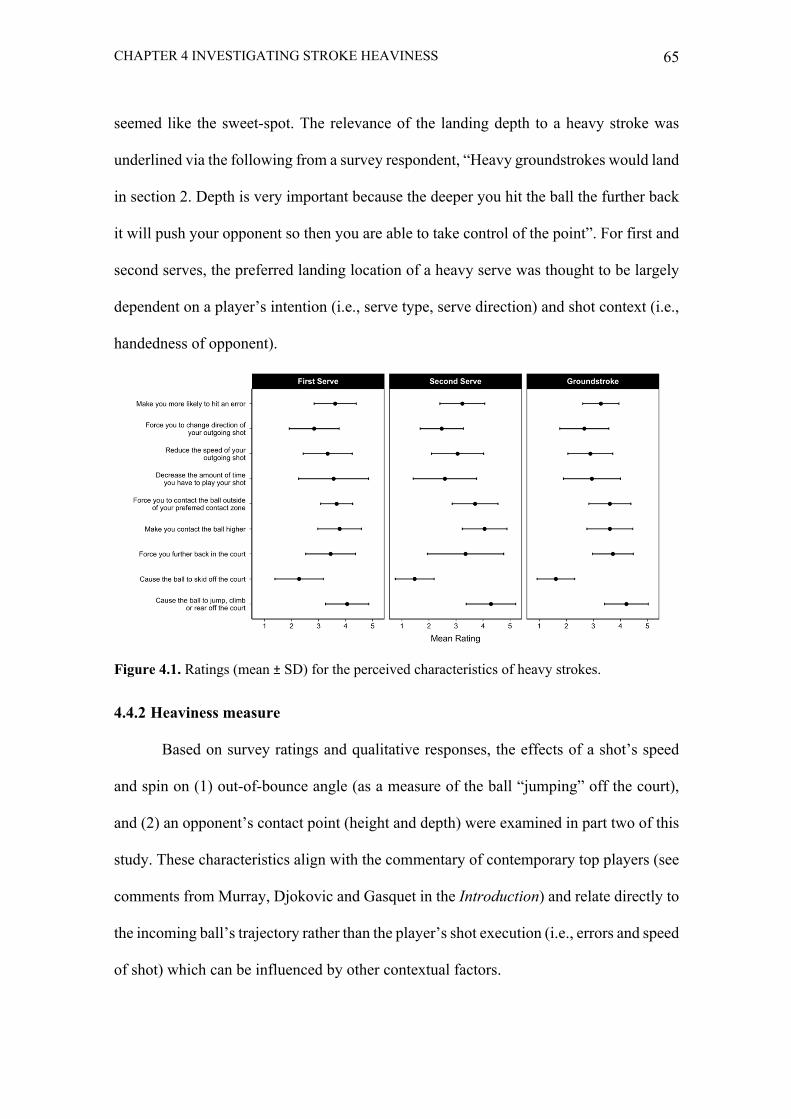
CHAPTER 4 INVESTIGATING STROKE HEAVINESS 65
seemed like the sweet-spot. The relevance of the landing depth to a heavy stroke was
underlined via the following from a survey respondent, “Heavy groundstrokes would land
in section 2. Depth is very important because the deeper you hit the ball the further back
it will push your opponent so then you are able to take control of the point”. For first and
second serves, the preferred landing location of a heavy serve was thought to be largely
dependent on a player’s intention (i.e., serve type, serve direction) and shot context (i.e.,
handedness of opponent).
Figure 4.1. Ratings (mean ± SD) for the perceived characteristics of heavy strokes.
4.4.2 Heaviness measure
Based on survey ratings and qualitative responses, the effects of a shot’s speed
and spin on (1) out-of-bounce angle (as a measure of the ball “jumping” off the court),
and (2) an opponent’s contact point (height and depth) were examined in part two of this
study. These characteristics align with the commentary of contemporary top players (see
comments from Murray, Djokovic and Gasquet in the Introduction) and relate directly to
the incoming ball’s trajectory rather than the player’s shot execution (i.e., errors and speed
of shot) which can be influenced by other contextual factors.
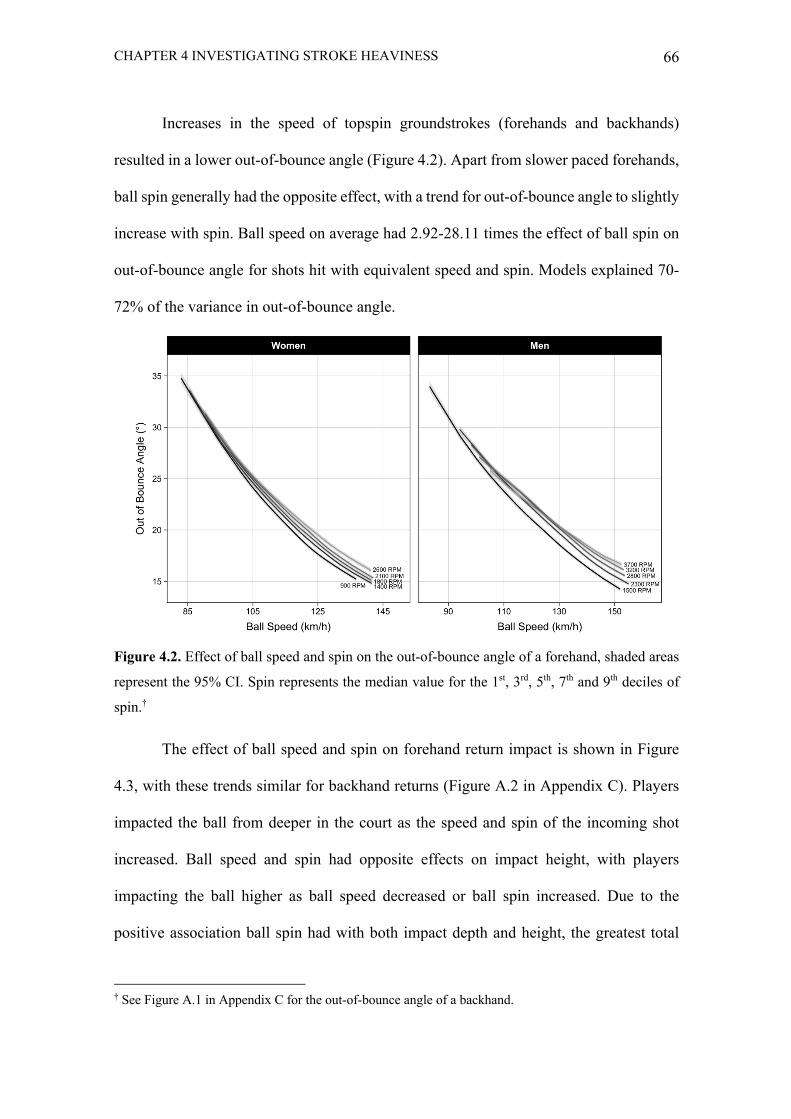
CHAPTER 4 INVESTIGATING STROKE HEAVINESS 66
Increases in the speed of topspin groundstrokes (forehands and backhands)
resulted in a lower out-of-bounce angle (Figure 4.2). Apart from slower paced forehands,
ball spin generally had the opposite effect, with a trend for out-of-bounce angle to slightly
increase with spin. Ball speed on average had 2.92-28.11 times the effect of ball spin on
out-of-bounce angle for shots hit with equivalent speed and spin. Models explained 70-
72% of the variance in out-of-bounce angle.
Figure 4.2. Effect of ball speed and spin on the out-of-bounce angle of a forehand, shaded areas
represent the 95% CI. Spin represents the median value for the 1st, 3rd, 5th, 7th and 9th deciles of
spin.†
The effect of ball speed and spin on forehand return impact is shown in Figure
4.3, with these trends similar for backhand returns (Figure A.2 in Appendix C). Players
impacted the ball from deeper in the court as the speed and spin of the incoming shot
increased. Ball speed and spin had opposite effects on impact height, with players
impacting the ball higher as ball speed decreased or ball spin increased. Due to the
positive association ball spin had with both impact depth and height, the greatest total
† See Figure A.1 in Appendix C for the out-of-bounce angle of a backhand.
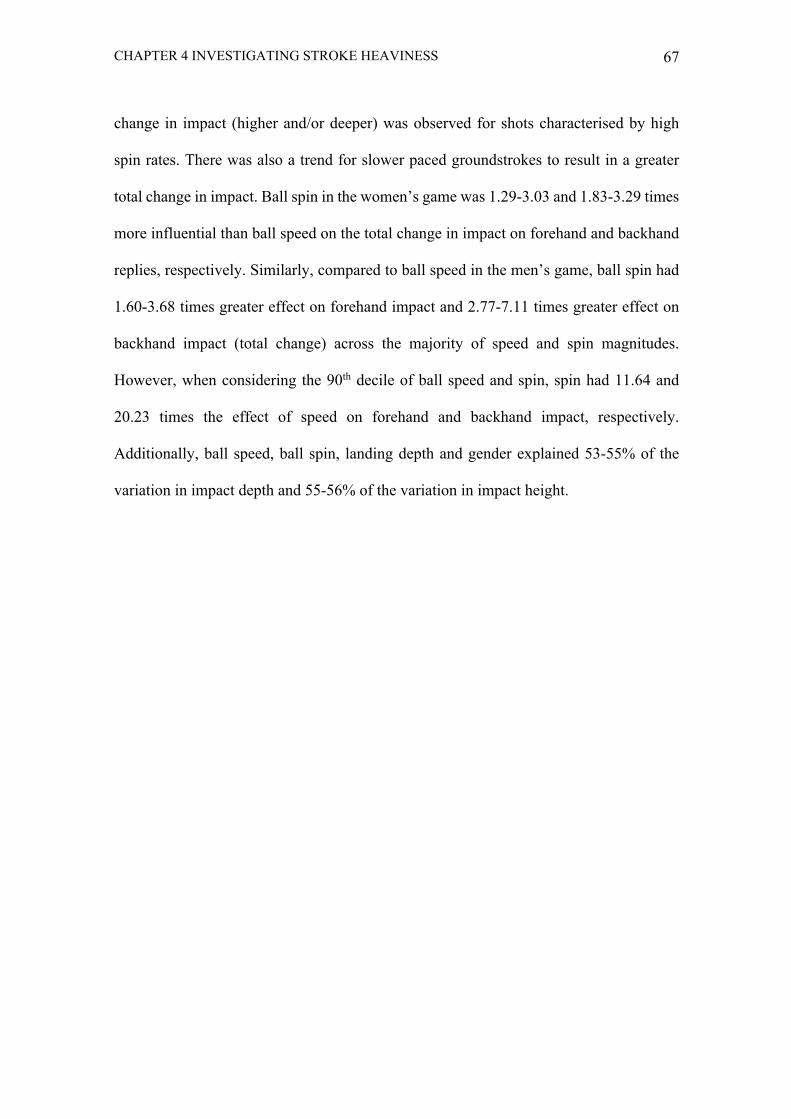
CHAPTER 4 INVESTIGATING STROKE HEAVINESS 67
change in impact (higher and/or deeper) was observed for shots characterised by high
spin rates. There was also a trend for slower paced groundstrokes to result in a greater
total change in impact. Ball spin in the women’s game was 1.29-3.03 and 1.83-3.29 times
more influential than ball speed on the total change in impact on forehand and backhand
replies, respectively. Similarly, compared to ball speed in the men’s game, ball spin had
1.60-3.68 times greater effect on forehand impact and 2.77-7.11 times greater effect on
backhand impact (total change) across the majority of speed and spin magnitudes.
However, when considering the 90th decile of ball speed and spin, spin had 11.64 and
20.23 times the effect of speed on forehand and backhand impact, respectively.
Additionally, ball speed, ball spin, landing depth and gender explained 53-55% of the
variation in impact depth and 55-56% of the variation in impact height.
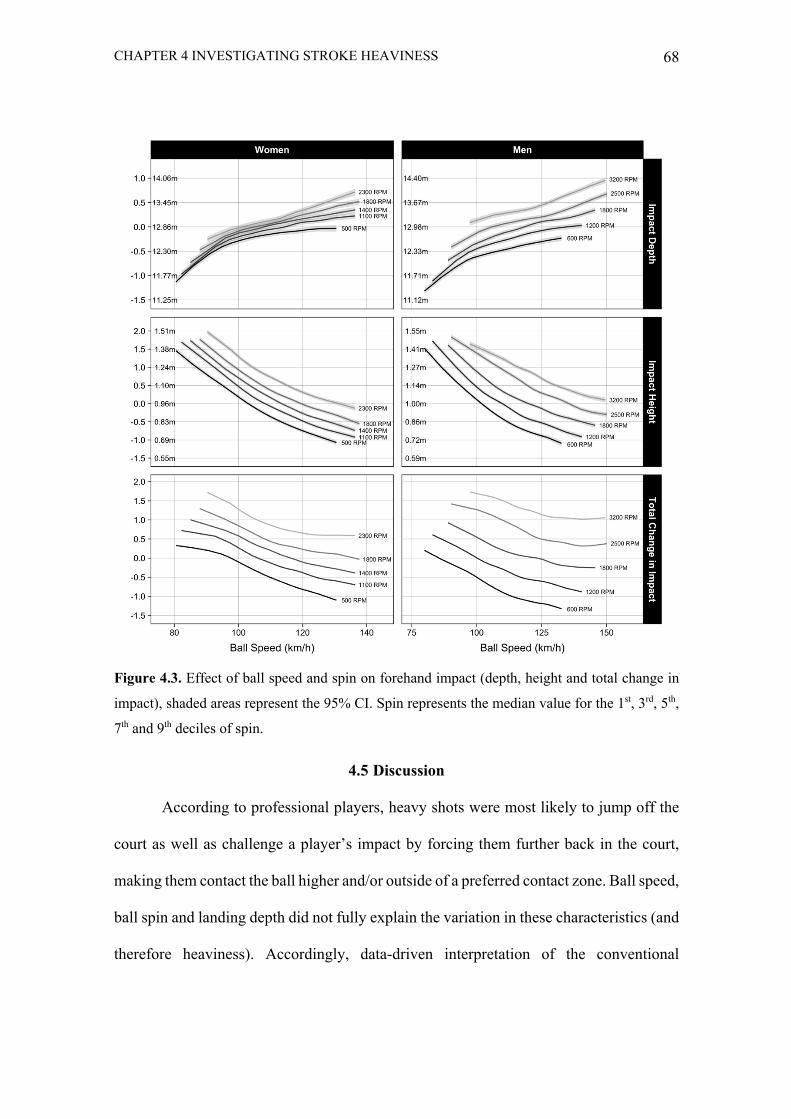
CHAPTER 4 INVESTIGATING STROKE HEAVINESS 68
Figure 4.3. Effect of ball speed and spin on forehand impact (depth, height and total change in
impact), shaded areas represent the 95% CI. Spin represents the median value for the 1st, 3rd, 5th,
7th and 9th deciles of spin.
4.5 Discussion
According to professional players, heavy shots were most likely to jump off the
court as well as challenge a player’s impact by forcing them further back in the court,
making them contact the ball higher and/or outside of a preferred contact zone. Ball speed,
ball spin and landing depth did not fully explain the variation in these characteristics (and
therefore heaviness). Accordingly, data-driven interpretation of the conventional
CHAPTER 4 INVESTIGATING STROKE HEAVINESS 69
characteristics of a heavy shot, greater speed and greater spin, did not perfectly align with
the experts’ view of heaviness.
One of the highest rated characteristics of a heavy stroke across both serves and
groundstrokes was the ball jumping, climbing or rearing off the court. This finding was
not surprising with professional players previously describing heavy strokes in this way
(Draper, 2016; Garber, 2008). We investigated the notion of the ball jumping off the court
by examining the ball’s out-of-bounce angle. The observed relationship between ball
speed, ball spin and out-of-bounce angle is consistent with previous trajectory modelling
work (Cross, 2020) and led to out-of-bounce angle (and therefore heaviness) being
highest for slower paced shots. It seems unlikely that low ball speeds are a feature of
heavy strokes as they tend to be easier to counter and less related to positive point-ending
outcomes (Kovalchik & Reid, 2018). This sentiment was echoed by this study’s surveyed
experts who highlighted the importance of ball speed to the heaviness of a stroke:
“Heaviness is not produced by spin alone, it must have velocity to create havoc”.
Therefore, out-of-bounce angle on its own does not adequately capture what players
describe as the ball “jumping” off the court.
Experts also indicated that their impact (height and depth) was challenged by the
heaviness of strokes, which is consistent with previous player descriptions (Fest, 2016;
Mutua Madrid Open, 2019). Additionally, qualitative survey responses referenced an
interaction between impact depth and height, with players describing the need to adjust
their court position in an effort to find a comfortable impact height. Thus, we used ball-
tracking data from the Australian Open to examine the effect of ball speed and spin on
both aspects of impact independently and subsequently combined these to reflect a total
change in impact. Impact height increased with ball spin and decreased with ball speed,
CHAPTER 4 INVESTIGATING STROKE HEAVINESS 70
an effect similar to that observed for groundstroke bounce height (Cross, 2020).
Additionally, professional players were observed to impact faster and heavily spun
strokes from deeper in the court. These observed effects led to females changing their
total impact the most (deeper and/or higher) when facing shots characterised by high spin
and low speed. A similar trend existed in the men’s game, although the effect of ball
speed was less pronounced at the highest spin rates. As with the above finding describing
the equivocal relationship between out-of-bounce angle, ball speed and spin in relation to
heaviness, it seems counterintuitive that slower paced strokes are considered as heavy or
heavier than those characterised by higher speeds and similar spin. It is worth noting
though that where a player intercepts a ball in its post-bounce trajectory was not
investigated and may be a limitation of our current approach. For instance, as described
by one of the experts (“If you don’t have the ability to take that heavy ball on the rise and
stand your ground in the baseline you will be forced further and further back to try and
find a comfortable height in which to contact the ball”), players can vary how early or
late they make contact in an effort to find the ball in a preferred or consistent strike zone.
In this way, taking the ball earlier and on the rise may have negligible effect on total
impact if players are able to hold court position and find the ball at a consistent height.
However, the extent to which players impact the ball on the rise or drop during match-
play and the effect this has on impact height are unknown and represent areas of future
research.
An objective of the current study was to take an empirical approach to identify
the contribution of ball speed and spin to a stroke’s heaviness and in doing so build upon
previous descriptions of the concept, such as the inferred equal weighting of ball speed
and spin (Elliott et al., 2009a). Quantifying heaviness through out-of-bounce angle
CHAPTER 4 INVESTIGATING STROKE HEAVINESS 71
highlights the importance of a shot’s speed, with the relative influence of speed being
2.92-28.11 times stronger than spin. The face validity of this approach however seems to
be debatable as shots characterised by higher speeds and lower rebound angles would be
classified as heavier, which is contrary to player perception of heavy shots jumping off
the court (Draper, 2016; Garber, 2008). Conversely, when we assess heaviness through
the combined change in impact depth and height (total impact), the influence of ball spin
on heaviness is evident. Quantification of heaviness in this way also pointed to a potential
effect for gender, with the average importance of spin higher in the men’s game.
However, with models explaining only ~54% of the variance in heaviness as measured
by impact depth and ~55% as measured by impact height, there remains a large portion
of unexplained variance in impact conditions (and therefore heaviness). In turn, this may
be related to the inconsistencies between our observed effects of heavy ball-striking and
that which is expected or perceived by players. Furthermore, it could be that players have
a reference shot in mind when describing the characteristics of a heavy shot (e.g., a heavy
shot only forces a player back in the court in comparison to a reference shot) and thus
heavy strokes are only distinguishable among a smaller subset of shots; a relationship our
models have not considered.
With limited information currently available on the effects of playing against
heavy ball strikers, the survey component of this study adds considerably to what is
known on the concept of stroke heaviness, especially given the wealth of knowledge and
playing experience of survey respondents. This information alone could be used by
players and coaches to guide match tactics and player development, although an
opportunity exists to gain a more in-depth understanding of the effects of stroke heaviness
on aspects of match-play through large-scale datasets. For this to occur, further modelling
CHAPTER 4 INVESTIGATING STROKE HEAVINESS 72
is required to examine the factors that may help explain the variance in the perceived
effects of heaviness among players, such as those abovementioned (e.g., where the ball
is taken in the post-bounce trajectory). Additionally, the current study examined the effect
of ball speed and spin off the racket on measures of heaviness, however, with both speed
and spin observed to change due to the bounce (Cross, 2019; Kelley et al., 2008; Lane et
al., 2017), post-bounce measures may better represent the heaviness perceived by players.
However, it is worth noting that more work is required to validate a post-bounce measure
of ball spin from ball-tracking data. Further, the measure of ball spin utilised in this study
combined the ball’s topspin and sidespin components of spin. While this is likely more
representative of a typical tennis shot, considering these components of ball spin
separately may have better revealed the different effects of spin on outcome measures.
We examined out-of-bounce angle as a measure of the ball jumping, climbing or
rearing off the court, however, as abovementioned this may not adequately capture
players’ perceptions of heaviness. Thus, further investigation through more in-depth
survey questioning or on-court testing may be beneficial to better understand this
perceived characteristic of ball-striking in tennis. Additionally, while we focused on the
ball’s out-of-bounce angle and player impact due to survey ratings and qualitative
responses, other lower rated characteristics (e.g., make you more likely to hit an error)
could also be explored. The examination of the effect of ball speed and spin at average
landing depths could also be expanded to identify if the relationship between ball speed,
ball spin and player impact vastly differs at different shot landing depths. Lastly, we fit
separate models for impact depth and impact height outcomes and subsequently
combined estimated effects to reflect a total change in impact. The effect of incoming
CHAPTER 4 INVESTIGATING STROKE HEAVINESS 73
shot characteristics could also be scrutinised through the use of a multivariate analysis to
model both outcomes at the same time.
4.6 Conclusion
Professional players surveyed in the current study identified a number of
characteristics and outcomes of heavy strokes, including that the ball jumps off the court
and challenges a player’s impact. Ball speed, ball spin and landing depth explained only
53-72% of the variation in these characteristics (and therefore heaviness). Additionally,
there were inconsistencies between the observed and expected effects of ball speed and
spin on out-of-bounce angle and player impact. This study details the characteristics of
heavy strokes perceived by a sample of professional players as well as highlighting areas
for further investigation to build upon the current work and assist future efforts in
developing a measure to quantify heaviness.
CHAPTER 5 EXPLORING IMPACT CONDITIONS DURING MATCH-PLAY 74
CHAPTER 5
HOW TENNIS PLAYERS ADJUST IMPACT CONDITIONS IN THE BATTLE
FOR TIME AND SPACE
CHAPTER 5 EXPLORING IMPACT CONDITIONS DURING MATCH-PLAY 75
5.1 Abstract
The battle for time and space is ubiquitous in tennis. Accordingly, players are
encouraged to contact the ball early and optimise the consistency of their impact point,
yet how these maxims manifest in match-play is unknown. For the first time in tennis,
ball-tracking data from Grand Slam matches was used to explore how early players
intercept the ball’s post-bounce trajectory and impact height/depth. The effect of shot
characteristics, gender and player rank on measures of impact was examined using
generalised additive models to account for non-linear effects of shot characteristics.
Trajectory equations estimated the peak height of post-bounce trajectories. Serve-returns
were commonly impacted between the hip-shoulder and groundstrokes in knee-hip and
hip-shoulder zones. Impact during topspin rallies on average occurred 0.06-0.23 m before
peak height. Serve-returns were typically impacted on the rise (OTR), with males on
average making contact earlier (0.74 m first, 1.09 m second serve-returns) than females.
Unexpectedly, lower-ranked players contacted certain shots OTR more or earlier.
Landing depth and ball spin were generally the most and least influential, respectively,
on how early contact occurred. While the value of early and consistent impact is
commonly espoused, our results show that impact position is largely beholden to the
incoming shot’s trajectory.
CHAPTER 5 EXPLORING IMPACT CONDITIONS DURING MATCH-PLAY 76
5.2 Introduction
Tennis experts have long acknowledged the importance of optimal player
positioning to maximise tactical choice and technical performance through a repeatable
and preferred contact point (Giles et al., 2019). With over 70% of shots in Grand Slam
singles played out of a bounce (Whiteside & Reid, 2017a), players search for strike zones
that are most advantageous to performance. A player’s impact can be challenged by an
incoming shot’s trajectory, and as such, subsequent compensatory adjustments to a
player’s court position are common, with players known to move forward to take the ball
“on the rise” or shift back to buy time and hit the ball as it drops. These decisions also
reflect a strategic choice by players to impose spatiotemporal pressure on an opponent or
increase the time available to themselves to execute a stroke. Indeed, the suggestion that
players “take time away” through earlier contact points has become a coaching catch-cry
in the modern game. Despite this, researchers have largely focused on evaluating other
areas of contemporary stroke and movement production.
To the authors’ knowledge, only one study has scrutinised the impact position of
shots in this way, with a small number of players shown to predominantly make contact
near the top of a ball’s arc during practice at Wimbledon Qualifying (Choppin et al.,
2007). Although novel, this study offered little insight into the effect of incoming shot
characteristics like speed, spin and landing depth (Choppin et al., 2007). Further,
coefficients of friction and restitution vary across court surfaces (Cross, 2003) and may
affect player impact, limiting the generalisability of findings. Additionally, no
information on player gender was provided, further constraining the study’s utility given
the established gender-based differences in aspects of stroke production (Reid et al.,
CHAPTER 5 EXPLORING IMPACT CONDITIONS DURING MATCH-PLAY 77
2016). To better understand the interplay between the incoming shot and a player’s
response from a stroke production point of view, these gaps need to be resolved.
The growth in high-resolution tracking systems at professional tennis events now
allows for the large-scale study of impact characteristics in elite competition. Binary
assessments of whether any particular shot was contacted before or after its peak height
can be achieved through inspection of the post-bounce trajectory. However, these are
relatively simplistic and crude, especially given the practical focus on players intercepting
incoming balls early. A more granular appreciation of where players contact a ball in its
post-bounce trajectory requires a method to estimate the horizontal and vertical distances
of impact from peak height. In a practical sense, players facing Roger Federer and Rafael
Nadal might contact incoming shots at very similar absolute heights, but likely at very
different horizontal and vertical distances from peak bounce height in the post-bounce
trajectory. Additionally, an understanding of the vertical displacement of impact,
especially in relation to player stature, has been a notable omission from previous
research. This is perplexing given the emphasis on players manufacturing consistent and
preferred impact heights, commonly reported to be around waist to shoulder height
depending on grip position (Crespo & Higueras, 2001).
Against this backdrop, the objectives of this study were to describe groundstroke
and serve-return impact and examine how this differs with incoming shot characteristics,
gender and player ranking. It was hypothesised that strokes hit with higher ball speed or
greater landing depth would be impacted on the rise more often, earlier and lower in the
ball’s post-bounce trajectory, at lower impact heights as well as from deeper in the court.
Further, it was hypothesised players would contact shots characterised by high spin rates
later in the trajectory. With males impacting a greater proportion of groundstrokes from
CHAPTER 5 EXPLORING IMPACT CONDITIONS DURING MATCH-PLAY 78
inside the baseline and generating higher shot speeds (Kovalchik & Reid, 2017; Reid et
al., 2016), they were expected to impact a greater proportion of shots on the rise, make
contact earlier, at higher impact heights and from further up the court. Impact earlier in
the ball’s trajectory was also hypothesised to be a characteristic of higher-ranked players,
who may dictate play and push lower-ranked opponents deeper in the court with their
higher quality shot-making.
5.3 Methods
5.3.1 Participants
Ball-tracking data were collected for 210 men’s and 214 women’s main draw
singles matches during the 2017 and 2019 Australian Open tournaments. An Institutional
Review Board approved this study.
5.3.2 Pre-processing and feature engineering
Ball-tracking data were recorded by Hawk-Eye (Hawk-Eye Innovations Ltd,
Basingstoke, UK) during Australian Open main draw singles matches. Hawk-Eye is a
ball and player tracking technology primarily used during professional matches to assist
in adjudication. The system is reported to determine the ball bounce location with a mean
error of 2.6 mm (Hawk-Eye Innovations, n.d.). Physical summary characteristics of ball
trajectories were derived (Table 5.1), including ball spin rate and direction off the racket
(Cant, Kovalchik, Cross, & Reid, 2020). Due to the deterioration in this measure’s
accuracy at higher spin rates, shots incoming with components of spin (topspin/backspin
or sidespin) >4500 revolutions per minute (RPM) were excluded. This resulted in the
following exclusions; 19.60% of men’s and 2.70% of women’s second serves, 2.38% of
men’s first serves and <0.5% of women’s first serves and groundstrokes.
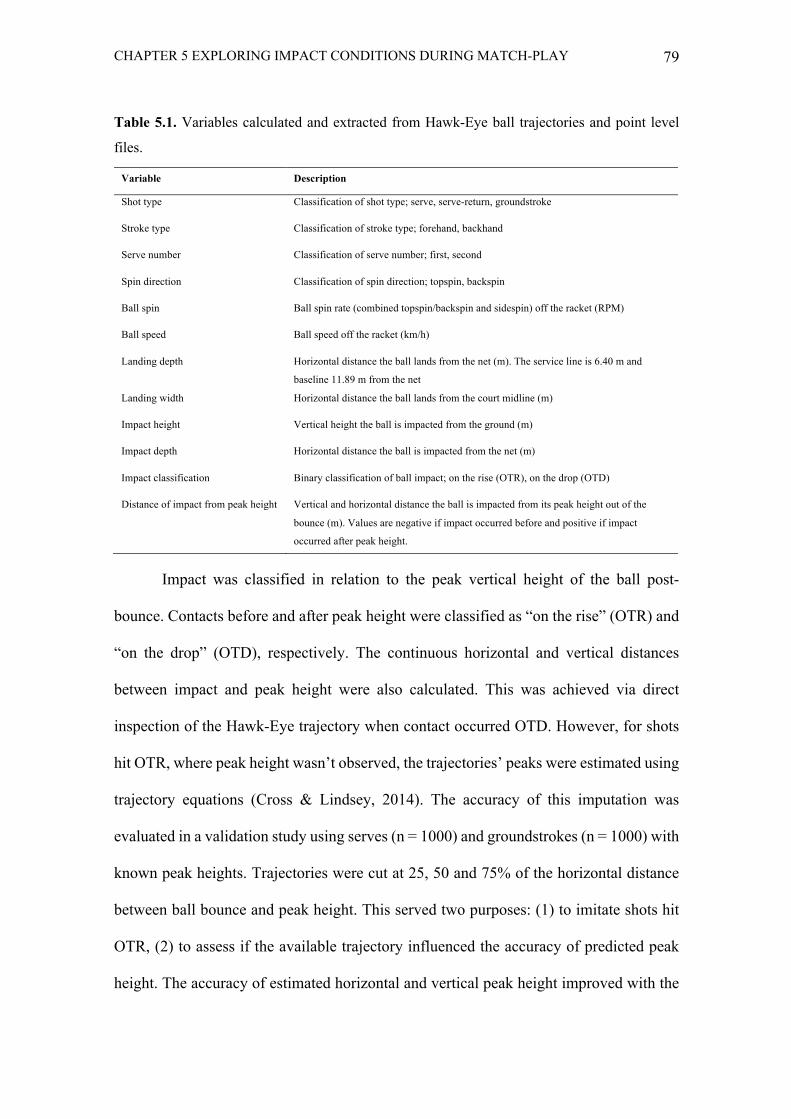
CHAPTER 5 EXPLORING IMPACT CONDITIONS DURING MATCH-PLAY 79
Table 5.1. Variables calculated and extracted from Hawk-Eye ball trajectories and point level
files.
Impact was classified in relation to the peak vertical height of the ball post-
bounce. Contacts before and after peak height were classified as “on the rise” (OTR) and
“on the drop” (OTD), respectively. The continuous horizontal and vertical distances
between impact and peak height were also calculated. This was achieved via direct
inspection of the Hawk-Eye trajectory when contact occurred OTD. However, for shots
hit OTR, where peak height wasn’t observed, the trajectories’ peaks were estimated using
trajectory equations (Cross & Lindsey, 2014). The accuracy of this imputation was
evaluated in a validation study using serves (n = 1000) and groundstrokes (n = 1000) with
known peak heights. Trajectories were cut at 25, 50 and 75% of the horizontal distance
between ball bounce and peak height. This served two purposes: (1) to imitate shots hit
OTR, (2) to assess if the available trajectory influenced the accuracy of predicted peak
height. The accuracy of estimated horizontal and vertical peak height improved with the
Variable Description
Shot type Classification of shot type; serve, serve-return, groundstroke
Stroke type Classification of stroke type; forehand, backhand
Serve number Classification of serve number; first, second
Spin direction Classification of spin direction; topspin, backspin
Ball spin Ball spin rate (combined topspin/backspin and sidespin) off the racket (RPM)
Ball speed Ball speed off the racket (km/h)
Landing depth Horizontal distance the ball lands from the net (m). The service line is 6.40 m and
baseline 11.89 m from the net
Landing width Horizontal distance the ball lands from the court midline (m)
Impact height Vertical height the ball is impacted from the ground (m)
Impact depth Horizontal distance the ball is impacted from the net (m)
Impact classification Binary classification of ball impact; on the rise (OTR), on the drop (OTD)
Distance of impact from peak height Vertical and horizontal distance the ball is impacted from its peak height out of the
bounce (m). Values are negative if impact occurred before and positive if impact
occurred after peak height.
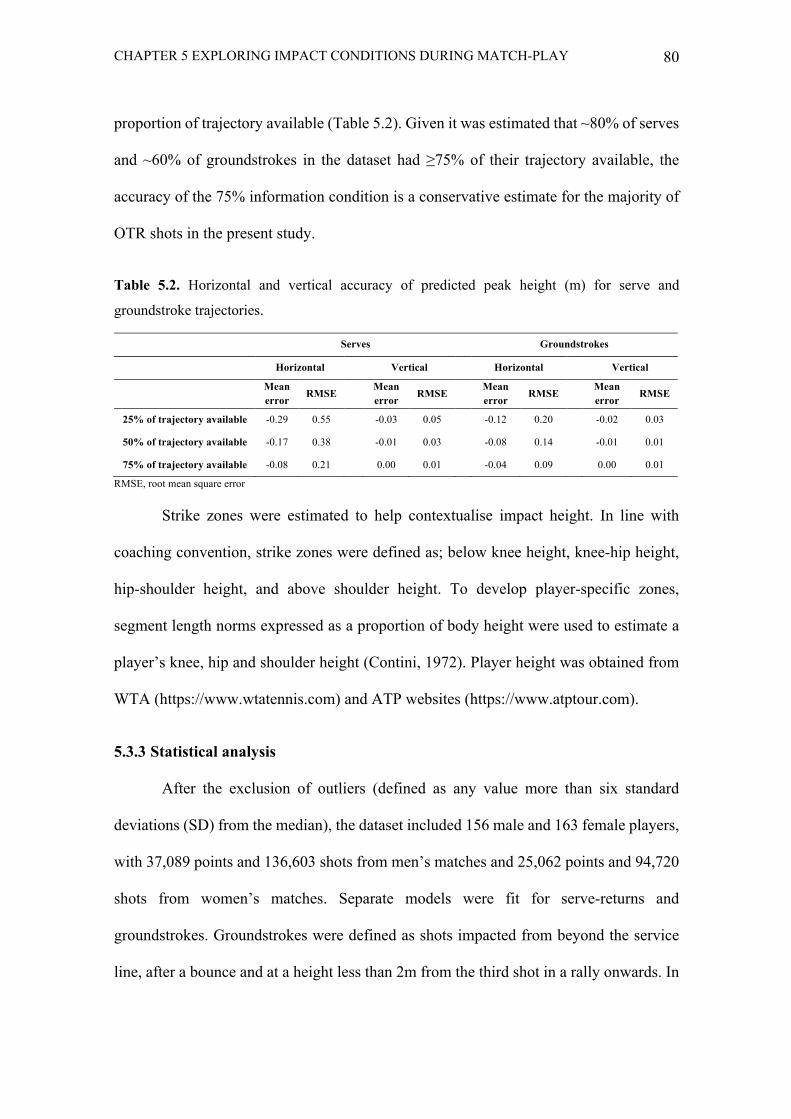
CHAPTER 5 EXPLORING IMPACT CONDITIONS DURING MATCH-PLAY 80
proportion of trajectory available (Table 5.2). Given it was estimated that ~80% of serves
and ~60% of groundstrokes in the dataset had ≥75% of their trajectory available, the
accuracy of the 75% information condition is a conservative estimate for the majority of
OTR shots in the present study.
Table 5.2. Horizontal and vertical accuracy of predicted peak height (m) for serve and
groundstroke trajectories.
RMSE, root mean square error
Strike zones were estimated to help contextualise impact height. In line with
coaching convention, strike zones were defined as; below knee height, knee-hip height,
hip-shoulder height, and above shoulder height. To develop player-specific zones,
segment length norms expressed as a proportion of body height were used to estimate a
player’s knee, hip and shoulder height (Contini, 1972). Player height was obtained from
WTA (https://www.wtatennis.com) and ATP websites (https://www.atptour.com).
5.3.3 Statistical analysis
After the exclusion of outliers (defined as any value more than six standard
deviations (SD) from the median), the dataset included 156 male and 163 female players,
with 37,089 points and 136,603 shots from men’s matches and 25,062 points and 94,720
shots from women’s matches. Separate models were fit for serve-returns and
groundstrokes. Groundstrokes were defined as shots impacted from beyond the service
line, after a bounce and at a height less than 2m from the third shot in a rally onwards. In
Serves Groundstrokes
Horizontal Vertical Horizontal Vertical
Mean
error RMSE
Mean
error RMSE
Mean
error RMSE
Mean
error RMSE
25% of trajectory available -0.29 0.55 -0.03 0.05 -0.12 0.20 -0.02 0.03
50% of trajectory available -0.17 0.38 -0.01 0.03 -0.08 0.14 -0.01 0.01
75% of trajectory available -0.08 0.21 0.00 0.01 -0.04 0.09 0.00 0.01
CHAPTER 5 EXPLORING IMPACT CONDITIONS DURING MATCH-PLAY 81
an effort to remove shots not representative of a typical impact, those originating and
ending up the same end of the court and wider than court boundaries were excluded from
analysis.
Regression models were fit to a baseline model to identify and exclude the top 1%
of influential data points based on Cook’s distance (Cook, 1979). Following this, all
analyses were performed using Generalised Additive Models (GAMs), fit using the mgcv
package in R (R Core Team, 2017). GAMs are a well-established strategy for modelling
complex and non-linear associations, such as those arising with spatial effects, thru the
use of non-parametric smoothing functions. In models, binary (OTR, OTD) and
continuous (distance of impact from peak height, impact depth, impact height) measures
of impact were specified as outcome variables. To control for and examine the effect of
incoming shot characteristics, standardised ball speed, ball spin, landing depth and
landing width were included as thin-plate smooths. Variables were standardised
according to gender and the incoming shot (i.e., spin direction or serve number). Ball
speed and spin were represented as a bivariate smooth to allow for their interaction to be
captured. For contextualisation, serve-return models included a fixed effect for serve
number (first, second) and groundstroke models included the incoming shot’s spin
direction (topspin, backspin). To examine differences in impact dependent on the return,
all models included the shot type (topspin forehand, topspin backhand, backspin
forehand, backspin backhand) used to return the incoming trajectory. Additionally, to
examine impact height when the ball was taken OTR compared to OTD, impact height
models included a shot’s impact classification (rise, drop). Models were fit with a gender
or ranking effect (inside, outside top-10 tournament seeds), to probe the effect of each on
CHAPTER 5 EXPLORING IMPACT CONDITIONS DURING MATCH-PLAY 82
impact. All models included a random effect for impact player to eliminate potential bias
associated with an unequal number of data points per player.
In addition to main effects of the explanatory variables, models estimated a
number of interaction effects. All categorical variables interacted with each other, making
a fully saturated model with respect to categorical variables. To prevent unstable
estimates due to sample size, subgroups with <30 data points were excluded from models
(Table 5.3). Further, a linear interaction term was included between each subgroup
created by the interactions among categorical variables and continuous variables of main
interest (ball speed, ball spin, landing depth). Model fit was measured by Akaike
information criterion and all models were compared to a baseline model with no
interaction terms (Table 5.4). Additionally, impact depth was log-transformed in
groundstroke models to improve the normality of the model residuals.
Approximate 95% confidence intervals (CI) were calculated and statistical
significance of effects was based on the lack of overlap of the CI. Additionally, effect
sizes (Cohen’s d) using a skew-adjusted SD were calculated and are presented when
interpreting categorical effects.
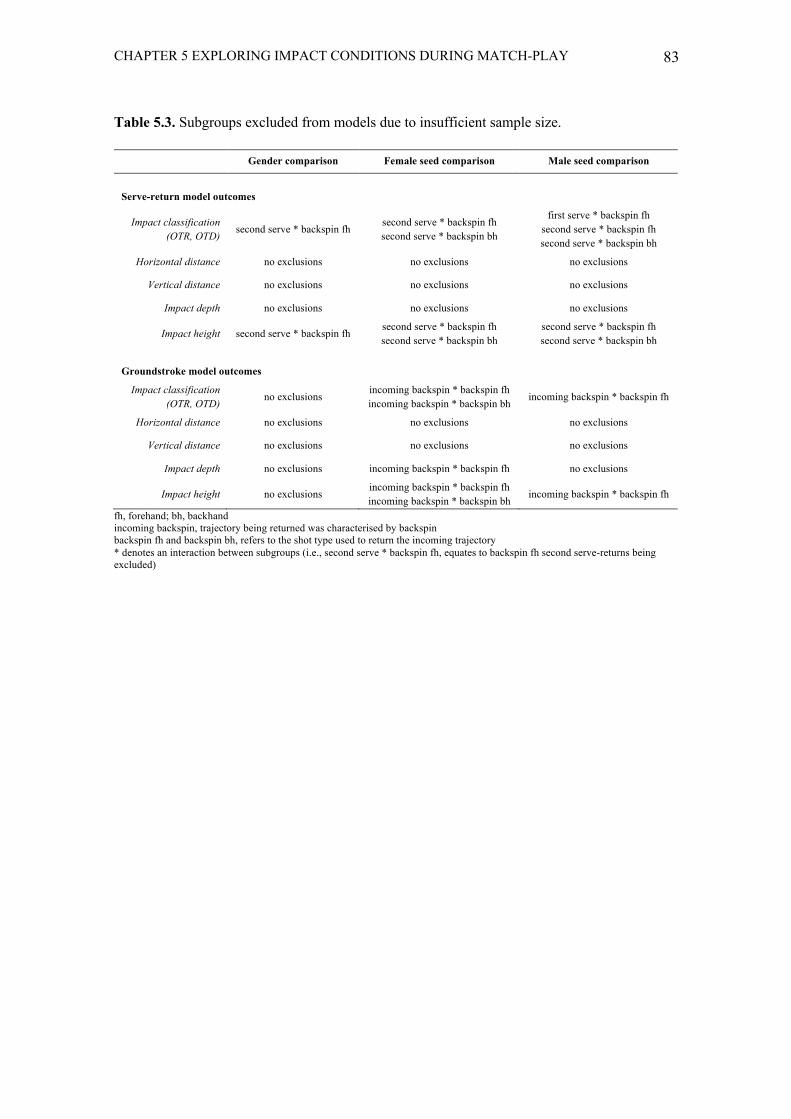
CHAPTER 5 EXPLORING IMPACT CONDITIONS DURING MATCH-PLAY 83
Table 5.3. Subgroups excluded from models due to insufficient sample size.
fh, forehand; bh, backhand incoming backspin, trajectory being returned was characterised by backspin backspin fh and backspin bh, refers to the shot type used to return the incoming trajectory * denotes an interaction between subgroups (i.e., second serve * backspin fh, equates to backspin fh second serve-returns being excluded)
Gender comparison Female seed comparison Male seed comparison
Serve-return model outcomes
Impact classification (OTR, OTD)
second serve * backspin fh second serve * backspin fh second serve * backspin bh
first serve * backspin fh second serve * backspin fh second serve * backspin bh
Horizontal distance no exclusions no exclusions no exclusions
Vertical distance no exclusions no exclusions no exclusions
Impact depth no exclusions no exclusions no exclusions
Impact height second serve * backspin fh second serve * backspin fh second serve * backspin bh
second serve * backspin fh second serve * backspin bh
Groundstroke model outcomes
Impact classification (OTR, OTD) no exclusions incoming backspin * backspin fh
incoming backspin * backspin bh incoming backspin * backspin fh
Horizontal distance no exclusions no exclusions no exclusions
Vertical distance no exclusions no exclusions no exclusions
Impact depth no exclusions incoming backspin * backspin fh no exclusions
Impact height no exclusions incoming backspin * backspin fh incoming backspin * backspin bh incoming backspin * backspin fh
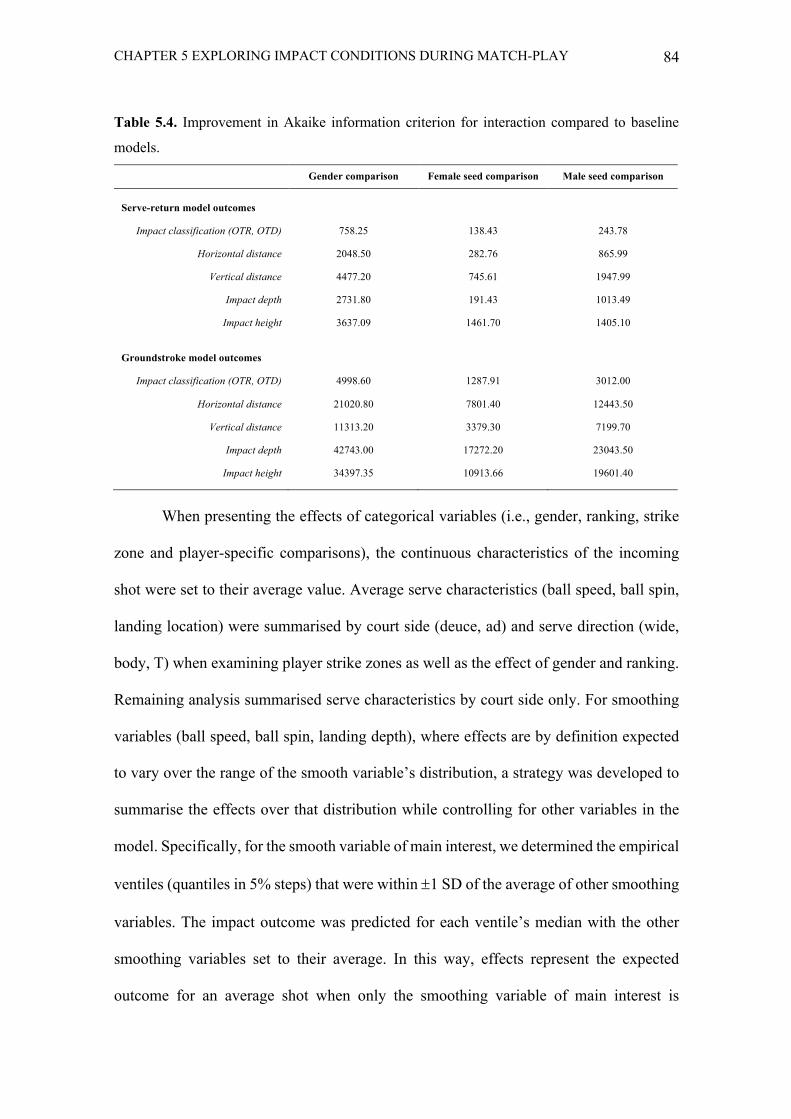
CHAPTER 5 EXPLORING IMPACT CONDITIONS DURING MATCH-PLAY 84
Table 5.4. Improvement in Akaike information criterion for interaction compared to baseline
models.
When presenting the effects of categorical variables (i.e., gender, ranking, strike
zone and player-specific comparisons), the continuous characteristics of the incoming
shot were set to their average value. Average serve characteristics (ball speed, ball spin,
landing location) were summarised by court side (deuce, ad) and serve direction (wide,
body, T) when examining player strike zones as well as the effect of gender and ranking.
Remaining analysis summarised serve characteristics by court side only. For smoothing
variables (ball speed, ball spin, landing depth), where effects are by definition expected
to vary over the range of the smooth variable’s distribution, a strategy was developed to
summarise the effects over that distribution while controlling for other variables in the
model. Specifically, for the smooth variable of main interest, we determined the empirical
ventiles (quantiles in 5% steps) that were within ±1 SD of the average of other smoothing
variables. The impact outcome was predicted for each ventile’s median with the other
smoothing variables set to their average. In this way, effects represent the expected
outcome for an average shot when only the smoothing variable of main interest is
Gender comparison Female seed comparison Male seed comparison
Serve-return model outcomes
Impact classification (OTR, OTD) 758.25 138.43 243.78
Horizontal distance 2048.50 282.76 865.99
Vertical distance 4477.20 745.61 1947.99
Impact depth 2731.80 191.43 1013.49
Impact height 3637.09 1461.70 1405.10
Groundstroke model outcomes
Impact classification (OTR, OTD) 4998.60 1287.91 3012.00
Horizontal distance 21020.80 7801.40 12443.50
Vertical distance 11313.20 3379.30 7199.70
Impact depth 42743.00 17272.20 23043.50
Impact height 34397.35 10913.66 19601.40
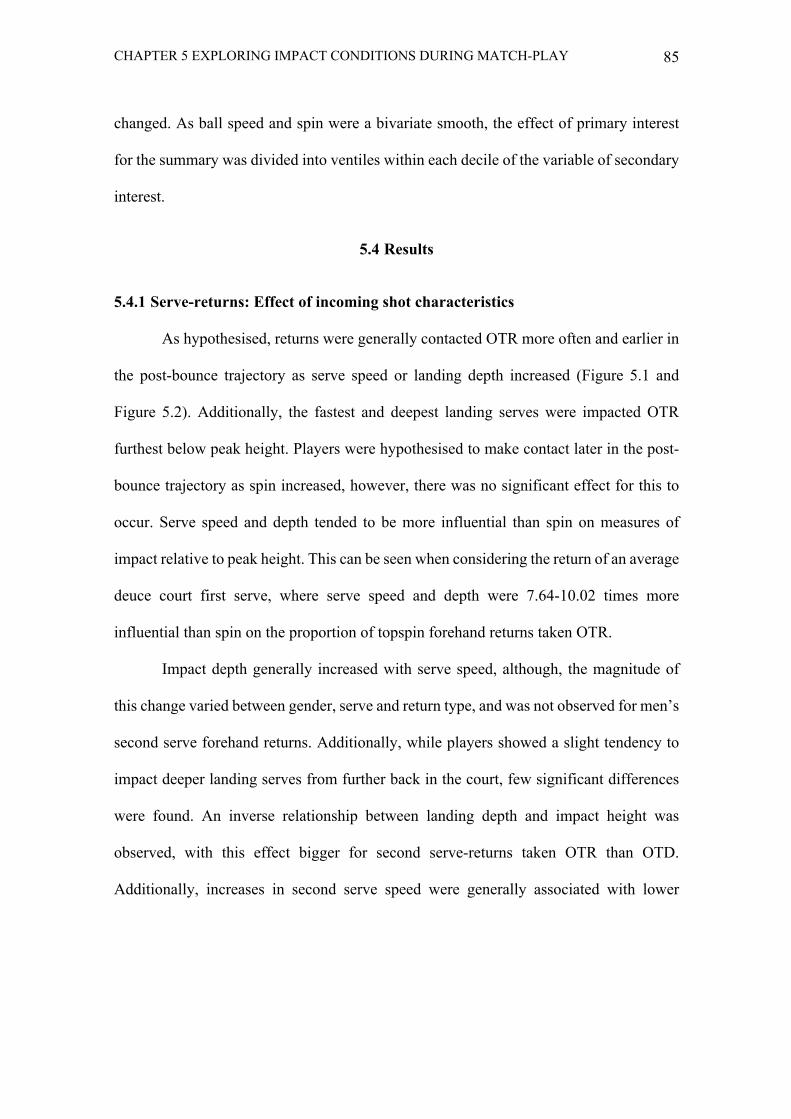
CHAPTER 5 EXPLORING IMPACT CONDITIONS DURING MATCH-PLAY 85
changed. As ball speed and spin were a bivariate smooth, the effect of primary interest
for the summary was divided into ventiles within each decile of the variable of secondary
interest.
5.4 Results
5.4.1 Serve-returns: Effect of incoming shot characteristics
As hypothesised, returns were generally contacted OTR more often and earlier in
the post-bounce trajectory as serve speed or landing depth increased (Figure 5.1 and
Figure 5.2). Additionally, the fastest and deepest landing serves were impacted OTR
furthest below peak height. Players were hypothesised to make contact later in the post-
bounce trajectory as spin increased, however, there was no significant effect for this to
occur. Serve speed and depth tended to be more influential than spin on measures of
impact relative to peak height. This can be seen when considering the return of an average
deuce court first serve, where serve speed and depth were 7.64-10.02 times more
influential than spin on the proportion of topspin forehand returns taken OTR.
Impact depth generally increased with serve speed, although, the magnitude of
this change varied between gender, serve and return type, and was not observed for men’s
second serve forehand returns. Additionally, while players showed a slight tendency to
impact deeper landing serves from further back in the court, few significant differences
were found. An inverse relationship between landing depth and impact height was
observed, with this effect bigger for second serve-returns taken OTR than OTD.
Additionally, increases in second serve speed were generally associated with lower
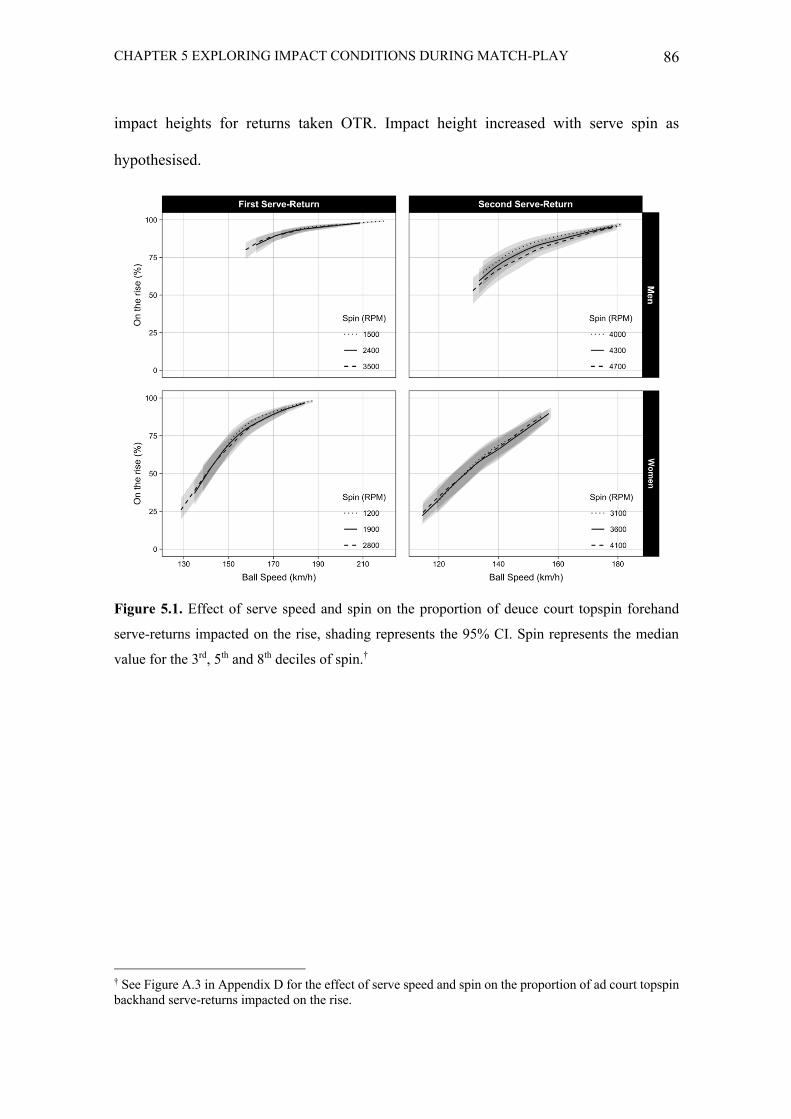
CHAPTER 5 EXPLORING IMPACT CONDITIONS DURING MATCH-PLAY 86
impact heights for returns taken OTR. Impact height increased with serve spin as
hypothesised.
Figure 5.1. Effect of serve speed and spin on the proportion of deuce court topspin forehand
serve-returns impacted on the rise, shading represents the 95% CI. Spin represents the median
value for the 3rd, 5th and 8th deciles of spin.†
† See Figure A.3 in Appendix D for the effect of serve speed and spin on the proportion of ad court topspin backhand serve-returns impacted on the rise.
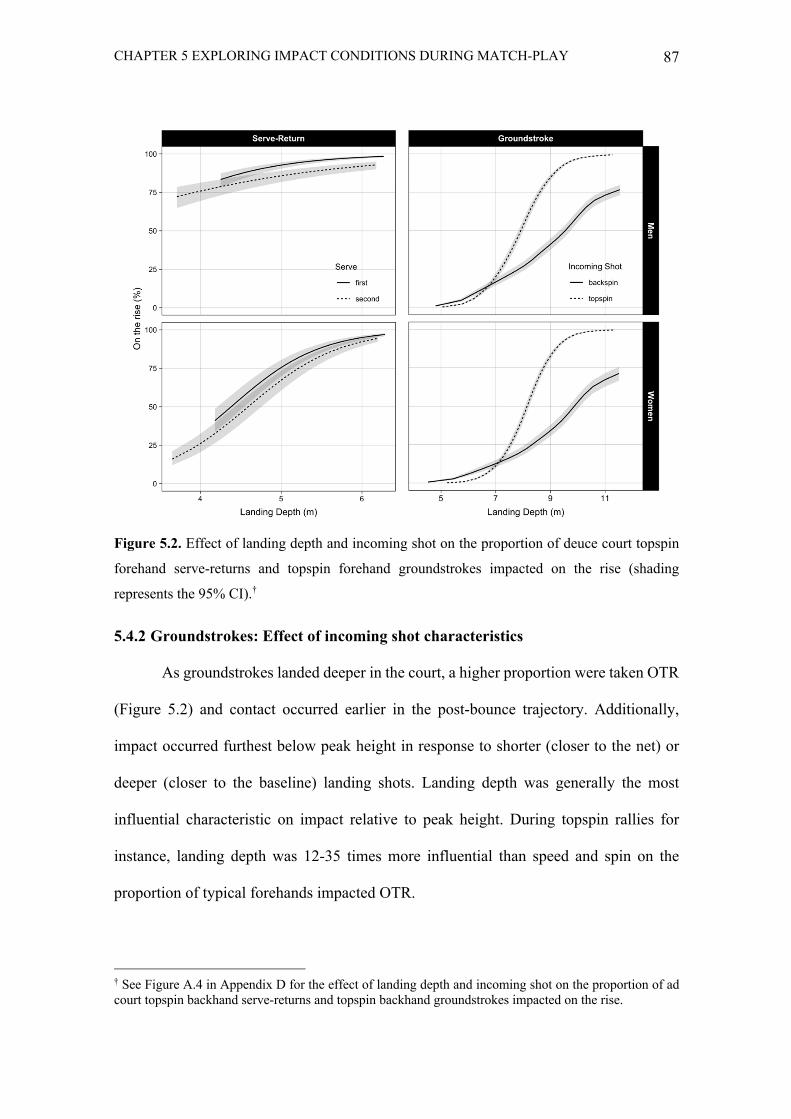
CHAPTER 5 EXPLORING IMPACT CONDITIONS DURING MATCH-PLAY 87
Figure 5.2. Effect of landing depth and incoming shot on the proportion of deuce court topspin
forehand serve-returns and topspin forehand groundstrokes impacted on the rise (shading
represents the 95% CI).†
5.4.2 Groundstrokes: Effect of incoming shot characteristics
As groundstrokes landed deeper in the court, a higher proportion were taken OTR
(Figure 5.2) and contact occurred earlier in the post-bounce trajectory. Additionally,
impact occurred furthest below peak height in response to shorter (closer to the net) or
deeper (closer to the baseline) landing shots. Landing depth was generally the most
influential characteristic on impact relative to peak height. During topspin rallies for
instance, landing depth was 12-35 times more influential than speed and spin on the
proportion of typical forehands impacted OTR.
† See Figure A.4 in Appendix D for the effect of landing depth and incoming shot on the proportion of ad court topspin backhand serve-returns and topspin backhand groundstrokes impacted on the rise.
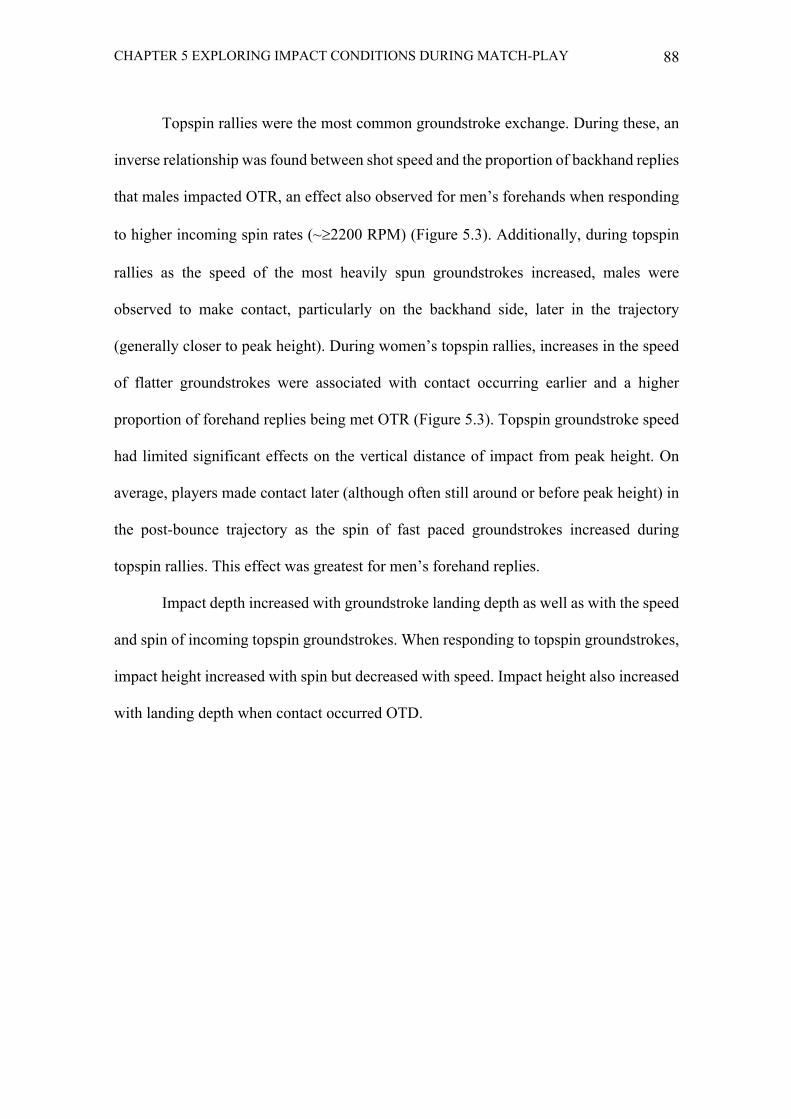
CHAPTER 5 EXPLORING IMPACT CONDITIONS DURING MATCH-PLAY 88
Topspin rallies were the most common groundstroke exchange. During these, an
inverse relationship was found between shot speed and the proportion of backhand replies
that males impacted OTR, an effect also observed for men’s forehands when responding
to higher incoming spin rates (~³2200 RPM) (Figure 5.3). Additionally, during topspin
rallies as the speed of the most heavily spun groundstrokes increased, males were
observed to make contact, particularly on the backhand side, later in the trajectory
(generally closer to peak height). During women’s topspin rallies, increases in the speed
of flatter groundstrokes were associated with contact occurring earlier and a higher
proportion of forehand replies being met OTR (Figure 5.3). Topspin groundstroke speed
had limited significant effects on the vertical distance of impact from peak height. On
average, players made contact later (although often still around or before peak height) in
the post-bounce trajectory as the spin of fast paced groundstrokes increased during
topspin rallies. This effect was greatest for men’s forehand replies.
Impact depth increased with groundstroke landing depth as well as with the speed
and spin of incoming topspin groundstrokes. When responding to topspin groundstrokes,
impact height increased with spin but decreased with speed. Impact height also increased
with landing depth when contact occurred OTD.
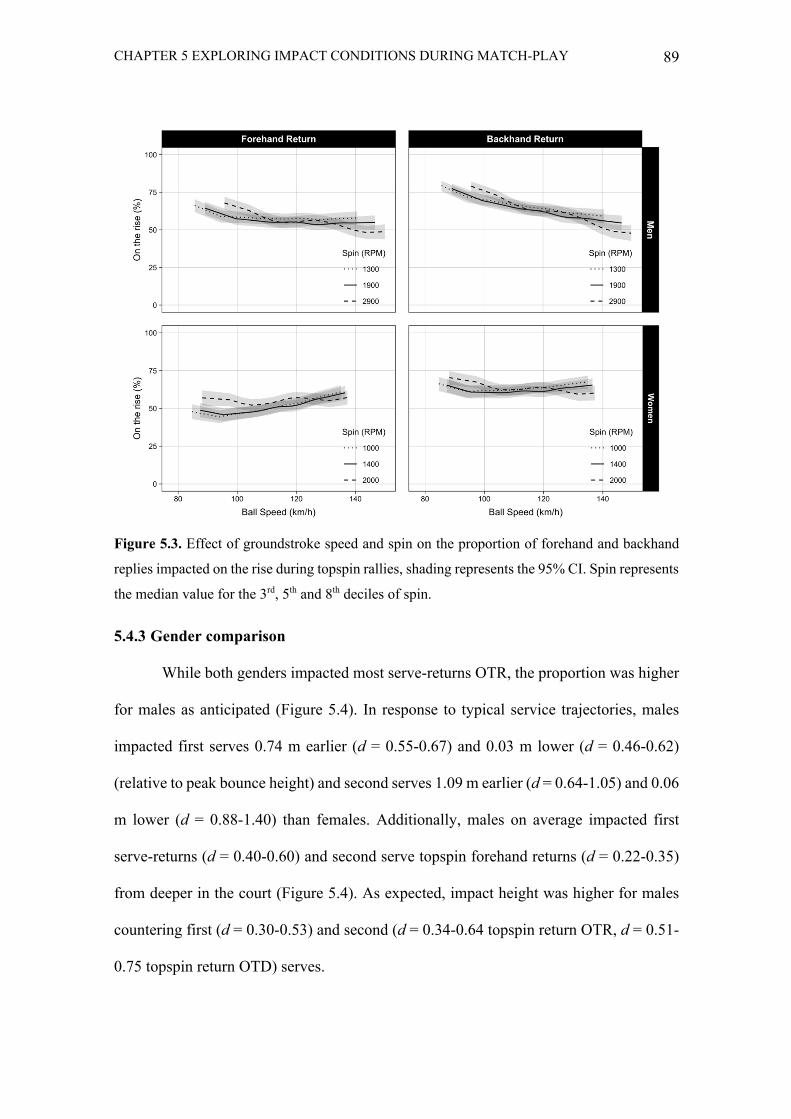
CHAPTER 5 EXPLORING IMPACT CONDITIONS DURING MATCH-PLAY 89
Figure 5.3. Effect of groundstroke speed and spin on the proportion of forehand and backhand
replies impacted on the rise during topspin rallies, shading represents the 95% CI. Spin represents
the median value for the 3rd, 5th and 8th deciles of spin.
5.4.3 Gender comparison
While both genders impacted most serve-returns OTR, the proportion was higher
for males as anticipated (Figure 5.4). In response to typical service trajectories, males
impacted first serves 0.74 m earlier (d = 0.55-0.67) and 0.03 m lower (d = 0.46-0.62)
(relative to peak bounce height) and second serves 1.09 m earlier (d = 0.64-1.05) and 0.06
m lower (d = 0.88-1.40) than females. Additionally, males on average impacted first
serve-returns (d = 0.40-0.60) and second serve topspin forehand returns (d = 0.22-0.35)
from deeper in the court (Figure 5.4). As expected, impact height was higher for males
countering first (d = 0.30-0.53) and second (d = 0.34-0.64 topspin return OTR, d = 0.51-
0.75 topspin return OTD) serves.
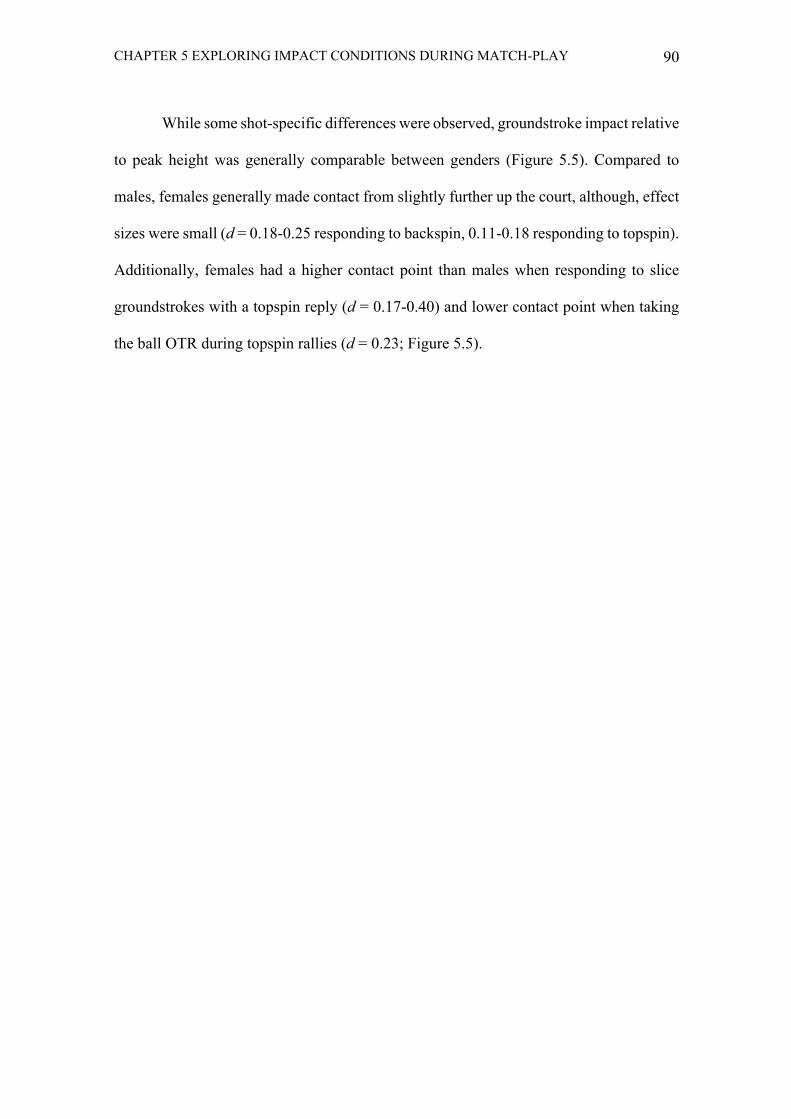
CHAPTER 5 EXPLORING IMPACT CONDITIONS DURING MATCH-PLAY 90
While some shot-specific differences were observed, groundstroke impact relative
to peak height was generally comparable between genders (Figure 5.5). Compared to
males, females generally made contact from slightly further up the court, although, effect
sizes were small (d = 0.18-0.25 responding to backspin, 0.11-0.18 responding to topspin).
Additionally, females had a higher contact point than males when responding to slice
groundstrokes with a topspin reply (d = 0.17-0.40) and lower contact point when taking
the ball OTR during topspin rallies (d = 0.23; Figure 5.5).
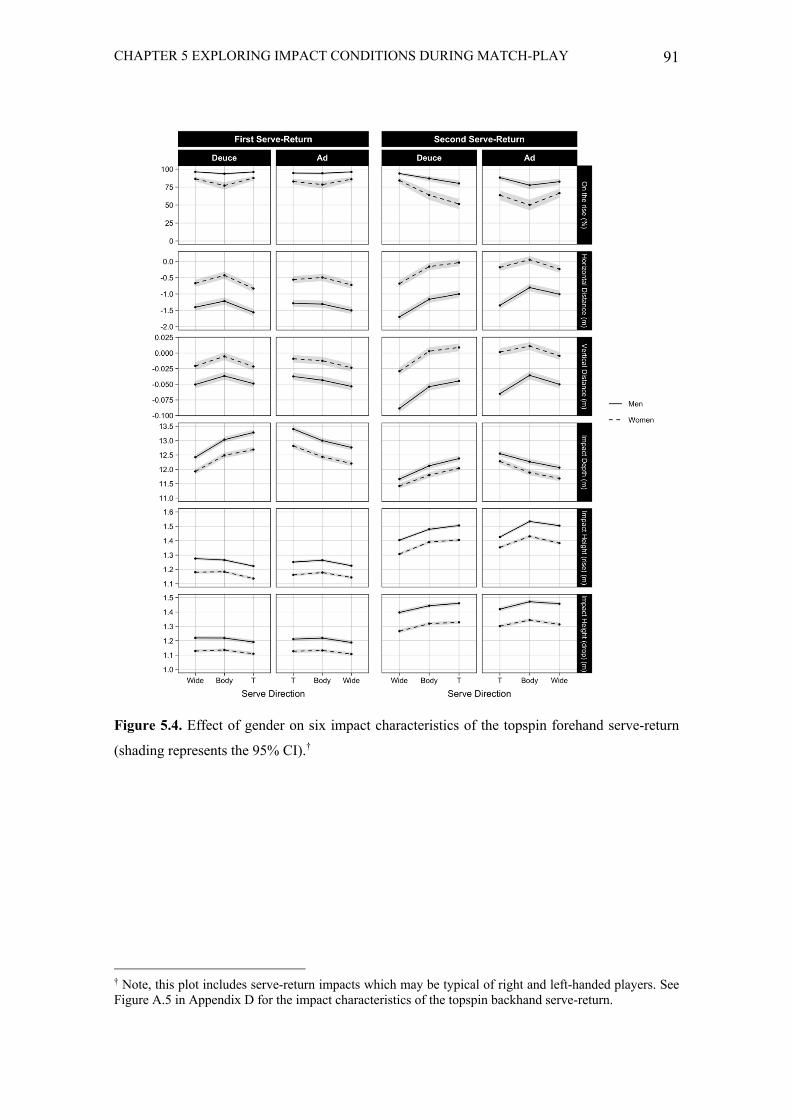
CHAPTER 5 EXPLORING IMPACT CONDITIONS DURING MATCH-PLAY 91
Figure 5.4. Effect of gender on six impact characteristics of the topspin forehand serve-return
(shading represents the 95% CI).†
† Note, this plot includes serve-return impacts which may be typical of right and left-handed players. See Figure A.5 in Appendix D for the impact characteristics of the topspin backhand serve-return.
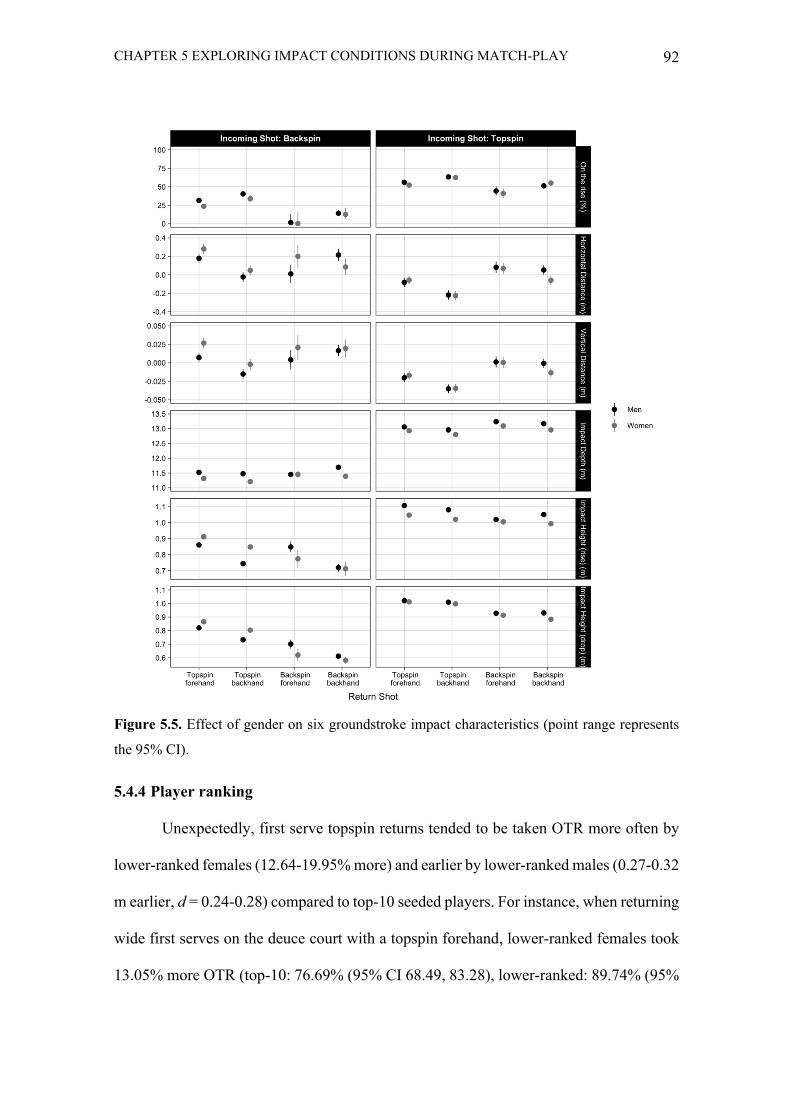
CHAPTER 5 EXPLORING IMPACT CONDITIONS DURING MATCH-PLAY 92
Figure 5.5. Effect of gender on six groundstroke impact characteristics (point range represents
the 95% CI).
5.4.4 Player ranking
Unexpectedly, first serve topspin returns tended to be taken OTR more often by
lower-ranked females (12.64-19.95% more) and earlier by lower-ranked males (0.27-0.32
m earlier, d = 0.24-0.28) compared to top-10 seeded players. For instance, when returning
wide first serves on the deuce court with a topspin forehand, lower-ranked females took
13.05% more OTR (top-10: 76.69% (95% CI 68.49, 83.28), lower-ranked: 89.74% (95%
CHAPTER 5 EXPLORING IMPACT CONDITIONS DURING MATCH-PLAY 93
CI 86.44, 92.31)) and lower-ranked males made contact 0.27 m earlier (top-10: -1.13 m
(95% CI -1.26, -0.99), lower-ranked: -1.40 m (95% CI -1.51, -1.28)).
Lower-ranked females contacted groundstrokes OTR more often than top-10
seeded players, on average hitting 12.19% more forehands OTR (top-10: 43.37% (95%
CI 37.88, 49.02), lower-ranked: 55.56% (95% CI 51.17, 59.86)) during topspin rallies.
There were shot-specific effects for lower-ranked players of both genders to take the ball
earlier when countering topspin groundstrokes (d = 0.10-0.20).
5.4.5 Strike zones
The following examines a player’s average contact point relative to stature. A
player’s average first serve-return contact point generally fell between hip-shoulder
height (>98% of players). On second serve-return, depending on impact classification and
serve type, players made contact between hip-shoulder or above shoulder height. For
instance, when returning deuce court serves, >65% of players contacted topspin returns
between hip-shoulder height. This was similar on the ad court (>70% of players between
hip-shoulder), although, for the average body serve, 40-53% of players contacted topspin
returns OTR above shoulder height.
The majority of players made contact between hip-shoulder height when taking
an average incoming topspin groundstroke OTR (>93% of players for topspin replies,
>67% of players for slice replies) and OTD (>65% of males, >95% of females for topspin
replies), with the exception of slice replies taken OTD which were met between knee-hip
height (>90% of males, >57% of females).
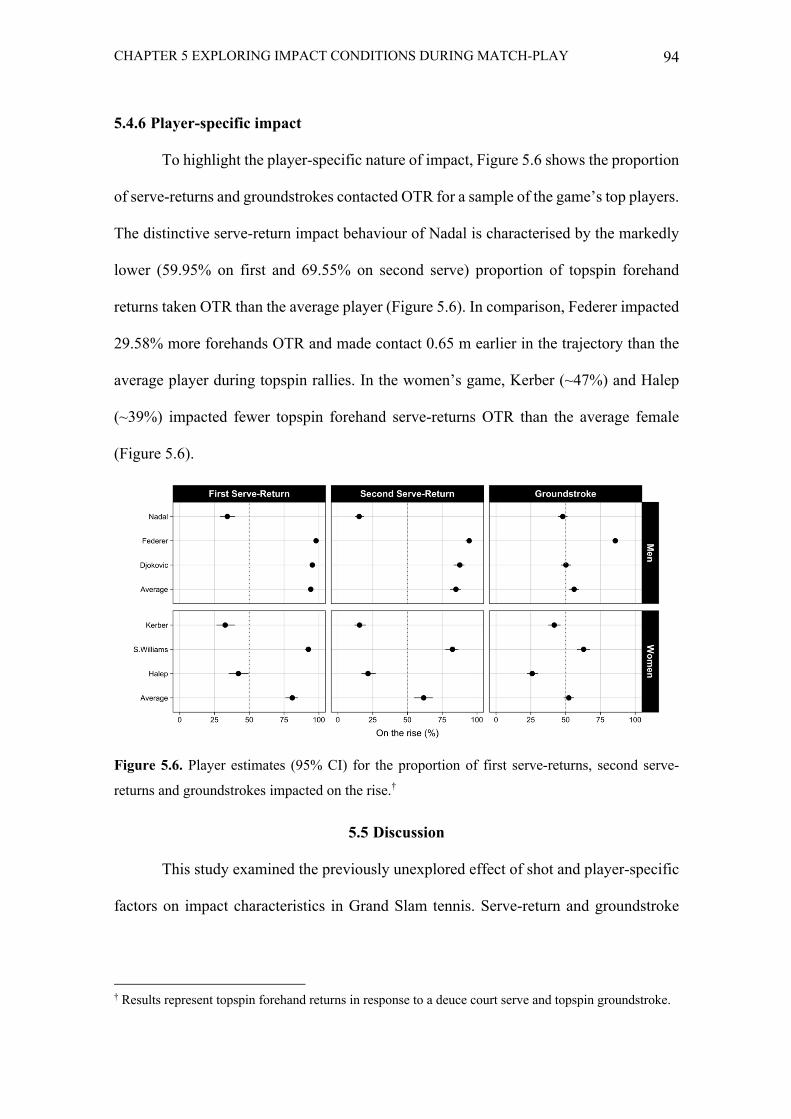
CHAPTER 5 EXPLORING IMPACT CONDITIONS DURING MATCH-PLAY 94
5.4.6 Player-specific impact
To highlight the player-specific nature of impact, Figure 5.6 shows the proportion
of serve-returns and groundstrokes contacted OTR for a sample of the game’s top players.
The distinctive serve-return impact behaviour of Nadal is characterised by the markedly
lower (59.95% on first and 69.55% on second serve) proportion of topspin forehand
returns taken OTR than the average player (Figure 5.6). In comparison, Federer impacted
29.58% more forehands OTR and made contact 0.65 m earlier in the trajectory than the
average player during topspin rallies. In the women’s game, Kerber (~47%) and Halep
(~39%) impacted fewer topspin forehand serve-returns OTR than the average female
(Figure 5.6).
Figure 5.6. Player estimates (95% CI) for the proportion of first serve-returns, second serve-
returns and groundstrokes impacted on the rise.†
5.5 Discussion
This study examined the previously unexplored effect of shot and player-specific
factors on impact characteristics in Grand Slam tennis. Serve-return and groundstroke
† Results represent topspin forehand returns in response to a deuce court serve and topspin groundstroke.
CHAPTER 5 EXPLORING IMPACT CONDITIONS DURING MATCH-PLAY 95
impact was influenced by the characteristics of the incoming ball’s trajectory, player,
gender and ranking.
5.5.1 Serve-return impact
In general agreement with our hypothesis, serve-returns were met earlier in the
post-bounce trajectory and taken OTR more often as serve landing depth or speed
increased. This earlier impact likely explains the deepest and fastest serves being met
furthest below peak height. Deeper return positions may neutralise the earlier arrival of
deeper or faster serves, whilst also providing additional return time against big servers.
However, observed changes in impact depth did not correspond to a consistent impact
relative to peak height and may reflect strategic decisions by players to hold court position
or the inability to anticipate serve-to-serve variation in speed and depth (Vernon et al.,
2018).
Males took a higher proportion of serve-returns OTR and made contact earlier,
despite females impacting first serve-returns and second serve topspin forehand returns
from further up the court. While these two findings appear contradictory, the higher serve
speeds generated by males may outweigh any effect of their deeper court positioning
(Kovalchik & Reid, 2017; Reid et al., 2016). Indeed, Reid et al. (2016) found males were
under slightly more time pressure on return of serve, having ≈0.3 s less time to return,
than the average female player. It could then be reasoned that females adopt more
aggressive return positions in an absolute but not relative sense (Reid et al., 2016). With
Krause, Buszard, et al. (2019) recently highlighting opportunities to strengthen the sport’s
approach to the representative practice of the serve-return, these data can also help
practitioners to improve the specificity of return practice.
CHAPTER 5 EXPLORING IMPACT CONDITIONS DURING MATCH-PLAY 96
Returners were not observed to contact heavily spun serves later in the post-
bounce trajectory, which was an expected adjustment to preserving a comfortable impact
height. With impact height increasing with serve spin and some evidence of average
serves being contacted above shoulder height, players may have benefited from greater
adjustments in return position. The generalisability of this finding is unknown, as players
may adjust to serve characteristics differently on other court surfaces to maintain
preferred hitting zones (United States Tennis Association, 2004). Additionally, this
finding highlights the importance of varying serve trajectories during practice to
familiarise players with differing return heights.
5.5.2 Groundstroke impact
Groundstrokes were impacted earlier and OTR more often as landing depth
increased, despite players adopting deeper return positions. This likely indicates players
were unable to make sufficient changes in court position to counter the effects of deeper
landing groundstrokes, which may in turn place players under increased time pressure.
With 75% of a shot’s outgoing speed determined by racket velocity (Brody, 2003),
imposing time pressure through deeper groundstrokes may limit the racket and
consequently ball speed opponents generate.
The effects of incoming shot speed on groundstroke impact characteristics were
varied according to its accompanying spin rate, gender, and the reply shot played. As
incoming groundstroke speed increased during topspin rallies, males impacted backhands
OTD more often. This was likely related to observed increases in impact depth with
incoming shot speed and the prospect of opponents attacking this side. This finding
appears consistent with the work of Choppin et al. (2007), whom suggested impact
occurred later with rising incoming shot speeds, albeit on a different court surface and in
CHAPTER 5 EXPLORING IMPACT CONDITIONS DURING MATCH-PLAY 97
practice settings. In comparison, females in particular were observed to impact flatter
groundstrokes earlier in the trajectory as speed increased during topspin rallies. This may
be a deliberate effort by players to maintain closer contact with the baseline (hold court
position) and not cede spatial advantage (Carvalho et al., 2013).
In partial support of our hypothesis, as the spin of faster paced groundstrokes
increased there was evidence that contact occurred later in the post-bounce trajectory
during topspin rallies. While this often led to impact occurring closer to peak height,
players generally maintained contact points below shoulder height, in line with
recommendations for eastern and semi-western forehand grips (Crespo & Higueras,
2001). An average impact point above shoulder height was only observed for the majority
of players when responding to an incoming topspin groundstroke characterised by the
lowest 20% of observed speeds. While potentially falling outside a player’s preferred
strike zone, these strokes may be easier to counter or attack given their lower speeds. The
observed relationship between ball spin and impact height is in line with previous
trajectory modelling work, which found moderate-high speed topspin groundstrokes
likely bounce to a height (2m past the baseline) that is comfortable for players to counter
(Cross, 2020).
Contrary to expectations, groundstroke impact relative to peak height was
generally comparable between genders. Males were anticipated to make contact earlier
due to reports they impact a greater proportion of groundstrokes from inside the baseline
(Reid et al., 2016), but in our study, if anything, males were observed to make contact
from deeper court positions. Interestingly though, male players did have a higher contact
point in absolute terms when taking the ball OTR during topspin rallies, likely reflecting
a gender differential in player stature.
CHAPTER 5 EXPLORING IMPACT CONDITIONS DURING MATCH-PLAY 98
5.5.3 Player ranking
We hypothesised top-10 seeds would make contact earlier as they dictated play
and imposed greater temporal and spatial pressure on lower-ranked opponents. This was
not the case, with shot-specific effects for players not seeded in the top-10 to make contact
earlier and OTR more often. This earlier impact is likely explained by lower-ranked
players adopting court positions slightly further up the court (Whiteside et al., 2015),
which may reflect a tactical decision to not cede ground against more fancied rivals
(Crespo & Miley, 1998). It is worth noting these effects may also reflect idiosyncratic
differences in playing style among those comprising the top-10 seeds.
5.5.4 Player-specific impact
Vast differences in player impact relative to peak height were observed even
among the sport’s top players. For instance, Roger Federer impacted a high proportion of
groundstrokes and serve-returns OTR, while this proportion was much lower for Rafael
Nadal, especially on serve-return (~63% fewer first and ~74% fewer second serve topspin
returns than Federer). These differences in impact reflect stylistic choices (Wei, Lucey,
Morgan, Reid, & Sridharan, 2016) and also seem to support their desire to hit as many
shots as possible in their preferred (and similar) strike zones. During topspin rallies,
Nadal’s average impact height when making contact OTD was similar to Federer’s, but
10 cm higher when hitting OTR. This may be linked to differences in grip (Crespo &
Higueras, 2001) as well as distinct racket and resulting ball trajectories for each player
(Elliott et al., 1997). Player contact may also vary in accordance with opponent game
style. For instance, players have described the difficulty in staying close to the baseline
in handling heavy ball-striking (Fest, 2016; Mutua Madrid Open, 2019). Similar
comparisons in impact are evident in the women’s game with player strategy, technique
CHAPTER 5 EXPLORING IMPACT CONDITIONS DURING MATCH-PLAY 99
and action capabilities all contributing to individual impact points (i.e., during topspin
rallies Simona Halep contacted ~37% fewer groundstrokes on the rise than Serena
Williams).
5.5.5 Limitations
By estimating a player’s knee, hip and shoulder position, we categorised strike
zones during match-play for the first time. A limitation of our approach was the use of
general population segment length norms to develop player-specific strike zones, as these
could not be directly measured. Additionally, while estimating ball spin from ball-
tracking data was central to understanding the effect of ball spin on impact characteristics
during match-play, the measure’s error at the highest spin rates may have prevented the
observation of effects specific to the most heavily spun strokes. This has the greatest
effect on interpreting responses to men’s second serves where the highest spin rates have
been recorded (Kelley, 2011). The use of a combined topspin/backspin and sidespin
measure of ball spin off the racket may have also prevented effects specific to each spin
component being observed as well as the effect of ball speed and spin post-bounce.
The current study categorised impact as occurring OTR or OTD based on contact
being made before or after peak bounce height. However, this approach may not
adequately depict what players and coaches practically describe these impacts as being.
For example, only impacts made well before peak height may be perceived by players as
“on the rise”, which, would support the inclusion and investigation of additional impact
categories (e.g., top of the bounce). The position of impact in the post-bounce trajectory
could also be considered as a relative rather than absolute measure (i.e., ratio of where
impact occurs between the bounce and peak height), which may account for changes in
the position of peak height. Additionally, despite attempts to meet model assumptions
CHAPTER 5 EXPLORING IMPACT CONDITIONS DURING MATCH-PLAY 100
when modelling the vertical distance of impact below peak height, residuals were not
normally distributed and had unequal variance, meaning that some caution is required in
interpreting results. Future work could also consider other approaches to estimate the
post-bounce trajectory and therefore peak height for shots impacted OTR, especially
when only a small proportion of the trajectory is observed.
This study estimated effects for shots with average incoming characteristics,
however, these do not necessarily combine to reflect the characteristics of an average
shot. Further, this analysis could be extended to examine differences in impact by gender,
ranking and player in response to varying incoming trajectories. Finally, while the current
analysis captured the interaction between a shot’s speed and spin, it did not examine
how the effect of ball speed and spin varied based on the shot’s depth or lateral landing
location. This represents a logical extension of the current work.
5.6 Conclusion
This study provides seminal insight into the impact characteristics of professional
tennis players during match-play, unearthing shot, gender, ranking and player effects
across measures of serve-return and groundstroke impact. On most serve-returns, impact
tended to be made between the hip-shoulder but mixed between knee-hip and hip-
shoulder for groundstrokes. While both genders typically contacted serve-returns OTR,
the proportion was higher for male players. Top-ranked players did not contact shots OTR
more often and earlier, which was unexpected. Across serve-returns and groundstrokes,
the landing depth of incoming shots tended to be the most influential factor on how early
players made contact, while ball spin tended to have the least effect. In sum, the ability
of players to manufacture a consistent impact point in tennis is influenced more by the

CHAPTER 5 EXPLORING IMPACT CONDITIONS DURING MATCH-PLAY 101
opponent’s ball’s trajectory than modern coaching convention appears to espouse. In
other words, players are not necessarily the masters of their own impact destiny.
CHAPTER 6 SHOT AND IMPACT EFFECTS ON RETURN QUALITY 102
CHAPTER 6
MODELLING THE EFFECT OF INCOMING SHOT TRAJECTORIES AND
IMPACT POSITIONS ON THE QUALITY OF A PLAYER’S BALL-STRIKING
CHAPTER 6 SHOT AND IMPACT EFFECTS ON RETURN QUALITY 103
6.1 Abstract
Science and practice routinely consider shots independently in tennis, giving rise
to labels like unforced errors and winners, yet little is known about the effect of one shot
on the next. Accordingly, this study explored the effects of incoming shot and impact
characteristics on the quality of a player’s outgoing reply. Australian Open ball-tracking
data was collated. The effects of incoming shot characteristics (speed, spin, landing
depth) and the receiving player’s impact (impact height, impact relative to peak height)
on reply quality (speed, spin, time pressure, error rate) were examined using generalised
additive models. Incoming shot and impact characteristics variously affected reply
quality. There was a general trend for serve-returns and groundstrokes hit with topspin to
be characterised by lower speed and time pressure in response to higher speed but not
necessarily spun shots. During topspin rallies, deeper incoming shots reduced reply
speed, spin and time pressure. Additionally, impacting balls on the rise or earlier in their
trajectory was associated with fewer shots being returned into play and those that were
featured lower speed and spin but higher time pressure. Findings highlight the complex
interplay between incoming and outgoing shots and emphasise the stylistic differences in
tennis with the contact point seemingly tailored to the individual.
CHAPTER 6 SHOT AND IMPACT EFFECTS ON RETURN QUALITY 104
6.2 Introduction
Tennis players generate ball speed and spin when hitting, with both generally
thought to aid performance. The advantages of higher ball speeds have been well
documented (Kovalchik & Reid, 2018; Mecheri et al., 2016), yet the efficacy of ball spin
during match-play is less obvious, although higher topspin rates increase a shot’s margin
for error (Brody, 2006) and higher spin intensities on serve have been positively linked
to a point’s outcome (Mecheri et al., 2016). However, exploring the relationship between
a shot’s characteristics (speed and spin) and whether a point was won or lost, essentially
ignores the interplay between successive shots or the contemplation that points are
constructed. This oversimplification has been discussed previously (Wei, Lucey, Morgan,
Reid, & Sridharan, 2016) and limits the actionable intelligence of much of this work.
Indeed, a greater appreciation of the incoming-outgoing shot dyad in tennis could provide
players with greater insight into how they can use the speed, spin and shape of their ball-
striking to effect the quality of an opponent’s reply and therefore assert strategic
advantage throughout a point.
In countering incoming shots with high quality replies, the impact point of players
is considered important (Giles et al., 2019). While coaches have traditionally simplified
impact to how closely it approximates the hip or shoulder height of players, recent work
by Cant, Kovalchik and Reid (2020) has highlighted the multi-faceted nature of impact.
For instance, impact can be conceived relative to player stature as well as in relation to
where players intercept the ball in its post-bounce trajectory. In a practical sense, later
impacts may afford players additional time to generate higher racket velocities and
consequently ball speed and spin (Genevois et al., 2020; Kwon et al., 2017), while
coaching texts have described taking the ball earlier as a method to impose time pressure
CHAPTER 6 SHOT AND IMPACT EFFECTS ON RETURN QUALITY 105
on opponents (Crespo & Miley, 1998; Hoskins-Burney & Carrington, 2014). Ultimately
the intent for players is to obtain impact positions that provide them the best chance of
achieving ascendancy in a rally with their ball-striking. There is limited analyses of
impact on stroke quality, however, with over 70% of shots in Grand Slam singles matches
played post-bounce (Whiteside & Reid, 2017a), being able to optimise stroke quality
through impact may have significant implications to performance.
This study aimed to investigate the above presumed interplay between incoming
and outgoing shots. In analysing the effect of incoming shot and impact characteristics
on the quality of a player’s reply (where ‘quality’ refers to the speed, spin, time pressure
and error rate of the return), it was hypothesised that shots (serves and groundstrokes)
characterised by deeper landing depths, higher speeds or higher spin rates would reduce
the speed, spin and time pressure as well as increase the error rate of shots hit in reply.
Where players impacted their shots in the post-bounce trajectory was also expected to be
influential, with shots hit on the drop or later thought to feature higher ball speeds and
spins as well as lower error rates. Shots hit on the rise and earlier in the post-bounce
trajectory were anticipated to increase time pressure on the opponent. Finally, we
expected to observe lower impact heights linked to replies characterised by higher speed,
spin and time pressure as well as a higher proportion of shots returned into play.
6.3 Methods
6.3.1 Participants
This study used ball-tracking data from main draw singles matches (210 men’s,
214 women’s) played during the 2017 and 2019 Australian Open tournaments. An
Institutional Review Board approved this study.
CHAPTER 6 SHOT AND IMPACT EFFECTS ON RETURN QUALITY 106
6.3.2 Pre-processing and feature engineering
Ball-tracking data utilised in this study were recorded by Hawk-Eye (Hawk-Eye
Innovations Ltd, Basingstoke, UK), a three-dimensional line-calling system which
determines the ball bounce location with a reported mean error of 2.6 mm (Hawk-Eye
Innovations, n.d.). Variables describing the physical characteristics of the shot and impact
position were derived from this data (Table 6.1), with ball spin (rate, direction) calculated
using previously published methods (Cant, Kovalchik, Cross, & Reid, 2020). Shots
incoming or returned with a component of spin (topspin/backspin or sidespin) >4500
revolutions per minute (RPM) were excluded due to the deterioration in the methods
accuracy at higher spin rates. The exclusion of these shots mainly affected men’s second
serves (~19.90% excluded), followed by women’s second (~2.78% excluded) and men’s
first (~2.48% excluded) serves. In accordance with methods described by Cant,
Kovalchik and Reid (2020), impact relative to peak height was represented through a
categorical (on the rise (OTR), on the drop (OTD)) and continuous (horizontal distance
of impact from peak height) measure.
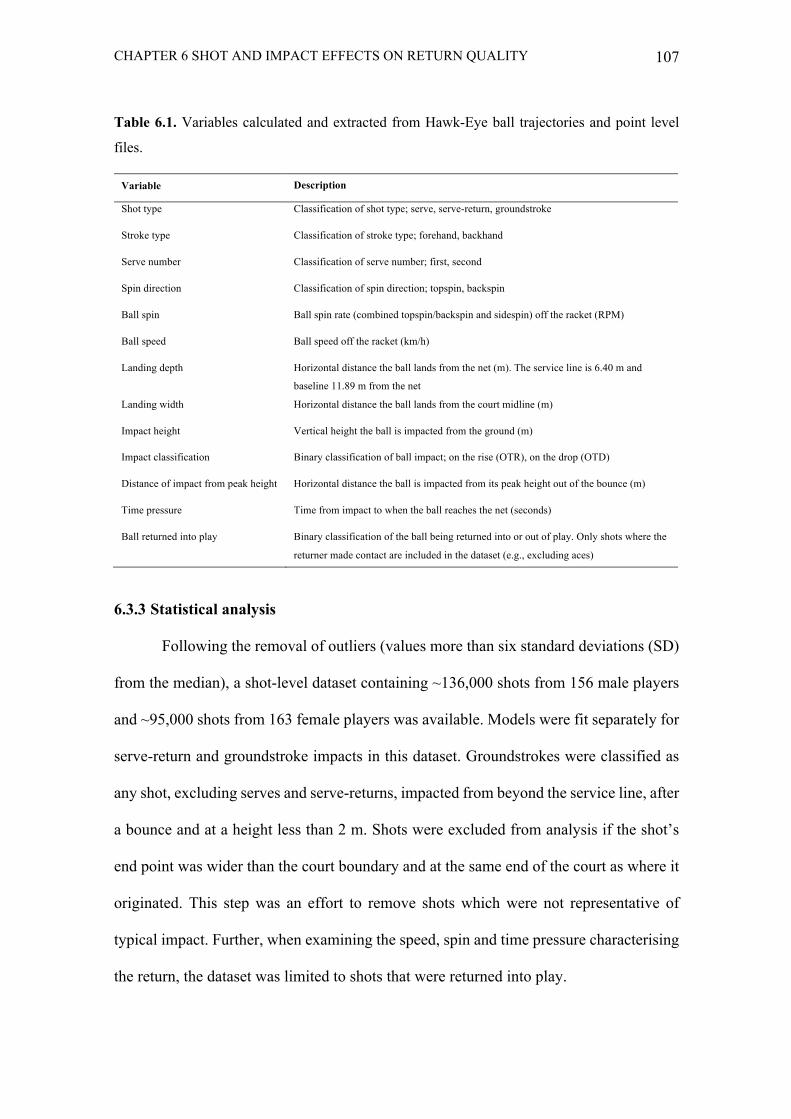
CHAPTER 6 SHOT AND IMPACT EFFECTS ON RETURN QUALITY 107
Table 6.1. Variables calculated and extracted from Hawk-Eye ball trajectories and point level
files.
6.3.3 Statistical analysis
Following the removal of outliers (values more than six standard deviations (SD)
from the median), a shot-level dataset containing ~136,000 shots from 156 male players
and ~95,000 shots from 163 female players was available. Models were fit separately for
serve-return and groundstroke impacts in this dataset. Groundstrokes were classified as
any shot, excluding serves and serve-returns, impacted from beyond the service line, after
a bounce and at a height less than 2 m. Shots were excluded from analysis if the shot’s
end point was wider than the court boundary and at the same end of the court as where it
originated. This step was an effort to remove shots which were not representative of
typical impact. Further, when examining the speed, spin and time pressure characterising
the return, the dataset was limited to shots that were returned into play.
Variable Description
Shot type Classification of shot type; serve, serve-return, groundstroke
Stroke type Classification of stroke type; forehand, backhand
Serve number Classification of serve number; first, second
Spin direction Classification of spin direction; topspin, backspin
Ball spin Ball spin rate (combined topspin/backspin and sidespin) off the racket (RPM)
Ball speed Ball speed off the racket (km/h)
Landing depth Horizontal distance the ball lands from the net (m). The service line is 6.40 m and
baseline 11.89 m from the net
Landing width Horizontal distance the ball lands from the court midline (m)
Impact height Vertical height the ball is impacted from the ground (m)
Impact classification Binary classification of ball impact; on the rise (OTR), on the drop (OTD)
Distance of impact from peak height Horizontal distance the ball is impacted from its peak height out of the bounce (m)
Time pressure Time from impact to when the ball reaches the net (seconds)
Ball returned into play Binary classification of the ball being returned into or out of play. Only shots where the
returner made contact are included in the dataset (e.g., excluding aces)
CHAPTER 6 SHOT AND IMPACT EFFECTS ON RETURN QUALITY 108
The top 1% of influential data points were excluded (Cook, 1979), after which,
the mgcv package in R was used to fit Generalised Additive Models (GAMs) for all
analysis (R Core Team, 2017). GAMs were selected due to their ability to handle non-
linear relationships thru non-parametric smoothing functions, which is particularly
necessary when dealing with spatial effects. In models, measures of stroke quality were
specified as outcome variables and included, ball speed and spin off the racket, time
pressure imposed by the return and if the ball was returned into play. To control for and
examine the effect of the incoming shot’s characteristics on return stroke quality,
standardised ball speed, ball spin, landing depth and landing width were included as thin-
plate smooths, with a bivariate smooth for ball speed and spin. Incoming shot
characteristics were standardised by gender and the incoming shot’s spin direction
(groundstroke models) or serve number (serve-return models). A measure of impact
(impact classification, distance of impact from peak height, impact height) was included
in each model, with continuous measures also standardised and represented as a smoothed
function. Additionally, a shot’s impact classification (OTR, OTD) was included in impact
height models, to allow the effect of impact height to be examined when the ball was
taken OTR compared to OTD. A binary gender effect and categorical variable describing
the return shot (topspin forehand, topspin backhand, backspin forehand, backspin
backhand) were incorporated in all models. Effects for serve number (first, second) and
the incoming shot’s spin direction (topspin, backspin) were included for additional
context in serve-return and groundstroke models, respectively. Additionally, a random
effect for impact player was included in models to eliminate player effects influencing
the main effects of the model owing to variation in shot sample by player.
CHAPTER 6 SHOT AND IMPACT EFFECTS ON RETURN QUALITY 109
Models accounted for a number of possible interaction effects. These included all
possible interactions among categorical variables and a linear interaction term between
each subgroup created from categorical interactions and continuous variables of main
interest (incoming speed, spin and landing depth as well as continuous impact measures).
Subgroups containing <30 data points were excluded from models (Table 6.2). Akaike
information criterion was used to assess model fit in contrast to a baseline model with no
interaction terms (Table 6.3). Additionally, there was evidence of overfitting of the
bivariate smooth for models with the binary outcome of the ball being returned into play.
Thus, a simpler smooth was forced using half of the median effective degrees across
equivalent models from other outcome variables. To improve the normality of model
residuals, a square root and log transformation were applied to model outcomes of ball
spin and time pressure, respectively.
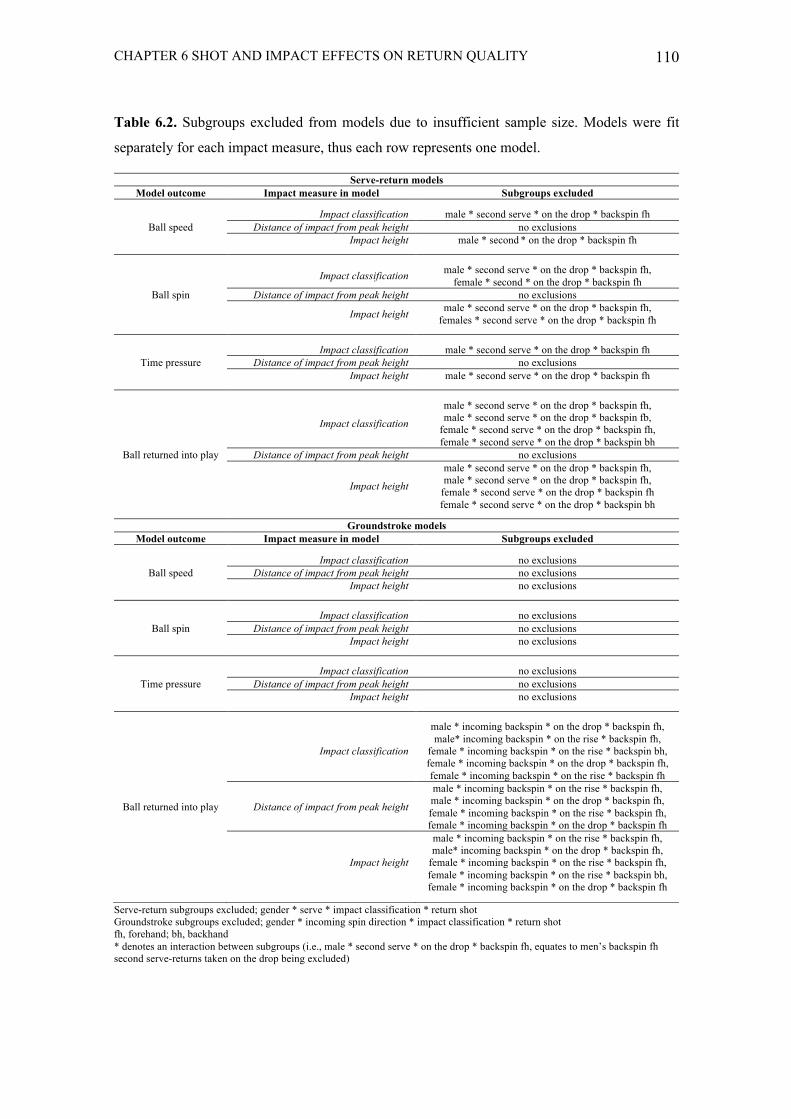
CHAPTER 6 SHOT AND IMPACT EFFECTS ON RETURN QUALITY 110
Table 6.2. Subgroups excluded from models due to insufficient sample size. Models were fit
separately for each impact measure, thus each row represents one model.
Serve-return subgroups excluded; gender * serve * impact classification * return shot Groundstroke subgroups excluded; gender * incoming spin direction * impact classification * return shot fh, forehand; bh, backhand * denotes an interaction between subgroups (i.e., male * second serve * on the drop * backspin fh, equates to men’s backspin fh second serve-returns taken on the drop being excluded)
Serve-return models
Model outcome Impact measure in model Subgroups excluded
Ball speed Impact classification male * second serve * on the drop * backspin fh
Distance of impact from peak height no exclusions Impact height male * second * on the drop * backspin fh
Ball spin
Impact classification male * second serve * on the drop * backspin fh, female * second * on the drop * backspin fh
Distance of impact from peak height no exclusions
Impact height male * second serve * on the drop * backspin fh, females * second serve * on the drop * backspin fh
Time pressure Impact classification male * second serve * on the drop * backspin fh
Distance of impact from peak height no exclusions Impact height male * second serve * on the drop * backspin fh
Ball returned into play
Impact classification
male * second serve * on the drop * backspin fh, male * second serve * on the drop * backspin fb,
female * second serve * on the drop * backspin fh, female * second serve * on the drop * backspin bh
Distance of impact from peak height no exclusions
Impact height
male * second serve * on the drop * backspin fh, male * second serve * on the drop * backspin fh,
female * second serve * on the drop * backspin fh female * second serve * on the drop * backspin bh
Groundstroke models
Model outcome Impact measure in model Subgroups excluded
Ball speed Impact classification no exclusions
Distance of impact from peak height no exclusions Impact height no exclusions
Ball spin Impact classification no exclusions
Distance of impact from peak height no exclusions Impact height no exclusions
Time pressure Impact classification no exclusions
Distance of impact from peak height no exclusions Impact height no exclusions
Ball returned into play
Impact classification
male * incoming backspin * on the drop * backspin fh, male* incoming backspin * on the rise * backspin fh,
female * incoming backspin * on the rise * backspin bh, female * incoming backspin * on the drop * backspin fh, female * incoming backspin * on the rise * backspin fh
Distance of impact from peak height
male * incoming backspin * on the rise * backspin fh, male * incoming backspin * on the drop * backspin fh, female * incoming backspin * on the rise * backspin fh, female * incoming backspin * on the drop * backspin fh
Impact height
male * incoming backspin * on the rise * backspin fh, male* incoming backspin * on the drop * backspin fh,
female * incoming backspin * on the rise * backspin fh, female * incoming backspin * on the rise * backspin bh, female * incoming backspin * on the drop * backspin fh
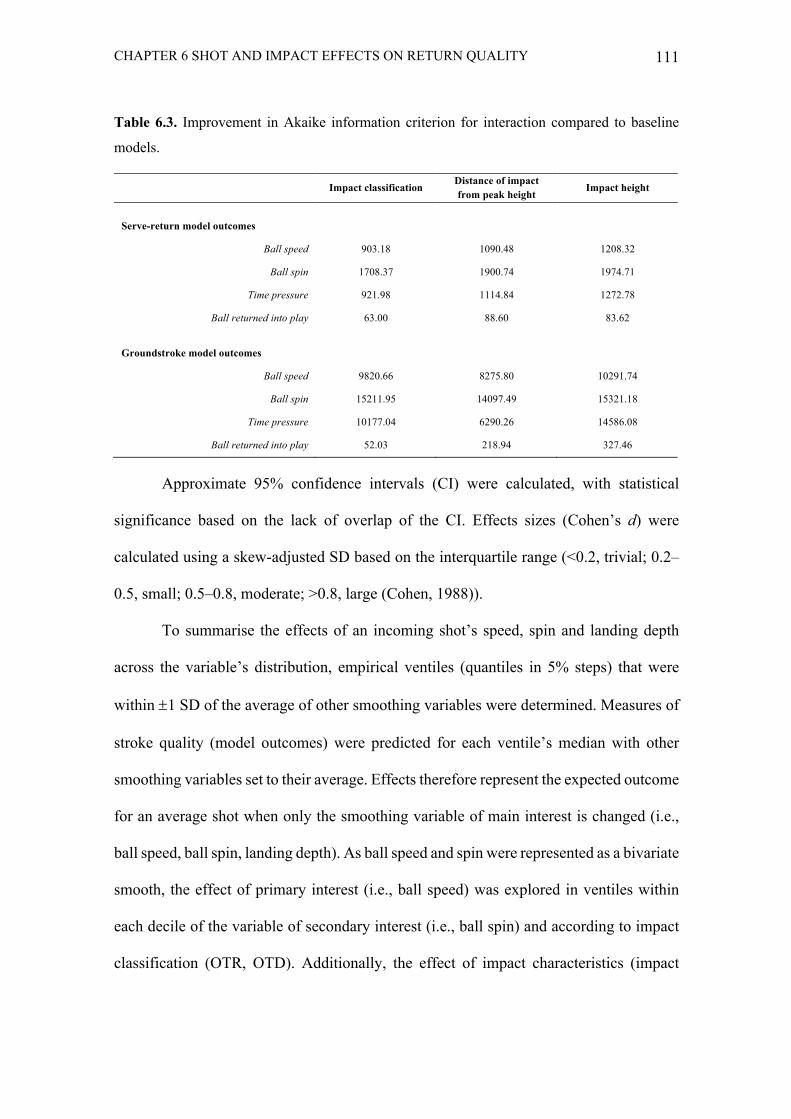
CHAPTER 6 SHOT AND IMPACT EFFECTS ON RETURN QUALITY 111
Table 6.3. Improvement in Akaike information criterion for interaction compared to baseline
models.
Approximate 95% confidence intervals (CI) were calculated, with statistical
significance based on the lack of overlap of the CI. Effects sizes (Cohen’s d) were
calculated using a skew-adjusted SD based on the interquartile range (<0.2, trivial; 0.2–
0.5, small; 0.5–0.8, moderate; >0.8, large (Cohen, 1988)).
To summarise the effects of an incoming shot’s speed, spin and landing depth
across the variable’s distribution, empirical ventiles (quantiles in 5% steps) that were
within ±1 SD of the average of other smoothing variables were determined. Measures of
stroke quality (model outcomes) were predicted for each ventile’s median with other
smoothing variables set to their average. Effects therefore represent the expected outcome
for an average shot when only the smoothing variable of main interest is changed (i.e.,
ball speed, ball spin, landing depth). As ball speed and spin were represented as a bivariate
smooth, the effect of primary interest (i.e., ball speed) was explored in ventiles within
each decile of the variable of secondary interest (i.e., ball spin) and according to impact
classification (OTR, OTD). Additionally, the effect of impact characteristics (impact
Impact classification Distance of impact
from peak height Impact height
Serve-return model outcomes
Ball speed 903.18 1090.48 1208.32
Ball spin 1708.37 1900.74 1974.71
Time pressure 921.98 1114.84 1272.78
Ball returned into play 63.00 88.60 83.62
Groundstroke model outcomes
Ball speed 9820.66 8275.80 10291.74
Ball spin 15211.95 14097.49 15321.18
Time pressure 10177.04 6290.26 14586.08
Ball returned into play 52.03 218.94 327.46
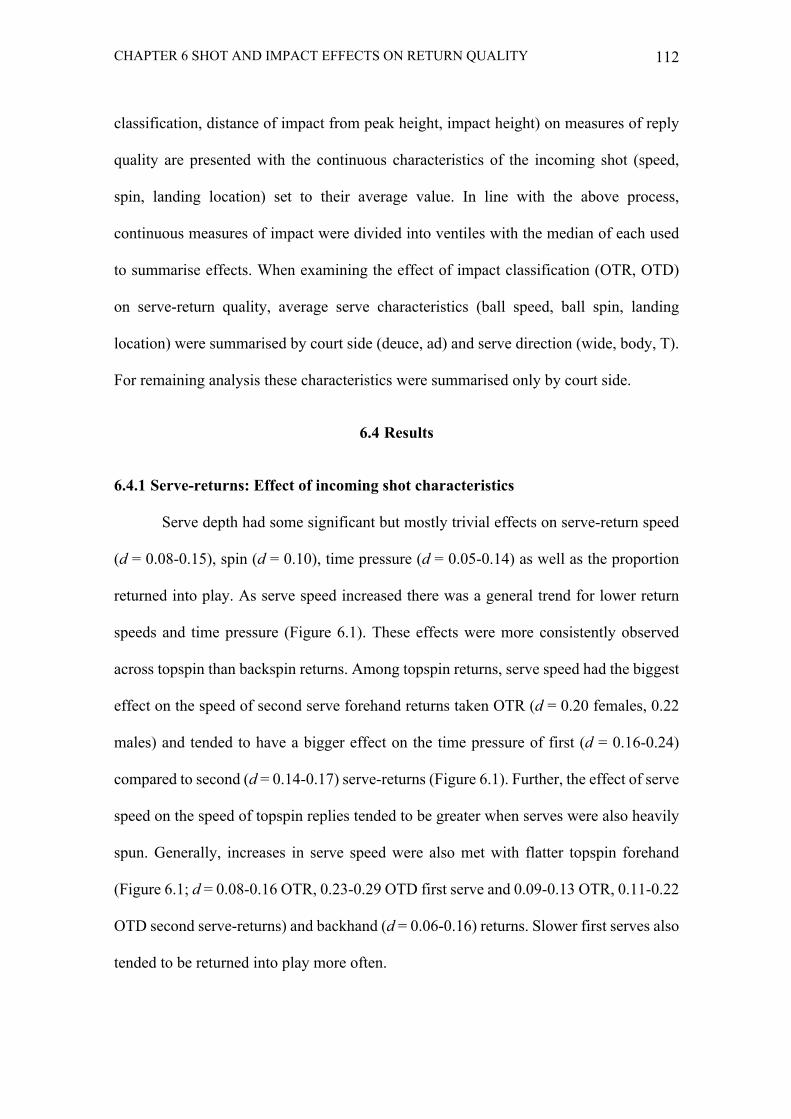
CHAPTER 6 SHOT AND IMPACT EFFECTS ON RETURN QUALITY 112
classification, distance of impact from peak height, impact height) on measures of reply
quality are presented with the continuous characteristics of the incoming shot (speed,
spin, landing location) set to their average value. In line with the above process,
continuous measures of impact were divided into ventiles with the median of each used
to summarise effects. When examining the effect of impact classification (OTR, OTD)
on serve-return quality, average serve characteristics (ball speed, ball spin, landing
location) were summarised by court side (deuce, ad) and serve direction (wide, body, T).
For remaining analysis these characteristics were summarised only by court side.
6.4 Results
6.4.1 Serve-returns: Effect of incoming shot characteristics
Serve depth had some significant but mostly trivial effects on serve-return speed
(d = 0.08-0.15), spin (d = 0.10), time pressure (d = 0.05-0.14) as well as the proportion
returned into play. As serve speed increased there was a general trend for lower return
speeds and time pressure (Figure 6.1). These effects were more consistently observed
across topspin than backspin returns. Among topspin returns, serve speed had the biggest
effect on the speed of second serve forehand returns taken OTR (d = 0.20 females, 0.22
males) and tended to have a bigger effect on the time pressure of first (d = 0.16-0.24)
compared to second (d = 0.14-0.17) serve-returns (Figure 6.1). Further, the effect of serve
speed on the speed of topspin replies tended to be greater when serves were also heavily
spun. Generally, increases in serve speed were also met with flatter topspin forehand
(Figure 6.1; d = 0.08-0.16 OTR, 0.23-0.29 OTD first serve and 0.09-0.13 OTR, 0.11-0.22
OTD second serve-returns) and backhand (d = 0.06-0.16) returns. Slower first serves also
tended to be returned into play more often.
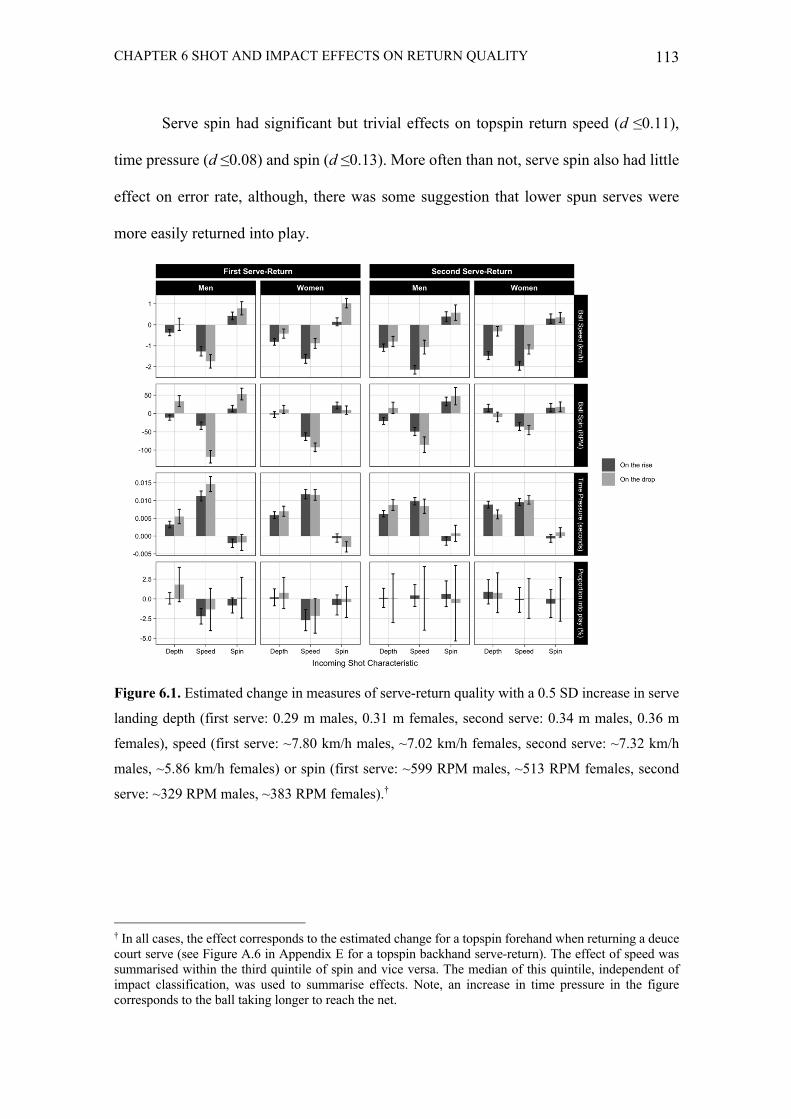
CHAPTER 6 SHOT AND IMPACT EFFECTS ON RETURN QUALITY 113
Serve spin had significant but trivial effects on topspin return speed (d ≤0.11),
time pressure (d ≤0.08) and spin (d ≤0.13). More often than not, serve spin also had little
effect on error rate, although, there was some suggestion that lower spun serves were
more easily returned into play.
Figure 6.1. Estimated change in measures of serve-return quality with a 0.5 SD increase in serve
landing depth (first serve: 0.29 m males, 0.31 m females, second serve: 0.34 m males, 0.36 m
females), speed (first serve: ~7.80 km/h males, ~7.02 km/h females, second serve: ~7.32 km/h
males, ~5.86 km/h females) or spin (first serve: ~599 RPM males, ~513 RPM females, second
serve: ~329 RPM males, ~383 RPM females).†
† In all cases, the effect corresponds to the estimated change for a topspin forehand when returning a deuce court serve (see Figure A.6 in Appendix E for a topspin backhand serve-return). The effect of speed was summarised within the third quintile of spin and vice versa. The median of this quintile, independent of impact classification, was used to summarise effects. Note, an increase in time pressure in the figure corresponds to the ball taking longer to reach the net.
CHAPTER 6 SHOT AND IMPACT EFFECTS ON RETURN QUALITY 114
6.4.2 Serve-returns: Effect of impact characteristics
As hypothesised, higher time pressure was generally imposed through returns
contacted earlier in the post-bounce trajectory (d = 0.17-0.25 first, 0.32-0.37 second serve
topspin returns) or OTR (Table 6.4). These effects tended to be more pronounced for
second compared to first serve-returns and for men’s compared to women’s serve-returns.
Male players were also noted to increase their topspin return speed when impacting the
ball later in its trajectory (d = 0.07-0.09 first, 0.15-0.17 second serve-return) as well as
when contacting first serve backhand and second serve-returns OTD (Table 6.4). Impacts
OTD were associated with higher spin rates on first (d = 0.17-0.47 men’s topspin returns,
0.16-0.21 women’s topspin returns, 0.35-0.57 backspin returns) and second (d = 0.26-
0.34 women’s topspin return) serve forehand returns, women’s first serve slice backhand
(d = 0.46-0.55) and men’s second serve topspin backhand (d = 0.30-0.35) returns. Further,
this effect for players to generate higher spin when provided more time on the ball was
especially evident for men’s second serve topspin forehand returns taken OTD (d = 0.80-
0.97) and intercepted later in the post-bounce trajectory (d = 0.45-0.47). When returning
second serves, a significantly higher proportion of men’s topspin and women’s topspin
backhand returns landed in play when contacted OTD (Table 6.4), while a similar trend
tended to exist for second serve topspin returns hit later in the trajectory.
There was general but mostly trivial support for men’s returns (d = 0.07-0.22) and
women’s topspin returns (d = 0.04-0.16) to impose greater time pressure through lower
contact points when taken OTR. Impact height only significantly affected the spin of
second serve topspin returns, which, in support of our hypothesis, was also observed to
increase with decreases in the impact height of backhands taken OTD (d = 0.09 females,
0.17-0.18 males) and women’s forehand (d = 0.11 OTR, 0.16 OTD) returns. This

CHAPTER 6 SHOT AND IMPACT EFFECTS ON RETURN QUALITY 115
association was also observed for the speed of men’s (OTR and OTD, d = 0.08-0.12) and
women’s (OTR, d = 0.10) second serve topspin backhand returns. Contrary to
expectation, increases in impact height either had no effect or increased the proportion of
shots returned into play, for instance, a higher proportion of second serve topspin
backhand returns taken OTR.
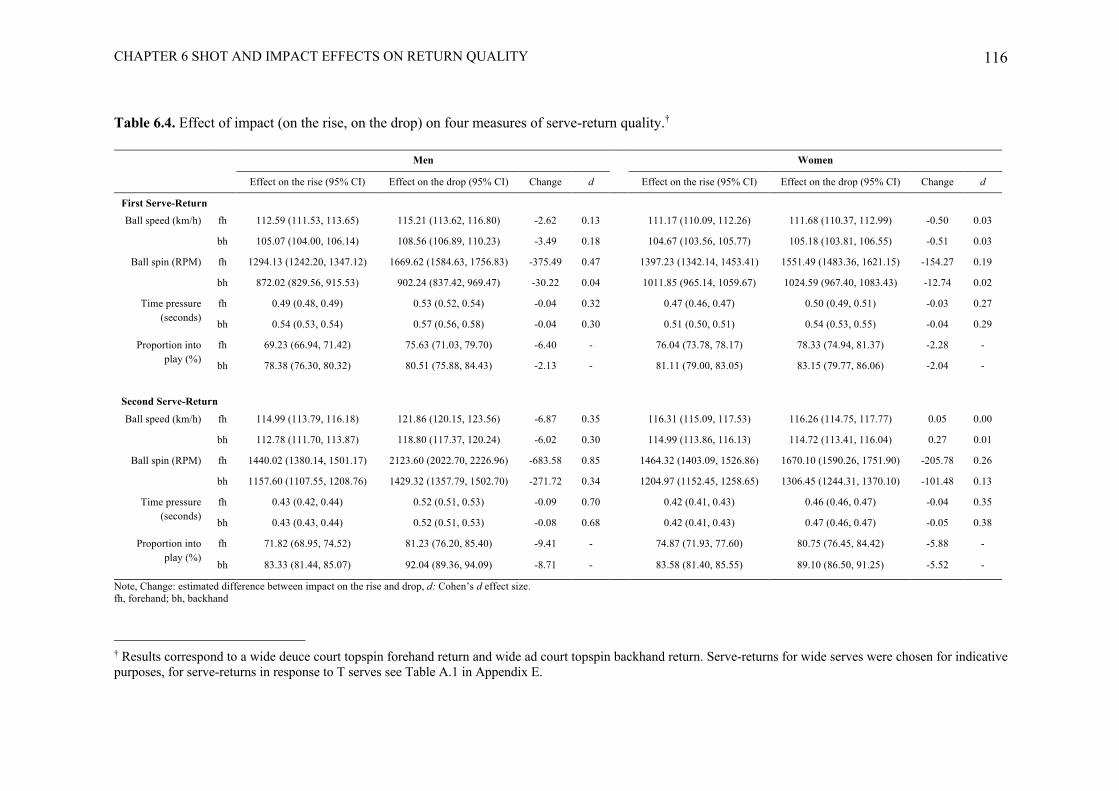
CHAPTER 6 SHOT AND IMPACT EFFECTS ON RETURN QUALITY 116
Table 6.4. Effect of impact (on the rise, on the drop) on four measures of serve-return quality.†
Note, Change: estimated difference between impact on the rise and drop, d: Cohen’s d effect size. fh, forehand; bh, backhand
† Results correspond to a wide deuce court topspin forehand return and wide ad court topspin backhand return. Serve-returns for wide serves were chosen for indicative purposes, for serve-returns in response to T serves see Table A.1 in Appendix E.
Men Women
Effect on the rise (95% CI) Effect on the drop (95% CI) Change d Effect on the rise (95% CI) Effect on the drop (95% CI) Change d
First Serve-Return
Ball speed (km/h) fh 112.59 (111.53, 113.65) 115.21 (113.62, 116.80) -2.62 0.13 111.17 (110.09, 112.26) 111.68 (110.37, 112.99) -0.50 0.03
bh 105.07 (104.00, 106.14) 108.56 (106.89, 110.23) -3.49 0.18 104.67 (103.56, 105.77) 105.18 (103.81, 106.55) -0.51 0.03
Ball spin (RPM) fh 1294.13 (1242.20, 1347.12) 1669.62 (1584.63, 1756.83) -375.49 0.47 1397.23 (1342.14, 1453.41) 1551.49 (1483.36, 1621.15) -154.27 0.19
bh 872.02 (829.56, 915.53) 902.24 (837.42, 969.47) -30.22 0.04 1011.85 (965.14, 1059.67) 1024.59 (967.40, 1083.43) -12.74 0.02
Time pressure (seconds)
fh 0.49 (0.48, 0.49) 0.53 (0.52, 0.54) -0.04 0.32 0.47 (0.46, 0.47) 0.50 (0.49, 0.51) -0.03 0.27
bh 0.54 (0.53, 0.54) 0.57 (0.56, 0.58) -0.04 0.30 0.51 (0.50, 0.51) 0.54 (0.53, 0.55) -0.04 0.29
Proportion into play (%)
fh 69.23 (66.94, 71.42) 75.63 (71.03, 79.70) -6.40 - 76.04 (73.78, 78.17) 78.33 (74.94, 81.37) -2.28 -
bh 78.38 (76.30, 80.32) 80.51 (75.88, 84.43) -2.13 - 81.11 (79.00, 83.05) 83.15 (79.77, 86.06) -2.04 -
Second Serve-Return
Ball speed (km/h) fh 114.99 (113.79, 116.18) 121.86 (120.15, 123.56) -6.87 0.35 116.31 (115.09, 117.53) 116.26 (114.75, 117.77) 0.05 0.00
bh 112.78 (111.70, 113.87) 118.80 (117.37, 120.24) -6.02 0.30 114.99 (113.86, 116.13) 114.72 (113.41, 116.04) 0.27 0.01
Ball spin (RPM) fh 1440.02 (1380.14, 1501.17) 2123.60 (2022.70, 2226.96) -683.58 0.85 1464.32 (1403.09, 1526.86) 1670.10 (1590.26, 1751.90) -205.78 0.26
bh 1157.60 (1107.55, 1208.76) 1429.32 (1357.79, 1502.70) -271.72 0.34 1204.97 (1152.45, 1258.65) 1306.45 (1244.31, 1370.10) -101.48 0.13
Time pressure (seconds)
fh 0.43 (0.42, 0.44) 0.52 (0.51, 0.53) -0.09 0.70 0.42 (0.41, 0.43) 0.46 (0.46, 0.47) -0.04 0.35
bh 0.43 (0.43, 0.44) 0.52 (0.51, 0.53) -0.08 0.68 0.42 (0.41, 0.43) 0.47 (0.46, 0.47) -0.05 0.38
Proportion into play (%)
fh 71.82 (68.95, 74.52) 81.23 (76.20, 85.40) -9.41 - 74.87 (71.93, 77.60) 80.75 (76.45, 84.42) -5.88 -
bh 83.33 (81.44, 85.07) 92.04 (89.36, 94.09) -8.71 - 83.58 (81.40, 85.55) 89.10 (86.50, 91.25) -5.52 -
CHAPTER 6 SHOT AND IMPACT EFFECTS ON RETURN QUALITY 117
6.4.3 Groundstrokes: Effect of incoming shot characteristics
As hypothesised, players countering deeper landing groundstrokes generally
imposed less time pressure through their reply, especially when taken OTR (d = 0.51-
0.65 OTR, 0.23-0.27 OTD topspin rallies, 0.66-0.78 OTR, 0.37-0.48 OTD countering
backspin with a topspin reply; Figure 6.2). In topspin rallies, these replies OTR (d = 0.20-
0.31) as well as groundstrokes contacted OTD in response to shorter landing balls (d =
0.14 backhand, 0.21 forehand) were hit with lower speed (Figure 6.2). Use of the slice by
players changed this dynamic and generally allowed players to maintain or increase ball
speeds in response to deeper incoming shots. Landing depth also variously reduced
players’ ability to impart spin on topspin groundstrokes (d = 0.12-0.15 OTR, 0.18-0.21
OTD topspin rallies, 0.18-0.25 OTR, 0.11-0.18 OTD countering backspin with a topspin
reply). Contrary to expectation, landing depth did not appear to negatively affect the error
rates of topspin groundstrokes.
An inverse relationship between the speeds of incoming and outgoing topspin
groundstrokes was observed (Figure 6.2). This effect was smaller on backhands (d = 0.21-
0.23) than forehands (d = 0.26-0.34). Lower topspin groundstroke speeds also tended to
be observed as the speed of incoming slice shots increased, especially on forehand replies
(d = 0.27-0.39 forehand, 0.10-0.14 backhand). Increased incoming shot speed also
resulted in less time pressure generally being imposed (d = 0.27-0.40 topspin rallies, 0.20-
0.53 countering backspin with a topspin reply). Shot speed during topspin rallies had
significant but trivial effects on reply spin, while the relationship between incoming ball
speed and the proportion of shots returned into play was inconsistent. However, there was
a trend for this proportion to be lower when countering faster paced topspin
groundstrokes, with this effect more consistently observed among the lowest spun shots.
CHAPTER 6 SHOT AND IMPACT EFFECTS ON RETURN QUALITY 118
Ball spin had little effect on the time pressure of replies during topspin rallies (d
≤0.07; Figure 6.2), but unexpectedly the spin of topspin shots tended to share a positive
relationship with outgoing shot speed, especially among male players (d = 0.14-0.28
males, 0.07-0.15 females). There was trivial to no effect between incoming and outgoing
ball spin during topspin exchanges (d ≤0.12), but the spin of topspin groundstrokes
increased in response to more heavily sliced incoming shots, especially when taken OTR
(d = 0.16-0.26 OTR, 0.09-0.15 OTD). For instance, a 0.5 SD increase in the spin (~530
RPM) of a typical incoming backspin shot was associated with a 148.22 RPM (95% CI
137.30, 159.13, d = 0.26) and 108.30 RPM (95% CI 96.50, 120.10, d = 0.19) increase in
the spin of men’s and women’s topspin backhands taken OTR. In general, incoming spin
had little significant or consistent effect on the proportion of groundstrokes returned into
play.
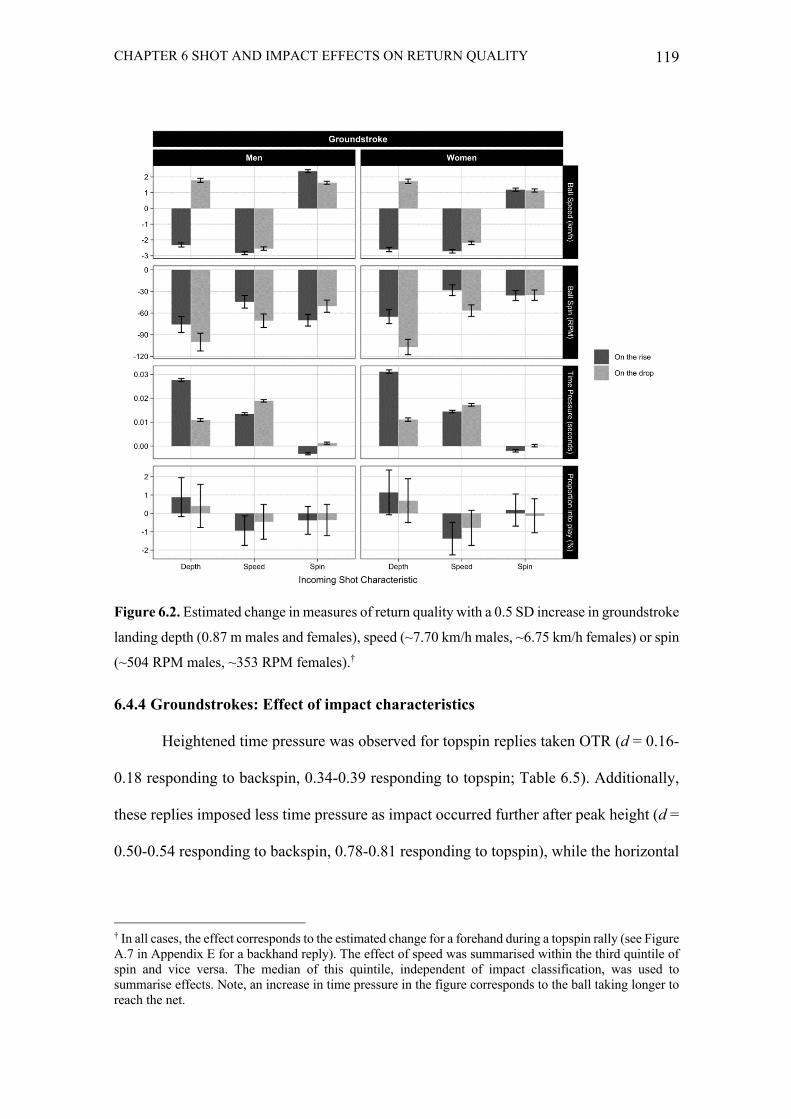
CHAPTER 6 SHOT AND IMPACT EFFECTS ON RETURN QUALITY 119
Figure 6.2. Estimated change in measures of return quality with a 0.5 SD increase in groundstroke
landing depth (0.87 m males and females), speed (~7.70 km/h males, ~6.75 km/h females) or spin
(~504 RPM males, ~353 RPM females).†
6.4.4 Groundstrokes: Effect of impact characteristics
Heightened time pressure was observed for topspin replies taken OTR (d = 0.16-
0.18 responding to backspin, 0.34-0.39 responding to topspin; Table 6.5). Additionally,
these replies imposed less time pressure as impact occurred further after peak height (d =
0.50-0.54 responding to backspin, 0.78-0.81 responding to topspin), while the horizontal
† In all cases, the effect corresponds to the estimated change for a forehand during a topspin rally (see Figure A.7 in Appendix E for a backhand reply). The effect of speed was summarised within the third quintile of spin and vice versa. The median of this quintile, independent of impact classification, was used to summarise effects. Note, an increase in time pressure in the figure corresponds to the ball taking longer to reach the net.
CHAPTER 6 SHOT AND IMPACT EFFECTS ON RETURN QUALITY 120
distance of impact before peak height had a comparatively smaller effect (d = 0.00-0.01
responding to backspin, 0.14-0.16 responding to topspin).
During topspin rallies, groundstroke speed appeared greatest among shots taken
near peak height, with lower shot speeds produced as impact occurred further horizontally
before (d = 0.41-0.48) or after (d = 0.13-0.19) peak height. Males also generated
significantly higher ball speeds during these exchanges when hitting balls OTD (Table
6.5).
Players tended to generate higher spin rates when contacting incoming topspin (d
= 0.31-0.41 backspin replies, 0.09-0.25 topspin replies) or backspin (d = 0.17-0.22
backspin replies, 0.12-0.20 topspin replies) groundstrokes later in the post-bounce
trajectory and when responding to incoming topspin groundstrokes OTD (d = 0.31-0.46
backspin replies, 0.07-0.25 topspin replies; Table 6.5). Across both genders, a higher
proportion of groundstrokes were returned into play as impact occurred later during
topspin rallies. Male players were also noted to land ~3% more topspin forehands in play
when contacting incoming topspin shots OTD than OTR (Table 6.5).
Contrary to expectation, the speed of topspin groundstrokes increased with impact
height when responding to topspin (d = 0.24-0.49) and backspin (d = 0.42-0.64)
groundstrokes. Similar associations were observed for the time pressure of topspin
groundstrokes, especially when taken OTD (responding to topspin: d = 0.07-0.15 OTR,
0.33-0.43 OTD, responding to backspin: d = 0.27-0.37 OTR, 0.50-0.54 OTD). The effect
of impact height on the spin rate of topspin replies was less notable (d ≤0.15). The
proportion of topspin groundstrokes returned into play generally increased with impact
height, with few exceptions including topspin forehand groundstrokes taken OTD.
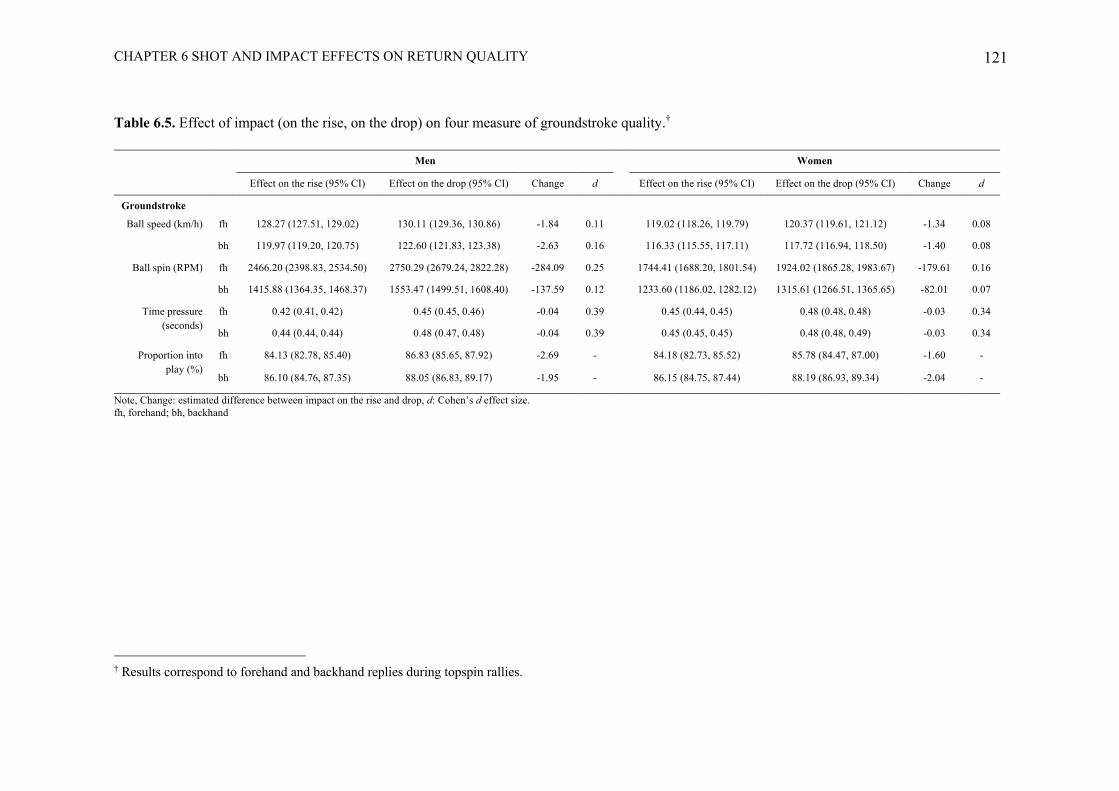
CHAPTER 6 SHOT AND IMPACT EFFECTS ON RETURN QUALITY 121
Table 6.5. Effect of impact (on the rise, on the drop) on four measure of groundstroke quality.†
Note, Change: estimated difference between impact on the rise and drop, d: Cohen’s d effect size. fh, forehand; bh, backhand
† Results correspond to forehand and backhand replies during topspin rallies.
Men Women
Effect on the rise (95% CI) Effect on the drop (95% CI) Change d Effect on the rise (95% CI) Effect on the drop (95% CI) Change d
Groundstroke
Ball speed (km/h) fh 128.27 (127.51, 129.02) 130.11 (129.36, 130.86) -1.84 0.11 119.02 (118.26, 119.79) 120.37 (119.61, 121.12) -1.34 0.08
bh 119.97 (119.20, 120.75) 122.60 (121.83, 123.38) -2.63 0.16 116.33 (115.55, 117.11) 117.72 (116.94, 118.50) -1.40 0.08
Ball spin (RPM) fh 2466.20 (2398.83, 2534.50) 2750.29 (2679.24, 2822.28) -284.09 0.25 1744.41 (1688.20, 1801.54) 1924.02 (1865.28, 1983.67) -179.61 0.16
bh 1415.88 (1364.35, 1468.37) 1553.47 (1499.51, 1608.40) -137.59 0.12 1233.60 (1186.02, 1282.12) 1315.61 (1266.51, 1365.65) -82.01 0.07
Time pressure (seconds)
fh 0.42 (0.41, 0.42) 0.45 (0.45, 0.46) -0.04 0.39 0.45 (0.44, 0.45) 0.48 (0.48, 0.48) -0.03 0.34
bh 0.44 (0.44, 0.44) 0.48 (0.47, 0.48) -0.04 0.39 0.45 (0.45, 0.45) 0.48 (0.48, 0.49) -0.03 0.34
Proportion into play (%)
fh 84.13 (82.78, 85.40) 86.83 (85.65, 87.92) -2.69 - 84.18 (82.73, 85.52) 85.78 (84.47, 87.00) -1.60 -
bh 86.10 (84.76, 87.35) 88.05 (86.83, 89.17) -1.95 - 86.15 (84.75, 87.44) 88.19 (86.93, 89.34) -2.04 -

CHAPTER 6 SHOT AND IMPACT EFFECTS ON RETURN QUALITY 122
6.5 Discussion
This study sought to identify the effect of incoming shot and impact characteristics
on the quality of the outgoing shot. The incoming shot’s speed, spin and landing depth
influenced aspects of a player’s serve-return or groundstroke reply, with one of the largest
effects being for lower time pressure to characterise topspin replies contacted OTR in
response to deeper landing groundstrokes. The height and position of players’ impacts in
the post-bounce trajectory also affected their ball-striking, with no one impact point
optimising all aspects of stroke quality examined. In particular, lower time pressure but
higher spin tended to characterise men’s second serve topspin returns impacted OTD,
while contacting groundstrokes further after peak height led to less time pressure being
imposed through topspin replies. Variation was observed in the effect sizes of presented
results, with a number of findings considered “small” or below based on standard criteria
for assessing effect sizes (Cohen, 1988). However, given the small margins involved in
high performance sport, standard criteria, based on the fraction of change in SD units,
may underestimate practically meaningful changes for an elite player population.
Nevertheless, the following discussion will focus on the more substantive effects.
6.5.1 Serve-returns
In general agreement with our hypothesis, increases in serve speed were often
associated with lower return speeds and time pressure. This is likely explained by faster
paced serves limiting the returner’s ability to generate racket and consequently ball speed
(Genevois et al., 2020). The deeper impact positions observed when returning faster
paced serves (Cant, Kovalchik, & Reid, 2020) may have also contributed to the lower
imposed time pressure. Additionally, while there was some evidence higher first serve
CHAPTER 6 SHOT AND IMPACT EFFECTS ON RETURN QUALITY 123
speeds led to positive point outcomes, even those returned into play were likely easier to
counter given the lower return speed and time pressure observed. These findings provide
some indication of how higher serve speeds may increase winning probability (Kovalchik
& Reid, 2018; Mecheri et al., 2016) and further support the use of this tactic during match-
play. That there were return specific effects for faster serves to be played with less spin
offered partial support to our hypothesis. This effect tended to be more pronounced for
topspin forehand returns contacted OTD, which may relate to players attempting to
generate heavily spun returns needing to make contact later in the post-bounce trajectory
(OTD) to afford themselves time to generate spin.
While previous research has suggested that heavily spun and high velocity serves
influence the winning probability of points to similar effect (Mecheri et al., 2016), we
believe caution is required in interpreting this work owing to the relatively small variation
in winning probability across spin categories examined coupled with no measure of
significance being reported. Nevertheless, our anticipated relationship of heavily spun
serves being returned with lower speed, spin and time pressure was generally not
observed. These findings point to higher serve speeds potentially being a more effective
shot-level strategy in isolation, yet this discounts the role of higher spin magnitudes in
offering greater margin for error (Brody, 2006). Furthermore, the current study used a
combined measure of topspin and sidespin and as the magnitudes of these components
vary across serve type (Sakurai et al., 2013), future research could examine the effect of
different serves (i.e., kick, slice) or components of ball spin on serve-return quality.
Return characteristics were affected by the position of impact in the serve’s post-
bounce trajectory. For instance, the speed of men’s second serve topspin returns in
particular were higher when impact occurred OTD, yet, on average players generally
CHAPTER 6 SHOT AND IMPACT EFFECTS ON RETURN QUALITY 124
imposed higher time pressure when returns were met earlier and OTR. Interestingly,
where impact was made relative to peak height did not significantly affect the speed of
women’s serve-returns. Additionally, return specific effects were observed for impact
OTD and later in the post-bounce trajectory to increase spin rates and the proportion of
serves returned into play. These differences in impact may reflect stylistic preferences of
players. For instance, the high spin rates that Rafael Nadal is known to generate (Mutua
Madrid Open, 2019) may be facilitated by his high proportion of serve-returns contacted
OTD (Cant, Kovalchik, & Reid, 2020). Interestingly, there were some effects for higher
speed, spin and time pressure to be imposed as impact height decreased, partially
supporting our hypothesis.
6.5.2 Groundstrokes
As anticipated, lower speed and time pressure tended to feature in the
groundstroke responses to deeper or faster shots in topspin rallies. Significant but smaller
effects for these replies to be characterised by lower spin rates were also observed. With
players requiring time to generate the horizontal and vertical racket velocities that drive
ball speed and spin (Genevois et al., 2020; Kwon et al., 2017), deeper or faster
groundstrokes may constrain swing length and speed. Increases in the incoming shot’s
speed and depth are also linked to deeper impact positions (Cant, Kovalchik, & Reid,
2020), likely further limiting the time pressure that can be applied through a player’s ball-
striking. Additionally, deeper incoming shot’s did not negatively affect the error rate of
topspin groundstrokes, which may stem from players hitting less aggressively (lower ball
speed) and the larger window of acceptance for these shots (Brody, 2006). The effects of
incoming groundstroke depth were often larger than those for serve depth, which could
be instructive for coaches.
CHAPTER 6 SHOT AND IMPACT EFFECTS ON RETURN QUALITY 125
The spin of inbound groundstrokes had limited effect on the time pressure of
replies during topspin rallies. Additionally, in contrast to our expectations increases in
the spin of these groundstrokes did not appear to reduce the subsequent shot’s speed and
there was no consistent evidence that these heavily spun shots were returned into play
less often. The spin of topspin shots did however increase to varying extents in response
to heavily spun slice groundstrokes. The presence of this effect when countering slice but
not topspin groundstrokes may relate to the additional effort required to reverse the spin
of incoming topspin shots (Brody, 2006). Other benefits of playing with topspin such as
heightened margin of error (Brody, 2006) are not captured in our analyses yet are worth
noting. Additionally, a player’s contact point is deeper when replying to heavily spun
topspin shots (Cant, Kovalchik, & Reid, 2020), in turn, deeper court positions (>1.5 m
from the baseline) have been linked to male players losing points by previous research
(Martínez-Gallego et al., 2019).
Impact later in the post-bounce trajectory was variously associated with more
heavily spun groundstroke replies as well as a lower error rate during topspin rallies. This
may be explained by the additional time on the ball that later impacts afford, while
reduced error rates are also presumably linked to the greater margin for error associated
with higher topspin rates (Brody, 2006). In comparison, higher time pressure was often
imposed when contact occurred before peak height. This is unsurprising as coaching texts
describe taking the ball on the rise as a method to impose pressure on opponents (United
States Tennis Association, 2004). Interestingly though, there appears a point of
diminishing return when it comes to taking the ball early, with time pressure generally
varying little based on how early before peak height impact occurred. This contrasts with
general coaching advice (Antoun, 2007) and may be partly explained by the decrease in
CHAPTER 6 SHOT AND IMPACT EFFECTS ON RETURN QUALITY 126
ball speed observed with earlier contact points, where players have less time to generate
the racket velocity underlying a ball’s outgoing speed (Brody, 2003). The speed and time
pressure of topspin replies tended to increase with impact height, although, the
appropriateness of a higher contact point may also depend on other factors such as a
player’s game-style and even grip position (Crespo & Higueras, 2001).
6.5.3 Limitations
While the current study examined ball speed, ball spin, time pressure and
returning the ball into play as measures of stroke quality, incoming shot characteristics
and impact are likely to also affect other aspects of the return (e.g., return placement,
return intent compared to outcome). We similarly controlled for and examined the effect
of incoming ball speed, ball spin and landing location as well as player contact point on
stroke quality, yet there are other factors that are likely influential and beyond this study’s
purview (e.g., player court position, incoming shot direction, racket speed generated).
In this study, peak height was not observed and therefore estimated for shots taken
OTR. The error associated with these estimates was larger for serves and when a small
proportion of the trajectory was available. Thus, additional work to improve upon the
accuracy of the current method or investigate alternate measures could be useful. Our
approach to quantifying ball spin, while recently validated (Cant, Kovalchik, Cross, &
Reid, 2020), did not perform as precisely at high spin rates and used a combined measure
of ball spin (topspin/backspin and sidespin) off the racket. Further improvements to ball
trajectory models are possible and examination of the effects of the components of ball
spin as well as post-bounce spin should be pursued.
In an effort to reflect a typical tennis shot and best examine different effects,
incoming shot characteristics (ball speed, ball spin, landing location) were variously
CHAPTER 6 SHOT AND IMPACT EFFECTS ON RETURN QUALITY 127
specified as their average value. However, it is worth noting that these characteristics may
not occur (or combine) simultaneously in this way to reflect an average shot. Further, we
controlled for but did not examine the effect lateral landing location has on reply quality
and did not consider the influence of the lateral component of impact. Average incoming
shot characteristics, independent of impact, were specified when examining the effect of
impact on the quality of the outgoing reply (i.e., reply quality for the same shot taken on
the rise compared to drop). Given player impact is influenced by the incoming shot (Cant,
Kovalchik, & Reid, 2020), the effect of impact could also be considered for varying
incoming shot characteristics (e.g., a shot typically taken on the rise compared to drop).
Lastly, the use of a bivariate smooth to capture the interaction between ball speed and
spin was a strength of the current analysis, however, we did not consider interactions
between other continuous model variables, which represents a logical extension of this
work.
6.6 Conclusion
This study examined the effect of incoming shot and impact characteristics on the
quality of a player’s groundstroke and serve-return. Effects were observed with both shot
types hit with lower speed and time pressure when responding to faster paced incoming
balls. Deeper incoming groundstrokes also had a shot-specific effect to reduce the speed
and time pressure of groundstroke replies. When players made contact OTR or earlier in
the post-bounce trajectory, returns were associated with higher time pressure but lower
speed, spin and fewer shots returned into play. Our results add to the popular commentary
around whether players control the ball or the ball controls the player and highlight that
the quality of a player’s ball-striking is influenced by a myriad of factors, many of which
are outside of their control.

CHAPTER 7 GENERAL DISCUSSION 128
CHAPTER 7
GENERAL DISCUSSION
CHAPTER 7 GENERAL DISCUSSION 129
7.1 General discussion
The overarching aim of this thesis was to use data recorded from Hawk-Eye
tracking technology to better understand the effect of ball speed and spin on aspects of
on-court hitting performance. Specifically, this thesis validated a method to estimate ball
spin using multi-camera tracking technology, which was subsequently used to estimate
spin from match-play data. This allowed remaining studies to investigate the concept of
stroke heaviness and examine factors (i.e., ball speed and spin) proposed to influence
player behaviour and point outcomes on-court. The following chapter will summarise key
findings as well as identify theoretical, methodological and practical implications arising
from this thesis. Additionally, the limitations of this work as well as suggestions for future
research will be detailed.
7.2 Main findings
Chapter 3 examined the accuracy of methods to estimate ball spin rate and spin
direction using multi-camera tracking technology (Hawk-Eye). This involved validating
Hawk-Eye’s proprietary measure and an alternate method which applied a theoretical ball
trajectory model to Hawk-Eye ball trajectories. Compared to Hawk-Eye’s proprietary
measure, a theoretical ball trajectory model was found to estimate spin rate and spin
direction more accurately. Further, this chapter found neither method consistently and
accurately estimated higher spin rates (>4500 RPM) and showed how a theoretical ball
trajectory model could be applied to quantify three-dimensional spin in tennis. Findings
from this chapter were used to quantify spin in subsequent studies in this thesis.
Chapter 4 aimed to develop a measure of stroke heaviness that could be
implemented during matches utilising available technology. This study surveyed a sample
CHAPTER 7 GENERAL DISCUSSION 130
of past and present professional tennis players to identify the perceived characteristics
and outcomes of a heavy shot, which were subsequently used to guide the development
of a data-driven method to quantify heaviness. Professional players identified that heavy
strokes were likely to “jump, climb or rear off the court” and challenge a player’s impact
(depth and height). Using these survey results and ball-tracking data from Australian
Open singles matches, models were developed which explained 53-72% of the variance
in stroke heaviness. Additionally, it was found that a data-driven interpretation of the
conventional characteristics of a heavy shot (greater speed and spin) and the perception
of heaviness held by professional players did not perfectly align. This chapter highlights
the complexity of stroke heaviness and identifies areas warranting further investigation
when attempting to quantify this style of shot-making among professional players.
In part guided by findings from Chapter 4, Chapter 5 aimed to describe
groundstroke and serve-return impact during Grand Slam matches. This included
examining the effect of gender, player ranking and incoming shot characteristics (speed,
spin, landing depth) on measures of impact (impact height, impact depth, impact relative
to peak height). During Australian Open singles matches, this study found shot, gender,
ranking and player effects across measures of serve-return and groundstroke impact. For
instance, across serve-returns and groundstrokes, the landing depth and ball spin of
incoming shots were generally the most and least influential on impact relative to peak
height, respectively. In turn, findings from this chapter reveal that while players are
readily encouraged to maintain a consistent and preferred contact point, a player’s impact
is largely dictated by the incoming shot’s trajectory.
Chapter 6 explored the effects of the incoming shot’s characteristics and the
receiving player’s impact on the quality of subsequent shots. Findings revealed that
CHAPTER 7 GENERAL DISCUSSION 131
incoming shot characteristics had various effects on the quality of a player’s reply,
varying by gender, return type and impact (on the rise, on the drop). There was a general
trend for increases in incoming shot speed, but not necessarily spin, to reduce the speed
and time pressure of serve-returns as well as groundstroke replies during topspin rallies.
These findings indicate that in general, higher ball speeds may be a more effective shot-
level strategy, although there are likely other benefits of ball speed and spin beyond those
investigated in Chapter 6. Additionally, deeper incoming shots also tended to reduce the
speed, spin and time pressure of replies during topspin rallies, while serve depth tended
to have a comparatively smaller effect. In terms of impact characteristics, findings
revealed that there were no universally optimal impact conditions, thus explaining why
players vary their contact points based on stylistic preferences.
7.3 Theoretical and methodological implications
Chapter 3 of this thesis demonstrated how a theoretical ball trajectory model could
be applied to trajectories recorded by the sport’s most common multi-camera tracking
technology in Hawk-Eye to accurately estimate ball spin. The development of this method
was important to subsequent studies in this thesis as it outperformed the accuracy of
Hawk-Eye’s proprietary measure of ball spin rate and spin direction. Beyond informing
the quantification of ball spin in this thesis, this new method can also be utilised by
practitioners and scientists interested in obtaining more accurate ball spin estimates as a
feature of players’ stroke production. It is worth noting however that the accuracy of this
measure deteriorated at higher spin rates, which had implications for the insight that could
be derived from the analyses in Chapters 4 to 6. Nevertheless, given the extent to which
ball-tracking technology is implemented in professional tennis, the validation of a method
CHAPTER 7 GENERAL DISCUSSION 132
to better estimate ball spin from current tracking data allows for the novel investigation
of the influence of ball spin in-situ.
The estimation of ball spin as revolutions per unit of time (e.g., RPM) also enabled
Chapters 4 to 6 to offer more practical and actionable insight than that which has emerged
from previous research that has relied on indirect measures of spin (i.e., lift coefficient,
angular change) (Kovalchik & Reid, 2018; Mecheri et al., 2016). Specifically, hypotheses
relating to a number of previously untested but popular concepts in tennis, including,
stroke heaviness (Chapter 4), professional player strikes zones (Chapter 5) and where
players contact the ball in its post-bounce trajectory during match-play (Chapter 5), were
examined using a large-scale ball trajectory dataset from the Australian Open.
To our knowledge, Chapter 4 represents the first documented attempt to
empirically investigate the concept of stroke heaviness. This chapter initially surveyed a
sample of professional players to identify the characteristics and outcomes of a heavy
shot. This survey was strengthened by the knowledge and playing experience of survey
respondents and provided a consensus view on the attributes of heavy shots among
professional players. Although, in retrospect, this survey may have benefited from
additional questioning to fully understand the discrepancies in the data-driven
interpretation and player perception of heaviness. Regardless, the exploration of this new
heaviness measure based on empirical insight rather than logic (Elliott, 2003; Elliott et
al., 2009a), allowed the study to highlight the complexity of stroke heaviness where
multiple factors clearly combine to produce what players perceive on-court.
Methods to describe specific spatial and temporal characteristics of player impact
that account for the interplay between the incoming shot and the movement of the
receiving player were considered in Chapter 5 and Chapter 6. These methods enabled
CHAPTER 7 GENERAL DISCUSSION 133
impact to be described in both a binary (on the rise, on the drop) and continuous (distance
between impact and peak height) fashion, which included the approximation of a
trajectory’s post-bounce peak height regardless of how much trajectory information was
available. For shots impacted on the rise, this involved a trajectory’s peak height being
estimated. Impact has rarely been reported in this way in tennis, and represents a new line
of research, allowing this thesis to extend previous understanding. That is, only Choppin
et al. (2007) has previously described where players contact shots in the post-bounce
trajectory. Their research was however limited by a relatively small sample size and the
collection of data in a practice context; both of which were overcome in this thesis.
Further, our analysis of this concept involved a more in-depth examination of the
influence incoming ball speed, ball spin and landing depth have on where players impact
shots in the post-bounce trajectory.
Chapters 4 through 6 used generalised additive models to investigate stroke
heaviness as well as examine factors influencing impact characteristics and the quality of
a player’s next shot. These models allowed for non-linear relationships to be observed,
such as that between the incoming shot’s landing depth and the proportion of replies taken
on the rise (see Figure 5.2). Additionally, the combined effect of ball speed and ball spin
was examined through their inclusion in models as a bivariate smooth. This interaction
between ball speed and spin was important given that both are simultaneously imparted
onto the ball and addressed a gap which has not been a predominant focus of prior
research.
More broadly, findings from this thesis build upon previous research investigating
the effect of ball speed and spin on aspects of on-court performance. Results revealed that
higher ball speeds are an effective shot-level strategy in influencing the quality of an
CHAPTER 7 GENERAL DISCUSSION 134
opponent’s serve-return and groundstroke reply. This offers some insight into the means
by which higher ball speeds ultimately influence winning probability (Kovalchik & Reid,
2018; Mecheri et al., 2016). Inferences from this work are that the production of higher
ball speeds rather than ball spins may be strategically more important, which contrasts
with previous suggestions (Mecheri et al., 2016).
7.4 Practical implications
The method developed and validated to estimate ball spin in this thesis (Chapter
3) may have a number of practical implications. Such a measure provides the opportunity
to examine the effect of any number of variables on the ball spin that players generate in
a controlled testing, practice or match-play context. As the ball spin measure is estimated
through ball-tracking data, other shot characteristics (e.g., speed, landing location) and
contextual factors (e.g., shot type, impact player) can be quantified and coupled with spin
estimates to provide even greater insight. This data may be used for comparison between
a player’s ball-striking in practice and match-contexts as well as to profile a player’s
stroke production over time. Further, the ability to quantify shot characteristics (e.g.,
speed, spin, landing depth) may be of value in equipment selection as examination of the
effect of racket (e.g., swing weight, mass) and string (e.g., composition, tension) have
historically relied on modelling techniques or been confined to laboratory and other
controlled settings (Allen et al., 2016).
The ability to quantify ball spin in addition to and/or in combination with ball
speed, as was done through the exploration of heaviness in Chapter 4, could also be used
by practitioners to track the intensity of ball-striking and fatigue across practice sessions
and matches, which the work of Reid et al. (2019) has recently emphasised. This may
have important implications for load monitoring and injury prevention given that previous
CHAPTER 7 GENERAL DISCUSSION 135
research has highlighted links between shot type (with varied speed and spin) and joint
loading (Abrams et al., 2014). While the cost of Hawk-Eye technology may limit
accessibility outside of tournaments and in practice settings, the methods developed and
validated in Chapter 3 could be applied to alternate optical tracking systems.
Findings from this thesis show how an opponent’s contact point and the quality
of their ball-striking are influenced by incoming ball trajectories. For instance, Chapters
5 and 6 highlighted the influence of groundstroke landing depth, finding that during
topspin rallies, deeper landing groundstrokes were contacted earlier and on the rise more
often while also forcing opponents to reply with lower speed and time pressure. The value
of depth from a tactical point of view is commonly referenced by coaches (Antoun, 2007;
Crespo & Miley, 1998; United States Tennis Association, 2004), but until now, primarily
supported by anecdote (ATP Staff, 2020; Miller, 2019; Trollope, 2017). The results of
Chapters 5 and 6 might also be used to shape a player’s ball-striking, especially in relation
to adjustments to his/her court position to intercept post-bounce trajectories at a particular
impact point (e.g., maintaining contact below shoulder height) and/or with different effect
(e.g., contacting replies on the rise during topspin rallies to maximise imposed time
pressure). Models from Chapters 4 to 6 could also be used from a profiling point of view,
where the impact characteristics and return stroke quality for individual or aspiring
players are compared to what is considered typical of the best players in the world (see
Figure 5.6). Such comparisons may in turn guide the technique, movement and/or strategy
development of players.
As it is generally accepted that practice should reflect the demands of match-play
(Pinder et al., 2011), the gender differences revealed in some of the impact characteristics
examined in Chapter 5 highlight the need for gender-specific training in this regard. That
CHAPTER 7 GENERAL DISCUSSION 136
is, some of the incoming trajectories and subsequent impact points of the male and female
game are unique. This likely poses a challenge to the specificity of certain practice
contexts, especially those that are commonly observed in the professional game where
male coaches may spar or practice with female players. Needless to say, in those settings,
coaches may need to adjust their ball-striking and positioning to better reflect the
trajectories typical of the female game. Recent research by Krause, Buszard, et al. (2019)
has highlighted opportunities for more representative practice of the serve-return in
tennis, given findings from the current thesis were based on match-play data, results may
help practitioners to improve the specificity of serve-return as well as groundstroke
practice.
7.5 Limitations of this thesis
This thesis has a number of limitations. Firstly, the accuracy of the method
validated and utilised to estimate ball spin deteriorated at higher spin rates (~>4500
RPM). Consequently, shots with a component of spin (topspin/backspin or sidespin) in
excess of 4500 RPM were excluded from the analysis in Chapters 4 to 6, notwithstanding
that comparisons to each shot’s true spin was difficult to ascertain. This exclusion may
have prevented effects specific to the most heavily spun shots being observed, which are
most commonly men’s second serves (Kelley, 2011). The observed performance of the
model at higher spin rates may be associated with the relationship between CL and the
spin parameter (Sp), where CL levelled off at higher magnitudes of Sp (absolute Sp > 0.7;
Figure 3.3). There is some suggestion that this effect was a characteristic of prior research
(Goff & Carré, 2009; Nathan, 2008). However, as Chapter 3 was limited by the spin rates
and therefore high Sp magnitudes able to be produced by the commercially available ball
machines, this suggestion warrants further investigation.
CHAPTER 7 GENERAL DISCUSSION 137
In addition to the above, the theoretical ball trajectory model used to estimate ball
spin in this thesis required the specification of ball mass, ball diameter and air density.
As it is not practical to measure the air density throughout every match played or the
specifications of each ball recorded by Hawk-Eye, these parameters were held constant
throughout the validation (Chapter 3) and quantification of ball spin (Chapters 4 to 6) in
this thesis. Similarly, this method did not account for the strength or direction of winds
present during the validation study (which occurred indoors) or when quantifying the spin
rate of shots from Grand Slam matches. While not an uncommon set of assumptions in
this field of work (Robinson & Robinson, 2015, 2018a), this still represents a limitation
of our approach given trajectory simulations have shown the direction and strength of
wind to influence the ball’s flight (Robinson & Robinson, 2018b, 2020). These influences
warrant further investigation in an effort to improve the accuracy of ball spin estimates.
Chapters 4 to 6 utilised a combined estimate of the topspin/backspin and sidespin
components of spin. This approach likely provided a more representative estimate given
shots in tennis spin in more than one-dimension (Sakurai et al., 2013), yet, may have also
prevented effects specific to each spin component being observed. For instance, increases
in the sidespin of slice serves have been shown to increase the ball’s lateral movement
through flight (Robinson & Robinson, 2018a), while the bounce height of serves and
groundstrokes increases with the shot’s topspin rate (Cross, 2011, 2020). Therefore,
examining these components of spin individually may highlight the unique effects of each
in match-play. Further, it is worth noting that the ball spin measure used throughout this
thesis estimated ball spin off the racket despite differences in pre- and post-bounce ball
speed and spin being observed both during matches at the professional-level (Kelley et
al., 2008; Lane et al., 2017) and in laboratory based experimental work (Cross, 2019).
CHAPTER 7 GENERAL DISCUSSION 138
Thus, the development and validation of a measure of post-bounce ball spin from ball-
tracking data would prove a valuable future addition to understanding the influence of
ball spin in tennis.
This thesis adopted a mixed methods approach to better understand the concept
of stroke heaviness in tennis. Professional players in this study indicated that heavy
strokes were characterised by the ball “jumping, climbing or rearing off the court”. As a
measure of this characteristic, we examined the contribution of ball speed and spin to a
shot’s out-of-bounce angle, however, out-of-bounce angle alone may not adequately
capture a player’s perception of the ball “jumping” off the court. Future work is needed
to ascertain which variable or more likely combination of variables (e.g., out-of-bounce
angle, out-of-bounce velocity (resultant, horizontal, vertical)) best represent this feature
of heaviness. An even more expansive survey to better understand the nuance of
heaviness as perceived by players may assist in this regard. Alternatively, a schedule of
controlled on-court testing where players qualitatively rate the heaviness of pre-planned
incoming shots that possess varying combinations of ball speed, ball spin and landing
position may be worthwhile. These data could then be compared to ball-tracking data to
better establish the characteristics of perceived heavy shots.
There were a series of other limitations related to the analysis and treatment of
different data throughout the thesis. For example, the analysis in Chapters 4 to 6
considered outcome variables separately. However, a multivariate analysis that
simultaneously modelled all outcome variables while gaining information from the
correlation that may exist between them may have been preferred. Chapters 5 and 6 also
examined measures of impact relative to peak height, including how early or late contact
occurred in the post-bounce trajectory. This was done by quantifying the distance
CHAPTER 7 GENERAL DISCUSSION 139
(metres) between impact and peak height. The accuracy of peak height estimates however
were reduced when a small portion of the trajectory was observed and for serve compared
to groundstroke trajectories. Future research could aim to improve upon the accuracy of
this peak height measure.
Chapters 4 through 6 investigated the effect of incoming shot characteristics,
continuous measures of impact and/or categorical variables (i.e., gender, ranking, impact)
on various outcome measures. Variables other than those being examined were set to their
average value. This allowed for effects to be examined in the context of ‘typical’ features
of shot trajectories, but other approaches may have better encapsulated the characteristics
of average shots. Similarly, to examine the effect of impact characteristics on measures
of return stroke quality (Chapter 6) we estimated effects for a shot of average incoming
characteristics (i.e., for the same trajectory taken on the rise versus on the drop, what
physical attributes characterise the return). While this approach was adopted to control
for the effect of the incoming shot on reply quality, future research should consider a
more diverse mix of shots, characterised by various combinations of ball speed, ball spin
and landing location. In the same vein, the generalised additive models that featured in
Chapters 5 and 6 were fit with a smooth to control for the incoming shot’s lateral landing
location, however, these chapters did not focus on the influence of this shot characteristic.
Further, the lateral component of impact was not considered in this thesis.
7.6 Future directions
A number of areas for further investigation could be proposed from this thesis.
Firstly, whilst a strength of this thesis was the use of a large-scale spatiotemporal dataset
encompassing numerous Grand Slam matches and players, it was limited to only one
tournament (Australian Open) and one court surface (hard court). Prior research has
CHAPTER 7 GENERAL DISCUSSION 140
observed differences in aspects of match-play (e.g., ball speed, really length) across court
surfaces (Brown & O’Donoghue, 2008; Lane et al., 2017; Vaverka et al., 2018), likely
explained by variations in player tactics as well as surface coefficients of friction (COF)
and restitution (COR) (Cross, 2003). Similar court-specific effects may be present in
outcomes examined throughout this thesis (i.e., in relation to player impact) and as COF
and COR capture the ball’s interaction with the court surface, the need for methods to
examine ball speed and spin post-bounce rather than off the racket is further underlined.
Notwithstanding the appeal of these between surface comparisons, it is worth noting that
comparable datasets from tournaments played on other court surfaces (i.e., clay, grass)
were not accessible.
This thesis examined the effect of incoming shot characteristics on an average
player’s impact and return stroke quality, yet it is possible that responses to features of an
incoming ball’s trajectory are player-specific. Further, players likely vary their tactical
response based on a specific opponent or a particular style of ball-striking; both of which
were not considered in Chapters 4 to 6. These avenues of potential enquiry are supported
by differences in playing style (i.e., aggressive baseliner/good returner – “plays close to
the baseline taking the ball early”) described in coaching texts (Crespo & Miley, 1998)
as well as the stylistics differences observed among samples of professional players in
Chapter 5 (Figure 5.6) and in prior research (Mlakar & Kovalchik, 2020; Wei et al., 2015;
Wei, Lucey, Morgan, Reid, & Sridharan, 2016; Wei et al., 2013).
Analysis in Chapters 4 and 5 examined a player’s contact point based on the ball’s
horizontal and vertical coordinates at impact in relation to the incoming shot’s
characteristics. The movement response by players (i.e., movement between when the
ball is struck by the opponent and when the player makes contact) was overlooked but is
CHAPTER 7 GENERAL DISCUSSION 141
likely of practical interest. For example, this type of analysis may identify if players adjust
their court position and impact based on their opponent (i.e., adopting a deeper return
position from the outset against an opponent with fast paced groundstrokes) or if these
changes are made in response to a given incoming trajectory (i.e., players move back in
the court in response to a faster incoming shot). Furthermore, adjustments to our inclusion
criteria in Chapter 6 so that the influence of incoming ball trajectories for shots hit as
clean winners could be examined seems a logical next step given the previously reported
link between serve speed and aces (Whiteside & Reid, 2017b).
Despite efforts to be as comprehensive as possible in the review of factors that
effect the features of ball-striking of interest to this thesis, there remains other influences
that were not considered. These include, but are not limited to, grip position, player
handedness, backhand style (one compared to two handed), equipment setup (e.g., string
tension), court speed, incoming and outgoing shot direction (e.g., cross court, down the
line), if the impact player is serving or receiving, player fatigue, the distance and speed
of movement required to make contact and the scoreboard (e.g., facing a break point).
Such factors may influence how players make contact, the physical attributes of the
outgoing shot and/or player tactics in a given rally. Lastly, researchers interested in using
tracking data to examine the dynamics of how points are won and lost, should consider
the role of shot combinations or variations in shot characteristics across a point. Such
analyses may reveal the efficiency and effectiveness of varying combinations of shot
speed and spin (both in terms of magnitude and direction). This concept was explored by
Wei, Lucey, Morgan, Reid, and Sridharan (2016) who emphasised that it is players’
strategies across a point (on tangible display through their ball trajectories) that allow
them to achieve strategic advantages and win points, games and matches.
CHAPTER 7 GENERAL DISCUSSION 142
7.7 Concluding remark
This thesis explored the effects of ball speed and spin in tennis using ball-tracking
data from Grand Slam matches. The accuracy of methods to estimate ball spin rate and
spin direction from multi-camera tracking technology was initially assessed. Based on
findings from this first study, ball spin was estimated from ball-tracking data collected
during Grand Slam matches. This was then used to investigate how ball speed and spin
combine to create the heaviness perceived by players as well as to explore the effect of
ball speed and spin on the impact and the quality of a player’s return shot while also
examining influences such as gender and ranking.
Findings from this thesis revealed that ball spin could be accurately estimated
from the outputs of the sport’s most common ball-tracking system. This allowed for the
concept of stroke heaviness to be explored, which in turn highlighted the complexity of
this measure in tennis. Results from this thesis also indicated that a player’s impact and
ball-striking are influenced by the incoming ball’s trajectory, outside of the player’s full
control and subject to individual stylistic preferences.

CHAPTER 8 REFERENCES 143
CHAPTER 8
REFERENCES
CHAPTER 8 REFERENCES 144
Abrams, G. D., Harris, A. H., Andriacchi, T. P., & Safran, M. R. (2014). Biomechanical
analysis of three tennis serve types using a markerless system. British Journal of
Sports Medicine, 48(4), 339-342. https://doi.org/10.1136/bjsports-2012-091371
Alam, F., Steiner, T., Chowdhury, H., Moria, H., Khan, I., Aldawi, F., & Subic, A. (2011).
A study of golf ball aerodynamic drag. Procedia Engineering, 13, 226-231.
https://doi.org/10.1016/j.proeng.2011.05.077
Alaways, L. W., & Hubbard, M. (2001). Experimental determination of baseball spin and
lift. Journal of Sports Sciences, 19(5), 349-358.
https://doi.org/10.1080/02640410152006126
Alcock, A., Gilleard, W., Brown, N. A. T., Baker, J., & Hunter, A. (2012). Initial ball
flight characteristics of curve and instep kicks in elite women’s football. Journal
of Applied Biomechanics, 28(1), 70-77. https://doi.org/10.1123/jab.28.1.70
Alcock, A., Gilleard, W., Hunter, A. B., Baker, J., & Brown, N. (2012). Curve and instep
kick kinematics in elite female footballers. Journal of Sports Sciences, 30(4), 387-
394. https://doi.org/10.1080/02640414.2011.643238
Allen, T., Choppin, S., & Knudson, D. (2016). A review of tennis racket performance
parameters. Sports Engineering, 19(1), 1-11. https://doi.org/10.1007/s12283-014-
0167-x
Antoun, R. (2007). Women's tennis tactics. Human Kinetics.
Asai, T., Seo, K., Kobayashi, O., & Sakashita, R. (2007). Fundamental aerodynamics of
the soccer ball. Sports Engineering, 10(2), 101-109.
https://doi.org/10.1007/BF02844207
CHAPTER 8 REFERENCES 145
ATP Staff. (2020, November 17). Tsitsipas saves match point, sends Thiem into semi-
finals. ATP Tour. https://www.atptour.com/en/news/tsitsipas-rublev-nitto-atp-
finals-2020-day-3
Bland, J. M., & Altman, D. G. (1999). Measuring agreement in method comparison
studies. Statistical Methods in Medical Research, 8(2), 135-160.
https://doi.org/10.1177/096228029900800204
Bray, K., & Kerwin, D. G. (2003). Modelling the flight of a soccer ball in a direct free
kick. Journal of Sports Sciences, 21(2), 75-85.
https://doi.org/10.1080/0264041031000070994
Brody, H. (2003). Bounce of a tennis ball. Journal of Science and Medicine in Sport, 6(1),
113-119. https://doi.org/10.1016/S1440-2440(03)80014-2
Brody, H. (2006). Unforced errors and error reduction in tennis. British Journal of Sports
Medicine, 40(5), 397-400. https://doi.org/10.1136/bjsm.2005.023432
Brown, E., & O’Donoghue, P. (2008). Gender and surface effect on elite tennis strategy.
ITF Coaching and Sport Science Review, (46), 9-11.
Busuttil, N. A., Reid, M., Connolly, M., Dascombe, B. J., & Middleton, K. J. (2020). A
kinematic analysis of the upper limb during the topspin double-handed backhand
stroke in tennis. Sports Biomechanics.
https://doi.org/10.1080/14763141.2020.1726994
Cant, O., Kovalchik, S., Cross, R., & Reid, M. (2020). Validation of ball spin estimates
in tennis from multi-camera tracking data. Journal of Sports Sciences, 38(3), 296-
303. https://doi.org/10.1080/02640414.2019.1697189
CHAPTER 8 REFERENCES 146
Cant, O., Kovalchik, S., & Reid, M. (2020). In the battle for time and space, how early
and consistently do professional tennis players intercept the ball. (under review -
Journal of Sports Sciences).
Capel-Davies, J., & Spurr, J. (2019). ITF report: the state of the game 2018. ITF Coaching
and Sport Science Review, (78), 16-20.
Carré, M. J., Asai, T., Akatsuka, T., & Haake, S. J. (2002). The curve kick of a football
II: Flight through the air. Sports Engineering, 5(4), 193-200.
https://doi.org/10.1046/j.1460-2687.2002.00109.x
Carvalho, J., Araújo, D., Travassos, B., Esteves, P., Pessanha, L., Pereira, F., & Davids,
K. (2013). Dynamics of players’ relative positioning during baseline rallies in
tennis. Journal of Sports Sciences, 31(14), 1596-1605.
https://doi.org/10.1080/02640414.2013.792944
Chin, A., Elliott, B., Alderson, J., Lloyd, D., & Foster, D. (2009). The off-break and
“doosra”: Kinematic variations of elite and sub-elite bowlers in creating ball spin
in cricket bowling. Sports Biomechanics, 8(3), 187-198.
https://doi.org/10.1080/14763140903229476
Choppin, S., Albrecht, S., Spurr, J., & Capel-Davies, J. (2018). The effect of ball wear on
ball aerodynamics: An investigation using Hawk-Eye data. Proceedings, 2(6),
265-270. https://doi.org/10.3390/proceedings2060265
Choppin, S., Goodwill, S., & Haake, S. (2011). Impact characteristics of the ball and
racket during play at the Wimbledon qualifying tournament. Sports Engineering,
13(4), 163-170. https://doi.org/10.1007/s12283-011-0062-7
CHAPTER 8 REFERENCES 147
Choppin, S., Goodwill, S., Haake, S., & Miller, S. (2007). 3D player testing results from
the Wimbledon Qualifying Tournament. In S. Miller & J. Capel-Davies (Eds.),
Tennis Science & Technology 3 (pp. 341 - 348). International Tennis Federation.
Cohen, J. (1988). Statistical power analysis for the behavioral sciences (2nd ed.).
Lawrence Erlbaum Associates.
Contini, R. (1972). Body segment parameters, Part II. Artificial Limbs, 16(1), 1-19.
Cook, R. D. (1979). Influential observations in linear regression. Journal of the American
Statistical Association, 74(365), 169-174. https://doi.org/10.2307/2286747
Craig, C. M., Berton, E., Rao, G., Fernandez, L., & Bootsma, R. J. (2006). Judging where
a ball will go: the case of curved free kicks in football. Naturwissenschaften,
93(2), 97-101. https://doi.org/10.1007/s00114-005-0071-0
Crespo, M., & Higueras, J. (2001). Forehands. In P. Roetert & J. Groppel (Eds.), World-
class tennis technique (pp. 146-171). Human Kinetics.
Crespo, M., & Miley, D. (1998). Advanced coaches manual. International Tennis
Federation.
Cross, R. (2003). Measurements of the horizontal and vertical speeds of tennis courts.
Sports Engineering, 6(2), 95-111. https://doi.org/10.1007/BF02903531
Cross, R. (2011). The kick serve in tennis. Sports Technology, 4(1-2), 19-28.
https://doi.org/10.1080/19346182.2012.663534
Cross, R. (2014). Men’s tennis vs Women’s tennis ITF Coaching and Sport Science
Review, (62), 3-5.
Cross, R. (2019). Effect of topspin on the apparent speed of a tennis court. Sports
Engineering, 22(1). https://doi.org/10.1007/s12283-019-0296-3
CHAPTER 8 REFERENCES 148
Cross, R. (2020). Calculations of groundstroke trajectories in tennis. Sports Engineering,
23(1). https://doi.org/10.1007/s12283-020-00322-1
Cross, R., & Lindsey, C. (2014). Measurements of drag and lift on tennis balls in flight.
Sports Engineering, 17(2), 89-96. https://doi.org/10.1007/s12283-013-0144-9
Diamond Kinetics. (n.d.). PitchTracker Baseball. Retrieved December 15, 2020, from
https://diamondkinetics.com/pitchtracker-baseball/
Doljin, B., & Fuss, F. K. (2015). Development of a smart cricket ball for advanced
performance analysis of bowling. Procedia Technology, 20, 133-137.
https://doi.org/10.1016/j.protcy.2015.07.022
Doljin, B., Jeong, K., Kim, Y.-K., & Fuss, F. K. (2020). Profiling of a pitcher’s
performance with a smart baseball: A case report. Proceedings, 49(1), 103-107.
https://doi.org/10.3390/proceedings2020049103
Draper, S. (2016, June 1). Power playing: Make you muscle matter. Tennismash.
https://tennismash.com/2016/06/01/power-plays-make-your-muscle-matter/
Elliott, B. (2003). The development of racquet speed. In B. Elliott, M. Reid, & M. Crespo
(Eds.), Biomechanics of advanced tennis (pp. 31-47). International Tennis
Federation.
Elliott, B., & Christmass, M. (1995). A comparison of the high and low backspin
backhand drives in tennis using different grips. Journal of Sports Sciences, 13(2),
141-151. https://doi.org/10.1080/02640419508732221
Elliott, B., & Marsh, T. (1989). A biomechanical comparison of the topspin and backspin
forehand approach shots in tennis. Journal of Sports Sciences, 7(3), 215-227.
https://doi.org/10.1080/02640418908729842
CHAPTER 8 REFERENCES 149
Elliott, B., Reid, M., & Crespo, M. (Eds.). (2003). Biomechanics of advanced tennis.
International Tennis Federation.
Elliott, B., Reid, M., & Crespo, M. (2009a). ‘Heaviness’ in stroke production. In
Technique development in tennis stroke production (pp. 56-62). International
Tennis Federation.
Elliott, B., Reid, M., & Crespo, M. (2009b). Technique development in tennis stroke
production. International Tennis Federation.
Elliott, B., & Saviano, N. (2001). Serves and returns. In P. Roetert & J. Groppel (Eds.),
World-class tennis technique (pp. 206-221). Human Kinetics.
Elliott, B., Takahashi, K., & Noffal, G. (1997). The influence of grip position on upper
limb contributions to racket head velocity in a tennis forehand. Journal of Applied
Biomechanics, 13(2), 182-196. https://doi.org/10.1123/jab.13.2.182
Elliott, B., Whiteside, D., Lay, B., & Reid, M. (2013). The female tennis serve: An
analogous version of the male serve. In T.-Y. Shiang, W.-H. Ho, P. C. Huang, &
C.-L. Tsai (Eds.), Proceedings of the 31st International Conference on
Biomechanics in Sports. https://ojs.ub.uni-konstanz.de/cpa/article/view/5590
Elliott, B. C., Marshall, R. N., & Noffal, G. J. (1995). Contributions of upper limb
segment rotations during the power serve in tennis. Journal of Applied
Biomechanics, 11(4), 433-442. https://doi.org/10.1123/jab.11.4.433
Fernández-García, Á. I., Blanca-Torres, J. C., Nikolaidis, P. T., & Torres-Luque, G.
(2019). Differences in competition statistics between winners and losers in male
and female tennis players in Olympic Games. German Journal of Exercise and
Sport Research, 49(3), 313-318. https://doi.org/10.1007/s12662-019-00608-y
CHAPTER 8 REFERENCES 150
Fest, S. (2016). Roger Federer and Rafael Nadal: The lives and careers of two tennis
legends. Skyhorse Publishing.
Fitzpatrick, A., Stone, J. A., Choppin, S., & Kelley, J. (2019). Important performance
characteristics in elite clay and grass court tennis match-play. International
Journal of Performance Analysis in Sport, 19(6), 942-952.
https://doi.org/10.1080/24748668.2019.1685804
Fuss, F. K., & Smith, R. M. (2011). Development of a smart oval ball for assessment of
angular flight dynamics and precision of kick execution. Sports Technology, 4(3-
4), 151-158. https://doi.org/10.1080/19346182.2012.726224
Garber, G. (2008, July 4). Nadal has improved virtually every aspect of his game. ESPN.
https://www.espn.com/sports/tennis/wimbledon08/columns/story?columnist=gar
ber_greg&id=3472238
Genevois, C., Reid, M., Creveaux, T., & Rogowski, I. (2020). Kinematic differences in
upper limb joints between flat and topspin forehand drives in competitive male
tennis players. Sports Biomechanics, 19(2), 212-226.
https://doi.org/10.1080/14763141.2018.1461915
Giles, B., Peeling, P., Dawson, B., & Reid, M. (2019). How do professional tennis players
move? The perceptions of coaches and strength and conditioning experts. Journal
of Sports Sciences, 37(7), 726-734.
https://doi.org/10.1080/02640414.2018.1523034
Gillet, E., Leroy, D., Thouvarecq, R., & Stein, J.-F. (2009). A notational analysis of elite
tennis serve and serve-return strategies on slow surface. Journal of Strength and
Conditioning Research, 23(2), 532-539.
https://doi.org/10.1519/JSC.0b013e31818efe29
CHAPTER 8 REFERENCES 151
Girard, O., Micallef, J.-P., & Millet, G. P. (2005). Lower-limb activity during the power
serve in tennis: Effects of performance level. Medicine and Science in Sports and
Exercise, 37(6), 1021-1029.
https://doi.org/10.1249/01.mss.0000171619.99391.bb
Goff, J. E., & Carré, M. J. (2009). Trajectory analysis of a soccer ball. American Journal
of Physics, 77(11), 1020-1027. https://doi.org/10.1119/1.3197187
Goodwill, S., Capel-Davies, J., Haake, S., & Miller, S. (2007). Ball spin generation by
elite players during match play. In S. Miller & J. Capel-Davies (Eds.), Tennis
Science & Technology 3. International Tennis Federation.
Goodwill, S. R., Chin, S. B., & Haake, S. J. (2004). Aerodynamics of spinning and non-
spinning tennis balls. Journal of Wind Engineering and Industrial Aerodynamics,
92(11), 935-958. https://doi.org/10.1016/j.jweia.2004.05.004
Hawk-Eye Innovations. (n.d.). Electronic Line Calling Technology: How it works.
https://resources.platform.pulselive.com/HawkEye/document/2016/08/15/1e6cd
aa4-2b70-4975-b722-7dca82b8e546/ELC_How_it_Works.pdf
Hernández-Davó, J. L., Moreno, F. J., Sanz-Rivas, D., Hernández-Davó, H., Coves, Á.,
& Caballero, C. (2019). Variations in kinematic variables and performance in the
tennis serve according to age and skill level. International Journal of
Performance Analysis in Sport, 19(5), 749-762.
https://doi.org/10.1080/24748668.2019.1653036
Hoskins-Burney, T., & Carrington, L. (2014). The tennis drill book (2nd ed.). Human
Kinetics.
CHAPTER 8 REFERENCES 152
International Tennis Federation. (2019). Procedures for obtaining 2020 ITF approval of
tennis balls. https://www.itftennis.com/media/2236/2020-itf-ball-approval-
procedures.pdf
International Tennis Federation. (2020). Approved PAT products. Retrieved December
15, 2020, from https://www.itftennis.com/en/about-us/tennis-tech/approved-pat-
products/
Jinji, T., & Sakurai, S. (2006). Direction of spin axis and spin rate of the pitched baseball.
Sports Biomechanics, 5(2), 197-214.
https://doi.org/10.1080/14763140608522874
Jinji, T., Sakurai, S., & Hirano, Y. (2011). Factors determining the spin axis of a pitched
fastball in baseball. Journal of Sports Sciences, 29(7), 761-767.
https://doi.org/10.1080/02640414.2011.553963
Kachel, K., Buszard, T., & Reid, M. (2015). The effect of ball compression on the match-
play characteristics of elite junior tennis players. Journal of Sports Sciences,
33(3), 320-326. https://doi.org/10.1080/02640414.2014.942683
Katić, R., Milat, S., Zagorac, N., & Durović, N. (2011). Impact of game elements on
tennis match outcome in Wimbledon and Roland Garros 2009. Collegium
antropologicum, 35(2), 341-346.
Keaney, E. M., & Reid, M. (2020). Quantifying hitting activity in tennis with racket
sensors: new dawn or false dawn? Sports Biomechanics, 19(6), 831-839.
https://doi.org/10.1080/14763141.2018.1535619
Kelley, J. (2011). Measuring ball spin rates in match play tennis [Doctoral dissertation,
Sheffield Hallam University].
CHAPTER 8 REFERENCES 153
Kelley, J., Choppin, S. B., Goodwill, S. R., & Haake, S. J. (2010). Validation of a live,
automatic ball velocity and spin rate finder in tennis. Procedia Engineering, 2(2),
2967-2972. https://doi.org/10.1016/j.proeng.2010.04.096
Kelley, J., Goodwill, S., Capel-Davies, J., & Haake, S. (2008). Ball spin generation at the
2007 Wimbledon qualifying tournament. In M. Estivalet & P. Brisson (Eds.), The
Engineering of Sport 7 (Vol. 1, pp. 571-578). Springer.
Kolbinger, O., & Lames, M. (2013). Ball trajectories in tennis - Lateral and vertical
placement of right handed men’s singles serves. International Journal of
Performance Analysis in Sport, 13(3), 750-758.
https://doi.org/10.1080/24748668.2013.11868686
Kolman, N., Huijgen, B., Kramer, T., Elferink-Gemser, M., & Visscher, C. (2017). The
Dutch Technical-Tactical Tennis Test (D4T) for talent identification and
development: Psychometric characteristics. Journal of human kinetics, 55(1),
127-138. https://doi.org/10.1515/hukin-2017-0012
Kovalchik, S., & Reid, M. (2017). Comparing matchplay characteristics and physical
demands of junior and professional tennis athletes in the era of big data. Journal
of Sports Science & Medicine, 16(4), 489-497.
Kovalchik, S., & Reid, M. (2018). A shot taxonomy in the era of tracking data in
professional tennis. Journal of Sports Sciences, 36(18), 2096-2104.
https://doi.org/10.1080/02640414.2018.1438094
Krause, L., Buszard, T., Reid, M., Pinder, R., & Farrow, D. (2019). Assessment of elite
junior tennis serve and return practice: A cross-sectional observation. Journal of
Sports Sciences, 37(24), 2818-2825.
https://doi.org/10.1080/02640414.2019.1665245
CHAPTER 8 REFERENCES 154
Krause, L., Farrow, D., Buszard, T., Pinder, R., & Reid, M. (2019). Application of
representative learning design for assessment of common practice tasks in tennis.
Psychology of Sport and Exercise, 41, 36-45.
https://doi.org/10.1016/j.psychsport.2018.11.008
Kwon, S., Pfister, R., Hager, R. L., Hunter, I., & Seeley, M. K. (2017). Influence of tennis
racquet kinematics on ball topspin angular velocity and accuracy during the
forehand groundstroke. Journal of Sports Science & Medicine, 16(4), 505-513.
Landlinger, J., Stöggl, T., Lindinger, S., Wagner, H., & Müller, E. (2012). Differences in
ball speed and accuracy of tennis groundstrokes between elite and high-
performance players. European Journal of Sport Science, 12(4), 301-308.
https://doi.org/10.1080/17461391.2011.566363
Lane, B., Sherratt, P., Hu, X., & Harland, A. (2017). Characterisation of ball degradation
events in professional tennis. Sports Engineering, 20(3), 185-197.
https://doi.org/10.1007/s12283-017-0228-z
Leach, R. J., Forrester, S. E., Mears, A. C., & Roberts, J. R. (2017). How valid and
accurate are measurements of golf impact parameters obtained using
commercially available radar and stereoscopic optical launch monitors?
Measurement, 112, 125-136. https://doi.org/10.1016/j.measurement.2017.08.009
Lin, C.-Y., Lo, K.-C., Lin, H.-T., & Wang, L.-H. (2011). Comparison of player’s center
of mass movement between high and low impact positions in tennis forehand
stroke. In J. P. Vilas-Boas, L. Machado, W. Kim, A. P. Veloso, F. Alves, R. J.
Fernandes, & F. Conceicao (Eds.), Proceedings of the 29th International
Conference on Biomechanics in Sports. https://ojs.ub.uni-
konstanz.de/cpa/article/view/4835
CHAPTER 8 REFERENCES 155
Lindsay, C., & Spratford, W. (2020). Bowling action and ball flight kinematics of
conventional swing bowling in pathway and high-performance bowlers. Journal
of Sports Sciences, 38(14), 1650-1659.
https://doi.org/10.1080/02640414.2020.1754717
Lückemann, P., Haid, D. M., Brömel, P., Schwanitz, S., & Maiwald, C. (2018).
Validation of an inertial sensor system for swing analysis in golf. Proceedings,
2(6), 246-251. https://doi.org/10.3390/proceedings2060246
Maquirriain, J., Baglione, R., & Cardey, M. (2016). Male professional tennis players
maintain constant serve speed and accuracy over long matches on grass courts.
European Journal of Sport Science, 16(7), 845-849.
https://doi.org/10.1080/17461391.2016.1156163
Martin, C., Bideau, B., Delamarche, P., & Kulpa, R. (2016). Influence of a prolonged
tennis match play on serve biomechanics. PLoS ONE, 11(8), Article e0159979.
https://doi.org/10.1371/journal.pone.0159979
Martin, C., Bideau, B., Ropars, M., Delamarche, P., & Kulpa, R. (2014). Upper limb joint
kinetic analysis during tennis serve: Assessment of competitive level on
efficiency and injury risks. Scandinavian Journal of Medicine & Science in
Sports, 24(4), 700-707. https://doi.org/10.1111/sms.12043
Martin, C., Bideau, B., Touzard, P., & Kulpa, R. (2018). Identification of serve pacing
strategies during five-set tennis matches. International Journal of Sports Science
& Coaching, 14(1), 32-42. https://doi.org/10.1177/1747954118806682
Martin, C., Kulpa, R., Delamarche, P., & Bideau, B. (2013). Professional tennis players'
serve: correlation between segmental angular momentums and ball velocity.
CHAPTER 8 REFERENCES 156
Sports Biomechanics, 12(1), 2-14.
https://doi.org/10.1080/14763141.2012.734321
Martínez-Gallego, R., Guzmán, J. F., Crespo, M., Ramón-Llin, J., & Vučković, G.
(2019). Technical, tactical and movement analysis of men's professional tennis on
hard courts. The Journal of Sports Medicine and Physical Fitness, 59(1), 50-56.
https://doi.org/10.23736/s0022-4707.17.07916-6
Matsuo, T., Nakamoto, H., & Kageyama, M. (2017). Comparison of properties of a
pitched-ball rotation measured by three different methods. Proceedings of the
35th Conference of the International Society of Biomechanics in Sports.
https://commons.nmu.edu/isbs/vol35/iss1/115
Mecheri, S., Rioult, F., Mantel, B., Kauffmann, F., & Benguigui, N. (2016). The serve
impact in tennis: First large-scale study of big Hawk-Eye data. Statistical Analysis
and Data Mining, 9(5), 310-325. https://doi.org/10.1002/sam.11316
Miller, S. (2019, August 22). The lost tennis art of returning up the middle. The New York
Times. https://www.nytimes.com/2019/08/22/sports/tennis/return-serve-up-the-
middle.html
Mlakar, M., & Kovalchik, S. A. (2020). Analysing time pressure in professional tennis.
Journal of Sports Analytics, 6(2), 147-154. https://doi.org/10.3233/JSA-200406
Murata, M., & Fujii, N. (2014). Mechanical energy flow of the trunk in tennis serve. In
K. Sato, W. A. Sands, & S. Mizuguchi (Eds.), Proceedings of the 32nd
International Conference of Biomechanics in Sports. https://ojs.ub.uni-
konstanz.de/cpa/article/view/6064
Murata, M., & Takahashi, H. (2020). Verification of the accuracy and reliability of the
TrackMan tennis radar. Proceedings of the Institution of Mechanical Engineers,
CHAPTER 8 REFERENCES 157
Part P: Journal of Sports Engineering and Technology.
https://doi.org/10.1177/1754337120953005
Mutua Madrid Open. (2019, May 11). Djokovic: “Beating Thiem was a huge challenge”.
https://www.madrid-open.com/en/mutua-news/djokovic-beating-thiem-was-a-
huge-challenge/
Myers, N. L., Kibler, W. B., Axtell, A. H., & Uhl, T. L. (2019). The Sony Smart Tennis
Sensor accurately measures external workload in junior tennis players.
International Journal of Sports Science & Coaching, 14(1), 24-31.
https://doi.org/10.1177/1747954118805278
Nathan, A. M. (2008). The effect of spin on the flight of a baseball. American Journal of
Physics, 76(2), 119-124. https://doi.org/10.1119/1.2805242
Nathan, A. M., Kensrud, J., Smith, L., & Lang, E. (2014, April 2). Testing TrackMan:
Just how well does TrackMan work?. Baseball Prospectus.
https://www.baseballprospectus.com/news/article/23202/testing-trackman-just-
how-well-does-trackman-work/
O’Donoghue, P. (2002). Performance models of ladies' and men's singles tennis at the
Australian Open. International Journal of Performance Analysis in Sport, 2(1),
73-84. https://doi.org/10.1080/24748668.2002.11868262
Pinder, R., A., Davids, K., Renshaw, I., & Araújo, D. (2011). Representative learning
design and functionality of research and practice in sport. Journal of Sport and
Exercise Psychology, 33(1), 146-155. https://doi.org/10.1123/jsep.33.1.146
R Core Team. (2017). R: A language and environment for statistical computing. In R
Foundation for Statistical Computing. https://www.R-project.org/
CHAPTER 8 REFERENCES 158
Reid, M., Cormack, S. J., Duffield, R., Kovalchik, S., Crespo, M., Pluim, B., & Gescheit,
D. T. (2019). Improving the reporting of tennis injuries: the use of workload data
as the denominator? British Journal of Sports Medicine, 53(16), 1041-1042.
https://doi.org/10.1136/bjsports-2017-098625
Reid, M., & Elliott, B. (2002). The one- and two-handed backhands in tennis. Sports
Biomechanics, 1(1), 47-68. https://doi.org/10.1080/14763140208522786
Reid, M., Elliott, B., & Alderson, J. (2007). Shoulder joint loading in the high
performance flat and kick tennis serves. British Journal of Sports Medicine,
41(12), 884-889. https://doi.org/10.1136/bjsm.2007.036657
Reid, M., Elliott, B., & Alderson, J. (2008). Lower-limb coordination and shoulder joint
mechanics in the tennis serve. Medicine and Science in Sports and Exercise,
40(2), 308-315. https://doi.org/10.1249/mss.0b013e31815c6d61
Reid, M., Morgan, S., & Whiteside, D. (2016). Matchplay characteristics of Grand Slam
tennis: implications for training and conditioning. Journal of Sports Sciences,
34(19), 1791-1798. https://doi.org/10.1080/02640414.2016.1139161
Reid, M., Whiteside, D., Gilbin, G., & Elliott, B. (2013). Effect of a common task
constraint on the body, racket, and ball kinematics of the elite junior tennis serve.
Sports Biomechanics, 12(1), 15-22.
https://doi.org/10.1080/14763141.2012.724702
Robinson, G., & Robinson, I. (2013). The motion of an arbitrarily rotating spherical
projectile and its application to ball games. Physica Scripta, 88(1), 018101–
018117. https://doi.org/10.1088/0031-8949/88/01/018101
CHAPTER 8 REFERENCES 159
Robinson, G., & Robinson, I. (2015). The effect of spin in swing bowling in cricket:
model trajectories for spin alone. Physica Scripta, 90(2), 028004-028021.
https://doi.org/10.1088/0031-8949/90/2/028004
Robinson, G., & Robinson, I. (2018a). Model trajectories for a spinning tennis ball: I. The
service stroke. Physica Scripta, 93(12), 123002-123024.
https://doi.org/10.1088/1402-4896/aae733
Robinson, G., & Robinson, I. (2018b). Model trajectories for a spinning tennis ball: II.
The service stroke in the presence of a wind. Physica Scripta, 93(12), 123003-
123021. https://doi.org/10.1088/1402-4896/aae744
Robinson, G., & Robinson, I. (2020). Model trajectories for a spinning tennis ball: III.
The effect of a light wind on ground strokes. Physica Scripta, 95(9), 095215-
095232. https://doi.org/10.1088/1402-4896/abaad6
Sakurai, S., Reid, M., & Elliott, B. (2013). Ball spin in the tennis serve: spin rate and axis
of rotation. Sports Biomechanics, 12(1), 23-29.
https://doi.org/10.1080/14763141.2012.671355
Sato, B., Wakatsuki, R., Kashiwagi, Y., & Funato, K. (2017). Ball velocity and spin at
the impact of tennis serves: Reliability of a ball motion measurement instrument
(TRACKMAN). ITF Coaching and Sport Science Review, (73), 24-26.
Sayers, A. T., & Hill, A. (1999). Aerodynamics of a cricket ball. Journal of Wind
Engineering and Industrial Aerodynamics, 79(1-2), 169-182.
https://doi.org/10.1016/S0167-6105(97)00299-7
Söğüt, M. (2017). A comparison of serve speed and motor coordination between elite and
club level tennis players. Journal of human kinetics, 55(1), 171-176.
https://doi.org/10.1515/hukin-2017-0015
CHAPTER 8 REFERENCES 160
Söğüt, M. (2018). Stature: Does it really make a difference in match-play outcomes
among professional tennis players? International Journal of Performance
Analysis in Sport, 18(2), 255-261.
https://doi.org/10.1080/24748668.2018.1466259
SportCor. (n.d.). Kookaburra Smart Ball. Retrieved December 15, 2020, from
https://www.sportcor.com/#ball
Spratford, W., Whiteside, D., Elliott, B., Portus, M., Brown, N., & Alderson, J. (2018).
Does performance level affect initial ball flight kinematics in finger and wrist-
spin cricket bowlers? Journal of Sports Sciences, 36(6), 651-659.
https://doi.org/10.1080/02640414.2017.1329547
Štěpánek, A. (1988). The aerodynamics of tennis balls—The topspin lob. American
Journal of Physics, 56(2), 138-142. https://doi.org/10.1119/1.15692
Stodden, D. F., Fleisig, G. S., McLean, S. P., & Andrews, J. R. (2005). Relationship of
biomechanical factors to baseball pitching velocity: Within pitcher variation.
Journal of Applied Biomechanics, 21(1), 44-56.
https://doi.org/10.1123/jab.21.1.44
Takahashi, K., Elliott, B., & Noffal, G. (1996). The role of upper limb segment rotations
in the development of spin in the tennis forehand. The Australian Journal of
Science and Medicine in Sport, 28(4), 106-113.
Timmerman, E., De Water, J., Kachel, K., Reid, M., Farrow, D., & Savelsbergh, G.
(2015). The effect of equipment scaling on children’s sport performance: the case
for tennis. Journal of Sports Sciences, 33(10), 1093-1100.
https://doi.org/10.1080/02640414.2014.986498
CHAPTER 8 REFERENCES 161
Trollope, M. (2017, March 11). WTA stars step out at Indian Wells. Tennismash.
https://tennismash.com/2017/03/11/wta-stars-step-indian-wells/
United States Tennis Association. (2004). Coaching tennis successfully (2nd ed.). Human
Kinetics.
US Open. (2020). IBM SlamTracker. Retrieved December 20, 2020, from
https://www.usopen.org/en_US/scores/stats/1701.html?promo=matchchanger
Vaverka, F., & Cernosek, M. (2013). Association between body height and serve speed
in elite tennis players. Sports Biomechanics, 12(1), 30-37.
https://doi.org/10.1080/14763141.2012.670664
Vaverka, F., Nykodym, J., Hendl, J., Zhanel, J., & Zahradnik, D. (2018). Association
between serve speed and court surface in tennis. International Journal of
Performance Analysis in Sport, 18(2), 262-272.
https://doi.org/10.1080/24748668.2018.1467995
Vernon, G., Farrow, D., & Reid, M. (2018). Returning serve in tennis: A qualitative
examination of the interaction of anticipatory information sources used by
professional tennis players. Frontiers in Psychology, 9.
https://doi.org/10.3389/fpsyg.2018.00895
Watts, R. G., & Ferrer, R. (1987). The lateral force on a spinning sphere: Aerodynamics
of a curveball. American Journal of Physics, 55(1), 40-44.
https://doi.org/10.1119/1.14969
Wei, X., Lucey, P., Morgan, S., Carr, P., Reid, M., & Sridharan, S. (2015). Predicting
serves in tennis using style priors. Proceedings of the 21st ACM SIGKDD
International Conference on Knowledge Discovery and Data Mining, 2207-2215.
https://doi.org/10.1145/2783258.2788598
CHAPTER 8 REFERENCES 162
Wei, X., Lucey, P., Morgan, S., Reid, M., & Sridharan, S. (2016). “The thin edge of the
wedge”: Accurately predicting shot outcomes in tennis using style and context
priors. Proceedings of the 10th Annual MIT Sloan Sports Analytics Conference.
Wei, X., Lucey, P., Morgan, S., & Sridharan, S. (2013). "Sweet-Spot": Using
spatiotemporal data to discover and predict shots in tennis. Proceedings of the 7th
Annual MIT Sloan Sports Analytics Conference.
Wei, X., Lucey, P., Morgan, S., & Sridharan, S. (2016). Forecasting the next shot location
in tennis using fine-grained spatiotemporal tracking data. IEEE Transactions on
Knowledge and Data Engineering, 28(11), 2988-2997.
https://doi.org/10.1109/TKDE.2016.2594787
Whiteside, D., Bane, M., & Reid, M. (2015). Differentiating top-ranked male tennis
players from lower-ranked players using Hawk-Eye data: An investigation of the
2012–2014 Australian Open tournaments. In F. Colloud, M. Domalain, & T.
Monnet (Eds.), Proceedings of the 33rd International Conference of
Biomechanics in Sports. https://ojs.ub.uni-konstanz.de/cpa/article/view/6659
Whiteside, D., Elliott, B., Lay, B., & Reid, M. (2013). The effect of age on discrete
kinematics of the elite female tennis serve. Journal of Applied Biomechanics,
29(5), 573-582. https://doi.org/10.1123/jab.29.5.573
Whiteside, D., Martini, D. N., Zernicke, R. F., & Goulet, G. C. (2016). Ball speed and
release consistency predict pitching success in Major League Baseball. Journal of
Strength and Conditioning Research, 30(7), 1787-1795.
https://doi.org/10.1519/JSC.0000000000001296

CHAPTER 8 REFERENCES 163
Whiteside, D., & Reid, M. (2017a). External match workloads during the first week of
Australian Open tennis competition. International Journal of Sports Physiology
and Performance, 12(6), 756-763. https://doi.org/10.1123/ijspp.2016-0259
Whiteside, D., & Reid, M. (2017b). Spatial characteristics of professional tennis serves
with implications for serving aces: A machine learning approach. Journal of
Sports Sciences, 35(7), 648-654.
https://doi.org/10.1080/02640414.2016.1183805

CHAPTER 9 APPENDICES 164
CHAPTER 9
APPENDICES

APPENDIX A: INFORMATION TO PARTICIPANTS (CHAPTER 4) 165
APPENDIX A – INFORMATION TO PARTICIPANTS (CHAPTER 4)
APPENDIX A: INFORMATION TO PARTICIPANTS (CHAPTER 4) 166
INFORMATION TO PARTICIPANTS INVOLVED IN RESEARCH You are invited to participate You are invited to participate in a research project entitled “Characteristics of stroke heaviness in professional tennis”. This project is being conducted by a student researcher, Olivia Cant, as part of a PhD study at Victoria University under the supervision of Dr Damian Farrow from the Institute for Health & Sport. Project explanation
Professional tennis players rely heavily on tactics to gain an advantage during matches. One common tactic is to manipulate stroke heaviness, the colloquial term used to refer to a shot’s combination of ball speed and spin, with a heavy stroke characterised by high speed and/or spin. While stroke heaviness is commonly referred to by coaches, players and commentators the concept has not been empirically examined. Therefore, there is limited insight into the stroke characteristics and outcomes which lead to players perceiving a stroke as ‘heavy’. This study aims to identify the key characteristics of stroke heaviness as perceived by tennis experts. What will I be asked to do? You will be asked to complete one online survey which will take approximately 15 - 20 minutes. The survey will ask a series of questions on what you believe the key characteristics and outcomes of ‘heavy’ strokes to be. What will I gain from participating? You will not be reimbursed for your time spent completing this survey. Information gained from this study will add to the currently limited insight into stroke heaviness in tennis, which may include the outcomes and benefits of ‘heavy’ ball striking during matches. This information could be used by players and coaches to guide and implement tactics during matchplay. How will the information I give be used? Survey responses from all participants will be aggregated and used to identify the characteristics and outcomes of ‘heavy’ 1st serves, 2nd serves and groundstrokes. This research, including results, may be reported in future publications and conference
APPENDIX A: INFORMATION TO PARTICIPANTS (CHAPTER 4) 167
presentations. Findings from this research will add to the currently limited insight on stroke heaviness. Additionally, findings may help future research identify ‘heavy’ strokes and investigate the effects of stroke heaviness on aspects of the game such as on-court performance. What are the potential risks of participating in this project? We do not anticipate there to be any physical risks associated with this project. There is a risk that you may feel pressure to participate in this research by another player or coach, however, you are reminded that participation in this project is completely voluntary and you should not feel pressured to participate. You may worry about answers you provide on the survey and how these will be perceived, however, this survey is asking for your perception of stroke heaviness and therefore there are no wrong answers. If you are concerned or uncomfortable with completing this survey, please remember that you may withdraw from this study at any time without any consequences. How will this project be conducted?
Once a signed consent form has been received, you will be provided with the survey via email to be completed online. Who is conducting the study?
This is study being conducted by Victoria University and Tennis Australia.
Dr. Damian Farrow Sport Scientist at Victoria University Victoria University – Institute for Health & Sport E. [email protected], Ph: (+61) 408 445 701 Olivia Cant, BEx&SpSc (Hons) PhD Student at the Victoria University - Institute for Health & Sport E: [email protected], Ph: (+61) 422 050 234 Any queries about your participation in this project may be directed to the Chief Investigator listed above. If you have any queries or complaints about the way you have been treated, you may contact the Ethics Secretary, Victoria University Human Research Ethics Committee, Office for Research, Victoria University, PO Box 14428, Melbourne, VIC, 8001, email [email protected] or phone (03) 9919 4781 or 4461.

APPENDIX B: PARTICIPANT CONSENT FORM (CHAPTER 4) 168
APPENDIX B – PARTICIPANT CONSENT FORM (CHAPTER 4)
APPENDIX B: PARTICIPANT CONSENT FORM (CHAPTER 4) 169
CONSENT FORM FOR PARTICIPANTS INVOLVED IN RESEARCH INFORMATION TO PARTICIPANTS: We would like to invite you to be a part of a study titled “Characteristics of stroke heaviness in professional tennis”. The project aims to identify the key characteristics of stroke heaviness as perceived by tennis experts. This project will require you to complete one online survey which will take approximately 15 - 20 minutes. In an effort to better understand the concept of stroke heaviness, the survey will involve you answering a series of questions on what you perceive the characteristics and outcome of a ‘heavy’ stroke to be. The survey will look at the heaviness of groundstrokes, 1st serves and 2nd serves separately. CERTIFICATION BY SUBJECT: I, (participant’s name) of (participant’s suburb) certify that I am at least 18 years old and that I am voluntarily giving my consent to participate in the study: “Characteristics of stroke heaviness in professional tennis” being conducted at Victoria University and Tennis Australia by Damian Farrow. I certify that the objectives of the study, together with any risks and safeguards associated with the procedures listed hereunder to be carried out in the research, have been fully explained to me by Olivia Cant and that I freely consent to participation involving the below mentioned procedures:
• Complete one online survey which will take approximately 15 – 20 minutes: o Answer a series of questions on the characteristics and outcomes of ‘heavy’
groundstrokes, 1st serves and 2nd serves.
I certify that I have had the opportunity to have any questions answered and that I understand that I can withdraw from this study at any time and that this withdrawal will not jeopardise me in any way. I have been informed that the information I provide will be kept confidential. Signed: Date:
APPENDIX B: PARTICIPANT CONSENT FORM (CHAPTER 4) 170
Any queries about your participation in this project may be directed to the researcher Dr. Damian Farrow Sport Scientist at Victoria University Victoria University – Institute for Health & Sport E. [email protected], Ph: (+61) 408 445 701
Dr Machar Reid Sport Scientist at Tennis Australia E: [email protected], Ph: (+61) 401 077 441 Olivia Cant, BEx&SpSc (Hons) PhD Student at the Victoria University - Institute for Health & Sport E: [email protected], Ph: (+61) 422 050 234 If you have any queries or complaints about the way you have been treated, you may contact the Ethics Secretary, Victoria University Human Research Ethics Committee, Office for Research, Victoria University, PO Box 14428, Melbourne, VIC, 8001, email [email protected] or phone (03) 9919 4781 or 4461.

APPENDIX C: ADDITIONAL FIGURES (CHAPTER 4) 171
APPENDIX C – ADDITIONAL FIGURES (CHAPTER 4)
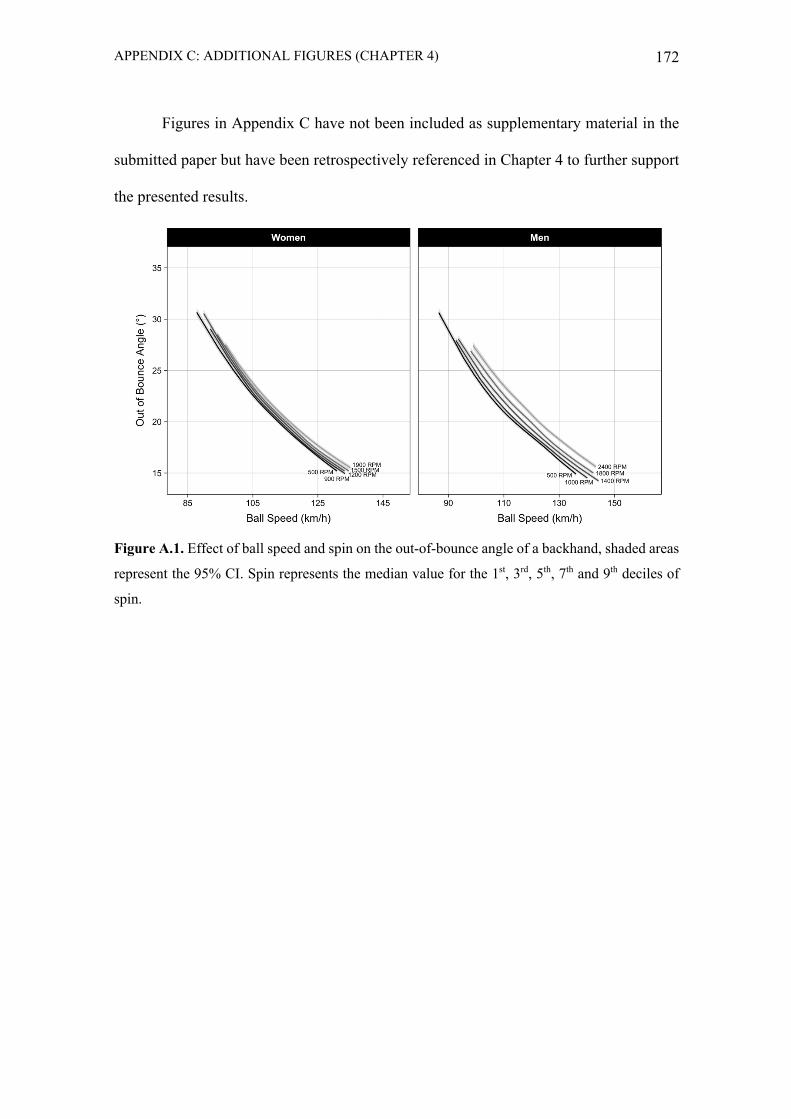
APPENDIX C: ADDITIONAL FIGURES (CHAPTER 4) 172
Figures in Appendix C have not been included as supplementary material in the
submitted paper but have been retrospectively referenced in Chapter 4 to further support
the presented results.
Figure A.1. Effect of ball speed and spin on the out-of-bounce angle of a backhand, shaded areas
represent the 95% CI. Spin represents the median value for the 1st, 3rd, 5th, 7th and 9th deciles of
spin.
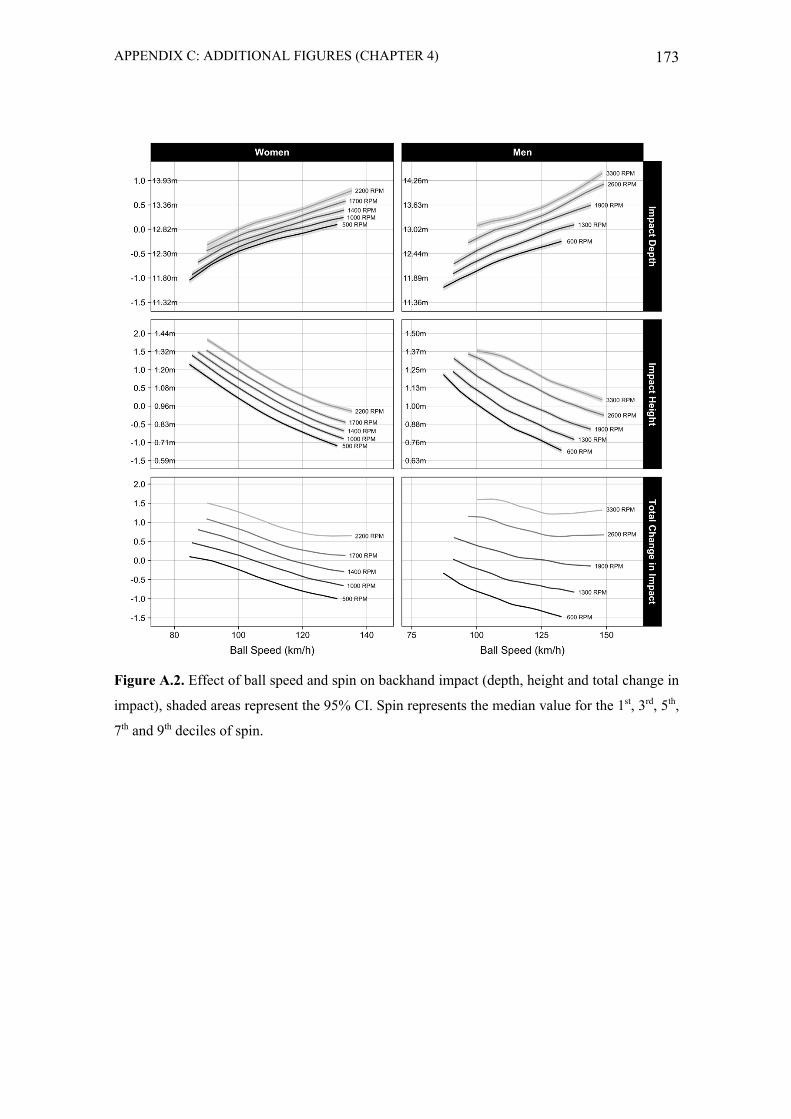
APPENDIX C: ADDITIONAL FIGURES (CHAPTER 4) 173
Figure A.2. Effect of ball speed and spin on backhand impact (depth, height and total change in
impact), shaded areas represent the 95% CI. Spin represents the median value for the 1st, 3rd, 5th,
7th and 9th deciles of spin.

APPENDIX D: ADDITIONAL FIGURES (CHAPTER 5) 174
APPENDIX D – ADDITIONAL FIGURES (CHAPTER 5)
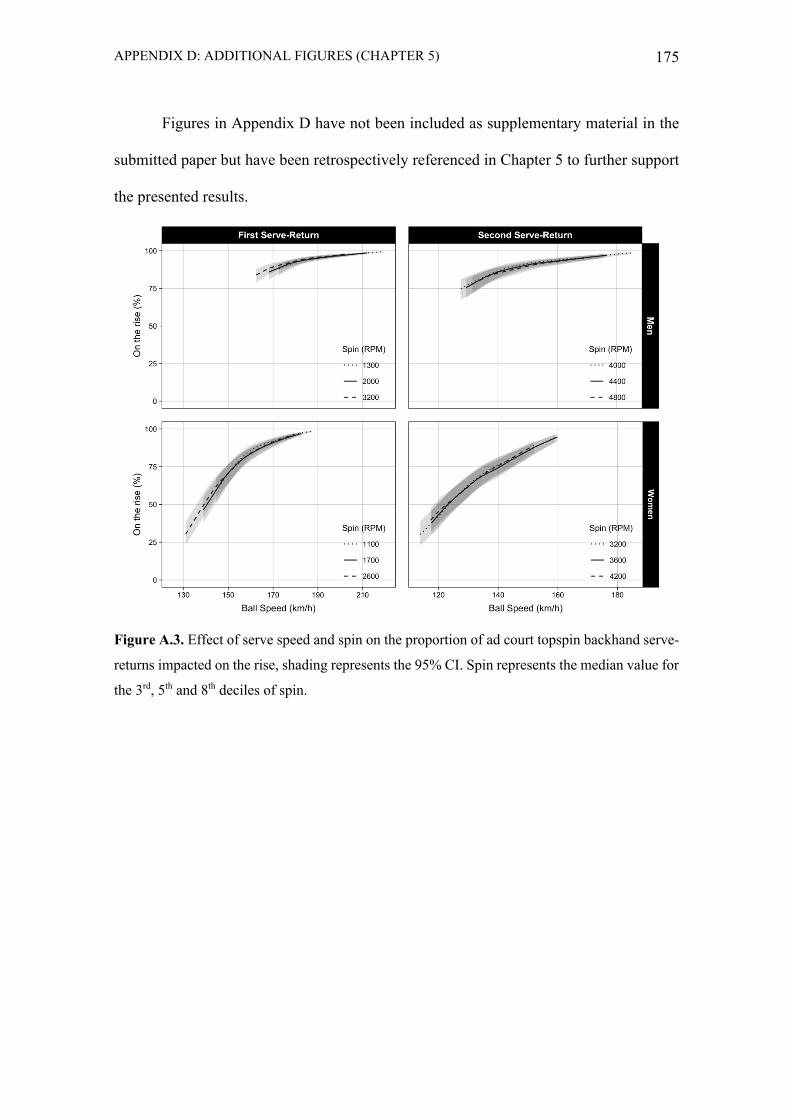
APPENDIX D: ADDITIONAL FIGURES (CHAPTER 5) 175
Figures in Appendix D have not been included as supplementary material in the
submitted paper but have been retrospectively referenced in Chapter 5 to further support
the presented results.
Figure A.3. Effect of serve speed and spin on the proportion of ad court topspin backhand serve-
returns impacted on the rise, shading represents the 95% CI. Spin represents the median value for
the 3rd, 5th and 8th deciles of spin.
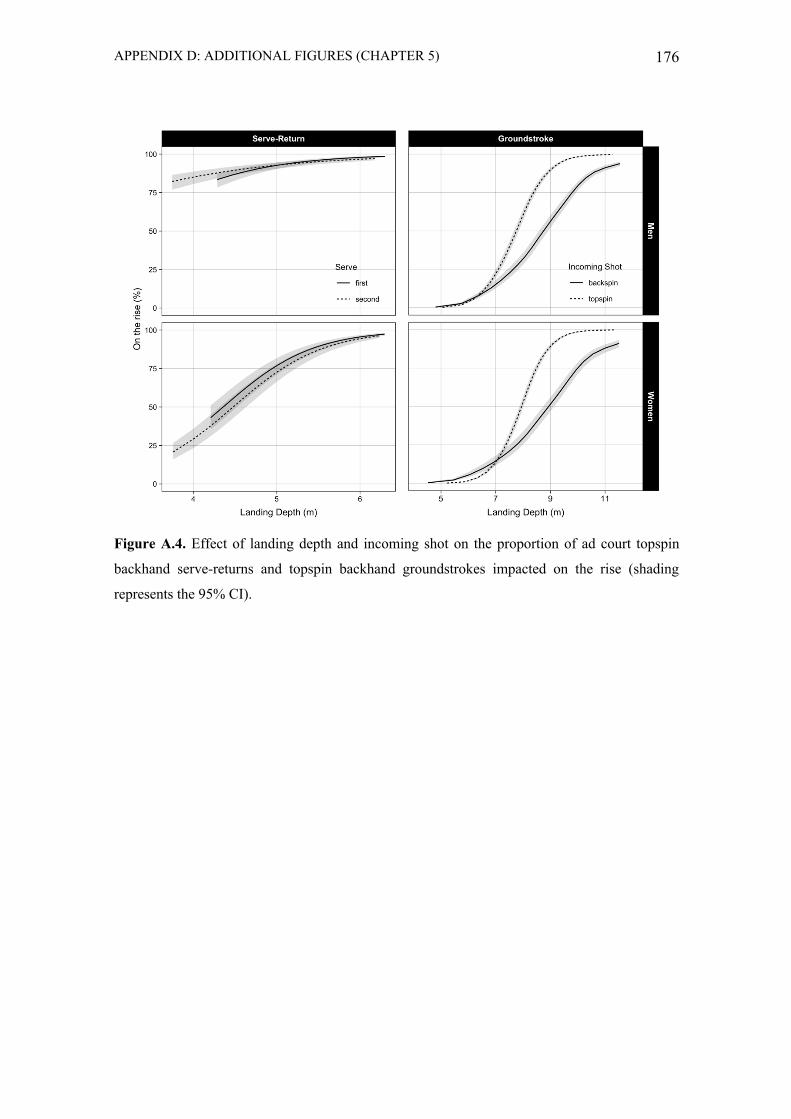
APPENDIX D: ADDITIONAL FIGURES (CHAPTER 5) 176
Figure A.4. Effect of landing depth and incoming shot on the proportion of ad court topspin
backhand serve-returns and topspin backhand groundstrokes impacted on the rise (shading
represents the 95% CI).
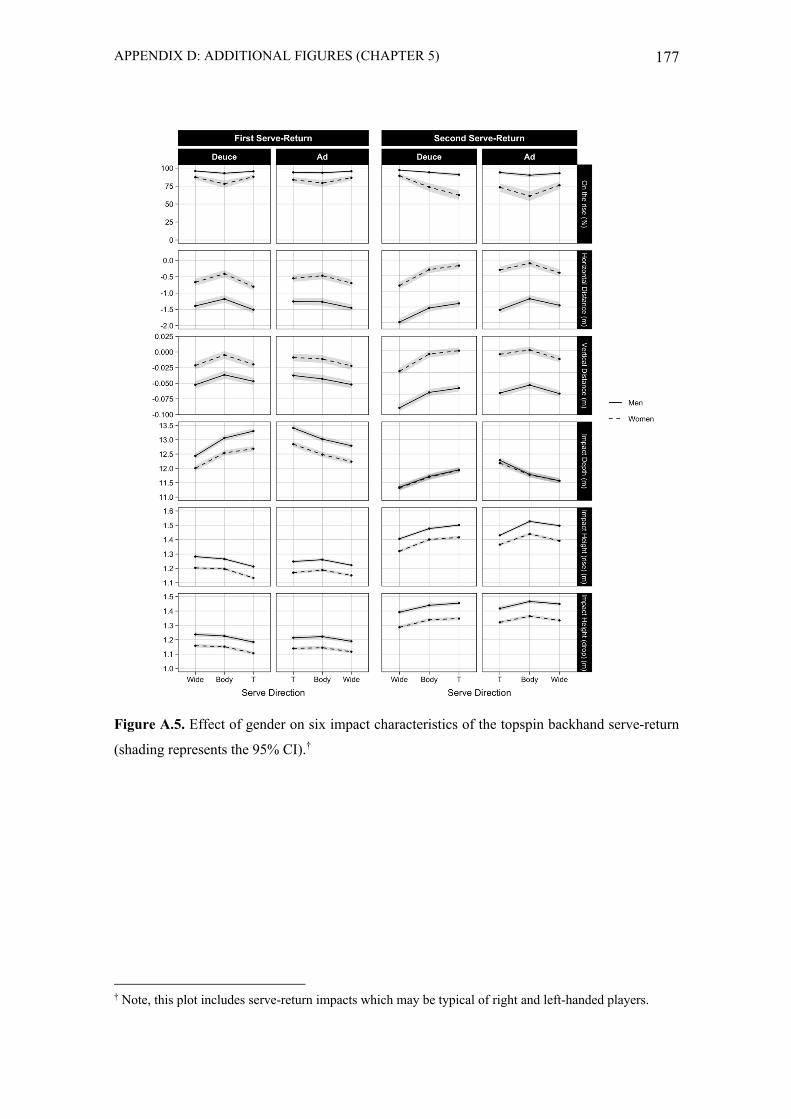
APPENDIX D: ADDITIONAL FIGURES (CHAPTER 5) 177
Figure A.5. Effect of gender on six impact characteristics of the topspin backhand serve-return
(shading represents the 95% CI).†
† Note, this plot includes serve-return impacts which may be typical of right and left-handed players.

APPENDIX E: ADDITIONAL FIGURES AND TABLE (CHAPTER 6) 178
APPENDIX E – ADDITIONAL FIGURES AND TABLE (CHAPTER 6)
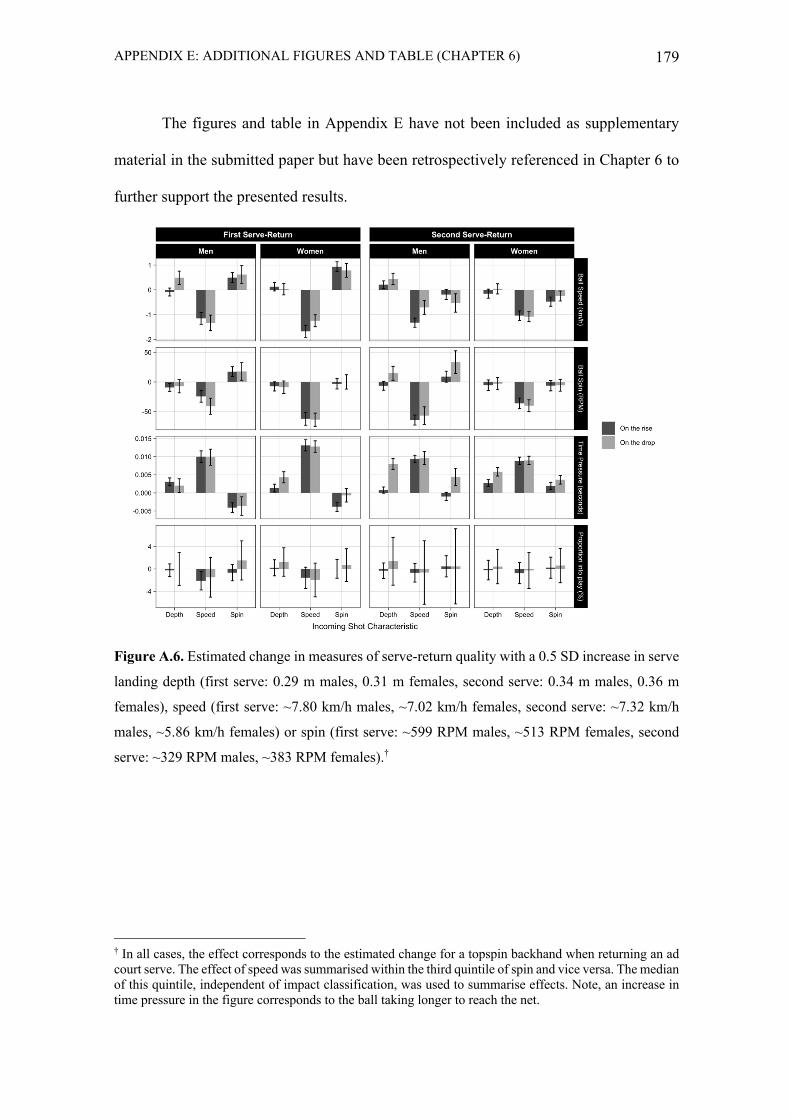
APPENDIX E: ADDITIONAL FIGURES AND TABLE (CHAPTER 6) 179
The figures and table in Appendix E have not been included as supplementary
material in the submitted paper but have been retrospectively referenced in Chapter 6 to
further support the presented results.
Figure A.6. Estimated change in measures of serve-return quality with a 0.5 SD increase in serve
landing depth (first serve: 0.29 m males, 0.31 m females, second serve: 0.34 m males, 0.36 m
females), speed (first serve: ~7.80 km/h males, ~7.02 km/h females, second serve: ~7.32 km/h
males, ~5.86 km/h females) or spin (first serve: ~599 RPM males, ~513 RPM females, second
serve: ~329 RPM males, ~383 RPM females).†
† In all cases, the effect corresponds to the estimated change for a topspin backhand when returning an ad court serve. The effect of speed was summarised within the third quintile of spin and vice versa. The median of this quintile, independent of impact classification, was used to summarise effects. Note, an increase in time pressure in the figure corresponds to the ball taking longer to reach the net.
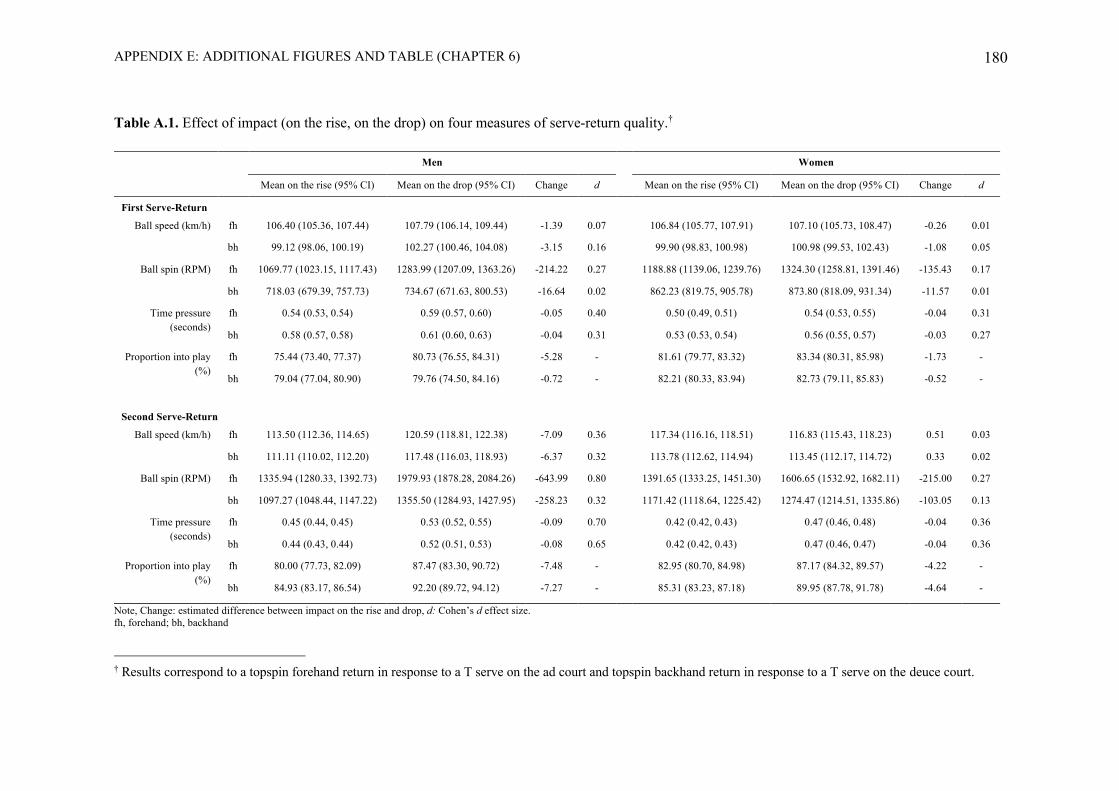
APPENDIX E: ADDITIONAL FIGURES AND TABLE (CHAPTER 6) 180
Table A.1. Effect of impact (on the rise, on the drop) on four measures of serve-return quality.†
Note, Change: estimated difference between impact on the rise and drop, d: Cohen’s d effect size. fh, forehand; bh, backhand
† Results correspond to a topspin forehand return in response to a T serve on the ad court and topspin backhand return in response to a T serve on the deuce court.
Men Women
Mean on the rise (95% CI) Mean on the drop (95% CI) Change d Mean on the rise (95% CI) Mean on the drop (95% CI) Change d
First Serve-Return
Ball speed (km/h) fh 106.40 (105.36, 107.44) 107.79 (106.14, 109.44) -1.39 0.07 106.84 (105.77, 107.91) 107.10 (105.73, 108.47) -0.26 0.01
bh 99.12 (98.06, 100.19) 102.27 (100.46, 104.08) -3.15 0.16 99.90 (98.83, 100.98) 100.98 (99.53, 102.43) -1.08 0.05
Ball spin (RPM) fh 1069.77 (1023.15, 1117.43) 1283.99 (1207.09, 1363.26) -214.22 0.27 1188.88 (1139.06, 1239.76) 1324.30 (1258.81, 1391.46) -135.43 0.17
bh 718.03 (679.39, 757.73) 734.67 (671.63, 800.53) -16.64 0.02 862.23 (819.75, 905.78) 873.80 (818.09, 931.34) -11.57 0.01
Time pressure (seconds)
fh 0.54 (0.53, 0.54) 0.59 (0.57, 0.60) -0.05 0.40 0.50 (0.49, 0.51) 0.54 (0.53, 0.55) -0.04 0.31
bh 0.58 (0.57, 0.58) 0.61 (0.60, 0.63) -0.04 0.31 0.53 (0.53, 0.54) 0.56 (0.55, 0.57) -0.03 0.27
Proportion into play (%)
fh 75.44 (73.40, 77.37) 80.73 (76.55, 84.31) -5.28 - 81.61 (79.77, 83.32) 83.34 (80.31, 85.98) -1.73 -
bh 79.04 (77.04, 80.90) 79.76 (74.50, 84.16) -0.72 - 82.21 (80.33, 83.94) 82.73 (79.11, 85.83) -0.52 -
Second Serve-Return
Ball speed (km/h) fh 113.50 (112.36, 114.65) 120.59 (118.81, 122.38) -7.09 0.36 117.34 (116.16, 118.51) 116.83 (115.43, 118.23) 0.51 0.03
bh 111.11 (110.02, 112.20) 117.48 (116.03, 118.93) -6.37 0.32 113.78 (112.62, 114.94) 113.45 (112.17, 114.72) 0.33 0.02
Ball spin (RPM) fh 1335.94 (1280.33, 1392.73) 1979.93 (1878.28, 2084.26) -643.99 0.80 1391.65 (1333.25, 1451.30) 1606.65 (1532.92, 1682.11) -215.00 0.27
bh 1097.27 (1048.44, 1147.22) 1355.50 (1284.93, 1427.95) -258.23 0.32 1171.42 (1118.64, 1225.42) 1274.47 (1214.51, 1335.86) -103.05 0.13
Time pressure (seconds)
fh 0.45 (0.44, 0.45) 0.53 (0.52, 0.55) -0.09 0.70 0.42 (0.42, 0.43) 0.47 (0.46, 0.48) -0.04 0.36
bh 0.44 (0.43, 0.44) 0.52 (0.51, 0.53) -0.08 0.65 0.42 (0.42, 0.43) 0.47 (0.46, 0.47) -0.04 0.36
Proportion into play (%)
fh 80.00 (77.73, 82.09) 87.47 (83.30, 90.72) -7.48 - 82.95 (80.70, 84.98) 87.17 (84.32, 89.57) -4.22 -
bh 84.93 (83.17, 86.54) 92.20 (89.72, 94.12) -7.27 - 85.31 (83.23, 87.18) 89.95 (87.78, 91.78) -4.64 -
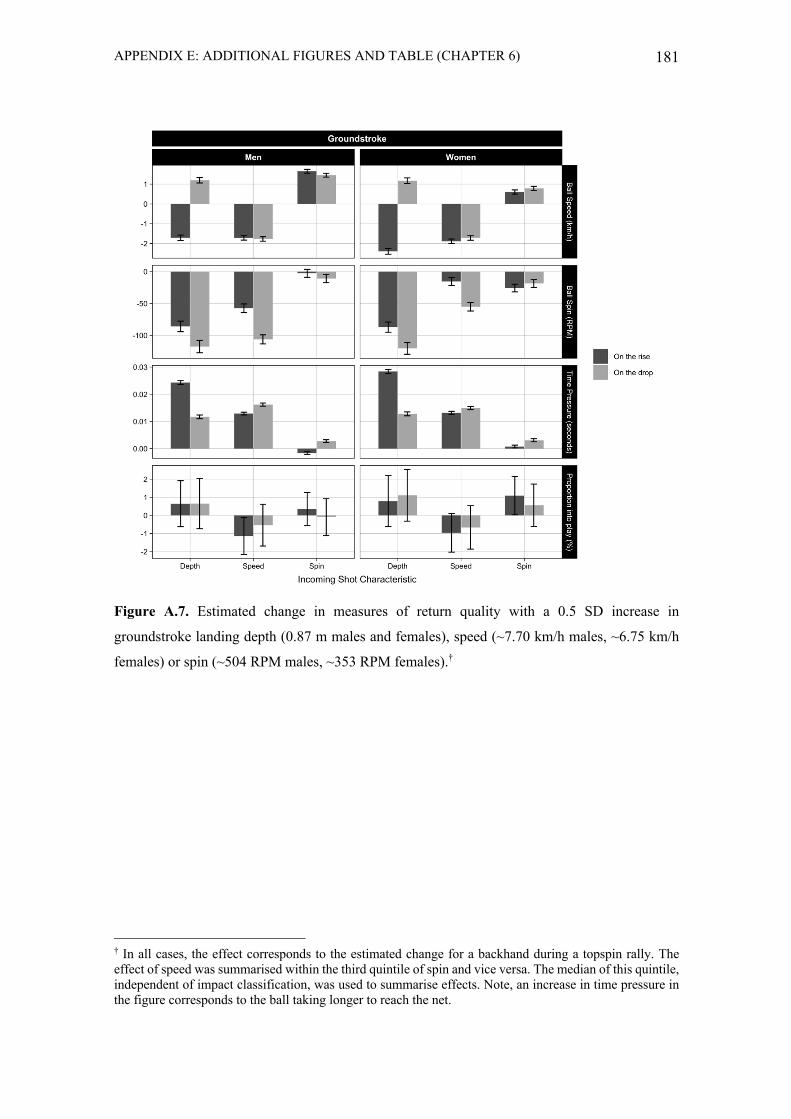
APPENDIX E: ADDITIONAL FIGURES AND TABLE (CHAPTER 6) 181
Figure A.7. Estimated change in measures of return quality with a 0.5 SD increase in
groundstroke landing depth (0.87 m males and females), speed (~7.70 km/h males, ~6.75 km/h
females) or spin (~504 RPM males, ~353 RPM females).†
† In all cases, the effect corresponds to the estimated change for a backhand during a topspin rally. The effect of speed was summarised within the third quintile of spin and vice versa. The median of this quintile, independent of impact classification, was used to summarise effects. Note, an increase in time pressure in the figure corresponds to the ball taking longer to reach the net.