Exploring the Association Between a Novel Index of Volume of ...
178
Exploring the Association Between a Novel Index of Volume of Exercise Performed and Health Outcomes Vincenzo Lauriola Submitted in partial fulfillment of the requirements for the degree of Doctor of Philosophy under the Executive Committee of the Graduate School of Arts and Sciences COLUMBIA UNIVERSITY 2021
-
Upload
khangminh22 -
Category
Documents
-
view
1 -
download
0
Transcript of Exploring the Association Between a Novel Index of Volume of ...
Exploring the Association Between a Novel Index of Volume
of Exercise Performed and Health Outcomes
Vincenzo Lauriola
Submitted in partial fulfillment of the requirements for the degree of
Doctor of Philosophy under the Executive Committee
of the Graduate School of Arts and Sciences
COLUMBIA UNIVERSITY
2021

© 2021
Vincenzo Lauriola
All Rights Reserved
Abstract
Exploring the Association Between a Novel Index of Volume
of Exercise Performed and Health Outcomes
Vincenzo Lauriola
The association between increased participation in physical activity (PA) and improvements in
health is so well established that the promotion of regular participation in PA is a key public health
priority. However, much remains to be explored about the dose-response relationship between PA
and the many health benefits. To address this issue, there is a need to accurately measure PA across
all population sub-groups. Finding a valid, reliable and sensitive measure of PA is essential for
improving our understanding of PA-related disorders, for more clearly defining the dose-response
relationship between the volume, intensity and pattern of PA and the associated health benefits,
and to examine the effectiveness of interventions and public health initiatives.
We conducted three exercise studies aimed at examining the associations between a novel index
of exercise volume and selected physiological and psychological outcomes. The first and second
studies were secondary analyses of studies in which the validity of this index was assessed in two
different exercise interventions: 12-weeks of moderate-intensity aerobic exercise and a 6-week
high intensity interval training intervention. The third study was a prospective randomized
controlled trial testing the feasibility and practicality of this index as applied to a specific
population in an at-home exercise intervention.
Taken as a whole, the results from the three studies indicate that the novel method of measuring
exercise volume is promising for tracking some of the biological and psychological benefits that
are associated with exercise. In these studies, this novel index of exercise volume was significantly
associated with specific markers of biological adaptation to exercise training that are clinically
meaningful. Further research is needed to replicate these findings in larger, diverse samples, and
to broaden our understanding of how applications of this novel index can expand our ability to
illuminate mechanisms whereby exercise might improve physical and mental health in research
and in practice.
i
Table of Contents
List of Charts, Graphs, Illustrations ............................................................................................... iii
Acknowledgments.......................................................................................................................... vi
Dedication ..................................................................................................................................... vii
Chapter 1: Introduction ................................................................................................................... 1
1.1 Significance........................................................................................................................... 3
1.2 Overview ............................................................................................................................... 5
1.3 Dissertation Structure ............................................................................................................ 7
Chapter 2: Health Benefits of Exercise: Is Performance What Really Matters? ............................ 8
Abstract ....................................................................................................................................... 8
2.1 Introduction ........................................................................................................................... 9
2.2 Methods............................................................................................................................... 13
2.3 Results ................................................................................................................................. 22
2.4 Discussion ........................................................................................................................... 26
2.5 Conclusion .......................................................................................................................... 33
Chapter 3: High Intensity Interval Training Is Associated With Decreased Negative Affect In
Individuals With Anxiety Disorders ............................................................................................. 34
Abstract ..................................................................................................................................... 34
3.1 Introduction ......................................................................................................................... 36
3.2 Methods............................................................................................................................... 39
3.3 Results ................................................................................................................................. 45
ii
3.4 Discussion ........................................................................................................................... 47
3.5 Conclusion .......................................................................................................................... 51
Chapter 4: Home-Based Exercise Training When You Can’t Leave the House: Promoting Physical
Activity in Postpartum Women .................................................................................................... 53
Abstract ..................................................................................................................................... 53
4.1 Introduction ......................................................................................................................... 56
4.1 Methods............................................................................................................................... 63
4.1 Results ................................................................................................................................. 78
4.1 Discussion ........................................................................................................................... 97
4.1 Conclusion ........................................................................................................................ 108
Chapter 5: Conclusion................................................................................................................. 110
Bibliography ............................................................................................................................... 113
Appendix A ................................................................................................................................. 125
Appendix B ................................................................................................................................. 129
Appendix C ................................................................................................................................. 132
iii
List of Charts, Graphs, Illustrations
Chapter 2:
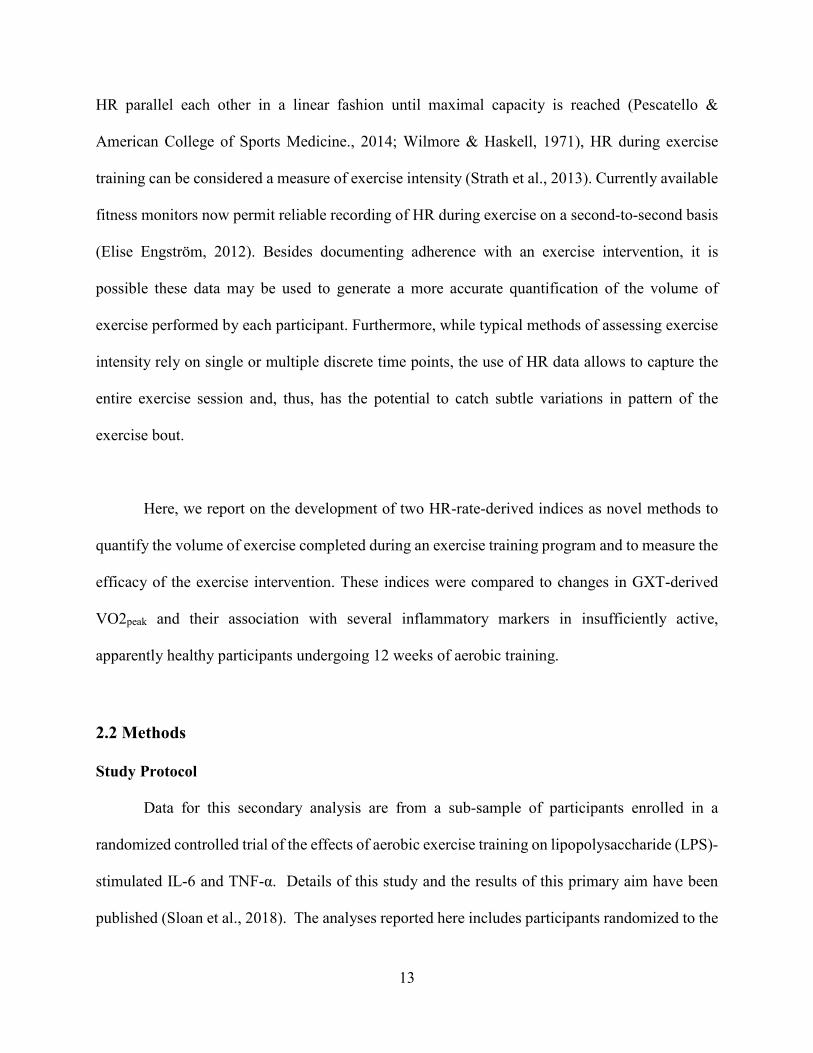
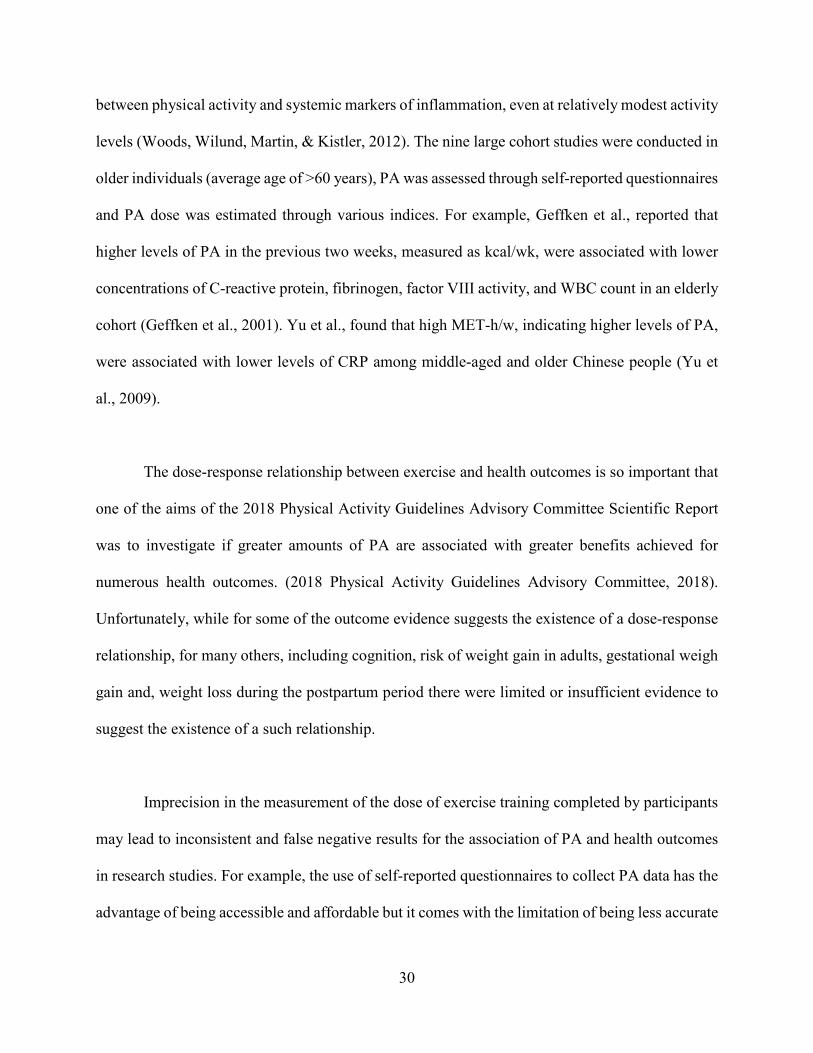
Figure 1 Example of the HR recorded during a single exercise session. Changes in HR of more
than 10 beats per minute between adjacent 1-second intervals are marked in green, and identical
HRs for 10 or more seconds are marked in red. The linear interpolation was drawn between the
last valid HR before the beginning of the artifact and the first valid HR after the end of the artifact.
The black horizontal line represents the target HR. ...................................................................... 19
Figure 2 Graphical representation of an exercise session, with AUC in grey. The black horizontal
line represents the resting HR. ................................................................................................... 129
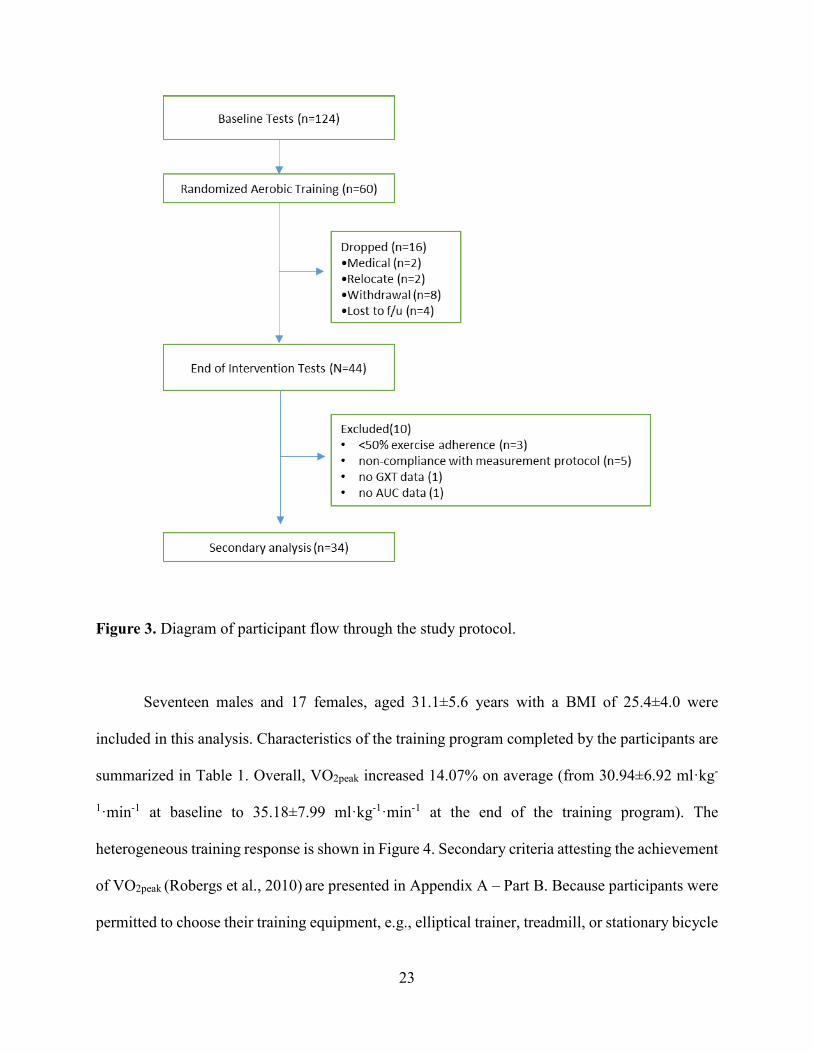
Figure 3 Diagram of participant flow through the study protocol. ............................................ 129
Table 1 Characteristics of the training program. ........................................................................ 129
Figure 4 Individual difference (delta) in increase in VO2peak with training for the 34 participants
of the study. ................................................................................................................................. 129
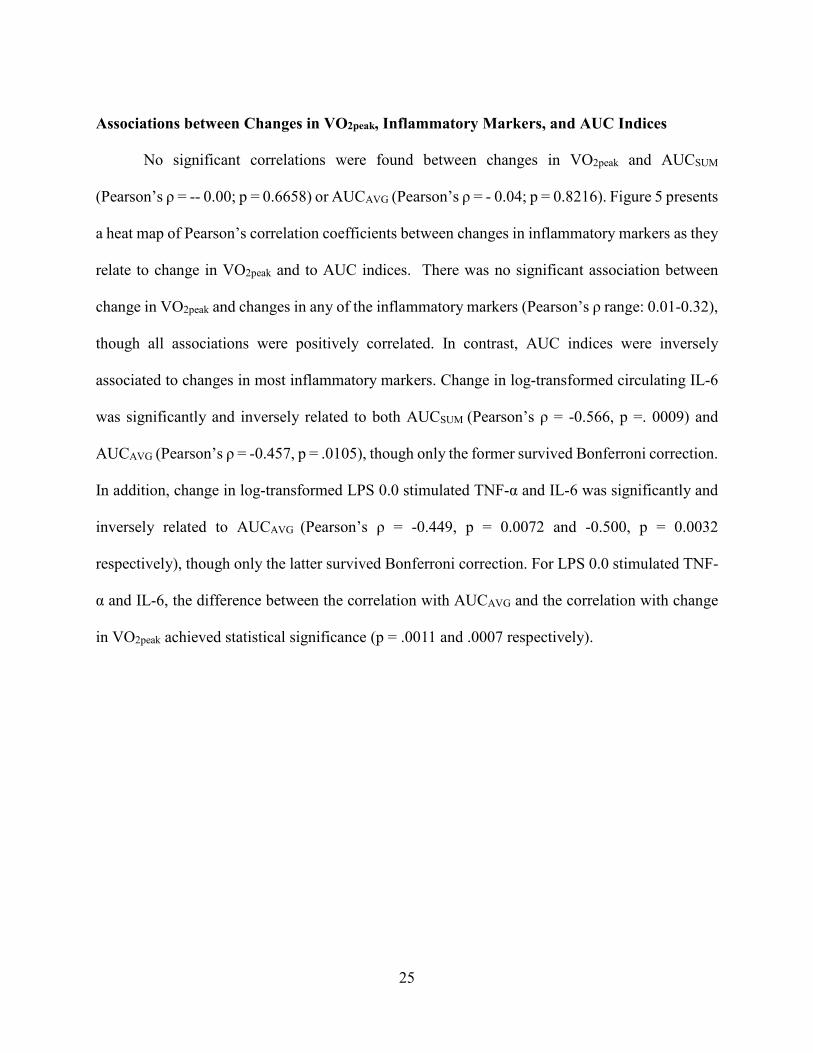
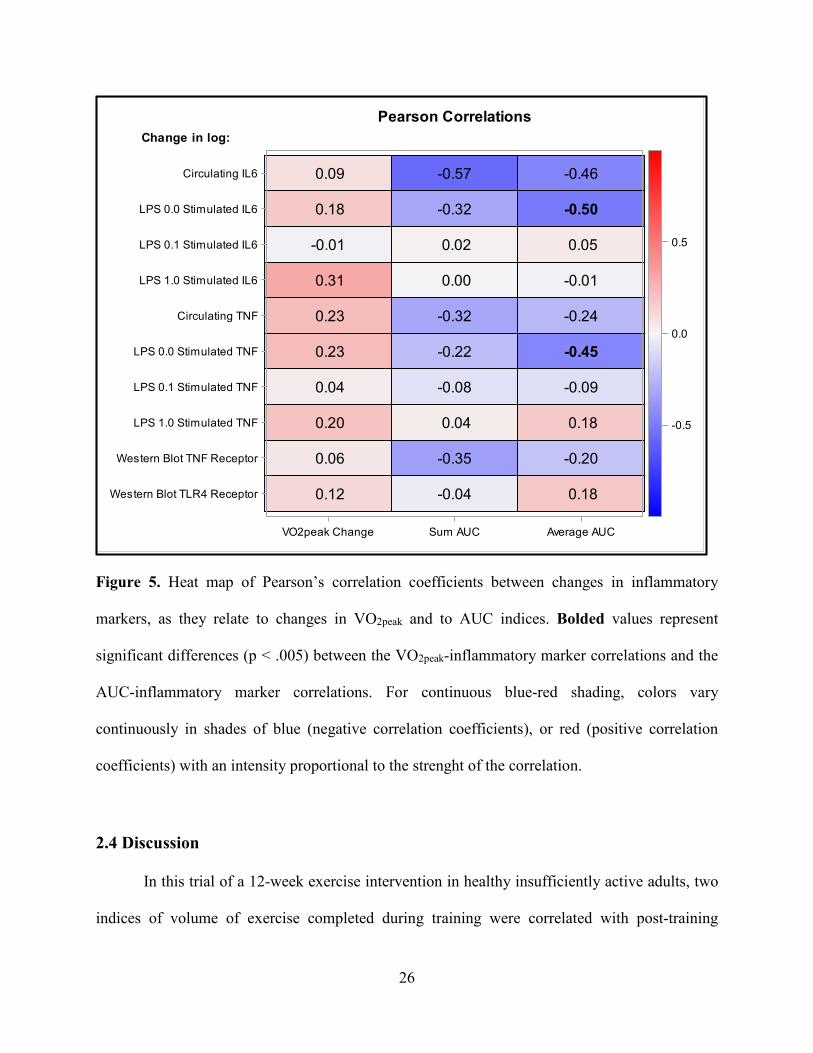
Figure 5 Heat map of Pearson’s correlation coefficients between changes in inflammatory
markers, as they relate to changes in VO2peak and to AUC indices. Bolded values represent
significant differences (p < .005) between the VO2peak-inflammatory marker correlations and the
AUC-inflammatory marker correlations. For continuous blue-red shading, colors vary
continuously in shades of blue (negative correlation coefficients), or red (positive correlation
coefficients) with an intensity proportional to the strength of the correlation. ............................. 26
Chapter 3:
Figure 1 Graphical representation of an exercise session. The AUC is represented by the area
contained within the black outline. The black horizontal line represents the resting HR. ........... 44
iv
Table 1 Mean scores for each psychological measure at study entry (week 0), after the first three
weeks of the training intervention (week 3) and at the end of the training intervention
(week 6). ....................................................................................................................................... 46
Table 2 Spearman correlations and corresponding p-value are based on 11 participants with AUC
and clinical data. ........................................................................................................................... 47
Chapter 4:
Figure 1 Consort Diagram of the study ........................................................................................ 78
Table 1 Participants’ data adherence to the exercise intervention. The total number of exercise
sessions and the total number of HIIT intervals completed by each participant are presented in the
second and third column. Adherence with the exercise intervention (calculated as percentage of
the total number of sessions completed) and with the HIIT (calculated as percentage of the total
number of high intensity intervals successfully completed) are presented in the last
two columns .................................................................................................................................. 79
Figure 2 Graphical representation of the weekly number of exercise sessions completed by the
participants randomized to the exercise group. For one participant (82011) the length of the
exercise intervention was extended of one week. Squares with diagonal lines indicate that the
participant returned to work. Squares with crossed lines indicate that the participant did not
complete any exercise session during that week........................................................................... 80
Figure 3 Example of an exercise session uploaded on the Polar Flow website. In yellow are the
20 seconds of high intensity and in green the 40 second of low intensity. ................................... 81
Table 2 Observed descriptive summaries of the exercise tests. Median and interquartile
range (IQR). .................................................................................................................................. 82
v
Figure 4 Boxplot with median and IQR of the change score values of the exercise tests
outcomes. ...................................................................................................................................... 82
Table 3 Baseline and post-intervention values fot the anthropometry and blood pressure
measurements. ............................................................................................................................... 84
Figure 5 Boxplot with median and IQR of the change score values of the anthropometry and blood
pressure measurements. ................................................................................................................ 84
Table 4 Baseline and post-intervention HR and HRV time and frequency domains data. SDRR=
Standard deviation of the RR interval; rMSSD= root mean squared successive difference; LF=
spectral power in the low frequency band; HF= spectral power in the high frequency band....... 85
Figure 6 Boxplot with median and IQR of the change score values of the data collected during the
24 hours free living conditions (A) and the 20 min supine condition (B). .............................. 86/87
Table 5 Baseline and post-intervention inflammatory markers data. ........................................... 88
Figure 7 Boxplot with median and IQR of the change score values of each inflammatory
biomarker: IL-1β (A), IL-6 (B), TNF-α (C), CRP (D) and HMGB1 (E). ............................... 89-91
Table 6 Baseline and post-intervention scores on the five mood questionnaires......................... 92
Figure 8 Boxplot with median and IQR of the change score values of the mood outcomes total
score (A) and the subscales of the BDI-II and CES-D (B).. ......................................................... 93
Table 7 Spearman's correlations between the mood outcomes and the caregiver burden at both
baseline and post-intervention. ..................................................................................................... 95
Table 8 Baseline and post-intervention scores on the two exercise readiness questionnaires. .... 95
Figure 9 Boxplot with median and IQR of the change score values of the exercise readiness
outcomes. ...................................................................................................................................... 96

vi
Acknowledgments
I would like to extend my sincere gratitude to each of my committee members, mentors and
colleagues for their guidance and support throughout my dissertation journey. My deepest
appreciation goes out to my doctoral advisors, Dr. Carol Ewing Garber and Dr. Richard Sloan, for
their invaluable expertise, constructive feedback, and countless hours of mentoring in the
development of my research topics and content. I would also like to thank them for their
meaningful companionship and support while navigating the dissertation process.
I am also grateful to Dr. Catherine Monk, Dr. John Allegrante, and Dr. Yaakov Stern for their time
and thoughtful feedback to improve my dissertation content. I would like to extend my sincere
thanks to Kathleen McIntyre for her unparalleled support and friendship.
I would also like to acknowledge the funding and support from The Nathaniel Wharton Fund
without which much of my research advancement and contributions to the field would not be
possible.
Finally, nobody has been more important to me in the pursuit of this project than the members of
my family. I would like to thank my parents, whose love and guidance are with me in whatever I
pursue. They are the ultimate role models. Most importantly, I wish to thank my loving and
supportive wife, Chiara, and my two wonderful children, Arianna and Isabella, who gave me joy
and happiness also in the most difficult moments.

vii
Dedication
I would like to dedicate this dissertation to my loving mom and dad.

1
Chapter 1: Introduction
Physical inactivity is a global public health problem. It has been estimated that worldwide
between 3 and 5 million deaths annually can be attributed to insufficient physical activity (PA)
(World Health Organization [@WHO], 2019). Furthermore, the median global burden of
premature mortality averted by PA is 15%, conservatively equating to 3.9 million deaths annually
(Strain et al., 2020). In 2016, the prevalence of insufficient PA in the United States was 72.1% in
adolescents ages 11-17 years and 42.5% among adults ages 18+ years (World Health Organization,
2016). According to Centers for Disease Control and Prevention data, in 2017 only 1 in 4 adults
and 1 in 5 adolescents met PA guidelines for aerobic and muscle-strengthening activities (U.S.
Department of Health and Human Services, 2018).
Physical activity can be defined as “any bodily movement produced by skeletal muscles
that results in caloric expenditure” and exercise is a component of leisure time physical activity
defined as “planned, structured and repetitive bodily movements performed to improve or maintain
one or more components of physical fitness” ((Caspersen, Powell, & Christenson, 1985) p. 126
and p. 128). Both physical activity and exercise are directly associated with health benefits with
an evidence base so strong that consensus panels routinely recommend them as part of a healthy
lifestyle (D. E. R. Warburton & Bredin, 2016; D. E. R. Warburton, Bredin, Jamnik, Shephard, &
Gledhill, 2016). A physically active lifestyle is so important that a leading health indicator in the
Healthy People 2030 is to “increase the proportion of adults who meet the current minimum
aerobic physical activity guideline needed for substantial health benefits”(Office of Disease
Prevention and Health Promotion, 2021) and to “increase and support outdoor physical activity”
is one of the 2030 American Heart Association impact goals (Angell et al., 2020). Regular PA

2
plays a key role in weight management and in the reduction of health risks such as cardiovascular
disease, type 2 diabetes, metabolic syndrome and even some cancers (bladder, breast, colon,
endometrium, esophagus, kidney, lung and stomach). Furthermore, PA has also been shown to be
positively associated with mental health (Tamminen, Kettunen, Martelin, Reinikainen, & Solin,
2019). Lastly, the increase in bone and muscle strength leads to an improvement in the ability to
engage in daily activities and it prevents falls that untimely results in an decrease of the lifespan
(Centers for Disease Control and Prevention, 2021). Physical activity exerts its benefits along the
whole lifespan and health spectrum, from childhood to older age and from healthy to chronic
disease.
Unfortunately, the specific amount of PA necessary to obtain such health benefits it is still
not yet clear. Current public health guidelines recommend a threshold amount of PA by which
health benefits are thought to be achieved by most people, although it is recognized that less that
these PA targets can yield health benefits. For example, the Physical Activity Guidelines for
Americans, 2nd edition, recommend 500 to 1000 Metabolic Equivalent of Task (MET)-minutes of
moderate-to-vigorous PA (or 150 to 300 minutes per week of moderate-intensity PA) (U.S.
Department of Health and Human Services, 2018).
Different systematic reviews and scientific statements have shown that the dose–response
relationships and minimal dosages vary across differing target populations and health outcomes.
For example, the 2019 Canadian Guideline for Physical Activity throughout Pregnancy strongly
recommended, with moderate-quality evidence, that pregnant women should accumulate at least
150 min of moderate-intensity physical activity a week to achieve clinically meaningful reductions
3
in pregnancy complications (Davies, Wolfe, Mottola, & MacKinnon, 2018). Systematic reviews
and meta-analysis performed by the same research group that put together these guidelines show
the existence of a dose-response relationship between an increasing amount of exercise and
improved pregnancy outcomes. As such, the minimum MET-min/week necessary to achieve a
25% reduction in the odds of developing an outcome varies depending on the outcome, with 260
MET-min/week for preeclampsia, 591 MET-min/week for gestational diabetes mellitus, 401
MET-min/week for gestational hypertension (Davenport, Ruchat, et al., 2018) and 456 MET-
min/week for excessive gestational weight gain (Ruchat et al., 2018). Similar results have been
shown by multiple systematic reviews that evaluated the role of physical activity on the prevention
of different diseases like diabetes (Aune, Norat, Leitzmann, Tonstad, & Vatten, 2015) and breast
cancer (Wu, Zhang, & Kang, 2013).
1.1 Significance
As the body of evidence linking increased participation in PA and improvements in health
has grown, so too has the search for valid, reliable and sensitive tools to measures PA. However,
because PA is a complex and multidimensional behavior, precise quantification is such a difficult
task that the 2018 Physical Activity Guidelines Advisory Committee concluded in their Scientific
Report that “measuring physical activity with reasonable accuracy and acceptable cost is vital to
the understanding of the relationship between physical activity and health. Because of the
complexity of physical activity, measuring it may be the most difficult aspect of the study and
promotion of physical activity” ((2018 Physical Activity Guidelines Advisory Committee, 2018)
p. C-11). In the past few decades, numerous methods for the assessment of PA have been created
and their methodological effectiveness (validity, reliability and responsiveness to change) has been

4
extensively examined. Currently employed PA assessment methods can be categorized in three
ways: criterion methods (e.g., doubly labelled water, indirect calorimetry, direct observation),
instrumented objective methods (e.g., activity monitors such as pedometers and accelerometers,
heart rate monitors and smart phone technology) and subjective methods (e.g., questionnaires and
activity diaries). Each method had advantages and limitations and the degree of accuracy varies
widely between them. Criterion methods allow very accurate quantification of PA but they are
very expensive and require a level of expertise that preclude their use on a large scale. Subjective
methods are accessible and affordable but they are less accurate and prone to reporting bias
(Fukuoka, Haskell, & Vittinghoff, 2016; Ronda, Van Assema, & Brug, 2001). Objective methods
offer moderate accessibility and affordability together with greater accuracy in comparison to
subjective methods (Dowd et al., 2018). Besides methodological effectiveness, other criteria such
as cost, feasibility and participant burden often influence the selection of the PA assessment
method used in research studies.
Heart rate is an indicator of the intensity of the relative physiological stress that is placed
upon the body during movement and is therefore an indirect measure of PA. This method relies on
the known linear relationship between heart rate and oxygen consumption up to submaximal
workloads (Astrand Po, 1977). In order to use HR to estimate energy expenditure (EE) it is
necessary to calibrate the HR-VO2 regression for each individual as the slope of the line varies
with cardiorespiratory fitness and other factors. Once this relationship is characterized, it is
possible to estimate the oxygen consumption and thus EE in free-living conditions. HR can also
be used as a measure of the volume of an exercise session by summing the second-by-second HR
values over the entire length of the session. For each exercise session, the HR data can be plotted
5
against time and the area under the HR curve (AUC) can be computed. Summing the AUCs of all
the exercise sessions performed during a participant’s entire training intervention produces an
index representing the total volume of exercise performed. Dividing this total volume by the
number of sessions completed results in the average volume per exercise session.
Accurate quantification of the volume of PA can shed a light on our understanding of PA-
related disorders and can help us understand the dose-response relationship between the volume
of PA and the associated health benefits. Furthermore, the success of interventions and public
health initiatives can only be established with a precise measurement of PA. Collectively, the
findings from the studies included in this dissertation series will impart crucial insight about
whether using measurement of the volume of training can allow for greater understanding of the
dose required to attain various health benefits of exercise.
1.2 Overview
The overarching purpose of this dissertation is to provide a foundation of empirical
evidence to recognize the use of an HR-derived index as a method to accurately quantify the
volume of exercise completed during a training program and to assess exercise training responses
and resultant health benefits. As such, the following series of research studies attempt to
understand the exercise volume-health benefits relationship, as well as whether the incorporation
of this novel objective measures of volume of exercise could provide information beyond that
which is provided by other methods such as VO2max.
6
This dissertation series includes three distinct, yet related, studies with the following specific aims:
1) To compare the relationships between changes in health-related inflammatory biomarkers
and a) training-induced improvements in performance on a maximal graded exercise test;
and b) HR-derived indices of the volume of exercise completed throughout a 12-week of
moderate aerobic exercise training in insufficiently active but healthy participants.
2) To test the associations between HR-derived indices of exercise volume and change scores
on anxiety and quality of life measures using a 6-weeks high intensity interval training
(HIIT) protocol administered at home with remote coaching in healthy but insufficiently
active adults diagnosed with an anxiety disorder.
3) To establish potential efficacy and feasibility of a home-based HIIT exercise intervention
with remote administration, monitoring, and testing in insufficiently active postpartum
women and, to test the hypothesis that an HR-derived index of exercise volume will be
associated with improvement in cardiorespiratory fitness, circulating inflammatory
markers, cardiac autonomic control, and dysphoric affect.
The hypotheses of these studies are:
1) Both improvements in aerobic capacity and volume of exercise completed during the
training intervention will be associated with reductions in inflammatory markers.
7
2) volume of exercise completed during the training intervention will be associated with lower
negative affect and higher life satisfaction.
3) volume of exercise completed during the training intervention will produce a significant
improvement in aerobic capacity, circulating inflammatory markers and dysphoric affect.
1.3 Dissertation Structure
Chapters I and II are secondary analyses of studies in which the validity of these indices of
exercise volume is assessed in an intervention of moderate-intensity aerobic exercise of 12-weeks
duration, and also in a 6-week HIIT intervention. Chapter III is a prospective randomized
controlled trial testing the feasibility and practicality of this novel index as applied to a specific
population in an at home intervention.
Each chapter is written in a typical journal format with an abstract, introduction, methods,
result, discussion, conclusion, references, and related tables and figures, with supplemental
material presented. Appendix A comprises additional analyses completed for study one.
Institutional Review Board documents from Teachers College and Columbia University Irving
Medical Center are presented in Appendix B. All relevant study instruments used within study
three are included in Appendix C.
8
Chapter 2: Health Benefits of Exercise: Is Performance
What Really Matters?
Abstract
Purpose: To compare relationships between changes in health-related inflammatory biomarkers
and 1) training-induced improvements in performance on a maximal graded exercise test; and 2)
heart rate (HR)-derived indices of the volume of exercise completed throughout a 12-week training
intervention.
Methods: 34 healthy, but insufficiently active, adults (17 males and 17 females, average age
31.1±5.6 years; average baseline VO2peak 30.2±6.7 ml·kg-1·min-1) participated in a 12-week
exercise intervention consisting of 45 min of aerobic activity performed at ~80% of the HRpeak
established during a baseline cardiorespiratory exercise test, on 4 days/week. The following
variables were measured pre- and post-intervention: VO2peak, unstimulated and lipopolysaccharide
(0.0, 0.1, and 1.0 ng/ml)-stimulated tumor necrosis factor-α (TNF-α) and interleukin-6 (IL-6)
production, TNF-α receptor protein level, toll-like receptor-4 (TLR4), and circulating IL-6 and
TNF-α. During each exercise training session, HR was recorded at 1 sample/sec, creating a HR
curve for each session. Volume of exercise performed during the exercise intervention was
summarized using the area under the HR curve (AUC) into two indices: 1) total volume of exercise
performed (AUCsum), and 2) average volume of exercise performed during each exercise session
(AUCavg). Age-adjusted Pearson’s correlations were used to examine the associations between the
AUC indices, VO2peak, and health biomarkers. Fisher’s z transformations were used to compare
potential differences in these correlations.
9
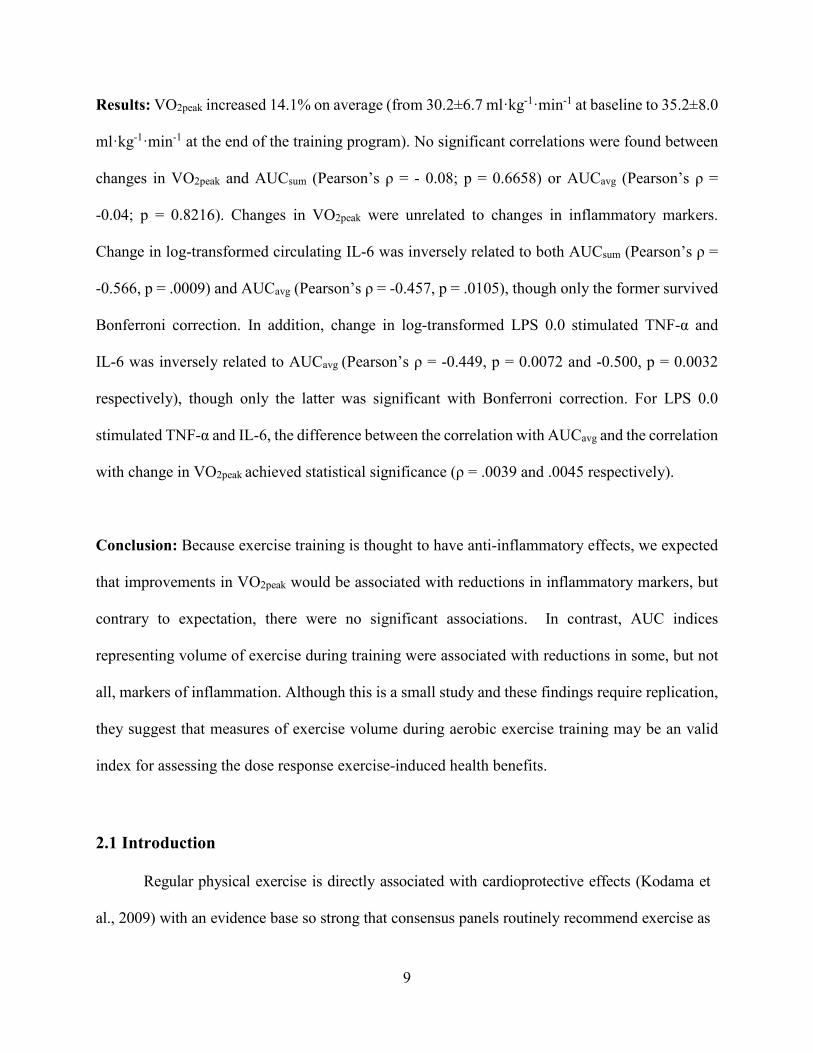
Results: VO2peak increased 14.1% on average (from 30.2±6.7 ml·kg-1·min-1 at baseline to 35.2±8.0
ml·kg-1·min-1 at the end of the training program). No significant correlations were found between
changes in VO2peak and AUCsum (Pearson’s ρ = - 0.08; p = 0.6658) or AUCavg (Pearson’s ρ =
-0.04; p = 0.8216). Changes in VO2peak were unrelated to changes in inflammatory markers.
Change in log-transformed circulating IL-6 was inversely related to both AUCsum (Pearson’s ρ =
-0.566, p = .0009) and AUCavg (Pearson’s ρ = -0.457, p = .0105), though only the former survived
Bonferroni correction. In addition, change in log-transformed LPS 0.0 stimulated TNF-α and
IL-6 was inversely related to AUCavg (Pearson’s ρ = -0.449, p = 0.0072 and -0.500, p = 0.0032
respectively), though only the latter was significant with Bonferroni correction. For LPS 0.0
stimulated TNF-α and IL-6, the difference between the correlation with AUCavg and the correlation
with change in VO2peak achieved statistical significance (ρ = .0039 and .0045 respectively).
Conclusion: Because exercise training is thought to have anti-inflammatory effects, we expected
that improvements in VO2peak would be associated with reductions in inflammatory markers, but
contrary to expectation, there were no significant associations. In contrast, AUC indices
representing volume of exercise during training were associated with reductions in some, but not
all, markers of inflammation. Although this is a small study and these findings require replication,
they suggest that measures of exercise volume during aerobic exercise training may be an valid
index for assessing the dose response exercise-induced health benefits.
2.1 Introduction
Regular physical exercise is directly associated with cardioprotective effects (Kodama et
al., 2009) with an evidence base so strong that consensus panels routinely recommend exercise as
10
part of a healthy lifestyle (Bull et al., 2020; Piercy et al., 2018). A growing body of literature now
suggests that exercise can contribute to cardioprotection via its anti-inflammatory effects,
specifically via decreasing low-grade systemic inflammation, including IL-6 and TNF-α (Gleeson
et al., 2011). Low-grade systemic inflammation itself has been shown to be a risk factor which can
lead to various adverse cardiac and other health-related outcomes (Kaptoge et al., 2014). However,
the literature on relationships between physical activity, exercise training, and inflammation is
mixed, with some studies showing the expected anti-inflammatory effects (Kohut et al., 2006;
Thompson et al., 2010; Wang, Chung, Chan, Tsai, & Chen, 2014) and others showing no effect
(Auerbach et al., 2013; Krause et al., 2014; Libardi et al., 2011).
Differences in study type and design, populations studied, exercise training protocols used,
inflammatory markers assessed and data analytic approaches utilized may account for some of
these inconsistencies. Furthermore, imprecision in the measurement of the dose of exercise
training completed by participants and in the assessment of the outcomes to determine efficacy
of the exercise intervention may contribute to the variability of the studies’ findings.
Whole-body maximal oxygen uptake at peak exercise capacity (VO2max) is considered the
gold standard for assessing cardiorespiratory fitness (Pescatello & American College of Sports
Medicine., 2014). Most exercise training studies rely on this physiological outcome alone to
determine the efficacy of the exercise intervention and to estimate the exercise-related change in
health outcomes. VO2max represents the maximal volume of oxygen uptake during a graded
exercise test (GXT), and it is defined as the point when further increases in exercise workload no
longer elicit a corresponding increase in VO2. VO2max is determined by the product of cardiac
11
output and arteriovenous oxygen difference and reflects the integrated function of several bodily
systems (e.g., cardiovascular, pulmonary, muscular). Physical activity triggers adaptive processes
whereby inactivity decreases VO2max while it increases with greater volumes of physical activity
and exercise training. VO2max is therefore a modifiable physiological parameter and individuals
with a higher VO2max tend to be in better health, present with fewer illnesses, and show reduced
rates of all-cause and disease-specific mortality and morbidity (Ross et al., 2016). The use of
VO2max as an independent predictor of risk of cardiovascular disease morbidity and mortality and
all-cause mortality, independent of age and sex has been well established in the literature (Harber
et al., 2017). VO2peak, used in the current protocol, is directly reflective of VO2max and represents
the highest value of maximal oxygen uptake achieved by a subject accounting for volitional
fatigue as the criteria for GXT termination, a relevant and widely accepted variable when
assessing less fit populations where a plateau in oxygen uptake is not commonly observed and
VO2max cannot be confirmed (Schaun, 2017).
Physical activity and exercise can be described by five dimensions: mode or type of
activity, frequency, duration, intensity, and progression. Frequency, duration and intensity are
used to estimate the volume or dose of physical activity (Garber, Blissmer, Deschenes, Franklin,
Lamonte, Lee, Nieman, Swain, & Med, 2011). Health agencies use these dimensions individually
as well as in various combinations to create their public health recommendations, but the most
widely used to estimate exercise volume is the MET·min·wk-1. For example, the American College
of Sport Medicine (ACSM) has defined light, moderate, and heavy physical activity to equate with
specific metabolic equivalent of task (MET) levels and use MET·min-1·wk-1 as well as relative
heart rate, oxygen uptake, and ratings of perceived exertion in their exercise guidelines (Garber,
12
Blissmer, Deschenes, Franklin, Lamonte, Lee, Nieman, Swain, & American College of Sports,
2011). The MET is an index used to express the absolute energy cost of physical activities as a
multiple of resting metabolic rate (Ainsworth et al., 2000). However, the use of an absolute
estimate of exercise intensity has some limitation (Garber, Blissmer, Deschenes, Franklin,
Lamonte, Lee, Nieman, Swain, & Med, 2011). Byrne et al., showed that in a large heterogeneous
sample, the 1-MET value of 3.5 ml O2·kg−1·min−1 overestimated the actual resting V̇O2 value on
average by 35% (Byrne, Hills, Hunter, Weinsier, & Schutz, 2005). Kozey et al, reported that in a
sample of 252 subjects, the use of 3.5 ml O2·kg−1·min−1 to calculate activity METs caused greater
misclassification of activities intensities and inaccurate point estimates of METs than a corrected
baseline which considered individual height, weight, and age. Furthermore, the errors
disproportionally affected subgroups of the population with the lowest activity levels (Kozey,
Lyden, Staudenmayer, & Freedson, 2010). Nonetheless, indices of activity volume such as
estimated MET·min·wk-1 have been linked to lower all-cause and disease specific mortality and
morbidity in numerous studies (2018 Physical Activity Guidelines Advisory Committee, 2018).
The imprecision of an absolute index of energy expenditure such as the MET suggests there is a
need for a measure that more precisely quantifies training volume (the product of frequency,
duration and intensity) of exercise undertaken during a training program as a supplement to using
outcome measures such as VO2max and other exercise-training-related biomarkers.
Whereas duration is readily assessed, intensity can be quantified by different methods such
as physiological measures (i.e., oxygen uptake, heart rate (HR), respiratory exchange ratio; RER),
subjective assessment by perception of effort (i.e., rate of perceived exertion; RPE) or body
movement quantification (e.g., stepping rate, 3-dimensional body acceleration). Because VO2 and
13
HR parallel each other in a linear fashion until maximal capacity is reached (Pescatello &
American College of Sports Medicine., 2014; Wilmore & Haskell, 1971), HR during exercise
training can be considered a measure of exercise intensity (Strath et al., 2013). Currently available
fitness monitors now permit reliable recording of HR during exercise on a second-to-second basis
(Elise Engström, 2012). Besides documenting adherence with an exercise intervention, it is
possible these data may be used to generate a more accurate quantification of the volume of
exercise performed by each participant. Furthermore, while typical methods of assessing exercise
intensity rely on single or multiple discrete time points, the use of HR data allows to capture the
entire exercise session and, thus, has the potential to catch subtle variations in pattern of the
exercise bout.
Here, we report on the development of two HR-rate-derived indices as novel methods to
quantify the volume of exercise completed during an exercise training program and to measure the
efficacy of the exercise intervention. These indices were compared to changes in GXT-derived
VO2peak and their association with several inflammatory markers in insufficiently active,
apparently healthy participants undergoing 12 weeks of aerobic training.
2.2 Methods
Study Protocol
Data for this secondary analysis are from a sub-sample of participants enrolled in a
randomized controlled trial of the effects of aerobic exercise training on lipopolysaccharide (LPS)-
stimulated IL-6 and TNF-α. Details of this study and the results of this primary aim have been
published (Sloan et al., 2018). The analyses reported here includes participants randomized to the
14
exercise intervention and who completed the training program and met criteria for protocol
compliance (post-training blood draw occurring less than 18 hours or more than 10 days from last
exercise session) and exercise adherence (less than 50% exercise adherence rate). Participants were
recruited from the Columbia University Medical Center/New York Presbyterian Hospital
community. Participants were aged 20-45 years and were healthy nonsmokers, with a BMI ≥18
and ≤ 33, a pre-training Baecke questionnaire (Baecke, Burema, & Frijters, 1982) score <10.
VO2max was predicted using Froelicher equation (60-(0.55*Age)) for men and (48-(0.37*Age)) for
women (Froelicher & Marcondes, 1989) and inclusion criteria required an actual VO2 at or above
70% of this predictive value. The study protocol was approved by the Institutional Review Board
of the New York State Psychiatric Institute and each participant provided informed consent. The
study was registered in ClinicalTrials.Gov (NCT01335737).
Laboratory Testing Sessions
Participants arrived at the Behavioral Medicine Laboratory in the morning after an
overnight fast. Forty-five milliliters of venous whole blood were drawn for cytokine analysis. To
reduce the possibility of the presence of factors that might have affected cytokine levels at baseline
and at the post-training assessment, before the blood draw procedure participants were asked about
last meal intake, last caffeinated beverage, last alcoholic beverage, intake of prescription or over-
the-counter medication and intake of any vitamins and/or herbal supplements in the past week.
Intake of any food, caffeine or alcohol in the 12 hours preceding the blood draw resulted in
rescheduling the blood draw for the next day. Any intake of medication, over-the-counter
medication, vitamins or herbal supplements with known anti-inflammatory effects was reported to
the principal investigator of the study who consulted with the study physician to determine whether
15
to reschedule the testing session. Data were collected prior to the first training session and after
completion of training. The post-exercise training assessment was conducted at least one day
following the last training session to avoid the acute pro-inflammatory effects of a bout of exercise.
Cardiorespiratory Exercise Test
Peak oxygen consumption (VO2peak) was measured by a GXT on an Ergoline 800S
electronic-braked cycle ergometer (SensorMedics Corporation, Anaheim, CA). Calibrations for
airflow and gas concentrations relative to medical grade gases were conducted before each test
according to manufacturer specifications. All subjects had their peak ventilatory capacity
(maximum voluntary ventilation) determined before the exercise test via a Vmax Encore
Metabolic System (Sensormedics, Yorba Linda, CA). An individualized ramping protocol (10, 15,
or 20 watts each two minutes) was selected according to each participant’s perceived exercise
capacity (ascertained by an exercise physiologist based on the participant’s age, prior exercise
history, and familiarity with cycling) to yield a test duration of approximately 10 minutes. Each
subject began the test with a 3-minute warm-up against no resistance, and the work rate was then
linearly increased at the individualized ramp rate. Participants were encouraged to maintain at all
times a pedal cadence <50 rpm, when they dropped below this threshold the test was terminated
(volitional fatigue) unless it was clearly evident that the participant was not at or close to VO2peak.
Minute ventilation, expired oxygen, and carbon dioxide were measured using a
pneumotachometer connected to a mouthpiece (Vmax Encore Metabolic System). Peak exercise
capacity was determined by having all subjects achieve at least 2 of the following: >90% peak
predicted heart rate (220 – age), maximal exertion with limitation due to dyspnea, maximum
16
exertion with muscle fatigue, RER >1.10, or a plateau in the slope of the VO2-work-rate
relationship (piece-wise linear regression analysis) (Mcgee & Carleton, 1970). After reviewing
the literature, we found that a 15-breath moving average, aligned to the time of the central breath,
has been suggested as the preferred method to use when calculating VO2peak (Robergs, Dwyer, &
Astorino, 2010). However, this technique was not able to address the presence of possible extreme
outliers in the raw data, that is, a VO2 measure that differ completely in magnitude in comparison
with the surrounding values. Possible determinant of such values could be participants-related
(i.e. mouthpiece not properly sealed) or glitch in the equipment. In our study, we used a 15-breath
moving median instead of the mean as a more robust measure to extreme outliers and we limited
the location of the VO2peak to the last minute of exercise (Appendix A – Part A).Ventilatory
threshold was determined for each subject using the V-slope technique (Beaver, Wasserman, &
Whipp, 1986). During the GXT, electrocardiogram (ECG) and respiratory gas exchange variables
(VO2, VCO2, VE, RER) were continuously monitored and recorded. Blood pressure and RPE
(Modified Borg 0-10 scale) were also measured every two minutes. Identical test procedures were
carried out at the end of the training phase of the trial.
Training Program
The 12-week standardized unsupervised training program was completed at the New York
Presbiterian Hospital/Columbia University Medical Center employee fitness center and consisted
of four exercise sessions per week, each one hour in length (48 total sessions). In order to increase
the level of compliance with the exercise protocol, participants were permitted to choose their
training equipment, e.g., elliptical trainer, treadmill, or stationary bicycle. Participants were also
asked to refrain from weight lifting or body weight workouts. For each participant, the exercise
17
intensity, prescribed as a percentage of peak heart rate (HRpeak), was progressively increased each
week: 65% (1st week), 70% (2nd week), 75% (3rd week) and 80% (4th to 12th weeks) of the measured
HRpeak achieved during the study entry GXT. At each exercise session, participants trained for at
least 45 minutes maintaining a HR at (±5 beats·min-1) or above the target intensity indicated by
the training protocol. The remaining 15 minutes were used for warm-up and cool-down. Although
participants were not supervised during the training, exercise session data were evaluated several
times per week by study staff assigned to each participant to monitor adherence to the protocol.
Based on data from the Polar monitors, participants were contacted if they did not exercise at the
intensity or frequency prescribed.
Adherence Measure
The study protocol required for women to have the blood draw scheduled during their
midluteal menstrual phase to control for the effects of menstrual cycle variation on cardiac
autonomic control (P. S. McKinley et al., 2009). Although the participants were provided with a
kit to track their menstrual cycle, in some instances the training protocol had to be extended in
order to fulfill this requirement (i.e. missing cycle, incorrect tracking). Participants were asked to
continue to maintain the training routine until their post-aerobic training tests were scheduled.
Adherence to the training program was calculated as the number exercise sessions completed out
of the maximum number of possible sessions.
Heart Rate Measurement
During each exercise session, participants’ HR was recorded with a Polar HR monitor
(model RS400, Polar Electro, Kempele Finland), a device that shows good validity and reliability
18
when compared with electrocardiogram assessment of beat-to-beat HR during physical activity
(Engström, Ottosson, Wohlfart, Grundström, & Wisén, 2012). Data were collected at a frequency
of 1 sample/second. At the end of each exercise session, participants uploaded the data from the
RS400 to a computer workstation and completed a printed diary log with date and time in/out of
their gym visit. Both items were located in the front desk of the fitness center. To account for
missing data due to equipment malfunction, for each participant the date and time of the uploaded
exercise session were then crosschecked with the diary log. In cases where a note indicating the
completion of an exercise session was found in the diary log but no data were recovered for that
day in the computer workstation, the missing length and intensity of the exercise session were
imputed as the average across the subjects’ observed sessions. The heart rate data from each
exercise session were reviewed for errors. Although the use of the Polar device is a common
standard in exercise studies, user error can create minor issues in the quality of the HR signal and
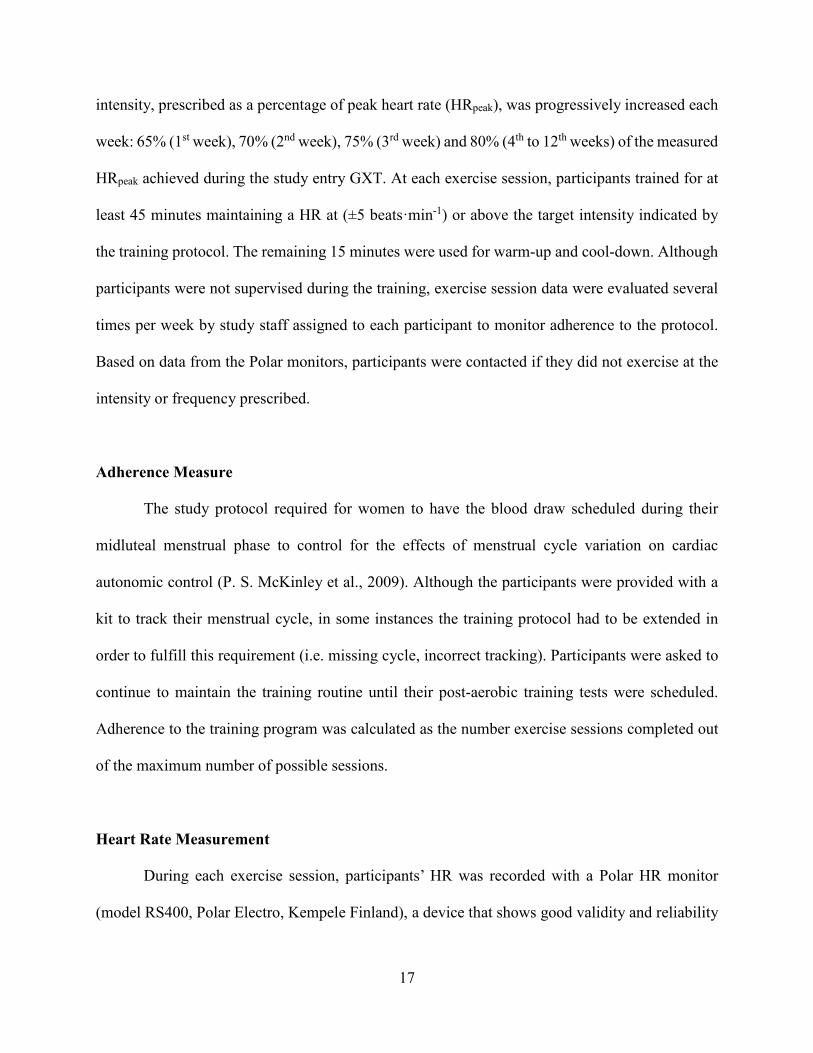
recording of some exercise sessions. Artifacts were identified as identical HRs for 10 or more
seconds or changes in HR of more than 10 beats per minute between adjacent 1-second intervals.
These data were discarded, along with any section between these data of less than 30 seconds, and
replaced by a linear interpolation between the HR values immediately preceding and following the
artifact segment (Figure1). Sessions which contained more than 30% interpolation were imputed
as above (n=61), while training sessions less than 10 minutes in length were excluded from
analysis (n=10).
19
Figure 1. Example of the HR recorded during a single exercise session. Changes in HR of more
than 10 beats per minute between adjacent 1-second intervals are marked in green, and identical
HRs for 10 or more seconds are marked in red. The linear interpolation was drawn between the
last valid HR before the beginning of the artifact and the first valid HR after the end of the artifact.
The black horizontal line represents the target HR.
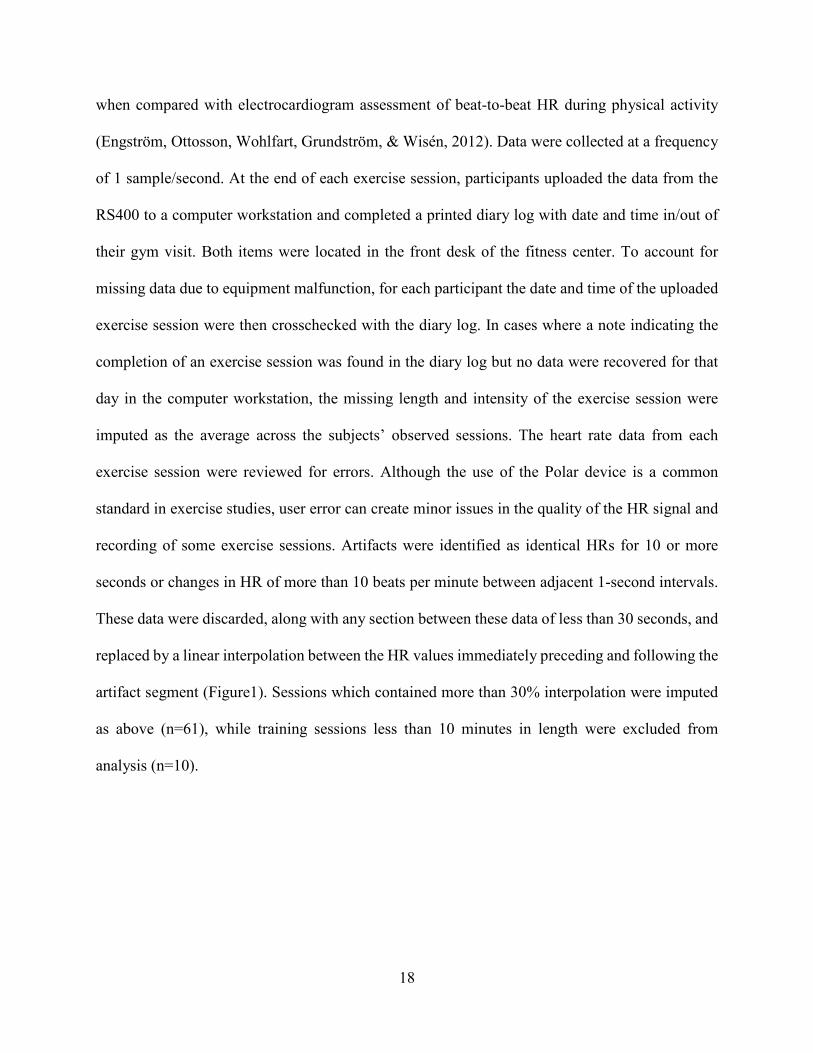
Volume of Exercise Session Training (AUC)
Volume of exercise for every exercise session was computed by summing the second-by-
second HR values over the entire length of the session, including the warm-up and cool-down
period. For each exercise session, these HR data were plotted against time and the area under the
HR curve (AUC) was computed (Figure 2). We wanted these indices to capture the full range of
the physiological response elicited by exercise. For this reason, we decided to use only the HR
above the participants’ baseline resting HR for the computation of the AUC indices. Using such
procedure allow also to account for the variability in resting HR values between participants.
20
Figure 2. Graphical representation of an exercise session, with AUC in grey. The black
horizontal line represents the resting HR.
For each participant, two AUC indices were then computed:
1. AUCsum, the sum of the AUC, above the baseline resting HR, of all the exercise sessions
performed during a participant’s entire training program. This index represents the total
volume of exercise performed;
AUCsum = ∑ ∑ (𝐻𝐻𝐻𝐻𝑙𝑙1
𝑠𝑠1 ij −𝐻𝐻𝑅𝑅𝑅𝑅𝑅𝑅𝑅𝑅𝑅𝑅𝑅𝑅 𝐻𝐻𝐻𝐻)
2. AUCavg, the average AUC per exercise session.
AUCavg = ∑ ∑ (𝐻𝐻𝐻𝐻𝑙𝑙1
𝑠𝑠1 ij −𝐻𝐻𝑅𝑅𝑅𝑅𝑅𝑅𝑅𝑅𝑅𝑅𝑅𝑅 𝐻𝐻𝐻𝐻) / s
21
Where s is the number of sessions the participant exercised; l = is the total number of seconds in
a session; HRij is the heart rate (in beats per second) at the jth second of the ith session, for a given
subject.
AUC indices of missing exercise sessions or sessions excluded due to more than 30%
interpolation (see above) were imputed as the average across the participants’ observed sessions.
Inflammation Measures
Ten inflammatory markers were analyzed as outcomes: circulating TNF-α and IL-6,
stimulated (0.0, 0.1 and 1 ng/mL) TNF-α and IL-6, Western Blot TNF-α receptor and Western
Blot TLR4 receptor. For stimulated TNF-α and IL-6, we used a standardized method to activate
cytokine release in whole blood ex vivo by addition of lipopolysaccharide (0.0, 0.1 and 1 ng/mL).
We quantified stimulated and study entry circulating TNF-α and IL-6 using a Discovery Assay
called the Human Cytokine Array Focused 11-Plex (Eve Technologies Corporation, Calgary, AB,
Canada). The multiplex assay was performed at Eve Technologies by using the Bio-Plex 200
system (Bio-Rad Laboratories, Inc, Hercules, CA, USA), and a Milliplex human cytokine kit
(Millipore, St Charles, MO, USA) according to their protocol. Further details appear in the primary
paper for this trial (Sloan et al., 2018).
Statistical Analysis
Descriptive statistics of demographic and training data were computed, and all variables
were examined for distribution prior to analysis. Values for all inflammatory markers were log
transformed to account for skewed distributions, and change scores from pre- to post-aerobic
22
exercise training were calculated for all inflammatory markers and for VO2peak. Partial Pearson’s
correlations adjusted for age were used to assess the relationships between: 1) the association
between changes in VO2peak and AUC indices, 2) the association between changes in VO2peak and
changes in inflammatory markers, and 3) the association between AUC indices and changes in
inflammatory markers. In addition, the partial correlation coefficients from 2) and 3) were
compared using Fisher’s Z transformations (Steiger, 1980). Tests for differences in the correlations
were subjected to Bonferroni correction for the ten primary inflammatory markers
(α=.05/10=.005). Correlations also were computed after further adjustment for gender, with
qualitatively equivalent results. All analyses were performed using SAS version 9.4 (SAS Institute,
Cary, NC).
2.3 Results
Sample characteristics and adherence
Of 60 participants randomized to the aerobic training condition, 16 dropped out during the
training program. Out of the 44 who completed the exercise intervention, three were excluded from
the present analyses due to exercise adherence rate below 50%, and an additional five were
excluded due to protocol compliance (see “Study Protocol” above). In addition, one participant
did not complete the post-training GXT data and one lacked usable HR data to calculate the AUC
measures, yielding a total of 34 participants included in the analysis (Figure 3).
23
Figure 3. Diagram of participant flow through the study protocol.
Seventeen males and 17 females, aged 31.1±5.6 years with a BMI of 25.4±4.0 were
included in this analysis. Characteristics of the training program completed by the participants are
summarized in Table 1. Overall, VO2peak increased 14.07% on average (from 30.94±6.92 ml·kg-
1·min-1 at baseline to 35.18±7.99 ml·kg-1·min-1 at the end of the training program). The
heterogeneous training response is shown in Figure 4. Secondary criteria attesting the achievement
of VO2peak (Robergs et al., 2010) are presented in Appendix A – Part B. Because participants were
permitted to choose their training equipment, e.g., elliptical trainer, treadmill, or stationary bicycle

24
but the GXT was conducted on a cycloergometer, we evaluated if differences in training-induced
VO2peak improvements were correlated with the aerobic machine used during training. Bicycle,
elliptical machine and treadmill were the three most used equipment. No difference was found in
percent change in VO2peak across these three aerobic machine. Complete results of this analysis are
presented in Appendix A – Part C.
Mean (SD) / N (%)
Length of training program (days) 92 (19)
Number of exercise sessions completed 46 (10)
Compliance with the training program 87 (14)
Length of exercise session (min) 53 (7)
Table 1. Characteristics of the training program.
Figure 4. Individual difference (delta) in increase in VO2peak with training for the 34 participants
of the study.
25
Associations between Changes in VO2peak, Inflammatory Markers, and AUC Indices
No significant correlations were found between changes in VO2peak and AUCSUM
(Pearson’s ρ = -- 0.00; p = 0.6658) or AUCAVG (Pearson’s ρ = - 0.04; p = 0.8216). Figure 5 presents
a heat map of Pearson’s correlation coefficients between changes in inflammatory markers as they
relate to change in VO2peak and to AUC indices. There was no significant association between
change in VO2peak and changes in any of the inflammatory markers (Pearson’s ρ range: 0.01-0.32),
though all associations were positively correlated. In contrast, AUC indices were inversely
associated to changes in most inflammatory markers. Change in log-transformed circulating IL-6
was significantly and inversely related to both AUCSUM (Pearson’s ρ = -0.566, p =. 0009) and
AUCAVG (Pearson’s ρ = -0.457, p = .0105), though only the former survived Bonferroni correction.
In addition, change in log-transformed LPS 0.0 stimulated TNF-α and IL-6 was significantly and
inversely related to AUCAVG (Pearson’s ρ = -0.449, p = 0.0072 and -0.500, p = 0.0032
respectively), though only the latter survived Bonferroni correction. For LPS 0.0 stimulated TNF-
α and IL-6, the difference between the correlation with AUCAVG and the correlation with change
in VO2peak achieved statistical significance (p = .0011 and .0007 respectively).
26
Figure 5. Heat map of Pearson’s correlation coefficients between changes in inflammatory
markers, as they relate to changes in VO2peak and to AUC indices. Bolded values represent
significant differences (p < .005) between the VO2peak-inflammatory marker correlations and the
AUC-inflammatory marker correlations. For continuous blue-red shading, colors vary
continuously in shades of blue (negative correlation coefficients), or red (positive correlation
coefficients) with an intensity proportional to the strenght of the correlation.
2.4 Discussion
In this trial of a 12-week exercise intervention in healthy insufficiently active adults, two
indices of volume of exercise completed during training were correlated with post-training
-0.45
-0.50
0.12
0.06
0.20
0.04
0.23
0.23
0.31
-0.01
0.18
0.09
-0.04
-0.35
0.04
-0.08
-0.22
-0.32
0.00
0.02
-0.32
-0.57
0.18
-0.20
0.18
-0.09
-0.24
-0.01
0.05
-0.46
VO2peak Change Sum AUC Average AUC
Western Blot TLR4 Receptor
Western Blot TNF Receptor
LPS 1.0 Stimulated TNF
LPS 0.1 Stimulated TNF
LPS 0.0 Stimulated TNF
Circulating TNF
LPS 1.0 Stimulated IL6
LPS 0.1 Stimulated IL6
LPS 0.0 Stimulated IL6
Circulating IL6
Change in log:Pearson Correlations
-0.5
0.0
0.5
27
reductions in inflammation, achieving statistical significance in the case of unstimulated levels of
TNF-α and IL-6. Training-related improvements in VO2peak were unrelated to changes in
inflammatory markers or AUC.
These findings suggest that indices of volume of exercise completed, operationalized as
the AUC indices, provide a comprehensive measure of exercise dose that can reveal associations
between exercise and health outcomes such as inflammatory markers, regardless of training
response assessed through pre-and post-intervention changes in aerobic capacity. Other studies
have shown similar findings with improvements in health-related biomarkers independent from
training-induced improvements in cardiorespiratory fitness. In the DREW study, 390
insufficiently active, overweight/obese postmenopausal women were randomized to a non-
exercise control group or one of three exercise groups: energy expenditure of 4, 8, or 12 kcal
kg−1⋅week−1 for 6 months at an intensity of 50% VO2peak. Aerobic exercise training reduced total
white blood cell (WBC) and neutrophil counts, in a dose-dependent manner, however increased
fitness (ΔVO2peak) was not directly associated with improved WBC counts and the effects of
exercise group on total WBC and neutrophil counts were independent of the change in fitness
(Johannsen et al., 2012). In the HART-D study a total of 202 participants with type 2 diabetes
underwent a 9-month randomized, controlled exercise trial comparing the effect of three different
modalities of exercise training on glycated hemoglobin (HbA1c). Participants who completed the
protocol were divided based on their aerobic capacity improvement (VO2peak increase <5% and
VO2peak increase >5%). Both groups had improvements in metabolic parameters such as HbA1c,
waist circumference and body fat. The fact that between the two groups there was no significant
difference in the magnitude of improvement in these metabolic parameters is a proof that
28
improvements in health-related biomarkers can be independent from training-induced
improvements in cardiorespiratory fitness. (Pandey et al., 2015).
It is conceivable that the degree to which indices of volume of exercise and improvements
in VO2peak relate to improvements in biomarkers are specific to the biomarker under investigation
and the mechanistic pathways responsible for these improvements (Garber et al., 2011). For
instance, reduction in body weight and visceral abdominal fat are benefits of exercise that are
volume-related and do not require cardiorespiratory fitness improvements. In the current study,
participants were in the high normal/overweight range, a condition often associated with an
increase of body fat, particularly visceral abdominal adiposity, and low-grade systemic
inflammation, including IL-6 and TNF-α (Neeland et al., 2019). TNF-α has a role in plaque
stability, endothelial dysfunction, and inflammatory damage in the arterial wall. An improvement
in TNF-α may be the result of peripheral adaptations in the adipose (reduction of visceral fat) and
skeletal muscle (improved glycemic control) tissue and the induction of an an-inflammatory
environment with each bout of exercise (Mathur & Pedersen, 2008; Petersen & Pedersen, 2005).
Although conjectural, a reduction in inflammatory biomarkers through a reduction of visceral
abdominal fat could be a plausible explanation for the different associations of AUC indices and
VO2peak with the inflammatory markers analyzed.
Furthermore, AUC indices may be more sensitive to detection of changes in inflammatory
biomarkers because they are a measure of volume of exercise training instead VO2peak is a measure
of performance during GXT. The fact that these novel indices can accurately capture the volume
of exercise completed during a training program suggest the value of their use as supplement to
29
other well-established indices such as VO2peak. The potential of the assessment of these novel
indices of volume of exercise completed is discussed below in the context of other support for
positive associations of exercise dose with health outcomes.
Existing research shows that activity levels are associated with positive health outcomes
such as attenuation of inflammatory markers. In the British Regional Heart Study (n=7735), an
exercise score was derived for each participant based on frequency and type (intensity) of the
physical activity. Scores were assigned for each type of activity and duration on the basis
of the intensity and energy demands of the activities reported (Shaper, Wannamethee, &
Weatherall, 1991). The total score used for each participant was not a measure of total time spent
in physical activity, but rather was a relative measure of the volume of physical activity that was
carried out. Participants were grouped into four groups based on their physical activity patterns
over a 20-year period. Currently active participants (irrespective of their past physical activity
patterns) showed lower levels of CRP and white blood cell (WBC) counts than those currently
inactive. Those who had been at least lightly active (score 6 to 8 - more frequent recreational
activities, sporting exercise less than once a week, or regular walking plus some recreational
activity) at study entry but were no longer active showed levels similar to those who had remained
inactive. Those who became active showed levels similar to those who remained continuously
active.
Although some observational studies have failed to find such cross-sectional relationships
between exercise and inflammatory biomarkers (Rawson et al., 2003; Verdaet et al., 2004), data
from a recent narrative literature review demonstrated an inverse, dose-response relationship
30
between physical activity and systemic markers of inflammation, even at relatively modest activity
levels (Woods, Wilund, Martin, & Kistler, 2012). The nine large cohort studies were conducted in
older individuals (average age of >60 years), PA was assessed through self-reported questionnaires
and PA dose was estimated through various indices. For example, Geffken et al., reported that
higher levels of PA in the previous two weeks, measured as kcal/wk, were associated with lower
concentrations of C-reactive protein, fibrinogen, factor VIII activity, and WBC count in an elderly
cohort (Geffken et al., 2001). Yu et al., found that high MET-h/w, indicating higher levels of PA,
were associated with lower levels of CRP among middle-aged and older Chinese people (Yu et
al., 2009).
The dose-response relationship between exercise and health outcomes is so important that
one of the aims of the 2018 Physical Activity Guidelines Advisory Committee Scientific Report
was to investigate if greater amounts of PA are associated with greater benefits achieved for
numerous health outcomes. (2018 Physical Activity Guidelines Advisory Committee, 2018).
Unfortunately, while for some of the outcome evidence suggests the existence of a dose-response
relationship, for many others, including cognition, risk of weight gain in adults, gestational weigh
gain and, weight loss during the postpartum period there were limited or insufficient evidence to
suggest the existence of a such relationship.
Imprecision in the measurement of the dose of exercise training completed by participants
may lead to inconsistent and false negative results for the association of PA and health outcomes
in research studies. For example, the use of self-reported questionnaires to collect PA data has the
advantage of being accessible and affordable but it comes with the limitation of being less accurate
31
and prone to reporting bias. Fukuoka et al., found in a sample of 215 women a large discrepancy
between self-reported and objective measures of moderate to vigorous physical activity (Fukuoka
et al., 2016). Ronda et al., reported that in a random sample of 2608 adults a substantial proportion
of the respondents (35.6%) were overestimating their physical activity level, and a small minority
(7.2%) underestimated their physical activity level. Among respondents who did not meet the
recommended level of physical activity, a majority (61.1%) overestimated their physical activity
(Ronda et al., 2001). Lastly, a systematic review aimed at investigating the validity of the
international physical activity questionnaire short form (IPAQ-SF) found that in those studies that
provided comparisons between PA levels derived from the IPAQ-SF and those obtained from
objective criterion, the IPAQ-SF overestimated PA level by 36 to 173 percent or underestimated
it by 28 percent (Lee et al., 2011). One of the reasons why people tend to overestimate their
physical activity levels is because they do not understand what is meant by moderate and vigorous
intensity exercise (Altschuler et al., 2009). Another possible reason is the fact that among
participants eager to comply with the study intervention aims, social desirability may result in
over-reporting of PA (Adams et al., 2005).
While methods that allows very accurate quantification of PA exists, such as doubly
labelled water, indirect calorimetry and direct observation (criterion methods), they are very
expensive and require a level of expertise that preclude their use on a large scale.
The AUC indices are derived from HR and therefore, like other objective methods (i.e.,
pedometers, accelerometers and smart phone technology) they provide accurate quantitative data.
They offer lower accessibility and affordability but greater accuracy in comparison to subjective
32
methods and, lower accuracy but greater accessibility and affordability in comparison to criterion
methods. Furthermore, some of the current methods of estimating exercise dose rely on an absolute
estimate of exercise intensity and such approach has been shown to have some limitation (Garber,
Blissmer, Deschenes, Franklin, Lamonte, Lee, Nieman, Swain, & Med, 2011). For example, MET
is an index used to express the estimated absolute energy cost of physical activities as a multiple
of resting metabolic rate (Ainsworth et al., 2000). Byrne et al., showed that in a large
heterogeneous sample, the 1-MET value of 3.5 ml O2·kg−1·min−1 overestimated the actual resting
V̇O2 value on average by 35% (Byrne, Hills, Hunter, Weinsier, & Schutz, 2005). Kozey et al,
reported that in a sample of 252 subjects, the use of 3.5 ml O2·kg−1·min−1 to calculate activity
METs caused greater misclassification of activities intensities and inaccurate point estimates of
METs than a corrected baseline which considered individual height, weight, and age. Researchers
also found that the errors disproportionally affected subgroups of the population with the lowest
activity levels (Kozey, Lyden, Staudenmayer, & Freedson, 2010). The AUC indices do not present
such limitation because they directly measure exercise intensity using a physiological parameter.
Lastly, the data processing required for the AUC indices is comparable to the one needed
for other activity trackers (i.e. accelerometers). The difference between these two methods is that
the PA-related information (i.e., energy expenditure, number of steps) provided directly by these
devices are based on equations that have been established by using specific population and
therefore are prone to either underestimation or overestimations (Feehan et al., 2018, O’Driscoll
et al., 2020).
33
2.5 Conclusion
Advance our understanding of how to best detect and quantify the benefits of exercise
remain an important aim of research. The AUC indices presented here represent an alternative way
to measure the volume of PA completed through the use of HR data collected during training.
Compared to the GXT and to other methods of exercise tracking, the collection of these data is
inexpensive, provides more accurate quantitative detail, and is less burdensome to participants and
research teams. As such, AUC indices may be more accessible for the conduction of large scale
exercise studies aimed at evaluating the health benefits of participation in an exercise program.
Future studies could build on the current findings by continuing to explore similarities and
differences in what measures of volume of exercise completed during a training program and other
measurements of training can tell us about exercise-induced benefits of PA.
34
Chapter 3: High Intensity Interval Training Is Associated with
Decreased Negative Affect in Individuals with Anxiety Disorders
Abstract
Purpose: Exercise is associated with reduced anxiety but few studies have evaluated the
effectiveness of high intensity interval training (HIIT) in patients with anxiety disorders. We tested
associations between two heart rate (HR)-derived indices of exercise volume and change scores
on anxiety and quality of life measures using a novel HIIT protocol administered at home with
remote coaching in people with anxiety disorders.
Methods: Eleven insufficiently active participants (estimated baseline VO2max 33.18±5.89 ml·kg-
1·min-1) diagnosed with an anxiety disorder and Spielberger State-Trait Anxiety Inventory (STAI)
score > 44 performed a 6-week, 4 days/week HIIT program using a stepper machine. Each session
included 8 to 12 minutes of HIIT (20/40 sec ratio - target HR 85% of estimated HR peak (HRpeak)).
At baseline (week 0), at the end of the third week of training (week 3) and at the end of the training
intervention (week 6) participants completed the STAI and the Quality-of-Life Enjoyment and
Satisfaction Questionnaire Short Form. During each training session, HR was recorded at 1
sample/5 sec, creating a HR curve for each session. Volume of exercise performed during the
exercise intervention was summarized using the area under the HR curve (AUC) into two indices:
1) total volume of exercise performed (AUCsum) and 2) average volume of exercise performed
during each exercise session (AUCavg). For each combination of the clinical outcomes (Spielberger
State Anxiety, Spielberger Trait Anxiety, Quality of Life Enjoyment and Satisfaction) and indices
of exercise volume (AUCsum, AUCavg), nonparametric correlations were calculated and adjusted by
35
Bonferroni correction for multiple comparisons (significant if p<.016). Correlations were
calculated for change scores from baseline to week 3 (model 1), week 3 to 6 (model 2), and baseline
to week 6 (model 3).
Results: 2 males and 9 females aged 25.05±2.82 years, BMI 23.95±4.27 completed the study.
Adherence to the exercise intervention was 89%. Model 1 showed AUCsum and AUCavg in the first
3 weeks were significantly negatively associated with Spielberger state anxiety at week 3 relative
to week 0 (r = -.90, p<.0001 and r = -.72, p<.011 respectively). AUCsum and AUCavg were also
significantly negatively associated with Spielberger trait anxiety at week 3 relative to week 0 (r =
-.65, p<.030 and r = -.73, p<.010 respectively), although only the former survived Bonferroni
correction. In model 2 AUCavg was significantly positively associated with Spielberger trait
anxiety at week 6 relative to week 3 (r = .67, p<.039), although it did not survive Bonferroni
correction. Model 3 resulted in nonsignificant negative correlations between both AUCsum and
AUCavg and pre- to post-intervention change scores in state and trait anxiety. Correlations between
both AUC indices and quality of life measures were nonsignificant across all 3 models.
Conclusions: In this pilot study, the high rate of adherence is promising initial evidence that an at
home HIIT protocol may be an effective intervention framework that reduces barriers faced by
people with anxiety disorders to participate in and accrue the biological/health benefits of exercise
training. While model 3 resulted in nonsignificant negative correlations between indices of volume
of exercise completed and pre- to post-intervention change scores in state and trait anxiety, in
model 1 indices of volume of exercise completed were significantly and inversely correlated with
36
changes in state and trait anxiety. These findings suggest that HIIT could be a promising
intervention to reduce negative affect in anxiety disorders.
3.1 Introduction
The benefits of physical activity for symptom reduction in anxiety disorders are well
established (2018 Physical Activity Guidelines Advisory Committee, 2018; Asmundson et al.,
2013; Stonerock, Hoffman, Smith, & Blumenthal, 2015). However, people with anxiety disorders
are more likely to be insufficiently active than those without an anxiety diagnosis (Stubbs et al.,
2017) and, for many people with anxiety disorders, a “prescription” of exercise can be challenging
to implement. Increased anxiety sensitivity (AS) can lead to avoidance of the physical discomfort
associated with exercise training (Brigitte C. Sabourin & Stewart, 2011), combined with
additional barriers to exercise which can be logistical (e.g., lack of financial resources, access, or
time) and behavioral (social anxiety about fitness centers, disorganization of behavior, low self-
efficacy) (Mason, Faller, LeBouthillier, & Asmundson, 2019). Nonetheless, exercise remains an
important non-pharmacologic intervention, given that a recent review of 48 studies estimated that
the lifetime prevalence rates of having any anxiety disorder in adults is 3.8-25% (Remes, Brayne,
van der Linde, & Lafortune, 2016).
More recent evidence suggests that high intensity interval training (HIIT) can provide
similar or stronger associations with improvements in anxiety and mood as moderate or low
intensity continuous aerobic training in people with anxiety disorders (Aylett, Small, & Bower,
2018). HIIT consists of multiple cycles of short bursts of high intensity physical activity followed
by lower intensity recovery periods (Campbell et al., 2019). HIIT can produce similar
37
physiological adaptations (and associated health benefits) to continuous exercise within a shorter
length of training session and overall length of training program (L. B. DeBoer, Powers, Utschig,
Otto, & Smits, 2012; Gibala, Little, Macdonald, & Hawley, 2012; Martland, Mondelli, Gaughran,
& Stubbs, 2020).
Beyond providing physiological conditioning that may contribute to anxiety reduction via
inflammatory, neurological, and stress response pathways (Kandola et al., 2018), participation in
a HIIT intervention study also provides exposure to other psychological and behavioral
components that have been associated with improvements in anxiety symptoms. These benefits
include engaging in consistent behavioral activation over time to build mastery (Boswell, Iles,
Gallagher, & Farchione, 2017; Chen, Liu, Rapee, & Pillay, 2013), and decreasing anxiety
sensitivity through exercise-based habituation to the uncomfortable body sensations of anxiety and
panic (Broman-Fulks, Berman, Rabian, & Webster, 2004; Smits et al., 2008).
However, the effectiveness of offering this psychologically and physically intense and
possibly uncomfortable intervention to insufficiently active adults is the subject of much debate
(Biddle & Batterham, 2015). A recent meta-analysis of HIIT trials in a sedentary population
identified dropout rates of 17.6% (1318 participants from 55 eligible studies) (Reljic et al., 2019),
indicating that HIIT is well-tolerated. However, few trials have been conducted to test feasibility,
adherence, and outcomes of HIIT in people with anxiety disorder. In the first randomized
controlled trial of HIIT for patients with generalized anxiety disorder, HIIT was associated with
significant decreases in anxiety and depression symptoms after just 12 days of training, when
compared with a low intensity stretching and yoga control condition (Plag et al., 2020). Plag and
38
coauthors found similar results in a pilot study of a 12-day HIIT intervention for people with panic
disorder (PD) (Plag, Ergec, Fydrich, & Strohle, 2019). In each of these studies, the intervention
was delivered in supervised on-site training sessions, and conditioning was verified by pre- and
post-intervention assessment of cardiorespiratory fitness.
More broadly, trials of moderate intensity training interventions for patients with anxiety
disorders have often suffered methodological shortcomings that can inform the design of new
studies investigating HIIT (Stork, Banfield, Gibala, & Martin Ginis, 2017). One drawback of these
studies was the tendency to rely solely on psychological measures as outcome variables, without
cardiorespiratory fitness assessment to verify that conditioning has occurred (Stonerock et al.,
2015). Further, existing studies vary widely on how adherence and exercise dose is tracked.
Methods range from self-report logs and questionnaires (e.g. (Merom et al., 2008) to beat-to-beat
HR monitoring and accelerometry (Linke, Gallo, & Norman, 2011), the latter of which is
preferable because it allows quantitative confirmation of the dose and quality of exercise
completed.
This pilot study tests whether a 6-week home-based HIIT exercise intervention with remote
supervision is feasible, and whether it will produce a significant improvement in anxiety symptoms
and quality of life ratings in insufficiently active individuals with anxiety disorder diagnoses. We
also report on the use of two HR-rate-derived indices as a novel method to accurately quantify the
volume (i.e., intensity, frequency and duration) of exercise completed during the training program
and to explore the potential use of these indices to assess exercise-induced health benefits.
39
3.2 Methods
Participants
Participants were recruited from the Anxiety Disorders Clinic at the New York State
Psychiatric Institute (NYSPI) using word of mouth, flyers, and print and web ads. Insufficiently
active patients (Baecke questionnaire score <10 (Baecke et al., 1982)) between 18 and 40 years of
age, with a BMI between 18.5 and 35 and, with a Diagnostic and Statistical Manual of Mental
Disorders-5 (American Psychiatric Association, 2013) diagnosis of an anxiety disorder and a
Spielberger State-Trait Anxiety Inventory (STAI) (C. D. Spielberger, Gorsuch, Lushene, Vagg,
& Jacobs, 1983) score >44 were deemed eligible to participate. Participants were compensated up
to $200 and were allowed to keep the fitness equipment as part of the compensation for
participating in the study. The study protocol was approved by the NYSPI Institutional Review
Board and each participant provided informed consent. The study was registered in
ClinicalTrials.Gov (NCT 03036371).
Submaximal Cardiopulmonary Exercise Test
Estimated maximal aerobic capacity (VO2max) was determined by a submaximal
cardiopulmonary stress test (Kevin S., 2004). Participants were instructed to refrain from caffeine,
exercise in the previous 24 and eating 4 hours prior to the test. Participants were fitted with a Polar
HR sensor (model H9, Polar Electro, Kempele Finland) and heart rate monitor (Model RS400,
Polar Electro OY, Finland) to record their HR during the test and they were instructed on the test
procedures and on the use of the ratings of perceived exertion (RPE). scale (Borg, 1998) The test
was conducted using a 12” plyo box and an audio recording with instructions and timed metronome
rhythms. Participants listened to the test instructions and commenced stepping to the metronome
40
beat at 15 steps per minute for a 2-minute period, following which HR and RPE were recorded
(Test Level 1). The step rate then increased to 20 steps per minute for an additional 2 minutes,
when HR and RPE were again be recorded (Test Level 2). The test continued with additional 2
min increments increasing the step rate by 5 steps/min until the participants reached a heart rate of
80% of their predicted maximal heart rate equation (220-age). Providing the participants showed
no overt signs of distress and that their rating of perceived exertion was below 17, the participants
were permitted to finish the 2-minute stage and the test was then terminated. The maximum test
duration was 10 minutes (i.e., test Level 5).
At-home Training Equipment
Participants trained on a folding climbing stepper (Sunny Health & Fitness, Los Angeles,
CA) shipped to their homes and assembled by participants with remote guidance from study staff.
During each exercise session, participant's HR was collected by a Polar heart rate sensor (model
H9), a device that shows good validity and reliability when compared with ECG assessment of
beat-to-beat HR during physical activity (Kingsley, Lewis, & Marson, 2005) and recorded with a
Polar HR monitor and fitness tracker (model Loop, Polar Electro, Kempele Finland). Data were
collected at a frequency of 1 sample/ 5 seconds. After completing each exercise session
participants uploaded the HR data on the Polar Flow server.
High Intensity Interval Training Protocol
The training protocol was repeated 4 times per week for 6 consecutive weeks, giving a total
of 24 unsupervised training sessions. The HIIT protocol compromised 20-seconds intervals at 85%
of peak heart rate (HRpeak) interspersed with 40 seconds of active recovery at 50%-60% of HRpeak.
41
Participants complete 8 such intervals for sessions 1 and 2, 10 intervals for sessions 3 and 4, and
12 intervals for sessions 5 to 24. During each training sessions participants completed also 3
minutes of warm up at the beginning of the exercise session and 3 minutes of cool-down at the end
of HIIT protocol. Total exercise time was 14 minutes for session 1 and 2, 16 minutes for sessions
3 and 4, and 18 minutes for the remaining sessions. Participants were asked to have a 24-hour rest-
periods between each training day. The exercise intensity was set based on the HRpeak reached
during baseline submaximal cardiopulmonary stress test and for each participant corresponded to
at least a 15 on the Borg scale. Adherence with the exercise intervention was calculated for each
participant as percentage of the maximal number of sessions completed (24).
Coaching
At consent, each participant was assigned a research assistant coach with training in
behavioral techniques such as motivational interviewing. During the intervention part of the study
participants were contacted either through e-mail, phone call or text message. Adherence to the
study requirements determined the number of contacts but all the participants were contacted at
least once a week. Contacts with the participants included the use of techniques designed to
promote good adherence and encourage improvement if needed, address reasons for
noncompliance (e.g., not enough time to exercise), use of positive suggestions, and reframing to
help identify feasible solutions for overcoming obstacles and setting obtainable goals. Data from
the exercise sessions were reviewed by the coach on a daily basis and the appropriate feedback
was provided to the participants in order to ensure that any issue with the exercise session (i.e., not
reaching the target HR during the high intensity intervals) was not repeated in the following
exercise session.
42
Psychological Assessments
At baseline (week 0), at the end of the third week of training (week 3) and at the end of the
training intervention (week 6) participants completed the STAI and the Quality of Life Enjoyment
and Satisfaction Questionnaire Short Form (Q-LES-Q-SF (Endicott, Nee, Harrison, & Blumenthal,
1993). The STAI is a 20-item scale with a range from 20 to 80, designated to assess the
predisposition to react with anxiety in stressful situations. State anxiety refers to transient worry
assessed “right now,” whereas trait anxiety assesses a patient’s self-report about how they
“generally” feel. The Q-LES-Q-SF assesses a holistic view of participants’ satisfaction and
enjoyment of life circumstances over the past week.
Estimated VO2max
The Chester step test (CST) has been validated as a predictor of aerobic capacity in males
and females of varying ages and fitness levels (Kevin S., 2004). The CST uses the ACSM stair-
stepping equation to estimate the workload oxygen cost (ml/kg/min) for the step height and pace
at each stage (American College of Sports Medicine, 2000; Glass S, 2007). While the test capacity
to provide a valid measure of VO2max has been questioned (Buckley, Sim, Eston, Hession, & Fox,
2004), its ability to detect changes in aerobic capacity has been confirmed (Renfro MO, 2019).
However, few recommendations have been made aimed at increasing the accuracy of the
measurement. The data processing procedure in the original CST paper (Kevin S., 2004) requires
the use of a graphical datasheet with heart rate (beats/min) on the Y axis and oxygen consumption
(ml/kg/min) on the X axis. First the participants’ HR values at the end of each level completed are
plotted on the graphical datasheet. The line of best fit is then drawn between these data points. HR
values above the 85% of the participant’s estimated maximal HR (HRmax) are not considered for
43
this step. Lastly, the estimated VO2max is obtained by drawing a perpendicular line to the X-axis at
the point of the intersection of the line of best fit with the line of the participants’ estimated HRmax.
Because the use of a visual line of best fit can introduce potential error (Bennett, Parfitt, Davison,
& Eston, 2016), impacting the accuracy of the results, we used a statistical line of best fit. The end
of stage HRs, end of stage V̇O2 values from the Chester step test data sheet, and estimated HRmax
were entered into a spreadsheet program (Microsoft Excel, Microsoft Canada Inc., Mississauga,
ON, Canada) to extrapolate VO2max using the “trendline” function. The line of best fit is described
by the equation ŷ = bX + a, where b is the slope of the line and a is the intercept. We calculated
the participant’s estimated VO2max by solving the equation of the line of best fit using the
participants’ HRmax as ŷ and the slope and intercept values provided by Excel.
Volume of Training (AUC)
During each exercise session, HR was recorded every 5 seconds, producing an HR curve
for each session. Volume of exercise was computed as the sum (AUCsum) and average (AUCavg)
area under these HR curves, excluding the warm-up and cool-down period (Figure 1). We wanted
these indices to capture the full range of the physiological response elicited by exercise. For this
reason, we decided to use only the HR above the participants’ baseline resting HR for the
computation of the AUC indices. Using such procedure allow also to account for the variability in
resting HR values between participants. AUC indices were computed as follows:
1. AUCSUM, the sum of the AUC of all the exercise sessions performed during a participant’s
entire training program. This index represents the total volume of exercise performed;

44
AUCsum = ∑ ∑ (𝐻𝐻𝐻𝐻𝑙𝑙1
𝑠𝑠1 ij −𝐻𝐻𝑅𝑅𝑅𝑅𝑅𝑅𝑅𝑅𝑅𝑅𝑅𝑅 𝐻𝐻𝐻𝐻)
2. AUCavg, the average AUC per exercise session.
AUCavg = ∑ ∑ (𝐻𝐻𝐻𝐻𝑙𝑙1
𝑠𝑠1 ij −𝐻𝐻𝑅𝑅𝑅𝑅𝑅𝑅𝑅𝑅𝑅𝑅𝑅𝑅 𝐻𝐻𝐻𝐻) / s
Where s is the number of sessions the participant exercised; l = is the total number of
seconds in a session; HRij is the heart rate (in beats per second) at the jth second of the ith session,
for a given subject.
In cases (n=3) where a participants reported completing an exercise session but no data
were recovered for that day in the participants’ Polar Flow account, the missing length and
intensity of the exercise session were imputed as the average across the subjects’ observed
sessions.
Figure 1. Graphical representation of an exercise session. The AUC is represented by the
area contained within the black outline. The black horizontal line represents the resting HR.
45
Statistical Analysis
Descriptive statistics of demographic and training data were computed, and all variables
were examined for distribution prior to analysis. Change scores from week 0 to week 6, week 0 to
week 3 and week 3 to week 6 were calculated for each of the clinical outcomes (state anxiety, trait
anxiety, quality of life). Indices of exercise volume (AUCsum, AUCavg), were calculated for the
first three weeks and the second three weeks of training. Nonparametric correlations were
calculated between:
- indices of exercise volume for the first three weeks of training and week 0 to week 3 change
scores in clinical outcomes (model 1);
- indices of exercise volume for the second three weeks of training and week 3 to week 6
change scores in clinical outcomes (model 2);
- indices of exercise volume for the six weeks of training and week 0 to week 6 change
scores in clinical outcomes (model 3).
Correlations were adjusted by Bonferroni correction for multiple comparisons (significant if
p<.0016).
3.3 Results
Sample characteristics and adherence
14 participants enrolled in the study, of these, 3 dropped out prior to beginning the exercise
protocol, and the remaining 11 (2 males and 9 females aged 25.05±2.83 years, BMI 23.95±4.28)
completed the training program and the study assessments. Reasons for non-participation included
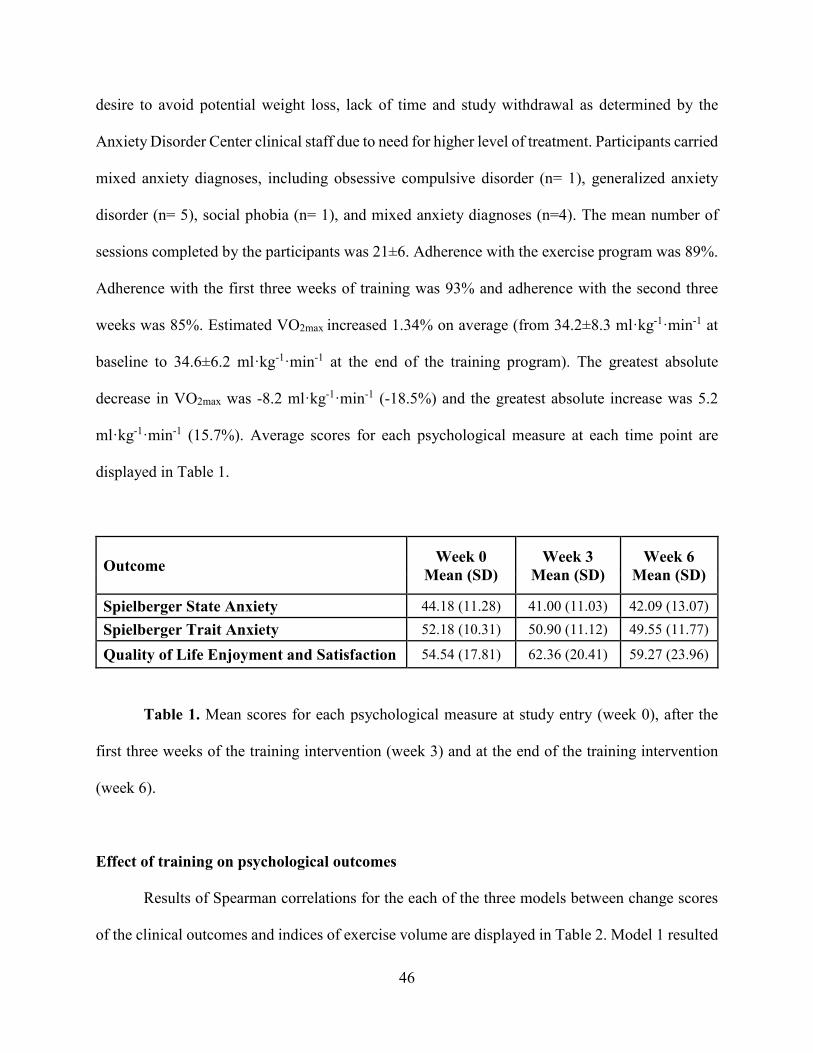
46
desire to avoid potential weight loss, lack of time and study withdrawal as determined by the
Anxiety Disorder Center clinical staff due to need for higher level of treatment. Participants carried
mixed anxiety diagnoses, including obsessive compulsive disorder (n= 1), generalized anxiety
disorder (n= 5), social phobia (n= 1), and mixed anxiety diagnoses (n=4). The mean number of
sessions completed by the participants was 21±6. Adherence with the exercise program was 89%.
Adherence with the first three weeks of training was 93% and adherence with the second three
weeks was 85%. Estimated VO2max increased 1.34% on average (from 34.2±8.3 ml·kg-1·min-1 at
baseline to 34.6±6.2 ml·kg-1·min-1 at the end of the training program). The greatest absolute
decrease in VO2max was -8.2 ml·kg-1·min-1 (-18.5%) and the greatest absolute increase was 5.2
ml·kg-1·min-1 (15.7%). Average scores for each psychological measure at each time point are
displayed in Table 1.
Outcome Week 0 Mean (SD)
Week 3 Mean (SD)
Week 6 Mean (SD)
Spielberger State Anxiety 44.18 (11.28) 41.00 (11.03) 42.09 (13.07) Spielberger Trait Anxiety 52.18 (10.31) 50.90 (11.12) 49.55 (11.77)
Quality of Life Enjoyment and Satisfaction 54.54 (17.81) 62.36 (20.41) 59.27 (23.96)
Table 1. Mean scores for each psychological measure at study entry (week 0), after the
first three weeks of the training intervention (week 3) and at the end of the training intervention
(week 6).
Effect of training on psychological outcomes
Results of Spearman correlations for the each of the three models between change scores
of the clinical outcomes and indices of exercise volume are displayed in Table 2. Model 1 resulted
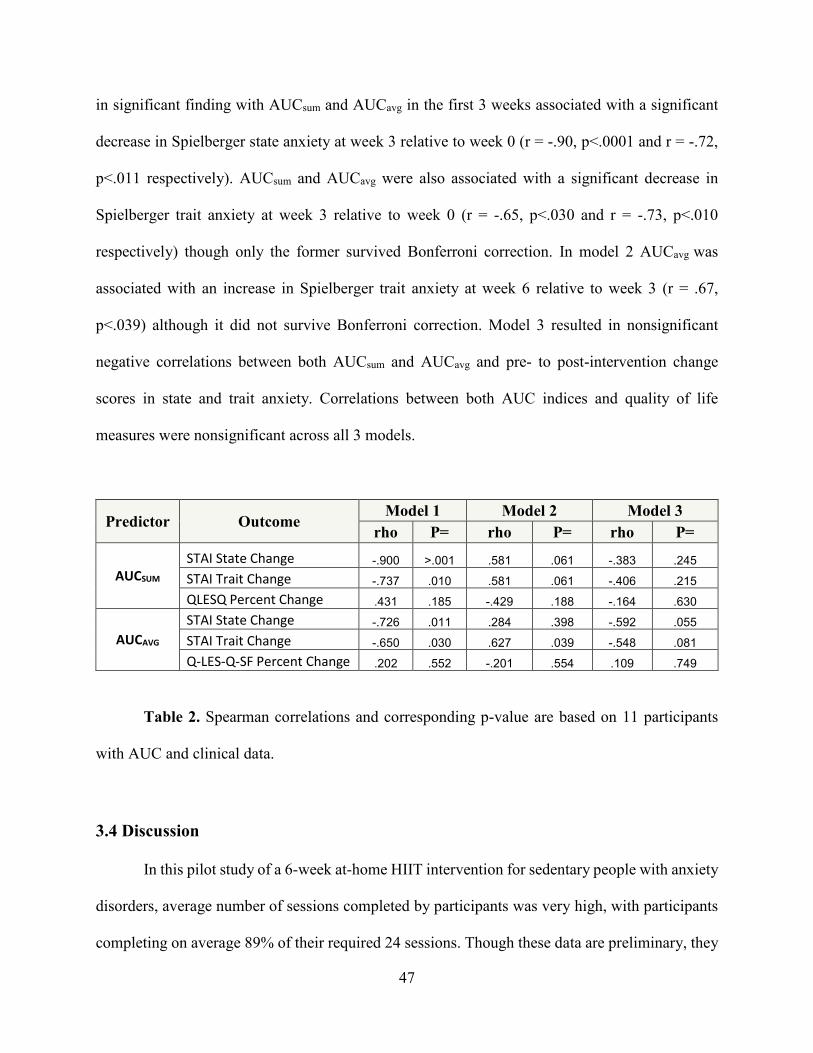
47
in significant finding with AUCsum and AUCavg in the first 3 weeks associated with a significant
decrease in Spielberger state anxiety at week 3 relative to week 0 (r = -.90, p<.0001 and r = -.72,
p<.011 respectively). AUCsum and AUCavg were also associated with a significant decrease in
Spielberger trait anxiety at week 3 relative to week 0 (r = -.65, p<.030 and r = -.73, p<.010
respectively) though only the former survived Bonferroni correction. In model 2 AUCavg was
associated with an increase in Spielberger trait anxiety at week 6 relative to week 3 (r = .67,
p<.039) although it did not survive Bonferroni correction. Model 3 resulted in nonsignificant
negative correlations between both AUCsum and AUCavg and pre- to post-intervention change
scores in state and trait anxiety. Correlations between both AUC indices and quality of life
measures were nonsignificant across all 3 models.
Predictor Outcome Model 1 Model 2 Model 3
rho P= rho P= rho P=
AUCSUM STAI State Change -.900 >.001 .581 .061 -.383 .245 STAI Trait Change -.737 .010 .581 .061 -.406 .215 QLESQ Percent Change .431 .185 -.429 .188 -.164 .630
AUCAVG STAI State Change -.726 .011 .284 .398 -.592 .055 STAI Trait Change -.650 .030 .627 .039 -.548 .081 Q-LES-Q-SF Percent Change .202 .552 -.201 .554 .109 .749
Table 2. Spearman correlations and corresponding p-value are based on 11 participants
with AUC and clinical data.
3.4 Discussion
In this pilot study of a 6-week at-home HIIT intervention for sedentary people with anxiety
disorders, average number of sessions completed by participants was very high, with participants
completing on average 89% of their required 24 sessions. Though these data are preliminary, they

48
indicate that at-home HIIT with remote oversight may be an effective intervention framework for
people with anxiety disorder. While further study with larger sample size is clearly needed to
elucidate the clinical efficacy of this training program, specific insights provided by these data
about adherence and affect score change are discussed below.
Adherence and attrition
Consistent exercise is a behavior change that is notoriously difficult to implement and this
study adds needed experimental data on adherence to HIIT regimens for individuals with anxiety
disorders. The high level of adherence in the present study may have been due to the accessibility
of this at-home HIIT intervention that reduced some common barriers to exercise training. The 18-
minute length of training sessions combined with weekly coaching contact used in the current
protocol is consistent with other data identifying factors likely to improve adherence. For example,
in a meta-analysis of adherence to exercise protocols of varying lengths Linke et al., identified a
wide range of attrition rates (7-58%), but the authors note that studies prescribing shorter bursts of
activity throughout the day that also included behavioral support components showed lower rates
of dropout than more traditionally-prescribed sustained exercise of 20 minutes or longer (Linke et
al., 2011). Nonetheless, two participants in this pilot study did have difficulty maintaining
consistency with HIIT sessions over the full 6-week period (one participant completed only 6
exercise sessions and the other participant 12 exercise sessions), indicating that further problem
solving might be needed to support adherence (such as addition of a portable protocol for when
participants may be away from home and thus from their stepper equipment).
49
Anxiety
Though our small sample size limits conclusions that can be drawn about associations
between this HIIT protocol and reduction in anxiety scores, it is notable that associations were
found between AUCsum and changes in state and trait anxiety at week 3, as well as associations
between AUCavg and changes in state anxiety at the same time point. Unfortunately, no significant
associations between any AUC measures and anxiety scores were found at week 6. The presence
of a negative association between AUC indices and anxiety measures at week 3, is consistent with
Plag’s studies of HIIT in participants with both general anxiety disorder (Plag et al., 2020) and
panic disorder in which increases in exercise capacity were positively correlated with clinical
improvements after just 12 days of HIIT training (Plag et al., 2019). In the current study. it is
unclear why, after the initial reduction at 3 weeks, state and trait anxiety scores after 6 weeks did
not remain significantly lower than baseline, but one possible explanation could be the slight
decline in adherence rate between the first and second halves of the intervention.
Though we did not collect any data on anxiety sensitivity for the current study, we offer
the hypothesis that the exercise-based desensitization to uncomfortable bodily sensations such as
increased heart and breathing rates common in anxiety disorders could be achieved in less than 6
weeks, mirroring or coupling with the accelerated rate of conditioning that HIIT is known to
produce (MacInnis & Gibala, 2017). Though the current study did not assess participants’ ratings
of physical discomfort while exercising, somatic anxiety symptom desensitization effects
associated with HIIT could be assessed in future studies using a measure of anxiety sensitivity at
each timepoint (such as the anxiety sensitivity index; (Broman-Fulks et al., 2004)). It may also be
that HIIT offered without additional anxiety-reduction therapies can produce some measure of
50
relatively rapid physiological and behavioral adaptation but that additional psychotherapeutic
intervention is needed to support robust and long-lasting anxiolytic effects after 3 weeks of HIIT
and beyond.
Finally, it may be that the affective and somatic responses associated with HIIT may vary
by diagnosis. For example, reduction in anxiety sensitivity from exposure to uncomfortable
exercise sensations via HIIT may be more relevant for those with panic disorder than those
suffering from social anxiety, given that anxiety sensitivity can be higher in individuals who
experience panic relative to those who experience social anxiety without panic (Khakpoor, 2019;
Scott, Heimberg, & Jack, 2000). Given that the present sample was diagnostically heterogeneous,
it is not possible to discern whether HIIT produced different benefits for some anxiety disorders
relative to others.
Quality of Life
Exercise is a behavior that has the potential benefit in additional areas of health and
functioning beyond the anxiety symptomatology assessed by the Q-LES-Q-SF. It is well-known
that individuals with anxiety disorders tend to score lower on quality-of-life ratings than
individuals without these diagnoses (Henning, Turk, Mennin, Fresco, & Heimberg, 2007). The Q-
LES-Q-SF has been used in some anxiety intervention studies to track participants’ experiences of
psychotherapy or psychotropic medication trial success (e.g. (Wyrwich et al., 2009)), in addition
to assessing changes in the typical measures of clinical anxiety. The current sample’s lack of Q-
LES-Q-SF change at either week 3 or 6 suggests that HIIT alone may be insufficient for long-term
anxiety symptom reduction in a diagnostically heterogeneous sample. Future studies should
51
continue assessing changes in subjective quality of life associated with HIIT in people with anxiety
disorder, including possible limitations of relying on HIIT alone in changing this important clinical
outcome.
Strengths and limitations
This pilot study of primarily young adults diagnosed with one of four types of anxiety
disorders showed that an intervention like this one is feasible. The small sample size limited our
ability to detect effects of exercise on affect measures, although it did reveal some potential
benefits of exercise. This was a select group of volunteer participants who accessed care through
the Anxiety Disorders Center of the New York Psychiatric Institute, so these participants may be
more motivated for both clinical change and physical activity than the larger population of people
with anxiety disorders. The single group no control group design introduced a number of potential
threats to the internal validity of the study, thus reducing confidence in the conclusions that can be
made. Future studies of HIIT in people with anxiety disorders should include assessments such as
anxiety sensitivity, overall quality of life, and physical activity behavior change to deepen insights
into possible clinical change mechanisms that this intervention format provides.
3.3 Conclusion
This pilot study was a unique application of an at-home HIIT protocol for people with
various anxiety disorders, a population at greater risk for adverse health effects and with specific
barriers to accessing regular exercise. The high rate of adherence is promising initial evidence that
an at home HIIT protocol may be an effective intervention framework that reduces barriers faced
by people with anxiety disorders to achieving the health benefits of exercise training. The AUC
52
indices presented here represent an accessible and accurate way to track volume of exercise
completed during the exercise intervention and to assess the dose response exercise-induced health
benefits. Because participants were able to upload the HR data collected during training remotely
to a cloud server after each session for review by a research team, they could receive feedback and
coaching aimed at strengthening fidelity to the intervention with minimal research staff time
investment after the initial equipment set up and training.
53
Chapter 4
Home-Based Exercise Training When You Can’t Leave the House: Promoting Physical Activity in Postpartum Women
Abstract Purpose: The primary aim of this study was to establish potential efficacy and feasibility of a
home-based high intensity interval training (HIIT) exercise intervention with remote
administration, monitoring, and testing in insufficiently active postpartum women. In particular,
data were collected about the quality and quantity of exercise performed remotely and to test the
hypothesis that the volume of exercise completed during the HIIT program will produce an
improvement in cardiorespiratory fitness, circulating inflammatory markers, cardiac autonomic
control, and dysphoric affect. The secondary aim was to provide further evidence for the
feasibility, practicality and validity of a novel index representing the total volume of exercise
completed during the training intervention.
Methods: 15 insufficiently active postpartum women enrolled in the study, of whom 2 dropped
out prior to beginning the exercise intervention; the remaining 13 were randomized (two to one
ratio) to either a 6-week, 4 days/week HIIT program, starting 6-8 weeks after delivery, or usual
care Each exercise session was completed with a stepper machine and included 5 minutes of warm
up, 5 minutes of cool down and a progressive HIIT program (20/40 sec ratio - target HR 85% of
estimated HR peak) of 8 to 15-minutes duration. At baseline and at the end of the training
intervention, participants completed a submaximal cardiorespiratory fitness test and assessment of
anthropometrics and blood pressure. Self-report questionnaires about mood and readiness to
exercise were completed. Lastly, participants provided blood samples and collected their ECG for
54
a 24-hour period. During each training session, HR was recorded at 1 sample/sec, creating a HR
curve for each session. Volume of exercise performed during the exercise intervention was
summarized using the area under the HR curve (AUC) into an index representing the total volume
of exercise performed (AUCsum). Change scores from pre- to post-intervention were calculated for
all the study outcomes. The Mann-Whitney U test was performed to compare the distribution of
scores on quantitative response variables across exercise intervention vs. usual care groups.
Spearman’s correlations were used to assess the relationship between estimated VO2max and
AUCsum and between the study outcomes, and either estimated VO2max or AUCsum.
Results: Participants completed 80.23±26.59% of the expected exercise sessions and adherence
to the prescribed HIIT regimen was 73.35±33.06%. Aerobic capacity in the exercise group
improved while in the usual care group, it slightly decreased (+2.29 (.23, 10) and -1.35 (-6.41, 2.7)
ml·kg-1·min-1 respectively). There was no difference between the exercise and usual care group in
the distribution of the change scores of the physiological outcomes (anthropometry, blood
pressure, cardiac autonomic regulation and inflammatory markers), with the exception of heart
rate recovery (HRR) at 120 seconds (Mann–Whitney U = 2, p = .048). Both HRR at 60 and 120
seconds following the cessation of the submaximal exercise test exercise improved in the exercise
group compared to the usual care group. AUCsum was inversely correlated with post-intervention
changes in systolic blood pressure (r = - .717, p =.003) and post-intervention changes in two
inflammatory markers (IL-1β, r = -.70, p = .036 and HMGB1, r = -.72, p = .03). Like with the
physiological outcomes, results from the Mann-Whitney U test indicated that there were no
differences between the exercise and usual care group in the distribution of the mood and exercise
readiness change scores. Although not statistically significant, the exercise group experienced
55
slight decreases in depression (as measured by the BDI-II), stress, and trait anxiety. In contrast,
depression (as measured by the CES-D) and trait anger slightly increased but did not reach
statistical significance. By the end of the intervention, participants in the usual care group
experienced a slight non-significant increase in all the mood outcomes. AUCsum and change in
estimated VO2max were not significantly associated with changes in any of the mood outcomes.
Conclusions: Contrary to larger literature documenting the difficulties of accessing or adhering to
exercise during the postpartum period, we have demonstrated that an exercise intervention can be
delivered effectively and physiological gains can be achieved. Moreover, new mothers are juggling
physiologic transitions, role transition, caregiver duties and burden, possibly transitioning back to
work after a maternity leave, all of which can affect psychological variables and feasibility of
exercise. Although conjectural, it is plausible that in this pilot study, these elements of context
over which new mothers may lack control attenuated some of the exercise-related physiological
and psychological health benefits. Improvements in estimated VO2max were not significantly
associated change score of any of the study outcomes. Total volume of exercise performed was
significantly correlated with improvements in physiological outcomes that have significant
prognostic value for the future health of the new mother. The principal limitation of the study was
its small sample size. The failure to detect significant effects on the outcome measures is likely
due to small sample size and wide variability in outcome measures. Nonetheless, some outcomes
achieved significance in the predicted direction and others showed the expected effects but were
not significant, suggesting a larger sample size is needed.
56
Introduction
COVID-19 Pandemic and Physical Activity Evidence demonstrating the association of physical activity (PA) with decreased risk of mortality
and morbidity is overwhelming (Ekelund et al., 2019). There is irrefutable evidence of the
association between regular PA and the primary and secondary prevention of several chronic
diseases (2018 Physical Activity Guidelines Advisory Committee, 2018; D. E. Warburton, Nicol,
& Bredin, 2006), including a clinically meaningful positive association between exercise and
mental health (Chekroud et al., 2018; Choi et al., 2019; McIntyre et al., 2020).
Most commonly, PA is undertaken outside the home, sometimes in fitness centers and public
spaces, e.g., city parks and playgrounds. However, participation in PA is subject to a variety of
factors that either promote or impede it (Sherwood & Jeffery, 2000). Barriers to PA have become
highly salient during the COVID-19 pandemic and the shelter-in-place mandates and associated
lockdown of fitness centers (Farah et al., 2021; Nienhuis & Lesser, 2020). Simply because of the
prevalence of COVID-19 or, additionally, because of public health efforts to mitigate the virus by
social distancing and lockdowns, levels of PA during the pandemic have fallen dramatically. For
example, within 10 days of the announcement of COVID-19 as a global pandemic, there was a
5.5% decrease in mean steps (287 steps), and within 30 days, there was a 27.3% decrease in mean
steps (1432 steps) in a sample of people using wearable device across cities worldwide (Tison et
al., 2020). The global trend for a dramatic reduction of PA during the COVID-19 pandemic led
the WHO and other health agencies to release guidelines underscoring the importance of remaining
physically active during pandemic-related quarantines and self-isolation periods for those without
symptoms or a COVID-19 diagnosis (Chtourou et al., 2020). In addition to imposing limitations
57
on PA, confinement to home also promotes social isolation and loneliness (Mattioli, Sciomer,
Cocchi, Maffei, & Gallina, 2020), well established as risk factors for excess morbidity and
mortality (Elovainio et al., 2017). Quarantine also induces increases in dysphoric affect including
depression, anxiety, anger, and stress (Mattioli et al., 2020), which also are associated with
elevated risk of excess morbidity and mortality.
However, COVID-19-related shelter-in-place mandates are not the only reason why people may
be largely confined to home. Those with illnesses or significant disabilities, caregivers of the
elderly, postpartum women caring for newborns or men and women caring for young children may
experience limitations on leaving home and as such may be similarly restricted in their ability to
leave home and engage in PA.
Home-Based Training
Programs that overcome barriers to PA have substantial value, and one such approach with
considerable promise is home-based exercise training. Home-based programs vary considerably
in their structure and delivery method (e.g., written instructions, multimedia, internet-based
programs or apps on smartphones). Studies of home-based exercise programs in a wide range of
participants have yielded promising support for home-delivered physical activity interventions.
For example, in a trial contrasting a home-based exercise program, a site-based supervised
program, and a usual care condition in patients with peripheral artery disease, the home-based
program produced improvements in claudication comparable to the supervised program and a
greater improvement in daily ambulatory activity compared to the supervised program (Gardner,
Parker, Montgomery, Scott, & Blevins, 2011). Kraal et al. randomized 90 low-to-moderate cardiac
58
risk patients entering cardiac rehabilitation to three months of either home-based training with
telemonitoring guidance or center-based training. The authors found no differences between the
two groups on physical fitness, physical activity level or health-related quality of life. However,
home-based training was associated with a higher patient satisfaction and appeared to be more
cost-effective than center-based training (Kraal et al., 2017). In a community-based clinical trial,
167 women and 197 men 50 to 65 years of age who were sedentary and free of cardiovascular
disease were randomized to either 1) higher-intensity group-based exercise training; 2) higher-
intensity home-based exercise training; 3) lower-intensity home-based exercise training; or 4)
assessment-only control. At the end of the intervention (12 months) subjects in all three exercise
training conditions showed significant improvements in treadmill exercise test performance when
compared with controls. Furthermore, exercise adherence rates were better for the two home-based
exercise training conditions relative to the group-based exercise training condition (King, Haskell,
Taylor, Kraemer, & DeBusk, 1991). Lastly, a systematic review aimed at assessing the
effectiveness of 'home based' versus 'center based' physical activity programs on the health of older
adults reported a greater adherence in home-based exercise programs compared to group
supervised exercise programs (Ashworth, Chad, Harrison, Reeder, & Marshall, 2005).
Home-based exercise training has multiple advantages over site-based programs. It reduces the
selection bias in favor of inclusion of highly motivated patients and increases access to vulnerable
populations in need of PA benefits, can be continued in the long-term, is less expensive, and offers
more flexibility in scheduling sessions. Home-based programs also reduce the primary barriers to
participation in site-based training: transportation, parking availability, out-of-pocket costs, poor
59
health, and interference with domestic responsibilities as well as social and work obligations
(Hwang & Marwick, 2009; Jones et al., 2007).
Evidence suggests that exercise interventions in which participants are in contact with trainers for
guidance, problem-solving, and motivation have higher adherence to the training regimen
compared with ones where no support is provided (Lacroix et al., 2016; Sinden, 2001). This is
especially important for long-term exercise interventions where direct contact with a trainer may
be a key factor in enhancing long-term motivation (K. L. Cox, Burke, Gorely, Beilin, & Puddey,
2003). Recent advances in telecommunications and wearable devices may offset the disadvantage
of lack of in person supervision in home-based interventions. Exercise training can be monitored
by activity trackers and heart rate monitors that permit remote confirmation of participant’s
participation in the recommended exercise and allow for more accurate assessment of daily levels
of physical activity. Devices such as these can upload data to cloud servers for remote evaluation
by trainers, even in real time. Telecommunication programs, such as Zoom, allow individuals who
exercise at home to receive real time training supervision. Evidence supports the value of such
remotely monitored training. For example, a home-based cardiac rehabilitation program with
telemedicine guidance was just as effective in improving aerobic capacity as a center-based
program and more effective than a usual care condition (Avila et al., 2018). Although the evidence
for the health benefits of physical activity is overwhelming, multiple impediments contribute to
low levels of physical activity, especially those that make it difficult to leave home. Home-based
exercise programs can overcome many of these obstacles.
60
Health Benefits of Exercise in the Postpartum Period
Women in general are less active than male counterparts at all ages. A global analysis published
in The Lancet Global Health, in 2018, found that women are less active than men across most
countries (global average of 31.7% for inactive women vs 23.4% for inactive men) (Guthold,
Stevens, Riley, & Bull, 2018). Pregnancy and the transition to parenthood are major life change
events associated with decreased PA. A systematic review aimed at evaluating the changes in
women’s physical activity before and during pregnancy and the postnatal period concluded that
compared to pre-pregnancy, the a magnitude of decrease in PA occurred over the course of
pregnancy and postnatally, and the types of activities engaged in tend to be of lesser intensity than
pre-pregnancy (Abbasi & Van den Akker, 2015). Similar findings have been found in other studies.
In a longitudinal study, becoming a parent was associated with a slight decrease in PA compared
to not becoming one (Corder et al., 2020). In the year following childbirth, women are less likely
to adhere to exercise targets recommended by consensus guidelines (Gilinsky et al., 2015) and
having children under 5 years of age is inversely associated with exercising (Berge, Larson, Bauer,
& Neumark-Sztainer, 2011; Nomaguchi, 2004).
Physical inactivity in postpartum women is associated with musculoskeletal problems, weight
gain, adverse mental health outcomes, and diabetes (Monteiro et al., 2014). Furthermore, retaining
excess weight after childbirth may be especially harmful because it tends to be deposited centrally,
raising the risk of development of chronic disease (Smith et al., 1994).
Evidence demonstrates multiple benefits of exercise during the postpartum period. Physically
active postnatal women are less likely to retain excess weight gained in pregnancy (Olson,
61
Strawderman, Hinton, & Pearson, 2003). PA is also effective in reducing postpartum depression
(Kyle Davis, 2012), in improving mood, sleep and in reducing stress and fatigue (Davenport,
McCurdy, et al., 2018). Postpartum dietary and exercise interventions for women with prior
gestational diabetes have been shown to reduce insulin resistance, diabetes, and cardiovascular
disease risk factors (Phelan, 2016). A supervised training program initiated 6-8 weeks postpartum
significantly increased aerobic capacity and had no adverse effects on lactation or infant growth
in sedentary women exclusively breastfeeding. Women were randomly assigned to an exercise
group (18 women) or a control group (15 women). The exercise program consisted of supervised
aerobic exercise (at a level of 60 to 70 percent of the heart-rate reserve) for 45 minutes per day, 5
days per week, for 12 weeks. Women in the control group were restricted from engaging in aerobic
exercise more than once a week in the same period (Dewey, Lovelady, Nommsen-Rivers,
McCrory, & Lonnerdal, 1994). Other studies report similar findings (Cary & Quinn, 2001;
Lovelady, Nommsen-Rivers, McCrory, & Dewey, 1995; Nguyen et al., 2019). Compared to
women in a usual care control group, postpartum women who were randomized to a tailored
walking program had greater improvements in weight and waist-hip ratio (Maturi, Afshary, &
Abedi, 2011). One meta-analyses on the benefits of physical activity in the post-partum period
concluded that supervised interventions (i.e., exercise class-based) resulted in greater weight loss
compared to unsupervised programs (Nascimento, Pudwell, Surita, Adamo, & Smith, 2014).
However, the studies reviewed in this meta-analysis were conducted before the widespread
availability of current telecommunication platforms and wearable monitors that allow supervision
from a distance. Furthermore, the advantage of supervised programs conducted at fitness facilities
is offset by the need for the financial and childcare resources required for attendance at these
classes. Overall, the evidence of health benefits is so substantial that the US Department of Health

62
and Human Services now recommends physical activity in the postpartum period (Piercy et al.,
2018), as does the Committee on Obstetric Practice of the American College of Obstetrics and
Gynecology: “The postpartum period is an opportune time for obstetrician–gynecologists and
other obstetric care providers to recommend and reinforce a healthy lifestyle” (p. e185, ("Physical
Activity and Exercise During Pregnancy and the Postpartum Period: ACOG Committee Opinion,
Number 804," 2020)).
Focusing on mothers of newborns offers the opportunity for a proof-of-principle study with the
potentially much wider relevance of a remotely monitored and administered home-based exercise
training program. Such intervention may benefit not only those whose activity is limited by viral
pandemics but also those with significant caregiving responsibilities or those for whom the
requirements of transportation, parking, expense, and time required to engage in exercise training
at a fitness center outside the home simply are too daunting.
The primary aim of this study is to establish feasibility of a home-based high intensity interval
training (HIIT) exercise intervention with remote administration, monitoring, and testing in
insufficiently active postpartum women. The secondary aim is to provide further evidence for the
feasibility, practicality and validity of a novel index of volume of exercise performed. In particular
data will be used to collect information about the exercise protocol performed remotely and to test
the hypothesis that the volume of exercise completed during the HIIT program will produce a
significant improvement in aerobic capacity, circulating inflammatory markers, cardiac autonomic
control, and dysphoric affect.
63
Methods Participants Participants were recruited using word of mouth, web posts on social media, or through the clinical
research team of the Department of Obstetrics and Gynecology of Columbia University Irving
Medical Center. The New York State Psychiatric Institute Institutional Review Board approved
the study protocol (#8055), and each participant provided informed consent and medical clearance
to exercise. Inclusion criteria were (a) age 18-45 years, (b) healthy singleton pregnancy, (c) six to
30 weeks after uncomplicated vaginal delivery or cesarean birth, (d) insufficiently active and (e)
BP within the normotensive range (90-140 mmHg for systolic and 50-90 mmHg for diastolic).
Exclusion criteria were (a) postpartum depression, (b) illicit drug use and (c) acute medical illness.
The Godin-Shepard leisure-time physical activity questionnaire (Amireault & Godin, 2015) was
used to classify participants as active (score >14) and insufficiently active. Only those with Godin
scores of < 14 were eligible to participate. The Edinburgh Postnatal Depression Scale (EPDS) (J.
L. Cox, Holden, & Sagovsky, 1987) was used to rule out current postpartum depression. Potential
participants who scored ≥9 were excluded from participating and offered referrals to appropriate
mental health services.
Participants received $140 for participation in the study and were allowed to keep some of the
testing equipment and the fitness equipment they used at home as part of the study compensation.
To encourage adherence, participants randomized to the exercise group who completed at least
85% of the training sessions received a $50 bonus. Usual care participants received $50 if they
64
refrained from exercising during the six-weeks intervention. Also, they received the fitness
equipment at the end of their participation in the study.
Study Procedures Run-in Period After providing informed consent and determination of eligibility, participants received a Polar
HR sensor (model H9, Polar Electro, Kempele Finland) and a Polar HR monitor (model Unite,
Polar Electro, Kempele Finland) together with detailed written instructions on the use of the
devices, in particular on how to record the exercise sessions and how to upload their HR data using
the Polar Flow app and the Polar server (hhtp://flow.polar.com). Participants were also provided
with a stretching guide, and they were asked to complete four 30 minutes stretching sessions in a
one-week period. Participants’ adherence to this run-in period was measured through the HR
monitor data. Only those who completed at least three exercise sessions were permitted to continue
in the study.
Anthropometry and Blood Pressure Assessment
Participants who successfully completed the run-in period received an Etekcity digital body weight
bathroom scale (Vesync Co., Ltd), an Omron Bronze blood pressure monitor (Omron Healthcare,
Inc.), a MyoTape body measure tape (Accufitness, LLC) and a 12” plyometric box (Retrospec),
all shipped directly to their homes. After receiving the equipment, participants completed the
anthropometric and blood pressure assessments. To guarantee fidelity to the designed procedures,
all the measurements were completed over a video call with the Zoom application and under the
guidance of a research staff member. Weight was measured with participants wearing light clothes,
65
waist circumference was measured at the level of the umbilicus and hip circumference was
measured at the maximal protuberance of the buttocks. Blood pressure was measured with the
participant seated and feet flat on the ground. After five minutes, three blood pressure measurement
were taken with two-minute intervals between them.
Exercise Tests
Within a week after completing the anthropometric and blood pressure assessments, participants
completed an exercise test over a video call with the Zoom application. A submaximal
cardiorespiratory fitness test (Kevin S., 2004) was used to estimate the participant’s aerobic
capacity and exercise tolerance. The test was conducted using a 12” plyometric box and an audio
recording with instructions and timed metronome rhythms. Resting HR was recorded on the Polar
device with the participant quietly seated on the plyometric box for five minutes. The participant
listened to the test instructions and commenced stepping to the metronome beat at 15 steps per
minute for 2-minutes, following which HR and ratings of perceived exertion (RPE) (Borg, 1998)
were recorded (Test Level 1). The step rate then increased to a second 2-minute stage at 20 steps
per minute and HR and RPE were again be recorded (Test Level 2). The test continued with
additional 2 min stages and heart rate measurements, with increasing the step rate by 5 steps/min.
The step test was terminated when the participant reached the stage where a heart rate of >80% of
their predicted maximal heart rate (220-age) was achieved. Additional test termination criteria
included overt signs of distress and an RPE >17. As per the test protocol, the test duration did not
exceed 10 minutes (i.e., Test Level 5). The participants then returned to the seated position as soon
as the test was terminated and their HR was collected at one and two minutes. Participants were
monitored until their HR returned to near pre-exercise levels.

66
After a 5-minute rest, participants completed a Sit to Stand Test (C J Jones, 1999). For this test,
the participant was asked to sit with a straight back in the middle of the plyometric box with arms
crossed at the wrists and held against the chest, with their feet approximately shoulder width apart
and placed on the floor. At the starting signal the participant was encouraged to complete as many
full stands as possible within 30 seconds, while maintaining a proper form. Repetitions were
counted as number of full sits between each stand.
Blood Sample Collection and 24-hours ECG Recording
After completing the exercise tests, participants were sent a Mitra® dried blood collection kit
(Neoteryx, LLC) and an ECG necklace (Maastricht Instruments BV) directly to their homes. The
Mitra dried blood collection kit contained all the necessary material for remote sampling of 180
µL of blood, shipping, and storage. This includes an instructional video which guided the
participants through the procedure of completing a valid blood sample. Participants randomized to
the exercise group completed the post-intervention blood collection at least 24 hours after the last
exercise session. The ECG necklace is a small wearable device worn on the surface of the skin that
records a single channel of ECG at 400 Hz and stores these data continuously on the device.
Participants were instructed to complete the first 20 minutes of the ECG collection in the supine
position. After completing the assessments, the participants returned both devices to research staff
using a prepaid mailer. The Mitra® dried blood collection kits were placed in a -80 freezer as soon
as they were delivered to research staff.
67
Mood Inventory Assessments
Before being randomized, participants were asked to complete some self-report questionnaires
online. Depression was measured using the Beck Depression Inventory version 2 (BDI-II) (Beck
AT, 1996), a 21-item self-report scale with a total score ranging from 0 to 63. Each item is
representative of a particular symptom of depression and corresponds to a diagnostic criteria listed
in the Diagnostic and Statistical Manual of Mental Disorders (American Psychiatric Association,
2013). Total score is characterized as minimal depression (0 to 13), mild depression (14 to 19),
moderate depression (20 to 28) and severe depression (29 to 63). Research using the BDI-II has
provided support for clinically-meaningful continuity between subclinical and clinical depression
constructs (Enns, Cox, & Borger, 2001; Judd, Rapaport, Paulus, & Brown, 1994).
Depression was also assessed with the Center for Epidemiological Studies-Depression (CES-D),
a 20-item scale with a total score range from 0 to 60. The CES-D provides a cutoff score (16 or
greater) that aids in identifying individuals at risk of clinical depression. This scale is sensitive to
changes in caregiver depressive symptoms after intervention (Pinquart & Sorensen, 2003). The
recall period for the BDI-II is 2 weeks and for the CES-D is one week. Though the BDI-II and
CES-D are often highly correlated, administering both of these well-validated measures (and their
respective subscales) in the current study was planned to ensure reliable and nuanced tracking of
this important postpartum mood outcome.
Anxiety was measured using the trait anxiety subscale of the Spielberger Trait Anxiety Inventory
(STAI) (Spielberger CD, 1970), a 20-item scale with a range from 20 to 80, designated to assess

68
the predisposition to react with anxiety in stressful situations. The STAI is commonly used to
assess sub-clinical changes in anxiety in exercise studies (e.g. (Conn, 2010).
Stress was measured using the Perceived Stress Scale, (PSS-14) (Cohen, Kamarck, &
Mermelstein, 1983) a widely-used psychological instrument measuring the perception of stress. It
consists of 14 items covering the preceding month. The score range is 0 to 56, with higher scores
indicating greater perceived stress. The PPS-14 is not a diagnostic instrument, and therefore there
are no cutoff scores. How often feeling angry was perceived over time was measured with the
Spielberger Trait Anger Inventory (STAI) (C. Spielberger, 1988), a 10 items scale with score range
from 10 to 40.
Exercise Readiness Assessment
Participants also completed the Decisional Balance Exercise Scale (Nigg CR, 1998), a 10 item
scale that measures positive (score range 5 to 25) and negative (score range 5 to 25) aspects of
decisions to exercise during leisure time. This scale follows the transtheoretical model of change,
with higher scores representing more subjectively-perceived benefit.
The Cognitive Behavioral Physical Activity Questionnaire (Schembre, Durand, Blissmer, &
Greene, 2015) is a 15 questions questionnaire that assesses, through three subscales, multiple
social and cognitive constructs to explain physical activity behavior. The first construct is outcome
expectation and is defined as the expectation that participation in physical activity will produce
positive and wanted results, including increased energy, sense of accomplishment, mood
improvements and stress relief, and feeling good physically. The second construct is self-
69
regulation and represents the self-regulatory actions used to maintain regular PA, including relapse
prevention strategies, making commitments and goals, prioritizing and contingency planning. The
last construct is personal barriers and is defined as the perceived barriers preventing the initiation
or maintenance of regular PA, including personal distractions, lack of time, lack of interest, and
lack of motivation. The score range for each construct is 0 to 5 and the total score, calculated as
the difference between the score on personal barriers and the sum of the scores on outcome
expectations and self-regulation, indicate readiness for exercise (higher scores equal greater
readiness).
Childcare Arrangements Scale and Infant Nutritional Questionnaire
Two non-validated questionnaires were used to assess childcare and nutritional data. The Childcare
Arrangements Scale (CAS) is a questionnaire aimed at collecting information regarding childcare
responsibilities. The Infant Nutritional Questionnaire (INQ) is used to collect information
regarding the feeding routine of the newborn. These two questionnaires were completed by the
new mothers at baseline and then biweekly.
High Intensity Interval Exercise Training Protocol and Treatment as Usual
After completing all the baseline tests, participants were randomized to the exercise or to treatment
as usual. A randomization ratio of 2-to-1 was used. Participants randomized to the exercise group
received a folding climbing stepper (Sunny Health & Fitness, Los Angeles, CA) delivered to their
homes. During training, the participant's HR was collected by a Polar heart rate sensor (model H9),
a device that has good validity and reliability when compared with ECG assessment of beat-to-
beat HR during physical activity (Kingsley et al., 2005) and recorded with a Polar HR monitor and
70
fitness tracker (model Unite, Polar Electro, Kempele, Finland). Data were collected at a frequency
of 1 sample/second. After completing each exercise session, participants uploaded the HR data on
the Polar Flow server available to research staff. The training protocol was repeated 4 times per
week for 6 consecutive weeks, giving a total of 24 training sessions. Each training session started
with a 5-minute warm-up period when the stepping rate was gradually increased in order to prepare
the participants for the HIIT part of the protocol. The HIIT protocol compromised 20-second
intervals at 85% (± 5 beats) of the estimated HRmax interspersed with 40 seconds of active recovery
at 50%-60% of the estimated HRmax. Participants completed 8 high-intensity intervals for sessions
1 and 2, 10 high-intensity intervals for sessions 3 and 4, 12 high-intensity intervals for session 5
and 6 and, 15 high-intensity intervals for session 7 to 24. At the end of each HIIT exercise session,
participants completed a 5-minute cool-down period. Total exercise time was 18 minutes for
session 1 and 2, 20 minutes for sessions 3 and 4, 22 minutes for session 6 and 7 and, 25 minutes
for the remaining sessions. Training settings were registered on the Polar Unite. During each
exercise session the participant received prompts from the Polar Unite indicating the beginning
and end of warm up, cool down and each high and low intensity interval. Participants were asked
to take a 24-hour rest-period between each training day.
Exercise Coaching
At consent, each participant was assigned a research assistant coach with training in behavioral
techniques, such as motivational interviewing. During the intervention part of the study,
participants in both groups were regularly contacted either through e-mail, phone call or text
message. Adherence to the study protocol determined the number of contacts, with those less
adherent receiving more contacts. Participants in the treatment as usual group were contacted at
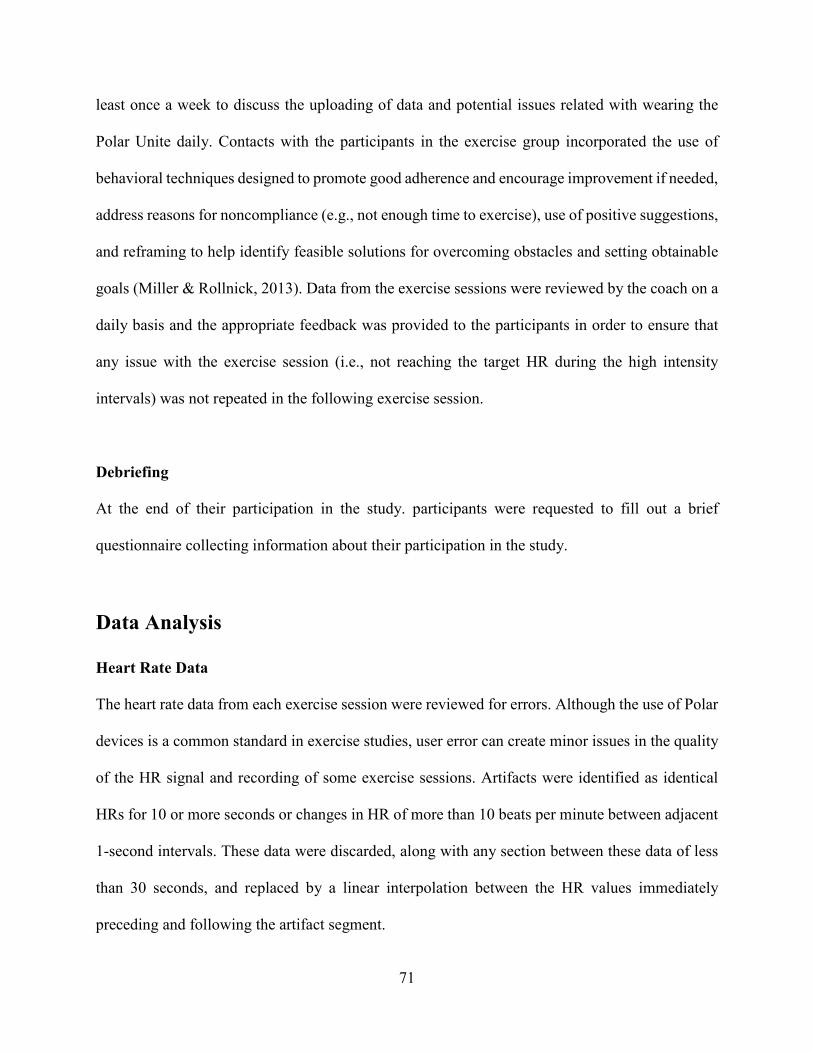
71
least once a week to discuss the uploading of data and potential issues related with wearing the
Polar Unite daily. Contacts with the participants in the exercise group incorporated the use of
behavioral techniques designed to promote good adherence and encourage improvement if needed,
address reasons for noncompliance (e.g., not enough time to exercise), use of positive suggestions,
and reframing to help identify feasible solutions for overcoming obstacles and setting obtainable
goals (Miller & Rollnick, 2013). Data from the exercise sessions were reviewed by the coach on a
daily basis and the appropriate feedback was provided to the participants in order to ensure that
any issue with the exercise session (i.e., not reaching the target HR during the high intensity
intervals) was not repeated in the following exercise session.
Debriefing
At the end of their participation in the study. participants were requested to fill out a brief
questionnaire collecting information about their participation in the study.
Data Analysis
Heart Rate Data
The heart rate data from each exercise session were reviewed for errors. Although the use of Polar
devices is a common standard in exercise studies, user error can create minor issues in the quality
of the HR signal and recording of some exercise sessions. Artifacts were identified as identical
HRs for 10 or more seconds or changes in HR of more than 10 beats per minute between adjacent
1-second intervals. These data were discarded, along with any section between these data of less
than 30 seconds, and replaced by a linear interpolation between the HR values immediately
preceding and following the artifact segment.
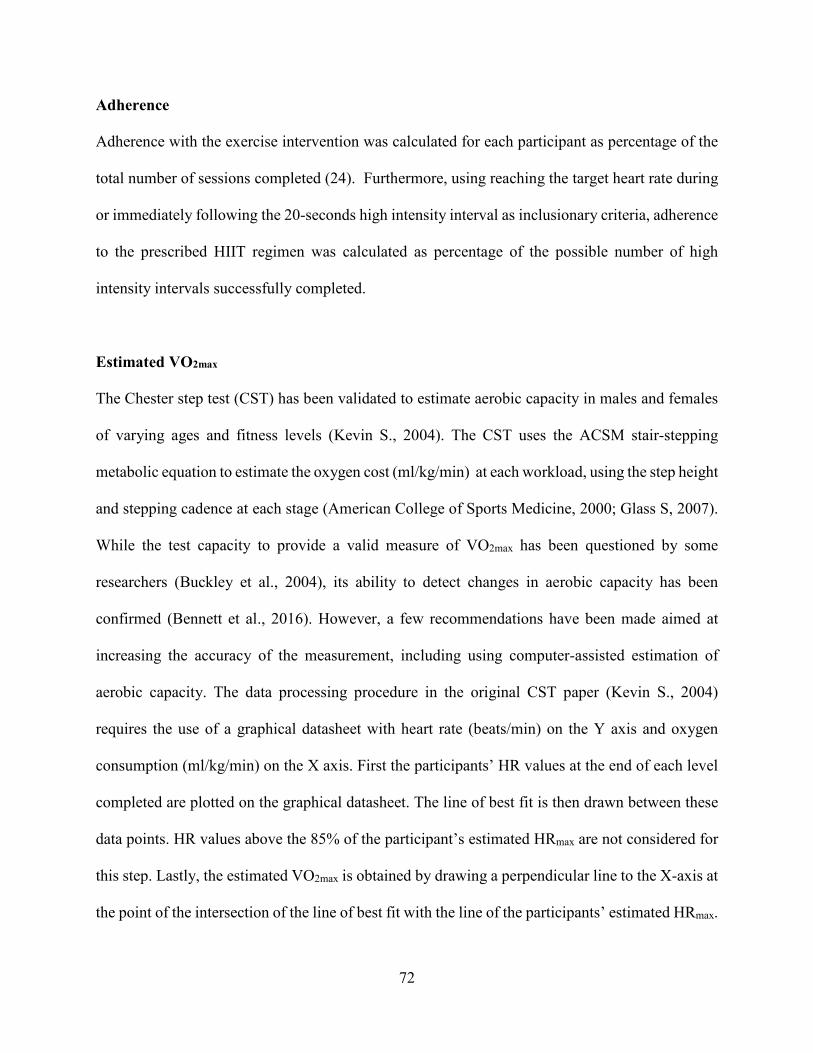
72
Adherence
Adherence with the exercise intervention was calculated for each participant as percentage of the
total number of sessions completed (24). Furthermore, using reaching the target heart rate during
or immediately following the 20-seconds high intensity interval as inclusionary criteria, adherence
to the prescribed HIIT regimen was calculated as percentage of the possible number of high
intensity intervals successfully completed.
Estimated VO2max
The Chester step test (CST) has been validated to estimate aerobic capacity in males and females
of varying ages and fitness levels (Kevin S., 2004). The CST uses the ACSM stair-stepping
metabolic equation to estimate the oxygen cost (ml/kg/min) at each workload, using the step height
and stepping cadence at each stage (American College of Sports Medicine, 2000; Glass S, 2007).
While the test capacity to provide a valid measure of VO2max has been questioned by some
researchers (Buckley et al., 2004), its ability to detect changes in aerobic capacity has been
confirmed (Bennett et al., 2016). However, a few recommendations have been made aimed at
increasing the accuracy of the measurement, including using computer-assisted estimation of
aerobic capacity. The data processing procedure in the original CST paper (Kevin S., 2004)
requires the use of a graphical datasheet with heart rate (beats/min) on the Y axis and oxygen
consumption (ml/kg/min) on the X axis. First the participants’ HR values at the end of each level
completed are plotted on the graphical datasheet. The line of best fit is then drawn between these
data points. HR values above the 85% of the participant’s estimated HRmax are not considered for
this step. Lastly, the estimated VO2max is obtained by drawing a perpendicular line to the X-axis at
the point of the intersection of the line of best fit with the line of the participants’ estimated HRmax.
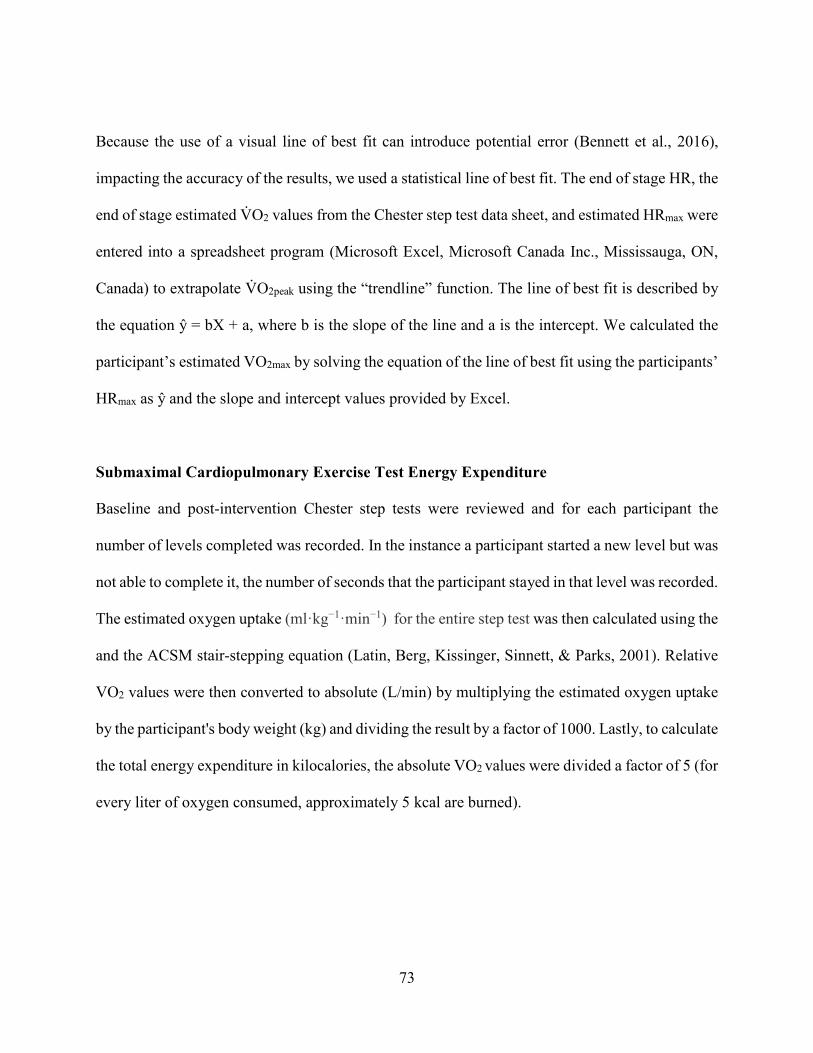
73
Because the use of a visual line of best fit can introduce potential error (Bennett et al., 2016),
impacting the accuracy of the results, we used a statistical line of best fit. The end of stage HR, the
end of stage estimated V̇O2 values from the Chester step test data sheet, and estimated HRmax were
entered into a spreadsheet program (Microsoft Excel, Microsoft Canada Inc., Mississauga, ON,
Canada) to extrapolate V̇O2peak using the “trendline” function. The line of best fit is described by
the equation ŷ = bX + a, where b is the slope of the line and a is the intercept. We calculated the
participant’s estimated VO2max by solving the equation of the line of best fit using the participants’
HRmax as ŷ and the slope and intercept values provided by Excel.
Submaximal Cardiopulmonary Exercise Test Energy Expenditure
Baseline and post-intervention Chester step tests were reviewed and for each participant the
number of levels completed was recorded. In the instance a participant started a new level but was
not able to complete it, the number of seconds that the participant stayed in that level was recorded.
The estimated oxygen uptake (ml·kg−1·min−1) for the entire step test was then calculated using the
and the ACSM stair-stepping equation (Latin, Berg, Kissinger, Sinnett, & Parks, 2001). Relative
VO2 values were then converted to absolute (L/min) by multiplying the estimated oxygen uptake
by the participant's body weight (kg) and dividing the result by a factor of 1000. Lastly, to calculate
the total energy expenditure in kilocalories, the absolute VO2 values were divided a factor of 5 (for
every liter of oxygen consumed, approximately 5 kcal are burned).
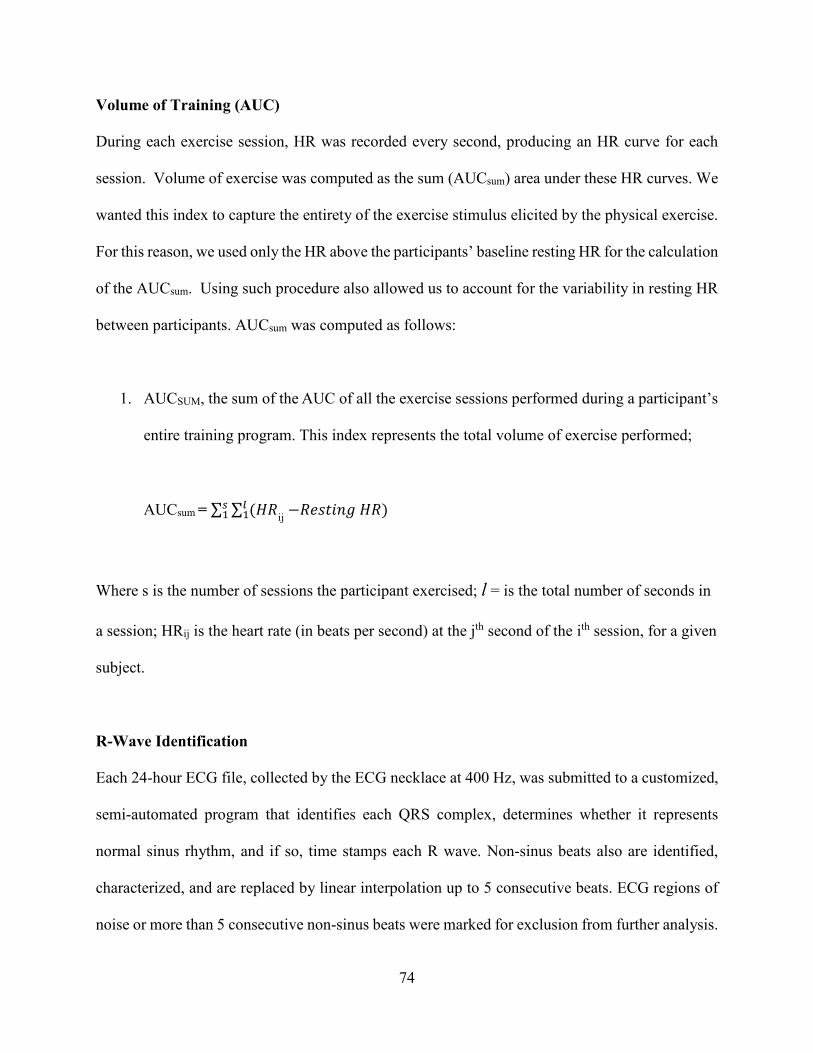
74
Volume of Training (AUC)
During each exercise session, HR was recorded every second, producing an HR curve for each
session. Volume of exercise was computed as the sum (AUCsum) area under these HR curves. We
wanted this index to capture the entirety of the exercise stimulus elicited by the physical exercise.
For this reason, we used only the HR above the participants’ baseline resting HR for the calculation
of the AUCsum. Using such procedure also allowed us to account for the variability in resting HR
between participants. AUCsum was computed as follows:
1. AUCSUM, the sum of the AUC of all the exercise sessions performed during a participant’s
entire training program. This index represents the total volume of exercise performed;
AUCsum = ∑ ∑ (𝐻𝐻𝐻𝐻𝑙𝑙1
𝑠𝑠1 ij −𝐻𝐻𝑅𝑅𝑅𝑅𝑅𝑅𝑅𝑅𝑅𝑅𝑅𝑅 𝐻𝐻𝐻𝐻)
Where s is the number of sessions the participant exercised; l = is the total number of seconds in
a session; HRij is the heart rate (in beats per second) at the jth second of the ith session, for a given
subject.
R-Wave Identification
Each 24-hour ECG file, collected by the ECG necklace at 400 Hz, was submitted to a customized,
semi-automated program that identifies each QRS complex, determines whether it represents
normal sinus rhythm, and if so, time stamps each R wave. Non-sinus beats also are identified,
characterized, and are replaced by linear interpolation up to 5 consecutive beats. ECG regions of
noise or more than 5 consecutive non-sinus beats were marked for exclusion from further analysis.
75
The program then outputs an RR interval time series. The 20 minutes collected in the supine
position and the full 24-hour record were analyzed separately.
Heart Rate Variability
The RR interval time series from the 24-hour recording and from the 20 minutes in the supine
position were then submitted to another custom-written program to compute mean HR, the
standard deviation of the RR interval (SDRR), the root mean squared successive difference
(RMSSD), and spectral power in the low (0.04-0.15 Hz (LF)) and high (0.15-0.40 Hz (HF))
frequency bands. Spectra are calculated on 300-second epochs using an interval method for
computing Fourier transforms similar to that described by DeBoer, Karamaker, and Strackee (R.
W. DeBoer, Karemaker, & Strackee, 1984). Prior to computing Fourier transforms, the mean of
the RR interval series was subtracted from each value in the series and the series then was filtered
using a Hanning window and the power, i.e., variance (in msec2), over the LF and HF bands was
summed. Estimates of spectral power were adjusted to account for attenuation produced by this
filter (FJ, 1978).
SDRR, the global standard deviation of the entire time series, predict both morbidity and mortality
("Heart rate variability: standards of measurement, physiological interpretation and clinical use.
Task Force of the European Society of Cardiology and the North American Society of Pacing and
Electrophysiology," 1996). RMSSD reflects variation in changes from consecutive RR intervals
and is the primary time-domain measure used to estimate the vagally mediated changes in HR
(Shaffer, McCraty, & Zerr, 2014). The LF band mainly reflects both sympathetic and
parasympathetic influences on HR. The HF band reflects parasympathetic activity alone.
76
Multiplex Analysis of Cytokines
Blood samples from the Mitra® dried blood collection kit were submitted for analysis of
inflammatory cytokines.
Circulating CRP were quantified using a Featured Assay called the Featured Human
Cardiovascular Disease Panel 3 5-Plex (Eve Technologies Corporation, Calgary, AB, Canada).
The assay sensitivity of CRP was 0.001 ng/mL.
Circulating High Mobility Group Box 1(HMGB1) were quantified using a Featured Assay called
the Featured Human Cytokine Panel 4 12‐Plex (Eve Technologies Corporation, Calgary, AB,
Canada). The assay sensitivity of HMGB1 was 3.8 ng/mL.
Circulating IL-1β, IL-6, and TNFα were quantified using a Discovery Assay called the Human
High Sensitivity 14-Plex (Eve Technologies Corporation, Calgary, AB, Canada). The assay
sensitivities of IL-1β, IL-6, and TNFα were 0.14, 0.11, and 0.16 pg/mL, respectively.
The multiplex assays were performed at Eve Technologies by using the Luminex™ 200 system
(Luminex, Austin, TX, USA), and a Milliplex human cytokine kit (MilliporeSigma, Burlington,
Massachusetts, USA) according to their protocol. Individual analyte values and other assays details
are available on the Eve Technologies website (www.evetechnologies.com). All assays were done
in duplicate.
77
Caregiver Burden
In the CAS, new mothers were asked how many hours in a typical day and how many days in a
typical week their provided care for the newborn. They were also asked to report the support that
they were receiving by indicating how many hours in a typical day and how many days in a typical
week someone else (e.g., father, grandparent) provided care for the newborn. Using these
questions, we calculated the new mother’s caregiver burden by subtracting from the weekly
number of hours that the new mothers provided care the weekly number of hours that they were
receiving support. Because we wanted to capture the overall caregiver burden that the new mothers
experience during the study, we decided to calculate the post-intervention caregiver burden as the
average of the score that the new mothers had at the end of the second, fourth and sixth week of
the intervention.
Statistical Analysis
Descriptive statistics of demographic and training data were computed as median and interquartile
range (IQR). All variables were examined for distribution prior to analysis. Values for all
inflammatory markers and for both HRV HF and LF bands were log transformed to account for
skewed distributions. Change scores from pre- to post-aerobic exercise training were calculated
for all the study outcomes. The Mann-Whitney U Test was performed to compare the distribution
of scores on quantitative response variables across exercise intervention vs. usual care groups.
Spearman’s correlations were used to assess the relationship between estimated VO2max and
AUCsum and between the study outcomes, and either estimated VO2max or AUCsum. Study
feasibility was set as adherence with the exercise intervention of 80% of the sessions required. All
the analyses were also repeated after removing participant 82010. The aim was to test if removing
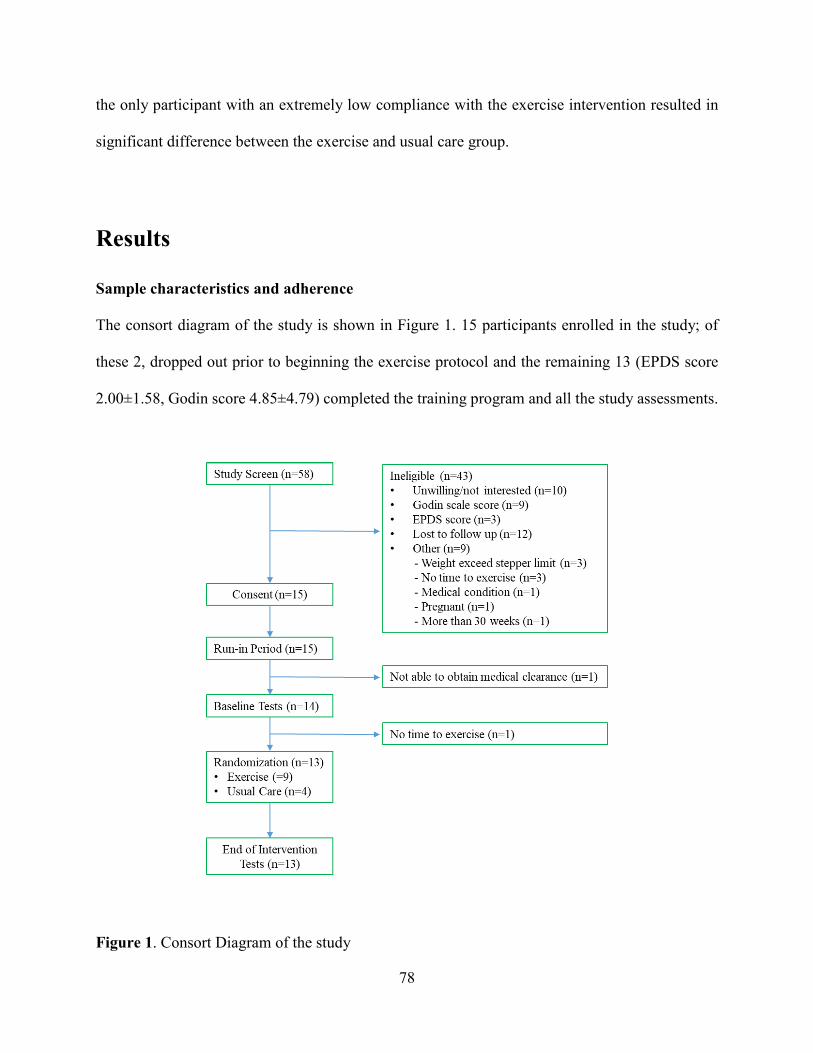
78
the only participant with an extremely low compliance with the exercise intervention resulted in
significant difference between the exercise and usual care group.
Results
Sample characteristics and adherence
The consort diagram of the study is shown in Figure 1. 15 participants enrolled in the study; of
these 2, dropped out prior to beginning the exercise protocol and the remaining 13 (EPDS score
2.00±1.58, Godin score 4.85±4.79) completed the training program and all the study assessments.
Figure 1. Consort Diagram of the study
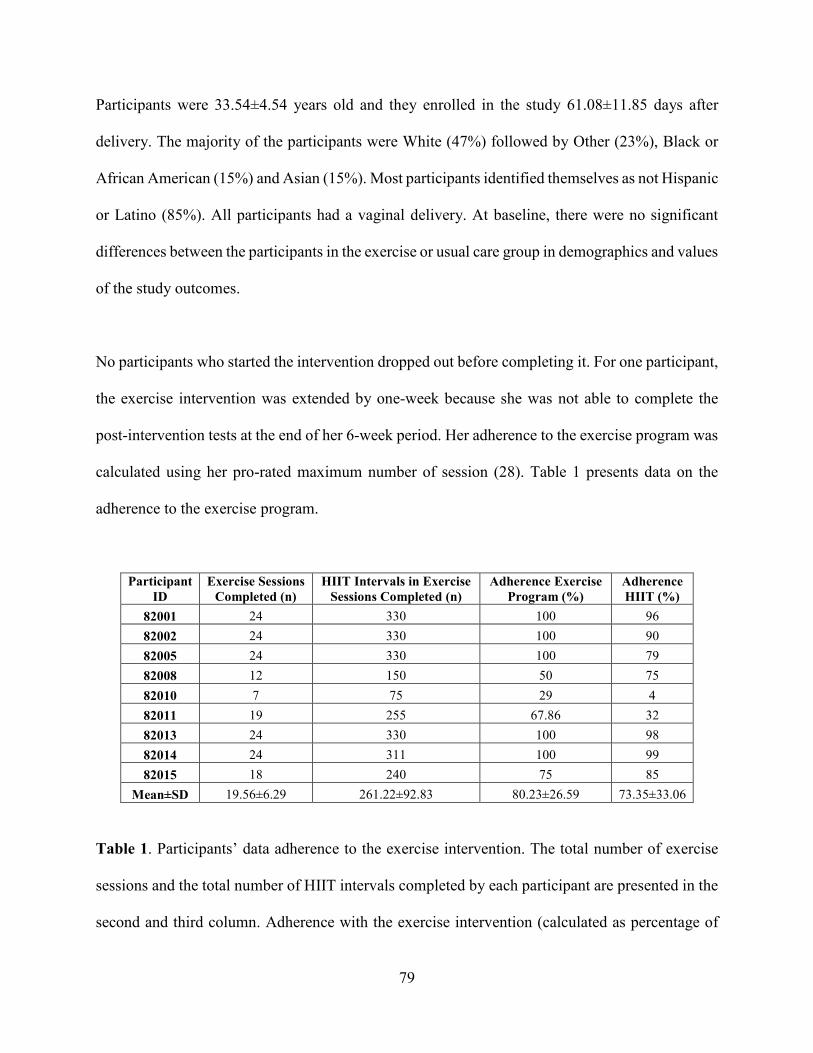
79
Participants were 33.54±4.54 years old and they enrolled in the study 61.08±11.85 days after
delivery. The majority of the participants were White (47%) followed by Other (23%), Black or
African American (15%) and Asian (15%). Most participants identified themselves as not Hispanic
or Latino (85%). All participants had a vaginal delivery. At baseline, there were no significant
differences between the participants in the exercise or usual care group in demographics and values
of the study outcomes.
No participants who started the intervention dropped out before completing it. For one participant,
the exercise intervention was extended by one-week because she was not able to complete the
post-intervention tests at the end of her 6-week period. Her adherence to the exercise program was
calculated using her pro-rated maximum number of session (28). Table 1 presents data on the
adherence to the exercise program.
Participant ID
Exercise Sessions Completed (n)
HIIT Intervals in Exercise Sessions Completed (n)
Adherence Exercise Program (%)
Adherence HIIT (%)
82001 24 330 100 96 82002 24 330 100 90 82005 24 330 100 79 82008 12 150 50 75 82010 7 75 29 4 82011 19 255 67.86 32 82013 24 330 100 98 82014 24 311 100 99 82015 18 240 75 85
Mean±SD 19.56±6.29 261.22±92.83 80.23±26.59 73.35±33.06
Table 1. Participants’ data adherence to the exercise intervention. The total number of exercise
sessions and the total number of HIIT intervals completed by each participant are presented in the
second and third column. Adherence with the exercise intervention (calculated as percentage of
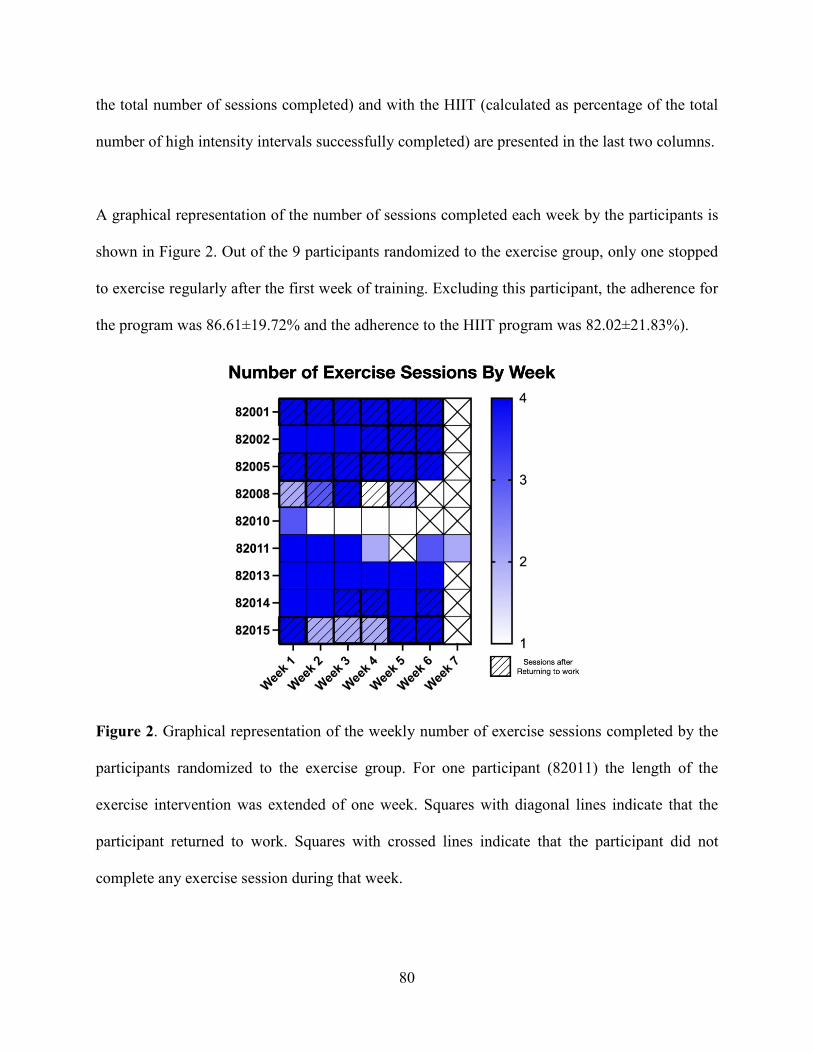
80
the total number of sessions completed) and with the HIIT (calculated as percentage of the total
number of high intensity intervals successfully completed) are presented in the last two columns.
A graphical representation of the number of sessions completed each week by the participants is
shown in Figure 2. Out of the 9 participants randomized to the exercise group, only one stopped
to exercise regularly after the first week of training. Excluding this participant, the adherence for
the program was 86.61±19.72% and the adherence to the HIIT program was 82.02±21.83%).
Figure 2. Graphical representation of the weekly number of exercise sessions completed by the
participants randomized to the exercise group. For one participant (82011) the length of the
exercise intervention was extended of one week. Squares with diagonal lines indicate that the
participant returned to work. Squares with crossed lines indicate that the participant did not
complete any exercise session during that week.
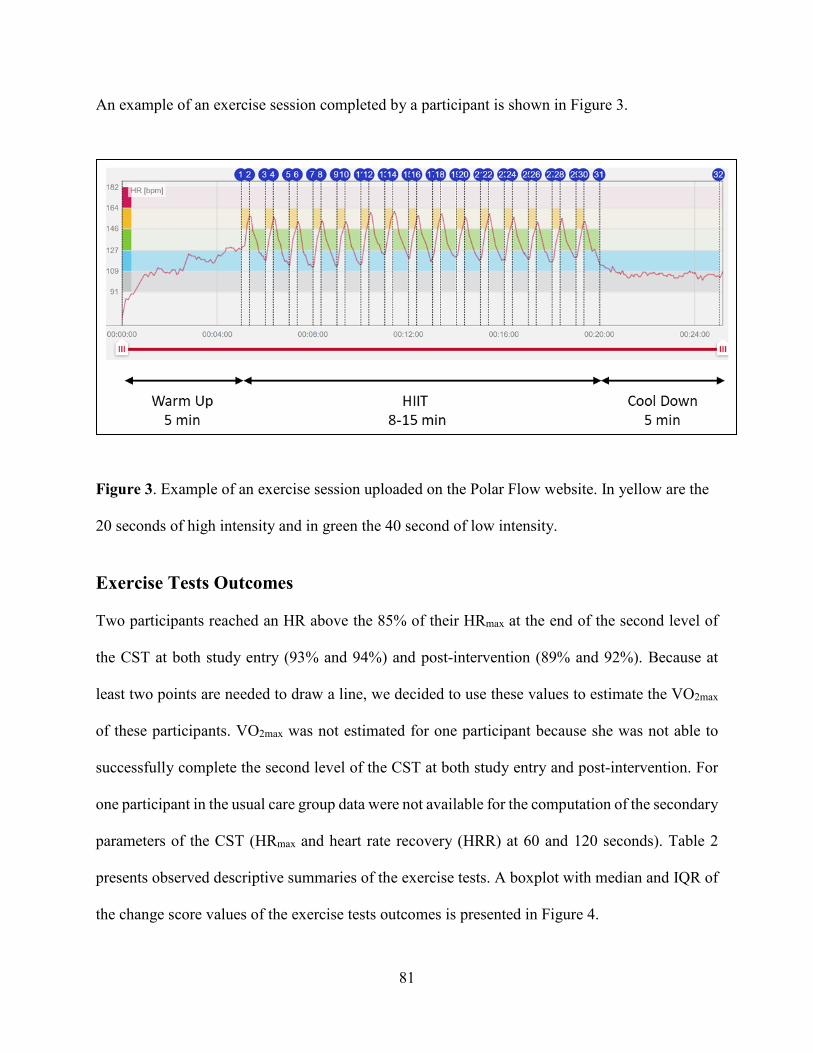
81
An example of an exercise session completed by a participant is shown in Figure 3.
Figure 3. Example of an exercise session uploaded on the Polar Flow website. In yellow are the
20 seconds of high intensity and in green the 40 second of low intensity.
Exercise Tests Outcomes Two participants reached an HR above the 85% of their HRmax at the end of the second level of
the CST at both study entry (93% and 94%) and post-intervention (89% and 92%). Because at
least two points are needed to draw a line, we decided to use these values to estimate the VO2max
of these participants. VO2max was not estimated for one participant because she was not able to
successfully complete the second level of the CST at both study entry and post-intervention. For
one participant in the usual care group data were not available for the computation of the secondary
parameters of the CST (HRmax and heart rate recovery (HRR) at 60 and 120 seconds). Table 2
presents observed descriptive summaries of the exercise tests. A boxplot with median and IQR of
the change score values of the exercise tests outcomes is presented in Figure 4.
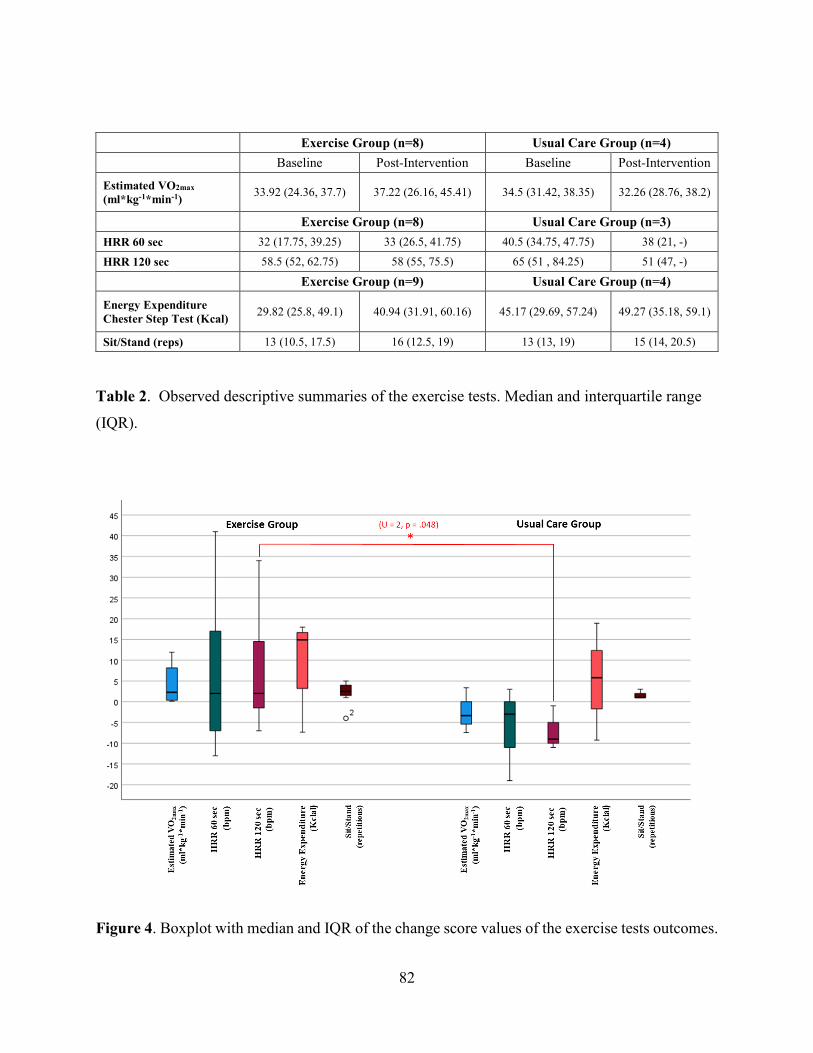
82
Exercise Group (n=8) Usual Care Group (n=4) Baseline Post-Intervention Baseline Post-Intervention
Estimated VO2max (ml*kg-1*min-1) 33.92 (24.36, 37.7) 37.22 (26.16, 45.41) 34.5 (31.42, 38.35) 32.26 (28.76, 38.2)
Exercise Group (n=8) Usual Care Group (n=3) HRR 60 sec 32 (17.75, 39.25) 33 (26.5, 41.75) 40.5 (34.75, 47.75) 38 (21, -)
HRR 120 sec 58.5 (52, 62.75) 58 (55, 75.5) 65 (51 , 84.25) 51 (47, -)
Exercise Group (n=9) Usual Care Group (n=4)
Energy Expenditure Chester Step Test (Kcal) 29.82 (25.8, 49.1) 40.94 (31.91, 60.16) 45.17 (29.69, 57.24) 49.27 (35.18, 59.1)
Sit/Stand (reps) 13 (10.5, 17.5) 16 (12.5, 19) 13 (13, 19) 15 (14, 20.5)
Table 2. Observed descriptive summaries of the exercise tests. Median and interquartile range
(IQR).
Figure 4. Boxplot with median and IQR of the change score values of the exercise tests outcomes.
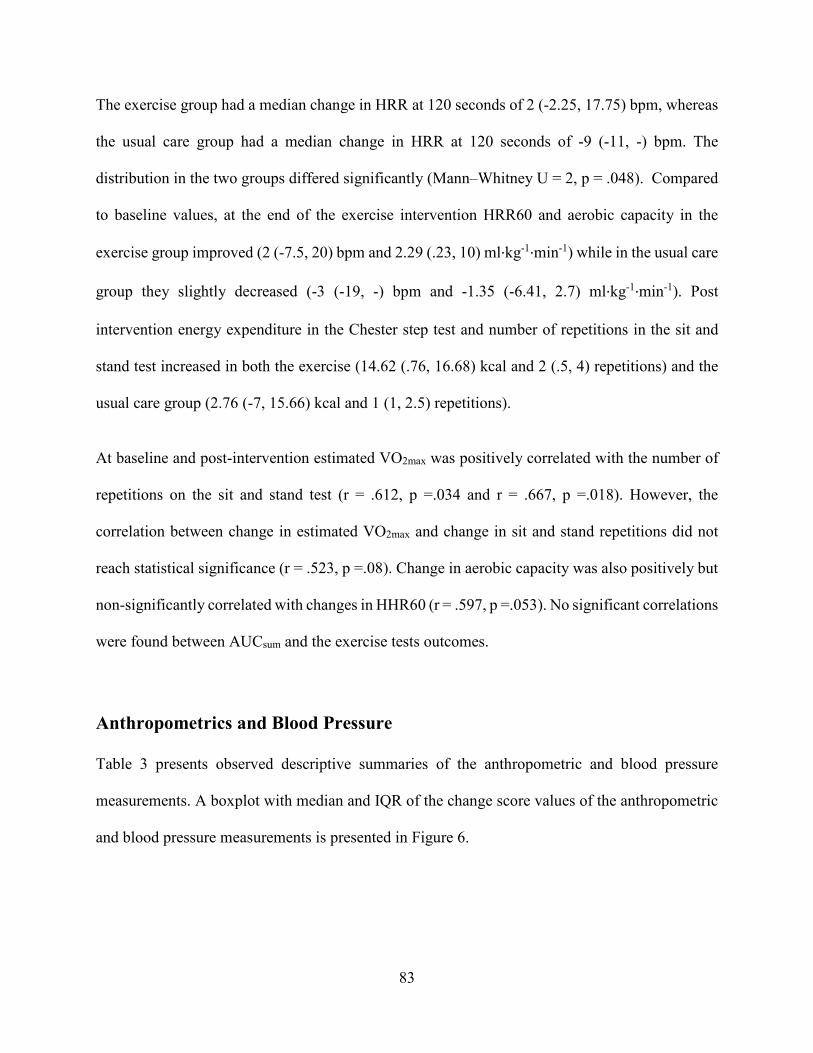
83
The exercise group had a median change in HRR at 120 seconds of 2 (-2.25, 17.75) bpm, whereas
the usual care group had a median change in HRR at 120 seconds of -9 (-11, -) bpm. The
distribution in the two groups differed significantly (Mann–Whitney U = 2, p = .048). Compared
to baseline values, at the end of the exercise intervention HRR60 and aerobic capacity in the
exercise group improved (2 (-7.5, 20) bpm and 2.29 (.23, 10) ml·kg-1·min-1) while in the usual care
group they slightly decreased (-3 (-19, -) bpm and -1.35 (-6.41, 2.7) ml·kg-1·min-1). Post
intervention energy expenditure in the Chester step test and number of repetitions in the sit and
stand test increased in both the exercise (14.62 (.76, 16.68) kcal and 2 (.5, 4) repetitions) and the
usual care group (2.76 (-7, 15.66) kcal and 1 (1, 2.5) repetitions).
At baseline and post-intervention estimated VO2max was positively correlated with the number of
repetitions on the sit and stand test (r = .612, p =.034 and r = .667, p =.018). However, the
correlation between change in estimated VO2max and change in sit and stand repetitions did not
reach statistical significance (r = .523, p =.08). Change in aerobic capacity was also positively but
non-significantly correlated with changes in HHR60 (r = .597, p =.053). No significant correlations
were found between AUCsum and the exercise tests outcomes.
Anthropometrics and Blood Pressure
Table 3 presents observed descriptive summaries of the anthropometric and blood pressure
measurements. A boxplot with median and IQR of the change score values of the anthropometric
and blood pressure measurements is presented in Figure 6.
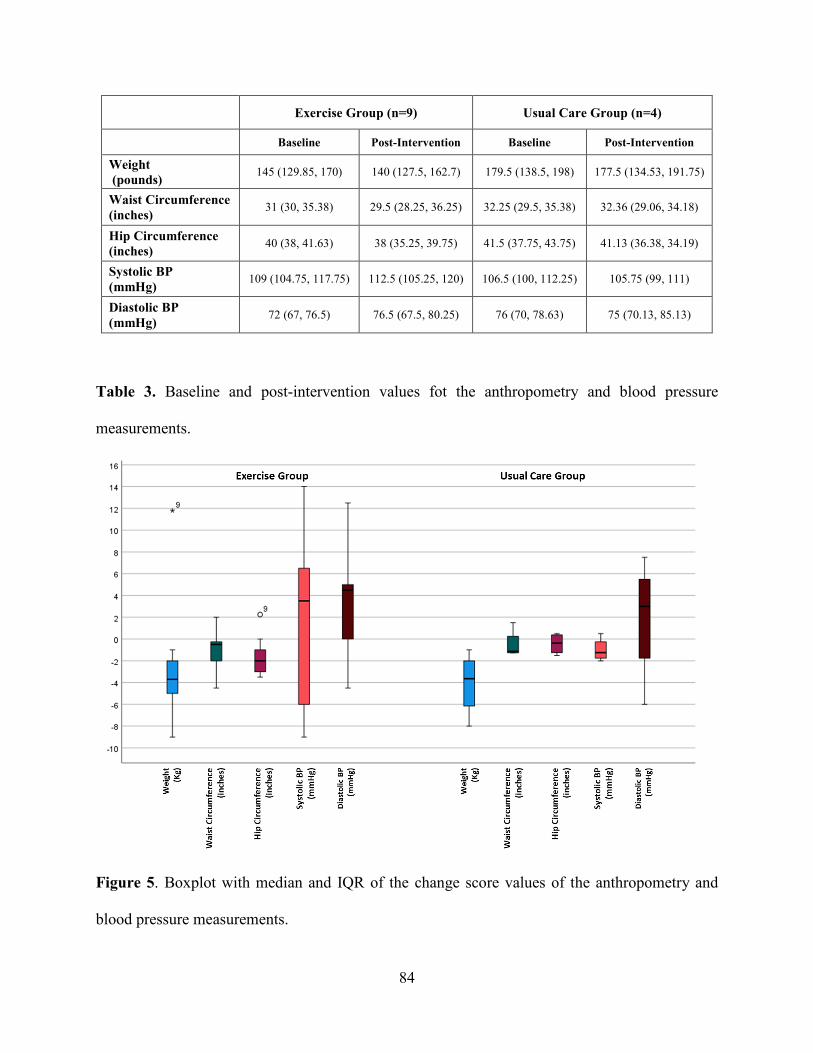
84
Exercise Group (n=9) Usual Care Group (n=4)
Baseline Post-Intervention Baseline Post-Intervention
Weight (pounds) 145 (129.85, 170) 140 (127.5, 162.7) 179.5 (138.5, 198) 177.5 (134.53, 191.75)
Waist Circumference (inches) 31 (30, 35.38) 29.5 (28.25, 36.25) 32.25 (29.5, 35.38) 32.36 (29.06, 34.18)
Hip Circumference (inches) 40 (38, 41.63) 38 (35.25, 39.75) 41.5 (37.75, 43.75) 41.13 (36.38, 34.19)
Systolic BP (mmHg) 109 (104.75, 117.75) 112.5 (105.25, 120) 106.5 (100, 112.25) 105.75 (99, 111)
Diastolic BP (mmHg) 72 (67, 76.5) 76.5 (67.5, 80.25) 76 (70, 78.63) 75 (70.13, 85.13)
Table 3. Baseline and post-intervention values fot the anthropometry and blood pressure
measurements.
Figure 5. Boxplot with median and IQR of the change score values of the anthropometry and
blood pressure measurements.

85
Results from the Mann-Whitney U test indicated that there was no difference between the exercise
and usual care group in the distribution of the change scores of the anthropometry and blood
pressure measurements. AUCsum was inversely correlated with post intervention changes in
systolic blood pressure (r = - .717, p =.003).
Cardiac Autonomic Regulation Table 4 presents observed descriptive summaries of the cardiac autonomic regulation outcomes.
A boxplot with median and IQR of the change score values of the data collected during the 24
hours free living conditions and the 20 min supine condition is presented in Figure 7. Results from
the Mann-Whitney U Test indicated that there was no difference between the exercise and usual
care group in the distribution of the change scores of the cardiac autonomic regulation outcomes.
Exercise Group (n=9) Usual Care Group (n=4)
Baseline Post-Intervention Baseline Post-Intervention Free living (24h)
HR (bpm) 78.17 (71.15, 87.12) 73.45 (62.23, 85.70) 74.95 (71.35, 82.35) 76.70 (67.5, 78.62)
HRV Time domain SDRR (ms) 59.79 (48.96, 62.29) 59.62 (54.32, 69.6) 63.62 (44.08, 72.81) 59.91 (53.72, 67.50)
RMSSD (ms) 31.54 (26.66, 47.95) 33 (28.02, 44.93) 32.18 (19.69, 38.60) 31.19 (28.7, 35.26)
HRV Frequency domain lnLF (ms2) 6.9 (6.81, 7.12) 7.11 (6.85, 7.17) 6.24 (5.80, 7.18) 6.48 (5.96, 7.03)
lnHF (ms2) 5.99 (5.73, 6.67) 6.05 (5.66, 6.58) 5.71 (4.81, 6.39) 5.99 (5.09, 6.38)
Supine (20 min) HR (bpm) 70.69 (59.73, 75.12) 73.5 (64.71, 78.85) 67.92 (58.62, 88.5) 70.82 (64.14, 73.43)
HRV Time domain SDRR (ms) 66.81 (54.38, 90.04) 78.83 (52.89, 96.73) 67.25 949.05, 84.24) 61.35 (38.04, 78.10)
RMSSD (ms) 43.16 (31.98, 60.99) 34.43 (27.16, 59.97) 31.39 (19.26, 69) 35.83 (29.27, 45.23)
HRV Frequency domain lnLF (ms2) 6.96 (6.40, 7.47) 7.32 (6.83, 7.80) 6.79 (6.46, 7.28) 6.71 (6.05, 7.26)
lnHF (ms2) 6.24 (5.69, 7.08) 6.19 (5.77, 6.88) 6.14 (4.67, 8.33) 6.07 (5.84, 7.83)
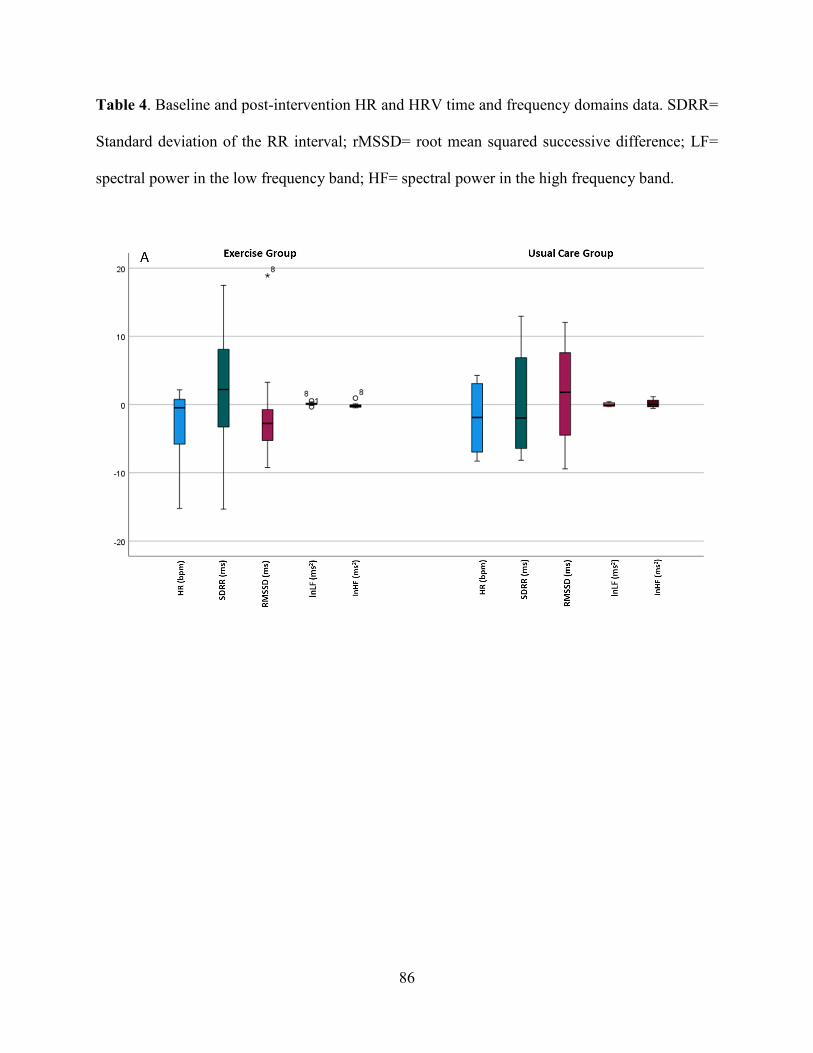
86
Table 4. Baseline and post-intervention HR and HRV time and frequency domains data. SDRR=
Standard deviation of the RR interval; rMSSD= root mean squared successive difference; LF=
spectral power in the low frequency band; HF= spectral power in the high frequency band.

87
Figure 6. Boxplot with median and IQR of the change score values of the data collected during
the 24 hours free living conditions (A) and the 20 min supine condition (B).
Change in log-transformed average ln LF was significantly and inversely related to change in
estimated VO2max (r = -.692, p =.013). There were no other significant associations between change
in estimated VO2max and changes in any of the cardiac autonomic regulation indices or AUCsum
and changes in any of the cardiac autonomic regulation indices.
There were no significant correlations at baseline between estimated VO2max and any of the cardiac
autonomic control indices. Post-intervention estimated VO2max was significantly and inversely
related to both post-intervention RMSSD and ln HF collected in 20 min supine position (r = -.615,
p =.033 and r = -.627, p =.029 respectively). After removing from the analysis participant 82010,
AUCsum was inversely correlated with average HR collected both during the 24h free living
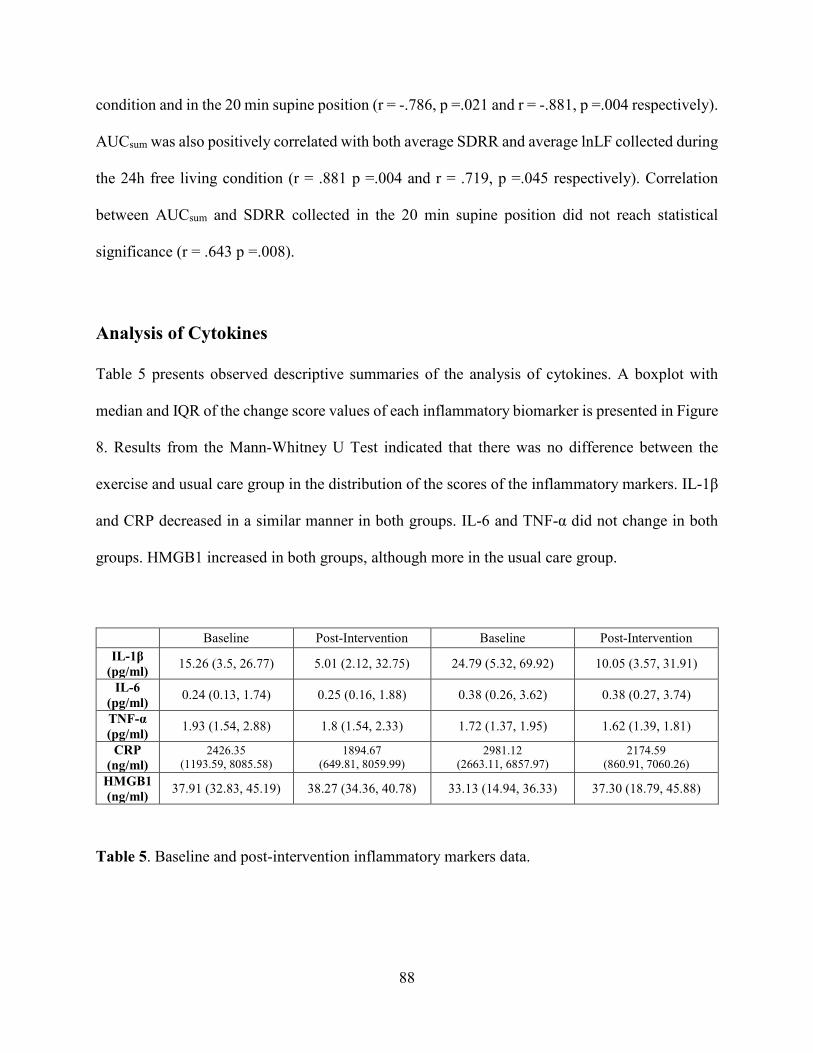
88
condition and in the 20 min supine position (r = -.786, p =.021 and r = -.881, p =.004 respectively).
AUCsum was also positively correlated with both average SDRR and average lnLF collected during
the 24h free living condition (r = .881 p =.004 and r = .719, p =.045 respectively). Correlation
between AUCsum and SDRR collected in the 20 min supine position did not reach statistical
significance (r = .643 p =.008).
Analysis of Cytokines
Table 5 presents observed descriptive summaries of the analysis of cytokines. A boxplot with
median and IQR of the change score values of each inflammatory biomarker is presented in Figure
8. Results from the Mann-Whitney U Test indicated that there was no difference between the
exercise and usual care group in the distribution of the scores of the inflammatory markers. IL-1β
and CRP decreased in a similar manner in both groups. IL-6 and TNF-α did not change in both
groups. HMGB1 increased in both groups, although more in the usual care group.
Baseline Post-Intervention Baseline Post-Intervention IL-1β
(pg/ml) 15.26 (3.5, 26.77) 5.01 (2.12, 32.75) 24.79 (5.32, 69.92) 10.05 (3.57, 31.91)
IL-6 (pg/ml) 0.24 (0.13, 1.74) 0.25 (0.16, 1.88) 0.38 (0.26, 3.62) 0.38 (0.27, 3.74)
TNF-α (pg/ml) 1.93 (1.54, 2.88) 1.8 (1.54, 2.33) 1.72 (1.37, 1.95) 1.62 (1.39, 1.81)
CRP (ng/ml)
2426.35 (1193.59, 8085.58)
1894.67 (649.81, 8059.99)
2981.12 (2663.11, 6857.97)
2174.59 (860.91, 7060.26)
HMGB1 (ng/ml) 37.91 (32.83, 45.19) 38.27 (34.36, 40.78) 33.13 (14.94, 36.33) 37.30 (18.79, 45.88)
Table 5. Baseline and post-intervention inflammatory markers data.
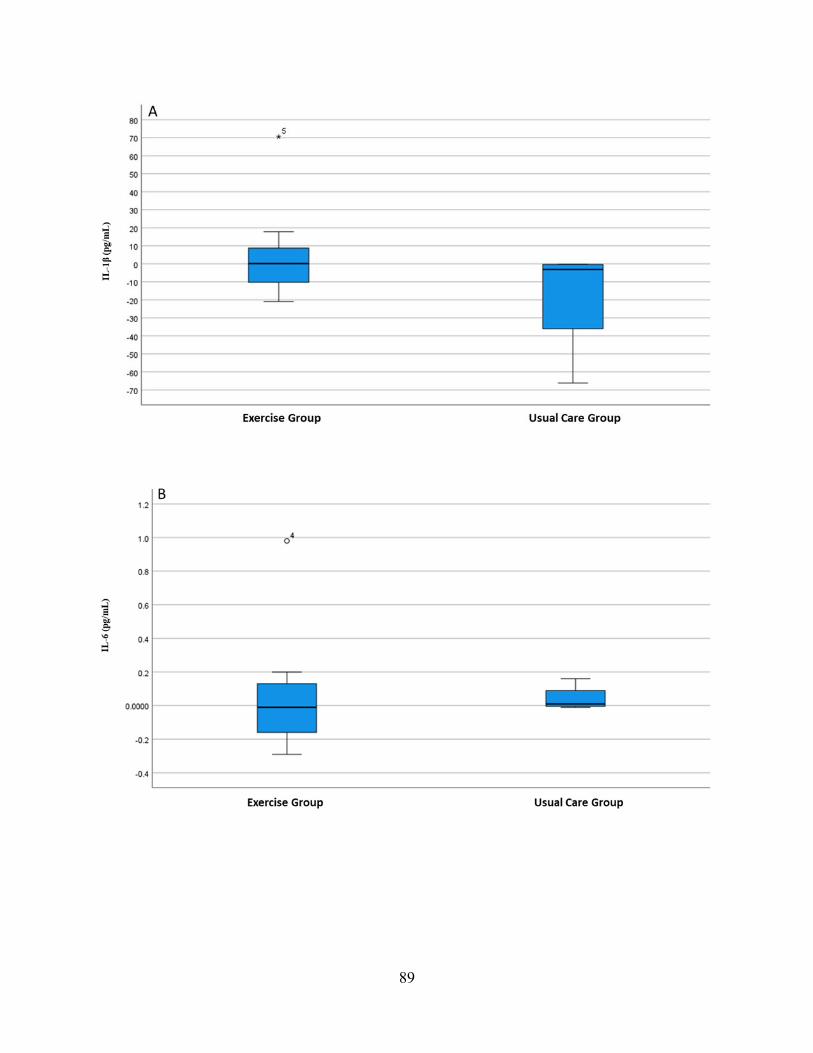
89
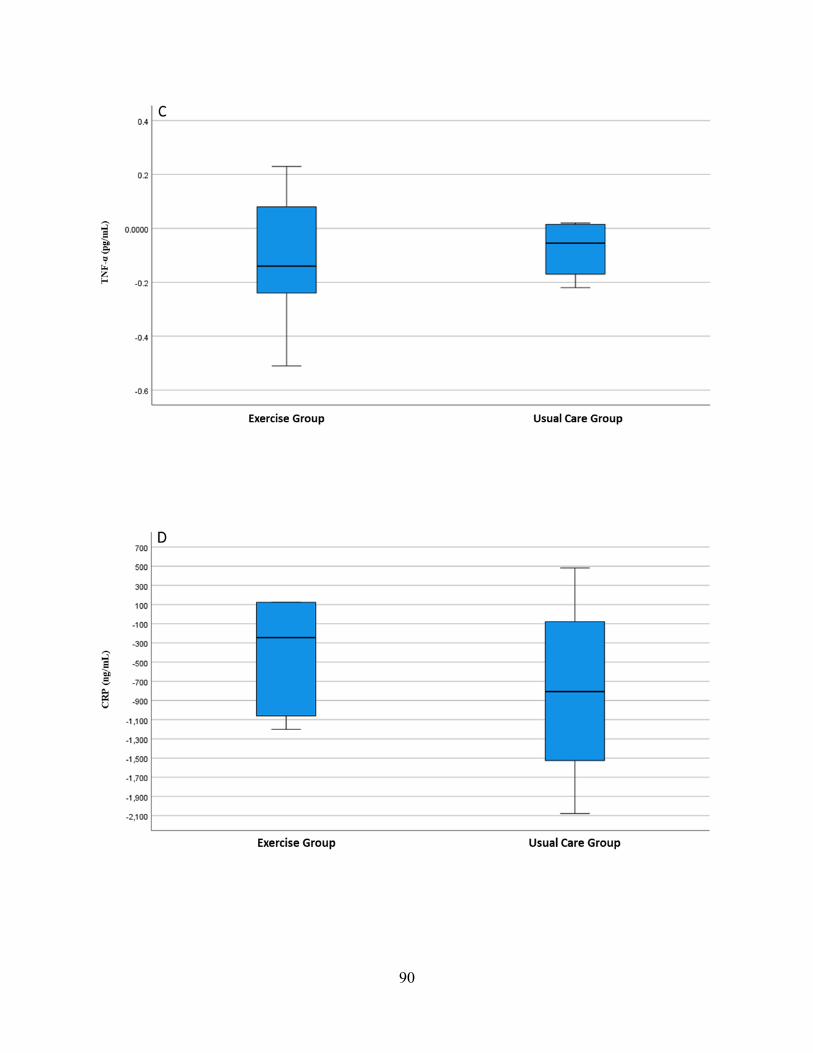
90
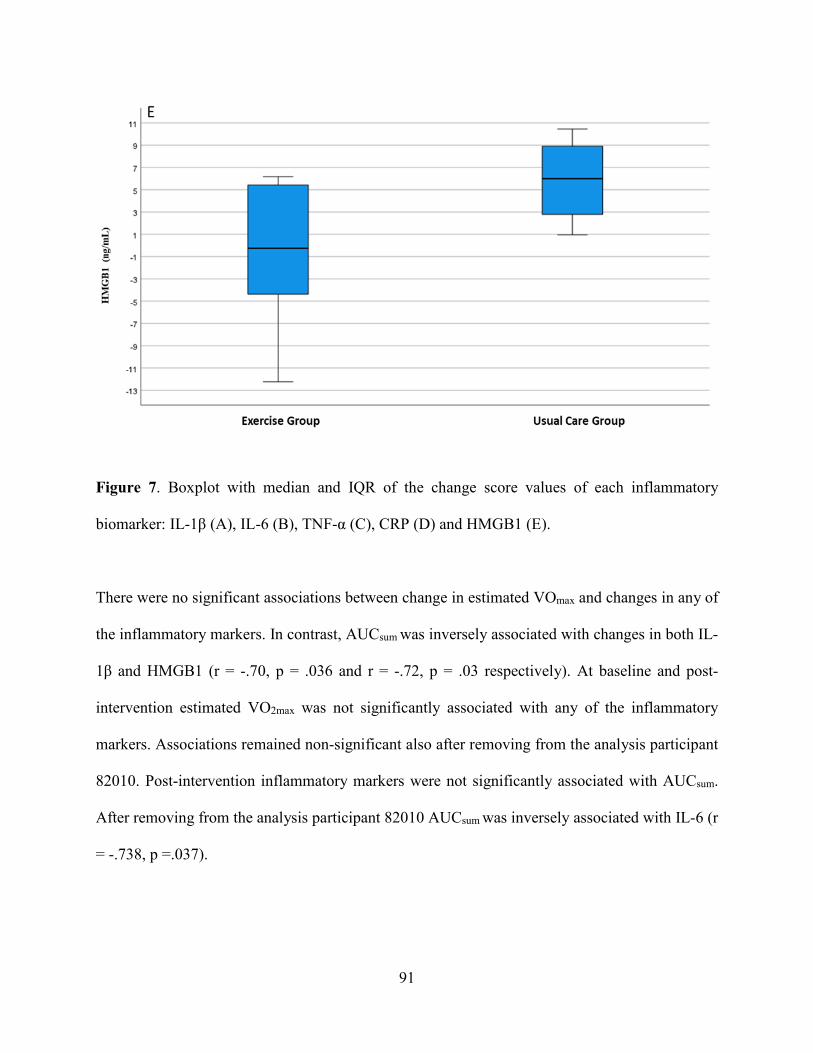
91
Figure 7. Boxplot with median and IQR of the change score values of each inflammatory
biomarker: IL-1β (A), IL-6 (B), TNF-α (C), CRP (D) and HMGB1 (E).
There were no significant associations between change in estimated VOmax and changes in any of
the inflammatory markers. In contrast, AUCsum was inversely associated with changes in both IL-
1β and HMGB1 (r = -.70, p = .036 and r = -.72, p = .03 respectively). At baseline and post-
intervention estimated VO2max was not significantly associated with any of the inflammatory
markers. Associations remained non-significant also after removing from the analysis participant
82010. Post-intervention inflammatory markers were not significantly associated with AUCsum.
After removing from the analysis participant 82010 AUCsum was inversely associated with IL-6 (r
= -.738, p =.037).
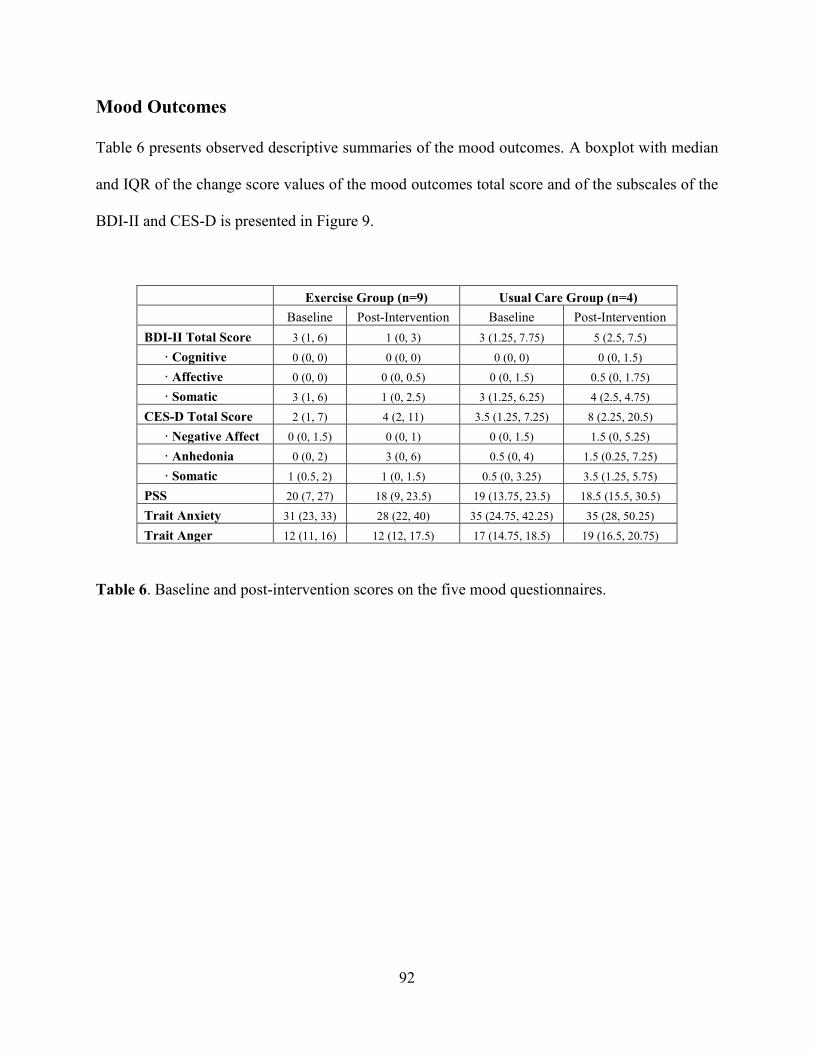
92
Mood Outcomes
Table 6 presents observed descriptive summaries of the mood outcomes. A boxplot with median
and IQR of the change score values of the mood outcomes total score and of the subscales of the
BDI-II and CES-D is presented in Figure 9.
Exercise Group (n=9) Usual Care Group (n=4) Baseline Post-Intervention Baseline Post-Intervention BDI-II Total Score 3 (1, 6) 1 (0, 3) 3 (1.25, 7.75) 5 (2.5, 7.5) · Cognitive 0 (0, 0) 0 (0, 0) 0 (0, 0) 0 (0, 1.5) · Affective 0 (0, 0) 0 (0, 0.5) 0 (0, 1.5) 0.5 (0, 1.75) · Somatic 3 (1, 6) 1 (0, 2.5) 3 (1.25, 6.25) 4 (2.5, 4.75) CES-D Total Score 2 (1, 7) 4 (2, 11) 3.5 (1.25, 7.25) 8 (2.25, 20.5) · Negative Affect 0 (0, 1.5) 0 (0, 1) 0 (0, 1.5) 1.5 (0, 5.25) · Anhedonia 0 (0, 2) 3 (0, 6) 0.5 (0, 4) 1.5 (0.25, 7.25) · Somatic 1 (0.5, 2) 1 (0, 1.5) 0.5 (0, 3.25) 3.5 (1.25, 5.75) PSS 20 (7, 27) 18 (9, 23.5) 19 (13.75, 23.5) 18.5 (15.5, 30.5) Trait Anxiety 31 (23, 33) 28 (22, 40) 35 (24.75, 42.25) 35 (28, 50.25) Trait Anger 12 (11, 16) 12 (12, 17.5) 17 (14.75, 18.5) 19 (16.5, 20.75)
Table 6. Baseline and post-intervention scores on the five mood questionnaires.
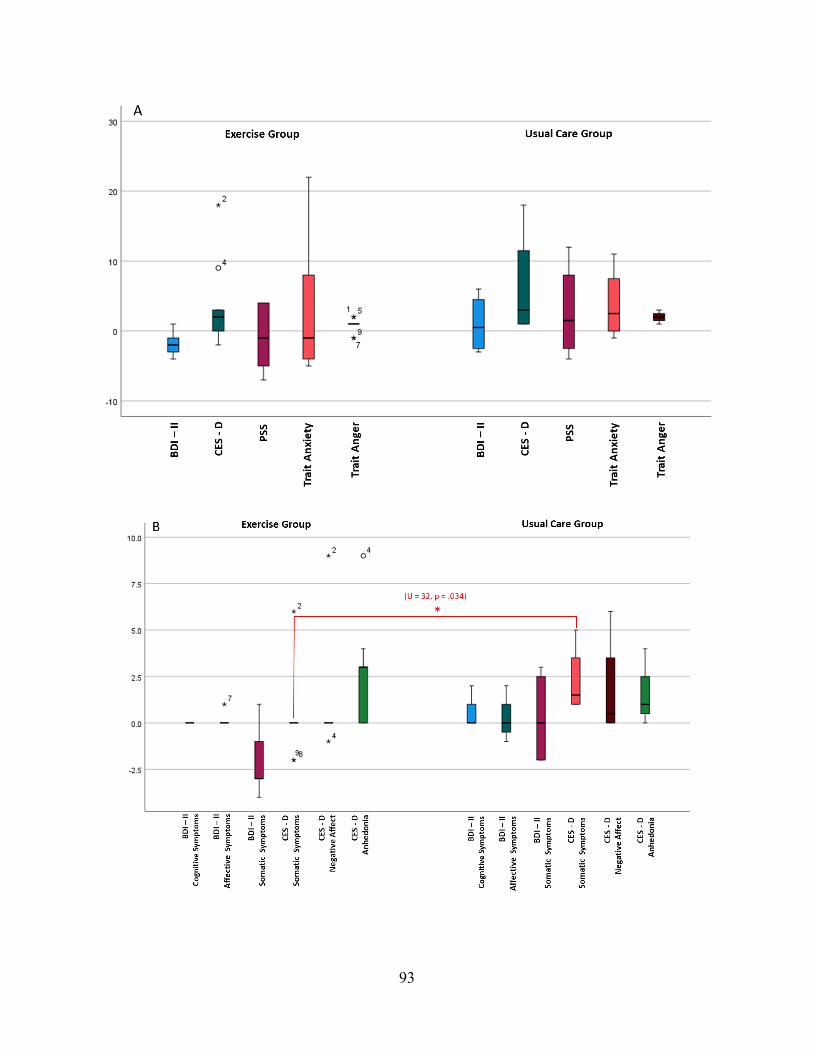
93
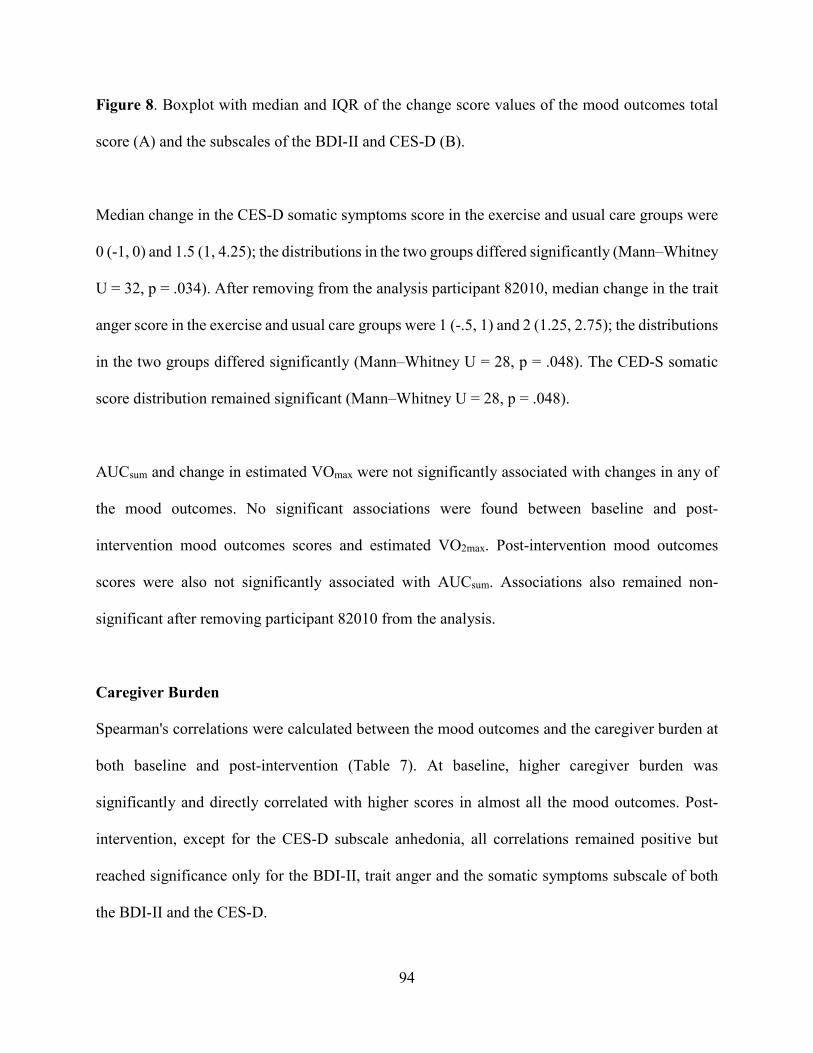
94
Figure 8. Boxplot with median and IQR of the change score values of the mood outcomes total
score (A) and the subscales of the BDI-II and CES-D (B).
Median change in the CES-D somatic symptoms score in the exercise and usual care groups were
0 (-1, 0) and 1.5 (1, 4.25); the distributions in the two groups differed significantly (Mann–Whitney
U = 32, p = .034). After removing from the analysis participant 82010, median change in the trait
anger score in the exercise and usual care groups were 1 (-.5, 1) and 2 (1.25, 2.75); the distributions
in the two groups differed significantly (Mann–Whitney U = 28, p = .048). The CED-S somatic
score distribution remained significant (Mann–Whitney U = 28, p = .048).
AUCsum and change in estimated VOmax were not significantly associated with changes in any of
the mood outcomes. No significant associations were found between baseline and post-
intervention mood outcomes scores and estimated VO2max. Post-intervention mood outcomes
scores were also not significantly associated with AUCsum. Associations also remained non-
significant after removing participant 82010 from the analysis.
Caregiver Burden Spearman's correlations were calculated between the mood outcomes and the caregiver burden at
both baseline and post-intervention (Table 7). At baseline, higher caregiver burden was
significantly and directly correlated with higher scores in almost all the mood outcomes. Post-
intervention, except for the CES-D subscale anhedonia, all correlations remained positive but
reached significance only for the BDI-II, trait anger and the somatic symptoms subscale of both
the BDI-II and the CES-D.
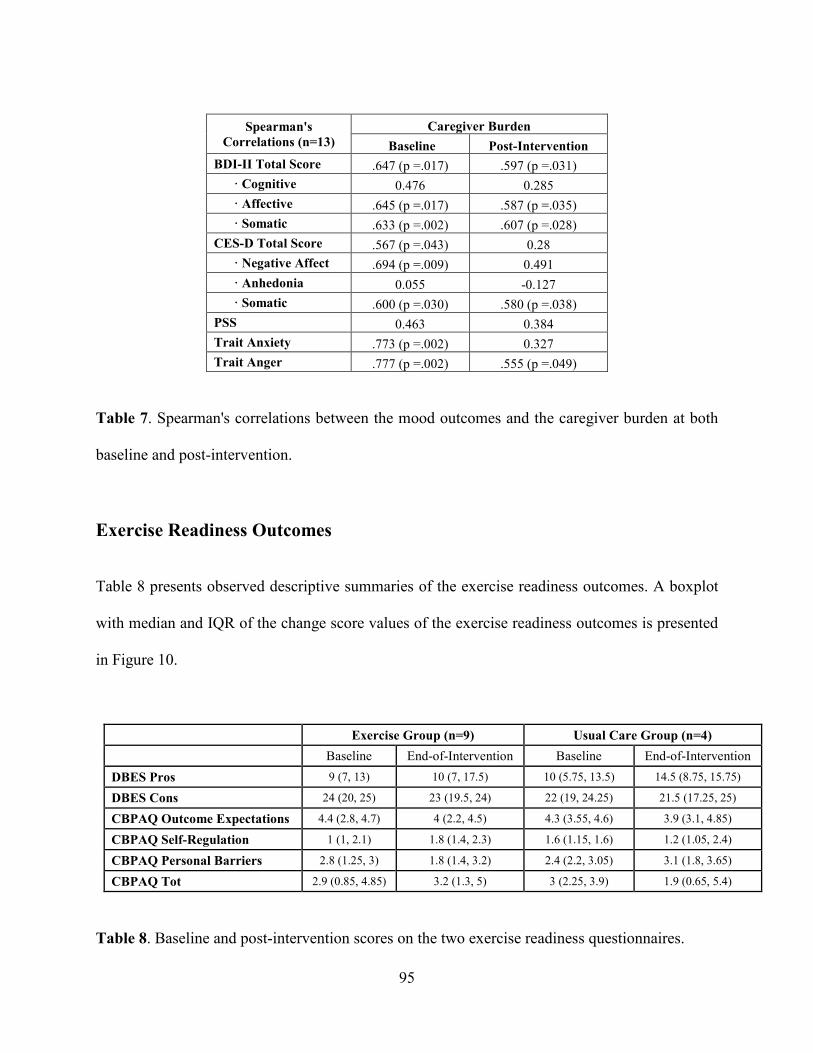
95
Spearman's
Correlations (n=13) Caregiver Burden
Baseline Post-Intervention BDI-II Total Score .647 (p =.017) .597 (p =.031) · Cognitive 0.476 0.285 · Affective .645 (p =.017) .587 (p =.035) · Somatic .633 (p =.002) .607 (p =.028) CES-D Total Score .567 (p =.043) 0.28 · Negative Affect .694 (p =.009) 0.491 · Anhedonia 0.055 -0.127 · Somatic .600 (p =.030) .580 (p =.038) PSS 0.463 0.384 Trait Anxiety .773 (p =.002) 0.327 Trait Anger .777 (p =.002) .555 (p =.049)
Table 7. Spearman's correlations between the mood outcomes and the caregiver burden at both
baseline and post-intervention.
Exercise Readiness Outcomes
Table 8 presents observed descriptive summaries of the exercise readiness outcomes. A boxplot
with median and IQR of the change score values of the exercise readiness outcomes is presented
in Figure 10.
Exercise Group (n=9) Usual Care Group (n=4) Baseline End-of-Intervention Baseline End-of-Intervention
DBES Pros 9 (7, 13) 10 (7, 17.5) 10 (5.75, 13.5) 14.5 (8.75, 15.75)
DBES Cons 24 (20, 25) 23 (19.5, 24) 22 (19, 24.25) 21.5 (17.25, 25)
CBPAQ Outcome Expectations 4.4 (2.8, 4.7) 4 (2.2, 4.5) 4.3 (3.55, 4.6) 3.9 (3.1, 4.85)
CBPAQ Self-Regulation 1 (1, 2.1) 1.8 (1.4, 2.3) 1.6 (1.15, 1.6) 1.2 (1.05, 2.4)
CBPAQ Personal Barriers 2.8 (1.25, 3) 1.8 (1.4, 3.2) 2.4 (2.2, 3.05) 3.1 (1.8, 3.65)
CBPAQ Tot 2.9 (0.85, 4.85) 3.2 (1.3, 5) 3 (2.25, 3.9) 1.9 (0.65, 5.4)
Table 8. Baseline and post-intervention scores on the two exercise readiness questionnaires.
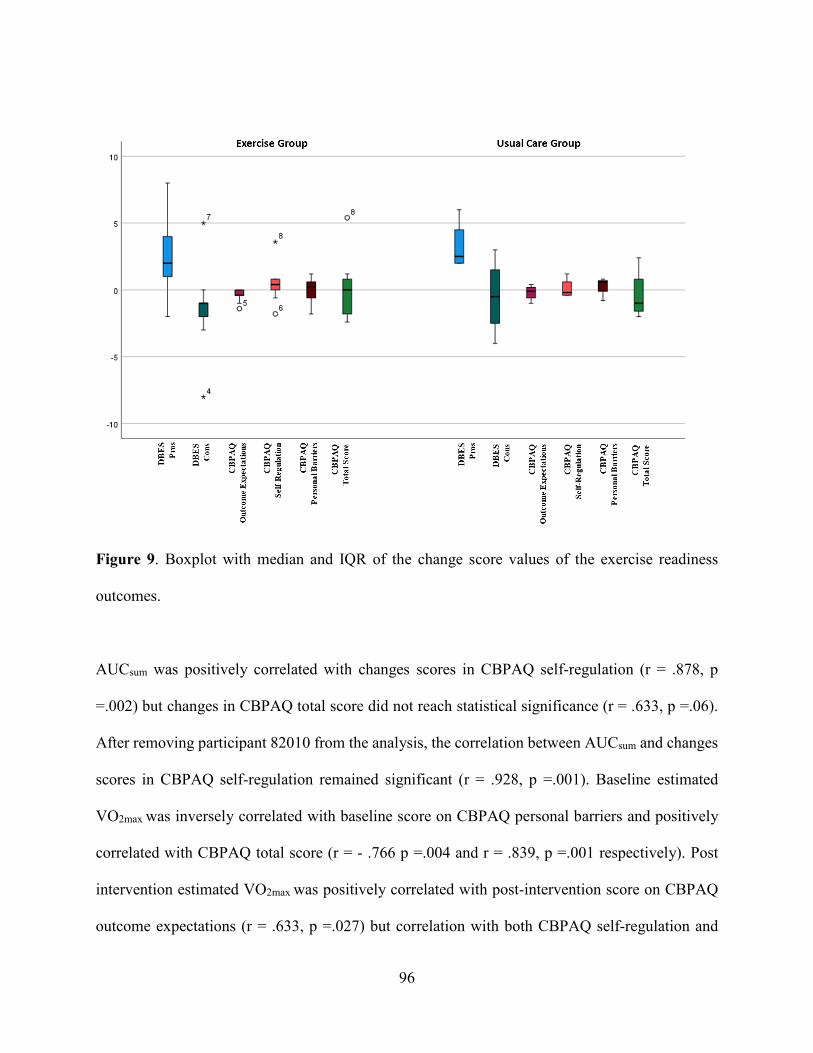
96
Figure 9. Boxplot with median and IQR of the change score values of the exercise readiness
outcomes.
AUCsum was positively correlated with changes scores in CBPAQ self-regulation (r = .878, p
=.002) but changes in CBPAQ total score did not reach statistical significance (r = .633, p =.06).
After removing participant 82010 from the analysis, the correlation between AUCsum and changes
scores in CBPAQ self-regulation remained significant (r = .928, p =.001). Baseline estimated
VO2max was inversely correlated with baseline score on CBPAQ personal barriers and positively
correlated with CBPAQ total score (r = - .766 p =.004 and r = .839, p =.001 respectively). Post
intervention estimated VO2max was positively correlated with post-intervention score on CBPAQ
outcome expectations (r = .633, p =.027) but correlation with both CBPAQ self-regulation and

97
CBPAQ total score did not reach statistical significance (r = - .544 p =.06 and r = .547, p =.06
respectively).
Discussion
In this pilot study of a HIIT exercise intervention with postpartum women conducted during the
COVID-19 pandemic, all aspects of the protocol from consent to pre-intervention testing, the 6-
week of intervention, monitoring of the training and post-intervention testing were conducted
completely remotely and did not require participants to leave their homes. This approach resulted
in a high level of protocol adherence, with associated physiological/conditioning gains
successfully achieved, demonstrating the intervention's feasibility and potential efficacy.
Exercise Protocol Adherence
Adherence to the exercise protocol was high. Measured as the percentage of training sessions
completed out of the expected 24 sessions, mean adherence was 80.23%. Measured as the
percentage of prescribed high intensity intervals in which participants achieved the target heart
rate, adherence was lower – 73.35%. However, this lower rate was largely the product of a single
outlier, who reached the target heart rate only 4% of the time and completed only 7 of the 24
scheduled training sessions. Nonetheless, adherence to the protocol was typical of more
conventional exercise training interventions, a fact that is noteworthy in light of the fact that
conventional programs generally are conducted with in-person supervision and in fitness centers.
Although this study requires replication with a larger sample size, achieving this level of adherence
to a home-based remotely administered training program suggests that it is a viable alternative to
more conventional training programs.
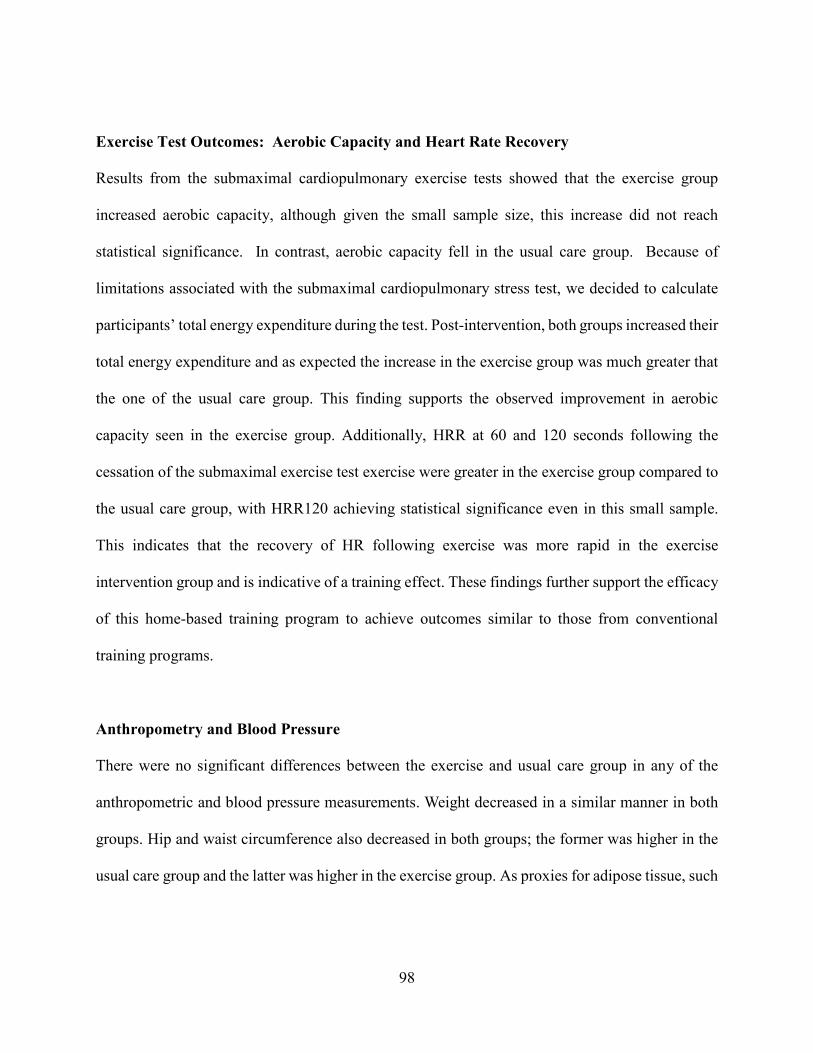
98
Exercise Test Outcomes: Aerobic Capacity and Heart Rate Recovery
Results from the submaximal cardiopulmonary exercise tests showed that the exercise group
increased aerobic capacity, although given the small sample size, this increase did not reach
statistical significance. In contrast, aerobic capacity fell in the usual care group. Because of
limitations associated with the submaximal cardiopulmonary stress test, we decided to calculate
participants’ total energy expenditure during the test. Post-intervention, both groups increased their
total energy expenditure and as expected the increase in the exercise group was much greater that
the one of the usual care group. This finding supports the observed improvement in aerobic
capacity seen in the exercise group. Additionally, HRR at 60 and 120 seconds following the
cessation of the submaximal exercise test exercise were greater in the exercise group compared to
the usual care group, with HRR120 achieving statistical significance even in this small sample.
This indicates that the recovery of HR following exercise was more rapid in the exercise
intervention group and is indicative of a training effect. These findings further support the efficacy
of this home-based training program to achieve outcomes similar to those from conventional
training programs.
Anthropometry and Blood Pressure
There were no significant differences between the exercise and usual care group in any of the
anthropometric and blood pressure measurements. Weight decreased in a similar manner in both
groups. Hip and waist circumference also decreased in both groups; the former was higher in the
usual care group and the latter was higher in the exercise group. As proxies for adipose tissue, such
99
findings are clinically meaningful since failure to reverse excessive postpartum weight gain
increases the risk of cardiometabolic disorders.
The fact that AUCsum was inversely correlated with post intervention changes in systolic blood
pressure is an important finding especially considering that according to a clinical review by
Bramham et al. (Bramham, Nelson-Piercy, Brown, & Chappell, 2013), about one in five women
with hypertension in pregnancy will have chronic hypertension and will need antihypertensive
drugs at two years postpartum.
Cardiac Autonomic Regulation
High frequency heart rate variability (RMSSD and HF), is a noninvasive index of cardiac vagal
modulation. The LF band mainly reflects baroreceptor activity during resting conditions. The HF
band reflects parasympathetic activity and is called the respiratory band because it corresponds to
the HR variations related to the respiratory cycle (respiratory sinus arrhythmia). The modulation
of vagal tone helps maintain the dynamic autonomic regulation important for cardiovascular
health. Deficient vagal inhibition is implicated in increased morbidity (Thayer, Yamamoto, &
Brosschot, 2010). While consensus in the field is that exercise training increases HF-HRV, the
literature is more mixed than consistent, with some studies showing that training leads to increased
HRV and others showing no effect. Findings from this home-based study showed no particular
pattern. Neither RMSSD nor HF increased after training, either during the 20-min supine resting
period or in the full 24-hour free-living recording. However, another index of cardiac vagal
modulation, HRR, was improved after exercise training. It is also possible that the partial lack of
an effect of training is the result of the postpartum physiological adjustments (i.e. hemodynamic,
100
blood pressure and hormonal changes) that are happening in the postpartum period (Kolovetsiou-
Kreiner et al., 2018).
Inflammation
The pro- and anti-inflammatory profile of pregnancy varies throughout the course of gestation in
such way that three distinct immunological phases can be identified (Mor & Cardenas, 2010). The
first phase, early pregnancy, is characterized by a pro-inflammatory profile that has the aim of
supporting implantation and placentation, the second phase, mid-pregnancy, has anti-
inflammatory characteristics aimed at supporting the rapid fetal growth and development. The last
phase, parturition and postpartum, is characterized by an acute pro-inflammatory environment
aimed at facilitate the delivery and by a gradual return to the cytokine profile seen in the
nonpregnant status.
These functional shifts are reflected in the observed changes throughout gestation in several
circulating inflammatory markers. For example, TNFα and IL-6 exhibit a monotonic increase with
a maximum level observed around delivery. CRP instead follows a monotonic reduction. The
return to the immunological profile of pre-pregnancy is modulated by different factors, one of the
strongest contributing factors is postpartum weight gain. Exercise could be able to accelerate the
speed by which pre-pregnancy levels are achieved by stimulating peripheral adaptations in the
adipose (reduction of visceral fat) and skeletal muscle (improved glycemic control) tissue and the
induction of an an-inflammatory environment with each bout of exercise (Mathur & Pedersen,
2008; Petersen & Pedersen, 2005). Although conjectural, the aforementioned mechanisms could
be a plausible explanation for the inverse association between AUCsum and both IL-1β and
101
HMGB1. While IL-1β is a potent pro-inflammatory cytokine that is crucial for host-defense
responses to infection an injury, excessive IL-1 activity underlies a wide range of inflammation-
related diseases. Increased circulating concentration of HMGB1 has been associated with the
pathogenesis of chronic low-grade inflammation, which has been shown to be a risk factor that can
lead to various adverse cardiac and other health-related outcomes (Kaptoge et al., 2014)
Mood Outcomes
There was no significant difference between the exercise and usual care group in any of the main
dysphoric mood outcomes. The exercise group experienced slight decreases in depression (as
measured by the BDI-II), stress and trait anxiety. In contrast, depression (as measured by the CES-
D) and trait anger slightly increased. By the end of the intervention participants in the usual care
group experienced a slight increase in all the mood outcomes. These results are discussed in more
detail below in the context of participants' caregiver burden, attitudes towards exercise, and
obstacles to exercise, which we argue must be considered along with the physiological effects of
the intervention in order to make effective public health recommendations for post-partum women.
Because current postpartum depression was an exclusion criterion for study enrollment, average
BDI-II scores at study entry fell in the range of only minimal depression symptoms. Nonetheless,
exercise has been associated with significant decreases in subclinical negative affect (McIntyre et
al., 2020) and depression remains a clinically important variable to continue assessing through the
first postpartum year. In both groups, the BDI-II total score was driven largely by the somatic
subscale, with endorsements of co-occurring affective and cognitive symptoms almost absent. We
hypothesize that similarities between the somatic symptoms of depression and the physiological
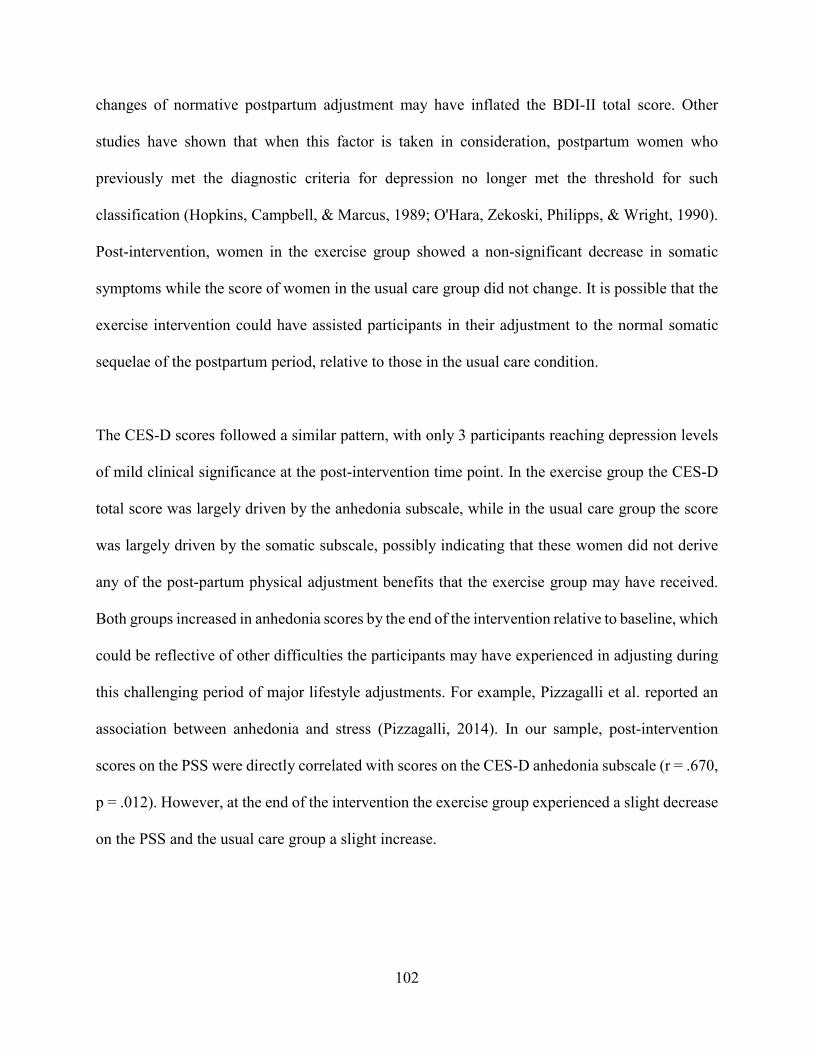
102
changes of normative postpartum adjustment may have inflated the BDI-II total score. Other
studies have shown that when this factor is taken in consideration, postpartum women who
previously met the diagnostic criteria for depression no longer met the threshold for such
classification (Hopkins, Campbell, & Marcus, 1989; O'Hara, Zekoski, Philipps, & Wright, 1990).
Post-intervention, women in the exercise group showed a non-significant decrease in somatic
symptoms while the score of women in the usual care group did not change. It is possible that the
exercise intervention could have assisted participants in their adjustment to the normal somatic
sequelae of the postpartum period, relative to those in the usual care condition.
The CES-D scores followed a similar pattern, with only 3 participants reaching depression levels
of mild clinical significance at the post-intervention time point. In the exercise group the CES-D
total score was largely driven by the anhedonia subscale, while in the usual care group the score
was largely driven by the somatic subscale, possibly indicating that these women did not derive
any of the post-partum physical adjustment benefits that the exercise group may have received.
Both groups increased in anhedonia scores by the end of the intervention relative to baseline, which
could be reflective of other difficulties the participants may have experienced in adjusting during
this challenging period of major lifestyle adjustments. For example, Pizzagalli et al. reported an
association between anhedonia and stress (Pizzagalli, 2014). In our sample, post-intervention
scores on the PSS were directly correlated with scores on the CES-D anhedonia subscale (r = .670,
p = .012). However, at the end of the intervention the exercise group experienced a slight decrease
on the PSS and the usual care group a slight increase.
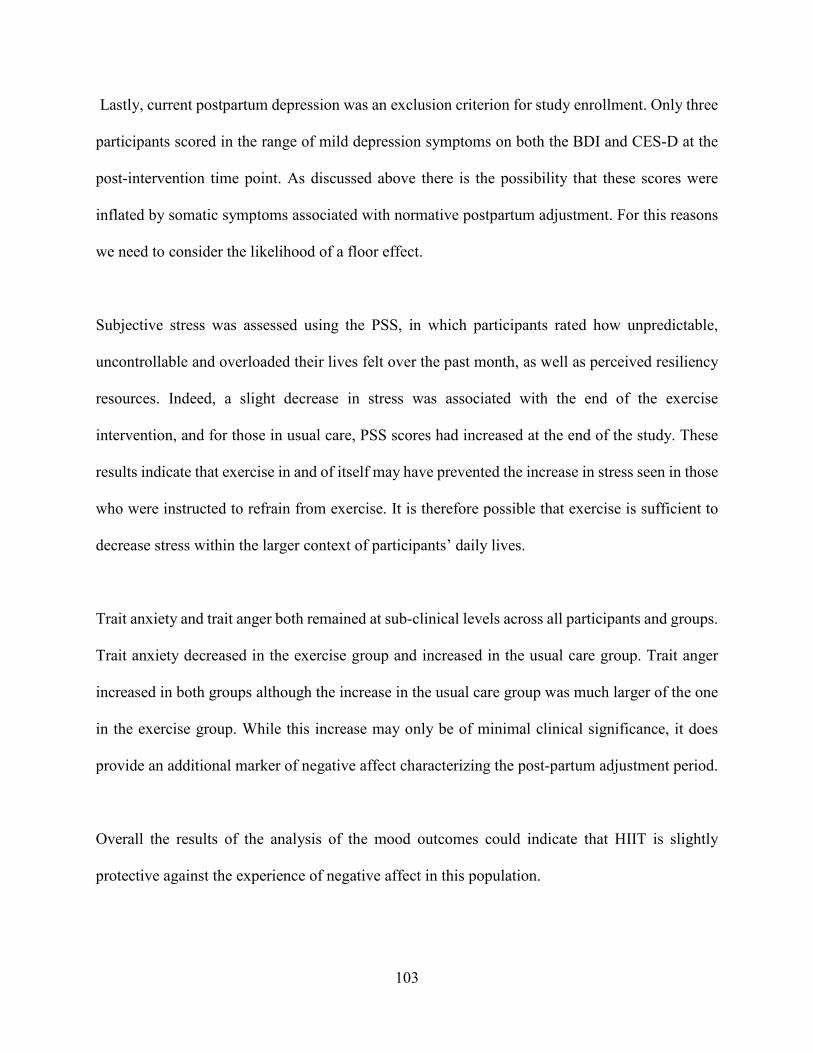
103
Lastly, current postpartum depression was an exclusion criterion for study enrollment. Only three
participants scored in the range of mild depression symptoms on both the BDI and CES-D at the
post-intervention time point. As discussed above there is the possibility that these scores were
inflated by somatic symptoms associated with normative postpartum adjustment. For this reasons
we need to consider the likelihood of a floor effect.
Subjective stress was assessed using the PSS, in which participants rated how unpredictable,
uncontrollable and overloaded their lives felt over the past month, as well as perceived resiliency
resources. Indeed, a slight decrease in stress was associated with the end of the exercise
intervention, and for those in usual care, PSS scores had increased at the end of the study. These
results indicate that exercise in and of itself may have prevented the increase in stress seen in those
who were instructed to refrain from exercise. It is therefore possible that exercise is sufficient to
decrease stress within the larger context of participants’ daily lives.
Trait anxiety and trait anger both remained at sub-clinical levels across all participants and groups.
Trait anxiety decreased in the exercise group and increased in the usual care group. Trait anger
increased in both groups although the increase in the usual care group was much larger of the one
in the exercise group. While this increase may only be of minimal clinical significance, it does
provide an additional marker of negative affect characterizing the post-partum adjustment period.
Overall the results of the analysis of the mood outcomes could indicate that HIIT is slightly
protective against the experience of negative affect in this population.
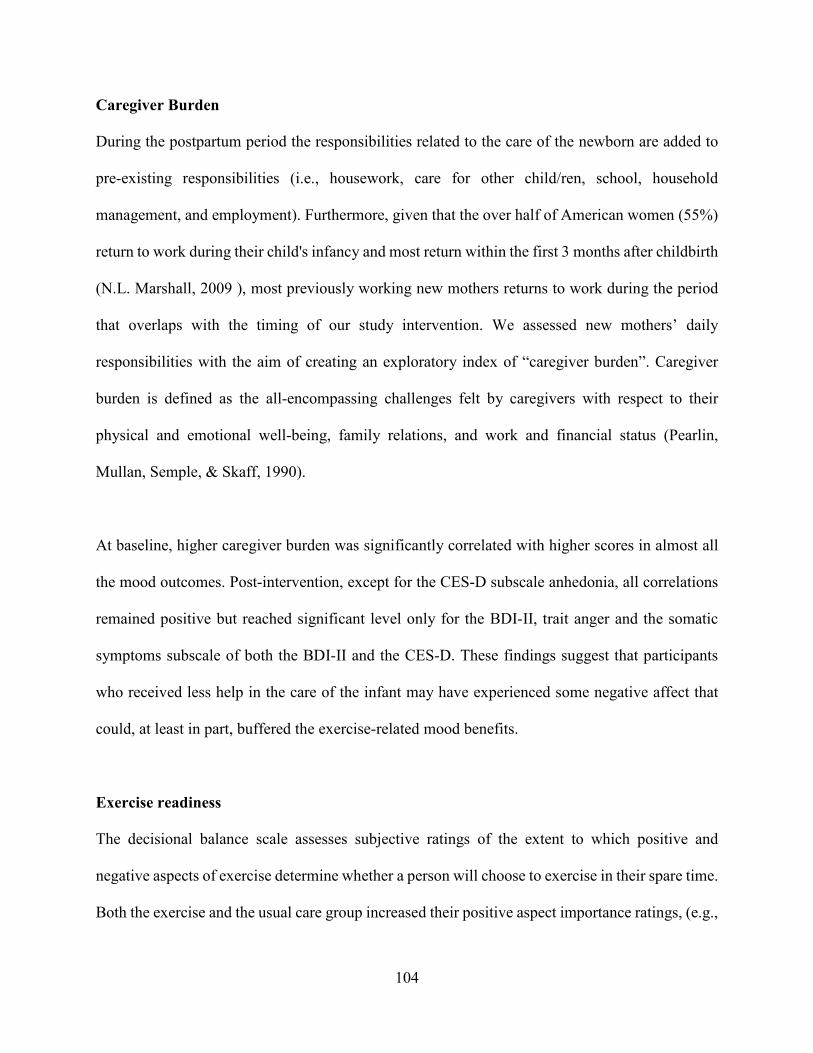
104
Caregiver Burden
During the postpartum period the responsibilities related to the care of the newborn are added to
pre-existing responsibilities (i.e., housework, care for other child/ren, school, household
management, and employment). Furthermore, given that the over half of American women (55%)
return to work during their child's infancy and most return within the first 3 months after childbirth
(N.L. Marshall, 2009 ), most previously working new mothers returns to work during the period
that overlaps with the timing of our study intervention. We assessed new mothers’ daily
responsibilities with the aim of creating an exploratory index of “caregiver burden”. Caregiver
burden is defined as the all-encompassing challenges felt by caregivers with respect to their
physical and emotional well-being, family relations, and work and financial status (Pearlin,
Mullan, Semple, & Skaff, 1990).
At baseline, higher caregiver burden was significantly correlated with higher scores in almost all
the mood outcomes. Post-intervention, except for the CES-D subscale anhedonia, all correlations
remained positive but reached significant level only for the BDI-II, trait anger and the somatic
symptoms subscale of both the BDI-II and the CES-D. These findings suggest that participants
who received less help in the care of the infant may have experienced some negative affect that
could, at least in part, buffered the exercise-related mood benefits.
Exercise readiness
The decisional balance scale assesses subjective ratings of the extent to which positive and
negative aspects of exercise determine whether a person will choose to exercise in their spare time.
Both the exercise and the usual care group increased their positive aspect importance ratings, (e.g.,
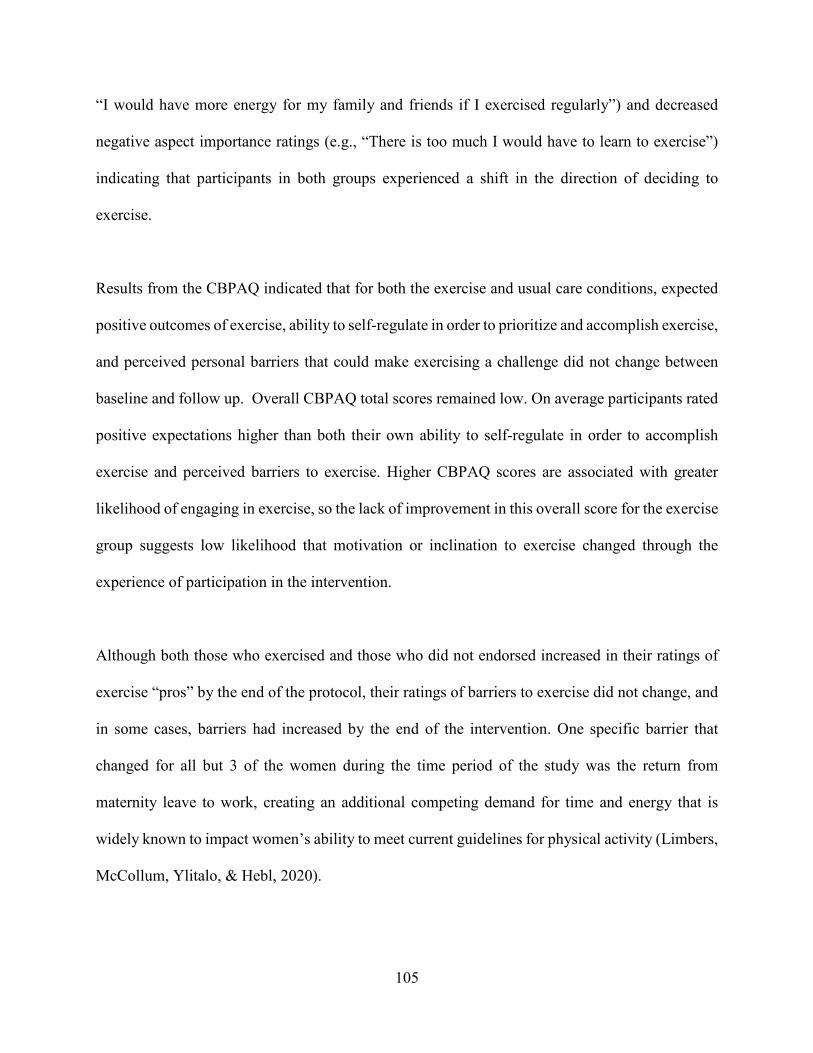
105
“I would have more energy for my family and friends if I exercised regularly”) and decreased
negative aspect importance ratings (e.g., “There is too much I would have to learn to exercise”)
indicating that participants in both groups experienced a shift in the direction of deciding to
exercise.
Results from the CBPAQ indicated that for both the exercise and usual care conditions, expected
positive outcomes of exercise, ability to self-regulate in order to prioritize and accomplish exercise,
and perceived personal barriers that could make exercising a challenge did not change between
baseline and follow up. Overall CBPAQ total scores remained low. On average participants rated
positive expectations higher than both their own ability to self-regulate in order to accomplish
exercise and perceived barriers to exercise. Higher CBPAQ scores are associated with greater
likelihood of engaging in exercise, so the lack of improvement in this overall score for the exercise
group suggests low likelihood that motivation or inclination to exercise changed through the
experience of participation in the intervention.
Although both those who exercised and those who did not endorsed increased in their ratings of
exercise “pros” by the end of the protocol, their ratings of barriers to exercise did not change, and
in some cases, barriers had increased by the end of the intervention. One specific barrier that
changed for all but 3 of the women during the time period of the study was the return from
maternity leave to work, creating an additional competing demand for time and energy that is
widely known to impact women’s ability to meet current guidelines for physical activity (Limbers,
McCollum, Ylitalo, & Hebl, 2020).
106
Interesting, change in CBPAQ Self-Regulation and AUCsum were positively correlated, indicating
the possibility that participants that used self-regulatory actions to maintain regular PA, including
relapse prevention strategies, making commitments and goals, prioritizing and contingency
planning, were able to complete more PA.
Strength and Limitations
The primary strength of this study was the demonstration of the feasibility of a completely
remotely administered and monitored home-based HIIT program in a sample of participants who
were largely limited in the capacity to engage in exercise training. Evidence demonstrates
significantly lower levels of physical activity in the postpartum period, due in large part to the
many impediments to training experienced by these women: insufficient time, inconvenience,
inability to leave the infant, and fatigue. This intervention was developed specifically to overcome
these impediments by reducing the amount of time required to achieve an effect of training,
maximizing convenience by having the training take place in the home, reducing the time away
from the newborn, and reducing fatigue because of the briefer intervention.
Consistent with this evaluation, adherence rates were comparable to those in more conventional
site-based training programs. Virtually all studies suffer from substantial attrition and exercise
studies are no exception. One of the strengths of this pilot study is the use of an intense “coaching”
approach derived from our experience in several exercise intervention studies and on the most
current literature on exercise behavior. Although the study was not designed to test this, it is very
likely that this approach may be partially responsible for the very high participant retention and
adherence to the training protocol. This conclusion is supported by the data collected in the study
107
debriefing where the majority of participants agreed (44%) or strongly agreed (44%) with the
statement “the regular coaching I received in this study helped me to stick with the exercise
program”. To reduce social acceptability bias, we also presented the same statement in a negative
format (the regular coaching I received in this study made no difference in my ability to stick with
the exercise program) and we obtained similar results (22% strongly disagree and 44% disagree).
One limitation to this approach was that participants in the usual care group received fewer overall
contacts from study coaches beyond regular weekly check-in calls, as there was no exercise data
on which to provide feedback.
It is important to note that while the structure of the exercise intervention was specifically designed
to remove common barriers to exercise in this population, still some participants experienced
difficulties in exercising as reported in the study debriefing (e.g., “It was stressful to try to fit in
sessions. I found myself working out at night, sacrificing sleep or work”, “I didn't realize how hard
it was to find 25 minutes of uninterrupted time. I had to ask my husband on numerous occasions
to take care of the baby. It was harder than I thought it was going to be”, “I just didn't have as
much time as I expected to do it”).
The principal limitation of the study was its small sample size. The lack of statistically significant
effects on the outcome measures is likely due to small sample size and wide variability in outcome
measures. Nonetheless, some outcomes achieved significance in the predicted direction and others
showed the expected effects but were not significant, suggesting a larger sample size is needed. It
is important also to consider the fact that this pilot study used a short-term exercise intervention
and, the possibility that a longer intervention is necessary to see more changes in clinically relevant
108
outcomes. Although the outcome is uncertain, a replication of this study with a larger
sample/longer exercise intervention may achieve significant improvements in aerobic capacity,
waist and hip circumference, and dysphoric affect, all of which have significant prognostic value
for the future health of the new mother.
Conclusion
The results of this pilot study clearly indicate that studies aimed at evaluating the benefits of
physical activity in postpartum women need to carefully address the context of the lives of these
women. Even if an exercise intervention can be delivered effectively and psychological and
physiological gains can be achieved, new mothers juggle somatic transition, role transition,
caregiver duties and burden, possibly transitioning back to work after a maternity leave, all of
which can affect psychological variables and feasibility and the measurable benefits of exercise.
Nonetheless, this period is critical to long-term health of the mother and child, and developing
effecting interventions to enhance lifestyle behaviors is important. Contrary to larger literature
documenting that post-partum exercise is difficult for new mothers to access or adhere, we have
demonstrated that conditioning is possible for post-partum women to achieve but may have limited
efficacy for improving mood and psychological wellbeing, depending on other elements of
context, over which they may not have control.
Home-based remotely-administered exercise interventions often rely either on self-reported or
supervisor-observed outcomes, the former of which are not free from reporting or recall bias, and
the latter of which require significant staff and oversight time investments for research teams. The
use of an index of exercise volume in the current study addressed this problem by providing an
109
objective measurement of training activity that could be monitored by research staff from the clinic
site with minimal use of resources.
In conclusion, data from this small pilot study are very promising, especially considering two
factors. First, this study was completed during a pandemic, with all the associated difficulties for
both the research team and the study participants. Second, previous literature has shown that new
mothers face challenges engaging in behavior change interventions, owing to the many demands
and lifestyle restrictions that come with having a new baby. For example, McKinley et al.
concluded that high levels of attrition and poor engagement have been an issue in research studies
aimed at evaluating the role of exercise on weight loss after pregnancy (M. C. McKinley, Allen-
Walker, McGirr, Rooney, & Woodside, 2018).
110
Chapter 5: Conclusion
The overarching purpose of this dissertation was to provide a foundation of empirical evidence for
the criterion validity of the of an HR-derived index as a method to accurately quantify the volume
of exercise completed during a training program and to assess exercise training responses and
resultant health benefits.
As such, three distinct, yet related, research studies were conducted with the following specific
aims 1) to compare the relationships between changes in health-related inflammatory biomarkers
and a) training-induced improvements in performance on a maximal graded exercise test; and b)
HR-derived indices of the volume of exercise completed throughout a 12-week of moderate
aerobic exercise training in insufficiently active but healthy participants 2) to test the associations
between HR-derived indices of exercise volume and change scores on anxiety and quality of life
measures using a 6-weeks high intensity interval training (HIIT) protocol administered at home
with remote coaching in healthy but insufficiently active adults diagnosed with an anxiety disorder
3) to establish potential efficacy and feasibility of a home-based HIIT exercise intervention with
remote administration, monitoring, and testing in insufficiently active postpartum women and, to
test the hypothesis that an HR-derived index of exercise volume will be associated with
improvement in cardiorespiratory fitness, circulating inflammatory markers, cardiac autonomic
control, and dysphoric affect.
Study one found that improvements in VO2peak were not significantly associated with reductions
in inflammatory markers. In contrast, indices representing volume of exercise completed during
the moderate aerobic exercise training intervention were associated with reductions in some, but
111
not all, markers of inflammation. Study two revealed that an at home HIIT protocol may be an
effective intervention framework that reduces barriers faced by people with anxiety disorders to
participate in and accrue the biological/health benefits of exercise training. Furthermore, indices
of volume of exercise completed during the first three weeks of the HIIT training intervention were
significantly and inversely correlated with changes in state and trait anxiety. Study three
demonstrated that a home-based remotely-administered exercise intervention can be delivered
effectively and psychological and physiological gains can be achieved by postpartum women.
However, new mothers juggle somatic transition, role transition, caregiver duties and burden,
possibly transitioning back to work after a maternity leave, all of which can affect psychological
variables and feasibility and the measurable benefits of exercise. Results from this pilot study
point to the need to carefully address the context of the lives of these women when evaluating the
benefits of physical activity in the postpartum period. Notably, even in this small sample study the
index representing the total volume of exercise performed was significantly correlated with
improvements in physiological outcomes that have significant prognostic value for the future
health of the new mother.
Taken as a whole, the results from the three studies indicate that this method of assessment of
exercise volume is promising for tracking some of the biological and psychological benefits that
are widely associated with exercise. In these studies, this novel index was significantly associated
with specific markers of biological adaptation to exercise training that are clinically meaningful.
Given the high levels of protocol adherence participants were able to achieve in these studies as
well as the relatively low participant and research staff burden that each of the studies required,
112
this novel index balances the need for accurate exercise tracking with accessibility and
affordability.
Although the findings from the studies included in this dissertation series impart crucial insight
about whether using measurement of the volume of training can allow for greater understanding
of the dose required to attain various health benefits of exercise, the small sample size limitation
should be taken into consideration when interpreting the results of the current dissertation series.
Further research is needed to replicate these findings in larger samples, and to broaden our
understanding of whether incorporation of this novel objective index of volume of exercise
completed can provide information beyond that which is provided by other methods such as
VO2max and expand our ability to illuminate mechanisms of how exercise might improve physical
and mental health in research and in practice.
113
Bibliography
2018 Physical Activity Guidelines Advisory Committee. (2018). Physical Activity Guidelines Advisory Committee Scientific Report. US Department of Health and Human Service., p. C-11.
Abbasi, M., & Van den Akker, O. (2015). A systematic review of changes in women’s physical activity before and during pregnancy and the postnatal period. Journal of Reproductive and Infant Psychology., 33 (4), 325-358. doi:10.1080/02646838.2015.1012710
Adams, S. A., Matthews, C. E., Ebbeling, C. B., Moore, C. G., Cunningham, J. E., Fulton, J., & Hebert, J. R. (2005). The effect of social desirability and social approval on self-reports of physical activity. Am J Epidemiol, 161(4), 389-398. doi:10.1093/aje/kwi054
Ainsworth, B. E., Haskell, W. L., Whitt, M. C., Irwin, M. L., Swartz, A. M., Strath, S. J., . . . Leon, A. S. (2000). Compendium of physical activities: an update of activity codes and MET intensities. Med Sci Sports Exerc, 32(9 Suppl), S498-504. doi:10.1097/00005768-200009001-00009
American College of Sports Medicine. (2000). ACSM's guidelines for exercise testing and prescription. Philadelphia :Lippincott Williams & Wilkins.
American Psychiatric Association. (2013). Diagnostic and statistical manual of mental disorders (5th ed.).
Amireault, S., & Godin, G. (2015). The Godin-Shephard leisure-time physical activity questionnaire: validity evidence supporting its use for classifying healthy adults into active and insufficiently active categories. Percept Mot Skills, 120(2), 604-622. doi:10.2466/03.27.PMS.120v19x7
Angell, S. Y., McConnell, M. V., Anderson, C. A. M., Bibbins-Domingo, K., Boyle, D. S., Capewell, S., . . . Warner, J. J. (2020). The American Heart Association 2030 Impact Goal: A Presidential Advisory From the American Heart Association. Circulation, 141(9), e120-e138. doi:10.1161/CIR.0000000000000758
Ashworth, N. L., Chad, K. E., Harrison, E. L., Reeder, B. A., & Marshall, S. C. (2005). Home versus center based physical activity programs in older adults. Cochrane Database Syst Rev(1), CD004017. doi:10.1002/14651858.CD004017.pub2
Asmundson, G. J., Fetzner, M. G., Deboer, L. B., Powers, M. B., Otto, M. W., & Smits, J. A. (2013). Let's get physical: a contemporary review of the anxiolytic effects of exercise for anxiety and its disorders. Depress Anxiety, 30(4), 362-373. doi:10.1002/da.22043
Astrand Po, R. K. (1977). Textbook of Work Physiology. Auerbach, P., Nordby, P., Bendtsen, L. Q., Mehlsen, J. L., Basnet, S. K., Vestergaard, H., . . .
Stallknecht, B. (2013). Differential effects of endurance training and weight loss on plasma adiponectin multimers and adipose tissue macrophages in younger, moderately overweight men. Am J Physiol Regul Integr Comp Physiol, 305(5), R490-498. doi:10.1152/ajpregu.00575.2012
Aune, D., Norat, T., Leitzmann, M., Tonstad, S., & Vatten, L. J. (2015). Physical activity and the risk of type 2 diabetes: a systematic review and dose-response meta-analysis. Eur J Epidemiol, 30(7), 529-542. doi:10.1007/s10654-015-0056-z
Avila, A., Claes, J., Goetschalckx, K., Buys, R., Azzawi, M., Vanhees, L., & Cornelissen, V. (2018). Home-Based Rehabilitation With Telemonitoring Guidance for Patients With Coronary Artery Disease (Short-Term Results of the TRiCH Study): Randomized Controlled Trial. J Med Internet Res, 20(6), e225. doi:10.2196/jmir.9943
114
Aylett, E., Small, N., & Bower, P. (2018). Exercise in the treatment of clinical anxiety in general practice - a systematic review and meta-analysis. BMC Health Serv Res, 18(1), 559. doi:10.1186/s12913-018-3313-5
Baecke, J. A., Burema, J., & Frijters, J. E. (1982). A short questionnaire for the measurement of habitual physical activity in epidemiological studies. Am J Clin Nutr, 36(5), 936-942. doi:10.1093/ajcn/36.5.936
Beaver, W. L., Wasserman, K., & Whipp, B. J. (1986). A new method for detecting anaerobic threshold by gas exchange. J Appl Physiol (1985), 60(6), 2020-2027. doi:10.1152/jappl.1986.60.6.2020
Beck AT, S. R. a. B. G. (1996). Beck Depression Inventory Manual 2nd ed. . San Antonio, TX: The Psychological Corporation;.
Bennett, H., Parfitt, G., Davison, K., & Eston, R. (2016). Validity of Submaximal Step Tests to Estimate Maximal Oxygen Uptake in Healthy Adults. Sports Med, 46(5), 737-750. doi:10.1007/s40279-015-0445-1
Berge, J. M., Larson, N., Bauer, K. W., & Neumark-Sztainer, D. (2011). Are parents of young children practicing healthy nutrition and physical activity behaviors? Pediatrics, 127(5), 881-887. doi:10.1542/peds.2010-3218
Biddle, S. J., & Batterham, A. M. (2015). High-intensity interval exercise training for public health: a big HIT or shall we HIT it on the head? Int J Behav Nutr Phys Act, 12, 95. doi:10.1186/s12966-015-0254-9
Borg, G. (1998). Borg's perceived exertion and pain scales. Human Kinetics. Boswell, J. F., Iles, B. R., Gallagher, M. W., & Farchione, T. J. (2017). Behavioral activation
strategies in cognitive-behavioral therapy for anxiety disorders. Psychotherapy (Chic), 54(3), 231-236. doi:10.1037/pst0000119
Bramham, K., Nelson-Piercy, C., Brown, M. J., & Chappell, L. C. (2013). Postpartum management of hypertension. BMJ, 346, f894. doi:10.1136/bmj.f894
Brigitte C. Sabourin , C. A. H., Marie-Josée Lefaivre ,, & Stewart, M. C. W. S. H. (2011). Why Do They Exercise Less? Barriers to Exercise
in High-Anxiety-Sensitive Women. Cognitive Behaviour Therapy, 40(3), 206-215. doi:https://doi.org/10.1080/16506073.2011.573572
Broman-Fulks, J. J., Berman, M. E., Rabian, B. A., & Webster, M. J. (2004). Effects of aerobic exercise on anxiety sensitivity. Behav Res Ther, 42(2), 125-136. doi:10.1016/S0005-7967(03)00103-7
Buckley, J. P., Sim, J., Eston, R. G., Hession, R., & Fox, R. (2004). Reliability and validity of measures taken during the Chester step test to predict aerobic power and to prescribe aerobic exercise. Br J Sports Med, 38(2), 197-205. doi:10.1136/bjsm.2003.005389
Bull, F. C., Al-Ansari, S. S., Biddle, S., Borodulin, K., Buman, M. P., Cardon, G., . . . Willumsen, J. F. (2020). World Health Organization 2020 guidelines on physical activity and sedentary behaviour. Br J Sports Med, 54(24), 1451-1462. doi:10.1136/bjsports-2020-102955
Byrne, N. M., Hills, A. P., Hunter, G. R., Weinsier, R. L., & Schutz, Y. (2005). Metabolic equivalent: one size does not fit all. J Appl Physiol (1985), 99(3), 1112-1119. doi:10.1152/japplphysiol.00023.2004
C J Jones, R. E. R., W C Beam. (1999). A 30-s chair-stand test as a measure of lower body strength in community-residing older adults. Res Q Exerc Sport, 70(2). doi:10.1080/02701367.1999.10608028.
115
Campbell, W. W., Kraus, W. E., Powell, K. E., Haskell, W. L., Janz, K. F., Jakicic, J. M., . . . Physical Activity Guidelines Advisory, C. (2019). High-Intensity Interval Training for Cardiometabolic Disease Prevention. Med Sci Sports Exerc, 51(6), 1220-1226. doi:10.1249/MSS.0000000000001934
Cary, G. B., & Quinn, T. J. (2001). Exercise and lactation: are they compatible? Can J Appl Physiol, 26(1), 55-75. doi:10.1139/h01-004
Caspersen, C. J., Powell, K. E., & Christenson, G. M. (1985). Physical activity, exercise, and physical fitness: definitions and distinctions for health-related research. Public Health Rep, 100(2), 126-131. Retrieved from https://www.ncbi.nlm.nih.gov/pubmed/3920711
Centers for Disease Control and Prevention. (2021). Benefits of Physical Activity. Retrieved from https://www.cdc.gov/physicalactivity/basics/pa-health/index.htm
Chekroud, S. R., Gueorguieva, R., Zheutlin, A. B., Paulus, M., Krumholz, H. M., Krystal, J. H., & Chekroud, A. M. (2018). Association between physical exercise and mental health in 1.2 million individuals in the USA between 2011 and 2015: a cross-sectional study. Lancet Psychiatry, 5(9), 739-746. doi:10.1016/S2215-0366(18)30227-X
Chen, J., Liu, X., Rapee, R. M., & Pillay, P. (2013). Behavioural activation: a pilot trial of transdiagnostic treatment for excessive worry. Behav Res Ther, 51(9), 533-539. doi:10.1016/j.brat.2013.05.010
Choi, K. W., Chen, C. Y., Stein, M. B., Klimentidis, Y. C., Wang, M. J., Koenen, K. C., . . . Major Depressive Disorder Working Group of the Psychiatric Genomics, C. (2019). Assessment of Bidirectional Relationships Between Physical Activity and Depression Among Adults: A 2-Sample Mendelian Randomization Study. JAMA Psychiatry, 76(4), 399-408. doi:10.1001/jamapsychiatry.2018.4175
Chtourou, H., Trabelsi, K., H'Mida, C., Boukhris, O., Glenn, J. M., Brach, M., . . . Bragazzi, N. L. (2020). Staying Physically Active During the Quarantine and Self-Isolation Period for Controlling and Mitigating the COVID-19 Pandemic: A Systematic Overview of the Literature. Front Psychol, 11, 1708. doi:10.3389/fpsyg.2020.01708
Cohen, S., Kamarck, T., & Mermelstein, R. (1983). A global measure of perceived stress. J Health Soc Behav, 24(4), 385-396. Retrieved from https://www.ncbi.nlm.nih.gov/pubmed/6668417
Conn, V. S. (2010). Anxiety outcomes after physical activity interventions: meta-analysis findings. Nurs Res, 59(3), 224-231. doi:10.1097/NNR.0b013e3181dbb2f8
Corder, K., Winpenny, E. M., Foubister, C., Guagliano, J. M., Hartwig, X. M., Love, R., . . . van Sluijs, E. M. F. (2020). Becoming a parent: A systematic review and meta-analysis of changes in BMI, diet, and physical activity. Obes Rev, 21(4), e12959. doi:10.1111/obr.12959
Cox, J. L., Holden, J. M., & Sagovsky, R. (1987). Detection of postnatal depression. Development of the 10-item Edinburgh Postnatal Depression Scale. Br J Psychiatry, 150, 782-786. doi:10.1192/bjp.150.6.782
Cox, K. L., Burke, V., Gorely, T. J., Beilin, L. J., & Puddey, I. B. (2003). Controlled comparison of retention and adherence in home- vs center-initiated exercise interventions in women ages 40-65 years: The S.W.E.A.T. Study (Sedentary Women Exercise Adherence Trial). Prev Med, 36(1), 17-29. doi:10.1006/pmed.2002.1134
Davenport, M. H., McCurdy, A. P., Mottola, M. F., Skow, R. J., Meah, V. L., Poitras, V. J., . . . Ruchat, S. M. (2018). Impact of prenatal exercise on both prenatal and postnatal anxiety
116
and depressive symptoms: a systematic review and meta-analysis. Br J Sports Med, 52(21), 1376-1385. doi:10.1136/bjsports-2018-099697
Davenport, M. H., Ruchat, S. M., Poitras, V. J., Jaramillo Garcia, A., Gray, C. E., Barrowman, N., . . . Mottola, M. F. (2018). Prenatal exercise for the prevention of gestational diabetes mellitus and hypertensive disorders of pregnancy: a systematic review and meta-analysis. Br J Sports Med, 52(21), 1367-1375. doi:10.1136/bjsports-2018-099355
Davies, G. A. L., Wolfe, L. A., Mottola, M. F., & MacKinnon, C. (2018). No. 129-Exercise in Pregnancy and the Postpartum Period. J Obstet Gynaecol Can, 40(2), e58-e65. doi:10.1016/j.jogc.2017.11.001
DeBoer, L. B., Powers, M. B., Utschig, A. C., Otto, M. W., & Smits, J. A. (2012). Exploring exercise as an avenue for the treatment of anxiety disorders. Expert Rev Neurother, 12(8), 1011-1022. doi:10.1586/ern.12.73
DeBoer, R. W., Karemaker, J. M., & Strackee, J. (1984). Comparing spectra of a series of point events particularly for heart rate variability data. IEEE Trans Biomed Eng, 31(4), 384-387. doi:10.1109/TBME.1984.325351
Dewey, K. G., Lovelady, C. A., Nommsen-Rivers, L. A., McCrory, M. A., & Lonnerdal, B. (1994). A randomized study of the effects of aerobic exercise by lactating women on breast-milk volume and composition. N Engl J Med, 330(7), 449-453. doi:10.1056/NEJM199402173300701
Dowd, K. P., Szeklicki, R., Minetto, M. A., Murphy, M. H., Polito, A., Ghigo, E., . . . Donnelly, A. E. (2018). A systematic literature review of reviews on techniques for physical activity measurement in adults: a DEDIPAC study. Int J Behav Nutr Phys Act, 15(1), 15. doi:10.1186/s12966-017-0636-2
Ekelund, U., Tarp, J., Steene-Johannessen, J., Hansen, B. H., Jefferis, B., Fagerland, M. W., . . . Lee, I. M. (2019). Dose-response associations between accelerometry measured physical activity and sedentary time and all cause mortality: systematic review and harmonised meta-analysis. BMJ, 366, l4570. doi:10.1136/bmj.l4570
Elise Engström, E. O., Björn Wohlfart, Nils Grundström & Anita Wisén. (2012). Comparison of heart rate measured by Polar RS400 and ECG, validity and repeatability. Advances in Physiotherapy, 14:3, 115-122. doi:10.3109/14038196.2012.694118
Elovainio, M., Hakulinen, C., Pulkki-Raback, L., Virtanen, M., Josefsson, K., Jokela, M., . . . Kivimaki, M. (2017). Contribution of risk factors to excess mortality in isolated and lonely individuals: an analysis of data from the UK Biobank cohort study. Lancet Public Health, 2(6), e260-e266. doi:10.1016/S2468-2667(17)30075-0
Endicott, J., Nee, J., Harrison, W., & Blumenthal, R. (1993). Quality of Life Enjoyment and Satisfaction Questionnaire: a new measure. Psychopharmacol Bull, 29(2), 321-326. Retrieved from https://www.ncbi.nlm.nih.gov/pubmed/8290681
Engström, E., Ottosson, E., Wohlfart, B., Grundström, N., & Wisén, A. (2012). Comparison of heart rate measured by Polar RS400 and ECG, validity and repeatability. Advances in Physiotherapy, 14(3), 115-122. doi:10.3109/14038196.2012.694118
Enns, M. W., Cox, B. J., & Borger, S. C. (2001). Correlates of analogue and clinical depression: a further test of the phenomenological continuity hypothesis. J Affect Disord, 66(2-3), 175-183. doi:10.1016/s0165-0327(00)00305-0
Farah, B. Q., do Prado, W. L., Malik, N., Lofrano-Prado, M. C., de Melo, P. H., Botero, J. P., . . . Ritti-Dias, R. M. (2021). Barriers to physical activity during the COVID-19 pandemic in adults: a cross-sectional study. Sport Sci Health, 1-7. doi:10.1007/s11332-020-00724-5
117
FJ, H. (1978). On the use of windows for harmonic analysis with the discrete Fourier transform. Proceedings of the IEEE(66), 51–83.
Froelicher, V. F., & Marcondes, G. D. (1989). Manual of exercise testing. Chicago: Year Book Medical Pub.
Fukuoka, Y., Haskell, W., & Vittinghoff, E. (2016). New insights into discrepancies between self-reported and accelerometer-measured moderate to vigorous physical activity among women - the mPED trial. BMC Public Health, 16(1), 761. doi:10.1186/s12889-016-3348-7
Garber, C. E., Blissmer, B., Deschenes, M. R., Franklin, B. A., Lamonte, M. J., Lee, I. M., . . . American College of Sports, M. (2011). American College of Sports Medicine position stand. Quantity and quality of exercise for developing and maintaining cardiorespiratory, musculoskeletal, and neuromotor fitness in apparently healthy adults: guidance for prescribing exercise. Med Sci Sports Exerc, 43(7), 1334-1359. doi:10.1249/MSS.0b013e318213fefb
Garber, C. E., Blissmer, B., Deschenes, M. R., Franklin, B. A., Lamonte, M. J., Lee, I. M., . . . Med, A. C. S. (2011). Quantity and Quality of Exercise for Developing and Maintaining Cardiorespiratory, Musculoskeletal, and Neuromotor Fitness in Apparently Healthy Adults: Guidance for Prescribing Exercise. Medicine and Science in Sports and Exercise, 43(7), 1334-1359. doi:10.1249/MSS.0b013e318213fefb
Gardner, A. W., Parker, D. E., Montgomery, P. S., Scott, K. J., & Blevins, S. M. (2011). Efficacy of quantified home-based exercise and supervised exercise in patients with intermittent claudication: a randomized controlled trial. Circulation, 123(5), 491-498. doi:10.1161/CIRCULATIONAHA.110.963066
Gibala, M. J., Little, J. P., Macdonald, M. J., & Hawley, J. A. (2012). Physiological adaptations to low-volume, high-intensity interval training in health and disease. J Physiol, 590(5), 1077-1084. doi:10.1113/jphysiol.2011.224725
Gilinsky, A. S., Dale, H., Robinson, C., Hughes, A. R., McInnes, R., & Lavallee, D. (2015). Efficacy of physical activity interventions in post-natal populations: systematic review, meta-analysis and content coding of behaviour change techniques. Health Psychol Rev, 9(2), 244-263. doi:10.1080/17437199.2014.899059
Glass S, D. G., America College of Sports Medicine. . (2007). ACSM’s Metabolic Calculations Handbook. Baltimore, MD: Lippincott Williams & Wilkins;.
Gleeson, M., Bishop, N. C., Stensel, D. J., Lindley, M. R., Mastana, S. S., & Nimmo, M. A. (2011). The anti-inflammatory effects of exercise: mechanisms and implications for the prevention and treatment of disease. Nat Rev Immunol, 11(9), 607-615. doi:10.1038/nri3041
Guthold, R., Stevens, G. A., Riley, L. M., & Bull, F. C. (2018). Worldwide trends in insufficient physical activity from 2001 to 2016: a pooled analysis of 358 population-based surveys with 1.9 million participants. Lancet Glob Health, 6(10), e1077-e1086. doi:10.1016/S2214-109X(18)30357-7
Harber, M. P., Kaminsky, L. A., Arena, R., Blair, S. N., Franklin, B. A., Myers, J., & Ross, R. (2017). Impact of Cardiorespiratory Fitness on All-Cause and Disease-Specific Mortality: Advances Since 2009. Prog Cardiovasc Dis, 60(1), 11-20. doi:10.1016/j.pcad.2017.03.001
Heart rate variability: standards of measurement, physiological interpretation and clinical use. Task Force of the European Society of Cardiology and the North American Society of
118
Pacing and Electrophysiology. (1996). Circulation, 93(5), 1043-1065. Retrieved from https://www.ncbi.nlm.nih.gov/pubmed/8598068
Henning, E. R., Turk, C. L., Mennin, D. S., Fresco, D. M., & Heimberg, R. G. (2007). Impairment and quality of life in individuals with generalized anxiety disorder. Depress Anxiety, 24(5), 342-349. doi:10.1002/da.20249
Hopkins, J., Campbell, S. B., & Marcus, M. (1989). Postpartum depression and postpartum adaptation: overlapping constructs? J Affect Disord, 17(3), 251-254. doi:10.1016/0165-0327(89)90007-4
Hwang, R., & Marwick, T. (2009). Efficacy of home-based exercise programmes for people with chronic heart failure: a meta-analysis. Eur J Cardiovasc Prev Rehabil, 16(5), 527-535. doi:10.1097/HJR.0b013e32832e097f
Jones, M., Jolly, K., Raftery, J., Lip, G. Y., Greenfield, S., & Committee, B. S. (2007). 'DNA' may not mean 'did not participate': a qualitative study of reasons for non-adherence at home- and centre-based cardiac rehabilitation. Fam Pract, 24(4), 343-357. doi:10.1093/fampra/cmm021
Judd, L. L., Rapaport, M. H., Paulus, M. P., & Brown, J. L. (1994). Subsyndromal symptomatic depression: a new mood disorder? J Clin Psychiatry, 55 Suppl, 18-28. Retrieved from https://www.ncbi.nlm.nih.gov/pubmed/8077164
Kandola, A., Vancampfort, D., Herring, M., Rebar, A., Hallgren, M., Firth, J., & Stubbs, B. (2018). Moving to Beat Anxiety: Epidemiology and Therapeutic Issues with Physical Activity for Anxiety. Curr Psychiatry Rep, 20(8), 63. doi:10.1007/s11920-018-0923-x
Kaptoge, S., Seshasai, S. R., Gao, P., Freitag, D. F., Butterworth, A. S., Borglykke, A., . . . Danesh, J. (2014). Inflammatory cytokines and risk of coronary heart disease: new prospective study and updated meta-analysis. Eur Heart J, 35(9), 578-589. doi:10.1093/eurheartj/eht367
Kevin S., A. R. (2004). The Chester step test—a simple yet effective tool for the prediction of aerobic capacity. Physiotherapy, 90(4), 183-188.
Khakpoor, S., Saed, O., & Shahsavar, A. (2019). The concept of "Anxiety sensitivity" in social anxiety disorder presentations, symptomatology, and treatment: A theoretical perspective. Cogent Psychology, 6(1). doi:doi:Artn 1617658
10.1080/23311908.2019.1617658 King, A. C., Haskell, W. L., Taylor, C. B., Kraemer, H. C., & DeBusk, R. F. (1991). Group- vs
home-based exercise training in healthy older men and women. A community-based clinical trial. JAMA, 266(11), 1535-1542. Retrieved from https://www.ncbi.nlm.nih.gov/pubmed/1880885
Kingsley, M., Lewis, M. J., & Marson, R. E. (2005). Comparison of Polar 810s and an ambulatory ECG system for RR interval measurement during progressive exercise. Int J Sports Med, 26(1), 39-44. doi:10.1055/s-2004-817878
Kodama, S., Saito, K., Tanaka, S., Maki, M., Yachi, Y., Asumi, M., . . . Sone, H. (2009). Cardiorespiratory fitness as a quantitative predictor of all-cause mortality and cardiovascular events in healthy men and women: a meta-analysis. JAMA, 301(19), 2024-2035. doi:10.1001/jama.2009.681
301/19/2024 [pii] Kohut, M. L., McCann, D. A., Russell, D. W., Konopka, D. N., Cunnick, J. E., Franke, W. D., . .
. Vanderah, E. (2006). Aerobic exercise, but not flexibility/resistance exercise, reduces serum IL-18 CRP, and IL-6 independent of beta-blockers, BMI, and psychosocial factors
119
in older adults. Brain Behavior and Immunity, 20(3), 201-209. doi:10.1016/j.bbi.2005.12.002
Kolovetsiou-Kreiner, V., Moertl, M. G., Papousek, I., Schmid-Zalaudek, K., Lang, U., Schlembach, D., . . . Lackner, H. K. (2018). Maternal cardiovascular and endothelial function from first trimester to postpartum. PLoS One, 13(5), e0197748. doi:10.1371/journal.pone.0197748
Kozey, S., Lyden, K., Staudenmayer, J., & Freedson, P. (2010). Errors in MET estimates of physical activities using 3.5 ml x kg(-1) x min(-1) as the baseline oxygen consumption. Journal of Physical Activity & Health, 7(4), 508-516. doi:10.1123/jpah.7.4.508
Kraal, J. J., Van den Akker-Van Marle, M. E., Abu-Hanna, A., Stut, W., Peek, N., & Kemps, H. M. (2017). Clinical and cost-effectiveness of home-based cardiac rehabilitation compared to conventional, centre-based cardiac rehabilitation: Results of the FIT@Home study. Eur J Prev Cardiol, 24(12), 1260-1273. doi:10.1177/2047487317710803
Krause, M., Rodrigues-Krause, J., O'Hagan, C., Medlow, P., Davison, G., Susta, D., . . . De Vito, G. (2014). The effects of aerobic exercise training at two different intensities in obesity and type 2 diabetes: implications for oxidative stress, low-grade inflammation and nitric oxide production. European Journal of Applied Physiology, 114(2), 251-260. doi:10.1007/s00421-013-2769-6
Kyle Davis, S. D. (2012). The Relationship Between Physical Activity and Mood Across the Perinatal Period: A Review of Naturalistic and Clinical Research to Guide Future Investigation of Physical Activity–Based Interventions for Perinatal Depression. Clinical Psychology: Science and Practice(19), 27-48. doi: https://doi.org/10.1111/j.1468-2850.2012.01273.x
Latin, R. W., Berg, K., Kissinger, K., Sinnett, A., & Parks, L. (2001). The accuracy of the ACSM stair-stepping equation. Med Sci Sports Exerc, 33(10), 1785-1788. doi:10.1097/00005768-200110000-00026
Libardi, C. A., Souza, G. V., Gaspari, A. F., Dos Santos, C. F., Leite, S. T., Dias, R., . . . Chacon-Mikahil, M. P. T. (2011). Effects of concurrent training on interleukin-6, tumour necrosis factor-alpha and C-reactive protein in middle-aged men. Journal of Sports Sciences, 29(14), 1573-1581. doi:10.1080/02640414.2011.609896
Limbers, C. A., McCollum, C., Ylitalo, K. R., & Hebl, M. (2020). Physical activity in working mothers: Running low impacts quality of life. Womens Health (Lond), 16, 1745506520929165. doi:10.1177/1745506520929165
Linke, S. E., Gallo, L. C., & Norman, G. J. (2011). Attrition and adherence rates of sustained vs. intermittent exercise interventions. Ann Behav Med, 42(2), 197-209. doi:10.1007/s12160-011-9279-8
Lovelady, C. A., Nommsen-Rivers, L. A., McCrory, M. A., & Dewey, K. G. (1995). Effects of exercise on plasma lipids and metabolism of lactating women. Med Sci Sports Exerc, 27(1), 22-28. Retrieved from https://www.ncbi.nlm.nih.gov/pubmed/7898332
MacInnis, M. J., & Gibala, M. J. (2017). Physiological adaptations to interval training and the role of exercise intensity. J Physiol, 595(9), 2915-2930. doi:10.1113/JP273196
Martland, R., Mondelli, V., Gaughran, F., & Stubbs, B. (2020). Can high-intensity interval training improve physical and mental health outcomes? A meta-review of 33 systematic reviews across the lifespan. J Sports Sci, 38(4), 430-469. doi:10.1080/02640414.2019.1706829
120
Mason, J. E., Faller, Y. N., LeBouthillier, D. M., & Asmundson, G. J. G. (2019). Exercise anxiety: A qualitative analysis of the barriers, facilitators, and psychological processes underlying exercise participation for people with anxiety-related disorders. Mental Health and Physical Activity, 16, 128-139. doi:10.1016/j.mhpa.2018.11.003
Mathur, N., & Pedersen, B. K. (2008). Exercise as a mean to control low-grade systemic inflammation. Mediators Inflamm, 2008, 109502. doi:10.1155/2008/109502
Mattioli, A. V., Sciomer, S., Cocchi, C., Maffei, S., & Gallina, S. (2020). Quarantine during COVID-19 outbreak: Changes in diet and physical activity increase the risk of cardiovascular disease. Nutr Metab Cardiovasc Dis, 30(9), 1409-1417. doi:10.1016/j.numecd.2020.05.020
Maturi, M. S., Afshary, P., & Abedi, P. (2011). Effect of physical activity intervention based on a pedometer on physical activity level and anthropometric measures after childbirth: a randomized controlled trial. BMC Pregnancy Childbirth, 11, 103. doi:10.1186/1471-2393-11-103
Mcgee, V. E., & Carleton, W. T. (1970). Piecewise Regression. Journal of the American Statistical Association, 65(331), 1109-&. doi:Doi 10.2307/2284278
McIntyre, K. M., Puterman, E., Scodes, J. M., Choo, T. H., Choi, C. J., Pavlicova, M., & Sloan, R. P. (2020). The effects of aerobic training on subclinical negative affect: A randomized controlled trial. Health Psychol, 39(4), 255-264. doi:10.1037/hea0000836
McKinley, M. C., Allen-Walker, V., McGirr, C., Rooney, C., & Woodside, J. V. (2018). Weight loss after pregnancy: challenges and opportunities. Nutr Res Rev, 31(2), 225-238. doi:10.1017/S0954422418000070
McKinley, P. S., King, A. R., Shapiro, P. A., Slavov, I., Fang, Y., Chen, I. S., . . . Sloan, R. P. (2009). The impact of menstrual cycle phase on cardiac autonomic regulation. Psychophysiology, 46(4), 904-911. doi:10.1111/j.1469-8986.2009.00811.x
Merom, D., Phongsavan, P., Wagner, R., Chey, T., Marnane, C., Steel, Z., . . . Bauman, A. (2008). Promoting walking as an adjunct intervention to group cognitive behavioral therapy for an anxiety disorders - A pilot group randomized trial. Journal of Anxiety Disorders, 22(6), 959-968. doi:10.1016/j.janxdis.2007.09.010
Miller, W. R., & Rollnick, S. (2013). Motivational interviewing: Helping people change (3rd edition). New York, NY: The Guilford Press.
Mor, G., & Cardenas, I. (2010). The immune system in pregnancy: a unique complexity. Am J Reprod Immunol, 63(6), 425-433. doi:10.1111/j.1600-0897.2010.00836.x
N.L. Marshall, A. J. T. (2009 ). After the baby: work-family conflict and working mothers' psychological health. Families and Health(58), 380-391.
Nascimento, S. L., Pudwell, J., Surita, F. G., Adamo, K. B., & Smith, G. N. (2014). The effect of physical exercise strategies on weight loss in postpartum women: a systematic review and meta-analysis. Int J Obes (Lond), 38(5), 626-635. doi:10.1038/ijo.2013.183
Neeland, I. J., Ross, R., Despres, J. P., Matsuzawa, Y., Yamashita, S., Shai, I., . . . International Chair on Cardiometabolic Risk Working Group on Visceral, O. (2019). Visceral and ectopic fat, atherosclerosis, and cardiometabolic disease: a position statement. Lancet Diabetes Endocrinol, 7(9), 715-725. doi:10.1016/S2213-8587(19)30084-1
Nguyen, P. T. H., Binns, C. W., Nguyen, C. L., Van Ha, A. V., Chu, K. T., Duong, D. V., . . . Lee, A. H. (2019). Physical Activity During Pregnancy is Associated with Improved Breastfeeding Outcomes: A Prospective Cohort Study. Int J Environ Res Public Health, 16(10). doi:10.3390/ijerph16101740
121
Nienhuis, C. P., & Lesser, I. A. (2020). The Impact of COVID-19 on Women's Physical Activity Behavior and Mental Well-Being. Int J Environ Res Public Health, 17(23). doi:10.3390/ijerph17239036
Nigg CR, R. J., Norman GJ, Benisovich SV. (1998). Structure of decisional balance for exercise adoption. Annals of Behavioral Medicine.
Nomaguchi, K. M., & Bianchi, S. M. (2004). Exercise time: Gender differences in the effects of marriage, parenthood, and employment. Journal of Marriage and Family, 66(2), 413–430.
O'Hara, M. W., Zekoski, E. M., Philipps, L. H., & Wright, E. J. (1990). Controlled prospective study of postpartum mood disorders: comparison of childbearing and nonchildbearing women. J Abnorm Psychol, 99(1), 3-15. doi:10.1037//0021-843x.99.1.3
Office of Disease Prevention and Health Promotion, O. o. t. S., U.S. Department of Health and Human Services. (2021). Healthy People 2030 Retrieved from https://health.gov/healthypeople/objectives-and-data/leading-health-indicators
Olson, C. M., Strawderman, M. S., Hinton, P. S., & Pearson, T. A. (2003). Gestational weight gain and postpartum behaviors associated with weight change from early pregnancy to 1 y postpartum. Int J Obes Relat Metab Disord, 27(1), 117-127. doi:10.1038/sj.ijo.0802156
Pearlin, L. I., Mullan, J. T., Semple, S. J., & Skaff, M. M. (1990). Caregiving and the stress process: an overview of concepts and their measures. Gerontologist, 30(5), 583-594. doi:10.1093/geront/30.5.583
Pescatello, L. S., & American College of Sports Medicine. (2014). ACSM's guidelines for exercise testing and prescription (9th ed.). Philadelphia: Wolters Kluwer/Lippincott Williams & Wilkins Health.
Petersen, A. M., & Pedersen, B. K. (2005). The anti-inflammatory effect of exercise. J Appl Physiol (1985), 98(4), 1154-1162. doi:10.1152/japplphysiol.00164.2004
Phelan, S. (2016). Windows of Opportunity for Lifestyle Interventions to Prevent Gestational Diabetes Mellitus. Am J Perinatol, 33(13), 1291-1299. doi:10.1055/s-0036-1586504
Physical Activity and Exercise During Pregnancy and the Postpartum Period: ACOG Committee Opinion, Number 804. (2020). Obstet Gynecol, 135(4), e178-e188. doi:10.1097/AOG.0000000000003772
Piercy, K. L., Troiano, R. P., Ballard, R. M., Carlson, S. A., Fulton, J. E., Galuska, D. A., . . . Olson, R. D. (2018). The Physical Activity Guidelines for Americans. JAMA, 320(19), 2020-2028. doi:10.1001/jama.2018.14854
Pinquart, M., & Sorensen, S. (2003). Differences between caregivers and noncaregivers in psychological health and physical health: a meta-analysis. Psychol Aging, 18(2), 250-267. doi:10.1037/0882-7974.18.2.250
Pizzagalli, D. A. (2014). Depression, stress, and anhedonia: toward a synthesis and integrated model. Annu Rev Clin Psychol, 10, 393-423. doi:10.1146/annurev-clinpsy-050212-185606
Plag, J., Ergec, D. L., Fydrich, T., & Strohle, A. (2019). High-Intensity Interval Training in Panic Disorder Patients: A Pilot Study. J Nerv Ment Dis, 207(3), 184-187. doi:10.1097/NMD.0000000000000944
Plag, J., Schmidt-Hellinger, P., Klippstein, T., Mumm, J. L. M., Wolfarth, B., Petzold, M. B., & Strohle, A. (2020). Working out the worries: A randomized controlled trial of high intensity interval training in generalized anxiety disorder. J Anxiety Disord, 76, 102311. doi:10.1016/j.janxdis.2020.102311
122
Rawson, E. S., Freedson, P. S., Osganian, S. K., Matthews, C. E., Reed, G., & Ockene, I. S. (2003). Body mass index, but not physical activity, is associated with C-reactive protein. Medicine and Science in Sports and Exercise, 35(7), 1160-1166. doi:10.1249/01.Mss.0000074565.79230.Ab
Reljic, D., Lampe, D., Wolf, F., Zopf, Y., Herrmann, H. J., & Fischer, J. (2019). Prevalence and predictors of dropout from high-intensity interval training in sedentary individuals: A meta-analysis. Scand J Med Sci Sports, 29(9), 1288-1304. doi:10.1111/sms.13452
Remes, O., Brayne, C., van der Linde, R., & Lafortune, L. (2016). A systematic review of reviews on the prevalence of anxiety disorders in adult populations. Brain Behav, 6(7), e00497. doi:10.1002/brb3.497
Renfro MO, W. R., Angeles E, et al. (2019). The Chester Step Test - A Graded Performance Measure for Orthopaedic Physical Therapy. Orthop Phys Ther Practice., 31(3), 172-178.
Robergs, R. A., Dwyer, D., & Astorino, T. (2010). Recommendations for improved data processing from expired gas analysis indirect calorimetry. Sports Med, 40(2), 95-111. doi:10.2165/11319670-000000000-00000
Ronda, G., Van Assema, P., & Brug, J. (2001). Stages of change, psychological factors and awareness of physical activity levels in The Netherlands. Health Promot Int, 16(4), 305-314. doi:10.1093/heapro/16.4.305
Ross, R., Blair, S. N., Arena, R., Church, T. S., Despres, J. P., Franklin, B. A., . . . Stroke, C. (2016). Importance of Assessing Cardiorespiratory Fitness in Clinical Practice: A Case for Fitness as a Clinical Vital Sign: A Scientific Statement From the American Heart Association. Circulation, 134(24), e653-e699. doi:10.1161/CIR.0000000000000461
Ruchat, S. M., Mottola, M. F., Skow, R. J., Nagpal, T. S., Meah, V. L., James, M., . . . Davenport, M. H. (2018). Effectiveness of exercise interventions in the prevention of excessive gestational weight gain and postpartum weight retention: a systematic review and meta-analysis. Br J Sports Med, 52(21), 1347-1356. doi:10.1136/bjsports-2018-099399
Schaun, G. Z. (2017). The Maximal Oxygen Uptake Verification Phase: a Light at the End of the Tunnel? Sports Med Open, 3(1), 44. doi:10.1186/s40798-017-0112-1
Schembre, S. M., Durand, C. P., Blissmer, B. J., & Greene, G. W. (2015). Development and Validation of the Cognitive Behavioral Physical Activity Questionnaire. Am J Health Promot, 30(1), 58-65. doi:10.4278/ajhp.131021-QUAN-539
Scott, E. L., Heimberg, R. G., & Jack, M. S. (2000). Anxiety sensitivity in social phobia: comparison between social phobics with and without panic attacks. Depress Anxiety, 12(4), 189-192. doi:10.1002/1520-6394(2000)12:4<189::AID-DA1>3.0.CO;2-X
Shaffer, F., McCraty, R., & Zerr, C. L. (2014). A healthy heart is not a metronome: an integrative review of the heart's anatomy and heart rate variability. Front Psychol, 5, 1040. doi:10.3389/fpsyg.2014.01040
Shaper, A. G., Wannamethee, G., & Weatherall, R. (1991). Physical activity and ischaemic heart disease in middle-aged British men. Br Heart J, 66(5), 384-394. doi:10.1136/hrt.66.5.384
Sherwood, N. E., & Jeffery, R. W. (2000). The behavioral determinants of exercise: implications for physical activity interventions. Annu Rev Nutr, 20, 21-44. doi:10.1146/annurev.nutr.20.1.21
Sloan, R. P., Shapiro, P. A., McKinley, P. S., Bartels, M., Shimbo, D., Lauriola, V., . . . Tracey, K. J. (2018). Aerobic Exercise Training and Inducible Inflammation: Results of a

123
Randomized Controlled Trial in Healthy, Young Adults. J Am Heart Assoc, 7(17), e010201. doi:10.1161/JAHA.118.010201
Smits, J. A., Berry, A. C., Rosenfield, D., Powers, M. B., Behar, E., & Otto, M. W. (2008). Reducing anxiety sensitivity with exercise. Depress Anxiety, 25(8), 689-699. doi:10.1002/da.20411
Spielberger, C. (1988). State-Trait Anger Expression Inventory. Tampa: Psychological Assessment Resources.
Spielberger CD, G., R., Luschene, R. . (1970). Manual for the State-Trait Anxiety Inventory. . Palo Alto: Consulting Psychologists Press; .
Spielberger, C. D., Gorsuch, R. L., Lushene, R., Vagg, P. R., & Jacobs, G. A. (1983). Manual for the state-trait anxiety inventory. Palo Alto, CA: Consulting Psychologists Press.
Steiger, J. H. (1980). Tests for Comparing Elements of a Correlation Matrix. Psychological Bulletin, 87(2), 245-251. doi:Doi 10.1037//0033-2909.87.2.245
Stonerock, G. L., Hoffman, B. M., Smith, P. J., & Blumenthal, J. A. (2015). Exercise as Treatment for Anxiety: Systematic Review and Analysis. Annals of Behavioral Medicine, 49(4), 542-556. doi:10.1007/s12160-014-9685-9
Stork, M. J., Banfield, L. E., Gibala, M. J., & Martin Ginis, K. A. (2017). A scoping review of the psychological responses to interval exercise: is interval exercise a viable alternative to traditional exercise? Health Psychol Rev, 11(4), 324-344. doi:10.1080/17437199.2017.1326011
Strain, T., Brage, S., Sharp, S. J., Richards, J., Tainio, M., Ding, D., . . . Kelly, P. (2020). Use of the prevented fraction for the population to determine deaths averted by existing prevalence of physical activity: a descriptive study. Lancet Glob Health, 8(7), e920-e930. doi:10.1016/S2214-109X(20)30211-4
Strath, S. J., Kaminsky, L. A., Ainsworth, B. E., Ekelund, U., Freedson, P. S., Gary, R. A., . . . Council. (2013). Guide to the assessment of physical activity: Clinical and research applications: a scientific statement from the American Heart Association. Circulation, 128(20), 2259-2279. doi:10.1161/01.cir.0000435708.67487.da
Stubbs, B., Koyanagi, A., Hallgren, M., Firth, J., Richards, J., Schuch, F., . . . Vancampfort, D. (2017). Physical activity and anxiety: A perspective from the World Health Survey. J Affect Disord, 208, 545-552. doi:10.1016/j.jad.2016.10.028
Tamminen, N., Kettunen, T., Martelin, T., Reinikainen, J., & Solin, P. (2019). Living alone and positive mental health: a systematic review. Syst Rev, 8(1), 134. doi:10.1186/s13643-019-1057-x
Thayer, J. F., Yamamoto, S. S., & Brosschot, J. F. (2010). The relationship of autonomic imbalance, heart rate variability and cardiovascular disease risk factors. Int J Cardiol, 141(2), 122-131. doi:10.1016/j.ijcard.2009.09.543
Thompson, D., Markovitch, D., Betts, J. A., Mazzatti, D., Turner, J., & Tyrrell, R. M. (2010). Time course of changes in inflammatory markers during a 6-mo exercise intervention in sedentary middle-aged men: a randomized-controlled trial. Journal of Applied Physiology, 108(4), 769-779. doi:10.1152/japplphysiol.00822.2009
U.S. Department of Health and Human Services. (2018). Physical Activity Guidelines for Americans, 2nd Edition. Retrieved from https://health.gov/paguidelines/second-edition/pdf/Physical_Activity_Guidelines_2nd_edition.pdf
Verdaet, D., Dendale, R., De Bacquer, D., Delanghe, J., Block, P., & De Backer, G. (2004). Association between leisure time physical activity and markers of chronic inflammation
124
related to coronary heart disease. Atherosclerosis, 176(2), 303-310. doi:10.1016/j.athersclerosis.2004.05.007
Wang, C. H., Chung, M. H., Chan, P., Tsai, J. C., & Chen, F. C. (2014). Effects of endurance exercise training on risk components for metabolic syndrome, interleukin-6, and the exercise capacity of postmenopausal women. Geriatric Nursing, 35(3), 212-218. doi:10.1016/j.gerinurse.2014.02.001
Warburton, D. E., Nicol, C. W., & Bredin, S. S. (2006). Health benefits of physical activity: the evidence. CMAJ, 174(6), 801-809. doi:10.1503/cmaj.051351
Warburton, D. E. R., & Bredin, S. S. D. (2016). Reflections on Physical Activity and Health: What Should We Recommend? Canadian Journal of Cardiology, 32(4), 495-504. doi:10.1016/j.cjca.2016.01.024
Warburton, D. E. R., Bredin, S. S. D., Jamnik, V., Shephard, R. J., & Gledhill, N. (2016). Consensus on Evidence-Based Preparticipation Screening and Risk Stratification. Annual Review of Gerontology and Geriatrics, Vol 36: Optimizing Physical Activity and Function across Settings, 36, 53-102. doi:10.1891/0198-8794.36.53
Wilmore, J. H., & Haskell, W. L. (1971). Use of Heart Rate-Energy Expenditure Relationship in Individualized Prescription of Exercise. American Journal of Clinical Nutrition, 24(9), 1186-&. Retrieved from <Go to ISI>://WOS:A1971K389000021
Woods, J. A., Wilund, K. R., Martin, S. A., & Kistler, B. M. (2012). Exercise, Inflammation and Aging. Aging and Disease, 3(1), 130-140. Retrieved from <Go to ISI>://WOS:000208950800008
World Health Organization. (2016). Noncommunicable diseases: Risk factors Retrieved from https://www.who.int/publications/data/gho/data/themes/topics/topic-details/GHO/ncd-risk-factors
World Health Organization [@WHO]. (2019). Wu, Y., Zhang, D., & Kang, S. (2013). Physical activity and risk of breast cancer: a meta-
analysis of prospective studies. Breast Cancer Res Treat, 137(3), 869-882. doi:10.1007/s10549-012-2396-7
Wyrwich, K., Harnam, N., Revicki, D. A., Locklear, J. C., Svedsater, H., & Endicott, J. (2009). Assessing health-related quality of life in generalized anxiety disorder using the Quality Of Life Enjoyment and Satisfaction Questionnaire. Int Clin Psychopharmacol, 24(6), 289-295. doi:10.1097/YIC.0b013e32832d6bf4
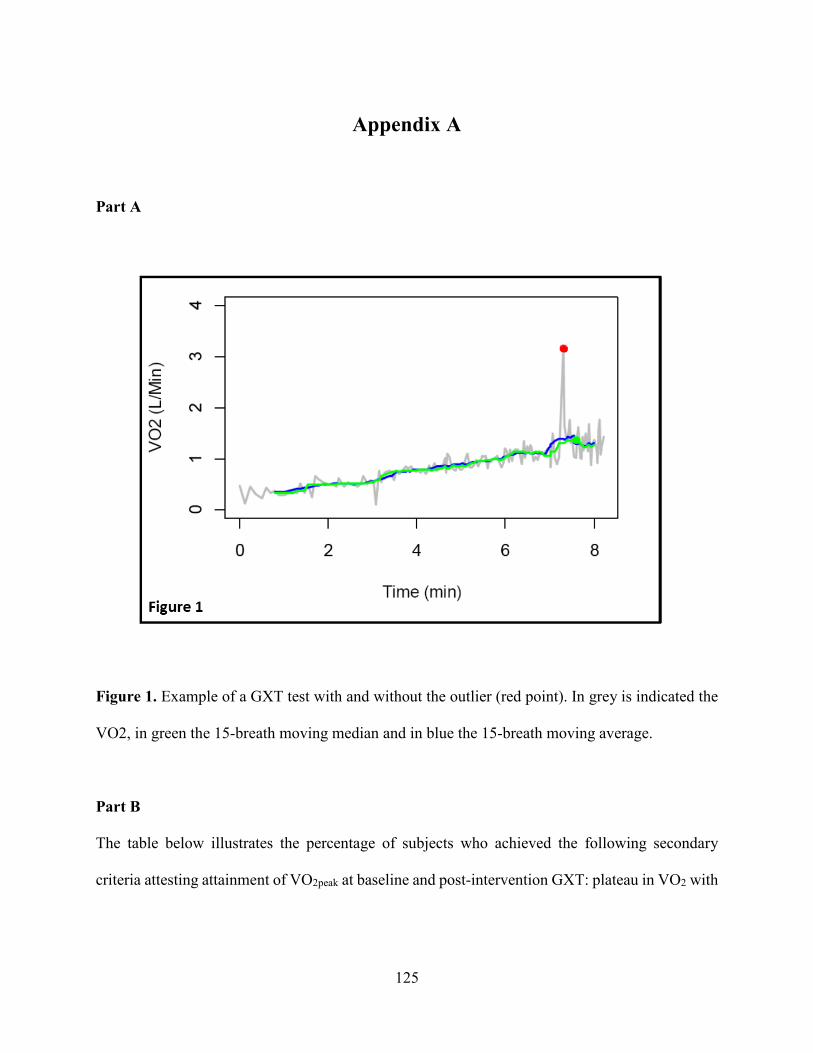
125
Appendix A
Part A
Figure 1. Example of a GXT test with and without the outlier (red point). In grey is indicated the
VO2, in green the 15-breath moving median and in blue the 15-breath moving average.
Part B
The table below illustrates the percentage of subjects who achieved the following secondary
criteria attesting attainment of VO2peak at baseline and post-intervention GXT: plateau in VO2 with
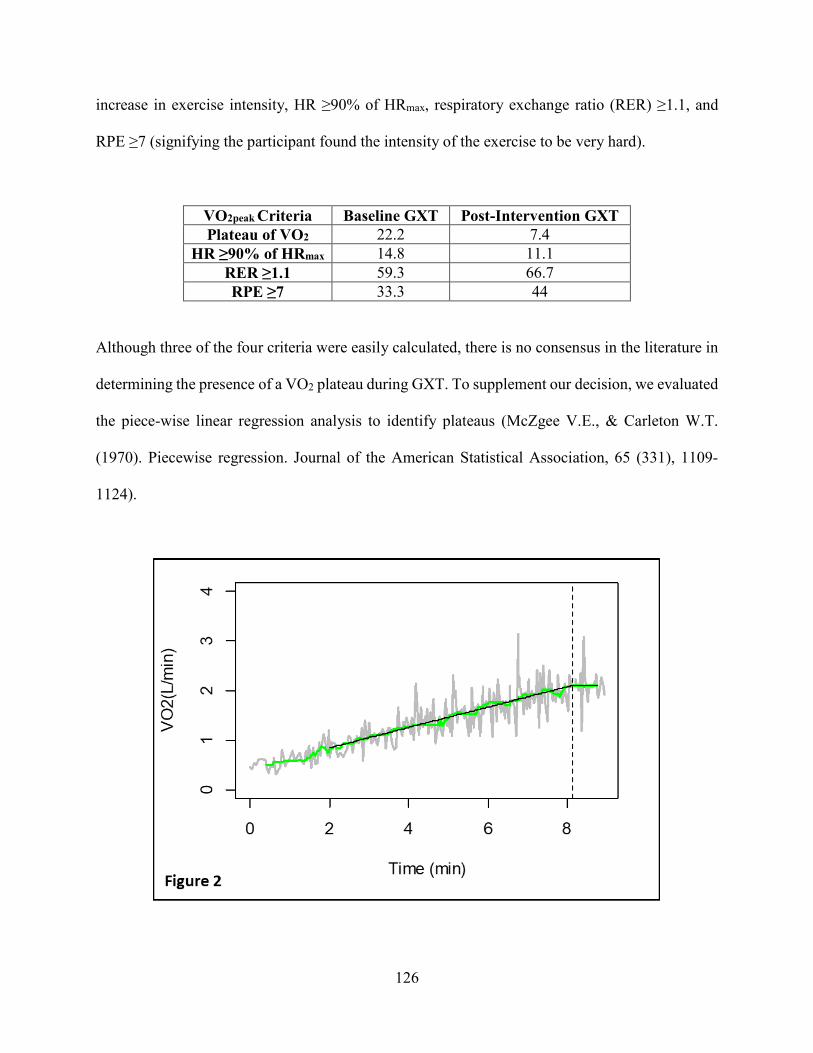
126
increase in exercise intensity, HR ≥90% of HRmax, respiratory exchange ratio (RER) ≥1.1, and
RPE ≥7 (signifying the participant found the intensity of the exercise to be very hard).
VO2peak Criteria Baseline GXT Post-Intervention GXT Plateau of VO2 22.2 7.4
HR ≥90% of HRmax 14.8 11.1 RER ≥1.1 59.3 66.7 RPE ≥7 33.3 44
Although three of the four criteria were easily calculated, there is no consensus in the literature in
determining the presence of a VO2 plateau during GXT. To supplement our decision, we evaluated
the piece-wise linear regression analysis to identify plateaus (McZgee V.E., & Carleton W.T.
(1970). Piecewise regression. Journal of the American Statistical Association, 65 (331), 1109-
1124).
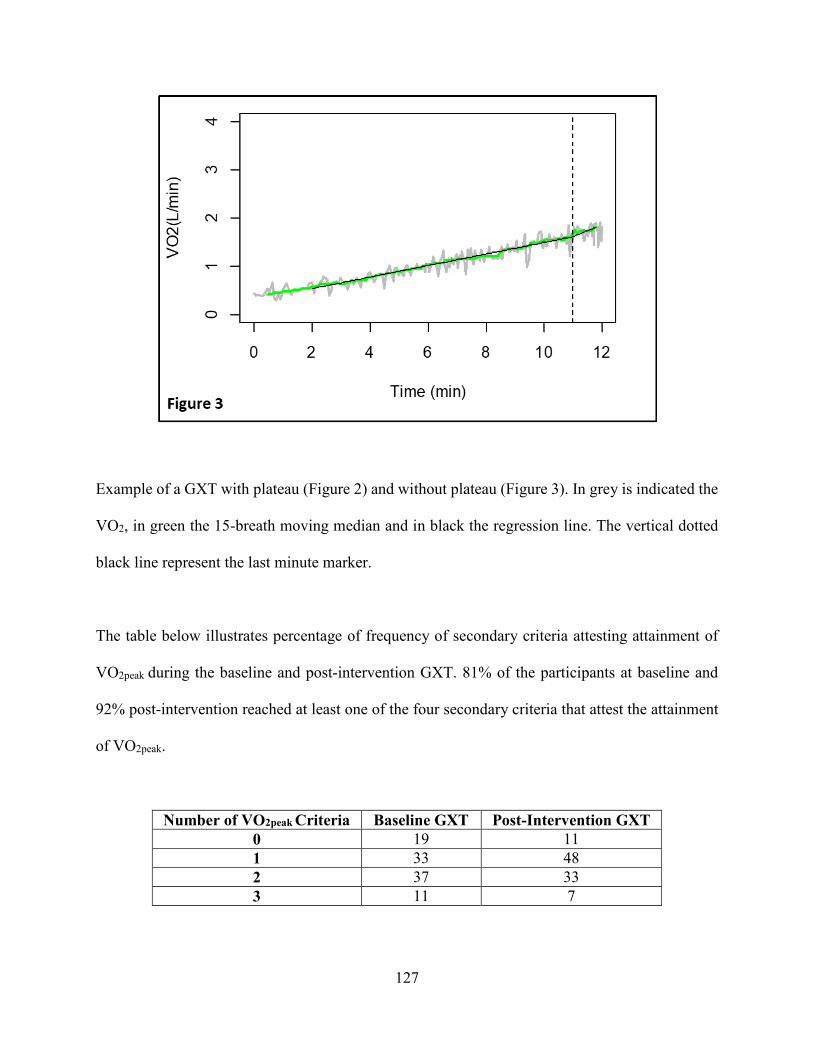
127
Example of a GXT with plateau (Figure 2) and without plateau (Figure 3). In grey is indicated the
VO2, in green the 15-breath moving median and in black the regression line. The vertical dotted
black line represent the last minute marker.
The table below illustrates percentage of frequency of secondary criteria attesting attainment of
VO2peak during the baseline and post-intervention GXT. 81% of the participants at baseline and
92% post-intervention reached at least one of the four secondary criteria that attest the attainment
of VO2peak.
Number of VO2peak Criteria Baseline GXT Post-Intervention GXT 0 19 11 1 33 48 2 37 33 3 11 7
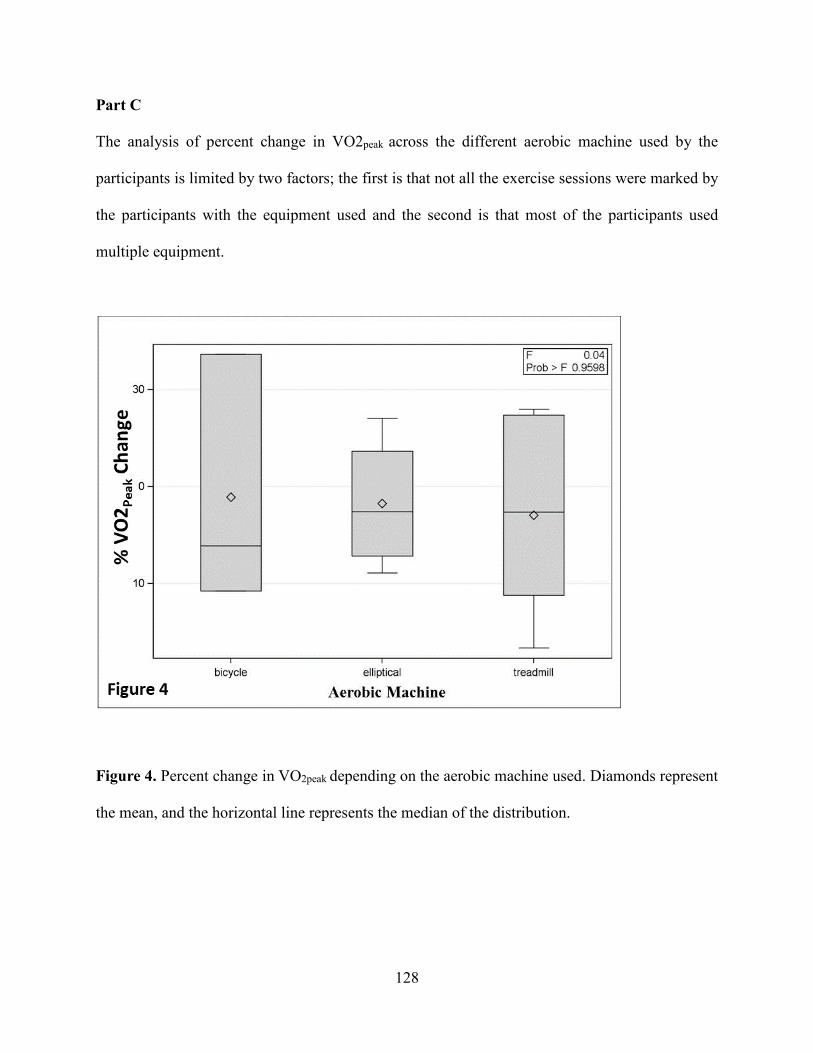
128
Part C
The analysis of percent change in VO2peak across the different aerobic machine used by the
participants is limited by two factors; the first is that not all the exercise sessions were marked by
the participants with the equipment used and the second is that most of the participants used
multiple equipment.
Figure 4. Percent change in VO2peak depending on the aerobic machine used. Diamonds represent
the mean, and the horizontal line represents the median of the distribution.

Appendix B
CUIMC and TC IRB Approval
129

New York State Psychiatric Institute
Institutional Review Board
September 8, 2020
To: Dr. Richard Sloan
From: Dr. Edward Nunes, Co-Chair
Dr. Agnes Whitaker, Co-Chair
Subject: APPROVAL NOTICE*: Expedited by Subcommittee*** per 45CFR46.110
(b)(1)(f)(2)&(7)
Your protocol # 8055 entitled: HOME-BASED EXERCISE TRAINING WHEN YOU CAN’T LEAVE THE
HOUSE: PROMOTING PHYSICAL ACTIVITY IN POSTPARTUM WOMEN Protocol version date
09/08/2020 and consent forms have been approved by the New York State Psychiatric Institute -
Columbia University Department of Psychiatry Institutional Review Board on 09/08/2020.
Consent requirements:
Not applicable:
√ Signature by the person(s) obtaining consent is required to document the consent process
Documentation of an independent assessment of the participant’s capacity to consent is also
required.
Approved for recruitment of subjects who lack capacity to consent: √ No Yes
Field Monitoring Requirements: √ Routine Special: ___________________
Only copies of consent documents that are currently approved by the IRB may be used to obtain
consent for participation in this study.
A progress report and application for continuing review is required 2 months prior to the
expiration date of IRB approval.
Changes to this research may not be initiated without the review and approval of the IRB except
when necessary to eliminate immediate hazards to participants.
All serious and/or unanticipated problems or events involving risks to subjects or others must be
reported immediately to the IRB. Please refer to the PI-IRB website at http://irb.nyspi.org for
Adverse Event Reporting Procedures and additional reporting requirements.
Cc: CU Business Office (internal)
Encl: CF, HIPAA
EN/AHW/alw
130

Attachments:• Exemption Notification - IRB ID: 21-235.pdf
Teachers College IRB Exempt Study Approval
To: Vincenzo LauriolaFrom: Myra Luna Lucero, Research Compliance Director
Subject: IRB Approval: 21-235 ProtocolDate: 03/08/2021
Thank you for submitting your study entitled, "HOME-BASED EXERCISE TRAINING WHEN YOU CAN’T LEAVE THE HOUSE: PROMOTINGPHYSICAL ACTIVITY IN POSTPARTUM WOMEN;" the IRB has determined that your study is Exempt from committee review (Category 4) on03/08/2021.
Due to COVID-19 quarantine, all in-person study activities with human subjects are suspended. Following guidance from New YorkState and Teachers College, the Institutional Review Board will announce when in-person research can resume and what steps totake at that time.
Please keep in mind that the IRB Committee must be contacted if there are any changes to your research protocol. The number assigned to yourprotocol is 21-235. Feel free to contact the IRB Office by using the "Messages" option in the electronic Mentor IRB system if you have anyquestions about this protocol.
As the PI of record for this protocol, you are required to:
Use current, up-to-date IRB approved documentsEnsure all study staff and their CITI certifications are on record with the IRBNotify the IRB of any changes or modifications to your study proceduresAlert the IRB of any adverse events
You are also required to respond if the IRB communicates with you directly about any aspect of your protocol. Failure to adhere to yourresponsibilities as a study PI can result in action by the IRB up to and including suspension of your approval and cessation of your research.
You can retrieve a PDF copy of this approval letter from Mentor IRB.
Best wishes for your research work.
Sincerely,Dr. Myra Luna LuceroResearch Compliance [email protected]
131

Appendix C
Study Consent Form and Study Materials
132
Overview Below is a summary of the study that you are asked to participate in. This outline is meant to be a guide for you to use while considering the study and reading the consent form. It is not meant to replace the consent form, which you will have to sign if you decide to participate in the study. The consent form contains detailed information about the study and about the risks which you will need to consider before making your decision. Read the consent form carefully and discuss it with others before deciding to take part. And remember that, even if you agree to participate, you can change your mind at any time.
Purpose of Study The purpose of this study is to test the benefits of an entirely home-based, remotely administered 6-week high intensity interval training (HIIT) program for postpartum women.
Participation is Voluntary As with all research, this is a voluntary study, and you do not have to participate if you do not want to. You may stop participating at any time.
Procedures Some of the procedures will be conducted remotely using the video teleconferencing Columbia University IT-supported Zoom application. The research staff members will use their HIPAA- compliant Zoom account for all the appointments completed remotely.
• Consent Appointment: You will be asked to read and sign the informed consent form as wellas complete some forms and evaluations. • Run-in Period: You will be asked to complete 4 at-home stretching sessions during the one-week run-in period. • First Baseline Test Session (T0): If you successfully complete the run-in period you will beasked to complete two exercise tests (submaximal cardiopulmonary stress test and 30 seconds sit to stand test) to determine your fitness level. You also will be asked to measure your blood pressure and your body metrics (height, weight, waist circumference). Finally, you will complete a food frequency questionnaire to assess your diet and some questionnaires to assess your mood. • Second Baseline Tests Session (T1): More or less one week after completing the first testsession, you will asked to complete a finger stick blood draw and to have your electrocardiogram recorded for a 24-hour period through the use of a wearable ECG monitor. • Exercise Intervention: You will be asked to complete 4 aerobic exercise sessions per week ona climbing stepper for a 6 week period. • End of the Intervention Tests Session (T2): You will be asked to complete the sameprocedures from the first and second baseline test sessions.
Risks This study includes some risks and discomfort (please refer to the consent form for further details and explanations of these risks). Like a blood draw at a doctor’s office, risks of at-home blood sampling include discomfort, bruising and, rarely, fainting or infection at the site where
133
the lancet enters the skin. The kit that you will receive includes bandages and gauze to reduce the risk of infection. The risks associated with exercise training are those typical of any physical activity. You will be carefully screened prior to the initiation of the exercise protocol to minimize the risk of adverse events. You will be also required to present a note from your physician indicating medical clearance for exercise training. While rare, there is an elevated risk of breach of confidentiality when conducting remote procedures. This risk is minimized by using HIPPA-compliant and secure platforms. Please see the confidentiality section for more information.
Benefits There are no direct benefits to participation in the study. You may contact the Principal Investigator, Dr. Richard Sloan at 646-774-8940 with any questions. Please read and sign the attached consent form for a full description of the study.
134
Purpose of Study The purpose of this study is to test the benefits of an entirely home-based, remotely administered 6-week high intensity interval training (HIIT) program for postpartum women. You are being asked to participate because you are a healthy new mother between the age of 18 and 45 years old. This research study is funded by the Nathaniel Wharton Fund.
Voluntary Participation in this research study is voluntary. If you decide not to participate, or if you later decide to stop participating, you will not lose any benefits to which you are otherwise entitled. A decision not to participate or withdraw your participation will not affect your current or future treatment at the New York State Psychiatric Institute or Columbia University Medical Center.
Alternatives to Participation This is not a treatment study. The information being collected is for research purposes only and is to learn more about the impact of exercise on new mothers’ health and wellbeing, not about you. The alternative to participating in this study is not to participate.
Study Procedures: Consent and Run-in Period
Eligibility During the Study Your eligibility is checked at multiple times over the course of the study through a series of evaluations and tests conducted during study meetings. These help to determine whether or not you are able to continue. Also, in the event that you are unable to follow the procedures required, you may be withdrawn from the study. Consent Session You are being invited to participate in this research study because you are a healthy new mother and are between the ages of 18 and 45. If you agree to participate, a video call with the CUIT- supported Zoom application will be scheduled and you will be asked to read and sign the informed consent form and complete additional forms that will be needed for the study. You will be able to download a copy of the consent form from RedCap, a secure web application. You then will use REDCap to sign the consent form electronically. A copy of the consent form signed by both you and the research staff member will be sent to you through RedCap. You are required to present a note from a physician indicating medical clearance for physical exercise training. If you meet the required eligibility criteria, study staff will use your address to send a heart rate monitor directly to your home. Once in possession of the equipment, you will contact the study line and a research staff member will guide you through the process of completing the run-in period. Run-in Period If you are eligible, you will be asked to begin a one-week period of stretching: one-half hour at a time, for four times during this week. Instructions for stretching will be provided to you. These stretching exercises will be conducted at your home.
135

Study Procedures: First Baseline Tests Session (T0) If you successfully complete the run-in period, study staff will use your address to send a scale, a blood pressure monitor, and a step box directly to your home. Once in possession of the equipment, you will contact the study line and a research staff member will guide you through the process of completing two exercise tests (submaximal cardiopulmonary stress test and 30 seconds sit to stand test) to determine your fitness level. You also will be asked to measure your blood pressure and your body metrics (height, weight, waist circumference). Finally, you will complete a food frequency questionnaire to assess your diet and some questionnaires to assess your mood.
30 Seconds Sit to Stand Test You will be guided to complete a 5-minute functional leg strength test. You will sit in the middle of the Go Fit Plyobox and you will place your hands on the opposite shoulders, crossed at the wrists. Your feet will be flat on the floor and you will have to keep your back straight and your arms against your chest. When given a signal you will rise to a full standing position and then sit back down again. You will repeat these actions for 30 seconds without any rest. Your aim will be to complete as many repetitions as possible while maintaining the proper form.
Chester Step Test You will be asked to wear the heart rate monitor and you will be guided to complete a submaximal aerobic fitness test which takes about 10 minutes. You will be asked to listen to audiotape test instructions and begin stepping on and off the Go Fit Plyobox to a metronome beat at 15 steps per minute for a 2 minute period. The step rate then will be increased to 20 steps per minute for an additional 2 minutes. The test will continue to increase in speed until your heart rate reaches 80% of your maximal heart rate. Upon completing this test, final eligibility for the study will be determined.
Study Procedures: Second Baseline Tests Session (T1) More or less one week after completing the first test session, study staff will use your address to send a wearable ECG monitor and a finger stick blood draw kit directly to your home. You will be asked to complete a finger stick blood draw and to have your electrocardiogram recorded for a 24-hour period through the use of a wearable ECG monitor.
Finger Stick Blood Draw The finger stick procedure is very similar to the way a diabetic patient checks blood sugar levels. In this routine procedure, you will use a sterile single-use needle to prick the end of a finger, discard the first drop of blood and collect few drops of blood on the absorbent end of a small probe. It will take about five (5) minutes to complete this collection. Occasionally it may be necessary to stick a second finger to get enough blood.
Electrocardiogram Recording You will be provided with detailed instructions on how to record your heart rate continuously for a 24-hour period using a wearable monitor made by Maastricht Instruments. This small device, slightly bigger than a quarter, is worn on the surface of the skin on the side of the chest.
136
Study Procedures: Randomization You will be randomly assigned (like flipping a coin) to one of two conditions: exercise training condition group or usual care group.
Study Procedures – Exercise Training Condition Group: Six-week Period - High Intensity Exercise Training If you are randomized to the exercise training condition group, study staff members will send a Sunny Folding Climbing Stepper to your home. Once you receive the equipment, you will contact the study line and a research staff member will guide you through the process of beginning the at-home aerobic exercise intervention. You will engage in 4 training sessions per week over a 6-week period, with 24-hour rest-periods between each training day. Each session will begin with a 5 min low intensity warm-up, and then you will exercise as rapidly as you can for 20 seconds, aiming to reach 85% of your maximum heart rate as established during the submaximal cardiopulmonary stress test. This 20 second period is followed by 40 seconds of low intensity exercise. You will complete 8 such intervals for sessions 1 and 2, 10 intervals for sessions 3 and 4, 12 intervals for sessions 5 and 6 and 15 intervals thereafter. A 5-min cool-down period will end each training session. The total length of the exercise sessions will be 18 minutes at the beginning of the six- week period, gradually increasing to a maximum of 25 min.
Study Procedures – Usual Care Group If you are randomized to the usual care group, you will be asked to refrain from aerobic exercise for the 6 weeks trial period.
Study Procedures: End of six-week Period Test Session After the end of the 6-week period, (in either the exercise training condition group or the usual care group) you will be asked to complete a second set of appointments that includes all the tests completed in the baseline test sessions.
Risks and Inconveniences Finger Stick Blood Draw Risks
Like a blood draw at a doctor’s office, risks of at-home blood sampling include discomfort, bruising and, rarely, fainting or infection at the site where the lancet enters the skin. The kit includes bandages and gauze to reduce the risk of infection.
Benefits This study is not designed for your benefit. The primary benefit will be to increase understanding of how exercise training in the postpartum period may improve physical and mental health. If examination discloses any abnormality, this information will be made available for evaluation by your physician.
Confidentiality Confidentiality will be protected through the use of HIPAA-compliant videoconferencing and encrypted email communication. Your participation in this study will be confidential and if the
137
results are published, your name will not be identified. Your records will be kept in locked file in locked offices and access will be allowed only to members of the research team or institutional personnel as part of a routine audit. Your name and other personal identifying information will be stored in an electronically secure database at Columbia University. We will use randomly generated, lab-maintained email addresses and IDs for registering the fitness tracking app used to monitor your exercise training. Records will be available to research staff and to Federal, State and Institutional regulatory personnel (who may review records as part of routine audits). The study cannot be completed without this information. We will do everything we can to avoid disclosure about your participation in this study.
Study Compensation You will be paid $45 for completing the first baseline test session, $25 for completing the second baseline test session and $70 for completing the final test session. If you are randomized to the exercise training condition group and you complete at least 90% of the total number of required exercise sessions and complete all testing sessions, you will be paid an additional $50 at the end of study. If you are randomized to the usual care group and you refrain from aerobic exercise for the 6 weeks trial period and complete all testing sessions, you will be paid an additional $50 at the end of study. The total possible compensation for both groups is $190. You will be compensated through a debit card, which will be provided to you. We will register you with the vendor of the debit cards, Bank of America (BOA), by providing your name, address, and phone number. These cards are “reloadable” which means you will receive one card, which will be “reloaded” within 2 weeks after each completed study visit. This card can be used as a credit card OR as an ATM card. You will be able to withdraw money from a bank either through a bank teller or an ATM. Please note that banks may charge a fee for using their ATM. If you lose the card, you can call BOA and have the card replaced. Please read the information sheet that comes with the card for more information. If you are randomized to the exercise training condition group at the end of the study, you will be able to keep the Stepper, the Go Fit Plyobox, the blood pressure monitor, and the scale as part of your compensation for completing the study. If you are randomized to the usual care group you will be able to keep the same equipment as part of your compensation for completing the study but you will receive the stepper at the end of the 6 weeks trial period.
In Case of Injury Federal regulations require that we inform participants about our institution's policy with regard to compensation and payment for treatment of research-related injuries.
Please be aware that:
- The New York State Psychiatric Institute, Columbia University, and New York Presbyterian Hospital will furnish that emergency medical care determined to be necessary by the medical staff of this hospital.
- You will be responsible for the cost of such care, either personally or through your medical insurance or other form of medical coverage.
- No monetary compensation for wages lost as a result of injury will be paid to you by the New York State Psychiatric Institute, Columbia University or by New York Presbyterian Hospital.
138

- By signing this consent form, you are not waiving any of your legal rights to seek compensation through the courts.
Questions
Research personnel will answer all current or future questions about the procedures and/or responses to the best of their ability. If you have any questions about this study in the future, you may reach the study’s Principal Investigator, Dr. Richard Sloan at (646) 774-8940.
If you have any questions about your rights as a research participant, want to provide feedback, or have a complaint, you may call the NYSPI Institutional Review Board (IRB). (An IRB is a committee that protects the rights of human subjects in research studies). You may call the IRB Main Office at (646)774-7155 during regular office hours.
Documentation of Consent
I voluntarily agree to participate in the research study described above.
Print Name:
Signed:
Date:
I have discussed the proposed research with this participant including the risks, benefits, and alternatives to participation (including the alternative of not participating in the research). The participant has had an opportunity to ask questions and in my opinion is capable of freely consenting to participate in this research.
Print Name:
Person Designated to Obtain Consent
Signed:
Date:
139
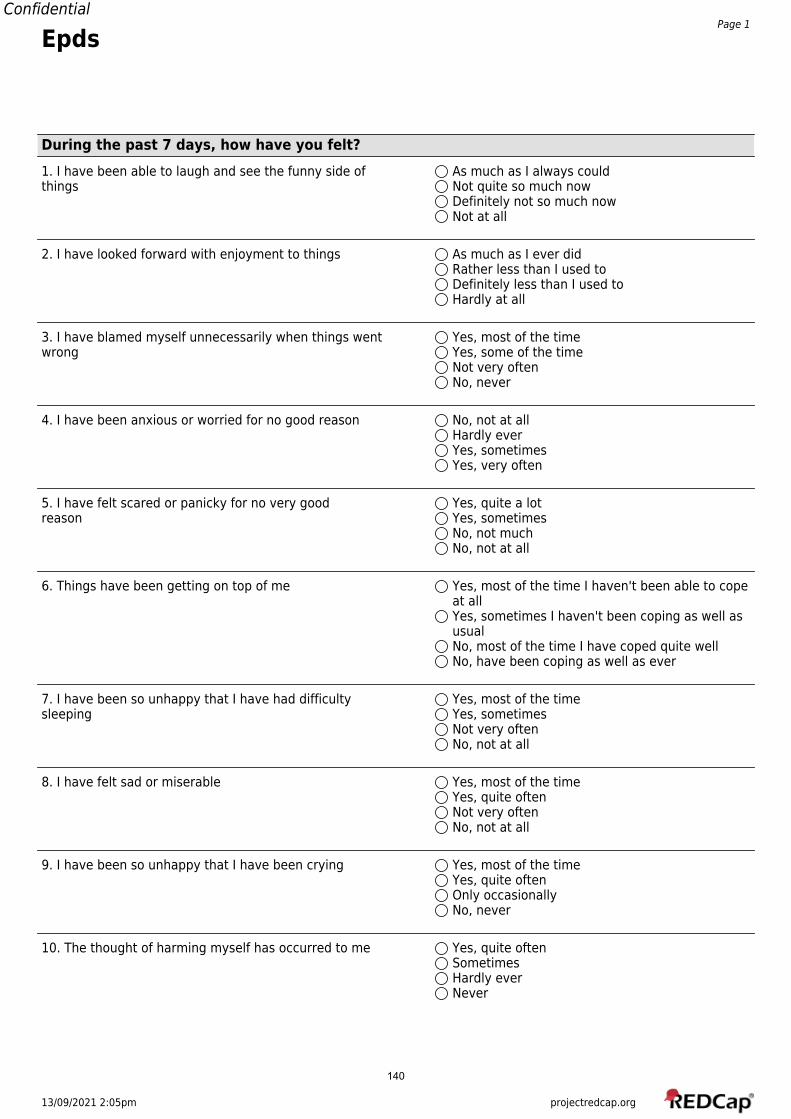
13/09/2021 2:05pm projectredcap.org
ConfidentialPage 1
Epds
During the past 7 days, how have you felt?1. I have been able to laugh and see the funny side of As much as I always couldthings Not quite so much now
Definitely not so much nowNot at all
2. I have looked forward with enjoyment to things As much as I ever didRather less than I used toDefinitely less than I used toHardly at all
3. I have blamed myself unnecessarily when things went Yes, most of the timewrong Yes, some of the time
Not very oftenNo, never
4. I have been anxious or worried for no good reason No, not at allHardly everYes, sometimesYes, very often
5. I have felt scared or panicky for no very good Yes, quite a lotreason Yes, sometimes
No, not muchNo, not at all
6. Things have been getting on top of me Yes, most of the time I haven't been able to copeat allYes, sometimes I haven't been coping as well asusualNo, most of the time I have coped quite wellNo, have been coping as well as ever
7. I have been so unhappy that I have had difficulty Yes, most of the timesleeping Yes, sometimes
Not very oftenNo, not at all
8. I have felt sad or miserable Yes, most of the timeYes, quite oftenNot very oftenNo, not at all
9. I have been so unhappy that I have been crying Yes, most of the timeYes, quite oftenOnly occasionallyNo, never
10. The thought of harming myself has occurred to me Yes, quite oftenSometimesHardly everNever
140
13/09/2021 2:05pm projectredcap.org
ConfidentialPage 2
EPDS__________________________________
1. He podido rer y ver el lado bueno de las cosas: Tanto como siempre he podido hacerloNo tanto ahoraSin duda, mucho menos ahoraNo, en absoluto
2. He mirado al futuro con placer para hacer cosas: Tanto como siempreAlgo menos de lo que solia hacerloDefinitivamente menos de lo que solia hacerloPracticamente nunca
3. Me he culpado sin necesidad cuando las cosas Si, casi siempremarchaban mal: Si, algunas veces
No muy a menudoNo, nunca
4. He estado ansiosa y preocupada sin motivo alguno: No, en absolutoCasi nadaSi, a vecesSi, muy a menudo
5. He sentido miedo o pánico sin motivo alguno: Si, bastanteSi, a vecesNo, no muchoNo, en absoluto
6. Las cosas me oprimen o agobian: Si, la mayor parte del tiempo no he podidosobrellevarlasSi, a veces no he podido sobrellevarlas de lamaneraNo, la mayoria de las veces he podidosobrellevarlas bastante bienNo, He podido sobrellevarlas tan bien como lohecho siempre
7. Me he sentido tan infeliz, que he tenido dificultad Si, casi siemprepara dormir: Si, a veces
No muy a menudoNo, en absoluto
8. Me he sentido triste y desgraciada: Si, casi siempreSi, a vecesNo muy a menudoNo, en absoluto
9. Me he sentido tan infeliz que he estado llorando: Si, casi siempreSi, algunas vecesNo muy a menudoNo, nunca
10. He pensado en hacerme daño: Si, bastante a menudoA vecesCasi nuncaNo, nunca
EPDS TOTAL SPANISH__________________________________
141
13/09/2021 2:06pm projectredcap.org
ConfidentialPage 1
Godin Leisure-Time ExercisePlease complete the survey below.
Thank you!
During a typical 7-Day period (a week), how many times on the average do you do the following kinds of exercise formore than 15 minutes during your free time (write on each line the appropriate number)
1) a) STRENUOUS EXERCISE(HEART BEATS RAPIDLY)(e.g., running, jogging, hockey, football, soccer, squash, basketball, cross country skiing, judo, roller skating, vigorousswimming, vigorous long distance bicycling)
01234567891011121314
2) b) MODERATE EXERCISE(NOT EXHAUSTING)(e.g., fast walking, baseball, tennis, easy bicycling, volleyball, badminton, easy swimming, alpine skiing, popular andfolk dancing)
01234567891011121314
142
13/09/2021 2:06pm projectredcap.org
ConfidentialPage 2
3) C) LIGHT EXERCISE(MINIMAL EFFORT)(e.g., yoga, archery, fishing from river bank, bowling, horseshoes, golf, snow-mobiling, easy walking)
01234567891011121314
4) strenuous total
__________________________________
5) moderate total
__________________________________
6) light total
__________________________________
7) total
__________________________________
8) Godin Scale Score and Interpretation 24 units or more --Active14 - 23 units--Moderately ActiveLess than 14 units--Insufficiently Active/Sedentary
143

13/09/2021 2:03pm projectredcap.org
ConfidentialPage 1
BdiiiPlease complete the survey below.
Thank you!
Instructions: This questionnaire consists of 21 groups of statements. Please read each group of statements carefully,and then pick out the one statement in each group that best describes the way you have been feeling during thepast two weeks, including today. If several statements in the group seem to apply equally well, choose the highestnumber for that group. Be sure that you do not choose more than one statement for any group, including Item 16(Changes in Sleeping Pattern) or Item 18 (Changes in Appetite).
1) 1. Sadness I do not feel sad.I feel sad much of the time.I am sad all the time.I am so sad or unhappy that I can't stand it.
2) 2. Pessimism I am not discouraged about my futureI feel more discouraged about my future than Iused to be.I do not expect things to work out for me.I feel my future is hopeless and will only getworse.
3) 3. Past Failure I do not feel like a failure.I have failed more than I should have.As I look back, I see a lot of failures.I feel I am a total failure as a person.
Please read each group of statements carefully, and then pick out the one statement in eachgroup that best describes the way you have been feeling during the past two weeks, includingtoday.
4) 4. Loss of Pleasure I get as much pleasure as I ever did from thethings I enjoy.I don't enjoy things as much as I used to.I get very little pleasure from the things I usedto enjoy.I can't get any pleasure from the things I used toenjoy.
5) 5. Guilty Feelings I don't feel particularly guilty.I feel guilty over many things I have done orshould have done.I feel quite guilty most of the time.I feel guilty all of the time.
6) 6. Punishment Feelings I don't feel I am being punished.I feel I may be punished.I expect to be punished.I feel I am being punished.
7) 7. Self-Dislike I feel the same about myself as ever.I have lost confidence in myself.I am disappointed in myself.I dislike myself.
144
13/09/2021 2:03pm projectredcap.org
ConfidentialPage 2
Please read each group of statements carefully, and then pick out the one statement in eachgroup that best describes the way you have been feeling during the past two weeks, includingtoday.
8) 8. Self-Criticalness I don't criticize or blame myself more than usual.I am more critical of myself than I used to be.I criticize myself for all of my faults.I blame myself for everything bad that happens.
9) 9. Suicidal Thoughts or Wishes I don't have any thoughts of killing myself.I have thoughts of killing myself, I would notcarry them out.I would like to kill myself.I would kill myself if I had the chance.
10) 10. Crying I don't cry anymore than I used to.I cry more than I used to.I cry over every little thing.I feel like crying, but I can't.
11) 11. Agitation I am no more restless or wound up than usual.I feel more restless or wound up than usual.I am so restless or agitated that it's hard tostay still.I am so restless or agitated that I have to keepmoving or doing something.
Please read each group of statements carefully, and then pick out the one statement in eachgroup that best describes the way you have been feeling during the past two weeks, includingtoday.
12) 12. Loss of Interest I have not lost interest in other people oractivities.I am less interested in other people or thingsthan before.I have lost most of my interest in other people orthings.It's hard to get interested in anything.
13) 13. Indecisiveness I make decisions about as well as ever.I find it more difficult to make decisions thanusual.I have much greater difficulty in making decisionsthan I used to.I have trouble making any decisions.
14) 14. Worthlessness I do not feel I am worthless.I don't consider myself as worthwhile and usefulas I used to.I feel more worthless as compared to other people.I feel utterly worthless.
15) 15. Loss of Energy I have as much energy as ever.I have less energy than I used to have.I don't have enough energy to do very much.I don't have enough energy to do anything.
145
13/09/2021 2:03pm projectredcap.org
ConfidentialPage 3
Please read each group of statements carefully, and then pick out the one statement in eachgroup that best describes the way you have been feeling during the past two weeks, includingtoday.
16) 16. Changes in Sleep Pattern I have not experienced any change in my sleepingpattern.I sleep somewhat more than usual.I sleep somewhat less than usual.I sleep a lot more than usual.I sleep a lot less than usual.I sleep most of the day.I wake up 1-2 hours early and can't get back tosleep.
17) 17. Irritability I am no more irritable than usual.I am more irritable than usual.I am much more irritable than usual.I am irritable all the time.
18) 18. Changes in Appetite I have not experienced any change in my appetite.My appetite is somewhat less than usual.My appetite is somewhat greater than usual.My appetite is much less than before.My appetite is much greater than usual.I have no appetite at all.I crave food all the time.
Please read each group of statements carefully, and then pick out the one statement in eachgroup that best describes the way you have been feeling during the past two weeks, includingtoday.
19) 19. Concentration Difficulty I can concentrate as well as ever.I can't concentrate as well as usual.I It's hard to keep my mind on anything for verylong.I find I can't concentrate on anything.
20) 20. Tiredness of Fatigue I am no more tired or fatigued than usual.I get more tired or fatigued more easily thanusual.I am too tired or fatigued to do a lot of thethings I used to do.I am too tired or fatigued to do most of thethings I used to do.
21) 21. Loss of Interest in Sex I have not noticed any recent change in myinterest in sex.I am less interested in sex than I used to be.I am much less interested in sex now.I have lost interest in sex completely.
22)__________________________________
23)__________________________________
146

13/09/2021 2:03pm projectredcap.org
ConfidentialPage 4
24) BDI Total__________________________________
25) BDI Cognitive__________________________________
26) BDI Affective__________________________________
27) BDI Somatic__________________________________
147
13/09/2021 2:04pm projectredcap.org
ConfidentialPage 1
CES-D
Below is a list of ways you may have felt or behaved. Please indicate how often you haveexperienced each one over the course of this past week.
1) 1. I was bothered by things that usually don't bother Rarely or none of the time (less than 1 day )me. Some or a little of the time (1-2 days)
Occasionally or a moderate amount of time (3-4days)Most or all of the time (5-7 days)
2) 2. I did not feel like eating; my appetite was poor. Rarely or none of the time (less than 1 day )Some or a little of the time (1-2 days)Occasionally or a moderate amount of time (3-4days)Most or all of the time (5-7 days)
3) 3. I felt that I could not shake off the blues even Rarely or none of the time (less than 1 day )with help from my family or friends. Some or a little of the time (1-2 days)
Occasionally or a moderate amount of time (3-4days)Most or all of the time (5-7 days)
4) 4. I felt I was just as good as other people. Rarely or none of the time (less than 1 day )Some or a little of the time (1-2 days)Occasionally or a moderate amount of time (3-4days)Most or all of the time (5-7 days)
5) 5. I had trouble keeping my mind on what I was doing. Rarely or none of the time (less than 1 day )Some or a little of the time (1-2 days)Occasionally or a moderate amount of time (3-4days)Most or all of the time (5-7 days)
6) 6. I felt depressed. Rarely or none of the time (less than 1 day )Some or a little of the time (1-2 days)Occasionally or a moderate amount of time (3-4days)Most or all of the time (5-7 days)
7) 7. I felt that everything I did was an effort. Rarely or none of the time (less than 1 day )Some or a little of the time (1-2 days)Occasionally or a moderate amount of time (3-4days)Most or all of the time (5-7 days)
8) 8. I felt hopeful about the future. Rarely or none of the time (less than 1 day )Some or a little of the time (1-2 days)Occasionally or a moderate amount of time (3-4days)Most or all of the time (5-7 days)
148
13/09/2021 2:04pm projectredcap.org
ConfidentialPage 2
9) 9. I thought my life had been a failure. Rarely or none of the time (less than 1 day )Some or a little of the time (1-2 days)Occasionally or a moderate amount of time (3-4days)Most or all of the time (5-7 days)
10) 10. I felt fearful. Rarely or none of the time (less than 1 day )Some or a little of the time (1-2 days)Occasionally or a moderate amount of time (3-4days)Most or all of the time (5-7 days)
11) 11. My sleep was restless. Rarely or none of the time (less than 1 day )Some or a little of the time (1-2 days)Occasionally or a moderate amount of time (3-4days)Most or all of the time (5-7 days)
12) 12. I was happy. Rarely or none of the time (less than 1 day )Some or a little of the time (1-2 days)Occasionally or a moderate amount of time (3-4days)Most or all of the time (5-7 days)
13) 13. I talked less than usual. Rarely or none of the time (less than 1 day )Some or a little of the time (1-2 days)Occasionally or a moderate amount of time (3-4days)Most or all of the time (5-7 days)
14) 14. I felt lonely. Rarely or none of the time (less than 1 day )Some or a little of the time (1-2 days)Occasionally or a moderate amount of time (3-4days)Most or all of the time (5-7 days)
15) 15. People were unfriendly. Rarely or none of the time (less than 1 day )Some or a little of the time (1-2 days)Occasionally or a moderate amount of time (3-4days)Most or all of the time (5-7 days)
16) 16. I enjoyed life. Rarely or none of the time (less than 1 day )Some or a little of the time (1-2 days)Occasionally or a moderate amount of time (3-4days)Most or all of the time (5-7 days)
17) 17. I had crying spells. Rarely or none of the time (less than 1 day )Some or a little of the time (1-2 days)Occasionally or a moderate amount of time (3-4days)Most or all of the time (5-7 days)
18) 18. I felt sad. Rarely or none of the time (less than 1 day )Some or a little of the time (1-2 days)Occasionally or a moderate amount of time (3-4days)Most or all of the time (5-7 days)
149

13/09/2021 2:04pm projectredcap.org
ConfidentialPage 3
19) 19. I felt that people dislike me. Rarely or none of the time (less than 1 day )Some or a little of the time (1-2 days)Occasionally or a moderate amount of time (3-4days)Most or all of the time (5-7 days)
20) 20. I could not get "going." Rarely or none of the time (less than 1 day )Some or a little of the time (1-2 days)Occasionally or a moderate amount of time (3-4days)Most or all of the time (5-7 days)
21) CESD Total__________________________________
22) CESD Somatic__________________________________
23) CESD Negative Affect__________________________________
24) CESD Anhedonia__________________________________
150
13/09/2021 2:04pm projectredcap.org
ConfidentialPage 1
PSS
PSS
The questions in this scale ask you about your feelings and thoughts during the last month. Ineach case, you will be asked to indicate how often you felt or thought a certain way.
Choose the answer that most closely corresponds to you in the last month.1) 1. In the last month, how often have you been upset Never
because of something that happened unexpectedly? Almost NeverSometimesFairly OftenVery Often
2) 2. In the last month, how often have you felt that you Neverwere unable to control the important things in your Almost Neverlife? Sometimes
Fairly OftenVery Often
3) 3. In the last month, how often have you felt nervous Neverand 'stressed'? Almost Never
SometimesFairly OftenVery Often
4) 4. In the last month, how often have you dealt Neversuccessfully with irritating life hassles? Almost Never
SometimesFairly OftenVery Often
5) 5. In the last month, how often have you felt that you Neverwere effectively coping with important changes that Almost Neverwere occurring in your life? Sometimes
Fairly OftenVery Often
6) 6. In the last month, how often have you felt Neverconfident about your ability to handle your personal Almost Neverproblems? Sometimes
Fairly OftenVery Often
7) 7. In the last month, how often have you felt that Neverthings were going your way? Almost Never
SometimesFairly OftenVery Often
151
13/09/2021 2:04pm projectredcap.org
ConfidentialPage 2
8) 8. In the last month, how often have you found that Neveryou could not cope with all the things that you had to Almost Neverdo? Sometimes
Fairly OftenVery Often
9) 9. In the last month, how often have you been able to Nevercontrol irritations in your life? Almost Never
SometimesFairly OftenVery Often
10) 10. In the last month, how often have you felt that Neveryou were on top of things? Almost Never
SometimesFairly OftenVery Often
11) 11. In the last month, how often have you been angered Neverbecause of things that happened that were outside of Almost Neveryour control? Sometimes
Fairly OftenVery Often
12) 12. In the last month, how often have you found Neveryourself thinking about things that you have to Almost Neveraccomplish? Sometimes
Fairly OftenVery Often
13) 13. In the last month, how often have you been able to Nevercontrol the way you spend your time? Almost Never
SometimesFairly OftenVery Often
14) 14. In the last month, how often have you felt Neverdifficulties were piling up so high that you could not Almost Neverovercome them? Sometimes
Fairly OftenVery Often
15) PSS Total__________________________________
152
13/09/2021 2:04pm projectredcap.org
ConfidentialPage 1
Spielberger Trait Anxiety
A number of statements which people have used to describe themselves are given below. Read each statement andthen press the appropriate key to indicate how you GENERALLY FEEL. There are no right or wrong answers. Do notspend too much time on any one statement but give the answer which seems to describe your present feelings best.
1) I feel pleasant. Almost NeverSometimesOftenAlmost Always
2) I feel nervous and restless. Almost NeverSometimesOftenAlmost Always
3) I feel satisfied with myself. Almost NeverSometimesOftenAlmost Always
4) I wish I could be as happy as others seem to be. Almost NeverSometimesOftenAlmost Always
5) I feel like a failure. Almost NeverSometimesOftenAlmost Always
6) I feel rested. Almost NeverSometimesOftenAlmost Always
7) I am "calm, cool, and collected". Almost NeverSometimesOftenAlmost Always
8) I feel that difficulties are piling up so that I Almost Nevercannot overcome them. Sometimes
OftenAlmost Always
9) I am worried too much over something that really Almost Neverdoesn't matter. Sometimes
OftenAlmost Always
10) I am happy. Almost NeverSometimesOftenAlmost Always
153
13/09/2021 2:04pm projectredcap.org
ConfidentialPage 2
11) I have disturbing thoughts. Almost NeverSometimesOftenAlmost Always
12) I lack self-confidence. Almost NeverSometimesOftenAlmost Always
13) I feel secure. Almost NeverSometimesOftenAlmost Always
14) I make decisions easily. Almost NeverSometimesOftenAlmost Always
15) I feel inadequate. Almost NeverSometimesOftenAlmost Always
16) I feel content. Almost NeverSometimesOftenAlmost Always
17) Some unimportant thought runs through my mind and Almost Neverbothers me. Sometimes
OftenAlmost Always
18) I take disappointments so keenly that I can't put them Almost Neverout of my mind. Sometimes
OftenAlmost Always
19) I am a steady person. Almost NeverSometimesOftenAlmost Always
20) I get in a state of tension or turmoil as I think over Almost Nevermy recent concerns and interests. Sometimes
OftenAlmost Always
21) Trait Anxiety Total__________________________________
154
13/09/2021 2:04pm projectredcap.org
ConfidentialPage 1
Spielberger Trait Anger
You will be presented with a number of statements that people use to describe themselves. Read each statementand circle the response that indicates how you GENERALLY feel. Remember that there are no right or wrong answers. Do not spend too much time on any one statement, but give the answer that seems to best describe how youGENERALLY feel.
1) I am quick tempered. Almost neverSometimesOftenAlmost Always
2) I have a fiery temper. Almost neverSometimesOftenAlmost Always
3) I am a hotheaded person. Almost neverSometimesOftenAlmost Always
4) I get angry when I'm slowed down by others' mistakes. Almost neverSometimesOftenAlmost Always
5) I feel annoyed when I am not given recognition for Almost neverdoing good work. Sometimes
OftenAlmost Always
6) I fly off the handle. Almost neverSometimesOftenAlmost Always
7) When I get mad, I say nasty things. Almost neverSometimesOftenAlmost Always
8) It makes me furious when I am criticized in front of Almost neverothers. Sometimes
OftenAlmost Always
9) When I get frustrated, I feel like hitting someone. Almost neverSometimesOftenAlmost Always
10) I feel infuriated when I do a good job and get a poor Almost neverevaluation. Sometimes
OftenAlmost Always
155

13/09/2021 2:04pm projectredcap.org
ConfidentialPage 2
11) Anger Total__________________________________
156
13/09/2021 2:04pm projectredcap.org
ConfidentialPage 1
Cognitive Behavioral Physical Activity QuestionnairePlease complete the survey below.
Thank you!
Directions: please choose a response that best expresses how well each statement describesyou.
1) 1. I find being physically active gives me a lot of Does not describe me at allenergy. Describes me slightly
Describes me more or lessDescribes me pretty wellDescribes me completely
2) 2.I feel good physically after I've exercised. Does not describe me at allDescribes me slightlyDescribes me more or lessDescribes me pretty wellDescribes me completely
3) 3. I schedule all events in my life around my exercise Does not describe me at allroutine. Describes me slightly
Describes me more or lessDescribes me pretty wellDescribes me completely
4) 4.I schedule exercise at specific times of the week in Does not describe me at allorder to maintain a routine. Describes me slightly
Describes me more or lessDescribes me pretty wellDescribes me completely
5) 5. I set goals for myself in order to keep physically Does not describe me at allactive Describes me slightly
Describes me more or lessDescribes me pretty wellDescribes me completely
6) 6.I make commitments to exercise and stick to them. Does not describe me at allDescribes me slightlyDescribes me more or lessDescribes me pretty wellDescribes me completely
7) 7.I am just too lazy to exercise regularly Does not describe me at allDescribes me slightlyDescribes me more or lessDescribes me pretty wellDescribes me completely
8) 8.I make back up plans to be sure I get enough Does not describe me at allexercise. Describes me slightly
Describes me more or lessDescribes me pretty wellDescribes me completely
157
13/09/2021 2:04pm projectredcap.org
ConfidentialPage 2
9) 9. Being physically active gives me a strong sense of Does not describe me at allaccomplishment. Describes me slightly
Describes me more or lessDescribes me pretty wellDescribes me completely
10) 10. I have too many things to do during the day and Does not describe me at allcan never find time to exercise Describes me slightly
Describes me more or lessDescribes me pretty wellDescribes me completely
11) 11. My lack of motivation stops me from being Does not describe me at allphysically active Describes me slightly
Describes me more or lessDescribes me pretty wellDescribes me completely
12) 12. When I am exercising, I often feel as though I Does not describe me at allwould rather be doing something else". In our Describes me slightlyquestionnaire the question is: Describes me more or less
Describes me pretty wellDescribes me completely
13) 13.Being physically active improves my mood. Does not describe me at allDescribes me slightlyDescribes me more or lessDescribes me pretty wellDescribes me completely
14) 14.I consider being physically active an effective way Does not describe me at allof relieving stress. Describes me slightly
Describes me more or lessDescribes me pretty wellDescribes me completely
15) 15.I don't exercise as regularly when I get depressed Does not describe me at allor upset about something. Describes me slightly
Describes me more or lessDescribes me pretty wellDescribes me completely
16) Outcome expectation__________________________________
17) Self Regulation__________________________________
18) Personal Barriers__________________________________
158
13/09/2021 2:04pm projectredcap.org
ConfidentialPage 1
Decisional Balance Exercise Scale
1) I would have more energy for my family and friends if Not ImportantI exercised regularly. A little bit important
Somewhat importantQuite importantExtremely Important
2) I would feel embarrassed if people saw me exercising. Not ImportantA little bit importantSomewhat importantQuite importantExtremely Important
3) I would feel less stressed if I exercised regularly. Not ImportantA little bit importantSomewhat importantQuite importantExtremely Important
4) Exercise prevents me from spending time with my Not Importantfriends. A little bit important
Somewhat importantQuite importantExtremely Important
5) Exercising puts me in a better mood for the rest of Not Importantthe day. A little bit important
Somewhat importantQuite importantExtremely Important
6) I feel uncomfortable or embarrassed in exercise Not Importantclothes. A little bit important
Somewhat importantQuite importantExtremely Important
7) I would feel more comfortable with my body if Not Importantexercised regularly. A little bit important
Somewhat importantQuite importantExtremely Important
8) There is too much I would have to learn to exercise. Not ImportantA little bit importantSomewhat importantQuite importantExtremely Important
9) Regular exercise would help me have a more positive Not Importantoutlook on life. A little bit important
Somewhat importantQuite importantExtremely Important
159

13/09/2021 2:04pm projectredcap.org
ConfidentialPage 2
10) Exercise puts an extra burden on my significant other. Not ImportantA little bit importantSomewhat importantQuite importantExtremely Important
11) Pros Total__________________________________
12) Cons Total__________________________________
160
13/09/2021 2:05pm projectredcap.org
ConfidentialPage 1
CasPlease complete the survey below.
Thank you!
Childcare Arrangments Scale1) Have you attended school since your baby was born? Yes
No
2) If yes, are you attending full time? YesNo
3) If yes, what age was your child when you returned toschool __________________________________
4) Does your baby go to a day care or nursery? YesNo
5) If yes, how many days per week?__________________________________
6) If yes, how many hours per day?__________________________________
7) Not including the staff at the day care nursery, how 1 personmany people are regularly involved in the care of your 2 peoplechild? 3 or 4 people
5 or more people
8) Who provides most of the care for your child? MeThe baby's fatherMy motherOther family member
9) If other, relationship to you?__________________________________
If you are primary caregiver10) How many hours in a typical day do you provide care? 0-2 hours
3-5 hours6-8 hours9-12 hours13 or more hours
11) Your care hours recoded__________________________________
12) Your care days recoded__________________________________
161
13/09/2021 2:05pm projectredcap.org
ConfidentialPage 2
13) How many days in at typical week do you provide care? 0-1 days2-3 days4-5 days6-7 daysno regular pattern
14) Who else provides care for your child? Baby's fatherBaby's GrandmotherOther family member
15) If other, relationship to you?__________________________________
16) How many hours in a typical day does this person 0-2 hoursprovide care? 3-5 hours
6-8 hours9-12 hours13 or more hours
17) other care hours recoded__________________________________
18) How many days in a typical week does this person 0-1 daysprovide care? 2-3 days
4-5 days6-7 daysno regular pattern
19) Other care days recoded__________________________________
20) Caregiver Burden Score__________________________________
21) Are you generally present when others are taking care Yesof your baby? No
If you are not primary caregiver22) How many hours in a typical day does this person 0-2 hours
provide care? 3-5 hours6-8 hours9-12 hours13 or more hours
23) How many days in a typical week does this person 0-1 daysprovide care? 2-3 days
4-5 days6-7 daysno regular pattern
24) Besides the primary caregiver, who then takes care of Methe baby the most? The baby's father
My motherOther family member
162

13/09/2021 2:05pm projectredcap.org
ConfidentialPage 3
25) How many hours in a typical day does this person 0-2 hoursprovide care? 3-5 hours
6-8 hours9-12 hours13 or more hours
26) How many days in a typical week does this person 0-1 daysprovide care? 2-3 days
4-5 days6-7 daysno regular pattern
Other27) How many hours in a typical day do you provide care? 0-2 hours
3-5 hours6-8 hours9-12 hours13 or more hours
28) How many days in at typical week do you provide care? 0-1 days2-3 days4-5 days6-7 daysno regular pattern
29) Are you generally present when others are taking care Yesof your baby? No
30) How satisfied are you with these childcare Very satisfiedarrangments? Moderately satisfied
Moderately dissatisfiedVery dissatisfied
31) How many times does your child wake at night? None1 time2 times3 timesMore than 3 times
32) Where does your son/daughter sleep? Own roomMy roomGrandparent's roomOther
33) If other, where__________________________________
34) How much does your son/daughter cry in a typical day? less than half hour(total for whole day) 30-59 minutes
1 hour2 hours3 hours4-5 hoursMore than 5 hours
163

13/09/2021 2:05pm projectredcap.org
ConfidentialPage 4
35) How much does your baby cry compared with what you less than expectedexpected? about the same
more than expected
36) Does the crying ever get you down? Not really/neverSometimesOftenMost of the time
37) Over the past year, have you felt criticized for the Not really/neverway you have looked after you baby? Sometimes
OftenMost of the time
Childcare routines for a typical week38) Who generally feeds the baby? Me
Baby's fatherBaby's grandmotherBaby's grandfatherOther family memberOther person
39) If other, name and relationship to you?__________________________________
40) Who generally changes wet diapers? MeBaby's fatherBaby's grandmotherBaby's grandfatherOther family memberOther person
41) If other, name and relationship to you?__________________________________
42) Who generally changes dirty diapers? MeBaby's fatherBaby's grandmotherBaby's grandfatherOther family memberOther person
43) If other, name and relationship to you?__________________________________
44) Who generally dresses the baby in the morning? MeBaby's fatherBaby's grandmotherBaby's grandfatherOther family memberOther person
45) If other, name and relationship to you?__________________________________
164
13/09/2021 2:05pm projectredcap.org
ConfidentialPage 5
46) Who generally washes or bathes the baby? MeBaby's fatherBaby's grandmotherBaby's grandfatherOther family memberOther person
47) If other, name and relationship to you?__________________________________
48) Who generally puts the baby to put at night? MeBaby's fatherBaby's grandmotherBaby's grandfatherOther family memberOther person
49) If other, name and relationship to you?__________________________________
50) Who generally gets up in the night to feed the baby? MeBaby's fatherBaby's grandmotherBaby's grandfatherOther family memberOther person
51) If other, name and relationship to you?__________________________________
165

13/09/2021 2:05pm projectredcap.org
ConfidentialPage 1
InqPlease complete the survey below.
Thank you!
INQ1. How do you feed your baby? Breastfeed
Breast and bottleBottle
IF BREASTFEEDING, how many times in 24 hours do youbreastfeed? __________________________________
Do you have any concerns about breastfeeding?__________________________________
IF BOTTLEFEEDING, how many times in 24 hours does yourbaby get a bottle? __________________________________
How many ounces does your baby drink at a feeding?__________________________________
Do you use? Concentrated formulaPowdered formulaReady to feed formulafresh milk
How do you prepare your formula?__________________________________
Blend:__________________________________
Does your baby drink a bottle in bed? NoYes
2. What else do you put in your baby's bottle? waterwater with sugarwater with honeywater with karo syrupjell-o waterrice waterjuicecerealhi-clemonadepunchkool-aidsodateacoffeechocolate milkSport Drink (Gatorade)
166

13/09/2021 2:05pm projectredcap.org
ConfidentialPage 2
3. Which do you feed your baby? homemade babyfoodbaby food in jarsBaby not yet eating foodsBottle only
4. What baby foods do you give your baby? baby cereal: rice, oats, barleybaby cereal: mixed or high proteinstrained vegetablesstrained fruitsstrained meatsvegetables/meat dinnersegg yolksbaby dessertsotherNone
If other, what foods?__________________________________
5. What finger foods or table foods to you give your cold/hot cerealbaby? rice
tortillasbread/toastnoodles/spaghetticrackerscheeseyogurtpudding/custardice creamfruitvegetablessouppeanut butterbeansbeef/chicken/fisheggsmeat stickshot dogsraisinscookiescandypopsiclesnutschips
6. Who else feeds your baby?__________________________________
9. My baby has: allergiesdiarrheaconstipationnone
Allergies:__________________________________
167