Exploring the Acceptance of Ubiquitous Computing-based ...
301
I Exploring the Acceptance of Ubiquitous Computing-based Information Services in Brick and Mortar Retail Environments An Integration of UTAUT2 and Media System Dependency Theory Vom Promotionsausschuss der Technischen Universität Hamburg zur Erlangung des akademischen Grades Doktorin der Wirtschafts- und Sozialwissenschaften (Dr. rer. Pol.) genehmigte Dissertation von Sara Kheiravar aus Tabriz 2018
-
Upload
khangminh22 -
Category
Documents
-
view
4 -
download
0
Transcript of Exploring the Acceptance of Ubiquitous Computing-based ...

I
Exploring the Acceptance of Ubiquitous Computing-based
Information Services in Brick and Mortar Retail Environments
An Integration of UTAUT2 and Media System Dependency Theory
Vom Promotionsausschuss der
Technischen Universität Hamburg
zur Erlangung des akademischen Grades
Doktorin der Wirtschafts- und Sozialwissenschaften (Dr. rer. Pol.)
genehmigte Dissertation
von
Sara Kheiravar
aus
Tabriz
2018

II
Erster Gutachter: Herr Prof. Dr.Thorsten Blecker
Zweiter Gutachter: Herr Prof. Dr. Christian M. Ringle
Tag der mündlichen Prüfung: 19.06.2018

III
Acknowledgment
Doing a PhD and writing a dissertation is an enjoyable and fulfilling but at the same time a long
and rough journey; loaded with many moments of excitement and motivation but also that of
exhaustion and disappointment. Without academic and emotional support of many people along
this journey I wouldn’t be able to successfully complete it.
First and foremost, with deep sense of gratitude, I wish to thank my advisor, Professor Thorsten
Blecker, for his academic support, insightful discussions, and constructive criticism. I would also
like to thank Professor Christian M. Ringle for accepting to be my second advisor. He was
always generous with his time answering my questions and giving invaluable feedbacks on my
work.
Even though this dissertation was a big milestone in completing my PhD, it might not do justice
summarizing my experience at the Institute of Business Logistics and General Management
(LOGU) of TUHH. My experience at LOGU was nothing short of amazing for which I am
indebted to my great colleagues, faculty and staff of LOGU, many of whom became my true
friends ever since we met at the institute. A special acknowledgment goes to my officemates:
Semah Ibrahim Ben Abdelaziz and Ahmed Ziad Benleulmi whose support especially during
survey design and data collection was invaluable.
In addition, I would like to thank Hella, Herman, and Thorsten who provided me with the best
imaginable warm and inviting environment upon my arrival in Hamburg. Since my first day in
Hamburg I have felt at home and since then they are like family to me.
Finally and most importantly, I am endlessly grateful to my family. I could not be the person I
am today without them. My dear parents, Hamideh and Belal, unconditionally and generously
supported me in every imaginable way to reach my dreams. They inspired me to love and enjoy
learning, and taught me that it is only with persistence and hard work that one could achieve her
dreams. My lovely sisters, Shirin, Solmaz, and Salma, and brothers, Mohammadhassan, and
Khaled, were always there to motivate and cheer me up. Finally, my best friend and husband,
Philipp, whom I cannot thank enough was an outstanding emotional support and a great
academic advisor. He patiently listened to each and every one of my presentations, discussed

IV
ideas, and shared the passion for research with me. I am eternally blessed to have him by my
side.

V
Table of Contents
List of Figures ............................................................................................................................... IX
List of Tables ................................................................................................................................ XI
1 Introduction ................................................................................................................................ 1
1.1 Motivation .......................................................................................................................... 1
1.2 Research Gap ..................................................................................................................... 4
1.3 Structure of the Thesis ..................................................................................................... 10
2 Research Background............................................................................................................... 13
2.1 Ubiquitous Computing ..................................................................................................... 13
2.1.1 Evolution of the Research ....................................................................................... 14
2.1.2 Characteristics ......................................................................................................... 23
2.2 Applications in Brick and Mortar Retail ......................................................................... 30
3 Theoretical Framework ............................................................................................................ 37
3.1 Technology Acceptance Research ................................................................................... 38
3.1.1 The Origin of Technology Acceptance Models ...................................................... 41
3.1.1.1 Theory of Reasoned Action .............................................................................. 41
3.1.1.2 Theory of Planned Behavior ............................................................................. 44
3.1.2 Technology Acceptance Model (TAM) .................................................................. 47
3.1.2.1 Extension of TAM by Social Factors ................................................................ 50
3.1.2.2 Extension of TAM by Affective Factors ........................................................... 55
3.1.2.3 Elaboration of TAM – Unified Theory of Acceptance and Use of
Technology (UTAUT) ...................................................................................... 60
3.1.3 Technology Acceptance Research on Ubiquitous Computing-based Information
Services in Brick and Mortar Retail ........................................................................ 64
3.2 Mass Media Effects Research .......................................................................................... 72

VI
3.2.1 Media System Dependency Theory ........................................................................ 73
3.2.2 Individual Media System Dependency Relations ................................................... 77
3.2.2.1 Determinants of Individual Media System Dependency Relations .................. 78
3.2.2.2 Typology of Individual Media System Dependency ........................................ 80
3.2.3 Individual Media System Dependency in Information System Research ............... 82
4 Exploring Consumers’ Acceptance of Ubiquitous Information Services in Brick and
Mortar Retail – Conceptual Model and Research Hypothesis ................................................. 87
4.1 Developing a Context-Specific Theory in Information Systems Research ..................... 87
4.2 Choice of the Base Model ................................................................................................ 92
4.3 Contextualizing UTAUT2 into In-Store Ubiquitous Computing-based Information
Services ............................................................................................................................ 94
4.3.1 Cognitive Factors .................................................................................................... 97
4.3.1.1 Performance Expectancy ................................................................................... 97
4.3.1.2 Effort Expectancy ............................................................................................. 99
4.3.2 Social Factor: Social Influence ............................................................................. 100
4.3.3 Affective Factor: Hedonic Motivation .................................................................. 102
4.3.4 Intention to Prefer ................................................................................................. 104
4.3.5 Moderators ............................................................................................................ 106
4.3.5.1 Age .................................................................................................................. 106
4.3.5.2 Gender ............................................................................................................. 108
4.4 Incorporating Contextual Factors – User Characteristics .............................................. 111
4.4.1 Incorporating Internet Dependency into UTAUT2 ............................................... 113
4.4.1.1 Internet Dependency to Fulfill Orientation goals ........................................... 116
4.4.1.2 Internet Dependency to Fulfill Play goals ....................................................... 121
4.4.2 Incorporating Personal Innovativeness and Involvement into UTAUT2 ............. 122
4.4.2.1 Personal Innovativeness in Information Technology ...................................... 123

VII
4.4.2.2 Personal Involvement – Personal Relevance and Importance ........................ 126
4.5 Incorporating Contextual Factors .................................................................................. 127
4.5.1 Service Type ......................................................................................................... 128
4.5.2 Technology Type .................................................................................................. 131
4.6 Summary of Hypotheses ................................................................................................ 132
5 Empirical Study ...................................................................................................................... 137
5.1 Selecting the Statistical Analysis Method ..................................................................... 137
5.1.1 Structural Equation Modeling ............................................................................... 139
5.1.2 PLS-SEM and CB-SEM ........................................................................................ 143
5.2 PLS-SEM Analyses ....................................................................................................... 145
5.2.1 Model Creation ..................................................................................................... 146
5.2.2 Data Collection and Examination ......................................................................... 152
5.2.3 Model Estimation and Results Assessment .......................................................... 160
5.2.3.1 Quality Criteria for Measurement Model Assessment .................................... 161
5.2.3.1 Measurement Model Assessment .................................................................... 163
5.2.3.2 Quality Criteria for Structural Model Assessment .......................................... 179
5.2.4 Assessing the Influence of Categorical Moderator Variables ............................... 187
5.2.4.1 Age .................................................................................................................. 190
5.2.4.2 Gender ............................................................................................................. 196
5.2.4.3 Service Type ................................................................................................... 199
5.2.4.4 Technology Type ............................................................................................ 202
5.2.5 Summary of Empirical Results ............................................................................. 205
6 Discussion of Results and Conclusion ................................................................................... 208
6.1 Theoretical Implications ................................................................................................ 208
6.2 Managerial Implications ................................................................................................ 216

VIII
6.3 Limitations and Recommendations for Future Research ............................................... 225
Appendix ..................................................................................................................................... 227
Questionnaire for the Use and Acceptance of Ubiquitous Technologies in Retail
Environment .................................................................................................................. 227
References ................................................................................................................................... 255

IX
List of Figures
Figure 1: Engel-Kollat-Blackwell’s consumer behavior model ..................................................... 1
Figure 2: Schematic presentation of the structure of thesis .......................................................... 12
Figure 3: Chronological evolution of research around ubiquitous computing and future
research challenges....................................................................................................... 23
Figure 4: Characteristic dimensions of ubiquitous computing applications ................................. 25
Figure 5: Schematic presentation of Theory of Reasoned Action (TRA) .................................... 42
Figure 6: A detailed schematic presentation of TRA including the external variables ................ 44
Figure 7: Schematic presentation of Theory of Planned Behavior (TPB) .................................... 45
Figure 8: A detailed schematic presentation of TPB including the background factors .............. 46
Figure 9: Schematic presentation of Technology Acceptance Model (TAM) .............................. 47
Figure 10: Schematic presentation of the basic concept underlying user acceptance models ...... 49
Figure 11: Schematic presentation of TAM extended to account for social influences ............... 51
Figure 12: Schematic presentation of TAM2 – an extension of TAM ......................................... 53
Figure 13: Schematic presentation of TAM3 – an extension of TAM ......................................... 57
Figure 14: Schematic presentation of Consumer Acceptance of Technology (CAT) .................. 59
Figure 15: Schematic presentation of Unified Theory of Acceptance and Use of Technology
(UTAUT) ..................................................................................................................... 62
Figure 16: Schematic presentation of UTAUT2 – an extension of UTAUT ................................ 64
Figure 17: Determinants of individual media system dependency relations ................................ 79
Figure 18: Approaches for incorporating the context into theorizing ........................................... 91
Figure 19: The procedure of contextual theory development ....................................................... 92
Figure 20: The primary research model – adjusted UTAUT2 to the context of ubiquitous
computing information services ................................................................................... 96
Figure 21: Incorporating the Internet media dependency relations into the base model ............ 116
Figure 22: Incorporating the personal innovativeness and involvement into the base model .... 123
Figure 23: Incorporating service type and technology type into the base model ....................... 128
Figure 24: The final conceptual model of this dissertation ......................................................... 136
Figure 25: Selecting a multivariate technique ............................................................................ 138
Figure 26: Graphical presentation of an exemplary structural equation model .......................... 141

X
Figure 27: Procedure of applying PLS-SEM for this work ........................................................ 146
Figure 28: Path diagram for the acceptance model of in-store ubiquitous computing-based
information services ................................................................................................... 147
Figure 29: Smart Mirror scenarios for information search and alternative evaluation stages .... 156
Figure 30: Mobile application scenario based on the customers own smart phones .................. 157
Figure 31: Reflective and formative measurement model conceptualization and
operationalization ....................................................................................................... 163
Figure 32: Importance-performance matrix analysis for determinants of intention to prefer
(information search and alternative evaluation) ......................................................... 218
Figure 33: Importance-performance matrix analysis for determinants of intention to prefer
(stationary technologies and mobile applications) ..................................................... 221

XI
List of Tables
Table 1: Different terms around the concept of ubiquitous computing and their highlighted
aspects .......................................................................................................................... 17
Table 2: Enabling technologies for the vision of ubiquitous computing ...................................... 18
Table 3: Characteristics of ubiquitous computing systems ........................................................... 26
Table 4: Comparison among ubiquitous computing-based in-store systems and web-based
retail ............................................................................................................................. 34
Table 5: An overview of existing store-based systems ................................................................. 35
Table 6: An overview of mobile applications ............................................................................... 36
Table 7: Factors capturing normative beliefs ................................................................................ 55
Table 8: Factors capturing affective beliefs .................................................................................. 60
Table 9: Studies on acceptance of in-store ubiquitous computing-based information services ... 65
Table 10: Typology of individual media dependency relations .................................................... 81
Table 11: Studies using MSD theory in the context of Internet – micro determinants and
outcomes of the Internet dependency ........................................................................... 84
Table 12: Direct determinates of individuals’ intention to use a technology in original
UTAUT2 ...................................................................................................................... 94
Table 13: User characteristics – Internet media dependency relations ....................................... 115
Table 14: User characteristics – personality traits ...................................................................... 122
Table 15: Summery of the factors used in the conceptual model of this dissertation ................ 133
Table 16: Summery of hypotheses on the acceptance determinants of in-store ubiquitous
computing-based information services ...................................................................... 134
Table 17: Indicators of UTAUT2 constructs in acceptance model of in-store ubiquitous
computing based information services ....................................................................... 148
Table 18: Indicators of Internet dependency constructs in acceptance model of in-store
ubiquitous computing-based information services..................................................... 149
Table 19: Indicator of the consequence construct of acceptance in acceptance model of in-
store ubiquitous computing based information services ............................................ 150
Table 20: Indicators of user characteristic constructs in acceptance model of in-store
ubiquitous computing- based information services.................................................... 151

XII
Table 21: Participant demographics ............................................................................................ 159
Table 22: Discriminant validity assessment – HTMT values and 95% confidence interval ...... 170
Table 23: Results of quality assessment criteria for the measurement model (aggregated data) 172
Table 24: Collinearity assessment .............................................................................................. 180
Table 25: Significance testing results for the structural model’s path coefficients .................... 182
Table 26: Results of the R2 and Q2 ............................................................................................. 186
Table 27: Summery of structural model’s quality criteria results ............................................... 186
Table 28: Summary of MICOM results for age groups .............................................................. 193
Table 29: PLS-MGA results for age ........................................................................................... 195
Table 30: Summary of MICOM results for gender groups ......................................................... 196
Table 31: Permutation test results for gender ............................................................................. 197
Table 32: PLS-MGA results for gender ...................................................................................... 198
Table 33: Summary of MICOM results for service type ............................................................ 199
Table 34: Permutation test results for service type ..................................................................... 201
Table 35: PLS-MGA results for service type ............................................................................. 201
Table 36: Summary of MICOM results for technology type ...................................................... 202
Table 37: Permutation test results for technology type .............................................................. 203
Table 38: PLS-MGA results for technology type ....................................................................... 204
Table 39: Summery of hypotheses testing .................................................................................. 205

XIII


1
1 Introduction
1.1 Motivation
In 1973, Engel, Kollat and Blackwell introduced a high level customer behavior model based on
the John Dewey’s (1910) five-stage problem solving process. Since then this model has been the
most accepted model in the customer behavior literature (Blackwell et al., 2005; Hawkins et al.,
2003). As shown in Figure 1, the model divides customer decision making process into five core
stages, namely need recognition, information search, alternative evaluation, purchase decision,
and post-purchase behavior.
Figure 1: Engel-Kollat-Blackwell’s consumer behavior model
For the purpose of this dissertation, the focus is on the information search and alternative
evaluation stages. In these stages, customers search information on the alternatives and/or
attributes of the alternatives they consider choosing and compare the various options to manage
the perceived risk involved in a purchase decision (Payne et al., 1993). Information search and
alternative evaluation and their impact on purchase choice have been a research focus of
customer research for more than three decades (Bettman, 1979; Kivetz and Simonson, 2000;
Levin et al., 2000; Srinivasan, 1990).
The interplay of the Internet technology and its ever increasing adaption has been the source of
structural changes in different aspects of customer behavior, from the ways customers search for
information to the ways they purchase products and communicate with companies or other
customers (Hennig-Thurau et al., 2010; Klein and Ford, 2003; Libai et al., 2010; Mathwick and
Rigdon, 2004; Shankar et al., 2011; Verhoef et al., 2007). Arguably, the information search and
evaluation stages have undergone the most dramatic shifts (Grewal et al., 2013).
Need Recognition
Information Search
Alternative Evaluation
Purchase Decision
Post-purchase Behavior

2
Difficulty (ease) in searching and finding products and product information at information search
and evaluation stages results in negative (positive) shopping experience and consequently affects
the choice of customers for their next purchase act (Kowatsch and Maass, 2010; Pantano and
Servidio, 2012; Udo et al., 2010; Yoon and Kim, 2007). Unique characteristics of the Internet
namely connectivity, interactivity (flexibility of choice in representing information), and access
(speed of access, scope of access) enable customers to effectively and efficiently find, classify,
and evaluate product information (Cook and Coupey, 1998; Kiang et al., 2000; Lehto et al.,
2006; Peterson and Merino, 2003). Equipped with powerful retrieval techniques, the Internet
makes the fast and convenient comparison and evaluation of a greater number of alternatives
possible. The availability of detailed product information is found to be the most appealing
feature of online shopping (Burke, 2002). Lower search costs and freedom from physical contact
with sales staff among others elevate the Internet to the most favorable channel for information
search and alternative evaluation (van Nierop et al., 2011).
In Germany, about 80% of the population use the Internet from which 63% use it daily (Frees
and Koch, 2015). 76% of the Internet users employ the Internet to search for information about
products and services, making information search the most favorable Internet-enabled service
after sending and receiving emails (78%) (Frees and Koch, 2015). The trend of online
information search threatens the competitiveness of the brick and mortar retail in two
dimensions: namely loss of customers and loss of influence:
Loss of customer: research shows that the information search channel is a strong predictor of the
choice of the purchase format (Cao, 2012; Cao et al., 2011; Schröder and Zaharia, 2008; Shim et
al., 2000). That is customers tend to conduct the act of purchasing in the channel through which
they search for and evaluate the product information. Therefore, the more people use the Internet
for information search and evaluation, the more people purchase online which means loss of
customers for brick and mortar retail (Shim et al., 2000). Based on a study by HDE1 and Gfk2;
the average growth of the offline retail industry in Germany has been only 0.2%, whereas this
1 Handelsverband Deutschland e.V (German retail association) is the umbrella organization of German retailing for approximately 400,000 independent companies with around 3.0 million employees and more than 420 billion Euros annually in sales. The organization represents the interests of the retail industry in Germany and the European Union. 2 Gesellschaft für Konsumforschung SE (society for consumer research) is Germany’s largest market research institute, and the fourth largest market research organization in the world.

3
number reaches to 12.2% for the online retail in the past ten years (Handel digital: Online
monitor 2014, 2014). Having a closer look at the more recent developments in Germany, the
nonfood online commerce captures all the gains in retail sales; in 2014 the nonfood online retail
market experienced around 7% growth, whereas the offline retail market has become stagnant
(Handel digital: online monitor 2015, 2015).
Loss of influence: the ultimate decision of purchasing or not purchasing is formed in the
information search and evaluation stages, therefore it is crucial for retailers to be able to
communicate with their customers in these stages. Based on a recent study published by PWC3,
64% of German customers search for information online before purchasing in brick and mortar
stores (Bovensiepen et al., 2015). The behavior pattern of search online and purchase offline
leads to the loss of valuable information about customers and consequently the loss of influence
on their decision making for brick and mortar retail (van Nierop et al., 2011); after all,
understanding and engaging with an increasing number of customers who have their decision
made or influenced outside the store is more challenging.
The experience of searching online has raised the bar for information services, today customers
expect more easy-to-access, easy-to-evaluate and transparent information (Burke, 2010). Thus in
today’s highly competitive and multi-channel retail environment, a channel’s capability to enable
the customers to spot the relevant product information turns to be a decisive channel driver. As a
result, the tendency of brick and mortar retailers to adopt new innovative technologies is
growing, technologies which can gratify customers’ rising demand for information services and
support retailers to obtain precise and real-time information about market trends and shopping
and selling processes (Bennett & Savani 2011; Fiorito et al. 2010; Shankar et al. 2011; Chen &
Tsou 2012; Pantano & Viassone 2013). For example, information kiosks (Zielke et al., 2011),
interactive displays, mobile shopping assistances (Resatsch et al., 2008; van der Heijden, 2006),
and smart mirrors offer customers all in-store and sometimes complementary information in a
similar way as the Internet does.
3 PricewaterhouseCoopers is the largest professional services firm in the world, and one of the Big Four accounting firms.

4
From the technological point of view, these technologies can be categorized under the concept of
ubiquitous computing. Ubiquitous computing is characterized by integration of the
computational resources into the physical environment to support users with customized services
on demand (Weiser, 1991). Henceforth, the digital technologies (services) developed to assist the
information search and evaluation of customers in brick and mortar retail will be referred to as
in-store ubiquitous computing-based information technologies (services).
Based on the information system research, to effectively deploy and manage the information
resources, companies should be able to answer two crucial questions: what is the value of
information technology to the firm and what are the determinants of that value (Taylor and Todd,
1995a). Therefore, to ensure the successful implementation of in-store ubiquitous computing-
based information technologies, retailers need to have a clear understanding about the benefits of
such technologies as well as the customers’ usage as a necessary condition for realization of
those benefits.
1.2 Research Gap
Consistent with the common practice in information system research, two streams of research
can be identified regarding the implementation of in-store ubiquitous computing information
services: studies assessing the benefits of such technologies for retailers and studies examining
the usage as a necessary condition for the realization of those benefits. However, as in-store
ubiquitous computing-based services are relatively new, an overview of previous studies shows a
rather skewed distribution of the literature with a penchant towards studying the benefits.
Various scholars investigated the benefits of implementing in-store ubiquitous computing
technologies (e.g. Burke, 2002; Pantano, 2010a; Pantano and Naccarato, 2010; Renko and
Druzijanic, 2014; Weber and Kantamneni, 2002). In general, the benefits can be summarized in
two dimensions namely cost reduction and value creation:
Cost reduction: implementing ubiquitous computing technologies enables brick and mortar retail
to reduce the interaction and communication costs with customers (Pantano and Naccarato,
2010). First of all, due to the self-service nature of ubiquitous computing systems, labor costs can
be significantly saved (Bitner et al., 2002). Furthermore, through such digital technologies, brick

5
and mortar retail can attain fast and precious digital information on customer behavior in the
store. Similar to the online clickstream data, such information is valuable as they allow the
prediction of market trends and the creation of personalized marketing and promotional
programs along with the possibility to track their effectiveness (Kourouthanassis and Roussos,
2003; Pantano, 2014a; Pantano and Naccarato, 2010). In addition, these information can be used
to eliminate out-of-shelf/out-of-stock conditions (Kourouthanassis and Roussos, 2003).
Value creation: augmenting stores by ubiquitous computing systems enables brick and mortar
retail to increase and sustain the sales volume by leveraging the quality of services and thus
customer experience (Bitner et al., 2002). Customers make their information channel choices
based on their prior experience (Verhoef et al., 2009). Thus the better the experience, the higher
the customer return rate. Furthermore, the more consumers enjoy their shopping experience, the
likelier that they make purchases (Kim and Kim, 2008). Extending the convenience of online
retail to offline retail, ubiquitous computing-based services enable an easier access to a large
amount of information on products and an improved response time to customer requests (Zhu et
al., 2013). In addition, such technologies can be used to directly target the service quality
blockages, for example, unprepared frontline employees, low speed in responding customer
requests and long queues resulting from limited human resources (Pantano and Migliarese,
2014). Due to the self-service nature of ubiquitous computing systems, customers can actively
participate in service creation (Pantano and Migliarese, 2014). The possibility to be involved in
service creation induces the feeling of autonomy and control, thus increasing customers’
perception of service quality (Pantano and Migliarese, 2014). In addition, augmenting retail
stores by ubiquitous computing systems modifies the appearance of stores in terms of style,
layout, and atmosphere making them more appealing (Grewal et al., 2013; Pantano and
Naccarato, 2010). As a consequence, there will be new elements capable of stimulating
customers’ attention and interest (Pantano and Di Pietro, 2012; Pantano and Naccarato, 2010;
Poncin and Ben Mimoun, 2014); such elements can influence customers’ shopping experience
(Baker et al., 2002; Grewal et al., 2013; Pantano and Naccarato, 2010). In this regard, Pantano
and Naccarato (2010) compare new in-store technologies with videogames: “consumers can play
with products as in a videogame, due to the high level of interactivity of technologies” (p. 203).
In today’s connected world, the notion of customer experience gets an additional touch of
importance; Grewal et al. (2013) perfectly illustrate this: “in the old days, a bad shopping

6
experience might have been shared with five to ten friends. Today, this reach extends to a
customer’s entire social network (…) and beyond if the customer chooses to share a bad
experience on various blogs or through YouTube”. Building on the same logic, delivering a
special and good experience would help the retailers to reach out to new customers.
The above-mentioned potential benefits of in-store ubiquitous computing-based services will not
come into sight unless customers embrace and use them. Therefore, before implementing,
retailers need to have a well-thought-out strategy to ensure the effectiveness of the design,
choice, and introduction of the technologies into their stores. The building block for developing
such strategy is to understand how customers will evaluate in-store ubiquitous computing-based
services, how this evaluation contributes to their usage decision and if the usage indeed affects
their future store choice.
Research on the usage of ubiquitous computing-based technologies has been a rather neglected
issue and only recently addressed in few studies (Kowatsch et al., 2011; Kowatsch and Maass,
2010; Pantano and Di Pietro, 2012; Pantano and Viassone, 2012). Therefore, yet, little is known
about how customers will actually evaluate these technologies. In her recent paper, Pantano
(2014b) analyzes the retail innovation drivers particularly for in-store ubiquitous computing
technologies, in her findings “the uncertainty of consumers’ reaction emerges as the most
significant restraining force” (p. 349) behind the implementation of such technologies. The
reason that despite its potential benefits and introduction of various successful prototypes, the
diffusion of ubiquitous computing-based services in retailing is still limited and discontinuous
with a quite high heterogeneity of systems (Pantano, 2014b). Caceres and Friday (2012) address
this issue emphasizing that to foster the way of ubiquitous computing technologies into the
market, the future research should focus on the user in terms of “who” and “why”. Addressing
this research gap and responding to the call for research, the overarching question of this
dissertation is:
What drives the usage of in-store ubiquitous computing-based information services?
Furthermore, it is important to examine if the usage of in-store ubiquitous computing-based
services indeed results in the above-mentioned hypothetical benefits for retailers in terms of
customer retention and acquisition. Thus another question which arises is:

7
Does the usage of in-store ubiquitous computing-based information services affect the
customers’ future store choice?
As discussed in the motivation section, the expanding trend of online information search
challenges the competitiveness of brick and mortal retail and the introduction of in-store
ubiquitous computing-based information services can help to deal with this challenge. However
frequently claimed in the literature, to the best of the author’s knowledge, there is neither a
theoretical nor an empirical study examining this claim, therefore the question to be asked is:
Does and how the expanding trend of customers’ online information search affect their
evaluation of in-store ubiquitous computing-based information services?
Although interrelated, the information search and alternative evaluation stages are distinct in
terms of needs. Rationally, in-store ubiquitous computing-based information services can be
divided into two categories: services for information search and screening and services for
alternative evaluation. As customers proceed in their decision making process, they stop to
gather information about certain attributes and start to build a set of the most promising
alternatives which then would be compared in more depth by processing bundles of product
attributes and customer benefits (Payne et al., 1993, 1988). Therefore, in general the alternative
evaluation stage is perceived as more complex than the information search stage (Payne et al.,
1993, 1988). In addition, becoming closer to the purchase decision in this stage, the effect of
possible undesirable consequences of a faulty choice is most comprehended by customers
(Tversky and Kahneman, 1981). Therefore, customers may evaluate the assisting technologies
for each of these stages differently. For example regarding the online technology, research shows
that the online channel is more compatible with customers’ needs in the information search stage
than in the alternative evaluation stage; as by increasing complexity customers tend to seek
expert or personal help in offline stores (Frambach et al., 2007). Regarding ubiquitous
computing-based information services, to the best of author’s knowledge, there is one single
exploratory study addressing this issue; Karaatli et al. (2010) investigated the user perception of
mobile based shopping assistance services at different stages of the consumer decision making
process. Based on their findings, more customers believed that mobile services can improve their
shopping experience in the information search stage than in the alternative evaluation stage.

8
However, they haven’t addressed the potential effect of this perception on customers’ technology
evaluation and use. Therefore, the question to be asked is:
Do customers’ evaluations of in-store ubiquitous computing-based information services differ for
different pre-purchase stages (information search vs. alternative evaluation)?
Reviewing the current developments of in-store ubiquitous computing-based technologies, it
becomes evident that different technologies have been developed to assist customers through the
information search and alternative evaluation process. However heterogeneous, these in-store
technologies can be divided in two main categories namely store-based systems (store owned
devices) (Melià-Seguí et al., 2013; Pantano, 2010b; Pantano and Naccarato, 2010) and
applications based on customers own smart mobile devices (Gao et al., 2010; Kowatsch et al.,
2011; Kowatsch and Maass, 2010). As the level of investment in store-based systems is
significantly higher than in mobile applications, it is important for retailers to know if customers
perceive and evaluate these technologies differently. In this regard, Pantano (2014b) argues that,
as current models fail to investigate the potential effect of technology type on customers’ usage
decisions, they are unable to provide retailers with a guideline on which is the best technology to
invest in and calls for further research on this topic. Therefore, another question to be asked is:
Do customers’ evaluations of in-store ubiquitous computing-based information services differ for
different technology types (store-owned vs. user-owned)?
From the theoretical point of view, in the information system research a mature stream of
research has been established which attempts to answer such questions. Referred to as
technology acceptance research, this stream of research is dedicated to the psychology of the
technology user and built on the grand theories of social psychology, such as the theory of
reasoned action (TRA) (Fishbein, 1967) and theory of planned behavior (TPB) (Ajzen, 1985).
These theories are designed to explain the human behavior taking a holistic approach and
therefore can be also applied to the acceptance of technological innovations. Here, acceptance is
defined as a consequence variable in “a psychological process that users go through in making
decisions about technology” (Dillon and Morris, 1996, p. 13).

9
The first and most famous theoretical model in the field is the technology acceptance model
(TAM) (Davis, 1986). TAM offers a unified set of constructs and indicators applicable for
understanding and describing an individual’s acceptance of information systems. Since its
introduction, TAM has been one of the most influential models in information systems field and
much of the technology acceptance studies are based on TAM or one of its various extensions
(Lee et al., 2003; M. D. Williams et al., 2009).
However, generalizability in different contexts and settings is one of the important attributes of a
theory, in the field of information system research, there has been a widely recognized need for
context-specific theory development (e.g. Chiasson and Davidson, 2005; Orlikowski and Iacono,
2001; Rosemann and Vessey, 2008; Venkatesh et al., 2007). TAM can serve as the basis for
technology acceptance studies, yet it needs to be refined and extended in regard to different
information technologies as there is no one universal set of determinants which could explain the
acceptance of all kind of technologies in any context (Adams et al., 1992; Davis, 1989; Davis et
al., 1989). Not surprisingly, as a subfield of information systems research, the need for
development of the context-specific theories is also recognized for the acceptance of ubiquitous
computing technologies. In this regard, Yoon and Kim (2007) note that “ubiquitous computing
technology is seen as an emerging new information technology with such potency that it has
changed the way we view IT. Although perceived ease of use and perceived usefulness constructs
have been considered important in determining the individuals’ acceptance and use of IT in the
last few decades, factors contributing to the acceptance of a new IT are likely to vary according
to the technological characteristics, the target users, and the context” (p. 102). Furthermore, a
recent literature review article of technology acceptance studies calls for the development of
context specific models for the state of the art technologies as ubiquitous computing technologies
(Chen et al., 2011).
Therefore, to address the above mentioned research gaps and questions, the objectives of this
dissertation are
developing a comprehensive and theoretically found model for the user acceptance of in-
store ubiquitous computing-based information services to analyze the antecedents and
consequences of the acceptance of such technologies,

10
developing theory driven hypotheses on the influences of the expanding trend of
customers’ online information search on the user acceptance of in-store ubiquitous
computing-based information services,
empirically exploring the developed theoretical model for the user acceptance of in-store
ubiquitous computing-based information services,
empirically exploring the developed theoretical model for different service types
(services for information search vs. alternative evaluation) in order to identify the stage
specific determinants of user acceptance,
empirically exploring the developed theoretical model for different technology types
(store owned vs. user-owned), in order to identify the technology specific determinants of
the user acceptance,
and deriving managerial implications and recommendations for brick and mortar retail to
increase the effectiveness of design, choice, and introduction strategies of in-store
ubiquitous computing-based information systems.
1.3 Structure of the Thesis
To achieve the above mentioned research objectives, the key findings of relevant research in
technology acceptance, consumer research and media effects have been combined to build a
comprehensive model and develop theoretically found hypotheses for acceptance of ubiquitous
computing-based information services. Based on the theoretical groundwork, in the empirical
part, using primary data collected through a scenario-based online survey and applying the
partial least squares structural equation modeling (PLS-SEM), both hypotheses-based and
exploratory analyses have been conducted. The results of these analyses then form the basis for
the derivation of recommendations for implementation of ubiquitous computing-based
information services. This procedure is elaborated below:
To specify the under scrutiny technology, the concept of ubiquitous computing and the current
applications in brick and mortar retail are thoroughly examined in chapter 2. Chapter 3 is then
dedicated to creating a sound theoretical framework for the derivation of hypotheses; two district
streams of research, namely technology acceptance and mass media effects are analyzed and
major theoretical and empirical findings relevant to the present research are summarized.

11
Chapter 4 begins with elaborating the procedure taken to build the context specific acceptance
model of this dissertation. The remainder of the chapter is dedicated to the model and hypotheses
development. Building on the various theories, namely technology acceptance, individual media
dependency theory, learning theories, and consumer behavior research, the rational for the
inclusion of each building block of the model is thoroughly discussed. Chapter 5 starts by
selecting the most appropriate statistical analysis method for testing the research model and
associated hypotheses. Following, the research model is operationalized and the procedure of the
data collection and the characteristics of the data are discussed. Finally, the PLS-SEM method is
used to estimate and analyze the results. In the last chapter (chapter 6) the theoretical
implications of the empirical results are thoroughly discussed. Following, using the Importance-
performance matrix analysis managerial implications are derived from the results. This chapter
closes by an outlook on future research areas. Figure 2 provides a schematic presentation of the
structure of this thesis.

12
Figure 2: Schematic presentation of the structure of thesis
Introduction (1)
Technology acceptance research (3.1)• The origin of technology acceptance models (3.1.1)• Technology acceptance model – TAM (3.1.2)• Technology acceptance research on ubiquitous
computing based information services (3.1.3)
Mass media affect research (3.2)• Media system dependency theory (3.2.1)• Individual media system dependency relations
(3.2.2)• Individual media system dependency in information
system research (3.2.3.)
• The choice of base model (4.2)• Contextualizing UTAUT2 into in-store ubiquitous
computing information services (4.3)
• Incorporating contextual factors – user characteristics (4.4)
• Incorporating contextual factors – service and technology type (4.5)
Developing a context-specific theory in information systems research (4.1)
Consumer acceptance of in-store ubiquitous computing-based information services (4)
Summary of hypotheses (4.6)
Theoretical framework (3)
• Theoretical implications (6.1)• Managerial implications (6.2)
• Limitations and recommendations for future research (6.3)
Discussion of results and conclusions (6)
Research background (2)
Applications in brick and mortar retail (2.2)Ubiquitous computing (2.1)
• Model creation (construction and operationalization of the research model) (5.2.1)
• Model estimation (data collection and preparation) (5.2.2)
• Assessment of results (5.2.3)
• Moderator effects (5.2.4)
Empirical analyses (5)
PLS-SEM analyses (5.2)Selection of the statistical method (5.1)

13
2 Research Background
When reviewing the literature, depending on the technologies and objectives of the study,
various terms are used to address technologies and applications developed to assist the decision
making process of customers in brick and mortar retail for example, among others, technology-
based innovations for the point of sales (Pantano and Di Pietro, 2012; Pantano and Viassone,
2014), advanced/new technologies in retailing (Pantano, 2010b; Pantano et al., 2013), ubiquitous
technologies in retailing (Kourouthanassis and Roussos, 2003; Pantano, 2013; Rothensee, 2010;
Roussos and Moussouri, 2004; Struker et al., 2004), pervasive technologies in retailing
(Narayanaswami et al., 2011; Pous et al., 2013; Roussos et al., 2002), self-service technologies in
retail setting (Dabholkar et al., 2003; Lee et al., 2011). In this dissertation, the notion of
ubiquitous computing is selected to address the technologies developed to assist customers while
searching and evaluating product information in brick and mortar retail: in-store ubiquitous
computing-based information services. The notion of ubiquitous computing is an umbrella
concept which can encompass all instances of the current technologies and offer a
comprehensive view of their characteristics; therefore, the most suitable for the holistic
objectives of this dissertation.
Thus, next, to specify the under scrutiny systems and services of this dissertation the concept of
ubiquitous computing, its state of research, and characteristics are examined. Following the state
of the academic and industrial research and developments that relate to applications of
ubiquitous computing technology in brick and mortar retail are thoroughly investigated.
2.1 Ubiquitous Computing
After the advent and widespread use of mainframes and personal computers, Weiser (1991)
adumbrated the third wave of computing labeled as ubiquitous computing. Weiser envisioned a
world where boundaries between the physical and digital are blurred and sometimes even
completely vanished; a world augmented with intelligent artifacts which provide us with
information and services, anytime and anywhere we wish for, in an easy and pleasant way.
14
For 25 years, intensive multifaceted research area has been emerged around the ubiquitous
computing concept (Bell and Dourish, 2007; Caceres and Friday, 2012) pushing the concept
gradually from a vision to reality. Although it cannot be claimed that the idea is fully realized
many of today’s innovations have greatly contributed to the reduction of temporal and spatial
limitations of computers, for example technologies as wireless and mobile services, sensor-
equipped products and devices, and smart pads and phones among others. This section discusses
the evolution and state of the art in the ubiquitous computing research as well as the
characteristics of the ubiquitous computing
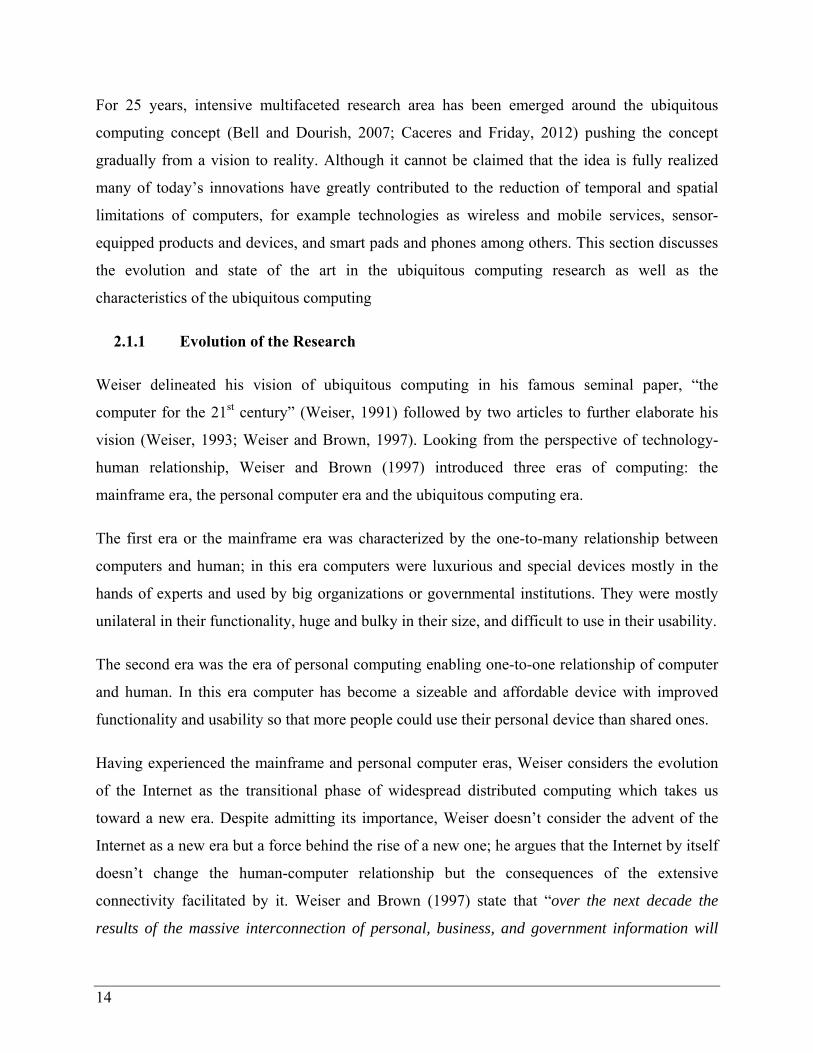
2.1.1 Evolution of the Research
Weiser delineated his vision of ubiquitous computing in his famous seminal paper, “the
computer for the 21st century” (Weiser, 1991) followed by two articles to further elaborate his
vision (Weiser, 1993; Weiser and Brown, 1997). Looking from the perspective of technology-
human relationship, Weiser and Brown (1997) introduced three eras of computing: the
mainframe era, the personal computer era and the ubiquitous computing era.
The first era or the mainframe era was characterized by the one-to-many relationship between
computers and human; in this era computers were luxurious and special devices mostly in the
hands of experts and used by big organizations or governmental institutions. They were mostly
unilateral in their functionality, huge and bulky in their size, and difficult to use in their usability.
The second era was the era of personal computing enabling one-to-one relationship of computer
and human. In this era computer has become a sizeable and affordable device with improved
functionality and usability so that more people could use their personal device than shared ones.
Having experienced the mainframe and personal computer eras, Weiser considers the evolution
of the Internet as the transitional phase of widespread distributed computing which takes us
toward a new era. Despite admitting its importance, Weiser doesn’t consider the advent of the
Internet as a new era but a force behind the rise of a new one; he argues that the Internet by itself
doesn’t change the human-computer relationship but the consequences of the extensive
connectivity facilitated by it. Weiser and Brown (1997) state that “over the next decade the
results of the massive interconnection of personal, business, and government information will

15
create a new field, a new medium, against which the next great relationship will emerge” (p. 2).
The third futuristic era of Weiser was entitled as the era of ubiquitous computing in which many
computers share each of us, the era of many-to-one relationship.
Categorizing the variations of human-computer relationships into three distinct eras, Weiser tried
to emphasize the emerging role of computers in our lives, putting the spotlight on user while
talking about the computer technologies. The vision has triggered a new way of thinking among
computer scientists which sets the user in the focus while computer vanishes into background. In
this regard, Weiser (1991) states that “the most profound technologies are those that disappear.
They weave themselves into the fabric of everyday life until they are indistinguishable from it”
(p. 94). As computers become the integrated part of user’s activities, users won’t be aware of
them, in other words users won’t perceive them as computers. Weiser (1991) compares this level
of integration with “writing” as the first information technology: “Not only books, magazines and
newspapers convey written information, but so do street signs, billboards, shop signs and even
graffiti. Candy wrappers are covered in writing. The constant background of “literacy
technology” does not require active attention” (p. 94). In the case of computers, this can be
realized in two ways, making them literally invisible for example by miniaturizing the computing
devices which could be embedded into the objects or making them invisible in metaphor by
integrating them into the user activities for example by offering natural interactions. The vision
could be considered the exact opposite point of the virtual reality. Contrary to virtual reality
which seeks to bring the physical world into the digital realm the ubiquitous computing is an idea
of the pervasive penetration of the virtual world into the physical one; virtual reality simulates
the real world, whereas ubiquitous computing enhances it (Weiser, 1991).
Weiser’s research group, at the Xerox Palo Alto, has created a laboratory scale realization of the
ubiquitous computing vision building two kinds of devices; large-scale stationary devices named
live boards which in combination with active badges, one could customize the displayed
information and small portable computing devices called tabs (inch-scale) and pads (foot-scale).
Based on his research, Weiser (1991) named three technological criteria for realization of the
ubiquitous computing vision as “cheap, low-power computers that include equally convenient
displays, software for ubiquitous applications, and a network that ties them all together” (p.
100).

16
In terms of service characteristics, the full-blown vision of ubiquitous computing encompasses
three main dimensions namely ubiquitous accessibility of information and services, a universal
connectivity of information which is a necessary condition of the ubiquitous accessibility, and an
unobtrusive and steady level of interactivity. Later, different terms were emerged around the
concept of ubiquitous computing through which researchers tried to underline the specific
characteristics of their technologies and researches. Pervasive computing, ambient intelligent,
and internet of things among others are the most common terms with somewhat different
interpretation of the original ubiquitous computing vision, putting the spotlight on one or the
other service characteristics of ubiquitous computing (see Table 1).
Seven years after the introduction of Weiser’s vision, Lohr and Markhoff (1998) from IBM, for
the first time, used the term pervasive computing envisioning the post-pc world where the
computers will leave the desktops and will be available everywhere. Later, Hansmann et al.
(2003) from IBM, Germany, used the term pervasive computing in line with the vision of
ubiquitous computing focusing more on the aspect of the “everywhere at anytime”. More
focused on the accessibility dimension, they introduced the IBM’s definition of pervasive
computing as “convenient access, through a new class of appliances, to relevant information
with the ability to easily take action on it when and where you need to” (Hansmann et al., 2003,
p. 11).
Simultaneously to IBM’s pervasive computing vision, Philips’ executive vice president, Pieper
(1998), introduced the term ambient intelligence in a series of presentations. The presentations
were targeted to the Philips’ own employees and brought about the vision of digital living room
equipped with various sensors which could intelligently response to speech or gesture of the
people. “Ambient intelligence refers to electronic environments that are sensitive and responsive
to the presence of people”(Aarts and Encarnacao, 2006); building on the vision of ubiquitous
computing, the focus of the term is more on the interactive aspect of ubiquitous computing.
More focused on the automated things to things connection and interaction, the term internet of
things has been used in 1999, for the first time by Kevin Ashton, co-founder of AutoID Labs, a
world-wide network of academic research laboratories in the field of networked RFID and
emerging sensing technologies (Caceres and Friday, 2012). However at its inception, the vision

17
was mostly focused on the RFID and barcode enabled items in the supply chain enabling an
improved item visibility for a greater business efficiency and accountability (Caceres and Friday,
2012); soon it has been picked up by the ubiquitous computing researchers for the similarity of
the concept and its potential applications in line with the realization of ubiquitous computing
vision. The paradigm of internet of things “continues on the path set by the concept of smart
environments and paves the way to the deployment of numerous applications with a significant
impact on many fields of future every-day life” (Giusto et al., 2010, p. v). Table 1 summarizes the
above mentioned terms around the vision of ubiquitous computing along with their most
common definitions. In addition, the highlighted dimensions of ubiquitous computing addressed
by each definition are listed.
Table 1: Different terms around the concept of ubiquitous computing and their highlighted aspects
Term Highlighted dimension/s
Definitions
Ubiquitous computing
Connectivity
Accessibility
Interactivity
Machines that fit the human environment, instead of forcing humans to enter theirs (Weiser, 1991, p. 104).
Computers embedded in our natural movements and interactions with our environment, both physical and social (Lyytinen and Yoo, 2002, p. 63).
A highly embedded technology that obtains and processes information from the environment. It can adapt to various situations and configure its services autonomously in order to assist and enhance interactions between humans and the real world. To this end ubiquitous computing even uses implicit input to reduce the level of interventions. Summarizing, ubiquitous computing is the cooperation of IT-artifacts in the environment to support the user with customized services on demand, while the interaction of the user with IT-artifact (Hoffmann et al., 2011, p. 5).
Countless very small, wirelessly intercommunicating microprocessors, which can be more or less invisibly embedded into objects. Equipped with sensors, these computers can record the environment of the object in which they are embedded and provide it with information processing and communication capabilities (Friedewald and Raabe, 2011, p. 55).
Pervasive computing
Accessibility convenient access, through a new class of appliances, to relevant information with the ability to easily take action on it when and where you need to (Hansmann et al., 2003, p. 11).
Interconnected technological artifacts diffused in their surrounding environment, which work together to sense, process, store and communicate information to ubiquitously and unobtrusively support their users’ objectives and tasks in a context-aware manner.(Kourouthanasis and Giaglis, 2008, p. 14)
Ubiquitous connected computing devices in the environment which are very tiny, even invisible, either mobile or embedded in almost any type of object (Singh, 2010, p. 1).

18
Ambient intelligence
Interactivity
Proactively
Ambient intelligence deals with a new world of ubiquitous computing devices, where physical environments interact intelligently and unobtrusively with people. These environments should be aware of people's needs, customizing requirements and forecasting behaviors (Ramos et al., 2008, in the abstract)
Internet of things
Connectivity
Object-to-object interaction (communicating things)
The pervasive presence around us of a variety of “things” and “objects”, such as RFID, sensors, actuators, mobile phones, which, through unique addressing schemes, are able to interact with each other and cooperate with their neighboring “smart” components to reach common goals (Giusto et al., 2010, p. v).
As any other technology-based vision, the most basic building block of the realization of the
vision of ubiquitous computing is the technological feasibility. From the technological point of
view, ubiquitous technology is not a single independent technology or a discrete field of
technology (Sen, 2012) but it encompasses a wide range of technological areas and devices (Bell
and Dourish, 2007; Friedewald and Raabe, 2011; Saha and Mukherjee, 2003).
Since the introduction of the ubiquitous computing vision the technological landscape has
changed thoroughly. Today, indeed computer devices have left the desktops. In industrialized
countries, the Internet as a powerful and overarching network has become part of the vital
infrastructures. The commercial versions of Internet-enabled taps and pads in the form of smart
phones and tablets are now available for more than 10 years. Considerable advances in hardware
developments, localization systems and mobile communication technologies all have advanced
the ubiquitous computing vision toward the technological feasibility. In general, enabling
technologies of ubiquitous computing can be divided into three broad areas namely devices,
networking, and middleware (Saha and Mukherjee, 2003). Table 2 presents a list of enabling
technologies for ubiquitous computing which their advances in recent years have particularly
been the core driving force of its realization (Friedewald and Raabe, 2011).
Table 2: Enabling technologies for the vision of ubiquitous computing
Enabling technologies Their share in realization of the vision of ubiquitous computing
Devices
Atomic light, temperature, motion, and voice sensor network
Atomic components which link the real world with the digital world (Atzori et al., 2010). They could automatically capture the context information and trigger an intelligent action by sending the information

19
to the other devices in the network; enabling context awareness and autonomy (Sen, 2012).
Localization systems as global positioning system (GPS) based sensors
Automatically capture spatial information of the user and/or device and trigger an intelligent action by sending the information to the other devices in the network.
Radio frequency identification (RFID) Automatically revealing the identity of the given object, RFID is one of the most common underlying technology for the current ubiquitous computing solutions (Friedewald and Raabe, 2011). Integrated into a network, enables the association of unlimited amount of information to the objects and/or persons.
Micro-electronics (enabled by semi-conducting polymers)
Embedding the computing elements in objects (Alcañiz and Rey, 2005; Chalasani and Conrad, 2008)
Networking
Mobile communication technologies such as universal mobile telecommunications systems (UMTS), near field communication (NFC), ultra-wide band technology (UWB)
Data exchange between communication infrastructure, end devices, and terminal devices (Lagasse and Moerman, 2006).
Middleware
Interactive user interfaces Precise knowledge of context enabling personalized responses (Wasinger and Wahlster, 2006)e.g. enabling physical interaction and/or external and internal automatic context sensing e.g. sensing the location (external) and emotional states or intended actions(internal) (Friedewald and Raabe, 2011)
In an article titled “20 years past Weiser: what’s next?”, Ferscha (2012) traces the evolutionary
path of the past research around ubiquitous computing in an attempt to outline the future research
directions. Considering three components of ubiquitous systems namely hardware (devices and
networking), middleware (interactive user interfaces) and applications (services), he identifies
three generations of research themes namely connectedness, awareness, and smartness.
The first generation of the research starting from late 90s to early 2000s was mostly a response to
“some computer science issues in ubiquitous computing” which Weiser (1993) himself published
in a paper under the same title. The paper discusses the most fundamental technologies of its
time to leverage the first applications of ubiquitous computing; here, the issue of connectivity
plays a central role. The research in this phase picked up the pace by the advances in networking
technologies as the gate packing, new wireless communication standards and most importantly
the rapidly growing Internet (Ferscha, 2012). Network technology advances added to the
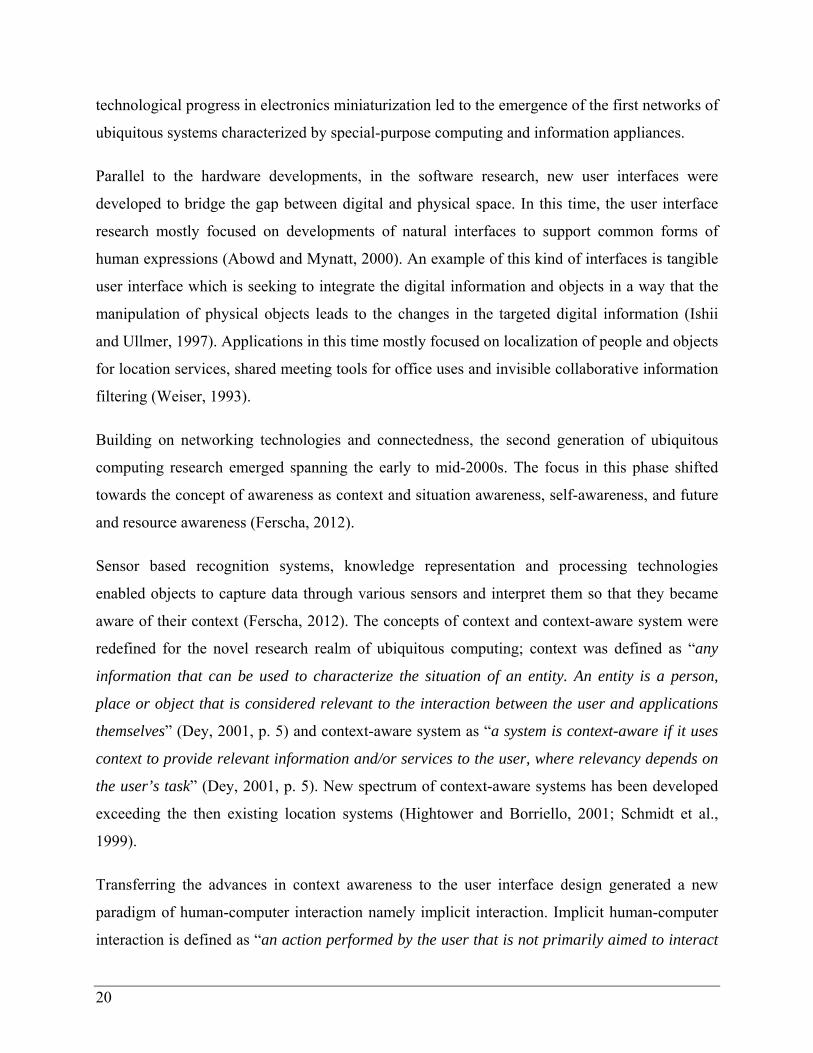
20
technological progress in electronics miniaturization led to the emergence of the first networks of
ubiquitous systems characterized by special-purpose computing and information appliances.
Parallel to the hardware developments, in the software research, new user interfaces were
developed to bridge the gap between digital and physical space. In this time, the user interface
research mostly focused on developments of natural interfaces to support common forms of
human expressions (Abowd and Mynatt, 2000). An example of this kind of interfaces is tangible
user interface which is seeking to integrate the digital information and objects in a way that the
manipulation of physical objects leads to the changes in the targeted digital information (Ishii
and Ullmer, 1997). Applications in this time mostly focused on localization of people and objects
for location services, shared meeting tools for office uses and invisible collaborative information
filtering (Weiser, 1993).
Building on networking technologies and connectedness, the second generation of ubiquitous
computing research emerged spanning the early to mid-2000s. The focus in this phase shifted
towards the concept of awareness as context and situation awareness, self-awareness, and future
and resource awareness (Ferscha, 2012).
Sensor based recognition systems, knowledge representation and processing technologies
enabled objects to capture data through various sensors and interpret them so that they became
aware of their context (Ferscha, 2012). The concepts of context and context-aware system were
redefined for the novel research realm of ubiquitous computing; context was defined as “any
information that can be used to characterize the situation of an entity. An entity is a person,
place or object that is considered relevant to the interaction between the user and applications
themselves” (Dey, 2001, p. 5) and context-aware system as “a system is context-aware if it uses
context to provide relevant information and/or services to the user, where relevancy depends on
the user’s task” (Dey, 2001, p. 5). New spectrum of context-aware systems has been developed
exceeding the then existing location systems (Hightower and Borriello, 2001; Schmidt et al.,
1999).
Transferring the advances in context awareness to the user interface design generated a new
paradigm of human-computer interaction namely implicit interaction. Implicit human-computer
interaction is defined as “an action performed by the user that is not primarily aimed to interact

21
with a computerized system but which such a system understands as input” (Schmidt, 2000, p.
192). In other words, such a system is capable of capturing the user’s interaction with the
environment to evaluate the situation (Schmidt, 2002). Consequently, the system is able to
synthesis the explicit input from the user with the automatically captured context-based
information (implicit input) to offer a context-specific service to the user’s request. Such
interfaces are very important for the realization of the notion of ubiquitous computing as they
reduce the interference of the computing system in user activities (Abowd and Mynatt, 2000) and
consequently push the computer device into the background.
Furthermore, in this time, a new understanding of the concept of invisibility in ubiquitous
computing has been introduced; Satyanarayanan (2001) called the Weiser’s vision of complete
invisibility an ideal and far from practice. He then offered an allegedly practical interpretation of
invisibility as “minimal user distraction” arguing that “if a pervasive computing environment
continuously meets user expectations and rarely presents him with surprises; it allows him to
interact almost at a subconscious level” (p.2)
From the application point of view, the advances on wireless technologies and protocols as well
as sensor technologies offered a huge potential on automatic and remote monitoring, analysis,
and execution, promising for various application areas for example industrial applications
(machine monitoring, pervasive maintenance), health applications (patient monitoring), and
home applications (water monitoring, temperature and light monitoring) (Akyildiz and Vuran,
2010; Lewis, 2004) among others.
The third wave of ubiquitous computing research has been started in the mid-2000s. Having the
foundation of connectedness and awareness, in third generation of the ubiquitous computing
research, the attention has turned towards the semantics of systems, services, and interactions to
lift the situations and actions into a novel level of sense (Ferscha, 2012), that is smartness. Here
research has focused on highly complex cooperative and coordinated ensemble of digital artifacts
capable of autonomous and spontaneous configuration toward a complex system (Ferscha,
2012). Supplementing the context and situation awareness with semantics enables a system to
take smart decision and evolve itself by adapting to the environment. Such systems “are able to
respond in a rational way in many different situations choosing the actions with the best

22
expected result, so making environment not just more connected and efficient, but smarter”
(Amato et al., 2012, p. 412). Ferscha (2012) postulates that the connection of a huge number of
diverse ensembles of digital artifacts embrace the future generation of ubiquitous computing.
Taking the current level of technology penetration into the fabric of our everyday life as
evidence with billions of personal computer nodes and Internet-enabled smart phones, Ferscha
(2012) argues that we have already arrived to the point of large-scale, complex, technology-rich
societal setting.
Tracing the trajectory of past research around the ubiquitous computing vision, it becomes
evident that the previous research mostly was focused on technological developments as well as
the feasibility of potential applications and services. To make the future research agenda book,
Ferscha (2012) created a web contribution portal to collect the future research challenges. The
portal could collect 100 research challenges from the invited experts in the field. Nine chapters
have been evolved from the collected challenges for the research agenda book (see Figure 3).
Among them, chapter seven is especially relevant for the motivation of this dissertation as it is
dedicated to human-centric adoption. In their paper, reviewing progress, opportunities, and
challenges of ubiquitous computing, Caceres and Friday (2012) address this issue emphasizing
that the main challenges of the implementation of ubiquitous computing applications today are
economic rather than technical; to foster the way of research and development projects into the
market, the future research should focus on the user and who and why of using ubiquitous
computing-based applications and services. To bring the vision of ubiquitous computing closer
to realization, in addition to technological research, substantial investigation into the human
behavior is needed (Aarts and Encarnacao, 2006). Figure 3 summarizes the evolution of research
around ubiquitous computing as well as future research challenges.
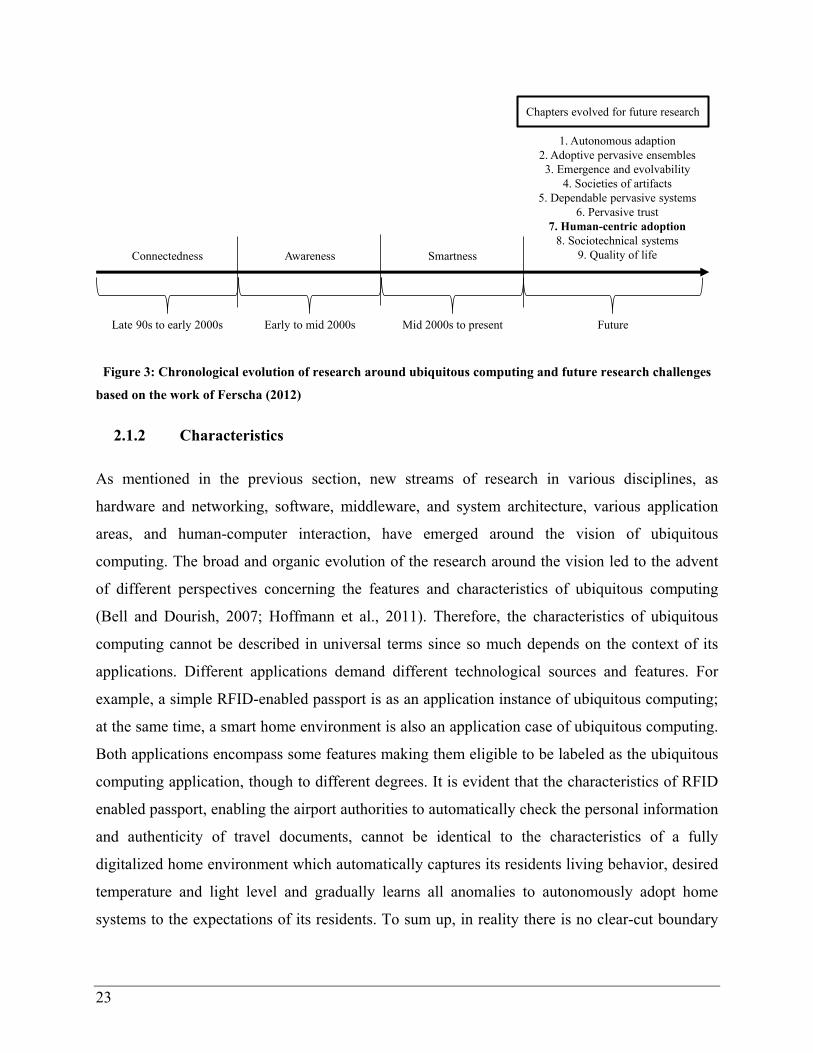
23
Figure 3: Chronological evolution of research around ubiquitous computing and future research challenges
based on the work of Ferscha (2012)
2.1.2 Characteristics
As mentioned in the previous section, new streams of research in various disciplines, as
hardware and networking, software, middleware, and system architecture, various application
areas, and human-computer interaction, have emerged around the vision of ubiquitous
computing. The broad and organic evolution of the research around the vision led to the advent
of different perspectives concerning the features and characteristics of ubiquitous computing
(Bell and Dourish, 2007; Hoffmann et al., 2011). Therefore, the characteristics of ubiquitous
computing cannot be described in universal terms since so much depends on the context of its
applications. Different applications demand different technological sources and features. For
example, a simple RFID-enabled passport is as an application instance of ubiquitous computing;
at the same time, a smart home environment is also an application case of ubiquitous computing.
Both applications encompass some features making them eligible to be labeled as the ubiquitous
computing application, though to different degrees. It is evident that the characteristics of RFID
enabled passport, enabling the airport authorities to automatically check the personal information
and authenticity of travel documents, cannot be identical to the characteristics of a fully
digitalized home environment which automatically captures its residents living behavior, desired
temperature and light level and gradually learns all anomalies to autonomously adopt home
systems to the expectations of its residents. To sum up, in reality there is no clear-cut boundary
Late 90s to early 2000s Early to mid 2000s Mid 2000s to present Future
Connectedness Awareness Smartness
1. Autonomous adaption2. Adoptive pervasive ensembles3. Emergence and evolvability
4. Societies of artifacts5. Dependable pervasive systems
6. Pervasive trust7. Human-centric adoption
8. Sociotechnical systems9. Quality of life
Chapters evolved for future research

24
between a ubiquitous system and a non-ubiquitous one; rather there exists a degree to which a
system encompasses a set of characteristics of ubiquitous computing or none.
Based on the Weiser’s description of the concept, in terms of service characteristics, an ideal
instance of ubiquitous computing encompasses ubiquitous accessibility, universal connectivity,
and unobtrusive interactivity. However, each of these characteristics can move along opposite
ends of a continuum. Accessibility of information and services moves along a continuum with
the “traditional desktop” and “everywhere at any time” standing on its opposite ends.
Interactivity moves along a continuum with two ends of “desktop bound” and “constant
companion”, and connectivity moves along a “sole device and information” and “every object
and user” continuum.
To put all these dimensions in a single platform, a three-dimensional-continuum concept of
ubiquitous computing service characteristics is introduced in Figure 4; these dimensions jointly
measure the ubiquitous computing capabilities of a technology application, however as
mentioned above, a ubiquitous computing application might encompass features from only one
or two dimensions.
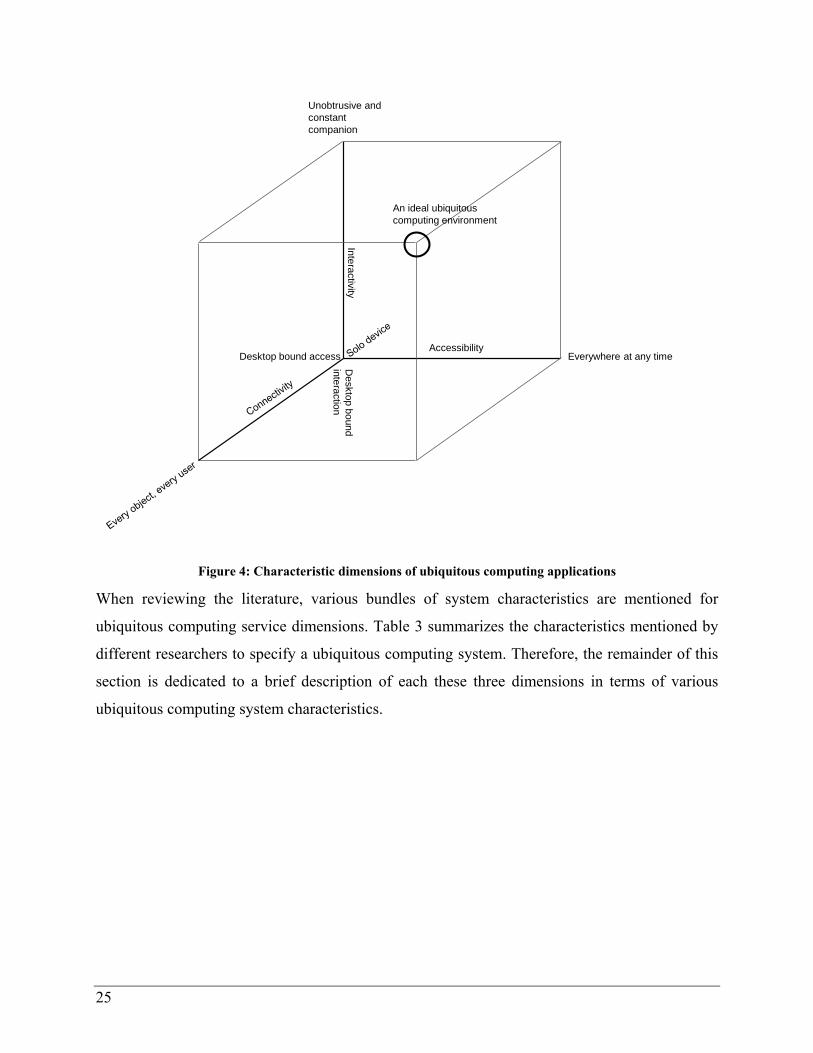
25
Figure 4: Characteristic dimensions of ubiquitous computing applications
When reviewing the literature, various bundles of system characteristics are mentioned for
ubiquitous computing service dimensions. Table 3 summarizes the characteristics mentioned by
different researchers to specify a ubiquitous computing system. Therefore, the remainder of this
section is dedicated to a brief description of each these three dimensions in terms of various
ubiquitous computing system characteristics.
Desktop bound access Everywhere at any time Accessibility
Interactivity D
esktop bound interaction
Unobtrusive and constant companion
An ideal ubiquitous computing environment

26
Table 3: Characteristics of ubiquitous computing systems
Source C
onne
ctiv
ity
Accessibility Interactivity
Sys
tem
ava
ilabi
lity
Dev
ice
mob
ility
Use
r m
obili
ty
App
licat
ion
mob
ility
Con
text
aw
aren
ess
Impl
icit
inte
ract
ion
Ado
ptio
n/
Aut
onom
y
Embedded-ness
Nat
ural
inte
ract
ion
Sim
plic
ity
Phy
sica
l
Cog
nitiv
e
(Aarts and Encarnacao, 2006) - - - - -
(Abowd, 1999) - - - - - - -
(Abowd and Mynatt, 2000) - - - - -
(Banavar and Bernstein, 2002) - - - - - -
(Bell and Dourish, 2007) - - - - - - - -
(Friedewald and Raabe, 2011) - - - - - -
(Gabriel et al., 2006) - - - - - -
(Kim et al., 2009) - - - - - -
(Kourouthanassis et al., 2008) - -
(Kurkovsky, 2005) - - - - - -
(Satyanarayanan, 2001) - - - - - -
(Schmidt, 2002) - - - - - - - -
(Sen, 2012) - - - - - -
(Spínola and Travassos, 2012) - - - - - -
Connectivity
The connectedness is a primary milestone towards achieving the ubiquitous computing vision
(Figure 3). The connectivity is in fact the most mentioned characteristic of ubiquitous computing
in the literature thus illuminating its importance (see Table 3). It is the necessary but not
sufficient condition for the accessibility and interactivity. That is the higher the level of the
connectivity between devices and information the more accessible and interactive applications

27
can be designed. Communication technologies, in particular wireless technologies enable a
seamless interaction and information access without a tangible connection step (Want et al.,
2002). It is the importance of the connectivity aspect which Weiser and Brown (1997) consider
the evolution of communication technologies, specifically the Internet as the transitional phase of
the widespread distributed computing which takes us toward a new era of ubiquitous computing.
Accessibility
The central idea of ubiquitous computing also apparent in its name is the ubiquity and
pervasiveness of its applications and services. Here, the goal is to go beyond the spatial and/or
temporal boundaries of the traditional computing and ideally make computing applications
accessible anywhere at anytime. As a consequence, a user is not required to go to a certain place
to access a given computing service but the service would be accessible independent from the
user’s location. Accessibility in this context refers to the ability of a system to allow its users a
permanent access to information sources regardless of their location, albeit within the borders of
the system. The level of the accessibility accordingly is the degree to which a system can fulfill
the unbroken access. The omnipresence of ubiquitous applications can be realized by either the
physical mobility (user and device mobility) or the logical mobility (application mobility) (see
Table 3).
The user mobility refers to the capability of a system to provide the user with services while she
moves within the system boundaries. Referred to as the local mobility, the first applications of its
kind was discussed in the organizational setting enabling employees to use computing services
while moving from office to office within a vicinity (Luff and Heath, 1998; Perry et al., 2001).
The current technological development in small-size sensors and microelectronics enables the
integration of computing elements in everyday objects (Alcañiz and Rey, 2005; Chalasani and
Conrad, 2008) leading to the rise of smart environments. While a user moves in such smart
environments, she can use the computing services. The device mobility, on the other side,
enables users accompanied by a mobile device to access computing services while moving from
one location to another (Banavar and Bernstein, 2002). Indeed the mobile technology is
addressed as the key enabling technology in ubiquitous computing (Friedewald and Raabe,
2011). Furthermore, making applications and information move between different devices while

28
tracking the user, referred to as the application mobility (Yu et al., 2013). The application
mobility is another way to offer a pervasive access to information sources (Banavar and
Bernstein, 2002). da Costa et al. (2008) refer to it as the logical mobility contrasting to the
physical (user and device) mobility. For example the cloud computing technology is one of the
technologies enabling its users to access their information content in other devices regardless of
where they have stored and worked on in the first place (Yu et al., 2013). Caceres and Friday
(2012) reviewing the progress, opportunities and challenges of ubiquitous computing in its 20th
anniversary, spot the cloud computing progress as an opportunity to leverage the ubiquitous
computing infrastructure.
While the notion of the mobility mostly encompasses the spatial aspect (everywhere) of the
accessibility, the accessibility of a system beyond the temporal boundaries (anytime), often
referred to as the system availability, is another important feature of ubiquitous computing
applications.
Interactivity
An important component of Weiser’s (1991) vision is making computing “an integral, invisible
part of people’s lives” (p. 94). Invisibility in this context refers to an ideal level integration of a
system into the user’s environment or activity resulting in an absolute attention-free interaction
of the user and the system. In other words, while interacting with a technology device to perform
a task, the user can fully concentrate on his primary activities and goals.
Human attention resources are limited; we are not capable of collecting and processing all
existing inputs in our surrounding environment. To function, the human attention filters out the
surrounding information, selecting some and ignoring others (Sanders, 1998). Thus, by
considering the everywhere anytime accessibility of computing artifacts, a new problem arises;
Garlan et al. (2002) address this problem by emphasizing that while computing systems
increasingly become accessible, the bottleneck in computing shifts from technological aspects to
the limited resource of human attention. In the case of ubiquitous computing, envisioning
integration of the computing in everyday life, the issue of the attention becomes even more
important, as users are supposed to interact with a computing artifact while they are preoccupied
with some other real-world interactions as walking, talking, shopping or driving (Garlan et al.,

29
2002; Scholtz and Consolvo, 2004). Therefore, the everywhere anytime accessibility dimension
of ubiquitous computing should be complemented by an unobtrusive level of interaction to
realize the notion of ubiquitous computing. In this context, interactivity refers to the ability of a
system to offer an unobtrusive interaction, demanding no attention from the user. The level of
the interactivity accordingly is the extent to which a system is capable of a distraction-free
interaction with its users.
As shown in Table 3, regarding the interactivity dimension of ubiquitous computing, six
characteristics are mentioned in the literature, each of which, alone or in combination with
others, contribute to the realization of a degree of distraction-free interaction of the user and the
computing artifact.
The context awareness is a feature mentioned by many authors as an enabler for a higher level of
interactivity. A context aware ubiquitous artifact can capture the contextual information from the
surroundings (Abowd, 1999) and accordingly personalize its services to the needs of its user
(Aarts and Encarnacao, 2006; Abowd, 1999; Dey, 2001). Related to the feature of the context
awareness is the notion of the implicit interaction. The implicit interaction is the ability of a
system interface to monitor the user’s interaction with the environment even when she is not
directly interacting with the system (Schmidt, 2000). Consequently, the system is able to
synthesize the explicit input from the user with the automatically captured context-based
information (implicit input) to offer a context-specific service to the user’s request. Such
interfaces reduce the interference of the computing system in user activities (Abowd and Mynatt,
2000). For example, consider a mobile product recommender system for an in-store shopping
situation which can automatically capture the users’ positions (context data); by analyzing the
position data, the system can implicitly capture the user’s preferences (implicit input) and
consider them while making product recommendations (Fang et al., 2012). Features of the
adoption and autonomy are the consequences of further development of context aware systems.
Enhancing the context awareness with semantics enables a system to take a smart decision and
evolve itself by adapting to the environment (Amato et al., 2012), and when needed even act on
behalf of the user (Aarts and Encarnacao, 2006). All these features aim to free the user from
constant instructing a system to support her given task (Rekimoto and Nagao, 1995) and
consequently offer a high level of interactivity.
30
Another important feature related to the interactivity dimension is the embeddedness. The notion
of the invisibility in the Weiser’s ubiquitous computing vision can be literally realized through
embedding the computing devices into the physical world. Often prerequisite for the context
awareness, embedding computing artifacts in the user’s environment, device, and clothing and
even in her body leads to disappearance of the computing technology from the user’s sight and
thus consciousness, hence demanding no attention from the user.
However, as mentioned in the previous section, the invisibility is not just a matter of the
embedment of computing artifacts in the environment; it is also about how the user perceives the
computer; referred to as the cognitive embeddedness and invisibility, this feature is based on the
idea that if a user accepts a computing artifact as a natural part of her life, it disappears from her
consciousness. Conceptually overlapping with the feature of the cognitive invisibility are
features of the natural interaction and simplicity. The concept of the simplicity or ease of use is
nothing new in the field of human-computer interaction; designing information artifacts in a way
that they perfectly fit to the user requirements and underlying task makes them part of the task
(Norman, 1999). Natural interaction interfaces as well as the implicit input contribute to the
general simplicity of a system (Hoffmann et al., 2011).
The simpler the use of a technology, the faster it passes the surface of awareness; so novel
technologies such as ubiquitous computing technologies “should contribute to the development
of easy to use and simple to experience products” (Aarts and Encarnacao, 2006, p. 1).
2.2 Applications in Brick and Mortar Retail
In the business context, the potential of ubiquitous computing in value creation for example by
the process and product improvement as well as new service development (Fleisch and
Tellkamp, 2006; Gershman and Fano, 2006) has triggered the rise of plethora of applications. A
discussion of all possible application areas is beyond the scope of this work, interested readers
can find reviews of these applications in the literature (e.g. Friedewald and Raabe, 2011; Gabriel
et al., 2006). This section offers an overview of the research in academia as well as industry on
applications which, based on the characteristics of ubiquitous computing discussed in the
previous section, can be classified as instances of ubiquitous computing technologies in brick
and mortar retail.

31
Internet-induced changes in the customer behavior along with recent technology advances to
enhance retailing operational processes and customers’ shopping activities and the increasing
willingness of customers to use new technology based services drive the retailing sector to be
more innovative for the sake of sustaining and growing profitability (Y.-T. H. Chiu et al., 2010;
Pantano and Viassone, 2013).
Initially, retailers focused on harnessing the advantages of ubiquitous computing in terms of
support-related technologies (Hristov et al., 2015), for example in logistics and supply chain
practices. Less visible for customers (Hristov et al., 2015), these technologies can boost the
efficiency of retail offer delivery by enabling a greater control over the purchase orders,
inventory, and product related information (Bennett and Savani, 2011; Garrido Azevedo and
Carvalho, 2012; López et al., 2011).
However, in recent years, there has been a growing interest on ubiquitous computing-based
customer-related innovations; such innovations are visible for customers and their key impact on
the brand positioning, growth and differentiation have already been proven (Hristov et al., 2015).
As a consequence, during the last decade, a growing body of research has been raised around the
development of customer oriented in-store ubiquitous computing systems (Bodhani, 2012;
Pantano and Di Pietro, 2012; Pantano and Viassone, 2013).
By deployment of ubiquitous technologies in retail, various innovative in-store applications came
into being, enabling retailers to offer their customers personalized services in an accurate and
prompt manner (Kourouthanassis and Giaglis, 2005); applications and services which make it
possible for retailers to transfer the advantages of the online world to the physical world (Pous et
al., 2013). Imagine a scenario where a customer enters a store to buy a pair of trousers. Here the
customer’s options to gather information are limited to the product labels and salespersons
assistance. None of these choices are similar to what the customer experiences in the online
world with regard to the obtaining customized, interactive, and automatic information,
recommendations, and comparison options.
Ubiquitous computing-based in-store applications make it possible to offer the customer an
automatic and personalized shopping assistance, tailored to her preferences e.g. support the store
navigation and show the way through the store, advise and give recommendation for a certain

32
product and/or relevant ones (cross-selling), compare the products in the store, spot the special
offers, and give additional information about the products. Technologies such as information
kiosks (Zielke et al., 2011), interactive displays, mobile shopping assistances (Resatsch et al.,
2008; van der Heijden, 2006), and smart mirrors offer customers all in-store and sometimes
complementary information in a similar way as the Internet does. To sum up, such technologies
can “influence the course of searching for, choosing, and comparing products, as well as
interacting with products and providing marketers new tools to understand consumer
preferences and needs” (Pantano and Naccarato, 2010, p. 202), comparable to the online world
(see Table 4).
Before the advent and widespread adoption of smart mobile devices, the realization of ubiquitous
computing services in brick and mortar retail could be only approached in two ways, “to provide
the user with mobile devices” (device mobility) or “to distribute different devices in the
environment” (user mobility) (Alcañiz and Rey, 2005, p. 7). However, recently Pantano and
Viassone (2014), considering the prevalent use of smartphones, categorize in-store ubiquitous
computing technologies into three main groups namely, touch screen displays/ store-owned
totems, hybrid systems consisting of store-owned portable devices, and systems for consumers’
own mobile devices.
As the core topic of current dissertation revolves around the user acceptance, the device
ownership is an important aspect to consider while categorizing the in-store technologies.
Technology device ownership is believed to increase the acceptance likelihood of new
applications based on the already owned device (Niehaves et al., 2012; Tretiakov and Kinshuk,
2005). In general, users feel more confident using their own devices while being engaged in a
new context as obtained experience and skills from the previous usage can be easily utilized in
the new context (Prete et al., 2011). Considering this aspect is especially important for retailers
as the level of investment on store-based systems is significantly higher than mobile applications.
Therefore, in this dissertation the current in-store systems are classified in two distinct categories
namely store-based systems (store owned devices) and software applications offered on the
customers own potable smart devices.

33
Systems included in the first category are technologies which are owned by and are part of the
store (Melià-Seguí et al., 2013; Pantano, 2010b; Pantano and Naccarato, 2010); current examples
are multimedia information desks, interactive displays, smart fitting rooms, smart mirrors and
smart trolleys.
The second category includes applications for consumers’ own mobile devices (Gao et al., 2010;
Kowatsch et al., 2011; Kowatsch and Maass, 2010). The recent technological advancement in
mobile phone and networking technologies along with the exponential growth of the number of
mobile phone users has opened a new avenues to the value creation for retailers (Yang, 2010). In
fact mobile computing is a subset of ubiquitous computing (Saha and Mukherjee, 2003). Yang
(2010) addresses the potential of mobile-based services in the store as “personal shopping
assistance for customers on move” (p. 262) which can revolutionize customer experiences in
traditional brick and mortar stores by
creating a real-time interaction between a retailer and a consumer;
assisting a consumer in making smart purchasing decisions by providing customized
product/service information; and
delivering non-intrusive mobile marketing to consumer that is based on consumer
preferences and priorities.
Applications such as localization apps and product information search and recommendation apps
tend to use consumers’ personal mobile devices as the main interface; for example, Välkkynen et
al. (2011) introduce a mobile application called mobile augmented reality for presenting product
information to the customers. The system allows customers to see the three-dimensional model
of product contents as well as additional product related information on their mobile phones
without opening of the package. Similar applications named as Shelf Torchlight (Löchtefeld et
al., 2010) and mobile product magnifier are introduced by Innovation Retail Laboratory, an
application-related research lab, a cooperation project of the German Research Center for
Artificial Intelligence (DFKI), the retailer GLOBUS, and Saarland University.

34
Table 4 lists the main service features of ubiquitous computing-based in-store applications (both
store-based and mobile-based) along with the web-based retailing service characteristics in order
to highlight the similarity of the offered services.
Table 4: Comparison among ubiquitous computing-based in-store systems and web-based retail adapted
from (Pantano, 2013)
Ubiquitous computing-based store systems
Ubiquitous computing-based mobile systems
Web based retailing
Facilities Fast response
System flexibility
Entertainment
System available in the point of sale
Context awareness
Reactive to consumers’ interaction
Consumers‘ usage choice
Fast response
System flexibility
Entertainment
System based on consumer’s own smart phone
Context awareness
Consumers‘ usage choice
Fast response
System flexibility
Entertainment
System available online
Context awareness
Compulsory the use of a computer
Product information search assistance
Product variety
Detailed and customized product information
Product comparison among available items
Product variety
Detailed and customized product information
Product comparison among available items
Product variety
Detailed and customized product information
Product comparison among products available through the network
Product selection assistance
Virtual assistance
Real salesperson assistance (physical support)
Several payment modalities
Assistance through network (also online assistance possible through network connection)
Real salesperson assistance (physical support)
Several payment modalities
Online assistance (through network connection)
No real salesperson assistance
Limited payment modalities
Space Fixed
Navigational efficiency
Possible location indicator
Open navigational efficiency
Location indicator
Virtual navigational efficiency
No locator indicator
Time Opening hours Opening hours Always open
Further improvements Retailers investment in both hardware and software
Retailers investments mainly in software
Retailers investments mainly in software
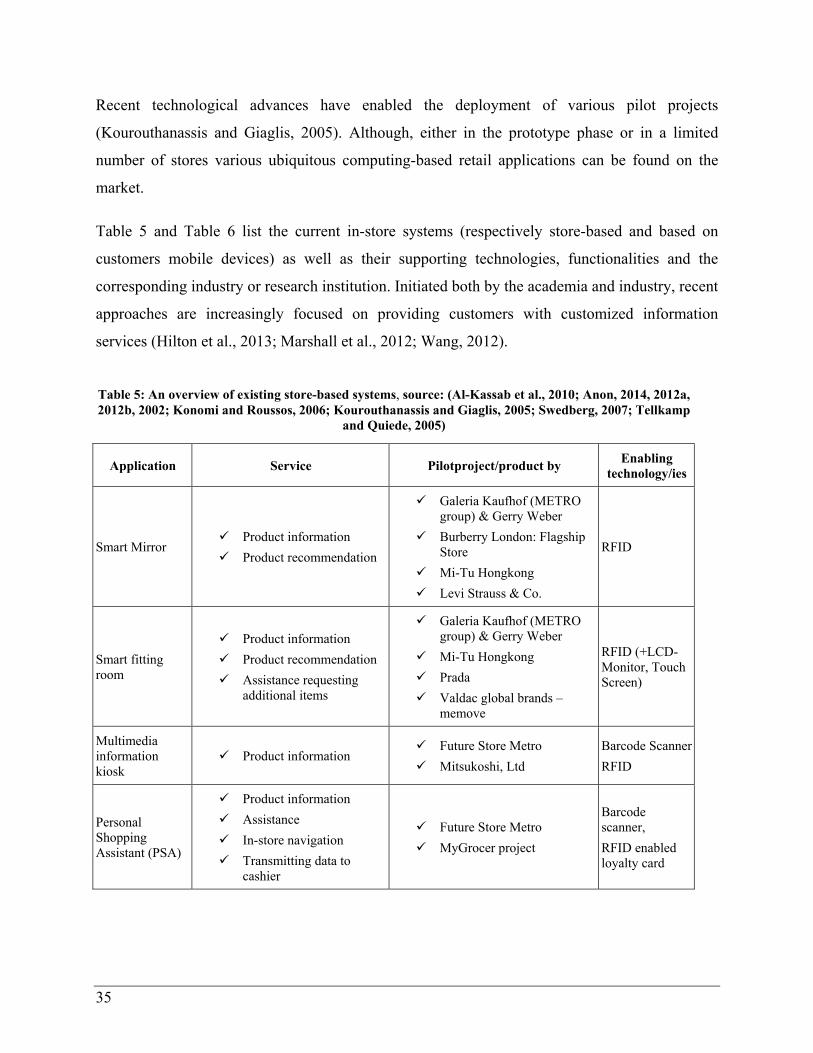
35
Recent technological advances have enabled the deployment of various pilot projects
(Kourouthanassis and Giaglis, 2005). Although, either in the prototype phase or in a limited
number of stores various ubiquitous computing-based retail applications can be found on the
market.
Table 5 and Table 6 list the current in-store systems (respectively store-based and based on
customers mobile devices) as well as their supporting technologies, functionalities and the
corresponding industry or research institution. Initiated both by the academia and industry, recent
approaches are increasingly focused on providing customers with customized information
services (Hilton et al., 2013; Marshall et al., 2012; Wang, 2012).
Table 5: An overview of existing store-based systems, source: (Al-Kassab et al., 2010; Anon, 2014, 2012a, 2012b, 2002; Konomi and Roussos, 2006; Kourouthanassis and Giaglis, 2005; Swedberg, 2007; Tellkamp
and Quiede, 2005)
Application Service Pilotproject/product by Enabling
technology/ies
Smart Mirror Product information
Product recommendation
Galeria Kaufhof (METRO group) & Gerry Weber
Burberry London: Flagship Store
Mi-Tu Hongkong
Levi Strauss & Co.
RFID
Smart fitting room
Product information
Product recommendation
Assistance requesting additional items
Galeria Kaufhof (METRO group) & Gerry Weber
Mi-Tu Hongkong
Prada
Valdac global brands – memove
RFID (+LCD-Monitor, Touch Screen)
Multimedia information kiosk
Product information Future Store Metro
Mitsukoshi, Ltd
Barcode Scanner
RFID
Personal Shopping Assistant (PSA)
Product information
Assistance
In-store navigation
Transmitting data to cashier
Future Store Metro
MyGrocer project
Barcode scanner,
RFID enabled loyalty card

36
Smart checkout
Self-checkout
Faster checkout
Checkout with PDA (sales persons have PDAs with customer purchase history)
Valdac global brands – memove
I.T.S. international
Burberry London
Future Store Metro
RFID
Smart shelves Product information
Mitsukoshi, Ltd
Galeria Kaufhof (METRO group) in collaboration with Gerry Weber
RFID
Loyalty card Payback loyalty card
Saves purchasing history, alert to sales desk
Future Store Metro
Mi-Tu RFID
Table 6: An overview of mobile applications,, source: online research among others on iTunes, Google Play, and individual websites
Application Services Pilot project/product by Enabling technologies
Mobile Apps Store Finder
Store Map
Special/insider-only offers and deals
Product information
Inventory and price check
Product recommendation
Event calendar
Connection to social networks
Gift registry
Paying via customer account
Macy‘s
Walmart
American Apparel
Benetton
Tchibo
Gap Inc Stores: GAP, Banana Republic, Piperlime, Old Navy, Athleta
H&M
Sport Scheck
Douglas
Metro and Pickbe
Neiman Marcus
Barcode Scanner
QR Code Scanner
RFID
Mobile Internet
GPS
Beacons

37
3 Theoretical Framework
One of the fundamental objectives of the current dissertation is the development of a
theoretically found model enabling to understand, explain, and predict the individuals’ behavior
regarding the acceptance and use of in-store ubiquitous computing-based information services.
The first step in building a theoretically found model is drawing a theoretical framework, a
system of theory/theories along with their assumptions and expectation which functions as a lens
with which a researcher observes the research questions. Eisenhart (1991) defines the theoretical
framework as “a structure that guides research by relying on a formal theory; that is, the
framework is constructed by using an established, coherent explanation of certain phenomena
and relationships” (P. 205). In line with constructing the theoretical framework of this
dissertation, the current chapter is dedicated to introduction and discussion of the theoretical
basis required to explain the acceptance of in-store ubiquitous computing-based information
systems.
The theoretical framework of this research incorporates two different set of theories. For clarity,
in this chapter, these theories are treated independently. First, regarding the technology
acceptance research, relevant concepts and models are discussed. In order to do so, different
approaches in the information system acceptance research are reviewed and the approach taken
by this dissertation is highlighted. Following, considering the research objectives of this
dissertation, the most relevant technology acceptance models as well as corresponding empirical
research in the field are synthesized.
Next, as one of the objectives of this dissertation is to explore the influences of the expanding
trend of individuals’ Internet-based information use on the user acceptance of in-store ubiquitous
computing-based information services, the second theory, namely media system dependency
theory which is used to explain the determinants and consequences of individuals’ media use is
discussed. At the end, to examine and ensure the applicability of the media system dependency
theory in the context of the Internet, the current adoptions of the theory in the Internet context are
analyzed. The theoretical background developed in this chapter is used then in chapter 4 to
construct the conceptual framework of this dissertation.

38
3.1 Technology Acceptance Research
Understanding the factors that influence the acceptance and use of information technologies has
been one of the major streams of research in information system since 1980. After the advent of
computers and introduction of various computer-based applications in the business realm with
the goal to ease the workload and boost its affectivity and efficiency, information technology has
become a decisive factor for the success of business operations. However, the advances were
coupled with the problem of the low adoption and underutilization making the issue of the
acceptance an enduring challenge in the system design and implementation. To overcome this
challenge, practitioners needed to understand the true causes of the acceptance or rejection of a
certain information system enabling them to decide about its implementation or to develop
intervention measures to promote its acceptance. As a result, the need for studies to understand,
explain, and predict the acceptance and use of information technologies has been born; the
response of the academia to this need has led to the vast amount of research on the acceptance of
information technologies.
As information technologies left the offices and reached a larger audience with products and
services targeting individual consumers who contrary to business users could voluntarily decide
to accept or reject them, this challenge has reached a new scale; especially for more radical
technologies as ubiquitous information systems. However, there are plenty of studies addressing
the individual level acceptance of information systems for different technologies and contexts;
there is no one universal set of determinants which can explain the acceptance of all kind of
technologies in any context. To emphasis the need for further studies in the individual
technology acceptance for emerging information technologies and contexts, Venkatesh (2006),
one of the well-known scholars in field, insists that “stating that research on individual-level
technology adoption is mature is an understatement” (p. 497).
The term acceptance stems from a Latin term, recipere, which means to receive, “to take what is
offered. Thus, acceptance means that an individual must partake in an action to take what is
offered” (Schwarz, 2003, p. 33). In this context, acceptance is not the act of the use itself but just
the precondition of use (Schwarz, 2003). Translating this into the information technology
paradigm, acceptance expresses a form of an affirmative attitude or a behavior of

39
subjects/individuals towards a certain object/information system to perform a certain task which
the system is designed to support.
As said, the concept of acceptance captures just the notion of willingness to use and not the
actual use; however, it is defined as a strong determinant of use. As Dillon and Morris (1996)
state, “obviously there is a degree of fuzziness here since actual usage is always likely to deviate
slightly form idealized, planned usage, but the essence of acceptance theory is that such
deviations are not significant; that is, the process of user acceptance of any information system
for intended purposes can be modeled and predicted” (p. 7). In information technology
literature, various terms can be found for the concept of acceptance, a meta-analysis of studies
for acceptance of information systems showed that the terms "adoption", "diffusion" and
"acceptance" are used almost identical, however the term “adoption” is slightly more favored (M.
D. Williams et al., 2009).
Tailoring to the objectives of this dissertation, acceptance in this work means the willingness of
an individual to voluntarily use an in-store ubiquitous computing information system to get the
benefits associated with such systems. The notion of voluntary use is quite important here as it
puts the current work in contrast to the classical office-based task-related information systems.
Basically, there are two main streams of research in the field of technology acceptance; the first
stream is concerned with the “objective features” of a technology causing its diffusion in the
market and the second stream is concerned with the “subjective qualities” persuading its use by
individuals.
The first stream is originated in the diffusion of innovation theory (Rogers, 2010, 1983). Rogers
defines diffusion as the process by which an innovation is communicated over time and through
the various channels to the members of a social system. Diffusion is therefore a special type of
communication and addresses the dissemination of information dealing with new products or
services. In marketing, diffusion research is used to explain and understand the development of
novel product or service purchases over the course of time. Understanding purchase dynamics of
a novel product enables marketers to influence the process for example by means of marketing
tools. Examining a large amount of innovation studies, Rogers (1983) summarizes five main
characteristics of an innovation which influence its diffusion rate, namely relative advantage,

40
complexity, compatibility, trialability and observability; that is the extent of presence of these
characteristics in a certain technology innovation is directly related to the extent of the
acceptance of that technology innovation. The diffusion based acceptance focuses on the
perceptions of the innovation itself rather than perceptions of using the innovation (Moore and
Benbasat, 1991), which stresses its objective view.
The second stream of research on the acceptance and use of technological innovations is
dedicated to the psychology of the user acceptance and built on the grand theories of social
psychology, such as the theory of reasoned action (TRA) (Fishbein, 1967) and theory of planned
behavior (TPB) (Ajzen, 1985). These theories are designed to explain the human behavior taking
a holistic approach and therefore can be also applied to the acceptance of technological
innovations. Here, acceptance is defined as a consequence variable in “a psychological process
that users go through in making decisions about technology” (Dillon and Morris, 1996, p. 13).
Tailoring the TRA to the field of information technology resulted in advent of the famous
technology acceptance model (TAM) (Davis, 1986). Since its introduction TAM has been the
most prominent model in technology acceptance studies. According to a meta-analysis from
2009, TAM was the predominately used theory in information technology acceptance studies,
however only 16% of studies were based on the innovation diffusion theory (M. D. Williams et
al., 2009). The objective of this stream of research is to comprehend the dynamics of human
decision making in the context of accepting or rejecting technology and to predict how
individuals in a certain context will respond to new technologies and consequently to take
necessary measures for its optimum acceptance.
Synthesizing the characteristics and objectives of each stream of research with those of this
dissertation, the second stream of research is the most suitable theoretical platform for the
purpose of the current dissertation:
Firstly, the technologies under study in this dissertation are still in their infancy and not
yet widely spread, so a process oriented approach of the diffusion theory is inappropriate
for analyzing their acceptance.
Secondly this dissertation in its core seeks to dig out the antecedent factors of acceptance
of in-store ubiquitous computing-based information services at individual level. The

41
perspective of diffusion research which is market and object oriented versus individual
user oriented (Verkasalo, 2009), keeps its usability in the individual user’s technology
acceptance limited. In this regard Dillon and Morris (1996) emphasize that “while
diffusion theory provides a context in which one may examine the uptake and impact of
information technology over time, it provides little explicit treatment of user
acceptance.” and further recommend “as researchers seek to identify the factors that
determine user acceptance of any information technology (…), the question of acceptance
has come to be tackled more directly by researchers working outside the classical
innovation diffusion tradition” (p. 12). Therefore, the objectives of this dissertation fit
better to the objectives of the second stream of research.
Hence, the remainder of this section is dedicated to review of relevant literature on technology
acceptance models; starting from the origins, introducing the TAM and its major extensions and
variations which are the most relevant for the purpose of current research, as well as analyzing
the empirical studies which apply the technology acceptance models into the ubiquitous
computing applications in physical stores.
3.1.1 The Origin of Technology Acceptance Models
As mentioned above, the origins of the most of the technology acceptance models are based on
the two theories of “Theory of Reasoned Action” and “Theory of Planned Behavior”. These two
theories are related in a way that the latter is an extension of the former.
3.1.1.1 Theory of Reasoned Action
Theory of Reasoned Action (TRA) was first introduced in 1967 (Fishbein, 1967) and later
revisited and refined by two psychologists, Ajzen and Fishbein (Ajzen and Fishbein, 1980;
Fishbein and Ajzen, 1975) as a result of their extensive research effort to integrate diverse
theories and research streams in the attitude studies. As its name implies, theory of reasoned
action builds on the notion of reasoned rather than automatic behavior in which “people consider
the implications of their actions before they decide to engage or not engage in a given behavior”
(Ajzen and Fishbein, 1980, p. 5).
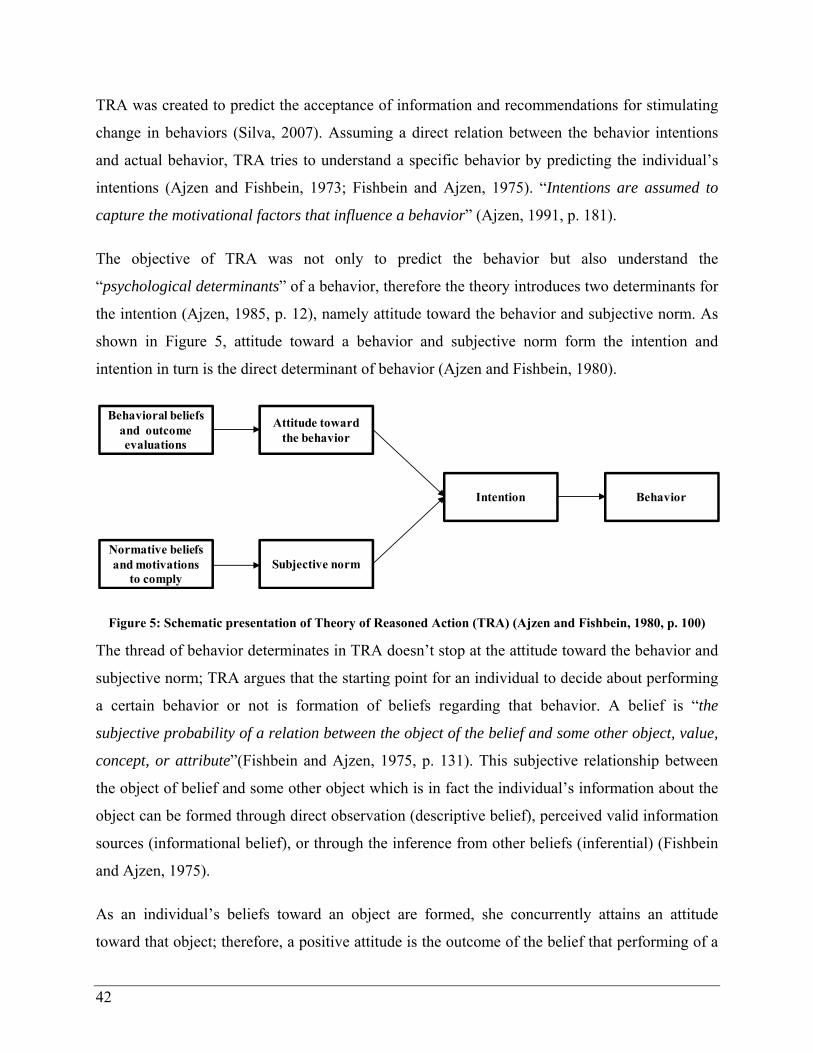
42
TRA was created to predict the acceptance of information and recommendations for stimulating
change in behaviors (Silva, 2007). Assuming a direct relation between the behavior intentions
and actual behavior, TRA tries to understand a specific behavior by predicting the individual’s
intentions (Ajzen and Fishbein, 1973; Fishbein and Ajzen, 1975). “Intentions are assumed to
capture the motivational factors that influence a behavior” (Ajzen, 1991, p. 181).
The objective of TRA was not only to predict the behavior but also understand the
“psychological determinants” of a behavior, therefore the theory introduces two determinants for
the intention (Ajzen, 1985, p. 12), namely attitude toward the behavior and subjective norm. As
shown in Figure 5, attitude toward a behavior and subjective norm form the intention and
intention in turn is the direct determinant of behavior (Ajzen and Fishbein, 1980).
Figure 5: Schematic presentation of Theory of Reasoned Action (TRA) (Ajzen and Fishbein, 1980, p. 100)
The thread of behavior determinates in TRA doesn’t stop at the attitude toward the behavior and
subjective norm; TRA argues that the starting point for an individual to decide about performing
a certain behavior or not is formation of beliefs regarding that behavior. A belief is “the
subjective probability of a relation between the object of the belief and some other object, value,
concept, or attribute”(Fishbein and Ajzen, 1975, p. 131). This subjective relationship between
the object of belief and some other object which is in fact the individual’s information about the
object can be formed through direct observation (descriptive belief), perceived valid information
sources (informational belief), or through the inference from other beliefs (inferential) (Fishbein
and Ajzen, 1975).
As an individual’s beliefs toward an object are formed, she concurrently attains an attitude
toward that object; therefore, a positive attitude is the outcome of the belief that performing of a
Attitude toward the behavior
Subjective norm
BehaviorIntention
Behavioral beliefs and outcome evaluations
Normative beliefs and motivations
to comply

43
certain action with high (low) probability will result in positive (negative) consequences.
Respectively, a negative attitude is the product of a belief that a behavior with high (low)
probability will have negative (positive) consequences. In other words, the attitude of an
individual toward a behavior “correspond to the favorability or unfavorability of the total set of
consequences, each weighted by the strength of the person’s beliefs that performing the behavior
will lead to each of the consequences” (Ajzen and Fishbein, 1980, p. 67). Thus different
individuals who expect the same consequences may have different attitudes towards an act
depending on the assessment of the desirability of the consequences.
The same logic applies to the subjective norm; subjective norm is a function of some beliefs, in
this case called normative beliefs (Ajzen and Fishbein, 1980; Fishbein and Ajzen, 2010).
Subjective norm is defined as “an individual’s perception (belief) that most people who are
important to her think she should perform a particular behavior” (Fishbein and Ajzen, 2010, p.
131). This is a measure of perceived social pressure to perform or to refrain from a behavior in
question. It results from aggregation of the perceived expectations of reference persons or groups
regarding a certain behavior and willingness to behave according to these expectations. So the
beliefs concerning what different people or groups consider correct or incorrect behavior
(injunctive norms) as well as beliefs about what important others are actually doing (descriptive
norms) are the informational foundation to form an individual’s subjective norm (Fishbein and
Ajzen, 2010).
TRA also considers so-called external factors such as situational factors, demographic variables
or personality traits to have indirect effects on behavior through their effects on central variables
of the theory (Ajzen and Fishbein, 1980). As depicted in Figure 6, external variables may
influence the behavior through individuals’ beliefs regarding the consequences of a certain
behavior and their evaluation as well as the beliefs concerning the referents’ expectations along
with the willingness to comply with a certain referent.

44
Figure 6: A detailed schematic presentation of TRA including the external variables (Ajzen and Fishbein, 1980, p. 84)
Although TRA predicts the volitional behavior quite well, its performance is rather limited when
it comes to the cases in which individuals cannot decide freely for their actions or may not have
total control over the potential obstacles which can prevent them from performing an intended
behavior (Ajzen, 1985). In this regard, TRA assumes that performing a behavior is not related to
opportunities and there is no pre-requirement for resources such as time, financial resources,
skills or social support to perform a behavior. Therefore, later the theory has been revisited and
extended to cover its limitations which resulted in the advent of the Theory of Planned Behavior.
3.1.1.2 Theory of Planned Behavior
In response to the limitations of the TRA, Ajzen (1985) introduced an extended version by
adding a control factor to the original TRA. Named as Theory of Planed Behavior (TPB), this
theory assumes that besides attitude toward the behavior and subjective norm, perceived
behavioral control is a direct determinant of the behavioral intention (Ajzen, 1991, 1985), as
shown in Figure 7.
BehaviorIntention
Beliefs that behavior leads to certain outcome
Motivation to comply with the specific referents
Attitude toward the behavior
Relative importance of attitudinal and
normative components
Perceived behavioral control
External Variables
Demographic variablesAge, Sex, Occupation, Socioeconomic statusReligion , Education Attitudes toward targets Attitude toward people Attitude toward institutions Personality traitsIntroversion-ExtraversionNeuroticism Dominance
Evaluations of outcomes
Beliefs that specific referents think that I should or should not perform the behavior
Possible explanations for observed relations between external variables and behaviorStable theoretical relations linking beliefs to behavior

45
Figure 7: Schematic presentation of Theory of Planned Behavior (TPB) (Ajzen, 1991, p. 182)
Perceived control embodies the potential internal and external interfering factors shaping an
individual’s perception concerning the ease or difficulty of performing a certain behavior (Ajzen,
1991). In a recent updated version of the theory, Fishbein and Ajzen (2010) define the perceived
behavioral control as “people’s perception of the degree to which they are capable of, or have
control over, performing a given behavior” (p.64). Perceived behavioral control is often
described as similar to the concept of self-efficacy (Bandura, 1977) that is “a judgment of one’s
ability to organize and execute given types of performances” (Bandura, 1997, p. 21) with a
distinction that it also includes the external control factors (Lim and Dubinsky, 2005). However
in empirical studies, the perceived difficulty of performing an act (self-efficacy) turned out to be
a better predictor of the behavioral intentions and behavior than the controllability (Ajzen, 2001).
Having integrated the control factor into the theory, TPB even modifies the notion of intention; it
is no longer merely the subjective probability of performing a behavior but also the amount of
effort that a person is willing to invest performing a certain behavior. In other words in the
context of TPB, intentions “are indications of how hard people are willing to try, of how much of
an effort they are planning to exert, in order to perform the behavior” (Ajzen, 1991, p. 181).
Identical to the notion of beliefs in TRA, control beliefs play a central role in TPB; perceived
behavioral control is a function of control beliefs that are the amount of resources, skills and
options which an individual believes to possess (Ajzen, 1985; Yzer, 2012); internal factors such
as self-discipline, willpower, constrains and habits as well as external factors such as unexpected
events or behavior of other people are the additional influencing factors of control beliefs
(Fishbein and Ajzen, 2010). In short, the greater the intention of the person to perform an act and
Attitude toward the behavior
Perceived norm BehaviorIntention
Behavioral beliefs and outcome evaluations
Control BeliefsPerceived
behavioral control
Normative beliefs and motivations
to comply

46
the greater his control over internal and external interfering factors, the greater the probability
that one would perform the planned behavior. Since its advent, TPB has been one of the most
influential models in prediction of individual behavior. However it has been often criticized for
its rational man assumption and consequently “not taking sufficient account of cognitive and
affective processes that are known to bias human judgments and behavior” (Ajzen, 2011, p.
1115). Although the affective and cognitive factors are not included in the central constructs of
TPB, their indirect influence on behavior have been considered by integrating the background
factors which influence the belief constructs in the theory (Ajzen, 2011) (see Figure 8). Ajzen
(2011) argues that TPB doesn’t hold the rational man assumption by comprising beliefs
mirroring an individual’s information concerning the performance of a certain behavior which
could be inaccurate, incomplete or emotionally biased. Independent from the quality of beliefs,
being it biased or unbiased, irrational or rational, attitudes and thus intentions and behaviors are
consistent with these beliefs (Geraerts et al., 2008). Figure 8 shows an elaborated version of
TPB, including the background factors and their influence on formation of beliefs.
Figure 8: A detailed schematic presentation of TPB including the background factors (Fishbein and Ajzen, 2010, p. 22)
Both the TRA and TPB have been applied in numerous studies to predict intentions and actual
use of the information systems (Agarwal, 2000; Armitage and Conner, 2001; Davis et al., 1989;
Khalifa and Cheng, 2002; Malek, 2011) and in many cases their validity for explanation of the
reasoned and planned behaviors have been confirmed with TPB having a better explanatory
Attitude toward the behavior
Perceived norm BehaviorIntention
Behavioral beliefs and outcome evaluations
Control BeliefsPerceived
behavioral control
Normative beliefs and motivations
to comply
Backgroundfactors
Individual Personality, Mood, Emotion, Values, Stereotypes ,General attitudes, Perceived risk, Past behaviorSocial Education, Age, Gender, Income, Religion, Race, Ethnicity, Culture InformationKnowledge, Media, Intervention Actual behavior
Skills, Abilities, Environmental
factors

47
power than TRA. However, due to the general approach of the TRA and TPB, usually it has been
necessary in empirical studies to tailor the model constructs to the research context and the
behavior in question.
3.1.2 Technology Acceptance Model (TAM)
As mentioned above, due to the general approach of the TRA and TPB, researchers often had to
tailor the model constructs to their research context and the behavior in question. By doing so,
Davis (Davis, 1993, 1989, 1986; Davis et al., 1989) introduced the technology acceptance model
(TAM); building on theoretical foundation of TRA, TAM offers a unified set of constructs and
indicators applicable for describing and understanding an individual’s acceptance of information
systems for different technologies and user populations. Since its introduction, TAM has been
one of the most influential models in information systems field and much of the technology
acceptance studies are based on TAM or one of its various extensions (Lee et al., 2003).
As shown in Figure 9, adopting the TRA to the domain of information technology, Davis
replaced the TRA’s attitudinal determinants with two other predictors of behavioral intention i.e.,
perceived usefulness and perceived ease of use. Perceived usefulness is defined as “the degree to
which an individual believes that using a particular system would enhance his or her job
performance” and perceived ease of use as “the degree to which an individual believes that using
a particular system would be free of physical and mental effort” (Davis, 1986, p. 26).
Figure 9: Schematic presentation of Technology Acceptance Model (TAM) (Davis et al., 1989, p. 985)
Inheriting from TRA, TAM posits that the actual system use is a function of behavioral intention
to use. But unlike TRA, behavioral intention is dependent on both attitudes toward using and
perceived usefulness. Davis justifies the direct relationship between the perceived usefulness and
behavioral intention by referring to the assumption that people build their intention to use an
Perceived usefulness
Actual system useBehavioral
intention to use External variables
Perceived ease of use
Attitude toward using

48
information system by cognitive assessment of potential performance improvements (Bagozzi,
1982). Therefore, if a system improves the performance of a user, regardless of her attitude
toward the using, the resulting benefits can drive the use intention (Konana and
Balasubramanian, 2005). Furthermore, as the notion of the attitude in TRA covers only the
affective aspects, the direct relationship between the perceived usefulness and behavioral
intention adds an unambiguous performance oriented or cognitive aspect to the whole model.
Usefulness and ease of use beliefs are the most important components of the information system
acceptance, as they are easy to manipulate through external factors such as system features,
training, and user support consultants (Davis et al., 1989). Therefore, TAM further theorizes that
the influences of external factors on attitude toward using are through perceived usefulness and
perceived ease of use. Additionally perceived usefulness is determined by perceived ease of use
based on the logic that “other things being equal, the easier the system use the more useful it can
be” (Venkatesh and Davis, 2000, p. 187).
Later, Davis et al (1989) proposed a more powerful version of TAM; based on the results of a
longitudinal study on intentions to use a specific system, they have removed the attitude
construct from the original model since the construct at best “only partially mediated” the
relationships between beliefs and intentions (p. 999). After introducing this new
conceptualization of the TAM, both Davis himself and subsequent research suggested that
however TAM can indeed serve as basis for technology acceptance studies, it needs to be refined
and extended in regard to different information technologies to improve its explanatory power
(Adams et al., 1992; Davis, 1989; Davis et al., 1989). So it comes as no surprise that reviewing
technology acceptance literature, different variations of TAM can be found. However, despite
many enhancements and adjustments, the basic concept of the TAM, illustrated in Figure 10, still
remains the foundation in design of the majority of technology acceptance models.

49
Figure 10: Schematic presentation of the basic concept underlying user acceptance models (Venkatesh et al., 2003, p. 427)
The development of TAM can be divided into four phases, namely, introduction, validation,
extension, and elaboration (Lee et al., 2003). The introduction phase was consisted of replication
and comparison studies to verify the model’s parsimoniousness as well as superiority to other
models (Lee et al., 2003). Through this phase many studies could successfully validate the
consistency of TAM’s explanatory power with regard to different technologies and in different
settings (e.g. Adams et al., 1992; Davis, 1993).
While TAM was empirically validated by many studies showing superior parsimoniousness and
explanatory power when compared with other models (e.g. King and He, 2006; Ma and Liu,
2004; Schepers and Wetzels, 2007; Mathieson, 1991; Yousafzai et al., 2007a; Shankar et al.,
2003; Davis et al., 1989), another stream of research was concerned with the validity of TAM’s
measurement instrument in different technologies, situations, and tasks (e.g. Barki and Hartwick,
1994; Davis and Venkatesh, 1996; Hendrickson et al., 1993; Lee et al., 2003; Segars and Grover,
1993; Szajna, 1994). The studies in validation period could more or less agree on the fact that
TAM instruments were powerful, consistent, valid, and reliable (Lee et al., 2003).
Although TAM proved to be exceptionally robust thanks to the substantial theoretical and
empirical support, several studies suggest that the model’s parsimonious approach tends to limit
its ability to provide a deeper understanding of the factors contributing to technology acceptance
(Benbasat and Barki, 2007; Lee et al., 2003; Mathieson, 1991; Venkatesh, 2000; Yousafzai et al.,
2007b). As a matter of fact, while usefulness and ease of use proved to be fundamental
determinants of usage intention (Adams et al., 1992), TAM overlooks other important beliefs as
normative and affective beliefs and does not provide a mechanism for their inclusion (Benbasat
and Barki, 2007). In addition, TAM only focuses on direct determinants of use overlooking the
prior/external factors influencing the formation of ease of use and usefulness beliefs and
Actual use of information technology
Intentions to use information technology
Individual reactions to using information
technology

50
consequently how they can be influenced to promote increased usage (Yousafzai et al., 2007a).
Furthermore TAM’s explanatory power declines when not applied in the workplace situations
(Yousafzai et al., 2007b).
Responding to TAM’s shortcomings, since 1994 researchers have made their extended models of
original TAM by introducing additional variables, linking TAM to other theories such as
innovation diffusion theory or TRA, and looking for antecedents of major TAM constructs (Lee
et al., 2003). Even in the context of consumer oriented innovations, numerous extensions of
TAM have been introduced trying to tailor the model to consumer technology acceptance for
example by adding personality traits and shopping motives (O’Cass and Fenech, 2003),
involvement (Koufaris, 2002), and computer affinity (Stern et al., 2008).
The results of studies in extension phase enriched the original model, but at the same time
generated numerous model variations and raised new questions and limitations. To synthesize
the results and resolve the limitation of these studies, a new class of research has emerged taking
the TAM based research to the elaboration phase (Lee et al., 2003). The efforts in this phase lead
to the introduction of further TAM based salient models as UTAUT (Venkatesh et al., 2003) and
set the groundwork for further research.
Having discussed TAM and its different development phases, the remainder of this section is
dedicated to the review of extensions and elaborations of TAM which are the most relevant for
the theoretical foundation of current dissertation.
3.1.2.1 Extension of TAM by Social Factors
Although TAM was built based on TRA which affirmed that both attitude towards an act and
subjective norms are the antecedents of the intention, it overlooked the effect of subjective norms
in its original form. Yet, the importance of social context on the formation of individual’s
perception regarding a certain object has been emphasized by social psychologists (Robertson,
1989; Triandis, 1979). Even Davis himself has noted that it is essential to consider the subjective
norm in technology acceptance studies (Davis, 1986; Davis et al., 1989). Being aware of its
importance, different scholars have tried to include the concept of subjective norm into TAM,
resulting in conception of different constructs and relationships.

51
Malhotra and Galletta (1999) for the first time introduced an extension of TAM including the
notion of social influence. As shown in Figure 11, they have set up a construct labeled as
psychological attachment made up of different social aspects to capture the concept of social
influence which directly affects the behavioral intention. The theoretical basis for this is provided
by Kelman (1958), he distinguishes three different processes of social influence namely
compliance, identification and internalization. Compliance refers to an influence when a person
adopts a behavior not because she wants it herself but with an incentive of receiving a reward.
Identification is referred to an influence which occurs when an individual accepts to follow other
person’s perception as she wills to keep or build a relationship to other person or group.
Internalization occurs when a person accepts influence since it is congruent with her own value
system.
Figure 11: Schematic presentation of TAM extended to account for social influences (Malhotra and Galletta, 1999, p. 4)
Based on a survey of 208 people, Malhotra and Galletta could conclude that social influences
play an important role in acceptance of new information technology products; results show that
the sense of compliance has a negative impact on the attitude towards use of a new information
technology. In contrast, when social influences generate feelings of internalization and
identification, they have a positive influence on attitude toward use. However, the study did not
deliver statistically significant results between the social influences and behavioral intention.
Hence social factors influenced the behavior intention only indirectly through attitude. Malhotra
and Galletta recommend that while introducing new information systems the focus should be on
Actual system useBehavioral
intention to use
Perceived usefulness
Perceived ease of use
Attitude toward using
Psychological attachment

52
the development of positive attitudes towards using by developing psychological attachment
which would ultimately lead to acceptance behavior. At the same time, they note the need for
more research in this area.
Later, Venkatesh and Davis (2000) introduced a theoretical extension of the basic TAM referred
as TAM2. As mentioned in previous section, many studies suggest that the original TAM’s
parsimonious approach tends to limit its ability and call for the extension of model by including
other components which can serve as determinants of the TAM’s main constructs, usefulness and
ease of use. Taking into account that perceived usefulness is the most important determinant of
usage intention, TAM2 integrated some new theoretical constructs into original TAM as
antecedents of perceived usefulness and intention of use. These new constructs captured the
notion of social influence and cognitive instrumental processes. The model covers the notion of
social influence processes by constructs of subjective norm, image and voluntariness and the
notion of cognitive instrumental processes by constructs of job relevance, output quality, result
demonstrability as well as perceived ease of use.
Figure 12 shows the proposed TAM2. The model particularly explains the role of social
influence on information systems acceptance and use. In this model, consistent with the TRA
(Fishbein and Ajzen, 1975) and TPB (Ajzen, 1991), the subjective norm is defined as direct
determinant of intention to use. This direct relationship was justified following the same
rationale as TRA that "people may choose to perform a behavior, even if they are not themselves
favorable toward the behavior or its consequences, if they believe one or more important
referents think they should, and they are sufficiently motivated to comply with the referents"
(Venkatesh and Davis, 2000, p. 187).

53
Figure 12: Schematic presentation of TAM2 – an extension of TAM (Venkatesh and Davis, 2000, p. 188)
Due to the conflicting results of previous studies on the effect of subjective norm on use
intention, no effect (Davis et al., 1989; Mathieson, 1991) versus significant effect (Taylor and
Todd, 1995a), Davis (1989) emphasized the need for more research on “conditions and
mechanisms governing the impact of social influences on usage behavior” (p. 999). To do so,
following the approach of Hartwick and Barki (1994), TAM2 posited voluntariness as a
moderating variable of the direct relationship between the subjective norm and intention to use;
so that relationship will only exist when the system use is perceived mandatory. This is also
referred as compliance effect or compliance with social influence as even in mandatory cases, if
a user is unwilling to comply, the relationship will not operate (Hartwick and Barki, 1994).
In addition, TAM2 assumes that this relationship becomes weaker as the user becomes more
experienced. Similar to Malhotra and Galletta’s model, TAM2 used the compliance,
identification and internalization processes of social influences. In TAM2, in addition to the
direct relationship between subjective norm and intention to use, subjective norm can influence
usage intentions through perceived usefulness which is justified by internalization effect. The
direct effect of subjective norm on image is on the other hand referred as identification effect
Output quality
Subjective Norm
Job relevance
ImagePerceived usefulness
Usage behaviorIntention to use
Perceived ease of use
Technology Acceptance Model
Result demonstrability
Experience Voluntariness

54
which implies that one will perceive a system useful when she believes that using the system will
improve her image among her social group.
In regard to cognitive instrumental process, TAM2 assumes that the perceived usefulness of a
system is dependent on the individuals’ perception of the suitability of system capabilities to
their needs. This assumption is valid for all cognitive instrumental process variables, job
relevance, output quality, and result demonstrability (Venkatesh and Davis, 2000); if the user
could match them with her needs, then the system will be perceived as useful.
TAM2 was tested in organizational context at three points in time; four organizations have been
included in the study, two for voluntary and two for mandatory use of information systems. All
TAM relationships as well as the most of the TAM2 relationships, except output quality, were
validated. The results showed that the new model explained 40-60% of the variance in perceived
usefulness and 34-52% of the variance in intention to use (Venkatesh and Davis, 2000). One of
the most important contributions of TAM2 was including the notion of social influence in the
technology acceptance model and showing a direct effect of subjective norm on intention to use.
Several other studies could empirically support the direct positive influence of social factors on
usage intention (e.g. Hsu and Lin, 2008; Hsu and Lu, 2004; Mun et al., 2006; Venkatesh et al.,
2012, 2003) .Table 7 summarizes the different labels used in the literature to capture the notion
of social response of individuals associated with system use. These constructs were chosen if
they satisfied the following two criteria:
A construct/label which captures a holistic vision of social response, therefore excluding
factors such as image and need for uniqueness.
Inclusion of the social factor was in line with an attempt to extend and improve the TAM
(TAM was the baseline model in the studies) and a direct significant relationship between
the social factor and intention to use could be empirically supported.

55
Table 7: Factors capturing normative beliefs
Belief structure Objective Selected constructs Studies
Normative beliefs To capture the essence of perceived social influences posed to an individual by the social surrounding regarding use of a certain system
Social influence (Venkatesh et al., 2012, 2003)
Subjective norm (Mun et al., 2006; Venkatesh and Davis, 2000)
Social factors/norms (Hsu and Lin, 2008; Hsu and Lu, 2004)
Psychological attachment (Malhotra and Galletta, 1999)
3.1.2.2 Extension of TAM by Affective Factors
Despite TRA and TPB which locates the individual on an affective and cognitive bipolar
evaluative dimension while deciding about the performing of a certain behavior (Ajzen and
Fishbein, 1980; Fishbein and Ajzen, 2010), in TAM the component of the behavioral beliefs has
been translated into two merely cognitive factors of perceived usefulness and ease of use. As a
result, in technology acceptance studies, the cognitive or utilitarian perspective which is the
answer to the question of “how useful a system is?” has been included since the introduction of
original TAM; however, the affective perspective which respectively is the answer to the
question of “how enjoyable the use a certain system is?” had long been neglected.
The notion of bidimensional attitudes has been suggested in consumer research literature (Batra
and Ahtola, 1990; Childers et al., 2001; Holbrook and Hirschman, 1982); overall the motivation
of consumers can be classified in two, cognitive and affective dimensions (McGuire, 1976). This
two-dimensional view of consumer attitude has been supported by many scholars from different
disciplines as sociology, psychology and economics (Clore and Schnall, 2005; Lewis et al.,
2010). In consumer research literature, these dimensions are usually mentioned as hedonic and
utilitarian components of consumer choice. Utilitarian and hedonic components are not mutually
exclusive, but both contribute to consumer behavior (Batra and Ahtola, 1990).
Furthermore, a stream of research in human-computer interaction dedicated to the role of
emotion in usage of computers stresses that, as the emotions are the essential part of being
human, individuals cannot put away their emotions and work only rationally and effectively with

56
computers (Brave et al., 2005; Brave and Nass, 2003; Norman, 2004; Norman et al., 2003).
Therefore, a decision for or against an information system can be as well influenced by user’s
hedonic motivation.
As a response to the importance of the affect in technology usage and acceptance, many scholars
tried to add the notion of affect into the technology acceptance model; this resulted in the rise of
a group of differently labeled constructs with an almost identical goal of capturing the emotional
side of technology use. Davis et al. (1992) for the first time introduced an affective factor called
enjoyment to the original TAM to cover the notion of intrinsic motivations versus extrinsic
motivations. Borrowing from the motivation theories, intrinsic motivation refers to the
performance of an activity just because of the process of performing whereas extrinsic
motivation refers to the performance of an activity because of the value of its consequences
(Davis et al., 1992). Empirically testing their new model in workplace context, they could show
that enjoyment has a significant direct effect on intention to use.
Later, Agarwal and Karahanna (2000) introduced a new multi-dimensional construct named
cognitive absorption compiling three different concepts from individual psychology, namely
absorption (Tellegen, 1982), state of flow (Csikszentmihalyi, 2014) and the notion of cognitive
engagement (Webster and Ho, 1997). This multi-dimensional construct captured the state of deep
involvement with software and enjoyment has been defined as one of its dimensions. Placing the
cognitive absorption as an external variable in TAM, they hypothesized that cognitive absorption
has a positive relationship with perceived usefulness and ease of use. In addition, playfulness as
an extra affective factor was a determinant of cognitive absorption. The model was tested in the
context of World Wide Web and results showed a significant relationship between the cognitive
absorption and intention to use as well as playfulness and cognitive absorption.
Furthermore, Van der Heijden (2004) investigated the validity of TAM in utilitarian and hedonic
information systems. Similarly, building on the motivational theory, the study could show that
for hedonic systems, perceived enjoyment and perceived ease of use were stronger predictors of
intention to use than perceived usefulness.
Most prominently, Venkatesh and Bala (2008) have introduced a new version of technology
acceptance model referred as TAM3. As illustrated in Figure 13, the new model combined

57
TAM2 with a model of perceived ease of use determinants (Venkatesh, 2000). Whereas major
contribution of TAM2 was introducing the influencing factors of perceived usefulness,
particularly, subjective norm, TAM3 introduced determinants of ease of use.
Figure 13: Schematic presentation of TAM3 – an extension of TAM (Venkatesh and Bala, 2008, p. 280)
Grounding on anchoring and adjustment heuristics (Tversky and Kahneman, 1973), in his model
of perceived ease of use determinants, Venkatesh (2000) divided the influencing factors of ease
of use in two anchor and adjustment variables; anchor variables which are related to individual’s
original beliefs are computer self-efficacy, perceptions of external control, computer anxiety, and
computer playfulness. Adjustment variables which are related to individual’s experience based
adjustments of original beliefs are perceived enjoyment and objective usability; these variables
become especially important when user’s experience does not match with the original beliefs.
Perceived usefulness
Usage behaviorIntention to use
Perceived ease of use
Technology Acceptance Model
Experience Voluntariness
Output quality
Subjective Norm
Job relevance
Image
Result demonstrability
Computer playfulness
Computer Self-efficacy
Computer anxiety
Perception of external control
Perceived enjoyment
Objective usability
An
chor
A
dju
stm
ent

58
Through including the variables of computer playfulness, computer anxiety, and perceived
enjoyment, TAM3 has integrated the affective variables into TAM. Venkatesh and Bala (2008)
have tested their model in organizational context. The results confirmed the relationships
between affective variables on perceived ease of use; the influence became stronger with
increasing experience. The determinants of perceived ease of use could explain up to 52% of the
variance and the determinants of perceived usefulness up to 67% of the variance. TAM3 could
explain up to 53% variance in behavioral intention and up to 36% variance in usage behavior
(Venkatesh and Bala, 2008).
Furthermore, in consumer context, Kulviwat et al. (2007) developed a new model by integrating
affective components namely pleasure, arousal, and dominance of PAD theory (Mehrabian and
Russell, 1974). This model, referred as consumer acceptance of technology (CAT), could explain
53% of the variance of intention, which correspond to up to 38% of improvement compared to
TAM. Concerning the affective variables, except dominance, pleasure and arousal were
significant predictors of attitudes. The empirical results showed that the higher the degree of
pleasure and arousal of a consumer regarding a new technology, the more positive the attitude
toward the adaption. Later Nasco et al. (2008) revised the CAT model especially because
dominance had not shown the expected results in the previous model. They integrated two new
factors, namely social influence and task type as moderators into the model; the empirical results
showed that both in utilitarian and hedonic tasks, affective factors play an important role in usage
intention of the individuals. Figure 14 provides a schematic presentation of the CAT model.

59
Figure 14: Schematic presentation of Consumer Acceptance of Technology (CAT) (Kulviwat et al., 2007, p. 1064)
Several other studies could empirically support the direct influence of affective factors on usage
intention (Brown and Venkatesh, 2005; Chang and Cheung, 2001; Koufaris, 2002; Moon and
Kim, 2001; Thong et al., 2006). Table 8, summarizes the different labels used in the literature to
capture the affective response of individuals associated with system use. These constructs were
chosen if they satisfied the following two criteria:
A construct/label which captures a holistic vision of emotional response, therefore
excluding factors such as satisfaction, arousal, pleasure, and playfulness.
Inclusion of the affective factor was in line with an attempt to extend and improve the
TAM (TAM was the baseline model in the studies) and a direct significant relationship
between the affective factor and intention to use could be empirically supported.
Adoption intention
Attitude toward adoption
Perceived usefulness
Perceived ease of use
Relative advantage
Cog
niti
on
Arousal
Dominance
Pleasure
Aff
ect

60
Table 8: Factors capturing affective beliefs
Belief structure Objective Selected constructs Studies
Behavioral beliefs: affective outcomes
Capture the emotional experience of an individual associated with an information system usage
Enjoyment/Perceived enjoyment
(Davis et al., 1992; Igbaria et al., 1995; Koufaris, 2002; Li, 2011; Teo et al., 1999; Thong et al., 2006; van der Heijden, 2004; Wen et al., 2011)
Affect/Affect toward use (Chang and Cheung, 2001; Goodhue and Thompson, 1995)
Hedonic motivation (Raman and Don, 2013; Venkatesh et al., 2012)
3.1.2.3 Elaboration of TAM – Unified Theory of Acceptance and Use of Technology
(UTAUT)
The vast variety of models produced through the course of the research in acceptance of
information systems made the model choice difficult for researchers. By an attempt to overcome
this problem, Venkatesh et al. (2003) synthesized the core conceptually similar intention
determinants of the eight prominent technology acceptance models in a Unified Theory of
Acceptance and Use of Technology (UTAUT). In UTAUT, in addition to the original technology
acceptance model, theory of reasoned action (discussed in section 3.1.1.1), and theory of planned
behavior (discussed in section 3.1.1.2), five other models have been used:
An adapted version of the social cognitive theory (Bandura, 1986) to the use of computer
systems proposed by Compeau and Higgins (1995), in which performance and personal
outcome expectations, self-efficacy as well as affect and anxiety influence the use
behavior.
The motivational model (Davis et al., 1992), which suggest that the adoption and use of
new technologies are dependent on two factors, extrinsic and intrinsic motivation. The
extrinsic motivation is based on the expected positive consequences of performing a
certain behavior. Intrinsic motivation, however, is based on an interest in the performing
an activity itself. In this model the notion of extrinsic motivation is captured by perceived
usefulness and intrinsic motivation by enjoyment associated with the use.

61
The combined TAM and TPB (Taylor and Todd, 1995a), which extends the theory of
planned behavior by integrating the technology acceptance model constructs, perceived
usefulness and ease of use.
The model of PC Utilization (Thompson et al., 1991), which suggest six determinants for
the computer use in professional context: Job fit and complexity of the technology, long-
term consequences of the use, affect, social factors and facilitating conditions.
An adopted version of innovation diffusion theory (Rogers, 1983) to the use of individual
technology acceptance by Moore and Benbasat (1991) which postulates that 7
characteristics of innovation namely relative advantage, ease of use, image, visibility,
compatibility, results demonstrability and voluntariness of use are determinates of
technology acceptance.
As shown in Figure 15, based on an empirical comparison of the eight models Venkatesh et al.
(2003) identified four constructs having a direct effect on intention to use or use behavior namely
performance expectancy, effort expectancy, social influence, and facilitating conditions. Similar
to the concept of usefulness, performance expectancy is a measure of the user’s belief that using
a system will increase her job performance. Effort expectancy indicates the degree of ease
associated with the use of system. The social influence identifies the influence of important
others on user’s system use decision and facilitating conditions are defined as a measure of the
user’s belief that an organizational and technical infrastructure is available to support the user.
The new unified model postulates that the strength of each relationship is dependent on the
individual factors of age, gender and experience as well as voluntariness of use.
The model was empirically tested using data from four organizations and additionally cross-
validated using data from two extra organizations. The empirical test of the UTAUT in
organizational context showed that the model could deliver significantly better results than each
of the eight original models; the researchers were able to explain 70 % of variance in usage
intention and 48% in usage itself. The UTAUT also confirms the importance of social influences
in user’s behavioral intention; however, it also shows that their effect is dependent on the user’s
experience that is the effect decreases with increasing user experience.

62
Figure 15: Schematic presentation of Unified Theory of Acceptance and Use of Technology (UTAUT) (Venkatesh et al., 2003, p. 447)
Similar to TAM, since its introduction, UTAUT turned to be a fairly popular theoretical choice
in technology acceptance studies and has been through a course of various replications and
extensions. In their meta-analysis of UTAUT studies, Dwivedi et al. (2011) identified 870
studies that cited UTAUT, of which 450 used UTAUT constructs (fully or partially) in their
empirical studies.
However, alike many other technology acceptance models, UTAUT was developed for
organizational and non-consumer context. As a result many studies tried to extend its
applicability to the consumer context (Venkatesh et al., 2012). In this perspective, UTAUT, in its
original or modified version has been utilized in studies of different technologies in consumer
context e.g. acceptance of mobile devices/services (Carlsson et al., 2006; Park et al., 2007; Shin,
2009; Wu et al., 2008), mobile banking (Luo et al., 2010; Zhou et al., 2010), Internet banking.
(Abu-Shanab and Pearson, 2009), web based learning (Sumak et al., 2010; van Schaik, 2009), e-
government services (Hung et al., 2007; Loo et al., 2009; van Dijk et al., 2008; Wang and Shih,
2009), digital television (Sapio et al., 2010) and online auctions (C.-M. Chiu et al., 2010).
Age
Use behaviorBehavioral Intention
Performance Expectancy
Facilitating Conditions
Effort Expectancy
Social Influence
Gender ExperienceVoluntariness of
Use

63
Yet, reviewing UTAUT applications reveals that only a subset of its constructs has been used in
consumer context; furthermore, the ever increasing number of consumer technology devices and
services makes the consumer technologies an extremely lucrative industry and therefore
understanding their acceptance a very important topic. Thus Venkatesh et al. (2012) affirmed the
need “for a systematic investigation and theorizing of the salient factors that would apply to a
consumer technology use context” (p. 158). Accordingly, he introduced the new version of
UTAUT labeled as UTAUT2. As shown in Figure 16, the new model is exclusively tailored to
consumer context by
identifying three key constructs from prior research on both general adoption and use of
technologies, and consumer adaption and use of technologies namely hedonic motivation,
price value, and habit.
altering some of existing relationships of the original conceptualization of UTAUT that is
dropping voluntariness.
introducing new relationships that are relationships between habit and use behavior,
price value, hedonic motivation, as well as habit and behavioral intention, including new
moderator relationships (age , gender, and experience) for the new constructs and a
moderator effect of experience on behavior intention and use (Venkatesh et al., 2012, p.
158).
Venkatesh et al. (2012) empirically tested the new model by conducting a two-stage online
survey of mobile Internet consumers. The results show that the variance explained in behavioral
intention and use behavior in UTAUT2 in comparison to UTAUT significantly increased in
consumer context, behavioral intention from 56% (UTAUT) to 74% (UTAUT2) and use
behavior from 40% (UTAUT) to 52% (UTAUT2). The results of UTAUT2 in consumer context
were comparable to the ones of UTAUT in organizational context which confirms the
importance of having tailored constructs and models in consumer context.

64
Figure 16: Schematic presentation of UTAUT2 – an extension of UTAUT (Venkatesh et al., 2012, p. 160)
3.1.3 Technology Acceptance Research on Ubiquitous Computing-based
Information Services in Brick and Mortar Retail
The ongoing research on acceptance of ubiquitous computing in general (see section 2.1.1) and
its in-store applications in particular “has not yet established a well-accepted set of
determinants” (Hoffmann et al., 2011). Since such applications are still in an early stage of
development, it is not surprising that reviewing the literature, only few empirical studies on
acceptance of in-store ubiquitous computing based information services exist. In addition, some
of the few existing studies are qualitative or exploratory and lacking the modeling and analysis
of complex causal relationships. Table 9 lists the existing studies in the field, summarizing their
study purposes, research methods as well as key findings. This table is the result of an extensive
literature review to locate all of the existing studies which address the acceptance of ubiquitous
computing based technologies in traditional retail context.
1. Moderated by age and gender2. Moderated by age, gender and experience3. Moderated by age, gender and experience4. Effect on use behavior is moderated by age and experience5. Effect of behavioral intention is moderated by age, gender and experience6. Moderated by age, gender and experience7. Moderated by age and gender8. Both relationships are moderated by age, gender and experience9. Moderated by experience
Use behaviorBehavioral Intention9
Performance Expectancy1
Facilitating Conditions4,5
Effort Expectancy2
Social Influence3
Hedonic Motivation6
Piece Value7
Habit8
AgeGender Experience

65
Table 9: Studies on acceptance of in-store ubiquitous computing-based information services
Author/s (year)
Research purpose
Base model
Extra Factors End construct/s
Sample size and method
Key findings
(Koller and Königsecker, 2012)
User acceptance of kiosk decision support systems by customers in apparel stores
n/a n/a n/a N:15
Qualitative study
Three focus groups of regular apparel shoppers
Usefulness (gathering the information in selected items quickly and easily, receiving up-to-date data, sufficient terminals available to avoid queues) as well as ease of use (easy to use the touch screen) were emerged as essential factors for the acceptance of an information kiosk system.
(Kowatsch and Maass, 2010)
User acceptance of mobile recommender system for in-store product information acquisition
TAM Intention to prefer
Intention to purchase
Intention to use
Intention to prefer
Intention to purchase
N: 47
Paper based survey after a lab experiment
Analysis method: PLS-SEM
Perceived usefulness had a positive significant effect on intention to use.
Perceived ease of use has no significant effect on intention to use.
Perceived ease of use and perceived usefulness had a positive direct relationship with intention to prefer a mobile recommender agent-enabled store and intention to purchase after using the mobile recommender agent.
(Kurkovsky and Harihar, 2006)
User acceptance of mobile recommender system for in-store information acquisition
TAM n/a Intention to use N:34
Paper based survey after visiting a test store
Ease of use and usefulness had a direct positive influence on intention to use.
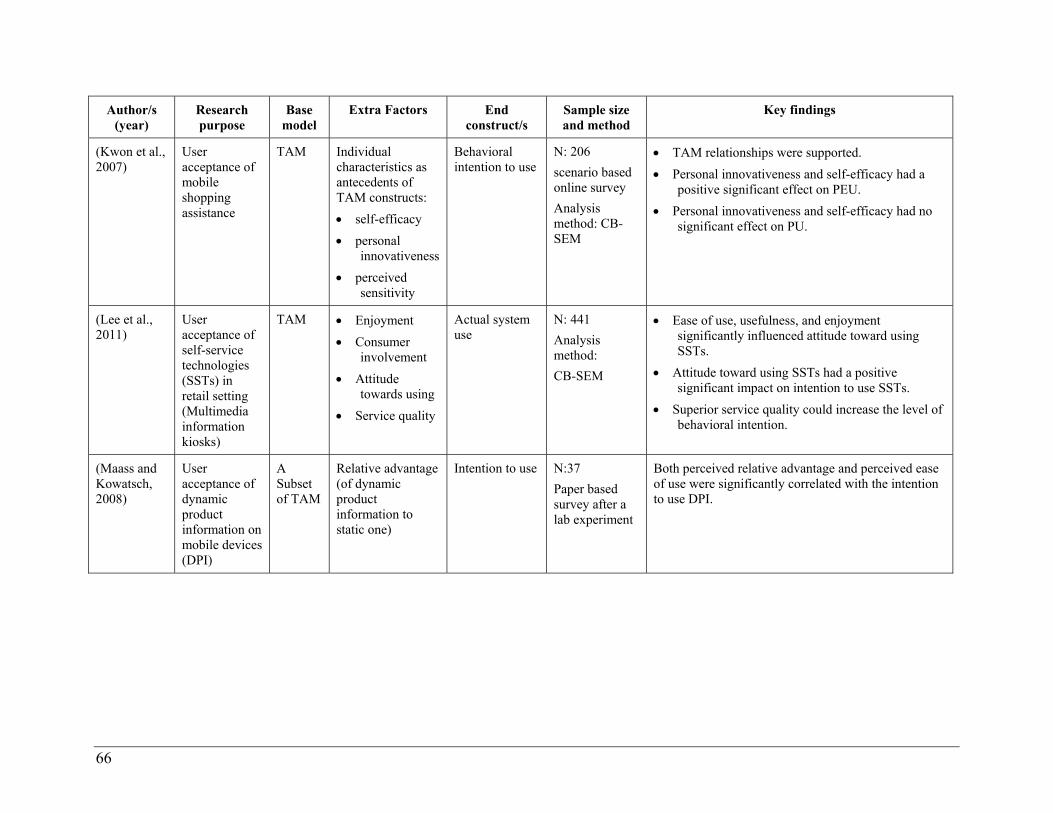
66
Author/s (year)
Research purpose
Base model
Extra Factors End construct/s
Sample size and method
Key findings
(Kwon et al., 2007)
User acceptance of mobile shopping assistance
TAM Individual characteristics as antecedents of TAM constructs:
self-efficacy
personal innovativeness
perceived sensitivity
Behavioral intention to use
N: 206
scenario based online survey
Analysis method: CB-SEM
TAM relationships were supported.
Personal innovativeness and self-efficacy had a positive significant effect on PEU.
Personal innovativeness and self-efficacy had no significant effect on PU.
(Lee et al., 2011)
User acceptance of self-service technologies (SSTs) in retail setting (Multimedia information kiosks)
TAM Enjoyment
Consumer involvement
Attitude towards using
Service quality
Actual system use
N: 441
Analysis method:
CB-SEM
Ease of use, usefulness, and enjoyment significantly influenced attitude toward using SSTs.
Attitude toward using SSTs had a positive significant impact on intention to use SSTs.
Superior service quality could increase the level of behavioral intention.
(Maass and Kowatsch, 2008)
User acceptance of dynamic product information on mobile devices (DPI)
A Subset of TAM
Relative advantage (of dynamic product information to static one)
Intention to use N:37
Paper based survey after a lab experiment
Both perceived relative advantage and perceived ease of use were significantly correlated with the intention to use DPI.

67
Author/s (year)
Research purpose
Base model
Extra Factors End construct/s
Sample size and method
Key findings
(Müller-Seitz et al., 2009)
User acceptance of RFID based intelligent racks, RFID checkouts, and customer complaint handling
TAM Security concerns
Attitude toward novel technologies
Actual system use
N: 206
Customers of two large electronic retail markets
Analysis method: multidimensional linear regression model
The perceived usefulness had the biggest impact on the acceptance of the RFID technologies.
The perceived ease of use had rather a minor influence on customer acceptance of RFID technology.
Security concerns regarding the protection of data privacy were also influential, though the impact was comparatively smaller than that of the other constructs.
(Pantano and Servidio, 2012)
User perception of technology-enabled stores (smart boards)
n/a Ease of use
enjoyment
Consumer satisfaction
Store perception
N: 150
CB-SEM
Enjoyment turned to be the most powerful predictor of satisfaction and store perception.
The direct positive relationships of ease of use toward perception and satisfaction were supported.
(Rothensee, 2010)
User acceptance of u-Commerce (various store-based ubiquitous computing applications in supermarket environment)
TAM Pleasure
Dominance
Trust
Technical competence
Intention to use N: 306
Paper based survey after a film that described various ubiquitous computing applications in the supermarket of future
Analysis method:
PLS-SEM
Usefulness and pleasure strongly influenced intention to use.
Technical competence had a significant influence on perceived ease of use.
Perceived ease of use didn’t have a significant influence on intention to use.
Trust plays a minor role in shaping acceptance.
Dominance plays no role in acceptance.

68
Author/s (year)
Research purpose
Base model
Extra Factors End construct/s
Sample size and method
Key findings
(Roussos et al., 2003)
User perception of ubiquitous computing based appliances in retail environment (a supermarket scenario)
n/a n/a n/a N: 60
An exploratory study
Paper based survey after a lab experiment
The majority (49 out of 60) of participants regarded ubiquitous retail as a useful addition to current supermarket shopping options and found the system user friendly and easy to use.
A significant number of participants stated that they would trust the system to do their shopping.
The majority of participants (54 out of 60) expressed their willingness to use the ubiquitous computing based appliances when they become available.
The majority (53 out of 60) of participants stated that they found the experience of shopping in a ubiquitous retail enjoyable with more than half considering it as an exciting activity.
(Spreer and Kallweit, 2014)
Intention to reuse a store owned pad for information search
A subset of TAM
Perceived enjoyment
Intention to reuse
Intention to reuse
N: 100
Paper based survey from customers of a book store
Analysis method:
Regression analysis
Perceived enjoyment had the biggest impact on the intention to reuse.
Perceived usefulness had a positive influence on intention to reuse.
Perceived ease of use had no significant effect on intention to reuse.
The perceived ease of use has rather a minor influence on the intention to reuse.
(Weijters et al., 2007)
User acceptance of self-service technologies in retail setting (self-scanner devices in groceries)
TAM Perceived fun
Reliability
Attitude toward using
Actual system use
N: 497
Paper based survey from customers of a grocery store
Analysis method:
CB-SEM
Perceived usefulness demonstrated the highest explanatory power on attitude.
Perceived ease of use and fun had a significant positive relationship toward attitude.
The perceived reliability has rather a minor influence on attitude.
User attitudes toward SST positively and significantly affected the actual use.
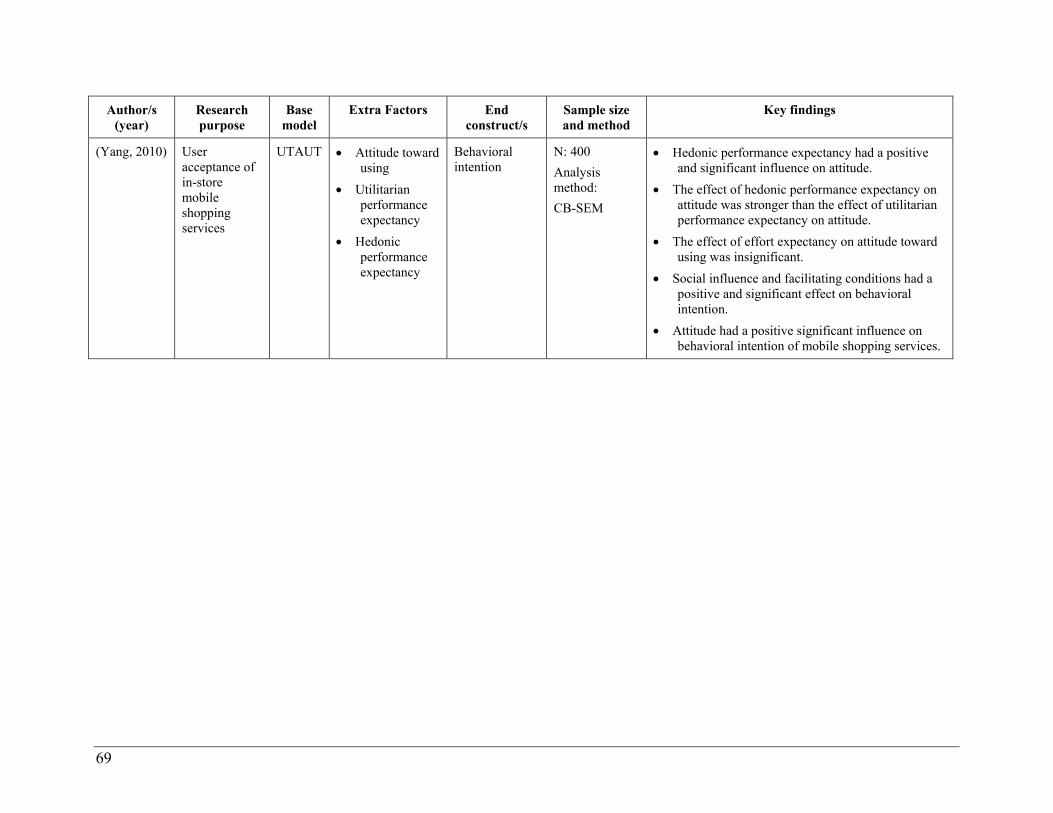
69
Author/s (year)
Research purpose
Base model
Extra Factors End construct/s
Sample size and method
Key findings
(Yang, 2010) User acceptance of in-store mobile shopping services
UTAUT Attitude toward using
Utilitarian performance expectancy
Hedonic performance expectancy
Behavioral intention
N: 400
Analysis method:
CB-SEM
Hedonic performance expectancy had a positive and significant influence on attitude.
The effect of hedonic performance expectancy on attitude was stronger than the effect of utilitarian performance expectancy on attitude.
The effect of effort expectancy on attitude toward using was insignificant.
Social influence and facilitating conditions had a positive and significant effect on behavioral intention.
Attitude had a positive significant influence on behavioral intention of mobile shopping services.

70
Reviewing the models used in existing studies (see Table 9) unveils that most of the current
studies are based on the original TAM model; there is only one study which applies the
original UTAUT as its base model. Attempting to better explain the individuals’ incentives to
use the technology, most of the studies extended the base models by incorporating one or
more factors. These additional variables can be categorized in five groups, namely (see Table
9):
affective factors (e.g. enjoyment, pleasure, hedonic performance expectancy),
consumers’ personal traits (e.g. self-efficacy, dominance, personal innovativeness,
technical competence)
security beliefs (e.g. security concerns, trust)
consequences of acceptance (e.g. intention to reuse, intention to prefer, intention to
purchase)
service characteristic (e.g. service quality)
Examining the results of the studies listed in Table 9 in regard to two main TAM constructs
(Perceived usefulness and ease of use), it can be concluded that perceived usefulness has a
significant positive impact on whether in-store ubiquitous computing based information
services will be accepted by customers. However, the results for perceived ease of use have
been contradictory; although in the majority of studies the relationship of perceived ease of
use toward intention to use is supported, four studies could not find any significant
relationship (Kowatsch and Maass, 2010; Müller-Seitz et al., 2009; Rothensee, 2010; Spreer
and Kallweit, 2014).
Moreover, all of the studies which included affective factors in their models found a direct
significant and positive relationship of affective variables toward study’s end construct (e.g.
intention to use and attitude toward using). Interestingly Spreer and Kallweit (2014) found
that perceived enjoyment had the biggest impact on the intention to reuse a store owned pad
system for information search and Yang (2010) found that hedonic performance expectancy
is a more significant determinant of attitude toward using in-store mobile shopping services
than utilitarian performance expectancy.
Regarding security and privacy beliefs, however the general research on acceptance of
ubiquitous computing applications has pointed out the importance of these beliefs (Hoffmann
et al., 2011), based on the results of the current studies in the area of in-store applications, it

71
can be concluded that security beliefs play a very minor role in shaping the acceptance
(Müller-Seitz et al., 2009; Rothensee, 2010). Furthermore, Resatsch et al. (2008) did a
prototype based focus group study to understand the needs and expectation of the customers
regarding the in-store ubiquitous computing based information services, their results show
that privacy was of no concern for the customers.
The results from previous studies are valuable for the acceptance research of in-store
ubiquitous computing technologies and undeniably important for the current study. However,
existing limitations in these studies restrain comprehensiveness and thus applicability to
accurately predict acceptance of any in-store ubiquitous computing based service. The main
limitations can be classified into two groups, namely research purpose and base model:
Research purpose: concerning the study purpose, all of the current studies have taken a
rather focused approach. That is focusing either on a single technology (Kowatsch and
Maass, 2010; Maass and Kowatsch, 2008; Müller-Seitz et al., 2009; Yang, 2010) or a
specific retail context as groceries or apparel stores (Koller and Königsecker, 2012;
Rothensee, 2010; Weijters et al., 2007). In fact, this approach limits the generalizability of
the findings for all in-store ubiquitous computing based information services. As a matter
of fact, none of the studies could offer a generic model to explore user acceptance
determinants of both store owned devices and mobile applications on the consumers’
smart phones. For example, Koller and Königsecker (2012) exclusively explored the user
acceptance of in-store kiosk decision support systems and call for future research
addressing the acceptance of mobile applications in general, and in comparison to in-store
kiosk solutions.
Base model: except one single study which is based on the original UTAUT (Yang,
2010), all of the other studies have chosen TAM as their base model. Though TAM was
originally theorized to predict the acceptance of technologies in workplace environment
and its explanatory power declines when applied in consumer context (Yousafzai et al.,
2007b). Furthermore, TAM only focuses on direct determinants of use overlooking the
prior/external factors influencing the formation of ease of use and usefulness beliefs and
consequently how they could be influenced to promote increased usage (Yousafzai et al.,
2007a). In addition, TAM overlooks the influence of important beliefs as normative and
affective beliefs (Benbasat and Barki, 2007). As a response to these limitations, from

72
current studies, five studies have included affective factors to their models; however, all
of them ignored the importance of social factors.
Especially considering such radical technologies as in-store ubiquitous computing
based technologies, individuals may consider the usage of technologies as a social
status symbol and intent to use to enhance their image among their friends and family
members (Lu et al., 2005; Sarker and Wells, 2003). In addition, the role of social
factors has been known to be greater in early phases of adoption of an innovation
(Triandis, 1971). As the implementation of in-store ubiquitous computing based
information services is still in its early stages and therefore individuals have little or
no experience on their use, it is more likely that their intention to use will be
influenced by opinions of significant others (Thompson et al., 1994; Venkatesh et al.,
2003).
3.2 Mass Media Effects Research
Mass communication is defined as “any form of communication transmitted through a
medium (channel) that simultaneously reaches a large number of people” (Wimmer and
Dominick, 2013, p. 2). Respectively, mass media is defined as “any communication channel
used to simultaneously reach a large number of people, including radio, TV, newspapers,
magazines, billboards, films, recordings, books, the Internet, and smart media” (Wimmer and
Dominick, 2013, p. 2).
In modern societies, characterized by specialization and diversity, media are considered as a
system in control of important information resources which individuals depend on to fulfill
their information needs, thus they may cause cognitive (e.g. changes in belief and value
system), effective (e.g. changes in feelings), and behavioral changes (e.g. changes in purchase
of products and services and decisions concerning the activation or de-activation of media
exposure) in consumers who are regularly exposed to them (Ball-Rokeach and DeFleur,
1976; Ball-Rokeach and Jung, 2009; Grant et al., 1991; Ruiz-Mafe and Sanz-Blas, 2006).
Therefore, investigating and understanding the effects that media might have on society and
individuals has always been the central focus of the mass communication research (Katz,
2001) and its dominant paradigm (Lang, 2013).
More important for the objectives of this dissertation is the stream of research in mass
communication whose focus is on individual level analysis of media effects; the research

73
stream which explores the function of mass media on individuals in terms of determinants of
their motivation to use a certain medium and the nature of their relations with a certain
medium, to understand the effects that a certain medium can cause on individuals’ behaviors.
The most established theory which allows such individual level exploration of media
relations is the media system dependency theory (Ball-Rokeach and DeFleur, 1976).
For more than four decades, media system dependency theory has provided a solid theoretical
base to understand consumers’ media use motivations and derived consequences. Since its
introduction, it has been applied to unfold the relationships between individuals and different
media as television (Grant et al., 1991; Skumanich and Kintsfather, 1998), radio and print
media (Loges, 1994; Loges and Ball-Rokeach, 1993) and recently Internet (Jung, 2008; Ruiz-
Mafe et al., 2014). The central assumption of this theory is that the influences of media will
only be powerful if individuals develop a dependency relation with information resources
controlled by media. Ball-Rokeach and DeFleur (1976) define dependency as “a relationship
in which the satisfaction of needs or the attainment of goals by one party is contingent upon
the resources of another party” (P. 6). They argue that the intensity of the media dependency
relationship is contingent on the perceived utility of a certain medium to meet goals.
One of the objectives of this dissertation is to investigate the potential role of Internet
information use on individuals’ intention to use in-store ubiquitous computing based
information services. Therefore, in this dissertation, the media dependency theory is selected
as theoretical framework to identify the effects that the use of the Internet as an information
medium can cause on individuals and hypothesize their influences on cognitive and effective
beliefs concerning the use of in-store ubiquitous computing based information services.
Hence, the remainder of this section is dedicated to review of relevant literature on media
system dependency theory; starting from the origins, explaining the approach of media
dependency theory in individual level as well as arguing its superiority comparing to
competing model of uses and gratification. This section will be closed by an exhaustive
review of studies on applications of individual media dependency in IS research, particularly
in the context of Internet.
3.2.1 Media System Dependency Theory
However, identifying the media effects has been the primary concern of mass communication
research; it has been always characterized by great controversy and even conflicting views

74
among theorists and scholars. Specifically, the disagreement about the magnitude of media
influences has even shaped the dominant historical narrative of the discipline itself around the
polarized notions of significant versus minimal effects (Neuman and Guggenheim, 2011).
The progression of the classical media effects literature was typically characterized as a
three-stage succession, starting with the prevalence of the magic-bullet theories positing
strong media effects followed by a pull in the opposite direction and the adoption of the
model of minimal effects and finally the renunciation of the earlier works in favor of the
rediscovery of powerful media influences (Lowery and De Fleur, 1983).
Typically attributed to the academic works concerned with propaganda and centralized media
control between the world wars, the magic bullet perspective contends the simplistic concept
of treating media messages as magic bullets targeted towards passive audience members who
lacked independent sources of information. This formulation posits that media effects are
direct, unmediated, immediate and uniform (McCombs, 2004; Wicks, 1996). This paradigm
was quickly proved to be exaggerated and even mythical after being discarded by empirical
findings. Notably, the work of Lazarsfeld et al. (1948) on the effects of political campaigns
on voting behavior, introduced the social science methodology of survey research to the mass
communication field and provided groundbreaking empirical evidence of the invalidity of the
magic bullet effect model. These findings opened the door for more consolidating research
against the idea of massive influences leading to the limited effects conceptualization. This
approach assumes that media influences are constrained by individual and social differences
meaning that only few people could be affected by certain media and this only in distinct
situations (Lowery and De Fleur, 1983).
The accumulating failure to prove more than small effects despite the glaring impact of media
on modern society split scholars between those who attempted to find compelling influences
and those confirming the notion of limited effects. While the latter mostly focused on adding
more specificity by investigating new variations of distinct groups, social situations, mediums
and message types, the former aspired to solve the problem through more theoretical
complexity. This controversy within mass communication research pushed the discipline to
tackle the matter of media effects each time from different paradigms and perspectives and
was a driving force behind its theoretical richness. However, it also resulted in less
abstraction within the field and more concerning theoretical dissimilarity and contradiction,
while always failing to provide a standout formulation that best explains mass media effects.

75
The theory of media system dependency comes about from the need for an overarching
theory that synthesizes previous paradigms to allow for generalizable knowledge (Ball-
Rokeach and DeFleur, 1976). Ball-Rokeach and DeFleur (1976) avoid taking a sterile all or
none approach by integrating the previous findings, instead of simply taking sides in a
conflicting line of research. Specifically, their theory attempts to explain when and why do
media exert power on individuals and society and with what consequences, rather than
narrowly seeking to prove whether media do have significant influences or not. In other
words, the theory avoids pre-assuming generalizations of powerful or minimal effects and
offers another theoretical alternative that focuses on investigating the conditions under which
those effects might occur.
The originators of the theory blame the tenacious ambiguity surrounding media effects on
“wrong theoretical conceptualizations to study the wrong questions” (Ball-Rokeach and
DeFleur, 1976, p. 3), suggesting that previous research relied too heavily on psychological
theory adaptations at the expense of the sociological perspective.
Ball-Rokeach and DeFleur (1976) admit that the previous approaches allow for engaging
more specificity and simplicity regarding the investigated variables and are convenient to
demonstrate how media effects can vary among individuals. However they argue that the bias
in the preceding body of research towards micro level analysis tackling specific units of
individuals, in specific situations, eventually favored conceptualizations that overlook the
englobing social context within which the media and its audience exist and how these
components among other social structures interact together; such interactions happen on a
massive scale and their engendered effects can take a long time to manifest due to the
sophisticated nature of these relationships. Hence those influences are very difficult to
capture through commonly conducted laboratory stimulus-response experiments that focus on
individuals’ short term reactions to media messages, in specific situational conditions.
Therefore, Ball-Rokeach and DeFleur (1976) regard the preceding formulations as unable to
grasp the full complexity of the mass communication processes, and recommend involving
more sociological theory elaborations instead of solely approaching the issue of media effects
from the individual (micro) level of analysis. Particularly, they suggest that works of
Durkheim (1933), Marx (1961), and Mead (1934) can provide a better framework to
investigate media influences, one which considers that neither media nor its audience exist in
a vacuum, rather they are pivotal components of a social system.

76
On one hand, according to the symbolic interaction paradigm of Mead (1934), people base
their actions upon meanings and these meanings are shaped through the encountered social
perspectives. People would employ the information resources around them to create
meanings in order to act properly. On the other hand, in societies of complex structure,
characterized by specialization and diversity, interpersonal communication becomes
restricted and ineffective in providing people with the information they need to make sense of
their environment. Thus individuals become unaware of the guiding norms of the larger
society and therefore incapable of constructing their social realities, which creates a state of
ambiguity (Durkheim, 1933). Hence media as a system in control of important information
resources imposes itself as a way to fill the void engendered by the social structure of modern
society. This leads systematically to the creation of interdependent relations between media
and other social components, which can be in terms of cooperation or conflict and change,
both at the level of individuals, groups or large scale social systems (Ball-Rokeach, 1998).
The most direct influencing theory on the MSD formulation is Emerson’s (Emerson, 1964,
1962) power-dependency theory (Ball-Rokeach, 1998). This theory considers that
dependence is the flip side of power, meaning that power lies not in the relative superiority of
resources’ control but rather in the extent to which those resources produce dependence.
Power is thus above all relational and based on the dynamics between resources and
dependences, which can be sustained or lost. In a similar manner, Ball-Rokeach tries to
explain why media effects can be powerful in some occasions and weak in others. In fact,
Emerson’s perspective inspired her to formulate MSD as a media power theory built around a
central conceptualization: the media dependency relation.
Ball-Rokeach and DeFleur (1976) define dependency as “a relationship in which the
satisfaction of needs or the attainment of goals by one party is contingent upon the resources
of another party” (P. 6). Therefore, the power of mass media is contingent upon the
dependency of individuals on the media controlled information resources. Media control
three types of resources: information gathering or creating, information processing and
information dissemination. However, the dependency relationship can be in both ways,
meaning that the media system itself may depend upon the resources controlled by others.
Media power in relation to other social systems is determined by the distribution of resources
and dependencies between them.

77
Unlike Emerson, Ball-Rokeach and DeFleur (1976) follow the social ecology approach of
considering the micro or individual media system relations in the context of the higher
influence of the macro level systems relations that is relations between media systems and
other systems as economic and political systems. They argue that although interdependencies
flow in both directions from small to large units and vice versa, the macro-level of influence
is stronger. In fact, the structural dependency relations between media and other social
systems (e.g. economic and political system) are set to characterize the dependency relations
between media on one hand and individuals and interpersonal networks on the other.
Ultimately, while the media centrality in shaping personal meaning can be intervened by
psychological, sociological differences, it is largely determined by the extent to which macro
media system dependency relationships permit media to be pivotal in social knowledge
construction.
MSD is hence conceived as an ecological theory that integrates both micro and macro units
of analysis through media dependency relations. According to the theory, it is only in the
light of the relations between media, audience members and the larger social system, that the
complex process of mass communication can be explained. Even further, Ball-Rokeach and
DeFleur (1976) propose these relations as a way out from the dilemma of why media
influences seems to be sometimes powerful and sometimes not. In other words, the nature of
those relations defines the nature and intensity of behavioral, affective and cognitive media
effects. As the originators of the theory most clearly posit, “whatever the particulars of the
relationship, it is the relationship that carries the burden of explanation” (DeFleur and Ball-
Rokeach, 1989, p. 303).
3.2.2 Individual Media System Dependency Relations
The micro level of MSD relations also known as individual media system dependency (IMD)
relations revolves around the assumption that individuals are contingent upon access to
information resources controlled by media in order to attain their personal goals. Unlike prior
mass media theories such as uses and gratification theory (Katz et al., 1973) in which
individual media use were presented in terms of gratification of needs, MSD presents
individual media use in terms of attainment of goals. This conceptualization of the human
motivations behind media exposure which favors goals over needs, derives from the theory’s
“insistence on keeping the audience member social as well as psychological” (Ball-Rokeach,
1998, p. 26).

78
The originators of the theory argue that goals provide a more appropriate conceptualization of
the individual motives behind media information consumption. Implying a problem-solving
motivation, goals are more responsive than needs to changes and difficulties occurring in the
individual’s personal and larger social environs. Therefore, considering audience members as
goal-oriented individuals, located in a social environment where media controls central
information resources, is more compatible with a social ecology conceptualization of macro
MSD relations. In other words, attainment of personal goals depends on media information
resources and hence IMD relations can be strongly altered by the macro relations media have
with other social systems. This approach avoids perceiving IMD relations as a product of
merely individual characteristics or overlooking their overarching environmental and
structural contexts (Ball-Rokeach, 1998, 1985).
However, IMD relations cannot be narrowed down to personal goals; for instance,
dependency on media is rather the contingency relation between these goals and media
resources than just a function of individual goals. Thus, by definition, variations in
individuals’ media system dependency relations do not only occur when goals are altered but
ultimately when the perceived utility of media resources to attain these goals changes.
Consequently, individuals sharing same hierarchy of goals do not necessarily have the same
individual dependency relations with media (Ball-Rokeach, 1998, 1985).
3.2.2.1 Determinants of Individual Media System Dependency Relations
As mentioned, IMD relations are function of goals and perceived utility of media resources.
In turn goals and perceived utility are influenced by macro media system dependency
relations, social environs, media activity, interpersonal networks and individuals’ structural
locations (Ball-Rokeach, 1985; Ball-Rokeach and Jung, 2009; Grant et al., 1991). Figure 17
illustrates all influencing factors in construction of individual media system dependency
relations.

79
Figure 17: Determinants of individual media system dependency relations (Ball-Rokeach and Jung, 2009, p. 535)
Macro media system dependency relations are central when it comes to determining the
nature of micro media dependency relations. Individuals live in societies where media has
interdependency relationships with other social systems such as economic and political
systems. These relations also known as structural dependencies, define the range and
exclusivity of knowledge construction roles that can be attributed to media in the society and
thus the potential range of media dependencies that individuals can develop. In other words,
the more macro media system dependency relations allow media to provide a larger number
of exclusive and central information functions, the more likely that media will have a
considerable influence on individuals. Therefore, structural dependencies are the central
determinant of individuals' media dependencies. Further, these macro media system
dependencies establish a coherent context for examining the other origins of variation in
micro dependency relations among the individuals of the same society (Ball-Rokeach, 1998,
1985; Ball-Rokeach and Jung, 2009).
These sources of variations include social environs, meaning any environs that are
susceptible to affect personal goals. Ambiguity and threat are two social environ attributes
Macro-level Systems Relations
Macro Level
Meso Level
Micro level
Structural Dependency Relations
Media systemEconomic SystemPolitical System Other Systems
Social Environment
Media System Activity
Interpersonal Network Activity
Individual Characteristics
Structural Location Personal Goals
Individual Media System Dependency Relations

80
that are expected to alter individual media dependency relationships. In fact, problematic
situations, whether accruing on the personal or social level, can cause a state of cognitive and
affective discomfort which pushes individuals to employ the accessible information resources
around them in order to achieve their goals of coping with and overcoming those chronic
conditions. Specifically, when the social environs are undergoing conflict and change and
therefore prominent aspects of these environs can be perceived as uninterpretable,
unpredictable and/or threatening, individuals’ reliance on media is more likely to be
intensified.
This leads to another important determinant of individual media dependency relations: media
activity. As structural dependencies “place the media in the position of being an essential link
between individuals and their social environs” (Ball-Rokeach, 1985, p. 501), media can
systematically implicate in constructing the perceived ambiguity and threat of individuals’
social environs. Therefore, the message focus of the media is assumed to have a considerable
effect on micro MSD relations.
Similarly, the message focus of audience members’ interpersonal networks can have an
impact on their individual media dependency relations through influencing their personal
goals. This is because Individuals’ goals can change in order to fit better with the social
influence of their interpersonal networks.
Lastly, audience members’ dependencies on media can also be affected by their structural
location within their societies. Individuals’ structural location determines their potential
resources acquisition and thus can impact their media system dependency relationships,
especially through personal goals (Ball-Rokeach, 1985). For example access to alternative
media resources, can alter these dependency relationships (Ball-Rokeach, 1998).
3.2.2.2 Typology of Individual Media System Dependency
MSD theory perceives individuals as having three general types of goals, namely
understanding, orientation, and play (Ball-Rokeach et al., 1984; Grant et al., 1991).
Accordingly individual’s motivations to use media information resources is in order to attain
these goals (Ball-Rokeach, 1998; DeFleur and Ball-Rokeach, 1989). Therefore, the individual
media dependency typology proposed by the theory consists of three dimensions, each of
which in turn comprises of a personal and social dimension resulting in six different types of
media dependency relations presented in Table 10.

81
On one hand, this typology is assumed to encompass all possible individual dependency
relations. On the other hand, the occurrence of one type of dependency doesn’t necessarily
exclude the others, rather individuals can seek to achieve understanding, orientation and play
goals at the same time through the same media resources. Additionally, all dependency
dimensions are perceived to be equally important for individuals and thus have the potential
to produce equally central media dependency relations (Ball-Rokeach, 1985).
Understanding dependency relations occur when audience members are motivated to employ
media information resources in order to establish knowledge and meaningful interpretations
of themselves and their social environs. While self-understanding dependencies derive from
the motivation to acquire the capacity to comprehend one’s self and to interpret personal
aspects such as one’s beliefs and behavior, social understanding dependencies concern
contingency on media information resources to make sense of the surrounding world
including interpretation of occurring, past or future events, and apprehension of the guiding
norms of larger society (Ball-Rokeach, 1985; Ball-Rokeach and Jung, 2009).
Individuals typically employ the understanding they gain in order to act properly and
meaningfully. This leads us to another dimension of individual dependency on media:
orientation dependency. This media dependency dimension stems from the individual
motivation to obtain the necessary decision-making guidance in order to behave correctly,
whether on the personal level or with others. Action orientation dependencies revolve around
seeking direction and support from media information resources, when it comes to
performing behaviors concerning solely individual actions that do not involve interacting
with others. Such behaviors can include purchasing items, voting, planning activities, etc.
Contrariwise, interaction orientation dependencies are about contingency on media with the
objective to figure out how to behave in a manner that provides or maintains effective
relationships whether they are personal, professional, communal or other (Ball-Rokeach et
al., 1984; Ball-Rokeach and Jung, 2009).
Table 10: Typology of individual media dependency relations
Dimension Understanding Orientation Play
Personal Dimension Self-understanding Action orientation Solitary play
Social Dimension Social understanding Interaction orientation Social play

82
Equally central are play goals. The MSD theory posits that individuals rely on media for play
driven by escape and tension release goals labeled as solitary play dependencies.
Furthermore, play fulfills important learning, communication, expression and socialization
roles that are crucial for both individuals and societies. While solitary play dependencies
revolve around the disseminated content and its capability to directly engender relaxation
stimulation and/or recreation, social play concerns more the medium’s capacity to provoke
and facilitate bonding and interaction between individuals through co-participation in play
activities rather than the proprieties of the content itself (Ball-Rokeach et al., 1984; Ball-
Rokeach and Jung, 2009).
This typology of individual media dependency relations is assumed to be valid for examining
whole audiences as well as particular social groups and individuals. Moreover, the typology
can be applicable to depict audience members’ dependencies on media systems in general,
singular mediums, and even dependency relations with specific media products.
3.2.3 Individual Media System Dependency in Information System Research
As Wimmer and Dominick (2013) state in their recently updated definition of mass media,
the Internet undeniably has become an instance of mass media. As of the 30th of November
2015, there are more than three billion Internet users in the world that is around 46% of the
world’s population (“World Internet Users Statistics and 2015 World Population Stats,”
2015). In Germany, meanwhile about 80% of population use the Internet from which 63%
use it daily (Frees and Koch, 2015). Thus the Internet can be used as a communication
channel to simultaneously reach a large number of people and therefore an instance of mass
media.
Adopting the theoretical concepts from reference disciplines to explore and understand the
conceptually analogous processes in IS contexts has been a long tradition in IS research. For
example adoption of TRA from social psychology (Davis, 1989) (see section 3.1.2) and Uses
and Gratification theory from mass communication (Larose et al., 2001; Shao, 2009; Smock
et al., 2011; Stafford et al., 2004) to information technology acceptance and use. In the same
manner, since the Internet has reached the mass audience, media system dependency theory
has attracted IS researchers, as it offers a robust foundation to explore individuals’
motivations to use and effects of using the mass media.

83
MSD theory has been employed as a theoretical framework to investigate the Internet
dependency relations on both the macro and micro ecological levels of analysis. From the
macro level perspective, several studies have inquired the determinants and outcomes of the
structural interdependencies between the Internet and other social systems (Groshek, 2012,
2011, 2009; Zhang, 2006); or tried to explain the variations and the effects of the individual
Internet dependency relations by examining the macro-origins of dependencies, such as
structural dependencies as well as ambiguous and/or threatening social environs (Jung, 2012;
Kim et al., 2004; Lyu, 2012; Tai and Sun, 2007).
For past two decades, Internet has been a key driver to economic growth and its role is
expanding. For example, in Germany, the Internet economy accounts for 65 billion Euros
only in 2014 and for the period of 2015-2019, this amount is expected to grow 12% annually
till reaching 114 billion Euros in 2019 (Riegel et al., 2015). Based on MSD theory, the above
mentioned figures translate to interdependencies of economic system and the Internet,
macro/structural dependencies. Therefore it can be argued that the structural dependency
relations have been already formed for this medium (see Figure 17). Thus there is a
dependency between the Internet as a specific mass medium and the economic system that is
merchandisers of goods and services are dependent on Internet information resources to
disseminate consumption-stimulating messages. Based on MSD theory as the structural
dependency relations are formed, there must be also individual media dependency instances.
Therefore, IS researchers have started to adopt the MSD theory focusing on the micro
determinants and outcomes of individual dependency on the Internet, meaning the personal
and situational origins as well as the cognitive, affective, and behavioral effects of
dependency relations.
As the micro level of analysis is more relevant to the purpose of this dissertation, to examine
the applicability of MSD theory in investigating the micro determinants and outcomes of
individual Internet relations, an exhaustive literature review was carried out. Articles using
the theory, however without employing it as the focal point of the study were discarded.
Additionally, studies focusing on political or news information were considered to be outside
the scope of this review. An extensive search of peer reviewed journals through relevant
academic publishing databases (e.g., Elsevier Science Direct, Emerald Insight, and Google
Scholar) provided 10 academic articles.

84
The first study which used the theoretical perspective of media system dependency in the
context of the Internet focusing on micro level of analysis was the work of Patwardhan and
Yang (2003) which introduced the Internet dependency relations as a predictor of online
consumer activities. Based on the MSD theory they defined Internet dependency relations
(IDR) as the extent to which people depend on the Internet [information] to meet their social
and personal goals (P. 57). They postulated that the intensity of the general Internet
dependency relations positively influences Internet users’ online shopping (including product
information search, alternative evaluation activities, and product purchase) experience. The
empirical results can show that IDR as a summed intensity (considering all goal dimensions)
had a significant positive effect on online shopping. In addition, they have tested the
relationship between the action orientation goal dimensions and the online shopping activity;
action orientation was found to be an even stronger predictor of online shopping experience.
Since the introduction of IDR by Patwardhan and Yang (2003), nine other studies adopted the
theoretical perspective of the media system dependency to examine the determinants and
outcomes of using the Internet or Internet based applications. The key findings of these
studies have been presented in Table 11 (Ben Abdelaziz, 2015). The findings of the recent
adoptions of micro level MSD theory in the Internet context demonstrate its applicability to
the context.
Table 11: Studies using MSD theory in the context of Internet – micro determinants and outcomes of the Internet dependency
Author/s (year) Subject of Dependency
Theme Key Findings
(Bigne-Alcaniz et al., 2008)
Online Shopping Dependency Determinants & Outcomes
Innovativeness and online information dependency predicted future online shopping intention.
Perceived usefulness mediated the positive effect of perceived ease of use on online shopping information.
(Jung, 2008) Internet Internet Connectedness Determinants
Scope and intensity of Internet-related goals, social and technological environments significantly influenced individuals’ Internet Connectedness.
(Jung et al., 2012) Internet Internet Connectedness Dimensions & Outcomes;
Internet goals Dimensions & Outcomes
The goals that adolescents had for going online affected the types of activities they engage online and also their use of other media.

85
Author/s (year) Subject of Dependency
Theme Key Findings
(Men and Tsai, 2013) Social Media Dependency Outcomes
Social media dependency, parasocial interaction and community identification predicted public engagement with corporate social network sites (SNSs).
(Patwardhan and Yang, 2003)
Internet Dependency Outcomes
Internet Dependency Relations (IDR) predicted online consumer activities.
IDR predicted online shopping activities and online news reading, however not online chatting.
Action orientation, solitary play and social understanding, predicted online shopping, online chatting, and online news reading, respectively.
(Riffe et al., 2008) Internet for In-Depth Information
Dependency Determinants & Outcomes
Dependent respondents valued Internet over other sources of in-depth information sources. Individual background variables predicted dependency.
(Ruiz-Mafe and Sanz-Blas, 2006)
Internet Dependency Determinants & Outcomes
Age, education, Internet affinity, exposure and experience predicted Internet dependency. Internet dependency predicted willingness to purchase online, with searching for information to take decisions as the most relevant factor.
(Ruiz-Mafe et al., 2014) Facebook Fan Pages
Dependency Outcomes
A significant positive influence of perceived usefulness, attitude, trust and dependency on loyalty in fan pages, and an indirect influence of perceived ease of use mediated by perceived usefulness and attitude.
(Sun et al., 2008) Internet Dependency Determinants
Motivation was a more relevant predictor of Internet dependency than demographics. Cognitive and affective involvement mediated the relationship between motivation and dependency.
(Wang and Yang, 2008) Online Shopping Dependency Determinants
Respondents with high levels of harmonious passion and obsessive passion significantly had higher online shopping dependency. Compulsive buyers are more dependent on online shopping than the other.


87
4 Exploring Consumers’ Acceptance of Ubiquitous Information Services in
Brick and Mortar Retail – Conceptual Model and Research Hypothesis
The purpose of this chapter is to develop a comprehensive and theoretically found conceptual
framework which can explain the antecedents and consequences of the user acceptance of in-
store ubiquitous computing-based information services. To do so, first the approach taken for the
development of the conceptual framework is discussed. The guidelines for the context-specific
theorizing in information system research from W. Hong et al. (2013) is used to build an
acceptance model for the context of in-store ubiquitous computing-based systems.
Pursuant to these guidelines, first the most appropriate base model is selected to guide the
contextualization process. In the next step the rationale to incorporate the Internet dependency
relations into the technology acceptance model is discussed. Furthermore, the constructed model
is augmented by germane user-specific variables derived from the customer research literature.
Research hypotheses derived from the conceptual framework will be then empirically tested in
chapter 5.
4.1 Developing a Context-Specific Theory in Information Systems Research
However, the generalizability in different contexts and settings is one of the important attributes
of a theory, in the information system research, there has been a widely recognized need for the
context-specific theory development (Chiasson and Davidson, 2005; Orlikowski and Iacono,
2001; Rosemann and Vessey, 2008; Venkatesh et al., 2007). In fact the first theory in the field,
TAM, is the result of the contextualizing social psychology theories into the context of
information systems (see section 3.1.2). Taking the context into consideration while developing
theories leads to the emergence of richer and more practically relevant theories (Bamberger,
2008; Bliese and Jex, 2002; W. Hong et al., 2013). In this regard, W. Hong et al. (2013) note that
“one way to develop richer theories that provide actionable advice is to take the context into
greater consideration to generate insights about the phenomena associated with the information
technologies, individuals, and organizations” (p. 2).

88
Johns (2006) defines the notion of the context as “situational opportunities and constraints that
affect the occurrence and meaning of (…) behavior as well as functional relationships between
variables” (p. 386). Synthesizing various definitions from the literature, Whetten (2009) defines
context effects as “the set of factors surrounding a phenomenon that exert some direct or
indirect influence on it-also characterized as explanatory factors associated with higher levels of
analysis than those expressly under investigation” (p. 31). Thus the context can be a significant
driver of the cognition, beliefs, and the behavior or the moderator of relations among them
(Bamberger, 2008).
Based on the above-mentioned definitions, in the field of technology acceptance research,
contextual factors which may have direct or indirect impacts on the technology usage behavior
can be classified into three categories, namely characteristics of technology-based services,
characteristics of technology artifacts and situational characteristics:
Characteristics of technology-based services: dimensions of users’ perceptions may vary
dependent on the characteristics of technology-based services, also in some literature referred
to as the system type (W. Hong et al., 2013). For example, in the case of an online banking
system, users’ perceptions of systems’ security may have a direct influence on its acceptance
(Pikkarainen et al., 2004). However, considering the perceived security for the acceptance of
an e-book reader device is not as justifiable by the type of the system. Similarly incorporating
perceived enjoyment as a direct influencing factor of acceptance of a gaming application can
be justified by hedonic nature of the system, however this cannot be the case while analyzing
a pure performance based system as a project management system. Regarding the system
type factors, W. Hong et al. (2013) note that “although these factors are context specific, they
are not directly connected to system characteristics but serve to capture high-level user
perceptions about a system” (p. 6).
Characteristics of technology artifacts: characteristics of technology artifacts are one of the
context factors which are considered while context-specific theorizing (W. Hong et al.,
2013). In fact characteristics of technology artifacts vary contingent on the type of
technology itself as well as its usage contexts; thus no one usage conceptualization can fit all
technologies (Lee and Baskerville, 2003; Orlikowski and Iacono, 2001). For example,
whereas download speed may influence users’ perceptions of usefulness of a wireless
89
Internet, the usefulness perception of an e-book reader may be influenced by the quality of its
screen. Technology characteristics are used either as indirect or moderating factors on the
usage of a technology. For example Lu et al. (2005) incorporated technology complexity as
the antecedent factor of usefulness and ease of use while developing a TAM based model for
the acceptance of wireless Internet. Similarly Pikkarainen et al. (2004) added quality of the
Internet connection in their acceptance model of online banking.
Situational characteristics: situational characteristics by themselves are divided into two
categories, namely usage context (e.g. organizational vs. personal) and characteristics of
users (e.g. experienced users vs. inexperienced) (Hevner et al., 2004). In this regard, Boiney
(1998) notes that “the same technology will not provide the same results with each group and
in each setting” (p. 343). Likewise Gopal and Prasad (2000) emphasize that technology
cannot be studied outside its social context and refer to inconsistent results in the information
systems research as potential consequence of overlooking the value of social context.
UTAUT2 is a prominent example of the contextualization of the original UTAUT (designed
for organizational context) into the personal usage context; the model also incorporates user
characteristics e.g. age and gender as moderators of its core relationships (see section
3.1.2.3).
Not surprisingly, as a subfield of information systems research, the need for development of
context-specific theories is also recognized for the acceptance of ubiquitous computing
technologies. In this regard, Yoon and Kim (2007) note that “ubiquitous computing technology is
seen as an emerging new information technology with such potency that it has changed the way
we view IT. Although perceived ease of use and perceived usefulness constructs have been
considered important in determining the individuals’ acceptance and use of IT in the last few
decades, factors contributing to the acceptance of a new IT are likely to vary according to the
technological characteristics, the target users, and the context” (p. 102). Furthermore, a recent
literature review article of technology acceptance studies calls for the development of context
specific models for the state of the art technologies as ubiquitous computing (Chen et al., 2011).
After all, the ultimate goal of the implementation of ubiquitous computing technologies in brick
and mortar stores is to entice customers to shop in these stores, not to merely be a generic
information system. However, review of the literature on the acceptance of in-store ubiquitous

90
computing systems (see section 3.1.3) shows that the majority of existing studies used TAM for
their analysis; but TAM doesn’t capture the context characteristics that are specific to ubiquitous
computing settings.
In line with the objectives of this dissertation and as a response to the need for the development
of context-specific models in the field of ubiquitous computing technologies, the remaining of
this chapter is dedicated to the development of a context-specific conceptual framework for the
acceptance of in-store ubiquitous computing-based information services. To do so, the guidelines
for the context-specific theorizing in information system research from W. Hong et al. (2013) are
used.
Examining the prior research and classifying the existing approaches, W. Hong et al. (2013)
recently introduced a framework as well as a set of guidelines for context-specific theorizing in
information systems research. They have divided the contextual theory development practice into
two general approaches, namely single-context theory contextualization and cross-context theory
replication. Whereas the latter approach is concerned with the validation of the generalizability
of theories in different contexts, the former approach is concerned with the refinement of general
theories based on the specific contexts being studied. The main objective of this dissertation is
developing a theoretically found model for the user acceptance of in-store ubiquitous computing-
based information services; thus theory development in this dissertation is an instance of the
single-context theory contextualization approach and not cross-context theory replication. Figure
18 is an illustration of contextual theorizing approaches in which the approaches taken by this
study are highlighted. The rationales for selecting the level 2a and 2b (see Figure 18) are
discussed in corresponding sections (see section 4.4).
In line with the objectives of this dissertation, different levels of contextualization are needed for
the development of the conceptual framework, namely service characteristics, technology
characteristics, and user characteristics. Thus, based on the proposed framework and guidelines
of W. Hong et al. (2013), while single context theoretical contextualization, the following stages
shall be taken
selecting a general theory as a base model,

91
contextualizing the general theory into the context of in-store ubiquitous computing-based
information services (general characteristics of technology-based services),
finer contextualizing of the context-specific general model to user characteristics in general
and characteristics of users induced by expanding penetration of the Internet in particular
(user characteristics),
and finer contextualizing of the context-specific general model to service and technology
characteristics.
Figure 18: Approaches for incorporating the context into theorizing (W. Hong et al., 2013, p. 5)
Figure 19 is an illustration of above mentioned stages accompanied with the corresponding steps
from W. Hong et al.’s (2013) context-specific theorizing guidelines in information systems
research adapted to the objectives of this dissertation.
Few steps have been already taken in in prior chapters to build the foundation for the theory
development; the remaining steps will be taken in the course of this chapter till complete
Contextual theory development
Cross-context theory replication
Replicate theoretical models in different contexts
Consolidate findings into context-contingent theory by conducting theory-grounded meta analyses
Single-context theory contextualization
Identify general theories
Level 1: Contextualize established theories by adding or removing core constructs
Level 2c: Decompose
core constructs into contextual
factors
Level 2b: Incorporate the
contextual factors as
moderators of relationships
Level 2a: Incorporate contextual factors as
antecedents of core constructs or dependent
variables
The approach taken in this work
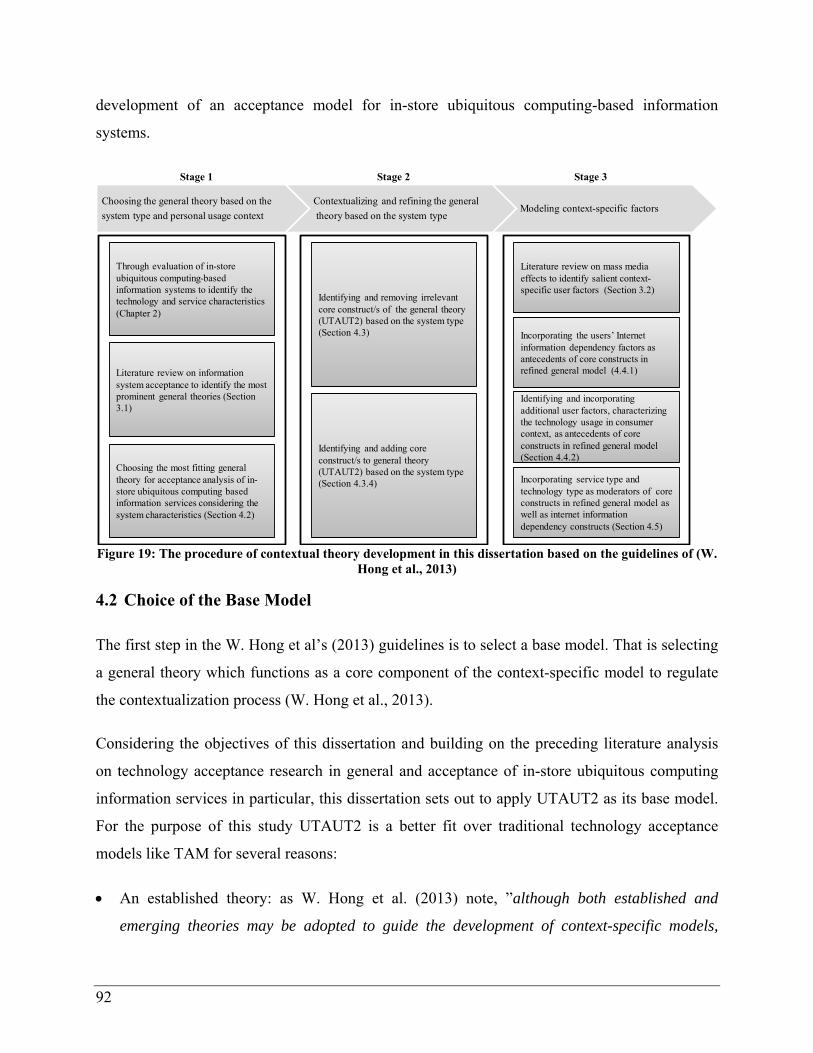
92
development of an acceptance model for in-store ubiquitous computing-based information
systems.
Figure 19: The procedure of contextual theory development in this dissertation based on the guidelines of (W.
Hong et al., 2013)
4.2 Choice of the Base Model
The first step in the W. Hong et al’s (2013) guidelines is to select a base model. That is selecting
a general theory which functions as a core component of the context-specific model to regulate
the contextualization process (W. Hong et al., 2013).
Considering the objectives of this dissertation and building on the preceding literature analysis
on technology acceptance research in general and acceptance of in-store ubiquitous computing
information services in particular, this dissertation sets out to apply UTAUT2 as its base model.
For the purpose of this study UTAUT2 is a better fit over traditional technology acceptance
models like TAM for several reasons:
An established theory: as W. Hong et al. (2013) note, ”although both established and
emerging theories may be adopted to guide the development of context-specific models,
Stage 1 Stage 2 Stage 3
Choosing the general theory based on the
system type and personal usage context
Contextualizing and refining the general
theory based on the system typeModeling context-specific factors
Identifying and removing irrelevant core construct/s of the general theory (UTAUT2) based on the system type (Section 4.3)
Identifying and adding core construct/s to general theory (UTAUT2) based on the system type (Section 4.3.4)
Literature review on information system acceptance to identify the most prominent general theories (Section 3.1)
Choosing the most fitting general theory for acceptance analysis of in-store ubiquitous computing based information services considering the system characteristics (Section 4.2)
Through evaluation of in-store ubiquitous computing-based information systems to identify the technology and service characteristics (Chapter 2)
Incorporating service type and technology type as moderators of core constructs in refined general model as well as internet information dependency constructs (Section 4.5)
Literature review on mass media effects to identify salient context-specific user factors (Section 3.2)
Incorporating the users’ Internet information dependency factors as antecedents of core constructs in refined general model (4.4.1)
Identifying and incorporating additional user factors, characterizing the technology usage in consumer context, as antecedents of core constructs in refined general model (Section 4.4.2)

93
researchers adopting an established theory, (…), will encounter fewer challenges,
particularly in terms of explaining the relevance of theory to the contexts” ( p. 8). UTAUT2
is developed by leading researchers in the field of technology acceptance. It is based on the
UTAUT which was created by synthesizing eight dominant and established models in the
field. In addition, UTAUT2 is one of the few acceptance models which is already
contextualized into the context of consumer technologies. However established, because of
its newness in comparison to the older models, the number of replication studies for its
generalizability are yet limited. In this regard Venkatesh et al. (2012) call for replication
studies on different technology contexts. Thus by choosing UTAUT2 as a base model, this
dissertation not only follows the W. Hong et al.’s (2013) guidelines but also it reflects to the
Venkatesh et al.’s (2012) call concerning the future research in UTAUT2.
A powerful model in the context of the consumer technology use: the original UTAUT is
empirically proven to vigorously outperform all of the eight previous models and their
extensions in terms of the explained variance (see section 3.1.2.3) (Venkatesh et al., 2003).
The empirical results of UTAUT2 in the consumer context are comparable to the ones of
UTAUT in organizational context (see section 3.1.2.3) (Venkatesh et al., 2012). Last but not
least, while extending the boundaries of classical TAM-based models, UTAUT2 retains a
parsimonious structure (Venkatesh et al., 2003).
Incorporating both affective and social factors: affective factors as hedonic motivation as
well as social factors as social influence are known to have a significant role in the
acceptance of technologies in the retail setting (Rintamäki et al., 2006a; Yim et al., 2013).
Therefore, it is expected that these factors will play an important role in the acceptance of in-
store ubiquitous computing systems. In their paper on the context-specific theorizing in
information system research, W. Hong et al. (2013) note that “the choice of a general
adoption model should adequately capture the key core constructs relevant to the context.
For example, in contexts where social influence is of great importance in understanding user
acceptance, general models that capture this aspect, such as UTAUT, will be appropriate.”
(p. 8). UTAUT2 is one of the few general technology acceptance models which covers both
of these aspects.
Including moderator effects: last but not least, due the importance of including moderators in
acceptance models in terms of avoiding inconsistencies and low explanatory power (Dwivedi

94
et al., 2011; Sun and Zhang, 2006), UTAUT2 provides a good framework to enquire the
moderating effects that are in the scope of the current dissertation (i.e., age and gender).
4.3 Contextualizing UTAUT2 into In-Store Ubiquitous Computing-based
Information Services
After selecting the base model, the next step in developing a contextual theory is contextualizing
and refining the base model (see Level1 in Figure 18 and Stage 2 in Figure 19). The
contextualizing and refinement of the base model is done by removing the context irrelevant core
constructs and adding the minimal set of core constructs which are relevant to the context (W.
Hong et al., 2013).
The original UTAUT2 posits that seven distinct factors determine individuals’ behavior intention
to use a technology: performance expectancy, effort expectancy, social influence, facilitating
conditions, hedonic motivation, price value, and habit. In turn, behavior intention to use a
technology determines the technology use behavior (see Section 3.1.2.3 and Figure 16). Table 12
lists the determinants of the behavior intention as well as their definitions. In addition, UTAUT2
posits that age, gender, and experience moderate the core relationships (see Section 3.1.2.3 and
Figure 16).
Table 12: Direct determinates of individuals’ intention to use a technology in original UTAUT2 (Venkatesh et al., 2012, 2003)
Direct determinants of behavior intention
Definition
Performance Expectancy The degree to which using a technology will provide benefits to consumers in performing certain activities
Effort expectancy The degree of ease associated with consumers’ use of the system
Social influence The degree to which a consumer perceives that important others believe he or she should use the new system.
Facilitating conditions The degree to which an individual believes that an organizational; and technical infrastructure exists to support use of the system
Hedonic motivation Fun or pleasure derived from using a technology
Price value Consumers cognitive tradeoff between the perceived benefits of the applications and the monetary cost for using them
Habit The extent to which people tend to perform behaviors automatically because of learning

95
In line with the contextualizing and refining the base model, UTAUT2, into in-store ubiquitous
computing-based information services, the following modifications are made to the original
model:
The construct “use behavior” is excluded from the model. Since diffusing in-store
ubiquitous computing-based information services is yet in its embryonic stage and users
rarely had the opportunity to use such services, the actual use behavior cannot be
observed. Therefore in this work, user acceptance is examined by behavior intention
rather than actual use, considering that behavior intention is a good predictor of the actual
use behavior (Ajzen, 2011; Ajzen and Fishbein, 1980; Yousafzai et al., 2007a).
For the same reason, behavior intention determinant of “habit” and the moderator factor
of “experience” are eliminated; both of these factors are related to the previous use of the
same technology which in regard to in-store ubiquitous computing-based information
services is most probably not the case.
Behavior intention determinants “facilitating condition” and “price value” are as well
excluded. Facilitating condition captures the impact of supportive infrastructure which is
not applicable in the current research setting. Correspondingly, price value is only
applicable when the use of a technology device or service is associated with monetary
costs for users. However, in-store ubiquitous computing information services are
considered as free of cost applications to improve the customer experience in store.
A new construct of “intention to prefer” has been added as a consequence of behavior
intention to use the technology. In the context of this dissertation, intention to prefer is
defined as the degree to which users will prefer a retail store which offers in-store
ubiquitous computing-based services. As mentioned in section 4.1, the key objective for
the development of contextual theories is to provide more practically relevant advices.
Incorporating the notion of intention to prefer into the UTAUT2 is in line with this
objective; the answer to the question if the intention to use ubiquitous computing
information services influences user preference of stores which offer such technologies
has crucial practical meanings for retailers, specially while deciding about implementing
such technologies. The rationale for the relationship between behavioral intention and
intention to prefer will be discussed in more detail in this section while developing the

96
corresponding hypothesis. The primary theoretical model for this dissertation resulted
from the above-mentioned adjustments in the original UTAUT2 is depicted in Figure 20.
Figure 20: The primary research model – adjusted UTAUT2 to the context of ubiquitous computing information services
Four factors (beliefs) are expected to play a direct role in customers’ use intention of ubiquitous
computing-based information services. Thus, the belief system pertains to cognitive, affective
and social beliefs. Below, the rationale for the relevance of each relationship to the present
context will be discussed followed by the formulation of each theoretical relationship as a
research hypothesis.
A Subset of UTAUT2
Consequence factor
Intention to Prefer
Cognitive Factors
Performance Expectancy
Effort Expectancy
Affective Factor
Hedonic Motivation
Behavioral Intention
Social Influence
Social Factor
Antecedent Factors: formation of belief system
AgeGender

97
4.3.1 Cognitive Factors
According to TRA and TPB, while an individual is deciding about performing a certain behavior,
her behavioral beliefs are formed by both cognitive and affective evaluation of the consequences
of that behavior (Ajzen and Fishbein, 1980; Fishbein and Ajzen, 2010) (see sections 3.1.1.1 and
3.1.2.2). The cognitive dimension of behavioral beliefs in TAM has been translated into two
cognitive factors of perceived usefulness and ease of use (see section 3.1.2). As a result, in
technology acceptance studies, the cognitive and utilitarian perspective which is the answer to
the question of “how useful a system is?” has been included since the introduction of original
TAM. UTAUT and UTAUT2 as well encompass this cognitive dimension by incorporating
performance expectancy and effort expectancy factors as direct determinants of the behavioral
intention.
4.3.1.1 Performance Expectancy
Davis justifies the direct relationship between the perceived usefulness and behavioral intention
in TAM by referring to the assumption that people build their intention to use an information
system by cognitive assessment of potential performance improvements (Bagozzi, 1982). That is
if a system improves the performance of a user, regardless of her attitude toward the using, the
resulting benefits can drive the use intention (Konana and Balasubramanian, 2005).
In line with the development of a unified theory (UTAUT), Venkatesh et al. (2003) empirically
compared the eight prominent models in the technology acceptance research (see section
3.1.2.3). They have identified five conceptually similar constructs in these models which covered
the notion of performance expectancy. The performance expectancy factor within each
individual model turned out to be the strongest predictor of the intention. However, it is
important to note that Venkatesh et al. (2012) empirically tested the UTAUT2 in consumer
context and found that hedonic motivation is more important driver of behavioral intention than
performance expectancy.
In retail setting, performance expectancy stands for the utilitarian aspect of the act of shopping
which asserts that while shopping, customers are concerned with conducting the act of buying in
a timely and efficient manner (Childers et al., 2001). Thus, in the context of in-store ubiquitous
98
computing-based information systems, performance expectancy captures customers’ beliefs
regarding the performance value of the technology; that is if using the technology will improve
their shopping performance. Indeed, augmenting retail stores by ubiquitous computing systems
increases the quality of service in terms of speed and convenience (Zhu et al., 2013). That is
easier access to a large amount of information on products and improved response time to
consumers’ requests. These systems are designed to target the service quality blockages as
unprepared frontline employee, low speed in consumers’ requests and long queues resulting from
limited human resources (Pantano and Migliarese, 2014). These utilitarian benefits, if perceived
by consumers, are likely to drive customers to use the system.
The reviewed studies on the acceptance of in-store ubiquitous computing-based technologies
(see Table 9) which included the notion of performance expectancy could find a direct and
positive relationship between the performance expectancy and use intention (Kowatsch and
Maass, 2010; Kwon et al., 2007; Lee et al., 2011; Müller-Seitz et al., 2009; Rothensee, 2010;
Weijters et al., 2007). Consistent with the results of Venkatesh et al. (2003), in two studies
performance expectancy was the most significant predictor of behavioral intention (Müller-Seitz
et al., 2009; Weijters et al., 2007). Müller-Seitz et al. (2009) studied the acceptance of RFID
based services in the retail setting, e.g. intelligent racks providing product information; their
empirical analysis showed that perceived usefulness had the biggest impact on the acceptance of
the in-store RFID-based services. Likewise Weijters et al. (2007) conducted an empirical study
on the acceptance of mobile self-scanners in the grocery retail setting; similarly they concluded
that perceived usefulness demonstrated the highest explanatory power on intention.
Consistent with UTAUT2 and the evidence from the previous literature, it is expected that users
focus on potential performance benefits when facing the choice of using in-store ubiquitous
computing-based information services. Thus, the hypothesis to be tested is:
H2: Performance expectancy has a significant positive effect on behavioral intention to use in-
store ubiquitous computing-based information services.

99
4.3.1.2 Effort Expectancy
Along with the performance expectancy, since the introduction of TAM, effort expectancy has
been considered as one the most important drivers of intention to use technologies. Capturing the
same notion as TAM’s perceived ease of use, the effect of effort expectancy on behavioral
intention has accumulated significant support in the literature (Dabholkar and Bagozzi, 2002;
Davis et al., 1989; Kwon et al., 2007; Venkatesh et al., 2003).
Consistent with the previous research, in consumer context, Venkatesh et al. (2012) found that
effort expectancy had a significant effect on behavioral intention. The rationale behind this
relationship is that customers’ perceptions concerning the degree of ease to learn and operate a
system positively influence their intention to use a particular technology.
However, all of the prominent technology acceptance models as TAM, UTAUT and UTAUT2
consider effort expectancy as a direct and important determinant of the behavioral intention,
empirical evidence on its role in the acceptance of in-store ubiquitous computing information
services is mixed. Although in the majority of studies the relationship of effort expectancy
toward behavioral intention is supported (see Table 9, P. 65), four studies could not find any
significant relationship (Kowatsch and Maass, 2010; Müller-Seitz et al., 2009; Rothensee, 2010;
Spreer and Kallweit, 2014).
Given the strong theoretical basis and consistent with UTAUT2 as well as the evidence from the
previous literature, it is expected that the ease with which consumers can operate the in-store
ubiquitous computing-based information systems will positively affect their intention to use such
systems. Thus, the hypothesis to be tested is:
H1: Effort expectancy has a significant positive effect on behavioral intention to use in-store
ubiquitous computing-based information services.
However, it is important to note that because of the inconsistent results of the previous empirical
research this hypothesis is stated with caution.

100
4.3.2 Social Factor: Social Influence
The importance of the social context on the formation of individual’s perceptions regarding a
certain object has been emphasized by social psychologists (Robertson, 1989; Triandis, 1979).
Hence the notion of the subjective norm was included in TRA and TPB as one of the major
determinants of intention (see section 3.1.1.1). According to TRA, subjective norm is a function
of normative beliefs (Ajzen and Fishbein, 1980; Fishbein and Ajzen, 2010) and defined as “an
individual’s perception (belief) that most people who are important to her think she should
perform a particular behavior” (Fishbein and Ajzen, 2010, p. 131). This is a measure of the
perceived social pressure to perform or to refrain from a behavior in question. It results from
aggregation of the perceived expectations of reference persons or groups regarding a certain
behavior and willingness to behave according to these expectations. So the beliefs concerning
what different people or groups consider correct or incorrect behavior as well as beliefs about
what important others are actually doing are the informational foundation to form an individual’s
subjective norm (Fishbein and Ajzen, 2010).
Although TAM overlooked the effect of the subjective norm in its original form, its originator,
Davis, later noted that it is essential to consider the subjective norm in technology acceptance
studies (Davis, 1986; Davis et al., 1989). As a result several scholars incorporated the notion of
subjective norm in technology acceptance models (see section 3.1.2.1) using different labels as
social influence and image (see section 3.1.2.1 and Table 7). However utilizing different labels,
these factors stand for the notion that “the individual’s behavior is influenced by the way in
which they believe others will view them as a result of having used the technology” (Venkatesh et
al., 2003, p. 451). In line with development of original UTAUT, Venkatesh et al. (2003)
empirically compared three different factors of subjective norm, social factors, and image and
found that all of these factors behave similarly. The notion of subjective norm is included under
the term of social influence in both original UTAUT and UTAUT2 (see section 3.1.2.3). Several
studies could empirically support the direct positive influence of social factors on usage intention
of various technologies in different contexts (e.g. Hsu and Lin, 2008; Hsu and Lu, 2004; Mun et
al., 2006; Venkatesh et al., 2012, 2003)

101
As discussed in section 3.1.2.3, the impact of social influence on the individual behavior is
through three mechanisms: compliance, identification and internalization. Compliance refers to a
perceived social pressure by an individual while deciding to use or not to use a technology; that
is when a person adopts a behavior not because she wants it herself but with an incentive of
receiving a reward. Therefore the consideration of compliance effects can be only logical when
those important others have the ability to reward the favored behavior or punish in the case of
refusing to perform the favored behavior (Venkatesh et al., 2003; Warshaw, 1980). That means
only in mandatory settings which is often the case in organizational settings (Hartwick and
Barki, 1994). Therefore, for the current analysis which is absolutely in a voluntary setting,
compliance is not expected to have an impact on behavioral intention.
Social influence in voluntary contexts functions through identification and internalization
mechanisms (Venkatesh et al., 2003). This means that an individual may intent to use a
technology believing that the important others, e.g. family members and friends, will do the same
and simply rely upon their opinions and/or in response to the potential social status gains among
them. Therefore, in the context of this dissertation, social influence is defined as the degree to
which an individual believes that members of her family and friends think she should use in-
store ubiquitous computing-based information services.
In retail context, social factors are known to have a significant role in the acceptance of
technologies (Rintamäki et al., 2006a; Yim et al., 2013). The effect of social influence is
expected to be more salient in the case of new and advanced technologies as in-store ubiquitous
computing-based information services (López-Nicolás et al., 2008; Lu et al., 2005; Sarker and
Wells, 2003). Individuals may consider the usage of novel technologies as a social status symbol
and intent to use to enhance their image among their friends and family members and identify
themselves as a member of the more innovative user group (Lu et al., 2005; Sarker and Wells,
2003). In addition when a penetration of a certain technology is not substantial, users may
perceive it as rare and fashionable and intend to use it to enhance their social status (López-
Nicolás et al., 2008).
Furthermore, the role of social influence has been known to be greater in the early phases of
adoption of an innovation (Triandis, 1971). In the early phases of adoption, individuals often

102
have little or no experience on the use of the particular technology and thus on its potential
utilitarian advantages, hence the expectations and opinions of family and friends concerning a
newly introduced technology may have a greater influence on behavioral intention to adopt that
technology (Teo and Pok, 2003; Thompson et al., 1994; Venkatesh et al., 2003).
Consistent with UTAUT2 and considering the characteristics of in-store ubiquitous computing-
based information services, that is being new and advanced technology which is in early phases
of implementation and adoption, it is expected that the perceived expectations and opinions of
family and friends regarding the use of in-store ubiquitous computing based information
technologies will positively affect consumers’ intention to use of such technologies. Thus, the
hypothesis to be tested is:
H3: Social influence has significant positive effect on behavioral intention to use in-store
ubiquitous computing-based information services.
4.3.3 Affective Factor: Hedonic Motivation
According to TRA and TPB, while an individual is deciding about performing a certain behavior,
her behavioral beliefs are formed by both cognitive and affective evaluation of the consequences
of that behavior (Ajzen and Fishbein, 1980; Fishbein and Ajzen, 2010) (see sections 3.1.1.1 and
3.1.2.2). However TRA and TPB advocated the influence of affective belief on behavioral
intention, it was excluded from TAM; the argument was that, within organizational context,
individuals form their behavioral intention toward use of a certain technology when they believe
that the use of the system will increase their performance “over and above whatever positive or
negative feelings may be evoked toward the behavior per se” (Davis et al., 1989, p. 986). As
extensively discussed in section 3.1.2.2, this assumption doesn’t hold for all contexts and
technologies; as a result, a new stream of research has been evolved seeking to integrate affective
factors into the technology acceptance models. In line with this stream of research, various labels
are created to capture the affective response of individuals associated with system use (see Table
8). In fact, many empirical studies could show the important role of affective factors in
determining the technology acceptance and use (Brown and Venkatesh, 2005; Chang and
Cheung, 2001; Koufaris, 2002; Moon and Kim, 2001; Thong et al., 2006; Venkatesh et al.,
2012).

103
In consumer context, the importance of the affective reactions in consumer decision making has
been long recognized (Batra and Ahtola, 1990; Childers et al., 2001; Holbrook and Hirschman,
1982); overall the motivation of customers to buy or use a product or service is divided into two,
cognitive and affective dimensions (McGuire, 1976). That is customers assess their shopping
experience not only based on the perceived utilitarian value of the attained products and services
but also on the enjoyment they perceive from the use of the products and services (Babin et al.,
1994). In consumer research literature, these dimensions are usually referred as hedonic and
utilitarian components of consumer choice (Batra and Ahtola, 1990). Therefore, while tailoring
the UTAUT to consumer context, Venkatesh et al. (2012) added the factor of hedonic motivation
to capture the affective dimension of technology use (see section 3.1.2.3). Consistent with the
prior research on IT adoption in non-organizational contexts (Van der Heijden, 2004), the
empirical results of UTAUT2 showed that hedonic motivation is a more important determinant
of consumers’ behavioral intentions to use a technology than performance expectancy.
Furthermore, Donovan and Rossiter (1982) could confirm the environmental psychology model
of Mehrabian and Russell (1974) in retail settings; in their model, Mehrabian and Russell (1974)
postulate that individuals react to environments with approach or avoidance behaviors. Approach
versus avoidance is defined as a desire and willingness to physically stay, to explore the
environment, to communicate with others in the environment, and the degree of enhancement of
task performances. Mehrabian and Russell (1974) suggest that perceived pleasure in an
environment is one of the important causal variables for an approach behavior. That is a
perceived pleasurable environment will be approached, whereas the unpleasurable one will be
avoided. Creation of a positive emotional experience in the retail environment can generate
enjoyment and pleasure (Hoffman and Novak, 2009). Referring back to the Mehrabian and
Russell’s (1974) theory, pleasure in turn results in customer satisfaction and thus approach
behavior. That is the retail environment generating a pleasurable experience is more likely to be
approached by consumers.
All of these assumptions are also valid for technologies in retail environment; affective factors as
hedonic motivation are known to have a significant role in the acceptance of technologies in
retail setting (Rintamäki et al., 2006a; Yim et al., 2013). For the case of ubiquitous computing
systems, their introduction into stores is expected to improve the stores appearance in terms of

104
style, layout, and atmosphere making them more appealing and pleasurable (Grewal et al., 2013;
Pantano and Naccarato, 2010). In this regard, Pantano and Naccarato (2010) compare new in-
store technologies with videogames: “consumers can play with products as in a videogame, due
to the high level of interactivity of technologies” (p. 203). Therefore, it is expected that such
technologies provide more hedonic value to customers and thus trigger an approach behavior that
is a tendency to use the technology.
Moreover, regarding the technology acceptance studies on in-store ubiquitous computing-based
information services, all of the studies which included affective factors in their models found a
direct significant and positive relationship of affective variables toward study’s end construct
(e.g. intention to use and attitude toward using) (see section 3.1.3). Interestingly Spreer and
Kallweit (2014) found that perceived enjoyment has the strongest impact on the intention to
reuse a store owned pad system for information search and Yang (2010) found that hedonic
performance expectancy is a more important determinant of the attitude toward using in-store
mobile shopping services than utilitarian performance expectancy.
Given the strong theoretical basis and consistent with UTAUT2 as well as the evidence from the
previous literature, it is expected that the perceived hedonic value of in-store ubiquitous
computing-based information services will be positively associated with the customers’ intention
to use them. Thus, the hypothesis to be tested is:
H4: Hedonic motivation has a significant positive effect on behavior intention to use in-store
ubiquitous computing-based information services.
4.3.4 Intention to Prefer
Customer acquisition and retention is one of the key objectives of every retail store. In the
literature, it is argued that through improved point of sale and enhanced customer services,
ubiquitous computing enabled stores would be able to reach-out to new customers and retain the
existing ones (e.g. Bitner et al., 2002; Grewal et al., 2013; Pantano and Migliarese, 2014;
Pantano and Naccarato, 2010, 2010; Poncin and Ben Mimoun, 2014). In other words, it is
assumed that customers will prefer the ubiquitous computing enabled stores to the other stores.
Undeniably gaining relative advantage over other stores is the primary motive for implementing

105
ubiquitous computing technologies. Therefore, from retailers’ perspective not only it is important
to understand if and how consumers will accept the in-store ubiquitous computing information
services but also whether the acceptance rate of in-store ubiquitous computing services positively
influences consumers’ preferences of the stores offering such services.
To answer this question, a new construct of “intention to prefer” is added to the base model. In
the context of this dissertation, intention to prefer is defined as the degree to which users will
prefer a retail store which offers in-store ubiquitous computing-based information services.
Similar to the actual use, actual preference cannot be observed for futuristic systems. However,
according to TRA, behavioral intention is a strong predictor of actual behavior; therefore, in this
work, intention to prefer is considered to be a satisfactory approximation of customer’s actual
preference.
Based on UTAUT2, the usage of in-store ubiquitous computing-based information services is
predicted by consumers’ behavioral intentions. However, a customer can only use the ubiquitous
computing based technologies for searching and evaluating information in a brick and mortar
store when they are available in the store. Therefore, when a customer intends to use in-store
ubiquitous computing information services, it is more likely that she would also prefer a
ubiquitous computing enabled store.
Building on a similar rationale, Kowatsch et al. (2011) hypothesized a direct positive relationship
between intention to use digital product reviews using mobile devices in retail stores and
intention to prefer review-enabled stores. Conducting an empirical study, they could confirm that
intention to use strongly influences the intention to prefer.
Based on the above-mentioned rationale as well as the evidence from the previous literature, it is
expected that the intention to use in-store ubiquitous computing-based information services will
positively affect the customers’ intentions to prefer ubiquitous computing enabled stores. Thus,
the hypothesis to be tested is:
H5: Behavior intention to use in-store ubiquitous computing based information services has a
significant positive effect on customers’ preference of stores offering such services

106
4.3.5 Moderators
As mentioned in section 4.2, considering the purpose of the current research, one of advantages
of UTAUT2 to other technology acceptance models is incorporating the moderator factors of age
and gender. Characteristics of users are one of the situational characteristics which are often used
for the context-specific theorizing (see section 4.1). Among user characteristics, age and gender
are the most prominent factors with a strong impact on individual’s perceptions (Nosek et al.,
2002) particularly perceptions of technology (Morris et al., 2005; Venkatesh et al., 2003;
Venkatesh and Morris, 2000).
Extensive research in the consumer behavior shows that the needs and wishes of customers are
diverse based on their socio-demographic background. Thus in marketing and customer research
literature socio-demographic factors specifically age and gender are often used for customers’
segmentation (Anselmsson, 2006; Bhatnagar and Ghose, 2004; Royne Stafford, 1996). Through
a comprehensive literature review in technology acceptance studies, Niehaves and Plattfaut
(2014) state that age and gender are the most used socio-demographic variables in the field,
respectively used in 87% and 95% of the reviewed studies followed by income and education
used in only 9% and 10% of the studies. Therefore researchers in the field of technology
acceptance argue that incorporating these factors as moderators of beliefs, intention relationships
in the research model will increase the contribution of results in the marketing strategy
development (Dabholkar and Bagozzi, 2002; Nysveen et al., 2005). The knowledge about
existence of age and gender induced decision making differences in the acceptance of in-store
ubiquitous computing-based information services can be used by retailers to design marketing
strategies to appropriately address the customers and when necessary to intervene their decisions
and consequently increase the probability that the service will be continually used. Therefore,
studying the role that age and gender may have on the relationships between beliefs and
behavioral intention is crucial for the context of this dissertation.
4.3.5.1 Age
There is an overwhelming evidence in the literature that younger people have a more positive
attitude towards new information technologies (Bigne-Alcaniz et al., 2005; Burton-Jones and
Hubona, 2006; Mulhern, 1997; Rai et al., 2013). Regarding in-store ubiquitous computing

107
information services, it is also expected that younger customers will be more favorably disposed
towards using emerging shopping schemas (Kourouthanassis and Giaglis, 2005). In his
exploratory research, Burke (2002) found that younger adults are considerably more interested to
use every instant of ubiquitous computing-based information services (e.g. handhelds, palm
computers and interactive kiosks) for both searching product information and evaluating the
alternatives in the shop. Therefore, it can be assumed that younger adults perceive new
technologies differently than older ones and hence the magnitude of acceptance determinants of
in-store ubiquitous computing information services may differ from younger to older age groups.
Explicitly concerning the effect of age on belief-intention relationships, previous empirical
research shows that whereas performance expectancy is a stronger determinant of younger users’
intentions, the effect of effort expectancy on intention is more salient for older users (Morris and
Venkatesh, 2000; Venkatesh et al., 2003). Respectively while the effect of social influence
increases with age (Morris and Venkatesh, 2000; Venkatesh et al., 2003), the importance of
hedonic aspect of a novel technology use decreases (Ha et al., 2007; Venkatesh et al., 2012).
In information system research literature, these age-induced decision making differences are
often explained by theoretical foundation of behavior changes (changing needs, a mellowing
process) (Gibson and Klein, 1970) and cognitive changes (decline in cognitive and memory
capabilities) (Law et al., 1998; Minton and Schneider, 1985; Welford, 1980) occurring through
aging process (Morris et al., 2005; Morris and Venkatesh, 2000; Venkatesh et al., 2012, 2003).
Older people tend to consider the extrinsic, performance-based rewards less valuable than
younger ones and therefore consider the usefulness of a technology not as important reason to
use the technology as younger users may do (Venkatesh et al., 2003). Respectively because of
declining cognitive and memory capabilities, older people have more difficulty in processing
complex stimuli (e.g. a new technology artifact) and focusing on the task itself, therefore the ease
with which they can work with a system is more salient reason to use a technology than for
younger users (Venkatesh et al., 2003). Based on a comprehensive literature review on age
differences in consumers’ information processing, Phillips and Sternthal (1977) concluded that
social influenceability increases with age, suggesting that when confronted with a new stimulus,
older consumers are more likely to base their decisions on peers’ opinion than their younger

108
counterparts. Hence, the expectations and opinions of family and friends concerning a newly
introduced technology may have a greater influence on older consumers’ use intentions than
younger ones. On the other hand younger individuals are more receptive to new ideas and keen
to try novel technologies (Lee et al., 2010) and make their use decisions independently (Midgley
and Dowling, 1978). Such novelty seeking contributes to hedonic motivation to use a novel
technology (Holbrook and Hirschman, 1982). Therefore, younger consumers are more likely to
be driven by hedonic motivation to use a new technology than the older ones.
Consistent with UTAUT2 and based on the above-mentioned rationale as well as the evidence
from the previous literature, it is expected that age has a moderating effect on the relationships
between behavior intention to use in-store ubiquitous computing based information services and
its antecedents. Thus, the hypotheses to be tested are:
H1.1: The influence of effort expectancy on behavior intention will be moderated by age such
that the effect will be stronger for older people than younger people
H2.1: The influence of performance expectancy on behavior intention will be moderated by age
such that the effect will be stronger for younger people than older people
H3.1: The influence of social influence on behavior intention will be moderated by age such that
the effect will be stronger for older people than younger people
H4.1: The influence of hedonic motivation on behavior intention will be moderated by age such
that the effect will be stronger for younger people than older people
4.3.5.2 Gender
There is a consensus among numerous studies that men have a more positive attitude towards
new information technologies (Gefen and Straub, 1997; Parasuraman, 2000; Venkatesh and
Morris, 2000). Regarding in-store ubiquitous computing-based information services, Elliott and
Hall (2005) assessed gender differences in consumers’ propensity to embrace self-service
technologies in retailing. They found that men were more eager to make use of new technologies
than women. Similarly, in his exploratory research, Burke (2002) found that men were
considerably more interested to use every instant of ubiquitous computing based information

109
services (e.g. handhelds, palm computers and interactive kiosks) for both searching product
information and evaluating the alternatives in the shop. Therefore, it can be assumed that men
perceive new technologies differently than women and hence the impact of acceptance
determinants of in-store ubiquitous computing information services may differ for men and
women.
Explicitly concerning the effect of gender on belief-intention relationships, the previous
empirical research shows that whereas performance expectancy is a stronger determinant of male
users’ intention, the effect of effort expectancy on intention is more salient for female users
(Venkatesh et al., 2003; Venkatesh and Morris, 2000). Respectively while the effect of social
influence is stronger for women (Venkatesh et al., 2003; Venkatesh and Morris, 2000), the
importance of hedonic aspect of a novel technology use is higher for men (Ha et al., 2007;
Venkatesh et al., 2012).
From theoretical point of view, such apparent gender decision making differences are often
explained by reinforced culture induced psychological differences rather than biological
differences between genders (Bem, 1981; Brosnan, 1998; Brosnan and Davidson, 1996; Lynott
and McCandless, 2000). Gender differences in customers’ decision making behavior is also
acknowledged in marketing literature; for example, it is found that women employ different
information processing strategies than men (Meyers-Levy and Maheswaran, 1991). That is
women often conduct a more comprehensive information processing while shopping (Cleveland
et al., 2003; Laroche et al., 2003, 2000). Furthermore men are mainly derived by utilitarian
purchase motivations (Citrin et al., 2003). Therefore while women tend to prefer to concentrate
on the act of shopping and avoid distraction, men tend to prefer to minimize the shopping effort
(Weijters et al., 2007). As stated by Venkatesh and Morris (2000), men tend to show a stronger
attitudes toward instrumental IT applications than women. In this regard, Burke (2002) found
that men were more interested to use in-store technologies which can increase their shopping
efficiency in terms of time and effort required to shop. The general research on gender
differences has also shown that men are more task-oriented and pragmatic than women (Minton
and Schneider, 1985). On the other hand research on gender differences in the information
technology indicates that the level of digital literacy differs between men and women in a way
that women exhibit lower digital literacy than men (Lee and Huang, 2014) which adds to the

110
perceived difficulty of using a new computer-based technology. Therefore it is expected that the
performance related values of a technology will be more salient for men whereas effort related
values will be more important for women (Venkatesh et al., 2003).
In addition, a solid stream of research on gender differences shows that women tend to value the
social relations and others peoples’ opinion to a higher degree than men (Becker, 1986; Miller,
1986). Evidence from technology acceptance research in different contexts leads to a similar
conclusion; that is women attach more importance to others’ opinions while deciding to use a
novel information technology application (Guo, 2015; Venkatesh et al., 2012, 2003, 2000;
Venkatesh and Morris, 2000; Zhang et al., 2014). On the contrary men tend to overlook the
advices of others and make an independent decision (Becker, 1986; Miller, 1986); the tendency
to make independent decisions rather based on the self-experience than others opinion leads to a
presence of novelty seeking and openness trait regarding new technologies (Midgley and
Dowling, 1978). Such novelty seeking in turn contributes to the hedonic motivation to use a
novel technology (Holbrook and Hirschman, 1982). Therefore, female customers are more likely
to be driven by social influence whereas male customers by hedonic motivation to use a new
technology.
Consistent with UTAUT2 and based on the above-mentioned rationale as well as the evidence
from the previous literature, it is expected that gender has a moderating effect on the
relationships between behavior intention to use in-store ubiquitous computing-based information
services and its antecedents. Thus, the hypotheses to be tested are:
H1.2: The influence of effort expectancy on behavior intention will be moderated by gender such
that the effect will be stronger for women than for men
H2.2: The influence of performance expectancy on behavior intention will be moderated by
gender such that the effect will be stronger for men than for women
H3.2: The influence of social influence on behavior intention will be moderated by gender such
that the effect will be stronger for women than for men
H4.2: The influence of hedonic motivation on behavior intention will be moderated by gender
such that the effect will be stronger for men than for women

111
4.4 Incorporating Contextual Factors – User Characteristics
As mentioned in section 4.1, after contextualizing the general theory (UTAUT2) based on the
general service characteristics of in-store ubiquitous computing-based information services, the
next step is the finer contextualizing of the general model regarding user, technology, and service
characteristics.
User characteristics or individual factors account for the differences in certain characteristics of
end users which might influence individuals’ belief development process regarding a given
technology. Emphasizing the importance of including the antecedent factors of the core beliefs in
acceptance models, Yousafzai et al. (2007a) state that without a better understanding of the
antecedents “practitioners are unable to know which levers to pull in order to affect these beliefs
and, through them, the use of technology” (p. 268). Similarly Chin and Gopal (1995) advocate
that “greater understanding may be garnered in explicating the causal relationships between
beliefs and their antecedent factors” (p. 46).
Consistent with the practice in information system literature, this dissertation uses the definition
of Agarwal and Prasad (1999) for individual differences: “individual differences refer to user
factors that include traits such as personality, demographic variables, as well as situational
variables that account for differences attributable to circumstances such as experience” (p. 362).
As demographic variables of age and gender are already discussed in the previous sections. The
focus of this section is only on individual differences originated in personality and situational
variables, in the literature also referred to as non-demographic characteristics.
Incorporating user characteristics in technology acceptance studies is based on the rationale that
supposing new technologies offer useful, easy, and fun to use services, the end users might
perceive none of these advantages depending on what kind of users they are. The importance of
the consideration of end user characteristics in the acceptance of new information technologies is
repeatedly asserted in technology acceptance literature (e.g. Agarwal and Prasad, 1999, 1997;
Benbasat and Zmud, 2003; Burton-Jones and Hubona, 2005; Y.-T. H. Chiu et al., 2010;
Karahanna et al., 2002; Kwon et al., 2007). General technology acceptance models as well as
their origins often focus on direct determinants of the behavior and don’t comprehensively
specify how technology related beliefs are formed. However, they introduced a place holder
112
construct emphasizing the importance of tracing back the impact of factors which influence
intentions and behavior indirectly through proximal beliefs, especially while developing a
context-specific theory. For example in TRA and TPB a class of variables has been introduced,
respectively called external variables and background factors (such as personality, broad life
values, and exposure to media or other sources of information), influencing behavior indirectly
by their effects on beliefs (Ajzen, 2011) (see Figure 6 and Figure 8). Similarly TAM introduces a
general construct named as external variables determining the belief system (see Figure 9). Davis
et al. (1989) even state that “a key purpose of TAM (…) is to provide a basis for tracing back the
impact of external factors on internal beliefs, attitudes and intentions” (p. 985).
In the context of retailing, the consideration of user characteristics is especially important as
retailers often serve several customer segments and it is crucial to discover whether the decision
of acceptance or rejection of a new technology is affected by the type of the user (Kwon et al.,
2007) and whether individual differences influence the formation of the beliefs. Therefore Y.-T.
H. Chiu et al. (2010) urge retailers to take a segment-oriented approach while introducing novel
retail technologies. For example, perceptions of a technology’s ease of use might differ between
innovative and non-innovative customers or a more assistant sensitive customer can find an in-
store technology-based assistant service more useful. Examining which characteristics are useful
for the market segmentation is crucial and hence should be considered in implementing in-store
ubiquitous computing technologies. Incorporating user characteristics into the acceptance model
as antecedents of beliefs has valuable managerial implications as mangers would be able to
profile individuals and either target only individuals with positive beliefs and/or develop
marketing measures to proactively intervene in belief development process by influencing such
factors.
However from the 13 studies in the acceptance of in-store ubiquitous computing-based
information services listed in Table 9, only three studies have included individual variables in
their models. Adding three individual variables of self-efficacy, personal innovativeness, and
perceived sensitivity as the antecedents of TAM constructs. Studying the acceptance of mobile
shopping assistance systems in the point of sale, Kwon et al. (2007) concluded that personal
innovativeness and self-efficacy has a positive significant effect on perceived ease of use of
mobile shopping assistance. Rothensee (2010) included dominance and technical competence to

113
his TAM-based model of ubiquitous computing acceptance (UbiTAM); the findings showed that
however dominance played no role in acceptance of in-store ubiquitous computing technologies,
technical competence had a significant influence on customers’ perceived ease of use. In their
infamous article introducing UTAUT2, Venkatesh et al. (2012) call for further research on
extending UTAUT2 by incorporating user characteristics as exogenous predictors of the
UTAUT2 core variables.
In their meta-analysis of TAM-based studies Yousafzai et al. (2007a) listed 24 user-specific
variables used in the literature. From which personal innovativeness, self-efficacy and user
experience are the most frequently adopted factors (Kwon et al., 2007, p. 483). Given a large
number of potential individual factors, it is recommended in the literature to use the context-
specific theory to guide the selection of important background factors in the behavioral domain
of interest (Albarracin and Ajzen, 2007; W. Hong et al., 2013).
Based on the context being studied, two classes of individual characteristics have been identified
as the most relevant for the purpose of this study that is the Internet dependency relations (action
orientation, interaction orientation, social play, and solitary play), personal innovativeness, and
involvement (relevance and importance). The remainder of this chapter is dedicated to the
theoretical rationale for the relevance of these factors to the context and core constructs of the
general model.
4.4.1 Incorporating Internet Dependency into UTAUT2
One of the objectives of this dissertation is to explore the potential influences of the expanding
trend of the Internet use as the information medium on the user acceptance of in-store ubiquitous
computing-based information services. The previous literature suggests that customers make
their information channel choices based on their prior experience (Verhoef et al., 2009) and the
experience of searching online has raised the expectation bar for services in offline retail so that
today customers expect a more easy-to-access, easy-to-evaluate and transparent information
(Burke, 2010). Thus it is logical to assume that based on the information service similarities
between the Internet and the in-store ubiquitous computing-based information services,
customers who use the Internet and have prior desirable experiences with it would evaluate the

114
in-store ubiquitous computing information services more positively and consequently be more
keen to use them.
To be able to theoretically integrate this assumption into the dissertation’s base model, the mass
media effects research has been explored in section 3.2 and the applicability of the individual
media dependency theory on analyzing and measuring the effects of the Internet on individuals
has been discussed (see section 3.2.3). It has been concluded that the individual media
dependency theory offers a salient theoretical framework to identify the effects that the use of the
Internet as an information medium can cause on individuals and understand why such effects
differ between individuals.
As discussed in section 3.2.2.2, MSD theory perceives individuals as having three general types
of goals, namely understanding, orientation, and play (Ball-Rokeach et al., 1984; Grant et al.,
1991). Accordingly individual’s motivations to use media information resources is in order to
attain these goals (Ball-Rokeach, 1998; DeFleur and Ball-Rokeach, 1989). Therefore, the
individual media dependency typology proposed by the theory consists of three dimensions, each
of which in turn comprises of a personal and social dimension resulting in six different types of
media dependency relations (see Table 10). Thus applying the MSD theory to the Internet as an
information medium, in this dissertation a multidimensional approach has been taken to
conceptualize the effects of the Internet information use on the individuals. However, based on
the definition of the understanding dimension, which is the dependency relationship of audience
members on the Internet information resources in order to establish knowledge and meaningful
interpretations of themselves and their social environs, has been identified as irrelevant to the
context of in-store ubiquitous computing-based information services.
As a result, four factors from orientation and play dimensions of the Internet dependency are
identified which are expected to play a direct role in customers’ belief formation regarding the
in-store ubiquitous computing-based information services. These factors are listed in Table 13
along with their definitions.

115
Table 13: User characteristics – Internet media dependency relations
External Factors – User Characteristics
Definition
Action orientation The degree to which an individual is dependent on the Internet information resources to take a purchasing decision
Interaction orientation The degree to which an individual is dependent on the Internet information resources to communicate with others
Social play The degree to which an individual is dependent on the Internet resources to satisfy her hedonic goals associated with interaction between individuals
Solitary play The degree to which an individual is dependent on the Internet resources to satisfy her solely individual hedonic goals
Figure 21 shows the process of incorporating these factors into the base model. In the following
sections, the theoretical rationale to incorporate the orientation and play dimensions of the
Internet dependency relations into the base model of this dissertation would be thoroughly
discussed followed by the formulation of each theoretical relationship as a research hypothesis.

116
Figure 21: Incorporating the Internet media dependency relations into the base model
4.4.1.1 Internet Dependency to Fulfill Orientation goals
While introducing their theory of reasoned action (see section 3.1.1.1), Fishbein and Ajzen
(1975) noted that “belief formation should follow the laws of learning” (p. 29). The law of
proactive inhibition (McGeoch and Irion, 1952) from human associative view of learning
postulates that individuals’ prior experiences (positively or negatively) intervene in their
capability to learn to exhibit novel behaviors. The magnitude and direction of intervention is
dependent on the similarity relationship between the structure of the existing and novel behavior
(Gick and Holyoak, 1987). That is the extent of similarity (dissimilarity) of individuals’ prior
experiences with the behavior under learning positively (negatively) influences the extent of their
learning (Gick and Holyoak, 1987). Synthesizing the literature in both social psychology and
learning theories, Agarwal and Prasad (1999) concluded that “factors that might influence the
formation of beliefs are posited to be the same as those that influence learning processes” (p.
366). Thus similar prior experiences which leads to enhanced learning may result in more
positive beliefs regarding the new behavior (Agarwal and Prasad, 1999).
A Subset of UTAUT2
Consequence factor
Intention to Prefer
Cognitive Factors
Effort Expectancy
Performance Expectancy
Affective Factor
Hedonic Motivation
Behavioral Intention
Social Influence
Social Factor
Antecedent factors: formation of belief system
AgeGender
A Subset of IMDT
User characteristics: dependency relations
with the Internet
Action Orientation
Interaction Orientation
Solitary Play
Social Play
A Subset of IMDT
117
In technology acceptance literature, the role of prior experience in formation of the individual’s
technology related belief system has long been recognized. Consistent with the learning theories,
it is believed that previous experiences with similar technologies result in formation of more
positive beliefs and consequently more favorable attitudes toward using a new technology
(Agarwal and Prasad, 1999; Lu et al., 2003). Yet the majority of studies which included prior
experience in their models refer to it as a repetition of the exact same behavior that is based on
the absolute similarity of the existing and novel task (Chau, 1996; Hernández et al., 2010; Igbaria
et al., 1995; June Lu et al., 2003; Taylor and Todd, 1995a).
However there are also few studies which have used the prior experience in terms of relative
similarity of the technologies; developing a TAM based model, Agarwal and Prasad (1999)
hypothesized that the extent of prior experience with similar technologies is positively associated
with ease of use and usefulness beliefs about an information technology innovation. They have
conducted an empirical study in organizational settings to test their hypotheses; the stimulus in
the study was a newly introduced operating system with graphical user interface environment. To
assess the prior familiarity with similar technologies, the study used three stimuli because of
their similarity and relevance to the technology being examined, namely level of familiarity with
personal computers, prior usage of graphical user interfaces, and prior usage of input devices as
computer mouse. Based on the empirical results, individuals who hold greater experiences with
similar technologies found the new technology easier to use. However, the study could not
support the direct relationship between the prior experience and usefulness.
Developing an acceptance model for in-store technology-based self-service options Dabholkar
(1996) postulated that the attitude toward using technological products in general has a positive
effect on service quality evaluation of technology-based self-service options and in turn the
expected service quality positively influences the intention to use. He used the notion of prior
similar experience to theoretically justify the relationship between attitude and expected service
quality noting that when individuals encounter a new technology with which they don’t have a
personal experience, they tend to evaluate and make decisions drawing on the compatible prior
experiences. Thus individuals who have used technology products and have formed a favorable
attitude towards them will evaluate new, but similar, technologies more positively. To test the
hypotheses, a scenario based empirical study was conducted. The stimulus was a computerized,

118
touch screen to order a meal in a fast food restaurant. For prior experience with similar
technologies and resulting attitude, participants were asked about their experience concerning the
computers in general and ATMs in particular. The hypothesized relationships could be supported
by empirical data.
Based on the studies reported above, it can be assumed that it is not prior experience in terms of
frequency and extent of usage but the resulted attitude which builds a salient foundation for the
evaluation of the similar new technologies. For example Agarwal and Prasad (1999) only used
level of usage and familiarity with technologies to measure the similar prior experience;
apparently the level of similar technology usage influenced individual’s technology perception
concerning the ease of use but had no direct effect on their perception of its utilitarian benefits.
However, Dabholkar (1996) added the notion of attitude toward using similar technology
products to the concept of prior experience. They could empirically show that individuals’
experience based favorable attitude towards a technology positively influences their utilitarian
and affective beliefs regarding new, but similar, technologies.
In-store ubiquitous computing technologies are not yet widely spread thus many customers do
not have a direct experience with them; based on the above-mentioned arguments, it is expected
that in the absence of a direct system experience consumers past experiences with similar
technologies will serve as the basis for their perceptions about how easy, how useful or how
enjoyable the new technologies are. As discussed in section 2.2, in-store ubiquitous computing
based services are similar to the Internet based information services. Individuals who have used
the Internet as an information medium have formed an attitude toward it ranging from very
favorable to very unfavorable. Therefore, it can be postulated that the favorable attitude toward
using internet information services will have a positive effect on the cognitive and affective
beliefs concerning the in-store ubiquitous computing-based information services.
In the previous literature, the conceptualization of the prior experience and the resulting attitude
often is missing the theoretical underpinning and thus lacking a theory-driven approach for its
measurement (Varma, 2010).
No specific definition of experience has been provided to date. Considering the key role of
experience in understanding the belief–intention–acceptance relationship, researchers might use
119
more finely grained of detail in its conceptualization of experience. Domain specific
conceptualization of experience should be addressed. (Sun and Zhang, 2006, p. 69)
Therefore, in this research individual media dependency theory has been chosen for
conceptualization of the prior Internet experience and resulting favorable attitude.
It can be argued that, in the context of this study, individual media dependency theory offers the
best proxy for conceptualization of the prior Internet experience and resulting favorable attitude.
First of all, it postulates that when it comes to information media, prior experience in terms of
extent and frequency of use alone cannot define the sustainable consequences of media use on
individual’s attitude toward the media. Second, individual media dependency theory offers a
salient theoretical framework to identify the effects that the usage of the Internet as an
information medium can cause on individuals and understand why such effects differ between
individuals. Third, it manifests a dimensional relationship between the person and medium
allowing a more comprehensive evaluation of media use effects.
Therefore, building on the above mentioned discussions, it can be postulated that the intensity of
the general Internet dependency relations would significantly influence individuals’ cognitive
and affective perceptions of the in-store ubiquitous computing-based information services.
Two orientation dimensions of media dependency, namely action and interaction orientation are
likely to positively influence the performance and effort expectancy beliefs. Orientation media
dependency dimension stems from the individual motivation to obtain the necessary decision-
making guidance from the information resources of a given media in order to behave correctly,
whether on the personal level or with others. Based on MSD theory, IMD relations are function
of goals and perceived utility value of media’s information resources (Ball-Rokeach, 1985; Ball-
Rokeach and Jung, 2009; Grant et al., 1991). That is an individual who is dependent on Internet
information resources to fulfill her orientation goals has already experienced the advantages of
the Internet information resources to attain her orientation goals and holds positive beliefs about
its instrumental value. Based on the notion of prior experience, when individuals encounter a
new technology, past favorable experiences with similar technologies will serve as the basis for
their perceptions. In addition in media research, considerable evidence amassed which show that
users perceive new similar communication technologies just as extensions of the existing ones

120
and evaluate them on the bases of their experience with the existing technologies (Williams et
al., 1985).
From the utilitarian perspective, Riffe et al (2008, p. 4) refer to four characteristics of the Internet
which are responsible for its spread and micro-level dependency of individuals:
The Internet features almost instantaneous delivery of information, which makes it faster
than traditional media.
The Internet is interactive, which allows more immediate feedback than any other
medium.
The Internet allows for the distribution of multimedia content which many media do not.
The Internet allows for the distribution of large amounts of low-cost, in-depth
information.
Although in a different scale, the information related advantages of the Internet can be also listed
for in-store ubiquitous computing based information services (see section 2.2). Therefore, it is
expected that individuals who are dependent on the Internet to fulfill their orientation goals
would extend the instrumental value of the Internet to the in-store ubiquitous computing
information services. Performance expectancy stands for the perceived instrumental value
obtained from the use of technology. Thus it is expected that the level of action orientation
dependency of customers resulting from usage experiences of the Internet information sources
will be positively associated with the customers’ beliefs concerning the performance expectancy
of in-store ubiquitous computing information services. Furthermore, formation of the
dependency relations is contingent upon the development of the required skills to use the media.
Thus, individuals who are dependent on internet to fulfill their orientation goals perceive no
cognitive burden caused by the Internet itself. Again referring to the concept of prior experience
with similar technologies, it is expected that the level of action orientation dependency of
customers resulting from usage experiences of the Internet information sources will be positively
associated with the customers’ beliefs concerning the effort expectancy of in-store ubiquitous

121
computing information services. Based on the above-mentioned rationale and considering two,
action and interaction, dimensions of the orientation the hypotheses to be tested are:
H6: Action orientation dependency of customers on the Internet has a significant positive effect
on effort expectancy of in-store ubiquitous computing-based information services.
H7: Action orientation dependency of customers on the Internet has a significant positive effect
on performance expectancy of in-store ubiquitous computing based information services.
H8: Interaction orientation dependency of consumers on the Internet has a significant positive
effect on effort expectancy of in-store ubiquitous computing based information services.
H9: Interaction orientation dependency of consumers on the Internet has a significant positive
effect on performance expectancy of in-store ubiquitous computing based information services.
4.4.1.2 Internet Dependency to Fulfill Play goals
Based on the classic theory of schema-triggered affect (Fiske, 1982), if individuals identify a
new object as an instance of, a prior experience-based, affectively weighted category, they will
automatically evaluate the instance on the bases of the associated affect with the category and
apply it to the newly encountered object (Fiske and Pavelchak, 1986; Fiske and Taylor, 2013).
Building on this theory, to evaluate the in-store ubiquitous computing-based information
services, customers will try to fit these technologies in their previously defined categories. Based
on the similarity of the services, the Internet as an information medium can be defined as the
reference category for information search and evaluation support services. Therefore, a customer
who has affective dependency relationships with the Internet will also apply it to in-store
ubiquitous computing information services. In other words, positive emotions concerning the
Internet would lead to positive emotions concerning the in-store ubiquitous computing
information services. Thus it is expected that users who are dependent on the Internet for
performing their play related actions would have a higher perceived hedonic value of in-store
ubiquitous computing based information services. Considering two, social and solitary,
dimensions of the play the hypotheses to be tested are:
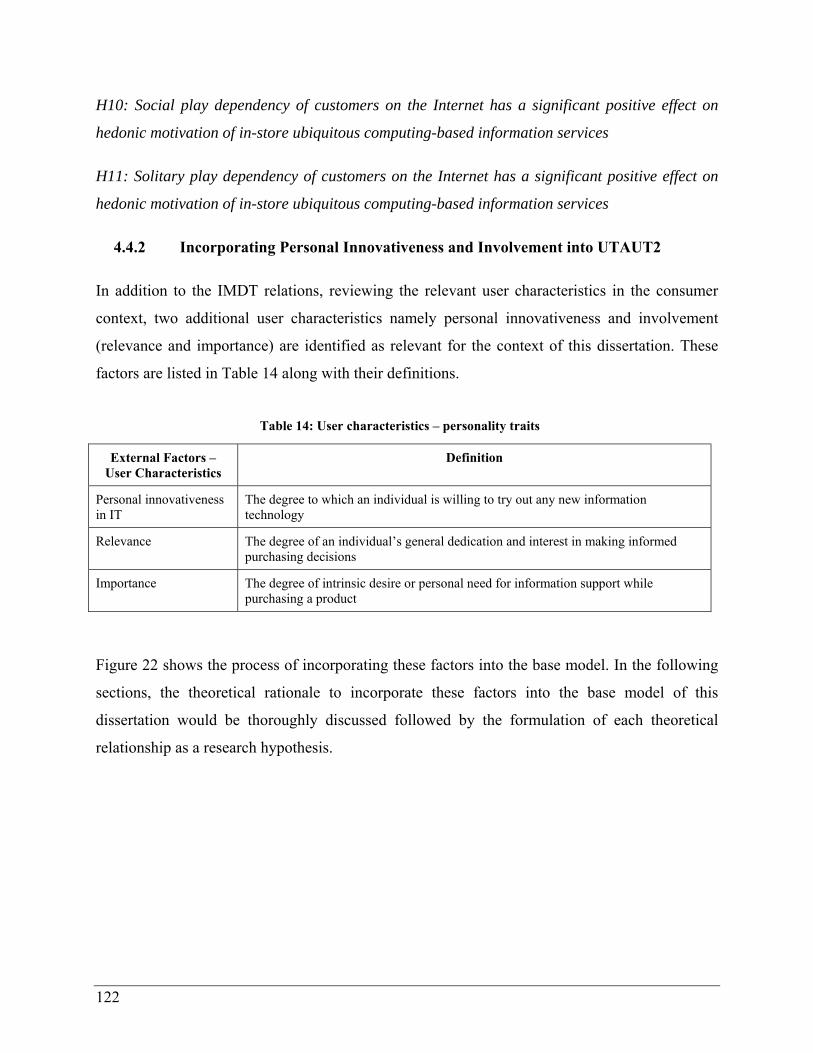
122
H10: Social play dependency of customers on the Internet has a significant positive effect on
hedonic motivation of in-store ubiquitous computing-based information services
H11: Solitary play dependency of customers on the Internet has a significant positive effect on
hedonic motivation of in-store ubiquitous computing-based information services
4.4.2 Incorporating Personal Innovativeness and Involvement into UTAUT2
In addition to the IMDT relations, reviewing the relevant user characteristics in the consumer
context, two additional user characteristics namely personal innovativeness and involvement
(relevance and importance) are identified as relevant for the context of this dissertation. These
factors are listed in Table 14 along with their definitions.
Table 14: User characteristics – personality traits
External Factors – User Characteristics
Definition
Personal innovativeness in IT
The degree to which an individual is willing to try out any new information technology
Relevance The degree of an individual’s general dedication and interest in making informed purchasing decisions
Importance The degree of intrinsic desire or personal need for information support while purchasing a product
Figure 22 shows the process of incorporating these factors into the base model. In the following
sections, the theoretical rationale to incorporate these factors into the base model of this
dissertation would be thoroughly discussed followed by the formulation of each theoretical
relationship as a research hypothesis.
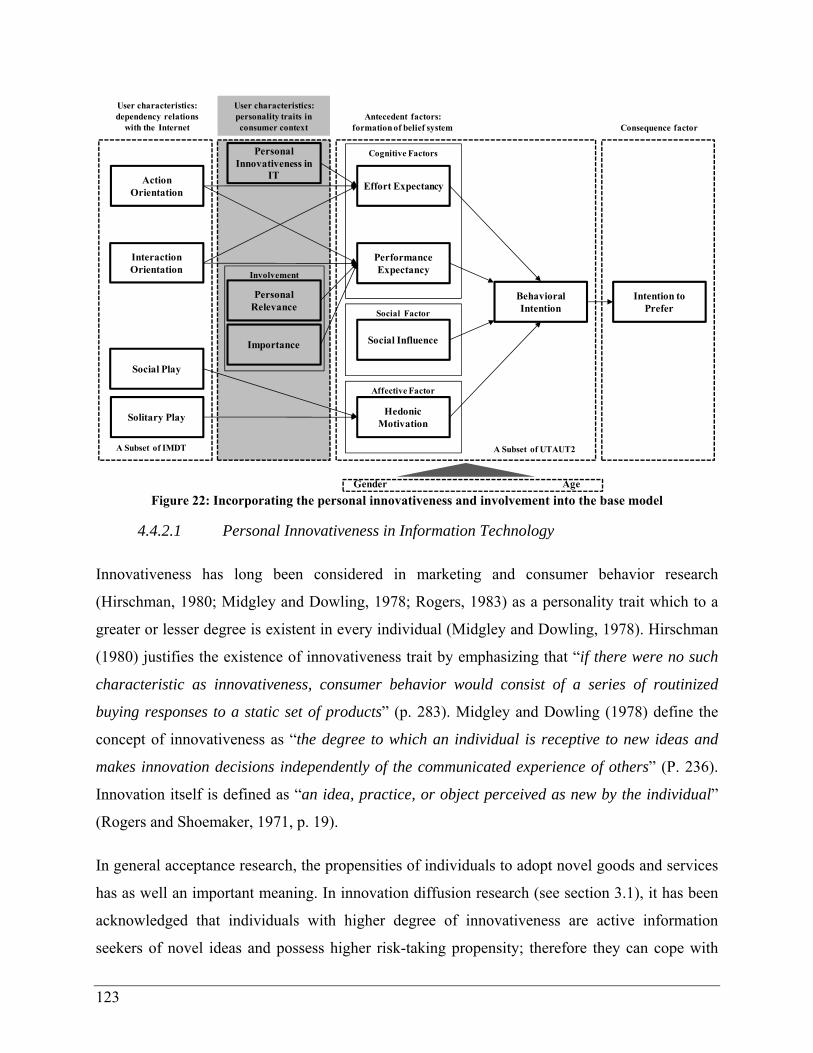
123
Figure 22: Incorporating the personal innovativeness and involvement into the base model
4.4.2.1 Personal Innovativeness in Information Technology
Innovativeness has long been considered in marketing and consumer behavior research
(Hirschman, 1980; Midgley and Dowling, 1978; Rogers, 1983) as a personality trait which to a
greater or lesser degree is existent in every individual (Midgley and Dowling, 1978). Hirschman
(1980) justifies the existence of innovativeness trait by emphasizing that “if there were no such
characteristic as innovativeness, consumer behavior would consist of a series of routinized
buying responses to a static set of products” (p. 283). Midgley and Dowling (1978) define the
concept of innovativeness as “the degree to which an individual is receptive to new ideas and
makes innovation decisions independently of the communicated experience of others” (P. 236).
Innovation itself is defined as “an idea, practice, or object perceived as new by the individual”
(Rogers and Shoemaker, 1971, p. 19).
In general acceptance research, the propensities of individuals to adopt novel goods and services
has as well an important meaning. In innovation diffusion research (see section 3.1), it has been
acknowledged that individuals with higher degree of innovativeness are active information
seekers of novel ideas and possess higher risk-taking propensity; therefore they can cope with
A Subset of UTAUT2
Consequence factor
Intention to Prefer
Cognitive Factors
Effort Expectancy
Performance Expectancy
Affective Factor
Hedonic Motivation
Behavioral Intention
Social Influence
Social Factor
Antecedent factors: formation of belief system
AgeGender
A Subset of IMDT
User characteristics: dependency relations
with the Internet
Action Orientation
Interaction Orientation
Solitary Play
Social Play
User characteristics:personality traits in consumer context
Personal Innovativeness in
IT
Personal Relevance
Importance
Involvement
124
high levels of uncertainty associated with new ideas and develop more positive attitude toward
their acceptance and use (Rogers, 2010, 1983).
In empirical research, two different conceptualization approaches have been evolved around the
notion of personal innovativeness namely global and domain specific. The global approach
focuses merely on individuals’ cognitive style postulating that an individual who scores high on
innovative cognitive style will be more likely to accept any novel product independent from the
domain and product category. However, in empirical studies on specific adoption decisions, the
global view of innovativeness revealed low predictive power (Gatignon and Robertson, 1985;
Goldsmith and Hofacker, 1991; Leonard-Barton and Deschamps, 1988). As a result, researchers
have developed a domain specific approach in which the personal innovativeness concept was
tailored to a specific domain of interest; despite the global innovativeness, domain specific
innovativeness could exhibit better predictions of adoption of innovations by consumers when
applied in a specific domain of innovation (Agarwal and Prasad, 1998; Goldsmith and Hofacker,
1991; Yi et al., 2006).
Consistent with the marketing and general innovation adoption literature, the notion of
innovativeness has received a notable attention in technology acceptance studies as one of the
key individual differences influencing the decision of acceptance and use of an innovative
technology. Agarwal and Prasad (1998) developed a domain specific conceptualization of
personal innovativeness for predicting information technology acceptance. Based on the
definition of Midgley and Dowling (1978), they defined the personal innovativeness in the
domain of information technology as “the willingness of individual to try out any new
information technology” (p. 206).
Agarwal and Prasad (1998) postulated that individuals with higher degree of innovativeness in
regard to information technology will develop more positive cognitive beliefs (ease of use and
usefulness) about the technology innovation and consequently will have higher intention to
accept the new technology under question. Using TAM as their base model, they have
incorporated the notion of innovativeness as a moderator of TAM’s main relationships; empirical
results could support the hypothesized relationships. Yi et al. (2006) examined two alternatives
TAM-based models, one with the innovativeness in the role of moderator of belief-intention

125
relationships and the other with the innovativeness as direct determinant of cognitive beliefs
(usefulness and ease of use). Empirical comparison of the models showed that personal
innovativeness was a direct determinant of beliefs; however, it had a very small and
nonsignificant effect as a moderator. The direct positive impact of personal innovativeness in IT
on cognitive beliefs of ease of use and usefulness has been empirically tested by various studies
in different technology contexts (Kuo and Yen, 2009; Lu, 2014; Lu et al., 2005, 2003; Rai et al.,
2013; Van Raaij and Schepers, 2008). However the direct and positive impact of innovativeness
on ease of use has been supported, the hypothesized relationship between innovativeness and
usefulness were often empirically rejected (Kuo and Yen, 2009; Van Raaij and Schepers, 2008).
More notably, in the context of in-store ubiquitous computing technologies, Kwon et al. (2007)
postulated direct positive impacts of personal innovativeness on both ease of use and usefulness
while developing a model for user acceptance of mobile shopping assistance. Based on the
empirical results, they could only find a significant effect of innovativeness on ease of use.
Building on the previous empirical results, in this study only the impact of innovativeness on
ease of use is hypothesized.
Innovative people are more likely to try an innovation in early stages of its introduction
(Agarwal and Prasad, 1998; Lu et al., 2003; Rogers, 2010). As in-store ubiquitous computing
information technologies are currently at very early stages of diffusion, it is expected that most
individuals do not have any or much knowledge and experience for formation of their beliefs.
Therefore, the risk taking and curious personalities in the domain of information technology who
have more self-confidence to handle the new information technology may perceive the
technology easier to use.
Given the strong theoretical basis and the evidence from the previous literature, it is expected
that the personal innovativeness in information technology will be positively associated with the
customers’ beliefs concerning the ease of use of the in-store ubiquitous computing information
services. Thus, the hypothesis to be tested is:
H12: Personal innovativeness in information technology has a significant positive effect on effort
expectancy of in-store ubiquitous computing-based information services

126
4.4.2.2 Personal Involvement – Personal Relevance and Importance
In marketing and consumer research, involvement has been long recognized as an individual
difference variable which influences the consumer purchase and communication behavior (Barki
and Hartwick, 1994; Laurent and Kapferer, 1985; Zaichkowsky, 1985). The traditional consumer
behavior theories were built based on the rational man assumption; which proposes that a
consumer vigorously search for and comprehensively evaluate information to make an informed
decision. However, in reality, different consumers search in different levels based on the
subjective relevance and importance of the purchase decisions. As a result the notion of
involvement has been introduced into the consumer behavior theories (Zaichkowsky, 1985).
Contingent on the degree of consumers’ involvement, consumers may differ greatly in the extent
of their purchase decision process and information search. That is consumers’ with higher
involvement level regarding the purchase decisions search for more information and spend more
time and effort for searching for the right selection (Zaichkowsky, 1985).
Barki and Hartwick (1994) define user involvement as “a subjective psychological state,
reflecting the importance and personal relevance of an object or event” (p. 62). The object of
involvement in this dissertation is the purchase decision; which reflects how interested
consumers are about purchase decisions and how important it is for them to make the best
decision.
Based on the definition of Barki and Hartwick (1994), involvement has two different facets,
namely relevance and importance. Mayer (2012) argued that however relevance and importance
are related concepts, depending on the context, their extent could differ for an individual. In his
doctoral dissertation analyzing the acceptance of persuasive kitchen environments, he
decomposed the involvement factor into two distinct factors of relevance and importance. These
two factors were then incorporated as moderators in his model theorizing a positive moderating
effect on the relationship between performance expectancy and behavioral intention. The
moderating effect of importance could be supported by empirical results; however personal
relevance had no significant moderating effect in this study.
In the context of this dissertation, importance is defined as the “the extent of intrinsic desire or
personal need for information support while purchasing a product”. Whereas relevance is defined

127
as “the extent of an individual’s general dedication and interest in making informed purchasing
decisions”, that is to which extent informed shopping in general is relevant to an individual. For
example, making an informed purchase decision can be very relevant for a person, however
getting help while shopping is not necessarily important for the same person due to her self-
confidence on finding the right information on her own. Thus to specify more fully the nature of
the relationship between the consumer and their purchase decision, in this dissertation the same
approach as Mayer’s has been taken. That is decomposing the involvement factor into relevance
and importance dimensions.
One of the main objectives of the in-store ubiquitous computing information services is to assist
consumers by searching for and evaluating the required information for their purchasing
decision. In cognitive theories, it is argued that a system can be only considered as useful if a
relationship between the use and its consequence is readily apparent (Venkatesh and Davis,
2000). Considering the personal relevance, it is expected that the consumers who are highly
dedicated to make informed purchase decisions and thus are more willing to search and evaluate
various product information find the systems more matching to their needs and therefore more
useful. In regard to importance, it is expected that the consumers who need help and to whom it
is important to get support while shopping will perceive the in-store ubiquitous computing
information services more useful. Thus, the hypotheses to be tested are:
H13: Personal relevance of making an informed decision has a significant positive effect on
performance expectancy of in-store ubiquitous computing-based information services.
H14: Importance of having shopping assistance has a significant positive effect on performance
expectancy of in-store ubiquitous computing-based information services.
4.5 Incorporating Contextual Factors
Apart from individual characteristics, based on the diversity of in-store ubiquitous computing-
based information services and technologies two additional contextual factors namely service
type and technology type are added to the base model. Service type and technology type account
for characteristics of tasks and technologies which might influence individuals’ beliefs regarding
a given service and technology. Figure 23 shows the process of incorporating these factors into

128
the base model. In the following sections, the theoretical rationale to incorporate the system type
and technology type as moderators into the base model of this dissertation will be thoroughly
discussed followed by the formulation of each theoretical relationship as a research hypothesis.
Figure 23: Incorporating service type and technology type into the base model
4.5.1 Service Type
In-store ubiquitous computing-based information services can be divided into two categories:
assisting the information search and screening tasks and assisting the alternative evaluation tasks.
Service type in this dissertation thus refers to these two service categories. Therefore, from the
user’s perspective, it represents the type of the task which is performed using the system, being it
searching for product information or evaluation of the alternatives.
In behavioral theories task type has been identified as one of the important influencing factors on
behavior as individuals’ decision to perform a certain behavior may vary contingent on
characteristics of the task (Hackman, 1969). Thus, in information system research, TAM-based
models are criticized for overlooking the potential effects of task type on behavioral intention
A Subset of UTAUT2
Consequence factor
Intention to Prefer
Cognitive Factors
Effort Expectancy
Performance Expectancy
Affective Factor
Hedonic Motivation
Behavioral Intention
Social Influence
Social Factor
Antecedent Factors: formation of belief system
AgeGender
A Subset of IMDT
User characteristics: dependency relations
with the Internet
Action Orientation
Interaction Orientation
Solitary Play
Social Play
User characteristics:personality traits in consumer context
Personal Innovativeness in
IT
Personal Relevance
Importance
Involvement
Service type Technology type

129
and use of new technologies (Gefen and Straub, 2000; Goodhue and Thompson, 1995). As a
response, various studies have integrated the characteristics of task in their acceptance models,
often as moderators of models’ core constructs (D’Ambra and Wilson, 2004; Fang et al., 2005;
Gefen and Straub, 2000; Sun and Zhang, 2006; Yen et al., 2010). The rationale for incorporating
the task type in the acceptance models is derived from the task-technology fit model (Goodhue
and Thompson, 1995); it postulates that individuals’ needs are functions of task characteristics,
therefore the fit between task requirements and service characteristics offered by a technology
influences the users’ system evaluation. The authors argued that as individuals have limited
cognitive capacity, the more multifaceted and difficult a task, the less capacity would be left to
deal with a system which then influences their evaluation of technology attributes (Goodhue and
Thompson, 1995; Sun and Zhang, 2006).
Although interrelated, the information search and alternative evaluation stages are distinct in
terms of needs. Whereas in the information search stage, customers conduct a more attribute-
based search, in the alternative evaluation stage the focus is more in alternative-based search
(Payne et al., 1993). As customers proceed in their decision making process, they stop to gather
information about certain attributes and start to build a set of the most promising alternatives
which then would be compared in more depth by processing bundles of product attributes and
customer benefits (Payne et al., 1993, 1988). In addition, while becoming closer to the purchase
decision, in alternative evaluation stage the effect of possible undesirable consequences of a
faulty choice is most comprehended by customers (Tversky and Kahneman, 1981). Therefore, in
general the alternative evaluation is perceived as a more complex task than information search
(Payne et al., 1993, 1988).
According to task-technology fit model, task complexity negatively influences the users’
perception regarding the match between the technology capabilities and task demands (Dishaw
and Strong, 1999; Frambach et al., 2007). Therefore, it can be assumed that because of the
relative complexity of alternative evaluation, users will perceive assisting technologies more
compatible with searching and screening the product information than evaluating the
alternatives. Current empirical research can support this assumption; regarding the online
technology, research shows that online channel is more compatible with customers’ needs in
information search than alternative evaluation stage; as by increasing complexity customers tend

130
to seek expert help in offline stores (Frambach et al., 2007). In addition, Karaatli et al. (2010)
investigated the user perception of mobile based shopping assistance services at different stages
of the consumer decision making. Based on their findings, more customers believed that mobile
services can improve their shopping experience in information search stage than alternative
evaluation stage. However, they haven’t addressed the potential effect of this perception on
customers’ technology evaluation and use.
Building on the task-technology fit model and assuming a better fit between the assisting
technologies and information search tasks than alternative evaluation tasks, it is expected that
customers evaluate in-store ubiquitous computing-based services differently. Based on task-
technology fit model, the more complex the task, the less cognitive capacity a user can allocate
for operating the technology (Goodhue and Thompson, 1995; Sun and Zhang, 2006). Therefore,
it is expected that effort expectancy would be more important for the acceptance of the
alternative evaluation services than information search services. In contrast, empirical results
show that the higher fit between the task and technology leads to a more positive beliefs
concerning the relative advantage of the system (Fang et al., 2005; Goodhue and Thompson,
1995; Klopping and McKinney, 2004; Yen et al., 2010; Zhou et al., 2010). Considering the two
cognitive and hedonic dimensions of the relative advantage, it is expected that customers would
perceive the information search services more useful and fun than alternative evaluation stages.
As said, while becoming closer to the purchase decision, in alternative evaluation stage the effect
of possible undesirable consequences of a faulty choice is most comprehended by customers
(Tversky and Kahneman, 1981). Therefore, it is expected that customers place relatively less
weight on the opinions of important others while making the decision to use the alternative
evaluation services.
Based on above mentioned arguments, it is expected that service type has a moderating effect on
the relationships between behavior intention to use in-store ubiquitous computing based
information services and its antecedents. Thus, the hypotheses to be tested are:
H1.3: The influence of effort expectancy on behavior intention will be moderated by service type
such that the effect will be stronger for services assisting alternative evaluation stage

131
H2.3: The influence of performance expectancy on behavior intention will be moderated by
service type such that the effect will be stronger for services assisting information search stage
H3.3: The influence of social influence on behavior intention will be moderated by service type
such that the effect will be stronger for services assisting information search stage
H4.3: The influence of hedonic motivation on behavior intention will be moderated by service
type such that the effect will be stronger for services assisting information search stage
4.5.2 Technology Type
As discussed in section 2.2, different technologies have been developed to assist customers
through information search and alternative evaluation process in brick and mortar retail. Based
on the technology device ownership, these technologies can be divided in two main categories
namely store-based systems (Melià-Seguí et al., 2013; Pantano, 2010b; Pantano and Naccarato,
2010) and applications based on customers own smart mobile devices (Gao et al., 2010;
Kowatsch et al., 2011; Kowatsch and Maass, 2010). The types of services provided by store-
based systems are replicable on customers own mobile devices. As the level of investment on
store-based systems is significantly higher than mobile applications, it is important for retailers
to know if customers perceive and evaluate these technologies differently. In this regard, Pantano
(2014b) argues that, as current models fail to investigate the potential effect of technology type
on customers’ usage decisions, they are unable to provide retailers with a guideline on which is
the best technology to invest in and calls for further research on this topic. Therefore, as the last
factor, technology type is incorporated in the conceptual model as a moderator of the
relationships between the behavioral intention and its direct antecedents. The rationale for this
integration is elaborated below.
Technology device ownership is believed to increase the acceptance likelihood of new
applications based on the already owned device (Niehaves et al., 2012; Tretiakov and Kinshuk,
2005). Several studies assume that the acceptance of advanced mobile services such as mobile
commerce, mobile learning, and mobile internet is positively influenced by the customers prior
mobile device use (Lu et al., 2003; Wang et al., 2009; Wu and Wang, 2005).

132
In general, users feel more confident using their own devices while being engaged in a new
context as obtained experience and skills from the previous usage can be easily utilized in the
new context (Prete et al., 2011). Empirical research shows that with increasing experience and
skill, the importance of the ease of using a system as well as hedonic and social motivations for
its use fades (Venkatesh et al., 2012, 2003). Therefore, it is expected that customers place less
weight on the effort expectancy, hedonic motivation, and social influence while evaluating in-
store information services provided on their own mobile devices. In contrast, individuals appear
to place a greater utilitarian value on technologies they have chosen to own (Conole, 2008;
Jeffery, 2013; Yen et al., 2010). Therefore, they might associate more utilitarian value with in-
store information services provided on their own mobile devices than the ones installed in the
store.
Based on the above mentioned arguments, it is expected that technology type has a moderating
effect on the relationships between behavior intention to use in-store ubiquitous computing-
based information services and its antecedents. Thus, the hypotheses to be tested are:
H1.4: The influence of effort expectancy on behavior intention will be moderated by technology
type such that the effect will be stronger for store-owned devices.
H2.4: The influence of performance expectancy on behavior intention will be moderated by
technology type such that the effect will be stronger for user-owned mobile devices.
H3.4: The influence of social influence on behavior intention will be moderated by technology
type such that the effect will be stronger for store-owned devices.
H4.4: The influence of hedonic motivation on behavior intention will be moderated by
technology type such that the effect will be stronger for store-owned devices.
4.6 Summary of Hypotheses
To develop a contextual acceptance model for in-store ubiquitous computing based information
services, UTAUT2 has been chosen as the base model. After refining the UTAUT2 based on the
context requirements, four factors are defined as the most important direct determinants of
behavioral intention. The base model was then extended step by step by integrating various
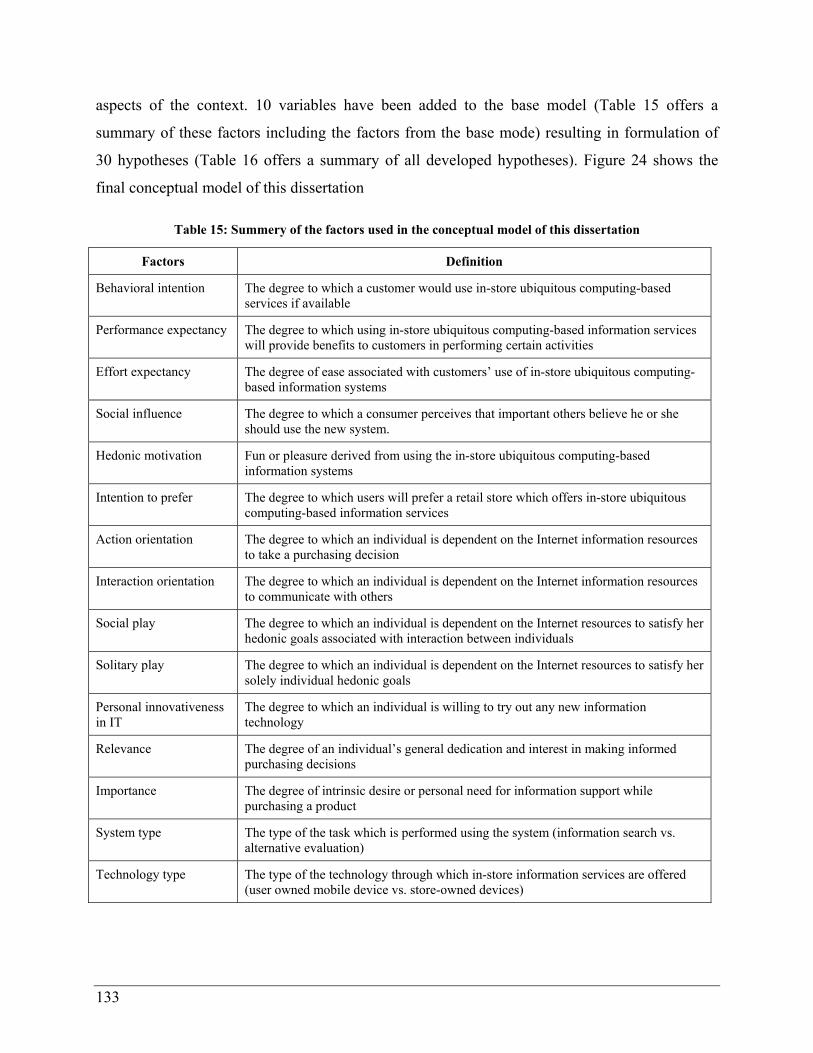
133
aspects of the context. 10 variables have been added to the base model (Table 15 offers a
summary of these factors including the factors from the base mode) resulting in formulation of
30 hypotheses (Table 16 offers a summary of all developed hypotheses). Figure 24 shows the
final conceptual model of this dissertation
Table 15: Summery of the factors used in the conceptual model of this dissertation
Factors Definition
Behavioral intention The degree to which a customer would use in-store ubiquitous computing-based services if available
Performance expectancy The degree to which using in-store ubiquitous computing-based information services will provide benefits to customers in performing certain activities
Effort expectancy The degree of ease associated with customers’ use of in-store ubiquitous computing-based information systems
Social influence The degree to which a consumer perceives that important others believe he or she should use the new system.
Hedonic motivation Fun or pleasure derived from using the in-store ubiquitous computing-based information systems
Intention to prefer The degree to which users will prefer a retail store which offers in-store ubiquitous computing-based information services
Action orientation The degree to which an individual is dependent on the Internet information resources to take a purchasing decision
Interaction orientation The degree to which an individual is dependent on the Internet information resources to communicate with others
Social play The degree to which an individual is dependent on the Internet resources to satisfy her hedonic goals associated with interaction between individuals
Solitary play The degree to which an individual is dependent on the Internet resources to satisfy her solely individual hedonic goals
Personal innovativeness in IT
The degree to which an individual is willing to try out any new information technology
Relevance The degree of an individual’s general dedication and interest in making informed purchasing decisions
Importance The degree of intrinsic desire or personal need for information support while purchasing a product
System type The type of the task which is performed using the system (information search vs. alternative evaluation)
Technology type The type of the technology through which in-store information services are offered (user owned mobile device vs. store-owned devices)

134
Table 16: Summery of hypotheses on the acceptance determinants of in-store ubiquitous computing-based information services
Hypothesis Relationship
H1 Effort expectancy has a significant positive effect on behavior intention to use in-store ubiquitous computing-based information services
H1.1 The influence of effort expectancy on behavior intention will be moderated by age such that the effect will be stronger for older people than younger people
H1.2 The influence of effort expectancy on behavior intention will be moderated by gender such that the effect will be stronger for women than for men
H1.3 The influence of effort expectancy on behavior intention will be moderated by service type such that the effect will be stronger for services assisting alternative evaluation stage
H1.4 The influence of effort expectancy on behavior intention will be moderated by technology type such that the effect will be stronger for store-owned devices.
H2 Performance expectancy has a significant positive effect on behavior intention to use in-store ubiquitous computing-based information services.
H2.1 The influence of performance expectancy on behavior intention will be moderated by age such that the effect will be stronger for younger people than older people
H2.2 The influence of performance expectancy on behavior intention will be moderated by gender such that the effect will be stronger for men than for women
H2.3 The influence of performance expectancy on behavior intention will be moderated by service type such that the effect will be stronger for services assisting information search stage
H2.4 H2.4: The influence of performance expectancy on behavior intention will be moderated by technology type such that the effect will be stronger for user-owned mobile devices.
H3 Social influence has a significant positive effect on behavior intention to use in-store ubiquitous computing-based information services.
H3.1 The influence of social influence on behavior intention will be moderated by age such that the effect will be stronger for older people than younger people
H3.2 The influence of social influence on behavior intention will be moderated by gender such that the effect will be stronger for women than for men
H3.3 The influence of social influence on behavior intention will be moderated by service type such that the effect will be stronger for services assisting information search stage
H3.4 The influence of social influence on behavior intention will be moderated by technology type such that the effect will be stronger for store-owned devices.
H4 Hedonic motivation has a significant positive effect on behavior intention to use in-store ubiquitous computing-based information services.
H4.1 The influence of hedonic motivation on behavior intention will be moderated by age such that the effect will be stronger for younger people than older people
H4.2 The influence of hedonic motivation on behavior intention will be moderated by gender such that the effect will be stronger for men than for women
H4.3 The influence of hedonic motivation on behavior intention will be moderated by service type such

135
Hypothesis Relationship
that the effect will be stronger for services assisting information search stage
H4.4 The influence of hedonic motivation on behavior intention will be moderated by technology type such that the effect will be stronger for store-owned devices.
H5 Behavior intention to use in-store ubiquitous computing based information services has a significant positive effect on customers’ preference of stores offering such services.
H6 Action orientation dependency of customers on the Internet has a significant positive effect on effort expectancy of in-store ubiquitous computing-based information services.
H7 Action orientation dependency of customers on the Internet has a significant positive effect on performance expectancy of in-store ubiquitous computing-based information services.
H8 Interaction orientation dependency of consumers on the Internet has a significant positive effect on effort expectancy of in-store ubiquitous computing-based information services.
H9 Interaction orientation dependency of consumers on the Internet has a significant positive effect on performance expectancy of in-store ubiquitous computing-based information services.
H10 Social play dependency of customers on the Internet has a significant positive effect on hedonic motivation of in-store ubiquitous computing-based information services
H11 Solitary play dependency of customers on the Internet has a significant positive effect on hedonic motivation of in-store ubiquitous computing-based information services
H12 Personal innovativeness in IT has a significant positive effect on effort expectancy of in-store ubiquitous computing-based information services.
H13 Personal relevance of making an informed decision has a significant positive effect on performance expectancy of in-store ubiquitous computing-based information services.
H14 Importance of having shopping assistance has a significant positive effect on performance expectancy of in-store ubiquitous computing-based information services.

136
Figure 24: The final conceptual model of this dissertation
User characteristics: dependency relations
with the Internet
A Subset of UTAUT2
Consequence factor
Intention to Prefer
Cognitive Factors
Effort Expectancy
Performance Expectancy
Affective Factor
Hedonic Motivation
Behavioral Intention
Social Influence
Social Factor
Antecedent Factors: formation of belief system
A Subset of IMDT
Action Orientation
Interaction Orientation
Solitary Play
Social Play
Personal Innovativeness in
IT
Personal Relevance
Importance
Involvement
AgeGender Service type Technology type
User characteristics:personality traits in consumer context

137
5 Empirical Study
After developing the conceptual model for the acceptance of in-store ubiquitous computing-
based information services, the purpose of this chapter is to empirically examine the model. The
first step in conducting an empirical study is to cautiously select a statistical analysis method.
Therefore, next, the suitability of different statistical methods to the objectives and
characteristics of the current research is discussed and PLS-SEM is chosen as the most
appropriate statistical method for the empirical analysis of this dissertation. After constructing
the structural and measurement models, a data set has been collected by conducting a scenario-
based online survey. Lastly, the quality of PLS estimates engendered from the data set are
assessed and their implications for the hypothesized relationships are discussed.
5.1 Selecting the Statistical Analysis Method
Hair et al. (2010) provide researchers with a classification of multivariate analysis methods and a
corresponding clear-cut procedure to select the most appropriate analysis method. As shown in
Figure 25, the procedure to determine the appropriate multivariate analysis method starts by
answering the straightforward question of “what types of relationships [between the variables]
are being examined” (Hair et al., 2010, p. 12). Due to the fact that in this dissertation, the
relationships between more than two variables will be investigated, univariate analysis (analysis
to examine the distribution of a single variable) and bivariate analysis (analysis to examine the
relationship between two variables) are subsequently excluded.
Following the recommended procedure by Hair et al. (2010) to choose the appropriate analysis
method, first the nature of the relationships under study needs to be examined; being it the
relationship between dependent and independent variables or the structure of the relationship,
different statistical analysis methods should be applied. In the theoretical model of this
dissertation, there are multiple relationships between several dependent and independent
variables. Therefore for this dissertation only multivariate dependence methods are applicable
(see the left branch in Figure 25) as opposed to interdependence methods (the right branch of
Figure 25).

138
The next step is to decide which dependence method is the most appropriate one for the purpose
of the study. This decision can be made by answering the question “how many variables are
treated as dependent in a single analysis”(Hair et al., 2010, p. 11); if the goal is a simultaneous
estimation of the relationships between multiple dependent and independent variables, as is the
case in this study, then structural equation modeling is the most appropriate method. Otherwise
multivariate analysis of variance or multiple regressions would be a better fit (Hair et al., 2010).
To sum up, for simultaneous estimation of complex, causal relationships, structural equation
modeling is the best fitting method (Chin, 1998a).
Figure 25: Selecting a multivariate technique (Hair et al., 2010, pp. 12–13)
Furthermore there are two additional motives to apply structural equation modeling, namely the
possibility to define relationships between latent variables and the ability to reduce the
measurement errors (Hair et al., 2010). Latent variables are “hypothetical constructs invented by
a scientist for the purpose of understanding a research area” (Bentler, 1980, p. 420) which
cannot be observed or directly measured (Borsboom et al., 2003). Structural equation modeling
What type of relationship is
being examined
How many variables being
predicted?
Is the structure of
relationships among:
What is the measurement scale of the dependent variable?
What is the measurement scale of the dependent variable?
Structural Equation modeling
Canonical correlation
analysis with dummy variables
What is the measurement scale of the predictor variable?
Canonical correlation
analysis
Multivariate analysis of variance
Multiple regression
Conjoint analysis
Multidimensional scaling
Multiple discriminant
analysis
Linear probability
models
Factor analysis
Cluster analysis
Confirmatory factor
analysis
Correspondence analysis
How are the attributes measured
Dependence Interdependence
Multiple relationships of dependant and
independent variables
Several dependent variables in a single relationship
Metric Nonmetric Metric Nonmetric
Nonmetric
One dependent variable in a single relationship
VariablesCases/Respondents Objects
Nonmetric NonmetricMetric
Legend
Decision pointMultivariate
technique selected

139
allow the analysis of relationships between latent variables through the integration of regression
and factor analysis methods (L. J. Williams et al., 2009). These theoretical constructs can be
estimated through so-called measurement models consisting of indicator variables which can be
empirically collected and tested (Rigdon, 1998). Hence, structural equation modeling enables the
measurement of latent variables and thus estimation of causal relationship between latent
variables. In addition, the potential measurement error, rooted in the very nature of the empirical
data collection, can be reduced by the inclusion of several indicator variables to measure a single
latent construct which also leads to better statistical estimates of existing relationships with other
latent variables (Hair et al., 2010).
Considering the reasons mentioned above, structural equation modeling has been chosen as the
most appropriate method to fulfill the objectives of this dissertation. The following two sections
( 5.1.1 and 5.1.2) are devoted to the review of the structural equation modeling technique, its
types, their strengths and weaknesses and the type of studies for which they are most suitable.
The goal of this review is guiding the decision of which structural equation technique fits the
best to the objectives of the current dissertation.
5.1.1 Structural Equation Modeling
The term, structural equation modeling, refers to a group of multivariate statistical methods used
for empirical examination of theoretically derived statements about complex relationships
between multiple variables (Chin, 1998b; Rigdon, 1998; Ringle, 2004a; Hair et al., 2010; Kline,
2011). In 1904, Spearman (1904) developed the exploratory factor analysis, a few years prior to
the introduction of path analysis by a biogeneticist, Wright (1918). Years later, during the 1970s,
a framework named the JKW model (Bentler, 1980) was developed. It was named as such in
reference to its three authors: Jöreskog, Keesling, and Wiley; the JKW model integrated the
factor analysis (measurement approach) and the path analysis (structural approach) bringing
about what became the basis for what is now known as the structural equation modeling (Kline,
2011). Thus, structural equation modeling is also referred as the second generation statistical
methods as it integrates the first generation methods namely regression and factor analysis
(Fornell and Larcker, 1987; Hair et al., 2012a, 2014a). Thanks to the significant theoretical and
methodological contribution of Jöreskog and Sörbom (Jöreskog, 1970; Jöreskog and Van Thillo,
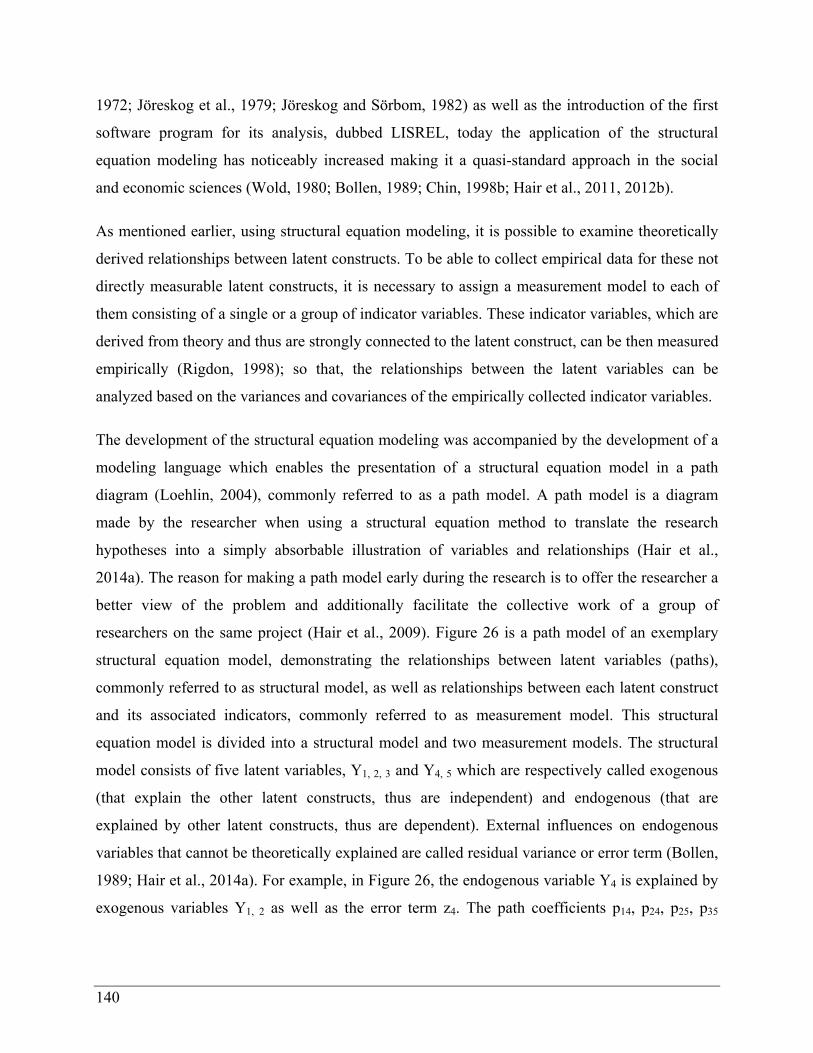
140
1972; Jöreskog et al., 1979; Jöreskog and Sörbom, 1982) as well as the introduction of the first
software program for its analysis, dubbed LISREL, today the application of the structural
equation modeling has noticeably increased making it a quasi-standard approach in the social
and economic sciences (Wold, 1980; Bollen, 1989; Chin, 1998b; Hair et al., 2011, 2012b).
As mentioned earlier, using structural equation modeling, it is possible to examine theoretically
derived relationships between latent constructs. To be able to collect empirical data for these not
directly measurable latent constructs, it is necessary to assign a measurement model to each of
them consisting of a single or a group of indicator variables. These indicator variables, which are
derived from theory and thus are strongly connected to the latent construct, can be then measured
empirically (Rigdon, 1998); so that, the relationships between the latent variables can be
analyzed based on the variances and covariances of the empirically collected indicator variables.
The development of the structural equation modeling was accompanied by the development of a
modeling language which enables the presentation of a structural equation model in a path
diagram (Loehlin, 2004), commonly referred to as a path model. A path model is a diagram
made by the researcher when using a structural equation method to translate the research
hypotheses into a simply absorbable illustration of variables and relationships (Hair et al.,
2014a). The reason for making a path model early during the research is to offer the researcher a
better view of the problem and additionally facilitate the collective work of a group of
researchers on the same project (Hair et al., 2009). Figure 26 is a path model of an exemplary
structural equation model, demonstrating the relationships between latent variables (paths),
commonly referred to as structural model, as well as relationships between each latent construct
and its associated indicators, commonly referred to as measurement model. This structural
equation model is divided into a structural model and two measurement models. The structural
model consists of five latent variables, Y1, 2, 3 and Y4, 5 which are respectively called exogenous
(that explain the other latent constructs, thus are independent) and endogenous (that are
explained by other latent constructs, thus are dependent). External influences on endogenous
variables that cannot be theoretically explained are called residual variance or error term (Bollen,
1989; Hair et al., 2014a). For example, in Figure 26, the endogenous variable Y4 is explained by
exogenous variables Y1, 2 as well as the error term z4. The path coefficients p14, p24, p25, p35

141
describe the direct relationships between the exogenous and endogenous variables, while the
path coefficient p45 represents the relationship between the endogenous variables.
As previously mentioned, for each latent construct, a measurement model is assigned which
consists of one or more indicators, also referred to as items or manifest variables. In Figure 26,
measurement models for endogenous and exogenous variables are illustrated on the right and left
side of the structural model. These directly measurable indicators that are theoretically connected
to their corresponding latent constructs shape the estimates of the structural relationships
between the latent constructs.
Figure 26: Graphical presentation of an exemplary structural equation model
After having the model ready, to obtain the results for the relationships in the structural equation
model, next, the structural and measurement model parameters should be estimated. For this
purpose, two major statistical approaches are available, the covariance-based technique (CB-
SEM) (Jöreskog, 1978, 1993) and variance-based partial least squares technique (PLS-SEM)
(Wold, 1966; Lohmöller, 1989) (Ringle, 2004b; Hair et al., 2012b, 2014a).
e1
e2
e3
e4
e5
e6
x1
x2
x3
x4
x5
x6
Y2
Y1
Y3 z5
Y5
Y4
z4
e7
e8
e9
e10
x7
x8
x9
x10
p14
p25
p35
p24
Structural Model
Measurement model for exogenous
latent variables
Measurement model for endogenous
latent variables
p45

142
Since 1970s the covariance-based structural modeling has found a prominent place in practice
and research. The partial least squares approach was developed by Wold (1975) during the 1970s
as a successor to non-linear iterative least squares (NILES) and non-linear iterative partial least
squares (NIPALS) (Jöreskog and Wold, 1982). However, unlike covariance-based structural
modeling, there was a late emergence of software programs utilizing the PLS-SEM algorithm
(Hair et al., 2011, p. 140) such as PLS-Graph (Chin, 2001) or SmartPLS (Ringle et al., 2005).
For Wold, the goal from establishing PLS-SEM was to have an alternative to CB-SEM; one that
had a better disposition towards prediction and more important, one that dealt with the rigidity in
the data requirements (e.g. the normality of the data and minimum sample size required) and the
rigidity in the specification of relationships (Hair et al., 2014a; Tenenhaus et al., 2005). Today,
there is a consensus among academia that PLS-SEM has, indeed, delivered on both counts.
Consequently, the number of publications featuring PLS-SEM has increased over the years and it
has become a reflex to many researchers to strongly consider this approach when dealing with
relationships between latent variables.
Although both CB-SEM and PLS-SEM approaches share the fundamentals of structural equation
modeling, there are still principal differences between them (Hair et al., 2012b; Jöreskog and
Wold, 1982; Rigdon et al., 2017). Typically, researchers are guided by the objective of their
research when choosing either approach. In this regard Ridgon et al. (2017, p. 11) note that
“there is not the single best option as the choice of a method depends on the explicit and implicit
assumptions a researcher makes regarding the phenomena under study and our ability to
measure them comprehensively”. Thus before applying a structural equation modeling method,
one should consider the pros and cons of each depending on the research question (Hair et al.,
2014a; Ringle et al., 2012).
The following section is dedicated to the comparison of both methods in contemplation of
identifying the most appropriate method for the analysis of the present work. It is important to
note that this section does not aim to offer a detailed description of the exact mathematical
processes of each approach but it will rather compare the principle functions, underlying
assumptions and restrictions of each method to finally answer the question of which method is
the most appropriate for this work.

143
5.1.2 PLS-SEM and CB-SEM
To answer the question of which structural equation modeling is the most appropriate method for
this research, the characteristics and objectives of each methodology should be considered along
with the nature of the question under research (Hair et al., 2014a). There is an ample support to
the claim that each of the two approaches is stronger than the other, contingent on the aim of the
research (Fornell and Bookstein, 1982; Hair et al., 2011, 2014a; Henseler et al., 2009;
Marcoulides et al., 2009; Ringle et al., 2012; Sarstedt et al., 2017; Rigdon et al., 2017). Detailed
guidelines can be found in the literature concerning the use of each approach. Thus, below there
will be no exhaustive review of literature in the field but simply a selective review of all criteria
relevant to the determination of the SEM approach that is most appropriate for the current work.
Differences between CB-SEM and PLS-SEM are mainly rooted in the differences in their
estimation procedure which in turn causes differences in the requirements for the data
characteristics, the theoretical model and consequently model evaluation results. The first step in
making the choice between CB-SEM and PLS-SEM is to clearly determine the research
objective.
A closer look at the estimation algorithms of CB-SEM and PLS-SEM reveals why researchers
need to determine their goal as a first step in choosing the analysis method. While the CB-SEM
uses a maximum likelihood estimation method, in the PLS-SEM, ordinary least squares (OLS)
regression-based method is used. The modus operandi in the CB-SEM approach is that a
covariance matrix is computed based on the sample dataset. Later on, calculations of parameters’
estimates are made. These estimates permit minimizing a fitting function defined as the
difference between the correlations implied by the parameter estimates and the sample
correlation (Anderson and Gerbing, 1988; Hair et al., 2011; Kline, 2011), this is done in an
iterative manner and only stops when there is no improvement possible. In other words CB-SEM
tries to maximize the fit of a model-based covariance matrix to the data-based covariance matrix
allowing the assessment of how well a theoretical model fits the observations (Chin, 1998b;
Lohmöller, 1989). This approach provides optimal estimations for the model parameters
however it does not permit to predict observed indicators.

144
On the other hand, PLS-SEM algorithm is mainly a sequence of ordinary least squares
regressions in terms of weight vectors. The resulting weight vectors satisfy fixed point equations
at convergence level which is obtained when outer weights between two iterations fall below a
fixed threshold (Hair et al., 2011, 2014a; Henseler, 2010; Henseler et al., 2009; Marcoulides et
al., 2009). Through the OLS approach, the aim is to minimize the error terms and residual
variances of endogenous variables thus maximizing the explained variance (also known as
predictive), R², of the total variance of a construct. This enables the most accurate prediction of
endogenous latent variables (Hair et al., 2014a, 2014b; Sarstedt et al., 2014; Urbach and
Ahlemann, 2010). For that reason PLS-SEM is particularly appropriate when the research
objective is prediction of influencing factors of a certain construct (Chin and Newsted, 1999a;
Hair et al., 2014a; Ringle et al., 2012; Sarstedt et al., 2014; Urbach and Ahlemann, 2010). The
superiority of PLS-SEM in predictive capabilities is also backed by various simulation studies
(Becker et al., 2013; Evermann and Tate, 2016; Sarstedt et al., 2017). In addition PLS-SEM
holds a higher statistical power making it particularly suitable for exploratory research setting
and development of new theories (Sarstedt et al., 2017).
Another important criterion for the choice of CB-SEM or PLS-SEM is the characteristics of the
data of the empirical study and the model complexity (Chin and Newsted, 1999a; Sarstedt et al.,
2017; Urbach and Ahlemann, 2010). The PLS-SEM is more appropriate when dealing with small
sample sizes (Reinartz et al., 2009). The statistical properties of the PLS-SEM, that is estimation
of the structural model’s partial regression relationships instead of simultaneous calculations of
all relationships, allow robust estimation results for small sample sizes even for complex models
with a large number of latent variables (Hair et al., 2014a; Hui and Wold, 1982; Sarstedt et al.,
2017).
Mapping the advantages and constraints of each method on the requirements of the empirical
analysis of this work, overall, the research objectives, the empirical data characteristics, and
model complexity are in favor of using PLS-SEM. The aim of this work is to identify the
relevant antecedent constructs of the intention to use and intention to prefer of in-store
ubiquitous computing-based information services. Here, one of the objectives is the assessment
of the potential effect of Internet information dependency on the intention to use determinants of
technology acceptance theory. Firstly, it is important to note that, acceptance studies in the field

145
of in-store ubiquitous technologies are not yet mature. Furthermore, there is no previous study in
this field incorporating media dependency theory into technology acceptance theory. Under these
circumstances, the developed conceptual model of this study cannot be considered as a well-
established theory; thus the focus here is on a high explanatory power of individual relationships.
Consequently, this study falls under the category of exploratory research and theory
development, hence making PLS-SEM the more appropriate choice.
In addition, in line with the objectives of this work, the analyses are also aimed to serve as
foundation for the follow-up recommendations on course of actions to support brick and mortar
retailers in development and implementation of the ubiquitous computing based information
services; to do so an importance-performance matrix analysis (IPMA) will be conducted. For
this, the latent variables scores which are generated within the framework of PLS-SEM
parameter estimation are required (Völckner et al., 2010). Besides, in agreement with UTAUT2,
the effects of demographic factors of age and gender on relationships between the determinants
and intention to use are included in the theoretical foundation. For empirical study, this means
the division of the total sample size into several subgroups in order to perform multi-group
analysis. Evidently, the divided sample sizes result in smaller sub-sample sizes, in the case of the
current study it lies partly below 150 observations; again making it more judicious to apply PLS-
SEM (Hair et al., 2014a; Sarstedt et al., 2017). Having chosen PLS-SEM for the analyses of this
work, following section is dedicated to the application procedure of this method.
5.2 PLS-SEM Analyses
Having discussed the structural equation modeling and the choice of PLS-SEM, the rest of this
chapter is dedicated to application procedure of PLS-SEM for the analyses objectives of this
dissertation. Figure 27 is an illustration of the typical stages for the application of the PLS-SEM
accompanied with the corresponding steps adapted to the objectives and characteristics of this
dissertation. The whole process can be divided into four different phases, namely creation of the
structural and measurement models, estimation of the models, and assessment of the results and
finally interpretation of the results. The very first step here is the construction of the structural
model based on the theoretically derived hypotheses. As mentioned in section 5.1.1, the latent
variables constructing the structural model are not directly observable; therefore in the second
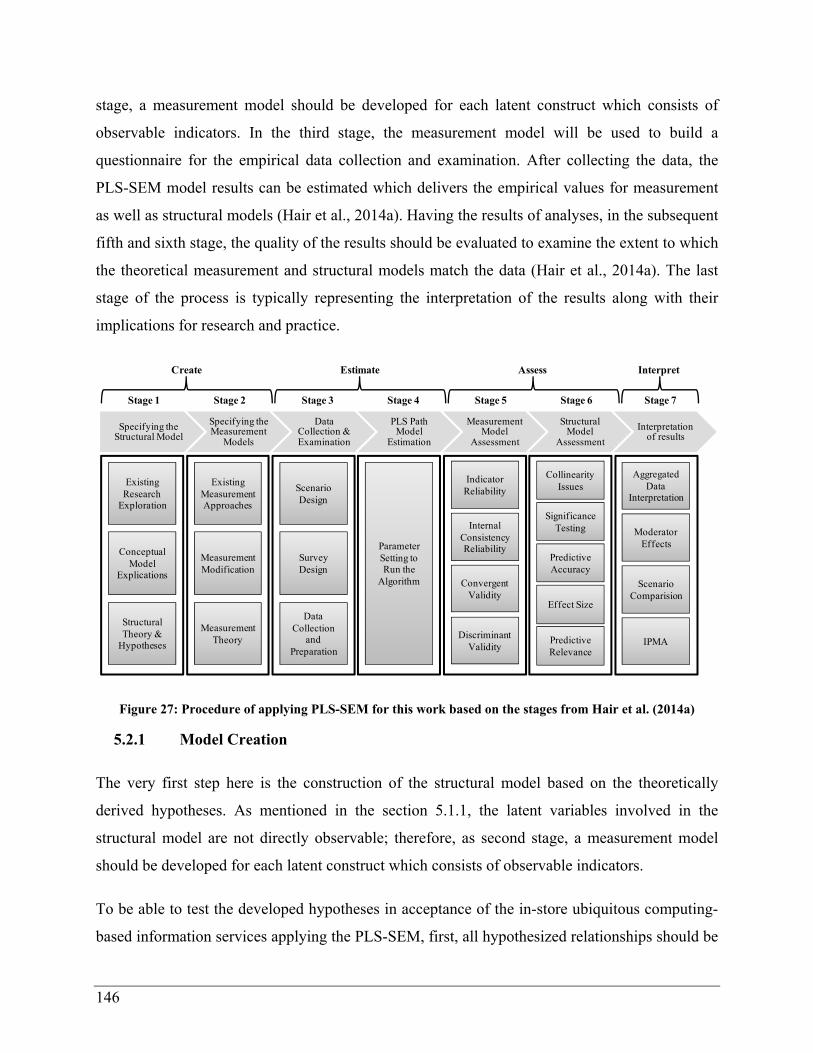
146
stage, a measurement model should be developed for each latent construct which consists of
observable indicators. In the third stage, the measurement model will be used to build a
questionnaire for the empirical data collection and examination. After collecting the data, the
PLS-SEM model results can be estimated which delivers the empirical values for measurement
as well as structural models (Hair et al., 2014a). Having the results of analyses, in the subsequent
fifth and sixth stage, the quality of the results should be evaluated to examine the extent to which
the theoretical measurement and structural models match the data (Hair et al., 2014a). The last
stage of the process is typically representing the interpretation of the results along with their
implications for research and practice.
Figure 27: Procedure of applying PLS-SEM for this work based on the stages from Hair et al. (2014a)
5.2.1 Model Creation
The very first step here is the construction of the structural model based on the theoretically
derived hypotheses. As mentioned in the section 5.1.1, the latent variables involved in the
structural model are not directly observable; therefore, as second stage, a measurement model
should be developed for each latent construct which consists of observable indicators.
To be able to test the developed hypotheses in acceptance of the in-store ubiquitous computing-
based information services applying the PLS-SEM, first, all hypothesized relationships should be
Specifying the Structural Model
Specifying the Measurement
Models
Data Collection & Examination
PLS Path Model
Estimation
Measurement Model
Assessment
Structural Model
Assessment
Interpretation of results
Indicator Reliability
Internal Consistency Reliability
Convergent Validity
Discriminant Validity
Existing Research
Exploration
Conceptual Model
Explications
Structural Theory &
Hypotheses
Existing Measurement Approaches
Measurement Modification
Measurement Theory
Significance Testing
Effect Size
Predictive Relevance
Collinearity Issues
Predictive Accuracy
IPMA
Moderator Effects
Scenario Comparision
Aggregated Data
Interpretation
Parameter Setting to Run the
Algorithm
Stage 1 Stage 2 Stage 3 Stage 4 Stage 5 Stage 6 Stage 7
Create Estimate Assess Interpret
Scenario Design
Survey Design
Data Collection
and Preparation

147
translated into a path diagram. Figure 28 shows the path diagram of this dissertation derived
from the developed conceptual model.
Figure 28: Path diagram for the acceptance model of in-store ubiquitous computing-based information services
After specifying the structural model for acceptance of in-store ubiquitous computing based
information services, the next step in model creation is development of the measurement theory.
The objective here is establishing a theoretically grounded measurement instrument to make the
latent constructs of the model measurable, thus enabling the empirical data collection for the
analyses. For this purpose, for each latent construct a measurement model should be assigned,
which may consist of one or more indicators. As shown in Figure 27, this stage is made of three
steps, namely exploring the existing measurement approaches, modification and adjustment of
the existing measurement instruments to the research context and finally development of a
measurement instrument.
Intention to Prefer
Importance
Personal Relevance
Personal Innovativeness
in IT
Solitary Play
Social Play
Action Orientation
Interaction Orientation
Effort Expectancy
Performance Expectancy
Social Influence
Hedonic Motivation
Behavior Intention
BI1 BI3BI2
IP
PE1 PE3PE2
EE4
EE2
EE3
EE1
SI1 SI3SI2
HM4
HM2
HM3
HM1
SOLP3
SOLP1
SOLP2
SOLP3
SOLP1
SOLP2
IO3
IO1
IO2
AO3
AO1
AO2
AO4
PR1 PR4PR3
IMP3
IMP2
PIIT1 PIIT3PIIT2
BI4
PE4 PE5
PIIT4
PR2
IMP1
AgeGender Service typeTechnology Type

148
As discussed thoroughly in chapter 4, the conceptual framework of this dissertation consists of
four distinct sets of constructs, namely antecedent factors of behavior intention (based on
UTAUT2), a consequence factor of behavior intention, and relevant user characteristics in the
technology and consumer context as external contextual factors along with user’s Internet
dependency relations (based on IMD theory) as external contextual factors. For each set of
constructs, the existing measurement instruments have been explored and the ones which have
been extensively validated in the literature were selected. In the next step the selected
measurement instruments were adjusted to the context of this dissertation. The remainder of this
section is dedicated to the elaboration of this process for each set of constructs.
The measurement instruments for the UTAUT2 constructs were developed based on the original
UTAUT constructs. For each, the original items were reexamined, screened and adapted (mostly
rephrased) to the context of the present study. Table 17 lists the indicators of UTAUT2
constructs for this study.
Table 17: Indicators of UTAUT2 constructs in acceptance model of in-store ubiquitous computing based information services
Construct (latent variable)
Indicator code Indicators
Behavioral Intention (BI)
BI1 I would like to shop in stores which have such technologies.
BI2 I would use this technology frequently.
BI3 I wish this technology was already available.
BI4 I intend to use the presented technology if available.
Performance Expectancy (PE)
PE1 I think using the presented technology will help me find what I want faster and easier in the shop.
PE2 The presented technology will make shopping more convenient for me.
PE3 Overall, I think the presented technology will be useful for me.
PE4 The presented technology will improve my shopping experience
PE5 The presented technology will fit with my shopping needs.
Effort Expectancy (EE)
EE1 Learning how to use the presented technology seems easy for me.
EE2 I think my interaction with this technology would be clear and understandable.
EE3 The presented technology appears to be easy to use.

149
EE4 It would be easy for me to become skillful at using the presented technology.
Hedonic Motivation (HM)
HM1 The presented technology will make the shopping more fun for me.
HM2 I will enjoy shopping more in shops with this technology.
HM3 The presented technology will make the shopping very entertaining.
HM4 The presented technology would feel like playing a game for me.
Social Influence (SI)
SI1 My friends and/or family would be impressed to hear that I use this technology.
SI2 My friends and/or family would be interested to use this technology.
SI3 I think most people in my community will use the presented technology for shopping.
Construct items related to the IMD theory were as well developed based on the original IMD
measurement tools. IMD theory consists of six different levels of dependency relations between
an individual and a media system. Each of these levels covers a specific goal (Understanding,
Orientation or Play) and is either targeting the persons themselves or their social environment
(see section 3.2.2). With only four dimensions selected as relevant, in this research the total
number of IMD measurement tools implemented is thirteen items. Items for each of the
mentioned variables were adopted and embedded directly from the literature with no changes
made in phrases except for action orientation where the items had to be adapted to the context of
the research. Table 18 lists the indicators of IMD constructs for this study.
Table 18: Indicators of Internet dependency constructs in acceptance model of in-store ubiquitous computing-based information services
Construct (latent variable)
Indicator code Indicators
Action Orientation (AO)
AO1 Internet helps you to decide where to buy certain products/services.
AO2 Internet helps you to decide what to buy.
AO3 Internet helps you to decide between alternative products/services.
AO4 Internet helps you to decide whether to buy a certain product/service or not.
Interaction Orientation (IO)
IO1 Internet helps you to discover better way to communicate with others.
IO2 Internet helps you to think about how to act with friends, relatives, or people you work with.

150
IO3 Internet helps you to get ideas about how to approach others in important or difficult situations.
Solitary Play (SOLP)
SOLP1 Internet helps you to stop thinking about work and problems after a hard day or week.
SOLP2 Internet helps you to relax when you are by yourself.
SOLP3 Internet helps you to have something to do when nobody is around.
Social Play (SOCP)
SOCP1 Internet gives you something to do with your friends.
SOCP2 Internet helps you to have fun with family or friends.
SOCP 3 Internet helps you to be a part of events you enjoy without having to be there.
In addition to UTAUT2 and IMD constructs, few additional variables that are not part of the two
theories is integrated in the research model namely intention to prefer, personal innovativeness in
information technology, importance and personal relevance. Intention to prefer is a unique
instrument construct; it measures the respondents’ intention to prefer a shop where the
technology is available over an ordinary store. The item for the this construct was developed
based on Intention to Prefer from Kowatsch et al. (2011) shown in Table 19.
Table 19: Indicator of the consequence construct of acceptance in acceptance model of in-store ubiquitous computing based information services
Construct (latent variable)
Indicator code Indicators Adopted from
Intention to Prefer (IP)
IP I would prefer a retail store where the presented technology is available to use over an ordinary store.
(Kowatsch et al., 2011)
The construct of personal innovativeness has a long tradition in innovation acceptance research.
The traditional approach to measure the personal innovativeness however is rather a posteriori
approach. That is measuring the innovativeness of a user after that she has taken the decision of
using an innovation. Such an approach doesn’t support an a priori identification of innovative
users (Goldsmith et al., 1998). As a response to this limitation, a variety of measurement
approaches have been introduced in the literature for a direct measurement of personal
innovativeness for an overview see (Agarwal and Prasad, 1998). Among them the scale
developed by Goldsmith and Hofacker (1991) has found a widespread acceptance. Goldsmith

151
and Hofacker (1991) proposed a domain specific innovativeness (DSI) scale to measure the
tendency of individuals to be among the first customers to try the new products in a particular
category. The DSI consists of six indicators based on personal opinions and behaviors. Various
studies report a relatively high reliability and validity of the DSI (Agarwal and Prasad, 1998;
Bearden et al., 2011; Goldsmith et al., 1998; Pagani, 2007; Roehrich, 2004). Applying the scale
of Goldsmith and Hofacker (1991) to the domain of information technology, Agarwal and Prasad
(1998) developed a new scale titled as personal innovativeness in the information technology.
The scale consists of four prototypical statements on the use of Information technologies, which
in the original work was measured using a seven-point scale. In this dissertation, the scale from
Agarwal and Prasad (1998) is used as the basis for the formulation of indicators of personal
innovativeness. Three general statements concerning individuals’ tendency to use information
technology have been formulated as indicators. Finally the indicators for importance and
personal relevance constructs have been derived from the work of Mayer (2012). Table 20 lists
the indicators for these constructs. The measurement models for all of the latent variables are
graphically presented in Figure 28.
Table 20: Indicators of user characteristic constructs in acceptance model of in-store ubiquitous computing- based information services
Construct (latent variable)
Indicator code Indicators Adopted from
Personal Innovativeness in IT (PIIT)
PIIT1 I like to experience products that use new technologies. (Agarwal and Prasad, 1998)
PIIT2 Among my peers, I am usually the first to explore new information technologies.
(Agarwal and Prasad, 1998)
PIIT3 I feel comfortable using new information technologies. (Agarwal and Prasad, 1998)
PIIT4 In general, I am hesitant to try out new information technologies.
(Agarwal and Prasad, 1998)
Importance (IMP)
IMP1 I often have trouble choosing which item to buy when I am shopping.
(Mayer, 2012)
IMP2 I often end up buying something that I don’t need, because I get confused when I am shopping.
(Mayer, 2012)
IMP3 I would like to have some assistance when I am shopping, especially when the product I need is expensive.
(Mayer, 2012)
Personal Relevance (PR)
PR1 It is important to me to feel like a smart shopper and to make successful purchases.
(Rintamäki et al., 2006b)

152
(Mayer, 2012)
PR2 It is important to me that the products I buy are consistent with my style.
(Rintamäki et al., 2006b)
(Mayer, 2012)
PR3 It is important for me to inform myself about the alternatives (e.g., price, quality) before making the purchase.
(Mayer, 2012)
PR4 When I am shopping, I am usually very careful with the decisions I make.
(Rintamäki et al., 2006b)
5.2.2 Data Collection and Examination
The second phase of application procedure of PLS-SEM is the estimation of the results. After
creating the structural and measurement model, to be able to run the PLS-SEM algorithm to
estimate the results, a data set for indicator variables of the model should be collected and
prepared. Therefore, next, first the data collection procedure and the characteristics of the
collected data will be discussed. To investigate the research questions and hypotheses of this
work, a scenario based survey method has been chosen.
Scenario Development
Application of scenario based surveys is quite common in technology acceptance research
(Kokkinou and Cranage, 2011); scenarios as research stimuli are especially employed when
innovations or new technologies are not existent or very rare in the market, but early customer
acceptance and requirements are to be explored (Cheng and Yeh, 2011; Lancelot Miltgen et al.,
2013; Rothensee, 2010). Therefore, using scenarios while empirically studying the acceptance of
ubiquitous computing systems has turned to be a common practice (Kaasinen et al., 2012;
Lancelot Miltgen et al., 2013; Lanseng and Andreassen, 2007; Mayer, 2012; Okazaki and
Mendez, n.d.; Olsson, 2012; Rothensee, 2010; Roussos and Moussouri, 2004). To conduct a
scenario based survey, formulated scenarios are presented to the subjects of the study as a
stimulus to make an acceptance decision. Scenarios in this context are short stories about an
incident in which a user is performing an act or a sequence of activities with a new technical
system (Carroll, 2000). They are used in order to visualize innovative technologies and to make
them tangible to customers (Carroll, 2000). A scenario includes description of the setting, agents
153
or actors, objectives, actions and events as well as the impact of actions and events on the goals
(Carroll, 2000).
The advantages of this survey method lie in its simple and inexpensive design and
implementation. In addition, the method enables the early acceptance assessment of the future
technologies. The challenge is however to design a scenario which can induce a uniform
conception about a given technology among all participants. Especially considering that people
differ in their abilities to put themselves in a hypothetical situation.
In this work scenarios are used to make in-store ubiquitous computing based information
services understandable to the users in order to carry out a corresponding questionnaire. Three
objectives of this dissertation are of special importance while developing the required scenarios:
Empirical exploration of the developed theoretical model for user acceptance of in-store
ubiquitous computing-based information services
Empirical exploration of theoretical model for different service types (services for
information search vs. alternative evaluation) in order to identify the stage specific
determinants of user acceptance
Empirical exploration of the theoretical model for different technology categories (store
owned vs. user-owned), in order to identify the potential system specific determinants of
user acceptance
Considering these objectives, three comprehensive technology-enabled retail scenarios that
include a number of realistic ubiquitous computing-based services to support information search
process of the customers in traditional retail environment is developed. First, to be able to
empirically explore the theoretical model for information search and alternative evaluation, two
distinct scenarios for a store based technology are developed each encompassing technology
based services supporting customers in the given stage. For empirical exploration of the
theoretical model for both store-based and mobile applications, one additional scenario for
services offered on users own mobile device is formulated. In addition, having different
scenarios for distinct service and technology types enables to collect a more valid aggregated
dataset.

154
To ensure the relevance and feasibility of the scenarios, the technology and the services
illustrated in the scenarios are chosen based on the literature, industrial reports, and real
applications of in-store ubiquitous computing technologies which have been thoroughly
discussed in section 2.2. The first and second scenarios are dedicated to store-based stationary
system (smart mirror). Whereas the first scenario focuses on information search stage, the second
one is about alternative evaluation stage, enabling the comparison of the empirical results among
the stages. The third scenario is dedicated to applications on customers own mobile devices so
that comparison of the empirical results between this scenario and the first scenario can enable
the exploration of the theoretical model for different technology types.
The formulation of the scenarios is kept clear and simple. All scenarios include a description the
usage environment, the person involved, the objectives and activities as well as the types of
assistance and the interaction with the system. To reduce the product bias, that means if a person
finds the product in a scenario not attractive or irrelevant it can affect her perception about the
technology based services, the opening paragraphs for scenario one and three are formulated to
stimulate the need to buy the product. To decrease the risk of the inconsistent conception of the
scenarios among participants, all scenarios are augmented by various pictures made in
Photoshop. In addition to make it easier for the participants to put themselves in the scenario
context, for each scenario a male and female version is formulated.
After developing the first drafts of the scenarios for the purpose of evaluation, the scenarios were
presented and discussed during a workshop. Nine peers attended the workshop for 120 minutes.
In a presentation, the attendants were briefed about the purpose of the research, purpose of the
workshop, the procedure as well as the evaluation criteria as:
Wording and clarity of scenarios and questions (considering that the English scenarios
are designed for German audience)
The consistency of the text and the pictures in the scenarios
The layout design of the scenarios (e.g. the alignments of the text and pictures)
Picture features (e.g. clarity, size in the text, color)
The suitability of the length and the number of scenarios (e.g. too many, too few
scenarios to cover the topic)

155
The scenarios were revised based on the comments and recommendations received from peers.
Then the edited scenarios were sent to two different evaluators with the request for written
comments. Again the scenarios were revised based on the evaluators’ comments. The final
scenarios for female participants are shown in Figure 29 and Figure 30.

156
Figure 29: Smart Mirror scenarios for information search and alternative evaluation stages
Lisa enters the floor dedicated for women clothing in a large department store. Sheneeds an outfit for her upcoming job interview. Therefore she is looking for a whiteblouse and a dark skirt. The floor is huge and full of different brands with differentstyles. She looks for a shop assistant to get some advice concerning where to find thebusiness outfits, but all shop assistants seem to be busy at the moment. So she pickstwo blouses and a skirt and takes them into the fitting room. The skirt fits very well,but none of the blouses suit her taste.She uses the Smart Mirror in the cabin for inspiration on blouses that could fit well tothe skirt and are available in the store: Pressing a button, Lisa activates the SmartMirror function; the Smart Mirror scans Lisa’s body.
Now Lisa interacts with the Smart Mirror and it proposes a list of blouses whichcould fit well to the skirt on a small screen located next to the Smart Mirror, based onthe occasion (formal outfit/interview outfit) and her age and size. She has the optionto filter the given list based on different criteria (size, co lor, brand, on sale etc). Shefilters the options based on price (less than 30 Euro) and color (white). Then, shebrowses the options and chooses five blouses to try on. She orders her favorite onesvia touch screen and a shop attendant delivers them to her.
Scenario 1- Smart Mirror (Information Search)_Female
Scenario 2- Smart Mirror (Alternative Evaluation)_Female
After trying on the five blouses she has ordered via touch screen to the fitting room,Lisa has three white blouses in her consideration set. She wants to buy just one. Shehas never bought from these brands and doesn’t know the quality.
Given that she is quite sensitive about the Price-Performance ratio (Preis-Leistungs-Verhältnis) of any product she buys, she interacts with the Smart Mirror again. Whiletrying on each blouse, she touches the blouse on the Mirror and the details of theproduct as well as reviews on the products from other customers appear in aninformation box in the corner of the Mirror. She chooses the one with the best reviewand buys the white shirt and the skirt. Being confident of his choices, she is lookingforward to convince her new boss in the upcomingjob interview.

157
Figure 30: Mobile application scenario based on the customers own smart phones
Survey Design
Online survey method is chosen in this dissertation as it is more practical in terms of time and
cost (Dillman, 2007; Thompson et al., 2003; Wright, 2005). LimSurvey, a free online survey
application is used to implement the online survey. The principles identified by Dillman et al.
(1998) and Dillman (2007) are followed while designing the survey. To ensure the consistency
of the answers, returning to the previous question and jumping to the next question without
answering are disabled. In addition saving and later resuming is enabled. However to submit the
questionnaire all questions should have been answered. Following the recommendation of
Valerie and Ritter (2007), 12-point Arial font has been used for the survey.
Considering the superiority of the seven-point Likert-scale in terms of reliability and validity of
results (Cox III, 1980; Krosnick and Wright, 2010) especially for unsupervised surveys (Crano
and Brewer, 2002; Finstad, 2010) and consistent with prior research on the IT acceptance, all
items were measured using a seven-point Likert-scale.
Scenario 3- Mobile Applications (Information Search)_Female
Three different Tablets fit her requirements and show up on her screen. She is able todirectly compare all the features: price, brand, technical features (front camera, rearcamera, expandable storage, etc) presented in an easy to compare matrix. By clickingon each option, she has the possibility to look for more detailed information of everyTablet in particular. Julia always needs some time to think about a bigger spending.She saves the search options in her “Dream Box” to get to see them later.
Julia studies at Hamburg University of Technology. In a gathering after a course,Julia’s friends are speaking about the advantages of Tablets (Tablet Computers) fortheir studies. One friend says that she could load all her lecture materials on it to readwhile sitting in the train, the other is fascinated with the possibility to find additionalinformation she might need through the internet and the other one uses her Tablet towrite comments and notes directly in the documents while sitting in the train orduring the lectures. Being convinced of the advantages, Julia decides to purchase aTablet. Few days later, she enters a very large elect ronics store and heads to the tabletsection. She goes through the assortment of Tablets in the store. Soon she finds aTablet which suites her taste. The design is very nice and it has all the features shedesires, but unfortunately it is too expensive. She uses her Smartphone to open theApp. of the store to find out if there is a similar (with the same main functions) but acheaper product. She scans the barcode of the Tablet she likes and it appears on herphone. Then she chooses the category “Similar Products” and filters all the functionsshe would like her new Tablet to have.

158
The survey was started by introducing the web questionnaire with an inviting and instructive
welcome screen. In addition, an incentive of entering into a drawing to win one of five, €25 gift
certificates from Amazon was added into the greeting text to encourage participation in the
survey. The questions about gender and age were presented in the beginning for two reasons:
their answers are used for branching later on in the survey, they play an important role in
lowering the chance for participants to abandon the survey and that by building investment
(Valerie and Ritter, 2007). The final product was then the first draft of a self-administered cross-
sectional questionnaire which included greetings, demographics-related questions and questions
spanning the measurement items covering three scenarios. For each scenario, the same set of the
questions were asked, with minor adaptation to the specific context.
The first draft of the questionnaire was presented and discussed with nine peers during a
workshop. The revised version of the questionnaire has then been lunched for a pre-test.
Throughout a two weeks’ period, the pre-test online survey was conducted for two purposes:
first, identifying any concerns linked to the survey’s functionality, accessibility and length;
second, to further improve and refine the questionnaire in provision for the main survey. 41
participants - mainly research associates - were completed the pre-test. According to the received
feedback, participants found the survey to require a longer period of time to be completed than
mentioned. The survey was fully functional, yet it included a number of minor design flaws.
Also some of the items seemed to be unclear and required further explanation or rephrasing.
Naturally, the necessary corrections and amendments were made. The questionnaire was also
redesigned to allow a more logical progression.
Data Collection and preparation
To collect the data, the survey was accessible for two weeks starting on April 23rd, 2014. The
participation was completely anonymous. Following the common practice in technology
acceptance research, a non-probability sampling technique has been used. 4189 people – mainly
students and staff of Hamburg University of Technology (Germany) - were invited via email to
complete the survey. 635 emails were returned as undeliverable leaving a total of 3554 emails
successfully sent. 548 participants started to answer the survey of which 308 did it to completion.
After an initial screening of the data, 6 cases were removed from the sample by reason of

159
suspicious patterns suggesting questionable responses. The resulting sample consisted of 302
cases, which is the equivalent to a final response rate of 8.5%. Considering that in technology
acceptance studies the average number of participants is around 290 (ranging from 25 to 2,500)
(Legris et al., 2003), with 302 participants, this dissertation holds above average sample size in
the field.
Regarding demographics, while the mean age of the respondents was 31, 45.4% of respondents
were under 25 years old, 34.4% were between 26 and 40 and 20.2% were older than 40 years
old, with the age ranging from 18 to 83. Obviously, that indicates a predilection for younger
people, which was expected considering the large number of students comprised in the sample
and the nature of the survey channel. Regarding gender, the distribution is not far from balanced
with 44.4% of the respondents being female and 55.6% being male. The majority of the
participants have more than 15 years of experience with the Internet. They access the Internet
several times a day (89.4%), are highly Internet-affine (59%) and consider the Internet to be their
primary source of information (95.7%). Table 21 offers an overview of participant
demographics.
However, the gender distribution is very close to the distribution of the gender in German
population, for age and education, the representativeness of the data cannot be claimed.
Nevertheless the representativeness of the data is of secondary importance for this dissertation,
as the focus of the research is not on the estimation of the population parameters but on
examination of the causal hypotheses (Göritz and Schumacher, 2000). Furthermore considering
the exploratory nature of the current research nonrepresentative sample is appropriate (Bhutta,
2012; Göritz and Schumacher, 2000). The reason that non-probability sampling technique is
frequently used in technology acceptance studies, particularly when the technology and the
model are new (Aldás‐Manzano et al., 2009; Davis et al., 1989; Ha and Stoel, 2009; Klopping
and McKinney, 2004; Porter and Donthu, 2006; Wu and Wang, 2005).
Table 21: Participant demographics
Variable Category Frequency In % Mode
Gender Male 168 55.6 Male
Female 134 44.4

160
Variable Category Frequency In % Mode
Age Under 20 50 16.6 21-25
21-25 87 28.8
26-30 59 19.5
31-40 45 14.9
41-50 15 5.0
51-60 27 8.9
61 or above 19 6.3
Education 8th grade or less 3 1 Graduated from college, graduate or postgraduate school Some high school (Grade 9-11) 19 6.3
Graduated from high school 32 10.6
1-3 years of college/university 100 33.1
Graduated from college, graduate or postgraduate school
138 45.7
Refused to answer 10 3.3
Job Status Full-time job 112 37.1 Full-time student
Part-time job/by the hour/occasionally 74 24.5
Unemployed 10 3.3
Retired 9 3.0
House wife /House husband 4 1.3
In professional education/traineeship/military service/civil service
12 4.0
Full-time student 122 40.4
Part-time student 14 4.6
Refused to answer 8 2.6
5.2.3 Model Estimation and Results Assessment
Once the data set is ready, using the PLS-SEM method, the relationships in the path diagram can
be estimated. SmartPLS software (SmartPLS 3.0 Professional) is chosen for the analyses of the
research model. However, before using the SmartPLS software, algorithmic options and
parameter settings must be selected (Hair et al., 2017).
161
In this dissertation, the recommendations of Hair (2012b) for initializing the PLS-SEM algorithm
is followed. First, it must be decided by which weighting scheme the relationships between the
latent variables will be estimated. Path weighting is particularly suitable in this context, as
hereby explained variances of endogenous latent constructs are maximized (Chin and Newsted,
1999b; Hair et al., 2014a). Following the recommendations of Hair (2012b) and Hair et al.
(2014a), using the SmartPLS, the row data is standardized with a mean of 0 and variance of 1. In
addition, the maximum number of iterations is set at 300 and for the first iteration of the
algorithm the values of 1 are specified for all relationships in the measurement model. Finally,
the stop criterion of the algorithm is set at 10-5. Once the algorithm is initialized, the data set is
used to execute the PLS-SEM algorithm and generate the estimation results.
Having the estimation results, the next step is the assessment of the quality of the results or
quality of the model, the goal here is to gauge how well the theoretical measurement and
structural models fit the data (Hair et al., 2014a). To do so, there is a need for appropriate
criteria, which in the context of PLS-SEM can ultimately assess the predictive ability of the
model (Hair et al., 2014a). In PLS-SEM the quality of measurement and structural model is
evaluated separately in a two-step process (Hair et al., 2011; Tenenhaus et al., 2005). Rationally,
as the first step, before assessing the structural relationships, one should examine if the indicators
can truly represent the corresponding constructs (Hair et al., 2011). To do so the validity and
reliability of the indicators should be evaluated. Once the validity and the reliability of the
measures proved, in the second step the quality of the structural model should be assessed (Hair
et al., 2011). There are several works offering a comprehensive guide for the evaluation criteria
and procedures of PLS-SEM result assessments (Chin, 1998b; Hair et al., 2014a, 2013, 2011;
Henseler et al., 2009). Aligned with the proposed quality criteria of these works and in line with
the two-step PLS-SEM assessment process, following the quality of measurement and structural
models of this dissertation will be examined.
5.2.3.1 Quality Criteria for Measurement Model Assessment
Before starting the assessment process, it is imperative to know the nature of the relationships in
measurement model, be it indicators reflecting the latent variable or forming it, considering that
the modus operandi is not the same assessing the quality of results. Generally, there are two

162
conceptually different approaches to generate measurement models (Sarstedt et al., 2016). The
first approach is called reflective (Fornell and Bookstein, 1982). It assumes that the latent
construct causes the measurement which is why, as shown in the first row of Figure 31, in its
arrow scheme the arrows are pointing from the construct towards the measurement items. The
logic of creating these indicators is that they all measure the same underlying concept which
means in case of a change in the actual level of the latent variable, all indicators should also
change in the same direction (Chin, 1998b; Fornell and Bookstein, 1982; Jarvis et al., 2003;
Sarstedt et al., 2016). In the other words reflective indicators, also referred to as effect indicators
are regarded as a “representative sample of all the possible items within the conceptual domain
of the construct” (Hair et al., 2014a, p. 43). Thus they should be interchangeable, highly
correlated and the omission of any of them should not have any repercussions on the meaning of
the construct (Chin, 1998b; Fornell and Bookstein, 1982; Hair et al., 2014a; Jarvis et al., 2003;
Sarstedt et al., 2016).
In contrast, the second approach referred to as the formative approach (Fornell and Bookstein,
1982) assumes the opposite that is the measurement items form the construct; mirroring this
logic also in its arrow scheme with arrows pointing towards the construct as shown in Figure 31.
Contrary to the case with the reflective model, deleting an item from the model potentially
changes the nature of the construct (Hair et al., 2014a; Sarstedt et al., 2016). In a formative
model, there are no expectations of correlation between the indicator variables; it even may
cause problems due to the collinearity (Hair et al., 2014a; Jarvis et al., 2003). There are two types
of formative models, models with causal indicators and models with composite indicators
(Sarstedt et al., 2016). Whereas in the former, the indicators cover the totality of the causes of an
underlying construct, in the latter they are rather contributors to a construct (Bollen, 2011;
Sarstedt et al., 2016). Since often identifying each and every aspect around a phenomenon is not
realistic, in formative models with causal indicators a construct-level error term representing the
unidentified causes has been taken into account. In contrast, as their name implies, composite
indicators form a composite fully representing a construct without any measurement error
(Bollen, 2011; Sarstedt et al., 2016). PLS-SEM treats formative model indicators as composite
indicators without construct level measurement error (Sarstedt et al., 2017).

163
Noting that, based on the definition of the constructs, in this dissertation only reflective
measurement approach has been used for measurement model conceptualization and
operationalization, the remainder of this section is dedicated to review of quality criteria solely
for reflective model assessment.
Figure 31: Reflective and formative measurement model conceptualization and operationalization adapted from Sarstedt et al. (2016, p. 4001)
5.2.3.1 Measurement Model Assessment
The quality of a reflective measurement model is assessed over two central criteria namely
reliability and validity. As mentioned in the section 5.1.1, measurement of latent constructs with
multiple variables reflects some error in addition to the true value of variable. In fact “when
indirect measures are used to gather data, measurement error is virtually guaranteed” (Lowry
Y3
The indicators are viewed as a representative sample of all the possible effects within the conceptual domain of construct Relationships go from the construct to its indicatorsTakes measurement error into account at the item level Indicators should be correlated with each other Dropping an indicator from the measurement model does not alter the meaning of the construct
The indicators are expected to cover all aspects of the content domainDirection of causality is from measure to construct Takes measurement error into account at construct levelNo reason to expect that measures are correlatedDropping and indicator from the measurement model may alter the meaning of the construct
Similar to causal indicators expect for following aspects: The indicators are rather contributors to the underlying construct No measurement error at construct-level
Y2z
Y1
e1 e2 e3 e4Eff
ect
Ind
icat
ors
Ref
lect
ive
Cau
sal I
nd
icat
ors
Com
pos
ite
Ind
icat
ors
For
mat
ive

164
and Gaskin, 2014, p. 127). The total measurement error is divided to systematic and random
error; while random error threatens reliability, systematic error threatens the validity of a
measurement (Hair et al., 2014a). A fully reliable measurement has a random measurement error
of zero whereas a totally valid measurement has both random and systematic measurement error
of zero (Churchill, 1987; Götz et al., 2010). To ensure the reliability of a reflective measurement
model two criteria should be assessed namely indicator reliability and internal consistency
reliability (composite reliability). The measurement criteria to assess validity are convergent
validity and discriminant validity. In addition to above mentioned criteria, the significance of the
indicator loadings should be examined in the measurement models. In the context of the PLS-
SEM, this can be done using the non-parametric bootstrapping method (Hair et al., 2014a). For
more extensive review of bootstrapping method see section 0.
Reliability is the degree to which a measurement model accurately measures a specific construct,
regardless of whether it really comprehends the underlying concept of the construct. A reliable
measurement does not produce random results and through repeated measurement, results remain
stable and consistent (Iacobucci and Churchill, 2009; Straub, 1989) in other words, “reliability is
an index of consistency” (Iacobucci and Churchill, 2009, p. 258). Therefore, usually the first step
to assess the quality of reflective measurement model is assessing its individual indicator
reliability and internal consistency reliability.
Individual indicator reliability
For each individual indicator, indicator reliability determines what proportion of its variance is
explained by the corresponding construct (Henseler et al., 2009) and referred to as the variance
extracted from the item, the remainder is the measurement error. Indicator reliability can have
values between zero and one, the higher the value, the higher the reliability. The indicator
reliability is denoted by / (Bagozzi and Yi, 2011, p. 17) where is the
standardized outer loading of indicator and is the variance of the measurement error of
indicator defined as1 . (Chin, 1998b). In literature, the lower bound for standardized
outer loading of an indicator is often considered as 0.708≈0.7, and accordingly the reliability as
0.50 which implies that at least 50% variance of an indicator should be explained by its
corresponding latent variable (Bagozzi and Yi, 2011; Hair et al., 2011; Henseler et al., 2009;

165
Ringle and Spreen, 2007). However, these values shouldn’t be applied rigidly, depending on the
model and the sample size (Bagozzi and Yi, 2011; Fritz, 1995), the values lower than 0.5 could
be still satisfactory if the corresponding construct do satisfactory in the overall model (Bagozzi
and Yi, 2011). Therefore, it is recommended to consider indicators with loadings between 0.40
and 0.70 for removal only if that results in an increase in the internal consistency reliability
(composite reliability) and/or the convergent validity (Bagozzi and Yi, 2011; Hair et al., 2014a).
However “results based on the retention of low-reliability items must be interpreted with
caution”, bearing in mind that low reliabilities can negatively affect the estimated relationships
between constructs (Hulland, 1999, p. 199). Items with very low loadings (< 0.40) should
however be eliminated (Hair et al., 2014a, 2011; Henseler et al., 2009).
The estimated results for the aggregated data showed that the majority of the items´ loadings
were satisfactory; except for three items: an item from personal innovativeness in IT (PIIT4) and
two items for personal relevance (PR3 and PR4) (see the items in Table 18 and Table 20). PIIT4
had loadings lower than 0.4 and therefore was excluded. The PR3, and PR4 had loadings
between 0.4 and 0.7, therefore their deletion impact on AVE and composite reliability was tested
before deciding to retain or delete them. Following the recommendation of the Hair et al. (2014a)
and after careful consideration, PR3 has been kept as the item’s loading (0.66) was just slightly
under the 0.7 threshold and its removal didn’t engendered any proper increase in the AVE and/or
the composite reliability. However, PR4 was deleted as its removal resulted in a healthy increase
in AVE. Additionally, the second item of the importance construct, IMP2, was discarded for it
presented very weak results in Scenario 3; satisfyingly, the removal of IMP2 resulted in a healthy
increase of the AVE.
Internal consistency reliability
Internal consistency is a measure to determine how accurate a given latent construct is measured
by its assigned indicators. In assessing the reliability of the measurement model, the reliability in
the construct level is of more importance than indicator level (Bagozzi and Baumgartner, 1994).
In the context of PLS-SEM, internal consistency is measured either by Cronbach’s alpha
(Cronbach, 1951) or by the composite reliability criterion (Werts et al., 1974). Hair et al. (2014a)

166
recommend using composite reliability over Cronbach’s alpha for it allows a better
approximation of the reliability.
The value of composite reliability could vary between zero and one, where higher values indicate
a higher reliability. The composite reliability is denoted by ∑ / ∑
∑ (Chin, 1998b, p. 320) where is the standardized loading between the construct and
indicator (Ringle, 2004c), and is variance of the measurement error defined as1 .
(Chin, 1998b). In exploratory research, values of 0.60 to 0.70 are usually viewed as satisfactory
for composite reliability, in more advanced research stages, the threshold is slightly higher with
values between 0.70 and 0.90 regarded as satisfactory (Hair et al., 2011, 2014a; Henseler et al.,
2009). Accordingly values inferior to 0.60 are usually synonymous with the lack of reliability
(Hair et al., 2014a) whereas values superior to 0.95 are typically not desirable for they usually
indicate that “all indicator variables are measuring the same phenomenon” (Hair et al., 2014a, p.
102). That said, it is possible in some cases to have a composite reliability superior to 0.95 even
though the indicators are in fact not similar nor do they cover exactly the same aspect (Chin and
Dibbern, 2010).
An alternative criterion to measure internal consistency reliability is recently proposed by
Dijkstra and Henseler (2015) referred to as reliability coefficient denoted by which usually
returns a value between Cronbach’s alpha and composite reliability (Sarstedt et al., 2017).
Following the recommendation of Hair et al. (2014a), in the present study, composite reliability
is used to measure the internal consistency reliability. All composite reliability values are clearly
higher than 0.7 implying satisfactory accuracy of the measurement of each construct by its items.
Nonetheless, composite reliability was observed to be higher than 0.95 in two constructs, namely
BI and PE. The items for the constructs in question were adopted from the original works of
Venkatesh et al. (2003, 2012) where they have demonstrated a good composite reliability. Thus,
it is assumed that these high composite reliability values are simply exceptionally good and
therefore no changes were deemed necessary. In addition the reliability coefficient is assessed.
The results from reliability coefficient are as well higher than 0.7 expect for PR and IMP being
slightly under 0.60. As in exploratory research, values of 0.60 to 0.70 for reliability are

167
acceptable, it is suggested that all construct measures exhibit sufficient levels of internal
consistency reliability.
After assessing the reliability of the measurement models, the next step is to evaluate the models’
validity. Validity is the extent to which a measurement model measures what it is supposed to
measure, that is the underlying concept of the latent variable (Iacobucci and Churchill, 2009). In
the context of PLS-SEM, the validity of reflective measurement model is inferred by looking for
two types of validity, namely convergent validity and discriminant validity.
Convergent validity
Convergent validity is the extent to which different measures of the same construct positively
correlate and converge. For the assessment of the convergent validity, the above mentioned
composite reliability criterion as well as a criterion called average variance extracted (AVE) are
used. Both tests describe, how well a construct is explained by the totality of its indicators (Hair
et al., 2009). AVE is denoted by ∑ / ∑ ∑ (Chin, 1998b, p. 321), the
same as in reliability tests formulas, is the standardized loading between the construct and
indicator and is variance of the measurement error defined as1 .Based on the
same logic as indicator reliability, the values above 0.5 is considered as satisfactory; so that the
total variance of indicators and their corresponding construct is greater than effect of
measurement error (Hair et al., 2011; Ping Jr, 2004; Ringle, 2004c).
The second step in the measurement model assessment is the assessment of the validity of the
measurement models; this is performed through the evaluation of model’s convergent validity
and discriminant validity. As discussed in the convergent validity section, the measurement
criterion for the convergent validity is the AVE. AVE depicts the variance captured by the
indictors relative to the measurement error (Fornell and Larcker, 1981). Customarily, an AVE
that is higher than 0.50 is required to justify the use of the construct (Hair et al., 2014a).
In the case of the present research, all AVE values are superior to the 0.5 threshold value with
0.53 being the lowest estimate recorded for personal relevance (PR) meaning that all constructs
of the model can, on average, explain more than the half of the variance of their indicators (Hair
et al., 2014a).

168
Discriminant validity
Discriminant validity is defined as the degree of autonomy of different constructs in a given
model. It is a case when the relationship between indicators measuring a construct is stronger
than the relationship between indicators measuring different constructs (Fornell and Cha, 1994;
Götz et al., 2010; Henseler et al., 2009). Three different approaches do exist in the literature for
assessment of discriminant validity, namely cross-loading, Fornell-Larcker and HTMT. Well-
known as a more liberal measure, cross-loading criterion is based on comparison of a given
indicator’s loadings through its associated construct with its loadings through other constructs in
a given model (Hair et al., 2011, 2014a). In contrast Fornell-Larcker criterion often is referred to
as a stricter method than cross-loadings. It suggests that average variance extracted of a latent
variable should be greater than each squared correlation of the given latent variable with another
latent variable in a given model (Fornell and Larcker, 1981), so that a construct shares more
variance with its indicators than with the ones of any other construct (Hair et al., 2011, 2014a).
Recently Henseler et al. (2015) introduced a new and more sensitive set of criteria for
discriminant validity, referred to as HTMT (Heterotrait-monotrait). Based on a simulation study,
they could show that the HTMT approaches outperform both previous methods in detecting lack
of discriminant validity (Henseler et al., 2015). There are two different approaches to use HTMT
to assess discriminant validity: first as a criterion with a pre-defined threshold and second as the
input for a statistical discriminant validity test, commonly referred to as HTMT inference (Henseler
et al., 2015). In the literature threshold for the criterion-based HTMT is 0.90 that is if the HTMT
value, which is an estimate of the correlation between the indicators of two distinct constructs, is
smaller than 0.90 then it can be concluded that these constructs are empirically distinct. However
for the HTMT inference, HTMT values are used to construct confidence intervals and test the null
hypothesis, lack of discriminant validity (H0: HTMT ≥ 1) against the alternative hypothesis, two
constructs are distinct (H1: HTMT < 1).
To assess the discriminant validity in this study first the Fornell-Larcker criterion has been used.
The results from Fornell-Larcker criterion analysis revealed no inadequacies except for three
items: an item from behavior intention (BI3) and two items from performance expectancy (PE3
and PE4), that had been linked to discriminant validity problems. After carefully considering the
measurements’ content validity, these three items were removed from the original model. Then

169
as recommended by Henseler et al. (2015), the more conservative method of the HTMT is used.
The revised model's HTMT values, shown in Table 22, demonstrate satisfactory discriminant
validity which implies that the model’s constructs are indeed positively distinct. All the results
are below the conservative threshold of 0.85 except for two constructs of PE and BI which hold a
HTMT value of 0.95. From theoretical point of view, these both constructs are conceptually
different and are frequently used in previous technology acceptance studies. Therefore as also
advocated by Henseler et al. (2015), in technology acceptance studies the choice of more liberal
HTMT criterion is justified. In addition the bootstrapping procedure with 5000 samples, no sign
changes option, and BCa bootstrap confidence intervals, and two-tailed testing at the 0.05
significance level (95% confidence interval) is conducted. The results of the more liberal HTMT
approach (HTMT inference), shown in Table 22, demonstrate that none of the HTMT confidence
intervals contains the value 1, suggesting that all the HTMT values are significantly different
from 1. Thus discernment validity has been met for all constructs of the model.

170
Table 22: Discriminant validity assessment – HTMT values and 95% confidence interval
IP BI EE PE SI HM SOCP SOLP AO IO PR IMP PIIT
IP
BI 0.785
[0.726;0.833]
EE 0.365
[0.263;0.460]
0.499
[0.387;0.601]
PE 0.793
[0.740;0.837]
0.954
[0.926;0.976]
0.480
[0.362;0.584]
SI 0.697
[0.607;0.777]
0.796
[0.714;0.865]
0.433
[0.302;0.552]
0.820
[0.731;0.891]
HM 0.718
[0.649;0.778]
0.757
[0.696;0.808]
0.276
[0.172;0.386]
0.770
[0.705;0.823]
0.751
[0.625;0.832]
SOCP 0.382
[0.261;0.495]
0.363
[0.227;0.485]
0.163
[0.054;0.290]
0.363
[0.225;0.484]
0.361
[0.216;0.503]
0.492
[0.373;0.606]
SOLP 0.324
[0.202;0.439]
0.355
[0.225;0.469]
0.254
[0.125;0.377]
0.352
[0.221;0.470]
0.361
[0.213;0.498]
0.324
[0.190;0.448]
0.543
[0.419;0.635]
AO 0.352
[0.227;0.475]
0.458
[0.321,0.589]
0.409
[0.266;0.541]
0.424
[0.285;0.558]
0.331
[0.192;0.482]
0.334
[0.218;0.464]
0.318
[0.180;0.471]
0.331
[0.198;0.462]
IO 0.348
[0.229;0.465]
0.371
[0.239;0.495]
0.254
[0.174;0.373]
0.426
[0.296;0548]
0.387
[0.230;0.522]
0.449
[0.328;0.570]
0.618
[0.488;0.739]
0.310
[0.171;0.453]
0.374
[0.235;0.510]
PR 0.433
[0.294;0.575]
0.585
[0.435;0.732]
0.353
[0.173;0.519]
0.584
[0.440;0.724]
0.592
[0.431;0.753]
0.471
[0.319;0.647]
0.272
[0.147;0.456]
0.277
[0.145;0.449]
0.499
[0.329;0.701]
0.321
[0.165;0.523]
IMP 0.235
[0.081;0.406]
0.392
[0.235;0.563]
0.058
[0.037;0.231]
0.400
[0.241;0.561]
0.355
[0.188;0.520]
0.266
[0.123;0.448]
0.153
[0.079;0.346]
0.297
[0.181;0.478]
0.314
[0.158;0.507]
0.212
[0.102;0.396]
0.324
[0.199;0.572]
PIIT 0.394
[0.272;0.513]
0.458
[0.329;0.577]
0.511
[0.393;0.615]
0.386
[0.247;0.516]
0.463
[0.309;0.604]
0.411
[0.284;0.528]
0.328
[0.178;0.463]
0.349
[0.208;0.481]
0.427
[0.295;0.553]
0.324
[0.186;0.455]
0.319
[0.181;0.513]
0.051
[0.049;0.235]

171
After applying the revisions stated above to meet all model evaluation assessment criteria, the
indicators were recorded and the PLS-SEM algorithm was recalculated for the final model. The
results for the revised model’s measurement model are summarized in Table 23. Relying on the
results, the quality criteria for measurement model are consistently met and thus it can be
concluded that the current measurement model is reliable and valid.
In addition, the significance of the indicators has been examined to verify if indicators in a
measurement model are indeed significant. The bootstrapping procedure with 5000 samples, no
sign changes option, and BCa bootstrap confidence intervals, and two-tailed testing at the 0.05
significance level (95% confidence interval) is conducted. The results show that none of the
confidence intervals include the value 1, therefore all items can be considered significant. Here,
it is important to note that for the analyses of this dissertation, the assessment of the
measurement models has been conducted for both aggregated data (aggregation of the data from
all three scenarios) and data generated for each scenario.

172
Table 23: Results of quality assessment criteria for the measurement model (aggregated data)
Latent Variable
Indicator
Convergent validity Internal consistency
reliability Discriminant Validity
Significant
(p <0.05)?
95% BCa Confidence
Interval
Loading Indicator reliability
AVE Composite reliability
Reliability coefficient
Behavioral Intention to Use (BI)
BI1: I would like to shop in stores which have such technologies.
0.973 0.95
0.940 0.979 0.968 Yes
Yes [0.965;0.979]
BI2: I would use this technology frequently.
0.969 0.95 Yes [0.957;0977]
BI3: I intend to use the presented technology if available.
0.967 0.95 Yes [0955;0975]
Effort Expectancy (EE)
EE1: Learning how to use the presented technology seems easy for me.
0.959 0.93
0.911 0.976 0.968 Yes
Yes [0.939;0.971]
EE2: I think my interaction with this technology would be clear and understandable.
0.961 0.93
Yes [0.941;0.973]
EE3: The presented technology appears to be easy to use.
0.956 0.93 Yes [0.937;0.968]
EE4: It would be easy for me to become skillful at using the presented technology.
0.942 0.89
Yes [0.919;0.959]

173
Performance Expectancy
(PE)
PE1: I think using the presented technology will help me find what I want faster and easier in the shop.
0.923 0.85
0.892 0.961 0.941 Yes
Yes [0.897;0942]
PE2: The presented technology will make shopping more convenient for me.
0.958 0.93
Yes [0.944;0.968]
PE3: The presented technology will fit with my shopping needs.
0.952 0.91
Yes [0.938;0.962]
Social Influence
(SI)
SI1: My friends and/or family would be impressed to hear that I use this technology.
0.756 0.58
0.732 0.891 0.851 Yes
Yes [0.687;0.811]
SI2: My friends and/or family would be interested to use this technology.
0.928 0.85
Yes [0.909;0.942]
SI3: I think most people in my community will use the presented technology for shopping.
0.873 0.76
Yes [0.819;0.909]
Hedonic Motivation
(HM)
HM1: The presented technology will make the shopping more fun for me.
0.961 0.93 0.794 0.938 0.951 Yes
Yes [0.951;0.969]

174
HM2: I will enjoy shopping more in shops with this technology.
0.915 0.85
Yes [0.894;0.931]
HM3: The presented technology will make the shopping very entertaining.
0.929 0.87
Yes [0.909;0.947]
HM4: The presented technology would feel like playing a game for me.
0.742 0.54
Yes [0.647;0.812]
Social Play
(SOCP)
SOCP1:Internet gives you something to do with your friends
0.836 0.71
0.683 0.866 0.770 Yes
Yes [0.768;0.811]
SOCP2: Internet helps you to have fun with family or friends
0.856 0.74 Yes [0.793;0.896]
SOCP3: Internet helps you to be a part of events you enjoy without having to be there
0.785 0.63
Yes [0.697;0.846]
Solitary Play
(SOLP)
SOLP1: Internet helps you to stop thinking about work and problems after a hard day or week
0.902 0.81
0.776 0.912 0.878 Yes
Yes [0.861;0.931]
SOLP2: Internet helps you to relax when you are by yourself.
0.923 0.85 Yes [0.887;0.946]

175
SOLP3: Internet helps you to have something to do when nobody else is around.
0.815 0.66
Yes [0.720;0.873]
Action Orientation
(AO)
AO1: Internet helps you to decide where to buy certain products/services.
0.749 0.57
0.587 0.850 0.776 Yes
Yes [0.671;0.812]
AO2: Internet helps you to decide what to buy.
0.712 0.51 Yes [0.603;0.788]
AO3: Internet helps you to decide between alternative products/services.
0.813 0.66
Yes [0.737;0.865]
AO4: Internet helps you to decide whether to buy a certain product/service or not.
0.785 0.61
Yes [0.718;835]
Interaction Orientation
(IO)
IO1: Internet helps you to discover better ways to communicate with others.
0.819 0.68
0.684 0.866 0.792 Yes
Yes [0.728;0.896]
IO2: Internet helps you to think about how to act with friends, relatives, or people you work with.
0.876 0.78
Yes [0.807;0.913]
IO3: Internet helps you to get ideas about how to approach others in important or difficult situations.
0.784 0.61
Yes [0.651;0.857]

176
Personal Relevance
(PR)
PR1: It is important to me to feel like a smart shopper and to make successful purchases.
0.807 0.66
0.525 0.767 0.558 Yes
Yes [0.712;0.868]
PR2: It is important to me that the products I buy are consistent with my style.
0.703 0.49
Yes [0.521;0.806]
PR3: It is important for me to inform myself about the alternatives (e.g., price, quality) before making the purchase.
0.656 0.44
Yes [0.491;0.777]
Importance
(IMP)
IMP1: I often have trouble choosing which item to buy when I am shopping.
0.742 0.55
0.655 0.790 0.512 Yes
Yes [0.485;0.886]
IMP2: I would like to have some assistance when I am shopping, especially when the product I need is expensive.
0.872 0.76
Yes [0.702;0.968]
Personal Innovativeness in IT
(PIIT)
PII1: I like to experience products that use new technologies.
0.904 0.81
0.706 0.877 0.897 Yes
Yes [0.870;0.928]
PII2: Among my peers, I am usually the first to explore new information technologies.
0.698 0.49
Yes [0.580;0.780]

177
PII3: I feel comfortable using new information technologies.
0.902 0.81
Yes [0.872;0.923]


179
5.2.3.2 Quality Criteria for Structural Model Assessment
After confirming the reliability and validity of the measurement models, the next step is
dedicated to assessment of the quality of structural model’s results. The goal here is to determine
how well empirical data backs the developed conceptual model and consequently to be able to
empirically confirm or reject the theoretical model (Hair et al., 2014a). As shown in Figure 27,
this has to be done in 5 steps: assessing the structural model for collinearity, assessing the
significance of structural model relationships (coefficient significance testing), assessing the
predictive accuracy and effect size of each individual exogenous variable and as a last step,
assessing the structural model’s predictive relevance.
Collinearity test
Following the systematic approach to the assessment of structural model suggested by Hair et al.
(2014a), the first step is assessing the structural model for collinearity issues. Since the path
coefficients in a PLS-SEM are established based on multiple regressions, inheriting from a
regular multiple regression, the path coefficients are subject to the risk of biased estimates if the
independent variables significantly correlate, in other words if “significant levels of collinearity
among the predictor constructs” exist (Hair et al., 2014a, p. 168). To assess collinearity two
measures of tolerance and variance inflation factor (VIF) should be applied (Hair et al., 2014a;
Henseler et al., 2009; Ringle and Spreen, 2007); tolerance indicates the amount of variance of an
exogenous variable not explained by the other exogenous variables of a certain endogenous
variable. VIF as reciprocal of the tolerance indicates whether the variance of an exogenous or
predictor variable of a given endogenous construct explained by other exogenous variables of the
same endogenous variable exceeds a critical level. The common variance of an independent
latent variable with the other independent variables should not exceed 80%, which corresponds
to a tolerance value of 0.20 and a VIF value of 5 (Hair et al., 2014a). Therefore tolerance levels
below 0.20 and VIF values above 5 indicate a collinearity problem and should be treated either
by merging the constructs, or creating higher-order constructs (Hair et al., 2014a). A more
conservative threshold for VIF values is 3.3 that is VIF values of 3.3 or higher indicate a
potential collinearity (Diamantopoulos and Siguaw, 2006).

180
In this study, VIF values smaller than 3.3 are considered adequate. Having four endogenous
variables that are explained by multiple constructs entailed the examination of four sets. The
results shown in Table 24, demonstrate the complete absence of collinearity issues, proven by
VIF values lower than 3.3 for the constructs in all four sets. Naturally the tolerance measure is
automatically satisfied for it is the reciprocal of the VIF.
Table 24: Collinearity assessment
First Set Second Set Third Set Forth Set
Constructs VIF Constructs VIF Constructs VIF Constructs VIF
AO 1.20 AO 1.20 SOCP 1.24 EE 1.30
IO 1.13 IO 1.12 SOLP 1.24 PE 3.11
PIIT 1.17 PR 1.14 SI 2.31
IMP 1.05 HM 2.41
Coefficient significance testing
The next step in structural model assessment is assessing the significance of the structural
model’s relationships to answer the question of whether an exogenous construct contributes
significantly to the explanation of an endogenous construct and consequently to confirm or reject
the theoretically derived relationships. Once paths are estimated by PLS-SEM algorithm, it is
relatively easy to determine whether a certain hypothesis is supported or not by observing the
estimates; the values are between -1 and +1. The signs show the direction of the relationship,
either positive or negative. The closer the estimated path coefficient to 1, the stronger the
relationship.
As said, one of the strengths of PLS-SEM is that it does not require the data to be normally
distributed; therefore assessing the significance of the path coefficients is conducted using the
non-parametric bootstrapping method (Good, 2005; Ringle and Spreen, 2007; Tenenhaus et al.,
2005). Bootstrapping is a computer-based resampling method developed by Efron (1979) (Kline,
2011). Treating the available empirical data as a pseudo population, bootstrapping method
generates a large number of random samples of the available empirical data by replacement; the
number of cases should be exactly the same as the empirically collected data (Kline, 2011). At
the beginning of a bootstrapping process, researchers pre-specify a number of bootstrap samples.

181
Once run, the PLS-SEM algorithm creates as many estimates as the number of bootstraps. Hair
et al. (2014a) recommend 5.000 bootstrap samples to achieve robust bootstrapping results. The
generated sub-samples are used to estimate the distribution of the total sample. This enables the
PLS-SEM to calculate the standard error of all bootstrap samples for each path coefficient; it is
then used in t-tests to measure the significance of path coefficients, in other words to check
whether a path coefficient is significantly different from zero (Chin, 1998b; Hair et al., 2014a;
Ringle, 2004c). The empirical t value is denoted by ∗⁄ (Henseler et al., 2009), here
is the original estimate of the coefficient between the construct and and ∗ is the
bootstrap standard error of . Besides path coefficients, the bootstrapping method for the
significance test can be applied for all parameter estimates of PLS-SEM (Henseler et al., 2009)
such as indicator weights (in formative measurement models) and loadings (in reflective
measurement models) by replacing the values of coefficients with the ones of loading or weights
in the above-mentioned equation. If the empirical t value is smaller than a theoretical t value, it is
assumed that the estimated parameters are not significantly different from zero, whereas if the
empirical value is greater than theoretical t value, the null hypothesis can be rejected (Ringle and
Spreen, 2007). The size of the theoretical or critical t values is based on the number of
observations as well as the considered significance level (Henseler et al., 2009); for more than 30
observations, the normal quantiles can be applied to establish critical t values (Hair et al., 2014a).
Referring to the commonly used critical values for two-tailed tests, empirical t value above 1.96
is considered significant at 5% significance level, respectively 2.57 at 1% and 1.65 at 10% (Hair
et al., 2014a). However “the choice of significance level depends on the field of study and the
study’s objectives” (Hair et al., 2014a, p. 171).
Following the recommendation of Hair et al. (2014a), in this study, the number of bootstraps was
set to 5000. Once the procedure was completed the results was compared to the threshold values
for two-tailed tests. The common significance thresholds for the t-values are 2.57 for 99%
confidence level, 1.96 for 95% confidence level and 1.65 for 90% confidence level (Hair et al.,
2014a). The results were very satisfactory with the majority of path coefficients being significant
at 99% confidence level; the path coefficient between the social play (SOLP) and hedonic
motivation (HM) is significant at 95% confidence level and the path coefficient between the
social influence (SI) and behavioral intention (BI) is significant at 90% confidence level.
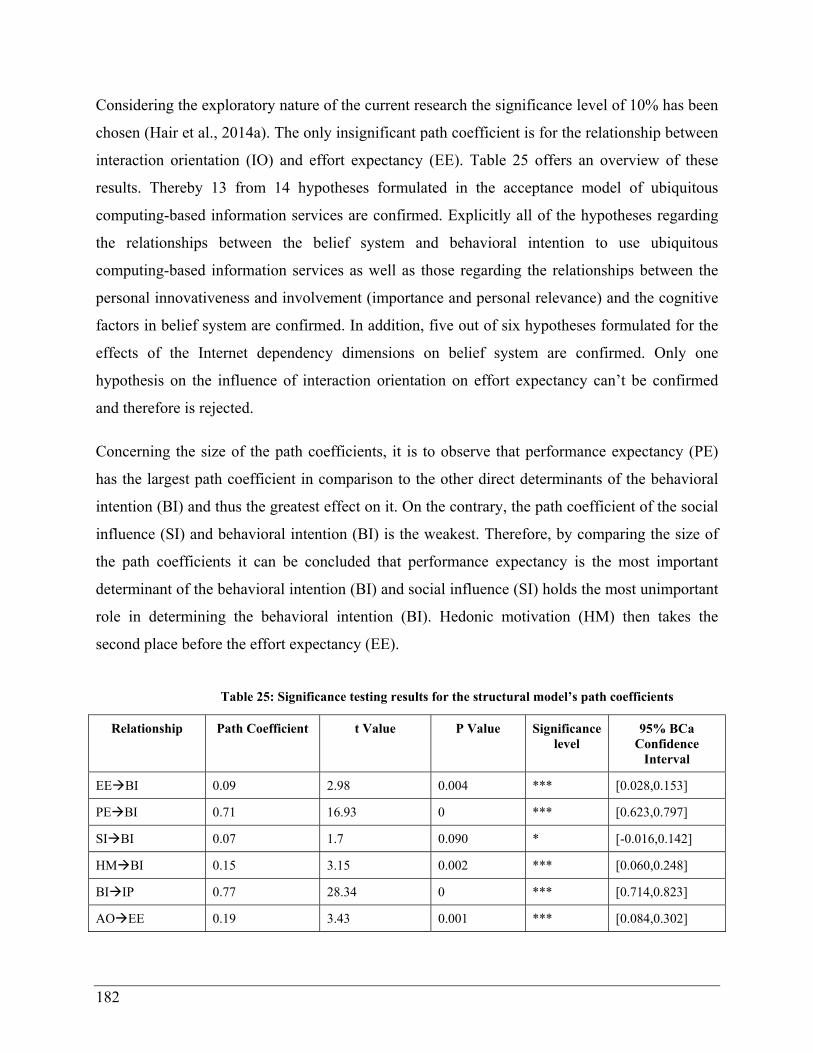
182
Considering the exploratory nature of the current research the significance level of 10% has been
chosen (Hair et al., 2014a). The only insignificant path coefficient is for the relationship between
interaction orientation (IO) and effort expectancy (EE). Table 25 offers an overview of these
results. Thereby 13 from 14 hypotheses formulated in the acceptance model of ubiquitous
computing-based information services are confirmed. Explicitly all of the hypotheses regarding
the relationships between the belief system and behavioral intention to use ubiquitous
computing-based information services as well as those regarding the relationships between the
personal innovativeness and involvement (importance and personal relevance) and the cognitive
factors in belief system are confirmed. In addition, five out of six hypotheses formulated for the
effects of the Internet dependency dimensions on belief system are confirmed. Only one
hypothesis on the influence of interaction orientation on effort expectancy can’t be confirmed
and therefore is rejected.
Concerning the size of the path coefficients, it is to observe that performance expectancy (PE)
has the largest path coefficient in comparison to the other direct determinants of the behavioral
intention (BI) and thus the greatest effect on it. On the contrary, the path coefficient of the social
influence (SI) and behavioral intention (BI) is the weakest. Therefore, by comparing the size of
the path coefficients it can be concluded that performance expectancy is the most important
determinant of the behavioral intention (BI) and social influence (SI) holds the most unimportant
role in determining the behavioral intention (BI). Hedonic motivation (HM) then takes the
second place before the effort expectancy (EE).
Table 25: Significance testing results for the structural model’s path coefficients
Relationship Path Coefficient t Value P Value Significance level
95% BCa Confidence
Interval
EEBI 0.09 2.98 0.004 *** [0.028,0.153]
PEBI 0.71 16.93 0 *** [0.623,0.797]
SIBI 0.07 1.7 0.090 * [-0.016,0.142]
HMBI 0.15 3.15 0.002 *** [0.060,0.248]
BIIP 0.77 28.34 0 *** [0.714,0.823]
AOEE 0.19 3.43 0.001 *** [0.084,0.302]

183
AOPE 0.18 3.04 0.002 *** [0.063,0.283]
IOEE 0.07 1.37 1.359 ns [-0.035,0.177]
IOPE 0.23 4.23 0 *** [0.119,0.328]
SOCPHM 0.35 6.11 0 *** [0.236,0.461]
SOLPHM 0.14 2.36 0.021 ** [0.014,0.461]
PIITEE 0.43 8.57 0 *** [0.327,0.523]
PRPE 0.29 5.81 0 *** [0.186,0.385]
IMPPE 0.16 3.42 0.001 *** [0.065,0.251]
Note: ns = non-significant. *p <.10. **p <.05. ***p <.0.1.
Coefficient of Determination
The central criterion for the evaluation of the individual relationships in the structural model,
known from regression analysis, is the coefficient of determination also referred to as R-squared
(R2) calculated for each existing endogenous latent variable in the structural model. “When the
case values of the latent variables are given by the weight relations, each inner structural model
can be estimated by OLS with predictor specification and the explanatory power of each model
can be evaluated by OLS’s standard R2’s”(Fornell and Cha, 1994, p. 69). Thus the coefficient of
determination stands for the explained variance of an endogenous variable by its associated
exogenous variables (Hair et al., 2012b, 2014a) and is the criterion for structural model’s
predictive accuracy. Aligned with its prediction-oriented approach, the goal of PLS-SEM is to
maximize the explained variance; and obtain a high R2 for the endogenous variables (Hair et al.,
2011). R² threshold values are in fact subject to change depending on the research discipline and
model complexity, for instance a value of 0.75 is regarded as high in success driver studies while
0.20 is viewed as high in disciplines such as consumer behavior (Hair et al., 2011, 2014a).
After assessing the significance of the path coefficient, next the coefficient of the determination
should be assessed to verify the predictive accuracy of the structural model. Also referred to as
the R², coefficient determination shows which portion of an endogenous construct’s variance can
be explained by the associated exogenous variable(s). Therefore, all R² values calculated for each
exogenous variable in the structural model should be examined.

184
The R² values are between 0 and 1; the higher the value, the higher the predictive accuracy. The
acceptance and interpretation of the R² values depend on the research discipline; whereas in
marketing research the R² value of 0.75 is considered high in consumer behavior research,
researchers consider R² value of 0.2 substantial (Hair et al. 2011; Hair et al. 2014). In current
research while the R² of behavioral intention (BI) and intention to prefer (IP) respectively
reaches the values of 0.85 and 0.6, the other endogenous variables cannot reach values over 0.3.
That is performance expectancy (PE): 0.31, effort expectancy (EE): 0.31, hedonic motivation
(HM): 0.19. In user acceptance studies, the R² values of 0.4 and 0.5 for behavior intention and
use are considered as substantial (Venkatesh et al., 2012). However for customers’ perceptions as
effort expectancy, performance expectancy and hedonic motivation, the R² values above 0.3 are
rarely observed (Agarwal and Prasad, 1999; Lu et al., 2005; Venkatesh and Bala, 2008).
Therefore, the obtained R² values for the current model are considered rather high.
Effect size
After assessing the total effect of exogenous variables on an endogenous variable, the next
quality measure is to verify if the effect of each of assigned exogenous variable is substantial;
this measure is referred as effect size (Chin, 1998b; Hair et al., 2014a; Ringle and Spreen, 2007).
To do so, the R2 of the endogenous variable should be calculated by one at a time elimination of
exogenous variables, the difference between R² before the deletion of a particular independent
variable and after that can be used for calculation of its effect size (Hair et al., 2014a). The effect
size is denoted by ² ² ² 1 ²⁄ (Chin, 1998b) where
and ² are the ²s obtained when the predictor latent variable
respectively is used or not. According to Chin (1998c), f² values of 0.02, 0.15 and 0.35 can be
regarded as small, medium and large.
The results obtained from the PLS-SEM algorithm show that the effect sizes of performance
expectancy (PE) on behavioral intention (BI) with the value of 1.07 and behavior intention (BI)
on intention to prefer (IP) with the value of 1.48 are large. The other exogenous constructs tend
to have medium or small effect sizes on their associated endogenous constructs. Only the effect
size of the social influence (SI) on behavioral intention (BI), 0.013, is under the threshold of
0.20. It is important to note that as the relationship between interaction orientation (IO) and

185
effort expectancy (EE) is already rejected, its effect size is not considered relevant for further
analyses.
Predictive relevance
An additional assessment of structural model involves a criterion only applicable for the
endogenous variables with reflective measurement model known as the predictive relevance. It is
a measure of the capability of the structure and the measurement model to derive the predictions
(Hair et al., 2011; Tenenhaus et al., 2005). That is how well the empirical data can be
reconstructed by the model and its parameter estimates (Chin, 1998b; Fornell and Cha, 1994).
Indicator of the predictive relevance is Stone-Geisser’s Q2 value (Geisser, 1974; Stone, 1974). In
the context of PLS-SEM, Stone-Geisser test criterion pursues a blindfolding procedure which
systematically omits part of the raw data matrix for the indicators of the endogenous constructs
during the parameter estimations, next, the estimates are used to predict the omitted data treated
as missing values (Chin, 1998b; Henseler et al., 2009; Ringle and Spreen, 2007). The procedure
iterates until all data points have been once gone through the procedure (Hair et al., 2014a). The
value of Q2 then is calculated by comparison of the actual data with the predicted ones.
Mathematically, 2 is denoted by 1 ∑ /∑ (Chin, 1998b), where is the sum
of squares of prediction error and is the sum of squares of the original values, and D is the
blindfolding procedure distance between two consecutive elimination and prediction cases (Chin,
1998b; Tenenhaus et al., 2005). Predictive relevance is demonstrated when Q² values are above
zero; failing that, negative values would indicate that the model is not capable of predicting raw
data better than a simple mean estimation so it can be assumed that the model lacks predictive
relevance (Chin, 1998b; Fornell and Cha, 1994; Götz et al., 2010; Hair et al., 2014a). Through
the process of elimination, it is possible to measure the contribution of each exogenous variable
to the predictive relevance. Similar to the effect size f², q² values as relative measures of
predictive relevance are calculated for each exogenous variable. The same as effect size q² values
of 0.02, 0.15 and 0.35 can be regarded as small, medium and large (Hair et al., 2014a; Henseler
et al., 2009).
Predictive relevance is the last aspect which should be examined in the assessment of the
structural model. To assess the predictive relevance of the current structural model, the

186
blindfolding procedure with d=7 was conducted. The resulting values were satisfactory with all
five Q² values being different from zero. Table 26 shows the calculated R² and Q² values for the
endogenous variables of the current structural model.
Table 26: Results of the R2 and Q2
Endogenous Variable R2 Value Q2 Values
Behavior Intention (BI) 0.85 0.80
Effort Expectancy(EE) 0.31 0.28
Performance Expectancy (PE) 0.31 0.28
Hedonic Motivation (HM) 0.19 0.15
Intention to Prefer(IP) 0.60 0.60
In addition, the q² values are estimated for each exogenous variable. The registered q² results are
sufficient to prove the predictive relevance. Only in two instances the effects are not satisfactory
that is the relationship between the social influence (SI) and behavioral intention (BI) and the
relationship between solitary play (SOLP) and hedonic motivation (HM).
Assessing the quality of results for the structural model shown in Table 27, it can be concluded
that, in general, the empirical data supports the conceptual model of this dissertation. All of the
relationships in the structural model are confirmed with the exception of the hypothesis H8.
Furthermore, the results of the R² and Q² prove that the model possesses a sufficient explanatory
power.
Table 27: Summery of structural model’s quality criteria results
Endogenous variable
Exogenous variable
Path coefficient
Hypothesis VIF
(<5)
T Value
(≥1.65)
f²
(≥0.02)
Q2
(>0)
q²
(≥0.02)
Behavior Intention
(R2=0.85)
Effort Expectancy
0.09 H1 ✔ 1.30 2.98 0.04
0.8
0.03
Performance Expectancy
0.71 H2 ✔ 3.11 16.93 1.07 0.74
Social Influence
0.07 H3 ✔ 2.31 1.7 0.013 0.009
Hedonic Motivation
0.15 H4 ✔ 2.41 3.15 0.06 0.04
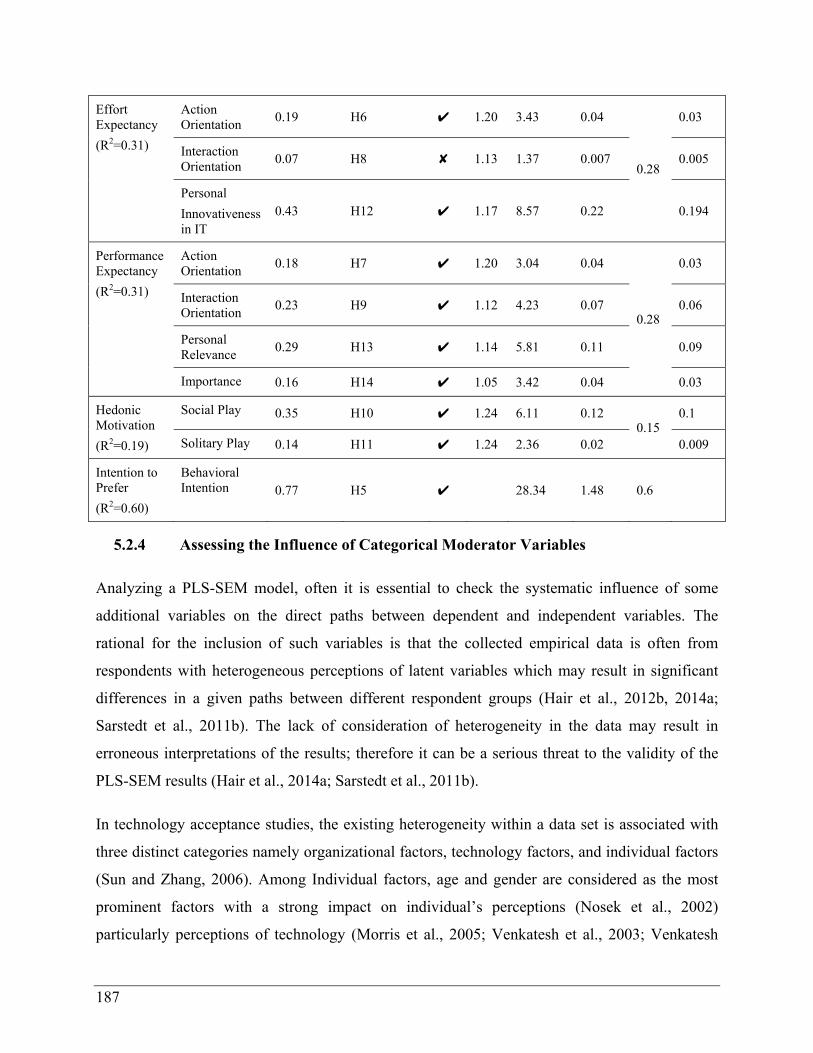
187
Effort Expectancy
(R2=0.31)
Action Orientation
0.19 H6 ✔ 1.20 3.43 0.04
0.28
0.03
Interaction Orientation
0.07 H8 ✘ 1.13 1.37 0.007 0.005
Personal
Innovativeness in IT
0.43 H12 ✔ 1.17 8.57 0.22 0.194
Performance Expectancy
(R2=0.31)
Action Orientation
0.18 H7 ✔ 1.20 3.04 0.04
0.28
0.03
Interaction Orientation
0.23 H9 ✔ 1.12 4.23 0.07 0.06
Personal Relevance
0.29 H13 ✔ 1.14 5.81 0.11 0.09
Importance 0.16 H14 ✔ 1.05 3.42 0.04 0.03
Hedonic Motivation
(R2=0.19)
Social Play 0.35 H10 ✔ 1.24 6.11 0.12 0.15
0.1
Solitary Play 0.14 H11 ✔ 1.24 2.36 0.02 0.009
Intention to Prefer
(R2=0.60)
Behavioral Intention 0.77 H5 ✔ 28.34 1.48 0.6
5.2.4 Assessing the Influence of Categorical Moderator Variables
Analyzing a PLS-SEM model, often it is essential to check the systematic influence of some
additional variables on the direct paths between dependent and independent variables. The
rational for the inclusion of such variables is that the collected empirical data is often from
respondents with heterogeneous perceptions of latent variables which may result in significant
differences in a given paths between different respondent groups (Hair et al., 2012b, 2014a;
Sarstedt et al., 2011b). The lack of consideration of heterogeneity in the data may result in
erroneous interpretations of the results; therefore it can be a serious threat to the validity of the
PLS-SEM results (Hair et al., 2014a; Sarstedt et al., 2011b).
In technology acceptance studies, the existing heterogeneity within a data set is associated with
three distinct categories namely organizational factors, technology factors, and individual factors
(Sun and Zhang, 2006). Among Individual factors, age and gender are considered as the most
prominent factors with a strong impact on individual’s perceptions (Nosek et al., 2002)
particularly perceptions of technology (Morris et al., 2005; Venkatesh et al., 2003; Venkatesh

188
and Morris, 2000). Through a comprehensive literature review in technology acceptance studies,
Niehaves and Plattfaut (2014) state that age and gender are the most used socio-demographic
variables, respectively used in 87% and 95% of the reviewed studies followed by income and
education used in only 9% and 10% of the studies. More extensively discussed in section 4.3.5,
in this study the individual factors of age and gender are considered as categorical moderator
variables of the direct relationships of UTAUT2.
In addition, aligned with the objectives of this dissertation, two factors namely service and
technology type are hypothesized to influence the strengths of UTAUT2 relationship. However,
despite age and gender, the goal is not to examine heterogeneity in technology related beliefs
within different age and gender groups but to assess the heterogeneity in individuals’ perceptions
concerning different technology and services.
In general, moderator variables can be divided into two categories namely metric or categorical
(Henseler and Fassott, 2010). Depending on whether the moderator is a latent variable measured
with metric data or a single item variable measured with nominal data, distinct methods have
been used for the estimation of the moderator effects. In the case of moderator being a metric and
continuous variable, the product term approach is used and in the case of moderator being a
single categorical variable, a group comparison method is applied (Henseler and Fassott, 2010).
Indeed “the grouping variable is nothing more than a categorical moderator” (Henseler and
Fassott, 2010, p. 715). It is important to note that if the metric data can be transformed to the
categorical data, also a group comparison method can be applied (Rigdon et al., 1998) for
example, transforming the metric variable of age to younger and older categories. As in this
dissertation only the group comparison approach is used, the remainder of this section is only
dedicated to a discussion about this method.
Applying a group comparison, the observations are divided into different groups based on the
categorical moderator variable (Rigdon et al., 2010). Then the model is estimated for each group
and the path coefficients are compared. If a path coefficient in one group differs significantly
from the one in the other group, it can be assumed that a moderating effect exists.
In PLS-SEM literature, there are several approaches to test the significance of differences among
two groups (Hair et al., 2017):

189
Parametric test: suggested by Chin (2000) and later introduced by keil et al. (2000), in
this approach, firstly the model parameters for each group is estimated and then the
standard errors generated form bootstrapping are used as input for the parametric test
(Henseler, 2007; Sarstedt et al., 2011b).
Permutation: as a response to the methodic shortcoming of the parametric approach in the
PLS-SEM, that is holding distribution assumptions in a distribution-free method
(Henseler et al., 2009), Chin (2003) introduced and elaborated (Chin and Dibbern, 2010;
Dibbern and Chin, 2005) a nonparametric method also called product indicator approach.
In this approach, the actual observed group differences are compared with those between
randomly generated groups.
PLS-MGA: Henseler (2007) proposed another nonparametric approach for PLS-SEM
multi-group analysis (PLS-MGA) which seeks the differences between groups by
comparing bootstrapping results of one group with that of the other group (Henseler et
al., 2009; Sarstedt et al., 2011b).
Heir et al. (2017) recommend to use permutation test to multi group analysis. They also state that
applying multiple methods provide additional confidence in the final results. Therefore for the
multi group analyses of this dissertation both permutation and PLS-MGA methods are chosen for
the multi-group analyses except for the analysis of differences in the age groups for which only
PLS-MGA method is used. As the size of the one group is more than the double the size of the
other group (Hair et al., 2017).
Besides the above-mentioned methods to test the pre-identified moderators, the use of PLS-SEM
FIMIX can help to reveal unobserved heterogeneity in the data set (Hair et al., 2014a; Sarstedt et
al., 2011a). The FIMIX procedure is applied for the given data set but no meaningful results
could be extracted.
To assess the influence of the categorical moderators, the relationships in the path diagram
should be estimated for each group. Here the same practice used for the quality assessment of the
overall model should be applied to gauge how well the theoretical measurement and structural
models fit the new data sets. Therefore, first the PLS-SEM quality criteria to verify the reliability
and validity of the measurement models for each new data set are assessed. The results of the
190
quality criteria for measurement model assessment for all groups are satisfactory without
reservation.
In addition, to ensure the validity of the group analysis results, prior to analysis, measurement
invariance should be tested. Established measurement invariance ensures that the variations in
model estimates are not originated in distinctive content and meanings of the latent variables but
indeed in true differences of structural relationships (Hair et al., 2017; Henseler et al., 2016).
Recently Henseler et al. (2016) developed a procedure enabling to test the measurement
invariance in PLS-SEM models referred to as measurement invariance composite models
(MICOM) procedure. This procedure involves three steps: the first step referred to as configural
invariance, ensures the identical specification of latent variables across the groups. That is if
indicators per measurement model, data treatment, and algorithm setting are identical across the
groups. Once the configural invariance is established, the next steps focus on systematic error of
measures (Henseler et al., 2016). In the second step, referred to as compositional invariance, it is
assessed if the composites are formed identically across groups. When both configural invariance
and compositional invariance exist, it can be concluded that a partial measurement invariance
which is a necessary and sufficient condition for conducting a multi group analysis is
established. In the final step, the equality of composite mean values and variances are assessed.
Having equal composite means and variances, it can be concluded that full measurement
invariance is established and multi group analysis as well as pooling of data would result in valid
outcomes and interpretations.
To ensure the validity of the group analysis results in this dissertation the MICOM approach is
applied to test the measurement invariance of the given composites. As the PLS path models as
well as data treatment used in all groups are alike and identical algorithm settings are used to
calculate the model estimates, it is concluded that the configural invariance is established. The
analyses for step 2 and step 3 of MICOM procedure are addressed below distinctly for each multi
group analysis.
5.2.4.1 Age
To analyze the effect of age, it is necessary to delineate the age group categories, which then can
be compared. The question here is how to define a theoretically sound cut-off point to create age

191
groups. Therefore, next, the theoretical basis of the age group selection for this dissertation is
discussed and the cut-off point for age groups is defined.
There are consistent empirical evidences that age differences are not only caused by pure aging
effects but also birth periods are important sources of behavior variation between different age
groups (Gunter and Furnham, 1992; Hofer and Sliwinski, 2006; Rogler, 2002; Ryder, 1965;
Zuschlag and Whitbourne, 1994). Individuals born in a certain period of time often experience
some unique historical circumstances surrounding their birth period; such shared experiences
contribute to shaping their long-term value system which virtually stays unchanged through life
(Meredith and Schewe, 2002). Therefore, in the literature there are different overlapping and
related concepts addressing the age effects and categorization.
Age group is defined as “a segment of a population that is of approximately the same age or is
within a specified range of ages” (Marriam-Webster, 2016). Cohort is a group of individuals who
based on their date of birth, all have gone through a certain period of time and more or less have
experienced the same micro- and macro-historical events (Ryder, 1965). As the term cohort
literally means division into ten years, in the literature cohort groups are often divided by ten-
year periods (Markert, 2004; Ryder, 1965). Generation on the other hand, usually encompasses a
broader range of ages in a single group as the central focus of this categorization is not the birth
period but certain historical circumstances surrounding that period (Markert, 2004). While the
term cohort mostly bears a chronological meaning, the concept of generation uses a common
determining experience for the delimitation and definition of a generation. Alike cohort,
members of a generation are sharing some common historical orientation, however the
corresponding birth period can span over twenty years (Markert, 2004). Hence, one generation
may include two or more cohort groups.
There are various generational labels in marketing literature (e.g. baby boomers, generation X,
generation Y, millennial generation, generation of digital natives, Net generation etc.). Labeling
the whole members of a group with a single symbolic term expressing the collective
characteristics of that group makes marketing efforts practical and manageable (Markert, 2004).
Furthermore based on the findings of several empirical studies on intragenerational differences,
Markert (2004) concludes that usually generational influences are greater than cohort influences.

192
Referring to the research objectives of this dissertation, more relevant for the analyses are
generations, which are delimited and defined due to the determining technical events relating to
the use of the digital technologies. By and large, in the history of mankind, individuals who
experience the technologies developed for general population (e.g. Internet) in their early life are
more advanced in the use of these technologies and are quite comfortable with these technologies
in their later years (Scialfa and Fernie, 2006). As the famous quote of the computer pioneer, Alan
Kay, says: “technology is anything that was invented after you were born” (e.g. see the quote in
Geer, 2006; S.-J. Hong et al., 2013).
Taking a generational view, Prensky (2001) divides the present population into two groups;
digital natives as those who grew up with digital media (e.g. Internet), and those who came of
age before the introduction of the digital media whom he labels as digital immigrants. This
generational terminology highlights the differences between two age groups suggesting that
digital immigrants usually no more can learn to deal with digital media so naturally and quickly
as digital natives (Palfrey and Gasser, 2010; Prensky, 2001, 2005). Digital natives are native
speakers of the digital language of computers and the Internet, however digital immigrants have
come to use digital technologies later in their lives and similar to learning a new language they
have a form of accent (Prensky, 2001). Prensky (2005) describes various cognitive differences of
digital natives and digital immigrants associated with growing up with different digital media
e.g., better visual skills, more spatial skills, and abstract reasoning through use of computer-
based applications. Based on these differences, digital natives and digital immigrants may
perceive the benefits of digital technologies differently resulting in differences in their behavioral
approaches in regard to digital technologies (Palfrey and Gasser, 2010; Prensky, 2001).
However, Prensky doesn’t define the exact birth period for his generational categorization, in
information system research literature, people who born after 1980 are often considered as digital
natives and the ones who born before 1980 as digital immigrants (Kirk et al., 2012; Palfrey and
Gasser, 2010; Resatsch et al., 2008; Thompson, 2013). The rationale is based on the advent of
the Internet in the early 1990s, as the people born after 1980, were at most yet in their formative
years using the Internet.

193
Based on the above-mentioned arguments, in this dissertation the generational approach of
Prensky is used to identify the cutoff point for age groups. As discussed, members of digital
native and digital immigrant generations are different in their perceptions of digital technologies
and consequently their behavior regarding these technologies. It might be argued that
considering interindividual differences, there could be heterogeneity within the members of
native or immigrant groups. Therefore, it is important to note that, by taking the generational
view this dissertation does not claim a complete homogeneity for all members of a generation.
However, it assumes that for the use of digital technologies as in-store ubiquitous computing-
based information services, the influence of intergenerational native or immigrant status is
greater than the intragenerational differences. Therefore, to explore the moderation effect of age
by multi-group analysis, the continuous variable of age is dichotomized; the complete sample
including 302 cases is divided into two age groups. Following the common practice in
information system research, the birth year of 1980 is chosen as a cutoff point. The first age
group is composed of the participants with the age equal or younger than 34 (227 cases) at the
day of the survey and the rest of participants with the age greater than 34 (75 cases) are the
members of the second group.
After defining the age groups, the relationships in the path diagram can be estimated for each age
group and the significance of the differences can be assessed. However, prior to multi group
analysis, permutation test in Smart-PLS is run to create required values for the step 2 and 3
assessments of MICOM procedure. Table 28 summarizes the MICOM results. For all of the
composites the full measurement invariance is established, except for BI which holds partial
measurement invariance.
Table 28: Summary of MICOM results for age groups
MICOM Step 1
Configural variance established? Yes
MICOM Step 2
Composite Correlation c 5% quantile of the empirical distribution of cu
P Value Compositional invariance established?
BI 1.000 1.000 0.325 Yes
EE 1.000 1.000 0.327 Yes

194
PE 1.000 1.000 0.856 Yes
SI 1.000 0.996 0.692 Yes
HM 0.999 0.997 0.457 Yes
MICOM Step 3
Composite Difference of the composite’s mean value (= 0)
95% confidence interval
P value Equal mean values?
BI 0.326 [-0.275;0.269] 0.011 No
EE 0.141 [-0.244;0.268] 0.302 Yes
PE 0.235 [-0.267;0.264] 0.085 Yes
SI 0.268 [-0.267;0.269] 0.050 Yes
HM 0.016 [-0.277;0.247] 0.924 Yes
Composite Logarithm of the composite’s variances ratio (= 0)
95% confidence interval
P value Equal variances?
BI -0175 [-0.371;0.425] 0.418 Yes
EE 0.083 [-0.535;0.687] 0.783 Yes
PE -0.250 [-0.358;0.443] 0.226 Yes
SI -0.270 [-0.345;0.411] 0.197 Yes
HM -0.171 [-0.292;0.357] 0.280 Yes
As the size of the one group is more than the double the size of the other group, to investigate the
significance of the differences between the path coefficients, only PLS-MGA method is applied.
The results are listed in Table 29. As can be seen, all of the path coefficients for the relationships
between behavioral intention (BI) and its direct antecedents do differ between two age groups.
An examination of the significance of group differences is usually carried out when the given
path is significant in both groups. As shown in Table 29, only the relationship between
performance expectancy (PE) and behavioral intention (BI) is significant for both groups with a
higher path coefficient for the older group than for the younger group. As the difference is
significant in 1% level, it can be assumed that age has a significant effect on the PE-BI
relationship, but this influence is opposed to the hypothesized direction. Therefore, the
hypothesis H2.1 is rejected.

195
Regarding the other relationships in the model, either both or one of the path coefficients are
insignificant. The relationship between the social influence (SI) and behavioral intention (BI) is
insignificant in both groups; therefore, the hypothesis 3.1 cannot be confirmed. However, the
relationships of effort expectancy (EE) and hedonic motivation (HM) with behavioral intention
(BI) are significant only for younger group; having a significant path coefficient for one group
and insignificant for the other group can still deliver important information concerning the
moderator effects. Based on these results, it can be assumed that effort expectancy (EE) and
hedonic motivation (HM) are the determinants of behavioral intention only for younger group.
Therefore, age can be considered as a moderator factor for these relationships. Regarding the
relationship between the effort expectancy (EE) and behavioral intention (BI), the empirical
results are opposed to the hypothesized direction. Therefore, the hypothesis H1.1 is rejected.
However, as hypothesized, age influences the effect of hedonic motivation on behavior intention
to use such that the effect is stronger for younger people than older people. Therefore, the
hypothesis H4.1 is confirmed.
Table 29: PLS-MGA results for age
Rel
atio
nshi
p
Age
gro
ups
Pat
h co
effi
cien
t
Stan
dard
err
or
t-V
alue
(≥1.
65)
Group1 vs. Group 2
| Pat
h co
effi
cien
ts-d
iff
|
p-V
alue
Sig
nifi
cant
le
vel
EE→BI
Group 1: ≤34
0.121 0.041 2.945
Group 2 ns n/a n/a Group 2:
>34 0.023 0.031 0.752
PE→BI
Group 1: ≤34
0.647 0.050 12.871
0.251 0.008 *** Group 2:
>34 0.898 0.062 14.322
SI→BI Group 1: ≤34
0.061 0.044 1.389 Both groups ns n/a n/a
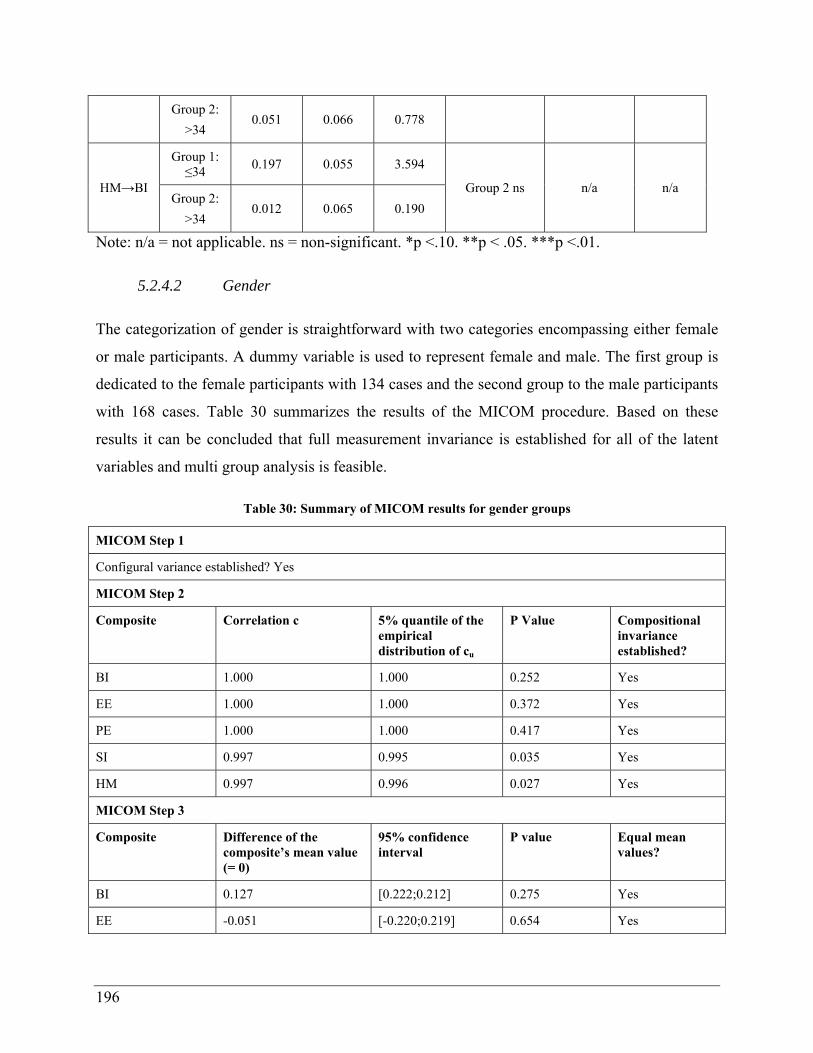
196
Group 2:
>34 0.051 0.066 0.778
HM→BI
Group 1: ≤34
0.197 0.055 3.594
Group 2 ns n/a n/a Group 2:
>34 0.012 0.065 0.190
Note: n/a = not applicable. ns = non-significant. *p <.10. **p < .05. ***p <.01.
5.2.4.2 Gender
The categorization of gender is straightforward with two categories encompassing either female
or male participants. A dummy variable is used to represent female and male. The first group is
dedicated to the female participants with 134 cases and the second group to the male participants
with 168 cases. Table 30 summarizes the results of the MICOM procedure. Based on these
results it can be concluded that full measurement invariance is established for all of the latent
variables and multi group analysis is feasible.
Table 30: Summary of MICOM results for gender groups
MICOM Step 1
Configural variance established? Yes
MICOM Step 2
Composite Correlation c 5% quantile of the empirical distribution of cu
P Value Compositional invariance established?
BI 1.000 1.000 0.252 Yes
EE 1.000 1.000 0.372 Yes
PE 1.000 1.000 0.417 Yes
SI 0.997 0.995 0.035 Yes
HM 0.997 0.996 0.027 Yes
MICOM Step 3
Composite Difference of the composite’s mean value (= 0)
95% confidence interval
P value Equal mean values?
BI 0.127 [0.222;0.212] 0.275 Yes
EE -0.051 [-0.220;0.219] 0.654 Yes
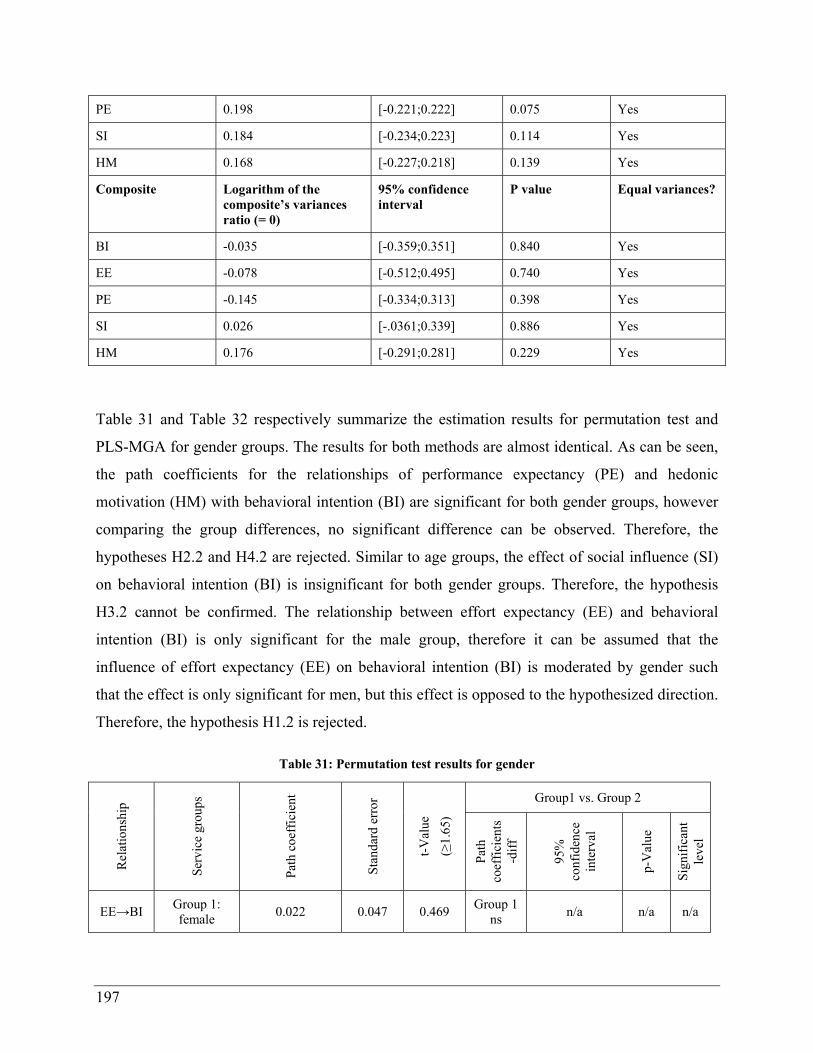
197
PE 0.198 [-0.221;0.222] 0.075 Yes
SI 0.184 [-0.234;0.223] 0.114 Yes
HM 0.168 [-0.227;0.218] 0.139 Yes
Composite Logarithm of the composite’s variances ratio (= 0)
95% confidence interval
P value Equal variances?
BI -0.035 [-0.359;0.351] 0.840 Yes
EE -0.078 [-0.512;0.495] 0.740 Yes
PE -0.145 [-0.334;0.313] 0.398 Yes
SI 0.026 [-.0361;0.339] 0.886 Yes
HM 0.176 [-0.291;0.281] 0.229 Yes
Table 31 and Table 32 respectively summarize the estimation results for permutation test and
PLS-MGA for gender groups. The results for both methods are almost identical. As can be seen,
the path coefficients for the relationships of performance expectancy (PE) and hedonic
motivation (HM) with behavioral intention (BI) are significant for both gender groups, however
comparing the group differences, no significant difference can be observed. Therefore, the
hypotheses H2.2 and H4.2 are rejected. Similar to age groups, the effect of social influence (SI)
on behavioral intention (BI) is insignificant for both gender groups. Therefore, the hypothesis
H3.2 cannot be confirmed. The relationship between effort expectancy (EE) and behavioral
intention (BI) is only significant for the male group, therefore it can be assumed that the
influence of effort expectancy (EE) on behavioral intention (BI) is moderated by gender such
that the effect is only significant for men, but this effect is opposed to the hypothesized direction.
Therefore, the hypothesis H1.2 is rejected.
Table 31: Permutation test results for gender
Rel
atio
nshi
p
Serv
ice
grou
ps
Pat
h co
effi
cien
t
Stan
dard
err
or
t-V
alue
(≥1.
65)
Group1 vs. Group 2
Pat
h co
effi
cien
ts-d
iff
95%
co
nfid
ence
in
terv
al
p-V
alue
Sig
nifi
cant
le
vel
EE→BI Group 1: female
0.022 0.047 0.469 Group 1
ns n/a n/a n/a
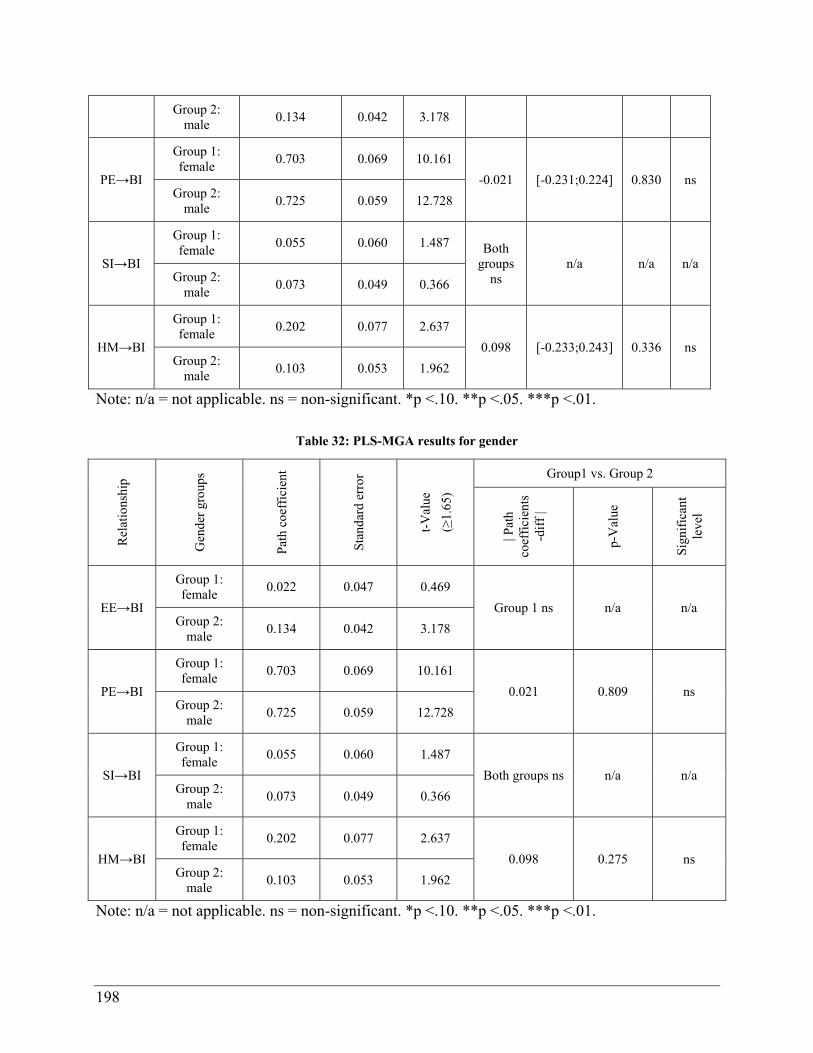
198
Group 2: male
0.134 0.042 3.178
PE→BI
Group 1: female
0.703 0.069 10.161
-0.021 [-0.231;0.224] 0.830 ns Group 2:
male 0.725 0.059 12.728
SI→BI
Group 1: female
0.055 0.060 1.487 Both groups
ns n/a n/a n/a
Group 2: male
0.073 0.049 0.366
HM→BI
Group 1: female
0.202 0.077 2.637
0.098 [-0.233;0.243] 0.336 ns Group 2:
male 0.103 0.053 1.962
Note: n/a = not applicable. ns = non-significant. *p <.10. **p <.05. ***p <.01.
Table 32: PLS-MGA results for gender
Rel
atio
nshi
p
Gen
der
grou
ps
Pat
h co
effi
cien
t
Stan
dard
err
or
t-V
alue
(≥1.
65)
Group1 vs. Group 2
| Pat
h co
effi
cien
ts-d
iff
|
p-V
alue
Sig
nifi
cant
le
vel
EE→BI
Group 1: female
0.022 0.047 0.469
Group 1 ns n/a n/a Group 2:
male 0.134 0.042 3.178
PE→BI
Group 1: female
0.703 0.069 10.161
0.021 0.809 ns Group 2:
male 0.725 0.059 12.728
SI→BI
Group 1: female
0.055 0.060 1.487
Both groups ns n/a n/a Group 2:
male 0.073 0.049 0.366
HM→BI
Group 1: female
0.202 0.077 2.637
0.098 0.275 ns Group 2:
male 0.103 0.053 1.962
Note: n/a = not applicable. ns = non-significant. *p <.10. **p <.05. ***p <.01.
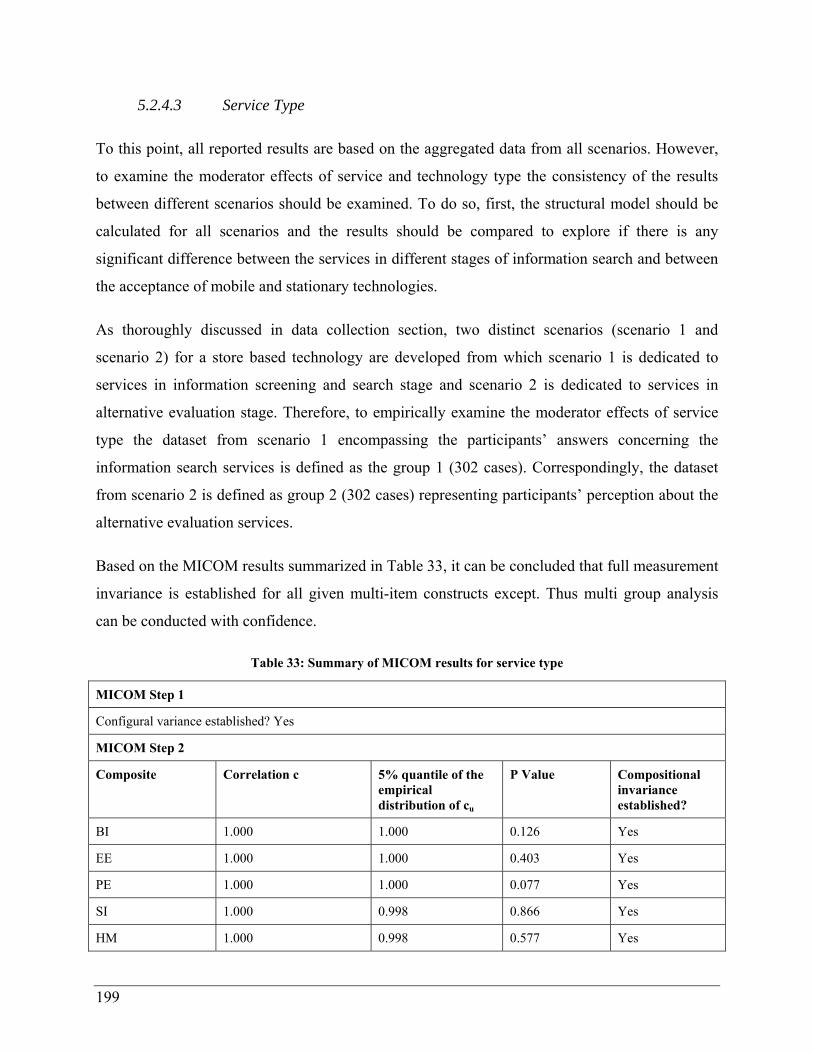
199
5.2.4.3 Service Type
To this point, all reported results are based on the aggregated data from all scenarios. However,
to examine the moderator effects of service and technology type the consistency of the results
between different scenarios should be examined. To do so, first, the structural model should be
calculated for all scenarios and the results should be compared to explore if there is any
significant difference between the services in different stages of information search and between
the acceptance of mobile and stationary technologies.
As thoroughly discussed in data collection section, two distinct scenarios (scenario 1 and
scenario 2) for a store based technology are developed from which scenario 1 is dedicated to
services in information screening and search stage and scenario 2 is dedicated to services in
alternative evaluation stage. Therefore, to empirically examine the moderator effects of service
type the dataset from scenario 1 encompassing the participants’ answers concerning the
information search services is defined as the group 1 (302 cases). Correspondingly, the dataset
from scenario 2 is defined as group 2 (302 cases) representing participants’ perception about the
alternative evaluation services.
Based on the MICOM results summarized in Table 33, it can be concluded that full measurement
invariance is established for all given multi-item constructs except. Thus multi group analysis
can be conducted with confidence.
Table 33: Summary of MICOM results for service type
MICOM Step 1
Configural variance established? Yes
MICOM Step 2
Composite Correlation c 5% quantile of the empirical distribution of cu
P Value Compositional invariance established?
BI 1.000 1.000 0.126 Yes
EE 1.000 1.000 0.403 Yes
PE 1.000 1.000 0.077 Yes
SI 1.000 0.998 0.866 Yes
HM 1.000 0.998 0.577 Yes

200
MICOM Step 3
Composite Difference of the composite’s mean value (= 0)
95% confidence interval
P value Equal mean values?
BI 0.055 [-0.164;0.165] 0.510 Yes
EE 0.053 [-0.158;0.155] 0.518 Yes
PE 0.156 [-0.167;0.156] 0.042 Yes
SI 0.082 [-0.161;0.158] 0.341 Yes
HM 0.135 [-0.161;0.164] 0.095 Yes
Composite Logarithm of the composite’s variances ratio (= 0)
95% confidence interval
P value Equal variances?
BI -0.077 [-0.208;0.206] 0.462 Yes
EE -0.258 [-0.344;0.377] 0.150 Yes
PE -0.167 [-0.191;0.190] 0.078 Yes
SI -0.105 [-0.201;0.236] 0.306 Yes
HM -0.017 [-0.185;0.182] 0.846 Yes
Table 34 and Table 35 respectively summarize the estimation results for permutation test and
PLS-MGA. Not surprisingly, the results for both methods are almost identical. All main
relationships in the model are significant for both groups, except the relationship between effort
expectancy (EE) and behavioral intention (BI) which is not significant for scenario 1. Therefore,
it can be assumed that effort expectancy (EE) only influences behavioral intention (BI) of the
users to use in-store ubiquitous computing-based services for alternative evaluation. Hence, the
hypothesis H1.3 is accepted. Concerning the relationships of performance expectancy (PE) and
social influence (SI) with behavioral intention (BI), no significant difference between two
scenarios can be observed. Therefore, hypotheses H2.3 and H3.3 are rejected. However, the
influence of hedonic motivation on behavior intention is significantly stronger for group 1.
Therefore, the hypothesis H4.3 is accepted.

201
Table 34: Permutation test results for service type R
elat
ions
hip
Serv
ice
grou
ps
Pat
h co
effi
cien
t
Stan
dard
err
or
t-V
alue
(≥1.
65)
Group1 vs. Group 2
Pat
h co
effi
cien
ts-d
iff
95%
co
nfid
ence
in
terv
al
p-V
alue
Sig
nifi
cant
le
vel
EE→BI
Group 1: information search
0.054 0.039 1.380 Group 1
ns n/a n/a n/a
Group 2: alternative evaluation
0.123 0.034 3.668
PE→BI
Group 1: information search
0.549 0.048 11.435
-0.096 [-0.145;0.150] 0.197 ns Group 2: alternative
evaluation 0.646 0.057 11.276
SI→BI
Group 1: information search
0.105 0.44 2.408
0.011 [-0.117;0.122] 0.868 ns Group 2: alternative
evaluation 0.095 0.47 2.012
HM→BI
Group 1: information search
0.288 0.048 5.997
0.158 [-0.153;0.140] 0.037 ** Group 2: alternative
evaluation 0.130 0.059 2.220
Note: n/a = not applicable. ns = non-significant. *p <.10. **p <.05. ***p <.01.
Table 35: PLS-MGA results for service type
Rel
atio
nshi
p
Serv
ice
grou
ps
Pat
h co
effi
cien
t
Stan
dard
err
or
t-V
alue
(≥1.
65)
Group1 vs. Group 2
| Pat
h co
effi
cien
ts-d
iff
|
p-V
alue
Sig
nifi
cant
le
vel
EE→BI
Group 1: information search
0.054 0.039 1.380
Group 1 ns n/a n/a Group 2: alternative
evaluation 0.123 0.034 3.668
PE→BI
Group 1: information search
0.549 0.048 11.435
0.096 0.198 ns Group 2: alternative
evaluation 0.646 0.057 11.276
SI→BI Group 1:
information search 0.105 0.44 2.408 0.011 0.869 ns

202
Group 2: alternative evaluation
0.095 0.47 2.012
HM→BI
Group 1: information search
0.288 0.048 5.997
0.158 0.037 ** Group 2: alternative
evaluation 0.130 0.059 2.220
Note: n/a = not applicable. ns = non-significant. *p <.10. **p <.05. ***p <.01.
5.2.4.4 Technology Type
To examine the influence of technology type, the aggregated dataset from scenario 1 and 2 is
defined as group 1 (302 cases) representing the responses for store-owned devices and dataset
from scenario 3 (302 cases) is defined as group 2 representing the responses for customer-owned
mobile devices. Based on the MICOM results summarized in Table 36, it can be concluded that
at least partial measurement invariance has been established for all given multi-item constructs.
Thus multi group analysis can be conducted with confidence.
Table 36: Summary of MICOM results for technology type
MICOM Step 1
Configural variance established? Yes
MICOM Step 2
Composite Correlation c 5% quantile of the empirical distribution of cu
P Value Compositional invariance established?
BI 1.000 1.000 0.169 Yes
EE 1.000 1.000 0.611 Yes
PE 1.000 1.000 0.269 Yes
SI 1.000 0.998 0.747 Yes
HM 1.000 0.999 0.428 Yes
MICOM Step 3
Composite Difference of the composite’s mean value (= 0)
95% confidence interval Equal mean values?
BI -0.294 [-0.166;0.156] No
EE -0.064 [-0.162;0.131] Yes
PE -0.484 [-0.165;0.150] No

203
SI -0.172 [-0.157;0.148] No
HM 0.001 [-0158;0.156] Yes
Composite Logarithm of the composite’s variances ratio (= 0)
95% confidence interval Equal variances?
BI 0.130 [-0.247;0.247] Yes
EE -0.050 [-0.409;0.365] Yes
PE 0.105 [-0.221;0.224] Yes
SI 0.035 [-0.243;0.227] Yes
HM 0.024 [-0.176;0.198] Yes
Table 37 and Table 38 respectively summarize the results for permutation test and the PLS-
MGA. As it can be seen, all main relationships in the model are significant for both groups,
except the relationship between social influence (SI) and behavioral intention (BI) which is not
significant for group 1. Therefore, it can be assumed that social influence (SI) only influences
behavioral intention (BI) of the users to use their own mobile devices for in-store ubiquitous
computing based services which is in contrast to the hypothesized relationship therefore the H3.4
is rejected. Only the relationship between the performance expectancy (PE) and behavioral
intention (BI) significantly differ between two groups however not in the hypothesized direction.
Hence none of the hypothesis formulated for the moderating effect of technology type could be
confirmed.
Table 37: Permutation test results for technology type
Rel
atio
nshi
p
Serv
ice
grou
ps
Pat
h co
effi
cien
t
Stan
dard
err
or
t-V
alue
(≥1.
65)
Group1 vs. Group 2
Pat
h co
effi
cien
ts-d
iff
95%
co
nfid
ence
in
terv
al
p-V
alue
Sig
nifi
cant
le
vel
EE→BI
Group 1:
stationary 0.106 0.033 3.223
-0.010 [-0.092;0.085] 0.824 ns Group 2:
mobile 0.117 0.035 3.358
PE→BI Group 1:
stationary 0.673 0.047 14.347 0.109 [-0.115;0.120] 0.078 *

204
Group 2:
mobile 0.563 0.045 12.383
SI→BI
Group 1:
stationary 0.056 0.039 1.426
Group 1 ns
n/a n/a n/a Group 2:
mobile 0.142 0.042 3.371
HM→BI
Group 1:
stationary 0.180 0.052 3.494
-0.018 [-0.133;0.134] 0.785 ns Group 2:
mobile 0.198 0.046 4.280
Note: n/a = not applicable. ns = non-significant. *p <.10. **p <.05. ***p <.01.
Table 38: PLS-MGA results for technology type
Rel
atio
nshi
p
Tec
hnol
ogy
grou
ps
Pat
h co
effi
cien
t
Stan
dard
err
or
t-V
alue
(≥1.
65)
Group1 vs. Group 2
| Pat
h co
effi
cien
ts-d
iff
|
p-V
alue
Sig
nifi
cant
le
vel
EE→BI
Group 1:
stationary 0.106 0.033 3.223
0.010 0.585 ns Group 2:
mobile 0.117 0.035 3.358
PE→BI
Group 1:
stationary 0.673 0.047 14.347
0.109 0.046 ** Group 2:
mobile 0.563 0.045 12.383
SI→BI
Group 1:
stationary 0.056 0.039 1.426
Group 1 ns n/a n/a Group 2:
mobile 0.142 0.042 3.371
HM→BI
Group 1:
stationary 0.180 0.052 3.494
0.018 0.603 ns Group 2:
mobile 0.198 0.046 4.280
Note: n/a = not applicable. ns = non-significant. *p <.10. **p <.05. ***p <.01.
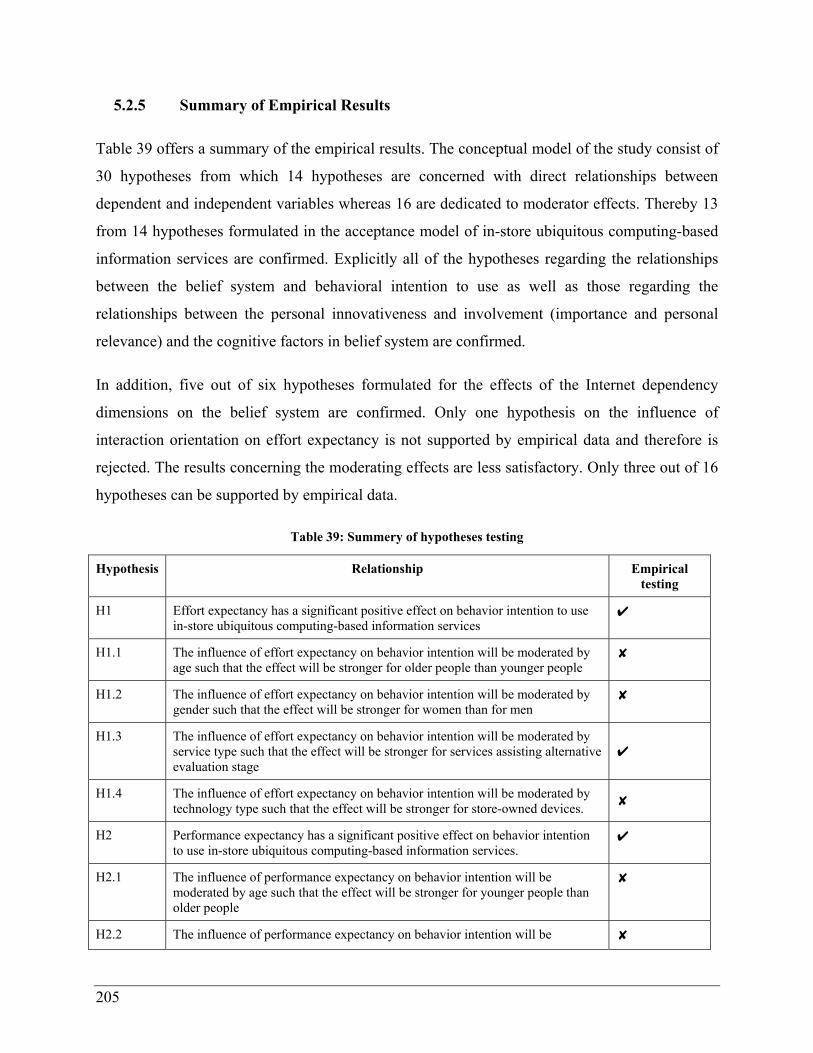
205
5.2.5 Summary of Empirical Results
Table 39 offers a summary of the empirical results. The conceptual model of the study consist of
30 hypotheses from which 14 hypotheses are concerned with direct relationships between
dependent and independent variables whereas 16 are dedicated to moderator effects. Thereby 13
from 14 hypotheses formulated in the acceptance model of in-store ubiquitous computing-based
information services are confirmed. Explicitly all of the hypotheses regarding the relationships
between the belief system and behavioral intention to use as well as those regarding the
relationships between the personal innovativeness and involvement (importance and personal
relevance) and the cognitive factors in belief system are confirmed.
In addition, five out of six hypotheses formulated for the effects of the Internet dependency
dimensions on the belief system are confirmed. Only one hypothesis on the influence of
interaction orientation on effort expectancy is not supported by empirical data and therefore is
rejected. The results concerning the moderating effects are less satisfactory. Only three out of 16
hypotheses can be supported by empirical data.
Table 39: Summery of hypotheses testing
Hypothesis Relationship Empirical testing
H1 Effort expectancy has a significant positive effect on behavior intention to use in-store ubiquitous computing-based information services
✔
H1.1 The influence of effort expectancy on behavior intention will be moderated by age such that the effect will be stronger for older people than younger people
✘
H1.2 The influence of effort expectancy on behavior intention will be moderated by gender such that the effect will be stronger for women than for men
✘
H1.3 The influence of effort expectancy on behavior intention will be moderated by service type such that the effect will be stronger for services assisting alternative evaluation stage
✔
H1.4 The influence of effort expectancy on behavior intention will be moderated by technology type such that the effect will be stronger for store-owned devices.
✘
H2 Performance expectancy has a significant positive effect on behavior intention to use in-store ubiquitous computing-based information services.
✔
H2.1 The influence of performance expectancy on behavior intention will be moderated by age such that the effect will be stronger for younger people than older people
✘
H2.2 The influence of performance expectancy on behavior intention will be ✘

206
Hypothesis Relationship Empirical testing
moderated by gender such that the effect will be stronger for men than for women
H2.3 The influence of performance expectancy on behavior intention will be moderated by service type such that the effect will be stronger for services assisting information search stage
✘
H2.4 H2.4: The influence of performance expectancy on behavior intention will be moderated by technology type such that the effect will be stronger for user-owned mobile devices.
✘
H3 Social influence has a significant positive effect on behavior intention to use in-store ubiquitous computing-based information services.
✔
H3.1 The influence of social influence on behavior intention will be moderated by age such that the effect will be stronger for older people than younger people
✘
H3.2 The influence of social influence on behavior intention will be moderated by gender such that the effect will be stronger for women than for men
✘
H3.3 The influence of social influence on behavior intention will be moderated by service type such that the effect will be stronger for services assisting information search stage
✘
H3.4 The influence of social influence on behavior intention will be moderated by technology type such that the effect will be stronger for store-owned devices.
✘
H4 Hedonic motivation has a significant positive effect on behavior intention to use in-store ubiquitous computing-based information services.
✔
H4.1 The influence of hedonic motivation on behavior intention will be moderated by age such that the effect will be stronger for younger people than older people
✔
H4.2 The influence of hedonic motivation on behavior intention will be moderated by gender such that the effect will be stronger for men than for women
✘
H4.3 The influence of hedonic motivation on behavior intention will be moderated by service type such that the effect will be stronger for services assisting information search stage
✔
H4.4 The influence of hedonic motivation on behavior intention will be moderated by technology type such that the effect will be stronger for store-owned devices.
✘
H5 Behavior intention to use in-store ubiquitous computing-based information services has a significant positive effect on customers’ preference of stores offering such services.
✔
H6 Action orientation dependency of customers on the Internet has a significant positive effect on effort expectancy of in-store ubiquitous computing-based information services.
✔
H7 Action orientation dependency of customers on the Internet has a significant positive effect on performance expectancy of in-store ubiquitous computing-based information services.
✔
H8 Interaction orientation dependency of consumers on the Internet has a significant positive effect on effort expectancy of in-store ubiquitous
✘

207
Hypothesis Relationship Empirical testing
computing-based information services.
H9 Interaction orientation dependency of consumers on the Internet has a significant positive effect on performance expectancy of in-store ubiquitous computing-based information services.
✔
H10 Social play dependency of customers on the Internet has a significant positive effect on hedonic motivation of in-store ubiquitous computing-based information services
✔
H11 Solitary play dependency of customers on the Internet has a significant positive effect on hedonic motivation of in-store ubiquitous computing-based information services
✔
H12 Personal innovativeness in IT has a significant positive effect on effort expectancy of in-store ubiquitous computing-based information services.
✔
H13 Personal relevance of making an informed decision has a significant positive effect on performance expectancy of in-store ubiquitous computing-based information services.
✔
H14 Importance of having shopping assistance has a significant positive effect on performance expectancy of in-store ubiquitous computing-based information services.
✔
208
6 Discussion of Results and Conclusion
6.1 Theoretical Implications
To draw a sound conclusion from the empirical results and outline the theoretical contribution of
this study, first empirical results are discussed and interpreted. At this point, the focus is mainly
on unexpected results and rejected hypotheses. Next, the theoretical findings are summarized,
highlighting the main contributions of this dissertation to theoretical knowledge.
Performance expectancy, effort expectancy, social influence, and hedonic motivation
significantly influence behavioral intention to use in-store ubiquitous computing-based
information technologies. Overall, the empirical results support the applicability and validity of
UTAUT2 as a base model to predict the behavioral intention of customers to use ubiquitous
computing-based technologies. Thus, this study satisfies the call for testing UTAUT2 in different
technology contexts (Venkatesh et al., 2012) and extends its generalizability to in-store
ubiquitous computing-based information technologies.
Having a closer look into the results, performance expectancy is by far the most important driver
of behavioral intention. Hedonic motivation is as well a significant determinant of behavioral
intention but it can only take the second place with a relatively smaller effect size than
performance expectancy. Previous studies in the context of in-store technologies report
inconsistent results regarding the importance of hedonic motivation. Whereas Spreer and
Kallweit (2014), aligned with the original UTAUT2 paper, report hedonic motivation to be the
more important driver of behavioral intention than performance expectancy, Rothensee (2010)
reports the vice versa. The former study is using a fully functional prototype in a real shop while
the later one uses a movie to describe the given technologies to the participants. Thus, one could
argue that the study methods are responsible for the contradictory results. That is without any
direct experience with a given technology, it is more difficult for participants to evaluate its
emotional benefits. This argument could be valid for the current results since a scenario-based
study does also build on participants’ indirect experiences. However, the difference between the
effects of performance expectancy and hedonic motivation on behavioral intention in this study
is too substantial to be associated to the method bias. Therefore, based on the current results, it

209
can be concluded that in-store ubiquitous computing-based information technologies are above
all decision-support agents that are valued by their contribution to more efficient purchase
decisions and thus, their functional benefits are much more important than hedonic aspects.
Based on the empirical results, social influence after effort expectancy is the most unimportant
driver of behavior intention to use in-store ubiquitous computing-based information services.
Consistent with previous research, the rather small effect of effort expectancy on behavioral
intention was already expected. Current empirical results confirm that the participants in general
do perceive in-store technologies easy to use, which is aligned with the design philosophy of
ubiquitous computing technologies. Previous research shows that if the technology is inherently
relatively easy to us, effort expectancy will have less impact on individuals’ technology use
decision (Subramanian, 1994; Yousafzai et al., 2007a). That is the users don’t see the ease of use
as a system quality but rather take it for granted. However, the minor impact of social influence
on behavior intention is rather surprising. A possible explanation is that the prediction of
expectation and opinions of important others prior to the existence of a technology is principally
difficult. In this study, participants have to gauge the reaction of their social environment
associated with them using a technology that yet does not exist.
Contrary to expectations, gender does not show salient moderating effect on base model
relationships. Explicitly, none of hypotheses concerning the moderating effect of gender can be
supported by the empirical data. Two possible reasons can be responsible for the absence of any
significant difference in perceptions of male and female participants, namely shrinking gender
gap (Leopold et al., 2016) and ever-increasing penetration of information technologies in
developed societies. Since gender decision making differences are rather culture-induced than
biological (Bem, 1981; Brosnan, 1998; Brosnan and Davidson, 1996; Lynott and McCandless,
2000), it is rational to expect that by shrinking gender divide, the gender related differences in
technology perceptions do as well vanish. Furthermore, several studies show that the gender
differences in technology perception and acceptance is diminishing as technologies are becoming
more pervasive (Faqih and Jaradat, 2015; Lip-Sam and Hock-Eam, 2011; Serenko et al., 2006;
Zhou et al., 2007). Thus, it can be argued that in the current social and technological landscape,
gender does not result in variations in individuals’ perceptions regarding in-store ubiquitous
computing-based information services and thus their willingness to use such services.

210
Regarding the moderating effect of age, only one hypothesis indicating moderating effect of age
on the relationship between hedonic motivation and behavior intention could be supported since
this relationship is only significant for the younger age group. The results for effort and
performance expectancy are quite surprising. The relationship between effort expectancy and
behavior intention is only significant for the younger age group and the relationship between
performance expectancy and behavior intention is significantly stronger for the older age group
stating exactly the opposite of hypothesized effects. In addition, performance expectancy is the
only determinant of behavior intention for the older age group. Based on these findings, it can be
argued that since other beliefs of the given technology has no effect on the older age group’s
decision to use that technology, its utilitarian value becomes even more salient for the usage
decision. Therefore performance expectancy is a stronger driver of intention behavior for the
older age group. However this discrepancy with previous research might also be caused by the
sample characteristics, most notably the sample size. Analyzing the moderator effects, the total
sample is split along age lines resulting in subgroups with rather small sample sizes. Additionally
the sample sizes for the age groups are quite unbalanced, 227 cases for younger group and 75
cases for older group. Several relationships that are statistically significant in total sample turn
out to be not significant in subgroups. Therefore a well-founded conclusion in this regard
requires additional research.
Two out of four hypotheses regarding the moderating effect of service type are supported by
empirical results. The effect of effort expectancy on behavior intention is only significant for
services supporting the alternative evaluation stage. Consistent with the corresponding
hypothesis, this finding indicates that the perceived ease associated with the use of in-store
ubiquitous computing-based services only influences the usage decision when the technology is
used to perform more complex tasks as alternative evaluation. Based on this finding, it can be
suggested that it is the overlooked effect of task complexity in previous research which is
responsible for inconsistent results for the effect of effort expectancy on behavior intention,
positive significant effect (Kurkovsky and Harihar, 2006; Kwon et al., 2007; Lee et al., 2011;
Weijters et al., 2007) versus no effect (Kowatsch and Maass, 2010; Müller-Seitz et al., 2009;
Rothensee, 2010; Spreer and Kallweit, 2014). Furthermore, as hypothesized, the effect of
hedonic motivation on behavior intention is significantly stronger for services assisting the
information search stage. However, contrary to hypothesized effects, the impacts of performance

211
expectancy and social influence on behavior intention do not significantly differ between
information search and alternative evaluation services. It can be argued that in-store ubiquitous
computing-based information technologies facilitate the alternative evaluation task to an extent
which mitigates the negative effect of task complexity on perceived usefulness. Therefore the
relative importance of utilitarian benefits of in-store ubiquitous computing-based information
technologies remains unchanged for information search and alternative evaluation services. In
regard to the non-existence moderator effect of service type on the relationship between social
influence and behavior intention, a possible explanation can be that since both services for
information search and alternative evaluation stages are offered in a single technology artifact,
individuals’ may evaluate the opinions of important others for the technology as a whole
regardless of complexity of the task for which they use the technology.
None of hypotheses regarding the moderator effect of technology type can be supported by the
empirical data. The impacts of effort expectancy and hedonic motivation on behavior intention
do not significantly differ between the stationary and mobile technologies. Regarding effort
expectancy, contrary to expectations, individuals’ skill and experience with mobile devices do
not significantly change their perception about ease of using in-store ubiquitous computing-
based information services which are offered on their own devices. On one hand, as expected,
empirical results show that individuals perceive services based on their own mobile devices
easier to use than those offered in store-owned devices. On the other hand, regardless of the type
of the technology, participants perceive in-store ubiquitous computing-based technologies
relatively easy to use and put relatively low weight on their easiness feature while making the
usage decision. Referring to previous literature, above, it is argued that this is because, in
accordance with the design philosophy of ubiquitous computing technologies, in-store ubiquitous
computing-based information technologies are inherently easy to use. Thus, however
individuals’ skill and experience with mobile devices leads to a more positive effort expectancy
belief regarding services offered in mobile devices, the difference is too marginal to significantly
change the relative importance of effort expectancy on behavior intention for services offered on
customer owned mobile devices versus store owned stationary devices. Similarly, the results
from parametric test show no significant difference induced by type of the technology for the
effect of hedonic motivation on behavior intention. The corresponding hypothesis is inferred
from the reasoning that the experience with mobile devices reduces the perceived novelty appeal

212
of in-store services which are offered on customers’ own devices. Thus, the perceived novelty
which contributes to the effect of hedonic motivation on behavior intention is hypothesized to be
weaker for in-store services offered on customer owned mobile devices than those offered on
store-owned devices. Failing to confirm this hypothesis, it can be suggested that individuals
perceive the novelty of services offered on their own mobile devices as attractive as those
offered on store-owned devices. A possible reason can be that as in-store ubiquitous computing-
based information technologies are yet future technologies and inherently novel, participants
experience with mobile devices does affect their novelty appeal.
The hypotheses concerning the moderator effects of technology type on relationships between
social influence and performance expectancy on behavior intention are as well rejected.
However, the parametric tests show that the strength of these relationships differ by the type of
technology but in the opposite direction of the hypothesized effects. Contrary to the hypothesis,
the relationship between social influence and behavior intention is non-significant for store-
based devices whereas it is significant for customer owned mobile devices. Above, while
discussing about the relatively weak effect of social influence on behavior intention in
aggregated data, it is argued that the prediction of expectation and opinions of important others
prior to the existence of a technology is principally difficult. Having a significant relationship
between social influence and behavior intention only for mobile technologies strengthens the
validity of this argument. Referring to the same argument, since the mobile devices already exist,
participants could gauge the reaction of their social environment associated with them using in-
store ubiquitous computing-based services offered on their own mobile devices better than those
offered on store-based devices. Regarding the relationship between performance expectancy and
behavior intention, contrary to the hypothesis, the relationship is significantly stronger for store
owned stationary devices than customer owned mobile devices. As expected, empirical results
show that participants perceive services offered on their own mobile devices more useful than
those offered on store owned stationary devices. However, it doesn’t translate to the stronger
effect of performance expectancy on behavior intention. A possible reason for this finding can be
the mitigating effect of perceived privacy concerns on perceived usefulness of services offered
on user owned mobile devices. Previous research, in other technology domains, show that with
increasing perceived privacy concerns the value of utilitarian advantages of the technology
decreases (McGoldrick, 2001; Ziesak, 2013). In-store ubiquitous computing information

213
technologies are designed to offer personalized services to their users for which user information
is essential. In this study, in the scenario designed for store owned stationary devices (smart
mirror scenario), the required information for service delivery is limited to customers’ actions in
the store and is not coupled with users’ personal information. However to use in-store
information services in mobile devices, users need to download an application in their own
mobile devices which automatically shares some user information with the provider and extends
the potential range of accessibility to outside of the store. Therefore, the perceived privacy
concerns about the collection of personal information and unauthorized secondary use might be
the barrier for willingness to use in-store services offered on user owned mobile devices.
Except the relationship between interaction orientation and effort expectancy, all relationships
hypothesizing the effects of user characteristics on belief system are supported by empirical data.
Thus as hypothesized, the empirical result show that user characteristics as Internet dependency
relations, personal innovativeness, and involvement influence various beliefs of individuals’
concerning in-store ubiquitous computing-based information services.
Based on the above mentioned discussions, this study provides strong contributions to theoretical
knowledge. These contributions can be summarized in four categories:
The first contribution is made by extending existing knowledge in technology acceptance into a
new context. A context-specific model for the acceptance of the in-store ubiquitous computing-
based information services is developed. UTAUT2 is modified for in-store ubiquitous
computing-based information services context and extended by germane user, service, and
technology characteristics. The model is the most extensive model ever developed in this
context. The study provides empirical support for the comprehensive acceptance model of in-
store ubiquitous computing-based information services. In addition, this study satisfies the call
for testing UTAUT2 in different technology contexts (Venkatesh et al., 2012) and extends its
generalizability to in-store ubiquitous computing-based information technologies. The contextual
model explains 85% of the variance in behavioral intention to use in-store ubiquitous computing-
based information services which is considerably high in acceptance studies in general and such
studies in the context of in-store technologies in particular. In the original UTAUT2 paper, the
model could only explain 44 % of the variance in behavioral intention and the highest explained

214
variance for behavioral intention among the reviewed studies in the context of in-store
technologies was 71% (Rothensee, 2010).
Considering the general gap in technology acceptance research (Venkatesh et al., 2003), the
second contribution resolves the gap in knowledge regarding the link between user acceptance
and desired usage outcome. The study identifies intention to prefer as an important positive
outcome of behavior intention. Incorporating intention to prefer into the model also increases the
practical relevance of the developed model. Behavior intention to use in-store ubiquitous
computing-based services explains 60% of variance in intention to prefer. That is the intention to
use in-store ubiquitous computing services strongly predicts the intention to prefer stores
offering those services.
The third contribution is made by incorporating individual differences into the acceptance model
of in-store ubiquitous computing-based information technologies. First, a theory of how prior
Internet experience drives the acceptance of in-store ubiquitous computing-based information
technologies through its influence on beliefs about the technology is posited and supported by
empirical data. By doing, new Internet dependency constructs are introduced into the technology
acceptance model. It is postulated that media dependency theory offers the best proxy for
conceptualization of individuals’ favorable attitude towards Internet. This study manifests the
feasibility of viewing the favorable attitude development process towards Internet as the process
of dependency relations formation on information resources of Internet. Consequently this study
shows that media dependency theory provides a rich theoretical foundation for identifying the
salient effects of Internet information use and consequently their influences on beliefs about new
but similar information technologies. In addition, this study satisfies the call for developing and
applying more detailed and domain specific conceptualization of experience in technology
acceptance studies (Sun and Zhang, 2006). Second two previously defined constructs, namely
personal innovativeness in IT and involvement are identified as additional important factors
driving the positive belief formation in the given context. The hypothesized relationships are
supported by empirical data. Furthermore, the findings indicate that in the context of in-store
ubiquitous computing-based information technologies, the extent of importance and relevance,
two different facets of the notion of involvement, differs for an individual. Consequently this
study delivers evidence that decomposing the involvement factor into two factors of relevance

215
and importance results in a better understanding of effects of involvement on beliefs formation.
Through the antecedent factors of beliefs, the proposed model can explain 31% variance in
performance expectancy, 31% of variance in effort expectancy, and 19% of variance in hedonic
motivation. In user acceptance studies, the R² values of 0.4 and 0.5 for behavior intention and
use are considered as substantial (Venkatesh et al., 2012). However for customers’ beliefs about
the technology as effort expectancy, performance expectancy and hedonic motivation, the R²
values above 0.3 are rarely observed (Agarwal and Prasad, 1999; Lu et al., 2005; Venkatesh and
Bala, 2008). Therefore, the obtained R² values for the current model are considered rather high.
The forth contribution to new knowledge is the evidence for generalizability of the developed
model across different in-store ubiquitous computing-based information technologies and
services. One of the objectives of this dissertation is to develop an acceptance model applicable
for entire range of in-store ubiquitous computing-based applications. Therefore, the model is
tested for three different scenarios each representing certain technology or service type. The
scenario comparisons in this study indicate that the proposed model performs about equally well
across different technology and service types. The explained variances in behavioral intention for
the information search stage (scenario 1), alternative evaluation stage (scenario 2), store owned
stationary devices (aggregated scenario 1 and 2), and customer owned mobile devices (scenario
3) are respectively 75%, 75%, 82%, 74%. At the same time, however, empirical results regarding
previously unidentified moderator effects of technology type and service type on the base model
relationships shows differences in path coefficients in some of the relationships. Although except
for two incidents, the observed path coefficient differences are inconsistent with the previously
stated hypotheses; the implications of these contradictory findings raise at least two important
theoretical issues. First, complexity of the task supported by a technology might be responsible
for the inconsistent results for the effect of effort expectancy on behavior intention, positive
significant effect (Kurkovsky and Harihar, 2006; Kwon et al., 2007; Lee et al., 2011; Weijters et
al., 2007) versus no effect (Kowatsch and Maass, 2010; Müller-Seitz et al., 2009; Rothensee,
2010; Spreer and Kallweit, 2014). Second, for the technologies which extend the potential range
of customer data accessibility to outside of the store, as customers’ mobile devices, perceived
privacy concerns might mitigate the value of utilitarian advantages. By and large, the proposed
model enables a reasonably accurate prediction of the applications of ubiquitous computing
technologies in the retail context.

216
6.2 Managerial Implications
To this point, through the empirical analysis, mainly the relative importance of individuals’
perceptions and characteristics to determine the behavioral intention and intention to prefer is
examined. The importance of these determinants is gauged by the value of estimates of path
model relationships. The results provide insights into how individuals evaluate and form
intentions to use ubiquitous computing-based information systems in retail stores. From a
managerial point of view, however, the more important issues are
how managers can utilize these findings to make interventions that can result in a greater
acceptance and successful introduction of such technologies in stores.
and how they can harvest the acceptance and use of such technologies to gain competitive
advantage.
As discussed in the method choice section, one of the features of the PLS-SEM method is the
extraction of the latent variable scores (Hair et al., 2014a; Völckner et al., 2010). That is in
addition to the relative importance of constructs in the structural model the average values of
latent variable scores representing their actual performance can be calculated enabling the
importance-performance matrix analysis (IPMA) (Hair et al., 2014a). IPMA allows the
identification and thus prioritization of the most important areas for management actions to
provide pertinent managerial recommendations from the empirical results.
Thus, to translate the empirical results into managerial actions, first important-performance
analysis of the path modeling results is conducted. Next, the findings are synthesized to derive
managerial recommendations for brick and mortar retail in terms of design, choice, and
introduction strategies of in-store ubiquitous computing-based information systems.
From the managerial point of view, increasing the store preference and customers’ return rate is
the ultimate goal to implement ubiquitous computing-based technologies in stores. Therefore,
intention to prefer is chosen as the target construct for the importance-performance analysis. To
provide a more comprehensive results the IPMA are conducted in scenario level.
Figure 32 shows the importance-performance matrices for information search and alternative
evaluation services. The importance of each variable emerges from its total effects on intention

217
to prefer, whereas the performance is determined by calculating the average values of each
exogenous variable on a scale from zero (lowest performance) to 100 (highest performance).
As mangers’ resources are always limited, it is important to first devote these resources on areas
holding higher priorities. Thus, having the importance-performance matrices, the next step is the
priority assignment to management-oriented actions. The common practice here is to focus on
exogenous variables with relatively high importance and relatively low performance values. The
rationale behind this approach is that first, these variables hold a relatively high performance
improvement potential and second because of their high importance level one unit improvement
in their performance results in rather sizeable improvement in the performance of the target
construct (Hair et al., 2014a; Ringle et al., 2016).
The theoretical model of this work consists of two distinct groups of variables, namely variables
representing individuals’ perceptions concerning the given technology (e.g. effort and
performance expectancy) and variables projecting various user characteristics (e.g. personal
relevance and action orientation). Individuals’ technology perception variables reveal which
technology features and to what extent are important for users’ store preference. Thus from
managerial point of view, analyzing their importance and performance can guide the technology
design and communication strategy development. Retail managers can take actions to improve
the performance level of these variables for example improving customers’ performance
expectancy perception about the given technology by communicating and highlighting its
functional advantages. Thus the focus of management-oriented actions should be on variables
with relatively high importance and relatively low performance values.
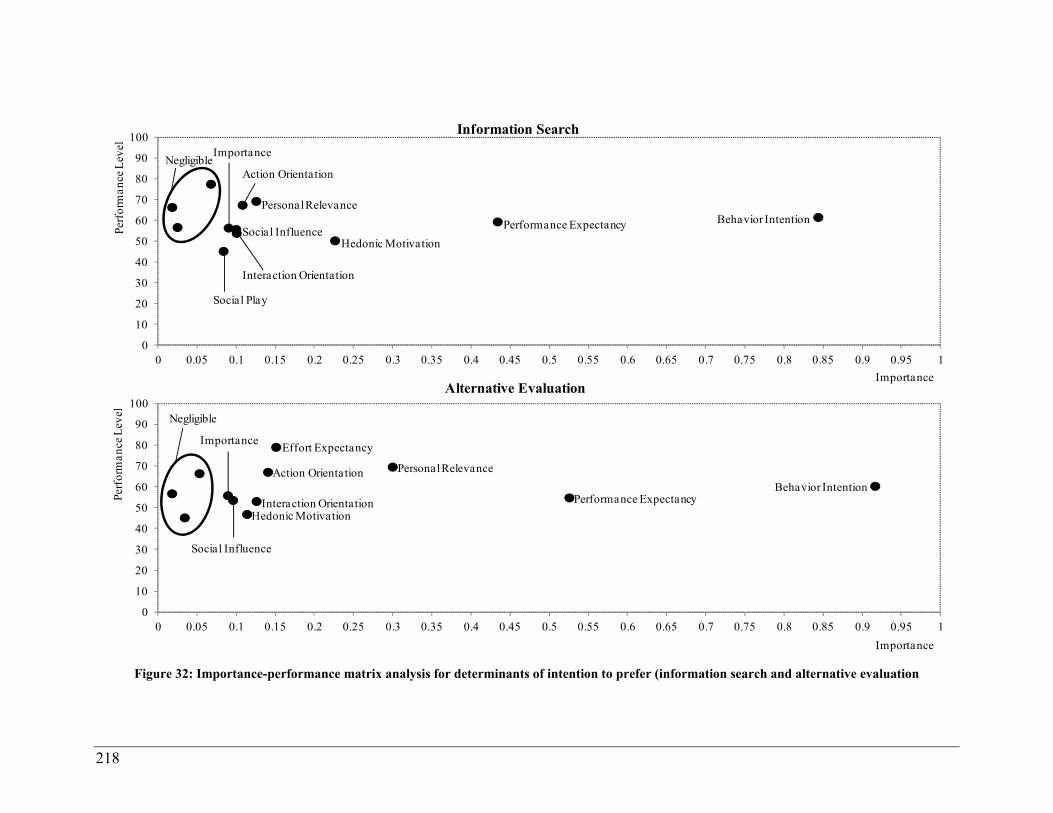
218
Figure 32: Importance-performance matrix analysis for determinants of intention to prefer (information search and alternative evaluation
Negligible
Negligible
0
10
20
30
40
50
60
70
80
90
100
0 0.05 0.1 0.15 0.2 0.25 0.3 0.35 0.4 0.45 0.5 0.55 0.6 0.65 0.7 0.75 0.8 0.85 0.9 0.95 1
Perf
orm
ance
Lev
el
Importance
Information Search
Action Orientation
Interaction Orientation
Social Play
Performance ExpectancySocial Influence
Behavior IntentionPersonal Relevance
Importance
Hedonic Motivation
0
10
20
30
40
50
60
70
80
90
100
0 0.05 0.1 0.15 0.2 0.25 0.3 0.35 0.4 0.45 0.5 0.55 0.6 0.65 0.7 0.75 0.8 0.85 0.9 0.95 1
Perf
orm
ance
Lev
el
Importance
Alternative Evaluation
Personal Relevance
Importance
Behavior IntentionPerformance Expectancy
Effort Expectancy
Hedonic Motivation Interaction Orientation
Action Orientation
Social Influence

219
In contrast, for user characteristics variables, it is not feasible for retail managers to improve the
performance level of these variables for example increasing the extent to which users are
dependent on the Internet information. These variables however can provide managers with
whom and how to target for successful introduction of ubiquitous computing-based information
services. Therefore, regarding user characteristic variables, the most important areas of
management-oriented actions are identified by focusing on variables with relatively strong
impact on intention to prefer and at the same time relatively high performance level. Relatively
high importance level indicates that the users with the given characteristic are comparatively
more inclined to prefer stores offering ubiquitous computing-based information services.
Relatively high performance level indicates the popularity of these characteristics. Here the goal
is not to identify technology features whose performance improvement result in a greater store
preference but to identify the users who are more inclined to prefer the stores which offer
ubiquitous computing-based information and therefore crucial for successful introduction of in-
store ubiquitous computing-based information technologies. For the sake of simplicity,
henceforth the first group of variables (technology perceptions) is referred to as controllable
variables and the second group (user characteristics) as uncontrollable variables.
Regarding controllable variables in information search services, it becomes apparent that because
of its major impact, behavior intention is highly relevant for increasing the customers store
preference. At the same time due to its intermediate performance level, there is relatively high
improvement potential. Therefore, this factor should be assigned the highest priority while
developing management-oriented measures. Nearly the same applies to importance and
performance in the performance expectancy. Thus, management measures should to be taken to
improve the performance expectancy of customers. In comparison to performance expectancy
and behavior intention, hedonic motivation exert lower impact on store preference but at the
same time it offers the major improvement potential in terms of performance level. Social
influence has relatively low impact and therefore is of less importance and low priority for
activities aimed at increasing customers store preference. Concerning alternative evaluation
services, similar to information search services, management efforts should be directed to
improve performance levels of behavior intention, performance expectancy, and hedonic
motivation. However, unlike information search services, the impact of effort expectancy is not
negligible for alternative evaluation services. Effort expectancy has the highest performance

220
value so that there is a relatively minor potential for further performance improvement. In
addition its impact on intention to prefer is relatively low therefore even an increase in
performance value cannot considerably change customers’ store preference. Therefore although
future maintenance of the performance level should be ensured, extra investment for its
improvement is not recommended.
Comparing the IPMA results of information search and alternative evaluation services, the
performance level of behavior intention to use information search services is about as good as
the one for alternative evaluation services. However, its total effects on intention to prefer is
relatively higher in alternative evaluation services than information search services. That is
customers’ intention to use in-store ubiquitous computing-based information technologies for
alternative evaluation increases customers’ store preference and thus loyalty more than their
intention to use the given technologies for information search. As a result, successful
implementation of management measures for improvement of performance level of intention to
use alternative evaluation services will lead to a higher store preference. From managerial point
of view, increasing the store preference and customers’ return rate is the ultimate goal to
implement ubiquitous computing technologies in stores. Therefore, as both services are often
offered based on the single technology artifact, it is more effective to direct the focus of
management activities on alternative evaluation services.
Regarding uncontrollable factors, personal relevance is the most relevant factor for managerial
actions in alternative evaluation services with both highest impact on behavior intention and
highest performance value indicating the individuals’ high dedication and interest to make
informed purchasing decisions. Action orientation, interaction orientation, and importance are
respectively of high relevance for activities targeting populations of user that are more inclined
to use the new services. Therefore these factors are important to consider while developing a
strategy for introduction of in-store ubiquitous computing-based information services. The rest of
the user characteristics have too small impact on store preference to be relevant for managerial-
oriented activities.
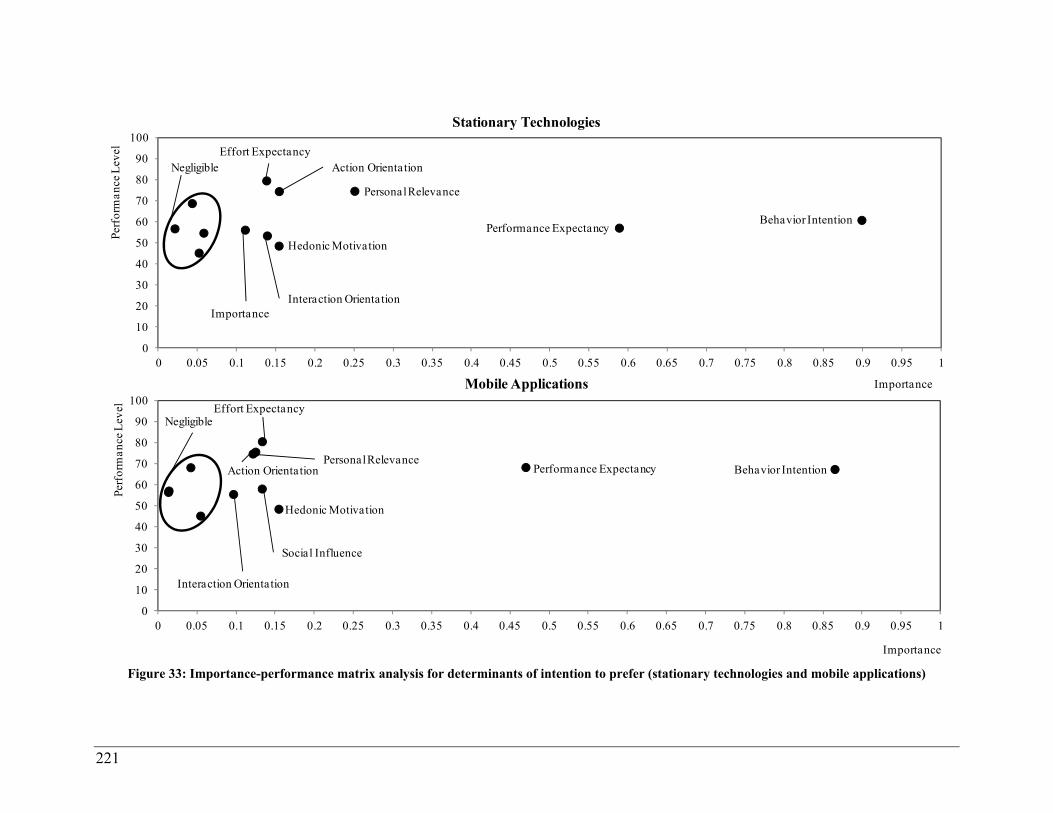
221
Figure 33: Importance-performance matrix analysis for determinants of intention to prefer (stationary technologies and mobile applications)
0
10
20
30
40
50
60
70
80
90
100
0 0.05 0.1 0.15 0.2 0.25 0.3 0.35 0.4 0.45 0.5 0.55 0.6 0.65 0.7 0.75 0.8 0.85 0.9 0.95 1
Perf
orm
ance
Lev
el
Importance
Stationary Technologies
Negligible Action Orientation
Interaction Orientation
Performance ExpectancyBehavior Intention
Personal Relevance
Importance
Hedonic Motivation
Effort Expectancy
0
10
20
30
40
50
60
70
80
90
100
0 0.05 0.1 0.15 0.2 0.25 0.3 0.35 0.4 0.45 0.5 0.55 0.6 0.65 0.7 0.75 0.8 0.85 0.9 0.95 1
Perf
orm
ance
Lev
el
Importance
Mobile Applications
Negligible
Action Orientation
Social Influence
Performance Expectancy Behavior IntentionPersonal Relevance
Interaction Orientation
Hedonic Motivation
Effort Expectancy

222
Figure 33 shows the importance-performance matrices for stationary technologies and mobile
applications. Regarding controllable variables in stationary technologies, it becomes apparent
that because of its major impact, behavior intention is highly relevant for increasing the
customers store preference. At the same time due to its intermediate performance level, there is
relatively high improvement potential. Therefore, this factor should be assigned the highest
priority while developing management-oriented measures. Nearly the same applies to importance
and performance in the performance expectancy. Thus, management measures should to be taken
to improve the performance expectancy. In comparison to performance expectancy and behavior
intention, hedonic motivation exerts lower impact on store preference but at the same time it
offers the major improvement potential in terms of performance level. Effort expectancy has the
highest performance value so that there is a relatively minor potential for a further performance
improvement. In addition its impact on intention to prefer is relatively low therefore even an
increase in performance value cannot considerably change customers’ store preference.
Therefore although future maintenance of the performance level should be ensured, extra
investment for its improvement is not recommended.
Concerning mobile applications, similar to stationary technologies, management efforts should
be directed to improve performance levels of behavior intention, performance expectancy, and
hedonic motivation and to maintain performance level of effort expectancy. However, unlike
stationary technologies, the impact of social influence is not negligible for mobile applications.
In comparison to behavior intention, performance expectancy and hedonic motivation, social
influence has lower impact on store preference. At the same time it holds a higher performance
level than hedonic motivation therefore it should be assigned a lower priority for management
oriented activities.
Comparing the IPMA results for stationary technologies and mobile applications, it becomes
apparent that no matter which technology retailers choose to implement, they have to focus their
managerial actions on improving customers’ behavior intention, performance expectancy, and
hedonic motivation. In addition as the importance and performance level of behavior intention as
the most relevant factor for increasing store preference are almost identical, it can be concluded
that both technologies are equally good to increase the store preference.

223
Regarding uncontrollable factors, personal relevance and action orientation are the most relevant
areas for managerial actions for both stationary technologies and mobile applications.
Managerial efforts should be directed to reach to customers who are more dedicated to make
informed purchasing decisions as well as the ones who are dependent on Internet information
resources to take purchasing decisions. Interaction orientation and importance are less important
with importance being negligible for store preference in mobile applications. The rest of the user
characteristics have too small impact on store preference to be relevant for managerial-oriented
activities.
Synthesizing the above mentioned IPMA results, major practical insights in terms of design,
promotion and choice can be derived. These insights are discussed and formulated as
recommendations for managerial actions. As in-store ubiquitous computing based information
services are not widely spread, following Venkatesh and Bala (2008) recommendation, the focus
here is on preimplementation intervention strategies.
Overall the results of this study show that in-store ubiquitous computing-based information
services are able to increase customers’ store preference. This finding should be quite
encouraging to brick and mortar stores. Independent from the service and technology type, this
preference depends considerably on customer’s intention to use and perceived usefulness of
services. Therefore managerial measures should assign the highest priority to increase the
performance level of these factors. Thus before introducing in-store ubiquitous computing-based
information services, these two factors should be emphasized in design and promotion. In terms
of promotion, it can be done by informing customers about different areas of applications and
their potential to improve shopping performance. For example by contrasting people making fast
and confident purchase decisions using in-store ubiquitous computing-based information
services with people waiting for service employees to require a piece of information. Here,
stressing the ease of making an informed decision for example by emphasizing the availability of
the detailed and customized product information and product comparison assistance can be
especially appealing for customers who are more dedicated in making informed purchase
decisions. While developing the promotion strategies, the beneficial aspects of alternative
evaluation services should be in foreground as even a minor improvement in performance
expectancy of services supporting alternative evaluation will have a substantial effect on store

224
preference. In addition, promotional programs can be designed to stimulate customers’ intention
to use above and beyond influencing their technology perceptions. For example, offering special
discounts on products which can be only used through given technologies. Once customers use
the system, it would be easier for them to recognize and acknowledge its beneficial impact. In
terms of design, the efforts should be directed at ensuring and improving service delivery speed
and reliability.
Furthermore measures to improve the performance level of hedonic motivation and maintaining
that of effort expectancy need to be incorporated into design and promotion strategies. Hedonic
motivation is especially relevant for information search services. Therefore it is recommended to
first focus on improving the fun and novelty aspects of services supporting customers’
information search. In terms of promotion, this could be emphasized by highlighting the
interactive characteristic of such technologies (Brave and Nass, 2003; Huang, 2003; Rothensee,
2010). In terms of design this could be done for example through integrating multimedia
modalities (graphic, voice, video) or human like characteristics as faces and emotion
manifestation in the system (Huang, 2003; Rothensee, 2010). To maintain the performance level
of effort expectancy, efforts should be directed at ensuring the design of user friendly service
options with intuitive user interfaces.
In addition, managerial measures should be taken to reach customers who are dependent on
Internet information resources to make purchase decision and to interact with others. Due to
ever-increasing trend of online medium penetration in different facets of our lives, it can be
argued that an organic increase in the performance level of Internet dependency relationships is
to expect over time. Therefore considering Internet dependency constructs with relatively strong
impact on store preference while developing promotional strategies would be vital for its
successful implementation of in-store ubiquitous computing-based information services.
Customers with relatively high action orientation dependency can be targeted by messages which
help them to recall the positive experiences that they had with online medium in searching and
evaluation of information and associate them with the functionalities of the in-store ubiquitous
computing-based information services. These customers can be reached through Internet-based
channels. Therefore it would be more effective to place such messages in for example social
media platforms.
225
Last but not least, the results of this study provide an answer to which technology to choose.
Services for information search and alternative evaluation offered by a stationary technology are
replicable on consumers’ own mobile devices. Comparing the IPMA results for stationary
technologies and mobile applications, it becomes apparent that the importance and performance
level of behavior intention as the most relevant factor for increasing store preference are almost
identical. Based on these results, it can be suggested that both technologies are equally good in
increasing store preference. As the level of investment in stationary systems is significantly
higher than in mobile applications, it would be more cost-effective for retailers to provide in-
store ubiquitous computing-based services on customers own devices.
6.3 Limitations and Recommendations for Future Research
Like any other research, this study has inevitable limitations inherited from its scope and analysis
method which at the same time indicate avenues for future research.
One limitation originates in the scenario-based survey studies. In this study, the scenario
development is based on the profound research on the existing real-world applications. In
addition, various measures are taken to ensure that the developed scenarios are neutral and
imitate a sufficient degree of real-world setting. However, it does not change the fact that a
scenario does not produce a real-world application but only reflects one. Therefore, the
participants’ perceptions are dependent on their ability to put themselves in a hypothetical
situation. As a result, it is possible that participants’ perceptions of the ubiquitous computing-
based information technologies have been biased by means of scenarios. It will be interesting for
future research to replicate this study in real-world setting by conducting a prototype-based
study, which allows participants to experience in-store ubiquitous computing-based information
technologies in a first-hand manner. In addition, future research could be focused on replicating
this study with a larger and more representative sample size particularly to test the effects of age
and gender
To develop a parsimonious model, this study does not include constructs whose roles in shaping
the acceptance in previous studies are either rejected or reported as minor. One of these
constructs is privacy. The general research on acceptance of ubiquitous computing applications
has pointed out the importance of privacy (Hoffmann et al., 2011), however based on the results

226
of the studies in the area of in-store applications privacy beliefs play a very minor role in shaping
the acceptance (Müller-Seitz et al., 2009; Rothensee, 2010). Yet privacy and data protection
issues in digital age are gaining more importance and the individuals’ awareness of privacy
issues is rising. Thus, it will be sound for future research to reexamine the influence of perceived
privacy on behavioral intention of using in-store ubiquitous computing-based information
services.
Another aspect which is not included in the scope of this study but is worthwhile to examine is
the impact of product category (e.g. more complex vs. less complex or more expensive vs. less
expensive) on customers’ willingness to use in-store ubiquitous computing-based information
services. The complexity level of a product associated with the number of attributes and
alternatives might influence the consumers’ decision making process (Bettman et al., 1998;
Swaminathan, 2003). That is the higher the number of features and alternatives in a product
category, the greater the cognitive load (Payne et al., 1993). In-store ubiquitous computing-based
information services assist customers through the information search and evaluation process
reducing the cognitive effort, for example by organizing the product/s information based on the
customer’s most important attribute/s in a small and easy to read table. Thus, for instance,
perceived benefit of in-store ubiquitous computing based services could be higher for more
complex products. Future research might examine the effects of product categories on the belief-
intention relationships of the current model.

227
Appendix
Questionnaire for the Use and Acceptance of Ubiquitous Technologies in Retail
Environment
Thank you for taking the time to complete this survey, your feedback is very important to us.
This survey should only take about 20 minutes of your time. Any questions marked with an
asterisk (*) require an answer in order to progress through the survey.
As a token of our appreciation for your participation in this important study, upon receipt of your
completed questionnaire, you will be asked whether you would like to be entered in a
lottery in which respondents are eligible to win 5, €25 gift certificates from Amazon.
Here we want to ask you about your own opinion and individual estimations. There are no right
or wrong answers. Therefore please answer the questions as spontaneously as possible.
If you have any questions about the survey, please contact us at [email protected] or call
040428784522
In order to progress through this survey, please use the following navigation buttons:
Click the Next button to continue to the next page.
Click the Submit button to submit your survey.

228
General Questions I
What is your gender?
( ) Male
( ) Female
What is your age?
___ Years old
Approximately, how old were you when you used Internet for the first time?
___ Years old
Smart Purchase Relevance
Please indicate the extent to which you agree or disagree with the following statements: (scale
1=strongly disagree to 7=strongly agree)
Strongly disagree
Disagree Disagree Somewhat
Undecided
Agree Somewhat
Agree Strongly Agree
It is important to me to feel like a smart shopper and to make successful purchases.
It is important to me that the products I buy are consistent with my style.
It is important for me to inform myself about the alternatives (e.g., price, quality) before making the purchase.
When I am shopping, I am usually very careful with the decisions I make..
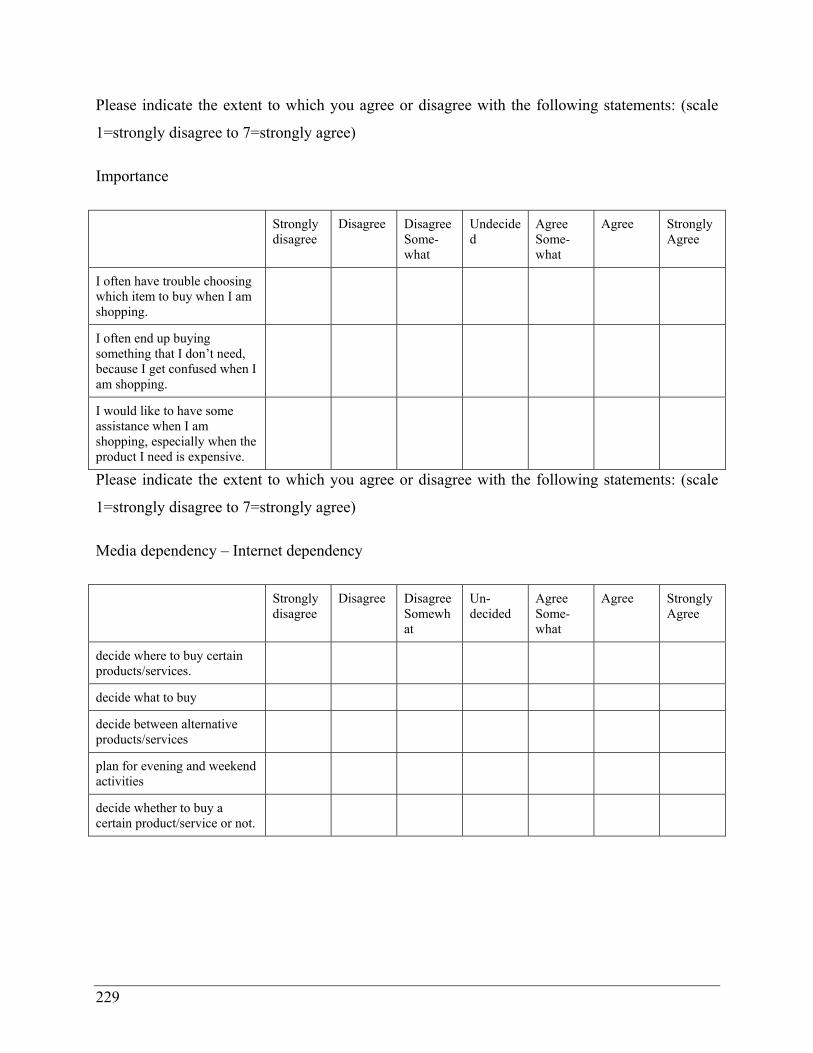
229
Please indicate the extent to which you agree or disagree with the following statements: (scale
1=strongly disagree to 7=strongly agree)
Importance
Strongly disagree
Disagree Disagree Some-what
Undecided
Agree Some-what
Agree Strongly Agree
I often have trouble choosing which item to buy when I am shopping.
I often end up buying something that I don’t need, because I get confused when I am shopping.
I would like to have some assistance when I am shopping, especially when the product I need is expensive.
Please indicate the extent to which you agree or disagree with the following statements: (scale
1=strongly disagree to 7=strongly agree)
Media dependency – Internet dependency
Strongly disagree
Disagree Disagree Somewhat
Un-decided
Agree Some-what
Agree Strongly Agree
decide where to buy certain products/services.
decide what to buy
decide between alternative products/services
plan for evening and weekend activities
decide whether to buy a certain product/service or not.

230
The scenarios
In the next pages you will find three brief texts each describing an individual trying to make a
purchase decision with some technology-enabled assistance available in the shop. Each scenario
will be followed by the same set of questions. Please read through the scenarios carefully and
imagine yourself in it. When you are ready, please click "next" to continue.
Scenario1 (male)
SMART MIRROR
Tom enters the floor dedicated to men’s clothing in a large department store. He needs an outfit
for his upcoming job interview. Therefore he is looking for a white shirt and a pair of dark
trousers. The floor is huge and full of different brands with different styles. He looks for a shop
assistant to get some advice concerning where to find the business outfits, but all shop assistants
seem to be busy at the moment. So he picks two shirts and a pair of trousers and takes them into
the fitting room. The trousers fit very well, but none of the shirts suit his taste.
He uses the Smart Mirror in the cabin for inspiration on shirts that could fit well to the trousers
and are available in the store: Pressing a button, Tom activates the Smart Mirror function; the
Smart Mirror scans Tom’s body.
Now Tom interacts with the Smart Mirror and it proposes a list of shirts which could fit well to
the trousers on a small screen located next to the Smart Mirror, based on the occasion (formal

231
outfit/interview outfit) and his age and size. He has the option to filter the given list based on
different criteria (size, colour, brand, on sale etc).
He filters the options based on price (less than 30 Euro) and colour (white). Then, he browses the
options and chooses five shirts to try on. He orders his favourite ones via touch screen and a shop
attendant delivers them to him.
Scenario1 (female)
SMART MIRROR
Lisa enters the floor dedicated for women clothing in a large department store. She needs an
outfit for her upcoming job interview. Therefore she is looking for a white blouse and a dark
skirt. The floor is huge and full of different brands with different styles. She looks for a shop
assistant to get some advice concerning where to find the business outfits, but all shop assistants
seem to be busy at the moment. So she picks two blouses and a skirt and takes them into the
fitting room. The skirt fits very well, but none of the blouses suit her taste.
She uses the Smart Mirror in the cabin for inspiration on blouses that could fit well to the skirt
and are available in the store: Pressing a button, Lisa activates the Smart Mirror function; the
Smart Mirror scans Lisa’s body.
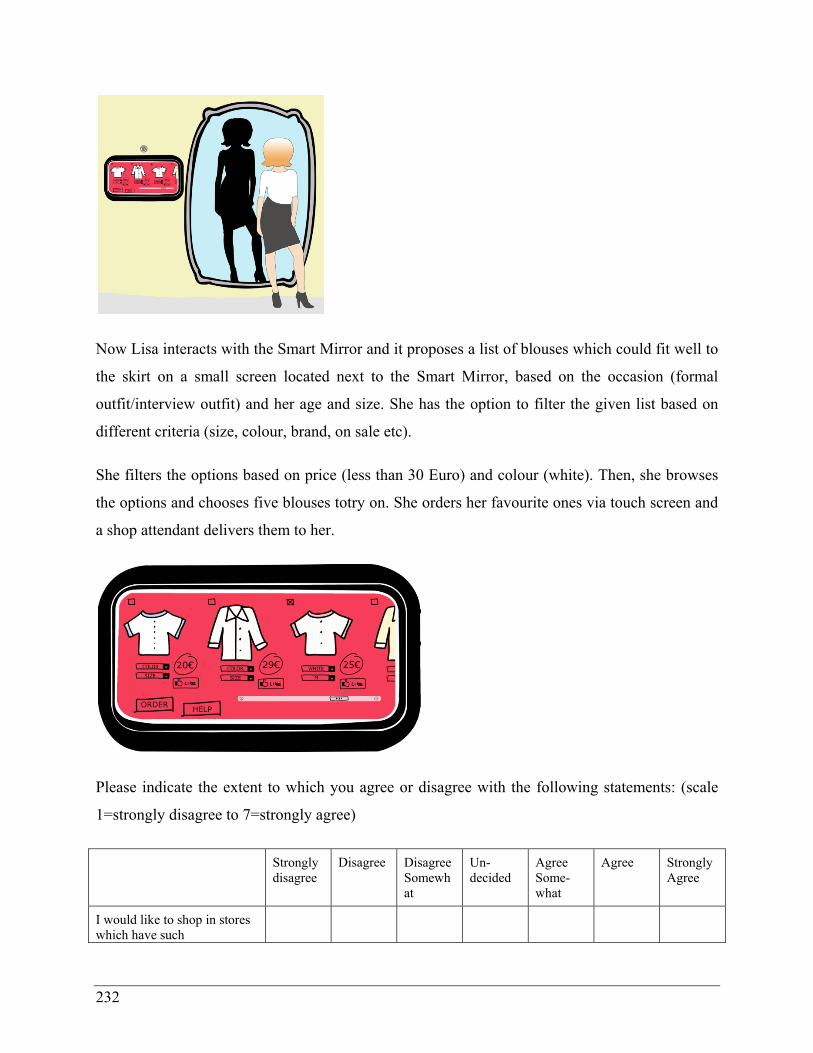
232
Now Lisa interacts with the Smart Mirror and it proposes a list of blouses which could fit well to
the skirt on a small screen located next to the Smart Mirror, based on the occasion (formal
outfit/interview outfit) and her age and size. She has the option to filter the given list based on
different criteria (size, colour, brand, on sale etc).
She filters the options based on price (less than 30 Euro) and colour (white). Then, she browses
the options and chooses five blouses totry on. She orders her favourite ones via touch screen and
a shop attendant delivers them to her.
Please indicate the extent to which you agree or disagree with the following statements: (scale
1=strongly disagree to 7=strongly agree)
Strongly disagree
Disagree Disagree Somewhat
Un-decided
Agree Some-what
Agree Strongly Agree
I would like to shop in stores which have such

233
technologies.
I would use this technology frequently.
I wish this technology was already available.
I intend to use the presented technology if available.
Please indicate the extent to which you agree or disagree with the following statements: (scale
1=strongly disagree to 7=strongly agree)
Strongly disagree
Disagree Disagree Somewhat
Un-decided
Agree Some-what
Agree Strongly Agree
I think using the presented technology will help me find what I want faster and easier in the shop.
The presented technology will make shopping more convenient for me.
Overall, I think the presented technology will be useful for me.
The presented technology will improve my shopping experience.
The presented technology will fit my shopping needs.
Please indicate the extent to which you agree or disagree with the following statements: (scale
1=strongly disagree to 7=strongly agree)
Strongly disagree
Disagree Disagree Somewhat
Un-decided
Agree Some-what
Agree Strongly Agree
Learning how to use the presented technology seems easy for me.
I think my interaction with this technology would be clear and understandable.

234
The presented technology appears to be easy to use.
It would be easy for me to become skilful at using the presented technology.
Please indicate the extent to which you agree or disagree with the following statements: (scale
1=strongly disagree to 7=strongly agree)
Strongly disagree
Disagree Disagree Somewhat
Un-decided
Agree Some-what
Agree Strongly Agree
My friends and/or family would be impressed to hear that I use this technology.
My friends and/or family would be interested to use this technology.
I think that using this technology would enhance my image.
I think most people in my community will use the presented technology for shopping.
Please indicate the extent to which you agree or disagree with the following statements: (scale
1=strongly disagree to 7=strongly agree)
Strongly disagree
Disagree Disagree Somewhat
Un-decided
Agree Some-what
Agree Strongly Agree
The presented technology will make the shopping more fun for me.
I will enjoy shopping more in shops with this technology.
The presented technology will make the shopping very entertaining.
The presented technology would feel like playing a game for me.
Please indicate the extent to which you agree or disagree with the following statements: (scale
1=strongly disagree to 7=strongly agree)

235
Strongly disagree
Disagree Disagree Somewhat
Un-decided
Agree Some-what
Agree Strongly Agree
I would prefer a retail store where the presented technology is available to use over an ordinary store.
Scenario2 (male)
SMART MIRROR
After trying on the five shirts he has ordered via touch screen to the fitting room, Tom has three
white shirts in his consideration set. He wants to buy just one. Furthermore, he has never bought
from these brands, which is why he doesn’t know about their quality.
Given that he is quite sensitive about the Price-Performance ratio (Preis-Leistungs-Verhältnis) of
any product he buys, he interacts with the Smart Mirror again. While trying on each shirt, he
touches the shirt on the Mirror and the details of the product as well as reviews on the products
from other customers appear in an information box in the corner of the Mirror.

236
He chooses the one with the best review and buys the white shirt and the trousers. Being
confident of his choices, he is looking forward to convince his new boss in the upcoming job
interview.
Scenario2 (female)
SMART MIRROR
After trying on the five blouses she has ordered via touch screen to the fitting room, Lisa has
three white blouses in her consideration set. She wants to buy just one. She has never bought
from these brands and doesn’t know the quality.
Given that she is quite sensitive about the Price-Performance ratio (Preis-Leistungs-Verhältnis)
of any product she buys, she interacts with the Smart Mirror again. While trying on each blouse,
she touches the blouse on the Mirror and the details of the product as well as reviews on the
products from other customers appear in an information box in the corner of the Mirror.
She chooses the one with the best review and buys the skirt and the blouse. Being confident of
her choices, she is looking forward to convince her new boss in the upcoming job interview.

237
Please indicate the extent to which you agree or disagree with the following statements: (scale
1=strongly disagree to 7=strongly agree)
Strongly disagree
Disagree Disagree Somewhat
Un-decided
Agree Some-what
Agree Strongly Agree
I would use this technology frequently.
I would like to shop in stores which have such technologies.
I intend to use the presented technology if available.
I wish this technology was already available.
Please indicate the extent to which you agree or disagree with the following statements: (scale
1=strongly disagree to 7=strongly agree)
Strongly disagree
Disagree Disagree Somewhat
Un-decided
Agree Some-what
Agree Strongly Agree
The presented technology will make shopping more convenient for me.
I think using the presented technology will help me find what I want faster and easier in the shop.
The presented technology will fit my shopping needs.
The presented technology will improve my shopping experience.
Overall, I think the presented technology will be useful for me.
Please indicate the extent to which you agree or disagree with the following statements: (scale
1=strongly disagree to 7=strongly agree)
Strongly disagree
Disagree Disagree Somewhat
Un-decided
Agree Some-what
Agree Strongly Agree

238
I think my interaction with this technology would be clear and understandable.
Learning how to use the presented technology seems easy for me.
It would be easy for me to become skilful at using the presented technology.
The presented technology appears to be easy to use.
Please indicate the extent to which you agree or disagree with the following statements: (scale
1=strongly disagree to 7=strongly agree)
Strongly disagree
Disagree Disagree Somewhat
Un-decided
Agree Some-what
Agree Strongly Agree
My friends and/or family would be interested to use this technology.
My friends and/or family would be impressed to hear that I use this technology.
I think most people in my community will use the presented technology for shopping
I think that using this technology would enhance my image.
Please indicate the extent to which you agree or disagree with the following statements: (scale
1=strongly disagree to 7=strongly agree)
Strongly disagree
Disagree Disagree Somewhat
Un-decided
Agree Some-what
Agree Strongly Agree
I will enjoy shopping more in shops with this technology.
The presented technology will make the shopping more fun for me.
The presented technology would feel like playing a

239
game for me.
The presented technology will make the shopping very entertaining.
Please indicate the extent to which you agree or disagree with the following statements: (scale
1=strongly disagree to 7=strongly agree)
Strongly disagree
Disagree Disagree Somewhat
Un-decided
Agree Some-what
Agree Strongly Agree
I would prefer a retail store where the presented technology is available to use over an ordinary store.
Scenario3 (male)
Mobile App
Paul and his friends are discussing the advantages of Tablets (Tablet Computers) and how
practical they can be. One friend says that he could load all his materials on his Tablet to work
on it while sitting in the train, the other is fascinated with the possibility to find additional
information he might need through the internet and the other one uses his Tablet to write
comments and notes directly in the documents while sitting in the train or during lectures and
project presentations.
Being convinced of its advantages, Paul decides to purchase a Tablet. Few days later, he enters a
very large electronics store and heads to the Tablet section. He goes through the assortment of
Tablets in the store. Soon he finds a Tablet that suites his taste. The design is very nice and it has
all the features he desires, but unfortunately it is too expensive.
He opens the store App in his Smartphone to find out if there is a similar (with the same main
functions) but cheaper product. He scans the barcode of the Tablet he likes and it appears on his
phone.

240
Then he chooses the category “Similar Products” and filters all the functions he would like his
new Tablet to have.
Three different Tablets fit his requirements and show up on his screen.
He is able to directly compare all the features: price, brand, technical features (front camera, rear
camera, expandable storage, etc) presented in an easy to compare matrix. By clicking on each
option, he has the possibility to look for more detailed information of every Tablet in particular.

241
Paul always needs some time to think about a bigger spending. He saves the search options in his
“Dream Box” to get to see them later.
Scenario3 (female)
Mobile App
Julia and her friends are discussing the advantages of Tablets (Tablet Computers) and how
practical they can be. One friend says that she could load all her materials on her Tablet to work
on it while sitting in the train, the other is fascinated with the possibility to find additional
information she might need through the internet and the other one uses her Tablet to write
comments and notes directly in the documents while sitting in the train or during lectures and
project presentations.
Being convinced of its advantages, Julia decides to purchase a Tablet. Few days later, she enters
a very large electronics store and heads to the Tablet section. She goes through the assortment of
Tablets in the store. Soon she finds a Tablet that suites her taste. The design is very nice and it
has all the features she desires, but unfortunately it is too expensive.
She opens the store App in her Smartphone to find out if there is a similar (with the same main
functions) but cheaper product. She scans the barcode of the Tablet she likes and it appears on
her phone.

242
Then she chooses the category “Similar Products” and filters all the functions she would like her
new Tablet to have.
Three different Tablets fit her requirements and show up on her screen.
She is able to directly compare all the features: price, brand, technical features (front camera,
rear camera, expandable storage, etc) presented in an easy to compare matrix. By clicking on
each option, she has the possibility to look for more detailed information of every Tablet in
particular.
Julia always needs some time to think about a bigger spending. She saves the search options in
her “Dream Box” to get to see them later.
Please indicate the extent to which you agree or disagree with the following statements: (scale
1=strongly disagree to 7=strongly agree)
Strongly disagree
Disagree Disagree Somewhat
Un-decided
Agree Some-what
Agree Strongly Agree
I wish this technology was already available.
I intend to use the presented technology if available.

243
I would use this technology frequently.
I would like to shop in stores which have such technologies.
Please indicate the extent to which you agree or disagree with the following statements: (scale
1=strongly disagree to 7=strongly agree)
Strongly disagree
Disagree Disagree Somewhat
Un-decided
Agree Some-what
Agree Strongly Agree
Overall, I think the presented technology will be useful for me.
The presented technology will improve my shopping experience.
The presented technology will fit my shopping needs.
The presented technology will make shopping more convenient for me.
I think using the presented technology will help me find what I want faster and easier in the shop.
Please indicate the extent to which you agree or disagree with the following statements: (scale
1=strongly disagree to 7=strongly agree)
Strongly disagree
Disagree Disagree Somewhat
Un-decided
Agree Some-what
Agree Strongly Agree
The presented technology appears to be easy to use.
It would be easy for me to become skilful at using the presented technology.
I think my interaction with

244
this technology would be clear and understandable.
Learning how to use the presented technology seems easy for me.
Please indicate the extent to which you agree or disagree with the following statements: (scale
1=strongly disagree to 7=strongly agree)
Strongly disagree
Disagree Disagree Somewhat
Un-decided
Agree Some-what
Agree Strongly Agree
I think that using this technology would enhance my image.
I think most people in my community will use the presented technology for shopping
My friends and/or family would be interested to use this technology.
My friends and/or family would be impressed to hear that I use this technology.
Please indicate the extent to which you agree or disagree with the following statements: (scale
1=strongly disagree to 7=strongly agree)
Strongly disagree
Disagree Disagree Somewhat
Un-decided
Agree Some-what
Agree Strongly Agree
The presented technology will make the shopping very entertaining.
The presented technology would feel like playing a game for me.
I will enjoy shopping more in shops with this technology.

245
The presented technology will make the shopping more fun for me.
Please indicate the extent to which you agree or disagree with the following statements: (scale
1=strongly disagree to 7=strongly agree)
Strongly disagree
Disagree Disagree Somewhat
Un-decided
Agree Some-what
Agree Strongly Agree
I would prefer a retail store where the presented technology is available to use over an ordinary store.
Online Information Dependency
Please indicate the extent to which you agree or disagree with the following statements: (scale
1=strongly disagree to 7=strongly agree)
Strongly disagree
Disagree Disagree Somewhat
Un-decided
Agree Some-what
Agree Strongly Agree
When I require information, I need to use the internet.
Internet is the preliminary (most important) source of information for me.
Internet is the first source I check when I need a certain information
Media Dependency Part I
Please indicate the extent to which you agree or disagree with the following statements: (scale
1=strongly disagree to 7=strongly agree)
Internet helps you to…

246
Strongly disagree
Disagree Disagree Somewhat
Un-decided
Agree Some-what
Agree Strongly Agree
stay on top of what is happening in the community
find out how the country is doing.
keep up with world events.
gain insight into why you do some of things that you do.
imagine what you will be like as you grow older.
observe how others cope with problems or situations like yours.
Media Dependency Part II
Please indicate the extent to which you agree or disagree with the following statements: (scale
1=strongly disagree to 7=strongly agree)
Internet helps you to…
Strongly disagree
Disagree Disagree Somewhat
Un-decided
Agree Some-what
Agree Strongly Agree
discover better ways to communicate with others.
think about how to act with friends, relatives, or people you work with.
get ideas about how to approach others in important or difficult situations
give you something to do with your friends.
have fun with your family or friends.

247
be a part of events you enjoy without having to be there.
Media Dependency Part III
Please indicate the extent to which you agree or disagree with the following statements: (scale
1=strongly disagree to 7=strongly agree)
Internet helps you to…
Strongly disagree
Disagree Disagree Somewhat
Un-decided
Agree Some-what
Agree Strongly Agree
to stop thinking about work and problems after a hard day or week.
relax when you are by yourself.
have something to do when nobody else is around.
Personal Innovativeness in IT
Please indicate the extent to which you agree or disagree with the following statements: (scale
1=strongly disagree to 7=strongly agree)
Strongly disagree
Disagree Disagree Somewhat
Un-decided
Agree Some-what
Agree Strongly Agree
I like to experience products that use new technologies.
Among my friends, I am usually the first to explore new information technologies.
I feel comfortable using new information technologies
In general, I am hesitant to try out new information technologies.

248
Questions for Internet Usage
Following we would like to speak about your internet use behavior. With “Internet”, we mean
any activity which you do in the internet including communications, searching, entertainment,
education etc. and with any internet-enabled device that you own (e.g. desktop, laptop, tablet,
and smart phone,etc).
The following questions are exclusively about your personal Internet use habits.
On average, how frequently do you use Internet?
Choose one of the following answers
( ) Never/almost never
( ) Less than once a month
( ) A few times a month
( ) A few times a week
( ) About once a day
( ) Several times a day
On average, how much time do you spend daily on the Internet?
Choose one of the following answers
( ) less than half an hour
( ) from half an hour to an hour
( ) 1-2 hours
( ) 2-3 hours

249
( ) more than 3 hours
Internet affinity
Please indicate the extent to which you agree or disagree with the following statements: (scale
1=strongly agree to 7=strongly disagree)
Not at all To a very small extent
To a small extent
To a mode-rate extent
To a fairly great extent
To a great extent
To a very great extent
Connecting to Internet is one of my main daily activities.
If the Internet is down I really miss it.
Internet is important in my life.
It doesn’t bother me to be without internet for several days
I would feel lost without internet
Questions for Internet Usage 2
Please indicate the extent to which you use Internet to perform the following tasks:
Not at all To a very small extent
To a small extent
To a mode-rate extent
To a fairly great extent
To a great extent
To a very great extent
Communication with others (not including email)
Education
Entertainment
Gathering information (e.g. for personal needs, product information)
Work/Business

250
Purchasing/Shopping
Shopping behavior
How frequently do you use each of the following channels during the below-mentioned purchase
steps?
Finding out about new products
Never Rarely
< 10 % chances
Occa-sionally
10 % - 30 % chances
Some-times
30 % - 50% chances
Fre-quently
50 % - 70% chances
Usually
70 % - 90% chances
Every time
Internet from home
Mobile Internet
Physical store
Searching for information on specific products
Never Rarely
< 10 % chances
Occa-sionally
10 % - 30 % chances
Some-times
30 % - 50% chances
Fre-quently
50 % - 70% chances
Usually
70 % - 90% chances
Every time
Internet from home
Mobile Internet
Physical store
Comparing and evaluating alternatives
Never Rarely
< 10 % chances
Occa-sionally
10 % - 30 % chances
Some-times
30 % - 50% chances
Fre-quently
50 % - 70% chances
Usually
70 % - 90% chances
Every time

251
Internet from home
Mobile Internet
Physical store
Purchasing and paying for products
Never Rarely
< 10 % chances
Occa-sionally
10 % - 30 % chances
Some-times
30 % - 50% chances
Fre-quently
50 % - 70% chances
Usually
70 % - 90% chances
Every time
Internet from home
Mobile Internet
Physical store
Device ownership
Which of the following computer devices do you own?
( ) Desktop computer
( ) Laptop
( ) Tablet PC
( ) Smart Phone
Which of your devices you use most to access internet?
( ) Desktop computer
( ) Laptop
( ) Tablet PC
( ) Smart Phone

252
( ) None
General Questions II
Which of the following best describes your highest education level?
( ) 8th grade or less
( ) Some high school (Grade 9-11)
( ) Graduated from high school
( ) 1-3 years of college/university
( ) Graduated from college, graduate or postgraduate school
( ) Refused to answer
What is/was your university major? (Feel free to answer in German)
___
What best describes your employment status? (Select all that apply)
( ) Full-time job
( ) Part-time job / by the hour / occasionally
( ) Unemployed
( ) Retired
( ) House wife / House husband
( ) Full-time student
( ) Part-time student
( ) Refused to answer

253
How much is your disposable income (Haushaltsnettoeinkommen)
( ) Less than 500 EUR
( ) 500 to 999 EUR
( ) 1.000 to 1.499 EUR
( ) 1.500 to 1.999 EUR
( ) 2.000 to 2.499 EUR
( ) 2.500 to 2.999 EUR
( ) 3.000 to 3.499 EUR
( ) 3.500 to 3.999 EUR
( ) 4.000 to 4.499 EUR
( ) 4.500 to 4.999 EUR
( ) 5.000 to 5.500 EUR
( ) More than 5.500 EUR
( ) Refused to answer
What is your nationality?
We sincerely thank you and appreciate your time, dedication, and participation in our online
survey. As a thank you for sharing your time, we would like to invite you to enter your email
address and be part of our prize drawing.
_________
Thank you for taking time out to participate in our survey. We truly value the information you
have provided.
If you have any questions about the survey, please contact us at [email protected] or call
040428784522.


255
References
Aarts, E., Encarnacao, J., 2006. Into ambient intelligence, in: Aarts, E., Encarnacao, J. (Eds.), True Visions: The Emergence of Ambient Intelligence. Springer, Berlin et al., pp. 1–17.
Abowd, G.D., 1999. Software engineering issues for ubiquitous computing, in: Software Engineering, 1999. Proceedings of the 1999 International Conference On. IEEE, pp. 75–84.
Abowd, G.D., Mynatt, E.D., 2000. Charting Past, Present, and Future Research in Ubiquitous Computing. ACM Transactions on Computer-Human Interaction 7, 29–58. https://doi.org/10.1145/344949.344988
Abu-Shanab, E., Pearson, J., 2009. Internet banking in Jordan: an Arabic instrument validation process. Int. Arab J. Inf. Technol. 6, 235–244.
Adams, D.A., Nelson, R.R., Todd, P.A., 1992. Perceived usefulness, ease of use, and usage of information technology: a replication. MIS quarterly 227–247.
Agarwal, R., 2000. Individual acceptance of information technologies, in: Zmud, R.W., Price, M.F. (Eds.), Framing the Domains of IT Management: Projecting the Future through the Past. Pinnaflex Educational Resources Inc, Cincinnati, pp. 85–104.
Agarwal, R., Karahanna, E., 2000. Time flies when you’re having fun: Cognitive absorption and beliefs about information technology usage. MIS Quarterly 24, 665–694.
Agarwal, R., Prasad, J., 1999. Are Individual Differences Germane to the Acceptance of New Information Technologies? Decision Sciences 30, 361–391. https://doi.org/10.1111/j.1540-5915.1999.tb01614.x
Agarwal, R., Prasad, J., 1998. A conceptual and operational definition of personal innovativeness in the domain of information technology. Information Systems Research 9, 204–215.
Agarwal, R., Prasad, J., 1997. The role of innovation characteristics and perceived voluntariness in the acceptance of information technologies. Decision sciences 28, 557–582.
Ajzen, I., 2011. The theory of planned behaviour: reactions and reflections. Psychology & health 26, 1113–1127.
Ajzen, I., 2001. Nature and operation of attitudes. Annual Review of Psychology 52, 27–58. Ajzen, I., 1991. The theory of planned behavior. Organizational behavior and human decision
processes 50, 179–211. Ajzen, I., 1985. From intentions to actions: A theory of planned behavior, in: Action Control,
SSSP Springer Series in Social Psychology. Springer, Berlin Heidelberg, pp. 11–39. Ajzen, I., Fishbein, M., 1980. Understanding attitudes and predicting social behaviour. Prentice-
Hall, Englewood Cliffs, NJ: Ajzen, I., Fishbein, M., 1973. Attitudinal and normative variables as predictors of specific
behavior. Journal of personality and Social Psychology 27, 41. Akyildiz, I.F., Vuran, M.C., 2010. Wireless sensor networks. John Wiley & Sons. Albarracin, D., Ajzen, I., 2007. Predicting and changing behavior: A reasoned action approach,
in: Ajzen, I., Albarracin, D., Honrik, R. (Eds.), Prediction and Change of Health Behavior: Applying the Reasoned Action Approach. Lawrence Erlbaum Associates, Mahwah, NJ, pp. 3–21.
Alcañiz, M., Rey, B., 2005. New technologies for ambient intelligence, in: Riva, G., Vatalaro, F., Davide, F., Alcañiz, M. (Eds.), Ambient Intelligence The Evolution of Technology,

256
Communication and Cognition towards the Future of Human-Computer Interaction. IOS Press, Amestrdam, pp. 3–15.
Aldás�Manzano, J., Ruiz�Mafé, C., Sanz�Blas, S., 2009. Exploring individual personality factors as drivers of M�shopping acceptance. Industrial Management & Data Systems 109, 739–757. https://doi.org/10.1108/02635570910968018
Al-Kassab, J., Blome, P., Wolfram, G., Thiesse, F., Fleisch, E., 2010. RFID in the Apparel Retail Industry: A Case Study from Galeria KaufhofGaleria Kaufhof, in: Ranasinghe, D.C., Sheng, Q.Z., Zeadally, S. (Eds.), Unique Radio Innovation for the 21st Century. Springer, Berlin Heidelberg, pp. 281–308.
Amato, A., Di Martino, B., Venticinque, S., 2012. A Semantic Framework for Delivery of Context-Aware Ubiquitous Services in Pervasive Environments, in: Intelligent Networking and Collaborative Systems (INCoS), 2012 4th International Conference On. pp. 412–419.
Anderson, J.C., Gerbing, D.W., 1988. Structural equation modeling in practice: A review and recommended two-step approach. Psychological bulletin 103, 411.
Anon, 2014. Levi Strauss & Co. : pockets of opportunity with EPC-enabled RFID. GS1 AISBL. Anon, 2012a. Inventory Management in Apparel - With EPC/RFID, Brazilian fashion brand gets
item-level visibility. Anon, 2012b. Inventory Management in Apparel - With EPC/RFID, Japanese company gains in
store efficiency. Anon, 2002. Learning From Prada. RFID Journal. Anselmsson, J., 2006. Sources of customer satisfaction with shopping malls: a comparative study
of different customer segments. International Review of Retail, Distribution and Consumer Research 16, 115–138.
Armitage, C.J., Conner, M., 2001. Efficacy of the theory of planned behaviour: A meta-analytic review. British journal of social psychology 40, 471–499.
Atzori, L., Iera, A., Morabito, G., 2010. The internet of things: A survey. Computer networks 54, 2787–2805.
Babin, B.J., Darden, W.R., Griffin, M., 1994. Work and/or fun: measuring hedonic and utilitarian shopping value. Journal of consumer research 20, 644–656.
Bagozzi, R.P., 1982. A field investigation of causal relations among cognitions, affect, intentions, and behavior. Journal of marketing research 562–583.
Bagozzi, R.P., Baumgartner, H., 1994. The evaluation of structural equation models and hypothesis testing, in: Bagozzi, R.P. (Ed.), Principles of Marketing Research. Cambridge, Blackwell, pp. 386–422.
Bagozzi, R.P., Yi, Y., 2011. Specification, evaluation, and interpretation of structural equation models. Journal of the Academy of Marketing Science 40, 8–34.
Baker, J., Parasuraman, A., Grewal, D., Voss, G.B., 2002. The influence of multiple store environment cues on perceived merchandise value and patronage intentions. Journal of marketing 66, 120–141.
Ball-Rokeach, S., Rokeach, M., Grube, J.W., 1984. The great American values test: Influencing behavior and belief through television. Free Press New York.
Ball-Rokeach, S.J., 1998. A theory of media power and a theory of media use: Different stories, questions, and ways of thinking. Mass Communication and Society 1, 5–40.
257
Ball-Rokeach, S.J., 1985. The origins of individual media-system dependency: a sociological Framework. Communication Research 12, 485–510. https://doi.org/10.1177/009365085012004003
Ball-Rokeach, S.J., DeFleur, M.L., 1976. A Dependency Model of Mass-Media Effects. Communication Research 3, 3–21. https://doi.org/10.1177/009365027600300101
Ball-Rokeach, S.J., Jung, J.-Y., 2009. The evolution of the media system dependency theory, in: nabi, R.L., Oliver, M.B. (Eds.), Media Processes and Effects. SAGE Publications, Inc., Thousand Oaks, CA, pp. 531–544.
Bamberger, P., 2008. Beyond Contextualization: Using Context Theories to Narrow the Micro-Macro Gap in Management Research. Academy of Management Journal 51, 839–846. https://doi.org/10.5465/AMJ.2008.34789630
Banavar, G., Bernstein, A., 2002. Software Infrastructure and Design Challenges for Ubiquitous Computing Applications. Commun. ACM 45, 92–96. https://doi.org/10.1145/585597.585622
Bandura, A., 1997. Self-efficacy: The Exercise of Control. Freeman & Co., New York, NY. Bandura, A., 1986. Social foundations of thought and action: a social cognitive theory. Prentice
Hall, Englewood Cliffs, NJ. Bandura, A., 1977. Self-efficacy: toward a unifying theory of behavioral change. Psychological
review 84, 191–215. Barki, H., Hartwick, J., 1994. Measuring user participation, user involvement, and user attitude.
Mis Quarterly 59–82. Baron, S., 1992. Marketing Research (2nd Edition) Research for Marketing. The Journal of the
Operational Research Society 43, 290. https://doi.org/10.2307/2583723 Batra, R., Ahtola, O.T., 1990. Measuring the hedonic and utilitarian sources of consumer
attitudes. Marketing Letters 2, 159–170. https://doi.org/10.1007/BF00436035 Bearden, W.O., Netemeyer, R.G., Haws, K.L., 2011. Handbook of Marketing Scales: Multi-Item
Measures for Marketing and Consumer Behavior Research, 3rd ed. SAGE, Thousand Oaks, CA.
Becker, B.J., 1986. Influence again: An examination of reviews and studies of gender differences in social influence, in: Hyde, J.S., Linn, M.C. (Eds.), The Psychology of Gender: Advances through Meta-Analysis. John Hopkins University Press, Baltimore, pp. 178–209.
Becker, J.-M., Rai, A., Rigdon, E., 2013. Predictive validity and formative measurement in structural equation modeling: Embracing practical relevance.
Bell, G., Dourish, P., 2007. Yesterday’s tomorrows: notes on ubiquitous computing’s dominant vision. Personal and Ubiquitous Computing 11, 133–143.
Bem, S.L., 1981. Gender schema theory: A cognitive account of sex typing. Psychological review 88, 354.
Ben Abdelaziz, S.I., 2015. Media Dependency Theory and Internet, Unpublished manuscript. Benbasat, I., Barki, H., 2007. Quo vadis, TAM? Journal of the Association for Information
Systems 8. Benbasat, I., Zmud, R.W., 2003. The identity crisis within the IS discipline: Defining and
communicating the discipline’s core properties. MIS quarterly 183–194. Bennett, R., Savani, S., 2011. Retailers’ preparedness for the introduction of third wave
(ubiquitous) computing applications: A survey of UK companies. International Journal of

258
Retail & Distribution Management 39, 306–325. https://doi.org/10.1108/09590551111130748
Bentler, P.M., 1980. Multivariate Analysis with Latent Variables: Causal Modeling. Annual Review of Psychology 31, 419–456. https://doi.org/10.1146/annurev.ps.31.020180.002223
Bettman, J.R., 1979. An information processing theory of consumer choice. Addison-Wesley Pub. Co.
Bettman, J.R., Luce, M.F., Payne, J.W., 1998. Constructive consumer choice processes. Journal of consumer research 25, 187–217.
Bhatnagar, A., Ghose, S., 2004. A latent class segmentation analysis of e-shoppers. Journal of Business Research 57, 758–767.
Bhutta, C.B., 2012. Not by the Book: Facebook as a Sampling Frame. Sociological Methods & Research 41, 57–88. https://doi.org/10.1177/0049124112440795
Bigne-Alcaniz, E., Ruiz-Mafe, C., Aldas-Manzano, J., Sanz-Blas, S., 2008. Influence of online shopping information dependency and innovativeness on internet shopping adoption. Online Information Review 32, 648–667. https://doi.org/10.1108/14684520810914025
Bigne-Alcaniz, E., Ruiz-Mafe, C., Sanz Blas, S., 2005. The impact of internet user shopping patterns and demographics on consumer mobile buying behaviour. Journal of Electronic Commerce Research 6, 193.
Bitner, M.J., Ostrom, A.L., Meuter, M.L., 2002. Implementing successful self-service technologies. Academy of Management Executive 16, 96–108. https://doi.org/10.5465/AME.2002.8951333
Blackwell, R.D., Miniard, P.W., Engel, J.F., 2005. Consumer behavior. Thomson/South-Western, Mason, OH.
Bliese, P.D., Jex, S.M., 2002. Incorporating a mulitilevel perspective into occupational stress research: Theoretical, methodological, and practical implications. Journal of occupational health psychology 7, 265–276.
Bodhani, A., 2012. Shops offer the e-tail experience. Engineering & Technology 7, 46–49. https://doi.org/10.1049/et.2012.0512
Boiney, L.G., 1998. Reaping the Benefits of Information Technology in Organizations A Framework Guiding Appropriation of Group Support Systems. The Journal of Applied Behavioral Science 34, 327–346.
Bollen, K.A., 2011. Evaluating effect, composite, and causal indicators in structural equation models. Mis Quarterly 359–372.
Bollen, K.A., 1989. Structural Equations with Latent Variables. John Wiley & Sons. Borsboom, D., Mellenbergh, G.J., Van Heerden, J., 2003. The theoretical status of latent
variables. Psychological review 110, 203–219. Bovensiepen, G., chmaus, B., Rumpff, S., Leskow, M., Raimund, S., 2015. Total retail 2015: wie
disruptive faktoren den deutschen Handel herausfordern. PricewaterhouseCoopers AG Wirtschaftsprüfungsgesellschaft (PwC).
Brave, S., Nass, C., 2003. Emotion in human–computer interaction, in: Sears, A., Jacko, J.A. (Eds.), Human-Computer Interaction Fundamentals. pp. 53–68.
Brave, S., Nass, C., Hutchinson, K., 2005. Computers that care: investigating the effects of orientation of emotion exhibited by an embodied computer agent. International journal of human-computer studies 62, 161–178.

259
Brosnan, M.J., 1998. Technophobia: The psychological impact of information technology. Routledge, New York.
Brosnan, M.J., Davidson, M.J., 1996. Psychological gender issues in computing. Gender, Work & Organization 3, 13–25.
Brown, S.A., Venkatesh, V., 2005. Model of adoption of technology in households: A baseline model test and extension incorporating household life cycle. MIS quarterly 399–426.
Burke, R.R., 2010. The third wave of marketing intelligence. Retailing in the 21st Century 159–171.
Burke, R.R., 2002. Technology and the customer interface: What consumers want in the physical and virtual store. J. of the Acad. Mark. Sci. 30, 411–432. https://doi.org/10.1177/009207002236914
Burton-Jones, A., Hubona, G.S., 2006. The mediation of external variables in the technology acceptance model. Information & Management 43, 706–717.
Burton-Jones, A., Hubona, G.S., 2005. Individual Differences and Usage Behavior: Revisiting a Technology Acceptance Model Assumption. SIGMIS Database 36, 58–77. https://doi.org/10.1145/1066149.1066155
Caceres, R., Friday, A., 2012. Ubicomp systems at 20: Progress, opportunities, and challenges. IEEE Pervasive Computing 11, 14–21.
Cao, X. (Jason), 2012. The relationships between e-shopping and store shopping in the shopping process of search goods. Transportation Research Part A: Policy and Practice 46, 993–1002. https://doi.org/10.1016/j.tra.2012.04.007
Cao, X.J., Xu, Z., Douma, F., 2011. The interactions between e-shopping and traditional in-store shopping: an application of structural equations model. Transportation 39, 957–974. https://doi.org/10.1007/s11116-011-9376-3
Carlsson, C., Carlsson, J., Hyvonen, K., Puhakainen, J., Walden, P., 2006. Adoption of mobile devices/services-searching for answers with the UTAUT, in: System Sciences, 2006. HICSS’06. Proceedings of the 39th Annual Hawaii International Conference On. IEEE, p. 132a–132a.
Carroll, J.M., 2000. Five reasons for scenario-based design. Interacting with computers 13, 43–60.
Chalasani, S., Conrad, J.M., 2008. A survey of energy harvesting sources for embedded systems, in: Proceedings of IEEE Southeastcon 2008. Presented at the IEEE, IEEE, Huntsville, Al, pp. 442–447.
Chang, M.K., Cheung, W., 2001. Determinants of the intention to use Internet/WWW at work: a confirmatory study. Information & Management 39, 1–14. https://doi.org/10.1016/S0378-7206(01)00075-1
Chau, P.Y., 1996. An empirical assessment of a modified technology acceptance model. Journal of management information systems 13, 185–204.
Chen, S.-C., Li, S.-H., Li, C.-Y., 2011. Recent related research in technology acceptance model: A literature review. Australian Journal of Business and Management Research 1, 124–127.
Cheng, Y.-H., Yeh, Y.-J., 2011. Exploring radio frequency identification technology’s application in international distribution centers and adoption rate forecasting. Technological Forecasting and Social Change 78, 661–673. https://doi.org/10.1016/j.techfore.2010.10.003
260
Chiasson, M.W., Davidson, E., 2005. Taking industry seriously in information systems research. Mis Quarterly 29, 591–605.
Childers, T.L., Carr, C.L., Peck, J., Carson, S., 2001. Hedonic and utilitarian motivations for online retail shopping behavior. Journal of Retailing 77, 511–535.
Chin, W.W., 2003. A permutation procedure for multi-group comparison of PLS models, in: Vilares, M., Tenenhaus, M., Coelho, P., Esposito Vinzi, V., Morineau, A. (Eds.), PLS and Related Methods: Proceedings of the International Symposium PLS’03. Lisbon: Decisia, pp. 33–43.
Chin, W.W., 2001. PLS-Graph user’s guide. CT Bauer College of Business, University of Houston, USA.
Chin, W.W., 2000. frequently Asked Questions—Partial Least Squares and PLS-Graph [WWW Document]. URL http://disc-nt.cba.uh.edu/chin/plsfaq.htm (accessed 1.27.15).
Chin, W.W., 1998a. Commentary: Issues and opinion on structural equation modeling. MIS Quarterly 22, 7–16.
Chin, W.W., 1998b. The partial least squares approach to structural equation modeling. Modern methods for business research 295, 295–336.
Chin, W.W., 1998c. The partial least squares approach to structural equation modeling, in: Marcoulides, G.A. (Ed.), Modern Methods for Business Research, Quantitative Methodology Series. Lawrance Erlbaum Associates, Inc., Publishers, Mahwah, N.J., pp. 295–336.
Chin, W.W., Dibbern, J., 2010. An introduction to a permutation based procedure for multi-group PLS analysis: Results of tests of differences on simulated data and a cross cultural analysis of the sourcing of information system services between Germany and the USA, in: Handbook of Partial Least Squares. Springer, Berlin Heidelberg, pp. 171–193.
Chin, W.W., Gopal, A., 1995. Adoption intention in GSS: relative importance of beliefs. Database Advances- Special double issue: diffusion of technological innovation 26, 42–64.
Chin, W.W., Newsted, P.R., 1999a. Structural equation modeling analysis with small samples using partial least squares. Statistical strategies for small sample research 1, 307–341.
Chin, W.W., Newsted, P.R., 1999b. Structural equation modeling analysis with small samples using partial least squares, in: Hoyle, R.H. (Ed.), Statistical Strategies for Small Sample Research. SAGE Publications, Thousand Oaks, London, New Delhi, pp. 307–341.
Chiu, C.-M., Huang, H.-Y., Yen, C.-H., 2010. Antecedents of trust in online auctions. Electronic Commerce Research and Applications, Special Issue: Theoretical and Empirical Advances in Electronic Auction Research 9, 148–159. https://doi.org/10.1016/j.elerap.2009.04.003
Chiu, Y.-T.H., Fang, S.-C., Tseng, C.-C., 2010. Early versus potential adopters: Exploring the antecedents of use intention in the context of retail service innovations. International Journal of Retail & Distribution Management 38, 443–459. https://doi.org/10.1108/09590551011045357
Churchill, G.A., 1987. Marketing research: methodological foundations, 4th ed. Dryden Press, Forth Woth.
Citrin, A.V., Stem, D.E., Spangenberg, E.R., Clark, M.J., 2003. Consumer need for tactile input: An internet retailing challenge. Journal of Business research 56, 915–922.

261
Cleveland, M., Babin, B.J., Laroche, M., Ward, P., Bergeron, J., 2003. Information search patterns for gift purchases: a cross-national examination of gender differences. Journal of Consumer Behaviour 3, 20–47.
Clore, G.L., Schnall, S., 2005. The influence of affect on attitude. The handbook of attitudes 437–489.
Compeau, D.R., Higgins, C.A., 1995. Computer self-efficacy: Development of a measure and initial test. MIS quarterly 189–211.
Conole, G., 2008. Listening to the learner voice: The ever changing landscape of technology use for language students. ReCALL 20, 124–140. https://doi.org/10.1017/S0958344008000220
Cook, D.L., Coupey, E., 1998. Consumer behavior and unresolved regulatory issues in electronic marketing. Journal of Business Research 41, 231–238.
Cox III, E.P., 1980. The optimal number of response alternatives for a scale: A review. Journal of marketing research 407–422.
Crano, W.D., Brewer, M.B., 2002. Principles and methods of social research. Lawrence Erlbaum Assoc., Mahwah, NJ.
Crawford, S.D., Couper, M.P., Lamias, M.J., 2001. Web Surveys: Perceptions of Burden. Social Science Computer Review 19, 146–162. https://doi.org/10.1177/089443930101900202
Cronbach, L.J., 1951. Coefficient alpha and the internal structure of tests 16, 297–334. Csikszentmihalyi, M., 2014. Flow. Springer. da Costa, C.A., Yamin, A.C., Geyer, C.F.R., 2008. Toward a general software infrastructure for
ubiquitous computing. IEEE Pervasive Computing 7, 64–73. Dabholkar, P.A., 1996. Consumer evaluations of new technology-based self-service options: an
investigation of alternative models of service quality. International Journal of research in Marketing 13, 29–51.
Dabholkar, P.A., Bagozzi, R.P., 2002. An attitudinal model of technology-based self-service: moderating effects of consumer traits and situational factors. Journal of the Academy of Marketing Science 30, 184–201.
Dabholkar, P.A., Bobbitt, L.M., Lee, E.-J., 2003. Understanding consumer motivation and behavior related to self-scanning in retailing: Implications for strategy and research on technology-based self-service. International Journal of Service Industry Management 14, 59–95. https://doi.org/10.1108/09564230310465994
D’Ambra, J., Wilson, C.S., 2004. Use of the World Wide Web for international travel: Integrating the construct of uncertainty in information seeking and the task-technology fit (TTF) model. J. Am. Soc. Inf. Sci. 55, 731–742. https://doi.org/10.1002/asi.20017
Davis, F.D., 1993. User acceptance of information technology: system characteristics, user perceptions and behavioral impacts. International journal of man-machine studies 38, 475–487.
Davis, F.D., 1989. Perceived usefulness, perceived ease of use, and user acceptance of information technology. MIS quarterly 3, 319–340.
Davis, F.D., 1986. A technology acceptance model for empirically testing new end-user information systems: Theory and results. Massachusetts Institute of Technology.
Davis, F.D., Bagozzi, R.P., Warshaw, P.R., 1992. Extrinsic and intrinsic motivation to use computers in the workplace. Journal of applied social psychology 22, 1111–1132.
Davis, F.D., Bagozzi, R.P., Warshaw, P.R., 1989. User acceptance of computer technology: a comparison of two theoretical models. Management science 35, 982–1003.

262
Davis, F.D., Venkatesh, V., 1996. A critical assessment of potential measurement biases in the technology acceptance model: three experiments. International Journal of Human-Computer Studies 45, 19–45.
DeFleur, M.L., Ball-Rokeach, S., 1989. Theories of mass communication, 5 edition. ed. Longman, New York and London.
Dey, A.K., 2001. Understanding and using context. Personal and ubiquitous computing 5, 4–7. Diamantopoulos, A., Siguaw, J.A., 2006. Formative versus reflective indicators in organizational
measure development: a comparison and empirical illustration. British Journal of Management 17, 263–282.
Dibbern, J., Chin, W.W., 2005. Multi-group comparison: Testing a PLS model on the sourcing of application software services across Germany and the USA using a permutation based algorithm, in: Bliemel, F., Eggert, A., Fassott, G., Henseler, J. (Eds.), Handbuch PLS-Pfadmodellierung. Methode, Anwendung, Praxisbeispiele. Schäffer-Poeschel, Stuttgart, pp. 135–160.
Dijkstra, T.K., Henseler, J., 2015. Consistent partial least squares path modeling. MIS quarterly= Management information systems quarterly 39, 297–316.
Dillman, D.A., 2007. Mail and Internet Surveys: The Tailored Design Method, 2nd ed. John Wiley & Sons.
Dillman, D.A., Tortora, R.D., Bowker, D., 1998. Principles for constructing web surveys: An initial statement, Technical Report. Washington State University, Social and Economic Sciences Research Center, Pullman, WA.
Dillon, A., Morris, M.G., 1996. User acceptance of new information technology: theories and models, in: Williams, M. (Ed.), Annual Review of Information Science and Technology. Information Today, Medford NJ, pp. 3–32.
Dishaw, M.T., Strong, D.M., 1999. Extending the technology acceptance model with task–technology fit constructs. Information & management 36, 9–21.
Donovan, R., Rossiter, J., 1982. Store atmosphere: an environmental psychology approach. Journal of retailing 58, 34–57.
Durkheim, E., 1933. The division of labor. Trans. G. Simpson, New York: Macmillan. Dwivedi, Y.K., Rana, N.P., Chen, H., Williams, M.D., 2011. A Meta-analysis of the Unified
Theory of Acceptance and Use of Technology (UTAUT), in: Governance and Sustainability in Information Systems. Managing the Transfer and Diffusion of IT. Springer, pp. 155–170.
Efron, B., 1979. Bootstrap methods: another look at the jackknife. The annals of Statistics 1–26. Eisenhart, M., 1991. Conceptual frameworks for research. Ideas from a cultural
anthropologist; implications for mathematics education researchers, in: Underhill, R.G. (Ed.), Proceedings of the Thirteenth Annual Meeting of Psychology of Mathematics Education. Presented at the Psychology of Mathematics Education, Christiansburg Printing Company, Blaksburg, VA.
Elliott, K.M., Hall, M.C., 2005. ASSESSING CONSUMERS’PROPENSITY TO EMBRACE SELF-SERVICE TECHNOLOGIES: ARE THERE GENDER DIFFERENCES? Marketing Management Journal 15.
Emerson, R.M., 1964. Power-Dependence Relations: Two Experiments. Sociometry 27, 282. https://doi.org/10.2307/2785619
Emerson, R.M., 1962. Power-Dependence Relations. American Sociological Review 27, 31. https://doi.org/10.2307/2089716

263
Evermann, J., Tate, M., 2016. Assessing the predictive performance of structural equation model estimators. Journal of Business Research 69, 4565–4582.
Fang, B., Liao, S., Xu, K., Cheng, H., Zhu, C., Chen, H., 2012. A novel mobile recommender system for indoor shopping. Expert Systems with Applications 39, 11992–12000. https://doi.org/10.1016/j.eswa.2012.03.038
Fang, X., Chan, S., Brzezinski, J., Xu, S., 2005. Moderating effects of task type on wireless technology acceptance. Journal of Management Information Systems 22, 123–157.
Faqih, K.M., Jaradat, M.-I.R.M., 2015. Assessing the moderating effect of gender differences and individualism-collectivism at individual-level on the adoption of mobile commerce technology: TAM3 perspective. Journal of Retailing and Consumer Services 22, 37–52.
Ferscha, A., 2012. 20 Years Past Weiser: What’s Next? IEEE Pervasive Computing 11, 52–61. Finstad, K., 2010. Response interpolation and scale sensitivity: Evidence against 5-point scales.
Journal of Usability Studies 5, 104–110. Fiorito, S.S., Gable, M., Conseur, A., 2010. Technology: advancing retail buyer performance in
the twenty-first century. International Journal of Retail & Distribution Management 38, 879–893.
Fishbein, M., 1967. Attitude and the prediction of the behavior., in: Fishbein, M. (Ed.), Readings in Attitude Theory and Measurement. John Wiley, New York, pp. 477–492.
Fishbein, M., Ajzen, I., 2010. Predicting and changing behavior: The reasoned action approach. Psychology Press, Taylor & Francis, New York, NY.
Fishbein, M., Ajzen, I., 1975. Belief, attitude, intention and behavior: An introduction to theory and research.
Fiske, S.T., 1982. Schema-triggered affect: Applications to social perception, in: Clark, M.S., Fiske, S.T. (Eds.), Affect and Cognition. Presented at the 17th Annual Carnegie Mellon Symposium on Cognition, Lawrence Erlbaum, Hillsdale: Nj, pp. 55–78.
Fiske, S.T., Pavelchak, M.A., 1986. Category-based versus piecemeal-based affective responses: Developments in schema-triggered affect.
Fiske, S.T., Taylor, S.E., 2013. Social cognition: From brains to culture, 2nd ed. Sage, Los Angeles et al.
Fleisch, E., Tellkamp, C., 2006. The business value of ubiquitous computing technologies, in: Ubiquitous and Pervasive Commerce. Springer London, pp. 93–113.
Fornell, C., Bookstein, F.L., 1982. Two structural equation models: LISREL and PLS applied to consumer exit-voice theory. Journal of Marketing research 440–452.
Fornell, C., Cha, J., 1994. Partial least squares, in: Bagozzi, R.P. (Ed.), Advanced Methods of Marketing Research. Basil Blackwel, Cambridge MA, pp. 52–78.
Fornell, C., Larcker, D., 1987. A second generation of multivariate analysis: Classification of methods and implications for marketing research. Review of marketing 87, 407–450.
Fornell, C., Larcker, D.F., 1981. Evaluating structural equation models with unobservable variables and measurement error. Journal of marketing research 39–50.
Frambach, R.T., Roest, H.C., Krishnan, T.V., 2007. The impact of consumer internet experience on channel preference and usage intentions across the different stages of the buying process. Journal of Interactive Marketing 21, 26–41.
Frees, B., Koch, W., 2015. ARD/ZDF-Onlinestudie 2015: Internetnutzung: Frequenz und Vielfalt nehmen in allen Altersgruppen zu. Media Perspektiven 366–377.
Friedewald, M., Raabe, O., 2011. Ubiquitous computing: An overview of technology impacts. Telematics and Informatics 28, 55–65. https://doi.org/10.1016/j.tele.2010.09.001

264
Fritz, W., 1995. Marketing-Management und Unternehmenserfolg: Grundlagen und Ergebnisse einer empirischen Untersuchung. Schäffer-Poeschel.
Gabriel, P., Bovenschulte, M., Hartmann, E., Gro\s s, W., Strese, H., Bayarou, K.M., Haisch, M., Matthe\s s, M., Brune, C., Strauss, H., Kelter, H., Oberweis, R., 2006. Pervasive Computing: Trends and Impacts. SecuMedia Verlags, Ingelheim.
Gao, T., Sultan, F., Rohm, A.J., 2010. Factors influencing Chinese youth consumers’ acceptance of mobile marketing. Journal of Consumer Marketing 27, 574–583.
Garlan, D., Siewiorek, D.P., Smailagic, A., Steenkiste, P., 2002. Project aura: Toward distraction-free pervasive computing. Pervasive Computing, IEEE 1, 22–31.
Garrido Azevedo, S., Carvalho, H., 2012. Contribution of RFID technology to better management of fashion supply chains. International Journal of Retail & Distribution Management 40, 128–156.
Gatignon, H., Robertson, T.S., 1985. A propositional inventory for new diffusion research. Journal of consumer research 11, 849–867.
Geer, D., 2006. Pervasive medical devices: less invasive, more productive. IEEE Pervasive Computing 5, 85–88.
Gefen, D., Straub, D.W., 2000. The Relative Importance of Perceived Ease of Use in IS Adoption: A Study of E-Commerce Adoption. J. AIS 1, 0.
Gefen, D., Straub, D.W., 1997. Gender differences in the perception and use of e-mail: An extension to the technology acceptance model. MIS quarterly 389–400.
Geisser, S., 1974. A predictive approach to the random effect model. Biometrika 61, 101–107. Geraerts, E., Bernstein, D.M., Merckelbach, H., Linders, C., Raymaekers, L., Loftus, E.F., 2008.
Lasting false beliefs and their behavioral consequences. Psychological Science 19, 749–753.
Gershman, A., Fano, A., 2006. Ubiquitous services: Extending customer relationship management, in: Roussos, G. (Ed.), Ubiquitous and Pervasive Commerce New Frontiers for Electronic Business, Computer Communications and Networks. Springer, pp. 75–92.
Gibson, J.L., Klein, S.M., 1970. Employee attitudes as a function of age and length of service: A reconceptualization. Academy of Management Journal 13, 411–425.
Gick, M.L., Holyoak, K.J., 1987. The cognitive basis of knowledge transfer., in: Cormier, S.M., Hagman, J.D. (Eds.), Transfer of Learning: Contemporary Research and Applications, The Educational Technology Series. Academic Press, San Diego, CA, USA, pp. 9–46.
Giusto, D., Iera, A., Morabito, G., Atzori, L. (Eds.), 2010. The Internet of Things: 20th Tyrrhenian Workshop on Digital Communications. Springer Science & Business Media, New York, et al.
Goldsmith, R.E., d’Hauteville, F., Flynn, L.R., 1998. Theory and measurement of consumer innovativeness: A transnational evaluation. European Journal of Marketing 32, 340–353.
Goldsmith, R.E., Hofacker, C.F., 1991. Measuring consumer innovativeness. Journal of the Academy of Marketing Science 19, 209–221.
Good, P.I., 2005. Permutation, parametric and bootstrap tests of hypotheses. Springer. Goodhue, D.L., Thompson, R.L., 1995. Task-technology fit and individual performance. MIS
quarterly 213–236. Gopal, A., Prasad, P., 2000. Understanding GDSS in Symbolic Context: Shifting the Focus from
Technology to Interaction. MIS Quarterly 24, 509–546. https://doi.org/10.2307/3250972

265
Göritz, A.S., Schumacher, J., 2000. The WWW as a Research Medium: An Illustrative Survey on Paranormal Belief. Percept Mot Skills 90, 1195–1206. https://doi.org/10.2466/pms.2000.90.3c.1195
Götz, O., Liehr-Gobbers, K., Krafft, M., 2010. Evaluation of structural equation models using the partial least squares (PLS) approach, in: Handbook of Partial Least Squares. Springer, pp. 691–711.
Grant, A.E., Guthrie, K.K., Ball-Rokeach, S.J., 1991. Television Shopping: A Media System Dependency Perspective. Communication Research 18, 773–798. https://doi.org/10.1177/009365091018006004
Grewal, D., Roggeveen, A., Runyan, R.C., 2013. Retailing in a connected world. Journal of Marketing Management 29, 263–270.
Groshek, J., 2012. Forecasting and observing: A cross-methodological consideration of Internet and mobile phone diffusion in the Egyptian revolt. International Communication Gazette 74, 750–768. https://doi.org/10.1177/1748048512459147
Groshek, J., 2011. Media, Instability, and Democracy: Examining the Granger-Causal Relationships of 122 Countries From 1946 to 2003. Journal of Communication 61, 1161–1182. https://doi.org/10.1111/j.1460-2466.2011.01594.x
Groshek, J., 2009. The Democratic Effects of the Internet, 1994—2003 A Cross-National Inquiry of 152 Countries. International Communication Gazette 71, 115–136.
Gunter, B., Furnham, 1992. Consumer Profiles: An Introduction to Psychographics. Routledge, New York.
Guo, Y., 2015. Moderating Effects of Gender in the Acceptance of Mobile SNS Based on UTAUT Model. technology 9.
Ha, I., Yoon, Y., Choi, M., 2007. Determinants of adoption of mobile games under mobile broadband wireless access environment. Information & Management 44, 276–286.
Ha, S., Stoel, L., 2009. Consumer e-shopping acceptance: Antecedents in a technology acceptance model. Journal of Business Research, Current Issues in Retailing: Relationships and Emerging Opportunities 62, 565–571. https://doi.org/10.1016/j.jbusres.2008.06.016
Hackman, J.R., 1969. Toward understanding the role of tasks in behavioral research. Acta psychologica 31, 97–128.
Hair, J.F., Black, W.C., Babin, B.J., Anderson, R.E., 2010. Multivariate Data Analysis, 7th ed. Pearron Prentice Hall, Upper Saddle River, N.J.
Hair, J.F., Black, W.C., Babin, B.J., Anderson, R.E., 2009. Multivariate Data Analysis, 7th ed. Prentice Hall, Upper Saddle River, N.J.
Hair, J.F., Hult, G.T.M., Ringle, C.M., Sarstedt, M., 2014a. A Primer on Partial Least Squares Structural Equation Modeling (PLS-SEM). SAGE Publications, Los Angeles et al.
Hair, J.F., Ringle, C.M., Sarstedt, M., 2013. Editorial-Partial Least Squares Structural Equation Modeling: Rigorous Applications, Better Results and Higher Acceptance. Long Range Planning 46, 1–12.
Hair, J.F., Ringle, C.M., Sarstedt, M., 2012a. Partial Least Squares: The Better Approach to Structural Equation Modeling? Long range planning 45, 312–319.
Hair, J.F., Ringle, C.M., Sarstedt, M., 2011. PLS-SEM: Indeed a silver bullet. The Journal of Marketing Theory and Practice 19, 139–152.

266
Hair, J.F., Sarstedt, M., Hopkins, L., Kuppelwieser, V.G., 2014b. Partial least squares structural equation modeling (PLS-SEM): An emerging tool in business research. European Business Review 26, 106–121.
Hair, J.F., Sarstedt, M., Ringle, C.M., Gudergan, S.P., 2017. Advanced Issues in Partial Least Squares Structural Equation Modeling. SAGE Publications.
Hair, J.F., Sarstedt, M., Ringle, C.M., Mena, J.A., 2012b. An assessment of the use of partial least squares structural equation modeling in marketing research. Journal of the Academy of Marketing Science 40, 414–433.
Handel digital: Online monitor 2014, 2014. , Online monitor. Handelsverband Deutschland (HDE), Berlin.
Handel digital: online monitor 2015, 2015. , Online monitor. Handelsverband Deutschland (HDE), Berlin.
Hansmann, U., Merk, L., Nicklous, M.S., Stober, T., 2003. Pervasive Computing: The Mobile World, 2nd ed. Springer Science & Business Media.
Hartwick, J., Barki, H., 1994. Explaining the role of user participation in information system use. Management science 40, 440–465.
Hawkins, D.I., Best, R.J., Coney, K.A., 2003. Consumer behavior: building marketing strategy. McGraw-Hill Education, Maidenhead.
Hendrickson, A.R., Massey, P.D., Cronan, T.P., 1993. On the test-retest reliability of perceived usefulness and perceived ease of use scales. MIS quarterly 227–230.
Hennig-Thurau, T., Malthouse, E.C., Friege, C., Gensler, S., Lobschat, L., Rangaswamy, A., Skiera, B., 2010. The impact of new media on customer relationships. Journal of Service Research 13, 311–330.
Henseler, J., 2010. On the convergence of the partial least squares path modeling algorithm. Computational Statistics 25, 107–120.
Henseler, J., 2007. A new and simple approach to multi-group analysis in partial least squares path modeling, in: Martens, H., Naes, T. (Eds.), Causalities Explores by Indirect Observation: Proceedings of the 5th International Symposium on PLS and Related Methods PLS’07. Oslo, pp. 104–107.
Henseler, J., Fassott, G., 2010. Testing moderating effects in PLS path models: An illustration of available procedures, in: Vinzi, V.E., Chin, W.W., Henseler, J., Wang, H. (Eds.), Handbook of Partial Least Squares. Springer, pp. 713–735.
Henseler, J., Ringle, C.M., Sarstedt, M., 2016. Testing measurement invariance of composites using partial least squares. International Marketing Review 33, 405–431.
Henseler, J., Ringle, C.M., Sarstedt, M., 2015. A new criterion for assessing discriminant validity in variance-based structural equation modeling. Journal of the Academy of Marketing Science 43, 115–135. https://doi.org/10.1007/s11747-014-0403-8
Henseler, J., Ringle, C.M., Sinkovics, R.R., 2009. The use of partial least squares path modeling in international marketing. Advances in international marketing 20, 277–319.
Hernández, B., Jiménez, J., Martín, M.J., 2010. Customer behavior in electronic commerce: The moderating effect of e-purchasing experience. Journal of Business Research 63, 964–971. https://doi.org/10.1016/j.jbusres.2009.01.019
Hevner, A.R., March, S.T., Park, J., Ram, S., 2004. Design Science in Information Systems Research. MIS Quarterly 28, 75–105.
Hightower, J., Borriello, G., 2001. Location systems for ubiquitous computing. Computer 34, 57–66.

267
Hilton, T., Hughes, T., Little, E., Marandi, E., 2013. Adopting self-service technology to do more with less. Journal of Services Marketing 27, 3–12.
Hirschman, E.C., 1980. Innovativeness, novelty seeking, and consumer creativity. Journal of Consumer Research 7, 283–295.
Hofer, S.M., Sliwinski, M.J., 2006. Design and analysis of longitudinal studies on aging, in: Birren, J., Schaie, W. (Eds.), Handbook of the Psychology of Aging. pp. 15–37.
Hoffman, D.L., Novak, T.P., 2009. Flow Online: Lessons Learned and Future Prospects. Journal of Interactive Marketing 23, 23–34. https://doi.org/10.1016/j.intmar.2008.10.003
Hoffmann, A., Söllner, M., Fehr, A., Hoffmann, H., Leimeister, J.M., 2011. Towards an approach for developing socio-technical ubiquitous computing applications, in: Heiß, H., Pepper, P., Schlingloff, H., Schneider, J. (Eds.), Beiträge Der 41. Jahrestagung Der Gesellschaft Für Informatik e.V. (GI). Presented at the Informatik 2011 - Informatik schafft Communities, Bonner Köllen Verlag, Belin, pp. 1–15.
Holbrook, M.B., Hirschman, E.C., 1982. The Experiential Aspects of Consumption: Consumer Fantasies, Feelings, and Fun. Journal of Consumer Research 9, 132–140.
Hong, S.-J., Lui, C.S.M., Hahn, J., Moon, J.Y., Kim, T.G., 2013. How old are you really? Cognitive age in technology acceptance. Decision Support Systems 56, 122–130. https://doi.org/10.1016/j.dss.2013.05.008
Hong, W., Chan, F.K., Thong, J.Y., Chasalow, L.C., Dhillon, G., 2013. A framework and guidelines for context-specific theorizing in information systems research. Information Systems Research 25, 111–136.
Hristov, L., Reynolds, J., Towers, N., 2015. Perceptions and practices of innovation in retailing: challenges of definition and measurement. International Journal of Retail & Distribution Management 43.
Hsu, C.-L., Lin, J.C.-C., 2008. Acceptance of blog usage: The roles of technology acceptance, social influence and knowledge sharing motivation. Information & Management 45, 65–74. https://doi.org/10.1016/j.im.2007.11.001
Hsu, C.-L., Lu, H.-P., 2004. Why do people play on-line games? An extended TAM with social influences and flow experience. Information & Management 41, 853–868. https://doi.org/10.1016/j.im.2003.08.014
Huang, M.-H., 2003. Designing website attributes to induce experiential encounters. computers in Human Behavior 19, 425–442.
Hui, B.S., Wold, H., 1982. Consistency and consistency at large of partial least squares estimates, in: Jöreskog, K.G., Wold, H. (Eds.), Systems under Indirect Observation, Part II. North Holland, Amsterdam, pp. 119–130.
Hulland, J., 1999. Use of partial least squares (PLS) in strategic management research: a review of four recent studies. Strat. Mgmt. J. 20, 195–204. https://doi.org/10.1002/(SICI)1097-0266(199902)20:2<195::AID-SMJ13>3.0.CO;2-7
Hung, Y.-H., Wang, Y.-S., Chou, S.-C.T., 2007. User acceptance of e-government services, in: PACIS 2007 Proceedings. Presented at the PACIS, Kaoshiung, p. 97.
Iacobucci, D., Churchill, G., 2009. Marketing Research: Methodological Foundations. Cengage Learning.
Igbaria, M., Iivari, J., Maragahh, H., 1995. Why do individuals use computer technology? A Finnish case study. Information & Management 29, 227–238.

268
Ishii, H., Ullmer, B., 1997. Tangible bits: towards seamless interfaces between people, bits and atoms, in: Proceedings of the ACM SIGCHI Conference on Human Factors in Computing Systems. ACM, pp. 234–241.
Jarvis, C.B., Mackenzie, S.B., Podsakoff, P.M., Mick, D.G., Bearden, W.O., 2003. A Critical Review of Construct Indicators and Measurement Model Misspecification in Marketing and Consumer Research. Journal of Consumer Research 30, 199–218.
Jeffery, P.-C., 2013. The convergent use of mobile phones: A comparison of user behaviors between Australia and Taiwan. African Journal of Business Management 7, 2234.
Johns, G., 2006. The essential impact of context on organizational behavior. Academy of management review 31, 386–408.
Jöreskog, K.G., 1993. Testing structural equation models, in: Bollen, K.A., Long, J.S. (Eds.), Testing Structural Equation Models. Sage, Newbury Park, CA, pp. 294–316.
Jöreskog, K.G., 1978. Structural analysis of covariance and correlation matrices. Psychometrika 43, 443–477.
Jöreskog, K.G., 1970. A general method for estimating a linear structural equation system. Jöreskog, K.G., Sörbom, D., 1982. Recent developments in structural equation modeling. Journal
of Marketing Research 404–416. Jöreskog, K.G., Sörbom, D., Magidson, J., 1979. Advances in factor analysis and structural
equation models. Jöreskog, K.G., Van Thillo, M., 1972. LISREL: A general computer program for estimating a
linear structural equation system involving multiple indicators of unmeasured variables. Jöreskog, K.G., Wold, H.O., 1982. Systems under indirect observation: Causality, structure,
prediction. North Holland. Jung, J.-Y., 2012. Social media use and goals after the Great East Japan Earthquake. First
Monday 17. https://doi.org/10.5210/fm.v17i8.4071 Jung, J.-Y., 2008. Internet Connectedness and its Social Origins: An Ecological Approach to
Postaccess Digital Divides. Communication Studies 59, 322–339. https://doi.org/10.1080/10510970802467387
Jung, J.-Y., Lin, W.-Y., Kim, Y.-C., 2012. The dynamic relationship between East Asian adolescents’ use of the internet and their use of other media. New Media Society 14, 969–986. https://doi.org/10.1177/1461444812437516
Kaasinen, E., Kymäläinen, T., Niemelä, M., Olsson, T., Kanerva, M., Ikonen, V., 2012. A User-Centric View of Intelligent Environments: User Expectations, User Experience and User Role in Building Intelligent Environments. Computers 2, 1–33. https://doi.org/10.3390/computers2010001
Karaatli, G., Jun Ma, Suntornpithug, N., 2010. Investigating Mobile Services’ Impact on Consumer Shopping Experience and Consumer Decision-Making. International Journal of Mobile Marketing 5, 75–86.
Karahanna, E., Ahuja, M., Srite, M., Galvin, J., 2002. Individual differences and relative advantage: the case of GSS. Decision Support Systems 32, 327–341.
Katz, E., 2001. Media Effects, in: Baltes, N.J.S.B. (Ed.), International Encyclopedia of the Social & Behavioral Sciences. Pergamon, Oxford, pp. 9472–9479.
Katz, E., Blumler, J.G., Gurevitch, M., 1973. Uses and gratifications research. Public opinion quarterly 37, 509–523.

269
Keil, M., Tan, B.C., Wei, K.-K., Saarinen, T., Tuunainen, V., Wassenaar, A., 2000. A cross-cultural study on escalation of commitment behavior in software projects. Mis Quarterly 299–325.
Kelman, H.C., 1958. Compliance, identification, and internalization: Three processes of attitude change. Journal of conflict resolution 51–60.
Khalifa, M., Cheng, S., 2002. Adoption of mobile commerce: role of exposure, in: 2013 46th Hawaii International Conference on System Sciences. IEEE Computer Society, pp. 46–46.
Kiang, M.Y., Raghu, T.S., Shang, K.H.-M., 2000. Marketing on the Internet—who can benefit from an online marketing approach? Decision Support Systems 27, 383–393.
Kim, C., Oh, E., Shin, N., Chae, M., 2009. An empirical investigation of factors affecting ubiquitous computing use and U-business value. International Journal of Information Management 29, 436–448. https://doi.org/10.1016/j.ijinfomgt.2009.06.003
Kim, H.-Y., Kim, Y.-K., 2008. Shopping enjoyment and store shopping modes: the moderating influence of chronic time pressure. Journal of Retailing and Consumer Services 15, 410–419.
Kim, Y.-C., Jung, J.-Y., Cohen, E.L., Ball-Rokeach, S.J., 2004. Internet connectedness before and after September 11 2001. New media & society 6, 611–631.
King, W.R., He, J., 2006. A meta-analysis of the technology acceptance model. Information & Management 43, 740–755. https://doi.org/10.1016/j.im.2006.05.003
Kirk, C.P., Chiagouris, L., Gopalakrishna, P., 2012. Some people just want to read: The roles of age, interactivity, and perceived usefulness of print in the consumption of digital information products. Journal of Retailing and Consumer Services 19, 168–178. https://doi.org/10.1016/j.jretconser.2011.11.006
Kivetz, R., Simonson, I., 2000. The effects of incomplete information on consumer choice. Journal of Marketing Research 427–448.
Klein, L.R., Ford, G.T., 2003. Consumer search for information in the digital age: An empirical study of prepurchase search for automobiles. Journal of Interactive Marketing 17, 29–49. https://doi.org/10.1002/dir.10058
Kline, R.B., 2011. Principles and practice of structural equation modeling. Guilford press, New York, NY.
Klopping, I.M., McKinney, E., 2004. Extending the technology acceptance model and the task-technology fit model to consumer e-commerce. Information Technology, Learning, and Performance Journal 22, 35.
Kokkinou, A., Cranage, D.A., 2011. Modeling human behavior in customer-based processes: the use of scenario-based surveys, in: Proceedings of the Winter Simulation Conference. pp. 683–689.
Koller, M., Königsecker, A., 2012. Shopping for apparel: how can kiosk systems help? Revista de Administração de Empresas 52, 672–680.
Konana, P., Balasubramanian, S., 2005. The social–economic–psychological model of technology adoption and usage: an application to online investing. Decision Support Systems 39, 505–524.
Konomi, S., Roussos, G., 2006. Ubiquitous computing in the real world: lessons learnt from large scale RFID deployments. Personal and Ubiquitous Computing 11, 507–521. https://doi.org/10.1007/s00779-006-0116-1

270
Koufaris, M., 2002. Applying the technology acceptance model and flow theory to online consumer behavior. Information systems research 13, 205–223.
Kourouthanasis, P.E., Giaglis, G.M., 2008. Toward pervasiveness: four eras of information systems development, in: Kourouthanasis, P.E., Giaglis, G.M. (Eds.), Pervasive Information Systems, Advances in Management Information Systems Vladimir Awass Series Editor. M.E. Sharpe, New York, pp. 3–20.
Kourouthanassis, P., Roussos, G., 2003. Developing the user experience in ubiquituous commerce, in: Workshop on Ubiquitous Commerce, International Conference on Ubiquitous Computing (UBICOMP’03).
Kourouthanassis, P.E., Giaglis, G.M., 2005. Shopping in the 21st century: Embedding technology in the retail arena, in: Consumer Driven Electronic Transformation. Springer, Berlin et al., pp. 227–239.
Kourouthanassis, P.E., Giaglis, G.M., Karaiskos, D.C., 2008. Delineating the Degree of “Pervasiveness” in Pervasive Information Systems: An Assessment Framework and Design Implications, in: Panhellenic Conference on Informatics, 2008. PCI ’08. Presented at the Panhellenic Conference on Informatics, 2008. PCI ’08, IEEE Computer Society, Samos Island, Greece, pp. 251–255. https://doi.org/10.1109/PCI.2008.28
Kowatsch, T., Maass, W., 2010. In-store consumer behavior: How mobile recommendation agents influence usage intentions, product purchases, and store preferences. Computers in Human Behavior 26, 697–704.
Kowatsch, T., Maass, W., Fleisch, E., 2011. The role of product reviews on mobile devices for in-store purchases: consumers’ usage intentions, costs and store preferences. International Journal of Internet Marketing and Advertising 6, 226–243.
Krosnick, S.P., Wright, J.D., 2010. Handbook of survey research. Emerald, Bingley, UK. Kulviwat, S., Bruner II, G.C., Kumar, A., Nasco, S.A., Clark, T., 2007. Toward a unified theory
of consumer acceptance technology. Psychol. Mark. 24, 1059–1084. https://doi.org/10.1002/mar.20196
Kuo, Y.-F., Yen, S.-N., 2009. Towards an understanding of the behavioral intention to use 3G mobile value-added services. Computers in Human Behavior 25, 103–110.
Kurkovsky, S., 2005. Using principles of pervasive computing to design m-commerce applications, in: International Conference on Information Technology: Coding and Computing, 2005. ITCC 2005. Presented at the International Conference on Information Technology: Coding and Computing, 2005. ITCC 2005, p. 59–64 Vol. 2. https://doi.org/10.1109/ITCC.2005.287
Kurkovsky, S., Harihar, K., 2006. Using ubiquitous computing in interactive mobile marketing. Personal and Ubiquitous Computing 10, 227–240.
Kwon, O., Choi, K., Kim, M., 2007. User acceptance of context-aware services: self-efficacy, user innovativeness and perceived sensitivity on contextual pressure. Behaviour & Information Technology 26, 483–498.
Lagasse, P., Moerman, I., 2006. Broadband communication, in: Aarts, E., Encarnacao, J. (Eds.), True Visions: The Emergence of Ambient Intellegence. Springer, Berlin Heidelberg, pp. 185–207.
Lancelot Miltgen, C., Popovič, A., Oliveira, T., 2013. Determinants of end-user acceptance of biometrics: Integrating the “Big 3” of technology acceptance with privacy context. Decision Support Systems 56, 103–114. https://doi.org/10.1016/j.dss.2013.05.010

271
Lang, A., 2013. Discipline in Crisis? The Shifting Paradigm of Mass Communication Research: Discipline in Crisis. Communication Theory 23, 10–24. https://doi.org/10.1111/comt.12000
Lanseng, E.J., Andreassen, T.W., 2007. Electronic healthcare: a study of people’s readiness and attitude toward performing self-diagnosis. International Journal of Service Industry Management 18, 394–417. https://doi.org/10.1108/09564230710778155
Laroche, M., Cleveland, M., Bergeron, J., Goutaland, C., 2003. The Knowledge-Experience-Evaluation Relationship: A Structural Equations Modeling Test of Gender Differences. Canadian Journal of Administrative Sciences/Revue Canadienne des Sciences de l’Administration 20, 246–259.
Laroche, M., Saad, G., Cleveland, M., Browne, E., 2000. Gender differences in information search strategies for a Christmas gift. Journal of Consumer Marketing 17, 500–522.
Larose, R., Mastro, D., Eastin, M.S., 2001. Understanding Internet Usage A Social-Cognitive Approach to Uses and Gratifications. Social Science Computer Review 19, 395–413. https://doi.org/10.1177/089443930101900401
Laurent, G., Kapferer, J.-N., 1985. Measuring consumer involvement profiles. Journal of marketing research 41–53.
Law, S., Hawkins, S.A., Craik, F.I., 1998. Repetition-Induced Belief in the Elderly: Rehabilitating Age-Related Memory Deficits. Journal of Consumer Research 25, 91–107.
Lazarsfeld, P., Bereison, B., Gtaudet, H., 1948. The people’s choice; how the voter makes up his mind in a presidential campaign.[2d ed.] Hew York. Columbia University Press.
Lee, A.S., Baskerville, R.L., 2003. Generalizing generalizability in information systems research. Information systems research 14, 221–243.
Lee, C.-L., Huang, M.-K., 2014. The influence of computer literacy and computer anxiety on computer self-efficacy: the moderating effect of gender. Cyberpsychology, Behavior, and Social Networking 17, 172–180.
Lee, H., Cho, H.J., Xu, W., Fairhurst, A., 2010. The influence of consumer traits and demographics on intention to use retail self‐service checkouts. Mrkting Intelligence & Plan 28, 46–58. https://doi.org/10.1108/02634501011014606
Lee, W.-I., Chiu, Y.T., Liu, C.-C., Chen, C.-Y., 2011. Assessing the effects of consumer involvement and service quality in a self-service setting. Human Factors and Ergonomics in Manufacturing & Service Industries 21, 504–515. https://doi.org/10.1002/hfm.20253
Lee, Y., Kozar, K.A., Larsen, K.R., 2003. The technology acceptance model: past, present, and future. Communications of the Association for Information Systems 12, 752–780.
Legris, P., Ingham, J., Collerette, P., 2003. Why do people use information technology? A critical review of the technology acceptance model. Information & Management 40, 191–204. https://doi.org/10.1016/S0378-7206(01)00143-4
Lehto, X.Y., Kim, D.-Y., Morrison, A.M., 2006. The effect of prior destination experience on online information search behaviour. Tourism and Hospitality Research 6, 160–178.
Leonard-Barton, D., Deschamps, I., 1988. Managerial influence in the implementation of new technology. Management science 34, 1252–1265.
Leopold, T.A., Ratcheva, V., Zahidi, S., 2016. The global gender gap report 2016, Global gender gap report. World Economic Forum, Geneva, Switzerland.
Levin, I.P., Huneke, M.E., Jasper, J.D., 2000. Information processing at successive stages of decision making: Need for cognition and inclusion-exclusion effects. Organizational Behavior and Human Decision Processes 82, 171–193.

272
Lewis, F.L., 2004. Wireless sensor networks. Smart environments: technologies, protocols, and applications 11–46.
Lewis, M., Haviland-Jones, J.M., Barrett, L.F. (Eds.), 2010. The emergence of human emotions, in: Handbook of Emotions. Guilford Press, New York.
Li, D.C., 2011. Online social network acceptance: a social perspective. Internet Research 21, 562–580. https://doi.org/10.1108/10662241111176371
Libai, B., Bolton, R., Bügel, M.S., de Ruyter, K., Götz, O., Risselada, H., Stephen, A.T., 2010. Customer-to-customer interactions: broadening the scope of word of mouth research. Journal of Service Research 13, 267–282.
Lim, H., Dubinsky, A.J., 2005. The theory of planned behavior in e-commerce: making a case for interdependencies between salient beliefs. Psychology & Marketing 22, 833–855.
Lip-Sam, T., Hock-Eam, L., 2011. Estimating the determinants of B2B e-commerce adoption among small & medium enterprises. International journal of business and society 12, 15.
Löchtefeld, M., Gehring, S., Schöning, J., Krüger, A., 2010. Shelftorchlight: Augmenting a shelf using a camera projector unit, in: Adjunct Proceedings of the Eighth International Conference on Pervasive Computing. Citeseer, pp. 1–4.
Loehlin, J.C., 2004. Latent Variable Models: An Introduction to Factor, Path, and Structural Equation Analysis. Psychology Press.
Loges, W.E., 1994. Canaries in the Coal Mine: Perceptions of Threat and Media System Dependency Relations. Communication Research 21, 5–23. https://doi.org/10.1177/009365094021001002
Loges, W.E., Ball-Rokeach, S.J., 1993. Dependency Relations and Newspaper Readership. Journalism & Mass Communication Quarterly 70, 602–614. https://doi.org/10.1177/107769909307000311
Lohmöller, J.-B., 1989. Latent variable path modeling with partial least squares. Physica-Verlag Heidelberg.
Lohr, S., Markhoff, J., 1998. Computing’s next wave is nearly at hand; imagining the future in a post-pc world. The New York Times 1.
Loo, W.H., Yeow, P.H., Chong, S.C., 2009. User acceptance of Malaysian government multipurpose smartcard applications. Government Information Quarterly 26, 358–367.
López, T.S., Ranasinghe, D.C., Patkai, B., McFarlane, D., 2011. Taxonomy, technology and applications of smart objects. Inf Syst Front 13, 281–300. https://doi.org/10.1007/s10796-009-9218-4
López-Nicolás, C., Molina-Castillo, F.J., Bouwman, H., 2008. An assessment of advanced mobile services acceptance: Contributions from TAM and diffusion theory models. Information & Management 45, 359–364. https://doi.org/10.1016/j.im.2008.05.001
Lowery, S., De Fleur, M., 1983. Milestones in mass communication research. Media effects. 701 1 CIC-UCAB/0613 Donado Caroline de Oteyza 20070222 MTiffany.
Lowry, P.B., Gaskin, J., 2014. Partial Least Squares (PLS) Structural Equation Modeling (SEM) for Building and Testing Behavioral Causal Theory: When to Choose It and How to Use It. Professional Communication, IEEE Transactions on 57, 123–146.
Lu, J., 2014. Are personal innovativeness and social influence critical to continue with mobile commerce? Internet Research 24, 134–159.
Lu, J., Yao, J.E., Yu, C.-S., 2005. Personal innovativeness, social influences and adoption of wireless Internet services via mobile technology. The Journal of Strategic Information Systems 14, 245–268. https://doi.org/10.1016/j.jsis.2005.07.003

273
Lu, J., Yu, C.-S., Liu, C., Yao, J.E., 2003. Technology acceptance model for wireless Internet. Internet Research 13, 206–222.
Luff, P., Heath, C., 1998. Mobility in collaboration, in: Proceedings of the 1998 ACM Conference on Computer Supported Cooperative Work. ACM, pp. 305–314.
Luo, X., Li, H., Zhang, J., Shim, J.P., 2010. Examining multi-dimensional trust and multi-faceted risk in initial acceptance of emerging technologies: An empirical study of mobile banking services. Decision Support Systems 49, 222–234.
Lynott, P.P., McCandless, N.J., 2000. The impact of age vs. life experience on the gender role attitudes of women in different cohorts. Journal of women & aging 12, 5–21.
Lyu, J.C., 2012. How young Chinese depend on the media during public health crises? A comparative perspective. Public Relations Review, Section 1: THE FUTURE OF US-CHINESE MEDIA COMMUNICATION AND PUBLIC DIPLOMACY IN A POST-CRISIS WORLD Section 2: The state of the field: Competing identities, emerging alliances, and the public relations of nation 38, 799–806. https://doi.org/10.1016/j.pubrev.2012.07.006
Lyytinen, K., Yoo, Y., 2002. Ubiquitous computing. Communications of the ACM 45, 63. Ma, Q., Liu, L., 2004. The technology acceptance model: A meta-analysis of empirical findings.
Journal of End User Computing 16, 59–72. Maass, W., Kowatsch, T., 2008. Adoption of dynamic product information: An empirical
investigation of supporting purchase decisions on product bundles. Malek, A., 2011. The Use Theory Reasoned of Action to Study Information technology (IT) in
Jordan. Journal of Internet Banking and Commerce 16, 1–11. Malhotra, Y., Galletta, D.F., 1999. Extending the technology acceptance model to account for
social influence: theoretical bases and empirical validation, in: Systems Sciences, 1999. HICSS-32. Proceedings of the 32nd Annual Hawaii International Conference On. IEEE, p. 14–pp.
Marcoulides, G.A., Chin, W., Saunders, C., 2009. Foreword: A critical look at partial least squares modeling. Management Information Systems Quarterly 33, 10.
Markert, J., 2004. Demographics of age: generational and cohort confusion. Journal of Current Issues & Research in Advertising 26, 11–25.
Marshall, G.W., Moncrief, W.C., Rudd, J.M., Lee, N., 2012. Revolution in sales: the impact of social media and related technology on the selling environment. Journal of Personal Selling and Sales Management 32, 349–363.
Marx, K., 1961. Economic and philosophical manuscripts. Eric Fromm, Marx’s concept of man. NY: Frederick Ungar.
Mathieson, K., 1991. Predicting user intentions: comparing the technology acceptance model with the theory of planned behavior. Information Systems Research 2, 173–191.
Mathwick, C., Rigdon, E., 2004. Play, Flow, and the Online Search Experience. Journal of Consumer Research 31, 324–332.
Mayer, P., 2012. Empirical Investigations on User Perception and the Effectiveness of Persuasive Technologies. Logos, Berlin.
McCombs, M.E., 2004. Setting the agenda: the mass media and public opinion. Polity ; Blackwell Pub., Cambridge, UK; Malden, MA.
McGeoch, J.A., Irion, A.L., 1952. The psychology of human learning.., 2nd ed. Longmans, Green & Co, Oxford, England.
274
McGoldrick, P., 2001. TV Home Banking and the Technology Acceptance Model: Intrinsic Motivation & Gender Issues, in: Hirose, M. (Ed.), Human-Computer Inteaction Interact 01. Presented at the IFIP TC, IOS Press, Tokyo, Japan, pp. 84–91.
McGuire, W.J., 1976. Some Internal Psychological Factors Influencing Consumer Choice. Journal of Consumer Research 2, 302–319.
Mead, G.H., 1934. Mind, self, and society. Chicago: U of Chicago P. Mehrabian, A., Russell, J.A., 1974. An approach to environmental psychology. MIT Press,
Cambridge MA. Melià-Seguí, J., Pous, R., Carreras, A., Morenza-Cinos, M., Parada, R., Liaghat, Z., De Porrata-
Doria, R., 2013. Enhancing the shopping experience through RFID in an actual retail store, in: Proceedings of the 2013 ACM Conference on Pervasive and Ubiquitous Computing Adjunct Publication, UbiComp ’13 Adjunct. Presented at the UbiComp 2013, ACM Press, New York, NY, USA, pp. 1029–1036. https://doi.org/10.1145/2494091.2496016
Men, L.R., Tsai, W.-H.S., 2013. Beyond liking or following: Understanding public engagement on social networking sites in China. Public Relations Review 39, 13–22. https://doi.org/10.1016/j.pubrev.2012.09.013
Meredith, G., Schewe, C., 2002. Defining markets, defining moments: America’s 7 generational cohorts, their shared experiences, and why businesses should care. Wiley & Sons, New York.
Meyers-Levy, J., Maheswaran, D., 1991. Exploring differences in males’ and females’ processing strategies. Journal of Consumer Research 63–70.
Midgley, D.F., Dowling, G.R., 1978. Innovativeness: The concept and its measurement. Journal of consumer research 4, 229–242.
Miller, J.B., 1986. Toward a new psychology of women, 2. ed. Beacon Press, Boston, MA. Minton, H.L., Schneider, F.W., 1985. Differential psychology. Waveland Press, Prospect
Heights, IL. Moon, J.-W., Kim, Y.-G., 2001. Extending the TAM for a World-Wide-Web context.
Information & Management 38, 217–230. Moore, G.C., Benbasat, I., 1991. Development of an instrument to measure the perceptions of
adopting an information technology innovation. Information systems research 2, 192–222.
Morris, M.G., Venkatesh, V., 2000. Age Differences in Technology Adoption Decisions: Implications for a Changing Work Force. Personnel Psychology 53, 375–403. https://doi.org/10.1111/j.1744-6570.2000.tb00206.x
Morris, M.G., Venkatesh, V., Ackerman, P.L., 2005. Gender and age differences in employee decisions about new technology: an extension to the theory of planned behavior. IEEE Transactions on Engineering Management 52, 69–84. https://doi.org/10.1109/TEM.2004.839967
Mulhern, F.J., 1997. Retail marketing: From distribution to integration. International Journal of Research in Marketing 14, 103–124.
Müller-Seitz, G., Dautzenberg, K., Creusen, U., Stromereder, C., 2009. Customer acceptance of RFID technology: Evidence from the German electronic retail sector. Journal of Retailing and Consumer Services 16, 31–39. https://doi.org/10.1016/j.jretconser.2008.08.002

275
Mun, Y.Y., Jackson, J.D., Park, J.S., Probst, J.C., 2006. Understanding information technology acceptance by individual professionals: Toward an integrative view. Information & Management 43, 350–363.
Narayanaswami, C., Kruger, A., Marmasse, N., 2011. Guest editors’ introduction: Pervasive Retail. IEEE Pervasive Computing 10, 16–18. https://doi.org/10.1109/MPRV.2011.30
Nasco, S.A., Kulviwat, S., Kumar, A., Bruner, I.I., Gordon, C., 2008. The CAT model: Extensions and moderators of dominance in technology acceptance. Psychology & Marketing 25, 987–1005.
Neuman, W.R., Guggenheim, L., 2011. The Evolution of Media Effects Theory: A Six-Stage Model of Cumulative Research. Communication Theory 21, 169–196. https://doi.org/10.1111/j.1468-2885.2011.01381.x
Niehaves, B., Köffer, S., Ortbach, K., Katschewitz, S., 2012. Towards an IT consumerization theory–a theory and practice review. Working chapters-European Research Center for Information Systems 1.
Niehaves, B., Plattfaut, R., 2014. Internet adoption by the elderly: employing IS technology acceptance theories for understanding the age-related digital divide. Eur J Inf Syst 23, 708–726. https://doi.org/10.1057/ejis.2013.19
Norman, D.A., 2004. Emotional design: Why we love (or hate) everyday things. Basic books, Cambridge MA.
Norman, D.A., 1999. The invisible computer. MIT press, Cambridge MA. Norman, D.A., Ortony, A., Russell, D.M., 2003. Affect and machine design: Lessons for the
development of autonomous machines. IBM Systems Journal 42, 38–44. Nosek, B.A., Banaji, M., Greenwald, A.G., 2002. Harvesting implicit group attitudes and beliefs
from a demonstration web site. Group Dynamics: Theory, Research, and Practice 6, 101. Nysveen, H., Pedersen, P.E., Thorbjørnsen, H., 2005. Explaining intention to use mobile chat
services: moderating effects of gender. Journal of consumer Marketing 22, 247–256. O’Cass, A., Fenech, T., 2003. Web retailing adoption: exploring the nature of internet users Web
retailing behaviour. Journal of Retailing and Consumer services 10, 81–94. Okazaki, S., Mendez, F., n.d. Perceived Ubiquity in Mobile Services. Journal of Interactive
Marketing. https://doi.org/10.1016/j.intmar.2012.10.001 Olsson, T., 2012. User expectations and experiences of mobile augmented reality services. Orlikowski, W.J., Iacono, C.S., 2001. Research commentary: Desperately seeking the “IT” in IT
research—A call to theorizing the IT artifact. Information systems research 12, 121–134. Pagani, M., 2007. A vicarious innovativeness scale for 3G mobile services: integrating the
domain specific innovativeness scale with psychological and rational indicators. Technology Analysis & Strategic Management 19, 709–728.
Palfrey, J.G., Gasser, U., 2010. Born Digital: Understanding the First Generation of Digital Natives. BasicBooks.
Pantano, E., 2014a. Innovation management in retailing: From consumer perspective to corporate strategy. Journal of Retailing and Consumer Services 21, 825–826. https://doi.org/10.1016/j.jretconser.2014.02.017
Pantano, E., 2014b. Innovation drivers in retail industry. International Journal of Information Management 34, 344–350. https://doi.org/10.1016/j.ijinfomgt.2014.03.002
Pantano, E., 2013. Ubiquitous Retailing Innovative Scenario: From the Fixed Point of Sale to the Flexible Ubiquitous Store. Journal of technology management & innovation 8, 84–92.

276
Pantano, E., 2010a. New technologies and retailing: trends and directions. Journal of Retailing and Consumer Services 17, 171–172.
Pantano, E., 2010b. New technologies and retailing: trends and directions. Journal of Retailing and Consumer Services 17, 171–172.
Pantano, E., Di Pietro, L., 2012. Understanding Consumer’s Acceptance of Technology-Based Innovations in Retailing. Journal of technology management & innovation 7, 1–19.
Pantano, E., Iazzolino, G., Migliano, G., 2013. Obsolescence risk in advanced technologies for retailing: A management perspective. Journal of Retailing and Consumer Services 20, 225–233. https://doi.org/10.1016/j.jretconser.2013.01.002
Pantano, E., Migliarese, P., 2014. Exploiting consumer–employee–retailer interactions in technology-enriched retail environments through a relational lens. Journal of Retailing and Consumer Services 21, 958–965.
Pantano, E., Naccarato, G., 2010. Entertainment in retailing: The influences of advanced technologies. Journal of Retailing and Consumer Services, New Technologies and Retailing: Trends and Directions 17, 200–204. https://doi.org/10.1016/j.jretconser.2010.03.010
Pantano, E., Servidio, R., 2012. Modeling innovative points of sales through virtual and immersive technologies. Journal of Retailing and Consumer Services 19, 279–286. https://doi.org/10.1016/j.jretconser.2012.02.002
Pantano, E., Viassone, M., 2014. Demand pull and technology push perspective in technology-based innovations for the points of sale: The retailers evaluation. Journal of Retailing and Consumer Services 21, 43–47. https://doi.org/10.1016/j.jretconser.2013.06.007
Pantano, E., Viassone, M., 2013. Demand pull and technology push perspective in technology-based innovations for the points of sale: The retailers evaluation. Journal of Retailing and Consumer Services. https://doi.org/10.1016/j.jretconser.2013.06.007
Pantano, E., Viassone, M., 2012. Consumers’s expectation of innovation in traditional points of sale: an explorative study. International Journal of Digital Content Technology and its Applications 6, 455–461. https://doi.org/10.4156/jdcta.vol6.issue21.52
Parasuraman, A., 2000. Technology Readiness Index (TRI) a multiple-item scale to measure readiness to embrace new technologies. Journal of Service Research 2, 307–320. https://doi.org/10.1177/109467050024001
Park, J., Yang, S., Lehto, X., 2007. Adoption of mobile technologies for Chinese consumers. Journal of Electronic Commerce Research 8, 196–206.
Patwardhan, P., Yang, J., 2003. Internet dependency relations and online consumer behavior: a media system dependency theory perspective on why people shop, chat, and read news online. Journal of interactive advertising 3, 57–69.
Payne, J.W., Bettman, J.R., Johnson, E.J., 1993. The adaptive decision maker. Cambridge Univ Pr.
Payne, J.W., Bettman, J.R., Johnson, E.J., 1988. Adaptive strategy selection in decision making. Journal of Experimental Psychology: Learning, Memory, and Cognition 14, 534.
Perry, M., O’hara, K., Sellen, A., Brown, B., Harper, R., 2001. Dealing with Mobility: Understanding Access Anytime, Anywhere. ACM Trans. Comput.-Hum. Interact. 8, 323–347. https://doi.org/10.1145/504704.504707
Peterson, R.A., Merino, M.C., 2003. Consumer information search behavior and the internet. Psychol. Mark. 20, 99–121. https://doi.org/10.1002/mar.10062

277
Phillips, L.W., Sternthal, B., 1977. Age differences in information processing: a perspective on the aged consumer. Journal of Marketing Research 444–457.
Pieper, R., 1998. From devices to “ambient intelligence”: the transformation of consumer electronics.
Pikkarainen, T., Pikkarainen, K., Karjaluoto, H., Pahnila, S., 2004. Consumer acceptance of online banking: an extension of the technology acceptance modelnull. Internet Research 14, 224–235. https://doi.org/10.1108/10662240410542652
Ping Jr, R.A., 2004. On assuring valid measures for theoretical models using survey data. Journal of Business Research 57, 125–141.
Poncin, I., Ben Mimoun, M.S., 2014. The impact of “e-atmospherics” on physical stores. Journal of Retailing and Consumer Services 21, 851–859. https://doi.org/10.1016/j.jretconser.2014.02.013
Porter, C.E., Donthu, N., 2006. Using the technology acceptance model to explain how attitudes determine Internet usage: The role of perceived access barriers and demographics. Journal of Business Research 59, 999–1007.
Pous, R., Melià-Seguí, J., Carreras, A., Morenza-Cinos, M., Rashid, Z., 2013. Cricking: Customer-product Interaction in Retail Using Pervasive Technologies, in: Proceedings of the 2013 ACM Conference on Pervasive and Ubiquitous Computing Adjunct Publication, UbiComp ’13 Adjunct. Presented at the UbiComp 2013, ACM, New York, NY, USA, pp. 1023–1028. https://doi.org/10.1145/2494091.2496015
Prensky, M., 2005. Computer games and learning: Digital game-based learning, in: Raessens, J., Goldstein, J. (Eds.), Handbook of Computer Game Studies. MIT Press, Cambridge, London, pp. 97–122.
Prensky, M., 2001. Digital natives, digital immigrants Part 2: Do they really think differently? On the horizon 9, 1–6.
Prete, C.D., Levitas, D., Grieser, T., Turner, M.J., Pucciarelli, J., Hudson, S., 2011. IT Consumers Transform the Enterprise: Are You Ready? IDC Analyze the Future, Framingham, Massachusetts, USA.
Rai, A., Chen, L., Pye, J., Baird, A., 2013. Understanding Determinants of Consumer Mobile Health Usage Intentions, Assimilation, and Channel Preferences. J Med Internet Res 15. https://doi.org/10.2196/jmir.2635
Raman, A., Don, Y., 2013. Preservice teachers’ acceptance of Learning Management Software: An application of the UTAUT2 model. International Education Studies 6, p157.
Ramos, C., Augusto, J.C., Shapiro, D., 2008. Ambient Intelligence-the Next Step for Artificial Intelligence. IEEE Intelligent Systems 23, 15–18. https://doi.org/10.1109/MIS.2008.19
Reinartz, W., Haenlein, M., Henseler, J., 2009. An empirical comparison of the efficacy of covariance-based and variance-based SEM. International Journal of research in Marketing 26, 332–344.
Rekimoto, J., Nagao, K., 1995. The world through the computer: Computer augmented interaction with real world environments, in: Proceedings of the 8th Annual ACM Symposium on User Interface and Software Technology. ACM, pp. 29–36.
Renko, S., Druzijanic, M., 2014. Perceived usefulness of innovative technology in retailing: Consumers׳ and retailers׳ point of view. Journal of Retailing and Consumer Services. https://doi.org/10.1016/j.jretconser.2014.02.015
Resatsch, F., Sandner, U., Leimeister, J.M., Krcmar, H., 2008. Do Point of Sale RFID-Based Information Services Make a Difference? Analyzing Consumer Perceptions for

278
Designing Smart Product Information Services in Retail Business. Electronic Markets 18, 216–231.
Riegel, L., Opitz, M., Summa, H.A., 2015. Die deutsche Internetwirtschaft 2015-2019. eco Verband der Internetwirtschaft e.V. and Arthur D. Little Austria GmbH, Köln.
Riffe, D., Lacy, S., Varouhakis, M., 2008. Media system dependency theory and using the Internet for in-depth, specialized information. Web Journal of Mass Communication Research 11, 1–14.
Rigdon, E.E., 1998. Structural equation modeling, in: Marcoulides, G.A. (Ed.), Modern Methods for Business Research. Lawrance Erlbaum Associates, Inc., Publishers, Mahwah, N.J., pp. 251–294.
Rigdon, E.E., Ringle, C.M., Sarstedt, M., 2010. Structural modeling of heterogeneous data with partial least squares, in: Malhotra, N.K. (Ed.), Review of Marketing Research. Emerald Group Publishing Limited, pp. 255–296.
Rigdon, E.E., Sarstedt, M., Ringle, C.M., 2017. On Comparing Results from CB-SEM and PLS-SEM: Five Perspectives and Five Recommendations. Marketing ZFP 39, 4–16.
Rigdon, E.E., Schumacker, R.E., Wothke, W., 1998. A comparative review of interaction and nonlinear modeling., in: Schumacker, R.E., Marcoulides, G.A. (Eds.), Interaction and Nonlinear Effects in Structural Equation Modeling. Lawrence Erlbaum, Mahwah, N.J., pp. 1–16.
Ringle, C.M., 2004a. Kooperation in virtuellen Unternehmungen: Auswirkungen auf die strategischen Erfolgsfaktoren der Partnerunternehmen. Deutscher Universitätsverlag, Hamburg.
Ringle, C.M., 2004b. Messung von Kausalmodellen. Ein Methodenvergleich,. Ringle, C.M., 2004c. Gütemaße für den Partial-least-squares-Ansatz zur Bestimmung von
Kausalmodellen. Ringle, C.M., Ringle, C.M., Sarstedt, M., Sarstedt, M., 2016. Gain more insight from your PLS-
SEM results: The importance-performance map analysis. Industrial Management & Data Systems 116, 1865–1886.
Ringle, C.M., Sarstedt, M., Straub, D.W., 2012. Editor’s comments: a critical look at the use of PLS-SEM in MIS quarterly. MIS quarterly 36, 3–14.
Ringle, C.M., Spreen, F., 2007. Beurteilung der Ergebnisse von PLS-Pfadanalysen. Das Wirtschaftsstudium 36, 211–216.
Ringle, C.M., Wende, S., Will, A., 2005. SmartPLS 2.0 (beta). Hamburg, Germany. Rintamäki, T., Kanto, A., Kuusela, H., Spence, M.T., 2006a. Decomposing the value of
department store shopping into utilitarian, hedonic and social dimensions: Evidence from Finland. International Journal of Retail & Distribution Management 34, 6–24. https://doi.org/10.1108/09590550610642792
Rintamäki, T., Kanto, A., Kuusela, H., Spence, M.T., 2006b. Decomposing the value of department store shopping into utilitarian, hedonic and social dimensions: Evidence from Finland. International Journal of Retail & Distribution Management 34, 6–24. https://doi.org/10.1108/09590550610642792
Robertson, D.C., 1989. Social determinants of information systems use. Journal of Management Information Systems 55–71.
Roehrich, G., 2004. Consumer innovativeness: concepts and measurements. Journal of Business Research 57, 671–677.
Rogers, E.M., 2010. Diffusion of innovations. Simon and Schuster.

279
Rogers, E.M., 1983. Difiusion of innovations. Free Press, New York. Rogers, E.M., Shoemaker, F.F., 1971. Communication of Innovations; A Cross-Cultural
Approach. The Free Press, New York. Rogler, L.H., 2002. Historical generations and psychology: The case of the Great Depression and
World War II. American Psychologist 57, 1013. Rosemann, M., Vessey, I., 2008. Toward improving the relevance of information systems
research to practice: the role of applicability checks. MIS Quarterly 32, 1–22. Rothensee, M., 2010. Psychological determinants of the acceptance of future ubiquitous
computing applications. Dr. Kovac, Hamburg. Roussos, G., Kourouthanasis, P., Moussouri, T., 2003. Designing appliances for mobile
commerce and retailtainment. Personal and Ubiquitous Computing 7, 203–209. Roussos, G., Moussouri, T., 2004. Consumer perceptions of privacy, security and trust in
ubiquitous commerce. Personal and Ubiquitous Computing 8, 416–429. Roussos, G., Tuominen, J., Koukara, L., Seppala, O., Kourouthanasis, P., Giaglis, G., Frissaer, J.,
2002. A case study in pervasive retail, in: Proceedings of the 2nd International Workshop on Mobile Commerce. pp. 90–94.
Royne Stafford, M., 1996. Demographic discriminators of service quality in the banking industry. Journal of services marketing 10, 6–22.
Ruiz-Mafe, C., Marti-Parreno, J., Sanz-Blas, S., 2014. Key drivers of consumer loyalty to Facebook fan pages. Online Information Review 38, 362–380.
Ruiz-Mafe, C., Sanz-Blas, S., 2006. Explaining Internet dependency: An exploratory study of future purchase intention of Spanish Internet users. Internet Research 16, 380–397. https://doi.org/10.1108/10662240610690016
Ryder, N.B., 1965. The cohort as a concept in the study of social change. American sociological review 843–861.
Saha, D., Mukherjee, A., 2003. Pervasive computing: a paradigm for the 21st century. Computer 36, 25–31.
Sanders, A.F., 1998. Elements of human performance: Reaction processes and attention in human skill. Psychology Press.
Sapio, B., Turk, T., Cornacchia, M., Papa, F., Nicolò, E., Livi, S., 2010. Building scenarios of digital television adoption: a pilot study. Technology Analysis & Strategic Management 22, 43–63. https://doi.org/10.1080/09537320903438054
Sarker, S., Wells, J.D., 2003. Understanding mobile handheld device use and adoption. Communications of the ACM 46, 35–40.
Sarstedt, M., Becker, J.-M., Ringle, C.M., Schwaiger, M., 2011a. Uncovering and treating unobserved heterogeneity with FIMIX-PLS: Which model selection criterion provides an appropriate number of segments? Schmalenbach Business Review 63, 34–62.
Sarstedt, M., Hair, J.F., Ringle, C.M., Thiele, K.O., Gudergan, S.P., 2016. Estimation issues with PLS and CBSEM: Where the bias lies! Journal of Business Research 69, 3998–4010.
Sarstedt, M., Henseler, J., Ringle, C.M., 2011b. Multigroup analysis in partial least squares (PLS) path modeling: Alternative methods and empirical results. Advances in International Marketing 22, 195–218.
Sarstedt, M., Ringle, C.M., Hair, J.F., 2017. Partial Least Squares Structural Equation Modeling, in: Homburg, P.D.C., Klarmann, P.D.M., Vomberg, D.A. (Eds.), Handbook of Market Research. Springer International Publishing, pp. 1–40. https://doi.org/10.1007/978-3-319-05542-8_15-1

280
Sarstedt, M., Ringle, C.M., Henseler, J., Hair, J.F., 2014. On the emancipation of PLS-SEM: A commentary on Rigdon (2012). Long Range Planning 47, 154–160.
Satyanarayanan, M., 2001. Pervasive computing: Vision and challenges. Personal Communications, IEEE 8, 10–17.
Schepers, J., Wetzels, M., 2007. A meta-analysis of the technology acceptance model: Investigating subjective norm and moderation effects. Information & Management 44, 90–103.
Schmidt, A., 2002. Ubiquitous computing-computing in context. Lancaster University. Schmidt, A., 2000. Implicit human computer interaction through context. Personal technologies
4, 191–199. Schmidt, A., Beigl, M., Gellersen, H.-W., 1999. There is more to context than location.
Computers & Graphics 23, 893–901. Scholtz, J., Consolvo, S., 2004. Toward a framework for evaluating ubiquitous computing
applications. Pervasive Computing, IEEE 3, 82–88. Schröder, H., Zaharia, S., 2008. Linking multi-channel customer behavior with shopping
motives: An empirical investigation of a German retailer. Journal of Retailing and Consumer Services 15, 452–468. https://doi.org/10.1016/j.jretconser.2008.01.001
Schwarz, A., 2003. Defining information technology acceptance: a human-centered, management-oriented perspective (Doctoral Thesis). University of Hoston-University PArk.
Scialfa, C.T., Fernie, G.R., 2006. Adaptive Technology, in: Birren, J., Schaie, W. (Eds.), Handbook of the Psychology of Aging. pp. 15–37.
Segars, A.H., Grover, V., 1993. Re-examining perceived ease of use and usefulness: A confirmatory factor analysis. MIS quarterly 517–525.
Sen, J., 2012. Ubiquitous Computing: Applications, Challenges and Future Trends, in: Santos, R.A., Block, A.E. (Eds.), Embedded Systems and Wireless Technology: Theory and Practical Applications. CRC Press, Boca Raton, FL, pp. 1–40.
Serenko, A., Turel, O., Yol, S., 2006. Moderating roles of user demographics in the American customer satisfaction model within the context of mobile services. Journal of Information Technology Management 17, 20–32.
Shankar, V., Inman, J.J., Mantrala, M., Kelley, E., Rizley, R., 2011. Innovations in Shopper Marketing: Current Insights and Future Research Issues. Journal of Retailing 87, Supplement 1, 29–42. https://doi.org/10.1016/j.jretai.2011.04.007
Shankar, V., Smith, A.K., Rangaswamy, A., 2003. Customer satisfaction and loyalty in online and offline environments. International journal of research in marketing 20, 153–175.
Shao, G., 2009. Understanding the appeal of user‐generated media: a uses and gratification perspective. Internet Research 19, 7–25. https://doi.org/10.1108/10662240910927795
Shim, S., Eastlick, M.A., Lotz, S., 2000. Assessing the impact of Internet shopping on store shopping among mall shoppers and Internet users. Journal of Shopping Center Research 7, 7–43.
Shin, D.-H., 2009. Towards an understanding of the consumer acceptance of mobile wallet. Computers in Human Behavior 25, 1343–1354.
Silva, L., 2007. Post-positivist Review of Technology Acceptance Model. Journal of the Association for Information Systems 8, 11.

281
Singh, R., 2010. Recent Trends in Pervasive and Ubiquitous Computing: A Survey, in: Klinger, K. (Ed.), Strategic Pervasive Computing Applications: Emerging Trends: Emerging Trends. IGI Global, Hershey, PA, p. 1.
Skumanich, S.A., Kintsfather, D.P., 1998. Individual Media Dependency Relations Within Television Shopping Programming: A Causal Model Reviewed and Revised. Communication Research 25, 200–219. https://doi.org/10.1177/009365098025002004
Smock, A.D., Ellison, N.B., Lampe, C., Wohn, D.Y., 2011. Facebook as a toolkit: A uses and gratification approach to unbundling feature use. Computers in Human Behavior 27, 2322–2329.
Spearman, C., 1904. The proof and measurement of association between two things. The American journal of psychology 15, 72–101.
Spínola, R.O., Travassos, G.H., 2012. Towards a framework to characterize ubiquitous software projects. Information and Software Technology 54, 759–785. https://doi.org/10.1016/j.infsof.2012.01.009
Spreer, P., Kallweit, K., 2014. Augmented Reality in Retail: Assessing the Acceptance and Potential for Multimedia Product Presentation at the PoS. Transactions on Marketing Research 1, 20–35.
Srinivasan, N., 1990. Pre-Purchase external search for information, in: Review of Marketing. American Marketing Association, Chicago, IL, pp. 153–189.
Stafford, T.F., Stafford, M.R., Schkade, L.L., 2004. Determining uses and gratifications for the Internet. Decision Sciences 35, 259–288.
Stern, B.B., Royne, M.B., Stafford, T.F., Bienstock, C.C., 2008. Consumer acceptance of online auctions: An extension and revision of the TAM. Psychology & Marketing 25, 619–636.
Stone, M., 1974. Cross-validatory choice and assessment of statistical predictions. Journal of the Royal Statistical Society. Series B (Methodological) 111–147.
Straub, D.W., 1989. Validating instruments in MIS research. MIS quarterly 147–169. Struker, J., Sackmann, S., Muller, G., 2004. Case study on retail customer communication
applying ubiquitous computing, in: E-Commerce Technology, 2004. CEC 2004. Proceedings. IEEE International Conference On. pp. 42–48.
Subramanian, G.H., 1994. A replication of perceived usefulness and perceived ease of use measurement. Decision sciences 25, 863–874.
Sumak, B., Polancic, G., Hericko, M., 2010. An empirical study of virtual learning environment adoption using UTAUT, in: Mobile, Hybrid, and On-Line Learning, 2010. ELML’10. Second International Conference On. IEEE, pp. 17–22.
Sun, H., Zhang, P., 2006. The role of moderating factors in user technology acceptance. International Journal of Human-Computer Studies 64, 53–78. https://doi.org/10.1016/j.ijhcs.2005.04.013
Sun, S., Rubin, A.M., Haridakis, P.M., 2008. The Role of Motivation and Media Involvement in Explaining Internet Dependency. Journal of Broadcasting & Electronic Media 52, 408–431. https://doi.org/10.1080/08838150802205595
Swaminathan, V., 2003. The Impact of Recommendation Agents on Consumer Evaluation and Choice: The Moderating Role of Category Risk, Product Complexity, and Consumer Knowledge. Journal of Consumer Psychology (Lawrence Erlbaum Associates) 13, 93.
Swedberg, C., 2007. Hong Kong Shoppers Use RFID-enabled Mirror to See What They Want - RFID Journal [WWW Document]. URL http://www.rfidjournal.com/articles/view?3595 (accessed 1.27.14).

282
Szajna, B., 1994. Software evaluation and choice: Predictive validation of the technology acceptance instrument. MIS quarterly 319–324.
Tai, Z., Sun, T., 2007. Media dependencies in a changing media environment: the case of the 2003 SARS epidemic in China. New Media Society 9, 987–1009. https://doi.org/10.1177/1461444807082691
Taylor, S., Todd, P.A., 1995a. Understanding Information Technology Usage: A Test of Competing Models. Information Systems Research 6, 144–176. https://doi.org/10.1287/isre.6.2.144
Taylor, S., Todd, P.A., 1995b. Assessing IT usage: The role of prior experience. MIS quarterly 19, 561–570.
Tellegen, A., 1982. Brief manual for the multidimensional personality questionnaire. Unpublished manuscript, University of Minnesota, Minneapolis 1031–1010.
Tellkamp, C., Quiede, U., 2005. Einsatz von RFID in der Bekleidungsindustrie—Ergebnisse eines Pilotprojekts von Kaufhof und Gerry Weber, in: Fleisch, E., Mattern, F. (Eds.), Das Internet Der Dinge. Springer, Berlin Heidelberg, pp. 143–160.
Tenenhaus, M., Vinzi, V.E., Chatelin, Y.-M., Lauro, C., 2005. PLS path modeling. Computational Statistics & Data Analysis 48, 159–205. https://doi.org/10.1016/j.csda.2004.03.005
Teo, T.S., Pok, S.H., 2003. Adoption of WAP-enabled mobile phones among Internet users. Omega 31, 483–498.
Teo, T.S.H., Lim, V.K.G., Lai, R.Y.C., 1999. Intrinsic and extrinsic motivation in Internet usage. Omega 27, 25–37. https://doi.org/10.1016/S0305-0483(98)00028-0
Thompson, L.F., Surface, E.A., Martin, D.L., Sanders, M.G., 2003. From paper to pixels: Moving personnel surveys to the Web. Personnel Psychology 56, 197–227.
Thompson, P., 2013. The digital natives as learners: Technology use patterns and approaches to learning. Computers & Education 65, 12–33. https://doi.org/10.1016/j.compedu.2012.12.022
Thompson, R.L., Higgins, C.A., Howell, J.M., 1994. Influence of experience on personal computer utilization: testing a conceptual model. Journal of management information systems 167–187.
Thompson, R.L., Higgins, C.A., Howell, J.M., 1991. Personal computing: toward a conceptual model of utilization. MIS quarterly 125–143.
Thong, J.Y., Hong, S.-J., Tam, K.Y., 2006. The effects of post-adoption beliefs on the expectation-confirmation model for information technology continuance. International Journal of Human-Computer Studies 64, 799–810.
Tretiakov, A., Kinshuk, K., 2005. Creating a Pervasive Testing Environment by Using SMS Messaging. IEEE, pp. 62–66. https://doi.org/10.1109/WMTE.2005.13
Triandis, H.C., 1979. Values, attitudes, and interpersonal behavior., in: Nebraska Symposium on Motivation. Presented at the Beliefs, Attitudes, and Values, University of Nebraska Press, Lincoln, NE, pp. 195–259.
Triandis, H.C., 1971. Attitude and attitude change. Wiley, New York. Tversky, A., Kahneman, D., 1981. The framing of decisions and the psychology of choice.
Science 211, 453–458. https://doi.org/10.1126/science.7455683 Tversky, A., Kahneman, D., 1973. Availability: A heuristic for judging frequency and
probability. Cognitive psychology 5, 207–232.
283
Udo, G.J., Bagchi, K.K., Kirs, P.J., 2010. An assessment of customers’ e-service quality perception, satisfaction and intention. International Journal of Information Management 30, 481–492. https://doi.org/10.1016/j.ijinfomgt.2010.03.005
Urbach, N., Ahlemann, F., 2010. Structural equation modeling in information systems research using partial least squares. Journal of Information Technology Theory and Application 11, 5–40.
Valerie, S., Ritter, L., 2007. Designing and Developing the Survey Instrument. SAGE Publications, Inc., 2455 Teller Road, Thousand Oaks California 91320 United States of America.
Välkkynen, P., Boyer, A., Urhemaa, T., Nieminen, R., 2011. Mobile augmented reality for retail environments, in: Proceedings of Workshop on Mobile Interaction in Retail Environments in Conjunction with MobileHCI.
van der Heijden, H., 2006. Mobile decision support for in-store purchase decisions. Decision Support Systems 42, 656–663. https://doi.org/10.1016/j.dss.2005.03.006
Van der Heijden, H., 2004. User acceptance of hedonic information systems. MIS quarterly 695–704.
van der Heijden, H., 2004. User acceptance of hedonic information systems. MIS quarterly 695–704.
van Dijk, J.A.G.M., Peters, O., Ebbers, W., 2008. Explaining the acceptance and use of government Internet services: A multivariate analysis of 2006 survey data in the Netherlands. Government Information Quarterly 25, 379–399. https://doi.org/10.1016/j.giq.2007.09.006
van Nierop, J.E.M., Leeflang, P.S.H., Teerling, M.L., Huizingh, K.R.E., 2011. The impact of the introduction and use of an informational website on offline customer buying behavior. International Journal of Research in Marketing 28, 155–165. https://doi.org/10.1016/j.ijresmar.2011.02.002
Van Raaij, E.M., Schepers, J.J., 2008. The acceptance and use of a virtual learning environment in China. Computers & Education 50, 838–852.
van Schaik, P., 2009. Unified Theory of Acceptance and use for Websites used by Students in Higher Education. Journal of Educational Computing Research 40, 229–257. https://doi.org/10.2190/EC.40.2.e
Varma, S., 2010. Prior Computer Experience and Technology Acceptance. ProQuest LLC. Venkatesh, V., 2006. Where To Go From Here? Thoughts on Future Directions for Research on
Individual-Level Technology Adoption with a Focus on Decision Making*. Decision Sciences 37, 497–518.
Venkatesh, V., 2000. Determinants of perceived ease of use: Integrating control, intrinsic motivation, and emotion into the technology acceptance model. Information systems research 11, 342–365.
Venkatesh, V., Bala, H., 2008. Technology acceptance model 3 and a research agenda on interventions. Decision sciences 39, 273–315.
Venkatesh, V., Davis, F.D., 2000. A theoretical extension of the technology acceptance model: Four longitudinal field studies. Management science 46, 186–204.
Venkatesh, V., Davis, F.D., Morris, M.G., 2007. Dead Or Alive? The Development, Trajectory And Future Of Technology Adoption Research. Journal of the association for information systems 8.

284
Venkatesh, V., Morris, M.G., 2000. Why don’t men ever stop to ask for directions? Gender, social influence, and their role in technology acceptance and usage behavior. MIS quarterly 115–139.
Venkatesh, V., Morris, M.G., Ackerman, P.L., 2000. A longitudinal field investigation of gender differences in individual technology adoption decision-making processes. Organizational behavior and human decision processes 83, 33–60.
Venkatesh, V., Morris, M.G., Davis, G.B., Davis, F.D., 2003. User acceptance of information technology: Toward a unified view. MIS quarterly 425–478.
Venkatesh, V., Thong, J., Xu, X., 2012. Consumer acceptance and use of information technology: Extending the unified theory of acceptance and use of technology. MIS quarterly 36, 157–178.
Verhoef, P.C., Lemon, K.N., Parasuraman, A., Roggeveen, A., Tsiros, M., Schlesinger, L.A., 2009. Customer Experience Creation: Determinants, Dynamics and Management Strategies. Journal of Retailing, Enhancing the Retail Customer Experience 85, 31–41. https://doi.org/10.1016/j.jretai.2008.11.001
Verhoef, P.C., Neslin, S.A., Vroomen, B., 2007. Multichannel customer management: Understanding the research-shopper phenomenon. International Journal of Research in Marketing 24, 129–148.
Verkasalo, H., 2009. Modeling the adoption of mobile services, in: Lee, I. (Ed.), Transforming E-Business Practices and Applications: Emerging Technologies and Concepts: Emerging Technologies and Concepts. Information science reference, Hershey, PA.
Völckner, F., Sattler, H., Hennig-Thurau, T., Ringle, C.M., 2010. The role of parent brand quality for service brand extension success. Journal of Service Research.
Wang, C.-C., Yang, H.-W., 2008. Passion for online shopping: The influence of personality and compulsive buying. Social Behavior and Personality: an international journal 36, 693–706. https://doi.org/10.2224/sbp.2008.36.5.693
Wang, M.C.-H., 2012. Determinants and consequences of consumer satisfaction with self-service technology in a retail setting. Managing Service Quality 22, 128–144.
Wang, Y.-S., Shih, Y.-W., 2009. Why do people use information kiosks? A validation of the Unified Theory of Acceptance and Use of Technology. Government Information Quarterly 26, 158–165.
Wang, Y.-S., Wu, M.-C., Wang, H.-Y., 2009. Investigating the determinants and age and gender differences in the acceptance of mobile learning. British Journal of Educational Technology 40, 92–118. https://doi.org/10.1111/j.1467-8535.2007.00809.x
Want, R., Pering, T., Danneels, G., Kumar, M., Sundar, M., Light, J., 2002. The personal server: Changing the way we think about ubiquitous computing, in: Borriello, G., Holmquist, L.E. (Eds.), UbiComp 2002: Ubiquitous Computing. Presented at the UbiComp 2002, Springer, Göteborg, Sweden, pp. 194–209.
Warshaw, P.R., 1980. A new model for predicting behavioral intentions: An alternative to Fishbein. Journal of Marketing Research 17, 153–172.
Wasinger, R., Wahlster, W., 2006. Multi-modal human–environment interaction, in: Aarts, E., Encarnacao, J. (Eds.), True Visions: The Emergence of Ambient Intellegence. Springer, Berlin Heidelberg, pp. 291–306.
Weber, M.M., Kantamneni, S.P., 2002. POS and EDI in retailing: an examination of underlying benefits and barriers. Supply Chain Management: An International Journal 7, 311–317. https://doi.org/10.1108/13598540210447755

285
Webster, J., Ho, H., 1997. Audience engagement in multimedia presentations. ACM SIGMIS Database 28, 63–77.
Weijters, B., Rangarajan, D., Falk, T., Schillewaert, N., 2007. Determinants and Outcomes of Customers’ Use of Self-Service Technology in a Retail Setting. Journal of Service Research 10, 3–21. https://doi.org/10.1177/1094670507302990
Weiser, M., 1993. Some computer science issues in ubiquitous computing. Communications of the ACM 36, 75–84.
Weiser, M., 1991. The computer for the 21st century. Scientific american 265, 94–104. Weiser, M., Brown, J.S., 1997. The coming age of calm technology, in: Denning, P.J., Metcalfe,
R.M. (Eds.), Beyond Calculation: The Next Fifty Years of Computing. Copernicus, pp. 75–85.
Welford, A.T., 1980. Sensory, perceptual, and motor processes in older adults, in: Birren, J., Sloane, R. (Eds.), Handbook of Mental Health and Aging. Prentice Hall, Englewood Cliffs, NJ, pp. 192–213.
Wen, C., Prybutok, V.R., Xu, C., 2011. An Integrated Model for Customer Online Repurchase Intention. Journal of Computer Information Systems 52, 14–23.
Werts, C.E., Linn, R.L., Jöreskog, K.G., 1974. Intraclass reliability estimates: Testing structural assumptions. Educational and Psychological measurement 34, 25–33.
Whetten, D.A., 2009. An examination of the interface between context and theory applied to the study of Chinese organizations. Management and Organization Review 5, 29–55.
Wicks, R.H., 1996. Standpoint: Joseph Klapper and the effects of mass communication: A retrospective. Journal of Broadcasting & Electronic Media 40, 563–569. https://doi.org/10.1080/08838159609364377
Williams, F., Phillips, A.F., Lum, P., 1985. Gratifications associated with new communication technologies, in: Rosengren, K.E., Wenner, L.A., Palmgreen, P. (Eds.), Media Gratifications Research. SAGE Publications, Beverly Hills, California, pp. 241–252.
Williams, L.J., Vandenberg, R.J., Edwards, J.R., 2009. Structural Equation Modeling in Management Research: A Guide for Improved Analysis. The Academy of Management Annals 3, 543–604.
Williams, M.D., Dwivedi, Y.K., Lal, B., Schwarz, A., 2009. Contemporary trends and issues in IT adoption and diffusion research. Journal of Information Technology 24, 1–10.
Wimmer, R., Dominick, J., 2013. Mass Media Research, 10th ed. Cengage Learning. Wold, H., 1980. Model construction and evaluation when theoretical knowledge is scarce, in:
Kmenta, J., Ramsey, J.B. (Eds.), Evaluation of Econometric Models. Academic Press, New York, pp. 47–74.
Wold, H., 1975. Path models with latent variables: The NIPALS approach, in: Blalock, H.M., Aganbegian, A., Borodkin, F.M., Boudon, R., Capecchi, V. (Eds.), Quantitative Sociology: International Perspectives on Mathematical and Statistical Modeling. Academic Press, New York, San Francisco, London, pp. 307–358.
Wold, H., 1966. Estimation of principal components and related models by iterative least squares, in: Krishnaiah, P.R. (Ed.), Multivariate Analysis. Academic Press, New York, pp. 391–420.
World Internet Users Statistics and 2015 World Population Stats [WWW Document], 2015. . Internet World Stats. URL http://www.internetworldstats.com/stats.htm (accessed 12.28.15).
286
Wright, K.B., 2005. Researching Internet-Based Populations: Advantages and Disadvantages of Online Survey Research, Online Questionnaire Authoring Software Packages, and Web Survey Services. Journal of Computer-Mediated Communication 10, 00–00. https://doi.org/10.1111/j.1083-6101.2005.tb00259.x
Wright, S., 1918. On the nature of size factors. Genetics 3, 367. Wu, J.-H., Wang, S.-C., 2005. What drives mobile commerce?: An empirical evaluation of the
revised technology acceptance model. Information & management 42, 719–729. Wu, Y.-L., Tao, Y.-H., Yang, P.-C., 2008. The use of unified theory of acceptance and use of
technology to confer the behavioral model of 3G mobile telecommunication users. Journal of Statistics and Management Systems 11, 919–949.
Yang, K., 2010. Determinants of US consumer mobile shopping services adoption: implications for designing mobile shopping services. Journal of Consumer Marketing 27, 262–270. https://doi.org/10.1108/07363761011038338
Yen, D.C., Wu, C.-S., Cheng, F.-F., Huang, Y.-W., 2010. Determinants of users’ intention to adopt wireless technology: An empirical study by integrating TTF with TAM. Computers in Human Behavior, Advancing Educational Research on Computer-supported Collaborative Learning (CSCL) through the use of gStudy CSCL Tools 26, 906–915. https://doi.org/10.1016/j.chb.2010.02.005
Yi, M.Y., Fiedler, K.D., Park, J.S., 2006. Understanding the Role of Individual Innovativeness in the Acceptance of IT-Based Innovations: Comparative Analyses of Models and Measures*. Decision Sciences 37, 393–426.
Yim, M.Y.-C., Yoo, S.-C., Sauer, P.L., Seo, J.H., 2013. Hedonic shopping motivation and co-shopper influence on utilitarian grocery shopping in superstores. Journal of the Academy of Marketing Science. https://doi.org/10.1007/s11747-013-0357-2
Yoon, C., Kim, S., 2007. Convenience and TAM in a Ubiquitous Computing Environment: The Case of Wireless LAN. Electron. Commer. Rec. Appl. 6, 102–112. https://doi.org/10.1016/j.elerap.2006.06.009
Yousafzai, S.Y., Foxall, G.R., Pallister, J.G., 2007a. Technology acceptance: a meta-analysis of the TAM: Part 1. Journal of Modelling in Management 2, 251–280. https://doi.org/10.1108/17465660710834453
Yousafzai, S.Y., Foxall, G.R., Pallister, J.G., 2007b. Technology acceptance: a meta-analysis of the TAM: Part 2. Journal of Modelling in Management 2, 281–304. https://doi.org/10.1108/17465660710834462
Yu, P., Ma, X., Cao, J., Lu, J., 2013. Application mobility in pervasive computing: A survey. Pervasive and Mobile Computing, Special Section: Pervasive Sustainability 9, 2–17. https://doi.org/10.1016/j.pmcj.2012.07.009
Yzer, M., 2012. Perceived Behavioral Control in Reasoned Action Theory A Dual-Aspect Interpretation. The ANNALS of the American Academy of Political and Social Science 640, 101–117. https://doi.org/10.1177/0002716211423500
Zaichkowsky, J.L., 1985. Measuring the involvement construct. Journal of consumer research 341–352.
Zhang, K.Z., Cheung, C.M., Lee, M.K., 2014. Examining the moderating effect of inconsistent reviews and its gender differences on consumers’ online shopping decision. International Journal of Information Management 34, 89–98.

287
Zhang, L.L., 2006. Behind the “Great Firewall”: Decoding China’s Internet Media Policies from the Inside. Convergence: The International Journal of Research into New Media Technologies 12, 271–291. https://doi.org/10.1177/1354856506067201
Zhou, L., Dai, L., Zhang, D., 2007. Online shopping acceptance model-A critical survey of consumer factors in online shopping. Journal of Electronic Commerce Research 8, 41–62.
Zhou, T., Lu, Y., Wang, B., 2010. Integrating TTF and UTAUT to explain mobile banking user adoption. Computers in Human Behavior 26, 760–767.
Zhu, Z., Nakata, C., Sivakumar, K., Grewal, D., 2013. Fix It or Leave It? Customer Recovery from Self-service Technology Failures. Journal of Retailing 89, 15–29. https://doi.org/10.1016/j.jretai.2012.10.004
Zielke, S., Toporowski, W., Kniza, B., 2011. Customer acceptance of a new interactive information terminal in grocery retailing: antecedents and moderators, in: Pantano, Eleonora, Timmermans, Harry (Eds.), Advanced Technologies Management for Retailing: Frameworks and Cases. IGI GlobalPublisher, USA, pp. 289–305.
Ziesak, J., 2013. The Dark Side of Personalization: Online Privacy Concerns influence Customer Behavior. Anchor Academic Publishing (aap_verlag).
Zuschlag, M.K., Whitbourne, S.K., 1994. Psychosocial development in three generations of college students. Journal of youth and adolescence 23, 567–577.