Exploring quadrilaterals in a small group computing environment
11
Exploring quadrilaterals in a small group computing environment Kevin Lai a, * , Tobin White b a Institute of Education, National Chiao Tung University,1001 Ta-Hsueh Rd., Hsin Chu City 300, Taiwan, ROC b School of Education, University of California, Davis, One Shields Avenue, Davis, CA 95616, USA article info Article history: Received 2 November 2011 Received in revised form 5 April 2012 Accepted 6 April 2012 Keywords: Cooperative learning Interactive learning environments abstract Though cooperative learning has been a topic of considerable interest in educational research, there has been little study specific to learning in the mathematics content area of geometry. This paper seeks to address that gap through a design experiment featuring a novel small-group computing environment for supporting student learning about quadrilaterals. In this design, each student controls a unique point in a shared geometric space, and those points are linked such that a group of four students collectively forms a quadrilateral. We first present results from pre- and post-measures to show how the students learned from the activities and developed in terms of geometric reasoning. We then present three episodes, elaborated with the notion of appropriation, to explain how students took up ways of using the technological tools and of talking about geometric concepts from one another in the interactive envi- ronment. Our study found that students achieved learning gains in this novel environment, that the environment provided rich opportunities for peer interaction around geometric objects, and that student learning opportunities and interactions were characterized by processes of appropriating ways of talking about and using software features. Ó 2012 Elsevier Ltd. All rights reserved. 1. Introduction 1.1. Background and research questions Studies of peer interactions have helped researchers better understand students’ thinking and learning processes in a variety of areas in mathematics (Barron, 2000, 2003; Stevens, 2000; White, 2006; White & Pea, 2011; Zurita & Nussbaum, 2004), but little research on cooperative learning of mathematics has specifically addressed the area of geometry. The present study seeks to address this gap in the mathematics education research literature by looking at peer interaction and communication in the context of small-group student learning activities involving geometric figures. This study also introduces a new way of using technology to promote geometry learning. The use of computer-based learning environments to engage students in the transformation and manipulation of geometric objects has been increasingly widespread in secondary mathematics education (Battista, 1998; Jones, 2000). However, most of these geometry learning environments involved only one learner (e.g. Erez & Yerushalmy, 2006) or two students working on tasks as a pair in front of a single shared computer (e.g. Jones, 2000; Yu, Barrett, & Presmeg, 2009). Recent technology advances have extended the computer environment to include networked handheld computing devices sometimes linked to a shared server (e.g. Infante, Hidalgo, Nussbaum, Alarcón, & Gottlieb, 2009; Nussbaum et al., 2009). Interactions in these envi- ronments take on additional layers as students use their handhelds to input into a server, and they need to attend to their individual screens and/or to a shared display as well as direct communication with peers. Liu, Chung, Chen, and Liu (2009) investigated students’ interactions in one networked handhelds environment, and found that the combination of the handhelds with a shared display promoted student engagement, generated deep discussion, and provided a social workspace for students to participate in lively interactions (e.g. frequent hand-pointing behaviors). As handhelds are used more widely now, researchers have the opportunity to look into how different features in a small group computing environment, from information displayed on a shared screen to information displayed on the handhelds, can afford different forms of student participation and interaction. Our approach builds on and extends this previous work by focusing on student * Corresponding author. Tel.: þ886 975313135. E-mail addresses: [email protected], [email protected] (K. Lai). Contents lists available at SciVerse ScienceDirect Computers & Education journal homepage: www.elsevier.com/locate/compedu 0360-1315/$ – see front matter Ó 2012 Elsevier Ltd. All rights reserved. doi:10.1016/j.compedu.2012.04.006 Computers & Education 59 (2012) 963–973
Transcript of Exploring quadrilaterals in a small group computing environment
Computers & Education 59 (2012) 963–973
Contents lists available at SciVerse ScienceDirect
Computers & Education
journal homepage: www.elsevier .com/locate/compedu
Exploring quadrilaterals in a small group computing environment
Kevin Lai a,*, Tobin White b
a Institute of Education, National Chiao Tung University, 1001 Ta-Hsueh Rd., Hsin Chu City 300, Taiwan, ROCb School of Education, University of California, Davis, One Shields Avenue, Davis, CA 95616, USA
a r t i c l e i n f o
Article history:Received 2 November 2011Received in revised form5 April 2012Accepted 6 April 2012
Keywords:Cooperative learningInteractive learning environments
* Corresponding author. Tel.: þ886 975313135.E-mail addresses: [email protected], laikevin@gm
0360-1315/$ – see front matter � 2012 Elsevier Ltd. Adoi:10.1016/j.compedu.2012.04.006
a b s t r a c t
Though cooperative learning has been a topic of considerable interest in educational research, there hasbeen little study specific to learning in the mathematics content area of geometry. This paper seeks toaddress that gap through a design experiment featuring a novel small-group computing environment forsupporting student learning about quadrilaterals. In this design, each student controls a unique point ina shared geometric space, and those points are linked such that a group of four students collectivelyforms a quadrilateral. We first present results from pre- and post-measures to show how the studentslearned from the activities and developed in terms of geometric reasoning. We then present threeepisodes, elaborated with the notion of appropriation, to explain how students took up ways of using thetechnological tools and of talking about geometric concepts from one another in the interactive envi-ronment. Our study found that students achieved learning gains in this novel environment, that theenvironment provided rich opportunities for peer interaction around geometric objects, and that studentlearning opportunities and interactions were characterized by processes of appropriating ways of talkingabout and using software features.
� 2012 Elsevier Ltd. All rights reserved.
1. Introduction
1.1. Background and research questions
Studies of peer interactions have helped researchers better understand students’ thinking and learning processes in a variety of areas inmathematics (Barron, 2000, 2003; Stevens, 2000; White, 2006; White & Pea, 2011; Zurita & Nussbaum, 2004), but little research oncooperative learning of mathematics has specifically addressed the area of geometry. The present study seeks to address this gap in themathematics education research literature by looking at peer interaction and communication in the context of small-group student learningactivities involving geometric figures. This study also introduces a new way of using technology to promote geometry learning. The use ofcomputer-based learning environments to engage students in the transformation and manipulation of geometric objects has beenincreasingly widespread in secondary mathematics education (Battista, 1998; Jones, 2000). However, most of these geometry learningenvironments involved only one learner (e.g. Erez & Yerushalmy, 2006) or two students working on tasks as a pair in front of a single sharedcomputer (e.g. Jones, 2000; Yu, Barrett, & Presmeg, 2009).
Recent technology advances have extended the computer environment to include networked handheld computing devices sometimeslinked to a shared server (e.g. Infante, Hidalgo, Nussbaum, Alarcón, & Gottlieb, 2009; Nussbaum et al., 2009). Interactions in these envi-ronments take on additional layers as students use their handhelds to input into a server, and they need to attend to their individual screensand/or to a shared display as well as direct communication with peers. Liu, Chung, Chen, and Liu (2009) investigated students’ interactionsin one networked handhelds environment, and found that the combination of the handhelds with a shared display promoted studentengagement, generated deep discussion, and provided a social workspace for students to participate in lively interactions (e.g. frequenthand-pointing behaviors). As handhelds are used more widely now, researchers have the opportunity to look into how different features ina small group computing environment, from information displayed on a shared screen to information displayed on the handhelds, can afforddifferent forms of student participation and interaction. Our approach builds on and extends this previous work by focusing on student
ail.com (K. Lai).
ll rights reserved.

K. Lai, T. White / Computers & Education 59 (2012) 963–973964
learning and interactions in the context of small groups equipped with both a shared computer and an individual handheld device for eachparticipant.
In our study, we incorporated elements of active construction and manipulation into the design of instructional activities involvingexploration of geometric shapes. Specifically, our learning activity designs focus on quadrilaterals, a topic students have difficulty with evenin their middle school years (Jones, 2000; Yu et al., 2009). In designing the learning environment, we drew heavily on the van Hiele theory(van Hiele, 1959/1985), which suggests that students initially understand shapes as gestalt figures, then later recognize the shapes’components and identify relationships among the components, then subsequently progress to understanding the hierarchical relationshipsamong the various shapes. To encourage students’ progression along this developmental trajectory, van Hiele stressed the importance ofactive exploration, communication, and verbalization as ways to make implicit ideas become more explicit (van Hiele, 1986).
A primary motivation for the present study is to investigate the premise that working in small groups might be a particularly effectiveway to engender opportunities for students to engage in active exploration of and social interaction around geometric shapes. To this end,we designed a computing environment that capitalizes on the relationship between vertices of a polygon and the number of students ina group. More specifically, each student controls a point in a space such that a group of four students’ points form a quadrilateral. Throughvarious activities, students move their points in the mathematical space to create various quadrilaterals (squares, rectangles, rhombi, etc.).To further support students’ progression toward more sophisticated reasoning about shapes along the lines proposed by van Hiele, thedesign included a succession of three different versions of the learning environment and a corresponding sequence of tasks.
This study investigates two main questions:
1) Do small group tasks involving the joint manipulation of quadrilaterals in a dynamic geometry environment support students’ learningabout geometric shapes and their relationships?
2) How do students interact and participate in small group activities involving the joint manipulation of quadrilaterals in a dynamicgeometry environment?
To address these questions, we examined both paper-based measures of individual student learning and interactions within studentgroups. We used the notion of appropriation (Rogoff, 1995) to provide a framework for studying how students made sense of quadrilateralsusing the technological tools through peer interactions during cooperative tasks. In our results, we first present students’ pre- and post-instruction performance to investigate what individuals learned through the intervention. We then present episodes that highlight thekinds of appropriation engaged by the participants in small group activities.
1.2. Theoretical frameworks
The van Hiele framework has been tremendously influential over several decades of research on children’s geometric understanding(Battista, 2007). Van Hiele’s original theory (1959/1985) used five levels to describe how children develop their geometric understanding. AtLevel 1 (Visual), students see geometric figures as gestalts and often describe themusing other familiar objects. At Level 2 (Analytic), studentsbegin to see the figures as having different components and properties. At Level 3 (Abstract/Relational), students are better able tounderstand categorizations and abstract definitions. They begin to see the hierarchical relationships between the various shapes, such asknowing that squares can be rhombuses. Students usually do not reach Levels 4 (Formal Deduction) and 5 (Rigor) until high school or beyond,if at all. At these levels, students start to reason using axioms and theorems and are able to make conjectures and develop proofs withina mathematical system. Because our study involved middle school students, we focus on those levels that pertain to students at that age,particularly van Hiele Levels 1 through 3.
Because communication and language are important aspects of the van Hiele theory, researchers can better understand students’learning of geometry by observing their negotiating and interacting with one another in group settings. In our analysis, we incorporated theidea of appropriation to account for how students work with others and with tools in a small group (Rogoff, 1990). Appropriation occurswhen students participate in a form of social activity and become familiar with the cultural tools that mediate that activity (Rogoff, 1995). Inessence, appropriation involves taking up someone else’s words or ways of talking or acting and making them one’s own (Rogoff, 1990).When students begin to make use of shared meanings and resources, they are becoming participants in collective practices. Several recentstudies have applied an appropriation framework to the examination of mathematics learning in interactional settings (e.g. Carlsen, 2010;Moschkovich, 2004; Radford, 2006). In our study, we investigated how students were able to appropriate ways of using the technologicaltools and of talking about geometric concepts in a small group computing environment (Jones, 2000). We examined towhat extent studentswere able to appropriate from one another ways of using features of the software and of explaining and viewing geometric shapes.
Carlsen (2010) explained how the appropriation process involves learners’ achieving new means of expressing mathematical meaning.He noted Rogoff (1990)’s three key components for appropriation:
1. involvement in joint activity- students work together on a given task2. shared focus of attention- the group has a consensus as to where to focus their attention3. shared meanings for utterances- students engage in a sense-making process and establish shared meanings in their interactions
Carlsen (2010) operationalized these three components by explaining how students’ gaze, gestures, and words function to establishshared focus andmeanings for utterances. Our study uses the notion of appropriation to examine the potential for a set of technological toolsto support students’ progression along the van Hiele levels. We examined how the students appropriated the use of the tools and termi-nology as they worked together in the computing environment. As there is a lack of research in student group learning about geometricshapes, an aim of our study was to incorporate the van Hiele levels into a framework for analyzing joint activity.
According to the van Hiele theory, students progress from viewing geometric shapes as gestalt figures to noticing the components of theshapes to understanding hierarchical relationships among the shapes. Communication and “explicitation” are important instructionalmeans to help students progress along the van Hiele levels. We examined how students appropriated the technology and geometric
K. Lai, T. White / Computers & Education 59 (2012) 963–973 965
terminology and how they used hand gestures, language, and other means to communicate with one another and to make their reasoningexplicit. Specifically, we looked at how students directed one another’s attention from simply viewing the shape as a gestalt whole toviewing the individual parts and understanding general properties to progress along the van Hiele levels. We also used the framework toinvestigate how students engaged in a shared sense-making process as they drew on prior knowledge, reasoned with one another, andbegan to establish shared meanings in the small group context.
2. Small group computing environment
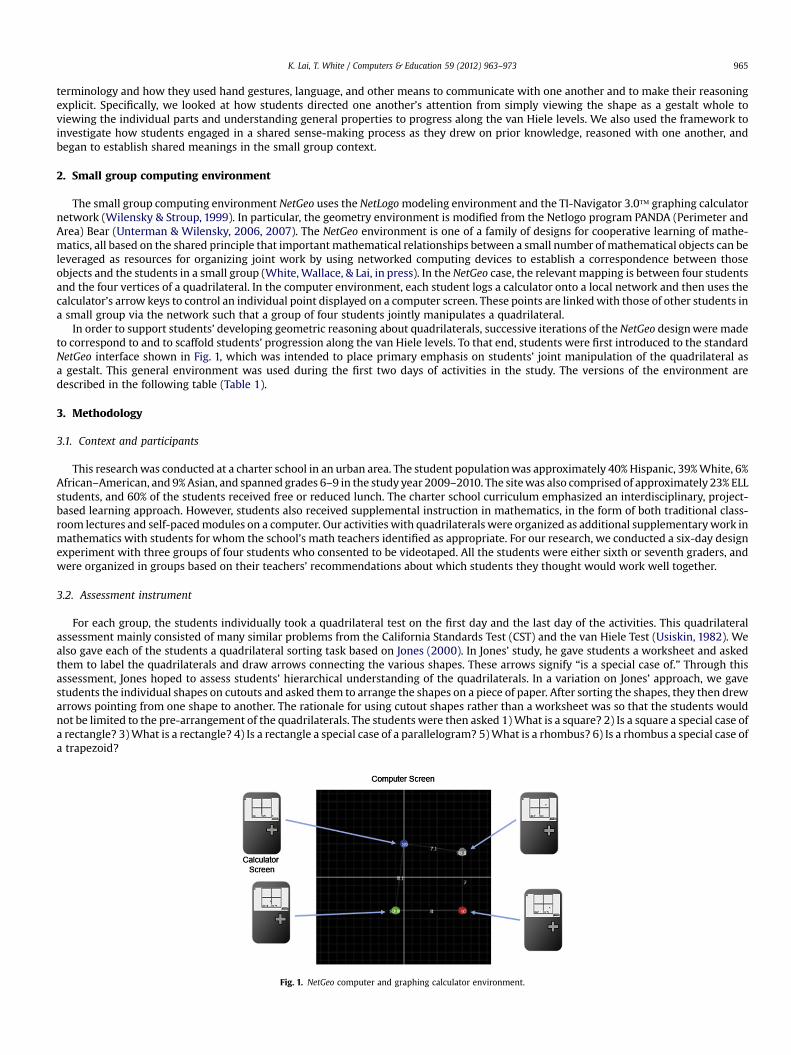
The small group computing environment NetGeo uses the NetLogomodeling environment and the TI-Navigator 3.0� graphing calculatornetwork (Wilensky & Stroup, 1999). In particular, the geometry environment is modified from the Netlogo program PANDA (Perimeter andArea) Bear (Unterman & Wilensky, 2006, 2007). The NetGeo environment is one of a family of designs for cooperative learning of mathe-matics, all based on the shared principle that important mathematical relationships between a small number of mathematical objects can beleveraged as resources for organizing joint work by using networked computing devices to establish a correspondence between thoseobjects and the students in a small group (White, Wallace, & Lai, in press). In the NetGeo case, the relevant mapping is between four studentsand the four vertices of a quadrilateral. In the computer environment, each student logs a calculator onto a local network and then uses thecalculator’s arrow keys to control an individual point displayed on a computer screen. These points are linkedwith those of other students ina small group via the network such that a group of four students jointly manipulates a quadrilateral.
In order to support students’ developing geometric reasoning about quadrilaterals, successive iterations of the NetGeo designwere madeto correspond to and to scaffold students’ progression along the van Hiele levels. To that end, students were first introduced to the standardNetGeo interface shown in Fig. 1, which was intended to place primary emphasis on students’ joint manipulation of the quadrilateral asa gestalt. This general environment was used during the first two days of activities in the study. The versions of the environment aredescribed in the following table (Table 1).
3. Methodology
3.1. Context and participants
This researchwas conducted at a charter school in an urban area. The student populationwas approximately 40% Hispanic, 39%White, 6%African–American, and 9%Asian, and spanned grades 6–9 in the study year 2009–2010. The sitewas also comprised of approximately 23% ELLstudents, and 60% of the students received free or reduced lunch. The charter school curriculum emphasized an interdisciplinary, project-based learning approach. However, students also received supplemental instruction in mathematics, in the form of both traditional class-room lectures and self-pacedmodules on a computer. Our activities with quadrilateralswere organized as additional supplementarywork inmathematics with students for whom the school’s math teachers identified as appropriate. For our research, we conducted a six-day designexperiment with three groups of four students who consented to be videotaped. All the students were either sixth or seventh graders, andwere organized in groups based on their teachers’ recommendations about which students they thought would work well together.
3.2. Assessment instrument
For each group, the students individually took a quadrilateral test on the first day and the last day of the activities. This quadrilateralassessment mainly consisted of many similar problems from the California Standards Test (CST) and the van Hiele Test (Usiskin, 1982). Wealso gave each of the students a quadrilateral sorting task based on Jones (2000). In Jones’ study, he gave students a worksheet and askedthem to label the quadrilaterals and draw arrows connecting the various shapes. These arrows signify “is a special case of.” Through thisassessment, Jones hoped to assess students’ hierarchical understanding of the quadrilaterals. In a variation on Jones’ approach, we gavestudents the individual shapes on cutouts and asked them to arrange the shapes on a piece of paper. After sorting the shapes, they then drewarrows pointing from one shape to another. The rationale for using cutout shapes rather than a worksheet was so that the students wouldnot be limited to the pre-arrangement of the quadrilaterals. The students were then asked 1)What is a square? 2) Is a square a special case ofa rectangle? 3)What is a rectangle? 4) Is a rectangle a special case of a parallelogram? 5)What is a rhombus? 6) Is a rhombus a special case ofa trapezoid?
Fig. 1. NetGeo computer and graphing calculator environment.

Table 1Summary of the NetGeo versions.
Environment Features
Version 1 (Days 1, 2) In the standard NetGeo environment, each calculator controls a vertex on the quadrilateral.Version 2 (Days 3, 4) In NetGeo with Calculator Value Displays, values for the lengths of the sides and the angles at the vertices were displayed on individual
students’ calculators. The goals of modifying the environment in this way were to direct students’ attention to the shape’s length and anglevalues and to distribute information about these properties of the figure across multiple student devices. In addition, the quadrilateral shapewas no longer constantly updated as students moved; instead, a student needed to press a “mark” button to mark a new vertex and thus forma new quadrilateral. This feature offered the potential advantage of encouraging students to reflect on which coordinate locationswarranted marking.
Version 3 (Days 5, 6) In NetGeo with Property Monitors, the group no longer had information regarding length and angle values on either the computer or calculatordisplays. Instead, there were monitors in the computer environment that indicated certain properties of the quadrilateral (e.g. the numberof right angles). This design iteration aimed to support students’ progression along the van Hiele levels by directing their attention to theshape’s general properties.
K. Lai, T. White / Computers & Education 59 (2012) 963–973966
We analyzed the results by looking at the termswritten down and the arrows drawn by the students. The students individually answeredeach of the above questions, and their verbal answers were recorded and transcribed. We then categorized their answers as eitherpredominantly visual (e.g. “rectangle is a long kind of square”), noticing components (e.g. “a rectangle has two sets of parallel sides”),a mixture of both (e.g. “a rectangle is a long kind of square, but and also has two sets of congruent sides”) or “other” in cases where none ofthe preceding categories applied.
3.3. Schedule of activities
Many of our activities and instruction were based on Jones (2000). In his study, Jones asked pairs of students to work in a Cabri envi-ronment to create certain quadrilaterals and explain why the shapes were of a certain type. Throughout the teaching units, the researcherlimited his interaction with the students to either responses (usually in the form of questions) or asking students for their explanations.
Many of our tasks involved asking students to create a certain shape and to justify their answer. All tasks were introduced and interviewsconducted by the first author. As our primary role in these interactions was that of researcher rather than teacher, we primarily askedquestions in order to elicit students’ thinking rather than as part of an instructional strategy. Throughout the activities, we gave studentsworksheets and asked them to refine their definitions for the various quadrilaterals. In our study, the students had to learn the followingterms: quadrilateral, rectangle, square, parallelogram, rhombus, trapezoid, and kite. For the first group, we also included isosceles trapezoid,which we subsequently removed because it posed too difficult of a task for some of the students.
Students’ learning sessions with the NetGeo environment spanned six days, including two days with each version of the computer andcalculator interfaces described above, and correspondingly different sets of activities. The schedule of activities is as follows (Table 2):
3.4. Data collection & analyses
There were four main data sources:
1. Pre- and post-assessments2. Video recordings of work sessions3. Field notes and design notes taken after sessions4. Video capture of computer screen and logs of students’ inputs
Fig. 2. Team members participating in the activity, while a student (most left) gestured toward screen.
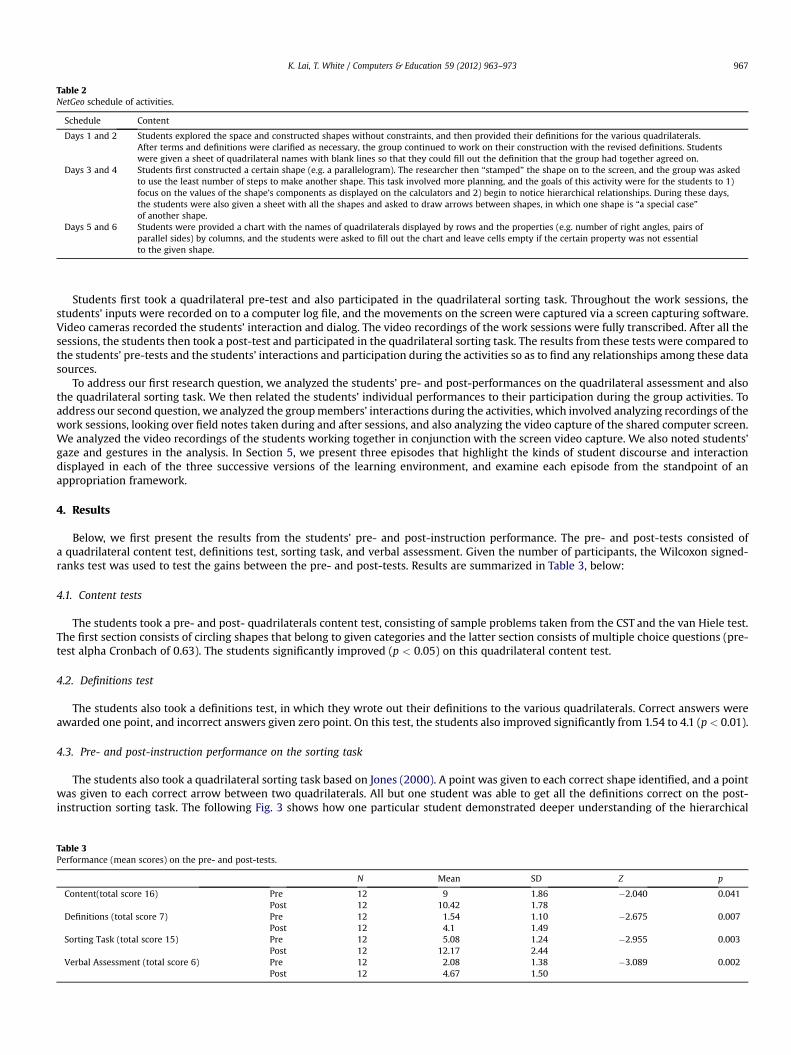
Table 2NetGeo schedule of activities.
Schedule Content
Days 1 and 2 Students explored the space and constructed shapes without constraints, and then provided their definitions for the various quadrilaterals.After terms and definitions were clarified as necessary, the group continued to work on their construction with the revised definitions. Studentswere given a sheet of quadrilateral names with blank lines so that they could fill out the definition that the group had together agreed on.
Days 3 and 4 Students first constructed a certain shape (e.g. a parallelogram). The researcher then “stamped” the shape on to the screen, and the group was askedto use the least number of steps to make another shape. This task involved more planning, and the goals of this activity were for the students to 1)focus on the values of the shape’s components as displayed on the calculators and 2) begin to notice hierarchical relationships. During these days,the students were also given a sheet with all the shapes and asked to draw arrows between shapes, in which one shape is “a special case”of another shape.
Days 5 and 6 Students were provided a chart with the names of quadrilaterals displayed by rows and the properties (e.g. number of right angles, pairs ofparallel sides) by columns, and the students were asked to fill out the chart and leave cells empty if the certain property was not essentialto the given shape.
K. Lai, T. White / Computers & Education 59 (2012) 963–973 967
Students first took a quadrilateral pre-test and also participated in the quadrilateral sorting task. Throughout the work sessions, thestudents’ inputs were recorded on to a computer log file, and the movements on the screen were captured via a screen capturing software.Video cameras recorded the students’ interaction and dialog. The video recordings of the work sessions were fully transcribed. After all thesessions, the students then took a post-test and participated in the quadrilateral sorting task. The results from these tests were compared tothe students’ pre-tests and the students’ interactions and participation during the activities so as to find any relationships among these datasources.
To address our first research question, we analyzed the students’ pre- and post-performances on the quadrilateral assessment and alsothe quadrilateral sorting task. We then related the students’ individual performances to their participation during the group activities. Toaddress our second question, we analyzed the groupmembers’ interactions during the activities, which involved analyzing recordings of thework sessions, looking over field notes taken during and after sessions, and also analyzing the video capture of the shared computer screen.We analyzed the video recordings of the students working together in conjunction with the screen video capture. We also noted students’gaze and gestures in the analysis. In Section 5, we present three episodes that highlight the kinds of student discourse and interactiondisplayed in each of the three successive versions of the learning environment, and examine each episode from the standpoint of anappropriation framework.
4. Results
Below, we first present the results from the students’ pre- and post-instruction performance. The pre- and post-tests consisted ofa quadrilateral content test, definitions test, sorting task, and verbal assessment. Given the number of participants, the Wilcoxon signed-ranks test was used to test the gains between the pre- and post-tests. Results are summarized in Table 3, below:
4.1. Content tests
The students took a pre- and post- quadrilaterals content test, consisting of sample problems taken from the CST and the van Hiele test.The first section consists of circling shapes that belong to given categories and the latter section consists of multiple choice questions (pre-test alpha Cronbach of 0.63). The students significantly improved (p < 0.05) on this quadrilateral content test.
4.2. Definitions test
The students also took a definitions test, in which they wrote out their definitions to the various quadrilaterals. Correct answers wereawarded one point, and incorrect answers given zero point. On this test, the students also improved significantly from 1.54 to 4.1 (p < 0.01).
4.3. Pre- and post-instruction performance on the sorting task
The students also took a quadrilateral sorting task based on Jones (2000). A point was given to each correct shape identified, and a pointwas given to each correct arrow between two quadrilaterals. All but one student was able to get all the definitions correct on the post-instruction sorting task. The following Fig. 3 shows how one particular student demonstrated deeper understanding of the hierarchical
Table 3Performance (mean scores) on the pre- and post-tests.
N Mean SD Z p
Content(total score 16) Pre 12 9 1.86 �2.040 0.041Post 12 10.42 1.78
Definitions (total score 7) Pre 12 1.54 1.10 �2.675 0.007Post 12 4.1 1.49
Sorting Task (total score 15) Pre 12 5.08 1.24 �2.955 0.003Post 12 12.17 2.44
Verbal Assessment (total score 6) Pre 12 2.08 1.38 �3.089 0.002Post 12 4.67 1.50

Fig. 3. Evan’s pre- and post-instruction performance on the sorting task.
K. Lai, T. White / Computers & Education 59 (2012) 963–973968
relationships of the various quadrilaterals after the activities. Initially, before the intervention, Evan only got 4 definitions correct and only 3correct arrows. His organization was also very linear. In the end, he was able to get all 7 definitions correct and get 7 correct arrows, as hebegan to recognize the interrelationships among the shapes.
4.4. Verbal assessment
At the end of the sorting task, we also asked the students some questions. Out of a total of 24 pre-instruction responses, eight responsesreferred to a shape’s components and properties. In the remaining instances, students typically responded by referring to the shape asa gestalt. For example, for question 2, a student Evan described a rectangle as “like two squares put together.”
By the post-instruction responses, 18 student responses referred to the attributes of the shapes. For question 2, although Evan’s answerstill had some aspects suggestive of visual thinking, he was beginning to notice components as well. He related a rectangle to a square ashaving the “same properties, just like 2 squares, four right angles, this one only has two equal sides, this one has four.” The studentssignificantly improved (p < 0.01) on this verbal assessment.
5. Participation and appropriation processes
We present three episodes, one taken from each version of the computing environment: the standard NetGeo interface, NetGeo withCalculator Value Displays, and NetGeo with Property Monitors. Through the episodes, we explain how the succession of tools scaffoldedparticipation by different students as they engaged in processes of appropriation.
5.1. Episode 1: creating a parallelogram (day 2)
This episode took place on Day 2, when the students were in the initial stages of attending to components of shapes. The students weregiven the task of creating any parallelogram, using the standard NetGeo interface. The episode is taken after the group had completed thefollowing Fig. 4 (which looks similar to but is not exactly a parallelogram).
1. Researcher: Dan, what’s the definition of a parallelogram?2. Dan: Like a rectangle, but like turned sideways and messed up.3. Alan: No no no.4. Researcher: (noticing that Matt had raised his hand as if waiting to speak) Matt?5. Matt: A parallelogram is kind of like a rectangle but has two parallel lines (Matt motions parallel lines with his hands)6. Dan: Two messed up lines.7. Matt: Two tilted.8. Alan: It’s a quadrilateral with two acute angles and two obtuse angles. (gesturing to the screen) See two obtuse, two acute.
At first, Dan responded that a parallelogram is “like a rectangle, but.turned sideways and messed up” (line 2), reasoning typical of vanHiele level 1. Matt then picked up but also modulated some of Dan’s phrasing as he asserted that a parallelogram is “kind of like a rectangle”(line 5). However, he also began to notice the shape’s components and further made a connection between the term parallelogram and thefact that its opposing sides should be parallel. In explaining this, Matt used his hands to motion parallel lines to his team members, whichdrew students’ attention to the lines and made explicit the concept of parallel lines.
Dan re-emphasized the idea of parallel lines, but he used language (“messed up”) that was both non-standard and non-specific (line 6).Matt then built on the idea using terminology (“tilted”) that was still informal but more descriptive (line 7). Matt and Dan’s successivecomments built on one another as each student in turn appropriated language from the other. Through this dialog, the groupmembers werebeginning to move beyond seeing the shape as a gestalt and to notice the components, although some of them were still using languagetypical of reasoning at van Hiele level 1 as they described these components.
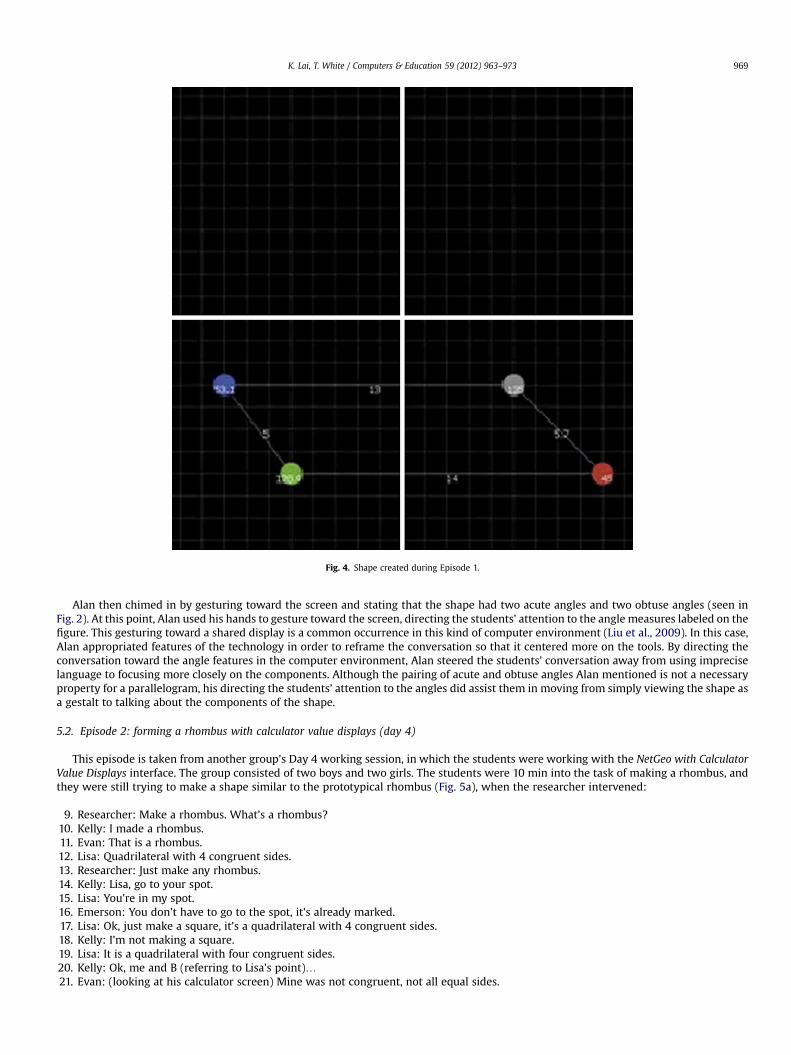
Fig. 4. Shape created during Episode 1.
K. Lai, T. White / Computers & Education 59 (2012) 963–973 969
Alan then chimed in by gesturing toward the screen and stating that the shape had two acute angles and two obtuse angles (seen inFig. 2). At this point, Alan used his hands to gesture toward the screen, directing the students’ attention to the angle measures labeled on thefigure. This gesturing toward a shared display is a common occurrence in this kind of computer environment (Liu et al., 2009). In this case,Alan appropriated features of the technology in order to reframe the conversation so that it centered more on the tools. By directing theconversation toward the angle features in the computer environment, Alan steered the students’ conversation away from using impreciselanguage to focusing more closely on the components. Although the pairing of acute and obtuse angles Alan mentioned is not a necessaryproperty for a parallelogram, his directing the students’ attention to the angles did assist them in moving from simply viewing the shape asa gestalt to talking about the components of the shape.
5.2. Episode 2: forming a rhombus with calculator value displays (day 4)
This episode is taken from another group’s Day 4 working session, in which the students were working with the NetGeo with CalculatorValue Displays interface. The group consisted of two boys and two girls. The students were 10 min into the task of making a rhombus, andthey were still trying to make a shape similar to the prototypical rhombus (Fig. 5a), when the researcher intervened:
9. Researcher: Make a rhombus. What’s a rhombus?10. Kelly: I made a rhombus.11. Evan: That is a rhombus.12. Lisa: Quadrilateral with 4 congruent sides.13. Researcher: Just make any rhombus.14. Kelly: Lisa, go to your spot.15. Lisa: You’re in my spot.16. Emerson: You don’t have to go to the spot, it’s already marked.17. Lisa: Ok, just make a square, it’s a quadrilateral with 4 congruent sides.18. Kelly: I’m not making a square.19. Lisa: It is a quadrilateral with four congruent sides.20. Kelly: Ok, me and B (referring to Lisa’s point).21. Evan: (looking at his calculator screen) Mine was not congruent, not all equal sides.

Fig. 5. Shapes created by Group 1 during Episode 2.
K. Lai, T. White / Computers & Education 59 (2012) 963–973970
22. Lisa: That’s a square.23. Kelly: All equal sides.24. Evan: All congruent sides. It’s exactly the same thing. It means the same thing.25. Lisa: Square is all congruent sides. We have to make any kind of rhombus.26. Kelly: D (referring to Evan’s point) move that way, move left.27. Lisa: Graph, graph. What did you get? (The group formed the square as seen in Fig. 5b). (looking at her calculator screen) 90, 2 and 2.28. Kelly: (looking at her calculator screen) 90, 2 and 2.29. Evan: (looking at his calculator screen) 90, 2.5 and 2 (later on, he mentions how he was just playing around when he said 2.5).
This episode shows how the group members began to move beyond seeing the shape as a whole to noticing components and beginningto understand hierarchical relationships. This episode also shows how group members began to establish a shared meaning of what isa rhombus and how the technology supported students’ progression in their geometric understanding. After unsuccessful attempts andbeing prompted by the researcher, Lisa stated that a rhombus is a quadrilateral with four congruent sides (line 12). The group then movedtheir points around, and Lisa came up with the idea of making a square, since “it’s a quadrilateral with four congruent sides” (line 17). Kellyinitially resisted Lisa’s proposal (line 18), so Lisa repeated her assertion that a square fits the definition of a rhombus (line 19). This exchangehighlights the importance of achieving consensus in this cooperative computing environment, as the group could not enact a suggestion likeLisa’s without all students agreeing to move their points accordingly.
At this point, looking at his calculator screen, Evan commented on how his length values appeared to be different: “Mine was notcongruent, not all equal sides” (line 21). Kelly also added, “All equal sides” (line 23), to which Evan replied, “All congruent sides.” (line 24).These turn-takings show how the ideas of congruence and squares having all equal sides continued to persist through the conversation andhow the team members built on the same idea.
An intended goal of introducing the NetGeo with Calculator Value Displays variation was that the students would use the information onthe calculator screens as resources for completing the tasks and as means for verbalizing their ideas. The group together made the square asseen in Fig. 5b. A strategy that students used to complete tasks in this environment was checking to see if the sides were equal by looking attheir calculator screens. After the group had created the square, Lisa looked at her calculator and observed, “90, 2 and 2.” Kelly and Evan alsoappropriated this use of the technology and looked at their calculator screens to confirm with one another that the sides were 2 and theangles were 90 by uttering the length values (line 27–29).
5.3. Episode 3: forming a rhombus with property monitors (day 6)
The following episodewas taken from the same group as in Episode 1, but occurred on the last day of the activities, after the introductionof the NetGeo with Property Monitors interface. On this last day, when asked to create a rhombus, the students were able to successfullyaccomplish the task by simply creating a square. The researcher followed up by asking the group to create a rhombus that is not a square.
30. Alan: Yeah yeah, okay Dan.Brad, youmove to the other side.Here rhombus (referring to Fig. 6a), but it’s not exactly a rhombus I know.31. Matt: (focusing on monitor on “congruent adjacent sides”) No, because a rhombus has a pair of congruent.2 congruent sides.32. Alan: No no.Yeah, but it has all the same side.33. Brad: (referring to the upper points) Matt and Dan, go up. There we go.34. Matt: It’s a rhombus. Check it out (referring to Fig. 6b).35. Alan: It is, it is, because it has the thing (pointing to the screen).oh no.36. Matt: It’s a rhombus, it’s a rhombus.37. Alan: (pointing to monitors) It can not be.It doesn’t have two pairs of adjacent sides.
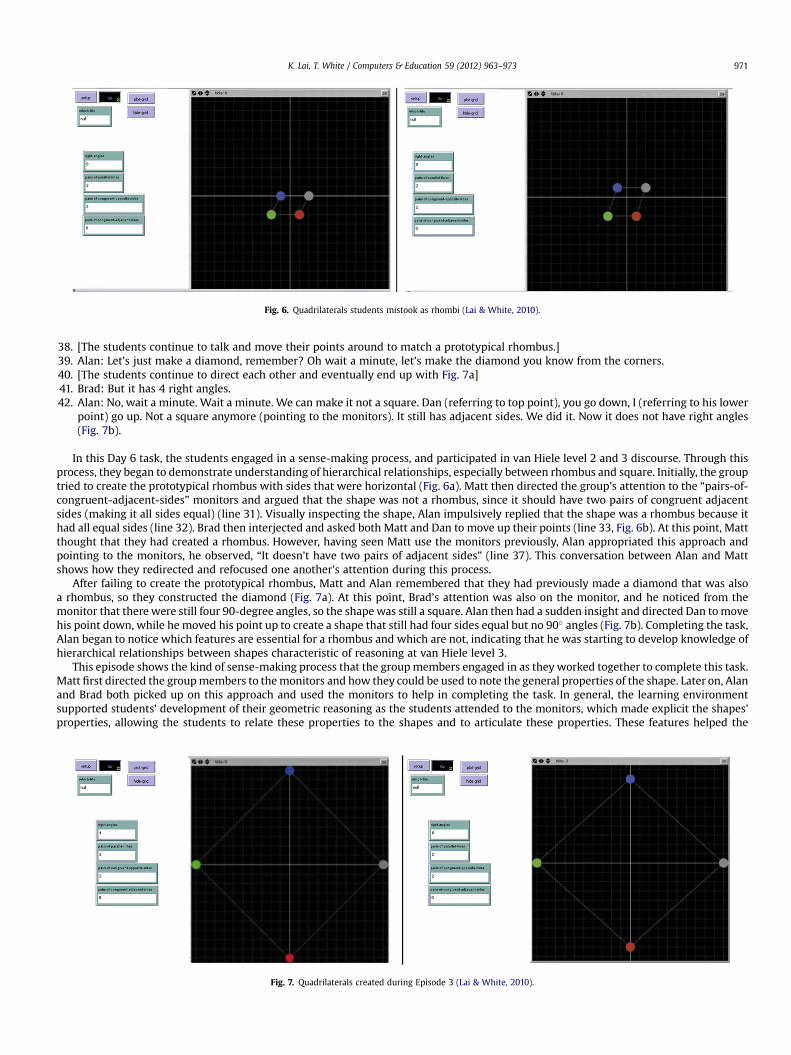
Fig. 6. Quadrilaterals students mistook as rhombi (Lai & White, 2010).
K. Lai, T. White / Computers & Education 59 (2012) 963–973 971
38. [The students continue to talk and move their points around to match a prototypical rhombus.]39. Alan: Let’s just make a diamond, remember? Oh wait a minute, let’s make the diamond you know from the corners.40. [The students continue to direct each other and eventually end up with Fig. 7a]41. Brad: But it has 4 right angles.42. Alan: No, wait a minute. Wait a minute. We can make it not a square. Dan (referring to top point), you go down, I (referring to his lower
point) go up. Not a square anymore (pointing to the monitors). It still has adjacent sides. We did it. Now it does not have right angles(Fig. 7b).
In this Day 6 task, the students engaged in a sense-making process, and participated in van Hiele level 2 and 3 discourse. Through thisprocess, they began to demonstrate understanding of hierarchical relationships, especially between rhombus and square. Initially, the grouptried to create the prototypical rhombus with sides that were horizontal (Fig. 6a). Matt then directed the group’s attention to the “pairs-of-congruent-adjacent-sides” monitors and argued that the shape was not a rhombus, since it should have two pairs of congruent adjacentsides (making it all sides equal) (line 31). Visually inspecting the shape, Alan impulsively replied that the shape was a rhombus because ithad all equal sides (line 32). Brad then interjected and asked both Matt and Dan to move up their points (line 33, Fig. 6b). At this point, Mattthought that they had created a rhombus. However, having seen Matt use the monitors previously, Alan appropriated this approach andpointing to the monitors, he observed, “It doesn’t have two pairs of adjacent sides” (line 37). This conversation between Alan and Mattshows how they redirected and refocused one another’s attention during this process.
After failing to create the prototypical rhombus, Matt and Alan remembered that they had previously made a diamond that was alsoa rhombus, so they constructed the diamond (Fig. 7a). At this point, Brad’s attention was also on the monitor, and he noticed from themonitor that there were still four 90-degree angles, so the shapewas still a square. Alan then had a sudden insight and directed Dan tomovehis point down, while he moved his point up to create a shape that still had four sides equal but no 90� angles (Fig. 7b). Completing the task,Alan began to notice which features are essential for a rhombus and which are not, indicating that he was starting to develop knowledge ofhierarchical relationships between shapes characteristic of reasoning at van Hiele level 3.
This episode shows the kind of sense-making process that the groupmembers engaged in as they worked together to complete this task.Matt first directed the groupmembers to themonitors and how they could be used to note the general properties of the shape. Later on, Alanand Brad both picked up on this approach and used the monitors to help in completing the task. In general, the learning environmentsupported students’ development of their geometric reasoning as the students attended to the monitors, which made explicit the shapes’properties, allowing the students to relate these properties to the shapes and to articulate these properties. These features helped the
Fig. 7. Quadrilaterals created during Episode 3 (Lai & White, 2010).
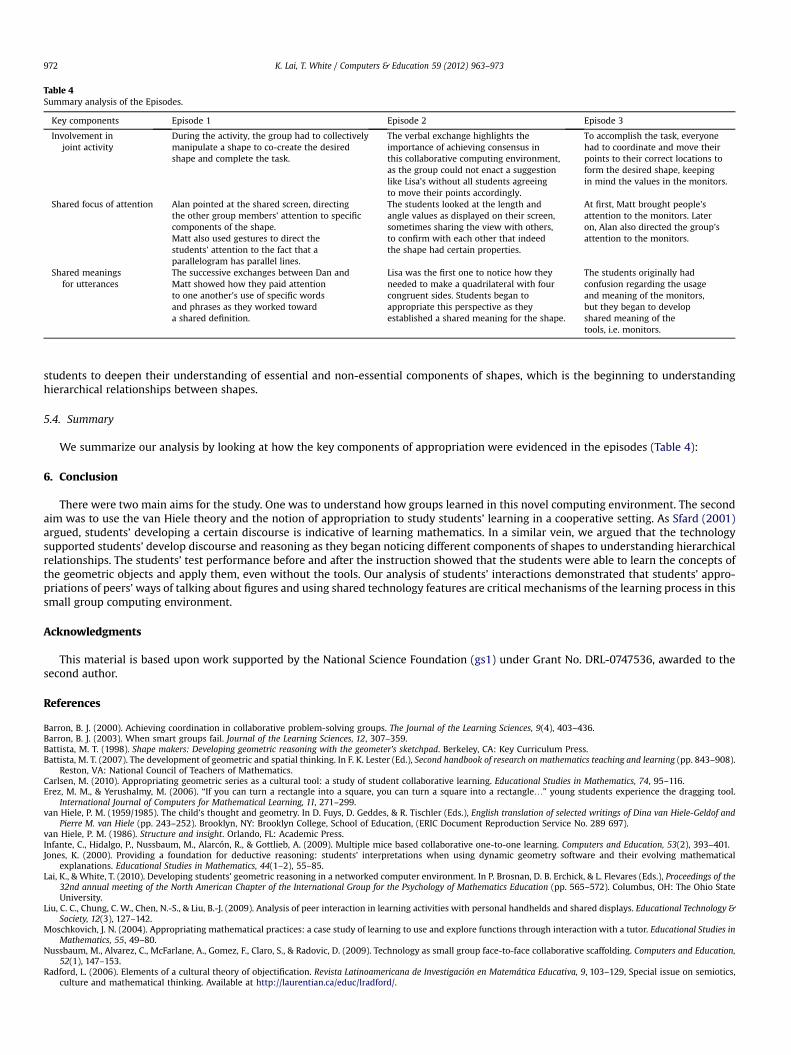
Table 4Summary analysis of the Episodes.
Key components Episode 1 Episode 2 Episode 3
Involvement injoint activity
During the activity, the group had to collectivelymanipulate a shape to co-create the desiredshape and complete the task.
The verbal exchange highlights theimportance of achieving consensus inthis collaborative computing environment,as the group could not enact a suggestionlike Lisa’s without all students agreeingto move their points accordingly.
To accomplish the task, everyonehad to coordinate and move theirpoints to their correct locations toform the desired shape, keepingin mind the values in the monitors.
Shared focus of attention Alan pointed at the shared screen, directingthe other group members’ attention to specificcomponents of the shape.Matt also used gestures to direct thestudents’ attention to the fact that aparallelogram has parallel lines.
The students looked at the length andangle values as displayed on their screen,sometimes sharing the view with others,to confirm with each other that indeedthe shape had certain properties.
At first, Matt brought people’sattention to the monitors. Lateron, Alan also directed the group’sattention to the monitors.
Shared meaningsfor utterances
The successive exchanges between Dan andMatt showed how they paid attentionto one another’s use of specific wordsand phrases as they worked towarda shared definition.
Lisa was the first one to notice how theyneeded to make a quadrilateral with fourcongruent sides. Students began toappropriate this perspective as theyestablished a shared meaning for the shape.
The students originally hadconfusion regarding the usageand meaning of the monitors,but they began to developshared meaning of thetools, i.e. monitors.
K. Lai, T. White / Computers & Education 59 (2012) 963–973972
students to deepen their understanding of essential and non-essential components of shapes, which is the beginning to understandinghierarchical relationships between shapes.
5.4. Summary
We summarize our analysis by looking at how the key components of appropriation were evidenced in the episodes (Table 4):
6. Conclusion
There were two main aims for the study. One was to understand how groups learned in this novel computing environment. The secondaim was to use the van Hiele theory and the notion of appropriation to study students’ learning in a cooperative setting. As Sfard (2001)argued, students’ developing a certain discourse is indicative of learning mathematics. In a similar vein, we argued that the technologysupported students’ develop discourse and reasoning as they began noticing different components of shapes to understanding hierarchicalrelationships. The students’ test performance before and after the instruction showed that the students were able to learn the concepts ofthe geometric objects and apply them, even without the tools. Our analysis of students’ interactions demonstrated that students’ appro-priations of peers’ways of talking about figures and using shared technology features are critical mechanisms of the learning process in thissmall group computing environment.
Acknowledgments
This material is based upon work supported by the National Science Foundation (gs1) under Grant No. DRL-0747536, awarded to thesecond author.
References
Barron, B. J. (2000). Achieving coordination in collaborative problem-solving groups. The Journal of the Learning Sciences, 9(4), 403–436.Barron, B. J. (2003). When smart groups fail. Journal of the Learning Sciences, 12, 307–359.Battista, M. T. (1998). Shape makers: Developing geometric reasoning with the geometer’s sketchpad. Berkeley, CA: Key Curriculum Press.Battista, M. T. (2007). The development of geometric and spatial thinking. In F. K. Lester (Ed.), Second handbook of research on mathematics teaching and learning (pp. 843–908).
Reston, VA: National Council of Teachers of Mathematics.Carlsen, M. (2010). Appropriating geometric series as a cultural tool: a study of student collaborative learning. Educational Studies in Mathematics, 74, 95–116.Erez, M. M., & Yerushalmy, M. (2006). “If you can turn a rectangle into a square, you can turn a square into a rectangle.” young students experience the dragging tool.
International Journal of Computers for Mathematical Learning, 11, 271–299.van Hiele, P. M. (1959/1985). The child’s thought and geometry. In D. Fuys, D. Geddes, & R. Tischler (Eds.), English translation of selected writings of Dina van Hiele-Geldof and
Pierre M. van Hiele (pp. 243–252). Brooklyn, NY: Brooklyn College, School of Education, (ERIC Document Reproduction Service No. 289 697).van Hiele, P. M. (1986). Structure and insight. Orlando, FL: Academic Press.Infante, C., Hidalgo, P., Nussbaum, M., Alarcón, R., & Gottlieb, A. (2009). Multiple mice based collaborative one-to-one learning. Computers and Education, 53(2), 393–401.Jones, K. (2000). Providing a foundation for deductive reasoning: students’ interpretations when using dynamic geometry software and their evolving mathematical
explanations. Educational Studies in Mathematics, 44(1–2), 55–85.Lai, K., & White, T. (2010). Developing students’ geometric reasoning in a networked computer environment. In P. Brosnan, D. B. Erchick, & L. Flevares (Eds.), Proceedings of the
32nd annual meeting of the North American Chapter of the International Group for the Psychology of Mathematics Education (pp. 565–572). Columbus, OH: The Ohio StateUniversity.
Liu, C. C., Chung, C. W., Chen, N.-S., & Liu, B.-J. (2009). Analysis of peer interaction in learning activities with personal handhelds and shared displays. Educational Technology &Society, 12(3), 127–142.
Moschkovich, J. N. (2004). Appropriating mathematical practices: a case study of learning to use and explore functions through interaction with a tutor. Educational Studies inMathematics, 55, 49–80.
Nussbaum, M., Alvarez, C., McFarlane, A., Gomez, F., Claro, S., & Radovic, D. (2009). Technology as small group face-to-face collaborative scaffolding. Computers and Education,52(1), 147–153.
Radford, L. (2006). Elements of a cultural theory of objectification. Revista Latinoamericana de Investigación en Matemática Educativa, 9, 103–129, Special issue on semiotics,culture and mathematical thinking. Available at http://laurentian.ca/educ/lradford/.
K. Lai, T. White / Computers & Education 59 (2012) 963–973 973
Rogoff, B. (1990). Apprenticeship in thinking. Cognitive development in social context. New York: Oxford University Press.Rogoff, B. (1995). Observing sociocultural activity on three planes: participatory appropriation, guided participation, and apprenticeship. In J. V. Wertsch, P. del Río, &
A. Alvarez (Eds.), Sociocultural studies of mind (pp. 139–164). Cambridge, MA: Cambridge University Press.Sfard, A. (2001). There is more to discourse than meets the ears: looking at thinking as communicating to learn more about mathematical learning. Educational Studies in
Mathematics, 46(1–3), 13–57.Stevens, R. (2000). Divisions of labor in school and in the workplace: comparing computer and paper-supported activities across settings. The Journal of the Learning Sciences,
9(4), 373–401.Unterman, J., & Wilensky, U. (2006). PANDA BEAR: Perimeter and area by embodied agent reasoning. Paper presented at the annual meeting of the American Educational
Research Association, San Francisco, CA.Unterman, J., & Wilensky, U. (2007). NetLogo HubNet PANDA BEAR model. Evanston, IL: Center for Connected Learning and Computer-Based Modeling, Northwestern
University. http://ccl.northwestern.edu/netlogo/models/HubNetPANDABEAR.Usiskin, Z. (1982). Van Hiele levels and achievement in secondary school geometry. (Eric Document Reproduction Service No. ED 220 288).White, T. (2006). Code talk: student discourse and participation with networked handhelds. International Journal of Computer-Supported Collaborative Learning, 1(3), 359–382.White, T., & Pea, R. (2011). Distributed by design: on the promises and pitfalls of collaborative learning with multiple representations. Journal of the Learning Sciences, 20(3),
489–547.White, T., Wallace, M., & Lai, K. (2012). Graphing in groups: Learning about lines in a collaborative classroom network environment.Mathematical Thinking and Learning, 14(2),
149–172.Wilensky, U., & Stroup, W. (1999). HubNet. Evanston, IL: Center for Connected Learning and Computer-Based Modeling, Northwestern University. http://ccl.northwestern.edu/
netlogo/hubnet.html.Yu, P., Barrett, J., & Presmeg, N. (2009). Prototypes and categorical reasoning. In Timothy V. Craine (Ed.), Understanding geometry for a changing world, seventy-first yearbook of
the National Council of Teachers of Mathematics (NCTM) (pp. 91–108). Reston, VA: NCTM.Zurita, G., & Nussbaum, M. (2004). Computer supported collaborative learning using wirelessly interconnected handheld computers. Computers & Education, 42, 289–314.