
EXPLORING PROCESS ASPECTS OF CHANGE IMPACT ...
290
Blekinge Institute of Technology Doctoral Dissertation Series No. 2007:13 School of Engineering EXPLORING PROCESS ASPECTS OF CHANGE IMPACT ANALYSIS Per Jönsson
-
Upload
khangminh22 -
Category
Documents
-
view
4 -
download
0
Transcript of EXPLORING PROCESS ASPECTS OF CHANGE IMPACT ...

ISSN 1653-2090
ISBN 978-91-7295-116-7
Change is inevitable in software development. During the entire lifecycle of a software system, from conception to retirement, things happen that require the system to be changed: the hardware and software environment changes, customer needs evolve, flaws are found, and so on. Under these conditions, it is crucial to have full control over and knowledge about what changes mean to the system and its environment. Otherwise, changes might lead to software deterioration and a multitude of other problems. The activity of as-sessing the implications of realising a change is ter-med change impact analysis.
Change impact analysis, or impact analysis for short, has a broad spectrum of definitions, ranging from the modification of source code to the iden-tification of risks associated with a change. Two parts of impact analysis are: (1) the assessment of the consequences of altering (or not) the functio-nality/capabilities of the software system, and (2) the identification of the software artefacts that are affected by the change. Impact analysis is perfor-med as part of the change management process which belongs to configuration management, and serves as a basis for determining whether to ac-cept or reject a change. Improper or non-existent impact analysis can be as problematic as having no control over changes in the first place.
The research presented in this thesis is explora-tory in its nature, conducted through empirical
studies in an industry setting. The main objective has been to contribute to the body of knowledge of change impact analysis by investigating challen-ges of working with impact analysis in large-scale software development. While having a wide scope, the studies are brought together by an overar-ching emphasis on process aspects of the topic. Traditionally, research on change impact analysis has mainly focused on technical aspects such as traceability analysis and change propagation. The thesis contributes instead to the understanding of aspects like process improvement opportunities, process support, and the role of impact analysis in software evolution.
The results of the presented research include: important impact analysis issues as seen by dif-ferent groups of software practitioners, related process improvement proposals, a checklist-based process support instrument helpful while perfor-ming impact analysis, an evaluation approach for the change control process, and the study of an evolution planning instrument with impact analysis focus. Some conclusions drawn are that software practitioners need support in performing impact analysis, that the main impact analysis challenges concern fundamental issues, and that impact ana-lysis is an important enabler in software evolution. The thesis further provides an in-depth study of two support methods used in the research, one for statistical imputation of missing data, and one for prioritising hierarchically arranged items.
ABSTRACT
2007:13
Blekinge Institute of TechnologyDoctoral Dissertation Series No. 2007:13
School of Engineering
EXPLORING PROCESS ASPECTS OF CHANGE IMPACT ANALYSIS
Per Jönsson
EX
PL
OR
ING
PR
OC
ES
S
AS
PE
CT
S O
F C
HA
NG
E IM
PAC
T A
NA
LYS
ISPer Jönsson
2007:13


Exploring Process Aspects
of Change Impact Analysis
Per Jönsson

Exploring Process Aspects
of Change Impact Analysis
Per Jönsson
Blekinge Institute of Technology Doctoral Dissertation SeriesNo 2007:13
ISSN 1653-2090ISBN 978-91-7295-116-7
Department of Systems and Software EngineeringSchool of Engineering
Blekinge Institute of TechnologySWEDEN

© 2007 Per JönssonDepartment of Systems and Software EngineeringSchool of EngineeringPublisher: Blekinge Institute of TechnologyPrinted by Printfabriken, Karlskrona, Sweden 2007ISBN 978-91-7295-116-7

To my family

ABSTRACT
Change is inevitable in software development. During the entire lifecycle ofa software system, from conception to retirement, things happen that requirethe system to be changed: the hardware and software environment changes,customer needs evolve, flaws are found, and so on. Under these conditions, itis crucial to have full control over and knowledge about what changes meanto the system and its environment. Otherwise, changes might lead to softwaredeterioration and a multitude of other problems. The activity of assessing theimplications of realising a change is termed change impact analysis.
Change impact analysis, or impact analysis for short, has a broad spectrumof definitions, ranging from the modification of source code to the identificationof risks associated with a change. Two parts of impact analysis are: (1) theassessment of the consequences of altering (or not) the functionality/capabilitiesof the software system, and (2) the identification of the software artefacts thatare affected by the change. Impact analysis is performed as part of the changemanagement process which belongs to configuration management, and servesas a basis for determining whether to accept or reject a change. Improper ornon-existent impact analysis can be as problematic as having no control overchanges in the first place.
The research presented in this thesis is exploratory in its nature, conductedthrough empirical studies in an industry setting. The main objective has been tocontribute to the body of knowledge of change impact analysis by investigatingchallenges of working with impact analysis in large-scale software development.While having a wide scope, the studies are brought together by an overarch-ing emphasis on process aspects of the topic. Traditionally, research on changeimpact analysis has mainly focused on technical aspects such as traceabilityanalysis and change propagation. The thesis contributes instead to the under-standing of aspects like process improvement opportunities, process support,and the role of impact analysis in software evolution.
i

The results of the presented research include: important impact analysisissues as seen by different groups of software practitioners, related process im-provement proposals, a checklist-based process support instrument helpful whileperforming impact analysis, an evaluation approach for the change control pro-cess, and the study of an evolution planning instrument with impact analysisfocus. Some conclusions drawn are that software practitioners need support inperforming impact analysis, that the main impact analysis challenges concernfundamental issues, and that impact analysis is an important enabler in soft-ware evolution. The thesis further provides an in-depth study of two supportmethods used in the research, one for statistical imputation of missing data,and one for prioritising hierarchically arranged items.
ii

ACKNOWLEDGMENTS
First and foremost, I want to express my gratitude to Prof. Claes Wohlin, myprimary advisor, for advice, support, enjoyable discussions, and an amazingability to find solutions to even the most complex problems. I am also grate-ful to my secondary advisor Dr. Michael Mattsson, for making me considerPh.D. studies in the first place. I would like to thank all the members of theSERL research group and the BESQ research environment for creating a pleas-ant research atmosphere. In particular, Dr. Patrik Berander for collaboration,discussions, feedback, and being a good friend.
I am grateful to all the people at Ericsson AB who have participated in mystudies, or otherwise supported my research in various ways. Thanks to HelenaOlá, Bengt Romberg, and Lars Angelin, for making the research collaborationpossible and for advice and support.
I am greatly indebted to Dr. Mikael Lindvall (Fraunhofer Center for Exper-imental Software Engineering, USA) and Dr. Lefteris Angelis (Aristotle Uni-versity of Thessaloniki, Greece) for fruitful collaboration, and to Prof. PhilipJohnson (University of Hawaii, USA) and Dr. Aybüke Aurum (University ofNew South Wales, Australia) for helpful advice.
I devote this thesis to my family. Without you, I would not be where Iam today, or who I am today. Thank you! Madeleine, especially, has shownsupport, compassion, and an understanding of my ups and downs, all of whichhave made this thesis a reality.
This work was partly funded by the Knowledge Foundation in Sweden un-der a research grant for the project “Blekinge Engineering Software Qualities(BESQ)” (http://www.bth.se/besq).
iii

iv
TABLE OF CONTENTS
1 INTRODUCTION 11.1 IMPACT ANALYSIS IN CONTEXT . . . . . . . . . . . . . . . . 3
1.1.1 Software development . . . . . . . . . . . . . . . . . . . . 41.1.2 Software configuration management . . . . . . . . . . . . 71.1.3 Change management . . . . . . . . . . . . . . . . . . . . . 10
1.2 RESEARCH QUESTIONS . . . . . . . . . . . . . . . . . . . . . 121.3 IMPACT ANALYSIS INTRODUCTION . . . . . . . . . . . . . . 13
1.3.1 Definitions . . . . . . . . . . . . . . . . . . . . . . . . . . 131.3.2 Process perspective . . . . . . . . . . . . . . . . . . . . . . 151.3.3 Purposes . . . . . . . . . . . . . . . . . . . . . . . . . . . 161.3.4 Analysis levels . . . . . . . . . . . . . . . . . . . . . . . . 181.3.5 Research trends . . . . . . . . . . . . . . . . . . . . . . . . 19
1.4 RESEARCH SETTING . . . . . . . . . . . . . . . . . . . . . . . 211.5 INCLUDED AND RELATED PAPERS . . . . . . . . . . . . . . 231.6 RESEARCH METHODOLOGY . . . . . . . . . . . . . . . . . . 25
1.6.1 What is research? . . . . . . . . . . . . . . . . . . . . . . 261.6.2 Research design . . . . . . . . . . . . . . . . . . . . . . . . 271.6.3 Exploratory research . . . . . . . . . . . . . . . . . . . . . 291.6.4 Empirical research . . . . . . . . . . . . . . . . . . . . . . 301.6.5 Trustworthiness . . . . . . . . . . . . . . . . . . . . . . . 341.6.6 Classification of studies . . . . . . . . . . . . . . . . . . . 37
1.7 OUTLINE AND CONTRIBUTION . . . . . . . . . . . . . . . . 391.7.1 Chapter research questions . . . . . . . . . . . . . . . . . 401.7.2 Contribution . . . . . . . . . . . . . . . . . . . . . . . . . 43
v
2 ROLES IN ARCHITECTURE-RELATED PROCESSIMPROVEMENT 452.1 RESEARCH CONTEXT . . . . . . . . . . . . . . . . . . . . . . 46
2.1.1 Architecture-related process improvement . . . . . . . . . 472.2 RELATED WORK . . . . . . . . . . . . . . . . . . . . . . . . . . 472.3 DESIGN . . . . . . . . . . . . . . . . . . . . . . . . . . . . . . . . 49
2.3.1 Questionnaire design . . . . . . . . . . . . . . . . . . . . . 492.3.2 Sampling and response rate . . . . . . . . . . . . . . . . . 502.3.3 Treatment of missing data . . . . . . . . . . . . . . . . . . 512.3.4 Roles . . . . . . . . . . . . . . . . . . . . . . . . . . . . . 512.3.5 Validity threats . . . . . . . . . . . . . . . . . . . . . . . . 52
2.4 RESULTS . . . . . . . . . . . . . . . . . . . . . . . . . . . . . . . 542.4.1 Infrastructure questions . . . . . . . . . . . . . . . . . . . 542.4.2 Most important improvement . . . . . . . . . . . . . . . . 56
2.5 ANALYSIS . . . . . . . . . . . . . . . . . . . . . . . . . . . . . . 572.5.1 Infrastructure questions . . . . . . . . . . . . . . . . . . . 572.5.2 Improvement question . . . . . . . . . . . . . . . . . . . . 58
2.6 DISCUSSION . . . . . . . . . . . . . . . . . . . . . . . . . . . . . 592.7 CONCLUSIONS . . . . . . . . . . . . . . . . . . . . . . . . . . . 60
3 IMPACT ANALYSIS OVERVIEW 633.1 CONCEPTS AND TERMS . . . . . . . . . . . . . . . . . . . . . 653.2 SOFTWARE CHANGE AND IMPACT ANALYSIS . . . . . . . 673.3 HISTORY AND TRENDS . . . . . . . . . . . . . . . . . . . . . . 703.4 STRATEGIES FOR IMPACT ANALYSIS . . . . . . . . . . . . . 71
3.4.1 Automatable strategies . . . . . . . . . . . . . . . . . . . 723.4.2 Manual strategies . . . . . . . . . . . . . . . . . . . . . . . 76
3.5 NON-FUNCTIONAL REQUIREMENTS . . . . . . . . . . . . . 793.6 IMPACT ANALYSIS METRICS . . . . . . . . . . . . . . . . . . 80
3.6.1 Metrics for quantifying change impact . . . . . . . . . . . 813.6.2 Evaluation metrics . . . . . . . . . . . . . . . . . . . . . . 83
3.7 TOOL SUPPORT . . . . . . . . . . . . . . . . . . . . . . . . . . 873.8 FUTURE OF IMPACT ANALYSIS . . . . . . . . . . . . . . . . 893.9 SUMMARY . . . . . . . . . . . . . . . . . . . . . . . . . . . . . . 90
4 VIEWS OF IMPACT ANALYSIS ISSUES 934.1 RESEARCH CONTEXT . . . . . . . . . . . . . . . . . . . . . . 944.2 RELATED WORK . . . . . . . . . . . . . . . . . . . . . . . . . . 954.3 METHOD . . . . . . . . . . . . . . . . . . . . . . . . . . . . . . . 96
4.3.1 Organisational levels . . . . . . . . . . . . . . . . . . . . . 97
vi
4.3.2 Interview design . . . . . . . . . . . . . . . . . . . . . . . 984.3.3 Results triangulation and filtering . . . . . . . . . . . . . 984.3.4 Post-test with prioritisation . . . . . . . . . . . . . . . . . 994.3.5 Workshop . . . . . . . . . . . . . . . . . . . . . . . . . . . 100
4.4 RESULTS . . . . . . . . . . . . . . . . . . . . . . . . . . . . . . . 1014.5 ANALYSIS AND DISCUSSION . . . . . . . . . . . . . . . . . . 106
4.5.1 Quantitative analysis . . . . . . . . . . . . . . . . . . . . . 1074.5.2 Qualitative analysis . . . . . . . . . . . . . . . . . . . . . 1144.5.3 Improvement proposals . . . . . . . . . . . . . . . . . . . 1204.5.4 Treatment of outliers . . . . . . . . . . . . . . . . . . . . 1224.5.5 Threats to validity . . . . . . . . . . . . . . . . . . . . . . 123
4.6 CONCLUSIONS . . . . . . . . . . . . . . . . . . . . . . . . . . . 124
5 CHECKLIST SUPPORT IN THE CHANGE CONTROLPROCESS 1275.1 BACKGROUND . . . . . . . . . . . . . . . . . . . . . . . . . . . 129
5.1.1 Research context and objective . . . . . . . . . . . . . . . 1295.1.2 Related work . . . . . . . . . . . . . . . . . . . . . . . . . 1295.1.3 Change control process . . . . . . . . . . . . . . . . . . . 1315.1.4 Previous work . . . . . . . . . . . . . . . . . . . . . . . . . 1315.1.5 Checklists . . . . . . . . . . . . . . . . . . . . . . . . . . . 132
5.2 RESEARCH METHODOLOGY . . . . . . . . . . . . . . . . . . 1345.2.1 Checklist adaptation . . . . . . . . . . . . . . . . . . . . . 1345.2.2 Process evaluation . . . . . . . . . . . . . . . . . . . . . . 135
5.3 RESULTS . . . . . . . . . . . . . . . . . . . . . . . . . . . . . . . 1405.3.1 Checklist adaptation outcome . . . . . . . . . . . . . . . . 1415.3.2 Pre-evaluation . . . . . . . . . . . . . . . . . . . . . . . . 1445.3.3 Main evaluation . . . . . . . . . . . . . . . . . . . . . . . 145
5.4 DISCUSSION . . . . . . . . . . . . . . . . . . . . . . . . . . . . . 1465.4.1 Industrial adoption . . . . . . . . . . . . . . . . . . . . . . 1475.4.2 Validity threats . . . . . . . . . . . . . . . . . . . . . . . . 148
5.5 SUMMARY AND CONCLUSIONS . . . . . . . . . . . . . . . . . 1485.5.1 Future work . . . . . . . . . . . . . . . . . . . . . . . . . . 150
6 IMPACT ANALYSIS AND SOFTWARE EVOLUTION 1516.1 RESEARCH OBJECTIVE . . . . . . . . . . . . . . . . . . . . . 1536.2 RESEARCH CONTEXT . . . . . . . . . . . . . . . . . . . . . . 1546.3 THE ANATOMY PLAN CONCEPT . . . . . . . . . . . . . . . . 157
6.3.1 Current practice . . . . . . . . . . . . . . . . . . . . . . . 1576.3.2 Challenges and needs . . . . . . . . . . . . . . . . . . . . 159
vii
6.3.3 Extended anatomy approach . . . . . . . . . . . . . . . . 1616.3.4 Dependencies . . . . . . . . . . . . . . . . . . . . . . . . . 1666.3.5 Organisational context . . . . . . . . . . . . . . . . . . . . 167
6.4 ROLE OF IMPACT ANALYSIS . . . . . . . . . . . . . . . . . . 1686.5 EVOLUTION AND EVOLVABILITY ASPECTS . . . . . . . . . 170
6.5.1 Evolution . . . . . . . . . . . . . . . . . . . . . . . . . . . 1706.5.2 Evolvability . . . . . . . . . . . . . . . . . . . . . . . . . . 171
6.6 CONCLUSIONS AND OPEN ISSUES . . . . . . . . . . . . . . . 172
7 K-NEAREST NEIGHBOUR IMPUTATION 1757.1 RELATED WORK . . . . . . . . . . . . . . . . . . . . . . . . . . 1777.2 RESEARCH DATA . . . . . . . . . . . . . . . . . . . . . . . . . 179
7.2.1 Evaluation data . . . . . . . . . . . . . . . . . . . . . . . . 1797.2.2 Missing data . . . . . . . . . . . . . . . . . . . . . . . . . 180
7.3 IMPUTATION METHODS . . . . . . . . . . . . . . . . . . . . . 1817.3.1 Random draw substitution . . . . . . . . . . . . . . . . . 1827.3.2 Random imputation . . . . . . . . . . . . . . . . . . . . . 1827.3.3 Median imputation . . . . . . . . . . . . . . . . . . . . . . 1837.3.4 Mode imputation . . . . . . . . . . . . . . . . . . . . . . . 1837.3.5 K-nearest neighbour . . . . . . . . . . . . . . . . . . . . . 184
7.4 EVALUATION PROCESS . . . . . . . . . . . . . . . . . . . . . . 1867.4.1 Data removal—step 1 . . . . . . . . . . . . . . . . . . . . 1877.4.2 Imputation—step 2 . . . . . . . . . . . . . . . . . . . . . . 1887.4.3 Evaluation—step 3 . . . . . . . . . . . . . . . . . . . . . . 190
7.5 SIMULATION . . . . . . . . . . . . . . . . . . . . . . . . . . . . 1917.5.1 Parameters . . . . . . . . . . . . . . . . . . . . . . . . . . 1917.5.2 Software . . . . . . . . . . . . . . . . . . . . . . . . . . . . 1927.5.3 Process reuse . . . . . . . . . . . . . . . . . . . . . . . . . 192
7.6 RESULTS . . . . . . . . . . . . . . . . . . . . . . . . . . . . . . . 1937.6.1 Incomplete data sets . . . . . . . . . . . . . . . . . . . . . 1937.6.2 Comparison of k-values and strategies . . . . . . . . . . . 1947.6.3 Comparison of attribute counts . . . . . . . . . . . . . . . 1977.6.4 Comparison of percentages . . . . . . . . . . . . . . . . . 1997.6.5 Benchmarking . . . . . . . . . . . . . . . . . . . . . . . . 2017.6.6 Summary and interpretation of the results . . . . . . . . . 203
7.7 VALIDITY AND FUTURE WORK . . . . . . . . . . . . . . . . 2057.7.1 Threats to validity . . . . . . . . . . . . . . . . . . . . . . 2067.7.2 Future work . . . . . . . . . . . . . . . . . . . . . . . . . . 207
7.8 CONCLUSIONS . . . . . . . . . . . . . . . . . . . . . . . . . . . 207
viii
8 HIERARCHICAL CUMULATIVE VOTING 2118.1 REQUIREMENTS PRIORITISATION . . . . . . . . . . . . . . 213
8.1.1 Scales of priority . . . . . . . . . . . . . . . . . . . . . . . 2138.1.2 Analytical hierarchy process (AHP) . . . . . . . . . . . . 2158.1.3 Cumulative voting (CV) . . . . . . . . . . . . . . . . . . . 2168.1.4 Empirical results for AHP and CV . . . . . . . . . . . . . 2178.1.5 Requirements levels and hierarchies . . . . . . . . . . . . 219
8.2 HIERARCHICAL CUMULATIVE VOTING . . . . . . . . . . . 2218.2.1 General idea of HCV . . . . . . . . . . . . . . . . . . . . . 2228.2.2 Multiple stakeholders . . . . . . . . . . . . . . . . . . . . 2258.2.3 Multiple levels . . . . . . . . . . . . . . . . . . . . . . . . 2258.2.4 Example: two-level hierarchy with one stakeholder . . . . 2268.2.5 Epilogue . . . . . . . . . . . . . . . . . . . . . . . . . . . . 230
8.3 EVALUATION OF HCV VS. CV . . . . . . . . . . . . . . . . . . 2308.3.1 Extent of explicit weights . . . . . . . . . . . . . . . . . . 2328.3.2 Divergence of assigned weights . . . . . . . . . . . . . . . 2338.3.3 Reflections on scalability . . . . . . . . . . . . . . . . . . . 2348.3.4 Opinions about HCV . . . . . . . . . . . . . . . . . . . . . 235
8.4 DISCUSSION . . . . . . . . . . . . . . . . . . . . . . . . . . . . . 2378.4.1 Using compensation or not? . . . . . . . . . . . . . . . . . 2378.4.2 Constructing hierarchies . . . . . . . . . . . . . . . . . . . 2388.4.3 Using HCV in practice . . . . . . . . . . . . . . . . . . . . 2398.4.4 Further studies on the use of HCV . . . . . . . . . . . . . 242
8.5 CONCLUSIONS . . . . . . . . . . . . . . . . . . . . . . . . . . . 243
9 CONCLUSIONS 2459.1 SUMMARY OF FINDINGS . . . . . . . . . . . . . . . . . . . . . 245
9.1.1 Impact analysis part . . . . . . . . . . . . . . . . . . . . . 2469.1.2 Main findings . . . . . . . . . . . . . . . . . . . . . . . . . 2479.1.3 Method part . . . . . . . . . . . . . . . . . . . . . . . . . 248
9.2 FUTURE RESEARCH . . . . . . . . . . . . . . . . . . . . . . . 249
REFERENCES 251
LIST OF FIGURES 267
LIST OF TABLES 268
ix

x

Chapter 1
Introduction
Impact analysis is an abstract concept, denoting the activity of analysing howsomething affects something else. Without a proper context, impact analysiscan refer to anything. Searching for the term using an Internet search engineuncovers a number of variants, such as: business impact analysis, environmentalimpact analysis, poverty & social impact analysis, and financial impact analy-sis. The epithet software change narrows the field to what is discussed in thisthesis, namely the analysis of the effects of a proposed change to the artefactsof a software system (e.g., source code and documentation), and thereby to itsdevelopment (e.g., time and cost) and use. Perhaps the most popular definitionof impact analysis in this particular context is that of Bohner and Arnold [1996]:
“. . . identifying the potential consequences of a change, or estimatingwhat needs to be modified to accomplish a change.”
More definitions are discussed in Section 1.3, but for now it is sufficientto note that the cited definition explicitly differentiates between consequencesand modifications. A typical consequence is increased project lead time andcost. However, a change may also affect the functional content (i.e., the featureset) of the system, which can have both positive and negative consequences on,for example, sales, customers’ attitudes, and competitive position. A changemust be analysed both from the perspective of the development organisation,and from the perspective of external actors such as customers, the market, andcompetitors.
Why is impact analysis important in software development? The answer tothis question is twofold. First, active use of any non-trivial software system
1: Introduction
stimulates a flow of changes from a number of different change sources. Addedfunctionality will in most cases require changes to the current system. Identifieddefects, anticipated environmental changes (i.e., changes to the environmentin which the system runs, for example the underlying operating system), andimprovement requests should be taken care of (requiring corrective, adaptive,and perfective maintenance, respectively [Chapin, 2000]). Users evolve theirknowledge about the problem solved by the system, and expect the system toevolve with them [Hass, 2002]. In any large-scale software development effort,all of these change sources are active, thus creating a massive flow of changes.Because of change conflicts, lack of resources, bad timing, etc., changes shouldnot and cannot be unconditionally implemented in the system. Impact analysisprovides a means for determining the characteristics and effects of a proposedchange, which form a basis for its conditional approval or disapproval.
Second, a modification to the source code of a system that follows from aproposed change is seldom isolated—other parts of the system than the onemodified must probably be updated, and defects may accidentally be intro-duced. Defects must of course be avoided, but modifications necessitated byother modifications are inevitable, in particular in systems with high couplingand low cohesion.∗ Impact analysis can be used to get a better idea of the scopeand complexity of the modification, and thereby the risk associated with it. Forexample, if impact analysis determines that a modification will lead to othermodifications throughout the entire system, the proposed change may be putoff with the argument that it is not worth the effort required to implement it,unless the expected gain is very high.
This thesis is the result of a number of empirical research studies on softwarechange impact analysis. The studies have focused on how impact analysis isused within large-scale software development. The emphasis lies on how oneworks with impact analysis within a development organisation rather than onmethods for determining the consequences and system impact of a change. Thischapter is organised as follows. Section 1.1 discusses impact analysis in relationto software development and related concepts. Section 1.2 presents the mainresearch questions upon which the thesis is built. Section 1.3 introduces impactanalysis and describes complementary aspects not covered by the subsequentthesis chapters. The research setting is described in Section 1.4. Section 1.5lists papers included and not included in the thesis. Section 1.6 describes the
∗ High coupling means that modules are tied together closely. Low cohesion means thatcoherent functionality is scattered over modules.
2
1: Introduction
research setting and research methodology. Finally, Section 1.7 provides anoutline of the thesis chapters and discusses the contribution of the thesis.
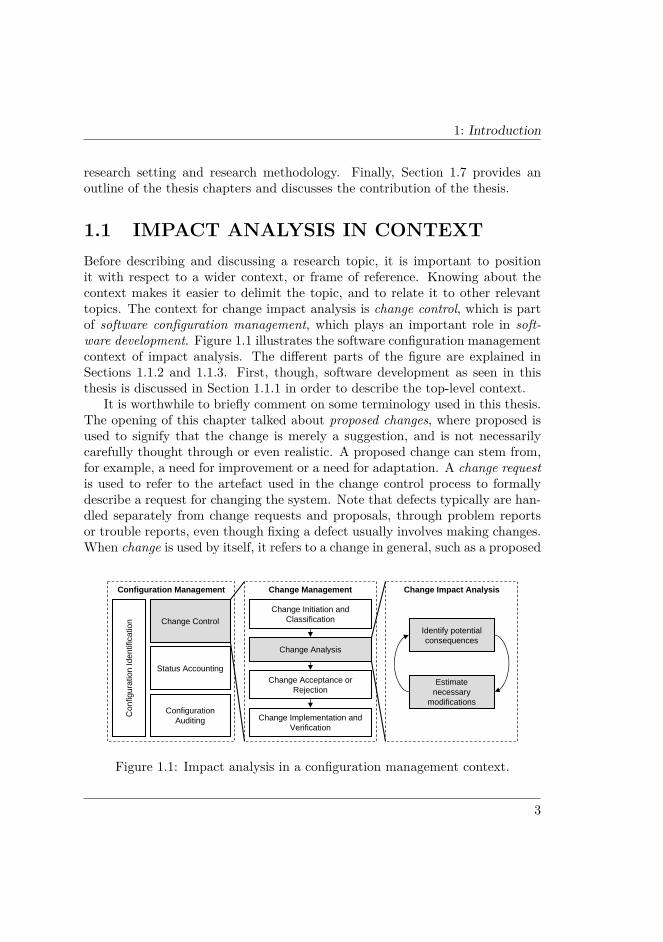
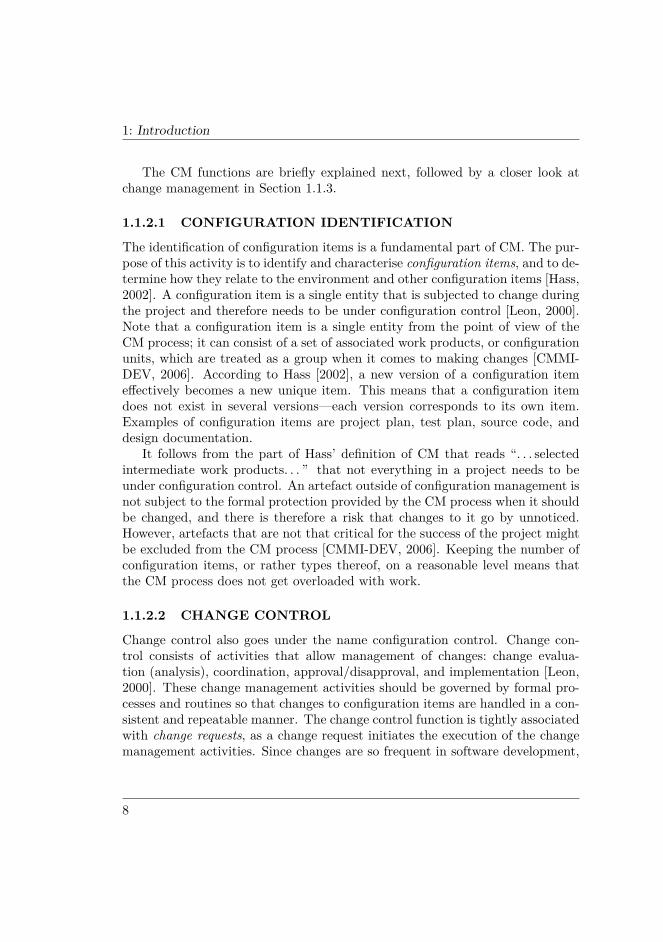
1.1 IMPACT ANALYSIS IN CONTEXTBefore describing and discussing a research topic, it is important to positionit with respect to a wider context, or frame of reference. Knowing about thecontext makes it easier to delimit the topic, and to relate it to other relevanttopics. The context for change impact analysis is change control, which is partof software configuration management, which plays an important role in soft-ware development. Figure 1.1 illustrates the software configuration managementcontext of impact analysis. The different parts of the figure are explained inSections 1.1.2 and 1.1.3. First, though, software development as seen in thisthesis is discussed in Section 1.1.1 in order to describe the top-level context.
It is worthwhile to briefly comment on some terminology used in this thesis.The opening of this chapter talked about proposed changes, where proposed isused to signify that the change is merely a suggestion, and is not necessarilycarefully thought through or even realistic. A proposed change can stem from,for example, a need for improvement or a need for adaptation. A change requestis used to refer to the artefact used in the change control process to formallydescribe a request for changing the system. Note that defects typically are han-dled separately from change requests and proposals, through problem reportsor trouble reports, even though fixing a defect usually involves making changes.When change is used by itself, it refers to a change in general, such as a proposed
Change Control
Status Accounting
Configuration Auditing
Con
figur
atio
n Id
entif
icat
ion
Configuration Management Change Management
Change Analysis
Change Acceptance or Rejection
Change Implementation and Verification
Change Initiation and Classification
Change Impact Analysis
Estimate necessary
modifications
Identify potential consequences
Figure 1.1: Impact analysis in a configuration management context.
3
1: Introduction
one, a requested one, one necessary to fix a defect, or one required to implementa new requirement. In other words, change is a very general concept.
1.1.1 SOFTWARE DEVELOPMENTWe see software development as the set of activities whereby a software systemis built to satisfy the needs of its users. Typically, a software system is createdbecause it automates mundane tasks, facilitates complex and time-consumingtasks, or makes otherwise unmanageable tasks possible, by utilising the process-ing power and storage capability of computers. In many cases, it is essentialthat software systems behave correctly and generate accurate output, for ex-ample in life-support equipment, in cars, and in airplanes. We rely on softwaresystems to perform their intended tasks flawlessly, still they are (for the mostpart) developed by humans who have limited cognitive capability and can (anddo) make mistakes. Below, we discuss software development with focus on thechange perspective.
A software process allows software development to proceed in a controlledand defined fashion, although its quality limits the quality of the produced sys-tem [CMMI-DEV, 2006]. Sommerville [2004] defines software process as “. . . aset of activities that leads to the production of a software product.” This defi-nition opens up for much variation, and there are numerous different softwareprocesses that are suitable in different situations and for different types of sys-tems. Royce [1970] noted in his classical waterfall model article that sufficientlysmall computer programs can be produced in two steps: analysis and coding,but that more steps are necessary in a more substantial development effort.According to Sommerville [2004], the fundamental activities of any softwareprocess are:
1. Specification: Define the functionality of the system.
2. Design and implementation: Produce the system according to thespecification.
3. Validation: Make sure that the system behaves in accordance with thecustomer’s expectations.
4. Evolution: Continually change the system to better suit changing needs.
Different processes have different characteristics that make them suitable indifferent contexts. Hampered’s Personal Software Process (PSP) is geared to-
4
1: Introduction
wards the individual engineer, and can help her improve planning and schedul-ing, and reduce the number of defects introduced in the code [Humphrey, 1997].The Team Software Process (TSP) helps organisations obtain a leverage ontheir team work by building on and making use of the disciplines dictated byPSP [Humphrey, 2002]. According to Humphrey [2002], TSP is suitable forteams of 2 to 20 engineers. Agile processes are light and sufficient, meaningthat they are not burdened by heavy plan-driven thinking; instead they cap-ture what is necessary and leave out the rest. For example, the agile manifestostates that an agile process emphasises interaction over documentation [Cock-burn, 2002]. Consequently, agile processes work better where good interactionscan be upheld, such as in smaller teams. Cleanroom is an example of a non-agile development process that focuses on formal specification and formal ver-ification using inspections and statistical testing, with the goal of producingzero-defect software [Sommerville, 2004]. However, the high level of formalitymakes changes costly.
The waterfall model is the first published model of a software process, andstill today development processes are based on this model [Sommerville, 2004].In a waterfall-based process, the phases of software development are sequentiallyarranged and do not overlap. For example, a set of needs is first captured inrequirements, which then are built into a system, which subsequently is testedagainst the requirements. This assumes that we can learn everything about asystem initially, and then do everything based on that. Already Royce [1970]pointed out that if testing occurs last, we cannot verify what we created until itbecomes difficult, and thus expensive, to change something if we made mistakes.Also, only on rare occasions can everything about a system be learnt initially;most of the time a model where learning is interleaved with doing is advan-tageous. Such models are called evolutionary, and examples include Boehm’sspiral model [Sommerville, 2004] and Gilb’s Evo model [see Larman and Basili,2003]. However, Sommerville notes that evolutionary development might beproblematic for large-scale software development due to difficulties in technicalcoordination, and recommends a process with some waterfall characteristics inthat case.
Evolutionary development is different from iterative and incremental de-velopment, in that the latter two dictate how the system is built and can bereleased. Pfleeger [1998] differentiates between iterative as building everythingfrom the beginning but with reduced capability, and incremental as building cer-tain parts first, and then adding new parts later on. However, also iterative andincremental development (and in particular the latter) support interleaved learn-ing and doing, as some learning can be postponed to later iterations/increments.
5

1: Introduction
In this respect, the three concepts are similar.An advantage of interleaved learning and doing is that changes can be incor-
porated more easily. A big upfront design (as in a waterfall-like process) mightbe sensitive to changes, but if the design is created in an evolutionary manner,it can incorporate and evolve around the changes as they arrive. Ironically,this advantage is also a disadvantage; frequent changes can lead to a poor andfragile system structure [Sommerville, 2004]. This is especially true for complexsystems developed by a large number of people, in which case changes must becontrolled and coordinated.
Market-driven software development is different from tailor-made (or be-spoke) software development. In the latter form of development, a single cus-tomer commissions a developer to produce a software system based on someidentified needs. It is the job of the developer to capture and understand theseneeds, which most certainly will change (evolve) during the development, inthe form of requirements. In market-driven software development, there is nosingle customer, but the system is instead produced with the goal of makingit available on a market for potential customers to purchase. For this to suc-ceed, the system must have features and qualities that the customers desire.However, the requirements for these cannot initially come from customers, asthere are none, but must instead be foreseen and formulated by the developerherself [see Potts, 1993]. When the system evolves over several releases, require-ments for new features and qualities can of course be elicited from customers ofthe old versions. This is in fact necessary to motivate the customer to upgradeto the new release. However, a new problem arises: different customers maywant the system to evolve (to change) in different and conflicting directions.Thus, market-driven software development opens up for a very change-proneenvironment.
The Capability Maturity Model R© Integration for Development (CMMI-DEV) is a process improvement maturity model aimed at helping organisa-tions improve their development and maintenance processes for products andservices [CMMI-DEV, 2006]. CMMI-DEV contains no less than 22 so calledprocess areas, which are clusters of best practices within certain areas, formedto allow for the assessment of a company’s capability or maturity. This neatlyillustrates the fact that software development is a complex task that builds ona plethora of processes in order to be successful.
It can be seen that different development processes and different contextscall for different ways of handling change [see also Hass, 2002: chap. 18]. In thisthesis, we assume development of such scale and character that changes mustbe formally controlled. The process for doing this is discussed next.
6
1: Introduction
1.1.2 SOFTWARE CONFIGURATION MANAGEMENTSoftware configuration management (SCM) is configuration management (CM)for software products (as opposed to, for example, hardware products). Thereare number of definitions of CM, for example the following by Bersoff (1997), ascited by the Software Engineering Body of Knowledge SWEBOK [2004] andLeon [2000] (Leon actually cites an older but nearly identical definition byBersoff et al. from 1980):
“. . . the discipline of identifying the configuration of a system atdistinct points in time for the purpose of systematically control-ling changes to the configuration, and maintaining the integrity andtraceability of the configuration throughout the system life cycle.”
The configuration of a system is the characteristics (physical and/or func-tional) of software and related hardware as specified in documentation and builtinto a final product [SWEBOK, 2004]. Hass [2002] provides a somewhat morestraightforward and concrete definition of CM:
“. . . unique identification, controlled storage, change control, and sta-tus reporting of selected intermediate work products, product compo-nents, and products during the life of a system.”
CMMI-DEV [2006] categorises CM as a support process. This means thatit contains activities that support product development and maintenance, andthat it is a process that is used to enable or facilitate other processes. CMMI-DEV describes the purpose of CM as:
“. . . establish and maintain the integrity of work products using con-figuration identification, configuration control, configuration statusaccounting, and configuration audits.”
The citations given above point out a number of CM functions: configura-tion identification, change/configuration control, status accounting/reporting,and configuration auditing (illustrated in Figure 1.1). Hass [2002] excludes con-figuration auditing from her definition of CM, noting that auditing should belongto general quality assurance activities rather than CM in particular. Both theSWEBOK definition and Hass’ definition make explicit the important fact thatCM spans over the entire life cycle of a system. In other words, CM is not aone-shot, pre-project task, but rather a continuous process upon which othersoftware processes depend, as noted in CMMI-DEV.
7
1: Introduction
The CM functions are briefly explained next, followed by a closer look atchange management in Section 1.1.3.
1.1.2.1 CONFIGURATION IDENTIFICATION
The identification of configuration items is a fundamental part of CM. The pur-pose of this activity is to identify and characterise configuration items, and to de-termine how they relate to the environment and other configuration items [Hass,2002]. A configuration item is a single entity that is subjected to change duringthe project and therefore needs to be under configuration control [Leon, 2000].Note that a configuration item is a single entity from the point of view of theCM process; it can consist of a set of associated work products, or configurationunits, which are treated as a group when it comes to making changes [CMMI-DEV, 2006]. According to Hass [2002], a new version of a configuration itemeffectively becomes a new unique item. This means that a configuration itemdoes not exist in several versions—each version corresponds to its own item.Examples of configuration items are project plan, test plan, source code, anddesign documentation.
It follows from the part of Hass’ definition of CM that reads “. . . selectedintermediate work products. . . ” that not everything in a project needs to beunder configuration control. An artefact outside of configuration management isnot subject to the formal protection provided by the CM process when it shouldbe changed, and there is therefore a risk that changes to it go by unnoticed.However, artefacts that are not that critical for the success of the project mightbe excluded from the CM process [CMMI-DEV, 2006]. Keeping the number ofconfiguration items, or rather types thereof, on a reasonable level means thatthe CM process does not get overloaded with work.
1.1.2.2 CHANGE CONTROL
Change control also goes under the name configuration control. Change con-trol consists of activities that allow management of changes: change evalua-tion (analysis), coordination, approval/disapproval, and implementation [Leon,2000]. These change management activities should be governed by formal pro-cesses and routines so that changes to configuration items are handled in a con-sistent and repeatable manner. The change control function is tightly associatedwith change requests, as a change request initiates the execution of the changemanagement activities. Since changes are so frequent in software development,
8
1: Introduction
change control is the CM function that is most frequently conducted [Leon,2000].
Change control is not only about controlling change requests, but also aboutcontrolling the implemented changes. It should be possible to trace a changeback to the configuration item it targeted, and for any configuration item, itshould be possible to identify the change relative to the previous version [Hass,2002]. This requires that traceability practices are in place and are used, so thatlinks among configuration items and other development artefacts can be createdand maintained.
Proper change control calls for roles and authorities in the change controlprocess. The most important authority is the Change Control Board (CCB, alsoknown as Configuration Control Board), where it is decided whether to approveor disapprove the change requests under consideration. The change managementprocess, impact analysis, and the CCB are described more in Section 1.1.3.
1.1.2.3 STATUS ACCOUNTING
The purpose of status accounting, or status reporting, is to make availabledata and reports from the change management process. The reported data caninclude the identified configuration items, the status of change requests, andthe implementation status of changes that have been approved [Leon, 2000].A status accounting system should be able to provide insight into the changemanagement process. This makes it possible to track individual change requests,but also to get an idea of the efficiency of the process. For example, the numberof change requests handled over a certain time period reflects the performanceof the project or the process [Leon, 2000]. Status accounting is therefore animportant tool both in project evaluation and process improvement.
Other uses of the information from the status accounting system include:spreading information to project members, monitoring the project progress,identifying problems early on, and finding the cause of problems by studyingthe history of configuration items [Leon, 2000]. An example of a report fromstatus accounting is the change log, which provides information about all changerequests in the system and their status [Leon, 2000].
1.1.2.4 CONFIGURATION AUDITING
The purpose of configuration auditing is to ensure that the delivered productcontains what has been promised an that it behaves as specified [Leon, 2000].This is accomplished using two different types of audits: functional and physical.
9
1: Introduction
The functional configuration audit verifies that the configuration items functionas they should, in other words that their behaviour corresponds to that specifiedin requirements and design documentation [Leon, 2000]. The physical configu-ration audit, on the other hand, verifies that the configuration items are fullycontained in the product. This audit examines the configuration items andchecks that the work products (the configuration units) corresponding to theitems are present in the product [Leon, 2000].
1.1.3 CHANGE MANAGEMENTChange management is used in this thesis as the collective name for those ac-tivities that are associated with the change control function of CM (thoughchange management process and change control process are used interchange-ably throughout the thesis to denote the process of managing change). Thechange management activities discussed here are [Leon, 2000; Hass, 2002]:
1. change initiation and classification,
2. change analysis,
3. change acceptance or rejection, and
4. change implementation and verification.
These activities are depicted in Figure 1.1. According to Leon [2000], thechain of activities starts when a change request comes from an external orinternal source. Therefore, the event from which the change stems is equatedwith the change request. Hass [2002] on the other hand means that change eventand change request are two different things, and for each configuration itemthat is estimated to be changed, a separate change request should be created.She claims that equating the event and request is a bad idea, as it hampersthe organisation’s ability to obtain statistics and status for individual changerequests. However, in this thesis the change request is seen as the initiatingentity, which means that one change request can prescribe changes to manyconfiguration items.
One purpose of change classification is to allow different change requests tobe handled by different authorities [Leon, 2000]. For example, major changesshould be evaluated by the CCB, whereas minor changes could be evaluatedby the person receiving the change request. Which classes to use is organisa-tion specific, but inputs to the classification could be change source (implying
10
1: Introduction
different degrees of urgency), severity, scope, and so on. Different classes areassociated with different priorities, which is particularly helpful when there aremany pending change requests. Another benefit of change classification is thatit permits statistics to be obtained that show, for example, the distribution ofchanges over different change sources (if that was part of the classification).
In the change analysis step, the change is analysed with respect to impact onsystem functionality, non-functional qualities (e.g., performance, reliability, andmaintainability), user interfaces, etc., but also cost and schedule [Leon, 2000;Hass, 2002]. This is what is referred to as change impact analysis. Figure 1.1illustrates the two aspects (consequences and modifications) of the analysis, andthe circular relationship between them. The aspects are not sequential becausethe estimated modifications may affect the consequences (e.g., a large modifica-tion means that the change is costly), while certain consequences (e.g., customer-related ones) can be identified before modifications are estimated. Hass [2002]proposes to use Wiegers’ analysis checklists [see Wiegers, 1999] to help deter-mine change impact. These checklists are discussed more in Chapter 5.
When the impact of the change is known, it is up to the selected authority todecide if the change should be accepted or rejected, by weighing how desirablethe change is against how much it would cost to realise [Leon, 2000]. Typically,the authority is the CCB, although as noted this does not need to be the case.It is important that proper impact analysis has been performed, otherwise theCCB (or other authority) will not be able to make an informed decision aboutthe change request, in which case it will have to be returned for further analysis.The cyclic nature of the change management process is visible earlier as well; ifthe change request is not written properly, it will be returned to the author forelaboration and correction. It follows that the lead time of the change controlprocess increases if a change request has to go back to a previous step, so highchange request quality and careful analysis must be strived for.
If a change is accepted, it is passed on for implementation and verification.Implementation involves modifying documentation, design, and source code,but also performing unit testing and verifying the correctness of the change.Thereafter, system tests must be run in order to verify that the change is correctalso from a system level perspective [Leon, 2000].
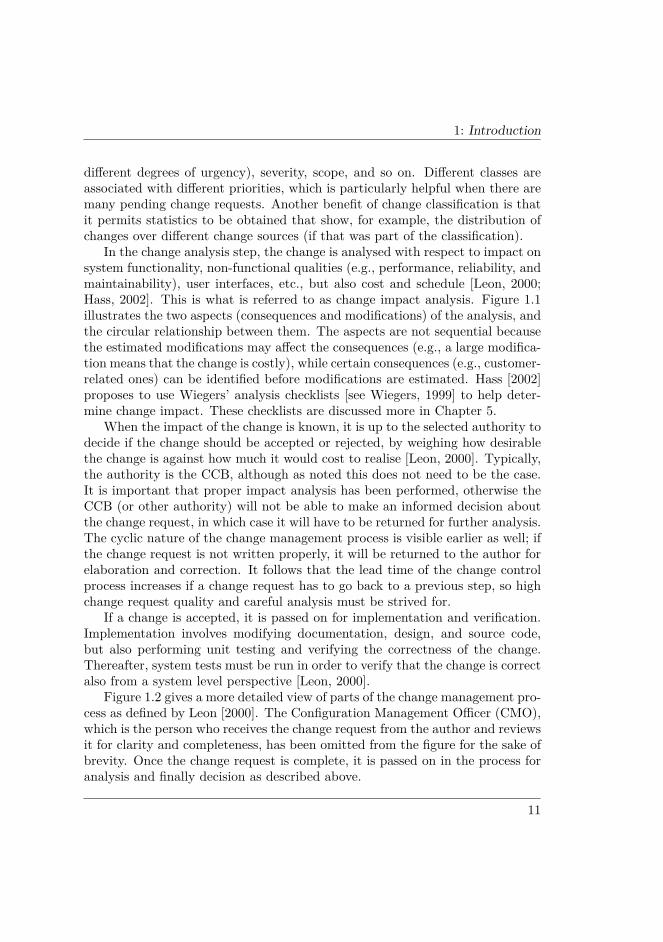
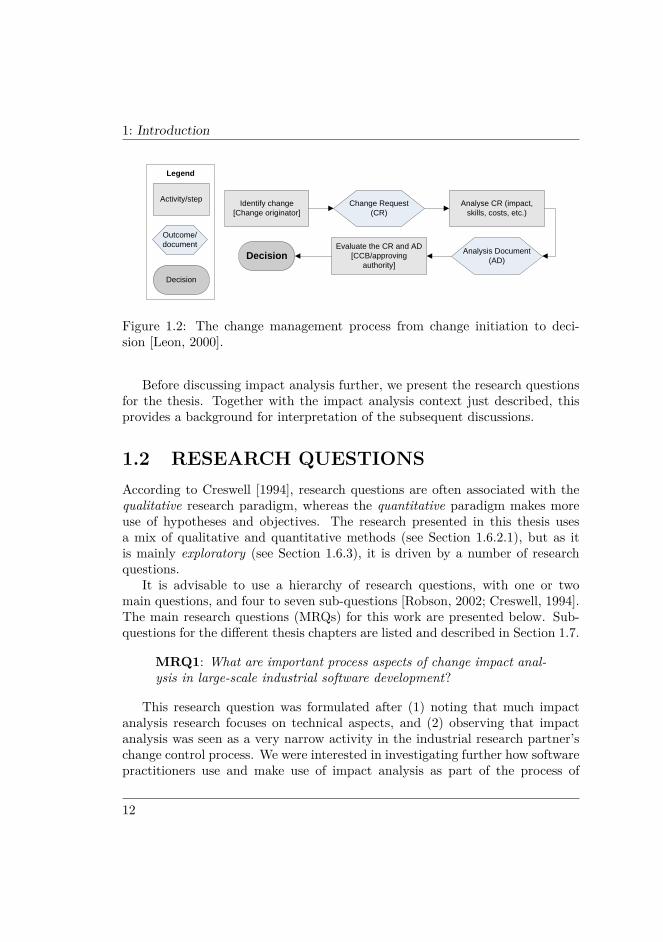
Figure 1.2 gives a more detailed view of parts of the change management pro-cess as defined by Leon [2000]. The Configuration Management Officer (CMO),which is the person who receives the change request from the author and reviewsit for clarity and completeness, has been omitted from the figure for the sake ofbrevity. Once the change request is complete, it is passed on in the process foranalysis and finally decision as described above.
11
1: Introduction
Identify change[Change originator]
Submit change to CMO/receiving authority
Analyse CR (impact, skills, costs, etc.)
Evaluate the CR and AD [CCB/approving
authority]Decision
Change Request (CR)
Analysis Document (AD)
Send CR and AD to CCB/approving
authority
Legend
Outcome/document
Activity/step
Decision
Identify change[Change originator]
Analyse CR (impact, skills, costs, etc.)
Evaluate the CR and AD [CCB/approving
authority]Decision
Change Request (CR)
Analysis Document (AD)
Legend
Outcome/document
Activity/step
Decision
Figure 1.2: The change management process from change initiation to deci-sion [Leon, 2000].
Before discussing impact analysis further, we present the research questionsfor the thesis. Together with the impact analysis context just described, thisprovides a background for interpretation of the subsequent discussions.
1.2 RESEARCH QUESTIONSAccording to Creswell [1994], research questions are often associated with thequalitative research paradigm, whereas the quantitative paradigm makes moreuse of hypotheses and objectives. The research presented in this thesis usesa mix of qualitative and quantitative methods (see Section 1.6.2.1), but as itis mainly exploratory (see Section 1.6.3), it is driven by a number of researchquestions.
It is advisable to use a hierarchy of research questions, with one or twomain questions, and four to seven sub-questions [Robson, 2002; Creswell, 1994].The main research questions (MRQs) for this work are presented below. Sub-questions for the different thesis chapters are listed and described in Section 1.7.
MRQ1: What are important process aspects of change impact anal-ysis in large-scale industrial software development?
This research question was formulated after (1) noting that much impactanalysis research focuses on technical aspects, and (2) observing that impactanalysis was seen as a very narrow activity in the industrial research partner’schange control process. We were interested in investigating further how softwarepractitioners use and make use of impact analysis as part of the process of
12
1: Introduction
managing change. This perspective is rewarding as it provides insight into howthe research community can develop impact analysis methods and tools thatwork in practice given the constraints induced by processes, culture, and waysof working.
MRQ2: How can change impact analysis practices be improved andsupported in a lightweight manner?
This research question stems from the industrial partner’s desire for theresearch to lead to process improvements. The part about lightweight mannerwas added to underscore that improvement proposals should entail as littleoverhead as possible in order to make industrial adoption realistic.
1.3 IMPACT ANALYSIS INTRODUCTIONImpact analysis is presented from a requirements change perspective in Chap-ter 3. Aspects such as non-functional requirements, strategies for impact analy-sis, tool support, and metrics are discussed. In this section, we introduce impactanalysis as seen in the thesis, and discuss aspects of more general nature.
1.3.1 DEFINITIONSMerriam-Webster [2003] defines impact as “the force of impression of one thingon another”. As noted in the beginning of this chapter, this knowledge is notvery helpful without a proper context. In the impact analysis definitions givenbelow, the words assess, identify, estimate, and evaluate are used to signifywhat is done in an impact analysis. These “action words” communicate differentthings, and can be said to signify different levels of thoroughness of the analysis.Merriam-Webster provides the following information about the words:
• Identify means simply “to establish the identity.” Of the four words, thisimplies the least analysis effort but also the least information obtainedthrough the analysis.
• Estimate and its synonyms evaluate and assess all mean “to judge some-thing with respect to its worth or significance,” though estimate implies ajudgment that is made prior to or instead of an actual measurement.
• Evaluate means to determine relative or actual non-monetary worth.
13
1: Introduction
• Assess means to critically estimate or evaluate for the sake of gaining anunderstanding or obtaining an action plan
There are many definitions of impact analysis, all coloured by the author(s)and by the context in which the they were formulated. The definitions below arelisted in chronological order. The action words defined above are highlighted inthe definitions.
Turver and Munro [1994] define impact analysis as:
“. . . the assessment of a change, to the source code of a module, onthe other modules of the system. It determines the scope of a changeand provides a measure of its complexity.”
A problem with this definition is that it has a very narrow scope; it isonly concerned with changes to and effects on the source code. Even if we onlyconsider impact on the system, this definition leaves out artefacts such as designand documentation. The definition given in the beginning of this chapter wasformulated by Bohner and Arnold [1996]:
“. . . identifying the potential consequences of a change, or esti-mating what needs to be modified to accomplish a change.”
This definition is not geared towards any particular type of developmentartefact, nor does it limit impact of the change to the system. Lindvall [1997]has an outspoken focus on impact analysis from a requirements perspective. Hedefines requirements-driven impact analysis (RDIA) as:
“. . . the identification of the set of software entities that need to bechanged to implement a new requirement in an existing system.”
This definition is particularly interesting, as it concerns new requirementsrather than changes to current requirements. As hinted in the definition, thistype of impact analysis is useful when a system is developed incrementally overseveral releases. Finally, Pfleeger [1998] defines impact analysis as:
“. . . the evaluation of the many risks associated with the change,including estimates of effects on resources, effort and schedule.”
This definition is also generic, but indicates, by explicitly mentioning risk andproject control, a broad view of what is meant by “impact” and a strong focuson non-technical aspects of impact analysis. Throughout this thesis, impactanalysis is seen as a combination of the definitions by Bohner and Arnold,Lindvall, and Pfleeger. The two most important points are:
14
1: Introduction
• The impact of a change is not only on the system, but also on its devel-opment and its (use) environment.
• We consider changes irrespective of source; also new development in amulti-release situation means change.
Potts noted already in 1993 that most software development is softwaremaintenance or evolution; software development that starts from scratch israre [Potts, 1993]. Thus, to not consider the change induced by new require-ments in an existing system would be limiting.
1.3.2 PROCESS PERSPECTIVEOne can study impact analysis from two different perspectives: process andtechnical. The technical perspective, which by far is the most common onein current research (consider, for example, the papers collected by Bohner andArnold [1996]), concerns the development of methods and tools for assessing theimpact of changes on the system level. The process perspective, on the otherhand, concerns in our view research with the goals of creating an understand-ing of how impact analysis is viewed and used by software practitioners, andimproving impact analysis processes.
A drawback with the purely technical perspective is that such research oftenassumes the presence of a detailed, structured, and connected infrastructure ofdevelopment artefacts [see, for example, Briand et al., 2003; Zhao, 1998]. Itwould of course be counterproductive for the development of an impact analysistechnique to start with the premise that the prerequisites are not in place.However, the reality is that the return on investment may not be perceivedas being big enough to motivate the effort required to maintain infrastructuresuch as traceability links among development artefacts (see Sidebar 1.1 for somenotes on this). This calls for the studying of how impact analysis is practisedand supported as part of the change control process—a process perspective.
The process perspective anchors the impact analysis activity in the con-text where it belongs as described in Section 1.1. Some reflections on what isnecessary to pursue with respect to the process perspective are:
• A focus on understanding what, when, and how about impact analysis incurrent software development practise. For example: What kinds of im-pact analysis are performed? Are different analysis approaches used based
15
1: Introduction
on when the analysis is performed (due to differences in knowledge, for ex-ample)? How detailed should an analysis be to maximise the yield/effortratio?
• The development of methods and tools that do not require a completelyupdated and accurate infrastructure of development artefacts. An excel-lent example is the method by Egyed [2003], which addresses the problemof missing traceability by deducing certain dependencies automatically.Also, Wiegers [1999] provides checklists that help the analyst perform amore rigourous and complete analysis (see also Chapter 5).
• The development of methods and tools that can be integrated with main-stream software development tools typically used in organisations. Forexample, von Knethen and Grund [2003] propose a traceability model andan associated tool environment that includes a requirements managementtool and a CASE tool.
• A focus on performing empirical research in general (see also Section 1.6.4).This is important to better tie industry and academia in order to obtaina healthy exchange of problems and solutions.
1.3.3 PURPOSESImpact analysis can potentially be a powerful project and product managementtool from which a lot of knowledge about a change and its effects can be ob-tained. Simply put, the information gathered through an impact analysis can
Sidebar 1.1: Traceability links
A traceability link refers here to a relationship between two development arte-facts, such as a requirement and a source code class. Such links can be missingfor a number of reasons. Our experience tells us that developers tend to thinkthat it is tedious to maintain traceability links, at least manually. It is alsodifficult, as different artefact types have different structural characteristics.For example, requirements belong to the problem space, and are thereforenot structured the same as source code classes, which belong to the solutionspace. Scattering (a single requirement is implemented by several source codeelements) and tangling (a single source code element implements several re-quirements) complicate the matter further [Clarke et al., 1999].
16
1: Introduction
serve different (but interconnected and related) purposes, examples of which arepresented below. In the study described in Chapter 4, we investigated impactanalysis purposes and issues as seen by software professionals. The chapter fo-cuses on the issues in detail and thus not on the purposes. More informationabout the purposes can be found in [Jönsson and Wohlin, 2005b] and [Jöns-son, 2005: chap. 4]. The list below contains the purposes ranked as the mostimportant ones in the study.
Deciding whether to accept or reject the change: The ultimate pur-pose of the information obtained through an impact analysis is just this. Theapproving authority in the change management process needs the informationin order to make a proper decision. This purpose is hierarchically related toother purposes, such as determining cost versus benefit (in that the latter is asub-purpose of the former).
Planning the project with respect to time and cost: This purposeis straightforward; the scope and technical complexity of a change feed directlyinto project planning. For example, if a change is extensive, it is likely thatordinary project activities will be delayed, which in turn will affect deadlinesand deliveries. A technically complex change may require requesting additionalexpertise into the project, which naturally will increase project costs.
Determining cost versus benefit: This purpose requires the analysisto include both an assessment of the cost of a change and the assessment ofthe perceived benefit for customers, for the market, and possibly internally.Cost/benefit ratios can be used to support prioritisation between several concur-rent changes, among other things. Certain combinations of the two dimensionscan be interesting: a high-cost, high-benefit change, for example, could indicatethat there is a large discrepancy between what the system can do and what isexpected from it (thus, the change is beneficial), while the architecture of thesystem is not designed in a way that the change can be easily accommodated(thus, the implementation cost is high).
Understanding technical and market consequences of including ornot including the change: This purpose is related to a number of the others,and is an important precursor to deciding whether to accept or reject a change.Clearly, there is also a relation to using impact analysis to determine cost versusbenefit. However, this use intuitively conveys a long-term perspective, including,for example, how the change will affect the position of the system in comparisonto competitors’ systems. Similarly, technical consequences of a change includearchitectural issues of changeability, maintainability, interoperability, etc.
Understanding the proposed change: An important aspect of impactanalysis is to create and spread an understanding of the change. This is partic-
17
1: Introduction
ularly important for changes that are technically complex or have large scope,as there otherwise is a risk that such changes are not implemented correctly,thereby potentially destabilising the system. However, there is also an aspectof education; it is crucial that all stakeholders are aware of changes made to thesystem and the actual functionality of the system, in particular when changesare frequent.
Assessing system impact: This purpose is the heart of impact analysis,and much effort has been put into devising and testing methods for determiningimpact based on dependencies in source code or between design entities [see,for example, Briand et al., 2003; Law and Rothermel, 2003; Lee et al., 2000].The notion of “system” here is very contextual, in that the types of artefacts forwhich to assess impact could vary depending on the organisation needs. Fromthe perspective of configuration management, the impact on configuration itemsmust be analysed (which requires that all relevant artefacts, including sourcecode, are included as configuration items).
Obtaining a new or changed requirements baseline: Leffingwell andWidrig [1999] define baseline to be “the itemised set of features, or requirements,intended to be delivered in a specific version of the application”. Of course, itis possible to envision multiple baselines within one single project, for exampledue to internal milestones or deliveries. This purpose emphasises the impor-tance of making sure that requirements are up-to-date and form a baseline forfuture changes. If the requirements baseline is out-of-date, it is not possible toaccurately verify that the system functions as required at a delivery or milestone.
Revealing synergies and conflicts between change proposals: This isa particularly important purpose, as it potentially can alleviate the change effortthrough an understanding of how concurrent changes interact. Without suchunderstanding, there is a risk that change activities become less than optimal(with respect to planning and resources), and that defects are introduced as aresults of changes not being fully compatible.
The purposes presented above illustrate that there is more to impact analysisthan technical aspects. Impact analysis is an activity that can provide inputto many different decision processes. Next, we look at two different levels ofimpact analysis that are related to the purpose of the analysis.
1.3.4 ANALYSIS LEVELSIn describing the change control process, Leon [2000] mentions a two-stagedevaluation of (requested) changes. In the first stage, a screening of the changeis performed, in order to filter out those changes which do not stand a chance
18
1: Introduction
of being approved anyway. Only changes that pass this first screening are for-warded to the second stage, in which proper analysis is performed. Leon doesnot provide any guidelines as to how thorough the screening should be, butmentions that cost or schedule aspects could be looked at. Having a screeningstep in the change control process makes a lot of sense, as it prevents the devel-opment organisation from being overloaded with changes that require (detailed)analysis. In additional to initial screening, this thesis argues for a differentiationbetween two levels of impact analysis:
• Decision-targeted impact analysis is a high-level analysis that is per-formed in order to make a decision concerning the approval or disapprovalof a requested change. The estimates produced on this level are ballparkfigures. Often, the magnitude of an estimate rather than the exact numberis important (it is necessary to know whether the realisation of a changetakes 100 or 1 000 hours, but it does not matter so much whether it takes50 or 150).
• Realisation-targeted impact analysis is a more detailed analysis per-formed in order to obtain an understanding of what is required to realisethe change. In other words, it serves as a preparation for the change imple-mentation. Estimates are more accurate (but still estimates) than in thedecision-targeted analysis, and allow for detailed planning and follow-up.
The separation of the two levels further relieves the development organisationof analysis work, as fewer changes need to be thoroughly analysed. For thechanges that are approved in the CCB, the decision-targeted analysis can actas a starting point for the subsequent realisation-targeted analysis. These twolevels are also referred to in Chapter 5.
It should be noted that the decision-targeted analysis necessarily involvesanalysing aspects such as consequences related to external actors, availabilityof technical competence, and general resource availability. Thus, this kind ofanalysis is not meant to be “quick-and-dirty”, but carries the same weight andsignificance (perhaps even more) than the realisation-targeted kind. However,due to the difference in analysis goal, the two kinds of analysis do not have tobe equally exhaustive.
1.3.5 RESEARCH TRENDSGlass et al. [2002] present a taxonomy developed for the investigation of topic,research approach, research method, reference discipline, and level of analysis
19
1: Introduction
0
5
10
15
20
25
30
35
1990-1993 1994-1997 1998-2001 2002-2006
Year
Cou
nt
Software maintenanceSoftware evolutionNew development
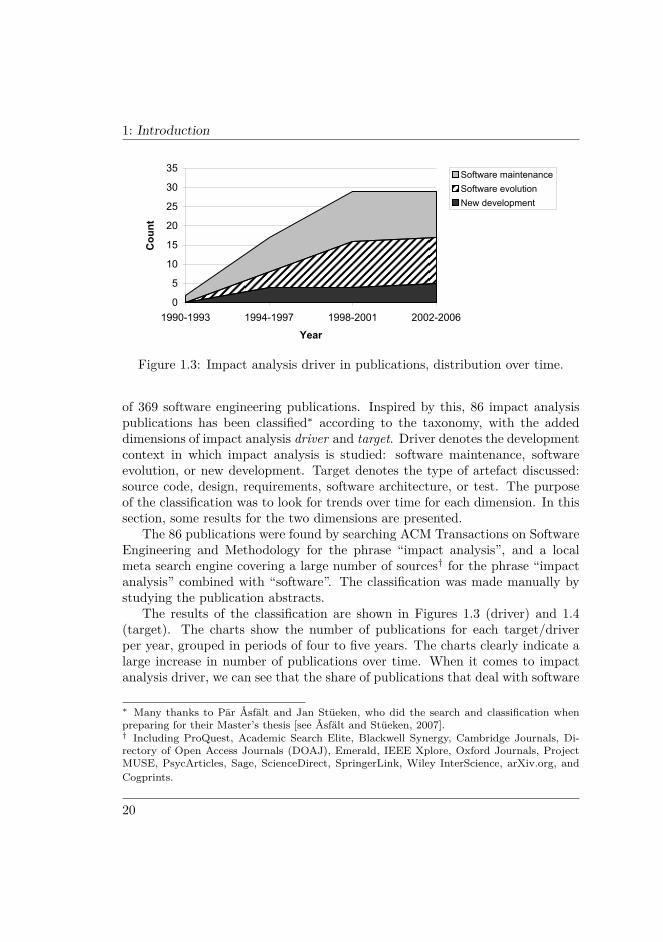
Figure 1.3: Impact analysis driver in publications, distribution over time.
of 369 software engineering publications. Inspired by this, 86 impact analysispublications has been classified∗ according to the taxonomy, with the addeddimensions of impact analysis driver and target. Driver denotes the developmentcontext in which impact analysis is studied: software maintenance, softwareevolution, or new development. Target denotes the type of artefact discussed:source code, design, requirements, software architecture, or test. The purposeof the classification was to look for trends over time for each dimension. In thissection, some results for the two dimensions are presented.
The 86 publications were found by searching ACM Transactions on SoftwareEngineering and Methodology for the phrase “impact analysis”, and a localmeta search engine covering a large number of sources† for the phrase “impactanalysis” combined with “software”. The classification was made manually bystudying the publication abstracts.
The results of the classification are shown in Figures 1.3 (driver) and 1.4(target). The charts show the number of publications for each target/driverper year, grouped in periods of four to five years. The charts clearly indicate alarge increase in number of publications over time. When it comes to impactanalysis driver, we can see that the share of publications that deal with software
∗ Many thanks to Pär Åsfält and Jan Stüeken, who did the search and classification whenpreparing for their Master’s thesis [see Åsfält and Stüeken, 2007].† Including ProQuest, Academic Search Elite, Blackwell Synergy, Cambridge Journals, Di-rectory of Open Access Journals (DOAJ), Emerald, IEEE Xplore, Oxford Journals, ProjectMUSE, PsycArticles, Sage, ScienceDirect, SpringerLink, Wiley InterScience, arXiv.org, andCogprints.
20
1: Introduction
0
5
10
15
20
25
30
1991-1993 1994-1997 1998-2001 2002-2006
Year
Cou
nt
TestSoftware architectureRequirementsDesignSource code
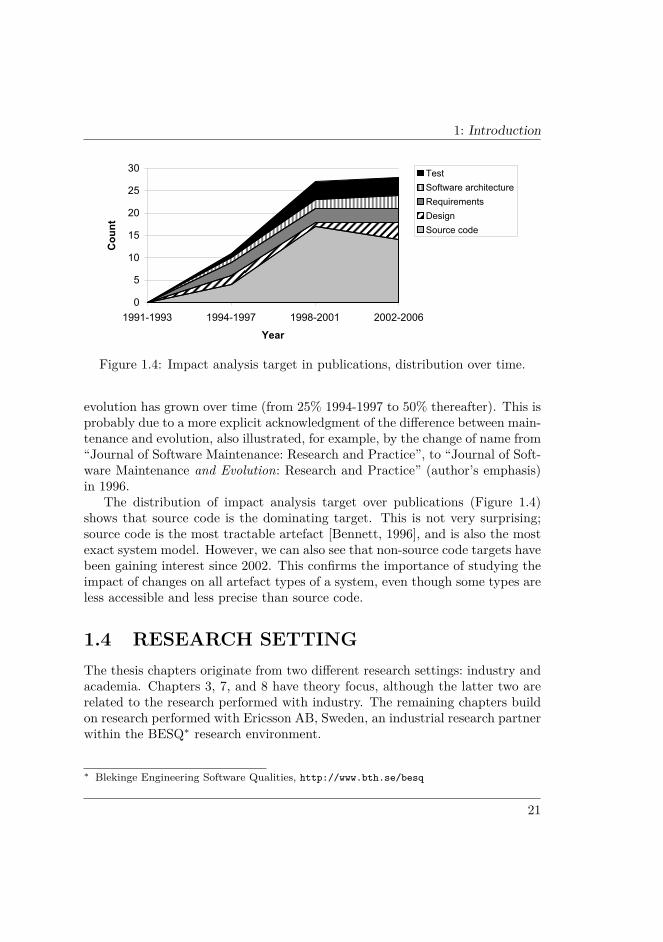
Figure 1.4: Impact analysis target in publications, distribution over time.
evolution has grown over time (from 25% 1994-1997 to 50% thereafter). This isprobably due to a more explicit acknowledgment of the difference between main-tenance and evolution, also illustrated, for example, by the change of name from“Journal of Software Maintenance: Research and Practice”, to “Journal of Soft-ware Maintenance and Evolution: Research and Practice” (author’s emphasis)in 1996.
The distribution of impact analysis target over publications (Figure 1.4)shows that source code is the dominating target. This is not very surprising;source code is the most tractable artefact [Bennett, 1996], and is also the mostexact system model. However, we can also see that non-source code targets havebeen gaining interest since 2002. This confirms the importance of studying theimpact of changes on all artefact types of a system, even though some types areless accessible and less precise than source code.
1.4 RESEARCH SETTINGThe thesis chapters originate from two different research settings: industry andacademia. Chapters 3, 7, and 8 have theory focus, although the latter two arerelated to the research performed with industry. The remaining chapters buildon research performed with Ericsson AB, Sweden, an industrial research partnerwithin the BESQ∗ research environment.
∗ Blekinge Engineering Software Qualities, http://www.bth.se/besq
21

1: Introduction
Ericsson develops, among other things, solutions for charging and positioningin mobile phone networks. The company operates on a world market, and sellssystems to many of the world’s largest mobile phone operators. Thus, Ericssonis a market-driven software development company, although there is often aprimary customer who is allowed to be most influential. Due to the inherentcomplexity in the type of systems developed, projects have traditionally beenboth long and large, ranging from 12 to 18 months. A project normally involvessomewhere between 60 and 120 persons. Due to the length of the projects, theybecome very sensitive to changes. Releases are, naturally, far apart. There isan ongoing shift from these long-term projects to shorter and swifter projectsthat can improve responsiveness towards customers and reduce the stress onthe development organisation. This mode of development has been termedstreamline development, and is discussed more in Chapter 6.
The change management process at Ericsson, depicted in Figure 1.5, differsslightly from the standard process described by Leon (see Section 1.1.3). Theprocess features a specific step for screening of change requests. This is similarto what Leon proposes (as mentioned in Section 1.3.4), although the charac-teristic of the screening is more syntactic than semantic (see Sidebar 1.2 for anexplanation of this). One purpose of the step is to ensure that the change controlprocess is not abused with non-changes (e.g., defects that should go through adifferent process). In addition, the screening step lowers the number of CRs thatneed to be considered, thus reducing the stress on the process. Furthermore,the process has a preliminary CCB step. In this step, it is decided whether ornot the change request is fit for detailed analysis prior to the final decision inthe CCB.
Identify change[Change originator]
Analyse CR (impact, skills, costs, etc.)
Evaluate the CR and AD [CCB/approving
authority]Decision
Change Request (CR)
Analysis Document (AD)
Legend
Outcome/document
Activity/step
Decision
Screen CR with respect to validity
Evaluate CR with respect to fitness
for analysis
Figure 1.5: Steps in the change management process at Ericsson. Additionalsteps in comparison to Leon’s process are highlighted with thick frames.
22
1: Introduction
The type of research performed is empirical, meaning that it is based onobservation and experience, in this case in an industrial context. Conductingresearch in close cooperation with industry is both rewarding and challenging,due to inherent differences between industry and academia. Empirical researchand characteristics thereof are discussed more in Section 1.6.4.
1.5 INCLUDED AND RELATED PAPERSThis thesis builds on a number of research studies which have previously beenreported in conference papers, journal papers, and a book chapter. This sectionprovides a brief description of the manuscripts that have been converted intothesis chapters. Earlier manuscripts that do not appear in the thesis or simplyprecede the included ones are listed as well for the sake of completeness. Thefollowing manuscripts appear in the thesis (Per Jönsson is the main author,unless otherwise noted):
(I) Chapter 2 is based on a paper entitled “Understanding the Importanceof Roles in Architecture-Related Process Improvement—A Case Study”,published in the proceedings of the Product Focused Software Develop-ment and Process Improvement (PROFES) conference in 2005 [Jönssonand Wohlin, 2005]. The paper describes data from a questionnaire on ar-chitecture documentation practices, and investigates how answers differamong different roles. Claes Wohlin is co-author of the paper.
(II) Chapter 3 is based on a book chapter entitled “Impact Analysis”, whichappeared in the book Engineering and Managing Software Requirementspublished by Springer-Verlag [Jönsson and Lindvall, 2005]. The chapter
Sidebar 1.2: Syntactic vs. semantic screening
A syntactic screening is one where the change request is checked with respectto completeness, clarity, and detail. In other words, focus is not on the changeitself, but rather on its appearance. The benefits of this type of screening arethat it can be performed by both engineers and non-engineers, and that itensures high-quality change requests. A semantic screening takes into accountthe meaning of the change described in the change requests, for example todetermine if it is realistic to begin with.
23
1: Introduction
describes impact analysis from a requirements engineering perspective.Mikael Lindvall is co-author of the chapter.
(III) Chapter 4 is based on a paper entitled “An Empirical Study on Views ofImportance of Change Impact Analysis Issues”, which has not yet beensubmitted. The paper describes and examines impact analysis issues, andanalyses how these are viewed by different groups of software practition-ers. Eleftherios Angelis and Claes Wohlin are co-authors of the paper.
(IV) Chapter 5 is based on a paper entitled “Using Checklists to Support theChange Control Process—A Case Study”, published in the proceedings ofthe Conference on Software Engineering Research and Practice in Sweden(SERPS) in 2006 [Jönsson and Wohlin, 2006b]. The paper describes achecklist-based support instrument for the change control process, andproposes an evaluation for said process. Claes Wohlin is co-author of thepaper.
(V) Chapter 6 is based on a paper entitled “The Anatomy—an Instrumentfor Managing Software Evolution and Evolvability”, published in the pro-ceedings of the International IEEE Workshop on Software Evolvability in2006 [Jönsson, 2006]. The paper describes a planning instrument formanaging software product and project evolution.
(VI) Chapter 7 is based on a paper entitled “Benchmarking k-Nearest Neigh-bour Imputation with Homogeneous Likert Data”, published in a specialissue of Empirical Software Engineering (EMSE) in 2006 [Jönsson andWohlin, 2006a]. The paper evaluates the performance of k-NN impu-tation, and benchmarks the method against other imputation methods.Claes Wohlin is co-author of the paper.
(VII) Chapter 8 is based on a paper entitled “Hierarchical Cumulative Voting(HCV)—Prioritization of Requirements in Hierarchies”, published in aspecial issue of International Journal of Software Engineering and Knowl-edge Engineering (IJ-SEKE) in 2006 [Berander and Jönsson, 2006b]. Thepaper presents a method for prioritisation of requirements that are hi-erarchically arranged, based on the Cumulative Voting method. PatrikBerander is the main author of the paper, Per Jönsson is co-author.
The following manuscripts do not appear in the thesis or are consideredprevious work:
24
1: Introduction
(VIII) A paper entitled “A Case Against Continuous Simulation for SoftwareArchitecture Evaluation”, published in the proceedings of the IASTEDInternational Conference on Applied Simulation and Modelling (ASM)in 2003 [Mårtensson et al., 2003]. Frans Mårtensson is main author ofthe paper. Per Jönsson, PerOlof Bengtsson, Håkan Grahn, and MichaelMattsson are co-authors.
(IX) A paper entitled “A Goal Question Metric Based Approach for EfficientMeasurement Framework Definition”, published in the proceedings of theACM/IEEE International Symposium on Empirical Software Engineering(ISESE) in 2006 [Berander and Jönsson, 2006a]. Patrik Berander is themain author of the paper, Per Jönsson is co-author.
(X) A paper entitled “Understanding Impact Analysis: An Empirical Study toCapture Knowledge on Different Organisational Levels”, published in theproceedings of the International Conference on Software Engineering andKnowledge Engineering (SEKE) in 2005 [Jönsson and Wohlin, 2005b].Claes Wohlin is co-author of the paper. Paper III described above is anextended version of this paper and the next.
(XI) A paper entitled “A Study on Prioritisation of Impact Analysis Issues: AComparison Between Perspectives”, published in the proceedings of SERPSin 2005 [Jönsson and Wohlin, 2005a]. Claes Wohlin is co-author of thepaper.
(XII) A licentiate thesis entitled “Impact Analysis—Organisational Views andSupport Techniques”, presented in 2005 [Jönsson, 2005]. The licentiatethesis includes some of the work also present in this thesis, but has morefocus on how impact analysis is seen from an organisational point of view,whereas this thesis has a process perspective.
1.6 RESEARCH METHODOLOGYWhen conducting research, it is imperative to be aware of and follow a researchmethodology. A methodology involves methods, rules, and claims inherent to aparticular discipline [Merriam-Webster, 2003]. It is also important to provideclear and transparent reporting of methods and procedures followed, as thisallows people to see how data have been collected, synthesised, and analysed.Without transparency, other researchers cannot replicate studies and may have
25
1: Introduction
problems trusting results. In this section, we discuss research in general, ap-proaches to research, and how trustworthiness is achieved in research. Finally,the chapters in the thesis are positioned with respect to the discussed aspects.
1.6.1 WHAT IS RESEARCH?Russ-Eft [2004] has surveyed a number of definitions of research, in order to beable to give an answer to the question: What is research anyway? She identifiestwo main features, each of which has two contrasting dimensions. The firstfeature, which is related to knowledge, is that research:
• . . . extends present scientific knowledge and adds new insights, includingconstraints and limitations, or
• confirms current knowledge, through replication of previous studies or bymaking current practises visible.
Clearly, research that presents new knowledge and introduces new conceptsor methods can be more “exciting” than research that tries to replicate earlierresearch to confirm (or reject) its findings. Replicating research can be difficult,though, as the papers describing the research might not provide enough detailsabout the design of the research approach for a replication to be possible. Unfor-tunately, the lack of widespread replication within software engineering researchposes a serious threat to the validity of research that bases assumptions on re-sults from non-replicated studies. For example, Lindvall and Sandahl [1998]performed a study which is commonly cited in change impact analysis papers asan undisputable fact that practitioners generally underestimate the impact ofchanges to software systems. However, lacking replication, this study representsonly one data point, which not necessarily has the wide generalisability it so farhas been attributed. This does not mean that the results put forward in thestudy are invalid, but they could be different in a different context.
The second feature, which is related to systematicness, is that research:
• . . . is performed in a systematic and orderly fashion using disciplined pro-cesses, or
• depends on the ability to recognise a solution to a problem even if itmanifests haphazardly.
In the first of these bullets, research is depicted as something structured,whereas in the second bullet, there is an element of chance. There is no conflict
26
1: Introduction
between these aspects, the point is merely that serendipity is important in acontrolled and ordered environment such as research. In fact, many significanthistorical discoveries have been made by chance, the discovery of penicillin be-ing an excellent example [Bud, 1998]. Russ-Eft concludes, in the light of themultidimensional features of research, that research by necessity must be clearlydescribed and fully transparent for replications to be made and follow-up studiesto be performed.
Full transparency can be problematic to achieve if the research is conductedin a setting where certain results may be sensitive, such as empirical researchwhere there are industrial research partners involved. In such situations, it isoften necessary to anonymise or hide certain data, which of course prevents fullreplicability.
1.6.2 RESEARCH DESIGNThe design of the research approach affects the type of data that can be collected,the analyses that are possible, and thereby the results that can be obtained. Itis very common to talk about quantitative and qualitative approaches. Here, wediscuss these terms, but also the concepts fixed and flexible design, and whatthese mean in relation to qualitative and quantitative.
1.6.2.1 QUANTITATIVE VS. QUALITATIVE
It is a non-trivial task to classify research using the labels qualitative and quan-titative. Qualitative research is concerned with understanding a problem inits natural setting, using words to describe a situation, and carefully report-ing the views of people (because, unlike in a positivistic approach, facts andtruths depend on the people involved) [Creswell, 1994]. Quantitative research,on the other hand, is concerned with measuring objective facts using num-bers, analysing data using statistical procedures, and testing theories [Creswell,1994]. For example, a quantitative approach is useful when one wants to gener-alise results based on a representative sample from a population, and/or show acause-effect relationship in data. However, Robson [2002] points out that theseconcepts when used to classify research can be misleading, because they haveto do with the methods used for data collection rather than the design of theresearch approach, and subsequently proposes to use the concepts fixed design(for quantitative research) and flexible design (for qualitative research) instead.
Combining qualitative and quantitative methods can be very useful. Someexamples are: using triangulation to check the results from a qualitative method
27
1: Introduction
with those of a quantitative method (or vice versa), create an understanding ofcontext and participants using a qualitative method prior to using a fixed designwith quantitative methods, and improving generalisability by doing statisticaltesting in a flexible design with otherwise qualitative methods [Robson, 2002].
1.6.2.2 FIXED VS. FLEXIBLE DESIGNS
The notions of fixed and flexible refer to the state of the design prior to data col-lection; in a fixed design, the design is established before data collection, whilein a flexible design it is allowed to evolve during the study. In a fixed design,you have a theory that you want to confirm (or reject), thus a fixed design canbe said to be theory driven [Robson, 2002]. Fixed designs often involve statisti-cal methods for testing a defined hypothesis which allows generalisation of theresults with statistical certainty, although qualitative data collection methodscan be used just as well. Fixed designs include the following variants [Robson,2002]:
• True experimental designs, in which case people are randomly assigned totwo or more groups. People in different groups participate under differentconditions, known as treatments, controlled by the researcher.
• Single case experimental designs, where individuals are in the spotlightrather than groups.
• Quasi-experimental designs, where the allocation of participants to groupsis not random.
• Non-experimental designs, where the researcher does not actively affect orcontrol the study setup.
Consider the following (simple) example of a true experimental design. Sup-pose that the researcher wants to test how two programming languages differwith respect to development speed. She would then let one group use languageA and the other group language B (these are the treatments), and randomlyallocate participants to the two groups. After the experiment, she would mea-sure programming speed in some way (e.g., lines of code per hour, putting asidethe fact that lines of code is a highly doubtful metric for several reasons) anduse a statistical test to check for a difference between the groups. The randomelement is crucial here; the results would not be very useful if, for some reason,the more skilled programmers were allocated to the group using language A.This design is known as a two-group design [Robson, 2002].
28
1: Introduction
In a flexible design, it is expected and accepted that initial research questionsare underdeveloped, since they will evolve during the study. However, beforethe study can start, it must be decided which data collection methods to useto begin with. Due to the researcher’s involvement in the study, and based onknowledge from early data collection, the overall approach as well as choice ofmethods can change. A good flexible design, though, makes use of rigourous andpreferably multiple data collection methods [Robson, 2002]. Types of flexibledesigns include:
• Grounded theory aims at developing a theory based on field data.
• Ethnography involves describing and interpreting a group of people, withfocus on social and cultural aspects.
• A case study is used to do a detailed analysis of one or more cases (wherecase is a unit of interest, for example a situation or an organisation).
Much of the research presented in this thesis has been performed as casestudies. According to Robson [2002], a case study is not a method, but rathera strategy for doing research. A case study is empirical in its nature, becauseit collects data through observation of a case in a real-world situation. Wohlinet al. [2000] argue that a case study is suitable for industrial evaluation ofmethods, because unlike in an experiment, both scale and variables are inherentto the situation rather than to the experimental setup. A problem with casestudies is that the results obtained can be specific to the case and therebydifficult to generalise. Being of flexible design, a case study should collect datafrom multiple sources. Note also that a case study can use both quantitativeand qualitative methods [Wohlin et al., 2000].
1.6.3 EXPLORATORY RESEARCHRobson [2002] lists four research purposes: exploratory, descriptive, explanatory,and emancipatory. Exploratory research is, as the name suggests, concernedwith exploring a particular situation. Asking questions, searching for insights,and looking at things from new perspectives are all important ingredients in ex-ploratory research. Exploratory research is well-suited in situations that are notwell-understood, or where it is desirable to examine premises for future research.In contrast, descriptive research serves to describe a situation, event, or person,about which extensive prior knowledge is required. Explanatory research seeksto develop and examine cause-effect relationships, and emancipatory researchhas to do with social action [Robson, 2002].
29
1: Introduction
The research behind this thesis is mainly exploratory, in the sense that im-pact analysis is looked upon from a different-than-usual perspective, and theresearch questions guiding the work are to a large extent open-ended. Robson[2002] notes that exploratory research often is of flexible design. This is not truefor all studies presented in the thesis, but also the fixed-design studies contributeto the overall exploration of the subject at hand. The impact analysis overview(Chapter 3) and the method chapters (7 and 8) are of descriptive nature.
1.6.4 EMPIRICAL RESEARCHAs a result of the research collaboration with industry, the research presentedin this thesis can be classified as empirical. Merriam-Webster [2003] definesempirical as:
“(1) originating in or based on observation or experience; (2) re-lying on experience or observation alone often without due regardfor system and theory; (3) capable of being verified or disproved byobservation or experiment.”
The recurring keywords which also are the important characteristics of em-pirical research are observation and experience. Observation is valuable becauseit allows the researcher to solve real problems instead of problems she herselfbelieves to be important, and there is often a difference between these two pointsof view [Potts, 1993]. According to Wohlin et al. [2000], there are three mainstrategies for doing empirical research: survey, case study, and experiment. Thefirst two support both qualitative and quantitative methods, while the thirdrequires quantitative methods.
The three strategies are explained next, followed by some aspects of con-ducting industry-close research, and challenges of empirical research.
1.6.4.1 SURVEY
A survey can be performed through a questionnaire or through interviews. Un-like a case study that takes place in the present, a survey is typically done inretrospect [Wohlin et al., 2000]. For a survey to be useful, the respondents haveto be sampled from the population in a proper manner, and questions must bephrased correctly and unambiguously [Robson, 2002]. Otherwise, the resultsof the survey are practically useless. A survey can generate large amounts ofgood and understandable data, and is relatively easy to setup and administer.Interview surveys are particularly beneficial as they allow the researcher to ask
30
1: Introduction
follow-up questions and request clarification if necessary. Another type of sur-vey is literature survey, in which the objects of study are articles, books, etc.Also here it is important to select a literature sample that is representative forthe field, which is usually accomplished by searching with different search terms(e.g., synonyms and related concepts) and in different databases.
1.6.4.2 CASE STUDY
As noted, case studies are done in the present, which is a necessity as theyinvolve studying the case in its natural setting. In a case study, data can becollected, for example, through observation, interviews, and documentary anal-ysis [Robson, 2002]. Objectives of a case study include to search for patterns inresults based on some theory, to build explanations by looking for causal rela-tionships, and to monitor changes in a pattern over time [Creswell, 1994]. Forprocess improvement research that generate process changes, case studies aresuitable as they can determine the effect of the change on a high level [Wohlinet al., 2000]. A possible problem when a case study is performed in an indus-trial setting is that it is intrusive, which may affect the subjects’ reactions andattitudes towards the study [Zelkowitz and Wallace, 1998].
1.6.4.3 EXPERIMENT
Experiments have the benefits of allowing the researcher to be in control of thesituation, including subjects, variables, and instrumentation. A variable is acharacteristic or property that can be measured and compared [Robson, 2002].Usually there is an independent variable (or a set of) and a dependent variable(or a set of). An independent variable can be controlled (it does not dependon anything in the experiment), which means that the researcher has the powerto determine what the value or values of the variable will be. Typically, thetreatments administered in an experiment are closely connected to the indepen-dent variables. A dependent variable can be measured after the experiment (itdepends on the execution of the experiment), to see how it was affected by theindependent variable. The basic premise of an experiment is that we have atheory or idea about a cause-effect relationship, based on which a hypothesiscan be formulated [Wohlin et al., 2000]. The experiment can help us determineif the hypothesis is true.
31
1: Introduction
1.6.4.4 INDUSTRY AS LABORATORY
Nearly one and a half decade ago, Potts [1993] discussed the problem of suc-cessfully transferring research results to industry. He considered the prevalentapproach of separating research and industrial application, termed research-then-transfer, a failure, and advocated instead an approach where research takesplace in close cooperation with industry, termed industry-as-laboratory. Theindustry-as-laboratory approach ensures that problems are anchored in indus-try and thereby relevant, and solutions are created in-place with allows quickfeedback and less need for a separate transfer phase. Three main consequencesof the industry-as-laboratory approach are [Potts, 1993]:
• Problems are observed empirically and justify research in themselves.
• Case studies become more relevant and suitable as research method. Asargued above, case studies are empirical and are well-suited for industry-close research.
• Context and setting become more important factors, and technical prob-lems must be related to non-technical situations.
The research presented in this thesis make use of the industry-as-laboratoryapproach. Problems have been observed in industry through discussions withthe industrial research partner. Many of the studies are case studies (in fact,the research collaboration is in reality one main case study, divided into smalland manageable sub-studies), and we study the application of impact analysis(a technical activity and problem) in its non-technical process context.
1.6.4.5 CHALLENGES
While empirical research has many advantages, there are challenges that theresearcher needs to be aware of. Some challenges specifically related to empiricalresearch following the industry-as-laboratory principle are summarised below.Potts [1993] identified a number of challenges that are very relevant still today:
• Many problems have a people element. People are part of the non-technical context that we need to consider when dealing with technicalproblems.
• Industry has a much higher pace than academia. The long-term perspec-tive that characterises research does not always fit in industrial projects,where short-term problems are more urgent.
32
1: Introduction
• Some problems and thereby solutions might be company-specific and dif-ficult to generalise.
• Evolutionary (small-scale) changes are more likely to happen than revo-lutionary (large-scale) changes. Empirical researchers should not expectlarge research leaps.
• The researcher might be thrown off by changes in the setting that occuroutside of her control. Also, small sample sizes and possible lack of goodquantitative data means that qualitative methods must be used to a largerextent.
• Sensitive data and unfavourable findings cannot be revealed (often underthe terms of a non-disclosure agreement signed by the researcher), whichmeans that the researcher must anonymise data while keeping it intact.
In additions to the challenges listed above, the following ones have beenexperienced within the scope of the research presented in this thesis:
• It can be difficult to obtain access to data and to establish good relation-ships with practitioners, because the researcher is not by default a trustedcolleague. Trust can be built in different ways. For example, when asked∗how to overcome this challenge, Vic Basili suggested to start with some“free consulting”, before advancing to more research-oriented work.
• The researcher is dependent on management individuals; if new managersenter the scene, these must be familiarised with the research and possiblyconvinced of its relevance.
• Some practitioners are more willing to participate in research studies thanothers, perhaps because they are interested in research or are otherwiseopen-minded. If multiple case studies are performed in the same setting,there can be a subject bias towards these willing practitioners, and thereis a risk that they grow tired of participating.
• Academia and industry speak different languages and have different tradi-tions in reporting results (due to differences in goals and needs). Failure toacknowledge this might mean that the researcher’s results are not properlycommunicated and transferred.
∗ After his keynote speech entitled “Empirically Evolving Software” at the METRICS 2004conference in Chicago, IL, USA.
33
1: Introduction
An understanding of the challenges presented above potentially results inmore structured and thoughtful research. It can also maximise return on in-vestment for all parties involved in the research.
1.6.5 TRUSTWORTHINESSEstablishing trustworthiness is a prerequisite for people to rely on your researchand trust your findings. Concepts such as validity (are the findings real?), gen-eralisability (do the findings hold outside the specified setting?), and reliability(would the results be the same a second time?) are all related to trustworthiness.Establishing trustworthiness is not the same for a fixed design with quantita-tive methods and a flexible design with qualitative methods. For the latter, theapplicability of the validity and reliability concepts has been debated [see Rob-son, 2002]. Still, Robson argues that validity of qualitative methods dependson, for example, clear and transparent reporting of results and interpretations,avoidance of bias (both researcher and subject), and triangulation of multipledata sources. The discussion below is an overview of measures taken to ensurevalidity in the thesis studies, irrespective of design and method types (thoughthe discussion is more geared towards validity in quantitative methods). Moredetailed discussions can be found in each chapter.
Kitchenham et al. [2002] bring up a discouraging observation about empiricalsoftware engineering—that the quality of its research generally is low. In par-ticular, they point out that statistical analysis often is incorrectly used withinthe software engineering field, mostly due to the fact that many researchers inthe field lack enough statistical knowledge and experience. This problem hasalso been acknowledged by Miller [2004], who provides an in-depth presenta-tion of the many statistical traps that even experienced software engineeringresearchers fall into. He states that a fundamental problem is that the soft-ware engineering field is widely different from the sciences for which statisticalsignificance testing was originally intended.
Kitchenham et al. provide a number of guidelines related to statistical anal-ysis. Since Chapters 2 and 4 describe statistical analyses, it is relevant tocomment on these analyses based on some of the guidelines. We see the follow-ing guidelines as of particular importance (see Kitchenham et al. [2002] for thecomplete list):
• Ensure that the data do not violate the assumptions of the testsused on them. In Chapter 2, non-parametric tests (the Kruskal-Wallisand Chi-square tests) are used in the data analysis because the data were
34
1: Introduction
collected using ordinal and nominal scales. In Chapter 4, both parametricand non-parametric tests are used. However, a violation of assumptionsregarding independence of measures is discussed when testing for corre-lation significance, and a different test (the Mantel test) is used to verifythe results.
• Present the raw data whenever possible. Otherwise, confirmthat they are available for confidential review by the review-ers and independent auditors. For confidentiality reasons, only some(screened) data are possible to disclose in the thesis. Furthermore, even ifmore data could be presented, they might be difficult to interpret withoutspecific context knowledge, especially if they are qualitative.
• Provide appropriate descriptive statistics. This type of statisticscan be found to some extent in both chapters. Chapter 2, for example,shows the distribution of answers on all questions posed in the study.Chapter 4 provides descriptive data as box plots, bar charts, and in tableform.
• Differentiate between statistical significance and practical im-portance. This is a strong point that applies to both chapters. As canbe seen in the chapters, the practical implications of the results are dis-cussed in addition to the statistical results. This is especially importantin the light of Miller’s assertion on the use of statistics in fields otherthan the intended ones (see above). In addition to the statistical analysis,Chapter 4 contains a qualitative analysis where importance is consideredfrom a practical perspective.
• Specify limitations of the study. Both chapters contain sections thatdiscuss threats to the validity of the results, and how these threats weresought to be eliminated. Some further general points on validity are givenbelow.
The guidelines above are mostly related to conclusion validity, which is con-cerned with the statistical relationship between the treatment and the out-come [Wohlin et al., 2000]. The other three main types of validity are explainedbelow based on examples from the thesis chapters (for details, see the respectivechapter).
35
1: Introduction
1.6.5.1 CONSTRUCT VALIDITY
Construct validity is concerned with the design of the main study instrumentand that it measures what it is intended to measure [Robson, 2002]. Thistype of validity is mainly relevant for the studies described in Chapters 2, 4,and 5. In these studies, questionnaires and interviews were used to collect data.In order to ensure construct validity in the first two mentioned studies, theinstruments were constructed in close cooperation with Ericsson. Furthermore,the interview in the Chapter 4 study was piloted before the real interviews,in order to further validate the correctness of the interview instrument. Theevaluation questionnaire presented in Chapter 5 was developed after it wasconcluded that a previous, simpler questionnaire would not be sufficient. In theChapter 7 study, a custom imputation tool was developed specifically for thestudy. The correctness of this tool was ensured through manual checking of thevalidity of its output for constructed test input.
1.6.5.2 EXTERNAL VALIDITY
External validity is concerned with the generalisability of the results [Wohlinet al., 2000]. It is therefore tightly connected to how study respondents aresampled. The most appropriate sampling technique is random sampling, as itgives each person in the population an equal chance of being selected for thesample [Robson, 2002].
In the Chapter 2 study, the questionnaire recipients were sampled usingsystematic sampling, since every second person in an employee directory wasselected. However, only one third of the persons in the sample responded to thequestionnaire. To confirm that the respondents represent the population, weverified that the departmental distributions of the population and the respon-dents are similar.
In the study described in Chapter 4, the interviewees were sampled basedon recommendations from persons in the organisation. This approach is oftenreferred to as convenience sampling [Robson, 2002]. However, as the samplingwas based on recommendations, the selected interviewees should be relevantrepresentatives for their respective groupings.
It is important to be aware of how far the generalisability of the results fromthe studies mentioned above extends. Since the studies were performed at Eric-sson, it can be argued that the results at least are generalisable to employees atEricsson. However, when presenting research results, it is desirable to assert awider generalisability. Given the brief presentation in Section 1.4, it is apparent
36
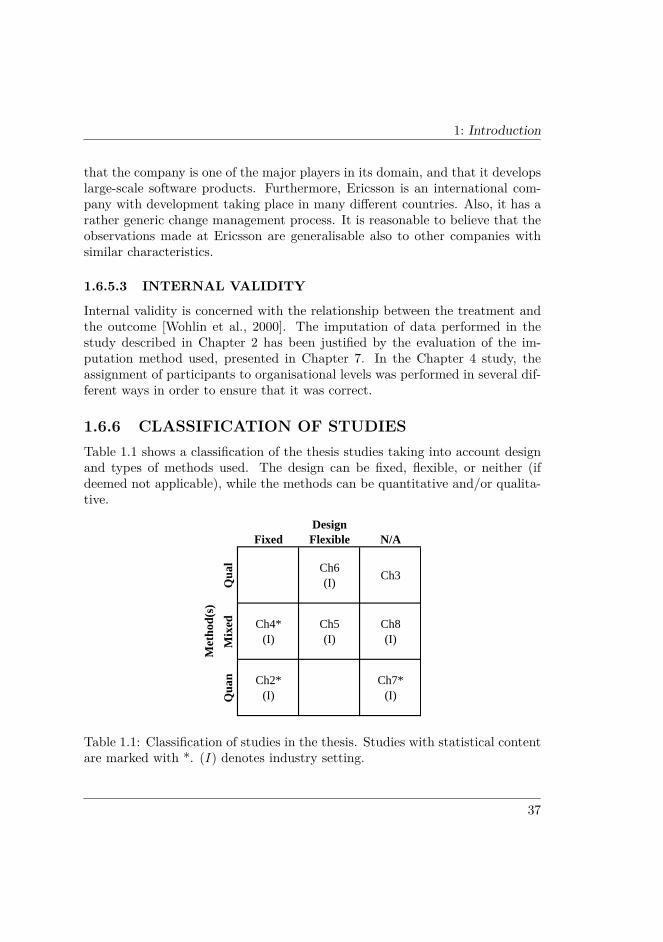
1: Introduction
that the company is one of the major players in its domain, and that it developslarge-scale software products. Furthermore, Ericsson is an international com-pany with development taking place in many different countries. Also, it has arather generic change management process. It is reasonable to believe that theobservations made at Ericsson are generalisable also to other companies withsimilar characteristics.
1.6.5.3 INTERNAL VALIDITY
Internal validity is concerned with the relationship between the treatment andthe outcome [Wohlin et al., 2000]. The imputation of data performed in thestudy described in Chapter 2 has been justified by the evaluation of the im-putation method used, presented in Chapter 7. In the Chapter 4 study, theassignment of participants to organisational levels was performed in several dif-ferent ways in order to ensure that it was correct.
1.6.6 CLASSIFICATION OF STUDIESTable 1.1 shows a classification of the thesis studies taking into account designand types of methods used. The design can be fixed, flexible, or neither (ifdeemed not applicable), while the methods can be quantitative and/or qualita-tive.
Fixed Flexible N/A
Qua
l Ch6(I) Ch3
Mix
ed Ch4*(I)
Ch5(I)
Ch8(I)
Qua
n Ch2*(I)
Ch7*(I)
Design
Met
hod(
s)
Table 1.1: Classification of studies in the thesis. Studies with statistical contentare marked with *. (I ) denotes industry setting.
37

1: Introduction
The study described in Chapter 2 was fully designed prior to data collection.A questionnaire was used to collect quantitative data about views of architecturedocumentation, and a statistical (quantitative) analysis is subsequently madein order to detect differences between roles of the study participants. Thus, thisstudy has been classified as fixed and quantitative. The study took place in anindustry setting. Chapter 3 gives an overview of the impact analysis field withrequirements engineering focus based on a qualitative literature survey. We donot consider the design alternatives to be applicable here. Chapter 4 describesa study in an industry setting, where the design was established prior to datacollection. The participants prioritised issues quantitatively, and a statisticalanalysis is performed on the data. In addition to this, a qualitative analysisis made to provide additional interpretation of the data. Thus, this study hasbeen classified as fixed and both quantitative and qualitative. The study de-scribed in Chapter 5 took place in an industry setting, but had a design thatevolved slightly during the study, due to a clear exploratory character of thestudy. The proposed checklists have been developed in a qualitative fashion(through meetings and discussions). Furthermore, quantitative data from anevaluation questionnaire are analysed and reported. Thus, the study is classi-fied as flexible and both quantitative and qualitative. The study described inChapter 6 was highly exploratory and had a flexible design. Qualitative datawere collected at meetings and from documentation in order to understand andpropose extensions to current anatomy planning practices. Thus, this study isclassified as flexible and qualitative.
Chapter 7 describes a method study that evaluated and benchmarked a sta-tistical method for imputation (i.e., dealing with missing data). The data usedto evaluate the method comes from a study in an industry setting (presented inChapter 2. Both evaluation and benchmarking are quantitative, and descriptivestatistics are used to present the results. This study is classified as quantita-tive, but we do not consider the design alternatives to be applicable. Chapter 8also describes a method study, which aimed at formulating a method for hier-archical prioritisation of requirements. The study included both a qualitativeliterature survey and data from a number of quantitative studies taking placein an industry setting (including the one presented in Chapter 4).
There are of course several additional ways in which the thesis studies canbe classified. The presented classification was chosen in order to position thestudies along some important research dimensions. All studies include a reviewof relevant literature to some extent, although it plays a larger role in the impactanalysis overview (Chapter 3) and in the method chapters (7 and 8).
38
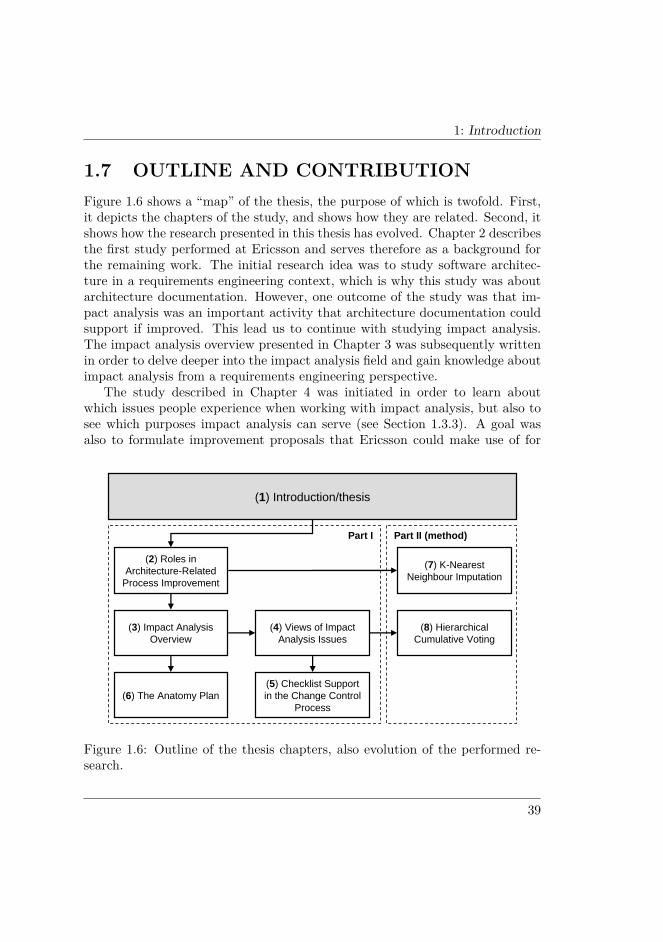
1: Introduction
1.7 OUTLINE AND CONTRIBUTIONFigure 1.6 shows a “map” of the thesis, the purpose of which is twofold. First,it depicts the chapters of the study, and shows how they are related. Second, itshows how the research presented in this thesis has evolved. Chapter 2 describesthe first study performed at Ericsson and serves therefore as a background forthe remaining work. The initial research idea was to study software architec-ture in a requirements engineering context, which is why this study was aboutarchitecture documentation. However, one outcome of the study was that im-pact analysis was an important activity that architecture documentation couldsupport if improved. This lead us to continue with studying impact analysis.The impact analysis overview presented in Chapter 3 was subsequently writtenin order to delve deeper into the impact analysis field and gain knowledge aboutimpact analysis from a requirements engineering perspective.
The study described in Chapter 4 was initiated in order to learn aboutwhich issues people experience when working with impact analysis, but also tosee which purposes impact analysis can serve (see Section 1.3.3). A goal wasalso to formulate improvement proposals that Ericsson could make use of for
(2) Roles in Architecture-Related
Process Improvement
(7) K-Nearest Neighbour Imputation
(8) Hierarchical Cumulative Voting
(6) The Anatomy Plan
(3) Impact Analysis Overview
(5) Checklist Support in the Change Control
Process
(4) Views of Impact Analysis Issues
(1) Introduction/thesis
Part II (method)Part I
Figure 1.6: Outline of the thesis chapters, also evolution of the performed re-search.
39
1: Introduction
their ongoing process improvement efforts. One finding from this study wasthat some sort of impact analysis support would be beneficial, for example inthe form of checklists. This lead to the study described in Chapter 5, wherea checklist-based support instrument was formulated. In addition to this, aprocess evaluation questionnaire was devised and tested in the study.
At Ericsson, the aforementioned move towards streamline development wasongoing. In conjunction with this, it was realised that anatomy planning, whichhad been done previously with mixed results, was one of the key factors in mak-ing streamline development a success [see also Tomaszewski, 2006: paper IX].Thus, research focus was changed to this topic, but it was decided to maintainan impact analysis perspective. Chapter 6 reports on anatomy planning andexplicitly discusses how impact analysis fits into the picture.
Conceptually, the thesis consists of two parts: one impact analysis part andone method part. Chapters 7 and 8 belong to the latter, and the studies they rep-resent are included since they originated from the impact analysis studies. Afterdata collection in the study about architecture documentation, some question-naire answers were missing. Instead of throwing away some of the respondents’answers, we decided to use an imputation method to “fill in the gaps.” Thechoice of method fell on k-Nearest Neighbour imputation, after reading aboutimputation in a software engineering context [see Cartwright et al., 2003]. Af-ter the study, we were interested in evaluating the performance of the method,which lead to the study described in Chapter 7.
In the study about impact analysis issues, the participants prioritised is-sues using the Cumulative Voting method, in which a number of points aredistributed among items to determine their relative priorities. This method wasused in a number of other studies performed at Ericsson, also with items ar-ranged in hierarchies. This lead us to investigate how Cumulative Voting couldbe used in a hierarchical context, which is described in Chapter 8.
1.7.1 CHAPTER RESEARCH QUESTIONSThe main research questions for the thesis are explained in Section 1.2. Forthe sake of convenience, they are repeated here. Sub-questions for the differentstudies that are included in the thesis are summarised and connected to themain research questions below.
• MRQ1: What are important process aspects of change impact analysis inlarge-scale industrial software development?
40
1: Introduction
• MRQ2: How can change impact analysis practices be improved and sup-ported in a lightweight manner?
In the study described in Chapter 2, the research question is whether thereare any differences in how software practitioners with different roles judge soft-ware architecture documentation and improvements thereof. The research ques-tion is captured in a null hypothesis and a corresponding alternative hypothesis,which are evaluated in a statistical analysis. The hypotheses are not connectedto any of the main research questions per se. As noted previously, this study isa background study that has lead to the impact analysis focus of the subsequentresearch.
The impact analysis overview in Chapter 3 is descriptive, and is based onthe question: what is the state-of-the-art of impact analysis from a requirementsengineering perspective? While the question is not a direct sub-question of anyof the main research questions, it relates to MRQ1 in that its answer providesan understanding of impact analysis that is useful in the study of process aspects.
For the study about impact analysis issues (Chapter 4), the following re-search questions were formulated:
1. How does the organisational level affect one’s assessment of importance ofIA issues?
2. What difference does the perspective make in determining the relative im-portance of IA issues?
3. Which are important IA issues, and how are these mitigated in softwareprocess improvement?
These questions are sub-questions to MRQ1. The stakeholders of the changecontrol process are many, and have different roles and perspectives. The firsttwo questions above thus provide knowledge about process stakeholders. Thelast question concerns issues that people experience while working with impactanalysis in the change control process. It also calls for the identification ofimprovement proposals, which is related to MRQ2.
For the study about checklist-based process support (Chapter 5), the follow-ing research questions were formulated:
1. Is checklist-based process support an effective way of improving the changecontrol process?
41
1: Introduction
2. How can we measure the efficiency of the change control process in aneffective way?
The first of these questions is a direct sub-question to MRQ2, in thatchecklist-based process support is seen as a lightweight way of improving theprocess. The second question is related to the first, and thus to MRQ2, as itprovides insight into which parts of the process that are necessary to addresswith process support.
For the study about anatomy planning (Chapter 6), the following researchquestions were formulated:
1. Of what use is impact analysis in relation to software evolution and incre-mental development?
2. How can impact analysis facilitate the identification of dependencies be-tween functional entities?
These questions are direct sub-questions of MRQ1. They concern the roleof impact analysis in software evolution and related processes (tied together byanatomy planning).
As noted previously, Chapter 7 is a method chapter. As such, the researchquestions shown below do not relate to any of the main research questions.They are of general interest as they concern a method for dealing with missingdata, which is relevant in any research study that involves people. The primaryresearch question concerns the performance of the k-NN method in relation toother methods. Specific research questions for the method are:
• How many donors should preferably be selected?
• At which proportion of missing data is it no longer relevant to use themethod?
• Is it possible to decrease the sensitivity to the proportion of missing databy allowing imputation from certain incomplete cases as well?
• What effect has the number of attributes (variables) on the results?
Finally, Chapter 8 is also a method chapter. The research question for thestudy is how to extend Cumulative Voting to support multiple levels of itemsto prioritise. As mentioned, Cumulative Voting was used in the study describedin Chapter 4, and the extension resulted from the application of the techniquein several studies at Ericsson.
42

1: Introduction
1.7.2 CONTRIBUTIONThe main contribution of the thesis is the study of how impact analysis is used inlarge-scale software development, and what its use brings in terms of challengesand improvement opportunities. The process perspective of impact analysis isimportant. Hass [2002] points out that any organisation that starts workingwith configuration management will have to focus on the process perspectivein terms of understanding and improvement, and impact analysis is of course apart of this.
Specific results of the studies included in the thesis are:
• Insight into the importance of impact analysis in relation to architecturedocumentation and for whom it is important. Also an overview of impactanalysis from a requirements engineering perspective.
• An understanding about important impact analysis issues as seen by dif-ferent groups of software practitioners (and how these differ), and relatedprocess improvement proposals for addressing these issues.
• A checklist-based process support instrument helpful while performingimpact analysis, and a related evaluation approach for the change controlprocess.
• The study of the role of impact analysis in software evolution and incre-mental software development, and how impact analysis can be helpful inthis context.
• In-depth knowledge about a method for dealing with missing data whenpeople’s opinions are collected. Also a technique for prioritising hierarchi-cally arranged items based on the simple and straightforward CumulativeVoting technique. Both of these results are relevant for research studiesin general.
These results are elaborated more in Chapter 9, which concludes the thesis.
43

1: Introduction
44
Chapter 2
Roles inArchitecture-RelatedProcess Improvement
Constraining factors such as time and budget make software development achallenging task for many organisations—a challenge that is leveraged by thefact that software plays an increasingly large role in society. In order to handlethe challenge and to turn the software industry into an engineering discipline, itis necessary to put the processes in focus [Zahran, 1998]. The goal of softwareprocess improvement (SPI) is to create an infrastructure that enables effectivemethods and practices to be incorporated into the business [Aaen, 2003].
The success of SPI depends on a number of factors, one of which is user (staff)involvement [Rainer and Hall, 2002]. It has been reported that process users’attitudes often are disregarded in quality initiatives, and that putting them inthe spotlight when designing SPI is an important step towards success [Aaen,2003; Hall and Wilson, 1997]. To involve process users and to regard theirattitudes can be far from trivial, because process users do neither necessarilyhave the same viewpoints, nor the same priorities. This chapter presents acase study in which we examined the viewpoints and priorities of process usersat Ericsson to pinpoint differences and similarities among roles. We selectedthe role perspective since a number of publications report that role can be adiscriminating factor when it comes to views in SPI [Baddoo and Hall, 2003;
2: Roles in Architecture-Related Process Improvement
Berander and Wohlin, 2004; Clements et al., 2003; Conradi and Dybå, 2001;Hall and Wilson, 1997; Karlström et al., 2002; Svahnberg, 2003].
Generic SPI frameworks, such as SEI’s IDEALSM [McFeeley, 1996], QualityImprovement Paradigm (QIP) [Basili and Green, 1994], and PROFES [Fraun-hofer IESE, 2000], all contain two important ingredients: a characterisation(also referred to as assessment or appraisal) of the current process, and an im-provement plan (also referred to as roadmap or actions). The viewpoints of theprocess users are crucial in the characterisation phase, because the more diversethey are, the harder it becomes to form a baseline. Similarly, the priorities ofthe process users are crucial in the planning phase, because the more diversethey are, the harder it becomes to create a plan that satisfies everyone.
The chapter is structured as follows. Section 2.1 presents the research con-text for the study. Section 2.2 addresses related work, while Section 2.3 explainsthe design of the study as well as how the study was carried out. The resultsare presented in Section 2.4, followed by a statistical analysis in Section 2.5, ageneral discussion in Section 2.6 and finally conclusions in Section 2.7.
2.1 RESEARCH CONTEXTThe objective of the study was to prepare improvement of the architecturedocumentation process at the company by examining process users’ viewpointsand priorities with respect to their roles. By doing so, we were able to create anawareness of the need for and scope of SPI. With “architecture documentationprocess”, we refer to the process of documenting the software architecture andkeeping the documentation up-to-date. This is not necessarily an explicitlydefined process of its own, but could, for example, be part of the developmentprocess. Our tool for examining viewpoints and priorities was a questionnairewith quantitative questions about architecture documentation.
In advance, we expected to see both diverse viewpoints and diverse pri-orities among process users regarding the architecture documentation process.The reason for this was mainly that architecture documentation typically hasdifferent stakeholders, such as project managers, product managers, designersand testers, most of whom have different needs and knowledge. Both needs andknowledge are factors that tend to affect how you view things and what youthink is important. This is one of the reasons that software architectures shouldbe designed and documented using multiple architectural views [Clements et al.,2003]. Since the organisational role most likely affects both needs and knowl-edge, we anticipated differences in both viewpoints and priorities.
46
2: Roles in Architecture-Related Process Improvement
We apply statistical methods to test for differences among roles. For thispurpose, the following statistical hypotheses are evaluated (independently forviewpoints and priorities):
• Null hypothesis, H0: There are no differences among roles.
• Alternative hypothesis, HA: There is a difference among roles.
This research is justified by two main reasons. First, it adds to existingknowledge about similarities and non-similarities among roles, which is nec-essary to better understand the impact of roles in various research contexts.Second, it provides an example of empirical SPI research targeted at industry,with the focus on creating an understanding of process users’ viewpoints andpriorities.
2.1.1 ARCHITECTURE-RELATED PROCESSIMPROVEMENT
As mentioned, we explored process users’ viewpoints and opinions in order toprepare for improvement of the architecture documentation process. However,the questions posed in the questionnaire were more germane to the product(i.e., the architecture documentation) than to the process (i.e., documentingthe architecture). Our reason for posing questions about the product ratherthan the process was that we considered the product to be more tangible to theprocess users than the process itself. In other words, we expected that we wouldget more well-founded answers by asking about the product. Furthermore, weargue that the quality of the documentation reflects the quality of the processof documenting it as much as, for example, the quality of requirements reflectsthe quality of the process of eliciting, formulating, and managing them.
Since the software architecture of a system is a fundamental building blockthat has many stakeholders within the organisation, changes to architecture-related processes can have great organisational impact, including new workflows, altered mind sets and changed team structures. This further establishesthe need for investigating differences in viewpoints and priorities among processusers.
2.2 RELATED WORKFor an overview of the Software Process Improvement area, we recommendZahran’s book, which covers the topic from a practitioner’s perspective [Zahran,
47
2: Roles in Architecture-Related Process Improvement
1998]. Zahran discusses the general challenges of SPI, such as managementcommitment, buy-in from process users etc. There are some publications (seebelow) that discuss differences among roles in various contexts. In general, theyshow that there are differences among roles in some situations, but not in others.It all depends on what you evaluate.
Baddoo and Hall [2003] have studied de-motivators in SPI among softwarepractitioners, in order to understand what hinders SPI success. Dividing thepractitioners into developers, project managers and senior managers, they findboth common and unique de-motivators. They conclude that differences inde-motivators for SPI often are related to the roles that software practitionershave.
Berander and Wohlin [2004] have looked at agreement on SPI issues amongtraditional software development roles. Their findings indicate that there isagreement among roles about communication of processes, but disagreementabout, for example, importance of improvement and urgency of problems.
Conradi and Dybå [2001] have investigated how the use of formal routines fortransferring knowledge and experience is perceived by developers and managers.Their results show that there is a difference between the two groups; developersare more sceptical to formal routines, while managers take them for granted.
Hall and Wilson [1997] have studied views of quality among software practi-tioners in UK companies, with focus on two groups: managers and developers.According to their findings, developers and managers differ in that they havedifferent primary quality concerns, although the differences are not conflicting.
Karlström et al. [2002] present a method for aggregating viewpoints of pro-cess users in an organisation. The essence of the method is to let process usersrate factors believed to affect the SPI goal according to their viewpoints. Theauthors divide the process users into two groups, managers and engineers, basedon their roles, and conclude that the groups differ on some factors, but not onall.
Svahnberg [2003] has studied how participants in an architecture assessmentform groups when prioritising quality attributes and assessing architecture can-didates. He concludes that the role of the participant is the main influence whenprioritising quality attributes, but not when assessing architecture candidates.
Questionnaires are often used as instruments in Software Process Assess-ment, for example the SEI Maturity Questionnaire for CMM-based assessmentand the BOOTSTRAP questionnaire [Zahran, 1998]. Klappholz et al. [2003]have developed an assessment tool, ATSE, for assessing attitude towards andknowledge of the development process. While questionnaires in process as-sessment commonly measure the effectiveness of an improvement programme,
48

2: Roles in Architecture-Related Process Improvement
our questionnaire was rather a part of the preparations for an upcoming im-provement programme. In other words, it was not a substitute for a processassessment questionnaire.
2.3 DESIGNIn this section, we outline the design of the study. We describe the contentsof the questionnaire, the sampling and response rate, the technique for treatingmissing data, roles in the study and finally threats to the validity of the study.
2.3.1 QUESTIONNAIRE DESIGNIn order to assess process users’ viewpoints and priorities, we designed a ques-tionnaire consisting of six questions collecting data about the current state ofthe architecture documentation (the infrastructure questions), and one questionabout how to improve the architecture documentation (the improvement ques-tion). There was also a question asking about the process user’s organisationalrole.
The infrastructure questions, which we believed would yield different resultsfor different roles, were formulated as follows (words in bold text are keywordsused for identifying the questions later):
1. In your opinion, to what extent does architecture documentation exist?
2. How would you, in general, describe the form of the architecture docu-mentation?
3. How would you judge the quality of the documentation?
4. In your opinion, to what extent is architecture documentation updatedas the system evolves?
5. In your opinion, how well does the architecture documentation match theactual architecture?
6. Imagine being a newly hired employee—how easy would it be to gaininsight into the system using the current architecture documentation?
For these questions, five point Likert scales (i.e., with five response optionsfor each question) were used. Such scales are ordinal and are often used for
49
2: Roles in Architecture-Related Process Improvement
collecting degrees of agreement [Robson, 2002]. For almost all questions, alow score indicated a negative response (little, low, seldom), while a high scoreindicated a positive response (much, high, often). The scale for the secondquestion was slightly different from the others, though, in that a low scoreindicated text-orientation, while a high score indicated model-orientation.
The improvement question was formulated as follows: “If architecture doc-umentation was to be improved in some way, what do you think is the mostimportant purpose it could serve in addition to the present ones?” Five prede-fined purposes were given: change impact analysis, risk analysis, cost analysis,driver for development and system insight. In case these were not satisfactory,the respondent could choose “other” and suggest a new purpose as the mostimportant one.
2.3.2 SAMPLING AND RESPONSE RATEThe recipients of the questionnaire were selected using systematic sampling [Rob-son, 2002]. We obtained a list of all employees from an employee directory, andselected every second person on the list for the study. The reason for thiswas that another study was performed simultaneously and the employees wereshared evenly between the studies.
The recipients of the questionnaire were given two weeks to fill it out andreturn the answers. The recipients were also allowed to reject the questionnaireif they had no time available or if they felt that it was not relevant for them.The two-week deadline seemed reasonable even for people with heavy workload.After one week, a reminder was sent to those who had not already respondedor explicitly rejected the first distribution.
The population consisted of the 400 persons employed at Ericsson at thetime of the study. The selection of employees described above resulted in asample of around 200 persons. While some responses were discarded becausethey contained invalid answers to some questions, around a third of the sample,or 65 persons, did give valid responses to the questionnaire. The other two thirdsexplicitly rejected the questionnaire, chose not to respond, or were unable torespond before the deadline. Not all 65 respondents did answer all the questions,however. Because of that, some respondents had to be discarded, while somecould be kept by imputing missing data in their answers, as described in the nextsection. As a result, the data presented in this chapter are based on answersfrom 58 respondents.
In order to verify that the respondents were representative for the popula-tion, we examined the departmental distribution. We could not use the role
50
2: Roles in Architecture-Related Process Improvement
distribution, since the roles were known only for the respondents, not the en-tire population. We saw that there were only minor differences in departmentaldistribution between the respondents and the population, and consequently con-sidered the respondents being representative for the population. In this context,it should also be noted that the roles are in many cases closely linked to de-partments (i.e., testers come from the test department and so forth). While therespondent drop-out is a threat to the external validity of the study, as discussedin Section 2.3.5, we consider the absolute size of the sample to be satisfactory.
2.3.3 TREATMENT OF MISSING DATAAs implied in the previous section, some of the initial respondents did not answerall the questions discussed in this chapter. To be able to keep as many datapoints as possible, missing answers for those respondents that had answeredat least five of the seven questions were imputed. The respondents that hadanswered only four questions or less were discarded, leaving 40 complete casesand 18 cases to impute. Only the complete cases were used as basis for theimputation.
The answers were imputed using the hot-deck k-Nearest Neighbour impu-tation technique, which imputes values based on the k cases most similar tothe target case [Duda and Hart, 1973]. A detailed evaluation of this method ispresented in Chapter 7. The similarity metric used was the Euclidean distancecalculated only for the infrastructure questions (the improvement question wasdisregarded because of its nominal scale). As a replacement for a missing datavalue, the median of the k nearest cases was used for the infrastructure ques-tions, while the mode was used for the improvement question. The value ofk was chosen to 7, which is approximately the square root of the number ofcomplete cases (k = 6, while closer, would be unsuitable when calculating themedian). In the few cases when the mode was not unique at k = 7, k wasincreased to 8 instead.
2.3.4 ROLESThe organisational roles of the respondents are somewhat specific for Ericsson.Thus, in order to increase the generalisability of the results, and the replicabilityof the study, we have mapped the organisational roles to traditional softwareengineering roles. We mean that these represent the parts of software devel-opment normally discussed in software engineering literature [see, for example,
51
2: Roles in Architecture-Related Process Improvement
Sommerville, 2004]. To ensure the relevance of the resulting role list, the map-ping was carried out together with a company-appointed specialist. The result-ing roles, with abbreviated form and number of respondents within parentheses,are:
• Designer (D, 6)—creates system descriptions that the programmer canbase the implementation on.∗
• Programmer (P, 8)—writes code that implements the requirements.∗
• Tester (T, 13)—catches faults that the programmer overlooks.∗
• Functional manager (FM, 5)—responsible for staffing, organising, and ex-ecuting project tasks within their functional areas.†
• Project manager (PRJ, 8)—plans, directs and integrates the work effortsof participants to achieve project goals.†
• Product manager (PRD, 4)—responsible for product related planning ac-tivities.‡
• Architect (A, 11) - makes decisions, coordinates, manages dependencies,negotiates requirements, recommends technology, etc.§
• Process group member (PGM, 3)—facilitates the definition, maintenanceand improvement of the software processes used by the organisation.¶
The process group member role is derived from Hampered’s Software Engi-neering Process Group (SEPG). Persons who work with infrastructure, which isseen as a kind of process support, are also included in this role. The architectrole stems from an organisational role with responsibility for the system as awhole and its survival in the product chain. Architecture work is a part of thisrole, but implementation and low-level design is not.
2.3.5 VALIDITY THREATSIn this section, the most important threats to the validity of the study arepresented together with measures that have been taken to avoid them.
∗ [Pfleeger, 1998] † [Nicholas, 2001] ‡ [Lehmann and Winer, 2002] § [Hofmeister et al.,2000] ¶ [Humphrey, 1989]
52
2: Roles in Architecture-Related Process Improvement
2.3.5.1 CONSTRUCT VALIDITY
A threat to construct validity is that not all respondents may have had thesame perception of what architecture is. In order to avoid that, a commondefinition of the term “software architecture” was given in the questionnaire,and each respondent was given the opportunity to disagree and give his or herown definition.
To counter the threat that some questions would be easier to answer forpersons with certain roles, the questionnaire was checked by a screening groupat the company. Because several roles (product manager, project manager,architect, designer and programmer) were represented by the persons in thescreening group, there should be little bias towards any particular role. Thescreening group also verified that the role list in the questionnaire did containrelevant organisational roles.
2.3.5.2 EXTERNAL VALIDITY
The main threat to external validity is that differences (and non-differences)found among roles could be true only for Ericsson. Since we are dealing withjust one case, this threat cannot be ruled out. There are, however, two cir-cumstances that we believe make our findings interesting in a wider context.First, Ericsson operates, as stated, on the world market with several large, in-ternational customers. As such, it should be considered a strong industrial case.Second, by mapping the organisational roles to traditional software engineeringroles, generalisability to a wider software engineering community, and greaterreplicability of the study, has been strived for.
Another threat to external validity is the fact that we cannot guarantee thatthe distribution of roles for the respondents equals the distribution of roles in thepopulation. Since we do not know the roles of all the persons in the population,we cannot avoid this threat. We have tried to ensure that the respondents arerepresentative of the population by looking at the departmental distributioninstead.
2.3.5.3 INTERNAL VALIDITY
The imputation of data described in Section 2.3.3 is a threat, since it essentiallyis fabrication of data. However, of the incomplete cases, almost all had only onequestion out of seven unanswered. Only one incomplete case had two questionsunanswered. Furthermore, the evaluation presented in Chapter 7 supports ourchoice of imputation technique.
53
2: Roles in Architecture-Related Process Improvement
2.3.5.4 CONCLUSION VALIDITY
A threat to conclusion validity is that we, in the data analysis, use the Kruskal-Wallis test when the number of ties in the data is large. To address this, we applyan additional Chi-square test to validate the outcome of the Kruskal-Wallis test.It should also be noted that the Kruskal-Wallis test includes correction for ties.Thus, the effect of this threat should be minimal.
Another threat to conclusion validity is that we use the Chi-square test whenthe expected frequencies in the cells are relatively small. While this may meanthat the outcome is not reliable, Siegel and Castellan Jr. [1988] acknowledgethat for a large number of cells, the expected frequencies should be allowed tobe small. In our case, the number of cells is nearly 50, which according to Siegeland Castellan Jr. should be enough to allow small expected frequencies. Thus,we believe that the effect of this threat should be small.
2.4 RESULTSIn this section, we present the results from the distributed questionnaire. Weshow the distribution of answers for the infrastructure questions as well as forthe improvement question. The results are analysed statistically in Section 2.5.
2.4.1 INFRASTRUCTURE QUESTIONSFigure 2.1 shows, for each of the infrastructure questions, how the answers aredistributed on the response options. The exact phrasing of the questions can befound in Section 2.3.1. The question about to what extent documentation existsis special in the sense that the respondents made use of all five response options.As response options 3 and 4 account for 50% or more of the answers from allroles, the agreement among roles can be seen as large. Internally, architects (A)and designers (D) disagree more than the other roles, whereas on the whole,there is a consensus that documentation exists to a large extent.
For the question about documentation form, it is apparent that responseoption 2 dominates the answers (i.e., accounts for 50% or more) from all rolesexcept the architects, meaning that most roles consider the documentation tobe more text-oriented than model-oriented.
The answers to the question about how well the documentation matches thesystem indicate that all roles consider the match to be medium to good (asresponse options 3 and 4 dominate the answers). Again, architects have greaterinternal disagreement than the other roles. Also, functional managers (FM)
54
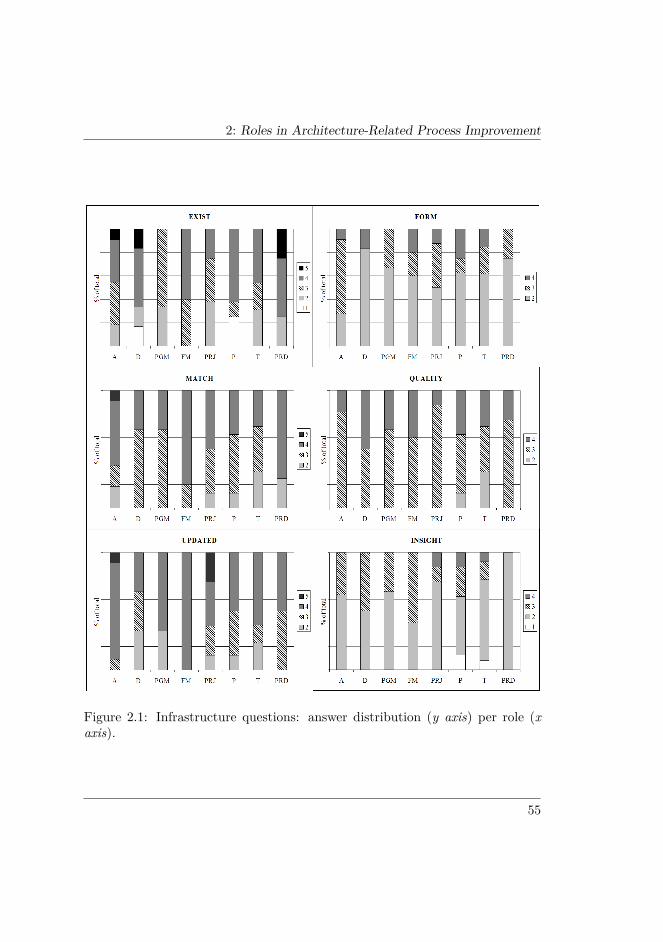
2: Roles in Architecture-Related Process Improvement
file:///c:/mydoc/Doktorand/Forskning/Papper-svn/profes05_roles/Figures/x.html
1 of 1 2006-12-13 16:10
Figure 2.1: Infrastructure questions: answer distribution (y axis) per role (xaxis).
55

2: Roles in Architecture-Related Process Improvement
and product managers (PRD) have a slightly more positive view than the otherroles.
The question about quality of documentation has the narrowest distributionof answers of all the infrastructure questions. The respondents only made useof three of the response options in total, while most roles only made use oftwo, namely 3 and 4. Hence, the roles seem to agree that the documentationquality is medium or slightly above medium. The designers have a somewhatmore positive view than other roles, whereas testers and programmers stand outbecause some of them consider the quality to be below medium.
In the answers to the question about to what extent documentation is up-dated, there seem to be a general consensus that the update frequency is high,with architects and functional managers having the most positive views. Forthis question, project managers (PRJ) have larger internal disagreement thanthe other roles.
Finally, for the question about how easy it is to gain insight into the sys-tem using the documentation, response option 2 dominates the answers fromall roles except designers (where it is tied with response option 3) and func-tional managers. This means that there is agreement among the roles also forthis question. Here, both programmers (P) and testers (T) have more internaldisagreement than the other roles.
2.4.2 MOST IMPORTANT IMPROVEMENTWhen answering the improvement question, the respondents could choose to adda new purpose if the predefined ones were not satisfactory (see Section 2.3.1).However, only one of the respondents chose to do this. We did not ask the otherrespondents to reconsider their answers with this additional purpose in mindfor two reasons: (1) we estimated the added value to be minimal, and (2) weanticipated that it would be difficult to get new answers from all respondents.Consequently, only the predefined purposes are included in the analysis.
Table 2.1 shows the results from the improvement question. An ocular in-spection reveals a couple of interesting differences (shown in the table with greybackground and bold typeface). First, system insight (SI) was frequently spec-ified by all roles except the product managers. Second, risk analysis (RA) andin particular cost analysis (CA) were more frequent for the product managerrole than for any other role. In fact, risk analysis was not specified at all bymost roles except product managers and testers. Third, impact analysis (IA)was considerably more frequent for designers than for any other role.
56

2: Roles in Architecture-Related Process Improvement
It should be noted that impact analysis is not only important for the de-signers. Based on the frequencies shown in Table 2.1, it can be calculated thatimpact analysis on average is the second most specified purpose (system insightis the first).
Role IA RA CA DD SIArchitect 27.3 0.0 9.1 27.3 36.4Designer 66.7 0.0 0.0 0.0 33.3Process group member 33.3 0.0 0.0 0.0 66.7Functional manager 20.0 0.0 0.0 0.0 60.0Project manager 0.0 0.0 12.5 37.5 50.0Programmer 25.0 0.0 0.0 25.0 50.0Tester 0.0 7.7 15.4 0.0 76.9Product manager 0.0 25.0 50.0 25.0 0.0
Table 2.1: Most important improvement: answer distribution among roles. Thefunctional manager row does not sum to 100 due to the omission of the self-chosen purpose.
2.5 ANALYSISIn this section, the results from the questionnaire are analysed statistically. Thenull hypothesis stated in Section 2.1 is tested at significance level α = 0.05. Twostatistical tests are used, the Kruskal-Wallis test and the Chi-square test [Siegeland Castellan Jr., 1988]. We use these tests because we consider the data, beingon ordinal and nominal scales, respectively, unsuitable for parametric tests.Both tests are applied to the infrastructure questions, whereas only Chi-squareis applied to the improvement question, because of its nominal scale.
2.5.1 INFRASTRUCTURE QUESTIONSThe statistical significances of the results for the infrastructure questions arefirst calculated using the Kruskal-Wallis test. As can be seen in the secondand third columns in Table 2.2, the results from the infrastructure questionsare not significant at the selected significance level, as p exceeds 0.05 for allquestions. This outcome aligns well with the results from the infrastructurequestions presented in Section 2.4, where it can be seen that there is muchagreement among the roles.
57
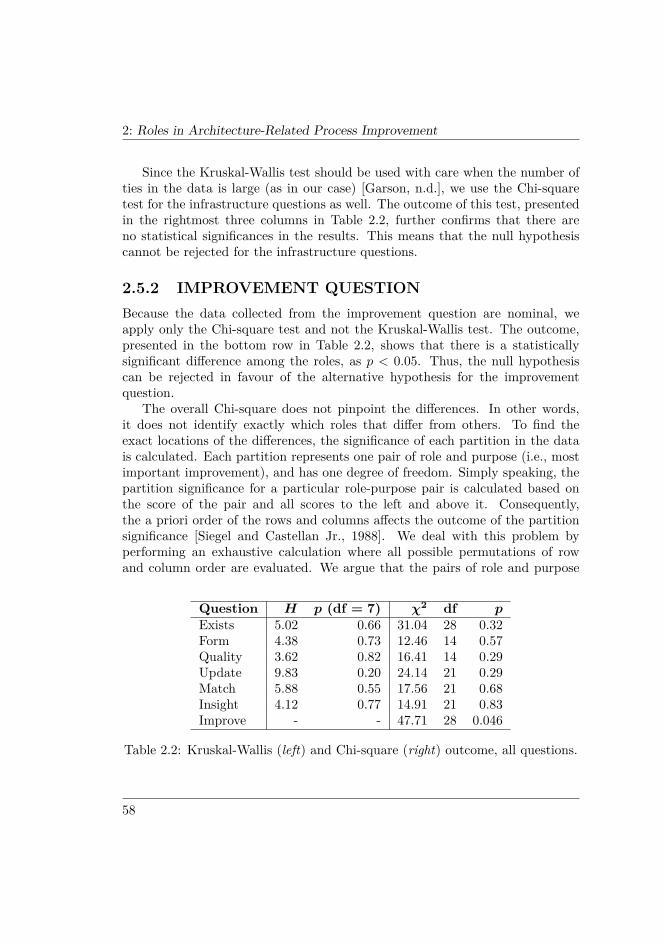
2: Roles in Architecture-Related Process Improvement
Since the Kruskal-Wallis test should be used with care when the number ofties in the data is large (as in our case) [Garson, n.d.], we use the Chi-squaretest for the infrastructure questions as well. The outcome of this test, presentedin the rightmost three columns in Table 2.2, further confirms that there areno statistical significances in the results. This means that the null hypothesiscannot be rejected for the infrastructure questions.
2.5.2 IMPROVEMENT QUESTIONBecause the data collected from the improvement question are nominal, weapply only the Chi-square test and not the Kruskal-Wallis test. The outcome,presented in the bottom row in Table 2.2, shows that there is a statisticallysignificant difference among the roles, as p < 0.05. Thus, the null hypothesiscan be rejected in favour of the alternative hypothesis for the improvementquestion.
The overall Chi-square does not pinpoint the differences. In other words,it does not identify exactly which roles that differ from others. To find theexact locations of the differences, the significance of each partition in the datais calculated. Each partition represents one pair of role and purpose (i.e., mostimportant improvement), and has one degree of freedom. Simply speaking, thepartition significance for a particular role-purpose pair is calculated based onthe score of the pair and all scores to the left and above it. Consequently,the a priori order of the rows and columns affects the outcome of the partitionsignificance [Siegel and Castellan Jr., 1988]. We deal with this problem byperforming an exhaustive calculation where all possible permutations of rowand column order are evaluated. We argue that the pairs of role and purpose
Question H p (df = 7) χ2 df pExists 5.02 0.66 31.04 28 0.32Form 4.38 0.73 12.46 14 0.57Quality 3.62 0.82 16.41 14 0.29Update 9.83 0.20 24.14 21 0.29Match 5.88 0.55 17.56 21 0.68Insight 4.12 0.77 14.91 21 0.83Improve - - 47.71 28 0.046
Table 2.2: Kruskal-Wallis (left) and Chi-square (right) outcome, all questions.
58
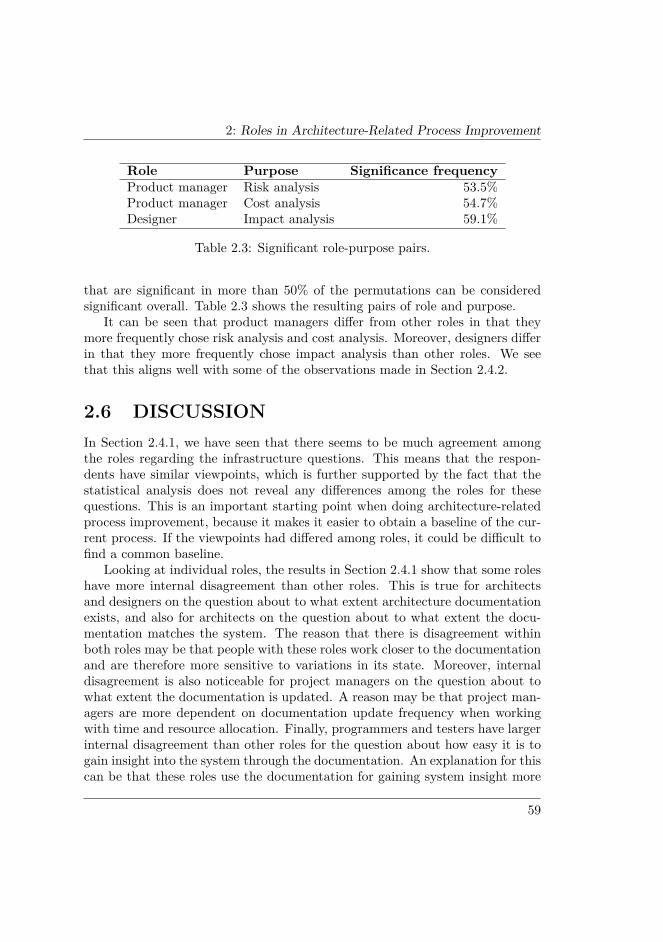
2: Roles in Architecture-Related Process Improvement
Role Purpose Significance frequencyProduct manager Risk analysis 53.5%Product manager Cost analysis 54.7%Designer Impact analysis 59.1%
Table 2.3: Significant role-purpose pairs.
that are significant in more than 50% of the permutations can be consideredsignificant overall. Table 2.3 shows the resulting pairs of role and purpose.
It can be seen that product managers differ from other roles in that theymore frequently chose risk analysis and cost analysis. Moreover, designers differin that they more frequently chose impact analysis than other roles. We seethat this aligns well with some of the observations made in Section 2.4.2.
2.6 DISCUSSIONIn Section 2.4.1, we have seen that there seems to be much agreement amongthe roles regarding the infrastructure questions. This means that the respon-dents have similar viewpoints, which is further supported by the fact that thestatistical analysis does not reveal any differences among the roles for thesequestions. This is an important starting point when doing architecture-relatedprocess improvement, because it makes it easier to obtain a baseline of the cur-rent process. If the viewpoints had differed among roles, it could be difficult tofind a common baseline.
Looking at individual roles, the results in Section 2.4.1 show that some roleshave more internal disagreement than other roles. This is true for architectsand designers on the question about to what extent architecture documentationexists, and also for architects on the question about to what extent the docu-mentation matches the system. The reason that there is disagreement withinboth roles may be that people with these roles work closer to the documentationand are therefore more sensitive to variations in its state. Moreover, internaldisagreement is also noticeable for project managers on the question about towhat extent the documentation is updated. A reason may be that project man-agers are more dependent on documentation update frequency when workingwith time and resource allocation. Finally, programmers and testers have largerinternal disagreement than other roles for the question about how easy it is togain insight into the system through the documentation. An explanation for thiscan be that these roles use the documentation for gaining system insight more
59
2: Roles in Architecture-Related Process Improvement
than the other roles, and are therefore more sensitive to its ability to provideinsight.
The results in Section 2.4.2 clearly show differences among the roles forthe improvement question. System insight is the top improvement for all rolesexcept designers and product managers. For these roles, impact analysis andcost analysis are most important, respectively. The product manager role alsostands out because it is the only role with strong focus on risk and cost analysis,and no focus at all on system insight. The reason that the product managerrole differs on several accounts may be that this role has more market focusand less development focus than the other roles. The reason that the designerrole differs may be that designers depend on the information in the architecturedocumentation more than other roles, and that this requires a strong focus onimpact analysis in order to handle ever-changing requirements.
The statistical analysis of the improvement question supports the differencesamong the roles outlined above. More specifically, designers’ focus on impactanalysis and product managers’ focus on cost and risk analysis are statisticallysignificant. The fact that product managers do not consider system insight animportant improvement is not significant, however. The existence of differencesamong the roles for the improvement question indicates that the priorities ofrespondents are different. This means that it becomes more difficult to createan improvement plan that satisfies all process users, since the plan needs to havea wider scope.
2.7 CONCLUSIONSIn this chapter, we have presented results from a case study at Ericsson wherewe used a questionnaire for investigating process users’ viewpoints and prioritiesregarding the architecture documentation process. The objective of the studywas to prepare improvement of the architecture documentation process at thecompany by examining process users’ viewpoints and priorities with respect totheir roles.
A large number of employees were asked questions about the current state ofthe architecture documentation and possible improvements of it. As explained inSection 2.1.1, we asked about the product (architecture documentation) ratherthan the process in order to have more tangible questions. The process userswere divided into groups according to their software engineering roles. In orderto analyse the results statistically, the following hypotheses were evaluated:
• H0: There are no differences among roles.
60
2: Roles in Architecture-Related Process Improvement
• HA: There is a difference among roles.
The two types of questions (current state and improvement) in the question-naire were analysed separately. When analysing the results from the questionsabout the current state of the process, the null hypothesis could not be rejected,meaning that we cannot assert that process users differ based on role. Someroles have larger internal disagreement compared to other roles for some of thequestion. This indicates that there may be underlying factors, other than role,that affect viewpoints.
When analysing the results from the improvement question, on the otherhand, the null hypothesis could be rejected in favour of the alternative hypothe-sis. By performing a more in-depth statistical test and investigating the resultsfrom the improvement question directly, we found the following:
• System insight is not considered important to improve by the productmanagers. It is, however, the most important improvement for all otherroles except the designers.
• Cost analysis and risk analysis are significantly more important to improvefor product managers than for other roles. The reason may be a strongermarket focus for this role than for the other roles.
• Impact analysis is significantly more important to improve for designersthan for other roles. The reason may be that designers use the documen-tation more than other roles when determining change impact.
Initially, we expected differences among roles both for viewpoints and pri-orities, since stakeholders of architecture documentation often are consideredto have different needs and knowledge. Our expectations were however onlyfulfilled for priorities, as these clearly were different among the roles. It couldbe argued that it is “common knowledge” that priorities differ, which is whyour expectations were set as they were. However, it remains difficult to foreseeexactly how roles differ, which is important to know in process improvement.Furthermore, we had expected larger differences than were actually found. Inany case, the fact that viewpoints, contrary to our expectations, did not differwhile priorities did, leads us to conclude the following:
• It is important to cover process users’ viewpoints and priorities in processimprovement work, because they may not coincide with the prevalentexpectations.
61

2: Roles in Architecture-Related Process Improvement
• Further research should investigate in which situations roles are likely todiffer and in which they are likely to be similar.
As noted in Section 2.4.2, impact analysis is on average the second mostimportant improvement. Thus, practically speaking, its importance is not re-stricted to designers. This observation has lead to the impact analysis focus ofsubsequent research. The next chapter provides an exposition of impact analysisin more detail.
62
Chapter 3
Impact Analysis Overview
Software deterioration occurs in many cases because changes to software seldomhave the small impact they are believed to have [Wiegers, 1999]. 25 years ago,Weinberg [1983] argued that some of the world’s most expensive programmingerrors each involved the change of a single digit in a previously correct program,indicating that a seemingly trivial change may have immense impact. A studyin the late 90s showed that software practitioners conducting impact analysisand estimating change in an industrial project underestimated the amount ofchange by a factor of three [Lindvall and Sandahl, 1998]. In addition, as soft-ware systems grow increasingly complex, the problems associated with softwarechange increase accordingly. For example, when the source code across severalversions of a 100 000 000 SLOC, fifteen-year-old telecom software system wasanalysed, it was noticed that the system had decayed due to frequent change.The programmers estimating the change effort drew the conclusion that thecode was harder to change than it should be [Eick et al., 2001].
Impact analysis is an important part of requirements engineering sincechanges to software often are initiated by changes to the requirements. In re-quirements engineering textbooks, impact analysis is recognised as an essentialactivity in change management, but details about how to perform it often leftout, or limited to reasoning about the impact of the change on the requirementsspecification [see, for example, Kotonya and Sommerville, 1998; Leffingwell andWidrig, 1999; Maciaszek, 2001; Robertson and Robertson, 1999; Sommervilleand Sawyer, 1997]. An exception is Wiegers [1999], who provides checklists tobe used by a knowledgeable developer to assess the impact of a change proposal.
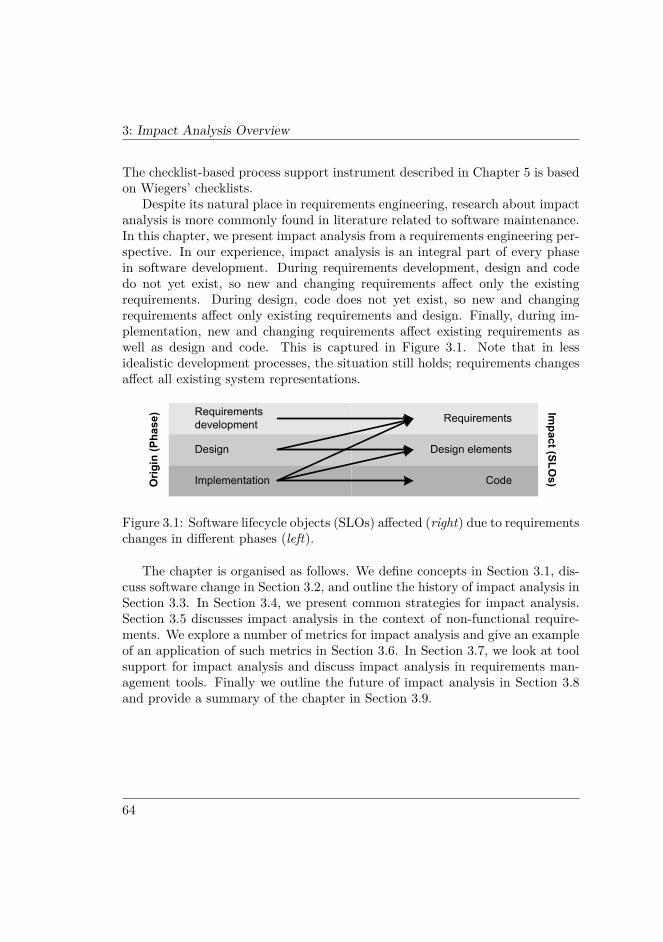
3: Impact Analysis Overview
The checklist-based process support instrument described in Chapter 5 is basedon Wiegers’ checklists.
Despite its natural place in requirements engineering, research about impactanalysis is more commonly found in literature related to software maintenance.In this chapter, we present impact analysis from a requirements engineering per-spective. In our experience, impact analysis is an integral part of every phasein software development. During requirements development, design and codedo not yet exist, so new and changing requirements affect only the existingrequirements. During design, code does not yet exist, so new and changingrequirements affect only existing requirements and design. Finally, during im-plementation, new and changing requirements affect existing requirements aswell as design and code. This is captured in Figure 3.1. Note that in lessidealistic development processes, the situation still holds; requirements changesaffect all existing system representations.
Code
Design elements
Requirements
Implementation
Design
Requirementsdevelopment
Orig
in (P
hase
) Impact (SLO
s)
Figure 3.1: Software lifecycle objects (SLOs) affected (right) due to requirementschanges in different phases (left).
The chapter is organised as follows. We define concepts in Section 3.1, dis-cuss software change in Section 3.2, and outline the history of impact analysis inSection 3.3. In Section 3.4, we present common strategies for impact analysis.Section 3.5 discusses impact analysis in the context of non-functional require-ments. We explore a number of metrics for impact analysis and give an exampleof an application of such metrics in Section 3.6. In Section 3.7, we look at toolsupport for impact analysis and discuss impact analysis in requirements man-agement tools. Finally we outline the future of impact analysis in Section 3.8and provide a summary of the chapter in Section 3.9.
64
3: Impact Analysis Overview
3.1 CONCEPTS AND TERMSThroughout this chapter, we use several terms and concepts that are relevantin the field of impact analysis. In this section, we briefly visit these terms andconcepts, and explain how each relates to impact analysis and to other termsand concepts.
Software lifecycle objects (SLOs; also called software products, or workingproducts) are central to impact analysis. An SLO is an artifact produced duringa project, such as a requirement, an architectural component, a class and so on.SLOs are connected to each other through a web of relationships. Relationshipscan be both between SLOs of the same type, and between SLOs of differenttypes. For example, two requirements can be interconnected to signify thatthey are related to each other. A requirement can also be connected to anarchitectural component, for example, to signify that the component implementsthe requirement.
Impact analysis is often carried out by analysing the relationships betweenvarious entities in the system. We distinguish between two types of analysis:dependency analysis and traceability analysis [Bohner and Arnold, 1996]. In de-pendency analysis, detailed relationships among program entities, for examplevariables or functions, are extracted from source code. Traceability analysis, onthe other hand, is the analysis of relationships that have been identified duringdevelopment among all types of SLOs. Traceability analysis is thus suitablefor analysing relationships among requirements, architectural components, doc-umentation and so on. It is evident that traceability analysis has a broaderapplication within requirements engineering than dependency analysis; it canbe used in earlier development phases and can identify more diverse impact interms of different SLO types.
It is common to deal with sets of impact in impact analysis. The followingsets have been defined by Bohner and Arnold [1996]:
• The System Set represents the set of all SLOs in the system—all the othersets are subsets of this set.
• The Starting Impact Set (SIS) represents the set of objects that are ini-tially thought to be changed. The SIS typically serves as input to impactanalysis approaches that are used for finding the Estimated Impact Set.
• The Estimated Impact Set (EIS) always includes the SIS and can thereforebe seen as an expansion of the SIS. The expansion results from the appli-cation of change propagation rules to the internal object model repeatedly
65
3: Impact Analysis Overview
until all objects that may be affected are discovered. Ideally, the SIS andEIS should be the same, meaning that the impact is restricted to whatwas initially thought to be changed.
• The Actual Impact Set (AIS), finally, contains those SLOs that have beenaffected once the change has been implemented. In the best-case scenario,the AIS and EIS are the same, meaning that the impact estimation wasperfect.
In addition to the impact sets, two forms of information are necessary inorder to determine the impact of a change: information about the dependenciesbetween objects, and knowledge about how changes propagate from object toobject via dependencies and traceability links. Dependencies between objectsare often captured in terms of references between them. Knowledge about howchange propagates from one object to another is often expressed in terms ofrules or algorithms.
It is common to distinguish between primary and secondary change. Primarychange, also referred to as direct impact, corresponds to the SLOs that areidentified by analysing how the effects of a proposed change affect the system.This analysis is typically difficult to automate because it is mainly based onhuman expertise. Consequently, little can be found in the literature about howto identify primary changes. It is more common to find discussions on howprimary changes cause secondary changes, also referred to as indirect impact.
The indirect impact can take two forms: Side effects are unintended be-haviours resulting from the modifications needed to implement the change. Sideeffects affect both the stability and function of the system and must be avoided.Ripple effects, on the other hand, are effects on some parts of the system causedby making changes to other parts. Ripple effects cannot be avoided, since theyare the consequence of the system’s structure and implementation. They must,however, be identified and accounted for when the change is implemented.
We have previously mentioned architectural components as an example ofSLOs. The software architecture of a system is its basic structure, consistingof interconnected components. There are many definitions of software archi-tecture, but a recent one is “the structure or structures of the system, whichcomprise software elements, the externally visible properties of those elements,and the relationships among them” [Bass et al., 2003]. The software architectureof a system is typically designed early in the project, hiding low-level design andimplementation details, and is then iteratively refined as the knowledge aboutthe system grows. This makes architecture models interesting from a require-
66
3: Impact Analysis Overview
ments engineering and impact analysis point-of-view, because they can be usedfor early, albeit initially coarse, impact analysis of changing requirements.
3.2 SOFTWARE CHANGE AND IMPACTANALYSIS
Software change occurs for several reasons, for example, in order to fix faults,to add new features, or to restructure the software to accommodate futurechanges [Mockus and Votta, 2000]. Changing requirements is one of the mostsignificant motivations for software change. Requirements change from the pointin time when they are elicited until the system has been rendered obsolete.Changes to requirements reflect how the system must change in order to stayuseful for its users and remain competitive on the market. At the same time,such changes pose a great risk as they may cause software deterioration. Thus,changes to requirements must be captured, managed, and controlled carefullyto ensure the survival of the system from a technical point of view. Factors thatcan inflict changes to requirements during both initial development as well asin software evolution are, according to Leffingwell and Widrig [1999]:
• The problem that the system is supposed to solve changes, for examplefor economic, political or technological reasons.
• The users change their minds about what they want the system to do, asthey understand their needs better. This can happen because the usersinitially were uncertain about what they wanted, or because new usersenter the picture.
• The environment in which the system resides changes. For example, in-creases in speed and capacity of computers can affect the expectations ofthe system.
• The new system is developed and released leading users to discover newrequirements.
The last factor is both real and common. When the new system is released,users realise that they want additional features, that they need data presentedin other ways, that there are emerging needs to integrate the system with othersystems, and so on. Thus, new requirements are generated by the use of thesystem itself. According to the “laws of software evolution”, a system must be
67
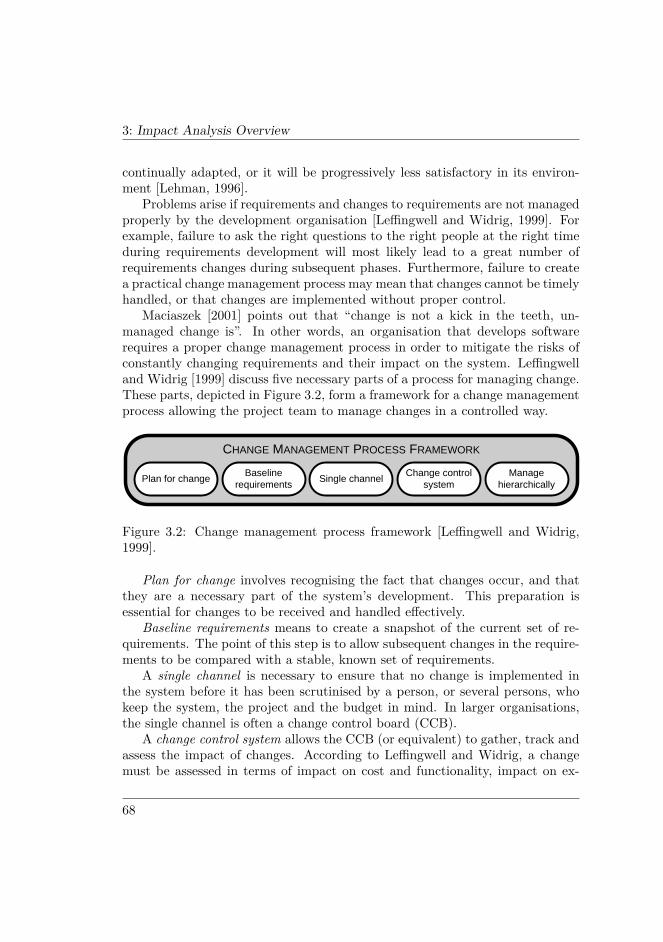
3: Impact Analysis Overview
continually adapted, or it will be progressively less satisfactory in its environ-ment [Lehman, 1996].
Problems arise if requirements and changes to requirements are not managedproperly by the development organisation [Leffingwell and Widrig, 1999]. Forexample, failure to ask the right questions to the right people at the right timeduring requirements development will most likely lead to a great number ofrequirements changes during subsequent phases. Furthermore, failure to createa practical change management process may mean that changes cannot be timelyhandled, or that changes are implemented without proper control.
Maciaszek [2001] points out that “change is not a kick in the teeth, un-managed change is”. In other words, an organisation that develops softwarerequires a proper change management process in order to mitigate the risks ofconstantly changing requirements and their impact on the system. Leffingwelland Widrig [1999] discuss five necessary parts of a process for managing change.These parts, depicted in Figure 3.2, form a framework for a change managementprocess allowing the project team to manage changes in a controlled way.
CHANGE MANAGEMENT PROCESS FRAMEWORK
Plan for change Baseline requirements Single channel Change control
systemManage
hierarchically
Figure 3.2: Change management process framework [Leffingwell and Widrig,1999].
Plan for change involves recognising the fact that changes occur, and thatthey are a necessary part of the system’s development. This preparation isessential for changes to be received and handled effectively.
Baseline requirements means to create a snapshot of the current set of re-quirements. The point of this step is to allow subsequent changes in the require-ments to be compared with a stable, known set of requirements.
A single channel is necessary to ensure that no change is implemented inthe system before it has been scrutinised by a person, or several persons, whokeep the system, the project and the budget in mind. In larger organisations,the single channel is often a change control board (CCB).
A change control system allows the CCB (or equivalent) to gather, track andassess the impact of changes. According to Leffingwell and Widrig, a changemust be assessed in terms of impact on cost and functionality, impact on ex-
68
3: Impact Analysis Overview
ternal stakeholders (for example, customers) and potential to destabilise thesystem. If the latter is overlooked, the system (as pointed out earlier) is likelyto deteriorate.
To manage hierarchically defeats a perhaps too common line of action: achange is introduced in the code by an ambitious programmer, who forgets oroverlooks the potential effect the change has on test cases, design, architecture,requirements, and so on. Changes should be introduced top-down (but can ofcourse be identified in a bottom-up fashion), starting with the requirements.If the requirements are decomposed and linked to other SLOs, it is possible topropagate the change in a controlled way.
This framework for the change process leaves open the determination ofan actual change process. Requirements engineering textbooks propose changemanagement processes with varying levels of detail and explicitness [Maciaszek,2001; Robertson and Robertson, 1999; Sommerville and Sawyer, 1997]. Theprocess proposed by Kotonya and Sommerville [1998] is, however, detailed andconsists of the following steps (compare with the change management activitiesdescribed in Section 1.1.3):
1. Problem analysis and change specification
2. Change analysis and costing, which in turn consists of:
a) Check change request validityb) Find directly affected requirementsc) Find dependent requirementsd) Propose requirements changese) Assess costs of changef) Assess cost acceptability
3. Change implementation
Impact analysis is performed in steps 2b, 2c, and 2e, by identifying require-ments and system components affected by the proposed change. The analysisshould be expressed in terms of required effort, time, money and available re-sources. Kotonya and Sommerville suggest the use of traceability tables toidentify and manage dependencies among requirements, and between require-ments and design elements. We discuss traceability as a strategy for performingimpact analysis in Section 3.4.1.1.
69
3: Impact Analysis Overview
3.3 HISTORY AND TRENDSIn some sense, impact analysis has been performed for a very long time, albeitnot necessarily using that term and not necessarily resolving the problem ofaccurately determining the effect of a proposed change. The need for softwarepractitioners to determine what to change in order to implement requirementchanges has always been present. Strategies for performing impact analysis wereintroduced and discussed early in the literature. For example, Haney’s paperfrom 1972 on a technique for module connection analysis is often referred to asthe first paper on impact analysis [Haney, 1972]. The technique builds on theidea that every module pair of a system has a probability that a change in onemodule in the pair necessitates a change in the other module. The techniquecan be used to model change propagation between any system components in-cluding requirements. Program slicing, which is a technique for focusing on aparticular problem by retrieving executable slices containing only the code thata specific variable depends on, was introduced by Weiser [1979]. Slicing, whichis explained in Section 3.4.1.2, can be used to determine dependencies in codeand can be used to minimise side effects. Slicing can also be used to determinedependencies between sections in documents, including requirements, which isdescribed below. Requirements traceability was defined in IEEE Std 830-1984[1984]. Traceability describes how SLOs are related to each other and can beused to determine how change in one type of artifact causes change in anothertype of artifact. The notion of ripple effect was introduced by Yau and Collofello[1980]. Their models can be used to determine how change in one area of thesource code propagates and causes change in other areas.
Impact analysis relies on techniques and strategies that date back a longtime. It is however possible to identify a trend in impact analysis researchover the years. Early impact analysis work focused on source code analysis,including program slicing and ripple effects for code. The maturation of softwareengineering among software organisations has led to a need to understand howchanges affect other SLOs than source code.
For example, Turver and Munro [1994] point out that source code is notthe only product that has to be changed in order to develop a new release ofthe software product. In a document-driven development approach, many doc-uments are also affected by new and changed requirements. The user manual isan example of a document that has to be updated when new user functionalitieshave been provided. Turver and Munro focus on the problem of ripple effectsin documentation using a thematic slicing technique. They note that this kindof analysis has not been widely discussed before. The same approach can be
70
3: Impact Analysis Overview
applied to the requirements document itself in order to determine how a new orchanged requirement impacts the requirements specification.
In 1996, Bohner and Arnold published a collection of research articles enti-tled Software Change Impact Analysis [Bohner and Arnold, 1996]. The purposeof the collection was to present the current, somewhat scattered, material thatwas available on impact analysis at the time. When reading the collection today,nearly ten years later, it becomes apparent that it still is very relevant. Paperspublished after 1996 seem to work with the same ideas and techniques. We donot mean to depreciate the work that has been done, but it indicates that thefield is not in a state of flux. Rather, the focus remains on adapting existingtechniques and strategies to new concepts and in new contexts. Impact analysison the architectural level is an example of this.
When the year 2000 approached, the Y2K problem made it obvious thatextensive impact analysis efforts were needed in order to identify software andparts of software that had to be changed to survive the century shift. Thisserved as a revelation for many organisations, in which the software processpreviously had not included explicit impact analysis [Bohner, 2002].
Today, software systems are much more complex than they were 25 yearsago, and it has become very difficult to grasp the combined implications of therequirements and their relationships to architecture, design, and source code.Thus, a need for impact analysis strategies that employ requirements and theirrelationships to other SLOs has developed. Still, dependency webs for largesoftware systems can be so complex that it is necessary to visualise them innovel ways. Bohner and Gracanin [2003] present research that combines impactanalysis and 3D visualisation in order to display dependency information in aricher format than is possible with 2D visualisation. Bohner [2002] also stressesthe need to extend impact analysis to middleware, COTS software and webapplications. The use of these types of software is becoming more common,moving the complexity away from internal data and control dependencies tointeroperability dependencies. Current impact analysis strategies are not verywell suited for this type of dependencies.
3.4 STRATEGIES FOR IMPACT ANALYSISThere are various strategies for performing impact analysis, some of which aremore germane to the requirements engineering process than others. Commonstrategies are:
• Analysing traceability or dependency information.
71
3: Impact Analysis Overview
• Utilising slicing techniques.
• Consulting design specifications and other documentation.
• Interviewing knowledgeable developers.
We divide these impact analysis strategies into two categories: automatableand manual. With automatable strategies, we mean those that are in somesense algorithmic in their nature. These have the ability to provide very fine-grained impact estimation in an automated fashion, but require on the otherhand the presence of a detailed infrastructure and result at times in too manyfalse positives [O’Neal and Carver, 2001]. With manual strategies, we meanthose that are best performed by human beings (as opposed to tools). Theserequire less infrastructure, but may be coarser in their impact estimation thanthe automatable ones. We recognise that the two categories are not entirely or-thogonal, but they do make an important distinction; the manual strategies arepotentially easier to adopt and work with because they require less structuredinput and no new forms of SLOs need to be developed.
A previous study indicated that developers’ impact analyses often result inoptimistic predictions [Lindvall and Sandahl, 1998], meaning that the predictedset of changes represents the least possible amount of work. Thus, the workcannot be easier, only more difficult. The study also identified the need forconservative predictions and establishing a “worst level” prediction. The realamount of work will lie between the optimistic and the conservative level. Animprovement goal would be to decrease variation as the impact analysis processstabilises and becomes more mature.
The cost associated with producing a conservative prediction depends onits expected accuracy. Since conservative predictions identify such a large partof the system, developers often cannot believe they are realistic. The benefitof having a conservative prediction is the ability to determine a most probableprediction somewhere between the optimistic and the conservative prediction.An ideal impact analysis approach would always provide an optimistic and aconservative estimate. By collecting and analysing empirical data from thepredictions as well as the actual changes, it can be established where in thatspan the correct answer lies.
3.4.1 AUTOMATABLE STRATEGIESAutomatable impact analysis strategies often employ algorithmic methods inorder to identify change propagation and indirect impact. For example, re-
72
3: Impact Analysis Overview
lationship graphs for requirements and other SLOs can be used with graphalgorithms to identify the impact a proposed change would have on the sys-tem. The prerequisite for automatable strategies is a structured specificationof the system. By structured, we mean that the specification is consistent andcomplete, and includes some semantic information (for example, type of rela-tionship). Once in place, such a specification can be used by tools in order toperform automatic impact analysis. Requirements dependency webs and objectmodels are examples of structured specifications.
The strategies presented here, traceability and dependency analysis and slic-ing, are typically used to assess the Estimated Impact Set by identifying sec-ondary changes made necessary because of primary changes to the system. Theyare not well suited for identifying direct impact.
3.4.1.1 TRACEABILITY/DEPENDENCY ANALYSIS
Traceability analysis and dependency analysis both involve examining relation-ships among entities in the software. They differ in scope and detail level;traceability analysis is the analysis of relationships among all types of SLOs,while dependency analysis is the analysis of low-level dependencies extractedfrom source code [Bohner and Arnold, 1996].
By extracting dependencies from source code, it is possible to obtain callgraphs, control structures, data graphs and so on. Since source code is the mostexact representation of the system, any analysis based on it can very preciselypredict the impact of a change. Dependency analysis is also the most maturestrategy for impact analysis available [Bohner and Arnold, 1996]. The drawbackof using source code is that it is not available until late in the project, whichmakes dependency analysis narrow in its field of application. When require-ments traceability exists down to the source, it can, however, be very efficientto use source code dependencies in order to determine the impact of require-ments changes. A drawback is that very large systems have massive amountsof source code dependencies, which make the dependency web difficult to bothuse and to get an overview of [Bohner and Gracanin, 2003].
Traceability analysis also requires the presence of relationship links betweenthe SLOs that are analysed. Typically, these relationships are captured andspecified progressively during development (known as pre-recorded traceability).The success of traceability analysis depends heavily on the completeness andconsistency of the identified relationships. However, if traceability informationis properly recorded from the beginning of development, the analysis can bevery powerful.
73
3: Impact Analysis Overview
A common approach for recording traceability links is to use a traceabil-ity matrix [see Kotonya and Sommerville, 1998; Leffingwell and Widrig, 1999;Wiegers, 1999]. A traceability matrix is a matrix where each row, and eachcolumn, corresponds to one particular SLO, for example a requirement. Therelationship between two SLOs is expressed by putting a mark where the rowof the first SLO and the column of the second SLO intersect. It is also possibleto add semantic information to the relationship between SLOs. For example,the relationship between a requirement and an architectural component can beexpanded to include information about whether the component implements therequirement entirely, or only partially.
Ramesh and Jarke [2001] report that current requirement practices do notfully embrace the use of semantic information to increase the usefulness of re-lationships between SLOs. A relationship stating that two SLOs affect eachother but not how, will be open to interpretation by all stakeholders. Accord-ing to Ramesh and Jarke, different stakeholders interpret relationships withoutsemantic information in different ways. For example, a user may read a relation-ship as “implemented-by”, while a developer may read the same relationship as“puts-constraints-on”.
To further illustrate the need for semantics in traceability links, we havecreated an example with six interconnected SLOs. Figure 3.3 shows the SLOsin a connectivity graph (left), where an arrow means that the source SLO affectsthe destination SLO. For example, SLO 2 affects, or has an impact on, SLO 1and SLO 4.
The connectivity graph corresponds exactly to a traceability matrix, shownnext in the figure. An arrow in the traceability matrix indicates that the rowSLO affects the column SLO. Both the connectivity graph and the traceabilitymatrix show direct impact, or primary change needed, whereas indirect impact,or secondary change needed, can only be deduced by traversing the traceabilitylinks. For systems with many SLOs, the amount of indirect impact quicklybecomes immense and hard to deduce from a connectivity graph or a traceabilitymatrix. In order to better visualise indirect impact, the traceability matrix canbe converted into a reachability matrix, using a transitive closure algorithm.∗The reachability matrix for our example is also in Figure 3.3, showing that allSLOs eventually have impact on every other SLO. Consequently, the reachabilitymatrix for this example is of limited use for assessing indirect impact. Bohner
∗ The transitive closure of a graph is a graph where an edge is added between nodes A andB if it is possible to reach B from A in the original graph.
74
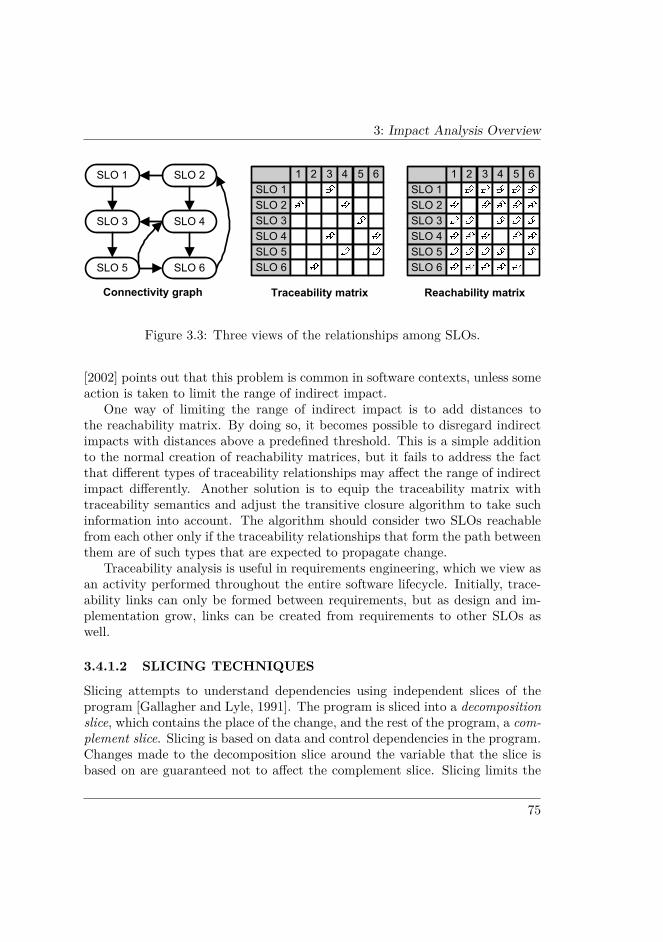
3: Impact Analysis Overview
SLO 1 SLO 2
SLO 4SLO 3
SLO 5 SLO 6
Connectivity graph Traceability matrix Reachability matrix
SLO 1SLO 2SLO 3SLO 4SLO 5SLO 6
1 2 3 4 5 6SLO 1SLO 2SLO 3SLO 4SLO 5SLO 6
1 2 3 4 5 6
Figure 3.3: Three views of the relationships among SLOs.
[2002] points out that this problem is common in software contexts, unless someaction is taken to limit the range of indirect impact.
One way of limiting the range of indirect impact is to add distances tothe reachability matrix. By doing so, it becomes possible to disregard indirectimpacts with distances above a predefined threshold. This is a simple additionto the normal creation of reachability matrices, but it fails to address the factthat different types of traceability relationships may affect the range of indirectimpact differently. Another solution is to equip the traceability matrix withtraceability semantics and adjust the transitive closure algorithm to take suchinformation into account. The algorithm should consider two SLOs reachablefrom each other only if the traceability relationships that form the path betweenthem are of such types that are expected to propagate change.
Traceability analysis is useful in requirements engineering, which we view asan activity performed throughout the entire software lifecycle. Initially, trace-ability links can only be formed between requirements, but as design and im-plementation grow, links can be created from requirements to other SLOs aswell.
3.4.1.2 SLICING TECHNIQUES
Slicing attempts to understand dependencies using independent slices of theprogram [Gallagher and Lyle, 1991]. The program is sliced into a decompositionslice, which contains the place of the change, and the rest of the program, a com-plement slice. Slicing is based on data and control dependencies in the program.Changes made to the decomposition slice around the variable that the slice isbased on are guaranteed not to affect the complement slice. Slicing limits the
75
3: Impact Analysis Overview
scope for propagation of change and makes that scope explicit. The techniqueis, for example, used by Turver and Munro [1994] for slicing of documents inorder to account for ripple effects as a part of impact analysis. Shahmehri et al.[1990] apply the technique to debugging and testing. Pointer-based languageslike C++ are supported through the work of Tip et al. [1996] and their slicingtechniques for C++. Slicing tools are often based on character-based presen-tation techniques, which can make it more difficult to analyse dependencies,but visual presentation of slices can be applied to impact analysis as shown byGallagher and Lyle [1991].
Architectural slicing was introduced by Zhao [1998], and is similar to pro-gram slicing in that it identifies one slice of the architecture that is subject tothe proposed change, and one that is not. As opposed to conventional programslicing, architectural slicing operates on the software architecture of a system.As such, it can be employed in early development, before the code has beenwritten. The technique uses a graph of information flows in order to trace thosecomponents that may be affected by the component being changed. In addi-tion, those components that may affect the component being changed are alsoidentified. This means that there must be a specification of the architecturethat exposes all the information flows that it contains.
Slicing techniques can be useful in requirements engineering to isolate theimpact of a requirements change to a specific part of the system. In order toprovide a starting point for the slicing technique, the direct impact of the changemust first be assessed.
3.4.2 MANUAL STRATEGIESManual impact analysis strategies do not depend as heavily on structured speci-fications as their automatable counterparts do. Consequently, there is a risk thatthey are less precise in their predictions of impact. On the other hand, theymay be easier to introduce in a change management process and are, in ourexperience, commonly employed in industry without regard to their precision.
The strategies presented here, using design documentation and interviewing,are primarily used for assessing the Starting Impact Set by identifying directimpact. The identification of secondary impact is possible, but is better handledby automatable strategies. Note that manual strategies, like the ones describedhere, can be used to capture traceability links between SLOs, to be used intraceability analysis.
76
3: Impact Analysis Overview
3.4.2.1 DESIGN DOCUMENTATION
Design documentation comes in many different forms, for example as architec-ture sketches, view-based architecture models, object-oriented UML diagrams,textual descriptions of software components and so on. The quality of designdocumentation depends on the purpose for which it was written, the frequencywith which it is updated, and the information it contains. It is far too com-mon in industry that design documentation is written early in a project only tobecome shelfware, or that the documentation is written after the project, justfor the sake of writing it. To perform impact analysis and determine how anew or changed requirement affect the system based on design documentationrequires the documentation to be up-to-date and consistent with any implemen-tation made so far. In addition, a prerequisite for using design documentationto assess direct impact is the possibility of relating requirements to design SLOsfound in the documentation. The success and precision of this activity dependson a number of factors:
• The knowledge and skills of the persons performing the analysis. Personswith little insight into the system will most likely have problems pinpoint-ing the impact of changed requirements in the system.
• The availability of the documentation. Documentation that is “hidden” inpersonal computers or stored in anonymous binders may be overlooked inthe analysis.
• The amount of information conveyed in the documentation. Simple designsketches are common, but fail to express the semantics in connectionsbetween classes or architectural components. Ill-chosen naming schemesor inconsistent notation makes the analysis task arduous.
• Clear and consistent documentation. Ambiguous documentation is openfor interpretation, meaning, for example, that the impact of a proposedchange is coupled with great uncertainty, simply because another inter-pretation would have yielded different impact.
If the factors above have been taken into account, impact analysis of a re-quirements change can be performed by identifying the design SLOs that imple-ment or in any other way depend on the requirements affected by the change.Additional measures that can be taken in order to alleviate the impact analysiseffort are:
77
3: Impact Analysis Overview
• Keep a design rationale. A design rationale is documentation describingwhy decisions are made the way they are. Bratthall et al. [2000] per-formed an experiment on the effect of a design rationale when performingimpact analysis. The results from the experiment suggest that a designrationale in some cases can shorten the time required for impact analysis,and increase the quality of the analysis.
• Estimate impact of requirements as soon as the requirements are devel-oped. The estimated impact is necessarily coarse to begin with, but canbe improved incrementally as knowledge about the system increases.
Of course, structured design documentation can also be used with trace-ability analysis (see Section 3.4.1.1) to identify indirect impact. For example,Briand et al. [2003] propose a method for performing impact analysis in UMLmodels, where they use a transitive closure algorithm to find indirect impacts inthe models. They do point out, however, the essential criterion that the UMLmodels are updated as the system undergoes changes.
3.4.2.2 INTERVIEWS
Interviewing knowledgeable developers is probably the most common way to ac-quire information about likely effects of new or changed requirements accordingto a study on impact analysis [Lindvall, 1997]. The study found that develop-ers perceive it as highly cost-effective to ask a knowledgeable person instead ofsearching in documents or other forms of information sources. Extensive com-munication between developers was also mentioned by developers as a successfactor for software development projects. Analysis of source code was the sec-ond most common way of acquiring information about the likely impact of newor changed requirements. While all developers said they interviewed other de-velopers and consulted source code, about half of the developers answered thatthey also consulted information, such as use-case models and object models,stored in the CASE tool in use. When asked why information in object modelswas not used more extensively, the developers answered that the information inobject models was not detailed enough for impact analysis. In addition, they didnot believe that the information in the models was up-to-date. “Source code,on the other hand, is always up-to-date.” Among some developers, especiallynewcomers, the attitude towards using object models as the basis for determin-ing change as an effect of new or changed requirements was less than positive.Object models (and the particular CASE tool that was used) were, however,mentioned as a good tool for documenting impact analysis and for answering
78
3: Impact Analysis Overview
questions about the relation between requirements and design objects using thesupport for traceability links.
3.5 NON-FUNCTIONAL REQUIREMENTSRequirements are often divided into functional and non-functional require-ments. Non-functional requirements, or quality requirements, are those re-quirements “which are not specifically concerned with the functionality of thesystem” [Kotonya and Sommerville, 1998]. Non-functional requirements are of-ten harder to deal with than functional ones, because their impact is generallynot localised to one part of the system, but cuts across the whole system.
A non-functional requirement that, for example, relates to and calls for highsecurity, often requires fundamental support in the software architecture, as itmay constrain data access, file management, database views, available func-tionality and so on. Changes to functional requirements may also affect non-functional requirements. For example, if a change involves replacing a datatransfer protocol to one that is more data intensive, overall system performancemay be degraded.
One approach for dealing with non-functional requirements is to convertthem into one or more functional requirements [Bosch, 2000]. For example, arequirement stating that “no unauthorised person should be allowed access tothe data” may be broken down into the more tangible requirements “a usermust log into the system using a password” and “the user’s identity must beverified against the login subsystem upon data access”. Not all non-functionalrequirements can be converted in this way, however, which means that changesto them still have system-wide impact. Unfortunately, most impact analysistechniques deal exclusively with changes that can be initially pinpointed to aspecific component, class or the like.
Lam and Shankararaman [1999] stress the distinction between functionalimpact analysis and quality impact analysis (i.e., impact analysis for functionaland quality requirements, respectively). They suggest the use of Quality Func-tion Deployment (QFD) for dealing with changes to both functional and non-functional requirements. In QFD, a matrix connecting customer requirementswith design features is constructed. A change to a requirement can be mappedto design features through the QFD matrix.
Cleland-Huang et al. [2003] accomplish performance-related impact analysisthrough event-based traceability. In their approach, requirements are inter-connected as event publishers to subscribing performance models. Whenever
79
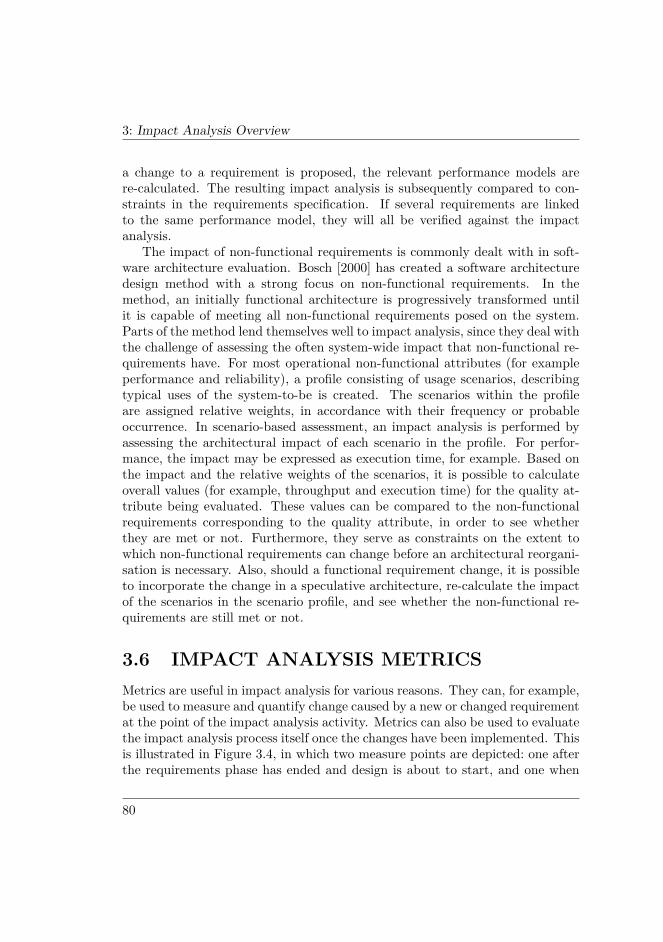
3: Impact Analysis Overview
a change to a requirement is proposed, the relevant performance models arere-calculated. The resulting impact analysis is subsequently compared to con-straints in the requirements specification. If several requirements are linkedto the same performance model, they will all be verified against the impactanalysis.
The impact of non-functional requirements is commonly dealt with in soft-ware architecture evaluation. Bosch [2000] has created a software architecturedesign method with a strong focus on non-functional requirements. In themethod, an initially functional architecture is progressively transformed untilit is capable of meeting all non-functional requirements posed on the system.Parts of the method lend themselves well to impact analysis, since they deal withthe challenge of assessing the often system-wide impact that non-functional re-quirements have. For most operational non-functional attributes (for exampleperformance and reliability), a profile consisting of usage scenarios, describingtypical uses of the system-to-be is created. The scenarios within the profileare assigned relative weights, in accordance with their frequency or probableoccurrence. In scenario-based assessment, an impact analysis is performed byassessing the architectural impact of each scenario in the profile. For perfor-mance, the impact may be expressed as execution time, for example. Based onthe impact and the relative weights of the scenarios, it is possible to calculateoverall values (for example, throughput and execution time) for the quality at-tribute being evaluated. These values can be compared to the non-functionalrequirements corresponding to the quality attribute, in order to see whetherthey are met or not. Furthermore, they serve as constraints on the extent towhich non-functional requirements can change before an architectural reorgani-sation is necessary. Also, should a functional requirement change, it is possibleto incorporate the change in a speculative architecture, re-calculate the impactof the scenarios in the scenario profile, and see whether the non-functional re-quirements are still met or not.
3.6 IMPACT ANALYSIS METRICSMetrics are useful in impact analysis for various reasons. They can, for example,be used to measure and quantify change caused by a new or changed requirementat the point of the impact analysis activity. Metrics can also be used to evaluatethe impact analysis process itself once the changes have been implemented. Thisis illustrated in Figure 3.4, in which two measure points are depicted: one afterthe requirements phase has ended and design is about to start, and one when
80
3: Impact Analysis Overview
testing has been completed. Using these measure points, one can capture thepredicted impact (the first point) and compare it to the actual impact (thesecond point). This kind of measurement is crucial for being able to do ananalysis and learn from experiences in order to continuously improve the impactanalysis capability. The figure is simplified and illustrates a learning cycle basedon a waterfall-like model. As discussed earlier, impact analysis can be usedthroughout the life cycle in order to analyse new requirements and the measurepoints can be applied accordingly: whenever a prediction has been conductedand whenever an implementation has been completed.
Requirementsdefinition
Requirementsselection
Impact analysis(Prediction of change)
LearningAnalysis
Detecting change
Measure points
Planning Design, coding & testing
Figure 3.4: Measuring impact using metrics.
3.6.1 METRICS FOR QUANTIFYING CHANGEIMPACT
Metrics for quantifying change impact are based on the SLOs that are predictedto be changed as an effect of new or changed requirements. In addition, indi-cators of how severe the change is can be used. Such measures of the predictedimpact can be used to estimate the cost of a proposed change or a new re-quirement. The more requirements and other SLOs that are affected, the morewidespread they are and the more complex the proposed change is, the moreexpensive the new or changed requirement will be. Requirements that are costlyin this sense but provide little value can, for example, be filtered out for thebenefit of requirements that provide more value but to a smaller cost.
Change impact can be measured based on the set of requirements that isaffected by the change. For example, the number of requirements affected by achange can be counted based on this set. The affected requirements’ complexity
81
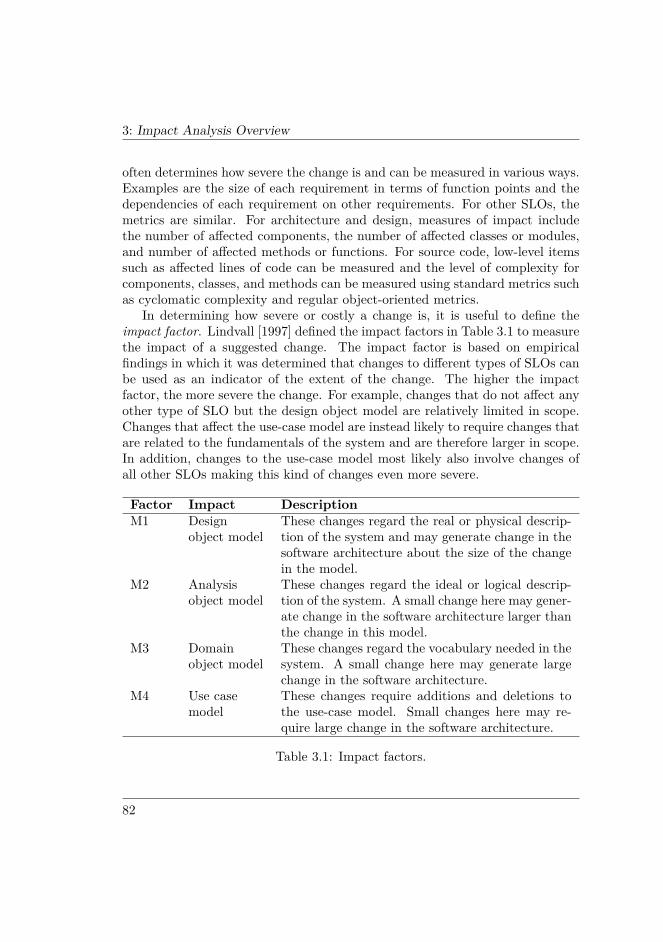
3: Impact Analysis Overview
often determines how severe the change is and can be measured in various ways.Examples are the size of each requirement in terms of function points and thedependencies of each requirement on other requirements. For other SLOs, themetrics are similar. For architecture and design, measures of impact includethe number of affected components, the number of affected classes or modules,and number of affected methods or functions. For source code, low-level itemssuch as affected lines of code can be measured and the level of complexity forcomponents, classes, and methods can be measured using standard metrics suchas cyclomatic complexity and regular object-oriented metrics.
In determining how severe or costly a change is, it is useful to define theimpact factor. Lindvall [1997] defined the impact factors in Table 3.1 to measurethe impact of a suggested change. The impact factor is based on empiricalfindings in which it was determined that changes to different types of SLOs canbe used as an indicator of the extent of the change. The higher the impactfactor, the more severe the change. For example, changes that do not affect anyother type of SLO but the design object model are relatively limited in scope.Changes that affect the use-case model are instead likely to require changes thatare related to the fundamentals of the system and are therefore larger in scope.In addition, changes to the use-case model most likely also involve changes ofall other SLOs making this kind of changes even more severe.
Factor Impact DescriptionM1 Design
object modelThese changes regard the real or physical descrip-tion of the system and may generate change in thesoftware architecture about the size of the changein the model.
M2 Analysisobject model
These changes regard the ideal or logical descrip-tion of the system. A small change here may gener-ate change in the software architecture larger thanthe change in this model.
M3 Domainobject model
These changes regard the vocabulary needed in thesystem. A small change here may generate largechange in the software architecture.
M4 Use casemodel
These changes require additions and deletions tothe use-case model. Small changes here may re-quire large change in the software architecture.
Table 3.1: Impact factors.
82
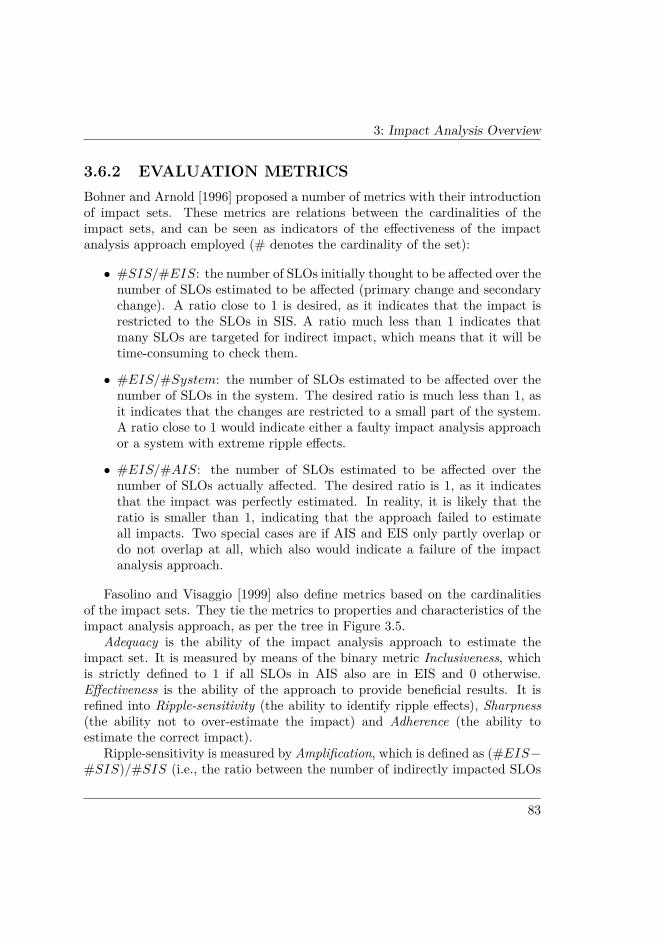
3: Impact Analysis Overview
3.6.2 EVALUATION METRICSBohner and Arnold [1996] proposed a number of metrics with their introductionof impact sets. These metrics are relations between the cardinalities of theimpact sets, and can be seen as indicators of the effectiveness of the impactanalysis approach employed (# denotes the cardinality of the set):
• #SIS/#EIS: the number of SLOs initially thought to be affected over thenumber of SLOs estimated to be affected (primary change and secondarychange). A ratio close to 1 is desired, as it indicates that the impact isrestricted to the SLOs in SIS. A ratio much less than 1 indicates thatmany SLOs are targeted for indirect impact, which means that it will betime-consuming to check them.
• #EIS/#System: the number of SLOs estimated to be affected over thenumber of SLOs in the system. The desired ratio is much less than 1, asit indicates that the changes are restricted to a small part of the system.A ratio close to 1 would indicate either a faulty impact analysis approachor a system with extreme ripple effects.
• #EIS/#AIS: the number of SLOs estimated to be affected over thenumber of SLOs actually affected. The desired ratio is 1, as it indicatesthat the impact was perfectly estimated. In reality, it is likely that theratio is smaller than 1, indicating that the approach failed to estimateall impacts. Two special cases are if AIS and EIS only partly overlap ordo not overlap at all, which also would indicate a failure of the impactanalysis approach.
Fasolino and Visaggio [1999] also define metrics based on the cardinalitiesof the impact sets. They tie the metrics to properties and characteristics of theimpact analysis approach, as per the tree in Figure 3.5.
Adequacy is the ability of the impact analysis approach to estimate theimpact set. It is measured by means of the binary metric Inclusiveness, whichis strictly defined to 1 if all SLOs in AIS also are in EIS and 0 otherwise.Effectiveness is the ability of the approach to provide beneficial results. It isrefined into Ripple-sensitivity (the ability to identify ripple effects), Sharpness(the ability not to over-estimate the impact) and Adherence (the ability toestimate the correct impact).
Ripple-sensitivity is measured by Amplification, which is defined as (#EIS−#SIS)/#SIS (i.e., the ratio between the number of indirectly impacted SLOs
83
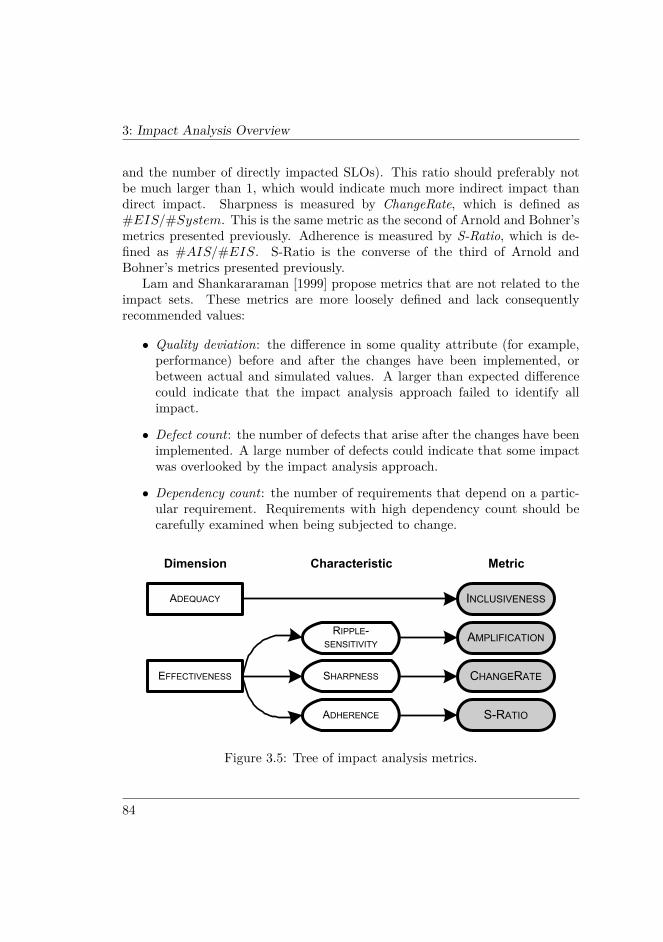
3: Impact Analysis Overview
and the number of directly impacted SLOs). This ratio should preferably notbe much larger than 1, which would indicate much more indirect impact thandirect impact. Sharpness is measured by ChangeRate, which is defined as#EIS/#System. This is the same metric as the second of Arnold and Bohner’smetrics presented previously. Adherence is measured by S-Ratio, which is de-fined as #AIS/#EIS. S-Ratio is the converse of the third of Arnold andBohner’s metrics presented previously.
Lam and Shankararaman [1999] propose metrics that are not related to theimpact sets. These metrics are more loosely defined and lack consequentlyrecommended values:
• Quality deviation: the difference in some quality attribute (for example,performance) before and after the changes have been implemented, orbetween actual and simulated values. A larger than expected differencecould indicate that the impact analysis approach failed to identify allimpact.
• Defect count: the number of defects that arise after the changes have beenimplemented. A large number of defects could indicate that some impactwas overlooked by the impact analysis approach.
• Dependency count: the number of requirements that depend on a partic-ular requirement. Requirements with high dependency count should becarefully examined when being subjected to change.
Dimension Characteristic Metric
INCLUSIVENESS
SHARPNESSEFFECTIVENESS
ADEQUACY
AMPLIFICATION
CHANGERATE
S-RATIOADHERENCE
RIPPLE-SENSITIVITY
Figure 3.5: Tree of impact analysis metrics.
84
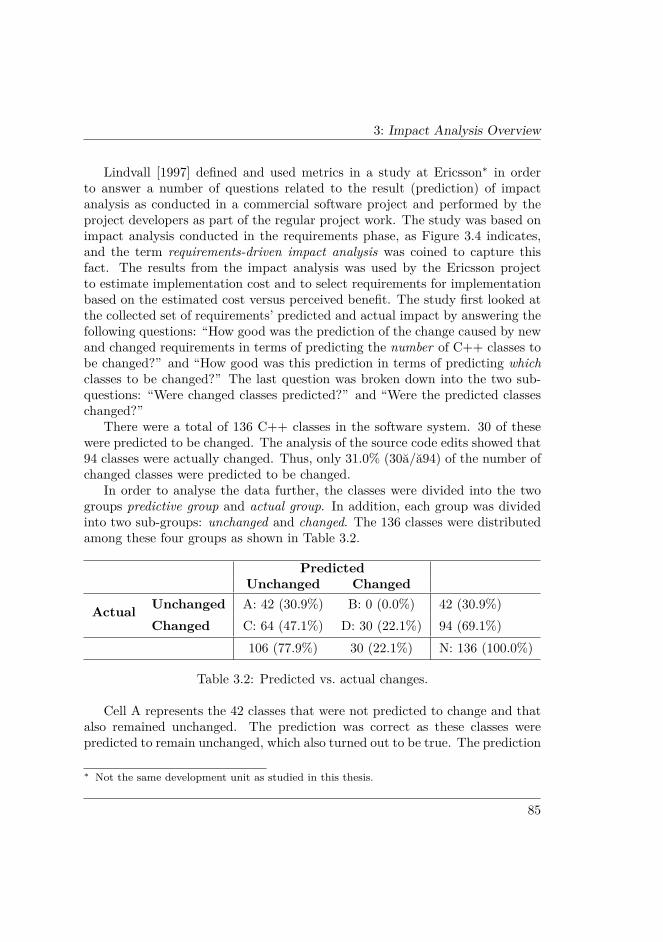
3: Impact Analysis Overview
Lindvall [1997] defined and used metrics in a study at Ericsson∗ in orderto answer a number of questions related to the result (prediction) of impactanalysis as conducted in a commercial software project and performed by theproject developers as part of the regular project work. The study was based onimpact analysis conducted in the requirements phase, as Figure 3.4 indicates,and the term requirements-driven impact analysis was coined to capture thisfact. The results from the impact analysis was used by the Ericsson projectto estimate implementation cost and to select requirements for implementationbased on the estimated cost versus perceived benefit. The study first looked atthe collected set of requirements’ predicted and actual impact by answering thefollowing questions: “How good was the prediction of the change caused by newand changed requirements in terms of predicting the number of C++ classes tobe changed?” and “How good was this prediction in terms of predicting whichclasses to be changed?” The last question was broken down into the two sub-questions: “Were changed classes predicted?” and “Were the predicted classeschanged?”
There were a total of 136 C++ classes in the software system. 30 of thesewere predicted to be changed. The analysis of the source code edits showed that94 classes were actually changed. Thus, only 31.0% (30ă/ă94) of the number ofchanged classes were predicted to be changed.
In order to analyse the data further, the classes were divided into the twogroups predictive group and actual group. In addition, each group was dividedinto two sub-groups: unchanged and changed. The 136 classes were distributedamong these four groups as shown in Table 3.2.
PredictedUnchanged Changed
Actual Unchanged A: 42 (30.9%) B: 0 (0.0%) 42 (30.9%)Changed C: 64 (47.1%) D: 30 (22.1%) 94 (69.1%)
106 (77.9%) 30 (22.1%) N: 136 (100.0%)
Table 3.2: Predicted vs. actual changes.
Cell A represents the 42 classes that were not predicted to change and thatalso remained unchanged. The prediction was correct as these classes werepredicted to remain unchanged, which also turned out to be true. The prediction
∗ Not the same development unit as studied in this thesis.
85
3: Impact Analysis Overview
was implicit as these classes were indirectly identified—they resulted as a sideeffect as complement of predicting changed classes.
Cell B represents the zero classes that were predicted to change, but actuallyremained unchanged. A large number here would indicate a large deviation fromthe prediction.
Cell C represents the 64 classes that were not predicted to change, but turnedout to be changed after all. As with cell B, a large number in this cell indicatesa large deviation from the prediction.
Cell D, finally, represents the 30 classes that were predicted to be changedand were, in fact, changed. This is a correct prediction. A large number in thiscell indicates a good prediction.
There are several ways to analyse the goodness of the prediction. One wayis to calculate the percentage of correct predictions, which was (42 + 30)/136 =52.9%. Thus, the prediction was correct in about half of the cases. Anotherway is to use Cohen’s Kappa value, which measures the agreement betweentwo groups ranging from 1.0 to 1.0. The 1.0 figure means total incompliancebetween the two groups, 1.0 means total compliance and 0.0 means that theresult is no better than pure chance [Cohen, 1960]. The kappa value in this caseis 0.22, which indicates a fair prediction. See [Lindvall and Sandahl, 1998] forfull details on the Kappa calculations for the example. A third way to evaluatethe prediction is to compare the number of classes predicted to be changed withthe number of classes actually changed. The number of classes predicted tobe changed in this case turned out to be largely underpredicted by a factor ofthree. Thus, only about one third of the set of changed classes was identified.It is, however, worth noticing that all of the classes that were predicted to bechanged were in fact changed.
The study then analysed the predicted and actual impact of each requirementby answering similar questions for each requirement. The requirements and theclasses that were affected by these requirements were organised in the followingmanner: For each requirement, the set of classes predicted to be changed, theset of changed classes, and the intersection of the two sets (i.e., classes that wereboth predicted and changed). In addition, the sets of classes that were predictedbut not changed and the set of classes that were changed but not predicted wereidentified.
The analysis showed that in almost all cases, there was an underpredictionin terms of number of classes. In summary, the analysis showed that the numberof changed classes divided by the number of predicted classes ranged from 1.0 to7.0. Thus, up to seven times more classes than predicted were actually changed.
86
3: Impact Analysis Overview
Estimating cost in requirements selection is often based on the predictionlike it was in the Ericsson case, which means that requirements predicted tocause change in only a few entities are regarded as less expensive, while re-quirements predicted to cause change in many entities are regarded as moreexpensive. This makes the rank-order of requirements selection equal to a re-quirements list sorted by the number of items predicted. By comparing therelative order based on the number of predicted classes with the relative orderbased on the number of actually changed classes, it was possible to judge thegoodness of the prediction from yet another point of view. In summary, theanalysis on the requirements level showed that a majority of the requirementswere underpredicted. It was also clear that it is relatively common that someclasses predicted for one requirement are not changed because of this particularrequirement, but because of some other requirement. This is probably becausethe developers were not required to implement the changed requirements exactlyas was specified in the implementation proposal resulting from the impact anal-ysis. The analysis of the order of requirements based on number of predictedclasses showed that the order was not kept entirely intact; some requirementsthat were predicted to be small proved to have a large change impact, and viceversa.
In order to try to understand the requirements-driven impact analysis pro-cess and how to improve it, an analysis of the various characteristics of changedand unchanged classes was undertaken. One such characteristic was size, and thequestions were: “Were large classes changed?”, “Were large classes predicted?”and “Were large classes predicted compared to changed classes?”
The analysis indicated that large classes were changed, while small classesremained unchanged. The analysis also indicated that large classes were pre-dicted to change, which leads to the conclusion that class size may be one ofthe ingredients used by developers, maybe unconsciously, when searching forcandidates for a new or changed requirement.
3.7 TOOL SUPPORTThe complexity of the change management process makes it necessary to usesome sort of tool support [Maciaszek, 2001; Sommerville and Sawyer, 1997]. Achange management tool can be used to manage requirements and other SLOs,manage change requests, link change requests to requirements and other SLOs,and monitor the impact analysis progress. A simple database or spreadsheettool may be used as basic change management support, but still requires a con-
87

3: Impact Analysis Overview
siderable amount of manual work, which eventually may lead to inconsistenciesin the change management data. If the tool support is not an integral part ofthe change management process, there is always a risk that it will not be usedproperly. A change management system that is not used to its full extent cannotprovide proper support to the process.
A problem with many change management tools is that they are restrictedto working with change and impact analysis on the requirements level. Ideally,a change management tool would support impact analysis on requirements,design, source code, test cases and so on. However, that would require theintegration of requirement management tools, design tools and development en-vironments into one tool or tool set. In a requirements catalog for requirementsmanagement tools, Hoffmann et al. [2004] list both traceability and tool inte-gration as high-priority requirements, and analysis functions as a mid-priorityrequirement, confirming the importance of these features.
In a survey of the features of 29 requirements management tools supportingtraceability, we could only find nine tools for which it was explicitly stated ontheir respective web sites that they supported traceability between requirementsand other SLOs, such as design elements, test cases and code. Depending onthe verbosity and quality of the available information, this may not be an exactfigure. However, it indicates that in many cases it is necessary to use severaldifferent tools to manage traceability and perform impact analysis, which canbe problematic depending on the degree of integration between the tools.
There are tools that extract dependency information from existing systemrepresentations, for example source code and object models, but the task ofsuch tools is nonetheless difficult and often requires manual work [Egyed, 2003].Higher-level representations may be too coarse, and source code may have hid-den dependencies, for instance due to late binding. Egyed, for example, proposesan approach for extracting dependencies primarily for source code. Input to theapproach is a set of test scenarios and some hypothesised traces that link SLOsto scenarios. The approach then calculates the footprints of the scenarios (i.e.,the source code lines they cover) and based on footprints and hypothesised tracesgenerates the remaining traces. The approach can also be used when no sourcecode exists, for example by simulating the system or hypothesising around thefootprints of the scenarios.
Tools that deal with source code are mostly used in software maintenancecontexts, and are obviously of limited use within the development project.Natt och Dag et al. [2002] have studied automatic similarity analysis as a meansto find duplicate requirements in market-driven development. In addition to theoriginal field of application, they suggest that their technique can be used to
88
3: Impact Analysis Overview
identify dependency relationships between requirements, for example that tworequirements have an “or” relation, or that several requirements deal with sim-ilar functionality.
Tools that aid in performing impact analysis can be synonymous with theunderlying methods. Methods that rely on traceability analysis are well suitedfor inclusion in tools that try to predict indirect impact. For example, Fa-solino and Visaggio [1999] present ANALYST, a tool that assesses impact independency-based models. Lee et al. [2000] present another tool, ChAT, whichcalculates ripple effects caused by a change to the system. Many such tools arecommonly proof-of-concept tools, constructed to show or support a particularalgorithm or methodology. What is lacking is the integration into mainstreamchange management tools.
3.8 FUTURE OF IMPACT ANALYSISMost strategies for impact analysis work under the assumption that changesonly affect functionality. It is thus more difficult to assess the impact of changesto non-functional requirements, or changes where non-functional requirementsare indirectly affected. Some work on this topic exists [see Cleland-Huang et al.,2003; Lam and Shankararaman, 1999], but a stronger focus on impact analysisfor non-functional requirements is needed.
As we have pointed out, impact analysis is mostly referred to in softwaremaintenance contexts. We have argued that impact analysis is an essentialactivity also in requirements engineering contexts, and that standard impactanalysis strategies apply in most cases (for example, traceability approaches arecommonly exercised for requirements). There is still, however, a need for moreresearch focusing on the requirements engineering aspects of impact analysis, forexample how to relate requirements to other SLOs and how to perform changepropagation in this context.
Most automatable strategies for impact analysis assume complete modelsand full traceability information. Since it is common in industry to encountermodels that are not updated and traceability information that is only partial,there is a need for more robust impact analysis strategies that can work withpartial information. Egyed [2003] has proposed one such approach.
Existing tools for impact analysis are often proof-of-concept tools, or workonly with limited impact analysis problems, such as the extraction of dependen-cies from system representations. Some mainstream requirements managementtools incorporate impact analysis of not only requirements, but also design, code
89
3: Impact Analysis Overview
and test, but far from all. Full-scale impact analysis must be an integral partof requirement management tools in order for change to be dealt with properly.
Impact analysis needs to be adapted to the types of systems that becomeincreasingly common today, such as web applications and COTS software. Webapplications, for example, often consist of stand-alone components that con-nect to a central repository, such as a database. Thus, there are few controldependencies between components, and instead rich webs of data dependenciestowards and within the central repository. The fact that such repositories can beshared among several distinct systems introduces interoperability dependenciesthat impact analysis strategies especially tailored for these technologies mustaddress in order to be effective.
3.9 SUMMARYImpact analysis is an important part of requirements engineering since changesto software often are initiated by changes to the requirements. As the de-velopment process becomes less and less waterfall-like and more of new andchanged requirements can be expected throughout the development process,impact analysis becomes an integral part of every phase in software develop-ment. In some sense, impact analysis has been performed for a very long time,albeit not necessarily using that term and not necessarily fully resolving theproblem of accurately determining the effect of a proposed change. The needfor software practitioners to determine what to change in order to implementrequirement changes has always been present. Classical methods and strate-gies to conduct impact analysis are dependency analysis, traceability analysisand slicing. Early impact analysis work focused on applying such methods andstrategies onto source code in order to conduct program slicing and determineripple effects for code changes. The maturation of software engineering amongsoftware organisations has, however, led to a need to understand how changerequests affect other SLOs than source code, including requirements, and thesame methods and strategies have been applied. Typical methods and strate-gies of today are based on analysing traceability or dependency information,utilising slicing techniques, consulting design specifications and other documen-tation, and interviewing knowledgeable developers. Interviewing knowledgeabledevelopers is probably the most common way to acquire information aboutlikely effects of new or changed requirements. Metrics are useful and importantin impact analysis for various reasons. Metrics can, for example, be used tomeasure and quantify change caused by a new or changed requirement at the
90
3: Impact Analysis Overview
point of the impact analysis activity. Metrics can also be used to evaluate theimpact analysis process itself once the changes have been implemented. In de-termining how severe or costly a change is, it is useful to determine the impactfactor as it indicates the likely extent of a change to a certain type of SLO.To summarise: Impact analysis is a crucial activity supporting requirementsengineering. The results from impact analysis feed into many activities includ-ing estimation of requirements’ cost and prioritisation of requirements. Theseactivities feed directly into project planning, making impact analysis a centralactivity in a successful project.
91

3: Impact Analysis Overview
92
Chapter 4
Views of Impact AnalysisIssues
As noted in Chapter 1, the gross of impact analysis research concerns the devel-opment of methods and algorithms for supporting and automating the analysis,or the adaptation of existing methods in new contexts. To our knowledge, thereis little research about more non-technical aspects of the subject, such as processand organisational aspects. In our experience, IA is, as a part of the changecontrol process, heavily dependent on organisational support and stakeholderviews.
In this chapter, we present an explorative, empirical study of the views ofimpact analysis at Ericsson. In the study, the change source in question waschange requests, and IA was seen in a broad sense: both with respect to theanalysis of the change requests, and the analysis of the modification induced bythe change.
In exploring issues of IA at Ericsson, we identified three organisational levelsof people with different foci: technical, resource, and product. Looking at man-agement science, we found that these levels mapped well to the decision-makingmodel originally defined by Anthony [see, for example, Aurum and Wohlin,2003; Ngo-The and Ruhe, 2005], where decisions are categorised as operative,tactical or strategic. We also identified two perspectives of views, namely self(individual) and organisational. The idea is that the organisational perspectivealigns with the overall goals of the organisation, whereas the self-perspectivealigns with the goals of oneself.
4: Views of Impact Analysis Issues
In order to understand how issues associated with IA are seen at the dif-ferent levels and under the different perspectives, we interviewed 18 employeesat the company in their roles as industrial experts. The resulting list of issueswas subsequently subjected to prioritisation by the interviewees. Our goal is toinvestigate whether people see IA differently depending on their level and per-spective, and whether these groupings are meaningful in process improvementefforts. We provide a qualitative analysis as well as a detailed statistical analysisof some of the results, and discuss possible improvements pertaining to issuesfound to be important.
The chapter is structured as follows. The following section describes thecontext of the research and presents the research questions for this work. There-after, Section 4.2 discusses related work. Next, the research method is describedin Section 4.3. The results obtained in the study are presented in Section 4.4,followed by analysis and discussion in Section 4.5. Finally, conclusions andfuture work are discussed in Section 4.6.
4.1 RESEARCH CONTEXTEricsson is a company that operates on a world market, and as such has severallarge international customers. The population we wish to generalise to is indus-trial/professional software practitioners in general rather than just within thecompany. We believe this to be possible due to the fact that the company dealswith large-scale software development and is ISO 9000 certified (which meansthat processes and ways of working are governed by predefined guidelines). Itcan be assumed that the challenges and characteristics of the development workexist in other companies of the same magnitude as well, and to some extent alsoin smaller companies.
The research questions for this work are:
• RQ1: How does the organisational level affect one’s assessment of impor-tance of IA issues?
• RQ2: What difference does the perspective make in determining the rel-ative importance of IA issues?
• RQ3: Which are important IA issues, and how are these addressed insoftware process improvement?
Answers to the first two research questions are sought by looking at differ-ences between groups with respect to how people in the groups have judged
94

4: Views of Impact Analysis Issues
the relative importance of the issues. For RQ1, the three groups correspond tothe three organisational levels. For RQ2, we look at two groups defined by theperspective used when judging the importance of issues. For these two researchquestions, both a qualitative analysis and a statistical analysis are performed.In addition, the two groupings are studied together. RQ3 is approached in amore holistic manner, with the purpose of weighing together importance fromthe different levels and perspectives.
The overarching goal of the conducted research is to explore the role of IAin the organisation, in order to be able to improve ways of working with IA.By studying and learning about differences in views of IA, process improvementefforts can be directed towards a certain target group. For example, the re-quirements on process support tools could differ between different target groupsbecause the groups consider different issues to be of importance.
4.2 RELATED WORKAurum and Wohlin [2003] tie requirements engineering (RE) activities to decision-making models, arguing that RE is a decision-intensive process. They suggestthat studying decision-making within RE helps organisations structure their REdecisions better and, ultimately, produce software with higher quality. We meanthat the same argument holds for IA, due to the strong connection between IAand RE.
Several researchers report on differences between managers and engineersin the context of software process improvement (SPI), for example concern-ing views of software quality [Hall and Wilson, 1997], use of formal routinesto transfer knowledge and experience [Conradi and Dybå, 2001] and how theyrate factors affecting an SPI goal [Karlström et al., 2002]. Even though bothmanagers and engineers have personal agendas, our experience is that managersoften have a more holistic view of the development work than engineers. Dueto this, the personal priorities of managers are likely to align well with thoseof the organisation, whereas the personal priorities of engineers should be nar-rower. Thus, differences between managers and engineers could be attributed todifferences between the organisational alignment of their default perspectives.
The notion of perspectives can be found in other research, for example onperspective-based reading (PBR). PBR is a scenario-based reading techniqueintroduced by Basili et al. [1996], with the purpose of maximising the numberof faults found when reading a document by reading it from several different per-spectives. The idea is that each perspective finds its own unique faults, and that
95
4: Views of Impact Analysis Issues
the union of the perspectives provides a good coverage of the document beingread. PBR is a good example of how to take advantage of differences betweenperspectives, although there is research that indicates that the perspectives neednot differ with statistical significance [Regnell et al., 2000b].
Finkelstein and Sommerville [1996] discuss perspective in relation to view-points. A viewpoint consists of an agent (i.e., actor) and a perspective. Large-scale software development requires, due to its complexity, multiple viewpointsand thus multiple perspectives. According to Finkelstein and Sommerville, dif-ferences in perspectives stem from the agents’ different responsibilities and rolesand thus variations in their goals and opinions. Furthermore, it is argued thatmultiple perspectives need to be integrated if there is a common or shared goal.In SPI, the common goal is to create a successful improvement programme thataddresses the organisation’s software processes [Zahran, 1998]. This motivatesthe relevance of looking at multiple perspectives when prioritising impact anal-ysis issues.
Karlsson and Ryan [1997] describe a requirements prioritisation approach,in which requirements are prioritised from two different perspectives—a value(customer) perspective and a cost (developer) perspective. Their visualisation ofthe prioritisations has inspired the visualisation approach used in this chapter. Adifference between our perspective comparison and their perspective comparisonis that in their case there is a preferable situation: the value/cost ratio for arequirement should be as high as possible. In our case, there is nothing thatsays that a high organisational/self ratio is more preferable than a low one.
4.3 METHODThe study consisted of three main steps: interviews, post-test, and workshop.In the interview step, 18 persons involved in the change management processwere asked questions about impact analysis and change management. The rolesof the participants ranged from programmers to product managers, but eachone had in one way or another a relation to the impact analysis activity, asdecision-maker, technical advisor, change request writer, implementer, etc.
The sampling of the participants can be characterised as convenience sam-pling [Robson, 2002], as no specific systematicness was used in selecting peopleto interview. Instead, people were selected mainly based on recommendation(and availability), although some were approached at random based on theirrole. As one of the initial objectives of the study was to look at organisational
96
4: Views of Impact Analysis Issues
levels (see Section 4.3.1), the sampling of participants were largely controlledby to which extent the levels were thought to be represented.
In the post-test, the participants gave input to the assessment of their or-ganisational levels, and prioritised issues elicited during the interviews. Weanticipated that each participant, when asked during the interview, would onlymention a limited set of issues, and thus not see (or be aware of) the wholepicture. This was the reason for the prioritisation being a separate step ratherthan being included in the interviews.
The purpose of the workshop was to let the participants discuss the outcomeof the prioritisation, and possibly come up with ideas how to address importantissues. Furthermore, as several roles were represented by the participants, theworkshop could allow people to gain greater understanding of each other’s views.
The following sections describe the steps of the study in more detail.
4.3.1 ORGANISATIONAL LEVELSAs mentioned earlier, the three organisational levels we identified map well to thedecision-making model defined by Anthony. The model differentiates betweendecisions at three levels as follows [Ngo-The and Ruhe, 2005]:
• Strategic decisions have typically large scope, large impact and long-termperspective. They concern organisational or product-related goals andstrategies.
• Tactical decisions concern planning of time and resources to reach strategicgoals, and are often made by middle management. They have smallerscope and impact, and shorter time horizon, than strategic decisions.
• Operative decisions are made when realising the project according to theplan, and are often of technical nature.
In terms of impact analysis and handling of change requests, people on theoperative level can be expected to do technical analysis of system impact, andalso manage the actual realisation (implementation) of the change when it hasbeen accepted. People on the tactical level can be expected to analyse basedon resource and time consumption, and also do planning and coordination ofchange realisation. Finally, people on the strategic level can be expected to lookat how a proposed change aligns with long-term goals, and what the product-or organisation-wide consequences of a change are.
97
4: Views of Impact Analysis Issues
4.3.2 INTERVIEW DESIGNThe interview instrument contained seven main topics, each of which was asso-ciated with one or more open questions. This chapter is only concerned with thetopic of potential issues of impact analysis and change handling. The questionfor this topic was (translated from Swedish): “Which potential issues are associ-ated with performing impact analysis?” Note here that we asked about potentialissues rather than actual ones. The reason for this was to avoid limiting thegeneralisability of the results by extracting company-specific issues only.
The remaining topics were more qualitative in their nature, and were in-tended both for providing a context for and for collecting hidden or implicitknowledge about the issues. We did not intend for the participants to prioritiseduring the interviews, as we expected each of them to see only a subset of thepossible issues.
In order to ensure the appropriateness and clarity of the questions, the in-terview instrument was developed in close cooperation with the company. Fur-thermore, we performed a pilot interview in order to find inconsistencies andproblems with the interview instrument. The pilot interview resulted in only mi-nor changes to the interview instrument, which lead us to include the interviewin the study.
The interviews were semi-structured, meaning that it was not necessary tofollow the predefined question order strictly, and that the wording of questionswas not seen as crucial for the outcome of the interviews [Robson, 2002]. Theparticipants could speak rather freely, but we made sure that all questions wereanswered in one way or another.
The participants were asked if they would agree to join in a follow-up activity,where they should prioritise the issues elicited during the interviews. This wasdone in order to prepare the participants and increase their commitment towardsthe follow-up prioritisation.
A great variety of roles were covered in the interviews, including developer,tester, technical coordinator, manager (functional, product and project) andsystem architect. It should also be noted that the participants in general hadbeen working at the company for a long time, and were thus familiar withprocesses and routines.
4.3.3 RESULTS TRIANGULATION AND FILTERINGA triangulation and filtering scheme was designed in order to get a completelist of issues. The scheme involved three information sources: (1) the list gener-
98
4: Views of Impact Analysis Issues
ated in the interviews, (2) qualitative information from the interviews, and (3)information from the literature.
By using information from all interview topics, it would be possible to extractboth explicit and implicit knowledge about issues. For example, it happenedon several occasions that participants mentioned issues while talking about pro-cesses and tools. These issues were specifically tagged and in the triangulationstep merged with the ones explicitly listed. By collecting information from theliterature, we would be able to add issues of which the participants were notaware.
The filtering part was intended to remove redundancies and inconsistenciesin the issue list by merging similar issues together, and by discarding issues thatwere not directly related to impact analysis.
4.3.4 POST-TEST WITH PRIORITISATIONA post-test was designed as a follow-up to the interviews, for two purposes. Thefirst purpose was to let the participants determine their respective organisationallevels, by stating the distribution of their decisions on the decision levels. Basedon this, it would be possible to deduce their organisational levels. For example,a participant making mostly strategic decisions would be regarded as belongingto the strategic organisational level. This scheme was used since, as Aurum andWohlin [2003] point out, Anthony’s decision levels are not entirely orthogonal.
The second purpose was to obtain a prioritised list of issues from each par-ticipant. The participants should prioritise such that the issue with the highestpriority would be the one most critical to the organisation if it existed, therebylooking at the issues under the organisational perspective. However, we werealso interested in knowing if the participants would prioritise differently from aself-perspective. Thus, we let each participant prioritise also from an individualpoint of view, assigning high priorities to issues critical to himself or herself ifthey existed.
To account for the problem that the first prioritisation of issues could affectthe second (due to maturation), a two group design was used for the post-test, such that half of the participants should prioritise from the organisationalperspective first, and the other half from the self-perspective first.
In the prioritisation, the participants should use the Cumulative Voting (CV)technique [Leffingwell and Widrig, 1999]. CV works as follows. For each item ibeing prioritised, the prioritising person assigns a weight, wi, such that the sumof weights over k items,
∑ki=1 wi, equals a constant number,W . The ratio wi/W
corresponds to the importance of item i relative to all other items. Typically,
99
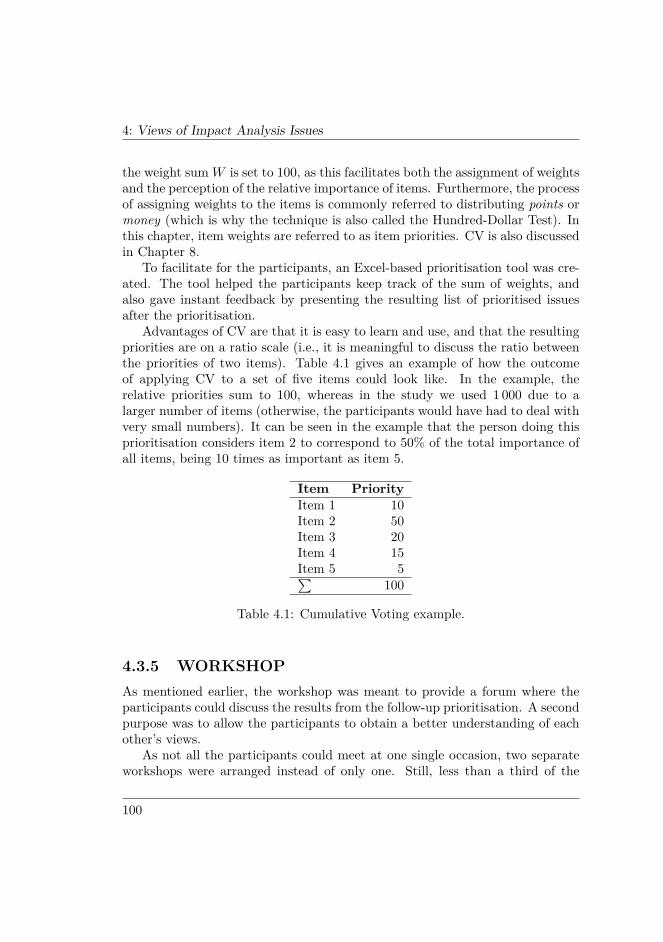
4: Views of Impact Analysis Issues
the weight sumW is set to 100, as this facilitates both the assignment of weightsand the perception of the relative importance of items. Furthermore, the processof assigning weights to the items is commonly referred to distributing points ormoney (which is why the technique is also called the Hundred-Dollar Test). Inthis chapter, item weights are referred to as item priorities. CV is also discussedin Chapter 8.
To facilitate for the participants, an Excel-based prioritisation tool was cre-ated. The tool helped the participants keep track of the sum of weights, andalso gave instant feedback by presenting the resulting list of prioritised issuesafter the prioritisation.
Advantages of CV are that it is easy to learn and use, and that the resultingpriorities are on a ratio scale (i.e., it is meaningful to discuss the ratio betweenthe priorities of two items). Table 4.1 gives an example of how the outcomeof applying CV to a set of five items could look like. In the example, therelative priorities sum to 100, whereas in the study we used 1 000 due to alarger number of items (otherwise, the participants would have had to deal withvery small numbers). It can be seen in the example that the person doing thisprioritisation considers item 2 to correspond to 50% of the total importance ofall items, being 10 times as important as item 5.
Item PriorityItem 1 10Item 2 50Item 3 20Item 4 15Item 5 5∑
100
Table 4.1: Cumulative Voting example.
4.3.5 WORKSHOPAs mentioned earlier, the workshop was meant to provide a forum where theparticipants could discuss the results from the follow-up prioritisation. A secondpurpose was to allow the participants to obtain a better understanding of eachother’s views.
As not all the participants could meet at one single occasion, two separateworkshops were arranged instead of only one. Still, less than a third of the
100
4: Views of Impact Analysis Issues
participants were able to take part in the workshops. The workshop resultswere compiled and sent to all participants afterwards, both to spread the resultsto those who did not attend, and to merge the results from the two separateworkshops. Furthermore, the participants could in this way control that thecompiled information was correct.
The set of issues and the prioritisation data were not altered in any way dueto the discussions during the workshops. Thus, the low attendance does notpose a threat to the validity of the study.
4.4 RESULTSThe mapping of participants to the organisational levels (described in Sec-tion 4.3.1) resulted in eight participants at the operative level, five at the tacticallevel and five at the strategic level. In total, 25 relevant issues could be extractedfrom the interview material. We found six issues described in the literature, butthese were already among the 25, which confirms that our 25 issues are indeedrelevant and complete.
All issues can be seen in Table 4.2, labelled from i1 to i25. Note that theoriginal issues were in Swedish and have been translated into English here. Inthe translation, we have strived to keep the main point of each issue.
The 25 issues vary in closeness to impact analysis. For example, some issuesconcern change requests, some concern the actual analysis activity, some concernprocess details, and others concern the analysis results. This is of course lessthan optimal from a prioritisation point of view. The alternative would howeverbe to divide the issues into groups and prioritise the groups separately, whichwould complicate the prioritisation further.
To illustrate the distribution of priorities over issues, Figure 4.1 shows thebox plot for the resulting priorities for the operative level under the individualperspective. It can be seen that for many issues, the majority of the prioritiesare low, while only a few issues have higher peaks. The situation is similar forthe other levels. This is a consequence of using Cumulative Voting with manyitems.
Figure 4.2 displays bar charts showing the mean priorities for all issues(sorted in descending order of importance) under each of the two perspectives.Error bars showing plus one standard deviation are provided to again illustratethe distribution of priorities. An interesting feature of the bar chart for theself-perspective is that the issues with high mean priorities are fewer and moreprominent than the remaining issues. This means that the participants allo-
101

4: Views of Impact Analysis Issues
cated more points to a smaller set of important issues under the self-perspectivethan under the organisational perspective.
When it comes to investigating the agreement (or disagreement) among thedifferent levels and perspectives, the original data have some characteristicsthat complicate visualisation and qualitative interpretation: (1) The Cumula-
id Issuei1 It is difficult to find resources for performing impact analysis.i2 There is not enough time to perform impact analysis.i3 System impact is underestimated or overlooked.i4 Change requests are unclear.i5 Responsibility and product/project balance are difficult to handle for
analyses that span several systems.i6 Analyses are incomplete or delayed.i7 Analyses require much expertise and experience.i8 Analyses are too coarse or uncertain.i9 It is difficult to handle conflicting and synergetic change requests.i10 Analyses are not prevented from being disregarded.i11 Existing traceability is manual and cumbersome.i12 It is difficult to see trends and statistics for collective impact.i13 Tools to support the analysis are missing.i14 Affected parties are overlooked.i15 Analyses are performed by the wrong persons.i16 Change request decisions are based on interest.i17 Requirements and baseline are missing for early change requests.i18 Analyses and change implementation evoke stress.i19 It is not possible to see the outcome of a change request.i20 It is difficult to see status and updates for a change request.i21 Different change request have different levels of complexity, and there
is no single method for handling all levels.i22 Cheap, short-term solutions win over good, long-term solutions.i23 Solutions are specified with too much detail by high-level analysts.i24 Hardware and protocol dependencies are difficult to handle for late
change requests.i25 Relevant structure and documentation to support the analysis are miss-
ing.
Table 4.2: Issues elicited in the interviews.
102
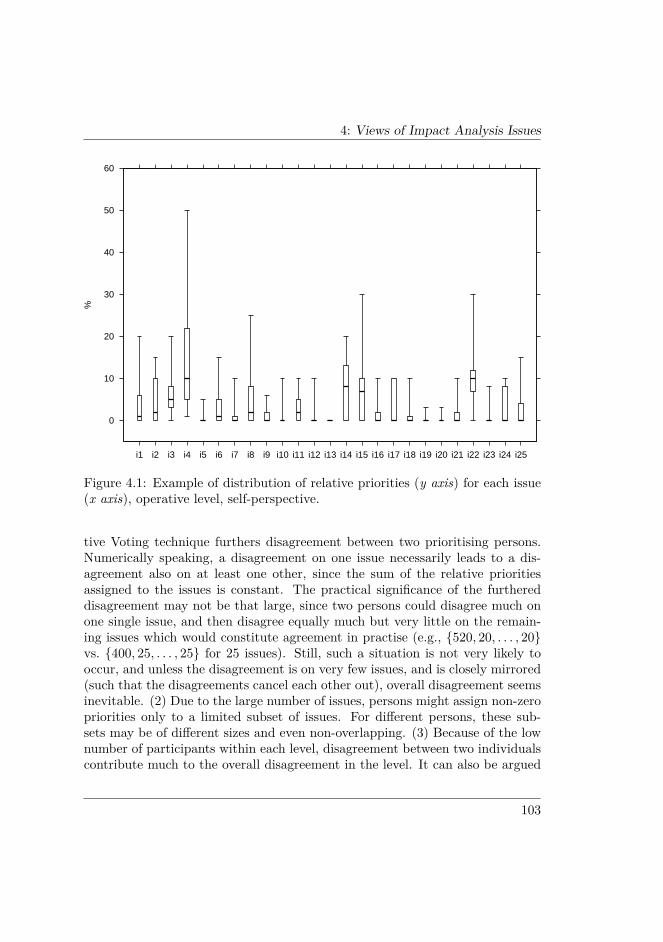
4: Views of Impact Analysis Issues
0
10
20
30
40
50
60
i1 i2 i3 i4 i5 i6 i7 i8 i9 i10 i11 i12 i13 i14 i15 i16 i17 i18 i19 i20 i21 i22 i23 i24 i25
%
Operative level, individual perspective
Figure 4.1: Example of distribution of relative priorities (y axis) for each issue(x axis), operative level, self-perspective.
tive Voting technique furthers disagreement between two prioritising persons.Numerically speaking, a disagreement on one issue necessarily leads to a dis-agreement also on at least one other, since the sum of the relative prioritiesassigned to the issues is constant. The practical significance of the furthereddisagreement may not be that large, since two persons could disagree much onone single issue, and then disagree equally much but very little on the remain-ing issues which would constitute agreement in practise (e.g., {520, 20, . . . , 20}vs. {400, 25, . . . , 25} for 25 issues). Still, such a situation is not very likely tooccur, and unless the disagreement is on very few issues, and is closely mirrored(such that the disagreements cancel each other out), overall disagreement seemsinevitable. (2) Due to the large number of issues, persons might assign non-zeropriorities only to a limited subset of issues. For different persons, these sub-sets may be of different sizes and even non-overlapping. (3) Because of the lownumber of participants within each level, disagreement between two individualscontribute much to the overall disagreement in the level. It can also be argued
103
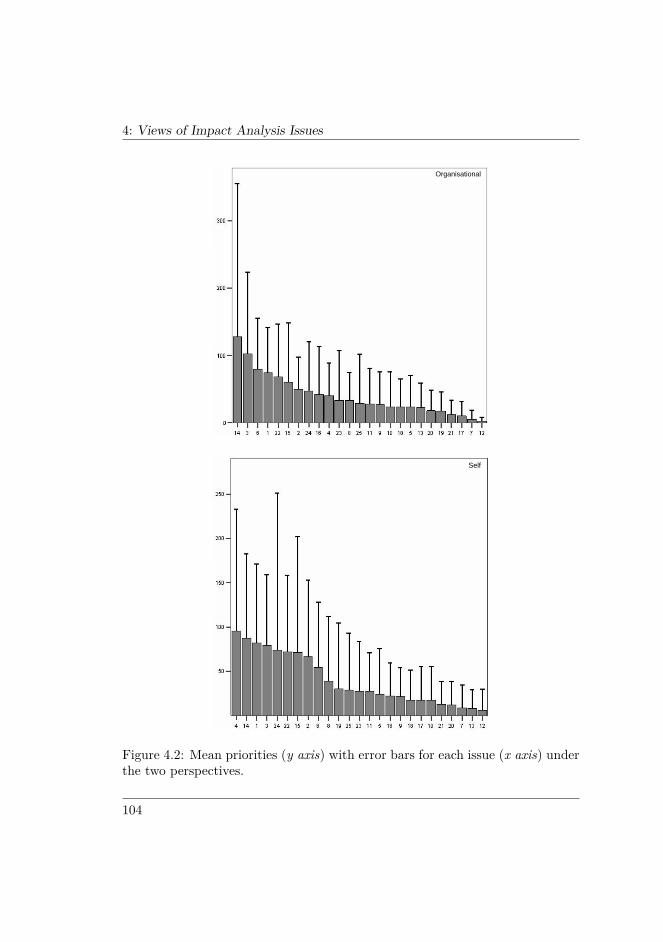
4: Views of Impact Analysis Issues
Organisational
Self
Figure 4.2: Mean priorities (y axis) with error bars for each issue (x axis) underthe two perspectives.
104
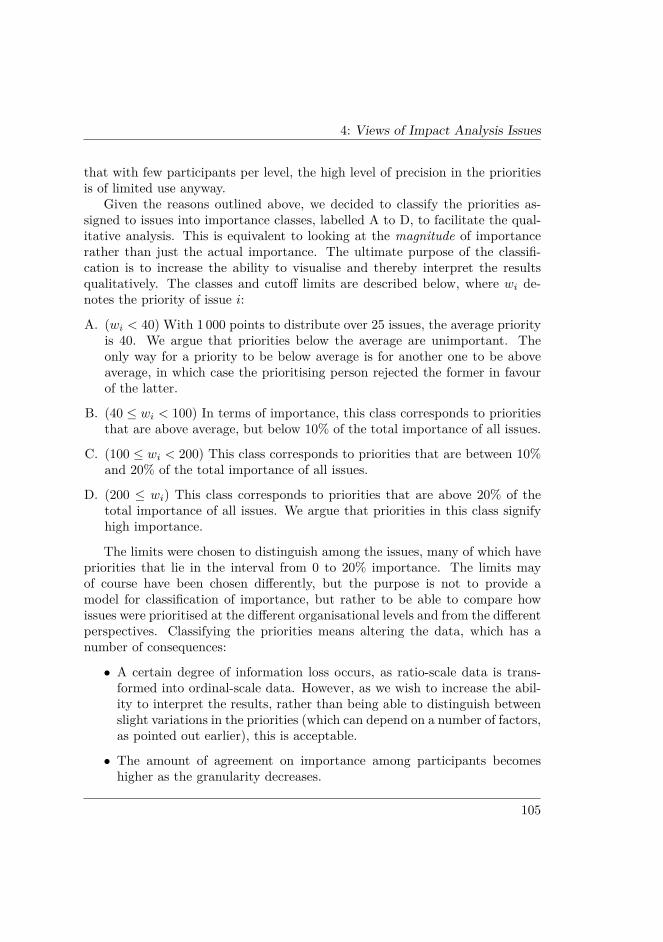
4: Views of Impact Analysis Issues
that with few participants per level, the high level of precision in the prioritiesis of limited use anyway.
Given the reasons outlined above, we decided to classify the priorities as-signed to issues into importance classes, labelled A to D, to facilitate the qual-itative analysis. This is equivalent to looking at the magnitude of importancerather than just the actual importance. The ultimate purpose of the classifi-cation is to increase the ability to visualise and thereby interpret the resultsqualitatively. The classes and cutoff limits are described below, where wi de-notes the priority of issue i:
A. (wi < 40) With 1 000 points to distribute over 25 issues, the average priorityis 40. We argue that priorities below the average are unimportant. Theonly way for a priority to be below average is for another one to be aboveaverage, in which case the prioritising person rejected the former in favourof the latter.
B. (40 ≤ wi < 100) In terms of importance, this class corresponds to prioritiesthat are above average, but below 10% of the total importance of all issues.
C. (100 ≤ wi < 200) This class corresponds to priorities that are between 10%and 20% of the total importance of all issues.
D. (200 ≤ wi) This class corresponds to priorities that are above 20% of thetotal importance of all issues. We argue that priorities in this class signifyhigh importance.
The limits were chosen to distinguish among the issues, many of which havepriorities that lie in the interval from 0 to 20% importance. The limits mayof course have been chosen differently, but the purpose is not to provide amodel for classification of importance, but rather to be able to compare howissues were prioritised at the different organisational levels and from the differentperspectives. Classifying the priorities means altering the data, which has anumber of consequences:
• A certain degree of information loss occurs, as ratio-scale data is trans-formed into ordinal-scale data. However, as we wish to increase the abil-ity to interpret the results, rather than being able to distinguish betweenslight variations in the priorities (which can depend on a number of factors,as pointed out earlier), this is acceptable.
• The amount of agreement on importance among participants becomeshigher as the granularity decreases.
105
4: Views of Impact Analysis Issues
• Outliers can be kept and be allowed to influence the analysis and conclu-sions. All outliers are grouped together with high (or low) priorities inany case. See also Section 4.5.4.
• The non-statistical assessment of disagreement becomes decoupled fromdescriptive statistics such as the mean or median. This is beneficial as themean is sensitive to outliers, while the median on the other hand mighthide high priorities due to the low number of participants.
Figure 4.3 shows an overview of the importance of issues for each level. Foreach issue, a score of importance has been calculated by weighing and summingthe priorities in each class, giving class A a weight of 0, class B a weight of 1,C a weight of 2, and D a weight of 3. The scores for the tactical and strategiclevels have been scaled up with a factor of 1.6, and rounded to the nearest wholenumber, to compensate for the fact that these levels contain five participantseach, whereas the operative level contains eight participants. The issue scorescorrelate well with the mean values of the relative priorities assigned throughCumulative Voting, but by basing the scores on the classes instead, they becomemore coherent. The figure only includes those issues that appear among the topfive (which may be more than five issues because of ties in the scores) for anylevel and any perspective. In addition to showing the importance of issues, thefigure also provides a comparison of the perspectives for each level. Note thatthe data points have been offset slightly in relation to each other to minimiseoverlap among the levels, but all scores are whole numbers. In other words,data points for different levels that are located in the same “grid square” havethe same scores.
Two main conclusions can be drawn from studying Figure 4.3. The first isthe analysis of how the importance of issues differ among the different levels.The second is the analysis of how the importance of an issue is affected by theperspective. The significance of the data shown in the figure is discussed inSection 4.5.2.
4.5 ANALYSIS AND DISCUSSIONIn this section, we discuss the analysis of the results presented in the previoussection. Both a quantitative (statistical) and a qualitative analysis have beenperformed, the former on the original data and the latter on the classified data.
106
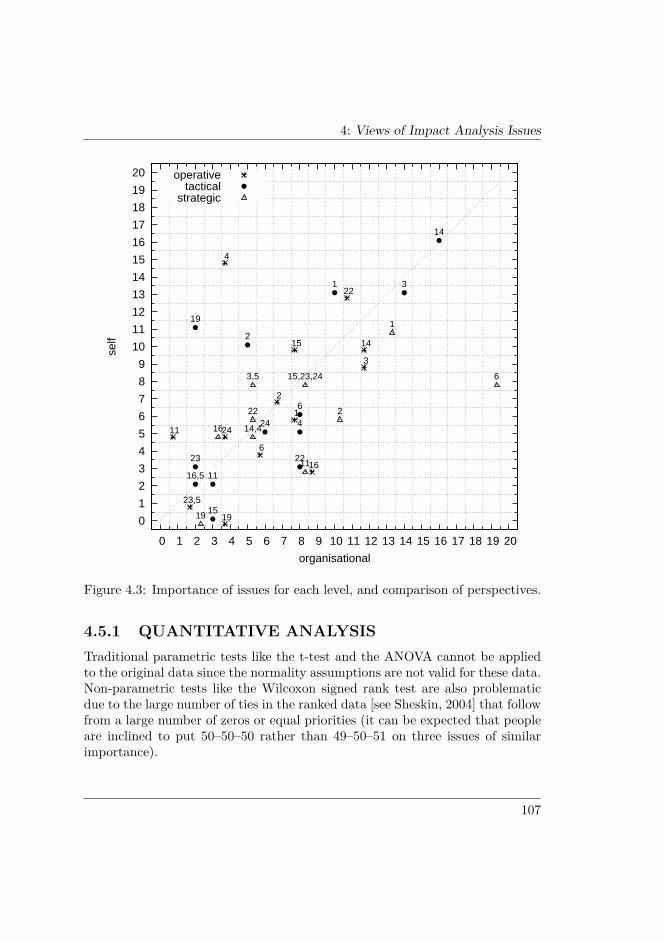
4: Views of Impact Analysis Issues
0
1
2
3
4
5
6
7
8
9
10
11
12
13
14
15
16
17
18
19
20
0 1 2 3 4 5 6 7 8 9 10 11 12 13 14 15 16 17 18 19 20
self
organisational
11
23,5
19
24
4
6
2
1
15
16
22
3
14
operative
16,5
23
19
15
11
2
24
22
4
6
1 3
14
tactical
19
16 14,4
22
3,5
11
15,23,24
2
1
6
strategic
Figure 4.3: Importance of issues for each level, and comparison of perspectives.
4.5.1 QUANTITATIVE ANALYSISTraditional parametric tests like the t-test and the ANOVA cannot be appliedto the original data since the normality assumptions are not valid for these data.Non-parametric tests like the Wilcoxon signed rank test are also problematicdue to the large number of ties in the ranked data [see Sheskin, 2004] that followfrom a large number of zeros or equal priorities (it can be expected that peopleare inclined to put 50–50–50 rather than 49–50–51 on three issues of similarimportance).
107
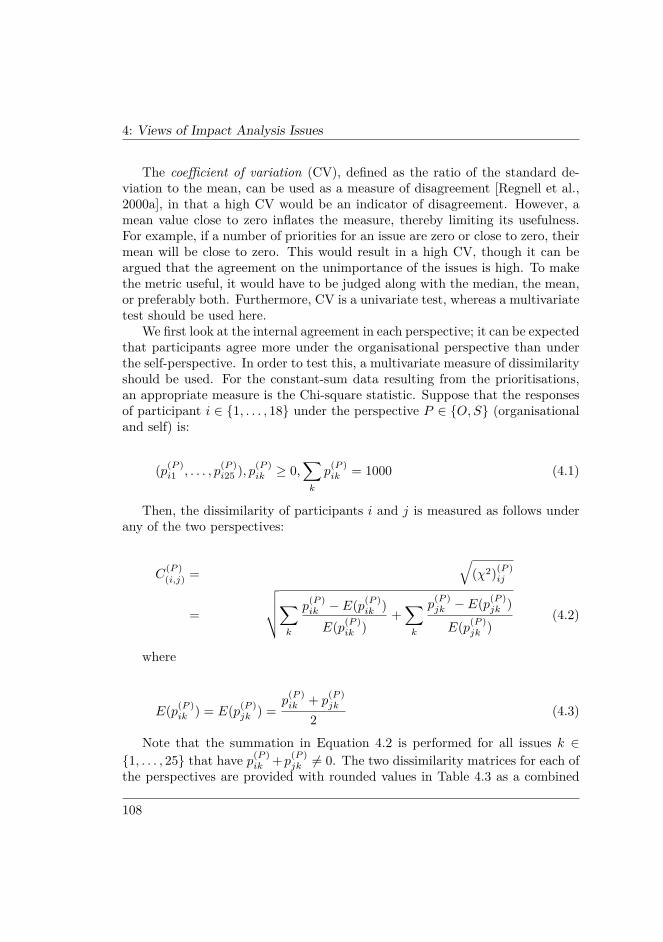
4: Views of Impact Analysis Issues
The coefficient of variation (CV), defined as the ratio of the standard de-viation to the mean, can be used as a measure of disagreement [Regnell et al.,2000a], in that a high CV would be an indicator of disagreement. However, amean value close to zero inflates the measure, thereby limiting its usefulness.For example, if a number of priorities for an issue are zero or close to zero, theirmean will be close to zero. This would result in a high CV, though it can beargued that the agreement on the unimportance of the issues is high. To makethe metric useful, it would have to be judged along with the median, the mean,or preferably both. Furthermore, CV is a univariate test, whereas a multivariatetest should be used here.
We first look at the internal agreement in each perspective; it can be expectedthat participants agree more under the organisational perspective than underthe self-perspective. In order to test this, a multivariate measure of dissimilarityshould be used. For the constant-sum data resulting from the prioritisations,an appropriate measure is the Chi-square statistic. Suppose that the responsesof participant i ∈ {1, . . . , 18} under the perspective P ∈ {O,S} (organisationaland self) is:
(p(P )i1 , . . . , p
(P )i25 ), p(P )
ik ≥ 0,∑k
p(P )ik = 1000 (4.1)
Then, the dissimilarity of participants i and j is measured as follows underany of the two perspectives:
C(P )(i,j) =
√(χ2)(P )
ij
=
√√√√∑k
p(P )ik − E(p(P )
ik )E(p(P )
ik )+∑k
p(P )jk − E(p(P )
jk )
E(p(P )jk )
(4.2)
where
E(p(P )ik ) = E(p(P )
jk ) =p
(P )ik + p(P )
jk
2(4.3)
Note that the summation in Equation 4.2 is performed for all issues k ∈{1, . . . , 25} that have p(P )
ik +p(P )jk 6= 0. The two dissimilarity matrices for each of
the perspectives are provided with rounded values in Table 4.3 as a combined
108

4: Views of Impact Analysis Issues
matrix. The values in the lower triangular part of the matrix are the distancesbetween the participants under the self-perspective, while the values in theupper triangular part are the distances under the organisational perspective.The diagonal contains the distances of the answers of each of the participantsunder the two perspectives.
It can be observed in Table 4.3 that there is no apparent trend in the dis-tances between participants—some of them are almost the same under the twoperspectives (i.e., the participants differ equally much irrespective of perspec-tive), while others differ quite much. Figure 4.4 shows box plots and descriptivestatistics for the two distributions of distances.
The question is how to test if there is a difference in the agreement of the
1 2 3 4 5 6 7 8 9 10 11 12 13 14 15 16 17 181 19 34 31 36 40 37 27 41 39 34 33 42 27 32 43 26 27 372 33 34 36 34 39 34 31 41 39 35 34 37 31 31 45 32 35 413 37 35 30 28 30 34 20 35 37 32 27 38 29 23 40 22 34 294 38 40 32 22 33 29 30 38 34 34 22 39 29 22 39 24 32 255 33 34 37 32 33 41 36 32 40 36 35 42 35 32 37 36 38 276 35 33 30 26 36 19 32 35 42 38 27 39 35 30 45 31 31 367 25 30 27 33 30 32 15 34 36 31 21 35 27 22 41 20 26 328 34 35 39 40 31 41 34 35 45 42 34 39 43 36 37 35 33 349 37 33 30 39 39 36 34 45 17 30 36 39 32 33 45 39 39 38
10 34 41 33 35 40 36 35 45 34 29 32 40 28 27 45 33 33 3611 29 32 36 38 37 35 29 34 45 32 30 30 32 23 40 19 26 2712 38 39 35 45 45 42 33 35 42 43 35 22 40 37 45 34 43 3713 44 37 28 37 37 37 36 42 38 45 45 39 33 25 43 28 34 3114 36 38 23 37 37 37 29 42 27 34 41 41 32 21 43 24 31 2715 42 39 33 37 36 37 35 41 37 41 45 42 27 27 33 39 40 4016 36 38 32 34 32 34 27 42 37 38 39 37 32 28 24 22 29 2817 34 37 40 42 41 41 34 43 41 38 37 39 43 39 43 41 31 3518 38 36 28 30 29 33 32 35 34 33 38 41 32 32 35 33 41 0
Self-
pers
pect
ive
Organisational perspective
Table 4.3: Distances of participants per perspective, using the χ2 dissimilaritymeasure.
109
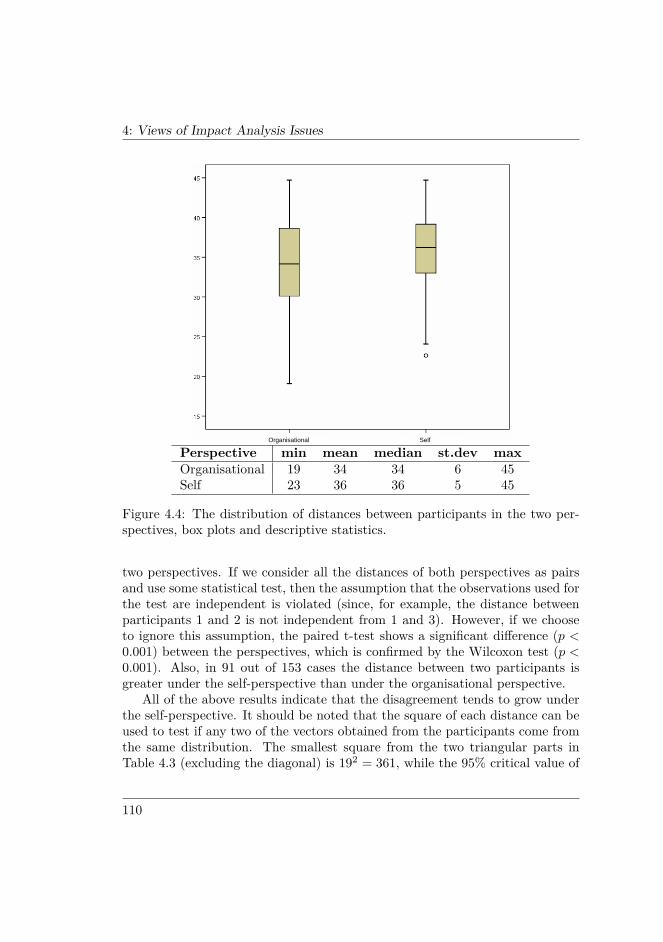
4: Views of Impact Analysis Issues
Organisational Self
Perspective min mean median st.dev maxOrganisational 19 34 34 6 45Self 23 36 36 5 45
Figure 4.4: The distribution of distances between participants in the two per-spectives, box plots and descriptive statistics.
two perspectives. If we consider all the distances of both perspectives as pairsand use some statistical test, then the assumption that the observations used forthe test are independent is violated (since, for example, the distance betweenparticipants 1 and 2 is not independent from 1 and 3). However, if we chooseto ignore this assumption, the paired t-test shows a significant difference (p <0.001) between the perspectives, which is confirmed by the Wilcoxon test (p <0.001). Also, in 91 out of 153 cases the distance between two participants isgreater under the self-perspective than under the organisational perspective.
All of the above results indicate that the disagreement tends to grow underthe self-perspective. It should be noted that the square of each distance can beused to test if any two of the vectors obtained from the participants come fromthe same distribution. The smallest square from the two triangular parts inTable 4.3 (excluding the diagonal) is 192 = 361, while the 95% critical value of
110
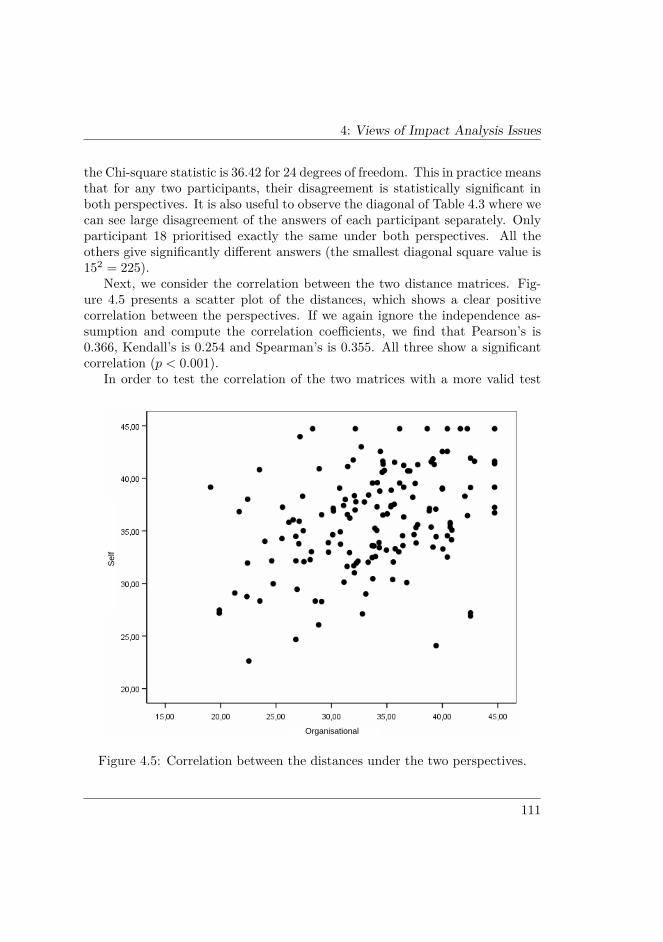
4: Views of Impact Analysis Issues
the Chi-square statistic is 36.42 for 24 degrees of freedom. This in practice meansthat for any two participants, their disagreement is statistically significant inboth perspectives. It is also useful to observe the diagonal of Table 4.3 where wecan see large disagreement of the answers of each participant separately. Onlyparticipant 18 prioritised exactly the same under both perspectives. All theothers give significantly different answers (the smallest diagonal square value is152 = 225).
Next, we consider the correlation between the two distance matrices. Fig-ure 4.5 presents a scatter plot of the distances, which shows a clear positivecorrelation between the perspectives. If we again ignore the independence as-sumption and compute the correlation coefficients, we find that Pearson’s is0.366, Kendall’s is 0.254 and Spearman’s is 0.355. All three show a significantcorrelation (p < 0.001).
In order to test the correlation of the two matrices with a more valid test
Organisational
Sel
f
Figure 4.5: Correlation between the distances under the two perspectives.
111
4: Views of Impact Analysis Issues
which overcomes the assumption of dependence, we use the Mantel test which isespecially designed for testing the null hypothesis that two distance matrices ofthe same cases are independent [Mantel, 1967]. The test is based on one of theusual correlation coefficients (e.g., Pearson’s) but uses for the computation of thesignificance a randomisation technique to permute the rows and columns of oneof the distance matrices a large number of times. For the two distance matrices,the application of 10 000 permutations resulted in p = 0.0031, showing that thecorrelation is significant (see Figure 4.6). For the application of the Mantel test,the Splus function mantel.fcn() was used, provided by J. Reynolds [Reynolds,2001].
As a conclusion of all the above we can say that:
• There is a large amount of disagreement between all the participants underboth perspectives,
• the disagreement on average grows under the self-perspective, and
Approx. Null Dist. of Standardized Mantel statistic
Observed r= 0.366 : Upper Tail p-value= 0.0031 : 10000 permutationsr
# of
per
mut
atio
ns
-0.4 -0.2 0.0 0.2 0.4 0.6
0.0
0.5
1.0
1.5
2.0
2.5
Figure 4.6: Results of the Mantel test for the two distance matrices.
112
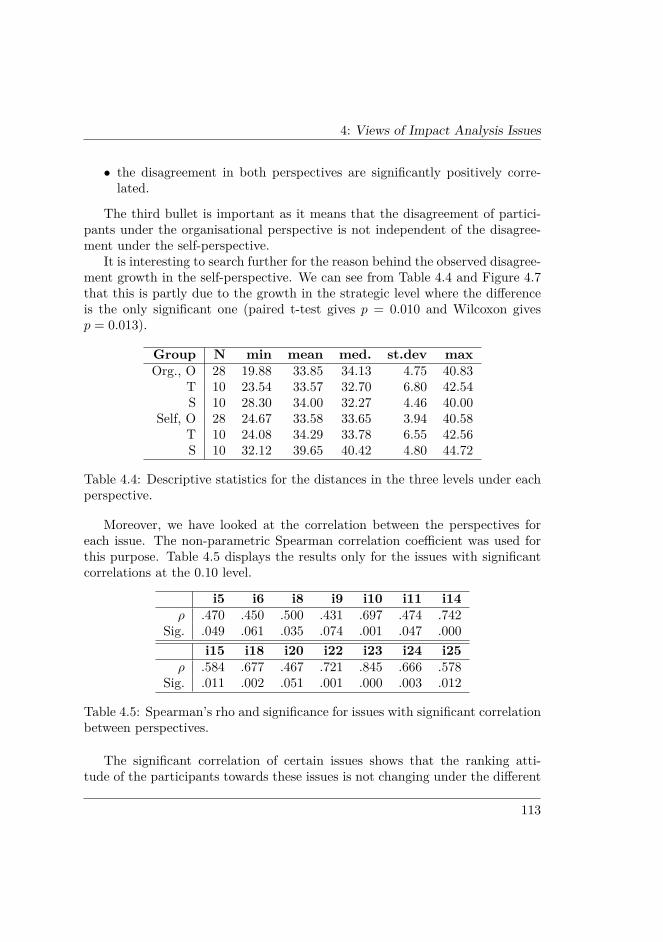
4: Views of Impact Analysis Issues
• the disagreement in both perspectives are significantly positively corre-lated.
The third bullet is important as it means that the disagreement of partici-pants under the organisational perspective is not independent of the disagree-ment under the self-perspective.
It is interesting to search further for the reason behind the observed disagree-ment growth in the self-perspective. We can see from Table 4.4 and Figure 4.7that this is partly due to the growth in the strategic level where the differenceis the only significant one (paired t-test gives p = 0.010 and Wilcoxon givesp = 0.013).
Group N min mean med. st.dev maxOrg., O 28 19.88 33.85 34.13 4.75 40.83
T 10 23.54 33.57 32.70 6.80 42.54S 10 28.30 34.00 32.27 4.46 40.00
Self, O 28 24.67 33.58 33.65 3.94 40.58T 10 24.08 34.29 33.78 6.55 42.56S 10 32.12 39.65 40.42 4.80 44.72
Table 4.4: Descriptive statistics for the distances in the three levels under eachperspective.
Moreover, we have looked at the correlation between the perspectives foreach issue. The non-parametric Spearman correlation coefficient was used forthis purpose. Table 4.5 displays the results only for the issues with significantcorrelations at the 0.10 level.
i5 i6 i8 i9 i10 i11 i14ρ .470 .450 .500 .431 .697 .474 .742
Sig. .049 .061 .035 .074 .001 .047 .000i15 i18 i20 i22 i23 i24 i25
ρ .584 .677 .467 .721 .845 .666 .578Sig. .011 .002 .051 .001 .000 .003 .012
Table 4.5: Spearman’s rho and significance for issues with significant correlationbetween perspectives.
The significant correlation of certain issues shows that the ranking atti-tude of the participants towards these issues is not changing under the different
113
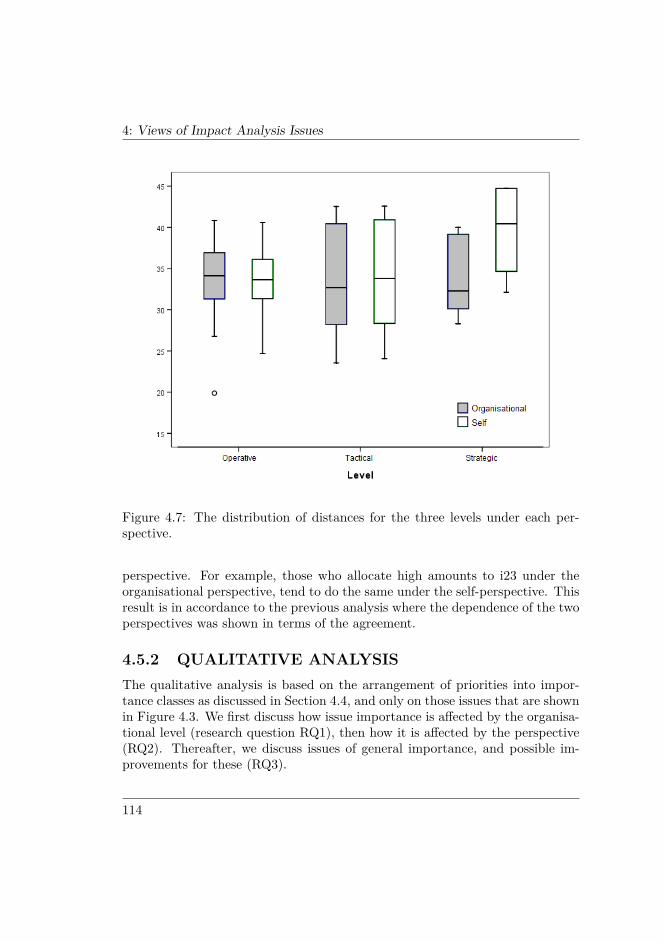
4: Views of Impact Analysis Issues
Figure 4.7: The distribution of distances for the three levels under each per-spective.
perspective. For example, those who allocate high amounts to i23 under theorganisational perspective, tend to do the same under the self-perspective. Thisresult is in accordance to the previous analysis where the dependence of the twoperspectives was shown in terms of the agreement.
4.5.2 QUALITATIVE ANALYSISThe qualitative analysis is based on the arrangement of priorities into impor-tance classes as discussed in Section 4.4, and only on those issues that are shownin Figure 4.3. We first discuss how issue importance is affected by the organisa-tional level (research question RQ1), then how it is affected by the perspective(RQ2). Thereafter, we discuss issues of general importance, and possible im-provements for these (RQ3).
114
4: Views of Impact Analysis Issues
4.5.2.1 LEVEL DIFFERENCES
The issues with high disagreement among organisational levels are those forwhich the data points are far apart in Figure 4.3. Note that this definition oflevel disagreement also takes into account disagreement between perspectives;two levels are said to disagree if an issue is important under one perspectivefor the first level, but under the other perspective for the second level. Theperimeter of the triangle defined by the level data points can be used as ameasure of the overall disagreement among the levels for a particular issue;the term perimeter distance is used onwards. The perimeter distance (Dk) forissue k corresponds to the sum of the Euclidean distances between each pair ofissue data points. Let X = {O, T, S} be the set of organisational levels, andY = {(a, b) ∈ X ×X|a 6= b}, then:
Dk = 12∑
(L,M)∈Y
√(q(L)ks − q
(M)ks )2 + (q(L)
ko − q(M)ko )2 (4.4)
where qks is the score of issue k under the self-perspective, and qko is the scoreunder the organisational perspective. The division by 2 must be performed sinceeach pair of levels occurs twice in Y . The five issues with the largest perimeterdisagreement are listed in Table 4.6 and discussed below:
• Issue i14 is most important at the tactical level, but also to some degreeat the operative level. Its importance at the tactical level most likelystems from the fact that resources, coordination, and planning are impor-tant factors to take into consideration at this level, all of which may bedisturbed by the omission of some party in the analysis. At the operativelevel, we believe that the importance comes from the fact that the omis-sion of a party in the analysis can result in solutions that are less thanoptimal and/or not general enough.
• Issue i6 is most important at the strategic level. The reason for thismay be that the effects are longer change request lead times and possiblydecisions made on loose terms. In the end, this may affect the end prod-uct negatively (in terms of feature set). Note that the difference amonglevels lies mainly in the organisational perspective; the spread for the self-perspective is much less.
• Issue i19 is most important at the tactical level. A possible explana-tion for this is that follow-up on estimates can be used to improve future
115
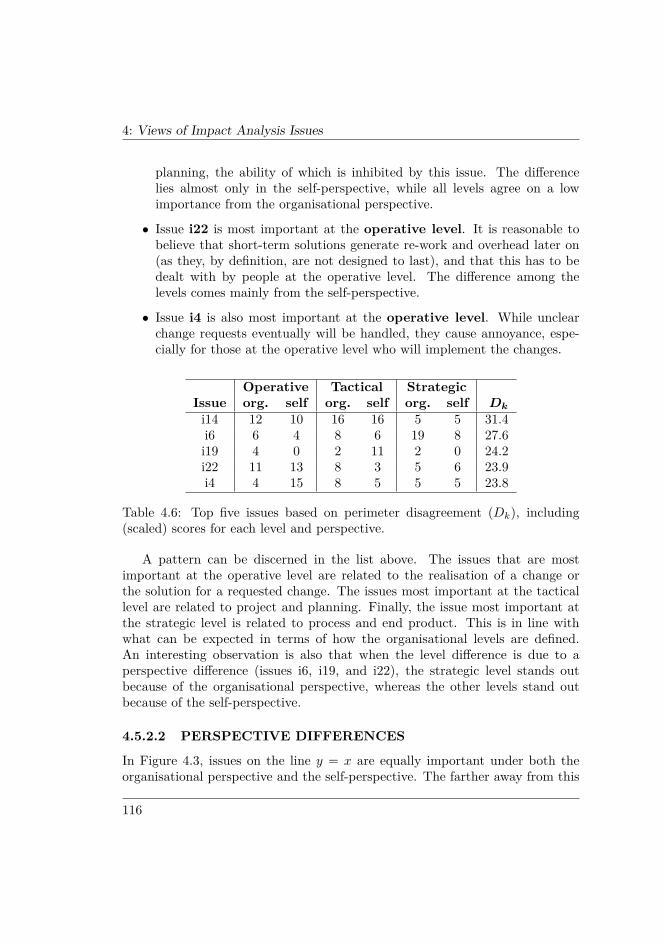
4: Views of Impact Analysis Issues
planning, the ability of which is inhibited by this issue. The differencelies almost only in the self-perspective, while all levels agree on a lowimportance from the organisational perspective.
• Issue i22 is most important at the operative level. It is reasonable tobelieve that short-term solutions generate re-work and overhead later on(as they, by definition, are not designed to last), and that this has to bedealt with by people at the operative level. The difference among thelevels comes mainly from the self-perspective.
• Issue i4 is also most important at the operative level. While unclearchange requests eventually will be handled, they cause annoyance, espe-cially for those at the operative level who will implement the changes.
Operative Tactical StrategicIssue org. self org. self org. self Dk
i14 12 10 16 16 5 5 31.4i6 6 4 8 6 19 8 27.6i19 4 0 2 11 2 0 24.2i22 11 13 8 3 5 6 23.9i4 4 15 8 5 5 5 23.8
Table 4.6: Top five issues based on perimeter disagreement (Dk), including(scaled) scores for each level and perspective.
A pattern can be discerned in the list above. The issues that are mostimportant at the operative level are related to the realisation of a change orthe solution for a requested change. The issues most important at the tacticallevel are related to project and planning. Finally, the issue most important atthe strategic level is related to process and end product. This is in line withwhat can be expected in terms of how the organisational levels are defined.An interesting observation is also that when the level difference is due to aperspective difference (issues i6, i19, and i22), the strategic level stands outbecause of the organisational perspective, whereas the other levels stand outbecause of the self-perspective.
4.5.2.2 PERSPECTIVE DIFFERENCES
In Figure 4.3, issues on the line y = x are equally important under both theorganisational perspective and the self-perspective. The farther away from this
116
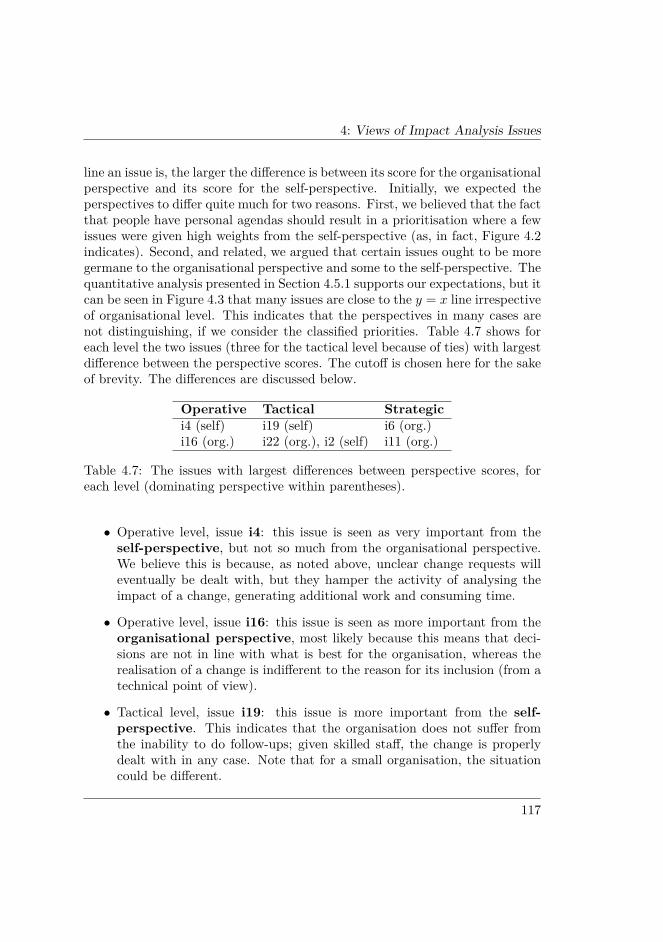
4: Views of Impact Analysis Issues
line an issue is, the larger the difference is between its score for the organisationalperspective and its score for the self-perspective. Initially, we expected theperspectives to differ quite much for two reasons. First, we believed that the factthat people have personal agendas should result in a prioritisation where a fewissues were given high weights from the self-perspective (as, in fact, Figure 4.2indicates). Second, and related, we argued that certain issues ought to be moregermane to the organisational perspective and some to the self-perspective. Thequantitative analysis presented in Section 4.5.1 supports our expectations, but itcan be seen in Figure 4.3 that many issues are close to the y = x line irrespectiveof organisational level. This indicates that the perspectives in many cases arenot distinguishing, if we consider the classified priorities. Table 4.7 shows foreach level the two issues (three for the tactical level because of ties) with largestdifference between the perspective scores. The cutoff is chosen here for the sakeof brevity. The differences are discussed below.
Operative Tactical Strategici4 (self) i19 (self) i6 (org.)i16 (org.) i22 (org.), i2 (self) i11 (org.)
Table 4.7: The issues with largest differences between perspective scores, foreach level (dominating perspective within parentheses).
• Operative level, issue i4: this issue is seen as very important from theself-perspective, but not so much from the organisational perspective.We believe this is because, as noted above, unclear change requests willeventually be dealt with, but they hamper the activity of analysing theimpact of a change, generating additional work and consuming time.
• Operative level, issue i16: this issue is seen as more important from theorganisational perspective, most likely because this means that deci-sions are not in line with what is best for the organisation, whereas therealisation of a change is indifferent to the reason for its inclusion (from atechnical point of view).
• Tactical level, issue i19: this issue is more important from the self-perspective. This indicates that the organisation does not suffer fromthe inability to do follow-ups; given skilled staff, the change is properlydealt with in any case. Note that for a small organisation, the situationcould be different.
117
4: Views of Impact Analysis Issues
• Tactical level, issue i22: this issue is more important from the organ-isational perspective. It is likely that this is because the short-termsolutions will have to be replaced later on, thus causing planning prob-lems, additional required resources, etc.
• Tactical level, issue i2: this issue is more important from the self-perspective. People on the tactical level need to balance many factorsregarding resources, tasks, and time constraints. A high normal workloadleaves little room for analysing proposed changes.
• Strategic level, issue i6: this issue is most important from the organi-sational perspective. It is most likely so, that the organisation as awhole suffers from negative end product effects (as discussed previously),whereas individuals manage to do their work anyway.
• Strategic level, issue i11: this issue is most important from the organ-isational perspective (but notably less important than issue i6). Areason for this can be that when it is difficult to ensure traceability, thelevel of transparency decreases, and so also the ability to check that alldevelopment is in line with the goals of the organisation.
The pattern here is that the issues most important from the organisationalperspective concern process, project, or end-product aspects, whereas the issuesmost important from the self-perspective rather concern the execution of theanalysis task, and/or the realisation of a change.
4.5.2.3 OVERALL IMPORTANCE
Intuitively, considering Figure 4.3, an issue has high overall importance if thepoints for all levels lie in the upper right corner of the chart, and close to they = x line. Then, participants on all levels agree on the (high) importance ofthe issue, and do so irrespective of perspective. However, it can also be arguedthat an issue is important to take care of if it is of high importance on any level,from any perspective. This reasoning can be used to divide issues into priorityclasses. Issues of high priority are the ones that have high overall importance,whereas issues of medium priority are the ones that have high importance forat least one group.
We have done this division as follows. The overall score of issue k ∈{1, . . . , 25} is the average distance from the origin to the issue data point (Fig-ure 4.3) over all levels L ∈ {O, T, S} (operative, tactical, and strategic):
118
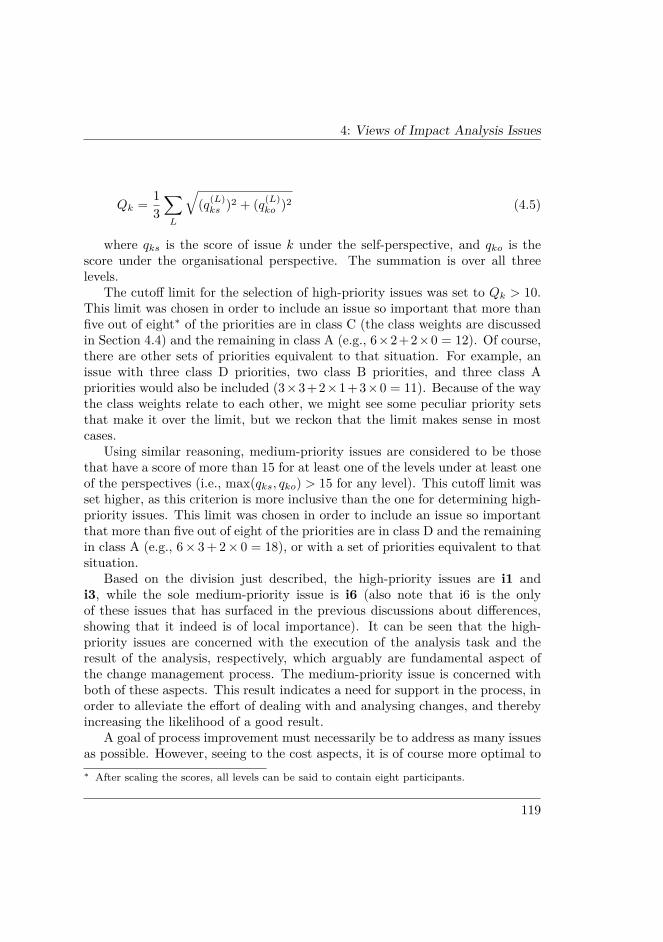
4: Views of Impact Analysis Issues
Qk = 13∑L
√(q(L)ks )2 + (q(L)
ko )2 (4.5)
where qks is the score of issue k under the self-perspective, and qko is thescore under the organisational perspective. The summation is over all threelevels.
The cutoff limit for the selection of high-priority issues was set to Qk > 10.This limit was chosen in order to include an issue so important that more thanfive out of eight∗ of the priorities are in class C (the class weights are discussedin Section 4.4) and the remaining in class A (e.g., 6×2+2×0 = 12). Of course,there are other sets of priorities equivalent to that situation. For example, anissue with three class D priorities, two class B priorities, and three class Apriorities would also be included (3×3+2×1+3×0 = 11). Because of the waythe class weights relate to each other, we might see some peculiar priority setsthat make it over the limit, but we reckon that the limit makes sense in mostcases.
Using similar reasoning, medium-priority issues are considered to be thosethat have a score of more than 15 for at least one of the levels under at least oneof the perspectives (i.e., max(qks, qko) > 15 for any level). This cutoff limit wasset higher, as this criterion is more inclusive than the one for determining high-priority issues. This limit was chosen in order to include an issue so importantthat more than five out of eight of the priorities are in class D and the remainingin class A (e.g., 6× 3 + 2× 0 = 18), or with a set of priorities equivalent to thatsituation.
Based on the division just described, the high-priority issues are i1 andi3, while the sole medium-priority issue is i6 (also note that i6 is the onlyof these issues that has surfaced in the previous discussions about differences,showing that it indeed is of local importance). It can be seen that the high-priority issues are concerned with the execution of the analysis task and theresult of the analysis, respectively, which arguably are fundamental aspect ofthe change management process. The medium-priority issue is concerned withboth of these aspects. This result indicates a need for support in the process, inorder to alleviate the effort of dealing with and analysing changes, and therebyincreasing the likelihood of a good result.
A goal of process improvement must necessarily be to address as many issuesas possible. However, seeing to the cost aspects, it is of course more optimal to∗ After scaling the scores, all levels can be said to contain eight participants.
119
4: Views of Impact Analysis Issues
focus on issues that are of overall high criticality. Having said that, it is impor-tant to note that addressing an issue has a positive effect on people experiencingthe issue, regardless of the criticality they have assigned to it. Differentiatingbetween levels and perspectives is a way to make more informed decisions aboutwhich issues to deal with first.
For medium-priority issues, there is the question of determining which per-spective and/or level to satisfy (in terms of trying to address the issue) first.For example, addressing issues important under the organisational perspectiveis of course in the best interest of the organisation, while addressing issuesimportant under the self-perspective should facilitate the daily work of the indi-vidual software developers. As we see it, the selection of issues to try to addressshould include both criticality and cost. Three aspects of dealing with issuesare important:
1. Focus on issues that have high criticality, in particular high-priority ones.
2. Also focus on issues that can be addressed in inexpensive ways.
3. Finally, consider improvements that affect as many issues as possible (dis-cussed later).
We believe that decisions based on perspective and/or level are specific forthe particular situation and context, and we do not feel confident in speculatingabout how these aspects should be handled.
4.5.3 IMPROVEMENT PROPOSALSDuring the workshops, a number of possible improvements to help address theissues at hand were discussed. These improvements are presented in this section.It is of course desirable to select those improvements that can address as manyissues as possible at the same time, to a reasonable cost. As many of the issuesare related in one way or another (e.g., i3 and i14 both have to do with missedimpact, albeit of different types), improvements are likely to have multi-issueimpact. However, a multi-issue improvement may be very expensive, in whichcase other, possibly narrower, improvements have to be considered instead.
The following list shows the improvements that were identified during theworkshops:
S1 Limit the number of outstanding change requests at any time and use aselection process for taking in change requests.
120
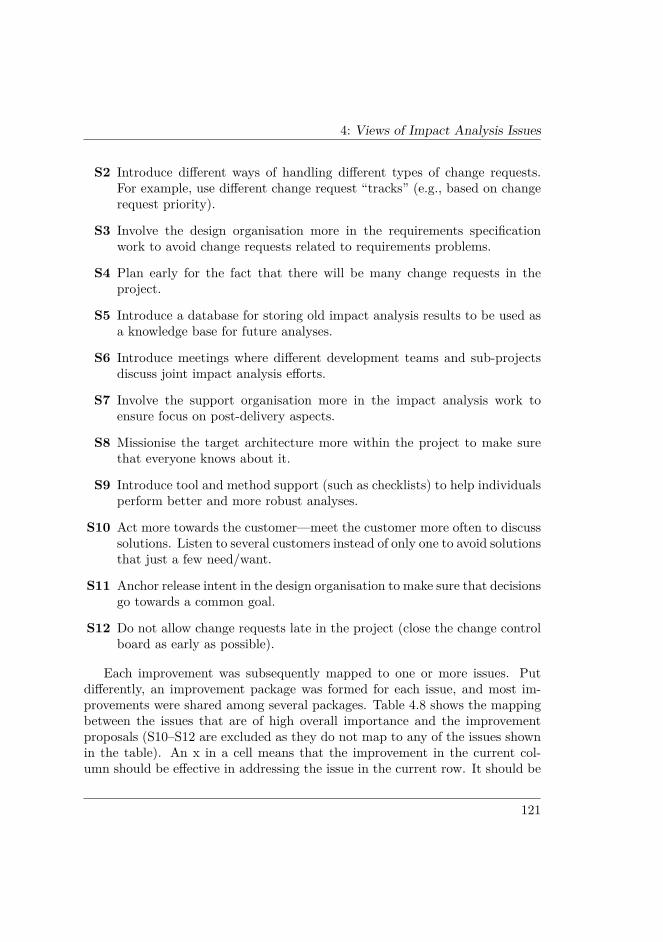
4: Views of Impact Analysis Issues
S2 Introduce different ways of handling different types of change requests.For example, use different change request “tracks” (e.g., based on changerequest priority).
S3 Involve the design organisation more in the requirements specificationwork to avoid change requests related to requirements problems.
S4 Plan early for the fact that there will be many change requests in theproject.
S5 Introduce a database for storing old impact analysis results to be used asa knowledge base for future analyses.
S6 Introduce meetings where different development teams and sub-projectsdiscuss joint impact analysis efforts.
S7 Involve the support organisation more in the impact analysis work toensure focus on post-delivery aspects.
S8 Missionise the target architecture more within the project to make surethat everyone knows about it.
S9 Introduce tool and method support (such as checklists) to help individualsperform better and more robust analyses.
S10 Act more towards the customer—meet the customer more often to discusssolutions. Listen to several customers instead of only one to avoid solutionsthat just a few need/want.
S11 Anchor release intent in the design organisation to make sure that decisionsgo towards a common goal.
S12 Do not allow change requests late in the project (close the change controlboard as early as possible).
Each improvement was subsequently mapped to one or more issues. Putdifferently, an improvement package was formed for each issue, and most im-provements were shared among several packages. Table 4.8 shows the mappingbetween the issues that are of high overall importance and the improvementproposals (S10–S12 are excluded as they do not map to any of the issues shownin the table). An x in a cell means that the improvement in the current col-umn should be effective in addressing the issue in the current row. It should be
121
4: Views of Impact Analysis Issues
Issue S1 S2 S3 S4 S5 S6 S7 S8 S9i1 x x x xi3 x x x x xi6 x x x x x
Table 4.8: Mapping from identified improvements to high- (top) and medium-priority (bottom) issues.
noted that the mapping of improvements to issues mainly took place during theworkshops, although it was reviewed and in some cases completed afterwards.
As pointed out, improvements affecting several issues should be favouredover more localised improvements. Thus, improvements S1, S2, S4, S5, andS9, which all affect two issues, are good candidates for a process improvementprogramme. Of course, one single improvement is unlikely to completely resolvean issue—it is better to use a combination of multiple improvements.
In addition to the ones presented above, a number of improvements weretailored specifically for the studied company. As these are not generic, theyhave been left out here.
4.5.4 TREATMENT OF OUTLIERSA participant who has prioritised completely different than other participants,for example by giving extremely high weights to certain issues, could be seenas an outlier. Outliers disturb statistical measures, such as the mean value,and may have severe impact on statistical tests. Figure 4.1 illustrates someof the data from the prioritisations, including outliers, for the sake of showingthe distribution of priorities. The classification of priorities into importancelevels allowed us to retain the importance of the outliers, while reducing theirextremeness to normal levels.
We argue that dealing with outliers is of particular importance when thedata consists of measurements of performance or effort, in which case outlierscould be seen as the result of measurement or sampling problems. In our case,however, each data point is a subjective opinion, meaning that removing outlierswould disqualify uncommon opinions. A way of dealing with outliers resultingfrom uncommon or extreme opinions is to go back to the source and discussthe reason behind the outlier. This approach has, however, not been pursuedin this study.
122
4: Views of Impact Analysis Issues
4.5.5 THREATS TO VALIDITYTwo general arguments against the threats discussed here are: (a) the research ismainly exploratory in the sense that it contributes in understanding how expertstend to prioritise IA issues, and (b) the data are not responses from randomlyselected individuals but from responsible experts interested in research and arefor this reason invaluable.
4.5.5.1 EXTERNAL VALIDITY
The small sample size and the fact that we sampled based on convenience arethreats, as the participants may not have been representative for the population.However, as the participants were selected mainly based on recommendationsby several persons, we believe they were good representatives both of their rolesand of professional software developers in general. Furthermore, the fact that wefocused on potential issues rather than actual ones should increase the externalvalidity. Also, the participants covered all issues from the literature, whichindicates that their views of impact analysis were not company specific. Thesethreats affect the internal validity as well.
4.5.5.2 INTERNAL VALIDITY
A threat is maturation, in our case that the first prioritisation of issues couldhave affected how the same issues were prioritised a second time (although froma different perspective). To counter this threat, we used a two-group designwhere participants did the prioritisations in different order (see Section 4.3.4).
Another threat is instrumentation, which means that the instruments usedin the study could have been badly designed. This threat affects conclusion va-lidity as well, and possibly construct validity. We believe the threat is reduceddue to the facts that we conducted a pilot interview to test the interview in-strument (see Section 4.3.2), and that the prioritisation tool (see Section 4.3.4)was designed to alleviate the prioritisation effort of the participants as much aspossible.
4.5.5.3 CONSTRUCT VALIDITY
A threat is that the participants may not have had the desired mind set whenprioritising issues. As stated in Section 4.3.4, we asked the participants toprioritise as if the issues currently were not present, but we could not verify ifthey adhered to our request.
123
4: Views of Impact Analysis Issues
Another threat is that the participants may not have been entirely neutralwhen prioritising under the organisational perspective. This argument is sup-ported by the finding that there is a correlation between the perspectives. It isprobably difficult to push the self-perspective aside, so there is a risk that thisperspective (here, we refer to state of mind rather than prioritisation because,as noted before, we used a two-group design to avoid maturation) has colouredthe organisational perspective in the prioritisations. A solution for reducing thisthreat would have been to let some participants prioritise under one perspectiveonly, and the others under the other perspective only. However, we chose notto do this due to the small sample size.
4.5.5.4 CONCLUSION VALIDITY
A threat is that the participants may have been disturbed when doing theprioritisation. As they prioritised individually in their work place, we could notcontrol this threat. We do not believe it to be very significant, though.
Another threat is the selection of limits (cutoff values) in the classificationof priorities, weighing of classes, and identification of top issues. We do notclaim that our choices are optimal, but it should be noted that the purpose ofthis chapter is not to provide a specific truth about the absolute importanceof issues, but rather to study the issues relative to each other. Thus, we claimthat the results and analyses presented are valid with respect to the researchquestions.
4.6 CONCLUSIONSIn this chapter, we have presented results from a study where impact analysisissues were prioritised by software professionals at three different organisationallevels (operative, tactical, and strategic) and under two different perspectives(organisational and self ). The organisational perspective was used to learnabout which issues were critical for the organisation, while the self-perspectivewas used to learn about issues critical for the software professionals themselves.The following paragraphs discuss the research questions posed in Section 4.1.
RQ1: How does the organisational level affect one’s assessment ofimportance of IA issues? From the point of view of organisational levels,we have discussed a number of issues for which there is disagreement amongthe levels on importance. While the data are not enough to provide statisticalevidence of the cause for disagreement, it appears as if the important issues
124
4: Views of Impact Analysis Issues
for a particular level are those that can be expected based on how the level isdefined. At the operative level, which is concerned with realising the projectaccording to plan, important issues are related to the realisation of a change,or the chosen solution. At the tactical level, which is concerned with planningof time and resources, important issues are related to project and planningaspects. Finally, at the strategic level, which addresses long-term goals andproduct aspects, important issues are related to process and product quality.We have also found that when the level difference depends on a perspectivedifference, the strategic level differs because of an organisational focus, whereasthe operative and tactical levels differ because of a self-focus.
RQ2: What difference does the perspective make in determiningthe relative importance of IA issues? We have seen that the character-istics of an issue seem to affect how it is prioritised from the two differentperspectives—issues that are most important from the organisational perspec-tive typically concern process, project, or end-product aspects, and thus aremore holistic in their nature. On the other hand, issues most important fromthe self-perspective rather concern the execution of the analysis task, and/or therealisation of a change. These issues are of more local nature. A finding is thatthe participants focused more on fewer issues under the self-perspective thanunder the organisational perspective. The statistical analysis shows that theagreement among participants within the organisational perspective is largerthan within the self-perspective; however, it also reveals that the participantsdisagree with each other regardless of perspective. The disagreement within per-spectives are positively correlated, meaning that the organisational perspectiveis not free from disagreement originating in the self-perspective. We concludethat personal opinions and attitudes cannot easily be disregarded from.
RQ3: Which are important IA issues, and how are these addressedin software process improvement? In comparing the perspectives and thelevels, we visualised the differences in a way that allowed us to discuss twoclasses of issues: high-priority and medium-priority. The priority classes canserve as a means to optimising a process improvement effort, as focus should beput mainly on the high-priority issues. These are issues that have overall highimportance (criticality), and addressing them would benefit a large group ofpeople. Medium-priority issues are important at least at some level, under someperspective. Addressing them is beneficial for a smaller group of people, but itdoes nevertheless make a difference. All issues found to have high or mediumpriority concern the execution of the analysis task or the outcome thereof: itis difficult to find resources for performing impact analysis, system impact isunderestimated or overlooked, and analyses are incomplete or delayed. This is
125
4: Views of Impact Analysis Issues
not surprising, as these are fundamental aspects of the change managementprocess.
A number of improvements for addressing the most important issues havebeen proposed. Each of the following five affects two out of three of the high-and medium-priority issues, and can therefore be considered highly relevant:
1. Limit the number of outstanding change requests at any time and use aselection process for taking in change requests.
2. Introduce different ways of handling different types of change requests.For example, use different change request “tracks” (e.g., based on changerequest priority).
3. Plan early for the fact that there will be many change requests in theproject.
4. Introduce a database for storing old impact analysis results to be used asa knowledge base for future analyses.
5. Introduce tool and method support (such as checklists) to help individualsperform better and more robust analyses.
In an improvement effort, these improvements should be combined, althoughthe cost aspect needs to be taken into consideration, to maximise the outcomewith respect to addressing existing issues. The issues and improvements pre-sented in this chapter are of generic nature, and should apply to other companiesthan the studied one. Thus, they could be used in future research about impactanalysis as a change management activity.
In summary, we want to highlight the following two points:(1) Studying issues from multiple perspectives and levels is rewarding and
entails certain benefits from a process improvement point of view. To answer twoof our research questions, we have found that both level (RQ1) and perspective(RQ2) affect the assessment of importance of impact analysis issues.
(2) The most important issues (RQ3) concern fundamental aspects of im-pact analysis and its execution. This underlines that impact analysis needsto be addressed as a crucial activity in the change management process. Morespecifically, it is imperative to realise that processes need to not only enforce theexistence of proper impact analysis, but also to prescribe how impact analysisshould be carried out in order to achieve satisfactory and timely results.
126
Chapter 5
Checklist Support in theChange Control Process
As noted in Chapter 1, impact analysis is performed in the change control pro-cess, in which change requests are used as a formal instrument to control changesto a software system. A change request undergoes analysis prior to its approvalor disapproval. In this chapter, we discuss change request analysis, which we seeas the totality of all evaluative aspects of the change control process. In otherwords, it encompasses screening of and discussions about a change request, butalso the impact analysis activities. It should be noted that impact analysisthat takes place as part of change request analysis differs in characteristics fromimpact analysis made before implementing the change. More specifically, theobjective is as mentioned to be able to make a decision about the approval ordisapproval of the change, and the granularity of impact analysis only needs tobe fine enough to allow this. Before implementing a change, on the other hand,the impact analysis needs to be more detailed in order to take into account sys-tem impact and possible ripple effects of the change [Bohner and Arnold, 1996].These two levels of impact analysis were introduced in Section 1.3.4, termeddecision-targeted and realisation-targeted, respectively.
One of the improvement proposals put forward in Chapter 4 was to introducetool support to help individuals perform impact analysis, and an example of suchsupport is checklists. This chapter provides the following:
• The design of an approach used for adapting a set of generic checklists(intended for analysing a proposed change) to suit the specific use context.
5: Checklist Support in the Change Control Process
• The characteristics of a checklist-based process support instrument, whichis the outcome of the aforementioned adaptation in the context of thechange control process at Ericsson.
• The design and execution of a process evaluation targeted at the changecontrol process.
• Some results which, pending further investigation and evaluation, shouldbe seen as preliminary.
The adapted process support instrument (henceforth abbreviated PSI ) com-prises a number of checklists, each containing items that are relevant for the sakeof controlling and analysing a change request. Our basic expectation is that theuse of the PSI leads to increased process efficiency, as it supports its users inmaking informed decisions.
According to Hales and Pronovost [2006], who report on the successful useof checklists in fields such as aviation, product manufacturing, and critical care,the main purpose of using checklists is to reduce errors or to increase adherenceto standards. Their view is that checklists are an important cognitive aid—moreformal than Post-It notes but less formal than a defined protocol—that can pro-vide guidance to the user and thereby improve the outcome or performance ofthe activity. While the use of checklists is common in the field of software in-spections, studies have reported discouraging results as to their usefulness whenlooking for defects [see Porter and Votta, 1994; Thelin et al., 2003]. However,we see inspection with the goal of defect detection as different from using achecklist to reduce errors in performing an activity, whereby the latter is thescope of this chapter. In other words, we do believe that checklists can providegood process support.
The chapter is organised as follows. Section 5.1 presents the study back-ground, including research context and related work. The design of the approachfor checklist adaptation is described in Section 5.2, together with the evaluationdesign. Thereafter, the outcome of the adaptation in our case (i.e., characteris-tics of the PSI) as well as preliminary results from the evaluation are presentedin Section 5.3. Section 5.4 contains a brief discussion of the implications of theresults, together with some notes on industrial adoption and threats to validity.Finally, Section 5.5 summarises the chapter and presents conclusions.
128
5: Checklist Support in the Change Control Process
5.1 BACKGROUNDThis section describes the background of the study. We present the researchcontext for the study, as well as relevant related work. We also discuss the rolesin the change control process, previous work, and aspects of using checklists forprocess support.
5.1.1 RESEARCH CONTEXT AND OBJECTIVEDevelopment projects at Ericsson have historically been long and have thereforebeen exposed to a large number of change requests. In order to deal with sucha situation, it is imperative that the change control process functions efficientlyand as intended. The overall goal of the research presented here has been toprovide a lightweight means of supporting the change control process. This goalhas been broken down to the following two research questions:
• RQ1: Is checklist-based process support an effective way of improving thechange control process?
• RQ2: How can we measure the efficiency of the change control process ina lightweight manner?
RQ1 stems from the fact that we see checklists as a lightweight means ofproviding process support (see Section 5.1.5). RQ2 was formulated since itis helpful to know the current state of the process when introducing processsupport.
5.1.2 RELATED WORKRamzan and Ikram [2005] discuss decision-making in requirements change man-agement, and stress the importance of making informed decisions. They arguethat the existence of relevant information, such as stakeholders affected by achange, cost versus benefit, and associated risks, is crucial when making firmlybased decisions. Our standpoint is that a checklist can help the user taking intoaccount different types of relevant information.
Wiegers [1999] provides a set of checklists for supporting the analysis ofchange impact. His checklists are meant to be further customised when used(which is what we have done and describe in this chapter). Like Wiegers, Hass[2002] promotes the use of checklists for doing impact analysis (the term she usesis consequence analysis), and presents a customisation of Wiegers’ checklists.
129
5: Checklist Support in the Change Control Process
Keil et al. [2006] study the use of checklists for risk identification. From theirperspective, the purpose of a checklist is to allow the user to identify more risksand make better decisions regarding project continuation. One of their findingsis that the use of checklists do lead to more risks found, and they argue thatchecklists may increase the user’s sensitivity to risks (and thereby likelihood offinding risks).
Brykczynski [1999] performed a survey of 117 checklists∗ for software inspec-tion, including not only ones suitable for finding defects, but also ones meantfor more general review. Among other things, he argues that checklists for non-code work products tend to be general in nature and should focus on consistency,correctness and completeness.
Despite the fact that checklists in software inspection are common, somestudies report that using checklists is not the best means for finding defects.Thelin et al. [2003], for example, have compared usage-based and checklist-based reading, and found usage-based reading to be superior over checklist-based reading with respect to finding faults. Porter and Votta [1994] comparedthree methods for finding defects in software requirements specifications, andfound that the checklist method was outperformed by the other two (ad hoc andscenario). As we see the use of checklists for finding defects as different fromwhat we have done in this study, we do not consider the otherwise discouragingresults from the software inspection field to be an inhibitor.
Impact analysis is often a manual activity, carried out through interviewswith knowledgeable developers (see Chapter 3). However, it is also possible touse more systematic methods such as consulting design documentation, usingslicing techniques, and performing dependency and/or traceability analysis. Asmentioned in the introduction, the work behind this chapter is concerned withthe entire process of controlling a change request, rather than only the impactanalysis activity. Thus, impact analysis methods or techniques, such as theones mentioned, can be used in conjunction with checklists in order to obtainthe information necessary to “check off” items in the checklists.
The distinction between the two stages of impact analysis discussed in theintroduction is also made by El Emam et al. [1997]. They distinguish betweenproblem-oriented preliminary analysis, the purpose of which is to identify so-lutions based on which the appropriate board can approve (or disapprove) thechange request, and detailed change analysis, the purpose of which is to identifyall necessary modifications resulting from the change.
∗ None of these were intended for change requests, though.
130
5: Checklist Support in the Change Control Process
5.1.3 CHANGE CONTROL PROCESSA generic change control process is described in Section 1.1.2 (see also theframework described in Section 3.2), and the one used by Ericsson is describedin Section 1.4. A number of process roles are defined at Ericsson. The CR is-suer, who can be anyone, writes the change request initially. The change requestis submitted to the CR receiver (corresponding to Leon’s Configuration Man-agement Officer (CMO) role [Leon, 2000]), who works tightly in the screeningstage to ensure the validity of the change request. The CR analyser (of whichthere typically are several) is responsible for coordinating the analysis of thechange request. The implementation responsible is responsible for taking careof the change request after it has been accepted (this person is not the one whoimplements the change, but rather the one who makes sure it happens).
5.1.4 PREVIOUS WORKIn the data collection phase of the study described in Chapter 4, two observa-tions were made during the interviews:
1. The top three bases of the analysis of change impact were gut feeling, expe-rience and competence (as opposed to models and other documentation).
2. Change requests had become a very effective means of communicationwithin the development projects (due to their importance; nobody woulddismiss one). Unfortunately, this had led to a certain amount of abuse, aschange requests were used for other things than requesting changes.
The first observation may not come as a surprise, but the actual conse-quences are nonetheless important to consider. Any analysis made based solelyon subjective basis is bound to be person dependent and, in the worst case, in-consistent with what someone else would produce. This points towards a needfor support during the change control process. For example, during impactanalysis, support could result in more objective and well-founded analyses, andalso decrease the risk that something is missed during an analysis.
The latter observation means that an early screening is necessary in orderto discard all invalid change requests. As noted in Section 1.4, such a screeningstep has been introduced in the change control process at Ericsson, yieldinggreater control over the items entering the process. The screening step, beinga point of evaluation in the process, also calls for support that could ease theprocess of deciding whether or not a particular item is indeed a proper changerequest that should be handled as such.
131
5: Checklist Support in the Change Control Process
During the interviews, process support, preferably in the form of check-lists, was actually requested. Checklists had been used before, but were mainlyproject specific and never promoted to a more general level. A combination ofthe need for and the explicit request for checklist-based process support wereamong the main motivators for the work described in this chapter.
The top issues identified in Chapter 4 are that system impact is often under-estimated or overlooked when analysing, that analyses generally are incompleteor delayed, and that it is difficult to find resources for performing impact analy-sis. We believe that the first two of these are a consequence of subjective impactanalysis, and the third is a consequence of the analysis being time-consuming.Thus, we argue that checklist-based process support should be geared towardsthese aspects.
5.1.5 CHECKLISTSThis section describes general aspects of using checklists, and provides anoverview of the generic checklists that have been the basis for the PSI discussedin this chapter.
5.1.5.1 CHECKLIST ASPECTS
It is relevant to discuss advantages and disadvantages of using a checklist asprocess support. A checklist is an effective way of making sure that nothingis omitted or forgotten, but its use can of course lack in regularity and thor-oughness. It is common to have a checklist when grocery shopping, at leastif the number of items to buy is more than a few. Without such a checklist,it is easy to forget some items. This is a consequence of how the human brainworks; we can only keep track of a limited amount of items at the same time [seeDoumont, 2002]. Similarly, a pilot has to go through a checklist before takeoff(and in various other situations), in order to ensure that safety procedures areproperly gone through [Hales and Pronovost, 2006].
The implications of not using the checklist are in these two examples vastlydifferent. Forgetting something when grocery shopping may ruin a meal, whereasa pilot’s negligence could be a matter of life and death. The consequences offorgetting something when analysing the impact of a software change lies some-where in between, and can mean everything from hardly anything to projectoverruns, unhappy customers, and lost revenue.
Apart from the obvious cognitive support described above, a checklist hasthe following advantages when used for the sake of process support:
132
5: Checklist Support in the Change Control Process
• It is a non-intrusive instrument for assisting in activities that are other-wise driven by subjective forces such as experience. Since such subjectiveforces should not be underestimated, a good support instrument shouldcomplement rather than replace them.
• A checklist can be used to various extents, depending on the situation. Forexample, a large complex change request would entail a thorough walk-through of the checklist, whereas a simpler change request would entail amore brief walkthrough. Thus, the use of a checklist can be very flexible.
• Adding an objective part to an activity, a checklist allows for consistencybetween performers of the activity.
A possible disadvantage of a checklist, on the other hand, is that when peopleget used to the checklist, they may stop using it because they believe they knowit by heart. Either they do, in which case the checklist has become a successfulpart of the organisational culture, or they do not, in which case the situation isback to as it was before introducing the checklist.
5.1.5.2 WIEGERS’ CHECKLISTS
When creating the PSI, we decided to base it on existing material, namelythe checklists proposed by Wiegers [1999]. Wiegers presents two checklists forimpact analysis, plus one form for effort calculation. The first checklist, hereafterreferred to as the implications checklist, consists of items that correspond topossible implications of a proposed change, and Wiegers argues that the analystcan use it for the sake of understanding the change better. An example itemis: “What are the possible adverse side effects or other risks of making theproposed change?” The second checklist, hereafter referred to as the impactchecklist, aids in identifying software artefacts affected by the proposed change.An example item from this checklist is: “Identify any changes required in buildfiles or procedures.”
Wiegers is, to our knowledge, one of the few authors of requirements en-gineering books that discusses impact analysis (as part of the change controlprocess) more in detail and actually provides some sort of support for perform-ing it. A set of checklists provided by Hass [2002] are adapted from Wiegers’checklists, but have coarser granularity. However, her use of Wiegers’ checklistssuggest that they are indeed meaningful in this context, and it is appropriateto use them as starting point.
133
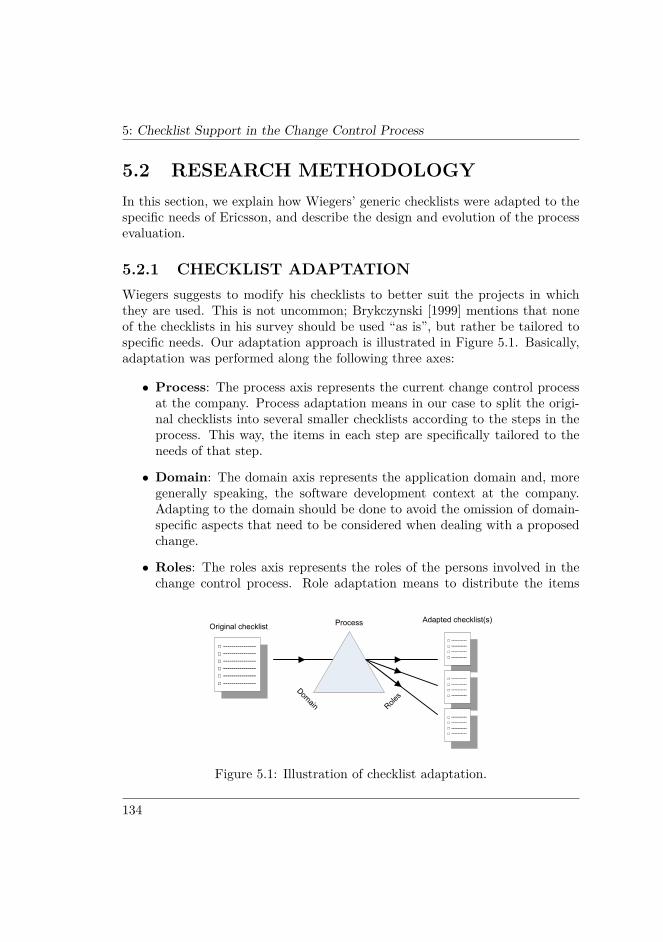
5: Checklist Support in the Change Control Process
5.2 RESEARCH METHODOLOGYIn this section, we explain how Wiegers’ generic checklists were adapted to thespecific needs of Ericsson, and describe the design and evolution of the processevaluation.
5.2.1 CHECKLIST ADAPTATIONWiegers suggests to modify his checklists to better suit the projects in whichthey are used. This is not uncommon; Brykczynski [1999] mentions that noneof the checklists in his survey should be used “as is”, but rather be tailored tospecific needs. Our adaptation approach is illustrated in Figure 5.1. Basically,adaptation was performed along the following three axes:
• Process: The process axis represents the current change control processat the company. Process adaptation means in our case to split the origi-nal checklists into several smaller checklists according to the steps in theprocess. This way, the items in each step are specifically tailored to theneeds of that step.
• Domain: The domain axis represents the application domain and, moregenerally speaking, the software development context at the company.Adapting to the domain should be done to avoid the omission of domain-specific aspects that need to be considered when dealing with a proposedchange.
• Roles: The roles axis represents the roles of the persons involved in thechange control process. Role adaptation means to distribute the items
□ ----------□ ----------□ ----------□ ----------
Process
Domain Roles
Original checklist
□ ----------------□ ----------------□ ----------------□ ----------------□ ----------------□ ----------------
□ ----------□ ----------□ ----------□ ----------
□ ----------□ ----------□ ----------□ ----------
Adapted checklist(s)
Figure 5.1: Illustration of checklist adaptation.
134
5: Checklist Support in the Change Control Process
in a checklist into different areas of responsibility, and assigning the re-sponsibilities to roles. This way, different aspects of analysing a proposedchange are dealt with by the persons who are most suitable.
The three axes where selected based on needs identified at Ericsson; wedo not wish to assert that these three are the only ones, or the best ones.Other thinkable axes relate to software architecture and software requirements.However, these are on a different level of abstraction than the three we haveused, and could tie the resulting PSI too close to a specific system.
The adaptation was performed through meetings with the various stake-holders of the change control process, such as project managers, configurationmanagers, technical coordinators, and test leaders. The objective was to in-clude persons relevant from the perspectives of Wiegers’ original checklists (i.e.,change implications, detailed impact analysis, and effort calculation).
The outcome of the adaptation was the actual PSI, consisting of a set ofchecklists tailored for the domain and mapped to the relevant change controlprocess steps. The role adaptation, however, was not made on all the resultingchecklists, but only on the one for detailed impact analysis (i.e., identificationof affected software artefacts). The reason was that this checklist was morediversified than the remaining checklists. The adaptation outcome is furtherdiscussed in Section 5.3.1.
5.2.2 PROCESS EVALUATIONIn order to be able to measure the effect of introducing the PSI at the company,it was decided to perform an evaluation for measuring the current process as abaseline. The evaluation form should preferably be reusable by the company atany later stage to measure the process health either routinely or in response tosome process change. Thus, the evaluation should be both relevant with respectto the PSI, but also with respect to the process in general.
Two separate evaluations are described here. The first one should be seenas a pre-evaluation. It was performed, but a number of disadvantages wherehighlighted afterwards. Based on these, the main evaluation was designed inorder to obtain a better view of the state of the process. The pre-evaluationand its outcome are presented for the sake of completeness and transparency.
5.2.2.1 PRE-EVALUATION
As mentioned, an objective of the evaluation was to allow it to be reused later on.Thus, it was decided to create a lightweight form that could be filled in quickly
135
5: Checklist Support in the Change Control Process
but still cover the most relevant aspects of the process. As a consequence ofthis, the pre-evaluation was entirely quantitative.
Each item on the form was a statement about the change control process, towhich the respondent could express level of agreement on a scale from stronglydisagree to strongly agree. This is known as the summated rating (or Likert)approach [Robson, 2002]. According to Robson, items developed using thisapproach can be interesting to the respondents. Thus, the chance of a highresponse rate can be assumed to be high. Robson advises that the statementsshould be both positive and negative, and that extreme statements should beavoided. The following considerations were made when creating statements forthe evaluation form:
• Statements should express the expected process state rather than a perfectprocess state. In other words, a statement about quality should not aimfor highest possible quality, but rather reasonable or acceptable quality.The motivation for this is that aiming for a perfect process in a large de-velopment organisation where processes are adapted and tweaked anywayis rather futile.
• Despite Robson’s advice on using both positive and negative statements,all were made positive (in the sense that strong agreement was the de-sirable answer). The reason for not having negative statements was toavoid the risk of a “not” or any other negation being missed. Since thecompany staff are busy in general, such a mistake could happen easily,and the evaluation validity would be jeopardised.
With respect to what to cover in the evaluation, we decided to include aspectsthat (1) are important from the point-of-view of an efficient change controlprocess; (2) we knew from earlier studies could be problematic; and (3) can beaffected by the use of the PSI. The included aspects are given below, and thefull list of statements can be seen in Table 5.1. All of the aspects representsituations that arguably should improve with the use of the PSI.
• Change request quality: An efficient change control process is depen-dent on high-quality input. In the study in Chapter 4, unclear changerequests were seen as an important issue.
• Decision easiness: Since the change control process is very decisionintense, decision-related aspects are relevant to include. The easiness ofa decision depends on the availability of input, and should be a goodindicator of process efficiency.
136
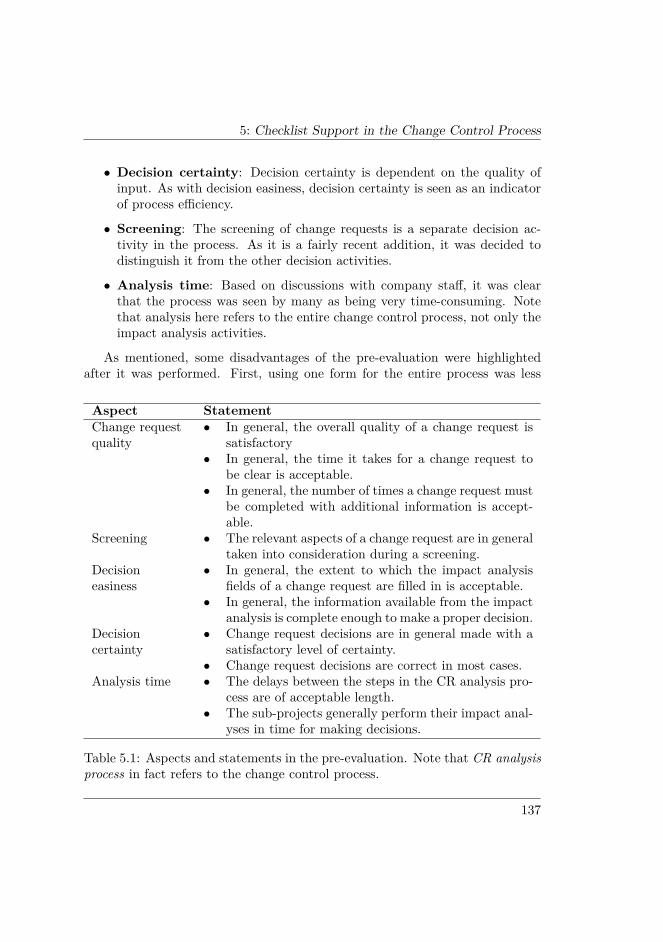
5: Checklist Support in the Change Control Process
• Decision certainty: Decision certainty is dependent on the quality ofinput. As with decision easiness, decision certainty is seen as an indicatorof process efficiency.
• Screening: The screening of change requests is a separate decision ac-tivity in the process. As it is a fairly recent addition, it was decided todistinguish it from the other decision activities.
• Analysis time: Based on discussions with company staff, it was clearthat the process was seen by many as being very time-consuming. Notethat analysis here refers to the entire change control process, not only theimpact analysis activities.
As mentioned, some disadvantages of the pre-evaluation were highlightedafter it was performed. First, using one form for the entire process was less
Aspect StatementChange requestquality
• In general, the overall quality of a change request issatisfactory
• In general, the time it takes for a change request tobe clear is acceptable.
• In general, the number of times a change request mustbe completed with additional information is accept-able.
Screening • The relevant aspects of a change request are in generaltaken into consideration during a screening.
Decisioneasiness
• In general, the extent to which the impact analysisfields of a change request are filled in is acceptable.
• In general, the information available from the impactanalysis is complete enough to make a proper decision.
Decisioncertainty
• Change request decisions are in general made with asatisfactory level of certainty.
• Change request decisions are correct in most cases.Analysis time • The delays between the steps in the CR analysis pro-
cess are of acceptable length.• The sub-projects generally perform their impact anal-
yses in time for making decisions.
Table 5.1: Aspects and statements in the pre-evaluation. Note that CR analysisprocess in fact refers to the change control process.
137
5: Checklist Support in the Change Control Process
than optimal; different parts of the process could not be distinguished. Second,and related, some confusion arose as to which part of the process the decisionaspects easiness and certainty referred to.
5.2.2.2 MAIN EVALUATION
In response to the disadvantages of the pre-evaluation, a second, more detailedevaluation has been designed. In particular, we try to take into account thestepwise character of the change control process, and direct the evaluation tothe corresponding process roles and decision fora.
For the sake of this evaluation, we outline the change control process as achain of steps, each with a specific process role. We argue that each step inthe chain can receive input from the previous step, provide output to the nextstep, or both. Also, we recognise that certain steps are explicit decision points.Based on this model, we formulate three labels for the process roles:
• A producer/contributor creates, refines or adds to the change request.Appending new information, such as an analysis, is a contribution. Makinga decision or passing on the change request also counts as a contribution.
• A receiver gets the change request as input for further work such asverifying appropriateness, making decisions, and adding information.
• A decision maker is part of a decision meeting where it decided what todo with the change request.
Each process role has been assigned one or more of these labels, and the setof labels determines the contents of the evaluation form. In other words, wehave customised the evaluation form based on the process role characteristics.
The contents of the evaluation form has been decided based on the in-put/output model described above. We argue that it would be difficult forsomeone to assess the quality of his or her own output in very much detail,whereas it would be simpler to assess the quality of input (i.e., someone else’soutput). Thus, for evaluation of output quality, the aspects confidence andeffort are used, and for evaluation of input quality, the aspects completeness,self-containedness, detail level, and overall quality are used.
For each label, a number of statements are given just as in the pre-evaluation.Each statement is formulated in a positive way, so that strong agreement isbeneficial. In order to get more information about process efficiency and im-provement details, a number of qualitative questions has been added to the
138
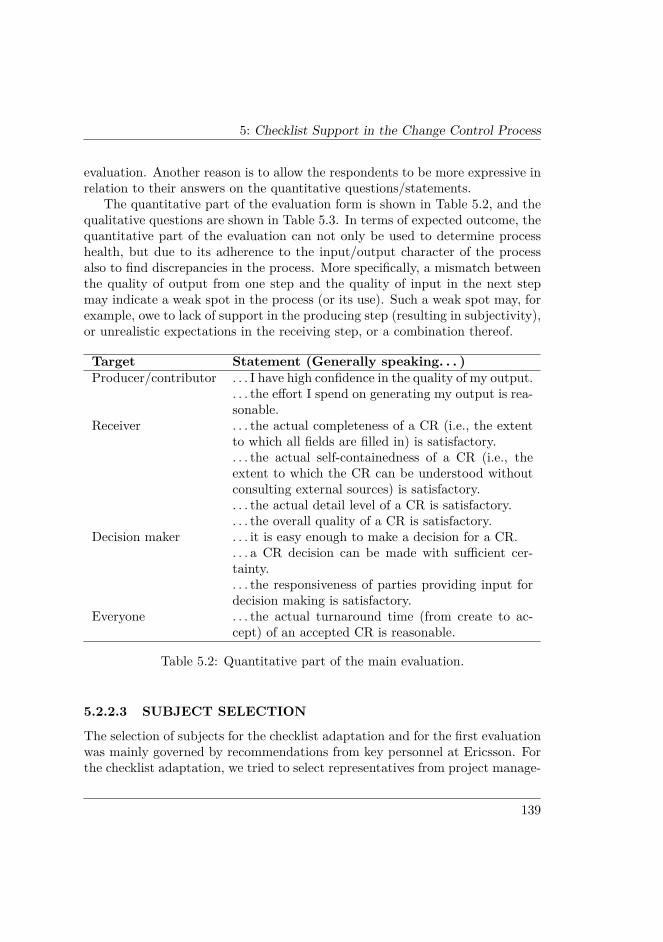
5: Checklist Support in the Change Control Process
evaluation. Another reason is to allow the respondents to be more expressive inrelation to their answers on the quantitative questions/statements.
The quantitative part of the evaluation form is shown in Table 5.2, and thequalitative questions are shown in Table 5.3. In terms of expected outcome, thequantitative part of the evaluation can not only be used to determine processhealth, but due to its adherence to the input/output character of the processalso to find discrepancies in the process. More specifically, a mismatch betweenthe quality of output from one step and the quality of input in the next stepmay indicate a weak spot in the process (or its use). Such a weak spot may, forexample, owe to lack of support in the producing step (resulting in subjectivity),or unrealistic expectations in the receiving step, or a combination thereof.
Target Statement (Generally speaking. . . )Producer/contributor . . . I have high confidence in the quality of my output.
. . . the effort I spend on generating my output is rea-sonable.
Receiver . . . the actual completeness of a CR (i.e., the extentto which all fields are filled in) is satisfactory.. . . the actual self-containedness of a CR (i.e., theextent to which the CR can be understood withoutconsulting external sources) is satisfactory.. . . the actual detail level of a CR is satisfactory.. . . the overall quality of a CR is satisfactory.
Decision maker . . . it is easy enough to make a decision for a CR.. . . a CR decision can be made with sufficient cer-tainty.. . . the responsiveness of parties providing input fordecision making is satisfactory.
Everyone . . . the actual turnaround time (from create to ac-cept) of an accepted CR is reasonable.
Table 5.2: Quantitative part of the main evaluation.
5.2.2.3 SUBJECT SELECTION
The selection of subjects for the checklist adaptation and for the first evaluationwas mainly governed by recommendations from key personnel at Ericsson. Forthe checklist adaptation, we tried to select representatives from project manage-
139
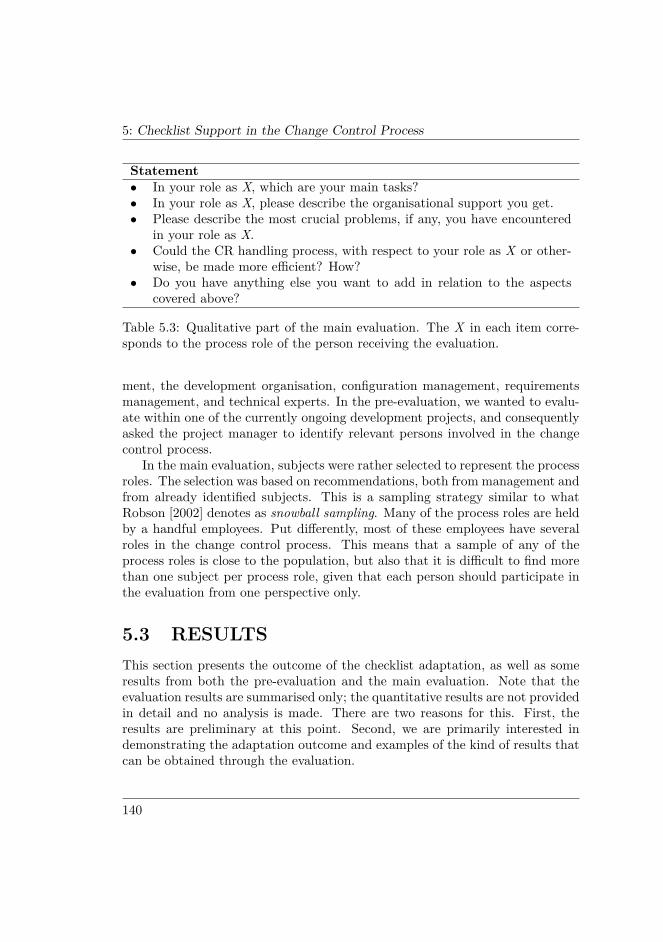
5: Checklist Support in the Change Control Process
Statement• In your role as X, which are your main tasks?• In your role as X, please describe the organisational support you get.• Please describe the most crucial problems, if any, you have encountered
in your role as X.• Could the CR handling process, with respect to your role as X or other-
wise, be made more efficient? How?• Do you have anything else you want to add in relation to the aspects
covered above?
Table 5.3: Qualitative part of the main evaluation. The X in each item corre-sponds to the process role of the person receiving the evaluation.
ment, the development organisation, configuration management, requirementsmanagement, and technical experts. In the pre-evaluation, we wanted to evalu-ate within one of the currently ongoing development projects, and consequentlyasked the project manager to identify relevant persons involved in the changecontrol process.
In the main evaluation, subjects were rather selected to represent the processroles. The selection was based on recommendations, both from management andfrom already identified subjects. This is a sampling strategy similar to whatRobson [2002] denotes as snowball sampling. Many of the process roles are heldby a handful employees. Put differently, most of these employees have severalroles in the change control process. This means that a sample of any of theprocess roles is close to the population, but also that it is difficult to find morethan one subject per process role, given that each person should participate inthe evaluation from one perspective only.
5.3 RESULTSThis section presents the outcome of the checklist adaptation, as well as someresults from both the pre-evaluation and the main evaluation. Note that theevaluation results are summarised only; the quantitative results are not providedin detail and no analysis is made. There are two reasons for this. First, theresults are preliminary at this point. Second, we are primarily interested indemonstrating the adaptation outcome and examples of the kind of results thatcan be obtained through the evaluation.
140

5: Checklist Support in the Change Control Process
5.3.1 CHECKLIST ADAPTATION OUTCOMEAs pointed out before, the original checklists by Wiegers [1999] were adaptedalong three axes: domain, process, and roles. The outcome of the adaptation inour case is presented below in terms of characteristics of the resulting PSI.
5.3.1.1 PROCESS ADAPTATION
The process adaptation resulted in a set of checklists, each one tailored fora specific step or phase in the process (see Section 5.1.3). With respect toindividual items, this adaptation resulted mainly in deletion or modification ofitems. The outcome of the process adaptation is summarised below, includingthe overall characteristics of the checklists.
A CR preparation checklist was created to support the initial change requestcreation. Thus, the checklist should be used by the CR issuer. This checklistcontains the fewest number of items of all checklists, mainly because anyone isallowed to create a change request. but not anyone has experience in doing so.Thus, a large checklist at this point could potentially “scare off” change requestissuers. In terms of Wiegers’ implications checklist, items about baseline conflictand reject consequence are included here. Added items cover self-containednessas well as completeness with respect to the change request form. The latterserves the purpose of increasing the chance that a change request is properlyfilled in already from the beginning.
A CR screening checklist was created to support the change request screen-ing activity. As such, it contains items for self-containedness, correctness, andconsistency. However, it also retains items about baseline conflict and rejectconsequence from the implications checklist. Furthermore, it contains an earlyimpact analysis, but on the level of configuration items. It can be used by theCR receiver before it is passed on to the screening step, and also at the actualscreening meeting. Size wise, this checklist is equivalent to the CR preparationlist. The main reason for keeping this checklist small is that items of interestat this early stage are primarily related to change request structure (syntax)rather than detailed analysis (semantics).
A CR prestudy checklist was created to support the pre-CCB step of theprocess. The pre-CCB determines whether or not a change request can bepassed on to detailed impact analysis. This checklist is more extensive thanthe previous two, and retains from the implications checklist items for baselineconflict, reject consequences, side effects, quality attributes affected, and projectplan impact. It adds items for relationship with pending changes, addition of
141
5: Checklist Support in the Change Control Process
third-party products, and relationships and impact on configuration items (moredetailed than the CR screening checklist).
A CR analysis checklist was created to support a general, high-level analysisof change implications. This checklist is intended for use in the analysis phasebefore the CCB meeting, as a high-level complement to more detailed impactanalysis. It retains many of the implications checklist items, such as items fortechnical consequences, testing, prototyping, project plan, product cost, andlost effort if the proposed change is rejected. A few items have been added,taking into account support and supply activities (since it is not uncommon tooverlook these) as well as the need for unfamiliar hardware.
Finally, a CR technical analysis checklist was created based on Wiegers’impact checklist. The items in this checklist are not on the form “What is...?”,“How much...?”, or “Does the...?”, but rather “Identify...” and “Estimate...”.The purpose of the checklist is to allow for a more detailed impact analysis thanthe general CR analysis checklist. In terms of what is discussed in Chapter 3,this checklist supports the identification of software lifecycle objects (SLOs)affected by a change. In a project with several development teams/sub projects,this checklist should be used separately by each team. Compared to Wiegers’impact checklist, the adapted checklist merges items together, such as impacton user interface and documentation into one item, and impact on differenttypes of software entities into one item. The rationale behind this is, as wasargued in the beginning of this chapter, that the impact analysis at this stage(before the change request actually has been accepted) does not need to bevery detailed. Added items concern domain-specific items (see below), requireddesign competence, configuration management, and test environments/types.There is also a “best before date” item, signaling to the receiving authority howlong the estimated impact (especially in terms of time and resources) is valid.Should the change request decision take a very long time, the estimated impactmay become outdated (because the system has evolved).
It should be mentioned that the process adaptation did not only take intoaccount the different process steps and their characteristics, but also relatedprocess documentation. For example, the process and the main tool used bothprescribe which information and attributes that must be provided for a changerequest.
5.3.1.2 DOMAIN ADAPTATION
The domain adaptation resulted mainly in the addition of checklist items, andaffected only the CR analysis and CR technical analysis checklists. Generally
142
5: Checklist Support in the Change Control Process
speaking, the domain adaptation concerned the following aspects:
• Hardware, as Ericsson develops systems rather than only software. Inother words, the customers buy prepackaged hardware/software solutions,for which the company has a whole responsibility. Consequently, it isimperative that the lifecycle and characteristics of the hardware used arefully known.
• Licensing, again as the company develops entire systems. Thus, licensingof external products must be taken into account.
• Third-party software, for the same reason.
• Whole-world distribution, as Ericsson’s customers are not within one singlecountry, and therefore differences in rules and regulations are importantto consider.
5.3.1.3 ROLE ADAPTATION
Role adaptation was performed only for the CR technical analysis checklist.The reason was to distribute the analysis effort among different roles, both toreduce stress and to account for the fact that the items in themselves alreadyare targeted at different roles. Normally, a single analyst would turn to personswith different roles for support in the analysis, but here the responsibilities areexplicitly assigned from the beginning.
The role-based division of checklist items also entails a prescribed order inwhich the checklist items should be dealt with. First, the technical coordinatoridentifies system impact (both software and hardware), licensing and third-party aspects, and required design competence. The configuration manager thenidentifies impact on non-system configuration items. Next, the test coordinatorestimates the impact on test cases and test strategies. Finally, the projectmanager summarises and estimates impact on various project-related plans.
5.3.1.4 ROLE ADAPTATION
Wiegers provides an effort calculation form that can be used to calculate therequired effort for realising the proposed change. In discussions with Ericsson,it was decided that a detailed effort calculation may not be worthwhile. Prior tothe change request decision, what is relevant in terms of effort is magnitude (e.g.,100 hours vs. 1 000 hours) rather than an exact figure. This is a characteristicof the so-called decision-targeted impact analysis, as discussed in Chapter 1 and
143
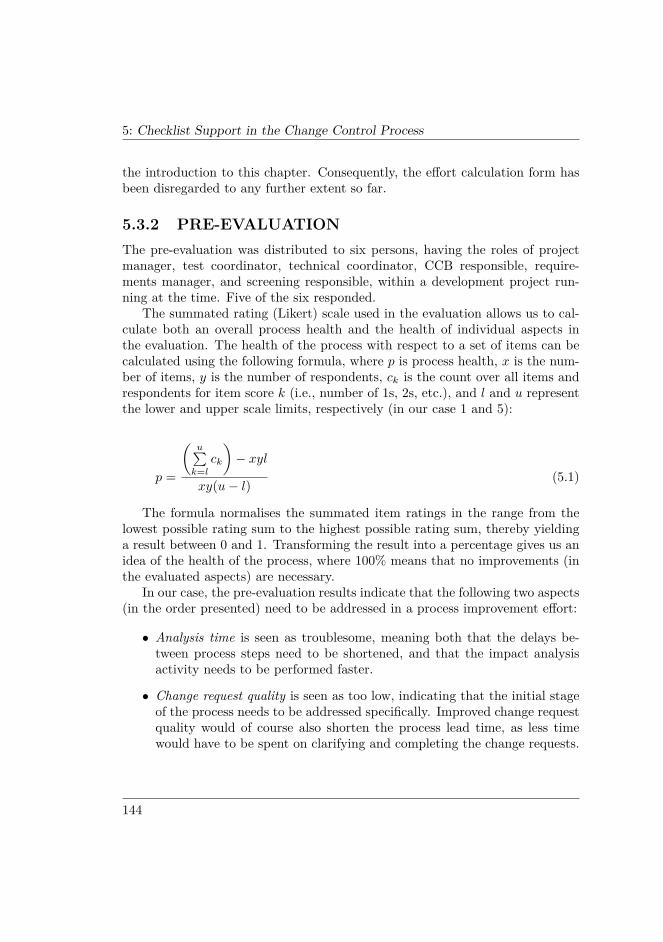
5: Checklist Support in the Change Control Process
the introduction to this chapter. Consequently, the effort calculation form hasbeen disregarded to any further extent so far.
5.3.2 PRE-EVALUATIONThe pre-evaluation was distributed to six persons, having the roles of projectmanager, test coordinator, technical coordinator, CCB responsible, require-ments manager, and screening responsible, within a development project run-ning at the time. Five of the six responded.
The summated rating (Likert) scale used in the evaluation allows us to cal-culate both an overall process health and the health of individual aspects inthe evaluation. The health of the process with respect to a set of items can becalculated using the following formula, where p is process health, x is the num-ber of items, y is the number of respondents, ck is the count over all items andrespondents for item score k (i.e., number of 1s, 2s, etc.), and l and u representthe lower and upper scale limits, respectively (in our case 1 and 5):
p =
(u∑k=lck
)− xyl
xy(u− l)(5.1)
The formula normalises the summated item ratings in the range from thelowest possible rating sum to the highest possible rating sum, thereby yieldinga result between 0 and 1. Transforming the result into a percentage gives us anidea of the health of the process, where 100% means that no improvements (inthe evaluated aspects) are necessary.
In our case, the pre-evaluation results indicate that the following two aspects(in the order presented) need to be addressed in a process improvement effort:
• Analysis time is seen as troublesome, meaning both that the delays be-tween process steps need to be shortened, and that the impact analysisactivity needs to be performed faster.
• Change request quality is seen as too low, indicating that the initial stageof the process needs to be addressed specifically. Improved change requestquality would of course also shorten the process lead time, as less timewould have to be spent on clarifying and completing the change requests.
144
5: Checklist Support in the Change Control Process
5.3.3 MAIN EVALUATIONThe main evaluation was adapted and distributed to persons representing thefollowing roles and steps of the change control process at Ericsson: CR issuer (3persons), CR receiver (1), pre-CCB member (1), screening meeting member (1),CCB member (2), and implementation responsible (1). The CR analyser rolewas not addressed in the evaluation, as some aspects regarding its responsibilitywere unclear at the time of the evaluation. The results shown here are basedon responses from seven persons, covering the roles of CR issuer, CR receiver,screening meeting member, CCB member, and implementation responsible.
As pointed out in Section 5.2.2.2, the results from the main evaluation canbe used both to determine process health, and to find discrepancies in the pro-cess. Furthermore, as the evaluation is more detailed than the pre-evaluation,a process health value of interest can be traced to a specific part of the process.For example, where the pre-evaluation could show the general quality of changerequests, the main evaluation allows us to distinguish change request quality inearly stages of the process from that in late stages of the process.
Calculating process health is done as in the pre-evaluation (see Equation 5.1).If an overall health value is desired, the process roles can simply be ignored, suchthat item scores are counted across roles. For example, in order to determine theoverall process health with respect to quality of change requests, the items forchange request completeness, self-containedness, detail level, and overall quality(see Table 5.2), for all receiving roles, should be used. However, to specificallylearn about the health with respect to initial change request quality, only thereceiving role CR receiver (and possibly screening meeting member) should beused.
If the process health for a receiving role is known, it is interesting to look atthe process health for the corresponding producing role. For example, based onconfidence in output for the CR issuer role, we could calculate a health valuethat can be compared to that of the change request quality-related items asseen by the CR receiver role. A mismatch between two health values obtainedlike this indicates that there is a discrepancy in the process that should be dealtwith.
Results from both the quantitative and qualitative parts of the main evalu-ation are summarised below:
• In general, people are confident in what they produce, and spend reason-able effort on generating their output. However, as seen both from CRreceiver and screening meeting member perspectives, the change request
145
5: Checklist Support in the Change Control Process
quality could clearly be improved. Thus, there is a mismatch regardingchange request quality in this early stage in the process.
• The process health with respect to decisions in the early screening step isin par with the result from the pre-evaluation.
• The change request turnaround time could be improved, but the answersare on the positive side of the scale. In particular, people seem more opti-mistic about this time aspect than the ones measured in the pre-evaluation(i.e., delays in the process and responsiveness of analysing parties).
• In terms of organisational support received, all respondents highlightedsupport by other project members and the project organisation in itself.Support by any kind of process instrument was not mentioned.
• Communication with strategic product management can be difficult. Oc-casionally, change requests that are not seen as strategic are dismissed,only to be issued again later on when there is a stronger strategic urge.This causes unnecessary work in the organisation.
In terms of improving process efficiency, no apparent pattern can be recog-nised. One mentioned improvement is to lower the number of change requestsin the process to alleviate the pressure (this can be achieved with some of theimprovement proposals presented in Chapter 4). One respondent pointed outthat an iterative change request approach, where a change request is graduallycompleted with more information, allows for good process flow, since not toomuch effort has been invested upfront if a change request is rejected in the earlyphases of the process.
5.4 DISCUSSIONIn this section, we briefly reflect on the evaluation results presented in Sec-tion 5.3.
The purpose of the pre-evaluation was to be able to assess a process health.Process health is seen as a simple and easily understood indicator of the stateof the process. In recurring evaluations, process health values can be plotted,and trends in the process state can be detected. Looking at specific aspectsof the performed evaluation, the results indicated that both analysis time andchange request quality are points of improvement, whereas the other aspects aremore healthy. A problem with this pre-evaluation was that it was not tailored
146
5: Checklist Support in the Change Control Process
to the change control process, and some confusion arose as to which steps in theprocess were targeted.
The main evaluation was created to take into account the different steps inthe process. As such, it is suitable for pinpointing discrepancies in the process,where the output of one step does not match the expected input to the followingstep. The results actually show such a case, where the initial change requestquality could be better according to receivers, while the producers are confidentin their output. Interestingly enough, one CR issuer also argued that an iterativeapproach to writing change requests results in an efficient process. However, thisis somewhat conflicting with the apparent high expectations in the receivingend; an iterative approach would not result in more complete and self-containedchange requests. This point was discussed at a subsequent meeting. It was seenthat the process allows for an iterative way of writing change requests, but thetool used is more detailed and demanding than the process. This means thatthe use of the tool increases the expectations on change request quality, whichis not compatible with an iterative approach.
The main evaluation also contained some qualitative questions. The issueof difficulty in communicating with strategic product management was raised;sometimes non-strategic change requests are dismissed although they shouldnot be. A possible remedy for this is to focus harder in the initial phase of theprocess on the long-term strategic consequences of both accepting and rejectingthe change request.
We believe that checklist-based process support is an important part of pro-cess improvement with respect to the improvement issues identified in the eval-uations. The results of the main evaluation indicates that no process supportof this kind or similar exists at the company today.
5.4.1 INDUSTRIAL ADOPTIONAs described in Section 5.1.4, the request for checklist-based process supportwas raised already in the previous study described in Chapter 4. While workingon the adaptation of the checklists, great interest has been shown by processstakeholders. Early on, an internal screening of the initial checklists was initi-ated inside the company, and several of the stakeholders have commented onthe checklists for the sake of improving them.
The PSI has also been partially adopted or will be adopted in various projectsat Ericsson. Furthermore, the company has expressed interest in using some-thing similar also for requirements management, as this process is similar tothe change control process. The outcome of the adoption, in terms of further
147
5: Checklist Support in the Change Control Process
required adaptation and general opinions, has not been investigated yet. How-ever, the intention is to repeat the main evaluation later on to see if anythinghas improved.
5.4.2 VALIDITY THREATSThreats to the validity of the study, and counteractions taken, are outlinedbelow.
A threat to construct validity is that the main evaluation may not coverthe right aspects, and may not be suitable for measuring process health ingeneral and checklist effects in particular. To void this threat, we have strivedto base the evaluation aspects on findings in previous studies. We have alsodiscussed the contents and input/output characteristics of the evaluation formwith research colleagues.
A second threat to construct validity is that the term quality used in theevaluations has not been defined. However, we argue that this is not necessary.Even if people have different notions of what quality means, an indication oflow quality in a process needs to be followed up. Quality has to do with whatpeople expect, so different perceptions of quality reflect different expectations,and an objective of every process is to satisfy all of its stakeholders’ expectations.Furthermore, when an evaluation is recurring, the relative quality is of moreimportance than the absolute quality at any time.
External validity is concerned with generalisability of the results. Whilethis is a single case study, and the selection of subjects has not been entirelyrandom, we consider the checklist adaptation to be successful so far. Thus,the methodology in the study should be generalisable. Also, the input/outputapproach used in the second evaluation seems promising, and should also begeneralisable.
5.5 SUMMARY AND CONCLUSIONSThe contribution of this chapter is threefold: (1) an approach for adapting aset of generic checklists for analysing a proposed change, to the context of theiruse; (2) the characteristics of a process support instrument—the outcome ofthe adaptation in our case; and (3) a process evaluation approach that takesinto account the input/output characteristics of the steps, as well as points ofdecision making, in the change control process.
148
5: Checklist Support in the Change Control Process
The generic checklists were adapted along three axes—process, domain, androles—in order to create a process support instrument that could cater for allrelevant aspects and stakeholders of the change control process at Ericsson. Thechecklists in the resulting instrument cover all phases of change request analysis,including detailed estimation of system impact.
We have designed and executed a main evaluation preceded by a pre-evaluation. The pre-evaluation was used to determine the health of the changecontrol process, and resulted in the identification of two important improve-ment issues: analysis time and change request quality (see also the importanceof issue i6 in Chapter 4). The main evaluation was designed to overcome somedisadvantages of the first evaluation, primarily that it was not tailored for thesteps in the process. In the main evaluation, the process steps were seen as hav-ing input, output, and/or decision character. By comparing input and outputquality, we can pinpoint discrepancies in the process in addition to determiningprocess health. The main evaluation also covered some qualitative aspects ofthe process, such as problem identification and determination of improvements.
Results from the main evaluation are that there is a difference between con-fidence of produced outcome and expected quality in the early process stages.One possible reason for this is that the expectations are influenced more bya detailed and unforgiving tool than the adaptable process. Another possiblereason is, of course, that the change request quality indeed is low early on. Aniterative change request approach would be appropriate for CR writers, butpossibly not for receivers. Moreover, the change request turnaround time couldbe improved. The results also suggest that process support is lacking, and thatthe strategic character of change requests needs to be highlighted more.
The checklist-based process support has been partially adopted at the stud-ied company, and the reception has been positive. We consider this to befavourable with respect to both the checklist adaptation approach and the re-sulting process support instrument. This suggests that the answer to researchquestion RQ1 (is checklist-based process support an effective way of improvingthe change control process?) is positive, although more investigation has to beperformed in order to obtain a proper result.
When it comes to research question RQ2 (how can we measure the efficiencyof the change control process in an effective way?), we believe the answer liesin the main evaluation approach. The evaluation has provided some interestingresults. However, we need to perform follow-up evaluations in order to learnmore about this.
149

5: Checklist Support in the Change Control Process
5.5.1 FUTURE WORKThe most imminent future work is the execution of a follow-up evaluation inorder to measure the effect of the described PSI. This must be done so we canbetter answer the research questions. Open research questions that have beenraised in this work are:
• Can the described checklist-based PSI be used successfully also in therequirements management process?
• How well does checklist-based process support perform in comparison toother approaches, such as automated support tools?
• Are there more relevant axes (than process, roles and domain) to be used inchecklist adaptation? Is there something other than need that determineswhich axes that are relevant to look at?
150
Chapter 6
Impact Analysis andSoftware Evolution
For a software system to be and remain useful over time, it needs to be con-tinually improved with respect to its environment and context of use. This istermed software evolution, and is closely related to concepts such as incrementalchange [Rajlich, 2001] and release planning [Saliu and Ruhe, 2005]. The evo-lution of a software system typically happens through changes that are smallin relation to the system itself, meaning that revolutionary changes are notconsidered part of the evolution concept [Lehman and Ramil, 2003].
Software evolution has been studied extensively, and eight laws of softwareevolution that govern the behaviour of real-world, problem-solving software sys-tems have been formulated [Lehman, 1996]. Three of these laws explicitly ex-press the fact that unless a system is evolved, it will become gradually lesssatisfactory for its users. This is in part due to evolving needs of the users, butalso to external factors such as pressure from competitors, regulations, etc.
The evolvability of a software system denotes its capability to be evolved,which is dependent on internal factors such as product quality, but also on exter-nal factors such as evolution processes and organisational use environment [Cooket al., 2000]. Put differently, evolvability is not only built into a system, but isalso affected by the context. An example of the latter is demonstrated in thischapter.
In this thesis, no difference is made between software evolution and “ordi-nary” large-scale software development, since developing release x + 1 means
6: Impact Analysis and Software Evolution
evolving the system from release x to a new state. Already in 1993, Potts notedthat most development was software maintenance rather than new developmentfrom scratch [Potts, 1993]. The situation is hardly any different now, and Er-icsson, the object of study here, develops software systems in a multi-releasemanner where each release is built on a previous one.
Incremental change is change induced by adding functionality to an existingsystem [Rajlich, 2001]. Incremental change involves modifying the existing sys-tem to incorporate and bind to the new functionality. The magnitude of suchmodifications obviously depends on the state of the existing system. Accordingto Rajlich, the basic concepts of the new functionality often already exist in thesystem, and adding new functionality means to extend these concepts. In orderto succeed with this, it is necessary to perform impact analysis to learn abouthow the new functionality will affect the system, and thus what the consequencesof adding the functionality will be.
Incremental software development is a way of developing software in aproject: the system is developed and possibly delivered to the customer inchunks denoted increments (this is also called incremental delivery [Sommerville,2004]). This allows the customer to give quick feedback on the ongoing devel-opment. From the point of view of adding functionality, incremental softwaredevelopment and software evolution are the same but differ in scale. More de-tails are known about how the system is incrementally developed in a projectthan about how it is evolved over the next few releases.
As mentioned in the thesis introduction, Ericsson is in the process of shift-ing from long-term projects to shorter and swifter projects that can improveresponsiveness towards customers and reduce the stress on the development or-ganisation. In practice, the increments are distributed over several projects, butwith the added benefit of possible parallel development and more explicit bound-aries. This mode of development is termed streamline development, and a keyfactor to ensure success is to improve the use of anatomy plans [Tomaszewski,2006: paper IX]. An anatomy plan is used within a project to control incremen-tal development, and shows the functional content of the delta between releasesx and x+ 1 laid out over time. With shorter and less release-oriented projects,there is a desire for using anatomy plans also to control the evolution of thesystem (or product).
We have worked with Ericsson in order to extend anatomy planning to alsotake into account software evolution, and to otherwise improve on anatomyplanning practices. This allowed us to study how impact analysis supports in-cremental development and software evolution. Information has been obtainedthrough discussions, work meetings, and internal documentation. In this chap-
152
6: Impact Analysis and Software Evolution
ter, we describe the result of our work, and discuss change impact analysis fromthe aforementioned perspective. The chapter is organised as follows. Section 6.1describes the objective of the study and lists the research questions. Section 6.2provides a context for the anatomy plan concept, which is presented in detail inSection 6.3. Section 6.4 discusses how impact analysis relates to the anatomyplan concept, while Section 6.5 discusses evolution and evolvability. Finally,Section 6.6 concludes the chapter and provides pointers for future research.
6.1 RESEARCH OBJECTIVEThe aim of the study was twofold: First, to extend and improve the way ofworking with anatomy plans (henceforth termed anatomy planning) at Ericsson,and second, to study how impact analysis fits into incremental development andsoftware evolution.
The improvement work (first part) had three main steps: (1) building anunderstanding of and positioning the anatomy plan concept in relation to otherrelevant software development concepts; (2) identifying challenges originatedfrom anatomy planning, and needs not met by the current practice; and (3)to formulate an extension of the anatomy plan concept, taking into accountidentified challenges and needs. Figure 6.1 illustrates the steps and parts of thestudy. The research questions for the second part are:
• RQ1: Of what use is impact analysis in relation to software evolution andincremental development?
• RQ2: How can impact analysis facilitate the identification of dependenciesbetween functional entities?
The research questions form a sort of parent-child relationship. However,the purpose of the first was to approach the study in an exploratory manner inorder to identify impact analysis purposes. The second one was formulated withknowledge about current anatomy practices; we wanted to explore dependencyaspects closer.
The research has been conducted through workshops, meetings, presenta-tions, and discussions with stakeholders at Ericsson. Involved parties includetechnical experts, designers, developers, project managers, and line managers.No empirical evaluation of the results put forward in this chapter has been made.
The contribution lies both in the description and extension of the anatomyplan concept, and in the study of how it is related to impact analysis.
153
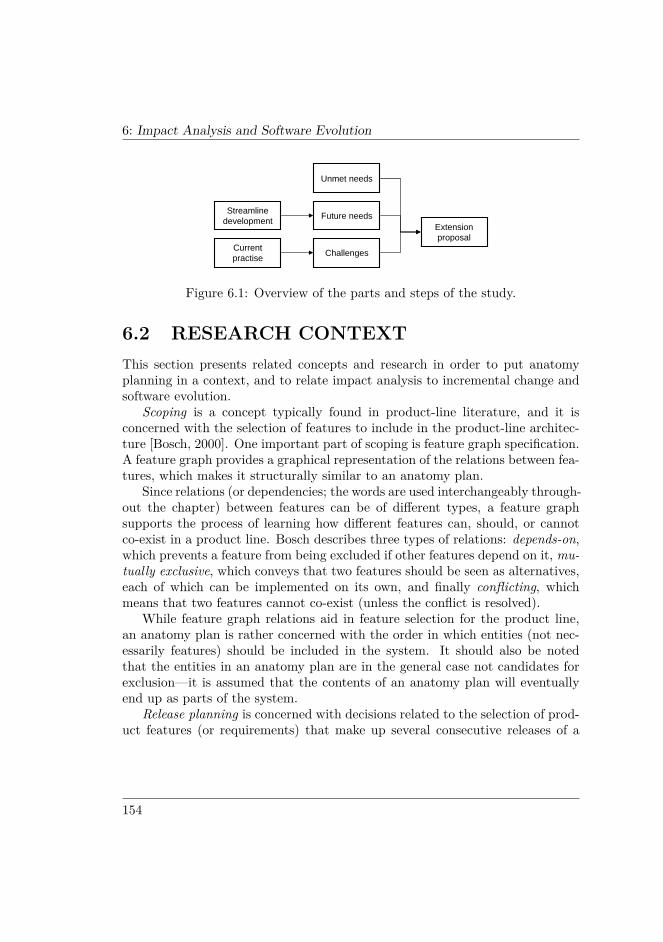
6: Impact Analysis and Software Evolution
Streamlinedevelopment
Currentpractise Challenges
Future needs
Unmet needs
Extension proposal
Figure 6.1: Overview of the parts and steps of the study.
6.2 RESEARCH CONTEXTThis section presents related concepts and research in order to put anatomyplanning in a context, and to relate impact analysis to incremental change andsoftware evolution.
Scoping is a concept typically found in product-line literature, and it isconcerned with the selection of features to include in the product-line architec-ture [Bosch, 2000]. One important part of scoping is feature graph specification.A feature graph provides a graphical representation of the relations between fea-tures, which makes it structurally similar to an anatomy plan.
Since relations (or dependencies; the words are used interchangeably through-out the chapter) between features can be of different types, a feature graphsupports the process of learning how different features can, should, or cannotco-exist in a product line. Bosch describes three types of relations: depends-on,which prevents a feature from being excluded if other features depend on it, mu-tually exclusive, which conveys that two features should be seen as alternatives,each of which can be implemented on its own, and finally conflicting, whichmeans that two features cannot co-exist (unless the conflict is resolved).
While feature graph relations aid in feature selection for the product line,an anatomy plan is rather concerned with the order in which entities (not nec-essarily features) should be included in the system. It should also be notedthat the entities in an anatomy plan are in the general case not candidates forexclusion—it is assumed that the contents of an anatomy plan will eventuallyend up as parts of the system.
Release planning is concerned with decisions related to the selection of prod-uct features (or requirements) that make up several consecutive releases of a
154

6: Impact Analysis and Software Evolution
product [Ruhe and Saliu, 2005]. For large∗ software systems, it is hardly everfeasible to include all foreseeable features in one single release. Developmentresources, timing and state of technology, just to mention a few, may limit whatis possible to accomplish in a single release. Release planning and software evo-lution are tightly coupled, as a system evolves through its releases. Therefore,the process of planning releases and the challenge of defining an evolution pathfor the system go hand in hand.
Ruhe and Saliu [2005] mention two feature relation types relevant froma release planning perspective, namely coupling, which means that two fea-tures should be released together, and precedence, which dictates an order inwhich features should be implemented. Relations among features constituteconstraints that influence the scope of a particular release.
Carlshamre et al. [2001] have studied requirements interdependencies in thecontext of release planning. They distinguish between functional dependenciesand value-based ones, arguing that the latter tend to be more important inmarket-driven, multi-release product development, as opposed to tailor-made(bespoke) development. The functional dependency types they discuss are or(providing alternatives), and (two-way depends-on), requires (one-way depends-on), cvalue (affecting the customer value of the target), and icost (affecting theimplementation cost of the target). The latter two are seen as value-baseddependencies, while the others are seen as functional ones. Figure 6.2 showshow these dependency types relate to the previously mentioned ones. As inrelease planning, relations between the involved entities play a large role in thedefinition and use of anatomy plans.
Pfleeger [1998] describes incremental software development as a mode of de-velopment where a system is partitioned into subsystems, which are developedin several steps that each extends the functionality of the system. Dependen-cies that affect how releases are formed in release planning may influence howincrements can be developed and delivered as well. Thus, there is a connectionbetween incremental software development and release planning, and therebyanatomy planning.
As noted, modifications that are required when new functionality should beadded go under the name incremental change, which is one of the key strategiesin Extreme Programming [Rajlich, 2001; Beck, 2000]. When adding new func-tionality to an existing system, four steps should be followed: locate the partof the system (based on the assumption that there is one) that holds the basis
∗ Lehman and Ramil [2003] define large to mean systems developed in a context with two ormore management levels. By this definition, Ericsson develops large systems.
155
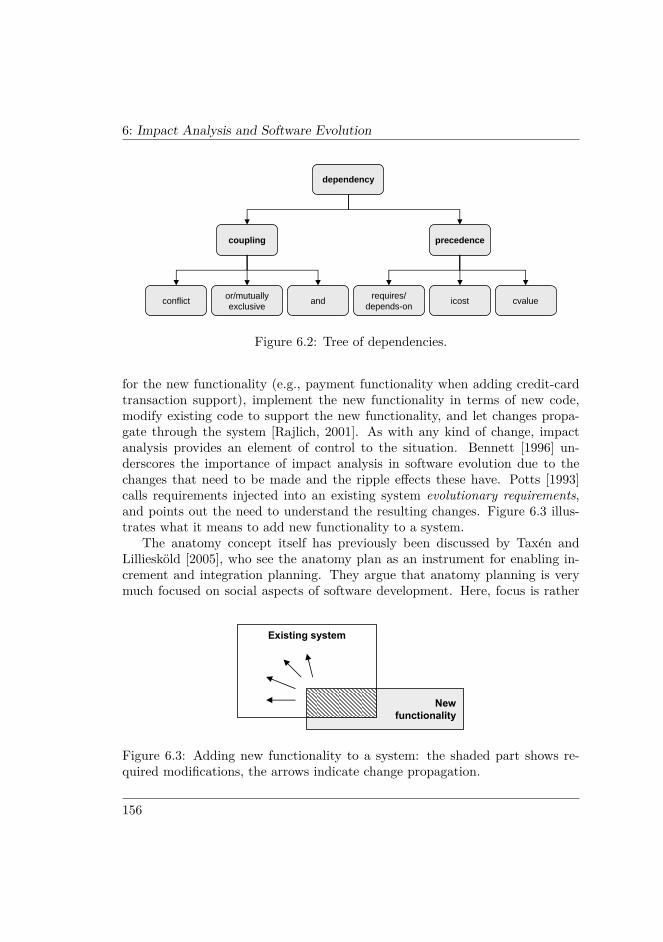
6: Impact Analysis and Software Evolution
coupling precedence
conflict or/mutuallyexclusive and requires/
depends-on icost cvalue
dependency
Figure 6.2: Tree of dependencies.
for the new functionality (e.g., payment functionality when adding credit-cardtransaction support), implement the new functionality in terms of new code,modify existing code to support the new functionality, and let changes propa-gate through the system [Rajlich, 2001]. As with any kind of change, impactanalysis provides an element of control to the situation. Bennett [1996] un-derscores the importance of impact analysis in software evolution due to thechanges that need to be made and the ripple effects these have. Potts [1993]calls requirements injected into an existing system evolutionary requirements,and points out the need to understand the resulting changes. Figure 6.3 illus-trates what it means to add new functionality to a system.
The anatomy concept itself has previously been discussed by Taxén andLilliesköld [2005], who see the anatomy plan as an instrument for enabling in-crement and integration planning. They argue that anatomy planning is verymuch focused on social aspects of software development. Here, focus is rather
Newfunctionality
Existing system
Figure 6.3: Adding new functionality to a system: the shaded part shows re-quired modifications, the arrows indicate change propagation.
156
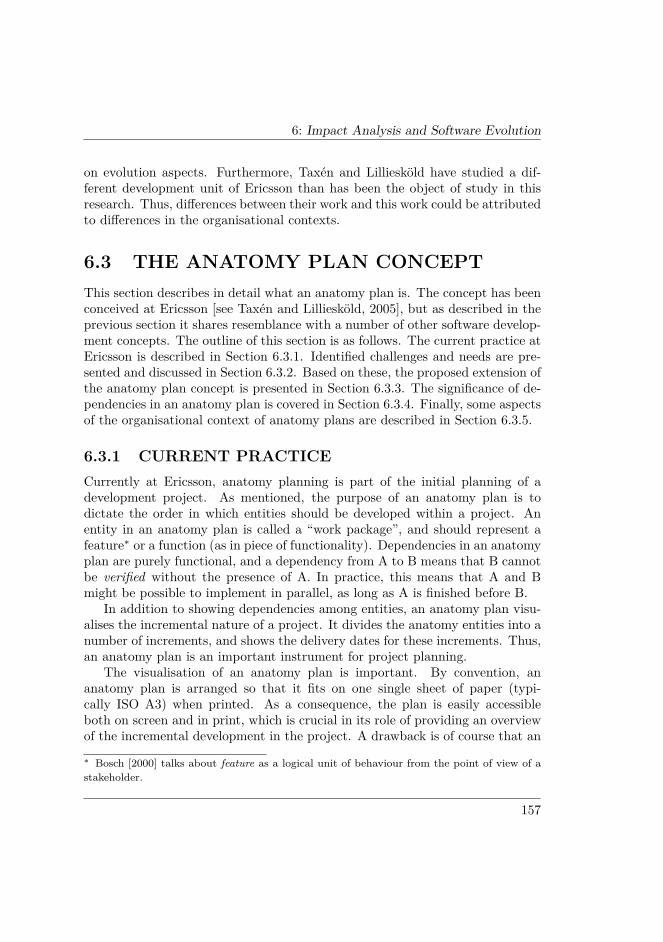
6: Impact Analysis and Software Evolution
on evolution aspects. Furthermore, Taxén and Lilliesköld have studied a dif-ferent development unit of Ericsson than has been the object of study in thisresearch. Thus, differences between their work and this work could be attributedto differences in the organisational contexts.
6.3 THE ANATOMY PLAN CONCEPTThis section describes in detail what an anatomy plan is. The concept has beenconceived at Ericsson [see Taxén and Lilliesköld, 2005], but as described in theprevious section it shares resemblance with a number of other software develop-ment concepts. The outline of this section is as follows. The current practice atEricsson is described in Section 6.3.1. Identified challenges and needs are pre-sented and discussed in Section 6.3.2. Based on these, the proposed extension ofthe anatomy plan concept is presented in Section 6.3.3. The significance of de-pendencies in an anatomy plan is covered in Section 6.3.4. Finally, some aspectsof the organisational context of anatomy plans are described in Section 6.3.5.
6.3.1 CURRENT PRACTICECurrently at Ericsson, anatomy planning is part of the initial planning of adevelopment project. As mentioned, the purpose of an anatomy plan is todictate the order in which entities should be developed within a project. Anentity in an anatomy plan is called a “work package”, and should represent afeature∗ or a function (as in piece of functionality). Dependencies in an anatomyplan are purely functional, and a dependency from A to B means that B cannotbe verified without the presence of A. In practice, this means that A and Bmight be possible to implement in parallel, as long as A is finished before B.
In addition to showing dependencies among entities, an anatomy plan visu-alises the incremental nature of a project. It divides the anatomy entities into anumber of increments, and shows the delivery dates for these increments. Thus,an anatomy plan is an important instrument for project planning.
The visualisation of an anatomy plan is important. By convention, ananatomy plan is arranged so that it fits on one single sheet of paper (typi-cally ISO A3) when printed. As a consequence, the plan is easily accessibleboth on screen and in print, which is crucial in its role of providing an overviewof the incremental development in the project. A drawback is of course that an
∗ Bosch [2000] talks about feature as a logical unit of behaviour from the point of view of astakeholder.
157
6: Impact Analysis and Software Evolution
anatomy plan for a large project can become difficult to manage because of itscomplexity.
According to one anatomy plan document studied, the visualisation of awork package should convey information about a number of aspects of the workpackage. For example, the background colour should reflect the status of thework package (e.g., red for problems), while the border colour should reflect therevision change status of the work package. Text inside the work package boxshows its name, the planned finish date, and so on. Packing so much informationinto a work package representation is done to have the information accessible,and to be able to adhere to the “one sheet” convention.
An aspect of anatomy planning related to its use in project planning, is thebreakdown of functions into functional “ladders”, addressing the composite andincremental nature of individual functions. This allows for a stepwise imple-mentation of a function, and thus provides greater control over the scope of aproject. At Ericsson, a function is loosely defined such that it should be possibleto decompose it in at least two parts, or steps. Each step should contain piecesof functionality that together make a defined, verifiable part of the function asa whole. A functional ladder can contain functionality that depends on otherfunctionality in the ladder, as well as non-coupled (loose) functionality. Func-tionality of the former type forces a certain order of items in the ladder, whereasnon-coupled functionality can be placed wherever it is best suited. The latteralso means in practice that different steps in a functional ladder can be paral-lelised to a certain extent. The purpose of using functional ladders is threefold:
• It facilitates the delimitation of the scope of a development project. Forexample, the scope could be set so that only subsets of one or a fewfunctions are delivered (while still providing value to the customers).
• It allows continuous testing during development as function incrementsare finished.
• If a function is excluded during development (e.g., because of time pres-sure), less work may be lost than if development of the function had beeniterative.
The last bullet warrants an explanation, as the distinction between incre-mental and iterative may not be obvious in this context. If a function is devel-oped iteratively, all of its constituent parts need to be designed and planned for;thus the upfront cost is higher than if one part of the function can be designedand planned for at a time. This is a somewhat simplified view, as both planningand design cannot be too short-term, but it serves to illustrate the point.
158

6: Impact Analysis and Software Evolution
An example of a functional ladder is given in Figure 6.4. In the example,the indexed function parts are meant to correspond to dependent pieces offunctionality. Only function part B is non-coupled, and has here been placedin a step of its own. Placing it in the first step would have made this step toolarge, while placing it in a later step would have excluded it from the currentproject scope, shown by the dashed line.
Function F
Part A1Part A2Part A3Part B
Part C1Part C2
A1A2
B
A3C1
C2
USSD Enquiry USSD UserAccount Refill
Scope limit
Figure 6.4: Example of a functional ladder. The dashed line shows how muchof the ladder to include in the project.
6.3.2 CHALLENGES AND NEEDSA number of challenges of working with anatomy planning and the resultinganatomy plan documents have been identified. One challenge is that the de-velopment order dictated by an anatomy plan is not always strictlyfollowed by developers, which ultimately defeats the purpose of the plan.One reason for this is the nature of the dependencies, or rather, the nature ofthe dependencies not included in the plan. While the included dependenciesare functional, there are typically several independent work package paths thatcan be scheduled in parallel in several different ways. As project incrementsare planned in order to achieve a balance between delivered customer value andtime constraints (suggesting implicit cvalue dependencies), icost dependenciesare not explicitly considered. An icost dependency can be process oriented orproduct oriented. Carlshamre et al. [2001] found that many temporal dependen-cies conveyed process-related knowledge about what was “smart” to implementbefore something else, suggesting that these were icost dependencies.
An example of product knowledge suggesting an icost dependency is thattwo functions, A and B, depend on the same architecture change, or are basedon the same technical solution. In this case, the dependency between A and Bis positive, as the implementation cost of B is lowered when A is implemented,
159
6: Impact Analysis and Software Evolution
since the implementation of A includes the architectural change or the technicalsolution. Therefore, the two functions should be implemented together or closein time. If the dependency is not made clear and the functions as a resultare scheduled for parallel implementation, there is a risk for implementationoverhead as both developers (or teams) do partly the same job. In the worstcase, a conflict arises when the two developers are going to implement the samearchitectural change or the same technical solution.
Another challenge is that it is difficult to visualise the anatomy plansin the prescribed way. They become less informative when the visualisationtype used is less rich than intended. This can happen because the tool usedto create and maintain anatomy plans primarily allows for working with thesyntax of an anatomy plan, but not the semantics. With syntax, we mean thevisualisation elements such as boxes and arrows. With semantics, we mean thelogic and constraints encoded in the boxes and arrows. Thus, the tool forces alot of manual work onto the user. Working manually with a large and complexplan is counterproductive.
A challenge is to maintain a proper balance between functional andimplementation-oriented content. While an anatomy plan is a functionalview of the system, work packages that are large may affect many subsystems(implemented by different development teams). Therefore, it is sometimes use-ful to break down such work packages into smaller and more implementation-oriented packages that target the different subsystems. A disadvantage is thatthis can result in lower flexibility as parts of the functional-implementationmapping are determined too early.
A dilemma that can occur while working according to an anatomy plan, iswhether to keep or remove an architectural change if a function isexcluded from the project. This can happen if the project runs short oftime, and certain functionality needs to be cut out. If a function is excluded, itshould be so in its entirety. However, if an architecture change was realised aspart of the function before it was excluded, it may be difficult to “roll back” allthe way. Thus, it can turn out to be risky to focus only on added functionalityand not on the impact on the underlying system in the anatomy plan.
A challenge related to the use of functional ladders is that the first stepusually becomes very large (i.e., the ladder becomes front heavy). Thishappens especially when a lot of work needs to be done before some customervalue can be provided, for example if the functionality is very complex, or due torequired architecture-related changes. This partly defeats the point of havingan incremental breakdown of functions; since a significant amount of designand planning may be necessary, much work is lost if the function is excluded.
160

6: Impact Analysis and Software Evolution
Moreover, a possible disadvantage of decomposing a function into incrementalsteps (as opposed to implementing the function iteratively) that was raised indiscussions is the fact that synergy effects during implementation may be lost.If different steps affect the same architecture components, for example, it wouldbe desirable to do those steps simultaneously. Thus, the decomposition intosteps need to take into account not only functional-logical aspects, but alsoimplementation aspects, much like using implementation-oriented dependencieson the feature/function level.
The overarching need at Ericsson is to be able to get better at using anatomyplanning, and to spread the use of anatomy planning in the organisation. Thereare several stakeholders for whom proper anatomy planning is very useful, pri-marily those who control the high-level development of systems, and those whoare responsible for integration and verification. Others, for example those whoare responsible for detailed system development, do not find it as useful. Thedifference between these groups is that the former mostly deals with features orhigh-level functions, while the latter deals with implementation aspects.
In streamline development, projects will be shorter and less resource heavy,which means that they can be run in parallel. This poses high demands on thedelineation of each project, and on the control of how within-project develop-ment fits into the evolution of the system as a whole. Here, anatomy planningis seen as a key player in the process of making streamline development pos-sible [Tomaszewski, 2006: paper IX]. Thus, a crucial need is to ensure thatanatomy planning fits this situation.
6.3.3 EXTENDED ANATOMY APPROACHBased on the identified needs and challenges, the following list of necessarychanges to how anatomy planning works today was compiled (order is not im-portant):
1. Distinguish between a product-level anatomy plan and a project-levelanatomy plan. The latter is meant to be closer to the implementationof the system, while the former is kept feature-oriented. This differentia-tion of levels supports streamline development.
2. Allow smaller steps in functional ladders by differentiating between value-producing steps and implementation-oriented steps. This puts more em-phasis on the incremental nature of functions, and can help in reducingeffort loss should a function be excluded.
161
6: Impact Analysis and Software Evolution
3. Separate structural changes to the underlying system, such as architecturechanges, from the functional content of a function or feature. This loosensthe dependency between code-base evolution and functional evolution.
4. Focus more on eliciting dependencies among entities in an anatomy plan,by involving all relevant stakeholders in a structured manner. This helpsensuring that the development order dictated by an anatomy plan is fol-lowed by everyone.
5. Make use of a tool or a set of tools that support both initial anatomyplanning and continuous maintenance of anatomy plans. This relievesanatomy planning efforts, and reduces the risk of anatomy plans becomingshelf-ware.
The first three changes point in the same direction, namely using anatomyplans to bridge the gap between functional content and implementation. Thefirst and fourth changes rely on impact analysis to determine how added func-tionality affect the current system (see Section 6.4). In the next few sections, wedescribe the extension to the anatomy plan concept resulting from the changeslisted above.
6.3.3.1 PRODUCT ANATOMY PLAN
The distinction between the product-level anatomy plan and the project-levelanatomy plan is that the former spans over several releases (i.e., is not bound toany particular release), whereas the latter is project specific. As a release canbe developed through one or more projects, the project-level anatomy plan canbe said to be valid within a single release.
The most prominent characteristic of a product anatomy plan is the lack ofresource and (to a large extent) time constraints. The idea is to allow planningof the system evolution over several possible releases without having to do ini-tial, detailed release planning. However, as the work packages in the plan areinterconnected and thus appear in a defined order of inclusion in the system, acertain time aspect can be discerned.
A question that arises is how far to break down the work packages in aproduct anatomy plan. The detail level to target should depend on at least twothings:
1. The amount of available knowledge about the work package. For example,if a feature is concrete and well-defined, it should be decomposed into
162
6: Impact Analysis and Software Evolution
functions and possibly functional ladders. Otherwise, it may be left as afeature for the time being.
2. The desired balance between the effort required to create the productanatomy plan and the future effort needed to create project anatomy plans.The more abstract the product anatomy plan is, the more effort is requiredlater on when projects are planned.
When the functional ladder for a function is created, two different typesof steps should be used. In the current practice, each step delivers customervalue. However, by allowing steps that deliver only “development value”, thepressure on the development organisation can be relieved somewhat, as upfrontdesign and planning can be optimised. These steps are termed intermediatesteps, whereas the value-delivering steps are termed release steps. If a projectincludes a release step, the delivered functionality that belongs to the particularfunction can be verified as a part of the system and can be acknowledged asbeing part of the release. Deliverables from the intermediate steps exist in thecode base and facilitate further development.
The product anatomy plan needs to be aligned with other strategic, long-term documents and plans. For example, Ericsson uses the concept of “targetarchitecture” to describe goals related to the structural evolution of systems.The functional evolution described in a product anatomy plan cannot be in-compatible with the target architecture. By involving certain implementationaspects in the plan, the compatibility can be ensured.
It was decided to introduce the concept of prerequisites in the productanatomy plan. A prerequisite is a non-functional entity, which typically cor-responds to an architectural change that is necessary for implementing somefunctionality that is not supported by the current architecture. A prerequisiteautomatically results in a requires/depends-on dependency between itself andthe functionality it enables, which can be not only a feature or function, butalso a step on a functional ladder. The latter is useful if, for example, a functioncan be partly evolved over a number of steps without changes to the currentarchitecture, but further evolution requires changes.
6.3.3.2 PROJECT ANATOMY PLAN
The project anatomy plan contains a subset of the entities in the productanatomy plan for one particular project. As pointed out, a release can bedeveloped through one or more projects, which means that the project anatomyplan is release specific. It follows that the product anatomy plan acts as input
163
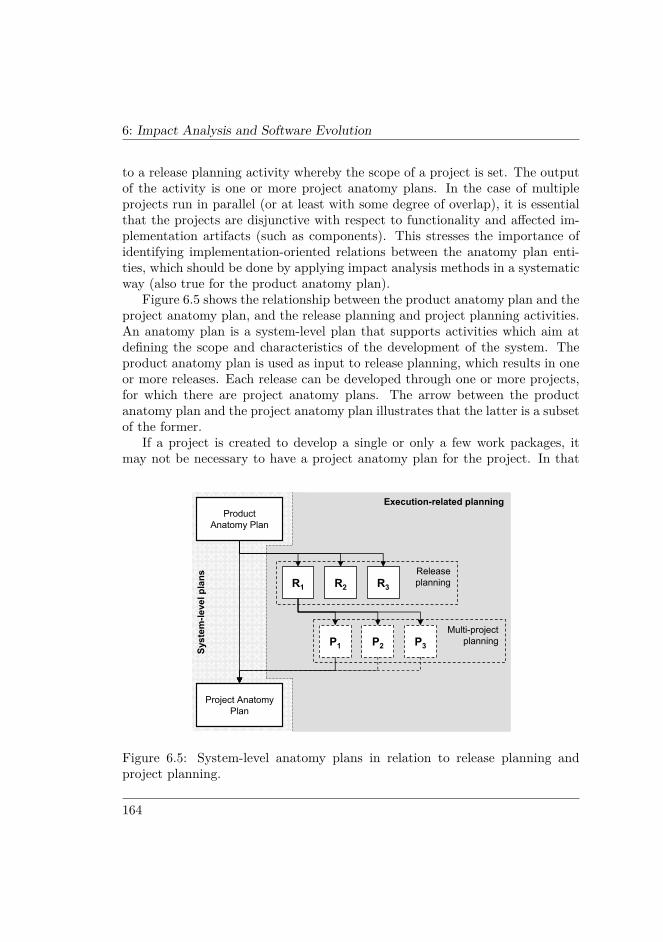
6: Impact Analysis and Software Evolution
to a release planning activity whereby the scope of a project is set. The outputof the activity is one or more project anatomy plans. In the case of multipleprojects run in parallel (or at least with some degree of overlap), it is essentialthat the projects are disjunctive with respect to functionality and affected im-plementation artifacts (such as components). This stresses the importance ofidentifying implementation-oriented relations between the anatomy plan enti-ties, which should be done by applying impact analysis methods in a systematicway (also true for the product anatomy plan).
Figure 6.5 shows the relationship between the product anatomy plan and theproject anatomy plan, and the release planning and project planning activities.An anatomy plan is a system-level plan that supports activities which aim atdefining the scope and characteristics of the development of the system. Theproduct anatomy plan is used as input to release planning, which results in oneor more releases. Each release can be developed through one or more projects,for which there are project anatomy plans. The arrow between the productanatomy plan and the project anatomy plan illustrates that the latter is a subsetof the former.
If a project is created to develop a single or only a few work packages, itmay not be necessary to have a project anatomy plan for the project. In that
Syst
em-le
velp
lans
Execution-related planningProduct
Anatomy Plan
Project AnatomyPlan
ReleaseplanningR1 R2 R3
Multi-projectplanningP1 P2 P3
Figure 6.5: System-level anatomy plans in relation to release planning andproject planning.
164
6: Impact Analysis and Software Evolution
case, a project anatomy plan can instead be created for several projects. Thisis illustrated in Figure 6.5 by the dashed arrows from projects P2 and P3.
Unlike the product anatomy plan, the project anatomy plan makes explicittime and resource constraints, obviously since these aspects are important steer-ing factors for any project. By adding time and resource constraints, it is possi-ble to plan increments in time, and thus to plan for incremental testing duringthe project. Taxén and Lilliesköld [2005] discuss integration planning as theactivity of assigning delivery dates and resources to increments. They also de-scribe the creation of the anatomy plan as being based on verifiable increments,a view that is shared here.
The project anatomy plan needs to a greater extent than the productanatomy plan be synchronised with implementation-oriented artifacts such asarchitecture and detailed design. Otherwise, there is a risk that the anatomyplan does not function as a guide for incremental development. Thus, beforedevelopment in the project starts, the following issues need to be checked:
• That there is an accurate mapping between the project anatomy plan andimplementation-oriented artifacts.
• That the relations in the project anatomy plan are correct and that norelations are missing.
• That the functional decomposition in the project anatomy plan is correctand complete with respect to the detail level necessary for the project.
The issues above imply that effort may need to be spent on further decom-posing work packages from the product anatomy plan, on identifying additionalrelations and prerequisites, and so on.
After a project has ended, the project anatomy plan should be synchronisedwith the product anatomy plan. The reason is that the work conducted inthe project may have changed the project anatomy plan to the extent that theproduct anatomy plan no longer is entirely valid. Without this feedback linkbetween the two levels, there is a risk that the product anatomy plan goes outof sync with what is going on in the development projects. The synchronisationalso means that the evolution can be traced backwards in old product anatomyplan documents, as product anatomy plans will function also as documentation.
6.3.3.3 THE ANATOMY PLAN AS A MODEL
In the current practice, an anatomy plan can be said to be a functional model ofthe system evolved under it, meaning that the units of interest in the anatomy
165
6: Impact Analysis and Software Evolution
plan are related to functionality rather than to some implementation-orientedaspect. This means that the anatomy plan for a system, depending on thedetail level of its contained work packages, may be supported by and related touse cases that govern the functionality of the system. More specifically, high-level use cases can be used to guide anatomy planning activities, aiding in theidentification of functionality to include in the plan.
As a contrast, purely implementation-oriented models, such as the softwarearchitecture of a system, contain units of responsibility for some specific as-pect or aspects of the functionality of the system. It follows that there is amapping, albeit not one-to-one, between a functional model of the system andan implementation-oriented model. We argue that for an anatomy plan to besuccessful, it is important to consider the mapping to implementation-orientedmodels of the system (including its source code, which is the most accuratemodel). During anatomy planning, this is done by applying methods for impactanalysis to the work packages. In a final anatomy plan, the mapping can, forexample, result in dependencies among work packages that otherwise would notbe apparent, but also in the addition of prerequisites as discussed above. Eventhough implementation aspects are taken into consideration, anatomy plans arestill functional models. They complement implementation-oriented models, andare used for a different purpose.
6.3.4 DEPENDENCIESThe relations between work packages in the anatomy also govern constraintsthat need to be taken into account when doing release planning and projectplanning. For example, a coupling relation indicates that the entities shouldbe developed in the same release, and possibly in the same project. It is notsufficient to identify the explicit work package relations; also implicit ones needto be identified. In incremental development, there is an existing system (theprevious release) on which the current development is based. As noted in Sec-tion 6.3.2, two work packages can have an overlapping impact on the existingsystem, which means that there is an implicit relation between them. Overlook-ing this relation can result in problems and development conflicts. Identifyingimplicit relations requires anatomy plan work packages to be traceable to archi-tecture, design and/or source code, and the exercise of proper impact analysis.
As a means to understanding how a work package affects the existing sys-tem, it is helpful to identify relations between the work package and previouslyimplemented work packages in the product anatomy plan (because the projectanatomy plan by definition does not contain the pre-project history). Such
166
6: Impact Analysis and Software Evolution
a relation (refines, or extends) would make it easier to determine the impactof a new work package based on how and where previous work packages areimplemented.
In the case of a stand-alone anatomy plan work package, contrived relationscan be introduced in order to connect it to other work packages. Such con-trived relations could be based on appropriateness with respect to, for example,business value, strategic intent, or market window.
6.3.5 ORGANISATIONAL CONTEXTThis section briefly discusses some aspects of the organisational context ofanatomy plans: stakeholders, visualisation, and tools.
6.3.5.1 STAKEHOLDERS
Being a versatile and central planning instrument, an anatomy plan (regardlessof level) has a number of stakeholders. Product managers define features that areused and decomposed in the anatomy plan. Thus, these contribute to the value-oriented evolution of the system captured in the plan. Architects and technicalexperts work with the decomposition of the anatomy plan entities, primarilyat a high level. Of course, these can also contribute with an implementation-oriented evolution of the system by adding prerequisites (for example, becausethe current architecture is a dead end and allows for little expansion). Peopleworking with release and project planning can use the anatomy plan as input tothese activities. Within a development project, architects and developers andalso project managers use the anatomy plan as a guiding instrument for theincremental development taking place there. Testers make use of the anatomyplan for planning testing and integration of functionality.
All the relevant stakeholders must cooperate in developing an anatomy planthat can satisfy their various needs and views of the system. The cooperationshould involve both the decomposition of work packages, so that everyone agreeon the functional content of the plan, and the definition of relations in the plan,so that everyone agree on how the work packages are structured (and, in thecase of the project anatomy plan, laid out over time). The different perspectivesand opinions expressed by different stakeholders need to be aggregated into acommon view for the anatomy plan.
167
6: Impact Analysis and Software Evolution
6.3.5.2 VISUALISATION AND TOOLS
The visualisation of anatomy plan work packages has not been given specialattention. Carlshamre et al. [2001] suggest using different colours for require-ments depending on how many relations they have to other requirements. Asimilar approach could be adopted in anatomy plans, but this would conflictwith the current practice of colouring work packages based on their status. Thevisualisation of a prerequisite should preferably depend on the magnitude of itsimpact (see the previous section).
As for using a different tool, it has been discussed to use a project planningtool based the on PERT∗ model. This tool would, however, have to be extendedto deal with different types of relations, as well as the decomposition of featuresinto functions and functional ladders. Given this, it may make more sense todevelop a custom tool. No formal evaluation of existing tools has been made.
6.4 ROLE OF IMPACT ANALYSISSaliu and Ruhe [2005] discuss feature-driven impact analysis as the activity ofdetermining which components in the software that are affected by an added fea-ture. In this chapter, we have talked about incremental change which is changeinduced by adding new functionality. Impact analysis is crucial in incremen-tal software development when the added functionality needs to be integratedwith the existing system. When adding new functionality, the magnitude of theimpact on the existing system can be divided into different levels (Chapter 3discusses other ways of measuring impact):
• Small: The impact is small if the existing system already has interfaces(code-wise as well as UI-wise) or communication protocols that supportthe new functionality. The impact then lies in making the system awareof the new functionality.
• Medium: The impact is medium if new interfaces and/or protocols needto be added in order to support the new functionality.
• Large: The impact is large if an architectural change is necessary toincorporate the new functionality, for example if a plugin architectureneeds to be created, or if the new functionality imposes a performancepenalty on the system. The impact is also large if the new functionalityreplaces existing functionality.
∗ Program Evaluation and Review Technique [see Pfleeger, 1998].
168
6: Impact Analysis and Software Evolution
Note that new functionality almost always has impact on the existing sys-tem.∗ Knowing about the magnitude of the impact of a new function or featureis useful when doing release planning and in particular project planning, as it canconstrain the scope of the release or project. It can also be useful to determinethe need for prerequisites (see Section 6.3.3) in an anatomy plan—a functionwith large impact is a candidate for splitting into prerequisite and functionality.
Regardless of the level of impact, changes to the existing system result inboth ripple effects and possibly side effects. The former can be planned for (aspart of the impact analysis), whereas the latter are undesirable and should beavoided.
If we see the analysis of the impact of new functionality as the generalpurpose of impact analysis, more specific purposes are:
• To facilitate bridging between functional and implementation-orientedviews of the system. This is important to ensure that the different viewsare compatible (cf. view-based architecture design, where it crucial thatthe views show the same system [Hofmeister et al., 2000]).
• To aid in the breakdown of functionality onto different subsystems, ifapplicable, which facilitates both planning and development. This is basedon the premise that the subsystems are developed by different teams.
• To identify implementation-oriented relations between functional entities.Such relations can be hidden or implicit, and can result in developmentproblems and conflicts if overlooked.
Even if we can divide new functionality into the addition of new code and themodification of existing code, all of the functionality may be contained withinthe same entity, for example an architecture component. Impact analysis canbe used to pinpoint this component and others that will encompass a particularpiece of functionality.
Figure 6.6 illustrates the identification of an implicit relation resulting fromthe impact of the functions on the existing system. Function A affects compo-nent C, and function B affects components C and D. Since the functions haveshared impact on the existing system through component C, they are not inde-pendent. The relation is implicit because it may not be obvious when studying
∗ A possible exception to this could be the addition of a service to a service-oriented systemwith automatic service discovery, where users/clients communicate with and are aware ofservices directly.
169
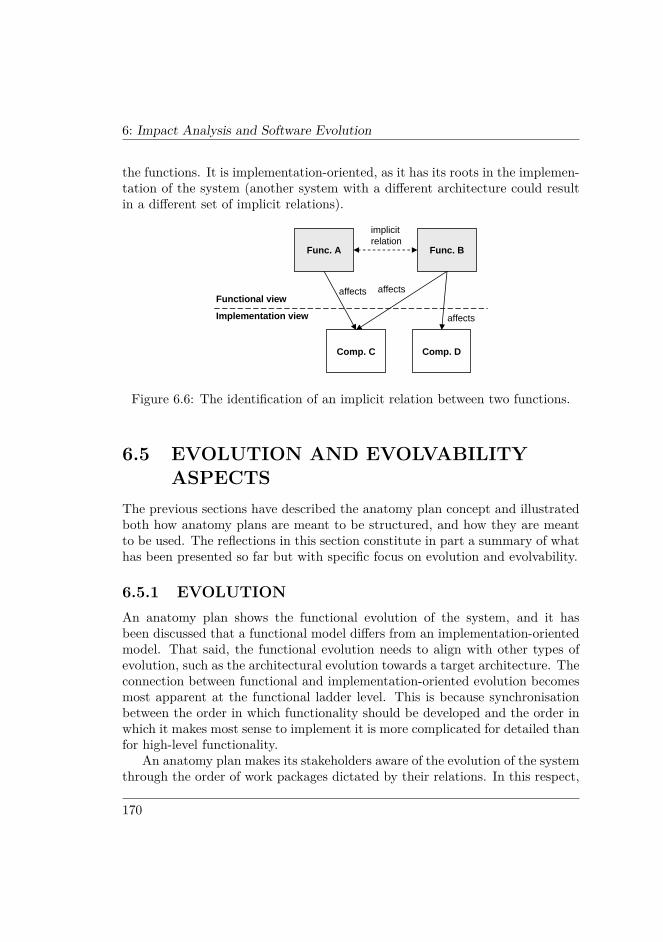
6: Impact Analysis and Software Evolution
the functions. It is implementation-oriented, as it has its roots in the implemen-tation of the system (another system with a different architecture could resultin a different set of implicit relations).
Func. A Func. B
Comp. C Comp. D
Functional view
Implementation view affects
affectsaffects
implicit relation
Figure 6.6: The identification of an implicit relation between two functions.
6.5 EVOLUTION AND EVOLVABILITYASPECTS
The previous sections have described the anatomy plan concept and illustratedboth how anatomy plans are meant to be structured, and how they are meantto be used. The reflections in this section constitute in part a summary of whathas been presented so far but with specific focus on evolution and evolvability.
6.5.1 EVOLUTIONAn anatomy plan shows the functional evolution of the system, and it hasbeen discussed that a functional model differs from an implementation-orientedmodel. That said, the functional evolution needs to align with other types ofevolution, such as the architectural evolution towards a target architecture. Theconnection between functional and implementation-oriented evolution becomesmost apparent at the functional ladder level. This is because synchronisationbetween the order in which functionality should be developed and the order inwhich it makes most sense to implement it is more complicated for detailed thanfor high-level functionality.
An anatomy plan makes its stakeholders aware of the evolution of the systemthrough the order of work packages dictated by their relations. In this respect,
170
6: Impact Analysis and Software Evolution
the anatomy plan is a learning/knowledge instrument that can serve to alignmultiple development efforts in the direction of the planned evolution.
The product anatomy plan provides the high-level evolution that spans overmultiple releases. It needs to be driven by strategic and business goals. Theproject anatomy plan corresponds to the incremental development within aproject (and hence within a release), and needs to be governed to a largerextent by the current architecture and design structures. A relation betweentwo work packages in the product anatomy plan will have an effect on the in-cremental development dictated by the project anatomy plan. Thus, relationsare inherited from a product anatomy plan into a project anatomy plan. Due tothe difference in focus between the plans, the discussed feedback link from theproject anatomy plan back to the product anatomy plan is necessary to ensurethat the high-level evolution is up-to-date with the incremental developmentgoing on at project and release level.
6.5.2 EVOLVABILITYEvolvability is, again, the capability of a system to be evolved [Cook et al.,2000]. As discussed, an anatomy plan contains not only functional entities,but also prerequisites, which typically are architectural changes required to addsome functionality later on. The identification of prerequisites requires knowl-edge about the evolvability of the system. Thus, prerequisites could be seen asevolvability indicators, as their presence hints at the system’s ability to includenew functionality given the state of its current architecture.
The number of prerequisites in an anatomy plan may function as an actualmetric for the evolvability of the system. More specifically, if an anatomy plancontains a large number of prerequisites, it can be argued that the evolvabilityof the system is low (since many changes are needed to enable the functionalevolution). Taking into account the magnitude of impact the prerequisites rep-resent into the measure could be beneficial as well. Whether this metric is valid,or at all useful, is an open issue to study.
Similarly, intermediate steps in functional ladders hint at a system’s evolv-ability. Recall that an intermediate step delivers developer value rather thancustomer value. A large number of initial intermediate steps in a functionalladder essentially means that much development work has to be done beforecustomer value can be created, which arguably could be an indication of lowevolvability.
Through the prerequisites (and intermediate steps in functional ladders), ananatomy plan informs its stakeholders not only about the functional evolution of
171
6: Impact Analysis and Software Evolution
the system, but also about what is required in order to accomplish the evolution.In other words, it educates the stakeholders about the state of the system withrespect to evolvability. Based on this knowledge, a developer may, for example,develop the system in a way that is aligned with the change dictated by theprerequisite. Thus, a certain focus on evolvability in the development can resultfrom using an anatomy plan. This particular behaviour has been observed atEricsson, and can be explained by the developers’ desire to prepare for changesand avoid re-work later on.
The prerequisites need to be assigned to development projects just as thefunctional entities. Thus, the evolvability focus becomes an intrinsic part of theincremental development in a project, in the way that the initial developmentwork need to cater for the future evolution of the system.
Cook et al. [2000] point out the need to study how the evolvability of a systemis affected by the relation between the system and the surrounding organisation.The previous argumentation is in line with this, and anatomy planning may beseen as a catalyst between evolvability aspects of a system and the organisationfor reasons given above.
6.6 CONCLUSIONS AND OPEN ISSUESIn this chapter, we have presented an evolution planning instrument called theanatomy plan. The anatomy plan as a concept brings together software evolu-tion, release planning, project planning, and incremental software development.It has been used previously to manage incremental development within projectsat Ericsson. Based on identified needs and challenges, we have proposed an ex-tension that takes into account both a product level and a project level anatomyplan.
An anatomy plan shows the functional evolution of a system. It works asa learning instrument for its stakeholders, who through it becomes aware ofevolution aspects of the system it models. On the product level, it spans severalreleases of the system and is used as input to release planning of individualreleases. On the project level, it models the incremental development and in-cremental deliveries, though still from a functional perspective.
By showing not only functionality, but also prerequisites for functionalitysuch as required architectural changes, the use of an anatomy plan can be arguedto result in a stronger focus on evolvability during development. The reason isthat the anatomy plan clearly shows not only the evolution of the system, butalso what is necessary to accomplish it.
172
6: Impact Analysis and Software Evolution
We have studied how impact analysis fits into the anatomy plan concept,and formulated two research questions:
• RQ1: Of what use is impact analysis in relation to software evolution andincremental development?
• RQ2: How can impact analysis facilitate the identification of dependenciesbetween functional entities?
In response to RQ1, we conclude that the main purpose of impact analysis isto manage the incremental change induced by adding new functionality to theexisting system. Knowledge about different levels of impact magnitude can helpin release planning and project planning. We have also seen that impact analysisis useful when bridging between the functional view in an anatomy plan andimplementation-oriented views such as the architecture. In response to RQ2, weconclude that impact analysis helps avoid development problems and conflictsas it can be used to reveal implicit implementation-oriented relations betweenfunctional entities in an anatomy plan.
So far, mostly infrastructure aspects of anatomy planning have been dis-cussed together with Ericsson. Processes and ways of working are subjects forongoing discussions, and require further attention. With respect to the con-tinuation of the current research, the following list shows a number of openissues:
• Some guidelines for decomposition of features with respect to the balancebetween a product anatomy plan and corresponding project anatomy plansare necessary, in particular to enable consistent use of anatomy planningin industry.
• The synchronisation between functional evolution and actual incrementaldevelopment order is crucial and needs further attention. The challenge isto make the anatomy plan a relevant instrument at all levels of evolution.
• The anatomy plan as a tool for release planning and integration needs tobe further studied, including needs seen by different roles involved in de-velopment and constraints resulting from organisational structures (suchas multiple levels of management, parallel development teams etc.)
• Evolvability metrics based on anatomy plans should be defined. The num-ber of prerequisites has been suggested, but whether it is valid needs tobe studied further.
173

6: Impact Analysis and Software Evolution
• More structured interviews pertaining to the problems experienced whenworking with evolving software systems are planned. The objective is tostudy whether the dimensions expressed by an anatomy plan are valid,and if more dimensions are required.
174

Chapter 7
K-Nearest NeighbourImputation
Missing data pose a serious problem to researchers in many different fields ofresearch, for example artificial intelligence [Gediga and Düntsch, 2003], machinelearning [Batista and Monard, 2001] and psychology [Downey and King, 1998].The situation is, unsurprisingly, similar in software engineering [Cartwrightet al., 2003; Myrtveit et al., 2001; Strike et al., 2001]. The absence of datamay substantially affect data analysis as statistical tests will lose power andresults may be biased because of underlying differences between cases with andwithout missing data [Huisman, 2000]. Simple ways to deal with missing dataare, for example, listwise deletion, in which incomplete cases are simply dis-carded from the data set, or variable deletion, in which variables with missingdata are discarded. However, a consequence of using a deletion procedure isthat potentially valuable data are discarded, which is even worse than havingmissing data in the first place. Another approach, advantageous because it doesnot require useful data to be removed, is to use a method for imputing data.Imputation methods work by substituting replacement values for the missingdata, hence increasing the amount of usable data.
A multitude of imputation methods exist (see, for example, [Hu et al., 1998]for an overview), whereas this chapter deals mainly with hot-deck k-NearestNeighbour imputation, but also with Random Draw Substitution, Random Im-putation, Median Imputation and Mode Imputation. In hot-deck imputation,a missing value is replaced by a value derived from one or more complete cases
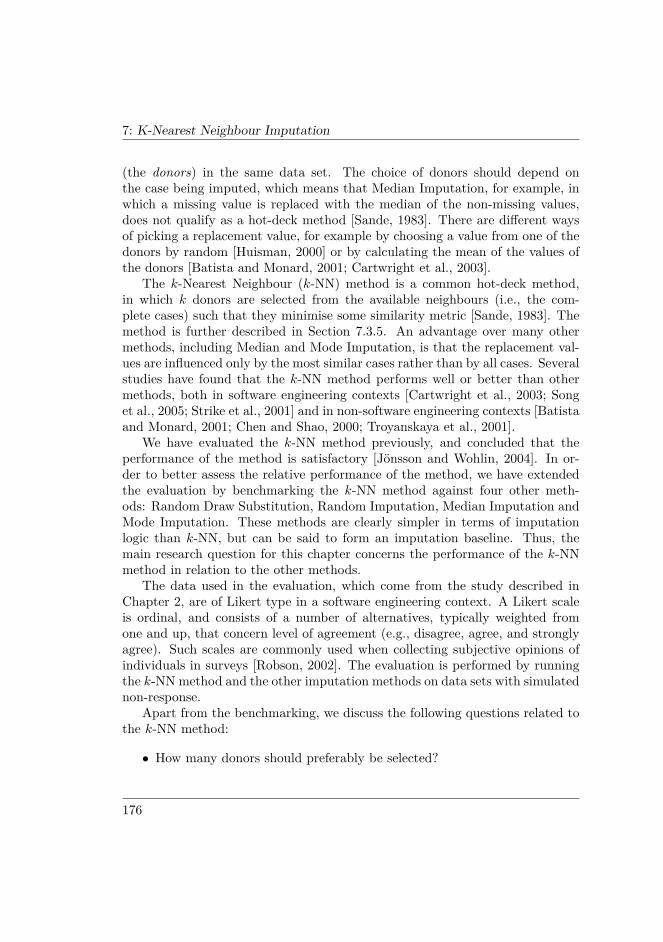
7: K-Nearest Neighbour Imputation
(the donors) in the same data set. The choice of donors should depend onthe case being imputed, which means that Median Imputation, for example, inwhich a missing value is replaced with the median of the non-missing values,does not qualify as a hot-deck method [Sande, 1983]. There are different waysof picking a replacement value, for example by choosing a value from one of thedonors by random [Huisman, 2000] or by calculating the mean of the values ofthe donors [Batista and Monard, 2001; Cartwright et al., 2003].
The k-Nearest Neighbour (k-NN) method is a common hot-deck method,in which k donors are selected from the available neighbours (i.e., the com-plete cases) such that they minimise some similarity metric [Sande, 1983]. Themethod is further described in Section 7.3.5. An advantage over many othermethods, including Median and Mode Imputation, is that the replacement val-ues are influenced only by the most similar cases rather than by all cases. Severalstudies have found that the k-NN method performs well or better than othermethods, both in software engineering contexts [Cartwright et al., 2003; Songet al., 2005; Strike et al., 2001] and in non-software engineering contexts [Batistaand Monard, 2001; Chen and Shao, 2000; Troyanskaya et al., 2001].
We have evaluated the k-NN method previously, and concluded that theperformance of the method is satisfactory [Jönsson and Wohlin, 2004]. In or-der to better assess the relative performance of the method, we have extendedthe evaluation by benchmarking the k-NN method against four other meth-ods: Random Draw Substitution, Random Imputation, Median Imputation andMode Imputation. These methods are clearly simpler in terms of imputationlogic than k-NN, but can be said to form an imputation baseline. Thus, themain research question for this chapter concerns the performance of the k-NNmethod in relation to the other methods.
The data used in the evaluation, which come from the study described inChapter 2, are of Likert type in a software engineering context. A Likert scaleis ordinal, and consists of a number of alternatives, typically weighted fromone and up, that concern level of agreement (e.g., disagree, agree, and stronglyagree). Such scales are commonly used when collecting subjective opinions ofindividuals in surveys [Robson, 2002]. The evaluation is performed by runningthe k-NN method and the other imputation methods on data sets with simulatednon-response.
Apart from the benchmarking, we discuss the following questions related tothe k-NN method:
• How many donors should preferably be selected?
176
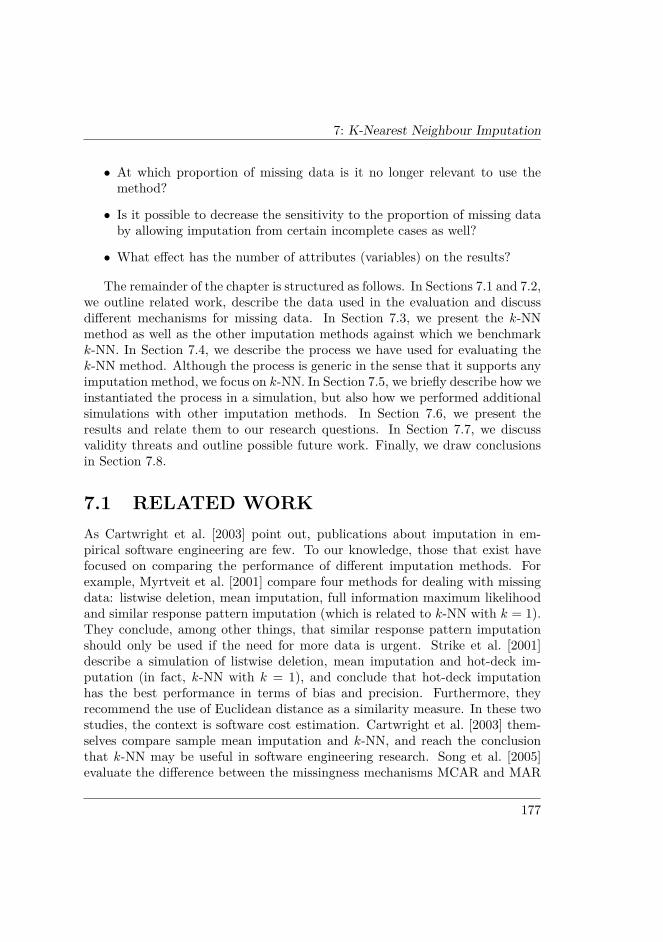
7: K-Nearest Neighbour Imputation
• At which proportion of missing data is it no longer relevant to use themethod?
• Is it possible to decrease the sensitivity to the proportion of missing databy allowing imputation from certain incomplete cases as well?
• What effect has the number of attributes (variables) on the results?
The remainder of the chapter is structured as follows. In Sections 7.1 and 7.2,we outline related work, describe the data used in the evaluation and discussdifferent mechanisms for missing data. In Section 7.3, we present the k-NNmethod as well as the other imputation methods against which we benchmarkk-NN. In Section 7.4, we describe the process we have used for evaluating thek-NN method. Although the process is generic in the sense that it supports anyimputation method, we focus on k-NN. In Section 7.5, we briefly describe how weinstantiated the process in a simulation, but also how we performed additionalsimulations with other imputation methods. In Section 7.6, we present theresults and relate them to our research questions. In Section 7.7, we discussvalidity threats and outline possible future work. Finally, we draw conclusionsin Section 7.8.
7.1 RELATED WORKAs Cartwright et al. [2003] point out, publications about imputation in em-pirical software engineering are few. To our knowledge, those that exist havefocused on comparing the performance of different imputation methods. Forexample, Myrtveit et al. [2001] compare four methods for dealing with missingdata: listwise deletion, mean imputation, full information maximum likelihoodand similar response pattern imputation (which is related to k-NN with k = 1).They conclude, among other things, that similar response pattern imputationshould only be used if the need for more data is urgent. Strike et al. [2001]describe a simulation of listwise deletion, mean imputation and hot-deck im-putation (in fact, k-NN with k = 1), and conclude that hot-deck imputationhas the best performance in terms of bias and precision. Furthermore, theyrecommend the use of Euclidean distance as a similarity measure. In these twostudies, the context is software cost estimation. Cartwright et al. [2003] them-selves compare sample mean imputation and k-NN, and reach the conclusionthat k-NN may be useful in software engineering research. Song et al. [2005]evaluate the difference between the missingness mechanisms MCAR and MAR
177
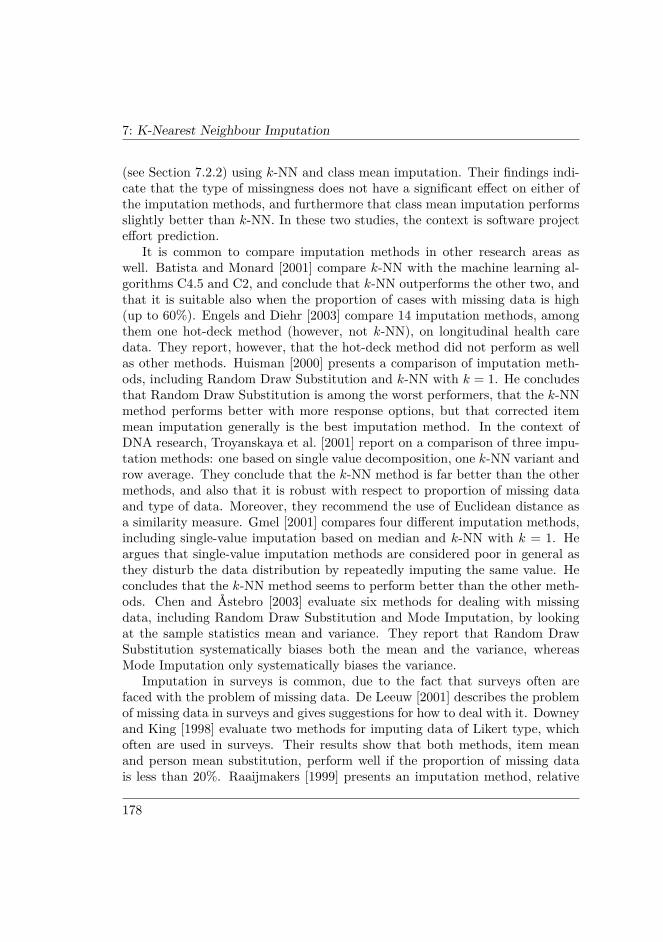
7: K-Nearest Neighbour Imputation
(see Section 7.2.2) using k-NN and class mean imputation. Their findings indi-cate that the type of missingness does not have a significant effect on either ofthe imputation methods, and furthermore that class mean imputation performsslightly better than k-NN. In these two studies, the context is software projecteffort prediction.
It is common to compare imputation methods in other research areas aswell. Batista and Monard [2001] compare k-NN with the machine learning al-gorithms C4.5 and C2, and conclude that k-NN outperforms the other two, andthat it is suitable also when the proportion of cases with missing data is high(up to 60%). Engels and Diehr [2003] compare 14 imputation methods, amongthem one hot-deck method (however, not k-NN), on longitudinal health caredata. They report, however, that the hot-deck method did not perform as wellas other methods. Huisman [2000] presents a comparison of imputation meth-ods, including Random Draw Substitution and k-NN with k = 1. He concludesthat Random Draw Substitution is among the worst performers, that the k-NNmethod performs better with more response options, but that corrected itemmean imputation generally is the best imputation method. In the context ofDNA research, Troyanskaya et al. [2001] report on a comparison of three impu-tation methods: one based on single value decomposition, one k-NN variant androw average. They conclude that the k-NN method is far better than the othermethods, and also that it is robust with respect to proportion of missing dataand type of data. Moreover, they recommend the use of Euclidean distance asa similarity measure. Gmel [2001] compares four different imputation methods,including single-value imputation based on median and k-NN with k = 1. Heargues that single-value imputation methods are considered poor in general asthey disturb the data distribution by repeatedly imputing the same value. Heconcludes that the k-NN method seems to perform better than the other meth-ods. Chen and Åstebro [2003] evaluate six methods for dealing with missingdata, including Random Draw Substitution and Mode Imputation, by lookingat the sample statistics mean and variance. They report that Random DrawSubstitution systematically biases both the mean and the variance, whereasMode Imputation only systematically biases the variance.
Imputation in surveys is common, due to the fact that surveys often arefaced with the problem of missing data. De Leeuw [2001] describes the problemof missing data in surveys and gives suggestions for how to deal with it. Downeyand King [1998] evaluate two methods for imputing data of Likert type, whichoften are used in surveys. Their results show that both methods, item meanand person mean substitution, perform well if the proportion of missing datais less than 20%. Raaijmakers [1999] presents an imputation method, relative
178
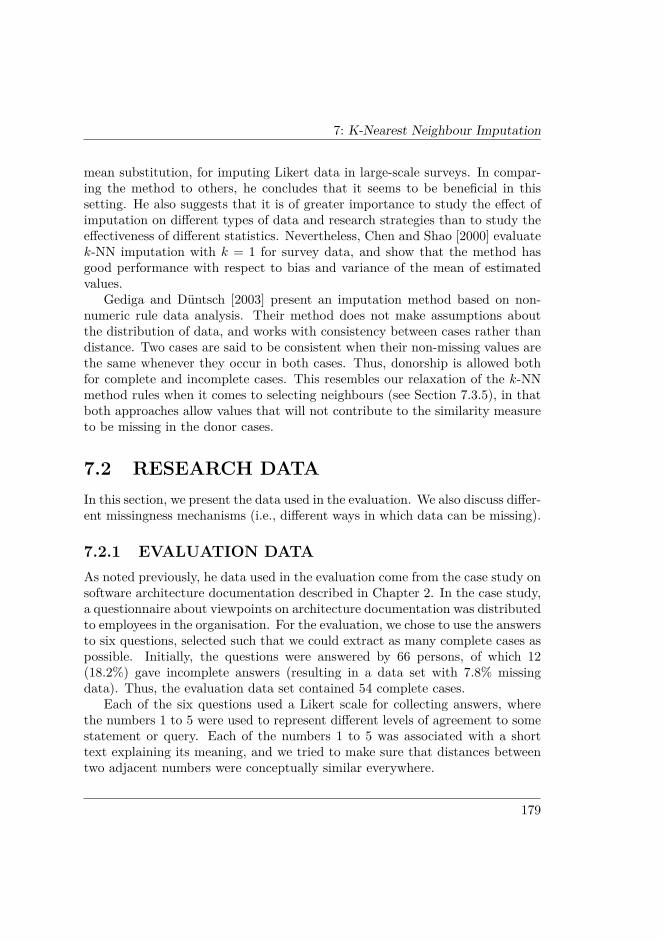
7: K-Nearest Neighbour Imputation
mean substitution, for imputing Likert data in large-scale surveys. In compar-ing the method to others, he concludes that it seems to be beneficial in thissetting. He also suggests that it is of greater importance to study the effect ofimputation on different types of data and research strategies than to study theeffectiveness of different statistics. Nevertheless, Chen and Shao [2000] evaluatek-NN imputation with k = 1 for survey data, and show that the method hasgood performance with respect to bias and variance of the mean of estimatedvalues.
Gediga and Düntsch [2003] present an imputation method based on non-numeric rule data analysis. Their method does not make assumptions aboutthe distribution of data, and works with consistency between cases rather thandistance. Two cases are said to be consistent when their non-missing values arethe same whenever they occur in both cases. Thus, donorship is allowed bothfor complete and incomplete cases. This resembles our relaxation of the k-NNmethod rules when it comes to selecting neighbours (see Section 7.3.5), in thatboth approaches allow values that will not contribute to the similarity measureto be missing in the donor cases.
7.2 RESEARCH DATAIn this section, we present the data used in the evaluation. We also discuss differ-ent missingness mechanisms (i.e., different ways in which data can be missing).
7.2.1 EVALUATION DATAAs noted previously, he data used in the evaluation come from the case study onsoftware architecture documentation described in Chapter 2. In the case study,a questionnaire about viewpoints on architecture documentation was distributedto employees in the organisation. For the evaluation, we chose to use the answersto six questions, selected such that we could extract as many complete cases aspossible. Initially, the questions were answered by 66 persons, of which 12(18.2%) gave incomplete answers (resulting in a data set with 7.8% missingdata). Thus, the evaluation data set contained 54 complete cases.
Each of the six questions used a Likert scale for collecting answers, wherethe numbers 1 to 5 were used to represent different levels of agreement to somestatement or query. Each of the numbers 1 to 5 was associated with a shorttext explaining its meaning, and we tried to make sure that distances betweentwo adjacent numbers were conceptually similar everywhere.
179
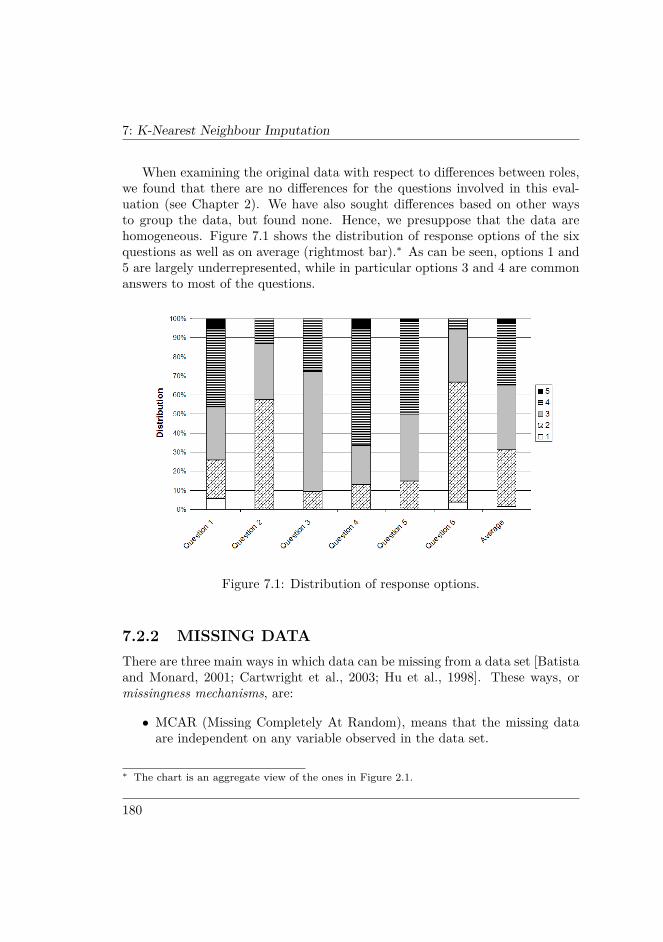
7: K-Nearest Neighbour Imputation
When examining the original data with respect to differences between roles,we found that there are no differences for the questions involved in this eval-uation (see Chapter 2). We have also sought differences based on other waysto group the data, but found none. Hence, we presuppose that the data arehomogeneous. Figure 7.1 shows the distribution of response options of the sixquestions as well as on average (rightmost bar).∗ As can be seen, options 1 and5 are largely underrepresented, while in particular options 3 and 4 are commonanswers to most of the questions.
Figure 7.1: Distribution of response options.
7.2.2 MISSING DATAThere are three main ways in which data can be missing from a data set [Batistaand Monard, 2001; Cartwright et al., 2003; Hu et al., 1998]. These ways, ormissingness mechanisms, are:
• MCAR (Missing Completely At Random), means that the missing dataare independent on any variable observed in the data set.
∗ The chart is an aggregate view of the ones in Figure 2.1.
180
7: K-Nearest Neighbour Imputation
• MAR (Missing At Random), means that the missing data may depend onvariables observed in the data set, but not on the missing values them-selves.
• NMAR (Not Missing At Random, or NI, Non-Ignorable), means that themissing data depend on the missing values themselves, and not on anyother observed variable.
Any action for dealing with missing data must take the missingness mecha-nism into account. For example, to discard cases with missing data altogetheris dangerous unless the missingness mechanism is MCAR [Scheffer, 2002]. Oth-erwise, there is a risk that the remaining data are severely biased. NMAR is thehardest missingness mechanism to deal with, because it, obviously, is difficultto construct an imputation model based on unobserved data.
When data are missing from the responses to a questionnaire, it is more likelythat the missingness mechanism is MAR than MCAR [Raaijmakers, 1999]. Forexample, a respondent could leave out an answer because of lack of interest,time, knowledge or because he or she did not consider a question relevant. Ifit is possible to distinguish between these different sources of missing data, ananswer left out because of lack of question relevance could be regarded as usefulinformation rather than a missing data point. If so, the degree of missingnesswould be different than if the source of missing data could not be distinguished.Thus, it is recommended to include a response option for lack of relevance. Itshould be noted, however, that the questions in our data did not offer such aresponse option.
7.3 IMPUTATION METHODSIn this section, we describe the k-NN imputation method as well as the imputa-tion methods used for benchmarking. We divide the imputation methods intothe three categories uninformed, informed and intelligent (see [Huisman, 2000]for other ways of categorising imputation methods):
• Uninformed imputation methods do not take into consideration propertiesof the data that are important from an imputation perspective, such asdistribution of response options. Random Draw Substitution, where areplacement value is randomly drawn from the set of response options,falls into this category.
181

7: K-Nearest Neighbour Imputation
• Informed imputation methods do take data properties into consideration.Random Imputation, where a replacement value is randomly drawn fromthe available (observed) answers, as well as Median Imputation and ModeImputation fall into this category.
• Intelligent imputation methods are those that base the imputation onhypothesised relationships in the data. The k-NN method falls into thiscategory.
We go deeper into details for the k-NN method than for the other methods, inparticular with respect to how the properties of the method affect the imputationresults. Based on this, we differentiate between two different strategies forselecting neighbours. The standard strategy adheres to the rules of the methodin that only complete cases qualify as neighbours, while the other relaxes thisrestriction slightly.
7.3.1 RANDOM DRAW SUBSTITUTIONRandom Draw Substitution (RDS) is an imputation method in which a missingvalue is replaced by a value randomly drawn from the set of available responseoptions [Huisman, 2000]. In our case, this means that we randomly generatereplacement values from 1 to 5 such that all values have equal possibilities ofbeing generated.
RDS falls into the category of uninformed imputation methods, as it doesnot consider data distribution or any other relevant properties. The relevance inbenchmarking against RDS, or any other uninformed method for that matter,can of course be debated. However, we argue that a hallmark of any methodnecessarily must be to beat the entirely random case.
7.3.2 RANDOM IMPUTATIONHu et al. [1998] describe generic Random Imputation (RI) as a method where re-placement values are drawn at random from observed data, given some samplingscheme. In our use of the method, we replace a missing value for a particularquestion with a value drawn randomly from all available answers to the question.Thus, we effectively set the probabilities of the response options in accordancewith the distribution of response options for the question. This means that RIcan be categorised as an informed imputation method.
By obeying the distribution of observed response options, we can expect RIto outperform RDS unless the possible response options are equally distributed
182

7: K-Nearest Neighbour Imputation
for each question. This is not the case in our data, where response options 1and 5 in particular are largely underrepresented (see Figure 7.1).
7.3.3 MEDIAN IMPUTATIONDue to the fact that our original data are ordinal, we impute based on medianrather than mean. In Median Imputation (MEI), a missing value is replacedby the median of all available answers to the question. As with any type ofsingle-value imputation, this method disturbs the distribution of response op-tions, since the same value is used to replace each missing value for a particularquestion [Gmel, 2001].
If the number of available answers to a question is even, the median maybecome a non-integer value. Since non-integer values are not compatible withordinal data, we round the value either downwards or upwards at random (foreach missing value) in order to get an integer value.
MEI is highly sensitive to the distribution of response options for a ques-tion. More specifically, if the median corresponds to a response option withlow frequency, the percentage of correct imputations will be low. Conversely,if the median corresponds to a frequent response option, MEI will have goodperformance.
7.3.4 MODE IMPUTATIONMode Imputation (MOI) is similar to MEI, except the mode is used instead ofthe median. As with MEI, MOI disturbs the distribution by imputing the samevalue for all missing values for a particular question.
A problem with using the mode as replacement value is that the distributionof available answers may be multimodal (i.e., have several modes). If that is thecase, we obtain a unique replacement value by randomly selecting one of themodes for each missing value.
If the mode corresponds to a response option with high frequency comparedto the other response options, the percentage of correct imputations will behigh. Otherwise, that is if the difference in frequency to the next most commonvalue is small, the imputation performance decreases. Similarly, if the mode isa response option towards one of the ends of the scale, and a response option inthe other end is common as well, the relative error of incorrectly imputed valueswill be high.
183

7: K-Nearest Neighbour Imputation
7.3.5 K-NEAREST NEIGHBOURIn the k-NN method, missing values in a case are imputed using values calculatedfrom the k nearest neighbours, hence the name. The nearest, most similar,neighbours are found by minimising a distance function, usually the Euclideandistance, defined as follows [see Wilson and Martinez, 1997]:
E(a, b) =√∑i∈D
(xai − xbi)2 (7.1)
Here,
• E(a, b) is the distance between the two cases a and b,
• xai and xbi are the values of attribute i in cases a and b, respectively, and
• D is the set of attributes with non-missing values in both cases.
The use of Euclidean distance as similarity measure is recommended byStrike et al. [2001] and Troyanskaya et al. [2001]. The k-NN method does notsuffer from the problem with reduced variance to the same extent as single-value imputation, because when mean imputation imputes the same value (themean) for all cases, k-NN imputes different values depending on the case beingimputed.
Consider the data set shown in Table 7.1; when calculating the distancebetween the cases Bridget and Eric, the attributes for which both have valuesare Q1, Q3, Q4 and Q5. Thus, D = {Q1, Q3, Q4, Q5}. We see that Bridget’sanswer to Q2 does not contribute to the calculation of the distance, because itis not in D. This implies that whether a neighbour has values for attributesoutside D or not does not affect its similarity to the case being imputed. Forexample, Bridget and Eric are equally similar to Susan, because
E(Bridget,Susan) = E(Eric,Susan) =√
2× (4− 2)2 ≈ 2.8
despite the fact that Bridget is more complete than Eric.Another consequence of how the Euclidean distance is calculated, is that it is
easier to find near neighbours when D is small. This occurs because the numberof terms under the radical sign has fairly large impact on the distance. Again,consider the data set in Table 7.1; based on the Euclidean distance, Bridget andEric are equally similar to Quentin (in fact, their distances are zero). Still, they
184
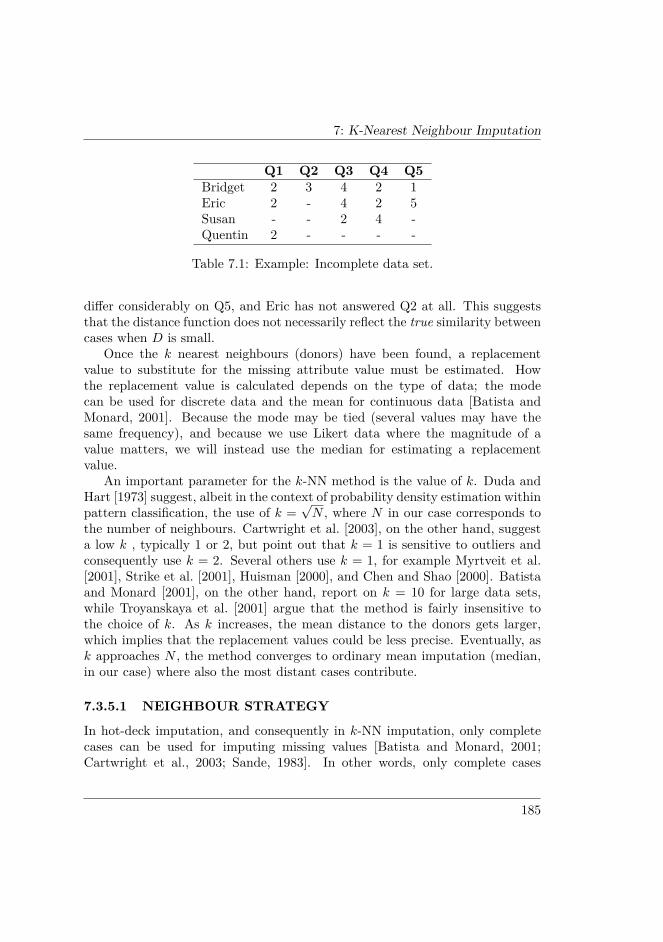
7: K-Nearest Neighbour Imputation
Q1 Q2 Q3 Q4 Q5Bridget 2 3 4 2 1Eric 2 - 4 2 5Susan - - 2 4 -Quentin 2 - - - -
Table 7.1: Example: Incomplete data set.
differ considerably on Q5, and Eric has not answered Q2 at all. This suggeststhat the distance function does not necessarily reflect the true similarity betweencases when D is small.
Once the k nearest neighbours (donors) have been found, a replacementvalue to substitute for the missing attribute value must be estimated. Howthe replacement value is calculated depends on the type of data; the modecan be used for discrete data and the mean for continuous data [Batista andMonard, 2001]. Because the mode may be tied (several values may have thesame frequency), and because we use Likert data where the magnitude of avalue matters, we will instead use the median for estimating a replacementvalue.
An important parameter for the k-NN method is the value of k. Duda andHart [1973] suggest, albeit in the context of probability density estimation withinpattern classification, the use of k =
√N , where N in our case corresponds to
the number of neighbours. Cartwright et al. [2003], on the other hand, suggesta low k , typically 1 or 2, but point out that k = 1 is sensitive to outliers andconsequently use k = 2. Several others use k = 1, for example Myrtveit et al.[2001], Strike et al. [2001], Huisman [2000], and Chen and Shao [2000]. Batistaand Monard [2001], on the other hand, report on k = 10 for large data sets,while Troyanskaya et al. [2001] argue that the method is fairly insensitive tothe choice of k. As k increases, the mean distance to the donors gets larger,which implies that the replacement values could be less precise. Eventually, ask approaches N , the method converges to ordinary mean imputation (median,in our case) where also the most distant cases contribute.
7.3.5.1 NEIGHBOUR STRATEGY
In hot-deck imputation, and consequently in k-NN imputation, only completecases can be used for imputing missing values [Batista and Monard, 2001;Cartwright et al., 2003; Sande, 1983]. In other words, only complete cases
185
7: K-Nearest Neighbour Imputation
qualify as neighbours. Based on the discussion in the previous section abouthow the Euclidean distance between cases is unaffected by values of attributesnot in D, we suggest that it is possible to relax this restriction slightly. Thus,we see two distinct strategies for selecting neighbours.
The first strategy is in line with how the method normally is used, and allowsonly the complete cases to be neighbours. This means that no incomplete casescan contribute to the substitution of a replacement value in an incomplete case.We will refer to this strategy as the CC (Complete Case) strategy.
The second strategy allows all complete cases and certain incomplete casesto be neighbours. More specifically, a case can act as a neighbour if and only ifit contains values for all attributes that the case being imputed has values for,and for the attribute being imputed. We will refer to this strategy as the IC(Incomplete Case) strategy.
It is important to note that we do not permit already imputed cases tobe donors in any of the strategies. Thus, imputed data will never be used toimpute new data. For an example of the two strategies, consult again Table 7.1.Assuming we are about to impute attribute Q1 for Susan, the CC strategywould only allow Bridget to be a neighbour. The IC strategy, however, wouldallow both Bridget and Eric to be neighbours, because Eric contains values forat least the necessary attributes: Q1, Q3 and Q4. Because the IC strategypotentially has more neighbours to select donors from, it can be expected to beable to handle large proportions of missing data better than the CC strategy.
7.4 EVALUATION PROCESSThe process for evaluating the k-NN method consists of the three main stepsdata removal, imputation and evaluation (illustrated in Figure 7.2). In thissection, we describe each step with respect to consumed input, responsibility,calculated metrics and produced output.
The process is generic in that it does not depend on any particular dataremoval mechanism or imputation method. Here, we present it using k-NN asthe imputation method. In Section 7.5, we detail the actual simulation of theprocess and describe how we have reused parts of it for benchmarking k-NNagainst the other imputation methods.
186
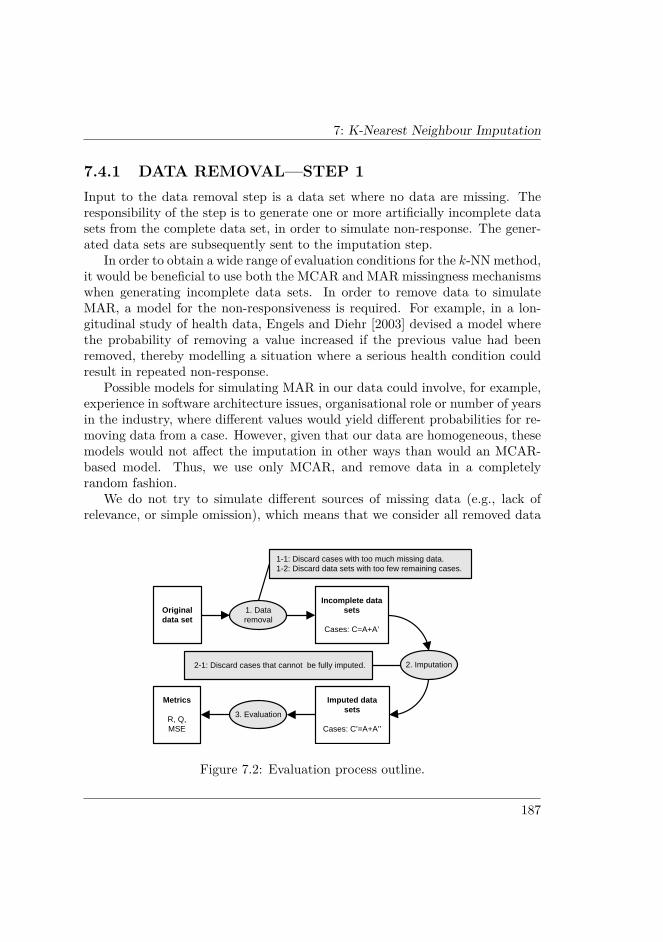
7: K-Nearest Neighbour Imputation
7.4.1 DATA REMOVAL—STEP 1Input to the data removal step is a data set where no data are missing. Theresponsibility of the step is to generate one or more artificially incomplete datasets from the complete data set, in order to simulate non-response. The gener-ated data sets are subsequently sent to the imputation step.
In order to obtain a wide range of evaluation conditions for the k-NN method,it would be beneficial to use both the MCAR and MAR missingness mechanismswhen generating incomplete data sets. In order to remove data to simulateMAR, a model for the non-responsiveness is required. For example, in a lon-gitudinal study of health data, Engels and Diehr [2003] devised a model wherethe probability of removing a value increased if the previous value had beenremoved, thereby modelling a situation where a serious health condition couldresult in repeated non-response.
Possible models for simulating MAR in our data could involve, for example,experience in software architecture issues, organisational role or number of yearsin the industry, where different values would yield different probabilities for re-moving data from a case. However, given that our data are homogeneous, thesemodels would not affect the imputation in other ways than would an MCAR-based model. Thus, we use only MCAR, and remove data in a completelyrandom fashion.
We do not try to simulate different sources of missing data (e.g., lack ofrelevance, or simple omission), which means that we consider all removed data
1. Data removal
2. Imputation
3. Evaluation
Original data set
Metrics
R, Q, MSE
1-1: Discard cases with too much missing data.1-2: Discard data sets with too few remaining cases.
2-1: Discard cases that cannot be fully imputed.
Incomplete data sets
Cases: C=A+A’
Imputed data sets
Cases: C’=A+A’’
Figure 7.2: Evaluation process outline.
187

7: K-Nearest Neighbour Imputation
points as being truly missing.There are two parameters that guide the data removal step, the case reduc-
tion limit and the data set reduction limit. These are called reduction limitsbecause they prevent the data from being reduced to an unusable level. Theeffects of the parameters can be seen in Figure 7.2. If it is decided in step 1-1that a case contains too many missing values after data removal, as dictated bythe case reduction limit, it is discarded from the data set. The reason for havingthis limit is to avoid single cases with so little data that it becomes meaninglessto calculate the Euclidean distance to other cases. If it is decided in step 1-2that too few cases remain in the data set, as dictated by the data set reductionlimit, the entire data set is discarded. The idea with this limit is to avoid a dataset with so few cases that it no longer can be said to represent the original dataset.
These limits mean, in a way, that we combine the k-NN imputation methodwith simple listwise deletion. As discussed earlier, this is dangerous unless themissing data truly is MCAR. However, we argue that keeping cases with verylittle data left would also be dangerous, because the imputed data would containloosely grounded estimates. In other words, it is a trade-off that has to be made.
The removal step is executed for a number of different percentages. Fur-thermore, it is repeated several times for each percentage. Thus, the outputfrom the removal step is a large number of incomplete data sets to be fed to theimputation step. For each incomplete data set coming from the removal step,we define:
• A as the number of complete cases remaining,
• A′ as the number of incomplete cases remaining, and thus
• C = A+A′ as the total number of cases remaining.
Since entire cases may be discarded in the removal step, the actual per-centage of missing data may be different from the intended percentage. For theincomplete data sets generated in the simulation, both the intended percentagesand the actual percentages of missing data are presented. When analysing anddiscussing the results, it is the actual percentages that are used, though.
7.4.2 IMPUTATION—STEP 2Input to the imputation step is the incomplete data sets generated in the dataremoval step. Here, each data set is fed to the imputation method in order
188
7: K-Nearest Neighbour Imputation
to have its missing values imputed. We exemplify this step using the k-NNmethod.
With the k-NN method, several imputations using different k-values anddifferent neighbour strategies are performed for each incomplete data set. Asdiscussed earlier, a missing value is replaced by the median of the answersgiven by the k nearest neighbours, which means that the replacement valuemay become a non-integer value if k is even. However, since the data in thedata set are of Likert type, non-integer values are not permitted. To avoid thisproblem, only odd k-values are used.
The k cases with least distances are chosen as donors, regardless of tiesamong the distances. That is, two cases with equal distances are treated as twounique neighbours. This means that it is not always possible to pick k cases suchthat the remaining K − k cases (where K is the total number of neighbours)have distances greater to that of the kth case. Should such a situation occur,it is treated as follows. If l, 0 ≤ l < k cases have been picked, and there arem, (k − l) < m ≤ (K − l) cases with distance d, then the k − l first cases of them, in the order they appear in the original data set, are picked. This procedureis safe since the cases in the original data set are not ordered in a way that couldaffect the imputation.
If there are not enough neighbours available, cases may get lost in the impu-tation process. For the CC strategy, this will always happen when k is greaterthan the number of complete cases in the incomplete data set. The IC strategyhas greater imputation ability, though, but will inevitably lose cases when k islarge enough. This second situation where cases can be discarded is numbered2-1 in Figure 7.2.
The output from the imputation step is a number of imputed data sets,possibly several for each incomplete data set generated in the data removalstep (depending on the imputation method used and its parameters). For eachimputed data set, we define
• A′′, 0 ≤ A′′ ≤ A′ as the number of cases that were imputed (i.e., that werenot lost in step 2-1), and consequently
• C ′ = A+A′′ as the total number of cases, and also
• B as the number of imputed attribute values.
189

7: K-Nearest Neighbour Imputation
7.4.3 EVALUATION—STEP 3In the evaluation step, each imputed data set from the imputation step is com-pared to the original data set in order to measure the performance of the im-putation. Three separate metrics are used: one ability metric and two qualitymetrics. The two quality metrics differ both in what they measure and how theymeasure it. The first quality metric is a measure of how many of the imputedattribute values that were imputed correctly. In other words, it is a precisionmetric. The second quality metric is a measure of how much those that werenot imputed correctly differ from their correct values, which makes it a distance(or error) metric.
We define the ability metric as follows:
R = A′′
A′(7.2)
R equals 0 if all incomplete cases were lost during the imputation (in step2-1), and 1 if all incomplete cases were imputed. To define the precision metric,let B′ be the number of matching imputed attribute values. Then, the metriccan be expressed as follows:
Q ={
B′
B if B > 0undefined if B = 0 (7.3)
Q equals 0 if all the imputed attribute values are incorrect, and 1 if all arecorrect. Finally, we calculate the mean square error of the incorrectly imputedattribute values as follows:
MSE =
{ ∑i(xi−xi)2
B−B′ if B > 0, B′ < Bundefined if B = 0 or B′ = B
(7.4)
Here, xi is the correct value and xi is the imputed value of the ith incorrectlyimputed attribute value.
Since B = 0 when R = 0, it is apparent that both the precision metric andthe mean square error are invalid when the ability metric is zero. Moreover,the mean square error becomes invalid when Q = 1. Consequently, the threemetrics need to have different priorities: R is the primary performance metric,Q is the secondary, and MSE is the tertiary. Recognising that it would be
190
7: K-Nearest Neighbour Imputation
difficult to create one single metric for measuring the performance, no attemptsto accomplish this have been made.
Average values of R, Q and MSE are presented in the results, becauseseveral imputations are performed with identical parameters (percentage, andfor k-NN, value of k and neighbour strategy). For R, the mean includes allmeasured instances, while for Q and MSE, only those instances where themetrics are not undefined are included.
7.5 SIMULATIONThe previous section described the outline of the evaluation process. In thissection, we briefly address the actual simulation of the process and which pa-rameters we used to control it. We also provide some information about thesimulation software used. Finally, we explain how we reused the process torun additional simulations with different imputation methods in order to obtainbenchmarking figures.
7.5.1 PARAMETERSEach of the three steps in the process described in Section 7.4 is guided by anumber of parameters. As discussed, two reduction limits, the case reductionlimit and the data set reduction limit, constrain the data removal step. Basedon the number of attributes and cases in the original data set, we used thefollowing values in the simulation:
• Case reduction limit = 3 (inclusive)
• Data set reduction limit = 27 (inclusive)
With six attributes in each case, the case reduction limit means that caseswith less than 50% of the attribute values left were discarded in step 1-1. Thereason for this limit is that we wanted each imputed case to have at least equallymuch real data as imputed data.
With 54 cases in the original data set, the data set reduction limit meansthat data sets with less than 50% of the cases left were discarded in step 1-2.Since each case is a respondent, we wanted to make sure that each data setbeing imputed contained at least half of the respondents in the original dataset.
191

7: K-Nearest Neighbour Imputation
The removal step generated data sets where 5, 10, 15, 20, 25, 30, 35, 40, 45,50, 55, and 60% data had been removed (however, as discussed in Section 7.4.1,the actual percentages became different). For each percentage, 1 000 data setswere generated, which means that a total of 12 000 data sets were generated.The simulation was controlled so that the removal step would generate therequested number of data sets even if some data sets were discarded because ofthe data set reduction limit.
In the imputation step, the controlling parameters depend on the imputationmethod. For the k-NN method, the only controlling parameter is the choice ofwhich k-values to use when imputing data sets. We decided to use odd values inan interval from 1 to C, inclusively. Even though we knew that the CC strategywould fail at k = A+ 1, we expected the IC strategy to be able to handle largerk-values.
7.5.2 SOFTWAREIn order to execute the simulation, an application for carrying out the dataremoval, imputation and evaluation steps was written. In addition, MicrosoftExcel and Microsoft Access were used for analysing some of the results from theevaluation step.
In order to validate that the application worked correctly with respect to thek-NN method, a special data set was designed. The data set contained a lownumber of cases, in order to make it feasible to impute data manually, and wascrafted so that the imputation should give different results both for differentk-values, and for the two neighbour strategies. By comparing the outcome ofthe imputations performed by the application to the outcome of imputationsmade manually, it was decided that the implementation of the k-NN methodwas correct. To further assess this fact, a number of application features wereinspected in more detail: the calculation of Euclidean distance, the calculationof median, and the selection of k donors for both strategies. Finally, a number ofentries in the simulation results were randomly picked and checked for feasibilityand correctness.
The implementation of the remaining imputation methods was deemed cor-rect through code reviews.
7.5.3 PROCESS REUSETo be able to benchmark k-NN against the other imputation methods, we tookadvantage of the fact that we could reuse the results from the data removal
192
7: K-Nearest Neighbour Imputation
step. We instructed the application to save the 12 000 incomplete data setsbefore passing them on to the imputation step. To obtain the benchmarkingfigures, we ran the simulation again for each of the other imputation methodsexcept Random Draw Substitution, this time skipping the data removal stepand feeding the saved incomplete data sets directly to the imputation step.This way, the other imputation methods worked with the same incomplete datasets as the k-NN method.
Moreover, we had constructed the application to accept a reference data setin the evaluation step, in case the data removal step was omitted. This allowedus to obtain values for the R, Q and MSE metrics.
7.6 RESULTSIn this section, we present the results from the simulations of the k-NN methodand the other imputation methods. First, we provide descriptive statistics ofthe incomplete data sets generated in the initial simulation (and reused in sub-sequent simulations). Then, we address the questions posed in the introductionto this chapter as follows:
• We compare the results for different values of k in order to find the appro-priate number of donors. In doing so, we also look at differences betweenthe CC and IC strategies, to assess whether or not the IC strategy isappropriate to use.
• We compare the results from the original simulation with results fromsimulations using data sets with 12 and 18 attributes, respectively.
• We look at how the performance of k-NN changes for different percentagesof missing data, in order to find a limit where the method stops beingusable.
• Finally, we compare the performance of k-NN with the performance of theother imputation methods described in Section 7.3, in order to be able tojudge its relative effectiveness.
7.6.1 INCOMPLETE DATA SETSAs discussed in Section 7.4.1, there is a difference between the amount of dataremoved from the original data set and the amount of data actually missing fromthe resulting, incomplete, data sets. The main reason for this is that entire cases
193
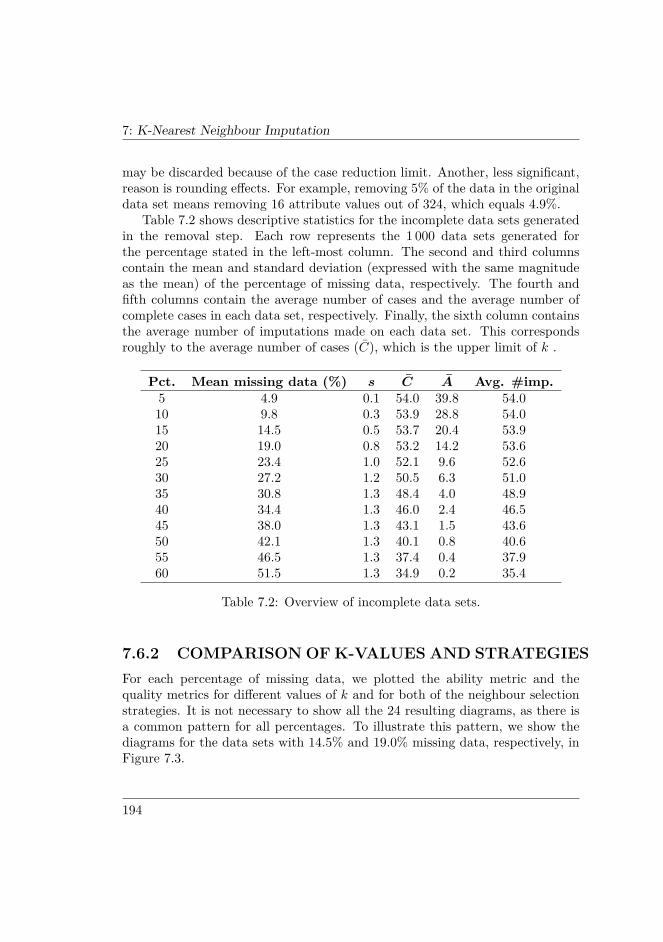
7: K-Nearest Neighbour Imputation
may be discarded because of the case reduction limit. Another, less significant,reason is rounding effects. For example, removing 5% of the data in the originaldata set means removing 16 attribute values out of 324, which equals 4.9%.
Table 7.2 shows descriptive statistics for the incomplete data sets generatedin the removal step. Each row represents the 1 000 data sets generated forthe percentage stated in the left-most column. The second and third columnscontain the mean and standard deviation (expressed with the same magnitudeas the mean) of the percentage of missing data, respectively. The fourth andfifth columns contain the average number of cases and the average number ofcomplete cases in each data set, respectively. Finally, the sixth column containsthe average number of imputations made on each data set. This correspondsroughly to the average number of cases (C), which is the upper limit of k .
Pct. Mean missing data (%) s C A Avg. #imp.5 4.9 0.1 54.0 39.8 54.010 9.8 0.3 53.9 28.8 54.015 14.5 0.5 53.7 20.4 53.920 19.0 0.8 53.2 14.2 53.625 23.4 1.0 52.1 9.6 52.630 27.2 1.2 50.5 6.3 51.035 30.8 1.3 48.4 4.0 48.940 34.4 1.3 46.0 2.4 46.545 38.0 1.3 43.1 1.5 43.650 42.1 1.3 40.1 0.8 40.655 46.5 1.3 37.4 0.4 37.960 51.5 1.3 34.9 0.2 35.4
Table 7.2: Overview of incomplete data sets.
7.6.2 COMPARISON OF K-VALUES AND STRATEGIESFor each percentage of missing data, we plotted the ability metric and thequality metrics for different values of k and for both of the neighbour selectionstrategies. It is not necessary to show all the 24 resulting diagrams, as there isa common pattern for all percentages. To illustrate this pattern, we show thediagrams for the data sets with 14.5% and 19.0% missing data, respectively, inFigure 7.3.
194
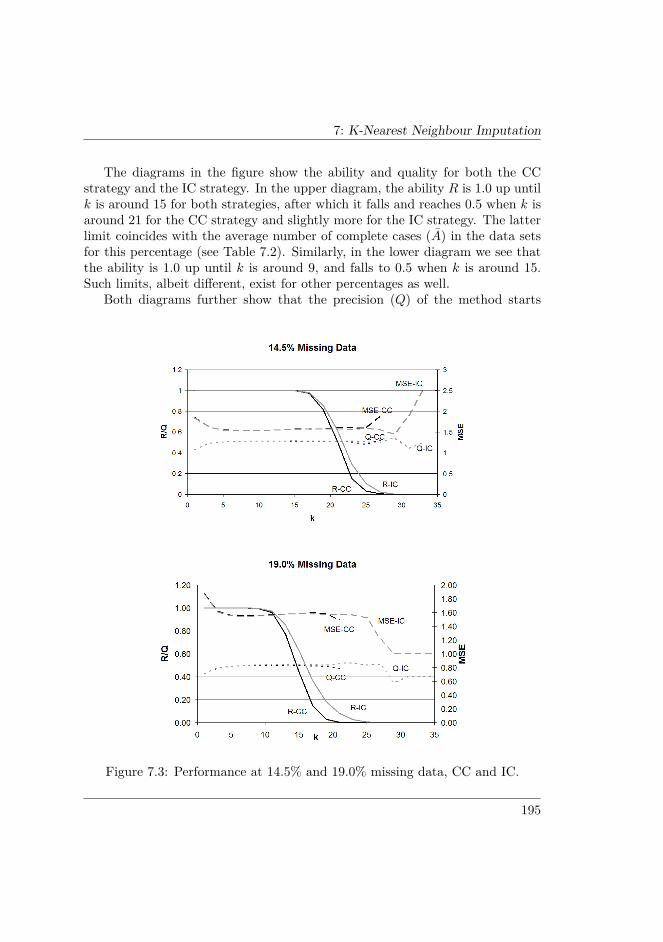
7: K-Nearest Neighbour Imputation
The diagrams in the figure show the ability and quality for both the CCstrategy and the IC strategy. In the upper diagram, the ability R is 1.0 up untilk is around 15 for both strategies, after which it falls and reaches 0.5 when k isaround 21 for the CC strategy and slightly more for the IC strategy. The latterlimit coincides with the average number of complete cases (A) in the data setsfor this percentage (see Table 7.2). Similarly, in the lower diagram we see thatthe ability is 1.0 up until k is around 9, and falls to 0.5 when k is around 15.Such limits, albeit different, exist for other percentages as well.
Both diagrams further show that the precision (Q) of the method starts
Figure 7.3: Performance at 14.5% and 19.0% missing data, CC and IC.
195

7: K-Nearest Neighbour Imputation
at around 0.4 when k is 1, and increases up to around 0.5 when k reaches5. Thereafter, the precision is fairly unaffected by the value of k and variesonly slightly on a “ledge” of k-values, an observation similar to that made byTroyanskaya et al. [2001]. This is true for both strategies. Because of thepriorities of the performance metrics, discussed in Section 7.4.3, the ledge hasa natural upper limit as the ability of the method drops. The initial increasein precision and the ledge of k-values exist for other percentages as well, up toa percentage where the drop in ability occurs already for a low k. In our data,this happens when around 30% data are missing, in which case the ability dropsto 0.8 for the CC strategy and 0.9 for the IC strategy already when k is 3.
The mean square error (MSE), which is the tertiary performance metric,starts off high but shows a noticeable decrease as k increases to 7. Then, it slowlyincreases for higher k-values on the aforementioned ledge. Although the increaseis minimal, it seems to concur with the observation made in Section 7.3.5 thatthe estimated replacement values get worse as the mean distance to the donorsincrease. The described pattern in mean square error occurs for both strategiesand for other percentages as well.
The differences between the neighbour strategies can be seen by comparingthe black curves, representing the CC strategy, to the grey curves, representingthe IC strategy. As can be seen, the curves for R, Q and MSE are nearlyidentical between the strategies. The main difference is that the ability (R) ofthe method, as expected, does not drop as fast for the IC strategy as it doesfor the CC strategy. Two important observations regarding the IC strategy arethat the precision is generally not lower than for the CC strategy, and the meansquare error is not larger.
We see, based on the discussion about the performance metrics above, that kshould be selected so that it is large enough to be on the ledge, but low enough tominimise the mean square error. Since the ledge gradually diminishes for higherpercentages of missing data, k would preferably depend on the proportion ofmissing data. In fact, the dependency should be on the number of availableneighbours for at least two reasons. First, the drop in ability occurs becausethe number of available neighbours decreases. For the CC strategy, the numberof available neighbours is the number of complete cases. For the IC strategy,it is slightly more, but not so much more that the number of complete casesis an unfit approximation. Second, removing a certain percentage of data fromtwo data sets with different numbers of attributes but the same number of caseswould result in different numbers of complete cases.
Tables 7.3 and 7.4 show the observed optimal k-values for the CC strategyand the IC strategy, respectively, given the average number of complete cases
196
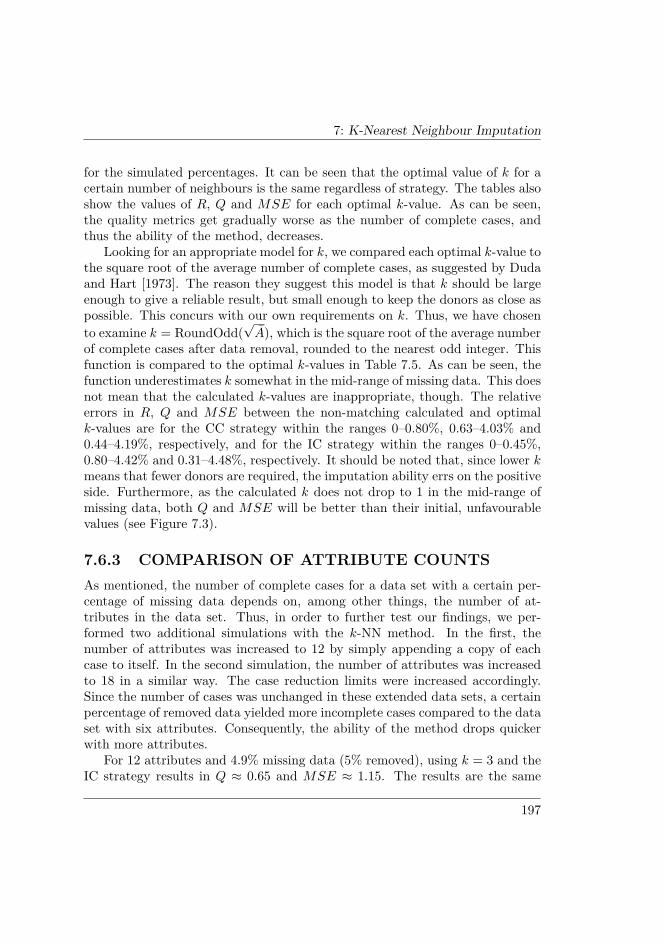
7: K-Nearest Neighbour Imputation
for the simulated percentages. It can be seen that the optimal value of k for acertain number of neighbours is the same regardless of strategy. The tables alsoshow the values of R, Q and MSE for each optimal k-value. As can be seen,the quality metrics get gradually worse as the number of complete cases, andthus the ability of the method, decreases.
Looking for an appropriate model for k, we compared each optimal k-value tothe square root of the average number of complete cases, as suggested by Dudaand Hart [1973]. The reason they suggest this model is that k should be largeenough to give a reliable result, but small enough to keep the donors as close aspossible. This concurs with our own requirements on k. Thus, we have chosento examine k = RoundOdd(
√A), which is the square root of the average number
of complete cases after data removal, rounded to the nearest odd integer. Thisfunction is compared to the optimal k-values in Table 7.5. As can be seen, thefunction underestimates k somewhat in the mid-range of missing data. This doesnot mean that the calculated k-values are inappropriate, though. The relativeerrors in R, Q and MSE between the non-matching calculated and optimalk-values are for the CC strategy within the ranges 0–0.80%, 0.63–4.03% and0.44–4.19%, respectively, and for the IC strategy within the ranges 0–0.45%,0.80–4.42% and 0.31–4.48%, respectively. It should be noted that, since lower kmeans that fewer donors are required, the imputation ability errs on the positiveside. Furthermore, as the calculated k does not drop to 1 in the mid-range ofmissing data, both Q and MSE will be better than their initial, unfavourablevalues (see Figure 7.3).
7.6.3 COMPARISON OF ATTRIBUTE COUNTSAs mentioned, the number of complete cases for a data set with a certain per-centage of missing data depends on, among other things, the number of at-tributes in the data set. Thus, in order to further test our findings, we per-formed two additional simulations with the k-NN method. In the first, thenumber of attributes was increased to 12 by simply appending a copy of eachcase to itself. In the second simulation, the number of attributes was increasedto 18 in a similar way. The case reduction limits were increased accordingly.Since the number of cases was unchanged in these extended data sets, a certainpercentage of removed data yielded more incomplete cases compared to the dataset with six attributes. Consequently, the ability of the method drops quickerwith more attributes.
For 12 attributes and 4.9% missing data (5% removed), using k = 3 and theIC strategy results in Q ≈ 0.65 and MSE ≈ 1.15. The results are the same
197
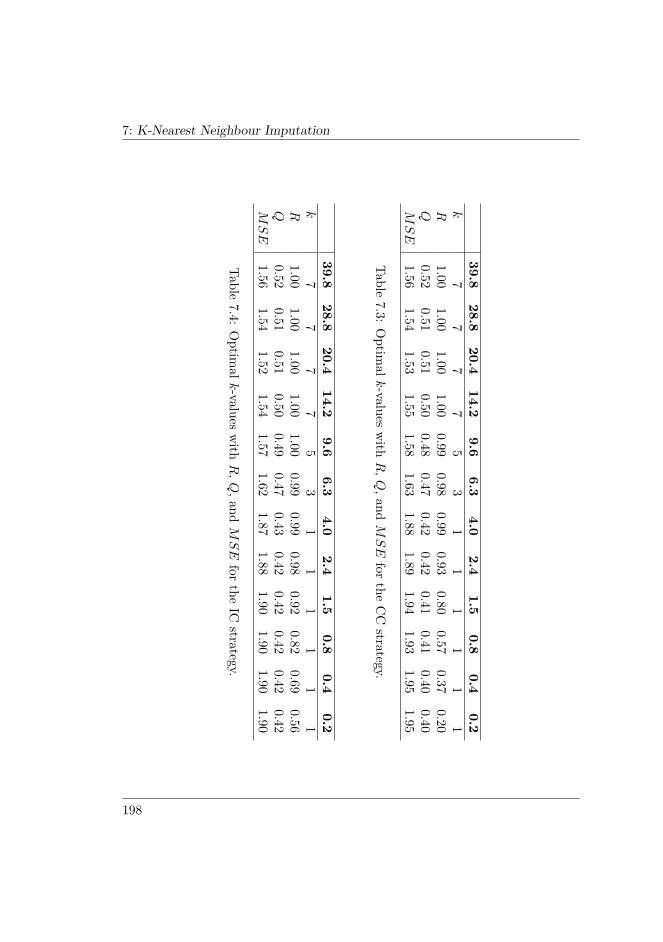
7: K-Nearest Neighbour Imputation
39.828.8
20.414.2
9.66.3
4.02.4
1.50.8
0.40.2
k7
77
75
31
11
11
1R
1.001.00
1.001.00
0.990.98
0.990.93
0.800.57
0.370.20
Q0.52
0.510.51
0.500.48
0.470.42
0.420.41
0.410.40
0.40MSE
1.561.54
1.531.55
1.581.63
1.881.89
1.941.93
1.951.95
Table7.3:
Optim
alk-values
withR
,Q
,andMSE
forthe
CC
strategy.
39.828.8
20.414.2
9.66.3
4.02.4
1.50.8
0.40.2
k7
77
75
31
11
11
1R
1.001.00
1.001.00
1.000.99
0.990.98
0.920.82
0.690.56
Q0.52
0.510.51
0.500.49
0.470.43
0.420.42
0.420.42
0.42MSE
1.561.54
1.521.54
1.571.62
1.871.88
1.901.90
1.901.90
Table7.4:
Optim
alk-values
withR
,Q
,andMSE
forthe
ICstrategy.
198
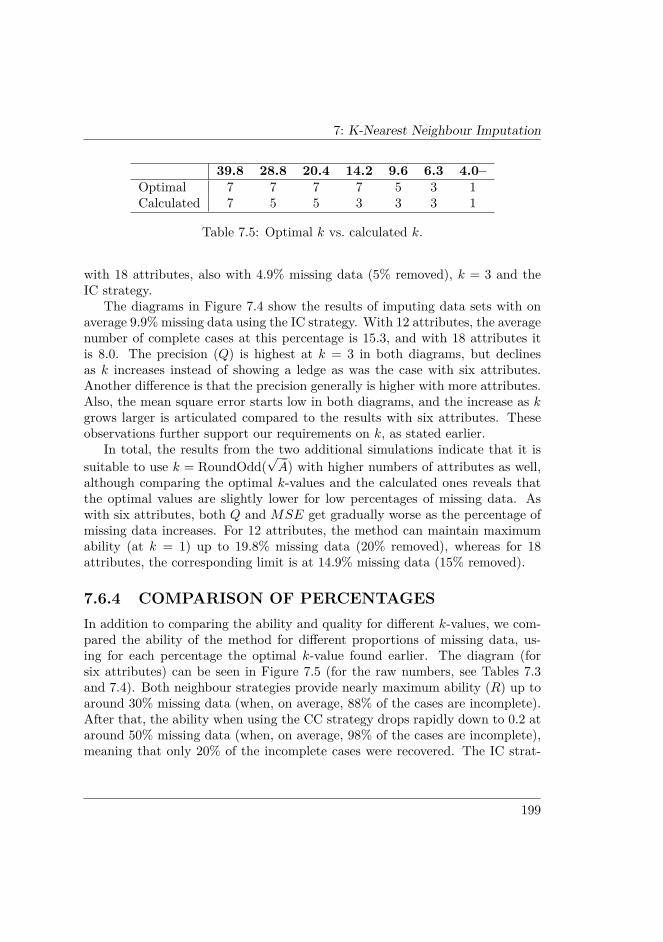
7: K-Nearest Neighbour Imputation
39.8 28.8 20.4 14.2 9.6 6.3 4.0–Optimal 7 7 7 7 5 3 1Calculated 7 5 5 3 3 3 1
Table 7.5: Optimal k vs. calculated k.
with 18 attributes, also with 4.9% missing data (5% removed), k = 3 and theIC strategy.
The diagrams in Figure 7.4 show the results of imputing data sets with onaverage 9.9% missing data using the IC strategy. With 12 attributes, the averagenumber of complete cases at this percentage is 15.3, and with 18 attributes itis 8.0. The precision (Q) is highest at k = 3 in both diagrams, but declinesas k increases instead of showing a ledge as was the case with six attributes.Another difference is that the precision generally is higher with more attributes.Also, the mean square error starts low in both diagrams, and the increase as kgrows larger is articulated compared to the results with six attributes. Theseobservations further support our requirements on k, as stated earlier.
In total, the results from the two additional simulations indicate that it issuitable to use k = RoundOdd(
√A) with higher numbers of attributes as well,
although comparing the optimal k-values and the calculated ones reveals thatthe optimal values are slightly lower for low percentages of missing data. Aswith six attributes, both Q and MSE get gradually worse as the percentage ofmissing data increases. For 12 attributes, the method can maintain maximumability (at k = 1) up to 19.8% missing data (20% removed), whereas for 18attributes, the corresponding limit is at 14.9% missing data (15% removed).
7.6.4 COMPARISON OF PERCENTAGESIn addition to comparing the ability and quality for different k-values, we com-pared the ability of the method for different proportions of missing data, us-ing for each percentage the optimal k-value found earlier. The diagram (forsix attributes) can be seen in Figure 7.5 (for the raw numbers, see Tables 7.3and 7.4). Both neighbour strategies provide nearly maximum ability (R) up toaround 30% missing data (when, on average, 88% of the cases are incomplete).After that, the ability when using the CC strategy drops rapidly down to 0.2 ataround 50% missing data (when, on average, 98% of the cases are incomplete),meaning that only 20% of the incomplete cases were recovered. The IC strat-
199
7: K-Nearest Neighbour Imputation
egy, on the other hand, drops less drastically and can recover nearly 60% of theincomplete cases at around 50% missing data.
The figure clearly shows that the IC strategy is more advantageous whenmore data are missing. Because the comparison of k-values showed that the ICstrategy does not give lower precision (Q) or larger mean square error (MSE)
Figure 7.4: 9.9% missing data, 12 and 18 attributes, IC strategy.
200
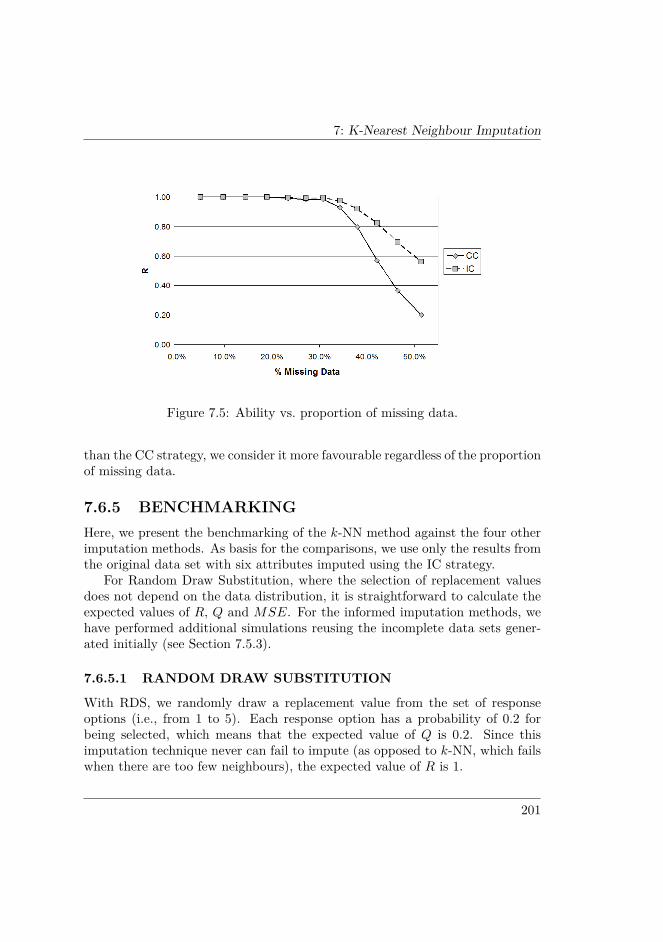
7: K-Nearest Neighbour Imputation
Figure 7.5: Ability vs. proportion of missing data.
than the CC strategy, we consider it more favourable regardless of the proportionof missing data.
7.6.5 BENCHMARKINGHere, we present the benchmarking of the k-NN method against the four otherimputation methods. As basis for the comparisons, we use only the results fromthe original data set with six attributes imputed using the IC strategy.
For Random Draw Substitution, where the selection of replacement valuesdoes not depend on the data distribution, it is straightforward to calculate theexpected values of R, Q and MSE. For the informed imputation methods, wehave performed additional simulations reusing the incomplete data sets gener-ated initially (see Section 7.5.3).
7.6.5.1 RANDOM DRAW SUBSTITUTION
With RDS, we randomly draw a replacement value from the set of responseoptions (i.e., from 1 to 5). Each response option has a probability of 0.2 forbeing selected, which means that the expected value of Q is 0.2. Since thisimputation technique never can fail to impute (as opposed to k-NN, which failswhen there are too few neighbours), the expected value of R is 1.
201
7: K-Nearest Neighbour Imputation
The expected value ofMSE can be calculated given the average distributionof response options in the original data set. Let P (z) denote the probability thatthe correct value of a missing value is z. Given the fact that the probability ofimputing any value is 1/W with W response options, the expected total MSE(here denoted TMSE) for all imputations can be expressed as follows:
TMSE = 1W
∑x
∑y
(P (y)|x− y|2) (7.5)
Here, x is the imputed value and y is the correct value. The problem is thatTMSE includes the errors also when the correct value is imputed. These errorsare all zero, which means that TMSE is lower than the expected MSE, whichis defined as the relative error for the incorrectly imputed values. To obtainthe correct MSE, TMSE must be divided by the probability of imputing anincorrect value, thus:
MSE = TMSE1− 1/W
= W × TMSEW − 1
(7.6)
With P (z) = {0.015, 0.296, 0.340, 0.327, 0.022}, 1 ≤ z ≤ 5, which is theaverage distribution of response options in the original data, we obtainMSE ≈3.465.
7.6.5.2 RANDOM IMPUTATION
With RI, we draw a replacement value from the set of available answers tothe current question, which means that the distribution of response options istaken into consideration. Given that the missingness mechanism for our data isMCAR, the distributions in the incomplete data sets can be assumed to equalthe distribution in the complete data set. Thus, RI can be expected to performreasonably well. With MAR as the missingness mechanism, the performancecould be worse.
As with RDS, this imputation technique cannot fail, and the expected valueof R is 1. The simulation with RI as the imputation method resulted in Q ≈ 0.41and MSE ≈ 1.97 averaged over all 12 000 incomplete data sets. The averagesfor each individual percentage did not deviate much from the total averages.
7.6.5.3 MEDIAN IMPUTATION
With MEI, the replacement value is the median of all available answers to thecurrent question. As pointed out in Section 7.3.3, the frequency of the response
202

7: K-Nearest Neighbour Imputation
option that corresponds to the median has large effect on the imputation per-formance. Figure 7.1 shows that our data are favourable for MEI in this aspect,since most questions have frequent median response options.
MEI cannot fail to impute, which means that the expected value of R is 1.The simulation with MEI as the imputation method gave the values Q ≈ 0.50and MSE ≈ 1.59 averaged over all incomplete data sets. The averages of Q forindividual percentages did not differ much from the total average. However, forMSE, the averages ranged from 1.55 to 1.61.
7.6.5.4 MODE IMPUTATION
With MOI, the replacement value is the mode of all available answers to thecurrent question. If the distribution of answers is multimodal, one of the modesis selected randomly.
As described in Section 7.3.4, MOI does not perform well if the responseoption that corresponds to the mode is only slightly more frequent than otherresponse options. Figure 7.1 clearly shows that this is not the case in our data,which means that we can expect MOI to perform well.
MOI cannot fail to impute, which means that the expected value of R is 1.The simulation with MOI as the imputation method resulted in Q ≈ 0.54 andMSE ≈ 1.85 averaged over all incomplete data sets. The variations in averageQ and average MSE for individual percentages were noticeable; Q varied from0.51 to 0.56, and MSE varied from 1.79 to 1.90.
7.6.6 SUMMARY AND INTERPRETATION OF THERESULTS
The results indicate that the k-NN method performs well on the type of datawe have used, provided that a suitable value of k is selected. Table 7.6 presentsan overview of the comparisons made in evaluating k-NN, whereas Table 7.7shows an overview of the benchmarking against the other imputation methods.
Table 7.6 shows that the IC strategy is favourable over the CC strategy,since it allows k-NN to maintain high ability for higher percentages of missingdata, while the precision and mean square error are equally good. In addition,Figure 7.5 shows that, when using the IC strategy, nearly 60% of the incompletecases could be saved when 50% of the data were missing.
It can be seen that k-NN performs better with more attributes, both withrespect to precision and mean square error. This is due to the fact that with
203
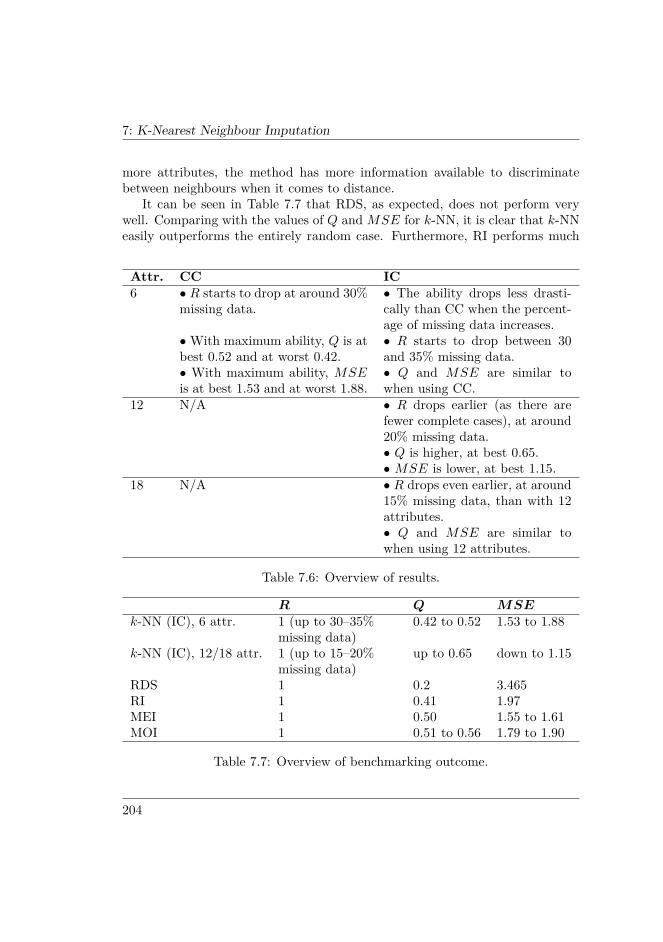
7: K-Nearest Neighbour Imputation
more attributes, the method has more information available to discriminatebetween neighbours when it comes to distance.
It can be seen in Table 7.7 that RDS, as expected, does not perform verywell. Comparing with the values of Q andMSE for k-NN, it is clear that k-NNeasily outperforms the entirely random case. Furthermore, RI performs much
Attr. CC IC6 • R starts to drop at around 30%
missing data.• The ability drops less drasti-cally than CC when the percent-age of missing data increases.
•With maximum ability, Q is atbest 0.52 and at worst 0.42.
• R starts to drop between 30and 35% missing data.
• With maximum ability, MSEis at best 1.53 and at worst 1.88.
• Q and MSE are similar towhen using CC.
12 N/A • R drops earlier (as there arefewer complete cases), at around20% missing data.• Q is higher, at best 0.65.• MSE is lower, at best 1.15.
18 N/A • R drops even earlier, at around15% missing data, than with 12attributes.• Q and MSE are similar towhen using 12 attributes.
Table 7.6: Overview of results.
R Q MSEk-NN (IC), 6 attr. 1 (up to 30–35%
missing data)0.42 to 0.52 1.53 to 1.88
k-NN (IC), 12/18 attr. 1 (up to 15–20%missing data)
up to 0.65 down to 1.15
RDS 1 0.2 3.465RI 1 0.41 1.97MEI 1 0.50 1.55 to 1.61MOI 1 0.51 to 0.56 1.79 to 1.90
Table 7.7: Overview of benchmarking outcome.
204
7: K-Nearest Neighbour Imputation
better than RDS. The precision (Q) is twice as high, and the error (MSE) ismuch lower. However, compared to k-NN, RI falls short.
MEI touches upon the six-attribute k-NN in terms of both precision andmean square error, and given that the ability (R) is always 1, it seems to be aviable alternative. Disadvantages of MEI are that it is more sensitive than k-NNto the distribution of response options (see Section 7.3.3), and that it does notperform better when the number of attributes increases. Furthermore, as withall single-value imputation, MEI may result in a disturbed data distribution,which becomes particularly noticeable when much data are missing.
MOI does perform slightly better than the six-attribute k-NN with respectto precision (Q), but performs worse with respect to relative error (MSE). Aswith MEI, MOI is sensitive for the distribution of response option and doesnot improve with more attributes. The reason for MOI having worse MSEthan MEI is that the modes of the majority of the questions in our data setcorrespond to response options 2 or 4, which do not dominate the distributions.Thus, if the mode is not the correct value, the error will be rather large.
With 12 or 18 attributes, k-NN outperforms both MEI and MOI. Thesemethods does not scale with respect to number of attributes, since they onlywork with one attribute at a time.
Judging from the results, k-NN proved to have good performance. However,both Median Imputation and Mode Imputation could compete with k-NN, giventhat both these methods were favoured by the distribution of our data. MedianImputation had similar precision and similar relative error, whereas Mode Im-putation had slightly better precision, but worse relative error. Both methodswill always have maximum ability (i.e., save all incomplete cases), which makesthem attractive when much data are missing and there are many incompletecases.
It is of course desirable to achieve good values on all three performancemetrics. However, when the performance decreases for whichever of the metrics,it is the priorities between them that should determine whether the imputationwas successful or not. For example, if the quality drops but the ability stays high,the imputation may still be considered successful, because resorting to listwisedeletion (or any other type of deletion procedure) may not be an option.
7.7 VALIDITY AND FUTURE WORKIn this section, we discuss threats to the validity of the evaluation and outlinepossible future work.
205
7: K-Nearest Neighbour Imputation
7.7.1 THREATS TO VALIDITYIn the k-NN method, we used Euclidean distance as the similarity measure.However, since the data were of Likert type (i.e., on an ordinal scale), it isdebatable to perform distance calculations, which normally requires an intervalscale. Still, we argue that the distance calculations were relevant, and thusthe validity threat minimal, because effort was put into making the distancesbetween Likert numbers similar. Furthermore, our results show that the k-NNimputations were successful after all.
In step 1 of the evaluation, we removed data from the original data set com-pletely at random, which means that the missingness mechanism was MCAR.It is more likely, though, that missing responses to a questionnaire are MAR, aspointed out by Raaijmakers [1999]. In other words, the missingness mechanismused in the evaluation did not fully represent a real-world situation. Due to thenature of our data, we could not avoid this problem.
It may be dangerous to use incomplete cases as donors when the missingnessmechanism is MAR, for example if incomplete cases can be said to contain lessvaluable data. This could be the case if missing answers were an indication thatthe respondents did not take the questionnaire seriously. As a precaution, werecommend using a limit to prevent cases with far too much missing data bothfrom being imputed and from acting as donors.
A threat to the generalisability of the results is that we used a fairly smalldata set with 54 cases as a basis for the simulation. With a small data setwith missing data, the neighbours that can be used as donors are few. Hence,the outcome of the imputation is sensitive to disturbances in the data, suchas outliers. We do, however, believe that it is not uncommon to get a smalldata set when collecting data from a survey, which means that our simulationshould be relevant from this point of view. Furthermore, that k-NN in our casegenerates replacement values based on the median of the donors’ values shouldalleviate the effect of outliers.
A threat to the evaluation of k-NN with 12 or 18 attributes is that we createdthese extended data sets by appending one or two copies of each case to itself.This means that the similarity, if any, between two cases is duplicated as well.In a real data set with 12 or 18 attributes, two cases could be similar for sixof the attributes, but different for six other attributes. This means that theperformance metrics for 12 and 18 attributes may be overly positive.
206
7: K-Nearest Neighbour Imputation
7.7.2 FUTURE WORKDue to the nature of our data, we used only MCAR as missingness mechanism(see Section 7.4.1). In future work, it would be interesting to study imputationof Likert data with systematic differences that allow MAR missingness. Forexample, Song et al. [2005] have concluded that the missingness mechanismdoes not significantly affect the k-NN method in the context of software projecteffort data.
Each of the questions in the original questionnaire used a Likert scale withfive response options. However, it is also common to use Likert scales withmore response options, for example seven or ten. Hypothetically speaking, k-NN should gain from the fact that more response options means that it wouldbe easier to differentiate between neighbours (and find close donors), but shouldlose from the fact that more response options makes it easier for two respon-dents to answer similarly, yet differently. The other imputation methods wouldlikely have worse performance, as more response options, provided they wereused, would result in a wider distribution with smaller frequencies for individ-ual response options. These hypotheses would be interesting to test in futurework.
7.8 CONCLUSIONSIn this chapter, we have presented an evaluation of the performance of the k-Nearest Neighbour imputation method when using homogeneous Likert data.This type of ordinal data is common in surveys that collect subjective opinionsfrom individuals. We performed the evaluation by simulating non-responsivenessin questionnaire data and subsequent imputation of the incomplete data.
Since we simulated the evaluation process, we were able to obtain greatvariation in the imputation parameters and operate on a large number of in-complete data sets. In the main imputation process, we used different valuesof k, and also two different strategies for selecting neighbours, the CC strategyand the IC strategy. The CC strategy, which concurs with the rules of the k-NN method, allows only complete cases to act as neighbours. The IC strategyallows as neighbours also incomplete cases where attribute values that wouldnot contribute to the distance calculation are missing.
In order to measure the performance of the method, we defined one abil-ity metric and two quality metrics. Based on the results of the simulation, wecompared these metrics for different values of k and for different proportions
207
7: K-Nearest Neighbour Imputation
of missing data. We also compared the ability of the method for different pro-portions of missing data using optimal values of k. Furthermore, we performedadditional simulations with more attributes, in order to see how the number ofattributes affected the performance of the method. Finally, we benchmarked themethod against four other imputation methods, in order to be able to assess itsrelative effectiveness. The methods were Random Draw Substitution, RandomImputation, Median Imputation and Mode Imputation. The benchmarking wasperformed through additional simulations where the k-NN method was replacedby the other methods.
Our findings lead us to conclude the following in response to our researchquestions:
• What is the performance of the k-NN method in relation to theother methods? Our results show that the k-NN method performedwell when imputing homogeneous Likert data, provided that an appropri-ate value of k was used. It outperformed both Random Draw Substitutionand Random Imputation, while both Median Imputation and Mode Im-putation performed equally good or slightly better. However, it is clearthat our data were favourable both for Median Imputation and Mode Im-putation. With a different distribution of response options, these methodscould perform worse, whereas the k-NN method should not, given that itis less sensitive to the data distribution.
• How many donors should preferably be selected? It is not best touse k = 1, as we have seen is common, in all situations. Our results showthat using the square root of the number of complete cases, rounded tothe nearest odd integer, is a suitable model for k.
• At which proportion of missing data is it no longer relevant touse the method? The outcome of the imputation depends on the numberof complete cases more than the proportion of missing data. The methodwas successful even for high proportions of incomplete cases. For example,with six attributes and the IC strategy, the method had close to maximumability when 95% of the cases were incomplete. Thus, we are confidentthat the method would have been able to handle our initial situation withmissing data (see Section 7.2.1) very well.
• Is it possible to decrease the sensitivity to the proportion ofmissing data by allowing imputation from certain incompletecases as well? When using the IC strategy, the ability of the method
208
7: K-Nearest Neighbour Imputation
increased substantially compared to the CC strategy for larger proportionsof missing data, while there was no negative impact on the quality of theimputations for smaller proportions of missing data. Consequently, the ICstrategy seems, from a quality perspective, safe to use in all situations.
• What effect has the number of attributes (variables) on the re-sults? The k-NN method proved to scale well to more attributes, as boththe precision and the mean square error improved for 12 and 18 attributescompared to six attributes. It is also evident that the other imputationmethods are not positively affected by the number of attributes, as theydo not make use of the additional amount of information.
209

7: K-Nearest Neighbour Imputation
210

Chapter 8
Hierarchical CumulativeVoting
Decisions are something that people make everyday and in many different situ-ations. These daily decisions can be non-trivial and are often relatively simple,such as which bus to take or which flavour of a soft drink to buy. When facingdecisions of more complex nature, and when more is at stake, decisions tend toget much harder. In complex areas, such as economics, management research,operations research, game theory and cognitive sciences, decision support (anddecision making) is a well-established research discipline [Ruhe, 2002]. Soft-ware engineering in general, and requirements engineering in particular, has astrong component of management which makes the situation similar to such ar-eas [Ngo-The and Ruhe, 2005]. Furthermore, software engineering is undertakenin a complex, uncertain and/or dynamic environment with decisions regardingproducts, processes, technologies, tools etc. [Ruhe, 2002] The demand for deci-sion support in software engineering concerns the entire product lifecycle, fromanalysis and requirements engineering to evolution and maintenance. Activitiesin all these phases need support in how to describe, evaluate, sort, rank, andselect/reject candidate products, processes etc. [Ruhe, 2002] Decision supportthat provides as much input as possible to a decision maker is essential, and istremendously important to be able to develop software faster, cheaper, and ofhigher quality [Ruhe, 2002].
The need for decision support in software engineering has lead to a new com-munity within software engineering, called software engineering decision support
8: Hierarchical Cumulative Voting
(SEDS) [Ruhe, 2002]. This is also closely related to another community, calledvalue based software engineering (VBSE), where the main concern is to delivervalue to stakeholders rather than being value-neutral as in most current devel-opment approaches [Boehm and Huang, 2003]. Software engineering decisionsupport plays a vital role in the value generation processes, as it facilitatesmaking the right decisions and developing the right things [Ngo-The and Ruhe,2005]. Hence, decision support is a crucial component in achieving the goalof delivering value to internal or external stakeholders. When delivering busi-ness value, one of the key issues is to decide what and when to develop, and itis important to make trade-offs between different objectives, stakeholders andconstraints [Ruhe, 2002]. Even though having decision support for requirementsengineering is a prerequisite for doing this effectively, and despite an emergingawareness of the role of decision support in requirements processes [Ngo-The andRuhe, 2005], little attention has been devoted to providing appropriate supportfor making decisions related to requirements.
While decision support in requirements engineering is a fairly broad area,requirements prioritisation together with release planning, elicitation, and ne-gotiation are considered as some of the most important requirements decisionactivities [Ngo-The and Ruhe, 2005]. At the same time, requirements prioritisa-tion has been identified as an integral (and important) part in both requirementsnegotiation and release planning in incremental software development [Ruhe,2002]. Moreover, requirements prioritisation concerns both strategic and tac-tical decisions even though the main focus is on tactical ones [Ngo-The andRuhe, 2005]. This makes requirements prioritisation a very important compo-nent of software requirements decision support, especially as input to other,more sophisticated release planning methodologies and negotiation approachesfor deciding what to develop and when to do it.
This chapter is outlined as follows. Section 8.1 gives an introduction torequirements prioritisation and presents Analytical Hierarchy Process and Cu-mulative Voting, which are two prioritisation techniques that produce ratio-scaleresults. Cumulative Voting was used to prioritise issues in the study describedin Chapter 4. Pros and cons of the two techniques are discussed as well. Sec-tion 8.2 presents the main contribution which is a new technique for conductingrequirements prioritisation called Hierarchical Cumulative Voting. Section 8.3presents empirical results from the use of Cumulative Voting and HierarchicalCumulative Voting. Section 8.4 discusses some open issues with HierarchicalCumulative Voting as well as issues to think about when using it in practice,while Section 8.5 concludes the chapter.
212

8: Hierarchical Cumulative Voting
8.1 REQUIREMENTS PRIORITISATIONThe quality of a software product is often considered as being the ability ofthe product to satisfy customer and user needs [Bergman and Klefsjö, 2003;Schulmeyer and McManus, 1999]. By finding, selecting, and planning the rightreleases with suitable functionality, the chance of a successful project or prod-uct increases [Berander and Andrews, 2005]. If the wrong requirements aredeveloped and users resist buying and using the product, it does not matterhow well other parts of development are conducted [Berander and Andrews,2005]. When developing products, decision makers often face the challenge ofhaving more candidate requirements than are possible to realise given differentconstraints (e.g., time, cost, and resources) [Berander and Andrews, 2005]. Insuch situations, it is necessary to distinguish the vital requirements from theless important ones in order to maximise the overall business value by satis-fying different key interests, technical constraints, and preferences of criticalstakeholders [Ruhe et al., 2002]. By identifying the requirements that are mostimportant, least costly, least risky etc., it is possible to find a favourable mix ofrequirements that can be used to produce a system that implements only a sub-set of all requirements, while still satisfying customers [Berander and Andrews,2005]. To find the requirements that add most value to business, it is possibleto utilise some of the available prioritisation techniques.
Prioritisation can be used in almost every situation when having choices toconsider. In software engineering, for example, it has been used for prioritisingsoftware process improvement issues (see Chapter 4), stakeholders [Ruhe andSaliu, 2005], software requirements [Regnell et al., 2001], etc. When prioritisingsoftware requirements, it can be useful in many different situations as supportfor decisions. Examples include but are not limited to requirements selection(primarily in bespoke/tailor-made or “one-off” project situations), and releaseplanning (primarily in market-driven situations) [Ngo-The and Ruhe, 2005].
8.1.1 SCALES OF PRIORITYDifferent prioritisation techniques are based on different types of measurementscales [Berander and Andrews, 2005]. The scale used determines which arith-metic operations that are allowed, and thus which kinds of analysis that canbe performed [Fenton and Pfleeger, 1997]. In requirements prioritisation, thetwo most commonly used scales are the ordinal scale and the ratio scale, withratio scale being the most powerful of the two [Berander and Andrews, 2005].An ordinal scale preserves ordering among elements and the numbers assigned
213
8: Hierarchical Cumulative Voting
to elements represent ranks, which means that no arithmetic operations (e.g.,addition, subtraction, multiplication) are allowed [Fenton and Pfleeger, 1997].With a ratio scale, all arithmetic operations are applicable, there can be a zeroelement, and not only ordering is relevant but also interval sizes and elementratios [Fenton and Pfleeger, 1997]. Thus, the ratio scale provides more infor-mation about the elements and can be said to have finer granularity than anordinal scale [Berander and Andrews, 2005].
Karlsson [1996] made a comparison between Analytical Hierarchy Process(further on referred to as AHP; see description in Section 8.1.2), a techniquethat produces ratio-scale priorities, and five-level numerical assignment, a tech-nique that produces ordinal-scale priorities (with multiple requirements sharingthe same priority). The numerical assignment approach [see, for example, IEEEStd 830-1998, 1998], is the most common technique for prioritisation of require-ments. When using numerical assignment, requirements are assigned to differentpriority groups (i.e., different importance levels). In the study by Karlsson, itwas found that subjects who prioritised requirements using both techniquesfound the additional information gained with the ratio scale to be important.One observation was that there sometimes were larger differences in priorities(as measured by AHP) within a single priority group than between two prioritygroups, implying that the ordinal scale in this case may have resulted in a toocoarse-grained prioritisation. It was concluded that AHP was better becauseit was seen as more accurate and informative, due to that it provides relativeratio-scale priorities rather than absolute ordinal-scale ones. This conclusion isalso supported by Karlsson et al. [1998], who conducted a more comprehensiveexperiment with a larger set of techniques.
When using a prioritisation technique that provides relative priorities on aratio scale, it is possible to calculate the total importance of a set of require-ments by adding together their priorities. It is also possible to combine differentaspects and calculate ratios in-between aspects. For example, it is possible tocalculate a cost-value ratio that shows how much value each requirement addsin relation to its cost [Karlsson and Ryan, 1997]. This way of finding the mostefficient requirements to implement is not possible with ordinal-scale techniques(although cost-value calculations for ordinal-scale prioritisation have been in-vestigated by Karlsson and Regnell [2005]). Another advantage of ratio-scaletechniques is the ability to take into account distances between requirements.For example, consider three requirements that have been prioritised as account-ing for 80, 15, and 5% of the total importance, respectively. Given the highimportance of the first requirement, it could be decided that it is sufficient toimplement only that. With ordinal-scale prioritisation, on the other hand, there
214
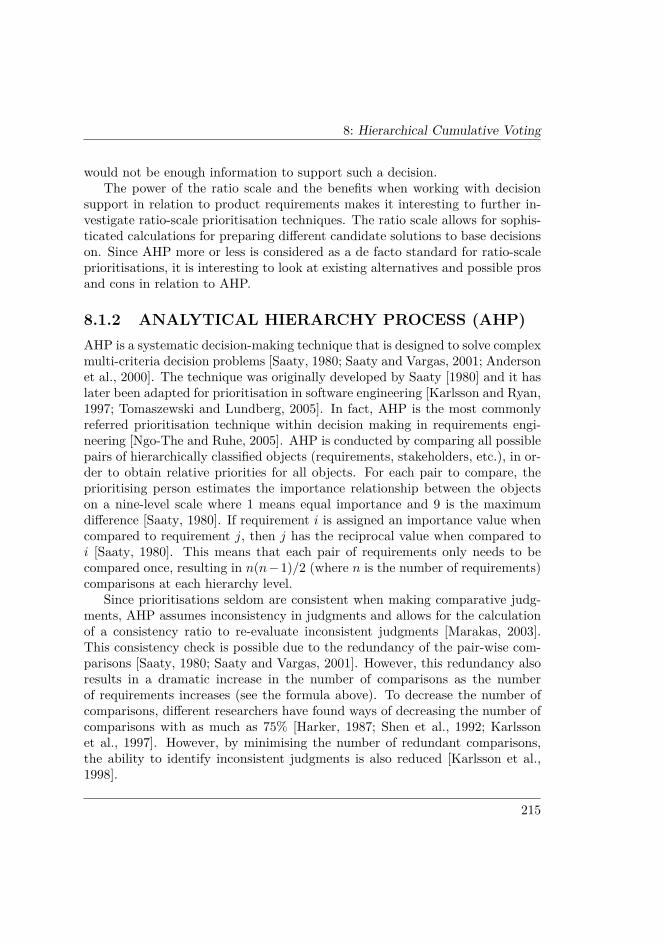
8: Hierarchical Cumulative Voting
would not be enough information to support such a decision.The power of the ratio scale and the benefits when working with decision
support in relation to product requirements makes it interesting to further in-vestigate ratio-scale prioritisation techniques. The ratio scale allows for sophis-ticated calculations for preparing different candidate solutions to base decisionson. Since AHP more or less is considered as a de facto standard for ratio-scaleprioritisations, it is interesting to look at existing alternatives and possible prosand cons in relation to AHP.
8.1.2 ANALYTICAL HIERARCHY PROCESS (AHP)AHP is a systematic decision-making technique that is designed to solve complexmulti-criteria decision problems [Saaty, 1980; Saaty and Vargas, 2001; Andersonet al., 2000]. The technique was originally developed by Saaty [1980] and it haslater been adapted for prioritisation in software engineering [Karlsson and Ryan,1997; Tomaszewski and Lundberg, 2005]. In fact, AHP is the most commonlyreferred prioritisation technique within decision making in requirements engi-neering [Ngo-The and Ruhe, 2005]. AHP is conducted by comparing all possiblepairs of hierarchically classified objects (requirements, stakeholders, etc.), in or-der to obtain relative priorities for all objects. For each pair to compare, theprioritising person estimates the importance relationship between the objectson a nine-level scale where 1 means equal importance and 9 is the maximumdifference [Saaty, 1980]. If requirement i is assigned an importance value whencompared to requirement j, then j has the reciprocal value when compared toi [Saaty, 1980]. This means that each pair of requirements only needs to becompared once, resulting in n(n−1)/2 (where n is the number of requirements)comparisons at each hierarchy level.
Since prioritisations seldom are consistent when making comparative judg-ments, AHP assumes inconsistency in judgments and allows for the calculationof a consistency ratio to re-evaluate inconsistent judgments [Marakas, 2003].This consistency check is possible due to the redundancy of the pair-wise com-parisons [Saaty, 1980; Saaty and Vargas, 2001]. However, this redundancy alsoresults in a dramatic increase in the number of comparisons as the numberof requirements increases (see the formula above). To decrease the number ofcomparisons, different researchers have found ways of decreasing the number ofcomparisons with as much as 75% [Harker, 1987; Shen et al., 1992; Karlssonet al., 1997]. However, by minimising the number of redundant comparisons,the ability to identify inconsistent judgments is also reduced [Karlsson et al.,1998].
215
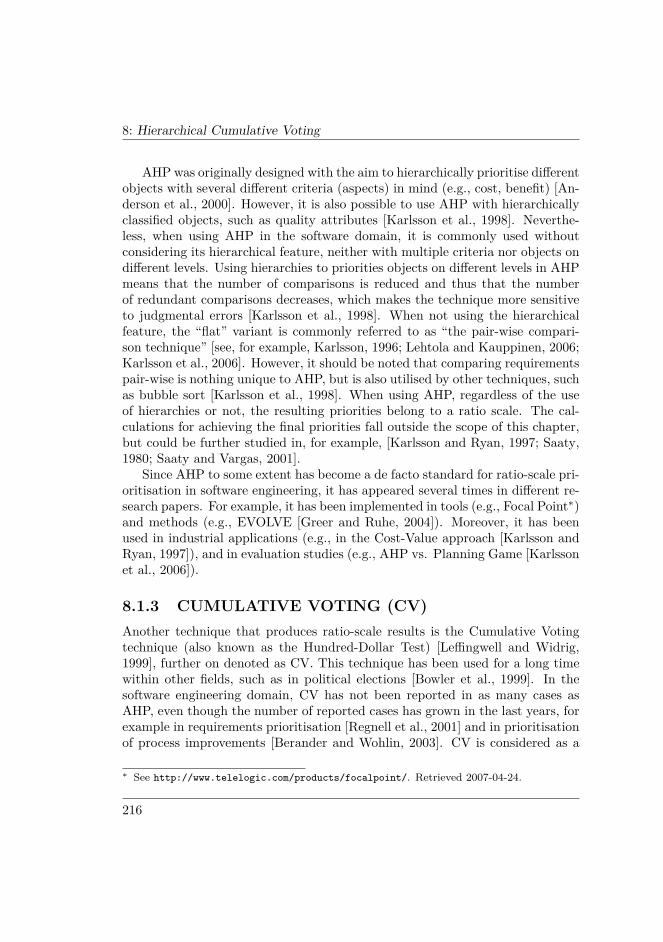
8: Hierarchical Cumulative Voting
AHP was originally designed with the aim to hierarchically prioritise differentobjects with several different criteria (aspects) in mind (e.g., cost, benefit) [An-derson et al., 2000]. However, it is also possible to use AHP with hierarchicallyclassified objects, such as quality attributes [Karlsson et al., 1998]. Neverthe-less, when using AHP in the software domain, it is commonly used withoutconsidering its hierarchical feature, neither with multiple criteria nor objects ondifferent levels. Using hierarchies to priorities objects on different levels in AHPmeans that the number of comparisons is reduced and thus that the numberof redundant comparisons decreases, which makes the technique more sensitiveto judgmental errors [Karlsson et al., 1998]. When not using the hierarchicalfeature, the “flat” variant is commonly referred to as “the pair-wise compari-son technique” [see, for example, Karlsson, 1996; Lehtola and Kauppinen, 2006;Karlsson et al., 2006]. However, it should be noted that comparing requirementspair-wise is nothing unique to AHP, but is also utilised by other techniques, suchas bubble sort [Karlsson et al., 1998]. When using AHP, regardless of the useof hierarchies or not, the resulting priorities belong to a ratio scale. The cal-culations for achieving the final priorities fall outside the scope of this chapter,but could be further studied in, for example, [Karlsson and Ryan, 1997; Saaty,1980; Saaty and Vargas, 2001].
Since AHP to some extent has become a de facto standard for ratio-scale pri-oritisation in software engineering, it has appeared several times in different re-search papers. For example, it has been implemented in tools (e.g., Focal Point∗)and methods (e.g., EVOLVE [Greer and Ruhe, 2004]). Moreover, it has beenused in industrial applications (e.g., in the Cost-Value approach [Karlsson andRyan, 1997]), and in evaluation studies (e.g., AHP vs. Planning Game [Karlssonet al., 2006]).
8.1.3 CUMULATIVE VOTING (CV)Another technique that produces ratio-scale results is the Cumulative Votingtechnique (also known as the Hundred-Dollar Test) [Leffingwell and Widrig,1999], further on denoted as CV. This technique has been used for a long timewithin other fields, such as in political elections [Bowler et al., 1999]. In thesoftware engineering domain, CV has not been reported in as many cases asAHP, even though the number of reported cases has grown in the last years, forexample in requirements prioritisation [Regnell et al., 2001] and in prioritisationof process improvements [Berander and Wohlin, 2003]. CV is considered as a
∗ See http://www.telelogic.com/products/focalpoint/. Retrieved 2007-04-24.
216
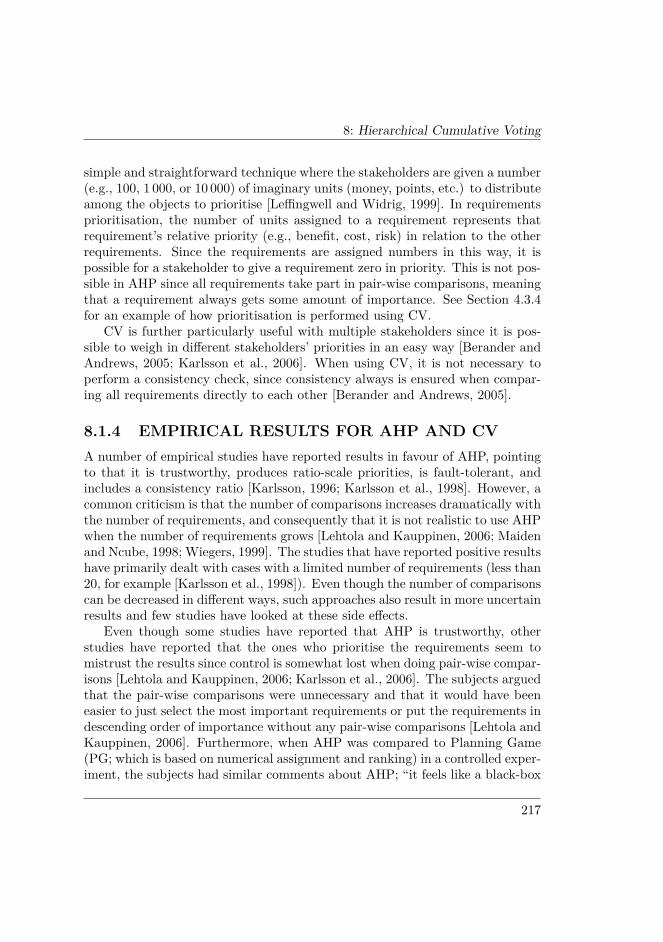
8: Hierarchical Cumulative Voting
simple and straightforward technique where the stakeholders are given a number(e.g., 100, 1 000, or 10 000) of imaginary units (money, points, etc.) to distributeamong the objects to prioritise [Leffingwell and Widrig, 1999]. In requirementsprioritisation, the number of units assigned to a requirement represents thatrequirement’s relative priority (e.g., benefit, cost, risk) in relation to the otherrequirements. Since the requirements are assigned numbers in this way, it ispossible for a stakeholder to give a requirement zero in priority. This is not pos-sible in AHP since all requirements take part in pair-wise comparisons, meaningthat a requirement always gets some amount of importance. See Section 4.3.4for an example of how prioritisation is performed using CV.
CV is further particularly useful with multiple stakeholders since it is pos-sible to weigh in different stakeholders’ priorities in an easy way [Berander andAndrews, 2005; Karlsson et al., 2006]. When using CV, it is not necessary toperform a consistency check, since consistency always is ensured when compar-ing all requirements directly to each other [Berander and Andrews, 2005].
8.1.4 EMPIRICAL RESULTS FOR AHP AND CVA number of empirical studies have reported results in favour of AHP, pointingto that it is trustworthy, produces ratio-scale priorities, is fault-tolerant, andincludes a consistency ratio [Karlsson, 1996; Karlsson et al., 1998]. However, acommon criticism is that the number of comparisons increases dramatically withthe number of requirements, and consequently that it is not realistic to use AHPwhen the number of requirements grows [Lehtola and Kauppinen, 2006; Maidenand Ncube, 1998; Wiegers, 1999]. The studies that have reported positive resultshave primarily dealt with cases with a limited number of requirements (less than20, for example [Karlsson et al., 1998]). Even though the number of comparisonscan be decreased in different ways, such approaches also result in more uncertainresults and few studies have looked at these side effects.
Even though some studies have reported that AHP is trustworthy, otherstudies have reported that the ones who prioritise the requirements seem tomistrust the results since control is somewhat lost when doing pair-wise compar-isons [Lehtola and Kauppinen, 2006; Karlsson et al., 2006]. The subjects arguedthat the pair-wise comparisons were unnecessary and that it would have beeneasier to just select the most important requirements or put the requirements indescending order of importance without any pair-wise comparisons [Lehtola andKauppinen, 2006]. Furthermore, when AHP was compared to Planning Game(PG; which is based on numerical assignment and ranking) in a controlled exper-iment, the subjects had similar comments about AHP; “it feels like a black-box
217
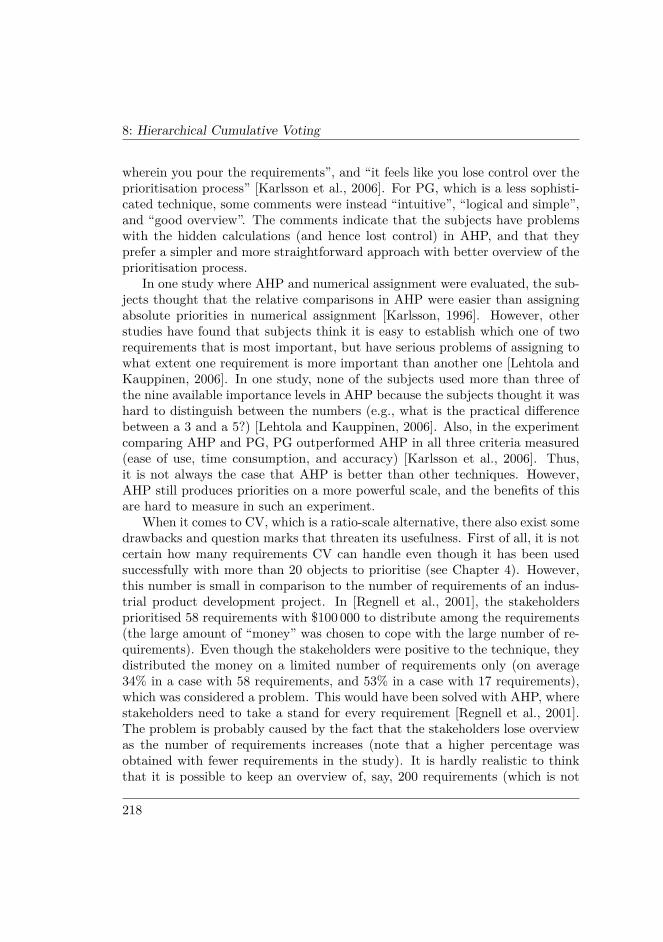
8: Hierarchical Cumulative Voting
wherein you pour the requirements”, and “it feels like you lose control over theprioritisation process” [Karlsson et al., 2006]. For PG, which is a less sophisti-cated technique, some comments were instead “intuitive”, “logical and simple”,and “good overview”. The comments indicate that the subjects have problemswith the hidden calculations (and hence lost control) in AHP, and that theyprefer a simpler and more straightforward approach with better overview of theprioritisation process.
In one study where AHP and numerical assignment were evaluated, the sub-jects thought that the relative comparisons in AHP were easier than assigningabsolute priorities in numerical assignment [Karlsson, 1996]. However, otherstudies have found that subjects think it is easy to establish which one of tworequirements that is most important, but have serious problems of assigning towhat extent one requirement is more important than another one [Lehtola andKauppinen, 2006]. In one study, none of the subjects used more than three ofthe nine available importance levels in AHP because the subjects thought it washard to distinguish between the numbers (e.g., what is the practical differencebetween a 3 and a 5?) [Lehtola and Kauppinen, 2006]. Also, in the experimentcomparing AHP and PG, PG outperformed AHP in all three criteria measured(ease of use, time consumption, and accuracy) [Karlsson et al., 2006]. Thus,it is not always the case that AHP is better than other techniques. However,AHP still produces priorities on a more powerful scale, and the benefits of thisare hard to measure in such an experiment.
When it comes to CV, which is a ratio-scale alternative, there also exist somedrawbacks and question marks that threaten its usefulness. First of all, it is notcertain how many requirements CV can handle even though it has been usedsuccessfully with more than 20 objects to prioritise (see Chapter 4). However,this number is small in comparison to the number of requirements of an indus-trial product development project. In [Regnell et al., 2001], the stakeholdersprioritised 58 requirements with $100 000 to distribute among the requirements(the large amount of “money” was chosen to cope with the large number of re-quirements). Even though the stakeholders were positive to the technique, theydistributed the money on a limited number of requirements only (on average34% in a case with 58 requirements, and 53% in a case with 17 requirements),which was considered a problem. This would have been solved with AHP, wherestakeholders need to take a stand for every requirement [Regnell et al., 2001].The problem is probably caused by the fact that the stakeholders lose overviewas the number of requirements increases (note that a higher percentage wasobtained with fewer requirements in the study). It is hardly realistic to thinkthat it is possible to keep an overview of, say, 200 requirements (which is not
218
8: Hierarchical Cumulative Voting
unusual in industry) when using CV. On the other hand, it is as unrealisticto get stakeholders to do 19 900 pair-wise comparisons as in the case of usingAHP with the same number of requirements. An additional problem with CV(especially with many requirements) is that the stakeholders may miscalculatethe points so they do not add up to the correct sum [Berander and Wohlin,2004].
An additional issue that has been raised in relation to CV is that it might besensitive to “shrewd tactics”, which means that stakeholders might distributetheir points based on how they think others will do it [Regnell et al., 2001].For example, if a stakeholder considers requirements A and B to be important,but realises that others see only A as important, he may put few points onA and many on B in order to create a balance between the two requirements.This problem is of course even more evident when doing several consecutiveprioritisations, since each stakeholder then knows how the others prioritised thelast time [Leffingwell and Widrig, 1999]. It should be said that the problemwith “shrewd tactics” is not unique to CV, but is present in every availableprioritisation technique, even though techniques such as AHP might diminishthe problem somewhat [Regnell et al., 2001].
The fact that the person who prioritises always has full overview of therequirements makes CV superior to AHP with respect to the trust on the resultsas mentioned in relation to AHP above. Furthermore, Ahl [2005] conducted astudy where several prioritisation techniques were compared, where AHP andCV were the only two producing ratio-scale results. When only looking at theresults in terms of AHP and CV, the study showed that CV was easier to apply,was faster, provided more accurate results, was thought of as more scalable,and was considered as better in total. The results from this study give anindication that CV is superior to AHP (used without its hierarchical feature) inthe aspects measured. However, the study does not really address the questionabout scalability in an objective way (just as many other studies).
8.1.5 REQUIREMENTS LEVELS AND HIERARCHIESWhen working with software requirements, it is common that the requirementscan be defined at different levels of abstraction. Dahlstedt and Persson [2005],for example, discuss requirements interdependencies in different forms, whereone form is when high-level requirements are refined to a number of more specific(further explanation, detail, or clarification) requirements. They also mentionthe opposite situation, when one high-level requirement is generalised from one
219
8: Hierarchical Cumulative Voting
or several more detailed requirements, and that a requirement can be dividedinto several parts (i.e., several simpler requirements from a more complex one).
Rolland and Salinesi [2005] also discuss similar relationships with goal-drivenrequirements engineering approaches where goals are decomposed into opera-tional and alternative sub-goals. Operational means that all sub-goals mustbe satisfied for the parent goal to be fulfilled, which in turn means that thesub-goals have AND relationships among themselves. Alternative, on the otherhand, means that the parent goal can be fulfilled by satisfying a subset of thesub-goals, which in turn means that the sub-goals have OR relationships amongthemselves. Requirements, in this context, can be seen as low-level goals, whichcan possess both kinds of relationships [Dahlstedt and Persson, 2005]. Goals asparts of the requirements structure are used by Gorschek and Wohlin [2006], whodivide requirements into four different abstraction levels: product level (goals),feature level (features), function level (functions/actions), and component level(details—consists of).
It is evident that requirements exist naturally on different levels of abstrac-tion and can form hierarchical structures. In large-scale software developmentin general, and in market-driven software development in particular, require-ments commonly arrive in different shapes and form, at multiple levels of ab-straction, and are described at various level of refinement [Maiden and Ncube,1998; Gorschek and Wohlin, 2006; Davis, 1993]. Different authors have re-ported problems when trying to compare (prioritise) requirements that resideon different levels of abstraction with each other [e.g., Lehtola and Kauppinen,2006; Gorschek and Wohlin, 2006; Wiegers, 1999]. For example, Lehtola andKauppinen [2006] concluded that requirements on different abstraction levelscaused problems when performing prioritisations since lower level requirementswere considered as less important than higher level requirements (e.g., “multi-language support” is commonly prioritised higher than “language shall be con-figurable at runtime” since the latter is only one way of achieving the former).Thus, it is important to be aware of different abstraction levels when prioritisingrequirements, and requirements should only be compared with requirements onthe same abstraction level.
When dealing with multi-level requirements prioritisation, lower-level re-quirements can either inherit priorities from higher-level requirements, or beassigned their own priorities [Wiegers, 1999]. The former is preferable when thelower-level requirements have AND relationships among themselves (cf. opera-tional sub-goals), while the latter is preferable with OR relationships (cf. alter-native sub-goals), since alternative requirements related to the same higher-levelrequirement commonly have different priorities [Wiegers, 1999]. If it is decided
220
8: Hierarchical Cumulative Voting
to give lower-level requirements unique priorities, it is favourable to use a ratio-scale prioritisation technique that allows various kinds of calculations to beperformed both within a level and between levels.
Given that the nature of requirements is suitable for hierarchical prioriti-sations, and that AHP has been successfully applied when prioritising hierar-chically structured requirements [Karlsson et al., 1998], it is surprising thatmulti-level prioritisation seldom is seen when prioritising with AHP within soft-ware engineering. This is especially strange when considering the fact that AHPin its flat variant is regarded as an unrealistic technique for coping with the largeamounts of requirements that are common in industry. In AHP, it is possible toreduce the number of comparisons by using the hierarchical feature, and therebymake it more scalable. For example, dividing 200 requirements into a hierar-chy with 10 equally large groups would reduce the number of comparisons from19 900 to 1 945—a rather dramatic decrease.
Consider the same example with CV; instead of prioritising a list of 200 re-quirements, the task could be broken down into several prioritisations with only20 requirements each, and one prioritisation on group level. This would of coursereduce the prioritisation complexity considerably. However, CV does not cur-rently support this kind of hierarchical prioritisation (Regnell et al. [2001] haveprioritised with CV on different levels, but treated the levels independently)even though it is based on ratio-scale prioritisation. Since several studies indi-cate that CV is superior to AHP in some aspects (see Section 8.1.4), it wouldof course be interesting to investigate the possibility for CV to handle hierar-chically structured requirements, which is done in the next section.
8.2 HIERARCHICAL CUMULATIVEVOTING
This section describes how CV (see Section 8.1.3) can be extended to give sup-port for managing hierarchical prioritisation. This extended version of CV,which shares several characteristics with AHP, is further on called HierarchicalCumulative Voting (HCV). Like AHP, it is possible to use HCV as a tool tosolve complex multi-criteria decision problems by arranging the problem intohierarchies. It is also possible to use the technique when prioritising objects(requirements, for example) on different abstraction levels (which is the focus inthis chapter). In such cases, HCV assumes that it is possible to hierarchicallydivide the objects into different levels but does not contain any mechanism for
221
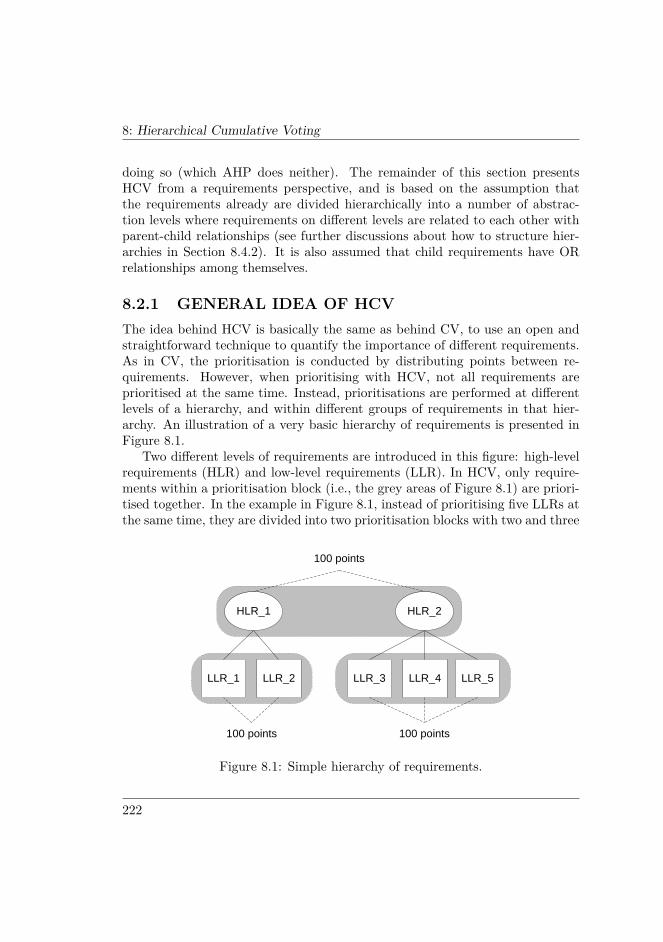
8: Hierarchical Cumulative Voting
doing so (which AHP does neither). The remainder of this section presentsHCV from a requirements perspective, and is based on the assumption thatthe requirements already are divided hierarchically into a number of abstrac-tion levels where requirements on different levels are related to each other withparent-child relationships (see further discussions about how to structure hier-archies in Section 8.4.2). It is also assumed that child requirements have ORrelationships among themselves.
8.2.1 GENERAL IDEA OF HCVThe idea behind HCV is basically the same as behind CV, to use an open andstraightforward technique to quantify the importance of different requirements.As in CV, the prioritisation is conducted by distributing points between re-quirements. However, when prioritising with HCV, not all requirements areprioritised at the same time. Instead, prioritisations are performed at differentlevels of a hierarchy, and within different groups of requirements in that hier-archy. An illustration of a very basic hierarchy of requirements is presented inFigure 8.1.
Two different levels of requirements are introduced in this figure: high-levelrequirements (HLR) and low-level requirements (LLR). In HCV, only require-ments within a prioritisation block (i.e., the grey areas of Figure 8.1) are priori-tised together. In the example in Figure 8.1, instead of prioritising five LLRs atthe same time, they are divided into two prioritisation blocks with two and three
HLR_1 HLR_2
LLR_1 LLR_2 LLR_3 LLR_4 LLR_5
100 points
100 points 100 points
Figure 8.1: Simple hierarchy of requirements.
222
8: Hierarchical Cumulative Voting
requirements prioritised at a time. In [Regnell et al., 2001], a similar approachwas used, but the subjects prioritised all LLRs at the same time. However,in a post-test, the subjects in this study supported the idea of dividing LLRsinto prioritisation blocks. This makes it is easier to keep an overview of therequirements to prioritise and the risk that not all requirements are explicitlyconsidered (as discussed in Section 8.1.4) decreases.
Still, it may be desirable to obtain a final prioritisation list where all require-ments at the LLR level are viewed in relation to each other. In CV, such a listis the immediate outcome of the prioritisation, whereas in HCV, it is necessaryto do some calculations to retrieve the final LLR priorities. Roughly speaking,this is done by multiplying the priority of each LLR with the priority of theHLR it is related to. Below is an outline of the steps involved in carrying outprioritisation using HCV:
Step 1: The first step is to assign priorities to all requirements on relevantlevels in the hierarchy. This is done by performing ordinary CV within each pri-oritisation block, on each level. Note that it is not necessary to assign prioritiesto requirements on levels below the lowest one of interest, as final priorities forthese requirements will not be calculated anyway.
Step 2: When all requirements have been assigned priorities, the next stepis to calculate intermediate priorities for the requirements. This can be doneusing straight or compensated calculation, depending on the characteristics ofthe requirements hierarchy and the objective of the prioritisation. The outcomeof the prioritisation depends on which of these two ways of calculating prioritiesthat is used. The two ways are explained below, and trade-offs to consider whenchoosing which way to use are further discussed in Section 8.4.1. How to dealwith an arbitrary number of levels in the hierarchy is discussed in Section 8.2.3.
Step 3: Final priorities are calculated for all requirements at the level ofinterest through normalisation. The normalisation is performed across the pri-oritisation blocks at the specific level, which means that all requirements at thelevel get priorities in relation to each other. How to do this normalisation isexplained below.
Step 4 (optional): If several stakeholders have prioritised the require-ments, their individual results should be weighted together. When doing so, itis possible to let different stakeholders influence the result to different extents.How to handle such a situation is discussed in Section 8.2.2.
223

8: Hierarchical Cumulative Voting
8.2.1.1 STRAIGHT CALCULATION
The first way of calculating the final priorities of the LLRs should be usedwhen the requirements set is final or the LLRs in a prioritisation block formsa complete decomposition of the corresponding HLR. In this case, the finalpriority of each LLR is obtained in two steps. First, the assigned LLR priority ismultiplied with the assigned priority of the “parent” HLR to get the intermediate(non-normalised) priority. Let pi denote intermediate priority and pa assignedpriority. Suppose LLRu has parent HLRv, then:
pi,LLRu = pa,LLRu × pa,HLRv (8.1)
Second, normalisation is performed over all LLRs (level normalisation). Letpf denote final priority. The final, normalised priority for LLRu at LLR levelthen becomes (the summation is over all k LLRs):
pf,LLRu = pi,LLRu∑k
pi,LLRk(8.2)
8.2.1.2 COMPENSATED CALCULATION
The second way of calculating the final priorities of the LLRs should be usedwhen the decomposition is not an exhaustive breakdown of the HLR or whenthe requirements set is not considered as final. This could be the case when notall LLRs are elicited or broken down yet, for example. The point is that thetotal value of LLRs in a prioritisation block may be different than the value ofthe parent HLR.
If Equation 8.1 is used to get the intermediate LLR priorities, prioritisationblocks with few LLRs will be favoured over blocks with many LLRs simplybecause the point average per LLR will be higher. To avoid this, a way ofcompensating for block size must be utilised. This is done when calculating theintermediate priorities by multiplying the assigned priority of each LLR with ablock-specific compensation factor, c. The intermediate priority of LLRu withparent HLRv becomes:
pi,LLRu = cHLRv × pa,LLRu × pa,HLRv (8.3)
Normalisation is still performed according to Equation 8.2. Note that thecompensation factor is common for all LLRs below a HLR, and is thus indexed
224
8: Hierarchical Cumulative Voting
by the HLR in question. An example of a compensation factor is the numberof requirements within the prioritisation block. Using this example, the com-pensation factor for LLR_1 and LLR_2 in Figure 8.1 would be 2, whereas thefactor used for LLR_3, LLR_4 and LLR_5 would be 3.
8.2.2 MULTIPLE STAKEHOLDERSWhen developing software products, it is normally the case that several stake-holders’ views must be taken into consideration [Berander and Andrews, 2005].HCV has support for taking several stakeholders of different importance into ac-count. Stakeholders can be divided in different ways (e.g., according to marketsegments), and different stakeholders or stakeholder groups may have differentweights from the point of view of the organisation [Ruhe and Saliu, 2005; Regnellet al., 2001].
When several stakeholders prioritise the requirements within a hierarchy, theformulas presented in Section 8.2.1 must be extended to account for stakeholderimportance. Let wx denote the normalised weight of stakeholder Sx, and pmfthe final priority for all stakeholders. The calculation for LLRu becomes (thesummation is over all k stakeholders):
pmf,LLRu =∑k
wk × pf,LLRu,Sk (8.4)
As can be seen in this formula, the final priority for each stakeholder ismultiplied by the stakeholder weight. Next, the weighted priorities are addedtogether to produce the combined priority of all stakeholders for the LLR. Byusing this approach, it is possible to achieve a complete prioritisation of therequirements in the hierarchy where different stakeholders’ views are taken intoaccount. Similar calculations would not be allowed if an ordinal-scale techniquehad been used.
When assigning priorities to stakeholders, it is of course possible to use CV(stakeholders on one level) or HCV (stakeholders on multiple levels) for thispurpose as well.
8.2.3 MULTIPLE LEVELSIn Figure 8.1, the requirements to prioritise were divided into two differenthierarchical levels. This is of course a simplified view of reality, since require-ments (or other objects of prioritisation) can be arranged on many more levels
225
8: Hierarchical Cumulative Voting
than that. When having more levels, it is still possible to use HCV since thetechnique is not sensitive to the number of requirement levels. Let Rk denotethe kth requirement at an arbitrary level, and H be a function that returnsthe set of parent requirements for any given requirement. In Equation 8.5, thecompensated calculation is generalised to account for requirements at any level(the generalisation of straight calculation is of course similar, except for thecompensation factor):
pi,Rk =∑
Rj∈H(Rk)
cRj × p(Rj)a,Rk× pi,Rj (8.5)
Here, p(Rj)a,Rkrefers to the assigned priority of Rk in the prioritisation block
under parent requirement Rj (because the requirement has an assigned priorityfor each parent, which is set in relation to its sibling requirements below thatparent). The result from this calculation can then be normalised at any of thelevels in the hierarchy according to Equation 8.2. It should be noted that theintermediate priority of a requirement at the highest level of the hierarchy ofcourse corresponds to its assigned priority.
If it is relevant to separate the final priorities of a multi-parent LLR under itsdifferent parents (as is done in the next section), the summation in Equation 8.5should not be used. Instead, the intermediate priority for each parent shouldbe calculated separately.
8.2.4 EXAMPLE: TWO-LEVEL HIERARCHY WITHONE STAKEHOLDER
In order to give a more practical view of how HCV works, an example is pre-sented below. In this example, there are two abstraction levels and one stake-holder. Furthermore, there are four high-level requirements (HLRs) and ninelow-level requirements (LLRs). Figure 8.2 visualises the structure of the re-quirements hierarchy.
As can be seen in Figure 8.2, a single LLR can relate to several parentHLRs (LLR_5 is related to both HLR_2 and HLR_3). For example, clockfunctionality (LLR) may belong to two different HLRs of a mobile phone, suchas calendar and alarm. In addition to this, one of the HLRs in the figure doesnot have any LLRs related to it. At a first glance, this might seem strange,but it is possible that no LLRs have been elicited for this HLR yet (as can beseen in the industrial case presented by Regnell et al. [2001]). The LLRs in the
226
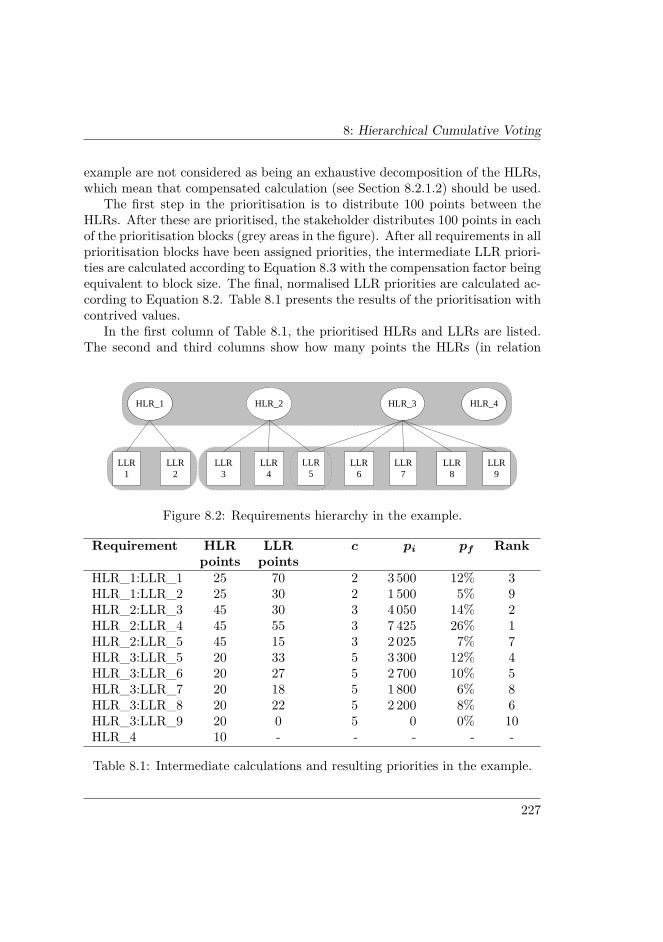
8: Hierarchical Cumulative Voting
example are not considered as being an exhaustive decomposition of the HLRs,which mean that compensated calculation (see Section 8.2.1.2) should be used.
The first step in the prioritisation is to distribute 100 points between theHLRs. After these are prioritised, the stakeholder distributes 100 points in eachof the prioritisation blocks (grey areas in the figure). After all requirements in allprioritisation blocks have been assigned priorities, the intermediate LLR priori-ties are calculated according to Equation 8.3 with the compensation factor beingequivalent to block size. The final, normalised LLR priorities are calculated ac-cording to Equation 8.2. Table 8.1 presents the results of the prioritisation withcontrived values.
In the first column of Table 8.1, the prioritised HLRs and LLRs are listed.The second and third columns show how many points the HLRs (in relation
HLR_1 HLR_3HLR_2
LLR1
LLR2
LLR3
LLR4
LLR8
LLR9
HLR_4
LLR6
LLR7
LLR5
Figure 8.2: Requirements hierarchy in the example.
Requirement HLRpoints
LLRpoints
c pi pf Rank
HLR_1:LLR_1 25 70 2 3 500 12% 3HLR_1:LLR_2 25 30 2 1 500 5% 9HLR_2:LLR_3 45 30 3 4 050 14% 2HLR_2:LLR_4 45 55 3 7 425 26% 1HLR_2:LLR_5 45 15 3 2 025 7% 7HLR_3:LLR_5 20 33 5 3 300 12% 4HLR_3:LLR_6 20 27 5 2 700 10% 5HLR_3:LLR_7 20 18 5 1 800 6% 8HLR_3:LLR_8 20 22 5 2 200 8% 6HLR_3:LLR_9 20 0 5 0 0% 10HLR_4 10 - - - - -
Table 8.1: Intermediate calculations and resulting priorities in the example.
227
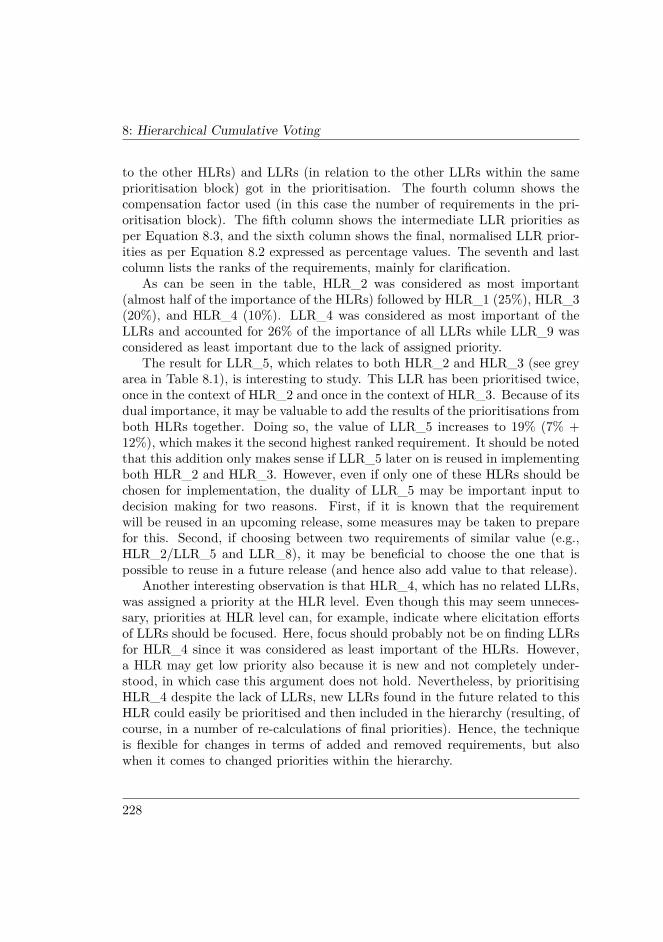
8: Hierarchical Cumulative Voting
to the other HLRs) and LLRs (in relation to the other LLRs within the sameprioritisation block) got in the prioritisation. The fourth column shows thecompensation factor used (in this case the number of requirements in the pri-oritisation block). The fifth column shows the intermediate LLR priorities asper Equation 8.3, and the sixth column shows the final, normalised LLR prior-ities as per Equation 8.2 expressed as percentage values. The seventh and lastcolumn lists the ranks of the requirements, mainly for clarification.
As can be seen in the table, HLR_2 was considered as most important(almost half of the importance of the HLRs) followed by HLR_1 (25%), HLR_3(20%), and HLR_4 (10%). LLR_4 was considered as most important of theLLRs and accounted for 26% of the importance of all LLRs while LLR_9 wasconsidered as least important due to the lack of assigned priority.
The result for LLR_5, which relates to both HLR_2 and HLR_3 (see greyarea in Table 8.1), is interesting to study. This LLR has been prioritised twice,once in the context of HLR_2 and once in the context of HLR_3. Because of itsdual importance, it may be valuable to add the results of the prioritisations fromboth HLRs together. Doing so, the value of LLR_5 increases to 19% (7% +12%), which makes it the second highest ranked requirement. It should be notedthat this addition only makes sense if LLR_5 later on is reused in implementingboth HLR_2 and HLR_3. However, even if only one of these HLRs should bechosen for implementation, the duality of LLR_5 may be important input todecision making for two reasons. First, if it is known that the requirementwill be reused in an upcoming release, some measures may be taken to preparefor this. Second, if choosing between two requirements of similar value (e.g.,HLR_2/LLR_5 and LLR_8), it may be beneficial to choose the one that ispossible to reuse in a future release (and hence also add value to that release).
Another interesting observation is that HLR_4, which has no related LLRs,was assigned a priority at the HLR level. Even though this may seem unneces-sary, priorities at HLR level can, for example, indicate where elicitation effortsof LLRs should be focused. Here, focus should probably not be on finding LLRsfor HLR_4 since it was considered as least important of the HLRs. However,a HLR may get low priority also because it is new and not completely under-stood, in which case this argument does not hold. Nevertheless, by prioritisingHLR_4 despite the lack of LLRs, new LLRs found in the future related to thisHLR could easily be prioritised and then included in the hierarchy (resulting, ofcourse, in a number of re-calculations of final priorities). Hence, the techniqueis flexible for changes in terms of added and removed requirements, but alsowhen it comes to changed priorities within the hierarchy.
228
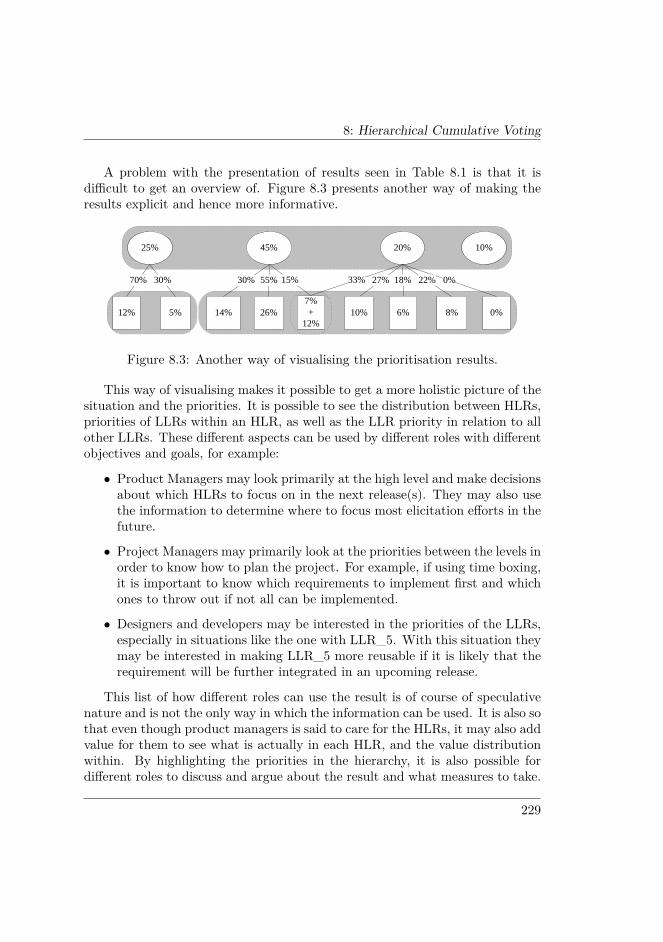
8: Hierarchical Cumulative Voting
A problem with the presentation of results seen in Table 8.1 is that it isdifficult to get an overview of. Figure 8.3 presents another way of making theresults explicit and hence more informative.
25% 20%45%
12% 5% 14% 26% 8% 0%
70% 30% 0%22%18%27%30% 55%
10%
10% 6%7%+
12%
15% 33%
Figure 8.3: Another way of visualising the prioritisation results.
This way of visualising makes it possible to get a more holistic picture of thesituation and the priorities. It is possible to see the distribution between HLRs,priorities of LLRs within an HLR, as well as the LLR priority in relation to allother LLRs. These different aspects can be used by different roles with differentobjectives and goals, for example:
• Product Managers may look primarily at the high level and make decisionsabout which HLRs to focus on in the next release(s). They may also usethe information to determine where to focus most elicitation efforts in thefuture.
• Project Managers may primarily look at the priorities between the levels inorder to know how to plan the project. For example, if using time boxing,it is important to know which requirements to implement first and whichones to throw out if not all can be implemented.
• Designers and developers may be interested in the priorities of the LLRs,especially in situations like the one with LLR_5. With this situation theymay be interested in making LLR_5 more reusable if it is likely that therequirement will be further integrated in an upcoming release.
This list of how different roles can use the result is of course of speculativenature and is not the only way in which the information can be used. It is also sothat even though product managers is said to care for the HLRs, it may also addvalue for them to see what is actually in each HLR, and the value distributionwithin. By highlighting the priorities in the hierarchy, it is also possible fordifferent roles to discuss and argue about the result and what measures to take.
229
8: Hierarchical Cumulative Voting
8.2.5 EPILOGUEIn this section, HCV has been presented and its use has been exemplified in acontrived but still realistic situation. Even though the power of the techniquemay not be obvious in the simple example given, the strengths of this techniquewill increase as the number of requirements grows (in comparison to techniqueslike CV and techniques based on “flat” pair-wise comparisons). When the num-ber of requirements grows, the need for a structured approach gets larger. HCVprovides that structure by using natural relationships between requirements toperform the prioritisation in a number of consecutive steps, and hence limitsthe number of requirements prioritised at a time (thereby increasing scalabil-ity). Similar existing approaches, like the one presented by Regnell et al. [2001],also account for requirements on different abstraction levels but fall short whenit comes to the possibility of reducing the number of requirements to prioritiseat a time.
HCV has been presented theoretically above, but it is of course essential toverify that the technique also works well in a real setting. The next sectionprovides a discussion about HCV based on some empirical studies made.
8.3 EVALUATION OF HCV VS. CVIn this section, an empirical evaluation of HCV is presented. In the evaluation,the scalability of HCV in comparison to CV and opinions about the use of HCVare investigated. As can be seen in Section 8.1.4, one of the major drawbackswith CV is that it does not scale very well. HCV, on the other hand, theoreticallyscales much better due to the increase in overview and decrease in complexitythat follow from arranging the objects to prioritise into hierarchies. An overviewof the empirical studies discussed in the evaluation can be seen in Table 8.2.
Two aspects of scalability (or rather, scalability measurements) have beenconsidered. The first aspect is the number of objects that have been given ex-plicit (i.e., non-zero) weights in the prioritisation. The second aspect is theextent to which different weights are given to different objects in the priori-tisation (i.e., amount of divergence). These two measurements are somewhatspeculative, and should be interpreted as such. They are not used in any sta-tistical analysis in this chapter.
The studies on which the cases are based were all conducted in the samesoftware development organisation, which is one of the market leaders in theworld with respect to the products it is offering. The persons participating
230
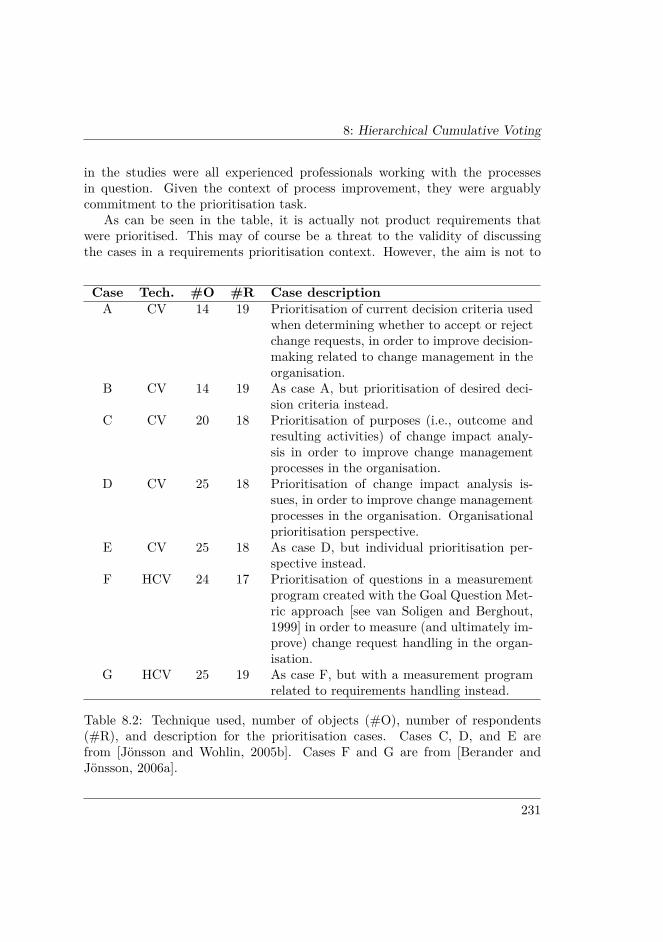
8: Hierarchical Cumulative Voting
in the studies were all experienced professionals working with the processesin question. Given the context of process improvement, they were arguablycommitment to the prioritisation task.
As can be seen in the table, it is actually not product requirements thatwere prioritised. This may of course be a threat to the validity of discussingthe cases in a requirements prioritisation context. However, the aim is not to
Case Tech. #O #R Case descriptionA CV 14 19 Prioritisation of current decision criteria used
when determining whether to accept or rejectchange requests, in order to improve decision-making related to change management in theorganisation.
B CV 14 19 As case A, but prioritisation of desired deci-sion criteria instead.
C CV 20 18 Prioritisation of purposes (i.e., outcome andresulting activities) of change impact analy-sis in order to improve change managementprocesses in the organisation.
D CV 25 18 Prioritisation of change impact analysis is-sues, in order to improve change managementprocesses in the organisation. Organisationalprioritisation perspective.
E CV 25 18 As case D, but individual prioritisation per-spective instead.
F HCV 24 17 Prioritisation of questions in a measurementprogram created with the Goal Question Met-ric approach [see van Soligen and Berghout,1999] in order to measure (and ultimately im-prove) change request handling in the organ-isation.
G HCV 25 19 As case F, but with a measurement programrelated to requirements handling instead.
Table 8.2: Technique used, number of objects (#O), number of respondents(#R), and description for the prioritisation cases. Cases C, D, and E arefrom [Jönsson and Wohlin, 2005b]. Cases F and G are from [Berander andJönsson, 2006a].
231
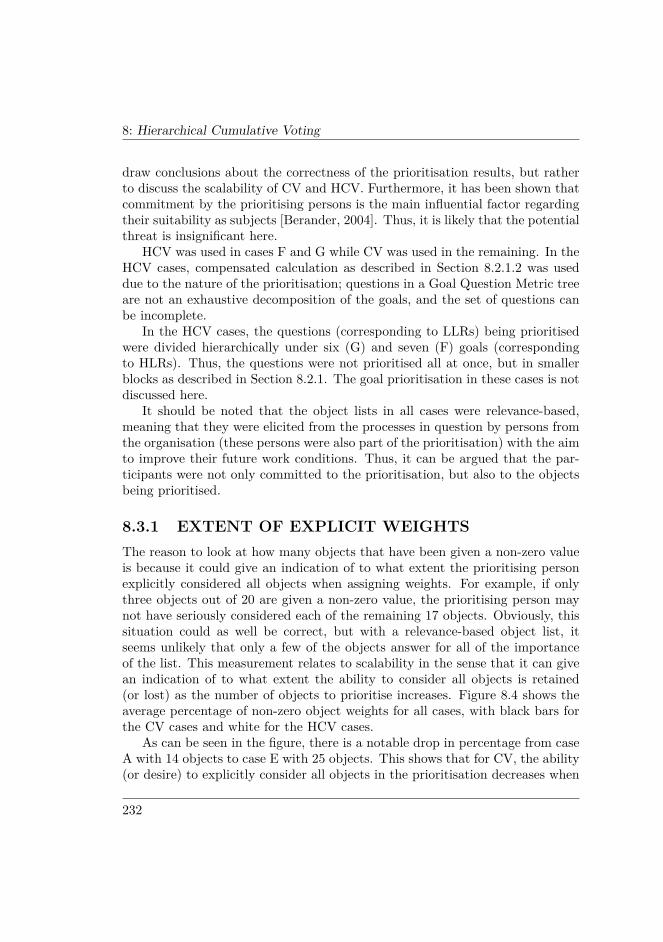
8: Hierarchical Cumulative Voting
draw conclusions about the correctness of the prioritisation results, but ratherto discuss the scalability of CV and HCV. Furthermore, it has been shown thatcommitment by the prioritising persons is the main influential factor regardingtheir suitability as subjects [Berander, 2004]. Thus, it is likely that the potentialthreat is insignificant here.
HCV was used in cases F and G while CV was used in the remaining. In theHCV cases, compensated calculation as described in Section 8.2.1.2 was useddue to the nature of the prioritisation; questions in a Goal Question Metric treeare not an exhaustive decomposition of the goals, and the set of questions canbe incomplete.
In the HCV cases, the questions (corresponding to LLRs) being prioritisedwere divided hierarchically under six (G) and seven (F) goals (correspondingto HLRs). Thus, the questions were not prioritised all at once, but in smallerblocks as described in Section 8.2.1. The goal prioritisation in these cases is notdiscussed here.
It should be noted that the object lists in all cases were relevance-based,meaning that they were elicited from the processes in question by persons fromthe organisation (these persons were also part of the prioritisation) with the aimto improve their future work conditions. Thus, it can be argued that the par-ticipants were not only committed to the prioritisation, but also to the objectsbeing prioritised.
8.3.1 EXTENT OF EXPLICIT WEIGHTSThe reason to look at how many objects that have been given a non-zero valueis because it could give an indication of to what extent the prioritising personexplicitly considered all objects when assigning weights. For example, if onlythree objects out of 20 are given a non-zero value, the prioritising person maynot have seriously considered each of the remaining 17 objects. Obviously, thissituation could as well be correct, but with a relevance-based object list, itseems unlikely that only a few of the objects answer for all of the importanceof the list. This measurement relates to scalability in the sense that it can givean indication of to what extent the ability to consider all objects is retained(or lost) as the number of objects to prioritise increases. Figure 8.4 shows theaverage percentage of non-zero object weights for all cases, with black bars forthe CV cases and white for the HCV cases.
As can be seen in the figure, there is a notable drop in percentage from caseA with 14 objects to case E with 25 objects. This shows that for CV, the ability(or desire) to explicitly consider all objects in the prioritisation decreases when
232

8: Hierarchical Cumulative Voting
0%
20%
40%
60%
80%
100%
A B C D E F G
Figure 8.4: Average percentage (y axis) of objects given a non-zero value percase (x axis). CV cases in black, HCV cases in grey.
the number of objects increases. However, the most interesting with the figureis the difference between cases D/E and F/G. All these four cases had 24 to25 objects to prioritise, but cases F and G used HCV rather than CV. Thedifference, which is in favour of HCV, shows that the increased overview andreduced prioritisation complexity of HCV allows for a larger proportion of theobjects to be explicitly considered in the prioritisation. This reflects the factthat HCV has better scalability than CV.
8.3.2 DIVERGENCE OF ASSIGNED WEIGHTSThe second scalability aspect complements the first one. Hypothetically speak-ing, a person could give a large amount of points to a single object, whiledistributing the remaining points evenly over the other objects. Thus, the di-vergence of given weights would be low, possibly indicating that the prioritisingperson did not seriously consider the uniqueness of each object in relation tothe other objects, but rather grouped (mentally) a number of objects togetherand put identical weights on them. As with the first measurement, the situ-ation depicted may of course be correct, but it is unlikely that the objects ina relevance-based list should be that homogenous. With respect to scalability,this measurement can give an indication of the ability to differentiate betweenthe objects as the number of objects increases. Figure 8.5 shows the divergenceof assigned weights for all cases.
233
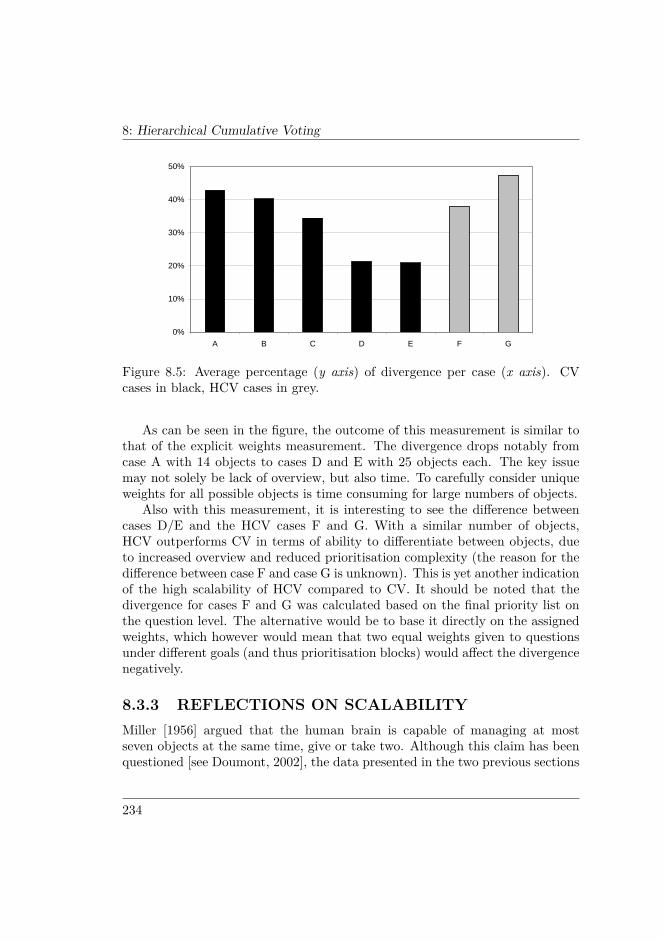
8: Hierarchical Cumulative Voting
0%
10%
20%
30%
40%
50%
A B C D E F G
Figure 8.5: Average percentage (y axis) of divergence per case (x axis). CVcases in black, HCV cases in grey.
As can be seen in the figure, the outcome of this measurement is similar tothat of the explicit weights measurement. The divergence drops notably fromcase A with 14 objects to cases D and E with 25 objects each. The key issuemay not solely be lack of overview, but also time. To carefully consider uniqueweights for all possible objects is time consuming for large numbers of objects.
Also with this measurement, it is interesting to see the difference betweencases D/E and the HCV cases F and G. With a similar number of objects,HCV outperforms CV in terms of ability to differentiate between objects, dueto increased overview and reduced prioritisation complexity (the reason for thedifference between case F and case G is unknown). This is yet another indicationof the high scalability of HCV compared to CV. It should be noted that thedivergence for cases F and G was calculated based on the final priority list onthe question level. The alternative would be to base it directly on the assignedweights, which however would mean that two equal weights given to questionsunder different goals (and thus prioritisation blocks) would affect the divergencenegatively.
8.3.3 REFLECTIONS ON SCALABILITYMiller [1956] argued that the human brain is capable of managing at mostseven objects at the same time, give or take two. Although this claim has beenquestioned [see Doumont, 2002], the data presented in the two previous sections
234
8: Hierarchical Cumulative Voting
support the existence of an upper limit on the number of objects that can beprioritised at the same time. The best results were achieved when using CV withfew objects, and when using HCV where the prioritisation task is distributed (toyield multiple prioritisations with few objects each). The limit has most likelyto do with how easy it is to get an overview of all objects to prioritise, whicharguably should be correlated to the number of objects that the human braincan manage simultaneously. As for a precise limit, neither the data presentedhere nor the theory about 7+/-2 are conclusive. Further studies have to beperformed to determine the maximum reasonable size of an object list.
As has been mentioned, HCV owes its scalability to the benefits that followfrom performing multiple “small” prioritisations rather than one “large”. How-ever, next to increased overview and reduced complexity, there may be a loss inprioritisation consistency due to the fact that the final LLR priorities are cal-culated (based on the hierarchy) rather than given. Thus, there is a potentialtrade-off between scalability and consistency. To understand more about thistrade-off, it is relevant to see how satisfied the prioritising persons are with theresult. This aspect is investigated in the next section.
8.3.4 OPINIONS ABOUT HCVIn case G mentioned above, the prioritising persons were asked to fill out apost-test after the prioritisation. Before the post-test, the final question priori-ties (corresponding to final LLR priorities) were presented, and the prioritisingperson had the opportunity to go back and revise the assigned weights beforeaccepting the outcome. The post-test investigated among other things to whatextent this resulting list matched the opinion of the prioritising person. Ta-ble 8.3 shows the post-test questions/statements relevant for this discussion,the scales for the questions and the median of all respondents’ answers.
Overall, the post-test results are favourable for HCV. The respondents didagree that the technique was useful; they were satisfied with the resulting list ofpriorities, to the extent that they did not feel a large need to adjust the assignedweights. In the light of this, it is somewhat surprising to see that they were onlyneutral when it came to the reliability of the technique. A possible explanationis that they may have been uncertain about the definition of reliability in thiscontext and thus reluctant to give a strong opinion.
A potential problem with the results from the post-test is that the respon-dents did not have another prioritisation technique (and its results) to comparewith. Thus, the assessment of the technique in relation to the three first ques-tions in Table 8.3 may have been difficult.
235
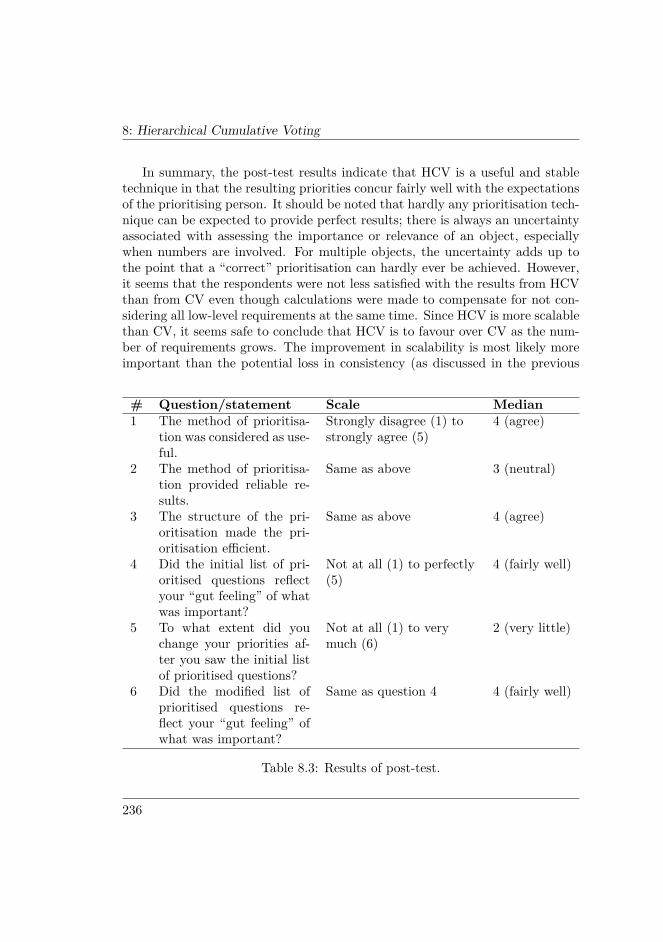
8: Hierarchical Cumulative Voting
In summary, the post-test results indicate that HCV is a useful and stabletechnique in that the resulting priorities concur fairly well with the expectationsof the prioritising person. It should be noted that hardly any prioritisation tech-nique can be expected to provide perfect results; there is always an uncertaintyassociated with assessing the importance or relevance of an object, especiallywhen numbers are involved. For multiple objects, the uncertainty adds up tothe point that a “correct” prioritisation can hardly ever be achieved. However,it seems that the respondents were not less satisfied with the results from HCVthan from CV even though calculations were made to compensate for not con-sidering all low-level requirements at the same time. Since HCV is more scalablethan CV, it seems safe to conclude that HCV is to favour over CV as the num-ber of requirements grows. The improvement in scalability is most likely moreimportant than the potential loss in consistency (as discussed in the previous
# Question/statement Scale Median1 The method of prioritisa-
tion was considered as use-ful.
Strongly disagree (1) tostrongly agree (5)
4 (agree)
2 The method of prioritisa-tion provided reliable re-sults.
Same as above 3 (neutral)
3 The structure of the pri-oritisation made the pri-oritisation efficient.
Same as above 4 (agree)
4 Did the initial list of pri-oritised questions reflectyour “gut feeling” of whatwas important?
Not at all (1) to perfectly(5)
4 (fairly well)
5 To what extent did youchange your priorities af-ter you saw the initial listof prioritised questions?
Not at all (1) to verymuch (6)
2 (very little)
6 Did the modified list ofprioritised questions re-flect your “gut feeling” ofwhat was important?
Same as question 4 4 (fairly well)
Table 8.3: Results of post-test.
236

8: Hierarchical Cumulative Voting
section). In relation to this, it would be interesting to compare HCV to AHP,for example, which also has potential consistency problems.
8.4 DISCUSSIONIn this section, a number of different unclear issues are brought up and discussed.First, the issue about compensation that was introduced in Section 8.2.1.2 isdiscussed further in Section 8.4.1. This is followed by a discussion on how toconstruct the hierarchies that HCV relies on in Section 8.4.2. Next, discussionsabout issues that must be cared for when using HCV in practice are discussedin Section 8.4.3. Finally, some open issues in relation to HCV are discussed andthe need for empirical studies about HCV is motivated in Section 8.4.4.
8.4.1 USING COMPENSATION OR NOT?As seen in Section 8.2.1, it is possible to use both straight and compensatedcalculation when prioritising with HCV. The reason for using compensated cal-culation is to make sure that some requirements do not get high ranks justbecause they belong to a prioritisation block with few requirements. For ex-ample, consider a situation with two HLRs, where HLR_1 has 60 in priorityand HLR_2 40 in priority. HLR_1 has 10 related LLRs while HLR_2 has onlyone related LLR. If the requirements within each block would get 100 pointsto share, the LLRs in HLR_1 would get 10 points each in average while theLLR in HLR_2 would get 100 points. Assuming that the points are distributedevenly between the requirements in the HLR_1 block, the intermediate priorityfor each LLR would be 600 (10×60), while the intermediate priority of the LLRrelated to HLR_2 would be 4,000 (100× 40). In fact, one single LLR related toHLR_1 would need to get at least 70 points by itself in order to beat the singlerequirement in HLR_2. By compensating for block size, the risk of ending upin such a situation is reduced.
While compensation is used to make sure that small prioritisation blocks arenot favoured, there is a risk that it results in large blocks being favoured instead(since these get more points to distribute). In extreme cases, this situationmay happen and could be problematic. In the empirical studies described inSection 8.3, there were rather large differences in block size (some blocks hadsix objects and some only one), but it was never seen that a large block wasfavoured due to its size. Thus, under normal conditions, this is probably not anissue.
237
8: Hierarchical Cumulative Voting
Guidelines for when to use compensation are briefly stated in Sections 8.2.1.1and 8.2.1.2. To reiterate, the guidelines are:
• Do not use compensation with a final requirements hierarchy, or when theLLRs form a complete decomposition of the corresponding HLRs. Themotivation is that prioritisation at each level can take into account theentire hierarchy, and that the composition relationship between an HLRand its LLRs implies that the collective value of the LLRs equals the valueof the HLR.
• Use compensation with a non-final requirements hierarchy, or when thedecomposition of an HLR into LLRs is not exhaustive. In these cases,there are likely unknown requirements that will be added later on, andthe collective value of LLRs in a prioritisation block can not be said toequal the value of the corresponding HLR.
While the guidelines are based on the authors’ experience, they are somewhatspeculative. The effects of using compensation are of course not evident. Whento use compensation, how to use it, and which compensation factor to useneed to be investigated further. One way of dealing with compensation if itsuse is doubtful is to present both compensated and uncompensated results tostakeholders and let them choose whatever feels best. This has the added benefitthat it is possible to get direct feedback on how good the compensation approachused was.
It should be noted that the issue with compensation is not unique to HCV.AHP, for example, would experience the same issues with prioritisation blocksof different sizes. The topic of compensation is important to investigate sincemany studies [e.g., Regnell et al., 2001; Karlsson et al., 1998] have encounteredprioritisation blocks of different sizes.
8.4.2 CONSTRUCTING HIERARCHIESWithout having requirements that can be organised into hierarchies, it is notpossible to use HCV as a technique for prioritising requirements. Saaty [1980](the creator of AHP) argues that there is no set way of arranging hierarchies,and that the difficulty in doing so depends on the complexity of the system.Even though software systems generally are considered to be very complex,several authors in software engineering argue that software requirements oftencan be naturally organised in hierarchies [Maiden and Ncube, 1998; Dahlstedtand Persson, 2005; Davis, 1993]. Thus, what is needed as input to HCV (and
238
8: Hierarchical Cumulative Voting
also AHP) is some way to structure the requirements into hierarchies in anefficient way.
One approach for structuring requirements into hierarchies is the Require-ments Abstraction Model (RAM) which was initiated based on the needs ofindustrial companies to support the management of requirements in hierar-chies [Gorschek and Wohlin, 2006]. RAM assumes that requirements exist ondifferent abstraction levels and it facilitates the abstraction and breakdown ofincoming requirements in order to place them on the suitable abstraction lev-els. One of the goals with RAM is to provide the possibility for stakeholdersto compare requirements on the same abstraction level rather than on differentlevels [Gorschek and Wohlin, 2006].
The division into abstraction levels also implies a notion of value depen-dencies (see [Dahlstedt and Persson, 2005] for more information about differentkinds of dependencies) between requirements at different levels. For example,in a situation where one LLR relates to two HLRs, it is possible that the im-plementation of the LLR for one HLR can be reused in the implementation ofthe second and thereby add value to it. This might give valuable input to, forexample, scoping of software product lines to see if one requirement can or isexpected to be reused in several parts of the system [Schmid, 2002].
8.4.3 USING HCV IN PRACTICESoftware product planning can be considered as a “wicked problem”, whichmeans that an optimal solution may not exist, that every development planis unique, and that no objective measure of success exists [Carlshamre, 2002].Since an optimal solution seldom exists, it is not possible to rely only and di-rectly on the results of requirements prioritisation. The reason for this is thatseveral different aspects (e.g., benefit, penalty, cost, risk) must be taken intoaccount when planning releases to have as much information as possible assupport for making the right decisions [Berander and Andrews, 2005]. Further-more, additional constraints and dependencies between requirements must alsobe considered in release planning, such as:
• Value dependencies may imply that even though some requirements areof low priority, they need to be implemented since they add much valueto other requirements [Dahlstedt and Persson, 2005].
• Implementation dependencies may imply that a certain requirements iseasier to implement if another requirement also is implemented [Dahlstedtand Persson, 2005].
239
8: Hierarchical Cumulative Voting
• A release theme, which often is desirable, may imply that requirementsthat fit well together should be implemented together [Berander and An-drews, 2005].
HCV and other prioritisation techniques do not (and should not) take allthese different factors into account. This is because such techniques are notintended for further processing of the priorities after they are obtained. Nev-ertheless, several consecutive prioritisations can of course be made with severaldifferent aspects in mind, just as shown by, for example, Berander and Andrews[2005]; Saaty and Vargas [2001]; Anderson et al. [2000]; Wiegers [1999]. How-ever, prioritisation techniques should primarily be seen as providing input tofurther analysis (e.g., negotiation and qualitative analysis). Such further anal-ysis can be done in more sophisticated decision-support tools like QuantitativeWinWin [Ruhe et al., 2002], EVOLVE [Greer and Ruhe, 2004], or the Cost-Value approach [Karlsson and Ryan, 1997]. These all use prioritisation resultsas input and also incorporate other implicit and explicit factors to allow for agood, final, decision.
Irrespective of what the prioritisation results are used for, it is importantto interpret them in a rational way and not have an over-trust in them. Intechniques such as HCV, it is easy to play around with numbers just becauseit is possible to do so. However, the best way to take advantage of the re-sults is to use them to graphically visualise the stakeholders’ needs and wants.Studies have shown that decision-support tools are most effective when they areeasy to understand and grasp, and when they are able to present overwhelm-ing volumes of information in a clear way [Dawson and de Chazal, 2004]. InHCV, a lot of information is retrieved and it is necessary to present how stake-holders favour things in a suitable way for decision makers. One way of doingthat is to present the information in charts. Charts that already have beenapplied with convincing results in industrial settings include but are not limitedto distribution charts, disagreement charts, satisfaction charts, and cost-valuecharts [Regnell et al., 2001; Karlsson and Ryan, 1997]. This way of presentingthe information may also facilitate better communication with stakeholders thatare not that knowledgeable of how the technique works or what the numbersrepresent.
It is sometimes stated that CV is easy to learn and use, and does not requiretool support to any further extent [Jönsson and Wohlin, 2005a]. Even thoughthis might be true, it has been found that stakeholders sometimes have problemsending up at the desired amount of points [Berander and Wohlin, 2004]. HCV ismore complex than CV, and requires much more calculations to reach the final
240
8: Hierarchical Cumulative Voting
priorities. Both from a complexity point of view and from a presentational pointof view (stakeholders should not be bored with performing or being involved inany of the computational aspects of the technique), tool support is preferablewhen using HCV in practice. The use of tools allows the stakeholder to con-centrate more on performing the prioritisation than on keeping the number ofpoints left to distribute in the head, for example. It probably also makes theprioritisation more correct since it is not necessary to use “easy” numbers (e.g.,10, 20. . . ) to be able to calculate the point sum.
In its simplest form, it is possible to achieve good tool support by construct-ing simple spreadsheets that automatically perform the calculations and presentthe result to the stakeholders. Spreadsheets were successfully used in the studiespresented in Section 8.3, where none of the stakeholders doing the prioritisationhanded in miscalculated results.
When using tools, it is easy to present the final results to the stakeholderwhen all prioritisations are performed, which gives him or her the opportunityto go back and make adjustments if necessary. More advanced tools may evendirectly present charts such as the ones mentioned above. Presenting the finalresults directly may motivate the prioritisation as the stakeholders really can seethe value of their efforts. However, as people might get suspicious about hiddencalculations and complex tools [Lehtola and Kauppinen, 2006; Karlsson et al.,2006], it is probably a good idea to show stakeholders the overall principles ofHCV before performing the prioritisation.
As with CV, there is a threat for shrewd tactics (see Section 8.1.4 for details)when using HCV, although the hierarchies may diminish the threat somewhat.It is of course important to be aware of this threat, and one way to reduceit is to limit the number of points possible to assign to each individual re-quirement [Leffingwell and Widrig, 1999]. However, a consequence of such anapproach is that stakeholders might be forced to prioritise in other ways thanwhat they actually think is right [Berander and Andrews, 2005]. Another wayof dealing with shrewd tactics may be to introduce a disagreement chart to visu-alise the dispersion between stakeholders [Regnell et al., 2001]. By doing so, itwould be possible to spot and act upon large disagreement among stakeholders,which could be a sign of shrewd tactics.
As discussed in Section 8.1.5, it is possible to handle requirement in hier-archies in different ways when it comes to prioritisation. When using HCV,two basic criteria need to be fulfilled. First, the requirements must be arrangedhierarchically already, as HCV does not include support for doing this. Second,lower-level requirements should have OR relationships among themselves. Thismeans that a subset of the requirements can be satisfied to fulfill the corre-
241
8: Hierarchical Cumulative Voting
sponding higher-level requirement. With AND relationships, prioritisation onthe lower level does not add value since all requirements must be implementedanyway to achieve the higher-level requirement. However, it may very well bethe case that requirements have a mix of AND and OR relationships (or otherinterdependencies [see Dahlstedt and Persson, 2005]). Then, it is recommendedto combine the requirements having AND relationships since they need to be im-plemented together anyway (and it is unnecessary work/distraction to prioritisethem separately), as suggested by Wiegers [1999].
8.4.4 FURTHER STUDIES ON THE USE OF HCVEven though some empirical results were presented in Section 8.3, more studiesabout HCV are required. As with all new techniques, methods and models, HCVneeds extensive empirical evaluation to determine its strengths and weaknessesin order to use it in the right situations. Even though Ngo-The and Ruhe[2005] argue that there is rather much research made within the prioritisationarea, little evidence exists regarding which methods to prefer over others indifferent situations and environments. Despite that several studies have beenperformed in the prioritisation area [e.g., Karlsson et al., 1998; Lehtola andKauppinen, 2006; Karlsson et al., 2006], the lack of evidence is amplified by thefact that different studies have shown different results when comparing the same(or very similar) approaches. For example, Karlsson [1996] concluded that AHPwas superior to numerical assignment, while Karlsson et al. [2006] showed thatPlanning Game (which basically is a modified way of doing numerical assignmentwhile also introducing ranking) was superior to AHP.
Below are a number of open questions regarding HCV that need to be an-swered:
• How do HCV compare to AHP with hierarchically arranged requirements?Since both approaches support requirements in hierarchies and produceratio-scale results, an empirical comparison between the two would beinteresting.
• When and how should compensation be used? Studying if compensatedprioritisations provide better or worse results than uncompensated priori-tisations in several different contexts with different aims, objectives, andrequirements structures is necessary.
• How many points should be distributed? Different studies have used dif-ferent numbers of points to distribute (see, e.g., [Regnell et al., 2001;
242
8: Hierarchical Cumulative Voting
Wohlin and Aurum, 2006], and Chapter 4), and it would be interesting toinvestigate psychological effects on the use of different numbers of pointsin different situations.
• How much of a requirements hierarchy should be (re-)prioritised? Howmany of the levels should be prioritised, and at which levels is it mostimportant to prioritise? It is also relevant to study how changes (due toadded, moved, changed, deleted requirements or just because the valueof a requirement changes) in the hierarchy should be handled in terms ofhow much is necessary to re-prioritise.
• How to handle an LLR that was assigned a zero priority (i.e., was seen asunimportant)? Should the prioritisation continue down in the hierarchyeven though the outcome is known at the lower levels? By not continuing,higher scalability would be achieved, but it would also be necessary to domore work when re-prioritising the requirements set due to changes in thehierarchy.
• How does requirements order effects affect the results? It might be in-teresting and necessary to investigate how the order of the requirementsaffects the priorities. Requirements may get different priorities based onwhere they are located in the list.
8.5 CONCLUSIONSSoftware engineering decision support plays a very important role when it comesto enabling the delivery of value to stakeholders. Within requirements engineer-ing decision support, several important areas are identified, of which require-ments prioritisation is regarded as a key one since it is also used as basis forother areas (e.g., release planning and negotiation). Several different prioritisa-tion techniques exist, and these produce results on different scales. In the past,Analytical Hierarchy Process (AHP) has been regarded as a de facto standardwhen it comes to ratio-scale prioritisation, especially because of positive reportsfrom empirical studies. However, other empirical studies have lately also beenreporting weaknesses of AHP.
This chapter has presented strengths and weaknesses of both AHP and Cu-mulative Voting (CV), a prioritisation technique that also produces ratio-scaleresults. While the techniques in many cases complement each other, an im-portant weakness of CV is that it currently does not support hierarchical re-
243
8: Hierarchical Cumulative Voting
quirements structures, which AHP does. The importance for a prioritisationtechnique to do so is two-fold: first, requirements are commonly structured inhierarchies, and second, by using hierarchies, scalability can be improved.
Based on the strengths and weaknesses of the two compared techniques, anew technique, called Hierarchical Cumulative Voting (HCV), has been pre-sented. This technique combines the strengths of AHP with those of CV toimprove the prioritisation of requirements. The main difference between HCVand CV is that HCV has support for hierarchically structured requirements,which also means that it scales better than CV. In addition to the presentationof the technique, some empirical results from studies using both CV and HCVhave been discussed. These results clearly support the fact that scalability im-proves with HCV compared to CV, and show that HCV produces good resultingpriorities.
The presented results indicate that HCV is very promising and that it com-petes well with other ratio-scale techniques such as CV and AHP. However, sinceonly a few empirical studies have been conducted to evaluate the suitability ofHCV, more are needed to get knowledge about when HCV is suitable to use,and also how to use HCV most efficiently. It is important to remember thatpriorities obtained from any prioritisation technique must be processed furtherbecause of factors that are out of control of the technique, such as requirementsinterdependencies and how well requirements fit together. That said, we con-clude that HCV is a technique that can be used with good results as a precursorto further decision-making activities.
244
Chapter 9
Conclusions
This chapter concludes the thesis. The main research questions, introduced andmotivated in Section 1.2, are:
• MRQ1: What are important process aspects of change impact analysis inlarge-scale industrial software development?
• MRQ2: How can change impact analysis practices be improved and sup-ported in a lightweight manner?
Each thesis chapter contains its own set of research questions, which aresummarised and connected to the main research questions in Section 1.7.1. Thefindings related to these sub-questions are provided below. For the impactanalysis chapters, findings not directly related to impact analysis have beenomitted here for the sake of brevity. The chapter findings are aggregated intomain findings which are given in response to the main research questions. Thechapter ends with some pointers and ideas for future research.
9.1 SUMMARY OF FINDINGSThis section is divided into three parts. First, findings from the impact analysispart of the thesis are provided. Then, the main research questions are addressed.Finally, the research questions in the method chapters are addressed.
9: Conclusions
9.1.1 IMPACT ANALYSIS PARTIn Chapter 2, a statistical analysis is performed with the goal of rejecting anull hypothesis about there being no difference among roles with respect toviewpoints as well as priorities regarding software architecture documentation.The null hypothesis for viewpoints cannot be rejected, but the null hypothesisfor priorities can. It is concluded that impact analysis is significantly moreimportant to improve for designers (a designer creates system descriptions thatthe programmer can base the implementation on) than for other roles. It shouldalso be noted that impact analysis is not unimportant for the other roles—it is,on average, the second most important improvement to make.
Chapter 3 does not conclude anything as such, since it is a description of thestate-of-the-art of impact analysis (from a requirements engineering perspec-tive). It does, however, highlight the need to study impact analysis on otherartefacts than source code, due to the maturation of software engineering amongsoftware organisations, and the new types of systems that are built today. Theclassification of publications discussed in Section 1.3.5 indicates that non-sourcecode artefacts are studied more today than before.
The research questions in Chapter 4 concern how organisational level andperspective affect the assessment of importance of impact analysis issues, andthe overall identification of important issues. We have seen that at the oper-ative level, important issues are related to the realisation of a change, or thechosen solution. At the tactical level, important issues are related to project andplanning aspects. Finally, at the strategic level, important issues are related toprocess and product quality. This fits neatly into the level definitions.
We have also seen that issues that are most important from the organisa-tional perspective typically concern process, project, or end-product aspects,and thus are more holistic in their nature. Issues most important from theself-perspective rather concern the execution of the analysis task, and/or therealisation of a change.
The most important issues concern fundamental aspects of impact analysisand its execution, specifically the assessment of system impact as well as timeand resource aspects. This means that impact analysis needs to be addressed asa crucial activity in the change management process. Furthermore, the findingsfrom this chapter underscore the importance of studying tactical and strategicaspects of impact analysis.
Research questions for Chapter 5 involve aspects of evaluating and improv-ing the change control process. More investigation is necessary, but the indus-trial reception suggests that checklist-based process support is beneficial. The
246
9: Conclusions
evaluation has provided interesting results, including that there is a differencebetween confidence of produced outcome and expected quality in the early pro-cess stages. An iterative change request approach would be appropriate for CRwriters, but possibly not for receivers. Moreover, the change request turnaroundtime could be improved. The results also suggest that process support is lack-ing, and that the strategic character of change requests needs to be highlightedmore.
The research questions in Chapter 6 concern impact analysis in relation tosoftware evolution and incremental software development, and the identificationof functional dependencies. These aspects are related to anatomy planning,which is introduced in the chapter. We have seen that an important purpose ofimpact analysis in this context is to manage the incremental change induced byadding new functionality to the existing system. We have also seen that impactanalysis is useful when bridging between the functional view in an anatomyplan and implementation-oriented views such as the architecture. Finally, weconclude that impact analysis helps avoid development problems and conflictsas it can be used to reveal implicit implementation-oriented relations betweenfunctional entities in an anatomy plan. Thus, it plays an important role inresource planning and even project planning.
9.1.2 MAIN FINDINGSFor MRQ1, we draw the following general conclusions based on the above pre-sented findings:
• Generally speaking, improvement of impact analysis-related process as-pects (e.g., that concern the change control process) makes it possible tobetter benefit from the analysis and its purposes (see Section 1.3.3).
• A number of important challenges are associated with performing impactanalysis. Acknowledging the presence of these and taking appropriateaction to address them is a step towards improving the process.
• Different stakeholders obviously have different opinions when it comes tochallenges, but we have seen that organisational level and perspective canprovide a useful differentiation between stakeholders.
• The differences in stakeholders’ opinions indicate the diversity and breadthof impact analysis as an activity; it is not sufficient to work with imple-mentation aspects (e.g., methods for assessing system impact), because
247

9: Conclusions
challenges concern aspects such as planning, resource allocation, process,and product as well.
• Impact analysis plays an important role in software evolution and in-cremental development. It enables parts of development and planningprocesses to be performed in a more informed manner.
The conclusions above clearly reflect the process perspective of impact anal-ysis held in this thesis (see Section 1.3.2). For MRQ2, we draw the followinggeneral conclusions:
• Checklist-based process support seems relevant based on initial good re-ception at the industrial partner. General impact analysis checklists canbe used, but need to be adapted to the situation at hand.
• In addition to checklist support, a number of improvement proposals havebeen presented: work to decrease number of change requests, handle dif-ferent CR types differently,∗ be more agile, and reuse old analysis resultsas a knowledge base.
• Tool support in general would be beneficial. As noted, there can be adifference between a process and its tools; a tool can be less forgivingthan the process, which means that it greatly influences the expectationsof the tool user.
9.1.3 METHOD PARTIn Chapter 7, our results show that the k-Nearest Neighbour method performswell in comparison to other methods, when applied to Likert data which arecommonly collected in software engineering surveys. It outperforms both Ran-dom Draw Substitution and Random Imputation, while both Median Imputa-tion and Mode Imputation perform equally good or slightly better. However,it is clear that our data are favourable both for Median Imputation and ModeImputation. With a different distribution of response options, these methodscould perform worse, whereas the k-NN method should not, given that it is lesssensitive to the data distribution. For answers to the more detailed researchquestions, see Section 7.8.
∗ Different types of CRs can be evaluated by different authorities, as noted in Chapter 1, butother types of handling are possible as well.
248
9: Conclusions
Finally, in Chapter 8, the results show that Hierarchical Cumulative Votinghas improved scalability over Cumulative Voting (CV), and that it competeswell with both CV and the Analytical Hierarchical Process. In other words, weconsider the technique to be relevant and useful in providing input to decision-making activities. The formulas that govern the calculations of hierarchicalpriorities are part of the answer to the question about how to extend CV totake into account multiple levels. They are not shown here; we refer to thechapter for more details.
9.2 FUTURE RESEARCHOn a general level, excluding the method chapters, a continuation of the impactanalysis track of the thesis could consider the directions outlined below. Morespecific pointers to future work are given in the thesis chapters, including themethod chapters.
Further exploration of process aspects of impact analysis is necessary, inorder to understand how changes should be handled in specific contexts. Forexample, Åsfält and Stüeken [2007] have studied challenges of working withchanges in software product lines and parallel software development. A contextimposes constraints and ways of working that possibly affect how impact analysiscan and should be performed.
Further investigation and evaluation of the checklist-based process supportintroduced in Chapter 5 are necessary (for details, see the chapter conclusions).In general, research should focus more on process support to help softwareprofessionals make better and more well-founded analyses.
Studying the role of impact analysis in software evolution, to see how it canbe helpful in controlling how a system evolves, is relevant. The incrementalchange induced by adding new functionality in an evolutionary manner requiresproper impact analysis. However, also tactical and strategic aspects come intoplay here, and the influence of these must be taken into account.
249

9: Conclusions
250
References
Aaen, I. (2003): Software process improvement: Blueprints versus recipes. IEEESoftware 20(5):86–92.
Ahl, V. (2005): An Experimental Comparison of Five PrioritizationTechniques—Investigating Ease of Use, Accuracy, and Scalability. MasterThesis No. MSE-2005-11, Blekinge Institute of Technology, Ronneby, Swe-den.
Anderson, D. R., Sweeney, D. J., and Williams, T. A. (2000): An Introduction toManagement Science—Quantitative Approaches to Decision Making. South-Western College Publishing, 9th ed.
Åsfält, P. and Stüeken, J. (2007): Controlling Changes in Large-Scale SoftwareDevelopment: Challenges of Parallel Development and Software Product LineDevelopment. Master Thesis No. MSE-2007-04, Blekinge Institute of Tech-nology, Ronneby, Sweden.
Aurum, A. and Wohlin, C. (2003): The fundamental nature of requirementsengineering activities as a decision-making process. Information and SoftwareTechnology 45(14):945–954.
Aurum, A. and Wohlin, C., eds. (2005): Engineering and Managing SoftwareRequirements. Berlin, Germany: Springer-Verlag.
Baddoo, N. and Hall, T. (2003): De-motivators for software process improve-ment: an analysis of practitioners’ view. Systems and Software 66(1):23–33.
Basili, V. and Green, S. (1994): Software process evolution at the SEL. IEEESoftware 11(4):58–66.
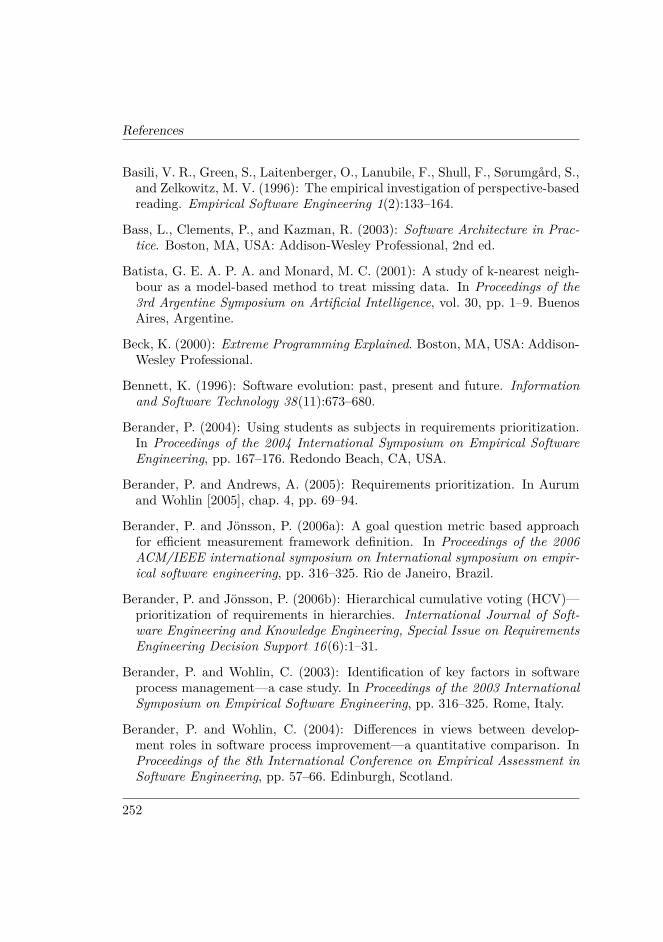
References
Basili, V. R., Green, S., Laitenberger, O., Lanubile, F., Shull, F., Sørumgård, S.,and Zelkowitz, M. V. (1996): The empirical investigation of perspective-basedreading. Empirical Software Engineering 1(2):133–164.
Bass, L., Clements, P., and Kazman, R. (2003): Software Architecture in Prac-tice. Boston, MA, USA: Addison-Wesley Professional, 2nd ed.
Batista, G. E. A. P. A. and Monard, M. C. (2001): A study of k-nearest neigh-bour as a model-based method to treat missing data. In Proceedings of the3rd Argentine Symposium on Artificial Intelligence, vol. 30, pp. 1–9. BuenosAires, Argentine.
Beck, K. (2000): Extreme Programming Explained. Boston, MA, USA: Addison-Wesley Professional.
Bennett, K. (1996): Software evolution: past, present and future. Informationand Software Technology 38(11):673–680.
Berander, P. (2004): Using students as subjects in requirements prioritization.In Proceedings of the 2004 International Symposium on Empirical SoftwareEngineering, pp. 167–176. Redondo Beach, CA, USA.
Berander, P. and Andrews, A. (2005): Requirements prioritization. In Aurumand Wohlin [2005], chap. 4, pp. 69–94.
Berander, P. and Jönsson, P. (2006a): A goal question metric based approachfor efficient measurement framework definition. In Proceedings of the 2006ACM/IEEE international symposium on International symposium on empir-ical software engineering, pp. 316–325. Rio de Janeiro, Brazil.
Berander, P. and Jönsson, P. (2006b): Hierarchical cumulative voting (HCV)—prioritization of requirements in hierarchies. International Journal of Soft-ware Engineering and Knowledge Engineering, Special Issue on RequirementsEngineering Decision Support 16(6):1–31.
Berander, P. and Wohlin, C. (2003): Identification of key factors in softwareprocess management—a case study. In Proceedings of the 2003 InternationalSymposium on Empirical Software Engineering, pp. 316–325. Rome, Italy.
Berander, P. and Wohlin, C. (2004): Differences in views between develop-ment roles in software process improvement—a quantitative comparison. InProceedings of the 8th International Conference on Empirical Assessment inSoftware Engineering, pp. 57–66. Edinburgh, Scotland.
252
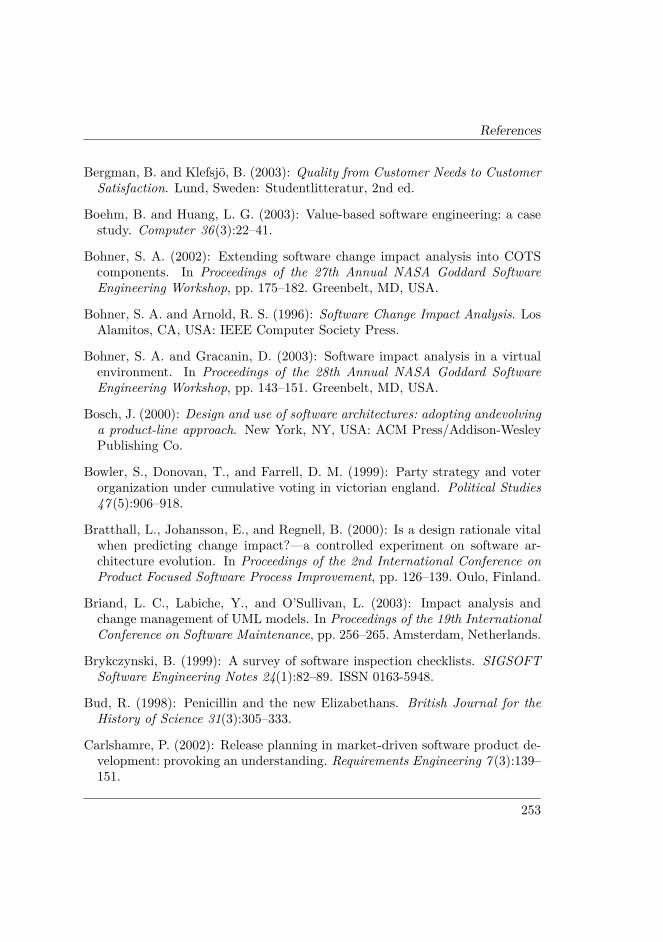
References
Bergman, B. and Klefsjö, B. (2003): Quality from Customer Needs to CustomerSatisfaction. Lund, Sweden: Studentlitteratur, 2nd ed.
Boehm, B. and Huang, L. G. (2003): Value-based software engineering: a casestudy. Computer 36(3):22–41.
Bohner, S. A. (2002): Extending software change impact analysis into COTScomponents. In Proceedings of the 27th Annual NASA Goddard SoftwareEngineering Workshop, pp. 175–182. Greenbelt, MD, USA.
Bohner, S. A. and Arnold, R. S. (1996): Software Change Impact Analysis. LosAlamitos, CA, USA: IEEE Computer Society Press.
Bohner, S. A. and Gracanin, D. (2003): Software impact analysis in a virtualenvironment. In Proceedings of the 28th Annual NASA Goddard SoftwareEngineering Workshop, pp. 143–151. Greenbelt, MD, USA.
Bosch, J. (2000): Design and use of software architectures: adopting andevolvinga product-line approach. New York, NY, USA: ACM Press/Addison-WesleyPublishing Co.
Bowler, S., Donovan, T., and Farrell, D. M. (1999): Party strategy and voterorganization under cumulative voting in victorian england. Political Studies47 (5):906–918.
Bratthall, L., Johansson, E., and Regnell, B. (2000): Is a design rationale vitalwhen predicting change impact?—a controlled experiment on software ar-chitecture evolution. In Proceedings of the 2nd International Conference onProduct Focused Software Process Improvement, pp. 126–139. Oulo, Finland.
Briand, L. C., Labiche, Y., and O’Sullivan, L. (2003): Impact analysis andchange management of UML models. In Proceedings of the 19th InternationalConference on Software Maintenance, pp. 256–265. Amsterdam, Netherlands.
Brykczynski, B. (1999): A survey of software inspection checklists. SIGSOFTSoftware Engineering Notes 24(1):82–89. ISSN 0163-5948.
Bud, R. (1998): Penicillin and the new Elizabethans. British Journal for theHistory of Science 31(3):305–333.
Carlshamre, P. (2002): Release planning in market-driven software product de-velopment: provoking an understanding. Requirements Engineering 7 (3):139–151.
253
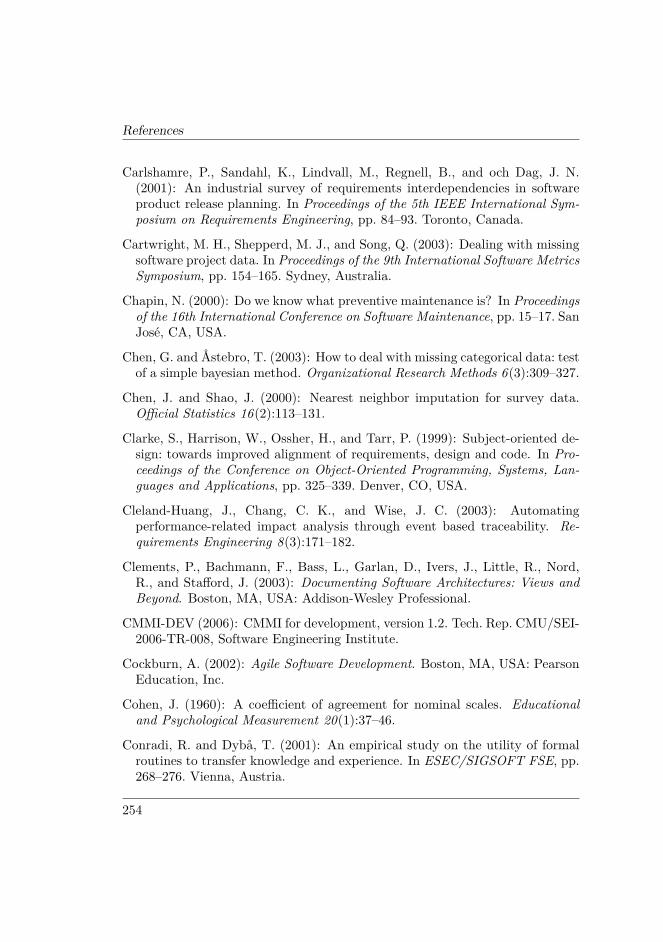
References
Carlshamre, P., Sandahl, K., Lindvall, M., Regnell, B., and och Dag, J. N.(2001): An industrial survey of requirements interdependencies in softwareproduct release planning. In Proceedings of the 5th IEEE International Sym-posium on Requirements Engineering, pp. 84–93. Toronto, Canada.
Cartwright, M. H., Shepperd, M. J., and Song, Q. (2003): Dealing with missingsoftware project data. In Proceedings of the 9th International Software MetricsSymposium, pp. 154–165. Sydney, Australia.
Chapin, N. (2000): Do we know what preventive maintenance is? In Proceedingsof the 16th International Conference on Software Maintenance, pp. 15–17. SanJosé, CA, USA.
Chen, G. and Åstebro, T. (2003): How to deal with missing categorical data: testof a simple bayesian method. Organizational Research Methods 6(3):309–327.
Chen, J. and Shao, J. (2000): Nearest neighbor imputation for survey data.Official Statistics 16(2):113–131.
Clarke, S., Harrison, W., Ossher, H., and Tarr, P. (1999): Subject-oriented de-sign: towards improved alignment of requirements, design and code. In Pro-ceedings of the Conference on Object-Oriented Programming, Systems, Lan-guages and Applications, pp. 325–339. Denver, CO, USA.
Cleland-Huang, J., Chang, C. K., and Wise, J. C. (2003): Automatingperformance-related impact analysis through event based traceability. Re-quirements Engineering 8(3):171–182.
Clements, P., Bachmann, F., Bass, L., Garlan, D., Ivers, J., Little, R., Nord,R., and Stafford, J. (2003): Documenting Software Architectures: Views andBeyond. Boston, MA, USA: Addison-Wesley Professional.
CMMI-DEV (2006): CMMI for development, version 1.2. Tech. Rep. CMU/SEI-2006-TR-008, Software Engineering Institute.
Cockburn, A. (2002): Agile Software Development. Boston, MA, USA: PearsonEducation, Inc.
Cohen, J. (1960): A coefficient of agreement for nominal scales. Educationaland Psychological Measurement 20(1):37–46.
Conradi, R. and Dybå, T. (2001): An empirical study on the utility of formalroutines to transfer knowledge and experience. In ESEC/SIGSOFT FSE, pp.268–276. Vienna, Austria.
254
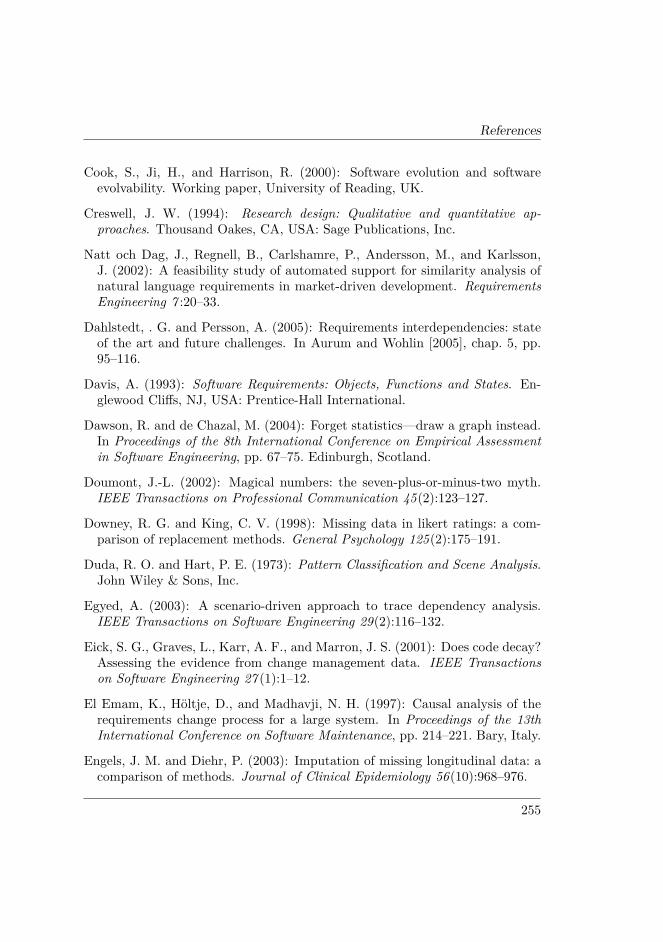
References
Cook, S., Ji, H., and Harrison, R. (2000): Software evolution and softwareevolvability. Working paper, University of Reading, UK.
Creswell, J. W. (1994): Research design: Qualitative and quantitative ap-proaches. Thousand Oakes, CA, USA: Sage Publications, Inc.
Natt och Dag, J., Regnell, B., Carlshamre, P., Andersson, M., and Karlsson,J. (2002): A feasibility study of automated support for similarity analysis ofnatural language requirements in market-driven development. RequirementsEngineering 7 :20–33.
Dahlstedt, . G. and Persson, A. (2005): Requirements interdependencies: stateof the art and future challenges. In Aurum and Wohlin [2005], chap. 5, pp.95–116.
Davis, A. (1993): Software Requirements: Objects, Functions and States. En-glewood Cliffs, NJ, USA: Prentice-Hall International.
Dawson, R. and de Chazal, M. (2004): Forget statistics—draw a graph instead.In Proceedings of the 8th International Conference on Empirical Assessmentin Software Engineering, pp. 67–75. Edinburgh, Scotland.
Doumont, J.-L. (2002): Magical numbers: the seven-plus-or-minus-two myth.IEEE Transactions on Professional Communication 45(2):123–127.
Downey, R. G. and King, C. V. (1998): Missing data in likert ratings: a com-parison of replacement methods. General Psychology 125(2):175–191.
Duda, R. O. and Hart, P. E. (1973): Pattern Classification and Scene Analysis.John Wiley & Sons, Inc.
Egyed, A. (2003): A scenario-driven approach to trace dependency analysis.IEEE Transactions on Software Engineering 29(2):116–132.
Eick, S. G., Graves, L., Karr, A. F., and Marron, J. S. (2001): Does code decay?Assessing the evidence from change management data. IEEE Transactionson Software Engineering 27 (1):1–12.
El Emam, K., Höltje, D., and Madhavji, N. H. (1997): Causal analysis of therequirements change process for a large system. In Proceedings of the 13thInternational Conference on Software Maintenance, pp. 214–221. Bary, Italy.
Engels, J. M. and Diehr, P. (2003): Imputation of missing longitudinal data: acomparison of methods. Journal of Clinical Epidemiology 56(10):968–976.
255
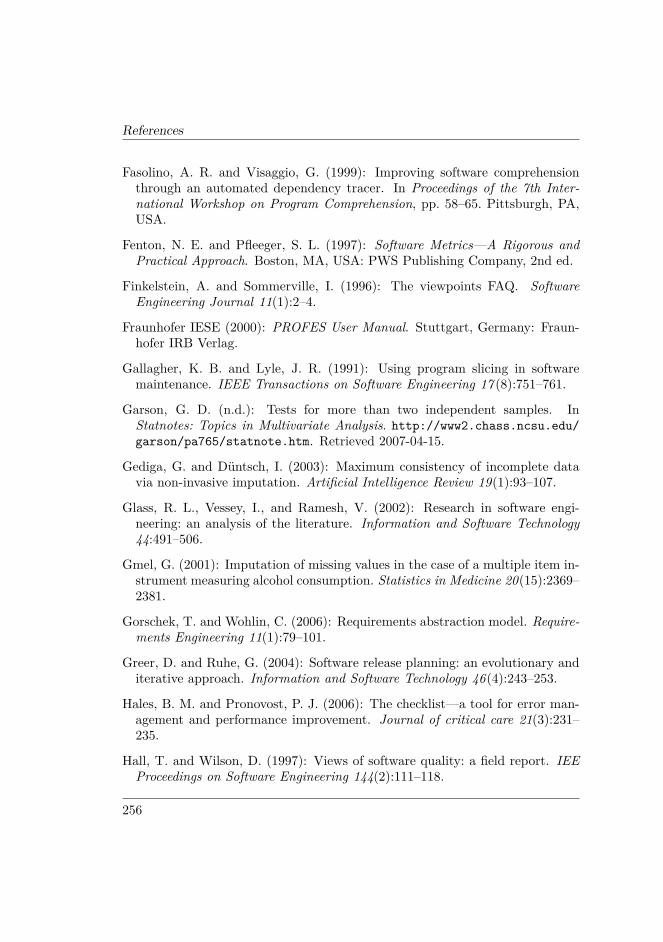
References
Fasolino, A. R. and Visaggio, G. (1999): Improving software comprehensionthrough an automated dependency tracer. In Proceedings of the 7th Inter-national Workshop on Program Comprehension, pp. 58–65. Pittsburgh, PA,USA.
Fenton, N. E. and Pfleeger, S. L. (1997): Software Metrics—A Rigorous andPractical Approach. Boston, MA, USA: PWS Publishing Company, 2nd ed.
Finkelstein, A. and Sommerville, I. (1996): The viewpoints FAQ. SoftwareEngineering Journal 11(1):2–4.
Fraunhofer IESE (2000): PROFES User Manual. Stuttgart, Germany: Fraun-hofer IRB Verlag.
Gallagher, K. B. and Lyle, J. R. (1991): Using program slicing in softwaremaintenance. IEEE Transactions on Software Engineering 17 (8):751–761.
Garson, G. D. (n.d.): Tests for more than two independent samples. InStatnotes: Topics in Multivariate Analysis. http://www2.chass.ncsu.edu/garson/pa765/statnote.htm. Retrieved 2007-04-15.
Gediga, G. and Düntsch, I. (2003): Maximum consistency of incomplete datavia non-invasive imputation. Artificial Intelligence Review 19(1):93–107.
Glass, R. L., Vessey, I., and Ramesh, V. (2002): Research in software engi-neering: an analysis of the literature. Information and Software Technology44:491–506.
Gmel, G. (2001): Imputation of missing values in the case of a multiple item in-strument measuring alcohol consumption. Statistics in Medicine 20(15):2369–2381.
Gorschek, T. and Wohlin, C. (2006): Requirements abstraction model. Require-ments Engineering 11(1):79–101.
Greer, D. and Ruhe, G. (2004): Software release planning: an evolutionary anditerative approach. Information and Software Technology 46(4):243–253.
Hales, B. M. and Pronovost, P. J. (2006): The checklist—a tool for error man-agement and performance improvement. Journal of critical care 21(3):231–235.
Hall, T. and Wilson, D. (1997): Views of software quality: a field report. IEEProceedings on Software Engineering 144(2):111–118.
256
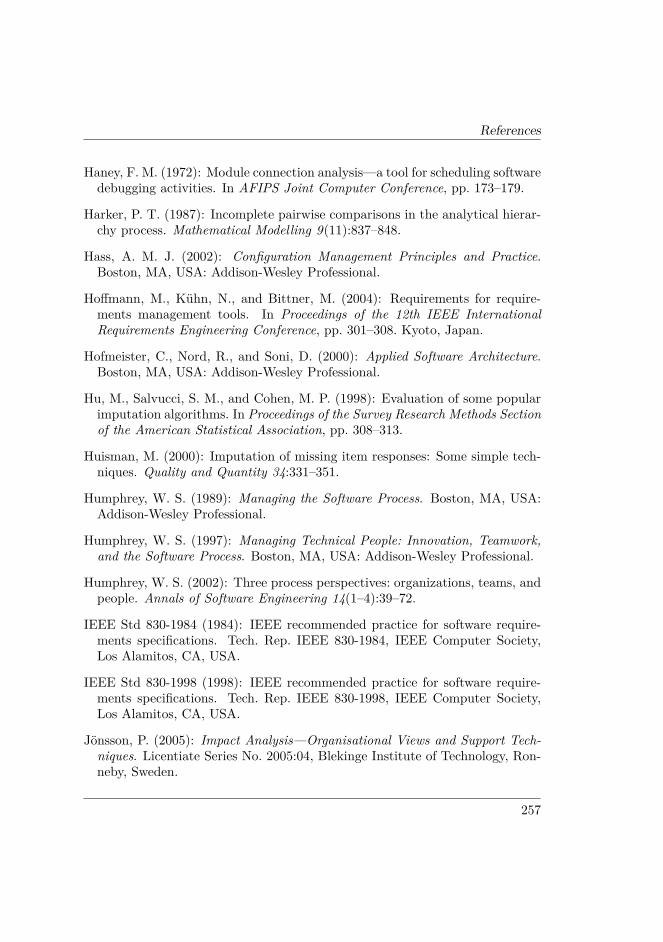
References
Haney, F. M. (1972): Module connection analysis—a tool for scheduling softwaredebugging activities. In AFIPS Joint Computer Conference, pp. 173–179.
Harker, P. T. (1987): Incomplete pairwise comparisons in the analytical hierar-chy process. Mathematical Modelling 9(11):837–848.
Hass, A. M. J. (2002): Configuration Management Principles and Practice.Boston, MA, USA: Addison-Wesley Professional.
Hoffmann, M., Kühn, N., and Bittner, M. (2004): Requirements for require-ments management tools. In Proceedings of the 12th IEEE InternationalRequirements Engineering Conference, pp. 301–308. Kyoto, Japan.
Hofmeister, C., Nord, R., and Soni, D. (2000): Applied Software Architecture.Boston, MA, USA: Addison-Wesley Professional.
Hu, M., Salvucci, S. M., and Cohen, M. P. (1998): Evaluation of some popularimputation algorithms. In Proceedings of the Survey Research Methods Sectionof the American Statistical Association, pp. 308–313.
Huisman, M. (2000): Imputation of missing item responses: Some simple tech-niques. Quality and Quantity 34:331–351.
Humphrey, W. S. (1989): Managing the Software Process. Boston, MA, USA:Addison-Wesley Professional.
Humphrey, W. S. (1997): Managing Technical People: Innovation, Teamwork,and the Software Process. Boston, MA, USA: Addison-Wesley Professional.
Humphrey, W. S. (2002): Three process perspectives: organizations, teams, andpeople. Annals of Software Engineering 14(1–4):39–72.
IEEE Std 830-1984 (1984): IEEE recommended practice for software require-ments specifications. Tech. Rep. IEEE 830-1984, IEEE Computer Society,Los Alamitos, CA, USA.
IEEE Std 830-1998 (1998): IEEE recommended practice for software require-ments specifications. Tech. Rep. IEEE 830-1998, IEEE Computer Society,Los Alamitos, CA, USA.
Jönsson, P. (2005): Impact Analysis—Organisational Views and Support Tech-niques. Licentiate Series No. 2005:04, Blekinge Institute of Technology, Ron-neby, Sweden.
257
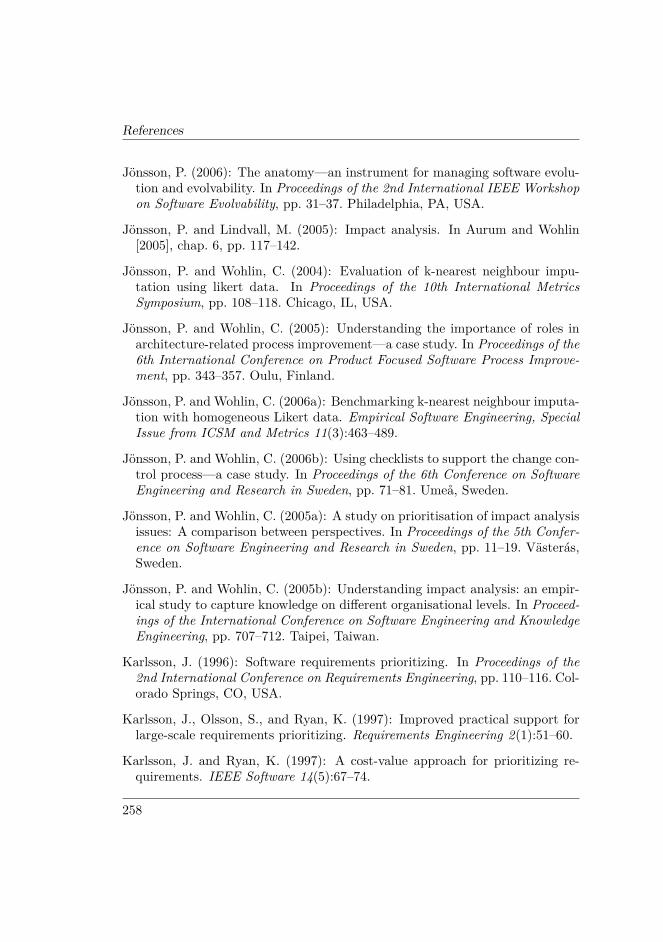
References
Jönsson, P. (2006): The anatomy—an instrument for managing software evolu-tion and evolvability. In Proceedings of the 2nd International IEEE Workshopon Software Evolvability, pp. 31–37. Philadelphia, PA, USA.
Jönsson, P. and Lindvall, M. (2005): Impact analysis. In Aurum and Wohlin[2005], chap. 6, pp. 117–142.
Jönsson, P. and Wohlin, C. (2004): Evaluation of k-nearest neighbour impu-tation using likert data. In Proceedings of the 10th International MetricsSymposium, pp. 108–118. Chicago, IL, USA.
Jönsson, P. and Wohlin, C. (2005): Understanding the importance of roles inarchitecture-related process improvement—a case study. In Proceedings of the6th International Conference on Product Focused Software Process Improve-ment, pp. 343–357. Oulu, Finland.
Jönsson, P. and Wohlin, C. (2006a): Benchmarking k-nearest neighbour imputa-tion with homogeneous Likert data. Empirical Software Engineering, SpecialIssue from ICSM and Metrics 11(3):463–489.
Jönsson, P. and Wohlin, C. (2006b): Using checklists to support the change con-trol process—a case study. In Proceedings of the 6th Conference on SoftwareEngineering and Research in Sweden, pp. 71–81. Umeå, Sweden.
Jönsson, P. and Wohlin, C. (2005a): A study on prioritisation of impact analysisissues: A comparison between perspectives. In Proceedings of the 5th Confer-ence on Software Engineering and Research in Sweden, pp. 11–19. Västerás,Sweden.
Jönsson, P. and Wohlin, C. (2005b): Understanding impact analysis: an empir-ical study to capture knowledge on different organisational levels. In Proceed-ings of the International Conference on Software Engineering and KnowledgeEngineering, pp. 707–712. Taipei, Taiwan.
Karlsson, J. (1996): Software requirements prioritizing. In Proceedings of the2nd International Conference on Requirements Engineering, pp. 110–116. Col-orado Springs, CO, USA.
Karlsson, J., Olsson, S., and Ryan, K. (1997): Improved practical support forlarge-scale requirements prioritizing. Requirements Engineering 2(1):51–60.
Karlsson, J. and Ryan, K. (1997): A cost-value approach for prioritizing re-quirements. IEEE Software 14(5):67–74.
258
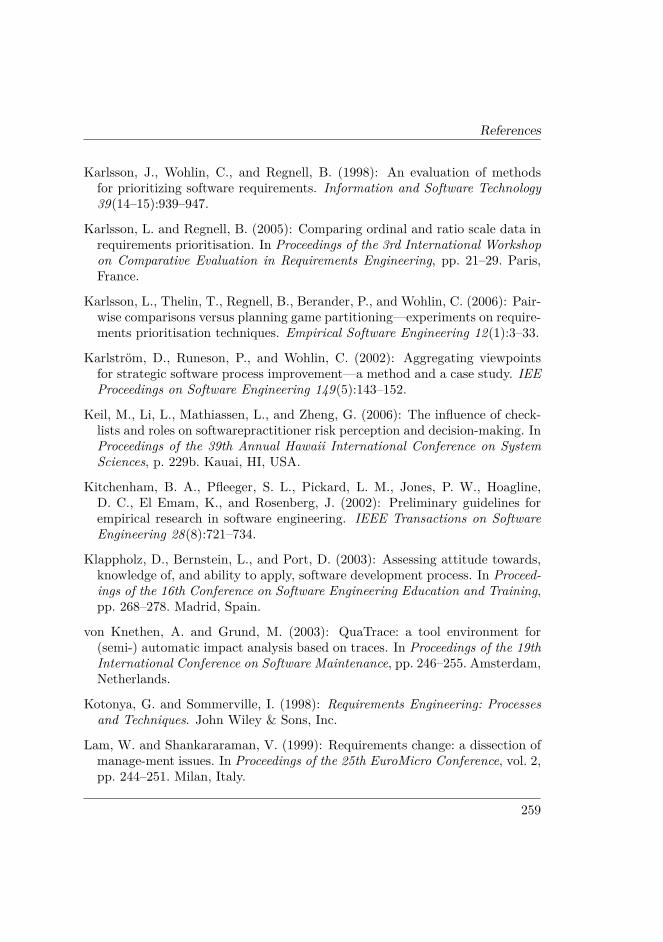
References
Karlsson, J., Wohlin, C., and Regnell, B. (1998): An evaluation of methodsfor prioritizing software requirements. Information and Software Technology39(14–15):939–947.
Karlsson, L. and Regnell, B. (2005): Comparing ordinal and ratio scale data inrequirements prioritisation. In Proceedings of the 3rd International Workshopon Comparative Evaluation in Requirements Engineering, pp. 21–29. Paris,France.
Karlsson, L., Thelin, T., Regnell, B., Berander, P., and Wohlin, C. (2006): Pair-wise comparisons versus planning game partitioning—experiments on require-ments prioritisation techniques. Empirical Software Engineering 12(1):3–33.
Karlström, D., Runeson, P., and Wohlin, C. (2002): Aggregating viewpointsfor strategic software process improvement—a method and a case study. IEEProceedings on Software Engineering 149(5):143–152.
Keil, M., Li, L., Mathiassen, L., and Zheng, G. (2006): The influence of check-lists and roles on softwarepractitioner risk perception and decision-making. InProceedings of the 39th Annual Hawaii International Conference on SystemSciences, p. 229b. Kauai, HI, USA.
Kitchenham, B. A., Pfleeger, S. L., Pickard, L. M., Jones, P. W., Hoagline,D. C., El Emam, K., and Rosenberg, J. (2002): Preliminary guidelines forempirical research in software engineering. IEEE Transactions on SoftwareEngineering 28(8):721–734.
Klappholz, D., Bernstein, L., and Port, D. (2003): Assessing attitude towards,knowledge of, and ability to apply, software development process. In Proceed-ings of the 16th Conference on Software Engineering Education and Training,pp. 268–278. Madrid, Spain.
von Knethen, A. and Grund, M. (2003): QuaTrace: a tool environment for(semi-) automatic impact analysis based on traces. In Proceedings of the 19thInternational Conference on Software Maintenance, pp. 246–255. Amsterdam,Netherlands.
Kotonya, G. and Sommerville, I. (1998): Requirements Engineering: Processesand Techniques. John Wiley & Sons, Inc.
Lam, W. and Shankararaman, V. (1999): Requirements change: a dissection ofmanage-ment issues. In Proceedings of the 25th EuroMicro Conference, vol. 2,pp. 244–251. Milan, Italy.
259
References
Larman, C. and Basili, V. R. (2003): Iterative and incremental development: abrief history. Computer 36(6):47–56.
Law, J. and Rothermel, G. (2003): Whole program path-based dynamic impactanalysis. In Proceedings of the 25th International Conference on SoftwareEngineering, pp. 308–318. Portland, OR, USA.
Lee, M., Offutt, J. A., and Alexander, R. T. (2000): Algorithmic analysis ofthe impacts of changes to object-oriented software. In Proceedings of theInternational Conference on Technology of Object-Oriented Languages andSystems, pp. 61–70. Santa Barbara, CA, USA.
de Leeuw, E. D. (2001): Reducing missing data in surveys: an overview ofmethods. Quality and Quantity 35(2):147–160.
Leffingwell, D. and Widrig, D. (1999): Managing Software Requirements—AUnified Approach. Boston, MA, USA: Addison-Wesley Professional.
Lehman, M. M. (1996): Laws of software evolution revisited. In Proceedingsof the 5th European Workshop on Software Process Technology, pp. 108–124.Nancy, France.
Lehman, M. M. and Ramil, J. F. (2003): Software evolution—background, the-ory, practice. Information Processing Letters 88(1–2):33–44.
Lehmann, D. R. and Winer, R. S. (2002): Product Management. New York,NY, USA: McGraw-Hill/Irwin, 3rd ed.
Lehtola, L. and Kauppinen, M. (2006): Suitability of requirements prioritizationmethods for market-driven software product development. Software ProcessImprovement and Practice 11:7–19.
Leon, A. (2000): A Guide to Software Configuration Management. London, UK:Artech House Publishers.
Lindvall, M. (1997): An Empirical Study of Requirements-Driven Impact Anal-ysis in Object-Oriented Systems Evolution. Ph.d. thesis, Linköping Studies inScience and Technology, No. 480, Linköping University, Institute of Technol-ogy, Linköping, Sweden.
Lindvall, M. and Sandahl, K. (1998): How well do experienced software devel-opers predict software change? Journal of Systems and Software 43:19–27.
260
References
Maciaszek, L. (2001): Requirements Analysis and System Design: DevelopingInformation Systems with UML. Boston, MA, USA: Addison Wesley.
Maiden, N. A. M. and Ncube, C. (1998): Acquiring COTS software selectionrequirements. IEEE Software 15(2):45–56.
Mantel, N. (1967): The detection of disease clustering and a generalized regres-sion approach. Cancer Research 27 :209–220.
Marakas, G. M. (2003): Decision Support Systems in the 21st Century. UpperSaddle River, NJ, USA: Prentice Hall, 2nd ed.
McFeeley, B. (1996): IDEALSM: A user’s guide for software process improve-ment. Tech. Rep. Handbook CMU/SEI-96-HB-001, Software Engineering In-stitute, Carnegie Mellon University.
Merriam-Webster (2003): Merriam-Webster’s Collegiate Dictionary. Spring-field, MA, USA: Merriam-Webster, 11th ed.
Miller, G. A. (1956): The magical number seven, plus or minus two: some limitson our capacity for processing information. Psychological Review 63:81–97.
Miller, J. (2004): Statistical significance testing—a panacea for software tech-nology experiments? Journal of Systems and Software 73(2):183–192.
Mockus, A. and Votta, L. G. (2000): Identifying reasons for software changesusing historic databases. In Proceedings of the 16th International Conferenceon Software Maintenance, pp. 120–130. San José, CA, USA.
Mårtensson, F., Jönsson, P., Bengtsson, P.-O., Grahn, H., and Mattsson, M.(2003): A case against continuous simulation for software architecture evalu-ation. In Proceedings of IASTED International Conference on Applied Simu-lation and Modelling, pp. 97–105. Marbella, Spain.
Myrtveit, I., Stensrud, E., and Olsson, U. H. (2001): Analyzing data sets withmissing data: an empirical evaluation of imputation methods and likelihood-based methods. IEEE Transactions on Software Engineering 27 (11):999–1013.
Ngo-The, A. and Ruhe, G. (2005): Decision support in requirements engineer-ing. In Aurum and Wohlin [2005], chap. 12, pp. 267–286.
261
References
Nicholas, J. M. (2001): Project Management for Business and Technology—Principles and Practice. Upper Saddle River, NJ, USA: Prentice Hall, 2nded.
O’Neal, J. S. and Carver, D. L. (2001): Analyzing the impact of changingrequirements. In Proceedings of the 17th International Conference on SoftwareMaintenance, pp. 190–195. Florence, Italy.
Pfleeger, S. L. (1998): Software engineering: theory and practice. Upper SaddleRiver, NJ, USA: Prentice Hall, international ed.
Porter, A. A. and Votta, L. G. (1994): An experiment to assess different de-fect detection methods for software requirements inspections. In Proceedingsof the 16th International Conference on Software Engineering, pp. 103–112.Sorrento, Italy.
Potts, C. (1993): Software-engineering research revisited. IEEE Software10(5):19–28.
Raaijmakers, Q. A. W. (1999): Effectiveness of different missing data treatmentsin surveys with likert-type data: introducing the relative mean substitutionapproach. Educational and Psychological Measurement 59(5):725–748.
Rainer, A. and Hall, T. (2002): Key success factors for implementing soft-ware process improvement: a maturity-based analysis. Systems and Software62(2):71–84.
Rajlich, V. (2001): Role of concepts in software evolution. In Proceedings of the4th International Workshop on Principles of Software Evolution, pp. 75–78.Vienna, Austria.
Ramesh, B. and Jarke, M. (2001): Towards reference models for requirementstraceability. IEEE Transactions on Software Engineering 27 (1):58–93.
Ramzan, S. and Ikram, N. (2005): Making decision in requirement change man-agement. In First International Conference on Information and Communica-tion Technologies, pp. 309–312. Karachi, Pakistan.
Regnell, B., Höst, M., Natt och Dag, J., Beremark, P., and Hjelm, T. (2001): Anindustrial case study on distributed prioritisation in market-driven require-ments engineering for packaged software. Requirements Engineering 6(1):51–62.
262
References
Regnell, B., Höst, M., Natt och Dag, J., Beremark, P., and Hjelm, T. (2000a):Visualization of agreement and satisfaction in distributed prioritization ofmarket requirements. In 6th International Workshop on Requirements Engi-neering: Foundation for Software Quality. Stockholm, Sweden.
Regnell, B., Runeson, P., and Thelin, T. (2000b): Are the perspectives re-ally different?—further experimentation on scenario-based reading of require-ments. Empirical Software Engineering 5(4):331–356.
Reynolds, J. (2001): Mantel test code. http://www.biostat.wustl.edu/archives/html/s-news/2001-03/msg00154.html. Retrieved 2007-04-15.
Robertson, S. and Robertson, J. (1999): Mastering the Requirements Process.Boston, MA, USA: Addison-Wesley Professional.
Robson, C. (2002): Real World Research. Blackwell Publishing.
Rolland, C. and Salinesi, C. (2005): Modeling goals and reasoning with them.In Aurum and Wohlin [2005], chap. 9, pp. 189–217.
Royce, W. W. (1970): Managing the development of large software systems: con-cepts and techniques. In Technical Papers of Western Electronic Show andConvention (WesCon).
Ruhe, G. (2002): Software engineering decision support. In Proceedings of the4th International Workshop of Advances in Learning Software Organizations,pp. 104–113. Chicago, IL, USA.
Ruhe, G., Eberlein, A., and Pfahl, D. (2002): Quantitative WinWin—a newmethod for decision support in requirements negotiation. In Proceedings ofthe 14th International Conference on Software Engineering and KnowledgeEngineering, pp. 159–166. Ischia, Italy.
Ruhe, G. and Saliu, M. O. (2005): The art and science of software releaseplanning. IEEE Software 22(6):47–54. ISSN 0740-7459.
Russ-Eft, D. F. (2004): So what is research anyway? Human Resource Devel-opment Quarterly 15(1):1–4.
Saaty, T. L. (1980): The Analytic Hierarchy Process. New York, NY, USA:McGraw-Hill.
263
References
Saaty, T. L. and Vargas, L. G. (2001): Models, Methods, Concepts & Applica-tions of the Analytic Hierarchy Process. Norwell, MA, USA: Kluwer AcademicPublishers.
Saliu, O. and Ruhe, G. (2005): Supporting software release planning decisionsfor evolving systems. In Proceedings of the 29th Annual IEEE/NASA SoftwareEngineering Workshop.
Sande, I. G. (1983): Hot-deck imputation procedures. In W. G. Madow andI. Olkin, eds., Proceedings of the Symposium, vol. 3 of Incomplete Data inSample Surveys, pp. 334–350. Academic Press.
Scheffer, J. (2002): Dealing with missing data. Research Letters in the Infor-mation and Mathematical Sciences 3:153–160.
Schmid, K. (2002): A comprehensive product line scoping and its validation.In Proceedings of the 24th International Conference on Software Engineering,pp. 593–603. Orlando, FL, USA.
Schulmeyer, G. G. and McManus, J. I. (1999): Handbook of Software QualityAssurance. Upper Saddle River, NJ, USA: Prentice Hall, 3rd ed.
Shahmehri, N., Kamkar, M., and Fritzson, P. (1990): Semi-automatic bug local-ization in software maintenance. In Proceedings of the Conference on SoftwareMaintenance, pp. 30–36. San Diego, CA, USA.
Shen, Y., Hoerl, A. E., and McConnell, W. (1992): An incomplete design in theanalytical hierarchy process. Mathematical Computer Modelling 16(5):121–129.
Sheskin, D. J. (2004): Handbook of parametric and non-parametric statisticalprocedures. Chapman & Hall.
Siegel, S. and Castellan Jr., N. J. (1988): Nonparametric Statistics for the Be-havioral Sciences. New York, NY, USA: McGraw-Hill, international ed.
van Soligen, R. and Berghout, E. (1999): Goal/Question/Metric Method: APractical Guide for Quality Improvement of Software Development. London,UK: McGraw-Hill Education.
Sommerville, I. (2004): Software Engineering. Boston, MA, USA: AddisonWesley, 7th ed.
264
References
Sommerville, I. and Sawyer, P. (1997): Requirements Engineering: A Good Prac-tice Guide. John Wiley & Sons, Inc.
Song, Q., Shepperd, M., and Cartwright, M. H. (2005): A short note on safestdefault missingness mechanism assumptions. Empirical Software Engineering10(2):235–243.
Strike, K., El Emam, K., and Madhavji, N. (2001): Software cost estima-tion with incomplete data. IEEE Transactions on Software Engineering27 (10):890–908.
Svahnberg, M. (2003): A study on agreement between participants in an ar-chitecture assessment. In Proceedings of the International Symposium onEmpirical Software Engineering, pp. 61–71. Rome, Italy.
SWEBOK (2004): Software configuration management. In Guide to the Soft-ware Engineering Body of Knowledge, chap. 7. Los Alamitos, CA, USA: IEEEComputer Society Press.
Taxén, L. and Lilliesköld, J. (2005): Manifesting shared affordances in systemdevelopment—the system anatomy. In Proceedings of the 3rd InternationalConference on Action in Language, Organisations and Information Systems,pp. 28–47. Limerick, Ireland.
Thelin, T., Runeson, P., and Wohlin, C. (2003): An experimental comparisonof usage-based and checklist-based reading. IEEE Transactions on SoftwareEngineering 29(8):687–704.
Tip, F., Jong, D. C., Field, J., and Ramlingam, G. (1996): Slicing class hi-erarchies in C++. In Proceedings of the 11th ACM SIGPLAN Conferenceon Object-Oriented Programming, Systems, Languages & Applications, pp.179–197. San José, CA, USA.
Tomaszewski, P. (2006): Software Development Productivity—Evaluation andImprovement for Large Industrial Projects. Doctoral Dissertation SeriesNo. 2006:05, Blekinge Institute of Technology, Ronneby, Sweden.
Tomaszewski, P. and Lundberg, L. (2005): Software development productiv-ity on a new platform—an industrial case study. Information and SoftwareTechnology 47 (4):257–269.
265
References
Troyanskaya, O., Cantor, M., Sherlock, G., Brown, P., Hastie, T., Tibshirani,R., Botstein, D., and Altman, R. B. (2001): Missing value estimation methodsfor DNA microarrays. Bioinformatics 17 (6):520–525.
Turver, R. J. and Munro, M. (1994): An early impact analysis technique forsoftware maintenance. Journal of Software Maintenance 6(1):35–52.
Weinberg, G. M. (1983): Kill that code. Infosystems 30:48–49.
Weiser, M. (1979): Program slices: formal, psychological, and practical investi-gations of an automatic program abstraction method. Ph.D. thesis, Universityof Michigan, Ann Arbor, MI, USA.
Wiegers, K. (1999): Software requirements. Microsoft Press.
Wilson, D. R. and Martinez, T. R. (1997): Improved heterogeneous distancefunctions. Journal of Artificial Intelligence Research 6 :1–34.
Wohlin, C. and Aurum, A. (2006): Criteria for selecting software requirementsto create product value: an industrial empirical study. In S. Biffl, A. Aurum,B. Boehm, H. Erdogmus, and P. Grünbacher, eds., Value-Based SoftwareEngineering, pp. 179–200. Berlin, Germany: Springer-Verlag.
Wohlin, C., Runeson, P., Höst, M., Ohlsson, M. C., Regnell, B., and Wesslén, A.(2000): Experimentation in Software Engineering: An Introduction. Norwell,MA, USA: Kluwer Academic Publishers.
Yau, S. S. and Collofello, J. S. (1980): Some stability measures for softwaremaintenance. IEEE Transactions on Software Engineering 6(6):545–552.
Zahran, S. (1998): Software process improvement: practical guidelines for busi-ness success. Boston, MA, USA: Addison-Wesley Professional.
Zelkowitz, M. V. and Wallace, D. R. (1998): Experimental models for validatingtechnology. Computer 31(5):23–31.
Zhao, J. (1998): Applying slicing technique to software architectures. In Pro-ceedings of the 4th IEEE International Conference on Engineering of ComplexComputer Systems, pp. 87–98. Monterey, CA, USA.
266
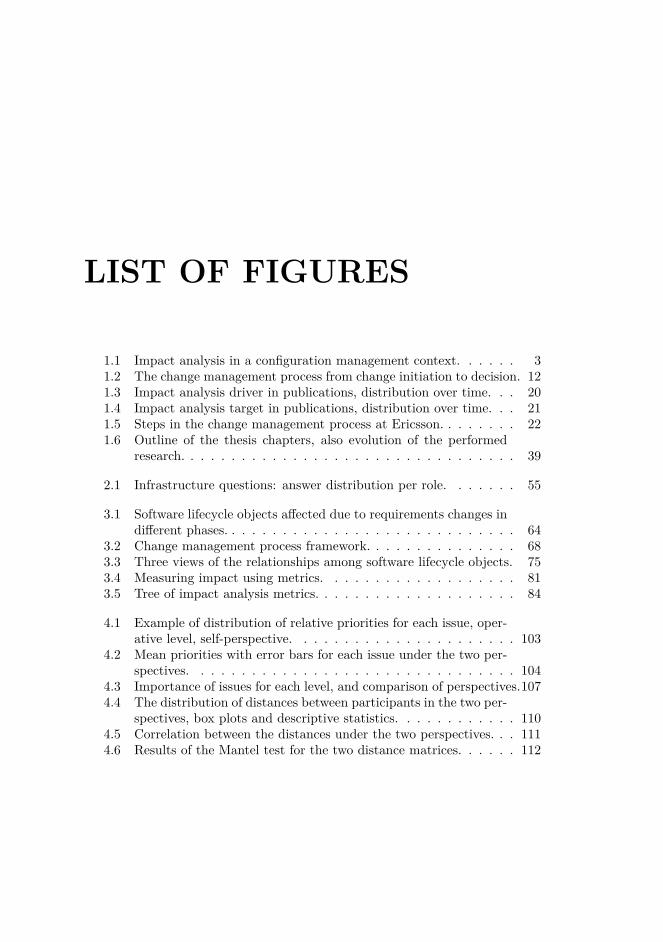
LIST OF FIGURES
1.1 Impact analysis in a configuration management context. . . . . . 31.2 The change management process from change initiation to decision. 121.3 Impact analysis driver in publications, distribution over time. . . 201.4 Impact analysis target in publications, distribution over time. . . 211.5 Steps in the change management process at Ericsson. . . . . . . . 221.6 Outline of the thesis chapters, also evolution of the performed
research. . . . . . . . . . . . . . . . . . . . . . . . . . . . . . . . . 39
2.1 Infrastructure questions: answer distribution per role. . . . . . . 55
3.1 Software lifecycle objects affected due to requirements changes indifferent phases. . . . . . . . . . . . . . . . . . . . . . . . . . . . . 64
3.2 Change management process framework. . . . . . . . . . . . . . . 683.3 Three views of the relationships among software lifecycle objects. 753.4 Measuring impact using metrics. . . . . . . . . . . . . . . . . . . 813.5 Tree of impact analysis metrics. . . . . . . . . . . . . . . . . . . . 84
4.1 Example of distribution of relative priorities for each issue, oper-ative level, self-perspective. . . . . . . . . . . . . . . . . . . . . . 103
4.2 Mean priorities with error bars for each issue under the two per-spectives. . . . . . . . . . . . . . . . . . . . . . . . . . . . . . . . 104
4.3 Importance of issues for each level, and comparison of perspectives.1074.4 The distribution of distances between participants in the two per-
spectives, box plots and descriptive statistics. . . . . . . . . . . . 1104.5 Correlation between the distances under the two perspectives. . . 1114.6 Results of the Mantel test for the two distance matrices. . . . . . 112
4.7 The distribution of distances for the three levels under each per-spective. . . . . . . . . . . . . . . . . . . . . . . . . . . . . . . . . 114
5.1 Illustration of checklist adaptation. . . . . . . . . . . . . . . . . . 134
6.1 Overview of the parts and steps of the study. . . . . . . . . . . . 1546.2 Tree of dependencies. . . . . . . . . . . . . . . . . . . . . . . . . . 1566.3 Adding new functionality to a system. . . . . . . . . . . . . . . . 1566.4 Example of a functional ladder. . . . . . . . . . . . . . . . . . . . 1596.5 System-level anatomy plans in relation to release planning and
project planning. . . . . . . . . . . . . . . . . . . . . . . . . . . . 1646.6 The identification of an implicit relation between two functions. . 170
7.1 Distribution of response options. . . . . . . . . . . . . . . . . . . 1807.2 Evaluation process outline. . . . . . . . . . . . . . . . . . . . . . 1877.3 Performance at 14.5% and 19.0% missing data, CC and IC. . . . 1957.4 9.9% missing data, 12 and 18 attributes, IC strategy. . . . . . . . 2007.5 Ability vs. proportion of missing data. . . . . . . . . . . . . . . . 201
8.1 Simple hierarchy of requirements. . . . . . . . . . . . . . . . . . . 2228.2 Requirements hierarchy in the example. . . . . . . . . . . . . . . 2278.3 Another way of visualising the prioritisation results. . . . . . . . 2298.4 Average percentage of objects given a non-zero value per case. . . 2338.5 Average percentage of divergence per case. . . . . . . . . . . . . . 234
268

LIST OF TABLES
1.1 Classification of studies in the thesis. . . . . . . . . . . . . . . . . 37
2.1 Most important improvement: answer distribution among roles. . 572.2 Kruskal-Wallis and Chi-square outcome, all questions. . . . . . . 582.3 Significant role-purpose pairs. . . . . . . . . . . . . . . . . . . . . 59
3.1 Impact factors. . . . . . . . . . . . . . . . . . . . . . . . . . . . . 823.2 Predicted vs. actual changes. . . . . . . . . . . . . . . . . . . . . 85
4.1 Cumulative Voting example. . . . . . . . . . . . . . . . . . . . . . 1004.2 Issues elicited in the interviews. . . . . . . . . . . . . . . . . . . . 1024.3 Distances of participants per perspective, using the χ2 dissimi-
larity measure. . . . . . . . . . . . . . . . . . . . . . . . . . . . . 1094.4 Descriptive statistics for the distances in the three levels under
each perspective. . . . . . . . . . . . . . . . . . . . . . . . . . . . 1134.5 Spearman’s rho and significance for issues with significant corre-
lation between perspectives. . . . . . . . . . . . . . . . . . . . . . 1134.6 Top five issues based on perimeter disagreement, including (scaled)
scores for each level and perspective. . . . . . . . . . . . . . . . . 1164.7 The issues with largest differences between perspective scores, for
each level. . . . . . . . . . . . . . . . . . . . . . . . . . . . . . . . 1174.8 Mapping from identified improvements to high- and medium-
priority issues. . . . . . . . . . . . . . . . . . . . . . . . . . . . . 122
5.1 Aspects and statements in the pre-evaluation. . . . . . . . . . . . 1375.2 Quantitative part of the main evaluation. . . . . . . . . . . . . . 1395.3 Qualitative part of the main evaluation. . . . . . . . . . . . . . . 140
7.1 Example: Incomplete data set. . . . . . . . . . . . . . . . . . . . 1857.2 Overview of incomplete data sets. . . . . . . . . . . . . . . . . . . 1947.3 Optimal k-values with R, Q, and MSE for the CC strategy. . . . 1987.4 Optimal k-values with R, Q, and MSE for the IC strategy. . . . 1987.5 Optimal k vs. calculated k. . . . . . . . . . . . . . . . . . . . . . 1997.6 Overview of results. . . . . . . . . . . . . . . . . . . . . . . . . . 2047.7 Overview of benchmarking outcome. . . . . . . . . . . . . . . . . 204
8.1 Intermediate calculations and resulting priorities in the example. 2278.2 Technique used, number of objects, number of respondents, and
description for the prioritisation cases. . . . . . . . . . . . . . . . 2318.3 Results of post-test. . . . . . . . . . . . . . . . . . . . . . . . . . 236
270


ISSN 1653-2090
ISBN 978-91-7295-116-7
Change is inevitable in software development. During the entire lifecycle of a software system, from conception to retirement, things happen that require the system to be changed: the hardware and software environment changes, customer needs evolve, flaws are found, and so on. Under these conditions, it is crucial to have full control over and knowledge about what changes mean to the system and its environment. Otherwise, changes might lead to software deterioration and a multitude of other problems. The activity of as-sessing the implications of realising a change is ter-med change impact analysis.
Change impact analysis, or impact analysis for short, has a broad spectrum of definitions, ranging from the modification of source code to the iden-tification of risks associated with a change. Two parts of impact analysis are: (1) the assessment of the consequences of altering (or not) the functio-nality/capabilities of the software system, and (2) the identification of the software artefacts that are affected by the change. Impact analysis is perfor-med as part of the change management process which belongs to configuration management, and serves as a basis for determining whether to ac-cept or reject a change. Improper or non-existent impact analysis can be as problematic as having no control over changes in the first place.
The research presented in this thesis is explora-tory in its nature, conducted through empirical
studies in an industry setting. The main objective has been to contribute to the body of knowledge of change impact analysis by investigating challen-ges of working with impact analysis in large-scale software development. While having a wide scope, the studies are brought together by an overar-ching emphasis on process aspects of the topic. Traditionally, research on change impact analysis has mainly focused on technical aspects such as traceability analysis and change propagation. The thesis contributes instead to the understanding of aspects like process improvement opportunities, process support, and the role of impact analysis in software evolution.
The results of the presented research include: important impact analysis issues as seen by dif-ferent groups of software practitioners, related process improvement proposals, a checklist-based process support instrument helpful while perfor-ming impact analysis, an evaluation approach for the change control process, and the study of an evolution planning instrument with impact analysis focus. Some conclusions drawn are that software practitioners need support in performing impact analysis, that the main impact analysis challenges concern fundamental issues, and that impact ana-lysis is an important enabler in software evolution. The thesis further provides an in-depth study of two support methods used in the research, one for statistical imputation of missing data, and one for prioritising hierarchically arranged items.
ABSTRACT
2007:13
Blekinge Institute of TechnologyDoctoral Dissertation Series No. 2007:13
School of Engineering
EXPLORING PROCESS ASPECTS OF CHANGE IMPACT ANALYSIS
Per Jönsson
EX
PL
OR
ING
PR
OC
ES
S
AS
PE
CT
S O
F C
HA
NG
E IM
PAC
T A
NA
LYS
ISPer Jönsson
2007:13