Telework and Organizational Citizenship Behaviors - CUNY ...
Upload
khangminh22Category
view
1download
0
Technische Universität München
Fakultät für Sport- und Gesundheitswissenschaften
Lehrstuhl für Sport- und Gesundheitsdidaktik
Exploring Physical Activity in the
Interplay of Health Behaviors and
Health
Matthias Rabel, MPH
Vollständiger Abdruck der von der Fakultät für Sport- und Gesundheitswissenschaften
der Technischen Universität München zur Erlangung des akademischen Grades eines
Doktors der Philosophie (Dr. phil.)
genehmigten Dissertation.
Vorsitzender: Prof. Dr. Jörg Königstorfer
Prüfer der Dissertation: 1. Prof. Dr. Filip Mess
2. Prof. Dr. Rolf Holle
Die Dissertation wurde am 21.01.2020 bei der Technischen Universität München einge-
reicht und durch die Fakultät für Sport- und Gesundheitswissenschaften am 16.04.2020
angenommen

Exploring Physical Activity in the Interplay of Health Behaviors and Health 2
Table of contents
List of figures ............................................................................................................ 4
List of tables .............................................................................................................. 4
Summary ................................................................................................................... 5
1. Introduction ........................................................................................................ 6
1.1. General introduction ...................................................................................... 6
1.2. Theoretical background: health and health behavior ..................................... 8
1.3. Physical activity and health ......................................................................... 11
1.4. Conducted studies....................................................................................... 13
2. Methods............................................................................................................. 16
2.1. KORA studies .............................................................................................. 16
2.2. Statistical methods ...................................................................................... 17
2.2.1. Latent class analysis ............................................................................. 17
2.2.2. Logistic regression ................................................................................ 20
2.2.3. Statistical methods in Study 3 and Study 4 ........................................... 22
3. Results .............................................................................................................. 24
3.1. Study 1 ........................................................................................................ 24
3.1.1. Abstract Study 1 ................................................................................... 24
3.1.2. Contribution to Study 1 ......................................................................... 25
3.2. Study 2 ........................................................................................................ 25
3.2.1. Abstract Study 2 ................................................................................... 25
3.2.2. Contribution to Study 2 ......................................................................... 26
3.3. Study 3 ........................................................................................................ 26
3.3.1. Abstract Study 3 ................................................................................... 26
3.3.2. Contribution to Study 3 ......................................................................... 27
3.4. Study 4 ........................................................................................................ 27
3.4.1. Abstract Study 4 ................................................................................... 27
3.4.2. Contribution to Study 4 ......................................................................... 28
Exploring Physical Activity in the Interplay of Health Behaviors and Health 3
4. Discussion ........................................................................................................ 29
4.1. Physical activity and health ......................................................................... 30
4.2. Physical activity and health including other factors ...................................... 31
4.3. General discussion...................................................................................... 32
4.4. Outlook ....................................................................................................... 34
5. References ........................................................................................................ 35
6. Appendix ........................................................................................................... 40
6.1. Bibliography ................................................................................................ 40
6.2. Reprints of conducted studies ..................................................................... 41
Exploring Physical Activity in the Interplay of Health Behaviors and Health 4
List of figures
Figure 1. Determinants of health framework by Evans & Stoddart ................................ 9
Figure 2. Determinants of health by Dahlgren & Whitehead ........................................ 10
Figure 3. Relationship between physical activity and health ........................................ 13
Figure 4. The studies of this dissertation in the context of Bouchard's model .............. 14
Figure 5. Overview of the relative frequencies of physical activity in the KORA
S4/F4/FF4 studies ....................................................................................................... 17
Figure 6. The idea of grouping people of a population based on shared health behavior
patterns ....................................................................................................................... 18
Figure 7. Health behavior as a latent variable ............................................................. 19
Figure 8. Graphical outline of the research aim of Study 2 .......................................... 21
Figure 9. Discussion outline ........................................................................................ 30
List of tables
Table 1. Definition of physical activity and related concepts ........................................ 11

Exploring Physical Activity in the Interplay of Health Behaviors and Health 5
Summary
Non-communicable and chronic diseases are a major health threat due to severe health
effects, high prevalence rates and enormous costs. The role of health behaviors is es-
sential, as they are relevant for individual as well as for public health. Moreover, a link
between health behaviors and several diseases has been scientifically demonstrated.
Physical activity is one important health behavior that is associated with numerous health
benefits such as reduced overall mortality, preventive factor for chronic diseases and
improved health-related quality of life. Bouchard’s model describes the association be-
tween physical activity and health and considers further important interrelated factors
like personal attributes, other health behaviors and the social or physical environment.
This doctoral thesis comprises four published studies located in the interplay of physical
activity and health described in Bouchard’s model. Study 1 examines and describes
health behavior patterns based on physical activity and other relevant health behaviors
like smoking, alcohol and nutrition. By using latent class analysis – a model-based clus-
tering method – different subgroups showing their own distinct health behavior pattern
were identified. Study 2 examines whether people change their physical activity behavior
after a doctoral diagnosis. Study 1 and Study 2 represent the two main studies of this
thesis. Study 3 and Study 4 serve as additional studies. Study 3 investigates trends in
important motor performance parameters monitored over a timespan of ten years. Study
4 investigates whether school programs (full-day versus half-day) are associated with
sports-club engagement. Study 1 and Study 2 investigate adults, whereas Study 3 and
Study 4 focus on primary school children.
The four included studies complement each other by exploring physical activity and as-
sociations with health considering different life phases. All four studies provide import
knowledge for health promotion and prevention programs. They underline the relevance
of physical activity and point out its significant role in tackling current health challenges
due to non-communicable and chronic diseases.

Exploring Physical Activity in the Interplay of Health Behaviors and Health 6
1. Introduction
1.1. General introduction
The interplay of health behaviors and health is a complex domain. Health behaviors have
been identified as major (risk) factors regarding non-communicable and chronic dis-
eases. Health behaviors comprise various behaviors affecting health, e.g. smoking, tak-
ing part in medical screenings or dental care. The rising threat of non-communicable or
chronic diseases such as heart diseases, cancer or diabetes imply a huge burden on
public health. Physical activity has been identified as an important preventive health be-
havior for multiple chronic conditions (Warburton, Charlesworth, Ivey, Nettlefold, &
Bredin, 2010). However, despite considerable evidence for the benefits of regular phys-
ical activity, more than one fourth of the global population show insufficient physical ac-
tivity rates (Guthold, Stevens, Riley, & Bull, 2018). 42.2% of the German population
(males: 40.2%, females: 44.1%) exhibit insufficient physical activity rates not fulfilling the
minimum requirement of 150 minutes of moderate or 75 minutes of vigorous physical
activity per week. Germany’s physical inactivity numbers are the least favorable among
all European countries (Guthold et al., 2018).
The presented research work is settled within the complex interplay of health behavior,
health promotion and health prevention. Both – the promotion of health as well as the
prevention of diseases – are relevant and effective tools regarding public health prob-
lems (Kumar & Preetha, 2012). Physical activity – a very common and important health
behavior – plays a central role in this discourse. This dissertation presents studies fol-
lowing a public health approach to investigate the relationship between physical activity
and health, as well as further associations that are relevant within this context. The dis-
sertation includes four peer-reviewed, published studies that are located in the interplay
of physical activity and health, focusing on prevention and health promotion:
Study 1: Rabel, M., Laxy, M., Thorand, B., Peters, A., Schwettmann, L., & Mess, F.
(2019). Clustering of Health-Related Behavior Patterns and Demographics.
Results From the Population-Based KORA S4/F4 Cohort Study. Front Public
Health, 6(387).

Exploring Physical Activity in the Interplay of Health Behaviors and Health 7
Study 2: Rabel, M., Mess, F., Karl, F. M., Pedron, S., Schwettmann, L., Peters, A., . . .
Laxy, M. (2019). Change in Physical Activity after Diagnosis of Diabetes or
Hypertension: Results from an Observational Population-Based Cohort Study.
International Journal of Environmental Research and Public Health, 16(21),
4247.
Study 3: Spengler, S., Rabel, M., Kuritz, A. M., & Mess, F. (2017). Trends in Motor Per-
formance of First Graders: A Comparison of Cohorts from 2006 to 2015. Front
Pediatr, 5, 206.
Study 4: Spengler, S., Kuritz, A., Rabel, M., & Mess, F. (2019). Are primary school chil-
dren attending full-day school still engaged in sports clubs? PLOS ONE,
14(11).
The focus of this dissertation is on Study 1 and Study 2. These two studies represent the
main part of the presented research work. Study 3 and Study 4 are add-ons comple-
menting Study 1 and 2. They fit within the theoretical context of this dissertation and
supplement the topic by focusing on a younger target group.
The modern scientific field is segregated into the major scientific branches of the natural
sciences, social sciences and formal sciences. Health sciences combine disciplines of
natural sciences and social sciences (Hurrelmann & Razum, 2012). In the spectrum of
research from fundamental research to applied research, the presented work is located
in the middle, comprising characteristics of both fundamental and applied research. In
health sciences, the combination of basic research with more applied population-based
and patient-oriented research is referred to as translational research (Rubio et al., 2010).
Translational research aims to ensure that scientific insights are transferred to the gen-
eral population (Woolf, 2008). Further, the research work comprised in this dissertation
bases on observational studies.
This dissertation is allocated to the research domain of health sciences, public health.
According to the OECD’s (Organization for Economic Co-operation and Development)
research and development classification, health sciences are a second-level classifica-
tion of the broader field of medical and health sciences (OECD, 2015). Public health is a
discipline that focuses on health promotion and can be described as what society does
collectively to assure the conditions for people to be healthy (Institute of Medicine (US)
Committee on Assuring the Health of the Public in the 21st Century, 2002). Wanless

Exploring Physical Activity in the Interplay of Health Behaviors and Health 8
defines public health comprehensively as “the science and art of preventing disease,
prolonging life and promoting health through the organized efforts and informed choices
of society, organisations, public and private communities and individuals” (Wanless,
2004 as cited in Schwartz et al., 2012, p. 4).
Following a public health approach, the overall aim of this dissertation is to investigate
health behaviors – especially physical activity – as major determinants of health. More
precisely, this dissertation aims to describe physical activity’s relevance for public health
and to extend the existing literature by examining associations between physical activity
and health while also considering individual characteristics and environmental factors.
Further, this dissertation emphasizes the discussion of resulting insights and its public
health implications.
1.2. Theoretical background: health and health behavior
Health is a broad, complex and multidisciplinary concept. There are numerous definitions
and theoretical models trying to explain health and its determinants. In 1948 the World
Health Organization defined health as “a state of complete physical, mental and social
well-being and not merely the absence of disease or infirmity” (World Health
Organization, 2014, p. 1). Former Canadian Minister of National Health and Welfare
Marc Lalonde (1974) defined health within his health field concept as a composition of
the four interrelated fields: Human biology, environment, lifestyle and health care organ-
ization. Evans and Stoddart (1990) provided a theoretical framework that builds on
Lalonde’s health field concept and intends to imply the complex interplay of behavioral
and biological responses within a social and physical environment. Figure 1 illustrates
this framework.

Exploring Physical Activity in the Interplay of Health Behaviors and Health 9
Figure 1. Determinants of health framework by Evans & Stoddart
Dahlgren and Whitehead (1991) follow a further common heuristic definition of health
and its determinants. Dahlgren and Whitehead’s model depicts health-affecting factors
as layers. The layer including age, sex and constitutional factors and the layer including
individual lifestyle factors account as proximal influences. The layers social community
networks, living and working conditions and the layer general socio-economic, cultural,
and environmental conditions represent more distal determinants of health. Figure 2
shows Dahlgren and Whitehead’s model.

Exploring Physical Activity in the Interplay of Health Behaviors and Health 10
Figure 2. Determinants of health by Dahlgren & Whitehead
Living and working conditions can further be categorized into: agriculture and food production, education, work environment, unemployment, water and sanitation, health care services and housing.
Both models declare behavior as significant determinants of health. According to Kasl
and Cobb (1966), health behavior can be described by health behavior, illness behavior
and sick role behavior for which they provide the following definition:
Health behavior is any activity undertaken by a person believing himself to be
healthy, for the purpose of preventing disease or detecting it in an asymptomatic
stage. Illness behavior is any activity, undertaken by a person who feels ill, to define
the state of his health and to discover a suitable remedy. The principal activities here
are complaining and seeking consultation from relatives, friends, and from those
trained in matters of health. Sick role behavior is the activity undertaken by those
who consider themselves ill, for the purpose of getting well. It includes receiving
treatment from appropriate therapists, generally involves a whole range of depend-
ent behaviors, and leads to some degree of neglect of one's usual duties. (Kasl &
Cobb, 1966, p. 246)
Build on Kasl and Cobbs’ definition, Cockerham (2014) defined health behavior as “the
activity undertaken by people for the purpose of maintaining or enhancing their health,
preventing health problems, or achieving a positive body image” (p. 764). The close link

Exploring Physical Activity in the Interplay of Health Behaviors and Health 11
between health behaviors and health is not only indicated in the context of theoretical
models. Furthermore, health behaviors are considered as key contributors to chronic
diseases, which are the greatest cause of death (Glanz, Rimer, & Viswanath, 2015).
Medical conditions including heart disease, cancer, lung diseases and diabetes are
mainly driven by key risk factors such as smoking, alcohol consumption, poor diet and
physical inactivity (Bauer, Briss, Goodman, & Bowman, 2014). The relationship between
health behaviors and health has also been shown empirically (Cheon et al., 2014). Many
different theoretical models center on health behaviors and their influences. In line with
numerous reviews, the most applied models in the context of health behavior are the
following (Glanz et al., 2015): Health Belief Model (Rosenstock, 1974), Social Cognitive
Theory (Bandura, 2004), and Theory of Planned Behavior (Ajzen, 1991). A further pop-
ular model that aims to explain health behavior is Schwarzer’s (1992) Health Action Pro-
cess Approach. Frequently investigated health behaviors are smoking, alcohol consump-
tion, nutrition and physical activity (Meader et al., 2016).
1.3. Physical activity and health
Physical activity is closely linked to health. Physical inactivity is listed among the top risk
factors for causes of death (WHO, 2009). Meta-analyses in the last ten years provide
evidence for physical activities’ positive effects on overall mortality (Kelly et al., 2014;
Lollgen, Bockenhoff, & Knapp, 2009). Physical activity can be defined as “any bodily
movement produced by skeletal muscles that results in energy expenditure” (Caspersen,
Powell, & Christenson, 1985, p. 126). In relation to this broad theoretical concept, one
has to distinguish between other related concepts such as exercise, sport and sedentary
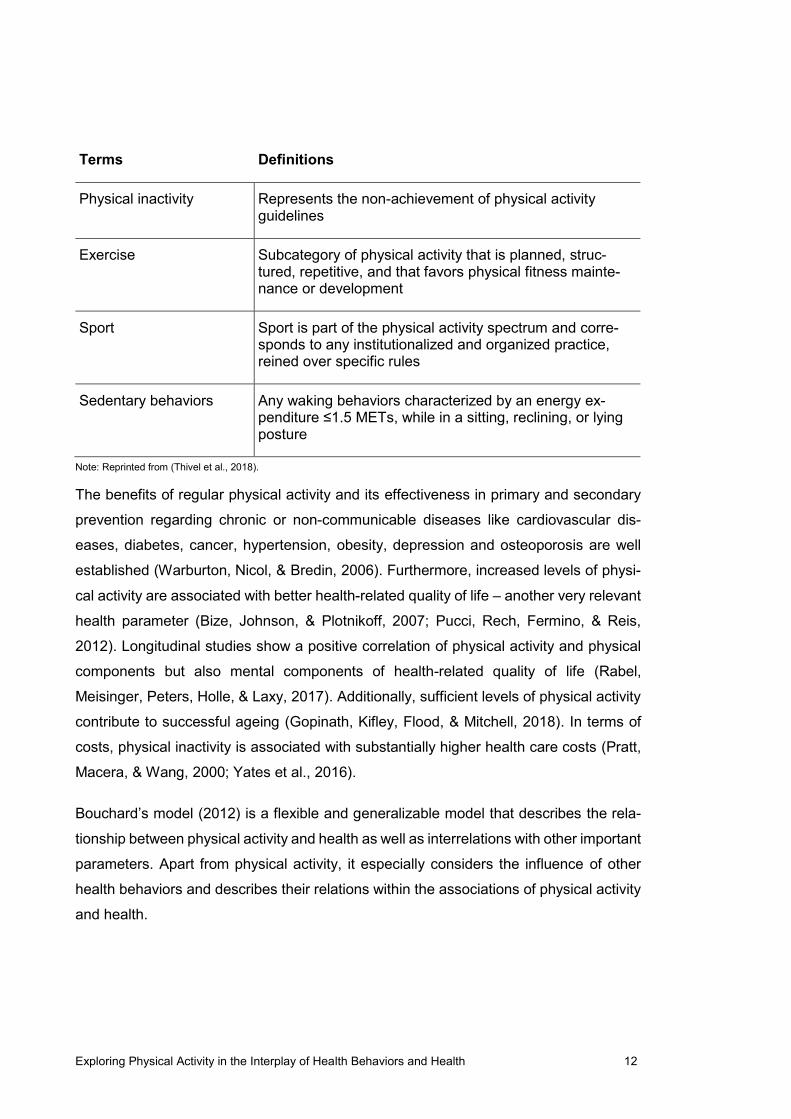
behavior. Thivel et al. (2018) provided an overview of the definitions of these terms which
can be seen in Table 1.
Table 1. Definition of physical activity and related concepts
Terms Definitions
Physical activity Any body movement generated by the contraction of skel-etal muscles that raises energy expenditure above resting metabolic rate. It is characterized by its modality, fre-quency, intensity, duration, and context of practice
Exploring Physical Activity in the Interplay of Health Behaviors and Health 12
Terms Definitions
Physical inactivity Represents the non-achievement of physical activity guidelines
Exercise Subcategory of physical activity that is planned, struc-tured, repetitive, and that favors physical fitness mainte-nance or development
Sport Sport is part of the physical activity spectrum and corre-sponds to any institutionalized and organized practice, reined over specific rules
Sedentary behaviors Any waking behaviors characterized by an energy ex-penditure ≤1.5 METs, while in a sitting, reclining, or lying posture
Note: Reprinted from (Thivel et al., 2018).
The benefits of regular physical activity and its effectiveness in primary and secondary
prevention regarding chronic or non-communicable diseases like cardiovascular dis-
eases, diabetes, cancer, hypertension, obesity, depression and osteoporosis are well
established (Warburton, Nicol, & Bredin, 2006). Furthermore, increased levels of physi-
cal activity are associated with better health-related quality of life – another very relevant
health parameter (Bize, Johnson, & Plotnikoff, 2007; Pucci, Rech, Fermino, & Reis,
2012). Longitudinal studies show a positive correlation of physical activity and physical
components but also mental components of health-related quality of life (Rabel,
Meisinger, Peters, Holle, & Laxy, 2017). Additionally, sufficient levels of physical activity
contribute to successful ageing (Gopinath, Kifley, Flood, & Mitchell, 2018). In terms of
costs, physical inactivity is associated with substantially higher health care costs (Pratt,
Macera, & Wang, 2000; Yates et al., 2016).
Bouchard’s model (2012) is a flexible and generalizable model that describes the rela-
tionship between physical activity and health as well as interrelations with other important
parameters. Apart from physical activity, it especially considers the influence of other
health behaviors and describes their relations within the associations of physical activity
and health.

Exploring Physical Activity in the Interplay of Health Behaviors and Health 13
Figure 3. Relationship between physical activity and health
Note: Reprinted from (Bouchard et al., 2012).
As illustrated in Figure 3, genetics, health-related fitness and other factors influence the
relationship between physical activity and health. Physical activity covers leisure-time
physical activity, work-related physical activity as well as chore-related physical activity.
The model’s health concept understands health as a continuum with positive and nega-
tive poles including wellness, morbidity and mortality. Health-related fitness covers phys-
iological parameters that adapt through physical activity and have an effect on health.
The interplay of physical activity, health-related fitness and health is further affected by
genetics and other factors such as other health behaviors, individual characteristics and
environmental factors. Bouchard’s model depicts a reciprocal relationship between phys-
ical activity and health. Besides a direct pathway between physical activity and health, in
most cases the effects are due to changes in the intermediate factor health-related fit-
ness (Bouchard et al., 2012).
1.4. Conducted studies
All four studies that are subject of this dissertation are rooted in the context of Bouchard’s
theoretical model. Figure 4 shows how the particular studies are located in Bouchard’s
model. The colored arrows do not represent the verification of a causal path between the
individual constructs of the model. Rather, they clarify which components of the model

Exploring Physical Activity in the Interplay of Health Behaviors and Health 14
were considered in the individual studies. Apart from the model’s central constructs
Physical activity and Health, each of the four studies addressed the construct Other fac-
tors. This includes in particular the consideration of other lifestyle behaviors besides
physical activity (Study 1) or different environments (Study 4). In addition, however, per-
sonal attributes such as age, gender or educational level were also taken into account.
Considering these factors is particularly relevant for health promotion. Including other
factors is particularly important in order to develop effective and tailor-made interventions
and health programs.
Figure 4. The studies of this dissertation in the context of Bouchard's model
Study 1: Rabel, M., Laxy, M., Thorand, B., Peters, A., Schwettmann, L., & Mess, F. (2019). Clustering of Health-Related Be-havior Patterns and Demographics. Results From the Population-Based KORA S4/F4 Cohort Study. Front Public Health, 6(387).
Study 2: Rabel, M., Mess, F., Karl, F. M., Pedron, S., Schwettmann, L., Peters, A., . . . Laxy, M. (2019). Change in Physical Activity after Diagnosis of Diabetes or Hypertension: Results from an Observational Population-Based Cohort Study. International Journal of Environmental Research and Public Health, 16(21), 4247.
Study 3: Spengler, S., Rabel, M., Kuritz, A. M., & Mess, F. (2017). Trends in Motor Performance of First Graders: A Compari-son of Cohorts from 2006 to 2015. Front Pediatr, 5, 206.
Study 4: Spengler, S., Kuritz, A., Rabel, M., & Mess, F. (2019). Are primary school children attending full-day school still en-gaged in sports clubs? PLOS ONE, 14(11).
Study 1 (Rabel, Laxy, et al., 2019) identifies and describes subgroups that share a similar
health behavior pattern. In addition, the identified subgroups are described in terms of
change in physical and mental health-related quality of life. Following Bouchard’s model,
this study covers physical activity as one health behavior that is considered for clustering
multiple health behaviors. The other considered health behaviors – smoking behavior,

Exploring Physical Activity in the Interplay of Health Behaviors and Health 15
alcohol consumption and dietary behavior – fall under the category Lifestyle behaviors.
Further, socio-demographic factors like sex, age, education and body mass index can
be summarized as Personal attributes. Physical and mental health-related quality of life
are health parameters. Therefore – as shown in Figure 4 – Study 1 covers the dimen-
sions Physical activity, Other factors and Health.
Study 2 (Rabel, Mess, et al., 2019) examines possible associations between a diabetes
diagnosis or a hypertension diagnosis and change in physical activity. Within Bouchard’s
model, this study includes information on Physical activity and Health by using data on
diabetes mellitus and hypertension. Other factors are represented by including infor-
mation on participants’ Personal attributes like sex, age, education and family status.
The first of two add-on studies for this dissertation, Study 3 (S. Spengler, Rabel, Kuritz,
& Mess, 2017) investigates trends in dimensions of motor performance. Therefore, in the
context of Bouchard’s model, this study incorporates information on Physical activity and
Health-related fitness via motoric tests examining the motor dimensions aerobic fitness,
strength, speed and balance. Furthermore, information on Other factors includes the
Personal attributes sex and anthropometrics.
The second add-on study, Study 4 (Sarah Spengler, Kuritz, Rabel, & Mess, 2019) ex-
amines whether sports club participation rates are affected by the school program (half-
day school or full-day school). Classing this study with Bouchard’s model, it focuses on
Physical activity and Other factors. Leisure time physical activity is represented by ha-
bitual sports club membership. Information on school program and personal attributes
fall under the category Other factors.
Although all studies are rooted within Bouchard’s theoretical framework, they can clearly
be distinguished regarding their target population. While the two main studies – Study 1
and Study 2 – focus on an adult population, Study 3 and Study 4 set the focus on primary
school children. Hence, this dissertation approaches the field of health behaviors, espe-
cially physical activity and health based on four studies covering an age range from first
grade school children to a general adult population. Physical activity is an important
health-related factor already in childhood but extending through adulthood (Sarah
Spengler et al., 2019). It is therefore advisable to consider the whole lifespan regarding
the interplay of physical activity and health.
Exploring Physical Activity in the Interplay of Health Behaviors and Health 16
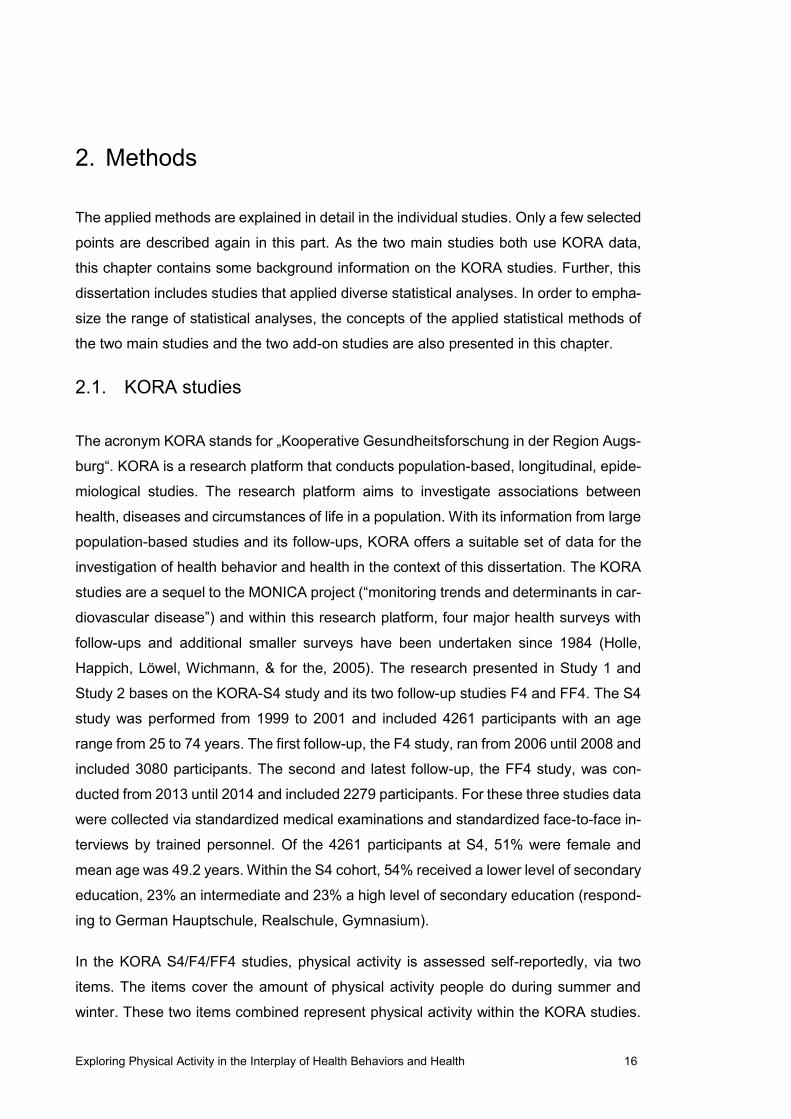
2. Methods
The applied methods are explained in detail in the individual studies. Only a few selected
points are described again in this part. As the two main studies both use KORA data,
this chapter contains some background information on the KORA studies. Further, this
dissertation includes studies that applied diverse statistical analyses. In order to empha-
size the range of statistical analyses, the concepts of the applied statistical methods of
the two main studies and the two add-on studies are also presented in this chapter.
2.1. KORA studies
The acronym KORA stands for „Kooperative Gesundheitsforschung in der Region Augs-
burg“. KORA is a research platform that conducts population-based, longitudinal, epide-
miological studies. The research platform aims to investigate associations between
health, diseases and circumstances of life in a population. With its information from large
population-based studies and its follow-ups, KORA offers a suitable set of data for the
investigation of health behavior and health in the context of this dissertation. The KORA
studies are a sequel to the MONICA project (“monitoring trends and determinants in car-
diovascular disease”) and within this research platform, four major health surveys with
follow-ups and additional smaller surveys have been undertaken since 1984 (Holle,
Happich, Löwel, Wichmann, & for the, 2005). The research presented in Study 1 and
Study 2 bases on the KORA-S4 study and its two follow-up studies F4 and FF4. The S4
study was performed from 1999 to 2001 and included 4261 participants with an age
range from 25 to 74 years. The first follow-up, the F4 study, ran from 2006 until 2008 and
included 3080 participants. The second and latest follow-up, the FF4 study, was con-
ducted from 2013 until 2014 and included 2279 participants. For these three studies data
were collected via standardized medical examinations and standardized face-to-face in-
terviews by trained personnel. Of the 4261 participants at S4, 51% were female and
mean age was 49.2 years. Within the S4 cohort, 54% received a lower level of secondary
education, 23% an intermediate and 23% a high level of secondary education (respond-
ing to German Hauptschule, Realschule, Gymnasium).
In the KORA S4/F4/FF4 studies, physical activity is assessed self-reportedly, via two
items. The items cover the amount of physical activity people do during summer and
winter. These two items combined represent physical activity within the KORA studies.

Exploring Physical Activity in the Interplay of Health Behaviors and Health 17
There is no clear optimal way to assess physical activity and although there are more
valid ways than questionnaires, questionnaires remain the most common method
(Sylvia, Bernstein, Hubbard, Keating, & Anderson, 2014). Furthermore, methods like
doubly labeled water or accelerometry are very expensive, provide a considerable pa-
tient burden and are thus not feasible for large population-based studies.
Figure 5. Overview of the relative frequencies of physical activity in the KORA S4/F4/FF4 studies
2.2. Statistical methods
2.2.1. Latent class analysis
The main aim of Study 1 was to identify subgroups within a population, based on the
health behaviors smoking, alcohol consumption, nutrition and physical activity. The iden-
tified subgroups represent clusters of people that share a similar pattern of their health
behaviors. Figure 6 illustrates a graphical example of this idea.
0,20
0,28
0,17
0,34
0,24
0,30
0,13
0,33
0,26
0,31
0,14
0,28
no activity about 1 hour, irregularly about 1 hour, regularly regularly, more than 2hours
relative frequencies of physical activity levels per week
S41999/2001N = 4261
F42006/2008N = 3080
FF42013/2014N = 2279

Exploring Physical Activity in the Interplay of Health Behaviors and Health 18
Figure 6. The idea of grouping people of a population based on shared health behavior patterns
Annotations: S = smoking behavior, A = alcohol consumption, N = nutrition, P = physical activity.
Latent class analysis is an approach to detect these latent, underlying, unobserved
groups named classes. Collins and Lanza (2010) describe latent class analysis as a
method “to look for subtypes of individuals that exhibit similar patterns of individual char-
acteristics” (Collins & Lanza, 2010, p. 8). Latent class analysis uses categorical infor-
mation on measured variables to describe an underlying, latent, categorical class
(Masyn, 2013). In case of Study 1, this underlying, latent class represents the different
identified subgroups. Figure 7 illustrates a generic path diagram with health behavior
classes in the context of latent class modelling. According to path diagram conventions,
an oval object denotes the latent variable. The measured indicator variables are denoted
by boxes. Arrows symbolize direct (causal) relationships between objects (Masyn, 2013).

Exploring Physical Activity in the Interplay of Health Behaviors and Health 19
Figure 7. Health behavior as a latent variable
As already mentioned, in latent class analysis observed categorical indicator variables
(here: smoking, alcohol consumption, nutrition and physical activity) are a function of a
categorical latent variable (here: health behavior classes) and measurement error. A
similar latent variable approach that is common in the social sciences is factor analysis.
The major difference between latent class analysis and factor analysis is the distribution
of the latent variable, as factor analysis treats the latent variable as continuous variable
(Collins & Lanza, 2010). A further difference between the two methods is that traditional
factor analysis is considered to be a variable-oriented approach and latent class analysis
a person-oriented approach. Variable-oriented approaches assume that associations be-
tween variables are true for all people. In contrast, “[p]erson-centered approaches de-
scribe similarities and differences among individuals with respect to how variables relate
to each other and are predicated on the assumption that the population is heterogeneous
with respect to the relationships between variables” (Laursen & Hoff, 2006, p. 379, as

Exploring Physical Activity in the Interplay of Health Behaviors and Health 20
cited in Masyn, 2013, pp. 552-553). Latent class analysis has become increasingly pop-
ular to cluster health behaviors (McAloney, Graham, Law, & Platt, 2013). Compared to
more traditional clustering techniques like k-means or hierarchical clustering, latent class
analysis has the advantage that it is a model-based approach. Due to its model-based
nature, latent class analysis is more flexible and provides better information on cluster
criteria (Hagenaars & McCutcheon, 2002).
The latent class analysis in Study 1 was conducted by using the poLCA R-package
(Linzer & Lewis, 2011). Technically, a basic unconditional latent class model uses cross-
tabulation tables of the measured variables. The latent class model probabilistically
groups latent classes based on the cross-tabulation tables by estimating latent class
prevalence and item-response probabilities. The item-response probabilities are condi-
tional, based on latent class membership. The basic unconditional model can be ex-
tended by including covariates to estimate latent class membership. In the unconditional
model, the probability for latent class membership is equal for all observations prior to
the responses in the observed indicator variables. By including covariates, prior proba-
bilities vary for each observation based on a function of the covariates (Linzer & Lewis,
2011). Latent class analysis assumes that the measured variables are conditionally in-
dependent and all dependencies are explained by latent class membership. This as-
sumption however might also be partially relaxed (Masyn, 2013).
2.2.2. Logistic regression
Study 2 investigates whether a doctoral diagnosis might be associated with a change in
health behavior. Specifically, the aim was to investigate possible associations between
a diabetes or a hypertension diagnosis and a change in physical activity. Figure 8 shows
a graphical representation of this research idea.

Exploring Physical Activity in the Interplay of Health Behaviors and Health 21
Figure 8. Graphical outline of the research aim of Study 2
The outcome of this study was change in physical activity, which was coded binary, in-
dicating a change between two measurement points. The main independent variable
was information on a doctoral diagnosis concerning diabetes or hypertension. Both types
of diagnoses were binary coded as well, indicating whether there has been a diabetes
or hypertension diagnosis or not. Logistic regression models were used to analyze this
research idea.
Logistic regression is a specialized type of generalized linear model. It is a suitable meth-
odological approach to build models that have a categorical, two-level outcome. Logistic
regression probabilistically estimates a binary outcome based on a linear combination of
independent variables. To align the ranges of possible values for the outcome and the
independent variables, logistic regression uses a logit transformation (Diez, Barr, &
Cetinkaya-Rundel, 2016). A logistic regression model with logit transformation can be
formulated as
𝑙𝑜𝑔𝑖𝑡(𝑝𝑖) = 𝑙𝑛 𝑝𝑖1 − 𝑝𝑖 = 𝛽0 + 𝛽1𝑥1,𝑖 + 𝛽2𝑥2,𝑖 +⋯+ 𝛽𝑘𝑥𝑘,𝑖 𝑝𝑖 and 1 − 𝑝𝑖 are the probability and complementary probability of the outcome, 𝑘 repre-
sents the number of the independent variables 𝑥𝑖 and 𝛽 stands for the (logistic) regres-
sion coefficients. The regression coefficients 𝛽1 represent the expected change in the
logarithmic probability, if the independent variable 𝑥1,𝑖 increases by one unit. 𝛽0 stands
for the logarithmic probability that the outcome becomes equal 1 while all independent

Exploring Physical Activity in the Interplay of Health Behaviors and Health 22
variables become 0. As expressed in the equation, the logistic regression model can be
written as logarithmic odds. Via an exponential transformation, the logarithmic odds can
be written as odds ratios. An exponentiated regression coefficient 𝑒𝛽1 = 1 means that
the independent variable 𝑥1 is not associated with the odds ratio. Hence, there is no
association between the outcome and the independent predictor variable. If 𝑒𝛽1 > 1
there is a positive correlation between the independent predictor and the outcome. If 𝑒𝛽1 < 1, then the correlation is negative (Eid, Gollwitzer, & Schmitt, 2015). Logistic re-
gression is considered a fairly robust method with only a small number of assumptions.
Logistic regression assumes a linear relationship between continuous independent var-
iables and the logit-transformed outcome. It assumes independence of errors, meaning
that the data should not contain related cases. A further assumption would be that there
is no multicollinearity which implies that the independent predictor variables should not
be highly correlated (Field, 2009).
2.2.3. Statistical methods in Study 3 and Study 4
Study 3 uses (multiple) linear regression models to analyze whether assessment year is
a significant predictor of annual measured motor performance dimensions. Linear re-
gression is a very common statistical approach to investigate an outcome variable of
interest dependent on covariates. The outcome variable is commonly the dependent var-
iable and the covariates are the independent variables. A common feature of linear re-
gression models is that the association between dependent and independent variables
is affected by random noise or error. The outcome variable is therefore a random variable
and its distribution depends on the independent explanatory variables. A simple linear
regression model can be formulated as follows (Fahrmeir, Kneib, & Lang, 2009):
𝑦 = 𝛽0 + 𝛽1𝑥1 +⋯+ 𝛽𝑘𝑥𝑘 + 𝜀 𝑦 represents the dependent outcome, 𝛽0 is the intercept, 𝛽 is the regression coefficient
and 𝑥 is the independent covariate. 𝑘 reflects the number of covariates and 𝜀 depicts the
residuals or the error term of the model. Linear regression relies on the assumption of a
linear relationship between 𝑦 and 𝑥, no collinearity between the covariates, independent
residuals and homoscedasticity.
In Study 4, the statistical methods of Chi2-test and Mann-Whitney-U-test are used. A
Chi2-test of independence can be used to investigate whether two categorical variables
are associated with each other. With this test, observed cross-tabulated frequencies are

Exploring Physical Activity in the Interplay of Health Behaviors and Health 23
compared to expected frequencies. The Chi2-test requires that none of the observed,
cross-tabulated frequencies is zero and all of these frequencies should be at least five
(Weiß, 2013).
The Mann-Whitney-U-test is a non-parametric alternative to the very common t-test. In
contrast to the t-test, the Mann-Whitney-U-test requires no symmetric distribution or nor-
mal distribution. The test is based on ranks and compares the medians of two samples
to assess differences between the two samples (Weiß, 2013).
Exploring Physical Activity in the Interplay of Health Behaviors and Health 24
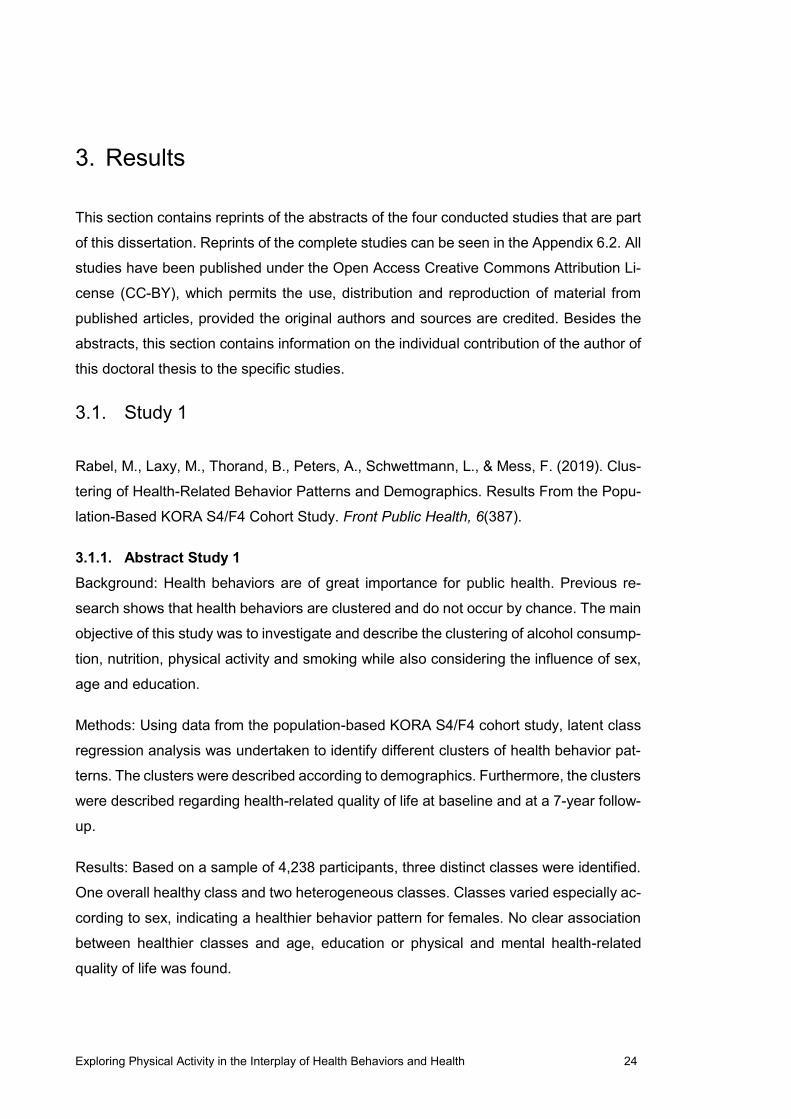
3. Results
This section contains reprints of the abstracts of the four conducted studies that are part
of this dissertation. Reprints of the complete studies can be seen in the Appendix 6.2. All
studies have been published under the Open Access Creative Commons Attribution Li-
cense (CC-BY), which permits the use, distribution and reproduction of material from
published articles, provided the original authors and sources are credited. Besides the
abstracts, this section contains information on the individual contribution of the author of
this doctoral thesis to the specific studies.
3.1. Study 1
Rabel, M., Laxy, M., Thorand, B., Peters, A., Schwettmann, L., & Mess, F. (2019). Clus-
tering of Health-Related Behavior Patterns and Demographics. Results From the Popu-
lation-Based KORA S4/F4 Cohort Study. Front Public Health, 6(387).
3.1.1. Abstract Study 1
Background: Health behaviors are of great importance for public health. Previous re-
search shows that health behaviors are clustered and do not occur by chance. The main
objective of this study was to investigate and describe the clustering of alcohol consump-
tion, nutrition, physical activity and smoking while also considering the influence of sex,
age and education.
Methods: Using data from the population-based KORA S4/F4 cohort study, latent class
regression analysis was undertaken to identify different clusters of health behavior pat-
terns. The clusters were described according to demographics. Furthermore, the clusters
were described regarding health-related quality of life at baseline and at a 7-year follow-
up.
Results: Based on a sample of 4,238 participants, three distinct classes were identified.
One overall healthy class and two heterogeneous classes. Classes varied especially ac-
cording to sex, indicating a healthier behavior pattern for females. No clear association
between healthier classes and age, education or physical and mental health-related
quality of life was found.

Exploring Physical Activity in the Interplay of Health Behaviors and Health 25
Discussion: This study strengthens the literature on the clustering of health behaviors
and additionally describes the identified clusters in association with health-related quality
of life. More research on associations between clustering of health behaviors and im-
portant clinical outcomes is needed.
3.1.2. Contribution to Study 1
Matthias Rabel is first and corresponding author of Study 1 and was mainly involved in
all steps of the manuscript production. Matthias Rabel together with Filip Mess and Mi-
chael Laxy conceptualized the study. He is responsible for the formal analysis and the
applied methods. He further wrote the original draft and was mainly involved in the editing
and review process of the manuscript. Michael Laxy, Barbara Thorand, Annette Peters,
Lars Schwettmann and Filip Mess provided supervision for Study 1 throughout the whole
process. All authors approved the manuscript for publication.
3.2. Study 2
Rabel, M., Mess, F., Karl, F. M., Pedron, S., Schwettmann, L., Peters, A., . . . Laxy, M.
(2019). Change in Physical Activity after Diagnosis of Diabetes or Hypertension: Results
from an Observational Population-Based Cohort Study. International Journal of Environ-
mental Research and Public Health, 16(21), 4247.
3.2.1. Abstract Study 2
Background: Chronic diseases like diabetes mellitus or hypertension are a major public
health challenge. Irregular physical activity (PA) is one of the most important modifiable
risk factors for chronic conditions and their complications. However, engaging in regular
PA is a challenge for many individuals. The literature suggests that a diagnosis of a
disease might serve as a promising point in time to change health behavior. This study
investigates whether a diagnosis of diabetes or hypertension is associated with changes
in PA.
Methods: Analyses are based on 4261 participants of the population-based KORA S4
study (1999–2001) and its subsequent 7-and 14-year follow-ups. Information on PA and
incident diagnoses of diabetes or hypertension was assessed via standardized inter-
views. Change in PA was regressed upon diagnosis with diabetes or hypertension, using
logistic regression models. Models were stratified into active and inactive individuals at
baseline to avoid ceiling and floor effects or regression to the mean.

Exploring Physical Activity in the Interplay of Health Behaviors and Health 26
Results: Active participants at baseline showed higher odds (OR = 2.16 [1.20;3.89]) for
becoming inactive after a diabetes diagnosis than those without a diabetes diagnosis.
No other significant association was observed.
Discussion: As PA is important for the management of diabetes or hypertension, ways
to increase or maintain PA levels in newly-diagnosed patients are important. Communi-
cation strategies might be crucial, and practitioners and health insurance companies
could play a key role in raising awareness.
3.2.2. Contribution to Study 2
Matthias Rabel is first and corresponding author of Study 2 and was mainly involved in
all steps of the manuscript production. Matthias Rabel contributed to the conceptualiza-
tion of the manuscript, decided on the methodological approach, was in charge of the
formal analysis, wrote the original draft, was primary responsible for the review and ed-
iting process. Filip Mess and Michael Laxy were involved in the conceptualization of
Study 2 as well. Filip Mess, Florian M. Karl, Sara Pedron, Lars Schwettmann, Annette
Peters, Margit Heier and Michael Laxy provided supervision during all steps of the crea-
tion and publication of the manuscript. All authors approved the manuscript for publica-
tion.
3.3. Study 3
Spengler, S., Rabel, M., Kuritz, A. M., & Mess, F. (2017). Trends in Motor Performance
of First Graders: A Comparison of Cohorts from 2006 to 2015. Front Pediatr, 5, 206.
3.3.1. Abstract Study 3
Background: Motor performance is an important factor for health. Already in childhood,
motor performance is associated with, e.g., obesity and risk factors for cardiovascular
diseases. It is widely believed that the motor performance of children has declined over
recent years. However, this belief is lacking clear evidence. The objective of this study
was to examine trends in motor performance of first grade students during a period of 10
years (2006–2015). We examined trends in (a) aerobic fitness, (b) strength, (c) speed,
and (d) balance for boys and girls separately and considered body mass index (BMI) as
a potential confounder.

Exploring Physical Activity in the Interplay of Health Behaviors and Health 27
Methods: From 2006 to 2015, we tested 5,001 first graders [50.8% boys; mean age 6.76
(0.56) years] of 18 primary schools in Germany. Each year between 441 and 552 stu-
dents of the same schools were surveyed. Performance tests were taken from the Mo-
torik-Module Study and the “German Motor Ability Test”: “6-min run,” “push-ups,” “20-m
sprint,” and “static stand.” Linear regression models were conducted for statistical anal-
ysis.
Results: A slightly negative trend in aerobic fitness performance was revealed in boys (β
= −0.050; p = 0.012) but not in girls. In the strength performance test no trend over time
was detected. Performance in speed (boys: β = −0.094; girls: β = −0.143; p ≤ 0.001) and
balance tests (boys: β = −0.142; girls: β = −0.232; p ≤ 0.001) increased over time for
both boys and girls. These findings held true when BMI was considered.
Conclusion: This study only partly supported the assumption that motor performance of
children has declined: in our study, aerobic fitness declined (only in boys), while strength
remained stable and speed and balance even increased in both sexes. Moreover, it
seems as if BMI can explain changes in performance only to a small extent. Changed
lifestyles might be a substantial cause. Further research on recent trends of motor per-
formance and interacting variables is needed to support the results of our study and to
provide more knowledge on causes of these trends.
3.3.2. Contribution to Study 3
Sarah Spengler is first and corresponding author of Study 3. Matthias Rabel is coauthor
of Study 3. He contributed to Study 3 as follows. Matthias Rabel was substantially in-
volved in the conceptualization and design of the study. He executed the analysis, criti-
cally revised the draft and approved the final manuscript. Furthermore, he was involved
in the review process of the manuscript.
3.4. Study 4
Spengler, S., Kuritz, A., Rabel, M., & Mess, F. (2019). Are primary school children at-
tending full-day school still engaged in sports clubs? PLOS ONE, 14(11).
3.4.1. Abstract Study 4
Purpose: Schools and organized sports both offer great chances to promote physical
activity among children. Full-day schools particularly allow for extensive participation in
extra-curricular physical activities. However, due to time reasons, full-day schools may

Exploring Physical Activity in the Interplay of Health Behaviors and Health 28
also prevent children from engagement in organized sports outside school. There is only
little national and international research addressing the possible competition of full-day
schools and providers of organized sports outside school and the potential effects on
children’s physical activity behavior. In Germany’s educational system, a transformation
towards more full-day schools is currently taking place. The existence of both, half-day
and full-day schools, gave occasion to the following research question: Do students at-
tending half-day and full-day school differ with respect to a) sports club membership rate
and b) weekly amount of sports club training?
Methods: Data were collected in eleven German primary schools. Selected schools of-
fered both half-day and full-day (minimum three days/week with at least seven hours)
care. 372 students’ data (grades 1–4; N = 153 half-day, N = 219 full-day; 47.4% male,
8.8±1.2y) were eligible for analyses. We assessed sports club membership and weekly
training duration via questionnaire. Statistical analyses included Chi-square and Mann-
Whitney-U-Tests.
Results: 83% of half-day school students and 67% of full-day school students were
sports club members (χ2(1) = 12.31, p<.001). Weekly duration of training in sports clubs
among sports club members (N = 266) also differed between the groups (mdn = 150 min
in half-day, mdn = 120 min in full-day school students; z = -2.37, p = .018). Additional
analyses stratified for age and gender showed similar results.
Conclusion: Primary school students attending full-day schools engage less in organized
sports outside school than half-day school students, regardless of age and gender. Fu-
ture studies should examine if the detected lower engagement in sports club physical
activity is compensated by physical activities in other settings such as school or non-
organized leisure time.
3.4.2. Contribution to Study 4
Sarah Spengler is first and corresponding author of Study 4. Matthias Rabel is coauthor
of Study 4. He contributed to Study 4 as follows. Matthias Rabel was involved in data
curation, execution of the formal analysis, decision on methodology, visualization of find-
ings and in the review and editing process of the manuscript for publication.
Exploring Physical Activity in the Interplay of Health Behaviors and Health 29
4. Discussion
This dissertation presents four studies in the context of health behaviors – especially
physical activity – and health. The overall aim of this dissertation is to investigate health
behaviors – especially physical activity – as major determinants of health. It is intended
to describe the public health relevance of physical activity and to extend the existing
literature by examining associations between physical activity and health while also con-
sidering individual characteristics and environmental factors. Study 1 identified three
subgroups within one population, representing distinct health behavior patterns. It further
described the characteristics of those subgroups and discussed its value for health pro-
motion interventions. Study 2 showed no indication for improved physical activity levels
after a diabetes or hypertension diagnosis. Furthermore, it showed that physically active
participants are more likely to become physically inactive after a diabetes diagnosis.
These two studies are the core of the presented research work. Next to the two main
studies, this dissertation includes two studies that additionally contribute to the outlined
research topic. Study 3 reported a decline in aerobic fitness performance in first grade
students over a period of ten years for boys exclusively. Other important health-related
fitness parameters – strength, speed and balance – remained stable or showed an in-
crease. Study 4 examined the potential conflict between full-day school programs and
organized sport clubs. It showed that primary school children who took part in a full-day
school program are less engaged in sport clubs.
All four studies provided valuable insights on the interplay of physical activity and health
or interrelated concepts that affect this relationship. In addition, the studies yield im-
portant findings for planning and implementing health-promotion programs. As already
shown in the introduction, Bouchard’s model provides a theoretical basis for examining
physical activity and health. The model is suitable as theoretical framework for the allo-
cation of the studies. The following section discusses two major parts of Bouchard’s
model by using results and implications of the conducted four studies. Figure 9 provides
an outline of how the discussion is structured. Analogous to Bouchard's (2012) descrip-
tion, the results of the studies are first related to the simplest derivation of the model,
including only the two central constructs Physical activity and Health. Afterwards, the two
constructs will be supplemented by the Other factors construct.

Exploring Physical Activity in the Interplay of Health Behaviors and Health 30
Figure 9. Discussion outline
The results of the study are discussed in the context of the Bouchard Model in two steps
4.1. Physical activity and health
Study 1 is primarily concerned with the identification of different subgroups based on
different health behaviors. Physical activity is considered as health behavior, but the fo-
cus is set on the pattern of the different health behaviors. Therefore, the results of Study
1 will be discussed in the next section, when different health behaviors are considered
by the Other factors construct.
Study 2 incorporates the constructs Physical activity and Health. Diabetes and hyperten-
sion are diseases that do not physically impair people to be physically active. Further,
treatment guidelines for both diseases demand a regular amount of physical activity.
Nevertheless, inactive participants were not more likely to become active after a hyper-
tension diagnosis. In case of a diabetes diagnosis active participants had even higher
odds of becoming inactive after a diagnosis compared to participants that did not receive
such a diagnosis. Hypothetical explanations for this observation have been discussed
within Study 2. Due to high prevalence rates, comparably less physical impairments and
good treatment options, diabetes and hypertension might have too little of an impact on
constructs like risk perception or threat appraisal that theoretically affect behavior
change. Patients might prefer simple medical treatment compared to the effort of a sus-
tainable change in physical activity. Furthermore, people might not be aware of health
benefits in the context of diabetes or hypertension. As the benefits of regular physical
activity are widespread among scientific researchers (Lavie, Ozemek, & Kachur, 2019),
this implicates the urge for a better communication and clarification of these benefits on
health. Research indicates that awareness on health benefits through physical activity is

Exploring Physical Activity in the Interplay of Health Behaviors and Health 31
associated with the engagement in physical activity (Williamson, 2016). The role of phys-
ical activity should be strengthened in both primary and secondary prevention. Therefore,
health promotion programs and interventions should emphasize physical activity related
health benefits to establish a better perception in the healthy population as well as in
patients.
Study 3 describes the change in motor performance over a period of 10 years. The motor
performance domains aerobic fitness, strength, speed and balanced were measured by
physical activity tasks like “6-minutes run”, “push-ups”, “20-meters sprint” or a “one-leg-
ged static stand”. Given the fact that improvements in these Health-related fitness do-
mains are associated with favorable effects on health (Bouchard et al., 2012), it is plau-
sible to discuss the results of Study 3 in this section of Physical activity and Health. In
the period from 2006 to 2015 aerobic fitness declined in boys, whereas it remained stable
or even improved over the years in the other domains. Because aerobic fitness is an
important health-related factor that is closely linked to chronic diseases like cardiovas-
cular diseases (Fernström, Fernberg, Eliason, & Hurtig-Wennlöf, 2017), public health
campaigns should stress the importance of regular aerobic exercise especially for boys.
It might be fruitful to implement physical exercises that focus on this domain in physical
education in primary schools.
4.2. Physical activity and health including other factors
The inclusion of Other factors adds a new construct to the relationship between Physical
activity and Health. The new construct incorporates e.g. further health behaviors, per-
sonal attributes or social and physical environment that are associated with differences
in Health or affect Physical activity and determine its relationships (Bouchard et al., 2012,
p. 17).
Study 1 considers physical activity and covers additional health behaviors like smoking,
alcohol consumption and nutrition to describe health-related behavior. Based on these
health behaviors, the study identified three classes (subgroups) that represent different
health behavior patterns. Class 2 represents a healthy subgroup showing the highest
probabilities for favorable health behavior categories. Class 1 and class 3 show an un-
healthier profile. Class 1 displays higher probabilities for risky alcohol consumption but
also higher probabilities for favorable physical activity. Class 3 shows higher probabilities
for unhealthy smoking behavior and alcohol consumption. All three subgroups reveal

Exploring Physical Activity in the Interplay of Health Behaviors and Health 32
somehow typical behavior patterns (overall health, unhealthy alcohol plus favorable
physical activity, unhealthy alcohol plus unhealthy smoking) that have been identified in
other studies as well (Conry et al., 2011; Mawditt, Sacker, Britton, Kelly, & Cable, 2016;
Poortinga, 2007). Regarding personal attributes, the subgroups were also identified con-
ditioned on socio-demographics. While the healthy subgroup (class 2) consisted exclu-
sively of women, there were no associations between healthier classes and age or edu-
cation. The results strengthen the notion of interrelated health behaviors (Prochaska,
Spring, & Nigg, 2008). Knowledge on interrelated health behaviors could be of great
importance for public health. With a more complete understanding of health behavior
patterns of a target group, public interventions could tackle multiple health behaviors at
the same time and thus be more cost-effective. Further, due to potential synergistic ef-
fects of multiple health behaviors, health promotion programs that focus on more than
one health behavior could be more effective. Combining the information on common be-
havior patterns with additional data of health care providers could lead to a comprehen-
sive health care.
Study 4 investigates differences in sports club engagement between primary school chil-
dren in half-day and full-day school programs. Children taking part in full-day school pro-
grams showed lower sport-club membership rates and less minutes of participation per
week. Thus, by including data on the school setting, this study adds information on chil-
dren’s social and physical environment. As sport clubs are a key environment for physical
activity and therefore health promotion in children (Rütten & Pfeifer, 2017), the results of
Study 4 stress the importance of alternative physical activity environments to compen-
sate for a poor sport club engagement. Hence, full-day school programs should offer
(extra-curricular) physical activity programs. A hypothetical fruitful approach would be to
promote collaborations between schools and sport clubs to provide opportunities for
physical activity across different settings.
4.3. General discussion
Physical activity is an important health behavior and relevant factor for health. A lack of
physical activity is considered as one of the most threatening risk factors for a variety of
medical conditions. The epidemiologist Jerry Morris acknowledged physical activity’s im-
portant status by declaring it public health’s “best buy” (Morris, 1994 as cited in Das &
Horton, 2016). Additionally, Das and Horton (2016) link the seriousness of physical ac-
Exploring Physical Activity in the Interplay of Health Behaviors and Health 33
tivity related health promotion and prevention to the following relevant points: There re-
cently has been new evidence on the relationship between physical activity and public-
health relevant diseases (e.g. dementia) (Sallis et al., 2016). A lack of physical activity is
associated with hefty costs for the health care system (Ding et al., 2016). Sedentariness
– a concept that is related to physical activity – has become a growing health-threat
(Ekelund et al., 2016). Furthermore, although physical activity levels are rising in more
and more countries, there is still no improvement in sight (Sallis et al., 2016). Against this
backdrop, it becomes obvious that there is a global need for action. This dissertation
contains studies that aim to gain knowledge for health promotion and prevention in the
field of physical activity and health. Moreover, it recognizes the importance of including
further aspects that interrelate with physical activity and health, such as other health
behaviors, personal attributes or the social and physical environment. In addition, the
included studies represent two different phases of life by taking into account both adult-
hood and childhood. Whereas Study 1 and Study 2 concentrate on an adult population,
Study 3 and Study 4 set the focus on children. Although the benefits of regular physical
activity are thoroughly examined and documented, numbers of insufficient physical ac-
tivity are alarmingly high (Guthold et al., 2018). Consequently, one could deduce the
need for better communicating scientific results to the general population. In the meaning
of translational research, the presented research work aims to give input to facilitate the
transfer of scientific knowledge on health promotion and prevention. For this purpose, it
is important to acknowledge the peculiarities of physical activity as a health behavior. On
the one hand, models and theories that are often used to explain change in physical
activity are mostly derived from other disciplines like psychology or sociology. On the
other hand, physical activity stands out as an adoption behavior compared to cessation
behaviors (e.g. smoking, alcohol). It is not a necessary behavior like eating and it needs
time and regularity (Rhodes & Nigg, 2011). Consequentially, practitioners declare coun-
seling on physical activity as more challenging than counseling on other health behaviors
(Dolor et al., 2010). Moreover, well-tailored health promotion or prevention programs
should carefully consider their target population. Study 1 pointed out that within a popu-
lation there might be subgroups that show multiple risky behavior patterns, which might
be tackled simultaneously to be more (cost-) effective. Based on Study 2, public aware-
ness of physical activity’s role especially in secondary prevention needs to be empha-
sized. Hence, practitioners need to be collaborate with all protagonists of the health care
system when it comes to enlighten patients on physical activity benefits. Following Study
3 and Study 4, primary schools should promote health literacy already by underlining the

Exploring Physical Activity in the Interplay of Health Behaviors and Health 34
importance of exercising and providing a social and physical environment in which one
can be physically active.
4.4. Outlook
In addition to the findings of the included studies, more research is needed in the field of
physical activity and health. The World Health Organization declared its vision of a
healthier world by aiming to reduce the global physical inactivity prevalence by 15%
(World Health Organization, 2018). To reach this goal, a scientific evidence-based un-
derstanding of the relationship between physical activity and health and interrelated pa-
rameters is needed. Further, more valid methods than questionnaires to measure phys-
ical activity in population-based studies are needed. Although questionnaires are com-
paratively cheap and easy to implement, self-reported data is prone to multiple biases.
Accelerometers or other valid devices that track information on physical activity (e.g.
pedometers) could provide better data quality for physical activity related research. Ad-
ditionally, there is a demand for transferring knowledge of interventions to a population
level. Interventions for health behavior change that showed to be effective under small
and controlled circumstances need to be scaled up at a population level (Reis et al.,
2016). Thus, there is a need for research that focuses on examining health behavior
change and associations with health based on interventions that are based in real-world
settings. Bauer et al. (2014) state the importance of tackling multiple risk factors for dis-
eases simultaneously. In order to get a more detailed description of overall health be-
havior, research needs to examine multiple health behaviors. In addition to frequently
investigated health behaviors such as smoking, alcohol consumption, nutrition and phys-
ical activity, studies should include other health behaviors like sleep, sexual health be-
havior, vaccination behavior or taking part in medical preventive check-ups. Cluster anal-
ysis could be a suitable approach to identify potential risk groups showing unfavorable
patterns of health behaviors. The clusters should be examined regarding medical or eco-
nomic outcomes in order to further investigate the relevance of the identified clusters.

Exploring Physical Activity in the Interplay of Health Behaviors and Health 35
5. References
Ajzen, I. (1991). The theory of planned behavior. Organizational Behavior and Human Decision Processes, 50(2), 179-211. doi:https://doi.org/10.1016/0749-5978(91)90020-T
Bandura, A. (2004). Health Promotion by Social Cognitive Means. Health Education & Behavior, 31(2), 143-164. doi:10.1177/1090198104263660
Bauer, U. E., Briss, P. A., Goodman, R. A., & Bowman, B. A. (2014). Prevention of chronic disease in the 21st century: elimination of the leading preventable causes of premature death and disability in the USA. Lancet, 384(9937), 45-52. doi:10.1016/s0140-6736(14)60648-6
Bize, R., Johnson, J. A., & Plotnikoff, R. C. (2007). Physical activity level and health-related quality of life in the general adult population: A systematic review. Preventive Medicine, 45(6), 401-415. doi:http://dx.doi.org/10.1016/j.ypmed.2007.07.017
Bouchard, C., Blair, S. N., & William, L. (2012). Physical Activity and Health (2nd ed.). Champaign: Human Kinetics.
Caspersen, C. J., Powell, K. E., & Christenson, G. M. (1985). Physical activity, exercise, and physical fitness: definitions and distinctions for health-related research. Public Health Rep, 100(2), 126-131.
Cheon, C., Oh, S.-M., Jang, S., Park, J.-S., Park, S., Jang, B.-H., . . . Ko, S.-G. (2014). The Relationship between Health Behavior and General Health Status: Based on 2011 Korea National Health and Nutrition Examination Survey. Osong Public Health and Research Perspectives, 5(1), 28-33. doi:10.1016/j.phrp.2013.12.003
Cockerham, W. C. (2014). Health Behavior. In W. C. Cockerham, R. Dingwall, & S. Quah (Eds.), The Wiley Blackwell Encyclopedia of Health, Illness, Behavior, and Society (pp. 764-766). Chichester: Wiley-Blackwell.
Collins, L. M., & Lanza, S. T. (2010). Latent Class and Latent Transition Analysis. Hoboken, NJ: Wiley.
Conry, M. C., Morgan, K., Curry, P., McGee, H., Harrington, J., Ward, M., & Shelley, E. (2011). The clustering of health behaviours in Ireland and their relationship with mental health, self-rated health and quality of life. BMC Public Health, 11, 692. doi:10.1186/1471-2458-11-692
Dahlgren, G., & Whitehead, M. (1991). Policies and strategies to promote social equity in health. Background document to WHO - Strategy paper for Europe.
Das, P., & Horton, R. (2016). Physical activity-time to take it seriously and regularly. Lancet, 388(10051), 1254-1255. doi:10.1016/s0140-6736(16)31070-4
Diez, D. M., Barr, C. D., & Cetinkaya-Rundel, M. (2016). OpenIntro Statistics (Third ed.): OpenIntro, Inc.
Ding, D., Lawson, K. D., Kolbe-Alexander, T. L., Finkelstein, E. A., Katzmarzyk, P. T., van Mechelen, W., & Pratt, M. (2016). The economic burden of physical inactivity: a global analysis of major non-communicable diseases. The Lancet, 388(10051), 1311-1324. doi:10.1016/S0140-6736(16)30383-X
Dolor, R. J., Ostbye, T., Lyna, P., Coffman, C. J., Alexander, S. C., Tulsky, J. A., . . . Pollak, K. I. (2010). What are physicians' and patients' beliefs about diet, weight, exercise, and smoking cessation counseling? Prev Med, 51(5), 440-442. doi:10.1016/j.ypmed.2010.07.023
Eid, M., Gollwitzer, M., & Schmitt, M. (2015). Statistik und Forschungsmethoden (Fourth ed.). Basel: Beltz.
Ekelund, U., Steene-Johannessen, J., Brown, W. J., Fagerland, M. W., Owen, N., Powell, K. E., . . . Lee, I. M. (2016). Does physical activity attenuate, or even eliminate,
Exploring Physical Activity in the Interplay of Health Behaviors and Health 36
the detrimental association of sitting time with mortality? A harmonised meta-analysis of data from more than 1 million men and women. The Lancet, 388(10051), 1302-1310. doi:10.1016/S0140-6736(16)30370-1
Evans, R. G., & Stoddart, G. L. (1990). Producing health, consuming health care. Social Science & Medicine, 31(12), 1347-1363. doi:https://doi.org/10.1016/0277-9536(90)90074-3
Fahrmeir, L., Kneib, T., & Lang, S. (2009). Regression - Modelle, Methoden und Anwendungen (2nd ed.). Heidelberg: Springer.
Fernström, M., Fernberg, U., Eliason, G., & Hurtig-Wennlöf, A. (2017). Aerobic fitness is associated with low cardiovascular disease risk: the impact of lifestyle on early risk factors for atherosclerosis in young healthy Swedish individuals - the Lifestyle, Biomarker, and Atherosclerosis study. Vascular health and risk management, 13, 91-99. doi:10.2147/VHRM.S125966
Field, A. (2009). Discovering statistics using SPSS (Third ed.). London: SAGE. Glanz, K., Rimer, B. K., & Viswanath, K. (2015). Health Behavior : Theory, Research,
and Practice. New York, NY, UNITED STATES: John Wiley & Sons, Incorporated.
Gopinath, B., Kifley, A., Flood, V. M., & Mitchell, P. (2018). Physical Activity as a Determinant of Successful Aging over Ten Years. Scientific Reports, 8(1), 10522. doi:10.1038/s41598-018-28526-3
Guthold, R., Stevens, G. A., Riley, L. M., & Bull, F. C. (2018). Worldwide trends in insufficient physical activity from 2001 to 2016: a pooled analysis of 358 population-based surveys with 1·9 million participants. The Lancet Global Health, 6(10), e1077-e1086. doi:10.1016/S2214-109X(18)30357-7
Hagenaars, J., & McCutcheon, A. (2002). Applied Latent Class Analysis (J. A. Hagenaars & A. L. McCutcheon Eds.). Cambridge: Cambridge University Press.
Holle, R., Happich, M., Löwel, H., Wichmann, H. E., & for the, M. K. S. G. (2005). KORA - A Research Platform for Population Based Health Research. [KORA - Eine Forschungsplattform für bevölkerungsbezogene Gesundheitsforschung]. Gesundheitswesen, 67(S 01), 19-25. doi:10.1055/s-2005-858235
Hurrelmann, K., & Razum, O. (2012). Handbuch Gesundheitswissenschaften (Vol. 5., vollst. überarb. Aufl.). Weinheim Beltz Juventa.
Institute of Medicine (US) Committee on Assuring the Health of the Public in the 21st Century. (2002). The Future of the Public's Health in the 21st Century. Washington (DC): National Academies Press (US).
Kasl, S. V., & Cobb, S. (1966). Health Behavior, Illness Behavior, and Sick-Role Behavior. Archives of Environmental Health: An International Journal, 12(4), 531-541. doi:10.1080/00039896.1966.10664421
Kelly, P., Kahlmeier, S., Götschi, T., Orsini, N., Richards, J., Roberts, N., . . . Foster, C. (2014). Systematic review and meta-analysis of reduction in all-cause mortality from walking and cycling and shape of dose response relationship. International Journal of Behavioral Nutrition and Physical Activity, 11(1), 132. doi:10.1186/s12966-014-0132-x
Kumar, S., & Preetha, G. (2012). Health promotion: an effective tool for global health. Indian journal of community medicine : official publication of Indian Association of Preventive & Social Medicine, 37(1), 5-12. doi:10.4103/0970-0218.94009
Lalonde, M. (1974). A New Perspective on the Health of Canadians. Retrieved from Ottawa, Canada:
Lavie, C. J., Ozemek, C., & Kachur, S. (2019). Promoting physical activity in primary and secondary prevention. European Heart Journal, 40(43), 3556-3558. doi:10.1093/eurheartj/ehz697

Exploring Physical Activity in the Interplay of Health Behaviors and Health 37
Linzer, D. A., & Lewis, J. B. (2011). poLCA: An R Package for Polytomous Variable Latent Class Analysis. 2011, 42(10), 29. doi:10.18637/jss.v042.i10
Lollgen, H., Bockenhoff, A., & Knapp, G. (2009). Physical activity and all-cause mortality: an updated meta-analysis with different intensity categories. Int J Sports Med, 30(3), 213-224. doi:10.1055/s-0028-1128150
Masyn, K. E. (2013). Latent Class Analysis and Finite Mixture Modeling. In T. D. Little (Ed.), The Oxford Handbook of Quantitative Methods. New York, NY: Oxford University Press.
Mawditt, C., Sacker, A., Britton, A., Kelly, Y., & Cable, N. (2016). The clustering of health-related behaviours in a British population sample: Testing for cohort differences. Prev Med, 88, 95-107. doi:10.1016/j.ypmed.2016.03.003
McAloney, K., Graham, H., Law, C., & Platt, L. (2013). A scoping review of statistical approaches to the analysis of multiple health-related behaviours. Preventive Medicine, 56(6), 365-371. doi:http://dx.doi.org/10.1016/j.ypmed.2013.03.002
Meader, N., King, K., Moe-Byrne, T., Wright, K., Graham, H., Petticrew, M., . . . Sowden, A. J. (2016). A systematic review on the clustering and co-occurrence of multiple risk behaviours. BMC Public Health, 16(1), 657. doi:10.1186/s12889-016-3373-6
OECD. (2015). Frascati Manual 2015: Guidelines for Collecting and Reporting Data on Research and Experimental Development, The Measurement of Scientific, Technological and Innovation Activities. Paris: OECD Publishing.
Poortinga, W. (2007). The prevalence and clustering of four major lifestyle risk factors in an English adult population. Preventive Medicine, 44(2), 124-128. doi:http://dx.doi.org/10.1016/j.ypmed.2006.10.006
Pratt, M., Macera, C. A., & Wang, G. (2000). Higher direct medical costs associated with physical inactivity. Phys Sportsmed, 28(10), 63-70. doi:10.3810/psm.2000.10.1237
Prochaska, J. J., Spring, B., & Nigg, C. R. (2008). Multiple health behavior change research: an introduction and overview. Prev Med, 46(3), 181-188. doi:10.1016/j.ypmed.2008.02.001
Pucci, G. C., Rech, C. R., Fermino, R. C., & Reis, R. S. (2012). Association between physical activity and quality of life in adults. Rev Saude Publica, 46(1), 166-179.
Rabel, M., Laxy, M., Thorand, B., Peters, A., Schwettmann, L., & Mess, F. (2019). Clustering of Health-Related Behavior Patterns and Demographics. Results From the Population-Based KORA S4/F4 Cohort Study. Front Public Health, 6(387). doi:10.3389/fpubh.2018.00387
Rabel, M., Meisinger, C., Peters, A., Holle, R., & Laxy, M. (2017). The longitudinal association between change in physical activity, weight, and health-related quality of life: Results from the population-based KORA S4/F4/FF4 cohort study. PLOS ONE, 12(9), e0185205. doi:10.1371/journal.pone.0185205
Rabel, M., Mess, F., Karl, F. M., Pedron, S., Schwettmann, L., Peters, A., . . . Laxy, M. (2019). Change in Physical Activity after Diagnosis of Diabetes or Hypertension: Results from an Observational Population-Based Cohort Study. International Journal of Environmental Research and Public Health, 16(21), 4247.
Reis, R. S., Salvo, D., Ogilvie, D., Lambert, E. V., Goenka, S., & Brownson, R. C. (2016). Scaling up physical activity interventions worldwide: stepping up to larger and smarter approaches to get people moving. Lancet, 388(10051), 1337-1348. doi:10.1016/s0140-6736(16)30728-0
Rhodes, R. E., & Nigg, C. R. (2011). Advancing physical activity theory: a review and future directions. Exerc Sport Sci Rev, 39(3), 113-119. doi:10.1097/JES.0b013e31821b94c8

Exploring Physical Activity in the Interplay of Health Behaviors and Health 38
Rosenstock, I. M. (1974). Historical Origins of the Health Belief Model. Health Education Monographs, 2(4), 328-335. doi:10.1177/109019817400200403
Rubio, D. M., Schoenbaum, E. E., Lee, L. S., Schteingart, D. E., Marantz, P. R., Anderson, K. E., . . . Esposito, K. (2010). Defining translational research: implications for training. Academic medicine : journal of the Association of American Medical Colleges, 85(3), 470-475. doi:10.1097/ACM.0b013e3181ccd618
Rütten, A., & Pfeifer, K. (2017). Nationale Empfehlungen für Bewegung und Bewegungsförderung. Forschung und Praxis der Gesundheitsförderung – Sonderheft 03.
Sallis, J. F., Bull, F., Guthold, R., Heath, G. W., Inoue, S., Kelly, P., . . . Hallal, P. C. (2016). Progress in physical activity over the Olympic quadrennium. The Lancet, 388(10051), 1325-1336. doi:10.1016/S0140-6736(16)30581-5
Schwartz, F. W., Badura, B., Busse, R., Leidl, R., Raspe, H., Siegrist, J., & Walter, U. (Eds.). (2012). Das Public Health Buch. Gesundheit und Gesundheitswesen. 3., völlig überarb. und erw. Aufl. München: Urban & Fischer.
Schwarzer, R. (1992). Self-efficacy in the adoption and maintenance of health behaviors: Theoretical approaches and a new model. In R. Schwarzer (Ed.), Self-efficacy: Thought control of action. Washington, DC: Hemisphere.
Spengler, S., Kuritz, A., Rabel, M., & Mess, F. (2019). Are primary school children attending full-day school still engaged in sports clubs? PLOS ONE, 14(11), e0225220. doi:10.1371/journal.pone.0225220
Spengler, S., Rabel, M., Kuritz, A. M., & Mess, F. (2017). Trends in Motor Performance of First Graders: A Comparison of Cohorts from 2006 to 2015. Front Pediatr, 5, 206. doi:10.3389/fped.2017.00206
Sylvia, L. G., Bernstein, E. E., Hubbard, J. L., Keating, L., & Anderson, E. J. (2014). Practical guide to measuring physical activity. Journal of the Academy of Nutrition and Dietetics, 114(2), 199-208. doi:10.1016/j.jand.2013.09.018
Thivel, D., Tremblay, A., Genin, P. M., Panahi, S., Rivière, D., & Duclos, M. (2018). Physical Activity, Inactivity, and Sedentary Behaviors: Definitions and Implications in Occupational Health. Frontiers in Public Health, 6(288). doi:10.3389/fpubh.2018.00288
Warburton, D., Charlesworth, S., Ivey, A., Nettlefold, L., & Bredin, S. (2010). A systematic review of the evidence for Canada's Physical Activity Guidelines for Adults. The international journal of behavioral nutrition and physical activity, 7, 39-39. doi:10.1186/1479-5868-7-39
Warburton, D., Nicol, C. W., & Bredin, S. (2006). Health benefits of physical activity: the evidence. Canadian Medical Association Journal, 174(6), 801-809. doi:10.1503/cmaj.051351
Weiß, C. (2013). Basiswissen medizinische Statistik (6th ed.). Berlin: Springer. WHO. (2009). Global health risks: mortality and burden of disease attributable to
selected major risks. Geneva: World Health Organization. Williamson, J. (2016). Awareness of Physical Activity Health Benefits can Influence
Participation and Dose. Sports Med Rehabil J, 1(1). Woolf, S. H. (2008). The Meaning of Translational Research and Why It Matters. JAMA,
299(2), 211-213. doi:10.1001/jama.2007.26 World Health Organization. (2014). Basic Documents - 48th ed. Retrieved from Geneva,
Switzerland: World Health Organization. (2018). Global action plan on physical activity 2018–2030:
more active people for a healthier world. Retrieved from https://www.who.int/ncds/prevention/physical-activity/global-action-plan-2018-2030/en/

Exploring Physical Activity in the Interplay of Health Behaviors and Health 39
Yates, N., Teuner, C. M., Hunger, M., Holle, R., Stark, R., Laxy, M., . . . Wolfenstetter, S. B. (2016). The Economic Burden of Obesity in Germany: Results from the Population-Based KORA Studies. Obes Facts, 9(6), 397-409. doi:10.1159/000452248

Exploring Physical Activity in the Interplay of Health Behaviors and Health 40
6. Appendix
6.1. Bibliography
Complete list of all scientific publications by Matthias Rabel.
Rabel, M., Mess, F., Karl, F. M., Pedron, S., Schwettmann, L., Peters, A., . . .
Laxy, M. (2019). Change in Physical Activity after Diagnosis of Diabetes or Hy-
pertension: Results from an Observational Population-Based Cohort Study. In-
ternational Journal of Environmental Research and Public Health, 16(21), 4247.
doi:10.3390/ijerph16214247
Rabel, M., Laxy, M., Thorand, B., Peters, A., Schwettmann, L., & Mess, F. (2019).
Clustering of Health-Related Behavior Patterns and Demographics. Results
From the Population-Based KORA S4/F4 Cohort Study. Front Public Health,
6(387). doi:10.3389/fpubh.2018.00387
Spengler, S., Kuritz, A., Rabel, M., & Mess, F. (2019). Are primary school children
attending full-day school still engaged in sports clubs? PLoS ONE, 14(11),
e0225220. doi:10.1371/journal.pone.0225220
Rabel, M., Meisinger, C., Peters, A., Holle, R., & Laxy, M. (2017). The longitudinal
association between change in physical activity, weight, and health-related qual-
ity of life: Results from the population-based KORA S4/F4/FF4 cohort study.
PLOS ONE, 12(9), e0185205. doi:10.1371/journal.pone.0185205
Spengler, S., Rabel, M., Kuritz, A. M., & Mess, F. (2017). Trends in Motor Per-
formance of First Graders: A Comparison of Cohorts from 2006 to 2015. Front
Pediatr, 5, 206. doi:10.3389/fped.2017.00206
Mess, F., Gerth, D., Hanke, J., Rabel, M., & Walter, U. N. (2015). Gesundheits-
verhalten und Gesundheit bei wissenschaftlichen und nicht-wissenschaftlichen
Beschäftigten – ein Vergleich an der Universität Konstanz. In A. Göring & D. Möl-
lenbeck (Eds.), Bewegungsorientierte Gesundheitsförderung an Hochschulen.
Hochschulsport: Bildung Und Wissenschaft. (Vol. 3, pp. 115-129). Göttingen:
Universitätsverlag.

Exploring Physical Activity in the Interplay of Health Behaviors and Health 41
6.2. Reprints of conducted studies
This section contains reprints of the four conducted studies that are part of this disserta-
tion. All studies have been published under the Open Access Creative Commons Attrib-
ution License (CC-BY), which permits the use, distribution and reproduction of material
from published articles, provided the original authors and sources are credited.

ORIGINAL RESEARCHpublished: 22 January 2019
doi: 10.3389/fpubh.2018.00387
Frontiers in Public Health | www.frontiersin.org 1 January 2019 | Volume 6 | Article 387
Edited by:
Onyebuchi A. Arah,
University of California, Los Angeles,
United States
Reviewed by:
Banu Cakir,
Hacettepe University, Turkey
Giridhara R. Babu,
Public Health Foundation of India,
India
*Correspondence:
Matthias Rabel
Specialty section:
This article was submitted to
Epidemiology,
a section of the journal
Frontiers in Public Health
Received: 09 November 2018
Accepted: 31 December 2018
Published: 22 January 2019
Citation:
Rabel M, Laxy M, Thorand B,
Peters A, Schwettmann L and Mess F
(2019) Clustering of Health-Related
Behavior Patterns and Demographics.
Results From the Population-Based
KORA S4/F4 Cohort Study.
Front. Public Health 6:387.
doi: 10.3389/fpubh.2018.00387
Clustering of Health-RelatedBehavior Patterns andDemographics. Results From thePopulation-Based KORA S4/F4Cohort StudyMatthias Rabel 1,2*, Michael Laxy 2,3, Barbara Thorand 3,4, Annette Peters 3,4,
Lars Schwettmann 2 and Filip Mess 1
1Department of Sport and Health Sciences, Technical University of Munich, Munich, Germany, 2Helmholtz Zentrum
München–German Research Center for Environmental Health (GmbH), Institute of Health Economics and Health Care
Management, Neuherberg, Germany, 3German Center for Diabetes Research (DZD), Neuherberg, Germany, 4Helmholtz
Zentrum München–German Research Center for Environmental Health (GmbH), Institute of Epidemiology, Neuherberg,
Germany
Background: Health behaviors are of great importance for public health. Previous
research shows that health behaviors are clustered and do not occur by chance. The
main objective of this study was to investigate and describe the clustering of alcohol
consumption, nutrition, physical activity and smoking while also considering the influence
of sex, age and education.
Methods: Using data from the population-based KORA S4/F4 cohort study, latent
class regression analysis was undertaken to identify different clusters of health behavior
patterns. The clusters were described according to demographics. Furthermore, the
clusters were described regarding health-related quality of life at baseline and at a 7
year follow-up.
Results: Based on a sample of 4,238 participants, three distinct classes were identified.
One overall healthy class and two heterogeneous classes. Classes varied especially
according to sex, indicating a healthier behavior pattern for females. No clear association
between healthier classes and age, education or physical and mental health-related
quality of life was found.
Discussion: This study strengthens the literature on the clustering of health behaviors
and additionally describes the identified clusters in association with health-related quality
of life. More research on associations between clustering of health behaviors and
important clinical outcomes is needed.
Keywords: health behavior pattern, latent class analysis, latent class regression, cluster analysis, alcohol,
nutrition, physical activity, smoking

Rabel et al. Clustered Health Behavior Patterns
INTRODUCTION
Health behaviors are closely linked to a person’s general health.This is not only postulated in theoretical models like thedeterminants of health-model (1), but has also been shownempirically (2). In addition to the individual level, healthbehaviors also have large public health implications. Particularly,alcohol consumption, nutrition, physical activity (PA) andsmoking are well-known and important factors regarding publichealth. In its report on global health risks, the World HealthOrganization (WHO) lists health behaviors among the leadingrisk factors for death in high-income countries (3, 4). Plentyof studies have investigated the association between one ofthese single risk behaviors and health (5–9). However, health-impairing factors usually do not occur apart, but tend to groupin clusters (10, 11). A bundling of different health risks canbe identified (12) and certain population strata show commonpatterns of multiple health behaviors (13–15). As there isevidence that multiple health behaviors have synergistic effectsandmight be targeted simultaneously by interventions, analyzingpatterns of health behaviors can be of great importance forpublic health (16). First, there is evidence that interventionswhich tackle multiple behaviors seem to be more cost effective(17). Second, with the already described bundling of behaviorsand a common culmination of risk factors for individuals(12), considering more than one health behavior to describeindividual health patterns seems to be appropriate. Third, inorder to design health promoting interventions it is crucialto identify the characteristics of the target group (18), whichrequires an understanding of how multiple health behaviors areclustered (19). In-depth knowledge about the characteristics of apopulation might be helpful to identify vulnerable groups, whichcould profit most from public health interventions (20).
Multiple studies have investigated the general clusteringof health behaviors in adults (11, 15, 20, 21). Yet, due tomethodological differences (22) as well as different investigatedhealth behaviors (11), the literature is quite heterogeneous.Furthermore, only few studies have investigated the associationsbetween the general clustering of health behaviors and importantphysical health outcomes like all-cause mortality (7, 23–25).
Health-related quality of life (HRQOL) is an important patientrelevant outcome combining physical and mental aspects ofhealth (26). Due to the rise of chronic diseases the concept ofHRQOL is crucial for public health (27). Several studies haveinvestigated associations between single health behaviors andHRQOL (28–31). However, little is known about the relationshipbetween patterns of several health behaviors and HRQOL atthe population level. Dumuid et al. (32) identified four distinctclusters based on PA, nutrition and screen time in school-aged children. They report differences in HRQOL scores withhighest scores for a mixed cluster (low screen time, healthyeating, and moderate PA) (32). Another study investigatedassociations between a clustering of healthy behaviors (non-smoking, adequate PA, consumption of at least five portionsof fruit or vegetables per day) and HRQOL in US adultswith diabetes. According to this study, an increase of healthybehaviors is associated with better HRQOL (33). To the bestof our knowledge, only one study investigated the relationship
of the clustering of health behaviors and HRQOL in a generalpopulation (16). Based on smoking, drinking alcohol, PA andnutrition, six health behavior clusters were identified. Thescientists report that healthier clusters tend to be associatedwith better aspects of HRQOL (16). To the best of ourknowledge, no study investigated the association between theclustering of health behaviors and HRQOL, including multiplemeasurements of HRQOL at different time points. Due to thisreason, the present study uses data from a population-basedcohort study including information on HRQOL at two timepoints approximately 7 years apart.
The main objective of this study was the identification ofclusters that share a similar pattern based on their healthbehavior. It is assumed that health behavior patterns are closelylinked to demographic factors (34). Therefore, sex, age andeducation are also included in the clustering process. Theconsidered behaviors are smoking, alcohol consumption, leisuretime PA, and nutrition. In order to attain comparability withother clustering solutions and with regard to the public healthimpact of these four behaviors, the present study considers thesebehaviors in order to identify health behavioral clusters. In orderto receive a profound understanding of the identified clustersand characterize their differences, it is helpful to describe themwith additional parameters (35). Therefore, the identified clusterswill be described regarding sociodemographic parameters. Withrespect to the sparse scientific background on the associationbetween the clustering of health behaviors and HRQOL, theclusters will be additionally described regarding longitudinalchange in physical and mental HRQOL between baseline and a7-year follow-up.
METHODS
Data SourceOur analyses are based on data obtained from the population-based KORA (Cooperative Health Research in the Regionof Augsburg) S4/F4 cohort study. In total 4,261 non-institutionalized inhabitants of the Augsburg Region inSouthern Germany took part in the baseline health surveyconducted in 1999-2001 (S4). All S4 participants were invitedto participate in a follow-up examination approximately 7 yearslater (F4; 2006-2008). A total of 3,080 (72%) participants wereinvestigated at follow-up. The reasons for losses at follow-up areas follows: death (176), claim for data deletion (12), no contactpossible (174), refusal to participate (395), illness/lack of time(218), no contact information available (206). At baseline and atfollow-up a physical examination and standardized interviewswere performed. More detailed information on the KORA S4study concerning sampling methods and data collection has beenpublished elsewhere (36). All study participants gave writteninformed consent and the KORA S4/F4 studies were approvedby the Ethics Committee of the Bavarian Medical Association.
MeasuresAlcoholAlcohol consumption was calculated based on participants’ self-reported information on beer, wine and spirits consumption onthe previous workday and weekend. The weekday consumption
Frontiers in Public Health | www.frontiersin.org 2 January 2019 | Volume 6 | Article 387

Rabel et al. Clustered Health Behavior Patterns
was multiplied by five and added to the weekend consumption.Total alcohol intake per day [g/day] was derived from dividingthis number by seven. Details on the calculation and validationprocess have already been published (37). For the presentstudy alcohol consumption has been grouped into the followingthree categories: (1) 0 g/day = “no alcohol,” (2) <20 g/day =
“moderate consumption,” (3) ≥20 g/day = “risky consumption”as suggested by published classifications (38).
NutritionDietary intake was collected by using a food-frequency-questionnaire investigating 24 food groups. Based onrecommendations of the German Nutrition Society (DGE)an index was built rating the frequency with which each foodwas consumed by assigning either 2, 1, or 0 points. Higherscores reflect better compliance to DGE recommendations. Aresulting sum score was then rated according to DGE guidelinesgrouped into the following three categories: (1) “favorable,” (2)“ordinary,” and (3) “adverse.” This approach was establishedin earlier KORA studies and was validated against a detailedseven-days-dietary protocol (39).
Physical ActivityParticipants were asked to report their weekly time spent onleisure-time PA (including cycling) in summer and winter. Thetwo responses were combined and categorized into four groups:(1) “(almost) no activity,” (2) “about 1 h per week irregularly,”(3) “about 1 hour per week regularly,” and (4) “regularly morethan 2 h per week.” Categories (2) and (3) were condensed for allstatistical analyses because they were not considered adequatelydistinct. The questions about leisure-time PA originated from theGerman Cardiovascular Prevention Study conducted between1979 and 1995 and were validated in the KORA population, byusing a PA diary (40).
SmokingSmoking behavior was classified considering the actual behaviorand the regularity with which the behavior was performed.Therefore, participants were asked whether they currently smokeand whether they have ever smoked. Additionally, regularity wassurveyed by inquiring whether someone usually smokes regularly(at least one cigarette per day) or irregularly (usually less thanone cigarette per day). According to this information, smokingbehavior was grouped into (1) non-smoker, (2) ex-smoker, (3)irregular smoker, and (4) regular smoker.
Health-Related Quality of LifeHRQOL was estimated with the SF-12 health survey. Thisshort version of the SF-36 health survey consists of 12 itemsdistinguishing between physical and mental components ofHRQOL. Both components can be summarized in a physicalcomponent summary score and a mental component summaryscore with a mean of 50 points and a standard deviation of tenpoints. Higher scores imply a better HRQOL. Information aboutpsychometric quality criteria can be found elsewhere (41).
CovariatesInformation about sex (male, female), age (continuous) andeducation (main-, middle- and grammar school correspondingto German “Hauptschule,” “Realschule,” and “Gymnasium”) werealso collected during the standardized interviews.
Statistical AnalysisIn order to identify homogeneous subgroups based on thesamples’ health behaviors, a latent class analysis was carried out.This method allows to cluster cases into unobserved classes.An advantage of latent class analysis compared to traditionalclustering techniques like hierarchical clustering or k-means isthat it is a model-based approach. Therefore, this approachis more flexible and the choice of a cluster criterion is lessarbitrary (42). Key assumptions to this approach are that thelatent class variable and the observed variables, in this casethe health behaviors alcohol consumption, nutrition, PA andsmoking, are treated as categorical. Another assumption isthat the observed variables are locally independent and thatdependencies are conditional on the latent classes’ variable (43).In a basic, unconditional model, latent class models analyzecross-classification tables of observed variables to estimate theprobability of latent class membership. This unconditional modelcan be extended with covariates which influence latent classmembership, into a latent class regression analysis. While inthe unconditional model it is assumed that every individualhas the same probability for class membership, this approachallows for varying probabilities depending upon observedcovariates (44). In our study, sex, age, and education wereadded to the analysis as covariates, since their importancein this process has been stressed in past studies (11). Latentclass membership is based solely on data from the S4 study(1999-2001). Figure A1 in the Appendix gives a visual overviewof the latent class regression model. Since in this case, thenumber of latent classes is unknown, multiple models with anincreasing number of classes were fit. To identify the mostparsimonious model that represents the data best, several modelfit criteria including Akaike information criterion (AIC) and(sample-sized-adjusted) Bayesian Information Criterion (BIC)were deployed. In this study we prioritized BIC as it is themost commonly used criterion which is supposed to be veryaccurate (45). In addition, model selection should also considerthe practical meaning of identified classes (46) and thereforea complex model that cannot provide a new meaningful classis seen as inferior to a simpler model with a marginallyworse model fit. Cluster analysis is an analysis to identifygroups/clusters. In latent class analysis the term for these groupsis class. Therefore, the terms will be used synonymously in thispaper.
Descriptive statistics were used to describe and interpretthe different latent classes. To investigate differences inHRQOL at baseline (S4) and the follow-up (F4) and toinvestigate the change in HRQOL between the measurementpoints a mixed model with a random intercept was fit. Inthis model HRQOL is the dependent variable and latentclass membership, and an interaction between latent classmembership and measurement time point are independent
Frontiers in Public Health | www.frontiersin.org 3 January 2019 | Volume 6 | Article 387

Rabel et al. Clustered Health Behavior Patterns
FIGURE 1 | Socio-demographic characteristics and distribution of
health behaviors. The figure displays descriptive information for the overall
applicable sample. N, number of observations; %, column percent (except for
the first row); SD, standard deviation.
variables. Sex, age, and education were introduced ascovariates in the model. Altogether two mixed modelswere fit to differentiate between physical and mentalHRQOL.
All data related processes and statistical analyses wereconducted using R (Version 3.4.3) (47). Latent class regressionanalysis was carried out using the “poLCA” package (Version1.4.1) (44).
RESULTS
ParticipantsTwenty three participants (0.5%) of the baseline S4 study wereexcluded from the latent class regression analysis due to missingdata in the behavioral variables or the covariates. The remainingsample of 4,238 had a mean age of 49.2 (±13.9) years rangingfrom 24 to 75 years. 49% of the sample were male, 54% graduatedfrom main school, 23.2% from middle school and 22.7% fromgrammar school. One third of the population had a normal BMI(≥18.5–<25 kg/m2). Nearly two third of the participants wereoverweight (BMI≥25–<30 kg/m2) or obese (BMI≥30 kg/m2).Only 0.6% was underweight (BMI<18.5 kg/m2). Figure 1 showsmore socio-demographic details and the distribution of thehealth behavior categories for the overall sample.
FIGURE 2 | Model fit for multiple models. The figure displays three different
model fit criteria for different models. Smaller values indicate a better model fit.
The model number represents the number of latent classes. AIC, Akaike
Information Criterion; BIC, Bayesian Information Criterion; ABIC, sample size
adjusted BIC.
FIGURE 3 | Class-conditional item probabilities. The figure shows the
probabilities of each health behavior category conditional on latent class
membership.
Class SelectionFigure 2 showsmodel fit criteria for the different models. Smallery-values indicate a better model fit. Multiple models with anincreasing number of classes from one to six were fit. The two-class (BIC = 36931.16), three-class (BIC = 36887.63) and four-class (BIC = 36936.96) solutions showed the best model fitregarding the BIC criteria. After a substantial comparison of allsolutions, the four-class solution did not reveal any new uniquebehavioral pattern. Therefore, the three-class solution was chosenas the most appropriate model. For comparison, see Figure 3 andFigures A2, A3 in the Appendix showing the class-conditionalitem probabilities.
Description of the Identified GroupsFigure 3 shows the class-conditional item probabilities. This plotdisplays the probability of an item response given latent class
Frontiers in Public Health | www.frontiersin.org 4 January 2019 | Volume 6 | Article 387

Rabel et al. Clustered Health Behavior Patterns
FIGURE 4 | Overview of the behavior distribution in the three latent classes. The figure displays the frequency of every health behavior category for the three classes.
membership. The specific values are presented in Table A1 in theAppendix.
In the following, the three classes from the selected three-classmodel solution are described regarding their health behaviorpatterns and socio-demographic characteristics. Figure 4 givesa detailed overview of the health behaviors of the identifiedclasses. Information on the distribution of the three covariatesincluded in the latent class regression can be found inFigure 5. Exact numbers on the distribution of the healthbehaviors and the covariates can be seen in Table A2 in theAppendix.
Class 1Class 1 has 1,366 members of which 84% are male. Meanage is 56.1 (±11.9) years, 45% are main school attendeesand it is the class with the most grammar school graduates(35%). 0.1% are underweight, 26% are of normal weight, 50%are overweight and 24% are obese. Conditional on class 1membership, class members have the highest probability for riskydrinking (51%), a favorable diet (54%), moderate PA (41%) andex-smoking (56%).
Class 2Class 2 is the biggest class. Class 2 consists of 1,562 participantsand is exclusively female. The biggest share are main schoolattendees (60%) and the mean age is 52.4 (± 13.0) years. 0.5% areunderweight, 34% have a normal weight, 37% are overweight and29% are obese. Regarding health behavior, class 2 membershiphas the highest probability for drinking no (45%) or moderately(47%) alcohol, having a favorable diet (63%), being moderatelyphysically active (49%), and being non-smoking (64%).
Class 3Class 3 is composed of 1,310 participants, 71% thereof are male.Most participants of class 3 received a main school educationaldegree (56%). Class 3 is the youngest class with a mean ageof 38.1 (± 9.8) years. Most participants have normal weight(40%) or are overweight (43%). 1.3% are underweight and 16%are obese. Concerning health behavior, class 3 membershipimplies highest probabilities for moderate (37%) or risky (38%)alcohol consumption, adverse dietary behavior (58%), moderatePA (47%) and regular smoking (48%).
Associations Between Latent Classes andHealth-Related Quality of LifeBased on the mixed model, class 1 (mean = 48.88; 95%-CI= 48.36–49.41) and 2 (mean = 48.47, 95%-CI = 47.89–49.06)have the highest physical HRQOL at baseline. Class 3 has amean score of 46.96 (95%-CI= 46.28–47.55) concerning physicalHRQOL. At follow-up, mean values for physical HRQOL are47.64 (95%-CI = 47.07–48.21) for class 1, 47.62 (95%-CI =
47.00–48.25) for class 2 and 47.17 (95%-CI = 46.51–47.82) forclass 3.
Regarding mental HRQOL, class 1 had a mean score of 51.06(95%-CI = 51.37–52.17), class 2 had a mean score of 50.77(95%-CI = 50.14–51.40) and class 3 had a mean score of 50.39(95%-CI = 49.76–51.02). Follow-up values for mental HRQOLwere 51.32 (95%-CI = 50.70–51.95) for class 1, 50.95 (95%-CI =50.27–51.63) for class 2 and 51.18 (95%-CI = 50.47–51.89) forclass 3.
Figure 6 provides a visual overview of the mean physical andmental HRQOL of the three classes.
Frontiers in Public Health | www.frontiersin.org 5 January 2019 | Volume 6 | Article 387
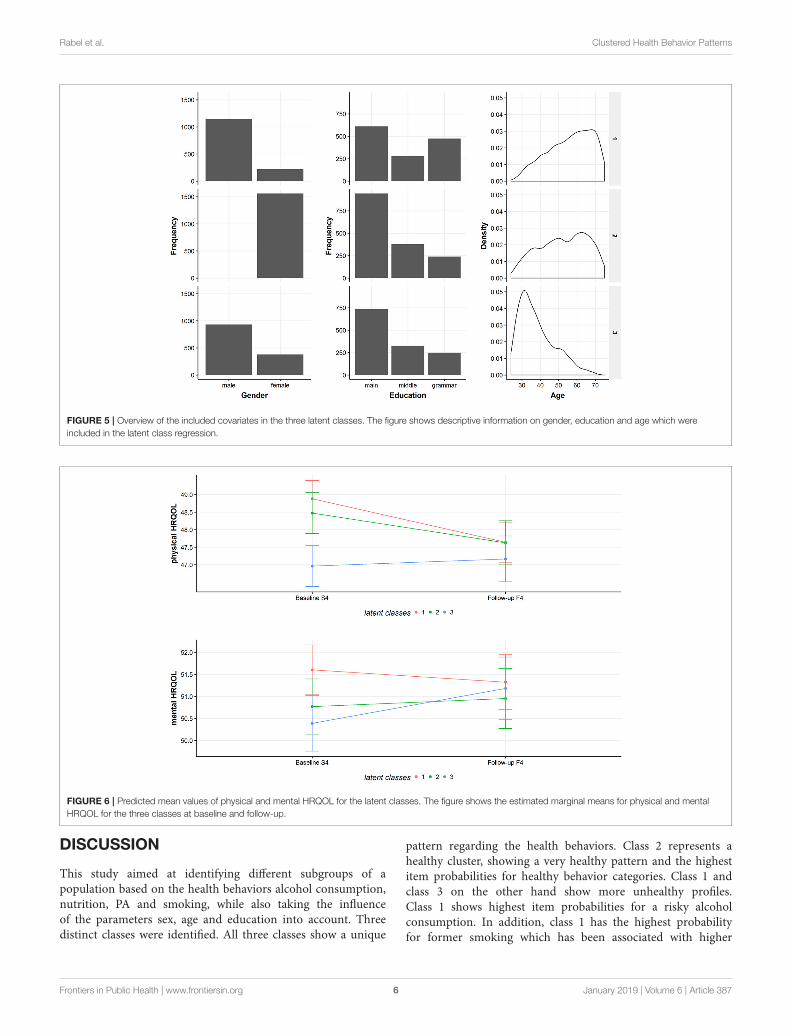
Rabel et al. Clustered Health Behavior Patterns
FIGURE 5 | Overview of the included covariates in the three latent classes. The figure shows descriptive information on gender, education and age which were
included in the latent class regression.
FIGURE 6 | Predicted mean values of physical and mental HRQOL for the latent classes. The figure shows the estimated marginal means for physical and mental
HRQOL for the three classes at baseline and follow-up.
DISCUSSION
This study aimed at identifying different subgroups of apopulation based on the health behaviors alcohol consumption,nutrition, PA and smoking, while also taking the influenceof the parameters sex, age and education into account. Threedistinct classes were identified. All three classes show a unique
pattern regarding the health behaviors. Class 2 represents ahealthy cluster, showing a very healthy pattern and the highestitem probabilities for healthy behavior categories. Class 1 andclass 3 on the other hand show more unhealthy profiles.Class 1 shows highest item probabilities for a risky alcoholconsumption. In addition, class 1 has the highest probabilityfor former smoking which has been associated with higher
Frontiers in Public Health | www.frontiersin.org 6 January 2019 | Volume 6 | Article 387

Rabel et al. Clustered Health Behavior Patterns
odds for hospital treatments and higher numbers in physicianvisits (48).
Cluster analysis is very exploratory and although comparisonswith other studies are difficult because of different investigatedhealth behaviors and methodological approaches, our resultsare in line with similar investigations. In line with previousstudies, we identified an overall healthy cluster with class2 (13, 14, 16, 20, 21, 49, 50). Similar to previous studies,we observed a clustering of unhealthy smoking behaviorand unhealthy alcohol consumption (11, 15, 16, 20). Thisclustering becomes very evident for class 3 and partiallyfor class 1 considering the high number of ex-smokers inthis class. Some studies report a combination of excessivealcohol consumption and higher PA rates (14, 16, 49). Atendency of this combination could be observed in class1, which has highest item probabilities for drinking andthe highest probability for active PA amongst the threeclasses.
Regarding socio-demographic characteristics of the identifiedclusters, the present results are in line with previous studies.Previous research reported a higher male prevalence in moreunhealthy clusters (14, 20). Our findings support this result,showing the highest female prevalence rates for the healthy class2. In our study, age and education were not a good indicatorfor distinguishing between healthy and unhealthy clusters, asyounger and older clusters or more and less educated clusters canbe found on both ends of the spectrum. A similar result is alsomentioned in the systematic review of Meader et al. (11).
Scientific evidence on associations between clustering ofhealth behaviors and HRQOL is sparse. Conry et al. (16)report a tendency for healthier clusters having a better qualityof life. This result could not be replicated by our study.We found no clear association between a healthier behaviorpattern and better physical or mental HRQOL. The differentlatent classes show different adjusted means in physical andmental HRQOL. The classes are also different in their changeof physical or mental HRQOL over the years. However, thedifferent changes in physical/mental HRQOL might be dueto regression to the mean. Furthermore, the differences inphysical/mental HRQOL are too small to be considered asclinically relevant. For the SF-12 questionnaire a difference fromthree to five points can be seen as the minimal clinically relevantthreshold (51).
Our study has several limitations. One problem lies in theway the health behaviors are measured and operationalized.All information on health behaviors is self-reported and thusprone to information bias like recall-bias or social desirability-bias. Furthermore, taking average scores for PA by combininginformation on winter and summer can be considered as anotherweakness. However, especially in large cohort studies with manyvariables, one has to balance the tradeoff between accuracy andfeasibility. Another limitation lies in the cross-sectional designof this study. The clustering of the health behaviors is basedon the baseline-study and therefore can only be seen as asnapshot. Nevertheless, the questions in the KORA-study areconceptualized to gather information on an established behavior.A further drawback is the assumption that the health behavior
pattern which was identified at baseline, remains stable over time.Even though, this assumption might be very bold, this is an adultpopulation and there is evidence, that health behavior patternsare quite stable over time (52, 53). Another limitation of thisstudy concerns the longitudinal description of HRQOL for theestablished clusters at baseline. The reduced sample size of theKORA-study might result in a biased depiction of HRQOL ashealthier people with better HRQOL are more likely to remainin the study. Taking this into account, the observed changes inphysical and mental HRQOL might not necessarily reveal a truechange on a population level. Although we adjusted our analysesfor several variables, chances are high that HRQOL might havebeen influenced by a factor we did not adjust for, e.g., socio-economic status. Therefore, residual confounding cannot beruled out.
Besides the aforementioned limitations, this study hasseveral noticeable strengths. The data are collected in alarge population-based cohort study. The clustering is basedon a latent class model. This approach offers a clusteringbased on a statistical model instead of more arbitrary clustercriteria and thus might be more sophisticated than traditionalclustering approaches (54). Moreover, this methodologicalapproach allows introducing covariates to factor in theirinfluence on health behavior patterns. Another strength ofthis study is that the clustering is not only based ondichotomous variables like the absence or presence of a riskfactor but also on polytomous variables. Despite its limitationsand the therefore limited level of inference, addressing therelevance of health behavior clusters by linking them toHRQOL—a clinically important outcome—adds value to thisstudy.
In conclusion, this study identified distinct patterns ofhealth behaviors within a large population-based sample. Theobserved health behavior patterns and the socio-demographiccharacteristics of the identified clusters are in line withthe few other existing international studies. Knowledge onspecific clusters which are common in an adult populationare an important step for comprehensive health promotingpublic health policies. The clustering of lifestyle factorslike health behaviors can give valuable information oncharacteristics of target groups for primary preventions.Combining these findings with further information on bigdata by health care providers or individual risk probabilitiesmight result in even more effective and comprehensive healthcare. Further research on health behavior patterns shouldfocus on linking identified clusters to important medicaloutcomes in order to identify vulnerable groups and toallow for individualized patient-centered primary preventionprograms.
AUTHOR CONTRIBUTIONS
MR, FM, and ML: Conceptualization. MR: Formal analysis,investigation, methodology, and writing-original draft. BT, AP,LS, ML, and FM: Supervision. MR, BT, AP, LS, ML, andFM: Writing–review and editing.
Frontiers in Public Health | www.frontiersin.org 7 January 2019 | Volume 6 | Article 387

Rabel et al. Clustered Health Behavior Patterns
FUNDING
The KORA research platform (KORA, Cooperative Researchin the Region of Augsburg) was initiated and financedby the Helmholtz Zentrum München—German ResearchCenter for Environmental Health, which is funded by theGerman Federal Ministry of Education and Research andby the State of Bavaria. Furthermore, KORA research wassupported within the Munich Center of Health Sciences (MC
Health), Ludwig-Maximilians-Universität, as part of the LMUinnovative.
SUPPLEMENTARY MATERIAL
The Supplementary Material for this article can be foundonline at: https://www.frontiersin.org/articles/10.3389/fpubh.2018.00387/full#supplementary-material
REFERENCES
1. Dahlgren G, Whitehead M. Levelling Up (part 2): A Discussion Paper on
European Strategies for Tackling Social Inequities in Health. Copenhagen:
WHO Regional Office for Europe (2006).
2. Cheon C, Oh S-M, Jang S, Park J-S, Park S, Jang B-H, et al. The Relationship
between Health Behavior and General Health Status: Based on 2011 Korea
National Health and Nutrition Examination Survey. Osong Public Health Res
Perspect. (2014) 5:28–33. doi: 10.1016/j.phrp.2013.12.003
3. WHO. Global Health Risks: Mortality and Burden of Disease Attributable to
Selected Major Risks. Geneva: World Health Organization (2009).
4. Forouzanfar MH, Alexander L, Anderson HR, Bachman VF, Biryukov S,
Brauer M, et al. Global, regional, and national comparative risk assessment
of 79 behavioural, environmental and occupational, and metabolic risks
or clusters of risks in 188 countries, 1990-2013: a systematic analysis for
the Global Burden of Disease Study 2013. Lancet (2015) 386:2287–323.
doi: 10.1016/S0140-6736(15)00128-2
5. Ezzati M, Lopez AD. Estimates of global mortality attributable to smoking in
2000. Lancet (2003) 362:847–52. doi: 10.1016/S0140-6736(03)14338-3
6. Ronksley PE, Brien SE, Turner BJ, Mukamal KJ, Ghali WA. Association
of alcohol consumption with selected cardiovascular disease outcomes:
a systematic review and meta-analysis. BMJ (2011) 342:d671.
doi: 10.1136/bmj.d671
7. Loef M, Walach H. The combined effects of healthy lifestyle behaviors on all
cause mortality: a systematic review and meta-analysis. Prevent Med. (2012)
55:163–70. doi: 10.1016/j.ypmed.2012.06.017
8. Reiner M, Niermann C, Jekauc D, Woll A. Long-term health benefits of
physical activity – a systematic review of longitudinal studies. BMC Public
Health (2013) 13:813. doi: 10.1186/1471-2458-13-813
9. Wang X, Ouyang Y, Liu J, Zhu M, Zhao G, Bao W, et al. Fruit and vegetable
consumption and mortality from all causes, cardiovascular disease, and
cancer: systematic review and dose-response meta-analysis of prospective
cohort studies. Br Med J. (2017) 349:g4490. doi: 10.1136/bmj.g4490
10. Singh A, Rouxel P, Watt RG, Tsakos G. Social inequalities in clustering of
oral health related behaviors in a national sample of British adults. Prev Med.
(2013) 57:102–6. doi: 10.1016/j.ypmed.2013.04.018
11. Meader N, King K, Moe-Byrne T, Wright K, Graham H, Petticrew
M, et al. A systematic review on the clustering and co-occurrence
of multiple risk behaviours. BMC Public Health (2016) 16:657.
doi: 10.1186/s12889-016-3373-6
12. Spring B, Moller AC, Coons MJ. Multiple health behaviours: overview
and implications. J Public Health (Oxf) (2012) 34(Suppl. 1):i3–10.
doi: 10.1093/pubmed/fdr111
13. Schuit AJ, Van Loon AJM, Tijhuis M, Ocké MC. Clustering of lifestyle
risk factors in a general adult population. Prevent Med. (2002) 35:219–24.
doi: 10.1006/pmed.2002.1064
14. Poortinga W. The prevalence and clustering of four major lifestyle risk
factors in an English adult population. Prevent Med. (2007) 44:124–8.
doi: 10.1016/j.ypmed.2006.10.006
15. Mawditt C, Sacker A, Britton A, Kelly Y, Cable N. The clustering of
health-related behaviours in a British population sample: Testing for cohort
differences. Prev Med. (2016) 88:95–107. doi: 10.1016/j.ypmed.2016.03.003
16. Conry MC, Morgan K, Curry P, Mcgee H, Harrington J, Ward M, et al. The
clustering of health behaviours in Ireland and their relationship with mental
health, self-rated health and quality of life. BMC Public Health (2011) 11:692.
doi: 10.1186/1471-2458-11-692
17. Prochaska JJ, Spring B, Nigg CR. Multiple health behavior change
research: an introduction and overview. Prev Med. (2008) 46:181–8.
doi: 10.1016/j.ypmed.2008.02.001
18. Carr SM, Lhussier M, Forster N, Geddes L, Deane K, Pennington M,
et al. An evidence synthesis of qualitative and quantitative research
on component intervention techniques, effectiveness, cost-effectiveness,
equity and acceptability of different versions of health-related lifestyle
advisor role in improving health. Health Technol Assess (2011) 15:1–284.
doi: 10.3310/hta15090
19. Busch V, Van Stel HF, Schrijvers AJP, De Leeuw JRJ. Clustering of
health-related behaviors, health outcomes and demographics in Dutch
adolescents: a cross-sectional study. BMC Public Health (2013) 13:1118.
doi: 10.1186/1471-2458-13-1118
20. Noble N, Paul C, Turon H, Oldmeadow C. Which modifiable health risk
behaviours are related? A systematic review of the clustering of Smoking,
Nutrition, Alcohol and Physical activity (’SNAP’) health risk factors. Prev
Med. (2015) 81:16–41. doi: 10.1016/j.ypmed.2015.07.003
21. De Vries H, Van ’T Riet J, Spigt M, Metsemakers J, Van Den Akker M,
Vermunt JK, et al. Clusters of lifestyle behaviors: results from the Dutch
SMILE study. Prev Med. (2008) 46:203–8. doi: 10.1016/j.ypmed.2007.08.005
22. Mcaloney K, Graham H, Law C, Platt L. A scoping review of statistical
approaches to the analysis of multiple health-related behaviours. Prevent Med.
(2013) 56:365–71. doi: 10.1016/j.ypmed.2013.03.002
23. Khaw KT, Wareham N, Bingham S, Welch A, Luben R, Day N. Combined
impact of health behaviours and mortality in men and women: the
EPIC-Norfolk prospective population study. PLoS Med. (2008) 5:e12.
doi: 10.1371/journal.pmed.0050012
24. Ford ES, Bergmann MM, Boeing H, Li C, Capewell S. Healthy lifestyle
behaviors and all-cause mortality among adults in the United States. Prevent
Med. (2012) 55:23–7. doi: 10.1016/j.ypmed.2012.04.016
25. Saint Onge JM, Krueger PM. Health lifestyle behaviors among U.S. adults.
SSM – Popul Health (2017) 3:89–98. doi: 10.1016/j.ssmph.2016.12.009
26. Yin S, Njai R, Barker L, Siegel PZ, Liao Y. Summarizing health-related quality
of life (HRQOL): development and testing of a one-factormodel. Popul Health
Metr. (2016) 14:22. doi: 10.1186/s12963-016-0091-3
27. Ellert U, Kurth BM. Health related quality of life in adults in Germany.
Bundesgesundheitsblatt - Gesundheitsforschung - Gesundheitsschutz (2013)
56:643–9. doi: 10.1007/s00103-013-1700-y
28. Vogl M, Wenig CM, Leidl R, Pokhrel S. Smoking and health-related quality
of life in English general population: implications for economic evaluations.
BMC Public Health (2012) 12:203. doi: 10.1186/1471-2458-12-203
29. Valencia-Martin JL, Galan I, Guallar-Castillon P, Rodriguez-Artalejo
F. Alcohol drinking patterns and health-related quality of life
reported in the Spanish adult population. Prev Med. (2013) 57:703–7.
doi: 10.1016/j.ypmed.2013.09.007
30. Milte CM, Thorpe MG, Crawford D, Ball K, Mcnaughton SA. Associations
of diet quality with health-related quality of life in older Australian men and
women. Exp Gerontol. (2015) 64:8–16. doi: 10.1016/j.exger.2015.01.047
31. Rabel M,Meisinger C, Peters A, Holle R, LaxyM. The longitudinal association
between change in physical activity, weight, and health-related quality of life:
results from the population-based KORA S4/F4/FF4 cohort study. PLoS ONE
(2017) 12:e0185205. doi: 10.1371/journal.pone.0185205
Frontiers in Public Health | www.frontiersin.org 8 January 2019 | Volume 6 | Article 387

Rabel et al. Clustered Health Behavior Patterns
32. Dumuid D, Olds T, Lewis LK, Martin-Fernández JA, Katzmarzyk PT, Barreira
T, et al. Health-related quality of life and lifestyle behavior clusters in
school-aged children from 12 countries. J Pediatr. (2017) 183:178–83.e172.
doi: 10.1016/j.jpeds.2016.12.048
33. Li C, Ford ES, Mokdad AH, Jiles R, Giles WH. Clustering of multiple
healthy lifestyle habits and health-related quality of life among US adults with
diabetes. Diabetes Care (2007) 30:1770–6. doi: 10.2337/dc06-2571
34. Cockerham WC. Lifestyles, social class, demographic characteristics and
health behavior. In: Gochman DS, editor. Handbook of Health Behavior
Research I. Personal and Social Determinants. New York, NY: Plenum Press
(1997). p. 253–65.
35. Kongsted A, Nielsen AM. Latent Class Analysis in health research. J Physiother
(2017) 63:55–8. doi: 10.1016/j.jphys.2016.05.018
36. Rathmann W, Haastert B, Icks A, Lowel H, Meisinger C, Holle R, et al. High
prevalence of undiagnosed diabetes mellitus in Southern Germany: target
populations for efficient screening. The KORA survey 2000. Diabetologia
(2003) 46:182–9. doi: 10.1007/s00125-002-1025-0
37. Wellmann J, Heidrich J, Berger K, Döring A, Heuschmann PU, Keil U.
Changes in alcohol intake and risk of coronary heart disease and all-cause
mortality in theMONICA/KORA-Augsburg cohort 1987-97. Eur J Cardiovasc
Prevent Rehabil. (2004) 11:48–55. doi: 10.1097/01.hjr.0000118174.70522.20
38. Lange C, Manz K, Kuntz B. Alkoholkonsum bei erwachsenen
in deutschland: riskante trinkmengen. J Health Monitor. (2017) 2:66–73.
doi: 10.17886/RKI-GBE-2017-031
39. Winkler G, Döring A. Validation of a short qualitative food frequency list used
in several German large scale surveys. Zeitschrift für Ernährungswissenschaft
(1998) 37:234–41. doi: 10.1007/PL00007377
40. Stender M, Döring A, Hense HW, Schlichtherle S, M’harzi S, Keil U.
Vergleich zweier methoden zur erhebung der körperlichen aktivität. Sozial-
und Präventivmedizin (1991) 36:176–83. doi: 10.1007/BF01352697
41. Ware JJr, Kosinski M, Keller SD. A 12-item short-form health survey:
construction of scales and preliminary tests of reliability and validity. Med
Care (1996) 34:220–33. doi: 10.1097/00005650-199603000-00003
42. Hagenaars J, Mccutcheon A. Applied Latent Class Analysis. Cambridge:
Cambridge University Press (2002).
43. Collins LM, Lanza ST. Latent Class and Latent Transition Analysis. Hoboken,
NJ: Wiley (2010).
44. Linzer DA, Lewis JB. poLCA: an R package for polytomous variable latent class
analysis. (2011) 42:29. doi: 10.18637/jss.v042.i10
45. Tein J-Y, Coxe S, Cham H. Statistical power to detect the correct number
of classes in latent profile analysis. Struc Equ Model. (2013) 20:640–57.
doi: 10.1080/10705511.2013.824781
46. Masyn KE. Latent class analysis and finite mixture modeling. In: Little TD,
editor. The Oxford Handbook of Quantitative Methods.New York, NY: Oxford
University Press (2013).
47. R Core Development Team. R: A Language and Environment for Statistical
Computing. Vienna: R Foundation for Statistical Computing (2010).
48. Wacker M, Holle R, Heinrich J, Ladwig KH, Peters A, Leidl R, et al. The
association of smoking status with healthcare utilisation, productivity loss
and resulting costs: results from the population-based KORA F4 study. BMC
Health Serv Res (2013) 13:278. doi: 10.1186/1472-6963-13-278
49. Schneider S, Huy C, Schuessler M, Diehl K, Schwarz S. Optimising
lifestyle interventions: identification of health behaviour patterns by cluster
analysis in a German 50+ survey. Eur J Public Health (2009) 19:271–7.
doi: 10.1093/eurpub/ckn144
50. Dodd LJ, Al-Nakeeb Y, Nevill A, Forshaw MJ. Lifestyle risk factors of
students: a cluster analytical approach. Prevent Med. (2010) 51:73–7.
doi: 10.1016/j.ypmed.2010.04.005
51. Warkentin LM, Majumdar SR, Johnson JA, Agborsangaya CB, Rueda-
Clausen CF, Sharma AM, et al. Weight loss required by the severely
obese to achieve clinically important differences in health-related quality
of life: two-year prospective cohort study. BMC Med. (2014) 12:1–9.
doi: 10.1186/s12916-014-0175-5
52. Fleary SA, Nigg CR. Trends in health behavior patterns among US adults,
2003–2015. Ann Behav Med. (2019) 53:1–15. doi: 10.1093/abm/kay010
53. Burgard SA, Lin KYP, Segal BD, Elliott MR, Seelye S. Stability and change
in health behavior profiles of U.S. adults. J Gerontol Series B (2018)
doi: 10.1093/geronb/gby088
54. Vermunt JK, Magidson J. Latent class cluster analysis. In: Mccutcheon
AL, Hagenaars JA, editors. Applied Latent Class Analysis. Cambridge:
Cambridge University Press (2002) 89–106. doi: 10.1017/CBO97805114995
31.004
Conflict of Interest Statement: The authors declare that the research was
conducted in the absence of any commercial or financial relationships that could
be construed as a potential conflict of interest.
Copyright © 2019 Rabel, Laxy, Thorand, Peters, Schwettmann and Mess. This is an
open-access article distributed under the terms of the Creative Commons Attribution
License (CC BY). The use, distribution or reproduction in other forums is permitted,
provided the original author(s) and the copyright owner(s) are credited and that the
original publication in this journal is cited, in accordance with accepted academic
practice. No use, distribution or reproduction is permitted which does not comply
with these terms.
Frontiers in Public Health | www.frontiersin.org 9 January 2019 | Volume 6 | Article 387

Clustered Health Behavior Patterns
1
Appendix
Figure A1. The latent class regression model.
A graphical description of the latent class regression model based on baseline (S4) data.
Figure A2. Two-class-conditional item probabilities.
The figure shows the probabilities of each health behavior category conditional on latent class
membership for a two-class model.
Latent class
membership
Alcohol (S4 data)
Smoking (S4 data)
Physical
activity (S4 data)
Nutrition (S4 data)
Sex (S4 data) Age (S4 data)
Education (S4 data)

Clustered Health Behavior Patterns
2
Figure A3. Four-class-conditional item probabilities.
The figure shows the probabilities of each health behavior category conditional on latent class
membership for a three-class model.
Table A1. Three-class-conditional item probabilities exact values
Referring to Figure 3 in the manuscript, this table shows the exact numerical values of the
class-conditional item probabilities.
Class 1 Class 2 Class 3
Alcohol
no 0.133 0.450 0.254
moderate 0.355 0.469 0.374
risky 0.512 0.081 0.372
Nutrition
favorable 0.543 0.630 0.200
ordinary 0.219 0.187 0.221
adverse 0.237 0.183 0.579
Physical activity
active 0.265 0.155 0.188
moderate 0.414 0.488 0.466
inactive 0.321 0.357 0.346
Smoking
non 0.324 0.644 0.258
ex 0.561 0.208 0.206
irregular 0.022 0.020 0.057
regular 0.094 0.128 0.479

Clustered Health Behavior Patterns
3
Table A2. Further descriptive statistics on latent classes.
In addition to the reported information in the manuscript, this table shows further descriptive
information concerning the three latent classes.
Latent Classes
I II III
Overall sample (n, %) 1366 (32.2) 1562 (36.9) 1310 (30.9)
Male (n, %) 1143 (83.7) 0 (0.0) 932 (71.1)
Female (n, %) 223 (16.3) 1562 (100.0) 378 (28.9)
Age (mean, SD) 56.1 (11.9) 52.4 (13.0) 38.1 (9.8)
Education
main school (n, %) 610 (44.7) 944 (60.4) 736 (56.2)
middle school (n, %) 281 (20.6) 378 (24.2) 325 (24.8)
grammar school (n, %) 475 (34.8) 240 (15.4) 249 (19.0)
Alcohol consumption
no (n, %) 153 (11.2) 697 (44.6) 331 (25.3)
moderate (n, %) 447 (32.7) 769 (49.2) 478 (36.5)
risky (n, %) 766 (56.1) 96 (6.1) 501 (38.2)
Nutrition
good (n, %) 761 (55.7) 997 (63.8) 200 (15.3)
normal (n, %) 306 (22.4) 297 (19.0) 282 (21.5)
bad (n, %) 299 (21.9) 268 (17.2) 828 (63.2)
Physical activity behavior
active (n, %) 377 (27.6) 241 (15.4) 243 (18.5)

Clustered Health Behavior Patterns
4
moderate (n, %) 552 (40.4) 771 (49.4) 609 (46.5)
inactive (n, %) 437 (32.0) 550 (35.2) 458 (35.0)
Smoking behavior
non (n, %) 432 (31.6) 1009 (64.6) 299 (22.8)
ex (n, %) 830 (60.8) 339 (21.7) 220 (16.8)
irregular (n, %) 18 (1.3) 34 (2.2) 86 (6.6)
regular (n, %) 86 (6.3) 180 (11.5) 705 (53.8)

International Journal of
Environmental Research
and Public Health
Article
Change in Physical Activity after Diagnosis ofDiabetes or Hypertension: Results from anObservational Population-Based Cohort Study
Matthias Rabel 1,2,* , Filip Mess 1, Florian M. Karl 2,3 , Sara Pedron 2,3, Lars Schwettmann 2,
Annette Peters 4, Margit Heier 4,5 and Michael Laxy 2,3,6
1 Department of Sport and Health Sciences, Technical University of Munich, Munich 80992, Germany;[email protected]
2 Helmholtz Zentrum München–German Research Center for Environmental Health (GmbH), Institute ofHealth Economics and Health Care Management, Garching 85748, Germany;[email protected] (F.M.K.); [email protected] (S.P.);[email protected] (L.S.); [email protected] (M.L.)
3 German Center for Diabetes Research (DZD), Munich-Neuherberg 85764, Germany4 Helmholtz Zentrum München—German Research Center for Environmental Health (GmbH), Institute of
Epidemiology, Neuherberg 85764, Germany; [email protected] (A.P.);[email protected] (M.H.)
5 KORA Study Centre, University Hospital Augsburg, Augsburg 86156, Germany6 Rollins School of Public Health—Global Diabetes Research Center, Emory University, Atlanta,
GA 30322, USA* Correspondence: [email protected]
Received: 19 September 2019; Accepted: 30 October 2019; Published: 1 November 2019�����������������
Abstract: Background: Chronic diseases like diabetes mellitus or hypertension are a major publichealth challenge. Irregular physical activity (PA) is one of the most important modifiable risk factorsfor chronic conditions and their complications. However, engaging in regular PA is a challenge formany individuals. The literature suggests that a diagnosis of a disease might serve as a promisingpoint in time to change health behavior. This study investigates whether a diagnosis of diabetes orhypertension is associated with changes in PA. Methods: Analyses are based on 4261 participantsof the population-based KORA S4 study (1999–2001) and its subsequent 7-and 14-year follow-ups.Information on PA and incident diagnoses of diabetes or hypertension was assessed via standardizedinterviews. Change in PA was regressed upon diagnosis with diabetes or hypertension, usinglogistic regression models. Models were stratified into active and inactive individuals at baselineto avoid ceiling and floor effects or regression to the mean. Results: Active participants at baselineshowed higher odds (OR = 2.16 [1.20;3.89]) for becoming inactive after a diabetes diagnosis thanthose without a diabetes diagnosis. No other significant association was observed. Discussion:
As PA is important for the management of diabetes or hypertension, ways to increase or maintainPA levels in newly-diagnosed patients are important. Communication strategies might be crucial,and practitioners and health insurance companies could play a key role in raising awareness.
Keywords: physical activity; diagnosis; diabetes; hypertension; health behavior; chronic disease
1. Introduction
Chronic diseases like cancer, diabetes mellitus, or cardiovascular conditions are considered to beamong the most important challenges to public health. Further, chronic diseases are the main driverfor impaired quality of life, and account globally for more than 70% of deaths [1]. Nonetheless, they
Int. J. Environ. Res. Public Health 2019, 16, 4247; doi:10.3390/ijerph16214247 www.mdpi.com/journal/ijerph

Int. J. Environ. Res. Public Health 2019, 16, 4247 2 of 12
are preventable. The key risk factors for chronic diseases include poor diet, alcohol consumption,smoking, and physical inactivity [2]. Furthermore, even though the benefits of positive health behaviorchanges are well known [3], people often have difficulties initiating a change in their health behaviorfor several reasons [4].
The literature suggests that so-called “health shocks” might serve as a “natural nudge” [5],“wake-up call” [6], “window of opportunity” [7] or “teachable moment” [8] to initiate a health behaviorchange. A health shock in this context is considered to be an unpredicted illness that lowers a person’shealth status [9]. Other sources define health shocks as an outbreak of a disease [5] or as a negativeeffect on someone’s health [10]. Further studies expand the term and describe a health shock as achange in self-assessed health [10] or a decline in grip strength [11]. Finally, according to Agüero andBeleche [5], the diagnosis of an illness like diabetes or hypertension can also be interpreted as a healthshock [5]. Within this study, we follow Agüero and Beleche’s [5] definition. Therefore, a medicaldiagnosis might be a promising point in time to initiate health behavior changes, as physicians occupya central role when it comes to health behavior [12].
There are several theoretical health behavior theories supporting the hypothesis that a diagnosismight lead to a health behavior change. One very popular theoretical model to describe behaviorchanges is the Health Action Process Approach Model by Schwarzer. This psychological approachsuggests that risk perception is an important factor when it comes to building an intention to changea health behavior [13]. The Protection Motivation Theory by Rogers is a further theory proclaimingthreat appraisals as a fundamental component of behavior change [14]. Both the Health Action ProcessApproach and the Protection Motivation Theory offer a theoretical foundation for the event of adiagnosis to be viewed as an important factor explaining health behavior and health behavior changes.
Empirically, a few studies have investigated possible associations between a diagnosis of several kindsof diseases and a change in different kinds of health behaviors. Whereas the effects of different types ofdiagnoses, for example a decline in self-assessed health status, cancer diagnosis, cardiovascular conditions,stroke, and diabetes, on smoking cessation have been documented by multiple studies [6,7,10,15–18],the body of evidence for other behaviors is smaller, and study results are more heterogeneous. Forexample, it was reported that alcohol consumption decreased slightly after the diagnosis of one ofmultiple chronic diseases [6] or after a cancer diagnosis [19]. Regarding dietary behavior, it was shownthat people eat a healthier diet after a cancer [15] or a diabetes diagnosis [20].
In terms of physical activity (PA), studies reported decreasing levels of PA after a cancerdiagnosis [15,19], or no change after experiencing a diabetes diagnosis [20,21] or any multiple chronicdisease diagnosis [6]. In contrast, one other study reported significant increases in women’s PA after adiabetes diagnosis [22].
Relative to the few studies on associations between changes in PA after a diabetes diagnosis,the number of studies examining PA changes after a hypertension diagnosis is even smaller; only twostudies have dealt with the latter relationship. Hernandez et al. described that only 25% of inactiveparticipants increased their PA after a hypertension diagnosis [23]. Neutel and Campell reported smallbut non-lasting improvements in PA behavior after a hypertension diagnosis [24].
For both, i.e., diabetes and hypertension, the benefits of PA are well known [25,26], and regularPA is recommended in treatment guidelines [27,28]. Hence, knowledge about a possible healthbehavior change after a diabetes or hypertension diagnosis is crucial for a couple of reasons concerningpublic health. First, it yields important information on designing public health interventions. It mightstrengthen the claim that for the whole process of behavior change, the moment of receiving informationabout health consequences could be even more important than the knowledge itself of the harmfulconsequences [5]. Second, as evidence suggests that physicians play an important role when it comesto promoting behavioral changes [12], behavioral interventions promoted by physicians could bedesigned more effectively in the context of the diagnosis. Third, a positive health behavior changecould lower the risk of disease reoccurrence, increase health-related quality of life, and positivelyinfluence longevity [6].

Int. J. Environ. Res. Public Health 2019, 16, 4247 3 of 12
Consequentially, the aim of this paper is to investigate possible associations between a diabetes orhypertension diagnosis and PA change. For this, we use well pheno-typed data from a large Germanpopulation-based cohort study comprising three measurements over a period of 14 years.
2. Materials and Methods
2.1. Study Design and Participants
The data originated from the KORA (Cooperative Health Research in the Region of Augsburg)S4/F4/FF4 cohort study located in Southern Germany. The S4 (1999–2001) study was a population-basedcross-sectional health survey including 4261 adult participants (67% response rate of all eligibleparticipants) aged 25 to 74 years [29]. Of those, 3080 (80% response rate) took part in the first follow-upF4 (2006–2008) examination and 2279 (79% response rate) in the second follow-up FF4 (2013–2014)examination (compare caption in Figure 1 for details). For all studies, information on participants wascollected during standardized medical examinations, standardized face-to-face interviews conductedby trained medical staff, and self-administered questionnaires. Additional information on the S4 studyregarding the sampling methods and data collection has been published elsewhere [30]. All studyparticipants gave written informed consent. The Ethics Committee of the Bavarian Medical Associationapproved the KORA S4/F4/FF4 studies.
Figure 1. Study population and analysis flow chart. * Of the baseline S4 sample, 174 died, 204 movedoutside the study region or to an unknown location, and 12 refused to be further contacted. Of theremaining 3871 eligible participants, 176 could not be contacted, 220 were too ill or busy, and 395 refusedto participate further. Thus, 3080 participants (80% response rate) took part in the first follow-up F4(2006-2008) examination. Of the F4 sample, 168 died, 97 moved outside the study region or to anunknown location, and 67 refused to be contacted further. Of the resulting eligible 2748 participants,48 could not be contacted, 332 were too ill or busy, and 207 refused to participate further. Adding118 participants from S4 without F4 information, 2279 (79% response rate, excluding 118 participantswithout F4 information) participants took part in the second follow-up FF4 (2013–2014) examination.Annotations: n = number of participants, Nobs = number of observations.

Int. J. Environ. Res. Public Health 2019, 16, 4247 4 of 12
2.2. Measures
Physical activity: Changes in PA was the main outcome of this study. Participants’ levels ofPA were assessed during standardized interviews using two separate, four-category item questionsreflecting weekly time spent on leisure-time PA during winter and summer. Within the KORAresearch platform, both items were combined into a single variable with the following categories:(1) “(almost) no activity”, (2) “about 1 h per week, irregularly”, (3) “about 1 hour per week, regularly”and (4) “regularly, more than 2 h per week”. The questions on leisure-time PA were derived from theGerman Cardiovascular Prevention Study conducted between 1979 and 1995. The questions werevalidated in the KORA population [31] using a PA diary as comparison.
For the present study, PA was dichotomized by condensing categories (1) and (2), representingirregular PA and inactive individuals, and categories (3) and (4), representing regular PA and activeindividuals. We decided to draw the line between categories (2) and (3), as (3) represents regularPA, and can therefore be considered as habitualized behavior, whereas category (2) still symbolizesirregular and infrequent PA behavior. This cut-off for the dichotomization of PA was also used inprevious KORA studies [32]. The change in PA is a binary variable indicating whether a person showeda change in PA at a follow-up session.
Incident diabetes and hypertension diagnosis: To consider individual awareness of a diabetes orhypertension diagnosis, we used self-reported information on the existence of diabetes (Questionnaireitem: “Are you diabetic?”, and further information on the intake of antidiabetics) and hypertension(Questionnaire item: “Have you ever had elevated blood pressure or been diagnosed with high bloodpressure?”) from the standardized interviews. An incident diagnosis of diabetes or hypertension wascoded binary if the condition was not present at baseline but present at follow up.
Covariates: Other relevant variables assessed at all three measurement points were sex (male,female), levels of secondary education (lower, intermediate, higher; corresponding to German“Hauptschule”, “Realschule”, “Gymnasium”), family status (living alone, living together), age(continuous), body mass index (BMI) (continuous), and physical and mental health-related qualityof life (both continuous). Both components of health-related quality of life were measured using theSF-12 health survey [33].
2.3. Statistical Analyses
We investigated the association between diabetes or a hypertension diagnoses and changes inPA between two measurement points. Therefore, participants with existing diabetes or hypertensionwere excluded from the respective models. To increase the statistical power, the two seven-yearfollow-up periods from S4 to F4 and from F4 to FF4 were combined, comprising the observations ofboth periods. This means that we treated the S4-F4 follow-up period and the F4-FF4 follow-up periodas two separated periods. Consequently, participants with an incident diagnosis in the first follow-upperiod only appeared once in the final analysis sample, whereas participants without an incidentdiagnosis in the first follow-up period appeared twice. To account for dependencies due to the repeatedmeasurement of participants, the participant ID was set as a random intercept in the models. To avoidceiling or floor effects and regression to the mean, we stratified our sample according to baselinePA categories, resulting in an “inactive” and “active” stratum. Thus, for individuals being inactiveat baseline, we compared the odds of becoming active between those with an incident diagnosis ofdiabetes or hypertension and those without such a diagnosis. Conversely, for active individuals atbaseline, we compared the odds of becoming inactive between those with a diagnosis of diabetesor hypertension and those without such a diagnosis. Figure 1 provides an overview of the studypopulation and the analysis set-up. Four logistic regression models were fit in order to investigatepossible changes in PA after experiencing a diabetes or hypertension diagnosis. For both strata, i.e.,active and inactive, changes in PA were regressed on either a diabetes diagnosis or a hypertensiondiagnosis. The models were adjusted for sex, age, education, family status, baseline BMI, change

Int. J. Environ. Res. Public Health 2019, 16, 4247 5 of 12
in BMI, and change in physical and mental health-related quality of life. For a better convergence,all continuous covariates were standardized, with mean equals zero and standard deviation equals one.
All data-related processes and statistical analyses were conducted using RStudio (Version 1.1.456,RStudio Inc., Boston, USA) [34]. Logistic regression models were carried out using the “lme4” package(Version 1.1.20) [35].
3. Results
3.1. Descriptive Analyses
Considering the S4 baseline sample with 4261 participants, 29 participants (0.68%) had missingvalues for PA, resulting in a baseline sample of 4232 participants of whom 51% were female andfor whom the mean age was 49.2 ± 13.9 years. The mean BMI was 27.2 ± 4.7 kg/m2. According tothe baseline PA value, 2058 participants showed active leisure-time PA and 2174 showed inactiveleisure-time PA. Table 1 depicts descriptive statistics for the baseline S4 study.
Table 1. Descriptive information on the baseline S4 study for the total sample.
Parameter Baseline S4
N 4232Female 2158 0.51Age (mean) (SD) 49.18 13.94BMI (mean) (SD) 27.22 4.73Physical activityInactive 1447 0.34About 1 h/week irregularly 727 0.17About 1 h/week regularly 1200 0.28More than 2 h/week 858 0.20Levels of secondary educationLower 2287 0.54Intermediate 981 0.23Higher 963 0.23Family statusSingle, living alone 483 0.11Single, living together with partner 223 0.05Married, living together 2901 0.69Married, separated 79 0.02Divorced 296 0.07Widowed 250 0.06Present diagnosis (Excluded from respective models)Diabetes 166 0.04Hypertension 1079 0.26
Absolute and relative frequencies regarding relevant covariates. Abbreviations: N = number of observations,SD = standard deviation, h/week = hours per week.
Regarding diabetes, there were 166 participants with existing diabetes at S4, 214 with existingdiabetes at F4, and 219 with existing diabetes at FF4. Regarding hypertension, there were1079 participants with existing hypertension at S4, 1043 with existing hypertension at F4, and 831 withexisting hypertension at FF4. The present study focuses on a new incident diagnoses of diabetes andhypertension. Therefore, Figure 2 shows the number of incident cases of diabetes and hypertensionby PA changes between S4 and F4 (columns 1 & 2), between F4 and FF4 (columns 3 & 4), and for thedataset of the assembled S4/F4 and F4/FF4 periods (columns 5 & 6). The assembled data set is the oneused for the main logistic regression models.

Int. J. Environ. Res. Public Health 2019, 16, 4247 6 of 12
Figure 2. Overview of the cases with incident diagnosis of diabetes or hypertension for the activeand inactive strata by PA change. See Figures S1 and S2 in the supplement for a detailed overviewof how the presented numbers were derived. Numbers of observations for the combination of bothfollow-up periods: Active-Diabetes = 2722; Active-Hypertension = 2174; Inactive-Diabetes = 2298;Inactive-Hypertension = 1679. Deviations from the numbers of Figures 2 and 3 are due to missingvalues in covariates for which the models of Figure 3 were adjusted. Abbreviations: PA = physicalactivity; S4 = baseline study (2000); F4 = first follow-up (2007); FF4 = second follow-up (2014).
Figure 3. The odds-ratios for changing PA after a diabetes/hypertension diagnosis for both baselinePA strata. ORs for the active stratum display the odds of changing to inactive. ORs for the inactivestratum display the odds of changing to active. All models were adjusted for the following factors:sex, age, education, family status, baseline BMI, change in BMI, and change in physical and mentalhealth-related quality of life. Abbreviations: Nobs =Number of observations, OR = Odds ratio, 95%CI = 95% Confidence interval.
3.2. Associations between Diabetes or Hypertension Diagnosis and PA Change
Figure 3 shows the odds ratios for changing PA after a diabetes or hypertension diagnosis.For participants who were active at baseline, the figure shows the odds of becoming inactive, while forinactive participants at baseline, it shows the odds of becoming active after receiving a diabetes orhypertension diagnosis. The results from the logistic regression models show that participants whowere active at baseline had higher odds (OR = 2.16, 95% CI = [1.20,3.89]) of changing PA and becominginactive after facing a diabetes diagnosis compared to individuals who did not receive such a diagnosisin the same period. Regarding hypertension, the odds of the already-active participants to becomeinactive after the diagnosis were smaller than those for participants that did not receive a diagnosis(OR = 0.93, 95% CI = [0.64,1.35]). For those participants who were inactive at baseline, the odds ofbecoming active after a diabetes diagnosis were smaller than those for participants who were notdiagnosed with diabetes (OR = 0.74, 95% CI = [0.46,1.18]). The odds of participants who were inactive

Int. J. Environ. Res. Public Health 2019, 16, 4247 7 of 12
at baseline to become active after a hypertension diagnosis were the same as those for participants thatdid not receive a hypertension diagnosis (OR = 1.02, 95% CI = [0.75,1.40]). A complete overview of thefour logistic regression models, including all variables, can be seen in Table S1 in the supplement.
3.3. Additional Analyses
We ran several sensitivity analyses to check the robustness of our results. In an additional analysis,we changed the decision line for the dichotomization of PA. In that case, we only classified the category“(almost) no activity” as inactive, and combined the other three categories as active. The associationbetween the two assessed diagnoses and change in PA did not differ from the main analyses. The resultsof the models, including the altered PA variable, are presented in Figure S3 in the supplement.
In another additional analysis, we ran the same logistic regression models on each follow-upperiod separately. These models showed similar results, justifying our approach to combine bothfollow-up periods in the main analyses. The corresponding results are presented in detail in Tables S2and S3 in the supplement.
4. Discussion
We examined the associations between a diabetes or hypertension diagnosis and changes in PAto investigate whether a diagnosis can be seen as catalyst for health behavior changes. For this, weanalyzed the data of 4232 participants, including three measurement points over the course of 14 years.The results showed no indication for improved PA among participants with a diabetes or hypertensiondiagnosis compared to participants without a diagnosis. Initially active participants showed higherodds of changing their PA and becoming inactive after a diabetes diagnosis. All other results hadsmall effect sizes and were not statistically significant. Active participants did not change their PAafter a hypertension diagnosis. Inactive participants prior to a diabetes or hypertension diagnosiswere not more likely to become active than participants without a diabetes or hypertension diagnosis.We performed several sensitivity analyses showing the robustness of our findings.
4.1. Interpretation and Implications
Although the literature suggests a pathway from the onset of a chronic disease leading to a changein health behavior, we have to point out that it might as well be the other way around. It might also bepossible that a lack of PA leads to the onset of a chronic disease. With our study, we can only investigateassociations between an diabetes or hypertension diagnoses and PA changes, but we cannot imply acausal relationship between those parameters. Hence, although we follow a theoretical framework thatsuggests the plausibility of the effect of a diabetes or hypertension diagnosis on PA, and although ourlongitudinal models were adjusted for important confounders, our estimates do not imply causality,and should rather be interpreted as descriptive measures.
According to the treatment guidelines for diabetes and hypertension, general practitionersshould stress the importance and benefits of regular PA [27,28]. Yet, in our study, we did not see animprovement in PA. Moreover, regarding diabetes diagnoses, we observed a higher decline in PAcompared to people without a diabetes diagnosis.
One possible reason for this could be that people might not be aware of the benefits of modified PAbehavior in the context of a diabetes or hypertension diagnosis. Other studies report that overweight orobese participants do not attribute their weight to a greater health risk [36,37]. This lack of knowledgeconcerning the connection of excessive weight and health could also be applicable to PA.
Furthermore, the aforementioned awareness problem might also explain deviations from theHealth Action Process Approach model and the Protection Motivation Theory. The perceived futurerisk of a diabetes or hypertension diagnosis may have too little effect on the theory’s risk perceptionand threat appraisal. The high prevalence of diabetes and hypertension, as well as good treatmentoptions, might be possible reasons for a limited perceived risk. Several studies have reported the

Int. J. Environ. Res. Public Health 2019, 16, 4247 8 of 12
limited use of risk perception as a predictor of behavioral changes within, for example, the frameworkof the Health Action Process Approach Model [38–40].
Another interpretation could be that the patient might be more accustomed to medical treatmentthan to changes in PA as a proper reaction to a medical diagnosis. Jarbøl et al. suggest that peoplemight prefer a change in their lifestyle behaviors over medicinal treatment when the perceived effectsof both options on disease management are equal [41]. Considering that the advantages of regular PAare not immediately noticeable [20,42], people might prefer a medicinal therapy after a diabetes orhypertension diagnosis.
Emotional factors might serve as another explanation for non-improved or even declined levels ofPA. Thomas et al. reported that a lack of confidence in the ability to exercise and the fear of deterioratingdiabetes are major barriers to physical activity for people with diabetes [43].
In view of these interpretations, there is potential to better communicate the benefits of regular PAto the public. There is a need for better information about the positive effects of behavioral changes inthe context of secondary prevention. Public health initiatives should aim to strengthen health literacy,and research should focus on ways in which to effectively communicate the benefits of positive healthbehavior to the patients and the public. Following the clinical practice guidelines for diabetes andhypertension, increased PA needs to be considered as an important factor in health care managementwhich ought to be better reimbursed by insurers. The importance of adherence to recommended PAlevels, especially regarding secondary prevention, has to be stressed by practitioners, and counsellingtime should be adequately reimbursed by health insurance companies.
4.2. Comparison with Similar Studies
Several studies have mentioned positive changes in health behavior following a diagnosis.When comparing these studies, one has to acknowledge the different characteristics of different diseasesand their effect on PA. Chronic diseases like cancer, stroke, or myocardial infarction come along withserious physical impairments that often make it difficult to stay physically active, whereas diabetesor hypertension usually do not restrict people in terms of their physical activity levels. It seems thatbesides the covered types of diagnoses, the results vary for different health behaviors. While severalstudies have reported a positive effect on smoking behavior [7,10,15–18], the present study did notshow comparably positive effects on PA behavior. In their qualitative study, Dolor et al. found thatpractitioners consider counseling on PA and weight management to be more time-consuming thancounseling on smoking [44].
Compared to previous studies, our results are in line with the majority of the published resultsreporting no increase in PA after a diabetes diagnosis [6,20]. Leung et al. reported that the observedhigher rates of exercise initiation for participants that have been diagnosed with diabetes did not reachstatistical significance [21]. In their study, including exclusively women aged from 50 to 79 years,Schneider, et al. observed an increase in PA after a diabetes diagnosis compared to women withouta diagnosis [22]. Divergence with the results of Schneider et al. might be due to the different studypopulation and a different operationalization of change in PA. Studies on the association between ahypertension diagnosis and PA change are scarce. Neutel and Campbell reported no lasting changes inlifestyle behavior after a hypertension diagnosis apart from smoking cessation [24]. Hernandez et al.mentioned that only a quarter of inactive participants started to increase their PA after a diabetesdiagnosis [23].
4.3. Limitations
The present study has several strengths, including a large population-based sample and a longstudy period with three measurement points. Further, the study addresses an important public healthissue for which only scarce, heterogeneous evidence is available. However, the following limitationsshould be considered when interpreting the study’s results. We have no data on the time of thediagnosis. Thus, we cannot disentangle the timing of a diagnosis and PA change, and do not know

Int. J. Environ. Res. Public Health 2019, 16, 4247 9 of 12
if a diagnosis preceded PA change or vice versa. A study investigating the relationship betweendiabetes and changes in PA found a decrease in PA over time after the diagnosis. Similar to our study,Chong et al. found no significant difference regarding PA changes for people that had been diagnosedwith diabetes and those who had not [20]. A further limitation of the present study is the assessmentmethod for PA. Information on PA behavior was self-reported and was gathered in standardizedinterviews. Therefore, measurement errors and recall bias could be an issue. However, one has tobalance the tradeoff between accuracy and feasibility, especially in large cohort studies with manyvariables, such as the KORA study. Further, the considerably reduced cohort size over the course of thestudy period could result in biased effects, as healthier and more active people are more likely to remainin the cohort. Admittedly, this could only be considered a bias if, for example, people with a diabetesdiagnosis and PA level increase were more likely stay in the cohort than those with a diagnosis but witha decrease in PA levels. Finally, although we adjusted our models for numerous potential confounders,our results still might be affected by additional confounders. Possible further confounders could beage-related comorbidities or prescribed medication for prediabetes or prehypertension. Therefore,residual confounding cannot be ruled out.
5. Conclusions
In conclusion, the present study showed that individuals who practice regular PA are more likelyto become inactive after a diabetes diagnosis compared to individuals who did not receive a diabetesdiagnosis. Instead, for the same group, a hypertension diagnosis was not associated with changesin PA. Furthermore, a diabetes or hypertension diagnosis is not associated with improved PA levelsamong inactive individuals. This indicates that the suggested “open window” following a clinicaldiagnosis in which patients are more likely to adopt health behavioral changes may not exist, or maynot yet have been effectively exploited for diabetes and hypertension. In order to make better use ofthis potential in the future, one should emphasize the general awareness of the benefits of PA in thecontext of secondary prevention.
Supplementary Materials: The following are available online at http://www.mdpi.com/1660-4601/16/21/4247/s1,Figure S1: Add-on for Figure 2. Description of sample size for the first follow-up period from S4 to F4. Annotations:N = number of participants, PA = physical activity, S4 = baseline study (2000); F4 = first follow-up (2007);FF4 = second follow-up (2014), Figure S2: Add-on for Figure 2. Description of sample size for the second follow-upperiod from F4 to FF4. Annotations: N = number of participants, PA = physical activity, S4 = baseline study (2000);F4 = first follow-up (2007); FF4 = second follow-up (2014), Figure S3: Sensitivity analysis. This figure is based onnew defined cutoff points for the PA dichotomization. The odds for changing PA after a diabetes/hypertensiondiagnosis for both baseline PA strata. OR’s for the active stratum display the odds of changing to inactive. OR’s forthe inactive stratum display the odds of changing to active, Table S1: In addition to Figure 3. Complete summaryof the four logistic regression models with all covariates, Table S2: Sensitivity Analysis: Results of the modelsonly including the first follow-up period from S4 to F4, Table S3: Sensitivity Analysis: Results of the models onlyincluding the second follow-up period from F4 to FF4.
Author Contributions: Conceptualization: M.R., F.M. and M.L.; methodology: M.R., F.M.K., S.P., L.S. and M.L.;software: M.R.; validation: M.R., F.M., F.M.K., S.P., L.S., A.P., M.H. and M.L.; formal analysis: M.R.; investigation:M.R., F.M., F.M.K., S.P., L.S., A.P., M.H. and M.L.; data curation: A.P. and M.H.; writing—original draft preparation:M.R.; writing—review and editing: M.R., F.M., F.M.K., S.P., L.S., A.P., M.H. and M.L.; visualization: M.R.;supervision: F.M., F.M.K., S.P., L.S., A.P., M.H. and M.L.; project administration: L.S., A.P., M.H., M.L.; fundingacquisition: A.P.
Funding: The KORA research platform (KORA, Cooperative Research in the Region of Augsburg) was initiatedand financed by the Helmholtz Zentrum München – German Research Centre for Environmental Health.Furthermore, KORA research was supported within the Munich Centre of Health Sciences (MC Health),Ludwig-Maximilians-Universität, Munich, as part of LMUinnovativ.
Ethics Approval and Consent to Participate: All procedures performed in studies involving human participantswere in accordance with the ethical standards of the ethics committee of the Bavarian Medical Association andwith the 1964 Helsinki Declaration and its later amendments or comparable ethical standards. Informed consentwas obtained from all individual participants included in the study.
Availability of Data and Material: The data that support the findings of this study are available from KORA(https://www.helmholtz-muenchen.de/en/kora/for-scientists/cooperation-with-kora/index.html) but restrictionsapply to the availability of these data, which were used under license for the current study, and so are not publicly

Int. J. Environ. Res. Public Health 2019, 16, 4247 10 of 12
available. However, data can be requested through an individual project agreement with KORA via the onlineportal KORA.passt (https://epi.helmholtz-muenchen.de/).
Conflicts of Interest: The authors declare that they have no competing interests.
References
1. Schmidt, H. Chronic disease prevention and health promotion. In Public Health Ethics: Cases Spanning
the Globe; Barret, D.H., Ortmann, L.W., Dawson, A., Saenz, C., Reis, A., Bolan, G., Eds.; Springer: Cham,
Switzerland, 2016.
2. Bauer, U.E.; Briss, P.A.; Goodman, R.A.; Bowman, B.A. Prevention of chronic disease in the 21st century:
Elimination of the leading preventable causes of premature death and disability in the USA. Lancet 2014, 384,
45–52. [CrossRef]
3. Institute of Medicine (US) Committee on Health and Behavior: Research, Practice and Policy. Health
and Behavior: The Interplay of Biological, Behavioral, and Societal Influences; National Academies Press (US):
Washington, DC, USA, 2001.
4. Kelly, M.P.; Barker, M. Why is changing health-related behaviour so difficult? Public Health 2016, 136, 109–116.
[CrossRef]
5. Agüero, J.M.; Beleche, T. Health shocks and their long-lasting impact on health behaviors: Evidence from the
2009 h1n1 pandemic in mexico. J. Health Econ. 2017, 54, 40–55. [CrossRef]
6. Newsom, J.T.; Huguet, N.; McCarthy, M.J.; Ramage-Morin, P.; Kaplan, M.S.; Bernier, J.; McFarland, B.H.;
Oderkirk, J. Health behavior change following chronic illness in middle and later life. J. Gerontol. Ser. B
Psychol. Sci. Soc. Sci. 2012, 67, 279–288. [CrossRef]
7. Keenan, P.S. Smoking and weight change after new health diagnoses in older adults. Arch. Inter. Med. 2009,
169, 237–242. [CrossRef]
8. McBride, C.M.; Puleo, E.; Pollak, K.I.; Clipp, E.C.; Woolford, S.; Emmons, K.M. Understanding the role of
cancer worry in creating a “teachable moment” for multiple risk factor reduction. Soc Sci. Med. 2008, 66,
790–800. [CrossRef]
9. Leive, A.; Xu, K. Coping with out-of-pocket health payments: Empirical evidence from 15 african countries.
Bull. World Health Organ. 2008, 86, 849–856. [CrossRef]
10. Sundmacher, L. The effect of health shocks on smoking and obesity. Eur. J. Health Econ. 2012, 13, 451–460.
[CrossRef]
11. Decker, S.; Schmitz, H. Health shocks and risk aversion. J. Health Econ. 2016, 50, 156–170. [CrossRef]
12. Cakir, B.; Tas, A.; Sanver, T.M.; Aslan, D. Doctor’s enquiry: An opportunity for promoting smoking
cessation-findings from global adult tobacco surveys in europe. Eur. J. Public Health 2017, 27, 921–925.
[CrossRef]
13. Schwarzer, R. Self-Efficacy in the adoption and maintenance of health behaviors: Theoretical approaches
and a new model. In Self-Efficacy: Thought Control of Action; Schwarzer, R., Ed.; Hemisphere: Washington,
DC, USA, 1992.
14. Boer, H.; Seydel, E.R. Protection motivation theory. In Predicting Health Behaviour: Research and Practice
with Social Cognition Models; Conner, M., Norman, P., Eds.; Open University Press: Buckingham, UK, 1996;
pp. 95–120.
15. Blanchard, C.M.; Denniston, M.M.; Baker, F.; Ainsworth, S.R.; Courneya, K.S.; Hann, D.M.; Gesme, D.H.;
Reding, D.; Flynn, T.; Kennedy, J.S. Do adults change their lifestyle behaviors after a cancer diagnosis? Am. J.
Health Behav. 2003, 27, 246–256. [CrossRef] [PubMed]
16. Richards, M.R.; Marti, J. Heterogeneity in the smoking response to health shocks by out-of-pocket spending
risk. Health Econ. Policy Law 2014, 9, 343–357. [CrossRef] [PubMed]
17. Schmittdiel, J.A.; Cunningham, S.A.; Adams, S.R.; Nielsen, J.; Ali, M.K. Influence of a new diabetes diagnosis
on the health behaviors of the patient’s partner. Ann. Family Med. 2018, 16, 290–295. [CrossRef] [PubMed]
18. Wang, Q.; Rizzo, J.A.; Fang, H. Changes in smoking behaviors following exposure to health shocks in china.
Int. J. Environ. Res. Public Health 2018, 15, 2905. [CrossRef]
19. Williams, K.; Steptoe, A.; Wardle, J. Is a cancer diagnosis a trigger for health behaviour change? Findings
from a prospective, population-based study. Br. J. Cancer 2013, 108, 2407–2412. [CrossRef]

Int. J. Environ. Res. Public Health 2019, 16, 4247 11 of 12
20. Chong, S.; Ding, D.; Byun, R.; Comino, E.; Bauman, A.; Jalaludin, B. Lifestyle changes after a diagnosis of
type 2 diabetes. Diabetes Spectr. Publ. Am. Diabetes Assoc. 2017, 30, 43–50. [CrossRef]
21. Leung, L.A.; Swaminathan, S.; Trivedi, A.N. Diabetes diagnosis and exercise initiation among older americans.
Prev. Med. 2014, 65, 128–132. [CrossRef]
22. Schneider, K.L.; Andrews, C.; Hovey, K.M.; Seguin, R.A.; Manini, T.; Lamonte, M.J.; Margolis, K.L.;
Waring, M.E.; Ning, Y.; Sims, S.; et al. Change in physical activity after a diabetes diagnosis: Opportunity for
intervention. Med. Sci. Sports Exerc. 2014, 46, 84–91. [CrossRef]
23. Hernandez, E.M.; Margolis, R.; Hummer, R.A. Educational and gender differences in health behavior changes
after a gateway diagnosis. J. Aging Health 2018, 30, 342–364. [CrossRef]
24. Neutel, C.I.; Campbell, N.R.C. Canadian Hypertension Society. Changes in lifestyle after hypertension
diagnosis in canada. Can. J. Cardiol. 2008, 24, 199–204. [CrossRef]
25. Hegde, S.M.; Solomon, S.D. Influence of physical activity on hypertension and cardiac structure and function.
Curr. Hypertens. Rep. 2015, 17, 77. [CrossRef] [PubMed]
26. Colberg, S.R.; Sigal, R.J.; Yardley, J.E.; Riddell, M.C.; Dunstan, D.W.; Dempsey, P.C.; Horton, E.S.; Castorino, K.;
Tate, D.F. Physical activity/exercise and diabetes: A position statement of the american diabetes association.
Diabetes Care 2016, 39, 2065. [CrossRef] [PubMed]
27. Bundesärztekammer (BÄK); Kassenärztliche Bundesvereinigung (KBV); Arbeitsgemeinschaft der
Wissenschaftlichen Medizinischen Fachgesellschaften (AWMF). Nationale Versorgungsleitlinie Therapie des
Typ-2-Diabetes—Langfassung; Bundesärztekammer: Berlin, Germany, 2014.
28. Williams, B.; Masera, G.; Spiering, W.; Agabiti Rosei, E.; Azizi, M.; Burnier, M.L.; Clement, D.; Coca, A.;
Simone, G.; Dominiczak, A.; et al. 2018 Esc/Esh guidelines for the management of arterial hypertension.
Eur. Heart J. 2018, 39. [CrossRef] [PubMed]
29. Holle, R.; Happich, M.; Löwel, H.; Wichmann, H.E. Kora—A research platform for population based health
research. Gesundheitswesen 2005, 67, 19–25. [CrossRef]
30. Rathmann, W.; Haastert, B.; Icks, A.; Lowel, H.; Meisinger, C.; Holle, R.; Giani, G. High prevalence of
undiagnosed diabetes mellitus in southern germany: Target populations for efficient screening. The kora
survey 2000. Diabetologia 2003, 46, 182–189. [CrossRef]
31. Stender, M.; Döring, A.; Hense, H.-W.; Schlichtherle, S.; M’Harzi, S.; Keil, U. Vergleich zweier methoden zur
erhebung der körperlichen aktivität. Sozial Präventivmedizin 1991, 36, 176–183. [CrossRef]
32. Karl, F.; Schwettmann, L.; Laxy, M.; Holle, R.; Peters, A. Status quo bias and health behavior: Findings from
a cross-sectional study. Eur. J. Public Health 2019. [CrossRef]
33. Ware, J., Jr.; Kosinski, M.; Keller, S.D. A 12-item short-form health survey: Construction of scales and
preliminary tests of reliability and validity. Med. Care 1996, 34, 220–233. [CrossRef]
34. RStudio Team. Rstudio: Integrated Development for R; RStudio Inc.: Boston, MA, USA, 2016.
35. Bates, D.; Mächler, M.; Bolker, B.; Walker, S. Fitting linear mixed-effects models using lme4. J. Stat. Softw.
2015, 67, 48. [CrossRef]
36. Morley, B.; Wakefield, M.; Dunlop, S.; Hill, D. Impact of a mass media campaign linking abdominal obesity
and cancer: A natural exposure evaluation. Health Educ. Res. 2009, 24, 1069–1079. [CrossRef]
37. Gregory, C.O.; Blanck, H.M.; Gillespie, C.; Maynard, L.M.; Serdula, M.K. Perceived health risk of excess
body weight among overweight and obese men and women: Differences by sex. Prev. Med. 2008, 47, 46–52.
[CrossRef] [PubMed]
38. Hattar, A.; Pal, S.; Hagger, M.S. Predicting physical activity-related outcomes in overweight and obese adults:
A health action process approach. Appl. Psychol. Health Well Being 2016, 8, 127–151. [CrossRef] [PubMed]
39. Barg, C.J.; Latimer, A.E.; Pomery, E.A.; Rivers, S.E.; Rench, T.A.; Prapavessis, H.; Salovey, P. Examining
predictors of physical activity among inactive middle-aged women: An application of the health action
process approach. Psychol. Health 2012, 27, 829–845. [CrossRef] [PubMed]
40. Schwarzer, R. Modeling health behavior change: How to predict and modify the adoption and maintenance
of health behaviors. Appl. Psychol. 2008, 57, 1–29. [CrossRef]
41. Jarbøl, D.E.; Larsen, P.V.; Gyrd-Hansen, D.; Søndergaard, J.; Brandt, C.; Leppin, A.; Barfoed, B.L.; Nielsen, J.B.
Determinants of preferences for lifestyle changes versus medication and beliefs in ability to maintain lifestyle
changes. A population-based survey. Prev. Med. Rep. 2017, 6, 66–73. [CrossRef]
42. Krug, L.M.; Haire-Joshu, D.; Heady, S.A. Exercise habits and exercise relapse in persons with
non-insulin-dependent diabetes mellitus. Diabetes Educ. 1991, 17, 185–188. [CrossRef]

Int. J. Environ. Res. Public Health 2019, 16, 4247 12 of 12
43. Thomas, N.; Alder, E.; Leese, G.P. Barriers to physical activity in patients with diabetes. Postgrad. Med. J.
2004, 80, 287–291. [CrossRef]
44. Dolor, R.J.; Ostbye, T.; Lyna, P.; Coffman, C.J.; Alexander, S.C.; Tulsky, J.A.; Brouwer, R.J.; Esoimeme, I.;
Pollak, K.I. What are physicians’ and patients’ beliefs about diet, weight, exercise, and smoking cessation
counseling? Prev. Med. 2010, 51, 440–442. [CrossRef]
© 2019 by the authors. Licensee MDPI, Basel, Switzerland. This article is an open access
article distributed under the terms and conditions of the Creative Commons Attribution
(CC BY) license (http://creativecommons.org/licenses/by/4.0/).

Int. J. Environ. Res. Public Health 2019, 16, x; doi: FOR PEER REVIEW www.mdpi.com/journal/ijerph
Supplement 1
2
Figure S1. Add-on for Figure 2. Description of sample size for the first follow-up period from S4 to 3
F4. Annotations: N = number of participants, PA = physical activity, S4 = baseline study (2000); F4 = 4
first follow-up (2007); FF4 = second follow-up (2014). 5
6
7
Figure S2. Add-on for Figure 2. Description of sample size for the second follow-up period from F4 to 8
FF4. Annotations: N = number of participants, PA = physical activity, S4 = baseline study (2000); F4 = 9
first follow-up (2007); FF4 = second follow-up (2014). 10
11

Int. J. Environ. Res. Public Health 2019, 16, x FOR PEER REVIEW 2 of 5
Table S1. In addition to Figure 3. Complete summary of the four logistic regression models with all 12
covariates. 13
95%CI
OR LL UL
Model: active, diabetes
(Intercept) 0.309 0.222 0.429
hs.diab 2.161 1.202 3.888
sexF 1.086 0.858 1.374
scale(age) 0.903 0.793 1.030
fam.together 0.723 0.551 0.950
schulintermediate 0.837 0.629 1.114
schulhigher 0.699 0.517 0.944
scale(bmi) 1.325 1.168 1.504
scale(bmi.diff) 1.218 1.090 1.361
scale(pqol.diff) 0.940 0.840 1.051
scale(mqol.diff) 0.916 0.818 1.024
Model: active, hypertension
(Intercept) 0.272 0.185 0.401
hs.hyp 0.929 0.639 1.350
sexF 1.074 0.822 1.402
scale(age) 0.830 0.714 0.965
fam.together 0.729 0.536 0.991
schulintermediate 1.014 0.733 1.402
schulhigher 0.779 0.558 1.089
scale(bmi) 1.306 1.131 1.508
scale(bmi.diff) 1.215 1.073 1.377
scale(pqol.diff) 0.944 0.830 1.074
scale(mqol.diff) 0.922 0.811 1.048
Model: inactive, diabetes
(Intercept) 0.278 0.211 0.366
hs.diab 0.738 0.460 1.184
sexF 1.279 1.045 1.564
scale(age) 0.933 0.832 1.046
fam.together 1.494 1.169 1.910
schulintermediate 1.255 0.978 1.610
schulhigher 1.202 0.932 1.552
scale(bmi) 0.887 0.795 0.989
scale(bmi.diff) 0.870 0.784 0.965
scale(pqol.diff) 1.069 0.965 1.184
scale(mqol.diff) 1.130 1.021 1.250
Model: inactive, diabetes
(Intercept) 0.267 0.193 0.370
hs.hyp 1.023 0.747 1.400
sexF 1.428 1.130 1.803
scale(age) 0.984 0.859 1.126
fam.together 1.457 1.100 1.930
schulintermediate 1.449 1.089 1.927
schulhigher 1.213 0.906 1.623

Int. J. Environ. Res. Public Health 2019, 16, x FOR PEER REVIEW 3 of 5
scale(bmi) 0.916 0.810 1.036
scale(bmi.diff) 0.883 0.786 0.992
scale(pqol.diff) 1.072 0.952 1.207
scale(mqol.diff) 1.187 1.054 1.336
Annotations: OR = odds ratio, 95%CI = 95% confidence interval, LL = lower limit, UL = upper limit 14
Note that all scaled variables have been standardized with mean equal to zero and standard deviation equal to 15
one. 16
17
18
Figure S3. Sensitivity analysis. This figure is based on new defined cutoff points for the PA 19
dichotomization. The odds for changing PA after a diabetes/hypertension diagnosis for both baseline 20
PA strata. OR’s for the active stratum display the odds of changing to inactive. OR’s for the inactive 21
stratum display the odds of changing to active. 22
23
Table S2. Sensitivity Analysis: Results of the models only including the first follow-up period from S4 24
to F4. 25
95%CI
OR LL UL
Model: active, diabetes
(Intercept) 0.216 0.083 0.557
hs.hyp 1.497 0.700 3.043
sexF 1.136 0.886 1.458
scale(age) 0.987 0.976 0.997
fam.together 0.774 0.583 1.032
schulintermediate 0.894 0.658 1.209
schulhigher 0.742 0.536 1.023
scale(bmi) 1.045 1.013 1.077
scale(bmi.diff) 1.095 1.023 1.172
scale(pqol.diff) 0.993 0.978 1.007
scale(mqol.diff) 0.985 0.973 0.997
Model: active, hypertension
(Intercept) 0.266 0.088 0.804
hs.hyp 0.938 0.616 1.406
sexF 1.157 0.876 1.532
scale(age) 0.980 0.967 0.992
fam.together 0.776 0.568 1.068
schulintermediate 1.091 0.777 1.528

Int. J. Environ. Res. Public Health 2019, 16, x FOR PEER REVIEW 4 of 5
schulhigher 0.854 0.597 1.216
scale(bmi) 1.043 1.005 1.082
scale(bmi.diff) 1.102 1.022 1.189
scale(pqol.diff) 0.993 0.976 1.010
scale(mqol.diff) 0.986 0.972 1.000
Model: inactive, diabetes
(Intercept) 0.511 0.213 1.222
hs.hyp 0.781 0.443 1.327
sexF 1.264 1.001 1.598
scale(age) 0.997 0.988 1.006
fam.together 1.545 1.165 2.064
schulintermediate 1.269 0.951 1.690
schulhigher 1.018 0.746 1.382
scale(bmi) 0.987 0.962 1.013
scale(bmi.diff) 0.956 0.904 1.011
scale(pqol.diff) 1.011 0.998 1.025
scale(mqol.diff) 1.011 1.000 1.023
Model: inactive, hypertension
(Intercept) 0.391 0.139 1.096
hs.hyp 1.266 0.876 1.820
sexF 1.339 1.018 1.762
scale(age) 0.999 0.988 1.011
fam.together 1.462 1.052 2.050
schulintermediate 1.392 0.997 1.940
schulhigher 1.037 0.722 1.481
scale(bmi) 0.990 0.959 1.022
scale(bmi.diff) 0.967 0.906 1.033
scale(pqol.diff) 1.018 1.002 1.034
scale(mqol.diff) 1.018 1.005 1.032
Annotations: OR = odds ratio, 95%CI = 95% confidence interval, LL = lower limit, UL = upper limit 26
Note that all scaled variables have been standardized with mean equal to zero and standard deviation equal to 27
one. 28
29
Table S3. Sensitivity Analysis: Results of the models only including the second follow-up period 30
from F4 to FF4. 31
95%CI
OR LL UL
Model: active, diabetes
(Intercept) 0.030 0.008 0.104
hs.hyp 2.168 1.133 4.098
sexF 0.968 0.710 1.318
scale(age) 1.011 0.998 1.026
fam.together 0.795 0.554 1.152
schulintermediate 0.802 0.551 1.159
schulhigher 0.707 0.476 1.041
scale(bmi) 1.068 1.031 1.106

Int. J. Environ. Res. Public Health 2019, 16, x FOR PEER REVIEW 5 of 5
scale(bmi.diff) 1.140 1.043 1.248
scale(pqol.diff) 0.992 0.973 1.011
scale(mqol.diff) 1.003 0.986 1.019
Model: active, hypertension
(Intercept) 0.030 0.006 0.135
hs.hyp 0.978 0.581 1.600
sexF 0.913 0.637 1.309
scale(age) 1.009 0.992 1.027
fam.together 0.798 0.524 1.237
schulintermediate 0.914 0.587 1.412
schulhigher 0.731 0.465 1.138
scale(bmi) 1.073 1.026 1.123
scale(bmi.diff) 1.129 1.019 1.251
scale(pqol.diff) 0.991 0.969 1.014
scale(mqol.diff) 1.005 0.985 1.025
Model: inactive, diabetes
(Intercept) 1.395 0.392 4.985
hs.hyp 0.676 0.278 1.477
sexF 1.219 0.884 1.683
scale(age) 0.992 0.979 1.005
fam.together 1.302 0.884 1.941
schulintermediate 1.241 0.825 1.859
schulhigher 1.539 1.041 2.272
scale(bmi) 0.961 0.927 0.995
scale(bmi.diff) 0.904 0.828 0.984
scale(pqol.diff) 1.000 0.981 1.020
scale(mqol.diff) 1.013 0.995 1.031
Model: inactive, hypertension
(Intercept) 0.711 0.153 3.289
hs.hyp 0.684 0.386 1.181
sexF 1.507 1.038 2.195
scale(age) 0.996 0.978 1.013
fam.together 1.433 0.916 2.278
schulintermediate 1.484 0.930 2.363
schulhigher 1.496 0.952 2.348
scale(bmi) 0.973 0.931 1.016
scale(bmi.diff) 0.878 0.785 0.978
scale(pqol.diff) 0.988 0.965 1.011
scale(mqol.diff) 1.014 0.994 1.035
Annotations: OR = odds ratio, 95%CI = 95% confidence interval, LL = lower limit, UL = upper limit 32
Note that all scaled variables have been standardized with mean equal to zero and standard deviation equal to 33
one. 34
35
36

September 2017 | Volume 5 | Article 2061
Original research
published: 29 September 2017doi: 10.3389/fped.2017.00206
Frontiers in Pediatrics | www.frontiersin.org
Edited by:
Gerry Leisman,
University of Haifa, Israel
Reviewed by:
Cihad Dundar,
Ondokuz Mayıs University, Turkey
Shahanawaz Syed,
JSS College of Physiotherapy, India
Tal Shafir,
University of Haifa, Israel
*Correspondence:
Sarah Spengler
Specialty section:
This article was submitted
to Child Health and Human
Development,
a section of the journal
Frontiers in Pediatrics
Received: 20 July 2017
Accepted: 11 September 2017
Published: 29 September 2017
Citation:
Spengler S, Rabel M, Kuritz AM and
Mess F (2017) Trends in
Motor Performance of First
Graders: A Comparison of
Cohorts from 2006 to 2015.
Front. Pediatr. 5:206.
doi: 10.3389/fped.2017.00206
Trends in Motor Performance of First graders: a comparison of cohorts from 2006 to 2015
Sarah Spengler1*, Matthias Rabel1, Arvid Marius Kuritz2 and Filip Mess1
1 Department of Sports and Health Science, Technical University of Munich, Munich, Germany, 2 Department of Sports Science, University of Konstanz, Konstanz, Germany
Background: Motor performance is an important factor for health. Already in childhood,
motor performance is associated with, e.g., obesity and risk factors for cardiovascular
diseases. It is widely believed that the motor performance of children has declined over
recent years. However, this belief is lacking clear evidence. The objective of this study
was to examine trends in motor performance of first grade students during a period of
10 years (2006–2015). We examined trends in (a) aerobic fitness, (b) strength, (c) speed,
and (d) balance for boys and girls separately and considered body mass index (BMI) as
a potential confounder.
Methods: From 2006 to 2015, we tested 5,001 first graders [50.8% boys; mean age
6.76 (0.56) years] of 18 primary schools in Germany. Each year between 441 and 552
students of the same schools were surveyed. Performance tests were taken from the
Motorik-Module Study and the “German Motor Ability Test”: “6-min run,” “push-ups,”
“20-m sprint,” and “static stand.” Linear regression models were conducted for statisti-
cal analysis.
results: A slightly negative trend in aerobic fitness performance was revealed in boys
(β = −0.050; p = 0.012) but not in girls. In the strength performance test no trend
over time was detected. Performance in speed (boys: β = −0.094; girls: β = −0.143;
p ≤ 0.001) and balance tests (boys: β = −0.142; girls: β = −0.232; p ≤ 0.001) increased
over time for both boys and girls. These findings held true when BMI was considered.
conclusion: This study only partly supported the assumption that motor performance
of children has declined: in our study, aerobic fitness declined (only in boys), while
strength remained stable and speed and balance even increased in both sexes.
Moreover, it seems as if BMI can explain changes in performance only to a small extent.
Changed lifestyles might be a substantial cause. Further research on recent trends of
motor performance and interacting variables is needed to support the results of our
study and to provide more knowledge on causes of these trends.
Keywords: trend, children, health, motor performance, aerobic fitness, strength, speed, balance
inTrODUcTiOn
Already in childhood motor performance is an important factor for health as it is associated with, e.g., obesity (1) and risk factors for cardiovascular diseases (2) in this early age. However, it is widely believed that motor performance of children has declined in recent years (3, 4). An often discussed reason for this potential decline is the verified increase of body mass index (BMI) among
Erschienen in: Frontiers in pediatrics ; 5 (2017). - 206. - http://dx.doi.org/10.3389/fped.2017.00206
Konstanzer Online-Publikations-System (KOPS) URL: http://nbn-resolving.de/urn:nbn:de:bsz:352-2--5g5ynpotdqic7
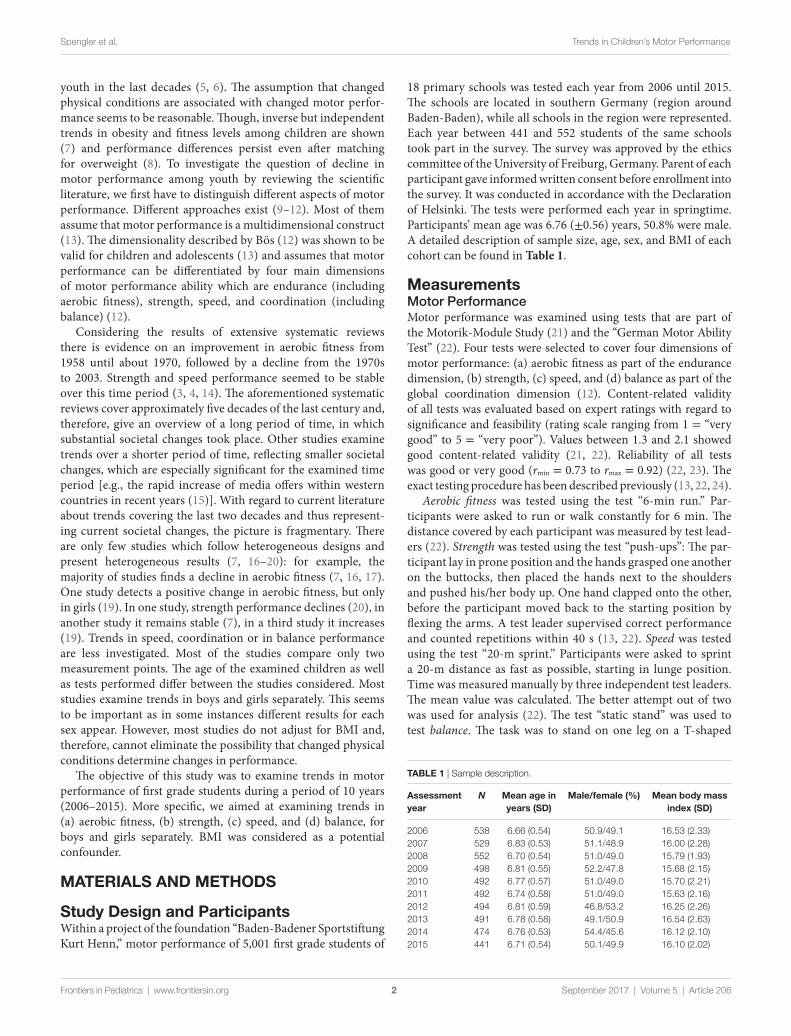
TaBle 1 | Sample description.
assessment
year
N Mean age in
years (sD)
Male/female (%) Mean body mass
index (sD)
2006 538 6.66 (0.54) 50.9/49.1 16.53 (2.33)
2007 529 6.83 (0.53) 51.1/48.9 16.00 (2.28)
2008 552 6.70 (0.54) 51.0/49.0 15.79 (1.93)
2009 498 6.81 (0.55) 52.2/47.8 15.68 (2.15)
2010 492 6.77 (0.57) 51.0/49.0 15.70 (2.21)
2011 492 6.74 (0.58) 51.0/49.0 15.63 (2.16)
2012 494 6.81 (0.59) 46.8/53.2 16.25 (2.26)
2013 491 6.78 (0.58) 49.1/50.9 16.54 (2.63)
2014 474 6.76 (0.53) 54.4/45.6 16.12 (2.10)
2015 441 6.71 (0.54) 50.1/49.9 16.10 (2.02)
2
Spengler et al. Trends in Children’s Motor Performance
Frontiers in Pediatrics | www.frontiersin.org September 2017 | Volume 5 | Article 206
youth in the last decades (5, 6). The assumption that changed physical conditions are associated with changed motor perfor-mance seems to be reasonable. Though, inverse but independent trends in obesity and fitness levels among children are shown (7) and performance differences persist even after matching for overweight (8). To investigate the question of decline in motor performance among youth by reviewing the scientific literature, we first have to distinguish different aspects of motor performance. Different approaches exist (9–12). Most of them assume that motor performance is a multidimensional construct (13). The dimensionality described by Bös (12) was shown to be valid for children and adolescents (13) and assumes that motor performance can be differentiated by four main dimensions of motor performance ability which are endurance (including aerobic fitness), strength, speed, and coordination (including balance) (12).
Considering the results of extensive systematic reviews there is evidence on an improvement in aerobic fitness from 1958 until about 1970, followed by a decline from the 1970s to 2003. Strength and speed performance seemed to be stable over this time period (3, 4, 14). The aforementioned systematic reviews cover approximately five decades of the last century and, therefore, give an overview of a long period of time, in which substantial societal changes took place. Other studies examine trends over a shorter period of time, reflecting smaller societal changes, which are especially significant for the examined time period [e.g., the rapid increase of media offers within western countries in recent years (15)]. With regard to current literature about trends covering the last two decades and thus represent-ing current societal changes, the picture is fragmentary. There are only few studies which follow heterogeneous designs and present heterogeneous results (7, 16–20): for example, the majority of studies finds a decline in aerobic fitness (7, 16, 17). One study detects a positive change in aerobic fitness, but only in girls (19). In one study, strength performance declines (20), in another study it remains stable (7), in a third study it increases (19). Trends in speed, coordination or in balance performance are less investigated. Most of the studies compare only two measurement points. The age of the examined children as well as tests performed differ between the studies considered. Most studies examine trends in boys and girls separately. This seems to be important as in some instances different results for each sex appear. However, most studies do not adjust for BMI and, therefore, cannot eliminate the possibility that changed physical conditions determine changes in performance.
The objective of this study was to examine trends in motor performance of first grade students during a period of 10 years (2006–2015). More specific, we aimed at examining trends in (a) aerobic fitness, (b) strength, (c) speed, and (d) balance, for boys and girls separately. BMI was considered as a potential confounder.
MaTerials anD MeThODs
study Design and ParticipantsWithin a project of the foundation “Baden-Badener Sportstiftung Kurt Henn,” motor performance of 5,001 first grade students of
18 primary schools was tested each year from 2006 until 2015. The schools are located in southern Germany (region around Baden-Baden), while all schools in the region were represented. Each year between 441 and 552 students of the same schools took part in the survey. The survey was approved by the ethics committee of the University of Freiburg, Germany. Parent of each participant gave informed written consent before enrollment into the survey. It was conducted in accordance with the Declaration of Helsinki. The tests were performed each year in springtime. Participants’ mean age was 6.76 (±0.56) years, 50.8% were male. A detailed description of sample size, age, sex, and BMI of each cohort can be found in Table 1.
MeasurementsMotor Performance
Motor performance was examined using tests that are part of the Motorik-Module Study (21) and the “German Motor Ability Test” (22). Four tests were selected to cover four dimensions of motor performance: (a) aerobic fitness as part of the endurance dimension, (b) strength, (c) speed, and (d) balance as part of the global coordination dimension (12). Content-related validity of all tests was evaluated based on expert ratings with regard to significance and feasibility (rating scale ranging from 1 = “very good” to 5 = “very poor”). Values between 1.3 and 2.1 showed good content-related validity (21, 22). Reliability of all tests was good or very good (rmin = 0.73 to rmax = 0.92) (22, 23). The exact testing procedure has been described previously (13, 22, 24).
Aerobic fitness was tested using the test “6-min run.” Par-ticipants were asked to run or walk constantly for 6 min. The distance covered by each participant was measured by test lead-ers (22). Strength was tested using the test “push-ups”: The par-ticipant lay in prone position and the hands grasped one another on the buttocks, then placed the hands next to the shoulders and pushed his/her body up. One hand clapped onto the other, before the participant moved back to the starting position by flexing the arms. A test leader supervised correct performance and counted repetitions within 40 s (13, 22). Speed was tested using the test “20-m sprint.” Participants were asked to sprint a 20-m distance as fast as possible, starting in lunge position. Time was measured manually by three independent test leaders. The mean value was calculated. The better attempt out of two was used for analysis (22). The test “static stand” was used to test balance. The task was to stand on one leg on a T-shaped

FigUre 1 | Mean values of the motor performance tests from 2006 to 2015 for boys and girls separately.
3
Spengler et al. Trends in Children’s Motor Performance
Frontiers in Pediatrics | www.frontiersin.org September 2017 | Volume 5 | Article 206
balancing bar (width 3 cm) wearing sneakers and to rest in the balance position. The number of contacts of the free foot with the ground or the T-bar (correction steps) within 1 min was counted by the test leader and was used for analysis. If the participant left the bar completely, the timer was paused until the participant was back in the initial position.
Anthropometrics
Height was measured with a height measuring scale (accuracy: 0.1 cm) with the participants standing upright not wearing shoes. Weight was measured by using an electronic scale (Soehnle, Murrhardt, Germany; accuracy: 0.1 kg), while participants wore sports clothes and no shoes. The measurements were performed each year by the same skilled test leaders. BMI was calculated as body mass divided by height squared (kg/m2).
Data analysisAll statistical tests were conducted using SPSS statistical soft-ware for Windows Version 23.0 (IBM Corporation, Armonk, NY, USA). Linear regression models were used to test if assess-ment year was a significant predictor of performance in the four motoric tests, having the year of examination as independent factor. The assumptions of linear regression were tested and confir med. Analyses were conducted for each sex and each test separately. In a second step, multiple regression analysis was con-ducted to detect if the effects of assessment year were influenced by BMI, i.e., assessment year and BMI were included together as independent factors. Again, analyses were made for each sex and
each test separately. For expressing temporal trends as change in percent, B coefficient of each test was multiplied by 10 to express the mean change per decade. Subsequently, we calculated the percentage of change in relation to the mean test performance. The significance level for all statistical tests was set a priori to α = 0.05.
resUlTs
Figure 1 displays mean values of performance in (a) “6-min run,” (b) “push-ups,” (c) “20-m sprint,” and (d) “static stand” for boys and girls separately.
Table 2 shows the results of linear regression analyses, dis-playing the effects of assessment year on performance within the four tests.
In linear regression analyses, assessment year had a sig-nificantly negative effect on the distance covered within the aerobic fitness test “6 min run” in boys. Among girls, the effect of assessment year was positive but not significant. For the strength test “push-ups” no significant effect of assessment year could have been observed neither for boys nor for girls. Values within the speed test “20 m sprint” were negatively affected by assessment year in boys and even more in girls, with lower values reflecting higher performance. For the balance test “static stand” significant effects of assessment year could have been observed, too. Assessment year negatively affected the number of correction steps (reflecting a positive performance trend) in boys and in girls. Overall, the explained variance of

TaBle 3 | Results of multiple regression analyses for boys and girls separately.
Dependent
variable
Boys girls
B (95% ci) β p-Value adj. R2 B (95% ci) β p-Value adj. R2
Distance
covered 6 min
run (m)
Constant 5160.031 (1683.288 to 8636.775) −503.787 (−4037.005 to 2555.367)
Year −1.897 (−3.627 to −0.167) −0.041 0.032 0.002 0.878 (−0.650 to 2.407) 0.021 0.260 ≤0.001
Body mass
index (BMI)
−20.158 (−22.435 to −17.881) −0.327 ≤0.001 0.109 −18.560 (−20.460 to −16.660) −0.362 ≤0.001 0.131
Push-up
repetitions
Constant −2.521 (−109.357 to 104.314) 33.628 (−69.557 to 136.812)
Year 0.008 (−0.045 to 0.061) 0.006 0.759 ≤0.001 −0.009 (−0.060 to 0.042) −0.007 0.730 ≤0.001
BMI −0.061 (−0.130 to 0.009) −0.034 0.088 ≤0.001 −0.142 (−0.206 to −0.078) −0.088 ≤0.001 0.007
Time for 20 m
sprint (s)
Constant 31.619 (20.722 to 42.517) 47.186 (35.425 to 58.947)
Year −0.014 (−0.018 to −0.008) −0.097 ≤0.001 0.008 −0.021 (−0.027 to −0.015) −0.141 ≤0.001 0.019
BMI 0.023 (0.016 to 0.030) 0.126 ≤0.001 0.024 0.028 (0.021 to 0.036) 0.151 ≤0.001 0.042
Static stand
correction steps
Constant 593.689 (440.012 to 747.366) 960.109 (804.189 to 1116.029)
Year −0.292 (−0.369 to −0.216) −0.146 ≤0.001 0.020 −0.476 (−0.553 to −0.398) −0.233 ≤0.001 0.054
BMI 0.420 (0.319 to 0.520) 0.160 ≤0.001 0.045 0.467 (0.371 to 0.564) 0.184 ≤0.001 0.087
B, unstandardized coefficient; β, standardized coefficient.
TaBle 2 | Results of linear regression analyses for boys and girls separately.
Dependent
variable
Boys girls
B (95% ci) β p-Value adj. R2 B (95% ci) β p-Value adj. R2
Distance covered
6 min run (m)
Constant 5690.046 (2,033.885 to 9,346.207) −843.739 (−4131.145 to 2443.668)
Year −2.322 (−4.140 to −0.503) −0.050 0.012 0.002 0.899 (−0.736 to 2.535) 0.022 0.281 ≤0.001
Push-up
repetitions
Constant −4.882 (−111.398 to 101.633) 27.703 (−75.693 to 131.099)
Year 0.009 (−0.044 to 0.062) 0.007 0.739 ≤0.001 −0.007 (−0.059 to 0.044) −0.006 0.783 ≤0.001
Time for 20 m
sprint (s)
Constant 31.163 (20.203 to 42.123) 48.099 (36.238 to 59.959)
Year −0.013 (−0.019 to −0.008) −0.094 ≤0.001 0.008 −0.021 (−0.027 to −0.016) −0.143 ≤0.001 0.020
Static stand
correction steps
Constant 581.070 (425.902 to 736.238) 964.125 (805.917 to 1122.333)
Year −0.283 (−0.360 to −0.206) −0.142 ≤0.001 0.020 −0.474 (−0.552 to −0.395) −0.232 ≤0.001 0.054
B, unstandardized coefficient; β, standardized coefficient.
4
Spengler et al. Trends in Children’s Motor Performance
Frontiers in Pediatrics | www.frontiersin.org September 2017 | Volume 5 | Article 206
the models was very low, with the highest value for girls in the test “static stand.”
Table 3 shows the results of the multiple regression analysis. Except for the test “push-ups,” BMI significantly predicted test performance. However, all significant effects of assessment year on test results remained nearly unchanged after including BMI into the model.
Expressing the trends of motor performance in percent, the mean change per decade in aerobic fitness performance was −2.3% (−4.0 to −0.5) in boys and 0.9% (−0.8 to 2.6) in girls. For strength performance, mean change per decade was 0.7% (−3.3 to 4.7) in boys and −0.5% (−4.5 to 3.3) in girls. For speed performance, mean change was 2.7% (1.7 to 4.0) in boys and 4.3% (3.3 to 5.5) in girls, and for balance performance, it was 22.8% (16.6 to 29.0) in boys and 41.1% (34.2 to 47.8) in girls.
DiscUssiOn
The aim of the present study was to examine trends in motor performance of first grade students during a period of 10 years (2006–2015). Overall, we found a negative trend in aerobic fitness performance in boys but a stable performance in girls. In the strength performance test no trend over time could have been detected. Performance in speed and balance tests increased
in both boys and girls. These findings held true even when BMI was considered as a confounder.
Aerobic fitness performance decreased in boys. This result is in line with the results of the reviews of Tomkinson and Olds (4) and Malina (14), where a negative trend of aerobic fitness between the 1970s and 2000 is shown. Moreover, the majority of the studies on trends over the last two decades also show a decline (7, 16, 17). Thus, our results support the assumption of an ongoing negative trend in aerobic fitness in boys. However, the effect (B- and β-coefficients) was small and the observed decline was smaller than in another examination from Germany, where cross-sectional data of different studies are compared (25). The divergence could be due to different methodological approaches and due to the time periods considered, as in the latter study trends between 1976 and 2005 are analyzed. In girls, aerobic fitness was stable over the 10-year period. This result is contrary to former studies which find a negative trend (4, 7, 16–18, 25). Only one study discovers a positive trend among its female sample (19). However, Tambalis et al. show in their study that performance of children living in rural areas did not change between 1997 and 2007, while performance of children in urban areas decreased (26). In our study, most of the schools where the sample was recruited are located in rural areas. With respect to the results of Tambalis et al., this might be a possible explanation

5
Spengler et al. Trends in Children’s Motor Performance
Frontiers in Pediatrics | www.frontiersin.org September 2017 | Volume 5 | Article 206
for the stable performance in girls and for the relatively small decline in boys.
Strength performance did not change over time, neither in boys nor in girls. Stability of strength performance in both boys and girls is also shown in a large systematic review for the time period between the 1960s and 2003 (3). While evidence for trends of strength performance during this time period is quite good, trend analyses for the time period between 2000 and today are rare. We found one study by Tambalis et al. reporting a stable performance between 1997 and 2007 (7). Another study reports a positive change between 1992/1993 and 2006/2007 (19), and a third study reports a negative change between 2001 and 2006 (20). Out of these three studies, Tambalis et al. are the only ones who performed tests every year and thus offer a higher reliability. With our results we confirm their results of a stability in strength performance in children. Our results suggest that the stability holds true until today. However, this suggestion should be taken with care, as evidence is small and results showed a huge vari-ability in strength performance for both sexes in our study.
Speed performance increased in both sexes over the period of 10 years. Again, our results are in line with the results of the Greek study of Tambalis et al. (7), but differ from results of the study of Dos Santos et al., where a negative change is observed for boys and girls (16). In our study, effects were relatively high compared to aerobic fitness and strength test results and the posi-tive trend was even higher in girls. Similar findings are reported in the Greek study, where the increase in girls is also higher than in boys (7). Compared to the trend from the 1960s to 2000, where a relative stability of speed performance in children is shown (3), it seems that between 2000 and today the trend line increased and today’s children are faster than children were in earlier times.
Balance performance also increased in both boys and girls from 2006 to 2015. Compared to the other test results, effects in balance performance were the highest, reflecting a relatively strong positive trend in balance performance, especially in girls. Another study, comparing the balance performance of Estonian and Lithuanian adolescents finds a decline in the Estonian group, while performance in the Lithuanians increases (27). In addition, German scientists published material on changes in balance per-formance, comparing their results with results of former German studies. They also find an increase in the test “static stand” in their sample (28). Though, comparability of these studies is lim-ited, as both include adolescents (11 years and older) and their methodological approach is different.
Body mass index predicted test performance. This result was expected, as BMI and motor performance were shown to be associated (1). However, BMI was included into the model to test if BMI was a confounder of the assessment year effects. By adding BMI into the regression models, effects of assessment year on test results remained significant. Actually, effects of assessment year remained almost unchanged. Tambalis et al. test the contrary hypothesis, i.e., that motor performance accounts for BMI trends in children. Likewise, after introducing the aerobic fitness variable into their model, obesity trends remain signifi-cant with practically unchanged effect sizes (7). In addition, Olds et al. report persisting performance differences after matching their sample for overweight (8). It seems as if BMI can explain
changes in performance only to some extent, and our study suggested that this holds true for performance in aerobic fitness, and moreover in speed and balance. These results indicated that changed lifestyle [e.g., level of physical activity, participation in organized sports, media use, transport patterns (15)] might be a substantial cause of changes in motor performance.
Comparing the identified trends overall, our results showed that trends in the four motor performance dimensions differed. It can be speculated that these differences have at least two reasons. First, speed and balance performance could have increased due to the fact that—in contrast to most other Western countries (15)—participation rates in organized sports in young children increased within the last years in Germany (20). Moreover, par-ticipation starts at an early age with 41% of the 4-year olds and 54% of the 5-year olds being a member of a sports club (29). Organized sports programs probably focus on games and exercises suit-able for young children, which are more likely to train speed and coordination instead of aerobic fitness. This could be a reason for the positive trend in speed and balance, as in former years young children were not specifically trained in such a way. Second, it is shown that everyday physical activity in children declined within recent years, as transport patterns changed from active to passive transport as well as to a more “dependent mobility” and the time playing outside decreased (15) [playing outdoors is strongly related to energy expenditure (30)]. The decrease in everyday physical activity might be a reason for the decline of aerobic fitness in boys in our study. Furthermore, in this study trends in girls were overall more positive than in boys. Similar results were found in other studies, where decreases in girls are smaller than in boys (4, 20, 25), or increases are stronger (19). Different “starting levels” could be a possible explanation: it can be assumed that motor performance in boys was on a higher relative level than in girls in earlier times. This could be due to the assumption that girls were more protected by their parents and thus played less outdoors, their games were more sedentary (e.g., playing with dolls vs. playing soccer) and boys had higher levels of overall physical activity (30). Therefore, their relative motor performance level was probably lower. So changes in lifestyle could have had less negative/stronger positive effects on their motor performance than on boys’ motor performance. In addition, it is shown that in Germany sports club participation increased more among girls than among boys (20). This could have had an impact on the more positive trends in girls, too.
The present study has some strengths and limitations that should be considered when interpreting the findings. Exam-inations took place in each year between 2006 and 2015, allowing the description of trends instead of single comparisons between measurement points. Moreover, data collection was region-exhaustive. However, as data are restricted to a regional sample it is not representative for Germany. Performed tests are validated and approved, but testing procedures were partly suboptimal, as the time needed for “20-m sprint” was measured manually and not with the use of a light barrier. The test “static stand” was used to measure balance. However, balance covers only one part of the complex motor performance ability dimension “coordination.” Further, comparisons with other studies should be interpreted with care, as at some stage different motor performance tests were used (e.g., “shuttle run” vs. “6-min run” to test aerobic fitness).

6
Spengler et al. Trends in Children’s Motor Performance
Frontiers in Pediatrics | www.frontiersin.org September 2017 | Volume 5 | Article 206
Nevertheless, this study accounted for all four dimensions of motor performance ability (10) which contributed to a compre-hensive picture of trends in motor performance of children.
In summary, this study only partly supported the widely believed assumption that the motor performance of children declines: in our study, aerobic fitness declined in boys—which is in line with other studies (4, 14)—but not in girls. All the other assessed dimensions of performance remained stable or even increased in both sexes. Strength performance remained stable. This is also shown by Tomkinson (3). In contrast, speed performance increased, while older studies present it as stable (3). Concerning balance performance, there are few studies to be found in the literature and results are heterogeneous (27, 28). In our study, balance performance increased substantially in both sexes. In addition, we showed that for all performance dimen-sions BMI explained changes only to a small extent. Changed lifestyles might be a substantial cause. More studies on recent trends and interacting variables are needed to support our results and to provide further knowledge on causes of these trends.
eThics sTaTeMenT
This study was carried out in accordance with the Declaration of Helsinki. Parent of each participant gave written informed con-sent before enrollment into the survey. The protocol was approved by the ethics committee of the University of Freiburg, Germany.
aUThOr cOnTriBUTiOns
SS conceptualized and designed the study, interpreted the data, drafted the initial manuscript, and approved the final manuscript
as submitted. MR contributed substantially to conceptualization and design of the study, carried out the initial analyses, critically revised the manuscript, and approved the final manuscript as submitted. AK was involved in the data assessment, contributed substantially to analysis and interpretation of data, critically revised the manuscript, and approved the final manuscript as submitted. FM contributed substantially to conceptualization and design of the study and to interpretation of data, critically revised the manuscript and approved the final manuscript as submitted. All authors agreed to be accountable for all aspects of the work ensuring that questions related to the accuracy or integrity of any part of the work are appropriately investigated and resolved.
acKnOWleDgMenTs
The authors would like to express our appreciation to Hans-Reinhard Scheu and Dr. Annette Henn (“Baden-Badener Sportstiftung Kurt Henn”) for the allocation of the data, to Patrick Henn (“Baden-Badener Sportstiftung Kurt Henn”) for supplying the authors with important information on assessment procedures, and to Melina Schnitzius (Technical University of Munich) for her writing assistance.
FUnDing
The authors received no external funding for this study. This work was supported by the German Research Foundation (DFG) and the Technical University of Munich (TUM) in the framework of the Open Access Publishing Program.
reFerences
1. Casonatto J, Fernandes RA, Batista MB, Cyrino ES, Coelho ESMJ, de Arruda M, et al. Association between health-related physical fitness and body mass index status in children. J Child Health Care (2016) 20(3):294–303. doi:10.1177/1367493515598645
2. Hurtig-Wennlof A, Ruiz JR, Harro M, Sjostrom M. Cardiorespiratory fitness relates more strongly than physical activity to cardiovascular disease risk factors in healthy children and adolescents: the European Youth Heart Study. Eur J Cardiovasc Prev Rehabil (2007) 14(4):575–81. doi:10.1097/HJR.0b013e32808c67e3
3. Tomkinson GR. Global changes in anaerobic fitness test performance of children and adolescents (1958-2003). Scand J Med Sci Sports (2007) 17(5): 497–507. doi:10.1111/j.1600-0838.2006.00569.x
4. Tomkinson GR, Olds TS. Secular changes in pediatric aerobic fitness test performance: the global picture. Med Sport Sci (2007) 50:46–66. doi:10.1159/ 0000101075
5. Tremblay MS, Willms JD. Secular trends in the body mass index of Canadian children. CMAJ (2000) 163(11):1429–33.
6. Johnson W, Li L, Kuh D, Hardy R. How has the age-related process of overweight or obesity development changed over time? Co-ordinated analyses of individual participant data from five United Kingdom birth cohorts. PLoS Med (2015) 12(5):e1001828. doi:10.1371/journal.pmed. 1001828
7. Tambalis KD, Panagiotakos DB, Psarra G, Sidossis LS. Inverse but independent trends in obesity and fitness levels among Greek children: a time-series analysis from 1997 to 2007. Obes Facts (2011) 4(2):165–74. doi:10.1159/000327994
8. Olds T, Ridley K, Tomkinson GR. Declines in aerobic fitness: are they only due to increasing fatness? In: Tomkinson GR, Olds T, editors. Pediatric Fitness
Secular Trends and Geografic Variability. Basel: Karger (2007). p. 226–40.9. Corbin CB. A multidimensional hierarchical model of physical fitness:
a basis for integration and collaboration. Quest (1991) 43:296–306. doi:10.1080/ 00336297.1991.10484032
10. Bös K. Differenzielle Aspekte der Entwicklung motorischer Fähigkeiten. [Differential aspects of the development of motor abilities]. In: Baur J, Bös K, Singer R, editors. Motorische Entwicklung. Ein Handbuch [Motor
Development. A Manual]. Schorndorf: Hofmann (1994). p. 238–54.11. Fleishman EA. Dimensional analysis of psychomotor abilities. J Exp Psychol
(1954) 48(6):437–54. doi:10.1037/h0058244 12. Bös K. Handbuch Sportmotorischer Tests [Handbook of Sport-Motor Tests].
Göttingen: Hogrefe (1987). 535 p.13. Lämmle L, Tittlbach S, Oberger J, Worth A, Bös K. A two level model
of motor performance ability. J Exerc Sci Fit (2010) 8:41–9. doi:10.1016/S1728-869X(10)60006-8
14. Malina RM. Physical fitness of children and adolescents in the United States: status and secular change. In: Tomkinson GR, Olds TS, editors. Pediatric
Fitness Secular Trends and Geographic Variability. (Vol. 50), Basel: Karger (2007). p. 67–90.
15. Dollman J, Norton K, Norton L. Evidence for secular trends in children’s physical activity behaviour. Br J Sports Med (2005) 39(12):892–7; discussion 7. doi:10.1136/bjsm.2004.016675
16. Dos Santos FK, Prista A, Gomes TN, Daca T, Madeira A, Katzmarzyk PT, et al. Secular trends in physical fitness of Mozambican school-aged children and adolescents. Am J Hum Biol (2015) 27(2):201–6. doi:10.1002/ajhb.22638

7
Spengler et al. Trends in Children’s Motor Performance
Frontiers in Pediatrics | www.frontiersin.org September 2017 | Volume 5 | Article 206
17. de Moreas Ferrari GL, Bracco MM, Rodrigues Matsudo VK, Fisberg M. Cardiorespiratory fitness and nutritional status of schoolchildren: 30-year evolution. J Pediatr (Rio J) (2013) 89(4):366–73. doi:10.1016/j.jped. 2012.12.006
18. Moller NC, Wedderkopp N, Kristensen PL, Andersen LB, Froberg K. Secular trends in cardiorespiratory fitness and body mass index in Danish children: the European Youth Heart Study. Scand J Med Sci Sports (2007) 17(4):331–9. doi:10.1111/j.1600-0838.2006.00583.x
19. Smpokos EA, Linardakis M, Papadaki A, Lionis C, Kafatos A. Secular trends in fitness, moderate-to-vigorous physical activity, and TV-viewing among first grade school children of Crete, Greece between 1992/93 and 2006/07. J Sci
Med Sport (2012) 15(2):129–35. doi:10.1016/j.jsams.2011.08.006 20. Klaes L, Rommel A, Cosler D. Entwicklung der Fitness von Kindern und
Jugendlichen in Deutschland [Development of fitness of children and adolescents in Germany]. In: Klaes L, Poddig F, Wedekind S, Zens Y, Rommel A, editors. Fit sein macht Schule [“Fit sein macht Schule”]. Köln: Deutscher Ärzte-Verlag (2008). p. 29–43.
21. Bös K, Worth A, Opper E, Oberger J, Woll A. Motorik-Modul. Eine Studie zur
motorischen Leistungsfähigkeit und körperlich-sportlichen Aktivität von Kindern
und Jugendlichen in Deutschland. Abschlussbericht zum Forschungsprojekt
[Motorik-Modul. A Study of Motor Performance and Physical Activity in
Children and Adolescents. Final Report on the Research Project]. Baden-Baden: Nomos (2009). 426 p.
22. Bös K. Deutscher Motorik Test 6-18 [German Motor Ability Test 6-18]. Hamburg: Czwalina (2016). 96 p.
23. Oberger J, Romahn N, Opper E, Tittlbach S, Wank V, Woll A, et al. Untersuchungen zur motorischen Leistungsfähigkeit und körperlich- sportlichen Aktivität im Rahmen des Kinder- und Jugendgesundheitssurveys des Robert Koch-Institutes Berlin [Examinations of motor performance and physical activity within the framework of the health interview and exam-ination survey for children and adolescents of the Robert Koch-Institute in Berlin]. In: Wydra G, Winchenbach H, Schwarz M, Pfeifer K, editors. Assessmentverfahren in Gesundheitssport und Bewegungstherapie [Assessment
Methods in Health-Related Physical Exercise and Exercise Therapy]. Hamburg: Czwalina (2004). p. 44–55.
24. Bös K, Worth A, Heel J, Opper E, Romahn N, Tittlbach S, et al. Testmanual
des Motorik-Moduls im Rahmen des Kinder- und Jugendgesundheitssurveys
des Robert Koch-Instituts [Test Manual of the Motorik-Module within the
Framework of the Health Interview and Examination Survey for Children and
Adolescents of the Robert Koch-Institute]. Wiesbaden: Bundesgemeinschaft für Haltungs- und Bewegungsförderung (2004). 41 p.
25. Bös K, Oberger J, Lämmle L, Opper E, Romahn N, Tittlbach S, et al. Motorische Leistungsfähigkeit von Kindern [Motor performance in children]. In: Schmidt WD, editor. Zweiter deutscher Kinder- und Jugendsportbericht
[Second German Children and Youth Sports Report]. Schorndorf: Hofmann (2008). p. 137–58.
26. Tambalis KD, Panagiotakos DB, Sidossis LS. Greek children living in rural areas are heavier but fitter compared to their urban counterparts: a compar-ative, time-series (1997-2008) analysis. J Rural Health (2011) 27(3):270–7. doi:10.1111/j.1748-0361.2010.00346.x
27. Jurimae T, Volbekiene V, Jurimae J, Tomkinson GR. Changes in eurofit test performance of Estonian and Lithuanian children and adolescents (1992-2002). Med Sport Sci (2007) 50:129–42. doi:10.1159/0000101356
28. Klein M, Emrich E, Schwarz M, Papathanassiou V, Pitsch W, Kindermann W, et al. Sportmotorische Leistungsfähigkeit von Kindern und Jugendlichen im Saarland – Ausgewählte Ergebnisse der IDEFIKS-Studie (Teil 2) [Sport-motor performance in children and adolescents from Saarland – selected results of the IDEFIKS study (part 2)]. Dtsch Z Sportmed (2004) 55(9):211–20.
29. Woll A, Jekauc D, Mess F, Bös K. Sportengagements und sportmotorische Aktivität von Kindern [Engagement in physical exercise and sport-motor activity in children]. In: Schmidt W, editor. Zweiter Kinder- und Jugendsport-
bericht [Second German Children and Youth Sports Report]. Schorndorf: Hofmann (2008). p. 177–92.
30. Sallis JF, Prochaska JJ, Taylor WC. A review of correlates of physical activity of children and adolescents. Med Sci Sports Exerc (2000) 32(5):963–75. doi:10.1097/00005768-200005000-00014
Conflict of Interest Statement: The authors declare that the research was con-ducted in the absence of any commercial or financial relationships that could be construed as a potential conflict of interest.
The reviewer TS and handling Editor declared their shared affiliation.
Copyright © 2017 Spengler, Rabel, Kuritz and Mess. This is an open-access article
distributed under the terms of the Creative Commons Attribution License (CC BY).
The use, distribution or reproduction in other forums is permitted, provided the
original author(s) or licensor are credited and that the original publication in this
journal is cited, in accordance with accepted academic practice. No use, distribution
or reproduction is permitted which does not comply with these terms.

RESEARCH ARTICLE
Are primary school children attending full-dayschool still engaged in sports clubs?
Sarah SpenglerID1*, Arvid Kuritz2, Matthias Rabel1, Filip MessID
1
1 Department of Sport and Health Sciences, Technical University of Munich, Munich, Germany,2 Department of Sports Science, University of Konstanz, Konstanz, Germany
Abstract
Purpose
Schools and organized sports both offer great chances to promote physical activity among
children. Full-day schools particularly allow for extensive participation in extra-curricular
physical activities. However, due to time reasons, full-day schools may also prevent children
from engagement in organized sports outside school. There is only little national and inter-
national research addressing the possible competition of full-day schools and providers of
organized sports outside school and the potential effects on children’s physical activity
behavior. In Germany’s educational system, a transformation towards more full-day schools
is currently taking place. The existence of both, half-day and full-day schools, gave occasion
to the following research question: Do students attending half-day and full-day school differ
with respect to a) sports club membership rate and b) weekly amount of sports club
training?
Methods
Data were collected in eleven German primary schools. Selected schools offered both half-
day and full-day (minimum three days/week with at least seven hours) care. 372 students’
data (grades 1–4; N = 153 half-day, N = 219 full-day; 47.4%male, 8.8±1.2y) were eligible for
analyses. We assessed sports club membership and weekly training duration via question-
naire. Statistical analyses included Chi-square and Mann-Whitney-U-Tests.
Results
83% of half-day school students and 67% of full-day school students were sports club mem-
bers (χ2(1) = 12.31, p<.001). Weekly duration of training in sports clubs among sports club
members (N = 266) also differed between the groups (mdn = 150 min in half-day, mdn = 120
min in full-day school students; z = -2.37, p = .018). Additional analyses stratified for age
and gender showed similar results.
Conclusion
Primary school students attending full-day schools engage less in organized sports outside
school than half-day school students, regardless of age and gender. Future studies should
PLOSONE | https://doi.org/10.1371/journal.pone.0225220 November 22, 2019 1 / 13
a1111111111a1111111111a1111111111a1111111111a1111111111
OPEN ACCESS
Citation: Spengler S, Kuritz A, Rabel M, Mess F
(2019) Are primary school children attending full-
day school still engaged in sports clubs? PLoS
ONE 14(11): e0225220. https://doi.org/10.1371/
journal.pone.0225220
Editor: David Meyre, McMaster University,
CANADA
Received: July 12, 2019
Accepted:October 30, 2019
Published: November 22, 2019
Peer Review History: PLOS recognizes the
benefits of transparency in the peer review
process; therefore, we enable the publication of
all of the content of peer review and author
responses alongside final, published articles. The
editorial history of this article is available here:
https://doi.org/10.1371/journal.pone.0225220
Copyright: © 2019 Spengler et al. This is an open
access article distributed under the terms of the
Creative Commons Attribution License, which
permits unrestricted use, distribution, and
reproduction in any medium, provided the original
author and source are credited.
Data Availability Statement: All relevant data are
within the manuscript and its Supporting
Information files.
Funding: This study was supported by funding
from the Ministry of Education, Youth and Sports

examine if the detected lower engagement in sports club physical activity is compensated
by physical activities in other settings such as school or non-organized leisure time.
Introduction
Already in childhood, physical activity is a key factor for health [1, 2]. Furthermore, studies
show that physical activity behavior adopted in early life most often tracks into adulthood [3,
4]. Therefore, physical activity is promoted as part of a healthy lifestyle [5, 6]. Recommenda-
tions for physical activity behavior and its promotion further point to different settings in
which children’s physical activity should take place, i.e. in the family context, at school and in
leisure time (organized sports and free play) [6].
Especially in school, physical activity programs have the potential to reach all children
regardless of their socioeconomic background. However, school systems differ between coun-
tries. In most countries primary school schedules encompass four to five curriculum-based les-
sons but schedules differ in terms of organization: E.g. in France, Spain and England children
generally spend the full day at school. In Italy parents and children can choose between a half-
day and a full-day schedule [7]. In Germany until recently, primary school education mostly
took place in the mornings only. However, since 2003 optional full-day school offers were
introduced and since then have expanded continuously [8]. Officially accredited full-day
schools have to offer at least three days a week with a minimum of seven hours of care on each
day (encompassing curricular and extra-curricular activities) [9]. Numbers of students attend-
ing full-day school in Germany are continuously rising with less than 10% in 2002 and 42.5%
in 2016 [9, 10]. A further expansion of full-day schools is claimed and subsidized until 2021
[11].
In primary school students, in 2016, 40.1% participated in full-day school [9]. As a result,
these children spend more time at school–time in which they take part in extra-curricular pro-
grams. More than 95% of the primary schools in Germany offering full-day care include vol-
untary physical activity-related programs in their extra-curricular programs [12–14]. Thus,
children can potentially be physically active there. They have less free time out of school
though which they could spend on leisure activities such as participating in organized sports.
Next to physical education and extra-curricular physical activities in school, participating
in organized sports outside school is another important and suitable way for children to be
physically active [6]. Participating in organized sports increases the chances of lifelong physi-
cal activeness due to the fact that membership can survive several life changes like finishing
school or changing jobs. Furthermore, performance- and competition-oriented athletes
find attracting offers in organized sports. Engagement in organized sports offers a chance for
social learning and integration with regard to children’s development [15, 16]. Participating
in organized sports is popular among children. International studies report participation rates
between 36% and 66% [17–19]. However, providing institutions differ between countries.
In Germany, sports clubs belong to the non-profit sector [15] and build the basis for mass
sport provision [20]. Currently there are around 91,000 sports clubs which amounts to one-
quarter of all third-sector organizations [21]. They are the main sports providers for the over-
all population in Germany. They offer affordable sports programs (monthly membership fee
for children does not exceed 2.50€ in 50% of the sports clubs [22]) for competitive as well as
recreational purposes [23]. German sports clubs are voluntary organizations with autono-
mous structures, focusing on their members’ interests. They follow democratic decision
Are primary school children attending full-day school still engaged in sports clubs?
PLOSONE | https://doi.org/10.1371/journal.pone.0225220 November 22, 2019 2 / 13
Baden-Wuerttemberg, https://km-bw.de/Lde/
Startseite. This work was also supported by the
German Research Foundation (DFG) and the
Technical University of Munich within the funding
program Open Access Publishing. The funders had
no role in study design, data collection and
analysis, decision to publish, or preparation of the
manuscript.
Competing interests: The authors have declared
that no competing interests exist.

structures and rely on voluntary work [24]. The prevalence of sports club membership in chil-
dren is comparatively high in Germany. In 2017, 65% of the six- to eleven-year-olds were
member of a sports club [25]. Next to offering various sports programs, sports clubs pursue
social tasks like educating tolerance and fair play, supporting sociability and integration [26].
Sports clubs are also seen as valuable to society due to their contribution to e.g. youth promo-
tion, social integration, crime prevention and health [15]. Thus, again from a societal perspec-
tive, young people’s participation in sports clubs is desirable. However, membership rates
decrease with children’s age [27, 28]. It seems especially crucial to recruit children at an early
age aiming at creating a long-term commitment towards the club and by this also towards
physical activity.
Both settings–school and organized sports–offer a great chance to promote physical activity
in children. Longer school days in full-day schools and hence more possibilities to participate
in extra-curricular physical activities can be beneficial for promoting physical activity espe-
cially in children who otherwise would not be committed to a sports club or another institu-
tion offering organized sports (e.g. children from difficult socioeconomic backgrounds [25,
29]). However, there is also the possibility that children attending full-day school will not
engage in organized sports outside school due to a (perceived) lack of time or clash of dates.
German sports clubs for example currently struggle to recruit members and volunteers and
further fear to loose potential members and volunteers due to the expansion of full-day schools
[15]. Consequently, a significantly increasing number of sports clubs started to cooperate with
full-day schools (35% in 2014) [26].
From a health perspective, knowing the impact of full-day school on overall physical activ-
ity behavior in children is crucial. Furthermore, certainty about the impact of full-day school
on engagement in organized sports would form the basis for developing innovative coopera-
tion strategies that motivate children to engage in organized sports. There is only little
research concerning the possible competition of full-day schools and providers of organized
sports and the potential effects on children’s physical activity behavior. Some studies com-
pare physical activity levels between in-school and off-school hours (e. g. [30–34]), indicating
that physical activity levels are lower in school than outside school. An Italian study [35]
finds that full-day school students spend a higher percentage of time with moderate-to-vigor-
ous physical activity (MVPA) in the afternoon timeslot than half-day school students (18%
vs. 15% of MVPA). No differences are present in the morning and evening timeslots. Zuch-
ner and Arnold [36] find that sports club membership rates in German secondary school stu-
dents who attend full-day school at least at two days a week are lower than in students
attending half-day school only. Further, they find that in 7th and 9th graders the frequency of
training in a sports club is lower in full-day school students. On the contrary, in another Ger-
man study secondary school students attending full-day school offers obtain higher sports
clubs membership rates than their counterparts attending half-day school only [37]. In sum-
mary, studies on the relationship of full-day school attendance and overall physical activity
behavior of students are rare and results are heterogeneous. Particularly with regard to pri-
mary school students as well as to participation in organized sports there is a lack of knowl-
edge to date.
The ongoing change in the German educational system and the existence of both half-day
and full-day schools constitutes a beneficial occasion to gain more insight into this field. Due
to the detected desiderata, this study aims to answer the following research question: Does
habitual sports club participation differ between children attending half-day and full-day
school with respect to a) sports club membership rate and b) weekly amount of sports club
training?
Are primary school children attending full-day school still engaged in sports clubs?
PLOSONE | https://doi.org/10.1371/journal.pone.0225220 November 22, 2019 3 / 13

Methods
Study design
The survey was conducted in eleven German primary schools in Baden-Wurttemberg between
May and July 2017. Selected schools were officially registered and accredited as full-day school
and installed an optional full-day school branch in the school year 2016/2017. Eleven out of 25
invited schools (44%) agreed to participate in the study. All students of grade 1 to grade 4 were
invited to take part, regardless of their affiliation to full-day or half-day school. To collect data
on students’ physical activity behavior in different settings, they were asked to fill out a paper-
pencil questionnaire [38] together with their parents.
Parents of each participant gave informed written consent before enrolling in the study.
The study was approved by the ethics committee of the University of Konstanz, Germany and
was conducted in accordance with the Declaration of Helsinki.
Measurements
Sex, age and attendance of half- and full-day school. Sex as well as date of birth was
assessed via questionnaire and age was calculated. Two age groups were built by using the
median age (8.79 years) as cut off for dividing the sample.
Within the questionnaire participants were asked if they were registered for full-day school
(i.e. these children spend at least seven hours a day at three days a week in school, according to
the accreditation requirements). If they were not registered, they were further asked if they
nevertheless attended full-day school offers. For both groups (registered and non-registered),
time spent at full-day school offers was assessed for each day during the week of the assess-
ment. Participants wrote down the exact time when they left school at each day they attended
full-day school offers. Participants were divided into two groups regarding their program:
Full-day and half-day group. All children that were registered for full-day school were allocated
to the full-day group. Children who answered that they were not registered and neither
attended full-day offers were allocated to the half-day group. Children who were not registered
for full-day school but attended full-day offers which cover–in combination with regular les-
sons–at least three days with a minimum of seven hours at school were also allocated to the
full-day group. This cut-off-point is in accord with the requirements to be accredited and
financially supported as full-day school in Germany. Children who attended lower amounts of
full-day school offers were not included in the analyses.
Habitual sports club participation. Habitual sports club participation was assessed using
the scale from the MoMo Physical activity questionnaire (wave 2) [38]. Sports club participa-
tion in Germany standardly includes regular training sessions, commonly on a weekly basis
throughout the whole year. Performing sports in a sports club can therefore be seen as a habit-
ual physical activity with fixed weekly practices that take place throughout the whole year.
Exceptions can be seasonal sports, e.g. skiing. Participants were asked if they are member of at
least one sports club. Further, they were asked how much and which physical activity they
exert in sports clubs. The questionnaire included questions considering type (which sport) of
their physical activity, weekly duration (in minutes) of each performed sport and months in
which each sport was performed throughout the year (to detect seasonal activities). Partici-
pants could report data for maximal four different types of sport in sports clubs. From these
data, a sum score was calculated reflecting the duration of performed physical activity in sports
clubs per week. The scale assessing sports club participation was checked in relation to reliabil-
ity (kappa = .81) and validity (correlations between scale and Actigraph GT1M: r = 0.35) [39].
However, this validation is based on data of adolescents aged 11 to 17 years and on a former
Are primary school children attending full-day school still engaged in sports clubs?
PLOSONE | https://doi.org/10.1371/journal.pone.0225220 November 22, 2019 4 / 13

version of the scale. The scale used here reflects an optimized version (with slight modifica-
tions) published by the authors of the MoMo Study [38].
Participants
Out of 1,620 invited students, 518 (32.0%) agreed to participate in the study. 450 participants
filled out the questionnaire (46.8% male, mean age 8.8±1.2y). Fig 1 shows how the final sample
size was achieved. Table 1 displays the final sample sizes for the analyses of each part of the
research question and shows the students’ distribution in grades 1 to 4.
Statistics
All statistical tests were performed in SPSS statistical software for Windows (release 23.0; SPSS
Inc., Chicago, IL, USA). Pearson’s chi-square test of independence was used to identify differ-
ences in sports club membership rate between groups. Mann-Whitney-U tests were performed
to compare weekly duration of training in sports clubs between groups. The significance level
for all statistical tests was set a priori to α�.05.
Results
Membership rates in sports clubs differed significantly between students attending half-day
and full-day school (Fig 2). 83% of the students attending half-day school were member in a
sports club compared to 67% of the students attending full-day school (χ2(1) = 12.31, p<.001).
Additional analyses stratified for students’ gender and age showed similar patterns for boys
and girls as well as for younger and older students: Regarding boys, 90.8% (half-day) and
Fig 1. Flow chart of the sample selection process. Bold frames indicate final sample sizes for the statistical analyses.
https://doi.org/10.1371/journal.pone.0225220.g001
Are primary school children attending full-day school still engaged in sports clubs?
PLOSONE | https://doi.org/10.1371/journal.pone.0225220 November 22, 2019 5 / 13

71.4% (full-day) were member of a sports club (χ2(1) = 9.13, p = .003) Regarding girls, 77.3%
(half-day) and 61.7% (full-day) were member of a sports club (χ2(1) = 5.46, p = .019). Further,
85.1% of younger students attending half-day school and 66.4% of younger students attending
full-day school were sports club members (χ2(1) = 8.03, p = .005). In older students, 80.8%
(half-day) and 67.0% (full-day) were member of a sports club (χ2(1) = 4.17, p = .041).
Table 1. Sample sizes.
Sports club membership (N) Habitual PA in sports clubs (N)
Grade 1 45 (m) / 35 (f) 33 (m) / 26 (f)
Grade 2 29 (m) / 55 (f) 23 (m) / 35 (f)
Grade 3 53 (m) / 42 (f) 44 (m) / 30 (f)
Grade 4 27 (m) / 40 (f) 18 (m) / 23 (f)
Inter-grade or no information about gradea 23 (m) / 23 (f) 17 (m) / 17 (f)
Average age 8.8±1.2 (m) / 8.7±1.2 (f) 8.8 ±1.1 (m) / 8.6±1.1 (f)
Total 372 266
a These students attended an inter-grade class (different combinations: grades 1 and 3; 2 and 4; 1 and 2; 3 and 4); 3
students (100% male) did not mention their grade in the questionnaire.
https://doi.org/10.1371/journal.pone.0225220.t001
Fig 2. Sports club membership rates overall and stratified for gender and age group (N = 372). � indicates a statistically significant difference on thealpha-level α�.05.
https://doi.org/10.1371/journal.pone.0225220.g002
Are primary school children attending full-day school still engaged in sports clubs?
PLOSONE | https://doi.org/10.1371/journal.pone.0225220 November 22, 2019 6 / 13

Including only sports club members (N = 266, Fig 3), our analyses showed a significant dif-
ference in weekly duration of training in sports clubs with a median of 150 min for students
attending half-day school and a median of 120 min for students attending full-day school
(z = -2.37, p = .018, r = .15). Stratified additional analyses for boys revealed no significant dif-
ference with medians of 150 min (half-day) and 165 min (full-day, z = -.28, p = .821, r = .02).
Duration of training among girls differed significantly with medians of 135 min (half-day) and
90 min (full-day, z = -3.51, p<.001, r = .31). In the younger age group, duration of training
was also significantly higher for half-day school students (mdn = 120 min) than for full-day
school students (mdn = 97.5 min, z = -2.11, p = .035, r = .18). In the older age group, differ-
ences were not significant but medians were 180 min for half-day school students and 120 min
for full-day school students (z = -1.15, p = .249, r = 0,10).
Discussion
This study aimed to identify potential differences in participation in organized sports (i.e.
sports clubs) between primary school students attending half-day or full-day school. We found
that full-day school students were less engaged in sports clubs. This holds true for boys and
girls as well as younger and older students.
Fig 3. Duration of training in sports clubs per week (Mdn) overall and stratified for gender and age group (N = 266). The boxplots display themedian and the 2nd and 3rd quartile. � indicates a statistically significant difference on the alpha-level α�.05.
https://doi.org/10.1371/journal.pone.0225220.g003
Are primary school children attending full-day school still engaged in sports clubs?
PLOSONE | https://doi.org/10.1371/journal.pone.0225220 November 22, 2019 7 / 13

Our result that boys were more often member of a sports club than girls, is in line with
other studies in this field [15, 27, 40]. Our results further confirm findings that membership
rates decline with children’s age [27, 28], as the prevalence was already lower in the older age
group. Interestingly, overall membership rates in our study were higher than reported in other
national studies [25, 27]. One possible explanation could be the fact that the participating
schools in our study are located in well situated areas of Southern Germany (Baden-Wurttem-
berg) with a relatively high mean net equivalent income [41]. The proportion of people with a
medium or high socioeconomic status (SES) therefore might be relatively high in our sample.
It is shown that children from difficult socioeconomic backgrounds tend to be less engaged in
organized sports [25, 29, 42, 43]. These children were potentially underrepresented in our
sample.
Our results indicate that participating in full-day school prevents some children from
engaging in organized sports outside school. One reason could be that these children already
attend extra-curricular physical activity programs at school and therefore do not want to
engage in further organized physical activity offers. Another reason might be a lack of time
due to the longer school day. It can be assumed that these children or their parents are not will-
ing to realize further binding activities during the week in addition to the fixed full-day sched-
ules. There is also the possibility that a clash of dates prevents these children from engaging in
a sports club [37], as especially in young children sports club training often takes place in the
afternoon. Similar results are found in secondary school students [36], with full-day school stu-
dents obtaining lower membership rates in sports clubs though with smaller differences
between the groups. One reason might be that sports clubs offers for older children and adoles-
cents usually take place in the evening and therefore do not overlap with full-day school sched-
ules. Furthermore, students’ age could be a relevant factor with younger children being more
protected by their parents from having huge amounts of bonded time, especially with regard
to the fact that younger children are more likely to engage in free play [25]. This assumption
holds also true for our results with a slightly greater difference in sports club membership prev-
alence between full-day and half-day school students in the younger age group. Heim and col-
leagues’ [37] contradictory results might be due to the fact that in their study students were
allocated to the full-day group even if they attended full-day school only one day per week,
which in consequence might not affect their engagement in sports clubs.
Even if full-day school students decide to participate in sports club physical activity they
spend a lower amount of weekly time exercising. Possible reasons might be similar to the rea-
sons mentioned before: Attended physical activity programs already at school, a clash of dates
and the desire not to have too many fixed appointments during the week. Again, Zuchner and
Arnoldt [36] show similar results for 7th and 9th graders, with full-day school students partici-
pating in less weekly training sessions than half-day school students. However, we found such
results in girls but not in boys and assume that if boys decide to participate in organized sports,
the performance motivation is more prevalent than in girls and hence they participate more
frequently. Studies on motivation towards sports support this assumption, as it is shown that
for boys performance is an important motivator for engaging in sports and physical exercise
[44]. The fact that the weekly amount of training in our study was lower in girls and in addi-
tion the variance was quite low compared to boys, indicates that in female full-day school stu-
dents the pattern of engaging in sports clubs in a manageable timeframe is typical. A similar
picture was found in younger students. It seems as if especially young kids as well as girls
might be less willing and/or be more protected by their parents from having several fixed
appointments and liabilities. A recent study from 2017 supports this assumption with regard
to age differences showing that younger children (six to seven years) participate less also in
Are primary school children attending full-day school still engaged in sports clubs?
PLOSONE | https://doi.org/10.1371/journal.pone.0225220 November 22, 2019 8 / 13
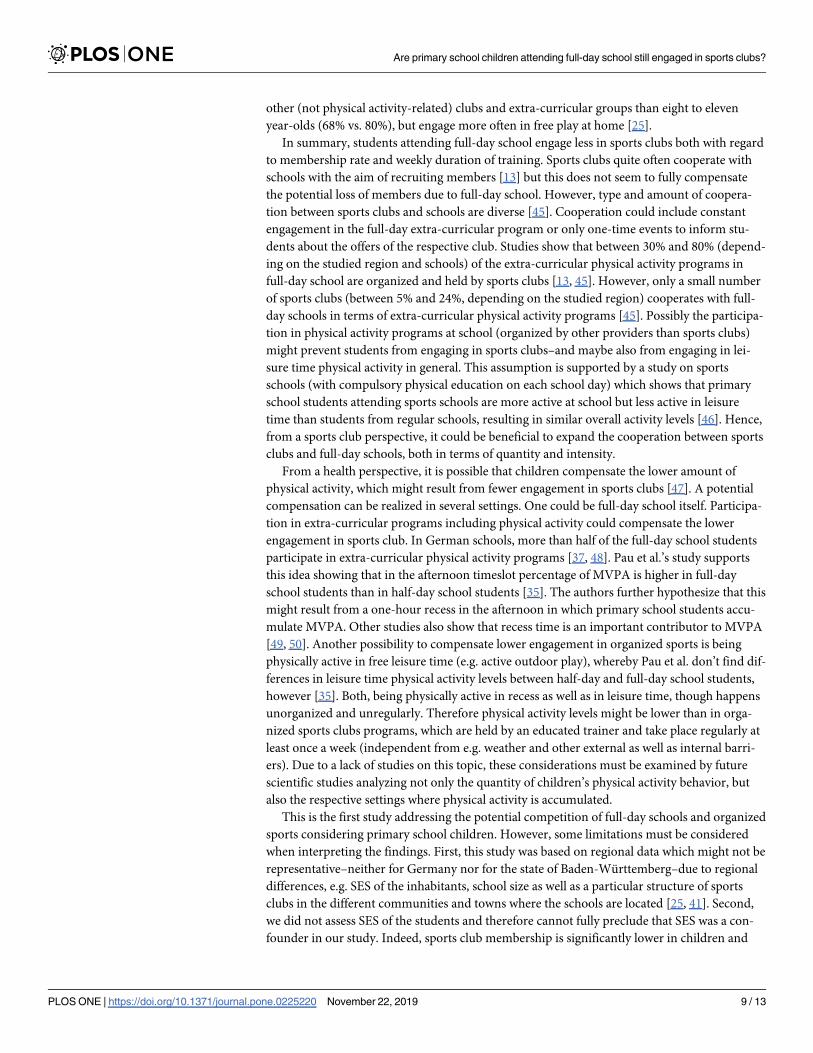
other (not physical activity-related) clubs and extra-curricular groups than eight to eleven
year-olds (68% vs. 80%), but engage more often in free play at home [25].
In summary, students attending full-day school engage less in sports clubs both with regard
to membership rate and weekly duration of training. Sports clubs quite often cooperate with
schools with the aim of recruiting members [13] but this does not seem to fully compensate
the potential loss of members due to full-day school. However, type and amount of coopera-
tion between sports clubs and schools are diverse [45]. Cooperation could include constant
engagement in the full-day extra-curricular program or only one-time events to inform stu-
dents about the offers of the respective club. Studies show that between 30% and 80% (depend-
ing on the studied region and schools) of the extra-curricular physical activity programs in
full-day school are organized and held by sports clubs [13, 45]. However, only a small number
of sports clubs (between 5% and 24%, depending on the studied region) cooperates with full-
day schools in terms of extra-curricular physical activity programs [45]. Possibly the participa-
tion in physical activity programs at school (organized by other providers than sports clubs)
might prevent students from engaging in sports clubs–and maybe also from engaging in lei-
sure time physical activity in general. This assumption is supported by a study on sports
schools (with compulsory physical education on each school day) which shows that primary
school students attending sports schools are more active at school but less active in leisure
time than students from regular schools, resulting in similar overall activity levels [46]. Hence,
from a sports club perspective, it could be beneficial to expand the cooperation between sports
clubs and full-day schools, both in terms of quantity and intensity.
From a health perspective, it is possible that children compensate the lower amount of
physical activity, which might result from fewer engagement in sports clubs [47]. A potential
compensation can be realized in several settings. One could be full-day school itself. Participa-
tion in extra-curricular programs including physical activity could compensate the lower
engagement in sports club. In German schools, more than half of the full-day school students
participate in extra-curricular physical activity programs [37, 48]. Pau et al.’s study supports
this idea showing that in the afternoon timeslot percentage of MVPA is higher in full-day
school students than in half-day school students [35]. The authors further hypothesize that this
might result from a one-hour recess in the afternoon in which primary school students accu-
mulate MVPA. Other studies also show that recess time is an important contributor to MVPA
[49, 50]. Another possibility to compensate lower engagement in organized sports is being
physically active in free leisure time (e.g. active outdoor play), whereby Pau et al. don’t find dif-
ferences in leisure time physical activity levels between half-day and full-day school students,
however [35]. Both, being physically active in recess as well as in leisure time, though happens
unorganized and unregularly. Therefore physical activity levels might be lower than in orga-
nized sports clubs programs, which are held by an educated trainer and take place regularly at
least once a week (independent from e.g. weather and other external as well as internal barri-
ers). Due to a lack of studies on this topic, these considerations must be examined by future
scientific studies analyzing not only the quantity of children’s physical activity behavior, but
also the respective settings where physical activity is accumulated.
This is the first study addressing the potential competition of full-day schools and organized
sports considering primary school children. However, some limitations must be considered
when interpreting the findings. First, this study was based on regional data which might not be
representative–neither for Germany nor for the state of Baden-Wurttemberg–due to regional
differences, e.g. SES of the inhabitants, school size as well as a particular structure of sports
clubs in the different communities and towns where the schools are located [25, 41]. Second,
we did not assess SES of the students and therefore cannot fully preclude that SES was a con-
founder in our study. Indeed, sports club membership is significantly lower in children and
Are primary school children attending full-day school still engaged in sports clubs?
PLOSONE | https://doi.org/10.1371/journal.pone.0225220 November 22, 2019 9 / 13

adolescents with a lower SES– 42.8% (low), 61.0% (medium) and 74.1% (high) [43]. However,
a representative study on full-day school attendance in (western) German primary schools
shows that the distribution of children from low, medium and high SES does not significantly
differ between full-day and half-day schools [51]. Thus, we can assume that our full-day and
half-day samples are similar regarding their SES distribution. Third, as data was assessed via
questionnaire, statements on physical activity behavior can be affected by the difficulty to recall
the duration of activities and summarizing as well as rounding this information. Questionnaire
data was used because it delivers information not only with respect to the quantity of physical
activity but also with respect to the setting in which the activity takes place.
Conclusions
This study showed that primary school students attending full-day school engage less in orga-
nized sports outside school than half-day school students. Future studies should examine if the
lower engagement in physical activity in sports clubs is compensated in other settings like
school or leisure time outside sports clubs. Sports clubs could intensify the cooperation with
schools in order to recruit long-term members and thus minimize the loss of members due to
full-day school. This is especially important as engagement in sports clubs can continue even
after graduation and thus contributes to continuous physical activity in adolescents and young
adults.
Supporting information
S1 File. Study dataset.
(XLSX)
Acknowledgments
The authors thank Melina Schnitzius (Technical University of Munich, Germany) for copy
editing the manuscript.
Author Contributions
Conceptualization: Sarah Spengler, Arvid Kuritz, Filip Mess.
Data curation: Arvid Kuritz, Matthias Rabel.
Formal analysis: Sarah Spengler, Matthias Rabel.
Funding acquisition: Filip Mess.
Investigation: Arvid Kuritz.
Methodology: Sarah Spengler, Matthias Rabel.
Project administration: Arvid Kuritz, Filip Mess.
Supervision: Filip Mess.
Validation: Sarah Spengler.
Visualization: Sarah Spengler, Matthias Rabel.
Writing – original draft: Sarah Spengler.
Writing – review & editing: Sarah Spengler, Arvid Kuritz, Matthias Rabel, Filip Mess.
Are primary school children attending full-day school still engaged in sports clubs?
PLOSONE | https://doi.org/10.1371/journal.pone.0225220 November 22, 2019 10 / 13

References1. Poitras VJ, Gray CE, Borghese MM, Carson V, Chaput JP, Janssen I, et al. Systematic review of the
relationships between objectively measured physical activity and health indicators in school-aged chil-dren and youth. Appl Physiol Nutr Metab. 2016; 41(6 Suppl 3): 197–239. https://doi.org/10.1139/apnm-2015-0663 PMID: 27306431
2. Janssen I, Leblanc AG. Systematic review of the health benefits of physical activity and fitness inschool-aged children and youth. Int J Behav Nutr Phys Act. 2010; 7: 40. https://doi.org/10.1186/1479-5868-7-40 PMID: 20459784
3. Craigie AM, Lake AA, Kelly SA, Adamson AJ, Mathers JC. Tracking of obesity-related behaviours fromchildhood to adulthood: a systematic review. Maturitas. 2011; 70(3): 266–84. https://doi.org/10.1016/j.maturitas.2011.08.005 PMID: 21920682
4. Trudeau F, Laurencelle L, Shephard RJ. Tracking of physical activity from childhood to adulthood. MedSci Sports Exerc. 2004; 36(11): 1937–43. https://doi.org/10.1249/01.mss.0000145525.29140.3b PMID:15514510
5. World Health Organisation. Global Recommendations on Physical Activity for Health. Geneva: WorldHealth Organisation; 2010.
6. Rutten A, Pfeifer K. Nationale Empfehlungen fur Bewegung und Bewegungsforderung. Koln: Bundes-zentrale fur gesundheitliche Aufklarung; 2017. German.
7. Kamette F. Organisation of school time in the European Union. European Issues. 2011; 212. https://www.robert-schuman.eu/en/doc/questions-d-europe/qe-212-en.pdf.
8. Naul R. Bewegung, Spiel und Sport in der Ganztagsschule: Bilanz und Perspektiven. Aachen: Meyer& Meyer; 2011. German.
9. Sekretariat der Standigen Konferenz der Kultusminister der Lander in der Bundesrepublik Deutschland.Allgemeinbildende Schulen in Ganztagsform in den Landern in der Bundesrepublik Deutschland. Statis-tik 2012 bis 2016. Berlin; 2018. https://www.kmk.org/fileadmin/Dateien/pdf/Statistik/Dokumentationen/GTS_2016_Bericht.pdf. German.
10. KlemmK, Zorn D. Gute Ganztagsschule fur alle. Kosten fur den Ausbau eines qualitatsvollen Ganz-tagsschulsystems in Deutschland bis 2030. Gutersloh: Bertelsmann Stiftung; 2017. https://www.bertelsmann-stiftung.de/fileadmin/files/Projekte/27_In_Vielfalt_besser_lernen/Gute_Ganztagsschule_01.pdf. German.
11. German Government. Ein neuer Aufbruch fur Europa. Eine neue Dynamik fur Deutschland. Ein neuerZusammenhalt fur unser Land. Koalitionsvertrag zwischen CDU, CSU und SPD. Berlin; 2018. https://www.cdu.de/system/tdf/media/dokumente/koalitionsvertrag_2018.pdf?file=1. German.
12. Holtappels HG. Angebotsstruktur, Schulerteilnahme und Ausbaugrad ganztagiger Schulen. In: Holtap-pels HG, Klieme E, Rauschenbach T, Stecher L, editors. Ganztagsschule in Deutschland. Ergebnisseder Ausgangserhebung der „Studie zur Entwicklung von Ganztagsschulen”(StEG). Weinheim, Mun-chen: Beltz Juventa; 2007. pp. 186–206. German.
13. Thieme L. Ganztag und Sportvereine. Empirische Befunde aus Rheinland-Pfalz. sportunterricht. 2013;62(5): 142–6. German.
14. Sußenbach J, Geis S. Evaluation von Bewegungs-, Spiel- und Sportangeboten an offenen Ganz-tagsschulen in Niedersachsen. Hannover: Landessportbund Niedersachsen; 2013. German.
15. Breuer C, Feiler S, Wicker P. Sport clubs in Germany. In: Breuer C, Hoekman R, Nagel S, van der WerffH, editors. Sport clubs in Europe. Cham: Springer; 2015. pp. 187–208.
16. Walk L. Bewegung formt das Hirn: lernrelevante Erkenntnisse der Gehirnforschung. DIE Zeitschrift furErwachsenenbildung. 2011; 1: 27–9. https://doi.org/10.3278/DIE1101W027 German.
17. Field SC, Temple VA. The relationship between fundamental motor skill proficiency and participation inorganized sports and active recreation in middle childhood. Sports. 2017; 5(2). https://doi.org/10.3390/sports5020043 PMID: 29910403
18. Howie EK, McVeigh JA, Smith AJ, Straker LM. Organized sport trajectories from childhood to adoles-cence and health associations. Med Sci Sports Exerc. 2016; 48(7): 1331–9. https://doi.org/10.1249/MSS.0000000000000894 PMID: 27314410
19. Kokko S, Martin L, Geidne S, Van Hoye A, Lane A, Meganck J, et al. Does sports club participation con-tribute to physical activity among children and adolescents? A comparison across six European coun-tries. Scand J Public Health. 2018. https://doi.org/10.1177/1403494818786110 PMID: 29999480
20. Petry K, Hallmann K. Germany. In: Hallmann K, Petry K, editors. Comparative sport development. NewYork: Springer; 2013. pp. 75–86.
21. Krimmer H, Priemer J. ZiviZ-Survey 2012. Zivilgesellschaft verstehen. Berlin: Stifterverband fur dieDeutscheWissenschaft; 2013. German.
Are primary school children attending full-day school still engaged in sports clubs?
PLOSONE | https://doi.org/10.1371/journal.pone.0225220 November 22, 2019 11 / 13

22. Breuer C, Wicker P, Feiler S. Empirische Analysen zur Entwicklung der Strukturen in Sportvereinen. In:Rutten A, Nagel S, Kahler R, editors. Handbuch Sportentwicklungsplanung. Schorndorf: Hofmann;2014. pp. 225–34. German.
23. Heinemann K. Einfuhrung in die Soziologie des Sports. 5th ed. Schorndorf: Hofmann; 2007. German.
24. Heinemann K, Horch HD. Soziologie der Sportorganisation. Ger J Exerc Sport Res. 1981; 11(2): 123–50. German.
25. Wolfert S, Pupeter M. Freizeit: Hobbys und Mediennutzung. In: World Vision Deutschland, editor. Kin-der in Deutschland 2018. 4World Vision Kinderstudie. Weinheim, Basel: Beltz; 2018. pp. 54–75.German.
26. Breuer C. Sportentwicklungsbericht 2013/2014: Analyse zur Situation der Sportvereine in Deutschland.Hellenthal: Strauß; 2015. German.
27. Schmidt SCE, Henn A, Albrecht C, Woll A. Physical activity of german children and adolescents 2003–2012: TheMoMo-Study. Int J Environ Res Public Health. 2017; 14(11). https://doi.org/10.3390/ijerph14111375 PMID: 29137127
28. Brettschneider W-D, Kleine T, Brandl-Bredenbeck HP. Jugendarbeit in Sportvereinen. Anspruch undWirklichkeit: eine Evaluationsstudie. Schorndorf: Hofmann; 2002. German.
29. Vella SA, Cliff DP, Okely AD. Socio-ecological predictors of participation and dropout in organisedsports during childhood. Int J Behav Nutr Phys Act. 2014; 11: 62. https://doi.org/10.1186/1479-5868-11-62 PMID: 24885978
30. Silva P, Santos R, Welk G, Mota J. Seasonal differences in physical activity and sedentary patterns:The relevance of the PA context. J Sports Sci Med. 2011; 10(1): 66–72. PMID: 24149297
31. Brooke HL, Atkin AJ, Corder K, Ekelund U, van Sluijs EM. Changes in time-segment specific physicalactivity between ages 10 and 14 years: A longitudinal observational study. J Sci Med Sport. 2016;19(1): 29–34. https://doi.org/10.1016/j.jsams.2014.10.003 PMID: 25459234
32. Brooke HL, Atkin AJ, Corder K, Brage S, van Sluijs EM. Frequency and duration of physical activitybouts in school-aged children: A comparison within and between days. Prev Med Rep. 2016; 4: 585–90.https://doi.org/10.1016/j.pmedr.2016.10.007 PMID: 27843758
33. Jauregui A, Villalpando S, Rangel-Baltazar E, Castro-Hernandez J, Lara-Zamudio Y, Mendez-Gomez-Humaran I. The physical activity level of Mexican children decreases upon entry to elementary school.Salud Publica Mex. 2011; 53(3): 228–36. PMID: 21829888
34. Aznar S, Naylor PJ, Silva P, Perez M, Angulo T, LagunaM, et al. Patterns of physical activity in Spanishchildren: a descriptive pilot study. Child Care Health Dev. 2011; 37(3): 322–8. https://doi.org/10.1111/j.1365-2214.2010.01175.x PMID: 21083695
35. PauM, Corona F, Leban B, Piredda S, Vacca MM, Mura G. Influence of school schedules on physicalactivity patterns in primary school children: A case study in Italy. J Phys Act Health. 2017; 14(7): 501–5.https://doi.org/10.1123/jpah.2016-0492 PMID: 28290766
36. Zuchner I, Arnoldt B. Sport von Kindern und Jugendlichen in Ganztagsschule und Sportverein. Sportpa-dagogik Heute. 2012; 3: 1–14. German.
37. Heim C, Prohl R, Bob A. Ganztagsschule und Sportverein. In: Hildebrandt-Stramann R, Laging R, Moe-gling K, editors. Korper, Bewegung und Schule. Theorie, Forschung und Diskussion. Kassel: Prolog;2013. pp. 136–56. German.
38. Schmidt S, Will N, Henn A, Reimers A, Woll A. Der Motorik-Modul AktivitatsfragebogenMoMo-AFB:Leitfaden zur Anwendung und Auswertung. KIT Scientific Working Papers. 2016; 53. https://publikationen.bibliothek.kit.edu/1000062199. German.
39. Jekauc D, Wagner MO, Kahlert D, Woll A. Reliabilitat und Validitat des MoMo-Aktivitatsfragebogens furJugendliche (MoMo-AFB). Diagnostica. 2013; 59(2): 100–11. German.
40. Baur J, Burrmann U, Krysmanski K. Sportbezogene Sozialisation von Madchen. In: Bundesinstitut furSportwissenschaft, editor. BISp-Jahrbuch 2001. Koln; 2002. pp. 219–26. https://www.bisp.de/SharedDocs/Downloads/Publikationen/Jahrbuch/Jb_2001_Artikel/Baur_etal.pdf?__blob=publicationFile&v=1. German.
41. Berger M, Boockmann B, Felbermayr G, Klempt C, Koch A, Kohler WK, et al. Strukturanalyse und Per-spektiven desWirtschaftsstandortes Baden-Wurttemberg im nationalen und internationalen Vergleich.Abschlussbericht. ZEW-Gutachten und Forschungsberichte. 2017. https://wm.baden-wuerttemberg.de/fileadmin/redaktion/m-wm/intern/Publikationen/Wirtschaftsstandort/Studien/Abschlussbericht_Strukturanalyse_final.pdf. German.
42. Mess F, AlexanderW. Soziale Ungleichheit im Kindes- und Jugendalter am Beispiel des Sportengage-ments in Deutschland. Zeitschrift fur Soziologie der Erziehung und Sozialisation. 2012; 32(4): 359–79.German.
Are primary school children attending full-day school still engaged in sports clubs?
PLOSONE | https://doi.org/10.1371/journal.pone.0225220 November 22, 2019 12 / 13

43. Manz K, Schlack R, Poethko-Muller C, Mensink G, Finger J, Lampert T, et al. Korperlich-sportliche Akti-vitat und Nutzung elektronischer Medien im Kindes- und Jugendalter. Ergebnisse der KiGGS-Studie:Erste Folgebefragung (KiGGSWelle 1). Bundesgesundheitsbl Gesundheitsforsch Gesundheitsschutz.2014; 57(7): 840–8. German.
44. KalmanM, Geckova AM, Hamrik Z, Kopcakova J, Iannotti RJ, Veselska ZD. Motives for physical activityamong adolescents in the Czech and Slovak Republics. Cent Eur J Public Health. 2015; 23 (Suppl):78–82. https://doi.org/10.21101/cejph.a4176 PMID: 26849549
45. Kuritz A, Dinkelacker M, Mess F. Bewegung und Sport in Ganztagsschulen—eine systematische Litera-turubersicht zum aktuellen Forschungsstand in Deutschland. Sportwissenschaft. 2016; 46(3): 162–78.German.
46. Møller NC, Tarp J, Kamelarczyk EF, Brønd JC, Klakk H, Wedderkopp N. Do extra compulsory physicaleducation lessons mean more physically active children? Findings from the childhood health, activity,and motor performance school study Denmark (The CHAMPS-study DK). Int J Behav Nutr Phys Act.2014; 11(1): 121.
47. Marques A, Ekelund U, Sardinha LB. Associations between organized sports participation and objec-tively measured physical activity, sedentary time and weight status in youth. J Sci Med Sport. 2016;19(2): 154–7. https://doi.org/10.1016/j.jsams.2015.02.007 PMID: 25766508
48. Zuchner I. Jugendalltag zwischen Ganztagsschule, Peers und außerschulischen Aktivitaten. In: BockK, Grabowsky S., Sander U., TholeW., editors. Jugend Hilfe Forschung. Baltmannsweiler: Schneider;2013. pp. 45–65. German.
49. Mota J, Silva P, Santos MP, Ribeiro JC, Oliveira J, Duarte JA. Physical activity and school recess time:differences between the sexes and the relationship between children’s playground physical activity andhabitual physical activity. J Sports Sci. 2005; 23(3): 269–75. https://doi.org/10.1080/02640410410001730124 PMID: 15966345
50. Guinhouya BC, Lemdani M, Vilhelm C, Hubert H, Apete GK, Durocher A. How school time physicalactivity is the "big one" for daily activity among schoolchildren: a semi-experimental approach. J PhysAct Health. 2009; 6(4): 510–9. PMID: 19842466
51. Marcus J, Nemitz J, Spieß CK. Ausbau der Ganztagsschule: Kinder aus einkommensschwachenHaushalten imWesten nutzen Angebote verstarkt. DIW-Wochenbericht. 2013; 80(27): 11–23. German.
Are primary school children attending full-day school still engaged in sports clubs?
PLOSONE | https://doi.org/10.1371/journal.pone.0225220 November 22, 2019 13 / 13
Copyright © 2022 FDOKUMEN