
Exploring Behavioral Markers of Long-Term Physical Activity Maintenance: A Case Study of System...
13
http://heb.sagepub.com/ Health Education & Behavior http://heb.sagepub.com/content/40/1_suppl/51S The online version of this article can be found at: DOI: 10.1177/1090198113496787 2013 40: 51S Health Educ Behav Christina S. McCrae, Beverly L. Roberts, Michael Marsiske and Peter R. Giacobbi, Jr. Eric B. Hekler, Matthew P. Buman, Nikhil Poothakandiyil, Daniel E. Rivera, Joseph M. Dzierzewski, Adrienne Aiken Morgan, Identification Modeling Within a Behavioral Intervention Exploring Behavioral Markers of Long-Term Physical Activity Maintenance: A Case Study of System Published by: http://www.sagepublications.com On behalf of: Society for Public Health Education can be found at: Health Education & Behavior Additional services and information for http://heb.sagepub.com/cgi/alerts Email Alerts: http://heb.sagepub.com/subscriptions Subscriptions: http://www.sagepub.com/journalsReprints.nav Reprints: http://www.sagepub.com/journalsPermissions.nav Permissions: by guest on October 11, 2013 heb.sagepub.com Downloaded from by guest on October 11, 2013 heb.sagepub.com Downloaded from by guest on October 11, 2013 heb.sagepub.com Downloaded from by guest on October 11, 2013 heb.sagepub.com Downloaded from by guest on October 11, 2013 heb.sagepub.com Downloaded from by guest on October 11, 2013 heb.sagepub.com Downloaded from by guest on October 11, 2013 heb.sagepub.com Downloaded from by guest on October 11, 2013 heb.sagepub.com Downloaded from by guest on October 11, 2013 heb.sagepub.com Downloaded from by guest on October 11, 2013 heb.sagepub.com Downloaded from by guest on October 11, 2013 heb.sagepub.com Downloaded from by guest on October 11, 2013 heb.sagepub.com Downloaded from by guest on October 11, 2013 heb.sagepub.com Downloaded from
Transcript of Exploring Behavioral Markers of Long-Term Physical Activity Maintenance: A Case Study of System...

http://heb.sagepub.com/Health Education & Behavior
http://heb.sagepub.com/content/40/1_suppl/51SThe online version of this article can be found at:
DOI: 10.1177/1090198113496787
2013 40: 51SHealth Educ BehavChristina S. McCrae, Beverly L. Roberts, Michael Marsiske and Peter R. Giacobbi, Jr.
Eric B. Hekler, Matthew P. Buman, Nikhil Poothakandiyil, Daniel E. Rivera, Joseph M. Dzierzewski, Adrienne Aiken Morgan,Identification Modeling Within a Behavioral Intervention
Exploring Behavioral Markers of Long-Term Physical Activity Maintenance: A Case Study of System
Published by:
http://www.sagepublications.com
On behalf of:
Society for Public Health Education
can be found at:Health Education & BehaviorAdditional services and information for
http://heb.sagepub.com/cgi/alertsEmail Alerts:
http://heb.sagepub.com/subscriptionsSubscriptions:
http://www.sagepub.com/journalsReprints.navReprints:
http://www.sagepub.com/journalsPermissions.navPermissions:
by guest on October 11, 2013heb.sagepub.comDownloaded from by guest on October 11, 2013heb.sagepub.comDownloaded from by guest on October 11, 2013heb.sagepub.comDownloaded from by guest on October 11, 2013heb.sagepub.comDownloaded from by guest on October 11, 2013heb.sagepub.comDownloaded from by guest on October 11, 2013heb.sagepub.comDownloaded from by guest on October 11, 2013heb.sagepub.comDownloaded from by guest on October 11, 2013heb.sagepub.comDownloaded from by guest on October 11, 2013heb.sagepub.comDownloaded from by guest on October 11, 2013heb.sagepub.comDownloaded from by guest on October 11, 2013heb.sagepub.comDownloaded from by guest on October 11, 2013heb.sagepub.comDownloaded from by guest on October 11, 2013heb.sagepub.comDownloaded from
Health Education & Behavior40(1S) 51S –62S© 2013 Society for PublicHealth EducationReprints and permissions: sagepub.com/journalsPermissions.navDOI: 10.1177/1090198113496787heb.sagepub.com
Article
Physical activity is a key behavior to prevent chronic dis-eases (Schroeder, 2007). Although advances have been made in best methods for promoting physical activity (King, Buman, & Hekler, in press; Marcus et al., 2006), there is still much we do not understand. There is a strong need to develop physical activity interventions that promote not just physical activity during an intervention but also maintenance of phys-ical activity after the intervention ceases. Previous research focused on behavioral maintenance has largely focused on group mean-difference analyses (Fjeldsoe, Neuhaus, Winkler, & Eakin, 2011). Specifically, results from a recent systematic review suggested that those trials that achieved maintenance (i.e., statistically significant difference between intervention and control at the end of an intervention that persisted during the follow-up period) tended to focus more
on women, had more pretrial screening, and included more intensive interventions (e.g., longer duration, face-to-face contact, more intervention components, and follow-up prompts; Fjeldsoe et al., 2011).
Although the overall average in an intervention group may indicate significant differences relative to control, often
496787 HEBXXX10.1177/1090198113496787Health Education & Behavior 40(1S)Hekler et al.research-article2013
1Arizona State University, Phoenix, AZ, USA2University of Florida, Gainesville, FL, USA3Duke University, Durham, NC, USA4West Virginia University, Morgantown, WV, USA
Corresponding Author:Matthew P. Buman, School of Nutrition and Health Promotion, Arizona State University, 500 North 3rd Street, Phoenix, AZ 85004-2135, USA. Email: [email protected]
Exploring Behavioral Markers of Long-Term Physical Activity Maintenance: A Case Study of System Identification Modeling Within a Behavioral Intervention
Eric B. Hekler, PhD1, Matthew P. Buman, PhD1, Nikhil Poothakandiyil, MS1, Daniel E. Rivera, PhD1, Joseph M. Dzierzewski, PhD2, Adrienne Aiken Morgan, PhD3, Christina S. McCrae, PhD2, Beverly L. Roberts, PhD, FAAN, FGSA2, Michael Marsiske, PhD2, and Peter R. Giacobbi Jr., PhD4
AbstractEfficacious interventions to promote long-term maintenance of physical activity are not well understood. Engineers have developed methods to create dynamical system models for modeling idiographic (i.e., within-person) relationships within systems. In behavioral research, dynamical systems modeling may assist in decomposing intervention effects and identifying key behavioral patterns that may foster behavioral maintenance. The Active Adult Mentoring Program was a 16-week randomized controlled trial of a group-based, peer-delivered physical activity intervention targeting older adults. Time-intensive (i.e., daily) physical activity reports were collected throughout the intervention. We explored differential patterns of behavior among participants who received the active intervention (N = 34; 88% women, 64.1 ± 8.3 years of age) and either maintained 150 minutes/week of moderate to vigorous intensity physical activity (MVPA; n = 10) or did not (n = 24) at 18 months following the intervention period. We used dynamical systems modeling to explore whether key intervention components (i.e., self-monitoring, access to an exercise facility, behavioral initiation training, behavioral maintenance training) and theoretically plausible behavioral covariates (i.e., indoor vs. outdoor activity) predicted differential patterns of behavior among maintainers and nonmaintainers. We found that maintainers took longer to reach a steady-state of MVPA. At week 10 of the intervention, nonmaintainers began to drop whereas maintainers increased MVPA. Self-monitoring, behavioral initiation training, percentage of outdoor activity, and behavioral maintenance training, but not access to an exercise facility, were key variables that explained patterns of change among maintainers. Future studies should be conducted to systematically explore these concepts within a priori idiographic (i.e., N-of-1) experimental designs.
Keywordsdynamical systems, maintenance, physical activity, system identification
52S Health Education & Behavior 40(1S)
wide variability exists that is largely lost when focusing only on mean-level differences (see, e.g., Buman, Hekler, Bliwise, & King, 2011). For example, even among intervention trials that promote 18-month maintenance relative to control based on mean-difference analyses (Buman, Giacobbi, et al., 2011; King et al., 2007), there is wide variability of success and failure within both study arms. Research methods from other disciplines (e.g., engineering, computer science) are increas-ingly being explored within behavioral science (Collins, Murphy, & Strecher, 2007). In particular, a wide array of engineering methods, broadly labeled system identification, are used to create dynamical system models (Ljung, 1999), which have been proposed to better understand the impact of intervention components rather than intervention packages (Rivera, Pew, & Collins, 2007).
Because dynamical systems modeling has historically not been applied in behavioral settings, some considerations important to behavioral applications, such as the need to model the response of multiple participants under difficult experimental and measurement conditions, may seem to limit the usefulness of the method. However, systems model-ing is based on the same principles as regression, and there-fore, lessons from behavioral science (e.g., mixed model analyses for controlling for clustering effects) can be used to solve these issues and thus motivate future research (see Limitations section). These current limitations aside, dynam-ical systems modeling affords new opportunities beyond what traditional statistical approaches allow, including (a) a much wider range of mathematically modeled responses using low-order differential equations that are estimated from intensive longitudinal data; this includes responses that are often observed in behavioral interventions but are diffi-cult to model via traditional behavioral science analytic tech-niques (see Glass, Wilson, & Gottman, 1975; Hayes, Barlow, & Nelson-Gray, 1999; and see Figures 1 and 2 for examples from system identification); (b) an explicit emphasis on cre-ating mathematical models for understanding how a mea-sured system functions, which results in strong internal validity for understanding exact mechanisms of change and dose–response relationships for an individual using a behav-ioral intervention; and (c) the direct utilization of these math-ematical models in the creation of “closed-loop control systems,” which are central for systems that tailor an inter-vention relying on individual response, thus providing increasingly personalized and adaptive interventions (Nandola & Rivera, 2013; Rivera et al., 2007).
Addressing Classical Methodological Challenges
Behavioral science has classically used both methodological and statistical strategies to improve the overall precision of our behavioral models and intervention approaches. These strategies essentially seek to improve the signal-to-noise ratio (Ljung, 1999) by (a) reducing or redistributing the “noise” in a model, which are the measurement and extraneous factors
occurring within the model, through randomization and sta-tistical control techniques; or (b) increasing the “signal” in the model, which is the ground truth information about a relation-ship of interest in the model, through more potent interven-tions or more tightly controlled studies. Classically these models then undergo null hypothesis testing procedures to determine “if” the hypothesis of proposed relationship(s) has met an a priori, sometimes arbitrary, threshold of significance to determine its merit.
System identification is a distinct yet complementary approach to traditional hypothesis testing endeavors as its primary emphasis is on modeling variations and responses within temporal data, classically, within a single “system” (a single individual or a small aggregation of individuals). In comparison to hypothesis testing endeavors, improving the signal-to-noise ratio is achieved by using all of the available time-linked data for an individual and then modeling the variations in these data for an individual system over time.
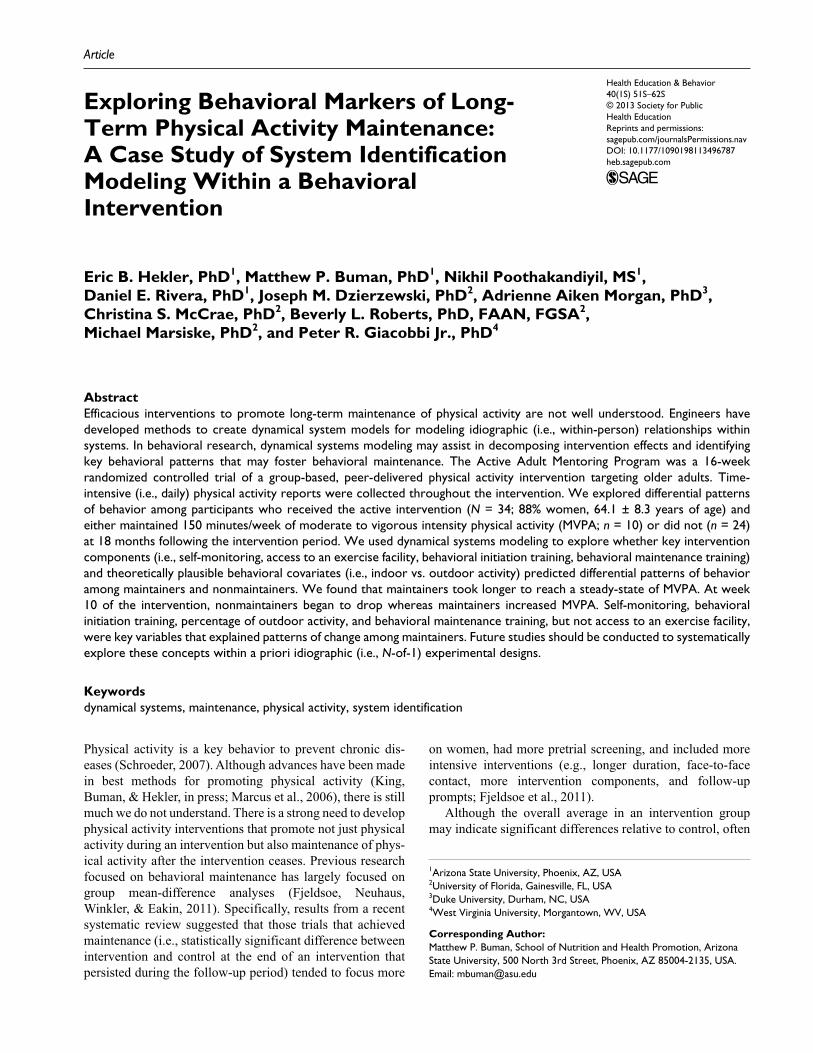
Figure 1. Unit step response (i.e., change in y for a unit change in x) for a classical first-order system.
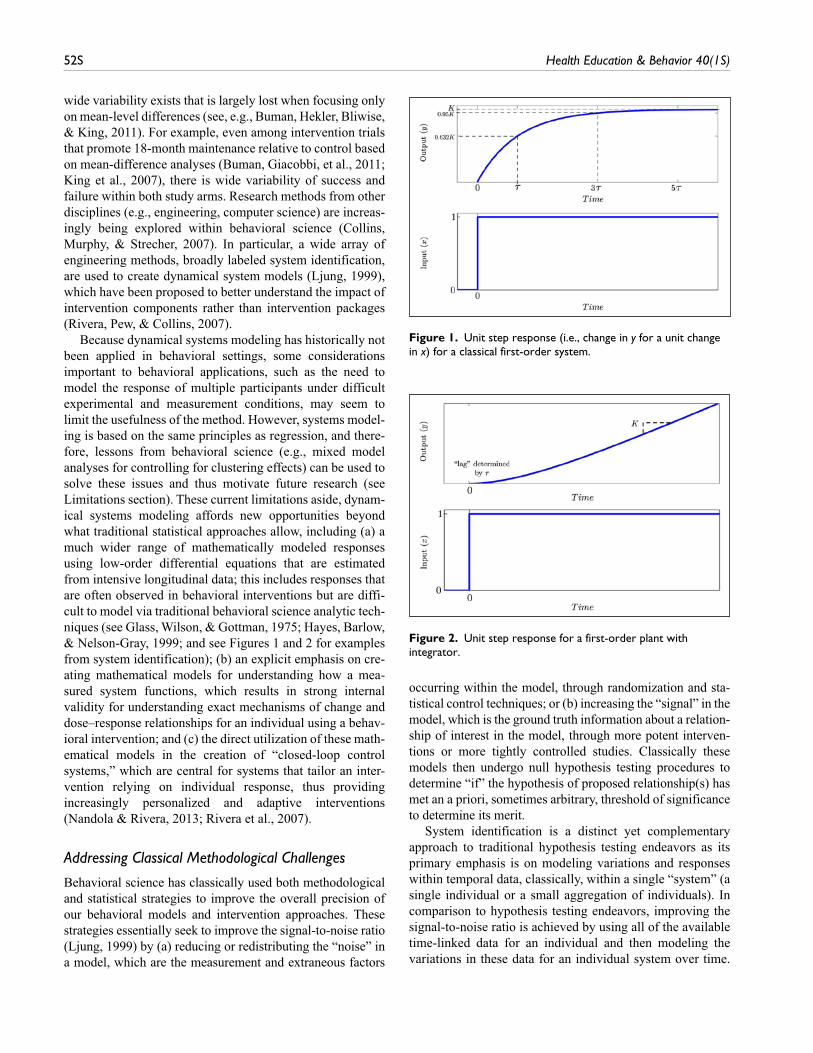
Figure 2. Unit step response for a first-order plant with integrator.

Hekler et al. 53S
This allows for a stronger signal by focusing on the dynami-cal system and interrelationships of model components within a single system over time. In contrast to hypothesis testing endeavors that explore if a relationship exists, dynam-ical systems modeling allows for explication on exactly “how” an individual system is functioning overall, thereby offering an important complement to hypothesis testing.
More explicitly, system identification and dynamical sys-tems modeling, in particular, explores the transient responses of manipulated input variables (i.e., intervention compo-nents) and disturbance variables (i.e., time-varying covari-ates known to influence the outcome such as social norms for being active) on an outcome within a single case or N-of-1 time series context (i.e., idiographic; Deshpande, Nandola, Rivera, & Younger, 2011; Molenaar & Campbell, 2009; Rivera et al., 2007; Timms, Rivera, Collins, & Piper, 2012; Velicer, 2010). As the techniques are generally based on regression, they share some characteristics with more commonly used methods within behavioral science; how-ever, dynamical systems modeling uses a wide variety of differential equation structures to mathematically model responses of intervention components and time-varying covariates. For example, it is plausible that the impact of an intervention component will initially be strong but gradually level off over time (e.g., see Figure 1). This response is called a first-order system within system identification and is difficult to model within current behavioral science ana-lytic techniques but a very basic response pattern within dynamical systems modeling. Indeed, this is only the start-ing point of a much wider range of possible responses that can be mathematically modeled within system identification (e.g., see Figure 2 for a first-order integrator system descrip-tion, which models a delayed but then continuous increase response, along with models for understanding multiple-component feedback loop systems; Ljung, 2009, 2011; Ogunnaike & Ray, 1994).
As such, system identification offers an exciting comple-mentary methodology for modeling time-intensive data. Because of the much greater flexibility for modeling, the resulting models have strong internal validity for mathemati-cally describing exactly what occurred within a single sys-tem, such as a single person. Furthermore, many of the traditional requirements for statistical power to detect “sig-nificant” effects (i.e., large number of subjects) are not as relevant in dynamical systems. Because the analytic tech-niques were originally devised to model single systems, they are well suited to model individual response patterns to inter-ventions when intensive repeated measures are gathered. Similar to how hypothesis testing individuals seek additional subjects to improve the signal-to-noise ratio, in system iden-tification, increased “power” is achieved by gathering data more often and over a longer period of time within an indi-vidual (or via more potent signals such as stronger interven-tions). As such, the use of dynamical system modeling offers promise as an important analytic technique for supporting
N-of-1 style experimental designs—an increasingly popular area of experimental inquiry within behavioral science (Smith, 2012).
Perhaps most exciting, the underlying mathematical mod-els, particularly if generated from strong within-person experimental designs (e.g., designs that are conceptually similar to alternating treatment designs; see Barlow & Hayes, 1979) that include validation studies to determine external validity of the models, can be used to create closed-loop con-trol systems—something that is not possible within tradi-tional null hypothesis endeavors. Control systems are algorithms that can monitor an outcome of interest (e.g., physical activity), a person’s responsiveness to different intervention components (e.g., self-monitoring, attending intervention sessions focused on behavioral initiation train-ing), and the impact of uncontrolled but influential and mea-surable factors on physical activity (e.g., weather patterns, or social norms of family and friends related to being active) and, based on all of those factors, provide the “right” inter-vention component at the “right” time for an individual. As such, dynamical systems modeling represents a potentially important enabler for realizing the dream of personalized behavioral medicine.
Although the norm in system identification is to expli-cate transient responses within one system (i.e., idiographic data), recent explorations into the use of system identifica-tion within a behavioral context have explored ways to aggregate data (e.g., average values between individuals based on the assumption of ergodicity) across individuals to reduce the signal-to-noise ratio even further, assuming there is strong a priori justification for the grouping. As dis-cussed earlier, two key groups that require further explora-tion are those individuals who maintain physical activity levels compared with those who do not. An increasingly popular approach for identifying variables that distinguish unknown groups within longitudinal data are growth mix-ture models (Duncan, Duncan, & Strycker, 2006). These analyses examine data to identify underlying or latent fac-tors that explain and distinguish different groups and thus could be one fruitful method for understanding maintainers versus nonmaintainers.
The purpose of this study was to use dynamical systems modeling to explore how intervention components (i.e., self-monitoring, access to an exercise facility, behavioral initia-tion training, behavioral maintenance training) and exogenous variables (i.e., percentage of activity accom-plished outdoors) may function differently among maintain-ers and nonmaintainers. Specifically, our goal was to use common data exploration practices from system identifica-tion (e.g., data visualization, progressive model building using system identification; Ljung, 2009, 2011) to generate empirically based hypotheses (King, Ahn, Atienza, & Kraemer, 2008) that could inform later a priori N-of-1 exper-imental testing of key intervention components that may pro-mote improved maintenance of physical activity.

54S Health Education & Behavior 40(1S)
Method
Study Design
The Active Adult Mentoring Program study was a 16-week randomized controlled trial with an 18-month follow-up that tested the impact of peer volunteers as delivery agents of a social cognitive theory-based, group-mediated, physical activity intervention in sedentary adults aged 50 years and older living in a university community in the southeastern United States. Enrollment occurred on a rolling basis throughout 2007 and 2008 to control for seasonality effects. The full methods and results have been reported elsewhere (Buman, Giacobbi, et al., 2011) and are briefly reviewed here. Participants were randomized to one of two 16-week study arms: (a) peer-led advice and support for physical activity initiation and maintenance, or (b) a “standard” com-munity-based physical activity promotion intervention. The main results suggested that, at 16 weeks, both arms had sig-nificant increases in physical activity, but with no significant differences between arms. At 18 months, the peer-led inter-vention arm had superior maintenance of physical activity relative to the standard arm, despite cessation of the inter-vention. Institutional approval was obtained for all aspects of the study protocol. The original study design was conceived to also test dynamical relationships with other key outcomes in older adults including sleep and cognition within the course of a physical activity promotion intervention; hence, an intensive repeated-measures design was adopted. In this article, we leverage this intensive repeated-measures design to explore additional questions related to the specific inter-vention components we had included in the study, to assess their impact on long-term maintenance of physical activity behavior. For these secondary analyses, we focus only on those individuals who were randomized to the active inter-vention group and completed the study (N = 34).
Intervention
Project Active Adult Mentoring Program was a multicompo-nent intervention grounded in social cognitive (Bandura, 1986) and self-determination (Deci & Ryan, 1985) theories. Prior to the intervention (Week 0), all participants were given a pedometer and a daily log for physical activity self-moni-toring and were encouraged to track their behavior daily. At Session 1, participants received access to the community exercise facility in which the intervention sessions were held. This facility was available for use from Weeks 1 to 12. Weeks 2 to 7 focused on behavioral initiation training, where content focused on self-management skills for physical activity initiation including goal setting, problem solving, social support, and mental imagery exercises. Weeks 8 to 12 focused on maintenance training, where content focused on relapse prevention and developing a plan to transition to a home- or community-based exercise routine.
Measures
The Leisure-Time Exercise Questionnaire (LTEQ) was used to assess self-reported physical activity behavior through the intervention and for an additional week at 18-month follow-up. The LTEQ is a 3-item scale that asks participants to rate how many 20-minute bouts they engaged in mild, moderate, and strenuous leisure-time exercise (Godin & Shephard, 1985). Although typically used as a 7-day recall, in the cur-rent study the LTEQ was used as a daily measure to reduce recall bias and to allow for time intensive data. Daily reports of minutes of moderate to vigorous intensity physical activ-ity (MVPA) were computed from the LTEQ by adding the number of bouts reported in the moderate and strenuous cat-egories and multiplying by 20. In a randomly selected sub-sample of study participants (n = 22, 11 in each arm), we found evidence for adequate concurrent validity for the LTEQ with accelerometer-derived MVPA (r = .48, p < .001) as measured by the RT3 triaxial accelerometer (Stayhealthy, Monrovia, CA). Although pedometer data were available, we did not include these data as a comparison with the LTEQ as the intervention targeted all types of MVPA, and pedom-eters are known to be less accurate at capturing nonambula-tory activities (Tudor-Locke, Williams, Reis, & Pluto, 2002). Immediately following daily completion of the LTEQ, par-ticipants were asked to indicate the number of exercise bouts that occurred indoors and outdoors. These data are expressed as a ratio of total bouts performed outdoors (outdoor bouts/[outdoor + indoor bouts]). Finally, for the intervention com-ponents, we dichotomously coded each day of the interven-tion to represent when each of the intervention components were either present or absent. For example, gym membership became available at Day 8 and then taken away at Day 84. As such, Days 0 to 7 were labeled 0, Days 8 to 84 were labeled 1, and 85 on were labeled 0 again. This temporally linked coding scheme of intervention components is visually sum-marized in Figure 3.
Participants
We have limited our sample to only completers of the 16-week intervention in the peer-led intervention arm (N = 41 were randomized but N = 34 completed the study) to test how the full set of behavioral and intervention components may have differentially affected physical activity levels dur-ing the intervention between maintainers versus nonmain-tainers (see Table 1). Specifically, we defined “maintainers” as those who reported ≥150 minutes of MVPA during the 18-month follow-up week of monitoring and “nonmaintain-ers” as those who reported less MVPA. Finally, because all intervention components were delivered during the first 13 weeks of the intervention period, and response rates to daily surveys were lower during the final 2-week period, we focused on data only from the first 14 weeks of measurement (1 baseline week and 13 intervention weeks). In total, our

Hekler et al. 55S
sample for these analyses comprised 10 maintainers and 24 nonmaintainers who reported their physical activity over 98 consecutive days (see Table 1).
Analysis Plan
First, we developed time-series visuals of our output vari-able (i.e., daily MVPA, see Figure 3A and B) and input/dis-turbance variables, using basic features of MatLab. These included metrics for the time during the intervention when self-monitoring (i.e., use of a pedometer and daily recording of physical activity levels) occurred. Self-monitoring occurred throughout the entire study; however, we used an implicit assumption that self-monitoring was not occurring prior to the intervention and that MVPA values from the first measurement were similar to previous days not measured. This assumption provided us with the ability to model
possible transient responses of MVPA to self-monitoring via system identification (Figure 1C and D). A dichotomous metric was entered for the timeframe when access to the exercise facility was available (Figure 3E and F). In addi-tion, the separated percentage of attendance of maintainers and nonmaintainers who participated in behavioral initia-tion and/or maintenance training sessions and the self-reported percentage of activity accomplished outdoors were visualized (see Figure 3G-L). These visualizations aided in conceptualizing the most appropriate dynamical model response patterns.
We used functions provided by the System Identification Toolbox (SITB) in Matlab to perform model estimation and validation (Ljung, 2011). In particular, we rely on the estima-tion of continuous-time linear models from sampled data using the SITB’s pem command, which is implemented as part of the Process Models option in the SITB’s graphical user
Figure 3. Time series plots of moderate to vigorous intensity physical activity (MVPA) and key inputs.

56S Health Education & Behavior 40(1S)
interface. The model estimation employed in software applies a continuous-time identification approach with a sophisti-cated filtering approach that is well suited for demanding noisy environments and is able to accomplish multiple input estimation as well (Garnier, 2011; Ljung, 2009).
As dynamical systems modeling is not commonly used in behavioral research, a more thorough description of response patterns explored in this study are in order. A dynamical sys-tem model may use the classical first-order system structure (see Figure 1). This model is represented in differential equa-tion form as follows:
τdy t
dty t Kx t
( )( ).+ ( ) = (1)
The signal x(t) denotes the input signal, which could be manipulated (customarily denoted as u in system identifica-tion) or an exogenous variable or disturbance (customarily denoted as d). K is the steady-state gain (in units of y/x) whereas τ is the time constant, which is in units of time. An effective means for understanding the first-order system can be seen from observing the response of y to a unit step change in x, as seen in Figure 1. The gain parameter K denotes the change in the output y at final time per unit of x. τ, mean-while, is indicative of the speed of response of the system. The smaller the value of τ, the faster the system is to reach a settling point where the output variable levels off, a larger time constant denotes a slower system. More precisely, one time constant τ is equivalent to 63.2% of the modeled final value for a step input change, whereas 3τ denotes T
95%, or the
95% settling time. At t = 5τ, the modeled-system step response is effectively settled, having reached over 99% of its final value. The first-order system displays a response curve that grows exponentially toward a new steady-state; this is known as an overdamped response. For the purposes of this article, we have focused on only first-order systems based on a priori expectations. That said, dynamical systems modeling includes capacities for capturing a variety of other response patterns such as oscillations, overshoots, or under-shoots via second-order or higher derivatives (Ogunnaike & Ray, 1994).
An additional dynamical model structure that is relevant to this work involves a first-order system with integrator. This system is represented by a model that includes a sec-ond-order derivative and is expressed as follows:
τd y t
dt
dy t
dtKx t
2
2
( ) ( )( ).+ = (2)
Figure 2 depicts the response of y for a unit step change in x for a first-order system with integrator. For this model there is an initial “lag” in the response whose length is influenced by τ, followed by what becomes an asymptotically ramp response with slope equivalent to the gain K. In effect, fol-lowing the initial lag period, K represents the slope of a lin-ear relationship per unit of time within this type of model (e.g., an initial lag period of a few days followed by a 5 min/day increase of MVPA that continues for the rest of the mea-surement period). As with the classical first-order system, K is in units of y/x, whereas τ has units of time.
Table 1. Demographics Characteristics of Maintainers and Nonmaintainers in the Active Intervention (N = 34).
Nonmaintainers (n = 24), n (%)
Maintainers (n = 10), n (%)
Women 21 (87.5) 9 (90.0)Ethnicity Hispanic/Latino 2 (8.3) 0 (0)Race White 20 (83.3) 10 (100) Black 2 (8.3) 0 (0) Other 2 (8.3) 0 (0)Education Less than college graduate 9 (37.5) 3 (30) College graduate 6 (25.0) 2 (20) More than college graduate 9 (37.5) 5 (50)Age (years), M ± SD 63.1 ± 8.7 66.7 ± 6.9 50-64 10 (41.7) 4 (40) 65+ 14 (58.3) 6 (60)Marital status Married 13 (54.1) 4 (40) Single (divorced/never married) 7 (29.2) 5 (50) Widowed 4 (16.7) 1 (10)Baseline PA (min/wk), M ± SD 19.1 ± 24.7 24.9 ± 17.2
Note. PA = physical activity.
Hekler et al. 57S
Model validation in system identification comprises many tasks, but ultimately corresponds to the researcher’s confi-dence that the estimated model will be suitable for an end use application (which can range anywhere from prediction of future outcomes to the design of an optimized intervention based on control systems engineering; Deshpande et al., 2011). For purposes of this article, we used a progressive model building strategy whereby we add plausible inputs (i.e., self-monitoring, gym membership, behavioral initiation training, maintenance training, and percentage of activity accomplished outdoors) into a hierarchical series of models. Within these models we strived for the most parsimonious model that had the best model fit.
The model’s goodness-of-fit index is expressed as a per-centage from 0% to 100% and calculated according to
Fity k y k
y k y [%] .= −
( )− ( )( )−
100 1 2
2
(3)
Here y(k) is the simulated output, y(k) is the data to which the model is fit, and y is the average of all y values and ║.║
2
indicates a vector 2-norm. As this is secondary data analysis, these goodness-of-fit estimates are more appropriately viewed as a numerical indicator of internal validity for the model explaining the available data rather than a determina-tion of the external validity of these results translating into other systems. Finally, similar to exploratory factor analysis (Thompson, 2004), when some model parameters are entered, they may result in a better model fit, but the overall model does not fit well with conventional wisdom (e.g., a strong negative response for self-monitoring) or simply cre-ates implausible outcomes (e.g., an increase of more than 1,000 min/day of MVPA). As such, the models are also judged based on conventional wisdom and plausibility of the model fits. As system identification emphasizes questions of how systems function, it does not have statistical signifi-cance testing for determining improved model fit. Therefore, no p-values were reported as that is not in line with this methodology, at present.
Results
Visualization Results
As described earlier, Figure 3 reports a time-series visual-ization of key output, input, and disturbance variables. Figures in the left column represent nonmaintainers, whereas figures on the right represent maintainers. Visual inspection from Figure 3A and B suggests that maintainers had a slightly greater increase early in the intervention (Days 0-40) and greater decrease later (Days 70-80) than nonmaintainers. Specifically, nonmaintainers showed a rapid increase in MVPA following completion of the base-line phase that then remained relatively steady for the rest of 14 weeks plotted with a possible slight reduction at the
end that started around Week 11. In contrast, maintainers appeared to have a somewhat slower increase to steady state activity, but this state was actually higher overall than the nonmaintainers. In addition, the maintainers appeared to have a slightly further increase in MVPA around approx-imately Week 10. A visual inspection of the inputs suggests plausible links between them and fluctuations in daily MVPA.
System Identification
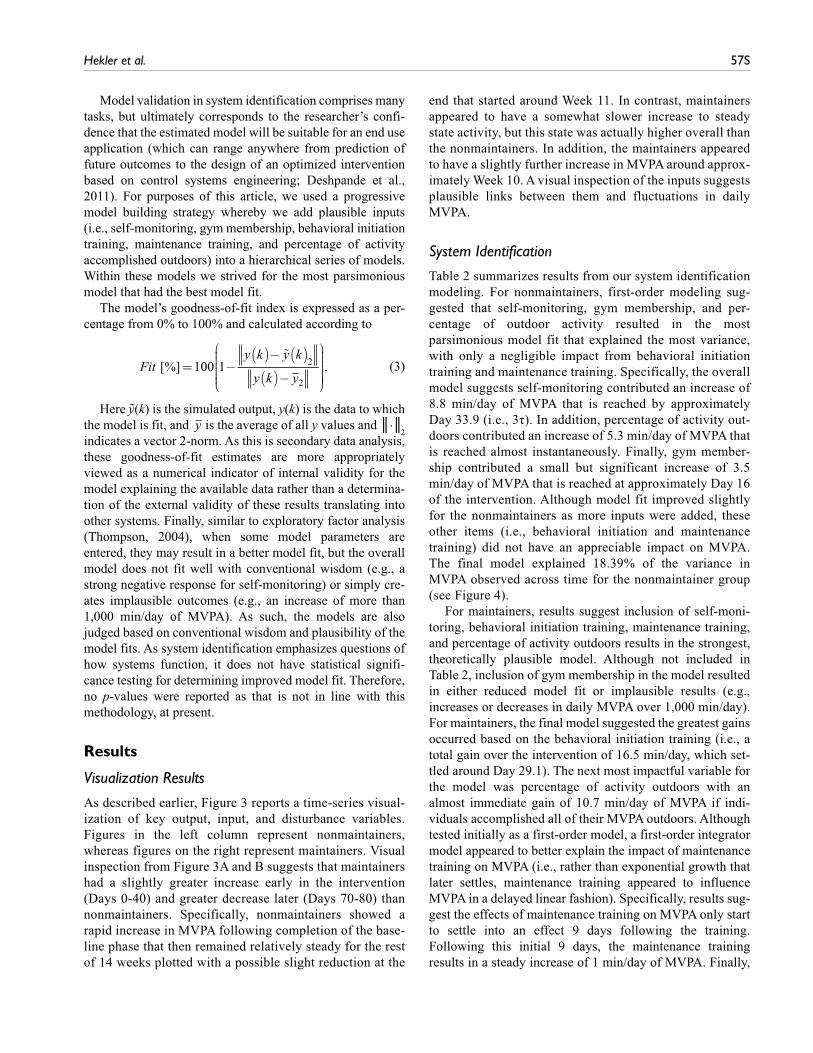
Table 2 summarizes results from our system identification modeling. For nonmaintainers, first-order modeling sug-gested that self-monitoring, gym membership, and per-centage of outdoor activity resulted in the most parsimonious model fit that explained the most variance, with only a negligible impact from behavioral initiation training and maintenance training. Specifically, the overall model suggests self-monitoring contributed an increase of 8.8 min/day of MVPA that is reached by approximately Day 33.9 (i.e., 3τ). In addition, percentage of activity out-doors contributed an increase of 5.3 min/day of MVPA that is reached almost instantaneously. Finally, gym member-ship contributed a small but significant increase of 3.5 min/day of MVPA that is reached at approximately Day 16 of the intervention. Although model fit improved slightly for the nonmaintainers as more inputs were added, these other items (i.e., behavioral initiation and maintenance training) did not have an appreciable impact on MVPA. The final model explained 18.39% of the variance in MVPA observed across time for the nonmaintainer group (see Figure 4).
For maintainers, results suggest inclusion of self-moni-toring, behavioral initiation training, maintenance training, and percentage of activity outdoors results in the strongest, theoretically plausible model. Although not included in Table 2, inclusion of gym membership in the model resulted in either reduced model fit or implausible results (e.g., increases or decreases in daily MVPA over 1,000 min/day). For maintainers, the final model suggested the greatest gains occurred based on the behavioral initiation training (i.e., a total gain over the intervention of 16.5 min/day, which set-tled around Day 29.1). The next most impactful variable for the model was percentage of activity outdoors with an almost immediate gain of 10.7 min/day of MVPA if indi-viduals accomplished all of their MVPA outdoors. Although tested initially as a first-order model, a first-order integrator model appeared to better explain the impact of maintenance training on MVPA (i.e., rather than exponential growth that later settles, maintenance training appeared to influence MVPA in a delayed linear fashion). Specifically, results sug-gest the effects of maintenance training on MVPA only start to settle into an effect 9 days following the training. Following this initial 9 days, the maintenance training results in a steady increase of 1 min/day of MVPA. Finally,

58S Health Education & Behavior 40(1S)
self-monitoring also appears to be influential with a total gain of 3.0 min/day in MVPA that occurs rapidly (i.e., less than 1 day) and then levels off for the duration of the study. In all, this final model explained 23.4% of the variance in MVPA for maintainers (see Figure 4).
Discussion
Results from these secondary, exploratory analyses suggest the maintainers in our sample exhibited different patterns of MVPA during the trial compared with nonmaintainers in our
Table 2. System Identification Results.
Transient Resp. Gains (min/day of MVPA) Time Constant (days)
Fit (%)Groups Inputs Inp. 1 Inp. 2 Inp. 3 Inp. 4 Inp. 1 Inp. 2 Inp. 3 Inp. 4
Nonmaintainers 1. Self-monitoring 12.1 11.1 16.45 1st 1st Maintainers 15.4 16.2 12.6 1st 1st Nonmaintainers 1. Self-monitoring 12.0 0.2 11.2 0.001 16.44 1st 1st 1st 1st Maintainers 2. Initiation training >1,000 13.6 >1,000 2.7 20.29 1st-Int 1st 1st-Int 1st Nonmaintainers 1. Self-monitoring 9.1 3.4 11.6 5.6 17.82 1st 1st 1st 1st Maintainers 2. Gym membership 59.2 −64.1 49.4 96.5 14.59 1st 1st 1st 1st Nonmaintainers 1. General intervention 11.9 4.6 10.8 0.001 16.9 1st 1st 1st 1st Maintainers 2. % Activity outdoors 16.7 42.6 16.1 3.6 17.91 1st 1st 1st 1st Nonmaintainersa 1. General intervention 8.8 5.3 3.5 11.3 0.0 5.4 18.39 1st 1st 1st 1st 1st 1st Maintainers 2. % Activity outdoors 2.4 63.8 16.4 0.0 4.1 16.0 16.34 3. Gym membership 1st 1st 1st 1st 1st 1st Nonmaintainers 1. General intervention 10.8 1.6 1.9 10.3 3.8 0.0 16.83 1st 1st 1st 1st 1st 1st Maintainers 2. Initiation training 1.7 22.5 4.2 1.2 12.1 57.1 21.92 3. Maintenance training 1st-Int 1st 1st 1st-Int 1st 1st Nonmaintainers 1. General intervention 11.8 0.4 4.6 11.1 2.7 0.001 16.92 1st 1st 1st 1st 1st 1st Maintainers 2. Initiation training 0.2 10.7 33.1 0.3 2.7 3.2 22.73 3. % Activity outdoors 1st-Int 1st 1st 1st-Int 1st 1st Nonmaintainers 1. General intervention 11.3 0.8 1.2 4.6 10.5 0.001 0.001 0.001 17.06 1st 1st 1st 1st 1st 1st 1st 1stMaintainers 2. Initiation training 2.9 16.7 41.2 14.0 0.001 10.1 195.4 0.5 23.59 3. Maintenance training 1st-Int 1st 1st 1st 1st-Int 1st 1st 1stMaintainersa 4. % Activity outdoors 3.0 16.5 1.0 10.7 0.0 9.7 9.1 0.3 23.38 1st 1st 1st-Int 1st 1st 1st 1st-Int 1st
Note. Inp. = Input (also may be thought of as independent variables).1st = first-order system; 1st-Int = first-order system with integrator. The step response plots for 1st-order systems and 1st-order systems with integrator are depicted in Figures 2 & 3, respectively (“K” represents the gain and “τ” represents time constant).MVPA (moderate to vigorous intensity physical activity): This is the key output (also known as dependent variable) measured on daily basis.Transient Resp. Gains: For first-order system, this value represents the value achieved when the influence of an input reaches a flattening steady-state, for first-order integrator systems, this value represents the slope and is conceptually similar to an unstandardized beta coefficient within regression. Refer Figures 2 and 3 wherein the gain is indicated by “K.”Time Constant (τ): For first-order systems, the time constant represents the number of units (in this case days) whereby it takes to reach a steady state, a standard convention within system ID is to use the 3 × Time Constant (3τ) as a benchmark of when the system has reached 95% of its gain; Time constants for first-order integrator systems represent the amount of time it takes before the system settles into a linear relationship.Nonmaintainers: The group of individuals in the intervention group who were not engaging in 150 minutes per week of MVPA at 18 months.Maintainers: The group of individuals who were engaging in 150 min/week of MVPA or more at 18 months.Fit %: This is an estimate of the percentage of variance explained within the output variable by overall model.aDenotes the best overall model.

Hekler et al. 59S
sample. This observation was confirmed both via visual inspection and through the establishment of system identifi-cation models quantifying these differential patterns. Results further suggest that, for those individuals who maintained, behavioral initiation training, percentage of activity out-doors, self-monitoring, and maintenance training each helped explain observed variance in MVPA during the trial, although the magnitude of these effects varied. For maintainers, behavioral initiation training and percentage of activity out-doors appeared to be key factors driving MVPA, with a more modest impact of self-monitoring and maintenance training. In contrast, nonmaintainers appeared to be most influenced by self-monitoring, percentage of activity outdoors, and access to an exercise facility.
To our knowledge, this is the first study that has explored system identification modeling to understand differential patterns of response to individual components to further elu-cidate best strategies for promoting maintenance of physical activity. Conceptually these results suggest, at least among the older healthy adult population in our sample, interven-tions may work better at promoting long-term maintenance at 18 months if they focus on performing activity outdoors rather than indoor activities in an exercise facility. This con-clusion is reached based on results suggesting that nonmain-tainers in our sample were influenced by access to an exercise facility to increase their MVPA during the trial, whereas for
maintainers in our sample, the higher percentage of time out-doors mapped to increases in their physical activity at the end of the intervention that appeared to be maintained for up to 18 months. Future research should further explore the potential unintended consequences of providing access to an exercise facility during the behavioral initiation phase of an intervention on long-term maintenance of physical activity behavior.
These results highlight how interventions may function differently to affect MVPA for those who later maintain com-pared with nonmaintainers. Although group mean-difference analyses can provide valuable insights for intervention pack-ages (Fjeldsoe et al., 2011), they do not provide guidance on the influence of intervention components that can lead to more efficient and impactful interventions (Collins et al., 2007). Dynamical system models provide guidance into how an intervention may function, which could later serve as an “open-loop” model in a just in time adaptive, time-varying intervention based on control systems engineering principles (Collins, Murphy, & Bierman, 2004; Rivera et al., 2007). An adaptive intervention designed on the basis of control sys-tems engineering principles (Rivera et al., 2007) directly incorporates dynamical models relating intervention dosages to outcomes to synthesize optimal decision rules that maxi-mize (or minimize) a performance objective reflective of desirable intervention outcomes. Deshpande et al. (2011), for example, showed that anxiety self-reports can be used to adjust naltrexone dosage for treatment of fibromyalgia symptoms. In the context of this article, weather forecasts could be used in conjunction with the dynamical model relat-ing outdoor activity to MVPA to anticipate periods of time amenable to outdoor activity; this information could then be communicated to intervention participants to enable better physical activity planning. It may be fruitful in future studies to explore variations in physical activity by weather individ-ually by season where seasonal impact would vary experi-mentally for individuals.
LimitationsThis investigation has several limitations. The study focused on secondary data analyses of a previously conducted study. As such, the sample was not explicitly designed for system identification methods nor was a large enough sample pres-ent to allow for validation of the models generated, thereby limiting any interpretation of the generailizability of these results. Related to design, several intervention components started and/or ceased together, thereby limiting our ability to parse out the differential impact of each intervention compo-nent. System identification techniques were explicitly designed for understanding response patterns in physical systems that are guided by fundamental laws of conservation (e.g., energy, matter, momentum). As such, the methods, by design, emphasize strong internal validity, particularly for modeling how a particular system functions. As alluded to
Figure 4. Simulation fits for final models for nonmaintainers and maintainers.

60S Health Education & Behavior 40(1S)
above, since system identification procedures are largely based on regression, there is the potential to take advantage of important lessons from statistical analytic techniques used in behavioral science to improve the methods, particularly for determining the generalizability of the results. With the current secondary data analyses, particularly without the use of a priori experimental designs that include a subset of data for validation of the models created, results from our models require replication within larger samples before any conclu-sions about generalizability of the results can be determined. Of particular importance, this study used only healthy older adults participating in a peer-led intervention. As such, addi-tional research is required to determine if these results gener-alize to other intervention packages or populations including older adults with chronic conditions such as arthritis.
In addition, the primary outcome measure we used was not a continuous variable, but instead reported daily physical activity levels in 20-minute increments. Although we attempted to reduce the impact of this by averaging across meaningful groups, future research, particularly using truly among N-of-1 “systems,” should incorporate continuous mea-sures of MVPA, such as accelerometry data. Although partici-pants did receive a pedometer in this trial, the pedometer was used to provide a tracking and feedback mechanism for par-ticipants. The pedometers used were not designed to provide research-grade data (e.g., easy to reset the numbers, steps were calculated with only the movements of a ball) and therefore were not appropriate to use in these analyses. In addition, self-report of key variables was poor during the final weeks of the trial and was completely lacking from the end of the interven-tion trial until the 18-month mark, thereby limiting our under-standing of long-term patterns of change. This may have been particularly impactful for the maintenance training interven-tion component as it was only activated during the final few weeks of the trial, thereby limiting our ability to fully map the response to maintenance training. In addition, self-monitoring was present throughout the measurement period. As such, con-clusions about this particular intervention component are par-ticularly tenuous. That said, based on the assumption that the effect of the self-monitoring would start to occur as soon as self-monitoring becomes available, the inclusion of it in the model still does provide some insights for understanding its impact on physical activity.
As discussed previously, although technically possible within system identification, commercial tools such as the System Identification Toolbox in MATLAB used in this work are not geared toward establishing statistical signifi-cance testing, particularly among clustered observations (e.g., participants who participated in the same group). As such, in these secondary analyses, which were primarily meant to drive hypothesis generation rather than hypothesis testing, we did not conduct formal statistical significance testing. As suggested by King et al. (2008), the type of exploratory analysis conducted in this study is a key first step for generating hypotheses and is conceptually distinct from
hypothesis-testing endeavors. The results provide guidance for subsequent hypothesis-testing endeavors but should not be considered confirmatory (King et al., 2008).
To fully capture the strength of system identification within a behavioral context, future research could explore improving the methods by developing techniques for better determining statistical significance of the models, applying analytic lessons from mixed model analyses to a system identification context, and use of more explicit N-of-1 exper-imental designs that are more in line with a system identifi-cation tradition. That said, these secondary data analyses provide an important “proof of concept” and bridge for link-ing these two traditions. We believe the melding of lessons from behavioral science (i.e., significance testing, mixed model analyses) and engineering (i.e., system identification, N-of-1 study designs) will result in particularly fruitful and robust methods for understanding behavioral interventions.
Future Directions
To fully use the strengths of system identification and dynamical systems models, a priori N-of-1 experiments would need to be devised to test the differential impact of intervention components during an intervention trial. These idiographic study designs are being explored more frequently within behavioral research (Deshpande et al., 2011; Molenaar & Campbell, 2009; Rivera et al., 2007; Smith, 2012; Timms et al., 2012; Velicer, 2010). The use of a priori N-of-1 experi-mental designs, whereby different intervention components are systematically activated and then deactivated, coupled with system identification methods, would allow for a more appropriate testing of each individual intervention compo-nent, which could then be used for better explicating how each individual component influences (or does not influ-ence) MVPA and developing control systems for behavioral interventions. Future research should explore the key vari-ables identified within this study but use stronger within-subject study designs for disaggregating intervention impact on patterns of change. For example, using a mixture of an alternating treatment design with a Latin Square study design to control for ordering effects across participants might be particularly fruitful (Barlow & Hayes, 1979; Grant, 1948). As these methods primarily emphasize how a system func-tions, additional research using latent growth modeling could be a valuable complement for determining if different intervention components significantly identify differences between maintainers and nonmaintainers. Beyond this, to ensure these types of analyses can be replicated, a central tenet of science, interdisciplinary teams that include both behavioral scientists and engineers are required for conduct-ing these types of analyses, at present. This will be particu-larly important to be mindful of when designing studies that explore questions related to temporally optimizing behav-ioral interventions to foster adaptive interventions; they will likely require a transdisciplinary team.

Hekler et al. 61S
Conclusions
Overall, results suggested different patterns of responses to intervention components between those who report ≥150 min/week of MVPA at 18 months (i.e., maintainers) com-pared with those who do not (i.e., nonmaintainers). Results further emphasize that, for behavioral maintenance, engag-ing in physical activity outdoors, and therefore in a place that can always be accessed (as opposed to providing gym mem-bership for only the intervention period), appeared to be important for differentially predicting behavioral mainte-nance. Future research should explore within-person experi-mental designs for better explicating the differential impact of each intervention component on physical activity levels. Overall though, the techniques used within this article offer a valuable “proof-of-concept” for the utility of system identifi-cation modeling within behavioral science that could open the door to improvements in theory, adaptive interventions, and pattern recognition of meaningful patterns for predicting long-term behavioral maintenance.
Authors’ Note
Drs. Hekler and Buman contributed equally to this work and thus the first two authors are listed at random. The content is solely the responsibility of the authors and does not necessarily represent the official views of the National Institutes of Health.
Declaration of Conflicting Interests
The authors declared no potential conflicts of interest with respect to the research, authorship, and/or publication of this article.
Funding
The authors disclosed receipt of the following financial support for the research, authorship, and/or publication of this article:
This work was supported in part by a Research Opportunity Fund in the College of Health and Human Performance at the University of Florida (PRG), an Age Network Multidisciplinary Research Enhancement grant at the University of Florida (CSM), a Mentorship Opportunity Grant from the Graduate Student Council at the University of Florida (MPB), institutional (T32-AG-020499, JMD; T32-AG-000029, AAM) and individual (F31AG032802, JMD; 1R36AG029664, AAM) training grants awarded to the University of Florida and Duke University School of Medicine, and grants (R21DA024266, DER; K25 DA021173, DER) awarded to Arizona State University.
Supplement Note
This article is published in the Health Education & Behavior supple-ment, Systems Science Applications in Health Promotion and Public Health, which was supported under contract HHSN276201200329P by the National Institutes of Health Office of Behavioral and Social Sciences Research, the Fogarty International Center, the National Cancer Institute, the National Institute on Dental and Craniofacial Research, and the National Institute on Aging.
References
Bandura, A. (1986). Social foundations of thought and action: A social cognitive theory. Englewood Cliffs, NJ: Prentice Hall.
Barlow, D. H., & Hayes, S. (1979). Alternating treatment designs: One strategy for comparing the effects of two treatments in a single subject. Journal of Applied Behavioral Analysis, 12, 199-210.
Buman, M. P., Giacobbi, P., Jr., Dzierzewski, J., Aiken, M. A., McCrae, C., Roberts, B., & Marsiske, M. (2011). Peer volunteers improve long-term maintenance of physical activity with older adults: A randomized controlled trial. Journal of Physical Activity & Health, 8, S257-S266.
Buman, M. P., Hekler, E. B., Bliwise, D., & King, A. C. (2011). Exercise effects on night-to-night fluctuations in self-rated sleep among older adults with sleep complaints. Journal of Sleep Research, 20, 28-37. doi:10.1111/j.1365-2869.2010.00866.x
Collins, L. M., Murphy, S. A., & Bierman, K. A. (2004). A con-ceptual framework for adaptive preventive interventions. Prevention Science, 5, 185-196.
Collins, L. M., Murphy, S. A., & Strecher, V. (2007). The multiphase optimization strategy (most) and the sequential multiple assign-ment randomized trial (Smart): New methods for more potent ehealth interventions. American Journal of Preventive Medicine, 32, S112-S118. doi:10.1016/j.amepre.2007.01.022
Deci, E. L., & Ryan, R. M. (1985). Intrinsic motivation and self-determination in human behavior. New York, NY: Plenum.
Deshpande, S., Nandola, N. N., Rivera, D. E., & Younger, J. (2011, June). A control engineering approach for designing an opti-mized treatment plan for fibromyalgia. Paper presented at the 2011 American Control Conference, San Francisco, CA.
Duncan, T. E., Duncan, S. C., & Strycker, L. A. (2006). An intro-duction to latent variable growth curve modeling: Concepts, issues, and applications. Mahwah, NJ: Lawrence Erlbaum.
Fjeldsoe, B., Neuhaus, M., Winkler, E., & Eakin, E. (2011). Systematic review of maintenance of behavior change fol-lowing physical activity and dietary interventions. Health Psychology, 30, 99-109. doi:10.1037/a0021974
Garnier, H. (2011, June). Teaching data-based continuous-time model identification with the Contsid toolbox for Matlab. Paper presented at the 18th IFAC World Congress, Milano, Italy.
Glass, G., Wilson, V., & Gottman, J. (1975). Design and analy-sis of time-series experiments. Boulder: Colorado Associated University Press.
Godin, G., & Shephard, R. J. (1985). A simple method to assess exercise behavior in the community. Canadian Journal of Applied Sports Science, 10, 141-146.
Grant, D. (1948). The Latin square principle in the design and anal-ysis of psychological experiments. Psychological Bulletin, 45, 427-442.
Hayes, S., Barlow, D. H., & Nelson-Gray, R. (1999). The scientific practitioner: Research and accountability in the age of man-aged care. Needham Heights, MA: Viacom.
King, A. C., Ahn, D. F., Atienza, A. A., & Kraemer, H. C. (2008). Exploring refinements in targeted behavioral medicine inter-vention to advance public health. Annals of Behavioral Medicine, 35, 251-260. doi:10.1007/s12160-008-9032-0
King, A. C., Buman, M. P., & Hekler, E. B. (in press). Physical activity strategies in populations. In L. Green, S. Kahan, A.

62S Health Education & Behavior 40(1S)
Gielen, & P. Fagan (Eds.), Health behavior change in popula-tions: The state of the evidence and roles for key stakeholders. Baltimore, MD: Johns Hopkins University Press.
King, A. C., Friedman, R., Marcus, B., Castro, C., Napolitano, M., Alm, D., & Baker, L. (2007). Ongoing physical activity advice by humans versus computers: The community health advice by telephone (chat) trial. Health Psychology, 26, 718-727. doi:10.1037/0278-6133.26.6.718
Ljung, L. (1999). System identification: Theory for the use (2nd ed.). Upper Saddle River, NJ: Prentice Hall.
Ljung, L. (2009, May). Experiments with identification of continu-ous time models. Paper presented at the 15th IFAC Symposium on System Identification, Saint-Malo, France.
Ljung, L. (2011). System identification toolbox for use with Matlab: User’s guide. Bangalore, India: MathWorks.
Marcus, B. H., Williams, D. M., Dubbert, P. M., Sallis, J. F., King, A. C., Yancey, A. K., & Claytor, R. P. (2006). Physical activity intervention studies: What we know and what we need to know: A scientific statement from the American Heart Association Council on Nutrition, Physical Activity, and Metabolism (Subcommittee on Physical Activity); Council on Cardiovascular Disease in the Young; and the Interdisciplinary Working Group on Quality of Care and Outcomes Research. Circulation, 114, 2739-2752. doi:10.1161/CIRCULATIONAHA.106.179683
Molenaar, P., & Campbell, C. (2009). The new person-specific paradigm in psychology. Current Directions in Psychological Science, 18, 112-117.
Nandola, N. N., & Rivera, D. E. (2013). An improved formu-lation of hybrid model predictive control with application to
production-inventory systems. IEEE Transactions on Control Systems Technology, 1, 121-135.
Ogunnaike, B., & Ray, W. (1994). Process dynamics, modeling, and control. Oxford, England: Oxford University Press.
Rivera, D. E., Pew, M. D., & Collins, L. M. (2007). Using engi-neering control principles to inform the design of adaptive interventions: A conceptual introduction. Drug and Alcohol Dependence, 88, S31-S40.
Schroeder, S. A. (2007). We can do better: Improving the health of the American people. New England Journal of Medicine, 357, 1221-1228.
Smith, J. D. (2012). Single-case experimental designs: A sys-tematic review of published research and current standards. Psychological Methods, 17, 510-550.
Thompson, B. (2004). Exploratory and confirmatory factor analy-sis: Understanding concepts and applications. Washington, DC: American Psychological Association.
Timms, K. P., Rivera, D. E., Collins, L. M., & Piper, M. E. (2012, July). System identification modeling of a smoking cessation intervention. Paper presented at the 16th IFAC Symposium on System Identification (SYSID 2012), Brussels, Belgium.
Tudor-Locke, C., Williams, J. E., Reis, J. P., & Pluto, D. (2002). Utility of pedometers for assessing physical activity: Convergent validity. Sports Medicine, 32, 795-808.
Velicer, W. (2010, July). Applying idiographic research meth-ods: Two examples. Paper presented at the 8th International Conference on Teaching Statistics, Ljubljana, Slovenia.