Exploring Agri-Food Import Dependency of Burundi: A Gravity Model Approach
11
Journal of Economics and Sustainable Development www.iiste.org ISSN 2222-1700 (Paper) ISSN 2222-2855 (Online) Vol.5, No.14, 2014 90 Exploring Agri-Food Import Dependency of Burundi: A Gravity Model Approach Willy-Marcel NDAYITWAYEKO 1* , Mark O. ODHIAMBO 2 , Mark KORIR 3 AND Philip O. NYANGWESO 2 1. School of Business and Economics, Department of Rural Economics, University of Burundi, B.P. 1028 Bujumbura, Burundi. 2. School of Business and Economics, Department of Agricultural Economics and Resource Management, Moi University, P.O. Box 3500 Eldoret, Kenya. 3. School of Business and Economics, Department of Economics, Moi University, P.O. Box 3500 Eldoret, Kenya. *Email of corresponding author: [email protected] Abstract The upward movement of agricultural and food imports has been a central issue in Burundi, since it hampers the growth of agricultural sector and poses a major disincentive to farmers’ ability to produce more and cope with the risks associated with food production. This paper aims to find critical factors that determine the surge of agri-food imports observed during post civil war (2000-2010). A gravity model was estimated from the data collected during the period of 2000-2010. The random fixed-effects model indicated that Burundi’s GDP, her trade partners’ populations, exchange rate, distance, being under the same colony and belonging to a regional trading bloc such as EAC and COMESA are the main factors determining food imports. The choice of trade instruments to use may seek to facilitate trade by reducing unnecessary tariff and non-tariff barriers but in a reciprocal agreement and dispensation of bilateral and multilateral protocols. Keywords: Gravity model, Agri-food, Imports, random fixed effects and Burundi 1. Introduction Burundi was self-sufficient in food production before 1990’s. However, it has become very much dependent on food imports and food aid to meet its food availability and nutrition needs. The current trend is quite alarming given the increase of Value Added Tax (VAT) on imported commodities, making food import prices to be exorbitantly high and rendering such commodities inaccessible to the majority of the people especially the rural and urban poor. According to GoB (2011), food deficit amounted to 499 thousand tons CE (Cereal Equivalent) in 2011, a 10 percent increase from that of the year 2010, was supposed to be compensated by food imports and food aid. If not planned well, food import behaviour through trade liberalization may thwart the agricultural policy agenda enshrined in national food security program 2009-2015 and strategic agriculture plan 2005-2015 and may hurt both domestic food production and changes food consumption taste and preferences. It also raises food import bill which is a deplorable situation for a country ranked 177 th out of 189 th countries in Human Development Index (UNDP, 2013). According to Herrmann (2006), subsidizing food imports by developing countries and/or food aid are necessary options that could address food crisis in the short run; though such options have adverse effects on economic development and food availability in the long-run. Over-reliance on food imports, specifically from country neighbours from EAC and COMESA, which has increased from 11% in 2008 to 14% in 2010 (Table 1), has resulted from a number of factors caused by a decade of socio-political instability, archaic agricultural technique and high population leading to high dependency ratio and pressure on land and other resources (USAID, 2010). Table 1: Food Exports and Imports of Burundi (in USA$ Millions)) Country/Region EXPORTS IMPORTS Trade Surplus/Deficit (Overall) 2000 2005 2010 2000 2005 2010 EAC 15.52 9.24 13.21 59.93 30.70 29.99 Deficit COMESA 13.32 10.10 15.85 12.04 37.93 47.98 Deficit EU27 64.61 81.87 71.26 25.60 44.29 18.75 Surplus AMERICA 1.01 0.42 0.02 0.19 0.008 3.41 - ASIA 0.59 3.49 11.56 10.97 13.27 37.34 Deficit Note: - means neutral. Source: Authors’ Results, 2014 The purpose of this study is to find out the critical factors that determine Burundi’s agri-food imports. The study is geared to shed light on the drivers of agri-food trade and how such drivers could be used to spur agricultural development in Burundi. The contribution of this paper is twofold: First, it provides background and policy
-
Upload
independent -
Category
Documents
-
view
0 -
download
0
Transcript of Exploring Agri-Food Import Dependency of Burundi: A Gravity Model Approach

Journal of Economics and Sustainable Development www.iiste.org
ISSN 2222-1700 (Paper) ISSN 2222-2855 (Online)
Vol.5, No.14, 2014
90
Exploring Agri-Food Import Dependency of Burundi: A Gravity
Model Approach
Willy-Marcel NDAYITWAYEKO1*
, Mark O. ODHIAMBO2 , Mark KORIR
3 AND Philip O. NYANGWESO
2
1. School of Business and Economics, Department of Rural Economics, University of Burundi, B.P. 1028
Bujumbura, Burundi.
2. School of Business and Economics, Department of Agricultural Economics and Resource Management,
Moi University, P.O. Box 3500 Eldoret, Kenya.
3. School of Business and Economics, Department of Economics, Moi University, P.O. Box 3500 Eldoret,
Kenya.
*Email of corresponding author: [email protected]
Abstract
The upward movement of agricultural and food imports has been a central issue in Burundi, since it hampers the
growth of agricultural sector and poses a major disincentive to farmers’ ability to produce more and cope with
the risks associated with food production. This paper aims to find critical factors that determine the surge of
agri-food imports observed during post civil war (2000-2010). A gravity model was estimated from the data
collected during the period of 2000-2010. The random fixed-effects model indicated that Burundi’s GDP, her
trade partners’ populations, exchange rate, distance, being under the same colony and belonging to a regional
trading bloc such as EAC and COMESA are the main factors determining food imports. The choice of trade
instruments to use may seek to facilitate trade by reducing unnecessary tariff and non-tariff barriers but in a
reciprocal agreement and dispensation of bilateral and multilateral protocols.
Keywords: Gravity model, Agri-food, Imports, random fixed effects and Burundi
1. Introduction
Burundi was self-sufficient in food production before 1990’s. However, it has become very much dependent on
food imports and food aid to meet its food availability and nutrition needs. The current trend is quite alarming
given the increase of Value Added Tax (VAT) on imported commodities, making food import prices to be
exorbitantly high and rendering such commodities inaccessible to the majority of the people especially the rural
and urban poor. According to GoB (2011), food deficit amounted to 499 thousand tons CE (Cereal Equivalent)
in 2011, a 10 percent increase from that of the year 2010, was supposed to be compensated by food imports and
food aid. If not planned well, food import behaviour through trade liberalization may thwart the agricultural
policy agenda enshrined in national food security program 2009-2015 and strategic agriculture plan 2005-2015
and may hurt both domestic food production and changes food consumption taste and preferences. It also raises
food import bill which is a deplorable situation for a country ranked 177th
out of 189th
countries in Human
Development Index (UNDP, 2013).
According to Herrmann (2006), subsidizing food imports by developing countries and/or food aid are necessary
options that could address food crisis in the short run; though such options have adverse effects on economic
development and food availability in the long-run. Over-reliance on food imports, specifically from country
neighbours from EAC and COMESA, which has increased from 11% in 2008 to 14% in 2010 (Table 1), has
resulted from a number of factors caused by a decade of socio-political instability, archaic agricultural technique
and high population leading to high dependency ratio and pressure on land and other resources (USAID, 2010).
Table 1: Food Exports and Imports of Burundi (in USA$ Millions))
Country/Region EXPORTS IMPORTS Trade
Surplus/Deficit
(Overall) 2000 2005 2010 2000 2005 2010
EAC 15.52 9.24 13.21 59.93 30.70 29.99 Deficit
COMESA 13.32 10.10 15.85 12.04 37.93 47.98 Deficit
EU27 64.61 81.87 71.26 25.60 44.29 18.75 Surplus
AMERICA 1.01 0.42 0.02 0.19 0.008 3.41 -
ASIA 0.59 3.49 11.56 10.97 13.27 37.34 Deficit
Note: - means neutral.
Source: Authors’ Results, 2014
The purpose of this study is to find out the critical factors that determine Burundi’s agri-food imports. The study
is geared to shed light on the drivers of agri-food trade and how such drivers could be used to spur agricultural
development in Burundi. The contribution of this paper is twofold: First, it provides background and policy

Journal of Economics and Sustainable Development www.iiste.org
ISSN 2222-1700 (Paper) ISSN 2222-2855 (Online)
Vol.5, No.14, 2014
91
information on agricultural trade for policymakers, commercial agribusiness practitioners and researchers who
take part in the trade negotiation and debates either at regional or international fora. Second, better understanding
of the factors that boost trade flows may enhance the prediction of the future of Burundi agricultural trade. In
general, empirical literature on gravity model is overwhelming. However, only one application has been used in
the case of Burundi. In the past, Richard (2009) investigated the determinants of trade flows of East African
Community (EAC) members in which Burundi is a member. His results were too general and used a standard
gravity model. This paper, therefore, provides further evidence on the effects of macroeconomic aggregates,
trade impediments, and regional trade agreements on Burundi’s expected level of agri-food imports given the
specification and estimated parameters of the expanded gravity trade equation.
2. Agricultural Trade and Trade Policy of Burundi
Like elsewhere in Sub-Sahara Africa, agriculture is the largest sector of the economy of Burundi, source of
employment and a vital determinant of reduction of poverty. Its contribution to GDP is recorded to be above 40
percent, (FAO, 2008 and GoB, 2008, p.10). Moreover, it constitutes the bulk of Burundian exports (48 percent
of the total exports) in which the traditional cash crops, such as coffee, tea and cotton play a great role in
fetching the most needed export foreign earnings for the country. However, Burundi’s agriculture remains
almost totally rain-fed, traditional and hardly mechanized. It is divided between growing food crops (30 per cent
of arable land) for consumption by farmers (admittedly 90 percent of the population) and cash crops (4 per cent
of arable land).
Prior to the 1993 war, Burundi was self-sufficient in various food crops. Currently, the demographic pressure is
forcing farmers to increase food crops and to go down to the low-laying marshland or destroy the natural forest
in order to increase production. This issue has exacerbated food insecurity and the possibility of expansion of
arable land. Hence, the country has relied on food imports in order to meet the food deficit recorded during this
post-conflict period. Since 1980, food imports as well as total imports followed an upward trend (Figure 1).
Figure 1: Burundi Agrifood Trade (2000-2011)
Source: FAOSTAT downloaded in January 31, 2014.
Overall, the agricultural trade performance has been problematic since 1980. Three phases have described the
trend of agricultural trade in Burundi. The first phase corresponded to the implementation of Structural
Adjustment Programs in the 1980’s and in early the 1990’s. The gaps between agricultural exports and imports
were quite controllable, with both of them having their peak in 1980. At this period, the government of Burundi
issued policies articulated on import substitution and devaluation of the domestic currency in order to promote
exports and even went further by creating Export Free Zone in 1992 to boost export diversification. All these
were the incentives given to exporters, but produced unsatisfactory results due to the hidden rent-seeking
behaviors and also the disregard of complimentary factors (access to markets of inputs and outputs, access to
credits, infrastructure, innovation, etc.).
The trade policy of Burundi, according to Baransaka (2007), revolves around the use of few trade policy
instruments, such as high import tariffs, mixed non tariff barrier and also various grants of import waivers.
Burundi revised its trade policy in general and agricultural trade policy in particular to pave way for the trade
agreement signed in trade blocs such as Common Market of Eastern and Southern Africa (COMESA), EAC,
0
20000
40000
60000
80000
100000
Exp
ort
s a
nd
Im
po
rts
(US
A$
in
10
00
)
Period
Burundi Agrifood Trade
Import Export

Journal of Economics and Sustainable Development www.iiste.org
ISSN 2222-1700 (Paper) ISSN 2222-2855 (Online)
Vol.5, No.14, 2014
92
European Union (EU) and World Trade Organization (WTO). In 2012, Burundi published her complete and
issue-driven trade policy to suit the current trend of Burundi trade issues and the influence of trade bloc
agreements approved so far. For instance, trade liberalization policy regimes were introduced in order to enable
the country to comply with the custom union of COMESA and EAC. The leading objective was to reduce or
eliminate custom tariffs and non-tariff barriers on products imported from the COMESA zones in a short term.
3. Materials and Methods
A number of theories have been developed on trade flows, but the most frequently revisited is the one that
mimics Newton’s gravitational theory. The gravity in the context of social sciences was first used by James
Stewart in 1940s and then proposed in trade theory by Tinbergen (1962) as well as Pӧyhӧnen (1963). The
standard gravity model postulates that the trade between two countries is determined positively by each
country’s GDP, and negatively by the distance between them. The model is represented as follows:
321
0
ββββ ijjiij dYYTr = (1)
This model presupposes that the volume of trade (Tr= exports, imports or average of exports plus imports)
between countries i and j is a function of their incomes (Yi and Yj) and the distance dij between the two
countries’ capital cities as proxy of transport costs. Later on the model was expanded to much explain the
determinants of trade flows by including population and a set of dummy variables either facilitate or restrict
trade between two countries (Anderson, 1979). the specification of the gravity model of this study will track the
following model framework:
(2)
Where: Trijt represents either imports, exports or average of volume of trade between country i and country j at
time t. Pit and Pjt are population of countries i and j in year t respectively. Aij represents other factors (dummies)
influencing trade flows, while µij is error term, and α0, βi (i=1…6) and γ are coefficients of the equation (2). The
choice among the three types of dependent variables depends on the scope of the study. Imports are commonly
used because many countries often keep record of imports rather than exports for tax purposes and value added.
Hence, imports are likely to be more accurate in the import data than in export data. Furthermore, import data are
likely to have few zeros. To avoid Silver Medal mistake, imports are often used. For the case of Burundi, imports
largely outweigh exports to the extent that it is always called import-oriented country because of its weak
industrialization capacity.
Though the gravity model has been successfully applied in analyses of trade theory (Erdem and Nazlioglu, 2008;
Welch, 2006; Melitz, 2007; Paas and Tafenau, 2005 and Kimura and Lee, 2004), criticisms have pointed out that
it deviates from the traditional international trade theory like those of Adam Smith (absolute advantage), Ricardo
(comparative advantage) and Heckscher-Ohlin (factor endowment). The main criticism has been that the gravity
model is an ad hoc tool and suffers a lot from lack of theoretical underpinnings. Some have regarded it purely as
an econometric tool. For instance, Ciuriak and Shinji (2005) showed that the model failed to explain the
comparative advantage of countries engaged in bilateral trade, yet it forms the bedrock of international trade.
However, Anderson (1979), Bergstrand (1985), Helpmann (1984) and Deardorff (1995) provide the theoretical
foundation of gravity model by assuming frictionless trade of iceberg transport cost. In Anderson and Van
Wincoop (2003), the expanded gravity model with multilateral resistance variables was meant to solve the
border effect puzzle found by McCallum (1995). Other points noticed in the literature are the following:
First, the imports and exports are averaged without theoretical justification and this has caused bias in analytical
model. This is because in Newton’s law of gravity, the two forces are not averaged, rather their interaction in the
opposite direction.To solve this biasness, Subramania and Wei (2007) proposed a specification with imports
which looks more closely aligned to the fundamental theory. Second, Empircal works followed Anderson (1979)
which suits cross-section data. However, this approach suffers from severe problems of misfications. Matyas
(1997) suggested that the best approach must includes both time (business cycle), export and import country
effects. These so-called three-way panel with (fixed or random) specification overcomes the shortcomings of
OLS (inconsistence and biasness). Finally, many studies assumed a positive values of trade flows between pair
of countries. However, missing values and zero trade flows between pair of countries is a common phenomenon.
Giving the impact of the above problems on the outcome of the estimated gravited model, this paper has
attempted to address them appropriately. The use of imports data and panel data analysis circumverted the first
and second hardles, while the last one, for missing values, interpolation and extrapolation were used; for zero
values of imports, small values that can be rounded to zero were used (Hatab, et al. 2010)
)()( 6054321
ijijijjtitjtitijt ExpAExpDPPGDPGDPTr γµβα βββββ=

Journal of Economics and Sustainable Development www.iiste.org
ISSN 2222-1700 (Paper) ISSN 2222-2855 (Online)
Vol.5, No.14, 2014
93
In this paper, the expanded gravity model was used to find out the factors affecting the agri-food imports of
Burundi. The framework used in this paper follows that of Hatab et al. (2010), Kandogan (2007) and Aguilar
(2006). In the equation (2), the subscripts i and j were used to denote the trade country i while the trade partner
country was represented by j. However, since this research applies to one import country (i.e. Burundi), the
subscript i is left out. Import only varies by recipient countries j as shown in equation (3) as follows:
)3(
Re
1514
13121110987
6543210
jtjj
jjjjjjt
tttjtjttjt
OneineuaOneincomes
OneineacBothineacBorderColonyLangDistserve
ExrateBopennessAgricapDiffgdpcapGDPGDPM
εββ
βββββββ
βββββββ
++
+++++++
+++++++=
All monetary values, openness of Burundi and distance are expressed as natural logarithms. The explanatory
variables are grouped into three categories: macroeconomic variables (income, income per capita, agricultural
land per capita, trade openness, exchange rate and foreign currency reserves), trade frictions or costs (distance,
foreign language, same colonial history and shared) and lastly impact of regional trade agreement (trade creation
and trade diversion). The equation (3) is explained as follows:
Mjt is the agri-food imports from country j to Burundi in year t. GDPt and GDPjt are income of Burundi and
country j respectively in year t. GDP as economic mass, proxy to economic growth is a key for describing the
bilateral trade flows. The choice of GDP at current price over the GDP-price parity has some empirical evidence.
The latter (GDP-price parity) explains how people live poor and is a proxy for import or export demand while
the former represents the economic size of a country and explains well the best fit (Cheng and Wall, 2004). The
model assumes that the economic mass will be positively associated to the imports.
Diffgdpcapt is the difference between GDP per capita of Burundi and that of trade partner j in year t. This
variable exhibits the difference in pattern of demand. This is known as Linder effect. This holds that
industrialized countries import the same kinds of goods as they export (Linder, 1961). Since Burundi is a small
economy, the expected sign is negative when it trades with industrialized country. However, the positive reflects
traditional trade or trade enhancing or inter-industrial trade. Agricapt is the agricultural land per capita of
Burundi in year t. This is a crucial variable in agricultural trade and explains the factor endowment, in the sense
of HO model. The larger it is the higher the country’s potential is to produce diverse and plenty of foods. Albeit
the trade barriers, the country will tend to trade more frequently with the land resource scare country. According
to Persson (2008), this variable is also considered in the gravity model as a crude measure of comparative
advantage. Bopenesst is trade openness index of Burundi. This is a result of trade liberalization and implies
reduction of trade barriers. It positively influences trade flows. Exratet is the real exchange rate of Burundi in
year t that acts as a proxy for prices in order to fulfill the requirement of multilateral resistance (Anderson and
van Wincoop, 2003). The appreciation of local currency will tend to boost the exports while the opposite is true
for the imports. Reservet is the foreign currency reserve of Burundi (excluded gold) in year t. The more foreign
currency reserve and moderate control implies more accessibility to it and more trade flows. The limited foreign
exchange reserve has been linked to trade import difficulties.
Distj represents distance between Burundi’s and trade partner j’s capital cities. This is a proxy of transaction
costs. The farther away a partner is situated, the larger the communication and transportation costs, and the lower
the profit margins of the importer. The expected sign, therefore, is negative since it reflects trade resistance.
Langj is common foreign language (1 is speaking same official language and zero otherwise). Language barrier
is an important hindrance of trade flows. Colonyj (1 share colonial history, 0 otherwise) stands for sharing same
colonial history. Burundi shares colonial history with Rwanda and DRC under Belgian rule. Therefore, it is
hypothesized that the three will intensively trade together than the rest of the world because of the colonial ties
(Anderson and Yotov, 2012). Borderj (1 share border, 0 otherwise) is sharing common border. The common
border signifies the closeness between trade partners. This stimulates trade because of tastes and awareness of
common interests. The sign is expected to be positive if the two countries share the same border, e.g., Burundi
and Tanzania.
The major regional trade agreement groups (RTA) that intensively trade more with Burundi are EAC, COMESA
and EU. RTA enhances trade liberalization and allows goods and services to permeate through countries’
borders. This study hypothesizes that RTA is beneficial to a landlocked country like Burundi. Terms BothinRTA
(Burundi and trade partner are in RTA, that is, Bothineac) and OneinRTA (Only Burundi or trade partner are in
RTA, e.g., Oneincomesa) are used in this study to ascertain if RTA is a source of trade creation or trade
diversion for Burundi agri-food trade. Bothincomesa was left out to avoid membership duplication of Burundi in
both EAC and COMESA, while Bothineu was also left out because Burundi is not geographically situated in
Europe. This analysis of RTA trade impact follows the procedure of Rose (2004). εjt are the usual disturbance
terms.
Journal of Economics and Sustainable Development www.iiste.org
ISSN 2222-1700 (Paper) ISSN 2222-2855 (Online)
Vol.5, No.14, 2014
94
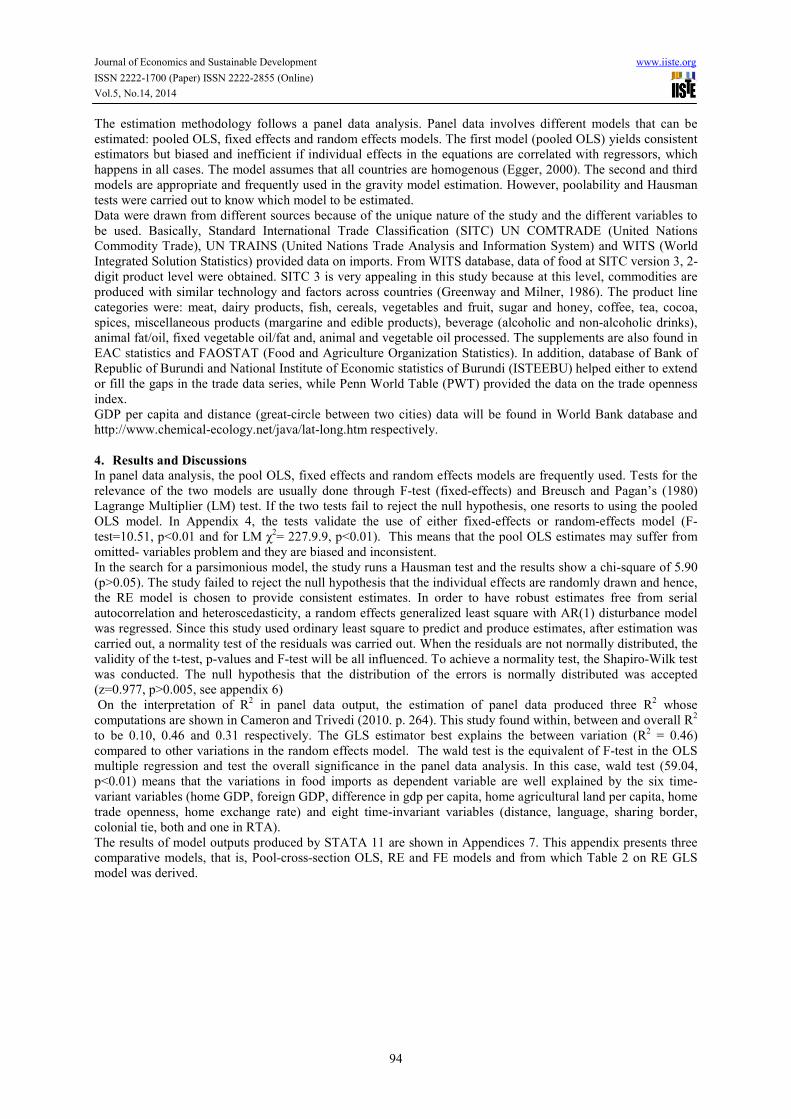
The estimation methodology follows a panel data analysis. Panel data involves different models that can be
estimated: pooled OLS, fixed effects and random effects models. The first model (pooled OLS) yields consistent
estimators but biased and inefficient if individual effects in the equations are correlated with regressors, which
happens in all cases. The model assumes that all countries are homogenous (Egger, 2000). The second and third
models are appropriate and frequently used in the gravity model estimation. However, poolability and Hausman
tests were carried out to know which model to be estimated.
Data were drawn from different sources because of the unique nature of the study and the different variables to
be used. Basically, Standard International Trade Classification (SITC) UN COMTRADE (United Nations
Commodity Trade), UN TRAINS (United Nations Trade Analysis and Information System) and WITS (World
Integrated Solution Statistics) provided data on imports. From WITS database, data of food at SITC version 3, 2-
digit product level were obtained. SITC 3 is very appealing in this study because at this level, commodities are
produced with similar technology and factors across countries (Greenway and Milner, 1986). The product line
categories were: meat, dairy products, fish, cereals, vegetables and fruit, sugar and honey, coffee, tea, cocoa,
spices, miscellaneous products (margarine and edible products), beverage (alcoholic and non-alcoholic drinks),
animal fat/oil, fixed vegetable oil/fat and, animal and vegetable oil processed. The supplements are also found in
EAC statistics and FAOSTAT (Food and Agriculture Organization Statistics). In addition, database of Bank of
Republic of Burundi and National Institute of Economic statistics of Burundi (ISTEEBU) helped either to extend
or fill the gaps in the trade data series, while Penn World Table (PWT) provided the data on the trade openness
index.
GDP per capita and distance (great-circle between two cities) data will be found in World Bank database and
http://www.chemical-ecology.net/java/lat-long.htm respectively.
4. Results and Discussions
In panel data analysis, the pool OLS, fixed effects and random effects models are frequently used. Tests for the
relevance of the two models are usually done through F-test (fixed-effects) and Breusch and Pagan’s (1980)
Lagrange Multiplier (LM) test. If the two tests fail to reject the null hypothesis, one resorts to using the pooled
OLS model. In Appendix 4, the tests validate the use of either fixed-effects or random-effects model (F-
test=10.51, p<0.01 and for LM χ2= 227.9.9, p<0.01). This means that the pool OLS estimates may suffer from
omitted- variables problem and they are biased and inconsistent.
In the search for a parsimonious model, the study runs a Hausman test and the results show a chi-square of 5.90
(p>0.05). The study failed to reject the null hypothesis that the individual effects are randomly drawn and hence,
the RE model is chosen to provide consistent estimates. In order to have robust estimates free from serial
autocorrelation and heteroscedasticity, a random effects generalized least square with AR(1) disturbance model
was regressed. Since this study used ordinary least square to predict and produce estimates, after estimation was
carried out, a normality test of the residuals was carried out. When the residuals are not normally distributed, the
validity of the t-test, p-values and F-test will be all influenced. To achieve a normality test, the Shapiro-Wilk test
was conducted. The null hypothesis that the distribution of the errors is normally distributed was accepted
(z=0.977, p>0.005, see appendix 6)
On the interpretation of R2 in panel data output, the estimation of panel data produced three R
2 whose
computations are shown in Cameron and Trivedi (2010. p. 264). This study found within, between and overall R2
to be 0.10, 0.46 and 0.31 respectively. The GLS estimator best explains the between variation (R2 = 0.46)
compared to other variations in the random effects model. The wald test is the equivalent of F-test in the OLS
multiple regression and test the overall significance in the panel data analysis. In this case, wald test (59.04,
p<0.01) means that the variations in food imports as dependent variable are well explained by the six time-
variant variables (home GDP, foreign GDP, difference in gdp per capita, home agricultural land per capita, home
trade openness, home exchange rate) and eight time-invariant variables (distance, language, sharing border,
colonial tie, both and one in RTA).
The results of model outputs produced by STATA 11 are shown in Appendices 7. This appendix presents three
comparative models, that is, Pool-cross-section OLS, RE and FE models and from which Table 2 on RE GLS
model was derived.

Journal of Economics and Sustainable Development www.iiste.org
ISSN 2222-1700 (Paper) ISSN 2222-2855 (Online)
Vol.5, No.14, 2014
95
Table 2: RE GLS Gravity Model Estimation
Variables Coefficient Standard Error Z-Value
Gdpb 2.71**
1.13 2.39
Gdppa -0.12 0.20 -0.60
Diffgdpca 0.11
0.22 0.48
Agricap -29.90 25.43 -1.18
Bopenes 0.04***
0.01 3.11
Exrate 0.19
0.15 1.24
Distance -0.99**
0.51 -1.97
Lang 1.22
0.86 1.42
Border 0.03 1.35 0.02
Colony -4.11**
1.84 -2.22
Bothineac 1.96***
0.67 2.94
Oneineac 1.02***
0.24 4.22
Oneincomesa -1.09
0.95 -0.10
Oneineu 1.41**
0.70 2.02
Constant -30.90*
18.54 -1.67
Value of R2
Within
Between
Overall
0.10
0.46
0.31
Wald test
59.04 (p=0.0001)
Note: *significance at 0.1level,
** significance at 0.05level,
*** significance at 0.01leve,
Source: Author’s Calculations, 2013
To interpret RE GLS model results (Table 2), a closer look was done at the estimated coefficients (signs and
magnitude) and their corresponding z-tests. The export GDP was found to be positively associated with trade
(imports) as was expected. Holding other factors constant, a one per cent increase in importer’s GDP (Burundi
GDP) tends to increase food imports by about 3.71 per cent points, that is, the richer a Burundian is, the easier it
is to afford food imports. Burundi’s trade policy in regard with trade openness is positive and very statistically
significant (p<0.01). This means that a slight change in trade policies in favor of economy openness may trigger
large trade inflows, that is, large food imports in this case.
In the perspective of linking Burundi’s GDP to food imports, two factors explain the dependence on imports in
general and food in particular. First, the economic and political instability, even during the post-conflict (from
2005), hindered the establishment of both local and foreign investment in the manufacturing sector. Importation
that consists of raw materials is regarded by economists as a tangible boost to the economic growth, in what it is
referred to as Import-Led-Growth Hypothesis. In fact, Coe and Helpman (1995) conveyed that the economic
growth could be driven primary by growth in imports. The theory of endogenous growth models show that
imports can be a channel for long-run economic growth, for it provides domestic firms with access to needed
intermediate and foreign technology. This means that a ‘virtuous circle’ is created in the causal relationship
between trade (imports) and growth through the provision of income in both instances. This points out that one
channel of increasing food imports is through harnessing activities linked to economic growth because it creates
a certain level of purchasing power that enables people to afford food imports. However, since Burundi enjoys a
good climate condusive for agriculture and also given that it is a less developed country, food imports may just
look like a luxury for the upper class of the society. The results of this study should be understood in a historical
context of Burundi because the country was a net food exporting nation before the 1993 socio-political war.
Hence, it is a matter of putting new oil in the agricultural engine sector and scale up agricultural technology in
order to feed 8 millions Burundians.
Second, Burundi has an infant industrial development that needs great support through government policies
conducive to Foreign Direct Investment (FDI). Its propensity to import manufactured goods is triggered by the
fact that there is a weak industrial sector. The secondary sector accounted for about 15.8 percent of GDP in
2010 and it serves the domestic market. The study underscores that there is a moderate reliance on trade partners
for food imports that will cater for any food deficit episodes of the country.
Although the imports of food in Burundi is not an alarming phenomenon (Ng and Aksoy, 2008 and FAO, 2012),
the study argues that there are two reasons explaining the adverse effects of Burundi’s importation of foods on
the national growth if consideration is given to the slow economic growth of the country (4% between 2002 and
2010). First, food imports increases the food import bill which cannot be compensated by exports. For a cash-

Journal of Economics and Sustainable Development www.iiste.org
ISSN 2222-1700 (Paper) ISSN 2222-2855 (Online)
Vol.5, No.14, 2014
96
strapped country like Burundi, these imports become a serious burden when the high and rising food import bills
take money away from other important agenda without resolving the thorny food insecurity issue (World Bank,
2011 and FAO, 2012). This creates the agriculture sector to be unproductive and inefficient since most the time
the imported products are cheaper than the local products or world price, implying a certain dumping behavior of
exporters (FAO, 2003). Second, FAO (2012) classifies Burundi among the lowest income countries which
account for only 40 percent of the total food imports. Such dependency on food imports exposes those countries
to a myriad of economic shocks. For instance, Burundi was forced to lift food imports duty when the rising price
of fuel and foodstuff imports (representing more than 50 percent of total imports by volume) commodity made
life of 8 million Burundians unbearable (IMF, 2011).
As reported earlier in this study, Burundi’s trade liberalization history started earlier in 1990s. However, after the
signing of Arusha peace agreement which saw the end of a decade straining civil war, Burundi engaged in
revamping its economy. Trade liberalization policies were once again revisited and ushered Burundi in signing
several bilateral and multilateral trade agreements. The most remarkable periods were the deepening of
COMESA integration initiatives and the entering in EAC in 2007, although the reinforcement of EAC laws
started in 2008. Trade liberalization entails the partial or total removal of trade and non-trade barriers. Since, the
period under study is 2000-2010 in which trade liberalization took shape in Burundi; it is evident that Burundi’s
trade openness promoted, among other things, food imports. However, Cyrus et al. (2007) cautioned that trade
openness is a double-edged sword. It can either promote or hurt the economic growth of a country if prudence is
not taken in implementing trade liberalization policies. In fact, a prominent variant of the compensation
hypothesis rests on the premise that increased trade exposure heightens domestic economic volatility. Therefore,
Burundi has to list trade policies safeguards permitted by trade blocs (WTO, EAC, COMESA) in order to
cushion the negative effects that come with trade liberalization policies implementation.
Trade friction factors considered in the study were distance and dummies which were explained by their direct
effect on trade flows. Distance and belonging to one of the regional trade agreements were highly significant.
Border variable was also a crucial factor affecting food imports to Burundi and had an expected sign, while
being under same colony regime was significant at 10% level. Distance which is a proxy to transport costs, had a
negative sign as predicted by the gravity model theory. An increase in the distance between the importer
(Burundi) and exporter tends to decrease imports of food items by about 1.24 percent point. These results were
consistent with those of Musila (2005). His study was concerned with the measurement of the intensity of trade
creation and deviation in COMESA, ECCAS and ECOWAS. He found that size (economic output and
population) and resistance (distance and language) factors played an important role in the determination of
international trade flows.
As already indicated, Burundi is a landlocked country straddling Central and East Africa. Low integration within
the domestic economy with the rest of the world has deep economic and geographic issues of origin. The
economic geography conjoined with the infrastructure deficit lead to high transport costs that affect trade
negatively (World Bank, 2011, p.15). Distance not only makes trade expensive and reduces the volume of trade,
but also affects the composition of trade. Burundi has serious infrastructure gaps that hinder ease of linkage
between domestic, regional and international markets. There are three main corridors through which Burundi
trade goods and services are transited: northern corridor (Mombasa to Bujumbura, via Kampala and Kigali),
central corridor (Dar-Es-Salam to Bujumbura, via border check point of Kobero or Kigoma), and southern
corridor (Southern African countries to Bujumbura, via port of Mpulungu or Kalemi).
The transport of tradable goods and services, mostly by road, is hampered by many trade and non-trade barriers,
namely, border procedures (red-tapes), incompatible and unnecessary documentation, weigh-bridge, perks or
corruption, etc. at the borders of Burundi. From Doing-Business Report point of view (World Bank, 2013), the
country is ranked among the last countries where business is hard to be carried out. It is ninth from bottom (159th
out of 185 countries) where trade across border is the most difficult. The improvement of logistics in Burundi
and the EAC regions, and the implementation of EAC trade protocols can ease trade between Burundi and her
partners. For instance, Burundi incurs huge costs on both exports and imports because of the high costs and
irregularities in the ports of Mombasa and Dar-Es-Salam, and this adds to its internal compounded obstacles.
Though the common colony factor plays a great role in trade of Burundi; this study found colonial tie as an
impediment to food imports due to the fact that the region common referred as ‘Great Lake region’ is politically
instable. In fact, the neighbors (DRC and Rwanda) are in the same regional integration with Burundi, that is,
COMESA and EAC. However, trade with DRC has been on the decline due to ongoing devastating civil war in
the East part of DRC which borders Burundi. The coefficient of colonial link was negative and significant
indicating that common colonial tie between Burundi and Belgium had a negative impact on food trade. This
may be surprising since Belgium participates in many Burundi economic development activities. However, food
trade in the form of monetized food aid is usually originated from USA or Scandinavian countries.
The results of the gravity model indicate that imports of food products tend to increase when Burundi traded
with a country belonging to a regional trade bloc, like, EAC and EU but no evidence was found when Burundi

Journal of Economics and Sustainable Development www.iiste.org
ISSN 2222-1700 (Paper) ISSN 2222-2855 (Online)
Vol.5, No.14, 2014
97
traded with COMESA countries. It was surprisingly found that when Burundi traded with EAC countries, there
was trade creation as well as trade deviation. Both bothineac and oneineac coefficients were very statistically
significant. The reasons may be the short period of Burundi membership considered in this study (2007-2010)
and given that the year 2007 was a period of probation. Hence, by trying to implement laws of EAC and also
enjoying trade integration, there might occur both trade creation (trading with a EAC member country with
cheaper factor endowments) and trade diversion (stopping to trade with a non-member country with cheaper
factor endowments because of EAC rules and regulations). These findings are in consonance with those of
Shinyekwa and Othieno (2013). Their RE gravity model showed a trade creation when Uganda is trading EAC
due to introduction of Custom Union and Common Market. However, Buigut (2012) found that custom union
has generated disproportional impacts on intra-trade EAC bloc for exports and imports for individual country
members. This may be a source of EAC trade diversion for Burundi.
While there was no significant impact on food trade within COMESA, there is strong evidence of trade creation
when Burundi traded with European Union (EU) as far as food trade is concerned. Burundi is offered
preferential trade by EU under the program called ‘Everything But Arms’ (EBA) and the access to European
markets is done through concessions made by Burundi with other developing countries during goods negotiation
(Uruguay Round of Multilateral Trade Negotiation). There are also bilateral trade agreements with individual
countries. Close ties exist between Burundi and two French speaking countries (Belgium and France) from
where Burundi gets most of food imports. The tie with European Union will be stronger if the New Partnership
Agreement will be signed for ease of access to European market, however Burundi like, other EAC countries,
has decided to take precautions before being bound by the agreement, especially due to the thorny issues of
subsidized agriculture and non-tariff barriers raised by European Union.
Despite the predicted benefits from regional integration, there seems to be consensus that the regional trade
agreement has achieved less than expected. According to World Bank (2008a), Burundi alone has two chief
reasons, inter alia: first, facing a potential high consumption costs that may rise by importing from a high
importing country (trade deviation) and secondly accepting an unequal distribution of gains and losses that may
follow an integration agreement. For the case of losses, COMESA compensated Burundi for big losses incurred
by virtue of importing goods from COMESA in which Burundi has less competition.
The overall trade of Burundi within EAC and EU showed a trade creating but since there is trade constraints
exhibited by the sign of the distance factor in the model, one may anticipate that being a member in the two RTA
alone is not sufficient to overcome other physical and economic trade barriers. In order to produce more trade
opportunities to their members, the two RTA should increase a high complementarity of natural endowments,
improve basic infrastructure such as transport and communication, and asymmetric and capacity food markets.
This creation of African Common Market for Agricultural Products (CMAP) by AU has an agenda on these
constraints that affect not only Burundi but also EAC and COMESA agricultural trade prospects.
5. Conclusion and Recommendations
Given that agriculture sector is the mainstay of the economy of Burundi and the imports of finished food
commodities may have either positive or negative effects on her agricultural production depending on the
availability or shortage of food in the country, it should be good to think of an optimum policy design. The latter
can enable Burundi to formulate and adopt trade policies that maximize benefits and minimize risks or dumping
behavior possible to de-motivate domestic agricultural production.
In the case of Burundi, food importation is just a means to overcome food shortage in the country. The argument
here is in line with the wisdom that food imports growth is more closely related to income growth in developing
countries (Ivory, 1990). In fact, the results show that food imports and Burundi GDP (usually proxy for
economic growth) are directly related and the elasticity is very large. Therefore, the evidence is that there could
be a strong food import replenishment effect when domestic food production fails, or economic growth may
trigger the importation of foodstuff. However, the truth is that Burundi relies heavily on food aid to overcome its
chronic food deficit despite having great potential to feed its own population.
The structural constraints in food production sector (poor infrastructure, research and extension service sectors,
etc.) demands that the government and donors should work together and mobilize the necessary financial support
needed to reverse the perennial problem of under investment in agriculture; and to build better safety nets to help
the poor in urban and remote rural areas to cope with the highly endemic agricultural production risks. This is
true because not everyone can afford to access food imports. Accelerating the implementation of national food
security program 2009-2015 and strategic agriculture plan 2008-2015 will increase food production in the
country. Furthermore, high agricultural output will allow Burundi to reverse food import trend and save foreign
exchange, but it may even enable the country to gain foreign exchange by rising food exports. Foreign exchange
is essential for the country as it builds up foreign reserve and facilitates the importation of capital goods for
domestic investment.
The study shows that sharing same colony and untapped benefits of regional integration prove to promote trade
Journal of Economics and Sustainable Development www.iiste.org
ISSN 2222-1700 (Paper) ISSN 2222-2855 (Online)
Vol.5, No.14, 2014
98
flows. Hence, Burundi needs to deepen its regional integration and strengthen diplomatic ties through relevant
economic foreign policies. The highly significant coefficients of the gravity model show that Burundi can still
derive opportunities from the EAC and COMESA trade blocs through expansion of its trade in food and
agriculture in these two trade blocs. This will definitely have implications for food security in the region. The
choice of trade instruments to use may seek to facilitate trade by reducing unnecessary tariff and non-tariff
barriers but in a reciprocal agreement and dispensation of bilateral and multilateral protocols. For this to happen,
African Union, regional bodies and African financial donors need to play a paramount role. The implementation
of Comprehensive Africa Agricultural Development Programs (CAADP) and the plan for creation of CMAP are
important to boost African agricultural intra-trade and hence to promote food security and agricultural
development at large.
6. Acknowledgement
This research was supported by the Government of Burundi through a scholarship grant for PhD studies. We
extended our sincere gratitude to the Government of Burundi. Our appreciation goes to the Moi University
(Kenya) for enabling a conducive learning environment.
References
Aguilar, C.A. (2006). Trade Analysis of Specific Agri-Food Commodities Using a Gravity Model. Unpublished
MSc. Thesis of Michigan State University.
Anderson, J. & Yotov, Y.V.(2012). Gold Standard Gravity. NBER Working Paper Series No 17835, Cambridge.
Anderson, J. (1979).A Theoretical Foundation for the Gravity Equation. The American Economic Review , Vol.
69 No1: 106-116.
Anderson, J. & van Wincoop, E. (2003). Gravity with Gravitas: A Solution to the Border Puzzle. The American
Economic Review , Vol. 93 No 1: 170-192.
Baransaka, D. (2007). Reuniion Preparatoire des Experts des Pays les Moins Avances a la 12eme Session de la
CNUCED: Etude du Cas du Burundi. Geneva: CNUCED.
Bergstrand, J. (1985). The Gravity Equation in International Trade: Some Microeconomic Foundations and
Empirical Evidence. The Review of Economics and Statistics Vol. 67 No 3: 474-481.
Breusch, T.S. & Pagan, A.R. (1980). A Simple Test of Heteroscedasticity and Random Coefficient Variation.
Econometrica 47: 1287-1294
Buigut, S. (2012). An Assessment of the Trade Effects of the East African Community Custom Union on
Member Countries. International Journal of Economics and Finance, No 4 No 10.
Cameron, C.A. and Trivedi, P.K. (2010). Microeconometrics Using Stata. Texas: A Stata Press Publication,
Texas College Station.
Ciuriak, D. and Shinji, K. (2005). Trade Specialiazation in the Gravity Model of International Trade. In Curtis,
J.M. & Ciuriak, D. Trade Policy Research 2005. Ottawa: Minister of Public Works and Government
Services, CANADA.
Cheng, I-H. & Wall, H.J. (2004). Controlling for Heterogeneity in Gravity Models of Trade and Integration.
Federal Reserve Bank of St Louis Working Paper 1999-010E, St Louis (USA).
Coe, T.D. and Helpman, E. (1995). International Research and Development Spillover. European Economic
Review 39: 859-887.
Cyrus, T., Lethbridge, L. & Osberg, L. (2007). The Double-Edge Sword of Trade. Eastern Economic Journal 33:
277-292.
Deardoff, A., (1995). Determinants of Bilateral Trade, Does Gravity work in Neoclassical World? MCREST, pp.
95-05.
Egger, P. (2000). A Note on the Proper Econometric Specification of the Gravity Equation. Economic Letters
Vol. 66:25-31
Erdem, E. and Nazlioglu, S. (2008). Gravity Model of Turkish Agricultural Exports to
European Union. International Trade and Finance Association Paper 21. Available at:
http://services.bepress.com/itfa/18th/art21
FAO (2012). The State of Food Insecurity in the World. Rome: FAO Press.
FAO (2008). Premiere Partie: Identification et Selection des Productions Prioritaires. Rome: FAO, Project
GTFS/RAF/391/ITA.
FAO (2003). Trade Reforms and Food Security: Conceptualizing the Linkages. Rome: FAO Press,.
Government of Burundi (2011). Evolution of Harvest, Food Supplyand Nutritional Situation: Season Report
2011-A. Bujumbura: Governmen of Burundi Press.
Government of Burundi (2008). Strategies Agricole Nationa. Bujumbura: Government of Burundi Press.
Hatab, A.A., Romstad, E. and Huo, X. (2010). ‘Determinants of Egyptian Agricultural Exports: A Gravity
Model Approach’. Modern Economics 1: 134-143.

Journal of Economics and Sustainable Development www.iiste.org
ISSN 2222-1700 (Paper) ISSN 2222-2855 (Online)
Vol.5, No.14, 2014
99
Helpman, E. (1984). A Simple Theory of International Trade with Multinational Corporations. Journal of
Political Economy Vol 92:451-471.
Herrmann, M. (2006). Agricultural Support Measures of Advanced Countries and Food Insecurity in Developing
Countries. UNU-WIDER Research Paper No. 2006/141.
IMF (2011). Burundi: Poverty Reduction Strategy Paper- Progress Report. IMF Country Report No 11/53.
Ivory, P. (1990). Food Import Growth in the Developing Countries. Trocaire Development Review Vol. 6: 59-71.
Kandogan, Y. (2007). ‘Sensitivity of International Blocs’ Trade Effect to Alterantive Specifications of the
Gravity Equations’. Journal of Applied Economics Vol. X No 2: 337-360.
Kimura, F. & Lee, H.H. (2004). The Gravity Equation in International Trade in Service. European Trade Study
Group Conference, University of Nottingham, September 9-11.
Linder, S. (1961). An Essay on Trade and Transformation. New York: John Wiley and Sons, Inc..
McCallum, J. (1995). National Borders Matter: Canada-US Regional Patterns. The American Economic Review
Vol. 85: 615-623.
Melitz, J. (2007). North, South and Distance in the Gravity Model. European EconomicReview Vol. 51: 971-991.
Musila, J.W. (2005). The Intensity of Trade Creation and Trade Deviation in COMESA, ECCAS and ECOWAS:
A Comparative Analysis. Journal of African Economies Vol. 14: 117-141.
Ng, F. & Yeats, A. (2003). Major Trade Trends in East Asia: What are their Implications for Regional
Cooperation and Growth? World Bank Working Paper No 3084.
Paas, T. & Tafenau, E. (2005). European Trade Integration in the Baltic Sea Region: A Gravity Model Based
Analysis. HWWA Discussion Paper 33.
Persson, E. (2008). The Gravity of EBA Preferences: Disagragated Trade Flow in Agriculture. Lund: Bachelor
Thesis, University of Lund, Sweden.
Pöyhönen, P. (1963). A Tentative Model for the Volume of Trade between Countries. Weltwirtschaftliches
Archiv. 90: 93-99.
Ndereyahaga, R., (2009). A Gravity Model of East African Trade Flows and/or Openness Determinants: A
Panel Data Analysis. Cahier de Curdes 10 : 21-29.
Rose A.K. (2004). Do we Really know that the WTO increases Trade. American Economic Review Vol. 94: 98-
114.
Shinyekwa, I & Othieno, L. (2013). Comparing the Performance of Uganda’s Intra East African Community
Trade and Other Trading Blocs: A Gravity Model Analysis. Economic Policy Research Centre (EPRC)
Research Series 100, Kampala.
Tinbergen, J. (1962). Shaping the World Economy: Suggestion for an International Economy. Twentieth Century
Fund, New York.
UNDP (2013). Human Development Report 2013: The Rise of the South- Human Progress in the Diverse World.
New York: Palgrave Macmillan.
Walsh, K. (2006). Trade in Services: Does Gravity Hold? A Gravity Model Approach to Estimating Barriers to
Services Trade. Dublin: Institute of International Integration Studies.
World Bank (2013). Doing Business in the East African Community 2013: Smarter Regulation for Small and
Medium-Size Enterprises. Washington D.C.: World Bank Publication.
World Bank (2011). Republic of Burundi Country Economic Memorandum (CEM). World Bank Report No
51880-BI, Washington DC.
World Trade Organization (2003). Trade Policy Review Body: Burundi. Report by the Secretariat. March 5.
WTO, Geneva. Available at: http://www.wto.org/english/tratop_E/tpr_e/tp212_e.htm

The IISTE is a pioneer in the Open-Access hosting service and academic event
management. The aim of the firm is Accelerating Global Knowledge Sharing.
More information about the firm can be found on the homepage:
http://www.iiste.org
CALL FOR JOURNAL PAPERS
There are more than 30 peer-reviewed academic journals hosted under the hosting
platform.
Prospective authors of journals can find the submission instruction on the
following page: http://www.iiste.org/journals/ All the journals articles are available
online to the readers all over the world without financial, legal, or technical barriers
other than those inseparable from gaining access to the internet itself. Paper version
of the journals is also available upon request of readers and authors.
MORE RESOURCES
Book publication information: http://www.iiste.org/book/
IISTE Knowledge Sharing Partners
EBSCO, Index Copernicus, Ulrich's Periodicals Directory, JournalTOCS, PKP Open
Archives Harvester, Bielefeld Academic Search Engine, Elektronische
Zeitschriftenbibliothek EZB, Open J-Gate, OCLC WorldCat, Universe Digtial
Library , NewJour, Google Scholar