Expert Gesture Analysis through Motion Capture using ...
215
Expert Gesture Analysis through Motion Capture using Statistical Modeling and Machine Learning Mickaël Tits University of Mons September 25, 2018 A dissertation submitted to the Faculty of Engineering of the University of Mons, for the degree of Doctor of Philosophy in Engineering Science Jury: Dr Nicolas D’ALESSANDRO ........................................... Hovertone Prof. Thierry DUTOIT, supervisor ............................. University of Mons Prof. Bernard GOSSELIN ...................................... University of Mons Dr Alexis HELOIR ...................................... University of Valenciennes Prof. Marc LEMAN .............................................. Ghent University Prof. Xavier SIEBERT, president ............................... University of Mons Dr Joëlle TILMANNE, co-supervisor ........................... University of Mons Prof. Marcelo WANDERLEY .................................... McGill University
-
Upload
khangminh22 -
Category
Documents
-
view
2 -
download
0
Transcript of Expert Gesture Analysis through Motion Capture using ...

Expert Gesture Analysis through MotionCapture using Statistical Modeling and
Machine Learning
Mickaël TitsUniversity of MonsSeptember 25, 2018
A dissertation submitted to the Faculty of Engineeringof the University of Mons, for the degree of Doctor of
Philosophy in Engineering Science
Jury:Dr Nicolas D’ALESSANDRO . . . . . . . . . . . . . . . . . . . . . . . . . . . . . . . . . . . . . . . . . . . HovertoneProf. Thierry DUTOIT, supervisor . . . . . . . . . . . . . . . . . . . . . . . . . . . . . University of MonsProf. Bernard GOSSELIN . . . . . . . . . . . . . . . . . . . . . . . . . . . . . . . . . . . . . . University of MonsDr Alexis HELOIR . . . . . . . . . . . . . . . . . . . . . . . . . . . . . . . . . . . . . .University of ValenciennesProf. Marc LEMAN . . . . . . . . . . . . . . . . . . . . . . . . . . . . . . . . . . . . . . . . . . . . . . Ghent UniversityProf. Xavier SIEBERT, president . . . . . . . . . . . . . . . . . . . . . . . . . . . . . . . University of MonsDr Joëlle TILMANNE, co-supervisor . . . . . . . . . . . . . . . . . . . . . . . . . . . University of MonsProf. Marcelo WANDERLEY . . . . . . . . . . . . . . . . . . . . . . . . . . . . . . . . . . . . McGill University

ii
© Mickaël Tits 2018
iii
ThesisEveryone has the same color.
DemonstrationThe black sheep idiom is a well-documented research subject in the litera-ture, as shepherds have existed from the depths of time, and have alwaysbeen intrigued by that mystery (Marques et al., 1988). This demonstrationwill hence be based on this subject.In a herd populated with a black and a white sheep, the white sheep isthe only white sheep of the herd. It is thus an outsider in its herd andcan therefore be considered as the black sheep of the herd. Hence, bothsheep are black. The herd is thus composed of two black sheep. As all thesheep of the herd have the same color, there is no outsider, i.e. no blacksheep, and both sheep are thus white. All the sheep thus have the samecolor. As it was demonstrated that humans are like sheep (Raafat et al.,2009), humans therefore have the same color. QED.
Mickaël TitsSeptember 25, 2018

iv

Acknowledgments
Merci tout d’abord à Thierry et Nicolas pour m’avoir donné goût à la recherche dansles domaines passionnants du traitement du signal et de l’intelligence artificielle dèsle début de mon Master. Merci à Julien Biral également pour avoir été un excellentcompagnon de voyage, et ami, et d’avoir partagé avec moi cette passion pendant nosétudes de Master. C’est grâce à vous que cette passion a pu mûrir et se transformerd’abord en un TFE, puis en une thèse. Merci à Joëlle pour avoir pris le relais, et pourm’avoir suivi, soutenu et poussé à me surpasser constamment pendant ces quatreannées. Nicolas, tu m’as transmis ta passion pour la folie de la recherche, nécessaireà la création et à la révolution des idées. Joëlle, tu m’as transmis ta passion pourla rigueur de la recherche, nécessaire à la réalisation des idées. J’espère que cettepassion vous emmènera loin dans la sphère de l’entreprenariat, avec Hovertone. Jesuis heureux d’avoir pu être votre padawan, et j’emmènerai également cette passionavec moi dans la suite de mon chemin.
Un grand merci également à Eric Caulier, Georgette Methens et Michèle Van Hemel-rijk pour leurs conseils, leur disponibilité et les enseignements qu’ils m’ont donnéssur leur discipline passionnante qu’est le Taijiquan.
Merci à ma famille, et en particulier à mes parents, et à mes prédécesseurs sur le che-min de la thèse, Jacques Tits, André Tits, Pierre-Antoine Absil, Olivier Absil, LaurentKohler, pour avoir cultivé et pour m’avoir transmis votre passion pour la science etla recherche. Je suis heureux d’avoir suivi cette voie que vous avez tracée, et heu-reux également d’être déjà suivi de près. Merci, Noé, d’avoir partagé cette passionégalement avec moi pendant un an. Je te souhaite bonne chance pour la suite. Merciégalement à Isabelle et Pierre-olivier pour m’avoir soutenu également tout ce temps.
Merci à tous mes amis également pour leur soutien et leurs encouragements toutau long de ce travail de longue haleine. En particulier, merci Ambroise, tu as étéun excellent compagnon, et ami, de voyage et de Citizen Fox. Merci pour m’avoirfait profiter de ton karma pendant ces quatre années. Ton altruisme, ton empathie etton équanimité ont été une inspiration pour moi. Merci pour avoir tant de fois relumes publications, et réfléchi posément avec moi sur des problèmes scientifiques ouexistentiels. J’espère que tu trouveras le chemin de la pleine conscience, je te souhaitebonne chance pour la fin de ta thèse.
Merci à tous mes collègues du TCTS pour votre bonne humeur et votre passionégalement partagée au labo. Vous avez été comme une deuxième famille pour moi
v

vi
(sauf Noé, qui est déjà de la première), et j’espère retrouver ça lors de ma prochaineétape, au CETIC.
Enfin, merci à ma chère et tendre, Julie, pour m’avoir soutenu et encouragé, et pouravoir supporté mes maux de tête, de ventre, de dos et mon indisponibilité chroniquespendant ces quatre années de thèse. Tu mérites un titre de docteur.

Abstract
The present thesis is a contribution to the field of human motion analysis. It studiesthe possibilities for a computer to interpret human gestures, and more specifically toevaluate the quality of expert gestures. These gestures are generally learned throughan empirical process, limited to the subjectivity and own perception of the teacher. Inorder to objectify the evaluation of the quality of these gestures, researchers have pro-posed various measurable criteria. However, these measurements are still generallybased on human observation.
Enabled by significant steps in the development of Motion Capture (MoCap) and arti-ficial intelligence technologies, research on automatic gesture evaluation has sparkeda new interest, due to its applications in education, health and entertainment. Thisresearch field is, however, recent and sparsely explored. The few studies on the sub-ject generally focus on a small dataset, limited to a specific type of gestures, and adata representation specific to the studied discipline, hereby limiting the validity oftheir results. Moreover, the few proposed methods are rarely compared, due to thelack of available benchmark datasets and of reproducibility on other types of data.
The aim of this thesis is therefore to develop a generic framework for the develop-ment of an evaluation model for the expertise of a gesture. The methods proposedin this framework are designed to be reusable on various types of data and in vari-ous contexts. The framework consists of six sequential steps, for each of which anoriginal contribution is proposed in the present thesis:
Firstly, a benchmark dataset is proposed to promote further research in the domainand allow method comparison. The dataset consists of repetitions of 13 Taijiquantechniques by 12 participants of various levels from novice to expert, resulting in atotal of 2200 gestures.
Secondly, the MoCap data must be processed, in order to ensure the use of high-quality data for the design of an evaluation model. To that end, an original methodis proposed for automatic and robust recovery of optical MoCap data, based on aprobabilistic averaging of different individual recovery models, and the applicationof automatic skeleton constraints. In an experiment where missing data were simu-lated into a MoCap dataset, the proposed method outperforms various methods ofthe literature, independently of gap length, sequence duration and the number ofsimultaneous gaps.
vii
viii
Thirdly, various motion features are proposed for the representation of various as-pects of motion, potentially correlated with different components of expertise. Ad-ditionally, a new set of features is proposed, inspired by Taijiquan ergonomic prin-ciples. In this respect, 36 new motion features, representing aspects of stability, jointalignments, joint optimal angles and fluidity are presented.
Fourthly, the features must be processed to provide a more relevant representationof expertise. In the present work, the morphology influence on motion is addressed.Morphology is an individual factor that has a great influence on motion, but is notrelated to expertise. A novel method is therefore proposed for the extraction ofmotion features independent of the morphology. From the linear modeling of therelation of each feature with a morphological factor, residues are extracted, provid-ing a morphology-independent version of the motion features. As a consequence,the resulting features are (i) less correlated between each other, and (ii) enable amore relevant comparison between the gestures of various individuals, hereby al-lowing a more relevant modeling of expertise. Results show that the method, termedas Morphology-Independent Residual Feature Extraction (MIRFE) outperforms abaseline method (skeleton scaling) in (i) reducing the correlation with the morpho-logical factor, and in (ii) improving the correlation with skill, for various gestures ofthe Taijiquan MoCap dataset, and for a large set of motion features.
Fifthly, an evaluation model must be developed from these features, allowing theprediction of the expertise level on a new gesture performed by a new user. A modelbased on feature statistics, dimension reduction and regression is proposed. Themodel is designed to be used with any motion feature, in order to be generic andrelevant in different contexts, including various users and various types of gesturaldisciplines. Trained on the Taijiquan MoCap dataset, the model outperforms twomethods of the literature for the evaluation of gestures of a new user, with a meanrelative prediction error of 10% (R = 0.909).
Additionally, a first exploration of the use of deep learning for gesture evaluation isproposed. To that end, MoCap sequences are represented as abstract RGB images,and used for transfer learning on a pre-trained image classification convolutionalneural network. Despite a lower performance (R = 0.518), an analysis of the resultssuggests that the model could achieve better performance given a larger dataset,including a larger number of novices and experts.
Sixthly, and finally, to allow a practical use of the evaluation model, a feedbacksystem must provide an intuitive interpretation of the predicted level, allowing aneffective understanding and assimilation by the user of the system. In the presentwork, an original and generic feedback system is proposed, based on the synthesisof an improved gesture, and its comparison to the user’s original gesture. Bothintuitive and precise feedback are proposed, based on (i) synchronized visualizationof both gestures, and (ii) striped images highlighting the motion features that needimprovement. As a validation of the proposed method, examples of feedback areproposed for various sequences of the Taijiquan MoCap dataset, showing its practicalinterest for objective and automated supervision.

Contents
Introduction 1
I Background 9
1 What is expertise ? 11
2 Motion Capture and Representations 15
2.1 Introduction . . . . . . . . . . . . . . . . . . . . . . . . . . . . . . . . . . . 15
2.2 Motion low-level representations . . . . . . . . . . . . . . . . . . . . . . . 17
2.3 Motion high-level representations . . . . . . . . . . . . . . . . . . . . . . 20
2.4 Multifactor influence . . . . . . . . . . . . . . . . . . . . . . . . . . . . . . 33
2.5 Discussion and conclusion . . . . . . . . . . . . . . . . . . . . . . . . . . . 34
3 Expert gesture evaluation: a state of the art 37
3.1 Introduction . . . . . . . . . . . . . . . . . . . . . . . . . . . . . . . . . . . 37
3.2 Machine learning for human activity analysis . . . . . . . . . . . . . . . 38
3.3 3D full-body motion capture . . . . . . . . . . . . . . . . . . . . . . . . . 39
3.4 Expert gesture evaluation . . . . . . . . . . . . . . . . . . . . . . . . . . . 41
3.5 Discussion and conclusion . . . . . . . . . . . . . . . . . . . . . . . . . . . 48
II Data Collection and Processing 53
ix

x Contents
4 Taijiquan motion capture dataset 55
4.1 Introduction . . . . . . . . . . . . . . . . . . . . . . . . . . . . . . . . . . . 55
4.2 Participants . . . . . . . . . . . . . . . . . . . . . . . . . . . . . . . . . . . 58
4.3 Recording protocol . . . . . . . . . . . . . . . . . . . . . . . . . . . . . . . 59
4.4 Data processing . . . . . . . . . . . . . . . . . . . . . . . . . . . . . . . . . 59
4.5 Manual annotation (segmentation) . . . . . . . . . . . . . . . . . . . . . 59
4.6 Kinect data . . . . . . . . . . . . . . . . . . . . . . . . . . . . . . . . . . . . 64
4.7 Conclusion . . . . . . . . . . . . . . . . . . . . . . . . . . . . . . . . . . . . 64
5 Robust and automatic motion capture data recovery 65
5.1 Introduction . . . . . . . . . . . . . . . . . . . . . . . . . . . . . . . . . . . 66
5.2 Method . . . . . . . . . . . . . . . . . . . . . . . . . . . . . . . . . . . . . . 68
5.3 Results . . . . . . . . . . . . . . . . . . . . . . . . . . . . . . . . . . . . . . 79
5.4 Discussion . . . . . . . . . . . . . . . . . . . . . . . . . . . . . . . . . . . . 87
5.5 Taijiquan dataset recovery . . . . . . . . . . . . . . . . . . . . . . . . . . . 91
5.6 Conclusion . . . . . . . . . . . . . . . . . . . . . . . . . . . . . . . . . . . . 91
6 Taijiquan ergonomic principles: a new set of features 93
6.1 Introduction . . . . . . . . . . . . . . . . . . . . . . . . . . . . . . . . . . . 93
6.2 Stability . . . . . . . . . . . . . . . . . . . . . . . . . . . . . . . . . . . . . . 94
6.3 Joint alignments . . . . . . . . . . . . . . . . . . . . . . . . . . . . . . . . . 97
6.4 Favorable angles . . . . . . . . . . . . . . . . . . . . . . . . . . . . . . . . . 98
6.5 Fluidity . . . . . . . . . . . . . . . . . . . . . . . . . . . . . . . . . . . . . . 101
6.6 Summary and conclusion . . . . . . . . . . . . . . . . . . . . . . . . . . . 102

Contents xi
7 Morphology-independent residual feature extraction (MIRFE) 105
7.1 Introduction . . . . . . . . . . . . . . . . . . . . . . . . . . . . . . . . . . . 105
7.2 Method . . . . . . . . . . . . . . . . . . . . . . . . . . . . . . . . . . . . . . 107
7.3 Results . . . . . . . . . . . . . . . . . . . . . . . . . . . . . . . . . . . . . . 112
7.4 Discussion . . . . . . . . . . . . . . . . . . . . . . . . . . . . . . . . . . . . 114
7.5 Conclusion . . . . . . . . . . . . . . . . . . . . . . . . . . . . . . . . . . . . 117
III Gesture Evaluation: a case study on Taijiquan 119
8 Gesture evaluation: a statistical-based approach 121
8.1 Introduction . . . . . . . . . . . . . . . . . . . . . . . . . . . . . . . . . . . 121
8.2 Methods . . . . . . . . . . . . . . . . . . . . . . . . . . . . . . . . . . . . . 122
8.3 Results . . . . . . . . . . . . . . . . . . . . . . . . . . . . . . . . . . . . . . 124
8.4 Discussion . . . . . . . . . . . . . . . . . . . . . . . . . . . . . . . . . . . . 128
8.5 Conclusion . . . . . . . . . . . . . . . . . . . . . . . . . . . . . . . . . . . . 131
9 Towards a deep-learning-based gesture evaluation model 133
9.1 Introduction . . . . . . . . . . . . . . . . . . . . . . . . . . . . . . . . . . . 133
9.2 Methods . . . . . . . . . . . . . . . . . . . . . . . . . . . . . . . . . . . . . 138
9.3 Results and discussion . . . . . . . . . . . . . . . . . . . . . . . . . . . . . 143
9.4 Conclusion . . . . . . . . . . . . . . . . . . . . . . . . . . . . . . . . . . . . 147
10 Towards a generic visual feedback model for gesture evaluation 149
10.1 Introduction . . . . . . . . . . . . . . . . . . . . . . . . . . . . . . . . . . . 149
10.2 Method . . . . . . . . . . . . . . . . . . . . . . . . . . . . . . . . . . . . . . 150
10.3 Results . . . . . . . . . . . . . . . . . . . . . . . . . . . . . . . . . . . . . . 155
10.4 Discussion . . . . . . . . . . . . . . . . . . . . . . . . . . . . . . . . . . . . 160
10.5 Conclusion . . . . . . . . . . . . . . . . . . . . . . . . . . . . . . . . . . . . 162

xii Contents
Conclusions 165
Bibliography 169
References 169
A ’Kick with the heel’ feedback images 185
B Publications 191
B.1 Journals . . . . . . . . . . . . . . . . . . . . . . . . . . . . . . . . . . . . . . 191
B.2 Conferences . . . . . . . . . . . . . . . . . . . . . . . . . . . . . . . . . . . 191
B.3 Scientific reports . . . . . . . . . . . . . . . . . . . . . . . . . . . . . . . . 192

List of Figures
1 Workflow of the proposed framework, and correspondence with themanuscript structure. . . . . . . . . . . . . . . . . . . . . . . . . . . . . . . 6
2.1 Joint representation of the body. . . . . . . . . . . . . . . . . . . . . . . . 18
2.2 Rotation using Euler angles (y, j and f). The original system is in black(Oxyz), the first rotation in blue (y around z), the second rotation ingreen (j around u), the third rotation in red (f around z’). The rotatedsystem is Ox’y’z’. (Source: Wikipedia) . . . . . . . . . . . . . . . . . . . . 18
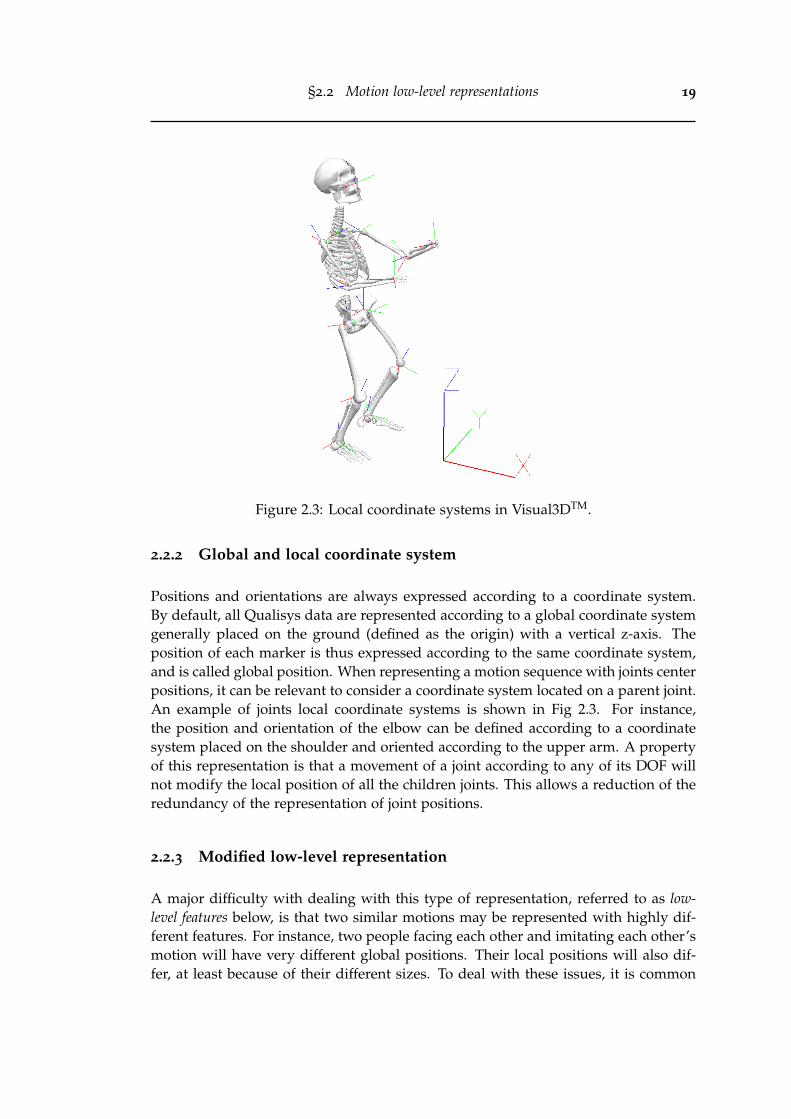
2.3 Local coordinate systems in Visual3DTM. . . . . . . . . . . . . . . . . . . 19
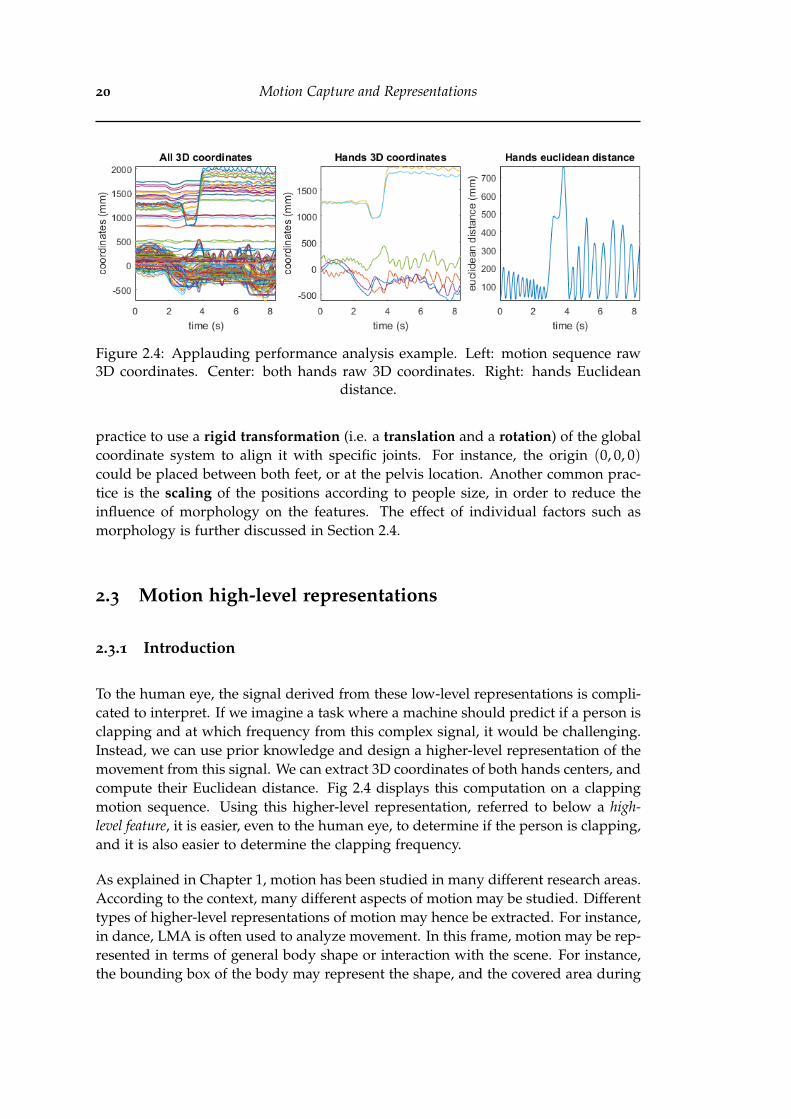
2.4 Applauding performance analysis example. Left: motion sequenceraw 3D coordinates. Center: both hands raw 3D coordinates. Right:hands Euclidean distance. . . . . . . . . . . . . . . . . . . . . . . . . . . . 20
2.5 Müller’s relational features. “hl” = humerus length, “hw” = hip width,“sw” = shoulder width. Reproduced from Müller and Röder (2006). . . 24
2.6 Postural load on a reaching task. Reproduced from Andreoni et al.(2009). . . . . . . . . . . . . . . . . . . . . . . . . . . . . . . . . . . . . . . . 31
3.1 The instrumented glove (Dipietro et al., 2003) and a surgery teleoper-ation system (BBZ Console) are both electronics devices allowing therecording of specific 3D motions. . . . . . . . . . . . . . . . . . . . . . . . 39
3.2 State-of-the-art magnetic and optical MoCap systems. Left: Qualisys(optical). Right: Polhemus (electromagnetic). . . . . . . . . . . . . . . . . 40
3.3 Evolution of the research on (left) surgical process modeling and (right)sports analysis with wearable sensors. The results are respectively re-produced from Lalys and Jannin (2014) and Camomilla et al. (2018). . . 41
4.1 Screenshot of the annotation software. Layered display of: 1. 3D mo-tion (gray spheres); 2. 2D-graphs showing evolution in time of theCOM coordinates (blue = x, purple = y, pink = z); 3. Annotations (redvertical lines and labels). 4. GUI (blue windows, allowing navigationin the file, and label edition). In this example, G06 has been annotated,and G07 is being annotated. For G06, labels are placed when the z-axis of the COM is low, and for G07, labels are placed when the COMy-axis if low (COM is on the left) or high (COM is on the right). . . . . . 63
xiii

xiv LIST OF FIGURES
5.1 Block diagram of the proposed method. The overall process can bedivided in five steps: 1) Extraction of marker trajectories parameters.2) Individual recovery models. 3) Time constraint: trajectory continu-ity. 4) Distance-probability weighted averaging. 5) Spacing constraint:reference marker distance likelihoods. . . . . . . . . . . . . . . . . . . . . 69
5.2 Trajectory continuity correction. The yellow curve shows incompletedata of a marker trajectory (m) on which a gap was introduced betweenframes 1130 and 1190 (only z-axis is shown). The blue curve representsthe recovered data (m), and the red curve shows the corrected datausing trajectory continuity constraint (m) (see Eq. 5.16-5.19). . . . . . . . 75
5.3 Reference distance soft constraints. The green intensity colormap indi-cates the probability of presence for the recovered frame. If the recov-ered frame m(n) is outside the confidence zone (delimited by spheresof radii r1 and R1), it is projected onto the closest point in this confi-dence zone (m(n)). . . . . . . . . . . . . . . . . . . . . . . . . . . . . . . . 77
5.4 Mean recovery error for different gap sizes and gap recovery meth-ods. Top: CMU1. Bottom: CMU3. Left: results including BoLeRomethod. Right: results without BoLeRo method. Each point representsthe mean of recovery errors, computed with 20 iterations, of three ran-domly created gaps of the same length (0.5, 1, 2 or 5 seconds). Solidlines show results for each individual method. Dashed lines showresults for distance-probability averages of various combinations of in-dividual methods. . . . . . . . . . . . . . . . . . . . . . . . . . . . . . . . . 81
5.5 Mean recovery error for different sequence durations and gap recoverymethods. To illustrate the influence of sequence duration on perfor-mance of gap recovery methods, fragments of different durations wereextracted from each motion file. Each point represents the mean of therecovery errors computed on 20 iterations of three randomly createdgaps of 1 second. Continuous lines show results for each individualmethod. Dashed lines show results for PMA with various methodscombinations. . . . . . . . . . . . . . . . . . . . . . . . . . . . . . . . . . . 82
5.6 Mean recovery error for different numbers of missing markers and gaprecovery methods. Each point represents the mean of recovery errorscomputed over 20 iterations of a number of randomly created gapsof 1 second (1, 3, 6, 10 or 20 gaps). Solid lines show results for eachindividual method. Dashed lines show results for distance-probabilityaverages of various methods combinations. . . . . . . . . . . . . . . . . . 84

LIST OF FIGURES xv
5.7 Mean recovery error for different recovery methods, for all test mo-tion sequences. Left: different gap lengths (3 concomitant gaps, totalsequence duration); Center: different motion durations (3 concomi-tant gaps of 1 second); Right: different numbers of concomitant gaps(gaps of 1 second, total sequence duration). Each point represents themean of recovery errors computed over 20 iterations of a number ofrandomly created gaps. Solid lines show results for each individualmethod. Dashed lines show results for PMA with various individualmethods combinations. . . . . . . . . . . . . . . . . . . . . . . . . . . . . . 86
5.8 Visual comparison of different gap recovery methods on different mo-tion sequences, with different marker sets. Red: original data. Gray:pchip interpolation (baseline) (Fritsch and Carlson, 1980). Blue: Gløersenand Federolf (2016). Green: our algorithm (PMA with constraints). . . . 88
6.1 Body joint representation and naming convention. . . . . . . . . . . . . . 94
6.2 Heel kick technique. During the gesture, arms move in synchronywith the foot, and are used as counterweights for a better stability.Reproduced from Caulier (2010). . . . . . . . . . . . . . . . . . . . . . . . 95
6.3 Visualization of some stability and alignment features inspired by Taiji-quan ergonomic principles. (a): F3 (verticality), F4 (horizontality) com-puted in the horizontal plane, and F7 (vertical alignment of left hip andleft ankle). (b): F11 (frontal alignment of left shoulder and left wrist)and F19 (right elbow not behind body) computed in the body frontalplane. . . . . . . . . . . . . . . . . . . . . . . . . . . . . . . . . . . . . . . . 96
6.4 Joint alignments in tree posture (Wuji). Reproduced from Caulier (2010). 97
6.5 Favorable joint angles in tree postures (Wuji). No joint is fully stretchednor fully bent. Reproduced from (Caulier, 2010). . . . . . . . . . . . . . . 99
6.6 Length-tension relation of a sarcomere in a muscle fiber. Reproducedfrom (Gordon et al., 1966). . . . . . . . . . . . . . . . . . . . . . . . . . . . 99
6.7 Some favorable angles, inspired by Taijiquan ergonomic principles. . . . 101
7.1 Kulpa et al. (2005) method for morphology-invariant representation ofmotion. Reproduced from Kulpa et al. (2005). . . . . . . . . . . . . . . . 107
7.2 Inter-individual factor independent residual feature extraction. (a):feature and statistics (µ and σ). (b): individual morphology (size).(c) and (d): linear regression of means and standard deviations. Theblue curve is the regressand (µ or σ), the red curve is the prediction(Eq. 7.1 and 7.2), and the green curve is the residue (Eq. 7.5 and 7.6).(e): residual feature extraction (Eq. 7.7). . . . . . . . . . . . . . . . . . . . 110

xvi LIST OF FIGURES
7.3 Absolute correlation analysis between feature statistics and motion fac-tors, for the eight Taijiquan Bafa techniques: (a) morphology and fea-tures means; (b) morphology and features standard deviations; (c) skilland features means: (d) skill and features standard deviations. . . . . . 113
7.4 Absolute correlation analysis between feature statistics and motion fac-tors, for each feature type: (a) morphology and features means; (b)morphology and features standard deviations; (c) skill and featuresmeans: (d) skill and features standard deviations. The indices of fea-ture type correspond to the list in Section 7.2.2. . . . . . . . . . . . . . . 115
7.5 Absolute pairwise correlations between features, for each type of fea-ture, without processing, after skeleton scaling, and after MIRFE). Theindices of feature type correspond to the list in Section 7.2.2. . . . . . . . 116
8.1 Generic workflow of the statistical-based gesture evaluation model. . . 123
8.2 Participant skill prediction using linear regression on PCs extracted onvarious features sets (no MIRFE post-processing). . . . . . . . . . . . . . 126
8.3 Participant skill prediction using linear regression on PCs extracted onvarious features sets, after MIRFE post-processing. . . . . . . . . . . . . 126
8.4 Score predictions for the eight Bafa techniques. Model: EN-regressionon 60 PCs from µ and σ of global positions and relational features,post-processed with MIRFE. . . . . . . . . . . . . . . . . . . . . . . . . . . 129
9.1 Feedforward neural network with one hidden layer. . . . . . . . . . . . . 135
9.2 CNN convolution layer (AlexNet first convolution layer). . . . . . . . . . 136
9.3 Convolutional layers and neuron visualization of AlexNet trained onthe ImageNet dataset. Reproduced from Wei et al. (2017). . . . . . . . . 137
9.4 (a) Similarity between 3D axes and RGB channels (Reproduced fromLaraba et al. 2017). (b) representation of a MoCap sequence as an RGBimage. . . . . . . . . . . . . . . . . . . . . . . . . . . . . . . . . . . . . . . 138
9.5 Eight Bafa techniques represented as abstract images. (a) Global po-sitions represented as RGB images. (b) Features (global positions,local quaternions, relational and ergonomic features) represented asgrayscale images. . . . . . . . . . . . . . . . . . . . . . . . . . . . . . . . . 139
9.6 Two-step transfer learning procedure. Step 1: a CNN is designed forclassification of the eight Bafa techniques. Step 2: a regression CNNis designed for the prediction of the participant skill level on one Bafatechnique. (AlexNet image adapted from Han et al. 2017). . . . . . . . . 141

LIST OF FIGURES xvii
9.7 Left: predictions of all motion sequences for each participant, againsttheir skill level. Right: prediction RMSE for each participant, againsttheir skill level. . . . . . . . . . . . . . . . . . . . . . . . . . . . . . . . . . 144
9.8 Prediction results for the statistical-based model from Chapter 8, basedon EN-regression on 60 PCs extracted from means and standard de-viations of global positions and relational features. Left: predictionsof all motion sequences for each participant, against their skill level.Right: prediction RMSE for each participant, against their skill level. . . 146
10.1 Synthesis-based feedback loop process. The integration of the feed-back by the performer can be viewed as a conceptual closed-loop pro-cess for the user’s progression. . . . . . . . . . . . . . . . . . . . . . . . . 152
10.2 Skilled gesture synthesis workflow. . . . . . . . . . . . . . . . . . . . . . . 153
10.3 Data adaptation for better comparison with the user’s motion. Thered skeleton represents the test sequence performed by the user of thefeedback system. The blue skeleton represents a sample of the dataset.Firstly, the sample is scaled to the size of the user. Then, horizontalcoordinates are fitted to the test sequence using the Kabsch algorithm.Finally, data are aligned temporally using DTW. . . . . . . . . . . . . . . 154
10.4 Validation of the feedback method. The level of the feedback sequencesis predicted back by the gesture evaluation model (y-axis) and con-fronted to the improved score (the target score, x-axis)). Each curvecorresponds to the mean of the predictions for all renditions of oneBafa technique by one participant. . . . . . . . . . . . . . . . . . . . . . . 156
10.5 Visual feedback for a rendition of G8 (Part the wild horse’s mane)by P11 (the lowest-skilled participant). Red: original sequence. Blue:feedback sequence with an improved score of 10 (h = 4.45). Left graph:gesture beginning, side-view. Right graph: gesture ending, front-view. . 158
10.6 Visual feedback for a rendition of G8 (Part the wild horse’s mane)by P11 (the lowest-skilled participant), for different values of h (linearramp of five values from 0 to 4.45). The colors of the skeleton follow acolor map from red to blue corresponding to h (0 = red, 4.45 = blue).(a): front view. (b): upper view. (c): feedback predictions. . . . . . . . . 159
10.7 Feedback for a rendition of G11 (Kick with the heel) by P11 (the lowest-skilled participant). (a): Visual feedback. (Red: original sequence.Blue: feedback sequence with an improved score of 10). (b): Markerdistances. (c): global positions difference. (d): Taijiquan features dif-ference. . . . . . . . . . . . . . . . . . . . . . . . . . . . . . . . . . . . . . . 161

xviii LIST OF FIGURES
A.1 Visual feedback for a rendition of G11 (Kick with the heel) by P11 (thelowest-skilled participant). Red: original sequence. Blue: feedbacksequence with an improved score of 10. . . . . . . . . . . . . . . . . . . 186
A.2 Differences between global positions, for a rendition of G11 (Kick withthe heel) by P11 (lowest-skilled participant). (scale in mm) . . . . . . . . 186
A.3 Distances between the markers of the original sequence with the mark-ers of the feedback sequence,for a rendition of G11 (Kick with the heel)by P11 (lowest-skilled participant). (scale in mm) . . . . . . . . . . . . . 187
A.4 Differences between relational features, for a rendition of G11 (Kickwith the heel) by P11 (lowest-skilled participant). The features usedare morphology-independent (processed with MIRFE), and on a stand-ardized scale. . . . . . . . . . . . . . . . . . . . . . . . . . . . . . . . . . . 188
A.5 Differences between ROMs, for a rendition of G11 (Kick with the heel)by P11 (lowest-skilled participant). The features used are morphology-independent (processed with MIRFE), and on a standardized scale. . . . 189
A.6 Differences between some Taijiquan features, for a rendition of G11(Kick with the heel) by P11 (lowest-skilled participant). The featuresused are morphology-independent (processed with MIRFE), and on astandardized scale. . . . . . . . . . . . . . . . . . . . . . . . . . . . . . . . 190

List of Tables
2.1 List of typical measured ROM. . . . . . . . . . . . . . . . . . . . . . . . . 29
3.1 Motion evaluation methods. D.S.= Direct Score. S.M.= Similarity Measure. S.P. = Score Predic-
tion. FB = feedback. v = number of captured variables. n = number of samples. p = number
of participants. ns = not specified. PM = Principal movement. *: for each task. R = Pearson’s
correlation. R2 = coefficient of determination. SLR: Single Linear Regression. MLR: Multiple
Linear Regression..KE = Kinetic Energy. . . . . . . . . . . . . . . . . . . . . . . . . . 50
4.1 Personal details of participants. Skill was ranked with a score between0 and 10 by three teachers. Each one of their rankings, as well as theirmean (Skillµ) is indicated in this table. . . . . . . . . . . . . . . . . . . . . 58
4.2 Table 2 - Marker placement. Labels and positions of 68 markers at-tached (scratched) to an elastic neoprene suit, according to Qualisysand C-Motion specification for standard full-body MoCap. Clustermarkers (upper arm, forearm, thigh and shank) are placed approxi-mately on the body and are only used for tracking in Visual3D™ soft-ware (C-Motion, Inc., Rockville, MD, USA). . . . . . . . . . . . . . . . . . 60
4.3 Five exercises and Eight techniques of the Yang Taijiquan style. . . . . . 61
4.4 Types of renditions performed by the participants. . . . . . . . . . . . . 61
4.6 Manual segmentation rules for the 13 gestures based on visual indica-tions on direct 3D motion and COM coordinates. . . . . . . . . . . . . . 62
5.1 Motion sequences used in the methods comparison. . . . . . . . . . . . . 78
5.2 Effect of constraints on mean recovery error (t-test, n = 200; conditions:3 gaps of 1 seconds). Paired t-test (n = 200) on constraints effect onPMA for the reconstruction of 3 gaps of 1 second, introduced intodifferent motion sequences. Individual methods 1 to 4 were used inthis test. . . . . . . . . . . . . . . . . . . . . . . . . . . . . . . . . . . . . . 83
xix

xx LIST OF TABLES
5.3 Effect of constraints on the mean recovery error (t-test, n = 200; condi-tions: 10 gaps of 5 seconds). Paired t-test (n = 200) on constraints effecton PMA for the reconstruction of 10 simultaneous gaps of 5 seconds,introduced into different motion sequences. Individual methods 1 to 4were used in this test. . . . . . . . . . . . . . . . . . . . . . . . . . . . . . 85
5.4 Taijiquan MoCap dataset recovery. . . . . . . . . . . . . . . . . . . . . . . 91
6.1 Features inspired by Taijiquan ergonomic principles. . . . . . . . . . . . 103
8.1 Participant skill prediction using various regression models: best re-sults. The numbers used to identify the features correspond to the listpresented in Section 8.2.2. . . . . . . . . . . . . . . . . . . . . . . . . . . . 127
8.2 Participant skill prediction using two methods from the literature. . . . 128
8.3 Correlations of the annotations of the three teachers with each otherand with participant experiences (years of practice). . . . . . . . . . . . . 131
8.4 Mean absolute difference between the annotations of the three teachers. 131
9.1 Validation of the first transfer learning step: classification accuracy ofthe Bafa techniques. . . . . . . . . . . . . . . . . . . . . . . . . . . . . . . . 143
9.2 Prediction correlations with annotations for various skill-level-regressionCNNs. . . . . . . . . . . . . . . . . . . . . . . . . . . . . . . . . . . . . . . 144
9.3 Prediction correlations with annotations for various skill-level-regressionCNNs, all participants except P2 and P11. . . . . . . . . . . . . . . . . . . 145
9.4 Prediction correlations with annotations for various skill-level-regressionCNNs, all participants except P1, P2, P11 and P12. . . . . . . . . . . . . . 145
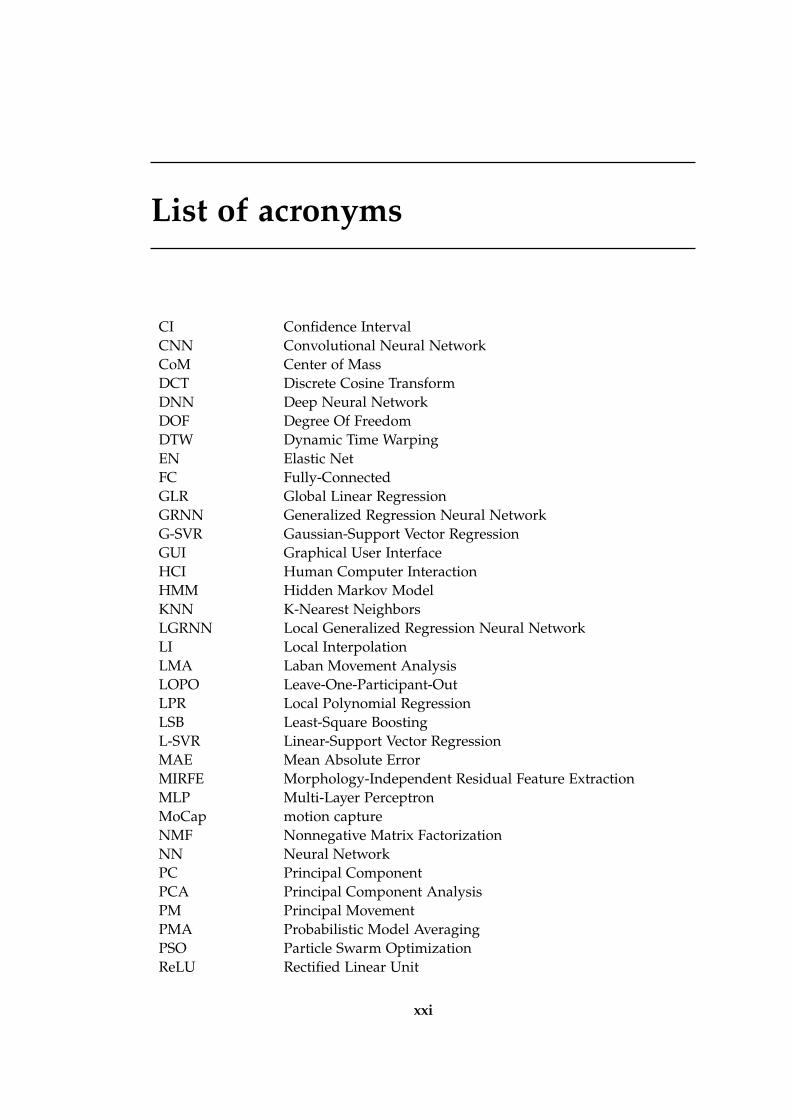
List of acronyms
CI Confidence IntervalCNN Convolutional Neural NetworkCoM Center of MassDCT Discrete Cosine TransformDNN Deep Neural NetworkDOF Degree Of FreedomDTW Dynamic Time WarpingEN Elastic NetFC Fully-ConnectedGLR Global Linear RegressionGRNN Generalized Regression Neural NetworkG-SVR Gaussian-Support Vector RegressionGUI Graphical User InterfaceHCI Human Computer InteractionHMM Hidden Markov ModelKNN K-Nearest NeighborsLGRNN Local Generalized Regression Neural NetworkLI Local InterpolationLMA Laban Movement AnalysisLOPO Leave-One-Participant-OutLPR Local Polynomial RegressionLSB Least-Square BoostingL-SVR Linear-Support Vector RegressionMAE Mean Absolute ErrorMIRFE Morphology-Independent Residual Feature ExtractionMLP Multi-Layer PerceptronMoCap motion captureNMF Nonnegative Matrix FactorizationNN Neural NetworkPC Principal ComponentPCA Principal Component AnalysisPM Principal MovementPMA Probabilistic Model AveragingPSO Particle Swarm OptimizationReLU Rectified Linear Unit
xxi

xxii Conclusions
RMSE Root Mean Square ErrorROM Range Of MotionSGD Stochastic Gradient DescentSVM Support Vector MachineSVT Singular Value Thresholding

Introduction
Context
The present thesis is a contribution to the field of human motion analysis. It studiesthe possibilities for a computer to interpret human gestures, and more specifically toevaluate the quality of an ’expert gesture’. An expert gesture can be defined as anycomplex and precise gesture requiring a high level of motor control acquired throughexperience, i.e. a long training process. This type of gesture is encountered in variousdisciplines in sports, music, dance, or in manual works like surgery, pottery andcalligraphy. All these gestures are usually learned through a long training process,either self-learned or guided by a teacher. This process is usually empirical, andlimited to the subjective perception of the discipline by the learner or the teacher.The perception of a gesture and the underlying characteristics defining expertise areindeed related to one’s unique body, experience and personality, and are thereforepartly subjective. Moreover, this perception is generally hard to describe with wordsand even harder to quantify, even for an expert of the discipline.
In order to objectify the evaluation of the quality of these gestures, researchershave proposed various measurable criteria, somehow defining what expertise is, alsotermed motor control, dexterity, or skills according to the research domain. In thefield of physiotherapy, various quantitative tests were developed to evaluate the grossand fine motor skills of patients, with various exercises for measuring motor preci-sion, integration, manual dexterity, uni- and bilateral coordination, balance, agility,and strength (Deitz et al., 2007; Cools et al., 2009). These tests have been widely usedfor diagnosis with patients with cerebral palsy or after a physical injury, or withchildren with development disorders. In ergonomics, evaluation matrices have beendeveloped to measure the quality of manual works in terms of ergonomy, by evalu-ating muscular fatigue and risks of injury (McAtamney and Corlett, 1993; Kee andKarwowski, 2001). In a more artistic context, Laban movement analysis (LMA) is amethod allowing the description and interpretation of motion in terms of intention,aesthetics and efforts, and is used by dancers, actors, but also by physiotherapists(Bartenieff and Lewis, 1980; Newlove, 1993). More specifically, the particular disci-pline of surgery has drawn a lot of attention, due to the impact of these gestures onpatient health. In this context, various evaluation matrices have also been proposedfor the supervision of the surgical training (Reiley et al., 2011).
Most of these gesture evaluation methods are still based on human observation or arelimited to basic measurements of the motion, such as the running speed, or the du-ration of a manual work. However, the use of computer technologies could provide
1

2 Introduction
more consistent, automatic and objective solutions to this issue. Recent motion cap-ture (MoCap) technologies allow the accurate and automatic recording of the motionof the entire body. On the other hand, artificial intelligence technologies, and moreparticularly machine learning, allow a computer to interpret various types of data,based on automatic algorithms modeling the relations between these data. Thesetechnologies could be used together, allowing an automatic modeling of expertisefrom MoCap data representing the analyzed gestures accurately. The models de-veloped could therefore be more precise and objective than the human observer, andcould find applications in various areas. In sports, wearable MoCap sensors are moreand more used for the monitoring of athletes and the evaluation of their performance(Camomilla et al., 2018). In the field of surgery, models based on artificial intelligencehave been tested for the evaluation of the surgical process (Lalys and Jannin, 2014). Ina medical context, MoCap has been used to investigate the long-term effect of med-ication on tremor for patients with Parkinson’s disease (Van Someren et al., 1998).More recently, Tahir and Manap (2012) tested machine learning algorithms for thedetection of the Parkinson’s disease from walking patterns. In the context of sportscompetition, Young and Reinkensmeyer (2014) proposed a model based on machinelearning for automatic and objective jury grades in an Olympic diving competition.In various contexts, specific computational features have been developed to objec-tively interpret various expertise criteria in gestures, including LMA (Aristidou andChrysanthou, 2014), ergonomics (Andreoni et al., 2009) and physiotherapy (Harrisonet al., 2007).
In general, automatic gesture evaluation models could be used either by a learnerfor automated supervision during the learning of an expert gesture, or as a tool bya teacher, a sports coach, a choreographer or a medical doctor for a more consistentand objective monitoring. Finally, the video-game industry could use these modelsfor the development of new video games, allowing the learning of sports and musicalgestures in an entertaining context.
Motivations and original contributions
Due to the recent spreading of MoCap and machine learning technologies, and dueto the range of potential applications, the analysis of expert gestures has recentlysparked a particular interest in research. This research field is, however, recent andsparsely explored. The few studies on the subject generally focus on a small dataset,limited to a specific type of gesture, and a data representation specific to the studieddiscipline, hereby limiting the validity of their results. Moreover, the few proposedmethods are rarely compared, due to the lack of available benchmark datasets andof reproducibility on other types of data.
The aim of this thesis is therefore to develop a generic framework for the develop-ment of an evaluation model for the expertise of a gesture. The methods proposed in

Introduction 3
this framework are designed to be reusable on various types of data and in variouscontexts. Moreover, a benchmark dataset is proposed to promote further researchin the domain and allow method comparison. The proposed models must be de-signed to take into consideration various aspects of motion, in order to be genericand relevant in different contexts, including various users and various types of ges-tural disciplines. The proposed models should also allow for a practical use, eitherfor automated supervision, or as a support for teachers, by providing a quantifiedand objective feedback to the user.
Fig 1 illustrates the proposed framework. The workflow of this framework includessix sequential steps. For each one of these steps, an original contribution is presentedin this thesis:
1. First, a large dataset must be collected. To be relevant for gesture evaluation,the dataset must contain a large number of participants to encode a large vari-ability of gestures, and a large number of expertise levels. In the present thesis,a dataset of Taijiquan gestures has been recorded, using 3D and accurate full-body MoCap. Most gestural disciplines are focused on the motion of a specificbody part, or on a specific purpose such as gesture aesthetics, musical soundor force production. On the contrary, Taijiquan focuses on the movement it-self, allowing for the development of general physical abilities such as balance,coordination, etc., as well as mental skills such as concentration. This generalexpertise learned during Taijiquan practice can often be transferred to variousother sports disciplines (Caulier, 2010). These characteristics make Taijiquan awell-suited discipline to study gesture expertise. The dataset recorded contains13 classes (Taijiquan gestures), performed by 12 participants of different lev-els of expertise from novice to expert. All the recordings have been manuallycorrected and segmented, resulting in 2200 gestures (≈ 170 / class). The 12participants have been ranked by three highly experienced Taijiquan teachers,providing an index of their global level of expertise. This dataset has beenpublished and is available for free download for research purposes (Tits et al.,2018a).1 To the author’s knowledge, this is the first published dataset of sportsgestures comprising simultaneously a large number of participants (12), a largenumber of different classes (13), and a variety of levels of expertise.
2. Secondly, the data must be processed, in order to ensure the use of high-qualitydata for the design of an evaluation model. To that end, an original method isproposed for automatic and robust recovery of optical MoCap data, based on aprobabilistic averaging of different individual MoCap data recovery models.
3. Thirdly, relevant motion features must be extracted from the data. Motion fea-tures allow the representation of various aspects of motion, such as dynamics,semantics, ergonomics or expressivity. In the present context, relevant mo-tion features are those that are related to expertise. In the present thesis, an
1Taijiquan MoCap dataset: https://github.com/numediart/UMONS-TAICHI
4 Introduction
original high-level representation of motion data is proposed, inspired by theergonomic principles of Taijiquan. The ergonomy of a gesture is closely relatedto expertise, but this aspect has never been explored in the literature known tothe author. This new type of motion features allows a relevant interpretation ofthe motion with a high-level of abstraction, in terms of ergonomics.
4. Fourthly, the features must be processed to provide a more relevant represen-tation of expertise. In the present work, the morphology influence on motionis addressed. Morphology is an individual factor that has a great influence onthe motion, but is not related to expertise. For instance, during a kick gesturethe foot of a tall person will generally move higher than the foot of a shortperson. On the contrary, if a particular height of the kick is aimed, then the hipangle of the taller person will be smaller. In both cases, some features of bothindividuals will be very different (either foot height, or hip angle), without anyindication about the quality of the performance. In this sense, the informationcontained in any feature about morphology can be considered as noise andshould therefore be reduced as much as possible. Moreover, this informationis generally redundant as it is contained in many features. In this respect, anovel method is proposed for the extraction of motion features independentof the morphology. The proposed method is based on the modeling of the re-lation of each feature with a morphological factor. From this model, residuesare extracted, providing a morphology-independent version of the motion fea-tures. As a consequence, the resulting features are (i) less correlated betweeneach other, and (ii) enable a more relevant comparison between the gestures ofvarious individuals, hereby allowing a more relevant modeling of expertise.
5. Fifthly, an evaluation model must be developed from these features, allowingthe prediction of the expertise level on a new gesture performed by a newuser. This step has been widely explored in the present work, and two keycontributions are proposed:
• A simple, efficient and generic evaluation model is presented. It is basedon the computation of basic statistics on motion features (means and stan-dard deviations), Principal Component Analysis (PCA) and regression. Itis tested with various configurations, including various feature types, dif-ferent regression models and different gesture classes. Tested on the Taiji-quan dataset, the proposed model outperforms two methods of the recentliterature. On this dataset, the best prediction accuracy (R = 0.909) wasobtained using a combination of global joint positions and relational fea-tures (Müller and Röder, 2006), 60 Principal Components (PCs) extractedon their statistics and L2-regularized linear regression.
• Additionally, a first exploration of the use of deep learning for the eval-uation of the expertise is proposed. The method is inspired by Larabaet al. (2017), representing MoCap data as abstract images, allowing theiruse with pre-trained deep-learning models for image classification. These

Introduction 5
models are adapted using transfer learning for the regression of the levelof expertise. Though the prediction accuracy is lower than with the pre-viously presented method (R = 0.518), an analysis of the results suggeststhat the model could achieve better performance given a larger dataset,including a larger number of novices and experts.
6. Sixthly and finally, to allow a practical use of the evaluation model for learn-ing, a feedback system must provide an intuitive interpretation of the predictedlevel, allowing an effective understanding and assimilation by the user of thesystem. In the present work, an original and generic feedback system is pro-posed. The method is based on the synthesis of gestures corresponding to agiven level of expertise, higher than the user’s level. These synthesized ges-tures are compared with the user’s performance, allowing various types of vi-sual feedback to the user: (i) a synchronized visualization of both gestures, (ii)a striped image representing the motion features that need improvement, and(iii) a striped image displaying the wrongly placed body joints. This feedbacksystem can be used with any expertise evaluation model as long as it providesa continuous score. The resulting feedback is intuitive, and can be used eitherby a learner for automated supervision, or by a teacher as a tool for objectivesupervision.
Thesis overview
Fig 1 illustrates the structure of the present thesis, showing the correspondence withthe proposed framework. This structure is divided into three main parts:
• Part I presents the global background for this research, and is distributed intothree chapters:
– Chapter 1 briefly explores and discusses different definitions of the con-cept of expertise.
– Chapter 2 presents different types of motion representation (i.e. motionfeatures). These representations can be divided into low-level features (seeSection 2.2), directly representing motion in terms of positions and orien-tations, and high-level features (see Section 2.3), allowing the abstract rep-resentation of various aspects of motion, such as semantics, expressivityor ergonomics.
– Chapter 3 then outlines the previous works concerning the evaluation ofexpert gestures. The various proposed methods are classified into threecategories according to the type of score provided to represent the ex-pertise: a score can be directly derived from a specific feature designed

6 Introduction
Figure 1: Workflow of the proposed framework, and correspondence with themanuscript structure.

Introduction 7
to represent a component of expertise (such as coordination, stability, orcomplexity indices, see Section 3.4.1) ; a similarity measure can be com-puted between a learner’s gesture and a model of the ideal gesture (seeSection 3.4.2) ; or a score can be predicted using a classification or a re-gression model (see Section 3.4.3). Additionally, the few works proposingmethods for feedback are presented in Section 3.4.4.
• Part II presents the proposed contributions of the present thesis concerning thecollection and processing of MoCap data. These processing steps aim at a morerelevant representation of the gesture, containing maximum information aboutits expertise level:
– Chapter 4 presents a new dataset of Taijiquan gestures, including 12 par-ticipants of different levels of expertise, from novice to expert, and 13classes of Taijiquan techniques. This dataset is used as a benchmark forthe methods proposed in this thesis.2
– Chapter 5 presents and discusses a method for robust and automatic re-covery of MoCap data, based on soft skeleton constraints and model aver-aging.3
– Chapter 6 presents a new set of motion features inspired by Taijiquanergonomic principles. These features can be divided into stability features(see Section 6.2), joint alignments (see Section 6.3), favorable angles (seeSection 6.4) and fluidity features (see Section 6.5).
– Chapter 7 presents and discusses an original method for the extractionof morphology-independent motion features, based on the extraction ofresiduals of a regression model predicting a morphological factor from theoriginal features (Morphology-Independent Residual Feature Extraction,MIRFE). The method is validated on the Taijiquan MoCap dataset.4
• In Part III, different methods are proposed for the evaluation of expertise, andfor feedback on the learning of an expert gesture:
– Chapter 8 presents a generic evaluation model, based on feature statisticsand classical machine learning. The model is based on PCA and regressionof the expertise level from statistics computed on motion features. Theproposed approach is tested on the Taijiquan MoCap dataset with varioustypes of motion features presented in the previous chapters (see Section8.3.1). The use of MIRFE is validated with the proposed method (seeSection 8.3.2). Various regression models are then tested (see Section 8.3.3),and are compared with methods of the recent literature (see Section 8.3.4).
– In Chapter 9, an exploration of the use of deep learning for gesture evalu-ation is proposed. To that end, a method proposed by Laraba et al. (2017),
2This chapter is partly reproduced from Tits et al. (2018a).3This chapter is partly reproduced from Tits et al. (2018b).4This chapter is partly reproduced from Tits et al. (2017).

8 Introduction
allowing representation of MoCap data as abstract images, is adapted forthe regression of the level of expertise. The method is based on a doubletransfer-learning step: a classification model is first trained for differentTaijiquan classes (see Section 9.3.1), and a regression model is then trainedfor the prediction of the level of expertise (see Section 9.3.2).
– Finally, Chapter 10 presents an original and generic feedback system basedon the synthesis of a feedback gesture corresponding to a particular levelof expertise. A gesture performed by a user of the system is first evaluatedthrough an evaluation model. It is then compared with a feedback gesturecorresponding to an improved level of expertise, allowing a highlightingof the motion features that need improvement for the user to reach a betterlevel of expertise. The synthesis system is quantitatively validated througha re-evaluation with the evaluation model (see Section 10.3.1). A qualita-tive validation is then proposed through various examples of the use ofthe system (see Section 10.3.2).
Conclusions are then provided at the end of the manuscript.

Part I
Background
9

Chapter 1
What is expertise ?
Expertise: “Expertise is special skill or knowledge that is acquired by training, study, orpractice.” (Collins)1
Expert: “having, involving, or displaying special skill or knowledge derived from trainingor experience.” (Merriam-Webster)2
Skill: “The ability to do something well; expertise.” (Oxford)3
Though it is not the goal of this thesis to dissert on the definition of expertise, it isrelevant to provide a brief picture of the research conducted on the subject. ’Gesturalexpertise’ is a complex concept, involving different physiological and psychologicalcomponents. Studies on this subject found in the literature explore very differentaspects of the question, showing the multidisciplinary nature of this research. Ac-cording to the context or field of research, gestural expertise overlaps with differentkeywords: "skilled performance", "motor skills", "motor control", "efficiency", "dex-terity". An important component of the definition of expertise is that it can only beacquired through the training of a skill, i.e. through experience.
Expertise is a concept that has already been explored in ancient Chinese philosophy.A famous excerpt from a traditional text called the Zhuangzi, pillar of the Taoistphilosophy and written more than two thousand years ago, draws the encounter ofa prince with a dexterous butcher (Tzu, 1964):
Cook Ting was cutting up an ox for Lord Wen-hui. As every touch of his hand, every heaveof his shoulder, every move of his feet, every thrust of his knee — zip! zoop! He slithered
1Expertise (Collins), retrieved on 20/07/2018: https://www.collinsdictionary.com/dictionary/english/expertise
2Expert (Merriam-Webster), retrieved on 20/07/2018: https://www.merriam-webster.com/dictionary/expert
3Skill (Oxford), retrieved on 20/07/2018: https://en.oxforddictionaries.com/definition/skill
11

12 What is expertise ?
the knife along with a zing, and all was in perfect rhythm, as though he were performing thedance of the Mulberry Grove or keeping time to the Ching-shou music.
“Ah, this is marvelous!” said Lord Wen-hui. “Imagine skill reaching such heights!”
Cook Ting laid down his knife and replied, “What I care about is the Way, which goes beyondskill. When I first began cutting up oxen, all I could see was the ox itself. After three yearsI no longer saw the whole ox. And now — now I go at it by spirit and don’t look with myeyes. Perception and understanding have come to a stop and spirit moves where it wants. Igo along with the natural makeup, strike in the big hollows, guide the knife through the bigopenings, and following things as they are. So I never touch the smallest ligament or tendon,much less a main joint.
“A good cook changes his knife once a year — because he cuts. A mediocre cook changes hisknife once a month — because he hacks. I’ve had this knife of mine for nineteen years andI’ve cut up thousands of oxen with it, and yet the blade is as good as though it had just comefrom the grindstone. There are spaces between the joints, and the blade of the knife has reallyno thickness. If you insert what has no thickness into such spaces, then there’s plenty of room— more than enough for the blade to play about it. That’s why after nineteen years the bladeof my knife is still as good as when it first came from the grindstone.
“However, whenever I come to a complicated place, I size up the difficulties, tell myself towatch out and be careful, keep my eyes on what I’m doing, work very slowly, and move theknife with the greatest subtlety, until — flop! the whole thing comes apart like a clod of earthcrumbling to the ground. I stand there holding the knife and look all around me, completelysatisfied and reluctant to move on, and then I wipe off the knife and put it away.”
“Excellent!” said Lord Wen-hui. “I have heard the words of Cook Ting and learned how tocare for life!”
This excerpt enlightens the idea of a particular knowledge acquired through an ex-tensive learning process, and through different steps. A common butcher hacks, agood butcher cuts, and the expert has integrated the whole task and can carve anox with eyes closed, and with a specific state of mind acquired through a systematictraining.
From this Chinese philosophy, Taijiquan was developed. Taijiquan is a Chinese mar-tial art, but it can be considered more broadly as an art of body awareness. It con-ciliates three components to define gestural expertise: the body external mechanics,the internal feeling or the mental image, and a spiritual aspect related to concepts offlow, trance and meditation. These three aspects may be seen as three major stepsduring the training for mastering any gestural discipline (Caulier, 2010, 2014, 2015).
In the field of cognitive science, the process of learning an activity and expertise havebeen studied (Ericsson and Lehmann, 1996; HAUW, 2009; FLEURANCE, 2009). Ac-cording to some authors, gestural expertise refers to a mental image of the gesture,

13
which then becomes finer and more stable through training (Cadopi, 2005; HAUW,2009). Others propose that expertise depends mainly on the ability to adapt to cir-cumstances when performing a gesture. These faculties of adaptation themselvesdepend on the training of the gesture in different contexts (King and Yeadon, 2003;HAUW, 2009).
In more practical terms, psychologists and physiotherapists defined the motor skill,and divided it down into several concepts. First, they divided it into two main cate-gories: the gross motor skills and the fine motor skills, according to whether gesturesare global movements of the body, or precise movements involving a specific groupof body muscles. To evaluate the motor skill, practical tests for fine and gross motorskills were developed. These tests were then divided down into different subteststo evaluate the various components of the motor skills: precision, integration, man-ual dexterity, uni- and bilateral coordination, balance, speed, agility, strength (Deitzet al., 2007; Cools et al., 2009).
In the field of neuroscience, the process of learning has been studied at the brain level,and allowed the discovery of brain plasticity. This mechanism allows a restructuringof synapses in the brain through motor training, to optimize the motor control, andthus to produce more efficient and economic gestures (Kami et al., 1995).
In the context of ergonomics, the quality of a gesture is assessed over the optimiza-tion of coordinated movements of all the parts of the body in the production of thegesture, to minimize body stress. This biomechanical optimization leads to energysavings, but also reduces the risk of injury (Andreoni et al., 2009; Multon and Olivier,2013; Multon, 2013).
In the context of the arts, and more precisely in dance, Laban Movement Analysis(LMA), from the name of the choreographer Rudolf Laban, allows the analysis ofthe quality of dance motion from an intentional and aesthetic point of view. Labandefined four main descriptions of motion (Aristidou and Chrysanthou, 2014):
• Body: description of the physical and structural characteristics of the body(positions and orientations);
• Effort or dynamics: description of the intention and dynamic characteristics ofthe motion;
• Form: description of the overall shape of the body and its aesthetic appearance(volume, height, etc.);
• Space: description of the relationship between motion and the environment.
Regardless of the research domain, whether in cognitive science, physiology or arts,the description of the quality of a gesture is divided into multiple components, whichare more relevant if used in a complimentary manner.
14 What is expertise ?
For an expert, it is difficult to define what expertise is with words. The expert simplyknows and feels it from experience, just as the Taoist butcher. In this research, thegoal is not a precise definition of expertise. The aim is instead to model from motiondata an expert’s perception of expertise. The concept of expertise is then not de-scribed with words, but with an algorithm. In this research, we will computationallyrepresent expertise. To that end, we endorse this aspect of multiplicity and complex-ity of its definition. In Chapter 2, we present techniques that allow a quantitativerepresentation of expertise from different aspects (termed as features below), includ-ing coordination, stability, energy, accuracy, etc., and thus leading to a more robustdescription of expertise. In Chapter 3, we then present algorithms used to model theexpert’s perception of expertise from these various features.

Chapter 2
Motion Capture andRepresentations
Contents2.1 Introduction . . . . . . . . . . . . . . . . . . . . . . . . . . . . . . . . . 15
2.2 Motion low-level representations . . . . . . . . . . . . . . . . . . . . 17
2.2.1 Positions and orientations . . . . . . . . . . . . . . . . . . . . . 17
2.2.2 Global and local coordinate system . . . . . . . . . . . . . . . 19
2.2.3 Modified low-level representation . . . . . . . . . . . . . . . . 19
2.3 Motion high-level representations . . . . . . . . . . . . . . . . . . . . 20
2.3.1 Introduction . . . . . . . . . . . . . . . . . . . . . . . . . . . . . 20
2.3.2 Kinematic and kinetic features . . . . . . . . . . . . . . . . . . 21
2.3.3 Relational features - Müller . . . . . . . . . . . . . . . . . . . . 22
2.3.4 Expressive features - Laban . . . . . . . . . . . . . . . . . . . . 23
2.3.5 Mathematical decomposition of motion . . . . . . . . . . . . . 25
2.3.6 Ergonomics . . . . . . . . . . . . . . . . . . . . . . . . . . . . . 27
2.4 Multifactor influence . . . . . . . . . . . . . . . . . . . . . . . . . . . 33
2.5 Discussion and conclusion . . . . . . . . . . . . . . . . . . . . . . . . 34
2.1 Introduction
MoCap appeared together with the development of instantaneous photography andcinematography at the end of the 19th century, making movement recording possible.Before the rise of this technology, it was difficult to perceive and measure complexmovements. At that time, Etienne-Jules Marey invented cyclography, the ancestor ofrecent optical motion capture methods. According to that technique, a patient mak-ing a periodic movement, and wearing a black suit with narrow white tapes placedalong each limb of her/his body, is captured with several photographic exposures on
15

16 Motion Capture and Representations
a single plate. This produces overlapping pictures allowing direct representation ofmotion on a single image, and accurate analysis thanks to the white tape. Cyclogra-phy was further developed into kymocyclography by Nikolai Bernstein in 1927, usingelectric bulbs as markers instead of tape, and a slowly and evenly moving photo-graphic film instead of a single plate. The bulbs captured on the photographic filmdrew wavelike curves, easy to decipher (Whiting, 1983).
The next step in the development of optical motion capture technology was stereo-scopic recording of movements, allowing recording of an object with three spatialcoordinates. This was achieved by recording the same scene from different pointsof observation. Details on the history of MoCap systems can be found in Whiting(1983), Kay et al. (2003) and Metcalf et al. (2014).
During the last three decades, different MoCap systems have been developed to al-low accurate 3D measures. These systems can be divided into two main categories:intrusive and non-intrusive systems. Intrusive systems use elements fixed on theobject to be captured, like an exoskeleton, inertial measurement units, magnetic sys-tems, or optical markers. Non-intrusive systems do not need the placement of in-trusive elements on the target. These systems, based on cameras, have a significantadvantage as they are not intrusive, and hence allow freer target movements. For in-stance, the Microsoft Kinect1 is a single camera allowing the extraction of a 3D mapfrom a single 3D depth infrared sensor. OpenStage2 is a multi-camera system, usingshape-from-silhouette construction to extract a visual hull of a body. However, theaccuracy of these markerless systems is still below that of intrusive systems (Brooksand Czarowicz, 2012; Mundermann et al., 2005). These systems are therefore moreadapted to less demanding applications.
In the present work, we used a state-of-the-art MoCap system using passive opticalmarkers manufactured by Qualisys 3. This system was chosen for its accuracy (< 1mm) and capability for recording motion at a fixed frame rate up to 400 fps.
This system allows measuring 3D positions of each marker placed on the body at afixed frame rate. In the remaining of this thesis, a MoCap recording will be referredto as a motion sequence. A motion sequence can be considered as a matrix representingall the trajectories of all the recorded markers during the entire sequence. This matrixhas the dimension N × (3 · M), where N is the number of frames of the sequence,and M is the number of recorded markers. A marker trajectory pj (j ∈ 1, ..., M) willbe represented as an N × 3 matrix.
MoCap data can be represented in various manners, with different advantages anddrawbacks. Basic representations (referred to as low-level features below) are directlyderived from recording systems and include various types of positions and orienta-tions. From these low-level features, higher-level representations may be extracted
1Kinect: http://www.microsoft.com/en-us/kinectforwindows/2OpenStage: http://www.organicmotion.com/open-stage-2dot4-release/3Qualisys: www.qualisys.com

§2.2 Motion low-level representations 17
(referred to as high-level features below). These features may represent various specificaspects of motion such as kinetics, ergonomics, expressiveness and intentions. ThisChapter is not intended to present the vast ensemble of motion features. It is ratherfocused on some major types of motion features that were used for the modelingof expertise in previous works and in the present thesis. Section 2.2 presents dif-ferent types of low-level features, including positions and orientations (2.2.1), theirrepresentation in global or local coordinate systems (2.2.2), as well as some basic pre-processing steps for their effective use (2.2.3). Different types of high-level featuresare then presented in Section 2.3, including kinematics and kinetics (2.3.2), relationalfeatures (2.3.3), expressive features (2.3.4), mathematical decomposition (2.3.5) andergonomic features (2.3.6). A few studies on the influence of individual factors onthese features are then briefly presented in Section 2.4. More specifically, morphologyis an individual factor having a direct influence on motion features, making difficultthe analysis of gestures performed by several individuals. The few works focusedon morphology-independent features will be briefly presented. Finally, a summaryof the presented features is provided in Section 2.5, as well as a discussion on theiradvantages and drawbacks.
2.2 Motion low-level representations
2.2.1 Positions and orientations
A motion sequence can be represented using only 3D coordinates (positions). Thesepositions can be related to markers placed on the body surface. However, it is moreconvenient to represent motion using landmarks corresponding to the centers of thebody joints (e.g., shoulders, elbows, wrist, etc.). This representation allows to sim-ply describe the movement of all body kinematic chains. Fig 2.1 shows an exampleof joint representation of the body. From positions of surface markers, a skeletonis reconstructed (using a biomechanical software such as Visual3DTM4. A few cen-ters can then be used as landmarks, describing the trajectories of the main kinematicchains of the body (both legs, both arms, and spine). Nonetheless, this representa-tion is incomplete, as a limb can also rotate without changing joint positions (e.g.,pronation/supination of the forearm). It is hence convenient to add orientation in-formation to the motion sequence representation. This orientation can be expressedusing for instance Euler angles, a rotation matrix or a quaternion, among other rep-resentations.
Euler angles represent a 3D rotation by three successive rotations around an axis (seeFig 2.2). It hence requires three parameters (angles y, j and f). A rotation matrixis a 3× 3 matrix where each column represents each new axis coordinates (Ox’, Oy’and Oz’ see Fig 2.2) in the original system Oxyz. This representation hence requires
4Visual3DTM: http://www2.c-motion.com/products/visual3d/

18 Motion Capture and Representations
Figure 2.1: Joint representation of the body.
Figure 2.2: Rotation using Euler angles (y, j and f). The original system is in black(Oxyz), the first rotation in blue (y around z), the second rotation in green (j aroundu), the third rotation in red (f around z’). The rotated system is Ox’y’z’. (Source:
Wikipedia)
nine parameters. This representation is useful for linear algebra as a rotation can beperformed by a matrix product. It can easily be shown that the parameters of therotation matrix can be obtained with the Euler angles.
An advantage of the Euler representation its compactness. However, it suffers froma major drawback, as the same rotation can be represented with several angles com-binations, leading to discontinuities in the representation of a motion sequence.
Quaternions, introduced by Hamilton (1866), are a generalization of complex num-bers, and allow another compact representation of a 3D rotation. A quaternion iscomposed of a scalar value, and a 3D imaginary part (i.e. 3 hypercomplex values).An advantage of quaternions is that they uniquely represent any 3D rotation, with-out discontinuities. More information on 3D rotation representations can be foundin Tilmanne (2013).
§2.2 Motion low-level representations 19
Figure 2.3: Local coordinate systems in Visual3DTM.
2.2.2 Global and local coordinate system
Positions and orientations are always expressed according to a coordinate system.By default, all Qualisys data are represented according to a global coordinate systemgenerally placed on the ground (defined as the origin) with a vertical z-axis. Theposition of each marker is thus expressed according to the same coordinate system,and is called global position. When representing a motion sequence with joints centerpositions, it can be relevant to consider a coordinate system located on a parent joint.An example of joints local coordinate systems is shown in Fig 2.3. For instance,the position and orientation of the elbow can be defined according to a coordinatesystem placed on the shoulder and oriented according to the upper arm. A propertyof this representation is that a movement of a joint according to any of its DOF willnot modify the local position of all the children joints. This allows a reduction of theredundancy of the representation of joint positions.
2.2.3 Modified low-level representation
A major difficulty with dealing with this type of representation, referred to as low-level features below, is that two similar motions may be represented with highly dif-ferent features. For instance, two people facing each other and imitating each other’smotion will have very different global positions. Their local positions will also dif-fer, at least because of their different sizes. To deal with these issues, it is common
20 Motion Capture and Representations
Figure 2.4: Applauding performance analysis example. Left: motion sequence raw3D coordinates. Center: both hands raw 3D coordinates. Right: hands Euclidean
distance.
practice to use a rigid transformation (i.e. a translation and a rotation) of the globalcoordinate system to align it with specific joints. For instance, the origin (0, 0, 0)could be placed between both feet, or at the pelvis location. Another common prac-tice is the scaling of the positions according to people size, in order to reduce theinfluence of morphology on the features. The effect of individual factors such asmorphology is further discussed in Section 2.4.
2.3 Motion high-level representations
2.3.1 Introduction
To the human eye, the signal derived from these low-level representations is compli-cated to interpret. If we imagine a task where a machine should predict if a person isclapping and at which frequency from this complex signal, it would be challenging.Instead, we can use prior knowledge and design a higher-level representation of themovement from this signal. We can extract 3D coordinates of both hands centers, andcompute their Euclidean distance. Fig 2.4 displays this computation on a clappingmotion sequence. Using this higher-level representation, referred to below a high-level feature, it is easier, even to the human eye, to determine if the person is clapping,and it is also easier to determine the clapping frequency.
As explained in Chapter 1, motion has been studied in many different research areas.According to the context, many different aspects of motion may be studied. Differenttypes of higher-level representations of motion may hence be extracted. For instance,in dance, LMA is often used to analyze movement. In this frame, motion may be rep-resented in terms of general body shape or interaction with the scene. For instance,the bounding box of the body may represent the shape, and the covered area during

§2.3 Motion high-level representations 21
a performance may represent the interaction with the scene. These motion featuresare based on specific prior knowledge of the domain. They are used to indirectlyrepresent the intentions or functions of motion. These higher-level representationsare easier to interpret and make motion analysis easier.
In the following sections, different types of high-level features commonly used inthe literature will be presented, including kinematic and kinetic features (2.3.2), re-lational features (2.3.3), LMA-based features (2.3.4), mathematic decomposition ofmotion (2.3.5) and ergonomic features (2.3.6).
2.3.2 Kinematic and kinetic features
Kinematics and kinetics are two branches of classical mechanics. Kinematics de-scribes the geometrical aspects of motion, and kinetic is the study of the relationsbetween the motion and its causes, i.e. mass and the forces applied to it.
Kinematic features such as limbs and joints velocities, accelerations and jerks caneasily be derived from positions and orientations. Kinetic features require an estima-tion of the body mass distribution. Most of the methods found in the literature toextract kinetic cues from MoCap are based on inertia parameter tables. Zatsiorsky(1990) measured relative body segments masses, and center of mass positions on asample of college-aged Caucasian males and females, using a gamma-ray scanningtechnique. These measurements were then adjusted by De Leva (1996). These mea-surements allow an estimation of the mass distribution of the body from its size andtotal mass.
To compute the body kinetic energy, the body center of mass must be extracted. Thecenter of mass (CoM) of the body corresponds to the weighted average position ofall the points of this body. A single point at this position with a mass correspondingto the total mass of the body has the same inertial properties as the entire body.
The CoM of the body can be computed as the weighted sum of the CoM positionsof each body segment:
−−−−−→CoMbody =
∑Nj=1 Wj ·
−−−→CoMj
∑Nj=1 Wj
, (2.1)
where N is the number of body segments considered in the sum, Wj is the mass of
the body segment j and−−−→CoMj is its center of mass, estimated from inertia parameter
tables (De Leva, 1996).
Finally, the kinetic energy of the body can be expressed as:
E =12
m · ‖−−→vCoM‖2, (2.2)
where m is the total mass of the body, and −−→vCoM is the velocity of the body CoM.
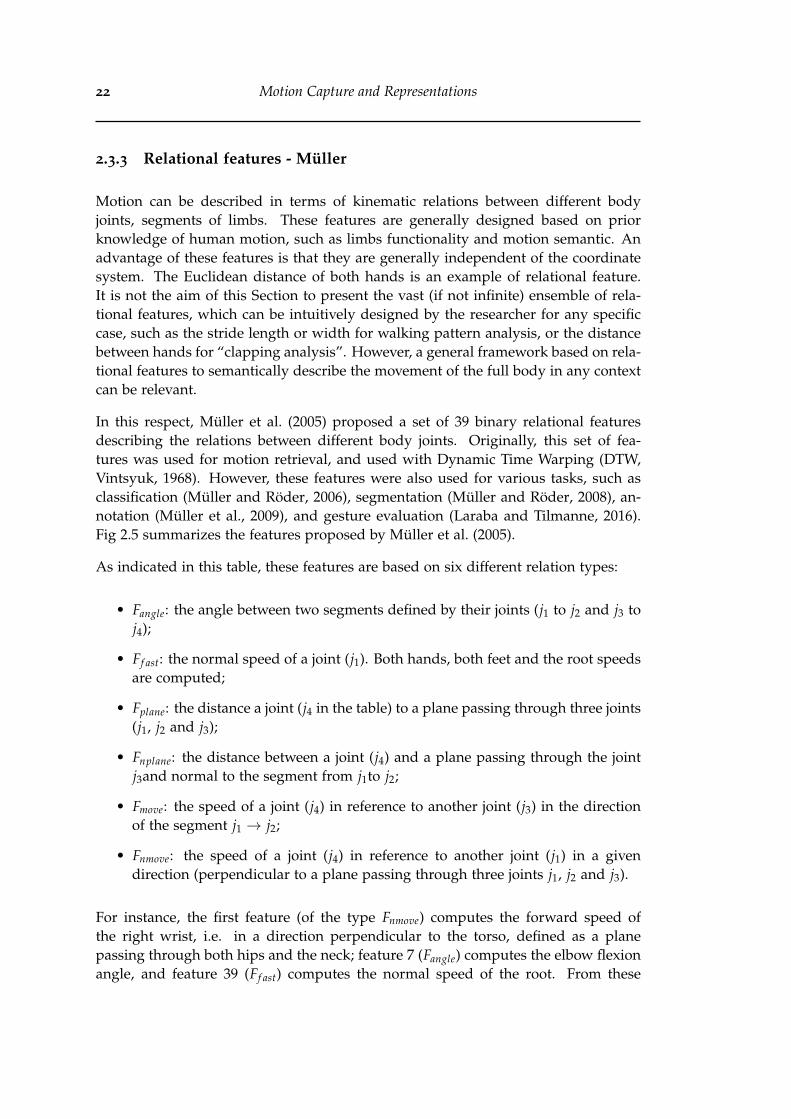
22 Motion Capture and Representations
2.3.3 Relational features - Müller
Motion can be described in terms of kinematic relations between different bodyjoints, segments of limbs. These features are generally designed based on priorknowledge of human motion, such as limbs functionality and motion semantic. Anadvantage of these features is that they are generally independent of the coordinatesystem. The Euclidean distance of both hands is an example of relational feature.It is not the aim of this Section to present the vast (if not infinite) ensemble of rela-tional features, which can be intuitively designed by the researcher for any specificcase, such as the stride length or width for walking pattern analysis, or the distancebetween hands for “clapping analysis”. However, a general framework based on rela-tional features to semantically describe the movement of the full body in any contextcan be relevant.
In this respect, Müller et al. (2005) proposed a set of 39 binary relational featuresdescribing the relations between different body joints. Originally, this set of fea-tures was used for motion retrieval, and used with Dynamic Time Warping (DTW,Vintsyuk, 1968). However, these features were also used for various tasks, such asclassification (Müller and Röder, 2006), segmentation (Müller and Röder, 2008), an-notation (Müller et al., 2009), and gesture evaluation (Laraba and Tilmanne, 2016).Fig 2.5 summarizes the features proposed by Müller et al. (2005).
As indicated in this table, these features are based on six different relation types:
• Fangle: the angle between two segments defined by their joints (j1 to j2 and j3 toj4);
• Ff ast: the normal speed of a joint (j1). Both hands, both feet and the root speedsare computed;
• Fplane: the distance a joint (j4 in the table) to a plane passing through three joints(j1, j2 and j3);
• Fnplane: the distance between a joint (j4) and a plane passing through the jointj3and normal to the segment from j1to j2;
• Fmove: the speed of a joint (j4) in reference to another joint (j3) in the directionof the segment j1 → j2;
• Fnmove: the speed of a joint (j4) in reference to another joint (j1) in a givendirection (perpendicular to a plane passing through three joints j1, j2 and j3).
For instance, the first feature (of the type Fnmove) computes the forward speed ofthe right wrist, i.e. in a direction perpendicular to the torso, defined as a planepassing through both hips and the neck; feature 7 (Fangle) computes the elbow flexionangle, and feature 39 (Ff ast) computes the normal speed of the root. From these

§2.3 Motion high-level representations 23
relations, binary features are extracted to semantically describe the movement of thebody. For instance, the first feature indicates if the right wrist is moving forward,feature 7 indicates if the elbow is bent, and feature 39 indicates if the root is movingfast. Thresholds for these binary decisions are defined by the parameters θ1 andθ2 in the table, and used with a Schimtt trigger (Schmitt, 1938). These thresholdswere defined relatively to different parameters of the body morphology (humeruslength, hip width and shoulder width, see Fig 2.5), in order to make them invariantto morphology.
Baak (2013) proposed a fortieth feature (F40) for computing the angular velocity ofthe root orientation. This feature was originally designed to discriminate betweenturning and non-turning full-body motions.
2.3.4 Expressive features - Laban
Rudolf Laban is a Hungarian choreographer (15 December 1879 – 1 July 1958). He isfamous for his proposition of a dance notation system known today as Labanotation.He is also famous for the development of a method for the analysis of movementqualities, divided in four main categories:
• Body (body): physical and structural body characteristics (movements and ori-entations)
• Effort or dynamics: description of the intention and dynamic characteristics ofthe movement
• Form: description of the overall body shape and its aesthetic appearance (vol-ume, height, etc.)
• Space: description of the relationship between movement and the environment
From his theory, many researchers developed algorithms extracting these qualities.Aristidou et al. (2015) proposed a framework based on 27 hand-crafted features forevaluation of folk dance based on Laban Movement Analysis (LMA). The body com-ponent was described by eight cues similar to Müller’s relational features describedin Section 2.3.3, such as distances between hands, feet, hips and the head, andthe height of the pelvis. The effort component is mainly represented by kinematicfeatures including velocities, accelerations and jerks of the root and the body end-effectors (hands and feet). To describe the intentional effort, they compute the headorientation in reference to the body movement direction. The shape component isrepresented by bounding volumes, as well as the torso height and hands level. Thesecues are also similar to Müller’s relational features. Finally, the space component isdescribed by the distance and the area covered, over a period, by the projection of

24 Motion Capture and Representations
236 11 Relational Features and Adaptive Segmentation
Table 11.1. A feature set consisting of 39 relational features
ID Set Type j1 j2 j3 j4 θ1 θ2 Description
F1/F2 u Fnmove neck rhip lhip rwrist 1.8 hl s−1 1.3 hl s−1 rhand movingforwards
F3/F4 u Fnplane chest neck neck rwrist 0.2 hl 0 hl rhand aboveneck
F5/F6 u Fmove belly chest chest rwrist 1.8 hl s−1 1.3 hl s−1 rhand movingupwards
F7/F8 u Fangle relbow rshoulder relbow rwrist [0◦, 110◦] [0◦, 120◦] relbow bent
F9 u Fnplane lshoulder rshoulder lwrist rwrist 2.5 sw 2 sw hands far apart,sideways
F10 u Fmove lwrist rwrist rwrist lwrist 1.4 hl s−1 1.2 hl s−1 handsapproachingeach other
F11/F12 u Fmove rwrist root lwrist root 1.4 hl s−1 1.2 hl s−1 rhand movingaway from root
F13/F14 u Ffast rwrist 2.5 hl s−1 2 hl s−1 rhand fast
F15/F16 ℓ Fplane root lhip ltoes rankle 0.38 hl 0 hl rfoot behindlleg
F17/F18 ℓ Fnplane (0, 0, 0)⊤ (0, 1, 0)⊤ (0, Ymin, 0)⊤ rankle 1.2 hl 1 hl rfoot raised
F19 ℓ Fnplane lhip rhip lankle rankle 2.1 hw 1.8 hw feet far apart,sideways
F20/F21 ℓ Fangle rknee rhip rknee rankle [0◦, 110◦] [0◦, 120◦] rknee bent
F22 ℓ Plane Π fixed at lhip, normal rhip→lhip. Test: rankle closer toΠ than lankle?
feet crossedover
F23 ℓConsider velocity v of rankle relative to lankle in rankle→lankledirection. Test: projection of v onto rhip→lhip line large?
feet movingtowards eachother, sideways
F24 ℓ Same as above, but use lankle→rankle instead of rankle→lankledirection.
feet movingapart, sideways
F25/F26 ℓ Ffast rankle 2.5 hl s−1 2hl s−1 rfoot fast
F27/F28 m Fangle neck root rshoulder relbow [25◦, 180◦] [20◦, 180◦] rhumerusabducted
F29/F30 m Fangle neck root rhip rknee [50◦, 180◦] [45◦, 180◦] rfemurabducted
F31 m Fplane rankle neck lankle root 0.5 hl 0.35 hl root behindfrontal plane
F32 m Fangle neck root (0, 0, 0)⊤ (0, 1, 0)⊤ [70◦, 110◦] [60◦, 120◦] spine horizontal
F33/F34 m Fnplane (0, 0, 0)⊤ (0,−1, 0)⊤ (0, Ymin, 0)⊤ rwrist -1.2 hl -1.4 hl rhand lowered
F35/F36 m Plane Π through rhip, lhip, neck. Test: rshoulder closer to Πthan lshoulder?
shouldersrotated right
F37 m Test: Ymin and Ymax close together? Y -extents ofbody small
F38 m Project all joints onto XZ-plane. Test: diameter of projectedpoint set large?
XZ-extents ofbody large
F39 m Ffast root 2.3 hl s−1 2hl s−1 root fast
11.2 Adaptive Segmentation
As mentioned earlier, two semantically similar motions may exhibit consider-able spatial as well as temporal deviations. One key idea is to absorb spatialvariations by transforming a motion data stream D in a posewise fashioninto a sequence F ◦D of binary feature vectors using a suitable feature func-tion F . In this section, we show how to achieve invariance toward local timedeformations by introducing the concept of adaptive segmentation.
Let F : P → {0, 1}f be a fixed feature function. Then, we say that twoposes P1, P2 ∈ P are F -equivalent if the corresponding feature vectors F (P1)and F (P2) coincide, i.e., F (P1) = F (P2). Then, an F -run of D is defined to
Figure 2.5: Müller’s relational features. “hl” = humerus length, “hw” = hip width,“sw” = shoulder width. Reproduced from Müller and Röder (2006).

§2.3 Motion high-level representations 25
the root joint on the ground. Though the proposed features are not original, the in-terest of this framework arises from the variety of types of features that are proposedas an ensemble, to describe all aspects of dance motion as described by LMA. Thisexplains why feature sets derived from LMA have been used for various tasks, in-cluding computer animation (Chi et al., 2000; Torresani et al., 2007; Zhao and Badler,2005), motion segmentation (Bouchard and Badler, 2007), retrieval (Kapadia et al.,2013), indexing (Aristidou and Chrysanthou, 2014), and evaluation (Aristidou et al.,2015).
2.3.5 Mathematical decomposition of motion
2.3.5.1 Introduction
Instead of using prior knowledge on motion to decompose it into various hand-crafted features, another approach is the use of mathematical tools allowing extrac-tion of new representations of data. These tools, widely used in signal processing orin machine learning, can be applied onto motion data. Though it is not the aim ofthis section to review all signal processing and machine learning techniques adaptedto motion data, a few well-known algorithms will be briefly presented, includingfrequency decomposition (2.3.5.2) and eigenmovement decomposition (2.3.5.3). Bothof these techniques were used for expertise modeling (Federolf et al., 2012; Zhanget al., 2010).
More details on the use of other mathematical tools on motion data can be foundin Samadani et al. (2013), where different statistical dimensionality reduction tech-niques such as supervised Principal Component Analysis, Isomap and functionalFisher Discriminant Analysis have been tested for motion representation. For theinterested reader, the development of motion manifolds based on machine learning,and especially deep learning, is also explored in Holden et al. (2015, 2016).
2.3.5.2 Fourier analysis - Frequency decomposition
MoCap data can be considered as a discrete multidimensional signal. During thelast three decades, as research on MoCap was expanding, many signal processingtechniques already extensively used in image and speech processing were appliedto motion. Bruderlin and Williams (1995), in their article simply entitled “MotionSignal Processing”, showed the interest of multiresolution filtering, a technique ini-tially used on images, to decompose motion. The intuition was that low frequenciescontained general, gross motion patterns, while high frequencies contained motiondetails and subtleties, as well as most of the noise.
Unuma et al. (1995) used Fourier analysis to generate human walking animationswith emotion. Interpolation in the frequency domain allowed them to synthesize

26 Motion Capture and Representations
a smooth transition from walking to running motion, as well as normal walkingto brisk walking motion. These works showed that frequencies efficiently encodeinformation about motion style and emotion. However, their interest is limited toperiodic motions like walking.
2.3.5.3 Principal Component Analysis - Eigenmovement decomposition
Principal Component Analysis (PCA, Pearson, 1901) is a widespread mathematicaltool, allowing to extract, from correlated observational variables, a new set of orthog-onal (linearly independent) variables, called principal components (PCs). These PCsare linear combinations of the original variables, obtained in such a way that the firstPC has the largest possible variance, i.e. following the axis with the largest variabilityin the observed data. Each one of the following PCs follows the orthogonal axis withthe largest remaining variance. This technique allows to efficiently reduce the sizeof a set of variables, by keeping only the PCs with the largest variance (i.e. the firstPCs).
MoCap data consist of complex and highly multidimensional signals, including 3Dcoordinates or orientations of various joints. However, due to the skeleton structure,all these variables are highly correlated. PCA is thus an efficient technique to reducethe signal complexity by removing the redundancy of all the variables, and extractinga few PCs encoding most of the information contained in the signal.
PCA has been first used to decompose gait patterns. Troje (2002) used PCA to decom-pose gait patterns in PCs, following axes called “eigenpostures”. As these PCs weresimilar to sinusoids due to the periodic pattern of walking, he extracted their fre-quencies and phases, and represented a whole gait pattern using a set of parametersincluding first PCs’ frequencies, phases and axes. From a dataset of these parametersextracted from different participants, he performed a second PCA to extract new PCscalled “eigenwalkers”. He then used this representation for gender classification, andfor walking synthesis.
This technique was then used for various applications, such as person identification(Troje et al., 2005) or synthesis of expressive gait (Tilmanne and Dutoit, 2010). In thecontext of gesture evaluation, Federolf et al. (2012) proposed the use of eigenmove-ments to quantify skill in sport. They analyzed alpine skiing as an example. Theyshow that PCs can be visualized as “principal movements” using a back-projectionon the original variables. They show that the visualization of these principal move-ments allows a semantic interpretation. For instance, in their case, the first principalmovement represented lateral body inclination, the second one represented flexion-extension of the legs, and the third one represented a rotation of the skis and theupper torso.
PCA is more general than frequency domain analysis, as it is not limited to the mo-tion decomposition into periodic patterns. As this technique was more efficient and

§2.3 Motion high-level representations 27
general than frequency analysis, the same idea has then been successfully appliedin many disciplines such as competitive diving (Young and Reinkensmeyer, 2014),karate (Zago et al., 2016), handball (Helm et al., 2017), soccer (Abdullah et al., 2017),cross-country skiing (Gløersen et al., 2017), and juggling (Zago et al., 2017).
2.3.6 Ergonomics
2.3.6.1 Introduction
Ergonomic features are related to biomechanical aspects of the movement. They arebased on musculoskeletal modeling of the body, aiming to describe the movementquality in terms of comfort, robustness, or load. Ergonomics is closely related to skill,especially in sports disciplines, as it is the study of motor control effectiveness whileminimizing energy expenditure and risks of injury. However, few previous workknown to the author used ergonomic features for evaluation of expertise. Andreoniet al. (2009) proposed a method based on perceived discomfort (see Section 2.3.6.4)to automatically assess the ergonomy of a posture from MoCap data, showing apotential use of ergonomic features in motion quantitative assessment. More recently,coordination indices were also developed for the evaluation of sports gestures (seeSection 2.3.6.6) (Kim et al., 2011; Alborno et al., 2017; Morel et al., 2016).
In this respect, different types of ergonomic features used in various fields of motionanalysis, such as medical research and animation, are presented in this Section. Someof these features are used in the present thesis for the development of gesture evalu-ation models. More particularly, a new set of features has been developed, inspiredby ergonomic features, and especially Taijiquan ergonomic principles (see Chapter6).
The following Sections will present different ergonomic characteristics of motion,including balance (2.3.6.2), the degrees of freedom and ranges of motion of thebody (2.3.6.4), postural load or discomfort (2.3.6.4), torques (2.3.6.5) and coordina-tion (2.3.6.6).
2.3.6.2 Balance
Balance is “the stability produced by even distribution of weight on each side ofthe vertical axis” (Merriam-Webster5). Balance is an essential component of motorcontrol, as it allows to move without losing one’s stability, and in extreme situations,falling. Balance has been vastly explored, mostly in the area of gait analysis (Bruijn
5Balance definition (Merriam-Webster): https://www.merriam-webster.com/dictionary/balance

28 Motion Capture and Representations
et al., 2013). Nonetheless, balance has been presented in the literature as an expres-sive feature as well, or for motion indexing (Tilmanne et al., 2015; Kapadia et al.,2013; Larboulette and Gibet, 2015).
A basic measure of balance is based on the computation of the body CoM (see eq.2.1), and the support base. The support base is defined as the area between thepoints of the body that are in contact with the ground. For instance, the support baseof a standing person is defined by the area between her/his two feet extremities.Balance can then be derived from the distance between the support base center andthe projection of the CoM on the ground (Tilmanne et al., 2015). A larger distancemeans a lower balance.
However, this basic measure does not take into account the velocity and inertia ofthe CoM, and the forces implied to keep the CoM above the support base. To assessbalance in dynamical situations, Hof et al. (2005) proposed the extrapolated centerof mass (XCoM), based on an extension of this model. This extension is inspired byan inverted pendulum system, adding a linear function of the CoM velocity to itsposition in evaluating its distance with the support base center:
XCoM = CoM +VCoM
ω0, (2.3)
where VCoM is the velocity of the CoM and ω0 is the eigenfrequency of the invertedpendulum:
ω0 =
√gl
, (2.4)
where g is the grativational acceleration and l is the length of the inverted pendu-lum equivalent to the body. However this model considers the body as a simplependulum (i.e. a rope and a mass), and not as a kinematic chain.
To take into account the forces implied in keeping the CoM above the support base,Duclos et al. (2009) proposed a method for quantifying the force needed to keepthe CoM above the support base (called the stabilizing force), and the destabilizingforce moving the CoM outside the support base. However, this method requires ameasurement of ground reactions forces (using for instance a force plate).
2.3.6.3 Degrees of freedom and ranges of motion
A degree of freedom (DOF) is any independent part of the body motion, i.e. therotation of a joint. The range of motion (ROM) defines the maximal rotation thatcan be applied along each DOF. For example, the ROM of the DOF corresponding

§2.3 Motion high-level representations 29
Neck Shoulder Elbow WristX+ Flexion Flexion Flexion FlexionX- Extension Extension - ExtensionY+ Left bending Adduction - Radial deviationY- Right bending Abduction - Ulnar deviationZ+ Left rotation Medial rotation Supination -Z- Right rotation Lateral rotation Pronation -
Spine Hip Knee AnkleX+ Flexion Flexion Flexion FlexionX- Extension Extension - ExtensionY+ Left bending Adduction - AdductionY- Right bending Abduction - AbductionZ+ Left rotation Internal rotation - -Z- Right rotation External rotation - -
Table 2.1: List of typical measured ROM.
to the flexion of an elbow usually varies from 140 to 159◦ according to individuals(NASA, 1995).
ROM are generally used in ergonomics to evaluate suppleness or disability (Booneand Azen, 1979). In motion processing, ROM can also be used as reference to nor-malize joint motions, to represent movement as a portion of the total possible motionof a joint.
ROM are usually expressed as Euler angle deviations from a reference position, cor-responding to a rest posture (standing, lying or sitting posture). In this manner, atmost six ROM are given for each joint, i.e. one for each rotation axis (x, y, z) on eachway (positive, negative). For instance, the shoulder is the most mobile body joint andis defined by six ROM: flexion and extension, adduction and abduction, medial rota-tion and lateral rotation. On the opposite, the knee has only one degree of freedom,on one way only, the flexion, and the other five ROM are considered as zero. Table2.1 lists different measurable ROM of each joint, as proposed in Kee and Karwowski(2003). The axes and signs are arbitrarily chosen in this example.
Normal values for these ROM can be found in Boone and Azen (1979), or in theNASA man-systems integration standards (NASA, 1995)6, among other sources.
Movement representation through DOF and ROM has the advantage to be anatomi-cally meaningful, as each component corresponds to a degree of freedom of the body.Motion normalization may have an interest when computing relationships betweenjoints in a movement, or comparing motions of various individuals. However, a lim-itation is due to the fact that joint ROM are not strictly independent variables. Themaximal orientation (the ROM) on a DOF can indeed depend on the orientation on
6NASA standards : http://msis.jsc.nasa.gov/sections/section03.htm

30 Motion Capture and Representations
another DOF. Haering et al. (2014) showed these interactions between DOF for theparticular case of the shoulder, and proposed a representation method based on a 3Dhull to account for these interactions.
2.3.6.4 Postural load (perceived discomfort)
The postural load, or perceived discomfort, or stress, of a joint is an indication ofthe perceived stressfulness of a joint, according to its orientation, taking into accounteach degree of freedom of the joint. The postural load of the whole body providesinformation about the comfort of a posture, and on the risk of injury.
The evaluation of the postural load has mainly applications in industrial ergonomics,to correct workers postures, or to design ergonomic workplaces. However, it can alsofind an interest in movement performance assessment, by evaluating if the movementis optimized in terms of stress, i.e. minimizing the pain, and risks of injury.
The joint stress can be defined as the sum of the perceived discomforts associatedto the independent movement of a joint on each degree of freedom. The perceiveddiscomfort on a degree of freedom can be interpolated from a table of perceived dis-comforts indices in relation with joint angles. Such tables can be found in ergonomicsliterature (Kee and Karwowski, 2001, 2003; Andreoni et al., 2009). The overall pos-tural load can then be deduced from the joint stresses. Kee and Karwowski (2001)defined a postural load index as the sum of all perceived discomforts for each joint:
Sj =mj
∑i=1
Sij
Postural load =n
∑j=1
Sj
(2.5)
where Sj is the stress of the joint j, Sij the part of the stress independently associatedto the degree of freedom i for the joint j, and mj the number of degrees of freedomof the joint j.
Andreoni et al. (2009) proposed a method based on a weighted sum of each jointstress, to evaluate the overall postural load. The weights (Wj) of each joint are propor-tional to the mass of the distal body district corresponding to each joint (as measuredby Zatsiorsky, 1990):
Postural load =n
∑j=1
WjSj (2.6)

§2.3 Motion high-level representations 31
They tested experimentally their method on a reaching task. During the experi-ment, participants were recorded with a MoCap system while reaching, with onehand, different points regularly placed from the ground to the top of an experimen-tal structure (see Figure 2.6). From the MoCap data, they calculated the postural loadfor the reaching movement of each point on the structure, and compared the resultsof their method to the previous method from Kee and Karwowski (2001).
Figure 2.6: Postural load on a reaching task. Reproduced from Andreoni et al. (2009).
The postural load is a feature specifically developed for ergonomics research. Nonethe-less, an interest can be found in the assessment of sport or dance performance. Insport, an efficient gesture will minimize the global stress for the same outcome, whiledistributing the load on each joint according to their robustness. In dance, on theother hand, the global stress may be high, displaying the emotion and intention ofthe dancer through her/his movements.
The postural load presents several limitations. First, as its name suggests, the featureis based on the posture only, and does not account for the movement dynamic. More-over, the perceived discomfort tables found in the literature rarely take the gravityinto consideration, nor the coupling between ROM and joints.
2.3.6.5 Torques
Torques represent the forces that are responsible for joint rotations. They allow thedefinition of the dynamic state of each body joint.
Though they could be classified as kinetic features, torques have direct applicationsin ergonomics, to evaluate muscles exertions and articular loads. They are also usedin computer animation, to evaluate the naturalness of a motion (Multon, 2013).
32 Motion Capture and Representations
Joint torques cannot be directly measured, but they can be calculated through dif-ferent “inverse dynamics” methods. One approach is to consider the body as a me-chanical system limited to rigid isolated segments (Si). For the center of mass of eachsegment, the resultant force and variation of angular momentum can be expressed asfollows, considering external forces and torques (Fi
e , Tie) such as gravity and ground
reaction, and internal forces and torques (Fim, Ti
m), due to muscle activity :
miγi = Fie + Fi
m
dLi
dt= MFi
e+ MFi
m+ Ti
e + Tim
(2.7)
where mi, γi and Li are the mass, acceleration, and angular momentum of the centerof mass of the segment Si , respectively. As connected segments apply forces andtorques on each other, the problem is resolved iteratively, from an extremity of thebody to another. Details can be found in Multon (2013).
Joint torques have the advantage of being more objective features than the perceivedpostural load, as they only depend on physical equations, and not on the subject’sfeelings. They allow for a precise ergonomic assessment of gestures and postures,and are therefore widely used in the evaluation of the ergonomics of user interfacesBachynskyi et al. (2015).
However, dynamic motion models generally depend on weight approximations foreach body segment, which can vary a lot from a person to another. Moreover, noisymotion data can result in a very inaccurate computation of accelerations. Finally,a specific instrument such as a force plate is needed to efficiently estimate groundreaction forces.
2.3.6.6 Coordination
Coordination is “the harmonious functioning of parts for effective results” (Merriam-Webster7). Coordination is the process of synchronizing joints and limbs movementsto efficiently perform a gesture. Coordination has been studied in various fields,such as gait analysis (Dejnabadi et al., 2008), music (Furuya et al., 2011, 2015), andsports (Kim et al., 2011; Alborno et al., 2017; Morel et al., 2016).
To assess the inter-joint coordination of a leg in a Taekwondo kick, Kim et al. (2011)proposed an index based on local joints angular velocities:
I IC = (−→ωH/∥∥−→ωH
∥∥) · (−→ωK/∥∥−→ωK
∥∥), (2.8)
7Coordination definition (Merriam-Webster): https://www.merriam-webster.com/dictionary/coordination

§2.4 Multifactor influence 33
where −→ωH and −→ωK are respectively the hip and knee 3D angular velocities. If thesevectors are in the same direction, the inter-joint coordination (I IC) is 1. I IC = −1 ifthey are in an opposite direction.
To evaluate limb synchronization in karate, Alborno et al. (2017) extracted limbsacceleration peaks using progressive filtering. They then analyzed time delay rela-tionships between the peaks of each limb.
Dejnabadi et al. (2008) proposed a method based on a neural network to model walk-ing coordination at different stride lengths and walking speeds. The neural networkwas designed to reconstruct a normal walking pattern from two input parameters:stride length and cadence. To evaluate the coordination of a walking motion, theycompared it to a reconstructed walking pattern at the same stride length and speed,and they computed a coordination index from joint angles differences.
Morel et al. (2016) proposed a method based on Dynamic Time Warping (DTW)for evaluation of limb synchronization during a sports gesture. From a dataset ofgestures performed by experts and aligned with DTW, they compute an average ges-ture, supposed as a perfectly synchronized gesture. For a new gesture, they performa temporal alignment of each limb’s data separately (called local alignment). Theythen evaluate the gesture synchronization from the delay between two limbs align-ments.
PCA (see Section 2.3.5.3) can be seen as a tool for coordination analysis, where eacheigenmovement can be seen as a coordinated part of movement (Daffertshofer et al.,2004).
2.4 Multifactor influence
In a dataset of any type of motion performance, a large number of factors can influ-ence the way a performer moves. Factors are the variables, intra- or inter-individual,which can have an effect on motion. Inter-individual factors may be of various types,including social factors (e.g., culture, education), psychological factors (e.g., person-ality, emotions, state of concentration), physiological factors (e.g., gender, age, mor-phology, force, suppleness), or psycho-physiological factors (e.g., handedness, motorskills). On the other hand, intra-individual factors are related to the performance,independently of the performer, such as the type of dance, or the purpose of a partic-ular exercise. Many specific research on these factors has been conducted in differentcontexts, such as clinical factor analysis on gait patterns (Lord et al., 2012; Verlindenet al., 2013), or investigation of emotion factors effects on body action and posture(Dael et al., 2012), and on kinematics of locomotion (Barliya et al., 2013), to mentiona few. All these factors may have different effects on motion features, effects whichare generally difficult to analyze separately.

34 Motion Capture and Representations
Morphology is a particular factor that has a direct influence on motion, making com-parisons between gestures of different individuals difficult. To alleviate this issue,different motion data representations have been proposed. Sie et al. (2014) proposeda simple skeleton scaling method, by placing the coordinate system on a referencenode of the body (i.e. on the pelvis), and dividing all nodes coordinates by the torsoheight. Features can then be extracted on these scaled data. This method was laterused by Morel et al. (2016) for evaluation of tennis serve. It has the advantage tobe very simple, but has many limitations. It is based on the simplistic hypothesisthat the motion of a short individual should be an homothety of those of a tall in-dividual. However, weight, height of the center of mass, shoulder width, and hipwidth, among others, may also influence motion in different ways, including inertia,balance, speed and power. These characteristics will be altered by this basic scaling.
Kulpa et al. (2005) developed a morphology-invariant representation of motion, origi-nally developed for animation, where they defined limbs with variable lengths. Eachlimb (legs and arms) is defined by the position of its end-effector, and by a planewhere the middle joint (knee and elbow) is located. The spine is represented as aspline. This representation allows reconstruction of the motion to fit specific con-straints. However, it does not fully store the actual motion, and it modifies it to fitthese constraints. It is relevant for animation and motion retrieval, but is not suitedfor motion analysis, which can require motion details that are lost in this representa-tion.
Müller et al. (2005) proposed a specific feature set based on 40 logical relational fea-tures, as described in Section 2.3.3. The boundaries for the logical decision weredefined by different body segment lengths such as the humerus length or the shoul-der width, so that each feature is scaled by a custom pre-defined body characteristic.However, the method is limited to the specific proposed feature set, and does notallow extraction of other high-level features.
In Chapter 7, we propose a novel method for removal of the influence of any quan-tifiable factor on any motion feature. This method has been published in Tits et al.(2017).
2.5 Discussion and conclusion
In this Chapter, we presented various motion representations, classified into twomain categories:
• low-level features, including positions and orientations, both in global or localcoordinate systems;
• and high-level features, including kinematic, kinetic, relational, expressive, er-gonomic and decomposition features, among others.

§2.5 Discussion and conclusion 35
Among these categories, a continuous scale could have been used. First, kinematicand kinetic features are close to low-level features, as they are directly derived frombasic mechanics, without using any a priori knowledge on human motion. Secondly,relational features and eigenmovements aim at a functional description of humanmotion. Nonetheless, this representation is closer to a direct description of motionthan higher-level representations like Laban or coordination features. The latter areindeed based on prior knowledge of human motion, and respectively intend for adescription of the motion quality in terms of expressiveness or ergonomics. On thiscontinuous scale, relational features and eigenmovements could be seen as mid-levelfeatures, and expressive or some ergonomic features as higher-level features.
High-level representations have the assumed advantage to be easier to interpret thanlow-level ones, and may be more representative of motion for the analysis of theintention, expressiveness, or expertise in the particular case of ergonomic features.
The drawback of this type of representation is that it does not ensure a full de-scription of the motion. On the opposite, a low-level feature set including all jointpositions and orientations intrinsically ensures a full representation of motion (lim-ited to the data recorded by the MoCap system). High-level features are inevitablyextracted from low-level features. Therefore, they do not add new information aboutmotion, but rather make it easier to interpret. Consequently, representing motionusing a high-level feature set may lead to a loss of information if all low-level fea-tures cannot be retrieved from them. For instance, Müller features indicate if handsare far apart sideways (F9 in Fig 2.5), but the information of the absolute positions ofboth hands is lost in this representation. This representation is sufficient in the caseof clapping detection, and is more relevant than hand positions as a single feature isneeded, compared to the six 3D coordinates of both hands. However hand positionswould be needed to analyze specific characteristics of the clapping gesture such asits ergonomy, or to discriminate between a flamenco clapping (with both hands onthe same side of the body), or basic clapping with hands in front of the body. Onthe other side, higher-level features like postural loads and torques would ease theanalysis of the ergonomy of the gesture, but do not allow the detection of a clappingmotion, nor the extraction of other specific characteristics such as the clapping fre-quency. Low-level representations such as joint positions allow analysis of all thesecharacteristics, although it would require a more complex modeling of the relationsbetween the joint positions and the analyzed characteristics.
In the present thesis, different types of features, including both low-level and high-level features, are tested for the development of gesture evaluation and feedbackmodels (see Part III). In particular, a new feature set inspired by Taijiquan ergonomicprinciples is presented in Chapter 6.
Finally, all these features may be influenced by various factors, and especially mor-phology, making difficult comparison between motions of different individuals. Vari-ous previous works proposed an adapted data representation to reduce morphologyinfluence (see Section 2.4), and a novel and more general method is proposed inChapter 7.

36 Motion Capture and Representations

Chapter 3
Expert gesture evaluation: a state ofthe art
Contents3.1 Introduction . . . . . . . . . . . . . . . . . . . . . . . . . . . . . . . . . 373.2 Machine learning for human activity analysis . . . . . . . . . . . . 383.3 3D full-body motion capture . . . . . . . . . . . . . . . . . . . . . . . 393.4 Expert gesture evaluation . . . . . . . . . . . . . . . . . . . . . . . . . 41
3.4.1 Direct (unsupervised) score . . . . . . . . . . . . . . . . . . . . 42
3.4.2 Similarity measure . . . . . . . . . . . . . . . . . . . . . . . . . 44
3.4.3 Score prediction . . . . . . . . . . . . . . . . . . . . . . . . . . 46
3.4.4 Feedback . . . . . . . . . . . . . . . . . . . . . . . . . . . . . . . 47
3.5 Discussion and conclusion . . . . . . . . . . . . . . . . . . . . . . . . 48
3.1 Introduction
The ability of a computer to interpret human gestures, and particularly to evaluatethe quality of an expert gesture, mainly depends on two major technologies that areMoCap and machine learning. MoCap technologies allow the automatic and accu-rate recording of human motion in 3D. On the other hand, machine learning is abranch of artificial intelligence concerned about the development of mathematicalmodels for the automatic prediction of a variable (such as expertise) from other re-lated variables (such as gestures). In order to understand better the context of thepresent research, a short history about the developments in both domains is pro-vided. Section 3.2 presents a history of the use of machine learning algorithms forthe analysis of human activity. Section 3.3 then provides a history of the developmentof 3D full-body MoCap technologies, and their use for human motion analysis, withor without machine learning. Section 3.4 then presents the state of the art concerningexpert gesture evaluation.
37
38 Expert gesture evaluation: a state of the art
3.2 Machine learning for human activity analysis
During the last decades, a vast number of new technologies has emerged, drivenby electronics, mathematics and computer science. One of the most important tech-nologies developed in contemporary computer science is machine learning. Morespecifically, applied to human activity analysis, machine learning allows a computerto decipher and interpret a human’s state or actions.
Machine learning techniques are algorithms that can be applied on any type of data,allowing a computer to automatically learn a mathematical model from these data.These algorithms are usually used to automatically predict a dependent variable (theoutcome) from various input variables (the predictors). The outcome can be a category,such as a word or a person’s gender, or a continuous variable, such as age, or the scaleof an emotion. The predictors are for instance pixels of an image, an audio signal,bio-signals, or various types of features extracted from them using signal processingtechniques. The modeling procedure is generally based on the probability theory,or on the optimization of a mathematical function representing the relation betweenthe predictors and the outcome (Dietterich, 2002; Kotsiantis et al., 2007; LeCun et al.,2015).
In the particular field of human activity analysis, these techniques have been vastlyexplored allowing machines to recognize, synthesize and characterize various typesof human actions measured with different sensing and computer vision systems.From audio data, speech recognition (Rabiner and Juang, 1993) and synthesis (Du-toit, 1997) have been extensively studied during the late 20th century, and used inmany applications including GPS guiding, text-to-speech, speech-to-text, and morerecently virtual assistants. From face images and videos, machine learning tech-niques allow face recognition (Zhao et al., 2003), synthesis (Blanz and Vetter, 1999),and facial expression recognition (Cohen et al., 2003). More broadly, images have alsobeen used for many tasks such as pose recognition (Bradski and Davis, 2002), sign-language recognition (Starner et al., 1998) and handwriting recognition (Plamondonand Srihari, 2000). Moreover, text data allow semantic analysis and text generation(Sebastiani, 2002). Most of these types of signals are now being used with the lateststate-of-the-art machine learning algorithms, i.e. deep learning (LeCun et al., 2015).A fundamental aspect of machine learning, and especially deep learning, is that mod-els can learn extremely complex relations between variables, if a large dataset andenough computational resources are provided.
Finally, another major but still emerging branch of human activity analysis is theanalysis of human motion. Unlike speech which is recorded from a single micro-phone, or faces which are recorded from a single 2D camera, full-body articulatedmotion is a complex signal, difficult to record with sensors. In the early 2000s, mostof the studies on human motion analysis are therefore limited by the type of motionrepresentation, generally based on 2D silhouettes extracted from a single camera

§3.3 3D full-body motion capture 39
Figure 3.1: The instrumented glove (Dipietro et al., 2003) and a surgery teleoperationsystem (BBZ Console) are both electronics devices allowing the recording of specific
3D motions.
(Poppe, 2010). Only hand gesture recognition was already explored using specificMoCap sensors such as an instrumented glove (see Fig 3.1, left image) (LaViola,1999). Other very specific domains have also been explored, such as evaluation ofteleoperation and minimally-invasive-surgery gestures, thanks to the specific elec-tronic devices required in these disciplines (see Fig 3.1, right image) (Hannaford andLee, 1991; Rosen et al., 2001). However, in this case, the study is limited to the motionof the manipulated tools rather than body motion itself.
3.3 3D full-body motion capture
MoCap is the process of recording the positions and/or orientations of any object orbody part, through any type of sensor (see examples Fig 3.2). Though the conceptappeared by the end of the 19th century through cyclography (Marey, 1873), the firstcommercial manufacturers of full-body MoCap systems appeared about a centurylater, such as Polhemus (1969), Motion-Analysis (1982), and VICON (1984). At thesame period, their systems began to be used for clinical research (Taylor et al., 1982)and for character animation in video games and movies (Sturman, 1994). However,before the end of the 1990s, the use of MoCap systems was generally limited to 2Dunstable recordings, requiring a time-consuming data post-treatment to revise andlabel all the recorded positions. The development of accurate 3D and automaticMoCap systems (Herda et al., 2000; Kakadiaris and Metaxas, 2000) allowed theireffective use for wider applications. As commercial MoCap systems integrated thesedevelopments, the first 3D full-body MoCap datasets were recorded and publishedon the web to promote research development in the domain (CMU, 2003; Ma et al.,2006; Müller et al., 2007). The high cost of these measurement systems1 may also
1The cost of a state-of-the-art 3D MoCap system (accuracy < 25 mm, frame rate > 100 fps) isgenerally higher than 10.000$ still today (Romero et al., 2017).

40 Expert gesture evaluation: a state of the art
Figure 3.2: State-of-the-art magnetic and optical MoCap systems. Left: Qualisys(optical). Right: Polhemus (electromagnetic).
partly explain the delay of the research on human motion analysis compared withother domains, where a low-cost microphone or camera is sufficient to record a largedataset or real-time data. Nevertheless, although such systems are still rarely usedin research because of their price, low-cost devices such as inertial sensors and depthcameras allowed a first insight of the potential of motion analysis.
The recent spreading of MoCap systems is illustrated in two specific and recentlyvery active research areas (see Fig 3.3 ): Lalys and Jannin (2014) proposed a sys-tematic review of surgical process modeling, showing the growing interest on thesubject from 2007. Note that most of the studies were still based on observation,surgical robot data measurements and video recordings, and that only 15% of thestudies actually used MoCap devices. In a different context, Camomilla et al. (2018)presented a thorough systematic review of the use of inexpensive wearable MoCapdevices (inertial sensors) for sports performance analysis, expanding from 2009 asillustrated in Fig 3.3. Most of these studies are still based on the use of a few sensors,placed either on the body or on an object (e.g. a racket or a golf club). Among the 286publications selected in this review, 19 were based on machine learning, generally foractivity detection, recognition and evaluation.
During the last few years, the use of high-quality 3D full-body MoCap systems hasbeen expanding, especially with multi-camera optical MoCap systems (e.g., QualisysTM,see Fig 3.2, left image) and electromagnetic systems (e.g., PolhemusTM, see Fig 3.2,right image).
These technologies have then been used in biomechanics (Olesh et al., 2014), in ani-mation (such as Happy Feet and Avatar movies (Fischer, 2018) ), as well as in music(Jensenius and Wanderley, 2010), dance (Aristidou et al., 2015) and sports analysis

§3.4 Expert gesture evaluation 41
Figure 3.3: Evolution of the research on (left) surgical process modeling and (right)sports analysis with wearable sensors. The results are respectively reproduced from
Lalys and Jannin (2014) and Camomilla et al. (2018).
(Federolf et al., 2012). More particularly, machine learning algorithms have beenprogressively tested on motion data, allowing computational interpretation of hu-man motion, such as expressivity (Tilmanne and Dutoit, 2010; Dael et al., 2012),coordination (Daffertshofer et al., 2004; Dejnabadi et al., 2008), style (Aristidou andChrysanthou, 2014) and skill (Federolf et al., 2012).
3.4 Expert gesture evaluation
The development of machine learning and MoCap technologies has unleashed re-search possibilities in many areas. One of the outstanding challenges is the analysis,and more particularly the evaluation of skill in an expert gesture. Gesture evaluationis essential in many disciplines, and has already been explored in different areas,including sports (Federolf et al., 2012), music (Tits et al., 2015), dance (Laraba andTilmanne, 2016), rehabilitation (Pham et al., 2016), driving (Zhang et al., 2010) andeven surgery (Megali et al., 2006). Regardless of the discipline, the typical approachto evaluating a gesture can be divided in four main steps:
• First, motion data must be captured. A dataset is recorded, generally includ-ing several individuals with different skill levels, for instance professionals orteachers and learners.
• Secondly, from these raw motion data, relevant features can be extracted. Thesefeatures aim to represent motion in an efficient way regarding the targetedtask. They can be derived for instance from body kinematics, kinetics, or mo-tion decomposition. They can also represent relations based on prior domain-knowledge and semantic interpretation, such as expressivity, biomechanics, er-gonomics or functionality (see Chapters 2 and 6).
42 Expert gesture evaluation: a state of the art
• Thirdly, features can be analyzed, allowing selection or extraction of the bestfeature set for the targeted task. A common technique for multi-factor depen-dent data such as a MoCap data is factor analysis (Tits et al., 2016). The goalof this step is to reduce the global amount of information contained in the datato keep the most relevant and reliable information regarding the targeted task.For instance, this step enables to discard unwanted bias, such as morphology,age or expression, while keeping features more dependent on the targeted fac-tor, i.e. skill in the present context. Features can also be post-processed, inorder to extract a more relevant representation of motion. Dimensionality re-duction techniques such as PCA can be used to extract a smaller set of relevantfeatures. Morhology-independent features may also be extracted (see Section2.4 and Chapter 7).
• Finally, the selected features, either low-level or high-level, are used to developa model for the evaluation of the skill of a gesture. To validate an evaluationmethod, the results are generally compared to annotations provided by one ormore expert of the discipline. These annotations may be either scores (for in-stance on a scale 0-10), classes (beginner, intermediate, expert), or a ranking ofthe participants. For specific sports, these scores can be derived from objectivemeasures, such as a timing in a race, the speed or the accuracy of a shot, thenumber of balls a juggler can manage, etc. If none of these variables are avail-able, the number of years and intensity of practice in a discipline can also beused to estimate the level of expertise.
Three major types of computational evaluation models can be found in the literature,and are presented in the following sections:
• Extract an unsupervised score directly from the features, i.e. without any useof annotations in the design of the model (see Section 3.4.1)
• Compute a similarity measure from a model of the ideal gesture (see Section3.4.2)
• Predict a score using a regression or classification model (see Section 3.4.3)
A main interest of gesture evaluation is the ability to provide feedback on a perfor-mance. However, most of the previous works focus on the evaluation process,and donot explicitly show how to use evaluation results to provide feedback to a user. Thefew works proposing solutions for feedback on a gestural performance are presentedin Section 3.4.4.
3.4.1 Direct (unsupervised) score
A score can be directly derived from the features and provide a quality index forthe gesture. This score can actually be considered as an even higher-level feature. It
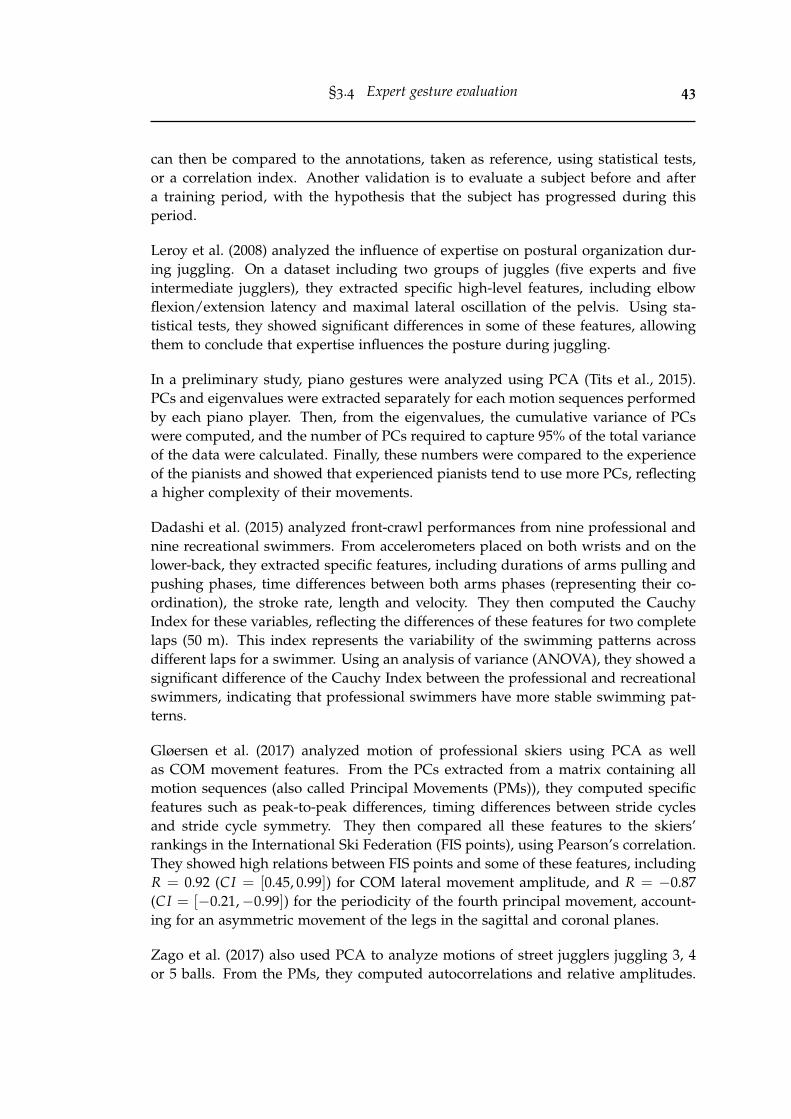
§3.4 Expert gesture evaluation 43
can then be compared to the annotations, taken as reference, using statistical tests,or a correlation index. Another validation is to evaluate a subject before and aftera training period, with the hypothesis that the subject has progressed during thisperiod.
Leroy et al. (2008) analyzed the influence of expertise on postural organization dur-ing juggling. On a dataset including two groups of juggles (five experts and fiveintermediate jugglers), they extracted specific high-level features, including elbowflexion/extension latency and maximal lateral oscillation of the pelvis. Using sta-tistical tests, they showed significant differences in some of these features, allowingthem to conclude that expertise influences the posture during juggling.
In a preliminary study, piano gestures were analyzed using PCA (Tits et al., 2015).PCs and eigenvalues were extracted separately for each motion sequences performedby each piano player. Then, from the eigenvalues, the cumulative variance of PCswere computed, and the number of PCs required to capture 95% of the total varianceof the data were calculated. Finally, these numbers were compared to the experienceof the pianists and showed that experienced pianists tend to use more PCs, reflectinga higher complexity of their movements.
Dadashi et al. (2015) analyzed front-crawl performances from nine professional andnine recreational swimmers. From accelerometers placed on both wrists and on thelower-back, they extracted specific features, including durations of arms pulling andpushing phases, time differences between both arms phases (representing their co-ordination), the stroke rate, length and velocity. They then computed the CauchyIndex for these variables, reflecting the differences of these features for two completelaps (50 m). This index represents the variability of the swimming patterns acrossdifferent laps for a swimmer. Using an analysis of variance (ANOVA), they showed asignificant difference of the Cauchy Index between the professional and recreationalswimmers, indicating that professional swimmers have more stable swimming pat-terns.
Gløersen et al. (2017) analyzed motion of professional skiers using PCA as wellas COM movement features. From the PCs extracted from a matrix containing allmotion sequences (also called Principal Movements (PMs)), they computed specificfeatures such as peak-to-peak differences, timing differences between stride cyclesand stride cycle symmetry. They then compared all these features to the skiers’rankings in the International Ski Federation (FIS points), using Pearson’s correlation.They showed high relations between FIS points and some of these features, includingR = 0.92 (CI = [0.45, 0.99]) for COM lateral movement amplitude, and R = −0.87(CI = [−0.21,−0.99]) for the periodicity of the fourth principal movement, account-ing for an asymmetric movement of the legs in the sagittal and coronal planes.
Zago et al. (2017) also used PCA to analyze motions of street jugglers juggling 3, 4or 5 balls. From the PMs, they computed autocorrelations and relative amplitudes.

44 Expert gesture evaluation: a state of the art
Then, a second PCA was performed separately for each motion sequence of eachparticipant. From these PCs, they extracted specific features, including variances ofthe first four PCs, and the residual variance (i.e. the sum of the variances of allthe other PCs). For all these features, they used Mann-Whitney tests and showedsignificant differences between two groups, defined as the expert group (includingparticipants able to juggle 6 or more balls), and the intermediate group (able to juggle5 balls).
Alborno et al. (2017) proposed a score for evaluation of the synchronization of karatemotions. To that end, they extracted limbs CoM acceleration peaks using progressivefiltering, and analyzed time delay relationships between the peaks of each limb. Theyderived an average degree of synchronization from the mean of these delays. Tovalidate their score, they conducted statistical tests on two populations of karateka (ahigh-skilled population and a low-skilled one), and showed a significant differencebetween their synchronization scores for both arms and legs motions.
3.4.2 Similarity measure
A model of an ideal gesture can be derived from a part of the dataset, containingonly gestures performed by experts of the discipline. A similarity measure can thenbe obtained by comparing a gesture to this model. This similarity measure can beconsidered as a score or a higher-level feature and be validated in the same way.
Bianco and Tisato (2013) used Dynamic Time Warping (DTW, Vintsyuk 1968) to eval-uate karate techniques. DTW is an algorithm allowing the warping of a time seriesto align it temporally with another one (called the reference). It finds the optimalwarping of frame indices of the time series to minimize its distance with the ref-erence. From the 3D coordinates of 15 joints recorded with a Microsoft Kinect V1,they extracted a set of 14 angles between joints triplets. They then aligned this 14-dimensional time series to a reference one (performed by an expert), using DTW.They extracted a score on a [0, 10] range, using a logistic function of the distancebetween the aligned time series and the reference one.
Aristidou et al. (2015) developed a similarity measure based on Laban features. Froma set of 27 temporal features, they extracted statistics on a sliding window, includingmaximum, minimum, mean and standard deviation. For each window, they simplycalculated the correlation between a novice trial and a reference one performed bya teacher. They iterated the same process either separately for each category ofLaban features (body, effort, shape and space, see Section 2.3.4), or for the entireset of features. As a demonstration, they integrated their method in a dance learningplatform, but did not propose any quantitative validation.
Pham et al. (2016) proposed a summative scoring system based on a trajectory doubleintegral to define the spatial distance between two trajectories. They tested their score

§3.4 Expert gesture evaluation 45
in a sign word recognition task, on the public dataset Australian Sign Language(Kadous et al., 1995). Then, to validate their score as an evaluation method, theycomputed a score for a novice signer at different periods, and verified that there wasa progression after several attempts for the same sign word.
Chen et al. (2016) used a k-Nearest Neighbors classification model to recognize threetypes of Timpani percussive gestures (legato, accent and vertical accent) . The clas-sification model was trained on a teacher’s motion, using arms and stick kinematicfeatures. The classification rates for each participant were then used as a similaritymeasure to the professional percussionist’s motions. As a validation, participantsranking obtained from their respective classification rates were compared to a rank-ing annotated by the teacher. For the six participants, the first two were correctlyranked, as well as the last one, while the three others obtained very close scores bothin annotations and in classification rates, showing the possible effectiveness of themethod.
Laraba and Tilmanne (2016) used a similar approach to evaluate Walloon dance mo-tions recorded with a Microsoft Kinect V2 and Qualisys. They trained a HiddenMarkov Model (HMM, Baum and Petrie 1966) with the data of an expert recordedwith a Qualisys system (high-quality data), to classify three different basic steps. Theinput variables of the HMM were seven relational features inspired by Müller et al.(2005), and 36 distances between pairs of leg joints. They then adapted the HMMusing maximal likelihood linear regression (Laraba et al., 2015) so that it can recog-nize motions recorded with the Microsoft Kinect V2. From the classification rates,they extracted a similarity score based on the time-normalized log-likelihood. Theytested their method on one novice for the three dance steps and showed that thescores were lower than those obtained by a teacher. As a demonstration, they alsointegrated their method into a Walloon dance learning platform using the MicrosoftKinect V2.
Morel et al. (2017) proposed a measure of limb spatial and temporal errors in amotion based on DTW. From a set of motion sequences performed by experts andaligned using DTW, and computed their mean and their variance, leading to an av-erage motion, called “nominal motion”, and a “spatial tolerance” based on the vari-ance. This process was performed separately for each limb (two legs, two arms, andtrunk), leading to a nominal motion and spatial tolerance for each limb. To computethe spatial error of a novice trial, they aligned each limb motion with their nominalmotion using DTW, and compute a Mahalanobis distance between them, to accountfor the spatial tolerance. As a measure of temporal errors, they computed the tim-ing difference between the warping of each limb motion to their respective nominalmotion. They validated their spatial error measure on a dataset of tennis serves andtheir temporal error measure on a dataset of karate motions, both annotated by pro-fessional coaches. As a result, the best-fitting exponential curves were computed forestimating the relation between measures and annotations of one expert, leading toR2 = 0.57 for the spatial error measure of tennis serves, and R2 = 0.4 in average(among two expert annotators) for the temporal error measure of karate motions.

46 Expert gesture evaluation: a state of the art
3.4.3 Score prediction
A regression or a classification model can be designed from the extracted features topredict a score. The score to predict can either be derived from an objective measure(timing, shot speed, years of practice, etc.), or be annotated by an expert.
Harrison et al. (2007) used bivariate functional PCA to analyze the development ofvertical jump performance on a sample of jumps performed by 49 children of about 4to 10 years. Each jump trial was annotated by expert observers according to criteria ofdevelopmental stage (Gallahue et al., 2006). They labeled each trial according to threedevelopmental stages. Discriminant analysis coupled with Mahalanobis distance wasthen used to design a classification model. The best model yielded a mean accuracyof 61% for each development stage of the hip-ankle coordination.
Zhang et al. (2010) analyzed driving skills of different drivers. From the steeringangle of the wheel, they performed a Discrete Fourier Transform (DFT, Welch 1967).They then designed a classification model to recognize the level of twelve driversas typical or expert (two classes) from 30 normalized DFT coefficients. The modelconsisted of a decision fusion of three independent classifiers, including a Multi-Layer Perceptron (MLP) with a hidden layer of 40 neurons, a decision tree, anda Support Vector Machine (SVM, Boser et al. 1992) with polynomial kernels. Thedecision fusion was performed using a majority-voting method. They obtained aclassification accuracy of 79% for a model trained on a balanced dataset of expertand typical drivers.
Harding and James (2010) analyzed snowboarding performance from half-pipe cham-pionships. From video footage captured during competitions, they extracted featuresrelated to the amount of time athletes spent in the air, and to their snowboard rota-tion degree. They selected the two best features according to their correlation withscores provided by the jury during the competition. They then trained a multiplelinear regression model with these two features to predict these scores, resulting inR = 0.902 in average for the various competitions. No cross-validation procedurewas used.
Young and Reinkensmeyer (2014) analyzed video-extracted 2D kinematic data ofcompetitive diving performance. To predict a score given by a professional jury,they used PCA following Troje (2002) to extract eigenpostures and PMs. They alsoextracted a set of specific features commonly thought to influence dive judging, in-cluding the splash area time evolution, the board tip trajectory, and the body centercoordinate trajectory. From these features, they selected different subsets, and per-formed a second PCA on them (following Troje (2002) again). For each subset, theydesigned a linear regression model with the PCs to predict the score provided by thejury. They obtained the best results (R2 = 0.66) with the PMs and the three specificfeatures, using a leave-one-participant-out cross-validation procedure.
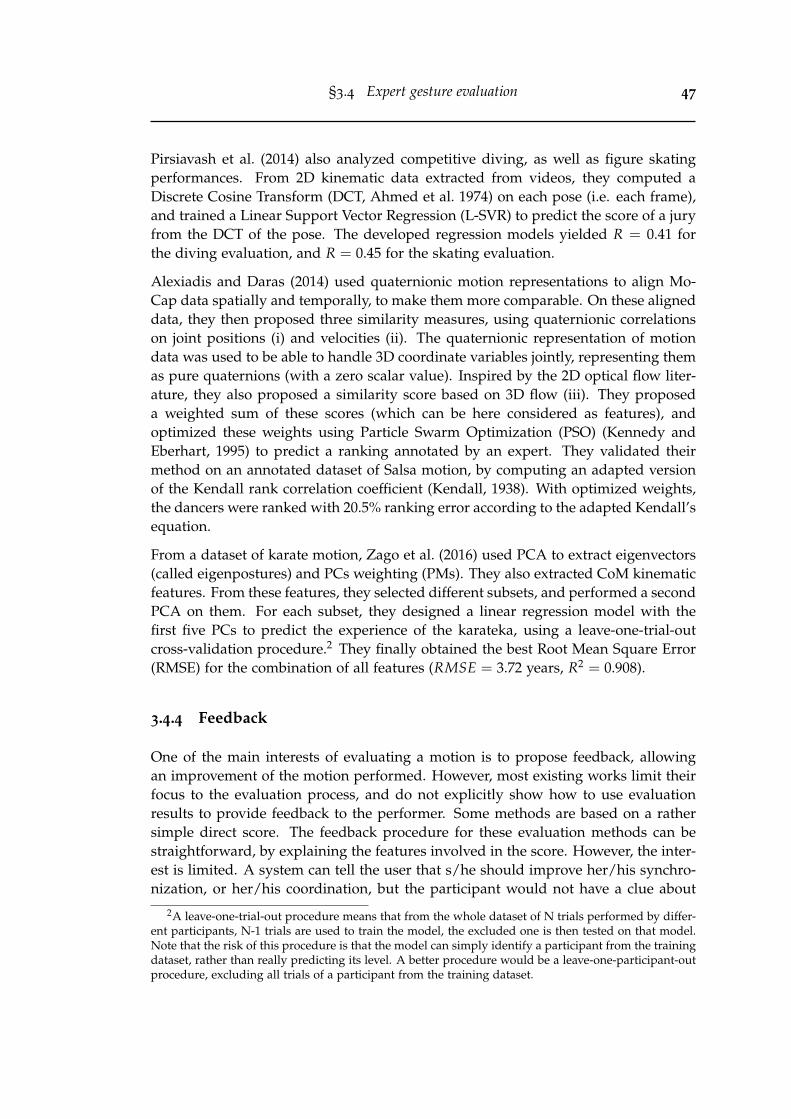
§3.4 Expert gesture evaluation 47
Pirsiavash et al. (2014) also analyzed competitive diving, as well as figure skatingperformances. From 2D kinematic data extracted from videos, they computed aDiscrete Cosine Transform (DCT, Ahmed et al. 1974) on each pose (i.e. each frame),and trained a Linear Support Vector Regression (L-SVR) to predict the score of a juryfrom the DCT of the pose. The developed regression models yielded R = 0.41 forthe diving evaluation, and R = 0.45 for the skating evaluation.
Alexiadis and Daras (2014) used quaternionic motion representations to align Mo-Cap data spatially and temporally, to make them more comparable. On these aligneddata, they then proposed three similarity measures, using quaternionic correlationson joint positions (i) and velocities (ii). The quaternionic representation of motiondata was used to be able to handle 3D coordinate variables jointly, representing themas pure quaternions (with a zero scalar value). Inspired by the 2D optical flow liter-ature, they also proposed a similarity score based on 3D flow (iii). They proposeda weighted sum of these scores (which can be here considered as features), andoptimized these weights using Particle Swarm Optimization (PSO) (Kennedy andEberhart, 1995) to predict a ranking annotated by an expert. They validated theirmethod on an annotated dataset of Salsa motion, by computing an adapted versionof the Kendall rank correlation coefficient (Kendall, 1938). With optimized weights,the dancers were ranked with 20.5% ranking error according to the adapted Kendall’sequation.
From a dataset of karate motion, Zago et al. (2016) used PCA to extract eigenvectors(called eigenpostures) and PCs weighting (PMs). They also extracted CoM kinematicfeatures. From these features, they selected different subsets, and performed a secondPCA on them. For each subset, they designed a linear regression model with thefirst five PCs to predict the experience of the karateka, using a leave-one-trial-outcross-validation procedure.2 They finally obtained the best Root Mean Square Error(RMSE) for the combination of all features (RMSE = 3.72 years, R2 = 0.908).
3.4.4 Feedback
One of the main interests of evaluating a motion is to propose feedback, allowingan improvement of the motion performed. However, most existing works limit theirfocus to the evaluation process, and do not explicitly show how to use evaluationresults to provide feedback to the performer. Some methods are based on a rathersimple direct score. The feedback procedure for these evaluation methods can bestraightforward, by explaining the features involved in the score. However, the inter-est is limited. A system can tell the user that s/he should improve her/his synchro-nization, or her/his coordination, but the participant would not have a clue about
2A leave-one-trial-out procedure means that from the whole dataset of N trials performed by differ-ent participants, N-1 trials are used to train the model, the excluded one is then tested on that model.Note that the risk of this procedure is that the model can simply identify a participant from the trainingdataset, rather than really predicting its level. A better procedure would be a leave-one-participant-outprocedure, excluding all trials of a participant from the training dataset.

48 Expert gesture evaluation: a state of the art
how to do so. It would be more interesting to provide feedback about lower-levelfeatures, so that the subject knows which part of her/his motion should be corrected.
Concerning a similarity measure or a prediction of a model based on multiple fea-tures, it can be interesting to investigate which features are mostly responsible for thecomputed score. It would allow a feedback system to tell which feature should bemodified, and how it should be modified, to improve the similarity with the modelor the predicted score. An even more interesting information for the user could be avisualization of an improved version of the motion.
In that direction, Young and Reinkensmeyer (2014) proposed an original methodwhich consists in synthesizing a new motion corresponding to a particular level.From a score, they calculated the eigenpostures and PMs which would predict thisscore using the linear regression coefficients (see Section 3.4.3), and using an inverseprocessing of the motion decomposition (following Troje 2002), they calculated agesture corresponding to these eigenpostures and PMs. From the visualization of thesynthesized gestures from different scores, they saw that better dives were performedwith a straighter position of the legs, with a body path closer to the board tip, andwith a narrower splash area.
Pirsiavash et al. (2014) modeled expertise from their diving and skating datasets us-ing an L-SVR on the pose DCT (see Section 3.4.3). To provide a feedback to the user,they computed the gradient of the score obtained with L-SVR, and performed aninverse-DCT to show the modification of the joint positions leading to an improve-ment of the score.
Morel (2017) proposed a simple semantic feedback method, based on a previouswork presented in Morel et al. (2017) (see Section 3.4.2). For each limb’s spatial andtemporal largest error during a trial, she indicates the time, duration and directionof the error. By comparing the trial to the nominal motion, the system indicates if alimb is too high, low, left or right for spatial error, or if it is too late or in advance.
Patrona et al. (2018) proposed a similar semantic feedback method. First, they usedDTW for human action evaluation. They aligned positions as well as kinetic energiesof eight joints (elbows, wrists, knees and ankles) of a test motion with a referencemotion. They then proposed a semantic feedback using a fuzzy logic engine. Thefeedback was both visual and textual, showing key frames corresponding to thehighest errors in position and velocity, and explaining which joint and at whichframe was causing the highest error, both for position and velocity features, andproposing a correction to apply to the motion. This method allows an individualfeedback, showing explicitly to the user how to improve her/his own technique.
3.5 Discussion and conclusion
In this chapter, a state of the art was presented on expert gesture evaluation. Thevarious methods proposed can be divided into three main categories: evaluation

§3.5 Discussion and conclusion 49
from a direct score extracted from features, a similarity measure to a model, or theprediction of a score using a regression or a classification model. Additionally, a fewworks also focus on the development of feedback methods. A summary of all theseworks can be found in Table 3.1.
These methods may have various advantages and drawbacks. Models based on di-rect scores do not intrinsically depend on experts annotations. They are fully basedon the extraction of specific features, and do not rely on the training of an algorithmsupervised with the annotations. Instead, they are usually based on prior knowledgeof a specific discipline and therefore rarely allow generalization to other disciplines.Models based on similarity measures are partly supervised, since the data used forthe modeling of the ideal gesture are supposedly performed by experts. However,they are not optimized to predict the level of expertise for new instances using su-pervised learning. For most of these methods, the validation is therefore limited tostatistical significance allowing the discrimination of two groups, or to examples ofthe use of the method, and do not prove their accuracy in the evaluation of any per-former’s level. Morel et al. (2017) investigated the correlation between their proposedsimilarity measures and annotations. However, for the experiment, annotators werespecifically asked to evaluate some characteristics of the gestures evaluated by thealgorithms, such as the delay between two punches in karate, or accuracy of specificlimb positions in a tennis serve. Gløersen et al. (2017) analyzed the correlations be-tween the extracted features and the FIS points of professional skiers. However, theirresults were based on only six skiers, and they do not prove the generalization onother performers (no cross-validation). Moreover, a large number of features was an-alyzed, increasing the chance that one of them had a correlation with the FIS pointsdue to coincidence.
On the opposite, score prediction methods are based on classification or regressionmodels, trained to predict the level of any performer from the annotations of adataset. The quality of these models therefore depends on the quality of the annota-tions. According to the discipline used as a case study, different types of annotationscan be derived and can be more or less objective. They can be a ranking in a com-petition, or a subjective score annotated by a jury. In the last case, an average scoreaveraged from several independent annotators is preferred to reduce its subjectivity.
Unfortunately, none of these works provide their dataset publicly as a benchmarkfor motion evaluation. Each one of the proposed methods is tested on a new dataset,recorded for that purpose. It is thus never possible to verify their results, and moreparticularly to compare different methods on the same data. Moreover, all theseworks are generally validated on a single category of gesture. The generalizationto other gestures is left as an assumption. An exception can be raised to some de-gree concerning the use of eigenpostures and PMs following Troje (2002) procedure,as it has been successfully reused in a number of studies including various sportsdisciplines.

50 Expert gesture evaluation: a state of the art
Reference Type Dataset (discipline, v, n, p) Features Model/Validation method
Harrison et al. (2007) S.P. Jump, 7× 2D, 49, 49 PCA Discriminant analysis
Leroy et al. (2008) D.S. Juggling, 5× 3D, 100, 10
- Height of the ball
- Elbow flexion/ext.
- Pelvis lateral oscillations
- Ball cycle duration
- Elbow flex./ext. cycle
- Pelvis oscillation cycle
Stat. significance tests
Zhang et al. (2010) S.P. Driving, 1, 1065, 12 steering angle DFT coefficients Voting:
- MLP
- SVM
- Decision tree
Harding and James (2010) S.P. Snowboarding, video, 169, 169- 3 Air-time feat.
- 4 Degree of rotation feat.
Selection with SLR
Prediction with MLR
Bianco and Tisato (2013) S.M. Karate, 15× 3D, ns, ns DTW on 14 body angles Example (preliminary)
Young and Reinkensmeyer (2014)- S.P.
- FBDiving, 8× 2D, 16, 16 PCA on
- Eigenpostures
- PMs
- CoM traject.
- Splash area
- Board tip traject.
Linear regression
Pirsiavash et al. (2014)S.P.
FB
Diving, 25× 2D, 159, ns
Skating, 25× 2D, 159, nspose-DCT L-SVR
Alexiadis and Daras (2014)S.M.
S.P.Salsa, ns, 9, 9
- Quaternionic R of joint pos.
- Quaternionic R of joint pos.
- “3D optical flow”
Score weighting using PSO
Tits et al. (2015) FB Piano, 27× 3D, 16, 4 PCs cumulative variance, PMs Preliminary comparison
Aristidou et al. (2015) S.M. Dance, 11× 3D, 3, 1 Laban, sliding-window stat. R Example (preliminary)
Dadashi et al. (2015) D.S. Swimming, 2× 3D, 5981, 18
variability (Cauchy Index) of:
- timings
- stroke rate
- arm coordination
- stroke length and speed
Stat.significance tests
Pham et al. (2016) S.M. Sign language, 1× 3D, 2, 1 Traject. double integral Example (preliminary)
Chen et al. (2016) S.M. Timpani, 21× 3D, 210, 7 Kinematics, k-NN classif. rate Ranking comparison
Zago et al. (2016) S.P. Karate, 42× 3D, 50, 10 PCA on
- Eigenpostures
- PMs
- CoM kinematics
Linear regression
Laraba and Tilmanne (2016) S.M. Dance, 11× 3D, ns, 2 HMM on- 7 Müller
- 36 leg joints dist.Example (preliminary)
- Morel et al. (2017)
- Morel (2017)
- S.M.
- FB
- Tennis, 25× 3D, 147, 17
- Karate 25× 3D , 95, 15
- DTW-Mahalanobis-distance
- Alignment differenceR2
Alborno et al. (2017) D.S. Karate, 25× 3D, 22, 5 CoM acc. peak-delta timing Stat.significance tests
Gløersen et al. (2017) D.S. Ski, 41× 3D, 72, 6
- PMs peak-to-peak diff.
- PMs timing diff.
- PMs stride symmetry
R
Zago et al. (2017) D.S. Juggling, 23× 3D, 36*, 12
- PMs auto-correlations
- PMs relative amplitudes
- PCs variances
Stat.significance tests
Patrona et al. (2018)S.M.
FBBasic actions, 20× 3D, N/A DTW+fuzzy-logic on
- pos.
- KEVisual feedback examples
Table 3.1: Motion evaluation methods. D.S.= Direct Score. S.M.= Similarity Measure. S.P. = Score Prediction. FB = feedback. v = number
of captured variables. n = number of samples. p = number of participants. ns = not specified. PM = Principal movement. *: for each task. R =
Pearson’s correlation. R2 = coefficient of determination. SLR: Single Linear Regression. MLR: Multiple Linear Regression..KE = Kinetic Energy.

§3.5 Discussion and conclusion 51
On the other hand, while a large set of low or high-level features have been proposedin previous works (see Chapter 2), all studies on motion evaluation generally focuson a single category of low or high-level features. More particularly, few studies useergonomic features for motion evaluation, although this category of features couldbe relevant for modeling expertise. A major objective of this thesis is to developdifferent models of expertise, using a large set of features from different categories,and confront them in the same evaluation task (see Chapters 8 and 9).
Another major limitation of the previously cited studies can be raised by comparingthem to existing work in different fields of motion processing. The fields of gesturerecognition, retrieval and synthesis are in high development due to their potentialuses in industry, for human-machine interaction, surveillance, and animation. Recentworks in this domain are based on the latest advances in artificial intelligence, i.e.deep learning and reinforcement learning (Holden et al., 2015, 2016; Neverova, 2016;Xia et al., 2017; Ding et al., 2017; Laraba et al., 2017; Devineau et al., 2018; Peng et al.,2018). The gap with research in motion evaluation may be explained by the fact thatthese deep-learning-based techniques require a large amount of data to be efficientlyused. However, the recording of datasets for motion evaluation is a laborious task.A high-quality of the data is necessary in order to extract subtleties of the motioncharacterizing expertise; and a large number of participants with different levels ofexpertise is needed for the design of a complex model, able to discriminate a skilledor a low-skilled performance.
In this context, we recorded a new high-quality MoCap dataset of Taijiquan gestures,including 12 participants with different levels of expertise from novice to expert (seeChapter 4). We also developed a new algorithm for automatic MoCap data recovery,to ease the laborious process of MoCap data recording and correction (see Chapter 5).In Chapter 9, we propose a first exploration of the use of deep learning technologies,and more particularly transfer learning, for the evaluation of expert gestures. Finally,we propose a generic method for visual feedback of the gesture evaluation, that canbe used with any score-prediction-based evaluation model (see Chapter 10).

52 Expert gesture evaluation: a state of the art

Part II
Data Collection and Processing
53

Chapter 4
Taijiquan motion capture dataset
Contents4.1 Introduction . . . . . . . . . . . . . . . . . . . . . . . . . . . . . . . . . 55
4.1.1 The need for a dataset . . . . . . . . . . . . . . . . . . . . . . . 55
4.1.2 Why Taijiquan ? . . . . . . . . . . . . . . . . . . . . . . . . . . . 57
4.2 Participants . . . . . . . . . . . . . . . . . . . . . . . . . . . . . . . . . 58
4.3 Recording protocol . . . . . . . . . . . . . . . . . . . . . . . . . . . . 59
4.4 Data processing . . . . . . . . . . . . . . . . . . . . . . . . . . . . . . . 59
4.5 Manual annotation (segmentation) . . . . . . . . . . . . . . . . . . . 59
4.6 Kinect data . . . . . . . . . . . . . . . . . . . . . . . . . . . . . . . . . 64
4.7 Conclusion . . . . . . . . . . . . . . . . . . . . . . . . . . . . . . . . . 64
4.1 Introduction
4.1.1 The need for a dataset
The last decades have seen a new adage becoming more and more popular, saying:“data is the new oil”. Due to the recent explosion of computational power, and ofnew artificial intelligence algorithms, many ambitious projects can now be achieved,including beating the best chess player in the world, autonomous vehicles, realisticvirtual agents, or even political manipulation. However, all these projects, achievablein theory, need a major resource to be completed: data. Depending on the objec-tive, hours of driving data, thousands of chess games, thousands of pronounced andwritten sentences and their corresponding facial expressions, or millions of messagesor interactions on social media must be acquired through any means to be able todesign a specific model to solve a problem. Not only must they be acquired, but ide-ally they should be of quality, in a sufficient amount, processed, and often annotated.For instance, to train an algorithm for identification of an object in an image, a large
55

56 Taijiquan motion capture dataset
number of images including this object and without it must have been acquired, andlabels should indicate which images contain the object to identify.
The aim of this thesis is the modeling of gestural expertise with the use of super-vised machine learning algorithms. In this context, a motion dataset is needed. Therecorded data must be accurate enough to provide relevant information about theexpertise contained in the motion. Moreover, along with the data, labels about thequality of the gesture must be provided.
Recent technologies enable accurate recording of motion in 3D, generally using opti-cal MoCap systems, such as Qualisys or Vicon. As an example, in Table 3.1 showingpast studies on motion evaluation, most recent studies (from 2015) use 3D data gen-erally recorded with an optical MoCap system, while many of the previous worksare based on 2D data extracted from videos, or signals extracted from specific sen-sors (such as a wheel steering angle in Zhang et al. (2010)). A major issue of accu-rate MoCap techniques is that they are expensive and time-consuming. To record aperformance of one participant, markers must be placed carefully on her/his body,following precise indications. An expensive MoCap system consisting of multiplecameras must be set up and calibrated. After the recording of a sequence, processingis generally required to correctly identify all the trajectories. Missing data must bereliably interpolated when possible. As a comparison, a cheap microphone is neededto record a voice with a good quality, and a cheap camera is sufficient to capture animage with a good quality, without post-processing. Moreover, a tremendous quan-tity of audiovisual data can be found directly on the internet.
In the literature regarding motion evaluation (see Table 3.1), a new dataset has beenrecorded for each research. Except for datasets of cyclic motions, 3D motion datasetsinclude fewer than 200 samples of the same gesture. The datasets including moresamples consist of cheaper sensors: Dadashi et al. (2015) used two accelerometers/-gyroscopes to record 18 swimmers performing each 300 m trials in three differentconditions, leading to a total of 5981 front-crawl cycles, i.e. roughly 2000 cycles forone condition. Zhang et al. (2010) simply recorded the wheel steering angle to an-alyze the 1065 driving trials in two different conditions performed by 12 subjects.Chen et al. (2016) recorded 3D motions of 210 percussive gestures performed byseven subjects, using a Qualisys system. They recorded 21 markers placed on theupper-body and the mallet. However, their analysis is based on the trajectory in thesagittal plane of only one marker, placed at the extremity of the mallet. Apart fromthese datasets, the largest 3D dataset in Table 3.1, containing full-body 3D motiondata for a rather complex gesture, was recorded by Morel et al. (2016), and contained147 tennis serves performed by 17 subjects. Besides their small size, these datasetsare generally limited to a single type of motion. Finally, these datasets, recorded forthese specific studies, are generally not publicly shared to the scientific community.As a consequence, not only a limited amount of accurate 3D motion data has beenrecorded, but it is generally not publicly available.

§4.1 Introduction 57
To address this issue, some works led to the publication of large motion datasets.The most well-known dataset is the Carnegie Mellon University (CMU) GraphicsLab Motion Capture Database (CMU, 2003), consisting of 109 activities recorded bymore than 100 subjects, with a total of 2605 motion sequences. The types of activi-ties include basic human interactions and scenarios, locomotion, as well as physicaland sports activities, generally performed by a single subject. Another large publicdataset is the HDM05 Motion Capture Database (Müller et al., 2007), including about1457 motion sequences of more than 70 activities, performed by 5 subjects. Manderyet al. (2015) recorded the KIT Whole-Body Human Motion Database, a large datasetof various locomotion and object-manipulation motions, including a total of 3704 mo-tion sequences performed by 38 subjects. Apart from these datasets recorded withaccurate optical MoCap systems, a number of lower-quality datasets were recordedfor research on action recognition. Surveys on these datasets can be found in Ofliet al. (2013); Zhang et al. (2016); Mandery et al. (2016); Shahroudy et al. (2016).
However, these datasets are generally intended for animation, or general actionrecognition purposes. Only a few instances of each gesture are usually recorded,and with rarely more than one participant performing the same gesture. The mainobjective of such datasets is to include a wide range of different gestures. Thesedata are thus not suited for the analysis of expert gestures, where a large numberof instances of the same gesture by several performers is required. Moreover, lit-tle information is provided on the performers, and never on their experience in aparticular activity.
Due to all these issues, a new 3D motion dataset of Taijiquan was recorded in thecontext of this thesis, and was made publicly available.
4.1.2 Why Taijiquan ?
Most of the gestural disciplines are usually focused on a part of the body. For in-stance, finger motions are crucial in piano, just as legs motions are important infootball. They can also be focused on the gesture purpose, such as the aestheticsof dance gestures, the sound emitted by a musical instrument, or the speed or thespin of a tennis ball. These disciplines are thus not the best candidate to promote ageneral approach to study the question of motion evaluation.
Taijiquan is a martial art. However, it can be distinguished from other martial dis-ciplines that are usually mostly fight-oriented. Taijiquan can be defined as an ’artof body awareness’. The practice of this discipline intends for the development ofphysical abilities such as balance, coordination, etc., as well as mental skills such asconcentration. These characteristics make Taijiquan a well-suited discipline to studygesture expertise. Contrarily to most other disciplines, Taijiquan practice is focusedon the quality of the motion itself, as a whole. This general motion quality learned

58 Taijiquan motion capture dataset
ID Gender(M/F)
Age Weight(kg)
Height(cm)
Practice(year)
Category Skill1(0-10)
Skill2(0-10)
Skill3(0-10)
Skillµ(0-10)
P01 M 56 95 196 32 Expert 9.3 9 10 9.43P02 F 57 78 163 30 Expert 9.6 9.1 10 9.57P03 F 62 58 162 24 Expert 8.5 8.5 9 8.67P04 F 47 53 150 12 Advanced 8.2 8 8 8.07P05 F 71 61 163 14 Advanced 6.8 7.4 7.5 7.23P06 M 25 76 180 10 Advanced 8.4 8.6 8.5 8.5P07 F 49 57 157 4 Intermed. 7 6.8 6.5 6.77P08 F 34 56 158 3 Intermed. 8 7.3 7 7.43P09 M 51 90 178 2.5 Intermed. 6.9 6.8 6.85 6.85P10 F 59 55 163 1 Novice 6 5.8 6.5 6.1P11 F 65 58 165 0.2 Novice 5 4.9 5 4.97P12 M 28 96 181 0.6 Novice 5.8 6 5.75 5.85
M 50.33 69.42 168 11.11 7.46 7.35 7.55 7.45SD 14 15.93 12.46 11.15 1.37 1.29 1.53 1.38
Table 4.1: Personal details of participants. Skill was ranked with a score between 0and 10 by three teachers. Each one of their rankings, as well as their mean (Skillµ) is
indicated in this table.
by the way of Taijiquan can often be transferred to various other sports disciplines(Caulier, 2010).
The following Sections present the multimodal Taichi dataset recorded during thisthesis with both Qualisys and Kinect data. In this work, only the Qualisys datawere used, and are described in the following Sections. The complete description,including Kinect data, is available under the publication Tits et al. (2018a). Thedataset is available for research purpose (license CC BY-NC-SA 4.0), at:https://github.com/numediart/UMONS-TAICHI
4.2 Participants
Twelve people volunteered to participate in the dataset recordings. All of them at-tended courses in the Taijiquan school of Eric Caulier, and were assigned a categoryaccording to their level: Novice, Intermediate, Advanced or Expert (three teachersof the school). Each Taijiquan teacher also provided individual rankings for eachparticipant, on a scale of 0 to 10. These rankings were provided independently byeach teacher, from their personal knowledge of all the participants during courses.Relevant personal details for each participant, including age, height, weight, gender,practice experience and skill level can be found in Table 4.1.

§4.3 Recording protocol 59
4.3 Recording protocol
The MoCap system (Qualisys) consisted of 11 cameras fixed on the walls and ceilingof a recording studio, leading to a recording area of 4× 4 m. This system tracked 68retroreflective markers placed on the whole body (for detailed placement, see Table4.2), with a frame rate of 179 Hz and a spatial accuracy < 1 mm. The dextrogyrecoordinate system was placed on the ground, in the middle of the recording area,with the vertical axis as the z-axis. At the beginning of each recording, the participantwas standing approximately above the origin of the coordinate system facing the x-axis direction. After each gesture, the participant was again approximately facingthe x-axis direction.
All participants performed 13 different techniques of the popular Taijiquan style’Yang’, all learned at the Taijiquan school Eric Caulier. These techniques are dividedinto two main categories: the Five Exercises (Wu gong), composed of five simplegestures, and the Eight Techniques (Bafa), composed of eight more complex gestures(see details in Table 4.3). All techniques are described in detail in Caulier (2010).Videos of the gestures performed by a teacher are included with the dataset as sup-plementary information. During the recording session, each participant was askedto perform three different rendition types, as described in Table 4.4.
4.4 Data processing
Qualisys MoCap data were manually corrected using the Qualisys Track Manager(QTM) software. The corrected data were then extracted in standard 3D motion dataformats (C3D and TSV). All missing data (generally due to marker occlusions) wereestimated with an automatic MoCap data recovery method developed during thisthesis, and presented in Chapter 5.
After the recovery process, 21 joint positions and orientations were extracted fromthe 68 surface markers using a Visual3dTM pipeline as illustrated in Fig 2.1. All themotion features used in this thesis were extracted from these data (see Chapters 2and 6).
4.5 Manual annotation (segmentation)
All renditions were manually labeled from Qualisys data to identify beginning andending of each instance of a gesture. To that end, the MotionMachine framework(Tilmanne and d’Alessandro, 2015) was used. The annotation software created from

60 Taijiquan motion capture dataset
Marker label Marker placement
Head markers (left and right)L/RFHD Approx. over left/right temple.
L/RBHD Back of the head, approx. in a horizontal plane with front head markers.
Torso markersCLAV Clavicles, located approx. at the jugular notch.
STRN Sternum xiphoidal process.CV7 7th cervical vertebrae.TV10 10th thoracic vertebrae.
Arm and hand markers (left and right)L/RAC Acromion.
L/RUA1-2 Cluster of two markers placed on the lateral surface of the upper arm.L/R_HLE Humerus lateral epicondyle.L/R_HME Humerus medial epicondyle.L/RF1-2 Cluster of two markers placed on the lateral surface of the forearm.L/R_RSP Radius styloid process.L/R_USP Ulna styloid process.L/R_HM1 2nd metacarpal (index).L/R_HL5 Lateral head of 5th metacarpal (pinkie).
Pelvis markers (left and right)L/R_IAS Anterior superior iliac spine.
L/R_IPS Posterior superior iliac spine.
Leg and foot markers (left and right)L/R_FTC Most lateral prominence of the greater trochanter.
L/R_TH1-4 Cluster of four markers placed on the lateral surface of thigh.L/R_FLE Femur lateral epicondyle.L/R_FME Femur medial epicondyle.L/R_SK1-4 Cluster of four markers placed on the lateral surface of shank.L/R_FAL Lateral prominence of the lateral malleolus.L/R_TAM Medial prominence of the medial malleolus.L/R_FCC Aspect of the Achilles tendon insertion on the calcaneus.L/R_FM1 Dorsal margin of the 1st metatarsal head.L/R_FM2 Dorsal aspect of the 2nd metatarsal head.L/R_FM5 Dorsal margin of the 5th metatarsal head.
Table 4.2: Table 2 - Marker placement. Labels and positions of 68 markers attached(scratched) to an elastic neoprene suit, according to Qualisys and C-Motion specifi-cation for standard full-body MoCap. Cluster markers (upper arm, forearm, thighand shank) are placed approximately on the body and are only used for tracking in
Visual3D™ software (C-Motion, Inc., Rockville, MD, USA).

§4.5 Manual annotation (segmentation) 61
Gesture ID Name Movement type
Five exercises (Wu gong)G01 Beginning position (Wuji) Static posture, symmetric
G02 Tree posture (Taiji) Static posture, symmetricG03 Open and close lotus flower SymmetricG04 Bring sky and earth together SymmetricG05 Canalize energy Asymmetric (left or right)
Eight techniques (Bafa)G06 Drive the monkey away Asymmetric (left or right)
G07 Move hands like clouds Asymmetric (left or right)G08 Part the wild horse’s mane Asymmetric (left or right)G09 Golden rooster stands on one leg Asymmetric (left or right)G10 Fair lady works shuttles Asymmetric (left or right)G11 Kick with the heel Asymmetric (left or right)G12 Brush knee and twist step Asymmetric (left or right)G13 Grasp the bird’s tail Asymmetric (left or right)
Table 4.3: Five exercises and Eight techniques of the Yang Taijiquan style.
Type ID Description of the rendition
T01 Five exercises Each exercise is repeated four times in a row. After thefour repetitions, a pause of 2-5 seconds is respected, before transitionto the next exercise. For the fifth exercise (Canalize energy), which isthe only asymmetrical gesture of the sequence, the four repetitionsconsist of a succession of left and right side gestures, in the order:‘left-right-left-right’.
T02 Eight techniques Each technique is repeated four times in a row.After the four repetitions (‘left-right-left-right’), a pause of 2-5seconds is respected, before transition to the next technique.
T03 Chained eight techniques Idem as the previous type, but no pause isrespected during transition between two different techniques.
Table 4.4: Types of renditions performed by the participants.

62 Taijiquan motion capture dataset
Manual segmentation rulesGesture Start EndG01 (static posture) (Static posture)G02 (Static posture) (Static posture)G03 COM lowa. COM low.G04 COM highb. COM high.G05 COM high. COM low, foot take-off.G06 COM low. COM low.G07 COM on one sidec. COM on the other side.G08 COM back at the centerd (Foot take-off). COM back at the centerG09 Foot take-off. Foot starts to go down.G10 COM back at the center. COM back at the center.G11 COM low (Just before foot take-off). COM low.G12 COM back at the center. COM back at the center.G13 Just before foot take-off. COM back at the center.
aCOM low: local minimum of COM z-axis.bCOM high: local maximum of COM z-axis.cCOM on one side: local extremum of COM y-axis.dCOM back at the center: local extremum of COM y-axis, generally near y-axis mean position.
Table 4.6: Manual segmentation rules for the 13 gestures based on visual indicationson direct 3D motion and COM coordinates.
this framework allows mouse-controlled simultaneous visualization of 3D move-ments (Qualisys data), and 2D curves displaying temporal evolution of each coor-dinate of their Center Of Mass (COM), estimated from the mean position of the 68markers. COM coordinates can be used as a global visual indication for systematicsegmentation, as described in Table 4.6. Fig 4.1 shows an example of the annotationprocedure. In this example, gestures G06 and G07 are being annotated.
From annotations, Qualisys data were automatically segmented using the MoCapToolbox for Matlab (Burger and Toiviainen, 2013a) and MoCap Toolbox extension1.All unsegmented files were named using the convention ’PppTttCcc’ (e.g. P01T01C01)for which ’pp’ is the performer ID (see Table 4.1), ’tt’ is the type of the sequence(see Table 4.4) and ’cc’ is the number of the clip (repetition of the same sequence).All segmented files were named using the convention ’PppTttCccGggDddSss’ (e.g.P01T01C01G01D01S01). ’gg’ indicates the gesture (see Table 4.3), ’dd’ indicates thedirection (01 for left and 02 for right – symmetric gestures are denoted D01), andfinally ’ss’ indicates the instance of the gesture (as each gesture is repeated severaltimes during a clip).
1MoCap Toolbox Extension : https://github.com/titsitits/MocapRecovery/tree/master /MoCap-ToolboxExtension

§4.5 Manual annotation (segmentation) 63
Figure 4.1: Screenshot of the annotation software. Layered display of: 1. 3D motion(gray spheres); 2. 2D-graphs showing evolution in time of the COM coordinates (blue= x, purple = y, pink = z); 3. Annotations (red vertical lines and labels). 4. GUI (bluewindows, allowing navigation in the file, and label edition). In this example, G06 hasbeen annotated, and G07 is being annotated. For G06, labels are placed when thez-axis of the COM is low, and for G07, labels are placed when the COM y-axis if low
(COM is on the left) or high (COM is on the right).

64 Taijiquan motion capture dataset
4.6 Kinect data
Simultaneously with Qualisys data, a Microsoft Kinet V2 was used. The Kinect isa low-cost MoCap device, consisting of a single depth-camera, and allowing therecording 25 3D body joints at a frame rate of approximately 30Hz. The data of bothsystems were then synchronized manually. Alhough the Kinect data are not usedin this thesis, they could be used in the future to investigate the possibility of usinglow-cost MoCap systems for the evaluation of expertise in gestures.
4.7 Conclusion
In this chapter, we presented a large 3D MoCap dataset of Taijiquan martial artgestures (n = 2200 samples) that includes 13 classes (relative to Taijiquan techniques)executed by 12 participants of various skill levels. Participants levels were ranked bythree experts on a scale of [0–10]. The dataset was captured simultaneously with (i) asophisticated optical MoCap system (Qualisys) consisting of 11 cameras that tracks 68retroreflective markers at 179 Hz, and (ii) a Microsoft Kinect V2. Data of both systemswere synchronized manually. The data from the Qualisys system were manuallycorrected, and then processed to complete any missing data (see Chapter 5). Datawere also manually annotated for segmentation. The data were initially recordedfor gesture recognition and skill evaluation, but they are also suited for research onsynthesis, segmentation, multi-sensor data comparison and fusion, sports science ormore general research on human science or MoCap.
To the authors’ knowledge, it is the first dataset of sports gestures comprising si-multaneously a large number of participants (12), a large number of different classes(13), and a variety of skill levels, and captured with two different MoCap systems.This dataset is used in the following chapters for validation of most of the methodsproposed in the present thesis. These methods include morphology-independentfeature extraction (see Chapter 7), gesture evaluation models (see Chapters 8 and 9),and a feedback model (see Chapter 10). Though only the Qualisys data are usedin the present research, the Kinect data could serve in future research on gestureevaluation with low-cost sensors.

Chapter 5
Robust and automatic motioncapture data recovery
Contents5.1 Introduction . . . . . . . . . . . . . . . . . . . . . . . . . . . . . . . . . 66
5.2 Method . . . . . . . . . . . . . . . . . . . . . . . . . . . . . . . . . . . . 68
5.2.1 Reference marker definition . . . . . . . . . . . . . . . . . . . . 70
5.2.2 Model 1: Global Linear Regression . . . . . . . . . . . . . . . . 70
5.2.3 Model 2: Local Interpolation . . . . . . . . . . . . . . . . . . . 71
5.2.4 Model 3: Local polynomial regression . . . . . . . . . . . . . . 72
5.2.5 Model 4: Local Generalized Regression Neural Network . . . 73
5.2.6 Time Constraint: Trajectory Continuity . . . . . . . . . . . . . 74
5.2.7 Probabilistic model averaging (PMA) . . . . . . . . . . . . . . 74
5.2.8 Spacing constraint: reference marker distance confidence in-terval . . . . . . . . . . . . . . . . . . . . . . . . . . . . . . . . . 76
5.2.9 Experiments . . . . . . . . . . . . . . . . . . . . . . . . . . . . . 78
5.3 Results . . . . . . . . . . . . . . . . . . . . . . . . . . . . . . . . . . . . 79
5.3.1 Gap length . . . . . . . . . . . . . . . . . . . . . . . . . . . . . . 80
5.3.2 Motion sequence duration . . . . . . . . . . . . . . . . . . . . . 80
5.3.3 Number of concomitant gaps . . . . . . . . . . . . . . . . . . . 83
5.3.4 Constraints effect . . . . . . . . . . . . . . . . . . . . . . . . . . 83
5.3.5 Synthesis - mean results . . . . . . . . . . . . . . . . . . . . . . 85
5.3.6 Visual results . . . . . . . . . . . . . . . . . . . . . . . . . . . . 86
5.4 Discussion . . . . . . . . . . . . . . . . . . . . . . . . . . . . . . . . . . 87
5.4.1 Limitations . . . . . . . . . . . . . . . . . . . . . . . . . . . . . 89
5.4.2 Improvement prospects . . . . . . . . . . . . . . . . . . . . . . 90
5.4.3 Processing time consideration . . . . . . . . . . . . . . . . . . 90
5.5 Taijiquan dataset recovery . . . . . . . . . . . . . . . . . . . . . . . . 91
5.6 Conclusion . . . . . . . . . . . . . . . . . . . . . . . . . . . . . . . . . 91
65
66 Robust and automatic motion capture data recovery
5.1 Introduction
This chapter addresses a common issue of optical MoCap: missing data. The follow-ing has been partly published under Tits et al. (2018b). It must be noted that thiswork is not exclusively related to the field of gesture expertise evaluation, and canbe useful to any application using optical MoCap data.
When using an optical MoCap system, if a marker or a body part is hidden fromthe cameras, its trajectory cannot be completely recorded, resulting in a gap in theMoCap data. Several issues may cause gaps, including occlusions, marker reflec-tion quality, lighting condition, calibration or the limited area covered by the system.These gaps make it difficult and sometimes impossible to use the data (Liu andMcMillan, 2006; Aristidou et al., 2008; Howarth and Callaghan, 2010). A number ofmethods have already been proposed to address this issue, based on various tech-niques. One basic method is direct interpolation. From an incomplete trajectory ofa marker, the coordinates over time can be interpolated using standard methods,such as linear, spline or monotone piecewise cubic interpolation (Fritsch and Carl-son, 1980), amongst others. Those methods are sufficient for small gaps (typicallyless than 0.5 second for human full-body motion (Liu and McMillan, 2006)), but areineffective for larger gaps. More advanced time-series interpolation methods havebeen proposed, based on linear dynamic systems (Li et al., 2009), Gaussian processdynamic models (Wang et al., 2008), or Kalman filters (Aristidou et al., 2008).
Other methods are based on the fact that MoCap data generally consist of highly re-lated trajectories of several markers, due to fixed bone length and to limited degreesof freedom in the skeleton. Expressing the incomplete trajectory using local coor-dinates, based on trajectories of three additional markers or based on a rigid bodyposition and orientation, can be used to improve recovery (Howarth and Callaghan,2010). Such coordinate transformation should reduce the variance of the trajectoryrepresentation, thereby easing the interpolation process. However, the three markersused for coordinate system transformation must have similar trajectories to the in-complete marker for the process to be efficient. This method thus highly depends onthe number of complete marker trajectories available in the data.
Yet other methods for recovering missing data are based on human motion modeling,trained on a pre-recorded dataset. Liu and McMillan (2006) trained a global linearmodel and a set of local linear models from a training set of MoCap data. Thelocal models are defined using segmentation with probabilistic principal componentanalysis (PCA), and K-means clustering. They first used the global model to recovermissing data, then, from the results, they assigned a local model to each frame usinga Random Forest classifier. On the other hand, Chai and Hodgins (2005) directlyretrieved nearest neighbors of incomplete frames in a dataset, and trained a locallinear model from these neighbors to recover the missing data. These methods are notfully automatic as they need a large dataset for the training of the models. Moreover,

§5.1 Introduction 67
the data to recover must have the same marker disposition as the one used in thesepre-trained models. It means that for a new type of MoCap data (with a differentmarker disposition), an entire dataset must be recorded to train a new model.
Finally, some methods are based on matrix transformation techniques, using PCA(Federolf, 2013; Gløersen and Federolf, 2016), singular value thresholding (SVT) (Laiet al., 2011) or nonnegative matrix factorization (NMF) (Peng et al., 2015). Thesemethods consider the entire motion as a matrix, with columns representing 3D com-ponents of all marker trajectories, and allow the use of information based on linearrelations between the columns to reconstruct a gap in the matrix. The transforma-tions are all based on low-rank properties of MoCap data. A key point with thesemethods is that a low-rank model of motion is trained on the available data of themotion sequence itself, and does not require a training dataset. These methods arethus automatic and can be used on any MoCap data (Feng et al., 2014).
A drawback of all previous methods is that the recovered trajectories may not respecthuman body properties, including bones’ fixed lengths. Motion animations may thuslead to unrealistic results. Yet, other methods are directly based on the body skele-ton, forcing marker positions to respect these properties. These constraints weresuccessfully applied to several previously mentioned methods. Li et al. (2010) pro-posed the BoLeRO algorithm, combining skeleton constraints with linear dynamicsystems. Tan et al. (2015) proposed a skeleton constrained SVT algorithm. Penget al. (2015) adapted NMF to a hierarchical block-based skeleton structure model.However, such methods are generally significantly more computationally intensiveas they are based on iterative optimization procedures. Moreover, they are often notautomatic, as they are defined for a specific skeleton model based on a pre-definedmarker set. Nonetheless, automatic procedures exist to estimate a skeleton structurein MoCap data (Kirk et al., 2005; De Aguiar et al., 2006).
Each one of the methods mentioned so far has different advantages and drawbacks,possibly making them more or less effective according to different factors, includ-ing gap length, number of markers, motion speed and complexity, and total motionsequence duration. For instance, interpolation techniques are inherently indepen-dent of the duration of the entire motion sequence and of the number of markers,unlike matrix-based and machine learning based techniques. The latter indeed re-quire training data based on the frames of the sequence without missing markers,to model the relationship between markers. The quality of the model thus dependson the size of the training set, i.e. sequence duration, and the number of markers.On the opposite, machine-learning techniques may be more robust to gap length ormotion complexity than interpolation-based methods (Liu and McMillan, 2006).
To the authors’ knowledge, most previously proposed automatic MoCap data recon-struction methods are based on low-rank or temporal properties of motion, and usematrix operations to model human motion. Few papers focus on the use of machine-learning techniques such as linear and non-linear regression (Seber and Lee, 2003;

68 Robust and automatic motion capture data recovery
Bates and Watts, 1988) to model the motion of a missing marker. Moreover, no pre-vious work known to the authors proposes the usage of ensemble learning to uselikelihoods of different models and construct a more robust global model from thedecisions of an ensemble of others (Dietterich, 2000; Hoeting et al., 1999).
Therefore, the aim of the research presented in this Chapter is to propose a probabilis-tic averaging method that can be used with any ensemble of recovery models, andthat enforces movement constraints. This method is referred to below as ProbabilisticModel Averaging (PMA). The averaging process is based on the posterior likelihoodsof the distances between the recovered body points and other markers. To validatethe method, we used existing recovery models and developed four new regression-based recovery models, which were used as inputs to the proposed probabilisticaveraging method.
5.2 Method
Fig 5.1 shows the overall approach of our data recovery method, which can be di-vided into five main steps. First, parameters are extracted from each marker trajec-tory of the motion sequence. These parameters mainly represent relations betweenmarkers, and allow identification of related markers (termed as reference markers be-low) and of their distance distributions. Then, various recovery models are appliedon the incomplete MoCap sequence, resulting in several candidate recovered se-quences. For each candidate, a correction is applied to respect motion continuity(except for interpolation which inherently respects motion continuity). From all re-sulting individually recovered sequences, a weighted average is applied, in the spiritof ensemble learning systems (Dietterich, 2000). Finally, a spacing constraint is ap-plied on the recovered trajectory, enforcing plausibility of the distance with relatedmarkers.
Note that it is good practice to center the motion sequence at the outset, by subtract-ing the mean position of all the markers available in each frame. This process makesit possible to reduce the component of global motion in the sequence, thus reducingmotion variations. After the gap recovery process, the mean position is added backto translate the motion sequence to its original trajectories.
In the remainder of this Chapter, a motion sequence will be considered by a ma-trix representing all the trajectories of all the recorded markers during the entiresequence. This matrix has the dimension N × (3 · M), where N is the number offrames of the sequence, and M the number of recorded markers. A marker trajectorypj (j ∈ 1, ..., M) is represented as an N × 3 matrix.
The method was implemented with Matlab R2017a and the MoCap Toolbox (Burgerand Toiviainen, 2013b). The code is available for free download at: https://github.
com/numediart/MocapRecovery.
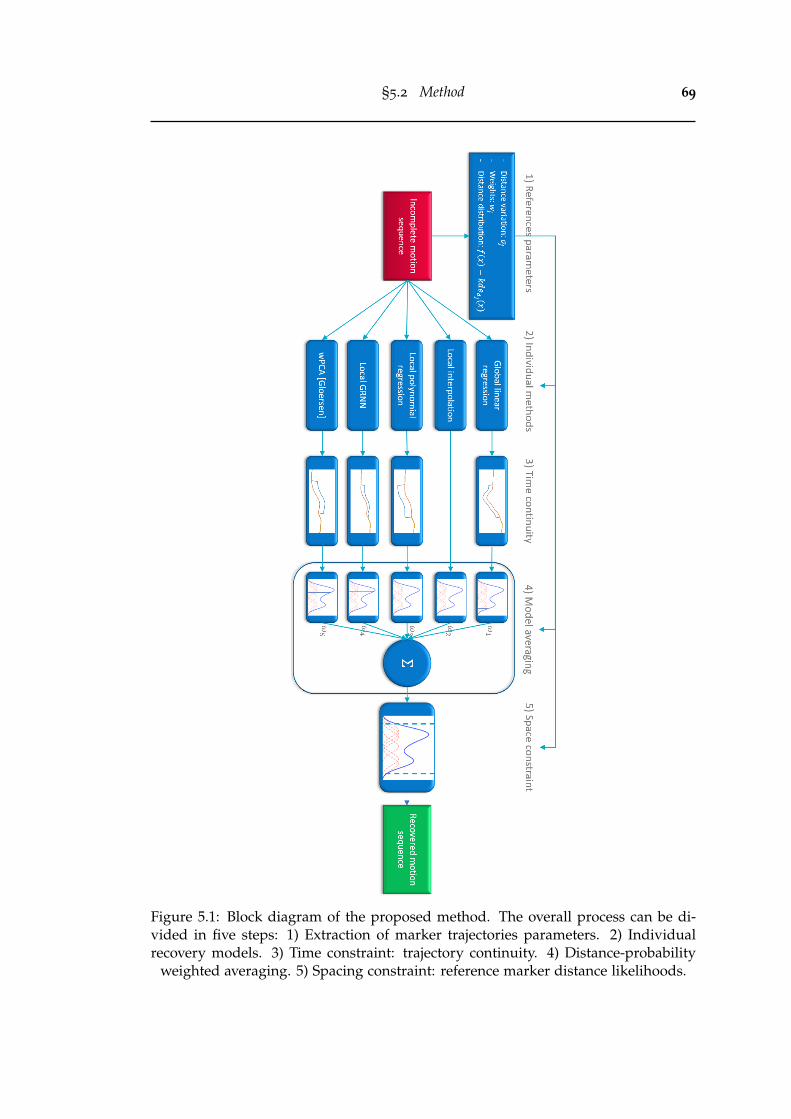
§5.2 Method 69
Figure 5.1: Block diagram of the proposed method. The overall process can be di-vided in five steps: 1) Extraction of marker trajectories parameters. 2) Individualrecovery models. 3) Time constraint: trajectory continuity. 4) Distance-probability
weighted averaging. 5) Spacing constraint: reference marker distance likelihoods.

70 Robust and automatic motion capture data recovery
5.2.1 Reference marker definition
All individual recovery models, as well as the proposed spacing constraint, dependon reference markers from which incomplete marker trajectories are to be recovered.We propose an automatic method to define such reference markers, based on inter-marker distance variations, inspired by skeleton-based methods where the intuitionis based on the fact that joints of a skeleton have limited distance variations, dueto bones’ fixed lengths and limited degrees of freedom. We hypothesize that inmany situations an incomplete marker trajectory can be recovered more effectivelywith methods using reference marker information, due to the close relation betweenthe markers and their references. For instance, the wrist trajectory is more closelyrelated to the elbow or shoulder trajectory than that of the foot. For each markertrajectory to be reconstructed, we can reorder related markers (referred to below asreference markers, or references) using distance standard variation. We denote bym the marker trajectory to recover, and pj any other marker trajectory (N × 3). Thedistance variation is computed as the standard deviation of the Euclidean distancebetween m and pj:
σj = std(||(m− pj)||) (5.1)
The marker pj with the smallest σj is the marker most related to m, i.e. the best refer-ence for reconstruction of m. All markers can then be sorted as potential referencesfor reconstruction of m, according to their distance variation with it.
5.2.2 Model 1: Global Linear Regression
An incomplete marker trajectory can be modeled based on trajectories of all presentmarkers as input information. In the present context of human motion data, we havea complex problem involving underlying non-linear relationships, with potentiallyimportant quadratic or circular components, due to angular motions of skeleton seg-ments. However, for the method to be fully automatic, the model training data arelimited to the incomplete sequence to recover itself, i.e. N frames minus the missingframes.
Because many input variables are considered for the design of the model (3 ·M), themodel must be simple, to avoid overfitting. Accordingly, we selected linear regression(Seber and Lee, 2003) for that task. Assuming that markers with lower distancevariation σj are more suited for predicting the missing marker trajectory, we defineda threshold θ on σj, and avoided markers with σj > θ to simplify the model. Thisway, only relevant markers (numbered MX) are used to model the position of theincomplete marker. This threshold was experimentally set to 50 mm in this research,as it gave the best results for the dataset, consisting of eight motion sequences with41 markers (see Results, Table 5.1). Intuitively, a larger threshold could be consideredfor data with fewer available markers.

§5.2 Method 71
Let m be missing between frames n1 and n2. In other words, the rows from n1 + 1to n2 − 1 of the matrix m must be recovered. A linear regression is performed oneach axis i of m. Let X = [pj]j:σj<θ,pj 6=m be the design matrix of dimension N × (3 ·MX), including all marker trajectories pj with σj < θ, except the incomplete markertrajectory itself m (in practice, we add an intercept column to the design matrix, allmissing frames are excluded, and we use only markers always present during thegap of m to recover). Denote by X(n) as the n-th row of X, mi the ith column (orspatial axis) of m (i ∈ 1, 2, 3), and mi(n) its n-th element. The missing part of m isrecovered using the following equations:
βi =argminbi(∑
n(X(n) · bi −mi(n))2)i={1,2,3},n∈{1,...,N}\{n1+1,...,n2−1} (5.2)
m =[X · βi]1≤i≤3 (5.3)
where βi is the vector of regression coefficients of mi extracted through least squareerror minimization, and m is the trajectory recovered with global linear regression.In practice, computation of m is needed only for the missing frames.
5.2.3 Model 2: Local Interpolation
To simplify the modeling of the incomplete marker trajectory, skeletal motion proper-ties involving strong relations between markers can be considered. A local coordinatesystem can be defined based on three references, and hence reduce the variance ofthe trajectory representation (Howarth and Callaghan, 2010).
Our second algorithm performs a local interpolation, i.e. an interpolation performedin a local reference defined by three other markers (the references).
Denote by p1, p2, and p3 the first three reference markers (ordered by σj, see Eq. 5.1),used to recover m. Define a local coordinate system based on these markers, withthree orthonormal vectors (u1,u2,u3) at each time (or frame) n (here n indicates therow of a matrix (1 ≤ n ≤ N) For instance, p2(n) is the nth row of p2, i.e. a 1× 3vector):
v1(n) =p2(n)− p1(n), u1(n) =v1(n)||v1(n)||
(5.4)
v2(n) =v1(n)× (p3(n)− p1(n)), u2(n) =v2(n)||v2(n)||
(5.5)
u3(n) =u1(n)× u2(n) (5.6)
where× indicates the cross product. m can then be projected into the local coordinatesystem:
P =[u1(n)T u2(n)T u3(n)T] (5.7)
ml(n) =(m(n)− p1(n)) · P (5.8)

72 Robust and automatic motion capture data recovery
P is the projection matrix, and ml the (projected) local trajectory.
ml can be interpolated with simple linear interpolation. The recovered local trajectorycan then be projected back into the original coordinate system:
ml(n) =
{ml(n1) +
n−n1n2−n1
· (ml(n2)−ml(n1)), f or n = {n1 + 1, ..., n2 − 1}ml(n), otherwise
(5.9)
m(n) =ml(n) · P−1 + p1(n) (5.10)
The interpolation is possible under the condition that all three references are presentat frames n1 and n2. Also, if there are missing frames in a reference during the gap(n ∈ {n1 + 1, ...n2 − 1}), the incomplete marker trajectory m will only be partially re-covered. In this case, we can iterate the process with other references on the residualgap (i.e. p1, p2, p4 if p3 was missing during the gap of m to fill, and so on) until m iscompletely recovered.
5.2.4 Model 3: Local polynomial regression
As just discussed, local interpolation takes advantage of markers relations by per-forming an interpolation in a local coordinate system. To further use that advantage,we can model and predict the position of the missing marker from its neighborhood(the local reference markers), using regression. As the number of input variables ismuch lower than for global regression, we can use a more complex model, able tomodel the non-linear relations between marker trajectories.
Our third algorithm is based on polynomial regression in the local coordinate system.First, the trajectory to recover is projected into a local coordinate system (ml) definedby reference markers p1, p2, and p3 (see Eq. 5.8). For each local coordinate of themarker to recover, a polynomial regression is performed, using reference markerslocal coordinates as input variables. In practice, only three input local coordinatesare useful: the origin of the system is located in p1 (p1 = (0, 0, 0)), the new x-axispasses through p2, giving p2 = (xp2 , 0, 0), and the new y-axis is normal to the planepassing through p1, p2, and p3, giving p3 = (xp3 , 0, zp3). Finally, the input set iscomposed of three variables:
Xl = {xp2 , xp3 , zp3} (5.11)
For polynomial regression, the input variable set Xl is extended to quadratic polyno-mials in the input variables, leading to a set of 9 variables:
Xq = {Xl1, Xl
2, Xl3, Xl
12, Xl
22, Xl
32, Xl
1 · Xl2, Xl
1 · Xl3, Xl
2 · Xl3} (5.12)
§5.2 Method 73
The regression model is trained on the frames of the motion sequence where allmarkers (ml ,p1,p2,p3) are present. The trained model is then used to predict allmissing values of ml :
βi =argminβi(∑
n(Xq(n) · βi −mi(n))2)i={1,2,3},n∈{1,...,N}\{n1+1,...,n2−1} (5.13)
ml =[Xq · βi]1≤i≤3 (5.14)
Finally, the recovered local trajectory ml can be projected back into the original co-ordinate system (see Eq. 5.10). Like local interpolation, this method is processediteratively on sorted references until the trajectory of m is completely recovered.
5.2.5 Model 4: Local Generalized Regression Neural Network
Generalized Regression Neural Network (GRNN) is a non-linear regression method,already used in various applications (Specht, 1991). It is a variant of an artificialneural network, consisting of four layers: the input layer, a radial basis layer, a sum-mation layer and the output layer. GRNN allows to estimate any arbitrarily com-plex function, given a sufficient number of observations (generating the radial basiskernels). Comparatively to standard neural networks, GRNN does not require aniterative training. Moreover, as the output of the model is bounded by the extremaof the training dataset, a GRNN can only give physically meaningful outputs (Firatand Gungor, 2009). It means for instance that a GRNN should not predict markerpositions with highly implausible distances.
The proposed algorithm applies a GRNN on local variables Xl , to model and predictthe local trajectory ml . The GRNN is thus trained with three input variables (inpractice, each input variable is standardized by subtracting its mean and dividingit by its standard deviation). (Xl , see Eq. 5.11) and three output variables (ml),according to:
ml(n) =∑k ml(k) · exp(− ||Xl(n)−Xl(k)||2
2s2 )k={1,...,N}\{n1+1,...,n2−1}
∑k exp(− ||Xl(n)−Xl(k)||22s2 )k={1,...,N}\{n1+1,...,n2−1}
(5.15)
Parameter s determines the smoothness of the regression, and was experimentallyset to 0.3 in this research (for standardized input variables), as it gave the best resultsfor the dataset tested. Intuitively, a larger s could be chosen to recover slow motions,and a smaller one for sharp and fast motions.
Like the other local recovery models, local GRNN process is iterated on sortedmarker references until the trajectory of m is completely recovered.
All these individual models can be used independently to recover a trajectory, lead-ing to several candidates. We explain in the next sections how these candidates arefurther processed and combined to produce a more robust recovery.
74 Robust and automatic motion capture data recovery
5.2.6 Time Constraint: Trajectory Continuity
Human motion time series are limited by two major constraints:
• a spacing constraint, defined by limited ranges of motion and fixed bone lengths;
• trajectory continuity, due to body inertia.
All recovery techniques that are based on interpolation intrinsically respect the con-tinuity constraint. However, this is not the case of predictive models. To enforcecontinuity on recovered data, we can add a linear correction ramp:
δn1 =m(n1)−m(n1) (5.16)
δn2 =m(n2)−m(n2) (5.17)
δ(n) =
{δn1 +
n−n1n2−n1
· (δn2 − δn1), f or n = {n1 + 1, ..., n2 − 1}(0 0 0), otherwise
(5.18)
m =m− δ (5.19)
For each axis, we compute the difference between the real value and the predictedvalue at each border (δn1 and δn2), and subtract from the recovered trajectory a linearramp from δn1 to δn2 . An example of this correction is illustrated in Fig 5.2.
5.2.7 Probabilistic model averaging (PMA)
Depending on the context, each model can be more or less effective, making difficultthe choice of the best model, and the development of a robust recovery method. Toaddress this issue, we propose a model averaging method, based on the posteriorlikelihoods of the distances between the recovered body points and other markers.This method is inspired by Bayesian model averaging (Hoeting et al., 1999).
We estimate the a posteriori probability of each predicted location according to theirdistance to reference markers. For references p1, p2, and p3, we estimate the distancedistribution with m throughout the entire motion sequence on non-missing frames,using kernel smoothing density estimation ("kde" (Parzen, 1962) used with Silver-man’s rule of thumb to choose the bandwidth of the kernel estimator (Silverman,1986) ). For each recovery method k, a weight is computed:
dj =||pj −m|| (5.20)
f j(x) =kdedj(x) (5.21)
djk(n) =||pj(n)− mk(n)|| (5.22)
ωk(n) = f1(d1k(n)) · f2(d2k(n)) · f3(d3k(n)) (5.23)

§5.2 Method 75
Figure 5.2: Trajectory continuity correction. The yellow curve shows incomplete dataof a marker trajectory (m) on which a gap was introduced between frames 1130 and1190 (only z-axis is shown). The blue curve represents the recovered data (m), andthe red curve shows the corrected data using trajectory continuity constraint (m) (see
Eq. 5.16-5.19).

76 Robust and automatic motion capture data recovery
Here ωk is the weight of the trajectory mk recovered with method k, and f j is theestimated probability density function of the distance between m and the referencemarker pj.
We then compute a weighted average of all the recovered trajectories:
m(n) = ∑Kk=1 mk(n) ·ωk(n)
∑Kk=1 ωk(n)
(5.24)
K is the number of individual models used for the recovery.
This process allows to give more importance to most likely recovered trajectories,according to their distance with other markers. In the remainder of this Chapter, wedenote this method as Probabilistic Model Averaging (PMA).
5.2.8 Spacing constraint: reference marker distance confidence interval
A final step is applied on the recovered trajectory. Knowing the probability densitydistribution of the distance ||p1 − m||, i.e. f1 (see Eq. 5.21), we can check if thedistance of the recovered trajectory with p1 respects the confidence interval:
CI = {x : F1(x) ∈ [0.05; 0.95]}, (5.25)
where F1 is the cumulated probability density function estimation of the distance||p1 − m||, i.e. F1(x) =
∫ x−∞ f1(ξ)dξ. The limits of this interval correspond to two
spheres centered on p1, with radii corresponding to:
r1 =arg(xF1(x) = 0.05) (5.26)
R1 =arg(xF1(x) = 0.95) (5.27)
If the recovered trajectory is outside these limits, it is projected onto the closest limitsphere. Fig 5.3 illustrates the projection of m(n) onto the limits of the confidenceinterval. In this example, the recovered frame m(n) is outside the confidence zone,as x = ||p1(n)− m(n)|| > R1. The red arrow shows m(n), projection of the recov-ered frame m(n) onto the R1-radius sphere centered at p1, to fit the soft skeletonconstraint. If the recovered frame is already in the confidence zone, no correction isapplied: m(n) = m(n). This process is thus used only if the recovered frame has lowa posteriori probability, i.e. an unusual distance with its first reference marker p1.
A stricter version of the spacing constraint can be applied by recursively projectingthe recovered point onto the CI obtained for several reference markers (e.g. the firstthree references p1, p2 and p3), iteratively until the point is at a plausible distance ofeach reference.
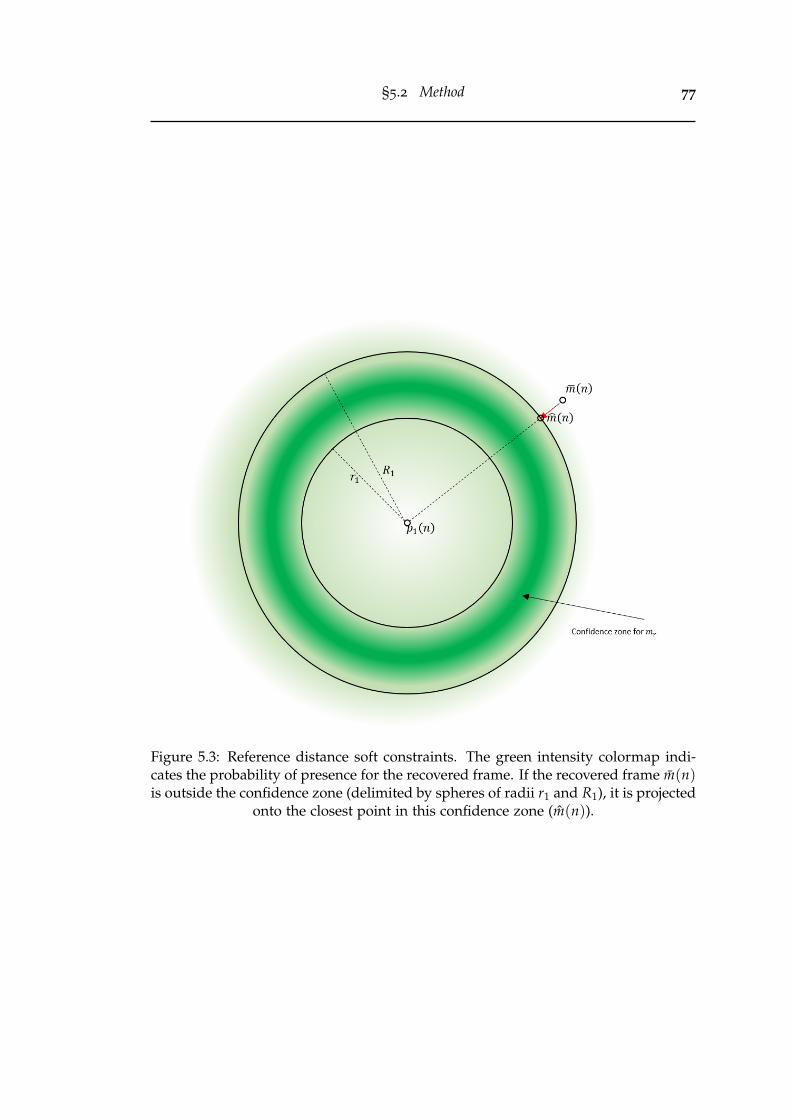
§5.2 Method 77
Figure 5.3: Reference distance soft constraints. The green intensity colormap indi-cates the probability of presence for the recovered frame. If the recovered frame m(n)is outside the confidence zone (delimited by spheres of radii r1 and R1), it is projected
onto the closest point in this confidence zone (m(n)).

78 Robust and automatic motion capture data recovery
File name Type of motion #markers Duration (s) #frames fpsHDM1 Locomotion on the spot 41 33.25 3990 120HDM2 Shelf (while walking) 41 70.83 8500 120HDM3 Kicking and punching 41 63.93 7671 120HDM4 Chair, table, floor 41 62.79 7535 120HDM5 Clapping and waving 41 57.94 6953 120CMU1 Break dance (Jumptwist) 41 6.75 810 120CMU2 Break dance 41 37.5 4499 120CMU3 Martial art (Empi) 41 43.35 5202 120
Table 5.1: Motion sequences used in the methods comparison.
5.2.9 Experiments
To validate our method, we tested each method used individually as well as themethod combination with PMA. For such testing, we used the online CMU MoCapdatabase (http://mocap.cs.cmu.edu/) (Hodgins) and the HDM05 database (http://resources.mpi-inf.mpg.de/HDM05/) (Müller et al., 2007). They contain a high numberof various motion sequences, and they have been used by much of the related work(Liu and McMillan, 2006; Li et al., 2010; Tan et al., 2013, 2015; Peng et al., 2015;Gløersen and Federolf, 2016). Table 5.11 shows the motion sequences selected for themethods comparison. Motion sequences were selected to include a large variety ofmotions, in terms of complexity, type of motion, and duration.
The performance of the recovery method on a motion sequence may depend ondifferent factors, including:
• The number of incomplete and complete marker trajectories
• The length of the gaps
• The sequence duration
• The motion complexity or periodicity
To analyze the performance of each method according to these factors, we introducedthree concomitant gaps into our motion sequences, at random locations (uniformly
1
The files names in this table corresponds to the following files in the respective datasets: HDM1=HDM_mm_01-02_03_120, HDM2 = HDM_mm_02-02_02_120, HDM3 = HDM_mm_03-02_01_120,
HDM4 = HDM_mm_04-01_02_120, HDM5 = HDM_bd_05-01_01_120, CMU1 = 85_02, CMU2 = 85_12,CMU3 = 135_02.

§5.3 Results 79
distributed random markers and frames). We applied each method on these incom-plete motion sequences, and extracted the recovery error for each method:
ε =1g
g
∑j=1
1n2j − (n1j + 1)
n2j
∑n=n1j
||mj(n)−mj(n)|| (5.28)
g is the number of random gaps created, n1 j and n2 j delimit the location (in frames)of the randomly introduced gap j, and mj and mj are respectively the original andthe recovered trajectories. We iterated this process 20 times with different randomgap locations, and a mean recovery error was extracted from all iterations to estimatethe general performance of each method. To analyze the influence of the sequenceduration, fragments with different duration were extracted from each motion file.
Our method performances were compared to related work available online, namelythe BoLeRo algorithm from Li et al. (2010) (Matlab code available for download at: https://github.com/lileicc/dynammo) and the weighted PCA-based reconstructionmethod from Gløersen and Federolf (2016) (Matlab code available for download at: https://doi.org/10.1371/journal.pone.0152616). In the sequel, these methods will beidentified with the following numbers and acronyms:
1. Global Linear Regression (GLR)
2. Local Interpolation (LI) (Howarth and Callaghan, 2010)
3. Local Polynomial Regression (LPR)
4. Local GRNN (LGRNN)
5. weighted PCA-based method (PCA) (Gløersen and Federolf, 2016)
6. BoLeRo algorithm with soft bone constraints (BoLeRo) (Li et al., 2010)
We used the soft bone constraints version of the BoLeRo algorithm, with 16 hiddendimensions as proposed by Li et al. (2010). The PCA-based method was used with theparameters proposed by their authors, using the consecutive reconstruction strategyfor multiple gaps (Gløersen and Federolf, 2016).
All results were obtained in MATLAB R2017a on a computer with Intel Core i7-4712HQ 2.3 GHz and 16 GB RAM running Windows 10.
5.3 Results
In this section, we present the results of the recovery on different simulated incom-plete motion sequences. We analyze the influence of gap length, motion sequenceduration, the number of incomplete marker trajectories, and the influence of the mo-tion type.

80 Robust and automatic motion capture data recovery
5.3.1 Gap length
Fig 5.4 shows the results for two different motion sequences (respectively CMU1 andCMU3). In both cases, BoLeRo gives higher errors than all other methods. Moreover,the processing time, due to the iterative optimization process of the method, is sig-nificantly higher than others. For instance, the process duration is above the minutefor filling three gaps of 2 seconds in the file CMU3, against less than a second forall other individual methods. For these reasons, and for better graphics readability,BoLeRo is left out in the remaining of the results.
On the right graphs, we can see results for all individual methods, except BoLeRo.Concerning the MoCap sequence CMU1 (top graph), Fig 5.4 shows a clear separationof each method accuracy, where LGRNN seems to reach the best accuracy (20.2 mmmean error for three random gaps of 5 seconds). Accuracy of all methods seemsto decrease with gap size. Concerning the MoCap sequence CMU3 (bottom graph),GLR seems to give the best results, with a mean recovery error of 12.7 mm for threerandom gaps of 5 seconds.
Fig 5.4 also shows results of model averaging of several methods (dashed lines). Ingeneral, each combination of individual methods (all but 5 (PCA), all but 2 (LI),and all methods) seems to lead to an error comparable to that of the best individualmethods in general. Our PMA method thus seems robust to gap size.
5.3.2 Motion sequence duration
Except for our most basic method based on interpolation (LI), each individual methodperformance may depend on the motion sequence duration. Indeed, more frames inthe sequence means more information (more possible data variation), and more sam-ples for model training.
To illustrate the influence of sequence duration on performance of gap recoverymethods, fragments with different durations were extracted from each motion file.Fig 5.5 shows the mean recovery error for different sequence durations, for differentmotion sequences. We can see on each graph that all methods follow similar patterns,showing that their performance highly depends on the specific motion. Nonetheless,for most graphs (except for HDM5), the mean recovery error seems to be higherfor sequence durations of 5 seconds, and decreases for a sequence duration of 10seconds. Beyond that duration, the recovery is not much improved. Concerning in-dividual methods, LGRNN seems to be more robust to sequence duration, comparedto other regression methods. For long durations, GLR seems to give the best resultsof all individual methods.
For all durations and all motion sequences, PMA effectively weights each individualmethod, hence providing optimal recovery in any context. The best combination isthe averaging of all methods but LI (dark red dashed line). Our PMA method is thusrobust to motion duration.

§5.3 Results 81
Figure 5.4: Mean recovery error for different gap sizes and gap recovery methods.Top: CMU1. Bottom: CMU3. Left: results including BoLeRo method. Right: resultswithout BoLeRo method. Each point represents the mean of recovery errors, com-puted with 20 iterations, of three randomly created gaps of the same length (0.5, 1,2 or 5 seconds). Solid lines show results for each individual method. Dashed linesshow results for distance-probability averages of various combinations of individual
methods.

82 Robust and automatic motion capture data recovery
Figure 5.5: Mean recovery error for different sequence durations and gap recoverymethods. To illustrate the influence of sequence duration on performance of gaprecovery methods, fragments of different durations were extracted from each motionfile. Each point represents the mean of the recovery errors computed on 20 itera-tions of three randomly created gaps of 1 second. Continuous lines show results foreach individual method. Dashed lines show results for PMA with various methods
combinations.

§5.3 Results 83
Sequence ε, noconstraint(mm)
ε, constraint(mm)
Difference(mm)
t-test p-value
HDM1 8.1 6.6 1.5 p < 10e− 5HDM2 4.8 4.4 0.4 p = 0.46HDM3 5.5 5.2 0.3 p = 0.07HDM4 8.5 7.4 1.2 p = 0.08HDM5 4.5 3.0 1.5 p = 0.001CMU1 17.1 15.7 1.5 p = 0.008CMU2 14.4 13.5 1.0 p < 10e− 3CMU3 10.5 8.4 2.1 p < 10e− 10
Table 5.2: Effect of constraints on mean recovery error (t-test, n = 200; conditions:3 gaps of 1 seconds). Paired t-test (n = 200) on constraints effect on PMA for thereconstruction of 3 gaps of 1 second, introduced into different motion sequences.
Individual methods 1 to 4 were used in this test.
5.3.3 Number of concomitant gaps
Except for basic interpolation or dynamic filtering methods, the reconstruction qual-ity of one marker trajectory depends on the presence of reference markers. If severalmarkers are missing at the same time during the motion sequence, less informationis available for reconstruction. According to the method, the reconstruction qualitymay be influenced differently. Fig 5.6 shows the mean recovery error of individualmethods and their PMA combinations for different motion sequences, and for differ-ent numbers of markers missing at the same time (gaps of one second). We can see ingeneral that for all motion sequences and for all methods, the recovery error growswith the number of concomitant gaps. Again, PMA generally give the best results.
5.3.4 Constraints effect
For all previous results, time and spacing constraints were applied for all individualmethods and model averages. To verify the effectiveness of these constraints, PMAreconstruction was tested with and without constraints for each motion sequence,with 200 iterations of three gaps of one second. For each motion sequence, a paired t-test was performed on the mean recovery error of the 200 iterations with and withoutconstraint, as shown in Table 5.2.
Results show that for almost all tested motion sequences, PMA yields a significantimprovement of the recovery method. The constraints did not improve the recoveryfor the sequence HDM2 (larger p-value), but this may be due to the fact that therecovery error is already low without constraint (ε = 4.8 mm).

84 Robust and automatic motion capture data recovery
Figure 5.6: Mean recovery error for different numbers of missing markers and gaprecovery methods. Each point represents the mean of recovery errors computed over20 iterations of a number of randomly created gaps of 1 second (1, 3, 6, 10 or 20 gaps).Solid lines show results for each individual method. Dashed lines show results for
distance-probability averages of various methods combinations.

§5.3 Results 85
Sequence ε, noconstraint(mm)
ε, constraint(mm)
Difference(mm)
t-test p-value
HDM1 40.9 13.5 27.4 p < 10e− 10HDM2 14.4 8.4 6.0 p < 10e− 3HDM3 32.2 10.8 21.4 p < 10e− 10HDM4 29.8 16.1 13.7 p < 10e− 8HDM5 25.0 8.6 16.4 p < 10e− 10CMU1 80.8 39.1 41.7 p < 10e− 10CMU2 27.7 26.2 1.5 p = 0.16CMU3 22.1 19.6 2.6 p = 0.02
Table 5.3: Effect of constraints on the mean recovery error (t-test, n = 200; conditions:10 gaps of 5 seconds). Paired t-test (n = 200) on constraints effect on PMA for thereconstruction of 10 simultaneous gaps of 5 seconds, introduced into different motion
sequences. Individual methods 1 to 4 were used in this test.
Table 5.3 shows a similar analysis in a situation of low marker presence. In thiscase, 10 simultaneous gaps of 5 seconds were introduced into each motion sequence.We can see that in such situation, PMA’s mean recovery error is much higher, andconstraints always improve it significantly, up to 40 mm for CMU1.
5.3.5 Synthesis - mean results
As a synthesis, fig 5.7 shows the mean results of each method, obtained from themean of the recovery errors on all the selected motion sequences. It can be seen thatthe various PMA combinations give more robust reconstruction regardless of the typeof motion, the gap length (left graph), the duration of the motion sequence (centergraph) and the number of incomplete marker trajectories (right graph). Among theindividual methods, there is no clear difference of performance according to gaplength. The local GRNN method seems more robust to gap length: it allows torecover three concomitant gaps of 5 seconds with a mean error of 10 mm. All othermethods lead to a mean error above 15 mm. The local GRNN seems to be morerobust to sequence duration. A duration of 5 seconds (with 41 markers, 120 fps)allows to train an effective model to reconstruct three concomitant gaps of 1 secondwith a mean error of 12 mm. However, for a longer sequence (40 seconds), GLRgives the best results, with a mean error of 9 mm. All individual methods are highlysensitive to the number of concomitant gaps, and thereby to the number of markersavailable to predict the missing trajectories. Finally, PMA systematically improvesthe gap recovery, independently of motion type, gap length, sequence duration ornumber of missing markers. As the local interpolation method seems to be the lesseffective, the best method combination is the averaging of methods 1, 3, 4 and 5.

86 Robust and automatic motion capture data recovery
Figure 5.7: Mean recovery error for different recovery methods, for all test motionsequences. Left: different gap lengths (3 concomitant gaps, total sequence duration);Center: different motion durations (3 concomitant gaps of 1 second); Right: differentnumbers of concomitant gaps (gaps of 1 second, total sequence duration). Each pointrepresents the mean of recovery errors computed over 20 iterations of a number ofrandomly created gaps. Solid lines show results for each individual method. Dashed
lines show results for PMA with various individual methods combinations.
5.3.6 Visual results
Besides error minimization in MoCap data reconstruction, the visual result is anotherimportant criterion, especially if data are used for an animation purpose. Moreover,simulated gaps allow for a comparison of the different methods based on objectiveand quantitative results, but may not completely represent the ground truth. Gapsoccurring in real situation may be more complicated to recover than randomly sim-ulated ones. For instance, when a marker is occluded in a real situation, it is likelythat the neighbor markers are also occluded. It is also very likely that a marker isrecurrently occluded during a MoCap session, due to its placement on the body. Fig.5.8 shows visual results of gap recovery with pchip interpolation (baseline), weightedPCA (Gløersen and Federolf, 2016) and our method, for three MoCap files originallyrecorded for various research and applications2. These motion sequences were se-lected as they are ground truth data, involving a high number of marker occlusions.A baseline method such as pchip interpolation (Fritsch and Carlson, 1980) could notrecover missing data with sufficient accuracy for effective use of these files:
• A karate MoCap sequence with 25 optical markers, recorded at 250 fps (dura-tion: 53 s, minimum marker presence: 86%, maximum number of simultaneousgaps: 12). This motion sequence involves sharp movements, difficult to recoverwith interpolation.
• A contemporary dance performance with a fall, recorded with 68 optical mark-ers at 180 fps (duration: 57 s, minimum presence: 65%, maximum number of
2Data can be retrieved at: https://github.com/titsitits/MocapRecovery

§5.4 Discussion 87
simultaneous gaps: 26). This motion sequence involves long and simultaneousgaps on a large number of markers.
• A contemporary dance performance where the dancer performs a roulade onthe ground, recorded with 68 optical markers at 180 fps (duration: 13 s, mini-mum presence: 34%, maximum number of simultaneous gaps: 30). This motionsequence has a poor quality for all markers throughout the whole sequence, asa roulade leads to many and frequent occlusions.
For better visualization, videos are supplied in supporting information (see the videosprovided at https://github.com/numediart/MocapRecovery). All screen-shots andvideos were created with the MotionMachine framework (Tilmanne and d’Alessandro,2015).
Though objective results cannot be obtained in this context, we can observe thatthe movements reconstructed with our method generally seem realistic and respectmovement constraints (for continuity, see the videos). Highly unrealistic results areobtained with pchip when gaps occur at the beginning or the end of a sequence. Thisis due to the fact that the recovered data are extrapolated and not interpolated.
The method proposed by Gløersen and Federolf (2016) obtained particularly bad re-sults on the roulade motion sequence. This may be due to the fact that the methodassigns weights to trajectories based on mean distance between markers. However,with roulade or similar movements, all limbs are gathered and their distance is re-duced. In this case, distance standard deviation would be a more robust indicator ofthe relation between neighbor markers.
Videos show results with all individual methods, without constraints, and with PMAand spatial and temporal constraint. We can observe that PMA and the constraint im-prove the stability of the recovered movement, avoiding glitches and discontinuitiesin marker trajectories.
Finally, unrealistic results may appear for each method. In this case, it is possible thatthe error is due to corrupted original data, such as a swapping of marker trajecto-ries. Several MoCap data softwares enable MoCap data post-processing, allowing tocorrect swapped trajectories, or simply to remove incoherent data. This step is hencerecommended before recovery to obtain better results.
5.4 Discussion
Our PMA method presents several advantages compared to the available state of theart. It is fully automatic and does not require any prior knowledge or any pre-trainedmodel. It can be used on MoCap data recorded with any marker set. Graphical

88 Robust and automatic motion capture data recovery
Figure 5.8: Visual comparison of different gap recovery methods on different motionsequences, with different marker sets. Red: original data. Gray: pchip interpolation(baseline) (Fritsch and Carlson, 1980). Blue: Gløersen and Federolf (2016). Green:
our algorithm (PMA with constraints).

§5.4 Discussion 89
results show that PMA is robust to various factors, including gap length, sequenceduration, the number of simultaneous gaps, and the type of motion. Additionally,the use of temporal and spacing constraints significantly improves the reconstruction,especially in challenging conditions (see Table 5.3).
Figs 5.4-5.7 show results where spacing and time constraints were applied to eachindividual method. These constraints may indeed be applied afterwards to any pre-diction method. The improvement of recovery after method combination is hence ex-clusively due to PMA, and confirms its effectiveness. In terms of quantitative results,no individual method shows better performance in general. All individual methodsare more or less sensitive to the context, including motion type, gap length, sequenceduration or the number of simultaneous missing markers. In contrast, PMA seems totake advantage of every individual method, improving the robustness of the recov-ery algorithm. Moreover, as averaging is based on distance with reference markers,PMA partly takes skeleton constraints into account.
Our methods could not be compared to some recently proposed methods, due tothe unavailability of the code. However, the recent skeleton-constrained SVT methodfrom Tan et al. (2015) (not included in our study), based on both skeleton constraintsand low rank properties, achieved similar results to BoLeRo (Li et al., 2010): theirimprovement over BoLeRo mainly lies in execution time, as explained in Tan et al.(2015). Their constraint-fitting optimization method converges significantly fasterthan BoLeRo.
The effectiveness of the method proposed in the present study, including PMA andtime and spacing constraints, is independent of the individual recovery model. It cantheoretically be applied to any other set of individual recovery models in the future,possibly leading to better performance.
5.4.1 Limitations
The methods included in the present study rely on several parameters, includingthe threshold for reference marker selection in GLR, the smoothing parameter inLGRNN, parameters from w-PCA (Gløersen and Federolf, 2016), as well as confi-dence interval thresholds for spacing constraints. All these parameters were experi-mentally chosen in this research, as they gave the best results for the dataset tested(see Table 5.1). The user should adapt these parameters for her/his own data if nec-essary. Optimal parameters could depend on MoCap data, including for instance thenumber of recorded markers, their particular placement, the complexity or speed ofthe motion, data accuracy, or noise due to marker vibrations or camera quality. Forinstance, a larger threshold for the linear regression model could be considered forMoCap data with fewer available markers, and the optimal smoothness parameterfor LGRNN could depend on the smoothness of the motion itself.
90 Robust and automatic motion capture data recovery
For the validation of the proposed methods, gaps were introduced into motion se-quences at random locations. It is possible that in some particular cases, a markercan be isolated, without any highly related reference. If this marker is missing, itcould lead to a poor recovery. This issue thus depends on the placement of markersIt is hence relevant to consider this aspect when defining marker placement, to avoidisolated markers. On the other hand, markers placed too close to each other risk to beoccluded simultaneously. A trade-off must thus be considered for their placement.
PMA has some limitations in comparison to a method such as BoLeRo (Li et al., 2010).In case of a blackout, i.e. when all markers disappear at the same time, a methodbased on a predictive filter such as Kalman filter can reconstruct an entire frame, andthen use gradient descent or a similar optimization method to fit skeleton constraints,whereas PMA needs at least three present markers as references to evaluate distanceprobabilities. However, this is an extreme case, which can generally be avoided withan efficient use of the MoCap system.
5.4.2 Improvement prospects
Our methods could be improved in various ways. First, human motion is not a sta-tionary process (Chiari et al., 2005). Each individual model might be made moreefficient by giving more importance to motion data that are close to the gap to re-construct. For instance, for each gap, a local model could be trained on a limitedtime window centered on that gap. The distance probabilities could also be locallydefined on a time window. However, this would limit the number of available datafor model training.
Secondly, we could use a more complex constraint fitting method, making use of adynamic model such as the Kalman filter (Kalman et al., 1960) to ensure trajectorycontinuity. Additionally, an optimization procedure could be used instead of projec-tion for skeleton constraints fitting whenever the inter-marker distance is outside theconfidence interval. However, this could significantly increase execution time.
Finally, an original interest in the distance variation density estimation is the pos-sibility to assess the quality of the reconstruction. It could further be used as anindication to identify and verify the most sensitive parts of the data, and possiblyreject them and reprocess them with another configuration or method.
5.4.3 Processing time consideration
It is interesting to note that in human motion data, adjacent frames are very similarif the frame rate is high enough. In this case, data can be easily subsampled with-out losing much information for model training. This subsampling can drastically
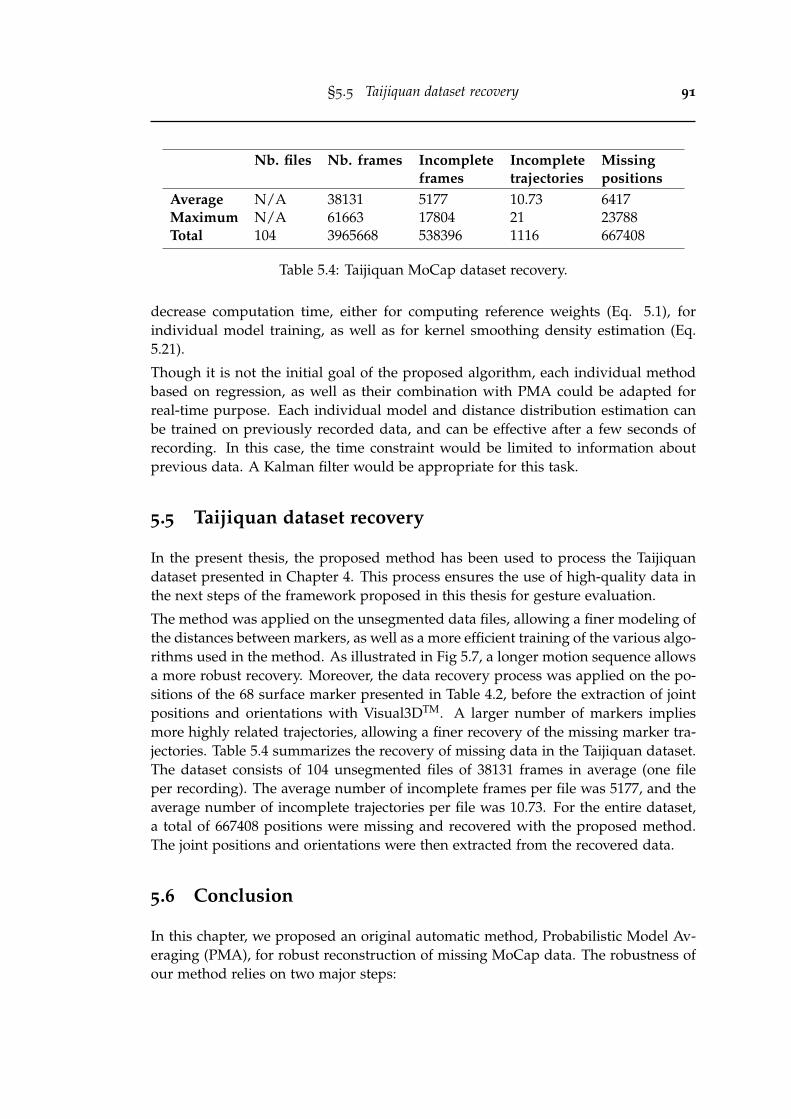
§5.5 Taijiquan dataset recovery 91
Nb. files Nb. frames Incompleteframes
Incompletetrajectories
Missingpositions
Average N/A 38131 5177 10.73 6417Maximum N/A 61663 17804 21 23788Total 104 3965668 538396 1116 667408
Table 5.4: Taijiquan MoCap dataset recovery.
decrease computation time, either for computing reference weights (Eq. 5.1), forindividual model training, as well as for kernel smoothing density estimation (Eq.5.21).
Though it is not the initial goal of the proposed algorithm, each individual methodbased on regression, as well as their combination with PMA could be adapted forreal-time purpose. Each individual model and distance distribution estimation canbe trained on previously recorded data, and can be effective after a few seconds ofrecording. In this case, the time constraint would be limited to information aboutprevious data. A Kalman filter would be appropriate for this task.
5.5 Taijiquan dataset recovery
In the present thesis, the proposed method has been used to process the Taijiquandataset presented in Chapter 4. This process ensures the use of high-quality data inthe next steps of the framework proposed in this thesis for gesture evaluation.
The method was applied on the unsegmented data files, allowing a finer modeling ofthe distances between markers, as well as a more efficient training of the various algo-rithms used in the method. As illustrated in Fig 5.7, a longer motion sequence allowsa more robust recovery. Moreover, the data recovery process was applied on the po-sitions of the 68 surface marker presented in Table 4.2, before the extraction of jointpositions and orientations with Visual3DTM. A larger number of markers impliesmore highly related trajectories, allowing a finer recovery of the missing marker tra-jectories. Table 5.4 summarizes the recovery of missing data in the Taijiquan dataset.The dataset consists of 104 unsegmented files of 38131 frames in average (one fileper recording). The average number of incomplete frames per file was 5177, and theaverage number of incomplete trajectories per file was 10.73. For the entire dataset,a total of 667408 positions were missing and recovered with the proposed method.The joint positions and orientations were then extracted from the recovered data.
5.6 Conclusion
In this chapter, we proposed an original automatic method, Probabilistic Model Av-eraging (PMA), for robust reconstruction of missing MoCap data. The robustness ofour method relies on two major steps:

92 Robust and automatic motion capture data recovery
1. The weighted combination of several models, based on the posterior likelihoodsof inter-marker distances.
2. The application of simple but effective constraints, enforcing trajectory conti-nuity and plausible distance of reconstructed trajectories with related markers.
To support and validate our model-averaging method, several reconstruction meth-ods based on regression and local coordinates were proposed, and were found tocompete with state-of-the-art methods. Results show that PMA used with the con-straints outperforms individual methods in various conditions, including variousgap lengths, motion sequence durations and numbers of simultaneous gaps.
Our method has the advantage of being fully automatic. The algorithm is data-driven, and does not need any prior knowledge or any pre-trained model. Moreover,the model averaging and the proposed constraints are general and can be used withany other individual reconstruction method, leading to possible future improvement.
In the present thesis, the proposed method was used for the processing of the Taiji-quan MoCap dataset.
Chapter 6
Taijiquan ergonomic principles: anew set of features
Contents6.1 Introduction . . . . . . . . . . . . . . . . . . . . . . . . . . . . . . . . . 936.2 Stability . . . . . . . . . . . . . . . . . . . . . . . . . . . . . . . . . . . 946.3 Joint alignments . . . . . . . . . . . . . . . . . . . . . . . . . . . . . . 976.4 Favorable angles . . . . . . . . . . . . . . . . . . . . . . . . . . . . . . 986.5 Fluidity . . . . . . . . . . . . . . . . . . . . . . . . . . . . . . . . . . . . 1016.6 Summary and conclusion . . . . . . . . . . . . . . . . . . . . . . . . . 102
6.1 Introduction
In Chapter 2, we presented various features allowing a low-level or high-level repre-sentation of motion. Among these features, we presented the category of ergonomicfeatures. Ergonomics is closely related to skill, as it is the study of motor controleffectiveness while minimizing energy expenditure and risks of injury. However, noprevious work known to the author used this type of feature for evaluation of ex-pertise. Andreoni et al. (2009) proposed a method based on perceived discomfort(see Section 2.3.6.4) to automatically assess the ergonomy of a posture from MoCapdata, showing a potential use of ergonomic features in quantitative motion qualityassessment.
In this Chapter, present a new set of ergonomic features is presented, inspired byTaijiquan. One major component in the learning of Taijiquan is focused on the ergon-omy of motion, as extensively developed in the work of the ergonomist and Taijiquanteacher Eric Caulier (Caulier, 2010). A collaboration with him led to the developmentof a new set of ergonomic features, inspired by principles largely taught in the schoolof Taijiquan Eric Caulier. The proposed feature set can be divided into four main cat-egories, as presented in the following sections:
93
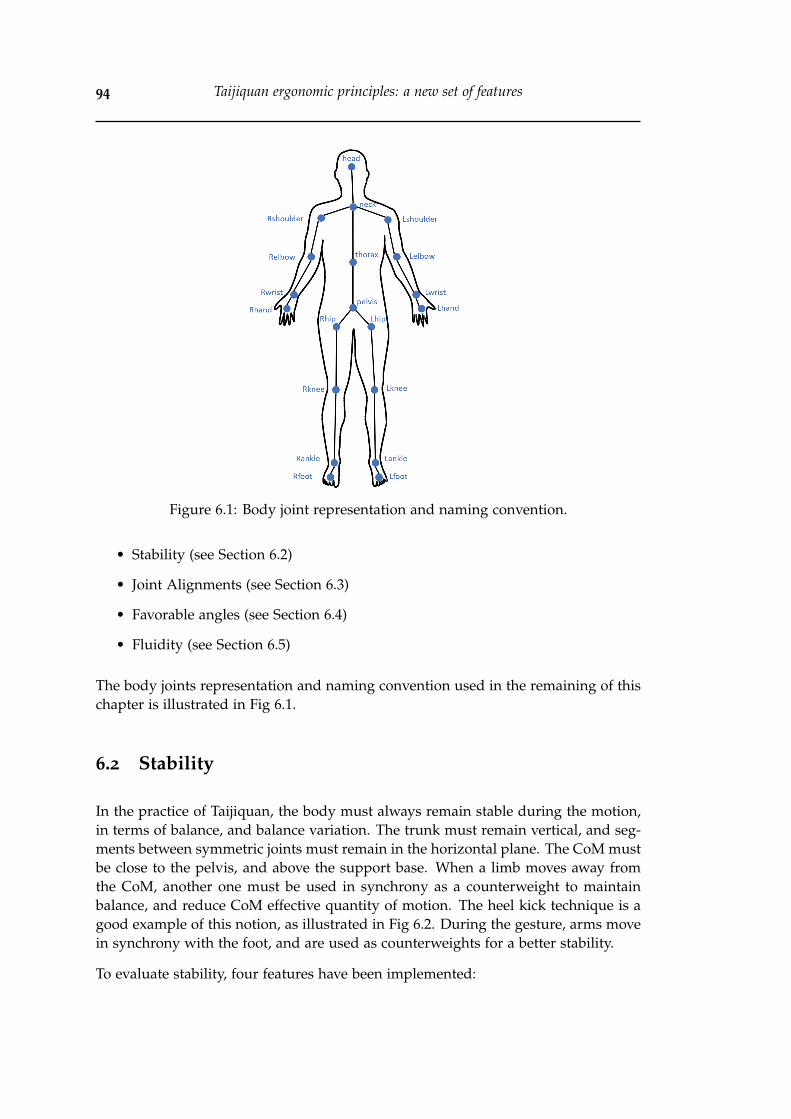
94 Taijiquan ergonomic principles: a new set of features
Figure 6.1: Body joint representation and naming convention.
• Stability (see Section 6.2)
• Joint Alignments (see Section 6.3)
• Favorable angles (see Section 6.4)
• Fluidity (see Section 6.5)
The body joints representation and naming convention used in the remaining of thischapter is illustrated in Fig 6.1.
6.2 Stability
In the practice of Taijiquan, the body must always remain stable during the motion,in terms of balance, and balance variation. The trunk must remain vertical, and seg-ments between symmetric joints must remain in the horizontal plane. The CoM mustbe close to the pelvis, and above the support base. When a limb moves away fromthe CoM, another one must be used in synchrony as a counterweight to maintainbalance, and reduce CoM effective quantity of motion. The heel kick technique is agood example of this notion, as illustrated in Fig 6.2. During the gesture, arms movein synchrony with the foot, and are used as counterweights for a better stability.
To evaluate stability, four features have been implemented:

§6.2 Stability 95
Figure 6.2: Heel kick technique. During the gesture, arms move in synchrony withthe foot, and are used as counterweights for a better stability. Reproduced from
Caulier (2010).
• Static stability: the static stability is evaluated by computing the Euclideandistance between the components of the pelvis and the CoM in a horizontalplane (x, y):
F1(t) =√(xpelvis(t)− xCoM(t))2 + (ypelvis(t)− yCoM(t))2 (6.1)
• Dynamic stability: the dynamic stability is computed as the time derivation ofthe static stability:
F2(t) =dF1(t)
dt(6.2)
• Verticality: the verticality of the trunk is computed as the Euclidean distancebetween the components of the pelvis and the neck in a horizontal plane (seeFig 6.3 (a) ):
F3(t) =√(xpelvis(t)− xneck(t))
2 + (ypelvis(t)− yneck(t))2 (6.3)
• Horizontality: the horizontality of the body is computed as the mean absolutedifference between the height (z) of main joint pairs (shoulders, hips and knees,see Fig 6.3 (a) ):
F4(t) =∑3
j
∣∣∣zLj(t)− zRj(t)∣∣∣
3(6.4)
where j stands for the joint index in L = {Lshoulder, Lhip, Lknee} and R =
{Rshoulder, Rhip, Rknee}.

96 Taijiquan ergonomic principles: a new set of features
Figure 6.3: Visualization of some stability and alignment features inspired by Tai-jiquan ergonomic principles. (a): F3 (verticality), F4 (horizontality) computed in thehorizontal plane, and F7 (vertical alignment of left hip and left ankle). (b): F11 (frontalalignment of left shoulder and left wrist) and F19 (right elbow not behind body) com-
puted in the body frontal plane.

§6.3 Joint alignments 97
Figure 6.4: Joint alignments in tree posture (Wuji). Reproduced from Caulier (2010).
6.3 Joint alignments
Joints must as often as possible remain aligned, vertically or horizontally. Fig 6.4illustrates this notion. Joint alignments allow a better stability, but also a bettertransmission of the forces from the ground to the body extremities.
To evaluate joint alignments, nine features have been proposed:
• Joints vertical alignments: computed as the Euclidean distance between thehorizontal components of two joints:
F4+j(t) =√(xUj(t)− xDj(t))
2 + (yUj(t)− yDj(t))2 (6.5)
for U ={Lshoulder, Rshoulder, Lhip, Rhip, Lknee, Rknee} andD ={Lhip, Rhip, Lankle, Rankle, L f oot, R f oot}.
• Shoulder-wrist frontal alignment: computed as the Euclidean distance betweenthe coordinates of the left (resp. right) wrist and the left (resp. right) shoulderinto the body frontal plane. At each time, the body frontal plane is definedby three points placed on both hips (−→p1 and −→p2 ) and the neck (−→p3 ). A localcoordinate system (referred to as body frontal coordinate system below, see Fig 6.3

98 Taijiquan ergonomic principles: a new set of features
(b) ) is then defined using these points:1
−→v1 = −→p1 −−→p2 , −→u1 =−→v1
||−→v1 ||(6.6)
−→v3 = −→v1 × (−→p3 −−→p1 ),−→u3 =
−→v3
||−→v3 ||(6.7)
−→u2 = −→u3 ×−→u1 (6.8)
where × is the cross product, −→u1 , −→u2 and −→u3 are three orthonormal vectors: −→u1
and −→u2 are in the body frontal plane, and −→u3 is normal to the body frontal plane(see Fig 6.3 (b) ). The origin of the body frontal coordinate system is defined as −→p1 .The coordinates of a joint in the body frontal coordinate system are thus definedas:
P = [−→u1T −→u2
T −→u3T] (6.9)
−→f j = (−→pj −−→p1 ) · P (6.10)−→f j = (x f
j , y fj , 0) (6.11)
where we replace the third coordinate (corresponding to −→u3 ) by 0. Finally, thefrontal alignment is computed as Euclidean distance between the componentsof the shoulder and the wrist in the body frontal plane:
F11 =
∥∥∥∥−−−−−→fLshoulder −−−−→fLwrist
∥∥∥∥ (6.12)
F12 =
∥∥∥∥−−−−−→fRshoulder −−−−→fRwrist
∥∥∥∥ (6.13)
• Feet alignment: feet must often be parallel in Taijiquan. To assess this align-ment, the absolute difference is computed between the Euclidean distance be-tween heels and the Euclidean distance between toes:
F13 =∣∣∥∥−−−→pLankle −−−−→pRankle
∥∥− ∥∥−−−→pL f oot −−−−→pR f oot∥∥∣∣ (6.14)
6.4 Favorable angles
Each body joint has an optimal flexion, leading to both suppleness and robustness.Joints must never be fully stretched nor too bent. An equilibrium must be foundbetween stretching and tenseness at any time of the motion. This notion is illustratedin Fig 6.5. This property can be related to optimal muscle lengths allowing thehighest force production: the force production of a muscle is at its minimum whenit is fully stretched or tense, as shown in Fig 6.6 (Gordon et al., 1966).
1Note that the time variable t is not indicated for readability.

§6.4 Favorable angles 99
Figure 6.5: Favorable joint angles in tree postures (Wuji). No joint is fully stretchednor fully bent. Reproduced from (Caulier, 2010).
Figure 6.6: Length-tension relation of a sarcomere in a muscle fiber. Reproducedfrom (Gordon et al., 1966).

100 Taijiquan ergonomic principles: a new set of features
To evaluate favorable angles, eight features have been proposed:
• The shoulders must be low. To avoid useless tension and stiffness of the shoul-ders, they must remain as low as possible during the gesture. To evaluate if theshoulders are low, the angle between the shoulder, the neck and the thorax isextracted. The angle between three joints j, k and l is calculated as:
−→vj,k =−→pj −−→pk (6.15)
−→vl,k =−→pl −−→pk (6.16)
(j, k, l) =arccos(−→vj,k · −→vl,k)∥∥−→vj,k
∥∥× ∥∥−→vl,k∥∥ (6.17)
The angles between shoulders, the neck and the thorax are obtained using eq.6.17, leading to (see Fig 6.7):
F14 = (Lshoulder, neck, thorax) (6.18)
F15 = (Rshoulder, neck, thorax) (6.19)
• Elbow flexion deviation from optimal angle: elbow flexion angle should remainapproximately between 90° and 135°. To evaluate the quality of the elbowflexion (computed as the angle between the wrist, the elbow and the shoulder),the optimal angle is estimated as 112.5°, and the deviation from this angle iscalculated as (see Fig 6.7):
F16 =∣∣∣112.5°− (Lwrist, Lelbow, Lshoulder)
∣∣∣ (6.20)
F17 =∣∣∣112.5°− (Rwrist, Relbow, Rshoulder)
∣∣∣ (6.21)
• The elbows must not be behind the body. To evaluate if the elbow is behind thebody, the elbow z-coordinate in body frontal coordinate system is extracted (cf. eq.6.10, see Fig 6.3):
F18 = z fLelbow (6.22)
F19 = z fRelbow (6.23)
• The elbows must not be too low (against the body), nor too high. The optimalabduction of the elbow (estimated as the angle between the elbow, the shoulderand the hip) is about 67.5°, and the deviation from this angle is calculated as(see Fig 6.7):
F20 =∣∣∣67.5°− (Lelbow, Lshoulder, Lhip)
∣∣∣ (6.24)
F21 =∣∣∣67.5°− (Relbow, Rshoulder, Rhip)
∣∣∣ (6.25)

§6.5 Fluidity 101
Figure 6.7: Some favorable angles, inspired by Taijiquan ergonomic principles.
6.5 Fluidity
During a gesture, the body must always be in motion, in order to keep a continuouskinetic energy, to keep joints warm and supple. On the other hand, the motion mustremain smooth, avoiding jerks: jerky motions lead to more impact on the joints, andmore energy expenditure. To evaluate the fluidity of each limb (arms and legs) andof the trunk, the normal speeds, accelerations and jerks of their CoMs are computed:
−−−→SLimbj(t) =
d−−−−−→CoMLimbj(t)
dt, F21+j(t) =
∥∥∥−−−→SLimbj(t)∥∥∥ (6.26)
−−−→ALimbj(t) =
d−−−→SLimbj(t)
dt, F26+j(t) =
∥∥∥−−−→ALimbj(t)∥∥∥ (6.27)
−−→JLimbj(t) =
d−−−→ALimbj(t)
dt, F31+j(t) =
∥∥∥−−→JLimbj(t)∥∥∥ (6.28)
where−−−→SLimbj(t),
−−−→ALimbj(t), and
−−→JLimbj(t) are respectively the speed, acceleration and
jerk of the CoM of Limbj, in Limb = {Larm, Rarm, Lleg, Rleg, Trunk}.

102 Taijiquan ergonomic principles: a new set of features
6.6 Summary and conclusion
In this chapter, a new feature set was presented, inspired by Taijiquan ergonomicprinciples. This set of 36 features can be divided into four main types: stability, jointalignments, favorable angles and fluidity features. A summary is provided in Table6.1.
Although these features are inspired by Taijiquan specific rules, most of them aregeneric and can be applied to other disciplines. However, according to the specificdiscipline, some features are more relevant than others. Some gestures might requirespecific alignments or joint angles. For instance, in a tennis serve, the tossing armis usually highly extended above the shoulder, and the striking arm is placed be-hind the body during the preparation step, discrediting F18/F19 (elbow bot behindthe body) and F20/F21(elbow abduction around 67.5°). Nonetheless, to optimize thegesture, experienced players will not exaggerate these positions. They will bend theirknees to avoid an exaggerate abduction of the tossing-arm elbow, and their body willbe in profile (i.e. not facing the court) to avoid a position of the striking-arm elbowbehind the body. In other words, it is assumed that most of these ergonomic featuresmust generally be respected, to the extent allowed by the specific constraints of thegesture. For validation purpose, this feature set will be tested in Part III, either forgesture evaluation (see Chapters 8 and 9), and for gesture feedback (see Chapter 10).

§6.6 Summary and conclusion 103
Index Definition Computation
StabilityF1 Static stability Distance between the horizontal
projections of CoM and pelvis.F2 Dynamic stability Time-derivation of static stability.F3 Verticality Distance between the horizontal
projections of neck and pelvis.F4 Horizontality Mean of vertical distances of joint pairs
(shoulders, hips, knees)AlignmentsF5/F6 Shoulder-hip vertical
alignmentDistance between the horizontalprojections of shoulder and hip.
F7/F8 Hip-ankle vertical alignment Distance between the horizontalprojections of hip and ankle.
F9/F10 Knee-foot vertical alignment Distance between the horizontalprojections of knee and foot.
F11/F12 Wrist-shoulder frontalalignment
Distance between the frontal projectionsof shoulder and wrist.
F13 Feet alignment Difference between length of segments(Lankle− L f oot) and (Rankle− R f oot).
Favorable anglesF14/F15 Shoulders low Angle between shoulder, neck and
thorax.F16/F17 Elbows optimal flexion Deviation from 112.5° of the angle
between wrist, elbow and shoulder.F18/F19 Elbows not behind body Elbow z-coordinate in body frontal
coordinate system.F20/F21 Elbows optimal abduction Deviation from 67.5° of the angle
between elbow, shoulder and hip.FluidityF22 − F26 Limb speed Normal speed of limb CoM (arms, legs
and trunk).F27 − F31 Limb acceleration Normal acceleration of limb CoM (arms,
legs and trunk).F32 − F36 Limb jerk Normal jerk of limb CoM (arms, legs
and trunk).
Table 6.1: Features inspired by Taijiquan ergonomic principles.

104 Taijiquan ergonomic principles: a new set of features

Chapter 7
Morphology-independent residualfeature extraction (MIRFE)
Contents7.1 Introduction . . . . . . . . . . . . . . . . . . . . . . . . . . . . . . . . . 105
7.2 Method . . . . . . . . . . . . . . . . . . . . . . . . . . . . . . . . . . . . 107
7.2.1 Morphology Independent Residual Feature Extraction (MIRFE)107
7.2.2 Experiments . . . . . . . . . . . . . . . . . . . . . . . . . . . . . 109
7.2.3 Factor definition . . . . . . . . . . . . . . . . . . . . . . . . . . 112
7.3 Results . . . . . . . . . . . . . . . . . . . . . . . . . . . . . . . . . . . . 112
7.3.1 Validation on the eight Bafa techniques . . . . . . . . . . . . . 112
7.3.2 Feature set correlation analysis . . . . . . . . . . . . . . . . . . 114
7.4 Discussion . . . . . . . . . . . . . . . . . . . . . . . . . . . . . . . . . . 114
7.5 Conclusion . . . . . . . . . . . . . . . . . . . . . . . . . . . . . . . . . 117
7.1 Introduction
The following is partly reproduced from Tits et al. (2017).
In Chapter 2, various features were presented, allowing a representation of differentaspects of motion. Chapter 6 presented a new feature set inspired by Taijiquan er-gonomic principles, aiming for a relevant description of expertise in sports gestures.More features means more information about the various aspects of motion, andpossibly about expertise. However, it also adds complexity in the data, due to thepossible noise, redundancy, as well as irrelevant information present in the features.Motion features can indeed be influenced by many factors, including psychological,social or physiological factors. As a consequence, these features are therefore not
105

106 Morphology-independent residual feature extraction (MIRFE)
optimal for expertise modeling. To solve this issue, a common step in machine learn-ing research is the use of feature selection techniques, allowing for the selection of asubset of features keeping only the most relevant and reliable information regardingthe targeted task (in the present case, expertise modeling). The problem of featureselection is that it discards all information contained in the non-selected features.Another solution is to post-process the features, in order to reduce the influence ofsome factors on them, and hence to improve the information related to the targetedfactor.
Morphology is a factor that has a direct influence on motion, making comparisonbetween gestures of different individuals difficult. For instance, during a kick gesturethe foot of a tall person will generally move higher than the foot of a short person.On the contrary, if a particular height of the kick is aimed, then the hip angle of thetaller person will be smaller. In both cases, some features of both individuals willbe very different (either foot height, or hip angle), without any indication about thequality of the performance, and making the comparison between gestures difficult.In this sense, the information contained in any feature about morphology can beconsidered as noise and should therefore be reduced as much as possible. Moreover,this information is generally redundant as it is contained in many features.
To alleviate this issue, different motion data representations have been proposed. Sieet al. (2014) proposed a simple skeleton scaling method, by placing the coordinatesystem on a reference node of the body (i.e. on the pelvis), and dividing all nodescoordinates by the torso height. Features can then be extracted on these scaled data.This method was later used by Morel et al. (2016) for gesture evaluation. It has theadvantage of being very simple, but has many limitations. It is based on the sim-plistic hypothesis that the movement of a short individual should be an homothetyof that of a tall individual. However, weight, height of the center of mass, shoulderwidth and hip width, among others, may also influence movement in different waysincluding inertia, balance, speed and power. These characteristics will be altered bysuch a basic scaling.
As described in Chapter 2 (see Section 2.3.3), Müller et al. (2005) proposed a specificfeature set based on 40 binary relational features, originally developed for whole-body motion classification and retrieval. These relations may for instance correspondto a foot being raised, a hand being in front of the body, legs being crossed, etc. Thethresholds for the binary decisions are defined by different body segment lengthssuch as the humerus length or the shoulder width, so that each feature is scaled by acustom pre-defined body characteristic. However, this method is limited to this typeof feature, and does not allow the extraction of new features afterwards.
Kulpa et al. (2005) developed a morphology-invariant representation of motion, origi-nally developed for animation, where they defined limbs with variable lengths. Eachlimb (legs and arms) is defined by the position of its end-effector and by a planewhere the middle joint (knee and elbow) is located. The spine is represented as a
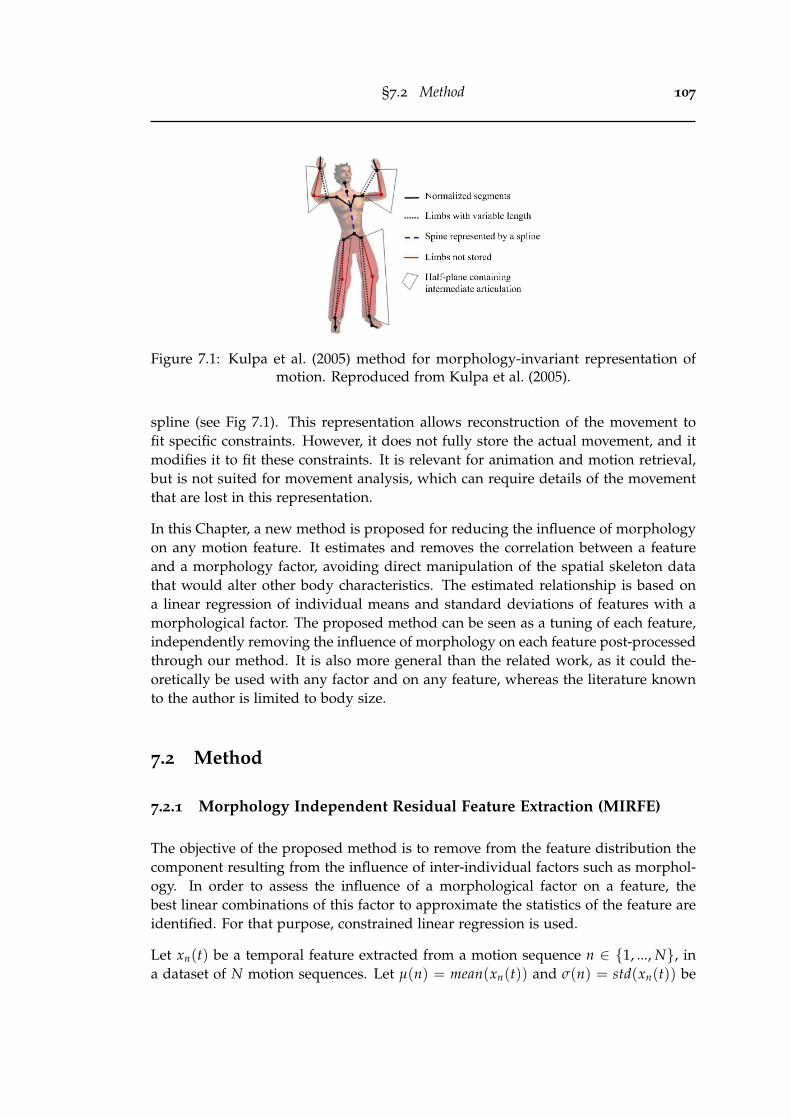
§7.2 Method 107
Figure 7.1: Kulpa et al. (2005) method for morphology-invariant representation ofmotion. Reproduced from Kulpa et al. (2005).
spline (see Fig 7.1). This representation allows reconstruction of the movement tofit specific constraints. However, it does not fully store the actual movement, and itmodifies it to fit these constraints. It is relevant for animation and motion retrieval,but is not suited for movement analysis, which can require details of the movementthat are lost in this representation.
In this Chapter, a new method is proposed for reducing the influence of morphologyon any motion feature. It estimates and removes the correlation between a featureand a morphology factor, avoiding direct manipulation of the spatial skeleton datathat would alter other body characteristics. The estimated relationship is based ona linear regression of individual means and standard deviations of features with amorphological factor. The proposed method can be seen as a tuning of each feature,independently removing the influence of morphology on each feature post-processedthrough our method. It is also more general than the related work, as it could the-oretically be used with any factor and on any feature, whereas the literature knownto the author is limited to body size.
7.2 Method
7.2.1 Morphology Independent Residual Feature Extraction (MIRFE)
The objective of the proposed method is to remove from the feature distribution thecomponent resulting from the influence of inter-individual factors such as morphol-ogy. In order to assess the influence of a morphological factor on a feature, thebest linear combinations of this factor to approximate the statistics of the feature areidentified. For that purpose, constrained linear regression is used.
Let xn(t) be a temporal feature extracted from a motion sequence n ∈ {1, ..., N}, ina dataset of N motion sequences. Let µ(n) = mean(xn(t)) and σ(n) = std(xn(t)) be

108 Morphology-independent residual feature extraction (MIRFE)
respectively the mean and standard deviation of this feature over time. Both of thesestatistics can be considered as non-temporal features.
Let m(n) be a variable corresponding to a morphological factor, known for eachmotion sequence n. For each statistic (µ, σ), a linear regression is performed with theregressor m, leading to the following predictive equations:
µpred(n) = β0,µ + β1,µ ·m(n) (7.1)
σpred(n) = β0,σ + β1,σ ·m(n) (7.2)
where β0µ, f and β1µ, f (resp. β0σ, f and β1σ, f ) are the intercept and slope of the linearregression of means µ f (resp. individual standard deviations σf ).
To ensure positive (and hence physically meaningful) predictions for the standarddeviation (σpred) , the slope parameter (β1,σ ) is constrained:
nmin = argminn(σpred(n)), n ∈ {1, ..., N}
i f σpred(nmin) < 0 : β1,σ =−β0,σ
m(nmin)+ ε (7.3)
where ε is a small positive number (arbitrarily defined as 0.0001 in our work). If thelowest value of σpred is negative, the application of the constraint on β1,σ defined inEq. 7.3 to Eq. 7.2 leads to:
σpred(nmin) = β0,σ + (−β0,σ
m(nmin)+ ε) ·m(nmin) = ε (7.4)
The method is then based on the hypothesis that the prediction of the linear regres-sion is the part of the statistic that can be fully described by the factor, while theresidue is the uncorrelated part of the statistic, i.e. the part that is not influenced bythe morphological factor. The residues µres and σres of the predictions are expressedas:
µres(n) = µ(n)− µpred(n) (7.5)
σres(n) =σ(n)
σpred(n)(7.6)
The following equation is then used to compute a version of the feature xn corre-sponding to these residual statistics, where the influence of morphology has beenremoved:
xres,n =(xn − µ(n))
σ(n)· σres(n) + µres(n) (7.7)
§7.2 Method 109
Eq. 7.7 can be interpreted as follows: for each motion sequence, the feature xn isfirst standardized to remove its initial mean (µ(n)) and standard deviation (σ(n)),and then scaled and translated so that its mean and standard deviation correspondto µres(n) and σres(n).
Figure 7.2 illustrates the extraction of such residues, on an example dataset consistingof six motion sequences (N = 6), each one from a different participant. This numberwas arbitrarily used for illustration, although a larger number of participants shouldbe recorded to avoid overfitting of the linear regression. The first graph (a) displaysa dummy feature for the 6 sequences, with means and standard deviations (µ and σ)for each sequence. The second graph (b) shows the morphological factor m, repre-senting in this example the size of the participant for each sequence. The third andfourth graphs (c and d) respectively show the results of linear regression of µ andσ with the regressor m. The blue curve is the regressand (µ or σ), the red curve isthe prediction (Eq. 7.1 and 7.2), and the green curve is the residue (Eq. 7.5 and 7.6).The final graph (e) then displays the result of the residual feature extraction, wheremeans (µres) and standard deviations (σres) are now independent of the morphology(Eq. 7.7).
When the residual features are extracted, a correlation analysis can be performedwith the factor of interest, e.g. skill. As skill is supposedly not correlated to mor-phology, it is assumed that the process will not decrease the correlation betweenfeatures and skill, but on the contrary, could increase it. Moreover, as the same infor-mation is removed from the features, their redundancy should decrease, allowing amore efficient use in machine-learning based modeling in general.
If the features were standardized before the process, they should be standardizedagain afterwards, as the overall mean and standard deviation may have changed. Inthe remainder of the paper, our method will be referred to as Morphology IndependentResidual Feature Extraction or MIRFE.
7.2.2 Experiments
The goal of the MIRFE method is to reduce the influence of the morphology onmotion features, while preserving information about other independent factors (i.e.expertise in the present research). To verify the effectiveness of the method, therelation between features and factors can be analyzed, with or without the use ofthis method, and results can be compared with a baseline method, i.e. skeletondata scaling (Sie et al., 2014). In the skeleton scaling, all global joint coordinates aredivided by the size of the individual before feature extraction. As a benchmark, theeight Bafa techniques of the Taijiquan dataset presented in Chapter 4 are used (seeTable 4.3). Different types of features are extracted from this dataset, including:

110 Morphology-independent residual feature extraction (MIRFE)
Figure 7.2: Inter-individual factor independent residual feature extraction. (a): fea-ture and statistics (µ and σ). (b): individual morphology (size). (c) and (d): linearregression of means and standard deviations. The blue curve is the regressand (µ orσ), the red curve is the prediction (Eq. 7.1 and 7.2), and the green curve is the residue
(Eq. 7.5 and 7.6). (e): residual feature extraction (Eq. 7.7).

§7.2 Method 111
1. Joint 3D global coordinates (reference placed on the hips) (F = 61)1
2. Joint 3D local coordinates (reference placed on each parent joint) (F = 53)2
3. Joint global quaternions (reference placed on the hips) (F = 64)3
4. Joint local quaternions (reference placed on each parent joint) (F = 64)
5. Continuous relational features (Müller feature set without thresholding, seeSection 2.3.3) (F = 40)
6. Ergonomic features (F = 93), including :
• ROM (in degrees, see Table 2.1) (F = 32)
• Joint perceived discomfort (see Section 2.3.6.4) (F = 14)4
• CoM kinematics (including CoM 3D coordinates, 3D speeds, 3D accelera-tions, as well as normal speed and acceleration) (F = 11)
• Taijiquan ergonomic principles (see Chapter 6) (F = 36)
The entire feature set hence comprises F = 375 features.
To analyze the relations between features statistics (µ and σ) and factors (morphologym and skill s), absolute correlation will be used:
Φa,b = |R(a, b)| (7.8)
where R(a, b) ∈ [−1, 1] denotes the correlation between a statistic variable a and afactor variable b, and Φa,b ∈ [0, 1] denotes their absolute correlation. The mean of theabsolute correlations (Φa,b) for the feature sets will then be extracted and comparedaccording to the method used, i.e. (i) without processing, (ii) with skeleton scalingand (iii) with MIRFE.
Not only the removal of morphology influence could allow for a improvement of therelation with other factors, but it could also reduce the redundancy of the features,as the same redundant information is removed from them. To analyze the redun-dancy of the motion features in a feature set, the mean of their absolute pairwisecorrelations will be computed, and will be denoted as Φ f (and referred to below asredundancy), where the index f ∈ (1, ..., 6) stands for the identifier of the feature typein the above list.
13D coordinates of 21 joints (pelvis, thorax, neck, back head and forehead, both shoulders, elbows,wrists, hands, hips, knees, ankles, feet) but due to the placement of the reference on the hips, thex-coordinates of both hips are always zeros, leading to only 61 useful features.
253 non-zero features from 3D coordinates of 21 joints.3Quaternions of 16 segments: head, thorax, both arms, forearms, hands, hips, thighs, calves, feet.4Perceived discomfort extracted for 14 joints: neck, pelvis, both shoulders, elbows, wrists, hips,
knees and ankles.

112 Morphology-independent residual feature extraction (MIRFE)
7.2.3 Factor definition
Morphology can be defined with numerous variables tightly linked together, suchas the size or weight of each body segment. To extract the most relevant variableto represent morphology, a PCA was performed on several variables, including in-dividual segment lengths (foot, calf, leg, trunk, arm, forearm, hand and head), hipwidth, shoulder width, size from feet to head, and size from feet to fingers.
The first principal component alone explained 76% of the data variance, and it wasalmost equivalent to the size from feet to fingers (R = 0.9932, p = 1.15× 10⁻¹⁵). Asa consequence, the size from feet to fingers is chosen as the morphology factor mfor the experiment. The use of only one variable to represent morphology limits thecomplexity of the regression model, and thus the risks of overfitting due to the smallnumber of individuals in the benchmark dataset (I = 12).
The skill factor s in the gesture will be estimated as the mean level of the individual’sskill as annotated by the experts (see Table 4.1, last column). To verify the indepen-dence of both factors (m and s), their correlation was computed for the 12 participantsof the benchmark dataset, resulting in R = −0.03 (p = 0.92).
7.3 Results
7.3.1 Validation on the eight Bafa techniques
To test the effectiveness of MIRFE in various situations, this section presents a cor-relation analysis of feature statistics and individual factors for various gestures (theeight Bafa techniques) extracted from the Taijiquan MoCap dataset. For each feature,absolute correlations of individual statistics (µ and σ) with morphology (m) andwith skill (s) were computed, without processing, after scaling, and after MIRFE. Themean of these absolute correlations was then extracted for all features. Results aredisplayed in Fig 7.3.
The upper graphs (a and b) show the mean absolute correlations of m with featuresstatistics (µ on the left graph and σ on the right graph). Without any processing,Φm,µ averages to 0.28 for all the analyzed features and techniques, and Φm,σ averagesto 0.22. It can be observed that the baseline, i.e. the scaling method only partiallyreduces the correlation between feature statistics and morphology (Φm,µ = 0.22 andΦm,σ = 0.19), whereas MIRFE removes it almost completely. With MIRFE, the ab-solute correlation with m is null for all features and for each technique (Φm,µ = 0),and Φm,σ averages to 0.018 for all features and techniques. As the results are similarfor the eight Bafa techniques, it seems therefore that MIRFE allows for an efficientremoval of the morphology influence on the features, independently of the type ofmotion.

§7.3 Results 113
Figure 7.3: Absolute correlation analysis between feature statistics and motion fac-tors, for the eight Taijiquan Bafa techniques: (a) morphology and features means; (b)morphology and features standard deviations; (c) skill and features means: (d) skill
and features standard deviations.
The lower graphs, c and d in Fig 7.3, respectively show the mean absolute correla-tions of the participant skill s with features statistics µ and σ. It can be seen that foreach technique, MIRFE yields the best results. Concerning Φs,µ, the use of MIRFEsignificantly increases the mean absolute correlation with s by [.0017− 0.025] for theeight Bafa techniques.5 Concerning Φs,σ, the use of MIRFE leads to a significant im-provement for all techniques except the first two (’Drive the monkey away’ and ’Movehands like clouds’), up to 0.012 for the last technique (’Grasp the bird’s tail’). On theopposite, no significant improvement could be observed for the baseline method,both for Φs,µ and Φs,σ.
5A significant difference between Φs,µ with and without MIRFE is assumed if the p-value of theStudent’s t-test on their difference for all features respects the condition: p < 0.005.
114 Morphology-independent residual feature extraction (MIRFE)
7.3.2 Feature set correlation analysis
In Section 7.3.1, the effectiveness of MIRFE was demonstrated for various types ofgestures from the Taijiquan dataset. In this section, factor effects are analyzed forvarious feature types, without processing, with skeleton scaling and after MIRFEpost-processing.
Fig 7.4 shows the mean absolute correlations computed on each feature set (see Sec-tion 7.2.2) for the eight Bafa techniques. Without any processing, global and localjoint coordinates seem to be the most related to morphology (Φm,µ = 0.40 for globalcoordinates and Φm,µ = 0.43 for local coordinates). As already seen in Section 7.3.1,the use of MIRFE allows an effective removal of the correlation of feature statisticswith m, while skeleton scaling only reduces it partly for some features (see Graphs(a) and (b) in Fig 7.4).
Graphs (c) and (d) respectively display the relations between feature statistics (µ onthe left graph and σ on the right graph) and skill (s). It can be observed that forany type of feature, the use of MIRFE leads to a significant improvement of theircorrelation with s by [0.01− 0.04] for Φm,µ, and by [0.004− 0.013] for Φm,σ (exceptfor relational and ergonomics features). On the opposite, skeleton scaling yieldssignificant improvement only for Φm,µ on global positions (improvement of 0.02) andon relational features (improvement of 0.018).
From these graphs, it seems that after the process with MIRFE the joint 3D globalcoordinates are the most linearly related features with s. However, it does not indi-cate that they provide the best description of skill, as joint global coordinates mayalso be highly redundant. To analyze the redundancy within the feature sets, ab-solute pairwise correlations were computed for each feature set (Φ f ), as illustratedin Fig 7.5. It can be observed in this figure the use of MIRFE significantly reducesthe redundancy of the features for all the feature sets by [0.035− 0.071], except forlocal quaternions. On the opposite, skeleton scaling reduces the redundancy onlyfor the joint local coordinates. It can also be observed from this graph that globalcoordinates are the most redundant features in every case. Their pairwise absolutecorrelations average to Φ1 = 0.27 without processing and with skeleton scaling, andare decreased to Φ1 = 0.23 after MIRFE.
7.4 Discussion
The results show that our MIRFE method allows to remove almost completely themorphological influence on the features (at least for one morphological factor). More-over, it seems that, by removing morphology influence, the redundancy between thefeatures is decreased, and that their relations with other factors such as skill can beimproved. This method could be used to improve the analysis of the influence of

§7.4 Discussion 115
Figure 7.4: Absolute correlation analysis between feature statistics and motion fac-tors, for each feature type: (a) morphology and features means; (b) morphology andfeatures standard deviations; (c) skill and features means: (d) skill and features stan-
dard deviations. The indices of feature type correspond to the list in Section 7.2.2.
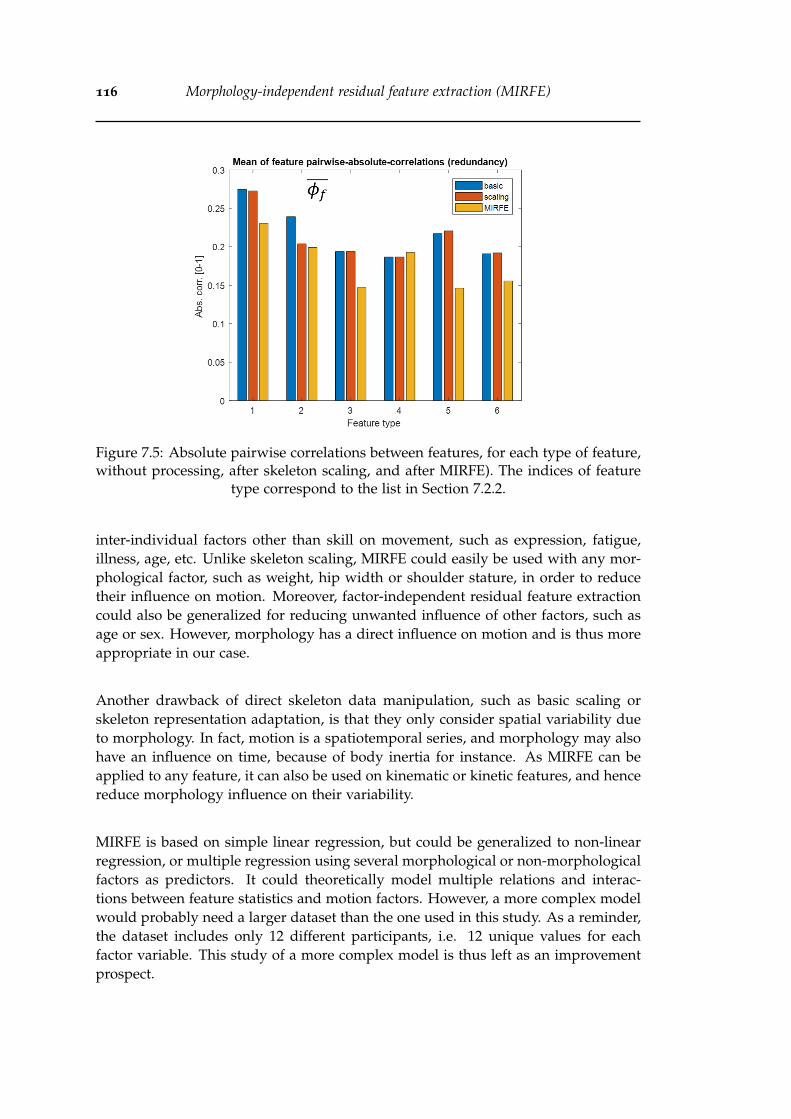
116 Morphology-independent residual feature extraction (MIRFE)
Figure 7.5: Absolute pairwise correlations between features, for each type of feature,without processing, after skeleton scaling, and after MIRFE). The indices of feature
type correspond to the list in Section 7.2.2.
inter-individual factors other than skill on movement, such as expression, fatigue,illness, age, etc. Unlike skeleton scaling, MIRFE could easily be used with any mor-phological factor, such as weight, hip width or shoulder stature, in order to reducetheir influence on motion. Moreover, factor-independent residual feature extractioncould also be generalized for reducing unwanted influence of other factors, such asage or sex. However, morphology has a direct influence on motion and is thus moreappropriate in our case.
Another drawback of direct skeleton data manipulation, such as basic scaling orskeleton representation adaptation, is that they only consider spatial variability dueto morphology. In fact, motion is a spatiotemporal series, and morphology may alsohave an influence on time, because of body inertia for instance. As MIRFE can beapplied to any feature, it can also be used on kinematic or kinetic features, and hencereduce morphology influence on their variability.
MIRFE is based on simple linear regression, but could be generalized to non-linearregression, or multiple regression using several morphological or non-morphologicalfactors as predictors. It could theoretically model multiple relations and interac-tions between feature statistics and motion factors. However, a more complex modelwould probably need a larger dataset than the one used in this study. As a reminder,the dataset includes only 12 different participants, i.e. 12 unique values for eachfactor variable. This study of a more complex model is thus left as an improvementprospect.

§7.5 Conclusion 117
7.5 Conclusion
In this Chapter, an original method was proposed for extraction of morphology-independent features (MIRFE). This method is based on constrained linear regressionwith a morphological factor on features statistics (means and standard deviations).The residues of these regressions allow for the computation of residual features,independent of the morphology. Results showed that MIRFE efficiently removes theinfluence of morphology and improves the relation with the participant skill. MIRFEoutperforms skeleton scaling both for morphology independence and skill relationimprovement. Its effectiveness will be further tested in various gesture evaluationmodels presented in the following chapters (see Chapters 8 and 9). MIRFE also has asadvantage that it could be used with any inter-individual factor, and on any feature.MIRFE could also be adapted with more complex models than linear regression, butwould probably require a larger dataset in that case.

118 Morphology-independent residual feature extraction (MIRFE)

Part III
Gesture Evaluation: a case study onTaijiquan
119


Chapter 8
Gesture evaluation: astatistical-based approach
Contents8.1 Introduction . . . . . . . . . . . . . . . . . . . . . . . . . . . . . . . . . 121
8.2 Methods . . . . . . . . . . . . . . . . . . . . . . . . . . . . . . . . . . . 122
8.2.1 Model design . . . . . . . . . . . . . . . . . . . . . . . . . . . . 122
8.2.2 Experiment . . . . . . . . . . . . . . . . . . . . . . . . . . . . . 122
8.2.3 Comparison with related work . . . . . . . . . . . . . . . . . . 124
8.3 Results . . . . . . . . . . . . . . . . . . . . . . . . . . . . . . . . . . . . 124
8.3.1 Feature comparison . . . . . . . . . . . . . . . . . . . . . . . . 124
8.3.2 MIRFE validation . . . . . . . . . . . . . . . . . . . . . . . . . . 125
8.3.3 Model comparison . . . . . . . . . . . . . . . . . . . . . . . . . 126
8.3.4 Comparison with related work . . . . . . . . . . . . . . . . . . 127
8.3.5 Synthesis . . . . . . . . . . . . . . . . . . . . . . . . . . . . . . . 127
8.4 Discussion . . . . . . . . . . . . . . . . . . . . . . . . . . . . . . . . . . 128
8.5 Conclusion . . . . . . . . . . . . . . . . . . . . . . . . . . . . . . . . . 131
8.1 Introduction
This third part of the present thesis focuses on the evaluation of the expertise within agesture. In the following chapters, several models will be proposed and tested. As areminder, previous works concerning gesture evaluation are presented and discussedin Chapter 3. All these studies proposed an original method generally using a singletype of motion features, and tested it on a specific motion capture dataset generallyconsisting of a single gesture type. Moreover, these methods were rarely compared,as their code was generally not provided for reproducibility, and because of the lackof any available benchmark dataset.
121

122 Gesture evaluation: a statistical-based approach
This chapter presents a model based on feature statistics and classical machine learn-ing for evaluating the expertise within a gesture. In the taxonomy presented inChapter 3, the proposed method can be ranked as a “score prediction” method (seeSection 3.4.3), based on a regression model. The regression is performed on PrincipalComponents (PCs) extracted on means and standard deviations over time of a largeset of motion features. The originality of the proposed method essentially resides in(i) the variety of features that can be used as input, allowing the combination of dif-ferent types of features, and (ii) the feature post-processing step (MIRFE, see Chapter7). In this chapter, the proposed method will be tested with various feature combi-nations, and with different regression models. The use of MIRFE will be assessed,using the proposed evaluation model as a validation procedure. In the next chapters,two original exploratory studies will be presented, proposing a gesture evaluationmodel based on deep learning (see Chapter 9), and an original and generic visualfeedback method (see Chapter 10).
8.2 Methods
8.2.1 Model design
Fig 8.1 illustrates the general workflow of the proposed gesture evaluation model. Aset of motion features is provided as the input of the workflow, containing N sam-ples (for N sequences of the same gesture), and F temporal features (extracted fromthe corresponding motion sequences). Any type of temporal feature can be used,including both low-level or high-level motion representations. From these features,statistics are extracted for each sample, including the mean (µ) and the standard de-viation (σ) over time, leading to 2× F variables. A PCA is then performed on thesevariables, allowing a reduction of the number of variables while keeping the largestvariance possible. Finally, a regression model is used on the extracted PCs to predictthe skill level of the participant. The proposed workflow is generic, in the sense thatit can be used with any number and type of motion features, and with any regressionmodel.
8.2.2 Experiment
The proposed model will be evaluated using various sets of features. The efficiency ofthe feature post-processing step with MIRFE will also be evaluated. As a benchmark,the eight Bafa techniques of the Taijiquan dataset presented in Chapter 4 will beused (see Table 4.3). Six different types of features will be used in this experiment,including:

§8.2 Methods 123
Figure 8.1: Generic workflow of the statistical-based gesture evaluation model.
1. Joint 3D global coordinates (reference placed on the hips) (F = 61)1
2. Joint 3D local coordinates (reference placed on each parent joint) (F = 53)2
3. Joint global quaternions (reference placed on the hips) (F = 64)3
4. Joint local quaternions (reference placed on each parent joint) (F = 64)
5. Continuous relational features (Müller feature set without thresholding, seeSection 2.3.3) (F = 40)
6. Ergonomic features (including 32 ROM from Table 2.1, 36 Taijiquan ergonomicprinciples from Table 6.1, and 11 CoM kinematic features) (F = 79)4
These categories of features will be used separately as well as in combination, inorder to determine which combination provides the best description of expertise.Finally, various commonly used regression models will be tested, including:
• Linear regression
• Elastic Net regularized linear regression (EN) (Zou and Hastie, 2005)
• Linear Support Vector Regression (L-SVR) (Drucker et al., 1997)
• Gaussian Support Vector Regression (G-SVR) (Aizerman, 1964; Smola and Schölkopf,2004)
13D coordinates of 21 joints (pelvis, thorax, neck, back head and forehead, both shoulders, elbows,wrists, hands, hips, knees, ankles, feet) but due to the placement of the reference on the hips, thex-coordinates of both hips are always zeros, leading to only 61 useful features.
253 non-zero features from 3D coordinates of 21 joints.3Quaternions of 16 segments: head, thorax, both arms, forearms, hands, hips, thighs, calves, feet.4The CoM kinematic features include its 3D coordinates, 3D speeds, 3D accelerations, as well as its
normal speed and acceleration.
124 Gesture evaluation: a statistical-based approach
• Generalized Regression Neural Network (GRNN) (Specht, 1991)
• Multi-Layer Perceptron (MLP) (2 hidden layers with 2 neurons each, trained for20 epochs) (Rumelhart et al., 1985)
• A tree ensemble using Least Square Boosting (LSB) (20 trees) (Friedman, 2001)
For each test configuration, including various feature types and various regressionmodels, the following procedure will be used: for each Bafa technique, a gestureevaluation model will be tested, following a leave-one-participant-out (LOPO) cross-validation procedure. It means that to test the model efficiency on one participant(the left-out participant), the model will be trained on the other eleven participants,and used to predict the skill level of the left-out participant. Finally, by gathering allthe predictions (N = 1660 for the 8 Bafa techniques and the 12 participants of thedataset), the Pearson’s correlation (R) with the reference skill level (the annotation)will be extracted, as well as the mean absolute error (ε) of the prediction.
8.2.3 Comparison with related work
Two methods presented in the recent literature will be compared to the proposedmethod:
• The first method is using eigenmovement decomposition. Eigenmovementshave been used to evaluate the skill in various motion disciplines, as presentedin Chapter 3. The method used in this work is similar to Young and Reinkens-meyer (2014) and Zago et al. (2016) (see Section 3.4.3). The first eigenmovementwere extracted for each sequence, and a linear regression model was trained ontheir weights to predict the participant skill.
• The second method is the spatial error computation method from Morel et al.(2017) (see Section 3.4.2). On motion sequences temporally aligned with DTW,a spatial error was computed for each limb (both arms, both legs and trunk).As this score is computed frame-by-frame, the mean over time was extracted,leading to a total of five variables (the mean spatial error for each limb). A linearregression was then used with these five variables to predict the participantskill.
8.3 Results
8.3.1 Feature comparison
This section presents a comparison of the effectiveness of various feature types for themodeling of expertise with the proposed model. In this experiment, linear regression

§8.3 Results 125
is used, and is tested with various numbers of PCs. The MIRFE post-processing stepis not used yet, in order to analyze the initial representation power of each featureset.
Fig 8.2 (a) shows the results for the prediction of the participant skill level for theeight Bafa techniques. Among the six compared features, the best results were ob-tained with the ergonomic features, leading to a correlation of R = 0.73, using onlythe first two PCs as predicting variables. Based on the assumption that the most di-versified feature set would allow the best modeling of expertise, a larger feature setwas used by combining global positions, local quaternions, relational and ergonomicfeatures. This feature set led to even better results with a correlation of R = 0.79 withtwo PCs as predicting variables. With this configuration, the participant level can bepredicted with a mean absolute error of ε = 0.72, for all participants and the eightBafa techniques.
Fig 8.2 (b) shows the variance accumulated by the PCs extracted from each featureset. All curves seem similar, except for the relational features, where the first PCsaccumulate more variance. This is probably due to the fact that this feature set issmaller than others (F = 2 ∗ 40 for µ and σ).
The best results were obtained with only two PCs, corresponding to 40% of the totalcumulated variance for the relational features and 30% for the combined feature set.The correlation then generally decreases while the number of PCs increases for mostfeature sets. The remaining information is either not relevant for the modeling ofexpertise or is not properly interpreted by the modeling algorithm (linear regressionin this case).
The previous chapter analyzed the impact of MIRFE on the feature correlation withskill. In the next section, models will be trained with features post-processed usingMIRFE, allowing an analysis of its real interest in the modeling of expertise.
8.3.2 MIRFE validation
In this section, the same comparison as in Section 8.3.1 is proposed.Various featurestypes are tested for the modeling of expertise with the proposed model, used withlinear regression and various numbers of PCs. However, in this case, the MIRFE post-processing step is applied on the features, allowing a comparison with the previousresults.
Fig 8.3 shows the results for the prediction of the participant skill level for the eightBafa techniques. It can be observed in the left graph (a) that results include severaldifferences with the ones presented above (see Fig 8.2 (a)). Firstly, for most featuresets the correlation seems to increase with the number of PCs used as predictingvariables, up to about 45 PCs, corresponding to 99% of the cumulated variance for

126 Gesture evaluation: a statistical-based approach
Figure 8.2: Participant skill prediction using linear regression on PCs extracted onvarious features sets (no MIRFE post-processing).
Figure 8.3: Participant skill prediction using linear regression on PCs extracted onvarious features sets, after MIRFE post-processing.
relational features and 94% for the combined feature set. Secondly, the best resultsare not obtained with high-level features nor with the combined feature set, but withthe global positions (R = 0.88 with 45 PCs). With this configuration, the participantlevel could be predicted with a mean absolute error of ε = 0.52, for all participantsand the eight Bafa techniques.
8.3.3 Model comparison
In this section, various commonly used regression models are compared for the mod-eling of the expertise. Each regression model is tested with various feature types andwith various number of PCs extracted on features processed with MIRFE. Table 8.1presents the best results for each regression model. The parameters of each modelwere optimized for the eight Bafa techniques dataset. Best results were obtained withthe three linear models (EN, L-SVR, linear regression), with 60 PCs extracted from

§8.3 Results 127
Model Feature types Npcs RLinear regression 1+5 60 0.904EN 1+5 60 0.909L-SVR 1+5 60 0.890G-SVR 1+4+5+6 1 0.789MLP 1+4+5+6 1 0.788LSB 1+4+5+6 1 0.769GRNN 1+4+5+6 1 0.800
Table 8.1: Participant skill prediction using various regression models: best results.The numbers used to identify the features correspond to the list presented in Sec-
tion 8.2.2.
global positions and relational features. For these three models, the correlation withannotations generally increased with the number of PCs until 60 PCs (similarly toFig 8.3 (a) ), up to R = 0.909 for EN5. A clear gap can be observed with non-linearmodels (G-SVR, MLP, LSB and GRNN). With all these models, the correlation withannotations decreased with the number of PCs. For these models, the best resultswere obtained with a single PC on the large feature set combining global positions,local quaternions, relational and ergonomic features.
8.3.4 Comparison with related work
Table 8.2 shows the results for two methods from the related work: eigenmovements,and limb spatial errors from Morel et al. (2017). These methods were used on featuresthat were either extracted on a scaled skeleton, or post-processed with MIRFE. Theseresults are compared with the best results obtained for the method proposed in thischapter. For both methods, the feature post-processing with MIRFE leads to betterpredictions. The score regression with limb spatial error leads to the worst correlation(R = 0.425 using MIRFE). Regression with 60 eigenmovement weights leads to acorrelation of R = 0.849. The proposed method outperforms both methods, withR = 0.909.
8.3.5 Synthesis
From all the tested models, the best results (of R = 0.909) were obtained for a modelbased on:
• A feature set combining global positions and relational features
5With optimal parameters, the EN corresponded to a L2-regularization with a regularization param-eter α = 0.0017

128 Gesture evaluation: a statistical-based approach
Method Nvariables REigenmovement weights (with scaling) 10 0.709Eigenmovement weights (with MIRFE) 60 0.849Morel et al. (2017) limb spatial error(with scaling)
(5) 0.319
Morel et al. (2017) limb spatial error(with MIRFE)
(5) 0.425
Proposed method (EN-regression on 60PCs extracted from statistics (µ and σ) ofglobal positions and relational features,with MIRFE)
60 0.909
Table 8.2: Participant skill prediction using two methods from the literature.
• A feature post-processing step using MIRFE
• The extraction of 60 PCs from the feature means and standard deviations
• An EN-regularized linear regression model
Fig 8.4 shows the predictions for all the samples of the dataset including the eightBafa techniques. The smallest correlation was obtained for the gesture G11 (’Kickwith the heel’), with R = 0.828, and the largest one was obtained for G06 (’Drive themonkey away’) and G13 (’Grasp the bird’s tail’), with R = 0.953. The mean absoluteerror of all the predictions is ε = 0.424.
8.4 Discussion
In this chapter, various skill evaluation methods were tested and compared with twomethods of the literature. The best results were obtained with the proposed method,configured with an EN-regression model, and using a combination of low-level fea-tures (global positions) and higher-level features (relational features), with a corre-lation of R = 0.909, and a mean absolute error of ε = 0.473. The proposed methodoutperformed two methods from the literature, including regression on eigenmove-ment weights (Young and Reinkensmeyer, 2014), and regression on spatial errors(Morel et al., 2017).
Two major advantages of the proposed method may explain these results: first, itcan be used with any type of feature, and the PCA allows extraction of a compactrepresentation while including various information due to the different types of fea-tures used. The combination of global positions with relational features, providinga higher-level representation of motion, allowed the extraction of the most relevantPCs for the description of skill in the present study.

§8.4 Discussion 129
Figure 8.4: Score predictions for the eight Bafa techniques. Model: EN-regression on60 PCs from µ and σ of global positions and relational features, post-processed with
MIRFE.

130 Gesture evaluation: a statistical-based approach
Secondly, another possible advantage of the proposed method is that it is based onthe comparison of statistics extracted from the gestures. On the opposite, eigenmove-ments and spatial errors are based on frame-by-frame relations between gestures.This type of comparison is thus highly sensitive to the temporal synchronization ofthe gestures to compare. Though temporal alignment methods such as DTW can beused to deal with synchronization, they only allow a global alignment of the motionsequence, and do not ensure an optimal alignment of each marker position or eachfeature independently. Moreover, they alter the original gestures and do not ensurethat the aligned movement still corresponds to the same skill level as the original.
Nevertheless, frame-by-frame relations could be relevant for other disciplines wherethe timing of different motion features in a gesture is particularly important. In thatcase, a statistical representation of the features would be inappropriate.
Another limitation arises from this same characteristic of the proposed model: as theskill is evaluated from statistics extracted on the entire motion sequence, a score canonly be predicted for the entire motion sequence. On the contrary, a method basedon frame-by-frame comparison such as Morel et al. (2017) provides a spatial error foreach frame of the gesture. A frame-by-frame score allows feedback information onwhich part of the sequence was performed more or less efficiently. Nonetheless, anew generic feedback method is presented in Chapter 10, allowing wider feedbackinformation, independently of the gesture evaluation model.
For each model tested in this chapter, the feature post-processing with MIRFE led tosignificantly better score predictions. With MIRFE, the quality of the model seems toincrease with the number of PCs (see Fig 8.3). As a comparison, without MIRFE, thebest results are obtained for one or two PCs for any feature set, as illustrated in Fig8.2. It seems therefore that MIRFE allows the extraction of features that are easier tointerpret by the proposed models. The same observation was made for two methodsof the related work (see Table 8.2). It is probably due to the fact that the processedfeatures are less dependent on morphology and are thus more comparable betweenparticipants, but also less correlated between each other.
These results can be compared to the differences between teachers’ annotations (seeTable 4.1). Tables 8.3 and 8.4 respectively show the correlations and mean abso-lute differences between these annotations. The largest difference is observed forSkill1 and Skill3 with a correlation of R = 0.949 and a mean absolute difference ofε = 0.392. The variability of the annotations enlightens some subjectivity in theteachers’ perception of each participant’s skills. As the model is trained to predictthese annotations, the results are limited to the teachers’ own perception of exper-tise. The prediction results (R = 0.909 and ε = 0.473) should hence be compared toannotation variability (represented by R = 0.949 and ε = 0.392).
Besides this annotation variability due to teachers’ subjectivity, the performer’s ownvariability must also be highlighted: each rendition of a gesture can be performed by

§8.5 Conclusion 131
R Skill1 Skill2 Skill3 ExperienceSkill1 1 0.972 0.949 0.831Skill2 0.972 1 0.963 0.854Skill3 0.949 0.963 1 0.934
Experience 0.831 0.854 0.934 1
Table 8.3: Correlations of the annotations of the three teachers with each other andwith participant experiences (years of practice).
ε Skill1 Skill2 Skill3Skill1 0 0.275 0.392Skill2 0.275 0 0.358Skill3 0.392 0.358 0
Table 8.4: Mean absolute difference between the annotations of the three teachers.
the same performer with a different quality. For instance, athletes never throw a diskat the same distance nor jump over the same distance in two consecutive attempts.This variability can be due to various factors, including the performer’s fatigue orconcentration. To assess this variability in this dataset, the first teacher was asked toannotate every rendition of the ’Kick with the heel’ gesture (G11) for each participant.On these annotations, the mean absolute difference to the average annotation of eachparticipant was calculated, resulting in εrendition = 0.402. According to the teacher,G11 is the most difficult technique. It requires more balance, accuracy and synchro-nization than others, probably leading to more variability between renditions.
Finally, the same target variable (the global participant level) was used to modelthe skill for each technique. However, each participant can master some techniquesbetter than others. This leads to another type of skill variability that is not learnedby the model.
A higher prediction accuracy could hence be obtained with individual annotationsfor each rendition, or at least for each type of gesture. However, such an annotationwould require an extensive work, and would still be limited to the annotators’ sub-jectivity. The use of global scores for each participant is a simplifying assumption,which still leads to interesting results (R = 0.909 and ε = 0.473). In other words, theglobal participant level can be predicted with a relative error (εrel) of 10.28%:
εrel =ε
(max(Skillµ)−min(Skillµ))=
0.4739.57− 4.97
= 0.1028 (8.1)
8.5 Conclusion
In this chapter, a new gesture evaluation method was presented. The method is pre-sented as a generic model which can be used with various types of motion features,
132 Gesture evaluation: a statistical-based approach
and any type of regression algorithm. From motion features post-processed withMIRFE, means and standard deviations are extracted for each gesture of the dataset.PCA is applied on the means and standard deviations, allowing a dimensionalityreduction to a smaller set of PCs. A regression model is then used on these PCsto predict the skill level annotated by experts. The proposed model was tested onthe eight-Bafa techniques dataset, leading to a correlation of R = 0.909 with the bestconfiguration, i.e. with global positions and relational features post-processed withMIRFE, 60 PCs , and EN-regression (actually corresponding to a ridge regressionwith a L2-regularization parameter of α = 0.017). The proposed method outper-formed other methods from the literature, including regression on eigenmovementweights (Young and Reinkensmeyer, 2014), and regression on spatial errors (Morelet al., 2017). Results show a significant effect of the MIRFE processing method pre-sented in Chapter 7. This post-processing step allows better interpretation of thefeatures by all of the models tested in this chapter, including methods from the re-lated work. The results are limited to the subjectivity of the annotations provided bythe teachers, and better prediction could be obtained if annotations were providedby a larger number of experts for each sample of the dataset.

Chapter 9
Towards a deep-learning-basedgesture evaluation model
Contents9.1 Introduction . . . . . . . . . . . . . . . . . . . . . . . . . . . . . . . . . 133
9.1.1 Neural network . . . . . . . . . . . . . . . . . . . . . . . . . . . 134
9.1.2 Convolutional neural network . . . . . . . . . . . . . . . . . . 136
9.1.3 Transfer learning and fine-tuning . . . . . . . . . . . . . . . . 137
9.1.4 Representing a MoCap sequence as an image . . . . . . . . . 137
9.2 Methods . . . . . . . . . . . . . . . . . . . . . . . . . . . . . . . . . . . 138
9.2.1 Representing features as an image . . . . . . . . . . . . . . . . 139
9.2.2 Two-step transfer learning . . . . . . . . . . . . . . . . . . . . . 139
9.2.3 Experiments . . . . . . . . . . . . . . . . . . . . . . . . . . . . . 140
9.3 Results and discussion . . . . . . . . . . . . . . . . . . . . . . . . . . 143
9.3.1 Step 1: Bafa classification CNN . . . . . . . . . . . . . . . . . . 143
9.3.2 Step 2: level regression CNN . . . . . . . . . . . . . . . . . . . 143
9.3.3 Comparison with the statistical-based model . . . . . . . . . . 145
9.3.4 Limitations and improvement prospects . . . . . . . . . . . . 145
9.4 Conclusion . . . . . . . . . . . . . . . . . . . . . . . . . . . . . . . . . 147
9.1 Introduction
In the previous chapter, we presented a statistical-based gesture evaluation methodusing classical machine learning algorithms (PCA and EN-regression). Recent de-velopments in machine learning include Deep Neural Networks (DNN), and moreparticularly Convolutional Neural Networks (CNN), originally designed for imageanalysis. These techniques dramatically outperform classical machine learning inmore and more disciplines including speech processing, image processing, and many
133

134 Towards a deep-learning-based gesture evaluation model
other domains (LeCun et al., 2015). This type of model has recently been successfullyadapted in Laraba et al. (2017) for gesture recognition in MoCap data. The followingsubsections briefly explain the basics of deep learning, which are necessary to under-stand the method proposed in Laraba et al. (2017). An adaptation of this method isthen proposed in Section 9.2, and serves as a first proof-of-concept in the explorationof the use of deep learning in gesture evaluation.
9.1.1 Neural network
A Neural Network (NN) is a machine learning system, consisting of connectionsbetween learning units, trained together with a dataset to learn a task such as regres-sion or classification. The basic unit of a NN, the neuron, is a non-linear function(usually a logistic sigmoid), called the activation function linking a set of input vari-ables with an output variable. A common type of NN is the Multilayer Perceptron(MLP), or feedforward NN (see Fig 9.1). In this type of network, layers of neuronsare connected in series. If neurons or hidden layers are added to the network, itallows modeling of more complex relations between the input variables (x) and theoutput variable (y). However, it also adds a large number of parameters (weightsw), increasing the risk of overfitting or convergence failing. A larger dataset is thenneeded to train the network efficiently.
A NN is trained by minimizing a cost function defined by the prediction errorsof the training set. This optimization procedure is generally performed using thebackpropagation technique. With this technique, the prediction error is computed atthe output and distributed back to the previous layers. An iterative gradient-descentwith a specified step size (called the learning rate) is used to reach a local minimumof the cost function. This procedure can be performed either with a batch process,using the entire training set at each iteration for computing the gradient, or with amini-batch process, using smaller sets of training samples at each iteration, generallyallowing a faster convergence to a local minimum with an adapted learning rate.The mini-batch process is also called stochastic gradient descent (SGD) as the gradientcomputed with the fewer training samples can be seen as a noisy estimation of thegradient computed on the entire training set (LeCun et al., 2015).
A simple DNN can be defined as a NN with a large number of layers. As the numberof layers (and hence complexity) increases, the convergence of the model is harderto reach. Due to the almost horizontal shape of the sigmoid function at its tails,the gradient is close to zero, and eventually becomes zero through backpropagationinto several layers, due to computer limited floating-point precision. To deal withthe vanishing gradient, different activation functions have been used, such as theRectified Linear Unit (ReLU, Glorot et al. 2011), following the equation:
y = max(0, x) (9.1)
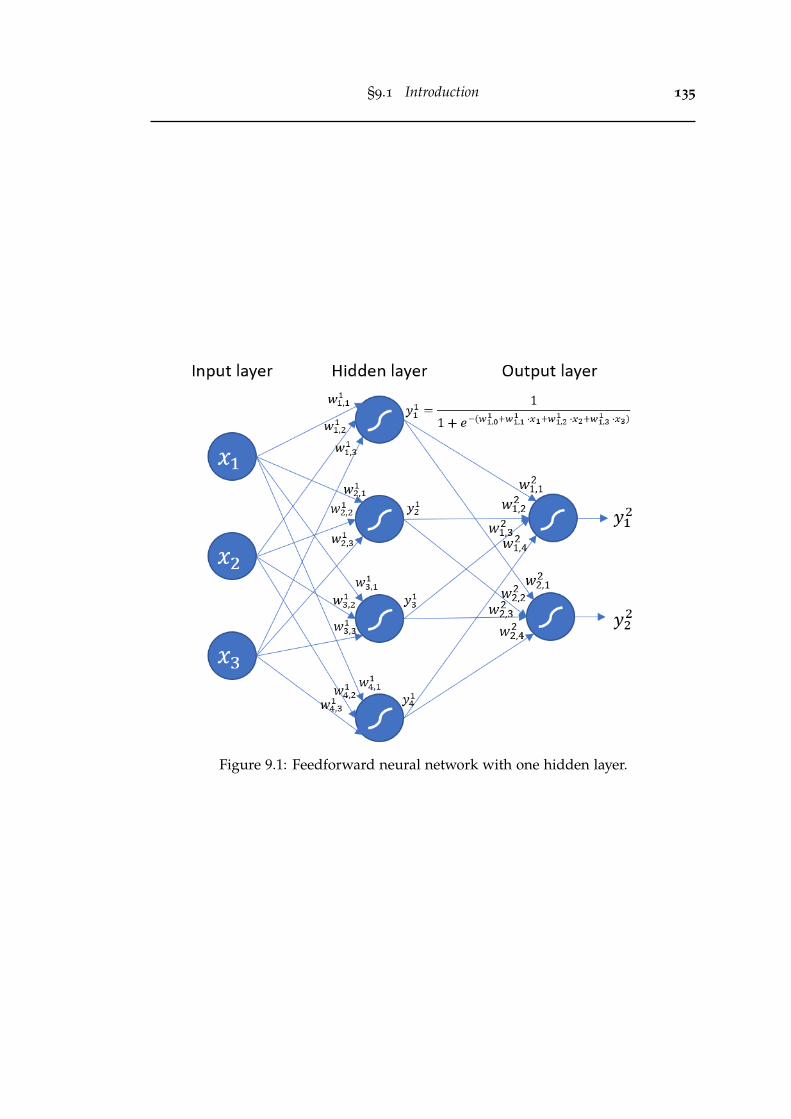
§9.1 Introduction 135
Figure 9.1: Feedforward neural network with one hidden layer.

136 Towards a deep-learning-based gesture evaluation model
Figure 9.2: CNN convolution layer (AlexNet first convolution layer).
9.1.2 Convolutional neural network
As a variation of DNN, CNN have been designed for the specific task of imageanalysis. In this type of network, a layer does not consist of logistic functions on allprevious neurons weighted sums, but of convolutional filter banks instead. Thesefilter banks replace the weights of the fully-connected (FC) layers from the MLP,and have the advantage of being more adapted to higher relations between neighborpixels. Fig 9.2 shows an example of convolutional layer. In this example (whichcorresponds to the first convolutional layer of the CNN AlexNet (Krizhevsky et al.,2012) ), 96 3D filters of dimensions 11× 11× 3 are convoluted on an input imageof dimension 227 × 227 × 3, leading to 96 × 11 × 11 × 3 = 34848 weights. As acomparison, a single neuron connected to all pixels of the input image would lead to227× 227× 3 = 154587 weights.
The output of the convolutional layer can be seen as 96 filtered and scaled grayscaleversions of the input image. A non-linear function (ReLU) is then applied on thisoutput.
Just as MLPs, some CNNs consist of several layers in series (Krizhevsky et al., 2012).Others are designed using more complex architectures with parallel layers or cycles(Szegedy et al., 2015).
Fig 9.3 illustrates the convolutional layers of AlexNet (Krizhevsky et al., 2012), anda visualization of the neurons based on Wei et al. (2017). It can be observed thatthe first convolutional layers are trained to extract general low-level features fromimages such as blobs and edges. The following layers allow extraction of higher-level features, such as texture patterns and even objects parts, more dependent onthe specific training images.

§9.1 Introduction 137
Figure 9.3: Convolutional layers and neuron visualization of AlexNet trained on theImageNet dataset. Reproduced from Wei et al. (2017).
9.1.3 Transfer learning and fine-tuning
In practice, large image-recognition CNNs are rarely trained from scratch. Theirtraining has an extensive computational cost, which can be several weeks with asingle GPU (You et al., 2017). Moreover, for an efficient training, a large datasetis needed. As an example, the state-of-the-art image-recognition DNNs are gen-erally benchmarked at the ’ImageNet Large Scale Visual Recognition Challenge’(Krizhevsky et al., 2012). They are trained on a dataset of 1.2 million images labeledinto 1000 categories, a subpart of the ImageNet dataset (Deng et al., 2009).
Instead of recording and labeling a large dataset, and training a CNN on it for weeksfor each new specific object-recognition task, an existing pre-trained CNN can beadapted for that task. As explained above, the first layers of a CNN encode genericfeatures which can be relevant for a wide range of tasks. On the opposite, the lastlayers encode more specific features, allowing classification into categories, such asthe 1000 categories of the ImageNet dataset. To avoid a complete retraining of aCNN, the first layers of a pre-trained model can be used as a basis, and the lastlayers can be either replaced by new ones or fine-tuned by pursuing their trainingon a smaller dataset including new images. The final layer can also be replaced, toclassify a few types of object rather than the 1000 categories, or for a regression task.The number of parameters to train is much lower in those cases, decreasing the riskof overfitting and the computational cost.
9.1.4 Representing a MoCap sequence as an image
Laraba et al. (2017) used transfer learning and fine-tuning on a pre-trained CNNmodel (GoogleNet, Szegedy et al. 2015), and adapted it for the classification of MoCap

138 Towards a deep-learning-based gesture evaluation model
Figure 9.4: (a) Similarity between 3D axes and RGB channels (Reproduced fromLaraba et al. 2017). (b) representation of a MoCap sequence as an RGB image.
sequences. As the input layer of the CNN needs an RGB image, they proposed arepresentation of a MoCap sequence as an image, as illustrated in Fig 9.4. They usedthe similarity between the 3D axes of MoCap data (x, y and z) and RGB images(red, green and blue channels, as illustrated Fig 9.4 (a)). They transformed MoCapdata into the RGB scale with a discretization and normalization of each 3D axison a [0-255] scale (see Fig 9.4 (b)), and resized the image linearly to fit the inputsize of the model (227× 227 pixels). The result is a striped abstract image whereeach stripe corresponds to a marker trajectory. Using this technique, they fine-tunedGoogleNet to recognize actions in various3D MoCap datasets, and outperformed therecent literature in most cases.
9.2 Methods
In this Section, a method inspired by Laraba et al. (2017) is proposed for gesture eval-uation, using transfer learning and a final regression layer on participant levels. Theproposed method is generalized to any type of motion representation as explainedin Section 9.2.1, and relies on two principal transfer learning steps (see Section 9.2.2).The pre-trained CNN used as a basis was AlexNet (Krizhevsky et al., 2012), trainedon a subset of the ImageNet dataset (1.2 million images labeled into 1000 categories).
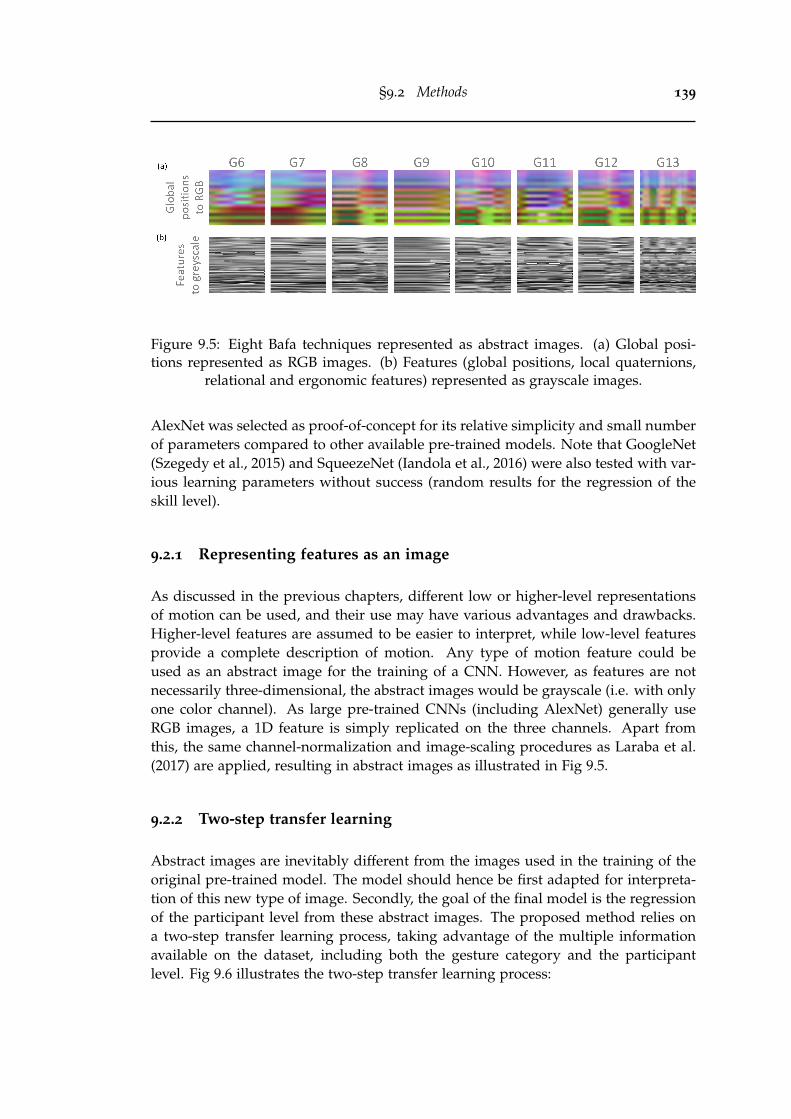
§9.2 Methods 139
Figure 9.5: Eight Bafa techniques represented as abstract images. (a) Global posi-tions represented as RGB images. (b) Features (global positions, local quaternions,
relational and ergonomic features) represented as grayscale images.
AlexNet was selected as proof-of-concept for its relative simplicity and small numberof parameters compared to other available pre-trained models. Note that GoogleNet(Szegedy et al., 2015) and SqueezeNet (Iandola et al., 2016) were also tested with var-ious learning parameters without success (random results for the regression of theskill level).
9.2.1 Representing features as an image
As discussed in the previous chapters, different low or higher-level representationsof motion can be used, and their use may have various advantages and drawbacks.Higher-level features are assumed to be easier to interpret, while low-level featuresprovide a complete description of motion. Any type of motion feature could beused as an abstract image for the training of a CNN. However, as features are notnecessarily three-dimensional, the abstract images would be grayscale (i.e. with onlyone color channel). As large pre-trained CNNs (including AlexNet) generally useRGB images, a 1D feature is simply replicated on the three channels. Apart fromthis, the same channel-normalization and image-scaling procedures as Laraba et al.(2017) are applied, resulting in abstract images as illustrated in Fig 9.5.
9.2.2 Two-step transfer learning
Abstract images are inevitably different from the images used in the training of theoriginal pre-trained model. The model should hence be first adapted for interpreta-tion of this new type of image. Secondly, the goal of the final model is the regressionof the participant level from these abstract images. The proposed method relies ona two-step transfer learning process, taking advantage of the multiple informationavailable on the dataset, including both the gesture category and the participantlevel. Fig 9.6 illustrates the two-step transfer learning process:

140 Towards a deep-learning-based gesture evaluation model
• First, a pre-trained AlexNet CNN is adapted for the classification of the gesturecategory. The last two FC layers of AlexNet are replaced by two smaller ones,with 64 neurons for the first one, followed by a ReLU function, and 8 neuronsfor the last one, followed by a softmax function, allowing classification of theeight Bafa techniques. This model is trained with the eight Bafa techniquedataset (n = 1660), using a large learning rate for the last two layers (0.01)and a learning-rate 50 times smaller (0.0002) for fine-tuning of the AlexNet pre-trained layers. For the training, mini-batches of 512 images are used. This firststep aims at a gross interpretation of the abstract images, in order to distinguishdifferent types of gestures.
• Secondly, the model is further adapted for the prediction of the participantlevel. To that end, the last layer is replaced by a FC layer with a single output,allowing the regression of the participant skill level. For each Bafa technique,a model is trained of the corresponding data subset (n ∼ 208), using a largerlearning rate for the last layer (0.0025) than for the rest of the network (0.00005).For this training, mini-batches of 20 images are used. This second step allowsa finer interpretation of the images of a single category, aiming at extractingdiscriminant features for different levels of expertise.
The optimal learning rates and batch sizes were determined with a manual iterativeprocedure.
9.2.3 Experiments
To test the validity of the proposed method, various experiments are conducted.First, the two-step transfer learning procedure are first tested in various configura-tions, including different feature types and post-processing (MIRFE), either for theclassification of Bafa techniques (Step 1) or for regression of the skill level (Step 2).The results of the regression are then compared with those of the statistical-basedmethod presented in Chapter 8.
9.2.3.1 Step 1: Bafa classification CNN
To test the validity of the first step of the transfer learning procedure, the classifica-tion model (see Fig 9.6) will be trained with a LOPO procedure, and the validationaccuracy will be calculated from the left-out-participant predictions. To that end, 12models (one for each participant) will be trained with various input feature sets:
1. Joint 3D global coordinates (reference placed on the hips)1
13D coordinates of 21 joints (pelvis, thorax, neck, back head and forehead, both shoulders, elbows,wrists, hands, hips, knees, ankles, feet) but due to the placement of the reference on the hips, thex-coordinates of both hips are always zeros, leading to only 61 useful features.

§9.2 Methods 141
Figure 9.6: Two-step transfer learning procedure. Step 1: a CNN is designed forclassification of the eight Bafa techniques. Step 2: a regression CNN is designed forthe prediction of the participant skill level on one Bafa technique. (AlexNet image
adapted from Han et al. 2017).

142 Towards a deep-learning-based gesture evaluation model
(a) represented as grayscale images (F = 61 1D features)
(b) represented as colored images (F = 21 3D features)
2. Joint 3D local coordinates (reference placed on each parent joint)2
(a) represented as grayscale images (F = 53 1D features)
(b) represented as colored images (F = 21 3D features)
3. Joint global quaternions (reference placed on the hips) (F = 64 1D features)3
4. Joint local quaternions (reference placed on each parent joint) (F = 64 1D fea-tures)
5. Continuous relational features (Müller feature set without thresholding, seeSection 2.3.3) (F = 40 1D features)
6. Ergonomic features (including 32 ROM from Table 2.1, 36 Taijiquan ergonomicprinciples from Table 6.1, and 11 CoM kinematic features) (F = 79 1D features)4
7. The combination of joint 3D global coordinates and relational features (F = 1011D features)
8. The combination of joint 3D global coordinates, joint local quaternions, rela-tional features and ergonomic features (F = 244 1D features)
In each case, the resulting images are linearly resized to fit the input size of the model(227× 227 pixels).
To verify the effectiveness of MIRFE, this experiment will be conducted both withand without the MIRFE feature post-processing step.
9.2.3.2 Step 2: level regression CNN
To test the validity of the two-steps transfer learning procedure, CNNs for the re-gression of the participant level will be trained, with and without a pre-training ofthe intermediate layers with step one (see Fig 9.6). The models will be trained witha LOPO procedure, and the correlation between the annotations and the predictionsof the left-out-participants will be extracted.
As a comparison with the two-step transfer learning procedure, a direct transferlearning procedure will be used. In this procedure, the pre-trained model is directlyadapted for the prediction of the participant level. To that end, layers FC7 and FC8of AlexNet are removed, and a final FC layer with a single output is directly addedafter FC6. A learning rate of 0.001 is used for the last layer, and 0.00005 for the restof the network.
253 non-zero features from 3D coordinates of 21 joints.3Quaternions of 16 segments: head, thorax, both arms, forearms, hands, hips, thighs, calves, feet.4The CoM kinematic features include its 3D coordinates, 3D speeds, 3D accelerations, as well as its
normal speed and acceleration.
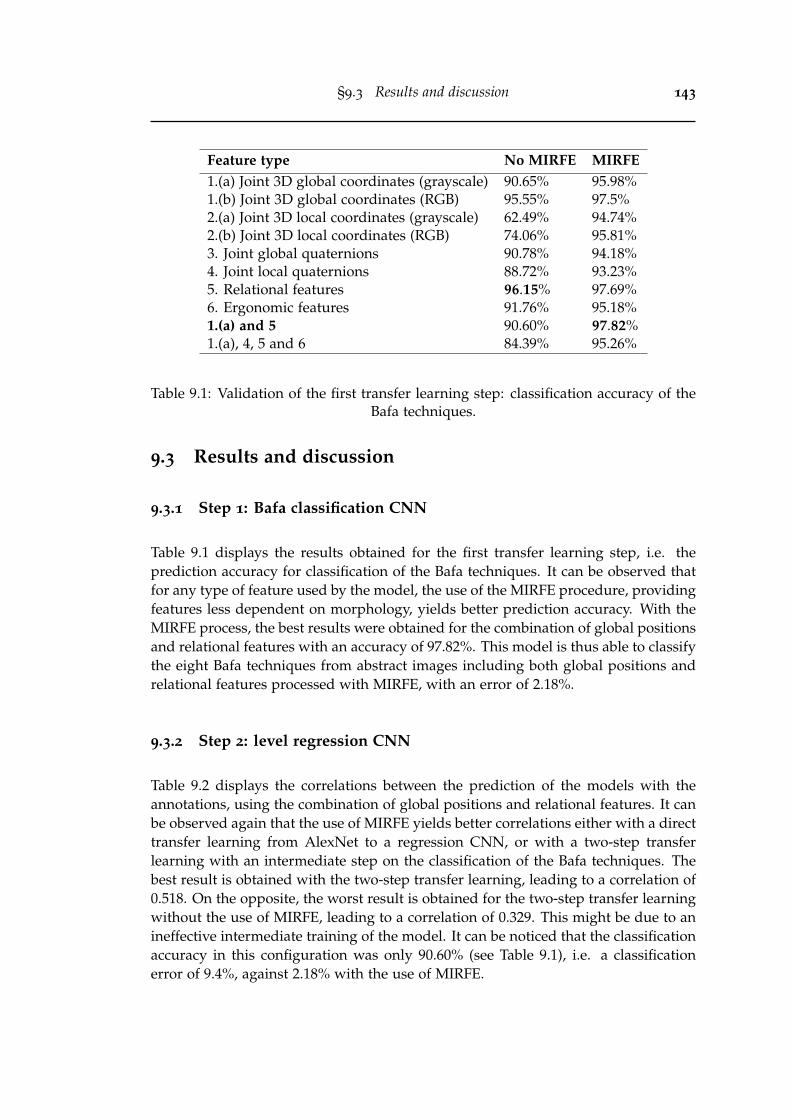
§9.3 Results and discussion 143
Feature type No MIRFE MIRFE1.(a) Joint 3D global coordinates (grayscale) 90.65% 95.98%1.(b) Joint 3D global coordinates (RGB) 95.55% 97.5%2.(a) Joint 3D local coordinates (grayscale) 62.49% 94.74%2.(b) Joint 3D local coordinates (RGB) 74.06% 95.81%3. Joint global quaternions 90.78% 94.18%4. Joint local quaternions 88.72% 93.23%5. Relational features 96.15% 97.69%6. Ergonomic features 91.76% 95.18%1.(a) and 5 90.60% 97.82%1.(a), 4, 5 and 6 84.39% 95.26%
Table 9.1: Validation of the first transfer learning step: classification accuracy of theBafa techniques.
9.3 Results and discussion
9.3.1 Step 1: Bafa classification CNN
Table 9.1 displays the results obtained for the first transfer learning step, i.e. theprediction accuracy for classification of the Bafa techniques. It can be observed thatfor any type of feature used by the model, the use of the MIRFE procedure, providingfeatures less dependent on morphology, yields better prediction accuracy. With theMIRFE process, the best results were obtained for the combination of global positionsand relational features with an accuracy of 97.82%. This model is thus able to classifythe eight Bafa techniques from abstract images including both global positions andrelational features processed with MIRFE, with an error of 2.18%.
9.3.2 Step 2: level regression CNN
Table 9.2 displays the correlations between the prediction of the models with theannotations, using the combination of global positions and relational features. It canbe observed again that the use of MIRFE yields better correlations either with a directtransfer learning from AlexNet to a regression CNN, or with a two-step transferlearning with an intermediate step on the classification of the Bafa techniques. Thebest result is obtained with the two-step transfer learning, leading to a correlation of0.518. On the opposite, the worst result is obtained for the two-step transfer learningwithout the use of MIRFE, leading to a correlation of 0.329. This might be due to anineffective intermediate training of the model. It can be noticed that the classificationaccuracy in this configuration was only 90.60% (see Table 9.1), i.e. a classificationerror of 9.4%, against 2.18% with the use of MIRFE.

144 Towards a deep-learning-based gesture evaluation model
Method No MIRFE MIRFEDirect transfer learning 0.357 0.454Two-step transfer learning 0.329 0.518
Table 9.2: Prediction correlations with annotations for various skill-level-regressionCNNs.
Figure 9.7: Left: predictions of all motion sequences for each participant, againsttheir skill level. Right: prediction RMSE for each participant, against their skill level.
These correlations are low in comparison with the results obtained with the methodproposed in Chapter 8. As a reminder, the best correlation (R = 0.909) was obtainedwith EN-regression on 60 PCs extracted from means and standard deviations of mo-tion features. However, as shown in Fig 9.7, the prediction error seems to depend onthe skill level of the participant, and is thus not fully random. It can be observed inFig 9.7 (right graph) that for all the participants with a skill level between 6 and 9, theprediction RMSE is below 0.65, and does not seem dependent of the skill level. Onthe opposite, for the extreme participants (the two best ones, P1 and P2 and the twoworst ones, P11 and P12), the prediction RMSE is above 1.2, i.e. worse than chance.5
A possible interpretation is that the model is not suited for generalization on unseenskill level values. In other words, it cannot predict values far from the ones used forits training, as the corresponding training sample is missing.
Based on these considerations, Tables 9.3 and 9.4 respectively show the correlationsbetween annotations and predictions, without two extreme participants (P2 and P11)and without four extreme participants (P1, P2, P11 and P12). It can be observed inthese tables that the predictions lead to a correlation of 0.573 without two extremeparticipants (see Table 9.3), and 0.809 without four extreme participants (see Table9.4), both with the two-step transfer learning and MIRFE methods. These resultssuggest that with a larger dataset, including a large number of beginners and experts,the overall accuracy of the model could be improved.
5RMSE would be about 1.0 for N (0, 1)-random predictions for a standardized skill-level.
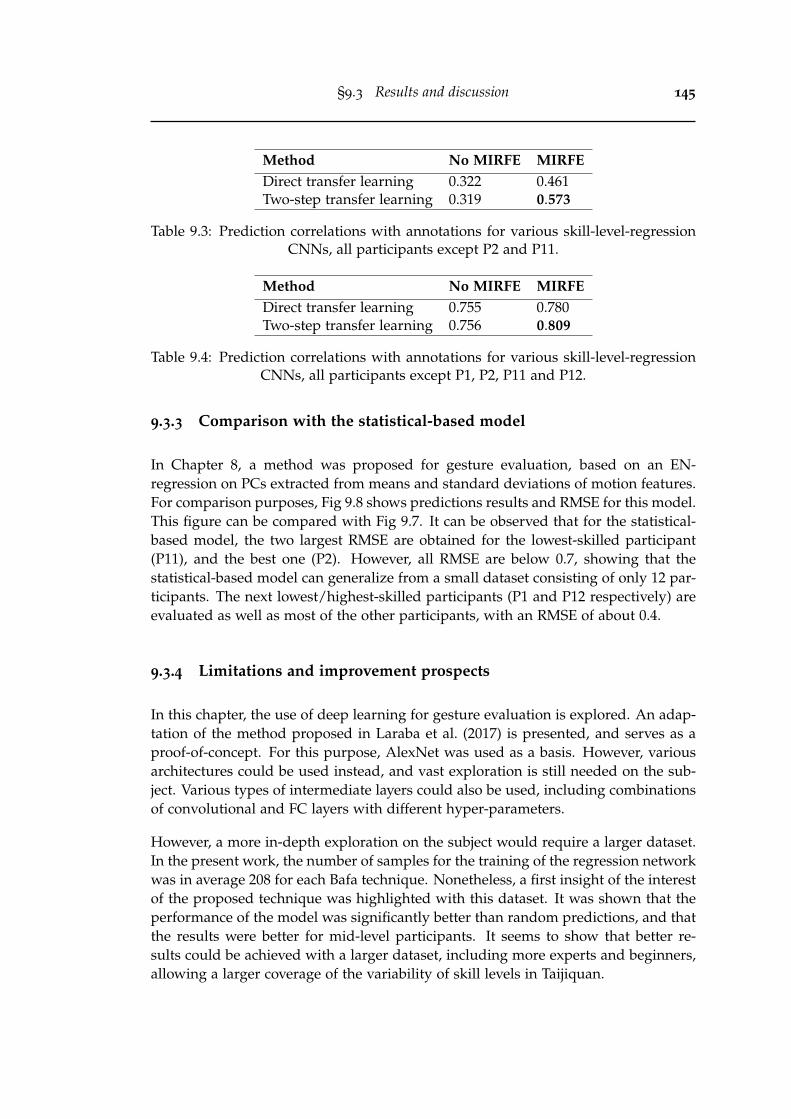
§9.3 Results and discussion 145
Method No MIRFE MIRFEDirect transfer learning 0.322 0.461Two-step transfer learning 0.319 0.573
Table 9.3: Prediction correlations with annotations for various skill-level-regressionCNNs, all participants except P2 and P11.
Method No MIRFE MIRFEDirect transfer learning 0.755 0.780Two-step transfer learning 0.756 0.809
Table 9.4: Prediction correlations with annotations for various skill-level-regressionCNNs, all participants except P1, P2, P11 and P12.
9.3.3 Comparison with the statistical-based model
In Chapter 8, a method was proposed for gesture evaluation, based on an EN-regression on PCs extracted from means and standard deviations of motion features.For comparison purposes, Fig 9.8 shows predictions results and RMSE for this model.This figure can be compared with Fig 9.7. It can be observed that for the statistical-based model, the two largest RMSE are obtained for the lowest-skilled participant(P11), and the best one (P2). However, all RMSE are below 0.7, showing that thestatistical-based model can generalize from a small dataset consisting of only 12 par-ticipants. The next lowest/highest-skilled participants (P1 and P12 respectively) areevaluated as well as most of the other participants, with an RMSE of about 0.4.
9.3.4 Limitations and improvement prospects
In this chapter, the use of deep learning for gesture evaluation is explored. An adap-tation of the method proposed in Laraba et al. (2017) is presented, and serves as aproof-of-concept. For this purpose, AlexNet was used as a basis. However, variousarchitectures could be used instead, and vast exploration is still needed on the sub-ject. Various types of intermediate layers could also be used, including combinationsof convolutional and FC layers with different hyper-parameters.
However, a more in-depth exploration on the subject would require a larger dataset.In the present work, the number of samples for the training of the regression networkwas in average 208 for each Bafa technique. Nonetheless, a first insight of the interestof the proposed technique was highlighted with this dataset. It was shown that theperformance of the model was significantly better than random predictions, and thatthe results were better for mid-level participants. It seems to show that better re-sults could be achieved with a larger dataset, including more experts and beginners,allowing a larger coverage of the variability of skill levels in Taijiquan.

146 Towards a deep-learning-based gesture evaluation model
Figure 9.8: Prediction results for the statistical-based model from Chapter 8, basedon EN-regression on 60 PCs extracted from means and standard deviations of globalpositions and relational features. Left: predictions of all motion sequences for eachparticipant, against their skill level. Right: prediction RMSE for each participant,
against their skill level.
With a larger dataset, various prospects for improvement could be explored. First,the use of more complex model architectures than AlexNet could be tested and com-pared. Secondly, a very large dataset would allow the development of new types ofdeep-learning-based models trained from scratch. These models could take advan-tage of the particular type of data that are motion sequences, including the spatialaspect, the higher relations between joints of the same limb, as well as the temporalaspect. For instance, the use of Recurrent Neural Network, particularly adapted forthe modeling of time series, could be explored (LeCun et al., 2015). Particular con-volutional filters could also be developed, taking into account the type of input data.For instance, particular CNNs with 1D filters have recently been used in speech pro-cessing for automatic translation (Tachibana et al., 2017). The input is a spectrogram,i.e. a large set of temporal variables, similar to a motion sequence. Finally, multitasklearning could be explored. Multitask learning allows the simultaneous modelingof different types of output from a single type of input. The use of a shared repre-sentation in the model for the learning of different tasks can result in an improvedefficiency for each separate task (Caruana, 1997). For instance, the use of informationon the category of gesture or on the participants, including morphology, age or sex,would allow the model to take these factors into account in the modeling of expertise.This approach can be compared to MIRFE, though the process would be handled bythe model itself.
In the proposed image representation of motion data, the order of the features orcoordinates is arbitrarily defined. However, different results could be obtained ac-cording to the order of the variables, i.e. of the stripes. As convolutional filters areapplied on neighbor pixels, the relations between neighbor variables are more im-plied at the beginning of the modeling process. In the present study, left and right

§9.4 Conclusion 147
pairs of joints are alternated in a specific order from the head to the feet. It couldbe interesting to group the stripes of the joints that are closer in the skeleton. How-ever, a new type of model specifically designed for motion data could directly takeaccount of the skeleton topology of the data. For instance, convolution filters in thefirst layer could be applied separately on the joints of each limb or segment of thebody, independently of the order of the variables.
9.4 Conclusion
In this chapter, a new gesture evaluation model based on deep learning is presented.For that purpose, motion sequences are represented as RGB images, for their use withpre-trained image classification models. The proposed model is based on AlexNet,and a two-step transfer learning procedure is applied in order to adapt it for skilllevel regression. First, the model is modified to allow classification of the eight Bafatechniques, and is trained on the entire dataset. Secondly, the classification layer isreplaced by a regression layer, allowing the prediction of the skill level. A modelis trained separately for each Bafa technique. The results showed that the two-steptransfer learning procedure coupled with the use of MIRFE on the input featuresallowed better predictions than direct transfer learning. Although the results aresignificantly lower than those of the method presented in Chapter 8, it could beobserved that the predictions were better for mid-level participants than for extremeones (the lowest-skilled and the highest-skilled). A larger dataset including moreexperts and beginners could hence lead to an improvement of the performance ofthe model. These results show the potential of the use of deep learning for gestureevaluation applications.

148 Towards a deep-learning-based gesture evaluation model
Chapter 10
Towards a generic visual feedbackmodel for gesture evaluation
Contents10.1 Introduction . . . . . . . . . . . . . . . . . . . . . . . . . . . . . . . . . 14910.2 Method . . . . . . . . . . . . . . . . . . . . . . . . . . . . . . . . . . . . 150
10.2.1 Synthesis-based feedback loop . . . . . . . . . . . . . . . . . . 150
10.2.2 Skilled-gesture synthesis . . . . . . . . . . . . . . . . . . . . . 151
10.2.3 Experiments . . . . . . . . . . . . . . . . . . . . . . . . . . . . . 154
10.3 Results . . . . . . . . . . . . . . . . . . . . . . . . . . . . . . . . . . . . 15510.3.1 Quantitative validation . . . . . . . . . . . . . . . . . . . . . . 155
10.3.2 Qualitative validation . . . . . . . . . . . . . . . . . . . . . . . 157
10.4 Discussion . . . . . . . . . . . . . . . . . . . . . . . . . . . . . . . . . . 16010.5 Conclusion . . . . . . . . . . . . . . . . . . . . . . . . . . . . . . . . . 162
10.1 Introduction
Gesture evaluation has applications in various areas, such as medicine, educationand serious gaming. It can provide a quantified measure of the quality of a ges-ture, allowing both the tracking of a patient’s progression, and the objectivity of theevaluation. However, more information could be obtained from data than a singlescore. Feedback information could be extracted from the evaluation model abouthow the gesture was performed, and how it should be modified to produce a betterskill level prediction. Users of such a feedback system could benefit from this moreinterpretable information, allowing a more efficient training. This system could beused either as an automated supervisor, or as a tool for teachers.
However, due to the newness of MoCap technologies, the small but emerging liter-ature on gesture evaluation as presented in Chapter 3 is not yet focusing on the use
149
150 Towards a generic visual feedback model for gesture evaluation
of the proposed evaluation models for actual training and supervision. Nonethe-less, the few works mentioned in Section 3.4.4 establish some reference points in thatdirection. Young and Reinkensmeyer (2014) proposed an original method for syn-thesis of a new motion corresponding to a particular skill level. From a score, theygenerate features (eigenpostures and PMs) that would predict this score (see Sec-tion 3.4.3), and then synthesize the corresponding gesture from a ’reciprocal process’of the eigenpostures (following a reciprocal procedure of Troje (2002) for eigenpos-tures extraction). Although they used this system to produce general interpretationson the analyzed discipline (competitive diving), the synthesized gestures could becompared to the user’s own performance, allowing feedback. In that direction, Pirsi-avash et al. (2014) used the same idea of ’reciprocal process’ of their evaluation model(based on pose-DCT and L-SVR , see Section 3.4.3) to generate new features corre-sponding to the gradient of the model. They first compute the gradient of the L-SVRmodel, and then perform an inverse-DCT on this gradient, providing information onthe modification of the joint positions that would improve the score.
In this chapter, a novel generic method for visual feedback based on synthesis isproposed. From a given score, a new motion sequence (or a new feature set ofany type) is synthesized from a weighted average of gestures from a pre-processeddataset. The synthesis method, based on GRNN, does not require the ’reciprocalprocess’ of any specific model or features, and can hence be used with any gestureevaluation model that allows the prediction of a continuous score. The method couldeven be used for direct interpretation on experts’ annotations, without any gestureevaluation model.
From the synthesized data (either a motion sequence or a feature set), three types offeedback information are generated: (i) a visual feedback, based on the synchronizedvisualization of the user’s performance with the synthesized motion sequence, (ii) astriped-image representation of the differences between the user’s features and thesynthesized ones, and (iii) a striped-image representation of the Euclidean distancesbetween the corresponding markers of both motion sequences.
10.2 Method
10.2.1 Synthesis-based feedback loop
Fig 10.1 shows the diagram of the proposed feedback method. First, a motion se-quence performed by a user is recorded and the skill level of the gesture is predictedusing an evaluation model. Any of the regression model presented above can beused. An increment (a hop) is then applied on the predicted score, resulting in animproved score. From this improved score, a synthesizer generates a new artificialmotion sequence and/or a new feature set corresponding to this score. The synthe-sis is based on a weighted average of sequences/features extracted from the dataset.

§10.2 Method 151
The synthesized data are then compared with the original ones, allowing extractionof various types of feedback:
1. The synthesized sequence is superimposed with the original one, and both canbe visualized synchronously. It allows a direct visual comparison showing thedifferences between both sequences to the user.
2. The difference between the original features and the synthesized ones is com-puted, and is illustrated as a striped image with scaled colors, where each stripecorresponds to the temporal evolution of a feature. Note that the features canbe joint global 3D positions. A raw motion sequence can be seen as a particulartype of feature set.
3. The Euclidean distances between each corresponding marker of the synthesizedand original sequences are computed, and are also illustrated as a striped image(one stripe per joint).
10.2.2 Skilled-gesture synthesis
The key part of the proposed feedback system relies on the synthesis of a gesture cor-responding to a particular skill level. To synthesize new motion data correspondingto a given skill level, a GRNN (or Gaussian-kernel regression) is used for the regres-sion of a motion sequence with the skill level as input variable. Fig 10.2 illustratesthe underlying process of the proposed synthesis method. For each sequence of apre-recorded dataset, scores are computed using the evaluation model from whichfeedback is requested. Annotations could be used instead if they are provided foreach sequence.1 For a new sequence performed by the user of the system (referredto below as the test sequence), the skill is evaluated, and a hop (h) is applied to thisscore, as explained in Section 10.2.1. All these scores, denoted by si, are then usedas input for the regression. The output of the regression is either a motion sequence(termed below as the feedback sequence), denoted by Xs, or any type of feature set Fs.Note that a motion sequence can be seen as a particular type of feature set. The sameapproach can thus be used for both.
The dataset of motion sequences is adapted for a more efficient weighted combina-tion of several motion sequences, and for optimal comparison with the user’s gesture,as illustrated in Fig 10.3:
1. First, all motion sequences are scaled to the size of the user using skeletonscaling.2
1If only general annotations are given for the participants of the dataset, only a few different values(12 in the case of the Taijiquan dataset) would be used as input for the training of the GRNN (i.e. askernels), resulting in a sparse regression space.
2MIRFE cannot be used for this purpose as it only extracts residual features that would result inan irrelevant 3D visualization. Nevertheless, MIRFE is used on the features used for the stripe imagedisplaying feature differences.

152 Towards a generic visual feedback model for gesture evaluation
Figure 10.1: Synthesis-based feedback loop process. The integration of the feedbackby the performer can be viewed as a conceptual closed-loop process for the user’s
progression.
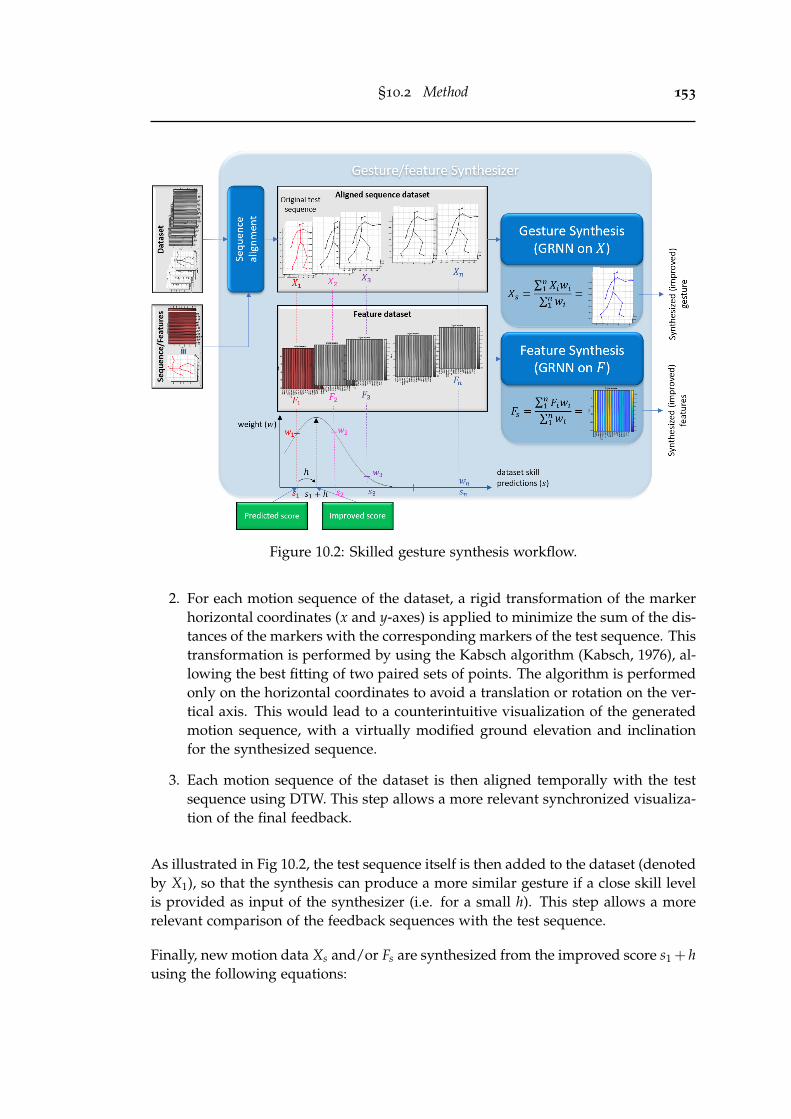
§10.2 Method 153
Figure 10.2: Skilled gesture synthesis workflow.
2. For each motion sequence of the dataset, a rigid transformation of the markerhorizontal coordinates (x and y-axes) is applied to minimize the sum of the dis-tances of the markers with the corresponding markers of the test sequence. Thistransformation is performed by using the Kabsch algorithm (Kabsch, 1976), al-lowing the best fitting of two paired sets of points. The algorithm is performedonly on the horizontal coordinates to avoid a translation or rotation on the ver-tical axis. This would lead to a counterintuitive visualization of the generatedmotion sequence, with a virtually modified ground elevation and inclinationfor the synthesized sequence.
3. Each motion sequence of the dataset is then aligned temporally with the testsequence using DTW. This step allows a more relevant synchronized visualiza-tion of the final feedback.
As illustrated in Fig 10.2, the test sequence itself is then added to the dataset (denotedby X1), so that the synthesis can produce a more similar gesture if a close skill levelis provided as input of the synthesizer (i.e. for a small h). This step allows a morerelevant comparison of the feedback sequences with the test sequence.
Finally, new motion data Xs and/or Fs are synthesized from the improved score s1 + husing the following equations:

154 Towards a generic visual feedback model for gesture evaluation
Figure 10.3: Data adaptation for better comparison with the user’s motion. The redskeleton represents the test sequence performed by the user of the feedback system.The blue skeleton represents a sample of the dataset. Firstly, the sample is scaled tothe size of the user. Then, horizontal coordinates are fitted to the test sequence using
the Kabsch algorithm. Finally, data are aligned temporally using DTW.
wi = exp(− (si − (s1 + h))2
2σ2smooth
) (10.1)
w′i =wi
∑ni=1 wi
(10.2)
Xs =n
∑i=1
Xiw′i (10.3)
Fs =n
∑i=1
Fiw′i (10.4)
where σsmooth is the smoothing parameter of the GRNN. This parameter was manu-ally set to 0.3 in the experiment. The choice of this parameter is discussed in Section10.4.
The synthesized motion sequence Xs can be visualized in synchronization with X1
(Feedback 1, see Fig 10.1), the distances between their corresponding markers can bevisualized as a striped image (Feedback 3, see Fig 10.1), or the difference between Fs
and F1 can also be visualized as a striped image (Feedback 2, see Fig 10.1).
10.2.3 Experiments
To validate the proposed synthesis-based feedback method, the skill-level of the syn-thesized data can be evaluated with the gesture evaluation model. For this experi-

§10.3 Results 155
ment, the best gesture evaluation model proposed in this research is used (featurestatistics PCs EN-regression, see Chapter 8). The resulting score can then simplybe compared to the input score of the synthesizer. As an experiment, feedback se-quences are generated for each sample of the 8-Bafa dataset, for five improved scoresfrom the initial predicted score (h = 0) to 12 (h = 12− s1). On these synthesizedsequences, the level is predicted using the evaluation model, allowing to verify theassumption that the generated sequence is actually better than the test sequence. Theresults are presented in Section 10.3.1.
Besides quantitative validation, some examples are qualitatively interpreted, to showthe interest of the proposed feedback method. These examples are presented inSection 10.3.2.
10.3 Results
10.3.1 Quantitative validation
Fig 10.4 shows the means of the level predictions of the synthesized sequences foreach participant, each Bafa technique, and for different improved scores (referredto as target score in the graph). For each graph, corresponding to the results forone participant, the blue star shows the reference level of the participant (as anno-tated by the teachers). Each curve, referred to below as feedback curve, correspondsto the mean prediction of the feedback sequences for all renditions of one gestureby one participant, according to the improved score. The origin of each feedbackcurve corresponds to a feedback without any improvement (h = 0). The x-axis thuscorresponds to the predicted score of the original sequence (s1), and the y-axis tothe prediction of a synthesized sequence corresponding to this level. Therefore, eachcurve should ideally start from the blue star. Then, as the improved score is increased(h > 0), the synthesized sequence should be of a greater quality, leading to a higherprediction, ideally equal to the improved score. The curves should hence follow thedashed line. It can be observed that for most of the participants, the curves seem tofollow this line at the beginning. As the improved score reaches the maximum scorefrom the annotation scale (10), the curves flatten and generally tend towards thismaximum. This result is due to the fact that the feedback sequences are generatedthrough an averaging of the available sequences in the dataset. As the best sequencesof the dataset are rated about 10 by the gesture evaluation model, corresponding tothe skill level of an expert, the synthesizer cannot generate sequences with a higherscore. Note that for P1, some curves exceed the dotted line. This is due to the factthat some predicted scores from the available dataset (P2 to P12, following the LOPOprocedure) are higher than 10.

156 Towards a generic visual feedback model for gesture evaluation
Figure 10.4: Validation of the feedback method. The level of the feedback sequencesis predicted back by the gesture evaluation model (y-axis) and confronted to theimproved score (the target score, x-axis)). Each curve corresponds to the mean of the
predictions for all renditions of one Bafa technique by one participant.

§10.3 Results 157
10.3.2 Qualitative validation
In this section, a few examples of the use of the feedback system will be presented,in order to show its practical interest as an improvement tool for the user. Fig 10.5shows the result of the feedback system for a rendition of G8 (Part the wild horse’smane) performed by P11, the lowest-skilled participant. The prediction of the origi-nal sequence was s1 = 5.55. A hop of h = 4.45 was applied to generate a sequencecorresponding to an improved score of 10. The gesture evaluation system was thenused on the synthesized sequence and predicted an actual skill level of 8.58. The leftgraph shows a frame at the beginning of the gesture. It can be observed that theoriginal skeleton (in red) is tilted back. On the opposite, the feedback skeleton seemsmore stable, with a more vertical trunk (cfr stability features, see Section 6.2). Theright graph shows a frame at the end of the gesture. At this moment of the gesture,the feet of the feedback skeleton seem to be further away, both in frontal plane (side-ways) and in sagittal plane (forward-backward direction), offering a larger supportbase. The attacking arm (left arm) is aligned vertically with the attacking foot (leftfoot). The head and the torso are also directed towards the attacking limbs (cfr align-ment features, see Section 6.3). Both arms and both legs are more widely opened,and are more similar to the shape of a sphere. This spherical shape of the body isan important concept of Taijiquan (Caulier, 2010). Although the gesture evaluationmodel is not trained with any particular feature involving this spherical shape, thevisual feedback seems to allow this observation, showing its interest. Even thoughthe algorithm is based on rather low-level features interpretation (global positionsand relational features), high-level interpretations can still be made by the humanobserver from the synthesis-based feedback system. It is important to note that theseinterpretations are made from an interactive 3D visualization of the sequences, al-lowing a better observation than allowed in the 2D snapshots shown in Fig 10.5.
The system also allows a visualization of the feedback sequence evolution, for dif-ferent values of h. Fig 10.6 shows five feedback sequences corresponding to a linearramp of h from 0 to 4.45. The colors of the feedback skeletons follow a mapping fromred (for h = 0) to blue (for h = 4.45). It can be observed that for each increment of hthe feet move away from each other, until they reach their optimal position in blue.It seems that for the first increments of h, the displacement of the feedback sequenceis larger. The differences between the feedback sequences seem more subtle after afew increments. The difference between the last two increments seems to essentiallylie in the head direction, and the wider opening of the left arm.
Fig 10.7 shows the results of the feedback system for a rendition of G11 (Kick withthe heel) performed by P11 (larger images are provided in Appendix B with axes,for better readability). Graph (a) shows 3D visualization of the original and feedbacksequences at the top of the kick (at about 45% of the sequence duration). It can beobserved that the feedback sequence, in blue, has a higher kicking foot. Moreover, itsleft hand is vertically aligned with its left foot, and the head has the same direction.

158 Towards a generic visual feedback model for gesture evaluation
Figure 10.5: Visual feedback for a rendition of G8 (Part the wild horse’s mane) byP11 (the lowest-skilled participant). Red: original sequence. Blue: feedback sequencewith an improved score of 10 (h = 4.45). Left graph: gesture beginning, side-view.
Right graph: gesture ending, front-view.
Both arms are opened more widely, and the position seems more stable, as the trunkis vertical.
Graph (b) displays the distances between the markers of the original sequence (redskeleton from Graph (a)) with the markers of the feedback sequence (blue skeletonin Graph (a)) across time. A large distance can be observed for the left foot, left ankleand left knee joints throughout the sequence. A peak for these distances occurs afterabout 60% of the sequence duration. A 3D visualization of the corresponding framesshowed that this peak is due to the fact that the user laid down the left foot soonerthan the feedback sequence. In other words, the left foot of the feedback sequencestays high for a longer time than the left foot of the original sequence. Two otherpoints of interest can be raised from this graph, one for the left arm (especially theleft hand), and one the right arm. A look at Graph (a) confirms this, as both arms ofboth skeletons are far apart.
Graph (c) displays the differences between joints global coordinates. It offers thus afew more information than the previous graph, emphasizing the important axes. Itcan be observed more clearly on this graph that the errors on the left leg joints seemsynchronized with the errors on the left arm. Moreover, it can be seen that majordifferences stand for the z-axis (vertical) for the left leg joints, and the y-axis (lateral)for both arms.
Finally, Graph (d) displays the differences between some of the Taijiquan ergonomicprinciples. Though they were not the best feature subset for use with the proposed

§10.3 Results 159
Figure 10.6: Visual feedback for a rendition of G8 (Part the wild horse’s mane) by P11(the lowest-skilled participant), for different values of h (linear ramp of five valuesfrom 0 to 4.45). The colors of the skeleton follow a color map from red to bluecorresponding to h (0 = red, 4.45 = blue). (a): front view. (b): upper view. (c):
feedback predictions.

160 Towards a generic visual feedback model for gesture evaluation
gesture evaluation models, they still allow an interesting feedback that can be in-terpreted by a user or a teacher. For instance, a first deep blue stripe concerningverticality (F3 in Table 6.1) appears throughout the entire sequence. This stripe indi-cates that the trunk should be more vertical, to provide more stability to the position.A second blue stripe indicates a wrong vertical alignment between the right shoulderand the right hip (F6 in Table 6.1). A third deep blue stripe indicates a wrong frontalalignment of the left shoulder with the left wrist (F11 in Table 6.1). Finally, the fourthdeep blue stripe indicates that at the end of the gesture, the left elbow is too far be-hind the body (F18 in Table 6.1). All these indications can generally be confirmed bya visualization of the 3D sequences.
10.4 Discussion
In this chapter, an original method for gesture evaluation feedback is presented. Themethod is validated quantitatively and qualitatively.
For the quantitative validation, the synthesized feedback sequences are evaluatedback using the gesture evaluation model, in order to verify if the predicted skill levelcorresponds to the desired skill level provided at the input of the synthesizer. The re-sults are consistent, as the prediction generally follows the desired skill level, and arebounded to the maximum level available in the dataset. Nonetheless, the smoothingparameter of the synthesizer (σsmooth, see eq. 10.1) could be tuned according to thedesired behavior of the synthesizer. A lower σsmooth would theoretically allow the syn-thesizer to generate sequences better corresponding to the input score. As σsmooth isincreased, wi in eq. 10.1 tends towards 1, giving the same weight to all the sequencesof the dataset (flat weighting). This allows a more generalized feedback sequence,as more sequences from the dataset are taken into account. However, the qualityof this sequence is also more limited. For an infinite σsmooth, the synthesizer wouldalways produce the same sequence resulting from the average of all sequences of thedataset, corresponding to the average skill level of the dataset. This would result ina flat feedback curve. On the opposite, as σsmooth tends towards zero, the weightingbecomes sharper and only the sequence with the closest prediction to the targetedscore is considered in the synthesis. The synthesized sequence is therefore simply acopy of this sequence, and the evaluation will inevitably lead to the same score. Inthis case, the feedback curve will follow a step function following the dashed lineand limited to the predictions available in the dataset. In this case, the synthesizedsequence will not be generalized at all, as it will copy a single rendition of a gestureby a single participant.
As qualitative validation, a few examples are presented, showing the practical in-terest of the method. However, to prove the effectiveness of the method, it shouldstill be tested in a real situation, by comparing its impact on actual training, with

§10.4 Discussion 161
Figure 10.7: Feedback for a rendition of G11 (Kick with the heel) by P11 (the lowest-skilled participant). (a): Visual feedback. (Red: original sequence. Blue: feedbacksequence with an improved score of 10). (b): Marker distances. (c): global positions
difference. (d): Taijiquan features difference.
162 Towards a generic visual feedback model for gesture evaluation
self-training and with teacher-supervised training. Nonetheless, the examples pro-vided in Section 10.3.2 give first indications on the possibilities offered by the pro-posed method. The synchronized visualization is an intuitive feedback system thatcan be easily interpreted by a novice user. Even without a priori knowledge on thediscipline, the user could learn a technique by successive imitation of the feedbacksequences, iteratively adapting her/his own gesture. A particular interest of the pro-posed method is that the synthesized feedback sequence is comparable to the user’s,as it was generated from adapted data, and from the user’s data themselves. Asthe feedback sequence can correspond to any small improvement step (small h), agradual feedback can be provided to the user, allowing a step-by-step progression.Besides the synchronized visualization, the striped images serve as a more precisefeedback. They allow to highlight particular features that require modification, giv-ing precise indications to the user. However, these images are harder to interpretthan the synchronized visualization. This type of feedback could have more inter-est for advanced users or teachers who already know which kind of feature shouldbe relevant in a particular technique, allowing them to focus on the relevant partsof the stripe image. Another solution could be a state-machine (similar to Patronaet al. 2018) that would provide a semantic feedback from pre-defined zones of theimage. For instance, for the ’Kick with the heel’ gesture, there is not much interestin features indicating the motion of the non-kicking foot as it is supposed to staystill. For standardized features, a relational feature such as ’the right foot is raised’(F17 in Table 2.5) could lead to a large feature difference (i.e. a stripe with a strongcolor) even if the synthesized foot is a few millimeters higher than the original one.Moreover, the differences near the beginning or the ending of the sequence may bedue to the inaccuracies of the motion sequence segmentation procedure, and not toa wrong position of the user.
To improve the feedback method, it could be interesting to derive from the modelthe importance of each feature for the prediction. This importance could be obtainedanalytically for some models. For instance, in the model proposed in Chapter 8, theimportance of the feature could be derived from the regression coefficients and theweight of features in the PCs. Otherwise, the importance of each feature could beextracted experimentally, by analyzing the impact of a modification of a feature inthe prediction. From the importance of each feature, a weighting of the colors inthe stripe images could be applied, in order to propose sharper images, easier tointerpret. The synchronized visualization could also be adapted by highlighting themost important joints (e.g. by modifying their color, size or transparency).
10.5 Conclusion
In this chapter, a novel feedback method is proposed. The method is based on thesynthesis of new data, either a motion sequence or a feature set, corresponding to a

§10.5 Conclusion 163
desired skill level. To synthesize these data, a weighted average of samples of a pre-processed dataset is performed. The motion sequences of the dataset are adaptedwith three steps, to be more comparable to the user’s motion (the test sequence).First, each motion sequence of the dataset is scaled to the size of the user. Secondly,each motion sequence is spatially matched to the test sequence using a rigid trans-formation minimizing the distances between the horizontal coordinates of the corre-sponding markers. Thirdly, each motion sequence is temporally aligned to the testsequence using DTW. Different types of feedback are then extracted by comparingthe synthesized data to the user’s ones: (i) a synchronized visualization of the test se-quence with the feedback sequence synthesized with any hop of skill improvement,(ii) a striped image representing the differences between the synthesized featuresand the user’s ones, and (iii) a striped image displaying the distances between thecorresponding markers of both sequences.
The proposed model has different advantages compared to the related work. First,it can be used either with motion sequences, or with any type of motion features.Secondly, it is independent of the gesture evaluation model. It could be used withany gesture evaluation model providing a continuous score. It could even be usedfor direct interpretation of the scores annotated by teachers, without the need of anyevaluation model.
As quantitative validation, various feedback sequences were generated for differentdesired skill levels, and their effective skill level was then estimated by the evaluationmodel. The comparison of the prediction with the desired skill level showed theeffectiveness of the synthesis method.
Examples of the use of the feedback method were then proposed, showing its practi-cal interest for training. The proposed visual feedback is intuitive and can be used bya novice user. However, the striped-image representations allow a specific feedbackon various features, and allow a more precise interpretation by advanced users or byteachers. The proposed method could hence be used as an automated supervisor, oras a tool for a teacher, allowing a more objective supervision.
Finally, the method could be improved in the future, by weighting the feedback foreach feature according to their importance in the used gesture evaluation model.This would allow a better highlighting of the most relevant features in the stripedimages, or the most relevant joints in the motion sequences.

164 Towards a generic visual feedback model for gesture evaluation

Conclusions
Original contributions of the thesis
In the present thesis, a framework for the evaluation of the expertise in gestures hasbeen proposed. This framework follows six main sequential steps.
First, a dataset of Taijiquan expert gestures has been collected and is presented inChapter 4. Taijiquan is a general discipline focusing on various aspects of motion.This dataset is an important contribution to the field, as no public dataset known tothe author was available for the study of gesture evaluation. The proposed datasetcontains a total of 2200 manually corrected and segmented gestures, divided into13 classes and performed by 12 participants of different expertise levels. The par-ticipants were ranked by three highly experienced Taijiquan teachers, allowing thetraining and validation of new evaluation models.
To deal with the issue of missing markers and improve the data quality, a method forautomatic MoCap data recovery has been proposed, based on the probabilistic aver-aging of various methods (PMA) and simple constraints on trajectory continuity andmarker distances (see Chapter 5). Results show that PMA used with the constraintsoutperforms methods used individually in various conditions, including various gaplengths, motion sequence durations and number of simultaneous gaps, showing therobustness of the method.
The next step was the choice and the development of new motion features, adaptedfor the representation of expertise. In this context, a large set of features from theliterature was used, including various low-level features as well as relational featuresand ergonomic features. Moreover, a new feature set was developed, inspired byTaijiquan ergonomic principles (see Chapter 6). This high-level feature set allows arepresentation of motion in terms of ergonomy, and is assumed to be related withexpertise. However, the best performance in gesture evaluation was not achievedwith this type of feature, showing that global positions and relational features weremore appropriate with the models tested. Further tests should be conducted with alarger dataset to investigate the use of these high-level features. It is possible thattheir relations are complex and that non-linear regression methods would performbetter with these features if a larger dataset is available.
Nevertheless, these features are relevant for feedback interpretation, at least in thecase of Taijiquan gesture evaluation, as illustrated in Chapter 10. They are of particu-lar interest to the teacher used to this type of motion representation in the teaching of
165

166 Towards a generic visual feedback model for gesture evaluation
Taijiquan. In order to validate their practical interest, a prototype of infield feedbackshould be developed, and be tested with various types of features. Moreover, infieldtests should also be conducted in other disciplines than Taijiquan.
The most relevant representation of expertise must then be drawn from the availablefeatures. To that end, a novel method for morphology-independent feature extractionhas been developed (MIRFE, see Chapter 7). The method has been shown to increasethe correlation of features with expertise. Furthermore, MIRFE was validated withvarious evaluation models, and generally improved their performance. More specif-ically, it was shown that evaluation models could be used efficiently with a largernumber of latent variables (PCs or eigenmovement weights), leading to significantlybetter predictions. It seems therefore that MIRFE allows the extraction of featuresthat are easier to interpret by the models. This may be due to the fact that the pro-cessed features are more comparable between participants, or due to the reduction ofuseless and redundant information contained in the features about the participants’morphology.
From these processed features, a new statistical-based model for the automatic eval-uation of expertise has been proposed (see Chapter 8). Basic statistics are computedfor each sequence, resulting in a mean and a standard deviation per sequence. PCAis then applied on these statistics, providing a smaller set of variables from whicha regression model can be trained to estimate a performer’s expertise level. Theproposed model has been designed to be generic, and can therefore be used withany type of features, and with various regression models. Both linear and non-linearregression models were tested and validated with the Taijiquan dataset. The best pre-diction accuracy (R = 0.909) was obtained for an EN-regularized linear regression,with 60 PCs extracted from global positions and relational feature statistics.
A first exploration of the use of deep learning algorithms was proposed for gestureevaluation (see Chapter 9). To that end, motion sequences were represented as RGBimages, allowing their use with pre-trained image classification models. AlexNetwas used as proof-of-concept, and a two-step transfer learning procedure allowed itsadaptation for the classification of Bafa techniques first, and then for the predictionof the level of expertise. The results seem to show that the proposed two-step transferlearning procedure yields better accuracy than a simple transfer learning. Althoughthe results were significantly lower than those of the statistical-based model (seeChapter 8), it could be observed that middle-level performers were evaluated moreaccurately than the lowest- and highest-skilled ones. This finding suggests that alarger dataset including more beginners and experts could allow for a better gener-alization of the model to new instances, showing the potential of deep learning forgesture evaluation.
Finally, as a practical application of the gesture evaluation models, a novel feedbackmethod has been proposed (see Chapter 10). From a test sequence performed by auser of the system, a feedback sequence or feature set is synthesized, corresponding

§10.5 Conclusion 167
to a desired skill level, and comparable to the user’s performance. Three types ofvisual feedback are then proposed, allowing: (i) a synchronized visualization of thetest sequence with the feedback sequence, (ii) a striped image representing the differ-ences between the synthesized features and the user’s ones, and (iii) a striped imagedisplaying the distances between the corresponding markers of both sequences. Theproposed method has as advantage that it can be used with any gesture evaluationmodel providing a continuous score as input for the synthesizer. Moreover, it can beused with any type of motion features.
The method was validated quantitatively by verifying that the synthesized sequencescorresponded to the skill level predicted by the evaluation model. Moreover, asqualitative validation, examples of the use of the feedback method were presented,showing its practical interest for training. The proposed visual feedback is intuitiveand could be used either by a novice user for automated supervision, or by a teacheras a tool allowing a more objective supervision.
General limitations and improvement prospects
The present thesis provides original elements to the recent research field of gestureevaluation. Moreover, the first three steps of the proposed framework, includingthe Taijiquan MoCap dataset, the MoCap recovery method and the morphology-independent feature extraction process (MIRFE) may have interests in a wider areaof research with MoCap data.
A complete pipeline of methods has been successfully developed, from the recordingof expert gestures to expertise evaluation and feedback. The evaluation results arepromising, as well as the feedback examples, showing a possible integration in prac-tical applications. However, various limitations must be raised, and numerous stepsare still needed for an effective use in hospitals, sports fields, serious games, etc.
First, the proposed methods should be tested on other types of gestures. AlthoughTaijiquan is assumed to be a relevant use case, a test on other gestural disciplineswould allow to verify if the methods are effective with them. It would also allow totest if the same configurations in the evaluation models yield the best results (featuretype, regression model used, MIRFE), and if the feedback method allows a relevantinterpretation. According to the disciplines, other methods from the literature mightalso be more relevant. For instance, the two methods used for comparison in Section8.3.4 rely on frame-by-frame relations, and might be more relevant for disciplinesmainly focusing on timing.
Secondly, all results are limited to the size of the Taijiquan MoCap dataset. Thisdataset comprises about 208 sequences for each of the eight Bafa techniques, per-formed by 12 participants. Moreover, the annotation is limited to a global score for
168 Towards a generic visual feedback model for gesture evaluation
each participant, and a score per sequence would be more relevant. For the model-ing of complex relations with multiple non-linear regression, a larger dataset wouldbe better. More complex relations systematically require more data to be efficientlymodeled. In the present case, the best results obtained for non-linear regression mod-els in Chapter 8 were based on a single PC (see Table 8.1). It is possible that with alarger dataset, a larger number of PCs could be used efficiently in these regressionmodels. In that case, different types of features, describing abstract aspects of motion(such as ergonomics) and non-linearly related to expertise could yield better results.Furthermore, deep learning models, which are the state of the art in many otherapplications, could also be investigated more thoroughly.
Finally, no validation was proposed for practical infield use of the gesture evalua-tion and feedback methods. Their interest, either for automated supervision or astools for teachers, must still be demonstrated. Practitioners of a discipline may allhave their own perception of a gesture and their own learning strategy, based eitheron feeling, observation and intense repetition, and personal mental images. Thesestrategies may also depend on the level of expertise already reached by the practi-tioner. According to their level, they may focus either on general aspects of motionor on specific details. Moreover, as suggested by Caulier (2010) and as discussed inChapter 1, the mastering of a discipline can be divided in various steps, including thebody external mechanics, the internal feeling and mental images, as well as a spiri-tual aspect related to concentration and awareness. The proposed methods, focusedexclusively on external aspects of motion, could be more relevant in some cases, andfor some users, than others.
A practical validation of the proposed methods based on an infield use by an end userwould be complicated at the present stage of development. The accurate recordingof the gestures with a MoCap system like Qualisys is expensive, complicated to setup, and too intrusive for various applications. Moreover, an automatic and user-friendly pipeline from the recording to gesture evaluation and feedback must still bedeveloped.
Nonetheless, recent technologies, including real-time human 3D mesh recovery in2D images (Güler et al., 2018; Kanazawa et al., 2018) show promising prospects forthe development of low-cost and user-friendly MoCap. This type of technique couldbe used in the future with a single camera, either for the fast recording of a dataset,the recording of multiple performers at the same time, or for easy infield use. Otherrecent MoCap technologies such as the Vive TrackersTM allow a friendly use andare calibrated with virtual-reality headsets, such as the HTC ViveTM (HTC, 2018).Coupled with virtual reality, a new and more intuitive type of feedback could beinvestigated.

References
Abdullah, M.; Maliki, A.; Musa, R.; Kosni, N.; Juahir, H.; and Mohamed, S.,2017. Identification and comparative analysis of essential performance indicators intwo levels of soccer expertise. International Journal on Advanced Science, Engineeringand Information Technology, 7, 1 (2017), 305–314.
Ahmed, N.; Natarajan, T.; and Rao, K. R., 1974. Discrete cosine transform. IEEEtransactions on Computers, 100, 1 (1974), 90–93.
Aizerman, M. A., 1964. Theoretical foundations of the potential function methodin pattern recognition learning. Automation and remote control, 25 (1964), 821–837.
Alborno, P.; De Giorgis, N.; Camurri, A.; and Puppo, E., 2017. Limbs synchroni-sation as a measure of movement quality in karate. In Proceedings of the 4th Interna-tional Conference on Movement Computing, 29. ACM.
Alexiadis, D. S. and Daras, P., 2014. Quaternionic signal processing techniques forautomatic evaluation of dance performances from mocap data. IEEE Transactions onMultimedia, 16, 5 (2014), 1391–1406.
Andreoni, G.; Mazzola, M.; Ciani, O.; Zambetti, M.; Romero, M.; Costa, F.; and
Preatoni, E., 2009. Method for movement and gesture assessment (mmga) in er-gonomics. In International Conference on Digital Human Modeling, 591–598. Springer.
Aristidou, A.; Cameron, J.; and Lasenby, J., 2008. Predicting missing markersto drive real-time centre of rotation estimation. Articulated Motion and DeformableObjects, (2008), 238–247.
Aristidou, A. and Chrysanthou, Y., 2014. Feature extraction for human motionindexing of acted dance performances. In Computer Graphics Theory and Applications(GRAPP), 2014 International Conference on, 1–11. IEEE.
Aristidou, A.; Stavrakis, E.; Charalambous, P.; Chrysanthou, Y.; and Himona,S. L., 2015. Folk dance evaluation using laban movement analysis. Journal on Com-puting and Cultural Heritage (JOCCH), 8, 4 (2015), 20.
Baak, A., 2013. Retrieval-based approaches for tracking and reconstructing humanmotions.
169

170 References
Bachynskyi, M.; Palmas, G.; Oulasvirta, A.; Steimle, J.; and Weinkauf, T., 2015.Performance and ergonomics of touch surfaces: A comparative study using biome-chanical simulation. In Proceedings of the 33rd Annual ACM Conference on HumanFactors in Computing Systems, 1817–1826. ACM.
Barliya, A.; Omlor, L.; Giese, M. A.; Berthoz, A.; and Flash, T., 2013. Expressionof emotion in the kinematics of locomotion. Experimental brain research, 225, 2 (2013),159–176.
Bartenieff, I. and Lewis, D., 1980. Body movement: Coping with the environment.Routledge.
Bates, D. M. and Watts, D. a. G., 1988. Nonlinear regression analysis and its applica-tions, vol. 2. Wiley Online Library.
Baum, L. E. and Petrie, T., 1966. Statistical inference for probabilistic functions offinite state markov chains. The annals of mathematical statistics, 37, 6 (1966), 1554–1563.
Bianco, S. and Tisato, F., 2013. Karate moves recognition from skeletal motion. InThree-Dimensional Image Processing (3DIP) and Applications 2013, vol. 8650, 86500K.International Society for Optics and Photonics.
Blanz, V. and Vetter, T., 1999. A morphable model for the synthesis of 3d faces. InProceedings of the 26th annual conference on Computer graphics and interactive techniques,187–194. ACM Press/Addison-Wesley Publishing Co.
Boone, D. C. and Azen, S. P., 1979. Normal range of motion of joints in malesubjects. The Journal of Bone & Joint Surgery, 61, 5 (1979), 756–759.
Boser, B. E.; Guyon, I. M.; and Vapnik, V. N., 1992. A training algorithm foroptimal margin classifiers. In Proceedings of the fifth annual workshop on Computationallearning theory, 144–152. ACM.
Bouchard, D. and Badler, N., 2007. Semantic segmentation of motion captureusing laban movement analysis. Intelligent Virtual Agents, (2007), 37–44.
Bradski, G. R. and Davis, J. W., 2002. Motion segmentation and pose recognitionwith motion history gradients. Machine Vision and Applications, 13, 3 (2002), 174–184.
Brooks, A. L. and Czarowicz, A., 2012. Markerless motion tracking: Ms kinect &organic motion openstage®. In International Conference Disability, Virtual Reality &Associated Technologies, 435–437.
Bruderlin, A. and Williams, L., 1995. Motion signal processing. In Proceedingsof the 22nd annual conference on Computer graphics and interactive techniques, 97–104.ACM.

References 171
Bruijn, S.; Meijer, O.; Beek, P.; and Van Dieën, J., 2013. Assessing the stabilityof human locomotion: a review of current measures. Journal of the Royal SocietyInterface, 10, 83 (2013), 20120999.
Burger, B. and Toiviainen, P., 2013a. MoCap Toolbox – A Matlab toolbox forcomputational analysis of movement data. In Proceedings of the 10th Sound and Mu-sic Computing Conference, 172–178. KTH Royal Institute of Technology, Stockholm,Sweden.
Burger, B. and Toiviainen, P., 2013b. Mocap toolbox-a matlab toolbox for compu-tational analysis of movement data. In 10th Sound and Music Computing Conference,SMC 2013, Stockholm, Sweden. Logos Verlag Berlin.
Cadopi, M., 2005. La motricité du danseur: approche cognitive. Bulletin de psycholo-gie, 1 (2005), 29–37.
Camomilla, V.; Bergamini, E.; Fantozzi, S.; and Vannozzi, G., 2018. Trendssupporting the in-field use of wearable inertial sensors for sport performance eval-uation: A systematic review. Sensors, 18, 3 (2018), 873.
Caruana, R., 1997. Multitask learning. Machine learning, 28, 1 (1997), 41–75.
Caulier, E., 2010. Comprendre le taijiquan, vol. 1. Editions Modulaires EuropéennesInterCommunication SPRL.
Caulier, E., 2014. Le taijiquan : une voie d’incorporation et de comprehension desnouveaux paradigmes. Plastir, 37 (12 2014), 86 – 107.
Caulier, E., 2015. Du geste formel a la gestuelle habitee : la voie du taijiquan.Recherches & Educations, 13, 2 (06 2015), 59 – 71.
Chai, J. and Hodgins, J. K., 2005. Performance animation from low-dimensionalcontrol signals. In ACM Transactions on Graphics (TOG), vol. 24, 686–696. ACM.
Chen, L.; Gibet, S.; Marteau, P.-F.; Marandola, F.; and Wanderley, M. M., 2016.Quantitative evaluation of percussive gestures by ranking trainees versus teacher. InProceedings of the 3rd International Symposium on Movement and Computing, 13. ACM.
Chi, D.; Costa, M.; Zhao, L.; and Badler, N., 2000. The emote model for effort andshape. In Proceedings of the 27th annual conference on Computer graphics and interactivetechniques, 173–182. ACM Press/Addison-Wesley Publishing Co.
Chiari, L.; Della Croce, U.; Leardini, A.; and Cappozzo, A., 2005. Humanmovement analysis using stereophotogrammetry: Part 2: Instrumental errors. Gait& posture, 21, 2 (2005), 197–211.
CMU, 2003. Cmu graphics lab motion capture database. http://mocap.cs.cmu.edu/.

172 References
Cohen, I.; Sebe, N.; Garg, A.; Chen, L. S.; and Huang, T. S., 2003. Facial expressionrecognition from video sequences: temporal and static modeling. Computer Visionand image understanding, 91, 1-2 (2003), 160–187.
Cools, W.; De Martelaer, K.; Samaey, C.; and Andries, C., 2009. Movement skillassessment of typically developing preschool children: A review of seven movementskill assessment tools. Journal of sports science & medicine, 8, 2 (2009), 154.
Dadashi, F.; Millet, G.; and Aminian, K., 2015. Front-crawl stroke descriptorsvariability assessment for skill characterisation. Journal of sports sciences, 34, 15(2015), 1405–1412.
Dael, N.; Mortillaro, M.; and Scherer, K. R., 2012. Emotion expression in bodyaction and posture. Emotion, 12, 5 (2012), 1085.
Daffertshofer, A.; Lamoth, C. J.; Meijer, O. G.; and Beek, P. J., 2004. Pca instudying coordination and variability: a tutorial. Clinical biomechanics, 19, 4 (2004),415–428.
De Aguiar, E.; Theobalt, C.; and Seidel, H.-P., 2006. Automatic learning of artic-ulated skeletons from 3d marker trajectories. In International Symposium on VisualComputing, 485–494. Springer.
De Leva, P., 1996. Adjustments to zatsiorsky-seluyanov’s segment inertia parame-ters. Journal of biomechanics, 29, 9 (1996), 1223–1230.
Deitz, J. C.; Kartin, D.; and Kopp, K., 2007. Review of the bruininks-oseretsky testof motor proficiency, (bot-2). Physical & occupational therapy in pediatrics, 27, 4 (2007),87–102.
Dejnabadi, H.; Jolles, B. M.; and Aminian, K., 2008. A new approach for quanti-tative analysis of inter-joint coordination during gait. IEEE Transactions on BiomedicalEngineering, 55, 2 (2008), 755–764.
Deng, J.; Dong, W.; Socher, R.; Li, L.-J.; Li, K.; and Fei-Fei, L., 2009. Imagenet: Alarge-scale hierarchical image database. In Computer Vision and Pattern Recognition,2009. CVPR 2009. IEEE Conference on, 248–255. IEEE.
Devineau, G.; Xi, W.; Moutarde, F.; and Yang, J., 2018. Deep learning for handgesture recognition on skeletal data. In 13th IEEE Conference on Automatic Face andGesture Recognition (FG’2018).
Dietterich, T. G., 2000. Ensemble methods in machine learning. In Internationalworkshop on multiple classifier systems, 1–15. Springer.
Dietterich, T. G., 2002. Machine learning for sequential data: A review. In JointIAPR International Workshops on Statistical Techniques in Pattern Recognition (SPR) andStructural and Syntactic Pattern Recognition (SSPR), 15–30. Springer.
References 173
Ding, Z.; Wang, P.; Ogunbona, P. O.; and Li, W., 2017. Investigation of differentskeleton features for cnn-based 3d action recognition. In Multimedia & Expo Work-shops (ICMEW), 2017 IEEE International Conference on, 617–622. IEEE.
Dipietro, L.; Sabatini, A. M.; and Dario, P., 2003. Evaluation of an instrumentedglove for hand-movement acquisition. Journal of rehabilitation research and develop-ment, 40, 2 (2003), 179–190.
Drucker, H.; Burges, C. J.; Kaufman, L.; Smola, A. J.; and Vapnik, V., 1997.Support vector regression machines. In Advances in neural information processingsystems, 155–161.
Duclos, C.; Desjardins, P.; Nadeau, S.; Delisle, A.; Gravel, D.; Brouwer, B.;and Corriveau, H., 2009. Destabilizing and stabilizing forces to assess equilibriumduring everyday activities. Journal of biomechanics, 42, 3 (2009), 379–382.
Dutoit, T., 1997. An introduction to text-to-speech synthesis, vol. 3. Springer Science& Business Media.
Ericsson, K. A. and Lehmann, A. C., 1996. Expert and exceptional performance:Evidence of maximal adaptation to task constraints. Annual review of psychology, 47,1 (1996), 273–305.
Federolf, P.; Reid, R.; Gilgien, M.; Haugen, P.; and Smith, G., 2012. The ap-plication of principal component analysis to quantify technique in sports. Scan-dinavian Journal of Medicine and Science in Sports, 24, 3 (2012), 491–499. doi:10.1111/j.1600-0838.2012.01455.x.
Federolf, P. A., 2013. A novel approach to solve the "missing marker problem"in marker-based motion analysis that exploits the segment coordination patterns inmulti-limb motion data. PloS one, 8, 10 (2013), e78689.
Feng, Y.; Xiao, J.; Zhuang, Y.; Yang, X.; Zhang, J. J.; and Song, R., 2014. Exploit-ing temporal stability and low-rank structure for motion capture data refinement.Information Sciences, 277 (2014), 777–793.
Firat, M. and Gungor, M., 2009. Generalized regression neural networks andfeed forward neural networks for prediction of scour depth around bridge piers.Advances in Engineering Software, 40, 8 (2009), 731–737.
Fischer, R., 2018. The history and current state of motion capture. http://www.
motioncapturesociety.com/resources/industry-history. Retrieved: 2018/31/07.
FLEURANCE, P., 2009. Sport de haute performance et cognition. introduction. "jevois la balle avec les mains". Intellectica, 52 (2009), 7–27.
Friedman, J. H., 2001. Greedy function approximation: a gradient boosting ma-chine. Annals of statistics, (2001), 1189–1232.

174 References
Fritsch, F. N. and Carlson, R. E., 1980. Monotone piecewise cubic interpolation.SIAM Journal on Numerical Analysis, 17, 2 (1980), 238–246.
Furuya, S.; Goda, T.; Katayose, H.; Miwa, H.; and Nagata, N., 2011. Distinctinter-joint coordination during fast alternate keystrokes in pianists with superiorskill. Frontiers in human neuroscience, 5 (2011), 50.
Furuya, S.; Tominaga, K.; Miyazaki, F.; and Altenmüller, E., 2015. Losing dexter-ity: patterns of impaired coordination of finger movements in musician’s dystonia.Scientific reports, 5 (2015), 13360.
Gallahue, D. L.; Ozmun, J. C.; and Goodway, J., 2006. Understanding motor devel-opment: Infants, children, adolescents, adults. Boston.
Gløersen, Ø. and Federolf, P., 2016. Predicting missing marker trajectories inhuman motion data using marker intercorrelations. PloS one, 11, 3 (2016), e0152616.
Gløersen, Ø.; Myklebust, H.; Hallén, J.; and Federolf, P., 2017. Technique anal-ysis in elite athletes using principal component analysis. Journal of sports sciences,36, 2 (2017), 229–237.
Glorot, X.; Bordes, A.; and Bengio, Y., 2011. Deep sparse rectifier neural net-works. In Proceedings of the fourteenth international conference on artificial intelligenceand statistics, 315–323.
Gordon, A.; Huxley, A. F.; and Julian, F., 1966. The variation in isometric tensionwith sarcomere length in vertebrate muscle fibres. The Journal of physiology, 184, 1(1966), 170–192.
Güler, R. A.; Neverova, N.; and Kokkinos, I., 2018. Densepose: Dense humanpose estimation in the wild. arXiv preprint arXiv:1802.00434, (2018).
Haering, D.; Raison, M.; and Begon, M., 2014. Measurement and description ofthree-dimensional shoulder range of motion with degrees of freedom interactions.Journal of biomechanical engineering, 136, 8 (2014).
Hamilton, W. R., 1866. Elements of quaternions. Longmans, Green, & Company.
Han, X.; Zhong, Y.; Cao, L.; and Zhang, L., 2017. Pre-trained alexnet architecturewith pyramid pooling and supervision for high spatial resolution remote sensingimage scene classification. Remote Sensing, 9, 8 (2017), 848.
Hannaford, B. and Lee, P., 1991. Hidden markov model analysis of force/torqueinformation in telemanipulation. The International journal of robotics research, 10, 5(1991), 528–539.
Harding, W. J. and James, A. D., 2010. Analysis of snowboarding performance atthe burton open australian half-pipe championships. International Journal of Perfor-mance Analysis in Sport, 10, 1 (2010), 66–81.
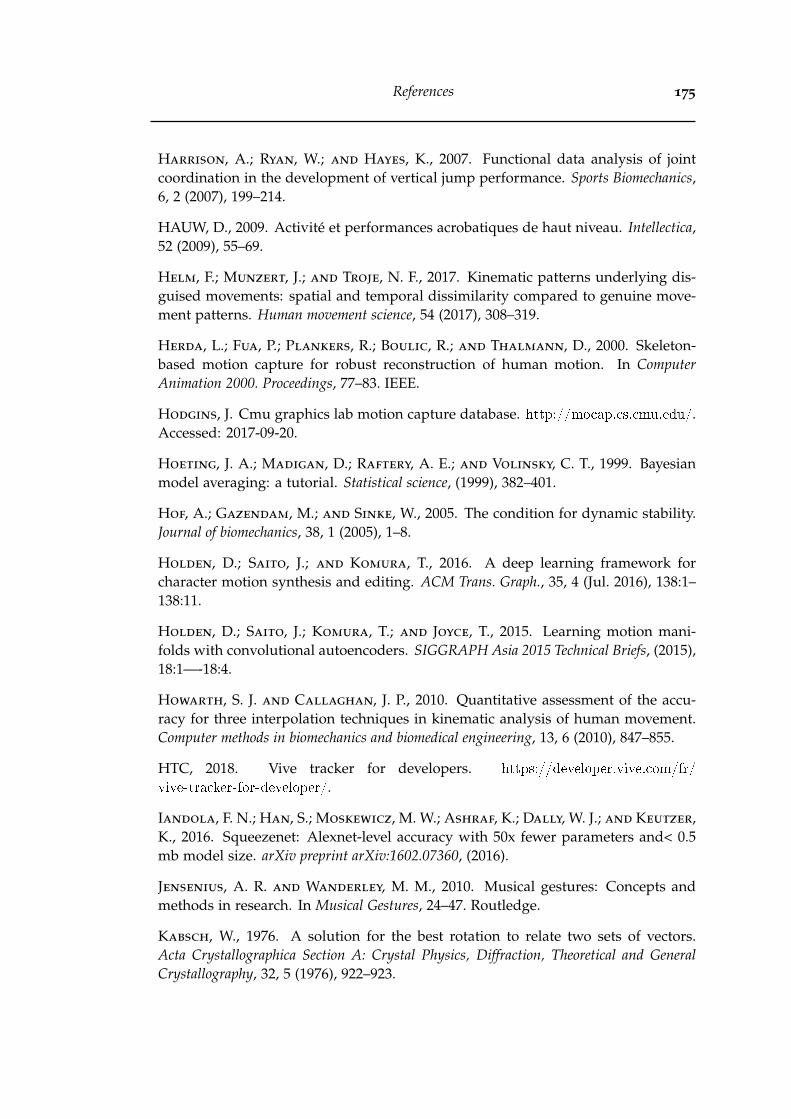
References 175
Harrison, A.; Ryan, W.; and Hayes, K., 2007. Functional data analysis of jointcoordination in the development of vertical jump performance. Sports Biomechanics,6, 2 (2007), 199–214.
HAUW, D., 2009. Activité et performances acrobatiques de haut niveau. Intellectica,52 (2009), 55–69.
Helm, F.; Munzert, J.; and Troje, N. F., 2017. Kinematic patterns underlying dis-guised movements: spatial and temporal dissimilarity compared to genuine move-ment patterns. Human movement science, 54 (2017), 308–319.
Herda, L.; Fua, P.; Plankers, R.; Boulic, R.; and Thalmann, D., 2000. Skeleton-based motion capture for robust reconstruction of human motion. In ComputerAnimation 2000. Proceedings, 77–83. IEEE.
Hodgins, J. Cmu graphics lab motion capture database. http://mocap.cs.cmu.edu/.Accessed: 2017-09-20.
Hoeting, J. A.; Madigan, D.; Raftery, A. E.; and Volinsky, C. T., 1999. Bayesianmodel averaging: a tutorial. Statistical science, (1999), 382–401.
Hof, A.; Gazendam, M.; and Sinke, W., 2005. The condition for dynamic stability.Journal of biomechanics, 38, 1 (2005), 1–8.
Holden, D.; Saito, J.; and Komura, T., 2016. A deep learning framework forcharacter motion synthesis and editing. ACM Trans. Graph., 35, 4 (Jul. 2016), 138:1–138:11.
Holden, D.; Saito, J.; Komura, T.; and Joyce, T., 2015. Learning motion mani-folds with convolutional autoencoders. SIGGRAPH Asia 2015 Technical Briefs, (2015),18:1—-18:4.
Howarth, S. J. and Callaghan, J. P., 2010. Quantitative assessment of the accu-racy for three interpolation techniques in kinematic analysis of human movement.Computer methods in biomechanics and biomedical engineering, 13, 6 (2010), 847–855.
HTC, 2018. Vive tracker for developers. https://developer.vive.com/fr/
vive-tracker-for-developer/.
Iandola, F. N.; Han, S.; Moskewicz, M. W.; Ashraf, K.; Dally, W. J.; and Keutzer,K., 2016. Squeezenet: Alexnet-level accuracy with 50x fewer parameters and< 0.5mb model size. arXiv preprint arXiv:1602.07360, (2016).
Jensenius, A. R. and Wanderley, M. M., 2010. Musical gestures: Concepts andmethods in research. In Musical Gestures, 24–47. Routledge.
Kabsch, W., 1976. A solution for the best rotation to relate two sets of vectors.Acta Crystallographica Section A: Crystal Physics, Diffraction, Theoretical and GeneralCrystallography, 32, 5 (1976), 922–923.

176 References
Kadous, W. et al., 1995. Grasp: Recognition of australian sign language usinginstrumented gloves. (1995).
Kakadiaris, L. and Metaxas, D., 2000. Model-based estimation of 3d human mo-tion. IEEE Transactions on Pattern Analysis and Machine Intelligence, 22, 12 (2000),1453–1459.
Kalman, R. E. et al., 1960. A new approach to linear filtering and predictionproblems. Journal of basic Engineering, 82, 1 (1960), 35–45.
Kami, A.; Meyer, G.; Jezzard, P.; Adams, M. M.; Turner, R.; and Ungerleider,L. G., 1995. Functional mri evidence for adult motor cortex plasticity during motorskill learning. Nature, 377, 6545 (1995), 155.
Kanazawa, A.; Black, M. J.; Jacobs, D. W.; and Malik, J., 2018. End-to-end re-covery of human shape and pose. In Proceedings of the IEEE Conference on ComputerVision and Pattern Recognition, 7122–7131.
Kapadia, M.; Chiang, I.-k.; Thomas, T.; Badler, N. I.; Kider Jr, J. T.; et al.,2013. Efficient motion retrieval in large motion databases. In Proceedings of the ACMSIGGRAPH Symposium on Interactive 3D Graphics and Games, 19–28. ACM.
Kay, B. A.; Turvey, M. T.; and Meijer, O. G., 2003. An early oscillator model:studies on the biodynamics of the piano strike (bernstein & popova, 1930). (2003).
Kee, D. and Karwowski, W., 2001. Luba: an assessment technique for posturalloading on the upper body based on joint motion discomfort and maximum holdingtime. Applied Ergonomics, 32, 4 (2001), 357–366.
Kee, D. and Karwowski, W., 2003. Ranking systems for evaluation of joint andjoint motion stressfulness based on perceived discomforts. Applied ergonomics, 34, 2(2003), 167–176.
Kendall, M. G., 1938. A new measure of rank correlation. Biometrika, 30, 1/2(1938), 81–93.
Kennedy, J. and Eberhart, R., 1995. Particle swarm optimization. In Neural Net-works, 1995. Proceedings., IEEE International Conference on, vol. 4, 1942–1948 vol.4.doi:10.1109/ICNN.1995.488968.
Kim, Y. K.; Kim, Y. H.; and Im, S. J., 2011. Inter-joint coordination in producingkicking velocity of taekwondo kicks. Journal of sports science & medicine, 10, 1 (2011),31.
King, M. A. and Yeadon, M. R., 2003. Coping with perturbations to a layoutsomersault in tumbling. Journal of Biomechanics, 36, 7 (2003), 921–927.
Kirk, A. G.; O’Brien, J. F.; and Forsyth, D. A., 2005. Skeletal parameter estimationfrom optical motion capture data. In Computer Vision and Pattern Recognition, 2005.CVPR 2005. IEEE Computer Society Conference on, vol. 2, 782–788. IEEE.
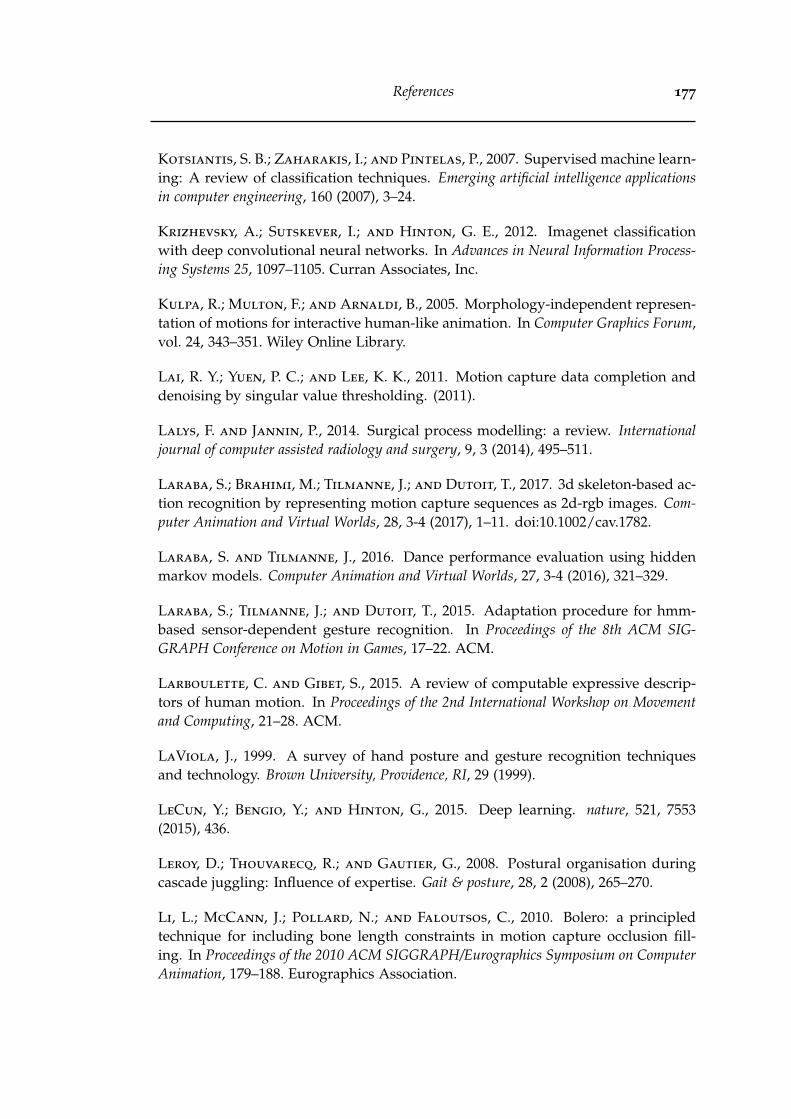
References 177
Kotsiantis, S. B.; Zaharakis, I.; and Pintelas, P., 2007. Supervised machine learn-ing: A review of classification techniques. Emerging artificial intelligence applicationsin computer engineering, 160 (2007), 3–24.
Krizhevsky, A.; Sutskever, I.; and Hinton, G. E., 2012. Imagenet classificationwith deep convolutional neural networks. In Advances in Neural Information Process-ing Systems 25, 1097–1105. Curran Associates, Inc.
Kulpa, R.; Multon, F.; and Arnaldi, B., 2005. Morphology-independent represen-tation of motions for interactive human-like animation. In Computer Graphics Forum,vol. 24, 343–351. Wiley Online Library.
Lai, R. Y.; Yuen, P. C.; and Lee, K. K., 2011. Motion capture data completion anddenoising by singular value thresholding. (2011).
Lalys, F. and Jannin, P., 2014. Surgical process modelling: a review. Internationaljournal of computer assisted radiology and surgery, 9, 3 (2014), 495–511.
Laraba, S.; Brahimi, M.; Tilmanne, J.; and Dutoit, T., 2017. 3d skeleton-based ac-tion recognition by representing motion capture sequences as 2d-rgb images. Com-puter Animation and Virtual Worlds, 28, 3-4 (2017), 1–11. doi:10.1002/cav.1782.
Laraba, S. and Tilmanne, J., 2016. Dance performance evaluation using hiddenmarkov models. Computer Animation and Virtual Worlds, 27, 3-4 (2016), 321–329.
Laraba, S.; Tilmanne, J.; and Dutoit, T., 2015. Adaptation procedure for hmm-based sensor-dependent gesture recognition. In Proceedings of the 8th ACM SIG-GRAPH Conference on Motion in Games, 17–22. ACM.
Larboulette, C. and Gibet, S., 2015. A review of computable expressive descrip-tors of human motion. In Proceedings of the 2nd International Workshop on Movementand Computing, 21–28. ACM.
LaViola, J., 1999. A survey of hand posture and gesture recognition techniquesand technology. Brown University, Providence, RI, 29 (1999).
LeCun, Y.; Bengio, Y.; and Hinton, G., 2015. Deep learning. nature, 521, 7553(2015), 436.
Leroy, D.; Thouvarecq, R.; and Gautier, G., 2008. Postural organisation duringcascade juggling: Influence of expertise. Gait & posture, 28, 2 (2008), 265–270.
Li, L.; McCann, J.; Pollard, N.; and Faloutsos, C., 2010. Bolero: a principledtechnique for including bone length constraints in motion capture occlusion fill-ing. In Proceedings of the 2010 ACM SIGGRAPH/Eurographics Symposium on ComputerAnimation, 179–188. Eurographics Association.

178 References
Li, L.; McCann, J.; Pollard, N. S.; and Faloutsos, C., 2009. Dynammo: Miningand summarization of coevolving sequences with missing values. In Proceedings ofthe 15th ACM SIGKDD international conference on Knowledge discovery and data mining,507–516. ACM.
Liu, G. and McMillan, L., 2006. Estimation of missing markers in human motioncapture. The Visual Computer, 22, 9 (2006), 721–728.
Lord, S.; Galna, B.; Verghese, J.; Coleman, S.; Burn, D.; and Rochester, L., 2012.Independent domains of gait in older adults and associated motor and nonmotorattributes: Validation of a factor analysis approach. Journals of Gerontology - SeriesA Biological Sciences and Medical Sciences, 68, 7 (2012), 820–827. doi:10.1093/gerona/gls255.
Ma, Y.; Paterson, H. M.; and Pollick, F. E., 2006. A motion capture library for thestudy of identity, gender, and emotion perception from biological motion. Behaviorresearch methods, 38, 1 (2006), 134–141.
Mandery, C.; Terlemez, O.; Do, M.; Vahrenkamp, N.; and Asfour, T., 2015. Thekit whole-body human motion database. In International Conference on AdvancedRobotics (ICAR), 329–336.
Mandery, C.; Terlemez, Ö.; Do, M.; Vahrenkamp, N.; and Asfour, T., 2016. Uni-fying representations and large-scale whole-body motion databases for studyinghuman motion. IEEE Transactions on Robotics, 32, 4 (2016), 796–809.
Marey, E.-J., 1873. La machine animale, vol. 3. Germer Baillière.
Marques, J. M.; Yzerbyt, V. Y.; and Leyens, J.-P., 1988. The "black sheep effect":Extremity of judgments towards ingroup members as a function of group identifi-cation. European Journal of Social Psychology, 18, 1 (1988), 1–16.
McAtamney, L. and Corlett, E. N., 1993. Rula: a survey method for the investi-gation of work-related upper limb disorders. Applied ergonomics, 24, 2 (1993), 91–99.
Megali, G.; Sinigaglia, S.; Tonet, O.; and Dario, P., 2006. Modelling and eval-uation of surgical performance using hidden markov models. IEEE Transactions onBiomedical Engineering, 53, 10 (2006), 1911–1919.
Metcalf, C. D.; Irvine, T. A.; Sims, J. L.; Wang, Y. L.; Su, A. W.; and Norris, D. O.,2014. Complex hand dexterity: a review of biomechanical methods for measuringmusical performance. Frontiers in psychology, 5 (2014).
Morel, M., 2017. Modélisation de séries temporelles multidimensionnelles. Application àl’évaluation générique et automatique du geste sportif. Ph.D. thesis, Université Pierre &Marie Curie.

References 179
Morel, M.; Achard, C.; Kulpa, R.; and Dubuisson, S., 2017. Automatic evaluationof sports motion: A generic computation of spatial and temporal errors. Image andVision Computing, 64 (2017), 67–78.
Morel, M.; Kulpa, R.; Sorel, A.; Achard, C.; and Dubuisson, S., 2016. Automaticand generic evaluation of spatial and temporal errors in sport motions. In 11thInternational Conference on Computer Vision Theory and Applications (VISAPP 2016),542–551.
Motion-Analysis, 1982. Motion analysis corporation. https://www.
motionanalysis.com/industry-�rsts/.
Müller, M.; Baak, A.; and Seidel, H.-P., 2009. Efficient and robust annotationof motion capture data. In Proceedings of the 2009 ACM SIGGRAPH/EurographicsSymposium on Computer Animation, 17–26. ACM.
Müller, M. and Röder, T., 2006. Motion templates for automatic classification andretrieval of motion capture data. In Proceedings of the 2006 ACM SIGGRAPH/Euro-graphics symposium on Computer animation, 137–146. Eurographics Association.
Müller, M. and Röder, T., 2008. A Relational Approach to Content-based Analysisof Motion Capture Data. Human Motion, (2008).
Müller, M.; Röder, T.; and Clausen, M., 2005. Efficient content-based retrieval ofmotion capture data. In ACM Transactions on Graphics (ToG), vol. 24, 677–685. ACM.
Müller, M.; Röder, T.; Clausen, M.; Eberhardt, B.; Krüger, B.; and Weber,A., 2007. Documentation mocap database hdm05. Technical Report CG-2007-2,Universität Bonn.
Multon, F., 2013. Sensing human walking: Algorithms and techniques for extract-ing and modeling locomotion. In Human Walking in Virtual Environments, 177–197.Springer.
Multon, F. and Olivier, A.-H., 2013. Biomechanics of walking in real world: natu-ralness we wish to reach in virtual reality. In Human Walking in Virtual Environments,55–77. Springer.
Mundermann, L.; Corazza, S.; Chaudhari, A. M.; Alexander, E. J.; and Andri-acchi, T. P., 2005. Most favorable camera configuration for a shape-from-silhouettemarkerless motion capture system for biomechanical analysis. In Electronic Imaging2005, 278–287. International Society for Optics and Photonics.
NASA, 1995. 3000. man systems integration standards. volume 1. section 3. anthro-pometry and biomechanics. National Aeronautics andSpace Administration, Houston,USA, (1995). https://msis.jsc.nasa.gov/sections/section03.htm.
Neverova, N., 2016. Deep learning for human motion analysis. Ph.D. thesis, Universitéde Lyon.

180 References
Newlove, J., 1993. Laban for actors and dancers: putting laban’s movement theory intopractice: a step-by-step guide.
Ofli, F.; Chaudhry, R.; Kurillo, G.; Vidal, R.; and Bajcsy, R., 2013. Berkeleymhad: A comprehensive multimodal human action database. In Applications ofComputer Vision (WACV), 2013 IEEE Workshop on, 53–60. IEEE.
Olesh, E. V.; Yakovenko, S.; and Gritsenko, V., 2014. Automated assessment ofupper extremity movement impairment due to stroke. PLoS ONE, 9, 8 (2014).
Parzen, E., 1962. On estimation of a probability density function and mode. Theannals of mathematical statistics, 33, 3 (1962), 1065–1076.
Patrona, F.; Chatzitofis, A.; Zarpalas, D.; and Daras, P., 2018. Motion analysis:Action detection, recognition and evaluation based on motion capture data. PatternRecognition, 76 (2018), 612–622.
Pearson, K., 1901. Liii. on lines and planes of closest fit to systems of points inspace. The London, Edinburgh, and Dublin Philosophical Magazine and Journal of Science,2, 11 (1901), 559–572.
Peng, S.-J.; He, G.-F.; Liu, X.; and Wang, H.-Z., 2015. Hierarchical block-basedincomplete human mocap data recovery using adaptive nonnegative matrix factor-ization. Computers & Graphics, 49 (2015), 10–23.
Peng, X. B.; Abbeel, P.; Levine, S.; and van de Panne, M., 2018. Deepmimic:Example-guided deep reinforcement learning of physics-based character skills.arXiv preprint arXiv:1804.02717, (2018).
Pham, T.; Pathirana, P. N.; Won, Y.; and Li, S., 2016. A summative scoring systemfor evaluation of human kinematic performance. Biomedical Signal Processing andControl, 23 (2016), 85–92.
Pirsiavash, H.; Vondrick, C.; and Torralba, A., 2014. Assessing the quality ofactions. In European Conference on Computer Vision, 556–571. Springer.
Plamondon, R. and Srihari, S. N., 2000. Online and off-line handwriting recog-nition: a comprehensive survey. IEEE Transactions on pattern analysis and machineintelligence, 22, 1 (2000), 63–84.
Polhemus, 1969. Polhemus. https://polhemus.com/company/history/.
Poppe, R., 2010. A survey on vision-based human action recognition. Image andvision computing, 28, 6 (2010), 976–990.
Raafat, R. M.; Chater, N.; and Frith, C., 2009. Herding in humans. Trends incognitive sciences, 13, 10 (2009), 420–428.
Rabiner, L. R. and Juang, B.-H., 1993. Fundamentals of speech recognition, vol. 14.PTR Prentice Hall Englewood Cliffs.

References 181
Reiley, C. E.; Lin, H. C.; Yuh, D. D.; and Hager, G. D., 2011. Review of methodsfor objective surgical skill evaluation. Surgical endoscopy, 25, 2 (2011), 356–366.
Romero, V.; Amaral, J.; Fitzpatrick, P.; Schmidt, R.; Duncan, A. W.; and
Richardson, M. J., 2017. Can low-cost motion-tracking systems substitute a pol-hemus system when researching social motor coordination in children? Behaviorresearch methods, 49, 2 (2017), 588–601.
Rosen, J.; Hannaford, B.; Richards, C. G.; and Sinanan, M. N., 2001. Markovmodeling of minimally invasive surgery based on tool/tissue interaction and force/-torque signatures for evaluating surgical skills. IEEE transactions on Biomedical Engi-neering, 48, 5 (2001), 579–591.
Rumelhart, D. E.; Hinton, G. E.; and Williams, R. J., 1985. Learning internalrepresentations by error propagation. Technical report, California Univ San DiegoLa Jolla Inst for Cognitive Science.
Samadani, A.-A.; Ghodsi, A.; and Kulic, D., 2013. Discriminative functional anal-ysis of human movements. Pattern Recognition Letters, 34, 15 (2013), 1829–1839.
Schmitt, O. H., 1938. A thermionic trigger. Journal of Scientific Instruments, 15, 1(1938), 24.
Sebastiani, F., 2002. Machine learning in automated text categorization. ACMcomputing surveys (CSUR), 34, 1 (2002), 1–47.
Seber, G. A. and Lee, A. J., 2003. Linear regression analysis. John Wiley & Sons.
Shahroudy, A.; Liu, J.; Ng, T.-T.; and Wang, G., 2016. Ntu rgb+ d: A large scaledataset for 3d human activity analysis. arXiv preprint arXiv:1604.02808, (2016).
Sie, M.-S.; Cheng, Y.-C.; and Chiang, C.-C., 2014. Key motion spotting in con-tinuous motion sequences using motion sensing devices. In Signal Processing, Com-munications and Computing (ICSPCC), 2014 IEEE International Conference on, 326–331.IEEE.
Silverman, B. W., 1986. Density estimation for statistics and data analysis, vol. 26. CRCpress.
Smola, A. J. and Schölkopf, B., 2004. A tutorial on support vector regression.Statistics and computing, 14, 3 (2004), 199–222.
Specht, D. F., 1991. A general regression neural network. IEEE transactions on neuralnetworks, 2, 6 (1991), 568–576.
Starner, T.; Weaver, J.; and Pentland, A., 1998. Real-time american sign languagerecognition using desk and wearable computer based video. IEEE Transactions onpattern analysis and machine intelligence, 20, 12 (1998), 1371–1375.

182 References
Sturman, D. J., 1994. A brief history of motion capture for computer characteranimation. SIGGRAPH94, Course9, (1994).
Szegedy, C.; Liu, W.; Jia, Y.; Sermanet, P.; Reed, S.; Anguelov, D.; Erhan, D.;Vanhoucke, V.; Rabinovich, A.; et al., 2015. Going deeper with convolutions.Cvpr.
Tachibana, H.; Uenoyama, K.; and Aihara, S., 2017. Efficiently trainable text-to-speech system based on deep convolutional networks with guided attention. arXivpreprint arXiv:1710.08969, (2017).
Tahir, N. M. and Manap, H. H., 2012. Parkinson disease gait classification basedon machine learning approach. Journal of Applied Sciences, 12, 2 (2012), 180–185.
Tan, C.-H.; Hou, J.; and Chau, L.-P., 2013. Human motion capture data recoveryusing trajectory-based matrix completion. Electronics Letters, 49, 12 (2013), 752–754.
Tan, C.-H.; Hou, J.; and Chau, L.-P., 2015. Motion capture data recovery usingskeleton constrained singular value thresholding. The Visual Computer, 31, 11 (2015),1521–1532.
Taylor, K. D.; Mottier, F. M.; Simmons, D. W.; Cohen, W.; Pavlak, R.; Cornell,D. P.; and Hankins, G. B., 1982. An automated motion measurement system forclinical gait analysis. Journal of Biomechanics, 15, 7 (1982), 505–516.
Tilmanne, J., 2013. Data-driven Stylistic Humanlike Walk Synthesis. Ph.D. thesis, PhDDissertation, University of Mons, 2013.(Cited on pages 28 and 55.).
Tilmanne, J. and d’Alessandro, N., 2015. Motion machine: A new frameworkfor motion capture signal feature prototyping. In Signal Processing Conference (EU-SIPCO), 2015 23rd European, 2401–2405. IEEE.
Tilmanne, J.; d’Alessandro, N.; Barborka, P.; Bayansar, F.; Bernardo, F.;Fiebrink, R.; Heloir, A.; Hemery, E.; Laraba, S.; Moinet, A.; Nunnari, F.; Ravet,T.; Sarasua, A.; Tits, M.; Tits, N.; Zajega, F.; and Reboursiere, L., 2015. Proto-typing a new audio-visual instrument based on extraction of high-level features onfull-body motion. In Proceedings of eNTERFACE 2015 Workshop on Intelligent Inter-faces.
Tilmanne, J. and Dutoit, T., 2010. Expressive gait synthesis using pca and gaus-sian modeling. In International Conference on Motion in Games, 363–374. Springer.
Tits, M.; Laraba, S.; Caulier, E.; Tilmanne, J.; and Dutoit, T., 2018a. Umons-taichi: A multimodal motion capture dataset of expertise in taijiquan gestures. Datain Brief, (2018).
Tits, M.; Tilmanne, J.; and d’Alessandro, N., 2016. A novel tool for motioncapture database factor statistical exploration. In Proceedings of the 3rd InternationalSymposium on Movement and Computing, 2. ACM.
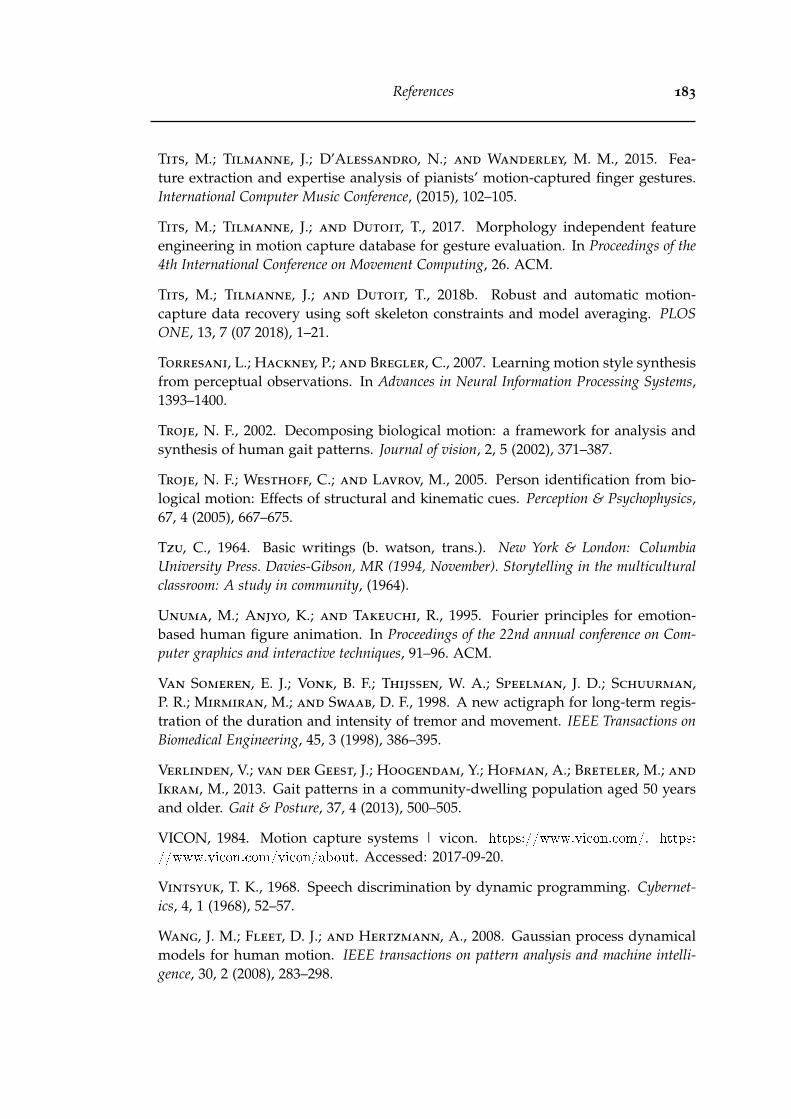
References 183
Tits, M.; Tilmanne, J.; D’Alessandro, N.; and Wanderley, M. M., 2015. Fea-ture extraction and expertise analysis of pianists’ motion-captured finger gestures.International Computer Music Conference, (2015), 102–105.
Tits, M.; Tilmanne, J.; and Dutoit, T., 2017. Morphology independent featureengineering in motion capture database for gesture evaluation. In Proceedings of the4th International Conference on Movement Computing, 26. ACM.
Tits, M.; Tilmanne, J.; and Dutoit, T., 2018b. Robust and automatic motion-capture data recovery using soft skeleton constraints and model averaging. PLOSONE, 13, 7 (07 2018), 1–21.
Torresani, L.; Hackney, P.; and Bregler, C., 2007. Learning motion style synthesisfrom perceptual observations. In Advances in Neural Information Processing Systems,1393–1400.
Troje, N. F., 2002. Decomposing biological motion: a framework for analysis andsynthesis of human gait patterns. Journal of vision, 2, 5 (2002), 371–387.
Troje, N. F.; Westhoff, C.; and Lavrov, M., 2005. Person identification from bio-logical motion: Effects of structural and kinematic cues. Perception & Psychophysics,67, 4 (2005), 667–675.
Tzu, C., 1964. Basic writings (b. watson, trans.). New York & London: ColumbiaUniversity Press. Davies-Gibson, MR (1994, November). Storytelling in the multiculturalclassroom: A study in community, (1964).
Unuma, M.; Anjyo, K.; and Takeuchi, R., 1995. Fourier principles for emotion-based human figure animation. In Proceedings of the 22nd annual conference on Com-puter graphics and interactive techniques, 91–96. ACM.
Van Someren, E. J.; Vonk, B. F.; Thijssen, W. A.; Speelman, J. D.; Schuurman,P. R.; Mirmiran, M.; and Swaab, D. F., 1998. A new actigraph for long-term regis-tration of the duration and intensity of tremor and movement. IEEE Transactions onBiomedical Engineering, 45, 3 (1998), 386–395.
Verlinden, V.; van der Geest, J.; Hoogendam, Y.; Hofman, A.; Breteler, M.; and
Ikram, M., 2013. Gait patterns in a community-dwelling population aged 50 yearsand older. Gait & Posture, 37, 4 (2013), 500–505.
VICON, 1984. Motion capture systems | vicon. https://www.vicon.com/. https:
//www.vicon.com/vicon/about. Accessed: 2017-09-20.
Vintsyuk, T. K., 1968. Speech discrimination by dynamic programming. Cybernet-ics, 4, 1 (1968), 52–57.
Wang, J. M.; Fleet, D. J.; and Hertzmann, A., 2008. Gaussian process dynamicalmodels for human motion. IEEE transactions on pattern analysis and machine intelli-gence, 30, 2 (2008), 283–298.

184 References
Wei, D.; Zhou, B.; Torralba, A.; and Freeman, W. T., 2017. mneuron: A matlabplugin to visualize neurons from deep models. http://vision03.csail.mit.edu/cnn_
art/index.html.
Welch, P., 1967. The use of fast fourier transform for the estimation of powerspectra: a method based on time averaging over short, modified periodograms.IEEE Transactions on audio and electroacoustics, 15, 2 (1967), 70–73.
Whiting, H. T. A., 1983. Human motor actions: Bernstein reassessed. Elsevier.
Xia, S.; Gao, L.; Lai, Y.-K.; Yuan, M.-Z.; and Chai, J., 2017. A survey on humanperformance capture and animation. Journal of Computer Science and Technology, 32,3 (May 2017), 536–554.
You, Y.; Zhang, Z.; Hsieh, C.; Demmel, J.; and Keutzer, K., 2017. Imagenettraining in minutes. CoRR, abs/1709.05011, (2017).
Young, C. and Reinkensmeyer, D. J., 2014. Judging complex movement perfor-mances for excellence: A principal components analysis-based technique applied tocompetitive diving. Human Movement Science, 36 (2014), 107–122.
Zago, M.; Codari, M.; Iaia, F. M.; and Sforza, C., 2016. Multi-segmental move-ments as a function of experience in karate. Journal of Sports Sciences, (2016), 1–8.
Zago, M.; Pacifici, I.; Lovecchio, N.; Galli, M.; Federolf, P. A.; and Sforza,C., 2017. Multi-segmental movement patterns reflect juggling complexity and skilllevel. Human Movement Science, 54, February (2017), 144–153.
Zatsiorsky, V., 1990. Methods of determing mass-inertial characteristics of humanbody segments. Contemporasy Problems of Biomechnics, (1990).
Zhang, J.; Li, W.; Ogunbona, P. O.; Wang, P.; and Tang, C., 2016. Rgb-d-basedaction recognition datasets: A survey. Pattern Recognition, 60 (2016), 86–105.
Zhang, Y.; Lin, W. C.; and Chin, Y.-K. S., 2010. A pattern-recognition approach fordriving skill characterization. IEEE transactions on intelligent transportation systems,11, 4 (2010), 905–916.
Zhao, L. and Badler, N. I., 2005. Acquiring and validating motion qualities fromlive limb gestures. Graphical Models, 67, 1 (2005), 1–16.
Zhao, W.; Chellappa, R.; Phillips, P. J.; and Rosenfeld, A., 2003. Face recogni-tion: A literature survey. ACM computing surveys (CSUR), 35, 4 (2003), 399–458.
Zou, H. and Hastie, T., 2005. Regularization and variable selection via the elasticnet. Journal of the Royal Statistical Society: Series B (Statistical Methodology), 67, 2(2005), 301–320.

Appendix A
’Kick with the heel’ feedbackimages
185

186 ’Kick with the heel’ feedback images
Figure A.1: Visual feedback for a rendition of G11 (Kick with the heel) by P11 (thelowest-skilled participant). Red: original sequence. Blue: feedback sequence with an
improved score of 10.
Figure A.2: Differences between global positions, for a rendition of G11 (Kick withthe heel) by P11 (lowest-skilled participant). (scale in mm)

187
Figure A.3: Distances between the markers of the original sequence with the markersof the feedback sequence,for a rendition of G11 (Kick with the heel) by P11 (lowest-
skilled participant). (scale in mm)
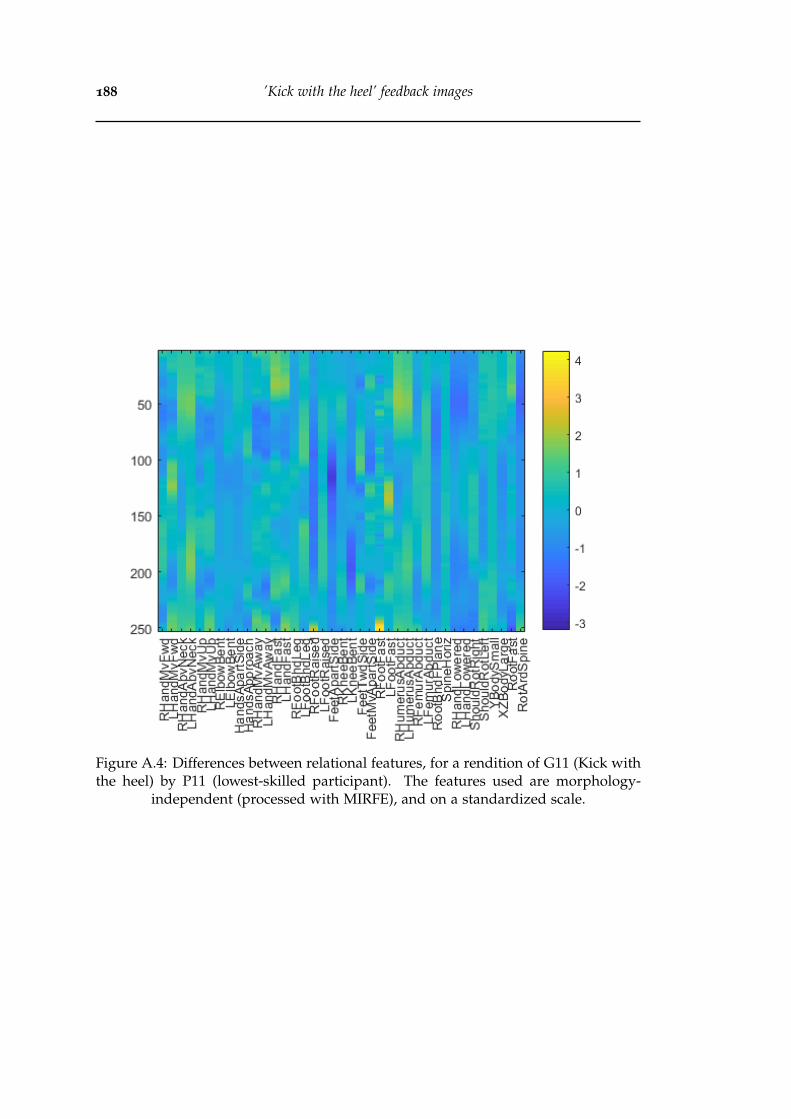
188 ’Kick with the heel’ feedback images
Figure A.4: Differences between relational features, for a rendition of G11 (Kick withthe heel) by P11 (lowest-skilled participant). The features used are morphology-
independent (processed with MIRFE), and on a standardized scale.

189
Figure A.5: Differences between ROMs, for a rendition of G11 (Kick with the heel)by P11 (lowest-skilled participant). The features used are morphology-independent
(processed with MIRFE), and on a standardized scale.
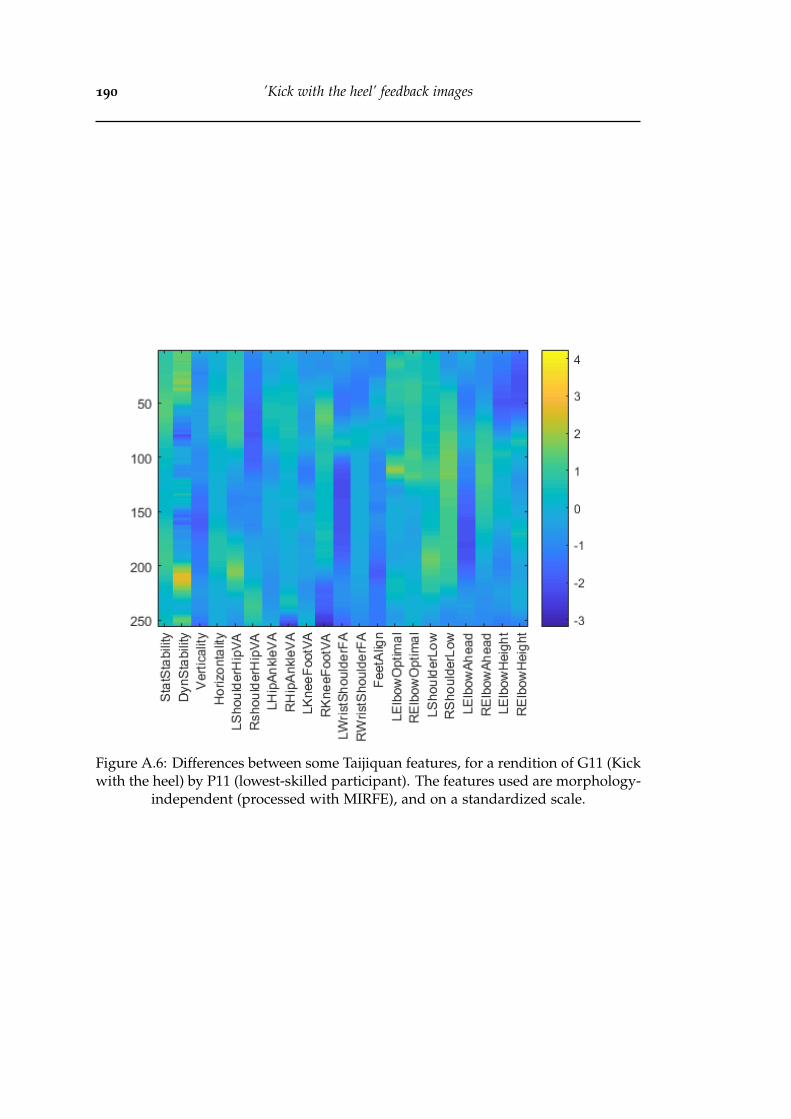
190 ’Kick with the heel’ feedback images
Figure A.6: Differences between some Taijiquan features, for a rendition of G11 (Kickwith the heel) by P11 (lowest-skilled participant). The features used are morphology-
independent (processed with MIRFE), and on a standardized scale.
Appendix B
Publications
B.1 Journals
• Tits, Mickaël and Tilmanne, Joëlle and Dutoit, Thierry, "Robust and automaticmotion-capture data recovery using soft skeleton constraints and model aver-aging", PLOS ONE 13, 7 (2018), pp. 1-21.
• Tits, Mickaël and Laraba, Sohaïb and Caulier, Eric and Tilmanne, Joëlle andDutoit, Thierry, "UMONS-TAICHI: A Multimodal Motion Capture Dataset ofExpertise in Taijiquan Gestures", Data in Brief (2018).
B.2 Conferences
• Tits Mickaël, Tilmanne Joëlle, Dutoit Thierry, "Morphology Independent Fea-ture Engineering in Motion Capture Database for Gesture Evaluation" in "4thInternational Conference on Movement Computing", London, United Kingdom(2017), ACM.
• Tits Mickaël, Tilmanne Joëlle, D’alessandro Nicolas, "A Novel Tool for Mo-tion Capture Database Factor Statistical Exploration" in "3rt International Sym-posium on Movement and Computing", Thessaloniki, Greece (2016), ACM.
• Grammalidis Nikos, Dimitropoulos Kosmas, Tsalakanidou Filareti, KitsikidisAlexandros, Roussel Pierre, Denby Bruce, Chawah Patrick, Buchman Lise, DupontStephane, Laraba Sohaib, Picart Benjamin, Tits Mickaël, Tilmanne Joëlle, Hadji-dimitriou Stelios, Hadjileontiadis Leontios, Charisis Vasileios, Volioti Christina,Stergiaki Athanasia, Manitsaris Athanasios, bouzos Odysseas, Manitsaris Sot-iris, "The i-Treasures Intangible Cultural Heritage dataset" in "IEEE Workshopon Movement and Computing" , Thessaloniki, Greece (2016), ACM.
• Tilmanne Joëlle, D’alessandro Nicolas, Barborka Petr, Bayansar Furkan, Bern-ardo Francisco, Fiebrink Rebecca, Heloir Alexis, Hemery Edgar, Laraba Sohaib,
191

192 Publications
Moinet Alexis, Nunnar Fabrizio, Ravet Thierry, Reboursiere Loic, Sarasua Al-varo, Tits Mickaël, Tits Noe, Zajega Francois, "Prototyping a New Audio-VisualInstrument Based on Extraction of High-Level Features on Full-Body Motion"in "Proceedings of the 10th International Summer Workshop on MultimodalInterfaces - eNTERFACE’15", Mons, Belgique, (2015).
• Tits Mickaël, Tilmanne Joëlle, D’alessandro Nicolas, Wanderley Marcelo, "Fea-ture Extraction and Expertise Analysis of Pianists’ Motion-Captured FingerGestures" in "International Computer Music Conference (ICMC 2015)", 19, 102-105, Denton, Texas (2015).
• Lourenco Sofia, Tits Mickaël, Wanderley Marcelo, Castro Sergio, "European Pi-ano Schools of Music Performance: Analysis towards a multimodal approach"in "International Conference on New Music Concepts (ICNMC 2015)", Treviso,Italy (2015).
• Lourenco Sofia, Martins Luis Gustavo, Wanderley Marcelo, Tits Mickaël, MegreRicardo, "Towards a Multimodal Analysis of European Piano Schools of MusicPerformance" in "Conference on Interdisciplinary Musicology" , Berlin, Ger-many (2014).
B.3 Scientific reports
• Tits Mickaël, Laraba Sohaib, Tilmanne Joëlle, Ververidis Dimitrios, Nikolo-poulos Spiros, Nikolaidis Stathis, Chalikias Anastasios-Papazoglou, "IntangibleCultural Heritage Indexing by Stylistic Factors and Locality Variations - FP7 i-Treasures Deliverable 4.5", 2016-03-13 (2016).

§B.3 Scientific reports 193
View publication statsView publication stats