Expert explanations of honeybee losses in areas of extensive agriculture in France: Gaucho®...
13
Expert explanations of honeybee losses in areas of extensive agriculture in France: Gaucho ® compared with other supposed causal factors This article has been downloaded from IOPscience. Please scroll down to see the full text article. 2010 Environ. Res. Lett. 5 014006 (http://iopscience.iop.org/1748-9326/5/1/014006) Download details: IP Address: 131.211.104.231 The article was downloaded on 16/02/2011 at 15:31 Please note that terms and conditions apply. View the table of contents for this issue, or go to the journal homepage for more Home Search Collections Journals About Contact us My IOPscience
Transcript of Expert explanations of honeybee losses in areas of extensive agriculture in France: Gaucho®...
Expert explanations of honeybee losses in areas of extensive agriculture in France: Gaucho®
compared with other supposed causal factors
This article has been downloaded from IOPscience. Please scroll down to see the full text article.
2010 Environ. Res. Lett. 5 014006
(http://iopscience.iop.org/1748-9326/5/1/014006)
Download details:
IP Address: 131.211.104.231
The article was downloaded on 16/02/2011 at 15:31
Please note that terms and conditions apply.
View the table of contents for this issue, or go to the journal homepage for more
Home Search Collections Journals About Contact us My IOPscience
IOP PUBLISHING ENVIRONMENTAL RESEARCH LETTERS
Environ. Res. Lett. 5 (2010) 014006 (12pp) doi:10.1088/1748-9326/5/1/014006
Expert explanations of honeybee losses inareas of extensive agriculture in France:Gaucho® compared with other supposedcausal factorsL Maxim1 and J P van der Sluijs2
1 Institut des Sciences de la Communication, CNRS UPS 3088, 27 Rue Damesme,75013 Paris, France2 Copernicus Institute for Sustainable Development and Innovation, Department of Science,Technology and Society, Utrecht University, Heidelberglaan 2, 3584 CS Utrecht,The Netherlands
E-mail: [email protected] and [email protected]
Received 15 August 2009Accepted for publication 4 January 2010Published 21 January 2010Online at stacks.iop.org/ERL/5/014006
AbstractDebates on causality are at the core of controversies as regards environmental changes. Thepresent paper presents a new method for analyzing controversies on causality in a context ofsocial debate and the results of its empirical testing. The case study used is the controversy asregards the role played by the insecticide Gaucho®, compared with other supposed causalfactors, in the substantial honeybee (Apis mellifera L.) losses reported to have occurred inFrance between 1994 and 2004.
The method makes use of expert elicitation of the perceived strength of evidence regardingeach of Bradford Hill’s causality criteria, as regards the link between each of eight possiblecausal factors identified in attempts to explain each of five signs observed in honeybee colonies.These judgments are elicited from stakeholders and experts involved in the debate, i.e.,representatives of Bayer Cropscience, of the Ministry of Agriculture, of the French Food SafetyAuthority, of beekeepers and of public scientists.
We show that the intense controversy observed in confused and passionate publicdiscourses is much less salient when the various arguments are structured using causationcriteria. The contradictions between the different expert views have a triple origin: (1) the lackof shared definition and quantification of the signs observed in colonies; (2) the lack ofspecialist knowledge on honeybees; and (3) the strategic discursive practices associated with thelack of trust between experts representing stakeholders having diverging stakes in the case.
Keywords: uncertainty, risk, honeybee, causality, imidacloprid
1. On causality
In a recent report on the emerging problem of honeybeedecline, the French Food Safety Agency (AFSSA 2008)claims that there exist more than forty possible causes thatmight explain the observed trends of honeybee decline. Thisnumber illustrates the apparent complexity of contemporary
environmental policy issues such as the loss of the world’s mostimportant pollinator: the honeybee. Pollinators are crucial to35% of the world’s crops (Klein et al 2007). To facilitatewell-informed risk governance of such complex issues, thereis an urgent need to increase the understanding of scientificand societal discourses on causality. Before exploring theparticular case of honeybee decline, we first introduce theconcept of causality.
1748-9326/10/014006+12$30.00 © 2010 IOP Publishing Ltd Printed in the UK1
Environ. Res. Lett. 5 (2010) 014006 L Maxim and J P van der Sluijs
This concept has been deeply discussed in epidemiology,other sciences, philosophy and law (Iversen et al 2008).Different models of causality exist in epidemiology, whichVineis and Kriebel (2006) divide into two classes. The firstclass are characterized by a linear monocausal pattern ofexplanation, based on the concept of a necessary cause (i.e.,the disease does not develop in the absence of exposure tothe agent). The second class are characterized by the conceptof a causal web (i.e., a concurrence of different conditions isrequired to induce disease).
A widely used multi-causal model is the ‘pie’ model ofRothman. The idea is that a sufficient causal complex (apie) is represented by a combination of several componentcauses (Rothman and Greenland 2005). The disease appearswhen the pie is completed. Such multi-causality provides theopportunity for removing only one or a small number of factorsfor preventing harm (Gee 2003).
Other causality models were developed in epidemiologybut all have many limitations, mainly related to the low degreeof accounting for interactions between causal factors, for theirdynamic character over time, and for differences betweenindividual and population levels (Valleron 2000, Vineis andKriebel 2006).
There are also probabilistic numerical approaches foranalyzing causal networks, such as Bayesian belief networks.These are often used for analyzing the complex probabilisticrelationships between different variables (Iversen et al 2008).Bayesian networks are composed of three elements: aset of nodes representing system variables, a set of linksrepresenting causal relationships between the nodes, and aset of probabilities, for each node, specifying the belief thata node will be in a particular state given the states of thosenodes that can affect it directly. By a process of updatingthe assumed probabilities by constraining them with observeddata, Bayesian networks seek to find a hypothesis with thehighest probability of being correct, given a specific set ofavailable data and prior beliefs on causality (Welp et al 2006).
In environmental studies, research into causal relation-ships has the advantage of being able to test a hypothesisby building up experimental evidence in the laboratory undercontrolled conditions. In natural systems, many factors mayinterfere with the researcher’s ability to assess causality: themultitude of toxicants, their interactions with non-contaminantstressors, and the high biological variability. Furthermore,effects issuing from different stressors might not be compara-ble and their synergic or antagonistic interactions may meanthat their combined effects are greater or less than the sumof their individual effects. These gaps in knowledge addto those concerning compensatory processes that influencepopulation dynamics, to the general lack of data, and tothe difficulties associated with communication among severaldisciplines (Munns 2006).
Causal relationships are at the core of social debateson environmental changes because identifying causality alsosignifies placing responsibility on one or several stakeholders(Iversen et al 2008). In controversial cases, irreduciblevalue judgments add to scientific difficulties for transformingcausality in a Gordian knot for the public exchanges of
arguments between the different stakeholders involved, and forthe policy-makers.
The present paper presents a new method for analyzingcausality in a context of social debate and its empirical testingusing a case study. We approach a situation of controversyusing the paradigm of ‘post-normal science’ (Funtowicz andRavetz 1990, Van der Sluijs et al 2008). Post-normal sciencerefers to issue-driven knowledge production in a context ofhard political pressure, values in dispute, high decision stakesand high epistemological and ethical system uncertainties. Itcan be understood as a strategy for the production of relevantknowledge. Where normal science aims at establishing theultimate truth or the final resolution of a scientific puzzle,post-normal science recognizes that as long as both scientificuncertainties and decision stakes are high, such an aim is inprinciple unachievable. Indeed it can be misleading and createfalse expectations to act as if the role of science in such issuesis just to get the facts right. Key elements of post-normalscience include the appropriate management of uncertainty andof quality, and the recognition of a plurality of perspectives andcommitments amongst both experts and stakeholders, and theinternal and external extension of the peer community.
We use, as an example of application of our new method,the case study of honeybee losses reported to have occurred inFrance between 1994 and 2004. This case study has indeedthe characteristics of a post-normal situation of environmentalchange: hard political pressure, disputed values, high stakesdecisions, and major system uncertainties.
New scientific practices are needed for these kinds ofsituations (Narasimhan 2007), and the post-normal paradigmrecommends the appropriate management of uncertainty, theacknowledgement of the plurality of problem perspectives,and the extension of the peer community to include non-scientific actors (Van der Sluijs et al 2008). For assessing thedegree of confidence (‘perceived uncertainty’) in the evidenceconcerning potentially causal relationships, we use the scaleproposed by Weiss (2003), with experts possessing differenttypes of knowledge (‘extended peer community’).
The application of the proposed method allows theidentification of the origins of the social debate on causality.Our results show that the intense controversy which canbe observed in confused, passionate and politically orientedpublic discourses is, in reality, much less intense whenthe arguments of different experts are structured and madetransparent, factor by factor, sign by sign and using wellestablished criteria for assessing causality.
The introductory section focuses on theories of causalityand on the place of the present paper in relation to theexisting literature. Section 2 presents the method and theunderlying theoretical considerations. Section 3 presents thecase study. The application of the method proposed to thechosen case study is described in section 4. We list thesigns observed in honeybee colonies and the supposed causalfactors, we present the questionnaire and the persons withwhom it has been employed, and we explain the statisticaltools employed for the identification of significant differencesbetween the stakeholders’ answers and of discourse coalitions.Section 5 presents the results of the empirical test of the
2
Environ. Res. Lett. 5 (2010) 014006 L Maxim and J P van der Sluijs
method proposed. This includes the grouping of actorsthat use the same patterns of argumentation for the samecausal relationships, and the agreement/disagreement betweenexperts, by supposed causal factor. Section 6 further exploresthe origins of the differences found between experts, and weconclude in section 7.
2. The method for analyzing causality in a context ofsocial debate
We propose the following steps for the analysis of discourseson causality in a context of controversy on the influence ofseveral potentially causal factors:
• Clear identification and description of the signs (i.e., theend-points in honeybee colonies for which the causes haveto be identified).
• Exhaustive identification of all the known factors,potentially involved in the signs described.
• Establishment of causality criteria and assessment ofeach of them, for the relationships between the factors(potentially causal) and signs, by the extended peercommunity.
Our method uses the nine criteria proposed by Sir AustinBradford Hill (Hill 1965) for distinguishing between a chanceassociation and a true cause and effect: strength of association,consistency, specificity, temporality, biological gradient,biological plausibility, biological coherence, experimentalevidence, and analogy.
These criteria are used by epidemiologists and weretested in environmental risk assessment (Collier 2003). Theirstatistical use, for inferring causation when association isobserved, has been criticized (Phillips and Goodman 2004),but their usefulness for the scientific inquiry on causal links,and the relationships between the available evidence and theactions to be taken, has been widely recognized (Phillips andGoodman 2006, Marshall 2005, Holt and Peveler 2006, Iversenet al 2008).
In order to elicit the perceived degree of evidence on apotentially causal link by the extended peer community, thepresent paper uses the subjective scale proposed by Weiss(2003). This scale is intended as a communication toolto help increase the clarity and rationality of discourse incontroversies in which generalists untrained in natural sciencesmust understand the merits of opposing arguments in disputesamong scientific experts in order to make their own judgmentsbetter informed.
The use of this scale is appropriate for our case for severalreasons:
(1) It seemed easy to understand and use for both scientistsand non-specialists (which was confirmed in our study).Weiss estimates that the levels proposed correspond ratherwell to both the informal scale of uncertainty used byscientists in their everyday work and by ordinary people asthey estimate the likelihood of one or another proposition.
(2) Is has enough levels for allowing the detailed and nuancedexpression of different and sometimes divergent views(which would have been more difficult with for examplea three-point or a five-point scale).
Table 1. Scale of perceived degree of uncertainty (Weiss 2003,modified).
Level (score) Convincingness of the evidence
10 Beyond any doubt9 Beyond a reasonable doubt8 Clear and convincing evidence7 Clear showing6 Substantial and credible evidence5 Preponderance of the evidence4 Clear indication3 Probable cause: reasonable grounds for belief2 Reasonable, articulable grounds for suspicion1 No reasonable grounds for suspicion0 Impossible
(3) The results can be easily interpreted, using non-parametrictesting.
The hierarchy defined in table 1 is expressed as a ten-point ordinal scoring scale. The standards from the column‘Convincingness of the evidence’ have been synthesized byWeiss (2003), drawing on different legal standards3 of proofused in US courts. This scale has been further developed byWeiss (2006).
3. The case study
Decline of honeybee colonies has been reported in manyEuropean countries (e.g. France, Belgium, Italy, Portugal,Germany, Netherlands, UK, Greece) and sometimes thishas been related to seed-dressing insecticides, especiallyGaucho® (active substance: imidacloprid) (Ministerio daAgricultura do Desenvolvimento Rural e das Pescas 2000,Panella 2001, CARI 2003, COLOSS 2009). Recently, manyAmerican apiaries have suffered sudden colony losses4. Thisphenomenon has been named colony collapse disorder. Giventhat the sign of disappearing adult honeybees recalled the signsfound by French beekeepers, parallels with honeybee colonydecline in France were drawn.
The French controversy started in 1994–1997, whenbeekeepers first reported alarming new signs in honeybeecolonies: in the summer, during sunflower flow, honeybeecolonies were suddenly and massively collapsing. Honeybeesalmost completely disappeared far from the hives and in somecases were dying in thousands in front of the hives. Thismortality was accompanied by behavioral signs (trembling,keeping the tongue extended, excessive cleaning of the headand the antennae, etc), and by a 30–70% loss in sunflowerhoney yield (e.g. beekeepers’ reports in Belzunces and Tasei(1997), CNEVA Sophia-Antipolis (1997), Pham-Delegue andCluzeau (1998), Coordination des Apiculteurs (2001), Aletru(2003), GVA (1998–2008)). High honeybee losses were alsoreported in early spring. It was acknowledged that a newinsecticide Gaucho® had been first used in sunflower seed-dressing in 1994.
3 A legal standard of proof is defined as ‘the level of certainty and the degreeof evidence necessary to establish proof in a criminal or civil proceeding’(Merriam–Webster (1996), in Weiss (2003), p 29).4 http://maarec.cas.psu.edu/ColonyCollapseDisorder.html
3
Environ. Res. Lett. 5 (2010) 014006 L Maxim and J P van der Sluijs
In 1999 a precautionary principle was applied, Gaucho®
being banned in sunflower seed treatment. This ban wasrenewed in 2001 and in 2004, and in 2004 extended to maize5
seed-dressing.
4. Applying the method to the chosen case study
4.1. Potential causal factors and signs
The analysis of the available documents (press releases,newspaper articles, other recordings of public statements ofdifferent stakeholders, etc) suggested eight potential causalfactors6 which different stakeholders considered responsible7
to a greater or lesser degree for the honeybee losses:(H1) Imported queens, which might not be adapted to local
conditions.(H2) Unfavorable climatic conditions (during sun-
flower/maize flowering).(H3) Intoxication with pollen and/or nectar foraged in
areas with Gaucho® in sunflower and/or maize seed-dressing.(H4) Intoxication with pollen and/or nectar foraged in
areas with sunflower and/or maize which are not seed-dressedwith Gaucho®, but which are grown in soil in which a Gaucho®
seed-dressed crop was cultivated in the year n − 1.(H5) Diseases and viruses (Nosema, Varroa, chronic
bee paralysis virus (CBPV)), the development of pathogenresistance to disease treatments, lack of preventative treatmentmeasures in certain hives, or inadequate treatment.
(H6) Inadequate or illegal use of pesticides and mixes ofpesticides by farmers.
(H7) An insufficient quantity of pollen, as a consequenceof intensive agricultural practices.
(H8) Changes in sunflower varieties.We synthesized the effects observed in the field into a list
of five signs:(S1) Unusual yield loss of sunflower honey (30–80%).(S2) Lethal signs uniquely during sunflower/maize
flowering: sudden disappearance and sometimes mortality offoragers in front of the hives.
(S3) Sublethal signs following the sunflower/maizeforaging: apathy, shivering, excessive self-cleaning, formationof mounds of perturbed honeybees on the ground, abnormalforaging behavior, and perturbation of comportment inside thehive.
(S4) Abnormal annual depopulations (more than 5–10%of the hives).
(S5) Excessive mortality during winter or at the beginningof the spring (more than 5–10% of the hives).
On the basis of the criteria for causation developed by SirBradford Hill (Hill 1965), eight questions were drafted, to elicitthe expert perception of the causality relationship between thefactors supposedly responsible for the damage to honeybeecolonies and the signs observed in the field (table 2):
5 Sunflower and maize are in flower in the same period of the year.6 This list of factors has been validated during the interviews with the expertsinvolved in the present exercise.7 Another seed-dressing insecticide played an important role in the Frenchcase, i.e. RegentTS® (active substance: fipronil), but we do not address thishere.
(1) Strength of the association (Q1): are the effects so great,in the presence of one factor, that we can justifiably ruleout other factors?
(2) Consistency (Q2): has the effect been observed bydifferent persons, in different places and circumstances?
(3) Specificity (Q3): is the exposure associated with a specificeffect, as opposed to a wide range of effects?
(4) Biological gradient (Q4): are increased exposuresassociated with increased signs?
(5) Biological plausibility (Q5): is there any crediblescientific mechanism that can explain the association?
(6) Coherence (Q6): is the association consistent with the pastexperience of the factors/signs?
(7) Temporality (Q6): did the exposure precede the effect?(8) Experimental evidence (Q7): are there studies/experiments
supporting the factor–sign association?(9) Analogy (Q8): is the observed association supported by
similar associations?
4.2. The questionnaire
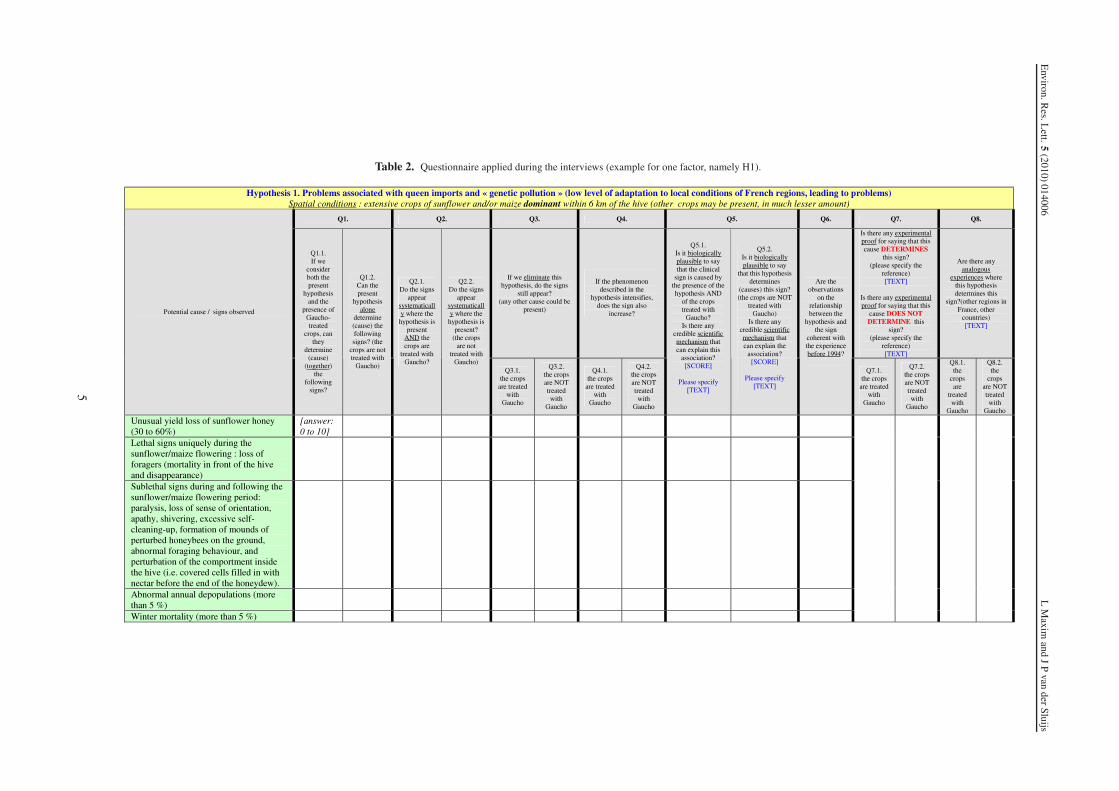
Using a questionnaire (table 2), each person interviewed(during a meeting or by telephone) was asked to give ascore to each question, i.e. to each combination of threeelements: one of Bradford Hill’s criteria × a potential cause ×a reported effect. They were asked to use the ten-point scoringscale of table 1 for answering.
In line with Funtowicz and Ravetz (1990), Wynne (1996)and Kloprogge and Van der Sluijs (2006) we took theposition that both ‘institutionally recognized’ experts andknowledgable ‘lay’ individuals (e.g., beekeepers) are equallyvaluable and important in the process of constructing sociallyrobust knowledge on environmental problems. The personsinterviewed had been and/or are still directly involved inthe debate on honeybee losses: representatives of BayerCropscience (2 persons), of the Ministry of Agriculture(3 persons), of the AFSSA (French Food Safety Authority;2 persons), of beekeepers (20 persons; all but one wereprofessional beekeepers, from French regions where the signsincluded in the questionnaire had been observed) and ofpublic scientists (5 persons, working in public research, whowere directly involved in studies of risks of imidacloprid tohoneybees).
As we focus on the controversy having taken place inFrance, the persons interviewed in this study were exclusivelyFrench, with one exception—one expert from Bayer havingbeen interviewed in Germany, in English. This was necessaryto have at least two experts from this company having beensignificantly involved in the French debate.
The persons who participated from Bayer, the Ministryof Agriculture, the AFSSA and the public scientists playedkey roles in the debate. We stopped at a sample size of 20beekeepers because of resource constraints and because wefound that their views corresponded closely with the publicstatements issued by the beekeeping profession during the de-bate. All our beekeeper respondents had experienced problemsin their own apiaries during the period concerned (1994–2004).They were identified on the basis of a ‘snowball’ procedure(each person was asked to supply the names of colleagues
4
Environ.R
es.Lett.5
(2010)014006L
Maxim
andJ
Pvan
derSluijs
Table 2. Questionnaire applied during the interviews (example for one factor, namely H1).
5
Environ. Res. Lett. 5 (2010) 014006 L Maxim and J P van der Sluijs
who had apiary problems). Most of them were involvedin activities dealing with the profession as a whole(e.g. syndicalism), which was considered an advantage (as ourintention was to ascertain the public attitude of the profession).They came from 13 departments (this is highly representativefor the areas in France where the signs were observed) and onaverage had 25 years of experience in beekeeping (calculatedup to 2007).
The interviews were carried out between September 2006and March 2007.
4.3. Identification of significant differences between thestakeholders’ answers and of discourse coalitions
In order to test whether the answers given by the stakeholdersare significantly different or, on the contrary, if they can beconsidered as being the expression of discourse coalitions, weused the Mann–Whitney U test, which:
(1) is adequate for the treatments of the ordinal data gatheredin our fieldwork, which demand a non-parametric test;
(2) allows two samples of arbitrary size to be compared;(3) is adequate for small samples;(4) is adequate for independent samples.
This test was applied to each pair of stakeholders (beekeepers–Bayer, AFSSA–Ministry, etc), for each particular answer. 3200tests were completed8, for the 10 pairs of stakeholders andfor each of the 320 questions of the questionnaire. For eachtest, the null hypothesis (H0) was: ‘There is no differencebetween the answers of the two stakeholders considered’ (here,each ‘stakeholder’ is a group of persons, that is: N = 20for beekeepers, N = 3 for the Ministry, etc). A confidencelevel, of 0.05, has been considered (that is: we tested thenull hypothesis that the probability that the answers of onestakeholder would be different from the answers of the secondstakeholder is 0.05).
For example, one ‘cell’ (of table 2) contains thestakeholders’ answers to a question: ‘Is it biologicallyplausible (HILL CRITERION) to say that 30%–60% sunflowerhoney yield loss (SIGN) is caused by the presence ofunfavorable climatic conditions alone (FACTOR), when cropsare not treated with Gaucho®?’ For this cell, the beekeepersgave 20 answers (that is 20 scores, each from 0 to 10), theMinistry of Agriculture gave 3 answers, etc. The Mann–Whitney test was applied, for instance, to these two groupsof answers, here the 20 answers from beekeepers and the3 answers from the Ministry, to ascertain whether they arestatistically significantly different.
After the completion of all the tests, two methods wereemployed to synthesize the results:
8 It was found that question Q4.1 had been interpreted differently by therespondents, and many of them declared that they had not understood it. Forthis reason, it has been excluded from the treatment of the results. Note that inthe group of scientists, one person was found to be an outlier: the scores givenwere consistently very low, even when this scientist declared that the degree ofcertainty was quite high. This can be attributed to a self-recognized extremelycautious nature, especially as regards public statements.
(a) The calculation of the percentage of rejections of thenull hypothesis, by pair of stakeholders and answer byanswer—both for the questions asked on Gaucho® (H3),for all the other questions which did not include Gaucho®
and for all the questions concerning diseases and viruses(H5). (See figures 1–3.)
(b) The method of Bonferroni for multiple tests was usedto calculate the differences between the answers of thestakeholders to a group of questions together. This methodconsists of a simple Mann–Whitney test for each question,considering a risk of 0.05 divided by the total number ofquestions. The null hypothesis in this case is: ‘There is nodifference between the answers of the two stakeholders toall the questions together’. The null hypothesis is rejectedwhen at least one simple test is rejected (meaning that thep-value is inferior to 0.05/No. of questions).
5. Results
5.1. Actors’ grouping and differences in arguing for the samecausal relationships
The debate on causal relationships can be structured aroundtwo storylines, each defended by a ‘discourse coalition’ amongseveral stakeholders:
(1) The first is represented by beekeepers and scientistsworking in public research9. Their arguments claimedthat Gaucho® was the main contributor to the damagecaused to honeybee colonies observed after 1994 in areaswith seed-dressed sunflower/maize extensive crops. Theystated that other causes might be involved in the honeybeeproblems in other areas in France (e.g., in mountainareas), but acknowledged that this was not the issue of thepublic debate relating to intensive agriculture areas. Theirarguments were based on the results of field observationsand of studies conducted in France after 1997 on theeffects of imidacloprid on honeybees.
(2) The second storyline argues for a non-causal relationshipbetween Gaucho® and honeybees (in general, in France),articulating that other factors are to blame. This wasrepresented by Bayer and AFSSA (the French Food SafetyAgency) and is based on the lack of evidence of harm,citing their research, whose results did not reproduce thesigns observed by beekeepers.
The position adopted by the Ministry of Agriculture wasambivalent, considering Gaucho® as one of several possiblecauses, with an unclear contribution to the final effects.
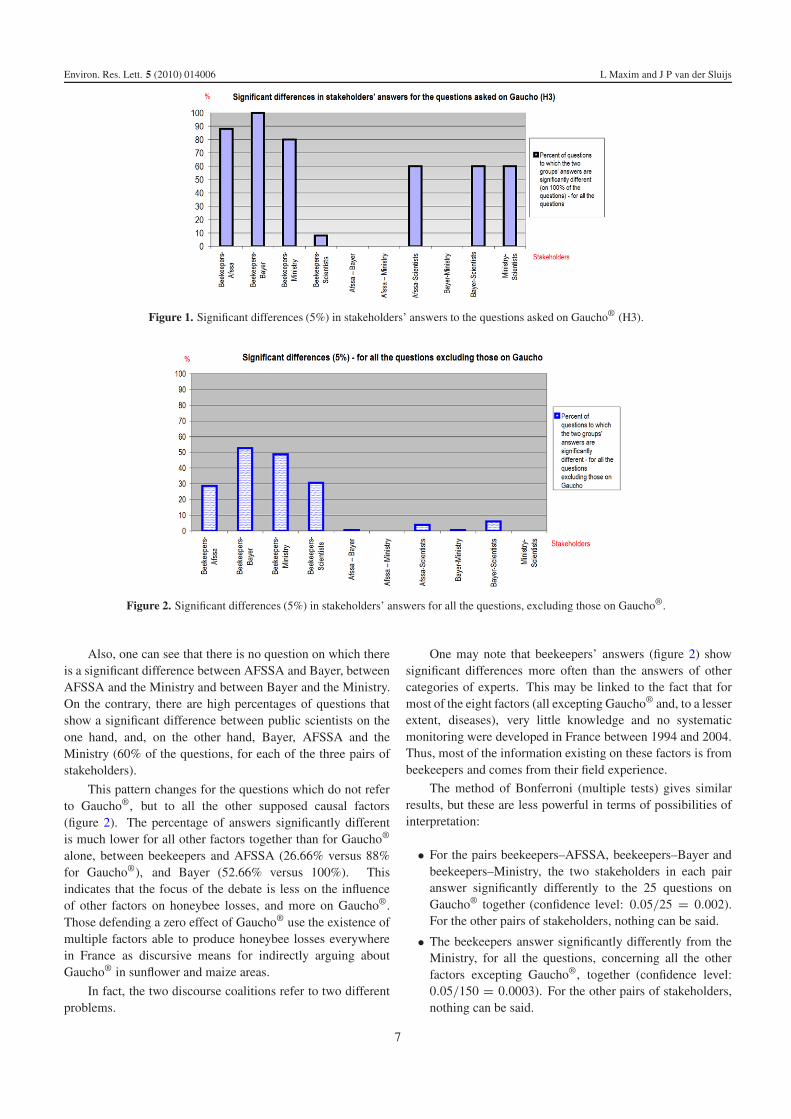
The results show that as regards the questions concerningGaucho® alone (H3), the number of questions for which thereis a statistically significant difference between beekeepers andBayer (88% of the questions), beekeepers and AFSSA (100%),beekeepers and the Ministry (80%) is much bigger than thenumber of questions for which there is a significant differencebetween beekeepers and public scientists (8%) (figure 1).
9 In France, scientists having permanent positions in national researchinstitutes (e.g., INRA, CNRS) and universities are public servants. 100% oftheir salaries and a part of their functioning (sometimes equipment) expensesare funded by the public institution.
6
Environ. Res. Lett. 5 (2010) 014006 L Maxim and J P van der Sluijs
Figure 1. Significant differences (5%) in stakeholders’ answers to the questions asked on Gaucho® (H3).
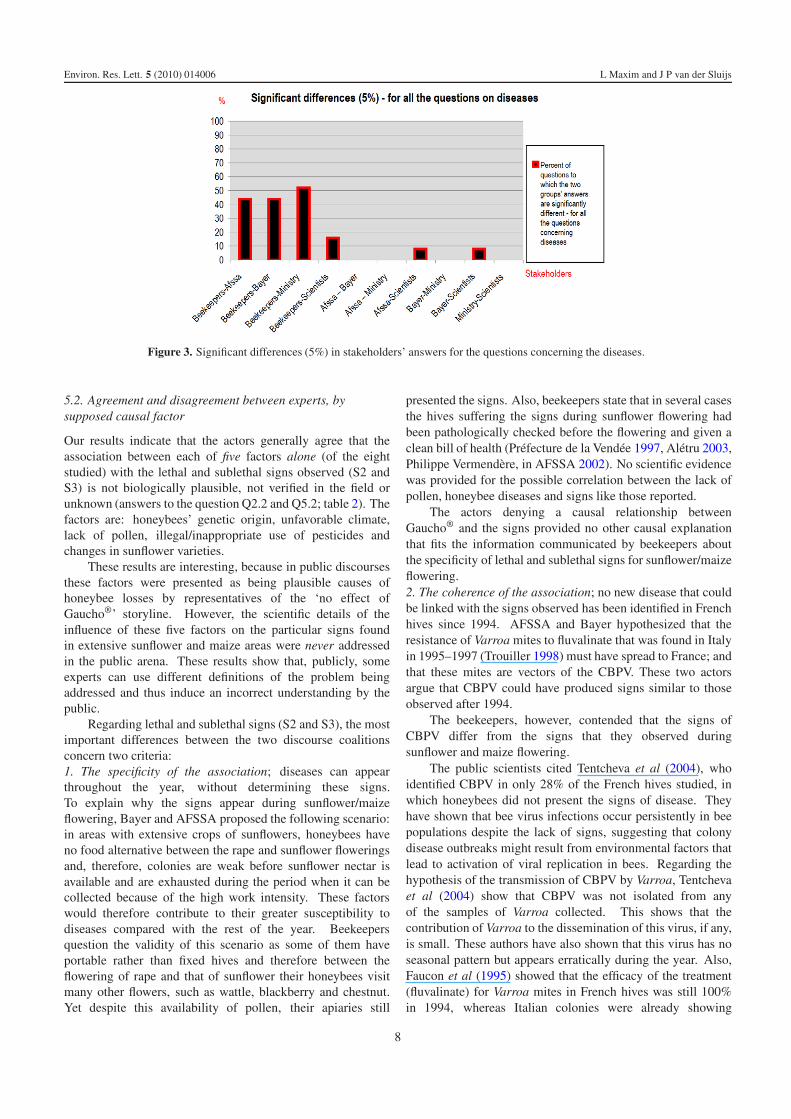
Figure 2. Significant differences (5%) in stakeholders’ answers for all the questions, excluding those on Gaucho®.
Also, one can see that there is no question on which thereis a significant difference between AFSSA and Bayer, betweenAFSSA and the Ministry and between Bayer and the Ministry.On the contrary, there are high percentages of questions thatshow a significant difference between public scientists on theone hand, and, on the other hand, Bayer, AFSSA and theMinistry (60% of the questions, for each of the three pairs ofstakeholders).
This pattern changes for the questions which do not referto Gaucho®, but to all the other supposed causal factors(figure 2). The percentage of answers significantly differentis much lower for all other factors together than for Gaucho®
alone, between beekeepers and AFSSA (26.66% versus 88%for Gaucho®), and Bayer (52.66% versus 100%). Thisindicates that the focus of the debate is less on the influenceof other factors on honeybee losses, and more on Gaucho®.Those defending a zero effect of Gaucho® use the existence ofmultiple factors able to produce honeybee losses everywherein France as discursive means for indirectly arguing aboutGaucho® in sunflower and maize areas.
In fact, the two discourse coalitions refer to two differentproblems.
One may note that beekeepers’ answers (figure 2) showsignificant differences more often than the answers of othercategories of experts. This may be linked to the fact that formost of the eight factors (all excepting Gaucho® and, to a lesserextent, diseases), very little knowledge and no systematicmonitoring were developed in France between 1994 and 2004.Thus, most of the information existing on these factors is frombeekeepers and comes from their field experience.
The method of Bonferroni (multiple tests) gives similarresults, but these are less powerful in terms of possibilities ofinterpretation:
• For the pairs beekeepers–AFSSA, beekeepers–Bayer andbeekeepers–Ministry, the two stakeholders in each pairanswer significantly differently to the 25 questions onGaucho® together (confidence level: 0.05/25 = 0.002).For the other pairs of stakeholders, nothing can be said.
• The beekeepers answer significantly differently from theMinistry, for all the questions, concerning all the otherfactors excepting Gaucho®, together (confidence level:0.05/150 = 0.0003). For the other pairs of stakeholders,nothing can be said.
7
Environ. Res. Lett. 5 (2010) 014006 L Maxim and J P van der Sluijs
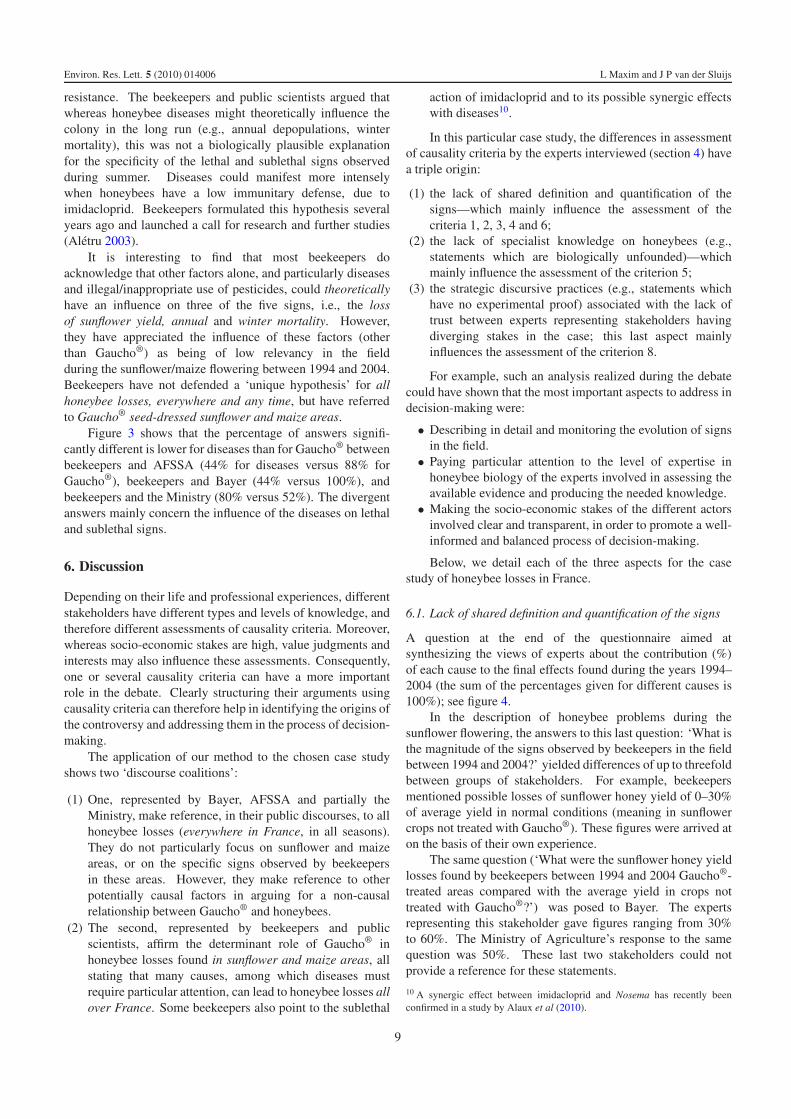
Figure 3. Significant differences (5%) in stakeholders’ answers for the questions concerning the diseases.
5.2. Agreement and disagreement between experts, bysupposed causal factor
Our results indicate that the actors generally agree that theassociation between each of five factors alone (of the eightstudied) with the lethal and sublethal signs observed (S2 andS3) is not biologically plausible, not verified in the field orunknown (answers to the question Q2.2 and Q5.2; table 2). Thefactors are: honeybees’ genetic origin, unfavorable climate,lack of pollen, illegal/inappropriate use of pesticides andchanges in sunflower varieties.
These results are interesting, because in public discoursesthese factors were presented as being plausible causes ofhoneybee losses by representatives of the ‘no effect ofGaucho®’ storyline. However, the scientific details of theinfluence of these five factors on the particular signs foundin extensive sunflower and maize areas were never addressedin the public arena. These results show that, publicly, someexperts can use different definitions of the problem beingaddressed and thus induce an incorrect understanding by thepublic.
Regarding lethal and sublethal signs (S2 and S3), the mostimportant differences between the two discourse coalitionsconcern two criteria:1. The specificity of the association; diseases can appearthroughout the year, without determining these signs.To explain why the signs appear during sunflower/maizeflowering, Bayer and AFSSA proposed the following scenario:in areas with extensive crops of sunflowers, honeybees haveno food alternative between the rape and sunflower floweringsand, therefore, colonies are weak before sunflower nectar isavailable and are exhausted during the period when it can becollected because of the high work intensity. These factorswould therefore contribute to their greater susceptibility todiseases compared with the rest of the year. Beekeepersquestion the validity of this scenario as some of them haveportable rather than fixed hives and therefore between theflowering of rape and that of sunflower their honeybees visitmany other flowers, such as wattle, blackberry and chestnut.Yet despite this availability of pollen, their apiaries still
presented the signs. Also, beekeepers state that in several casesthe hives suffering the signs during sunflower flowering hadbeen pathologically checked before the flowering and given aclean bill of health (Prefecture de la Vendee 1997, Aletru 2003,Philippe Vermendere, in AFSSA 2002). No scientific evidencewas provided for the possible correlation between the lack ofpollen, honeybee diseases and signs like those reported.
The actors denying a causal relationship betweenGaucho® and the signs provided no other causal explanationthat fits the information communicated by beekeepers aboutthe specificity of lethal and sublethal signs for sunflower/maizeflowering.2. The coherence of the association; no new disease that couldbe linked with the signs observed has been identified in Frenchhives since 1994. AFSSA and Bayer hypothesized that theresistance of Varroa mites to fluvalinate that was found in Italyin 1995–1997 (Trouiller 1998) must have spread to France; andthat these mites are vectors of the CBPV. These two actorsargue that CBPV could have produced signs similar to thoseobserved after 1994.
The beekeepers, however, contended that the signs ofCBPV differ from the signs that they observed duringsunflower and maize flowering.
The public scientists cited Tentcheva et al (2004), whoidentified CBPV in only 28% of the French hives studied, inwhich honeybees did not present the signs of disease. Theyhave shown that bee virus infections occur persistently in beepopulations despite the lack of signs, suggesting that colonydisease outbreaks might result from environmental factors thatlead to activation of viral replication in bees. Regarding thehypothesis of the transmission of CBPV by Varroa, Tentchevaet al (2004) show that CBPV was not isolated from anyof the samples of Varroa collected. This shows that thecontribution of Varroa to the dissemination of this virus, if any,is small. These authors have also shown that this virus has noseasonal pattern but appears erratically during the year. Also,Faucon et al (1995) showed that the efficacy of the treatment(fluvalinate) for Varroa mites in French hives was still 100%in 1994, whereas Italian colonies were already showing
8
Environ. Res. Lett. 5 (2010) 014006 L Maxim and J P van der Sluijs
resistance. The beekeepers and public scientists argued thatwhereas honeybee diseases might theoretically influence thecolony in the long run (e.g., annual depopulations, wintermortality), this was not a biologically plausible explanationfor the specificity of the lethal and sublethal signs observedduring summer. Diseases could manifest more intenselywhen honeybees have a low immunitary defense, due toimidacloprid. Beekeepers formulated this hypothesis severalyears ago and launched a call for research and further studies(Aletru 2003).
It is interesting to find that most beekeepers doacknowledge that other factors alone, and particularly diseasesand illegal/inappropriate use of pesticides, could theoreticallyhave an influence on three of the five signs, i.e., the lossof sunflower yield, annual and winter mortality. However,they have appreciated the influence of these factors (otherthan Gaucho®) as being of low relevancy in the fieldduring the sunflower/maize flowering between 1994 and 2004.Beekeepers have not defended a ‘unique hypothesis’ for allhoneybee losses, everywhere and any time, but have referredto Gaucho® seed-dressed sunflower and maize areas.
Figure 3 shows that the percentage of answers signifi-cantly different is lower for diseases than for Gaucho® betweenbeekeepers and AFSSA (44% for diseases versus 88% forGaucho®), beekeepers and Bayer (44% versus 100%), andbeekeepers and the Ministry (80% versus 52%). The divergentanswers mainly concern the influence of the diseases on lethaland sublethal signs.
6. Discussion
Depending on their life and professional experiences, differentstakeholders have different types and levels of knowledge, andtherefore different assessments of causality criteria. Moreover,whereas socio-economic stakes are high, value judgments andinterests may also influence these assessments. Consequently,one or several causality criteria can have a more importantrole in the debate. Clearly structuring their arguments usingcausality criteria can therefore help in identifying the origins ofthe controversy and addressing them in the process of decision-making.
The application of our method to the chosen case studyshows two ‘discourse coalitions’:
(1) One, represented by Bayer, AFSSA and partially theMinistry, make reference, in their public discourses, to allhoneybee losses (everywhere in France, in all seasons).They do not particularly focus on sunflower and maizeareas, or on the specific signs observed by beekeepersin these areas. However, they make reference to otherpotentially causal factors in arguing for a non-causalrelationship between Gaucho® and honeybees.
(2) The second, represented by beekeepers and publicscientists, affirm the determinant role of Gaucho® inhoneybee losses found in sunflower and maize areas, allstating that many causes, among which diseases mustrequire particular attention, can lead to honeybee losses allover France. Some beekeepers also point to the sublethal
action of imidacloprid and to its possible synergic effectswith diseases10.
In this particular case study, the differences in assessmentof causality criteria by the experts interviewed (section 4) havea triple origin:
(1) the lack of shared definition and quantification of thesigns—which mainly influence the assessment of thecriteria 1, 2, 3, 4 and 6;
(2) the lack of specialist knowledge on honeybees (e.g.,statements which are biologically unfounded)—whichmainly influence the assessment of the criterion 5;
(3) the strategic discursive practices (e.g., statements whichhave no experimental proof) associated with the lack oftrust between experts representing stakeholders havingdiverging stakes in the case; this last aspect mainlyinfluences the assessment of the criterion 8.
For example, such an analysis realized during the debatecould have shown that the most important aspects to address indecision-making were:
• Describing in detail and monitoring the evolution of signsin the field.
• Paying particular attention to the level of expertise inhoneybee biology of the experts involved in assessing theavailable evidence and producing the needed knowledge.
• Making the socio-economic stakes of the different actorsinvolved clear and transparent, in order to promote a well-informed and balanced process of decision-making.
Below, we detail each of the three aspects for the casestudy of honeybee losses in France.
6.1. Lack of shared definition and quantification of the signs
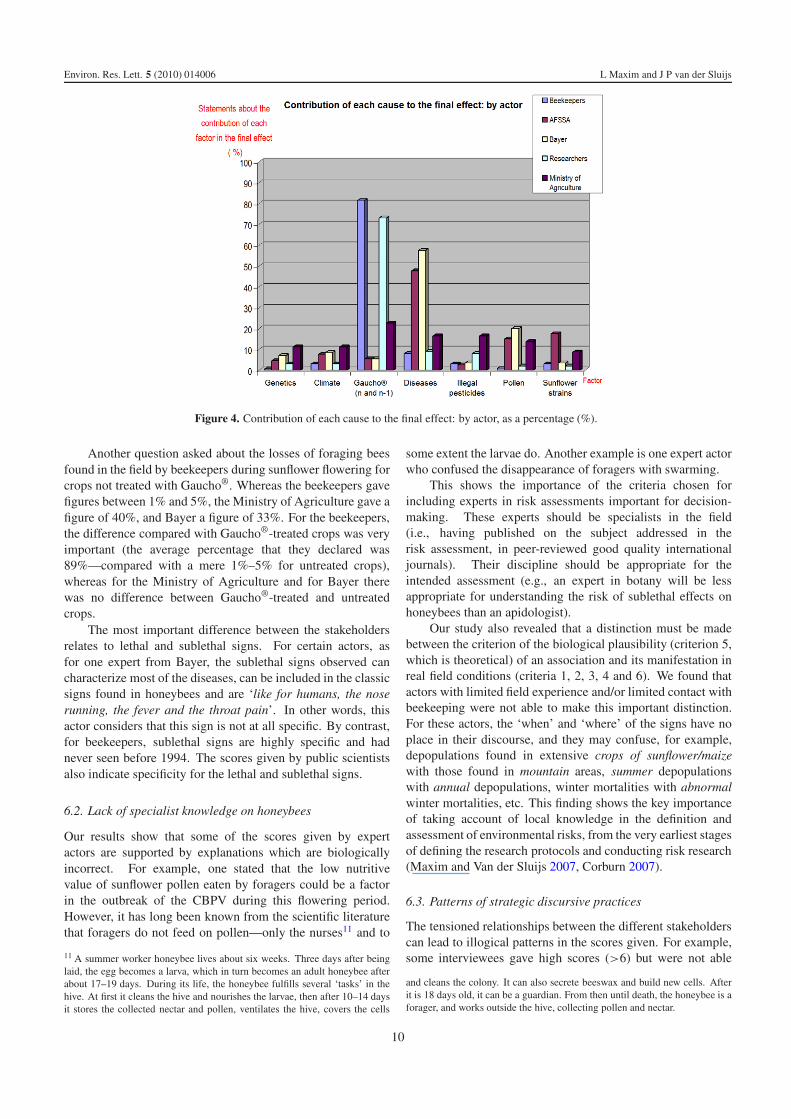
A question at the end of the questionnaire aimed atsynthesizing the views of experts about the contribution (%)of each cause to the final effects found during the years 1994–2004 (the sum of the percentages given for different causes is100%); see figure 4.
In the description of honeybee problems during thesunflower flowering, the answers to this last question: ‘What isthe magnitude of the signs observed by beekeepers in the fieldbetween 1994 and 2004?’ yielded differences of up to threefoldbetween groups of stakeholders. For example, beekeepersmentioned possible losses of sunflower honey yield of 0–30%of average yield in normal conditions (meaning in sunflowercrops not treated with Gaucho®). These figures were arrived aton the basis of their own experience.
The same question (‘What were the sunflower honey yieldlosses found by beekeepers between 1994 and 2004 Gaucho®-treated areas compared with the average yield in crops nottreated with Gaucho®?’) was posed to Bayer. The expertsrepresenting this stakeholder gave figures ranging from 30%to 60%. The Ministry of Agriculture’s response to the samequestion was 50%. These last two stakeholders could notprovide a reference for these statements.
10 A synergic effect between imidacloprid and Nosema has recently beenconfirmed in a study by Alaux et al (2010).
9
Environ. Res. Lett. 5 (2010) 014006 L Maxim and J P van der Sluijs
Figure 4. Contribution of each cause to the final effect: by actor, as a percentage (%).
Another question asked about the losses of foraging beesfound in the field by beekeepers during sunflower flowering forcrops not treated with Gaucho®. Whereas the beekeepers gavefigures between 1% and 5%, the Ministry of Agriculture gave afigure of 40%, and Bayer a figure of 33%. For the beekeepers,the difference compared with Gaucho®-treated crops was veryimportant (the average percentage that they declared was89%—compared with a mere 1%–5% for untreated crops),whereas for the Ministry of Agriculture and for Bayer therewas no difference between Gaucho®-treated and untreatedcrops.
The most important difference between the stakeholdersrelates to lethal and sublethal signs. For certain actors, asfor one expert from Bayer, the sublethal signs observed cancharacterize most of the diseases, can be included in the classicsigns found in honeybees and are ‘like for humans, the noserunning, the fever and the throat pain’. In other words, thisactor considers that this sign is not at all specific. By contrast,for beekeepers, sublethal signs are highly specific and hadnever seen before 1994. The scores given by public scientistsalso indicate specificity for the lethal and sublethal signs.
6.2. Lack of specialist knowledge on honeybees
Our results show that some of the scores given by expertactors are supported by explanations which are biologicallyincorrect. For example, one stated that the low nutritivevalue of sunflower pollen eaten by foragers could be a factorin the outbreak of the CBPV during this flowering period.However, it has long been known from the scientific literaturethat foragers do not feed on pollen—only the nurses11 and to
11 A summer worker honeybee lives about six weeks. Three days after beinglaid, the egg becomes a larva, which in turn becomes an adult honeybee afterabout 17–19 days. During its life, the honeybee fulfills several ‘tasks’ in thehive. At first it cleans the hive and nourishes the larvae, then after 10–14 daysit stores the collected nectar and pollen, ventilates the hive, covers the cells
some extent the larvae do. Another example is one expert actorwho confused the disappearance of foragers with swarming.
This shows the importance of the criteria chosen forincluding experts in risk assessments important for decision-making. These experts should be specialists in the field(i.e., having published on the subject addressed in therisk assessment, in peer-reviewed good quality internationaljournals). Their discipline should be appropriate for theintended assessment (e.g., an expert in botany will be lessappropriate for understanding the risk of sublethal effects onhoneybees than an apidologist).
Our study also revealed that a distinction must be madebetween the criterion of the biological plausibility (criterion 5,which is theoretical) of an association and its manifestation inreal field conditions (criteria 1, 2, 3, 4 and 6). We found thatactors with limited field experience and/or limited contact withbeekeeping were not able to make this important distinction.For these actors, the ‘when’ and ‘where’ of the signs have noplace in their discourse, and they may confuse, for example,depopulations found in extensive crops of sunflower/maizewith those found in mountain areas, summer depopulationswith annual depopulations, winter mortalities with abnormalwinter mortalities, etc. This finding shows the key importanceof taking account of local knowledge in the definition andassessment of environmental risks, from the very earliest stagesof defining the research protocols and conducting risk research(Maxim and Van der Sluijs 2007, Corburn 2007).
6.3. Patterns of strategic discursive practices
The tensioned relationships between the different stakeholderscan lead to illogical patterns in the scores given. For example,some interviewees gave high scores (>6) but were not able
and cleans the colony. It can also secrete beeswax and build new cells. Afterit is 18 days old, it can be a guardian. From then until death, the honeybee is aforager, and works outside the hive, collecting pollen and nectar.
10
Environ. Res. Lett. 5 (2010) 014006 L Maxim and J P van der Sluijs
to cite observations or experimental evidence supportingtheir statements, and sometimes were not able to give abiologically plausible explanation which they themselvesconsidered satisfactory. Despite being unable to justify thescore that they gave, some respondents nevertheless stuck totheir score. The ‘evidence’ for one potential causal relationshipor another expresses, in the words of an expert, a ‘conviction’,even if in some cases there is as yet no biological explanation.This is, for example, the case for the scores an expert gave tothe relationship between diseases and the lethal and sublethalsigns.
We found that part of the debate on ‘multi-causalityversus Gaucho®’ was due to confusion, to strategic discursivepractices and to passionate attitudes regarding persons fromthe ‘opposite camp’. The arguments developed by expertsestablish a certain place in the political arena and become, intime, immovable. The experts themselves are trapped in thesocio-political position associated with an argument and stopinquiring about its plausibility. Thus, for example, one expertsaid that the exercise that we proposed ‘pushes (one) to think,to realize that there are things that we have been repeatingfor years, which are now part of our convictions, whereas infact they are not substantiated by concrete evidence. But theyare part of our discourse, and we know that our opponentsare doing the same, when they build their discourse. We triedto say to ourselves that we have to be coherent and have ascientific justification for what we are saying, but I realize thatas soon as we speak about hypotheses other than Gaucho®, weare playing the same game as the others’.
Our results (section 5.2) showed that in public discourses,some expert actors can present as being plausible hypotheseswhich are not scientifically validated and thus downplay acorrect understanding of the problem by their listeners. Not allexperts are equally attentive to the robustness of the scientificsupport for the hypothesis that they evoke.
This indicates that decision-making should always bebased on ‘contradictory expertise’, in which all the competentscientists are able to communicate their results and assess thestatements of the others.
Furthermore, experts involved in risk assessments shouldbe asked to declare their conflicts of interest. These statementsshould be public and easily available to anyone asking, andin our opinion they should lead to the refusal of participationof these experts in risk assessment committees concerningproducts of companies that market them.
7. Concluding remarks
Often, in controversial situations (such as the one describedhere), the political positions and the arguments of thestakeholders involved become polarized and immovable. Areal dialog is therefore very difficult because agreeing toa compromise solution sometimes supposes changing onesviews on the problem, which can be tricky in such publicdebates. One of the creators of the paradigm of post-normalscience, Ravetz (2007), characterized the essence of such a realdialog by the term ‘negotiation in good faith’. In the light ofour findings, this proposal translates into a research question:
that of what potential procedures like those described here,which help structure, communicate and find the reasons fordivergent expert statements, have for achieving ‘negotiationin good faith’? This would amount to a test of whethergreater self-awareness of their own subjectivity would makestakeholders more appreciative of the legitimacy of the otherstakeholders in the common description of causal patterns ofenvironmental problems.
Acknowledgments
The authors are profoundly indebted to all the persons whokindly agreed to participate in this exercise, for their openness,for their time and for their efforts to understand and provideanswers in the exercise. Many thanks to Jerry Ravetz forhis very helpful comments, to Pierre-Benoıt Joly for veryinteresting discussion and to Aurelien Garivier, Gerard Biau,Gilles Saporta, Pierre Cazes and Alex Alber for theirmethodological advice.
References
AFSSA 2002 Analyse des phenomenes d’affaiblissement descolonies d’abeilles AFSSA, www.affaire-gaucho-regent.com/pdf abeilles/RapportAfssaSept2002.pdf
AFSSA 2008 Weakening, collapse and mortality of bee coloniesAFSSA, www.afssa.fr/Documents/SANT-Ra-MortaliteAbeillesEN.pdf
Alaux C, Brunet J-L, Dussaubat C, Mondet F, Tchamitchan S,Cousin M, Brillard J, Baldy A, Belzunces L P and Le Conte Y2010 Interactions between Nosema microspores and aneonicotinoid weaken honeybees (Apis mellifera) Environ.Microbiology doi:10.1111/j.1462-2920.2009.02123.x
Aletru F 2003 Documents Communiques par MFrankAletru auCST—Janvier 2003
Belzunces L and Tasei J-N 1997 Rapport sur les effets destraitements de semences de tournesol au Gaucho®
(imidaclopride). Impacts sur les peuplements des coloniesd’abeilles et sur les miellees Commission d’Etude de la Toxicitedes Produits Antiparasitaires a Usage Agricole et des ProduitsAssimiles (Paris: Ministere de l’Agriculture)
CARI 2003 Suivi sanitaire d’urgence de ruchers presentant dessymptomes de deperissement: Projet FF 02/15 (414) du FondsBudgetaire des Matieres Premieres. Avec la participation de laRegion Wallonne (equipe PRIME) et du programme europeen1221/97 ‘Miel’ Rapport Final Belgium
CNEVA Sophia-Antipolis 1997 Programme de Recherches surl’implication des Traitements des Semences de Tournesol dansles Diminutions de Miellee 4 p
Collier T K 2003 Forensic ecotoxicology: establishing causalitybetween contaminants and biological effects in field studiesHuman Ecol. Risk Assess. 9 259–66
COLOSS 2009 Proc. 4th COLOSS Conf.—Prevention of HoneybeeCOlony LOSSes (Zagreb: Faculty of Agriculture, University ofZagreb) 49 p
Coordination des Apiculteurs 2001 Communication a l’attention desmembres du Comite de Pilotage—Etude Multifactorielle, reunisen CE le 28 Septembre 2001 a Paris 8 p
Corburn J 2007 Community knowledge in environmental healthscience: co-producing policy expertise Environ. Sci. Policy10 150–61
Faucon J-P, Drajnudel P and Fleche C 1995 Mise en evidence d’unediminution de l’efficacite de l’ Apistan® utilise contre lavarroase de l’abeille (Apis mellifera L) Apidologie 26 291–6
Funtowicz S O and Ravetz J R 1990 Uncertainty and Quality inScience for Policy (Dordrecht: Kluwer)
11
Environ. Res. Lett. 5 (2010) 014006 L Maxim and J P van der Sluijs
Gee D 2003 Presentation at the Stakeholder Forum on Environmentand Health Strategy (Belgium: Brussels)
GVA (Galerie Virtuelle Apicole) 1998–2008 Apiservices—Le PortailApiculture, www.beekeeping.com last checked in August 2009
Hill B A 1965 The environment and disease: association orcausation? Proc. R. Soc. Med. 58 295–300
Holt R I G and Peveler R C 2006 Antipsychotic drugs anddiabetes—an application of the Austin Bradford Hill criteriaDiabetologia 49 1467–76
Iversen B, Hofmann B and Aavitsland P 2008 Questions on causalityand responsibility arising from an outbreak of Pseudomonasaeruginosa infections in Norway Emerg. Themes Epidemiol.5 22
Klein A-M, Vaissiere B E, Cane J H, Steffan-Dewenter I,Cunningham S A, Kremen C and Tscharntke T 2007Importance of pollinators in changing landscapes for worldcrops Proc. R. Soc. B 274 303–13
Kloprogge P and Van der Sluijs J P 2006 The inclusion ofstakeholder knowledge and perspectives in integratedassessment of climate change Clim. Change 75 359–89
Marshall T 2005 Bradford–Hill criteria provide the way ahead forcontroversial theory Int. J. Surg. 3 287–8
Maxim L and Van der Sluijs J P 2007 Uncertainty: cause or effect ofstakeholders’ debates? Analysis of a case study: the risk forhoneybees of the insecticide Gaucho® Sci. Total Environ.376 1–17
Ministerio da Agricultura do Desenvolvimento Rural e dasPescas 2000 Letter to M Nichelatti (Direction de la Preventiondes Pollutions et des Risques) March 2000
Munns W R Jr 2006 Assessing risks to wildlife populations frommultiple stressors: overview of the problem and research needsEcol. Soc. 11 23 (http://www.ecologyandsociety.org/vol11/iss1/art23/)
Narasimhan T N 2007 Limitations of science and adapting to NatureEnviron. Res. Lett. 2 034003 (5 p)
Panella F 2001 Letter of Presidente Unione Nazionale AssociationiApicoltori Italiani to Giovanni Alemanno, Ministro per lePolitiche Agricole 10 November
Pham-Delegue M-H and Cluzeau S 1998 Effets des produitsphytosanitaires sur l’abeille: incidence du traitement dessemences de tournesol par Gaucho® sur la disparition debutineuses Rapport de Synthese du Programme National deRecherches 44 p
Phillips C V and Goodman K J 2004 The missed lessons of SirAustin Bradford Hill Emerg. Themes Epidemiol. 1 3
Phillips C V and Goodman K J 2006 Causal criteria andcounterfactuals; nothing more (or less) than scientific commonsense Emerg. Themes Epidemiol. 3 5
Prefecture de la Vendee 1997 Compte-rendu de la reunion qui s’esttenue a la Direction des Services Veterinaires de la Vendee le29 septembre 1997 sur la suspicion d’intoxication des abeillesdans plusieurs departements dont la Vendee a partir dutournesol traite au Gaucho
Ravetz J 2007 Post-normal science and the complexity of transitionstowards sustainability Ecol. Complexity 3 275–84
Rothman K J and Greenland S 2005 Causation and causal inferencein epidemiology Am. J. Public Health 95 144–50
Tentcheva D, Gauthier L, Zappulla N, Dainat B, Cousserans F,Colin M-E and Bergoin M 2004 Prevalence and seasonalvariations of six bee viruses in Apis mellifera L. and Varroadestructor mite populations in France Appl. Environ. Microbiol.70 7185–91
Trouiller J 1998 Monitoring Varroa Jacobsoni resistance topyrethroids in western Europe Apidologie 29 537–46
Valleron A-J 2000 Mise en evidence des faits et recherche des causesen epidemiologie environnementale: enjeux methodologiquesC. R. Acad. Sci. Paris 323 617–28
Van der Sluijs J P, Petersen A C, Janssen P H M, Risbey J S andRavetz J R 2008 Exploring the quality of evidence for complexand contested policy decisions Environ. Res. Lett. 3 024008(9 p)
Vineis P and Kriebel D 2006 Causal models in epidemiology: pastinheritance and genetic future Environ. Health: Global AccessSci. Source 5 21 (www.ehjournal.net/content/5/1/21)
Weiss C 2003 Expressing scientific uncertainty Law Probab. Risk2 25–46
Weiss C 2006 Can there be science-based precaution? Environ. Res.Lett. 1 014003 (7 p)
Welp M, De la Vega-Leinerta A, Stoll-Kleemann S and Jaeger C C2006 Science-based stakeholder dialogues: theories and toolsGlob. Environ. Change 16 170–81
Wynne B 1996 May the sheep safely graze? A reflexive view of theexpert–lay divide Risk Environment and Modernity: Towards aNew Ecology ed S Lash, B Szerszynski and B Wynne (London:Sage) pp 44–83
12