
International experiences with comprehensive and effective road safety campaigns
Upload
independentCategory
view
3download
0
ARTICLE IN PRESS
1352-2310/$ - se
doi:10.1016/j.at
�CorrespondGermany.
E-mail addr1Now at: De
Atmospheric Environment 40 (2006) S3–S20
www.elsevier.com/locate/atmosenv
Experiments on forest/atmosphere exchange: Climatology andfluxes during two summer campaigns in NE Bavaria
O. Klemma,�, A. Helda, R. Forkelb, R. Gascheb, H.-J. Kanterb, B. Rappengluckb,1,R. Steinbrecherb, K. Mullerc, A. Plewkac, C. Cojocariud, J. Kreuzwieserd,
J. Valverde-Canossae, G. Schustere, G.K. Moortgate, M. Grausf, A. Hanself
aUniversitat Bayreuth, BITOK, Bayreuth, GermanybForschungszentrum Karlsruhe, Institut fur Meteorologie und Klimaforschung, Atmospharische Umweltforschung (IMK-IFU)
Kreuzeckbahnstr. 19, D-82491 Garmisch-Partenkirchen, GermanycLeibniz-Institut fur Tropospharenforschung (IfT), Permoserstr. 15, D-04318 Leipzig, Germany
dInstitut fur Forstbotanik und Baumphysiologie, Universitat Freiburg, Georges-Kohler-Allee, Geb. 053/054, D-79110 Freiburg, GermanyeMax-Planck-Institut fur Chemie, Joh.-Joachim-Becher-Weg 27, D-55128 Mainz, Germany
fInstitut fur Ionenphysik, Universitat Innsbruck, Technikerstr. 25, A-6020 Innsbruck
Received 20 June 2005; received in revised form 11 January 2006; accepted 19 January 2006
Abstract
During two summer field campaigns in 2001 and 2002, biosphere/atmosphere exchange fluxes of energy, gases, and
particles were quantified in a Norway spruce forest in NE Bavaria at 775m a.s.l. The overall goal of the BEWA campaigns
was to study the influence of the emissions of reactive biogenic volatile organic compounds (BVOCs) on chemical and
physical processes in the atmosphere, and an overview over the meteorological conditions, experimental frame, and the
achieved results is provided. A rigorous quality assurance/quality control plan was implemented. From analysis of
meteorological conditions and experimental success, golden day periods were selected for coordinated data analysis. These
periods cover typical summertime conditions with various wind directions, NOx mixing ratios between 2 and 10 ppb, and
O3 mixing ratios ranging between 13 and 98 ppb. Diurnal patterns of trace gas concentrations resulted from the dynamics
of the boundary layer, from regional atmospheric processes (for example production of O3 in the atmosphere), and
deposition. Turbulence also exhibited a diurnal pattern indicating thermal production during daytime and calm conditions
during nighttime. However, in many cases, turbulence was often well developed during the nights. Horizontal advection of
air masses into the trunk space occurred due to the patchiness of the forest. Nevertheless, for most conditions, the
application of a one-dimensional model to describe the vertical exchange processes was appropriate. Therefore, the use of
one single meteorological tower to study biosphere/atmosphere exchange is valid. Measured turbulent vertical exchange
fluxes were estimated to be representative within an error of less than 25%. The results for VOC concentrations and fluxes
e front matter r 2006 Elsevier Ltd. All rights reserved.
mosenv.2006.01.060
ing author. Institut fur Landschaftsokologie (ILOK), Universitat Munster, Robert-Koch-Str. 26, D-48149 Munster,
ess: [email protected] (O. Klemm).
partment of Geosciences, University of Houston, 4800 Calhoun Rd., Houston, TX 77204-5007, USA.
ARTICLE IN PRESSO. Klemm et al. / Atmospheric Environment 40 (2006) S3–S20S4
were rather heterogeneous. Both model and measurements demonstrated that the Norway spruce trees acted as a weak
source of formaldehyde.
r 2006 Elsevier Ltd. All rights reserved.
Keywords: Atmospheric boundary layer; Biogenic volatile organic compounds; BVOC; Norway spruce; Quality assurance of flux data;
Surface exchange fluxes; Ozone fluxes; Turbulent exchange
1. Introduction
Biogenic volatile organic compound (BVOC) emis-sions greatly contribute to total VOC emissionsinto the atmosphere (Guenther et al., 1995). Theircontribution to atmospheric processes, includingthe formation and growth of aerosol particles, isestimated to be very significant (Andreae and Crutzen,1997; Griffin et al., 1999). Considerable research hasbeen carried out on emissions of BVOCs to theatmosphere, but so far there is no detailed study offluxes of these compounds from forest canopies inGermany. The BEWA 2000 research cluster wasinitiated to address this gap in atmospheric research.
BEWA 2000 comprised experimental and model-ling activities at various scales. A key componentconsisted of two integrated field experiments duringthe summers of 2001 and 2002 at the Norway spruceforest site Waldstein in NE Bavaria. This site wasselected because spruce is an important tree species inGermany, and because the site is an establishedecosystem research site with extensive historical dataand knowledge concerning ecosystem fluxes andprocesses (Matzner, 2004). This contribution setsan overview of the site and the experiments in 2001and 2002. Data quality assurance (QA) activities arepresented in detail, an overview over the meteor-ological and air chemistry is given, and VOC mixingratios and fluxes are described. The applicability of aone-dimensional model to describe vertical fluxes atour experimental site is discussed. Further details onBEWA 2000 results are given in a series of separatepapers in this issue (Valverde-Canossa et al. thisissue; Held et al., 2004; Held and Klemm, this issue;Forkel et al., this issue; Ganzeveld et al., this issue A,B; Grabmer et al., this issue; Graus et al., this issue;Grote et al., this issue; Magel et al., this issue; Mulleret al., this issue; Plewka et al., this issue; Smiatek andSteinbrecher, this issue; Spittler et al., this issue).
2. Site and experimental phases
The experimental ecosystem research site Wald-
stein is located in the Fichtelgebirge mountain range,
NE Bavaria, at an altitude of approximately 800ma.s.l. This area exhibited one of the highest degree offorest decline symptoms in Europe in the 1980s.During that period, acid precipitation and itsimpact on pollutant and nutrient cycling wasextensively studied (Schulze et al., 1989). After themid-1980, the emissions of precursors of acidprecipitation in Europe were reduced, and subse-quently, the air concentrations of SO2 and thedeposition rates of sulfate and other acidifyingcompounds to the forest decreased as well (Klemmand Lange, 1999; Matzner, 2004). As a conse-quence, but also due to extensive liming activities ofthe soils on acidic, mainly granitic bedrock of theregion, the forest health recovered.
The experimental site is located within theLehstenbach catchment 1 km to the SW of the‘‘Bergkopf’’ summit (857m a.s.l.) The catchmentcovers an area of about 4 km2. The forest isdominated by planted Norway spruce, with patchesof stands of various age classes. Ecosystem balancestudies have been performed here since 1988(Matzner, 2004). A 30-m scaffolding walk-up towerat the Weidenbrunnen site, at 5010803200N,1115200400E, 775m a.s.l., is located close to thewatershed and in a terrain that slopes to the SSWwith an angle of about 51. The forest extendsapproximately 6.5 km to the SW, 2.5 km to the W,and 5.5 km to the E. A detailed footprint analysisshowed that the source area (90% of the biosphere/atmosphere fluxes) is about 15 ha in the cases of ahighly unstable stratification of the boundary layer,40 ha for unstable cases, 100 ha for neutral stratifi-cation, and 750 ha for a stable boundary layer(Klemm and Mangold, 2001). Independent of winddirection and stability, the source area is in mostcases covered with spruce forest of 60–120 yearstand age, except in the highly stable cases where theinfluence from the agricultural area to the west maynot be excluded. These situations were excludedfrom data analysis anyway due to poorly developedfriction velocities (see Section 4). Towards the SE,there are further mountain ranges, also covered withspruce forest. Although these areas host small towns
ARTICLE IN PRESSO. Klemm et al. / Atmospheric Environment 40 (2006) S3–S20 S5
and motorways, air masses advecting from the SEmake surface contact with a more or less homo-geneous spruce forest cover.
At the meteorological tower, the spruce stand wasplanted in 1945, is up to 19m high and about200m� 200m large. At distances more than about50m to the W and E, respectively, the spruce treeheight is 25–30m. A 100m� 100m open field withforest nursery (Pflanzgarten) is located at a distanceof 200m to the W from the tower. A forest road of6m width crosses from WNW to ESE at a distanceof 100m to the N from the tower. This road ishardly used by any vehicles. To the N of this road,the 150-year-old spruce trees are about 27m highand exhibit a relatively open trunk space. This standis called Coulissenhieb and was used within theBEWA 2000 experiment for the quantification ofsoil fluxes. Within the forest, considerable gapsbetween trees have developed and horizontaladvection of air parcels into the trunk space cannotbe ruled out.
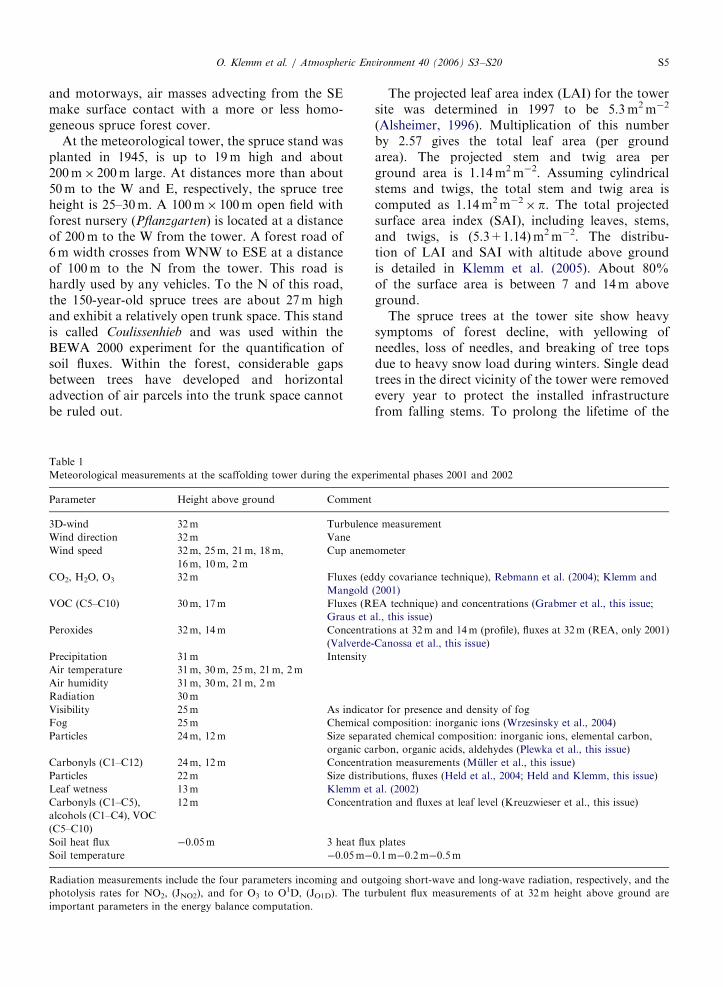
Table 1
Meteorological measurements at the scaffolding tower during the expe
Parameter Height above ground Comment
3D-wind 32m Turbulenc
Wind direction 32m Vane
Wind speed 32m, 25m, 21m, 18m,
16m, 10m, 2m
Cup anem
CO2, H2O, O3 32m Fluxes (ed
Mangold
VOC (C5–C10) 30m, 17m Fluxes (R
Graus et a
Peroxides 32m, 14m Concentra
(Valverde-
Precipitation 31m Intensity
Air temperature 31m, 30m, 25m, 21m, 2m
Air humidity 31m, 30m, 21m, 2m
Radiation 30m
Visibility 25m As indicat
Fog 25m Chemical
Particles 24m, 12m Size separ
organic ca
Carbonyls (C1–C12) 24m, 12m Concentra
Particles 22m Size distri
Leaf wetness 13m Klemm et
Carbonyls (C1–C5),
alcohols (C1–C4), VOC
(C5–C10)
12m Concentra
Soil heat flux �0.05m 3 heat flux
Soil temperature �0.05m�
Radiation measurements include the four parameters incoming and ou
photolysis rates for NO2, (JNO2), and for O3 to O1D, (JO1D). The tu
important parameters in the energy balance computation.
The projected leaf area index (LAI) for the towersite was determined in 1997 to be 5.3m2m�2
(Alsheimer, 1996). Multiplication of this numberby 2.57 gives the total leaf area (per groundarea). The projected stem and twig area perground area is 1.14m2m�2. Assuming cylindricalstems and twigs, the total stem and twig area iscomputed as 1.14m2m�2� p. The total projectedsurface area index (SAI), including leaves, stems,and twigs, is (5.3+1.14)m2m�2. The distribu-tion of LAI and SAI with altitude above groundis detailed in Klemm et al. (2005). About 80%of the surface area is between 7 and 14m aboveground.
The spruce trees at the tower site show heavysymptoms of forest decline, with yellowing ofneedles, loss of needles, and breaking of tree topsdue to heavy snow load during winters. Single deadtrees in the direct vicinity of the tower were removedevery year to protect the installed infrastructurefrom falling stems. To prolong the lifetime of the
rimental phases 2001 and 2002
e measurement
ometer
dy covariance technique), Rebmann et al. (2004); Klemm and
(2001)
EA technique) and concentrations (Grabmer et al., this issue;
l., this issue)
tions at 32m and 14m (profile), fluxes at 32m (REA, only 2001)
Canossa et al., this issue)
or for presence and density of fog
composition: inorganic ions (Wrzesinsky et al., 2004)
ated chemical composition: inorganic ions, elemental carbon,
rbon, organic acids, aldehydes (Plewka et al., this issue)
tion measurements (Muller et al., this issue)
butions, fluxes (Held et al., 2004; Held and Klemm, this issue)
al. (2002)
tion and fluxes at leaf level (Kreuzwieser et al., this issue)
plates
0.1m�0.2m�0.5m
tgoing short-wave and long-wave radiation, respectively, and the
rbulent flux measurements of at 32m height above ground are
ARTICLE IN PRESSO. Klemm et al. / Atmospheric Environment 40 (2006) S3–S20S6
forest stand, liming with dolomite, CaMg(CO3)2,was performed in the vicinity of the tower inNovember 1999, and around the tower site itselfin December 2001.
The meteorological routine program at the toweris operational since 1993. Table 1 shows themeasurements at the tower during the BEWA2000 campaign. Trace gas measurements of NO,NO2, NH3, O3, and SO2 were performed in thePflanzgarten forest clearing, with the air inlet at 3mabove ground. NO, NO2, NH3, and SO2 weremeasured within the routine program and withstandard techniques: NO was detected with gasphase chemiluminescence of activated NO2 afterreaction of NO with O3, NO2 was measured as NOafter reduction on a 300 1C molybdenum converter,and SO2 was measured with gas phase UV-fluorescence. Ammonia (NH3) was measured aselectric conductivity in aqueous solution afterstripping the gas phase in a rotating annulardenuder (Wyers et al., 1993). During the BEWAexperiments, the bulk particle composition was alsomeasured at the Pflanzgarten site with a high-volume sampler. During selected time periods,surface exchange fluxes of O3 were measuredwith eddy covariance (Klemm et al., 2004), andthose of NO, NO2, and VOC (C5–C10) werequantified with dynamic chambers (Butterbach-Bahl et al., 1997) in the Coulissenhieb site. Eddycovariance measurements of the exchange of O3
were also realized at this site during a short timeperiod in 2002. Measurements were made during theperiods 09.07.2001–03.08.2001 and 24.06.2002–02.08.2002 and data QA activities took place duringthe periods 09.07.2001–14.07.2001 and 24.06.2002–30.06.2002.
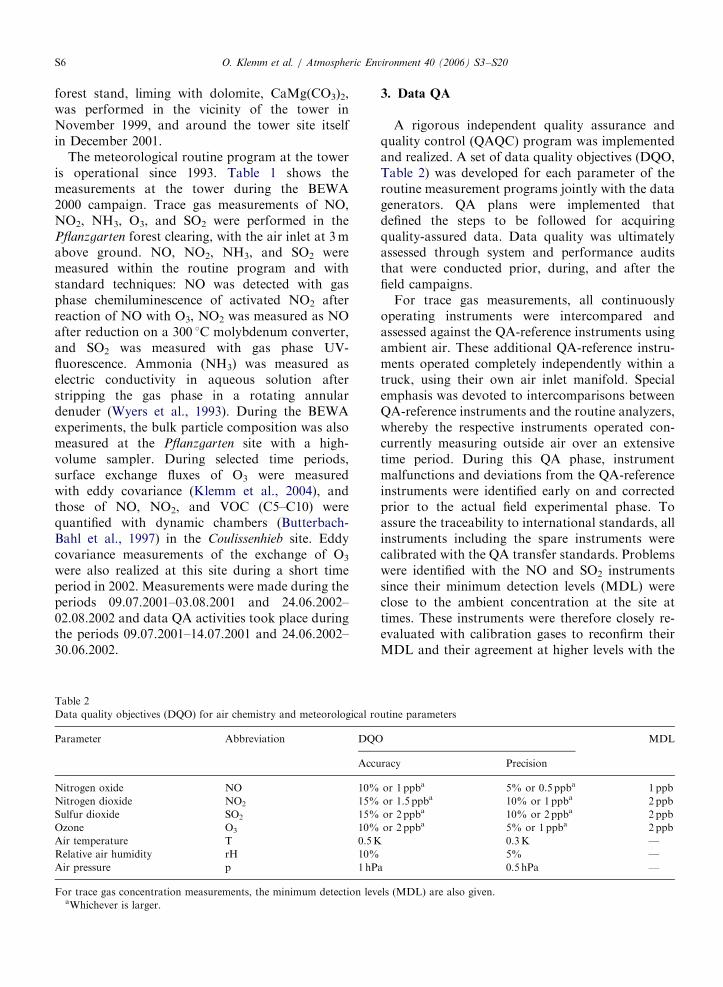
Table 2
Data quality objectives (DQO) for air chemistry and meteorological ro
Parameter Abbreviation DQO
Accu
Nitrogen oxide NO 10%
Nitrogen dioxide NO2 15%
Sulfur dioxide SO2 15%
Ozone O3 10%
Air temperature T 0.5K
Relative air humidity rH 10%
Air pressure p 1 hP
For trace gas concentration measurements, the minimum detection levaWhichever is larger.
3. Data QA
A rigorous independent quality assurance andquality control (QAQC) program was implementedand realized. A set of data quality objectives (DQO,Table 2) was developed for each parameter of theroutine measurement programs jointly with the datagenerators. QA plans were implemented thatdefined the steps to be followed for acquiringquality-assured data. Data quality was ultimatelyassessed through system and performance auditsthat were conducted prior, during, and after thefield campaigns.
For trace gas measurements, all continuouslyoperating instruments were intercompared andassessed against the QA-reference instruments usingambient air. These additional QA-reference instru-ments operated completely independently within atruck, using their own air inlet manifold. Specialemphasis was devoted to intercomparisons betweenQA-reference instruments and the routine analyzers,whereby the respective instruments operated con-currently measuring outside air over an extensivetime period. During this QA phase, instrumentmalfunctions and deviations from the QA-referenceinstruments were identified early on and correctedprior to the actual field experimental phase. Toassure the traceability to international standards, allinstruments including the spare instruments werecalibrated with the QA transfer standards. Problemswere identified with the NO and SO2 instrumentssince their minimum detection levels (MDL) wereclose to the ambient concentration at the site attimes. These instruments were therefore closely re-evaluated with calibration gases to reconfirm theirMDL and their agreement at higher levels with the
utine parameters
MDL
racy Precision
or 1 ppba 5% or 0.5 ppba 1 ppb
or 1.5 ppba 10% or 1 ppba 2 ppb
or 2 ppba 10% or 2 ppba 2 ppb
or 2 ppba 5% or 1 ppba 2 ppb
0.3K —
5% —
a 0.5 hPa —
els (MDL) are also given.
ARTICLE IN PRESS
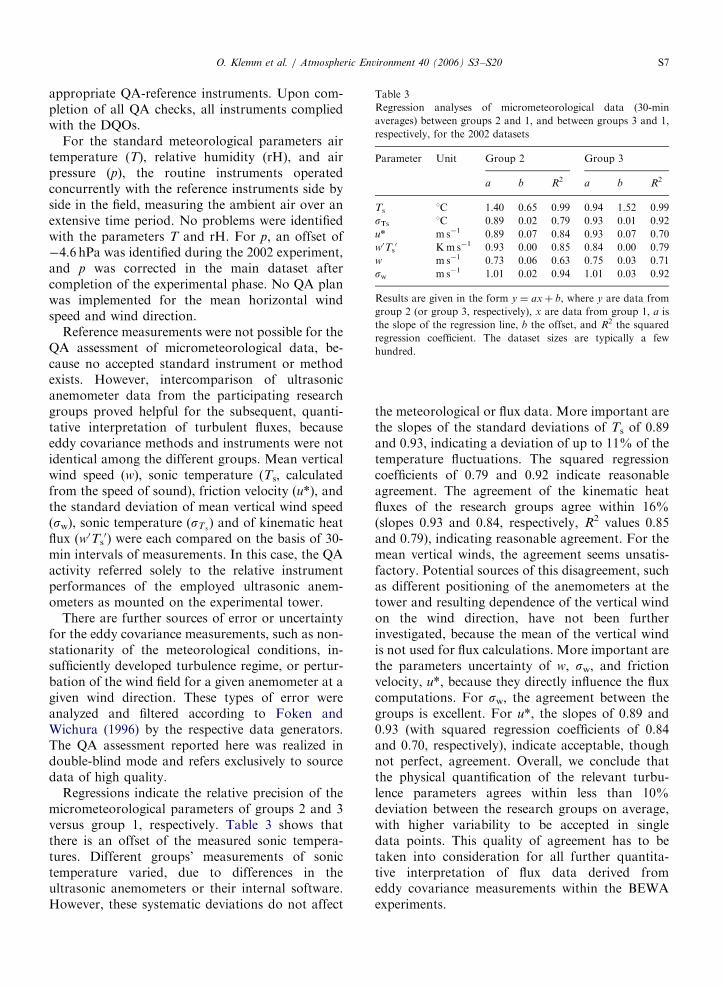
Table 3
Regression analyses of micrometeorological data (30-min
averages) between groups 2 and 1, and between groups 3 and 1,
respectively, for the 2002 datasets
Parameter Unit Group 2 Group 3
a b R2 a b R2
Ts 1C 1.40 0.65 0.99 0.94 1.52 0.99
sTs 1C 0.89 0.02 0.79 0.93 0.01 0.92
u* m s�1 0.89 0.07 0.84 0.93 0.07 0.70
w0Ts0 Kms�1 0.93 0.00 0.85 0.84 0.00 0.79
w ms�1 0.73 0.06 0.63 0.75 0.03 0.71
sw m s�1 1.01 0.02 0.94 1.01 0.03 0.92
Results are given in the form y ¼ axþ b, where y are data from
group 2 (or group 3, respectively), x are data from group 1, a is
the slope of the regression line, b the offset, and R2 the squared
regression coefficient. The dataset sizes are typically a few
hundred.
O. Klemm et al. / Atmospheric Environment 40 (2006) S3–S20 S7
appropriate QA-reference instruments. Upon com-pletion of all QA checks, all instruments compliedwith the DQOs.
For the standard meteorological parameters airtemperature (T), relative humidity (rH), and airpressure (p), the routine instruments operatedconcurrently with the reference instruments side byside in the field, measuring the ambient air over anextensive time period. No problems were identifiedwith the parameters T and rH. For p, an offset of�4.6 hPa was identified during the 2002 experiment,and p was corrected in the main dataset aftercompletion of the experimental phase. No QA planwas implemented for the mean horizontal windspeed and wind direction.
Reference measurements were not possible for theQA assessment of micrometeorological data, be-cause no accepted standard instrument or methodexists. However, intercomparison of ultrasonicanemometer data from the participating researchgroups proved helpful for the subsequent, quanti-tative interpretation of turbulent fluxes, becauseeddy covariance methods and instruments were notidentical among the different groups. Mean verticalwind speed (w), sonic temperature (Ts, calculatedfrom the speed of sound), friction velocity (u*), andthe standard deviation of mean vertical wind speed(sw), sonic temperature (sT s
) and of kinematic heatflux (w0Ts
0) were each compared on the basis of 30-min intervals of measurements. In this case, the QAactivity referred solely to the relative instrumentperformances of the employed ultrasonic anem-ometers as mounted on the experimental tower.
There are further sources of error or uncertaintyfor the eddy covariance measurements, such as non-stationarity of the meteorological conditions, in-sufficiently developed turbulence regime, or pertur-bation of the wind field for a given anemometer at agiven wind direction. These types of error wereanalyzed and filtered according to Foken andWichura (1996) by the respective data generators.The QA assessment reported here was realized indouble-blind mode and refers exclusively to sourcedata of high quality.
Regressions indicate the relative precision of themicrometeorological parameters of groups 2 and 3versus group 1, respectively. Table 3 shows thatthere is an offset of the measured sonic tempera-tures. Different groups’ measurements of sonictemperature varied, due to differences in theultrasonic anemometers or their internal software.However, these systematic deviations do not affect
the meteorological or flux data. More important arethe slopes of the standard deviations of Ts of 0.89and 0.93, indicating a deviation of up to 11% of thetemperature fluctuations. The squared regressioncoefficients of 0.79 and 0.92 indicate reasonableagreement. The agreement of the kinematic heatfluxes of the research groups agree within 16%(slopes 0.93 and 0.84, respectively, R2 values 0.85and 0.79), indicating reasonable agreement. For themean vertical winds, the agreement seems unsatis-factory. Potential sources of this disagreement, suchas different positioning of the anemometers at thetower and resulting dependence of the vertical windon the wind direction, have not been furtherinvestigated, because the mean of the vertical windis not used for flux calculations. More important arethe parameters uncertainty of w, sw, and frictionvelocity, u*, because they directly influence the fluxcomputations. For sw, the agreement between thegroups is excellent. For u*, the slopes of 0.89 and0.93 (with squared regression coefficients of 0.84and 0.70, respectively), indicate acceptable, thoughnot perfect, agreement. Overall, we conclude thatthe physical quantification of the relevant turbu-lence parameters agrees within less than 10%deviation between the research groups on average,with higher variability to be accepted in singledata points. This quality of agreement has to betaken into consideration for all further quantita-tive interpretation of flux data derived fromeddy covariance measurements within the BEWAexperiments.
ARTICLE IN PRESSO. Klemm et al. / Atmospheric Environment 40 (2006) S3–S20S8
4. Meteorological conditions
4.1. Meteorology and air chemistry
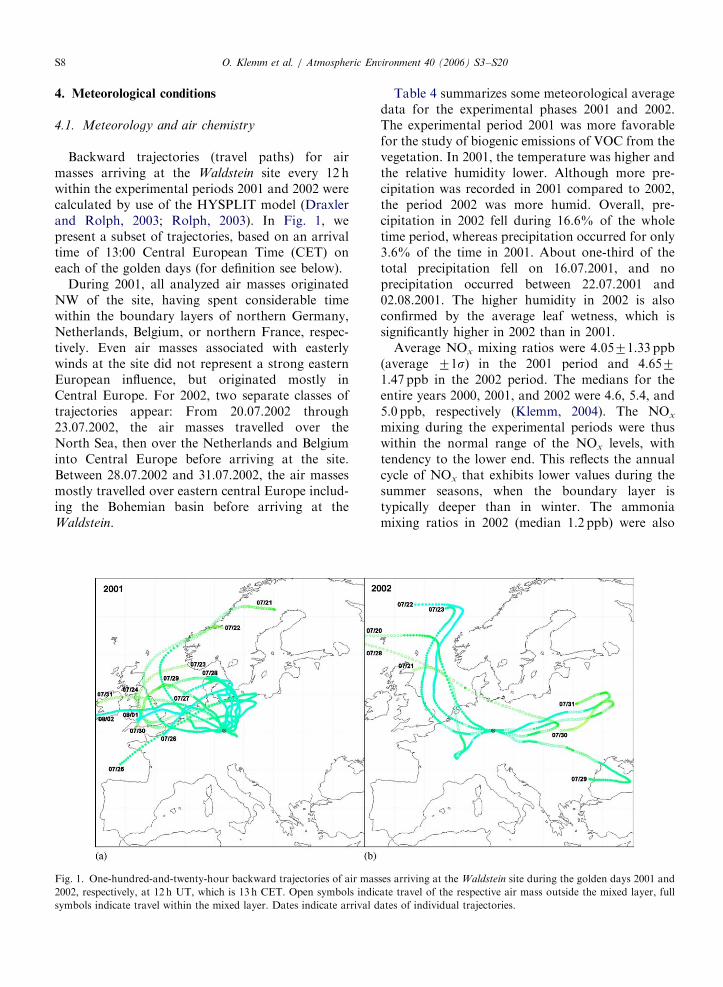
Backward trajectories (travel paths) for airmasses arriving at the Waldstein site every 12 hwithin the experimental periods 2001 and 2002 werecalculated by use of the HYSPLIT model (Draxlerand Rolph, 2003; Rolph, 2003). In Fig. 1, wepresent a subset of trajectories, based on an arrivaltime of 13:00 Central European Time (CET) oneach of the golden days (for definition see below).
During 2001, all analyzed air masses originatedNW of the site, having spent considerable timewithin the boundary layers of northern Germany,Netherlands, Belgium, or northern France, respec-tively. Even air masses associated with easterlywinds at the site did not represent a strong easternEuropean influence, but originated mostly inCentral Europe. For 2002, two separate classes oftrajectories appear: From 20.07.2002 through23.07.2002, the air masses travelled over theNorth Sea, then over the Netherlands and Belgiuminto Central Europe before arriving at the site.Between 28.07.2002 and 31.07.2002, the air massesmostly travelled over eastern central Europe includ-ing the Bohemian basin before arriving at theWaldstein.
Fig. 1. One-hundred-and-twenty-hour backward trajectories of air mas
2002, respectively, at 12 h UT, which is 13 h CET. Open symbols indic
symbols indicate travel within the mixed layer. Dates indicate arrival d
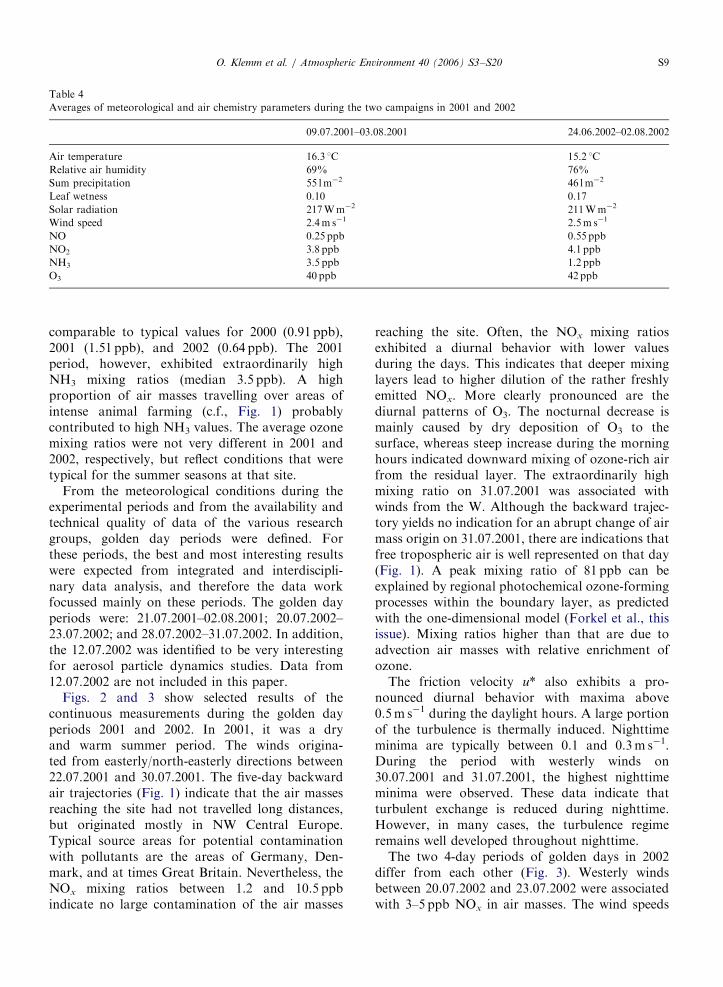
Table 4 summarizes some meteorological averagedata for the experimental phases 2001 and 2002.The experimental period 2001 was more favorablefor the study of biogenic emissions of VOC from thevegetation. In 2001, the temperature was higher andthe relative humidity lower. Although more pre-cipitation was recorded in 2001 compared to 2002,the period 2002 was more humid. Overall, pre-cipitation in 2002 fell during 16.6% of the wholetime period, whereas precipitation occurred for only3.6% of the time in 2001. About one-third of thetotal precipitation fell on 16.07.2001, and noprecipitation occurred between 22.07.2001 and02.08.2001. The higher humidity in 2002 is alsoconfirmed by the average leaf wetness, which issignificantly higher in 2002 than in 2001.
Average NOx mixing ratios were 4.0571.33 ppb(average 71s) in the 2001 period and 4.6571.47 ppb in the 2002 period. The medians for theentire years 2000, 2001, and 2002 were 4.6, 5.4, and5.0 ppb, respectively (Klemm, 2004). The NOx
mixing during the experimental periods were thuswithin the normal range of the NOx levels, withtendency to the lower end. This reflects the annualcycle of NOx that exhibits lower values during thesummer seasons, when the boundary layer istypically deeper than in winter. The ammoniamixing ratios in 2002 (median 1.2 ppb) were also
ses arriving at the Waldstein site during the golden days 2001 and
ate travel of the respective air mass outside the mixed layer, full
ates of individual trajectories.
ARTICLE IN PRESS
Table 4
Averages of meteorological and air chemistry parameters during the two campaigns in 2001 and 2002
09.07.2001–03.08.2001 24.06.2002–02.08.2002
Air temperature 16.3 1C 15.2 1C
Relative air humidity 69% 76%
Sum precipitation 55 lm�2 46 lm�2
Leaf wetness 0.10 0.17
Solar radiation 217Wm�2 211Wm�2
Wind speed 2.4m s�1 2.5m s�1
NO 0.25 ppb 0.55 ppb
NO2 3.8 ppb 4.1 ppb
NH3 3.5 ppb 1.2 ppb
O3 40 ppb 42ppb
O. Klemm et al. / Atmospheric Environment 40 (2006) S3–S20 S9
comparable to typical values for 2000 (0.91 ppb),2001 (1.51 ppb), and 2002 (0.64 ppb). The 2001period, however, exhibited extraordinarily highNH3 mixing ratios (median 3.5 ppb). A highproportion of air masses travelling over areas ofintense animal farming (c.f., Fig. 1) probablycontributed to high NH3 values. The average ozonemixing ratios were not very different in 2001 and2002, respectively, but reflect conditions that weretypical for the summer seasons at that site.
From the meteorological conditions during theexperimental periods and from the availability andtechnical quality of data of the various researchgroups, golden day periods were defined. Forthese periods, the best and most interesting resultswere expected from integrated and interdiscipli-nary data analysis, and therefore the data workfocussed mainly on these periods. The golden dayperiods were: 21.07.2001–02.08.2001; 20.07.2002–23.07.2002; and 28.07.2002–31.07.2002. In addition,the 12.07.2002 was identified to be very interestingfor aerosol particle dynamics studies. Data from12.07.2002 are not included in this paper.
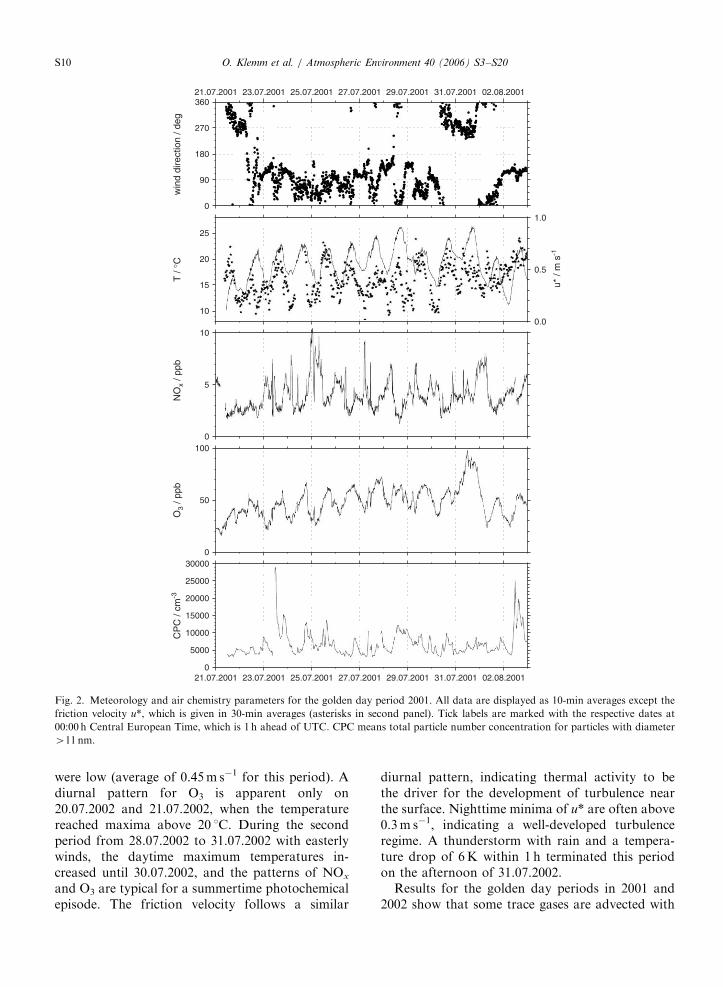
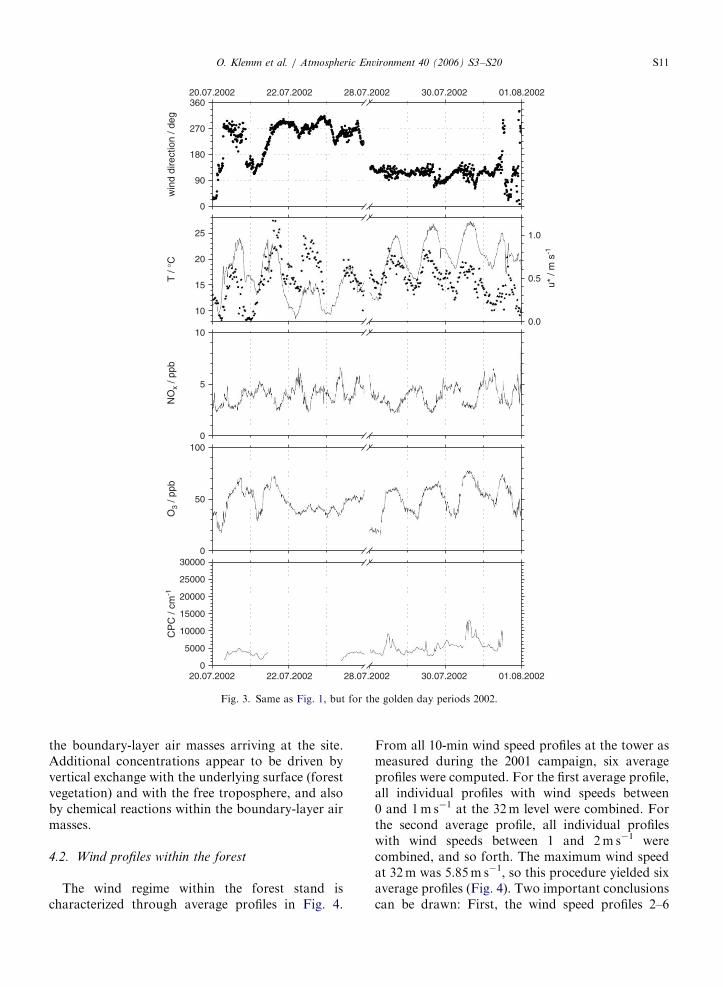
Figs. 2 and 3 show selected results of thecontinuous measurements during the golden dayperiods 2001 and 2002. In 2001, it was a dryand warm summer period. The winds origina-ted from easterly/north-easterly directions between22.07.2001 and 30.07.2001. The five-day backwardair trajectories (Fig. 1) indicate that the air massesreaching the site had not travelled long distances,but originated mostly in NW Central Europe.Typical source areas for potential contaminationwith pollutants are the areas of Germany, Den-mark, and at times Great Britain. Nevertheless, theNOx mixing ratios between 1.2 and 10.5 ppbindicate no large contamination of the air masses
reaching the site. Often, the NOx mixing ratiosexhibited a diurnal behavior with lower valuesduring the days. This indicates that deeper mixinglayers lead to higher dilution of the rather freshlyemitted NOx. More clearly pronounced are thediurnal patterns of O3. The nocturnal decrease ismainly caused by dry deposition of O3 to thesurface, whereas steep increase during the morninghours indicated downward mixing of ozone-rich airfrom the residual layer. The extraordinarily highmixing ratio on 31.07.2001 was associated withwinds from the W. Although the backward trajec-tory yields no indication for an abrupt change of airmass origin on 31.07.2001, there are indications thatfree tropospheric air is well represented on that day(Fig. 1). A peak mixing ratio of 81 ppb can beexplained by regional photochemical ozone-formingprocesses within the boundary layer, as predictedwith the one-dimensional model (Forkel et al., thisissue). Mixing ratios higher than that are due toadvection air masses with relative enrichment ofozone.
The friction velocity u* also exhibits a pro-nounced diurnal behavior with maxima above0.5m s�1 during the daylight hours. A large portionof the turbulence is thermally induced. Nighttimeminima are typically between 0.1 and 0.3m s�1.During the period with westerly winds on30.07.2001 and 31.07.2001, the highest nighttimeminima were observed. These data indicate thatturbulent exchange is reduced during nighttime.However, in many cases, the turbulence regimeremains well developed throughout nighttime.
The two 4-day periods of golden days in 2002differ from each other (Fig. 3). Westerly windsbetween 20.07.2002 and 23.07.2002 were associatedwith 3–5 ppb NOx in air masses. The wind speeds
ARTICLE IN PRESS
0
90
180
270
36021.07.2001 23.07.2001 25.07.2001 27.07.2001 29.07.2001 31.07.2001 02.08.2001
10
15
20
25
0.0
0.5
1.0
0
5
10
0
50
100
21.07.2001 23.07.2001 25.07.2001 27.07.2001 29.07.2001 31.07.2001 02.08.20010
5000
10000
15000
20000
25000
30000
win
d di
rect
ion
/ deg
T /
°C
u*
/ m s
-1
NO
x / p
pbO
3 / p
pbC
PC
/ cm
-3
Fig. 2. Meteorology and air chemistry parameters for the golden day period 2001. All data are displayed as 10-min averages except the
friction velocity u*, which is given in 30-min averages (asterisks in second panel). Tick labels are marked with the respective dates at
00:00 h Central European Time, which is 1 h ahead of UTC. CPC means total particle number concentration for particles with diameter
411 nm.
O. Klemm et al. / Atmospheric Environment 40 (2006) S3–S20S10
were low (average of 0.45m s�1 for this period). Adiurnal pattern for O3 is apparent only on20.07.2002 and 21.07.2002, when the temperaturereached maxima above 20 1C. During the secondperiod from 28.07.2002 to 31.07.2002 with easterlywinds, the daytime maximum temperatures in-creased until 30.07.2002, and the patterns of NOx
and O3 are typical for a summertime photochemicalepisode. The friction velocity follows a similar
diurnal pattern, indicating thermal activity to bethe driver for the development of turbulence nearthe surface. Nighttime minima of u* are often above0.3m s�1, indicating a well-developed turbulenceregime. A thunderstorm with rain and a tempera-ture drop of 6K within 1 h terminated this periodon the afternoon of 31.07.2002.
Results for the golden day periods in 2001 and2002 show that some trace gases are advected with
ARTICLE IN PRESS
0
90
180
270
36020.07.2002 22.07.2002 28.07.2002 30.07.2002 01.08.2002
10
15
20
25
0.0
0.5
1.0
0
5
10
0
50
100
20.07.2002 22.07.2002 28.07.2002 30.07.2002 01.08.20020
5000
10000
15000
20000
25000
30000
win
d di
rect
ion
/ deg
T /
°C
u*
/ m s
-1
NO
x / p
pbO
3 / p
pbC
PC
/ cm
-1
Fig. 3. Same as Fig. 1, but for the golden day periods 2002.
O. Klemm et al. / Atmospheric Environment 40 (2006) S3–S20 S11
the boundary-layer air masses arriving at the site.Additional concentrations appear to be driven byvertical exchange with the underlying surface (forestvegetation) and with the free troposphere, and alsoby chemical reactions within the boundary-layer airmasses.
4.2. Wind profiles within the forest
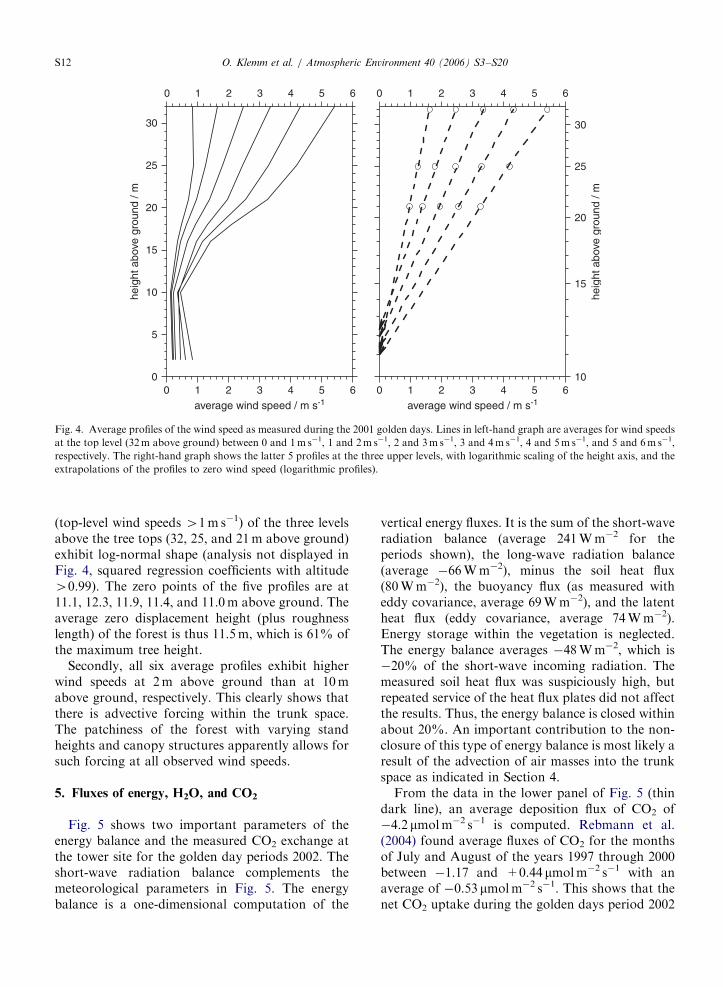
The wind regime within the forest stand ischaracterized through average profiles in Fig. 4.
From all 10-min wind speed profiles at the tower asmeasured during the 2001 campaign, six averageprofiles were computed. For the first average profile,all individual profiles with wind speeds between0 and 1m s�1 at the 32m level were combined. Forthe second average profile, all individual profileswith wind speeds between 1 and 2m s�1 werecombined, and so forth. The maximum wind speedat 32m was 5.85m s�1, so this procedure yielded sixaverage profiles (Fig. 4). Two important conclusionscan be drawn: First, the wind speed profiles 2–6
ARTICLE IN PRESS
0
5
10
15
20
25
30
0 210
15
20
25
30
average wind speed / m s-1 average wind speed / m s-1
heig
ht a
bove
gro
und
/ m
heig
ht a
bove
gro
und
/ m
1 3 4 5 6 0 21 3 4 5 6
0 21 3 4 5 6 0 21 3 4 5 6
Fig. 4. Average profiles of the wind speed as measured during the 2001 golden days. Lines in left-hand graph are averages for wind speeds
at the top level (32m above ground) between 0 and 1m s�1, 1 and 2m s�1, 2 and 3m s�1, 3 and 4m s�1, 4 and 5m s�1, and 5 and 6m s�1,
respectively. The right-hand graph shows the latter 5 profiles at the three upper levels, with logarithmic scaling of the height axis, and the
extrapolations of the profiles to zero wind speed (logarithmic profiles).
O. Klemm et al. / Atmospheric Environment 40 (2006) S3–S20S12
(top-level wind speeds 41m s�1) of the three levelsabove the tree tops (32, 25, and 21m above ground)exhibit log-normal shape (analysis not displayed inFig. 4, squared regression coefficients with altitude40.99). The zero points of the five profiles are at11.1, 12.3, 11.9, 11.4, and 11.0m above ground. Theaverage zero displacement height (plus roughnesslength) of the forest is thus 11.5m, which is 61% ofthe maximum tree height.
Secondly, all six average profiles exhibit higherwind speeds at 2m above ground than at 10mabove ground, respectively. This clearly shows thatthere is advective forcing within the trunk space.The patchiness of the forest with varying standheights and canopy structures apparently allows forsuch forcing at all observed wind speeds.
5. Fluxes of energy, H2O, and CO2
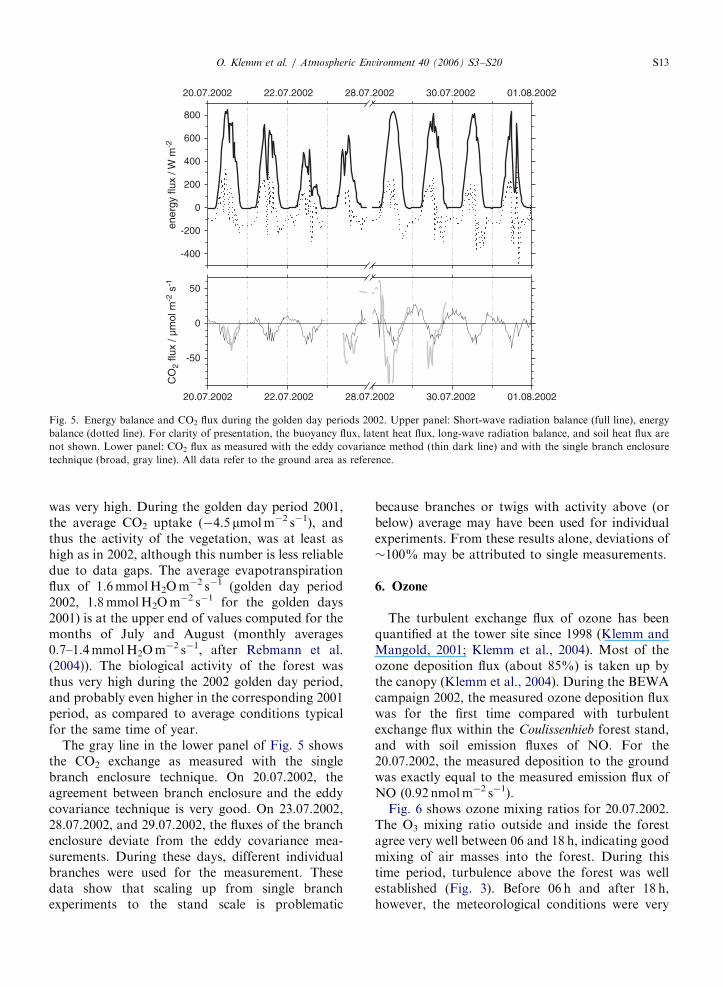
Fig. 5 shows two important parameters of theenergy balance and the measured CO2 exchange atthe tower site for the golden day periods 2002. Theshort-wave radiation balance complements themeteorological parameters in Fig. 5. The energybalance is a one-dimensional computation of the
vertical energy fluxes. It is the sum of the short-waveradiation balance (average 241Wm�2 for theperiods shown), the long-wave radiation balance(average �66Wm�2), minus the soil heat flux(80Wm�2), the buoyancy flux (as measured witheddy covariance, average 69Wm�2), and the latentheat flux (eddy covariance, average 74Wm�2).Energy storage within the vegetation is neglected.The energy balance averages �48Wm�2, which is�20% of the short-wave incoming radiation. Themeasured soil heat flux was suspiciously high, butrepeated service of the heat flux plates did not affectthe results. Thus, the energy balance is closed withinabout 20%. An important contribution to the non-closure of this type of energy balance is most likely aresult of the advection of air masses into the trunkspace as indicated in Section 4.
From the data in the lower panel of Fig. 5 (thindark line), an average deposition flux of CO2 of�4.2 mmolm�2 s�1 is computed. Rebmann et al.(2004) found average fluxes of CO2 for the monthsof July and August of the years 1997 through 2000between �1.17 and +0.44 mmolm�2 s�1 with anaverage of �0.53 mmolm�2 s�1. This shows that thenet CO2 uptake during the golden days period 2002
ARTICLE IN PRESS
20.07.2002 22.07.2002 28.07.2002 30.07.2002 01.08.2002
-50
0
50
-400
-200
0
200
400
600
800
20.07.2002 22.07.2002 28.07.2002 30.07.2002 01.08.2002
CO
2 flu
x / µ
mol
m-2
s-1
ener
gy fl
ux /
W m
-2
Fig. 5. Energy balance and CO2 flux during the golden day periods 2002. Upper panel: Short-wave radiation balance (full line), energy
balance (dotted line). For clarity of presentation, the buoyancy flux, latent heat flux, long-wave radiation balance, and soil heat flux are
not shown. Lower panel: CO2 flux as measured with the eddy covariance method (thin dark line) and with the single branch enclosure
technique (broad, gray line). All data refer to the ground area as reference.
O. Klemm et al. / Atmospheric Environment 40 (2006) S3–S20 S13
was very high. During the golden day period 2001,the average CO2 uptake (�4.5 mmolm�2 s�1), andthus the activity of the vegetation, was at least ashigh as in 2002, although this number is less reliabledue to data gaps. The average evapotranspirationflux of 1.6mmolH2Om�2 s�1 (golden day period2002, 1.8mmolH2Om�2 s�1 for the golden days2001) is at the upper end of values computed for themonths of July and August (monthly averages0.7–1.4mmolH2Om�2 s�1, after Rebmann et al.(2004)). The biological activity of the forest wasthus very high during the 2002 golden day period,and probably even higher in the corresponding 2001period, as compared to average conditions typicalfor the same time of year.
The gray line in the lower panel of Fig. 5 showsthe CO2 exchange as measured with the singlebranch enclosure technique. On 20.07.2002, theagreement between branch enclosure and the eddycovariance technique is very good. On 23.07.2002,28.07.2002, and 29.07.2002, the fluxes of the branchenclosure deviate from the eddy covariance mea-surements. During these days, different individualbranches were used for the measurement. Thesedata show that scaling up from single branchexperiments to the stand scale is problematic
because branches or twigs with activity above (orbelow) average may have been used for individualexperiments. From these results alone, deviations of�100% may be attributed to single measurements.
6. Ozone
The turbulent exchange flux of ozone has beenquantified at the tower site since 1998 (Klemm andMangold, 2001; Klemm et al., 2004). Most of theozone deposition flux (about 85%) is taken up bythe canopy (Klemm et al., 2004). During the BEWAcampaign 2002, the measured ozone deposition fluxwas for the first time compared with turbulentexchange flux within the Coulissenhieb forest stand,and with soil emission fluxes of NO. For the20.07.2002, the measured deposition to the groundwas exactly equal to the measured emission flux ofNO (0.92 nmolm�2 s�1).
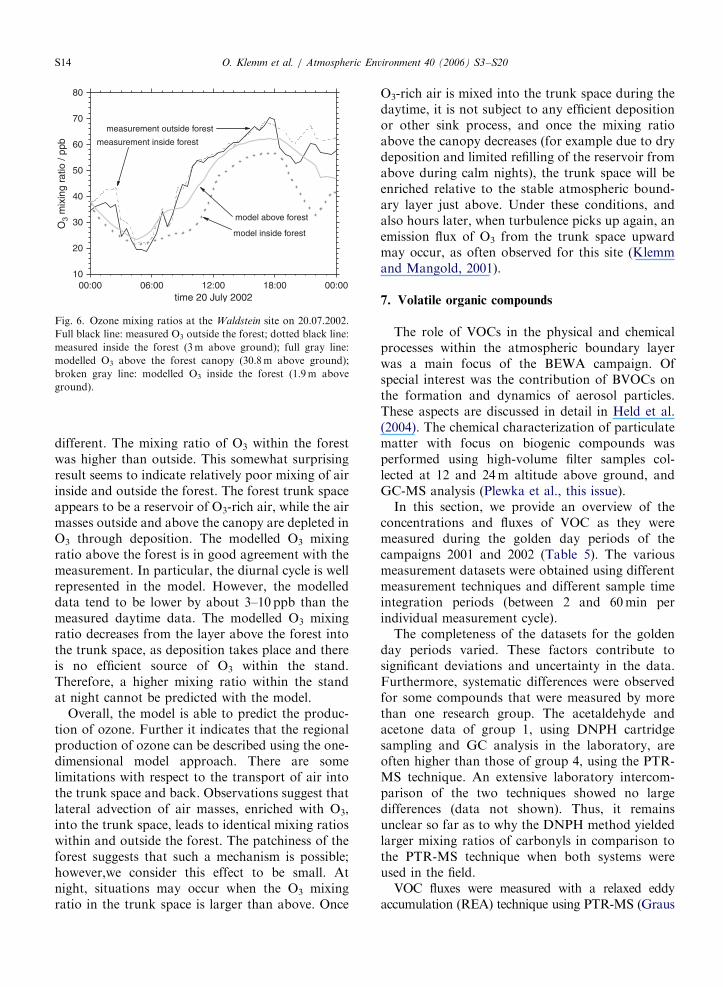
Fig. 6 shows ozone mixing ratios for 20.07.2002.The O3 mixing ratio outside and inside the forestagree very well between 06 and 18 h, indicating goodmixing of air masses into the forest. During thistime period, turbulence above the forest was wellestablished (Fig. 3). Before 06 h and after 18 h,however, the meteorological conditions were very
ARTICLE IN PRESS
00:00 06:00 12:00 18:00 00:0010
20
30
40
50
60
70
80
O3
mix
ing
ratio
/ pp
b
time 20 July 2002
model above forest
model inside forest
measurement outside forest
measurement inside forest
Fig. 6. Ozone mixing ratios at the Waldstein site on 20.07.2002.
Full black line: measured O3 outside the forest; dotted black line:
measured inside the forest (3m above ground); full gray line:
modelled O3 above the forest canopy (30.8m above ground);
broken gray line: modelled O3 inside the forest (1.9m above
ground).
O. Klemm et al. / Atmospheric Environment 40 (2006) S3–S20S14
different. The mixing ratio of O3 within the forestwas higher than outside. This somewhat surprisingresult seems to indicate relatively poor mixing of airinside and outside the forest. The forest trunk spaceappears to be a reservoir of O3-rich air, while the airmasses outside and above the canopy are depleted inO3 through deposition. The modelled O3 mixingratio above the forest is in good agreement with themeasurement. In particular, the diurnal cycle is wellrepresented in the model. However, the modelleddata tend to be lower by about 3–10 ppb than themeasured daytime data. The modelled O3 mixingratio decreases from the layer above the forest intothe trunk space, as deposition takes place and thereis no efficient source of O3 within the stand.Therefore, a higher mixing ratio within the standat night cannot be predicted with the model.
Overall, the model is able to predict the produc-tion of ozone. Further it indicates that the regionalproduction of ozone can be described using the one-dimensional model approach. There are somelimitations with respect to the transport of air intothe trunk space and back. Observations suggest thatlateral advection of air masses, enriched with O3,into the trunk space, leads to identical mixing ratioswithin and outside the forest. The patchiness of theforest suggests that such a mechanism is possible;however,we consider this effect to be small. Atnight, situations may occur when the O3 mixingratio in the trunk space is larger than above. Once
O3-rich air is mixed into the trunk space during thedaytime, it is not subject to any efficient depositionor other sink process, and once the mixing ratioabove the canopy decreases (for example due to drydeposition and limited refilling of the reservoir fromabove during calm nights), the trunk space will beenriched relative to the stable atmospheric bound-ary layer just above. Under these conditions, andalso hours later, when turbulence picks up again, anemission flux of O3 from the trunk space upwardmay occur, as often observed for this site (Klemmand Mangold, 2001).
7. Volatile organic compounds
The role of VOCs in the physical and chemicalprocesses within the atmospheric boundary layerwas a main focus of the BEWA campaign. Ofspecial interest was the contribution of BVOCs onthe formation and dynamics of aerosol particles.These aspects are discussed in detail in Held et al.(2004). The chemical characterization of particulatematter with focus on biogenic compounds wasperformed using high-volume filter samples col-lected at 12 and 24m altitude above ground, andGC-MS analysis (Plewka et al., this issue).
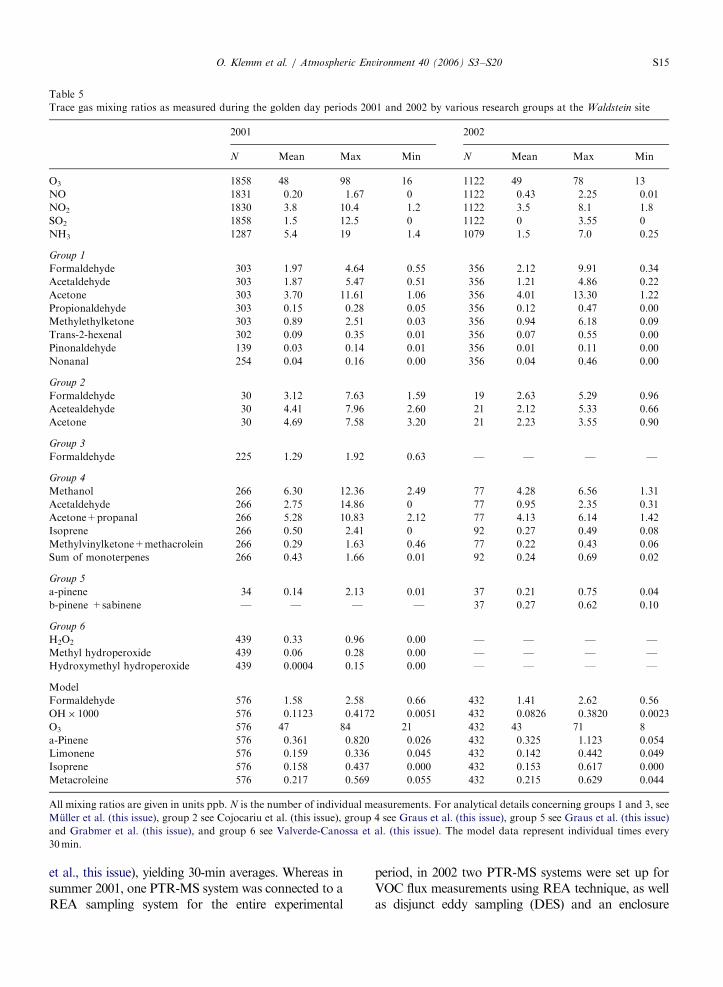
In this section, we provide an overview of theconcentrations and fluxes of VOC as they weremeasured during the golden day periods of thecampaigns 2001 and 2002 (Table 5). The variousmeasurement datasets were obtained using differentmeasurement techniques and different sample timeintegration periods (between 2 and 60min perindividual measurement cycle).
The completeness of the datasets for the goldenday periods varied. These factors contribute tosignificant deviations and uncertainty in the data.Furthermore, systematic differences were observedfor some compounds that were measured by morethan one research group. The acetaldehyde andacetone data of group 1, using DNPH cartridgesampling and GC analysis in the laboratory, areoften higher than those of group 4, using the PTR-MS technique. An extensive laboratory intercom-parison of the two techniques showed no largedifferences (data not shown). Thus, it remainsunclear so far as to why the DNPH method yieldedlarger mixing ratios of carbonyls in comparison tothe PTR-MS technique when both systems wereused in the field.
VOC fluxes were measured with a relaxed eddyaccumulation (REA) technique using PTR-MS (Graus
ARTICLE IN PRESS
Table 5
Trace gas mixing ratios as measured during the golden day periods 2001 and 2002 by various research groups at the Waldstein site
2001 2002
N Mean Max Min N Mean Max Min
O3 1858 48 98 16 1122 49 78 13
NO 1831 0.20 1.67 0 1122 0.43 2.25 0.01
NO2 1830 3.8 10.4 1.2 1122 3.5 8.1 1.8
SO2 1858 1.5 12.5 0 1122 0 3.55 0
NH3 1287 5.4 19 1.4 1079 1.5 7.0 0.25
Group 1
Formaldehyde 303 1.97 4.64 0.55 356 2.12 9.91 0.34
Acetaldehyde 303 1.87 5.47 0.51 356 1.21 4.86 0.22
Acetone 303 3.70 11.61 1.06 356 4.01 13.30 1.22
Propionaldehyde 303 0.15 0.28 0.05 356 0.12 0.47 0.00
Methylethylketone 303 0.89 2.51 0.03 356 0.94 6.18 0.09
Trans-2-hexenal 302 0.09 0.35 0.01 356 0.07 0.55 0.00
Pinonaldehyde 139 0.03 0.14 0.01 356 0.01 0.11 0.00
Nonanal 254 0.04 0.16 0.00 356 0.04 0.46 0.00
Group 2
Formaldehyde 30 3.12 7.63 1.59 19 2.63 5.29 0.96
Acetealdehyde 30 4.41 7.96 2.60 21 2.12 5.33 0.66
Acetone 30 4.69 7.58 3.20 21 2.23 3.55 0.90
Group 3
Formaldehyde 225 1.29 1.92 0.63 — — — —
Group 4
Methanol 266 6.30 12.36 2.49 77 4.28 6.56 1.31
Acetaldehyde 266 2.75 14.86 0 77 0.95 2.35 0.31
Acetone+propanal 266 5.28 10.83 2.12 77 4.13 6.14 1.42
Isoprene 266 0.50 2.41 0 92 0.27 0.49 0.08
Methylvinylketone+methacrolein 266 0.29 1.63 0.46 77 0.22 0.43 0.06
Sum of monoterpenes 266 0.43 1.66 0.01 92 0.24 0.69 0.02
Group 5
a-pinene 34 0.14 2.13 0.01 37 0.21 0.75 0.04
b-pinene +sabinene — — — — 37 0.27 0.62 0.10
Group 6
H2O2 439 0.33 0.96 0.00 — — — —
Methyl hydroperoxide 439 0.06 0.28 0.00 — — — —
Hydroxymethyl hydroperoxide 439 0.0004 0.15 0.00 — — — —
Model
Formaldehyde 576 1.58 2.58 0.66 432 1.41 2.62 0.56
OH� 1000 576 0.1123 0.4172 0.0051 432 0.0826 0.3820 0.0023
O3 576 47 84 21 432 43 71 8
a-Pinene 576 0.361 0.820 0.026 432 0.325 1.123 0.054
Limonene 576 0.159 0.336 0.045 432 0.142 0.442 0.049
Isoprene 576 0.158 0.437 0.000 432 0.153 0.617 0.000
Metacroleine 576 0.217 0.569 0.055 432 0.215 0.629 0.044
All mixing ratios are given in units ppb. N is the number of individual measurements. For analytical details concerning groups 1 and 3, see
Muller et al. (this issue), group 2 see Cojocariu et al. (this issue), group 4 see Graus et al. (this issue), group 5 see Graus et al. (this issue)
and Grabmer et al. (this issue), and group 6 see Valverde-Canossa et al. (this issue). The model data represent individual times every
30min.
O. Klemm et al. / Atmospheric Environment 40 (2006) S3–S20 S15
et al., this issue), yielding 30-min averages. Whereas insummer 2001, one PTR-MS system was connected to aREA sampling system for the entire experimental
period, in 2002 two PTR-MS systems were set up forVOC flux measurements using REA technique, as wellas disjunct eddy sampling (DES) and an enclosure
ARTICLE IN PRESSO. Klemm et al. / Atmospheric Environment 40 (2006) S3–S20S16
sampling system to determine direct VOC emissionsfrom individual branches (enclosure measurements,Grabmer et al., this issue). At times between conductingthe flux measurements, the PTR-MS systems acquiredVOC mixing ratios in the ambient air within, as well asabove, the canopy.
The average isoprene mixing ratio during the goldenday period of 2002 was 0.27ppb at both levels (17 and32m above ground). The average isoprene emissionfluxes, as measured by group 4 were 0.6471.6nmolm�2 s�1 (mean7one standard deviation) in2001 and 0.2370.36nmolm�2 s�1 in 2002, which are inrather good agreement with the modelled emissionfluxes of 0.42 and 0.39nmolm�2 s�1, respectively.Terpenes, which are also emitted from spruce trees,were present at mixing ratios similar to those ofisoprene, with average emission fluxes of 0.7371.1nmolm�2 s�1 in 2001 and 0.5570.67nmolm�2 s�1
in 2002. The high average mixing ratios and emissionfluxes of all BVOCs measured in 2001 compared tothose measured in 2002 indicate that the forest wasmore physiologically active during the golden dayperiod in 2001. This is consistent with the meteorolo-gical data shown in Table 4.
Measurements of H2O2 and organic peroxidemixing ratios (see Table 5) and surface fluxes were
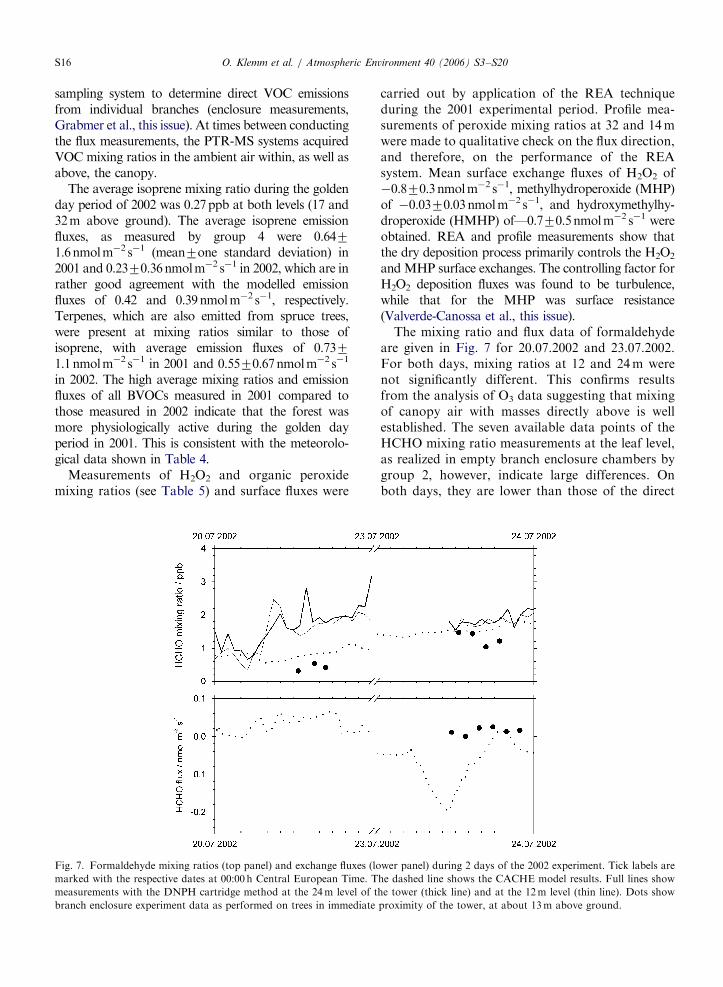
Fig. 7. Formaldehyde mixing ratios (top panel) and exchange fluxes (lo
marked with the respective dates at 00:00 h Central European Time. T
measurements with the DNPH cartridge method at the 24m level of t
branch enclosure experiment data as performed on trees in immediate
carried out by application of the REA techniqueduring the 2001 experimental period. Profile mea-surements of peroxide mixing ratios at 32 and 14mwere made to qualitative check on the flux direction,and therefore, on the performance of the REAsystem. Mean surface exchange fluxes of H2O2 of�0.870.3nmolm�2 s�1, methylhydroperoxide (MHP)of �0.0370.03nmolm�2 s�1, and hydroxymethylhy-droperoxide (HMHP) of—0.770.5nmolm�2 s�1 wereobtained. REA and profile measurements show thatthe dry deposition process primarily controls the H2O2
andMHP surface exchanges. The controlling factor forH2O2 deposition fluxes was found to be turbulence,while that for the MHP was surface resistance(Valverde-Canossa et al., this issue).
The mixing ratio and flux data of formaldehydeare given in Fig. 7 for 20.07.2002 and 23.07.2002.For both days, mixing ratios at 12 and 24m werenot significantly different. This confirms resultsfrom the analysis of O3 data suggesting that mixingof canopy air with masses directly above is wellestablished. The seven available data points of theHCHO mixing ratio measurements at the leaf level,as realized in empty branch enclosure chambers bygroup 2, however, indicate large differences. Onboth days, they are lower than those of the direct
wer panel) during 2 days of the 2002 experiment. Tick labels are
he dashed line shows the CACHE model results. Full lines show
he tower (thick line) and at the 12m level (thin line). Dots show
proximity of the tower, at about 13m above ground.
ARTICLE IN PRESSO. Klemm et al. / Atmospheric Environment 40 (2006) S3–S20 S17
DNPH method (group 1). On 20.07.2002, thedeviation is by a factor of 4. Possible reasons forthis disagreement may be adsorption or reaction atthe enclosure walls or in the pumps which were usedfor flushing ambient air through the enclosures.
On 20.07.2002, the CACHE model HCHO dataare about half those of the measured data (directDNPH method) at 12 and 24m above ground. TheCACHE model data are more similar to the datafrom enclosure chambers (between 12 and 18 h, seeFig. 7). On 23.07.2002, the modelled data agree wellwith the measured data in the range between 1.6 and2.0 ppb during the afternoon hours.
In the model, the ecosystem may act as net source(on 20.07.2002) or as a net sink (on 23.07.2002) forformaldehyde. The branch enclosure experimentsshow an emission of formaldehyde on 23.07.2002while the model predicts deposition. Emission offormaldehyde by the leaves of trees is a well-knownphenomenon (Kesselmeier et al., 1997; Kreuzwieser etal., 2002) which has also been described for Norwayspruce (Janson et al., 1999, 2001; Cojocariu et al.,2004) and other conifers (e.g. Kesselmeier et al., 1997).Parameterization studies showed that formaldehydeexchange of Norway spruce is dependent on tempera-tures, relative humidity, and transpiration of theleaves. The biochemical pathways underlying theproduction and emission of this carbonyl by leavesare still not completely understood (Kesselmeier andStaudt, 1999), nor is deposition of formaldehyde tothe surfaces of the forest.
In addition to formaldehyde, mainly acetalde-hyde and acetone were emitted by Norway spruceneedles as determined by enclosure measurementsand detection by both DNPH-coated silica gelcartridges (with HPLC) and PTR-MS. Like for-maldehyde emissions, the release of acetaldehydeand acetone showed a clear diurnal pattern withhigher emissions during midday than at night.Canopy flux measurements in a Pinus ponderosaplantation revealed similar patterns for acetalde-hyde and acetone emission (Schade and Goldstein,2001, 2002).
8. Concluding discussion
It is the purpose of this contribution to offer anoverview over the BEWA field campaigns in theFichtelgebirge mountain range in NE Bavaria duringthe summers of 2001 and 2002. The exchange ofmatter, in particular VOC, between the Norwayspruce forest and the atmosphere was studied in an
integrated experiment. The scope of the BEWAcampaigns was to develop further understanding ofthe surface/atmosphere exchange on the physical andchemical processes in the atmospheric boundarylayer.
The Waldstein study site is an experimental forest,well suited for such intensive programs, because (i) aplanted Norway spruce forest represents one of themajor types of ecosystems, typical for the CentralEuropean middle altitude ranges between 500 and1200m a.s.l., (ii) long-term ecosystem researchactivities at that site offer a good understanding ofthe plant physiology, nutrient and pollutant fluxeswithin the ecosystem, and meteorological processes(Matzner, 2004), and (iii) because the site offersexcellent logistical opportunities including powersupply and a meteorological tower.
We found that, on the time scale of the golden dayperiods in 2001 and 2002, the closure of the one-dimensional energy balance is within 20%; therefore,any measured vertical turbulent exchange fluxes ofgases or particulates are probably not reliable with aprecision better than 20%. The quality control ofmicrometeorological techniques (i.e. ultrasonic an-emometers) indicates a precision of 10% (or better)between parallel setups. It is not clear from our dataif these two sources of error are independent fromeach other or if the instrumental uncertainty isalready included within the uncertainty of the energybalance. We conclude that the precision of verticalexchange flux measurements lie within 725%confidence for the BEWA experiments.
Long-term quantification of vertical fluxes of gasessuch as CO2 and H2O are associated with largeuncertainties and sources of large errors, mainly dueto gaps in the data series resulting from instrumentfailures and data losses during times of poorlydeveloped turbulence (Rebmann et al., 2004). Ourapproach to select shorter experimental time periodsand select high-quality data for further analysis leadsus to believe that the 25% precision, as indicatedabove, represents a maximum margin of error forthese types of measurements. On the single branchlevel, however, the heterogeneity is much larger anddeviations between single measurements on the orderof a factor of 2 must be expected.
A possible cause of error lies in the patchiness ofthe forest. We showed that momentum and gases(ozone) could enter the trunk space without leavinga corresponding signature at the canopy-top level.Vertical escape of these scalars doubtlessly jeopar-dizes the applicability of a one-dimensional model
ARTICLE IN PRESSO. Klemm et al. / Atmospheric Environment 40 (2006) S3–S20S18
or the applicability of a one-tower measurement toquantify vertical fluxes with acceptable spatialrepresentativeness. Upward fluxes of ozone, asobserved at the top level of the meteorologicaltower (Klemm and Mangold, 2001), may resultfrom such transport. However, the CACHE model(Forkel et al., this issue) successfully described themagnitude and diurnal behavior of the ozone fluxesand the profile of ozone concentrations within thestand for most of the time during the BEWAexperimental phases. We conclude that the model isa suitable tool for our purposes.
On a regional scale, gases and particles arecertainly advected to the site. The Waldstein
represents a remote site in Central Europe. Spikesof primary pollutants (i.e. NOx) occur rarely at thisexperimental site, and diurnal behavior of NOx andO3 (Figs. 2 and 3) can be almost completelyunderstood considering the boundary dynamicsand deposition processes. It is predominantly thevegetation cover itself and its interaction with theatmospheric boundary layer that leads to dynamicsof trace gases (and particles) on short time scales.
For VOCs, the general picture is less homoge-neous. A general overview of the predominantconcentrations at the Waldstein site was presentedfor the first time (Table 5). However, some of thefluxes are uncertain. The ambient mixing ratios offormaldehyde predicted with the atmospheric modelCACHE agree reasonably well with the measureddata. Modelled formaldehyde fluxes exhibit alternat-ing net emission and net depositional fluxes. On23.07.2002, CACHE predicts a net deposition whilesimultaneously branch enclosure measurements showemissions, suggesting that the spruce leaves act as aweak source for formaldehyde. These data do notnecessarily contradict each other, as the enclosuremeasurements represent the process at the leaf level,while the model data reflect the net ecosystemresponse. It remains unclear under what exactconditions sinks within the ecosystem (stems, under-storey vegetation, soil) are stronger than the principalformaldehyde source (leaves). The same could betrue for other carbonyls (acetaldehyde, acetone) thathave been shown to be emitted by vegetation with thebranch enclosure technique. Conversely, good agree-ment between ecosystem and leaf level flux patternswas observed for isoprenoids (Cojocariu et al., thisissue, Grabmer et al., this issue, Graus et al., thisissue). Further research should aim at solving thisproblem in understanding the biogeochemistry ofHCHO and other VOCs over spruce forests.
In addition to the overview presented in con-tribution about climatology, fluxes, and techniques,this interdisciplinary and integrated research ap-proach, as realized in the BEWA project, yielded animproved understanding of parameters and me-chanisms driving forest/atmosphere interaction onlocal and regional scales. An operational tool hasbeen developed to estimate VOC emissions withhigh spatial and temporal resolution (Smiatek andSteinbrecher, this issue). A new canopy chemistryemission model explicitly describes canopy effectson VOC emissions (Forkel et al., this issue). Therole of VOC emissions on particle formation hasbeen identified, and the growth of ultrafine particleshas been quantified (Held et al., 2004).
Acknowledgments
This study was supported by the German federalresearch ministry (BMBF) through the BEWA 2000program, which was part of the Atmospharen-forschung 2000 initiative. The study was furthersupported by the BMBF through grant PT-BEO51–0339476D to the Bayreuther Institut fur Terres-trische Okosystemforschung (BITOK) at the Uni-versitat Bayreuth. We are particularly indebted toJ. Gerchau, G. Muller, C. Thomas for their helpduring data collection and analysis. The authorsgratefully acknowledge the NOAA Air ResourcesLaboratory for the provision of the HYSPLITtransport and dispersion model and READY(http://www.arl.noaa.gov/ready.html) website usedin this publication. We thank T. Ferdelman forlanguage editing and two anonymous reviewers forvery detailed comments on a previous version of themanuscript.
References
Alsheimer, M., 1996. Xylemflussmessungen zur Charakterisier-
ung raumzeitlicher Heterogenitaten in der Transpiration
montaner Fichtenbestandende (Picea abies (L.) KARST).
Bayreuther Forum Okologie 46, 1–143.
Andreae, M.O., Crutzen, P., 1997. Atmospheric aerosols:
biogeochemical sources and role in atmospheric chemistry.
Science 276, 1052–1058.
Butterbach-Bahl, K., Gasche, R., Breuer, L., Papen, H., 1997.
Fluxes of NO and N2O from temperate forest soils: impact of
forest type, N deposition and of liming on the NO and N2O
emissions. Nutrient Cycling in Agroecosystems 48, 79–90.
Cojocariu, C., Kreuzwieser, J., Rennenberg, H., 2004. Correla-
tion of short-chained carbonyls emitted from Picea abies with
physiological and environmental parameters. New Phytolo-
gist 162, 717–727.
ARTICLE IN PRESSO. Klemm et al. / Atmospheric Environment 40 (2006) S3–S20 S19
Draxler, R.R., Rolph, G.D., 2003. HYSPLIT (HYbrid Single-
Particle Lagrangian Intregrated Trajectory) Modell access via
NOAA ARL READY Website (http://www.arl.noaa.gov/
ready/hysplit4.html). NOAA Air Resources Laboratory,
Silver Spring, MD, USA.
Foken, T., Wichura, B., 1996. Tools for quality assessment of
surface-based flux measurements. Agricultural and Forest
Meteorology 78, 83–105.
Forkel, R., Klemm, O., Graus, M., Rappengluck, B., Stockwell,
W.R., Grabmer, W., Held, A., Hansel, A., Steinbrecher, R.
Trace gas exchange and gas phase chemistry in a Norway
spruce forest: a study with a coupled 1-dimensional canopy
atmospheric chemistry emission model. Atmospheric Envir-
onment, this issue, doi:10.1016/j.atmosenv.2005.11.070.
Ganzeveld, L., Klemm, O., Rappengluck, B., Valverde-Canossa,
J. Evaluation of meteorological parameters over a coniferous
forest in a single-column chemistry-climate model. Atmo-
spheric Environment, this issue A, doi:10.1016/j.atmosenv.
2006.01.061.
Ganzeveld, L., Valverde-Canossa, J., Moortgat, G.K., Steinbre-
cher, R. Evaluation of peroxide exchanges over a coniferous
forest in a single-column chemistry-climate model. Atmo-
spheric Environment, this issue B, doi:10.1016/j.atmosenv.
2006.01.062.
Grabmer, W., Kreuzwieser, J., Wisthaler, A., Cojocariu, C.,
Graus, M., Rennenberg, H., Steigner, D., Steinbrecher, R.,
Hansel, A. VOC emissions from Norway spruce (Picea abies
L. [Karst]) twigs in the field—results of a dynamic enclosure
study. Atmospheric Environment, this issue, doi:10.1016/
j.atmosenv.2006.03.043.
Graus, M., Hansel, A., Wisthaler, A., Lindinger, C., Forkel, R.,
Hauff, K., Klauer, M., Pfichner, A., Rappengluck, B.,
Steigner, D., Steinbrecher, R. A relaxed-eddy-accumulation
(REA) method using an online gas-chromatographic techni-
que and PTR-MS for the measurement of isoprenoid canopy-
fluxes. Atmospheric Environment, this issue, doi:10.1016/
j.atmosenv.2005.09.094.
Griffin, R.J., Cocker, D.R., Flagan, R.C., Seinfeld, J.H., 1999.
Organic aerosol formation from the oxidation of biogenic
hydrocarbons. Journal of Geophysical Research 104,
3555–3567.
Grote, R., Mayrhofer, S., Fischbach, R. J., Steinbrecher, R.,
Staudt, M., Schnitzler, J.-P. Process-based modelling of
isoprenoid emissions from evergreen leaves of Quercus ilex
(L.). Atmospheric Environment, this issue, doi:10.1016/
j.atmosenv.2005.10.071.
Guenther, A.B., Hewitt, C.N., Erickson, D., Fall, R., Geron, C.,
Graedel, T., Harley, P.C., Klinger, L., Lerdau, M., McKay,
W.A., Pierce, T., Scholes, B., Steinbrecher, R., Tallamraju,
R., Taylor, J., Zimmerman, P., 1995. A global model of
natural volatile organic compound emissions. Journal of
Geophysical Research 100, 8873–8892.
Held, A., Klemm, O. Direct measurement of turbulent particle
exchange with a twin CPC eddy covariance system. Atmo-
spheric Environment, this issue, doi:10.1016/j.atmosenv.2005.
09.092.
Held, A., Nowak, A., Birmili, W., Wiedensohler, A., Forkel, R.,
Klemm, O., 2004. Observations of particle formation and
growth in a mountainous forest region in Central Europe.
Journal of Geophysical Research 109, D23204.
Janson, R., De Serves, C., Romero, R., 1999. Emission of
isoprene and carbonyl compounds from a boreal forest and
wetland in Sweden. Agricultural and Forest Meteorology 98,
671–681.
Janson, R., Rosman, K., Karlsson, A., Hansson, H.-C., 2001.
Biogenic emissions and gaseous precursors to forest aerosols.
Tellus 53B, 423–440.
Kesselmeier, J., Staudt, M., 1999. Biogenic volatile organic
compounds (VOC): an overview on emission, physiology and
ecology. Journal of Atmospheric Chemistry 33, 23–88.
Kesselmeier, J., Bode, K., Hofmann, U., Muller, H., Schafer, L.,
Wolf, A., Ciccioli, P., Brancaleoni, E., Cecinato, A., Frattoni,
M., Foster, P., Ferrari, C., Jacob, V., Fugit, J.L., Dutaur, L.,
Simon, V., Torres, L., 1997. The BEMA project: emission of
short chained organic acids, aldehydes and monoterpenes
from Quercus ilex L. Pinus pinea L. in relation to
physiological activities, carbon budget and emission algo-
rithms. Atmospheric Environment 31, 119–133.
Klemm, O., 2004. Trace gases and particles in the atmospheric
boundary layer at the Waldstein site: present state and historic
trends. In: Matzner, E. (Ed.), Temperate Forest Ecosystem
Functioning in a Changing Environment—Watershed Studies
in Germany. Ecological Studies 172, 45–58.
Klemm, O., Lange, H., 1999. Trends of air pollution in the
Fichtelgebirge Mountains, Bavaria. Environmental Science
and Pollution Research 6, 193–199.
Klemm, O., Mangold, A., 2001. Deposition of ozone at a forest
site in NE Bavaria. Water, Air, and Soil Pollution: Focus 1,
223–232.
Klemm, O., Milford, C., Sutton, M.A., van Putten, E., Spindler,
G., 2002. A climatology of leaf surface wetness. Theoretical
and Applied Climatology 71, 107–117.
Klemm, O., Mangold, A., Held, A., 2004. Turbulent Deposition
of Ozone to a Mountainous Forest Ecosystem. In: Matzner,
E. (Ed.), Temperate Forest Ecosystem Functioning in a
Changing Environment—Watershed Studies in Germany.
Ecological Studies 172, 203–213.
Klemm, O., Wrzesinsky, T., Scheer, C., 2005. Fog water flux at a
canopy top: direct measurement versus one-dimensional
model. Atmospheric Environment 39, 5375–5386.
Kreuzwieser, J., Cojocariu, C., Jussen, V., Rennenberg, H., 2002.
Elevated atmospheric CO2 causes seasonal changes in
carbonyl emissions from a Mediterranean oak species. New
Phytologist 154, 327–333.
Matzner, E. (Ed.), 2004. Temperate Forest Ecosystem Function-
ing in a Changing Environment—Watershed Studies in
Germany. Ecological Studies 172.
Magel, E., Mayrhofer, S., Muller, A., Zimmer, Hampp, R.,
Schnitzler, J.-P. Photosynthesis and substrate supply for
isoprene biosynthesis in poplar leaves. Atmospheric Environ-
ment, this issue, doi:10.1016/j.atmosenv.2005.09.091.
Muller, K., Haferkorn, S., Grabmer, W., Wisthaler, W., Hansel,
A., Kreuzwieser, J., Cojocariu, C., Rennenberg, H., Herr-
mann, H. Biogenic carbonyl compounds from a coniferous
forest in Germany. Atmospheric Environment, this issue,
doi:10.1016/j.atmosenv.2005.10.070.
Plewka, A., Gnauk, T., Bruggemann, E., Herrmann, H. Biogenic
contributions to the chemical composition of airborne
particles in a coniferous forest in Germany. Atmospheric
Environment, this issue, doi:10.1016/j.atmosenv.2005.09.090.
Rebmann, C., Anthoni, P., Falge, E., Gockede, M., Mangold, A.,
Subke, J.-A., Thomas, C., Wichura, B., Schulze, E.-D.,
Tenhunen, J., Foken, T., 2004. Carbon budget of a spruce
forest ecosystem. In: Matzner, E. (Ed.) Temperate Forest
ARTICLE IN PRESSO. Klemm et al. / Atmospheric Environment 40 (2006) S3–S20S20
Ecosystem Functioning in a Changing Environment—Watershed
Studies in Germany. Ecological Studies 172, 143–159.
Rolph, G.D., 2003. Real-time environmental applications and
display system (READY) Website (http://www.arl.noaa.gov/
ready/hysplit4.html). NOAA Air Resources Laboratory,
Silver Spring, MD, USA.
Schade, G.W., Goldstein, A.H., 2001. Fluxes of oxygenated
volatile organic compounds from a ponderosa pine planta-
tion. Journal of Geophysical Research 106, 3111–3123.
Schade, G.W., Goldstein, A.H., 2002. Plant physiological influences
on the fluxes of oxygenated volatile organic compounds from
ponderosa pine trees. Journal of Geophysical Research 107,
3111–3123.
Schulze, E.-D., Lange, O.L., Oren, R. (Eds.), 1989. Forest
Decline and Air Pollution: A Study of Spruce (Picea abies) on
Acid Soils. Ecological Studies77, 475.
Smiatek, G., Steinbrecher, R. Temporal and spatial variation of
forest VOC emissions in Germany in the decade 1994–2003.
Atmospheric Environment, this issue, doi:10.1016/j.atmosenv.
2005.11.071.
Spittler, M., Barnes, I., Bejan, I., Brockmann, K. J., Benter, T.,
Wirtz, K. Reactions of NO3 radicals with limonene and a-pinene: product and SOA formation and chemical mechanism
validation. Atmospheric Environment, this issue, doi:10.1016/
j.atmosenv.2005.09.093.
Valverde-Canossa, J., Ganzeveld, L., Rappengluck, B., Stein-
brecher, R., Klemm, O., Schuster, G., Moortgat, G.K.
First Measurements of H2O2 and organic peroxides
surface fluxes by the relaxed eddy accumulation technique.
Atmospheric Environment, this issue, doi:10.1016/j.atmosenv.
2006.03.038.
Wrzesinsky, T., Scheer, C., Klemm, O., 2004. Fog deposition and
its role in biogeochemical cycles of nutrients and pollutants.
In: Matzner, E. (Ed.), Temperate Forest Ecosystem Function-
ing in a Changing Environment—Watershed Studies in
Germany. Ecological Studies 172, 191–202.
Wyers, G.P., Otjes, R.P., Slanina, J., 1993. A continuous-flow
denuder for the measurement of ambient concentrations and
surface-exchange fluxes of ammonia. Atmospheric Environ-
ment 27A, 2085–2090.
Copyright © 2022 FDOKUMEN