![Jet [Novela] Biblioteca](https://static.fdokumen.com/doc/165x107/6321c71564690856e108db2b/jet-novela-biblioteca.jpg)
Experimental study of Spatial Inclined Air Impingement Jet on a Target Plate
15
- 1 - Experimental study of Spatial Inclined Air Impingement Jet on a Target Plate Asst. Prof. Dr.Adnan A. Abdurasuol Dr. Muna S. Kassim Al-Mustansyria University/Mech. Eng. Dept. Al-Mustansyria University/Mech. Eng. Dept. Iraq/Baghdad /[email protected] Iraq/Baghdad /[email protected] B.Sc. Thamer KH. Ali Al-MmustansyriaUniversity/Mech. Eng. Dept. Iraq/Baghdad /[email protected] Abstract Present work studies the inclined impingement of air with relatively small jet diameter on a uniformly heated plate fixed at the upper side of the test section placed in a long narrow duct simulating the internal cooling of a gas turbine blade. Thermocouples are fitted at the plate surface at certain points designed to cover the stagnation point of impingement of air and the zone beyond it. Experimental tests cover two duct sizes of H=20mm and 30mm, with duct size to jet diameter ratio of H/d=4 and 6 respectively. Experimental results show that temperature distribution and local and average heat transfer coefficients on the plate is varied with different parameters tested. As jet velocities increases, rate of heated plate cooling increases. As jet impingement angle increases local and average heat transfer coefficient decreases. Comparison of the results at different skew angles of 45° and 60° relative to =0° with keeping constant show that increasing Re Number, always heat transfer coefficient ratio [(h av ) =45°,60° /(h av ) =0° ] will decreases the values for the ratio (maximum decrease 5%). Average heat transfer coefficient for the bigger duct size to that of smaller duct size tested decreases with increasing Re number ( 6 % maximum decrease ) .
-
Upload
uomustansiriyah -
Category
Documents
-
view
3 -
download
0
Transcript of Experimental study of Spatial Inclined Air Impingement Jet on a Target Plate

- 1 -
Experimental study of Spatial Inclined Air Impingement Jet on a Target Plate
Asst. Prof. Dr.Adnan A. Abdurasuol Dr. Muna S. Kassim
Al-Mustansyria University/Mech. Eng. Dept. Al-Mustansyria University/Mech. Eng. Dept.
Iraq/Baghdad /[email protected] Iraq/Baghdad /[email protected]
B.Sc. Thamer KH. Ali
Al-MmustansyriaUniversity/Mech. Eng. Dept.
Iraq/Baghdad /[email protected]
Abstract
Present work studies the inclined impingement of air with relatively small jet diameter on a uniformly
heated plate fixed at the upper side of the test section placed in a long narrow duct simulating the internal
cooling of a gas turbine blade. Thermocouples are fitted at the plate surface at certain points designed to
cover the stagnation point of impingement of air and the zone beyond it. Experimental tests cover two
duct sizes of H=20mm and 30mm, with duct size to jet diameter ratio of H/d=4 and 6 respectively.
Experimental results show that temperature distribution and local and average heat transfer coefficients
on the plate is varied with different parameters tested. As jet velocities increases, rate of heated plate
cooling increases. As jet impingement angle increases local and average heat transfer coefficient
decreases. Comparison of the results at different skew angles of 45° and 60° relative to =0° with
keeping constant show that increasing Re Number, always heat transfer coefficient ratio
[(hav) =45°,60°/(hav) =0°] will decreases the values for the ratio (maximum decrease 5%). Average heat
transfer coefficient for the bigger duct size to that of smaller duct size tested decreases with increasing
Re number ( 6 % maximum decrease ) .

- 2 -
Latin Symbol
Cross-section area of the jet
impingement, m2
A
Surface area of the plate, m2 AS
Diameter of jet pipe [mm] d
Gravitational acceleration (m/s2) g
Local heat transfer coefficient W/m2.K h
Average heat transfer coefficient
[W/m2.K]
hav
Stagnation heat transfer coefficient
[W/m2.K]
hst
Height of duct (m). H
Current (amp). I
Thermal conductivity (W/m.K) K
Local Nusselt number Nu
Average Nusselt numbe Nuav
Stagnation Nusselt number Nust
Power (Watt) P
Wall heat flux (W/m2) q"
Heat energy W Q
Radial distance from the jet centerline
impingement plane intersection.
r
Reynold Number Re
Surface temperature [°C] TS
Ambient temperature [°C ] T∞
Velocity of jet [m/s] VJ
Cartesian coordinate x,y,z
Distance between jet and target plate
[m]
Z
Greek Symbol
Skew angle(°) θ
Dynamic viscosity (N.sec/m2) μ
Kinematics viscosity (m2/sec) v
Fluid density (kg/m3) ρ
Density of air (kg/m3)
Airρ
Pitch angle(°)
Subscribe
jet J
Average value av
Stagnation state st

- 3 -
1-Introduction Jet impingement cooling is a forced convection
technique which is common in industrial cooling or
drying and has been the subject of numerous
investigations in thermal control of gas turbine
blades, annealing of metals and nonmetals, tempering
of glass, cooling of pistons in internal combustion
engines, and drying of various materials. Obliquely
impinging air jets have many applications in heat
transfer due to their ability to produce high localized
and area averaged heat transfer coefficients. The
main variables for jet impingement heat transfer are
the angle of impingement, the Reynolds number, the
distance of the nozzle above the impingement surface
being cooled, the angle of the jet number of jets and
the presence of cross flow. In terms of geometry,
there are two cases: a planar case with the jet issuing
from a slot, and an axisymmetric case with a round
nozzle. The dynamics of both cases are different:
round jets exhibit formation of axisymmetric vortex
rings, which are stretched during their convection
along the wall. In plane jets, the vortices are formed
as filaments parallel to the slot. The flow field in an
impinging jet can be divided into three characteristic
regions : the jet zone, the stagnation zone, and the
wall jet zone. See Figure (1)
J.F. Foss and S.J. Kleis, [1] studied the mean flow
characteristics for the oblique impingement of an
axisymmetric jet. This study was motivated by the
(under the wing, externally blown flap) configuration
for stool air craft; its objectives were to identify the
characteristics of this flow field and to dominant
mechanisms responsible for them. If the propulsion
jet interacts with the airfoil surface prior to its
impingement upon the extended flap, then the proper
design of the gap should allow the streamwise
vorticity, which is created by the interaction, to be
passed to the suction side of the flap. Stevens and B.
W. Webb, [2] studied the effect of inclination on
local heat transfer under an axisymmetric, free liquid
jet it is found that the point of maximum heat transfer
along the x–axis (the line of intersection of the jet
inclination plane with the impingement surface) is
shifted upstream (with respect to the jet flow) as a
function of jet inclination with a maximum observed
shift of 0.5 nozzle diameter. Lamyaa A. EL–Gabry
and Deborah A. Kaminski, [3] studied the
experimental investigation of local heat transfer
distribution on smooth and roughened surfaces under
an array of angled impinging jets. Measurements of
the local heat transfer distribution on smooth and
roughened surfaces under an array of angled
impinging jets are presented. Tadhg S. O’Donovan
and Darina B. Murray, [4] studied the fluctuating
fluid flow and heat transfer of an obliquely impinging
air jet. Heat transfer to an obliquely impinging air jet
is investigated experimentally. Distributions of the
mean and the fluctuating component of the surface
heat transfer are reported for a jet Reynolds number
of 10000, nozzle to impingement surface distance,
H/D, from 2 to 8 and angle of impingement, α, from
30 t0 90 degree (normal impingement ).
As noticed in the previous literature little of work is
done of the case of jet impingement with spatial
variation of pitch angle and skew angle.
The purpose of present work is to verify cooling rate
of a target plate subjected to an inclined jet
impingement from a small pipe diameter local
temperature on the plate is measured from which
local and averaged heat transfer coefficient are
calculated.
2- Experimental Rig
The aim of the present work is to construct a rig
in which a direct impingement flow of air through a
pipe to the bottom face of a uniformly heated plate is
modeled. The air strikes the plate at the certain point
(same stagnation point for all angles (X=105mm,
Z=60mm)) of its bottom face. The air jet maximum
velocity is to be limited to a value of ~ 30 m/sec as
restricted by the accuracy of temperature
measurements in ref. [34] due to the temperature rise
in the stagnation zone. Local temperature
distributions on the plate face are to be measured and
local heat transfer coefficients are to be calculated at
variable jet velocities impinging from a 5mm pipe
diameter. A test section is to be designed in which the
plate is fitted in it and air impinges on it. The
apparatus shown in Figure (2) works in an open–
loop airflow circuit which takes air from building and
discharges it to the surrounding atmosphere. Blower
is used for air impingement at which a 5mm pipe is
fitted at its end for air impingement on the target
plate. The experimental facility consists of the
following items:
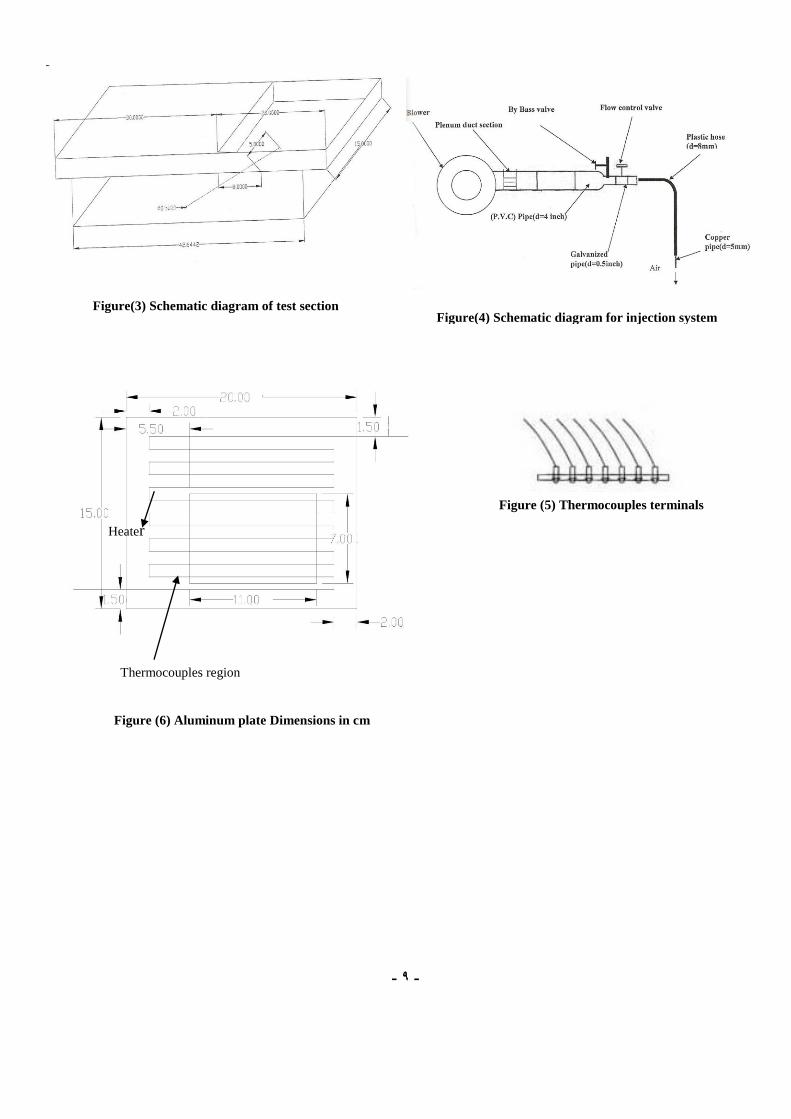
1. The test section.: The test section is rectangular
in shape 50cm in length and a 15cm wide, its height
can be varied in accordance with test being done.
Two heights are used 20mm and 30mm in the
experimental section of this work. It is manufactured
from Plexiglas sheet 8mm in thickness. Plexiglas is
chosen due to transparency and low thermal
conductivity. Figure (3) shows a schematic diagram
for test section.

- 4 -
2. The impinging blower and pipe system: This
system is used to inject a jet of air from a pipe of
diameter 5mm fitted at the lower face of the duct into
the upper side of the test section at which the heated
plate is fixed. The injection system is shown in the
Figure (4) as a schematic diagram. The injection
system consists of the following parts :
a) A blower of 22.17 m3/min blowing capacity
used to supply air flow for inclined
impingement on the heated plate.
b) A P.V.C pipe 4inch in diameter and 1.5
meter in length.
c) Plenum duct for minimizing turbulence
intensity at pipe inlet The straightener length
is chosen as 100 mm so as its length/
diameter ratio as 20 fixed at blower outlet
and in the inlet of the p.v.c. pipe.
d) Two control valves are placed in the a short
pipe (0.5 inch in diameter ) fitted at the PVC
pipe outlet , one to control air flow and velocity
in the injection pipe and the other as a second
control of flow by passing the air to the
surrounding.
e) Injection pipe. In which air is injected from
circular pipe into the boundary layer developing
along the top wall of the test section. Diameter of
the injection pipe is 5 mm .
The compound angle was inclined at different angles
with respect to the test surface when projected into
the stream wise /normal plane, and different angles
with respect to the test surface when projected into
the span wise /normal plane.
The employed compound angles are θ={0, 45,
60}deg. and =30, 45, 60, 75, 90.Where θ is the
angle of the injection pipe with respect to the test
surface as projected into the stream wise / normal
plane. is the angle of the injection pipe with
respect to the test surface as projected into the span
wise normal plane.
3. The target plate : The plate is manufactured so as
to be heated with constant heat flux, fixed at the top
wall of the test section, to be subjected to a jet of air
of varying velocity from the pipe fitted at the lower
wall. The heated plate is made of Duralumin Alloy
(0.6% Mn, 4.4% Cu, 1.5% Mg and 93.5% Aluminum
with a high thermal conductivity (177 W/m.K)). Its
dimension is 150mm wide, 200mm length and 3mm
in thickness. The back side of the plate is wrapped
with a heater wire 3.5 ohm/m resistance. The heater
wire is distributed on the plate as in Figure (6) to
ensure uniform heating of the plate and wire heater is
chosen to satisfy the requirements in accordance with
the power input by the power supply. A certain zone
of the heated plate is drilled with 96 holes distributed
as eight horizontal rows and twelve vertical columns.
This zone is chosen and designed to cover the
impingement region during different tests to be
carried out for heat coefficients measurements in
inclined impingement of air on the heated plate.
Each of the holes is equipped with a thermocouple
junction type K (Chromel Alumel). The
thermocouple wire is 0.2mm in diameter and welded
by spark welding forming a tip junction less than
0.5mm diameter. The thermocouple wire is of length
of 1meter each, its tip is inserted into the desired hole
in the plate face holes. The thermocouple junction is
spherical in shape and is inserted through the plate
hole, fitted in position in the plate by forcing the
cylindrical portion of the formed hole (the cylindrical
part is formed due to high ductility of the Aluminum
alloy) onto the thermocouple junction Figure (5).
The outer portion of the plate is filled with
polyurethane foam (thermal conductivity 0.06
W/m.K) [37] to reduce the heat loss by conduction to
the back side of plate assembly of the plate and also
through the thermocouple wires. Two thermocouple
junctions of the same type are installed in the outer
face of the plate; first one is fixed at the middle
section of the back layer of the insulation material
used for estimating the conduction losses through the
insulation (polyurethane) layer. A second
thermocouple is fixed at the Plexiglas section nearer
to the plate edge, used for measuring conduction
loses through the Plexiglas plate used for test section
construction.
3- Calculations Procedure:
The following procedure has been followed to
perform the calculations operation:
a- Jet Air Velocity: The air jet velocity is measured by a Pitot tube
calculated by using the following equation
Airρ
Airρ
H2Oρ
H2OΔHg2
JV
….(1)
Where, ∆HH2O, ρ and g were pressure drop of water
(mm), density of air or water and gravitational
acceleration, respectively.
Air impingement velocity is measured using a Pitot
tube of diameter 1mm fixed near the pipe exit.
Velocity distribution at pipe exit is formed to be

- 5 -
uniformly distributed due to small size of pipe
diameter.
b-Input Electrical power : Qinput=IV* Watt ……………………(2)
c-Heat Transfer by Convection Qconv.:
The net heat transferred by convection from
the plate face is calculated as:
Qconv = Qinput -Qrad -Qcond -Qleads W ………….(3)
where )T4
T4S
(S
Aσrad
Q
W ………..(4)
= emissivity of plate face
= Stevan–Boltzman constant = 5.67 x 10⁻⁸
W/m2.K
4
TS = mean surface temperature of plate face °K
T∞ = ambient temperature °K
For polyurethane foam layer
L
)faceupper
Tfacelower
(T
SA
fpK
condQ
.( 5)
Where Kp.f = conductivity of polyurethane foam layer
taken as 0.06 W/m.K
AS : cross sectional area of plate = (15*20) cm2
Tlower face-Tupper face: temperature difference
between the lower plate face and the upper plate face
at
L: thickness of polyurethane layer from lower face to
the upper face
Qleads : the heat lost to the thermocouple leads
terminals which is calculated using:
Qleads=n* Qlead watt ……….(6)
n : number of thermocouples
Qlead : heat conducted through one thermocouple
calculate
lethermocoupL
TS
T
lethermocoupA
lethermocoupK
leadQ
……(7)
where Kthermocouple, Athermocouple, Lthermocouple are
conductivity, cross sectional area and length of
thermocouple wire.
d--Heat flux by convection Qconv: The heat flux on each of cube five faces is
assumed constant and
equal to:
SA
conv.Q
conv.q W/m
2 …………..(8)
AS = surface area of the plate
=0.2*0.15=0.03m2
The local heat transfer coefficient on each point
of lower face of the plate is calculated by:
fT
sT
conv.q
h
………….. (9)
Ts : local surface temperature C°
Tf: is taken as a film temperature where
2
)Ts
T
fT
……. (10)
T∞ : is the ambient temperature °C.
Air temperature at blower exit is noticed to be
0..2°C higher than ambient temperature due to
compression effect through the blower. For the case
of impingement and cross flow T is taken as the mean
value of ambient temperature and impingement air
temperature i.e. the bulk mean temperature is used in
this case.
The values of (Ts - T∞ ) are in the range 10- 30 °C to
reduce the conduction and radiation losses.
The heat transfer coefficient of plate face is
calculated by integrating the local heat transfer on
each point of the plate and dividing by the face area
as:
sA
96i
1i
h.dA
avh
W/m
2.K ………. (11)
The local heat transfer coefficients is calculated for
the portion of the heated target plate at which the
thermocouple junctions are fitted.
hav : The average heat transfer coefficient.
dA : the infinitesimal area of one node of the
plate.
The Nusselt number is calculated on the basis of
average heat transfer coefficient
for a plate face, hav, using the formula:

- 6 -
airK
h.d
Nu ………………..(12)
Kair : the thermal conductivity of air
d: diameter of the pipe of jet (d).
e-Error analysis : Error analysis using
method Kline & Melintock method mentioned in
reference [17] is used in this work .The
measured quantities and the errors estimated for each
of them are as follows:
Temperature, T , max error 0.2 °C
Voltage , V, max error 0.005 Volt
Current, I, max error 0.01 Amp.
Manometer head, max error 0.5 mm H2O
The result for above mentioned method in calculating
the min -max percentage errors is as follows:
Heat transfer coefficient , h ( W/m2.C ) 0.8%-1.6%
Jet velocity , Vj ( m / sec ) , 0.84%-4.5%
Nusselt number , Nu , 0.5%- 1.26 %
Reynolds number , Re , 0.5%- 1.32%
4-Results and Discussion The following is the results of the present
work for two case of duct sizes 20mm and 30mm ,
H/d= 4 and 6 respectively. In each duct size the
inclined jet impinges the target plate at different
angles of pitch and skew . Pipe diameter is 5mm for
H=20mm and H=30mm the following is a description
for the local, average, stagnation and Nu number
distribution on the heated target plate. Examples of
local heat transfer coefficients contours and its
average values for a skew angle θ=45° with variable
a pitch angle are shown in Figures (7) and (8) for
=30° and =45° respectively .A comparison
between the two Figures show that as increases
the local and average heat transfer coefficients
decreases.
Figure (9) and Figure (10) show local heat
transfer coefficients contours for θ=60° and for
=45° and 60° respectively. The same behavior is
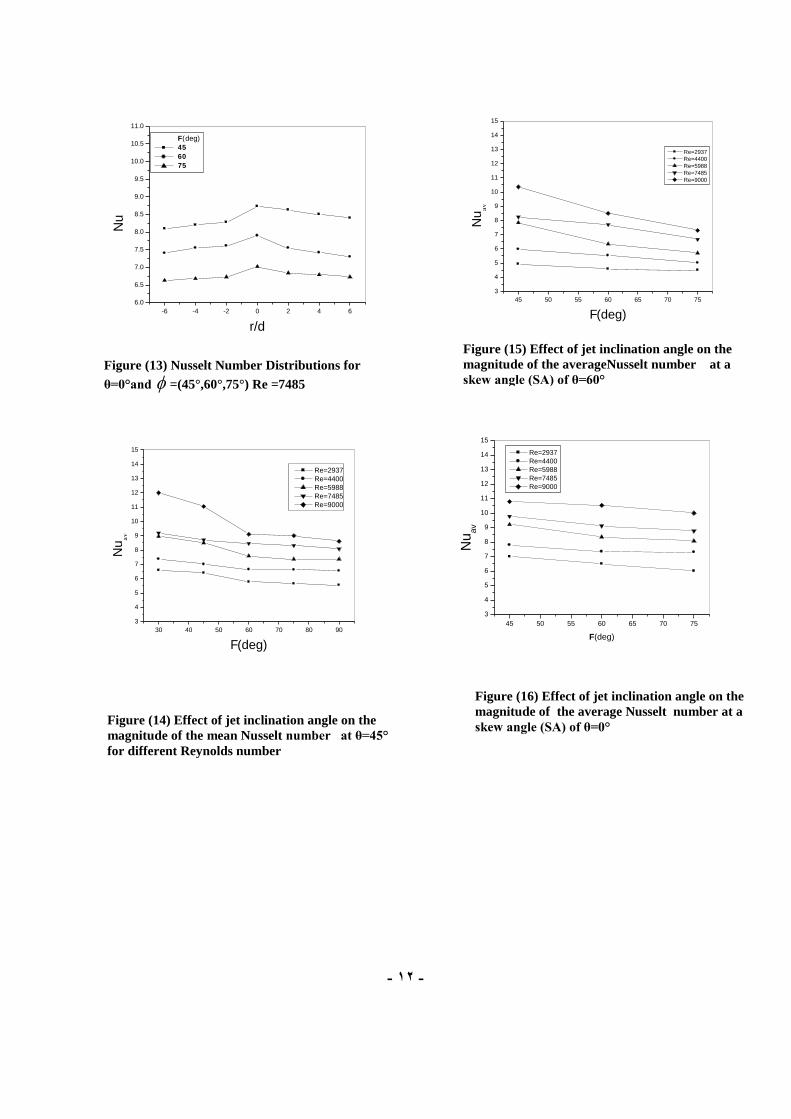
noticed. Figure (11) shows the local Nusselt
distribution at the stagnation point and the
neighboring points in radial direction for the case of
skew angle θ =45° and variation in the pitch
angle =30°, 45°, 60°, 75° and 90°.
The figure declares that increases the angle
reduces the average heat transfer coefficients on the
plate represented by the Nusselt number values. The
same trend of decreasing results of Nu number is
noticed for θ =60° in Figure (12) and θ =0° in Figure
(13).
Figure (14) , Figure (15) and Figure (16) show
the average Nusselt number on the target plate
variation with pitch angle for a skew angle θ=45°
and 60° and 0° respectively. Higher average Nusselt
number is noticed relative to air impingement angle.
The Figure shows as increases the average
Nusselt number decreases.
Figure (17) and Figure (18) show the average
heat transfer coefficient on the target plate variation
with Reynolds number for a skew angle θ=45° and
60° respectively. Higher average heat transfer
coefficient is noticed relative to Reynolds number.
The Figures show that as Re increases the average
heat transfer coefficient increases.
Figure (19) and Figure (20) show the
stagnation heat transfer coefficient on the target plate
variation with Reynolds number for a skew angle
θ=45° and 60° respectively. Higher stagnation heat
transfer coefficient is noticed relative to Reynolds
number. The Figures show as Re increases the
stagnation heat transfer coefficient increases.
In order to verify the variation in average heat
transfer rates in case of air impingement only with
θ=45° and 60° to Average heat transfer coefficient in
air impingement with (θ=0°). . The hav on the plate
face is calculated for different jet velocities tested and
for different pitch angle .
The general behavior of [hav]θ=45° /[hav] θ=0° ratio
with Re shows a linear decrease in the ratio with
increase Re and the ratio decreases with increase
. This results shown in the Figure (21) and Figure
(22).
Experimental results for inclined impingement
of air on the target plate for duct height H=30mm
show that Nu number and h have the same trend of
behavior as for the impingement of air only with
H=20mm. The Figures from 23 to 25 show the same
behavior for inclined air impingement only
(H=20mm) with higher values of average and
stagnation heat transfer coefficients on the target
plate.
In order to verify the variation in average heat
transfer rates in case of air impingement only with
(H/d=6), H=30mm to average heat transfer
coefficient in air impingement only with (H/d=4),
H=20mm. The average heat transfer coefficient is
calculated for plate using local temperature

- 7 -
distributions on plate face using equation (11). The
hav on the plate face is calculated for different jet
velocities tested and for different pitch angle .
The general behavior of [hav]H/d=6/[hav]H/d=4 ratio
with Re shows a linear decrease in the ratio with
increase Re and the ratio decreases with increase of
for θ=45°. The results are shown in the Figure
(26).
4- Conclusions The present work uses on inclined jet of air
impingement on a target plate fixed at the upper side
of a test section which represent part of along narrow
duct simulating the cooling passage in a gas turbine
blade. Two cases are studied, one for inclined
impingement with H=20mm and the other case for
H=30mm. The air jet is 5 mm in diameter is
impinged on the heated target plate from a long pipe
(with fully developed flow) having the same
mentioned inner diameter. Different impingement
and skew θ angles are tested. The followings
conclusions are found:
1) A pre test to verify the validity of the heated
plate use shows that temperature distribution on
the plate is uniform in case when the plate
subjected to no impingement.
.
2) In all studied cases the results show that
stagnation point heat transfer coefficient are with
the highest values relative to the other points,
regardless of the angles of impingement used and
the jet velocities (Re number) in the tests.
3) Keeping the skew angle θ within a certain
values of 45°, 60° the results show the average
heat transfer coefficients increases as the pitch
angle is decreased. Increasing jet velocities
represented by Reynolds number shows that as
jet velocity increases, the average heat transfer
coefficient also increased relatively.
4) Stagnation point heat transfer coefficients show
the same behavior as the average values
coefficient mentioned in (4).
5) At certain pitch angle the ratio of average heat
transfer coefficient at tested skew angles θ of
45°, 60° to the average heat transfer coefficient
at skew angle of θ =0° angle, decrease as the
velocity of the impinging jet increases.
6) The same behavior mentioned in (6) is noticed
for the stagnation local heat transfer coefficient.
7) The parameter representing relative heat transfer
coefficient for duct height to jet diameter ratio
(H/d=6) relative to the similar values for
(H/d=4), and at same tested values of θ and
shows that this parameter decreases as the jet
velocities increases. The percentage of
decrement is within very small values ranges
from (2–6%).
5-References
[1] J.F. Foss, and S.J. Kleis, 1976, “Mean flow
characteristics for the oblique impingement
of an axisymmetric jet”, AIAA journal
vol.14,No.6.
[2] J. Stevens and B.W. Webb, 1990, “The effect
of inclination on local heat transfer under
an axisymmetric free liquid jet”, Int. J. Heat
Mass Transfer. Vol. 34, No.4/5, pp. 1227-
1236.1991.
[3] L.M. El-Gabry and D.A. Kaminski,
“Experimental Investigation of Local Heat
Transfer Distribution on Smooth and
Roughened Surfaces under an Array of
Angled Impinging Jets”, Proceedings of Int.
Mech. Eng. Congress and Exposition,
November, 2001.
[4] Tadhg S. O’Donovan and Darina B. Murray,
2008, “Fluctuating fluid flow and heat
transfer of an obliquely impinging air jet”, International Journal of heat and mass transfer
, volume 51, page 6169–6179, 2008.
[5] Kercher D.M. and Tabakoff W. , “Heat
Transfer by a Square Array of Round Air
Jets Impinging Perpendicular to a Flat
Surface Including the Effect of Spent Air”, Trans. ASME, Journal of Engineering for
Power, Vol. 92, PP. 73-82, 1970.
[6] A.K. Mohanty and A.A. Tawfek, “Heat
Transfer Due to a Round Jet. Impinging
Normal to a Flat Surface ”, Jr. Heat Mass
Transfer, Vol.36, No.6, PP.1639-1647, 1993.
[7] D. Lytle and B.W. Webb, “Air Jet
Impingement Heat Transfer at Low Nozzle
Plate Spacings”, Jr. Heat Mass Transfer,
Vol.37, No.12, PP.1687-1697, 1994.

- 8 -
[8] M. Dianat and M. Fairweather and W. P.
Jones, 1996, “Predictions of axisymmetric
and two-dimensional impinging turbulent
jets”, Int. j. Heat and Fluid Flow 17: 530-538,
1996.
[9] J.Y. Sang, C.H. Huang and M.H. Shu,
“Impingement Cooling of Confined
Circular Jet”, Int. Jr. Heat Mass Transfer,
Vol.40, No.6,PP.1355-1364, 1997.
[10] J. Mi, G.J. Nathan and D.S. Nobes, “Mixing
Characteristics of Axisymmetric Free Jets
from a Contoured Nozzle, an Orifice Plate and a Pipe” , Transaction of the ASME,
Vol.123, PP.878-883, 2001.
[11] E.A. Anderson, R.E. Spall, “Experimental
and Numerical Investigation of Two-
Dimensional Parallel Jets” , Jr. Fluid
Engineering, Vol.123, PP.401-406, 2001.
[12] James P. Johnston and Bruce P. Mosier and
Zia U. Khan, “Vortex generating jets;
effects of jet-hole inlet geometry”, International Journal of Heat and Fluid Flow
23 (2002) 744–749.
[13] J.A. Kadhim, “Low Speed Wind Tunnel
Design, Construction, and Calibration”, M.Sc. Thesis, Military Technical College,
1986.
[14] Fluid Flow in Closed Conduits, “British
Standard Methods, Part 1 ”, Pressure
Differential Devices, BS No.1042: Section
1.1, 1981.
[15] F.P. In Cropera and D.P. Dewitt,
“Fundamentals of Heat Transfer”, Fourth
Edition, John Wiley and Sons, 1996.
[16] R.J. Moffat, “What s New in Convective Heat
Transfer ”, Int. Jr.Heat and Fluid Flow,
Vol.19, PP.90-101, 1998.
[17] J.P. Holman, “Heat Transfer” 5th
edition,
McGraw-Hill, 1981.
[18] Goldstien, R.j Sobolik.K.A and Seol.W.S.
,“Effect of entrainment on the heat transfer
to a heated circular air jet impinging on a
flat surface”, ASME journal of heat transfer
vol 112,pp608-611.1990.
Figure (1) Characteristic zones in impinging jets
Figure (5) Thermocouples terminals
Figure(2) Photo picture of test section
plexiglass duct
Secondary selector
Primary selector
Reader
Aluminum plate
- 9 -
Figure (6) Aluminum plate Dimensions in cm
Heater
Thermocouples region
Figure(3) Schematic diagram of test section Figure(4) Schematic diagram for injection system
Figure (5) Thermocouples terminals

- 11 -

- 11 -
Figure (10) h contours θ=60°, =60°, VJ=25 m/sec,
VC=0 m/sec, hav=47.22 W/m2.k, Nuav=9.12, Nust=9.62
0 5 10h
0
1
2
3
4
5
6
7
8
V3
50.3877
49.776
48.0277
45.9199
44.866
43.8121
42.7582
41.7043
40.6504
39.5965
Figure (7) h contours, θ=45°, =30°, VJ=25 m/sec,
VC=0 m/sec , hav=48.54 w/m2.k, Nuav=9.19, Nust=9.64
0 5 10h
0
1
2
3
4
5
6
7
8
V3
49.0607
48
46.4953
43.4362
42.5652
41.6942
40.8233
39.9523
39.0813
Figure (8) h contours θ=45°, =45°, VJ=25 m/sec,
VC=0 m/sec , hav=42.74 w/m2.k, Nuav=8.09, Nust=8.47
-6 -4 -2 0 2 4 6
6.0
6.5
7.0
7.5
8.0
8.5
9.0
9.5
10.0
10.5
11.0
Nu
r/d
F(deg)
30
45
60
75
90
Figure (11) Nusselt Number Distributions for θ=45°
and = (30°, 45°, 60°, 75°, 90°), Re =7485
-6 -4 -2 0 2 4 6
6.0
6.5
7.0
7.5
8.0
8.5
9.0
9.5
10.0
10.5
11.0
Nu
r/d
F(deg)
45
60
75
Figure (12) Nusselt Number Distributions for
θ=60°and =(45°,60°,75°), Re=7485
0 5 10h
0
1
2
3
4
5
6
7
8
V3
53.7031
51.8024
50.9347
48.2695
47.2368
46.2041
45.1715
44.1388
43.1061
42.0734
0 5 10h
0
1
2
3
4
5
6
7
8
V3
50.6312
49.6183
48.75
47.3007
46.8285
46.449
44.0419
43.2088
42.3757
41.5426
40.7096
39.8765
39.0434
Figure (9) h contours θ=60°, =45°, VJ=25 m/sec,
VC=0 m/sec, hav=51.36w/m2.k, Nuav =9.78, Nust=9.93
Stagnation point
r
- 12 -
Figure (13) Nusselt Number Distributions for
θ=0°and =(45°,60°,75°) Re =7485
30 40 50 60 70 80 90
3
4
5
6
7
8
9
10
11
12
13
14
15
Nuav
F(deg)
Re=2937
Re=4400
Re=5988
Re=7485
Re=9000
Figure (14) Effect of jet inclination angle on the
magnitude of the mean Nusselt number at θ=45°
for different Reynolds number
45 50 55 60 65 70 75
3
4
5
6
7
8
9
10
11
12
13
14
15
Nu
av
F(deg)
Re=2937
Re=4400
Re=5988
Re=7485
Re=9000
Figure (15) Effect of jet inclination angle on the
magnitude of the averageNusselt number at a
skew angle (SA) of θ=60°
45 50 55 60 65 70 75
3
4
5
6
7
8
9
10
11
12
13
14
15
Nuav
F(deg)
Re=2937
Re=4400
Re=5988
Re=7485
Re=9000
Figure (16) Effect of jet inclination angle on the
magnitude of the average Nusselt number at a
skew angle (SA) of θ=0°
-6 -4 -2 0 2 4 6
6.0
6.5
7.0
7.5
8.0
8.5
9.0
9.5
10.0
10.5
11.0N
u
r/d
F(deg)
45
60
75

- 13 -
Figure (19) Effect of Reynolds number on the magnitude of
the stagnation heat transfer coefficient at a skew angle (SA)
of θ=45° with different jet inclination angle
2000 3000 4000 5000 6000 7000 8000 9000
30
35
40
45
50
55
60
65
70
hav(w
/m2.k
)
Re
F(deg)
30
45
60
75
90
Figure (17) Effect of Reynolds number on the
magnitude of the average heat transfer coefficient
at a skew angle (SA) of θ=45°
2000 3000 4000 5000 6000 7000 8000 9000
30
35
40
45
50
55
60
65
70
hst(w
/m2.k
)
Re
F(deg)
30
45
60
75
90
2000 3000 4000 5000 6000 7000 8000 9000
30
35
40
45
50
55
60
65
70
hav(w
/m2.k
)
Re
F(deg)
45
60
75
Figure (18) Effect of Reynolds number on the magnitude
of the average heat Transfer Coefficient at a skew angle
(SA) of θ=60° with different PA(pitch angle)
2000 3000 4000 5000 6000 7000 8000 9000
30
35
40
45
50
55
60
65
70
hst(w
/m2.k
)
Re
(F)(deg)
45
60
75
Figure (20) Effect of Reynolds number on the
magnitude of the stagnation heat transfer coefficient
at a skew angle (SA) of θ=60° with different PA(pitch angle)

- 14 -
2000 3000 4000 5000 6000 7000 8000 9000
1.00
1.05
1.10
1.15
1.20
1.25
1.30
1.35
1.40
1.45
1.50
1.55
1.60
[hav]Q
=4
5/
[hav]Q
=0
Re
F
45
60
75
2000 3000 4000 5000 6000 7000 8000 9000
1.00
1.05
1.10
1.15
1.20
1.25
1.30
1.35
1.40
1.45
1.50
1.55
1.60
[ha
v]Q
=6
0/
[ha
v]Q
=0
Re
F(deg)
45
60
75
Figure (21) Average heat transfer coefficient
enhancement at a skew angle (SA) θ=45° relative
to zero angle of a skew angle of impingement
Figure (22) Average heat transfer coefficient
enhancement at a skew angle (SA) θ=60° relative
to zero angle of a skew angle of impingement
2000 3000 4000 5000 6000 7000 8000 9000
3
4
5
6
7
8
9
10
11
12
13
14
15
F(deg)
45
60
75
Nu
av
Re
Figure (23) Effect of Reynolds number on the magnitude
of the average Nusselt number at a skew angle (SA) of
θ=45° with different PA (pitch angle) H=30mm
2000 3000 4000 5000 6000 7000 8000 9000
3
4
5
6
7
8
9
10
11
12
13
14
15
Re
Nuav
F(deg)
45
60
75
Figure (24) Effect of Reynolds number on the magnitude
of the average Nusselt number at a skew angle (SA) of
θ=60° with different PA (pitch angle) H=30mm

- 15 -
40 50 60 70 80 90
3
4
5
6
7
8
9
10
11
12
13
14
15
Nu
st
F(deg)
Re=2937
Re=4400
Re=5988
Re=7485
Re=9000
Figure (25) Effect of jet inclination on the magnitude
of the stagnation Nusselt number θ=60° H=30mm
2000 3000 4000 5000 6000 7000 8000 9000
1.015
1.020
1.025
1.030
1.035
1.040
1.045
1.050
1.055
1.060
1.065
1.070
(ha
v) H
/d=
6/(
ha
v) H
/d=
4
Re
F(deg)
45
60
75
Figure (26) The ratio of the average heat transfer coefficient for
Impingement only with H/d=6 relative to average heat transfer
Coefficient for impingement only with H/d=4 for: θ=45° .