Experimental investigation on spontaneously active hippocampal cultures recorded by means of...
12
NEUROENGINEERING ORIGINAL RESEARCH ARTICLE published: 10 May 2010 doi: 10.3389/fneng.2010.00004 Frontiers in Neuroengineering www.frontiersin.org May 2010 | Volume 3 | Article 4 | 1 Routinely used as main research tool or in combination with conventional imaging and electrophysiological methods, the typi- cal dataset acquired on commercially available MEAs (e.g. Multi Channel Systems, Reutlingen, Germany; Panasonic, Osaka, Japan; Ayanda Biosystems, Lausanne, Switzerland) consists in acquisi- tions from 64–256 microelectrodes. This provides a global view of the network activity with a typical interelectrode separation of 100–200 μm and at sampling frequencies of 10–50 kHz. To ana- lyze this extracellular network activity, a wide range of algorithms were developed and are constantly upgraded. Upon spike/burst detection (Tetko and Villa, 2001; Thakur et al., 2007) the com- mon approach used to characterize the overall spiking and bursting activities, is based on first order statistics performed by computing for example the Mean Firing Rate (MFR), Inter Spike Intervals (ISI), Mean Bursting Rate (MBR). One of the main issues affect- ing this kind of analysis on dissociated neuronal networks is the relatively large variability of the experimental results requiring thus a large number of experiments and/or long-term recordings to achieve a statistically significant characterization. This is due to intrinsic properties of the cultured network, e.g. network devel- opment, behavior, connectivity, composition, but also to extrinsic contributions of the measurement and culturing conditions (Blau et al., 2009). Spatial undersampling of the network might also con- tribute to this variability, but it was not possible to evaluate this aspect until the development of high-resolution MEAs. Indeed, the access to a more detailed spatial-temporal view of the global INTRODUCTION Electrophysiological investigations of the extracellular activity of in vitro neuronal preparations by using microelectrode arrays (MEAs) are involving a constantly increasing number of neuroscience labo- ratories. The reason of this growing interest is probably due to the main feature of this methodology that is the ability to extracellularly interface for relatively long periods of time, i.e. up to several weeks, large populations of neurons on several tens of microelectrodes arranged on the culture substrate (Morin et al., 2005). Developed at the end of the seventies (Thomas et al., 1972; Gross, 1979; Pine, 1980) and constantly improved by adding and completing the on-chip functionalities (Thiébaud et al., 1997; Baumann et al., 1999; Heuschkel et al., 2002; Berdondini et al., 2006; Kraus et al., 2006; Rowe et al., 2007), this methodology enabled for example to investigate the neuronal signaling behavior expressed by complex in vitro experimental models (Chiappalone et al., 2006; Wagenaar et al., 2006), to explore coding and learning basic mechanisms at the neuronal population and cellular levels (Jimbo et al., 1999; Marom and Eytan, 2005) and to study the effects of neuro-active compounds (Morefield et al., 2000; Keefer et al., 2001) on the global network activity. In the last decade these devices were also utilized to under- stand the electrical propagation patterns between different areas or layers in acute brain slices (Egert et al., 2002) and for studying organotypic slices as experimental models of neurodegenerative disorders (Kristensen et al., 2001; Magloire and Streit, 2009). Experimental investigation on spontaneously active hippocampal cultures recorded by means of high-density MEAs: analysis of the spatial resolution effects Alessandro Maccione 1 *, Mauro Gandolfo 2 , Mariateresa Tedesco 2 , Thierry Nieus 1 , Kilian Imfeld 3 , Sergio Martinoia 1,2 and Luca Berdondini 1 1 Neuroscience and Brain Technologies, Italian Institute of Technology, Genova, Italy 2 Department of Biophysical and Electronic Engineering, University of Genova, Genova, Italy 3 Nanomedicine, Centre Suisse d’Electronique et de Microtechnique, Landquart, Switzerland Based on experiments performed with high-resolution Active Pixel Sensor microelectrode arrays (APS-MEAs) coupled with spontaneously active hippocampal cultures, this work investigates the spatial resolution effects of the neuroelectronic interface on the analysis of the recorded electrophysiological signals.The adopted methodology consists, first, in recording the spontaneous activity at the highest spatial resolution (interelectrode separation of 21 μm) from the whole array of 4096 microelectrodes. Then, the full resolution dataset is spatially downsampled in order to evaluate the effects on raster plot representation, array-wide spike rate (AWSR), mean firing rate (MFR) and mean bursting rate (MBR). Furthermore, the effects of the array-to-network relative position are evaluated by shifting a subset of equally spaced electrodes on the entire recorded area. Results highlight that MFR and MBR are particularly influenced by the spatial resolution provided by the neuroelectronic interface. On high-resolution large MEAs, such analysis better represent the time-based parameterization of the network dynamics. Finally, this work suggest interesting capabilities of high-resolution MEAs for spatial- based analysis in dense and low-dense neuronal preparation for investigating signaling at both local and global neuronal circuitries. Keywords: microelectrode array, CMOS-MEA, neuronal networks, data analysis, high-resolution Edited by: Michele Giugliano, Ecole Polytechnique Federale De Lausanne, Switzerland; University of Antwerp, Belgium; University of Antwerpen (UIA), Belgium Reviewed by: Stephan Theiss, University of Dusseldorf, Germany John M. Beggs, Indiana University, USA *Correspondence: Alessandro Maccione, Italian Institute of Technology, Neuroscience and Brain Technologies, Via Morego 30, Genova 16163, Italy. e-mail: [email protected]
-
Upload
independent -
Category
Documents
-
view
6 -
download
0
Transcript of Experimental investigation on spontaneously active hippocampal cultures recorded by means of...
NEUROENGINEERING
ORIGINAL RESEARCH ARTICLEpublished: 10 May 2010
doi: 10.3389/fneng.2010.00004
Frontiers in Neuroengineering www.frontiersin.org May 2010 | Volume 3 | Article 4 | 1
Routinely used as main research tool or in combination with
conventional imaging and electrophysiological methods, the typi-
cal dataset acquired on commercially available MEAs (e.g. Multi
Channel Systems, Reutlingen, Germany; Panasonic, Osaka, Japan;
Ayanda Biosystems, Lausanne, Switzerland) consists in acquisi-
tions from 64–256 microelectrodes. This provides a global view
of the network activity with a typical interelectrode separation of
100–200 µm and at sampling frequencies of 10–50 kHz. To ana-
lyze this extracellular network activity, a wide range of algorithms
were developed and are constantly upgraded. Upon spike/burst
detection (Tetko and Villa, 2001; Thakur et al., 2007) the com-
mon approach used to characterize the overall spiking and bursting
activities, is based on fi rst order statistics performed by computing
for example the Mean Firing Rate (MFR), Inter Spike Intervals
(ISI), Mean Bursting Rate (MBR). One of the main issues affect-
ing this kind of analysis on dissociated neuronal networks is the
relatively large variability of the experimental results requiring thus
a large number of experiments and/or long-term recordings to
achieve a statistically signifi cant characterization. This is due to
intrinsic properties of the cultured network, e.g. network devel-
opment, behavior, connectivity, composition, but also to extrinsic
contributions of the measurement and culturing conditions (Blau
et al., 2009). Spatial undersampling of the network might also con-
tribute to this variability, but it was not possible to evaluate this
aspect until the development of high-resolution MEAs. Indeed,
the access to a more detailed spatial- temporal view of the global
INTRODUCTION
Electrophysiological investigations of the extracellular activity of in
vitro neuronal preparations by using microelectrode arrays (MEAs)
are involving a constantly increasing number of neuroscience labo-
ratories. The reason of this growing interest is probably due to the
main feature of this methodology that is the ability to extracellularly
interface for relatively long periods of time, i.e. up to several weeks,
large populations of neurons on several tens of microelectrodes
arranged on the culture substrate (Morin et al., 2005). Developed
at the end of the seventies (Thomas et al., 1972; Gross, 1979; Pine,
1980) and constantly improved by adding and completing the
on-chip functionalities (Thiébaud et al., 1997; Baumann et al.,
1999; Heuschkel et al., 2002; Berdondini et al., 2006; Kraus et al.,
2006; Rowe et al., 2007), this methodology enabled for example to
investigate the neuronal signaling behavior expressed by complex
in vitro experimental models (Chiappalone et al., 2006; Wagenaar
et al., 2006), to explore coding and learning basic mechanisms at the
neuronal population and cellular levels (Jimbo et al., 1999; Marom
and Eytan, 2005) and to study the effects of neuro-active compounds
(Morefi eld et al., 2000; Keefer et al., 2001) on the global network
activity. In the last decade these devices were also utilized to under-
stand the electrical propagation patterns between different areas
or layers in acute brain slices (Egert et al., 2002) and for studying
organotypic slices as experimental models of neurodegenerative
disorders (Kristensen et al., 2001; Magloire and Streit, 2009).
Experimental investigation on spontaneously active hippocampal cultures recorded by means of high-density MEAs: analysis of the spatial resolution effects
Alessandro Maccione1*, Mauro Gandolfo2, Mariateresa Tedesco2, Thierry Nieus1, Kilian Imfeld3, Sergio Martinoia1,2 and Luca Berdondini1
1 Neuroscience and Brain Technologies, Italian Institute of Technology, Genova, Italy2 Department of Biophysical and Electronic Engineering, University of Genova, Genova, Italy3 Nanomedicine, Centre Suisse d’Electronique et de Microtechnique, Landquart, Switzerland
Based on experiments performed with high-resolution Active Pixel Sensor microelectrode
arrays (APS-MEAs) coupled with spontaneously active hippocampal cultures, this work
investigates the spatial resolution effects of the neuroelectronic interface on the analysis of
the recorded electrophysiological signals. The adopted methodology consists, fi rst, in recording
the spontaneous activity at the highest spatial resolution (interelectrode separation of 21 µm)
from the whole array of 4096 microelectrodes. Then, the full resolution dataset is spatially
downsampled in order to evaluate the effects on raster plot representation, array-wide spike
rate (AWSR), mean fi ring rate (MFR) and mean bursting rate (MBR). Furthermore, the effects
of the array-to-network relative position are evaluated by shifting a subset of equally spaced
electrodes on the entire recorded area. Results highlight that MFR and MBR are particularly
infl uenced by the spatial resolution provided by the neuroelectronic interface. On high-resolution
large MEAs, such analysis better represent the time-based parameterization of the network
dynamics. Finally, this work suggest interesting capabilities of high-resolution MEAs for spatial-
based analysis in dense and low-dense neuronal preparation for investigating signaling at both
local and global neuronal circuitries.
Keywords: microelectrode array, CMOS-MEA, neuronal networks, data analysis, high-resolution
Edited by:
Michele Giugliano, Ecole Polytechnique
Federale De Lausanne, Switzerland;
University of Antwerp, Belgium;
University of Antwerpen (UIA),
Belgium
Reviewed by:
Stephan Theiss, University of
Dusseldorf, Germany
John M. Beggs, Indiana University,
USA
*Correspondence:
Alessandro Maccione, Italian Institute
of Technology, Neuroscience and Brain
Technologies, Via Morego 30, Genova
16163, Italy.
e-mail: [email protected]
Frontiers in Neuroengineering www.frontiersin.org May 2010 | Volume 3 | Article 4 | 2
Maccione et al. High-density MEAs coupled to hippocampal cultures
network electrophysiological signaling has become feasible only
recently with the development of MEAs based on Complementary
Metal Oxide Semiconductor (CMOS) technology, providing on
large active areas, recording site separations in the range of (or
below) soma dimensions (Berdondini et al., 2002; Eversmann et al.,
2003; Heer et al., 2007). In particular, our recent development of an
Active Pixel Sensor based MEA platform (APS-MEA) provides 4096
microelectrodes at spatial resolution of 21 µm (i.e. interelectrode
separation) and enables to achieve a sampling rate of 7.7 kHz/
channel when recording from the full active area of 2.7 × 2.7 mm2
(Imfeld et al., 2008). This reduced spatial undersampling provided
by the achieved high electrode density enables to observe the propa-
gation of spontaneous activity patterns over large neuronal net-
works with unprecedented spatial resolution. As reported in a recent
paper (Berdondini et al., 2009a), such a dense electrode array does
not entail the recording of the same spiking event between nearby
electrodes. Indeed, simulations demonstrated that in our working
conditions there is no cross-talk among electrodes, which could lead
to false positive spike event detection. Therefore, the reduced spatial
undersampling provided by the achieved high electrode density
improves the capabilities in analyzing the network dynamics and
opens the perspective to access the network activity at the global
level and at the level of single microcircuits down to cellular/sub-
cellular levels (Berdondini et al., 2009b).
In this work we are interested in experimentally evaluating the
effects of the spatial resolution of MEA-based devices for character-
izing the spontaneous activity in random neuronal networks. Indeed,
the APS-MEA technology enables to experimentally investigate these
effects by processing subsets of electrodes, selected at different spatial
resolutions and at different position from the original full resolution
acquisition. In this way, it is possible to study how temporal and
spatial analysis parameters commonly used in the MEA fi eld are
affected by varying the interelectrode separation and the number of
the electrodes as well. At fi rst, we focus on dense neuronal prepara-
tions to evaluate the acquisition and analysis of the spontaneous
network dynamics. Successively, we evaluate the capabilities of the
APS-MEA platform to observe local propagating patterns and to
interface low-density neuronal cultures featuring well distinguish-
able neuronal circuits. Neuronal cultures at different cell density
and Days In Vitro (DIVs) were used in order to highlight at different
developmental conditions the effects of the spatial resolution.
MATERIALS AND METHODS
In this section, after a brief introduction on our high-resolution
platform, cell culture protocols and immunostaining methods are
described in details. Finally, after a description of the data analysis
methods applied to the recordings, statistical analysis is provided
to demonstrate the reliability of the presented results.
HIGH-DENSITY MEA PLATFORM
The high-resolution MEA platform was deeply described in a
previous paper (Imfeld et al., 2008) and recently validated on
dissociated neuronal preparations (Berdondini et al., 2009b).
Briefl y, our approach is based on the Active Pixel Sensor (APS)
concept originally developed for image-sensors and adapted to
electrophysiological recordings by integrating in-pixel microelec-
trodes and pre-amplifi ers. By applying image-video concepts at
the device and acquisition system levels, the system achieves a
read-out of a 4096 electrode (pixel) array at a suffi cient sam-
pling rate for performing effi cient spike detection (i.e. 7.7 kHz for
each channel). The in-pixel microelectrodes have dimensions of
21 × 21 µm, are spaced by 21 µm and are arranged in a 64 by 64
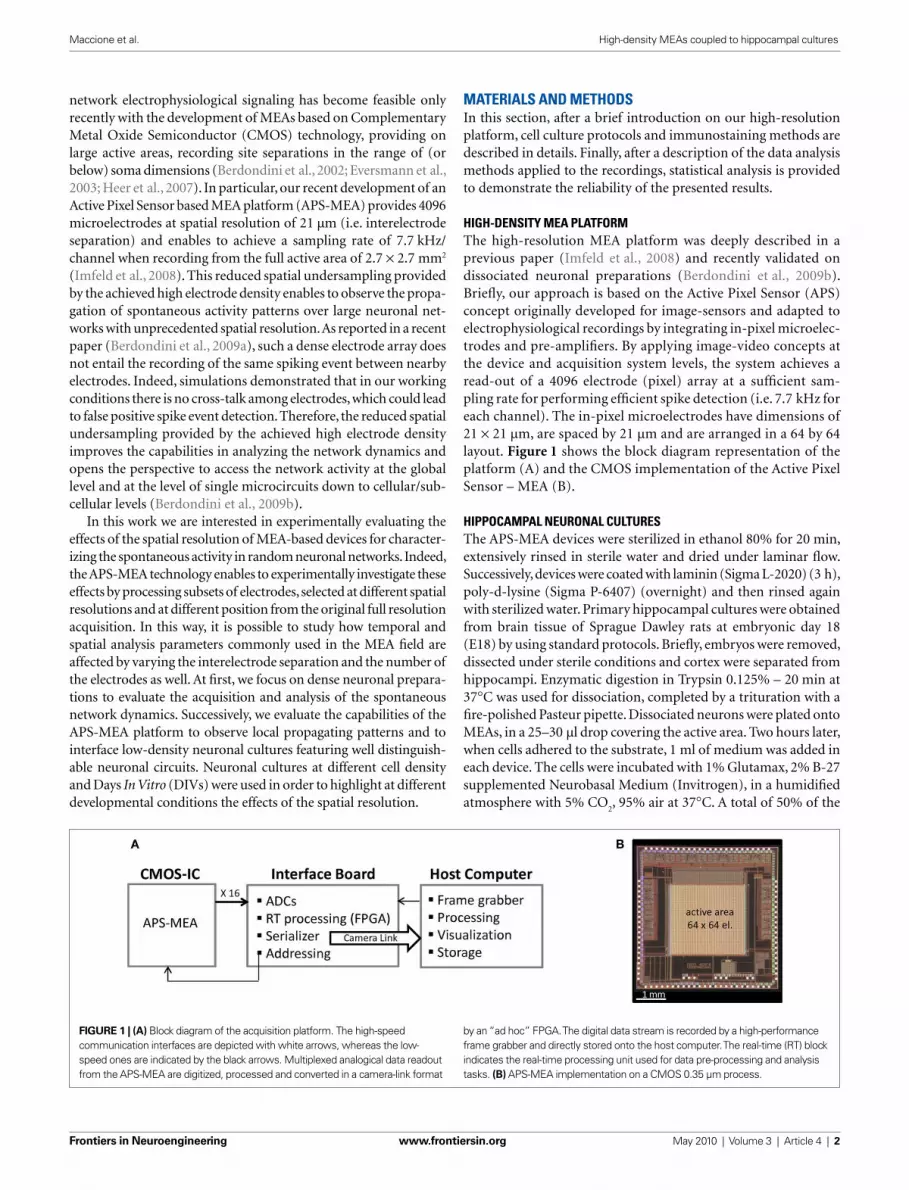
layout. Figure 1 shows the block diagram representation of the
platform (A) and the CMOS implementation of the Active Pixel
Sensor – MEA (B).
HIPPOCAMPAL NEURONAL CULTURES
The APS-MEA devices were sterilized in ethanol 80% for 20 min,
extensively rinsed in sterile water and dried under laminar fl ow.
Successively, devices were coated with laminin (Sigma L-2020) (3 h),
poly-d-lysine (Sigma P-6407) (overnight) and then rinsed again
with sterilized water. Primary hippocampal cultures were obtained
from brain tissue of Sprague Dawley rats at embryonic day 18
(E18) by using standard protocols. Briefl y, embryos were removed,
dissected under sterile conditions and cortex were separated from
hippocampi. Enzymatic digestion in Trypsin 0.125% – 20 min at
37°C was used for dissociation, completed by a trituration with a
fi re-polished Pasteur pipette. Dissociated neurons were plated onto
MEAs, in a 25–30 µl drop covering the active area. Two hours later,
when cells adhered to the substrate, 1 ml of medium was added in
each device. The cells were incubated with 1% Glutamax, 2% B-27
supplemented Neurobasal Medium (Invitrogen), in a humidifi ed
atmosphere with 5% CO2, 95% air at 37°C. A total of 50% of the
FIGURE 1 | (A) Block diagram of the acquisition platform. The high-speed
communication interfaces are depicted with white arrows, whereas the low-
speed ones are indicated by the black arrows. Multiplexed analogical data readout
from the APS-MEA are digitized, processed and converted in a camera-link format
by an “ad hoc” FPGA. The digital data stream is recorded by a high-performance
frame grabber and directly stored onto the host computer. The real-time (RT) block
indicates the real-time processing unit used for data pre-processing and analysis
tasks. (B) APS-MEA implementation on a CMOS 0.35 µm process.
Frontiers in Neuroengineering www.frontiersin.org May 2010 | Volume 3 | Article 4 | 3
Maccione et al. High-density MEAs coupled to hippocampal cultures
medium was changed every week and no antimitotic drug was
used. For the work presented here, we adopted two different cell’s
concentrations for achieving a dense monolayer of neurons cover-
ing the entire pixel area (∼ 1000 cells/µl) and for obtaining a sparse
network presenting isolated single cell bodies or very small cluster
of a few cells (∼ 195 cells/µl). The interest in this last biological
model is the clear identifi cation by immunofl uorescence of nucleus,
axons and branches allowing a morphological reconstruction of
the network by using fl uorescence imaging.
IMMUNOSTAINING
After electrophysiological recordings, low-density cultures were
fi xed, stained and fl uorescence imaging was performed. In this
way it was possible to acquire morphological and topographic
distribution of the neuronal network and to correlate this infor-
mation with the functional electrical activity recorded by the
APS-MEA system. Briefl y, cells were fi xed in 4% paraformal-
dehyde for 20 min at room temperature, rinsed with PBS and
then permeabilized with 0.05% Triton-X100 for 10–15 min. We
used a specifi c antibody to assess the expression of microtubule-
associated protein 2 (MAP2), a major neuronal marker for den-
dritic processes, entwined with a second major neuronal marker
(NeuN), that represents a nuclear protein specifi cally expressed
in post-mitotic neurons.
Primary antibodies NeuN (MAB377 monoclonal by Chemicon)
and MAP2 (AB5622 polyclonal by Chemicon) were diluted in block-
ing buffer composed by PBS, 3% FCS, 2% BSA, 0.1% sodium azide.
After 1 h, cultures were rinsed three times for 5 min each in PBS
and exposed to secondary antibody: Alexa Fluor® 546 Goat anti-
mouse to NeuN and Alexa Fluor® 488 Goat anti-rabbit to MAP2,
previously diluted in PBS, 0.3% BSA 0.1% sodium azide. Therefore,
cultures were incubated for 1 h at room temperature and rinsed
two times in PBS to eliminate excess of secondary antibody solu-
tion. Afterwards cultures on the chip were inspected under BX51
M Olympus microscope equipped with 20× 0.45 SLM objective.
DIC and fl uorescence images were taken with the care of preserving
overlapping regions by using a Hamamatsu ORCA ER II camera
driven by Image-Pro Plus software (from Media Cybernetics) and
successively manually stitched together by using Photoshop CS3
(from Adobe). The result is a high-resolution picture of the entire
active area of 2.7 × 2.7 mm2, where neuron’s nuclei and dendrite-
like processes are clearly resolved.
DATA ANALYSIS
The APS-MEA platform acts as a sort of video camera that records
the electrophysiological activity expressed by the in vitro neuronal
network. Data can be visualized off-line and during experimen-
tation as image sequences by encoding in a false color map the
signal variance computed over a bin (i.e. sequence of frames). This
method enables to highlight neuronal activation and signal propa-
gations through the whole culture. The acquired experimental data
are stored in fi les of several gigabytes due to the high data transfer
rate of about 80 MByte/s and need fast software tools to be analyszd
off-line. This was done by implementing the analysis algorithms in
“ad hoc” developed software tools able to manage off-line the large
amount of data acquired by the APS-MEA platform. In particular,
the spike detection was performed by using the recently presented
Precise Timing Spike Detection (PTSD) algorithm (Maccione et al.,
2008) since it enables a fast and precise identifi cation of the spike
events. To identify spikes, a threshold of 7.5 times the standard
deviation of the basal noise was adopted while a burst was detected
if fi ve or more consecutive spikes presented an inter spike interval
lower than 30 ms.
In order to compare analysis results at different spatial reso-
lutions, we extracted from the full resolution recording, subsets
of electrodes at different spatial densities while maintaining a
constant active area for the so defi ned layouts. This area (i.e.
1.7 × 1.7 mm2) was defi ned in order to be also comparable with
a commercially available device (MEA200-30, from Multichannel
Systems) even if it is smaller compared to the active area provided
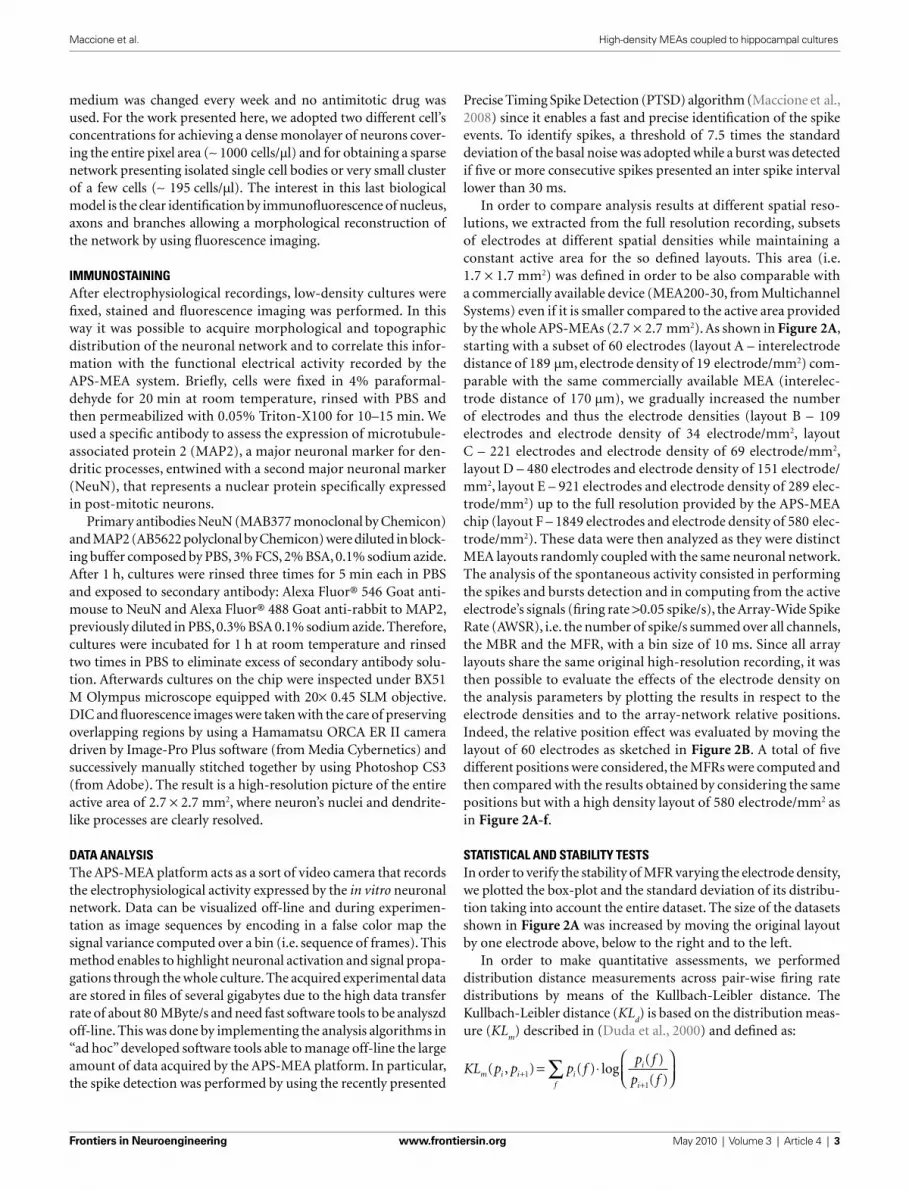
by the whole APS-MEAs (2.7 × 2.7 mm2). As shown in Figure 2A,
starting with a subset of 60 electrodes (layout A – interelectrode
distance of 189 µm, electrode density of 19 electrode/mm2) com-
parable with the same commercially available MEA (interelec-
trode distance of 170 µm), we gradually increased the number
of electrodes and thus the electrode densities (layout B – 109
electrodes and electrode density of 34 electrode/mm2, layout
C – 221 electrodes and electrode density of 69 electrode/mm2,
layout D – 480 electrodes and electrode density of 151 electrode/
mm2, layout E – 921 electrodes and electrode density of 289 elec-
trode/mm2) up to the full resolution provided by the APS-MEA
chip (layout F – 1849 electrodes and electrode density of 580 elec-
trode/mm2). These data were then analyzed as they were distinct
MEA layouts randomly coupled with the same neuronal network.
The analysis of the spontaneous activity consisted in performing
the spikes and bursts detection and in computing from the active
electrode’s signals (fi ring rate >0.05 spike/s), the Array-Wide Spike
Rate (AWSR), i.e. the number of spike/s summed over all channels,
the MBR and the MFR, with a bin size of 10 ms. Since all array
layouts share the same original high-resolution recording, it was
then possible to evaluate the effects of the electrode density on
the analysis parameters by plotting the results in respect to the
electrode densities and to the array-network relative positions.
Indeed, the relative position effect was evaluated by moving the
layout of 60 electrodes as sketched in Figure 2B. A total of fi ve
different positions were considered, the MFRs were computed and
then compared with the results obtained by considering the same
positions but with a high density layout of 580 electrode/mm2 as
in Figure 2A-f.
STATISTICAL AND STABILITY TESTS
In order to verify the stability of MFR varying the electrode density,
we plotted the box-plot and the standard deviation of its distribu-
tion taking into account the entire dataset. The size of the datasets
shown in Figure 2A was increased by moving the original layout
by one electrode above, below to the right and to the left.
In order to make quantitative assessments, we performed
distribution distance measurements across pair-wise fi ring rate
distributions by means of the Kullbach-Leibler distance. The
Kullbach-Leibler distance (KLd) is based on the distribution meas-
ure (KLm) described in (Duda et al., 2000) and defi ned as:
KL p p p fp f
p fm i i i
i
if
( , ) ( ) log( )
( )+
+
= ⋅⎛⎝⎜
⎞⎠⎟∑1
1
Frontiers in Neuroengineering www.frontiersin.org May 2010 | Volume 3 | Article 4 | 4
Maccione et al. High-density MEAs coupled to hippocampal cultures
where pi(f) and p
i+1(f ) are neighbor fi ring rate distributions (i =
19,34,69,151,289,580 el/mm2). In the case of two identical distri-
butions (pi(f) = p
i+1(f )) KL
m equals zero, i.e. log(1) = 0. Because
the original KLm lacks of symmetry, a more appropriate distance
measure is given by the following symmetrization:
KL p pKL p p KL p p
d i im i i m i i( , )
( , ) ( , )+
+ +=+
11 1
2
Finally, to assess “smallness” of the KLd parameter associated
to the el/mm2 distributions we used a bootstrap procedure. The
principle consists in shuffl ing, i.e. randomizing, the values of the
fi ring rates measured at different el/mm2. The resulting distances
among the randomized fi ring rate distributions are expected to
be of the same order or even larger with respect to the distances
among the original distributions. The shuffl ing procedure was
repeated 1000 times and the 5% percentile of the shuffl ed dis-
tances was taken as a threshold value. Distances falling below
that threshold would unlikely result from the original data or
from their randomization (the probability is less than 5%), there-
fore the threshold allows asserting when distributions are likely
close to each other.
RESULTS
The extracellular spontaneous activity at different Days In Vitro
(from 21 to 33 DIVs) of seven hippocampal cultures seeded at
∼1200 cell/mm2 and one low-density culture seeded at ∼195 cell/
mm2, was acquired on the APS-MEA platform for 10 min and at full
resolution (7.7 kHz/channel, 4096 electrode array, interelectrode
separation of 21 µm). Table 1 summarizes the experimental ses-
sions. At fi rst, the recorded data were processed with spike and burst
detection as described in the Section “Materials and Methods”. The
upper row of Figure 3 shows a typical raster plot and AWSR of
10 min spontaneous activity (DIV 32, exp 1) acquired at full reso-
lution on APS-MEA (∼580 el/mm2). Regular and relevant bursting
activity can be clearly visually identifi ed. Additionally, consecutive
FIGURE 2 | (A) Layouts representation corresponding to the electrode subsets
and used for analyzing the data at different spatial-scales. (top) Entire active area
of an APS-MEA (2.7 × 2.7 mm2) arranged in a 64 × 64 layout. (bottom) The
electrode array subsets are defi ned by considering a constant active area of
1.7 × 1.7 mm2. The lowest electrode density is of 19 electrode/mm2 for the 60
electrodes layout, and values gradually scale up to the full resolution
confi guration at 580 electrode/mm2 for the 1849 electrodes layout. (B) Subset of
60 channels at different positions with respect to the entire active area. The
different layouts are moved within an equivalent electrode area integrating
580 electrode/mm2.

Frontiers in Neuroengineering www.frontiersin.org May 2010 | Volume 3 | Article 4 | 5
Maccione et al. High-density MEAs coupled to hippocampal cultures
close-ups on the time-scale show a detailed view of a burst event
and allow appreciating the raster plot profi le representative of
the pattern propagation at the burst onset (Figure 3C). In this
experiment, a total of 1849 spontaneously actives electrodes were
identifi ed (i.e. average fi ring rate >0.05 spike/s).
As a fi rst comparison with what would be observed at a low
spatial resolution, the bottom section of Figure 3 shows the
same representations for the spatially undersampled layout of
60 electrodes (19 el/mm2). It can be observed that the visual
comparison of the raster plots and AWSRs processed from low
and high spatial resolution acquisitions does not show clear dif-
ferences. Indeed, the upper raster plot provides a more detailed
description of the network activations, but at a global network
level, the time-based identifi cation of the network bursts can also
be performed on the low-resolution data. Moreover, by looking
Table 1 | Summary of the performed experimental neuronal
preparations on APS-MEAs.
Experiment # DIV Plating density Spontaneously
(Days In Vitro) (area 25 mm2) active channels
1 32 1200 cell/mm2 1096
2 32 1200 cell/mm2 2197
3 28 1200 cell/mm2 879
4 28 1200 cell/mm2 628
5 28 1200 cell/mm2 653
6 21 1200 cell/mm2 307
7 21 1200 cell/mm2 953
8 33 195 cell/mm2 138
FIGURE 3 | Raster plots and AWSRs at the highest (top) and the lowest (bottom) spatial resolution. (A) Raster plots and AWSR of 10 min of activity acquired
from a hippocampal culture at 32 DIV (exp 1) and (B,C) close-ups on a burst event respectively of 15 sec and 300 msec.
Frontiers in Neuroengineering www.frontiersin.org May 2010 | Volume 3 | Article 4 | 6
Maccione et al. High-density MEAs coupled to hippocampal cultures
at the close-ups of a burst (Panel B – 15 s, Panel C – 300 ms) it
is possible to extract the same temporal information for both
spatial resolution datasets, i.e. single network burst events are
clearly detectable and envelops of the AWSRs are comparable.
This fi rst result indicates that the network is behaving as a sin-
gle neuronal population with characteristic global bursting fea-
tures that spread over the whole network. At the same time the
detailed raster plot profi le observed at high-resolution shows that
by means of APS-MEAs it is possible to resolve the propagating
pattern of the burst onset.
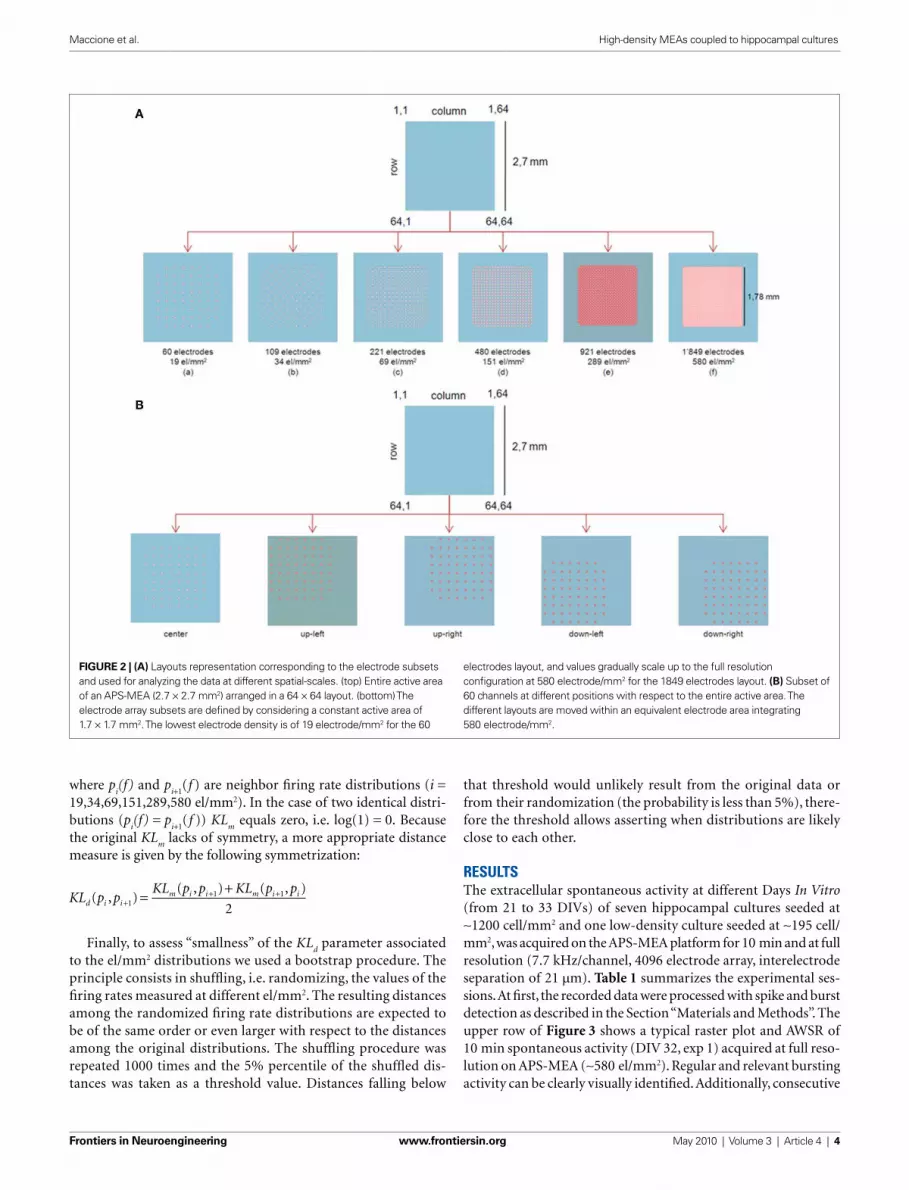
Differences between the different array layouts can be observed
for the MFR and for the MBR. This is shown in Figure 4 reporting
the MFR (Figure 4A) and MBR (Figure 4B) calculated for 7 prepa-
rations on subsets of electrodes featuring an increasing electrode
density. As shown by these plots, by increasing the electrode density
a stable MFR and MBR is reached especially for experiments 2, 3
and 7. The achievement of a refi ned statistics of global parameters
such as MFR and MBR is particularly important for experiments
involving dissociated cultures that generally present a high vari-
ability both inter and intra-cultures. However, the extrapolation of
a general quantifi cation of the minimum electrode density required
FIGURE 4 | (A) Mean Firing Rate (MFR) and (B) Mean Bursting Rate (MBR)
obtained by varying the array electrode density on 7 experiments at different
DIVs. Instable values in the MFR for the some experiments (2–3–7) are
observed for electrode densities lower than 151 electrode/mm2 (480 electrodes
on the active area of 1.7 × 1.7 mm2). This instability is more evident for the MBR
where almost all experiments are stable for a density higher than 151 electrode/
mm2. (C) Box-plots representation of the fi ring rate distribution (left axis)
superimposed to the StdDev (right axis) at different electrode densities and
layout positions. First and third quartile, median and standard deviation, are
almost identical for electrode density of 289 and 580 el/mm2. At the same
values StdDev shows a stable plateau. (D) Logarithmic representation of the
Kullbach-Leibler distances of pair-wise fi ring rate distribution. Distributions,
whose distance fall below the threshold (gray dashed line), are close to each
other. This holds true from the fi ring rate distributions at 289 and 580 el/mm2.
Frontiers in Neuroengineering www.frontiersin.org May 2010 | Volume 3 | Article 4 | 7
Maccione et al. High-density MEAs coupled to hippocampal cultures
for reaching stable values is rather diffi cult since the steady-state
stability depends also on the time-window of observation. Here,
to evaluate the threshold at least at our experimental conditions
we further analyzed the data as described in Section “Statistical
and stability tests”.
As shown in Figure 4C, the distribution of the standard devi-
ation computed by considering the whole experimental dataset
shows a plateau for electrode densities higher than 151 el/mm2.
Furthermore, at the highest recording electrode densities, box-
plots of the fi ring rates tend to resemble. For instance, at 289 el/
mm2 and 500 el/mm2 the statistical indexes, i.e. fi rst and third
quartile, median and standard deviation, are almost identical. This
qualitative observation is also confi rmed by computing the distri-
bution distance KLd across pair-wise distributions. A clear drop in
KLd ranging from 10−1 to around 10−4 is observable on Figure 4D
between the last two points. In addition, the latter distance falls
below the 5% percentile threshold (gray dashed line in Figure 4D)
and thus we can assert that for electrode densities higher than
289 el/mm2 the fi ring rate distributions are stable. These results
confi rm the relevance of the electrode density to optimally evalu-
ate the MFR and MBR in neuronal networks. Interestingly, for
almost all the datasets, the MBR graph shows high variability at
low electrode density. This behavior is probably due to the fact
that the “bursting” channels are less compared to the spiking ones
(Figure 4B).
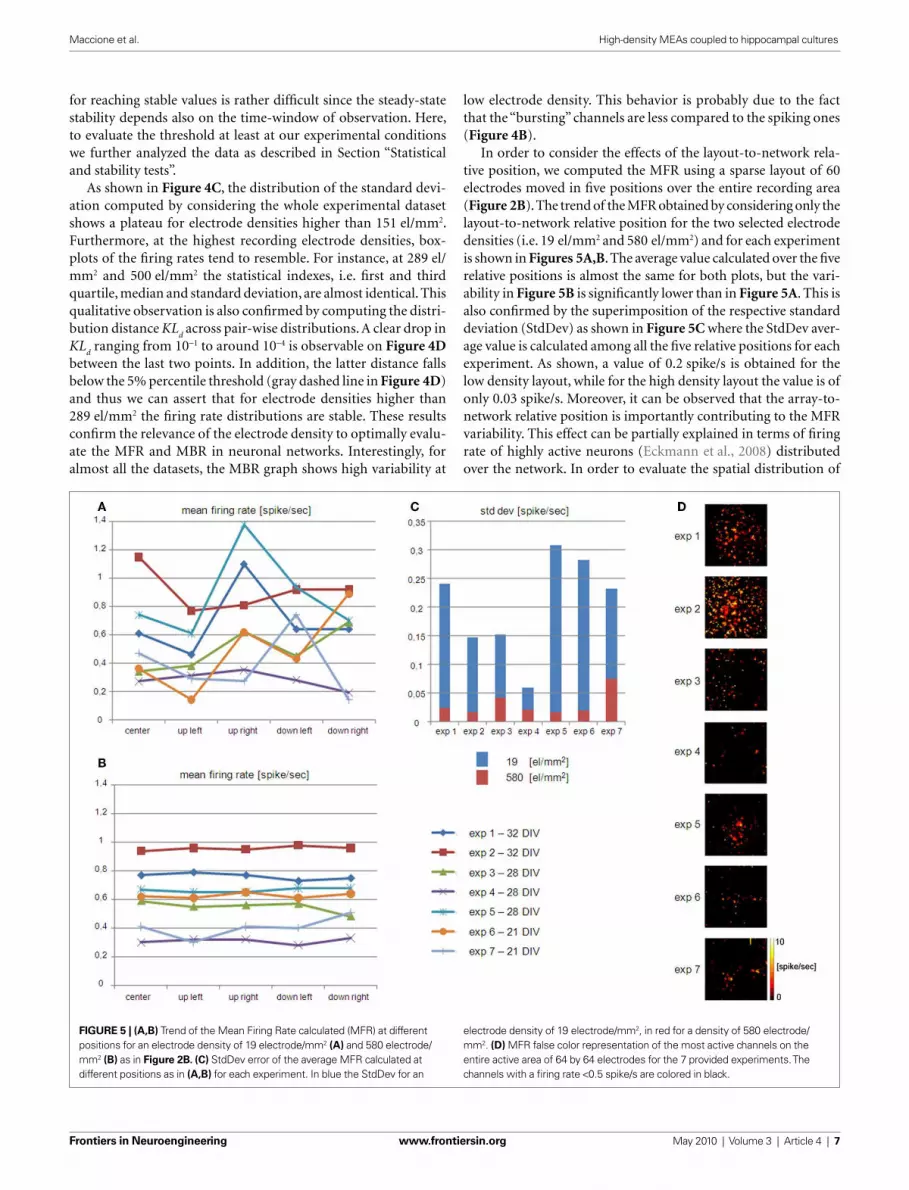
In order to consider the effects of the layout-to-network rela-
tive position, we computed the MFR using a sparse layout of 60
electrodes moved in fi ve positions over the entire recording area
(Figure 2B). The trend of the MFR obtained by considering only the
layout-to-network relative position for the two selected electrode
densities (i.e. 19 el/mm2 and 580 el/mm2) and for each experiment
is shown in Figures 5A,B. The average value calculated over the fi ve
relative positions is almost the same for both plots, but the vari-
ability in Figure 5B is signifi cantly lower than in Figure 5A. This is
also confi rmed by the superimposition of the respective standard
deviation (StdDev) as shown in Figure 5C where the StdDev aver-
age value is calculated among all the fi ve relative positions for each
experiment. As shown, a value of 0.2 spike/s is obtained for the
low density layout, while for the high density layout the value is of
only 0.03 spike/s. Moreover, it can be observed that the array-to-
network relative position is importantly contributing to the MFR
variability. This effect can be partially explained in terms of fi ring
rate of highly active neurons (Eckmann et al., 2008) distributed
over the network. In order to evaluate the spatial distribution of
FIGURE 5 | (A,B) Trend of the Mean Firing Rate calculated (MFR) at different
positions for an electrode density of 19 electrode/mm2 (A) and 580 electrode/
mm2 (B) as in Figure 2B. (C) StdDev error of the average MFR calculated at
different positions as in (A,B) for each experiment. In blue the StdDev for an
electrode density of 19 electrode/mm2, in red for a density of 580 electrode/
mm2. (D) MFR false color representation of the most active channels on the
entire active area of 64 by 64 electrodes for the 7 provided experiments. The
channels with a fi ring rate <0.5 spike/s are colored in black.

Frontiers in Neuroengineering www.frontiersin.org May 2010 | Volume 3 | Article 4 | 8
Maccione et al. High-density MEAs coupled to hippocampal cultures
these highly active neurons, Figure 5D provides a representation
in false color maps of sites with a MFR >0.5 spike/s. Enabled by
the high-resolution performance of the APS-MEAs. results show
that the distribution of the most active sites is not the same over
different experiments. Indeed, it is possible to distinguish networks
where highly fi ring neurons are quite isolated and arranged cov-
ering partially or almost all the area, while in other cases they are
organized in clusters localized in specifi c areas. Thus, the presence
and variable distribution of these neurons is certainly affecting the
analysis results of datasets acquired from low density and small
electrode array layouts.
In addition to the exploration of the effects of the electrode den-
sity and of the amount of recording sites on time-based fi rst order
statistical parameters, clear spatial resolution effects are observed
on space-based analysis. Indeed, for the localization of ignition sites
(i.e., the sites from which the activity propagates) and for describing
such network propagations, a high electrode density enables the
clear identifi cation of these events. In this respect, we were inter-
ested to estimate the electrode density threshold that enables the
visual identifi cation of these events, allowing further quantitative
and precise analysis. Figure 6 represents at different time intervals
of 5 ms and at different spatial resolutions, the arising and propaga-
tion of a burst on a culture at 32 DIV (exp 1). As presented in the
Section “Materials and Methods”, the variance of the acquired raw
signal on a time window of 35 ms is represented by using a false
color map. It can be appreciated that only for electrode densities
near to the full resolution (580 electrodes/mm2) it is possible to
identify the source of the burst and the propagating pattern. This
result highlights that MEAs with lower electrode densities are not
suitable to spatially characterize extracellular signaling propagating
at the global network level.
The effects of a low spatial resolution of the neuroelectronic
interface become even more relevant when scaling down the
analysis focus to local propagations. Indeed, the observation of
microcircuit activations requires a high electrode density. This
aspect is illustrated in Figure 7A, which shows an example of raw
data acquired from a small active area of 25 electrodes, integrated
at the highest electrode density provided by this generation of
APS-MEAs. The raster plot of these data (Figure 7B) is reported
by ordering the electrode channels with respect to the fi rst spike
FIGURE 6 | Representation in a false color map of a burst event at different
spatial resolutions (32 DIV, exp1). (top) at lowest resolution (bottom) at full
APS-MEA resolution. The fi rst 35 ms of activity are showed with a time-step of
5 ms, by integrating the signal variance over a bin of 10 ms. The considered
active area (1.7 × 1.7 mm2) for the different spatially undersampled layouts is
indicated with the red square.

Frontiers in Neuroengineering www.frontiersin.org May 2010 | Volume 3 | Article 4 | 9
Maccione et al. High-density MEAs coupled to hippocampal cultures
occurrences. As shown in Figure 7C, the achieved electrode density
allows following the activity propagation on a small active area (i.e.
1000 µm2 for 25 electrodes). This example illustrates that to enable
the possibility to follow local microcircuit activations, high-density
MEAs are required. As a reference and for comparison, the same
fi gure indicates with blue electrodes the sites that would have been
available on this active area with a low electrode density layout
(60 electrodes). As shown, this layout would not allow following
local propagations.
Finally, a direct advantage of MEA-based devices featuring a
high spatial resolution is the possibility to address the electrophysi-
ological study of low density neuronal cultures given the higher
probability to effi ciently couple sparse neuronal networks. These
preparations enable to well resolve the network with imaging
methods and allow acquiring morphological data (e.g. neurons
localizations, neuritis, synaptic connections) to be combined with
electrophysiological recordings on high-resolution MEAs. As a pre-
liminary assessment of this feature aimed at correlating the neu-
ronal network topology with its spontaneous electrophysiological
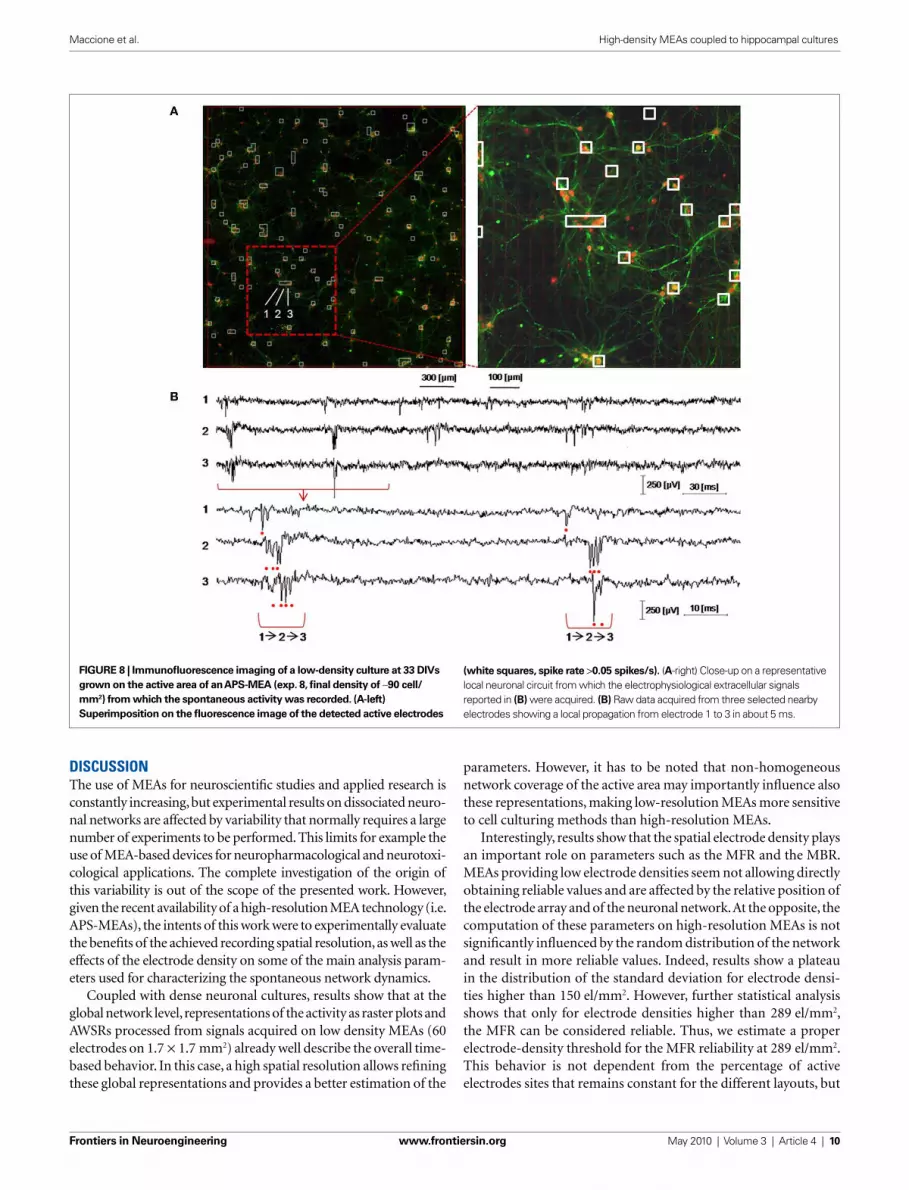
functionality, Figure 8A shows an image of the whole APS-MEA
active area where a low density culture seeded at 195 cell/mm2 was
grown for 33 DIVs. At this developmental stage, the fi nal neuronal
density is of ∼90 cell/mm2. As shown, neurons are clearly distin-
guishable, their spatial distribution is homogeneous, and neurites
defi ne a quite complex wiring between the cell bodies. In addi-
tion, the fi gure superimposes with white squares the spontaneously
active electrode sites and the well matching between morphological
and electrophysiological data can be appreciated. It can be noted
that not all the electrodes covered by neurons are detected as active.
This is not surprising under the considered spontaneous activity
conditions as well as the observation time-window and detection
thresholds used in this work.
The right panel of Figure 8A shows a close up of an area
from which the raw signals reported in Figure 8B were acquired.
As illustrated in the fi gure, it is possible to identify the activa-
tion sequence from the raw signals of a few representative sites
belonging to local microcircuits (from electrode site 1 to 3). This
example shows that this technology enables to identify the propa-
gating signaling in neuronal microcircuits and this methodology
could be used for investigating the interplay between single cell,
local microcircuits and global network dynamics within large
neuronal assemblies.
FIGURE 7 | High resolution MEAs enable the observation of local
electrophysiological signal propagations within high density cultures.
(A) Raw data showing a local electrical propagation involving about 25 pixels
(5 by 5 pixel area represented by the white squares of (B) for a culture at 32
DIV (exp 1) and the (C) corresponding raster plot obtained upon spike
detection ordered for temporal appear of the fi rst spike. Additionally, B shows
the spatial reconstruction of the fi rst spike occurrences. The star represents
the electrode where the fi rst spike is detected. Blue sites indicate the
electrodes that would be available with a low resolution, 60
electrodes layout.
Frontiers in Neuroengineering www.frontiersin.org May 2010 | Volume 3 | Article 4 | 10
Maccione et al. High-density MEAs coupled to hippocampal cultures
DISCUSSION
The use of MEAs for neuroscientifi c studies and applied research is
constantly increasing, but experimental results on dissociated neuro-
nal networks are affected by variability that normally requires a large
number of experiments to be performed. This limits for example the
use of MEA-based devices for neuropharmacological and neurotoxi-
cological applications. The complete investigation of the origin of
this variability is out of the scope of the presented work. However,
given the recent availability of a high-resolution MEA technology (i.e.
APS-MEAs), the intents of this work were to experimentally evaluate
the benefi ts of the achieved recording spatial resolution, as well as the
effects of the electrode density on some of the main analysis param-
eters used for characterizing the spontaneous network dynamics.
Coupled with dense neuronal cultures, results show that at the
global network level, representations of the activity as raster plots and
AWSRs processed from signals acquired on low density MEAs (60
electrodes on 1.7 × 1.7 mm2) already well describe the overall time-
based behavior. In this case, a high spatial resolution allows refi ning
these global representations and provides a better estimation of the
parameters. However, it has to be noted that non-homogeneous
network coverage of the active area may importantly infl uence also
these representations, making low-resolution MEAs more sensitive
to cell culturing methods than high-resolution MEAs.
Interestingly, results show that the spatial electrode density plays
an important role on parameters such as the MFR and the MBR.
MEAs providing low electrode densities seem not allowing directly
obtaining reliable values and are affected by the relative position of
the electrode array and of the neuronal network. At the opposite, the
computation of these parameters on high-resolution MEAs is not
signifi cantly infl uenced by the random distribution of the network
and result in more reliable values. Indeed, results show a plateau
in the distribution of the standard deviation for electrode densi-
ties higher than 150 el/mm2. However, further statistical analysis
shows that only for electrode densities higher than 289 el/mm2,
the MFR can be considered reliable. Thus, we estimate a proper
electrode-density threshold for the MFR reliability at 289 el/mm2.
This behavior is not dependent from the percentage of active
electrodes sites that remains constant for the different layouts, but
FIGURE 8 | Immunofl uorescence imaging of a low-density culture at 33 DIVs
grown on the active area of an APS-MEA (exp. 8, fi nal density of ∼90 cell/
mm2) from which the spontaneous activity was recorded. (A-left)
Superimposition on the fl uorescence image of the detected active electrodes
(white squares, spike rate >0.05 spikes/s). (A-right) Close-up on a representative
local neuronal circuit from which the electrophysiological extracellular signals
reported in (B) were acquired. (B) Raw data acquired from three selected nearby
electrodes showing a local propagation from electrode 1 to 3 in about 5 ms.

Frontiers in Neuroengineering www.frontiersin.org May 2010 | Volume 3 | Article 4 | 11
Maccione et al. High-density MEAs coupled to hippocampal cultures
multielectrode surface. IEEE Trans.
Biomed. Eng. 26, 273–279.
Heer, F., Hafizovic, S., Ugniwenko, T.,
Frey, U., Franks, W., Perriard, E.,
Perriard, J.-C., Blau, A., Ziegler, C., and
Hierlemann, A. (2007). Single-chip
microelectronic system to interface
with living cells. Biosens. Bioelectron
22, 2546–2553.
Heuschkel, M. O., Fejtl, M., Raggenbass,
M., Bertrand, D., and Renaud, P.
(2002). A three-dimensional multi-
electrode array for multi-site stimula-
tion and recording in acute brain slices.
J. Neurosci. Methods 114, 135–148.
Imfeld, K., Neukom, S., Maccione, A.,
Bornat, Y., Martinoia, S., Farine, P. A.,
Koudelka-Hep, M., and Berdondini,
L. (2008). Large-Scale, high-resolution
data acquisition system for extracel-
lular recording of electrophysiological
activity. IEEE Trans. Biomed. Eng. 55,
2064–2073.
Jimbo, Y., Tateno, Y., and Robinson, H.
P. C. (1999). Simultaneous induction
of pathway-specifi c potentiation and
depression in networks of cortical
neurons. Biophys. J. 76, 670–678.
Keefer, E. W., Gramowski, A., Stenger,
D. A., Pancrazio, J. J., and Gross, G.
W. (2001). Characterization of acute
neurotoxic effects of trimethylolpro-
pane phosphate via neuronal network
biosensors. Biosens. Bioelectron. 16,
513–525.
Kraus, T., Verpoorte, E., Linder, V.,
Franks, W., Hierlemann, A., Heer, F.,
Hafi zovic, S., Fujii, T., de Rooij, N. F.,
and Koster, S. (2006). Characterization
mainly depends from the amount of electrodes contributing to
the statistics. Additionally, the so called highly active neurons can
further polarize the values of the fi ring parameters if the density
and number of recording sites are too low. A similar threshold in
the electrode density is empirically obtained for visually identifying
at the global network level activation sources and propagating pat-
terns involved in burst activations. In this case, the spatial resolution
resulting from the electrode density plays a direct role. Indeed, we
observed that a bursting event usually starts with a sort of wave-
like propagation pattern, followed by co-activation in distinct areas
probably due to long-axons propagating signal or reverberating
local microcircuits. This really variable and complex behavior
makes the high spatial resolution a mandatory requirement for
detailed observation both of propagating patterns at the local level
of microcircuits in high-density preparations and for coupling
with low-density cultures. In particular, the interest in the latter
experimental condition is the possibility to correlate morphologi-
cal data acquired with immune-fl uorescence imaging techniques
with MEA-based electrophysiological recordings for studying the
tight link between network morphology and functional behavior.
Without using a high resolution MEA technology, this experimental
model cannot be easily coupled to MEAs, unless specifi c patterning
techniques and positioning methods would be used.
All these considerations provide some interesting “design rules”
for realizing effi cient MEAs with respect to the recording and the
analysis of the network activity to be performed. These observa-
tions do not only infl uence the chip design, but have implica-
tions also for the design of the acquisition platforms, i.e. to the
number of acquisition channels to be managed and processed.
Interestingly, the integration of large electrode arrays featuring
higher electrode densities than the current APS-MEA used in this
work, is not expected to further improve global activity analysis
parameters such as the MBR and MFR, but will certainly contribute
in achieving detailed descriptions of the involved spatial-temporal
signaling at cellular, microcircuit and network levels. Therefore,
the presented results indicate that further CMOS-MEA devel-
opments should target the read-out from very large active areas
integrating dense electrode arrays with the aim to enhance such
multi-dimensional neuronal interfacing (i.e. from single neurons
to networks) and to elaborate reliable statistical parameters of the
observed activities.
ACKNOWLEDGMENTS
This work was supported by a grant from the European Community
in the New and Emerging Science and Technology program (IDEA
project, FP6-NEST, contract No. 516432).
REFERENCES
Baumann, W. H., Lehmann, M., Schwinde,
A., Ehret, R., Brischwein, M., and Wolf,
B. (1999). Microelectronic sensor sys-
tem for microphysiological applica-
tion on living cells. Sens. Actuators B
Chem. 55, 77–89.
Berdondini, L., Chiappalone, M., van
der Wal, P. D., Imfeld, K., de Rooij, N.
F., Koudelka-Hep, M., Tedesco, M.,
Martinoia, S., van Pelt, J., Le Masson,
G., and Garenne, A. (2006). A micro-
electrode array (MEA) integrated with
clustering structures for investigating
in vitro neurodynamics in confi ned
interconnected sub-populations of
neurons. Sens. Actuators B Chem.
114, 530–541.
Berdondini, L., Massobrio, P., Chiappalone,
M., Tedesco, M., Imfeld, K., Maccione,
A., Gandolfo, M., Koudelka-Hep, M.,
and Martinoia, S. (2009a). Extracellular
recordings from locally dense micro-
electrode arrays coupled to dissociated
cortical cultures. J. Neurosci. Methods
177, 386–396.
Berdondini, L., Imfeld, K., Maccione, A.,
Tedesco, M., Neukom, S., Koudelka-
Hep, M., and Martinoia, S. (2009b).
Active pixel sensor array for high
spatio-temporal resolution electro-
physiological recordings from single
cell to large scale neuronal networks.
Lab Chip. doi: 10.1039/b907394a.
Berdondini, L., Overstolz, T., de Rooij,
N. F., Koudelka-Hep, M., Martinoia,
S., Seitz, P., Wäny, M., and Blanc, N.
(2002). “High resolution electrophysi-
ological activity imaging of in vitro
neuronal networks,” in IEEE-EMBS
(Madison: IEEE Press), 241–244.
Blau, A., Neumann, T., Ziegler, C., and
Benfenati, F. (2009). Replica-molded
poly (dimethylsiloxane) culture vessel
lids attenuate osmotic drift in longterm
cell culturing. J. Biosci. 34, 59–69.
Chiappalone, M., Bove, M., Vato, A.,
Tedesco, M., and Martinoia, S. (2006).
Dissociated cortical networks show
spontaneously correlated activity
patterns during in vitro development.
Brain Res. 1093, 41–53.
Duda, R. O., Hart, P. E., and Stork, D. G.
(2000). Pattern Classifi cation, 2nd edn.
New York: Wiley.
Eckmann, J.-P., Jacobi, S., Marom, S.,
Moses, E., and Zbinden, C. (2008).
Leader neurons in population bursts
of 2D living neural networks. New J.
Phys. 10, 015011.
Egert, U., Heck, D., and Aertsen, A. (2002).
Two-dimensional monitoring of spik-
ing networks in acute brain slices.
Exp. Brain Res. 142, 268–274. doi:
10.1007/s00221-001-0932–935.
Eversmann, B., Jenkner, M., Hofmann, F.,
Paulus, C., Brederlow, R., Holzapfl , B.,
Fromherz, P., Merz, M., Brenner, M.,
Schreiter, M., Gabl, R., Plehnert, K.,
Steinhauser, M., Eckstein, G., Schmitt-
Landsiedel, D., and Thewes, R. (2003).
A 128 × 128 CMOS biosensor array
for extracellular recording of neural
activity. IEEE J. Solid-State Circuits 38,
2306–2317.
Gross, G. W. (1979). Simultaneous sin-
gle unit recording in vitro with a
photoetched laser deinsulated gold
of a microfl uidic dispensing system for
localised stimulation of cellular net-
works. Lab Chip 6, 218–229.
Kristensen, B. W., Noraberg, J., Thiébaud,
P., Koudelka-Hep, M., and Zimmer, J.
(2001). Biocompatibility of silicon-
based arrays of electrodes coupled to
organotypic hippocampal brain slice
cultures. Brain Res. 896, 1–17.
Maccione, A., Gandolfo, M., Massobrio,
P., Novellino, A., Martinoia, S., and
Chiappalone, M. (2008). A novel
algorithm for precise identifi cation
of spikes in extracellularly recorded
neuronal signals. J. Neurosci. Methods
177, 241–249.
Magloire, V., and Streit, J. (2009). Intrinsic
activity and positive feedback in motor
circuits in organotypic spinal cord
slice cultures. Eur. J. Neurosci. 30,
1487–1497.
Marom, S., and Eytan, D. (2005). Learning
in ex vivo developing networks of
cortical neurons. Prog. Brain Res. 147,
189–199.
Morefi eld, S. I., Keefer, E. W., Chapman,
K. D., and Gross, G. W. (2000). Drug
evaluations using neuronal networks
cultured on microelectrode arrays.
Biosens. Bioelectron. 15, 383–396.
Morin, F. O., Takamura, Y., and Tamiya, E.
(2005). Investigating neuronal activ-
ity with planar microelectrode arrays:
Achievements and new perspectives. J.
Biosci. Bioeng. 100, 131–143.
Pine, J. (1980). Recording action poten-
tials from cultured neurons with
extracellular microcircuit electrodes.
J. Neurosci. Methods 2, 19–31.

Frontiers in Neuroengineering www.frontiersin.org May 2010 | Volume 3 | Article 4 | 12
Maccione et al. High-density MEAs coupled to hippocampal cultures
S and Berdondini L (2010) Experimental
investigation on spontaneously active hip-
pocampal cultures recorded by means of
high-density MEAs: analysis of the spatial
resolution effects. Front. Neuroeng. 3:4. doi:
10.3389/fneng.2010.00004
Copyright © 2010 Maccione, Gandolfo,
Tedesco, Nieus, Imfeld, Martinoia and
Berdondini. This is an open-access
article subject to an exclusive license
agreement between the authors and the
Frontiers Research Foundation, which
permits unrestricted use, distribution,
and reproduction in any medium, pro-
vided the original authors and source
are credited.
attractors in activity patterns of
cultured neuronal networks. Phys.
Rev. E Stat. Nonlin. Soft Matter Phys.
73 (5 Pt 1), 051907.
Conflict of Interest Statement: The
authors declare that the research was con-
ducted in the absence of any commercial or
fi nancial relationships that could be con-
strued as a potential confl ict of interest.
Received: 21 December 2009; paper pending
published: 03 February 2010; accepted: 06
April 2010; published online: 10 May 2010.
Citation: Maccione A, Gandolfo M,
Tedesco M, Nieus T, Imfeld K, Martinoia
Rowe, L., Almasri, M., Lee, K., Fogleman,
N., Brewer, G. J., Nam, Y., Wheeler,
B. C., Vukasinovic, J., Glezer, A., and
Frazier, A. B. (2007). Active 3-D micro-
scaffold system with fl uid perfusion
for culturing in vitro neuronal net-
works. Lab. Chip 7, 475–482.
Tetko, I. V., and Villa, A. E. P. (2001). A pat-
tern grouping algorithm for analysis of
spatiotemporal patterns in neuronal
spike trains. 1. Detection of repeated
patterns. J. Neurosci. Methods 105,
1–14.
Thakur, P. H., Lu, H., Hsiao, S. S., and
Johnson, K. O. (2007). Automated
optimal detection and classifica-
tion of neural action potentials in
extra- cellular recordings. J. Neurosci.
Methods 162, 364–376.
Thiébaud, P., de Rooij, N. F., Koudelka-
Hep, M., and Stoppini, L. (1997).
Microelectrode arrays for electrophys-
iological monitoring of hippocampal
organotypic slice cultures. IEEE Trans.
Biomed. Eng. 44, 1159–1163.
Thomas, C. A., Springer, P. A., Okun, L. M.,
Berwaldn, Y., and Loeb, G. E. (1972).
Miniature microelectrode array to
monitor bioelectric activity of cul-
tured cells. Exp. Cell Res. 74, 61–66.
Wagenaar, D. A., Nadasdy, Z., and Potter,
S. M. (2006). Persistent dynamic