
Experimental Evaluation of an NoC Synthesis Tool
86
University of Windsor University of Windsor Scholarship at UWindsor Scholarship at UWindsor Electronic Theses and Dissertations Theses, Dissertations, and Major Papers 2015 Experimental Evaluation of an NoC Synthesis Tool Experimental Evaluation of an NoC Synthesis Tool Jenita Priya Rajamanickam Manokara University of Windsor Follow this and additional works at: https://scholar.uwindsor.ca/etd Recommended Citation Recommended Citation Rajamanickam Manokara, Jenita Priya, "Experimental Evaluation of an NoC Synthesis Tool" (2015). Electronic Theses and Dissertations. 5286. https://scholar.uwindsor.ca/etd/5286 This online database contains the full-text of PhD dissertations and Masters’ theses of University of Windsor students from 1954 forward. These documents are made available for personal study and research purposes only, in accordance with the Canadian Copyright Act and the Creative Commons license—CC BY-NC-ND (Attribution, Non-Commercial, No Derivative Works). Under this license, works must always be attributed to the copyright holder (original author), cannot be used for any commercial purposes, and may not be altered. Any other use would require the permission of the copyright holder. Students may inquire about withdrawing their dissertation and/or thesis from this database. For additional inquiries, please contact the repository administrator via email ([email protected]) or by telephone at 519-253-3000ext. 3208.
-
Upload
khangminh22 -
Category
Documents
-
view
1 -
download
0
Transcript of Experimental Evaluation of an NoC Synthesis Tool

University of Windsor University of Windsor
Scholarship at UWindsor Scholarship at UWindsor
Electronic Theses and Dissertations Theses, Dissertations, and Major Papers
2015
Experimental Evaluation of an NoC Synthesis Tool Experimental Evaluation of an NoC Synthesis Tool
Jenita Priya Rajamanickam Manokara University of Windsor
Follow this and additional works at: https://scholar.uwindsor.ca/etd
Recommended Citation Recommended Citation Rajamanickam Manokara, Jenita Priya, "Experimental Evaluation of an NoC Synthesis Tool" (2015). Electronic Theses and Dissertations. 5286. https://scholar.uwindsor.ca/etd/5286
This online database contains the full-text of PhD dissertations and Masters’ theses of University of Windsor students from 1954 forward. These documents are made available for personal study and research purposes only, in accordance with the Canadian Copyright Act and the Creative Commons license—CC BY-NC-ND (Attribution, Non-Commercial, No Derivative Works). Under this license, works must always be attributed to the copyright holder (original author), cannot be used for any commercial purposes, and may not be altered. Any other use would require the permission of the copyright holder. Students may inquire about withdrawing their dissertation and/or thesis from this database. For additional inquiries, please contact the repository administrator via email ([email protected]) or by telephone at 519-253-3000ext. 3208.
Experimental Evaluation of an NoC Synthesis Tool
By
Jenita Priya Rajamanickam Manokaran
A Thesis
Submitted to the Faculty of Graduate Studies
through the Department of Electrical and Computer Engineering
in Partial Fulfillment of the Requirements for
the Degree of Master of Applied Science
at the University of Windsor
Windsor, Ontario, Canada
2015
© 2015 Jenita Priya Rajamanickam Manokaran

Experimental Evaluation of an NoC Synthesis Tool
By
Jenita Priya Rajamanickam Manokaran
APPROVED BY:
______________________________________________
Dr. S. Das
Civil and Environmental Engineering
______________________________________________
Dr. K. Tepe
Electrical and Computer Engineering
______________________________________________
Dr. M. A. S. Khalid, Advisor
Electrical and Computer Engineering
February 10, 2015

iii
Author’s Declaration of Originality
I hereby certify that I am the sole author of this thesis and that no part of this thesis has
been published or submitted for publication.
I certify that, to the best of my knowledge, my thesis does not infringe upon anyone’s
copyright nor violate any proprietary rights and that any ideas, techniques, quotations, or
any other material from the work of other people included in my thesis, published or
otherwise, are fully acknowledged in accordance with the standard referencing practices.
Furthermore, to the extent that I have included copyrighted material that surpasses the
bounds of fair dealing within the meaning of the Canada Copyright Act, I certify that I
have obtained a written permission from the copyright owner(s) to include such material(s)
in my thesis and have included copies of such copyright clearances to my appendix. The
material taken from different thesis is as follows:
i. From Chapter 3 section 3.1.1.3 (Routing Algorithm), Figure 14, Figure 15, section
3.3.1, Figure 18, Table 3.1, Figure 19 from thesis by K. Jetley “Experimental
Comparison of Store-and-Forward and Wormhole NoC Routers for FPGA's,” Feb
2013.
I declare that this is a true copy of my thesis, including any final revisions, as approved
by my thesis committee and the Graduate Studies office, and that this thesis has not been
submitted for a higher degree to any other University or Institution.
iv
Abstract
Rapid growth in the number of IP cores in SoCs resulted in the need for effective and
scalable interconnect scheme for system components – Network-on-Chip (NoC). Design
and implementation of an NoC from scratch is very time consuming and limits the NoC
design space that can be explored. In this thesis we evaluate and compare NoC synthesis
tool CONNECT with manually generated NoC design using Altera Quartus II. Three sizes
of ring, mesh and torus NoC topologies are used for evaluation based on two metrics: logic
resource utilization and maximum clock frequency. For larger NoC sizes manual design
provides up to 85% reduction in area utilization. With respect to maximum clock
frequency, CONNECT provides superior results for all NoC sizes, providing up to 80%
higher clock frequency. These results provide an insight into the area versus frequency
tradeoffs when using the CONNECT NoC synthesis tool.

v
Dedication
To LORD ALMIGHTY JESUS CHRIST, “I can do all things through
CHRIST who strengthens me”. PHILIPPIANS 4:13.

vi
Acknowledgements
I would like to thank my supervisor, Dr. M. A. S. Khalid, for trusting my competence
to pursue my M.A.Sc research. His guidance and advice helped me to enlarge my
knowledge during the course of this research. His interest in the embedded field and his
knowledge about the FPGA technologies amazed me all the time. It kindled my interest
towards this field. Without him I would have missed the golden opportunity to work with
him.
My sincere thanks to all my committee members, Dr. K. Tepe and Dr. S. Das, for their
suggestions without which this work wouldn’t have seen the light of the day. Thanks to
Dr. D. Munday, Altera Corporation for kindly going through my results and his valuable
suggestions.
I would like to thank my husband without whom I would not have reached this far. I
want to thank my parents for all their prayers and blessing that they showered on me.
Thanks to my dear brother Prashant and sisters Jenifer and Rani for helping me to work
through all my problems and prayed for me whenever I feel so stressful.
Finally, I would like to thank Krunal for giving me permission to use his router and all
my friends for their friendship and guidance. Thanks to Andria, for her help, prayers and
continuous support over the course of this research. Last but not the least thanks to my
little princess Yazhini, who kept me busy all the time.
vii
Table of Contents
Author’s Declaration of Originality iii
Abstract iv
Dedication v
Acknowledgements vi
List of Figures xi
List of Tables xiii
List of Abbreviations xiv
1. Chapter 1 – Introduction 1
1.1. Thesis Objective 3
1.2. Thesis Organization 4
2. Chapter 2 – Background and Related Research 5
2.1. On – Chip Architecture 5
2.2. NoC Overview 5
2.2.1. NoC Technology 5
2.2.2. Sample NoC Architecture 5
2.2.2.1. IP Core 6
2.2.2.2. Network Adapter 6
2.2.2.3. Routing Nodes 6
2.2.2.4. Routing Links 7
2.2.3. NoC Parameters 7
2.2.3.1. NoC Topology 7

viii
2.2.3.1.1. Ring Topology 8
2.2.3.1.2. Mesh Topology 9
2.2.3.1.3. Torus Topology 9
2.2.3.2. Buffering 10
2.2.3.3. Flow Control 10
2.2.3.4. Switching Mode 11
2.2.3.5. Routing Algorithm 12
2.2.4. NoC Evaluation Metrics 12
2.2.4.1. Area 13
2.2.4.2. Power Consumption 13
2.2.4.3. Latency/Throughput 13
2.3. Altera Quartus II CAD Tool 13
2.4. Field Programmable Gate Arrays 14
2.4.1. FPGA Target Device 16
2.5. Related work 16
2.6. Summary 19
3. Chapter 3 – NoC Design and Implementation Using Manual &
Automated Synthesis Methods 20
3.1. Manual NoC Design and Implementation Method 20
3.1.1. Functionality of WH router 21
3.1.1.1. Protocols 21
3.1.1.2. Routing Algorithm 21
3.1.2. Router Implementation 23
ix
3.1.2.1. WH Router Exterior Structure 24
3.1.2.2. WH Router Internal Structure 25
3.1.3. Adapter Overview 27
3.1.3.1. Adapter Internal Design 29
3.2. NoC Synthesis and Implementation Using CONNECT 30
3.2.1. Overview of CONNECT 30
3.2.1.1. CONNECT Router Architecture 30
3.2.2. Implementation Of Topologies 31
3.2.2.1. Ring, Mesh and Torus Topologies 32
4. Chapter 4 – NoC Synthesis Tool: Evaluation Results 33
4.1. Manual Design and Implementation of NoC using Quartus II 33
4.1.1. Comparison of Area Utilization for Ring, Mesh and
Torus Topologies 34
4.1.2. Effects of Increase in Data Width and NoC Sizes on
Area Utilization 35
4.1.3. Comparison of Maximum Clock Frequency for Ring,
Mesh and Torus Topologies 39
4.2. NoC Synthesis results using CONNECT tool 45
4.2.1. Comparison of Area Utilization for Ring, Mesh and
Torus Topologies 45
4.2.2. Effects of Increase in Data Width and NoC Sizes on
Area Utilization 47
x
4.2.3. Comparison of Maximum Clock Frequency for Ring,
Mesh and Torus Topologies 49
4.3. Comparison of manually designed NoC with Automated NoC Synthesis 54
4.3.1. Comparison of Area Utilization Results 55
4.3.2. Comparison of Maximum Clock frequency Results 57
4.4. Summary 59
5. Chapter 5 – Conclusions and Future Work 60
5.1. Future work 62
6. References 63
Appendix A: Copyright Permission 68
Vita Auctoris 70

xi
List of figures
Figure 2.1: NoC Architecture 6
Figure 2.2: Ring topology 8
Figure 2.3: Mesh topology 9
Figure 2.4: Torus topology 10
Figure 2.5: Packetization 11
Figure 2.6: Typical CAD flow for mapping a design to Altera FPGA 14
Figure 2.7: FPGA Architecture 15
Figure 3.1: Router with port allocation 23
Figure 3.2: WH Router 24
Figure 3.3: WH Router Internal Structure 26
Figure 3.4: NoC with master and slave adapter 27
Figure 3.5: Request Types 28
Figure 3.6: Adapter Internal Design 29
Figure 3.7: Ring, Mesh, Torus topologies generated by CONNECT 32
Figure 4.1: Area Utilization for three NoC sizes and topologies
using manual NoC design 35
Figure 4.2: Area Utilization for Ring Topology 36
Figure 4.3: Area Utilization for Mesh Topology 37
Figure 4.4: Area Utilization for Torus Topology 38
Figure 4.5: Maximum Clock frequency for three NoC topologies and
sizes using manual NoC design 40
Figure 4.6: Maximum Clock frequency for Ring Topology 41
xii
Figure 4.7: Maximum Clock frequency for Mesh Topology 42
Figure 4.8: Maximum Clock frequency for Torus Topology 43
Figure 4.9: Maximum Clock frequency for three topologies by varying data width 44
Figure 4.10: Area Utilization for three NoC sizes and topologies using
CONNECT tool 46
Figure 4.11: Area Utilization for Ring Topology 47
Figure 4.12: Area Utilization for Mesh Topology 48
Figure 4.13: Area Utilization for Torus Topology 49
Figure 4.14: Maximum Clock frequency for three NoC sizes and topologies
using CONNECT tool 51
Figure 4.15: Maximum Clock frequency for Ring topology 52
Figure 4.16: Maximum Clock frequency for Mesh topology 53
Figure 4.17: Maximum Clock frequency for Torus topology 54
Figure 4.18: Area Utilization - Comparison Results for 2X2 NoC topologies 55
Figure 4.19: Area Utilization - Comparison Results for 3X3 NoC topologies 56
Figure 4.20: Area Utilization - Comparison Results for 4X4 NoC topologies 56
Figure 4.21: Maximum Clock frequency – Comparison Results 58

xiii
List of Tables
Table 3.1: Routing Table 22
Table 3.2: CONNECT Parameters 31
xiv
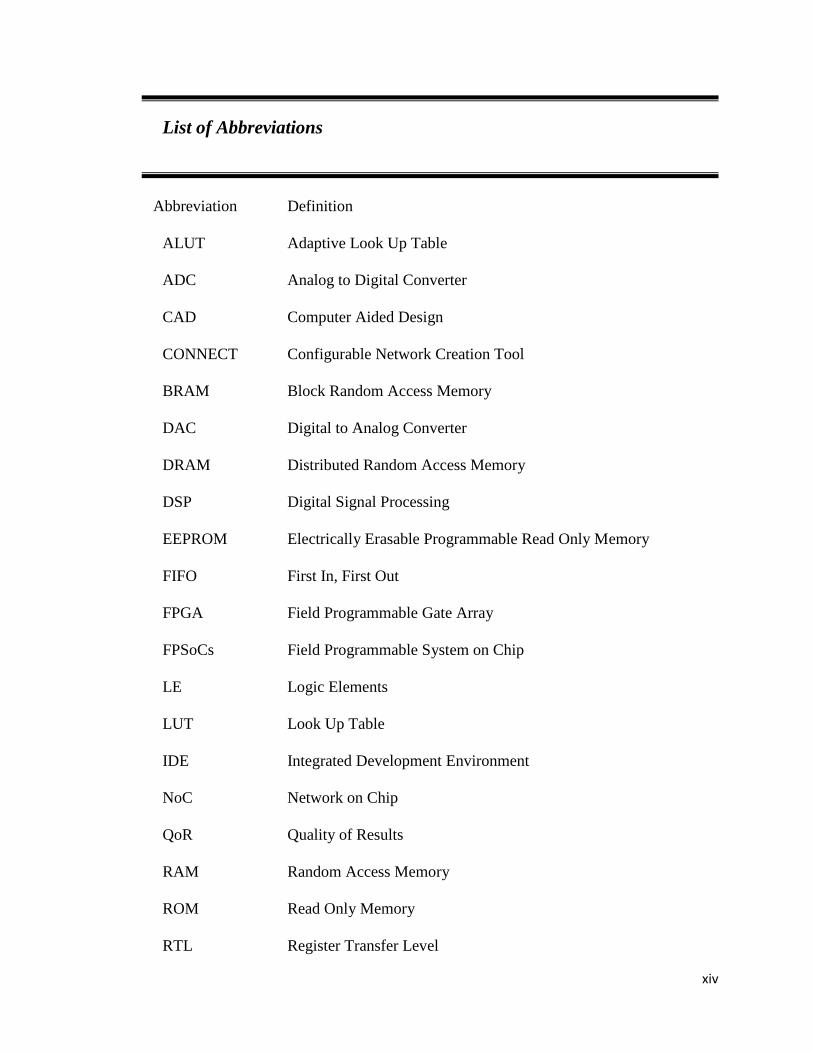
List of Abbreviations
Abbreviation Definition
ALUT Adaptive Look Up Table
ADC Analog to Digital Converter
CAD Computer Aided Design
CONNECT Configurable Network Creation Tool
BRAM Block Random Access Memory
DAC Digital to Analog Converter
DRAM Distributed Random Access Memory
DSP Digital Signal Processing
EEPROM Electrically Erasable Programmable Read Only Memory
FIFO First In, First Out
FPGA Field Programmable Gate Array
FPSoCs Field Programmable System on Chip
LE Logic Elements
LUT Look Up Table
IDE Integrated Development Environment
NoC Network on Chip
QoR Quality of Results
RAM Random Access Memory
ROM Read Only Memory
RTL Register Transfer Level
xv
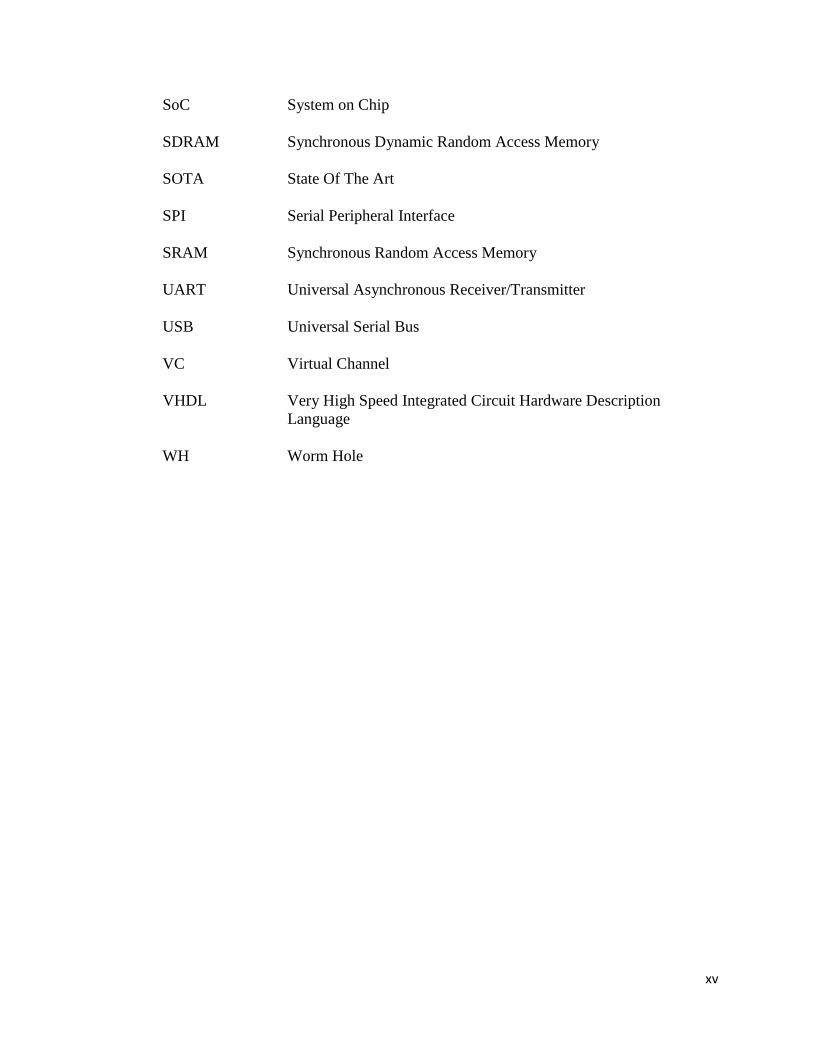
SoC System on Chip
SDRAM Synchronous Dynamic Random Access Memory
SOTA State Of The Art
SPI Serial Peripheral Interface
SRAM Synchronous Random Access Memory
UART Universal Asynchronous Receiver/Transmitter
USB Universal Serial Bus
VC Virtual Channel
VHDL Very High Speed Integrated Circuit Hardware Description
Language
WH Worm Hole
1
Chapter 1
Introduction
In today’s world digital technology plays a major role in the electronics industry. The
invention of transistor in 1947 paved the way for more advanced digital computers which
then resulted in the evolution of the digital technology. Moore's law proposed in 1965
states the number of transistors on integrated circuits doubles approximately every two
years. This increased the complexity of the embedded systems. To overcome this designers
shifted their focus towards system on chip (SoC) that integrates all components of an
electronic system into a single chip.
A typical SoC consists of microcontroller, microprocessor or DSP core(s); memory
blocks including a selection of ROM, RAM, EEPROM and flash memory, timing sources;
external interfaces including industry standards such as USB, FireWire, Ethernet, USART,
SPI; analog interfaces including ADCs and DACs. Most SoCs are developed from pre-
qualified hardware blocks for the hardware elements together with the software drivers
that control their operation. The hardware blocks are put together using CAD tools and the
software modules are integrated using a software-development environment.
Therefore, as the complexity of integrated systems keeps growing, the interconnection
between the modules becomes challenging. In SoCs traditional interconnect such as bus or
point to point was used between the IP cores. The traditional interconnect was sufficient
2
for smaller SoCs. This interconnection problem in larger SoCs was overcome by the
invention of Network on Chip technology.
Network on chip (NoC) is a communication subsystem on an integrated circuit between
IP cores in a system on a chip (SoC). NoC consists of IP cores, the network adapters,
routing nodes and links. It replaces the traditional interconnect by a network that uses
packets for transaction between the nodes in the system. It has the potential of increasing
the design productivity and the efficiency of interconnect. NoC improves the scalability of
SoCs, and the power efficiency of complex SoCs compared to other designs.
FPGAs are the configurable chips which provides custom hardware functionality using
prebuilt logic blocks and programmable routing resources. It is a single platform that can
provide verification for hardware and application software. As FPGAs continue to evolve,
the devices have become more integrated. Hard intellectual property (IP) blocks built into
the FPGA fabric provide rich functions while lowering power and cost and freeing up logic
resources for product differentiation. FPGAs offer many design advantages, including
Rapid prototyping, shorter time to market and the ability to re-program in the field for
debugging which makes it the efficient platform for research purposes.
Our research group experience shows that trying to design and implement an NoC from
scratch is very time consuming and tedious and will not give a high performance network
in a reasonable time frame. It also severely limits NoC design space that can be explored.
Hence the task of this thesis is to explore, evaluate and compare NoC synthesis tool
CONNECT [1] with manually generated NoC design using Quartus II. The topologies
taken for comparison and evaluation are ring, mesh and torus topologies.
3
1.1 Thesis Objective
The main objective of the thesis is to evaluate an NoC synthesis tool. This is achieved
by implementing three NoC topologies ring, torus and mesh using CONNECT [1], an
academic NoC synthesis tool. The results are compared with manually designed NoC
topologies (ring, torus and mesh) using Quartus II CAD tool of Altera Corporation. This
gives us an idea about the quality of results (QoR) produced by the CONNECT synthesis
tool. The evaluation metrics used for the comparison are logic resource utilization, the
most important one [2] and maximum clock frequency for the target FPGA. Our results
will be useful to the designers who are contemplating utilization of NoC based systems on
FPGAs.
The thesis research was completed using following steps:
1. Synthesis of three NoC topologies mesh, torus and ring using CONNECT NoC
synthesis tool. CONNECT used Wormhole (WH) [3] router and parameter values
such as flit size and buffer depth [2] were kept the same as those used in manually
designed NoC topologies.
2. The same three NoC topologies were implemented using a manually designed WH
router and the same NoC parameter values. The topologies were specified using
the VHDL language and were synthesized at the RTL level using the Altera
Quartus II CAD tool.
3. The results obtained from the above two steps were compared on the basis of logic
resource utilization and maximum clock frequency for the target FPGA
EP3SL340H1152I4L

4
1.2 Thesis Organization
The remainder of this thesis is organized as follows. Chapter 2 reviews basic NoC and
FPGA concepts and provides a summary of related academic research. Chapter 3 describes
the implementation of the three NoC topologies using automated and manual synthesis
methods. Chapter 4 presents the experimental evaluation results and their analysis. The
thesis concludes with the summary and future work in Chapter 5.

5
Chapter 2
Background and Related Research
2.1 On-Chip Architecture
As predicted by Moore’s law the number of transistors in an integrated circuit doubles
every eighteen months which enabled packing of more and more digital components on a
single chip. Currently high capacity FPGAs provide full-fledged Field Programmable
System on Chip (FPSoC). But efficient communication between components is a major
problem. Traditionally components were connected using one or more buses. This strategy
is not scalable for FPSoCs and does not meet performance and power requirements. Hence
a new paradigm, NoC was required in order to overcome these limitations.
2.2 NoC – Overview
2.2.1 NoC Technology
Using NoC technology, many IP cores can be efficiently connected by using a set of
network adapters, routers and links. Compared to bus based interconnect NoC technology
is faster, smaller and power efficient [4]. The routers in an NoC can be connected using a
wide variety of topologies such as mesh, torus, ring, star, butterfly etc. [5].
2.2.2 Sample NoC Architecture
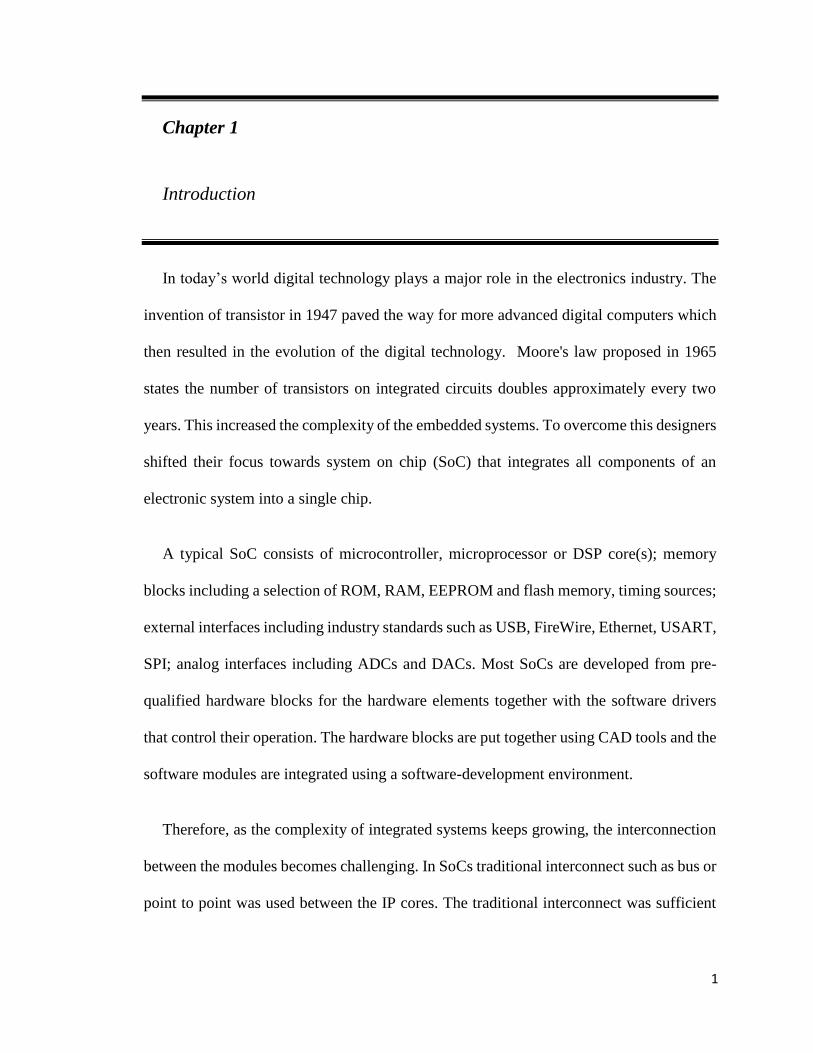
A sample NoC architecture using 4X4 array is shown in Figure 2.1. It consists of basic
components: IP cores, network interface modules, routers and links. Each of these basic
components is described below.
6
Figure 2.1 - NoC Architecture
2.2.2.1 IP Core
The aim of the NoC is to provide better communication between IP cores using an on-
chip network. Since the functionality of IP cores varies for different applications, they are
not considered as the main part of the NoC architecture.
2.2.2.2 Network Adapter
It is also referred to as Network Interface. It is mainly used for interfacing the IP core
with the router for the transmission of messages. The Network adapter is responsible for
converting the messages from IP cores into packets at the sending end and also converting
the packets back into messages at the receiving end. It also implements end to end flow
control and other higher level network issues.
2.2.2.3 Routing Nodes
Router is considered as a central component in an NoC interconnect. Routing is the
process of forwarding the packets from source to destination through the destined path. It
7
also forwards and receives the packets based on the NoC parameters. Router has a greater
impact on the area utilization and the performance of the NoC system. A larger range of
parameters in an NoC networks are selected based on the router design being implemented.
The routing node used in this design is the WH router [6].
2.2.2.4 Routing Links
They provide the physical link either between two routers or between a router and
network interface module. They may consist of one or more physical channels based on
the data width used, an important NoC parameter.
2.2.3. NoC Parameters
NoC parameters play a major role, as the designers has to vary the NoC parameters
in order to optimise the cost, performance and power consumption of the NoCs. The choice
of parameter value is not an easy task because most of the parameters are dependent on
each other. Network parameters can be divided into three different groups namely:
Infrastructure, Communication Mechanism and mapping. Infrastructure can be classified
as channel width, topology, buffering and mapping [7]. We now discuss different NoC
topologies used in this research.
2.2.3.1. NoC Topology
Network Topology determines how the nodes and links are interconnected. Selecting
an appropriate topology plays a vital role in designing an area and power efficient NoC
that provides high performance. Network Topology can be classified as direct or indirect.
In direct topology, every router has an associated IP core which acts as a source or
destination of packets. In indirect topology, nodes are classified as intermediate or
8
terminal. Terminal nodes are the source and destination for packets and the intermediate
nodes only help in switching the packets between two or more terminal nodes.
In this thesis the topologies used for experimentation are mesh, torus and ring. Ring is
known for simple architecture and is a commonly used topology [5, 8] Mesh is known for
its simplicity, scalability and predictable area cost [5, 9 and 10]. Torus is similar to mesh
topology except for the wraparound links [5, 11]. Hence we included the torus topology to
evaluate how the wraparound links in torus would affect the performance of the NoC.
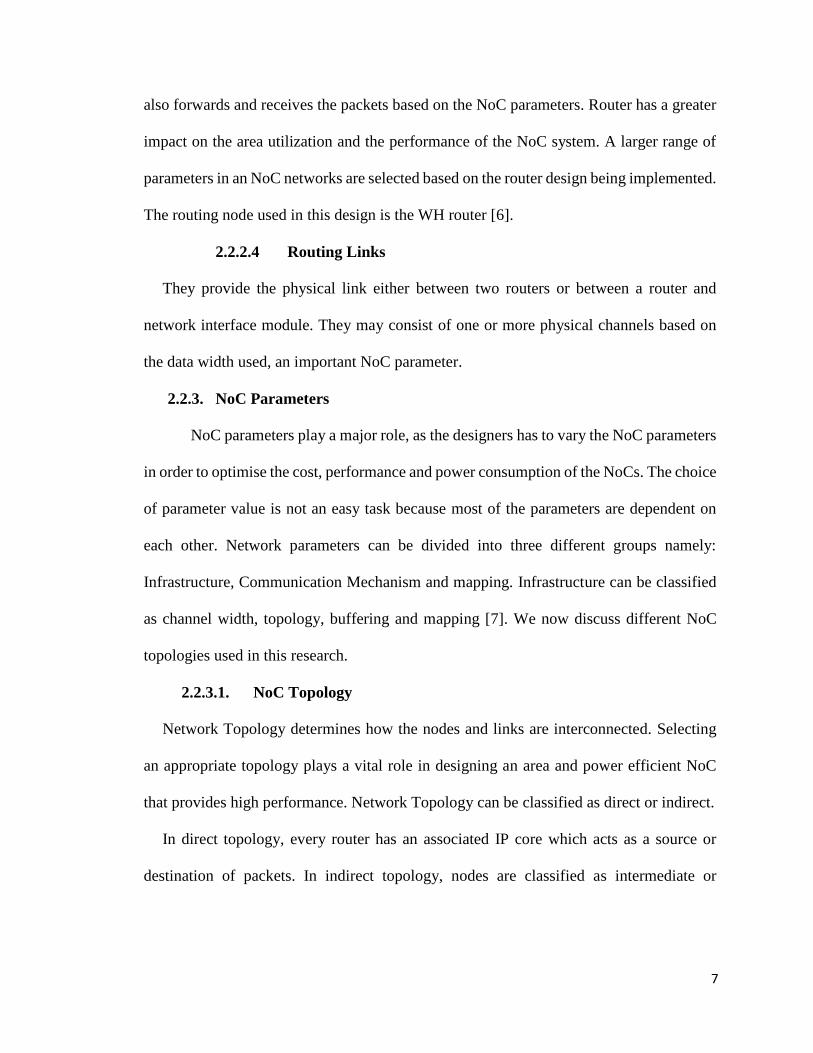
2.2.3.1.1. Ring Topology
It is a network topology, where the nodes are connected in a circular fashion as shown
in Fig. 2.2. The nodes in the ring topology can be unidirectional or bidirectional. Ring is
also considered as a simple and least studied topology [8]. In this thesis we have used a
bi-directional ring topology in order to evaluate the performance and cost of the topology.
Figure 2.2 - Ring Topology

9
2.2.3.1.2. Mesh Topology
It is a network topology, where each node is connected to its neighboring nodes as
shown in Fig. 2.3. When a routing technique is applied to the mesh topology, the packet
hops from one node or router to another router until it reaches its final destination. In mesh
topology nodes in the edge are considered to have lower degree than the nodes in the center
of the network. Degree defines the connectivity of each router with its neighboring router.
In this thesis 2x2, 3x3 and 4X4 connected mesh topology is used.
Figure 2.3 - Mesh Topology
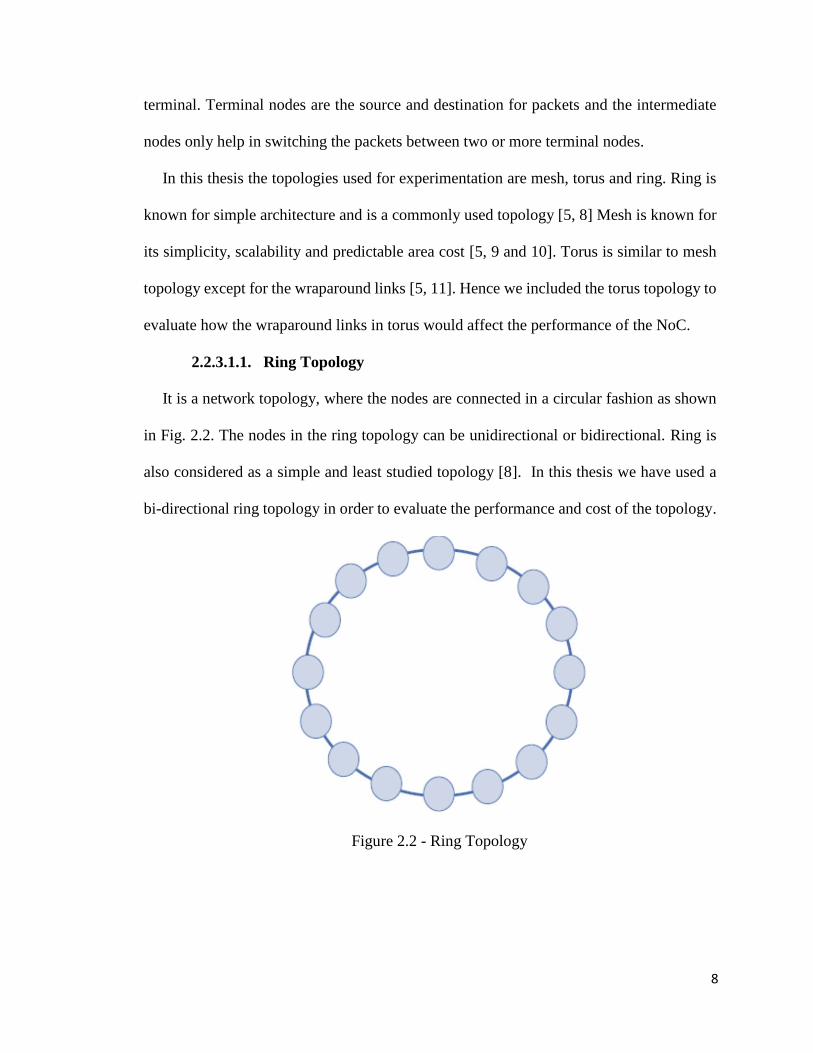
2.2.3.1.3. Torus Topology
Torus topology is similar to the mesh topology, except it has the wrap around links at
the edges of the network. So the nodes are considered to have the same degree. In this
thesis 2X2, 3X3 and 4X4 torus topologies are used in our experiments. The torus topology
is shown in Fig. 2.4.
10
Figure 2.4 - Torus Topology
2.2.3.2. Buffering
Buffering helps in storing the packets before they are forwarded to the other routers
based on the routing algorithm implemented in the router. This parameter has a big impact
on the area overhead of the network because as the buffer size increases the area also
increases as shown in [12], where the experiments were conducted by varying the flit
buffer depth and flit data width. Generic router with parameterizable buffer depth is
introduced [13]. In this research one of our evaluation metrics is area utilization. Hence
we use WH router to minimize buffer space used in the router.
2.2.3.3. Flow Control
The flow control helps in determining the method used to forward the packets from
source to destination. The two switching methods used are circuit switching and packet
switching. In circuit switching the packet travels using a dedicated connection. Hence the
connection has to be set up and the message uses the same connection to reach the
destination. But in packet switched network the dedicated connection is not required. The
message is broken down into packets which move from one router to another until they

11
reach their final destination based on the destination address in the packet. When we look
into the packet transmission a packet is normally broken down into flits, which is described
in Fig. 2.5, given below.
Figure 2.5 – Packetization
2.2.3.4. Switching mode
The switching mode helps in determining how the packet moves through the
network. It is mainly divided into store-and-forward (SAF), virtual cut-through (VCT),
and WH. The SAF stores the flits until all the flits have been received and then forwarded.
It requires a large buffer space. In WH, the header in the packet determines the next hop
and hence every other flits follows the previous one. It requires a complex routing
algorithm. In VCT, both the above schemes are implemented to provide a good trade-off
between latency and buffer size. In this thesis, we have chosen the WH router, as it requires
less buffering space which helps to minimize the area consumption.
2.2.3.5. Routing Algorithm
12
The routing algorithm selects the path required for a packet to travel from its source
to its destination in an NoC. The routing algorithms are classified based on three different
criteria.
i. Routing decision
ii. Path determination
iii. Path length
Based on the routing decision, the routing algorithm is classified as source routing
or distributed routing. In the former, the path is decided initially by the source. In the latter,
each router determines the route based on information in the packet.
Based on path determination, routing algorithms are classified as deterministic or
adaptive. In deterministic routing the path is completely specified from source to
destination. In adaptive routing the path is determined dynamically based on the network
traffic.
Path length, measured in number of hops determines whether routing algorithm is
minimal or non-minimal routing. Minimal routing provides the shortest path. In non-
minimal routing greater flexibility is provided in terms of utilization of all possible path.
Although non minimal routing increases the flexibility it can lead to live-lock situations
which in turn increase the latency.
2.2.4. NoC Evaluation Metrics
There are many evaluation metrics for evaluating NoC router architectures such as area,
performance, power consumption and latency/throughput [14]. Most of the metrics are
dependent on other. Therefore optimizing one metric can adversely affect the other.
2.2.4.1. Area

13
The chip area utilization is a very important metric. Minimizing the area reduces the
overall system cost and has the potential to reduce the power consumption. CAD tool used
for hardware synthesis at the RTL level or behavioral level report the area utilization result.
2.2.4.2. Power Consumption
The power consumption of an NoC topology depends on the area utilization and the
maximum clock frequency used. The power consumption are also reported by the synthesis
CAD tools.
2.2.4.3. Latency/Throughput
Speed can be measured in two ways: using delay and using bandwidth. If it is measured
using delay, it is referred to as latency. Latency is given by the overall time required by
the application and is measured using clock cycles.
If speed is measured using bandwidth, it is referred to as throughput. Throughput is
defined in a variety of way based on the type of implementation [15]. In message passing
system it is defined as the number of packets transferred over a period of time. According
to [14], Throughput is defined as
TP = (Number of messages ∗ message Length)
Number of IPs ∗ Total time take
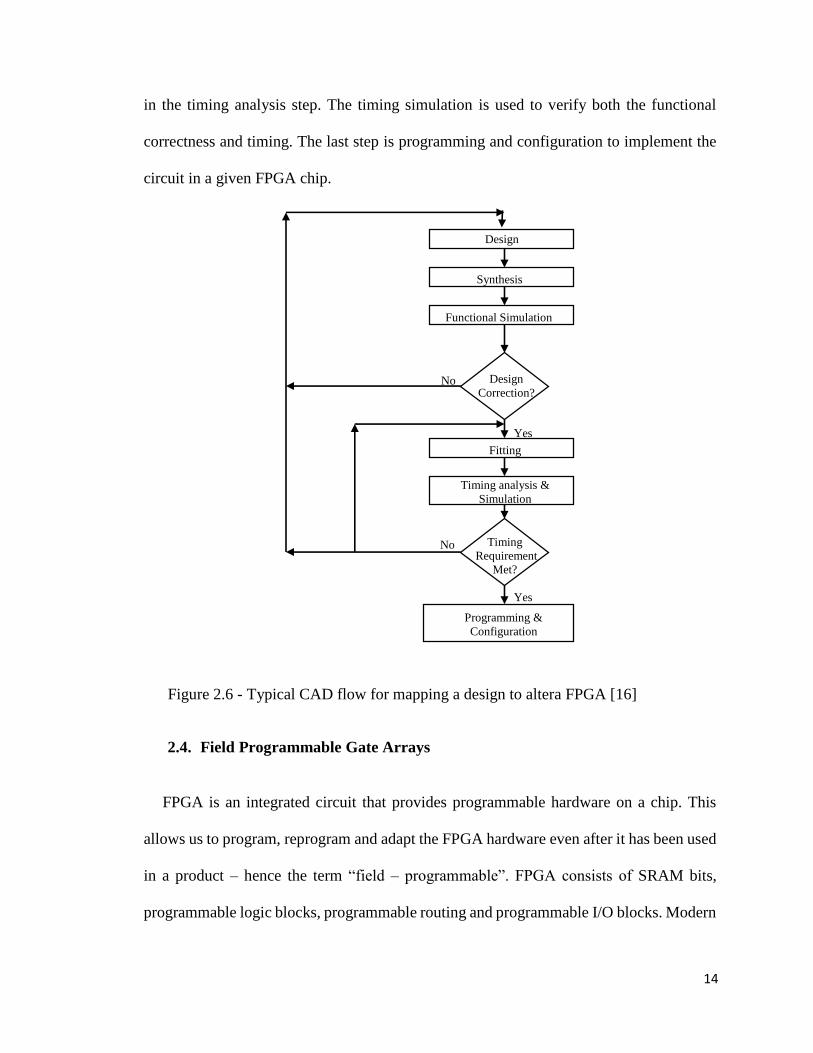
2.3. Altera Quartus II CAD tool
The CAD flow used for mapping digital hardware design described using VHDL or
Verilog is illustrated in Fig. 2.6. The user specifies the desired design in VHDL or Verilog.
The design is synthesized into a circuit that consists of logic elements (LEs). The functional
simulation is used to verify the functional correctness. Timing issues are not considered at
this time. Fitter helps in the placement of LEs in an actual FPGA chip. The routing wires
between specific LEs are chosen at this step. The performance of the circuit is estimated
14
in the timing analysis step. The timing simulation is used to verify both the functional
correctness and timing. The last step is programming and configuration to implement the
circuit in a given FPGA chip.
Figure 2.6 - Typical CAD flow for mapping a design to altera FPGA [16]
2.4. Field Programmable Gate Arrays
FPGA is an integrated circuit that provides programmable hardware on a chip. This
allows us to program, reprogram and adapt the FPGA hardware even after it has been used
in a product – hence the term “field – programmable”. FPGA consists of SRAM bits,
programmable logic blocks, programmable routing and programmable I/O blocks. Modern
Design
Entry
Synthesis
Functional Simulation
Design
Correction?
Timing analysis &
Simulation
Fitting
Timing
Requirement
Met?
Programming &
Configuration
Yes
No
Yes
No
15
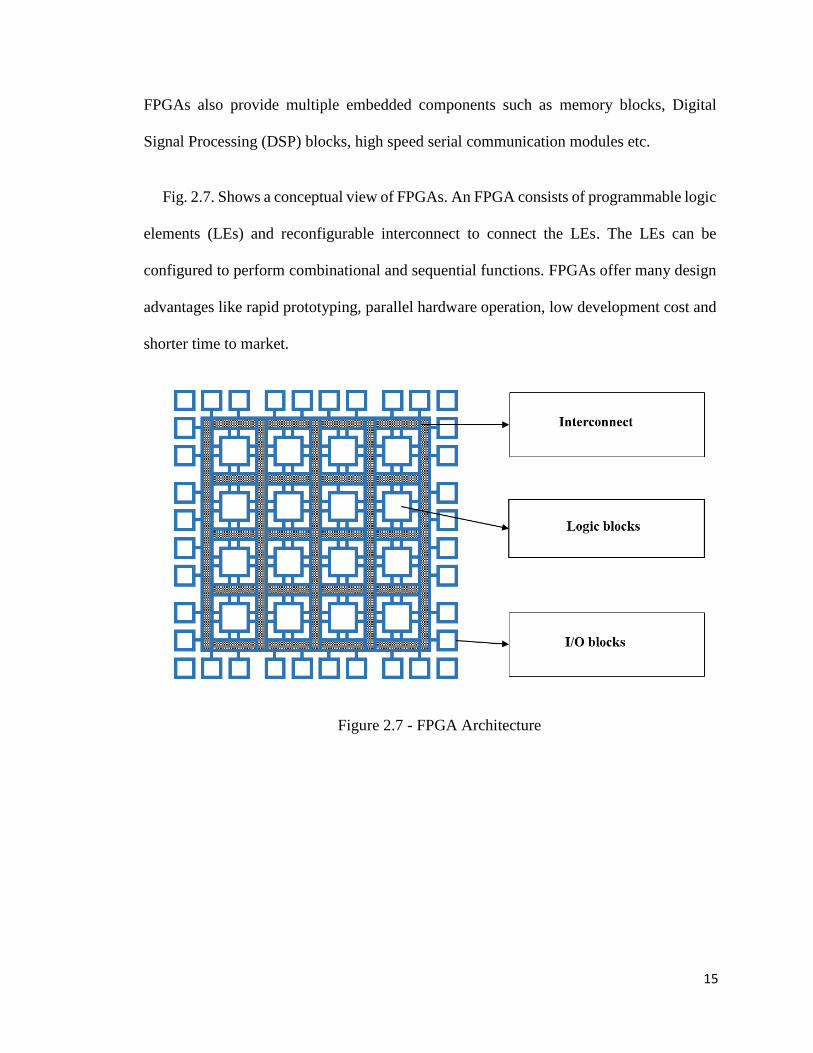
FPGAs also provide multiple embedded components such as memory blocks, Digital
Signal Processing (DSP) blocks, high speed serial communication modules etc.
Fig. 2.7. Shows a conceptual view of FPGAs. An FPGA consists of programmable logic
elements (LEs) and reconfigurable interconnect to connect the LEs. The LEs can be
configured to perform combinational and sequential functions. FPGAs offer many design
advantages like rapid prototyping, parallel hardware operation, low development cost and
shorter time to market.
Figure 2.7 - FPGA Architecture
16
2.4.1. FPGA target device
The FPGA used in our experiments was Altera Stratix III EP3SL340H1152I4L is
used as the targeted device for the analysis of the area usage and maximum clock frequency
results for the three topologies: ring, mesh and torus.
2.5 Related Work
In this section the research works relevant to the thesis is summarized.
In [5] Saldana, et al explore the routability of different multiprocessor network
topologies such as ring, star, hypercube and mesh with different network sizes. They have
shown that for fully connected topologies, routing congestion was the major concern. The
maximum speed was achieved only for topologies up to 16 nodes. Beyond 16 nodes speed
drops off. The routing capacity of the device would have to be increased to achieve
complete routing and to meet the timing. They conclude that application specific topology
reduces the system connectivity allowing the implementation of systems with larger
number of nodes.
In [17] the author has explored the design space for a NoC router using router
parameters. Two NoC components were; a flexible adapter based on the Altera Avalon
standard [18] and a parameterizable WH router. Using these components two well-known
architectures, torus and ring were synthesized. The architectures were compared based on
area, latency and throughput. The results show that ring architecture gives better area
versus performance tradeoff when compared to torus for the benchmark used. It was also
shown that flit size has a greater impact on evaluation metrics for NoC. An 8 bit flit size is
17
recommended due to its higher area resource efficiency at the expense of larger message
latencies and a 64 bit flit size offers lowest message latency but occupies the most FPGA
resources.
In [19] the proposed BRS router shares the Block RAM between multiple router ports
for high performance, high maximum clock frequency and reduced logic utilization. The
BRS router was synthesized and simulated using 4x4 torus and 4x4 mesh. A 71% reduction
in ALM usage was obtained compared to the one that did not use Block RAM split. The
maximum clock frequency was higher compared to CONNECT [1] but still less than the
normal router without block RAM split. Experiments were performed on 4x4 networks but
there are no experimental results for larger networks.
In [1], CONNECT, an NoC synthesis tool is described that produce synthesizable RTL
designs of FPGA-tuned multi-node NoCs of arbitrary topology. Distributed RAM is used
instead of Block RAM to make use of each consumed LUT. Lower latency and three to
four times higher network performance was achieved by CONNECT when comparing the
results with state-of-the-art NoC (SOTA) router. In this thesis research our main goal was
to evaluate the CONNECT NoC synthesis tool using area utilization and maximum clock
frequency metrics.
In [20] a tool for fast RTL-Based Design Space Exploration of Multicore Processors is
designed. It is designed with a high degree of modularity to support fast exploration of
different topologies, routing schemes, processing elements (cores), and memory system
organizations. Experimental evaluation were done based on a 2D mesh topology. Dynamic
memory allocation is not supported in the current version of the tool.

18
In [21] a comparison between store and forward router and WH router for FPGAs is
performed. Mesh topology was used compare the routers performance using different
parameters such as area, power consumption, maximum clock frequency and throughput.
Real benchmark was implemented on 4X4 mesh NoCs using commercially available SoC
CAD tools: Altera’s SOPC builder, Nios IDE and Modelsim simulator. Experimental
results show that the SAF router is superior to the WH router. The comparison was only
for 4X4 mesh topologies.
In [12] a methodology to study the impact of NoC parameters is proposed. The effect
of flit buffer depth and flit data width and virtual channel are studied through
experimentation and simulation for scalable and adaptive NoC. The experiments and
simulation were carried out on two network topologies namely torus and mesh. Low area
overhead could not be achieved in torus network. Results show that the traffic pattern with
4 VCs offer the best performance with 95% throughput, low latency and efficient silicon
area in both mesh and torus networks.
In [10] a hybrid mesh based star topology is proposed to provide low latency, high
throughput and more evenly distributed traffic throughout the network. Simulation was
performed on a Network simulator. The proposed topology gives 62% latency
improvement and 42% throughput improvement compared to mesh topology. This came
at the cost of area overhead and channel contention problem. Other hybrid topologies are
proposed in [22, 23 and 24]. Even though hybrid topologies give improved performance
they suffer from either higher node degree or from channel contention problem with
increase in network size.
19
2.6 Summary
In this chapter, the relevant background material and related research works were
discussed. First, a brief discussion about the NoC technology and architecture was
presented. Then different NoC topologies were discussed. Evaluation metrics such as area
utilization (cost), latency, throughput and power consumption were discussed. An
overview of FPGA technology were presented and the chapter concluded with a discussion
of related work. In next chapter we describe NoC design and implementation using manual
and automated synthesis method. The CONNECT tool was used for automated synthesis
and the Altera Quartus II CAD tool was used for manual NoC design and implementation.
20
Chapter 3
NoC Design & Implementation Using Manual & Automated Synthesis
Methods
This chapter describes how the different NoC topologies were designed and
implemented. The first approach used the manual design method utilizing VHDL models
of NoC components. The second approach use the CONNECT NoC synthesis tool.
3.1. Manual NoC design & Implementation
The VHDL code generated using the manual NoC design is explained as follows: The
top module consists of master and slave top and the router top through which the
interconnection between the routers are made with the signals in the top module. The
master and slave top consists of the master sampler and slave sampler respectively. The
sub module consists of Adr2dest, awb, router and FIFO. Adr2destconverts the address into
NoC destination. Awb explains the glue logic for the conversion between Avalon and
wishbone. FIFO is used in as the register bank to store the incoming and outgoing flits. All
the files are synthesized using the Altera Quartus II CAD tool. The router used in this
research is WH router [3 and 17]. Adapter was included in the first router to obtain the
synthesis results. The adapter has a negligible area which can be ignored as the CONNECT
tool doesn’t include the adapter.
21
3.1.1. Functionality of WH router
The performance and the area consumption of a router is directly affected by the
protocol and the algorithm used, which play a vital role in governing the flow of data
through the NoC Network. It is very important to select the appropriate protocol and
algorithm required for the particular router used in the NoC network. Now we describe the
protocol and algorithm used in the WH router.
3.1.1.1. Protocols
Switching mode plays a major role in forwarding the packets from source to
destination. Switching mode determines the buffer size required and the channels required
to forward the packets. The WH router uses a packet switched flow control. The packet
switched network helps in forwarding the packets from source to destination through a
series of interconnected routers. There is no predetermined path between the
communicating cores like in the circuit switched network. When a packet is created at the
source, the packet is released into the network and it is forwarded from one router to
another based on the information included in the header and traffic congestion, until it
reaches the destination IP core.
3.1.1.2. Routing Algorithm
The routing algorithm used in the WH router is source routing which is a
deterministic algorithm. Deterministic algorithm describes how the path is defined in the
network. The source routing specifies partial or complete information about the route that
packet takes through the network.
22
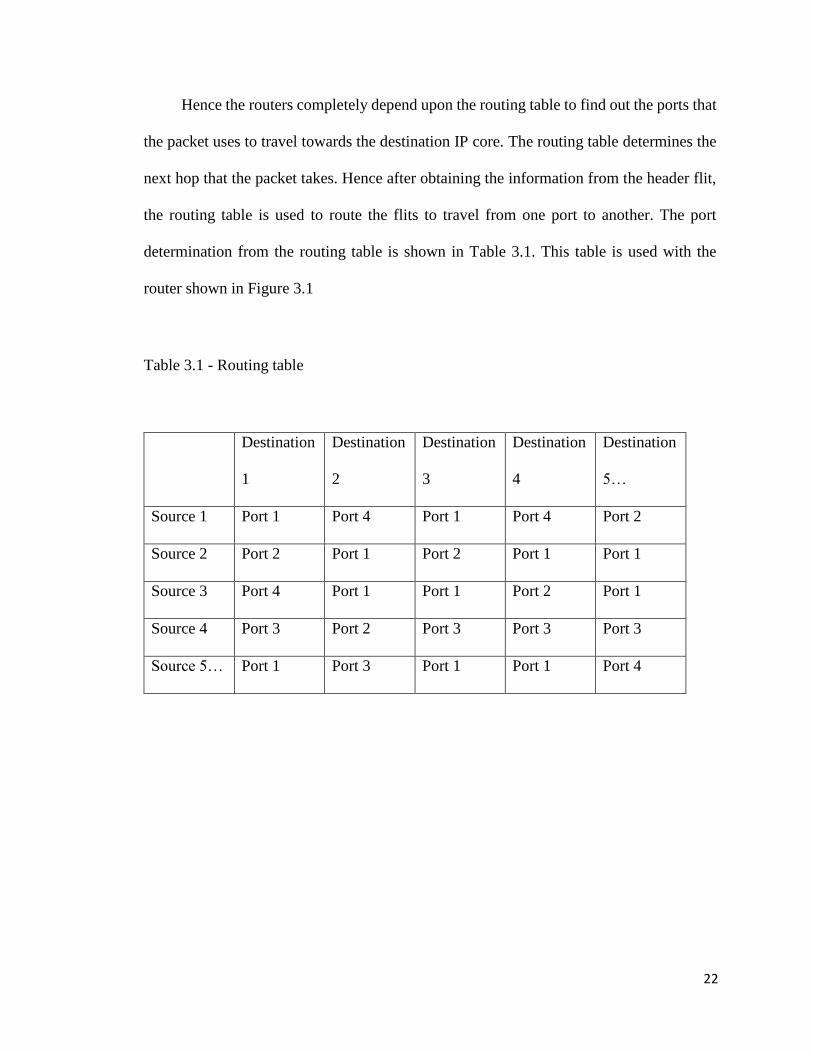
Hence the routers completely depend upon the routing table to find out the ports that
the packet uses to travel towards the destination IP core. The routing table determines the
next hop that the packet takes. Hence after obtaining the information from the header flit,
the routing table is used to route the flits to travel from one port to another. The port
determination from the routing table is shown in Table 3.1. This table is used with the
router shown in Figure 3.1
Table 3.1 - Routing table
Destination
1
Destination
2
Destination
3
Destination
4
Destination
5…
Source 1 Port 1 Port 4 Port 1 Port 4 Port 2
Source 2 Port 2 Port 1 Port 2 Port 1 Port 1
Source 3 Port 4 Port 1 Port 1 Port 2 Port 1
Source 4 Port 3 Port 2 Port 3 Port 3 Port 3
Source 5… Port 1 Port 3 Port 1 Port 1 Port 4

23
Figure 3.1 – Router with port allocation
The Figure 3.1. clearly gives an idea about the number of hops a packet takes to
travel to the destination. The routers are named as R0, R1, R2 and R3. N0, N1, N2 and N3
represents the IP cores. But the design of the routing table plays a vital role. By using
proper port allocation, livelock [25], congestion, deadlock can be avoided. Hence the
overall performance of the system can be improved.
3.1.2. Router Implementation
The general structure of the WH router is now discussed in detail. The WH router
is designed with flexibility to implement many topologies. Ring, mesh and torus topologies
can be implemented without changing the VHDL code. The WH router has the flexibility
24
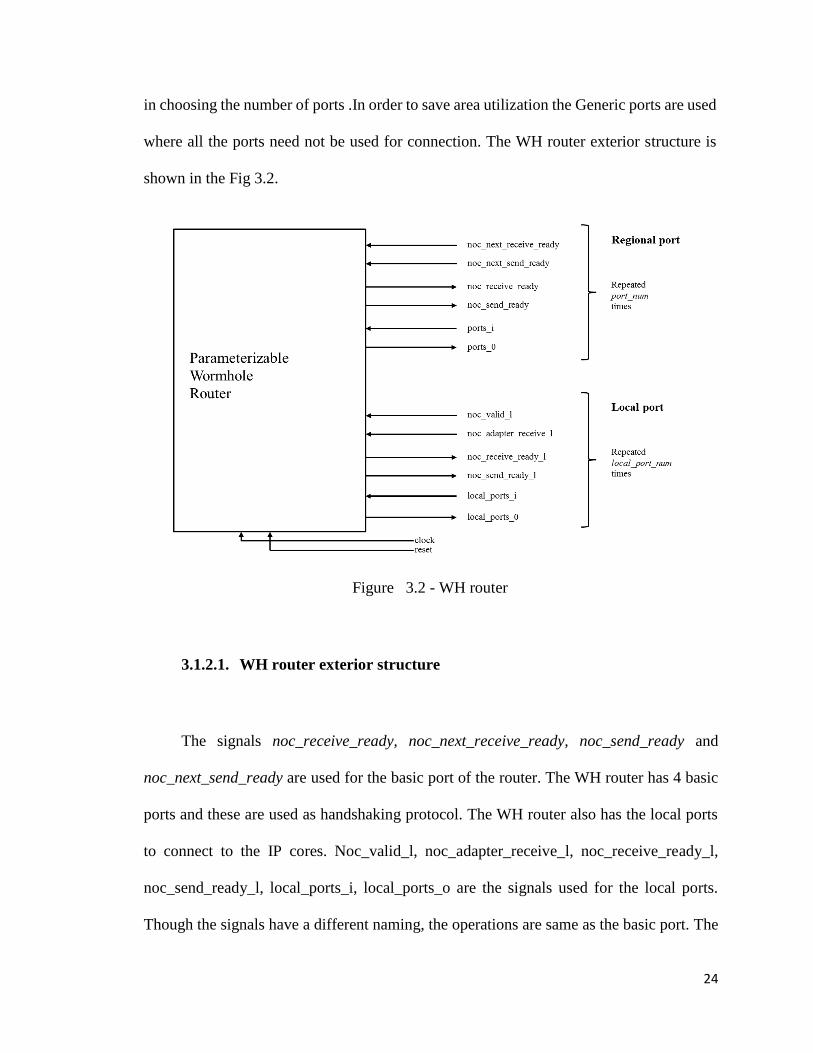
in choosing the number of ports .In order to save area utilization the Generic ports are used
where all the ports need not be used for connection. The WH router exterior structure is
shown in the Fig 3.2.
Figure 3.2 - WH router
3.1.2.1. WH router exterior structure
The signals noc_receive_ready, noc_next_receive_ready, noc_send_ready and
noc_next_send_ready are used for the basic port of the router. The WH router has 4 basic
ports and these are used as handshaking protocol. The WH router also has the local ports
to connect to the IP cores. Noc_valid_l, noc_adapter_receive_l, noc_receive_ready_l,
noc_send_ready_l, local_ports_i, local_ports_o are the signals used for the local ports.
Though the signals have a different naming, the operations are same as the basic port. The
25
WH router used in the topologies has a single local port. As the number of local ports
increases the area also increases. Hence for this thesis, the number of local ports used is
restricted to one as the area is the one of the evaluation metrics taken into account.
There are a number of VHDL generics available which paves way for a
parameterizable WH router. These parameters are used in creating the constant required
for the flit worm. The flit_size determines the size of the flit, routing_table, src_width and
dest_width are used to describe the bit widths for Noc source and destination address,
num_ports, num_local_ports, routing_type. Num_ports is used to indicate the amount of
ports in the router, where num_local_ports is for local ports. Routing_type when set to 1,
source routing is activated. In this thesis we have used the source routing to avoid
congestion, deadlock and livelock.
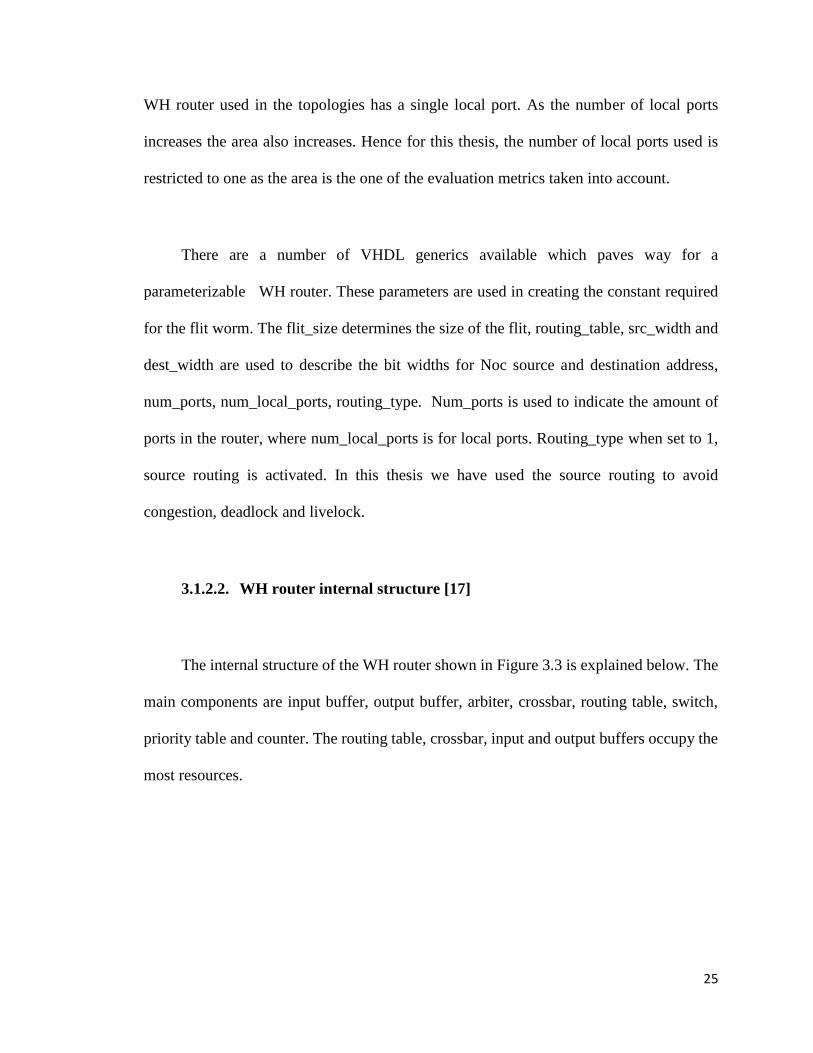
3.1.2.2. WH router internal structure [17]
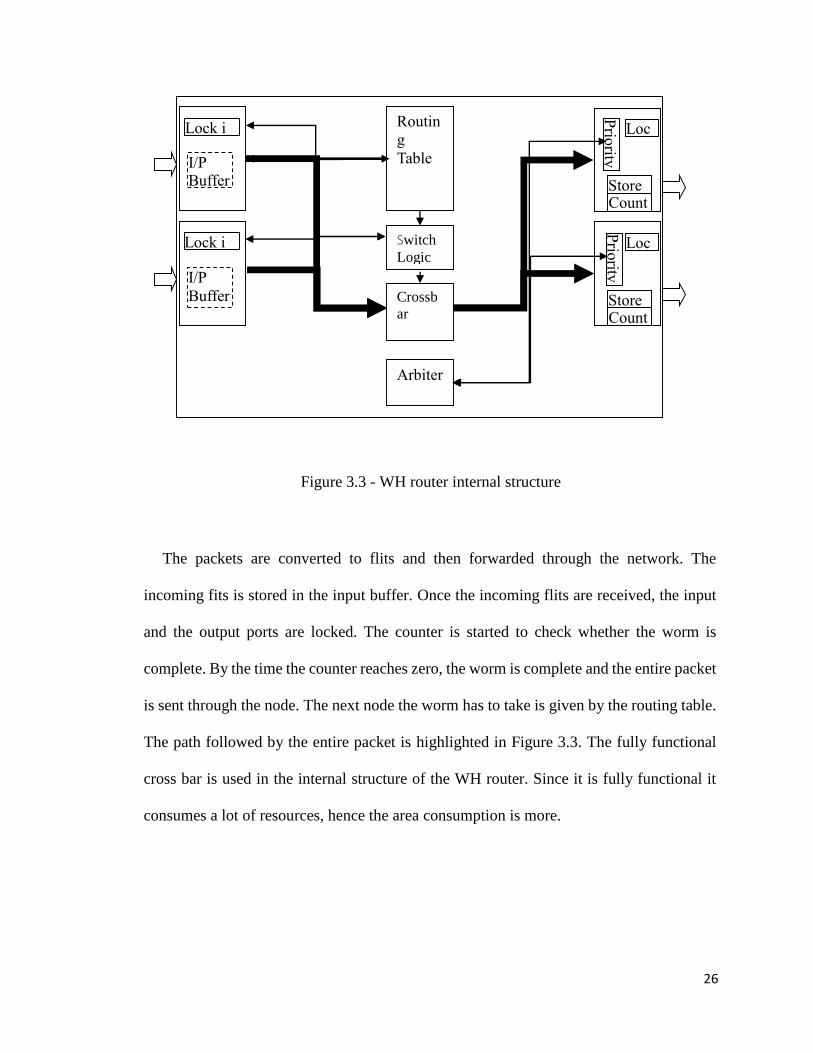
The internal structure of the WH router shown in Figure 3.3 is explained below. The
main components are input buffer, output buffer, arbiter, crossbar, routing table, switch,
priority table and counter. The routing table, crossbar, input and output buffers occupy the
most resources.
26
Figure 3.3 - WH router internal structure
The packets are converted to flits and then forwarded through the network. The
incoming fits is stored in the input buffer. Once the incoming flits are received, the input
and the output ports are locked. The counter is started to check whether the worm is
complete. By the time the counter reaches zero, the worm is complete and the entire packet
is sent through the node. The next node the worm has to take is given by the routing table.
The path followed by the entire packet is highlighted in Figure 3.3. The fully functional
cross bar is used in the internal structure of the WH router. Since it is fully functional it
consumes a lot of resources, hence the area consumption is more.
Routin
g
Table
Switch
Logic
Crossb
ar
Arbiter
Prio
rity
Loc
k
Store Count
I/P Buffer
Lock i
I/P
Buffer
Lock i
Prio
rity
Loc
k
Store Count

27
3.1.3. Adapter Overview
The WH router consists of basic ports for communication between the routers and
the local ports for communicating with the IP cores. For the local port to communicate
with IP core, it requires an adapter. The adapter acts as an interface and its main function
is to packetize the incoming message from the IP core and to de-packetize. The adapter is
designed to work with wishbone protocol. The adapter works with IP cores. Figure 3.4.
Illustrates how the adapter works with the NoC.
Figure 3.4 - NoC with master and slave adapter
The adapters are divided into two types, master adapter and slave adapter. The master
adapter helps in receiving the request signals from the master core and forwards the
response signals. The slave adapter works the same way as the master adapter but in the
opposite direction. The adapter provides design flexibility through a variety of VHDL
generics. The adapter is compatible with both the Avalon and wishbone standards.
The parameters that provides the flexibility with the wishbone/Avalon interfacing
and makes the adapter to be compatible with different NoC architectures. Parameters that
are common for both the master and slave adapters are data width (WB_width), address
width (adr_width), address tag width (tga_width), cycle tag width (tgc_width), data tag
width (tgd_width) and selection width (sel_width). These signals are specific to the
28
wishbone standard. The cti_lsb and bte_lsb both indicate cycle type identifier and burst
type extension least significant bit locations are specific to only slave adapter.
The parameters that are specific to NoC are flit_size – determines the size of a flit in
bits, fifo_depth – helps the adapter to store the flits when the NoC is congested , src_width
and dest_width – represents the source and destination addresses. The internal parameters
are fast_burst, burst_depth, burst_tag_en, no_ack, sdram_delay and Avalon_bursts.
Fast_burst are activated by request types 4 and 5 to queue up when there is burst and block
transfer. Burst_depth is the size of the burst buffer. Burst_tag_en is used to enable burst
tags for Wishbone transfers – 1 to enable, 0 to disable. No_ack it is set to 1, as no
acknowledgement signals are used. Avalon_bursts is used if Avalon block transfers are
used.
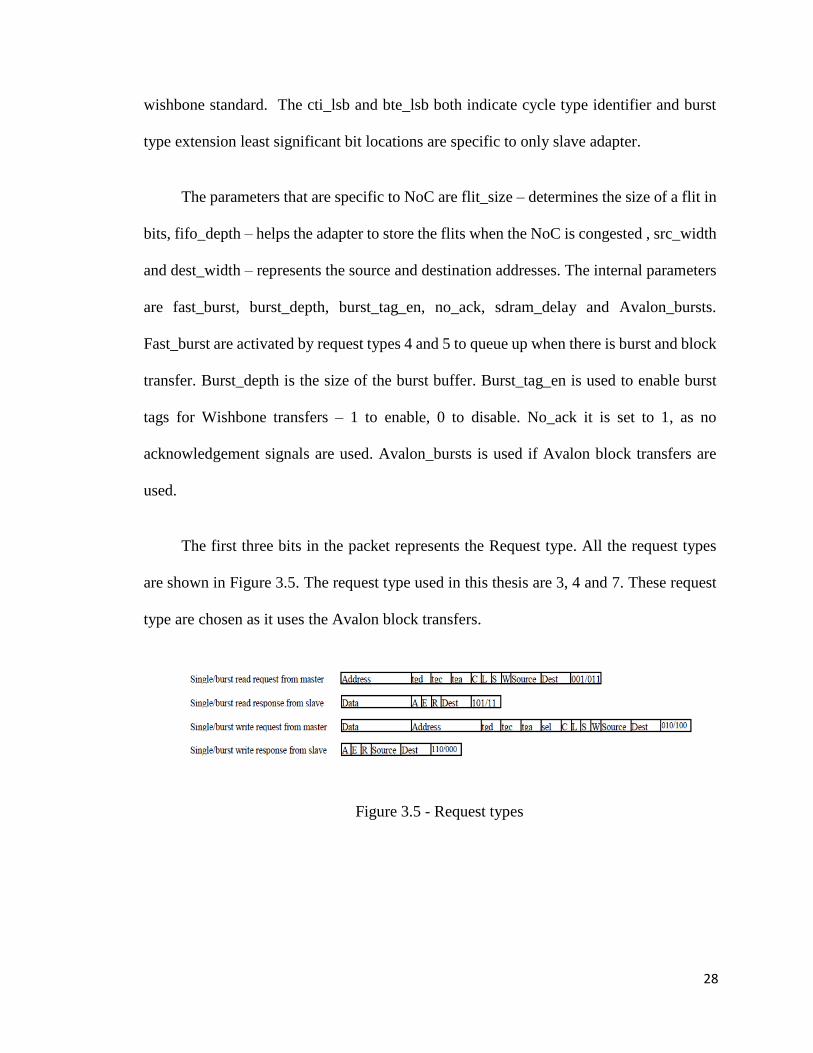
The first three bits in the packet represents the Request type. All the request types
are shown in Figure 3.5. The request type used in this thesis are 3, 4 and 7. These request
type are chosen as it uses the Avalon block transfers.
Figure 3.5 - Request types

29
3.1.3.1. Adapter internal design
The internal design of the adapter uses five modules. They are adr2dest, awb, fifo,
master/slave sampler and master/slave top.
Figure 3.6 - Adapter Internal Design
The top module is the master/slave top. The top modules has the sub modules
master/slave sampler, input FIFO and output FIFO. It is mainly responsible for hand-
shaking protocol between the sampler, FIFOs and NoC. Adr2dest module helps in
converting the address signals into NoC destinations. Wbs/wbm initials are used to
represent the master adapter interface in awb. Similarly, avs/avm initials are used to
represent the slave adapter interface in awb. The adapter is designed to be flexible with
both Avalon and wishbone standards. The flexibility is obtained by using the glue logic
module. The adapter internal design is shown in Fig.3.5.
30
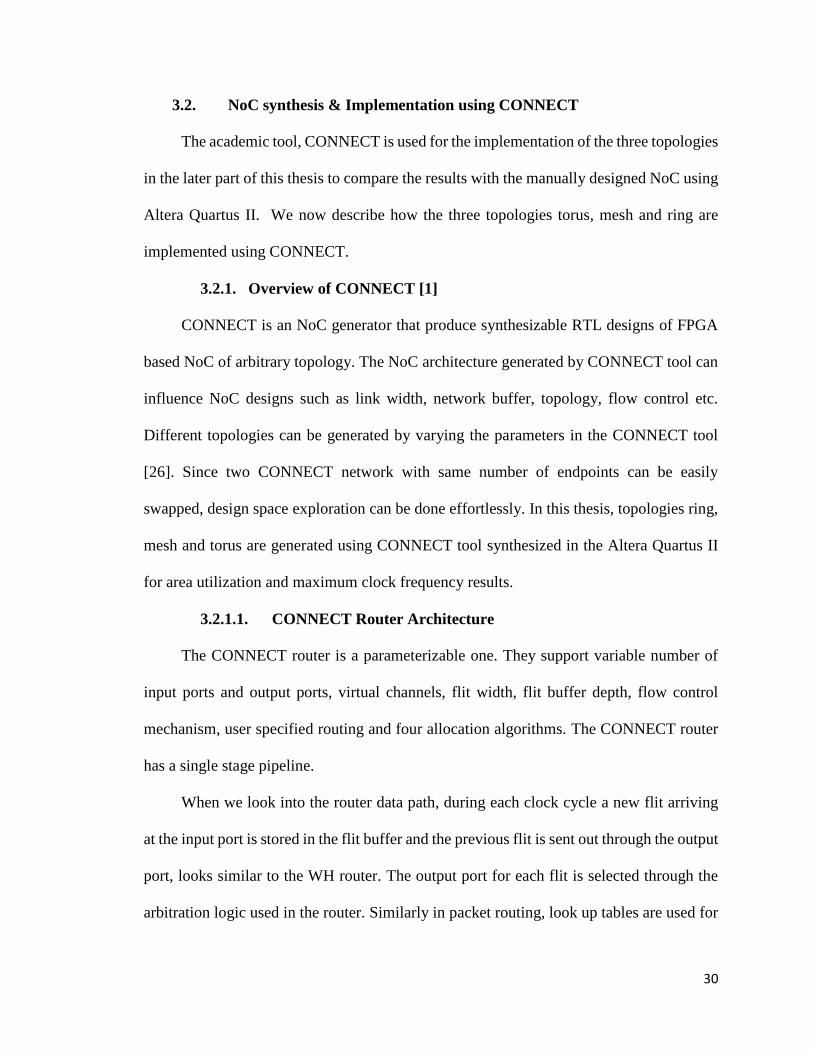
3.2. NoC synthesis & Implementation using CONNECT
The academic tool, CONNECT is used for the implementation of the three topologies
in the later part of this thesis to compare the results with the manually designed NoC using
Altera Quartus II. We now describe how the three topologies torus, mesh and ring are
implemented using CONNECT.
3.2.1. Overview of CONNECT [1]
CONNECT is an NoC generator that produce synthesizable RTL designs of FPGA
based NoC of arbitrary topology. The NoC architecture generated by CONNECT tool can
influence NoC designs such as link width, network buffer, topology, flow control etc.
Different topologies can be generated by varying the parameters in the CONNECT tool
[26]. Since two CONNECT network with same number of endpoints can be easily
swapped, design space exploration can be done effortlessly. In this thesis, topologies ring,
mesh and torus are generated using CONNECT tool synthesized in the Altera Quartus II
for area utilization and maximum clock frequency results.
3.2.1.1. CONNECT Router Architecture
The CONNECT router is a parameterizable one. They support variable number of
input ports and output ports, virtual channels, flit width, flit buffer depth, flow control
mechanism, user specified routing and four allocation algorithms. The CONNECT router
has a single stage pipeline.
When we look into the router data path, during each clock cycle a new flit arriving
at the input port is stored in the flit buffer and the previous flit is sent out through the output
port, looks similar to the WH router. The output port for each flit is selected through the
arbitration logic used in the router. Similarly in packet routing, look up tables are used for
31
routing. In WH router routing tables are used for routing the packets from one router to
another. CONNECT uses only Distributed RAMs (DRAM) to reduce the usage of LUTs
to make it more efficient. In WH router it targets both DRAM and Block RAM (BRAM)
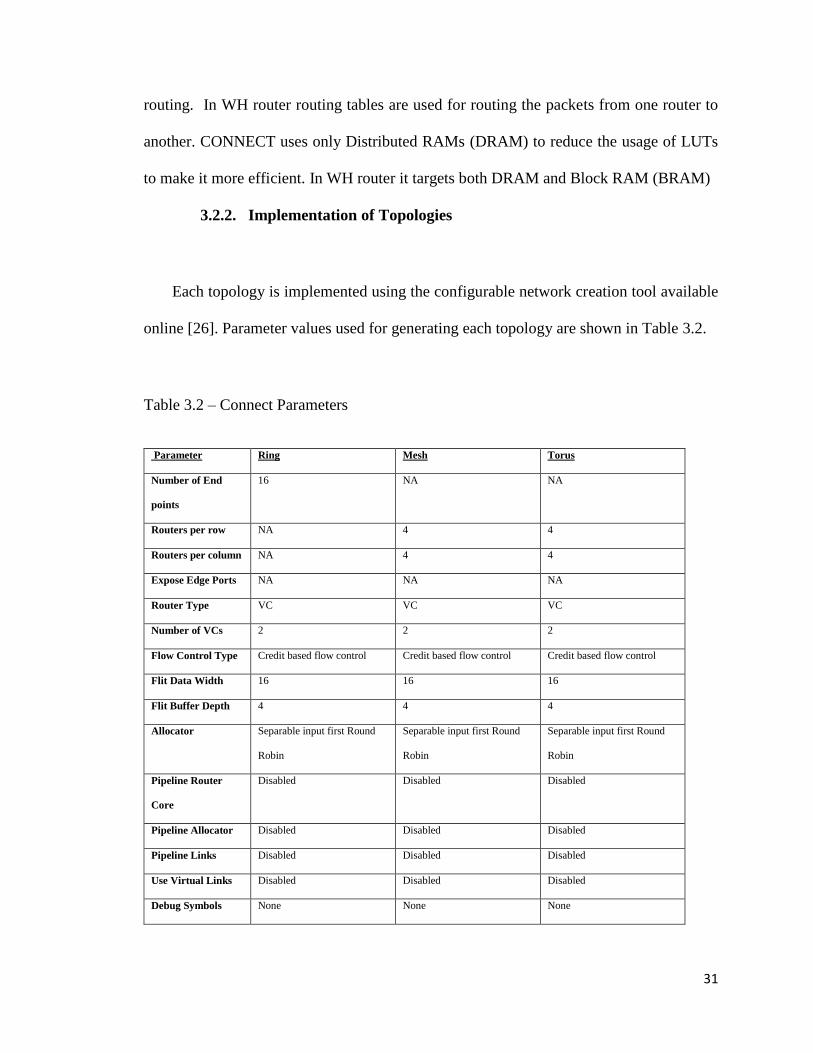
3.2.2. Implementation of Topologies
Each topology is implemented using the configurable network creation tool available
online [26]. Parameter values used for generating each topology are shown in Table 3.2.
Table 3.2 – Connect Parameters
Parameter Ring Mesh Torus
Number of End
points
16 NA NA
Routers per row NA 4 4
Routers per column NA 4 4
Expose Edge Ports NA NA NA
Router Type VC VC VC
Number of VCs 2 2 2
Flow Control Type Credit based flow control Credit based flow control Credit based flow control
Flit Data Width 16 16 16
Flit Buffer Depth 4 4 4
Allocator Separable input first Round
Robin
Separable input first Round
Robin
Separable input first Round
Robin
Pipeline Router
Core
Disabled Disabled Disabled
Pipeline Allocator Disabled Disabled Disabled
Pipeline Links Disabled Disabled Disabled
Use Virtual Links Disabled Disabled Disabled
Debug Symbols None None None

32
Once the parameter values are entered and synthesis started, the Verilog code is
generated automatically by the CONNECT tool.
3.2.2.1. Ring, Mesh and Torus topologies
The ring, mesh and torus topologies generated using the
CONNECT tool are shown in Fig. 3.6.
Figure 3.7 – Ring, Mesh, Torus Topologies generated by CONNECT
The automatically generated Verilog code is synthesized using Altera Quartus II
targeting Stratix III device EP3SL340H1152I4L. The area utilization and the maximum
clock frequency results that are obtained are discussed in detail in the next chapter.

33
Chapter 4
Experimental Evaluation Results
This chapter discusses the experimental evaluation results obtained using two
methods for NoC implementation on Altera Stratix III FPGA EP3SL340H1152I4L:
manually designed NoC and automated NoC synthesis using the CONNECT CAD tool.
Three different NoC topologies ring, mesh and torus were implemented. The NoC sizes
used were 4, 9 and 16 nodes (routers). The NoC implementation results were evaluated
using two metrics: resource utilization and maximum clock frequency. For each NoC size
and topology the effect of varying data width on the evaluation metrics is also explored.
Finally the results obtained by manual NoC design and implementation are compared with
the results obtained by automated NoC synthesis.
4.1. Manual Design and Implementation of NoC using Quartus II
In this approach, the VHDL model for the entire NoC is created manually and then
synthesized at the RTL level to FPGA hardware using the Altera Quartus II CAD tool. The
VHDL model for the WH router used was designed in [3]. The VHDL model of the entire
NoC is organised in a hierarchical manner. Due to CAD tool constraints an adapter was
used in one of the routers to obtain the area utilization results, whereas the other routers
did not have to use adapters. The area used by the adapter is negligible.

34
4.1.1. Comparison of Area Utilization for Ring, Mesh and Torus Topologies
Our first experiment was performed by calculating the area utilization for different
topologies by varying the number of routers in the topology architecture. The area
utilization for different topologies are measured by obtaining the Synthesis results from
Quartus II CAD tool. Figure 4.1. shows the area utilization for three topologies (ring, mesh
and torus) and three NoC sizes (4, 9, and 16). A constant data width value of 32 is used for
all cases.
0
500
1000
1500
2000
2500
3000
Ring (4) Mesh (2X2) Torus (2X2)
Area Utilization
Combinational ALUTs Registers
0
1000
2000
3000
4000
5000
6000
Ring (9) Mesh (3X3) Torus (3X3)
Area Utilization
Combinational ALUTs Registers
35
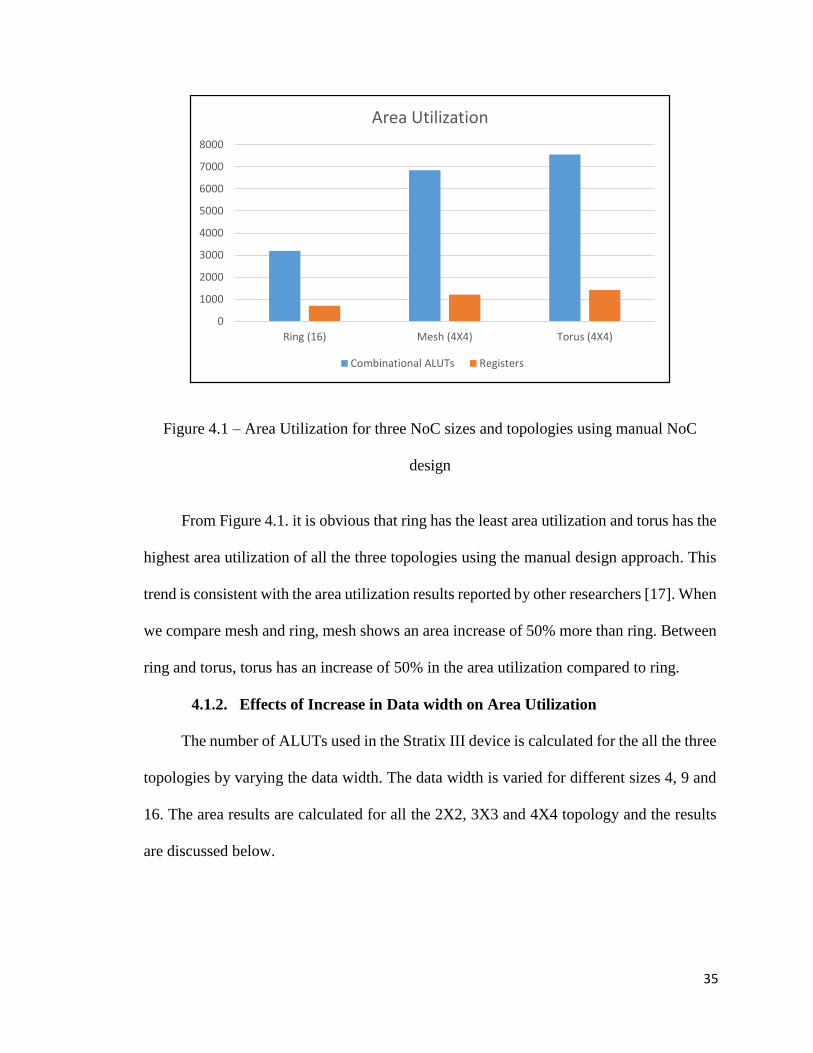
Figure 4.1 – Area Utilization for three NoC sizes and topologies using manual NoC
design
From Figure 4.1. it is obvious that ring has the least area utilization and torus has the
highest area utilization of all the three topologies using the manual design approach. This
trend is consistent with the area utilization results reported by other researchers [17]. When
we compare mesh and ring, mesh shows an area increase of 50% more than ring. Between
ring and torus, torus has an increase of 50% in the area utilization compared to ring.
4.1.2. Effects of Increase in Data width on Area Utilization
The number of ALUTs used in the Stratix III device is calculated for the all the three
topologies by varying the data width. The data width is varied for different sizes 4, 9 and
16. The area results are calculated for all the 2X2, 3X3 and 4X4 topology and the results
are discussed below.
0
1000
2000
3000
4000
5000
6000
7000
8000
Ring (16) Mesh (4X4) Torus (4X4)
Area Utilization
Combinational ALUTs Registers
36
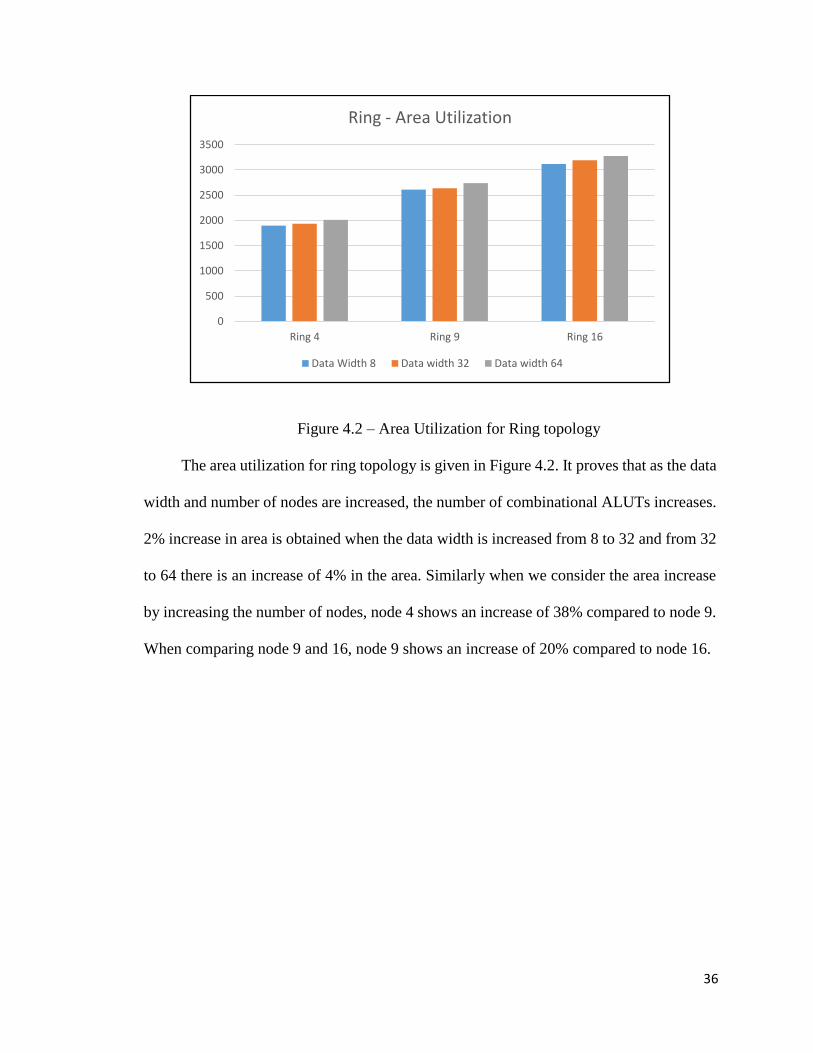
Figure 4.2 – Area Utilization for Ring topology
The area utilization for ring topology is given in Figure 4.2. It proves that as the data
width and number of nodes are increased, the number of combinational ALUTs increases.
2% increase in area is obtained when the data width is increased from 8 to 32 and from 32
to 64 there is an increase of 4% in the area. Similarly when we consider the area increase
by increasing the number of nodes, node 4 shows an increase of 38% compared to node 9.
When comparing node 9 and 16, node 9 shows an increase of 20% compared to node 16.
0
500
1000
1500
2000
2500
3000
3500
Ring 4 Ring 9 Ring 16
Ring - Area Utilization
Data Width 8 Data width 32 Data width 64

37
Figure 4.3 – Area Utilization for Mesh topology
The area utilization for the mesh topology is given in Figure 4.3. Increase in area is
less than 2% when the data width is increased from 8 to 32 but an increase of 4% is shown
when the data width is increased from 32 to 64. When number of nodes is considered,
mesh shows a change of 120% when increased from 4 to 9 and an increase of 20% between
9 and 16.
0
1000
2000
3000
4000
5000
6000
7000
8000
Mesh 2x2 Mesh 3x3 Mesh 4X4
Mesh - Area Utilization
Data Width 8 Data width 32 Data width 64
38
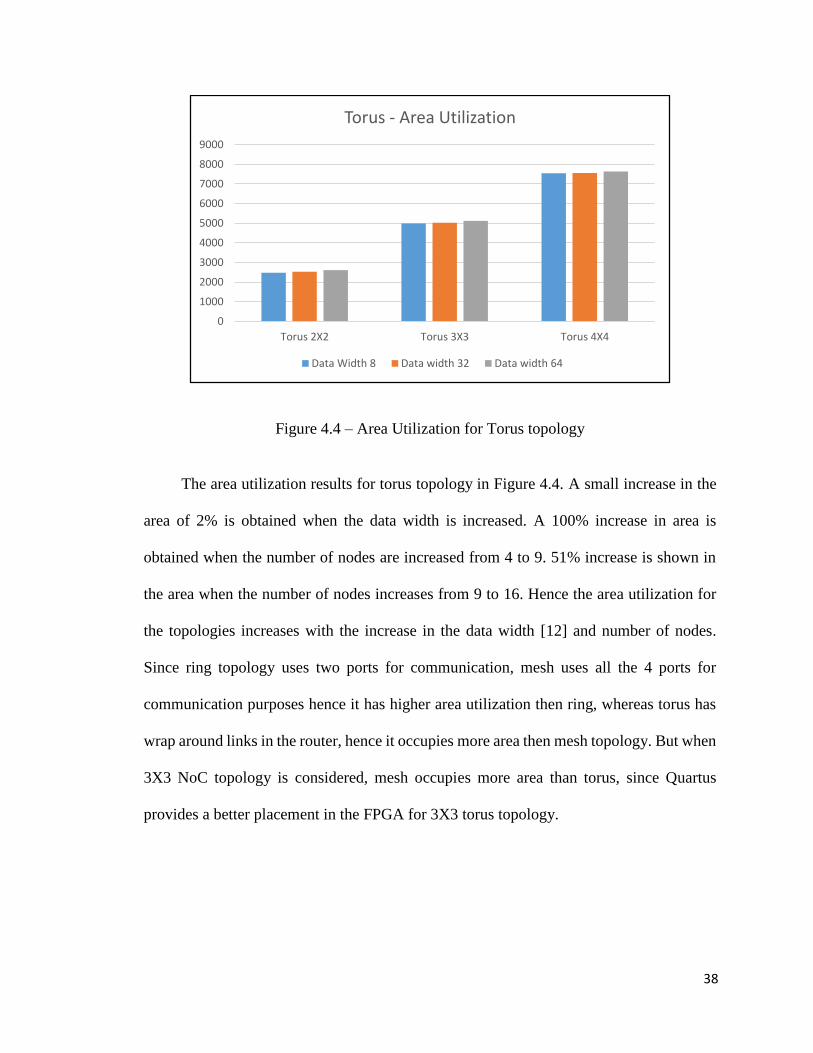
Figure 4.4 – Area Utilization for Torus topology
The area utilization results for torus topology in Figure 4.4. A small increase in the
area of 2% is obtained when the data width is increased. A 100% increase in area is
obtained when the number of nodes are increased from 4 to 9. 51% increase is shown in
the area when the number of nodes increases from 9 to 16. Hence the area utilization for
the topologies increases with the increase in the data width [12] and number of nodes.
Since ring topology uses two ports for communication, mesh uses all the 4 ports for
communication purposes hence it has higher area utilization then ring, whereas torus has
wrap around links in the router, hence it occupies more area then mesh topology. But when
3X3 NoC topology is considered, mesh occupies more area than torus, since Quartus
provides a better placement in the FPGA for 3X3 torus topology.
0
1000
2000
3000
4000
5000
6000
7000
8000
9000
Torus 2X2 Torus 3X3 Torus 4X4
Torus - Area Utilization
Data Width 8 Data width 32 Data width 64
39
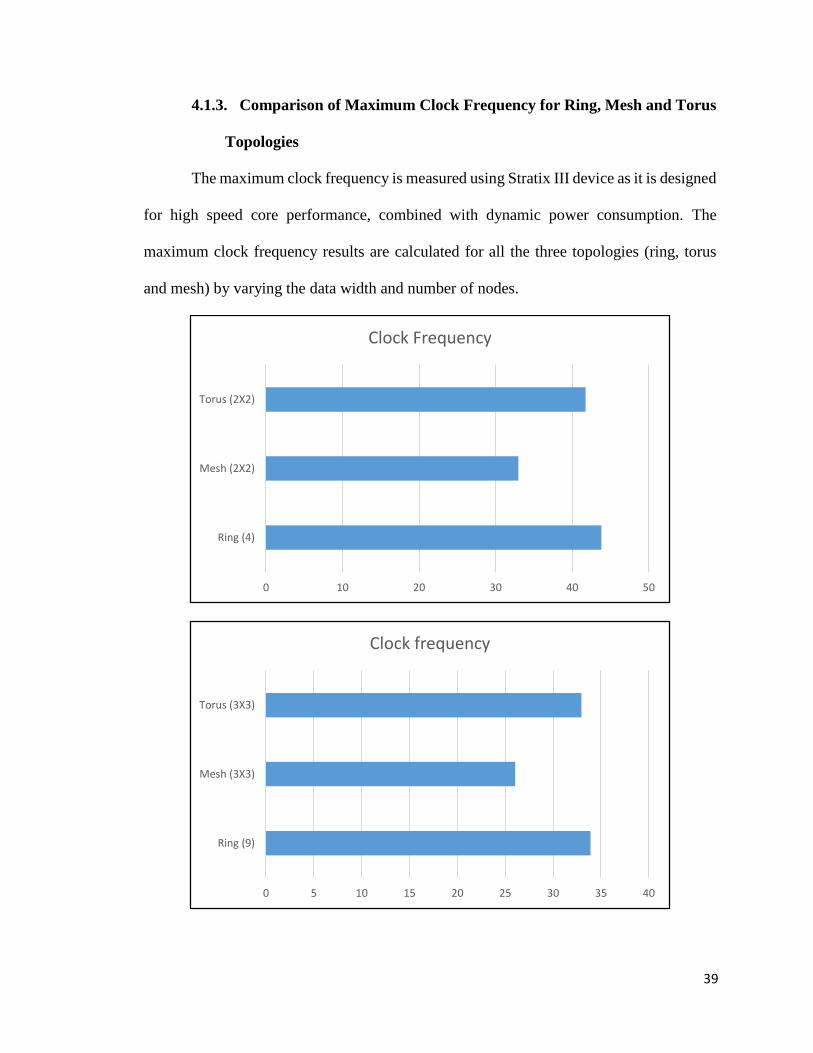
4.1.3. Comparison of Maximum Clock Frequency for Ring, Mesh and Torus
Topologies
The maximum clock frequency is measured using Stratix III device as it is designed
for high speed core performance, combined with dynamic power consumption. The
maximum clock frequency results are calculated for all the three topologies (ring, torus
and mesh) by varying the data width and number of nodes.
0 10 20 30 40 50
Ring (4)
Mesh (2X2)
Torus (2X2)
Clock Frequency
0 5 10 15 20 25 30 35 40
Ring (9)
Mesh (3X3)
Torus (3X3)
Clock frequency

40
Figure 4.5 – Maximum clock frequency for three NoC topologies and sizes using manual
NoC design
Figure 4.5. gives the maximum clock frequency results for all the three topologies
(ring, mesh and torus). The maximum clock frequency results shows that ring has the
highest maximum clock frequency and the mesh has the least maximum clock frequency.
So comparing ring with mesh, ring shows 20% increase in the maximum clock frequency
compared to mesh. Similarly torus shows 17% increase in the maximum clock frequency
compared to mesh. Hence ring shows a 4% increase in maximum clock frequency
compared to torus topology.
0 5 10 15 20 25 30 35
Ring (16)
Mesh (4X4)
Torus (4X4)
Clock frequency

41
Figure 4.6 – Clock frequency for Ring topology
Figure 4.6. shows the maximum clock frequency results for ring topology. When
comparing the maximum clock frequency results for data width 8 and 32, there is an
increase of 2% compared to data width 32. Between 32 and 64, there is 4% decrease in
maximum lock frequency compared to 64. Considering the increase in the number of
nodes, there is a 28% increase in the maximum clock frequency when the number of node
is 4 compared to 9. Between 9 and 16, there is a 2% decrease in 9 compared to 16 nodes.
0 10 20 30 40 50
Ring 4
Ring 9
Ring 16
Ring - Clock Frequency
Data width 64 Data width 32 Data Width 8
42
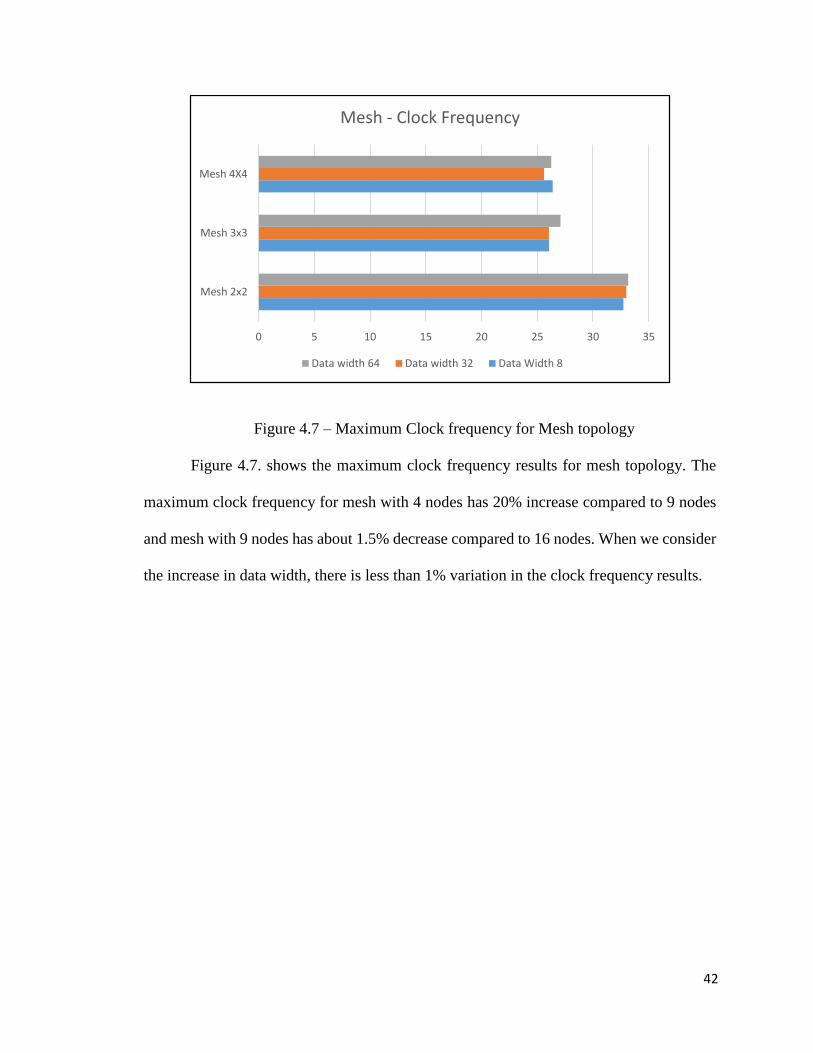
Figure 4.7 – Maximum Clock frequency for Mesh topology
Figure 4.7. shows the maximum clock frequency results for mesh topology. The
maximum clock frequency for mesh with 4 nodes has 20% increase compared to 9 nodes
and mesh with 9 nodes has about 1.5% decrease compared to 16 nodes. When we consider
the increase in data width, there is less than 1% variation in the clock frequency results.
0 5 10 15 20 25 30 35
Mesh 2x2
Mesh 3x3
Mesh 4X4
Mesh - Clock Frequency
Data width 64 Data width 32 Data Width 8
43
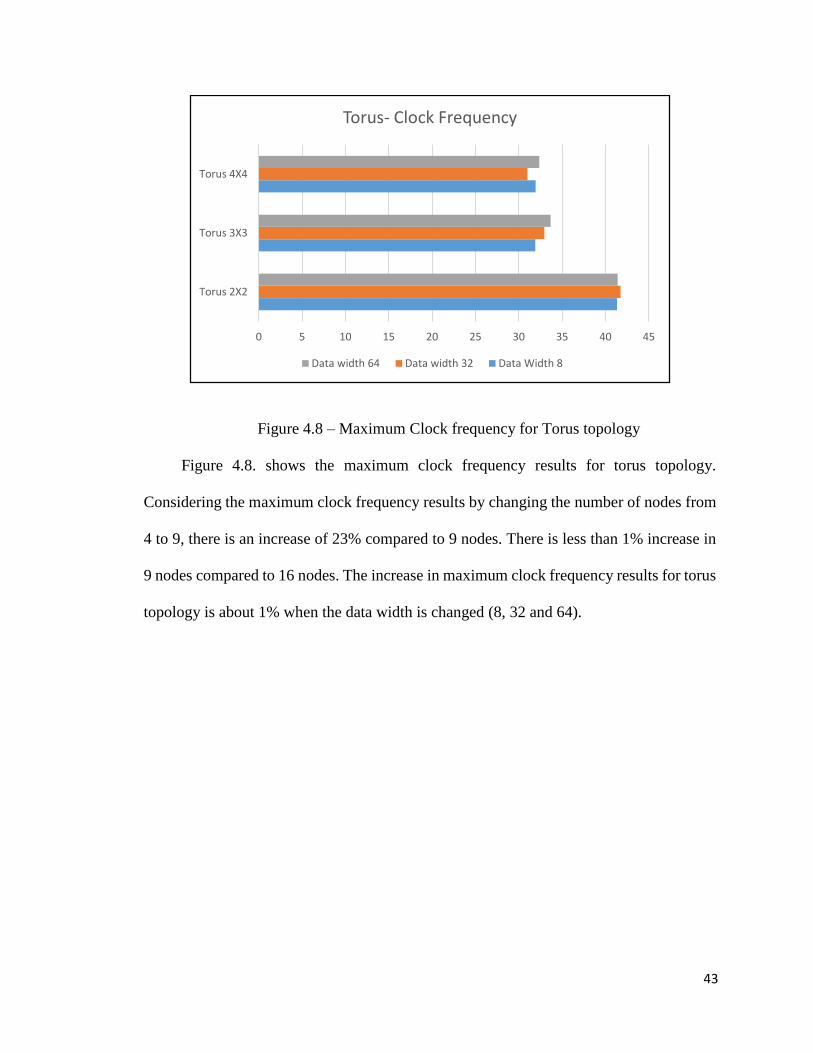
Figure 4.8 – Maximum Clock frequency for Torus topology
Figure 4.8. shows the maximum clock frequency results for torus topology.
Considering the maximum clock frequency results by changing the number of nodes from
4 to 9, there is an increase of 23% compared to 9 nodes. There is less than 1% increase in
9 nodes compared to 16 nodes. The increase in maximum clock frequency results for torus
topology is about 1% when the data width is changed (8, 32 and 64).
0 5 10 15 20 25 30 35 40 45
Torus 2X2
Torus 3X3
Torus 4X4
Torus- Clock Frequency
Data width 64 Data width 32 Data Width 8
44
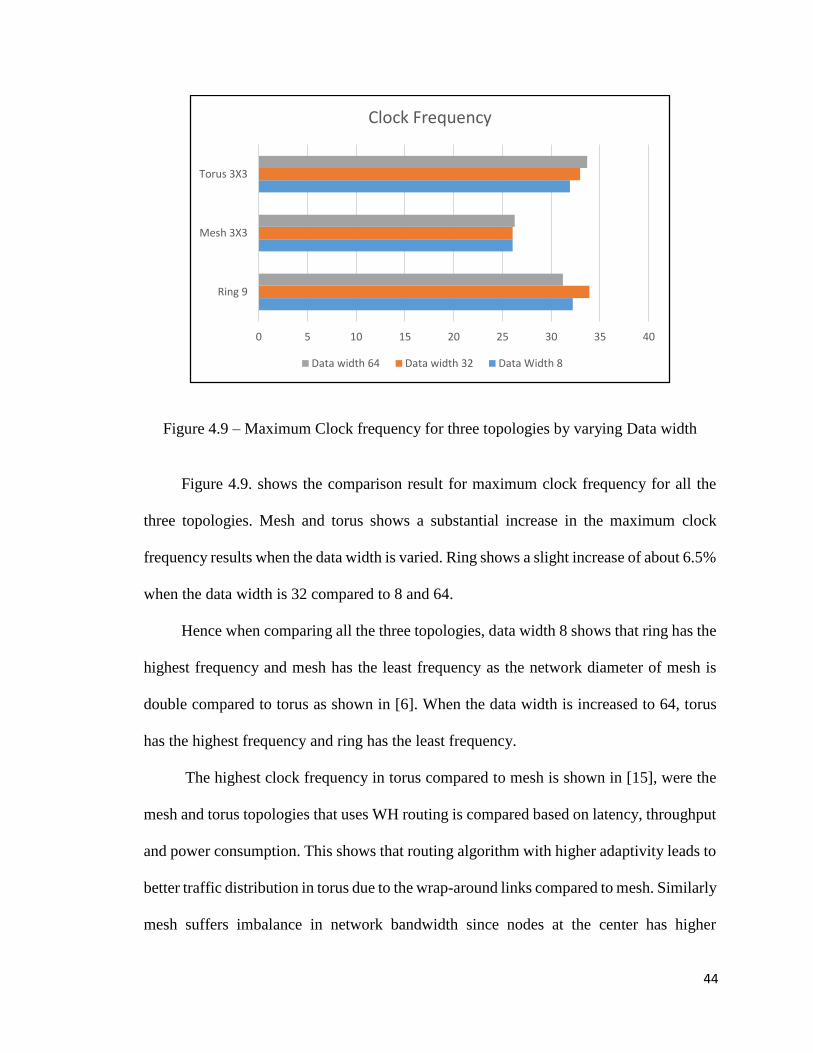
Figure 4.9 – Maximum Clock frequency for three topologies by varying Data width
Figure 4.9. shows the comparison result for maximum clock frequency for all the
three topologies. Mesh and torus shows a substantial increase in the maximum clock
frequency results when the data width is varied. Ring shows a slight increase of about 6.5%
when the data width is 32 compared to 8 and 64.
Hence when comparing all the three topologies, data width 8 shows that ring has the
highest frequency and mesh has the least frequency as the network diameter of mesh is
double compared to torus as shown in [6]. When the data width is increased to 64, torus
has the highest frequency and ring has the least frequency.
The highest clock frequency in torus compared to mesh is shown in [15], were the
mesh and torus topologies that uses WH routing is compared based on latency, throughput
and power consumption. This shows that routing algorithm with higher adaptivity leads to
better traffic distribution in torus due to the wrap-around links compared to mesh. Similarly
mesh suffers imbalance in network bandwidth since nodes at the center has higher
0 5 10 15 20 25 30 35 40
Ring 9
Mesh 3X3
Torus 3X3
Clock Frequency
Data width 64 Data width 32 Data Width 8
45
bandwidth then nodes at the boundaries and corner, whereas torus has balanced network
bandwidth [27]. Hence the clock frequency results for torus is higher compared to mesh
topology.
4.2. NoC Synthesis Results using CONNECT Tool.
In this approach, the Verilog model for the entire NoC is created automatically by
the NoC synthesis tool (CONNECT) [26]. The Verilog code is generated for the topology
selected based on the parameters as shown in Table 3.2 selected such as buffer depth, flit
data width, topology, number of nodes etc. The generated Verilog is synthesized using the
Altera Quartus II CAD tool.
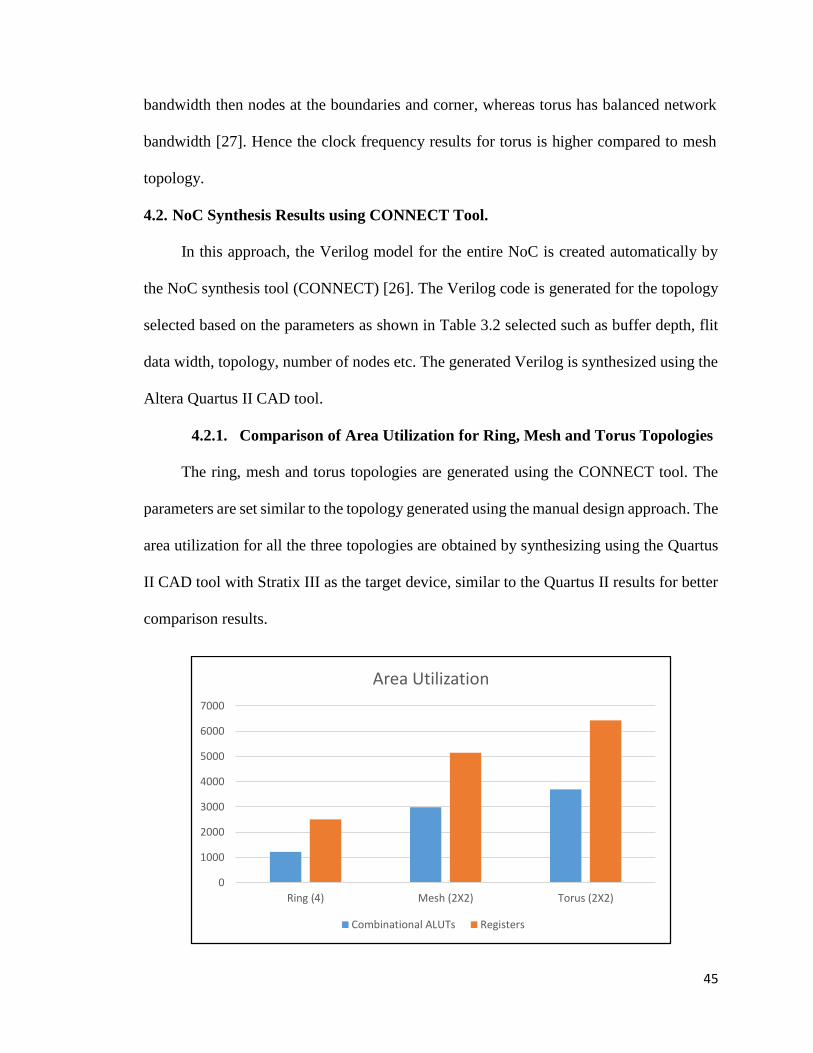
4.2.1. Comparison of Area Utilization for Ring, Mesh and Torus Topologies
The ring, mesh and torus topologies are generated using the CONNECT tool. The
parameters are set similar to the topology generated using the manual design approach. The
area utilization for all the three topologies are obtained by synthesizing using the Quartus
II CAD tool with Stratix III as the target device, similar to the Quartus II results for better
comparison results.
0
1000
2000
3000
4000
5000
6000
7000
Ring (4) Mesh (2X2) Torus (2X2)
Area Utilization
Combinational ALUTs Registers
46
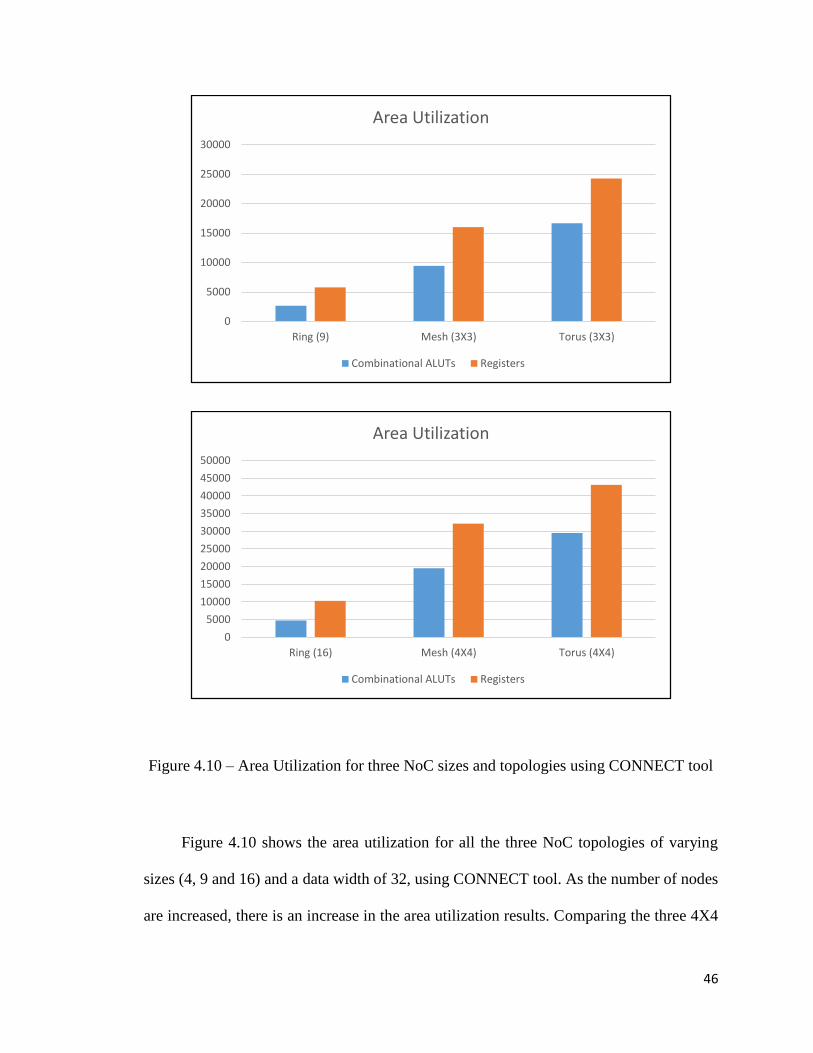
Figure 4.10 – Area Utilization for three NoC sizes and topologies using CONNECT tool
Figure 4.10 shows the area utilization for all the three NoC topologies of varying
sizes (4, 9 and 16) and a data width of 32, using CONNECT tool. As the number of nodes
are increased, there is an increase in the area utilization results. Comparing the three 4X4
0
5000
10000
15000
20000
25000
30000
Ring (9) Mesh (3X3) Torus (3X3)
Area Utilization
Combinational ALUTs Registers
0
5000
10000
15000
20000
25000
30000
35000
40000
45000
50000
Ring (16) Mesh (4X4) Torus (4X4)
Area Utilization
Combinational ALUTs Registers
47
topologies, ring shows 529% reduction in area compared to torus and 256% decrease
compared to mesh. Mesh shows a decrease of 76% compared to torus. For 3X3 topologies,
rings shows a decrease of 523% compared to torus and 312% compared to mesh. Mesh
occupies 50% less area compared to torus. For 2X2 topologies, ring occupies 200% less
area than torus 145% less area than mesh. Mesh occupies 23% less area than torus.
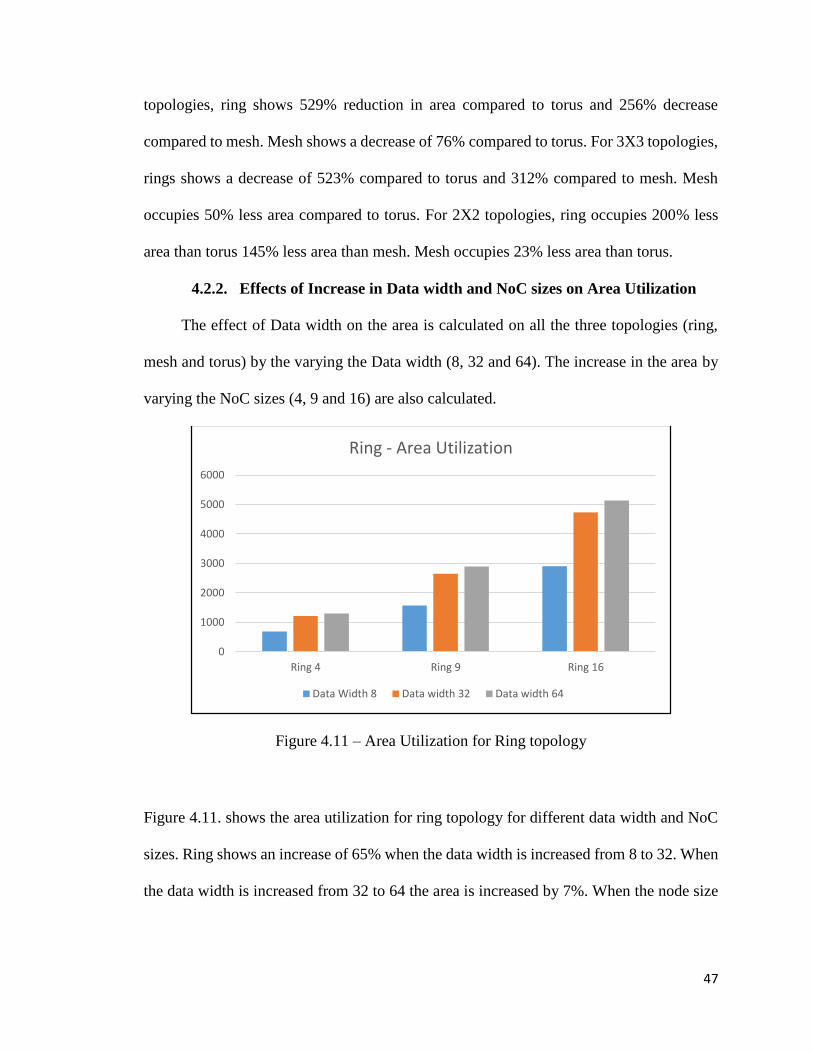
4.2.2. Effects of Increase in Data width and NoC sizes on Area Utilization
The effect of Data width on the area is calculated on all the three topologies (ring,
mesh and torus) by the varying the Data width (8, 32 and 64). The increase in the area by
varying the NoC sizes (4, 9 and 16) are also calculated.
Figure 4.11 – Area Utilization for Ring topology
Figure 4.11. shows the area utilization for ring topology for different data width and NoC
sizes. Ring shows an increase of 65% when the data width is increased from 8 to 32. When
the data width is increased from 32 to 64 the area is increased by 7%. When the node size
0
1000
2000
3000
4000
5000
6000
Ring 4 Ring 9 Ring 16
Ring - Area Utilization
Data Width 8 Data width 32 Data width 64

48
is increased from 4 to 9, the area increases by 120% when the node size is increased from
9 to 16, there is an increase of 80% in the area utilization.
Figure 4.12 – Area Utilization for Mesh topology
Figure 4.12. shows the area utilization for mesh topology. When the number of
nodes is increased from 4 to 9, there is an increase of 250% and when the number of node
is increased from 9 to 16 there is an increase of 112% in the area utilization. Similarly when
considering the data width, with data width 8 there is an increase of 60% on average when
compared with data width 32 and comparing data width 32 and 64, there is an increase of
7 % in the area.
0
5000
10000
15000
20000
25000
Mesh 2x2 Mesh 3x3 Mesh 4X4
Mesh - Area Utilization
Data Width 8 Data width 32 Data width 64

49
Figure 4.13 – Area Utilization for Torus topology
Figure 4.13. shows the area utilization result for Torus topology. When comparing
the data width 8 and 32, there is an increase of about 56% in the area utilization and data
width 32 shows an increase of 8% compared to data width 64. When the node size is
increased torus with node size 4 shows an area of 390% compared to node size 9. Torus
with node size 9 has an increase of 77% compared to node size 16.
4.2.3. Comparison of maximum clock frequency for Ring, Mesh and Torus
Topologies
The maximum clock frequency for the three topologies are obtained using Quartus
II tool. The maximum clock frequency of the three topologies are obtained by varying the
data width (8, 32 and 64) and NoC sizes (4, 9 and 16). The results obtained are discussed
in detail.
0
5000
10000
15000
20000
25000
30000
35000
Torus 2X2 Torus 3X3 Torus 4X4
Torus - Area Utilization
Data Width 8 Data width 32 Data width 64

50
0 20 40 60 80 100 120 140 160
Ring (4)
Mesh (2X2)
Torus (2X2)
Clock frequency
0 20 40 60 80 100 120 140 160
Ring 9
Mesh 3X3
Torus 3X3
Clock Frequency

51
Figure 4.14 – Maximum Clock frequency for three NoC sizes and topologies using
CONNECT tool
From Figure.4.14. the maximum clock frequency results for all the three
topologies by varying node size and data width of 32. Ring shows an increase of about 40
% with the mesh topology and an increase of about 50% when compared with the torus
topology. This holds true only for all node sizes 4, 9 and 16. As the node size is increased,
there is a decrease in the maximum clock frequency results. This difference is less for ring
topology. When the node size is varied from 4 to 9, there is a greater difference in the clock
frequency results for mesh and torus. When increased from 9 to 16, there is not much
variation in the clock frequency results.
0 20 40 60 80 100 120 140 160
Ring (16)
Mesh (4X4)
Torus (4X4)
Clock frequency
52
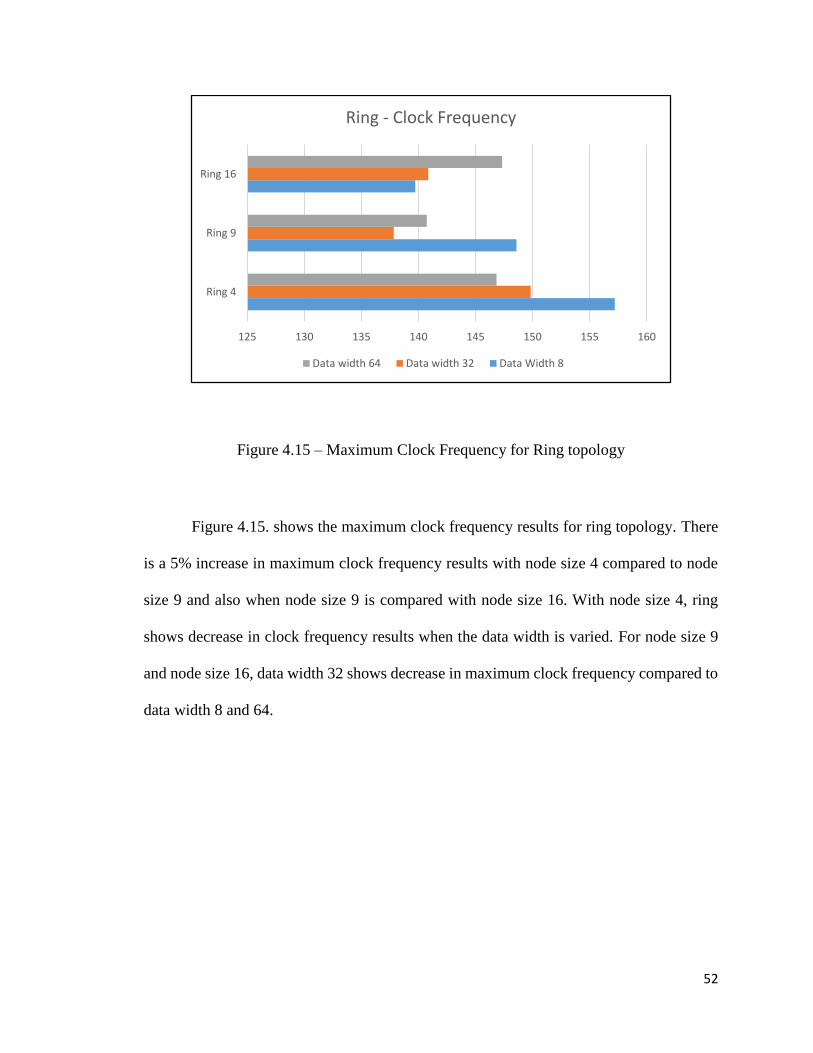
Figure 4.15 – Maximum Clock Frequency for Ring topology
Figure 4.15. shows the maximum clock frequency results for ring topology. There
is a 5% increase in maximum clock frequency results with node size 4 compared to node
size 9 and also when node size 9 is compared with node size 16. With node size 4, ring
shows decrease in clock frequency results when the data width is varied. For node size 9
and node size 16, data width 32 shows decrease in maximum clock frequency compared to
data width 8 and 64.
125 130 135 140 145 150 155 160
Ring 4
Ring 9
Ring 16
Ring - Clock Frequency
Data width 64 Data width 32 Data Width 8
53
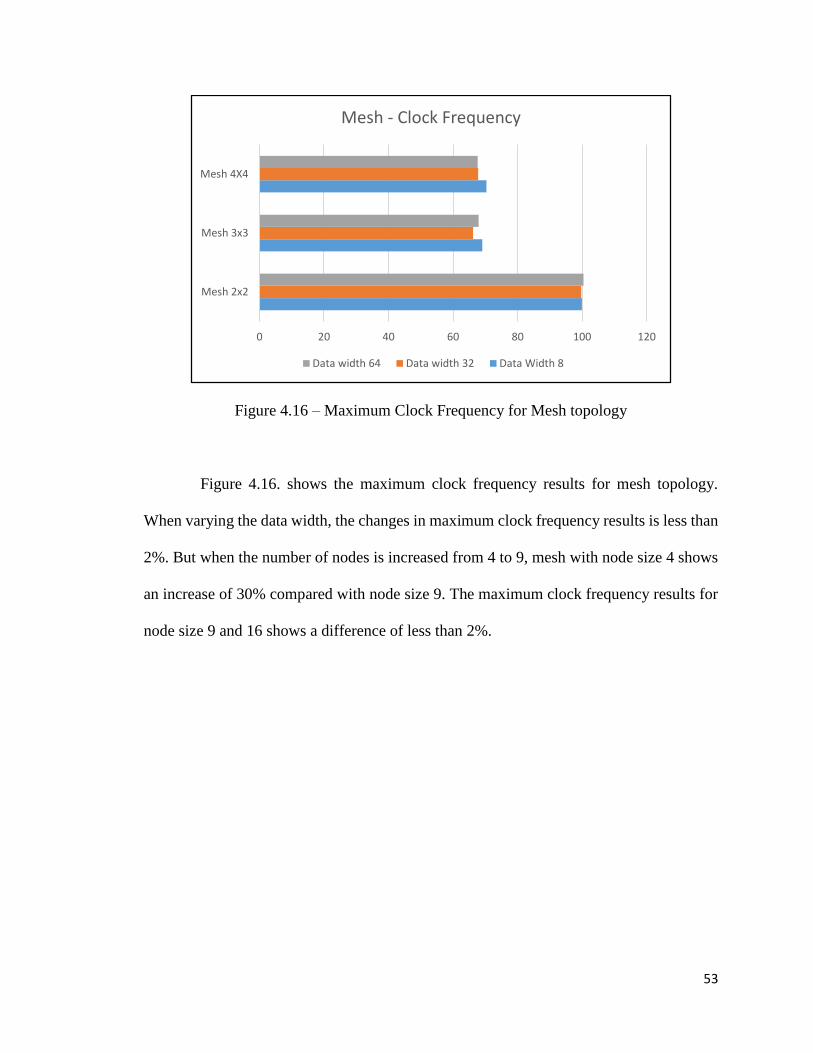
Figure 4.16 – Maximum Clock Frequency for Mesh topology
Figure 4.16. shows the maximum clock frequency results for mesh topology.
When varying the data width, the changes in maximum clock frequency results is less than
2%. But when the number of nodes is increased from 4 to 9, mesh with node size 4 shows
an increase of 30% compared with node size 9. The maximum clock frequency results for
node size 9 and 16 shows a difference of less than 2%.
0 20 40 60 80 100 120
Mesh 2x2
Mesh 3x3
Mesh 4X4
Mesh - Clock Frequency
Data width 64 Data width 32 Data Width 8

54
Figure 4.17 – Maximum Clock Frequency for Torus topology
Figure 4.17. shows the maximum clock frequency for torus topologies by varying the
number of nodes and data width. When the number of nodes is varied from 4 to 9, 4 shows
an increase of 24% compared to 9. But the change in maximum clock frequency is less
than 2 % when the node 9 is compared with node 16. When the data width is varied, the
change in maximum clock frequency is about 1%.
4.3. Comparison of Manual NoC Design with Automated NoC Synthesis.
The ring, mesh and torus are the three main topologies used for comparison. The
topologies are then generated using the manual NoC design and the automated NoC
synthesis (CONNECT) tool. The three NoC topologies (ring, mesh and torus) generated
are synthesized in the Quartus II CAD tool. Area utilization and maximum clock frequency
are the evaluation metric used for comparison between the manual NoC design and
automated NoC design approach.
0 20 40 60 80 100
Torus 2X2
Torus 3X3
Torus 4X4
Torus - Clock Frequency
Data width 64 Data width 32 Data Width 8
55
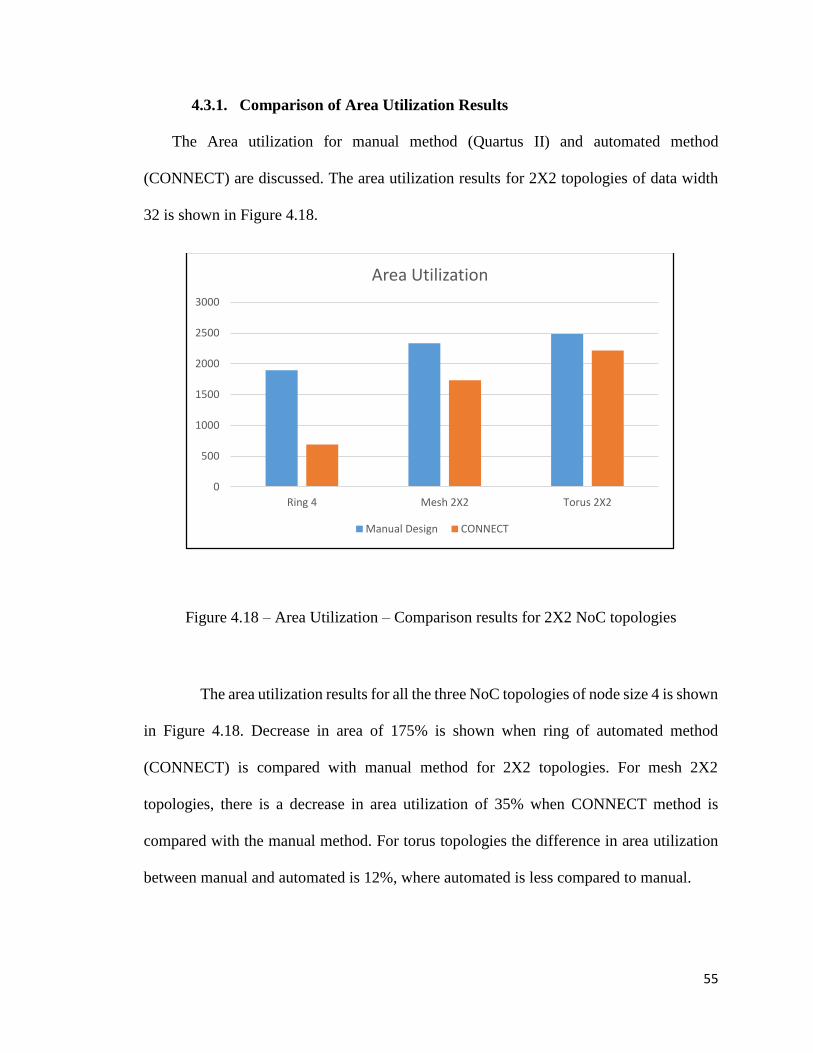
4.3.1. Comparison of Area Utilization Results
The Area utilization for manual method (Quartus II) and automated method
(CONNECT) are discussed. The area utilization results for 2X2 topologies of data width
32 is shown in Figure 4.18.
Figure 4.18 – Area Utilization – Comparison results for 2X2 NoC topologies
The area utilization results for all the three NoC topologies of node size 4 is shown
in Figure 4.18. Decrease in area of 175% is shown when ring of automated method
(CONNECT) is compared with manual method for 2X2 topologies. For mesh 2X2
topologies, there is a decrease in area utilization of 35% when CONNECT method is
compared with the manual method. For torus topologies the difference in area utilization
between manual and automated is 12%, where automated is less compared to manual.
0
500
1000
1500
2000
2500
3000
Ring 4 Mesh 2X2 Torus 2X2
Area Utilization
Manual Design CONNECT
56
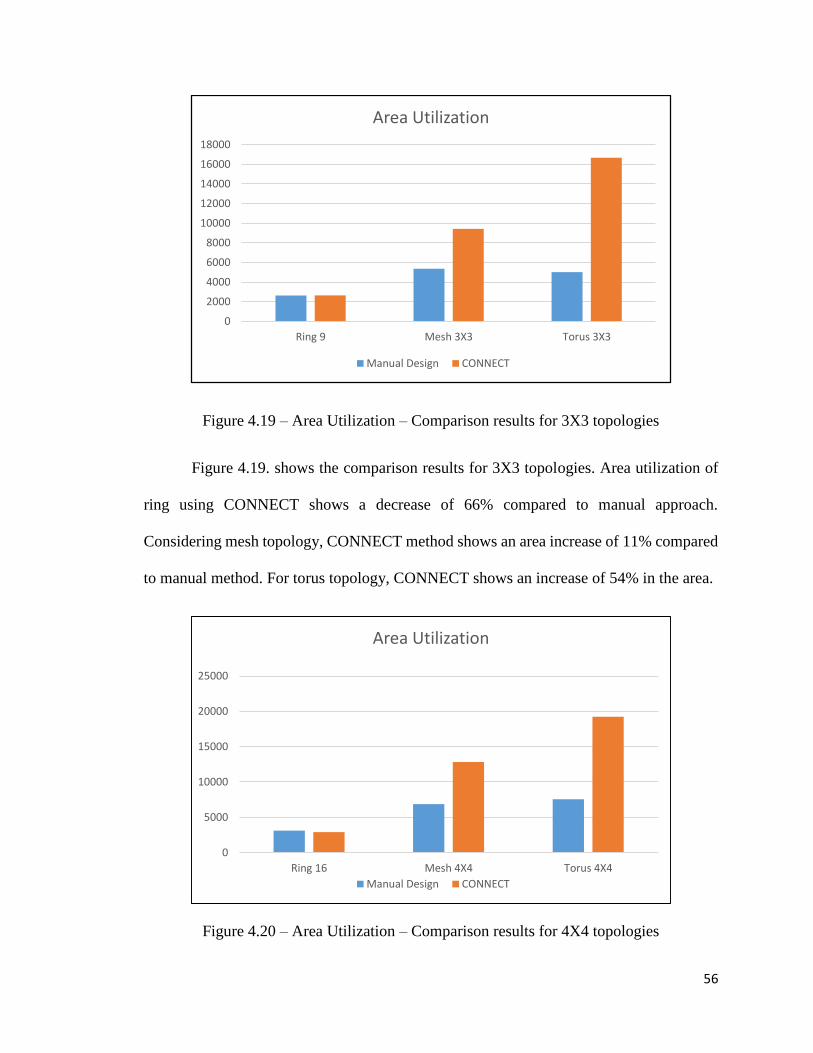
Figure 4.19 – Area Utilization – Comparison results for 3X3 topologies
Figure 4.19. shows the comparison results for 3X3 topologies. Area utilization of
ring using CONNECT shows a decrease of 66% compared to manual approach.
Considering mesh topology, CONNECT method shows an area increase of 11% compared
to manual method. For torus topology, CONNECT shows an increase of 54% in the area.
Figure 4.20 – Area Utilization – Comparison results for 4X4 topologies
0
2000
4000
6000
8000
10000
12000
14000
16000
18000
Ring 9 Mesh 3X3 Torus 3X3
Area Utilization
Manual Design CONNECT
0
5000
10000
15000
20000
25000
Ring 16 Mesh 4X4 Torus 4X4
Area Utilization
Manual Design CONNECT

57
Figure 4.20. shows the area utilization for 4x4 ring, mesh and torus topologies using
manual and CONNECT method. The results are similar to the 3X3 topologies. The area
utilization of ring using manual method is 7% more compared to CONNECT. Whereas the
area utilization for mesh (87%) and torus (55%) using manual method is less compared to
CONNECT tool. As CONNECT uses more area for VC buffer storage [1], whereas manual
method WH routing which uses less space (only one flit) [8].
4.3.2. Comparison of Maximum Clock frequency Results
The maximum clock frequency results for the three NoC topologies implemented
in manual and CONNECT method are compared. The Fig. 4.21 below shows the
comparison results for all the three NoC topologies of varying sizes (4, 9 and 16) with data
width 8.
0 20 40 60 80 100 120 140 160
Ring 4
Mesh 2X2
Torus 2X2
Clock Frequency
CONNECT Manual Design

58
Figure 4.21 – Maximum Clock frequency – Comparison results of NoC topologies
The maximum clock frequency for CONNECT is better compared to the manual
method. When the maximum clock frequency results are considered, CONNECT shows a
better clock frequency results compared to the manual method. Ring implemented using
CONNECT shows an increase of about 80% in the maximum clock frequency results
0 20 40 60 80 100 120 140 160
Ring 9
Mesh 3X3
Torus 3X3
Clock Frequency
CONNECT Manual Design
0 20 40 60 80 100 120 140 160
Ring 16
Mesh 4X4
Torus 4X4
Clock frequency
CONNECT Manual Design

59
compared to the manual method. Mesh shows an increase of about 65% compared to the
maximum clock frequency results obtained using the manual method. Similarly maximum
clock frequency of torus using automated method is 55% more compared to the manual
method.
4.4. Summary
This chapter discusses about the experimental evaluation of the ring, torus and mesh
topologies obtained by implementing the topologies using manual and automated method
(CONNECT). The evaluation results shows that as the number of nodes increases in the
topologies, the area utilization by manual method is better compare to the automated
method using CONNECT. On an average, the reduction in area utilization is 85% for torus
topologies and 50% for mesh topologies when manual method is used. Huge percentage
of area is used by CONNECT for VC buffer storage [1 and 19]. Considering the results
for small topologies, CONNECT shows an average increase of 120% for ring, 35 % for
mesh and 12% for torus topologies. But for better clock frequency results, the CONNECT
synthesis tool is the better option compared to the topology implemented in manual
method, as CONNECT router uses single stage pipeline which is not used in the WH
router. The thesis is concluded and the future work is discussed in chapter 5.
60
Chapter 5
Conclusion and Future Work
As integrated circuit technology improves, the growth in chip density resulted in
larger and more complex systems-on-chip. The traditional bus based interconnect was not
scalable, slower and resulted in performance bottlenecks. Hence a new strategy was
introduced for on-chip communication architecture called the Network-on-chip. Many
NoC topologies were introduced and some of them were later enhanced.
Our research group experience showed that trying to design and implement an NoC
from scratch is very time consuming and tedious. The NoC design space that can be
explored is severely limited. The key research contribution of this thesis is to
experimentally evaluate the automated CONNECT NoC synthesis tool.
The NoC topologies ring, mesh and torus are used in this research for evaluating
CONNECT and comparing it with manual NoC design and implementation. The NoC sizes
used were 4, 9 and 16 nodes. The comparison between the two methods are performed on
the basis of logic resource utilization and maximum clock frequency. The experimental
evaluation results are obtained by implementing the NoC topologies on Altera Stratix III
FPGA EP3SL340H1152I4L.
In the manual approach, the NoC topologies are manually generated by creating a
VHDL model and then synthesizing it using the Altera Quartus II CAD tool. The VHDL

61
model is organized in a hierarchical manner. The area utilization for ring, mesh and torus
shows that as the data width and number of nodes are increased, the area utilization also
increases. When comparing the three topologies of sizes 2X2 and 4X4, torus has the
highest resource utilization and ring has the least resource utilization. But for 3X3
topology, mesh has the highest resource utilization and ring has the least resource
utilization. For maximum clock frequency results, ring has the maximum clock frequency
results and mesh has the least clock frequency results of all the three topologies.
In the automated NoC synthesis approach, the NoC topologies are generated
automatically by the CONNECT tool as a Verilog model and then synthesized using the
Altera Quartus II CAD tool. The results are obtained by varying the NoC sizes and data
width. For ring, mesh and torus topology when the data width and the number of nodes are
increased, there is an increase in the area utilization. For maximum clock frequency results
in 2X2 and 3X3 topologies torus has the least frequency and ring has the highest. But for
4X4 topologies mesh has the least value and ring has the highest value.
The experimental evaluation results for manual method are compared with the results
from CONNECT. Considering the area utilization evaluation metric, manual design on
average occupies 85% less area for torus compared to the CONNECT tool. It also shows
a reduction in area of about 50% for mesh. This holds true as the topology size increases.
But for 2X2 topologies CONNECT shows better area utilization, resulting in an area
decrease of 120% for ring, 35% for mesh and a very small decrease of about 12% in case
of torus topologies. Hence we can conclude that as the topology sizes and the data width
increases, there is an increase in the area utilization. But when both the methods are
62
compared as the number of nodes are increased, manual approach shows better results for
area utilization. For maximum clock frequency results, CONNECT has better results.
5.1. Future Work
Future work includes realistic performance evaluation of topologies using NoC
simulators. Previous experience in our research group shows performance evaluation using
benchmark is not practical [3 and 17]. Pipeline stages can be used to improve the maximum
clock frequency results for the manual method. Qsys of Altera Corporation can be used to
implement the three topologies and can be compared. Additional topologies such as star,
hierarchy, butterfly can also be studied which will provide a suitable area for research.
While the effect of data width and NoC sizes on area utilization and maximum clock
frequency was studied, other high level performance metrics such as throughput and
latency can also be studied.

63
References
1. Papamichael, Michael K., and James C. Hoe. "CONNECT: re-examining
conventional wisdom for designing nocs in the context of FPGAs." In Proceedings
of the ACM/SIGDA international symposium on Field Programmable Gate Arrays,
pp. 37-46. ACM, 2012.
2. Salminen, Erno, Ari Kulmala, and Timo D. Hamalainen. "On network-on-chip
comparison." In Digital System Design Architectures, Methods and Tools, 2007.
DSD 2007. 10th Euromicro Conference on, pp. 503-510. IEEE, 2007.
3. Krunal Jetly, “Experimental Comparison of Store-and-Forward and Wormhole NoC
Routers for FPGA's,” M.S. thesis, Dept. of Electr. & Comput. Eng., Univ. of
Windsor, Windsor, ON, Canada, 2013.
4. Liang, Jian, Sriram Swaminathan, and Russell Tessier. "ASOC: A scalable, single-
chip communications architecture." In Parallel Architectures and Compilation
Techniques, 2000. Proceedings. International Conference on, pp. 37-46. IEEE,
2000.
5. Saldana, Manuel, Lesley Shannon, Jia Shuo Yue, Sikang Bian, John Craig, and Paul
Chow. "Routability of network topologies in FPGAs." Very Large Scale Integration
(VLSI) Systems, IEEE Transactions on 15, no. 8 (2007): 948-951.

64
6. Ni, Lionel M., and Philip K. McKinley. "A survey of wormhole routing techniques
in direct networks." Computer 26, no. 2 (1993): 62-76.
7. Marculescu, Radu, Umit Y. Ogras, Li-Shiuan Peh, Natalie Enright Jerger, and Yatin
Hoskote. "Outstanding research problems in NoC design: system,
microarchitecture, and circuit perspectives." Computer-Aided Design of Integrated
Circuits and Systems, IEEE Transactions on 28, no. 1 (2009): 3-21.
8. Salminen, Erno, Ari Kulmala, and Timo D. Hamalainen. "Survey of network-on-
chip proposals." white paper, OCP-IP (2008): 1-13.
9. Kundu, Santanu, Radha Purnima Dasari, Santanu Chattopadhyay, and Kanchan
Manna. "Mesh-of-Tree based scalable network-on-chip architecture." In Industrial
and Information Systems, 2008. ICIIS 2008. IEEE Region 10 and the Third
international Conference on, pp. 1-6. IEEE, 2008.
10. Das, Tuhin Subhra, Prasun Ghosal, Saraju P. Mohanty, and Elias Kougianos. "A
performance enhancing hybrid locally mesh globally star NoC topology." In
Proceedings of the 24th edition of the great lakes symposium on VLSI, pp. 69-70.
ACM, 2014.
11. Dally, William J., and Brian Towles. "Route packets, not wires: on-chip
interconnection networks." In Design Automation Conference, 2001. Proceedings,
pp. 684-689. IEEE, 2001.
65
12. Abba, Sani, and Jeong-A. Lee. "Examining the performance impact of NoC
parameters for scalable and adaptive FPGA-based network-on-chips." In
Computational Intelligence, Modelling and Simulation (CIMSim), 2013 Fifth
International Conference on, pp. 364-372. IEEE, 2013.
13. Moraes, Fernando, Ney Calazans, Aline Mello, Leandro Möller, and Luciano Ost.
"HERMES: an infrastructure for low area overhead packet-switching networks on
chip." INTEGRATION, the VLSI journal 38, no. 1 (2004): 69-93.
14. Pande, Partha Pratim, Cristian Grecu, Michael Jones, Andre Ivanov, and Resve
Saleh. "Performance evaluation and design trade-offs for network-on-chip
interconnect architectures." Computers, IEEE Transactions on 54, no. 8 (2005):
1025-1040.
15. Mirza-Aghatabar, Mohammad, Somayyeh Koohi, Shaahin Hessabi, and Massoud
Pedram. "An empirical investigation of mesh and torus NoC topologies under
different routing algorithms and traffic models." In Digital System Design
Architectures, Methods and Tools, 2007. DSD 2007. 10th Euromicro Conference
on, pp. 19-26. IEEE, 2007.
16. Altera Corporation. Quartus II Handbook Version 9.1. Design Software. [Online]
November 2009. [Cited: May 5, 2010.]
http://www.altera.com/literature/hb/qts/quartusii_handbook.pdf.
66
17. Matt Murawski, "NoC Prototyping on FPGAs: Component Design, Architecture
Implementation and Comparison,” M.S. thesis, Dept. Electrical and Computer Eng.,
University of Windsor, Ontario, Canada (2010).
18. Altera Corporation. Altera Avalon Interface Specifications. Literature: SOPC
Builder. [Online] April 2009.
http://www.altera.com/literature/manual/mnl_avalon_spec.pdf.
19. Kwa, Jimmy, and Tor M. Aamodt. "Small virtual channel routers on FPGAs through
block RAM sharing." In FPT, pp. 71-79. 2012.
20. Kinsy, Michel A., Michael Pellauer, and Srinivas Devadas. "Heracles: a tool for fast
RTL-based design space exploration of multicore processors." In Proceedings of
the ACM/SIGDA international symposium on Field programmable gate arrays, pp.
125-134. ACM, 2013.
21. Francis, Rosemary M. "Exploring networks-on-chip for FPGAs." PhD diss.,
University of Cambridge, 2009.
22. Chen, Kuan-Ju, Chin-Hung Peng, and Feipei Lai. "Star-type architecture with low
transmission latency for a 2D mesh NOC." In Circuits and Systems (APCCAS),
2010 IEEE Asia Pacific Conference on, pp. 919-922. IEEE, 2010.
23. Ghosal, P., and T. S. Das. "L2STAR: A Star Type level-2 2D Mesh architecture for
NoC." In Asia Pacific Conference on Postgraduate Research in Microelectronics
and Electronics (PrimeAsia), pp. 155-159. 2012.

67
24. Wang, Xiaofang, and Leeladhar Bandi. "A low-area and low-latency network on
chip." In Electrical and Computer Engineering (CCECE), 2010 23rd Canadian
Conference on, pp. 1-5. IEEE, 2010.
25. Michael Brugge, “Design and evaluation of a parameterizable NoC router for
FPGAs,” M.S. thesis, Dept. Electrical and Computer Eng., University of Windsor,
Ontario, Canada, 2009.
26. Papamichael, M. K., and J. C. Hoe. "CONNECT: CONfigurable NEtwork Creation
Tool." http://users. ece. cmu. edu/∼ mpapamic/connect (2012).
27. Ouyang, Jin. "Architecting On-chip Interconnection Network for Future Many-core
Chip-multiprocessors." PhD diss., The Pennsylvania State University, 2012.

68
Appendix A: Copyright Permission
REQUEST FOR PERMISSION TO USE COPYRIGHTED MATERIAL
On Tue, Feb 17, 2015 at 4:10 PM, Jenita Priya Rajamanickam Manokaran
<[email protected]> wrote:
Dear Krunal/Dr.Khalid,
I am completing a Master’s Thesis at the University of Windsor entitled
"Experimental Evaluation of an NoC Synthesis Tool" I would like your permission to
include in my thesis the following material:
i. From Chapter 3 section 3.1.1.3 (Routing Algorithm), Figure 14, Figure 15, section
3.3.1, Figure 18, Table 3.1, Figure 19 from thesis by K. Jetley “Experimental Comparison
of Store-and-Forward and Wormhole NoC Routers for FPGA's,” Feb 2013.
I have used this information in my experiments and also this information was best
described in the above mentioned thesis written by you. I have also used the Worm Hole
Router for comparison results.
My thesis will be deposited to the University of Windsor’s online thesis and
dissertations repository (http://winspace.uwindsor.ca) and will be available in full-text on
the internet for reference, study and / or copy. I will also be granting Library and Archives
Canada and ProQuest/UMI a non-exclusive license to reproduce, loan, distribute, or sell
single copies of my thesis by any means and in any form or format. These rights will in no
way restrict republication of the material in any other form by you or by others authorized
by you. Please confirm by email that these arrangements meet with your approval.
Thank you very much for your attention to this matter.

69
Sincerely,
Jenita Priya Rajamanickam Manokaran
From: [email protected]
Sent: Tuesday, February 17, 2015 5:45 PM
To: Mohammed Khalid
Cc: rajamanj
Hello,
I am pleased to hear that you have completed your thesis. You have my permission to
use the data in thesis as stated below.
Regards,
Krunal
From: Mohammed Khalid
Sent: Tuesday, February 17, 2015 5:34 PM
To: rajamanj
Cc: Krunal Jetly, [email protected]
Dear Jenita:
I hereby give you permission to use Krunal's data in your thesis. I know for a fact that
Krunal is fine with allowing his successor students working with me to use any material
from his thesis for their research as long as it is acknowledged.
Regards,
Khalid
70
Vita Auctoris
NAME: Jenita Priya Rajamanickam Manokaran
PLACE OF BIRTH:
Coimbatore, TN, India
YEAR OF BIRTH:
1987
EDUCATION:
Bachelor’s degree in Electronics and Communication Engineering,
Karunya University, Coimbatore, India, 2008.
Master of Applied Science in Electrical and Computer
Engineering, University of Windsor, Ontario, Canada, 2015.