Identification of the Parameter Values of the Constitutive and ...
Upload
independentCategory
view
6download
0
lable at ScienceDirect
Polymer 49 (2008) 2728–2737
Contents lists avai
Polymer
journal homepage: www.elsevier .com/locate/polymer
Experimental characterisation and constitutive modellingof RTM-6 resin under impact loading
Robert Gerlach*, Clive R. Siviour, Nik Petrinic, Jens WiegandUniversity of Oxford, Department of Engineering Science, Parks Road, Oxford OX1 3PJ, United Kingdom
a r t i c l e i n f o
Article history:Received 12 February 2008Received in revised form 9 April 2008Accepted 10 April 2008Available online 13 April 2008
Keywords:RTM-6 ResinHopkinson bar pulse shapingConstitutive Modelling
* Corresponding author. Tel.: þ44 1865 283475; faxE-mail address: [email protected] (R. Ge
0032-3861/$ – see front matter � 2008 Elsevier Ltd.doi:10.1016/j.polymer.2008.04.018
a b s t r a c t
The response to mechanical loading of the thermosetting resin system RTM-6 has been investigatedexperimentally as a function of strain rate and a constitutive model has been applied to describe theobserved and quantified material behaviour. In order to determine strain rate effects and to draw con-clusions about the hydrostatic stress dependency of the material, specimens were tested in compressionand tension at strain rates from 10�3 to 104 s�1. A Standard screw-driven tensile machine was used forquasi-static testing, with an ‘in house’ hydraulic rig and Hopkinson bars for medium and high strainrates, respectively. At all rates appropriate photography and optical metrology have been used for directstrain measurement, observation of failure and validation of experimental procedures. In order to enablethe experimental characterisation of this brittle material at very high rates in tension, a novel pulseshaping technique has been applied. With the help of this device, strain rates of up to 3800 s�1 have beenachieved while maintaining homogeneous deformation state until specimen fracture in the gauge sec-tion of the tensile specimens. The yield stress and initial modulus increased with increasing strain ratefor both compression and tension, while the strain to failure decreased with strain rate in tension. Anexisting constitutive model, the Goldberg model has been extended in order to take into account thenonlinear strain rate dependence of the elastic modulus. The model has been validated against 3-pointimpact bending tests of prismatic RTM-6 beams.
� 2008 Elsevier Ltd. All rights reserved.
1. Introduction
Thermosetting polymers, such as HEXCEL RTM-6, are net-worked polymers in which chain motion is restricted by a highdegree of cross-linking, and are generally much stronger and moretemperature resistant than thermoplastic materials. One of themajor applications of thermosetting polymers is their use as a ma-trix material for a wide variety of modern fibre reinforced polymers(FRPs) in the aerospace, automotive, marine, oil and gas industries[1–3]. RTM-6 is a one component system especially developed forthe aerospace industry and is widely used as a matrix in compositematerials. In particular, the system is designed for the resin transfermoulding (RTM) production processes.
The importance of characterising and modelling the response ofthis matrix to loading at different strain rates has become apparentdue to the development of 3D fibre reinforced composite materials,in which the usual ‘in-plane’ fibres are augmented by some form ofreinforcement in the ‘out of plane’ direction. In these composites,the matrix volume content can reach up to 50%, and large matrixpockets can be formed at meso-scale (tow level, Fig. 1). The
: þ44 1865 273906.rlach).
All rights reserved.
influence of these pockets on the strain rate dependency, the de-formation of fibre tows or damage behaviour of the 3-D compositehas only received limited attention [4]. Furthermore, the variety ofdifferent matrix systems available for 3-D composites creates theopportunity to investigate the optimal choice: to find the mostdesirable combination of matrix properties and select a resin sys-tem that best matches this combination for particular applications.One approach to investigate this issue is by means of virtual testingat meso-scale using a finite element model of the constituents(tows and matrix). It is therefore necessary to understand the be-haviour of the matrix material in detail and to apply an appropriateconstitutive model capturing important characteristics of the ma-trix that contribute to the global response of the final compositematerial.
This approach is currently restricted, as the dynamic responseof thermosets is not yet fully understood. No data for RTM-6 havebeen published for high rates of strain in either compression ortension; data on other resin materials are also limited and generallyrestricted to compressive behaviour only. It is therefore important toprovide the growing research community focusing on virtual modelsat meso-scale level with accurate experimental data on the mostcommon matrix systems, especially since the question as to whatextent dynamic compressive behaviour could be used as a referencefor derivation of tensile properties still needs to be answered.

Fig. 1. Cross section of a 3D woven composite showing distribution of matrix pockets.
R. Gerlach et al. / Polymer 49 (2008) 2728–2737 2729
A constitutive model suitable for virtual tests must capture thenonlinear, strain rate dependent and hydrostatic stress dependentmaterial behaviour of the polymer. Furthermore, it should be pos-sible to account for the different failure behaviours in compressionand tension. An additional criterion is ease of calibration andnumerical efficiency, especially as virtual modelling tackles in-creasingly complex problems.
The present study therefore includes a comprehensive experi-mental characterisation of the strain rate dependent and hydro-static stress dependent material response of RTM-6. Special focuswas given to the brittle behaviour of the resin at high rates intension. With the help of a novel pulse shaping technique, strainrates not yet reported could be achieved while maintaining validtesting conditions (failure in the gauge section and homogeneousstrain field). An existing constitutive model, the Goldberg model[5], has been applied and extended to take into account the non-linear strain rate dependency of the elastic modulus. This modelhas been calibrated against the characterisation experiments andvalidated against 3-point impact bending tests of RTM-6 beams.
1.1. Measurement of the constitutive response of brittle materialswith a low sound speed at high rates of strain
Compared to metals, only very limited data are available forstrain rate sensitivity of polymers in general and resins in particular[5–9]. Furthermore, most of the published data on resins deal withcompression only. Generally, these tests show an increase in mod-ulus and failure stress with increasing strain rate. The small data setfor tension can be explained by the various difficulties in performinghigh strain rate characterisation experiments on resins with pro-nounced hydrostatic stress effects and comparably brittle responsein tension, as well as a low sound speed (<2000 m/s). Reported re-sults indicate that the brittle behaviour in tension is much morepronounced than in compression [5,7,8], but high rates of strain(above 500 s�1) have rarely been achieved and no data could befound for strain rates in excess of 1500 s�1. Additionally, most of thepublished high strain rate data in tension are of questionable benefitsince tensile specimens tend to fail outside the gauge section and thedata produced have unacceptably large scatter.
This paper therefore describes novel experimental techniquesthat have been developed to increase the understanding of thetensile behaviour of resins at high rates of strain. Characterisationexperiments were performed successfully using a tensile Hopkinsonbar modified with a pulse shaper. Brazilian tests were also consid-ered, but found to be unsuitable for this material. Nevertheless,these tests are briefly described. The data from these experiments, aswell as traditional compressive experiments at different rates ofstrain, were used to calibrate the Goldberg model. In order to vali-date a constitutive polymer model, additional experiments ata larger scale are often used in order to exercise the model witha variety of stress states and failure modes. Components [10], discimpact [11] and three point bending tests on notched beams [12]have been reported. For this study, an unnotched 3-point impactbending test [13] was used, and results comparing experimentaldata to model predictions are presented in this paper.
1.2. Constitutive modelling of thermosetting resins
The traditional approach to modelling polymers usually adoptsviscoelastic models such as the Maxwell model and the Kelvin/Voigt model to describe the time dependent behaviour whilemodified von Mises or Tresca yield criteria capture the pressuresensitivity [14,15]. Recently, more advanced models that are able topredict nonlinear behaviour of polymers have been developed forboth small and large strain formulations (see Refs. [7,16,17] for moredetailed information). In particular, the large strain formulationBuckley model [7,18] has been successfully extended to representstrain rate dependency in resins and is able to accurately predictstrain softening in compression. However, the expected materialbehaviour of 3-D composites suggests that the focus of a polymermodel for an application in virtual testing of FRPs should be onstrain rate dependency in general and hydrostatic pressure sensi-tivity in particular. A small-strain formulation with a less complexmaterial model and a sound failure criterion may be sufficient.
The basis of this study has been the recently developed Goldbergmodel which describes the nonlinear response of polymers by re-lying on the theory which describes viscous flow in liquids. Thismodel has been successfully applied to several glassy polymers[5,19–22]. A distinct advantage of this model compared to manyexisting models using complex large strain formulations is its ac-curacy in the small-strain regime and the manageable number ofmaterial constants needed to be determined experimentally (only 6compared to up to 16 constants for other polymer models). It is,furthermore, comparably straightforward to implement into explicitFE codes such as LS-DYNA. The main disadvantage of this small-strainformulation compared to a large strain formulation such as theBuckley model lies in the inability to capture strain softening incompression. The effect of this shortcoming on modelling the globalbehaviour of a FRP is assumed to be negligible, however, since shearfailure in the yarns will most likely occur well before large com-pression strains are achieved in the matrix pockets. For these rea-sons, the Goldberg model has been chosen as a basis for this research.
2. Experiments
2.1. Material and specimen design
The thermoset tested in this programme, Hexcel RTM-6, isoptimised for RTM-processing (air-tight conditions under pres-sure), but can be used in open moulds as well. The raw samplematerial consisted of 10 mm thick plates produced under RTMconditions and 9 mm diameter rods produced by moulding. Thecure cycle used was 2 �C/min heating to 130 �C, 1 h dwell at 130 �C,1 �C/min heating to 180 �C and finally 2 h cure at 180 �C. Finalproperties are independent of heating rate and dwell temperature,provided that the final cure of 2 h at 180 �C is used, resulting inidentical mechanical properties for both sources of material.
The material was characterised under three loading configura-tions: quasi-uniaxial compression, uniaxial tension and 3-pointbending. The specimens for compression tests were right cylindersdesigned such that the effect of inertia on the measured stressesduring high strain rate compression is minimised. Following theGorham formulation [23], the applied ratio of radius r to height h ofthe manufactured cylinders is
h ¼ffiffiffi3p
2
!r: (1)
The tensile specimens were dog-bone shaped, produced byadhesively bonding a polymer cylinder into a hollow M12 threadedsteel rod and subsequent grinding of the gauge section. The finalgeometry was found after a number of iterations explained below.

Fig. 2. Specimen dimensions for compression, tension and 3-point bending; all di-mensions are in millimetres. For compression experiments above 4000 s�1 specimensof 6 mm diameter and 2.6 mm length were used.
Fig. 3. Split Hopkinson pressure bar (A) and split Hopkinson tensile bar (B). Arrowsrepresent loading provided by a gas gun driven striker, directly in compression, or viaa loading bar in tension.
R. Gerlach et al. / Polymer 49 (2008) 2728–27372730
The 3-point bend specimens are simple beams cut out of the resinplate. All specimen dimensions can be found in Fig. 2.
2.2. Loading and data acquisition devices
Experiments were performed in three strain rate regimes:quasi-static ð_3z3—6� 10�4 s�1Þ; medium ð_3z10—100 s�1Þ; andhigh ð_3z1000—6000 s�1Þ.
For quasi-static testing, a commercial screw-driven Hounsfieldtensile testing machine was used. All experiments were performedwith a cross-head velocity of up to 2�10�5 m/s in tension orcompression as required. A high precision laser extensometer(FIEDLER Optoelektronik, model P-50, resolution 0.1 mm) was usedfor displacement measurement. These data were then used tocalculate the strain and strain rate in the gauge section as functionsof time for each individual experiment. Force measurements weremade using a calibrated load cell. A high-resolution camera capableof taking one picture every 4 s was used to examine crack propa-gation patterns and to correlate failure phenomena with the cor-responding points on the stress–strain curves. Illumination for thecameras was provided by LED lights with appropriate filters toprevent interference between the cameras and the laser exten-someter. It should be noted that in the compression experimentsthe displacement measurement points were on the loading anvils,as close as possible to the specimen. In tensile experiments mea-surements were performed on the specimen surface. The effect ofthis is that there is a tendency to under predict the specimenmodulus in compression tests, whilst the modulus in tension isaccurate. Because the focus of this study was on high strain rate andpost-yield behaviour, short specimens were used to (a) preventbuckling and (b) enable stress equilibrium at high strain rates.
For medium strain rates an in house hydraulic system was used.A strain gauge based load cell is used to measure the force sup-ported by the specimen during loading, and two methods wereemployed for displacement measurements. The first was an LVDTsystem measuring the relative movement of the endcaps (tension)or loading anvils (compression), the second was a high speedcamera used to monitor the gauge length displacement by trackingtwo white stripes attached to the specimen (tension) or anvils(compression).
The high-rate experiments were performed using the splitHopkinson compression bar (SHPB) and tension bar (SHTB) dis-cussed in Ref. [7], see Fig. 3. In these systems a compressive or tensilestress wave is produced, using a gas gun driven striker, and travelsdown the input bar to the specimen. At the interfaces between the
loading bars and the specimen, the stress wave separates intoreflected and transmitted components at the input and output ends,respectively. The strains in the bars as functions of time are recordedusing two strain gauge stations on the input bar and one on theoutput bar. The stresses and velocities at the interfaces between theinput and output bars and the specimen are calculated usinga standard analysis outlined in Ref. [24]. These values are used toobtain the forces and displacements on the specimen’s ends. Theaverage specimen strain, as a function of time, is calculated fromthese displacements; the specimen stress is calculated by furthertime shifting the forces to the middle of the specimen gauge lengthtaking into account the travel time between the end of the inputbar and the beginning of the output bar. A further displacementmeasurement was performed using high speed photography. Incompression, stripes were painted on the ends of the bars, and, asexpected, the displacement of these confirmed the results of thestandard analysis. In the tensile experiments, speckles were paintedonto the specimen surface, enabling displacement to be calculatedas a function of position (on the specimen) and time using imagecorrelation [25,26], see Fig. 10. Again, this direct measurementmeans that specimen strains are more accurately calculated in thetensile experiments than in the compressive.
Three point bend experiments were performed using theHounsfield machine for quasi-static loading and an impact bendingsystem, based on the Hopkinson bar technique, for high-rate loading[13,27]. In this device, an instrumented titanium rod (the impactor)with a wedge-shaped tip is propelled into the centre of a beamshaped specimen, which is supported rigidly at its two ends. Theimpactor is held in low friction bearings and is initially at rest. A gasgun is used to propel a striker into the impactor; the striker andimpactor are of the same material and dimensions, so this theoret-ically causes the impactor to travel unstressed into the specimen.During the experiment the axial strains within the impactor bar arerecorded by means of 4 strain gauges arranged in a single straingauge station halfway down the bar, and converted into a voltageusing an uncompensated Wheatstone bridge. The same methodol-ogy as described by Ref. [24] is applied and the force, velocity andthus displacement at the tip of the impactor are obtained as func-tions of time. Knowing the displacement of the impactor, and as-suming a rigid support, the deflection of the specimen is given.Furthermore, an energy balance can be drawn and the amount ofenergy dissipated due to inelastic deformation and fracture can beestimated. The results of these experiments were quantitativelycompared to those from LS-DYNA simulations, thus validating theconstitutive model.
The techniques so-far described are quite typical for low, me-dium and high strain rate material characterisation. However, inorder to fully characterise the resin material, further techniqueswere developed as described below.
2.2.1. Challenges for uniaxial tensile testing of epoxy resinsThe difficulty in testing resins in tension arises from several
characteristics of these materials. Firstly, they are brittle, resulting

Fig. 5. Failure modes of RTM-6 tensile specimens: (A) failure in endcap; (B) failure intransition region; (C) failure in gauge section.
R. Gerlach et al. / Polymer 49 (2008) 2728–2737 2731
in a very high sensitivity to surface irregularities and bending [7]. Acrack that will be suppressed from growing further in compressionwill result in abrupt failure in tension, and a comparably largescatter in supported stress is inevitable. Furthermore, dog-bonetensile specimens tend to break at random places outside the gaugesection [7] or immediately after the transition from the loading barto the specimen [22], resulting in an invalid test. Results with twocracks along the gauge section have been achieved for strain ratesup to 680 s�1 [8], where the existence of two cracks has beenargued to be an indicator for mechanical equilibrium.
An alternative possibility for measurement of tensile strength ofbrittle materials over a range of strain rates is the Brazilian test[28,29]. It is often used for concrete and short fibre or particlereinforced polymers. However, tests performed in this studyshowed that although brittle in tensile tests, the RTM-6 resin doesnot form tensile cracks at all in Brazilian tests performed usinganvils with 11 mm radius, and only does so using flat anvils aftera large portion of the specimen has undergone considerable plasticdeformation (Fig. 4). Apart from the fact that the resin exhibitssome plastic deformation in tension, the hydrostatic stress sensi-tivity results in increased failure strength during the Brazilian test,and it was concluded that this technique is therefore not applicableto RTM-6.
An improvement on the tensile Hopkinson bar apparatus andthe specimen design therefore needs to be undertaken in order togenerate high strain rate tensile data. Four factors were identifiedthat contribute to the invalidity of tensile tests performed so far:stress concentrations in the specimens, too long a gauge length,a very short rise time of the input stress wave and a considerableinitial peak on this wave. Initially, specimen design was in-vestigated (see Fig. 2). Preliminary specimens were produced witha large radius of curvature, 20 mm, in the transition region betweenthe endcaps and the specimen gauge length; the gauge length was9 mm. These specimens showed a tendency to fail at the transitionbetween the endcap and the resin rod even at the slowest possiblestrain rates on the split Hopkinson tensile bar, forming a cavitywithin the endcap (Fig. 5A); this occurred despite a 70� anglemachined in the endcap. A shortened gauge section (of 7 mm)along with a reduced radius of curvature of 5 mm was thereforeadopted, and the strain rate at which this cavity occurred increasedto 600 s�1, with occasional failure closer towards the gauge section(Fig. 5B). A further increase of strain rate was achieved by adoptingpulse shaping techniques. The aim of these techniques is to increasethe rise time of the input wave, and they are often applied to splitHopkinson compression bars; for example, by using dummy spec-imens [30] or pre-loading bars [31]. A recent study on Epon 828/T-403 epoxy made use of a split Hopkinson tensile bar pulse
Fig. 4. Plastic deformation of RTM-6 under Brazilian test conditions with curved andflat anvils.
shaping technique, utilising modified striker and incident bars, andstrain rates of 1200 s�1 were achieved [8]. For the current study,a form of pre-loading bar has been developed which sits at the endof the input bar (see Figs. 3 and 6).
The pre-loading bar is a flanged rod in which several modestimpedance jumps result in parts of the input wave being reflected,leading to an increased rise time of the stress pulse. There is a fur-ther impedance jump due to the flange connecting the pulse shaperand the input bar. The effect of the pulse shaper is to increase therise time of the input signal, and therefore also smooth the stresspeak, caused by Pochhammer–Chree oscillations of the input sig-nal. The chosen geometry of the rod is shown in Fig. 6 and the effectof this device can be seen in Fig. 7. Using this device, it was possibleto increase the achievable strain rates to 3800 s�1, whilst reliablyfailing the specimen in the gauge section (Fig. 5C).
Fig. 6. Pulse shaper geometry, for overview of the connection to the split Hopkinsontensile bar see Fig. 3.

Fig. 7. Influence of the pulse shaper on the input stress wave.
Fig. 9. Representative stress–strain curves at 6 selected strain rates in compression.
R. Gerlach et al. / Polymer 49 (2008) 2728–27372732
2.3. Results in compression and tension
In order to ensure that friction between the anvils and thespecimen is minimised, the anvils were carefully polished and thelubricant ‘‘Castrol LMX Grease’’ was used for all compression ex-periments. Fig. 10 shows a photographic record of the deformationat two strain rates, where no significant barrelling occurred up tothe point of failure. For all high-rate tests stress equilibrium wasconfirmed by comparing the stress at the end of the input bar withthat at the end of the output bar, and good agreement between thetwo curves was observed (e.g. Fig. 8). For the following results true-stress and strain (calculated assuming conservation of volume) arereported.
The results from compression experiments are shown in Fig. 9.These experiments show a marked increase of yield and flow stress
Fig. 8. Stress at ends of input and output bar as function of time for a compressionspecimen (example of specimen HR-C-03, 4400 s�1).
and apparent elastic modulus with strain rate. Failure in both quasi-static and high-rate experiments was catastrophic; the specimenstarted breaking at the outer diameter due to a combination ofshear, tensile and compression stresses, resulting in ultimate dis-integration of the specimens. The strain to failure was higher in thehigh-rate experiments (55%) than in the quasi-static experiments(45%), see Fig. 10. No failure was achieved at medium rates of straindue to limitations of the loading system used.
For tensile experiments, the specimens were carefully alignedwith the load axis in order to reduce bending effects; however,these are nearly impossible to completely eliminate, as reported inRef. [7], and a comparably large scatter in failure strength measuredis inevitable for all rates of loading. Analogical to the compressionexperiments a validity check was performed for the high-rate
Fig. 10. Sequence of photographs of compressive experiments at quasi-static and highstrain rates.
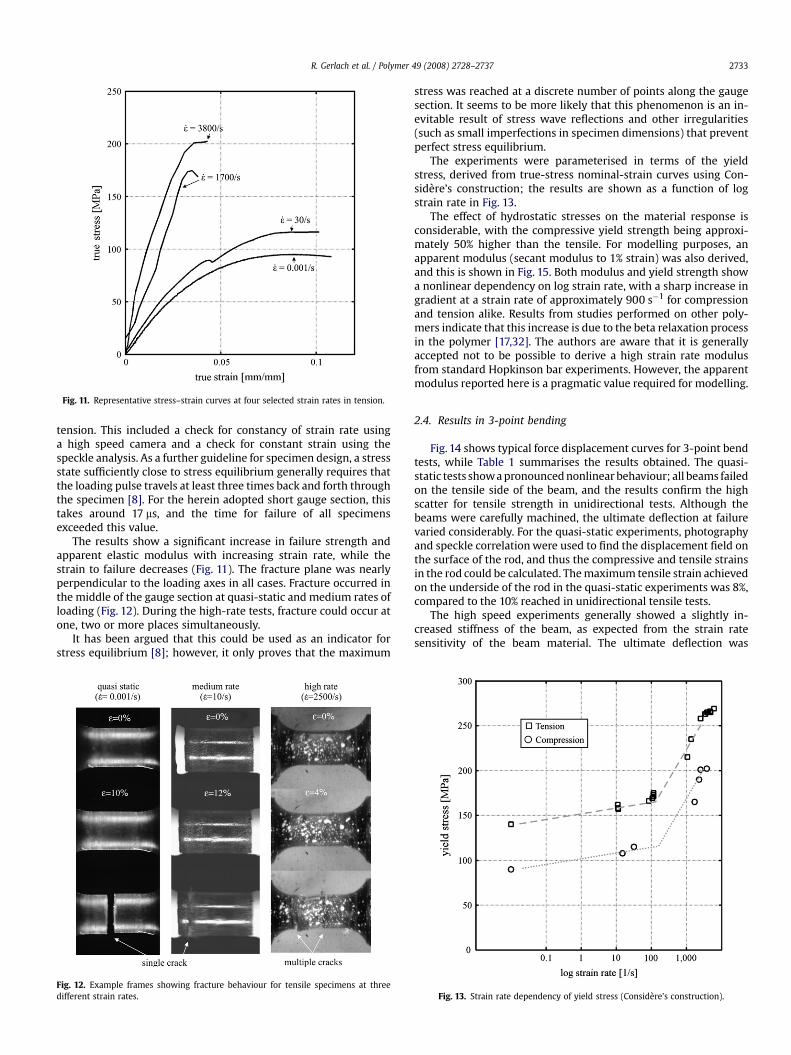
Fig. 11. Representative stress–strain curves at four selected strain rates in tension.
R. Gerlach et al. / Polymer 49 (2008) 2728–2737 2733
tension. This included a check for constancy of strain rate usinga high speed camera and a check for constant strain using thespeckle analysis. As a further guideline for specimen design, a stressstate sufficiently close to stress equilibrium generally requires thatthe loading pulse travels at least three times back and forth throughthe specimen [8]. For the herein adopted short gauge section, thistakes around 17 ms, and the time for failure of all specimensexceeded this value.
The results show a significant increase in failure strength andapparent elastic modulus with increasing strain rate, while thestrain to failure decreases (Fig. 11). The fracture plane was nearlyperpendicular to the loading axes in all cases. Fracture occurred inthe middle of the gauge section at quasi-static and medium rates ofloading (Fig. 12). During the high-rate tests, fracture could occur atone, two or more places simultaneously.
It has been argued that this could be used as an indicator forstress equilibrium [8]; however, it only proves that the maximum
Fig. 12. Example frames showing fracture behaviour for tensile specimens at threedifferent strain rates.
stress was reached at a discrete number of points along the gaugesection. It seems to be more likely that this phenomenon is an in-evitable result of stress wave reflections and other irregularities(such as small imperfections in specimen dimensions) that preventperfect stress equilibrium.
The experiments were parameterised in terms of the yieldstress, derived from true-stress nominal-strain curves using Con-sidere’s construction; the results are shown as a function of logstrain rate in Fig. 13.
The effect of hydrostatic stresses on the material response isconsiderable, with the compressive yield strength being approxi-mately 50% higher than the tensile. For modelling purposes, anapparent modulus (secant modulus to 1% strain) was also derived,and this is shown in Fig. 15. Both modulus and yield strength showa nonlinear dependency on log strain rate, with a sharp increase ingradient at a strain rate of approximately 900 s�1 for compressionand tension alike. Results from studies performed on other poly-mers indicate that this increase is due to the beta relaxation processin the polymer [17,32]. The authors are aware that it is generallyaccepted not to be possible to derive a high strain rate modulusfrom standard Hopkinson bar experiments. However, the apparentmodulus reported here is a pragmatic value required for modelling.
2.4. Results in 3-point bending
Fig. 14 shows typical force displacement curves for 3-point bendtests, while Table 1 summarises the results obtained. The quasi-static tests show a pronounced nonlinear behaviour; all beams failedon the tensile side of the beam, and the results confirm the highscatter for tensile strength in unidirectional tests. Although thebeams were carefully machined, the ultimate deflection at failurevaried considerably. For the quasi-static experiments, photographyand speckle correlation were used to find the displacement field onthe surface of the rod, and thus the compressive and tensile strainsin the rod could be calculated. The maximum tensile strain achievedon the underside of the rod in the quasi-static experiments was 8%,compared to the 10% reached in unidirectional tensile tests.
The high speed experiments generally showed a slightly in-creased stiffness of the beam, as expected from the strain ratesensitivity of the beam material. The ultimate deflection was
Fig. 13. Strain rate dependency of yield stress (Considere’s construction).

Fig. 14. Results of the quasi-static and dynamic 3-point bending tests on RTM-6. Thenominal stress, s, is calculated by dividing the force by the beam width.
R. Gerlach et al. / Polymer 49 (2008) 2728–27372734
considerably lower than in the quasi-static experiments. This trendis consistent with the findings from the uniaxial tensilecharacterisation.
3. Constitutive model
The Goldberg model is extensively described in Refs. [19–21]. Itassumes that the total strain (3T) in the deformed polymer consist ofan elastic (3E) and an inelastic (3I) parts:
3Tij ¼ 3E
ij þ 3Iij: (2)
Using the elastic strain tensor and the isotropic compliancematrix C(E, n), the stress tensor and its deviatoric component Sij canbe calculated. Written in incremental notation to highlight thecomponents that evolve with the strain/time-increment, the in-elastic strain rate-tensor is
_3Iij tð Þ¼ 2D0 exp �1
2Z tð Þse tð Þ
!2n24
35 SijðtÞ
2ffiffiffiffiffiffiffiffiJ2ðtÞ
q þ a tð Þdij
0B@
1CA: (3)
Table 1Summary of experimental results for 3-point bending tests
Specimen smax [kN/mm] dmax[mm] Speed [m/s]
HR-01 – 5.70 8.0HR-02 – 5.80 9.5HR-03 – 5.80 5 (intact)HR-04 – 5.60 7.0QS-05 0.082 10.00 3.4E�06QS-06 0.079 9.24 3.4E�06QS-07 0.072 7.70 3.4E�06
In Eq. (6) D0 is a material constant representing the maximuminelastic strain rate, and the constant n controls the rate de-pendency of the material. J2(t) is the absolute value of the secondinvariant of the deviatoric stress tensor, dij is the Kronecker-symbol,and se(t) is the effective stress
seðtÞ ¼ffiffiffiffiffiffiffiffiffiffiffi3J2ðtÞ
qþ
ffiffiffi3p
a tð ÞakkðtÞ with skkðtÞ ¼ 3shðtÞ (4)
while sh(t) is the hydrostatic stress. Z(t) is a state variable repre-senting the resistance to molecular flow, and a is a state variablecontrolling the effect of hydrostatic stresses. Their evolution-equations are
_Z tð Þ ¼ q Z1 � Z tð Þ� �
_eIeðtÞ
_a tð Þ ¼ q a1 � a tð Þ� �
_eIeðtÞ: (5)
Integrating these equations leads to
Z tð Þ ¼ Z1 � Z1 � Z0ð Þ$exp �q$ _eIeðtÞ
��
a tð Þ ¼ a1 � a1 � a0ð Þ$exp �q$ _eIeðtÞ
��(6)
with the indices 0 and 1 marking the initial and maximum values ofthe state variables Z and a, and q being a material constant repre-senting the ‘‘hardening’’ of the material. Finally, the effectivedeviatoric inelastic strain rate is defined as follows:
_eIeðtÞ ¼
ffiffiffiffiffiffiffiffiffiffiffiffiffiffiffiffiffiffiffiffiffi23
_eIijðtÞ _e
IijðtÞ
r
_eIijðtÞ ¼ _3I
ijðtÞ � _3ImðtÞdij
_3ImðtÞ ¼ _3I
11ðtÞ þ _3I22ðtÞ þ _3I
33ðtÞ
�=3:
�(7)
The material constants that need to be determined are D0, n, q,Z0, Z1, a0 and a1. The procedure used to define the material con-stants D0, n, q, Z0, Z1 in this study follows the original approach [33],which uses a number of uniaxial tensile or compression tests atdifferent strain rates to curve fit the constants. Since experimentaldata for shear were not available, a0 and a1 were obtained itera-tively by comparing compressive and tensile data at the same strainrate.
3.1. Incorporation of rate dependent modulus and rate dependentfailure criterion
In the original Goldberg Model, the elastic modulus is strainrate-independent. However, the purely elastic part of a polymer’smechanical response occupies only a very small region of strain,and experimental stress–strain curves show nonlinear stress–strain behaviour almost from the start of the loading. Experi-mental data from the literature and the experiments on RTM-6resin within this project have shown, that this ‘‘apparent’’ elasticmodulus (secant modulus) of glassy polymers is in fact highlystrain rate dependent. This phenomenon is assumed to be of sig-nificant importance for strain rate dependent virtual testing of 3Dweavings. Therefore, a simple formula to account for this strainrate dependency, as suggested in Ref. [34], has been introduced.Firstly, a linear dependence of elastic modulus Elin(t) on log strainrate was introduced:
ElinðtÞ ¼ E0 1þ C1 ln_3 tð Þ_30
�:
�(8)

R. Gerlach et al. / Polymer 49 (2008) 2728–2737 2735
The subscript 0 denotes the initial values of the strain rate andmodulus, and C1 is scaling material constant. This modulus onlyfeeds back into the compliance matrix. The effective strain rate isgiven by
_3 tð Þ ¼ffiffiffiffiffiffiffiffiffiffiffiffiffiffiffiffiffiffiffiffiffiffiffiffiffiffiffiffiffiffiffiffiffiffiffiffiffiffiffiffiffiffiffiffiffiffiffiffiffiffiffiffiffiffiffiffiffiffiffiffiffiffiffiffiffiffiffiffiffiffiffiffiffiffiffiffiffiffiffiffiffiffiffiffiffiffiffiffiffiffiffiffiffiffiffiffiffiffiffiffiffiffiffiffiffiffiffiffiffiffiffiffiffiffiffiffiffiffiffiffiffiffiffiffiffiffiffiffiffiffiffiffiffiffiffiffiffi23
�_311 � _3mÞ2 þ
�_322 � _3mÞ2 þ
�_333 � _3mÞ2 þ 2_32
12 þ 2_3223 þ 2_32
13
ihr(9)
and
_3m ¼13
_311 þ _322 þ _333Þ:ð (10)
However, the experimental results (see Fig. 13) show a markednonlinear rate dependence of engineering properties. This needs tobe taken into account by the model, and simple variation of theWeibull distribution formulation has been adopted:
EaddðtÞ ¼ Ediff 1� exp C2�_3 tð Þ�C3��:
��(11)
with both C2 and C3 being scaling material constants and Ediff
representing the maximum increase of elastic modulus that can bemodelled. The reason for the choice of an upper boundary for theelastic modulus is the unavailability of experimental validation dataat strain rates in excess of 6000 s�1. The total strain rate dependentmodulus used for the modified Goldberg model is
E tð Þ ¼ ElinðtÞ þ EaddðtÞ: (12)
The determination of the material constants C1, C2 and C3 isperformed using the experimentally measured apparent moduli atdifferent strain rates (Fig. 15).
When evaluating the moduli, it is important to note that in thetensile experiments at all strain rates the specimen strain wascalculated by tracking or stripes speckles applied to the specimensurface within the gauge length, using the laser extensometer forthe quasi-static experiments and appropriate high speed camerasat the medium and high strain rates. On the other hand, the strainin the compressive experiments was calculated using the
Fig. 15. Experimentally measured modulus and computed rate depended modulusincorporated into the Goldberg model.
displacement of the anvils. This means that there was a tendency tounderestimate the apparent compressive modulus, especially inthe high-rate experiments where the rise time of the input andreflected pulses as well as the travel time in the specimen also play
a role. Therefore, the tensile modulus must be regarded as morereliable than the compressive modulus in these data.
The original Goldberg model does not include a failure criterion.In order to simulate the fundamentally different failure behaviourof RTM-6 in compression and tension, it is assumed that com-pression does not lead to failure, whilst the brittle response intension is modelled. In order to differentiate between compressionand tension the hydrostatic stress is used. In order to predict tensilefailure, the failure criterion must be chosen taking into account thevery small post-yield gradient of the stress–strain curve (close toperfect plasticity) in tensile experiments. A stress based failurecriterion would lead to a very high sensitivity of the failure strain;therefore, a simple strain based formulation (maximum principalstrain) for failure was chosen:
3Tets ¼
ffiffiffi23
r$
ffiffiffiffiffiffiffiffiffiffiffiffiffiffiffiffiffiffiffiffiffiffiffiffiffiffiffiffiffiffiffiffiffiffiffiffiffiffiffiffiffi3T
1
� �2þ 3T2
� �2þ 3T3
� �2q
: (13)
The equivalent total strain 3Tets is, furthermore, assumed to be
rate dependent, as observed in the experiments. For simplicity, thesame rate dependence as observed for the modulus is used:
3fail tð Þ ¼ 3in þ 3diff 1� exp C2�_3 tð Þ�C3������
(14)
where the constants C2 and C3 are the same as in Eq. (11), 3in is theinitial failure strain, and 3diff is the difference between the failurestrain in quasi-static and high-rate experiments. The used materialconstants are shown in Table 2.
3.2. Results and model validation
The model was implemented into the FEM software LS-DYNA asa user defined material model. A comparison of the model andexperimental results at different strain rates is shown in Fig. 16.
Qualitatively, the model captures the hydrostatic stress effects,the brittle response in tension, the ductile response in compres-sion, the strain rate dependency in general and the rate de-pendency of the modulus and the failure strain in particular.Quantitatively, the stress–strain relationship is very well capturedfor quasi-static loading. At medium rates, the tensile behaviouris captured well too, while in compression, the stresses areslightly over predicted. At high rates, the model is capable ofdescribing the compressive response reasonably well while itunder predicts the tensile stresses. The tensile stress–strain
Table 2Summary of material constants required for room temperature modelling of RTM-6resin
Material constants for the original Goldberg model
E0 v a0 a1 Z0 Z1 n D0 q
2840 0.38 0.06 0.13 400 750 0.93 1� 106 90
Material constants required for the extended model
30 Ediff 3in 3diff C1 C2 C3
0.001 3500 0.1 �0.05 0.01 �1� 10�10 3

Fig. 16. Comparison of experimentally generated data against the output of the extended Goldberg model in compression and tension at different strain rates.
Fig. 17. Comparison of the deflections measured from high speed camera footage ofa 3-point bend validation experiment against the LS-DYNA simulation (specimen HR-03, see Fig. 14).
Fig. 18. Comparison of the force record from a 3-point bend validation experiment theLS-DYNA simulation (specimen HR-03, see Fig. 14).
R. Gerlach et al. / Polymer 49 (2008) 2728–27372736
relationship is represented very well for quasi-static and mediumrates of strain, but the failure stresses at high strain rates areunder-represented by roughly 20%. The experimental data suggestthat in terms of the Goldberg constants the value of Z1 should bemade rate dependent for tensile behaviour, but this has not beenaddressed in this study.
In order to perform a large scale validation of the constitutivemodel, the 3-point impact bending test described in Section 2.2was simulated. The applied boundary conditions were the initialvelocity of the impactor and rigid contact between the specimenand the support (see Section 2.1). Validation consists of comparingthe model output for the velocity and force at the tip of the im-pactor with that observed in the experiment. Figs. 17 and 18 showthe results for specimen HR-03. Quantitatively the force time curveis very well captured. The displacement time curve agrees excel-lently with experimental results until the point of maximum de-flection, subsequent differences are related to the unloadingbehaviour of the resin.
4. Conclusions
The results of comprehensive mechanical characterisation of theroom temperature response of RTM-6 resin system at a range ofstrain rates have been presented. By applying a novel pulse shapingtechnique and improved specimen design tensile data at strainrates not yet reported in the literature were generated. Thus de-rived data contribute to the understanding of the observed differ-ences between compressive and tensile behaviour at high rates ofstrain.
The Goldberg polymer model has been modified to comprisethe observed and quantified strain rate depended stiffness. Asimple fracture criterion has been added that takes the differentresponses in compression and tension into account. The consti-tutive model has been implemented into the explicit FEM softwareLS-DYNA, allowing for a verification of the model against experi-ments with complex stress states. The modified constitutivemodel showed an excellent agreement with the experimentaldata.

R. Gerlach et al. / Polymer 49 (2008) 2728–2737 2737
Acknowledgments
R. Gerlach would like to thank Rolls-Royce for funding hisresearch, and, in particular, A. McMillan for her continued support.Furthermore, the authors kindly acknowledge funding of EPSRCand the supply of the resin RTM-6 by HEXCEL, and would like tothank S. Mortimer for his assistance, without which the projectwould not have been possible. Also, the support of C. P. Buckley, ondifferent aspects of this study, has been invaluable. The Cordin 550high speed camera used in this research was provided by the EPSRCinstrument loan pool. We are particularly grateful to A. Walker forhis advice and support whilst using this camera.
References
[1] Mazumdar SK. Composites manufacturing – materials, product, and processengineering. CRC Press; 2002.
[2] Staab GH. Laminar composites. Butterworth Heinemann; 1999.[3] Peters ST. Handbook of composites. Chapman and Hall; 1998.[4] Zhao LG, Warrior NA, Long AC. Composites Science and Technology 2006;66:
36–50.[5] Gilat A, Goldberg RK, Roberts GD. Journal of Aerospace Engineering 2007;20:
75–89.[6] Chen W, Zhou B. Mechanics of Time-Dependent Materials 1998;2:103–11.[7] Buckley CP, Harding J, Hou JP, Ruiz C, Trojanowski A. Journal of the Mechanics
and Physics of Solids 2001;49:1517–38.[8] Chen W, Lu F, Cheng M. Polymer Testing 2002;21:113–21.[9] Khan MZS, Simpson G, Townsend CR. Materials Letters 2002;52:173–9.
[10] Pyttel T, Weyer S. International Journal of Crashworthiness 2003;8:433–42.[11] Duan Y, Saigal A, Greif R. Polymer Engineering and Science 2003;43:
112–24.
[12] Rager A, Williams JG, Ivankovic A. International Journal of Fracture 2005;135:199–215.
[13] Wiegand J, Petrinic N. VITAL material down-selection by 3 point bending test. In:Internal-Report 228. Department of Engineering, University of Oxford; 2006.
[14] Young RJ, Lovell PA. Introduction to polymers. London: Chapmann and Hall;1991.
[15] Ward IM, Sweeney J. An introduction to the mechanical properties of solidpolymers. Wiley; 2004.
[16] Porter D. Group interaction modelling of polymer properties. New York:Marcel Dekker; 1995.
[17] Mulliken AD, Boyce MC. International Journal of Solids and Structures 2006;43:1331–56.
[18] Buckley CP, Dooling PJ, Harding J, Ruiz C. Journal of the Mechanics and Physicsof Solids 2004;52:2355–77.
[19] Goldberg RK, Roberts GD, Gilat A. Composites Part B: Engineering 2003;34:151–65.
[20] Goldberg RK, Roberts GD, Gilat A. Journal of Aerospace Engineering 2005;18:18–27.
[21] Goldberg RK, Stouffer DC. Journal of Composite Materials 2002;36:773–93.[22] Gilat A, Goldberg RK, Roberts GD. Strain rate sensitivity of epoxy resin in
tensile and shear loading. NASA/TM-2005–213595; 2005.[23] Gorham DA. Journal of Physics D – Applied Physics 1989;22:1888–93.[24] Harding J, Welsh LM. Journal of Materials Science 1983;18:1810–26.[25] Sjodahl M. Applied Optics 1994;33:6667–73.[26] Sjodahl M, Benckert LR. Applied Optics 1993;32:2278–84.[27] Hallett SR. Composites Science and Technology 2000;60:115–24.[28] Awaji H, Sato S. Journal of Engineering Materials and Technology 1979;101:
139–47.[29] Grantham SG, Siviour CR, Proud WG, Field JE. Measurement Science and
Technology 2004;15:1867–70.[30] Frew DJ, Forrestal MJ, Chen W. Experimental Mechanics 2002;42:93–106.[31] Parry DJ, Walker AG, Dixon PR. Measurement Science and Technology 1995;6:
443–6.[32] Siviour CR, Walley SM, Proud WG, Field JE. Polymer 2005;46:12546–55.[33] Goldberg RK, Stouffer DC. NASA/TM-1998-206969; 1998.[34] Zheng X. Nonlinear strain rate dependent composite model for explicit FEM
analysis. Ph.D. Thesis. University of Akron; 2006.
Copyright © 2022 FDOKUMEN