Experimental and theoretical analysis of mechanical draft ...
15
Full Terms & Conditions of access and use can be found at https://www.tandfonline.com/action/journalInformation?journalCode=uhvc21 Science and Technology for the Built Environment ISSN: (Print) (Online) Journal homepage: https://www.tandfonline.com/loi/uhvc21 Experimental and theoretical analysis of mechanical draft counterflow wet cooling towers Görkem Zengin & Ayhan Onat To cite this article: Görkem Zengin & Ayhan Onat (2020): Experimental and theoretical analysis of mechanical draft counterflow wet cooling towers, Science and Technology for the Built Environment, DOI: 10.1080/23744731.2020.1822084 To link to this article: https://doi.org/10.1080/23744731.2020.1822084 Published online: 05 Oct 2020. Submit your article to this journal Article views: 33 View related articles View Crossmark data
-
Upload
khangminh22 -
Category
Documents
-
view
2 -
download
0
Transcript of Experimental and theoretical analysis of mechanical draft ...

Full Terms & Conditions of access and use can be found athttps://www.tandfonline.com/action/journalInformation?journalCode=uhvc21
Science and Technology for the Built Environment
ISSN: (Print) (Online) Journal homepage: https://www.tandfonline.com/loi/uhvc21
Experimental and theoretical analysis ofmechanical draft counterflow wet cooling towers
Görkem Zengin & Ayhan Onat
To cite this article: Görkem Zengin & Ayhan Onat (2020): Experimental and theoretical analysisof mechanical draft counterflow wet cooling towers, Science and Technology for the BuiltEnvironment, DOI: 10.1080/23744731.2020.1822084
To link to this article: https://doi.org/10.1080/23744731.2020.1822084
Published online: 05 Oct 2020.
Submit your article to this journal
Article views: 33
View related articles
View Crossmark data
Experimental and theoretical analysis of mechanical draftcounterflow wet cooling towers
GÖRKEM ZENGIN1� AND AYHAN ONAT2
1Cenk End€ustri Tesisleri _Imalat ve Taahh€ut A.S, _Istanbul, Turkey2Marmara University, _Istanbul, Turkey
Wet cooling towers have high thermal efficiency and are cost-effective industrial cooling units, used in factories, in energy plants, andin the HVAC market. The working principle of the cooling towers is based on cooling of the hot process water with cold atmosphericair via cooling fills and water distribution systems. This study investigates the pressure losses and thermal performance of mechanicaldraft counterflow water cooling towers having different cooling fill heights. During the thermal performance tests, the pressure lossthrough cooling fill was separately measured for each condition. The variation of pressure losses with air velocity was plotted throughcooling fills at different loading heights. Performance curves were obtained and compared as graphs relating the liquid–gas ratio (L/G)to the Merkel number for cooling fills at different heights between 1500mm and 2400mm. Although the lowest and the highest flowresistances were measured at fill heights of 1500mm and 2400mm, the lowest and the highest performances for the cooling towerwere calculated at 1500mm and 2400mm, respectively.
Introduction
Cooling towers are industrial units that cool water throughheat and mass transfer. They are generally used in heavyindustry power plants, chemical plants, and iron and steelfactories, as well as in the HVAC market. In power plants,cooling towers generally work with turbine and electric gen-erator systems, while in the HVAC market, they work withwater-cooled chillers. They can also be used wherever thereis a need for cooling water. Their simple working principleis: The hot water is sprayed onto the fill zone with a distri-bution system, and cools there with an extended surface areaand atmospheric air. The atmospheric air used is providedby mechanical or natural draft systems. Mechanical draftsystems have fans, motors, and other drive equipment andthey use electrical energy, but natural draft systems onlyhave a shell to create airflow. In both systems, a small por-tion of the process flow is evaporated because of the inletair’s relative humidity and direct evaporative cooling prin-ciple. Air evaporates water until the saturation moisture limitat the beginning of heat transfer. Afterward, water consump-tion continues according to direct evaporative cooling princi-ples until the process ends (Kr€oger 2004). The working
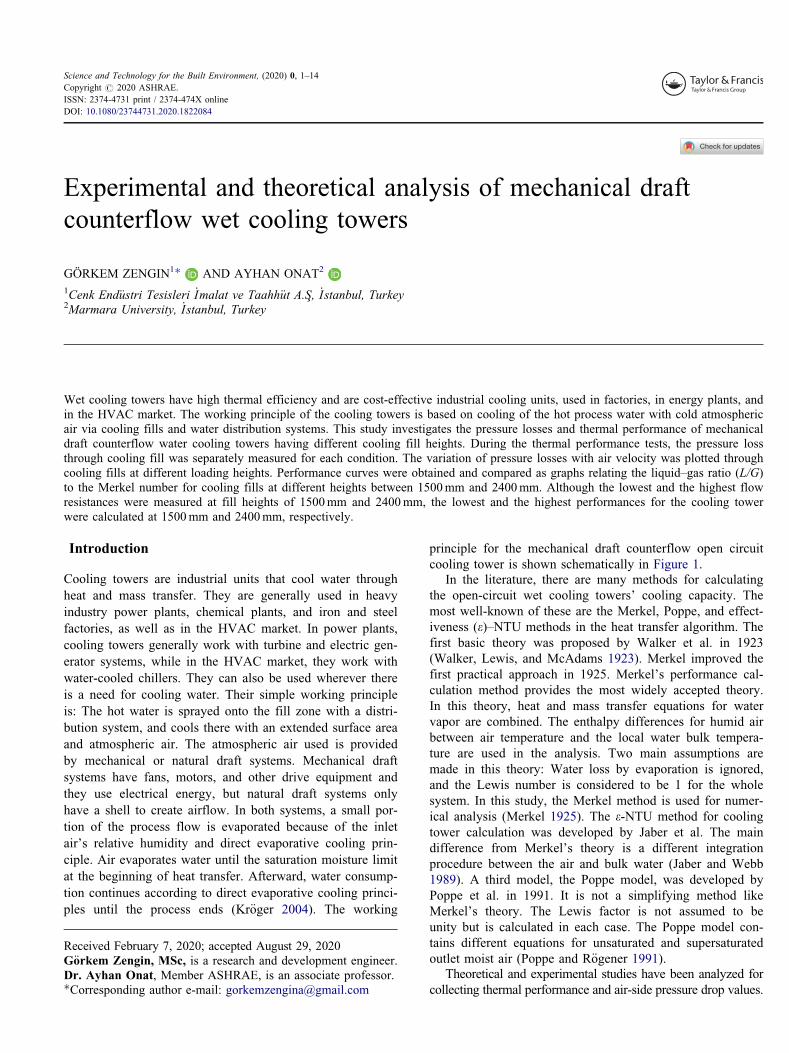
principle for the mechanical draft counterflow open circuitcooling tower is shown schematically in Figure 1.
In the literature, there are many methods for calculatingthe open-circuit wet cooling towers’ cooling capacity. Themost well-known of these are the Merkel, Poppe, and effect-iveness (e)–NTU methods in the heat transfer algorithm. Thefirst basic theory was proposed by Walker et al. in 1923(Walker, Lewis, and McAdams 1923). Merkel improved thefirst practical approach in 1925. Merkel’s performance cal-culation method provides the most widely accepted theory.In this theory, heat and mass transfer equations for watervapor are combined. The enthalpy differences for humid airbetween air temperature and the local water bulk tempera-ture are used in the analysis. Two main assumptions aremade in this theory: Water loss by evaporation is ignored,and the Lewis number is considered to be 1 for the wholesystem. In this study, the Merkel method is used for numer-ical analysis (Merkel 1925). The e-NTU method for coolingtower calculation was developed by Jaber et al. The maindifference from Merkel’s theory is a different integrationprocedure between the air and bulk water (Jaber and Webb1989). A third model, the Poppe model, was developed byPoppe et al. in 1991. It is not a simplifying method likeMerkel’s theory. The Lewis factor is not assumed to beunity but is calculated in each case. The Poppe model con-tains different equations for unsaturated and supersaturatedoutlet moist air (Poppe and R€ogener 1991).
Theoretical and experimental studies have been analyzed forcollecting thermal performance and air-side pressure drop values.
Received February 7, 2020; accepted August 29, 2020G€orkem Zengin, MSc, is a research and development engineer.Dr. Ayhan Onat, Member ASHRAE, is an associate professor.�Corresponding author e-mail: [email protected]
Science and Technology for the Built Environment, (2020) 0, 1–14Copyright # 2020 ASHRAE.ISSN: 2374-4731 print / 2374-474X onlineDOI: 10.1080/23744731.2020.1822084
Theoretical studies were used for creating a thermal calculationalgorithm, and experimental studies considered installation of acooling tower test unit. The Merkel, Poppe, and e-NTU methodswere examined in detail in the PhD thesis of Johannes ChristianKloppers, published in 2003 (Kloppers 2003). Experimentalparameters were collected from a counterflow natural draft cool-ing tower. A software package that can perform calculations withrespect to all three of these methods was developed at the end ofthis study. The calculation algorithms that were used for analyz-ing thermal performance of a cooling tower are from the MScthesis of Andre Alexis Dreyer, published in 1988 (Dreyer 1988).Similar to Kloppers’s study, the thesis included these three typesof analysis methods. Also, evaporative-type condensers wereexamined in this study.
Many studies have examined setting up a test cooling towerin a facility. The study by Stefanovic et al. examined specifyingthe locations of temperature transmitters on the test coolingtower in order to obtain the same input and output values inexperimental tests (Stefanovi�c et al. 2000). A thermal modelinggraphical analysis made with 26 temperature transmitter meas-urements was performed by Stefanovic et al. in 2000.Measurements were recorded at different air and water flows.Heat and mass transfer were modeled in this study. Performancecurves for different cooling fills were obtained, and it was foundthat heat and mass transfer coefficients changed according todesign conditions. A performance test unit was designed andmanufactured by Dvo�r�ak et al. in 2006 (Vitkovi�c et al. 2006).The air-side pressure drop value was measured by four pressuretransmitters on this test unit. Air-side pressure drop measure-ment factors were examined. Air-side pressure drop equationswere developed by Vitkovi�c et al. in 2006.
In the literature, most of the studies described mainly calcu-lation methods and effects on performance from differentwater loading, air velocity, or type of fill. In this study, thecooling performance of a mechanical draft wet cooling toweris analyzed experimentally based on a theoretical approach.The fill height varies between 1500mm and 2400mm, andeach fill height option has its own test results in terms of per-formance and air pressure drop. In this study, all of the calcula-tion methods were analyzed and the Merkel method wasselected as perferable, because it is more basic than the othersand more suitable for use in a software package for calculatingthe performance of thousands of different products with onecommand. It is used to evaluate numerical results, and theChebyshev theorem is used to solve equations. A similar pres-sure loss measuring system was used in the present study, butonly the pressure loss related to cooling fill was measured.
Experimental setup and method
Experimental tests were used to evaluate the performance andconstruct the pressure-drop curves for cooling fill. A perform-ance test station in _Istanbul was used to record data for the per-formance and pressure loss curves of the cooling tower. The testfacility has a boiler system that can generate up to 500 kW heatload for tests, with two burners to provide a flexible heat load.One of the boilers had two stages and the other one had a single
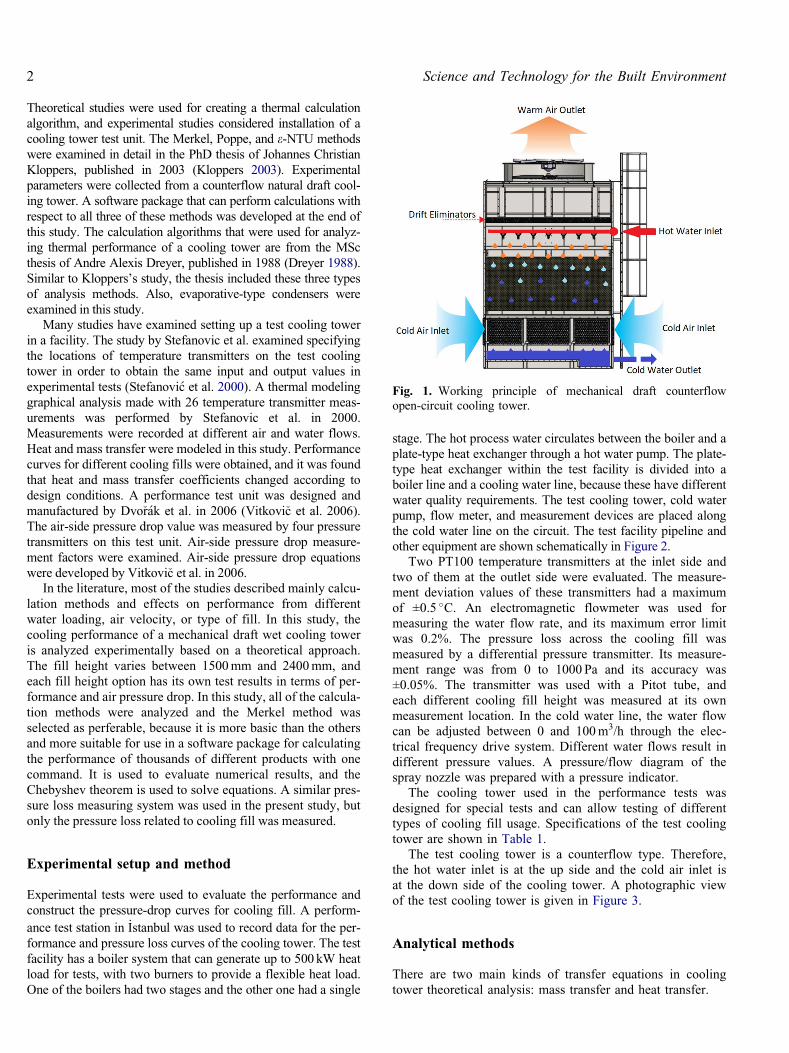
stage. The hot process water circulates between the boiler and aplate-type heat exchanger through a hot water pump. The plate-type heat exchanger within the test facility is divided into aboiler line and a cooling water line, because these have differentwater quality requirements. The test cooling tower, cold waterpump, flow meter, and measurement devices are placed alongthe cold water line on the circuit. The test facility pipeline andother equipment are shown schematically in Figure 2.
Two PT100 temperature transmitters at the inlet side andtwo of them at the outlet side were evaluated. The measure-ment deviation values of these transmitters had a maximumof ±0.5 �C. An electromagnetic flowmeter was used formeasuring the water flow rate, and its maximum error limitwas 0.2%. The pressure loss across the cooling fill wasmeasured by a differential pressure transmitter. Its measure-ment range was from 0 to 1000 Pa and its accuracy was±0.05%. The transmitter was used with a Pitot tube, andeach different cooling fill height was measured at its ownmeasurement location. In the cold water line, the water flowcan be adjusted between 0 and 100m3/h through the elec-trical frequency drive system. Different water flows result indifferent pressure values. A pressure/flow diagram of thespray nozzle was prepared with a pressure indicator.
The cooling tower used in the performance tests wasdesigned for special tests and can allow testing of differenttypes of cooling fill usage. Specifications of the test coolingtower are shown in Table 1.
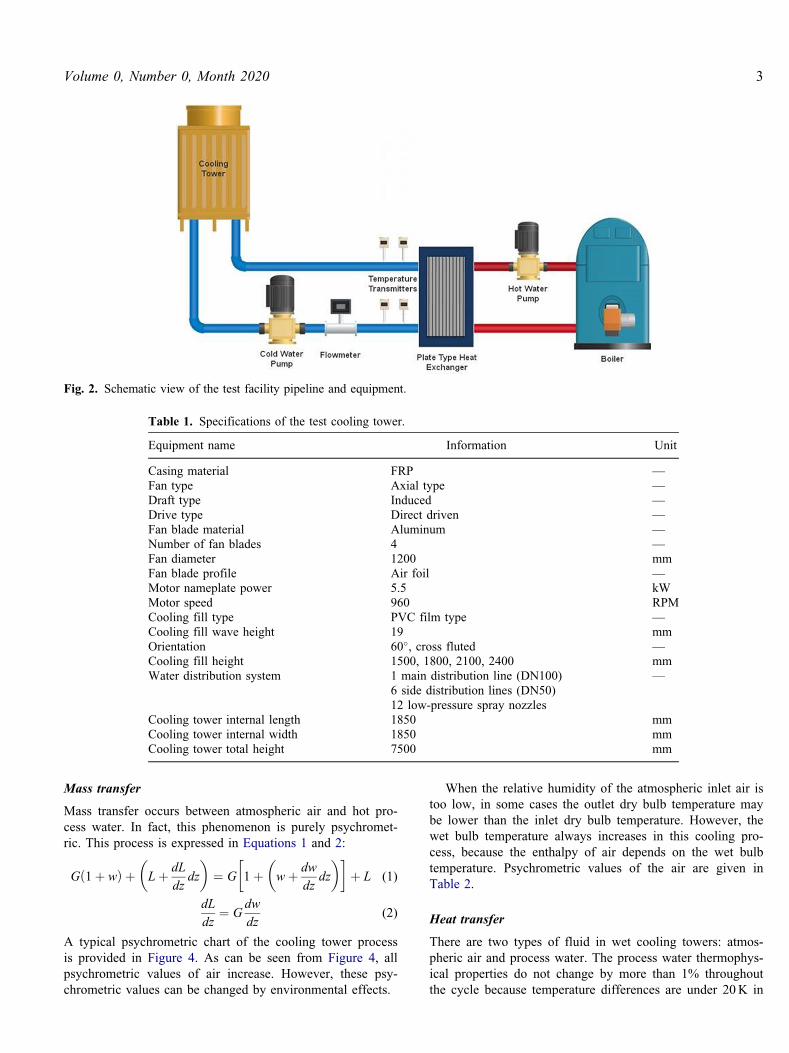
The test cooling tower is a counterflow type. Therefore,the hot water inlet is at the up side and the cold air inlet isat the down side of the cooling tower. A photographic viewof the test cooling tower is given in Figure 3.
Analytical methods
There are two main kinds of transfer equations in coolingtower theoretical analysis: mass transfer and heat transfer.
Fig. 1. Working principle of mechanical draft counterflowopen-circuit cooling tower.
2 Science and Technology for the Built Environment
Mass transfer
Mass transfer occurs between atmospheric air and hot pro-cess water. In fact, this phenomenon is purely psychromet-ric. This process is expressed in Equations 1 and 2:
G 1þ wð Þ þ Lþ dL
dzdz
� �¼ G 1þ wþ dw
dzdz
� �� �þ L (1)
dL
dz¼ G
dw
dz(2)
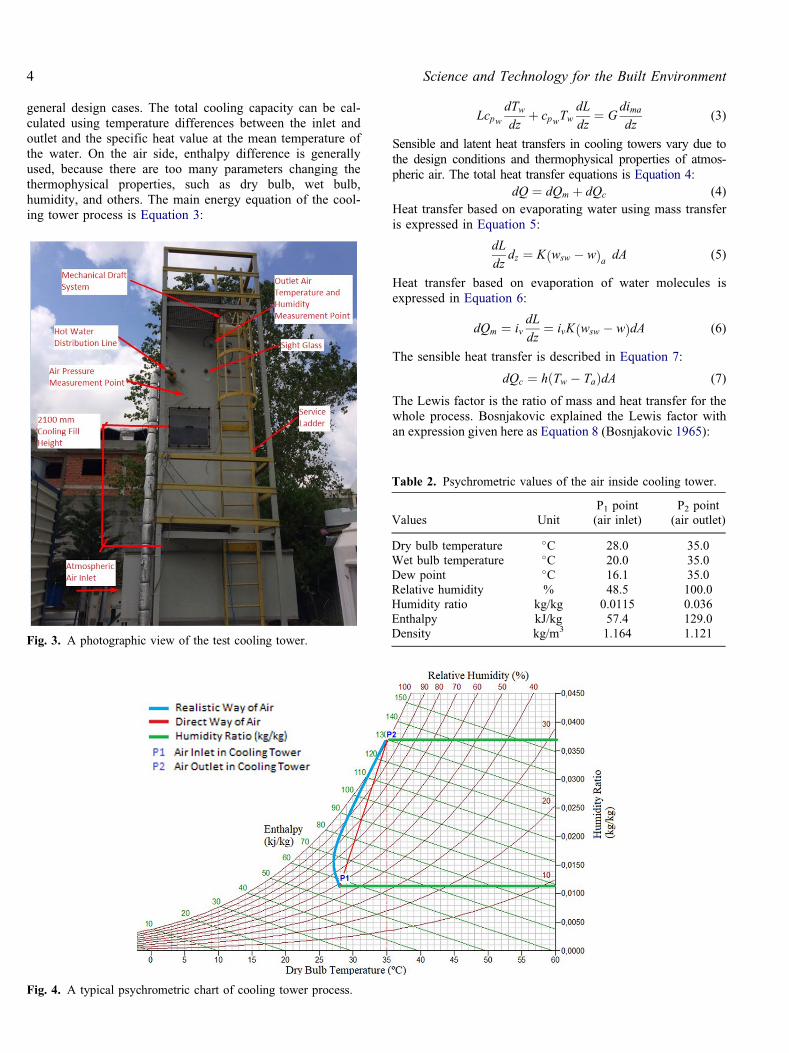
A typical psychrometric chart of the cooling tower processis provided in Figure 4. As can be seen from Figure 4, allpsychrometric values of air increase. However, these psy-chrometric values can be changed by environmental effects.
When the relative humidity of the atmospheric inlet air istoo low, in some cases the outlet dry bulb temperature maybe lower than the inlet dry bulb temperature. However, thewet bulb temperature always increases in this cooling pro-cess, because the enthalpy of air depends on the wet bulbtemperature. Psychrometric values of the air are given inTable 2.
Heat transfer
There are two types of fluid in wet cooling towers: atmos-pheric air and process water. The process water thermophys-ical properties do not change by more than 1% throughoutthe cycle because temperature differences are under 20K in
Fig. 2. Schematic view of the test facility pipeline and equipment.
Table 1. Specifications of the test cooling tower.
Equipment name Information Unit
Casing material FRP —Fan type Axial type —Draft type Induced —Drive type Direct driven —Fan blade material Aluminum —Number of fan blades 4 —Fan diameter 1200 mmFan blade profile Air foil —Motor nameplate power 5.5 kWMotor speed 960 RPMCooling fill type PVC film type —Cooling fill wave height 19 mmOrientation 60�, cross fluted —Cooling fill height 1500, 1800, 2100, 2400 mmWater distribution system 1 main distribution line (DN100)
6 side distribution lines (DN50)12 low-pressure spray nozzles
—
Cooling tower internal length 1850 mmCooling tower internal width 1850 mmCooling tower total height 7500 mm
Volume 0, Number 0, Month 2020 3
general design cases. The total cooling capacity can be cal-culated using temperature differences between the inlet andoutlet and the specific heat value at the mean temperature ofthe water. On the air side, enthalpy difference is generallyused, because there are too many parameters changing thethermophysical properties, such as dry bulb, wet bulb,humidity, and others. The main energy equation of the cool-ing tower process is Equation 3:
LcpwdTwdz
þ cpwTwdL
dz¼ G
dimadz
(3)
Sensible and latent heat transfers in cooling towers vary due tothe design conditions and thermophysical properties of atmos-pheric air. The total heat transfer equations is Equation 4:
dQ ¼ dQm þ dQc (4)Heat transfer based on evaporating water using mass transferis expressed in Equation 5:
dL
dzdz ¼ K wsw � wð Þa dA (5)
Heat transfer based on evaporation of water molecules isexpressed in Equation 6:
dQm ¼ ivdL
dz¼ ivK wsw � wð ÞdA (6)
The sensible heat transfer is described in Equation 7:
dQc ¼ h Tw � Tað ÞdA (7)
The Lewis factor is the ratio of mass and heat transfer for thewhole process. Bosnjakovic explained the Lewis factor withan expression given here as Equation 8 (Bosnjakovic 1965):
Fig. 3. A photographic view of the test cooling tower.
Fig. 4. A typical psychrometric chart of cooling tower process.
Table 2. Psychrometric values of the air inside cooling tower.
Values UnitP1 point(air inlet)
P2 point(air outlet)
Dry bulb temperature �C 28.0 35.0Wet bulb temperature �C 20.0 35.0Dew point �C 16.1 35.0Relative humidity % 48.5 100.0Humidity ratio kg/kg 0.0115 0.036Enthalpy kJ/kg 57.4 129.0Density kg/m3 1.164 1.121
4 Science and Technology for the Built Environment
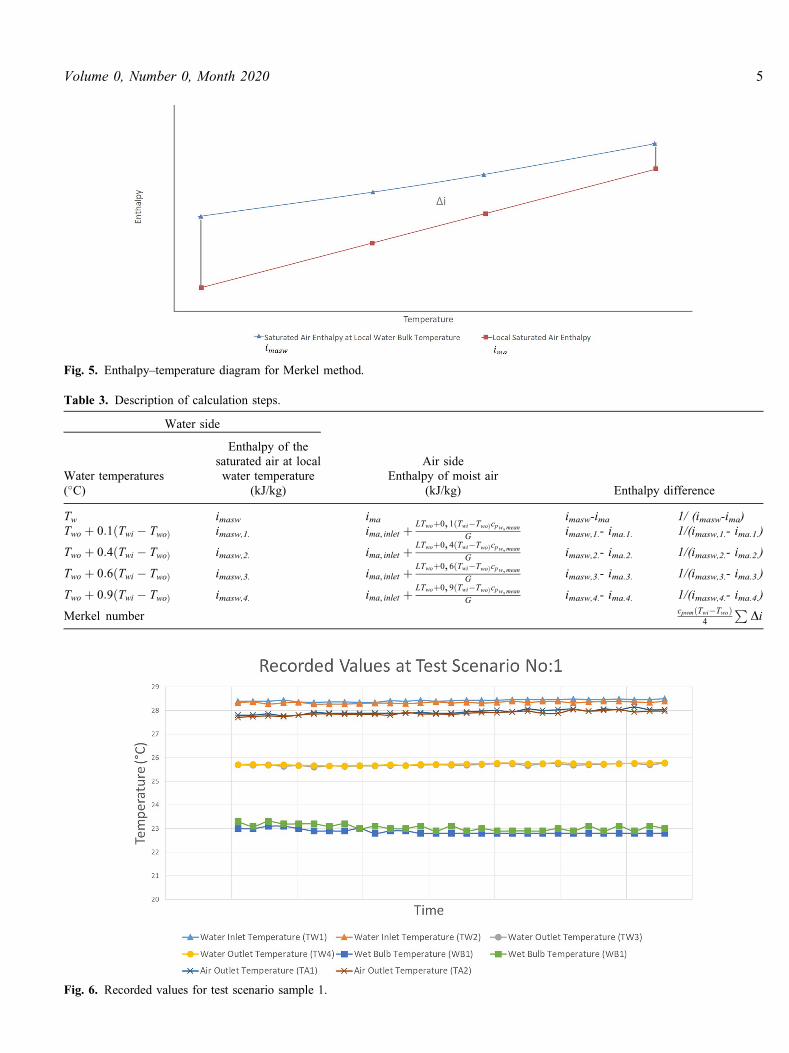
Fig. 5. Enthalpy–temperature diagram for Merkel method.
Table 3. Description of calculation steps.
Water side
Enthalpy differenceWater temperatures(�C)
Enthalpy of thesaturated air at localwater temperature
(kJ/kg)
Air sideEnthalpy of moist air
(kJ/kg)
Tw imasw ima imasw-ima 1/ (imasw-ima)Two þ 0:1ðTwi � TwoÞ imasw,1. ima, inlet þ LTwoþ0, 1ðTwi�TwoÞcpw,mean
G imasw,1.- ima.1. 1/(imasw,1.- ima.1.)
Two þ 0:4ðTwi � TwoÞ imasw,2. ima, inlet þ LTwoþ0, 4ðTwi�TwoÞcpw,meanG imasw,2.- ima.2. 1/(imasw,2.- ima.2.)
Two þ 0:6ðTwi � TwoÞ imasw,3. ima, inlet þ LTwoþ0, 6ðTwi�TwoÞcpw,meanG imasw,3.- ima.3. 1/(imasw,3.- ima.3.)
Two þ 0:9ðTwi � TwoÞ imasw,4. ima, inlet þ LTwoþ0, 9ðTwi�TwoÞcpw,meanG imasw,4.- ima.4. 1/(imasw,4.- ima.4.)
Merkel number cpwmðTwi�TwoÞ4
PDi
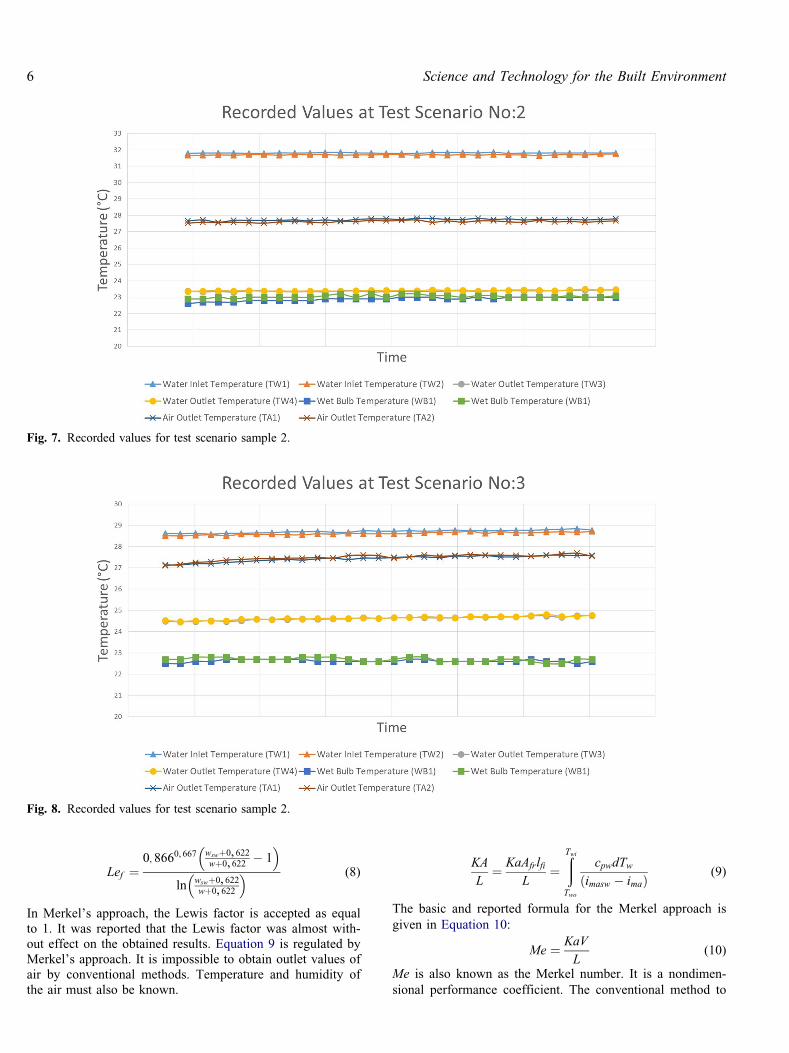
Fig. 6. Recorded values for test scenario sample 1.
Volume 0, Number 0, Month 2020 5
Lef ¼0, 8660, 667 wswþ0, 622
wþ0, 622 � 1� �
ln wswþ0, 622wþ0, 622
� � (8)
In Merkel’s approach, the Lewis factor is accepted as equalto 1. It was reported that the Lewis factor was almost with-out effect on the obtained results. Equation 9 is regulated byMerkel’s approach. It is impossible to obtain outlet values ofair by conventional methods. Temperature and humidity ofthe air must also be known.
KA
L¼ KaAfrlfi
L¼
ðTwiTwo
cpwdTwimasw � imað Þ (9)
The basic and reported formula for the Merkel approach isgiven in Equation 10:
Me ¼ KaV
L(10)
Me is also known as the Merkel number. It is a nondimen-sional performance coefficient. The conventional method to
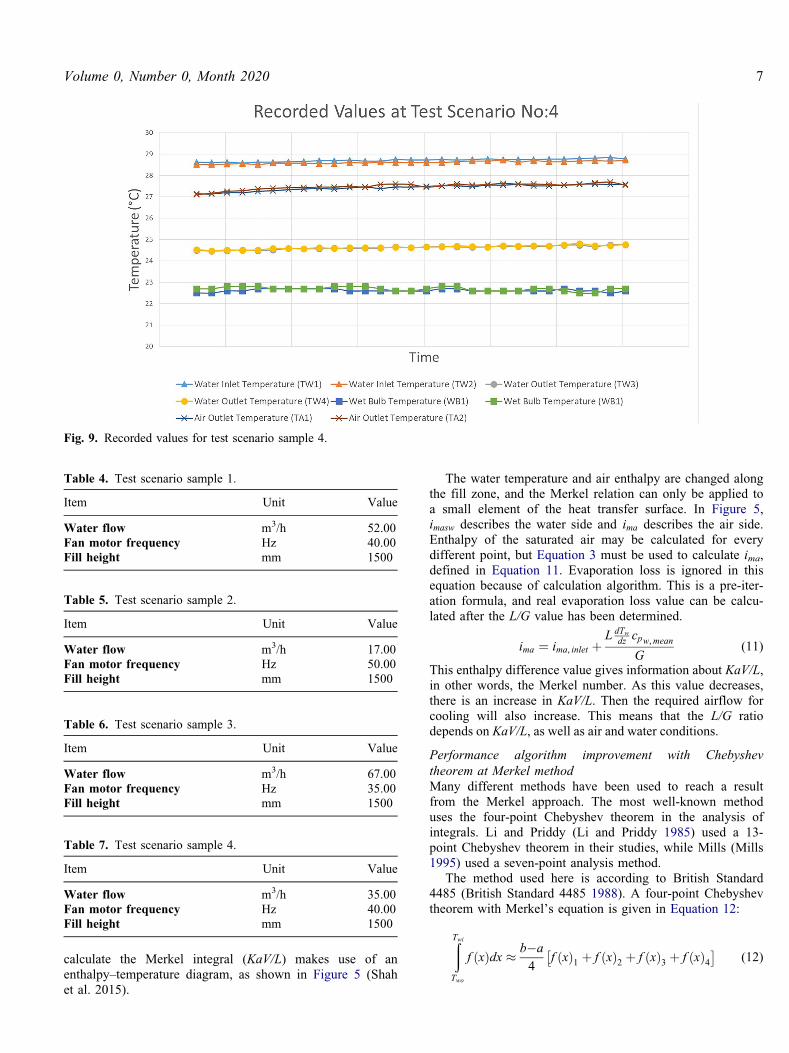
Fig. 7. Recorded values for test scenario sample 2.
Fig. 8. Recorded values for test scenario sample 2.
6 Science and Technology for the Built Environment
calculate the Merkel integral (KaV/L) makes use of anenthalpy–temperature diagram, as shown in Figure 5 (Shahet al. 2015).
The water temperature and air enthalpy are changed alongthe fill zone, and the Merkel relation can only be applied toa small element of the heat transfer surface. In Figure 5,imasw describes the water side and ima describes the air side.Enthalpy of the saturated air may be calculated for everydifferent point, but Equation 3 must be used to calculate ima,defined in Equation 11. Evaporation loss is ignored in thisequation because of calculation algorithm. This is a pre-iter-ation formula, and real evaporation loss value can be calcu-lated after the L/G value has been determined.
ima ¼ ima, inlet þL dTw
dz cpw,meanG
(11)
This enthalpy difference value gives information about KaV/L,in other words, the Merkel number. As this value decreases,there is an increase in KaV/L. Then the required airflow forcooling will also increase. This means that the L/G ratiodepends on KaV/L, as well as air and water conditions.
Performance algorithm improvement with Chebyshevtheorem at Merkel methodMany different methods have been used to reach a resultfrom the Merkel approach. The most well-known methoduses the four-point Chebyshev theorem in the analysis ofintegrals. Li and Priddy (Li and Priddy 1985) used a 13-point Chebyshev theorem in their studies, while Mills (Mills1995) used a seven-point analysis method.
The method used here is according to British Standard4485 (British Standard 4485 1988). A four-point Chebyshevtheorem with Merkel’s equation is given in Equation 12:
ðTwiTwo
f xð Þdx � b�a
4f xð Þ1 þ f xð Þ2 þ f xð Þ3 þ f xð Þ4�
(12)
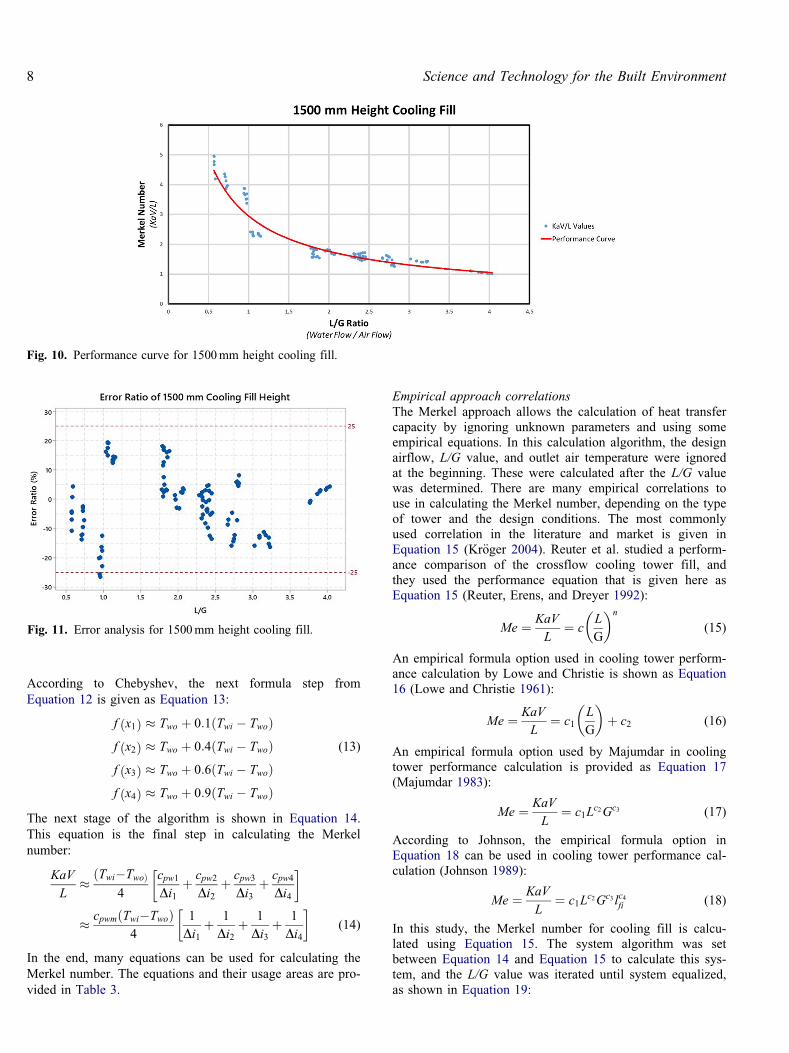
Fig. 9. Recorded values for test scenario sample 4.
Table 6. Test scenario sample 3.
Item Unit Value
Water flow m3/h 67.00Fan motor frequency Hz 35.00Fill height mm 1500
Table 7. Test scenario sample 4.
Item Unit Value
Water flow m3/h 35.00Fan motor frequency Hz 40.00Fill height mm 1500
Table 4. Test scenario sample 1.
Item Unit Value
Water flow m3/h 52.00Fan motor frequency Hz 40.00Fill height mm 1500
Table 5. Test scenario sample 2.
Item Unit Value
Water flow m3/h 17.00Fan motor frequency Hz 50.00Fill height mm 1500
Volume 0, Number 0, Month 2020 7
According to Chebyshev, the next formula step fromEquation 12 is given as Equation 13:
f x1ð Þ � Two þ 0:1ðTwi � TwoÞf x2ð Þ � Two þ 0:4ðTwi � TwoÞ (13)
f x3ð Þ � Two þ 0:6ðTwi � TwoÞf x4ð Þ � Two þ 0:9ðTwi � TwoÞ
The next stage of the algorithm is shown in Equation 14.This equation is the final step in calculating the Merkelnumber:
KaV
L� ðTwi�TwoÞ
4
cpw1Di1
þ cpw2Di2
þ cpw3Di3
þ cpw4Di4
� �
� cpwmðTwi�TwoÞ4
1Di1
þ 1Di2
þ 1Di3
þ 1Di4
� �(14)
In the end, many equations can be used for calculating theMerkel number. The equations and their usage areas are pro-vided in Table 3.
Empirical approach correlationsThe Merkel approach allows the calculation of heat transfercapacity by ignoring unknown parameters and using someempirical equations. In this calculation algorithm, the designairflow, L/G value, and outlet air temperature were ignoredat the beginning. These were calculated after the L/G valuewas determined. There are many empirical correlations touse in calculating the Merkel number, depending on the typeof tower and the design conditions. The most commonlyused correlation in the literature and market is given inEquation 15 (Kr€oger 2004). Reuter et al. studied a perform-ance comparison of the crossflow cooling tower fill, andthey used the performance equation that is given here asEquation 15 (Reuter, Erens, and Dreyer 1992):
Me ¼ KaV
L¼ c
L
G
� �n
(15)
An empirical formula option used in cooling tower perform-ance calculation by Lowe and Christie is shown as Equation16 (Lowe and Christie 1961):
Me ¼ KaV
L¼ c1
L
G
� �þ c2 (16)
An empirical formula option used by Majumdar in coolingtower performance calculation is provided as Equation 17(Majumdar 1983):
Me ¼ KaV
L¼ c1L
c2Gc3 (17)
According to Johnson, the empirical formula option inEquation 18 can be used in cooling tower performance cal-culation (Johnson 1989):
Me ¼ KaV
L¼ c1L
c2Gc3 lc4fi (18)
In this study, the Merkel number for cooling fill is calcu-lated using Equation 15. The system algorithm was setbetween Equation 14 and Equation 15 to calculate this sys-tem, and the L/G value was iterated until system equalized,as shown in Equation 19:
Fig. 10. Performance curve for 1500mm height cooling fill.
Fig. 11. Error analysis for 1500mm height cooling fill.
8 Science and Technology for the Built Environment
cL
G
� �n
� cpwmðTwi�TwoÞ4
1Di1
þ 1Di2
þ 1Di3
þ 1Di4
� �(19)
Pressure loss calculationsCooling towers are industrial equipment and need freshatmospheric air when they cool water. Airflow is requiredfor heat transfer, and it loses pressure in some sections ofthe cooling tower. These sections are the air inlet louver,rain zone, fill zone, spray zone, drift eliminator area, andfan stack entrance. Such pressure loss makes it difficult forthe fans to move the air, which leads motors to workharder and consume more electricity. More motor workmeans increased electricity consumption. A general pres-sure loss formula is shown as Equation 20 (Kloppers andKr€oger Detlev 2003):
Dpfi ¼ kfiqav2a
2(20)
The kfi value used as a variable in Equation 20 is calculatedfor different geometric structures and parameters to find the
fill pressure loss. Due to the increasing effect of air velocityon pressure loss, the velocity of air is selected to be as lowas possible in cooling tower designs (Lemouari, Boumaza,and Kaabi 2011)
Experimental results
The air-side pressure loss values were measured in the cool-ing tower performance tests, and the thermal performanceparameters were evaluated. General performance test proce-dures of Cenk End€ustri Tesisleri _Imalat (CTI) and otherinstitutions were followed. Measurement data were collectedafter a thermal balance was reached. Every test conditionwas recorded for 1 hour after the system had been stabilized.Many parameters, such as water flow, air velocity, and heatload, and others, were changed to establish a curve for acooling fill type. In this study, more than 20 performancetests were performed to establish these curves. These testsand procedures were restarted for each different fill heightoption. At the end of the experimental study, performancecoefficients and pressure loss graphs for four differentheights of cooling fill had been obtained. The values of theinput parameters and output parameters corresponding tothese inputs are indicated in Tables 4–7 and Figures 6–9,respectively.
The process sides of the test cooling tower were eval-uated by measuring the thermophysical properties. Airinlet enthalpy values were assessed using a wet bulb tem-perature transmitter that has its own fan and water supplysystem for measurement at 100% relative humidity. Outlettemperature was measured using a standard PT100 tem-perature transmitter. The relative humidity of the outletair was found to be 100% at multiple outlet air pointsduring the performance tests. A hand-held humidity sen-sor, with accuracy ±2.5%, was used to measure relativehumidity. From the recorded values, inlet and outletenthalpy of air could be calculated. On the other hand,
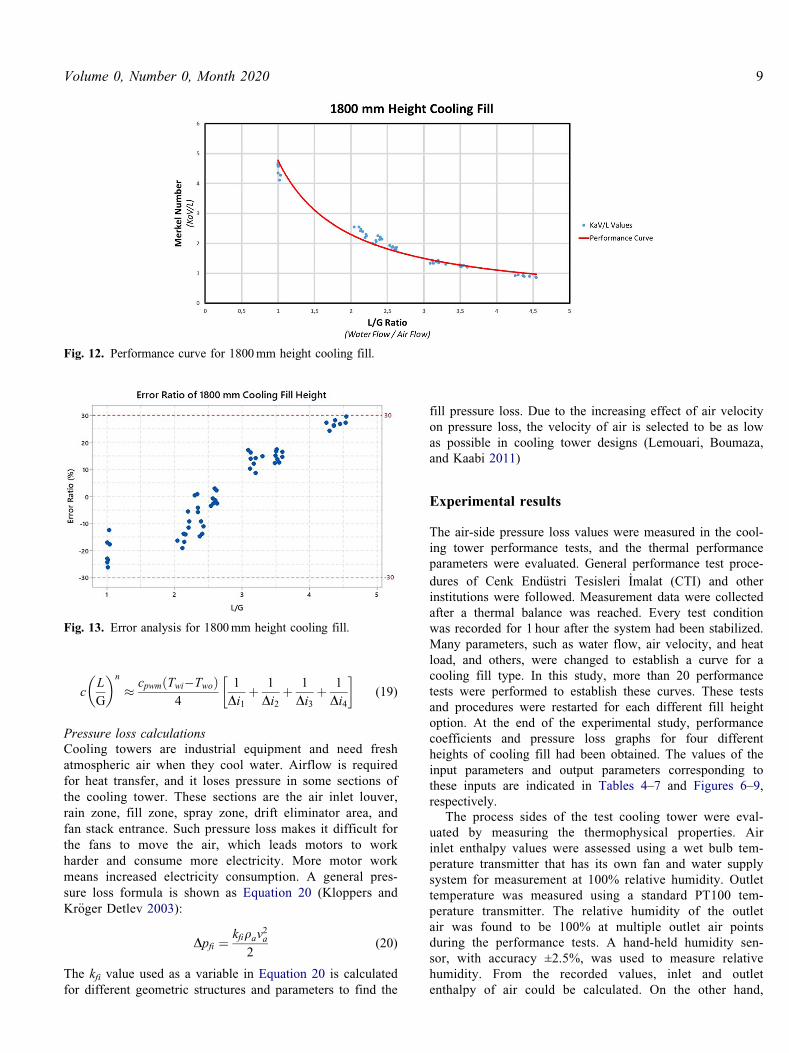
Fig. 12. Performance curve for 1800mm height cooling fill.
Fig. 13. Error analysis for 1800mm height cooling fill.
Volume 0, Number 0, Month 2020 9
the air mass flow rate could be calculated fromEquation 3.
There are more conventional methods to measure airspeed in cooling towers by using anemometers. However,our experimental performance tests were made in open air.The winds could distort the measurement of air speed. Formore accurate results, differential enthalpy was calculatedfor this process.
Analyses of thermal performance test results
The L/G term is the ratio of liquid flow to gas flow.Performance graphics for cooling fill were created from theL/G and Merkel number values. The frequencies of the cir-culation pump and fan motor were changed for differentflow options. In this study, five different airflow options anda minimum of four different water flow optionswere measured.
According to Merkel, it is necessary to know performancecoefficients of the cooling fill in order to design to the ther-mal capacity of the cooling tower. One of the main
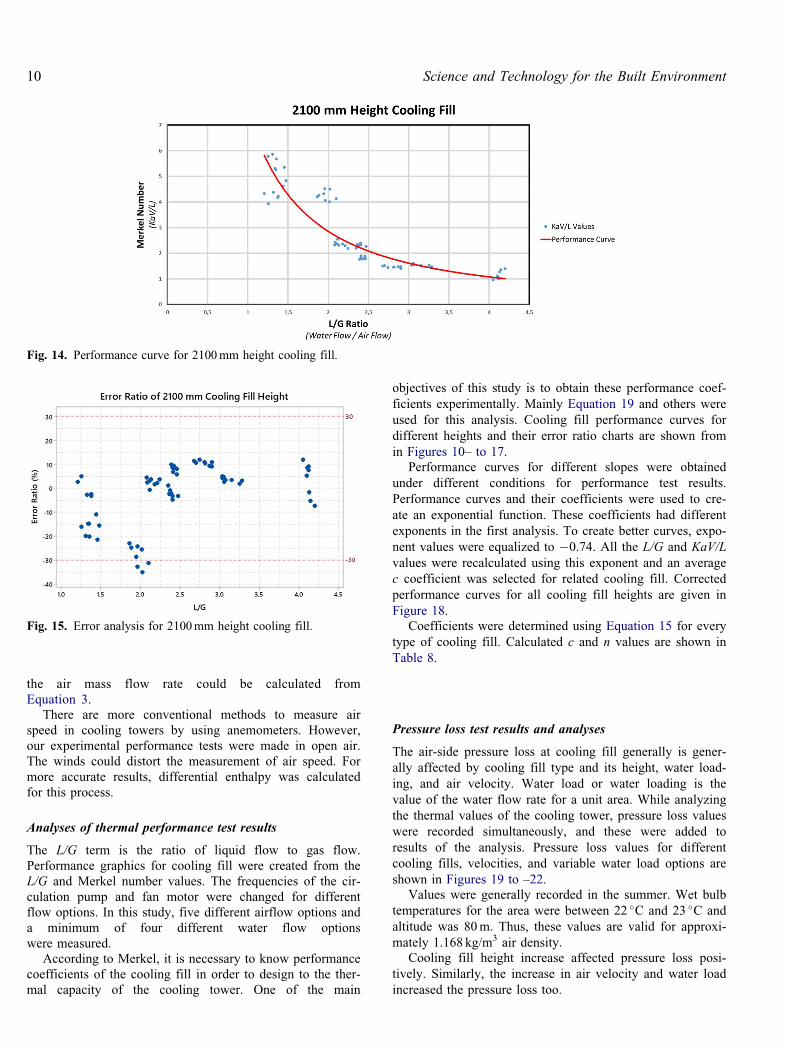
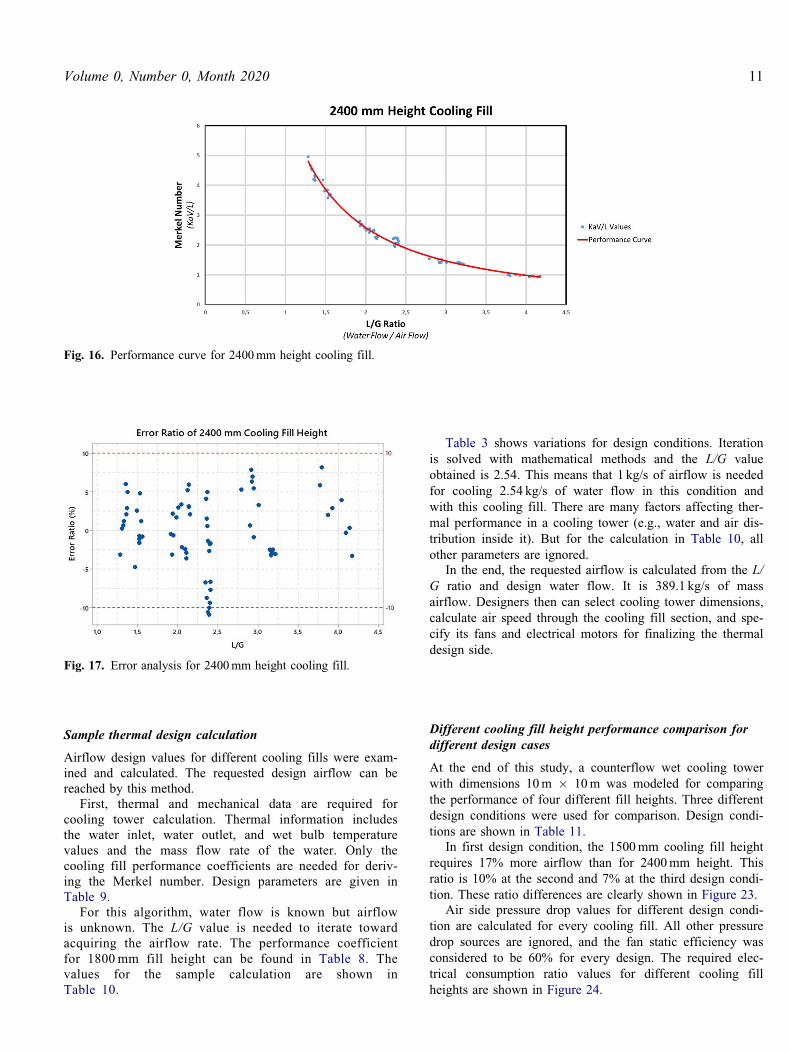
objectives of this study is to obtain these performance coef-ficients experimentally. Mainly Equation 19 and others wereused for this analysis. Cooling fill performance curves fordifferent heights and their error ratio charts are shown fromin Figures 10– to 17.
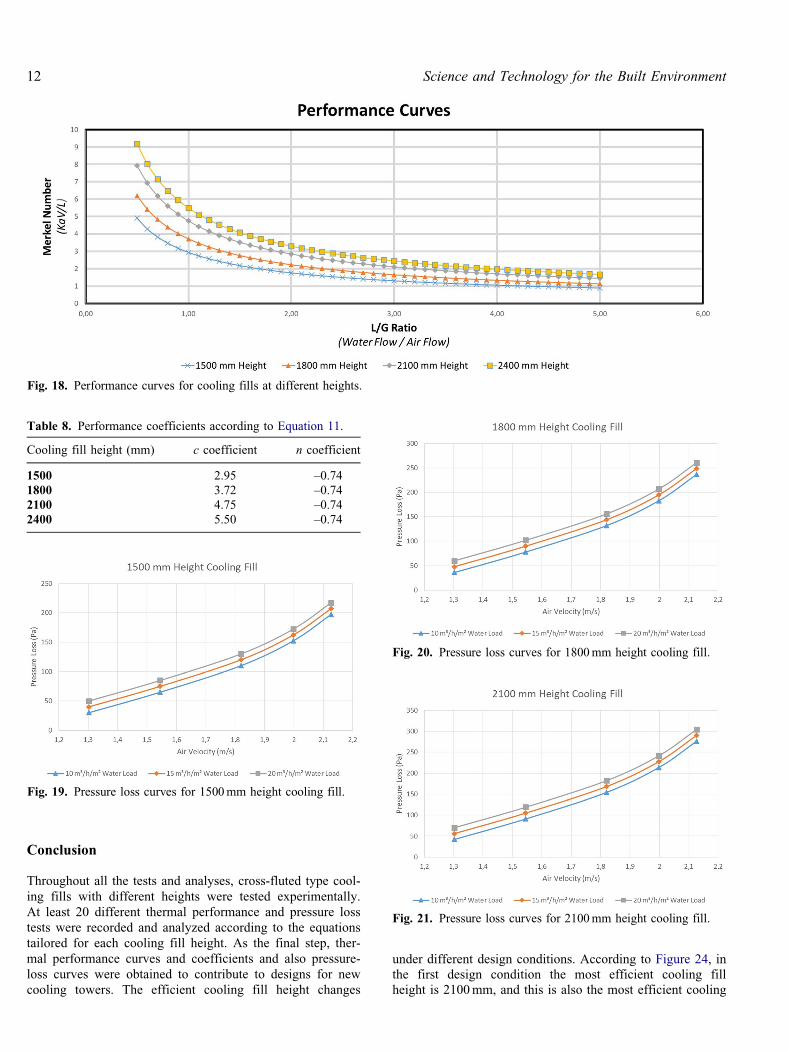
Performance curves for different slopes were obtainedunder different conditions for performance test results.Performance curves and their coefficients were used to cre-ate an exponential function. These coefficients had differentexponents in the first analysis. To create better curves, expo-nent values were equalized to �0.74. All the L/G and KaV/Lvalues were recalculated using this exponent and an averagec coefficient was selected for related cooling fill. Correctedperformance curves for all cooling fill heights are given inFigure 18.
Coefficients were determined using Equation 15 for everytype of cooling fill. Calculated c and n values are shown inTable 8.
Pressure loss test results and analyses
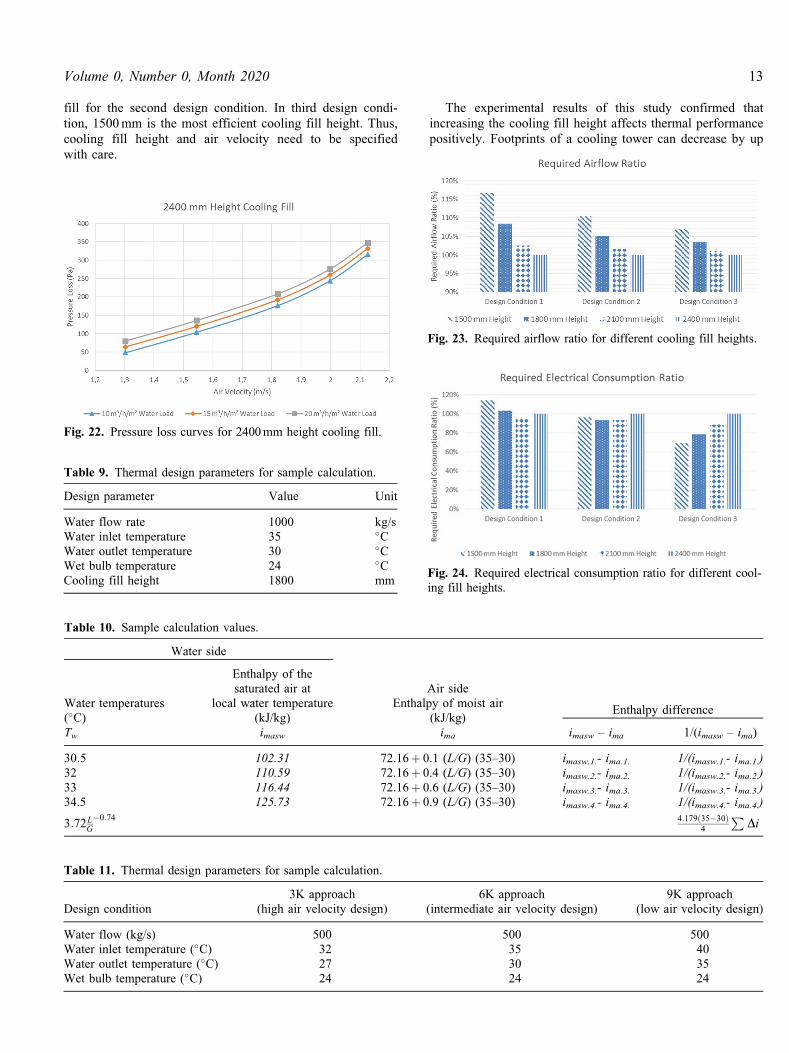
The air-side pressure loss at cooling fill generally is gener-ally affected by cooling fill type and its height, water load-ing, and air velocity. Water load or water loading is thevalue of the water flow rate for a unit area. While analyzingthe thermal values of the cooling tower, pressure loss valueswere recorded simultaneously, and these were added toresults of the analysis. Pressure loss values for differentcooling fills, velocities, and variable water load options areshown in Figures 19 to –22.
Values were generally recorded in the summer. Wet bulbtemperatures for the area were between 22 �C and 23 �C andaltitude was 80m. Thus, these values are valid for approxi-mately 1.168 kg/m3 air density.
Cooling fill height increase affected pressure loss posi-tively. Similarly, the increase in air velocity and water loadincreased the pressure loss too.
Fig. 14. Performance curve for 2100mm height cooling fill.
Fig. 15. Error analysis for 2100mm height cooling fill.
10 Science and Technology for the Built Environment
Sample thermal design calculation
Airflow design values for different cooling fills were exam-ined and calculated. The requested design airflow can bereached by this method.
First, thermal and mechanical data are required forcooling tower calculation. Thermal information includesthe water inlet, water outlet, and wet bulb temperaturevalues and the mass flow rate of the water. Only thecooling fill performance coefficients are needed for deriv-ing the Merkel number. Design parameters are given inTable 9.
For this algorithm, water flow is known but airflowis unknown. The L/G value is needed to iterate towardacquiring the airflow rate. The performance coefficientfor 1800 mm fill height can be found in Table 8. Thevalues for the sample calculation are shown inTable 10.
Table 3 shows variations for design conditions. Iterationis solved with mathematical methods and the L/G valueobtained is 2.54. This means that 1 kg/s of airflow is neededfor cooling 2.54 kg/s of water flow in this condition andwith this cooling fill. There are many factors affecting ther-mal performance in a cooling tower (e.g., water and air dis-tribution inside it). But for the calculation in Table 10, allother parameters are ignored.
In the end, the requested airflow is calculated from the L/G ratio and design water flow. It is 389.1 kg/s of massairflow. Designers then can select cooling tower dimensions,calculate air speed through the cooling fill section, and spe-cify its fans and electrical motors for finalizing the thermaldesign side.
Different cooling fill height performance comparison fordifferent design cases
At the end of this study, a counterflow wet cooling towerwith dimensions 10m � 10m was modeled for comparingthe performance of four different fill heights. Three differentdesign conditions were used for comparison. Design condi-tions are shown in Table 11.
In first design condition, the 1500mm cooling fill heightrequires 17% more airflow than for 2400mm height. Thisratio is 10% at the second and 7% at the third design condi-tion. These ratio differences are clearly shown in Figure 23.
Air side pressure drop values for different design condi-tion are calculated for every cooling fill. All other pressuredrop sources are ignored, and the fan static efficiency wasconsidered to be 60% for every design. The required elec-trical consumption ratio values for different cooling fillheights are shown in Figure 24.
Fig. 16. Performance curve for 2400mm height cooling fill.
Fig. 17. Error analysis for 2400mm height cooling fill.
Volume 0, Number 0, Month 2020 11
Conclusion
Throughout all the tests and analyses, cross-fluted type cool-ing fills with different heights were tested experimentally.At least 20 different thermal performance and pressure losstests were recorded and analyzed according to the equationstailored for each cooling fill height. As the final step, ther-mal performance curves and coefficients and also pressure-loss curves were obtained to contribute to designs for newcooling towers. The efficient cooling fill height changes
under different design conditions. According to Figure 24, inthe first design condition the most efficient cooling fillheight is 2100mm, and this is also the most efficient cooling
Fig. 18. Performance curves for cooling fills at different heights.
Table 8. Performance coefficients according to Equation 11.
Cooling fill height (mm) c coefficient n coefficient
1500 2.95 –0.741800 3.72 –0.742100 4.75 –0.742400 5.50 –0.74
Fig. 19. Pressure loss curves for 1500mm height cooling fill.
Fig. 20. Pressure loss curves for 1800mm height cooling fill.
Fig. 21. Pressure loss curves for 2100mm height cooling fill.
12 Science and Technology for the Built Environment
fill for the second design condition. In third design condi-tion, 1500mm is the most efficient cooling fill height. Thus,cooling fill height and air velocity need to be specifiedwith care.
The experimental results of this study confirmed thatincreasing the cooling fill height affects thermal performancepositively. Footprints of a cooling tower can decrease by up
Fig. 22. Pressure loss curves for 2400mm height cooling fill.
Table 9. Thermal design parameters for sample calculation.
Design parameter Value Unit
Water flow rate 1000 kg/sWater inlet temperature 35 �CWater outlet temperature 30 �CWet bulb temperature 24 �CCooling fill height 1800 mm
Table 10. Sample calculation values.
Water side
Enthalpy differenceWater temperatures(�C)
Enthalpy of thesaturated air at
local water temperature(kJ/kg)
Air sideEnthalpy of moist air
(kJ/kg)Tw imasw ima imasw – ima 1/(imasw – ima)
30:5 102.31 72.16þ 0.1 (L/G) (35–30) imasw.1.- ima.1. 1/(imasw.1.- ima.1.)32 110.59 72.16þ 0.4 (L/G) (35–30) imasw.2.- ima.2. 1/(imasw.2.- ima.2.)33 116.44 72.16þ 0.6 (L/G) (35–30) imasw.3.- ima.3. 1/(imasw.3.- ima.3.)34.5 125.73 72.16þ 0.9 (L/G) (35–30) imasw.4.- ima.4. 1/(imasw.4.- ima.4.)
3:72LG�0:74 4:179ð35�30Þ
4
PDi
Table 11. Thermal design parameters for sample calculation.
Design condition3K approach
(high air velocity design)6K approach
(intermediate air velocity design)9K approach
(low air velocity design)
Water flow (kg/s) 500 500 500Water inlet temperature (�C) 32 35 40Water outlet temperature (�C) 27 30 35Wet bulb temperature (�C) 24 24 24
Fig. 23. Required airflow ratio for different cooling fill heights.
Fig. 24. Required electrical consumption ratio for different cool-ing fill heights.
Volume 0, Number 0, Month 2020 13
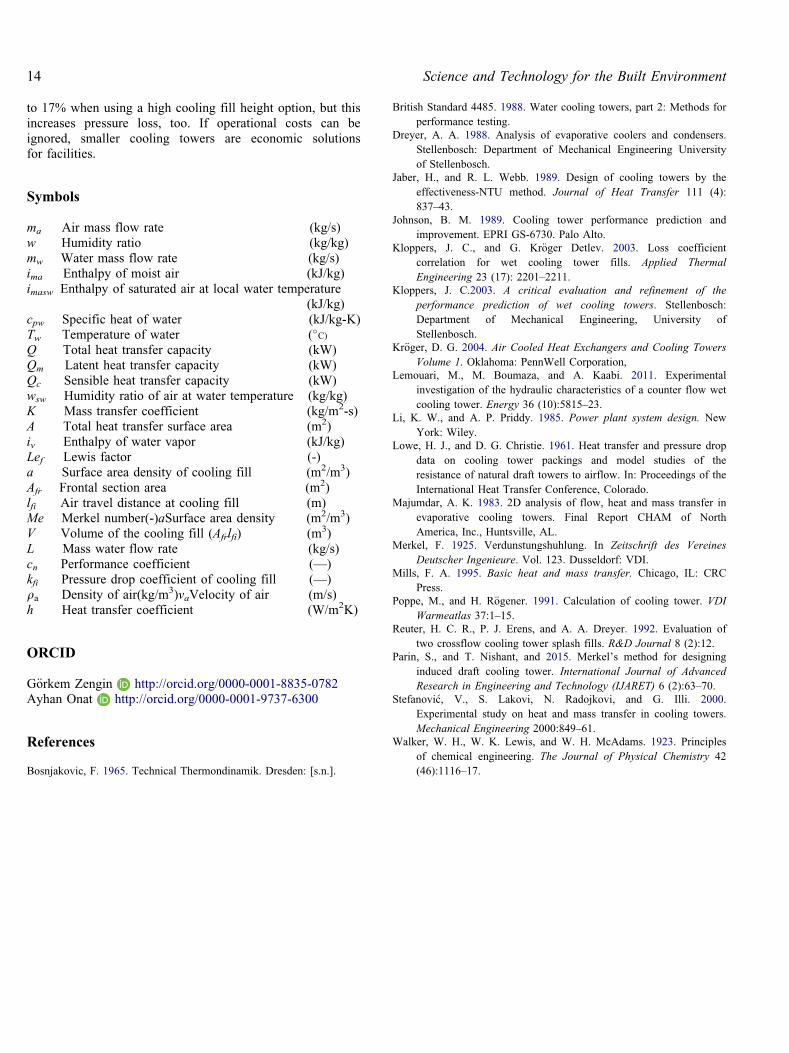
to 17% when using a high cooling fill height option, but thisincreases pressure loss, too. If operational costs can beignored, smaller cooling towers are economic solutionsfor facilities.
Symbols
ma Air mass flow rate (kg/s)w Humidity ratio (kg/kg)mw Water mass flow rate (kg/s)ima Enthalpy of moist air (kJ/kg)imasw Enthalpy of saturated air at local water temperature
(kJ/kg)cpw Specific heat of water (kJ/kg-K)Tw Temperature of water (�C)Q Total heat transfer capacity (kW)Qm Latent heat transfer capacity (kW)Qc Sensible heat transfer capacity (kW)wsw Humidity ratio of air at water temperature (kg/kg)K Mass transfer coefficient (kg/m2-s)A Total heat transfer surface area (m2)iv Enthalpy of water vapor (kJ/kg)Lef Lewis factor (-)a Surface area density of cooling fill (m2/m3)Afr Frontal section area (m2)lfi Air travel distance at cooling fill (m)Me Merkel number(-)aSurface area density (m2/m3)V Volume of the cooling fill (Afrlfi) (m3)L Mass water flow rate (kg/s)cn Performance coefficient (—)kfi Pressure drop coefficient of cooling fill (—)qa Density of air(kg/m3)vaVelocity of air (m/s)h Heat transfer coefficient (W/m2K)
ORCID
G€orkem Zengin http://orcid.org/0000-0001-8835-0782Ayhan Onat http://orcid.org/0000-0001-9737-6300
References
Bosnjakovic, F. 1965. Technical Thermondinamik. Dresden: [s.n.].
British Standard 4485. 1988. Water cooling towers, part 2: Methods forperformance testing.
Dreyer, A. A. 1988. Analysis of evaporative coolers and condensers.Stellenbosch: Department of Mechanical Engineering Universityof Stellenbosch.
Jaber, H., and R. L. Webb. 1989. Design of cooling towers by theeffectiveness-NTU method. Journal of Heat Transfer 111 (4):837–43.
Johnson, B. M. 1989. Cooling tower performance prediction andimprovement. EPRI GS-6730. Palo Alto.
Kloppers, J. C., and G. Kr€oger Detlev. 2003. Loss coefficientcorrelation for wet cooling tower fills. Applied ThermalEngineering 23 (17): 2201–2211.
Kloppers, J. C.2003. A critical evaluation and refinement of theperformance prediction of wet cooling towers. Stellenbosch:Department of Mechanical Engineering, University ofStellenbosch.
Kr€oger, D. G. 2004. Air Cooled Heat Exchangers and Cooling TowersVolume 1. Oklahoma: PennWell Corporation,
Lemouari, M., M. Boumaza, and A. Kaabi. 2011. Experimentalinvestigation of the hydraulic characteristics of a counter flow wetcooling tower. Energy 36 (10):5815–23.
Li, K. W., and A. P. Priddy. 1985. Power plant system design. NewYork: Wiley.
Lowe, H. J., and D. G. Christie. 1961. Heat transfer and pressure dropdata on cooling tower packings and model studies of theresistance of natural draft towers to airflow. In: Proceedings of theInternational Heat Transfer Conference, Colorado.
Majumdar, A. K. 1983. 2D analysis of flow, heat and mass transfer inevaporative cooling towers. Final Report CHAM of NorthAmerica, Inc., Huntsville, AL.
Merkel, F. 1925. Verdunstungshuhlung. In Zeitschrift des VereinesDeutscher Ingenieure. Vol. 123. Dusseldorf: VDI.
Mills, F. A. 1995. Basic heat and mass transfer. Chicago, IL: CRCPress.
Poppe, M., and H. R€ogener. 1991. Calculation of cooling tower. VDIWarmeatlas 37:1–15.
Reuter, H. C. R., P. J. Erens, and A. A. Dreyer. 1992. Evaluation oftwo crossflow cooling tower splash fills. R&D Journal 8 (2):12.
Parin, S., and T. Nishant, and 2015. Merkel’s method for designinginduced draft cooling tower. International Journal of AdvancedResearch in Engineering and Technology (IJARET) 6 (2):63–70.
Stefanovi�c, V., S. Lakovi, N. Radojkovi, and G. Illi. 2000.Experimental study on heat and mass transfer in cooling towers.Mechanical Engineering 2000:849–61.
Walker, W. H., W. K. Lewis, and W. H. McAdams. 1923. Principlesof chemical engineering. The Journal of Physical Chemistry 42(46):1116–17.
14 Science and Technology for the Built Environment