Unit-3 Transformer Transformer Voltage regulation, losses ...
Upload
khangminh22Category
view
0download
0
Appl. Sci. 2022, 12, 1758. https://doi.org/10.3390/app12031758 www.mdpi.com/journal/applsci
Article
Experimental Analysis of Transformer Core Vibration
and Noise under Inter‐Harmonic Excitation
Qiang He 1, Chao Fan 1, Guang Yang 2,*, Huiqi Li 2, Jiadong Li 2 and Xiaogang Chen 3
1 State Key Laboratory of Advanced Power Transmission Technology, Global Energy Interconnection
Research Institute Co., Ltd., Beijing 102209, China; [email protected] (Q.H.); [email protected] (C.F.) 2 Hebei Provincial Key Laboratory of Power Transmission Equipment Security Defense, North China Electric
Power University, Baoding 071000, China; [email protected] (H.L.); [email protected] (J.L.) 3 State Grid Zhejiang Electric Power Co., Ltd., Hangzhou 310007, China; [email protected]
* Correspondence: [email protected]; Tel.: +86‐159‐312‐15916
Abstract: With the wide application of power electronic devices and nonlinear loads, the resulting
inter‐harmonic pollution is becoming more and more serious in the power system. As important
equipment in power systems, transformers have always been the focus of research. However, there
are few studies on the abnormal increase in vibration and noise caused by inter‐harmonic excitation.
In this work, a transformer core vibration and noise measurement platform that can generate arbi‐
trary inter‐harmonic excitations was built. The real‐time vibration displacement waveforms of the
core model under normal and inter‐harmonic conditions were experimentally measured as well as
the surrounding noise level amplitude and spectrum analysis result. The influence law of excitation
of intermediate harmonic content and frequency on core vibration displacement and surrounding
sound pressure level was summarized. The work of this paper lays a theoretical foundation for
studying the vibration and noise of power transformers and other equipment under inter‐harmon‐
ics.
Keywords: inter‐harmonics; transformer core; vibration; transformer noise
1. Introduction
Power inter‐harmonic refers to any harmonic whose frequency is not an integer mul‐
tiple of the fundamental frequency, and the inter‐harmonic whose frequency is less than
the fundamental frequency is usually called sub‐harmonic [1]. Common main sources are
nonlinear loads, inverter speed governors, and sub‐synchronous oscillation of wind tur‐
bines [2,3], etc. Among them, the inter‐harmonic frequency generated by common non‐
linear loads is 0~50 Hz; the inter‐harmonic frequency generated by the frequency conver‐
sion device is a discrete value related to the sum or difference of the input and output side
frequencies, the inter‐harmonic generated by the sub‐synchronous oscillation of the wind
turbine. The frequency is generally less than the synchronization frequency of 50 Hz. As
the main equipment of the power system, the transformer is bound to be affected by inter‐
harmonics. The existence of inter‐harmonics will cause many problems, such as prema‐
ture saturation of the transformer core, severe distortion of the excitation current, in‐
creased vibration, and an abnormal increase in noise.
At present, many scholars have carried out a lot of research on transformer vibration
and noise. Through experimental research, literature [4,5] concludes that the main reason
for transformer vibration and noise is iron core magnetostriction; literature [6,7] studied
the vibration and noise of transformer core under power frequency sinusoidal excitation;
literature [8–11] studied the magnetostriction of the material and the magnetization state
and vibration of the iron core under DC bias; literature [12–14] studied the vibration noise
Citation: He, Q.; Fan, C.; Yang, G.;
Li, H.; Li, J.; Chen, X. Experimental
Analysis of Transformer Core Vibra‐
tion and Noise under Inter‐Har‐
monic Excitation. Appl. Sci. 2022, 12,
1758. https://doi.org/10.3390/
app12031758
Academic Editor:
Lamberto Tronchin
Received: 30 December 2021
Accepted: 5 February 2022
Published: 8 February 2022
Publisher’s Note: MDPI stays neu‐
tral with regard to jurisdictional
claims in published maps and institu‐
tional affiliations.
Copyright: © 2022 by the authors. Li‐
censee MDPI, Basel, Switzerland.
This article is an open access article
distributed under the terms and con‐
ditions of the Creative Commons At‐
tribution (CC BY) license (https://cre‐
ativecommons.org/licenses/by/4.0/).

Appl. Sci. 2022, 12, 1758 2 of 14
of the transformer core under harmonic and DC bias excitation. Many scholars have sim‐
ulated the vibration and noise values of transformers and reactors through multiphysics
coupling software [15–17]; literature [18,19] analyzed the influence on the electromagnetic
vibration characteristics of equipment by simulating the condition of each harmonic by
superimposing harmonics of fundamental wave excitation; literature [20] systematically
studied the magnetization characteristics and loss characteristics of electrical steel mate‐
rials under excitation with inter‐harmonics. However, research on the influence of inter‐
harmonics on power transformers is still rare, so it is very important to measure the vi‐
bration and noise characteristics of transformer cores under the action of inter‐harmonics.
In this paper, the inter‐harmonic influences on transformer core vibration and noise
are studied through experiments. A core model laminated by oriented silicon steel sheets
was made, and core vibration and noise experiments were carried out. The effects of inter‐
harmonic frequency and content on transformer core vibration and noise were analyzed.
At present, there is little research on transformer core vibration and noise under inter‐
harmonic excitation. The experimental platform and experimental methods in this paper
can provide a reference on transformer core vibration and noise under inter‐harmonic ex‐
citation.
2. Experimental Methods
2.1. Experimental Scheme
This paper has built a vibration measurement platform that can generate arbitrary
inter‐harmonic excitation. Inter‐harmonics with different contents and frequencies are set,
and vibration and noise measurement experiments are carried out under this excitation.
The experimental flow chart is shown in Figure 1.
Figure 1. Experimental flow chart.
Appl. Sci. 2022, 12, 1758 3 of 14
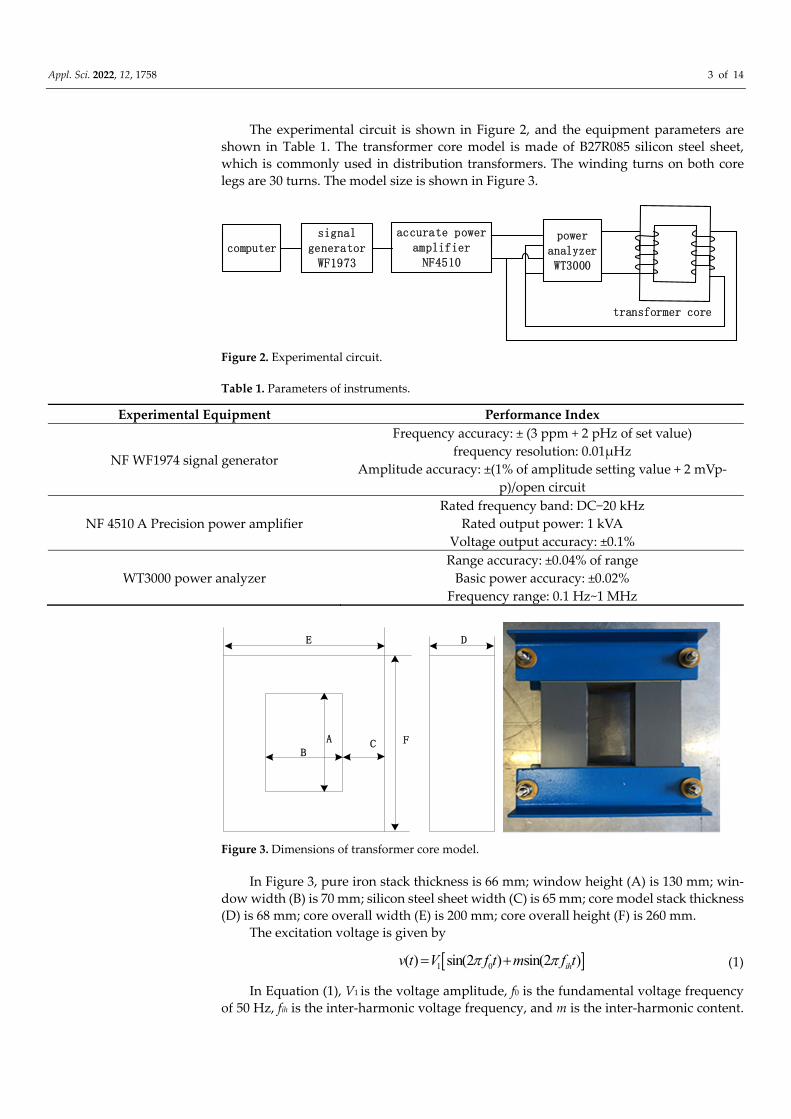
The experimental circuit is shown in Figure 2, and the equipment parameters are
shown in Table 1. The transformer core model is made of B27R085 silicon steel sheet,
which is commonly used in distribution transformers. The winding turns on both core
legs are 30 turns. The model size is shown in Figure 3.
accurate power amplifierNF4510
transformer core
signal generatorWF1973
power analyzerWT3000
computer
Figure 2. Experimental circuit.
Table 1. Parameters of instruments.
Experimental Equipment Performance Index
NF WF1974 signal generator
Frequency accuracy: ± (3 ppm + 2 pHz of set value)
frequency resolution: 0.01µHz
Amplitude accuracy: ±(1% of amplitude setting value + 2 mVp‐
p)/open circuit
NF 4510 A Precision power amplifier
Rated frequency band: DC−20 kHz
Rated output power: 1 kVA
Voltage output accuracy: ±0.1%
WT3000 power analyzer
Range accuracy: ±0.04% of range
Basic power accuracy: ±0.02%
Frequency range: 0.1 Hz~1 MHz
A
BC
DE
F
Figure 3. Dimensions of transformer core model.
In Figure 3, pure iron stack thickness is 66 mm; window height (A) is 130 mm; win‐
dow width (B) is 70 mm; silicon steel sheet width (C) is 65 mm; core model stack thickness
(D) is 68 mm; core overall width (E) is 200 mm; core overall height (F) is 260 mm.
The excitation voltage is given by
1 0( ) sin(2 ) sin(2 )ihv t V f t m f t (1)
In Equation (1), V1 is the voltage amplitude, f0 is the fundamental voltage frequency
of 50 Hz, fih is the inter‐harmonic voltage frequency, and m is the inter‐harmonic content.

Appl. Sci. 2022, 12, 1758 4 of 14
The experiment studied the influence of the frequency and content of inter‐harmonics on
the vibration characteristics of the transformer core by changing the parameters fih and m.
The main sources of common inter‐harmonics are nonlinear loads, frequency con‐
verter speed control devices, and sub‐synchronous oscillations of wind turbines. Accord‐
ing to the above main sources of inter‐harmonics, this part of the experiment sets the inter‐
harmonic content to 3%, that is, m = 0.03 unchanged. Take fih as: 2, 5, 7, 10, 15, 17, 20, 25,
30, 40, 45, and 53 Hz. Under the condition of introducing different inter‐harmonic fre‐
quencies, the voltage amplitude is gradually increased from 0 to 50 V. During debugging,
the vibration displacement of different measuring points is recorded, and the vibration
displacement is analyzed by frequency spectrum.
In order to further analyze the influence of the inter‐harmonic content on the vibra‐
tion characteristics of the iron core, experiments were carried out under the conditions of
inter‐harmonic frequencies of 5, 20, and 40 Hz. Keep the inter‐harmonic frequency con‐
stant, set the inter‐harmonic content to 1%, 3%, and 5%, respectively, and compare and
study the peak‐to‐peak variation of the core vibration under the same voltage amplitude.
2.2. Transformer Core Vibration Experiment
The experiment uses SOPTOP LV‐S01 laser Doppler vibrometer and DH5902 data
acquisition and analysis system for vibration data acquisition and FFT spectrum analysis.
Before the experiment, the laser reflection acceptance rate was adjusted and stabilized
above 70%, the secondary side of the transformer core was set to a no‐load state, and the
voltage amplitude was gradually increased. When the real‐time vibration signal is ob‐
served to be stable through the external supporting software, the vibration waveform of
the measuring point is collected, and the measured velocity signal is integrated to obtain
the displacement waveform.
Due to the rotating magnetic flux at the corner of the iron core, the direction of part
of the magnetic flux is perpendicular to the rolling direction, and the vibration displace‐
ment is more obvious than other parts. In order to study the overall vibration characteris‐
tics of the iron core, three different measuring points located in the middle and both sides
of the iron yoke were selected in the iron yoke. The distribution of the measuring points
is shown in Figure 4.
Figure 4. Distribution of vibration displacement measuring points.
2.3. Transformer Core Noise Experiment
According to the national standard “GB/T1094.10‐2003” [21], the B&K2250 handheld
noise analyzer was used to measure 9 measuring points around the transformer in the
Appl. Sci. 2022, 12, 1758 5 of 14
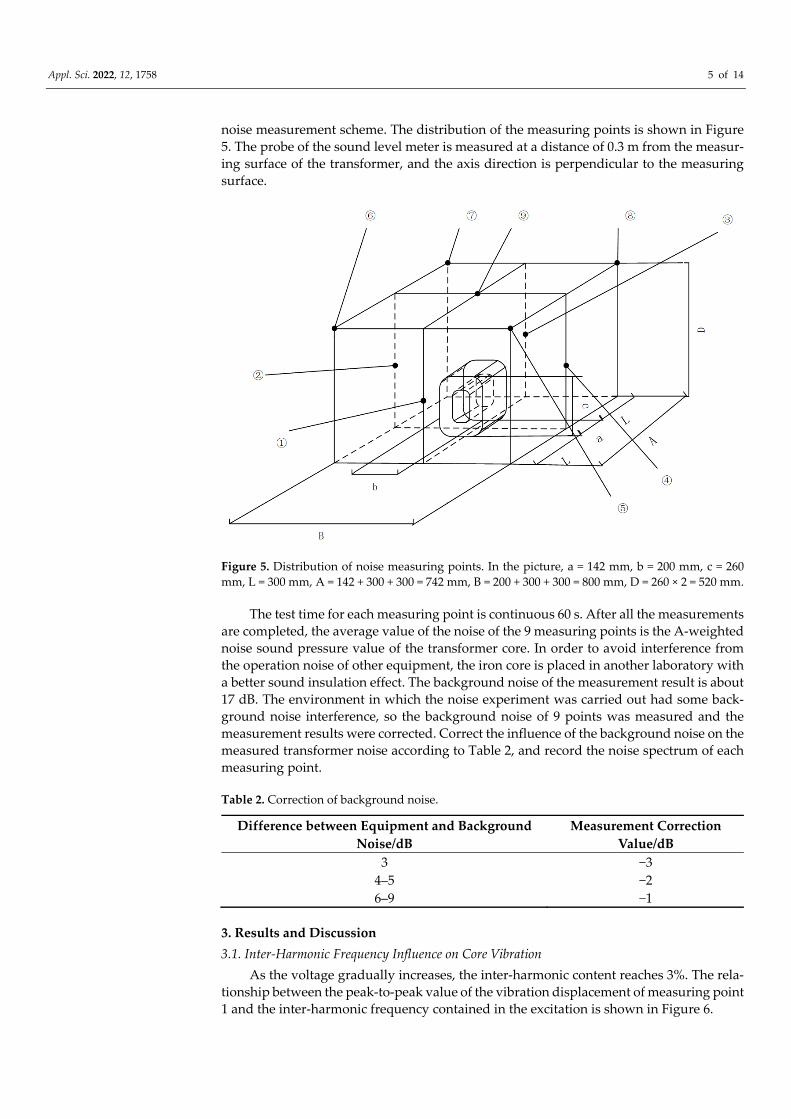
noise measurement scheme. The distribution of the measuring points is shown in Figure
5. The probe of the sound level meter is measured at a distance of 0.3 m from the measur‐
ing surface of the transformer, and the axis direction is perpendicular to the measuring
surface.
Figure 5. Distribution of noise measuring points. In the picture, a = 142 mm, b = 200 mm, c = 260
mm, L = 300 mm, A = 142 + 300 + 300 = 742 mm, B = 200 + 300 + 300 = 800 mm, D = 260 × 2 = 520 mm.
The test time for each measuring point is continuous 60 s. After all the measurements
are completed, the average value of the noise of the 9 measuring points is the A‐weighted
noise sound pressure value of the transformer core. In order to avoid interference from
the operation noise of other equipment, the iron core is placed in another laboratory with
a better sound insulation effect. The background noise of the measurement result is about
17 dB. The environment in which the noise experiment was carried out had some back‐
ground noise interference, so the background noise of 9 points was measured and the
measurement results were corrected. Correct the influence of the background noise on the
measured transformer noise according to Table 2, and record the noise spectrum of each
measuring point.
Table 2. Correction of background noise.
Difference between Equipment and Background
Noise/dB
Measurement Correction
Value/dB
3 −3
4–5 −2
6–9 −1
3. Results and Discussion
3.1. Inter‐Harmonic Frequency Influence on Core Vibration
As the voltage gradually increases, the inter‐harmonic content reaches 3%. The rela‐
tionship between the peak‐to‐peak value of the vibration displacement of measuring point
1 and the inter‐harmonic frequency contained in the excitation is shown in Figure 6.

Appl. Sci. 2022, 12, 1758 6 of 14
10 15 20 25 30 35 40 45 500
100
200
300
400
500
displacements(nm)
voltage amplitude(V)
0 2Hz 5Hz 7Hz 15Hz 20Hz 40Hz
Figure 6. The peak‐to‐peak value of core vibration displacement.
From the overall trend analysis in the figure, it is found that the lower the inter‐har‐
monic frequency, the greater the peak‐to‐peak value of the core vibration displacement,
but in different frequency ranges, the increase in amplitude varies greatly. When the fre‐
quency of inter‐harmonics is less than 20 Hz, the amplitude of vibration increase is much
greater than when the frequency is greater than 20 Hz. For example, when the fundamen‐
tal voltage amplitude is 50 V, the peak‐to‐peak displacement under excitation with 2 Hz
inter‐harmonic component is 450.3 nm, which is 1.8 times that of excitation without an
inter‐harmonic component. The excitation with 20 Hz inter‐harmonics is only 1.05 times
the peak‐to‐peak value of vibration without inter‐harmonic excitation.
Figure 7 shows the time‐domain waveform of the vibration displacement of measur‐
ing point 1 without inter‐harmonic excitation. It can be seen from Figure 7b that when the
transformer core is in normal working conditions, the frequency spectrum is mainly con‐
centrated on even‐numbered components such as 100 Hz and 200 Hz. It also contains a
small number of odd harmonics, and they are basically concentrated below 500 Hz. Due
to the experimental environment and core resonance, there are some interference signals
in the range of less than 20 Hz. The existence of interference signals may be caused by
problems such as experimental equipment and the iron core manufacturing process.
When the excitation does not contain inter‐harmonics, there will be some interference sig‐
nals in the spectrogram, and the difference between the interference signal and the main
signal is about ten times, so it is considered that the interference signal will not affect the
experimental results.

Appl. Sci. 2022, 12, 1758 7 of 14
0.00 0.25 0.50 0.75 1.00-200
-100
0
100
200
Disp
lace
ment
s(nm
)
Time(s)
0 50 100 150 200 250 300 3500
20
40
60
80
Dis
placem
ent co
mpone
nt(nm)
Frequency(Hz)
(a) (b)
Figure 7. Vibration displacement of iron core without inter‐harmonics; (a) time‐domain waveform;
(b) spectrum analysis.
Since the inter‐harmonics below 20 Hz have a greater impact on vibration, the exper‐
imental results containing low‐frequency inter‐harmonics are mainly analyzed. Figures 8
and 9 show the time‐domain waveform diagram and spectrum analysis diagram of the
core vibration displacement within 1 s when the excitation contains 2 Hz and 5 Hz inter‐
harmonics.
0.00 0.25 0.50 0.75 1.00
-200
-100
0
100
200
Displa
cem
ents
(nm
)
Time(s)
0 50 100 150 200 250 300 3500
10
20
30
40
50
Disp
lace
men
t com
pone
nt(
nm)
Frequency(Hz)
(a) (b)
Figure 8. Vibration displacement of iron core with 2 Hz inter‐harmonics in excitation; (a) time‐do‐
main waveform;(b) spectrum analysis.
Appl. Sci. 2022, 12, 1758 8 of 14
0.0 0.2 0.4 0.6 0.8 1.0-200
-100
0
100
200
Displacements(nm)
Time(s)
0 50 100 150 200 250 300 3500
10
20
30
40
50
60
70
80
Dis
plac
emen
t co
mpo
nent
(nm)
Frequency(Hz)
(a) (b)
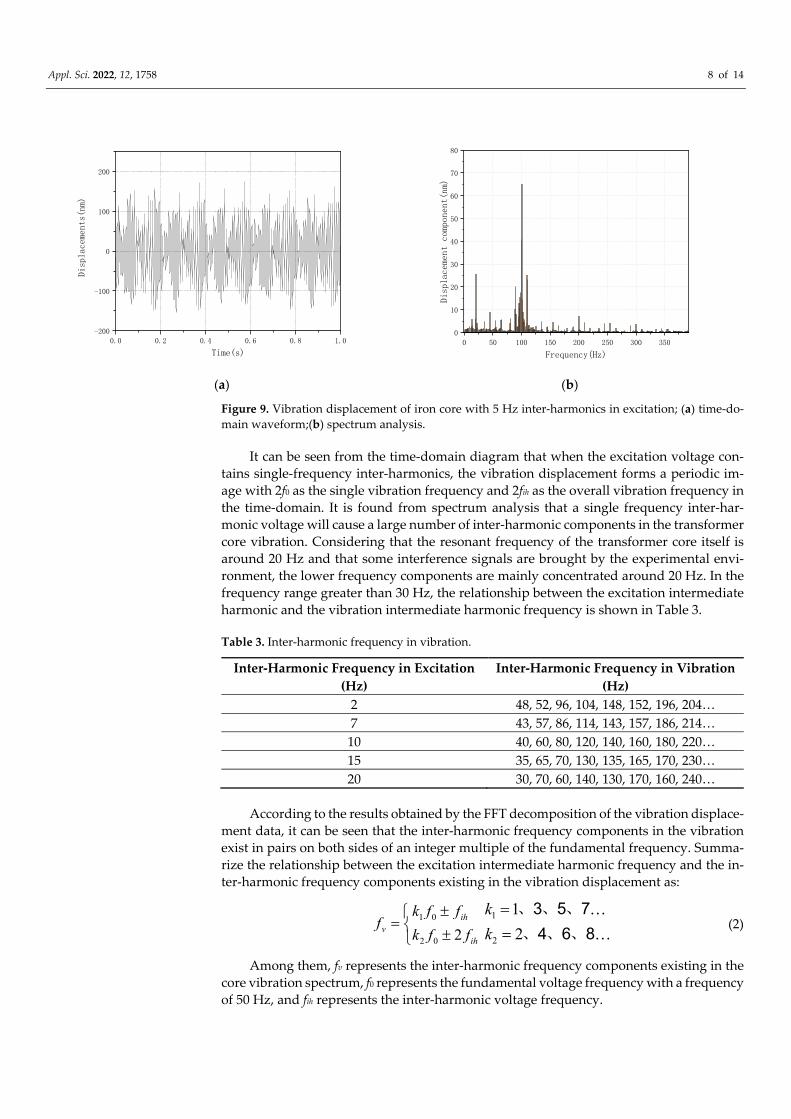
Figure 9. Vibration displacement of iron core with 5 Hz inter‐harmonics in excitation; (a) time‐do‐
main waveform;(b) spectrum analysis.
It can be seen from the time‐domain diagram that when the excitation voltage con‐
tains single‐frequency inter‐harmonics, the vibration displacement forms a periodic im‐
age with 2f0 as the single vibration frequency and 2fih as the overall vibration frequency in
the time‐domain. It is found from spectrum analysis that a single frequency inter‐har‐
monic voltage will cause a large number of inter‐harmonic components in the transformer
core vibration. Considering that the resonant frequency of the transformer core itself is
around 20 Hz and that some interference signals are brought by the experimental envi‐
ronment, the lower frequency components are mainly concentrated around 20 Hz. In the
frequency range greater than 30 Hz, the relationship between the excitation intermediate
harmonic and the vibration intermediate harmonic frequency is shown in Table 3.
Table 3. Inter‐harmonic frequency in vibration.
Inter‐Harmonic Frequency in Excitation
(Hz)
Inter‐Harmonic Frequency in Vibration
(Hz)
2 48, 52, 96, 104, 148, 152, 196, 204…
7 43, 57, 86, 114, 143, 157, 186, 214…
10 40, 60, 80, 120, 140, 160, 180, 220…
15 35, 65, 70, 130, 135, 165, 170, 230…
20 30, 70, 60, 140, 130, 170, 160, 240…
According to the results obtained by the FFT decomposition of the vibration displace‐
ment data, it can be seen that the inter‐harmonic frequency components in the vibration
exist in pairs on both sides of an integer multiple of the fundamental frequency. Summa‐
rize the relationship between the excitation intermediate harmonic frequency and the in‐
ter‐harmonic frequency components existing in the vibration displacement as:
1 0
2 0 2ih
vih
k f ff
k f f
1
2
1
2
k
k
、3、5、7
、4、6、8 (2)
Among them, fv represents the inter‐harmonic frequency components existing in the
core vibration spectrum, f0 represents the fundamental voltage frequency with a frequency
of 50 Hz, and fih represents the inter‐harmonic voltage frequency.

Appl. Sci. 2022, 12, 1758 9 of 14
Therefore, the vibration displacement waveform and frequency spectrum of the
transformer core can be used to determine whether the transformer excitation contains
inter‐harmonic components.
3.2. Inter‐Harmonic Content Influence on Core Vibration
In the excitation, the inter‐harmonics with the same frequency and different content
are added respectively. The comparison results of the peak‐to‐peak displacement of the
transformer core under the same voltage amplitude are shown in Tables 4 and 5.
It can be seen that the vibration of measuring point 1 and measuring point 3 is more
severe than measuring point 2, but from the general trend of the three measuring points,
the same conclusion is obtained: when the inter‐harmonic content increases, the vibration
displacement gradually increases, especially when the frequency is less than 20 Hz inter‐
harmonic excitation, and the increasing speed will be more obvious when the voltage am‐
plitude is large. For example, when the voltage amplitude is 41.18 V, when the excitation
contains 5 Hz inter‐harmonics, the peak‐to‐peak vibration displacement of 5% of the har‐
monic content is 1.8 times that of the content of 1%. In contrast, the 20 Hz inter‐harmonics
reaches 1.34 times. The 40 Hz inter‐harmonic is only 1.17 times. When the voltage ampli‐
tude is 44.12 V, the above‐mentioned ratio reaches 2.17 times, 1.49 times, and 1.35 times.
Table 4. Peak‐to‐peak vibration displacement with voltage amplitude of 41.18 V.
Inter‐Harmonic Content Frequency (Hz) Peak‐to‐Peak Vibration Displacement (nm)
Measuring Point 1 Measuring Point 2 Measuring Point 3
1%
5 177.8 157.3 179.6
20 175.2 162.0 174.5
40 168.8 165.5 172.2
3%
5 283.6 242.1 276.3
20 198.4 177.4 205.0
40 165.3 170.2 167.9
5%
5 320.6 281.5 323.4
20 236.7 200.1 235.7
40 198.1 180.3 193.8
Table 5. Peak‐to‐peak vibration displacement with voltage amplitude of 44.12 V.
Inter‐Harmonic Content Frequency (Hz) Peak‐to‐Peak Vibration Displacement (nm)
Measuring Point 1 Measuring Point 2 Measuring Point 3
1%
5 179.2 158.6 178.2
20 177.7 159.9 173.3
40 170.3 164.3 176.6
3%
5 324.5 290.6 328.7
20 227.1 190.2 221.1
40 200.3 173.1 206.3
5%
5 390.6 315.5 383.3
20 264.4 246.1 260.1
40 231.0 202.7 225.5
3.3. Inter‐Harmonic Frequency Influence on Core Noise
In the noise characteristic research, similar to the vibration characteristic experi‐
mental scheme, the inter‐harmonic content in the excitation is 5% of the fundamental
wave, that is, m = 0.05. The inter‐harmonic frequencies contained in the excitation are re‐
spectively taken as: 2, 5, 10, 15, 20, and 40 Hz. Under different inter‐harmonic frequency
conditions, gradually increase the voltage amplitude from 0 to 50 V, use a sound level
Appl. Sci. 2022, 12, 1758 10 of 14
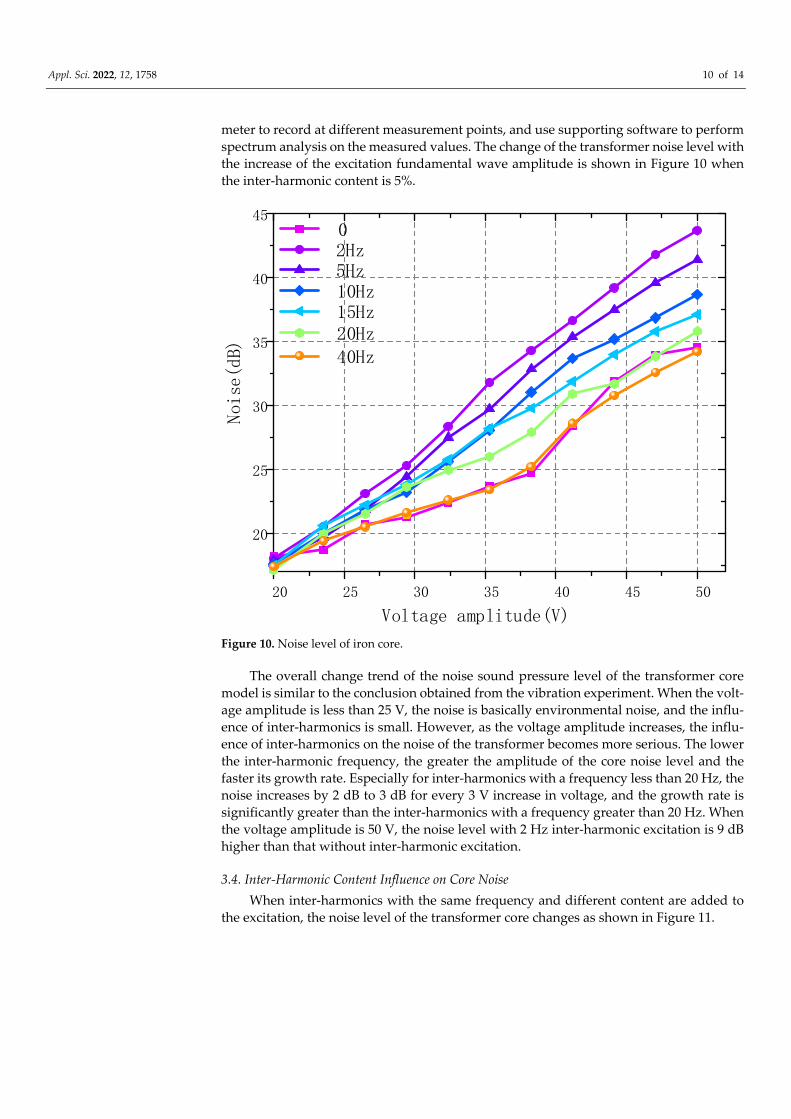
meter to record at different measurement points, and use supporting software to perform
spectrum analysis on the measured values. The change of the transformer noise level with
the increase of the excitation fundamental wave amplitude is shown in Figure 10 when
the inter‐harmonic content is 5%.
20 25 30 35 40 45 50
20
25
30
35
40
45Noise(d
B)
Voltage amplitude(V)
0 2Hz 5Hz 10Hz
15Hz
20Hz
40Hz
Figure 10. Noise level of iron core.
The overall change trend of the noise sound pressure level of the transformer core
model is similar to the conclusion obtained from the vibration experiment. When the volt‐
age amplitude is less than 25 V, the noise is basically environmental noise, and the influ‐
ence of inter‐harmonics is small. However, as the voltage amplitude increases, the influ‐
ence of inter‐harmonics on the noise of the transformer becomes more serious. The lower
the inter‐harmonic frequency, the greater the amplitude of the core noise level and the
faster its growth rate. Especially for inter‐harmonics with a frequency less than 20 Hz, the
noise increases by 2 dB to 3 dB for every 3 V increase in voltage, and the growth rate is
significantly greater than the inter‐harmonics with a frequency greater than 20 Hz. When
the voltage amplitude is 50 V, the noise level with 2 Hz inter‐harmonic excitation is 9 dB
higher than that without inter‐harmonic excitation.
3.4. Inter‐Harmonic Content Influence on Core Noise
When inter‐harmonics with the same frequency and different content are added to
the excitation, the noise level of the transformer core changes as shown in Figure 11.

Appl. Sci. 2022, 12, 1758 11 of 14
20 25 30 35 40 45 5015
20
25
30
35
40
45
Noise
(dB)
Voltage amplitude(V)
5% 3% 1%
(a)
20 25 30 35 40 45 5015
20
25
30
35
Nois
e (d
B)
Voltage amplitude(V)
5% 3% 1%
(b)

Appl. Sci. 2022, 12, 1758 12 of 14
20 25 30 35 40 45 5015
20
25
30
35
Nois
e (
dB)
Voltage amplitude(V)
5% 3% 1%
(c)
Figure 11. Noise level under excitation with different inter‐harmonic content; (a) With 5 Hz inter‐
harmonics; (b) With 20 Hz inter‐harmonics; (c) With 40 Hz inter‐harmonics.
It can be seen from the figure that when the fundamental wave amplitude is 50 V, the
inter‐harmonic frequency is 5 Hz, and the content of 5% is 5 dB greater than the content
of 1%. In the case of frequency 20 Hz and above, the change of inter‐harmonic content has
no obvious effect on noise. Similar to the results of the vibration displacement experiment,
the addition of inter‐harmonics with a frequency lower than 20 Hz has a serious impact
on noise. As the voltage amplitude increases, the effect of inter‐harmonics gradually in‐
creases, which proves the rationality of the experiment.
4. Conclusions
As important equipment in the power system, the transformer contains the problem
of abnormal increase in vibration and noise caused by inter‐harmonic excitation, which
needs to be studied urgently. In this work, an experimental circuit that can generate arbi‐
trary inter‐harmonic excitations is first built according to the experimental requirements.
Then, vibration measurement equipment and a noise sound level meter were used to test
the vibration and noise of transformer core under conditions of different inter‐harmonic
frequencies and amplitudes. The following conclusions are drawn through the experi‐
mental results:
(1) When the excitation voltage contains inter‐harmonics of a single frequency (the inter‐
harmonic frequency is fih), the transformer core contains components with frequen‐
cies that are integer multiples of the fundamental frequency as well as inter‐harmonic
components of other frequencies. Inter‐harmonic frequencies exist at ±2fih of even har‐
monics of the fundamental frequency and ±fih of odd harmonics of the fundamental
frequency.
(2) Inter‐harmonics have a serious impact on the vibration and noise of the transformer
core (especially the inter‐harmonics with a frequency lower than 20 Hz). Vibration
and noise increase with the decrease of the inter‐harmonic frequency and the increase
of the amplitude, and the effect of inter‐harmonics is more obvious with the voltage
amplitude increase.

Appl. Sci. 2022, 12, 1758 13 of 14
The test platform and experimental conclusions of transformer core vibration and
noise characteristics under inter‐harmonic excitation in this paper provide effective refer‐
ence and data support for such experiments.
Author Contributions: Conceptualization, Q.H.; methodology, C.F.; validation, G.Y.; writing—
original draft preparation, G.Y. and J.L.; writing—review and editing, G.Y. and H.L.; project admin‐
istration, Q.H. and X.C. All authors have read and agreed to the published version of the manu‐
script.
Funding: This research was funded by the Scientific and Technological Project of State Grid Corpo‐
ration of China (Grant No.5500‐202058312A‐0‐0‐00).
Institutional Review Board Statement: Not applicable.
Informed Consent Statement: Not applicable.
Conflicts of Interest: The authors declare no conflict of interest.
References
1. Lin, H. Interharmonics in power system. Distrib. Util. 2001, 18, 6–9.
2. Bi, T.; Kong, Y.; Xiao, S.W.; Zhang, P.; Zhang, T. Review of sub‐synchronous oscillation with large‐scale wind power transmis‐
sion. J. Electr. Power Sci. Technol. 2012, 7, 10–15.
3. Lin, F.; Lin, Y.; Huang, D.; Lin, C.; Zhang, Y. Ultra‐High‐Power Arc Furnace Model for Low Frequency Non‐Stationary Inter‐
harmonics. In Proceedings of the 2020 5th Asia Conference on Power and Electrical Engineering (ACPEE), Chengdu, China, 4–
7 June 2020; pp. 2049–2053.
4. Weiser, B.; Pfützner, H. Relevance of magnetostrictionand forces for the generation of audible noise oftransformer cores. IEEE
Trans. Magn. 2000, 36, 3759–3777.
5. Tang, Z.; Wang, Z. Study on Statistical Characteristics of Audible Noise and Vibration Signals of UHV Transformers and Reac‐
tors. In Proceedings of the 2020 IEEE International Conference on High Voltage Engineering and Application (ICHVE), Beijing,
China, 6–10 September 2020; pp. 1–4.
6. Zhu, L.; Yang, Q.; Yan, R.; Zhan, X. Researchon vibration and noise of power transformers conside‐ring magnetostrictive effect.
Trans. China Electrotech. Soc. 2013, 28, 19.
7. Zhu, L. Study on the Influence of Laminated Magnet Core Magnetostrictive Effect on the Vibration and Noise of Transformer and AC
Motor; Hebei University of Technology: Tianjin, China, 2013.
8. Zhang, Y.; Wang, J.; Bai, B. Analysis of the influence of DC bias magnetic field on the magnetostrictive properties of silicon steel
sheet. Proc. CSEE 2016, 36, 4299–4307.
9. Wang, J.; Bai, B.; Liu, H.; Ma, C. Influence of DC Bias on Transformer Vibration and Noise. J. Electr. Eng. Technol. 2015, 30, 59–
61.
10. He, J.; Yu, Z.; Zeng, R.; Zhang, B. Vibration and Audible Noise Characteristics of AC Transformer Caused by HVDC System
under Monopole Operation. IEEE Trans. Power Deliv. 2012, 27, 1835–1842.
11. Xu, Y.; Dai, M.; Wang, W. An Analysis of Transformer Core Vibration and Noise under DC Bias Condition. In Proceedings of
the 2017 International Conference on Computer Systems, Electronics and Control (ICCSEC), Dalian, China, 25–27 December
2017; pp. 1612–1615.
12. Duan, X. Research on Vibration Mechanism and Signal Analysis of Transformer under DC Bias; Chongqing University: Chongqing,
China, 2013.
13. Bai, B.; Liu, C.; Wang, J. Simulation and Experimental Study of Transformer Vibration under DC Bias. J. Electr. Eng. Technol.
2013, 28, 427–433.
14. Liu, H. Research on Multiphysics Coupling Problem of Transformer Core Vibration and Noise; Shenyang University of Technology:
Shenyang, China, 2014.
15. Wei, Y.; Zang, C.; Dun, L. Multiphysics study of vibration and noise of three‐phase power transformers. Sci. Technol. Eng. 2013,
13, 5632–5635.
16. Liu, W.; Li, J.; Zhang, Y.; Zhu, J. Research on vibration and noise control of dry series iron core reactors. Mach. Des. Manuf. 2010,
8, 141–143. doi:10.19356/j.cnki.1001‐3997.2010.08.058.
17. Yang, F.; Ren, Z.; Zhang, D.; Li, L.; Fan, X.; Zhou, Y. Simulation Analysis and Experiment Validation of Vibration and Noise of
Oil‐immersed Transformer. In Proceedings of the 2019 22nd International Conference on Electrical Machines and Systems
(ICEMS), Harbin, China, 11–14 August 2019; pp. 1–5.
18. Tian, C.; Li, L.; Song, Y.; Zhang P.; Wang X.; Cheng Z.; Liu L.; Nie J.; Fan C. Model experiment and simulation of core vibration
for shunt reactor. Adv. Technol. Electr. Eng. Energy 2018, 37, 64–70. 19. Yan, R.; Gao, X.; Zhu, L.; Yang Q.; Ben T.; Li Y.; Yang W. Research on three‐dimensional stress distribution of reactor core. IEEE
Trans. Appl. Supercond. 2016, 26, 1–4.
Appl. Sci. 2022, 12, 1758 14 of 14
20. Jia, Y. Measurement and Calculation of Magnetization Properties of Electrical Steel under Interharmonics Excitation; North China Elec‐
tric Power University: Baoding, China, 2018.
21. China National Standardization Commission. GB/T 1094.10‐2003, Power Transformers, Part 10: Determination of Sound Level; China
Standard Press: Beijing, China, 2003.
Copyright © 2022 FDOKUMEN