
Investigation of flame propagation over an inclined fuel wetted porous bed
Upload
independentCategory
view
1download
0
Nuclear Engineering and Design 175 (1997) 131–146
Experiment and numerical simulation of bubbly two-phase flowacross horizontal and inclined rod bundles
Akimi Serizawa *, Khoirul Huda, Yoshio Yamada, Isao KataokaDepartment of Nuclear Engineering, Kyoto Uni6ersity Yoshida, Sakyo, Kyoto 606-01, Japan
Received 26 June 1997; accepted 14 July 1997
Abstract
Experimental and numerical analyses were carried out on vertically upward air-water bubbly two-phase flowbehavior in both horizontal and inclined rod bundles with either in-line or staggered array. The inclination angle ofthe rod bundle varied from 0 to 60° with respect to the horizontal. The measured phase distributions indicatednon-uniform characteristics, particularly in the direction of the rod axis when the rods were inclined. The mechanismsfor this non-uniform phase distribution is supposed to be due to: (1) Bubble segregation phenomenon which dependson the bubble size and shape; (2) bubble entrainment by the large scale secondary flow induced by the pressuregradient in the horizontal direction which crosses the rod bundle; (3) effects of bubble entrapment by vorticesgenerated in the wake behind the rods which travel upward along the rod axis; and (4) effect of bubble entrainmentby local flows sliding up along the front surface of the rods. The liquid velocity and turbulence distributions were alsomeasured and discussed. In these speculations, the mechanisms for bubble bouncing at the curved rod surface andturbulence production induced by a bubble were discussed, based on visual observations. Finally, the bubblebehaviors in vertically upward bubbly two-phase flow across horizontal rod bundle were analyzed based on a particletracking method (one-way coupling). The predicted bubble trajectories clearly indicated the bubble entrapment byvortices in the wake region. © 1997 Elsevier Science S.A.
1. Introduction
Two-phase flow across horizontal or inclinedtube bundle is popularly encountered with shell-and-tube type heat exchangers such as condensers,evaporators, reboilers, etc. Specifically, both staticand dynamic characteristics of two-phase crossflow in the inverted U-tube bundle of a PWRsteam generator are of vital importance in its
safety and reliable operations. For example, two-phase cross flow-induced vibrations of the in-verted U-tube bundle can cause serious tubefailures. One such flow-induced vibration is thefluid-elastic vibration which occurs at high voidfractions in churn flow (Mann and Mayinger,1995). On the other hand, at low void fractions inbubbly two-phase flow the bubbles dampen thevibration amplitude. However, these vibration ex-citation and damping mechanisms, due to two-phase flow, have not yet been fully understood,even in rather simple geometries of tube bundles.
* Corresponding author. Fax: +81 75 7535829; e-mail:[email protected]
0029-5493/97/$17.00 © 1997 Elsevier Science S.A. All rights reserved.
PII S0029 -5493 (97 )00169 -6

A. Serizawa et al. / Nuclear Engineering and Design 175 (1997) 131–146132
In actual PWR steam generators, there are manyflow obstacles such as supports for tubes, struc-tural components, etc. and therefore the two-phase flow becomes much more complicated. Inaddition, the vibration characteristics vary signifi-cantly depending on the pitch-to-diameter ratio(p/d ratio) of the tube bundle, fluids properties,flow rates, two-phase flow patterns and so on.Specifically the time- and space-dependent charac-ters and structures of two-phase flow are keys toreach better understanding of the vibration mech-anisms. Therefore, we first studied experimentally,the air-water two-phase flow structures and bub-ble motions in vertically upward flow across hori-zontal or inclined tube bundle with either in-lineor staggered lattice. We also carried out two-di-mensional numerical simulation of bubble mo-tions and void distributions in a flow acrosshorizontal tube bundle. This simulation is basedon a Lagrangian scheme for bubble motions insingle-phase liquid flow calculated by a conven-tional k−o model (one-way coupling).
As for the literature, Kondo and Nakajima(1980) studied experimentally an air-water two-phase flow across staggered rod bundles and pro-posed a flow pattern map and a correlation ofcross-sectional averaged void fraction for the rodbundle system. Grant and Chisholm (1979),Schrage et al. (1988), Dowlati et al. (1988) andDowlati et al. (1990) have also reported theirworks on two-phase crossflow in horizontal rodbundles. All these experimental works are limitedto straight tube bundles. While in the case oftwo-phase crossflow in the U-tube bundle which isthe case with a PWR steam generator, thedifficulty lies both in fabrication problems of suchgeometries at university laboratories and also inmeasuring techniques due to complex geometries.In our study, as well as elsewhere, simplificationof the problems was made by assuming that thebent part of a U-tube can be divided into severalparts, i.e. yawed straight tubes having differentinclination angles. The measurement is thus un-dertaken for each inclination angle separately andthen the total results are integrated. The effect ofthe inclination angle of rod bundles on phasedistribution was previously reported by Serizawaet al. (1994). In their experiments, they studied
both in-line and staggered bundle geometries withseveral inclination angles. They found that theinclination angle of the bundles affects signifi-cantly the phase distributions. This effect wasremarkably observed at lower liquid flow ratesand the flow indicated a significant non-homoge-neous character. However, the phase distributionmeasurements were unfortunately restricted onlyto a center region of the bundle flows. The presentstudy is therefore inherently an extension of theprevious works by the present authors. Alongwith these experiments, numerical simulations ofthe bubble motions and local void fraction distri-bution have been performed to compare with theexperiments. We also discuss our new findings onbubble bouncing at the curved surface of the rodand turbulence generated by non-rectilinear bub-ble rising in the liquid continuum.
2. Experimental apparatus and procedures
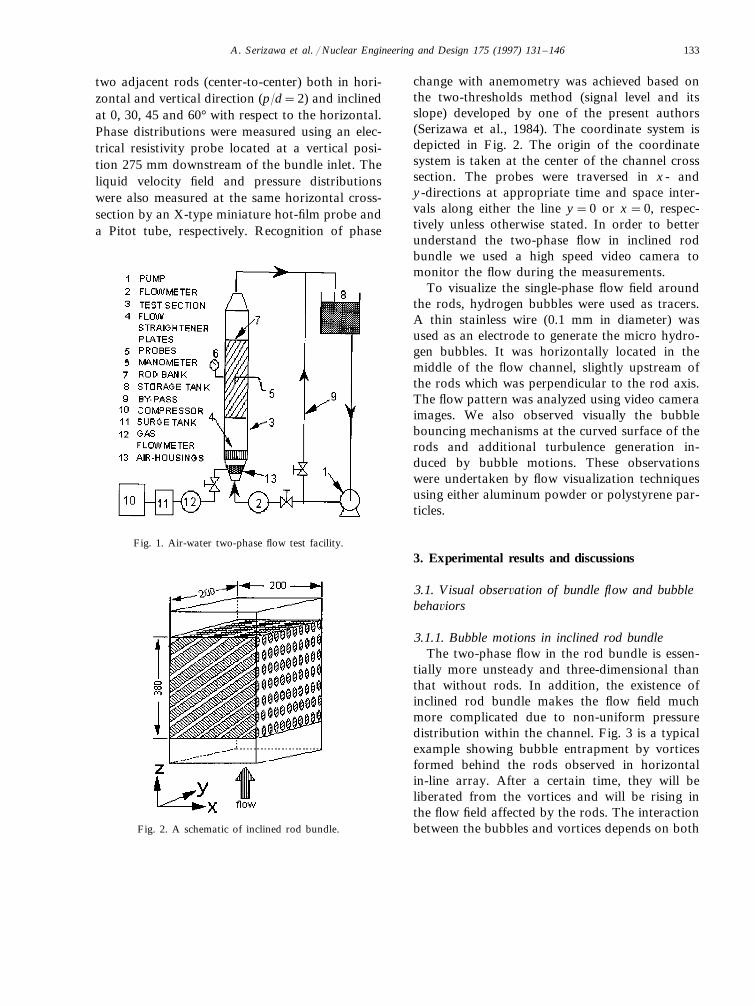
Fig. 1 is a schematic diagram of the test facilityused in the present study. Water is circulated by apump from a storage tank through an orificeflowmeter into the test section and then mixedwith the air, metered by a thermal flowmeter togenerate a two-phase flow. The air is blown intothe mixing zone, located upstream of the testsection, through 0.5 mm diameter holes drilled atthe four bottom side walls at equal flow rate.Two-phase mixture flows vertically upward in therod bundle and then returns into the storage tank,where the air and water are separated (Serizawa etal., 1995). The test channel is a 1030 mm long,transparent square duct of acrylic resin with a200×200 mm cross-section. The rod bundle isassembled in the center part of the test sectionover the length of 380 mm as shown in Fig. 2. Ahoneycomb type flow straightner, to assure a uni-form flow field, is located upstream of the testsection.
The rod bundle consists of 10 mm diameterpolycarbonate rods with nine full and two halfrods in each horizontal row. The half rods on thechannel walls are to minimize the effect of bypassleakage. The rod bundle is either an in-line orstaggered lattice with 20 mm distance between the
A. Serizawa et al. / Nuclear Engineering and Design 175 (1997) 131–146 133
two adjacent rods (center-to-center) both in hori-zontal and vertical direction (p/d=2) and inclinedat 0, 30, 45 and 60° with respect to the horizontal.Phase distributions were measured using an elec-trical resistivity probe located at a vertical posi-tion 275 mm downstream of the bundle inlet. Theliquid velocity field and pressure distributionswere also measured at the same horizontal cross-section by an X-type miniature hot-film probe anda Pitot tube, respectively. Recognition of phase
change with anemometry was achieved based onthe two-thresholds method (signal level and itsslope) developed by one of the present authors(Serizawa et al., 1984). The coordinate system isdepicted in Fig. 2. The origin of the coordinatesystem is taken at the center of the channel crosssection. The probes were traversed in x- andy-directions at appropriate time and space inter-vals along either the line y=0 or x=0, respec-tively unless otherwise stated. In order to betterunderstand the two-phase flow in inclined rodbundle we used a high speed video camera tomonitor the flow during the measurements.
To visualize the single-phase flow field aroundthe rods, hydrogen bubbles were used as tracers.A thin stainless wire (0.1 mm in diameter) wasused as an electrode to generate the micro hydro-gen bubbles. It was horizontally located in themiddle of the flow channel, slightly upstream ofthe rods which was perpendicular to the rod axis.The flow pattern was analyzed using video cameraimages. We also observed visually the bubblebouncing mechanisms at the curved surface of therods and additional turbulence generation in-duced by bubble motions. These observationswere undertaken by flow visualization techniquesusing either aluminum powder or polystyrene par-ticles.
3. Experimental results and discussions
3.1. Visual obser6ation of bundle flow and bubblebeha6iors
3.1.1. Bubble motions in inclined rod bundleThe two-phase flow in the rod bundle is essen-
tially more unsteady and three-dimensional thanthat without rods. In addition, the existence ofinclined rod bundle makes the flow field muchmore complicated due to non-uniform pressuredistribution within the channel. Fig. 3 is a typicalexample showing bubble entrapment by vorticesformed behind the rods observed in horizontalin-line array. After a certain time, they will beliberated from the vortices and will be rising inthe flow field affected by the rods. The interactionbetween the bubbles and vortices depends on both
Fig. 1. Air-water two-phase flow test facility.
Fig. 2. A schematic of inclined rod bundle.

A. Serizawa et al. / Nuclear Engineering and Design 175 (1997) 131–146134
Fig. 3. Bubble trajectories and entrapment by vortices (horizontal in-line rods).
Fig. 4. Bubble trajectories and entrapment by vortices (horizontal staggered rods).
the bubble size relative to the vortex scale and theinitial location at which the bubbles enter thewake region. Smaller bubbles tend to be en-trapped more easily than larger bubbles. Whereas,in the case of staggered array, the bubble entrap-ment by vortices were less remarkably observed as
shown in Fig. 4. This may be attributed to diverg-ing flows caused by the rods in staggered array, aswill be shown later in Fig. 21.
In inclined rod bundle geometry, the bubblebehaviors are more complex. Fig. 5 demonstratestypical trajectories of bubbles in 45°-inclined in-
A. Serizawa et al. / Nuclear Engineering and Design 175 (1997) 131–146 135
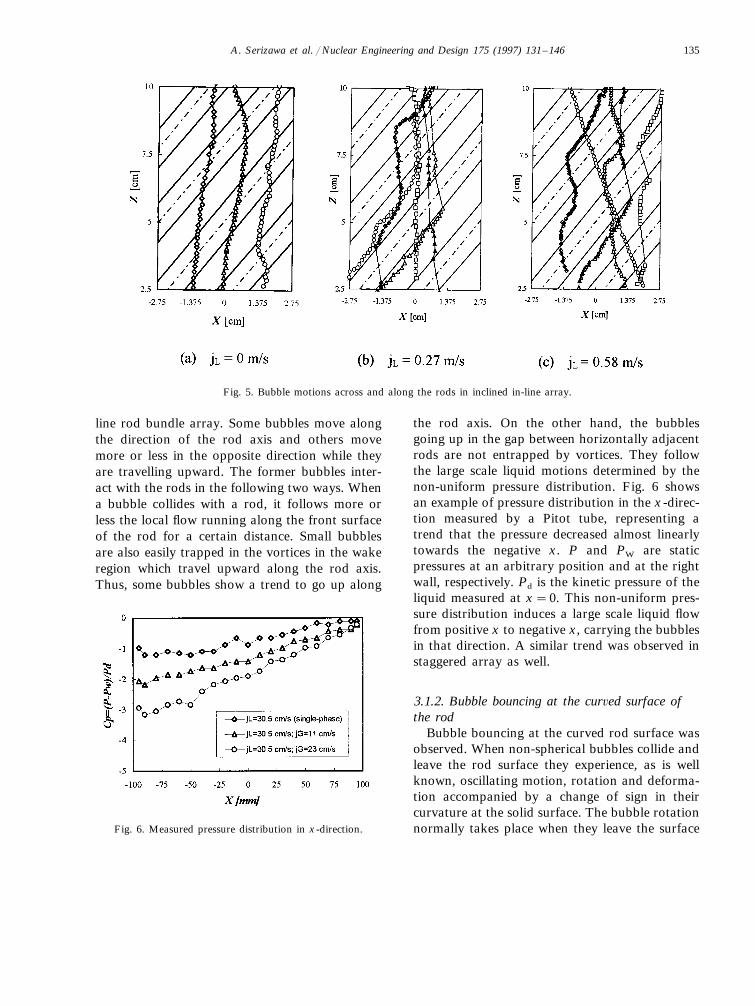
Fig. 5. Bubble motions across and along the rods in inclined in-line array.
line rod bundle array. Some bubbles move alongthe direction of the rod axis and others movemore or less in the opposite direction while theyare travelling upward. The former bubbles inter-act with the rods in the following two ways. Whena bubble collides with a rod, it follows more orless the local flow running along the front surfaceof the rod for a certain distance. Small bubblesare also easily trapped in the vortices in the wakeregion which travel upward along the rod axis.Thus, some bubbles show a trend to go up along
the rod axis. On the other hand, the bubblesgoing up in the gap between horizontally adjacentrods are not entrapped by vortices. They followthe large scale liquid motions determined by thenon-uniform pressure distribution. Fig. 6 showsan example of pressure distribution in the x-direc-tion measured by a Pitot tube, representing atrend that the pressure decreased almost linearlytowards the negative x. P and PW are staticpressures at an arbitrary position and at the rightwall, respectively. Pd is the kinetic pressure of theliquid measured at x=0. This non-uniform pres-sure distribution induces a large scale liquid flowfrom positive x to negative x, carrying the bubblesin that direction. A similar trend was observed instaggered array as well.
3.1.2. Bubble bouncing at the cur6ed surface ofthe rod
Bubble bouncing at the curved rod surface wasobserved. When non-spherical bubbles collide andleave the rod surface they experience, as is wellknown, oscillating motion, rotation and deforma-tion accompanied by a change of sign in theircurvature at the solid surface. The bubble rotationnormally takes place when they leave the surfaceFig. 6. Measured pressure distribution in x-direction.

A. Serizawa et al. / Nuclear Engineering and Design 175 (1997) 131–146136
Fig. 7. Bubble bouncing at the rod surface in stagnant water(time increment is 5 m s−1).
Fig. 8. Bubble bouncing and coalescence.
after a certain period of contact with the surface,as typically shown in Figs. 7 and 8. Thus, thebubble bouncing at the curved rod surface is alwaysaccompanied by a change of their curvatures androtating motions. Because of these bubble hydrody-namics, the bubbles often behave like rigid par-ticles when they collide the solid surface. Thisunexpectedly enhanced bubble bouncing at thesurface has not been successfully predicted bynumerical simulations. Fig. 9 shows the elasticitycoefficient of bubble collisions with the rod esti-mated from the observed bubble motions. Al-though the data scatter considerably, the bubbleelastic coefficient shows values around 0.6, inde-pendent of the bubble size.
3.1.3. Turbulence generation induced by bubblemotion
In general, the bubbles move in the liquid witha relative velocity with respect to the liquid deter-mined hydrodynamically. It has been well recog-nized that this relative motion of the bubbles,generates additional turbulence in the liquid phasein terms of the wakes formed behind the bubbles(turbulence modification). However, it has not beenmade clear yet as to what extent and how thebubble-induced wakes affect the flow field. Ourpresent observation has revealed very interestingevidence relating to the turbulence production bybubble motions. Everybody knows that the bubblesflowing in the liquid exhibit more or less non-rec-tilinear motions. We observed that everytime thebubbles change the direction of their motions in theliquid, they are followed, after a short period oftime, by a bursting or ejection of the turbulence ofthe wake region into the bulk liquid towards thedirection of their initial motions. The outline of thisprocess of turbulence ejection is illustrated in Fig.10. The area of influence associated with bubble-in-duced turbulence is thus broader than our previousknowledge based on a simple wake model withoutturbulence ejection.
3.2. Phase distribution
Phase distribution measurements were con-ducted in bubbly two-phase flow for both in-lineand staggered arrays at inclination angle u=0,

A. Serizawa et al. / Nuclear Engineering and Design 175 (1997) 131–146 137
Fig. 9. Bubble elasticity coefficient.
Fig. 10. Turbulence ejection from the wake.
a general trend commonly observed in both casesis that the bubbles are collected towards the x-di-rection. It is noted in Fig. 12 which represents thelocal void fraction distribution in y-directionwithin a typical one segment of the whole channelcross section, that in both in-line and staggeredrod bundle geometries, the minimum void frac-tion was observed at a location behind the rod.The visual observation revealed that the wakeregion has a part with low bubble number densityshortly behind the rods. The downstream of thisregion in the wake is the region where the trappedbubbles are collected. Therefore, the local voidfraction within the wake region varies significantlydepending on the location within the wake. In thepresent work the resistivity probe was traversedjust in the middle between the two horizontal rodarrays. We also realize that the local void fractiondistribution along the y-direction is more uniformin staggered array than in in-line array. This issupposed to be due to the diverging cross flow iny-direction enhanced by staggered arrayed rodswhich brings about more homogeneous turbulentfield. It is also noted that the scale of the vorticeswas smaller in the case of staggered rod arraythan in in-line rod array. The vortex was observedto become smaller at higher liquid velocity andthus more uniform turbulence field was realized athigh liquid velocities.
Fig. 13 shows lateral (x-direction) distributionsof the local void fraction and average chordlength in bubbly flows for u=45°, measured atdifferent y-positions. Here x/X and y/Y representthe dimensionless lateral positions normalized bythe half width of the test channel (X=Y=100mm). The local void fraction changes significantlyin x-direction at all y/Y locations, but the profileschange very slightly in y-direction. This trend wasmore remarkably observed at high liquid veloc-ities. The typical feature of the measured voidfraction is that the profiles exhibit double voidpeaks at about x/X= −0.9 and 0.5.
Fig. 14 represents typical results in higher voidfraction regimes (bubbly and churn flows). Byconsidering a good coincidence between the localvoid fraction and the bubble chord length distri-bution (approximately proportional to mean bub-ble diameter), the major mechanism for these void
30, 45 and 60°. The experimental condition coversthe volumetric liquid and gas flow rates of jL=0–60 cm s−1 and jG=0–23 cm s−1, where thevolumetric flux is defined based on the minimumflow cross-sectional area.
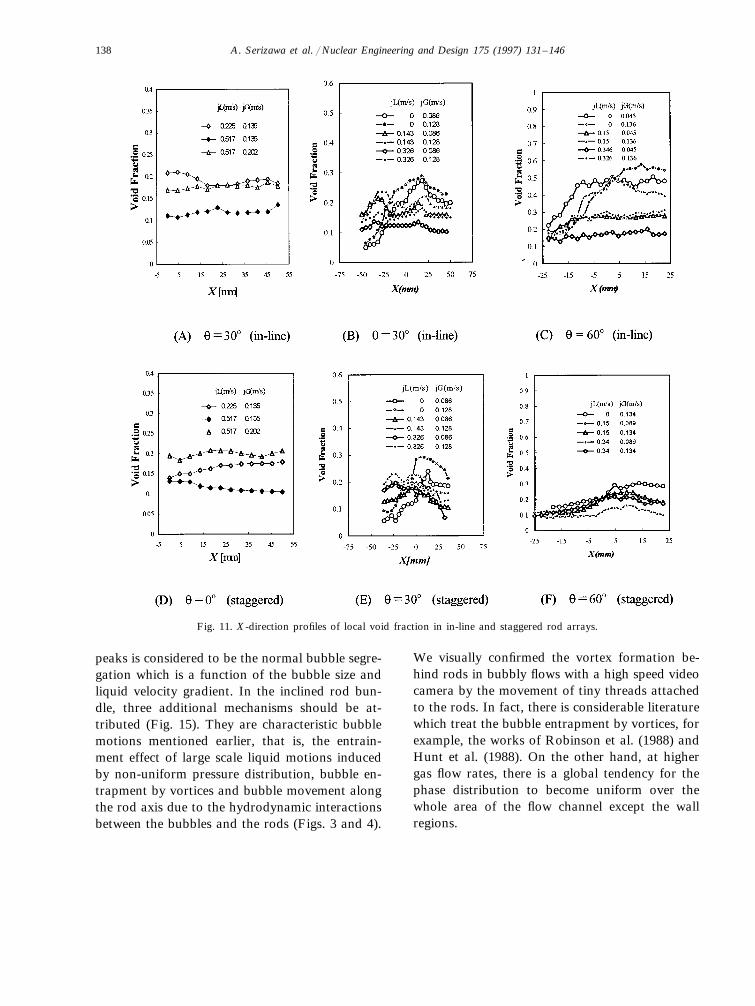
Fig. 11 shows comparisons of the lateral (x-di-rection) distributions of the local void fractionbetween in-line and staggered rod arrays mea-sured at different inclination angles in a limitedregion of the flow passage. Although non-homo-geneous nature of the flow is more remarkablyobserved in in-line array than in staggered array,
A. Serizawa et al. / Nuclear Engineering and Design 175 (1997) 131–146138
Fig. 11. X-direction profiles of local void fraction in in-line and staggered rod arrays.
peaks is considered to be the normal bubble segre-gation which is a function of the bubble size andliquid velocity gradient. In the inclined rod bun-dle, three additional mechanisms should be at-tributed (Fig. 15). They are characteristic bubblemotions mentioned earlier, that is, the entrain-ment effect of large scale liquid motions inducedby non-uniform pressure distribution, bubble en-trapment by vortices and bubble movement alongthe rod axis due to the hydrodynamic interactionsbetween the bubbles and the rods (Figs. 3 and 4).
We visually confirmed the vortex formation be-hind rods in bubbly flows with a high speed videocamera by the movement of tiny threads attachedto the rods. In fact, there is considerable literaturewhich treat the bubble entrapment by vortices, forexample, the works of Robinson et al. (1988) andHunt et al. (1988). On the other hand, at highergas flow rates, there is a global tendency for thephase distribution to become uniform over thewhole area of the flow channel except the wallregions.

A. Serizawa et al. / Nuclear Engineering and Design 175 (1997) 131–146 139
Fig. 12. Y-direction profiles of local void fraction in in-line and staggered arrays.
3.3. Liquid 6elocity and turbulence
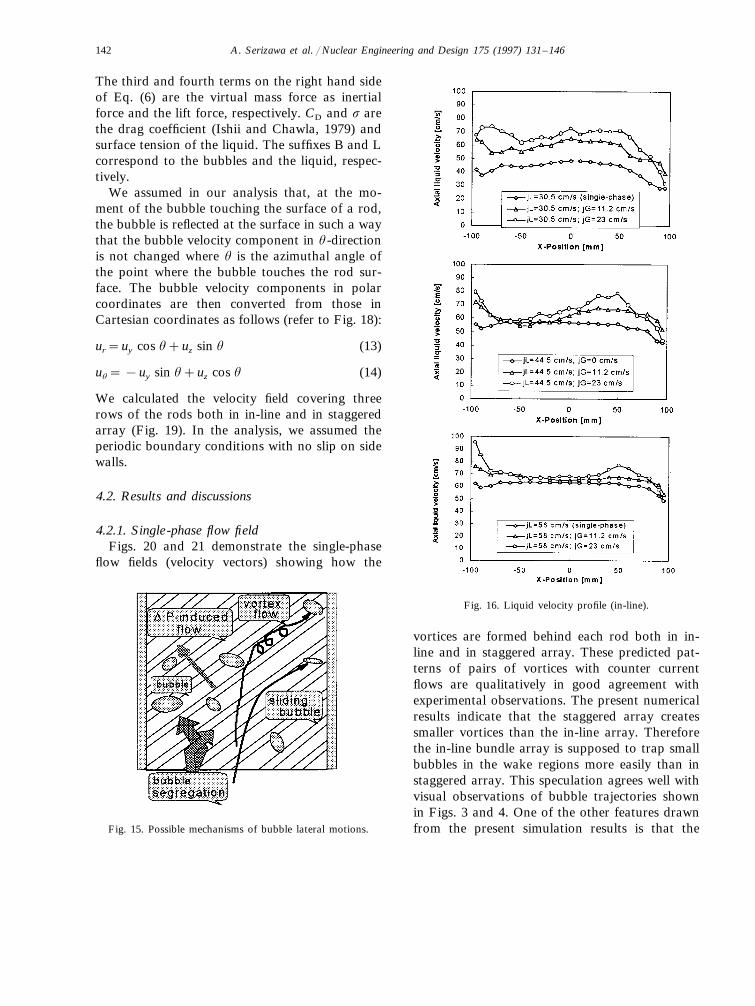
The liquid velocity and turbulence profiles weremeasured using an X-type miniature hot filmprobe in 45° inclined in-line rod bundle geometryat y/Y=0.5 for three different superficial liquidvelocities, jL=0.305, 0.445 and 0.580 m s−1. Theresults are represented in Figs. 16 and 17. Asshown in these plots, the axial liquid velocity(time averaged velocity in vertical direction z) isgenerally increasing with an increase of the su-perficial gas velocity jG. There is a general trendthat the liquid velocity profile has a peak at ahorizontal location which corresponds to the voidfraction peak due to buoyancy effect. On theother hand, the turbulence profiles indicated avery complex nature of the structure in rod bun-dle geometry. At low liquid velocity, jL=0.305 ms−1, the axial turbulence component u is, as awhole, larger than the x-component 6 and theynormally increased with an increase of the gasvelocity jG. However, at higher liquid velocitiesjL=0.445 and 0.580 m s−1, the results clearlyindicate the reduction of the axial turbulencecomponent by the gas bubbles, showing locallylower intensities of the axial turbulence compo-nent u than those of the horizontal component 6.
Although the mechanism for this observed trendhas not been fully clarified yet, the result appearsto qualitatively agree with the observation madeby Mann and Mayinger (1995), that the vibrationamplitude of the rods was significantly reduced bygas bubbles in bubbly two-phase cross flow.
4. Numerical simulation
4.1. Modeling
In order to gain a better understanding of thehydrodynamic interactions between the bubblesand the rods, we carried out a two-dimensionalnumerical simulation of bubble behaviors basedon a particle tracking method by assuming non-compressible spherical bubbles without rotation.For simplicity of the analysis, we assumed one-way coupling method as first approximation. Thesingle-phase flow field was calculated by a conven-tional k−o model. The basic equations in thek−o model are given as follows:
Mass conservation
(ui
(xi
=0 (1)

A. Serizawa et al. / Nuclear Engineering and Design 175 (1997) 131–146140
Fig. 13. X-direction profiles of local void fraction and bubble diameter at different y-locations.

A. Serizawa et al. / Nuclear Engineering and Design 175 (1997) 131–146 141
Fig. 14. Phase and bubble diameter distributions in high void fraction regimes (left: in-line, right: staggered).
Momentum conservation
(pui
(t+(ujpui
(xj
= −(P(xi
+(
(xi
�m(ui
(xj
�(2)
Conservation of turbulence energy and dissipa-tion
(pk(t
+(uipk(xi
= −(
(xi
�mt
sk
(k(xi
�+Gs−ro (3)
(ro
(t+(uiro
(xi
=(
(xi
�mt
so
(o
(xi
�+
o
kC1Gs−C2
ro2
k(4)
Gs=mt
�(ui
(xj
+(uj
(xi
� (ui
(xj
(5)
where, r, P, m, k, o and g are fluids density,pressure, viscosity, turbulence energy, dissipationand acceleration due to gravity. C1, C2 are con-stants.
Equation of bubble motion
p
6rLd3
B
duB
dt= −
p
6Dpd3
Bg+p
8CDrLd2
B(uL−uB)�uL
−uB�− p
12rLd3
B
d(uB−uL)dt
+1.615 mLdB(uL−uB)×v
�v �(6)
where
v=�uL−uB�2 (7)
Dr=rL−rB (8)
CD=max (CD1, min (CD2, CD3) (9)
CD1=24(1+0.1 Re0.75)/R (10)
CD2=2dB
3'gDr
s(11)
CD3=83
(12)
A. Serizawa et al. / Nuclear Engineering and Design 175 (1997) 131–146142
The third and fourth terms on the right hand sideof Eq. (6) are the virtual mass force as inertialforce and the lift force, respectively. CD and s arethe drag coefficient (Ishii and Chawla, 1979) andsurface tension of the liquid. The suffixes B and Lcorrespond to the bubbles and the liquid, respec-tively.
We assumed in our analysis that, at the mo-ment of the bubble touching the surface of a rod,the bubble is reflected at the surface in such a waythat the bubble velocity component in u-directionis not changed where u is the azimuthal angle ofthe point where the bubble touches the rod sur-face. The bubble velocity components in polarcoordinates are then converted from those inCartesian coordinates as follows (refer to Fig. 18):
ur=uy cos u+uz sin u (13)
uu= −uy sin u+uz cos u (14)
We calculated the velocity field covering threerows of the rods both in in-line and in staggeredarray (Fig. 19). In the analysis, we assumed theperiodic boundary conditions with no slip on sidewalls.
4.2. Results and discussions
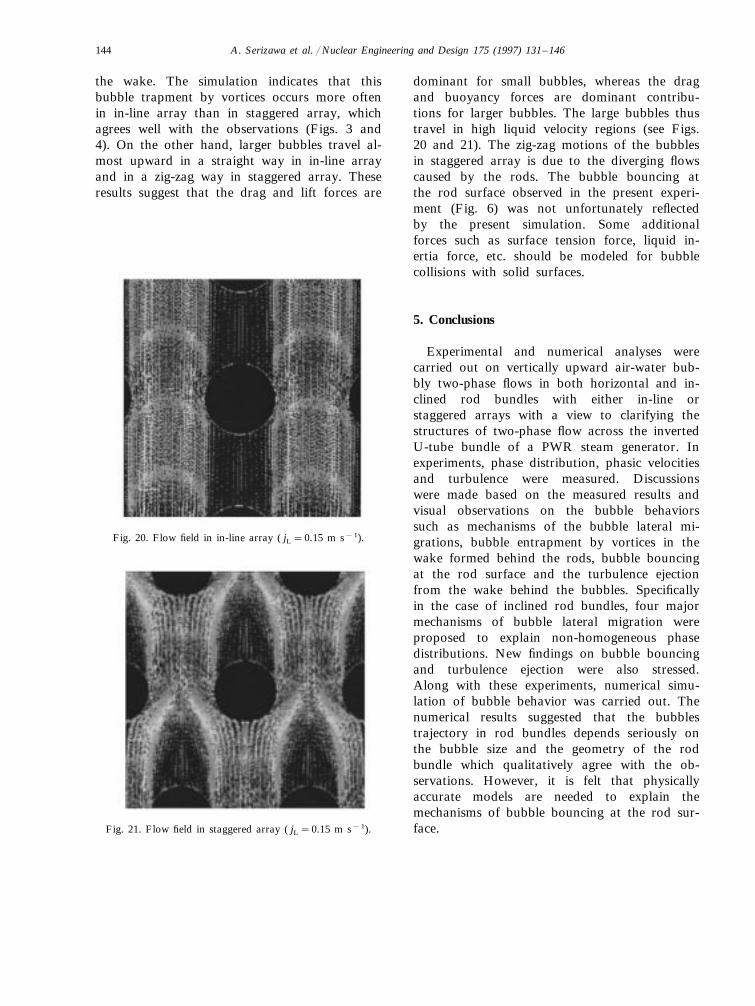
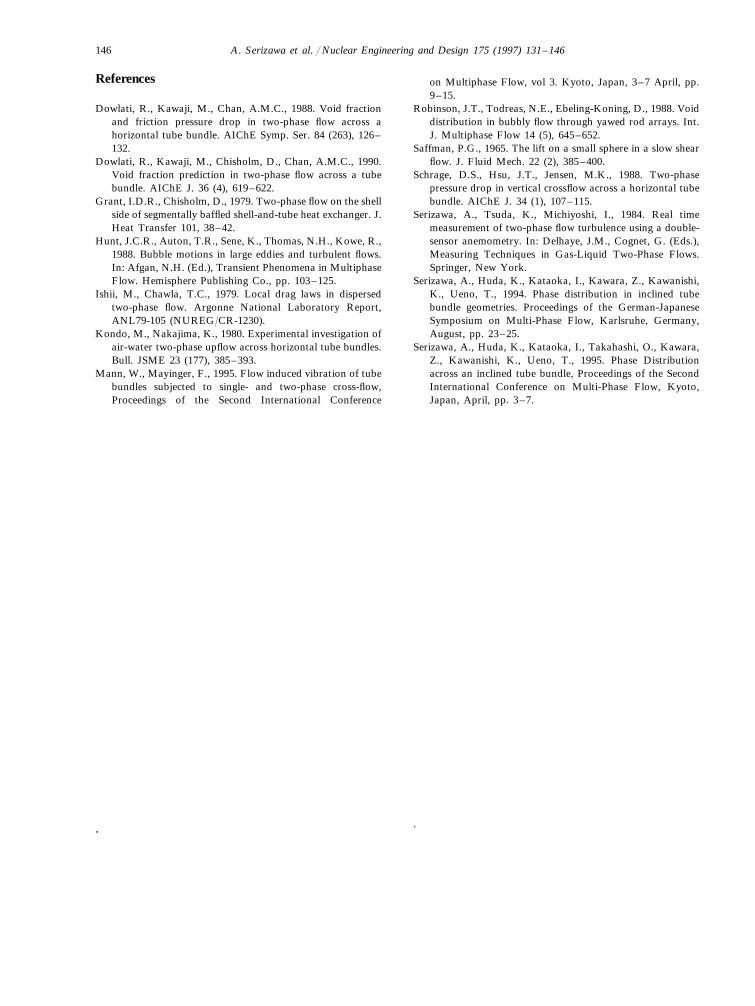
4.2.1. Single-phase flow fieldFigs. 20 and 21 demonstrate the single-phase
flow fields (velocity vectors) showing how the
Fig. 16. Liquid velocity profile (in-line).
Fig. 15. Possible mechanisms of bubble lateral motions.
vortices are formed behind each rod both in in-line and in staggered array. These predicted pat-terns of pairs of vortices with counter currentflows are qualitatively in good agreement withexperimental observations. The present numericalresults indicate that the staggered array createssmaller vortices than the in-line array. Thereforethe in-line bundle array is supposed to trap smallbubbles in the wake regions more easily than instaggered array. This speculation agrees well withvisual observations of bubble trajectories shownin Figs. 3 and 4. One of the other features drawnfrom the present simulation results is that the

A. Serizawa et al. / Nuclear Engineering and Design 175 (1997) 131–146 143
staggered rod array has a trend to cause periodictransverse diverging flows across the rod spacingwhich results in a more uniformly mixed flowfield.
4.2.2. Bubble trajectories and bubble entrapmentby wakes
Figs. 22 and 23 show the results of bubbletrajectories in in-line and staggered arrays fordifferent bubble size. The bubble lateral migration
Fig. 18. Transformation of bubble velocity components at therod surface.
Fig. 19. Layout of rod bundle geometries for numerical calcu-lation.
Fig. 17. Turbulence profile (in-line).
in the y-direction (perpendicular to the rod axis)is determined mainly by a balance between thedrag force and the lift force which is expressed ina form of Saffman (1965) in Eq. (6). It alsodepends on the buoyancy force, particularly in thecase of staggered rod array where the liquid lat-eral motion is essentially enhanced by rods. Theresults of the simulated bubble trajectories showthat the bubble movement in the y-direction ismore distinct for small bubbles and this trend ismore remarkable in in-line array than in staggeredarray. Some bubbles are trapped by the vortices in
A. Serizawa et al. / Nuclear Engineering and Design 175 (1997) 131–146144
the wake. The simulation indicates that thisbubble trapment by vortices occurs more oftenin in-line array than in staggered array, whichagrees well with the observations (Figs. 3 and4). On the other hand, larger bubbles travel al-most upward in a straight way in in-line arrayand in a zig-zag way in staggered array. Theseresults suggest that the drag and lift forces are
dominant for small bubbles, whereas the dragand buoyancy forces are dominant contribu-tions for larger bubbles. The large bubbles thustravel in high liquid velocity regions (see Figs.20 and 21). The zig-zag motions of the bubblesin staggered array is due to the diverging flowscaused by the rods. The bubble bouncing atthe rod surface observed in the present experi-ment (Fig. 6) was not unfortunately reflectedby the present simulation. Some additionalforces such as surface tension force, liquid in-ertia force, etc. should be modeled for bubblecollisions with solid surfaces.
5. Conclusions
Experimental and numerical analyses werecarried out on vertically upward air-water bub-bly two-phase flows in both horizontal and in-clined rod bundles with either in-line orstaggered arrays with a view to clarifying thestructures of two-phase flow across the invertedU-tube bundle of a PWR steam generator. Inexperiments, phase distribution, phasic velocitiesand turbulence were measured. Discussionswere made based on the measured results andvisual observations on the bubble behaviorssuch as mechanisms of the bubble lateral mi-grations, bubble entrapment by vortices in thewake formed behind the rods, bubble bouncingat the rod surface and the turbulence ejectionfrom the wake behind the bubbles. Specificallyin the case of inclined rod bundles, four majormechanisms of bubble lateral migration wereproposed to explain non-homogeneous phasedistributions. New findings on bubble bouncingand turbulence ejection were also stressed.Along with these experiments, numerical simu-lation of bubble behavior was carried out. Thenumerical results suggested that the bubblestrajectory in rod bundles depends seriously onthe bubble size and the geometry of the rodbundle which qualitatively agree with the ob-servations. However, it is felt that physicallyaccurate models are needed to explain themechanisms of bubble bouncing at the rod sur-face.
Fig. 20. Flow field in in-line array ( jL=0.15 m s−1).
Fig. 21. Flow field in staggered array ( jL=0.15 m s−1).

A. Serizawa et al. / Nuclear Engineering and Design 175 (1997) 131–146 145
Fig. 22. Predicted bubble trajectories for different bubble size in in-line array.
Fig. 23. Predicted bubble trajectories for different bubble size in staggered array.
A. Serizawa et al. / Nuclear Engineering and Design 175 (1997) 131–146146
References
Dowlati, R., Kawaji, M., Chan, A.M.C., 1988. Void fractionand friction pressure drop in two-phase flow across ahorizontal tube bundle. AIChE Symp. Ser. 84 (263), 126–132.
Dowlati, R., Kawaji, M., Chisholm, D., Chan, A.M.C., 1990.Void fraction prediction in two-phase flow across a tubebundle. AIChE J. 36 (4), 619–622.
Grant, I.D.R., Chisholm, D., 1979. Two-phase flow on the shellside of segmentally baffled shell-and-tube heat exchanger. J.Heat Transfer 101, 38–42.
Hunt, J.C.R., Auton, T.R., Sene, K., Thomas, N.H., Kowe, R.,1988. Bubble motions in large eddies and turbulent flows.In: Afgan, N.H. (Ed.), Transient Phenomena in MultiphaseFlow. Hemisphere Publishing Co., pp. 103–125.
Ishii, M., Chawla, T.C., 1979. Local drag laws in dispersedtwo-phase flow. Argonne National Laboratory Report,ANL79-105 (NUREG/CR-1230).
Kondo, M., Nakajima, K., 1980. Experimental investigation ofair-water two-phase upflow across horizontal tube bundles.Bull. JSME 23 (177), 385–393.
Mann, W., Mayinger, F., 1995. Flow induced vibration of tubebundles subjected to single- and two-phase cross-flow,Proceedings of the Second International Conference
on Multiphase Flow, vol 3. Kyoto, Japan, 3–7 April, pp.9–15.
Robinson, J.T., Todreas, N.E., Ebeling-Koning, D., 1988. Voiddistribution in bubbly flow through yawed rod arrays. Int.J. Multiphase Flow 14 (5), 645–652.
Saffman, P.G., 1965. The lift on a small sphere in a slow shearflow. J. Fluid Mech. 22 (2), 385–400.
Schrage, D.S., Hsu, J.T., Jensen, M.K., 1988. Two-phasepressure drop in vertical crossflow across a horizontal tubebundle. AIChE J. 34 (1), 107–115.
Serizawa, A., Tsuda, K., Michiyoshi, I., 1984. Real timemeasurement of two-phase flow turbulence using a double-sensor anemometry. In: Delhaye, J.M., Cognet, G. (Eds.),Measuring Techniques in Gas-Liquid Two-Phase Flows.Springer, New York.
Serizawa, A., Huda, K., Kataoka, I., Kawara, Z., Kawanishi,K., Ueno, T., 1994. Phase distribution in inclined tubebundle geometries. Proceedings of the German-JapaneseSymposium on Multi-Phase Flow, Karlsruhe, Germany,August, pp. 23–25.
Serizawa, A., Huda, K., Kataoka, I., Takahashi, O., Kawara,Z., Kawanishi, K., Ueno, T., 1995. Phase Distributionacross an inclined tube bundle, Proceedings of the SecondInternational Conference on Multi-Phase Flow, Kyoto,Japan, April, pp. 3–7.
..
Copyright © 2022 FDOKUMEN