Experiences in building a Grid-based platform to serve Earth observation training activities
17
This article appeared in a journal published by Elsevier. The attached copy is furnished to the author for internal non-commercial research and education use, including for instruction at the authors institution and sharing with colleagues. Other uses, including reproduction and distribution, or selling or licensing copies, or posting to personal, institutional or third party websites are prohibited. In most cases authors are permitted to post their version of the article (e.g. in Word or Tex form) to their personal website or institutional repository. Authors requiring further information regarding Elsevier’s archiving and manuscript policies are encouraged to visit: http://www.elsevier.com/copyright
Transcript of Experiences in building a Grid-based platform to serve Earth observation training activities

This article appeared in a journal published by Elsevier. The attachedcopy is furnished to the author for internal non-commercial researchand education use, including for instruction at the authors institution
and sharing with colleagues.
Other uses, including reproduction and distribution, or selling orlicensing copies, or posting to personal, institutional or third party
websites are prohibited.
In most cases authors are permitted to post their version of thearticle (e.g. in Word or Tex form) to their personal website orinstitutional repository. Authors requiring further information
regarding Elsevier’s archiving and manuscript policies areencouraged to visit:
http://www.elsevier.com/copyright
Author's personal copy
Experiences in building a Grid-based platform to serve Earth observationtraining activities☆
Dana Petcu a,b,⁎, Silviu Panica a,b, Marc Frîncu a,b, Marian Neagul a,b, Daniela Zaharie a, Georgiana Macariu b,Dorian Gorgan c, Teodor Ştefănuţ c
a Computer Science Department, West University of Timişoara, Romaniab Institute e-Austria Timişoara, Romaniac Computer Science Department, Technical University of Cluj Napoca, Romania
a b s t r a c ta r t i c l e i n f o
Article history:Received 20 August 2010Received in revised form 14 April 2011Accepted 21 October 2011Available online 28 October 2011
Keywords:Distributed systemsImage processing softwareEarth and atmospheric sciencesComputer uses in education
Earth observation data processing and storing can be done nowadays only using distributed systems. Experi-ments dealing with a large amount of data are possible within the timeframe of a lesson and can give traineesthe freedom to innovate. Following these trends and ideas, we have built a proof-of-the-concept platform,named GiSHEO, for Earth observation educational tasks. It uses Grid computing technologies to analyze andstore remote sensing data, and combines them with eLearning facilities. This paper provides an overview ofthe GiSHEO's platform architecture and of its technical and innovative solutions.
© 2011 Elsevier B.V. All rights reserved.
1. Introduction
Earth observation (EO) mostly refers to satellite imagery or satel-lite remote sensing. The result of sensing process is an image or amap. The remote sensing data represent the results of the measure-ments of the reflected or emitted radiations from Earth. Remote sens-ing systems include besides the collection of the data, methods andmeans for their processing and distribution.
Several technical issues are nowadays affecting the wide scaleusage of remote sensing systems. The remote sensing data volumeis continuously growing to a level that makes it impossible to processall the daily acquired data using the current computing facilities of bigdata centers. Moreover, the number of users and applications is alsoincreasing and the data as well as resource sharing has become akey issue in remote sensing systems. Furthermore, EO scientists areoften hindered by difficulties in locating and accessing the data andservices.
In this context, a shift in the design of remote sensing systems wasregistered in the last decade, from centralized environments towardswide-area distributed environments that allow a scale-out in a widerange of issues from experimental repeatability to real-time access toenormous quantities of data. As a consequence, Earth observation sys-tems are nowadays intensively used to monitor and assess the statusof the natural and built environments. The underlying technologiesallowing this shift are aligned to the service-oriented architecture con-cepts: Web, Grid or Cloud computing, storage and service techniquesare facilitating the integration of data, processing and resources. Notethat remote sensing image processing is usually a computational anddata consuming task and special techniques are required for both datastorage and processing in distributed environments, like the move ofthe migration of the code to the data location.
In particular, the promise of Grid computing made to the EO com-munity at the beginning of this decade was to provide a shared envi-ronment for accessing a wide range of resources: instrumentation,data, high-performance computing resources, and software tools.Three main scenarios are motivating the usage of Grid computingtechnologies to serve EO requests: (1) the required computingperformance or storage capacity is not available locally, the solutionbeing remote computing; (2) the required computing performanceor storage capacity is not available in one location, the solutionbeing cooperative computing; (3) the required services are onlyavailable in specialized centers, the solution being service-orientedcomputing. Realizing the potential of Grid computing for EO, severalresearch projects were launched to make the Grid usage idea a reality.
Computer Standards & Interfaces 34 (2012) 493–508
☆ This work is partially supported by European Space Agency grant PECS - 98061,GiSHEO: On Demand Grid Services for High Education and Training in Earth Observa-tion (http://gisheo.info.uvt.ro).⁎ Corresponding author at: Computer Science Department, West University of
Timisoara, Romania.E-mail addresses: [email protected] (D. Petcu), [email protected] (S. Panica),
[email protected] (M. Frîncu), [email protected] (M. Neagul), [email protected](D. Zaharie), [email protected] (G. Macariu), [email protected] (D. Gorgan),[email protected] (T. Ştefănuţ).
0920-5489/$ – see front matter © 2011 Elsevier B.V. All rights reserved.doi:10.1016/j.csi.2011.10.010
Contents lists available at SciVerse ScienceDirect
Computer Standards & Interfaces
j ourna l homepage: www.e lsev ie r .com/ locate /cs i

Author's personal copy
We review the most important ones in Section 2. Our platform solu-tion is subscribing mainly to the third scenario.
While intensive research activities in the direction of buildingGrid-based platforms for remote sensing processing have been regis-tered recently, the training activities are lagging behind.
Extrapolating our experience in teaching activities related to com-puter science, we consider that ‘hands-on’ activities can deeply affectthe effectiveness of the learning processes in science fields. But only asmall percent of current eLearning environments are based on realexperiments (simulations are usually preferred). On the other hand,Earth observation in particular is a field in which the training canstrongly benefit from performing real data experiments in the class-room. But due to the huge dimensions of the real data and the com-plexity of classical EO applications, both leading to memory or timeconstraints unreachable with desktop computers, experimenting inthe classroom is almost impossible without using a distributed sys-tem. The typical data sets used now in EO trainings are rather big(at least of several tens of GBs), and the desktop-based softwaretools are allowing only simple image processing tasks. Acquiringnew real data at trainee side is also a time consuming task (usuallyseveral minutes, which is not acceptable in a training event). Movingthe specialized software tool or the user-designed code where thedata are located could be a viable alternative, but leads to legal andtechnical issues, solved only partially by Grid technologies. Detailsare given in Section 3.
Following these beliefs, we have built in the last three years aproof-of-the-concept Grid-based service-oriented training platform,namely GiSHEO (On Demand Grid Services for Training and High Ed-ucation in EO), in which Grid technologies are not visible for the user,the specialized EO applications are encapsulated as services, and thelessons are based on the experiments and innovation facilities.
While the Grid technologies are usually employed for respondingto research requests for consuming resources in computational-intensive or data-intensive tasks, GiSHEO aims to use them fornear-real time applications for short-time data-intensive tasks. Weare exploiting also the fact that a Grid-based fabric service, availableon the entry point of the platform, responds to user requests byinstantiating processing services where the pointed data reside.Web service technologies are used for interfacing with image trans-formation procedures. These interfaces allow also the remote accessand application execution on a Grid using different strategies for fastresponses.
Details about the GiSHEO architecture are provided in Section 4.New solutions were proposed for data management, image proces-sing service deployment, workflow-based service composition, anduser interaction. eGLE, GiSHEO's eLearning environment, providestemplates for trainers and teachers specialized in Earth observationto develop lessons for others to follow. Most importantly, it givesspace for trainees to experiment and innovate: in lesson related ex-periments, trainees have access to large amounts of data and, thanksto remote processing, they can analyze and receive results within thetimeframe of the lesson. Furthermore, they can do all this withoutinstalling any software, or transferring large amounts of data ontotheir computer.
A case study for training in archeology using remote sensing data,presented in detail in [10], is re-discussed in Section 5 in order tohighlight the platform benefits in comparison with other existingsolutions.
Particular components of the platform were partially described inour earlier papers as they evolved in the process of GiSHEO develop-ment: data management in [8], e-learning component in [6], work-flow related solutions in [11], or application examples in [10]. Whilein the previous papers the focus was on certain components at differ-ent development stages or the platform usefulness for satellite imageprocessing, this paper intends to provide an overview of the final ver-sion of the platform, with a special focus on the main technological
approaches and its performance. Therefore Section 6 is dedicated tothe performance studies.
2. Grid-based platforms for Earth observation
Grid-based experimental platforms were developed already at thebeginning of this century with the strong support of NASA and ESA.Powerful software tools have evolved in parallel for satellite data pro-cessing: open source products like GDAL, GRASS, OpenGIS, WMS (seeTable 1) or proprietary ones from ESA and NASA. GiSHEO is partiallybased on the open source products (details are provided in the nextsection).
An overview of the technological challenges and user require-ments in remote sensed image processing, as well as the solutionsprovided by the Grid-based platforms built in the last decade, wasprovided in a report of DEGREE project. Moreover, production plat-forms like G-POD [4] have proved the usefulness of the Grid conceptfor real applications like flood area detection.
We consider that we can distinguish until now at least two devel-opment periods in the Grid-based platforms for Earth Observation.The first period is related to the development of the proof-of-the-concept platforms in international projects like DataGrid, SARA DigitalPuglia, GEOGrid (see Table 2). The DEGREE reports concluded thisperiod of experiments with the case studies in which Grid is useful forEarth sciences. The second period, that of production platforms, ismarked by: (1) the availability of GENESI-DR catalog of EO data, LandsatGrid Prototype LGP or G-POD for on-demand processing; (2) thefurther development of Grid middleware components adapted to EOneeds, like the ones in the frame of SEE-Grid-SCI; and (3) the focuson data management in Grids like in D4Science project.
A generic architecture of a Remote Sensing Grid (RSG) was de-fined at the end of the first period in [5] as a highly distributed systemthat includes resources that support the collection, processing, andutilization of the remote sensing data. A RSG is made up of resourcesfrom a variety of organizations which provide specific capabilities,like observing elements, data management elements, data processingand utilization elements, communications, command, and control el-ements, and core infrastructure. If a service oriented architecture isused, modular services can be discovered and used to build complexapplications by clients. The services should have the following charac-teristics: composition, communication, workflow, interaction, andadvertise. These requirements are mapped into the definition of spe-cific services for workflow management, data management and pro-cessing, resource management, infrastructure core functions, policyspecification, and performance monitoring. The services are distribut-ed in four categories: workflow management services, data manage-ment services, applications in the form of services, and core Gridservices. Despite the fact that GiSHEO has been developed simulta-neously with the RSG vision, it implements almost all RSG concepts.
The rapid evolution of the remote sensing technology is not fol-lowed at the same developing rate by the training and high educationresources in this field. Currently there are only a few number of re-sources involved in educational activities in EO. The CEOS Working
Table 1Open source software tools in Earth observation.
Acronym Title and reference
GDAL Geospatial Data Abstraction Librarywww.gdal.org
GRASS Geographic Resources Analysis Support Systemwww.cecer.army.mil/grass/Grass.main.html
OpenGIS Open Geographic Information Systemwww.opengis.com
WMS Web Map Servicewww.opengeospatial.org/standards/wms
494 D. Petcu et al. / Computer Standards & Interfaces 34 (2012) 493–508

Author's personal copy
Group of Education, Training and Capacity Building [1] is one of thefew facilities that are collecting an index of free EO educational mate-rials. Grids have not been seen as valuable training platforms in EOuntil the proposal of GiSHEO.
Signs of the evolution towards a next period are already visiblethrough the increased interest of EO community in Cloud computingtechnologies and the rise of the power of social networks. We havethe strong belief that EO learning experiments performed by GiSHEOin Grid environments can be moved from the classroom level (con-straint: institution part of Grid virtual organization) to the individuallevel (as in classical eLearning scenario) by using Cloud technologies.
GiSHEO do not reach the large scale deployment of the projectsdescribed in Table 2, but allows the performance of classroom tasksthat are otherwise prohibited by the resources that are needed, eitherin terms of data or software.
3. EO data management issues and standards
The management of the distribution of data, from storing to long-term archiving, is currently an important topic in EO systems. In par-ticular for GiSHEO, data management is essential due to its data-centric design. To explain the particular solutions that we considered,it is necessary to start with a general image of the current issues andavailable solutions. We follow here the main ideas expressed in thepublic documents of the e-IRG (European e-Infrastructure ReflectionGroup [2]).
The first issue in data management is the data format that is vary-ing from image files, databases to structured files. To overcome thisproblem, usually, an EO data contains: metadata, a set of informationfor describing the data (information like dimensionality or referencecoordinates) and the physical dataset, received from a satellite device,represented using a standard format (ETM, ETM+, raster). The map-ping process between the data and the input parameters of variousprocedures need to take care of matching the metadata with the pa-rameters restrictions.
A second issue is related to the user need to access remotely theEO data. Due to the huge size of the EO data, a distributed file systemis needed. For more than three decades there have been several dis-tributed file systems enabling multiple, distributed servers to be fed-erated under the same file namespace.
Replica management services are essential for EO systems, allow-ing the determination of an optimal physical location for data accessbased on data destination aiming to reduce the network traffic andthe response time. Data transfers secure protocols were developedto extend the traditional file transfer protocol.
Another issue is data discovery and this is currently solvedexploiting metadata catalogs, currently available also in hierarchicaldistributed versions.
In what concerns media file catalogs there are no current stan-dards, but several implementations are available in Grid environ-ments that are using special file catalogs allowing data replications.
The same situation is valid also for metadata catalogs; fortunately,in the particular case of EO this issue is pursued by the Open Geospa-tial Consortium.
While for the basic needs mentioned above there are several stableand standardized solutions, the current key issue in EO datamanagementis tomake the data reachable anduseful for any application through inter-operability. Interoperability is achieved through the usage of standard in-terfaces and protocols. There are at least two layers for interoperability:for resource format and domain encoding, and semantic interoperability.For the first layer, at device level, the solutions are mostly standardizedand are referring to the interfaces of the storage devices; at communica-tion level, there are standardized data transfer protocols like http, httpsor GridFTP, standardized protocols for Web services, and less standard-ized data movers for heterogeneous computing environments. OPeNDAP[9] is a data transport architecture and protocol widely used in EO; it isbased on http and includes standards for encapsulating structured data,annotating the data with attributes, and adding semantics that describethe data. At middleware level there are fewer standard solutions; for ex-ample, for data storage it is necessary to have a single consistent interfacefor different storage systems, and a solution is coming again from Gridcommunity through the open standard storage resource manager, a con-trol protocol for accessingmass storage. In what concerns the interopera-bility of federated databases, a standard proposed by the Grid communityis the Open Grid Services Architecture Data Movement Interface (OGSA-DMI). At deployment level, interoperability degradation is related to theevent of new deployments and currently there are no automated toolsor standard interfaces allowing the propagation of updates.
Despite the adoption of the above mentioned technical solutions,data provision services in EO are still not satisfying the needs oftoday's user due to current application and infrastructure limitations.The process of identifying and accessing data takes up a lot of timedue to physical discontinuity of data, diversity of metadata formats,large volume of data, unavailability of historic data, and many differ-ent actors involved. Recognizing these limitations, the European IN-SPIRE Directive requires all public authorities holding spatial data toprovide access to that data through common metadata, data and net-work service standards. The Committee on EO Satellites also main-tains a Working Group on Information Systems and Services withthe responsibility to promote the development of interoperable sys-tems for the management of EO data internationally. This groupplans to build in the next decade the Global EO System of Systems(GEOSS) targeting the development of a global, interoperable geospa-tial service architecture.
4. Overview of GiSHEO's platform and its technical solutions
We describe in what follows our platform structure and functionality.
4.1. General architecture
The GiSHEO architecture is a Grid-enabled platform for satelliteimage processing using a service oriented architecture structured onseveral levels including user, security, service, processing and a datalevel.
The user level is in charge of access to the Web user interface(built by using Google's Web ToolKit framework [7]).
The security level provides security context for both users and ser-vices. The security context defines the mechanisms used for authenti-cation, authorization and delegation. Each user must be identified byeither using a username/password pair or a canonical name providedby a digital certificate. The services are using a digital certificate forauthentication, authorization, and trust delegation. The authorizationis based on VOMS service which extends the PKI mechanism by add-ing support for certificate attributes. GiSHEO CA or EUGridPMAsigned certificates are required to access the full facilities of theplatform.
Table 2Main Grid projects serving Earth observation.
Acronym Title and reference
GEOGrid Global Earth Observation Gridwww.geogrid.org
DataGrid DataGrid Projecteu-datagrid.web.cern.ch/eu-datagrid/
DEGREE Dissemination and Exploitation of Grids in Earth Science,www.eu-degree.eu
LGP Landsat Grid Prototype [5]G-POD Grid Processing on Demand [4]GENESI-DR Ground European Network for Earth Science
Interoperations - Digital Repositories, genesi-dr.euD4Science Data infrastructure ecosystem for science www.d4science.euSEE-Grid-SCI eInfrastructure for Regional eScience, www.see-grid-sci.eu
495D. Petcu et al. / Computer Standards & Interfaces 34 (2012) 493–508

Author's personal copy
The service level exposes internal mechanisms part of the GiSHEOplatform by using various Grid services technologies including:
• The Grid processing service — internal processing platform exposedas a specialized Web service and capable of connecting with an ex-ternal resource management system.
• The workflow service — internal workflow engine which can beaccessed by using a specialized Web service.
• The data indexing and discovery — access to the GiSHEO proposeddata management mechanisms.
Fig. 1 presents the conceptual view of the GiSHEOs platform archi-tecture. Here WMS stands for to the well-known Web Mapping Ser-vice that ensures access to the distributed database. The securityrelated component is referred by GiS. WAS is the acronym for theplatform's specific Web Application Service that is invocated by userinterface at run-time. It allows workflow description for user specificscenarios of data processing and storage combining existing servicesor deploying new ones. The Workflow Service Composition (WSC)and Workflow Manager (WfM) are the engines behind WAS and areconnected with the tasks manager (G-PROC WS). Each simple imageprocessing operation is viewed as a task. Several tasks can be linkedtogether to form a workflow in an order that is decided at clientside (either through the teacher's or student's interface).
G-PROC is a service enabling an interface for easy task deploymenton platform resources. It is based on Condor HTC (Condor HighThroughput Computing) as processing model, task registration,scheduling and execution environment. It uses also a direct job sub-mission interface using Condor's specific Web service interface.
GDIS is a data index service built as Web service providing infor-mation about the available data to its clients. It intermediates accessto data repositories, stores the processing results, ensures role basedaccess control to the data, retrieves data from various informationsources, queries external data sources, and has a simple interfacethat is usable by various data consumers. More details about GDIS
can be found in the next subsections. Due to the low security restric-tion between the Grid infrastructure partner institutions, data distri-bution between the clusters is done using Apache's Hadoopdistributed file system HDFS. The data transfer from and to externaldatabases is done using GridFTP. This is for example the case for theconnection with GENESI-DR database.
At data level two different types of data are involved: databasedatasets – which contain the satellite imagery repository and proces-sing application datasets – used by applications to manipulate satel-lite images.
The platform has distributed data repositories. It uses PostGIS forstoring raster extent information (postgis polygons) and in somecases vector data. Moreover, the data search is based on PostGIS spa-tial operators.
4.2. Processing services
GiSHEO's processing platform component consists of two parts,the interface exposed as a Web service (WS) and the workload man-agement system.
The Grid interface G-PROC (GiSHEO ProcessingWS) is built by usingAXIS2 Web Service technology and it is responsible for the interactionwith other internal services as the data index service GDIS in order to fa-cilitate access to the processing platform. Itsmain responsibilities are: toreceive tasks from the workflow engine or directly from user interface;to use a task description language (the ClassAdmeta language for exam-ple in case of Condor HTC) in order to describe a job unit; to submit andcheck the status of jobs inside the workload management system; or toretrieve different job logs for debugging purposes.
As a workload management system, GiSHEO uses Condor HTC andprovides Condor HTC resource manager accessible through its built-inWS interface to access an internal component called Condor Job Man-ager used for task dispatching and administration.
Fig. 1. GiSHEOs platform architectural design.
496 D. Petcu et al. / Computer Standards & Interfaces 34 (2012) 493–508

Author's personal copy
G-PROCWS is also used by the user interface to query the task da-tabase in order to get various information about the tasks, as status orlogging files useful for debugging purposes (e.g. see those exposed inthe user interface and described in the next subsection).
The Web services interfaces, specific for the platform or for satel-lite image processing, are described on GiSHEO'sWeb site. Anyone in-terested to exploit the platform and available data can design its owninterface or application on top of these services.
G-PROC WS functionality is resumed in Fig. 2. A standard use caseof G-PROC involves three components: GDIS, EO Application Databaseand the WMS. From the user interface a task request is received; thetask should contain at least the EO processing application, the argu-ments set by the user and a dataset. G-PROC uses GDIS to find thereal physical location of the dataset and prepares a task to be submit-ted to the WMS. The task, described using Condor's ClassAd language,is submitted to the workload management system, and is scheduledon one of the platform's available clusters. When the task is finisheda notification is sent back to the user interface with the task status(same schema is applied in case of an error).
4.3. Data management
One of the fundamental components of the GiSHEO platform is theone responsible for storing and querying the data. Two types of dataare involved: databases containing the remote sensing data and theprocessing applications.
GiSHEO's Data Indexing and Storage Service (GDIS) provides fea-tures for data storage, indexing data using a specialized RDBMS, find-ing data by various conditions, querying external services, and forkeeping track of temporary data generated by other components.GDIS is available to other components or external parties using a
special Grid service. This service is also responsible for enforcingdata access rules based on specific Grid credentials (e.g. VO attri-butes). The storage layer of GDIS is responsible for storing the databy using available storage back-ends such as local disk file systems(e.g. ext3), local cluster storage (e.g. GFS, GPFS), or distributed filesystems (e.g. HDFS, KosmosFS, GlusterFS).
An important requirement for the storage component is that of aunique interface exposing the data distributed across various storagedomains (local or remote). This requirement fulfillment was achievedby implementing a front-end GridFTP service capable of interactingwith the storage domains on behalf of the clients and in a uniformway. The GridFTP service also enforces the security restrictions pro-vided by other specialized services and related with data access. TheGridFTP service based on an Apache Mina FtpServer has native accessto the Hadoop Distributed File System offering access to data storedinside the internal HDFS file systems and providing the required ac-cess control facilities. The GridFTP service provides also special fea-tures for manipulating the data repository through basic methodsfor managing data like upload, deletion, retrieval, etc.
The data indexing is performed by PostGIS, an extension for thePostgreSQL RDBMS engine. The PostGIS layer indexes the metadataand location of the geographical data available in the storage layer.The metadata usually represents the extent or bounding box andthe geographical projection of the data (representing the exact geo-location). The PostGIS layer provides also advanced geographical op-erations (backed by a GiST index) which allow searching the data byusing various criteria including interaction with raw shapes, interac-tion with shapes representing geo-political data (like country, city,road, etc.) or any other type of geographical data which can be repre-sented in PostGIS. The geo-political data is typically provided by dataimported from the Open Street Map (OSM).
Fig. 2. G-PROC with Condor wrappers.
497D. Petcu et al. / Computer Standards & Interfaces 34 (2012) 493–508

Author's personal copy
Based on the advanced data indexing capabilities of the PostGISlayer, GiSHEO's platform provides an advanced and highly flexible in-terface for searching in the platform's repositories.
The search interface is built around our custom query language,named LLQL (Lisp Like Query Language), designed to provide finegrained access to the data in the repository and to query external ser-vices like TerraServer or GENESI-DR. The syntax of the query languageis inspired from the syntax of the LISP language and partially by LDAPfilters. The language allows querying the repository both for rasterimages like in
(select’(url, owner)
(and(or
(ogc: interacts(osm: country "Germany"))
(ogc: interacts(osm: country "Austria"))
)(gdis:type "RASTER/AERIAL")
))
and also for various aggregated data or object properties, like in; Find cities in Romania
; filter by bbox(select-place’(name)
(and(ogc:interacts
(ogc:bbox 16.69 43.97 24.8 48.48))(osm:country "Romania")
(osm:type "city"))
)The PostGIS related queries are translated directly to PostGreSQL
queries, while the external lookups are resolved prior to submittingthe queries to PostGIS.
Besides the developer oriented LLQL filters, GDIS also provides asimple, user oriented query language usable on the public search in-terfaces. These simple query filters are similar to the filters used bymainstream search engines:
vendor:NASA type:DEM
place:Timisoara,Timis,RomaniaLike in LLQL case, this language is translated into PostgreSQL spa-
tial queries.Another set of tasks handled by GDIS is represented by the inter-
action with external services. In this case GDIS represents a thin mid-dleware layer interacting with external repositories and exposes onlyone unique interface (similar and possibly integrated with the inter-nal repositories). One example of external back-ends supported byGDIS is represented by the GENESI-DR catalog.
4.4. Workflow engine
Remote sensing imagery could require large amount of processingsteps involving different, but rather simple, image processing trans-formations. This scenario implies linking the processing algorithmsto form a workflow either defined by the user or selected from an al-ready existing list. These algorithms could be located on the same oron different machines spread over the platform. In the former caseeach of them could be exposed as services. Moreover, distributingthem across the platform where each resource exposes several algo-rithms could help in balancing the resource workload.
In general workflow image processing transformations are se-quential or parallel involving at some point a join or a split. Thereare a few cases which require the use of loops.
Due to the dynamic nature of Grids, a self adaptive scenario, inwhich tasks would be reassigned when their corresponding resources
might become unable to solve their needs, should be taken intoconsideration.
To enable this reassignment we considered an Event-Condition-Action (ECA) approach. ECA usually implies a rule governed scenarioin which an action takes place on as a result of an event and in caseone or more conditions are met. The reason for choosing this para-digm is that it allows the separation of logic, represented by rules,and data, represented by objects.
The GiSHEO workflow engine, namely OSyRIS (Orchestration Sys-tem using a Rule based Inference Solution) is based on DROOLS whichuses an object oriented version of the RETE algorithm. A simplifiedrule-based workflow language, named SiLK (Simple Language forworKflow), has been built on top of it with the aim of offering a sim-ple yet general rule based language.
The SiLK language allows the introduction of more workflow spe-cific issues and the ECA approach allows a greater flexibility whenexpressing data and task dependencies. Details about SiLK and OSyRIScan be found in [3]. Here we describe them shortly, in the connectionwith the information provided in this paper.
Each task description is made up of several mandatory and option-al attributes. The mandatory attributes consist of at least one inputand one output port. Each task can have several such ports as itcould receive input from more than one task and could producemore than one output. The optional attributes are called here meta-attributes. They are not used by the workflow engine and are simplypassed over to the service handling the task under the assumptionthat it can decode and understand them. Meta-attributes are declaredby using quotation marks both for the attribute name as well as forthe attribute value.
Several meta-attributes including datagroup, dataset, processingand argument-list need to be introduced in order to fully define aGiSHEO workflow. The meta-attributes are used to identify theimage to be processed, the operation and the arguments to be used.For example the datagroup and dataset attributes identify the groupand the set inside the group to which the image belongs. The proces-sing attribute identifies the operation to be applied to the image. Itsvalue follows a C-like prototype format with return type, operationname and argument list. The attribute list specifies the optional attri-butes used by the operation. It is a list where the values are pairs inthe form bname=value>. Each value is separated by a # sign. Thename inside the pair must match the name given to the attribute inthe processing description.
Each task needs to be declared before actually being used. It can benoticed that there is a lack of any mandatory attributes concerningthe input or output data type and content. This is due to the factthat the compatibility issues between tasks are resolved at the mo-ment the workflow is created by using methods which are specificto each workflow. These methods should be implemented by theplatform running the workflow engine and should not be incorporat-ed inside the workflow description. Because of the nature of the ruleengine there is a need for a fictive start task which has the role of atrigger causing the first actual task in the workflow to be executed.
Rules are defined by simply mentioning the events and conditionswhich should take place in order to trigger the execution of righthand side tasks. Each event is seen as a completed task and is placedon the left hand side of the rule. Linking the output of left hand taskswith the input of right hand side tasks is accomplished by using vari-ables. For example the rule:
A[a=o1] ->B[i1=a]links the output of task A with the input of task B through variable
a. Conditions are placed at the end of the rule and can involve numer-ical or string variables:
A[d=o1] ->B[i1=d] | db1.In the same way splits and joins made of, but not restricted to, two
tasks could be expressed by rules like://synchronized join
498 D. Petcu et al. / Computer Standards & Interfaces 34 (2012) 493–508

Author's personal copy
A[b=o1],B[c=o1] ->C[i1=bi2=c]//parallel split
A[a=o1] ->B[i1=a],C[i1=a],D[i1=a]Loops can be also modeled as in the following example:A[d=o1],B[e=o1] ->A[i1=di2=e] | db1//and
A[d=o1],B[e=o1] ->C[i1=di2=e] | d>=1.
The former rule expresses the condition to reiterate the loop whilethe latter expresses the condition to exit the loop. As a remark itshould be noticed that when several right hand side tasks need tobe activated their execution will take place in parallel. Synchroniza-tion between several tasks can also be achieved by adding theminto the left hand side of the rule:
A[b=o1],B ->C[i1=b].The previous example shows how task A is synchronized with task
B and cannot be executed until the latter one is completed. Tasks canalso have multiple instances. For instance, a rule could produce 4 in-stances of a task:
B[a=o1] ->C[i1=ainstances=4]
with the default number of instances being one. Instances of lefthand tasks are usually consumed when the rule fires
B[a=o1consume=true] ->C[i1=a].However this feature is optional with the default behavior being
consumed.Fig. 3 shows an example of SiLK usage in detecting linear struc-
tures by combining several basic operations as: grayscale conversion,edge detection with Canny filter, and line detection with Houghtransform (see the results of processing in Section 5). In each task de-scription, beyond the procedure name as well as the number and typeof parameters, the values of the parameters at run-time and the groupand set of the input/output data are mandatory.
As previously mentioned, using an ECA approach allows for creat-ing adaptive workflows which can react to changes either in the con-figuration of the Grid or inside the workflow itself. Changes inside theGrid are handled by creating specific rules which allow resource se-lection based on various task scheduling criteria. Modifications ofthe workflow are usually accomplished either by inserting or retract-ing at run time rules belonging to it or by modifying the executor ofthe task in case a better one is found. Note that it is very hard or al-most impossible to express adaptivity by using classic workflow lan-guages such as WS-BPEL, SCUFL, JSDL, DAGs or Petri Nets.
The workflow engine has been built on top of the workflow lan-guage described above. Its role is to execute the workflow and to han-dle system and logical failures by inserting additional rules inside theinitial rule database. The workflow engine is also responsible forchecking the integrity of the workflow syntax.
The above describedworkflow technique is useful especially in thecase when the user goal is to build a workflow backwards from thedesired result to the input data.
4.5. User interface
Our platform uses the SOA design model and the user interfacecan be seen as a client to the platform services. Note that new user in-terfaces or applications can be easily built on top of our Web servicesthat are publicly exposed on the GiSHEO Web site.
Due to the fact that EO applications are data-intensive, the key el-ement in any Web portal for EO is the selection of the data and, onlyafter it, the selection of the processing task or workflow that will beapplied to them. Note GiSHEO's current solution: datasets representthe main component of the interface and each data has a list of pro-cessing tasks associated depending on its type; these processingtasks can be launched using the selected dataset and inputparameters.
The EO data selection in different EO portals range from simple se-lection from list based catalogs to visual selection of region of
interests. The early interface of GiSHEO has been designed having inmind a low level of knowledge about data types and therefore the vi-sual selection was preferred (see the interface functionality in thedemos provided on the platform Web site). But this option has puta high stress on the platform, as well as on the user's Web browser,in order to be able to present multiple pre-views of the huge data(at different zooming scales) simultaneously available for the sameregion. Moreover the computing task dependability on the type ofthe input data was hardly sustained in the case of multiple inputsrepresenting data from the same region of interest. The new proposedsolution allows the user to select the images that she wants to processusing the location, type, date and so on parameters, and presents thedata available in a list form, each entry having only one preview formand a list of possible tasks to be applied. Fig. 4 shows the results ofselecting the NASA catalog from GiSHEO platform (on the left side)and the geographical coordinates (on the right side). The figure indi-cates also how the user can specify a particular location of interest.
Fig. 3. Workflow example using SiLK.
499D. Petcu et al. / Computer Standards & Interfaces 34 (2012) 493–508

Author's personal copy
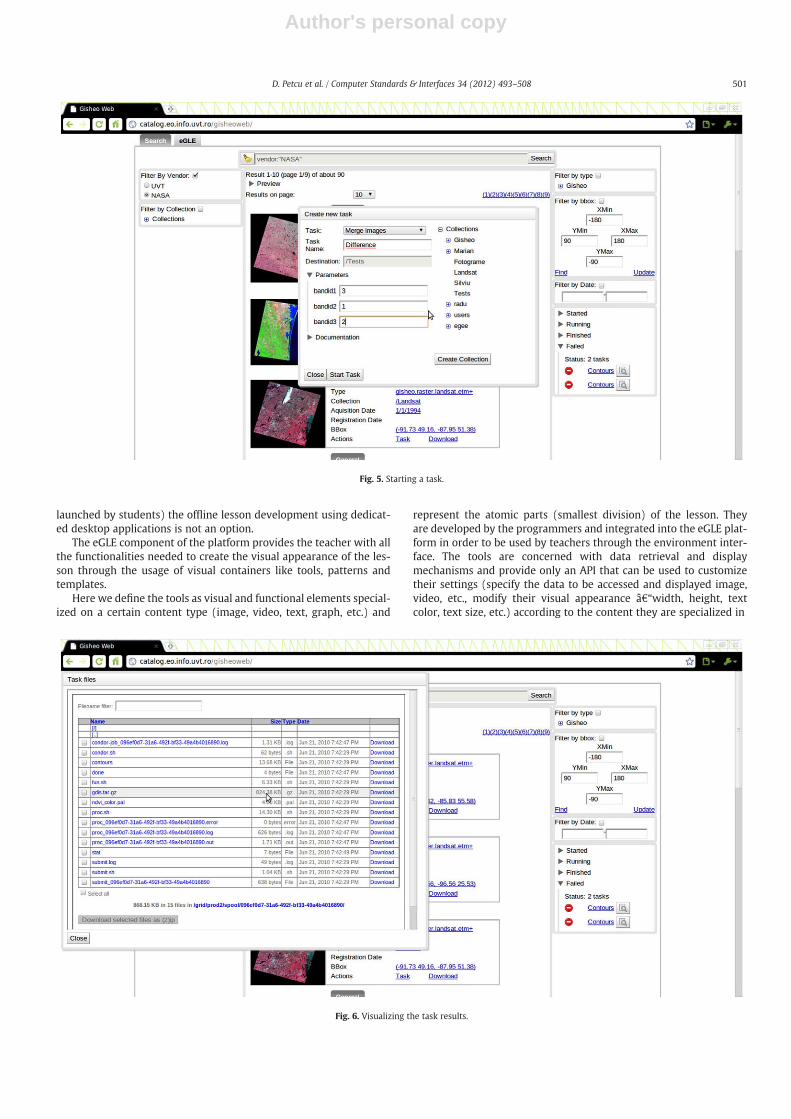
Note that the input and output (huge) images are transferred tothe user site only on request, all processing taking place where thedata are, i.e. on GiSHEO platform. Fig. 5 presents a specific casewhen a merging service is selected from the task list for a multispec-tral data and the user enters the service parameters, e.g. spectralbands to be combined. The processing results are stored at remotesite in catalogs specified by the user and which can be shared laterwith other users. Since the processing time of huge satellite imagescan be of second order (depending on the type of task), the commu-nication with the user is asynchronous and the status of the tasks canbe watched in the bottom-right panel. After the task completion, theuser can retrieve the results through the interface presented in Fig. 6.
We used a classical approach to access a Web portal: the Grid cre-dentials of the users are maintained in a database of the users. Theuser authentication is done via login and password on theWeb portal.
4.6. eGLE
As mentioned earlier, the platform is designed with the trainingpurpose in mind. The easy development of the EO lessons based onthe interactive experimental facilities of the platform has been aclear goal of the GiSHEO development. The current e-learning compo-nent of the platform allows the teacher to build, in a short time, newlessons based on templates for texts, images, videos, etc.
eGLE (GiSHEO eLearning Environment) is a particular componentof theWeb Application Server (WAS) and aims to offer to teachers theability to easily create lessons for different topics. eGLE providesmechanisms for knowledge presentation and assessment based onGrid processing capabilities, both for teachers and students. The plat-form implements user interaction tools as well as other componentsrequired for the development, execution and management of theteaching materials.
The aim of the eGLE component is to provide the non-technicalspecialists in Earth observation with a platform that allows them tosearch and retrieve information from distributed sources, launchlarge scale computations on massive data and create lessons basedon these pieces of information in a transparent manner. The interface
of the eGLE is focused on simplicity in order to be easy to use for av-erage computer users, but the implemented functionalities allow thelaunching of complex Grid operations.
Using the eGLE tools the teacher has the ability to: (a) search theavailable sources for existing learning objects and material thatcould be added to his lesson; (b) create new teaching materialsthrough the implementation and execution of new workflows basedon platform's application services; (c) create visual containers for in-formation display and format their appearance; (d) manage the ac-quired learning components and combine them using visualelements in order to create the lesson; (e) specify the desired interac-tivity level for each of the lesson components.
The students can follow the lesson static description and can exe-cute the associated experiments according to the constraints estab-lished by the teacher. Depending on the interaction level specified,they could also be allowed to describe and experiment new work-flows or choose different input data (e.g. remote sensing data) forexisting ones.
The eGLE related database includes conceptual and particularworkflow based descriptions, teaching materials and lesson re-sources, and selected remote sensing data. In a transparent manner,without having any knowledge of the location of the data or the pro-tocol needed to access it, the teacher is able to browse and search forinformation based on keywords, time intervals or latitude-longitudedefined areas. Another type of information that the teacher can in-clude in the lesson are the results of his own computations executedon the platform resources. Through the visual tools included in theeGLE interface, the teacher can describe his own workflow, andlaunch it in execution, monitor the execution progress and accessthe results without possessing any technical information related toGrid or Web technologies.
Once the information needed for the lesson is acquired, the teach-er is able to set up the lesson structure, to organize logically the infor-mation and to define the desired display settings (e.g. text size andcolor). As the amount of data included in the lesson can be verylarge (satellite images, videos, files with measured values, etc.) ormay be accessible only at runtime (the custom computations
Fig. 4. Location search.
500 D. Petcu et al. / Computer Standards & Interfaces 34 (2012) 493–508
Author's personal copy
launched by students) the offline lesson development using dedicat-ed desktop applications is not an option.
The eGLE component of the platform provides the teacher with allthe functionalities needed to create the visual appearance of the les-son through the usage of visual containers like tools, patterns andtemplates.
Here we define the tools as visual and functional elements special-ized on a certain content type (image, video, text, graph, etc.) and
represent the atomic parts (smallest division) of the lesson. Theyare developed by the programmers and integrated into the eGLE plat-form in order to be used by teachers through the environment inter-face. The tools are concerned with data retrieval and displaymechanisms and provide only an API that can be used to customizetheir settings (specify the data to be accessed and displayed image,video, etc., modify their visual appearance –width, height, textcolor, text size, etc.) according to the content they are specialized in
Fig. 5. Starting a task.
Fig. 6. Visualizing the task results.
501D. Petcu et al. / Computer Standards & Interfaces 34 (2012) 493–508

Author's personal copy
Fig. 7. Wizard steps that helps the teacher to define patterns and instantiate tools.
502 D. Petcu et al. / Computer Standards & Interfaces 34 (2012) 493–508

Author's personal copy
The patterns represent visual containers and logical informationorganizers. They can be created directly by the teachers at authoringtime through a wizard like interface (Fig. 7) that will allow them tocustomize their visual appearance. On each column of a pattern canbe integrated a different tool that will be chosen on the second stepof the wizard. Once a pattern is created, it can be reused by all plat-form users.
The templates are visual containers and pattern collections thatdefine the general layout and settings at lesson global level. The visualattributes defined at template level provide unitary visual formattingthroughout the entire lesson, and can be overridden at pattern or toollevel if necessary.
After creating a pattern and selecting the desired tools to be inte-grated into the lesson, the teacher has the opportunity to specify theinstantiated data that will be displayed in each tool by moving to step3 of the wizard. At this point each tool will display visual user inter-face components that are specific to the tools data type.
For some of the tools, the teacher will have the ability to specify acertain student interaction level. For example, the student could re-ceive the right to launch Grid computations on certain data sets.From this point of view, the eGLE platform aims to implement threedifferent lesson scenarios (details can be found in [6]):
1. Static lessons: the student cannot modify the displayed informa-tion. Nevertheless, the student may be granted the ability to con-trol slideshows, videos or multimedia content (Fig. 8 - top image).
2. Dynamic data lessons: the students can launch specific applicationservices with input data sets that are predefined by the teacher atauthoring time. All the available options will be displayed using alist component while the processing results are automatically in-cluded into the lesson in a specific area chosen by the teacher.
3. Dynamic workflow lessons: the students are granted the abilityto modify a predefined workflow (Fig. 8 - bottom image). For se-curity reasons, the elements that can be added to the graph arechosen at authoring time by the teacher, but the student willhave the ability to describe any processing graph using the pro-vided components. After finishing the workflow description thestudents could be allowed to launch the computation over theGrid on a specific data set or on several data sets, also predefinedby the teacher.
5. Case study: support for a history lesson
A simple example of platform usage, as well as an innovative one,is about assisting the students in history to identify archeological sitesthrough visual inspection and interpretation of aerial images. The aimof the lesson is either a detailed analysis of known archeological sitesin order to identify anthropological characteristics or to identify newarcheological sites through intensive study of a large set of images.The specific requirements are related to: image enhancement, assis-tance in the identification of morphological elements like circular,rectangular or linear shapes, assistance in the identification of mor-phological characteristics like size of pit houses or distribution anddistances between them. The image enhancement process dependson the aim of the analysis.
We consider for example the case of searching for linear shapescorresponding to wave-like fortifications. The appropriate pipelineof transformations could include: gray level conversion, emboss (con-volution operation), histogram equalization and layer combination.Such transformations just enhance the image in order to help theuser to identify the shapes of interest by visual inspection. In orderto provide a semi-automatic tool for linear shapes identificationmore sophisticated operations should be used. One of these opera-tions is the Hough transform which is applied to the binary imagewhich locates the edges in the image. Therefore the proposed flowof operations allowing the identification of linear shapes in an
image is: (i) gray level conversion; (ii) histogram equalization; (iii)edge detection (e.g. by using the Canny filter); (iv) lines identificationby Hough transform.
In Fig. 9 is presented the result obtained by applying this flow ofoperations on the image in the top left corner which corresponds toa land on which one can visually identify the marks of a wave-likeRoman fortification.
The main problem in identifying the marks of this fortification isthe fact that it is somehow obscured by the marks of current land di-vision. A possible way to mask the obvious shapes and to enhance theother ones is to use the singular value decomposition of the imageand to ignore the components corresponding to the highest singularvalue(s) (which contain the most important features in the image).Substituting histogram equalization with the transformation whichreplaces the image with the sum of the components correspondingto the singular values of ranks between 2 and 200 we obtained the re-sults illustrated in Fig. 9 (top right). By applying the typical sequenceof operations for line detection (Canny filter followed by the Houghtransform) a lot of lines are detected (Fig. 9 - bottom left), thus a post-processing step is needed in order to eliminate the lines correspond-ing to current land division. Since these lines are almost parallel whilethe fortification has a rather different direction, the ancient marks canbe identified by eliminating all almost parallel lines, i.e. those havingclose enough slopes. The result after post-processing is illustrated inFig. 9 (bottom right) and it corresponds to the real mark of a romanfortification. The parameters of the image transformation procedures(that are publicly available also as Web services — see the platform'sWeb site) are set for this experiment according to the values indicat-ed in the SiLK code from the previous section.
If a number of data is to be treated simultaneously by all the stu-dents from the classroom, a single computing node is not able to re-spond in a reasonable time. In order to obtain a fast response thestudents pairs bworkflow, input aerial image> are scheduled by theplatform on different computing nodes.
The transformations presented above match a sequential pipelinetemplate. Other more complex transformations related to clustering(for statistics related issues in archeology) are not only data-intensive but also computing-intensive requiring further split: differ-ent tasks of the workflow on different computational nodes (distrib-uted tasks or distributed pipeline) or parts of the input data ondifferent computational nodes (parallel tasks). Templates differentfrom the sequential pipeline should be used in these cases.
Other examples of using GiSHEO's basic application services areprovided in [10]. Here we selected this case study also to point to-wards the fact that the process of identifying the right combinationof image processing algorithms to reach the requested result can betedious. Moreover the fortification detection is a good example for abackwards pursue of workflow steps or services (mentioned earlierin the workflow related subsection). Furthermore, the three lessonscenarios mentioned in the previous section are reflected in the fol-lowing potential actions of the teacher:
1. The teacher follows a known recipe having a good knowledge onhow to set parameters of each image processing service to obtainthe expected results;
2. The teacher spends some time tuning these parameters for a particu-lar workflow by experiments. Parameter sweep is matching very wellthe platform design, since the communication with the platform isasynchronous and multiple tasks can run simultaneously. Using theplatform, the teacher will receive a fast response to several requestsand can compare easily the results to select the proper parametercombinations for different services of the workflow. The traineeswill be able to repeat the teacher's experiments in order to understandthe process of the selection of the optimal parameters.
3. The teacher stimulates the creativity of the students leaving the taskof parameters identification to the available human resources, the
503D. Petcu et al. / Computer Standards & Interfaces 34 (2012) 493–508

Author's personal copy
students, who are able to redesign theworkflow or to change the pa-rameters of the basic services encountered in a given workflow.
6. Experimental results
Several stress tests were applied to the GiSHEO platform in order tosimulate a teaching environment where the platform must deal with
several clients and each client can make several requests to the platformservices. We measured the entire process that can be described asfollows:
Step 1. A client selects an image and it submits the image forprocessing.
Step 2. The platform translates user's request in form of a task and itsubmits the task to the processing platform.
Fig. 8. Lesson and workflow in eGLE.
504 D. Petcu et al. / Computer Standards & Interfaces 34 (2012) 493–508

Author's personal copy
Step 3. The processing platform transfers all the tools and images to acompute node and starts the processing.
Step 4. When the processing finishes the output is uploaded to thecentral catalog and a notification is sent.
Step 5. The processing platform cleans up the compute node and theuser is notified about the result.
In the next two subsections we present the results of two differentkinds of tests, concerning processing run times and services' responsetimes.
6.1. Number of simultaneous requests
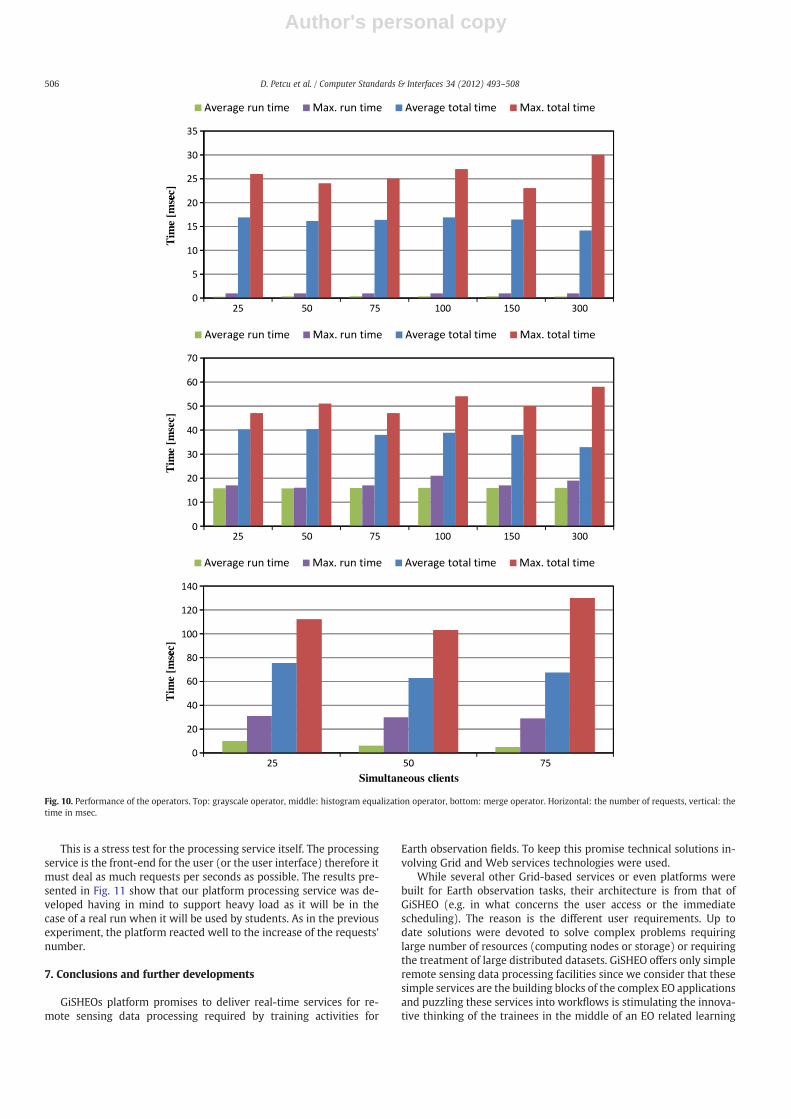
The first set of tests targeted to measure the influence on the pro-cessing time of the number of clients requesting simultaneously to beserved. Taking into account the target of classroom lessons, the ex-periment assumed that all clients request the following operatorson various images: (1) grayscale; (2) histogram equalization; (3)merge. Note that despite the simplicity of the operations, often theycannot be performed on a desktop due to the huge dimension of theinput data (this is especially the case with the third operation).
The tests targeted two measurements: the run time (the timeneeded by the algorithm to finish the analysis) and the total time(the execution time for the entire process).
All three processings are different in terms of difficulty. The gray-scale transformation is the simplest one, it is neither data or computeintensive but this processing is used in combinationwith several othersto create complex analysis on the images. Being a simple processing wecan interpret it as a processing platform response time test. The resultsfrom the experiments (depicted by Fig. 10 - top) show that the platform
responds in almost the same time (between 25 and 30 ms) either thatwe have 25 clients or we burst up to 300 clients simultaneously. A setof ten images with different characteristics (size, quality, complexity)were considered as inputs leading to considerable differences betweenthe average run time and themaximum run time. The histogram equal-ization operator is a bit more complex that the grayscale operator.Therefore the results for both execution time and total time are higheras depicted in Fig. 10 - middle.
The merge operator is more complex, in comparison with theother two operators presented, in terms of data and memory. Themerge operator works with multispectral images where it combinesthree bands (at the user's choice) in order to create one outputmerged image. This processing has to deal with bigger images aseach band can have 100 MB or more (in the case of grayscale and his-togram equalization the medium image size is 70 MB) therefore theresponse time is considerable affected by the overhead time inducedby the data transfer (Fig. 10 - bottom).
The test conclusion is that platform allows the seamless concur-rent access of the clients for training purposes, and it does not exhibitperformance losses when the number of simultaneous users reach ahundred orders (the maximum expected for a training platform).
6.2. Service request rate
The following test aimed to show how processing time is influ-enced by the frequency of service requests (number of requests persecond). The experiment assumes a client sends requests for applyingthe grayscale and histogram operators on the same set of images as inthe previous experiment, with increasing rates of 10, 25 and 50 re-quests/second in the same period of time of 10 seconds.
Fig. 9. Using singular value decomposition to enhance the ancient marks: original image - top left; image transformed by retaining the components corresponding to singular valueswith ranks between 2 and 200 - top right; lines detected by applying Canny filter and Hough transform - bottom left; the line obtained by post-processing - bottom right.
505D. Petcu et al. / Computer Standards & Interfaces 34 (2012) 493–508
Author's personal copy
This is a stress test for the processing service itself. The processingservice is the front-end for the user (or the user interface) therefore itmust deal as much requests per seconds as possible. The results pre-sented in Fig. 11 show that our platform processing service was de-veloped having in mind to support heavy load as it will be in thecase of a real run when it will be used by students. As in the previousexperiment, the platform reacted well to the increase of the requests'number.
7. Conclusions and further developments
GiSHEOs platform promises to deliver real-time services for re-mote sensing data processing required by training activities for
Earth observation fields. To keep this promise technical solutions in-volving Grid and Web services technologies were used.
While several other Grid-based services or even platforms werebuilt for Earth observation tasks, their architecture is from that ofGiSHEO (e.g. in what concerns the user access or the immediatescheduling). The reason is the different user requirements. Up todate solutions were devoted to solve complex problems requiringlarge number of resources (computing nodes or storage) or requiringthe treatment of large distributed datasets. GiSHEO offers only simpleremote sensing data processing facilities since we consider that thesesimple services are the building blocks of the complex EO applicationsand puzzling these services into workflows is stimulating the innova-tive thinking of the trainees in the middle of an EO related learning
Fig. 10. Performance of the operators. Top: grayscale operator, middle: histogram equalization operator, bottom: merge operator. Horizontal: the number of requests, vertical: thetime in msec.
506 D. Petcu et al. / Computer Standards & Interfaces 34 (2012) 493–508

Author's personal copy
process. Puzzle pieces in the form of tools, templates and patterns areavailable also for teachers to build personalized lessons. Moreover,GiSHEO basic application services are expected to respond in a shorttime since they are conceived for the classroom's real experiments.
Looking beyond the user interface, one can find implemented newtechnical solutions like the rule-based workflow language or the sim-ple query language for EO data. These solutions are platform indepen-dent and can be reused for other aims.
Note that the platform was stressed in classroom experiments bythe master students in the Geographic Information Systems enrolledin the academic year 2009–2010 at the university of the first groupof authors, at an international GiSHEO-dedicated training event inSeptember 2009, and during a demo session in April 2009 at EGEEUser Forum. As a consequence, several weaknesses in GiSHEO designand implementation were identified and the platform architecturehas suffered several reiterations in its three years of development.In this context, the user interface was the most dynamic component,and the results at stress tests exposed in this paper are revealing thefact that the latest interface is able to serve hundreds of clients.
Further developments of GisHEO solutions are expected in the di-rection of assimilating the newest technologies provided by Cloudcomputing. GiSHEO is currently used as case study for the mOSAICproject [12] building a solution for the portability of Cloud applica-tions on different Cloud resources.
References
[1] CEOS Working Group on Training and Education, http://www.acrors.ait.ac.th/ceos/.
[2] e-IRG, Data Management Task Force report, http://www.e-irg.eu/images/stories/e-irgdmtfreportfinal.pdf.
[3] M.E. Frincu, D. Petcu, OSyRIS: a nature inspiredworkflow engine for service orientedenvironments, Scalable Computing: Practice and Experience 11 (1) (2010) 81–97.
[4] L. Fusco, R. Cossu, C. Retscher, Open grid services for Envisat and Earth observa-tion applications, in: A. Plaza, C. Chang (Eds.), High Performance Computing inRemote Sensing, Chapman & Hall, Taylor & Francis Group, 2008, pp. 237–280.
[5] S.D. Gasster, C.A. Lee, J.W. Palko, Remote sensing Grids: architecture and imple-mentation, in: A. Plaza, C. Chang (Eds.), High Performance Computing in RemoteSensing, 2008, pp. 203–236.
[6] D. Gorgan, T. Stefanut, V. Bacu, Grid based training environment for Earth obser-vation, in: N. Abdenaher, D. Petcu (Eds.), Advances in Grid and Pervasive Comput-ing, Springer, 2009, pp. 98–109, LNCS 5529.
[7] GWT - Google Web Toolkit, http://code.google.com/webtoolkit/.[8] M. Neagul, S. Panica, D. Petcu, D. Zaharie, D. Gorgan, Web and Grid services for
training in Earth observation, IEEE International Workshop on Intelligent DataAcquisition and Advanced Computing Systems: Technology and Applications21–23, September 2009, pp. 241–246, Rende (Cosenza), Italy.
[9] Open-source Project for a Network Data Access Protocol, http://opendap.org/.[10] D. Petcu, D. Zaharie, M. Neagul, S. Panica, M. Frincu, D. Gorgan, T. Stefanut, V.
Bacu, Remote sensed image processing on grids for training in Earth observation,in: Yung-Sheng Chen (Ed.), Image Processing, InTech, 2009, pp. 115–140.
[11] A. Radu, V. Bacu, D. Gorgan, Diagrammatic description of satellite image proces-sing workflow, Procs. SYNASC08, IEEE Computer Press, 2009, pp. 341–348.
[12] mOSAIC Consortium, D3.1 - Cloud usage patternsAvailable at, http://www.mosaic-cloud.eu/dissemination/deliverables/FP7-256910-D3.1-1.0.pdf.
Prof. Dana PETCU is Director of Computer Science Depart-ment and of the private research Institute e-Austria Timisoa-ra. Her research experience is related to the topics of paralleland distributed computing, and computational mathematics.She has authored more than 250 reviewed articles and 10textbooks. She is chief editor of the international journalScalable Computing: Practice and Experiences and co-editorof over 15 conference proceedings. She leads three EuropeanCommission’s projects in software services, HPC and Cloudcomputing and was involved as team leader in more thanten others related to distributed and parallel computing. Shehas also lead the ESA-PECS project GiSHEO and severalRomanian research projects. She received the international
Maria-Sybilla-Merian award for women in science and an IBM award, and is nominatedRomanian representative in FP7-ICTC, eIRG and eIPF.
Silviu Panica has more than six years of experience indistributed computing being involved in several Europeanfunded projects related to grid computing and cloud com-puting. He was Research Assistant in the Computer ScienceDepartment of West University of Timisoara from 2005 until2007. During this period his research interest was in remotesensing field using Grid computational power combinedwiththe high performance infrastructure to optimize the overallprocessing time of the satellite images. Starting with 2007he is a PhD student at West University of Timisoara. His cur-rent research interest is in Cloud computing area focusingon the resource identification protocols applied in heteroge-neous unstable distributed systems.
Dr. Marc Eduard Frincu has received his B.Sc. and M.Sc. in2006 and 2008 respectively from the West University ofTimisoara, Romania. In 2011 he earned his Ph.D. from thesame university in the field of Distributed Systems withthe topic “Adaptive Scheduling for Distributed Systems”.His main interests are distributed systems with emphasison scheduling algorithms for Grids and Clouds. These arebacked by more than 30 papers in conference proceedingsand journals. He is now a teaching assistant at theWest Uni-versity of Timisoara and researcher at the e-Austria Institute.
Marian Neagul is instructor and PhD student at the Facultyof Mathematics and Computer Science, West University ofTimisoara. His current research interests are focused ondistributed data management, focusing mainly on Cloudcomputing.
Fig. 11. Processing time for increasing request rates. Horizontal: the number of requests per second, vertical: the time in ms for the serving the requests registered in 10 s.
507D. Petcu et al. / Computer Standards & Interfaces 34 (2012) 493–508

Author's personal copy
Prof. Daniela Zaharie is professor of Computer Science atthe West University of Timisoara, Romania. Her main re-search topics are data mining, machine learning, evolu-tionary computing and image processing. Her list ofpublications contains around 80 titles. She is member ofthe program committee of more than 15 internationalconferences and one of the editors of the proceedings ofthe Symposium of Symbolic and Numeric Algorithms forScientific Computing.
Dr. Georgiana Macariu received her MSc in Computer Sci-ence in 2008 and PhD degree in 20101 at the “Politehnica”University of Timisoara, Computer Science Department,where she is currently assistant professor. She carries outalso her research activities at the research Institute e-Austria Timisoara. Her area of interest covers distributedcomputingwith a focus on creating a framework for dynamiccomposition of computational services tailored for largescale systems, and embedded systems with a particular in-terest in task scheduling on multi-core mobile communi-cation systems.
Prof. Dorian Gorgan is PhD supervisor in Computer Scienceand Information Technologies at the Technical University ofCluj-Napoca. He is the chair of the CGIS (Computer Graphicsand Interactive Systems) Laboratory. His fields of interestconcern with graphical modeling and processing based ongraphics clusters, grid computing, interactive and distribut-ed applications, eLearning, Earth Science applications andtools development, geospatial and Grid infrastructures in-teroperability. He was the initiator and the director of theMedioGrid project and national research and academic Gridinfrastructure. He is involved as well in other Grid andeLearning related international research projects such asEnviroGRIDS, GiSHEO, mEducator, and SEE-GRID-SCI.
Teodor Stefanut received his MSc degree in ComputerScience in 2009 and continues his PhD studies in the samedomain at the Technical University of Cluj-Napoca. He iscurrently member of the Computer Graphics and Interac-tive Systems Laboratory (CGIS) and junior lecturer at thesame institution, in the Computer Science Department.His research interests include new user interactions tech-niques, development of Grid applications for non-technicalspecialists, eLearning platforms based on distributedarchitectures, graphical annotation as user interactiontechnique in the context of a lesson.
508 D. Petcu et al. / Computer Standards & Interfaces 34 (2012) 493–508