Restoration of Oligodendrocyte Pools in a Mouse Model of Chronic Cerebral Hypoperfusion
Upload
independentCategory
view
3download
0
www.elsevier.com/locate/scitotenv
Science of the Total Environm
Exo-enzymatic activities and dissolved organic pools in relation with
mucilage development in the Northern Adriatic Sea
R. Danovaro a,*, M. Armeni a, G.M. Luna a, C. Corinaldesi a, A. Dell’Anno a,
C.R. Ferrari c, C. Fiordelmondo a, C. Gambi a, M. Gismondi c, E. Manini d,
M. Mecozzi b, F.M. Perrone a, A. Pusceddu a, M. Giani e
a DSM-Dipartimento Scienze del Mare, Universita Politecnica delle Marche, Via Brecce Bianche-60131 Ancona, Italyb ICRAM-Istituto Centrale per la Ricerca Scientifica e Tecnologica Applicata al Mare, via di Casalotti 300, 00166 Rome, Italy
c ARPA-Agenzia Regionale Prevenzione Ambiente Emilia Romagna, V.le Vespucci 2, 47042 Cesenatico FC, Italyd CNR-ISMAR-Istituto Scienze Marine, Sezione Ecosistemi Costieri e Lagunari, Via Pola 4, 70100 Lesina, Italy
e ICRAM-Istituto Centrale per la Ricerca Scientifica e Tecnologica Applicata al Mare, Chioggia, Italy
Available online 12 October 2005
Abstract
We tested the hypothesis that the appearance of mucilage in the Northern Adriatic Sea was related with the accumulation of
dissolved organic compounds released by intensive enzymatic activities and not utilized as direct substrate for microbial growth. To
do this enzymatic activities and dissolved organic and inorganic pools in periods characterized by the presence of mucilage and in
the same seasons but in absence of mucilage were compared. Extracellular enzymatic activities (aminopeptidase, h-glucosidase andalkaline phosphatase), nutrient pool concentrations (total dissolved nitrogen, dissolved organic nitrogen, total dissolved phospho-
rus, dissolved organic phosphorus) and the biochemical composition of particulate and dissolved organic matter (in terms of
proteins and carbohydrates) were determined on a monthly basis over a period of 3 years. Aminopeptidase and alkaline
phosphatase activities displayed higher values in springs preceding the appearance of mucilage than in spring when no mucilage
was observed. h-Glucosidase activity showed significantly higher values in summer periods characterized by the massive
production of mucilage than in summers without mucilage events. The months preceding mucilage events were also characterized
by an increase of the alkaline phosphatase to aminopeptidase activity ratio and by a significant accumulation of dissolved proteins.
These findings, together with the significant increase of the DON/DOP ratio, suggest that mucilage formation is favoured by the
deficiency of organic P. The present study provides compelling evidences that mucilage formation is favoured by the unbalance
between organic matter mobilization by enzymatic activities and the accumulation of labile dissolved organic-N compounds.
D 2005 Elsevier B.V. All rights reserved.
Keywords: Mucilage; Aminopeptidase; h-Glucosidase; Alkaline phosphatase; Dissolved organic matter; Adriatic Sea
1. Introduction
0048-9697/$ - see front matter D 2005 Elsevier B.V. All rights reserved.
doi:10.1016/j.scitotenv.2005.09.029
* Corresponding author. Department of Marine Science, Faculty of
Science, Polytechnic University of Marche, Via Brecce Bianche,
60131 Ancona, Italy. Tel.: +39 71 220 4654; fax: +39 71 220 4650.
E-mail address: [email protected] (R. Danovaro).
The appearance of large mucilage aggregates in the
Adriatic Sea has been documented since the 18th
century, but has become increasingly evident in the
last decades (Funari et al., 1999). This phenomenon
has been also increasingly reported in several areas
worldwide, as repeatedly reported from studies carried
ent 353 (2005) 189–203
R. Danovaro et al. / Science of the Total Environment 353 (2005) 189–203190
out in Tyrrhenian Sea (Innamorati, 1995), in the North
Aegean (Gotsis-Skretas, 1995), in the North Sea (Rie-
besell, 1992), in coastal areas of the Pacific Ocean
(Alldredge et al., 2002) and New Zealand (MacKenzie
et al., 2002). In the Adriatic Sea, mucilage aggregates
usually appear in late-spring/summer. Each aggregate
can have a size from few mm up to several meters
extending up to several hundred km2. Mucilage scav-
enging plankton and detrital particles, settling on the
bottom, can determine ipoxic and/or anoxic conditions
particularly in the bottom waters and at the sediment–
mucilage interface. The suffocation of benthic and
epibenthic (including nekton) organisms poses serious
fishery and sanitary problems, with important socio-
economical implications.
It has been hypothesised that mucilage aggregates are
an exacerbated and evolving stage of the bmarine snowQ(Herndl and Peduzzi, 1988; Herndl, 1992; Fogg, 1995),
appearing in environmental conditions able to favour the
progressive coalescence of marine aggregates. Although
the phenomenon of mucilage appearance has been al-
ready well described, little is known yet about mechan-
isms triggering its massive formation. Although there is
a converging opinion that mucilage production is the
result of synergistic effects of biological and physico-
chemical factors, several other hypotheses have been
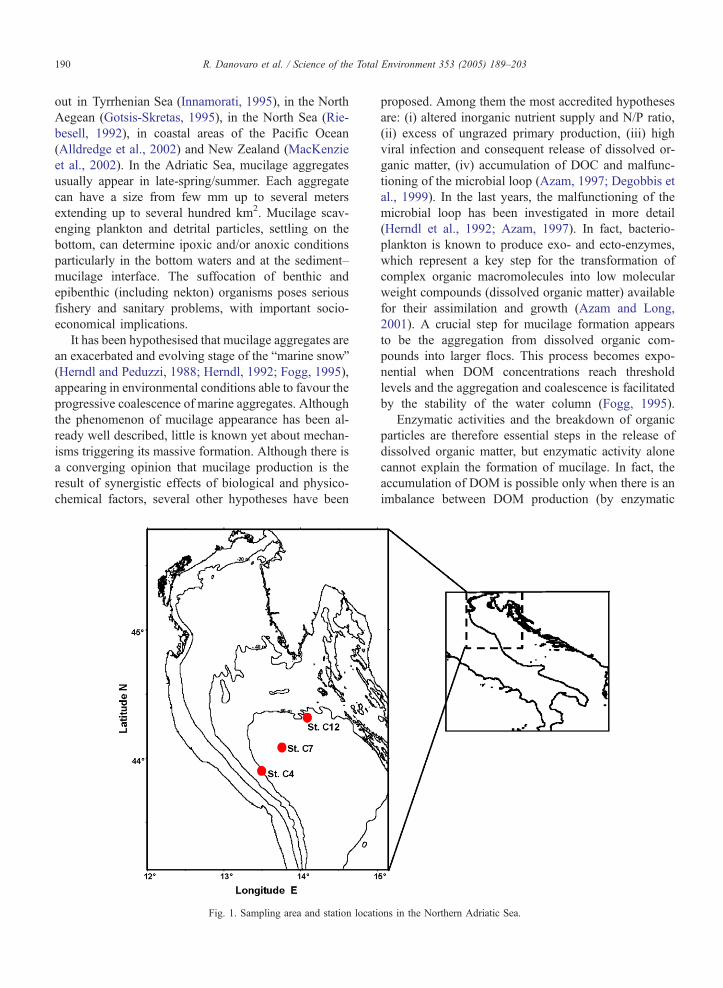
Fig. 1. Sampling area and station locati
proposed. Among them the most accredited hypotheses
are: (i) altered inorganic nutrient supply and N/P ratio,
(ii) excess of ungrazed primary production, (iii) high
viral infection and consequent release of dissolved or-
ganic matter, (iv) accumulation of DOC and malfunc-
tioning of the microbial loop (Azam, 1997; Degobbis et
al., 1999). In the last years, the malfunctioning of the
microbial loop has been investigated in more detail
(Herndl et al., 1992; Azam, 1997). In fact, bacterio-
plankton is known to produce exo- and ecto-enzymes,
which represent a key step for the transformation of
complex organic macromolecules into low molecular
weight compounds (dissolved organic matter) available
for their assimilation and growth (Azam and Long,
2001). A crucial step for mucilage formation appears
to be the aggregation from dissolved organic com-
pounds into larger flocs. This process becomes expo-
nential when DOM concentrations reach threshold
levels and the aggregation and coalescence is facilitated
by the stability of the water column (Fogg, 1995).
Enzymatic activities and the breakdown of organic
particles are therefore essential steps in the release of
dissolved organic matter, but enzymatic activity alone
cannot explain the formation of mucilage. In fact, the
accumulation of DOM is possible only when there is an
imbalance between DOM production (by enzymatic
ons in the Northern Adriatic Sea.
R. Danovaro et al. / Science of the Total Environment 353 (2005) 189–203 191
cleavage of macromolecules) and bacterial uptake.
Such uncoupling, whose reasons are still under debate,
enhances the accumulation of DOM and TEP leading to
the coalescence of organic matter into large aggregates
(Decho and Herndl, 1995).
We investigated for 3 years, on a monthly basis, a
transect of stations crossing coast to coast the Northern
Adriatic Sea, in a sector frequently interested by muci-
lage formation. We analyzed the interactions between
dissolved and particulate organic matter pools (i.e.,
proteins and carbohydrates), in relation with extra-
cellular enzymatic activities, such as aminopeptidase
(which hydrolyses peptides and proteins), h-glucosi-dase (a key enzyme in carbohydrate degradation) and
alkaline phosphatase (which hydrolyses organic phos-
phoesters). These variables were investigated also in
relation with dissolved organic and inorganic N and P
Total Dissolved
0
5
10
15
20
25
Jun
e 99
July
99
Au
g 9
9
Sep
t 99
Oct
99
No
v 99
Jan
00
Feb
r 00
Mar
ch 0
0
Ap
ril 0
0
May
00
Jun
e 00
July
1 0
0
July
2 0
0
Au
g 0
0
Oct
00
No
v 00
Jun
e 99
July
99
Au
g 9
9
Sep
t 99
Oct
99
No
v 99
Jan
00
Feb
r 00
Mar
ch 0
0
Ap
ril 0
0
May
00
Jun
e 00
July
1 0
0
July
2 0
0
Au
g 0
0
Oct
00
No
v 00
Jun
e 99
July
99
Au
g 9
9
Sep
t 99
Oct
99
No
v 99
Jan
00
Feb
r 00
Mar
ch 0
0
Ap
ril 0
0
May
00
Jun
e 00
July
1 0
0
July
2 0
0
Au
g 0
0
Oct
00
No
v 00
µM-N
C4 surface C
0
5
10
15
20
25
µM-N
C7 surface C
a
b
0
5
10
15
20
25
µM-N
C12 surface C
c
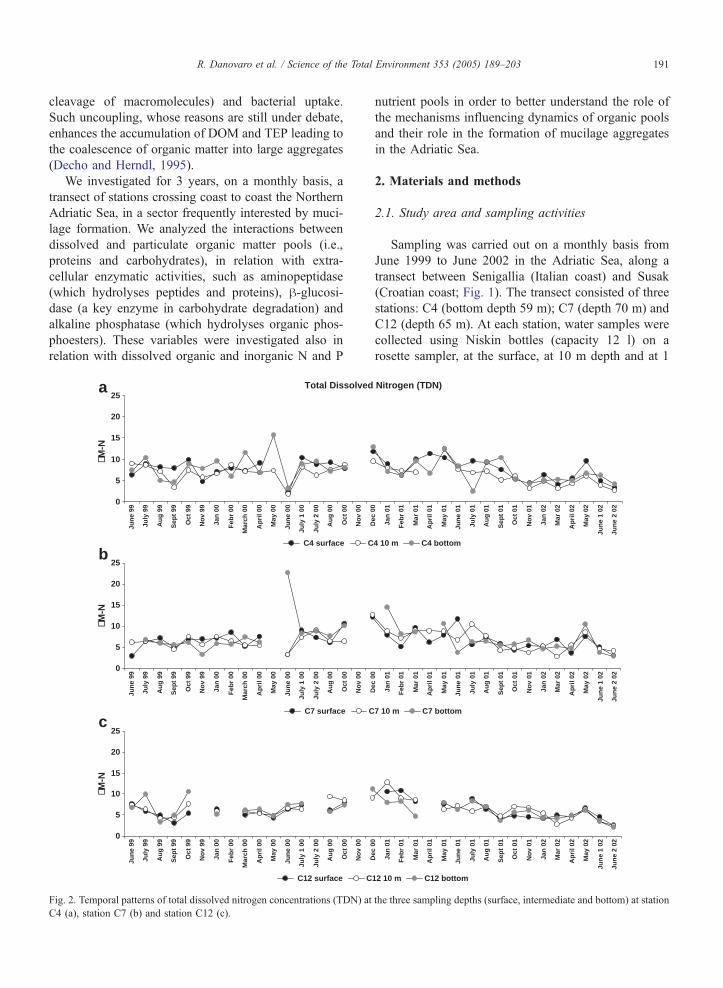
Fig. 2. Temporal patterns of total dissolved nitrogen concentrations (TDN) at
C4 (a), station C7 (b) and station C12 (c).
nutrient pools in order to better understand the role of
the mechanisms influencing dynamics of organic pools
and their role in the formation of mucilage aggregates
in the Adriatic Sea.
2. Materials and methods
2.1. Study area and sampling activities
Sampling was carried out on a monthly basis from
June 1999 to June 2002 in the Adriatic Sea, along a
transect between Senigallia (Italian coast) and Susak
(Croatian coast; Fig. 1). The transect consisted of three
stations: C4 (bottom depth 59 m); C7 (depth 70 m) and
C12 (depth 65 m). At each station, water samples were
collected using Niskin bottles (capacity 12 l) on a
rosette sampler, at the surface, at 10 m depth and at 1
Nitrogen (TDN)D
ec 0
0
Jan
01
Feb
r 01
Mar
01
Ap
ril 0
1
May
01
Jun
e 01
July
01
Au
g 0
1
Sep
t 01
Oct
01
No
v 01
Jan
02
Mar
02
Ap
ril 0
2
May
02
Jun
e 1
02
Jun
e 2
02
Dec
00
Jan
01
Feb
r 01
Mar
01
Ap
ril 0
1
May
01
Jun
e 01
July
01
Au
g 0
1
Sep
t 01
Oct
01
No
v 01
Jan
02
Mar
02
Ap
ril 0
2
May
02
Jun
e 1
02
Jun
e 2
02
Dec
00
Jan
01
Feb
r 01
Mar
01
Ap
ril 0
1
May
01
Jun
e 01
July
01
Au
g 0
1
Sep
t 01
Oct
01
No
v 01
Jan
02
Mar
02
Ap
ril 0
2
May
02
Jun
e 1
02
Jun
e 2
02
4 10 m C4 bottom
7 10 m C7 bottom
12 10 m C12 bottom
the three sampling depths (surface, intermediate and bottom) at station
R. Danovaro et al. / Science of the Total Environment 353 (2005) 189–203192
m above the bottom. Samples were processed immedi-
ately after collection, as described below.
2.2. Analyses of dissolved inorganic nitrogen and
phosphorus
Water samples for nutrient determinations were fil-
tered utilizing HA 0.45 Am Millipore membrane filters
and then stored frozen until laboratory processing,
which was usually carried out within 3 days after sam-
pling. Total dissolved nitrogen (TDN), total dissolved
phosphorus (TDP), total nitrogen (TN) and total phos-
phorus (TP) were measured according to Koroleff
(1983) after persulfate digestion. Analyses of inorganic
nutrient concentrations (NO2, NO3, NH4, PO4) were
carried out spectrophotometrically using a Bran Luebbe
autoanalyzer (Traacs 800 and AAIII). Dissolved organic
Dissolved Organi
0
5
10
15
20
Jun
e 99
July
99
Au
g 9
9
Sep
t 99
Oct
99
No
v 99
Jan
00
Feb
r 00
Mar
ch 0
0
Ap
ril 0
0
May
00
Jun
e 00
July
1 0
0
July
2 0
0
Au
g 0
0
Oct
00
No
v 00
Jun
e 99
July
99
Au
g 9
9
Sep
t 99
Oct
99
No
v 99
Jan
00
Feb
r 00
Mar
ch 0
0
Ap
ril 0
0
May
00
Jun
e 00
July
1 0
0
July
2 0
0
Au
g 0
0
Oct
00
No
v 00
Jun
e 99
July
99
Au
g 9
9
Sep
t 99
Oct
99
No
v 99
Jan
00
Feb
r 00
Mar
ch 0
0
Ap
ril 0
0
May
00
Jun
e 00
July
1 0
0
July
2 0
0
Au
g 0
0
Oct
00
No
v 00
µM-N
C4 surface C
0
5
10
15
20
µM-N
C7 surface C
0
5
10
15
20
µM-N
C12 surface C
a
b
c
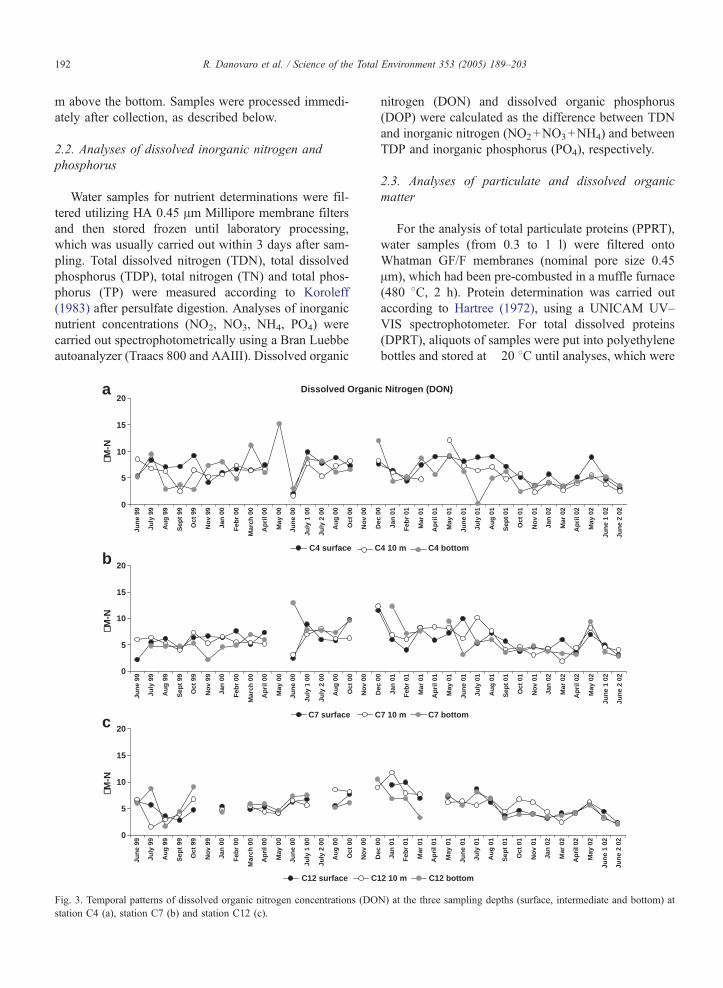
Fig. 3. Temporal patterns of dissolved organic nitrogen concentrations (DO
station C4 (a), station C7 (b) and station C12 (c).
nitrogen (DON) and dissolved organic phosphorus
(DOP) were calculated as the difference between TDN
and inorganic nitrogen (NO2+NO3+NH4) and between
TDP and inorganic phosphorus (PO4), respectively.
2.3. Analyses of particulate and dissolved organic
matter
For the analysis of total particulate proteins (PPRT),
water samples (from 0.3 to 1 l) were filtered onto
Whatman GF/F membranes (nominal pore size 0.45
Am), which had been pre-combusted in a muffle furnace
(480 8C, 2 h). Protein determination was carried out
according to Hartree (1972), using a UNICAM UV–
VIS spectrophotometer. For total dissolved proteins
(DPRT), aliquots of samples were put into polyethylene
bottles and stored at �20 8C until analyses, which were
c Nitrogen (DON)D
ec 0
0
Jan
01
Feb
r 01
Mar
01
Ap
ril 0
1
May
01
Jun
e 01
July
01
Au
g 0
1
Sep
t 01
Oct
01
No
v 01
Jan
02
Mar
02
Ap
ril 0
2
May
02
Jun
e 1
02
Jun
e 2
02
Dec
00
Jan
01
Feb
r 01
Mar
01
Ap
ril 0
1
May
01
Jun
e 01
July
01
Au
g 0
1
Sep
t 01
Oct
01
No
v 01
Jan
02
Mar
02
Ap
ril 0
2
May
02
Jun
e 1
02
Jun
e 2
02
Dec
00
Jan
01
Feb
r 01
Mar
01
Ap
ril 0
1
May
01
Jun
e 01
July
01
Au
g 0
1
Sep
t 01
Oct
01
No
v 01
Jan
02
Mar
02
Ap
ril 0
2
May
02
Jun
e 1
02
Jun
e 2
02
4 10 m C4 bottom
7 10 m C7 bottom
12 10 m C12 bottom
N) at the three sampling depths (surface, intermediate and bottom) at
R. Danovaro et al. / Science of the Total Environment 353 (2005) 189–203 193
carried out by adapting the procedure described for
sediment samples by Lawrence et al. (1995). For the
analysis of total particulate carbohydrates (PCHO),
water samples (1 l) were filtered onto Whatman GF/F
membranes, which had been pre-treated in a muffle
furnace (480 8C), and stored at �20 8C until analyses.
Filters were then processed according to a colorimetric
method (Mecozzi et al., 2004), using a double beam
DMS 200 Varian UV–VIS spectrophotometer. For total
dissolved carbohydrates (DCHO), aliquots of samples
(25 ml) were put into plastic tubes and stored at �20 8Cuntil analyses, which were carried out as described by
Mecozzi et al. (1999). Standard used for protein and
carbohydrates quantification were solutions of BSA
(Bovine Albumin Serum) and D(+)glucose, respective-
ly. All biochemical analyses were carried out on three
replicates.
Total Dissolved P
0.0
0.4
0.8
1.2
1.6
2.0
Jun
e 99
July
99
Au
g 9
9
Sep
t 99
Oct
99
No
v 99
Jan
00
Feb
r 00
Mar
ch 0
0
Ap
ril 0
0
May
00
Jun
e 00
July
1 0
0
July
2 0
0
Au
g 0
0
Oct
00
No
v 00
Jun
e 99
July
99
Au
g 9
9
Sep
t 99
Oct
99
No
v 99
Jan
00
Feb
r 00
Mar
ch 0
0
Ap
ril 0
0
May
00
Jun
e 00
July
1 0
0
July
2 0
0
Au
g 0
0
Oct
00
No
v 00
Jun
e 99
July
99
Au
g 9
9
Sep
t 99
Oct
99
No
v 99
Jan
00
Feb
r 00
Mar
ch 0
0
Ap
ril 0
0
May
00
Jun
e 00
July
1 0
0
July
2 0
0
Au
g 0
0
Oct
00
No
v 00
µM-P
0.0
0.4
0.8
1.2
1.6
2.0
µM-P
0.0
0.4
0.8
1.2
1.6
2.0
µM-P
C4 surface C
C7 surface C
C12 surface C
c
b
a
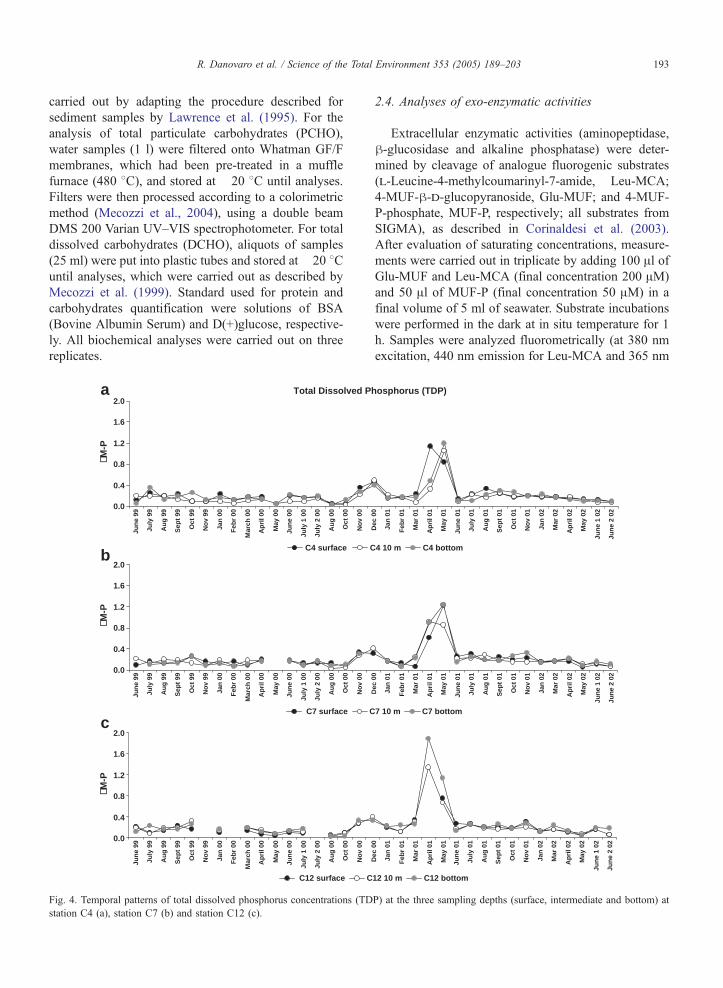
Fig. 4. Temporal patterns of total dissolved phosphorus concentrations (TD
station C4 (a), station C7 (b) and station C12 (c).
2.4. Analyses of exo-enzymatic activities
Extracellular enzymatic activities (aminopeptidase,
h-glucosidase and alkaline phosphatase) were deter-
mined by cleavage of analogue fluorogenic substrates
(l-Leucine-4-methylcoumarinyl-7-amide, Leu-MCA;
4-MUF-h-d-glucopyranoside, Glu-MUF; and 4-MUF-
P-phosphate, MUF-P, respectively; all substrates from
SIGMA), as described in Corinaldesi et al. (2003).
After evaluation of saturating concentrations, measure-
ments were carried out in triplicate by adding 100 Al ofGlu-MUF and Leu-MCA (final concentration 200 AM)
and 50 Al of MUF-P (final concentration 50 AM) in a
final volume of 5 ml of seawater. Substrate incubations
were performed in the dark at in situ temperature for 1
h. Samples were analyzed fluorometrically (at 380 nm
excitation, 440 nm emission for Leu-MCA and 365 nm
hosphorus (TDP)
Dec
00
Jan
01
Feb
r 01
Mar
01
Ap
ril 0
1
May
01
Jun
e 01
July
01
Au
g 0
1
Sep
t 01
Oct
01
No
v 01
Jan
02
Mar
02
Ap
ril 0
2
May
02
Jun
e 1
02
Jun
e 2
02
Dec
00
Jan
01
Feb
r 01
Mar
01
Ap
ril 0
1
May
01
Jun
e 01
July
01
Au
g 0
1
Sep
t 01
Oct
01
No
v 01
Jan
02
Mar
02
Ap
ril 0
2
May
02
Jun
e 1
02
Jun
e 2
02
Dec
00
Jan
01
Feb
r 01
Mar
01
Ap
ril 0
1
May
01
Jun
e 01
July
01
Au
g 0
1
Sep
t 01
Oct
01
No
v 01
Jan
02
Mar
02
Ap
ril 0
2
May
02
Jun
e 1
02
Jun
e 2
02
4 10 m C4 bottom
7 10 m C7 bottom
12 10 m C12 bottom
P) at the three sampling depths (surface, intermediate and bottom) at
R. Danovaro et al. / Science of the Total Environment 353 (2005) 189–203194
excitation, 455 nm emission for Glu-MUF and MUF-P)
using a Shimadzu RS-1501 fluorometer. Fluorescence
of samples was measured immediately after addition of
the substrate and after incubation. The increase of
fluorescence units during incubation was converted
into activity by comparison with standard curves of 7-
amino-4-methylcoumarin for Leu-MCA and of 4-
methylumbelliferone for both Glu-MUF and MUF-P.
Enzymatic activities were expressed as nmol of sub-
strate hydrolysed l�1 h�1.
2.5. Statistical analyses
A Spearman-Rank correlation was performed to test
relationships between all the investigated variables.
Differences in the investigated variables were investi-
Dissolved Organic
0.0
0.4
0.8
1.2
1.6
2.0
Jun
e 99
July
99
Au
g 9
9
Sep
t 99
Oct
99
No
v 99
Jan
00
Feb
r 00
Mar
ch 0
0
Ap
ril 0
0
May
00
Jun
e 00
July
1 0
0
July
2 0
0
Au
g 0
0
Oct
00
No
v 00
Jun
e 99
July
99
Au
g 9
9
Sep
t 99
Oct
99
No
v 99
Jan
00
Feb
r 00
Mar
ch 0
0
Ap
ril 0
0
May
00
Jun
e 00
July
1 0
0
July
2 0
0
Au
g 0
0
Oct
00
No
v 00
Jun
e 99
July
99
Au
g 9
9
Sep
t 99
Oct
99
No
v 99
Jan
00
Feb
r 00
Mar
ch 0
0
Ap
ril 0
0
May
00
Jun
e 00
July
1 0
0
July
2 0
0
Au
g 0
0
Oct
00
No
v 00
µM-P
0.0
0.4
0.8
1.2
1.6
2.0
µM-P
0.0
0.4
0.8
1.2
1.6
2.0
µM-P
C4 surface
C7surface C
C12 surface C
a
b
c
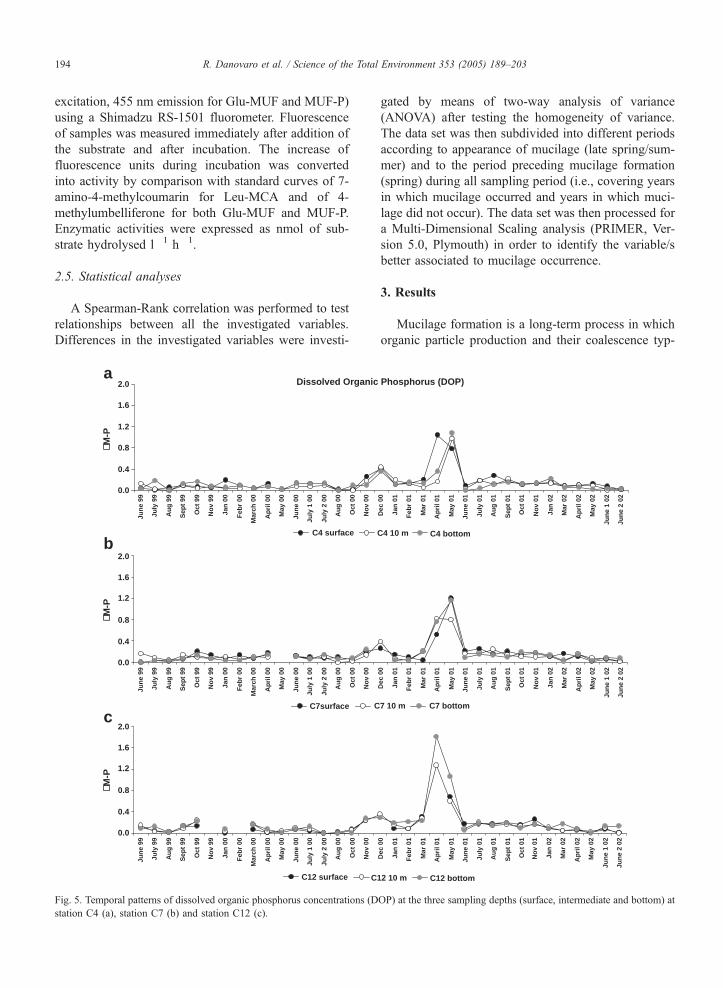
Fig. 5. Temporal patterns of dissolved organic phosphorus concentrations (D
station C4 (a), station C7 (b) and station C12 (c).
gated by means of two-way analysis of variance
(ANOVA) after testing the homogeneity of variance.
The data set was then subdivided into different periods
according to appearance of mucilage (late spring/sum-
mer) and to the period preceding mucilage formation
(spring) during all sampling period (i.e., covering years
in which mucilage occurred and years in which muci-
lage did not occur). The data set was then processed for
a Multi-Dimensional Scaling analysis (PRIMER, Ver-
sion 5.0, Plymouth) in order to identify the variable/s
better associated to mucilage occurrence.
3. Results
Mucilage formation is a long-term process in which
organic particle production and their coalescence typ-
Phosphorus (DOP)D
ec 0
0
Jan
01
Feb
r 01
Mar
01
Ap
ril 0
1
May
01
Jun
e 01
July
01
Au
g 0
1
Sep
t 01
Oct
01
No
v 01
Jan
02
Mar
02
Ap
ril 0
2
May
02
Jun
e 1
02
Jun
e 2
02
Dec
00
Jan
01
Feb
r 01
Mar
01
Ap
ril 0
1
May
01
Jun
e 01
July
01
Au
g 0
1
Sep
t 01
Oct
01
No
v 01
Jan
02
Mar
02
Ap
ril 0
2
May
02
Jun
e 1
02
Jun
e 2
02
Dec
00
Jan
01
Feb
r 01
Mar
01
Ap
ril 0
1
May
01
Jun
e 01
July
01
Au
g 0
1
Sep
t 01
Oct
01
No
v 01
Jan
02
Mar
02
Ap
ril 0
2
May
02
Jun
e 1
02
Jun
e 2
02
C4 10 m C4 bottom
7 10 m C7 bottom
12 10 m C12 bottom
OP) at the three sampling depths (surface, intermediate and bottom) at
R. Danovaro et al. / Science of the Total Environment 353 (2005) 189–203 195
ically start in spring. Therefore, from the data set
composed of 35 oceanographic cruises, we selected
the late-spring/summer (June, July and August) and
the spring (March, April and May) seasons as period
better describing the starting process of mucilage for-
mation. For data elaboration and statistical analyses
we used seven sampling periods: summer 1999 (no
mucilage observed), spring 2000 (before mucilage
appearance), summer 2000 (during a massive muci-
lage event), spring 2001 and summer 2001 (no mu-
cilage observed), spring 2002 (before the second
mucilage event) and summer 2002 (during the second
mucilage event). Average values were calculated for
each season mediating values observed along the 3
stations and integrated throughout the entire water
column.
Particulate p
0
100
200
300
400
500
600
Jun
e 99
July
99
Au
g 9
9
Sep
t 99
Oct
99
No
v 99
Jan
00
Feb
r 00
Mar
ch 0
0
Ap
ril 0
0
May
00
Jun
e 00
July
1 0
0
July
2 0
0
Au
g 0
0
Oct
00
No
v 00
Jun
e 99
July
99
Au
g 9
9
Sep
t 99
Oct
99
No
v 99
Jan
00
Feb
r 00
Mar
ch 0
0
Ap
ril 0
0
May
00
Jun
e 00
July
1 0
0
July
2 0
0
Au
g 0
0
Oct
00
No
v 00
Jun
e 99
July
99
Au
g 9
9
Sep
t 99
Oct
99
No
v 99
Jan
00
Feb
r 00
Mar
ch 0
0
Ap
ril 0
0
May
00
Jun
e 00
July
1 0
0
July
2 0
0
Au
g 0
0
Oct
00
No
v 00
µg L
-1
0
100
200
300
400
500
600
µg L
-1
0
100
200
300
400
500
600
µg L
-1
C4surface C4
C7 surface C
C12 surface C
a
b
c
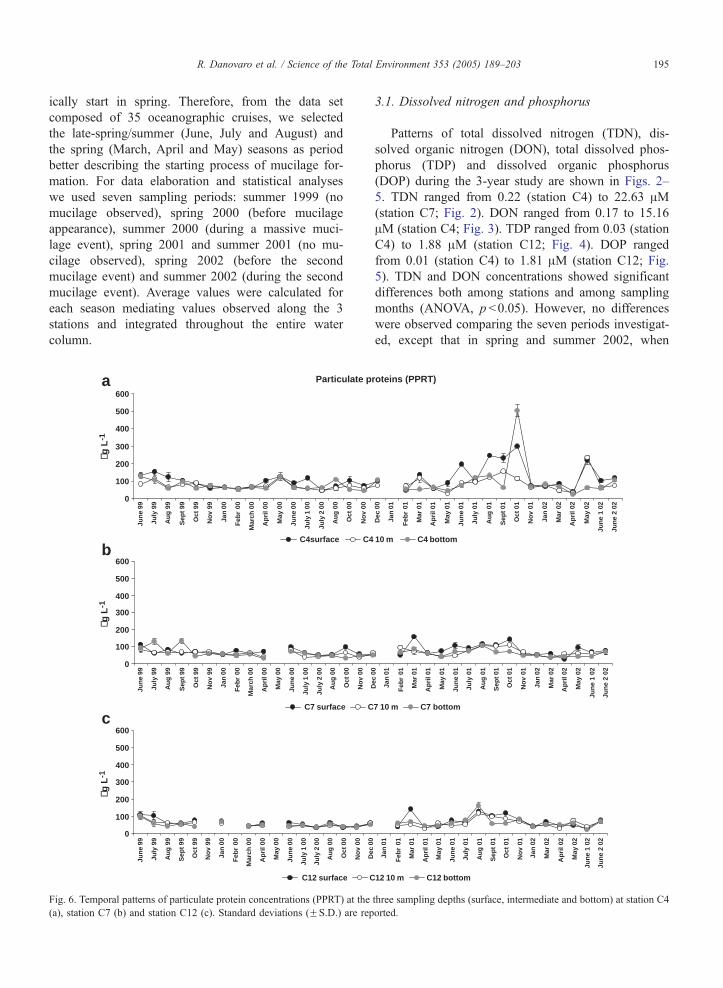
Fig. 6. Temporal patterns of particulate protein concentrations (PPRT) at the
(a), station C7 (b) and station C12 (c). Standard deviations (FS.D.) are rep
3.1. Dissolved nitrogen and phosphorus
Patterns of total dissolved nitrogen (TDN), dis-
solved organic nitrogen (DON), total dissolved phos-
phorus (TDP) and dissolved organic phosphorus
(DOP) during the 3-year study are shown in Figs. 2–
5. TDN ranged from 0.22 (station C4) to 22.63 AM(station C7; Fig. 2). DON ranged from 0.17 to 15.16
AM (station C4; Fig. 3). TDP ranged from 0.03 (station
C4) to 1.88 AM (station C12; Fig. 4). DOP ranged
from 0.01 (station C4) to 1.81 AM (station C12; Fig.
5). TDN and DON concentrations showed significant
differences both among stations and among sampling
months (ANOVA, pb0.05). However, no differences
were observed comparing the seven periods investigat-
ed, except that in spring and summer 2002, when
roteins (PPRT)D
ec 0
0
Jan
01
Feb
r 01
Mar
01
Ap
ril 0
1
May
01
Jun
e 01
July
01
Au
g 0
1
Sep
t 01
Oct
01
No
v 01
Jan
02
Mar
02
Ap
ril 0
2
May
02
Jun
e 1
02
Jun
e 2
02
Dec
00
Jan
01
Feb
r 01
Mar
01
Ap
ril 0
1
May
01
Jun
e 01
July
01
Au
g 0
1
Sep
t 01
Oct
01
No
v 01
Jan
02
Mar
02
Ap
ril 0
2
May
02
Jun
e 1
02
Jun
e 2
02
Dec
00
Jan
01
Feb
r 01
Mar
01
Ap
ril 0
1
May
01
Jun
e 01
July
01
Au
g 0
1
Sep
t 01
Oct
01
No
v 01
Jan
02
Mar
02
Ap
ril 0
2
May
02
Jun
e 1
02
Jun
e 2
02
10 m C4 bottom
7 10 m C7 bottom
12 10 m C12 bottom
three sampling depths (surface, intermediate and bottom) at station C4
orted.
R. Danovaro et al. / Science of the Total Environment 353 (2005) 189–203196
lower values of TDN were observed (ANOVA,
p b0.05). No significant differences in inorganic nitro-
gen concentrations (ANOVA, ns) were observed in
periods characterized by the presence of mucilage.
TDP did not display a significant temporal and spatial
variability throughout the 3 years of investigation, with
the exception of a strong and significant increase ob-
served in spring 2001 at all stations and all sampling
depths (year in which no mucilage was observed;
ANOVA, p b0.05). The same trend was evident for
DOP, but not for orthophosphate, whose concentrations
did not show a significant seasonal variability neither
differences among periods of presence and periods of
absence of mucilage (ANOVA, ns). TDN/TDP ratios
were 2–3 times higher in spring 2000 and 2002 (66 and
Dissolved p
0
500
1000
1500
2000
2500
3000
Jun
e 9
9
July
99
Aug
99
Se
pt 9
9
Oct
99
No
v 99
Jan
00
Fe
br
00
Ma
rch
00
Ap
ril 0
0
Ma
y 00
Jun
e 0
0
July
1 0
0
July
2 0
0
Aug
00
Oct
00
No
v 00
µg L
-1
0
500
1000
1500
2000
2500
3000
µg L
-1
0
500
1000
1500
2000
2500
3000
µg L
-1
C4 surface
Jun
e 9
9
July
99
Au
g 9
9
Se
pt 9
9
Oct
99
Nov
99
Jan
00
Fe
br
00
Ma
rch
00
Ap
ril 0
0
Ma
y 00
Jun
e 0
0
July
1 0
0
July
2 0
0
Au
g 0
0
Oct
00
Nov
00
C7 surface
Jun
e 9
9
July
99
Aug
99
Se
pt 9
9
Oct
99
Nov
99
Jan
00
Fe
br
00
Ma
rch
00
Ap
ril 0
0
Ma
y 00
Jun
e 0
0
July
1 0
0
July
2 0
0
Aug
00
Oct
00
Nov
00
C12 surface
a
b
c
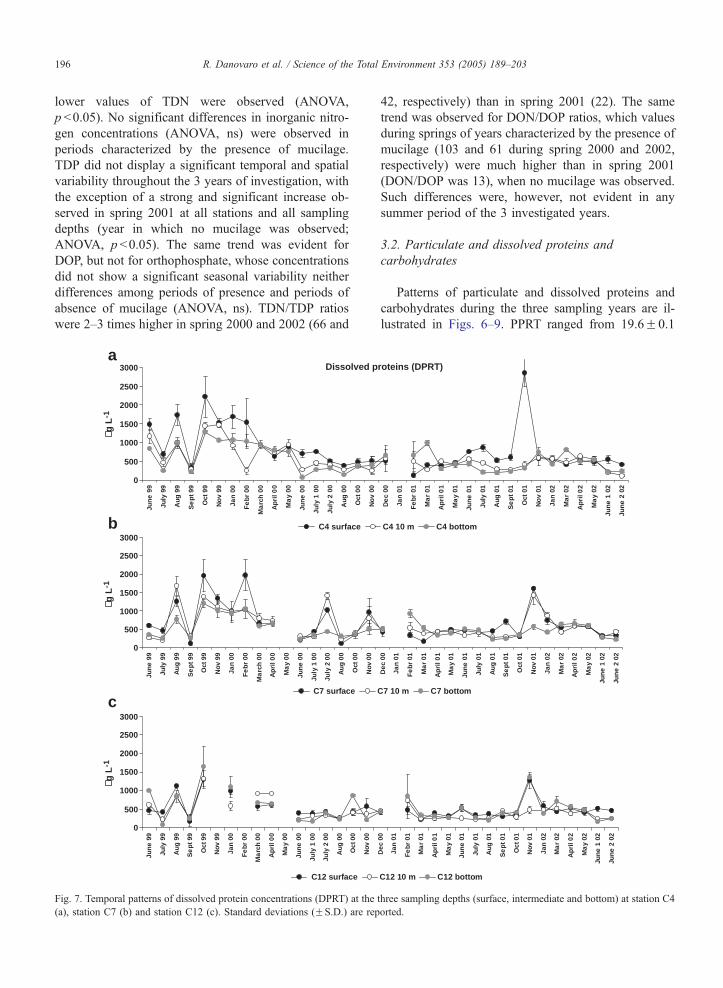
Fig. 7. Temporal patterns of dissolved protein concentrations (DPRT) at the
(a), station C7 (b) and station C12 (c). Standard deviations (FS.D.) are rep
42, respectively) than in spring 2001 (22). The same
trend was observed for DON/DOP ratios, which values
during springs of years characterized by the presence of
mucilage (103 and 61 during spring 2000 and 2002,
respectively) were much higher than in spring 2001
(DON/DOP was 13), when no mucilage was observed.
Such differences were, however, not evident in any
summer period of the 3 investigated years.
3.2. Particulate and dissolved proteins and
carbohydrates
Patterns of particulate and dissolved proteins and
carbohydrates during the three sampling years are il-
lustrated in Figs. 6–9. PPRT ranged from 19.6F0.1
roteins (DPRT)
De
c 00
Jan
01
Fe
br
01
Ma
r 01
Ap
ril 0
1
Ma
y 01
Jun
e 0
1
July
01
Aug
01
Se
pt 0
1
Oct
01
No
v 01
Jan
02
Ma
r 02
Ap
ril 0
2
Ma
y 02
Jun
e 1
02
Jun
e 2
02
C4 10 m C4 bottom
Dec
00
Jan
01
Fe
br
01
Ma
r 01
Ap
ril 0
1
Ma
y 01
Jun
e 0
1
July
01
Au
g 0
1
Se
pt 0
1
Oct
01
Nov
01
Jan
02
Ma
r 02
Ap
ril 0
2
Ma
y 02
Jun
e 1
02
Jun
e 2
02
C7 10 m C7 bottom
Dec
00
Jan
01
Fe
br
01
Ma
r 01
Ap
ril 0
1
Ma
y 01
Jun
e 0
1
July
01
Aug
01
Se
pt 0
1
Oct
01
Nov
01
Jan
02
Ma
r 02
Ap
ril 0
2
Ma
y 02
Jun
e 1
02
Jun
e 2
02
C12 10 m C12 bottom
three sampling depths (surface, intermediate and bottom) at station C4
orted.
R. Danovaro et al. / Science of the Total Environment 353 (2005) 189–203 197
(station C12) to 503.6F35.4 Ag l�1 (station C4; Fig.
6). DPRT ranged from 64.8F0.0 to 2854.9F360.8 Agl�1 (both values reported at station C4; Fig. 7). PCHO
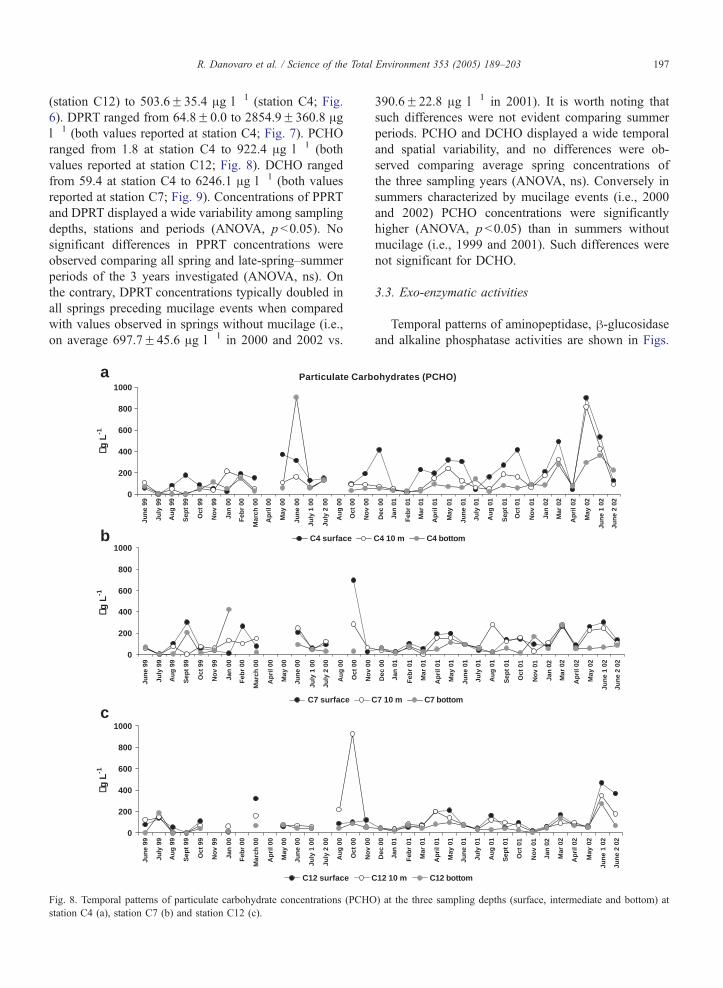
ranged from 1.8 at station C4 to 922.4 Ag l�1 (both
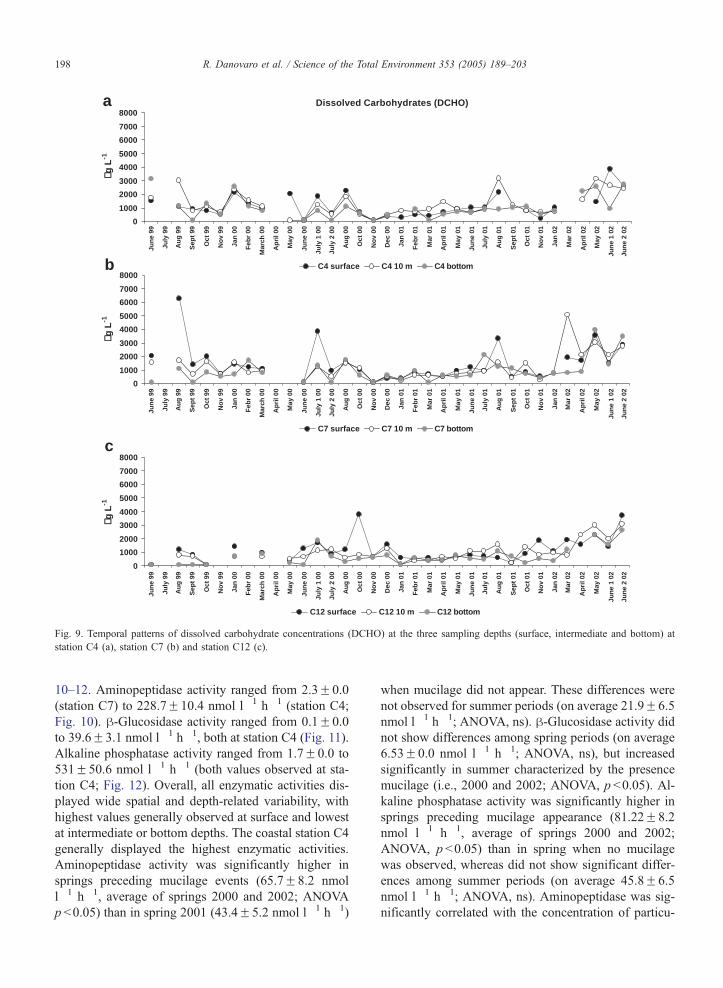
values reported at station C12; Fig. 8). DCHO ranged
from 59.4 at station C4 to 6246.1 Ag l�1 (both values
reported at station C7; Fig. 9). Concentrations of PPRT
and DPRT displayed a wide variability among sampling
depths, stations and periods (ANOVA, p b0.05). No
significant differences in PPRT concentrations were
observed comparing all spring and late-spring–summer
periods of the 3 years investigated (ANOVA, ns). On
the contrary, DPRT concentrations typically doubled in
all springs preceding mucilage events when compared
with values observed in springs without mucilage (i.e.,
on average 697.7F45.6 Ag l�1 in 2000 and 2002 vs.
Particulate Carb
0
200
400
600
800
1000
C4 surface
0
200
400
600
800
1000
0
200
400
600
800
1000
a
b
c
µg L
-1µg
L-1
µg L
-1
Jun
e 99
July
99
Au
g 9
9
Sep
t 99
Oct
99
No
v 99
Jan
00
Feb
r 00
Mar
ch 0
0
Ap
ril 0
0
May
00
Jun
e 00
July
1 0
0
July
2 0
0
Au
g 0
0
Oct
00
No
v 00
C7 surface
Jun
e 99
July
99
Au
g 9
9
Sep
t 99
Oct
99
No
v 99
Jan
00
Feb
r 00
Mar
ch 0
0
Ap
ril 0
0
May
00
Jun
e 00
July
1 0
0
July
2 0
0
Au
g 0
0
Oct
00
No
v 00
C12 surface
Jun
e 99
July
99
Au
g 9
9
Sep
t 99
Oct
99
No
v 99
Jan
00
Feb
r 00
Mar
ch 0
0
Ap
ril 0
0
May
00
Jun
e 00
July
1 0
0
July
2 0
0
Au
g 0
0
Oct
00
No
v 00
Fig. 8. Temporal patterns of particulate carbohydrate concentrations (PCHO
station C4 (a), station C7 (b) and station C12 (c).
390.6F22.8 Ag l�1 in 2001). It is worth noting that
such differences were not evident comparing summer
periods. PCHO and DCHO displayed a wide temporal
and spatial variability, and no differences were ob-
served comparing average spring concentrations of
the three sampling years (ANOVA, ns). Conversely in
summers characterized by mucilage events (i.e., 2000
and 2002) PCHO concentrations were significantly
higher (ANOVA, p b0.05) than in summers without
mucilage (i.e., 1999 and 2001). Such differences were
not significant for DCHO.
3.3. Exo-enzymatic activities
Temporal patterns of aminopeptidase, h-glucosidaseand alkaline phosphatase activities are shown in Figs.
ohydrates (PCHO)
C4 10 m C4 bottom
Dec
00
Jan
01
Feb
r 01
Mar
01
Ap
ril 0
1
May
01
Jun
e 01
July
01
Au
g 0
1
Sep
t 01
Oct
01
No
v 01
Jan
02
Mar
02
Ap
ril 0
2
May
02
Jun
e 1
02
Jun
e 2
02
C7 10 m C7 bottom
Dec
00
Jan
01
Feb
r 01
Mar
01
Ap
ril 0
1
May
01
Jun
e 01
July
01
Au
g 0
1
Sep
t 01
Oct
01
No
v 01
Jan
02
Mar
02
Ap
ril 0
2
May
02
Jun
e 1
02
Jun
e 2
02
C12 10 m C12 bottom
Dec
00
Jan
01
Feb
r 01
Mar
01
Ap
ril 0
1
May
01
Jun
e 01
July
01
Au
g 0
1
Sep
t 01
Oct
01
No
v 01
Jan
02
Mar
02
Ap
ril 0
2
May
02
Jun
e 1
02
Jun
e 2
02
) at the three sampling depths (surface, intermediate and bottom) at
Dissolved Carbohydrates (DCHO)
0
1000
2000
3000
4000
5000
6000
7000
8000
0
1000
2000
3000
4000
5000
6000
7000
8000
0
1000
2000
3000
4000
5000
6000
7000
8000
a
b
c
µg L
-1µg
L-1
µg L
-1
C4 surface C4 10 m C4 bottom
Jun
e 99
July
99
Au
g 9
9
Sep
t 99
Oct
99
No
v 99
Jan
00
Feb
r 00
Mar
ch 0
0
Ap
ril 0
0
May
00
Jun
e 00
July
1 0
0
July
2 0
0
Au
g 0
0
Oct
00
No
v 00
Dec
00
Jan
01
Feb
r 01
Mar
01
Ap
ril 0
1
May
01
Jun
e 01
July
01
Au
g 0
1
Sep
t 01
Oct
01
No
v 01
Jan
02
Mar
02
Ap
ril 0
2
May
02
Jun
e 1
02
Jun
e 2
02
C7 surface C7 10 m C7 bottom
Jun
e 99
July
99
Au
g 9
9
Sep
t 99
Oct
99
No
v 99
Jan
00
Feb
r 00
Mar
ch 0
0
Ap
ril 0
0
May
00
Jun
e 00
July
1 0
0
July
2 0
0
Au
g 0
0
Oct
00
No
v 00
Dec
00
Jan
01
Feb
r 01
Mar
01
Ap
ril 0
1
May
01
Jun
e 01
July
01
Au
g 0
1
Sep
t 01
Oct
01
No
v 01
Jan
02
Mar
02
Ap
ril 0
2
May
02
Jun
e 1
02
Jun
e 2
02
C12 surface C12 10 m C12 bottom
Jun
e 99
July
99
Au
g 9
9
Sep
t 99
Oct
99
No
v 99
Jan
00
Feb
r 00
Mar
ch 0
0
Ap
ril 0
0
May
00
Jun
e 00
July
1 0
0
July
2 0
0
Au
g 0
0
Oct
00
No
v 00
Dec
00
Jan
01
Feb
r 01
Mar
01
Ap
ril 0
1
May
01
Jun
e 01
July
01
Au
g 0
1
Sep
t 01
Oct
01
No
v 01
Jan
02
Mar
02
Ap
ril 0
2
May
02
Jun
e 1
02
Jun
e 2
02
Fig. 9. Temporal patterns of dissolved carbohydrate concentrations (DCHO) at the three sampling depths (surface, intermediate and bottom) at
station C4 (a), station C7 (b) and station C12 (c).
R. Danovaro et al. / Science of the Total Environment 353 (2005) 189–203198
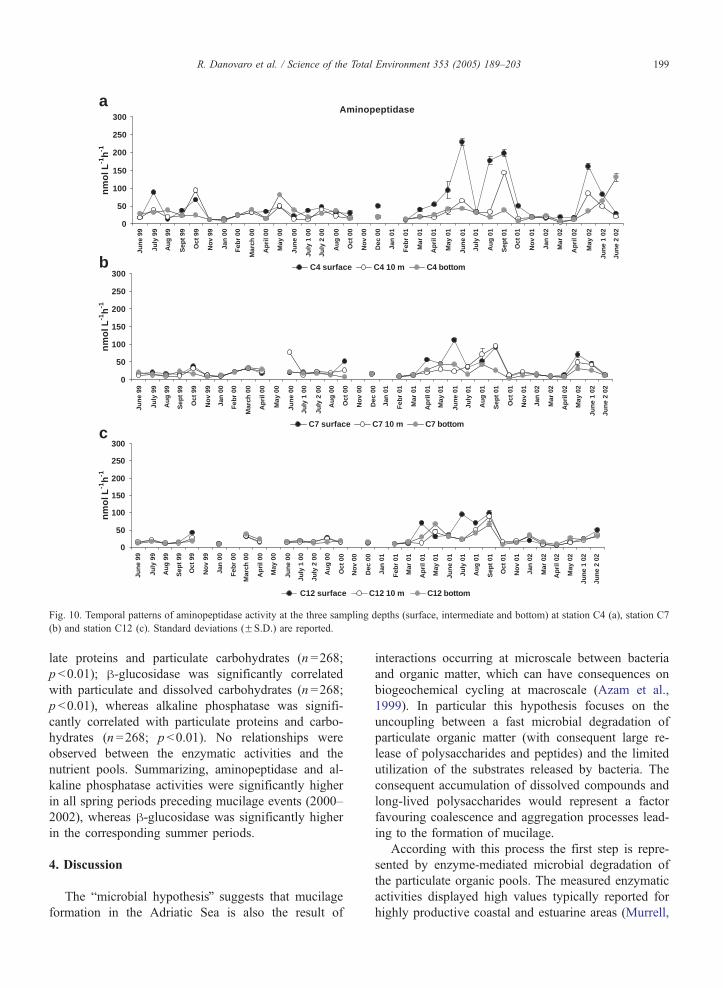
10–12. Aminopeptidase activity ranged from 2.3F0.0
(station C7) to 228.7F10.4 nmol l�1 h�1 (station C4;
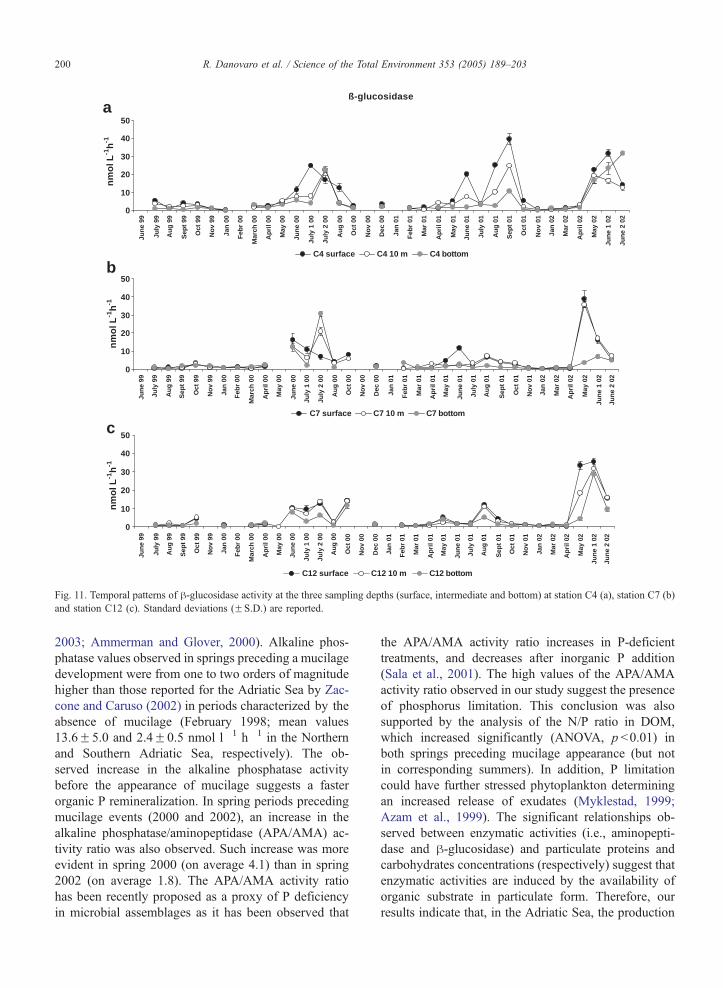
Fig. 10). h-Glucosidase activity ranged from 0.1F0.0
to 39.6F3.1 nmol l�1 h�1, both at station C4 (Fig. 11).
Alkaline phosphatase activity ranged from 1.7F0.0 to
531F50.6 nmol l�1 h�1 (both values observed at sta-
tion C4; Fig. 12). Overall, all enzymatic activities dis-
played wide spatial and depth-related variability, with
highest values generally observed at surface and lowest
at intermediate or bottom depths. The coastal station C4
generally displayed the highest enzymatic activities.
Aminopeptidase activity was significantly higher in
springs preceding mucilage events (65.7F8.2 nmol
l�1 h�1, average of springs 2000 and 2002; ANOVA
p b0.05) than in spring 2001 (43.4F5.2 nmol l�1 h�1)
when mucilage did not appear. These differences were
not observed for summer periods (on average 21.9F6.5
nmol l�1 h�1; ANOVA, ns). h-Glucosidase activity did
not show differences among spring periods (on average
6.53F0.0 nmol l�1 h�1; ANOVA, ns), but increased
significantly in summer characterized by the presence
mucilage (i.e., 2000 and 2002; ANOVA, p b0.05). Al-
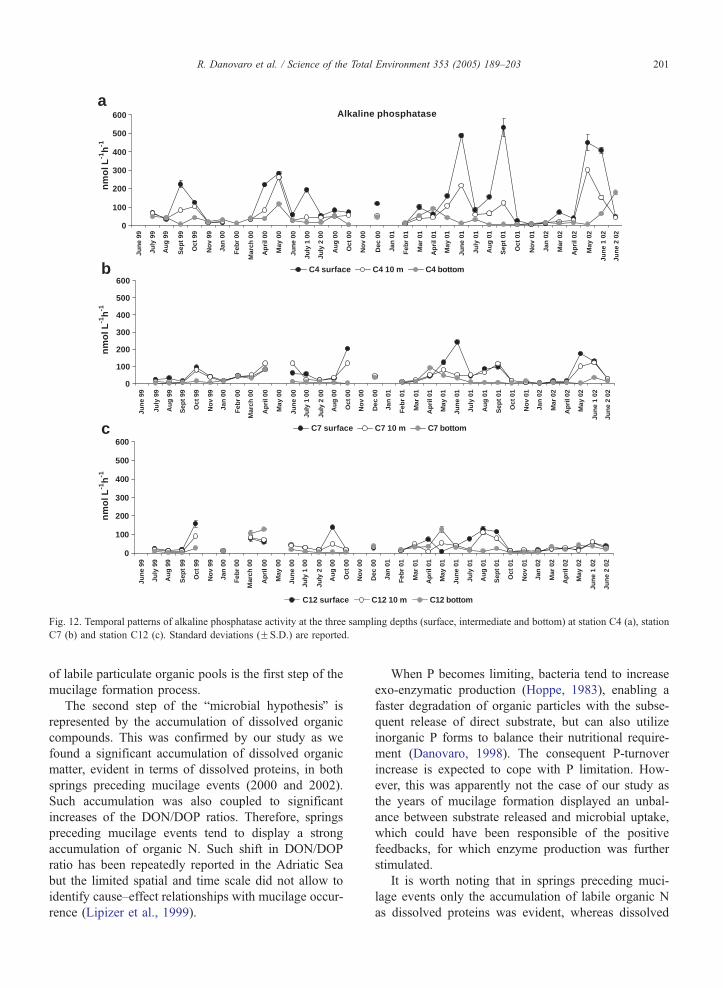
kaline phosphatase activity was significantly higher in
springs preceding mucilage appearance (81.22F8.2
nmol l�1 h�1, average of springs 2000 and 2002;
ANOVA, p b0.05) than in spring when no mucilage
was observed, whereas did not show significant differ-
ences among summer periods (on average 45.8F6.5
nmol l�1 h�1; ANOVA, ns). Aminopeptidase was sig-
nificantly correlated with the concentration of particu-
Aminopeptidase
0
50
100
150
200
250
300n
mo
l L-1
h-1
nm
ol L
-1h
-1n
mo
l L-1
h-1
0
50
100
150
200
250
300
0
50
100
150
200
250
300
a
b
c
Jun
e 99
July
99
Au
g 9
9
Sep
t 99
Oct
99
No
v 99
Jan
00
Feb
r 00
Mar
ch 0
0
Ap
ril 0
0
May
00
Jun
e 00
July
1 0
0
July
2 0
0
Au
g 0
0
Oct
00
No
v 00
Dec
00
Jan
01
Feb
r 01
Mar
01
Ap
ril 0
1
May
01
Jun
e 01
July
01
Au
g 0
1
Sep
t 01
Oct
01
No
v 01
Jan
02
Mar
02
Ap
ril 0
2
May
02
Jun
e 1
02
Jun
e 2
02
C4 surface C4 10 m C4 bottom
Jun
e 99
July
99
Au
g 9
9
Sep
t 99
Oct
99
No
v 99
Jan
00
Feb
r 00
Mar
ch 0
0
Ap
ril 0
0
May
00
Jun
e 00
July
1 0
0
July
2 0
0
Au
g 0
0
Oct
00
No
v 00
Dec
00
Jan
01
Feb
r 01
Mar
01
Ap
ril 0
1
May
01
Jun
e 01
July
01
Au
g 0
1
Sep
t 01
Oct
01
No
v 01
Jan
02
Mar
02
Ap
ril 0
2
May
02
Jun
e 1
02
Jun
e 2
02
Jun
e 99
July
99
Au
g 9
9
Sep
t 99
Oct
99
No
v 99
Jan
00
Feb
r 00
Mar
ch 0
0
Ap
ril 0
0
May
00
Jun
e 00
July
1 0
0
July
2 0
0
Au
g 0
0
Oct
00
No
v 00
Dec
00
Jan
01
Feb
r 01
Mar
01
Ap
ril 0
1
May
01
Jun
e 01
July
01
Au
g 0
1
Sep
t 01
Oct
01
No
v 01
Jan
02
Mar
02
Ap
ril 0
2
May
02
Jun
e 1
02
Jun
e 2
02
C7 surface C7 10 m C7 bottom
C12 surface C12 10 m C12 bottom
Fig. 10. Temporal patterns of aminopeptidase activity at the three sampling depths (surface, intermediate and bottom) at station C4 (a), station C7
(b) and station C12 (c). Standard deviations (FS.D.) are reported.
R. Danovaro et al. / Science of the Total Environment 353 (2005) 189–203 199
late proteins and particulate carbohydrates (n =268;
p b0.01); h-glucosidase was significantly correlated
with particulate and dissolved carbohydrates (n =268;
p b0.01), whereas alkaline phosphatase was signifi-
cantly correlated with particulate proteins and carbo-
hydrates (n =268; p b0.01). No relationships were
observed between the enzymatic activities and the
nutrient pools. Summarizing, aminopeptidase and al-
kaline phosphatase activities were significantly higher
in all spring periods preceding mucilage events (2000–
2002), whereas h-glucosidase was significantly higher
in the corresponding summer periods.
4. Discussion
The bmicrobial hypothesisQ suggests that mucilage
formation in the Adriatic Sea is also the result of
interactions occurring at microscale between bacteria
and organic matter, which can have consequences on
biogeochemical cycling at macroscale (Azam et al.,
1999). In particular this hypothesis focuses on the
uncoupling between a fast microbial degradation of
particulate organic matter (with consequent large re-
lease of polysaccharides and peptides) and the limited
utilization of the substrates released by bacteria. The
consequent accumulation of dissolved compounds and
long-lived polysaccharides would represent a factor
favouring coalescence and aggregation processes lead-
ing to the formation of mucilage.
According with this process the first step is repre-
sented by enzyme-mediated microbial degradation of
the particulate organic pools. The measured enzymatic
activities displayed high values typically reported for
highly productive coastal and estuarine areas (Murrell,
ß-glucosidase
0
10
20
30
40
50
0
10
20
30
40
50
0
10
20
30
40
50
a
b
c
nm
ol L
-1h
-1n
mo
l L-1
h-1
nm
ol L
-1h
-1
Jun
e 99
July
99
Au
g 9
9
Sep
t 99
Oct
99
No
v 99
Jan
00
Feb
r 00
Mar
ch 0
0
Ap
ril 0
0
May
00
Jun
e 00
July
1 0
0
July
2 0
0
Au
g 0
0
Oct
00
No
v 00
Dec
00
Jan
01
Feb
r 01
Mar
01
Ap
ril 0
1
May
01
Jun
e 01
July
01
Au
g 0
1
Sep
t 01
Oct
01
No
v 01
Jan
02
Mar
02
Ap
ril 0
2
May
02
Jun
e 1
02
Jun
e 2
02
C4 surface C4 10 m C4 bottom
Jun
e 99
July
99
Au
g 9
9
Sep
t 99
Oct
99
No
v 99
Jan
00
Feb
r 00
Mar
ch 0
0
Ap
ril 0
0
May
00
Jun
e 00
July
1 0
0
July
2 0
0
Au
g 0
0
Oct
00
No
v 00
Dec
00
Jan
01
Feb
r 01
Mar
01
Ap
ril 0
1
May
01
Jun
e 01
July
01
Au
g 0
1
Sep
t 01
Oct
01
No
v 01
Jan
02
Mar
02
Ap
ril 0
2
May
02
Jun
e 1
02
Jun
e 2
02
C7 surface C7 10 m C7 bottom
Jun
e 99
July
99
Au
g 9
9
Sep
t 99
Oct
99
No
v 99
Jan
00
Feb
r 00
Mar
ch 0
0
Ap
ril 0
0
May
00
Jun
e 00
July
1 0
0
July
2 0
0
Au
g 0
0
Oct
00
No
v 00
Dec
00
Jan
01
Feb
r 01
Mar
01
Ap
ril 0
1
May
01
Jun
e 01
July
01
Au
g 0
1
Sep
t 01
Oct
01
No
v 01
Jan
02
Mar
02
Ap
ril 0
2
May
02
Jun
e 1
02
Jun
e 2
02
C12 surface C12 10 m C12 bottom
Fig. 11. Temporal patterns of h-glucosidase activity at the three sampling depths (surface, intermediate and bottom) at station C4 (a), station C7 (b)
and station C12 (c). Standard deviations (FS.D.) are reported.
R. Danovaro et al. / Science of the Total Environment 353 (2005) 189–203200
2003; Ammerman and Glover, 2000). Alkaline phos-
phatase values observed in springs preceding a mucilage
development were from one to two orders of magnitude
higher than those reported for the Adriatic Sea by Zac-
cone and Caruso (2002) in periods characterized by the
absence of mucilage (February 1998; mean values
13.6F5.0 and 2.4F0.5 nmol l�1 h�1 in the Northern
and Southern Adriatic Sea, respectively). The ob-
served increase in the alkaline phosphatase activity
before the appearance of mucilage suggests a faster
organic P remineralization. In spring periods preceding
mucilage events (2000 and 2002), an increase in the
alkaline phosphatase/aminopeptidase (APA/AMA) ac-
tivity ratio was also observed. Such increase was more
evident in spring 2000 (on average 4.1) than in spring
2002 (on average 1.8). The APA/AMA activity ratio
has been recently proposed as a proxy of P deficiency
in microbial assemblages as it has been observed that
the APA/AMA activity ratio increases in P-deficient
treatments, and decreases after inorganic P addition
(Sala et al., 2001). The high values of the APA/AMA
activity ratio observed in our study suggest the presence
of phosphorus limitation. This conclusion was also
supported by the analysis of the N/P ratio in DOM,
which increased significantly (ANOVA, p b0.01) in
both springs preceding mucilage appearance (but not
in corresponding summers). In addition, P limitation
could have further stressed phytoplankton determining
an increased release of exudates (Myklestad, 1999;
Azam et al., 1999). The significant relationships ob-
served between enzymatic activities (i.e., aminopepti-
dase and h-glucosidase) and particulate proteins and
carbohydrates concentrations (respectively) suggest that
enzymatic activities are induced by the availability of
organic substrate in particulate form. Therefore, our
results indicate that, in the Adriatic Sea, the production
Alkaline phosphatase
0
100
200
300
400
500
600
0
100
200
300
400
500
600
0
100
200
300
400
500
600
a
b
c
nm
ol L
-1h
-1n
mo
l L-1
h-1
nm
ol L
-1h
-1
Jun
e 99
July
99
Au
g 9
9
Sep
t 99
Oct
99
No
v 99
Jan
00
Feb
r 00
Mar
ch 0
0
Ap
ril 0
0
May
00
Jun
e 00
July
1 0
0
July
2 0
0
Au
g 0
0
Oct
00
No
v 00
Dec
00
Jan
01
Feb
r 01
Mar
01
Ap
ril 0
1
May
01
Jun
e 01
July
01
Au
g 0
1
Sep
t 01
Oct
01
No
v 01
Jan
02
Mar
02
Ap
ril 0
2
May
02
Jun
e 1
02
Jun
e 2
02
C4 surface C4 10 m C4 bottom
Jun
e 99
July
99
Au
g 9
9
Sep
t 99
Oct
99
No
v 99
Jan
00
Feb
r 00
Mar
ch 0
0
Ap
ril 0
0
May
00
Jun
e 00
July
1 0
0
July
2 0
0
Au
g 0
0
Oct
00
No
v 00
Dec
00
Jan
01
Feb
r 01
Mar
01
Ap
ril 0
1
May
01
Jun
e 01
July
01
Au
g 0
1
Sep
t 01
Oct
01
No
v 01
Jan
02
Mar
02
Ap
ril 0
2
May
02
Jun
e 1
02
Jun
e 2
02
Jun
e 99
July
99
Au
g 9
9
Sep
t 99
Oct
99
No
v 99
Jan
00
Feb
r 00
Mar
ch 0
0
Ap
ril 0
0
May
00
Jun
e 00
July
1 0
0
July
2 0
0
Au
g 0
0
Oct
00
No
v 00
Dec
00
Jan
01
Feb
r 01
Mar
01
Ap
ril 0
1
May
01
Jun
e 01
July
01
Au
g 0
1
Sep
t 01
Oct
01
No
v 01
Jan
02
Mar
02
Ap
ril 0
2
May
02
Jun
e 1
02
Jun
e 2
02
C7 surface C7 10 m C7 bottom
C12 surface C12 10 m C12 bottom
Fig. 12. Temporal patterns of alkaline phosphatase activity at the three sampling depths (surface, intermediate and bottom) at station C4 (a), station
C7 (b) and station C12 (c). Standard deviations (FS.D.) are reported.
R. Danovaro et al. / Science of the Total Environment 353 (2005) 189–203 201
of labile particulate organic pools is the first step of the
mucilage formation process.
The second step of the bmicrobial hypothesisQ is
represented by the accumulation of dissolved organic
compounds. This was confirmed by our study as we
found a significant accumulation of dissolved organic
matter, evident in terms of dissolved proteins, in both
springs preceding mucilage events (2000 and 2002).
Such accumulation was also coupled to significant
increases of the DON/DOP ratios. Therefore, springs
preceding mucilage events tend to display a strong
accumulation of organic N. Such shift in DON/DOP
ratio has been repeatedly reported in the Adriatic Sea
but the limited spatial and time scale did not allow to
identify cause–effect relationships with mucilage occur-
rence (Lipizer et al., 1999).
When P becomes limiting, bacteria tend to increase
exo-enzymatic production (Hoppe, 1983), enabling a
faster degradation of organic particles with the subse-
quent release of direct substrate, but can also utilize
inorganic P forms to balance their nutritional require-
ment (Danovaro, 1998). The consequent P-turnover
increase is expected to cope with P limitation. How-
ever, this was apparently not the case of our study as
the years of mucilage formation displayed an unbal-
ance between substrate released and microbial uptake,
which could have been responsible of the positive
feedbacks, for which enzyme production was further
stimulated.
It is worth noting that in springs preceding muci-
lage events only the accumulation of labile organic N
as dissolved proteins was evident, whereas dissolved
R. Danovaro et al. / Science of the Total Environment 353 (2005) 189–203202
carbohydrates (which, in the Adriatic Sea, account for
15–20% of DOC; Pettine et al., 1999; Pettine et al.,
2001) did not change. The accumulation of dissolved
proteins would lead to the increase of DOC that,
however, has never been demonstrated before muci-
lage formation. Such discrepancy might be explained
because the protein contribution to DOC (1%, Pettine
et al., 1999) is much lower than that of dissolved
carbohydrates.
Therefore our results clearly indicate that the two
steps favouring the possible formation of mucilage
were actually observed in springs preceding mucilage
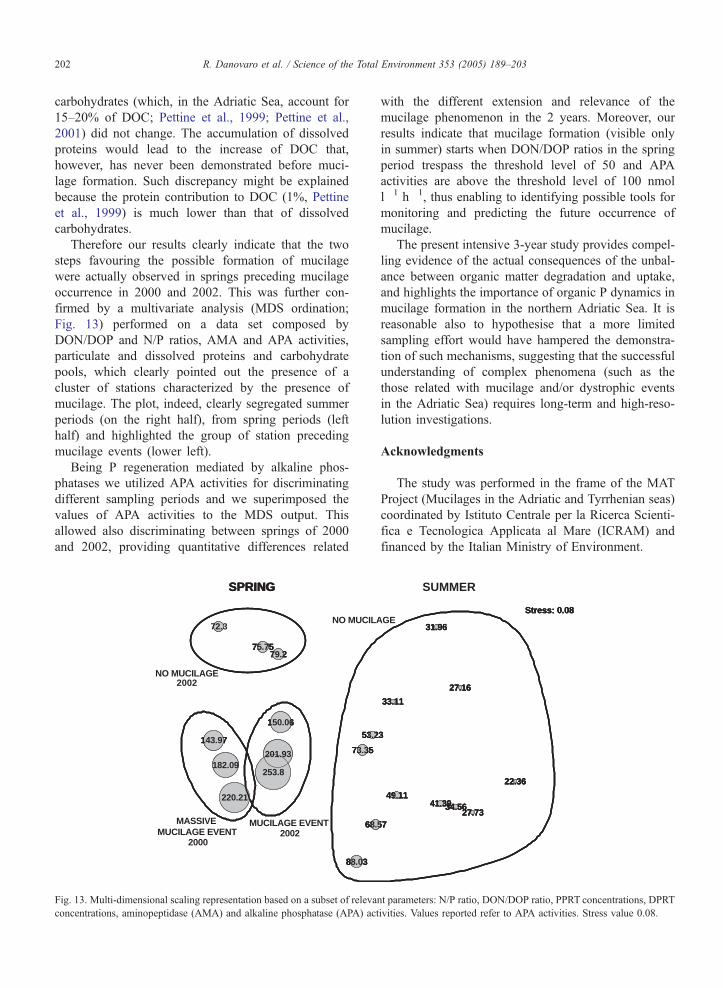
occurrence in 2000 and 2002. This was further con-
firmed by a multivariate analysis (MDS ordination;
Fig. 13) performed on a data set composed by
DON/DOP and N/P ratios, AMA and APA activities,
particulate and dissolved proteins and carbohydrate
pools, which clearly pointed out the presence of a
cluster of stations characterized by the presence of
mucilage. The plot, indeed, clearly segregated summer
periods (on the right half), from spring periods (left
half) and highlighted the group of station preceding
mucilage events (lower left).
Being P regeneration mediated by alkaline phos-
phatases we utilized APA activities for discriminating
different sampling periods and we superimposed the
values of APA activities to the MDS output. This
allowed also discriminating between springs of 2000
and 2002, providing quantitative differences related
201.93
253.8
150.06
75.7579.2
182.09
220.21
143.97 53.2
73.35
68.
88.03
MASSIVE MUCILAGE EVENT
2002
2000
MUCILAGE EVENT2002
SPRING
NO MUCILA
NO MUCILAGE
201.93
253.8
150.06
75.7579.2
182.09
220.21
143.97 53.2
73.35
68.
88.03
SPRING
201.93
253.8
150.06
75.7579.2
72.3
182.09
220.21
143.97 53.2
73.35
68.
88.03
SPRING
Fig. 13. Multi-dimensional scaling representation based on a subset of releva
concentrations, aminopeptidase (AMA) and alkaline phosphatase (APA) act
with the different extension and relevance of the
mucilage phenomenon in the 2 years. Moreover, our
results indicate that mucilage formation (visible only
in summer) starts when DON/DOP ratios in the spring
period trespass the threshold level of 50 and APA
activities are above the threshold level of 100 nmol
l�1 h�1, thus enabling to identifying possible tools for
monitoring and predicting the future occurrence of
mucilage.
The present intensive 3-year study provides compel-
ling evidence of the actual consequences of the unbal-
ance between organic matter degradation and uptake,
and highlights the importance of organic P dynamics in
mucilage formation in the northern Adriatic Sea. It is
reasonable also to hypothesise that a more limited
sampling effort would have hampered the demonstra-
tion of such mechanisms, suggesting that the successful
understanding of complex phenomena (such as the
those related with mucilage and/or dystrophic events
in the Adriatic Sea) requires long-term and high-reso-
lution investigations.
Acknowledgments
The study was performed in the frame of the MAT
Project (Mucilages in the Adriatic and Tyrrhenian seas)
coordinated by Istituto Centrale per la Ricerca Scienti-
fica e Tecnologica Applicata al Mare (ICRAM) and
financed by the Italian Ministry of Environment.
27.16
31.96
22.36
34.5641.3927.73
3
33.11
57
49.11
Stress: 0.08
SUMMER
GE
27.16
31.96
22.36
34.5641.3927.73
3
33.11
57
49.11
Stress: 0.08
27.16
31.96
22.36
34.5641.3927.73
3
33.11
57
49.11
Stress: 0.08
nt parameters: N/P ratio, DON/DOP ratio, PPRT concentrations, DPRT
ivities. Values reported refer to APA activities. Stress value 0.08.
R. Danovaro et al. / Science of the Total Environment 353 (2005) 189–203 203
References
Alldredge AL, Cowles TJ, MacIntyre S, Rines JEB, Donaghay PL,
Greenlaw CF, et al. Occurrence and mechanisms of formation of a
dramatic thin layer of marine snow in a shallow Pacific fjord. Mar
Ecol Prog Ser 2002;233:1–12.
Ammerman JW, Glover WB. Continuous underway measurement of
microbial ectoenzyme activities in aquatic ecosystems. Mar Ecol
Prog Ser 2000;201:1–12.
Azam F. Possible cause of massive mucilage production in the
northern Adriatic Sea: a novel hypothesis. In: Nolan C, editor.
Physical and biogeochemical processes of the Adriatic Sea: eu-
trophic limits of the northern Adriatic. The Adriatic Sea. Brussels7
European Communities Ecosystems Research Reports Series;
1997.
Azam F, Long RA. Sea snow microcosms. Nature 2001;414:495–8.
Azam F, Fonda Umani S, Funari E. Significance of bacteria in the
mucilage phenomenon in the northern Adriatic Sea. Ann Ist Super
Sanita 1999;35:411–9.
Corinaldesi C, Crevatin E, Del Negro P, Marini M, Russo A, Fonda-
Umani S, et al. Large-scale spatial distribution of virioplankton in
the Adriatic Sea: testing the trophic state control hypothesis. Appl
Environ Microbiol 2003;69:2664–73.
Danovaro R. Do bacteria compete with phytoplankton for inorganic
nutrients? Possible ecological implications. Chem Ecol 1998;14:
83–96.
Decho AW, Herndl GJ. Microbial activities and the transformation of
organic matter within mucilaginous material. Sci Total Environ
1995;165:33–42.
Degobbis D, Malej A, Fonda Umani S. The mucilage phenomenon in
the Northern Adriatic A critical review of the past scientific
hypotheses. Ann Ist Super Sanita 1999;35:373–82.
Fogg GE. Some speculations on the nature of the pelagic mucilage
community of the northern Adriatic Sea. Sci Total Environ 1995;
165:59–63.
Funari E, Azam F, Fonda Umani S, Pagnotta R. State of art and new
scientific hypotheses of the phenomenon of mucilages in the
Adriatic Sea. Ann Ist Super Sanita 1999;35:353.
Gotsis-Skretas O. Mucilage appearance in Greek waters during 1982–
1994. Sci Total Environ 1995;165:229–30.
Hartree EF. Determination of proteins: a modification of the Lowry
method that give a linear photometric response. Anal Biochem
1972;48:422–7.
Herndl GJ. Marine snow in northern Adriatic Sea: possible causes and
consequences for a shallow ecosystem. Mar Microb Food Webs
1992;6:149–72.
Herndl GJ, Peduzzi P. Ecology of amorphous aggregations (marine
snow) in the Northern Adriatic Sea: I General considerations.
PSZNI Mar Ecol 1988;9:79–90.
Herndl GJ, Karner M, Peduzzi P. Floating mucilage in the Northern
Adriatic Sea: the potential role of a microbial ecological approach
to solve the bmysteryQ. Sci Total Environ 1992;525–38 (Suppl.).
Hoppe HG. Significance of exoenzymatic activities in the ecology of
brackish water: measurements by means of methylumbelliferyl-
substrates. Mar Ecol Prog Ser 1983;11:299–308.
Innamorati M. Hyperproduction of mucilages by micro and macro
algae in Tyrrhenian Sea. Sci Total Environ 1995;165:65–81.
Koroleff F. Determination of phosphorus. In: Grasshoff K, Ehrhardt
F, Kremling F, editors. Methods of seawater analysis, 2nd edn;
1983. p. 125–39.
Lawrence MM, Schick LL, Sawyer T, Plante CJ. Bioavailable amino
acids in sediments: a biomimetic, kinetic based approach. Limnol
Oceanogr 1995;40:511–20.
Lipizer M, Cozzi S, Catalano G, Falconi C. Seasonal fluctuations of
DIN/DIP and DON/DOP ratio in the northern Adriatic Sea. Ann
Ist Super Sanita 1999;35:383–8.
MacKenzie L, Sims I, Beuzenberg V, Gillespie P. Mass accumulation
of mucilage caused by dinoflagellate polysaccharide exudates in
Tasman bay, New Zealand. Harmful Algae 2002;1:69–83.
Mecozzi M, Amici M, Pietrantonio E, Acquistucci R. Ultrasound
assisted analysis of total carbohydrates in environmental and
food samples. Ultrason Sonochem 1999;6:133–9.
Mecozzi M, Amici M, Cordisco CA. Relationships between dissolved
and particulate carbohydrate temporal patterns and mucilaginous
aggregates formation: evidences from time series analysis and
biochemical composition of aggregates. Chem Ecol 2004;20:
41–54.
Murrell C. Bacterioplankton dynamics in a subtropical estuary:
evidence for substrate limitation. Aquat Microb Ecol 2003;32:
239–50.
Myklestad SM. Phytoplankton extracellular production and leakage
with consideration on the polysaccharide accumulation. Ann Ist
Super Sanita 1999;35:401–4.
Pettine M, Patrolecco L, Manganelli M, Capri S, Farrace MG. Sea-
sonal variations of dissolved organic matter in the northern Adria-
tic Sea. Mar Chem 1999;64:153–69.
Pettine M, Capri S, Manganelli M, Patrolecco L, Puddu A, Zoppini A.
The dynamics of DOM in the Northern Adriatic Sea. Estuar Coast
Shelf Sci 2001;52:471–89.
Riebesell U. The formation of large marine snow and its sustained
residence in surface waters. Limnol Oceanogr 1992;37:63–76.
Sala MM, Karner M, Arin L, Marrase C. Measurement of ectoenzyme
activities as an indication of inorganic nutrient imbalance in
microbial communities. Aquat Microb Ecol 2001;23:301–11.
Zaccone R, Caruso G. Microbial hydrolysis of polysaccharides and
organic phosphates in the northern Adriatic Sea. Chem Ecol 2002;
18:85–94.
Copyright © 2022 FDOKUMEN


![Azabrendanes IV. Synthesis and characterization of N-(alkyl- and benzylsulfonyl)-exo-2-hydroxy-4-azatricyclo[4.2.1.03,7]nonanes](https://static.fdokumen.com/doc/165x107/6337033c20d9c9602f0b1d24/azabrendanes-iv-synthesis-and-characterization-of-n-alkyl-and-benzylsulfonyl-exo-2-hydroxy-4-azatricyclo421037nonanes.jpg)