Existence of multiple critical cooling rates which generate ...
11
ETH Library Existence of multiple critical cooling rates which generate different types of monolithic metallic glass Journal Article Author(s): Schawe, Jürgen E.K.; Löffler, Jörg F. Publication date: 2019 Permanent link: https://doi.org/10.3929/ethz-b-000334986 Rights / license: Creative Commons Attribution 4.0 International Originally published in: Nature Communications 10(1), https://doi.org/10.1038/s41467-018-07930-3 This page was generated automatically upon download from the ETH Zurich Research Collection . For more information, please consult the Terms of use .
-
Upload
khangminh22 -
Category
Documents
-
view
1 -
download
0
Transcript of Existence of multiple critical cooling rates which generate ...

ETH Library
Existence of multiple criticalcooling rates which generatedifferent types of monolithicmetallic glass
Journal Article
Author(s):Schawe, Jürgen E.K.; Löffler, Jörg F.
Publication date:2019
Permanent link:https://doi.org/10.3929/ethz-b-000334986
Rights / license:Creative Commons Attribution 4.0 International
Originally published in:Nature Communications 10(1), https://doi.org/10.1038/s41467-018-07930-3
This page was generated automatically upon download from the ETH Zurich Research Collection.For more information, please consult the Terms of use.

ARTICLE
Existence of multiple critical cooling rates whichgenerate different types of monolithic metallicglassJürgen E.K. Schawe1 & Jörg F. Löffler 2
Via fast differential scanning calorimetry using an Au-based glass as an example, we show
that metallic glasses should be classified into two types of amorphous/monolithic glass. The
first type, termed self-doped glass (SDG), forms quenched-in nuclei or nucleation precursors
upon cooling, whereas in the so-called chemically homogeneous glass (CHG) no quenched-in
structures are found. For the Au-based glass investigated, the critical cooling and
heating rates for the SDG are 500 K s−1 and 20,000 K s−1, respectively; for the CHG they are
4000 K s−1 and 6000 K s−1. The similarity in the critical rates for CHG, so far not reported in
literature, and CHG’s tendency towards stochastic nucleation underline the novelty of this
glass state. Identifying different types of metallic glass, as is possible by advanced chip
calorimetry, and comparing them with molecular and polymeric systems may help to ela-
borate a more generalized glass theory and improve metallic glass processing.
https://doi.org/10.1038/s41467-018-07930-3 OPEN
1Mettler-Toledo GmbH, Analytical, 8606 Nänikon, Switzerland. 2 Laboratory of Metal Physics and Technology, Department of Materials, ETH Zurich, 8093Zurich, Switzerland. Correspondence and requests for materials should be addressed to J.F.L. (email: [email protected])
NATURE COMMUNICATIONS | (2019) 10:1337 | https://doi.org/10.1038/s41467-018-07930-3 | www.nature.com/naturecommunications 1
1234
5678
90():,;
The kinetic concept of glass formation was developed byGustav Tammann1 85 years ago. According to hisassumption, a glass can be formed by cooling if the curves
of the temperature dependency of nucleation and growth aresignificantly separated. The tendency of a metallic alloy to form aglass is usually characterized by the glass-forming ability (GFA),which corresponds to a critical cooling rate, βc,cr, at which nocrystallization occurs during cooling from the melt2-6. Aftercooling at βc,cr to temperatures below the glass transition regionthe material is expected to form a monolithic glass, i.e., a glasswhose atomic structure is completely amorphous. The structureof the glass can be changed by annealing it in the glassy state7–12
or by varying the cooling rate during glass formation13–16.Another kinetic phenomenon is the critical heating rate, βh,cr,
at which a glass does not crystallize upon heating14,15,17. It maybe expected that βh,cr ≫ - βc,cr, because nucleation is much moredominant at deep undercooling, i.e., the maximum of thenucleation rate is at lower temperatures than the maximum of thegrowth rate14,15, and the critical size of nuclei may decrease atlower temperatures15.
The competition between glass formation and nucleation is ageneral phenomenon and occurs not only in rapidly quenchedmetallic alloys, but in various classes of metastable materials withdifferent types of bonding. While glass formation is relatively rarein metallic alloys, polymers usually form a semicrystallinestructure where the macromolecule is part of the crystalline andamorphous phase. Complete crystallization from the melt is thusbasically impossible in such systems, so that glass formation inpolymers can be considered a universal phenomenon. In poly-meric materials the terms amorphous glass and semicrystallineglass are commonly used and distinguished from one another.For metals, a somewhat different terminology is used and theequivalent terms are monolithic glass and metallic glass compo-site, respectively.
Since the introduction of non-adiabatic chip calorimetry18,19
and its commercialization20,21, calorimetric measurements atdefined cooling and heating conditions have been possible usingfast differential scanning calorimetry (FDSC). This technique isfrequently used to study glass transition phenomena andnanostructure formation in polymers22–24, molecular glass for-mers25, and chalcogenides26–29. However, recently FDSC has alsobeen identified by the metals community as a suitable method forstudying glass formation, nucleation, and phase transitions inmetastable metallic alloys14,30–36. In14, one of the authors of thispaper reported on the crystallization kinetics of an Au-based bulkmetallic glass (Au49Ag5.5Pd2.3Cu26.9Si16.337), and constructed, viaisothermal measurements in the millisecond range, completetime–temperature–transformation (TTT) diagrams of crystal-lization in the undercooled/supercooled liquid range upon cool-ing and heating.
In this study we use a newly developed Flash DSC2+ instru-ment (see Methods) which allows us to perform calorimetricexperiments at ultrafast cooling rates of 40,000 Ks−1 and heatingrates greater than 60,000 Ks−1. The latter also allows us to up-quench a certain phase, where up-quenching denotes a heatingprocess that is so rapid that no structural changes occur beforemelting of the previously frozen phase36.
In this work we performed FDSC investigations on the bulkmetallic glass (BMG) Au49Ag5.5Pd2.3Cu26.9Si16.3 at ultrafast rateswith linear heating and cooling. We illustrate here that in the caseof metals, amorphous (monolithic) glasses need to be classifiedinto two categories. We term these self-doped glass (SDG) andchemically homogeneous glass (CHG). We show that quenched-in nuclei or nucleation precursors form in the SDG upon coolingat medium rates, which generates significant differences in thecritical cooling and heating rates (βc,SDG ≈ 500 K s−1 ≪ βh,SDG ≈
20,000 K s−1). In contrast, such nuclei no longer form upon rapidcooling, which leads to the fact that the rates of critical cooling(βc,CHG ≈ 4000 K s−1) and critical heating (βh,CHG= 6000 K s−1)are very similar for the CHG. This similarity has not beenreported before because the critical cooling rate measured hasalways been that of an SDG38,39. The ramifications for theunderstanding of metallic glass processing are, however, sig-nificant because the conjectured and/or measured great differ-ences between critical cooling and heating rates have often beenexplained by a pronounced asymmetry in crystallization beha-vior14,15,17. By analyzing the FDSC results and discussing thecommonalities and differences involved in nucleation and glassformation for metallic and polymeric glass formers, we alsointend to contribute to the development of a more generalizedglass theory.
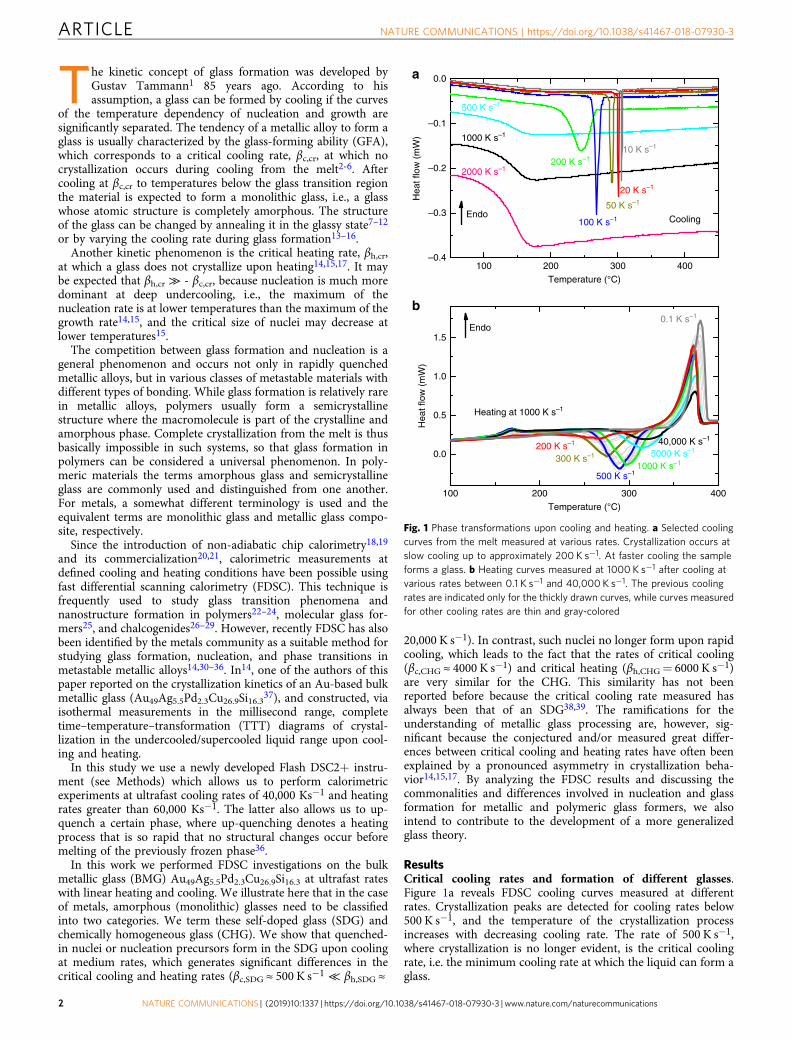
ResultsCritical cooling rates and formation of different glasses.Figure 1a reveals FDSC cooling curves measured at differentrates. Crystallization peaks are detected for cooling rates below500 K s−1, and the temperature of the crystallization processincreases with decreasing cooling rate. The rate of 500 K s−1,where crystallization is no longer evident, is the critical coolingrate, i.e. the minimum cooling rate at which the liquid can form aglass.
100 200
Temperature (°C)
Temperature (°C)
300 400
Cooling
Heating at 1000 K s–1
Endo
Endo
–0.4
–0.3
–0.2
–0.1
0.0a
b
100 200 300 400
0.0
0.5
1.0
1.5
2000 K s–1
1000 K s–1
500 K s–1
200 K s–110 K s–1
20 K s–1
50 K s–1
100 K s–1
Hea
t flo
w (
mW
)
200 K s–1
300 K s–1
500 K s–11000 K s–1
5000 K s–140,000 K s–1
Hea
t flo
w (
mW
)
0.1 K s–1
Fig. 1 Phase transformations upon cooling and heating. a Selected coolingcurves from the melt measured at various rates. Crystallization occurs atslow cooling up to approximately 200 K s−1. At faster cooling the sampleforms a glass. b Heating curves measured at 1000 K s−1 after cooling atvarious rates between 0.1 K s−1 and 40,000 K s−1. The previous coolingrates are indicated only for the thickly drawn curves, while curves measuredfor other cooling rates are thin and gray-colored
ARTICLE NATURE COMMUNICATIONS | https://doi.org/10.1038/s41467-018-07930-3
2 NATURE COMMUNICATIONS | (2019) 10:1337 | https://doi.org/10.1038/s41467-018-07930-3 | www.nature.com/naturecommunications

Figure 1b shows heating curves at 1000 K s−1 measured aftercooling at various rates (between 0.1 and 40,000 K s−1). The glasstransition takes place at about 160 °C, and the exothermiccrystallization peak accrues in the temperature range between 260and 315 °C followed by an endothermic melting peak. Thecrystallization shows a strong dependence on the previous coolingconditions, an effect that has been seen frequently in variousmaterials14,32,40. The temperature of the crystallization peak,TPeak, the intensity of the glass transition (step height Δcp), andthe total enthalpy, ΔH, (containing crystallization and melting)are evaluated from these curves.
The total enthalpy ΔH reflects the crystallinity of the sampleafter the cooling process41,42. In a first approximation thecrystallinity is α= ΔH/ΔHm, where ΔHm is the equilibriummelting enthalpy measured using a completely crystallizedmaterial which was previously cooled at 1 K s−1. The actualmelting enthalpy measured, ΔHmelt, is usually smaller than theequilibrium melting enthalpy, ΔHm. This is because the phasewhich eventually melts is not necessarily the stable phase, and/orthe material has not completely crystallized before melting. In thecase of an amorphous specimen, ΔH= ΔHcryst+ ΔHmelt ispractically zero, i.e., α= 0, because the enthalpy of possibleexothermic crystallization processes during heating is the same asthe enthalpy of melting of these crystals. Small differences aregenerated by the heat capacity contribution43. On the other hand,α= 1 for a fully crystallized sample.
The increase in the heat capacity at the glass transition, Δcp, isthe intensity of the glass transition, which also dependson crystallinity. The relative intensity of the glass transition,Δcp/Δcp,a, has been found to depend linearly on the crystallinity α(see Supplementary Note 1 and Supplementary Fig. 1), where forthe completely amorphous phase the intensity of the glasstransition is Δcp,a= 0.14 J g−1 K−1 (see Fig. 2b). Such a lineardependence is expected for semi-crystalline materials with asingle type of amorphous phase and has also been observed formolecular glasses, in contrast to macromolecular glasses44. Thus,the relative glass transition intensity, Δcp/Δcp,a, can be used as ameasure for the content of amorphous phase in semi-crystallineglasses (SCGs). This is important because for small crystallinitiesthe change in Δcp is often more sensitive than the variation intransformation enthalpy.
Measurements similar to those in Fig. 1 were recentlyperformed on a Ce-based BMG30, where the authors evaluatedthe crystallization and melting events of the heating curvesobtained by nanocalorimetry. They interpreted the data byintroducing two critical cooling rates, and found that during slowcooling only the crystalline phase occurred. After cooling atmedium rates, i.e., at those between the two critical cooling ratesidentified, they observed a mixed glassy-crystalline structure,while very rapid cooling above the second critical cooling ratesuppressed crystallization30. In our work, we performed experi-ments with a sample mass on the order of micrograms to avoidcritical size effects14,45 and also evaluated the glass transition indetail. We avoided potential oxidation effects by investigating aprecious-metal-based BMG. By significantly refining the mea-surements we were thus able to distinguish between two differenttypes of amorphous glasses, as discussed in the following.
Figure 2a plots the temperature of the crystallization peaksobserved during heating at a rate of 1000 K s−1 vs. the coolingrate at which the glass was formed (Fig. 1b). At slow cooling rates(<200 K s−1) no crystallization is observed in the heating curvesbecause the sample completely crystallized during cooling. Afterfast cooling (≥4000 K s−1) the temperature of the crystallizationpeak is constant and amounts to 314 °C, i.e., in this range thecrystallization is invariant with respect to the previous coolingrate or, in other words, the cooling condition required to form a
glass has no influence on the crystallization process duringheating. We assume that here no nuclei have formed duringcooling, so all nucleation must occur during heating.
After cooling at rates between 200 and 4000 K s−1 thecrystallization temperature, TPeak, is significantly lower than thatafter fast cooling, and in this range TPeak increases with increasingcooling rate. In these more slowly cooled glasses, the crystal-lization is accelerated and may be interpreted by the formation of(nano)structures during cooling such as quenched-in nuclei46 orprecursors of nucleation.
If a glass contains a sufficiently high number of quenched-innuclei, heterogeneously nucleated crystallization occurs duringheating. Based on the Kolmogorov–Johnson–Mehl–Avrami(KJMA) equation47–49 for isothermal crystallization we can showthat the cooling rate dependence of the peak temperature followsa power law (see Supplementary Discussion), i.e.,
TPeak ¼ T1 þ C βc � β0��
��κ; ð1Þ
where C and κ are empirical constants, T1 is the minimumcrystallization temperature during heating, β0 is the minimumcooling rate for crystallization during heating, and βc is thecooling rate.
By fitting of the data in Fig. 2a, the parameters are determinedas C= 34.2 K, κ= 0.1, T1= 224.9 °C, and β0= 190.7 K s−1. Theresulting curve fits the experimental data well. This indicates thatthe nucleation density is, in a first approximation, proportional to
105104103102
105104103102
260
280
300
Pea
k te
mpe
ratu
re (
°C)
Δcp
(J g
–1 K
–1)
320
�c,SCG �c,SDG �c,CHGa
b
0.00
0.05
0.10
0.15
SCG SDG
Cooling rate (K s–1)
CHG
Fig. 2 Cooling rate dependence of the crystallization peak and glasstransition. Data derived from the heating curves measured at 1000 K s−1 vs.cooling rate at which the glass was formed (see Fig. 1b). a Peaktemperature of crystallization event. b Intensity of the glass transition, Δcp.The solid curve in a results from a fit using Eq. (1); the dashed curves ina and b are guides for the eye
NATURE COMMUNICATIONS | https://doi.org/10.1038/s41467-018-07930-3 ARTICLE
NATURE COMMUNICATIONS | (2019) 10:1337 | https://doi.org/10.1038/s41467-018-07930-3 | www.nature.com/naturecommunications 3

the previous cooling rate. This agrees with investigations on a Zr-based BMG, where model calculations indicate that the crystal-lization kinetics during heating can be described by a numberdensity of pre-existing nuclei rather than by a nucleation rate50.
Figure 2b shows the intensity of the glass transition as afunction of the previous cooling rate. Below a cooling rate ofapproximately 200 K s−1 no glass transition occurs, and thematerial is completely crystalline. After cooling at a rate of morethan 500 K s−1 the glass transition intensity is constant (Δcp=0.14 J g−1 K−1) and the sample is completely amorphous. Atcooling rates between these limits, crystals have formed but thecrystallization time is too short for complete crystallization of thesample. The reaming glassy phase generates a reduced glasstransition with Δcp < 0.14 J g−1 K−1. The intensity of the glasstransition vs. the previous cooling rate to form a glass in Fig. 2b,and the shift of the crystallization temperature in Fig. 2a, indicatethe existence of three critical cooling rates.
The lowest critical cooling rate, βc,SCG ≈ 200 K s−1, is the uppercooling rate limit at which the material completely crystallizesduring cooling. Above this rate (and below 500 K s−1) crystalsand glassy regions coexist, and a semi-crystalline glass (SCG) orglass composite (using metallurgy terminology) forms. Such aglass often has the structure of a dispersion of nanoparticles in theamorphous matrix51.
The second critical cooling rate, βc,SDG ≈ 500 K s−1, is the lowercooling rate limit at which an amorphous glass can be formed.Above this rate (and below 4000 K s−1), the glass contains regionswith an increased local order, which comprises quenched-innuclei or precursors for nucleation (embryos). These metastablestructures accelerate nucleation or act directly as nuclei duringsubsequent heating. We call such a glass self-doped glass (SDG).The mass content of the quenched-in nuclei or precursors is sosmall that it has no influence on the glass transition intensity(Fig. 2b). The increase in the crystallization temperature withincreasing cooling rate, however, indicates a reduced number ofquenched-in nuclei or precursors after faster cooling (Fig. 2a).
The SDG contains nanostructures which may be non-crystalline metastable clusters in the glass resulting from spatialheterogeneities11,52,53 or quenched-in nuclei, as frequently notedin Al-based BMGs54–59. Such nuclei form during quenching, buttheir growth is limited due to the reduced temperature and soluterejection55. Transmission electron microscopy (TEM) and X-raydiffraction (XRD) measurements have shown that a BMG appearscompletely amorphous even if it contains quenched-in nuclei56.The number density of such structures in an Al-based BMG is onthe order of 1021 m−3 (ref. 60).
Above the highest critical cooling rate of βc,CHG ≈ 4000 K s−1, achemically homogeneous glass (CHG) forms. Such a glasscontains no quenched-in nuclei or precursors which acceleratenucleation during heating.
A comparison of the crystallization kinetics of the SCG and theSDG in Fig. 2a shows no abrupt variations in the cooling-ratedependence. In fact, for both glasses the cooling rate dependenceof the crystallization peak follows Eq. (1) with the same parameterset, i.e., the nucleation kinetics in the SCG and the SDG arecomparable. This indicates that the crystals and the quenched-inclusters act similarly in the crystallization process, which leads usto conclude that the quenched-in clusters are nuclei rather thanprecursors of nucleation at low temperatures.
In contrast to the above, a comparison of the crystallizationkinetics of SDG and CHG in Fig. 2a clearly shows a cooling-ratedependence of the crystallization peak during heating for thesetwo types of amorphous glasses. Whereas in the CHG crystal-lization is independent of cooling-rate variation, in the SDG alower previous cooling rate results in accelerated crystallization.The influence of processing and cooling conditions on
crystallization of glasses during heating has been reported formany different families of BMGs14,40,50,61,62. This leads us toconclude that the formation of SDGs is a common occurrence inBMG alloy processing.
To study the generality of this phenomenon, we also performedsimilar measurements on the Pt-based BMG Pt57.3Cu14.6-Ni5.3P22.8, as described in Supplementary Note 2. Here we canalso distinguish between SCG, SDG, and CHG and obtain criticalcooling rates of βc,SCG ≈ 2 K s−1, βc,SDG ≈ 20 K s−1, and βc,CHG ≈150 K s−1, respectively, as seen in Supplementary Fig. 2. Theoccurrence of SDG and CHG thus appears to be a generalphenomenon in BMG processing.
Critical heating rates. If a glass is heated at sufficiently high rates,no crystallization occurs. The critical heating rate is the lowerheating rate limit for avoiding crystallization, and it has beenfrequently reported that it is substantially higher (in orders ofmagnitude) than the critical cooling rate14,15,45,63,64. The exis-tence of differently structured glasses (SDG and CHG), however,leads us to expect that each type of glass has its characteristiccritical heating rate.
To determine the critical heating rate of the CHG, the Au-based liquid was cooled at 20,000 K s−1 and the resulting glassreheated at various rates. Selected curves are shown in Fig. 3a. Atlow heating rates crystallization occurs after the glass transition,followed by melting. The crystallization peak shifts to higher
100 200 300 400 500 600
0.0
0.5
1.0
1.5
2.0
2.5
Endo
Endo
8000
3000
5000
1000
6000
100
20,000
10,000
15,000
25,000
1000
Heating rate (K s–1)
Heating rate (K s–1)
Cooling at 20,000 K s–1
Cooling at 600 K s–1
a
b
100 200 300
Temperature (°C)
400 500 600
0
2
4
6
Hea
t flo
w (
mW
)H
eat f
low
(m
W)
Fig. 3 Heating behavior of CHG and SDG. Selected heating curves measuredat various rates, as indicated in the figure. a Chemically homogeneous glass(CHG) that was formed at a cooling rate of 20,000 K s−1. b Self-doped glass(SDG) that was formed at a cooling rate of 600 K s−1. The curves measuredat the critical heating rates (6000 K s−1 for CHG in a and 20,000 K s−1 forSDG in b) are illustrated as bold curves
ARTICLE NATURE COMMUNICATIONS | https://doi.org/10.1038/s41467-018-07930-3
4 NATURE COMMUNICATIONS | (2019) 10:1337 | https://doi.org/10.1038/s41467-018-07930-3 | www.nature.com/naturecommunications
temperatures when the heating rate is increased, and at a heatingrate between 1000 and 5000 K s−1 crystallization is not finishedwhen melting starts. The material cannot crystallize completely,i.e., the crystallization rate is thermodynamically limited. Never-theless, for all crystallization and melting processes the totaltransformation enthalpy (containing crystallization and melting)becomes zero within the error of the experimental detection limit.Above the critical heating rate of βh,CHG ≈ 6000 K s−1 nocrystallization can be observed. In that case, also no meltingevent occurs14.
To determine the critical heating rate, βh,SDG, of an SDG theliquid was cooled at 600K s−1 to RT before heating the glass atvarious rates (Fig. 3b). The curves appear similar to those in Fig. 3a,but the effect of neither crystallization nor melting appears at amuch higher critical heating rate of βh,SDG ≈ 20,000 K s−1.
The assumption that in metallic glasses the critical heating rate isorders of magnitude higher than the critical cooling rate15,63,64 isthus only valid for the nanostructured SDG (βc,SDG ≈ 500 K s−1,βh,SDG ≈ 20,000 K s−1), where quenched-in nuclei or precursorsalready exist. Here, to completely melt the glassy phase the heatingprocess has to be fast enough so that existing nuclei stay atsubcritical size. This happens when the heating rate is so high thatthe increase in the critical size of a nucleus due to temperature
increase is faster than the actual nucleation, i.e.,
� βhV
dv�
dT>dNdt
; ð2Þ
where βh is the heating rate, V is the volume, v* is the volume of acritical nucleus, and N is the number of nuclei. The secondpossible mechanism for avoiding crystallization of a glass withexisting nuclei is to bypass the growth region during heating. Inthe framework of a TTT diagram this means that the curve of thetotal temperature program does not touch the growth region.
For CHGs the critical cooling and heating rates only differ by afactor of 1.5 (βc,CHG ≈ 4000 K s−1, βh,CHG ≈ 6000 K s−1). Thisrelatively small difference can be explained by an asymmetriccurve shape of the nucleation rate vs. temperature, or by a verysmall number of remaining quenched-in nuclei or precursors.
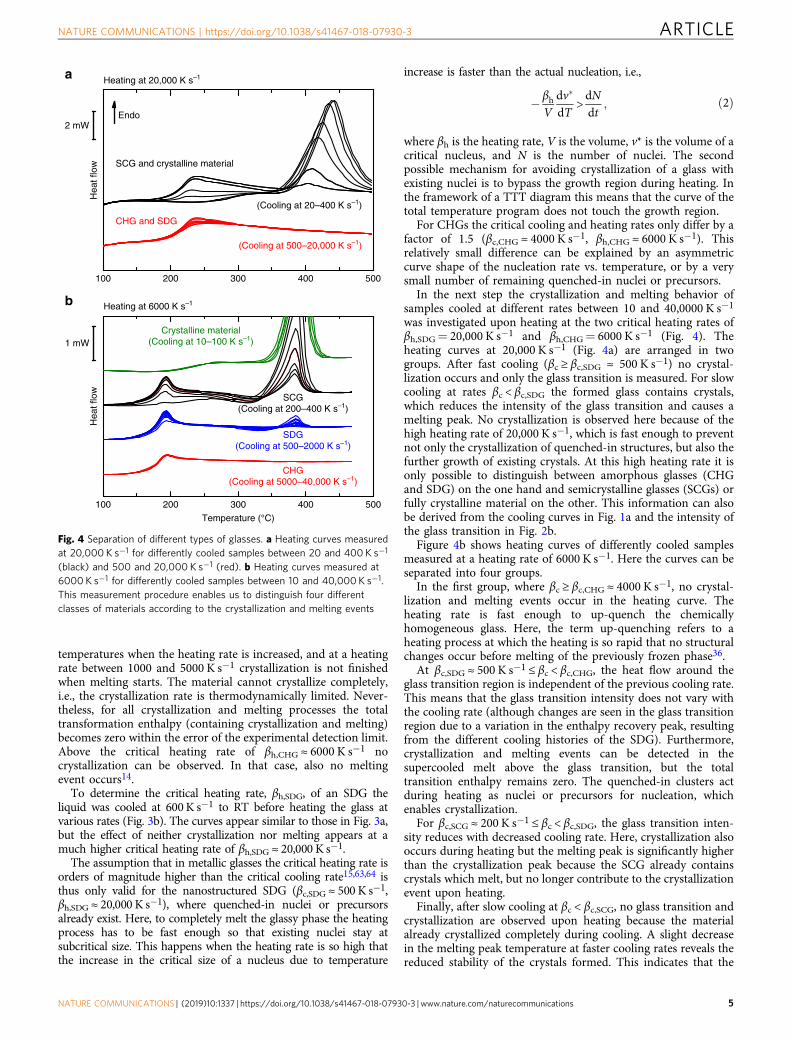
In the next step the crystallization and melting behavior ofsamples cooled at different rates between 10 and 40,0000 K s−1
was investigated upon heating at the two critical heating rates ofβh,SDG= 20,000 K s−1 and βh,CHG= 6000 K s−1 (Fig. 4). Theheating curves at 20,000 K s−1 (Fig. 4a) are arranged in twogroups. After fast cooling (βc ≥ βc,SDG ≈ 500 K s−1) no crystal-lization occurs and only the glass transition is measured. For slowcooling at rates βc < βc,SDG the formed glass contains crystals,which reduces the intensity of the glass transition and causes amelting peak. No crystallization is observed here because of thehigh heating rate of 20,000 K s−1, which is fast enough to preventnot only the crystallization of quenched-in structures, but also thefurther growth of existing crystals. At this high heating rate it isonly possible to distinguish between amorphous glasses (CHGand SDG) on the one hand and semicrystalline glasses (SCGs) orfully crystalline material on the other. This information can alsobe derived from the cooling curves in Fig. 1a and the intensity ofthe glass transition in Fig. 2b.
Figure 4b shows heating curves of differently cooled samplesmeasured at a heating rate of 6000 K s−1. Here the curves can beseparated into four groups.
In the first group, where βc ≥ βc,CHG ≈ 4000 K s−1, no crystal-lization and melting events occur in the heating curve. Theheating rate is fast enough to up-quench the chemicallyhomogeneous glass. Here, the term up-quenching refers to aheating process at which the heating is so rapid that no structuralchanges occur before melting of the previously frozen phase36.
At βc,SDG ≈ 500 K s−1 ≤ βc < βc,CHG, the heat flow around theglass transition region is independent of the previous cooling rate.This means that the glass transition intensity does not vary withthe cooling rate (although changes are seen in the glass transitionregion due to a variation in the enthalpy recovery peak, resultingfrom the different cooling histories of the SDG). Furthermore,crystallization and melting events can be detected in thesupercooled melt above the glass transition, but the totaltransition enthalpy remains zero. The quenched-in clusters actduring heating as nuclei or precursors for nucleation, whichenables crystallization.
For βc,SCG ≈ 200 K s−1 ≤ βc < βc,SDG, the glass transition inten-sity reduces with decreased cooling rate. Here, crystallization alsooccurs during heating but the melting peak is significantly higherthan the crystallization peak because the SCG already containscrystals which melt, but no longer contribute to the crystallizationevent upon heating.
Finally, after slow cooling at βc < βc,SCG, no glass transition andcrystallization are observed upon heating because the materialalready crystallized completely during cooling. A slight decreasein the melting peak temperature at faster cooling rates reveals thereduced stability of the crystals formed. This indicates that the
100
1 mW
2 mW
a
b
Endo
200 300
Crystalline material(Cooling at 10–100 K s–1)
(Cooling at 20–400 K s–1)
(Cooling at 500–20,000 K s–1)
CHG and SDG
Heating at 6000 K s–1
Heating at 20,000 K s–1
SCG and crystalline material
400
SCG(Cooling at 200–400 K s–1)
SDG(Cooling at 500–2000 K s–1)
CHG(Cooling at 5000–40,000 K s–1)
500
100 200 300
Temperature (°C)
400 500
Hea
t flo
wH
eat f
low
Fig. 4 Separation of different types of glasses. a Heating curves measuredat 20,000 K s−1 for differently cooled samples between 20 and 400 K s−1
(black) and 500 and 20,000 K s−1 (red). b Heating curves measured at6000 K s−1 for differently cooled samples between 10 and 40,000 K s−1.This measurement procedure enables us to distinguish four differentclasses of materials according to the crystallization and melting events
NATURE COMMUNICATIONS | https://doi.org/10.1038/s41467-018-07930-3 ARTICLE
NATURE COMMUNICATIONS | (2019) 10:1337 | https://doi.org/10.1038/s41467-018-07930-3 | www.nature.com/naturecommunications 5

crystals have sizes in the nanometer range, and that the meltingtemperature of the nanocrystals decreases with a decrease inparticle size due to their surface enthalpy (Gibbs–Thomsoneffect). A melting point depression has, for example, beenexperimentally verified for nanosized indium particles65.
The intensity of the glass transition, Δcp, the total transforma-tion enthalpy, ΔH, and the enthalpy of the exothermic crystal-lization peak, ΔHcryst, were evaluated from the curves in Fig. 4b.The 6000 K s−1 heating rate data regarding Δcp and ΔH were alsoadded to Supplementary Fig. 1 to further verify the linearcorrelation between the relative intensity of the glass transitionand the crystallinity. Figure 5 shows all data (ΔH, ΔHcryst, Δcp) asa function of the cooling rate at which the glass was formed, andclearly links the four different regimes with the cooling process.In the CHG no crystallization and melting occur and the intensityof the glass transition is maximal. The latter is also true for theSDG, but here a small crystallization event is observed, and themodulus of the crystallization enthalpy |ΔHcryst| slightly increaseswith a decrease in cooling rate. However, because the totalenthalpy of transformation is zero, all crystals must have formedupon heating (whereas no crystals had formed upon cooling). Thecrystallization process is accelerated (see Fig. 2a) due to theexistence of quenched-in nuclei, which, however, do not influencethe intensity of the glass transition.
In the SCG the crystallinity increases with a decrease in coolingrate, which is reflected in the related increase in the totaltransformation enthalpy and the decrease in the glass transitionintensity. During heating the remaining amorphous fractiontends to crystallize, which generates a finite crystallizationenthalpy. Finally, in the crystalline material created after slowcooling, only melting can be measured in the subsequent heatingcurve, so that Δcp= 0 and ΔH= ΔHmelt ≈ ΔHm reaches amaximum.
These results agree nicely with the findings in Fig. 2, so thatrecommendations regarding the experimental parameters for adetailed analysis of glass behavior can be derived: In coolingexperiments it is only possible to determine the critical coolingrate for SDGs (see Fig. 2b), while more information on glassproperties can only be obtained from heating measurements.Here, the heating rate selected is essential for the resolution of themeasurement, and the rate must be adapted to the kinetics of the
nucleation and growth processes. If the heating rate is ≥βh,SDG=20,000 K s−1 (Fig. 4a), the results will only duplicate theconclusions of the cooling measurements. If the heating rate istoo slow, nucleation will always occur during heating and theresolution in the kinetic analysis will not be sufficient todifferentiate the various initial conditions in the glass. At heatingrates βh,CHG ≤ βh < βh,SDG (Fig. 4b), the enthalpy determination bypeak integration (see Fig. 5) can be used. This is more sensitiveand robust than the evaluation of the peak temperature (Fig. 2a),because it is an integral method without any curve shapeinfluence.
Isothermal crystallization. The non-isothermal measurementsindicate that two different kinds of completely amorphous glasscan be formed during cooling. The different nucleation densitiesin the glasses also influence the isothermal crystallization kinetics.To demonstrate this, CHG and SDG were formed upon cooling at20,000 K s−1 and 500 K s−1, respectively, and heated at a rate of30,000 K s−1 to a crystallization temperature between 179 and349 °C (see Supplementary Note 3). The heat-flow curves ofisothermal crystallization measured within a timeframe of 5 s areshown in Supplementary Fig. 3. Most curves show multiplecrystallization events, which are possibly induced by the forma-tion of different phases. Multiple peaks during isothermal crys-tallization are frequently reported for BMGs51,66. Here weconcentrate on the first event.
In the isothermal crystallization curves of the CHG (Supple-mentary Fig. 3a) the shape of the crystallization peaks and theirpositions fluctuate significantly. This can be explained by a lack ofnuclei in the supercooled melt, with the heat-flow curvesreflecting the statistics of spontaneous nuclei formation. Thiscauses the stochastic and non-predictable appearance of thecrystallization peaks seen in Supplementary Fig. 3a.
In contrast to the above, the crystallization curves of the SDG(Supplementary Fig. 3b) show smoothed crystallization peaks, asexpected for nucleated material or materials with a highnucleation rate. This means that the glass already contains(quenched-in) nuclei, or at least precursors which require only asmall amount of free enthalpy to reach the critical size.
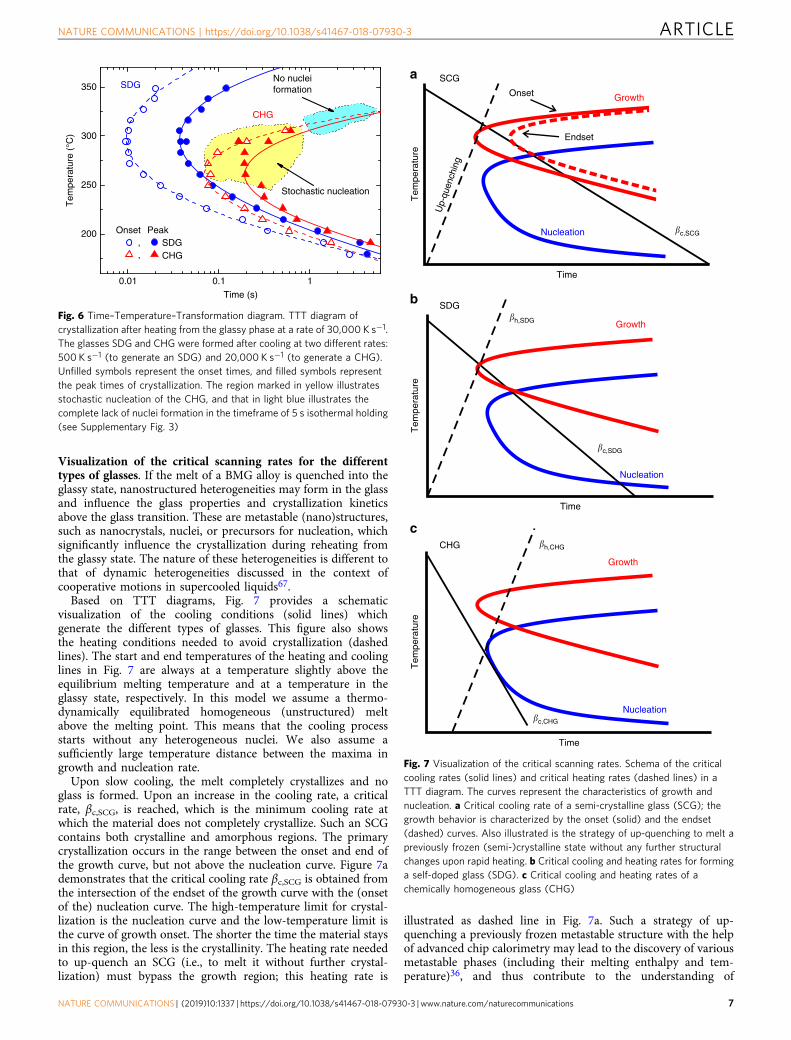
Time–temperature–transformation diagram. To characterizethe crystallization process, from the heat-flow curves in Supple-mentary Fig. 3 we evaluated the onset times (beginning of crys-tallization) and peak times of the crystallization (maximumcrystallization rate) as a function of temperature. The endset wasnot selected due to the potential influences of subsequent crys-tallization processes. Using these data, we can constructtime–temperature–transformation (TTT) diagrams (see Fig. 6)for the SDG, obtained by cooling at a rate of 500 K s−1, and theCHG, obtained by cooling at a rate of 20,000 K s−1. While theTTT diagrams of the SDG and CHG are close at low tempera-tures, which is the region of high nucleation rate and growth-controlled crystallization, they are significantly different at med-ium and high temperatures, where the nucleation rate is low.There the SDG crystallizes significantly faster than the CHG.Furthermore, crystallization of the CHG becomes stochastic nearand above the nose of the TTT diagram (see region marked inyellow) as the result of a stochastic nucleation process, and athigh temperatures the supercooled melt from the CHG does noteven crystallize in the timeframe of the investigation (see regionmarked in light blue) due to a lack of nuclei. A TTT diagram onheating was also measured in ref. 14 using a comparable Au-basedglass cooled at a rate of ≤5000 K s−1. There, however, the TTTdiagram of an SDG was determined without detecting stochasticnucleation.
104103102101
0
10
20
30
40
50
60
SCGCrystals SDG
Ent
halp
y (J
g–1
)
Cooling rate (K s–1)
CHG
Δcp
ΔHcryst
0.00
0.05
0.10
0.15
Gla
ss tr
ansi
tion
inte
nsity
(J
g–1 K
–1)
ΔH
Fig. 5 Indication of different structures. Total enthalpy of the phasetransformation (ΔH), enthalpy of crystallization during heating (ΔHcryst)and intensity of the glass transition (Δcp) upon heating at 6000 K s−1
(Fig. 4b) vs. cooling rate at which the glass was formed. Four differentstates can be clearly observed: the fully crystalline region, the semi-crystalline glass (SCG), the self-doped glass (SDG), and the chemicallyhomogeneous glass (CHG)
ARTICLE NATURE COMMUNICATIONS | https://doi.org/10.1038/s41467-018-07930-3
6 NATURE COMMUNICATIONS | (2019) 10:1337 | https://doi.org/10.1038/s41467-018-07930-3 | www.nature.com/naturecommunications
Visualization of the critical scanning rates for the differenttypes of glasses. If the melt of a BMG alloy is quenched into theglassy state, nanostructured heterogeneities may form in the glassand influence the glass properties and crystallization kineticsabove the glass transition. These are metastable (nano)structures,such as nanocrystals, nuclei, or precursors for nucleation, whichsignificantly influence the crystallization during reheating fromthe glassy state. The nature of these heterogeneities is different tothat of dynamic heterogeneities discussed in the context ofcooperative motions in supercooled liquids67.
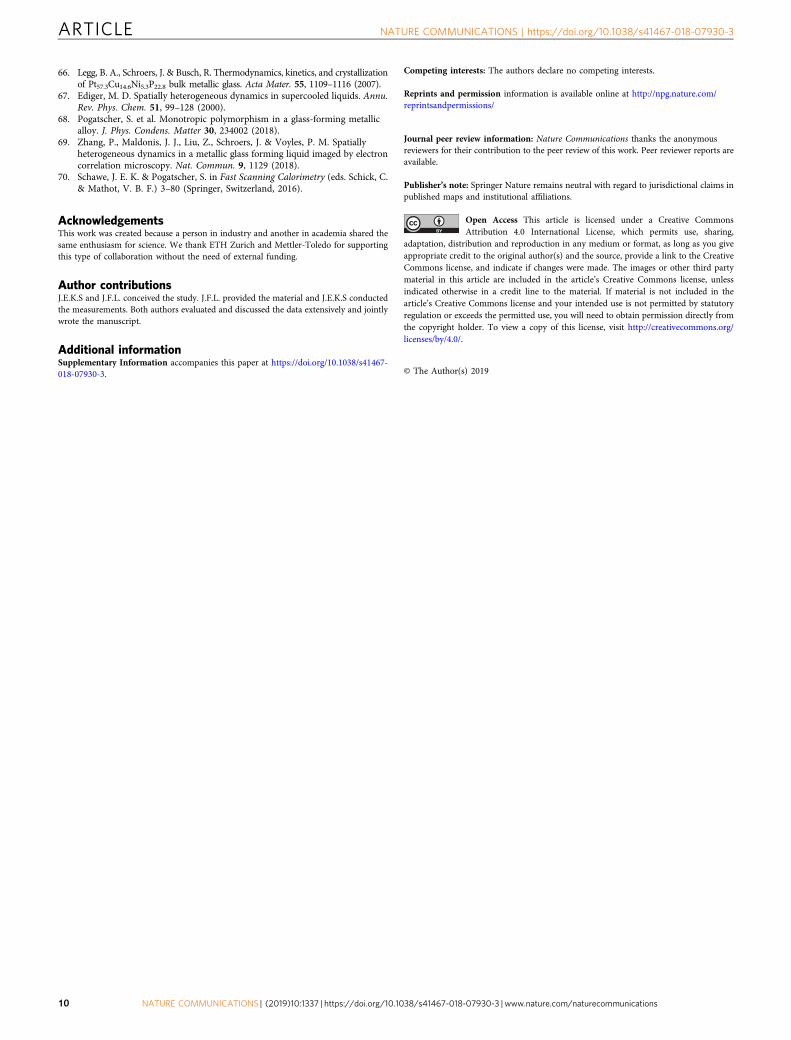
Based on TTT diagrams, Fig. 7 provides a schematicvisualization of the cooling conditions (solid lines) whichgenerate the different types of glasses. This figure also showsthe heating conditions needed to avoid crystallization (dashedlines). The start and end temperatures of the heating and coolinglines in Fig. 7 are always at a temperature slightly above theequilibrium melting temperature and at a temperature in theglassy state, respectively. In this model we assume a thermo-dynamically equilibrated homogeneous (unstructured) meltabove the melting point. This means that the cooling processstarts without any heterogeneous nuclei. We also assume asufficiently large temperature distance between the maxima ingrowth and nucleation rate.
Upon slow cooling, the melt completely crystallizes and noglass is formed. Upon an increase in the cooling rate, a criticalrate, βc,SCG, is reached, which is the minimum cooling rate atwhich the material does not completely crystallize. Such an SCGcontains both crystalline and amorphous regions. The primarycrystallization occurs in the range between the onset and end ofthe growth curve, but not above the nucleation curve. Figure 7ademonstrates that the critical cooling rate βc,SCG is obtained fromthe intersection of the endset of the growth curve with the (onsetof the) nucleation curve. The high-temperature limit for crystal-lization is the nucleation curve and the low-temperature limit isthe curve of growth onset. The shorter the time the material staysin this region, the less is the crystallinity. The heating rate neededto up-quench an SCG (i.e., to melt it without further crystal-lization) must bypass the growth region; this heating rate is
illustrated as dashed line in Fig. 7a. Such a strategy of up-quenching a previously frozen metastable structure with the helpof advanced chip calorimetry may lead to the discovery of variousmetastable phases (including their melting enthalpy and tem-perature)36, and thus contribute to the understanding of
200
250
300
Tem
pera
ture
(°C
)
350
0.01 0.1 1
No nucleiformation
CHG
Onset Peak, SDG, CHG
Time (s)
SDG
Stochastic nucleation
Fig. 6 Time–Temperature–Transformation diagram. TTT diagram ofcrystallization after heating from the glassy phase at a rate of 30,000 K s−1.The glasses SDG and CHG were formed after cooling at two different rates:500 K s−1 (to generate an SDG) and 20,000 K s−1 (to generate a CHG).Unfilled symbols represent the onset times, and filled symbols representthe peak times of crystallization. The region marked in yellow illustratesstochastic nucleation of the CHG, and that in light blue illustrates thecomplete lack of nuclei formation in the timeframe of 5 s isothermal holding(see Supplementary Fig. 3)
�c,SCG
Time
Tem
pera
ture
Time
Tem
pera
ture
Growth
Growth
Nucleation
Nucleation
Time
Tem
pera
ture
Growth
Nucleation
a
c
b
Onset
Endset
SCG
SDG
CHG
Up-
quen
chin
g
�h,SDG
�c,SDG
�h,CHG
�c,CHG
Fig. 7 Visualization of the critical scanning rates. Schema of the criticalcooling rates (solid lines) and critical heating rates (dashed lines) in aTTT diagram. The curves represent the characteristics of growth andnucleation. a Critical cooling rate of a semi-crystalline glass (SCG); thegrowth behavior is characterized by the onset (solid) and the endset(dashed) curves. Also illustrated is the strategy of up-quenching to melt apreviously frozen (semi-)crystalline state without any further structuralchanges upon rapid heating. b Critical cooling and heating rates for forminga self-doped glass (SDG). c Critical cooling and heating rates of achemically homogeneous glass (CHG)
NATURE COMMUNICATIONS | https://doi.org/10.1038/s41467-018-07930-3 ARTICLE
NATURE COMMUNICATIONS | (2019) 10:1337 | https://doi.org/10.1038/s41467-018-07930-3 | www.nature.com/naturecommunications 7

crystallization pathways not only in metallic systems, but also inpolymers, pharmaceuticals and biological systems.
Figure 7b shows the critical conditions for an SDG. The criticalcooling rate, βc,SDG, at which the melt no longer crystallizes ischaracterized by the intersection point of the growth and nucleationcurve. At such cooling the material remains in the nucleation regionfor a certain time and, consequently, nuclei are formed duringcooling. The number of (quenched-in) nuclei in such SDGsdepends on the time during cooling in the nucleation region. Thecritical heating rate, βh,SDG, has to bypass the growth region. It is thesame as the up-quench rate for generating an SCG, and issignificantly greater than the critical cooling rate βc,SDG.
Figure 7c illustrates the critical cooling and heating conditionsfor a CHG. At the critical rates βc,CHG and βh,CHG the nucleationregion is bypassed and, thus, quenched-in nuclei do not form inCHGs. Because of the lack of nuclei, the material can passthrough the growth region during heating without any crystal-lization. To consider the dwell time of the supercooled liquid inthe temperature range of the maximum nucleation rate, theheating line in Fig. 7c does not start at the origin of thecoordinates. Consequently, the critical heating and cooling ratesfor a CHG differ somewhat (in our case by a factor of 1.5), butnot by orders of magnitude as reported frequently in literature bydetermining the thermodynamics of an SDG14,15,63,64.
While scanning electron microscopy, X-ray diffraction orconventional high-resolution TEM can detect metastable micro-structures and nano-scale precipitates in an SCG68, thesetechniques may not be able to resolve structural inhomogeneitiesin an SDG. Here electron correlation microscopy, as recentlyapplied to BMGs69, may resolve the nuclei in SDGs that clearlyinfluence the crystallization kinetics, as observed by FDSC.Revealing atomic/nano-scale differences between SDGs andCHGs via imaging techniques may be the focus of future work.
DiscussionAn Au49Ag5.5Pd2.3Cu26.9Si16.3 metallic glass quenched from themelt into the glassy state under controlled linear cooling wasmeasured over a wide range of cooling rates by fast differentialscanning calorimetry (FDSC). The critical cooling rate at whichthe sample does not crystallize can be directly determined fromthe cooling curves measured. More information, however, wasobtained by analyzing the subsequent heating scans. This studyshows that different kinds of glass can be formed via cooling fromthe melt, and that three different critical cooling rates for metallicglass formation exist: βc,SCG ≈ 200 K s−1, βc,SDG ≈ 500 K s−1, andβc,CHG ≈ 4000 K s−1. The crystallization behavior of these glassesdiverges completely.
Cooling between βc,SCG and βc,SDG produces a semi-crystallineglass (SCG) or glass composite, respectively. The crystalline phasecontent increases with a decrease in the cooling rate. This is mea-sured using FDSC by the change in the intensity of the glasstransition, Δcp, or in the total enthalpy of phase transformation, ΔH.
A self-doped glass (SDG) is formed at cooling rates betweenβc,SDG and βc,CHG. Such a glass appears completely amorphous, butit contains nanoclusters which act as quenched-in nuclei or pre-cursors (embryos) and accelerate crystallization during reheating,even though the glass transition intensity is maximal. Here, thecritical heating rate βh,SDG= 20,000K s−1 (which is the minimumrate to melt the SDG without crystallization) is 40 times greaterthan the critical cooling rate βc,SDG. It seems that most of thetechnically cooled bulk metallic glasses are SDGs, and that thecritical cooling and heating rates reported so far always relate toSDGs14,38,39,61.
Cooling at rates higher than βc,CHG produces a chemicallyhomogeneous glass (CHG) without such quenched-in nuclei, and
thus crystallization ability is significantly reduced. For such aCHG the critical heating rate βh,CHG= 6000 K s−1 is much lowerthan that of an SDG, and is comparable to the critical cooling rateβc,CHG.
In conclusion, we emphasize that such detailed distinctionsbetween different types of glasses upon cooling have never beenmade so far. In fact, they are only now possible because of newlydeveloped chip calorimetry which allows cooling rate variationsof up to 40,000 K s−1. The occurrence of SDG and CHG appearsto be a general phenomenon in metallic glass formation, as alsorevealed by additional measurements on a Pt-based BMG (seeSupplementary Figure 2). The distinction between SDGs andCHGs has important consequences for metallic glass processing,and for glass theory in particular, in view of the fact that manypublications have reported on various glass-forming criteriawithout drawing on detailed experimental knowledge of the glassnanostructure or medium-range order. The concept of differentlystructured glasses presented here is based on fundamental modelsof glass formation and nucleation, and may also hold for otherkinds of thermal treatment (e.g., short annealing above the glasstransition). We therefore assume that SCG, SDG and CHG canalso form in molecular glasses in dependence on their preparationcondition. We thus also expect this phenomenon to be highlyrelevant to the physical stability of molecular glasses, which areused in many areas such as pharmaceuticals and biology.
MethodsSample preparation. The elements Au (99.95%), Cu (99.9%), Ag (99.5%), Si(99.95%), and Pd (99.95%) were pre-alloyed to a sample with nominal compositionAu49Ag5.5Pd2.3Cu26.9Si16.3 (in at.%) via repeated induction melting in a quartz tubethat was sealed under 99.999% pure Ar atmosphere14. The mass loss duringalloying was negligible, so that the real composition equaled the nominal one.Chemically homogenous glassy ribbons of approximately 30 μm thickness werethen produced by melt spinning under 5N+ pure He atmosphere.
Fast differential scanning calorimetry. FDSC measurements were performedusing a prototype of a Mettler-Toledo Flash DSC 2+. This instrument is anadvanced version based upon Flash DSC technology, with a sealed measurementcell for reduced oxygen content. The Flash DSC 2+ can be operated with a UFS1 sensor70 or a new UFH 1 sensor (see insert to Supplementary Fig. 4), which canbe operated to about 1000 °C. The active area of the latter sensor is reduced by 1/3and the membrane thickness is reduced compared to the UFS 1 sensor. The dia-meter of the active zone is approximately 100 μm, which increases the applicablecooling rate to approximately 40,000 K s−1.
The sample support temperature of the FDSC was set to −30 °C using a Huberintracooler TC45, and the furnace was purged with nitrogen at a flow rate of 60 mlmin−1. The melt-spun ribbons were cut under a stereomicroscope into small pieceswith a surface of approximately 104 μm2. Their mass was estimated using themelting enthalpy of ΔHm= 40.4 J g−1 (ref. 14) to be on the order of 1 μg, for whichno size-dependent nucleation and crystallization effects are expected45. Detailsregarding temperature calibration, thermal lag (Supplementary Fig. 4), andenthalpy resolution (Supplementary Fig. 5) are given in the SupplementaryMethods section.
Data availabilityThe datasets generated during and/or analysed during the current study areavailable from the corresponding author on reasonable request.
Received: 28 March 2018 Accepted: 26 November 2018
References1. Tammann, G. Der Glaszustand 7 (Leopold Voss, Leipzig, 1933).2. Inoue, A. High strength bulk amorphous alloys with low critical cooling rates
(overview). Mater. Trans. JIM 36, 866–875 (1995).3. Takeuchi, A. & Inoue, A. Quantitative evaluation of critical cooling rate for
metallic glasses. Mater. Sci. Eng. A 304-306, 446–451 (2001).4. Weinberg, M. C. Glass-forming ability and glass stability in simple systems. J.
Non-Cryst. Solids 167, 81–88 (1994).
ARTICLE NATURE COMMUNICATIONS | https://doi.org/10.1038/s41467-018-07930-3
8 NATURE COMMUNICATIONS | (2019) 10:1337 | https://doi.org/10.1038/s41467-018-07930-3 | www.nature.com/naturecommunications

5. Carbal, A. A. Jr., Fredericci, C. & Zanotto, E. D. A test of the Hruby parameterto estimate glass-forming ability. J. Non-Cryst. Solids 219, 182–186 (1997).
6. Löffler, J. F. Bulk metallic glasses. Intermetallics 11, 529–540 (2003).7. Gallino, I., Shah, M. B. & Busch, R. Enthalpy relaxation and its relation to the
thermodynamics and crystallization of the Zr58.5Cu15.6Ni12.8Al10.3Nb2.8 bulkmetallic glass-forming alloy. Acta Mater. 55, 1367–1376 (2007).
8. Uhlenhaut, D. I. et al. Structural analysis of rapidly solidified Mg–Cu–Yglasses during room-temperature embrittlement. Philos. Mag. 89, 233–248(2009).
9. Hwang, J. et al. Nanoscale structure and structural relaxation in bulk metallicglass. Phys. Rev. Lett. 108, 195505 (2012).
10. Gallino, I. et al. Hierarchical aging pathways and reversible fragile-to-strongtransition upon annealing of a metallic glass former. Acta Mater. 144, 400–410(2018).
11. Herrmann, H., Mattern, N., Kühn, U., Heinemann, A. & Lazarev, N. P.Evolution of spatial heterogeneity in a Zr-based metallic glass. J. Non-Cryst.Solids 317, 91–96 (2003).
12. Löffler, J. F. & Johnson, W. L. Model for decomposition andnanocrystallization of deeply undercooled Zr41.2Ti13.8Cu12.5Ni10Be22.5. Appl.Phys. Lett. 76, 3394–3396 (2000).
13. Kumar, G., Neibecker, P., Liu, Y. H. & Schroers, J. Critical fictive temperaturefor plasticity in metallic glasses. Nat. Commun. 4, 1536 (2013).
14. Pogatscher, S., Uggowitzer, P. J. & Löffler, J. F. In-situ probing of metallic glassformation and crystallization upon heating and cooling via fast differentialscanning calorimetry. Appl. Phys. Lett. 104, 251908 (2014).
15. Schroers, J., Masuhr, A., Johnson, W. L. & Busch, R. Pronounced asymmetryin the crystallization behavior during constant heating and cooling of a bulkmetallic glass-forming liquid. Phys. Rev. B 60, 11855–11858 (1999).
16. Evenson, Z., Gallino, I. & Busch, R. The effect of cooling rates on the apparentfragility of Zr-based bulk metallic glasses. J. Appl. Phys. 107, 123529 (2010).
17. Bai, F. X., Yao, J. H., Wang, Y. X., Pan, J. & Li, Y. Crystallization kinetics of anAu-based metallic glass upon ultrafast heating and cooling. Scr. Mater. 132,58–62 (2017).
18. Adamovsky, S. A., Minakov, A. A. & Schick, C. Scanning microcalorimetry athigh cooling rate. Thermochim. Acta 403, 55–63 (2003).
19. Zhuravlev, E. & Schick, C. Fast scanning power compensated differentialscanning nano-calorimeter: 1. The device. Thermochim. Acta 505, 1–13(2010).
20. Schawe, J. The revolutionary new Flash DSC 1: optimum performance formetastable materials. Mettler-Toledo Thermal Analysis User Com. 32, 12–16(2010).
21. Mathot, V. et al. The Flash DSC 1, a power compensation twin-type, chip-based fast scanning calorimeter (FSC): first findings on polymers.Thermochim. Acta 552, 36–45 (2011).
22. Zhuravlev, E., Schmelzer, J. W. P., Wunderlich, B. & Schick, C. Kinetics ofnucleation and crystallization in poly(ɛ-caprolactone) (PCL). Polymer 52,1983–1997 (2011).
23. Andorosch, R., Di Laurenzo, M. L. & Schick, C. Crystal nucleation in randomL/D-lactide copolymers. Eur. Polym. J. 75, 474–486 (2016).
24. Martin., J., Stingelin, N. & Cangialosi, D. Direct calorimetric obeservation ofthe rigid amorphous fraction in a semiconducting polymer. J. Phys. Chem.Lett. 9, 990–995 (2018).
25. Kobayashi, M. & Tanaka, H. The reversibility and first-order nature of liqid-liquid transition in a molecular liquid. Nat. Commun. 7, 3438 (2016).
26. Orava, J., Greer, A. L., Gholipour, B., Hewak, D. W. & Smith, C. E.Characterization of supercooled liquid Ge2Sb2Te5 and its crystallization byultrafast-heating calorimetry. Nat. Mater. 11, 279–283 (2012).
27. Orava, J., Greer, A. L., Gholipour, B., Hewak, D. W. & Smith, C. E. Ultra-fastcalorimetry study of Ge2Sb2Te5 crystallization between dielectric layers. Appl.Phys. Lett. 101, 091906 (2012).
28. Chen, B., Momand, J., Vermeulen, P. A. & Kooi, B. J. Crystallization kineticsof supercooled liquid Ge–Sb based on ultrafast calorimetry. Cryst. Growth Des.16, 242–248 (2016).
29. Vermeulen, P. A., Momand, J. & Kooia, B. J. Reversible amorphous-crystallinephase changes in a wide range of Se1−xTex alloys studied using ultrafastdifferential scanning calorimetry J. Chem. Phys. 141, 024502 (2014).
30. Zhao, B. et al. Beating homogeneous nucleation and tuning atomic odering inglass-forming metals by nanocalorimetry. Nano Lett. 17, 7751–7760 (2017).
31. Pogatscher, S., Leutenegger, D., Schawe, J. E. K., Uggowitzer, P. J. & Löffler, J.F. Solid–solid phase transitions via melting in metals. Nat. Commun. 7, 11113(2016).
32. Bai, F. X., Yao, J. H. & Li, Y. Conversion of isothermal and isochronalcrystallization in a supercooled liquid through additivity rule. Intermetallics86, 73–79 (2017).
33. Wang, J. Q. et al. The ultrastable kinetic behavior of an Au-based nanoglass.Acta Mater. 79, 30–36 (2014).
34. Wang, J. Q., Shen, Y., Perepezko, J. H. & Ediger, M. D. Increasing the kineticstability of bulk metallic glasses. Acta Mater. 104, 25–32 (2016).
35. Simon, C., Gao, J., Mao, Y. & Wilde, G. Fast scanning calorimetric study ofnucleation rates and nucleation transitions of Au-Sn alloys. Scr. Mater. 139,13–16 (2017).
36. Kurtuldu, G., Shamlaye, K. F. & Löffler, J. F. Metastable quasicrystal-inducednucleation in a bulk glass-forming liquid. PNAS 115, 6123–6128 (2018).
37. Schroers, J., Lohwongwatana, B., Johnson, W. L. & Peker, A. Gold based bulkmetallic glass. Appl. Phys. Lett. 87, 061912 (2005).
38. Löffler, J. F., Schroers, J. & Johnson, W. L. Time–temperature–transformationdiagram and microstructures of bulk glass forming Pd40Cu30Ni10P20. Appl.Phys. Lett. 77, 681–683 (2000).
39. Mukherjee, S., Kang, H. G., Johnson, W. L. & Rhim, W. K. Noncontactmeasurement of crystallization behavior, specific volume, and viscosity of bulkglass-forming Zr-Al-Co-(Cu) alloys. Phys. Rev. B 70, 174205 (2004).
40. Granata, D., Fischer, E., Wessels, V. & Löffler, J. F. Fluxing of Pd–Si–Cu bulkmetallic glass and the role of cooling rate and purification. Acta Mater. 17,145–152 (2014).
41. Perepezko, J. H., Santhaweesuk, C., Wang, J. Q. & Imhoff, S. D. Kineticcompetition during glass formation. J. Alloy. Comp. 615, S192–S197 (2014).
42. Perepezko, J. H., Glendenning, T. W. & Wang, J. Q. Nanocalorimetrymeasurements of metastable states. Thermochim. Acta 603, 24–28 (2015).
43. Wilde, G., Görler, G. P., Willnecker, R. & Dietz, G. Thermodynamicproperties of Pd40Ni40P20 in the glassy, liquid, and crystalline states. Appl.Phys. Lett. 65, 397–399 (1994).
44. Schick, C., Stoll, B., Schawe, J., Roger, A. & Gnoth, M. Dielectric and thermalrelaxations in low molecular mass liquid crystals. Progr. Colloid Polym. Sci. 85,148–156 (1991).
45. Pogatscher, S., Leutenegger, D., Hagmann, A., Uggowitzer, P. J. & Löffler, J. F.Characterization of bulk metallic glasses via fast differential scanningcalorimetry. Thermochim. Acta 590, 84–90 (2014).
46. Greer, A. L. Crystallisation kinetics of Fe80B20 glass. Acta Metall. 30, 171–192(1982).
47. Kolmogorov, A. N. On the statistical theory of the crystallization of metals (inRussian). Izv. Akad. Nauk SSSR Ser. Math. 1, 355–359 (1937).
48. Johnson, W. A. & Mehl, R. F. Reaction kinetics in processes of nucleation andgrowth. Trans. Am. Inst. Min. Eng. 135, 416–458 (1939).
49. Avrami, M. Kinetics of phase change. I. General theory. J. Chem. Phys. 7,1103–1109 (1939).
50. Lee, S. B. & Kim, N. J. Crystallisation kinetics of Zr41.2Ti13.8Cu12.5Ni10Be22.5BMG alloy during heating. Philos. Mag. 85, 139–152 (2005).
51. Gravier, S. et al. Evaluation of the crystal volume fraction in a partiallynanocrystallized bulk metallic glass. J. Alloy. Comp. 504S, S226–S229 (2010).
52. Löffler, J. F. et al. Crystallization of bulk amorphous Zr–Ti(Nb)–Cu–Ni–Al.Appl. Phys. Lett. 77, 525–527 (2000).
53. Pekarskaya, E., Löffler, J. F. & Johnson, W. L. ‘Microstructural studies ofcrystallization of a Zr-based bulk metallic glass’. Acta Mater. 51, 4045–4057(2003).
54. Foley, J. C., Allen, D. R. & Perepezko, J. H. Analysis of nanocrystaldevelopment in Al-Y-Fe and Al-Sm glasses. Scr. Mater. 35, 655–660 (1996).
55. Allen, D. R., Foley, J. C. & Perepezko, J. H. Nanocrystal developmentduring primary crystallization of amorphous alloys. Acta Mater. 46, 431–440(1998).
56. Perepezko, J. H. & Wilde, G. Amorphization and alloy metastability inundercooled systems. J. Non-Cryst. Solids 274, 271–281 (2000).
57. Kalay, Y. E., Chumbley, L. S. & Anderson, I. E. Crystallization behavior in ahighly driven marginal glass forming alloy. J. Non-Cryst. Solids 354,3040–3048 (2008).
58. Yang, H. W., Wen, J., Quan, M. X. & Wang, J. Q. Evaluation of the volumefraction of nanocrystals devitrified in Al-based amorphous alloys. J. Non-Cryst. Solids 355, 235–238 (2009).
59. Shen, Y. & Perepezko, J. H. Al-based amorphous alloys: glass-forming ability,crystallization behavior and effects of minor alloying additions. J. Alloy. Comp.707, 3–11 (2017).
60. Perepezko, J. H., Hebert, R. J., Wu, R. I. & Wilde, G. Primary crystallization inamorphous Al-based alloys. J. Non-Cryst. Solids 317, 52–61 (2003).
61. Schroers, J., Johnson, W. L. & Busch, R. Crystallization kinetics of thebulk-glass-forming Pd43Ni10Cu27P20 melt. Appl. Phys. Lett. 77, 1158–1160(2000).
62. Schroers, J., Löffler, J. F., Pekarskaya, E., Busch, R. & Johnson, W. L.Crystallization of bulk glass forming Pd-based melts. Mater. Sci. Forum 360-362, 79–84 (2001).
63. Hays, C. C. et al. Vitrification and determination of the crystallization timescales of the bulk-metallic-glass-forming liquid Zr58.5Nb2.8Cu15.6Ni12.8Al10.3.Appl. Phys. Lett. 79, 1605–1607 (2001).
64. Schroers, J., Busch, R., Bossuyt, S. & Johnson, W. L. Crystallization behavior ofthe bulk metallic glass forming Zr41Ti14Cu12Ni10Be23 liquid.Mater. Sci. Eng. A304–306, 287–291 (2001).
65. Zhang, M. et al. Size-dependent melting point depression of nanostructures:nanocalorimetric measurements. Phys. Rev. B 62, 10548–10557 (2000).
NATURE COMMUNICATIONS | https://doi.org/10.1038/s41467-018-07930-3 ARTICLE
NATURE COMMUNICATIONS | (2019) 10:1337 | https://doi.org/10.1038/s41467-018-07930-3 | www.nature.com/naturecommunications 9
66. Legg, B. A., Schroers, J. & Busch, R. Thermodynamics, kinetics, and crystallizationof Pt57.3Cu14.6Ni5.3P22.8 bulk metallic glass. Acta Mater. 55, 1109–1116 (2007).
67. Ediger, M. D. Spatially heterogeneous dynamics in supercooled liquids. Annu.Rev. Phys. Chem. 51, 99–128 (2000).
68. Pogatscher, S. et al. Monotropic polymorphism in a glass-forming metallicalloy. J. Phys. Condens. Matter 30, 234002 (2018).
69. Zhang, P., Maldonis, J. J., Liu, Z., Schroers, J. & Voyles, P. M. Spatiallyheterogeneous dynamics in a metallic glass forming liquid imaged by electroncorrelation microscopy. Nat. Commun. 9, 1129 (2018).
70. Schawe, J. E. K. & Pogatscher, S. in Fast Scanning Calorimetry (eds. Schick, C.& Mathot, V. B. F.) 3–80 (Springer, Switzerland, 2016).
AcknowledgementsThis work was created because a person in industry and another in academia shared thesame enthusiasm for science. We thank ETH Zurich and Mettler-Toledo for supportingthis type of collaboration without the need of external funding.
Author contributionsJ.E.K.S and J.F.L. conceived the study. J.F.L. provided the material and J.E.K.S conductedthe measurements. Both authors evaluated and discussed the data extensively and jointlywrote the manuscript.
Additional informationSupplementary Information accompanies this paper at https://doi.org/10.1038/s41467-018-07930-3.
Competing interests: The authors declare no competing interests.
Reprints and permission information is available online at http://npg.nature.com/reprintsandpermissions/
Journal peer review information: Nature Communications thanks the anonymousreviewers for their contribution to the peer review of this work. Peer reviewer reports areavailable.
Publisher’s note: Springer Nature remains neutral with regard to jurisdictional claims inpublished maps and institutional affiliations.
Open Access This article is licensed under a Creative CommonsAttribution 4.0 International License, which permits use, sharing,
adaptation, distribution and reproduction in any medium or format, as long as you giveappropriate credit to the original author(s) and the source, provide a link to the CreativeCommons license, and indicate if changes were made. The images or other third partymaterial in this article are included in the article’s Creative Commons license, unlessindicated otherwise in a credit line to the material. If material is not included in thearticle’s Creative Commons license and your intended use is not permitted by statutoryregulation or exceeds the permitted use, you will need to obtain permission directly fromthe copyright holder. To view a copy of this license, visit http://creativecommons.org/licenses/by/4.0/.
© The Author(s) 2019
ARTICLE NATURE COMMUNICATIONS | https://doi.org/10.1038/s41467-018-07930-3
10 NATURE COMMUNICATIONS | (2019) 10:1337 | https://doi.org/10.1038/s41467-018-07930-3 | www.nature.com/naturecommunications