Executive Summary: Heart Disease and Stroke Statistics--2013 Update: A Report From the American...
11
143 Table of Contents Summary e7 1 About These Statistics e11 Cardiovascular Health 2 American Heart Association’s 2020 Impact Goals e14 Health Behaviors 3 Smoking/Tobacco Use e32 4 Physical Inactivity e37 5 Nutrition e45 6 Overweight and Obesity e59 Health Factors and Other Risk Factors 7 Family History and Genetics e68 8 High Blood Cholesterol and Other Lipids e72 9 High Blood Pressure e77 10 Diabetes Mellitus e87 11 Metabolic Syndrome e98 12 Chronic Kidney Disease e104 Conditions/Diseases 13 Total Cardiovascular Diseases e109 14 Stroke (Cerebrovascular Disease) e132 15 Congenital Cardiovascular Defects and Kawasaki Disease e153 16 Disorders of Heart Rhythm e159 17 Subclinical Atherosclerosis e175 (Circulation. 2013;127:143-152.) © 2013 American Heart Association, Inc Circulation is available at http://circ.ahajournals.org DOI: 10.1161/CIR.0b013e318282ab8f *The findings and conclusions of this report are those of the authors and do not necessarily represent the views of the Centers for Disease Control and Prevention The 2013 Statistical Update full text is available online at http://circahajournalsorg/content/127/1/e6full The American Heart Association makes every effort to avoid any actual or potential conflicts of interest that may arise as a result of an outside relationship or a personal, professional, or business interest of a member of the writing panel Specifically, all members of the writing group are required to complete and submit a Disclosure Questionnaire showing all such relationships that might be perceived as real or potential conflicts of interest The American Heart Association requests that this document be cited as follows: Go AS, Mozaffarian D, Roger VL, Benjamin EJ, Berry JD, Borden WB, Bravata DM, Dai S, Ford ES, Fox CS, Franco S, Fullerton HJ, Gillespie C, Hailpern SM, Heit JA, Howard VJ, Huffman MD, Kissela BM, Kittner SJ, Lackland DT, Lichtman JH, Lisabeth LD, Magid D, Marcus GM, Marelli A, Matchar DB, McGuire DK, Mohler ER, Moy CS, Mussolino ME, Nichol G, Paynter NP, Schreiner PJ, Sorlie PD, Stein J, Turan TN, Virani SS, Wong ND, Woo D, Turner MB; on behalf of the American Heart Association Statistics Committee and Stroke Statistics Subcommittee Executive summary: heart disease and stroke statistics—2013 update: a report from the American Heart Association Circulation 2013;127:143–152 A copy of the document is available at http://myamericanheartorg/statements by selecting either the “By Topic” link or the “By Publication Date” link To purchase additional reprints, call 843-216-2533 or e-mail: kelleramsay@wolterskluwercom Expert peer review of AHA Scientific Statements is conducted by the AHA Office of Science Operations For more on AHA statements and guidelines development, visit http://wwwmyamericanheartorg/statements and select the “Policies and Development” link Permissions: Multiple copies, modification, alteration, enhancement, and/or distribution of this document are not permitted without the express permission of the American Heart Association Instructions for obtaining permission are located at http://wwwheartorg/HEARTORG/General/Copyright- Permission-Guidelines_UCM_300404_Articlejsp A link to the “Copyright Permissions Request Form” appears on the right side of the page Executive Summary: Heart Disease and Stroke Statistics—2013 Update A Report From the American Heart Association WRITING GROUP MEMBERS Alan S Go, MD; Dariush Mozaffarian, MD, DrPH, FAHA; Véronique L Roger, MD, MPH, FAHA; Emelia J Benjamin, MD, ScM, FAHA; Jarett D Berry, MD, FAHA; William B Borden, MD, FAHA; Dawn M Bravata, MD; Shifan Dai, MD, PhD*; Earl S Ford, MD, MPH, FAHA*; Caroline S Fox, MD, MPH; Sheila Franco, MS*; Heather J Fullerton, MD; Cathleen Gillespie, MS*; Susan M Hailpern, DPH, MS; John A Heit, MD, FAHA; Virginia J Howard, PhD, FAHA; Mark D Huffman, MD, MPH; Brett M Kissela, MD, MS; Steven J Kittner, MD, FAHA; Daniel T Lackland, DrPH, MSPH, FAHA; Judith H Lichtman, PhD, MPH; Lynda D Lisabeth, PhD, MPH, FAHA; David Magid, MD; Gregory M Marcus, MD, MAS, FAHA; Ariane Marelli, MD, MPH; David B Matchar, MD, FAHA; Darren K McGuire, MD, MHSc, FAHA; Emile R Mohler, MD, FAHA; Claudia S Moy, PhD, MPH; Michael E Mussolino, PhD, FAHA; Graham Nichol, MD, MPH, FAHA; Nina P Paynter, PhD, MHSc; Pamela J Schreiner, PhD, FAHA; Paul D Sorlie, PhD; Joel Stein, MD; Tanya N Turan, MD, MSCR, FAHA; Salim S Virani, MD, PhD; Nathan D Wong, PhD, MPH, FAHA; Daniel Woo, MD, MS, FAHA; Melanie B Turner, MPH; on behalf of the American Heart Association Statistics Committee and Stroke Statistics Subcommittee AHA Statistical Update at UNIV OF CINCINNATI on June 2, 2015 http://circ.ahajournals.org/ Downloaded from
Transcript of Executive Summary: Heart Disease and Stroke Statistics--2013 Update: A Report From the American...

143
Table of Contents
Summary . . . . . . . . . . . . . . . . . . . . . . . . . . . . e7 1 . About These Statistics . . . . . . . . . . . . . . . . . . .e11Cardiovascular Health 2 . American Heart Association’s 2020 Impact Goals . . . .e14Health Behaviors 3 . Smoking/Tobacco Use . . . . . . . . . . . . . . . . . .e32 4 . Physical Inactivity . . . . . . . . . . . . . . . . . . . . .e37 5 . Nutrition . . . . . . . . . . . . . . . . . . . . . . . . . .e45 6 . Overweight and Obesity . . . . . . . . . . . . . . . . .e59
Health Factors and Other Risk Factors 7 . Family History and Genetics . . . . . . . . . . . . . . .e68 8 . High Blood Cholesterol and Other Lipids . . . . . . . .e72 9 . High Blood Pressure . . . . . . . . . . . . . . . . . . .e77 10 . Diabetes Mellitus . . . . . . . . . . . . . . . . . . . . .e87 11 . Metabolic Syndrome . . . . . . . . . . . . . . . . . . .e98 12 . Chronic Kidney Disease . . . . . . . . . . . . . . . . e104Conditions/Diseases 13 . Total Cardiovascular Diseases . . . . . . . . . . . . . e109 14 . Stroke (Cerebrovascular Disease) . . . . . . . . . . . . e132 15 . Congenital Cardiovascular Defects and Kawasaki
Disease . . . . . . . . . . . . . . . . . . . . . . . . . e153 16 . Disorders of Heart Rhythm . . . . . . . . . . . . . . . e159 17 . Subclinical Atherosclerosis . . . . . . . . . . . . . . . e175
(Circulation. 2013;127:143-152.)© 2013 American Heart Association, Inc .
Circulation is available at http://circ.ahajournals.org DOI: 10.1161/CIR.0b013e318282ab8f
2013
00
January 1/8,
00
00
© 2013 American Heart Association, Inc .
2013
*The findings and conclusions of this report are those of the authors and do not necessarily represent the views of the Centers for Disease Control and Prevention .
The 2013 Statistical Update full text is available online at http://circ .ahajournals .org/content/127/1/e6 .full .The American Heart Association makes every effort to avoid any actual or potential conflicts of interest that may arise as a result of an outside relationship
or a personal, professional, or business interest of a member of the writing panel . Specifically, all members of the writing group are required to complete and submit a Disclosure Questionnaire showing all such relationships that might be perceived as real or potential conflicts of interest .
The American Heart Association requests that this document be cited as follows: Go AS, Mozaffarian D, Roger VL, Benjamin EJ, Berry JD, Borden WB, Bravata DM, Dai S, Ford ES, Fox CS, Franco S, Fullerton HJ, Gillespie C, Hailpern SM, Heit JA, Howard VJ, Huffman MD, Kissela BM, Kittner SJ, Lackland DT, Lichtman JH, Lisabeth LD, Magid D, Marcus GM, Marelli A, Matchar DB, McGuire DK, Mohler ER, Moy CS, Mussolino ME, Nichol G, Paynter NP, Schreiner PJ, Sorlie PD, Stein J, Turan TN, Virani SS, Wong ND, Woo D, Turner MB; on behalf of the American Heart Association Statistics Committee and Stroke Statistics Subcommittee . Executive summary: heart disease and stroke statistics—2013 update: a report from the American Heart Association . Circulation . 2013;127:143–152 .
A copy of the document is available at http://my .americanheart .org/statements by selecting either the “By Topic” link or the “By Publication Date” link . To purchase additional reprints, call 843-216-2533 or e-mail: kelle .ramsay@wolterskluwer .com .
Expert peer review of AHA Scientific Statements is conducted by the AHA Office of Science Operations . For more on AHA statements and guidelines development, visit http://www .my .americanheart .org/statements and select the “Policies and Development” link .
Permissions: Multiple copies, modification, alteration, enhancement, and/or distribution of this document are not permitted without the express permission of the American Heart Association . Instructions for obtaining permission are located at http://www .heart .org/HEARTORG/General/Copyright-Permission-Guidelines_UCM_300404_Article .jsp . A link to the “Copyright Permissions Request Form” appears on the right side of the page .
AQ5
Executive Summary: Heart Disease and Stroke Statistics—2013 UpdateAQ1
AQ2
Executive Summary: Heart Disease and Stroke Statistics—2013 Update
A Report From the American Heart Association
WRITING GROUP MEMBERS
Alan S . Go, MD; Dariush Mozaffarian, MD, DrPH, FAHA; Véronique L . Roger, MD, MPH, FAHA; Emelia J . Benjamin, MD, ScM, FAHA; Jarett D . Berry, MD, FAHA; William B . Borden, MD, FAHA;
Dawn M . Bravata, MD; Shifan Dai, MD, PhD*; Earl S . Ford, MD, MPH, FAHA*; Caroline S . Fox, MD, MPH; Sheila Franco, MS*; Heather J . Fullerton, MD; Cathleen Gillespie, MS*;
Susan M . Hailpern, DPH, MS; John A . Heit, MD, FAHA; Virginia J . Howard, PhD, FAHA; Mark D . Huffman, MD, MPH; Brett M . Kissela, MD, MS; Steven J . Kittner, MD, FAHA;
Daniel T . Lackland, DrPH, MSPH, FAHA; Judith H . Lichtman, PhD, MPH; Lynda D . Lisabeth, PhD, MPH, FAHA; David Magid, MD; Gregory M . Marcus, MD, MAS, FAHA; Ariane Marelli, MD, MPH; David B . Matchar, MD, FAHA; Darren K . McGuire, MD, MHSc, FAHA;
Emile R . Mohler, MD, FAHA; Claudia S . Moy, PhD, MPH; Michael E . Mussolino, PhD, FAHA; Graham Nichol, MD, MPH, FAHA; Nina P . Paynter, PhD, MHSc;
Pamela J . Schreiner, PhD, FAHA; Paul D . Sorlie, PhD; Joel Stein, MD; Tanya N . Turan, MD, MSCR, FAHA; Salim S . Virani, MD, PhD; Nathan D . Wong, PhD, MPH, FAHA; Daniel Woo, MD, MS, FAHA; Melanie B . Turner, MPH; on behalf of the American Heart Association
Statistics Committee and Stroke Statistics Subcommittee
LWWAHA Statistical Update
at UNIV OF CINCINNATI on June 2, 2015http://circ.ahajournals.org/Downloaded from

144 Circulation January 1/8, 2013
18 . Coronary Heart Disease, Acute Coronary Syndrome, and Angina Pectoris . . . . . . . . . . . . . . . . . . . e185
19 . Cardiomyopathy and Heart Failure . . . . . . . . . . . e199 20 . Valvular, Venous, Aortic, and Peripheral Artery
Diseases . . . . . . . . . . . . . . . . . . . . . . . . . e205Outcomes 21 . Quality of Care . . . . . . . . . . . . . . . . . . . . . e215 22 . Medical Procedures . . . . . . . . . . . . . . . . . . . e229 23 . Economic Cost of Cardiovascular Disease . . . . . . . e234Supplemental Materials 24 . At-a-Glance Summary Tables . . . . . . . . . . . . . . e238 25 . Glossary . . . . . . . . . . . . . . . . . . . . . . . . . e243
SummaryEach year, the American Heart Association (AHA), in con-junction with the Centers for Disease Control and Prevention, the National Institutes of Health, and other government agen-cies, brings together the most up-to-date statistics on heart disease, stroke, other vascular diseases, and their risk factors and presents them in its Heart Disease and Stroke Statisti-cal Update . The Statistical Update is a valuable resource for researchers, clinicians, healthcare policy makers, media pro-fessionals, the lay public, and many others who seek the best national data available on heart disease, stroke, and other car-diovascular disease–related morbidity and mortality and the risks, quality of care, medical procedures and operations, and costs associated with the management of these diseases in a single document . Indeed, since 1999, the Statistical Update has been cited >10 500 times in the literature, based on cita-tions of all annual versions . In 2011 alone, the various Statis-tical Updates were cited ≈1500 times (data from ISI Web of Science) . In recent years, the Statistical Update has undergone some major changes with the addition of new chapters and major updates across multiple areas, as well as increasing the number of ways to access and use the information assembled .
For this year’s edition, the Statistics Committee, which pro-duces the document for the AHA, updated all of the current chapters with the most recent nationally representative data and inclusion of relevant articles from the literature over the past year . This year’s edition also implements a new chapter organization to reflect the spectrum of cardiovascular health behaviors and health factors and risks, as well as subsequent complicating conditions, disease states, and outcomes . Also, the 2013 Statistical Update contains new data on the monitoring and benefits of cardiovas-cular health in the population, with additional new focus on evi-dence-based approaches to changing behaviors, implementation strategies, and implications of the AHA’s 2020 Impact Goals . Below are a few highlights from this year’s Update .
The 2013 Update Expands Data Coverage of the Epidemic of Poor Cardiovascular Health Behaviors and Their Antecedents and Consequences
●● Adjusted population attributable fractions for cardiovascular disease (CVD) mortality were as follows1: 40 .6% (95% confi-dence interval [CI], 24 .5–54 .6) for high blood pressure; 13 .7% (95% CI, 4 .8–22 .3) for smoking; 13 .2% (95% CI, 3 .5–29 .2) for poor diet; 11 .9% (95% CI, 1 .3–22 .3) for insufficient physi-cal activity; and 8 .8% (95% CI, 2 .1–15 .4) for abnormal glu-cose levels .
●● Despite 4 decades of progress, in 2011, among Americans ≥18 years of age, 21 .3% of men and 16 .7% of women con-tinued to be cigarette smokers . In 2011, 18 .1% of students in grades 9 through 12 reported current cigarette use .
●● The percentage of the nonsmoking population with detect-able serum cotinine (indicating exposure to secondhand smoke) declined from 52 .5% in 1999 to 2000 to 40 .1% in 2007 to 2008, with declines higher for those 3 to 11 years of age (–53 .6%) and those 12 to 19 years of age (–46 .5%) than for those 20 years of age and older (–36 .7%) .
●● The proportion of youth (≤18 years of age) who report engag-ing in no regular physical activity is high, and the proportion increases with age . In 2011, among adolescents in grades 9 through 12, 17 .7% of girls and 10 .0% of boys reported that they had not engaged in ≥60 minutes of moderate-to-vigor-ous physical activity, defined as any activity that increased heart rate or breathing rate, even once in the previous 7 days, despite recommendations that children engage in such activity 7 days per week .
●● Thirty two percent of adults reported engaging in no aero-bic leisure-time physical activity .
●● Data from the National Health and Nutrition Examination Survey (NHANES) indicate that between 1971 and 2004, average total energy consumption among US adults increased by 22% in women (from 1542 to 1886 kcal/d) and by 10% in men (from 2450 to 2693 kcal/d) .
●● The increases in calories consumed during this time period are attributable primarily to greater average carbohydrate intake, in particular, of starches, refined grains, and sugars . Other spe-cific changes related to increased caloric intake in the United States include larger portion sizes, greater food quantity and calories per meal, and increased consumption of sugar-sweet-ened beverages, snacks, commercially prepared (especially fast food) meals, and higher energy-density foods .
●● The estimated prevalence of overweight and obesity in US adults (≥20 years of age) is 154 .7 million, which represents 68 .2% of this group in 2010 . Fully 34 .6% of US adults are obese (body mass index ≥30 kg/m2) . Men and women of all race/ethnic groups in the population are affected by the epi-demic of overweight and obesity .
●● Among children 2 to 19 years of age, 31 .8% are over-weight and obese (which represents 23 .9 million children) and 16 .9% are obese (12 .7 million children) . Mexican American boys and girls and African American girls are disproportionately affected . Over the past 3 decades, the prevalence of obesity in children 6 to 11 years of age has increased from ≈4% to >20% .
●● Obesity (body mass index ≥30 kg/m2) is associated with marked excess mortality in the US population . Even more notable is the excess morbidity associated with overweight and obesity in terms of risk factor development and incidence of diabetes mellitus, CVD end points (including coronary heart disease, stroke, and heart failure), and numerous other health conditions, including asthma, cancer, end-stage renal disease, degenerative joint disease, and many others .
at UNIV OF CINCINNATI on June 2, 2015http://circ.ahajournals.org/Downloaded from

Executive Summary: Heart Disease and Stroke Statistics—2013 Update 145
Prevalence and Control of Cardiovascular Health Factors and Risks Remains an Issue for Many Americans
●● An estimated 31 .9 million adults ≥20 years of age have total serum cholesterol levels ≥240 mg/dL, with a preva-lence of 13 .8% .
●● Based on 2007 to 2010 data, 33 .0% of US adults ≥20 years of age have hypertension . This represents 78 million US adults with hypertension . The prevalence of hypertension is nearly equal between men and women . African American adults have among the highest prevalence of hypertension (44%) in the world .
●● Among hypertensive adults, ≈82% are aware of their con-dition and 75% are using antihypertensive medication, but only 53% of those with documented hypertension have their condition controlled to target levels .
●● In 2010, an estimated 19 .7 million Americans had diagnosed diabetes mellitus, representing 8 .3% of the adult population . An additional 8 .2 million had undiagnosed diabetes mellitus, and 38 .2% had prediabetes, with abnormal fasting glucose levels . African Americans, Mexican Americans, Hispanic/Latino individuals, and other ethnic minorities bear a strik-ingly disproportionate burden of diabetes mellitus in the United States .
●● The prevalence of diabetes mellitus is increasing dramati-cally over time, in parallel with the increases in prevalence of overweight and obesity .
●● On the basis of NHANES 2003–2006 data, the age-adjusted prevalence of metabolic syndrome, a cluster of major car-diovascular risk factors related to overweight/obesity and insulin resistance, is ≈34% (35 .1% among men and 32 .6% among women) .
Rates of Death Attributable to CVD Have Declined, but the Burden of Disease Remains High
●● The 2009 overall rate of death attributable to CVD (Inter-national Classification of Diseases, 10th Revision, codes I00–I99) was 236 .1 per 100 000 . The rates were 281 .4 per 100 000 for white males, 387 .0 per 100 000 for black males, 190 .4 per 100 000 for white females, and 267 .9 per 100 000 for black females .
●● From 1999 to 2009, the relative rate of death attributable to CVD declined by 32 .7% . Yet in 2009, CVD (I00–I99; Q20–Q28) still accounted for 32 .3% (787 931) of all 2 437 163 deaths, or 1 of every 3 deaths in the United States .
●● On the basis of 2009 death rate data, >2150 Americans die of CVD each day, an average of 1 death every 40 seconds . About 153 000 Americans who died of CVD (I00–I99) in 2009 were <65 years of age . In 2009, 34% of deaths attrib-utable to CVD occurred before the age of 75 years, which is well before the average life expectancy of 78 .5 years .
●● Coronary heart disease alone caused ≈1 of every 6 deaths in the United States in 2009 . In 2009, 386 324 Americans died of coronary heart disease . Each year, an estimated ≈635 000 Americans have a new coronary attack (defined as first hospitalized myocardial infarction or coronary heart disease death) and ≈280 000 have a recurrent attack . It is
estimated that an additional 150 000 silent first myocardial infarctions occur each year . Approximately every 34 sec-onds, 1 American has a coronary event, and approximately every 1 minute, an American will die of one .
●● From 1999 to 2009, the relative rate of stroke death fell by 36 .9% and the actual number of stroke deaths declined by 23 .0% . Yet each year, ≈795 000 people continue to experi-ence a new or recurrent stroke (ischemic or hemorrhagic) . Approximately 610 000 of these are first attacks, and 185 000 are recurrent attacks . In 20ss09, stroke caused ≈1 of every 19 deaths in the United States . On average, every 40 seconds, someone in the United States has a stroke and dies of one approximately every 4 minutes .
●● In 2009, 1 in 9 death certificates (274 601 deaths) in the United States mentioned heart failure . Heart failure was the underly-ing cause in 56 410 of those deaths in 2009 . The number of any-mention deaths attributable to heart failure was approxi-mately as high in 1995 (287 000) as it was in 2009 (275 000) . Additionally, hospital discharges for heart failure remained essentially unchanged from 2000 to 2010, with first-listed discharges of 1 008 000 and 1 023 000, respectively .
The 2013 Update Provides Critical Data About Cardiovascular Quality of Care, Procedure Utilization, and CostsIn light of the current national focus on healthcare utilization, costs, and quality, it is critical to monitor and understand the magnitude of healthcare delivery and costs, as well as the quality of healthcare delivery, related to CVD risk factors and conditions . The Statistical Update provides these critical data in several sections .
Quality-of-Care Metrics for CVDsQuality data are available from the AHA’s “Get With The Guidelines” programs for coronary artery disease and heart failure and from the American Stroke Association/AHA’s “Get With The Guidelines” program for acute stroke . Similar data from the Veterans Healthcare Administration, national Medicare and Medicaid data, and Acute Coronary Treatment and Intervention Outcomes Network (ACTION)–“Get With The Guidelines” Registry data are also reviewed . These data show impressive adherence to guideline recommendations for many, but not all, metrics of quality of care for these hospitalized patients . Data are also reviewed on screening for CVD risk factor levels and control .
Cardiovascular Procedure Use and Costs
●● The total number of inpatient cardiovascular operations and procedures increased 28%, from 5 939 000 in 2000 to 7 588 000 in 2010 (National Heart, Lung, and Blood Insti-tute computation based on National Center for Health Sta-tistics annual data) .
●● The total direct and indirect cost of CVD and stroke in the United States for 2009 is estimated to be $312 .6 billion . This figure includes health expenditures (direct costs, which include the cost of physicians and other professionals, hos-pital services, prescribed medications, home health care, and other medical durables) and lost productivity that results from morbidity and premature mortality (indirect costs) .
at UNIV OF CINCINNATI on June 2, 2015http://circ.ahajournals.org/Downloaded from

146 Circulation January 1/8, 2013
●● By comparison, in 2008, the estimated cost of all cancer and benign neoplasms was $228 billion ($93 billion in direct costs, $19 billion in morbidity indirect costs, and $116 billion in mortality indirect costs) . CVD costs more than any other diagnostic group .
The AHA, through its Statistics Committee, continuously monitors and evaluates sources of data on heart disease and stroke in the United States to provide the most current data available in the Statistics Update .
Finally, it must be noted that this annual Statistical Update is the product of an entire year’s worth of effort by dedicated professionals, volunteer physicians and scientists, and out-standing AHA staff members, without whom publication of this valuable resource would be impossible . Their contribu-tions are gratefully acknowledged .
Alan S. Go, MDMelanie B. Turner, MPHOn behalf of the American Heart Association Statistics Committee and Stroke Statistics Subcommittee
Note: Population data used in the compilation of NHANES prevalence estimates are for the latest year of the NHANES survey being used . Extrapolations for NHANES prevalence estimates are based on the census resident population for 2010 because this is the most recent year of NHANES data used in the Statistical Update .
AcknowledgmentsWe wish to thank Lucy Hsu, Michael Wolz, Sean Coady, and Laurie Whitsel for their valuable comments and contributions . We would like to acknowledge Karen Modesitt and Lauren Rowell for their administrative assistance .
Reference 1 . Yang Q, Cogswell ME, Flanders WD, Hong Y, Zhang Z, Loustalot F,
Gillespie C, Merritt R, Hu FB . Trends in cardiovascular health metrics and associations with all-cause and CVD mortality among US adults . JAMA . 2012;307:1273–1283 .
Key Words: AHA Scientific Statements ■ cardiovascular diseases ■ epidemiology ■ risk factors ■ statistics ■ stroke
at UNIV OF CINCINNATI on June 2, 2015http://circ.ahajournals.org/Downloaded from

Executive Summary: Heart Disease and Stroke Statistics—2013 Update 147
Table 1. Males and CVD: At-a-Glance Table
Diseases and Risk Factors Both Sexes Total Males White Males Black MalesMexican
American Males
Smoking
Prevalence, 2011* 43.8 M (19.0%) 24.1 M (21.3%) 22.8% 23.3% 16.2%†
PA‡
Prevalence, 2011* 21.0% 24.9% 26.2% 25.9% 19.0%†
Overweight and obesity
Prevalence, 2010
Overweight and obesity, BMI >25.0 kg/m2§ 154.7 M (68.2%) 79.9 M (72.9%) 73.1% 68.7% 81.3%
Obesity, BMI >30.0 kg/m2§ 78.4 M (34.6%) 36.8 M (33.6%) 33.8% 37.9% 36.0%
Blood cholesterol
Prevalence, 2010
Total cholesterol >200 mg/dL§ 98.9 M (43.4%) 45.3 M (41.3%) 40.5% 38.6% 48.1%
Total cholesterol >240 mg/dL§ 31.9 M (13.8%) 14.0 M (12.7%) 12.3% 10.8% 15.2%
LDL cholesterol >130 mg/dL§ 71.0 M (31.1%) 35.2 M (31.9%) 30.1% 33.1% 39.9%
HDL cholesterol <40 mg/dL§ 48.7 M (21.8%) 34.6 M (31.8%) 33.1% 20.3% 34.2%
HBP
Prevalence, 2010§ 77.9 M (33.0%) 37.2 M (33.6%) 33.4% 42.6% 30.1%
Mortality, 2009|| 61 762 27 668 20 286 6574 N/A
DM
Prevalence, 2010
Physician-diagnosed DM§ 19.7 M (8.3%) 9.6 M (8.7%) 7.7% 13.5% 11.4%
Undiagnosed DM§ 8.2 M (3.5%) 5.3 M (4.7%) 4.5% 4.8% 6.6%
Prediabetes§ 87.3 M (38.2%) 50.7 M (46.0%) 47.7% 35.7% 47.0%
Incidence, diagnosed DM§ 1.9 M N/A N/A N/A N/A
Mortality, 2009|| 68 705 35 054 28 205 5488 N/A
Total CVD
Prevalence, 2010§ 83.6 M (35.3%) 40.7 M (36.7%) 36.6% 44.4% 33.4%
Mortality, 2009|| 787 931 386 436 329 565 46 334 N/A
Stroke
Prevalence, 2010§ 6.8 M (2.8%) 3.0 M (2.6%) 2.4% 4.3% 2.3%
New and recurrent strokes|| 795.0 K 370.0 K 325.0 K 45.0 K N/A
Mortality, 2009|| 128 842 52 073 43 190 6962 N/A
CHD
Prevalence, CHD, 2010§ 15.4 M (6.4%) 8.8 M (7.9%) 8.2% 6.8% 6.7%
Prevalence, MI, 2010§ 7.6 M (2.9%) 5.0 M (4.2%) 4.4% 3.9% 3.6%
Prevalence, AP, 2010§ 7.8 M (3.2%) 3.7 M (3.3%) 3.3% 2.4% 3.4%
New and recurrent CHD¶# 915.0 K 535.0 K 465.0 K 65.0 K N/A
New and recurrent MI# 715.0 K 410.0 K N/A N/A N/A
Incidence, AP (stable angina)** 500.0 K 320.0 K N/A N/A N/A
Mortality, 2009, CHD|| 386 324 210 069 183 453 21 051 N/A
Mortality, 2009, MI|| 125 464 68 814 60 316 6717 N/A
HF
Prevalence, 2010§ 5.1 M (2.1%) 2.7 M (2.5%) 2.5% 4.1% 1.9%
Mortality, 2009|| 56 410 23 563 20 815 2341 N/A
CVD indicates cardiovascular disease; M, millions; PA, physical activity; LDL, low-density lipoprotein; HDL, high-density lipoprotein; BMI, body mass index; HBP, high blood pressure; N/A, data not available; DM, diabetes mellitus; K, thousands; CHD, coronary heart disease (includes heart attack, angina pectoris chest pain, or both); MI, myocardial infarction (heart attack); AP, angina pectoris (chest pain); and HF, heart failure.
*Age ≥18 years (National Health Interview Survey).†All Hispanic (National Health Interview Survey).‡Met 2008 full Federal PA guidelines for adults.§Age >20 years.||All ages.¶New and recurrent MI and fatal CHD.#Age ≥35 years.**Age ≥45 years.
at UNIV OF CINCINNATI on June 2, 2015http://circ.ahajournals.org/Downloaded from
148 Circulation January 1/8, 2013
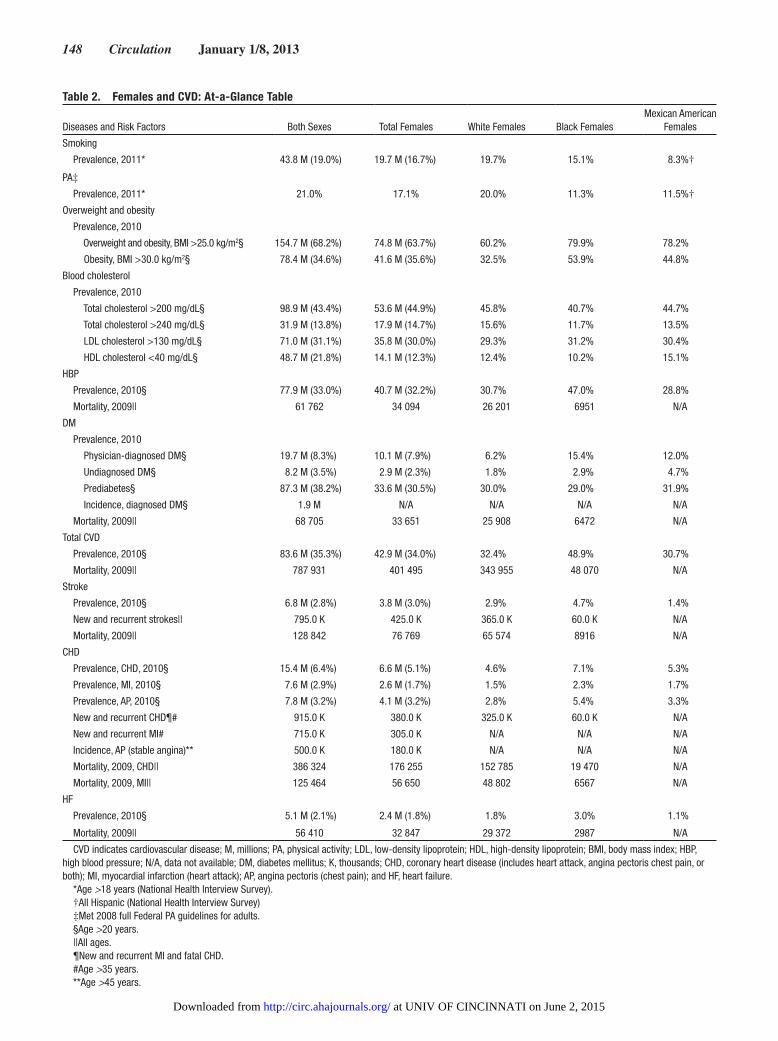
Table 2. Females and CVD: At-a-Glance Table
Diseases and Risk Factors Both Sexes Total Females White Females Black FemalesMexican American
Females
Smoking
Prevalence, 2011* 43.8 M (19.0%) 19.7 M (16.7%) 19.7% 15.1% 8.3%†
PA‡
Prevalence, 2011* 21.0% 17.1% 20.0% 11.3% 11.5%†
Overweight and obesity
Prevalence, 2010
Overweight and obesity, BMI >25.0 kg/m2§ 154.7 M (68.2%) 74.8 M (63.7%) 60.2% 79.9% 78.2%
Obesity, BMI >30.0 kg/m2§ 78.4 M (34.6%) 41.6 M (35.6%) 32.5% 53.9% 44.8%
Blood cholesterol
Prevalence, 2010
Total cholesterol >200 mg/dL§ 98.9 M (43.4%) 53.6 M (44.9%) 45.8% 40.7% 44.7%
Total cholesterol >240 mg/dL§ 31.9 M (13.8%) 17.9 M (14.7%) 15.6% 11.7% 13.5%
LDL cholesterol >130 mg/dL§ 71.0 M (31.1%) 35.8 M (30.0%) 29.3% 31.2% 30.4%
HDL cholesterol <40 mg/dL§ 48.7 M (21.8%) 14.1 M (12.3%) 12.4% 10.2% 15.1%
HBP
Prevalence, 2010§ 77.9 M (33.0%) 40.7 M (32.2%) 30.7% 47.0% 28.8%
Mortality, 2009|| 61 762 34 094 26 201 6951 N/A
DM
Prevalence, 2010
Physician-diagnosed DM§ 19.7 M (8.3%) 10.1 M (7.9%) 6.2% 15.4% 12.0%
Undiagnosed DM§ 8.2 M (3.5%) 2.9 M (2.3%) 1.8% 2.9% 4.7%
Prediabetes§ 87.3 M (38.2%) 33.6 M (30.5%) 30.0% 29.0% 31.9%
Incidence, diagnosed DM§ 1.9 M N/A N/A N/A N/A
Mortality, 2009|| 68 705 33 651 25 908 6472 N/A
Total CVD
Prevalence, 2010§ 83.6 M (35.3%) 42.9 M (34.0%) 32.4% 48.9% 30.7%
Mortality, 2009|| 787 931 401 495 343 955 48 070 N/A
Stroke
Prevalence, 2010§ 6.8 M (2.8%) 3.8 M (3.0%) 2.9% 4.7% 1.4%
New and recurrent strokes|| 795.0 K 425.0 K 365.0 K 60.0 K N/A
Mortality, 2009|| 128 842 76 769 65 574 8916 N/A
CHD
Prevalence, CHD, 2010§ 15.4 M (6.4%) 6.6 M (5.1%) 4.6% 7.1% 5.3%
Prevalence, MI, 2010§ 7.6 M (2.9%) 2.6 M (1.7%) 1.5% 2.3% 1.7%
Prevalence, AP, 2010§ 7.8 M (3.2%) 4.1 M (3.2%) 2.8% 5.4% 3.3%
New and recurrent CHD¶# 915.0 K 380.0 K 325.0 K 60.0 K N/A
New and recurrent MI# 715.0 K 305.0 K N/A N/A N/A
Incidence, AP (stable angina)** 500.0 K 180.0 K N/A N/A N/A
Mortality, 2009, CHD|| 386 324 176 255 152 785 19 470 N/A
Mortality, 2009, MI|| 125 464 56 650 48 802 6567 N/A
HF
Prevalence, 2010§ 5.1 M (2.1%) 2.4 M (1.8%) 1.8% 3.0% 1.1%
Mortality, 2009|| 56 410 32 847 29 372 2987 N/A
CVD indicates cardiovascular disease; M, millions; PA, physical activity; LDL, low-density lipoprotein; HDL, high-density lipoprotein; BMI, body mass index; HBP, high blood pressure; N/A, data not available; DM, diabetes mellitus; K, thousands; CHD, coronary heart disease (includes heart attack, angina pectoris chest pain, or both); MI, myocardial infarction (heart attack); AP, angina pectoris (chest pain); and HF, heart failure.
*Age >18 years (National Health Interview Survey).†All Hispanic (National Health Interview Survey)‡Met 2008 full Federal PA guidelines for adults.§Age >20 years.||All ages.¶New and recurrent MI and fatal CHD.#Age >35 years.**Age >45 years.
at UNIV OF CINCINNATI on June 2, 2015http://circ.ahajournals.org/Downloaded from

Executive Summary: Heart Disease and Stroke Statistics—2013 Update 149
Table 3. Race/Ethnicity and CVD: At-a-Glance Table
Diseases and Risk FactorsBoth
Sexes
Whites BlacksMexican
AmericansHispanics/
LatinosAsians: Both
Sexes
American Indian/Alaska Native:
Both SexesMales Females Males Females Males Females Males Females
Smoking
Prevalence, 2011* 43.8 M (19.0%) 22.8% 19.7% 23.3% 15.1% 12.3% 16.2% 8.3% 9.6% 26.7%
PA†
Prevalence, 2011* 21.0% 21.7% 17.8% 15.4% 15.4% 16.7% 17.0%
Overweight and obesity
Prevalence, 2010
Overweight and obesity, BMI >25.0 kg/m2‡
154.7 M (68.2%) 73.1% 60.2% 68.7% 79.9% 81.3% 78.2% N/A N/A N/A N/A
Overweight and obesity, BMI >30.0 kg/m2‡
78.4 M (34.6%) 33.8% 32.5% 37.9% 53.9% 36.0% 44.8% N/A N/A N/A N/A
Blood cholestrol
Prevalence, 2010
Total cholesterol >200 mg/dL‡ 98.9 M (43.4%) 40.5% 45.8% 38.6% 40.7% 48.1% 44.7% N/A N/A N/A N/A
Total cholesterol >240 mg/dL‡ 31.9 M (13.8%) 12.3% 15.6% 10.8% 11.7% 15.2% 13.5% N/A N/A N/A N/A
LDL cholesterol >130 mg/dL‡ 71.0 M (31.1%) 30.1% 29.3% 33.1% 31.2% 39.9% 30.4% N/A N/A N/A N/A
HDL cholesterol <40 mg/dL‡ 48.7 M (21.8%) 33.1% 12.4% 20.3% 10.2% 34.2% 15.1% N/A N/A N/A N/A
HBP
Prevalence, 2010‡ 77.9 M (33.0%) 33.4% 30.7% 42.6% 47.0% 30.1% 28.8% 22.2%* 18.7* 25.8%*
Mortality, 2009§ 61 762 20 286 26 201 6574 6951 N/A N/A N/A N/A N/A N/A
DM
Prevalence, 2010
Physician-diagnosed DM‡ 19.7 M (8.3%) 7.7% 6.2% 13.5% 15.4% 11.4% 12.0% N/A N/A N/A N/A
Undiagnosed DM‡ 8.2 M (3.5%) 4.5% 1.8% 4.8% 2.9% 6.6% 4.7% N/A N/A N/A N/A
Prediabetes‡ 87.3 M (38.2%) 47.7% 30.0% 35.7% 29.0% 47.0% 31.9% N/A N/A N/A N/A
Incidence, diagnosed DM‡ 1.9 M N/A N/A N/A N/A N/A N/A N/A N/A N/A N/A
Mortality, 2009§ 68 705 28 205 25 908 5488 6472 N/A N/A N/A N/A N/A N/A
Total CVD
Prevalence, 2010‡ 83.6 M (35.3%) 36.6% 32.4% 44.4% 48.9% 33.4% 30.7% N/A N/A N/A N/A
Mortality, 2009§ 787 931 329 565 343 955 46 334 48 070 N/A N/A N/A N/A N/A N/A
Stroke
Prevalence, 2010‡ 6.8 M (2.8%) 2.4% 2.9% 4.3% 4.7% 2.3% 1.4% 2.8%* 2.7%* 4.6%||
New and recurrent strokes§ 795.0 K 325.0 K 365.0 K 45.0 K 60.0 K N/A N/A N/A N/A N/A N/A
Mortality, 2009§ 128 842 43 190 65 574 6962 8916 N/A N/A N/A N/A N/A N/A
CHD
Prevalence, CHD, 2010‡ 15.4 M (6.4%) 8.2% 4.6% 6.8% 7.1% 6.7% 5.3% N/A N/A N/A N/A
Prevalence, MI, 2010‡ 7.6 M (2.9%) 4.4% 1.5% 3.9% 2.3% 3.6% 1.7% N/A N/A N/A N/A
Prevalence, AP, 2010‡ 7.8 M (3.2%) 3.3% 2.8% 2.4% 5.4% 3.4% 3.3% N/A N/A N/A N/A
New and recurrent CHD¶# 915.0 K 465.0 K 325.0 K 65.0 K 60.0 K N/A N/A N/A N/A N/A N/A
Mortality, CHD, 2009§ 386 324 183 453 152 785 21 051 19 470 N/A N/A N/A N/A N/A N/A
Mortality, MI, 2009§ 125 464 60 316 48 802 6717 6567 N/A N/A N/A N/A N/A N/A
HF
Prevalence, 2010‡ 5.1 M (2.1%) 2.5% 1.8% 4.1% 3.0% 1.9% 1.1% N/A N/A N/A N/A
Mortality, 2009§ 56 410 20 815 29 372 2341 2987 N/A N/A N/A N/A N/A N/A
CVD indicates cardiovascular disease; M, millions; PA, physical activity; N/A, data not available; LDL, low-density lipoprotein; HDL, high-density lipoprotein; BMI, body mass index; HBP, high blood pressure; DM, diabetes mellitus; K, thousands; CHD, coronary heart disease (includes heart attack, angina pectoris chest pain, or both); MI, myocardial infarction (heart attack); AP, angina pectoris (chest pain); and HF, heart failure.
*Age >18 years (National Health Interview Survey).†Met 2008 full Federal PA guidelines for adults.‡Age >20 years.§All ages.||Figure not considered reliable.¶New and recurrent MI and fatal CHD.#Age >35 years.
at UNIV OF CINCINNATI on June 2, 2015http://circ.ahajournals.org/Downloaded from

150 Circulation January 1/8, 2013
Table 4. Children, Youth, and CVD: At-a-Glance Table
NH Whites NH BlacksMexican
Americans
Diseases and Risk Factors Both Sexes Total Males Total Females Males Females Males Females Males Females
Smoking, %
High school students, grades 9–12
Current cigarette smoking, 2011 18.1 19.9 16.1 21.5 18.9 13.7 7.4 19.5* 15.2*
Current cigar smoking, 2011 13.1 17.8 8.0 19.0 7.5 15.1 8.5 17.2* 9.1*
PA†
Prevalence, grades 9–12, 2011‡
Met currently recommended levels of PA, % 49.5 59.9 38.5 62.1 42.6 57.1 31.9 57.1* 33.0*
Overweight and obesity
Prevalence, 2010
Children and adolescents, ages 2–19 y, overweight or obese
23.9 M (31.8%) 12.7 M (33.0%) 11.2 M (30.4%) 30.1% 25.6% 36.9% 41.3% 40.5% 38.2%
Children and adolescents, age 2–19 y, obese‡
12.7 M (16.9%) 7.2 M (18.6%) 5.5 M (15.0%) 16.1% 11.7% 24.3% 24.3% 24.0% 18.2%
Blood cholesterol, mg/dL, 2010
Mean total cholesterol
Ages 4–11 y 161.9 162.3 161.5 160.9 161.6 165.2 157.9 159.6 160.7
Ages 12–19 y 158.2 156.1 160.3 156.8 161.1 154.1 160.6 157.8 158.0
Mean HDL cholesterol
Ages 4–11 y 53.6 55.1 51.9 53.9 51.4 59.9 55.3 53.5 50.5
Ages 12–19 y 51.4 49.2 53.6 48.4 53.0 53.9 55.4 47.5 53.3
Mean LDL cholesterol
Ages 12–19 y 89.5 88.6 90.5 90.4 90.9 85.8 91.8 90.6 87.1
Congenital cardiovascular defects
Mortality, 2009§ 3189 1754 1435 1370 1086 304 268 N/A N/A
CVD indicates cardiovascular disease; NH, non-Hispanic; PA, physical activity; HDL, high-density lipoprotein; LDL, low-density lipoprotein; M, millions; and N/A, data not available. Overweight indicates a body mass index in the 95th percentile of the Centers for Disease Control and Prevention 2000 growth chart.
*Hispanic.†Regular leisure-time PA.‡Eaton DK, Kann L, Kinchen S, Shanklin S, Flint KH, Hawkins J, Harris WA, Lowry R, McManus T, Chyen D, Whittle L, Lim C, Wechsler H; Centers for Disease Con-
trol and Prevention. Youth risk behavior surveillance: United States, 2011. MMWR Surveill Summ. 2012;61:1–162.§All ages.
at UNIV OF CINCINNATI on June 2, 2015http://circ.ahajournals.org/Downloaded from

Executive Summary: Heart Disease and Stroke Statistics—2013 Update 151
DisclosuresWriting Group Disclosures
Writing Group Member Employment Research Grant
Other Research Support
Speakers’ Bureau/Honoraria Expert Witness Ownership Interest
Consultant/ Advisory Board Other
Alan S. Go Kaiser Permanente None None None None None None None
Emelia J. Benjamin Boston University School of Medicine
NIH† None None None None None Associate Editor of
Circulation
Jarett D. Berry UT Southwestern AHA†; NIH† None Merck† None None None None
William B. Borden Weill Cornell Medical College/U.S. Department of Health
and Human Services
None None None None None None None
Dawn M. Bravata Department of Veteran Affairs NIH/NHLBI† None None None None None None
Shifan Dai Centers for Disease Control and Prevention
None None None None None None None
Earl S. Ford Centers for Disease Control and Prevention
None None None None None None None
Caroline S. Fox National Heart Lung and Blood Institute
None None None None None None None
Sheila Franco Centers for Disease Control and Prevention/National
Center for Health Statistics
None None None None None None None
Heather J. Fullerton University of California, San Francisco
None None None None None None None
Cathleen Gillespie Centers for Disease Control and Prevention
None None None None None None None
Susan M. Hailpern Independent Consultant None None None None None None None
John A. Heit Mayo Clinic None None None None None Daiichi Sankyo*; GTC Biotherapeutics*;
Janssen Pharmaceuticals*
None
Virginia J. Howard University of Alabama at Birmingham
NIH† None None None None None None
Mark D. Huffman Northwestern University Feinberg School of Medicine
NIH/NHLBI†; Scientific Therapeutic Information*
None None None None None None
Brett M. Kissela University of Cincinnati None None None None None None None
Steven J. Kittner University of Maryland School of Medicine
None None None None None None None
Daniel T. Lackland Medical University of South Carolina
None None None None None None None
Judith H. Lichtman Yale University None None None None None None None
Lynda D. Lisabeth University of Michigan NHLBI; NINDS† None None None None None None
David Magid Colorado Permanente Medical Group
None None None None None None None
Gregory M. Marcus University of California, San Francisco
Forest Research Institute*; Gilead*; Medtronic*; SentreHeart†; Zoll*
None St. Jude Medical* None None None None
Ariane Marelli McGill University Health Center
None None None None None None None
David B. Matchar Duke University Medical Center/Duke-NUS Graduate
Medical School
None None None None None AstraZeneca*; Boehringer Ingelheim*
None
Darren K. McGuire UT Southwestern Medical Center
Boehringer Ingelheim*; Bristol-Meyers Squibb*;
Daiichi Sankyo*; Eli Lilly*; Merck*; Orexigen†; Roche/
Genentech*; Takeda*
None None Expert Witness for Takeda in class action
suit for Actos*
None Boehringer Ingelheim*; Daiichi Sankyo*;
Genentech*; Janssen Pharmaceuticals†;
Regeneron Pharmaceuticals*;
Sanofi-Aventis*
None
Emile R. Mohler III University of Pennsylvania AHA†; Department of Defense†; NIH†
None None CytoVas*; FloxiMedical* GlaxoSmithKline*; Merck*; Roche*; Takeda*
None None
Claudia S. Moy National Institutes of Health None None None None None None None
(Continued)
at UNIV OF CINCINNATI on June 2, 2015http://circ.ahajournals.org/Downloaded from

152 Circulation January 1/8, 2013
Writing Group Disclosures, Continued
Writing Group Member Employment Research Grant
Other Research Support
Speakers’ Bureau/Honoraria Expert Witness Ownership Interest
Consultant/ Advisory Board Other
Dariush L. Mozaffarian Harvard School of Public Health/Brigham and Women’s
Hospital/Harvard Medical School
NIH†; GlaxoSmithKline†; Pronova†; Sigma Tau†
None Bunge*; International Life
Sciences Institute*; Nutrition Impact*; Pollock Institute*;
Sprim*
None Harvard has filed a provisional patent
application that has been assigned to Harvard, listing Dr. Mozaffarian
as a co-inventor for use of trans-palmitoleic acid
to prevent and treat insulin resistance, type 2 diabetes and related conditions*; Royalties from UpToDate for an
online chapter*
Foodminds*; McKinsey Health Systems
Institute*; Unilever North America*
None
Michael E. Mussolino National Heart, Lung, and Blood Institute
None None None None None None None
Graham Nichol University of Washington None None None None None None None
Nina P. Paynter Brigham and Women’s Hospital
Celera Corp.†; NHLBI†; NIH/NCRR†
None None None None None None
Veronique L. Roger Mayo Clinic None None None None None None None
Pamela J. Schreiner University of Minnesota None None None None None None None
Paul D. Sorlie National Heart, Lung, and Blood Institute, NIH
None None None None None None None
Joel Stein Columbia University Myomo, Inc.*; Tibion, Inc.*; Tyromotion, Inc.*
None QuantiaMF* None None Myomo, Inc.* None
Tanya N. Turan Medical University of South Carolina
NIH/NINDS† None None None None None None
Melanie B. Turner American Heart Association None None None None None None None
Salim S. Virani Department of Veterans Affairs
Merck†; NFL Charities†; NIH†; VA†
None None None None None None
Nathan D. Wong University of California, Irvine Bristol-Myers Squibb†; Merck†
None None None None Abbott Pharmaceuticals*
None
Daniel Woo University of Cincinnati NIH† None None None None None None
This table represents the relationships of writing group members that may be perceived as actual or reasonably perceived conflicts of interest as reported on the Disclosure Questionnaire, which all members of the writing group are required to complete and submit. A relationship is considered to be “significant” if (a) the person receives $10 000 or more during any 12-month period, or 5% or more of the person’s gross income; or (b) the person owns 5% or more of the voting stock or share of the entity, or owns $10 000 or more of the fair market value of the entity. A relationship is considered to be “modest” if it is less than “significant” under the preceding definition.
*Modest.†Significant.
at UNIV OF CINCINNATI on June 2, 2015http://circ.ahajournals.org/Downloaded from
Subcommitteeon behalf of the American Heart Association Statistics Committee and Stroke Statistics
Virani, Nathan D. Wong, Daniel Woo and Melanie B. TurnerNina P. Paynter, Pamela J. Schreiner, Paul D. Sorlie, Joel Stein, Tanya N. Turan, Salim S.
Darren K. McGuire, Emile R. Mohler, Claudia S. Moy, Michael E. Mussolino, Graham Nichol,Lynda D. Lisabeth, David Magid, Gregory M. Marcus, Ariane Marelli, David B. Matchar,
Mark D. Huffman, Brett M. Kissela, Steven J. Kittner, Daniel T. Lackland, Judith H. Lichtman,Heather J. Fullerton, Cathleen Gillespie, Susan M. Hailpern, John A. Heit, Virginia J. Howard,
Franco,William B. Borden, Dawn M. Bravata, Shifan Dai, Earl S. Ford, Caroline S. Fox, Sheila Alan S. Go, Dariush Mozaffarian, Véronique L. Roger, Emelia J. Benjamin, Jarett D. Berry,
the American Heart Association2013 Update: A Report From−−Executive Summary: Heart Disease and Stroke Statistics
Print ISSN: 0009-7322. Online ISSN: 1524-4539 Copyright © 2013 American Heart Association, Inc. All rights reserved.
is published by the American Heart Association, 7272 Greenville Avenue, Dallas, TX 75231Circulation doi: 10.1161/CIR.0b013e318282ab8f
2013;127:143-152Circulation.
http://circ.ahajournals.org/content/127/1/143World Wide Web at:
The online version of this article, along with updated information and services, is located on the
http://circ.ahajournals.org//subscriptions/
is online at: Circulation Information about subscribing to Subscriptions:
http://www.lww.com/reprints Information about reprints can be found online at: Reprints:
document. Permissions and Rights Question and Answer this process is available in the
click Request Permissions in the middle column of the Web page under Services. Further information aboutOffice. Once the online version of the published article for which permission is being requested is located,
can be obtained via RightsLink, a service of the Copyright Clearance Center, not the EditorialCirculationin Requests for permissions to reproduce figures, tables, or portions of articles originally publishedPermissions:
at UNIV OF CINCINNATI on June 2, 2015http://circ.ahajournals.org/Downloaded from