
Examining global emerging market changes and what the retraction of capital could mean for mining ...
31
Examining global emerging market changes and what the retraction of capital could mean for mining companies Dr. Fabio Scacciavillani, Chief Economist, OIF 1 23-25th June Intercontinental Hotel
Transcript of Examining global emerging market changes and what the retraction of capital could mean for mining ...
Examining global emerging market changes and what the retraction of capital could mean for mining
companies
Dr. Fabio Scacciavillani, Chief Economist, OIF
1
23-25th JuneIntercontinental Hotel

Agenda
2
Understanding the emerging market investment situation:
Availability of capital and the move to a service economy in
China
To what extent could this impact emerging market
consumption of commodities and what could this mean for
African mining?
Examining the growing role of Sovereign Wealth funds, how active will they be in the
future and what could this mean for commodities markets?
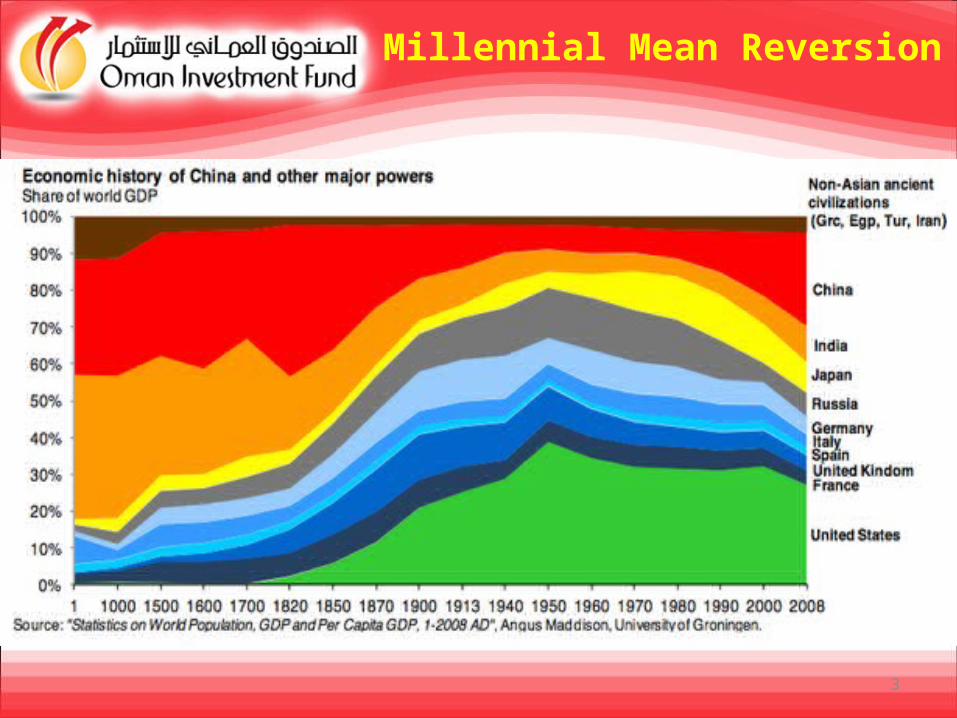
Millennial Mean Reversion
3
Globalization
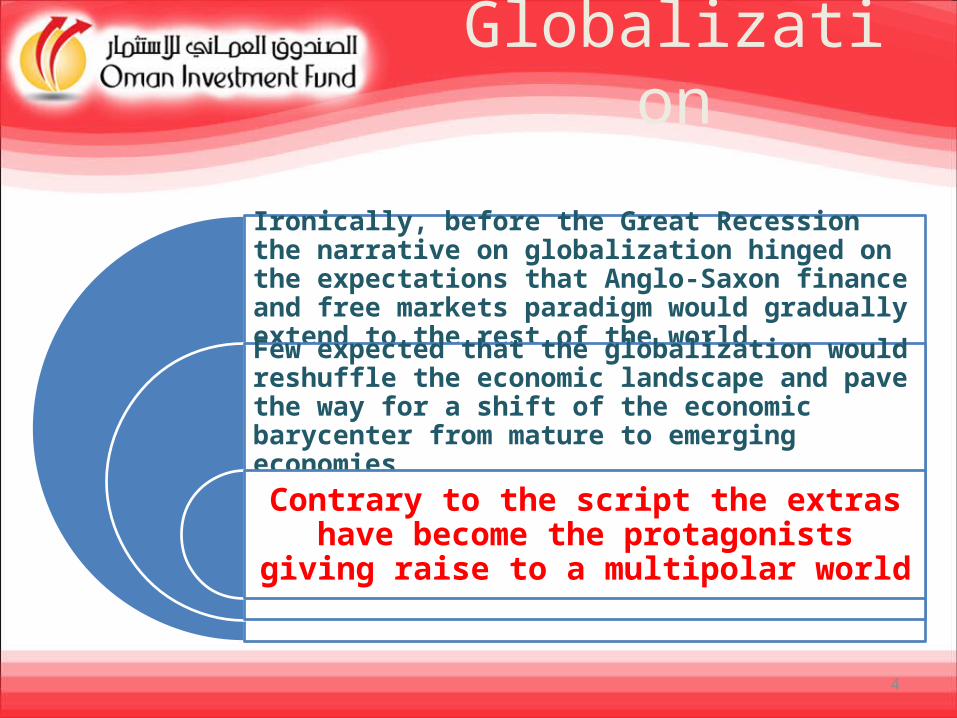
Ironically, before the Great Recession the narrative on globalization hinged on the expectations that Anglo-Saxon finance and free markets paradigm would gradually extend to the rest of the worldFew expected that the globalization would reshuffle the economic landscape and pave the way for a shift of the economic barycenter from mature to emerging economiesContrary to the script the extras
have become the protagonists giving raise to a multipolar world
4
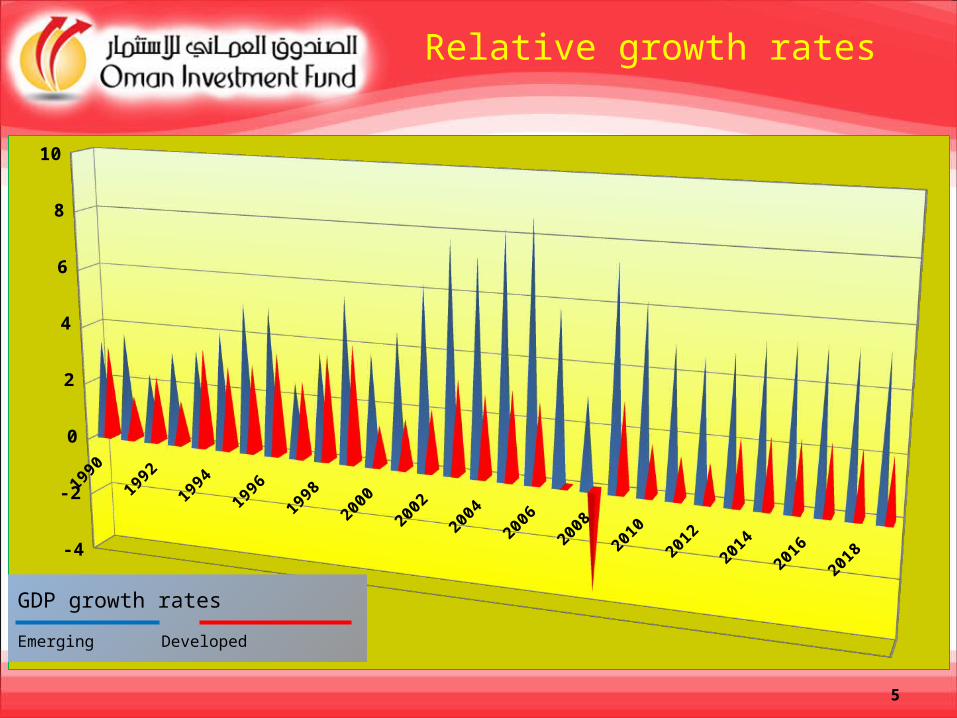
Relative growth rates
5
1990
1992
1994
1996
1998
2000
2002
2004
2006
2008
2010
2012
2014
2016
2018-4
-2
0
2
4
6
8
10
GDP growth rates Emerging Developed
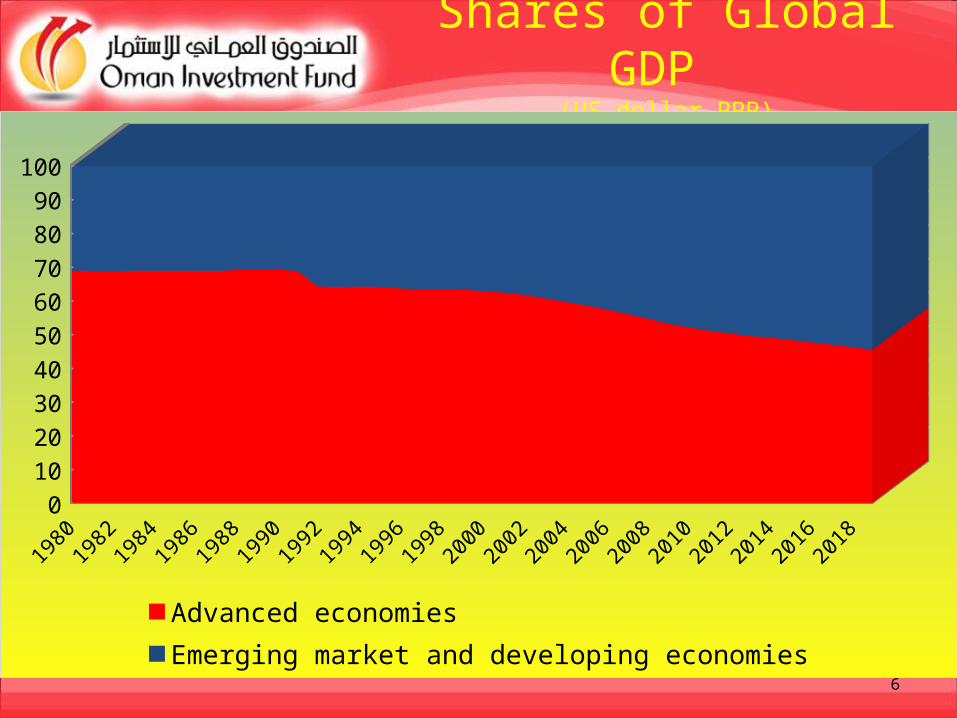
Shares of Global GDP
(US dollar PPP)
6
19801982198419861988199019921994199619982000200220042006200820102012201420162018
0102030405060708090100
Advanced economiesEmerging market and developing economies
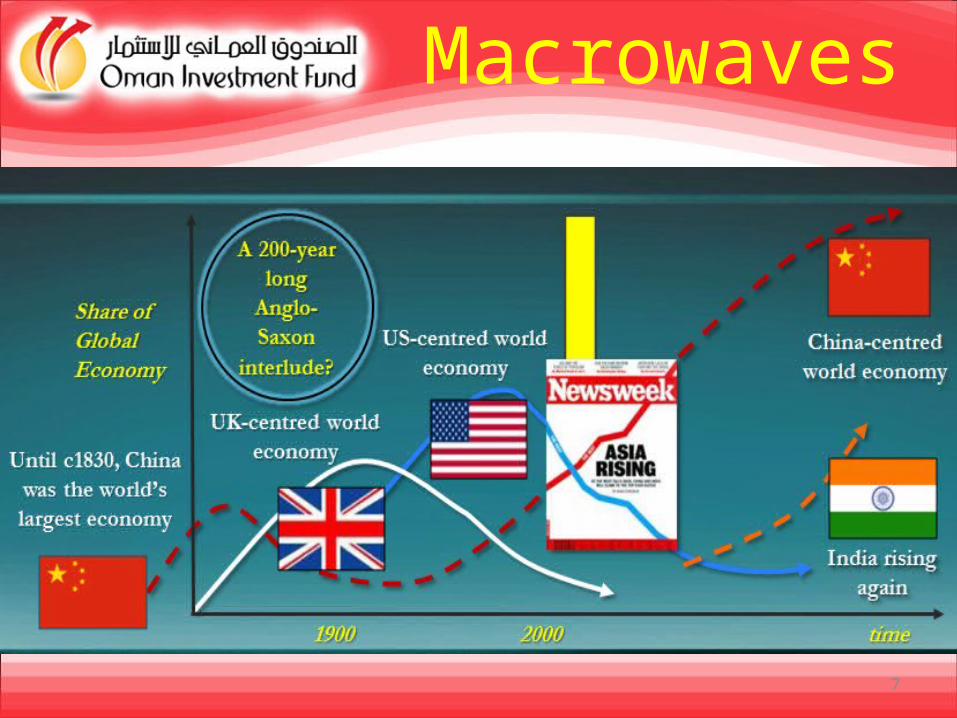
Macrowaves
7
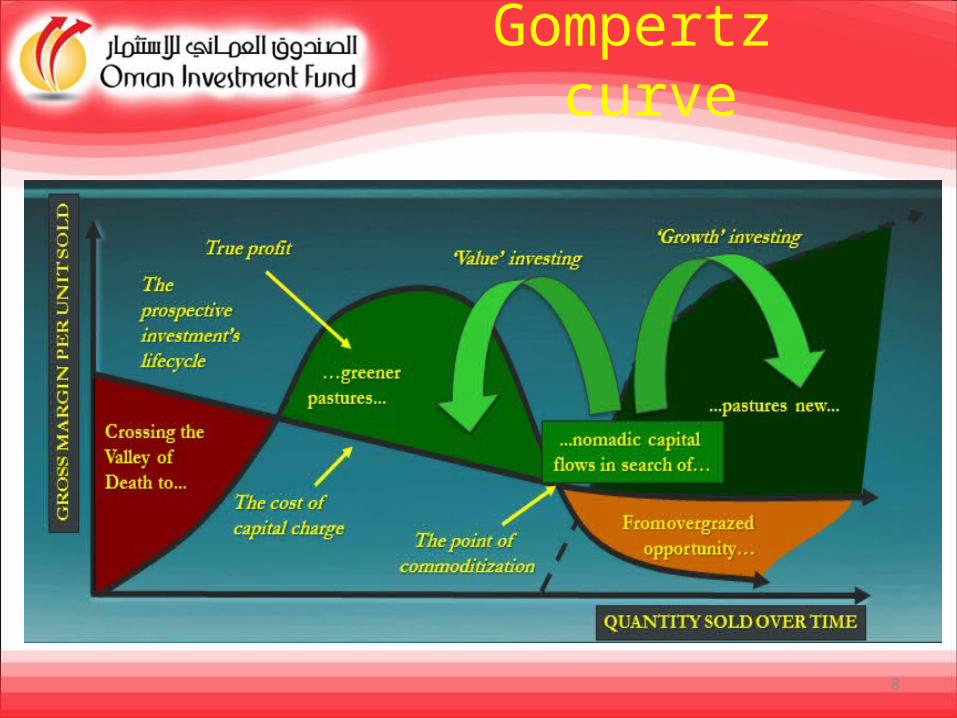
Gompertz curve
8
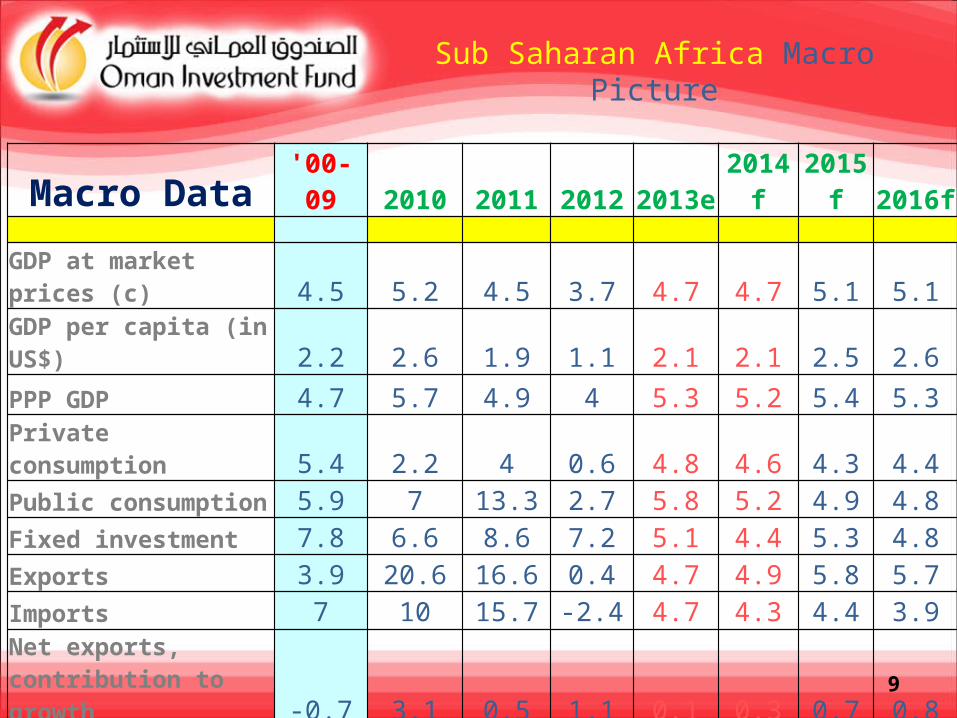
Sub Saharan Africa Macro Picture
Macro Data'00-09 2010 2011 2012 2013e
2014f
2015f 2016f
GDP at market prices (c) 4.5 5.2 4.5 3.7 4.7 4.7 5.1 5.1GDP per capita (in US$) 2.2 2.6 1.9 1.1 2.1 2.1 2.5 2.6PPP GDP 4.7 5.7 4.9 4 5.3 5.2 5.4 5.3Private consumption 5.4 2.2 4 0.6 4.8 4.6 4.3 4.4Public consumption 5.9 7 13.3 2.7 5.8 5.2 4.9 4.8Fixed investment 7.8 6.6 8.6 7.2 5.1 4.4 5.3 4.8Exports 3.9 20.6 16.6 0.4 4.7 4.9 5.8 5.7Imports 7 10 15.7 -2.4 4.7 4.3 4.4 3.9Net exports, contribution to growth -0.7 3.1 0.5 1.1 0.1 0.3 0.7 0.8Current Account, % of GDP -0.1 -1 -0.7 -2.7 -3.4 -3.6 -4.3 -4.4GDP defl, median in LCU 6.5 7.2 6.9 5.3 4.4 6.1 5.5 5.7Fiscal Balance, % of GDP -0.4 -3.7 -1.3 -2.8 -3 -2.7 -2.5 -2.5
9
Commodities Supercycle
• A commodities supercycle is an approximately 10-35 year trend of rising commodity prices.
• Global commodity markets have historically constituted the main link between developing countries and the rest of the world.
• The unfavorable terms of trade between manufactured goods and commodities meant that the developed countries had the upper hand until the XX century.
10
The drivers
• The current super-cycle is based on population growth and the expansion of infrastructure in emerging market.
• Infrastructure building requires raw materials such as copper, aluminum, steel, lumber etc
• A burgeoning global middle class adds to demand for agricultural commodities, including meats, corn, soybeans, and wheat, as well as soft commodity “luxury items” such as cocoa and coffee.
11
12

The Fire of the Dragon
13
Crystal Ball
• Chinese overcapacity remains an issue, as the investment-led boom over the past few years increased plant capacity.
• A tighter financing environment awaits local governments due to the need to contain the expansion of local government debt and reorient the economic model.
• The last leg of a bull market always ends in hysteria; the last leg of a bear market always ends in panic
14
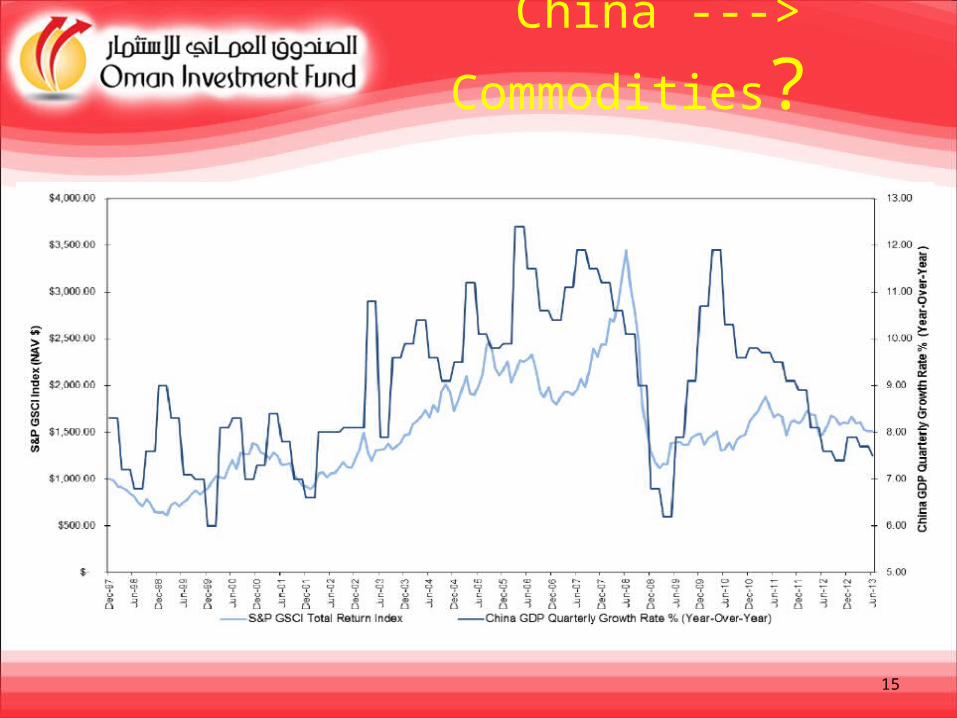
China ---> Commodities?
15
16
Q
P
P EQ
P
Time
PEQ
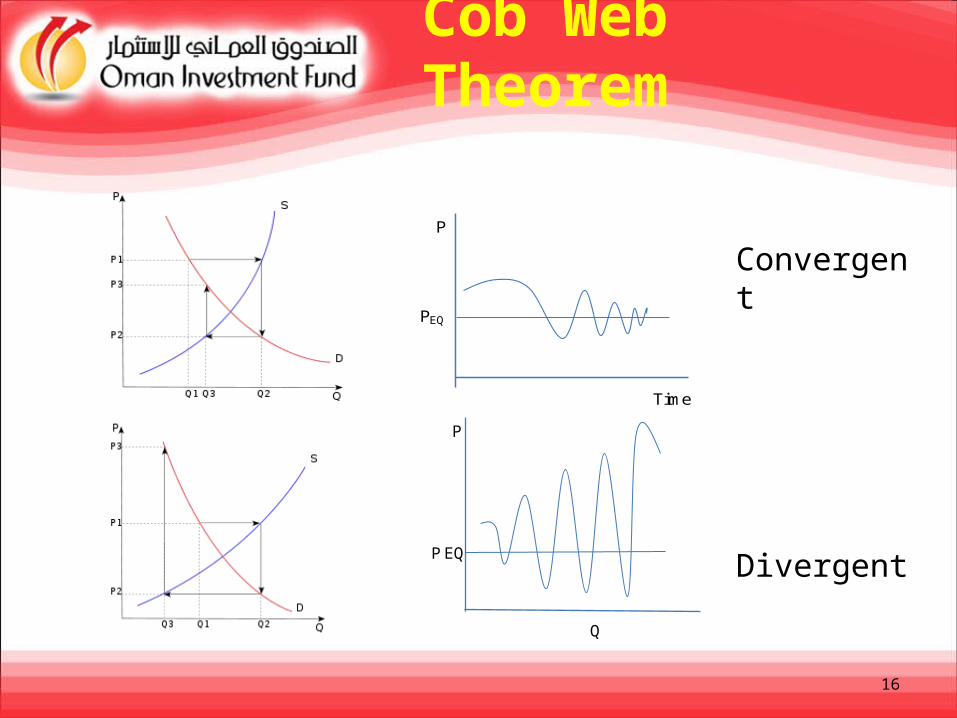
Cob Web Theorem
Convergent
Divergent
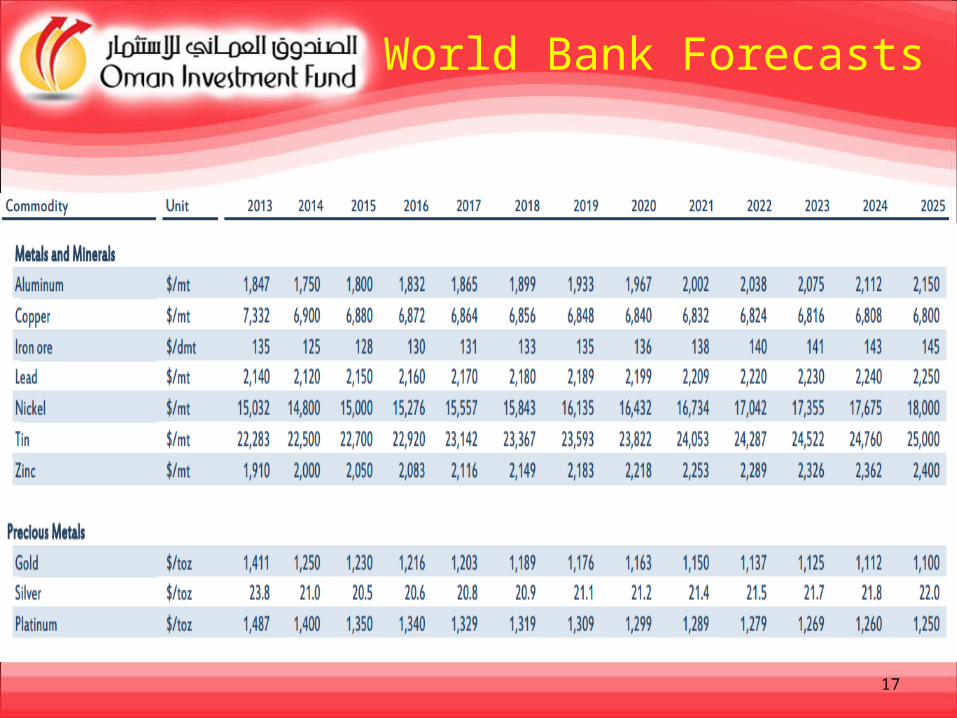
World Bank Forecasts
17
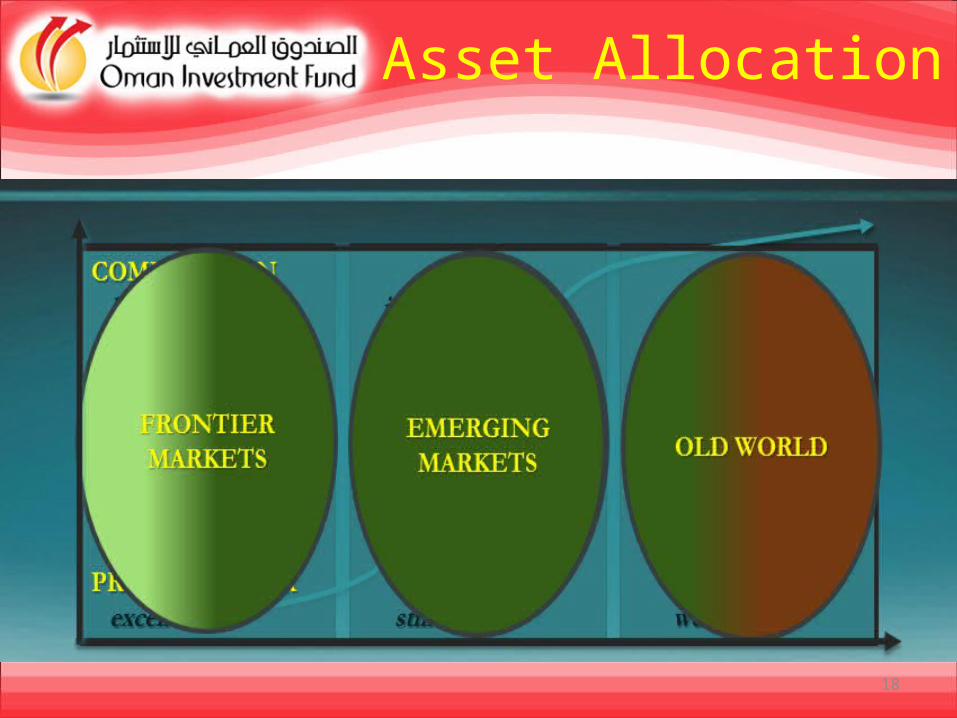
Asset Allocation
18
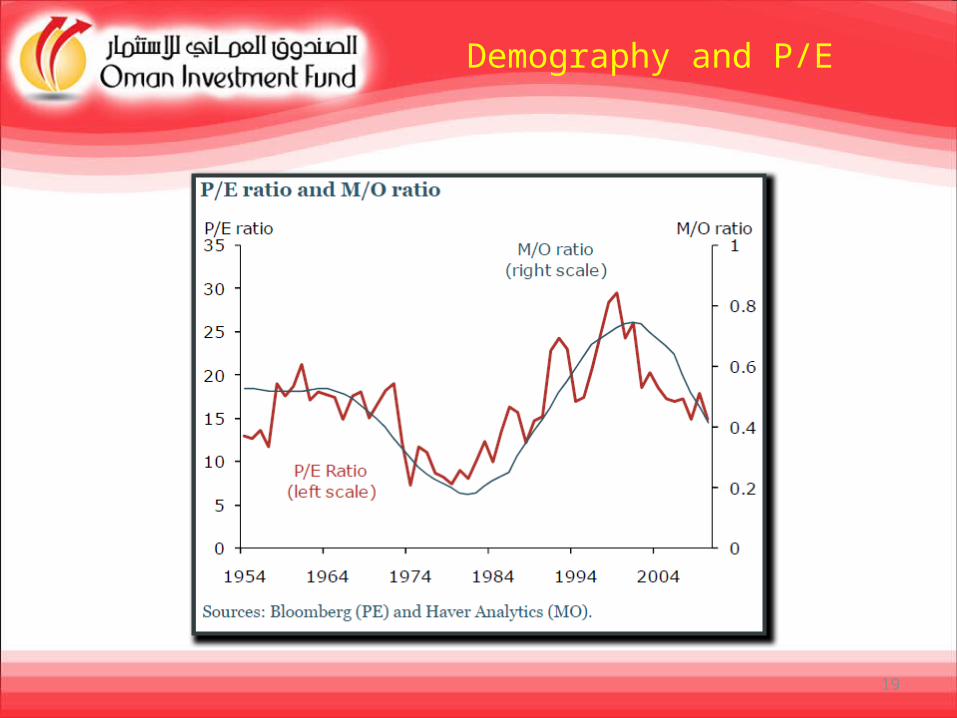
Demography and P/E
19

Capital Flows
20
20082009201020112012 2013e 2014f 2015f 2016fCapital Inflows 47 59.4 44.9 68.2 82.5 75.9 72.2 77.4 83.8FDI 33.6 30.2 24 31.5 28.8 31.9 32.5 35.6 38.4Portfolio investment -6.4 14.7 19 13 30.3 23.8 20.8 22.3 22.3Equity -5.7 10.5 8.2 -1 9.4 13.5 13.7 14.8 15.1Debt instruments -0.7 4.1 10.9 14 20.9 10.2 7.1 7.5 7.2Other investment* 19.8 14.6 2 23.7 23.4 20.2 18.9 19.5 23.1
Bank lending 2.5 1.7 1.2 3.5 4.6 5.7 5.5 6.1 7.4Short-term debt flows 1.9 -5.5 3 1.6 8 6.2 5.8 4.1 4.5
Offical inflows 5 10.2 13.5 12.8 11 10.1 10.6 11.4 11World Bank 1.9 3.1 4 3.2 3.9 3.5 .. .. ..IMF 0.7 2.2 1.2 1.4 0.9 0.5 .. .. ..Other official 2.5 4.9 8.3 8.2 6.2 6.1 .. .. ..Memo items (as % of GDP)Current account -1.5 -3.9 -1.3 -1.1 -2.4 -3 -3.2 -3.9 -4.1Capital inflows 4.9 6.5 4.1 5.5 6.4 5.8 5.2 5.3 5.4Capital outflows 2.3 1.8 3 3.1 2.7 2.8 .. .. ..
Outlook for Capital Flows
• In 2030 half the global stock of capital, totaling $158 trillion (in 2010 dollars), will reside in the developing world, compared to less than one-third today.
21

African Mining Companies
22
23

State Capitalism?
24
“The crisis of Western liberal capitalism has coincided with the rise of a powerful new form of state capitalism in emerging markets”
“The crisis of liberal capitalism has been rendered more serious by the rise of a potent alternative: state capitalism which tries to meld the powers of the state with the powers of capitalism”. Source : Special Report on State Capitalism

Financial Architecture for a Multipolar World
The financial system hinges on a hub and spoke model with London and New York representing the main pinnaclesSuch an arrangement has proven inadequate, prone to political interferences, fragile to regulatory shortcomings, exposed to oligopolistic manipulationIt would be wise to foster a network of financial center capable of bypassing nodes affected by illiquidity or insolvency 25

Financial Barycenter
• The “hubs and spikes” model of global financial markets is inadequate for a multipolar world and implies a dangerous concentration of systemic risks
• Pinnacles: London and New York• Cobweb model is the most natural alternative
• South-South relationships need to strengthen and find alternatives linkages
• Towards a multi-currency regime
26
Global Role of SWFs
• Long term investments: SWFs as the ultimate risk bearers
• SWF emerging investments trends • SWFs investing in the less developed economies: Africa as the last investment frontier: savings – investment bottleneck
27

SWFs as an Asset Class
• SWFs rarely face sudden redemptions, hence they do not need to be over-concerned about liquidity risk or margin calls.
• Stable endowment and long-term focus do not imply complacency on risk management or careless risk assessment.
• It means that they need to assign a different set of weights to various sources of risks than mainstream asset managers.
• The risk management for long term investing is completely different from the mainstream concept.
28
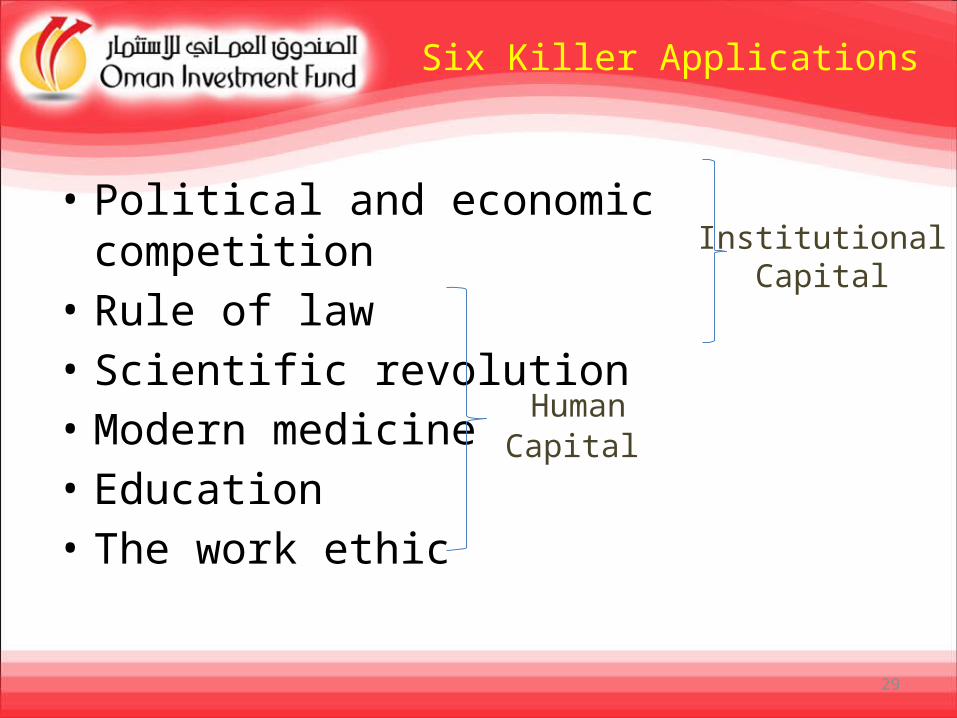
Six Killer Applications
• Political and economic competition
• Rule of law • Scientific revolution • Modern medicine • Education• The work ethic
29
Institutional Capital
Human Capital
Final good news
• Graduates of Colorado School of Mines, US top engineering school, in 2013 got higher average salaries than Harvard Business School graduates
• Graduates from South Dakota School of Mining and Technology in 2013 got an average salary of $56,700, their Harvard peers a median salary of $54,100.
30
Thank YouFabio Scacciavillani
31