EXAMINATION MALPRACTICES IN KENYA -PSYCHOLOGICAL CHARACTERISTICS OF A CHEAT
114
EXAMINATION MALPRACTICES IN KENYA BY; PASCAL MUTHEE KAGETE A RESEARCH PROJECT REPORT SUBMITTED IN PARTIAL FULFILLMENT OF THE REQUIREMENTS FOR THE DEGREE OF MASTER OF EDUCATION IN MEASUREMENTS AND EVALUATION, IN THE FACULTY OF EDUCATION; UNIVERSITY OF NAIROBI. 2008
-
Upload
independent -
Category
Documents
-
view
1 -
download
0
Transcript of EXAMINATION MALPRACTICES IN KENYA -PSYCHOLOGICAL CHARACTERISTICS OF A CHEAT
EXAMINATION MALPRACTICES
IN KENYA
BY;
PASCAL MUTHEE KAGETE
A RESEARCH PROJECT REPORT SUBMITTED IN PARTIAL FULFILLMENT OF
THE REQUIREMENTS FOR THE DEGREE OF MASTER OF EDUCATION IN
MEASUREMENTS AND EVALUATION, IN THE FACULTY OF EDUCATION;
UNIVERSITY OF NAIROBI.
2008
ii
DECLARATION
This research project is my original work and has not been presented for a degree in any
other university.
Sign:___________________________ Date __________________________
PASCAL M. KAGETE
E58/P/8149/2006
This research project has been submitted for examination with my approval as the
University Supervisor.
Sign:___________________________ Date __________________________
Dr. KAREN ODHIAMBO
Supervisor
Department of Psychology, Faculty of Education
University of Nairobi
iii
DEDICATION
To my loving wife Mary Wanjiku Muthee; my children Tony Kagete Muthee and Eric
Kamau Muthee. May they live to appreciate and cherish the power of education and find
solace in love for each other. To my ever loving parents Mzee Henry Kagete and Mama
Tabitha Wanjiru Kagete; may they live long to reap the fruits of their hard work in bringing
me up. God bless them abundantly.

iv
ACKNOWLEDGEMENTS
I wish to appreciate and acknowledge the following personalities whose input made it possible
for the success of this study.
First, Dr Karen Odhiambo, my supervisor, whose guidance, commitment and patience enabled
me to complete this study.
I wish to convey my gratitude to the University of Nairobi, in particular the Department of
Psychology, Faculty of Education, for offering me the opportunity to pursue this degree and all
the lecturers whose contribution enabled me to successfully go through the requirements of the
course.
My sincere gratitudes are directed to the Kenya National Examinations Council for sponsoring
me for this course and the immense support that enabled me to actualize my long time dream
of achieving this academic level. Special thanks to Mr. Paul Wasanga, Chief Executive -
Kenya National Examinations Council (KNEC), for allowing me unlimited access to the
secondary data used in this study, Mr. Paul Waweru of The Kenya National Bureau of
Statistics for the data analysis and software support; my colleague, Ms Margaret Kimanthi, for
continuously proofreading this work and my secretary, Ms Brenda Luchemo for in putting the
data and secretarial support. Finally, I wish to thank my KNEC colleagues namely; Leah Edith
Ngesu, Patrick Muriithi Miano, Mahmud Sheikh Ibrahim and Hassan Suleiman Bundu for their
encouragement. May the almighty bless them all.
Thanks to all the respondents for their honest responses and co-operation in providing me with
the invaluable information that I used to compile this report.
Above all, I thank the Almighty God, without whose grace, wisdom and favour I would not
have accomplished the completion of this piece of work
v
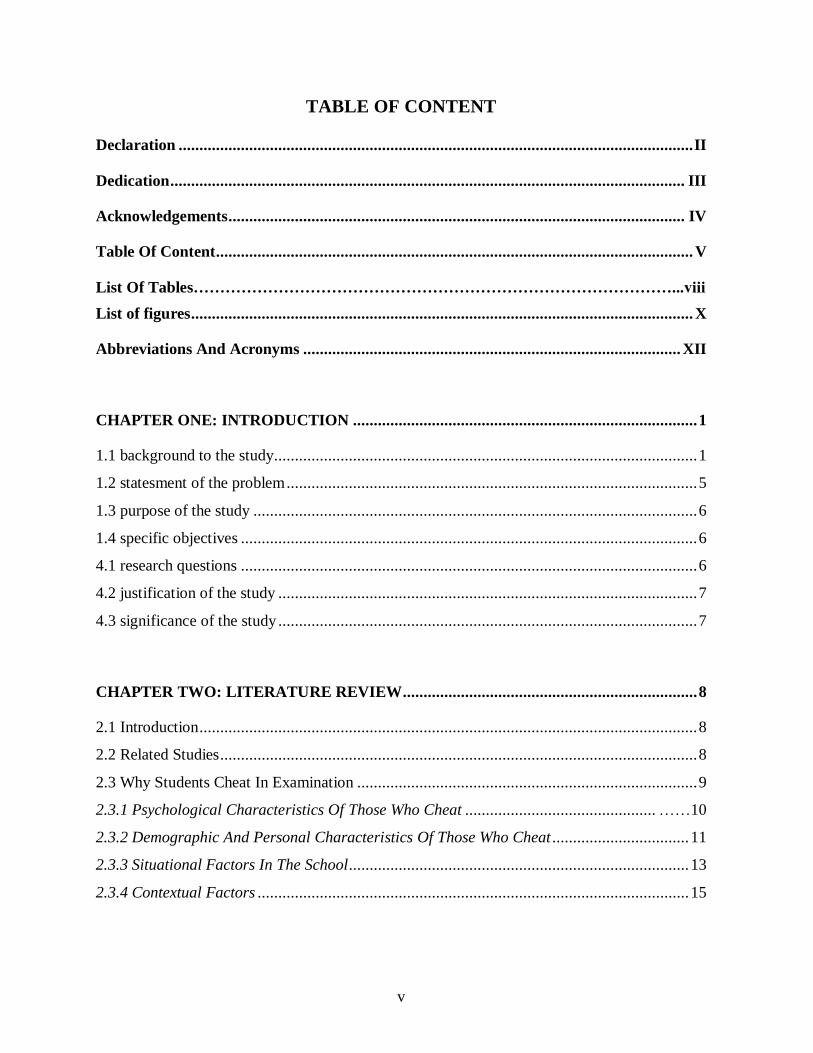
TABLE OF CONTENT
Declaration ............................................................................................................................ II
Dedication ............................................................................................................................ III
Acknowledgements .............................................................................................................. IV
Table Of Content ................................................................................................................... V
List Of Tables………………………………………………………………………………...viii
List of figures ......................................................................................................................... X
Abbreviations And Acronyms ........................................................................................... XII
CHAPTER ONE: INTRODUCTION ................................................................................... 1
1.1 background to the study ...................................................................................................... 1
1.2 statesment of the problem ................................................................................................... 5
1.3 purpose of the study ........................................................................................................... 6
1.4 specific objectives .............................................................................................................. 6
4.1 research questions .............................................................................................................. 6
4.2 justification of the study ..................................................................................................... 7
4.3 significance of the study ..................................................................................................... 7
CHAPTER TWO: LITERATURE REVIEW ....................................................................... 8
2.1 Introduction ........................................................................................................................ 8
2.2 Related Studies ................................................................................................................... 8
2.3 Why Students Cheat In Examination .................................................................................. 9
2.3.1 Psychological Characteristics Of Those Who Cheat .............................................. ……10
2.3.2 Demographic And Personal Characteristics Of Those Who Cheat ................................. 11
2.3.3 Situational Factors In The School .................................................................................. 13
2.3.4 Contextual Factors ........................................................................................................ 15

vi
2.3.5 Ethical Factors .............................................................................................................. 17
2.3.6 Reasons Given For Cheating ......................................................................................... 18
2.4 Effects of cheating in examinations .................................................................................. 20
2.4.2 Effects On The Institutions ............................................................................................ 20
CHAPTER THREE: RESEARCH METHODOLOGY ..................................................... 21
3.1 Introduction ...................................................................................................................... 21
3.2 Research Design ............................................................................................................... 21
3.3 The Sample ...................................................................................................................... 22
3.4 Sampling Procedure ......................................................................................................... 22
3.5 Data Collection Instruments ............................................................................................. 22
3.5.1 Trends Analysis Format:................................................................................................ 22
3.5.2 Questionnaire On Behaviour Characteristics: ................................................................. 23
3.6 Pre-Testing Of Instruments ............................................................................................... 24
3.7 Preparation For Data Collection And Data Collection Procedures ..................................... 25
3.8 Data Analysis ................................................................................................................... 25
3.8.1 Data Entry Programme .................................................................................................. 25
3.8.2 Data Analysis Programme ............................................................................................. 25
3.8.3 Description Of Analysis ................................................................................................ 26
3.9 Data Presentation ............................................................................................................. 26
CHAPTER FOUR: DATA ANALYSIS AND INTERPRETATION ................................. 27
4.1 Introduction ...................................................................................................................... 27
4.2 Legal Instrument And The Policy On Examination Malpractices ...................................... 27
4.2.1 KCSE Registration Requirements .................................................................................. 28
4.2.2 Rules To Ensure Fairness .............................................................................................. 28
4.2.3 KNEC‟s Legal Instrument ............................................................................................. 29
4.3 General Overview Of Personal Data Of Respondents ....................................................... 31

vii
4.4 Demographics As It Relates To Data From KNEC Statistical Bank .................................. 32
4.4 Psychological Characteristics ........................................................................................... 43
4.5 Behavioural Characteristics .............................................................................................. 52
CHAPTER FIVE: RESEARCH DISCUSSIONS ............................................................... 81
5.1 Introduction ...................................................................................................................... 81
5.2 Trends In Cheating In Examinations ............................................................................... 81
5.3 Psychological Factors Related To Cheating In Examinations ............................................ 82
5.3.1 Anxiety And Cheating ................................................................................................... 82
5.3.2 Perception Of Cheating ................................................................................................. 83
5.4 Situational Analysis .......................................................................................................... 83
5.5 Ethical Factors And Student Perception ............................................................................ 84
CHAPTER SIX: SUMMARY, CONCLUSION AND RECOMMENDATIONS .............. 87
6.1 Summary Of The Results ................................................................................................. 87
6.2 Conclusion ....................................................................................................................... 88
6.3 Recommendations ............................................................................................................ 89
REFERENCES ..................................................................................................................... 91
APPENDIX I: STUDENTS QUESTIONNAIRE ............................................................... 95
APPENDIX II: LETTER OF AUTHORITY…………………………………………… 101
APPENDIX III: THE KNEC ACT .................................................................................... 102
viii
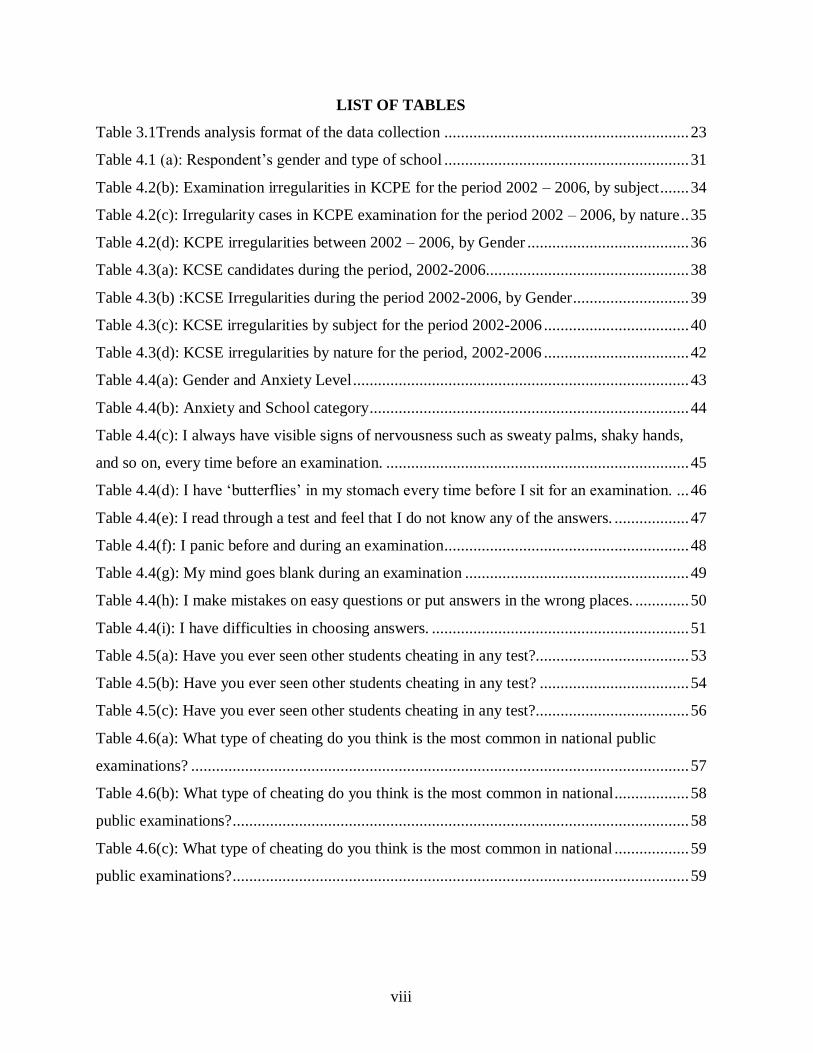
LIST OF TABLES
Table 3.1Trends analysis format of the data collection ........................................................... 23
Table 4.1 (a): Respondent‟s gender and type of school ........................................................... 31
Table 4.2(b): Examination irregularities in KCPE for the period 2002 – 2006, by subject ....... 34
Table 4.2(c): Irregularity cases in KCPE examination for the period 2002 – 2006, by nature .. 35
Table 4.2(d): KCPE irregularities between 2002 – 2006, by Gender ....................................... 36
Table 4.3(a): KCSE candidates during the period, 2002-2006................................................. 38
Table 4.3(b) :KCSE Irregularities during the period 2002-2006, by Gender ............................ 39
Table 4.3(c): KCSE irregularities by subject for the period 2002-2006 ................................... 40
Table 4.3(d): KCSE irregularities by nature for the period, 2002-2006 ................................... 42
Table 4.4(a): Gender and Anxiety Level ................................................................................. 43
Table 4.4(b): Anxiety and School category ............................................................................. 44
Table 4.4(c): I always have visible signs of nervousness such as sweaty palms, shaky hands,
and so on, every time before an examination. ......................................................................... 45
Table 4.4(d): I have „butterflies‟ in my stomach every time before I sit for an examination. ... 46
Table 4.4(e): I read through a test and feel that I do not know any of the answers. .................. 47
Table 4.4(f): I panic before and during an examination ........................................................... 48
Table 4.4(g): My mind goes blank during an examination ...................................................... 49
Table 4.4(h): I make mistakes on easy questions or put answers in the wrong places. ............. 50
Table 4.4(i): I have difficulties in choosing answers. .............................................................. 51
Table 4.5(a): Have you ever seen other students cheating in any test?..................................... 53
Table 4.5(b): Have you ever seen other students cheating in any test? .................................... 54
Table 4.5(c): Have you ever seen other students cheating in any test?..................................... 56
Table 4.6(a): What type of cheating do you think is the most common in national public
examinations? ........................................................................................................................ 57
Table 4.6(b): What type of cheating do you think is the most common in national .................. 58
public examinations? .............................................................................................................. 58
Table 4.6(c): What type of cheating do you think is the most common in national .................. 59
public examinations? .............................................................................................................. 59

ix
Table 4.7(a): Would you say cheating happens in every test? ................................................. 61
Table 4.7(b): Would you say cheating happens in every test? ................................................. 62
Table 4.7(c): Would you say cheating happens in every test? ................................................. 63
Table 4.7(d): Frequency of cheating and Gender .................................................................... 64
Table 4.7(e-i): School category and cheating engagement ...................................................... 66
Table 4.7(e-ii): Anxiety level and engagement in cheating ..................................................... 67
Table 4.7(f-i): Overall reasons for cheating ............................................................................ 68
Table 4.7(f-ii): Gender and reasons for cheating ..................................................................... 69
Table 4.7(g): School Category and reasons for Cheating ........................................................ 70
Table 4.7(h): Anxiety Level and reasons for cheating ............................................................. 71
Table 4.8(a): Overall reasons for not cheating ........................................................................ 73
Table 4.8(b); Gender and reasons given for not cheating ........................................................ 74
Table 4.8(c): School category and reasons for not cheating .................................................... 75
Table 4.8(d): Anxiety and reasons for not cheating ................................................................. 76
Table 4.9(a): Do you think it is wrong to cheat in national public examination? ..................... 77
Table 4.9(b): Do you think it is wrong to cheat in national public Examinations? ................... 78
Table 4.9(c): School category and perception on cheating ...................................................... 79
Table 4.9(d): Anxiety and perception on cheating................................................................... 80
x
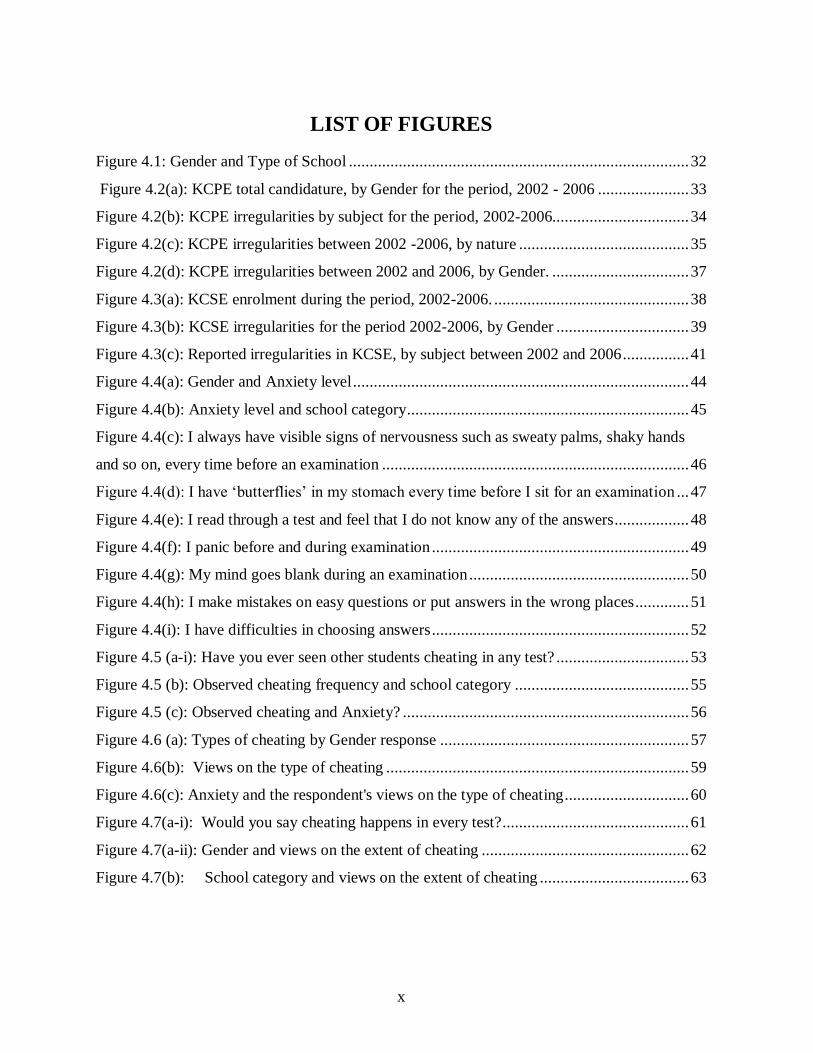
LIST OF FIGURES
Figure 4.1: Gender and Type of School .................................................................................. 32
Figure 4.2(a): KCPE total candidature, by Gender for the period, 2002 - 2006 ...................... 33
Figure 4.2(b): KCPE irregularities by subject for the period, 2002-2006................................. 34
Figure 4.2(c): KCPE irregularities between 2002 -2006, by nature ......................................... 35
Figure 4.2(d): KCPE irregularities between 2002 and 2006, by Gender. ................................. 37
Figure 4.3(a): KCSE enrolment during the period, 2002-2006. ............................................... 38
Figure 4.3(b): KCSE irregularities for the period 2002-2006, by Gender ................................ 39
Figure 4.3(c): Reported irregularities in KCSE, by subject between 2002 and 2006 ................ 41
Figure 4.4(a): Gender and Anxiety level ................................................................................. 44
Figure 4.4(b): Anxiety level and school category .................................................................... 45
Figure 4.4(c): I always have visible signs of nervousness such as sweaty palms, shaky hands
and so on, every time before an examination .......................................................................... 46
Figure 4.4(d): I have „butterflies‟ in my stomach every time before I sit for an examination ... 47
Figure 4.4(e): I read through a test and feel that I do not know any of the answers.................. 48
Figure 4.4(f): I panic before and during examination .............................................................. 49
Figure 4.4(g): My mind goes blank during an examination ..................................................... 50
Figure 4.4(h): I make mistakes on easy questions or put answers in the wrong places ............. 51
Figure 4.4(i): I have difficulties in choosing answers .............................................................. 52
Figure 4.5 (a-i): Have you ever seen other students cheating in any test? ................................ 53
Figure 4.5 (b): Observed cheating frequency and school category .......................................... 55
Figure 4.5 (c): Observed cheating and Anxiety? ..................................................................... 56
Figure 4.6 (a): Types of cheating by Gender response ............................................................ 57
Figure 4.6(b): Views on the type of cheating ......................................................................... 59
Figure 4.6(c): Anxiety and the respondent's views on the type of cheating .............................. 60
Figure 4.7(a-i): Would you say cheating happens in every test? ............................................. 61
Figure 4.7(a-ii): Gender and views on the extent of cheating .................................................. 62
Figure 4.7(b): School category and views on the extent of cheating .................................... 63

xi
Figure 4.7(c): Anxiety level ad views on the extent of cheating .............................................. 64
Figure 4.7(d-i): Overall response to cheating .......................................................................... 65
Figure 4.7(d-ii): Gender and the response to cheating ............................................................ 65
Figure 4.7(e-i): School category and cheating engagement .................................................. 66
Figure 4.7(e-ii): Anxiety level and engagement in cheating .................................................. 67
Figure 4.7(f-i): Overall reasons for cheating ........................................................................... 68
Figure 4.7 (f-ii): Gender and reasons for cheating ................................................................... 69
Figure 4.7g): School Category and reasons for Cheating ........................................................ 71
Figure 4.7(h): Anxiety and reasons for cheating ..................................................................... 72
Figure 4.8(b); Gender and reasons given for not cheating .................................................... 74
Figure 4.8(c): School category and reasons for not cheating ................................................... 75
Figure 4.8(d): Anxiety and reasons for not cheating .............................................................. 76
Figure 4.9(a): Do you think it is wrong to cheat in national public examination? .................... 77
Figure 4.9(b): Gender and perception to cheating ................................................................... 78
Figure 4.9(c): School category and perception on cheating ..................................................... 79
Figure 4.9(d): Anxiety and perception on cheating ................................................................. 80

xii
ABBREVIATIONS AND ACRONYMS
1. CSPro Census and Survey processing system
2. DEO District Education Officer
3. Epsem Equal probability of selection method
4. GCSE General Certificate of Secondary Education
5. GPA Grade point average
6. IMF International Monetary Fund
7. KCPE Kenya Certificate of Primary Education
8. KCSE Kenya Certificate of Secondary Education
9. KNEC Kenya National Examinations Council
10. MEO Municipal Education Officer
11. PDE Provincial Director of Education
12. SAP Structural Adjustments Programme
13. SAT Scholastic Assessment Test
14. SPSS Statistical Package for Social Scientists
15. UK United Kingdom
16. USA United States of America

1
CHAPTER ONE: INTRODUCTION
1.1 Background to the Study
The quality of an education system is very important and crucial to the economic
development and social stability of any country. It leads to the acquisition of the
necessary skills and knowledge that are needed for national development. One of the
major indicators of the quality of education is the national public examinations.
The central purpose of national public examinations is to enhance transparency, effectiveness,
and efficiency in making decisions about people, which may have tremendous implications on
their lives. Examinations are generally used to monitor learning and are the most common
measure of student learning achievement. Anderson Ball and Murphy (1975) define an
examination as any series of questions or exercises or other means of measuring the skills,
knowledge, intelligence, capacities or aptitudes of an individual.
Public examinations are legally fortified instruments of the states by Acts of Parliament. They
are meant to enhance accountability to the taxpayers by educators, and therefore levels of
performance are good indicators of how well or badly an education system is functioning. It is
fundamental that examination results should reflect the true effort of the students and teachers.
It is equally important that the selection and placement decisions made on the basis of
examination results are based on a water-tight examination system, and thus the results reflect
the true picture of the abilities of examinees.
In Kenya, examination results are the major determinants of access to the job market and
selection into institutions of higher learning. Given the very stiff competition for places, it is
imperative that objectivity and fairness be the overriding concerns in the allocation of
these places. Any practice that threatens fairness and objectivity in examinations must
be detected and if possible, stamped out.

2
Examination malpractices are clear manifestations of the competitiveness of the examinations,
which induce high anxieties in candidates, declining ethical standards, and erosion of self-
efficacy and confidence among examinees and their guardians. The clear consequence of
examination irregularities is that decisions made on the basis of such results will inadvertently
be wrong to the people being selected for further education or training, or placed in
employment vacancies while, highly deserving and morally upright people get left out because
they did not tamper with the system. The universal sine quo non (the necessary and sufficient)
conditions for good examinations, i.e., validity and reliability get violated, and when
irregularities are discovered, the states incurs horrendous expenses for repeat examinations.
The loss of confidence in public examination systems due to irregularities may lead to social
instabilities and importation of foreign examinations, which further erodes confidence of the
people in the states. The credibility of an education system and its examinations is put in
jeopardy whenever the laid down rules and regulations are not adhered to. The regulations are
intended to provide an environment of fair play, equal opportunity and validity of the
assessment.
Examination malpractice involves various methods employed by candidates to cheat during
examinations; it is an unlawful behaviour or activity engaged by students to have personal
advantage in an examination over their colleagues or mates who are competing in the same
examination (Sahman, et al., 1990). Cheating in examinations is one such practice and can be
defined as claiming or appropriating more than one has a right to achieve in an
examination. This refers to a situation where a candidate tries to gain unfair advantage in the
examination over the other candidates. Different terminologies have been used as indicated by
Harvey Goldstein and Toby Lewis (1999). These include unfair practice, cheating,
dishonesty, misconduct, irregularity and malpractice. These terminologies will be used
interchangeably in this study.
Examination malpractices can be traced in history through thousands of years. Brickman
(1961) reports that during the civil service examinations in ancient China tests were given in
3
individual small rooms (cubicles) to prevent examinees from looking at the test papers of
others; and that examinees were searched for notes before they entered the cubicles; that the
death penalty was in effect for both examinees and examiners if anyone was found guilty of
cheating. This not withstanding cheating still occurred. In modern society, cheating is a
frequent occurrence. Zastrow (1970) provides evidence of a 40% incidence of cheating among
graduate students. In a study by Schab (1969), approximately 24% of the girls and 20% of the
boys admitted that they first began cheating in the first grade, 17% of the girls and 15% of the
boys began in the eighth grade, and 13% of the girls and 9% of the boys began in the seventh
grade.
Currently, examination security is a major governments‟ preoccupation and is not unique in
Kenya. In China, for example, the country is considering enacting a law for examination
security as examination cheating continues unabated. In Britain, the examiners have now
resorted to use high-tech gadgets to curb growing cheating incidents in examinations like the
General Certificate of Secondary Examination, (GCSE) and A-levels. One of the biggest exam
boards in United Kingdom, Edexcel, has claimed that they have made cheating in exams a lot
more difficult by tagging papers with radio transmitters and microscopic identification in order
to make sure that the papers reach the specific school. They are also planning to go for secure
boxes containing papers that could be opened only by codes transmitted from mobile phones;
while in India the Chhattisgarh states assembly recently passed a bill that provides for up to
five years in jail for those found guilty of aiding students to cheat in exams - 'Copying in
Examination (Prevention) Act, 2008'. And in Washington in the United Statess of America,
(USA), bottled water is sometimes banned at students' desks for fear that someone may have
scrawled a formula on the inside of the wrapper, and at the same time, tests with the same
labels are passed out but with questions in a different order, a trick meant to trap would-be
cheats who steal glances at their neighbours. Sometimes even seemingly minor actions, such as
tying a shoelace or looking at the ceiling, are forbidden.

4
It would seem that cheating is widespread in every corner of the globe. Characteristics of
public/national examination systems in Kenya can be described as “fiercely competitive”
(Wasanga & Muiruri, 2002). The very competitive nature of the public examinations has led
the candidates, schoolheads, teachers and other stakeholders to engage in unfair practices to
enhance their scores during public examinations. The high stake placed on examinations is
perhaps the lead influence in the prevalence of examination irregularities in the Kenyan
context.
There are several factors that lure candidates into cheating in examinations. Among the most
common ones include, stiff competition, poor preparation by both, candidates and teachers,
poor invigilation and administration, pressure to pass examination and pass with high grades,
as well as inadequate facilities for examinations. While there are many reasons that could lead
to examination malpractices, focus can also be turned on the learning environment and the
facilities available for implementation of curriculum. It is argued that when curriculum is
delivered in non-conducive environment, the learning objectives can hardly be achieved
(Ndalichako, 2002), yet the examinations are set on the basis of the learning outcomes as
stipulated in the curriculum.
Debt and globalization of the economy have resulted into the increased marginalization of the
African countries in general, and Kenya in particular. As a prerequisite to becoming active
players on the stage of the global market, all African countries had to accept some kind of
socio-economic and political structural adjustment programmes (SAP), prescribed by the
Bretton Wood Institutes – World Bank and International Monetary Fund, (IMF). Since the
implementation of the SAPs, there has been a growing interest in the way in which adjustment
policies affect the poor in African countries, and how these policies could be modified to
provide some protection to the poor. What has emerged is that the implementation of these
policies involved cuts in government spending, devaluation, globalization and liberalization of
the economy and international trade, and to a large extent, the reduction of available funds for
social services including financing education. This resulted into the deterioration of the school

5
system manifested in poor examination results. The demand for the highly qualified candidates
for the present competitive labour market, and the limited places in higher learning institutions
made students deregulate the established norms of orderly examination conduct, which have
often led to increased examination malpractices. It therefore appears like examination
malpractices, curriculum delivery, policy, testing styles, school environment etc. form a
complex web and many questions are bound to arise such as:
Is there any linkage between examination irregularities and what may be described “high
stake examinations”?
Could testing style lend itself prone to examination irregularities particularly in science
practical subjects?
Is there a relationship between curriculum delivery and examination irregularities?
Is there a relationship between major education policies and examination malpractices?
In the absence of concrete research findings, the causal relationship between these subjects and
examination malpractices can only be speculated. The field is open for comprehensive
research, the findings of which would help to invite search for curriculum delivery approaches
which would stem the growing tendency by candidates to seek shortcuts to good grades in their
academic certificates.
1.2 Statement of the Problem
Although the examination boards world over have laid down rules on examinations, students
still cheat in their examinations. The students who cheat get marks that they do not deserve.
The efficiency of the country's educational system is reduced, because cheating distorts
competition, diminishes the student's incentive to study, and leads to inaccurate evaluation of
the student's abilities. To design appropriate deterrence mechanisms, more information about
the phenomenon of cheating, especially why and how students cheat, is needed. Research in
these areas has mainly looked into frequencies and type of cheating. This is the situation in
Kenya. There is need to look into cheating in an integrated manner, which brings to bare,
perception and attitude towards cheating. There is also need to bring to bare data from the most

6
affected students and teachers. This study aimed to establish why and how the students cheat
and their attitudes to cheating in national public examinations.
1.3 Purpose of the Study
The study sought to establish why students cheat and the most common method used to cheat
in national public examinations. The study also sought to establish the student‟s perception
towards the vice.
1.4 Specific Objectives
The study seeks to establish:
1. What policy exist regarding examination malpractices in examinations in Kenya
2 The situational factors regarding assessment design that influences cheating in national
public examinations.
3 What opportunities arise in administration of examinations that may result in cheating?
4 What type of behavioural characteristics arises regarding students and cheating?
4.1 Research questions
The following research questions were formulated for the study:
1) What factors influence cheating in examinations
2) What are the trends that arise in cheating
3) What is the scale of cheating
4) What is the behaviour that arise as a result of cheating in examinations

7
4.2 Justification of the Study
There has been research done on cheating in examinations in Kenya. However, this has been
based on incidences of cheating and punishment. The area has not been explored to determine
the underlying factors in relation to individual characteristics or gender relationship and
achievement level, neither have the behavioural characteristics and ethics. This research comes
as an opportunity not only to add knowledge in these areas but also to meet the challenge the
education system is facing right now; that is, the continued cheating in national examinations.
4.3 Significance of the Study
The Ministry of Education as it addresses cheating in examination may find this study useful.
Schools may find this study useful in guiding on deterrent measures regarding students and
teachers. Scholars can use the information in this study to carry out further research in
challenging areas

8
CHAPTER TWO: LITERATURE REVIEW
2.1 Introduction
In this section, related studies were covered. Also to be addressed was the literature review on
examination irregularities.
2.2 Related Studies
A number of studies have been carried out as found in the literature. Bunn, Caudill, and
Gropper (1992) interviewed some American economics undergraduates and concluded that
many students cheat; that the brighter the student, the less likely it is that he or she has cheated;
and that there is a higher probability attached to having cheated once if the student believes
others to be cheating. Whereas Bunn, et al. covered only the cheating-once case, Mixon (1996)
was interested in habitual cheating. His main conclusion was that the determinants of habitual
cheating are much the same as those that relate to having cheated once.
Bunn, Caudill, and Gropper (1992), on one hand, and Mixon (1996) on the other hand, the
analogy between cheating and crime (especially theft). Kerkvliet (1994), also using U.S. data,
concludes that about one-third of students had cheated on at least one occasion. Nowell and
Laufer (1997) found that non-tenure track faculty, large classes, poor performance in the class,
and being employed all lead to more cheating. Kadane (1999) assessed whether data over
eleven (11) examinations supported an accusation of copying multiple-choice answers. Finally,
Kerkvliet and Sigmund (1999) explored the determinants of source-specific cheating
behaviour, including student characteristics and deterrent measures. They concludes that large
alcohol consumption and low grade point average (GPA) increase the probability of cheating.
Interestingly, they found that the further along a student was in his or her academic career, the
more likely he or she was to cheat. The most striking result was the difference in student
cheating between students who were taught by teaching assistants and those taught by faculty;
students taught by teaching assistants were 32 percent more likely to cheat than students taught
by faculty. In response to this problem, a great deal of research has been performed in
education and psychology. Most studies deal with:

9
Demographic and personal characteristics of cheats.
The situational factors involved in a student's decision about whether or not to cheat.
The contextual factors
The ethical factors
The reasons students often give for cheating
These five areas are vitally important in determining why cheating occurs.
2.3 Why Students Cheat in Examination
Rooted in the philosophy of Thomas Hobbes, Adam Smith, and the standard economic model
of rational and selfish human behaviour (i.e., homo economicus) is the belief that people carry
out dishonest acts consciously and deliberatively by trading off the expected external benefits
and costs of the dishonest act (Becker 1968; Allingham & Sandmo 1972). According to this
perspective, people would consider three aspects as they pass a petrol station: the expected
amount of cash they stand to gain from robbing the place, the probability of being caught, and
the magnitude of punishment if caught in this act.
On the basis of these inputs, people reach a decision that maximizes their interests. Thus,
according to this perspective, people are honest or dishonest only to the extent that the planned
trade-off favours a particular action (Hechter 1990; Lewicki 1984). In addition to being central
to economic theory, this external cost-benefit view plays an important role in the theory of
crime and punishment, which forms the basis for most policy measures aimed at preventing
dishonesty and guides punishments against those who exhibit dishonest behaviour.
In summary, this standard external cost-benefit perspective generates three hypotheses as to the
forces that are expected to increase the frequency and magnitude of dishonesty:
The higher magnitude of external rewards,
The lower probability of being caught and
The lower magnitude of punishment.

10
2.3.1 Psychological Characteristics of Those Who Cheat
People are often torn between two competing motivations: gaining from cheating versus
maintaining their positive self-concept as honest individuals (Aronson 1969; Harris, Mussen, &
Rutherford, 1976). If they cheat, they could, for example, gain materially or financially, but at
the expense of an honest self-concept. In contrast, if they take the high road, they might forego
material or financial benefits but maintain their honest self-concept. This seems to be a win–
loose situation; choosing one path involves sacrificing the other.
From a psychological perspective, and in addition to material or financial considerations,
another set of important inputs to the decision of whether to be honest (or not) is based on
internal rewards. Psychologists show that as part of socialization, people internalize the norms
and values of their society (Campbell 1964; Henrich ,et al. 2001), which serve as an internal
benchmark against which a person compares his/her behaviour. Compliance with the internal
values system provides positive rewards, whereas non-compliance leads to negative rewards
(i.e. punishments).
Applied to the context of dishonesty, one major way in which the internal reward system exerts
control over behaviour is by influencing people‟s self-concept, that is, the way individuals
view and perceive themselves (Aronson 1969; Baumeister 1998; Bem 1972). It has been
shown that people typically value honesty (i.e., honesty is part of their internal reward system),
that they have very strong beliefs in their own morality, and that they want to maintain this
aspect of their self-concept (Griffin and Ross 1991; Sanitioso, Kunda, and Fong 1990;
Greenwald 1980; Josephson Institute of Ethics 2004). This means that if a person fails to
comply with her internal standards for honesty, she will have to negatively update her self-
concept, which is aversive. On the other hand, if a person complies with her internal standards,
she avoids such negative updating and maintains her positive self-view in terms of being an
honest person. Interestingly, this perspective suggests that in order to maintain their positive
11
self-concepts, individuals will comply with their internal standards even when doing so
involves investments of effort or sacrificing financial gains
2.3.2 Demographic and Personal Characteristics of Those who Cheat
Extensive studies have found that no personal characteristics correlate well with cheating, that
is, there are no people "born to cheat" (Mcabe & Trevino, 1997). Indeed, one experiment found
that there was no relationship between how a student performed on a morality test and his
likelihood of cheating that is, students at a pre-conventional stage of morality are as likely to
cheat as those at a post-conventional stage (West, Ravenscroft & Shrader, 2004). Demographic
variables are also generally not strongly correlated with cheating, with a few minor exceptions.
While men cheated slightly more often than women in the 1960s, that gap has disappeared in
recent years (Mcabe & Trevino, 1997); they further observe that another demographic variable
that affects cheating behaviour is academic achievement, in that students who perform poorly
tend to cheat more than students who perform well. For instance, low grades and low
Scholastic Assessment Test, (SAT) scores have a correlation with high levels of cheating
(Carroll, 1992) and in the same study it is found that parental education shows a weak but
positive correlation with cheating; students whose parents received college degrees are slightly
more likely to cheat than are students whose parents did not attend college. One of the
strongest demographic correlations with academic misconduct in the United Statess is with
language. Students who speak English as a second language have been shown to commit
academic dishonesty more and are more likely to be caught than native speakers, since they
will often not want to rewrite sources in their own words, fearing that the meaning of the
sentence will be lost through poor paraphrasing skills.
Hartshorne and May (1928) statess that students who associated with cheats were more likely
to cheat than were students who associated with none cheats. Thus, the degree of closeness to
others in the class seems to affect cheating behaviour. Hetherington and Feldman (1964)
inferred that cheats were more neurotic than non-cheats. Brownell (1928) supports their
findings and added that cheats were more extraverted as well. Keehn (1956), statess that

12
cheating should be "more related to either extraversion alone or to extraversion and
neuroticism than to neuroticism alone". His research found more cheating among students
scoring high on both extraversion and neuroticism scales, but he said that it was impossible to
find a relationship between cheating and extraversion alone because most of his subjects who
scored high on the extraversion scale also scored high on the neuroticism scale. In a 1967 study
White, Zielonka, and Gaier reported that cheaters were more "tense, irritable, anxious, and in
turmoil" than none heaters.
Other investigators have concerned themselves with a diversity of other behavioural
characteristics and their relationship to cheating. Hetherington and Feldman (1964) found
cheating more common among students who were less self-sufficient and who exerted little
effort in their studies. Boodish (1962) notes that cheats were often good, but overambitious,
students. Vitro (1971) found that cheats generally had parents who punished them severely or
not at all. Thus, his results suggest that a moderate degree of discipline results in children who
internalize moral values and are thus honest in their school work. Black (1962) states that there
were no significant differences in the cheating behaviour of students who attended class
regularly and those who frequently cut class. Hartshorne and May (1928) found a relationship
between age and cheating with older students cheating slightly more often, although Black
(1962) found no significant differences in various age groups. Drake (1941) published some
findings suggesting that interest in a course content influenced cheating behaviour. In his study
20% of the cheats and 90% of the non-cheats enrolled in further courses in the department in
which they had cheated. He added that lack of success may have also accounted for part of the
difference. Steininger, Johnson, and Kirts (1964) found a definite relationship between lack of
meaningfulness of courses and cheating. Zastrow (1970), in contrast to all these findings,
found no significant personal differences in cheating and non-cheating students. In most cases
though, these research studies do suggest that there are differences in the personal and
behavioural characteristics of those who cheat and those who do not cheat.

13
2.3.3 Situational Factors in the School
Several investigators have determined that particular characteristics of a situation have a great
influence on whether or not a student cheats. McQueen (1957) reported that situational factors
were a very important determinant of cheating. Rogosin (1951) interpreted some of the studies
in the area to mean that the situation was more important than behavioural characteristics as a
determinant of whether or not cheating occurred. Other researchers, though, have merely
identified characteristics of a situation that influence cheating without making any judgments
about the relative influence of personal or situational characteristics.
The moral climate of the school influences the amount of cheating. Steiner (1930) indicated
that the moral tone of the school can have a positive effect on the characters of students as well
as on the incidence of cheating in the school. Atkins and Atkins (1936) found that a good
emotional tone in the classroom and instruction about not cheating before taking a test and
great difficulty in cheating led to less cheating. Thus, the tone of the classroom seems to have
an influence. In a related study, Fischer (1970) examined five classroom situations in an
attempt to determine when students would be most likely to cheat. The five conditions were:
A "control" condition in which students were given instructions for the test,
An "informative appeal to honesty" condition in which students were given the instructions
and were also told that their being honest on the test was important in providing results that
could be used in helping the teacher assess her teaching techniques,
A "public affirmation of value" condition in which a pretest discussion was held about
cheating and the students were asked to states why they would not cheat on the upcoming
test,
A "value-relevant threat of punishment" condition in which students were told prior to the
examination that if they were caught cheating they would have to write fifty times a
sentence about cheating and
A "non-value-relevant threat of punishment" condition in which students were told that
their punishment for cheating would be writing numbers repeatedly.
14
Under the first two conditions, Fischer reported that approximately two-thirds of the control
and three-fourths of the informative appeal groups cheated. The incidence of cheating was
lower in the other three situations, but no significant differences in incidence of cheating were
found between the three; these were significantly lower than the second group. Thus,
punishment conditions appear equally as effective as non- punishment conditions in their
influence on cheating behaviour. It would seem that these researchers have shown, in different
ways, that cheating is influenced by the moral climate of the school.
The chances of success in cheating were another situational determinant that some researchers
dealt with. The literature seems to indicate that students are less likely to cheat if the chances
are greater that they may get caught. Vitro and Schoer (1972) found that the highest incidence
of cheating occurred among students who were:
unlikely to do well on the test;
who were unlikely to get caught;
And to whom the particular test was very important.
Ludeman (1938) lent support to the findings of likelihood of success as a determinant when he
reported that one of the two major reasons that students cheated was the fact that they had seen
others get away with it. Atkins and Atkins (1936) reported that "the amount of individual
dishonesty increased with the ease of dishonesty". Uhlig and Howes (1967) found that a large
percentage of college students would cheat even in a no pressure situation, if the opportunity
was present. On the other hand Williams (1969) reported that "cheating does not increase with
the number of opportunities". Nevertheless, the literature indicates the likelihood of success as
an important determinant of cheating behaviour.
Personality and teaching style of the teacher have been found to be other situational
determinants. Steininger, Johnson, and Kirts (1964) found that poor teachers produced more
students cheating. Shirk and Hoffman (1961) theorized that a teacher who was very
authoritarian, indicating to the students that he knew all the answers, that they were inferior

15
beings, and that the grades he gave were an adequate and accurate measure of the students'
intelligence frequently led students to cheat more. Weldon (1966) underscored this argument
with her discussion of the relationships between amount of cheating and the democratic or
totalitarian characteristics of teachers. She suggested that students cheated much less
frequently when they were freer to voice their opinions about their work and were not tested by
totalitarian procedures. According to Montor (1971), students felt that negative attitude of
teachers towards inquisitive students was a factor in encouraging some students to cheat. In a
related study, Johnson and Klores (1968) found that a dissatisfying classroom situation was
judged by students as producing a greater amount of cheating. Woods (1957) mentioned
teachers giving work that was too difficult and teachers who were too busy as factors that
might contribute to cheating. Steininger, Johnson, and Kirts (1964) suggested the giving of
excessively difficult tests by a teacher as a situation which may increase cheating. Excessively
difficult tests may lead to feelings of hopelessness in students. Finally, the Montor, (1971) and
Whitley (1998) reported that some students saw a teacher's grading on a curve as an
inducement to cheating because under such a grading system poor students would have to
cheat or would be doomed to get a low grade. Thus, there seems to be a relationship between
teaching style and the amount of cheating that occurs.
2.3.4 Contextual Factors
Academic misconduct is more easily traced to the academic and social environment of the
student than to his or her background. These contextual factors can be as broad as the social
milieu at school to as narrow as what instructions a teacher gives before an exam.
Contextual factors that individual teachers can affect, often makes the least difference on
cheating behaviour. A study found that increasing the distance between students taking an
exam has little effect on cheating, and that threatening students before an exam with expulsion
if they cheat actually promotes cheating behaviour (Kerkvliet and Sigmund,1999). Indeed,
increased exam invigilation and other methods of detecting cheating in the classroom are
largely ineffective. As teachers invent more elaborate methods of deterring cheating, students
invent even more elaborate methods of cheating (sometimes even treating it as a game).
16
Increased punishment for academic misconduct also has little correlation with cheating
behaviour. It has been found that students with markedly different perceptions of what the
severity of the punishment for cheating were all equally likely to cheat, probably indicating
that they thought that increased penalties were immaterial since their cheating would never be
discovered (Bunn, Caudill and Gropper, 1992).
Teachers can, however, accidentally promote cheating behaviour. A study found a correlation
between how harsh or unfair a teacher is perceived as and academic misconduct, since students
see cheating as a way of getting back at the teacher ( Bushway and Nash, 1977).
The most important contextual causes of academic misconduct are often out of individual
teachers' hands. One very important factor is time management. One survey reported two-
thirds of teachers believed that poor time management was the principal cause of cheating
(Carroll, 2002).
Another important cause of academic misconduct is the contextual factor of an environment of
peer disapproval of cheating, that is, peer pressure. Psychologists note that all people tend to
follow the norms of their peer group, which would include norms about academic dishonesty
(Power, Higgins and Kohlberg, 1989). Thus, students who believe that their peers disapprove
of cheating are less likely to cheat. Indeed, multiple studies show that the most decisive factor
in a student's decision to cheat is his perception of his peers' relationship with academic
dishonesty (Mcabe and Trevino, 2002). Peer pressure works both ways, as a study found that
there is a 41% increase in the probability of a student cheating if he/she has seen someone else
cheat (Bunn Caudill and Gropper, 1992). However, even if most students strongly disapprove
of cheating, there has to be a community in order for those norms to be enforced via peer
pressure. For instance, larger schools, which usually have much higher cheating rates than
small schools, tend to have a weaker community, being more split up into different peer groups
that exert little social pressure on each other (Bowers, 1964).

17
2.3.5 Ethical Factors
No matter what the demographic or contextual influences are on a student who decides to
engage in cheating behaviour, before he/she can cheat he/she must overcome his/her own
conscience. This depends both on how strongly someone disapproves of academic dishonesty
and what types of justifications the student uses to escape a sense of guilt. For instance,
students who personally do not have a moral problem with academic misconduct can cheat
guilt-free. However, while many students have been taught and have internalized that academic
dishonesty is wrong, it has been shown that on average a third of students who strongly
disapprove of cheating have in fact cheated (Bowers, 1964). People who cheat despite personal
disapproval of cheating engage in something called "neutralization", in which a student
rationalizes the cheating as being acceptable due to certain mitigating circumstances (Bernadi,
et al, 2004). According to psychologists of deviant behaviour, people who engage in
neutralization support the societal norm in question, but "conjure up" reasons why they are
allowed to violate that norm in a particular case (Smith, Davy and Easterling, 2004).
Neutralization is not a simple case of ex-post facto rationalization, but is rather a more
comprehensive affair, occurring before, during, and after the act of cheating (LaBeff, et al.,
1990). Researchers have found four major types of neutralization of academic dishonesty,
which they categorize by type of justification:
Denial of responsibility - that is, the accusation that others are to blame or that
something forced the student to cheat
Condemnation of condemner - that is, that the teachers are hypocrites or brought it on
themselves.
The appeal to higher loyalties - where the student thinks his/her responsibility to some
other entity, usually his/her peers, is more important than doing what he/she knows to
be morally right.
Denial of injury - that nobody is worse off for the cheating.

18
2.3.6 Reasons Given for Cheating
Related to the situational influences as determinants of cheating are the reasons students give
for their dishonesty in the classroom. In the relevant literature, investigators have cited
numerous reasons for cheating. Concern about grades was most frequently mentioned. Drake
(1941), Ludeman (1938), Montor (1971), Schab (1969), Smith, Ryan, and Diggins (1972),
Trabue (1962), and Woods (1957) all states that pressure to get grades to gain admittance to
college or pressure to maintain their existing average caused many students to cheat. Related to
all these studies are the findings of Cornehlsen (1965), whose results showed that any kind of
pressure from administrators, teachers, and/or parents frequently influenced cheating. Boodish
(1962), Montor (1971), Woods (1957), and Uhlig and Howes (1967) reported on the perceived
relationship of morality and cheating. Boodish indicated that one type of cheat could not see
any relationship between cheating and morality. Montor statesd that students cheated because
they did not understand why it was wrong, whereas Woods claimed, on the basis of his
findings, that "a large amount of cheating occurs where students are ignorant of or indifferent
to the immediate and ultimate consequences" of their behaviour. Uhlig and Howes suggest that
some students were confused about what is considered to be dishonest behaviour. Thus, their
research seems to indicate that cheating is more frequent when students do not understand the
relationship of cheating and morality.
Other reasons for cheating reported in the literature are found in the studies of Cornehlsen
(1965), Woods (1957), and Zastrow (1970). Cornehlsen studied 200 high school seniors and
found that "33% of the girls and 55% of the boys felt that cheating was justified when success
or survival was in jeopardy". Woods similarly reported fear of failure as a reason. Zastrow
reported "handicaps," such as extracurricular activities or a job, and being unprepared for a test
as reasons given by some students. It is obvious that there are numerous reasons for cheating, a
fact which may explain why cheating is so widespread.

19
In Kenya, some of the reasons cited by the ministerial committee appointed to investigate the
KCSE irregularities in the year 2000 (Ambassador Kisilu Report) included:
Stiff Competition
This is as a result of too many people chasing too few opportunities either for employment,
higher education or training.
Poor preparation
Teachers who have not done their work well and who fear that their failure will be revealed
by the poor performance of their students may look for opportunities to assist their students
during the examinations. On the other hand, students who have not prepared well for the
examinations may be tempted to cheat in order to perform well during the examinations.
Poor Supervision /Invigilation
The main objective of invigilation during examinations is to prevent cheating. If
invigilation is poor or lax or the people involved lack integrity, then cheating may occur.
Pressure to "Pass" Examinations
An obvious reason why many candidates cheat in examinations is due to the pressure to
perform well in examinations. The pressure could stem from the candidates own desire to
excel, or to please other significant people like parents, guardians, mentors, friends, peers
etc. When this pressure to pass examinations is too high, it generates a consequent desire to
succeed by any means - orthodox or unorthodox.
Inadequate Facilities in Examination Centre
Inadequate facilities, for example: classrooms, laboratories, halls, chairs, desks, working
tables and equipment in some examination centres may enable cheating to occur. Lack of
adequate space in examination rooms leads candidates to sit close to one another which can
easily lead to copying from each other. Situations where candidates sit for their
examination in shifts especially in science practicals can make control and supervision of
candidates very challenging. If supervision of candidates in such situations is lax or
ineffective, examination malpractices can occur.

20
2.4 Effects of Cheating in Examinations
2.4.1 Effects on the Student
Cheating in academia has a host of effects on students, on teachers, on individual schools, and
on the educational system itself. For instance, students who engage in neutralization to justify
cheating, even once, are more likely to engage in cheating in the future, potentially putting
them on a road to a life of dishonesty (Smith, Davy and Easterling, 2004). One study found
that students who are dishonest in class are more likely to engage in fraud and theft on the job
when they enter the workplace (Nonis and Swift, 2001). Students are also negatively affected
by academic dishonesty after graduation. Moreover, a case of cheating often will cause
emotional distress to faculty members, many considering it to be a personal slight against them
or a violation of their trust.
2.4.2 Effects on the Institutions
Academic misconduct can also have an effect on an institution‟s reputation, one of the most
important assets of any school. An institution plagued by cheating scandals may become less
attractive to potential donors and students and especially prospective employers. Alternately,
schools with low levels of academic dishonesty can use their reputation to attract students and
employers. Ultimately, academic dishonesty undermines the academic world. It interferes with
the basic mission of education, the transfer of knowledge, by allowing students to get by
without having to master the knowledge (Whitley and Keith-Spiegel, 1998).
Furthermore, academic dishonesty creates an atmosphere that is not conducive to the learning
process, which affects honest students as well (Bowers, 1964). When honest students see
cheats escape detection, it can discourage student morale, as they see the rewards for their
work cheapened. Cheating also undermines academia when students steal ideas. Ideas are a
professional author's "capital and identity", and if a person's ideas are stolen, it retards the
pursuit of knowledge (Mallon, 2004).
21
CHAPTER THREE: RESEARCH METHODOLOGY
3.1 Introduction
This chapter outlines the research design, sampling methodology and describes analysis done
on the data. It also includes a brief description of the data collection instruments and steps used
to ensure validity and reliability of the instruments.
3.2 Research design
This study used both qualitative and quantitative approaches in investigating the trends in
examination malpractices over a five-year period between the year 2002 and 2006, and gauged
it against behavioural characteristics elicited from a sample of Form Four students. The
quantitative data were obtained from the archives of KNEC and the student‟s responses. The
survey is a non-experimental, descriptive research method.
Qualitative research is a field of inquiry that cross-cuts discipline and subject matters, (Adler,
1987). The researcher‟s aim was to gather an in-depth understanding of the students‟ behaviour
and the reasons guiding those behaviours in examination malpractices. Hence research relied
on reasons behind various aspects of behaviour. Since qualitative research categorizes data into
patterns as the primary basis for organizing and reporting results, the researcher could rely on
any of the four methods for gathering information, that is: (1) participation in the setting, (2)
direct observation, (3) in-depth interviews, and (4) analysis of documents and materials. In this
study the researcher participated in the setting, and administration the instruments as well as
compiling of the analysis report.
Quantitative research is often an iterative process whereby evidence is evaluated, theories and
hypotheses are refined, technical advances are made, and so on. In the social sciences
particularly, quantitative research is often contrasted with qualitative research which is the
examination, analysis and interpretation of observations for the purpose of discovering
underlying meanings and patterns of relationships, including classifications of types of
phenomena and entities, in a manner that does not involve mathematical models. In this study,

22
the researcher relied on the quantitative data from the KNEC archives to analyze the
demographic trends.
3.3 The Sample
The sample comprised two parts, namely:
a. Records from KNEC; these were used in determining cheating trends. They comprised
schools as determined from the KCPE and KCSE irregularity records for the period
between 2002 and 2006, and were categorized into various demographics and attributes of
high achieving, low achieving and other schools; gender, subject areas, types of cheating,
and the documents selected for review to determine policy on examinations, and
specifically cheating; as well as regulations related to cheating.
b. Students; these were the four hundred (400) Form Four students from the selected
Secondary schools who were the respondents for behaviour characteristics. The schools
which had been appearing in the first ten (10) positions in the KCSE examination results
during the last five years were considered as high achievers. The others were lumped
together as low achievers and others.
3.4 Sampling Procedure
The sampling was done purposefully with equal representation on gender; coupled with
specific clusters of high achievers and low achievers/others.
3.5 Data Collection Instruments
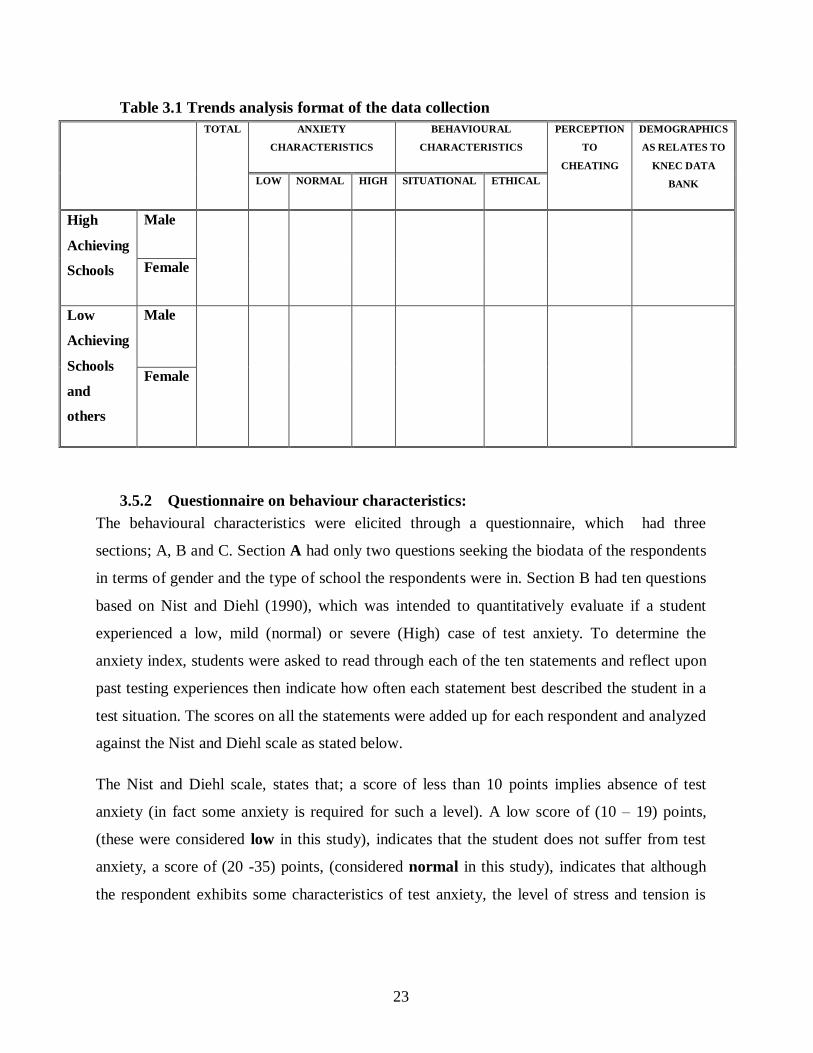
3.5.1 Trends Analysis Format:
Framework
Table I represents the trends analysis format of the data collection.
23
Table 3.1 Trends analysis format of the data collection
TOTAL ANXIETY
CHARACTERISTICS
BEHAVIOURAL
CHARACTERISTICS
PERCEPTION
TO
CHEATING
DEMOGRAPHICS
AS RELATES TO
KNEC DATA
BANK LOW NORMAL HIGH SITUATIONAL ETHICAL
High
Achieving
Schools
Male
Female
Low
Achieving
Schools
and
others
Male
Female
3.5.2 Questionnaire on behaviour characteristics:
The behavioural characteristics were elicited through a questionnaire, which had three
sections; A, B and C. Section A had only two questions seeking the biodata of the respondents
in terms of gender and the type of school the respondents were in. Section B had ten questions
based on Nist and Diehl (1990), which was intended to quantitatively evaluate if a student
experienced a low, mild (normal) or severe (High) case of test anxiety. To determine the
anxiety index, students were asked to read through each of the ten statements and reflect upon
past testing experiences then indicate how often each statement best described the student in a
test situation. The scores on all the statements were added up for each respondent and analyzed
against the Nist and Diehl scale as stated below.
The Nist and Diehl scale, states that; a score of less than 10 points implies absence of test
anxiety (in fact some anxiety is required for such a level). A low score of (10 – 19) points,
(these were considered low in this study), indicates that the student does not suffer from test
anxiety, a score of (20 -35) points, (considered normal in this study), indicates that although
the respondent exhibits some characteristics of test anxiety, the level of stress and tension is

24
probably healthy. A score of over 35 (considered high in this study), suggests that the
respondent is experiencing an unhealthy level of test anxiety.
Section C elicited the behavioural characteristics of the students. The first part of it has two
questions which sought to establish the prevalence and situational setup under which cheating
occurs, while the second part elicited the ethical perception of the respondents on the vice.
3.6 Pre-Testing Of Instruments
According to Onocha & Okpala (1995), a research instrument must be pre-tested so as to
determine its validity and reliability. For this reason, the validity of the instruments used in this
study was determined through pre-testing of the questionnaire in two schools in Nairobi. The
assumption was that the pretest schools, both being in Nairobi, had similar learning
environments and experiences that were bound to provide similar students‟ experience to the
sample. The researcher found it important to do this because the pretest assisted in identifying
ambiguities, useless and inadequate items in the questionnaire. It also aided in determining the
sustainability of the instrument in measuring what it was intended to measure and establishing
clarity of each item in the instrument in terms of language and technical terms used. After the
pretest items were revised, adjusted appropriately and finalized accordingly.
The reliability of the instrument was determined by the use of a test-retest method. Test-retest
procedure entails the administration of the same instrument on two or more occasions to the
same respondents. According to Wiersma (1986), use of test-retest procedure gives a reliability
coefficient of stability-the extent to which the scores on the single administration remains
stable. In this study, the instruments were administered to the respondents on two occasions on
an interval of two weeks. The scores of the two sets of administrations were then correlated
using Pearson-Product Moment Correlation Coefficient to determine the reliability estimate.
The items were found to be 0.91, that is 91% reliable.
25
3.7 Preparation for Data Collection and Data Collection Procedures
The researcher sought authority from the Ministry of Higher Education (Appendix II), which
was copied to the principals of secondary schools and the Kenya National Examinations
Council to provide records on past reports regarding examination malpractices.
The researcher wrote letters to the heads of schools requesting permission to collect data from
the selected schools. When permission was granted, the researcher visited the schools on set
out dates when required data were to be collected. The researcher prepared questionnaires and
hand-delivered them to the schoolheads in each of the schools selected on the set dates. The
researcher made his own observation to cross-validate the information provided by the
respondents. Respondents were allowed enough time to fill the questionnaires after which the
researcher collected them for analysis.
3.8 Data analysis
There exists several computer programmes that may be utilized for data management and their
strength and weakness varies.
3.8.1 Data Entry Programme
The Census and Survey Processing System (CSPro) Version 3.3 was identified and used as
the computer programme for data capture and management for this research. The software was
developed by U.S Census Bureau and has been extensively used to capture and analyze survey
data in many countries. It was preferred because the programme has in-built controls and
procedures that enable accurate data capture. The accuracy facilitated by double entry, is that it
is possible to convert from different programmes and also performs tabulations. The
programme is freely available from U.S Census Bureau website for public use and is
continuously updated. The programme is a window based and is user friendly.
3.8.2 Data Analysis Programme
Once the data was captured using CSPro and preliminary data cleaning checks were done to
remove duplicate records and then the data was exported to Statistical Package for Social
Scientist (SPSS) for analysis and tabulation. SPSS is a powerful statistical package with

26
extensive features in tabulation and data manipulation. The researcher used Version 12 of
SPSS for this study.
3.8.3 Description of Analysis
The data were analyzed with respect to the research objectives. Frequencies were determined
the different malpractices. These were used to identify presentations made on tables and pie
charts for clarity. This was done with reference to gender and school category.
Qualitative data were also collected and categorized with respect to the above listed attributes.
3.9 Data presentation
The data was presented in:
a) Frequencies, percentages, tables and pie-charts for the demographic information and the
behavioural characteristics.
b) Scale used for the anxiety measure was based on Nist-Diehl as described earlier.
27
CHAPTER FOUR: DATA ANALYSIS AND INTERPRETATION
4.1 Introduction
This chapter includes a description of what is arising from the data collection. It is divided into
the following sections:
The legal instruments guiding the policy on dealing with the examinations
malpractices.
The general overview of personal data of the sampled respondents.
The demographics as relate to the data from KNEC statistical data bank.
The anxiety characteristics of the respondents; the psychological and situational
factors relating to cheating in national public examinations and the observed trends.
The students‟ perception on cheating.
The organization of the findings was guided by the research questions of this study.
4.2 Legal instrument and the policy on examination malpractices
The purpose of setting rules and regulations for any examining board, is to have a clear
understanding of what such a board stands for and what it expects from the candidates. The
rules and regulations set unequivocal conditions for the examination so that there is fairness
for all those taking the examination.
The KNEC has put in place rules and regulations to govern the various examinations that are
run by the Council. These rules include, among others, registration of candidates, conduct of
examinations, marking, processing of results and award of grades and certification.
Some of the rules that create a level playing ground for all the candidates include:
28
4.2.1 KCSE Registration Requirements
This states that:
No school can be approved as an examination centre unless it is registered as a
learning institution according to the requirement of the Education Act (1968) Cap 212;
a school can operate as a centre only if it registers a minimum of 15 candidates.
Schools with less than 15 candidates can only submit their entries if they have made
sitting arrangements with a host school; Candidates must enter a minimum of eight
subjects; Candidates must have been bonafide enrolled students studying continuously
during the three ( 3) years preceding registrations and must be presented for the
examination by the Headteachers. Each candidate must submit copies of recently taken
photographs for identification.
4.2.2 Rules to Ensure Fairness
The rules that ensure fairness among candidates taking an examination states that:
The Council reserves the right to withhold results of the examination of any candidate
or group of candidates or examination centres suspected of having been involved in an
examination irregularity or misconduct pending completion of investigations and the
final disposal of any consequent disciplinary action or other proceeding;
If the Council is satisfied that the candidates or schools have been involved in any
irregularity or misconduct, the Council may cancel the results of such candidates or
schools;
The schools whose results are cancelled under this rule may be removed from the roll
of the Council's approved examination centres and depending on degree of
misconduct; the candidates may be barred from entering future Council examinations.
If the Council is satisfied that the examinations at any centre have not been conducted
in accordance with its regulations, or that there has been widespread irregularities at
an examination centre, it may at its sole discretion disqualify all candidates at the'
centre;
29
Schools whose results are withheld or cancelled are informed in writing through their
respective Provincial Director of Education,(PDE), The District Education Officer,
(DEO), , Director City Education MEOs as soon as the examination results are
released. The officers are in turn required to inform their respective candidates.
4.2.3 KNEC’s Legal Instrument
The Council has legal provisions in place to punish those infringing these regulations (see
appendix III); The Council has revised the Act in order to strengthen it and was awaiting its
approval by the Attorney General; The Council has also included a new section on the
appointment of Council agents (PDEs, DEOs, MEOs, Heads and any other field officer in
Government Service) for the purposes of administration of its examinations. The Council's
rules and regulations are not gazetted. The following paragraph outlines the mode of
punishment for any infringement. Any person who;
a) unlawfully obstructs officers and staff appointed under the provisions of this Act from
executing their duties or who does anything which would make the conducting of
examinations difficult, or
b) instigates or incites others to obstruct the conduct of examination, or issues threats to or
intimidates officers and staff who are lawfully executing their duties under this Act with a
view to obstructing the efficient conducting of examinations, or
c) presenting forged certificate, diploma, letter of confirmation of results, or result slip to a
prospective employer, an institution of learning or any other organizations with intent to
gain employment, admission or any other form of assistance shall be guilty of an offence
and liable to a fine not exceeding one hundred thousand shillings or to imprisonment for a
term not exceeding thirty-six months or to both such imprisonment and fine.
d) Any person who;
30
(i) Gains access to examination material and knowingly reveals the contents, whether
orally or in writing, to an unauthorized party, whether a candidate or not; or
(ii) Willfully and maliciously damages examinations materials: or
(iii) Tampers with a candidate's script or certificate with intent to alter results or the
contents of the certificate; or
(iv) Prints or facilitates the printing of examinations material, result slips, letters of
confirmation of results or certificates, without authority; or
(v) Sells, trades in or awards forged certificate, result slips or letters of confirmation;
or.
(vi) With intent to impersonate, presents or attempts to present himself to take the
part of an enrolled candidate; or
(vii) Assists a candidate during an examination with the intent of enabling the candidate
to gain unfair advantage.
Shall be guilty of an offence and is liable to a fine not exceeding one hundred thousand
shillings or to imprisonment for a term not exceeding thirty-six months or to both such
imprisonment and fine.
e) In furtherance to the legal provisions under Sub-Section 15(B) of the Act, the Council or
its Agents shall have authority to enter and inspect any premises, place or equipment
where the Council has cause to suspect that examination or certification is taking place or
the printing, storage and trading in. examination materials is taking place.
f) The equipment used to facilitate examination malpractice under this section shall be liable
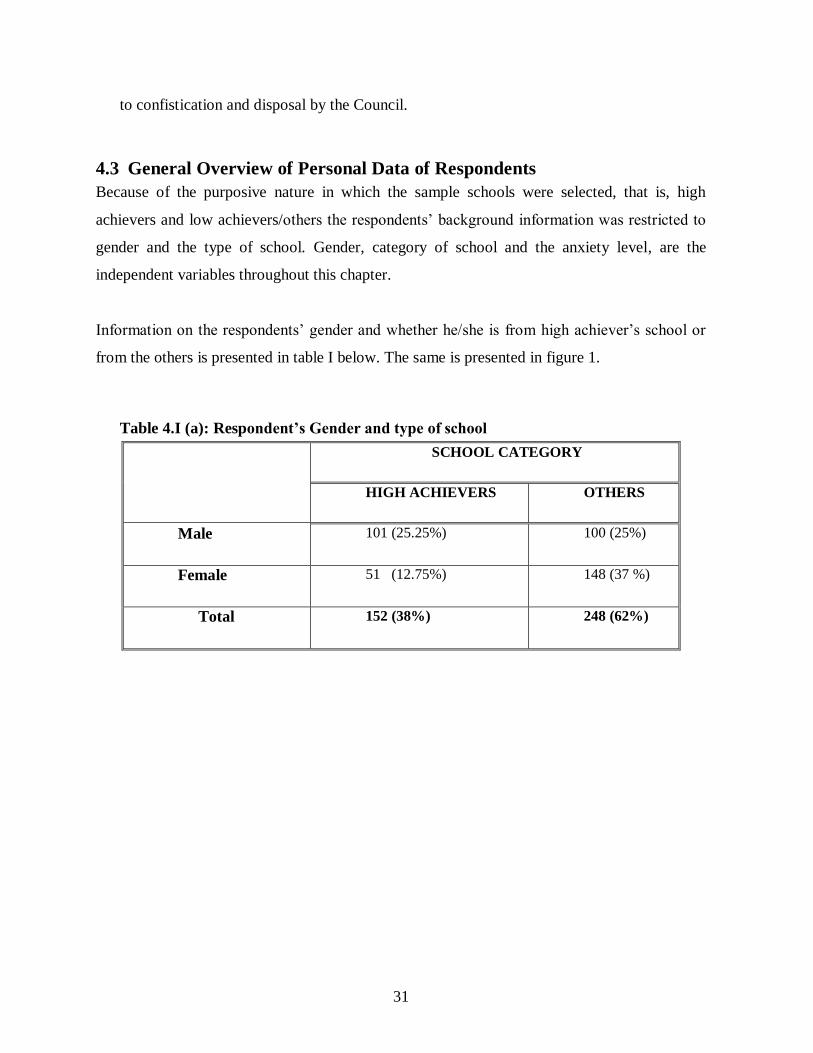
31
to confistication and disposal by the Council.
4.3 General Overview of Personal Data of Respondents
Because of the purposive nature in which the sample schools were selected, that is, high
achievers and low achievers/others the respondents‟ background information was restricted to
gender and the type of school. Gender, category of school and the anxiety level, are the
independent variables throughout this chapter.
Information on the respondents‟ gender and whether he/she is from high achiever‟s school or
from the others is presented in table I below. The same is presented in figure 1.
Table 4.I (a): Respondent’s Gender and type of school
SCHOOL CATEGORY
HIGH ACHIEVERS OTHERS
Male 101 (25.25%) 100 (25%)
Female 51 (12.75%) 148 (37 %)
Total 152 (38%) 248 (62%)
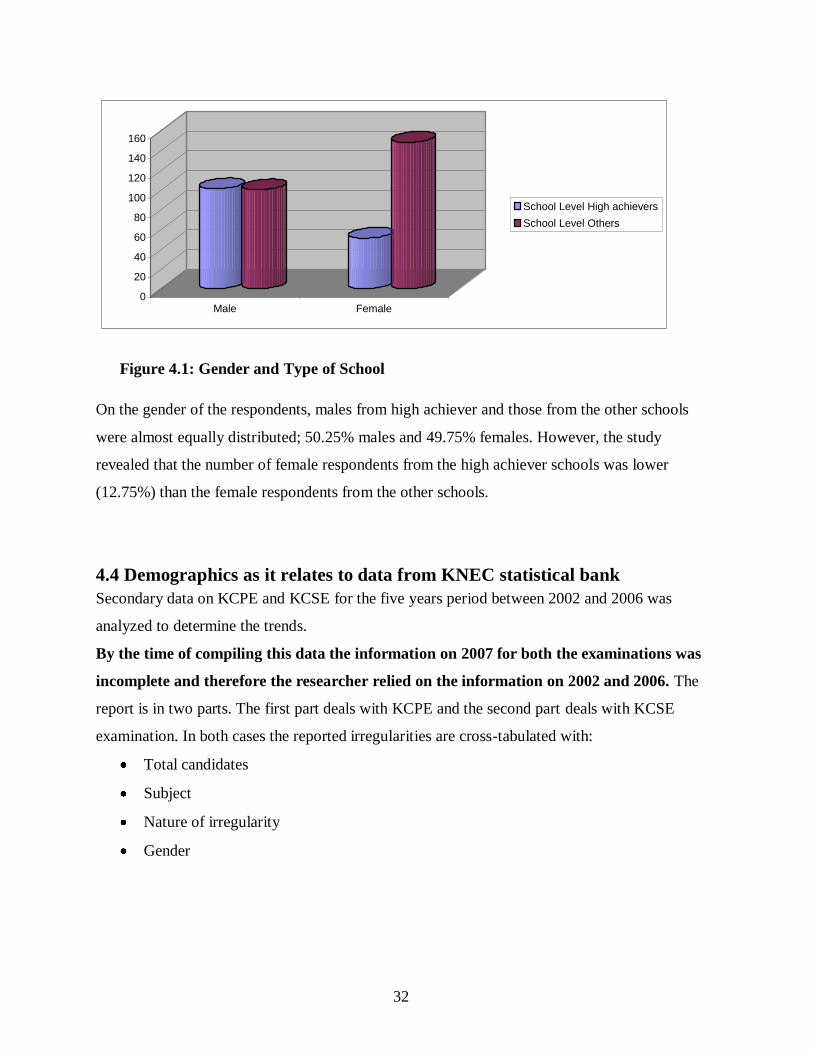
32
0
20
40
60
80
100
120
140
160
Male Female
School Level High achievers
School Level Others
Figure 4.1: Gender and Type of School
On the gender of the respondents, males from high achiever and those from the other schools
were almost equally distributed; 50.25% males and 49.75% females. However, the study
revealed that the number of female respondents from the high achiever schools was lower
(12.75%) than the female respondents from the other schools.
4.4 Demographics as it relates to data from KNEC statistical bank
Secondary data on KCPE and KCSE for the five years period between 2002 and 2006 was
analyzed to determine the trends.
By the time of compiling this data the information on 2007 for both the examinations was
incomplete and therefore the researcher relied on the information on 2002 and 2006. The
report is in two parts. The first part deals with KCPE and the second part deals with KCSE
examination. In both cases the reported irregularities are cross-tabulated with:
Total candidates
Subject
Nature of irregularity
Gender
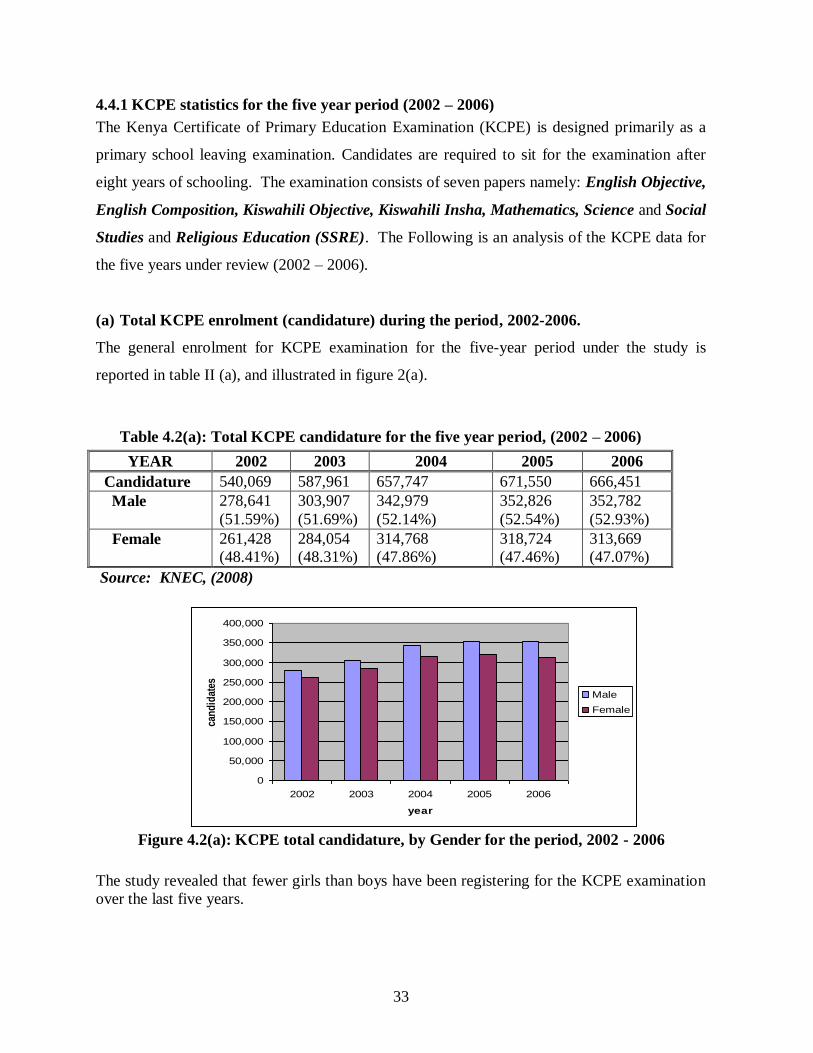
33
4.4.1 KCPE statistics for the five year period (2002 – 2006)
The Kenya Certificate of Primary Education Examination (KCPE) is designed primarily as a
primary school leaving examination. Candidates are required to sit for the examination after
eight years of schooling. The examination consists of seven papers namely: English Objective,
English Composition, Kiswahili Objective, Kiswahili Insha, Mathematics, Science and Social
Studies and Religious Education (SSRE). The Following is an analysis of the KCPE data for
the five years under review (2002 – 2006).
(a) Total KCPE enrolment (candidature) during the period, 2002-2006.
The general enrolment for KCPE examination for the five-year period under the study is
reported in table II (a), and illustrated in figure 2(a).
Table 4.2(a): Total KCPE candidature for the five year period, (2002 – 2006)
YEAR 2002 2003 2004 2005 2006
Candidature 540,069 587,961 657,747 671,550 666,451
Male 278,641
(51.59%)
303,907
(51.69%)
342,979
(52.14%)
352,826
(52.54%)
352,782
(52.93%)
Female 261,428
(48.41%)
284,054
(48.31%)
314,768
(47.86%)
318,724
(47.46%)
313,669
(47.07%)
Source: KNEC, (2008)
Figure 4.2(a): KCPE total candidature, by Gender for the period, 2002 - 2006
The study revealed that fewer girls than boys have been registering for the KCPE examination
over the last five years.
0
50,000
100,000
150,000
200,000
250,000
300,000
350,000
400,000
2002 2003 2004 2005 2006
year
can
did
ates
Male
Female
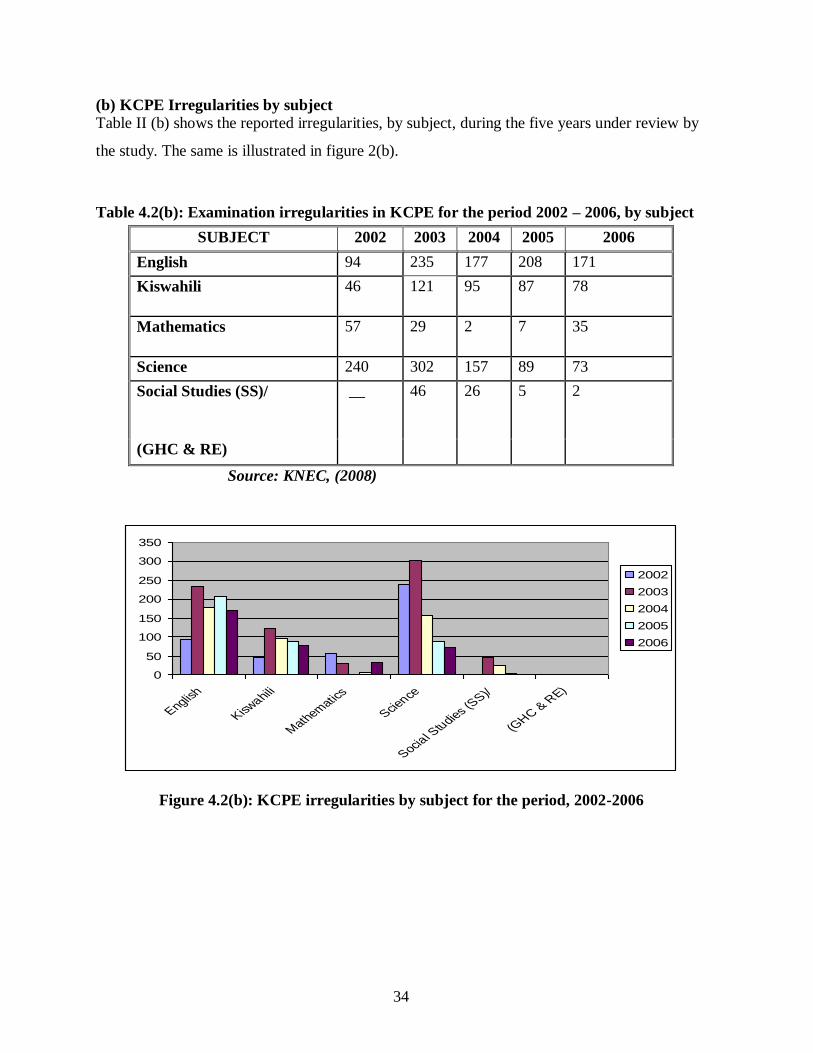
34
(b) KCPE Irregularities by subject
Table II (b) shows the reported irregularities, by subject, during the five years under review by
the study. The same is illustrated in figure 2(b).
Table 4.2(b): Examination irregularities in KCPE for the period 2002 – 2006, by subject
SUBJECT 2002 2003 2004 2005 2006
English 94 235 177 208 171
Kiswahili 46 121 95 87 78
Mathematics 57 29 2 7 35
Science 240 302 157 89 73
Social Studies (SS)/ __ 46 26 5 2
(GHC & RE)
Source: KNEC, (2008)
0
50
100
150
200
250
300
350
English
Kiswahili
Math
ematic
s
Science
Social S
tudies (S
S)/
(GHC &
RE)
2002
2003
2004
2005
2006
Figure 4.2(b): KCPE irregularities by subject for the period, 2002-2006

35
The study revealed that:-
(i) The highest number of irregularity cases occurred in year 2003, (0.10%), since then, the
cases went down to 0.05% in year 2006.
(ii) Most cases of examination irregularities are found in Science, English Objective and
Kiswahili Objective.
(c) Irregularities and their nature
Table II(c) shows the reported KCPE irregularities and their nature for the period covered by
the study, (2002-2006). The same is illustrated in figure 2(c).
Table 4.2(c): Irregularity cases in KCPE examination for the period 2002 – 2006, by
nature
YEAR COLLUSION
SMUGGLED
MATERIALS
UNREGISTERED
CANDIDATES
IMPERSONATION TOTAL
2006 302 03 0 01 306
2005 347 01 02 03 353
2004 371 15 0 04 390
2003 579 09 07 0 595
2002 390 0 0 0 390
Source: KNEC, (2008)
0
100
200
300
400
500
600
700
2006 2005 2004 2003 2002
Year
Nu
mb
er
of
cases
Collusion
Smuggled Materials
Unregistered Candidates
Impersonation
Figure 4.2(c): KCPE irregularities between 2002 -2006, by nature

36
The study revealed that:
i. Most KCPE candidates engage in collusion1 as a form of cheating.
ii. A few candidates also try to smuggle in some unauthorized materials related to
examinations.
iii. Irregularities arising from registration and impersonation are insignificant.
(d) KCPE irregularities and Gender
Table II (d) shows the reported irregularities and Gender, the same is illustrated in figure 2(d).
Table 4.2(d): KCPE irregularities between 2002 and 2006, by Gender
YEAR MALE FEMALE TOTAL
CANDIDATES
2006 138 168 306
2005 148 205 353
2004 164 226 390
2003 232 363 595
2002 156 234 390
Source: KNEC, (2008)
1 Collusion takes various forms including; Candidates being assisted by an external agent (third
party) to perform tasks during the examination; Candidates copying from each other or from external
sources; Smuggling question papers out of the examination rooms for other people to workout the
answers and then circulating the same among candidates; Candidates exposing their work intentionally or unintentionally with the resultant effect of other candidates copying the same,
swapping of scripts between candidates for the purpose of assisting each other, teachers exposing
their results obtained from science practical examinations for candidates to copy.
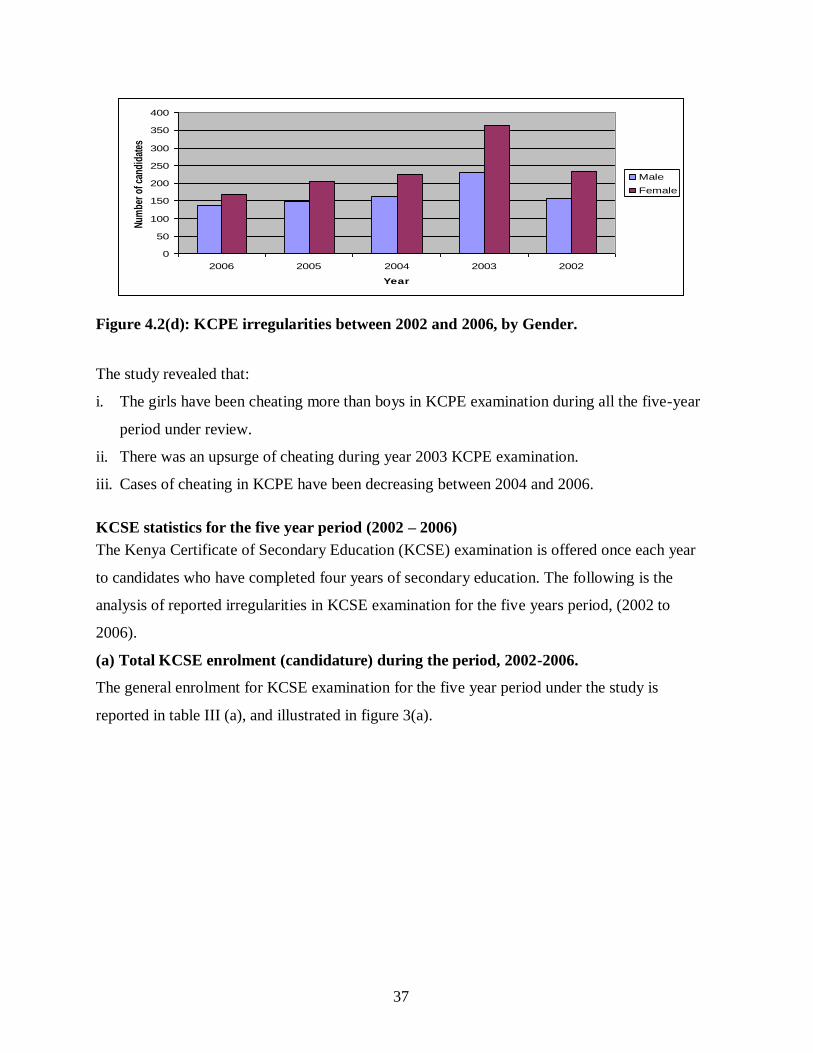
37
0
50
100
150
200
250
300
350
400
2006 2005 2004 2003 2002
Year
Num
ber
of c
andi
date
s
Male
Female
Figure 4.2(d): KCPE irregularities between 2002 and 2006, by Gender.
The study revealed that:
i. The girls have been cheating more than boys in KCPE examination during all the five-year
period under review.
ii. There was an upsurge of cheating during year 2003 KCPE examination.
iii. Cases of cheating in KCPE have been decreasing between 2004 and 2006.
KCSE statistics for the five year period (2002 – 2006)
The Kenya Certificate of Secondary Education (KCSE) examination is offered once each year
to candidates who have completed four years of secondary education. The following is the
analysis of reported irregularities in KCSE examination for the five years period, (2002 to
2006).
(a) Total KCSE enrolment (candidature) during the period, 2002-2006.
The general enrolment for KCSE examination for the five year period under the study is
reported in table III (a), and illustrated in figure 3(a).

38
Table 4.3(a): KCSE candidates during the period, 2002-2006
YEAR TOTAL CANDIDATES MALE FEMALE
2002 198,356 106,164
(53.52%)
92,192
(46.48%)
2003 207,730 111,589
(53.72%)
96,141
(46.28%)
2004
222,676 120,067
(53.92%)
102,609
(46.08%)
2005 260,665 141,256
(54.19%)
119,409
(45.81%)
2006 243,453 129,071
(53.02%)
114,382
(46.98%)
Source: KNEC, (2008)
0
20,000
40,000
60,000
80,000
100,000
120,000
140,000
160,000
2002 2003 2004 2005 2006
Year
Nu
mb
er
of
can
did
ate
s
Male
Female
Figure 4.3(a): KCSE enrolment during the period, 2002-2006.
The study revealed that:
i. The total number of candidates sitting for the KCSE examination increased steadily
between the years 2002 and 2005, but decreased in the year 2006.
ii. In the five year period under review, there have been more male candidates registered for
the KCSE examination than female candidates.

39
(a) KCSE irregularities by Gender
Table 4.3(b): KCSE Irregularities during the period 2002-2006, by Gender
YEAR MALE FEMALE TOTAL
2006 473 190 646
2005 200 110 310
2004 1225 506 1731
2003 560 462 1022
2002 546 440 986
Source: KNEC, (2008)
0
200
400
600
800
1000
1200
1400
2006 2005 2004 2003 2002
Year
Nu
mb
er
invo
lved
in
ch
eati
ng
Male
Female
Figure 4.3(b): KCSE irregularities for the period 2002-2006, by Gender
The study revealed that:
(i) The male respondents have been cheating more than their female counterparts in KCSE
examination for the five year period covered by the study.
(b) KCSE Irregularities by subject.
Table III (b) shows the reported irregularities, by subject, during the five years under review by
the study. The same is illustrated in figure 3 (b).

40
Table 4.3(c): KCSE irregularities by subject for the period 2002-2006
SUBJECT REPORTED CASES OF IRREGULARITIES IN FIVE YEARS
2002 2003 2004 2005 2006
English 24 12 25 47 62
Kiswahili 07 10 25 52 85
Mathematics 704 431 470 60 156
Biology 25 69 551 64 199
Physics 113 19 37 11 26
Chemistry 580 493 969 185 313
History & Govt. 13 12 29 41 39
Geography 07 03 22 12 37
CRE 02 16 12 05 25
IRE - - - - 03
SEE - 03 08 16 -
Home Science - - 02 07 02
Art and Design - - - - 01
Agriculture 06 19 35 27 18
Woodwork - - 01 - -
Building Construction - 01 - - -
Power Mechanics - 01 - - -
Computer Studies 26 - 70 34 32
French - - - - 02
Accounting - 01 03 01 -
Commerce 06 37 19 31 -
Economics - - 01 - -
Business Studies - - - - 35
Source: KNEC, (2008)
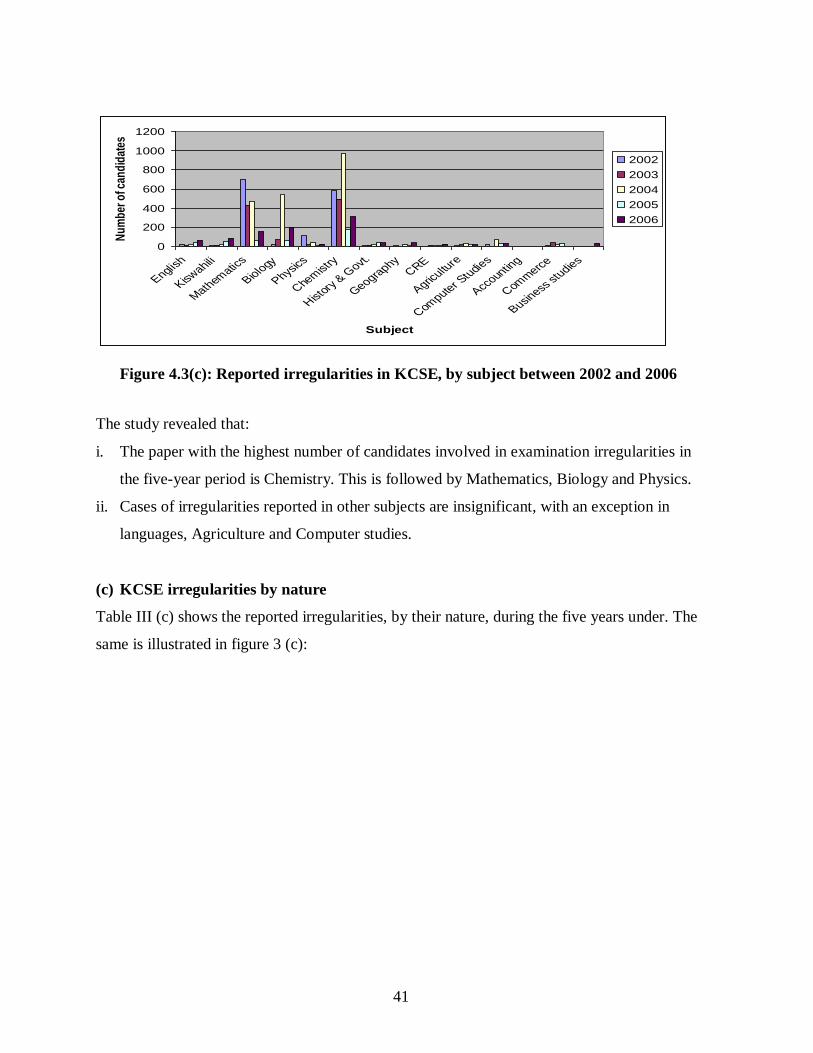
41
0
200
400
600
800
1000
1200
English
Kiswahili
Math
ematic
s
Biology
Physics
Chem
istry
Histor
y & G
ovt.
Geography
CRE
Agricultu
re
Compute
r Stu
dies
Accoun
ting
Comm
erce
Business
studies
Subject
Nu
mb
er o
f can
did
ates
2002
2003
2004
2005
2006
Figure 4.3(c): Reported irregularities in KCSE, by subject between 2002 and 2006
The study revealed that:
i. The paper with the highest number of candidates involved in examination irregularities in
the five-year period is Chemistry. This is followed by Mathematics, Biology and Physics.
ii. Cases of irregularities reported in other subjects are insignificant, with an exception in
languages, Agriculture and Computer studies.
(c) KCSE irregularities by nature
Table III (c) shows the reported irregularities, by their nature, during the five years under. The
same is illustrated in figure 3 (c):

42
Table 4.3(d): KCSE irregularities by nature for the period, 2002-2006
NATURE OF
IRREGULARITY
2002 2003 2004 2005 2006
Collusion 1,201 908 1,609 183 496
Pre-Prepared Notes 59 101 134 70 119
Impersonation - 06 16 24 15
Different
Handwriting
02 06 02 03 01
Two Script Cases 03 01 02 04 01
Registration Irregularities
- - 08 31 34
Source: KNEC, (2008)
0
200
400
600
800
1,000
1,200
1,400
1,600
1,800
Collusion Pre-Prepared
Notes
Impersonation Different
Handwriting
Two Script
Cases
Registration
Irregularities
2002
2003
2004
2005
2006
Figure 4.3(d): KCSE irregularities by nature (2002-2006)
The study revealed that:
i. Collusion is the most common type of examination irregularity reported in the five-year
period.
ii. The highest number of candidates involved in collusion and possession of pre-prepared
notes in the examination rooms was recorded in the year 2004, while that involved in
impersonation was recorded in the year 2005.

43
4.4 Psychological Characteristics
To determine the psychological status of the respondents about examinations, an anxiety index
was used to collect information. The respondents were asked to read through a set of the ten
statements and reflect upon their past testing experiences and anxieties while taking
examinations. They were then asked to indicate the statement that best described their situation
(then indicate how often each statement best described them in a test situation). The scores on
all the statements were added up for each respondent. According to Nist and Diehl (1990), a
score of less than 10 points indicates absence of test anxiety. A score of (10 – 19) points
indicates that the respondent does not suffer from test anxiety, while a score of (20 -35) points
indicates that although the respondent exhibits some characteristics of test anxiety, the level of
stress and tension is probably healthy. A score of over 35 suggests that the respondent is
experiencing an unhealthy level of test anxiety.
The results were analyzed in two parts: first by cross-tabulating the anxiety level against the
gender and secondly against the school category. The results were tabulated in table IV (a) and
IV (b) and illustrated with figures 4(a) - (i).
(a) Gender and the general level of Anxiety
Table 4.4 (a): Gender and Anxiety Level
TOTAL
GENDER
MALE FEMALE
Anxiety Level 400 201 199
100% 100% 100%
10 - 19 102 77 25
26% 38% 13%
20 - 35 282 116 166
71% 58% 83%
Over 35 16 8 8
4% 4% 4%

44
0
20
40
60
80
100
120
140
160
180
10_19 20 - 35 Over 35
Anxiety level
Tota
l num
ber
Male
Female
Figure 4.4(a): Gender and Anxiety level
The study revealed that female respondents suffer from examination anxiety more than their
male cohorts. Although majority of male (58%) and female (83%) exhibited some
characteristics of test anxiety (20 – 35) points, the level of tension and stress is probably
healthy at such level according to Nist and Diehl. The study further revealed that 38% of male
and 13% of female respondents do not suffer from low test anxiety, while on the other end of
the scale, only 4% of both male and female respondents suffer from unhealthy(high) level of
test anxiety (above 35 points).
(b) School category and general Anxiety level
Table 4.4 (b): Anxiety and school category
ANXIETY LEVEL
SCHOOL LEVEL
HIGH ACHIEVERS LOW ACHIEVERS/OTHERS
10 - 19 42 60
28% 24%
20 - 35 107 175
70% 71%
Over 35 3 13
2% 5%
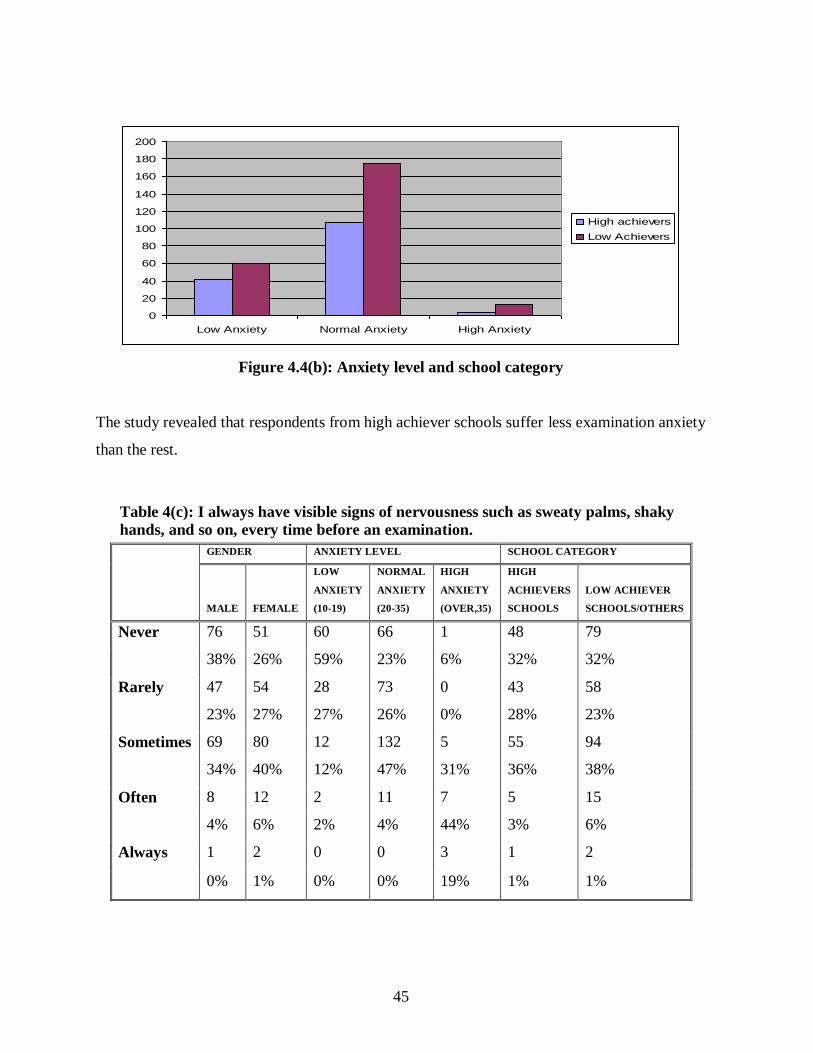
45
0
20
40
60
80
100
120
140
160
180
200
Low Anxiety Normal Anxiety High Anxiety
High achievers
Low Achievers
Figure 4.4(b): Anxiety level and school category
The study revealed that respondents from high achiever schools suffer less examination anxiety
than the rest.
Table 4(c): I always have visible signs of nervousness such as sweaty palms, shaky
hands, and so on, every time before an examination.
GENDER ANXIETY LEVEL SCHOOL CATEGORY
MALE FEMALE
LOW
ANXIETY
(10-19)
NORMAL
ANXIETY
(20-35)
HIGH
ANXIETY
(OVER,35)
HIGH
ACHIEVERS
SCHOOLS
LOW ACHIEVER
SCHOOLS/OTHERS
Never 76 51 60 66 1 48 79
38% 26% 59% 23% 6% 32% 32%
Rarely 47 54 28 73 0 43 58
23% 27% 27% 26% 0% 28% 23%
Sometimes 69 80 12 132 5 55 94
34% 40% 12% 47% 31% 36% 38%
Often 8 12 2 11 7 5 15
4% 6% 2% 4% 44% 3% 6%
Always 1 2 0 0 3 1 2
0% 1% 0% 0% 19% 1% 1%

46
I always have vissible signs of nervousness such as sweaty palms, shaky hands and so on,
every time before an examination
0
20
40
60
80
100
120
140
Never Rarely Sometimes Often Always
Male
Female
Low Anxiety
Normal Anxiety
High Anxiety
High achievers schools
Others Schools
Figure 4.4(c): I always have visible signs of nervousness such as sweaty palms, shaky
hands and so on, every time before an examination
Table 4.4(d): I have ‘butterflies’ in my stomach every time before I sit for an
examination.
MALE FEMALE
LOW
ANXIETY
(10 -19)
NORMAL
ANXIETY
(20 -35)
HIGH
ANXIETY
(OVER,35)
HIGH
ACHIEVER
SCHOOLS
LOW ACHIEVER
SCHOOLS/OTHERS
Never 70 25 53 42 0 23 72
35% 13% 52% 15% 0% 15% 29%
Rarely 49 37 32 53 1 48 38
24% 19% 31% 19% 6% 32% 15%
Sometimes 60 94 12 138 4 60 94
30% 47% 12% 49% 25% 39% 38%
Often 8 22 3 26 1 13 17
4% 11% 3% 9% 6% 9% 7%
Always 14 21 2 23 10 8 27
7% 11% 2% 8% 63% 5% 11%

47
I have 'butterflies' in my stomach every time before i sit for an examination
0
20
40
60
80
100
120
140
160
Never Rarely Sometimes Often Always
Male
Female
Low Anxiety (10 - 19)
Normal Anxiety (20 - 35)
High Anxiety (Over 35)
High achiever Schools
Others Schools
Figure 4.4(d): I have ‘butterflies’ in my stomach every time before I sit for an
examination
Table 4.4(e): I read through a test and feel that I do not know any of the answers.
GENDER ANXIETY LEVEL SCHOOL CATEGORY
MALE FEMALE
LOW
ANXIETY
(10 -19)
NORMAL
ANXIETY
(20-35)
HIGH
ANXIETY
(OVER,35)
HIGH
ACHIEVER
SCHOOLS
LOW
ACHIEVER
SCHOOLS
Never 80 44 71 53 0 54 70
40% 22% 70% 19% 0% 36% 28%
Rarely 37 51 17 71 0 39 49
18% 26% 17% 25% 0% 26% 20%
Sometimes 65 84 14 132 3 54 95
32% 42% 14% 47% 19% 36% 38%
Often 6 13 0 14 5 1 18
3% 7% 0% 5% 31% 1% 7%
Always 13 7 0 12 8 4 16
6% 4% 0% 4% 50% 3% 6%

48
I read through a test and feel that I do not know any of the answers
0
20
40
60
80
100
120
140
Never Rarely Sometimes Often Always
Male
Female
Low Anxiety
Normal Anxiety
High Anxiety
High achiever Schools
Other Schools
Figure 4.4(e): I read through a test and feel that I do not know any of the answers
Table 4.4(f): I panic before and during an examination
GENDER ANXIETY LEVEL SCHOOL CATEGORY
MALE FEMALE
LOW
ANXIETY
(10–19)
NORMAL
ANXIETY
(20-35)
HIGH
ANXIETY
(OVER,35)
HIGH
ACHIEVER
SCHOOLS
LOW ACHIEVER
SCHOOLS/OTHERS
Never 62 26 52 36 0 22 66
31% 13% 51% 13% 0% 14% 27%
Rarely 60 62 38 84 0 59 63
30% 31% 37% 30% 0% 39% 25%
Sometimes 59 77 12 123 1 52 84
29% 39% 12% 44% 6% 34% 34%
Often 7 18 0 23 2 15 10
3% 9% 0% 8% 13% 10% 4%
Always 13 16 0 16 13 4 25
6% 8% 0% 6% 81% 3% 10%
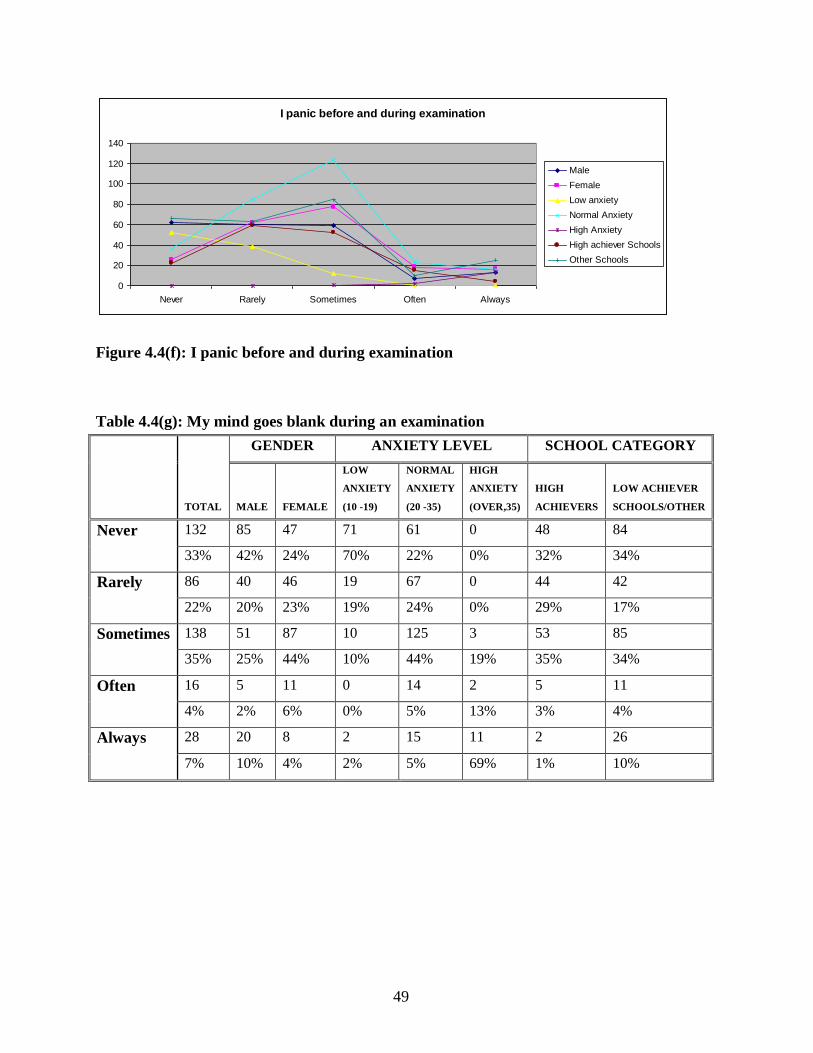
49
I panic before and during examination
0
20
40
60
80
100
120
140
Never Rarely Sometimes Often Always
Male
Female
Low anxiety
Normal Anxiety
High Anxiety
High achiever Schools
Other Schools
Figure 4.4(f): I panic before and during examination
Table 4.4(g): My mind goes blank during an examination
TOTAL
GENDER ANXIETY LEVEL SCHOOL CATEGORY
MALE FEMALE
LOW
ANXIETY
(10 -19)
NORMAL
ANXIETY
(20 -35)
HIGH
ANXIETY
(OVER,35)
HIGH
ACHIEVERS
LOW ACHIEVER
SCHOOLS/OTHER
Never 132 85 47 71 61 0 48 84
33% 42% 24% 70% 22% 0% 32% 34%
Rarely 86 40 46 19 67 0 44 42
22% 20% 23% 19% 24% 0% 29% 17%
Sometimes 138 51 87 10 125 3 53 85
35% 25% 44% 10% 44% 19% 35% 34%
Often 16 5 11 0 14 2 5 11
4% 2% 6% 0% 5% 13% 3% 4%
Always 28 20 8 2 15 11 2 26
7% 10% 4% 2% 5% 69% 1% 10%

50
My mind goes blank during an examination
0
20
40
60
80
100
120
140
Never Rarely Sometimes Often Always
Male
Female
Low Anxiety
Normal Anxiety
High Anxiety
High achiever Schools
Other Schools
Figure 4.4(g): My mind goes blank during an examination
Table 4(h): I make mistakes on easy questions or put answers in the wrong places.
GENDER ANXIETY LEVEL SCHOOL CATEGORY
MALE FEMALE
LOW
ANXIETY
(10-19)
NORMAL
ANXIETY
(20-35)
HIGH
ANXIETY
(OVER,35)
HIGH
ACHIEVERS
LOW
ACHIEVER
SCHOOLS
Never 46 18 37 27 0 6 58
23% 9% 36% 10% 0% 4% 23%
Rarely 36 26 25 36 1 23 39
18% 13% 25% 13% 6% 15% 16%
Sometimes 79 104 38 141 4 81 102
39% 52% 37% 50% 25% 53% 41%
Often 23 36 1 54 4 32 27
11% 18% 1% 19% 25% 21% 11%
Always 17 15 1 24 7 10 22
8% 8% 1% 9% 44% 7% 9%

51
I make mistakes on easy questions or put answers in the wrong places
0
20
40
60
80
100
120
140
160
Never Rarely Sometimes Often Always
Male
Female
Low Anxiety
Normal Anxiety
High anxiety
High achiever School
Other Schools
Figure 4.4(h): I make mistakes on easy questions or put answers in the wrong places
Table 4.4 (i): I have difficulties in choosing answers.
GENDER ANXIETY LEVEL SCHOOL CATEGORY
MALE FEMALE
LOW
ANXIETY
(10 –19)
NORMAL
ANXIETY
(20-35)
HIGH
ANXIETY
(OVER,35)
HIGH
ACHIEVERS
LOW ACHIEVER
SCHOOLS/OTHERS
Never 53 20 45 28 0 18 55
26% 10% 44% 10% 0% 12% 22%
Rarely 37 41 30 48 0 32 46
18% 21% 29% 17% 0% 21% 19%
Sometimes 81 103 26 150 8 81 103
40% 52% 25% 53% 50% 53% 42%
Often 14 25 1 35 3 19 20
7% 13% 1% 12% 19% 13% 8%
Always 16 10 0 21 5 2 24
8% 5% 0% 7% 31% 1% 10%

52
I have difficulties in choosing answers
0
20
40
60
80
100
120
140
160
Never Rarely Sometimes Often Always
Male
Female
Low Anxiety
Normal Anxiety
High Anxiety
High achiever Schools
Other Schools
Figure 4.4(i): I have difficulties in choosing answers
The study revealed that:
(a) The pattern across the seven observations (figures 2d – 2i), in the anxiety test seemingly
takes a normal distribution, with majority of those whose orientation is in the middle of the
five-point anxiety scale being the same ones exhibiting normal (healthy) anxiety
characteristics.
4.5 Behavioural characteristics
One of the objectives of this study is to establish why students cheat in national public
examinations. It was therefore imperative to evaluate how prevalent cheating is in national
public examinations. Why do students cheat and how do they cheat? It was instructive for this
study to explore this question from both student and the school‟s perspectives.
4.5.1 Situational factors
To elicit response to these issues the respondents were at first asked to states whether they have
ever seen other students cheat in any examination. Secondly they were asked to states the
method of cheating which they believe is most commonly used during examinations. Their
responses were cross – tabulated against gender and type of school (to show the demographic
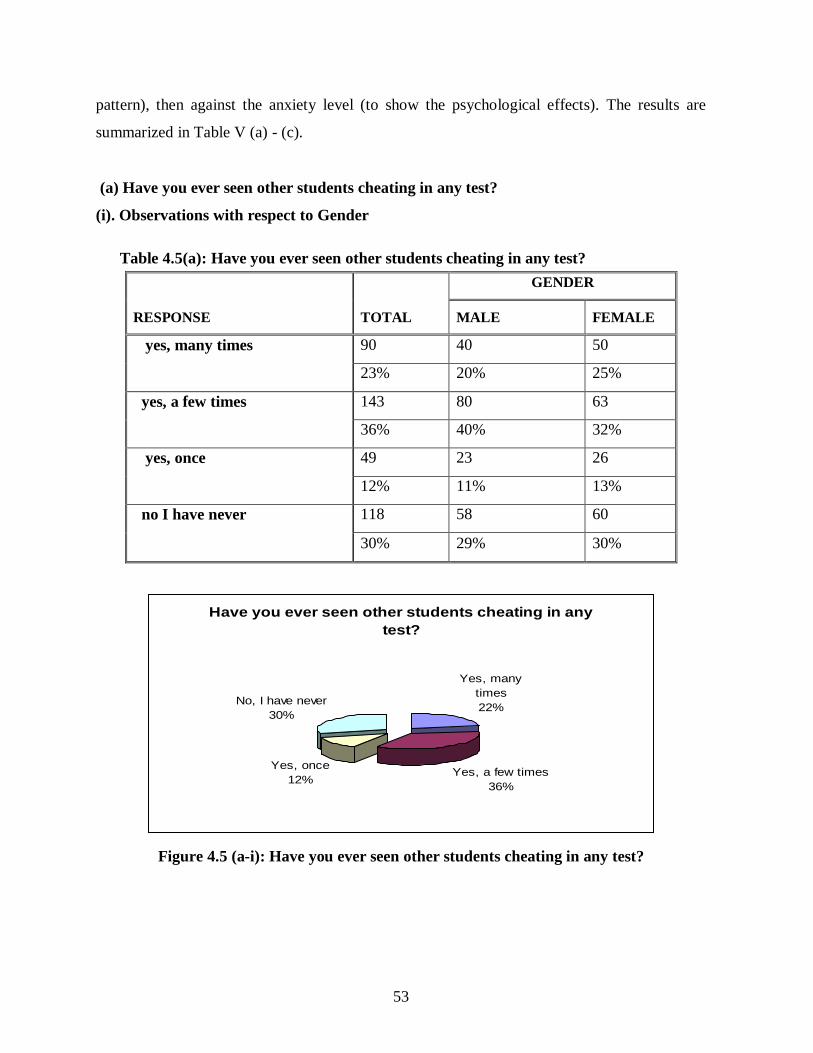
53
pattern), then against the anxiety level (to show the psychological effects). The results are
summarized in Table V (a) - (c).
(a) Have you ever seen other students cheating in any test?
(i). Observations with respect to Gender
Table 4.5(a): Have you ever seen other students cheating in any test?
RESPONSE TOTAL
GENDER
MALE FEMALE
yes, many times
90 40 50
23% 20% 25%
yes, a few times 143 80 63
36% 40% 32%
yes, once 49 23 26
12% 11% 13%
no I have never 118 58 60
30% 29% 30%
Have you ever seen other students cheating in any
test?
Yes, many
times
22%
Yes, a few times
36%
Yes, once
12%
No, I have never
30%
Figure 4.5 (a-i): Have you ever seen other students cheating in any test?

54
The study revealed that 71% of the respondents have witnessed cheating in examination at
least once, with female respondents having have observed more frequent cheating incidences.
Only 30% of the respondents reposted that they have never witnessed cheating in exams and
there is no significant difference in gender for this observation.
0
10
20
30
40
50
60
70
80
yes, many times yes, a few times yes, once no I have never
Fig. 5(a-ii): Observed frequency of cheating by Gender
Male
Female
Figure 4.5(a-ii): Observed frequency of cheating by Gender
(ii) Observations with respect to School categorization
Table 4.5(b): Have you ever seen other students cheating in any test?
HIGH
ACHIEVERS
LOW ACHIEVER
SCHOOLS/OTHERS
Yes, many times 23 67
15% 27%
yes, a few times 67 76
44% 31%
Yes, once 18 31
12% 13%
no I have never 44 74
29% 30%

55
0
10
20
30
40
50
60
70
80
Yes, many
times
yes, a few
times
Yes, once no I have
never
Observations
Fre
qu
en
cy
High achievers
Others
Figure 4.5 (b): Observed cheating frequency and school category
The study revealed that the respondents from high achiever schools have witnessed less
incidences of cheating in examination situations than those from other schools. Of the
respondents who have witnessed cheating many times, the former recorded 15% incidences
while the later recorded 27% incidences.
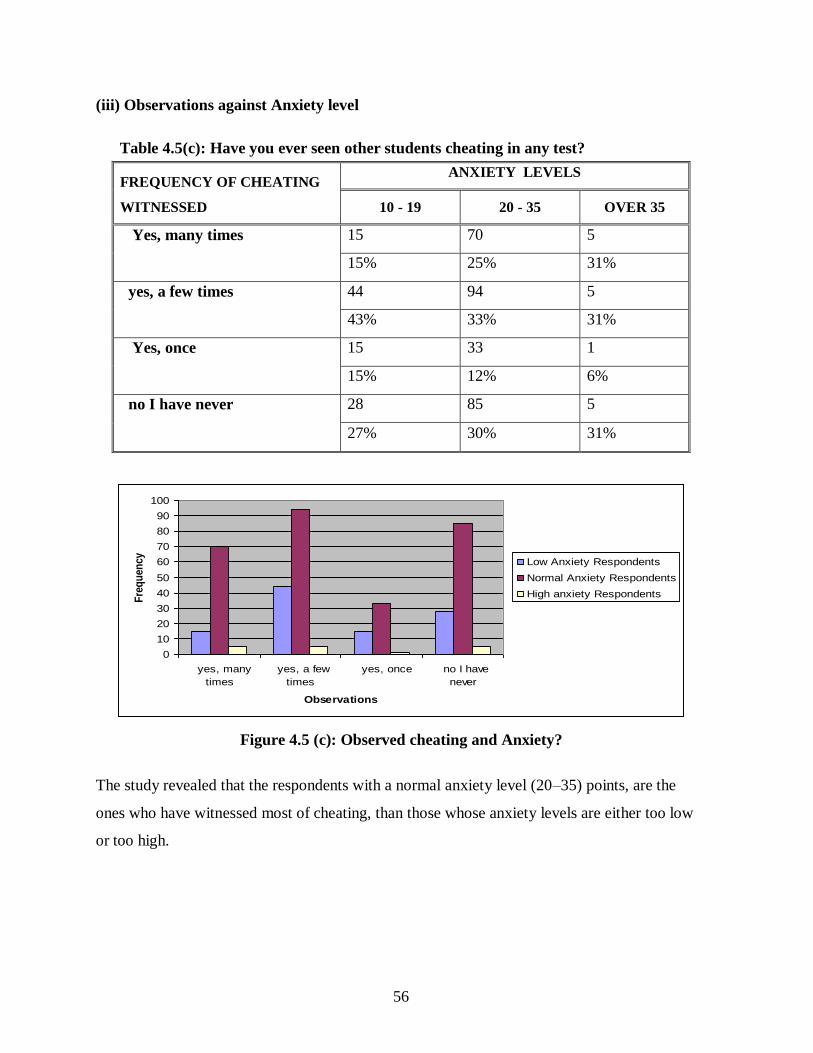
56
(iii) Observations against Anxiety level
Table 4.5(c): Have you ever seen other students cheating in any test?
FREQUENCY OF CHEATING
WITNESSED
ANXIETY LEVELS
10 - 19 20 - 35 OVER 35
Yes, many times 15 70 5
15% 25% 31%
yes, a few times 44 94 5
43% 33% 31%
Yes, once 15 33 1
15% 12% 6%
no I have never 28 85 5
27% 30% 31%
0
10
20
30
40
50
60
70
80
90
100
yes, many
times
yes, a few
times
yes, once no I have
never
Observations
Fre
qu
ency Low Anxiety Respondents
Normal Anxiety Respondents
High anxiety Respondents
Figure 4.5 (c): Observed cheating and Anxiety?
The study revealed that the respondents with a normal anxiety level (20–35) points, are the
ones who have witnessed most of cheating, than those whose anxiety levels are either too low
or too high.

57
(b)How do students cheat in examination?
When asked to states the type of cheating that they think take place in national public
examinations, their responses were again cross-tabulated against Gender, School category and
Anxiety. The results are summarized in tables VI (a) – (d).
(i) Observations by Gender
Table 4.6(a): What type of cheating do you think is the most common in national
public examinations?
GENDER
MALE FEMALE
copying from one another 33 22
16% 11%
using signal to communicate answers 28 10
14% 5%
getting access to question papers before the day of the exam 91 155
45% 78%
copying from notes or papers which are sneaked into the
exam 28 9
14% 5%
No response 24 3
12% 2%
0
20
40
60
80
100
120
140
160
180
copying from one
another
using signal to
communicate
answers
getting access to
question papers
before the day of
the exam
copying from
notes or papers
which are
sneaked into the
exam
No response
Observations
Fre
qu
en
cy
Male Respondents
Female Respondents
Figure 4.6 (a): Types of cheating by Gender response

58
The study revealed that most respondents believe that getting access to the question papers
before the actual date of the examination is the most common type of cheating technique
employed by students. On the contrary the data obtained from the KNEC, [see table III(c)]
seems to contradict these observations. According to the data from KNEC, the most common
form of examination malpractice involves collusion, closely followed by use of pre-prepared
notes (cribs).
iii. Observations by School category
Table 4.6(b): What type of cheating do you think is the most common in national
public examinations?
RESPONDENTS VIEW HIGH ACHIEVERS OTHERS
copying from one another 12 43
8% 17%
using signal to communicate answers 11 27
7% 11%
getting access to question papers before the day
of the exam
115 131
76% 53%
copying from notes or papers which are
sneaked into the exam
14 23
9% 9%
No response 3 24
2% 10%
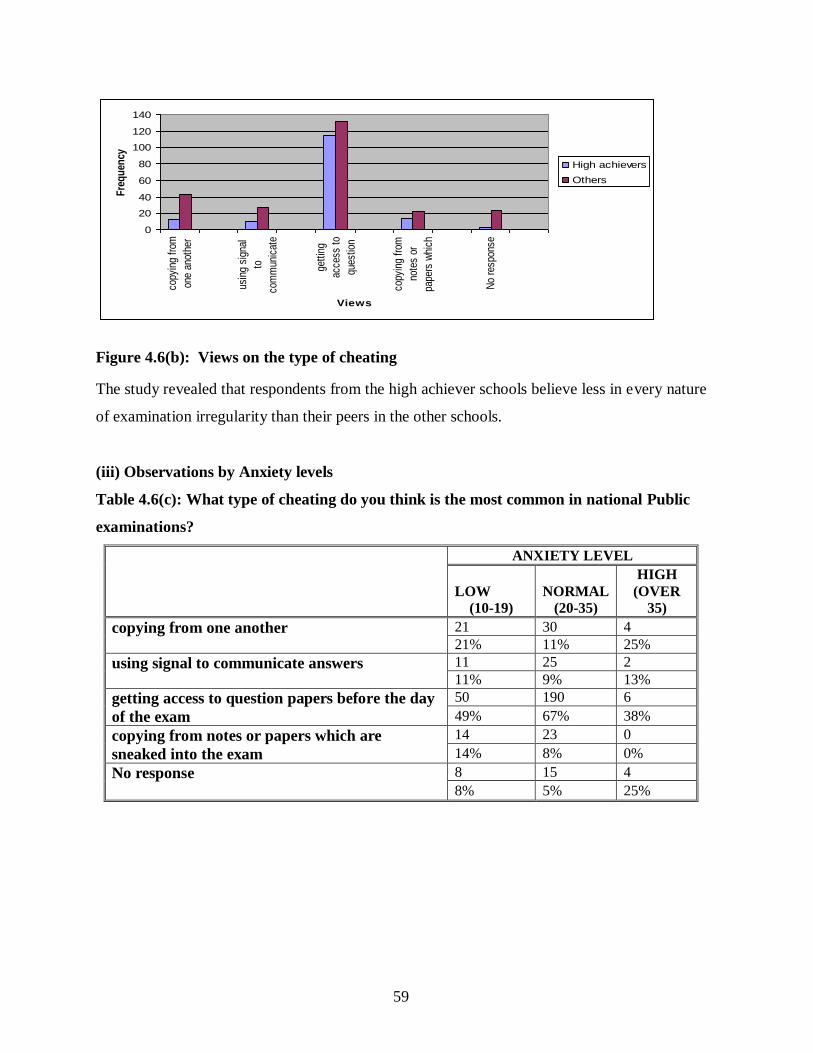
59
0
20
40
60
80
100
120
140
copy
ing
from
one
anot
her
usin
g si
gnal
to
com
mun
icat
e
gett
ing
acce
ss t
o
ques
tion
copy
ing
from
note
s or
pape
rs w
hich
No
resp
onse
Views
Fre
qu
ency
High achievers
Others
Figure 4.6(b): Views on the type of cheating
The study revealed that respondents from the high achiever schools believe less in every nature
of examination irregularity than their peers in the other schools.
(iii) Observations by Anxiety levels
Table 4.6(c): What type of cheating do you think is the most common in national Public
examinations?
ANXIETY LEVEL
LOW
(10-19)
NORMAL
(20-35)
HIGH
(OVER
35)
copying from one another 21 30 4
21% 11% 25%
using signal to communicate answers 11 25 2
11% 9% 13%
getting access to question papers before the day
of the exam
50 190 6
49% 67% 38%
copying from notes or papers which are
sneaked into the exam
14 23 0
14% 8% 0%
No response 8 15 4
8% 5% 25%
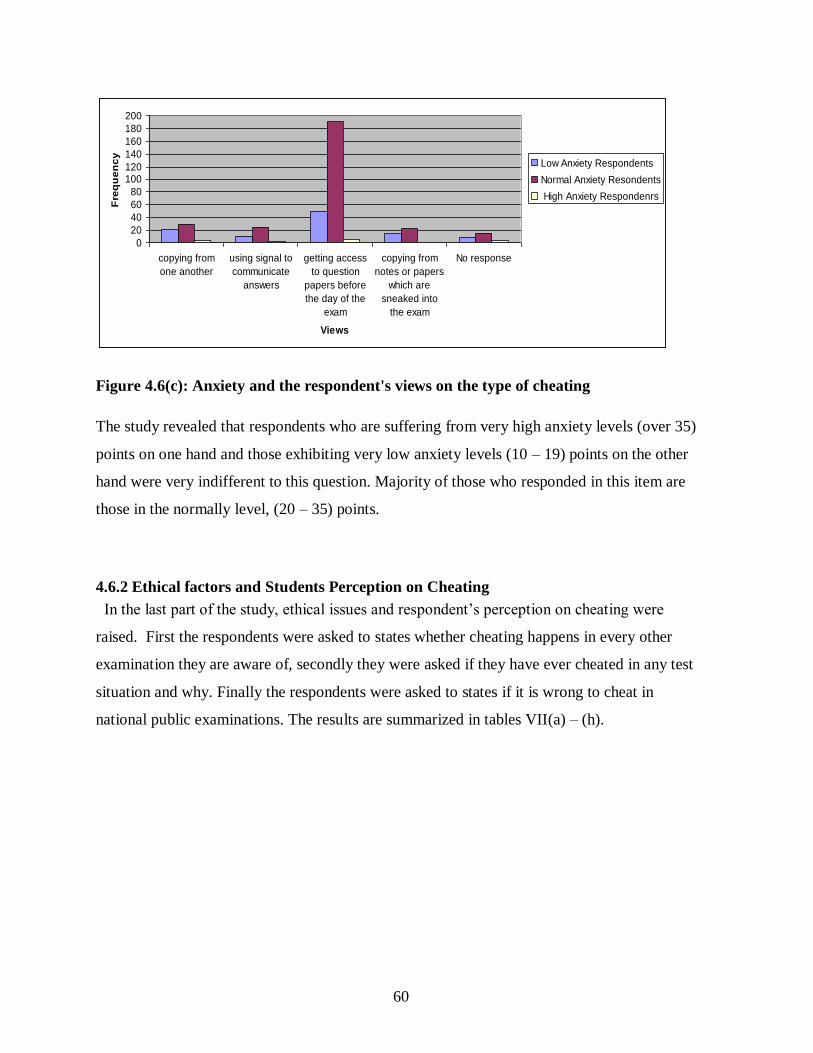
60
0
20
40
60
80
100120
140
160
180
200
copying from
one another
using signal to
communicate
answers
getting access
to question
papers before
the day of the
exam
copying from
notes or papers
which are
sneaked into
the exam
No response
Views
Fre
qu
en
cy
Low Anxiety Respondents
Normal Anxiety Resondents
High Anxiety Respondenrs
Figure 4.6(c): Anxiety and the respondent's views on the type of cheating
The study revealed that respondents who are suffering from very high anxiety levels (over 35)
points on one hand and those exhibiting very low anxiety levels (10 – 19) points on the other
hand were very indifferent to this question. Majority of those who responded in this item are
those in the normally level, (20 – 35) points.
4.6.2 Ethical factors and Students Perception on Cheating
In the last part of the study, ethical issues and respondent‟s perception on cheating were
raised. First the respondents were asked to states whether cheating happens in every other
examination they are aware of, secondly they were asked if they have ever cheated in any test
situation and why. Finally the respondents were asked to states if it is wrong to cheat in
national public examinations. The results are summarized in tables VII(a) – (h).

61
(a) Would you say cheating happens in every test?
i. Views based on Gender
Table 4.7(a): Would you say cheating happens in every test?
TOTAL
GENDER
MALE FEMALE
Yes 154 63 91
39% 31% 46%
No 229 123 106
57% 61% 53%
No response 17 15 2
4% 7% 1%
Would you say cheating happens in every test?
Yes
39%
No
57%
No response
4%
Figure 4.7(a-i): Would you say cheating happens in every test?
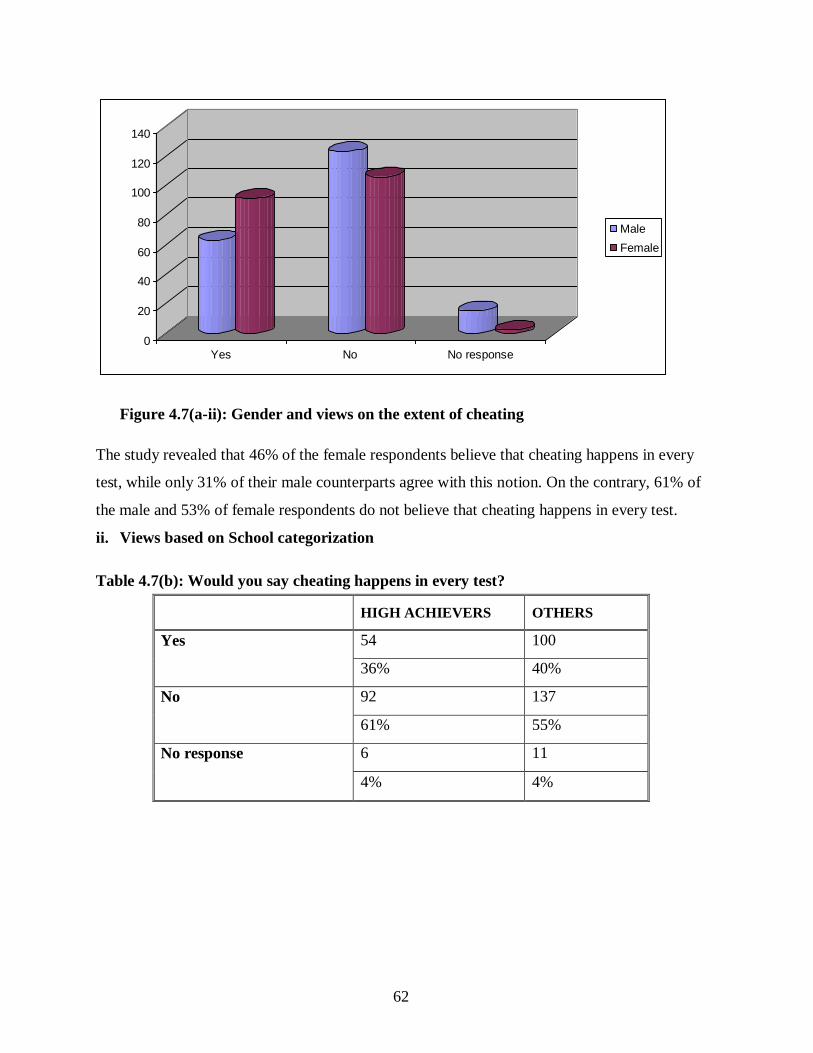
62
0
20
40
60
80
100
120
140
Yes No No response
Male
Female
Figure 4.7(a-ii): Gender and views on the extent of cheating
The study revealed that 46% of the female respondents believe that cheating happens in every
test, while only 31% of their male counterparts agree with this notion. On the contrary, 61% of
the male and 53% of female respondents do not believe that cheating happens in every test.
ii. Views based on School categorization
Table 4.7(b): Would you say cheating happens in every test?
HIGH ACHIEVERS OTHERS
Yes 54 100
36% 40%
No 92 137
61% 55%
No response 6 11
4% 4%

63
0
20
40
60
80
100
120
140
Yes No No response
High achievers
Others
Figure 4.7(b): School category and views on the extent of cheating
The study revealed that the respondents from high achiever school believe less in the in the
suggestion that cheating happens in every other test than their peers from other schools.
(iii) Views based on the Anxiety Levels
Table 4.7(c): Would you say cheating happens in every test?
ANXIETY LEVEL
10 - 19 20 - 35 OVER 35
Yes 38 110 6
37% 39% 38%
No 61 160 8
60% 57% 50%
No response 3 12 2
3% 4% 13%
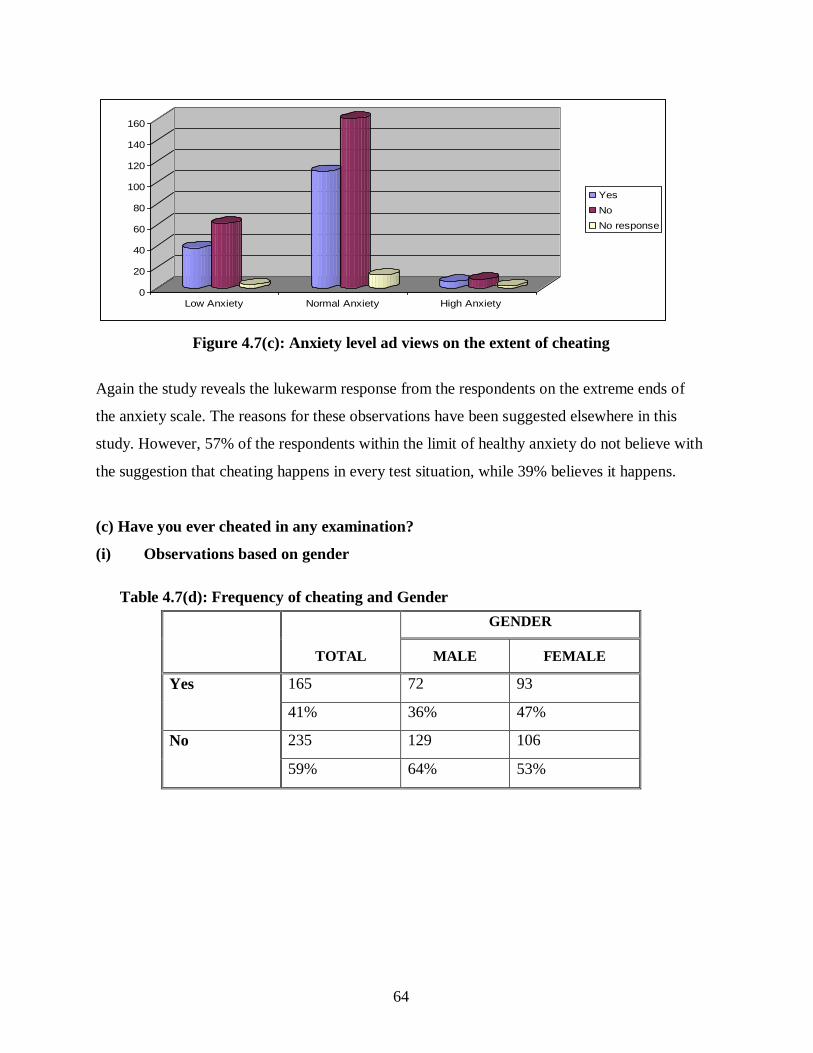
64
0
20
40
60
80
100
120
140
160
Low Anxiety Normal Anxiety High Anxiety
Yes
No
No response
Figure 4.7(c): Anxiety level ad views on the extent of cheating
Again the study reveals the lukewarm response from the respondents on the extreme ends of
the anxiety scale. The reasons for these observations have been suggested elsewhere in this
study. However, 57% of the respondents within the limit of healthy anxiety do not believe with
the suggestion that cheating happens in every test situation, while 39% believes it happens.
(c) Have you ever cheated in any examination?
(i) Observations based on gender
Table 4.7(d): Frequency of cheating and Gender
TOTAL
GENDER
MALE FEMALE
Yes 165 72 93
41% 36% 47%
No 235 129 106
59% 64% 53%

65
Have you ever cheated in any examination?
Yes
41%
No
59%
Figure 4.7(d-i): Overall response to cheating
0
20
40
60
80
100
120
140
Yes No
Male
Female
Figure 4.7(d-ii): Gender and the response to cheating
The study revealed that:
At least 41% of the respondents have cheated in a test situation in the past.

66
Out of this lot, females have been cheating more, (47%), than males, (36%).
(ii) Observation based on school categorization
Table 4.7(e-i): School category and cheating engagement
HIGH ACHIEVERS OTHERS
Yes 59 106
39% 43%
No 93 142
61% 57%
0
20
40
60
80
100
120
140
160
Yes No
High achievers
Others
Figure 4.7(e-i): School category and cheating engagement
The study revealed that of the 165 respondents who confessed to having had engaged in exam
cheating in the past, 59 of them (39%), came from high achiever schools, while 106 of them
(43%) comes from other schools.
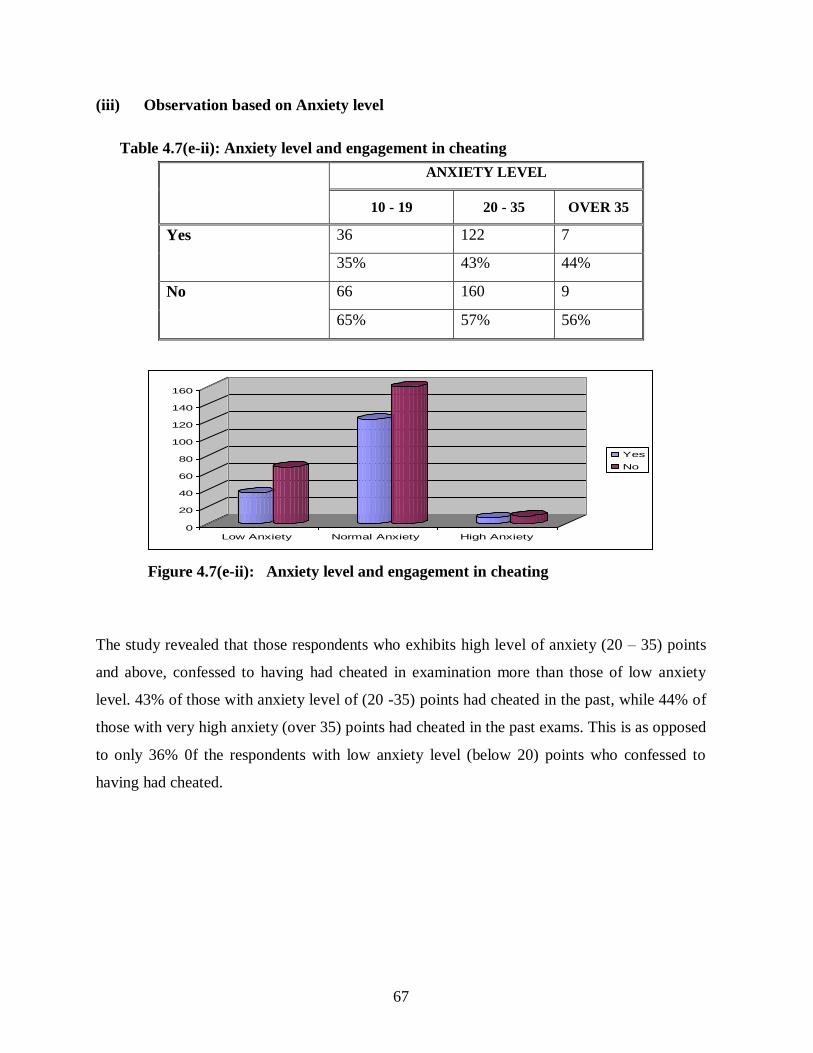
67
(iii) Observation based on Anxiety level
Table 4.7(e-ii): Anxiety level and engagement in cheating
ANXIETY LEVEL
10 - 19 20 - 35 OVER 35
Yes 36 122 7
35% 43% 44%
No 66 160 9
65% 57% 56%
0
20
40
60
80
100
120
140
160
Low Anxiety Normal Anxiety High Anxiety
Yes
No
Figure 4.7(e-ii): Anxiety level and engagement in cheating
The study revealed that those respondents who exhibits high level of anxiety (20 – 35) points
and above, confessed to having had cheated in examination more than those of low anxiety
level. 43% of those with anxiety level of (20 -35) points had cheated in the past, while 44% of
those with very high anxiety (over 35) points had cheated in the past exams. This is as opposed
to only 36% 0f the respondents with low anxiety level (below 20) points who confessed to
having had cheated.

68
4.6.3 Reasons for Cheating
(i) Overall reasons
Table 4.7(f-i): Overall reasons for cheating
REASONS GIVEN
TOTAL NUMBER OF
RESPONDENTS
The examination was difficult 40
24%
I had not prepared myself well for the examination 43
26%
There was no teacher or supervisor around 3
2%
I have seen others cheat and escape unpunished 14
8%
Pressure to get high marks 60
36%
I was nervous 5
3%
0
10
20
30
40
50
60
70
The examination
was difficult
I had not
prepared myself
well for the
examination
There was no
teacher or
supervisor
around
I have seen
others cheat and
escape
unpunished
Pressure to get
high marks
I was nervous
Reasons for cheating
Fre
qu
en
cy
Figure 4.7(f-i): Overall reasons for cheating

69
(ii) Reasons for cheating by Gender
Table 4.7(f-ii): Gender and reasons for cheating
Reasons given
Gender
Male Female
The examination was difficult 16 24
22% 26%
I had not prepared myself well for the examination 23 20
32% 22%
There was no teacher or supervisor around 2 1
3% 1%
I have seen others cheat and escape unpunished 2 12
3% 13%
Pressure to get high marks 28 32
39% 34%
I was nervous 1 4
1% 4%
0
5
10
15
20
25
30
35
The
examination
was difficult
I had not
prepared
myself well for
the
examination
There was no
teacher or
supervisor
around
I have seen
others cheat
and escape
unpunished
Pressure to
get high marks
I was nervous
Reasons
Fre
qu
ency
Male
Female
Figure 4.7 (f-ii): Gender and reasons for cheating

70
The study revealed the following as the major reasons given by the respondents for engaging in
cheating:
36% of the respondents cited pressure to get high marks as the main reason; of this lot,
39% were males and 34% were females.
26% felt that not being well prepared for the examination was the second major reason;
of which 32% males and 22% females concurred respectively.
The examination being difficult was another reason given by 24% of the respondents
and of these, 22% were males and 26% were females.
The study also revealed that 8% of the respondents have witnessed their peers cheat in
examination and get away with it. Female respondents, at (13%) have witnessed this
kind of situation more than their male counterparts (3%).
(iii) By School category
Table 4.7(g): School Category and reasons for Cheating
REASONS FOR CHEATING
SCHOOL CATEGORY
HIGH ACHIEVERS OTHERS
The examination was difficult
8 32
14% 30%
I had not prepared myself well for the
examination
24 19
41% 18%
There was no teacher or supervisor
around
1 2
2% 2%
I have seen others cheat and escape
unpunished
1 13
2% 12%
Pressure to get high marks
23 37
39% 35%
I was nervous
2 3
3% 3%
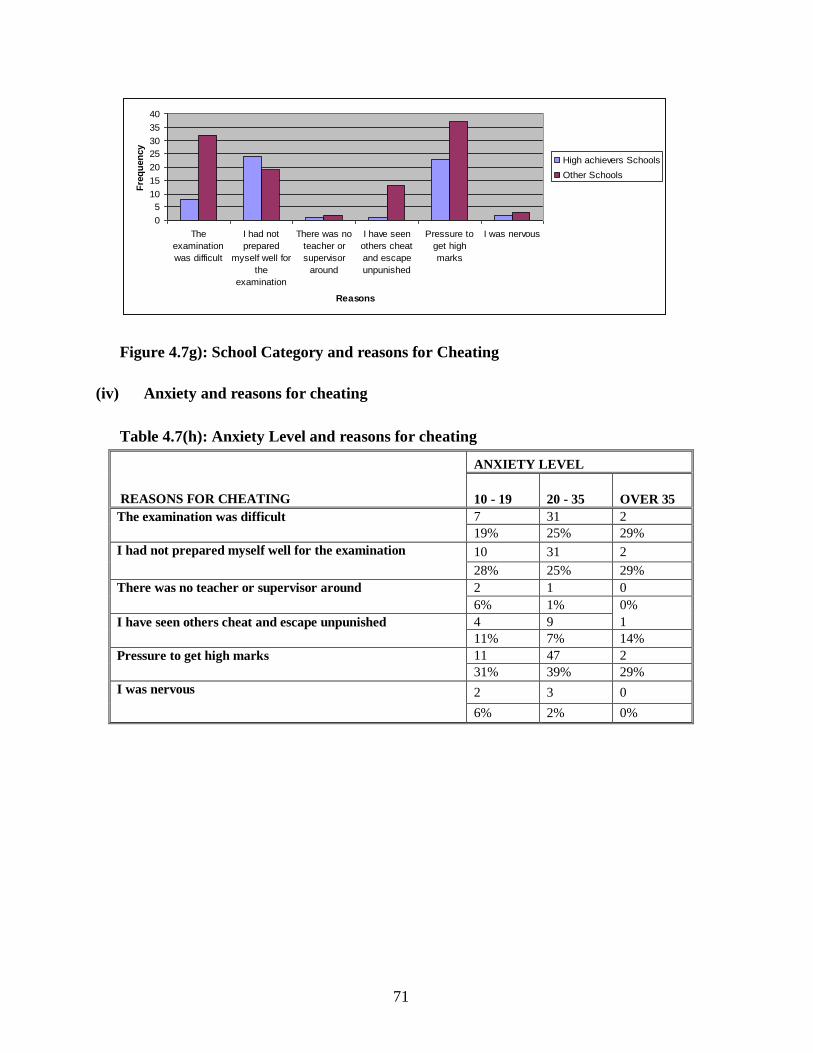
71
0
5
10
15
20
25
30
35
40
The
examination
was difficult
I had not
prepared
myself well for
the
examination
There was no
teacher or
supervisor
around
I have seen
others cheat
and escape
unpunished
Pressure to
get high
marks
I was nervous
Reasons
Fre
qu
en
cy
High achievers Schools
Other Schools
Figure 4.7g): School Category and reasons for Cheating
(iv) Anxiety and reasons for cheating
Table 4.7(h): Anxiety Level and reasons for cheating
REASONS FOR CHEATING
ANXIETY LEVEL
10 - 19 20 - 35 OVER 35
The examination was difficult
7 31 2
19% 25% 29%
I had not prepared myself well for the examination
10 31 2
28% 25% 29%
There was no teacher or supervisor around
2 1 0
6% 1% 0%
I have seen others cheat and escape unpunished
4 9 1
11% 7% 14%
Pressure to get high marks
11 47 2
31% 39% 29%
I was nervous
2 3 0
6% 2% 0%

72
05
101520253035404550
The
examination
was difficult
I had not
prepared
myself well for
the
examination
There was no
teacher or
supervisor
around
I have seen
others cheat
and escape
unpunished
Pressure to
get high marks
I was nervous
Reasons
Fre
qu
en
cy
Low Anxiety Respondents
Normal Anxiety Respondents
High Anxiety Respondents
Figure 4.7(h): Anxiety and reasons for cheating
The study revealed that pressure to get high marks, was the major reason identified as the cause
of cheating took the highest toll on the respondents who have a healthy anxiety level, 39%. As
for those respondents with low anxiety level, only 31% cited pressure to get high marks as a
reason for cheating, while those with high anxiety level, only 29% gave the same reason,
giving credence to Yerkes-Dodson law2. The study also revealed that, the respondents who
cited not being well prepared as the reason for engaging in cheating, the majority (28% and
29% respectively) were those who suffer from low and high anxiety as opposed to the normal
ones (25%).
4.6.4 Reasons given for not Cheating
Those respondents who indicated that they have never cheated in any test were asked to give
reasons as to why they chose that path. The results are summed up in tables 8(a) – (d).
2 Yerkes-Dodson law (1908) (first observed by Robert M. Yerkes and John D. Dodson, The Relation of Strength
of Stimulus to Rapidity of Habit-Formation; Journal of Comparative Neurology and Psychology, It predicts an
inverted U-shaped function between arousal and performance. A certain amount of arousal can be a motivator
toward change (with change in this discussion being learning). Too much or too little change will certainly work
against the learner. There should be some mid-level of arousal to provide the motivation to change (learn). Too
little arousal has an inert affect on the learner, while too much has a hyperactive affect.
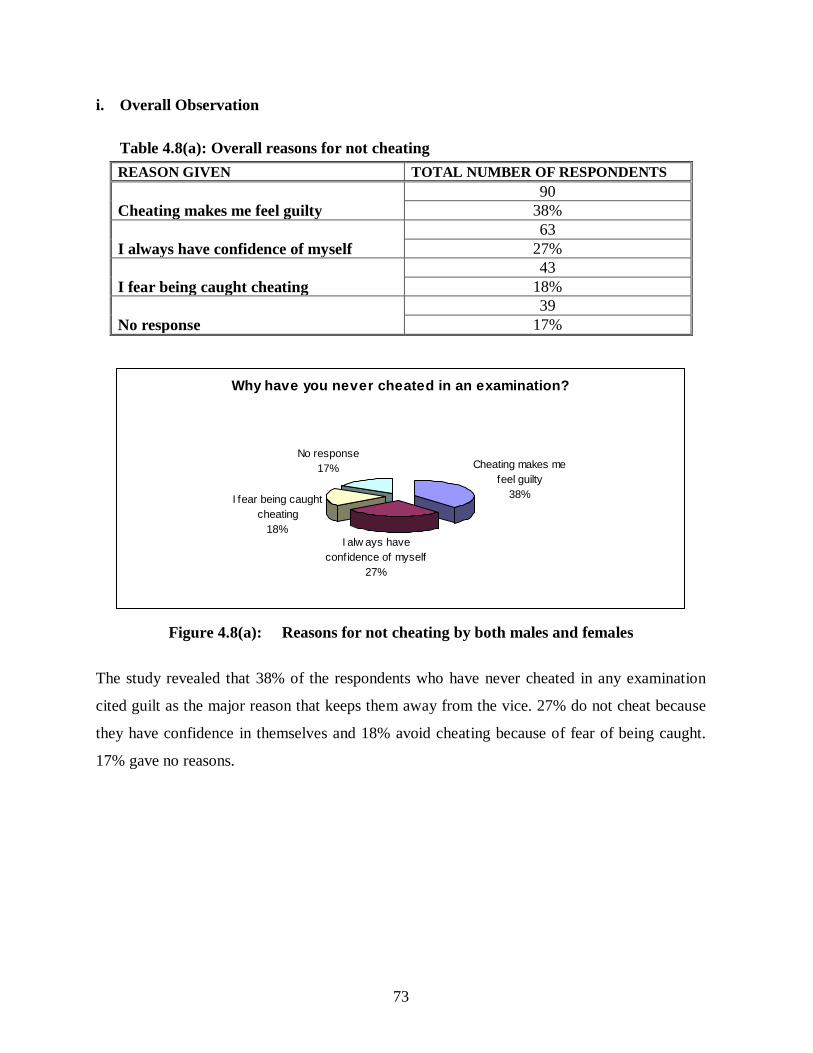
73
i. Overall Observation
Table 4.8(a): Overall reasons for not cheating
REASON GIVEN TOTAL NUMBER OF RESPONDENTS
Cheating makes me feel guilty
90
38%
I always have confidence of myself
63
27%
I fear being caught cheating
43
18%
No response
39
17%
Why have you never cheated in an examination?
Cheating makes me
feel guilty
38%
I alw ays have
confidence of myself
27%
I fear being caught
cheating
18%
No response
17%
Figure 4.8(a): Reasons for not cheating by both males and females
The study revealed that 38% of the respondents who have never cheated in any examination
cited guilt as the major reason that keeps them away from the vice. 27% do not cheat because
they have confidence in themselves and 18% avoid cheating because of fear of being caught.
17% gave no reasons.

74
ii. Observations by Gender
Table 4.8(b); Gender and reasons given for not cheating
MALE FEMALE
Cheating makes me feel guilty 39 51
30% 48%
I always have confidence of myself 42 21
33% 20%
I fear being caught cheating 17 26
13% 25%
No response 31 8
24% 8%
0
10
20
30
40
50
60
Cheating makes
me feel guilty
I always have
confidence of
myself
I fear being caught
cheating
No response
Reasons
Fre
qu
en
cy
Male Respondents
Female Respondents
Figure 4.8(b); Gender and reasons given for not cheating
The study revealed that female respondents, 48%, are less are conscious of cheating than their
male counterparts, (30%). Male respondents who have not engaged in cheating because of
confidence were 33%, while female respondents were 20%. The study also revealed that more
female respondents avoid cheating for fear of being caught (25%), than their male peers (13%).
Quite a sizeable number of male respondents, 24%, did not give reasons for not cheating.

75
iii. Observation by School category
Table 4.8(c): School category and reasons for not cheating
HIGH ACHIEVERS OTHERS
Cheating makes me feel guilty 42 48
45% 34%
I always have confidence of myself 19 44
20% 31%
I fear being caught cheating 20 23
22% 16%
No response 12 27
13% 19%
0
10
20
30
40
50
60
Cheating makes
me feel guilty
I always have
confidence of
myself
I fear being caught
cheating
No response
Reasons
Fre
qu
en
cy
High achiever Schools
Other Schools
Figure 4.8(c): School category and reasons for not cheating
The study revealed that respondents from the high achiever schools are more guilt conscious
than their peers from the other schools. The high achiever school respondents showed more
fear of being caught (22%) than their other counterparts (16%).
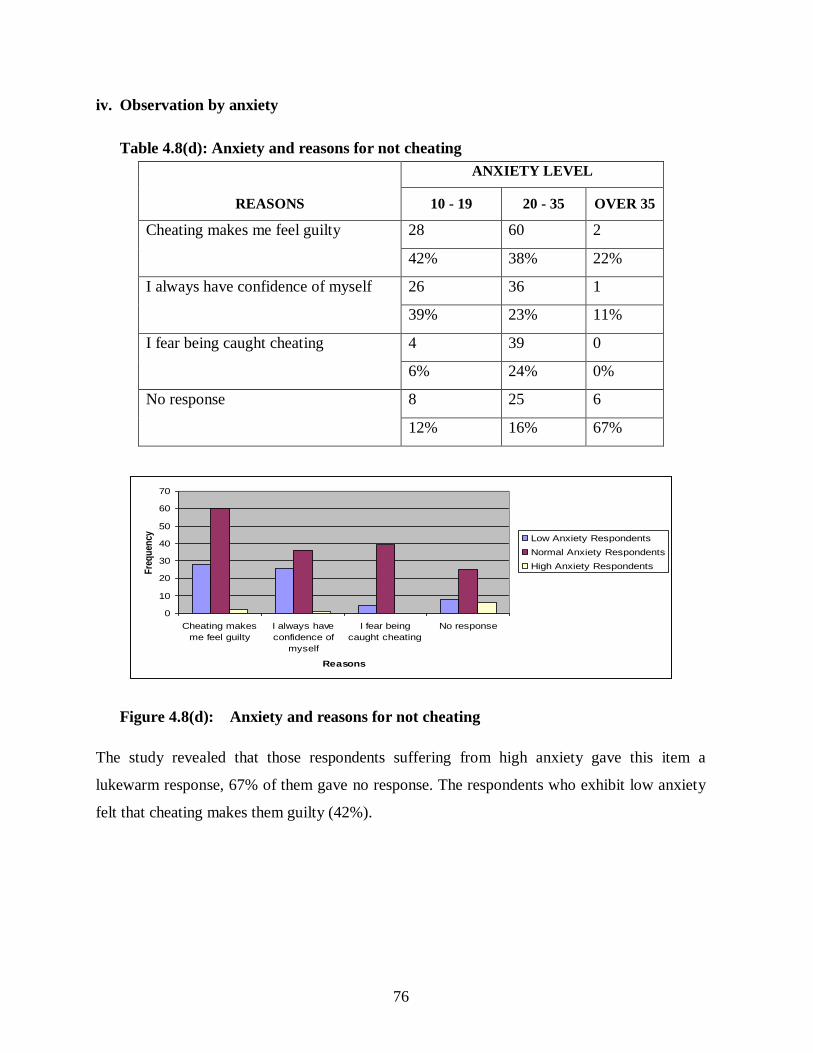
76
iv. Observation by anxiety
Table 4.8(d): Anxiety and reasons for not cheating
REASONS
ANXIETY LEVEL
10 - 19 20 - 35 OVER 35
Cheating makes me feel guilty 28 60 2
42% 38% 22%
I always have confidence of myself 26 36 1
39% 23% 11%
I fear being caught cheating 4 39 0
6% 24% 0%
No response 8 25 6
12% 16% 67%
0
10
20
30
40
50
60
70
Cheating makes
me feel guilty
I always have
confidence of
myself
I fear being
caught cheating
No response
Reasons
Fre
qu
ency Low Anxiety Respondents
Normal Anxiety Respondents
High Anxiety Respondents
Figure 4.8(d): Anxiety and reasons for not cheating
The study revealed that those respondents suffering from high anxiety gave this item a
lukewarm response, 67% of them gave no response. The respondents who exhibit low anxiety
felt that cheating makes them guilty (42%).

77
4.6.5 Perception on Cheating in Examinations
Lastly, the respondents were asked to states whether it they found it wrong to cheat in national
public examinations. The results are summed up in tables IX (a) – (d)
i. Overall observations
Table 4.9(a): Do you think it is wrong to cheat in national public examination?
TOTAL
Yes 302
76%
No 77
19%
No response 21
5%
Do you think it is wrong to cheat in national public examinations?
Yes
76%
No
19%
No response
5%
Figure 4.9(a): Do you think it is wrong to cheat in national public examination?
The study revealed that seventy six percent of the respondents found it wrong to cheat in
national public examinations. Nineteen percent found nothing wrong with cheating in national
examinations.

78
i. Observations by Gender
Table 4.9(b): Do you think it is wrong to cheat in national public Examinations?
GENDER
MALE FEMALE
Yes 144 158
72% 79%
No 36 41
18% 21%
No response 21 0
10% 0%
Do you think it is wrong to cheat in national public examinations?
0
20
40
60
80
100
120
140
160
180
Yes No No response
Response
Fre
qu
en
cy
Male
Female
Figure 4.9(b): Gender and perception to cheating
The study revealed that 79% of female and 72% of male respondents believe it is wrong to
cheat in national public examinations.

79
ii. Observations by School category
Table 4.9(c): School category and perception on cheating
School Category
High achievers Low Achievers/Others
Yes 136 166
89% 67%
No 15 62
10% 25%
No response 1 20
1% 8%
Do you think it is wrong to cheat in national public examinations?
0
20
40
60
80
100
120
140
160
180
Yes No No response
Response
Fre
qu
en
cy
High achiever Scools
Other Scools
Figure 4.9(c): School category and perception on cheating
The study revealed that 89% of high achiever schools believe it wrong to with cheat in national
public examinations. 67% of respondents from other category of schools also believe it is
wrong with cheating in national examinations.

80
v. Observations by anxiety levels
Table 4.9(d): Anxiety and perception on cheating
ANXIETY LEVEL
10 - 19 20 - 35 OVER 35
Yes 83 211 8
81% 75% 50%
No 12 61 4
12% 22% 25%
No response 7 10 4
7% 4% 25%
Do you think it is wrong to cheat in national public
examinations?
0
50
100
150
200
250
Yes No No response
Response
Fre
qu
en
cy
Low Anxiety Respondents
Normal Anxiety Respondents
High anxiety Respondents
Figure 4.9(d): Anxiety and perception on cheating
The study revealed that 83% of the respondents in the lower side of the anxiety scale (below 20
points); 75% of those in the normal range of the scale (20 – 35 points) and 50% of those on
upper end of the scale (above 35 points) do not agree with cheating in national examinations.

81
CHAPTER FIVE: RESEARCH DISCUSSIONS
5.1 Introduction
The discussion was guided by the objectives set out in the research. The research was set out to
provide knowledge on cheating and has come up with various trends and behaviour
characteristics. This has been articulated in chapter four and will be discussed in the following
section. Consequences and implications have also been addressed regarding cheating in
examinations. Generally, there are problems that are administrative and on site while taking
examinations. The discussions will cover the following:
Trends in cheating in examinations
Psychological aspects of cheating in examinations
Situational factors related to cheating in examinations
Ethical principles regarding cheating in examinations
5.2 Trends in cheating in examinations
Trends in cheating do not take any particular pattern. However, it was noticed that, at KCPE
level, there is more cheating in English (171), followed by Kiswahili (78) and mathematics
(35). At KCSE, the worst case over time was a case in 2004 in mathematics (704) and
chemistry (580). These have since reduced in the year 2006 and 2007 (243:453 respectively).
At primary school level girls seem to cheat more than boys while at secondary school the
reverse is the case. The practical subjects rated high that is, chemistry and biology, as well as
mathematics. In terms of the nature of cheating, collusion rates highest at both primary and
secondary schools. The subjects where cheating occurs least at secondary level is in Social
Education and Ethics (2), Home Science (2) and French (2). Though Business Studies has had
no incidences of cheating previously, but this has since started appearing and rates (35).
There should be further exploration to determine why and how these areas attract most
cheating. The researcher also realizes the nature of the subject, more so, the practical subjects
82
where the preparations begin before examinations have reported higher cheating. Perhaps it is
possible to predict what will be tested. The case of mathematics also needs to be explored as
well as languages. Is it the nature of setting or drilling that occurs? It would also be interesting
to determine if what is considered to be cheating is actually cheating.
Maybe the testing is suffering from the issue of test wise whereby over time marks go up.
There could also be the issue of drill teaching that occurs whereby teachers who have taught
for long, and also those who mark examinations, have developed skills that they have passed
on to their students through their teaching. Whatever the case, cheating in examinations still
occurs and that no matter what KNEC does, there seems to be no end to the cheating. It would
also be interesting to determine why there are few incidences of cheating in some specific
subjects and establish if there is anything unique in these subjects which make them not
venerable to cheating. This is may be one way to go if the examination system is to be
reviewed.
5.3 Psychological factors related to cheating in examinations
5.3.1 Anxiety and cheating
It seems there is a relationship between anxiety and cheating. This has also a bearing on certain
behaviour characteristics, especially when considering why students cheat. Low achievers are
more likely to cheat compared to the high achievers. Girls have a tendency to be more anxious.
Anxiety is usually triggered by a situation that involves a decision or judgment. Examinations
become common precursors of anxiety in educational settings. Anxiety has been shown to
impair performance in a wide range of cognitive functions including attention, memory,
concept formation and problem solving (e.g., Sieber, et al., 1977; Spielberger, 1966). The high
achiever schools seemed to suffer less from test anxiety than the other schools. Several causes
of test anxiety may also be related to internal aspects of students, including self – image,
motivation and attitudes. Specifically, students may experience test anxiety if they have
83
negative self – images and lack confidence in their abilities or if they have histories of poor
performance on examinations in general. Anxiety can be an inhibiting factor in learning, hence
creating pressure for cheating in the examination.
5.3.2 Perception of Cheating
Despite what drives students to cheat and the rampant cheating realized in Kenya, the results
show that students do feel guilty about cheating and do attest to this more often than not.
Thirty-eight percent (38%) of those responding admitted to feeling guilty about cheating and
admitted that cheating was wrong. There are some who did not think cheating was wrong
however. More girls felt guilty about cheating compared to the boys. A substantive number of
boys (24%) did not respond to the issue of guilt. Anxiety was an interesting factor. High
achievers were more confident and so did not find reason to cheat as much as low achievers.
Fear of being caught was a factor that affected girls‟ more than boys. The more anxious group
did also respond to this item, 67% of them. This shows a level of indifference that is generally
referred to in the literature. It may appear that cheating is not much of an issue to the students
as quite a number do states that it does occur and further many cases go undetected.
It was established that students still had a moral sense to cheating. Seventy six percent (76%)
attested to cheating being wrong. Up to nineteen percent (19%) felt that there was nothing
wrong with cheating. This could be as a result of what is arising or the scope of cheating.
Further still students do get away with cheating many more times. A good number of students
within the category of high and low achievers thought it was wrong to cheat. Punishment being
severe and the fact that it results in cancellation of one‟s overall results, it did not deter
cheating. This is a problem as this may lead to undermining the processes of examinations.
5.4 Situational Analysis
In both high and low achievers, cheating in examination does occur. It appears it is not possible
to identify all cases where cheating occurs. Cases that come up are fewer than those found in
84
the administrative records of KNEC. This reflects the frustration that is experienced by
students who felt cheating is wrong but are driven by need for high scores. There is less traits
cheating among high achievers compared to the low achievers.
The point to note is the need for high scores which is a key driving factor for cheating in
exams. This means, there may be need to review the focus of examinations that is mainly
oriented towards high stakes testing. Further in Kenya, to get admitted into university and be
awarded a scholarship one has to have passed amongst the top 10% of those who sit the
examination at the secondary school level. This seems to be the departure point regarding
policy and should be given attention. There may be need to open up a debate on the form of
testing which inherently results in a high anxiety leading to higher chances of cheating. The
challenge is to reduce anxiety that arises from using examinations for placement, a factor of an
individuals social standing.
Of interest was the levels of anxiety and the way in which it affects or influences cheating. The
less anxious resulted in few cases of cheating compared to the more anxious students.
Accessing examination papers before the actual examination was a predominant observation
recorded by many respondents. It means that the low achievers who are also more likely to
cheat, who are the largest number of students taking the examinations feels that getting access
to the examination papers in advance is the most likely possible malpractice. Is this true or
their thinking is misplaced? There is need to have a clearly defined distinction between such
serious irregularities like leakage and other lesser malpractices which candidates may
misconstrue to mean leakage.
5.5 Ethical Factors and Student Perception
This element brought in some interesting relationships. More girls than boys thought cheating
happens in every test (46% of girls and 31% of boys). At the same time, high achievers did not
think cheating happens as much as low achievers. High achieving amongst girls‟ shared a
similar view. This is not an established empirical link and may need further research to
determine the strength. However, ethical factor seems to be an issue that should be addressed.

85
There is need to determine how ethical needs can be brought to bear so as to come up with
ways in which it can be dealt with. The researcher here summarizes what arose regarding
students responses regarding ethical factors.
Students at all levels of anxiety do cheat more than those who confess to having cheated.
However, the least anxious are less likely to cheat. This may be because of their high
Intelligent Quotient (IQ) as they are assured of high scores. It seems once the driving factor
that is, the need to achieve high scores is attained, then, the drive to cheat is reduced. This
would also mean that if the system was restructured away from the high stakes model then
cheating would be reduced or even eliminated. It therefore, seems that if what is driving
students to cheat and the anxiety created by the thought of examinations is addressed, then
cheating can be addressed appropriately.
It also seems clear that administrative measures are not the most critical. Literature shows that
increased punishment or even teachings on why cheating is not good does not stop cheating in
examinations. This is captured at length in the literature review.
The issue of lack of preparedness also rated high. About forty-one percent (41%) of those who
responded to the questionnaire attested to the fact that they cheated out of ill preparedness.
Preparedness has to do with a lot of factors. Learning styles and time allowed for revising. The
value people put in education also motivates learning. The idea of examinations can create
situations that results in anxiety as explored already even if one is prepared.
In Kenya, questions have been raised as to the nature of preparing students for examinations
that leads to tutoring, or commonly „tuitions.‟ There could be a problem in that the teacher
takes over students‟ preparations style. In which case the student is not in control of their own
learning, thus preparation. There is need to look into this issue and determine if the learning
design and style as perceived and applied in learning is appropriate or if this is what leads to
lack of preparedness. There is need to explore this issue and determine the democratic space

86
provided for students during their learning period and the extent to which they are able to
manage their learning. This is important as the Kenyan system is one of rigour with tuitions
whereby students‟ progammes are defined within a tight learning schedule with a lot of
homework.
This is an important revelation that needs to be considered by the education system policy
makers. Is there another way? The question to ask is if the education system can still
accomplish the task of academic excellence that is competitive locally and globally and yet still
meet the need for selection from one level of learning to the other. This is a challenge. It is
stated in the literature that Testing is not the best way to determine if learning has been
achieved or not but it is the best method that exists so far. However, there are many forms of
testing that have been used across the world that does not lead to high stakes testing. This is not
a simple decision and would require review of the education system as a whole.

87
CHAPTER SIX
SUMMARY, CONCLUSION AND RECOMMENDATIONS
6.1 Summary of the Results
The researcher set out to determine cheating within the context of Kenyan education system. It
may seem that the situation arising concerning the environment of the student seems to be
more of contextual behavioural characteristics as to whether or not cheating will occur. The
social environmental context affects more than a student‟s family background and
circumstance. Two factors that arise are the achievement level and gender. Overtime there has
been teacher talk against cheating, increased vigil on examinations to deter teaching and
increased punitive measures through policy. These have not been as effective as envisaged.
This can be seen from the results that show that cheating is not only happening but many more
cases of cheating go undetected.
The competitive nature of the national examination like KCSE, does lead to cheating even
more. Students are driven by the need to be placed in higher learning institutions, and more
still, better job positions. This situation is aggregated by the way in which examinations are
handled in that results nationally are presented through best performance whereby there is
more of who has done better than the other, as well as ranking by schools, school types,
districts and provinces. (There is some comparison of subject discipline area mainly sciences,
however, not enough. Focus is still the best in terms of grades).
Time management seemed to be a key contributor too. This is reflected in our education
system of learning where there is no flexibility for teachers whereby the time-table for learning
is set out by the school without much break. It does not also take into consideration the
learning levels of learners. Further, students‟ learning is basically controlled whereby after
class is either taken up doing homework or teachers desired activity. Learning goes on into the
school holidays including weekends without any rest. The system also does not allow students
to develop their own learning styles.
88
Peer pressure common at this age is high. The influence put upon student to cheat simply
because others are cheating is great. The problem results in a peer perceived view of cheating
whereby there is no guilt when cheating has occurred as attested by many of the respondents.
Almost all of those who were interviewed consented to having cheated or had seen someone
cheat at least once. There was also the concern that cheating may then become an occurrence
that did not result in guilt in most cases, this is a problem. An internal aspect of students
becomes an indicator of measure and has a bearing on cheating. The result is that issues of
anxiety creating becomes a concern and should be dealt with. Low achievers and motivation to
cheat is related. Issues of attitude, self-image and confidence become a problem. This is
coupled with a history of poor performance. The result of this is:
1. Effect on institutions repulsion on an important asset, academic performance and
excellence
2. A system of education not being attractive to outsiders
3. Undermining of a countries academic world through interference of basic mission of
education, transfer of knowledge resulting in non-transference
4. Atmosphere not conducive to learning due to it‟s effects on honest students since the
reward of their work is cheapened
5. Identity of a learner is eventually questioned regarding their pursuit of knowledge
6. Tendency for a „road to life‟ of dishonesty
7. Emotional distress on those who do not cheat
6.2 Conclusion
The relations that arise create interesting multi-dimensional aspects of cheating in
examinations that need to be explored further. Most studies carried out in cheating have mainly
looked at occurrences and not the underlying psychological and situational causes. There is
need to explore these attributes that arise further in order to make more conclusions on the
causes cheating and to provide information that would give scholarly guidance. It is then that
cheating in examinations can be comprehensively addressed. There is also need to see how

89
other countries have dealt with these issues to provide a broad dimension on the aspect of
cheating in examinations that is so broad.
The authenticity of the examinations done in Kenya can be questioned. The sense of the
fairness of the examinations to the individual and the system of education becomes an issue.
How do we maintain the status quo, while the systems and structures in place have not resulted
in elimination of cheating altogether? One questions the extent to which policy will introduce
legislation over cheating while in fact dimensions that arise in cheating is embedded in a
psychological manifestations. This calls for an integrated approach with the administrative
solutions requiring government legislation while and education psychologists review the
system of testing, test preparedness beyond administration and resources, to needs of the
learners that form various categories of high and low achievers, gender, and discipline specific.
Lately in Kenya, a need to address the challenge of cheating in national examinations more so
in secondary schools has risen and is even greater. The issue has been high on the agenda on
media, educators, legislators, educationalists and test specialists. There is a need to urgently
address the challenge of cheating in examinations since this has implications of the integrity of
the examination process and the education system as a whole. It is not easy to restructure the
system to do away with public national examinations much as it is seems the best solution so
far. The problem is that one has to come up with a system that will not be riddled with the
same problems as the current one. However, something must be done.
6.3 Recommendations
There is need to review the preferred mode of examinations, that is, public national
examinations with a view of moving on to a system that does not create such anxiety and
competition. This basically calls for moving away from „High-stakes Testing.‟ This
requires debates on the issue as well as studies to determine the most appropriate
examination system considering the selection into higher learning levels that rely on these
examinations.
90
The Kenya education system should review the process that creates controls in the learning
process so that there is more time created for individual learning styles and ways of
learning away from the lecturer/tutor method and learning without breaking for seven days
in a week and during the school holidays.
There is need to explore through empirical research behaviour characteristics that lead to
dishonesty and dealing with anxiety so as to come up with measures that can help reduce
elements of these, more so, student groups prone to cheating such as the lower achievers.
Worse still these take on a regional dimension.
There is need to focus on the social environmental factors that affect cheating beyond
incidences of cheating and punitive measures. These include demand for high scores by
students themselves, teachers, and parents. It is important to come up with guidelines and
knowledge on these and how to deter such effects.
The realization that there is need to harmonize the process of punishment so that this does
not only take on a punitive approach towards a compromise that requires the student to
repeat the paper that student failed in; or ring-fencing the course a student has cheated in
rather than withholding the whole certificate. This is because these measures have not
worked over time as cheating still continues.
The process of examination that include it‟s management and administration from the time
it is developed, printed, up to the time it is presented to students should be audited to
determine the points of vulnerability. This is to deal with what arose from the respondents
feeling is that most cheating results form access to examination papers before an
examination
91
References
Aronson, E. (1969), “A Theory of Cognitive Dissonance: A Current Perspective,” in
Advances in Experimental Social Psychology, Vol. 4, Leonard Berkowitz, ed.
New York: Academic Press, 1-34.
Association of Certified Fraud Examiners (2006). “ACFE Report to the Nation on
Occupational Fraud & Abuse,”
[Available http://www.acfe.com/documents/2006rttn.pdf].
Atkin,B E and Atkin R E ,Study of honesty of prospective teachers –Elementary
Bateson, Melissa, Daniel, and Roberts (2006), “Cues of Being Watched Enhance
Cooperation in a Real-World Setting,” Biology Letters, 2 (June), 412-414. Baumeister,
Roy F. (1998), “The Self,” in Handbook of Social Psychology, Daniel T. Gilbert,
Bernardi, R A, Rene L, Metzger, Ryann G, Bruno S, Marisa A. Hoogkamp W, Reyes L E, and
Barnaby G H, "Examining the Decision Process of Students' Cheating Behaviour:
An Empirical Study" Journal of Business Ethics 50, no. 1, (2004),
Black, D. B. The falsification of reported examination marks in a senior university education
course. Journal of Educational Sociology, 1962.
Boodish, H. M. The teacher's page: School vs. life. The Social Studies,1962
Bowers W, Student Dishonesty and its Control in Colleges (New York: Bureau of
Applied Social Research, Columbia University, 1964),
Bowers, W. J. (1964). Student dishonesty and its control in college. New York:Bureau
of Applied Social Research. Columbia University.
Brickman, W. W. Ethics, examinations and education, School and Society, 1961.
Brownell, H. C. Mental test traits of college cribbers. School and Society, 1928,
Bunn, D N. Caudill, S B and Gropper, D M. "Crime in the Classroom: An Economic
Analysis of Undergraduate Student Cheating Behaviour", The Journal of Economic
Education 23, no. 3, (Summer 1992),
Bushway A and Nash W, "School Cheating Behaviour", Review of Educational Research 47,
no. 4 (Autumn 1977),
Carlsmith, J M. (1962), “Performance Expectancy as a Determinant of Actual Performance,”

92
Journal of Abnormal and Social Psychology, 65 (3), 178-182.
Carroll J, A Handbook for Deterring Plagiarism in Higher Education (Oxford: The Oxford
Centre for Staff and Learning Development, 2002),
Cornehlsen, V. H. Cheating attitudes and practices in a suburban high school.Journal of
the National Association of Women Deans and Counselors, 1965.
Drake, C. A. Why students cheat. Journal of Higher Education, 1941
Fischer, C. T. Levels of cheating under conditions of informative appeal to honesty,
public affirmation of value and threats of punishment. Journal of Educational
Research, 1970. Hartshorne, H., & May, M. A. Studies in deceit. New York:
Macmillan, 1928.
Fiske, T S and Lindzey G, eds. New York: McGraw-Hill, 680-740. Becker, Gary S.
(1968), “Crime and Punishment: An Economic Approach,” Journal of Political Economy,
76 (2), 169-217
Hetherington, E. M., & Feldman, S. E. College cheating as a function of subject and
situational variables. Journal of Educational Psychology, 1964.
Johnson, R. E., & Klores, M. S. Attitudes toward cheating as a function of classroom
dissatisfaction and peer norms. Journal of Educational Research,1968.
Keehn, J. D. Unrealistic reporting as a function of extraverted neuroses. Journal of Clinical
Psychology, 1956.
Kerkvliet,J and. Sigmund,C. L. "Can We Control Cheating in the Classroom?", The Journal of
Economic Education 30, no. 4, (Autumn, 1999),
LaBeff E, et al., "Situational Ethics and College Student Cheating", Sociological Inquiry 60,
no. 2 (May 1990),
Ludeman, W. W. A study of cheating in public schools. American School Board Journal, 1938.
McCabe D and Trevino L, "Academic Dishonesty: Honor Codes and Other Contextual
Influences", The Journal of Higher Education 64, no. 5, (September-October 1993),
McCabe D and Trevino L, "Individual and Contextual Influences on Academic Dishonesty: A
Multicampus Investigation", Research in Higher Education 38, no. 2, (1997),
McCabe D, Trevino L, and. Butterfield D, "Honor Code and Other Contextual Influences on

93
Academic Integrity: A Replication and Extension to Modified Honor Code Settings"
Research in Higher Education 43, no. 3, (June 2002),
McQueen, R. Examination deception as a function of residual background and immediate
stimulus factors. Journal of Personality, 1957.
Mixon, F. Crime in the classroom. Journal of Economic Education 27 (Summer,1996.)
Montor, K. Cheating in high school. School and Society, 1971.
Nonis, S and Swift, C O. "An Examination of the Relationship between Academic Dishonesty
and Workplace Dishonesty", Journal of Business Education 77, no. 2, (November-
December 2001),
Power, F C, Higgins, A and Kohlberg, L. Lawrence Kohlberg's Approach to Moral Education
(New York: Columbia University Press, 1989),
Rogosin, H. What about "cheating" on examinations and honesty? School and Society, 1951.
Schab, F. Cheating in high school: Differences between the sexes. Journal of the National
Association of Women Deans and Counselors, 1969.
Shirk, E., & Hoffman, R. W. The academic setting of the dishonest student. Improving College
and University Teaching, 1961.
Smith K, Davy J, and Easterling D, "An Examination of Cheating and its Antecedents Among
Marketing and Management Majors", The Journal of Business Ethics 50, no. 1, (March 2004),
Smith, C. P., Ryan, E. R., & Diggins, D. R. Moral decision making: Cheating on
examinations. Journal of Personality, 1972.
Steiner, M. A. Does the school strengthen or weaken the tendency to cheat? Journal of
Educational Research, 1930.
Steininger, M., Johnson, R. E., & Kirts, D. K. Cheating on college examinations as a function
of situationally aroused anxiety and hostility. Journal of Educational Psychology, 1964.
Trabue, A. Classroom cheating-An isolated phenomenon? Educational Record,1962.
Uhlig, G. E., & Howes, B. Attitude toward cheating and opportunistic behaviour. Journal of
Educational Research, 1967. .
Vitro, F. T. The relationship of classroom dishonesty to perceived parental discipline. Journal
of College Student Personnel, 1971.

94
Vitro, F. T., & Schoer, L. A. The effects of probability of test success, test importance, and risk
of detection on the incidence of cheating. Journal of School Psychology, 1972.
West T, Ravenscroft S, and Shrader C, "Cheating and Moral Judgment in the College
Classroom: A Natural Experiment", Journal of Business Ethics 54, no. 2, (October
2004),
White. W. F. Zielonka. A. W. & Gaier,E L. Personality correlates of cheating 'among college
women under stress of independent opportunistic behaviour. Journal of Educational
Research, 1967.
Whitley, B E. "Factors Associated with Cheating Among College Students: A Review",
Research in Higher Education 39, no. 3, (June, 1998).
Williams, F. N. Cheating in the classroom. Improving College and University Teaching, 1969.
Woods, R. C. Factors affecting cheating and their control. West Virginia Academy of Science
Proceedings, 1957.
Zastrow, C. H. Cheating among college graduate students. Journal of Educational Research,
1970

95
APPENDIX I
STUDENTS QUESTIONNAIRE
This is a survey to gather information and students opinion on cheating in national public
examinations, so as to make suitable recommendations on how to eliminate the elements
of cheating.
(i) All your responses will be treated as confidential.
(j) Do not write your name in the questionnaire but please give your most honest
independent answers.
(k) Your responses to the questions will be used for research purposes only.
DIRECTIONS
Please answer all the items in the questionnaire by ticking appropriately (or writing your
answer in the spaces provided to some specific questions).
SECTION A:
PERSONAL DETAILS
1. What is your gender?
i. Male [ ]
ii. Female [ ]
2. Please describe the type of school which you are attending?
National [ ] Provincial [ ]
District [ ] Private [ ]

96
SECTION B:
ANXIETY CHARACTERISTICS OF TEST TAKERS
For each of the following questions tick only one response.
3. I always have visible signs of nervousness such as sweaty palms, shaky hands, and so on,
every time before an examination.
a) Never [ ]
b) Rarely [ ]
c) Sometimes [ ]
d) Often [ ]
e) Always [ ]
4. I have „butterflies‟ in my stomach every time before I sit for an examination.
a) Never [ ]
b) Rarely [ ]
c) Sometimes [ ]
d) Often [ ]
e) Always [ ]
5. I feel nauseated every time before taking an examination.
a) Never [ ]
b) Rarely [ ]
c) Sometimes [ ]
d) Often [ ]
e) Always [ ]

97
6. I read through a test and feel that I do not know any of the answers.
a) Never [ ]
b) Rarely [ ]
c) Sometimes [ ]
d) Often [ ]
e) Always [ ]
7. I panic before and during an examination.
a) Never [ ]
b) Rarely [ ]
c) Sometimes [ ]
d) Often [ ]
e) Always [ ]
8. My mind goes blank during an examination.
a) Never [ ]
b) Rarely [ ]
c) Sometimes [ ]
d) Often [ ]
e) Always [ ]
9. I remember the information that I blanked on once I get out of the examination Situation.
a) Never [ ]
b) Rarely [ ]
c) Sometimes [ ]
d) Often [ ]
e) Always [ ]
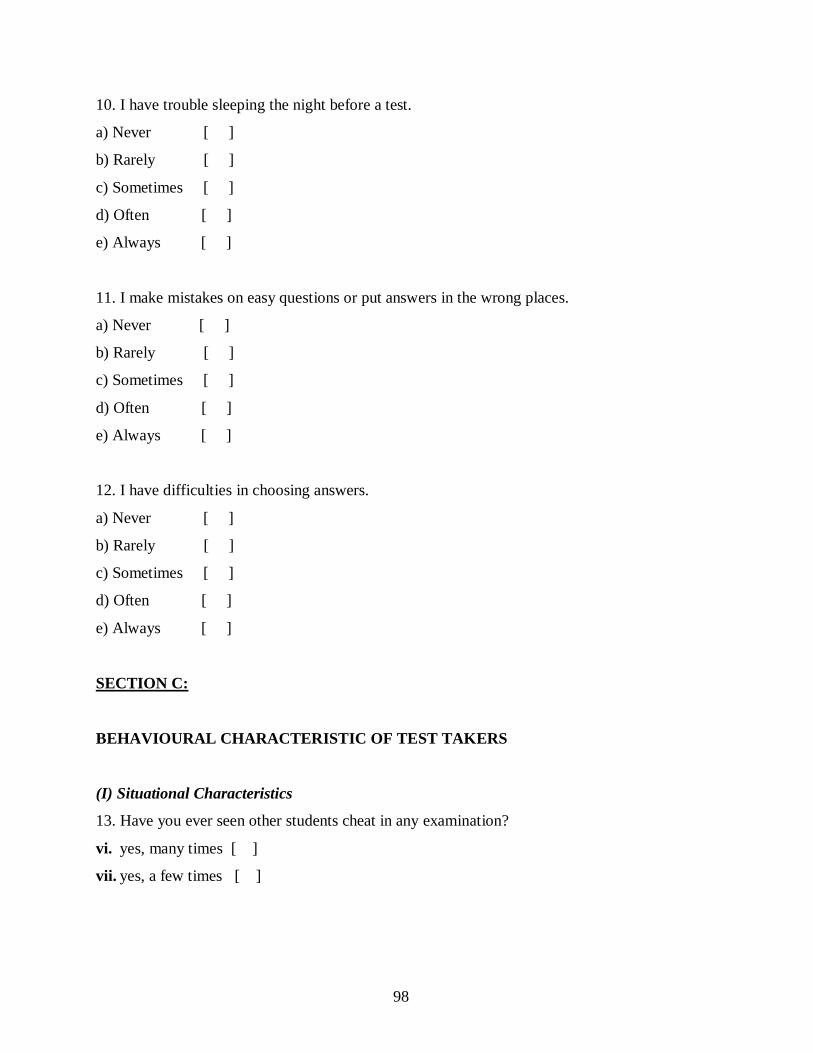
98
10. I have trouble sleeping the night before a test.
a) Never [ ]
b) Rarely [ ]
c) Sometimes [ ]
d) Often [ ]
e) Always [ ]
11. I make mistakes on easy questions or put answers in the wrong places.
a) Never [ ]
b) Rarely [ ]
c) Sometimes [ ]
d) Often [ ]
e) Always [ ]
12. I have difficulties in choosing answers.
a) Never [ ]
b) Rarely [ ]
c) Sometimes [ ]
d) Often [ ]
e) Always [ ]
SECTION C:
BEHAVIOURAL CHARACTERISTIC OF TEST TAKERS
(I) Situational Characteristics
13. Have you ever seen other students cheat in any examination?
vi. yes, many times [ ]
vii. yes, a few times [ ]

99
viii. yes, once [ ]
ix. no I have never [ ]
14. What type of cheating do you think is most common in national public examinations?
a) copying from one another [ ]
b) using signal to communicate answers [ ]
c) getting access to question papers before
the day of the examination [ ]
d) copying from notes or papers which are
sneaked into the examination room [ ]
f) other methods (please specify) ________________________________
__________________________________________________________
__________________________________________________________
(II) Ethical characteristics
15. Would you say that cheating happens in every test?
a) Yes [ ]
b) No [ ]
16. Have you ever cheated in any examination?
a) Yes [ ]
b) No [ ]
17. If you cheated, what caused you to do it?
a) The examination was difficult [ ]
b) I had not prepared myself well for the examination [ ]
c) There was no teacher or supervisor around [ ]
d) I have seen others cheat and escape unpunished [ ]
e) Pressure to get high marks [ ]
f) I was nervous [ ]
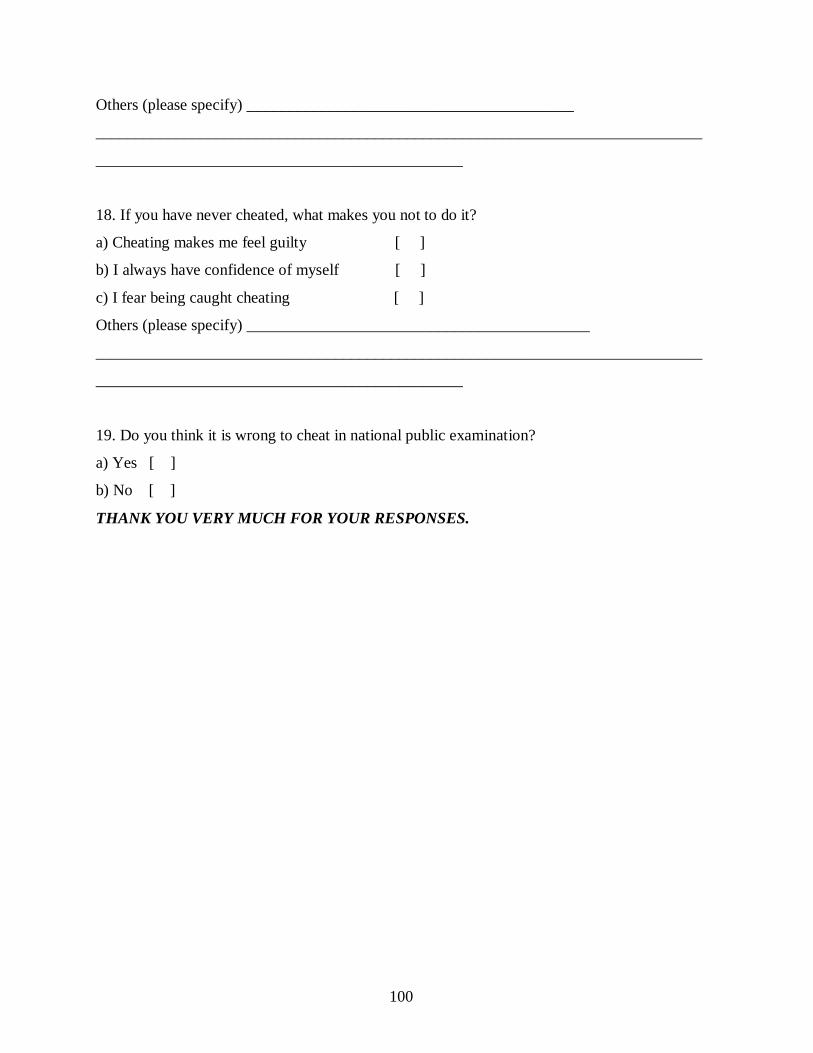
100
Others (please specify) _________________________________________
____________________________________________________________________________
______________________________________________
18. If you have never cheated, what makes you not to do it?
a) Cheating makes me feel guilty [ ]
b) I always have confidence of myself [ ]
c) I fear being caught cheating [ ]
Others (please specify) ___________________________________________
____________________________________________________________________________
______________________________________________
19. Do you think it is wrong to cheat in national public examination?
a) Yes [ ]
b) No [ ]
THANK YOU VERY MUCH FOR YOUR RESPONSES.

101

102
APPENDIX III
Kenya Subsidiary Legislation, 1998 21
LEGAL NOTICE NO. 18
THE KENYA NATIONAL EXAMINATIONS
COUNCIL ACT
(Cap. 225A) In EXERCISE of the powers conferred by the section 10 of the Kenya National Examinations Council Act, the Kenya National Examinations Council makes the following Rules:
THE KENYA NATIONAL EXAMINATIONS COUNCIL
(KENYA CERTIFICATE OF SECONDARY EDUCATION
EXAMINATION) RULES, 1998
1. These Rules may be cited as the Kenya National Examinations Council (Kenya Certificate of Secondary
Education Examination) Rules. 1998, and shall be deemed to have come into operation on the 1st January, 1989. (citation)
2. In these Rules, unless the context otherwise requires - “Council” means the Kenya National Examinations
Council; (interpretation)
“examination” means the Kenya Certificate of Secondary Education‟ “secondary school” means a school recognized by the Council as eligible to present candidates for the examination; “headteacher” means the headteacher of a secondary school.
3. (1) The Kenya Certificate of Secondary Education examination shall be open to all bona-fide residents of Kenya who meet the Examination entry requirements specified in these Rules. (condition for eligibility).
(2) The examination shall be administered to eligible candidates within Kenya by District Education Officers on behalf of the Council and in conformity with the Council‟s regulations for the conduct of public examination.
(3) The examination shall be conducted once every year in the month of November.
4. (1) Candidates shall be accepted by the Council as school candidates if they have been attending a secondary school continuously during the three years immediately preceeding registration for the examination. (Entry requirements for candidates)
(2) Private candidates shall be registered for the examination at the District Education Offices by agents appointed by the Council in the month of March of the year of the examination, and shall possess the
following qualifications.:
(a) they shall be holders of the Kenya Certificate of Secondary Education or the Kenya Certificate of Education or the East African Certificate of Education with a minimum of Division 1v; Or (b) they shall provide to the Council proof of having sat for the Kenya Certificate of Primary Education at least three years before the year in which they apply to sit for the examination; or