Berlin as an Urban Archive. The Institutionalisation of History in Monumental Projects since 1989
Upload
khangminh22Category
view
0download
0
Sveriges Lantbruksuniversitet Jägmästarprogrammet Examensarbete i skogsvetenskap, 60 hp, avancerad nivå A2E ISSN 1654-1898Handledare: Tomas Lundmark, SLU, Inst för skogens ekologi och skötsel Bitr handledare: Annika Nordin, SLU, Inst för skoglig genetik och växtfysiologi Examinator: Lars Lundqvist, SLU, Inst för skogens ekologi och skötsel Umeå 2018
Carbon budgets in northern Swedish forests, 1800-2013
Gustav Stål
Examensarbeten 2018:6Fakulteten för skogsvetenskap Institutionen för skogens ekologi och skötsel


ISSN 1654-1898 Umeå 2018 Swedish University of Agricultural Sciences / Sveriges Lantbruksuniversitet Faculty of Forest Sciences / Fakulteten för skogsvetenskap Master of Science in Forestry / Jägmästarprogrammet Master degree thesis in Forest Sciences / Examensarbete i skogsvetenskap EX0818, 60 hp, advanced level A2E / avancerad nivå A2E
Supervisor / Handledare: Tomas Lundmark SLU, Dept of Forest Ecology and Management / SLU, Inst för skogens ekologi och skötsel Assistant supervisor / Bitr handledare: Annika Nordin SLU, Dept of Forest Genetics and Plant Physiology / SLU, Inst för skoglig genetik och växtfysiologi Examiner / Examinator: Lars Lundqvist SLU, Dept of Forest Ecology and Management / SLU, Inst för skogens ekologi och skötsel
Carbon budgets in northern Swedish forests, 1800-2013
Kolbalansen i norra Sveriges skogar, 1800-2013
Gustav Stål
Keywords / Nyckelord: Climate change mitigation, Northern Swedish forests, Carbon debt, Substitution, Harvested wood
products / Klimatförändringar, Norra Sveriges skogar, Kolskuld, Substitution, Träprodukter
Examensarbeten 2018:6Fakulteten för skogsvetenskap Institutionen för skogens ekologi och skötsel

I denna rapport redovisas ett examensarbete utfört vid Institutionen för skogens ekologi och skötsel, Skogsvetenskapliga fakulteten, SLU. Arbetet har handletts och granskats av handledaren, och godkänts av examinator. För rapportens slutliga innehåll är dock författaren ensam ansvarig.
This report presents an MSc/BSc thesis at the Department of Forest Ecology and Management, Faculty of Forest Sciences, SLU. The work has been supervised and reviewed by the supervisor, and been approved by the examiner. However, the author is the sole responsible for the content.

Preface This paper is a master’s thesis in forest science which comprises 60 credits, at the Department of
Forest Ecology and Management. The complex question of how forests and forest management can help mitigate the threat of climate
change on human health and concurrently provide services and products for well-being is of great concern. To help me answer this question I contacted Professor Tomas Lundmark at the Department of Forest Ecology and Management, who is an expert in adaptive forest management and climate change mitigation. I first contacted him in spring 2016, and via mail correspondence we outlined the premise for this master’s thesis and came up with a holistic approach to address it. Because of the many factors that influence how forests and forest management relate to the carbon balance between the atmosphere and the terrestrial zone, a large amount of literature was studied. In this project, gaps in my personal knowledge about how forests and forest management interact with the atmosphere and how this interaction is a part of the bigger puzzle that controls the climate have been filled. Forest management in relation to climate change mitigation is a crucial part of our future and should be addressed more in the Master of Science forestry program at the Swedish University of Agricultural Sciences (SLU).
I acknowledge the support of Professor Lars Östlund at the Department of Forest Ecology and Management for the assistance in trying to recreate a historic forest condition; Mr. Neil Cory at the Department of Forest Resource Management for providing processed data from the National Forest Inventory; Professor Annika Nordin, Program Manager for the Future Forest project, for her insightful reflections about the work in general; and Mr. Johan Stendahl at the Swedish Forest Soil Inventory for information and reflections about Swedish forest soil carbon stocks. Finally, I would like to thank my supervisor Professor Tomas Lundmark for the provision of his knowledge, great support, and for letting me discuss my thoughts and encouraging creative thinking.
Gustav Stål, Sweden, Umeå
May 2017

Table of Contents
1. Introduction ....................................................................................................................................1 1.1. Aim ...........................................................................................................................................3
2. Background ....................................................................................................................................4 2.1. Carbon balance of forest ...........................................................................................................4
2.1.1. Carbon balance of managed forests ..................................................................................5 2.1.2. Carbon balance of old-growth forests ..............................................................................5
2.2. Substitution, sequestration, and climate change mitigation .....................................................6 2.3. Soil carbon ................................................................................................................................6
2.3.1. Swedish soil carbon stocks ...............................................................................................7 2.4. Carbon debt ..............................................................................................................................7
3. Material and method .......................................................................................................................9 3.1. Study area .................................................................................................................................9 3.2. History of northern Sweden......................................................................................................9
3.2.1. Deadwood .......................................................................................................................11 3.2.2. Tree-species distribution and small diameter trees .........................................................11 3.2.3. Substitution becomes a climate change mitigation factor ..............................................11
3.3. Historical data on the state of the forest .................................................................................12 3.3.1. Data from studies on historical estimates of growing stocks. ........................................13 3.3.2. Deciduous trees and small diameter trees.......................................................................14
3.4. Present inventory data from protected areas...........................................................................14 3.5. Calculation of carbon pools and forest carbon uptake from 1800-2013 ................................15
3.5.1. Deadwood .......................................................................................................................15 3.5.2. Biomass expansion factor ...............................................................................................16 3.5.3. Soil carbon ......................................................................................................................16 3.5.4. Harvested wood products ...............................................................................................16 3.5.5. Substitution .....................................................................................................................17
3.6. Summary of assumptions .......................................................................................................18
4. Results ..........................................................................................................................................19 4.1. Total carbon stocks, carbon debt and carbon pool development ............................................19 4.2. The forest carbon uptake ........................................................................................................21 4.3. Sensitivity analysis and alterations of independent variables.................................................22
5. Discussion ....................................................................................................................................26 5.1. Conclusion ..............................................................................................................................30
6. References ....................................................................................................................................31

AbstractForests and forest management can mitigate increased carbon dioxide (CO2) concentrations in the
atmosphere through sequestration of carbon and/or substitution. A major question has been whether it is better to use or conserve forests, with some claiming that European forests carry a huge carbon debt as a result of forestry.
The overall aim of this study was to quantify a baseline for the total carbon stock in the pre-industrial forest (PIF) (1800-1850) for the two northernmost counties in Sweden, Västerbotten and Norrbotten, and the carbon stock development until 2013. The total carbon storage in the forest was divided into three carbon pools, including above and below-ground biomass, soil, and deadwood. Also, the carbon sequestered in the harvested wood product (HWP) pool was estimated and added to the analysis. The estimated pre-industrial forest state was based on existing studies of forest history and inventory data from areas with no or limited impact of forestry. From 1923, inventory data from the national forest inventory (NFI) were used. The concept of climate change mitigation efficiency (CCME) was applied to describe the total effect of forest use, i.e. the average avoided and reduced CO2-emissions per cubic meter of harvested biomass. A sensitivity analysis was conducted on different levels of wood storage in the pre-industrial forest and altered soil carbon accumulation rate and substitution effects were analyzed.
The results showed that a carbon debt had occurred largely during the 19th century and had been repaid in 2001. The carbon debt payback time was almost 100 years but could have been faster with a product use strategy resulting in higher CCME. The sensitivity analysis shows that the above ground carbon stock in the PIF, had the largest impact on the size of the carbon debt. It also confirms that the carbon debt was of a temporary character and has most likely been repaid. The present trajectory of the forest sectors carbon balance in the study area outlines that active forest management increases carbon stocks in the forests and forest-based products. While allowing for substitution of fossil-based products and energy-intensive materials. Consequently, climate change is mitigated since the buildup of CO2 concentration in the atmosphere is countered due to the carbon sink in the forest, HWP and the substitution effect from the use of forest products.
Keywords: Climate change mitigation, Northern Swedish forests, Carbon debt, Substitution, HWP

Sammanfattning
Skogen och skogsbruket kan motverka ökande koncentrationer av koldioxid i atmosfären genom att lagra kol i skogen och i skogsprodukter eller genom substitution. En återkommande fråga har varit huruvida det är bättre att använda eller spara skogar för att motverka klimatförändringar. Vissa menar att europeiska skogar har bidragit till klimatförändringen genom stora nettoutsläpp av koldioxid till följd av skogsbruk.
Det övergripande syftet med denna studie var att försöka bestämma storleken på kollagret i den förindustriella skogen (1800–1850) i de nordligaste delarna av Sverige samt hur kollagret har förändrats över tid, fram till 2013. Det totala kollagret i skogen var uppdelat i tre kolpooler levande trädbiomassa, död ved och mark. Upplagringen av kol i avverkade träprodukter samt mängden undvikna utsläpp till följd utav substitution av fossila produkter och energiintensiva material analyserades också. Det uppskattade förindustriella skogstillståndet var baserat på befintliga studier i skogshistoria samt inventeringar i avsatta områden i studieområdet. En känslighetsanalys på det uppskattade levande virkesförrådet samt analyser på förändrad substitutionseffekt och kolupplagringshastighet i marken utfördes.
Resultatet visar att en kolskuld hade skapats under 1800-talets senare hälft men blivit helt eller i det närmast helt återbetald under 2000-talet. I studiens grundscenario återbetalades kolskulden på 96 år vilket kunde ha minskat om en produktanvändningsstrategi mot mera långlivade träprodukter samt mindre pappersmassa hade använts. Känslighetsanalysen visade att kolförrådet i levande biomassa hade störst betydelse för kolskuldens storlek och styrker samtidigt ett antagande om att kolskulden har blivit återbetald helt eller nästan helt fram till dags dato.
Denna studie tyder på att skogen och skogssektorn i norra Sverige ökar kollagren i skogen samt i träprodukter och tillåter substitution av fossila bränslen och mera energiintensiva material. Följaktligen motverkas klimatförändringen eftersom uppbyggnaden av koldioxid i atmosfären motverkas på grund av upplagring av kol i skogen, skördade träprodukter och inte minst till följd av de undvikna utsläppen som uppstår när trä används istället för fossila material och cement.
Nyckelord: Klimatförändringar, Norra Sveriges skogar, Kolskuld, Substitution, Träprodukter

1
1. Introduction There are two key climate change indicators; global surface temperatures and the extent of the Arctic
sea ice. Both broke several records in 2016 for highest temperatures and smallest Arctic sea ice extent (GISTEMP, 2016). The main driver of these changes is anthropogenic activities such as fossil fuel combustion, cement production, deforestation and other land use changes releasing greenhouse gases (GHG) into the atmosphere (Crowley, 2000). Carbon dioxide (CO2), methane, nitrous oxide and fluorinated gases are four major GHGs. The most important GHG is CO2 which in 2010 contributed to 76% of total global emissions due mainly to combustion of fossil fuels (coal, gas, and oil) and industrial processes (IPCC, 2014).
The process of photosynthesis, both in the aquatic and terrestrial zone, is specifically important for the uptake of CO2 from the atmosphere (Read et al., 2001). Since the pre-industrial era, about 40% of all anthropogenic CO2 emissions have remained in the atmosphere and 30% have been absorbed by the oceans while the rest have been stored in the terrestrial zone within plants and soil (IPCC, 2014). Before industrialization global CO2 concentrations in the atmosphere were well below 300 parts per million (ppm) but since then these CO2 concentrations have increased rapidly and are now over 400 ppm with the largest increase from the second half of the 20th century (Figure 1). Last time CO2 concentrations reached these levels was around 4.5 million years ago and global average temperatures were ~3-4°C higher than today (Martinez-Boti et al., 2015). The consequences of a changing climate is changing biodiversity due to adaptation of ecosystems, rising sea levels, warming of the oceans, ocean acidification, storms, pest and drought among other direct and indirect effects which in turn affect human health and welfare (Cardinale et al., 2012; Maestre et al., 2012; Midgley, 2012; Knutson et al., 2010; Lindner et al., 2010; Hoegh-Guldberg et al., 2007; Parmesan & Yohe, 2003; Sala et al., 2000).
Figure 1. The Keeling-curve. CO2 reading from the Mauna Loa observatory in Hawaii which has measured CO2 concentrations in the atmosphere since 1958 (SIO, 2017).
The fact that the climate is changing has led to numerous political agreements on a global scale. In 1994, the United Nations Framework Convention on Climate Change (UNFCCC) entered into force and has been ratified by 197 nations. The main objective is to stabilize concentrations of human-made GHGs in the atmosphere to prevent interference with the climate system, while ensuring sustainable food
2
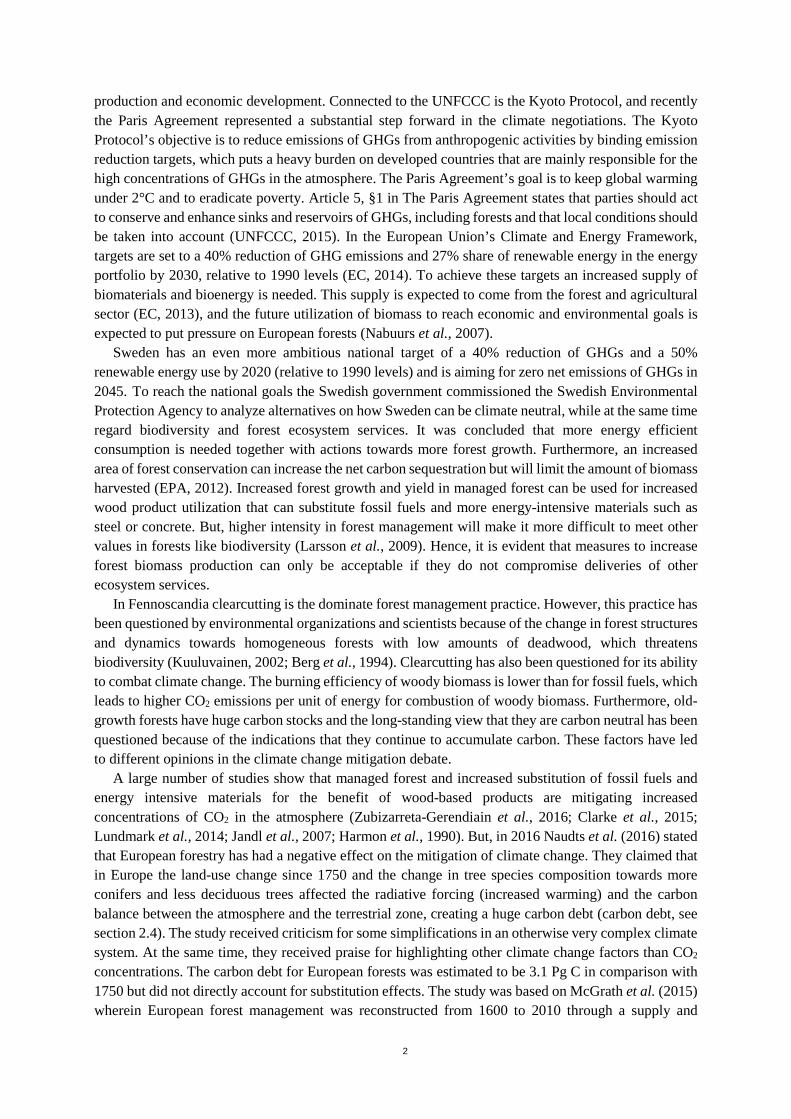
production and economic development. Connected to the UNFCCC is the Kyoto Protocol, and recently the Paris Agreement represented a substantial step forward in the climate negotiations. The Kyoto Protocol’s objective is to reduce emissions of GHGs from anthropogenic activities by binding emission reduction targets, which puts a heavy burden on developed countries that are mainly responsible for the high concentrations of GHGs in the atmosphere. The Paris Agreement’s goal is to keep global warming under 2°C and to eradicate poverty. Article 5, §1 in The Paris Agreement states that parties should act to conserve and enhance sinks and reservoirs of GHGs, including forests and that local conditions should be taken into account (UNFCCC, 2015). In the European Union’s Climate and Energy Framework, targets are set to a 40% reduction of GHG emissions and 27% share of renewable energy in the energy portfolio by 2030, relative to 1990 levels (EC, 2014). To achieve these targets an increased supply of biomaterials and bioenergy is needed. This supply is expected to come from the forest and agricultural sector (EC, 2013), and the future utilization of biomass to reach economic and environmental goals is expected to put pressure on European forests (Nabuurs et al., 2007).
Sweden has an even more ambitious national target of a 40% reduction of GHGs and a 50% renewable energy use by 2020 (relative to 1990 levels) and is aiming for zero net emissions of GHGs in 2045. To reach the national goals the Swedish government commissioned the Swedish Environmental Protection Agency to analyze alternatives on how Sweden can be climate neutral, while at the same time regard biodiversity and forest ecosystem services. It was concluded that more energy efficient consumption is needed together with actions towards more forest growth. Furthermore, an increased area of forest conservation can increase the net carbon sequestration but will limit the amount of biomass harvested (EPA, 2012). Increased forest growth and yield in managed forest can be used for increased wood product utilization that can substitute fossil fuels and more energy-intensive materials such as steel or concrete. But, higher intensity in forest management will make it more difficult to meet other values in forests like biodiversity (Larsson et al., 2009). Hence, it is evident that measures to increase forest biomass production can only be acceptable if they do not compromise deliveries of other ecosystem services.
In Fennoscandia clearcutting is the dominate forest management practice. However, this practice has been questioned by environmental organizations and scientists because of the change in forest structures and dynamics towards homogeneous forests with low amounts of deadwood, which threatens biodiversity (Kuuluvainen, 2002; Berg et al., 1994). Clearcutting has also been questioned for its ability to combat climate change. The burning efficiency of woody biomass is lower than for fossil fuels, which leads to higher CO2 emissions per unit of energy for combustion of woody biomass. Furthermore, old-growth forests have huge carbon stocks and the long-standing view that they are carbon neutral has been questioned because of the indications that they continue to accumulate carbon. These factors have led to different opinions in the climate change mitigation debate.
A large number of studies show that managed forest and increased substitution of fossil fuels and energy intensive materials for the benefit of wood-based products are mitigating increased concentrations of CO2 in the atmosphere (Zubizarreta-Gerendiain et al., 2016; Clarke et al., 2015; Lundmark et al., 2014; Jandl et al., 2007; Harmon et al., 1990). But, in 2016 Naudts et al. (2016) stated that European forestry has had a negative effect on the mitigation of climate change. They claimed that in Europe the land-use change since 1750 and the change in tree species composition towards more conifers and less deciduous trees affected the radiative forcing (increased warming) and the carbon balance between the atmosphere and the terrestrial zone, creating a huge carbon debt (carbon debt, see section 2.4). The study received criticism for some simplifications in an otherwise very complex climate system. At the same time, they received praise for highlighting other climate change factors than CO2 concentrations. The carbon debt for European forests was estimated to be 3.1 Pg C in comparison with 1750 but did not directly account for substitution effects. The study was based on McGrath et al. (2015) wherein European forest management was reconstructed from 1600 to 2010 through a supply and

3
demand approach for wood and wood-based products. The same method has also been used for the reconstruction of smaller pre-industrial forest (PIF) areas in northern Sweden, and in northern Sweden a change in tree species composition is much less pronounced than in Europe as a whole. Moreover, the northern parts of Sweden were much less populated and large-scale forestry was introduced much later (mid- 19th century), and it is increasingly difficult to find documents and records of forested areas from distant past. Therefore, it is of particular interest to reconstruct the total carbon storage in the PIFs of the northernmost parts of Sweden, which were the last areas to be affected by large-scale logging in the country and where it is still possible to find some information about the status of the forests. This can give an estimate with higher accuracy than in McGrath et al. (2015) whom worked with higher resolution which gives more uncertainties.
The first large-scale exploitation of northern Swedish forests has been described as very intense and it led to a decline in growing stocks. However, since the first NFI in 1923, growing stocks have stabilized and increased but it is still unclear how much forests there were in the PIF in northern Sweden. In this sense it is also unclear how large the carbon debt became after the period of intense exploitation. Moreover, was that carbon debt repaid since a more active management was introduced in the early 20th century? According to Harmon et al. (1990) it can take up to 200 years to repay the carbon debt that occur when old-growth forests is converted to plantations (not including substitutional effects) and Naudts et al. (2016) stated that Europe’s forest still had a large carbon debt. To answer these questions for the northernmost Sweden, the total carbon stock in the PIF areas must be determined which will have to be based on old records and documents of forests states and utilizations in Sweden. Though, it should be noted that even in the northernmost parts of Sweden indigenous people and early farmers have utilized the forests to some extent prior industrialization. That is why the forests cannot be defined as a primary forests according to the Food and Agriculture Organization of the United Nations. They defines a primary forest as: “Naturally regenerated forests of native species, where there are no clearly visible indications of human activities and the ecological processes are not significantly disturbed” (FAO, 2015). Therefore, the term PIF is used before 1850 and the industrialization and exploitation of northern Swedish forests.
1.1. Aim The overall aim of this study was to quantify a baseline for the total carbon stock in the PIFs (1800-
1850) for the two northernmost counties in Sweden, Västerbotten and Norrbotten. The total carbon stock included above- and below-ground biomass, deadwood, and soil (O-horizon down to 50 cm mineral soil). From this baseline the dynamics of total carbon stock development in the forest was calculated until 2013, where carbon in the harvested wood products (HWP) pool along with a substitution effect was also included. Four more specific aims of this study were to: 1) quantify a presumed remaining carbon debt; 2) analyze the long-term effects of forest management and an increased use of forest products with long lifespans on the forest carbon balance; 3) determine a potential carbon debt payback time; and 4) conclude how the utilization of forests in the northernmost parts of Sweden have affected the carbon concentration in the atmosphere.

4
2. Background
2.1. Carbon balance of forest A forest stand, ecosystem or biome can remove CO2 from the atmosphere and are then referred to as
a carbon sink and in the reverse scenario a carbon source. A net removal of CO2 occurs as long CO2 fixation via photosynthesis (gross primary production, GPP) surpluses CO2 emissions via autotrophic (Ra) and heterotrophic respiration (Rh). Net primary production (NPP) equals GPP minus Ra. In the forest sector, focus is normally on net production of woody biomass (NPPw), in other words the share of GPP of the trees minus Ra of the trees allocated to above-ground production and coarse roots. NPPw is about half of the NPP. The net accumulation of carbon in an ecosystem, net ecosystem production (NEP), is NPP minus Rh. NEP can be considered as the most relevant parameter of carbon balance from the atmospheric perspective. If non-respiratory carbon losses (storm, fire, harvest etc.) are added to the NEP, we get the net biome production (NBP). In a sustainably managed forest system annual harvesting is lower than annual NEP. Harvesting decreases NBP but allows the use of renewable forest products to substitute fossil-based products and other energy-intensive materials. Consequently, CO2 emissions will be avoided. How the carbon budget in the terrestrial system relates to the atmosphere over time is illustrated in figure 2. The above-mentioned carbon fluxes in a forest ecosystem depend on forest conditions such as stand structure, tree age and species composition but also on environmental factors, natural disturbance and harvesting. An analyses of carbon balance will also depend on the spatial and temporal scale that is assumed (IPCC, 2017).
A large part of European forests is subjected to silviculture, and European forests have proven to be sinks also when harvesting is considered (Bellassen et al., 2011; Ciais et al., 2008; Nabuurs et al., 2003; Nabuurs et al., 1997). When discussing the terrestrial carbon uptake two different techniques have been widely applied; biometric measurements (inventory based) and eddy covariance observations. The eddy covariance technique measures the exchange, or fluxes, of gases between the atmosphere and the terrestrial zone while biometric measurements quantify differences in the carbon pools.
Figure 2. Terrestrial carbon uptake. GPP (gross primary production) = carbon fixed in the process of photosynthesis. Ra (autotrophic respiration) = respiration from plants. NPP (net primary production) = GPP reduced by Ra. Rh (heterotrophic respiration) = respiration from decomposition. NEP (net ecosystem production) = NPP reduced by Rh. D (disturbance). NBP (net biome production) = NEP over several ecosystems reduced by D. At a global level GPP is approx. 120 Gt C yr-1, NPP is approx. 60 Gt C yr-1, NEP is approx. 10 Gt C yr-1 and NBP is approx. ± 1 Gt C yr-1 (IPCC, 2017).

5
2.1.1. Carbon balance of managed forests
The aim of a managed forest is usually to allow for sustainable harvest levels and an even flow of timber. To meet this boundary condition Swedish forests are divided into management units (stands) to provide for planning and efficient management. Forestry in Sweden is largely based on clearcutting with even-aged forest stands and an even age-class distribution at the landscape level (Yrjölä, 2002). Tree growth of managed even-aged stands follows a pattern whereby the current annual increment (≈NPPw) increases after stand establishment, peaks when maximum leaf area is attained, and then declines (Assmann, 1970). Directly after a regeneration cut a managed forest stand can be a source of carbon, but during most of a rotation cycle the stand is a sink (Zha et al., 2009; Desai et al., 2005; Valentini et al., 2000; Schulze et al., 1999). Lagergren et al. (2006) found that Swedish forests were a strong carbon sink with an average annual NEP of 1.27 Mg C ha-1 yr-1, assuming a steady state (carbon flux equal zero) in the soil. Stem volume increment (≈NPPw) across a forest landscape is maximized if the harvest is performed when the mean annual volume increment in each forest stand culminates. This occurs when the current annual increment intersects with the average annual increment since stand establishment. In Fennoscandia forest management development is driven by society’s product demands, resulting in a continuous improvement in the efficiency of forestry (Nordin & Sandstrom, 2016; Filip et al., 2000). This has led to increased NPPw and lower Rh at the landscape level, allowing for an increased harvest without lowering the growing stock. This has been the situation in many European countries as well, but less active management during the last few decades has resulted in older forests and signs of saturated NEP (Nabuurs et al. (2013).
2.1.2. Carbon balance of old-growth forests
Old-growth forests contain large amounts of carbon and NBP is normally low over longer periods, and their carbon flux has long been presumed to be in a neutral stage. The idea that old-growth forests are carbon neutral comes from the theory that respiration and carbon sequestration in forests and soil cancel each other out, meaning that NEP between the biosphere and the atmosphere equals zero (Desai et al., 2005). Though, other studies suggest that old-growth forests can continue to accumulate carbon, especially in the soil (Wharton & Falk, 2016; Xu et al., 2014; Luyssaert et al., 2008; Zhou et al., 2006; Knohl et al., 2003). Luyssaert et al. (2008) studied eddy covariance measurements of old-growth forests in the boreal and temperate regions and estimated that forest >200 years had an average NEP of 2.4 ± 0.8 Mg C ha-1 yr-1 where 1.3 ± 0.8 Mg C ha-1 yr-1 was sequestered in soil, roots, and soil organic matter. If an old-growth forest >200 years would sequester as much carbon as suggested by Luyssaert et al. (2007) the highest number would correspond to a mean stem volume increment of about 12,8 m3 ha-1 yr-1. This is equal to a site productivity of a Norway spruce stand on the most fertile soil in the south of Sweden. These somewhat controversial findings were challenged by Xu et al. (2014) who compared the eddy covariance database of Luyssaert et al. (2007) (used in Luyssaert et al. (2008)) with biometric measurements and found that in comparison the eddy covariance measurements overestimated the carbon sink and that planted forests had higher NEP. This was due to an exponential increase, with increasing NPP, in Rh in natural forests while planted forests Rh seemed to level out. Still, carbon accumulation in old-growth forests should be regarded. Yet, carbon flux in old-growth forests does not seem to be in a steady state neither in a short nor in a long-time perspective. Knohl et al. (2003) used eddy covariance measurements over an old-growth beech forest in Germany and saw that carbon flux differed depending on the time of day and year. More than a decade of carbon flux measurements in old-growth forests in the American Pacific northwest showed that old-growth forests can oscillate between being a carbon sink and a source depending on climate variabilities (Wharton & Falk, 2016). It has been suggested that old-growth forests carbon balance might be effected by anthropogenic induced

6
changes in the atmosphere such as increased temperature, CO2 concentrations, and nitrogen deposition (Hyvonen et al., 2007).
2.2. Substitution, sequestration, and climate change mitigation Sustainable forest management can mitigate the buildup of CO2 concentrations in the atmosphere in
two ways. One way is sequestration, wherein CO2 is removed from the atmosphere through photosynthesis and stored in living and dead biomass and soils. The second way is when HWP substitute or displace fossil fuels or more energy-intensive materials for example cement in construction, which leads to reduced emissions to the atmosphere and buildup of the HWP carbon pool. This leads to trade-offs in the climate change mitigation strategy. A reduced harvest leads to an increased carbon stock in the forest while reducing the potential for substitution and avoided emissions and vice versa. It is important to note that both storage and substitution can be increased by increased tree growth, just not at the same time. The NEP determines how much carbon that can be stored and/or used for consumption.
The importance of a holistic approach that simultaneously consider substitution effects and carbon stock changes has been outlined in several studies (Ji et al., 2016; Lundmark et al., 2016; Lundmark et al., 2014; Klein et al., 2013; Sathre & O'Connor, 2010; Hennigar et al., 2008) and the benefit of using wood products with long lifespans is underlined by (Klein et al., 2013). Furthermore, energy can be gained and fossil emissions avoided when wood-based products and fibers are reused (cascade effects) (Sikkema et al., 2013). By substituting fossil-based products and energy intensive materials, such as fossil fuel, steel or concrete with wood-based products Lundmark et al. (2014) concluded, that if current Swedish forestry practice continues it would correspond to 60 million tons of avoided CO2 annually within Sweden and abroad. However, effects of substituting fossil-based products and energy intensive materials with woody biomass varies a lot between studies and are dependent on several criteria and assumptions like wood density, factors connected to harvest and forest management, product displacement, and product life span. An important sustainability criterion is that the overall volume increment in a forest landscape must be higher than the overall biomass harvested to avoid a net loss of carbon from the landscape and a reduced forest resource in the long term.
One cubic meter of spruce and pinewood contains ≈206 kg of carbon corresponding to ≈755 units of carbon dioxide. Climate change mitigation efficiency (CCME) is a substitution factor expressed as avoided emissions expressed as Mg CO2-eq/m3 of utilized wood. In different studies, the CCME for forest biomass varies between 0,3-1.0 Mg CO2-eq/m3 (Braun et al., 2016; Lundmark et al., 2014; Pukkala, 2014; Klein et al., 2013; Werner et al., 2010). A meta-analysis including 21 different studies on substitution effects of construction wood performed by Sathre and O'Connor (2010) showed an even higher substitution effect that varied between 1.0-3.0 Mg C avoided emissions per Mg C content in wood (Mg C/Mg C). Werner et al. (2010) used a CCME of 0,6 Mg CO2-eq/m3 for biofuels while Wihersaari (2005) concluded that a substitution rate corresponding to 0,56 Mg CO2-eq/m3 can be justified. It should be noted that substitution is additive since avoided emissions represent a climate benefit where the effects accumulate over time.
2.3. Soil carbon The world’s forests are large carbon sinks and in the boreal forest most of the carbon is in the soil
(Pan et al., 2011; Nabuurs et al., 2003; Dixon, 1994). The vegetation turns the captured CO2 into polymers, which are the building blocks of different plant tissues. Via litter fall and decomposition some of the carbon from the vegetation will add to the soil carbon stock, while some will be emitted back to the atmosphere through Rh from decomposing substrates. The soil carbon pool in the boreal forest has

7
developed slowly over a period of 6,000-10,000 years since the last glaciation period and among forest ecosystems the largest pool of soil carbon is found in the boreal forest (Janzen, 2004; Raich & Schlesinger, 1992). About two-thirds of the carbon storage in a boreal forest ecosystem can be found in the soil (Pan et al., 2011; Dixon, 1994). Therefore, short-term significant changes in forest soil carbon stocks can outweigh changes in above ground vegetation carbon stocks (Medlyn et al., 2005). Some studies indicate that harvesting and site preparation can decrease the soil carbon stocks through loss of litter input, changes in belowground vegetation, and altered soil hydrology and temperature, which accelerate decomposition and leads to leaching of dissolved organic carbon. (Jackson et al., 2000; Kalbitz et al., 2000; Johnson et al., 1995). Others indicate that decomposition rates decrease after clearcutting and that harvest residues compensate for reductions of biomass input (Lal, 2005; Yanai et al., 2003). Therefore, below-ground carbon stocks must be considered in discussions of carbon sequestration in forest ecosystems after wood harvesting (Clarke et al., 2015).
2.3.1. Swedish soil carbon stocks
The National Forest Soil Inventory (NFSI) collects information about the Swedish soils through field-based measurements on permanent inventory plots throughout Sweden. A challenge when estimating soil carbon stocks in Sweden and in many other countries is that the dominating soil type is moraine which constitutes of an unsorted mixture of particles in different sizes (>0,002mm - <60cm). Another challenge when trying to estimate an average soil carbon stock over larger areas is the variation in site factors which can greatly impact litter production and decomposition and therefore the soil carbon accumulation. These challenges are not unique for Sweden but the consistent, standardized measuring, and the permanent inventory plots throughout the country that coincide with the plots for the NFI make these datasets among the best in the world. A couple of studies have been conducted based on data from the NFI and NFSI on soil carbon stocks in Swedish forests (with different methods and variables analyzed) and showed a national soil carbon stock average range from 47 Mg C ha-1 to 93 Mg C ha-1 (<100cm depth) (Ortiz et al., 2013; Stendahl et al., 2010; Olsson et al., 2009; Agren et al., 2008; Liski et al., 2002). Agren et al. (2008) used a model-based approach with NFI data to calculate carbon stocks in Swedish forest soils from 1926-2000 and found a national average soil carbon accumulation of 0.075 Mg C ha-1 yr-1, with an accumulation in the far north of ~0.01 Mg C ha-1 and up to 0.1 Mg C ha-1 in the south. Another model-based approach by Liski et al. (2002) showed an annual average soil carbon stock accumulation of 0.09 Mg C ha-1 yr-1 in Sweden. Site characteristics that correlate with accumulation of soil carbon are latitude, nitrogen deposition, temperature sum, site productivity, and hydrology, which negatively correlate with latitude and positively correlate with nitrogen deposition, temperature sum, site index and hydrology (Stendahl et al., 2010; Olsson et al., 2009; Agren et al., 2007). Scots pine is a more common tree species in the north (NFI, 2016) and Stendahl et al. (2010) showed that Scots pine dominating sites contain less soil carbon than Norway spruce dominating sites, in total 57 Mg C ha-1 and 92 Mg C ha-1, respectively. These factors make the northern parts of Sweden accumulate less carbon than the more southerly parts as demonstrated in Agren et al. (2008).
2.4. Carbon debt In this study the concept of carbon debt refers to the reduction in carbon stock that may occur due to
anthropogenic or natural disturbance of forests, where the loss of carbon is assumed to have been released to the atmosphere. It is important to consider both the temporal and spatial scale when analyzing the carbon debt in forests. Harvests can lead to a carbon debt when extraction of wood exceeds the volume increment. This is typically the case for harvests in old-growth forests with a low level of NEP and long recovery times for the growing stock. The carbon debt can be repaid by sequestration of carbon
8
in the re-growing vegetation, in the area harvested, and reduced if the harvested wood is used for substitution and/or to increase the HWP carbon stock. A distinction must also be made between carbon debt at the stand level and at the landscape level. A carbon debt at the stand level can be compensated by regrowth in other stands at the landscape level, while a carbon debt at the landscape level is an overall carbon debt of the system.
Studies have been made on carbon debts in futuristic scenarios with different levels of harvest, management systems, and wood use strategies, where carbon balances have been calculated and compared. Nabuurs et al. (2017) concluded that with a higher demand on wood for bioenergy a likely increase in harvest levels would not create a carbon debt in European forests. This was because the volume increment in European forests still exceeded the volume harvested. Pukkala (2017) compared simulations of different harvesting scenarios with a scenario where all harvesting had ceased. This comparison was made for 210 years and it was concluded that the carbon balance of the ceased harvesting scenario was better in the short time perspective while all harvesting scenarios were better in a longer time perspective. In Sweden, current annual volume increment is higher than the volume harvested and has been so since the start of the NFI in 1923 (NFI, 2016). However, that has not always been the case; during industrialization in the mid-1800s, demand for forests in Europe increased sharply, and the previously relatively untouched forest that remained in the Nordic countries began to be exploited (see 3.2). It is very likely that during this period harvesting exceeded growth at a regional scale creating a carbon debt.

9
3. Material and method
3.1. Study area The study included the two counties Norrbotten and Västerbotten in
northern Sweden (from now on referred to as the study area, see Figure 3) and was restricted to the productive forest land constituting 6,593,000 ha, excluding national parks, nature reserves, and set asides that are protected from forestry as of 2016. The definition of productive forest land is that the stem-wood production capacity is at least 1 m3 ha-
1 yr-1. The areas latitudinal range is from 63°N to 68°N and borders Finland and the Baltic Sea to the east and the Scandinavian mountain chain to the west with an increasing altitude from east to west, which leads to lower productivity to the northwest. This is within the boreal and north boreal vegetation zone dominated by coniferous forest. Today the average growing stock is 96 m3 ha-1 with a mean productivity of 3.1 m3 ha-1 yr-1 and a mean age of 60 years. The silvicultural system practiced is even-aged management with a rotation cycle ranging from 80-140 years. Still ~17% of the forests have an age of >120 years. The main tree-species are Scots pine (Pinus sylvestris (L.)) and Norway spruce (Picea abies (L.) Karst.), which constitutes >80% of the growing stock. Harvest levels have over time remained at about the same level since 1957 while volume increment and growing stock have increased since the 1950s (NFI, 2016) (Figure 4). The study period ranged from 1800-2013.
3.2. History of northern Sweden In pre-industrial times, human impact on the forest landscape of northern Sweden was limited to the
indigenous people (Sami) and early farmers (Rautio et al., 2016; Josefsson et al., 2010; Ostlund et al., 1997). The Sami relied on reindeer herding for their subsistence since the 11th century (Bergman et al., 2008) and cutting of trees, mainly birch, pine, and snags (standing dead trees), was primarily for firewood and building construction (Josefsson et al., 2010). The early farmers also used the trees for tar production and manufacturing of tools (Rautio et al., 2016). From the late 18th century and ending in the 1860s, some farmers produced potash from deciduous trees and locally this was a large industry (Ostlund et al., 1998; Tiren, 1937). Tar and potash production had a wider impact on the forest landscape since the cutting of trees was not restricted to the immediate surroundings of the settlements (Ostlund et al., 1997). These pre-industrial land uses have often been neglected, but studies indicate that it can still influence the composition and structure of areas, which have been described as untouched by humans (Josefsson et al., 2010). On the other hand, these activities had a minor impact on the overall landscape in comparison with the exploitation and the effective control of fires that was introduced along with the large-scale logging of northern Swedish forest in the 19th century. Along with the industrial revolution in Europe there became an increasing demand for construction timber. In the second half of the 1800s this led to the establishment of sawmills along the northern Swedish coast, and old growth forests was exploited on old large diameter trees throughout the second half of the 19th century (Josefsson & Ostlund, 2010). Furthermore, in the early 20th century there was an increasing demand for pulpwood, firewood, and small diameter saw timber which allowed for cutting of small diameter trees (Ostlund et
Figure 3. Sweden, grey area is the study area constituting the two counties of Norrbotten and Västerbotten.

10
al., 1997). With no real consideration for regeneration, this led to a decline in northern Swedish forest stocks during the industrialization. Yet, with the aim of a more sustainable forest sector, the first Swedish Forestry Act was established in 1903 and put in operation in 1905. It was a forest legislation aimed to secure regeneration of forests, stating that everyone who harvested trees was obliged to regenerate the forest stands that were cut down (Ekelund & Hamilton, 2001).
In 1909, Sweden was the first European country to establish national parks (EPA, 2017). A national park’s purpose is to maintain the natural state of large areas when it comes to forests flora and fauna, and structural dynamics. Nature reserves is another conservation measure with the main purpose of species conservation and are not restricted to a specific size. However, predominantly all national parks and nature reserves have to some extent been subjected to anthropogenic activities in the past (Josefsson et al., 2009). Studies have shown that nature reserves tend to have a lower productivity than the average forest land and that they are skewed to old Norway spruce stands in the northwest Sweden (Simonsson et al., 2016; Fridman, 2000). Though, lack of natural fire disturbance due to improved fire protection has probably allowed these kinds of forest to accumulate biomass without disruption. Before industrialization, the coniferous northern Swedish boreal forest was disturbed by fires with a mean interval of about 80 years (Zackrisson, 1977; Kohh, 1975).
In the first half of the 20th century harvests remained at a relatively high level because of an expanding pulp and paper industry and the positive effects on the timber market after World War I (Lundmark et al., 2013). This meant that Sweden quickly became a wealthy industrialized nation. In the 1950s, clearcutting forests with an even age stand structure became the dominant forest management regime in Sweden, instead of selective cutting which had been practiced on an industrial scale since the mid-19th century (Lundmark et al., 2013). In Sweden there has been a steady increase in total growing stock since 1923 as previously mentioned but a visible increase in the study area cannot be distinguished until the mid-1950s (figure 4.) (NFI, 2016).
Figure 4. Moving five-year average growing stock in the study area and Sweden from 1923 until 2013. Primary y-axis growing stock Sweden, secondary y-axis growing stock study area. Excluding areas protected from forestry (national parks, nature reserves, etc.) as of 2016. Source: (NFI, 2016).
0
100
200
300
400
500
600
700
800
0,0
500
1000
1500
2000
2500
3000
3500
1923 1933 1943 1953 1963 1973 1983 1993 2003 2013
Mm
3
Mm
3
year
Sweden study area

11
3.2.1. Deadwood
A characteristic of the natural forest landscape in northern Sweden was, according to reports from travelers and foresters from the 1700s onwards, a large number of snags (dead standing trees) (Linder & Ostlund, 1998; Linder & Ostlund, 1992). According to Linder and Ostlund (1992), deadwood was a considerable part of the wood storage but their abundance and part of total volume estimates in historical records are scarce. It is presumed that there are and have been low quantities of dead trees in the northern boreal forest of Sweden during the 1900s compared with the PIFs due to the continuous removal of snags and logs for fuel wood and log-driving constructions (Rautio et al., 2016; Ostlund et al., 2013; Linder & Ostlund, 1998). In the same century, there was a general view that the forest should be cleared from unwanted trees such as damaged or newly dead trees and it was recommended in the 1979 Swedish Forestry Act (SKSFS, 1979:3). However, as of 1993, according to the Swedish Forestry Act (SKSFS, 1993:2), it is allowed to leave up to 5 m3 ha-1 newly deadwood. The reason behind the previous recommendations and the current limit of 5 m3 ha-1 is to minimize the risk for pest outbreaks by removing suitable substrate for reproduction of unwanted insects and fungi. Removal of dead trees is the most dramatic change in the structure of the boreal Swedish forest landscape and 47% of red listed species are dependent on such substrate (Linder & Ostlund, 1998; Berg et al., 1994). From 1996 inventory data from the NFI contain information about deadwood in the landscape. Previously, both access and quality of information is poor.
3.2.2. Tree-species distribution and small diameter trees
Tree species distribution in the 19th century forests is not well documented and difficult to estimate. Linder and Ostlund (1998) found a 2-3% mixture of deciduous trees in Orsa Forest Common and Hamra State Forest, indicating a low proportion of deciduous trees at the end of the 19th century. Unpublished material by Elfing (2014) showed that the mean proportion of deciduous trees in virgin forests in the study area was 10% of the growing stock. Today about 15% of the growing stock in the study area consists of deciduous trees while areas protected from forestry (e.g. national parks, nature reserves) in the study area contained about 16-17% deciduous trees of the growing stock (NFI, 2016). However, tree species distribution varies between different areas, and estimations and descriptions may have been influenced by earlier human activities such as burning or selective cuttings.
Like the tree species distribution, small diameter trees also lack documentations in old records. The proportion of trees with a diameter <10 cm in breast height (DBH) in areas protected from forestry in the study area today is 8% of the growing stock. Corresponding figures for the production forest in the study area is about 12% of the growing stock (NFI, 2016).
3.2.3. Substitution becomes a climate change mitigation factor
A major part of Sweden’s energy usage in the first half of the 20th century came from coal, and in the 1930s it represented more than 50% of its total energy use (SEA, 2017). Yet, in mid-1910s, the industry started to utilize more fuel wood, which reduced the amount of coal needed. At the same time there was an expansion of the railroad to the north which increased the catchment area for charcoal. Also, at the end of the 1920s, large-scale industrial production of concrete commenced. This energy-intensive material became a competitor to wood-based building materials (SvenskBetong.se). During that period, about half of all wood consumption was for household heating, but at the end of World War II, both the consumption of wood for households and the usage of coal plummeted in favor of the cheaper and more manageable oil (SEA, 2017; Arpi, 1959).
In the 1950s, Sweden was one of the largest consumers of oil-based products per capita. Oil, gas, and coal for fuel, heating, and transportation became the base of today’s society and infrastructure. This led to a total dependency on oil as well as a societal vulnerability. When the oil price skyrocketed in the

12
1970s it led to an international oil crisis and an establishment of the International Energy Program in 1974. To guarantee the completion of the program Sweden adopted a law that could be applied to limit oil consumption (SFS, 1975:197). This reformation of the Swedish energy policies led to the search for new alternative energy sources. Sweden started to utilize nuclear energy and thereafter renewable energy to diminish its dependency on fossil fuels. Its final energy consumption from raw oil and petroleum-based products in 1970 amounted to 247 TWh while the amount of final energy consumption from biofuels represented only 45 TWh. Since then, the use of biofuels increased and are now almost tied with raw oil and petroleum based products which have decreased by more than 60% (SEA, 2017). Already in 2013, the amount of renewable energy of the total final energy consumption in Sweden was about 52% (Eurostat, 2015). Beginning in the 1990s, wood based biofuels increased and are now the single largest biofuel source in Sweden (SEA, 2017). The wood-based biofuels in Sweden derive from wood residues after harvest, industrial residues from saw-/paper mills, and from demolition and scrap wood.
3.3. Historical data on the state of the forest In Sweden, there are almost no forests that show a complete absence of human influence today,
including nature reserves and national parks (Nilsson & Gotmark, 1992). Therefore, to determine a PIF state and to get an idea and understand how forests in Sweden looked like before they were utilized, one must turn to historical archives, old studies, documents and reports from northern Sweden and the boreal zone. However, consistent and reliable inventory data on forest and forest structures before the industrialization in Sweden are scarce. There were no standardized measuring techniques and estimations of the state of the forest depended on subjective estimates. The reason for this is that there was no need for or interest in more thorough inventories before the industrial utilization of northern Swedish forests. Data in this study are mainly from published reports on forest history where historical records throughout northern Sweden were used (Table 1). The best data derived from state forests and forest commons in the late 1800s. Often inventories were carried out when forest holdings were divided or changed ownership and documents on timber sales could be used to assess the growing stock prior commercial exploitations (Linder & Ostlund, 1998). However, to get the best estimate possible of the growing stock in the PIF, more current inventory data from studies on protected areas such as national parks, nature reserves, and set asides were used although lack of natural disturbances must be taken into consideration.
Locations with inconsistent inventory data such as only stem counts or data points with high uncertainties at the level of previous harvests, as well as estimates that cannot explain what they are based on are ruled out. Because of the previous lack of interest in documentation of deciduous trees, small diameter trees and amount of deadwood (particularly lying deadwood) this information had to be complemented and generalized in some cases. Data from locations outside of the study area had to in the best way possible resemble that of the study area. Growing conditions (site productivity and altitude) outside of the study area have been compared and calibrated with growing conditions in the study area, based on information from the first NFI (SOU, 1932:26). All volume estimates on growing stocks are from the northern parts of Sweden while some data points on deadwood are derived from old-growth forests in Finland, Norway, and northwest Russia (Table 2). For practical reasons, the carbon content is estimated to be 50% of tree biomass dry weight (DW) (IPCC, 2003). From 1923 data on growing stock is derived from the NFI. Data on harvested volumes from 1850 until 1957 are derived from Arpi (1959) using mean volumes over five-year periods. From 1957 onwards data from the NFI are used, with a five-year moving average.

13
3.3.1. Data from studies on historical estimates of growing stocks.
Four areas did not originate from the study area (Orsa Forest Common, Hamra State Forest, Älvdalen State Forest and Finnäs State Forest). They were all included because of the good inventory data and the growing conditions were similar to the study area although they have a slightly higher productivity because of their latitudinal range (61°N) in comparison with the study area (63°N to 68°N). The first three areas outside the study area were considered virgin forest at the time of the first inventory. Orsa Forest Common and Hamra State Forest located in the northern part of the county of Dalarna comprises 56,000 ha and 28,000 ha productive forest land respectively. They were established in the late 1800s and considered virgin forests at the time. The standing volume for Orsa Forest Common was 120 m3 ha-
1 and for Hamra State Forest 141 m3 ha-1 (Table 1.) and included dead standing trees but did not include trees smaller than 10 cm in breast height (DBH) (Linder & Ostlund, 1998; Linder & Ostlund, 1992).
Southwest of Orsa Forest Common and Hamra State Forest is Älvdalen State Forest, which comprises 49,000 ha of forestland. Like Orsa and Hamra it was established in the late 1800s and the first inventory was directed to large diameter trees. The state forest was located on low productive soil and some commercial cutting in the 1850s had occurred. The standing volume was estimated at 95 m3 ha-1
(Table 1) including dead standing trees, not including trees < 10 cm in DBH (Linder & Ostlund, 1998). Finnäs State Forest located in Bodsjön in eastern Jämtland became a state forest in 1892. In the year
1900, the forest was divided and a complete inventory was carried out. The standing volume was estimated at 135 m3 ha-1 (Table 1.) but the forest had been utilized for household and a larger harvest had occurred (Linder & Ostlund, 1992).
Vargisåvattnen is a state forest in the county of Norrbotten and was inventoried for the first time in 1910. Within the state forest, an area of 6,000 ha, which was hardly touched by harvests, contained a growing stock of 88 m3 ha-1 (table 1.) (Linder & Ostlund, 1992).
Tjeggelvas nature reserve in the county of Norrbotten is on the brink of productive forest land close to the mountain chain. This nature reserve has a history of no commercial logging but has known evidence of Sami settlements. Within this area there is an area that has been minimally affected by human activities. In 2009, this area contained a growing stock of 68 m3 ha-1 (see Table 1) (Josefsson et al., 2010).
According to Linder and Ostlund (1992), the Swedish government’s knowledge in the 1800s of the forests in the north was inadequate. Therefore, inventories were conducted quite early and in 1870 a forest committee was established to assess the forests resources. The committee estimated the growing stock in Norrbotten and Västerbotten to be a total of 320 and 280 million m3 respectively. The estimated growing stock was criticized by members of the committee for being about 20% too high. Linder and Ostlund (1992) estimated that the productive forest land assessed was about two-thirds of what was considered to be productive forest land in 1991. In 1991, the productive forest land cover was 3,840,000 ha for Norrbotten and 3,289,000 ha for Västerbotten (NFI, 1991). Two-thirds of that leads to a growing stock in the committee assessment to 125 m3 ha-1 and 131 m3 ha-1 respectively (see Table 1.) This included deciduous trees but not trees with a diameter < 10 cm in DBH and industrial logging had occurred (Linder & Ostlund, 1992). But this estimation does not include low productive areas within the productive forest area. Hence, we can assume that the average volume per hectare for the productive forest land at the time was lower.
14
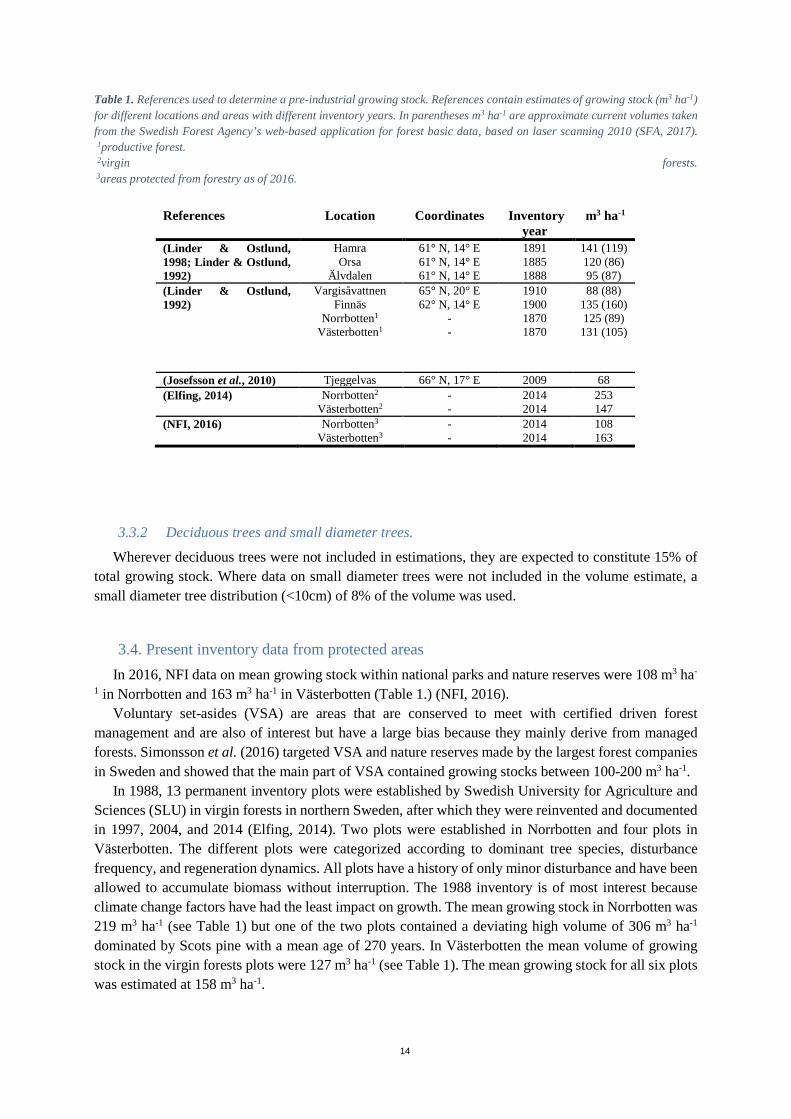
Table 1. References used to determine a pre-industrial growing stock. References contain estimates of growing stock (m3 ha-1) for different locations and areas with different inventory years. In parentheses m3 ha-1 are approximate current volumes taken from the Swedish Forest Agency’s web-based application for forest basic data, based on laser scanning 2010 (SFA, 2017). 1productive forest. 2virgin forests. 3areas protected from forestry as of 2016.
3.3.2 Deciduous trees and small diameter trees.
Wherever deciduous trees were not included in estimations, they are expected to constitute 15% of total growing stock. Where data on small diameter trees were not included in the volume estimate, a small diameter tree distribution (<10cm) of 8% of the volume was used.
3.4. Present inventory data from protected areas In 2016, NFI data on mean growing stock within national parks and nature reserves were 108 m3 ha-
1 in Norrbotten and 163 m3 ha-1 in Västerbotten (Table 1.) (NFI, 2016). Voluntary set-asides (VSA) are areas that are conserved to meet with certified driven forest
management and are also of interest but have a large bias because they mainly derive from managed forests. Simonsson et al. (2016) targeted VSA and nature reserves made by the largest forest companies in Sweden and showed that the main part of VSA contained growing stocks between 100-200 m3 ha-1.
In 1988, 13 permanent inventory plots were established by Swedish University for Agriculture and Sciences (SLU) in virgin forests in northern Sweden, after which they were reinvented and documented in 1997, 2004, and 2014 (Elfing, 2014). Two plots were established in Norrbotten and four plots in Västerbotten. The different plots were categorized according to dominant tree species, disturbance frequency, and regeneration dynamics. All plots have a history of only minor disturbance and have been allowed to accumulate biomass without interruption. The 1988 inventory is of most interest because climate change factors have had the least impact on growth. The mean growing stock in Norrbotten was 219 m3 ha-1 (see Table 1) but one of the two plots contained a deviating high volume of 306 m3 ha-1 dominated by Scots pine with a mean age of 270 years. In Västerbotten the mean volume of growing stock in the virgin forests plots were 127 m3 ha-1 (see Table 1). The mean growing stock for all six plots was estimated at 158 m3 ha-1.
References Location Coordinates Inventory year
m3 ha-1
(Linder & Ostlund, 1998; Linder & Ostlund, 1992)
Hamra Orsa
Älvdalen
61° N, 14° E 61° N, 14° E 61° N, 14° E
1891 1885 1888
141 (119) 120 (86) 95 (87)
(Linder & Ostlund, 1992)
Vargisåvattnen Finnäs
Norrbotten1
Västerbotten1
65° N, 20° E 62° N, 14° E
- -
1910 1900 1870 1870
88 (88) 135 (160) 125 (89)
131 (105)
(Josefsson et al., 2010) Tjeggelvas 66° N, 17° E 2009 68 (Elfing, 2014) Norrbotten2
Västerbotten2 - -
2014 2014
253 147
(NFI, 2016) Norrbotten3
Västerbotten3 - -
2014 2014
108 163

15
In 2017 an inventory of old-growth forests in the western parts of Västerbotten and Norrbotten was carried out by Jenny Dahl, an MSc student at SLU. The area contained large coherent old-growth forests mostly in the county of Västerbotten. The forests were not considered to be virgin forest but had a long history of being undisturbed by human activities. The mean growing stock for the inventoried areas were 116 m3 ha-1 (Figure 5).
3.5. Calculation of carbon pools and forest carbon uptake from 1800-2013 This study is using biometric measurements to quantify carbon pools and by calculating annual
differences in these carbon pools quantify the forest carbon uptake (NPPw, NEP, and NBP). Because it is based on inventories the GPP and Ra cannot be estimated. Firstly, a total carbon budget including whole tree biomass, deadwood, and soil had to be determined for the PIF areas. Secondly, the carbon budget development had to be calculated from the PIF until today. Then the buildup of carbon in the HWP pool had to be added along with the climate benefit of using wood instead of fossil fuels and other more energy-intensive materials. Assumptions are summarized in Table 3.
3.5.1. Deadwood
The lack of direct estimates of the amount of dead wood in PIFs called for an alternative approach. The parameter with the highest level of certainty was the estimate of living standing wood biomass. Deadwood volume in this study was set to 25% of the total living and deadwood stem volume, derived from estimates of earlier studies and inventories in old-growth forests where both components had been analyzed (see Table 2). From 1955 information on hard deadwood became available in the NFI and from 1996 inventories of all fractions of deadwood was included. Charcoal and tar production was a commercial activity during the late 1800s until mid-1900s (Arpi, 1959). Therefore, in this study the estimated amount of deadwood dropped from the levels in 1850 to 4 m3 ha-1 in 1950 and then remained constant until inventory data became available in 1996. Four m3 ha-1 is about double the amount of hard deadwood recorded between 1955 and 1996, to compensate for the lack of information about lying and decaying deadwood. A mean conversion factor of 0.42 Mg DW per m3 deadwood is used. Makinen et al. (2006) concluded that carbon content during decomposition remained close to 50% of wood DW. This factor is a commonly used assumption of carbon content in woody debris (IPCC, 2003).
Table 2. Amount of deadwood in % of living and dead volume derived from studies on different locations in boreal old-growth forests and NFI data from areas protected from forestry in Sweden.
References Forest type Locality Coordinates % (Siitonen, 2001) old-growth
forests Fennoscandia - 28
(Aakala, 2011) old-growth forests old-growth forests
Dvina-Pinega Pallas-Yllä
63° N, 44° E 67° N, 24° E
24 17
(Josefsson et al., 2010) old-growth forests
Tjeggelvas 66° N, 17° E 25
(Elfing, 2014) virgin forest Study area - 27 (NFI, 2016) areas
protected from forestry
Study area - 17

16
3.5.2. Biomass expansion factor
For the estimation of all above- and below-ground biomass in the PIF, biomass expansion factors (BEF) by Lehtonen et al. (2004) were used. These BEFs are made for Finnish forests but are based on Swedish biomass functions by Marklund (1988). They build upon mean stand age for Scots pine, Norway spruce and Birch (Betula spp.). For Birch only above-ground biomass was available, and for simplicity, the whole volume was calculated as Scots pine and Norway spruce excluding Birch and other minority tree species and assuming the same tree species distribution ratio as in NFI (2016) (Scots pine 59% and Norway spruce 41%). The mean forest age for the study area is about 60 years (NFI, 2016). Table 2 in Lehtonen et al. (2004), gives a BEF for forests with a mean age of 60 years 0.710 for Scots pine and 0.791 for Norway spruce, which is used for growing stock according to NFI from 1923-2013. For the pre-industrial stage, a BEF for stands >140 years was used which corresponds to 0.690 for Scots pine and 0.788 for Norway spruce. These BEFs converts stem volume directly to DW for whole trees (foliage, branches, stem, dead branches, bark, stump, coarse roots, and small roots). These BEFs are consistent with that of Teobaldelli et al. (2009) and calculations made by NFI.
3.5.3. Soil carbon
Based on estimations of organic soil carbon stocks and accumulation rates in earlier mentioned studies and personal communication (Stendahl, 2017), the soil carbon stock for the study area at the end of the study period was determined to be 60 Mg C ha-1 including the humus layer (O-horizon) and 50 cm mineral soil. The accumulation of carbon in the soil was inspired by Agren et al. (2008) where total carbon stocks over different latitudes in Sweden for the years 1926 and 2000 were estimated. Latitudes corresponding to the study area gave an accumulation rate of approximately 0.03 Mg ha-1 year-1. This was used with the assumption that the mean carbon accumulation has been faster in the last 200 years because of a decrease in natural occurring forest fires, compared to a mean soil carbon accumulation from the final deglaciation. This study assumes that when the last glacial ice withdrew from northern Sweden, around 9000 years ago (GSS, 2017; Cuzzone et al., 2016; Fabel et al., 2006), there were zero soil carbon because the ice had scraped it all away. With a total soil carbon storage of 60 Mg C ha-1 in 2013 the mean carbon accumulation since the end of the last ice age is approximately 0,007 Mg C ha-1 yr-1. Therefore, an analysis of an alternative soil carbon accumulation rate of 0,007 Mg C ha-1 yr-1 will be done. Historic soil carbon storage was determined by subtracting the accumulation rate for each year back to 1800.
3.5.4. Harvested wood products
The starting point for the buildup of carbon storage in the HWP pool is assumed to be 1850. The carbon stock and annual carbon stock change of the HWP pool was calculated with the first order decay and half-life (HL) function (eq.1) according to IPCC 2013 good practice guidance for estimating and reporting emissions and removals of forest management activities within the LULUCF sector to UNFCCC (Hiraishi et al., 2013). Calculations for HWP are made for three carbon pools. Sawn wood with a HL of 35 years, paper, and paper boards with a HL of 2 years, and wooden boards with a HL of 25 years.

17
Eq. 1.
𝐶𝐶(𝑖𝑖 + 1) = 𝑒𝑒−𝑘𝑘 ∙ 𝐶𝐶(𝑖𝑖) + ��1 − 𝑒𝑒−𝑘𝑘�
𝑘𝑘� ∙ Inflow(i)
∆C(i) = 𝐶𝐶(𝑖𝑖 + 1) − 𝐶𝐶(𝑖𝑖)
Where:
i = year
C (i) = the carbon stock in the particular HWP category at the beginning of year i, Gg C
k = decay constant of FOD for each HWP category given in units yr-1 (k = ln(2)/HL)
Inflow (i) = the inflow of the particular HWP category during year i, Gg C yr-1
∆C (i) = carbon stock change of the HWP category during year i, Gg C yr-1
For the period 1850-1955, harvested volumes corresponding to the three assortments of the HWP pools were taken from Arpi (1959). For the period 1955-2013, an average of 40% sawn wood, 55% paper and paper boards and 5% wood-based boards were assumed and calculated over the harvested volumes. The exchange of 1 m3 raw material to finished product is assumed to be 50%. Thirty percent of the saw logs are expected to go into paper and paper boards as bi-products and 5% is expected to go to wood-based panels. The remaining 15% is expected to be instantaneously oxidized as biofuels.
3.5.5. Substitution
The intention of this study was not to determine an exact substitution factor rather to illustrate the contribution of avoided emissions through substitution to the atmosphere. Since the 1950s and through the 20th century a large proportion of the harvested woody biomass in the study area have been used in pulp and paper mills were the substitution effect is low. Therefore, a general substitution effect of 0,5 Mg CO2-eq/m3 of utilized wood (CCME 0,5) is used based on studies mentioned in section 2.2 and in particular Lundmark et al. (2014).
Today more wood biomass is being used in integrated heat and power plants and for district heating, which has a higher substitution effect. Also, in the first half of the 20th century a large proportion of the harvested woody biomass was used for household heating in effective cast iron stoves, which substituted fossil fuels. Thus, an analysis of an altered CCME was conducted. The altered CCME reflected a more active management and product use strategy, where a larger part of the small diameter trees went into combined heat and power plants instead of pulp and paper mills, and the large diameter trees went into products with long lifespan (e.g. construction). The altered CCME was determined to be 0.7 Mg CO2-eq/m3 of wood based on the work of Lundmark et al. (2014). When the CCME is altered the share of products in the HWP pool also change. When a CCME of 0.7 is used the share of sawn timber increases by 20%, the share of wood-based panel’s increases by 10% and the share of pulp and paper decreases correspondingly.
The substitution was introduced in the calculation 1920 when wood started to substitute coal, oil, and concrete on a larger scale.

18
3.6. Summary of assumptions Table 3. Summary of assumptions for calculations of carbon stock from 1800-2013. 1For the BEFs deciduous trees were excluded and Scots pine and Norway spruce were calculated over the whole volume with the same tree species relationship as in 2016 (Scots pine 59% and Norway spruce 41%). Soil carbon stock development was calculated from the determined soil carbon stock in 2013 reduced by the two soil carbon accumulation rates for each year back to 1800.
Variable Parameter Description BEF Scots pine > 140 yr1 0,690 Scandinavian boreal forest with mean
age > 140 years, stem volume (m3) to DW.
BEF Norway spruce >140 yr1 0,788 Scandinavian boreal forest with mean age > 140 years, stem volume (m3) to DW.
BEF Scots pine 60 years 0,710 Scandinavian boreal forest with mean age 60 years, stem volume (m3) to DW.
BEF Norway spruce 60 years 0,791 Scandinavian boreal forest with mean age 60 years, stem volume (m3) to DW.
Tree-species distribution in PIFs Scots pine: 59% Norway spruce: 41%
For calculations of total biomass Scots pine and Norway spruce is used for the whole volume with same tree species relationship as in NFI (2016).
Distribution of deciduous trees in the PIFs
15% Where information about deciduous trees was missing this parameter of the total volume was added.
Small diameter trees <10cm DBH 8% Areas protected from forestry in the study area (NFI 2016).
DW/m3 420 kg Average conversion factor for all tree-species.
Mg C/Mg DW 0,5 For living- and deadwood. Deadwood 25% Of living and dead volume Soil carbon stock (Mg C ha-1) 60 In 2013, O-horizon and 50 cm mineral
soil. Soil carbon accum. (Mg C ha-1 yr-1) 0,007 Mg C ha-1 year-1 since the end of
deglaciation in northern Sweden Soil carbon accum. (Mg C ha-1 yr-1) 0,03 Approx. soil carbon accum. today in
northernmost parts of Sweden (baseline).
CCME 0,5 More than 50% of the harvested wood is going into pulp and paper (baseline).
CCME 0,7 A larger proportion of the harvested wood is being used in integrated heat and power plants instead of pulp and paper production.
HWP Eq.1. Calculated on harvested volumes since 1850 with half-life functions of 35 years for sawn wood, 25 years for wooden boards and 2 years for pulp and paper.
19
4. Results
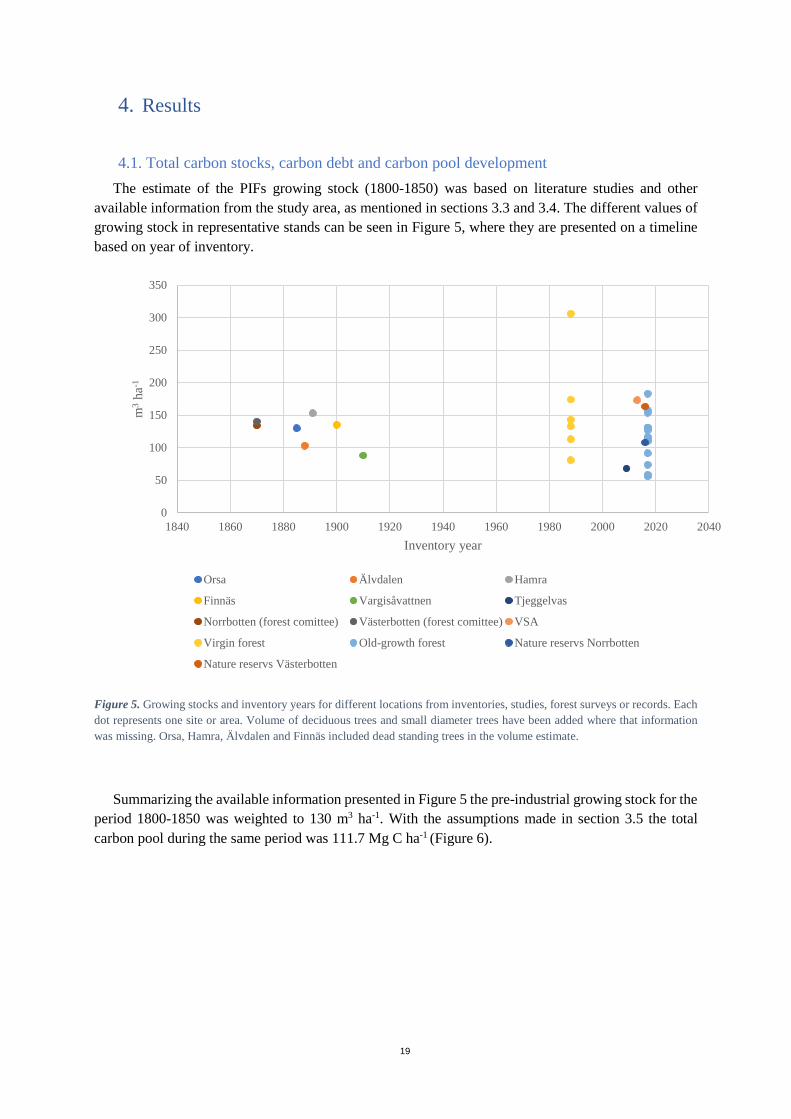
4.1. Total carbon stocks, carbon debt and carbon pool development The estimate of the PIFs growing stock (1800-1850) was based on literature studies and other
available information from the study area, as mentioned in sections 3.3 and 3.4. The different values of growing stock in representative stands can be seen in Figure 5, where they are presented on a timeline based on year of inventory.
Figure 5. Growing stocks and inventory years for different locations from inventories, studies, forest surveys or records. Each dot represents one site or area. Volume of deciduous trees and small diameter trees have been added where that information was missing. Orsa, Hamra, Älvdalen and Finnäs included dead standing trees in the volume estimate.
Summarizing the available information presented in Figure 5 the pre-industrial growing stock for the period 1800-1850 was weighted to 130 m3 ha-1. With the assumptions made in section 3.5 the total carbon pool during the same period was 111.7 Mg C ha-1 (Figure 6).
0
50
100
150
200
250
300
350
1840 1860 1880 1900 1920 1940 1960 1980 2000 2020 2040
m3
ha-1
Inventory year
Orsa Älvdalen Hamra
Finnäs Vargisåvattnen Tjeggelvas
Norrbotten (forest comittee) Västerbotten (forest comittee) VSA
Virgin forest Old-growth forest Nature reservs Norrbotten
Nature reservs Västerbotten
20
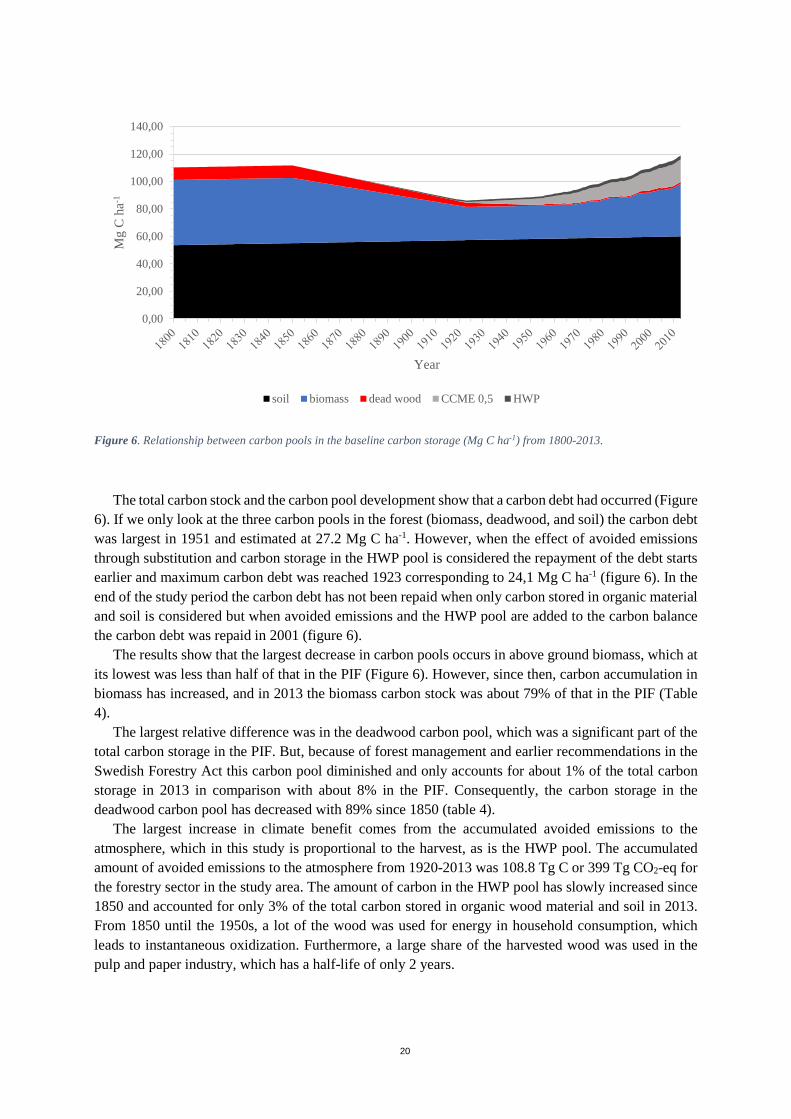
Figure 6. Relationship between carbon pools in the baseline carbon storage (Mg C ha-1) from 1800-2013.
The total carbon stock and the carbon pool development show that a carbon debt had occurred (Figure 6). If we only look at the three carbon pools in the forest (biomass, deadwood, and soil) the carbon debt was largest in 1951 and estimated at 27.2 Mg C ha-1. However, when the effect of avoided emissions through substitution and carbon storage in the HWP pool is considered the repayment of the debt starts earlier and maximum carbon debt was reached 1923 corresponding to 24,1 Mg C ha-1 (figure 6). In the end of the study period the carbon debt has not been repaid when only carbon stored in organic material and soil is considered but when avoided emissions and the HWP pool are added to the carbon balance the carbon debt was repaid in 2001 (figure 6).
The results show that the largest decrease in carbon pools occurs in above ground biomass, which at its lowest was less than half of that in the PIF (Figure 6). However, since then, carbon accumulation in biomass has increased, and in 2013 the biomass carbon stock was about 79% of that in the PIF (Table 4).
The largest relative difference was in the deadwood carbon pool, which was a significant part of the total carbon storage in the PIF. But, because of forest management and earlier recommendations in the Swedish Forestry Act this carbon pool diminished and only accounts for about 1% of the total carbon storage in 2013 in comparison with about 8% in the PIF. Consequently, the carbon storage in the deadwood carbon pool has decreased with 89% since 1850 (table 4).
The largest increase in climate benefit comes from the accumulated avoided emissions to the atmosphere, which in this study is proportional to the harvest, as is the HWP pool. The accumulated amount of avoided emissions to the atmosphere from 1920-2013 was 108.8 Tg C or 399 Tg CO2-eq for the forestry sector in the study area. The amount of carbon in the HWP pool has slowly increased since 1850 and accounted for only 3% of the total carbon stored in organic wood material and soil in 2013. From 1850 until the 1950s, a lot of the wood was used for energy in household consumption, which leads to instantaneous oxidization. Furthermore, a large share of the harvested wood was used in the pulp and paper industry, which has a half-life of only 2 years.
0,00
20,00
40,00
60,00
80,00
100,00
120,00
140,00M
g C
ha-1
Year
soil biomass dead wood CCME 0,5 HWP

21
The carbon stored in the O-horizon and down to 50 cm of mineral soil is the largest carbon pool in the forest ecosystem (table 4). The total amount of carbon in the soil in 1850 was 54.7 Mg C ha-1 and has steadily increased since 1850 (Figure 6).
Table 4. Comparison of carbon pools and total carbon storage for the period 1850-2013.
4.2. The forest carbon uptake The forest carbon uptake expressed as NEP was determined by estimating annual change in the
different components of the total carbon balance. The NPPw and the changes in soil and deadwood carbon stocks was added to get a value of NEP. Since NPPw has steadily increased since the 1970s and accumulation of soil carbon was assumed to be constant the NEP follows a similar pattern as the NPPw. The mean NEP for the period 1996-2013 was 1.06 Mg C ha-1 yr-1 and for the period 2003-2013 it was 1.13 Mg C ha-1 yr-1. The mean NBP in the baseline 1957-2013 was 0.28 Mg C ha-1 yr-1 and for the period 2003-2013 it was 0.48 Mg C ha-1 yr-1 indicating that net growth of the forests exceeded harvest levels.
The study areas ability to act as a carbon sink or a carbon source was analyzed by estimating NBP over the whole study period. In addition also two alternatives where analyzed where also the substitution effects was included to also consider the use of harvested forest biomass. This was done by using two levels of CCME. NBP from 1800 to 1850 was slightly positive (meaning that the forest land was a carbon sink) as a result of the annual increase in total soil carbon. In 1850 the NBP dropped because of the introduction of large-scale logging, and the forested land became a carbon source. The NBP steadily dropped until 1923. From 1923 the NBP started to increase in the study area but it was not until the 1950s that the forested land itself became a carbon sink. Ever since, the NBP has steadily increased making the study area a strong carbon sink (Figure 7). The mean NBP in the baseline demonstrates an increasing trend. But, as mentioned the forest alone is not the only contributor to mitigating climate change. By adding CCME to the carbon balance a more appropriate measure of climate benefit (in terms of carbon) of the forest and forestry is obtained. By doing so the study area became a carbon sink in the 1930s and from there it has been a net sink of carbon repaying the carbon debt created in the 1850s and combating increasing CO2 concentrations. The overall climate change mitigation benefit of the forest and the forestry sector, in terms of carbon sequestered and avoided emissions to the atmosphere, is 0.73 Mg C ha-1 yr-1 for the period 2003-2013. About 14% of this is related to permanently avoided emissions of CO2-eq to the atmosphere when woody biomass is used instead of fossil fuels and more energy-
Variable 1850 2013
soil carbon 49% 59%
biomass 43% 37%
deadwood 8% 1%
HWP - 3%
Tot. Mg C ha-1 111,7 102
avoided emissions (Mg C ha-1) -
CCME 0,5 - 16,5
Tot. Mg C ha-1 incl. avoided emissions 118,4
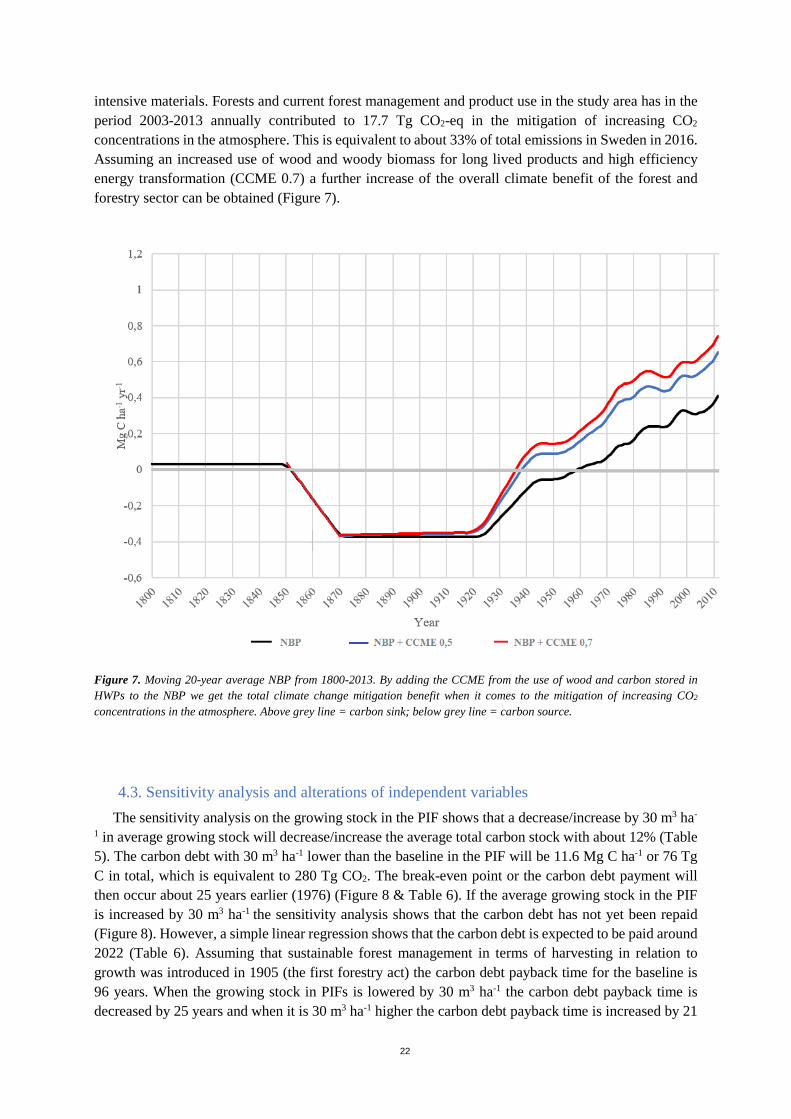
22
intensive materials. Forests and current forest management and product use in the study area has in the period 2003-2013 annually contributed to 17.7 Tg CO2-eq in the mitigation of increasing CO2 concentrations in the atmosphere. This is equivalent to about 33% of total emissions in Sweden in 2016. Assuming an increased use of wood and woody biomass for long lived products and high efficiency energy transformation (CCME 0.7) a further increase of the overall climate benefit of the forest and forestry sector can be obtained (Figure 7).
Figure 7. Moving 20-year average NBP from 1800-2013. By adding the CCME from the use of wood and carbon stored in HWPs to the NBP we get the total climate change mitigation benefit when it comes to the mitigation of increasing CO2
concentrations in the atmosphere. Above grey line = carbon sink; below grey line = carbon source.
4.3. Sensitivity analysis and alterations of independent variables The sensitivity analysis on the growing stock in the PIF shows that a decrease/increase by 30 m3 ha-
1 in average growing stock will decrease/increase the average total carbon stock with about 12% (Table 5). The carbon debt with 30 m3 ha-1 lower than the baseline in the PIF will be 11.6 Mg C ha-1 or 76 Tg C in total, which is equivalent to 280 Tg CO2. The break-even point or the carbon debt payment will then occur about 25 years earlier (1976) (Figure 8 & Table 6). If the average growing stock in the PIF is increased by 30 m3 ha-1 the sensitivity analysis shows that the carbon debt has not yet been repaid (Figure 8). However, a simple linear regression shows that the carbon debt is expected to be paid around 2022 (Table 6). Assuming that sustainable forest management in terms of harvesting in relation to growth was introduced in 1905 (the first forestry act) the carbon debt payback time for the baseline is 96 years. When the growing stock in PIFs is lowered by 30 m3 ha-1 the carbon debt payback time is decreased by 25 years and when it is 30 m3 ha-1 higher the carbon debt payback time is increased by 21

23
years (Table 6). The difference in the carbon debt payback time for the different growing stocks in the PIFs also shows that the carbon sink strength of the forest and the forestry sector is increasing every year, making for faster carbon debt payment, as is demonstrated in Figure 7.
Figure 8. Sensitivity analysis of 130 ± 30 m3 ha-1 in PIF. Break even or carbon debt payment occurs when dashed line intersects solid line.
Table 5. Total carbon storage and relationship between the carbon pools, in the PIFs, when the growing stock is altered ± 30 m3 ha-1.
m3 ha-1 (yr 1850) - 30 130 +30
Tot. Mg C ha-1 98,6 111,7 124,7
soil carbon 56% 49% 44%
biomass 37% 43% 47%
deadwood 7% 8% 9%
The analysis of altered soil carbon accumulation (Figure 9) shows that a mean soil carbon of 0.007 Mg C ha-1 yr-1 would have prolonged the carbon debt payment for about nine years. In comparison with the baseline (Table 6). Because soil carbon storage in the PIF was calculated by subtracting the soil carbon accumulation from the soil carbon storage in 2013 for each year back to 1800, the total soil carbon stored in the PIF in 1850 would have been 9% higher with the slower soil carbon accumulation.
0,00
20,00
40,00
60,00
80,00
100,00
120,00
140,00To
t. M
g C
ha-1
Year
Baseline break even´- 30 m3/ha break even´+ 30 m3/ha break even

24
Figure 9. Difference in carbon debt payment between the baseline soil carbon accumulation and if the soil carbon accumulation has accumulated slower (0,007 Mg C ha-1 yr-1) based on the assumption of equal accumulation pace since the last ice age.
The analysis of altered CCME (Figure 10) shows, that if the northern Swedish forestry sector would have increased the share of harvested wood that goes into long lived products and increased the utilization of woody biomass in integrated heat and power plants and decreased the amount of pulp and paper production, the carbon debt payment time would have been shortened by seven years (Table 6). It also shows that the difference between the higher CCME and the baseline increases every year (Figure 10).
Figure 10. Difference in carbon debt payment if wood products had been directed to more long-lived products and a larger share of woody biomass had been used more energy efficiently than for the production of pulp and paper, in comparison with the baseline.
0
20
40
60
80
100
120
140
Tot.
Mg
C h
a-1
Year
Baseline 0,007 Mg C/ha/yr
0
20
40
60
80
100
120
140
Tot.
Mg
C h
a-1
Year
Baseline CCME 0,7
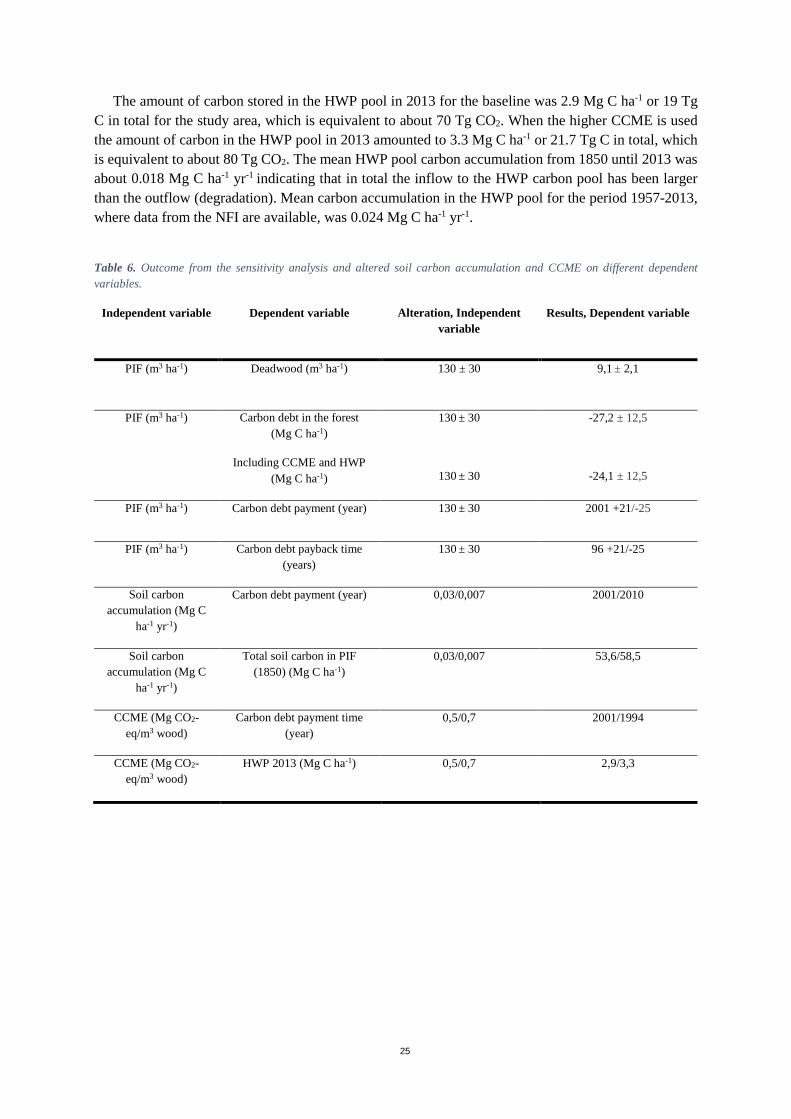
25
The amount of carbon stored in the HWP pool in 2013 for the baseline was 2.9 Mg C ha-1 or 19 Tg C in total for the study area, which is equivalent to about 70 Tg CO2. When the higher CCME is used the amount of carbon in the HWP pool in 2013 amounted to 3.3 Mg C ha-1 or 21.7 Tg C in total, which is equivalent to about 80 Tg CO2. The mean HWP pool carbon accumulation from 1850 until 2013 was about 0.018 Mg C ha-1 yr-1 indicating that in total the inflow to the HWP carbon pool has been larger than the outflow (degradation). Mean carbon accumulation in the HWP pool for the period 1957-2013, where data from the NFI are available, was 0.024 Mg C ha-1 yr-1.
Table 6. Outcome from the sensitivity analysis and altered soil carbon accumulation and CCME on different dependent variables.
Independent variable Dependent variable Alteration, Independent variable
Results, Dependent variable
PIF (m3 ha-1) Deadwood (m3 ha-1) 130 ± 30 9,1 ± 2,1
PIF (m3 ha-1) Carbon debt in the forest (Mg C ha-1)
Including CCME and HWP (Mg C ha-1)
130 ± 30
130 ± 30
-27,2 ± 12,5
-24,1 ± 12,5
PIF (m3 ha-1) Carbon debt payment (year) 130 ± 30 2001 +21/-25
PIF (m3 ha-1) Carbon debt payback time (years)
130 ± 30 96 +21/-25
Soil carbon accumulation (Mg C
ha-1 yr-1)
Carbon debt payment (year) 0,03/0,007 2001/2010
Soil carbon accumulation (Mg C
ha-1 yr-1)
Total soil carbon in PIF (1850) (Mg C ha-1)
0,03/0,007 53,6/58,5
CCME (Mg CO2-eq/m3 wood)
Carbon debt payment time (year)
0,5/0,7 2001/1994
CCME (Mg CO2-eq/m3 wood)
HWP 2013 (Mg C ha-1) 0,5/0,7 2,9/3,3
26
5. Discussion In this study, a total pre-industrial carbon stock including the three carbon pools soil, biomass, and
deadwood was determined for the northernmost part of Sweden constituting the two counties Norrbotten and Västerbotten. The reference level of total carbon stock before industrialization rest for the most part on the forest committee assessment in the 1870s of the northern Swedish forest, present inventories from nature reserves, virgin forests, and old-growth forests. The Orsa Forest Common, Hamra State Forest and Älvdalen State Forest have been regarded because of their description of being virgin forest at the time of inventory in late 1800s, but considerations are taken to the fact that they are located in regions with higher productivity. All other information on pre-industrial wood storage from studies and inventories has been used as supporting materials (Figure 5). In the 1870s forest committee assessment, the average growing stock for the inventoried area was 137 m3 ha-1. However, members of the forest committee considered the assessment to be 20% lower in the area. If this is the case is hard to determine but the interest in that time and for the committee was to assess the timber supply. Moreover, Linder and Ostlund (1992) estimated that the area assessed was about two-thirds of what we consider to be productive forest land in 1991 because low productive areas was not included. This makes the committee assessment a bit biased because of the probability that many areas with lower productivity were disregarded and are not accounted for. Therefore, if the whole study area was considered the average standing volume per hectare in the forest committee assessment should have been lower.
Today, the mean growing stock in nature reserves in the study area is approximately 135 m3 ha-1. Nature reserves have shown to be skewed to low productive areas but at the same time they have accumulated biomass without major disturbances. The inventoried virgin forests in the study area have a mean growing stock of 158 m3 ha-1. Yet four out of six plots are located in Västerbotten where the productivity on average is slightly higher than in Norrbotten. The growing stocks in the different plots ranged from a high 306 m3 ha-1 to a low 81 m3 ha-1 in 1988. This shows that the study area contains areas with both high growing stocks and productivity as well as areas with low growing stocks and productivity. These areas are also biased because of the non-existing large disturbances (in particular fires) that otherwise were more common in the PIFs. The old-growth forests showed a mean growing stock of 116 m3 ha-1. The old-growth forests were for the most part located in Västerbotten, which should decrease the average standing stock if more plots from Norrbotten was considered in the estimate. In summary, taking all this into account the estimated total carbon stock in the study area before industrialization must be seen as realistic.
The increased global demand for timber made harvest in the north of Sweden profitable, and focus was initially to harvest trees with large diameter selecting stands with high growing stocks. Yet, after a while forest stocks started to decline because there were no thoughts about regeneration and the natural regeneration was very slow because of the barren land and climate conditions. This harvest was unsustainable in the long term because it was conducted in old-growth forests with low volume increment at a landscape level, and the overall wood volume increment could not make up for the wood that was taken out from the forests. In the beginning of the 20th century, laws and regulations were implemented to increase and sustain volume growth but biomass stocks did not change much until the 1950s when it started to increase steadily. The expanding forest industry was at this time influenced by an upcoming fear of a future shortage of timber supply. This fear emerged because of the low volume increment in the forests that had been left after the earlier selective cuttings. Therefore, many forest stands with unsatisfying production were cut down early to speed up the process of changed forest management to the even-aged management regime. This led to a decline in total forest stocks in that period. The increase in growing stocks in the 1950s was not because harvest levels decreased but because the growth increased. The reason for this has been suggested to be forest science development together with Swedish forest policies and strong private forest owner associations (RSAAF, 2015).
27
The results show that the carbon debt was at its highest in the 1920s. It cannot be determined if the total forest carbon stock was even lower prior 1923 (first NFI) because of the non-existing data from that period but an exact estimation about the magnitude of the carbon debt is of minor importance. What is important is that a carbon debt was created during the 19th century and that present forestry is no longer a carbon source. This study shows that the carbon debt in the study area has been repaid while at the same time providing ecosystem services and bio-based products for the human society. This is when the substitution effect of using woody biomass and carbon stored in the HWP pool are included. However, if one only look at the carbon stored in the ecosystem the carbon debt has not been repaid and simple calculations of the current rate of carbon sequestration in the study area suggest that the carbon payback time would have been around 160 years. In other words, almost in line with Harmon et al. (1990). The apparent transition from unmanaged forest to high stand plantations agrees with McGrath et al. (2015) and a suggested carbon debt for Europe´s forest stated by Naudts et al. (2016) seems to apply for the northernmost parts of Sweden when substitution effects are not included. Yet, the need to include substitution effects when calculating the climate benefit of forests and forestry stated by authors in section 2.2, adds importance to this study and the conclusion that the carbon debt for the study area has been repaid.
The substitution effect in this study was primarily based on Lundmark et al. (2014), where the CCME 0.5 was based on a mapping of the entire Swedish forestry sector and the CCME 0.7 on a scenario with higher energy efficiency and long-lived wood products. The substitution effect came into effect in 1920 when coal was a big part of the industrial energy supply and when industrial production of concrete commenced. Thereafter, oil became an energy supply to be reckoned with. If the Swedish forestry sector had not been so influential for the Swedish economy, there is a chance that the major efforts to maintain high volume-growth in the forests and a steady flow of timber to the industry would not have been conducted. Thus, it is probable that more fossil fuels to meet energy demands and more cement in construction would have been used if Swedish forestry would have been absent. Consequently, that would probably have led to higher CO2 concentrations in the atmosphere. The substitution effect was calculated for all harvested volume which of course can be questioned if all harvested wood leads to avoided emissions and not increased consumptions but that distinction is almost impossible to make. That is why in this study we assume that if wood-based products would not be on the market the gap in energy and building materials etc. would have been filled with more energy-intensive materials or fossil fuels. By using wood products from what we can call a biogenic carbon consumption cycle (wood is being used for consumption and biogenic carbon emissions are being sequestered in the forest), emissions to the atmosphere are being avoided because fossil-based products are displaced and fossil carbon is being kept from the atmosphere. Because of the long rotation of millions of years in the fossil carbon cycle, and with our perception of time, substitution effect can be equal to forever avoided emissions which accumulates over time.
The growing stocks from inventories in the study area show that local variations between forest stands can differ a lot from areas with low productivity and low growing stocks to areas with high productivity and growing stocks. That is why a sensitivity analysis was conducted. An important conclusion of the sensitivity analysis, apart from the more obvious fact that the carbon debt is repaid earlier with lower growing stocks in the PIF and vice versa, is that the carbon debt payment time is decreasing from the baseline and forward in time (Table 6). This indicates, just as the NBP does (Figure 7), that the climate benefit of the forest and forestry in the study area is increasing for every year.
Lagergren et al. (2006) made model-based simulations covering Sweden and estimated the NEP for Västerbotten and Norrbotten to 1.2-1.6 Mg C ha-1 yr-1 for the period 2000-2001. This is more than estimated in this study, where the NEP in the year 2000 were 1.06 Mg C ha-1 yr-1. This study, however, represents the whole landscape of the study area, while Lagergrens study is based on eddy covariance measurements where towers measuring the gas fluxes can only reflect a certain part of the landscape

28
and must be generalized to a large extent. Also, the removal of harvested wood via thinning’s has a more significant impact on this study when changes in the biomass carbon pool are measured in addition to the use of eddy covariance where the gas fluxes are being measured. The carbon in the harvested wood from thinning is being emitted elsewhere and are not accounted for in the eddy covariance measurements while thinning has shown signs to increase photosynthesis and therefore generate a higher NEP. The NEP presented in this study is also significantly lower than the NEP in old-growth forests presented by Luyssaert et al. (2008). Yet, only 30% of the plots in Luyssaert et al. (2008) stemmed from boreal forests while the rest were temperate forests and Yuan et al. (2009) showed that NEP decreased from the equator to the poles. This might affect the transmissibility of Luyssaert et al. (2008) to boreal forests.
A potential error of this study and in the use of biometric measurements is, for example the lack of data on the respiratory effects from the soil, ground vegetation, leaves, and small woody debris in comparison with the eddy covariance technique where gas exchange between the atmosphere and the biosphere is being measured. However, just as biometric measurements have its weakness the eddy covariance technique also has been questioned about its accuracy because of periods with shifting air turbulence and tendency to overestimate the NEP (Xu et al., 2014). Therefore, a combination of these two techniques should be applied more often.
Berg et al. (1994) and Linder and Ostlund (1998) described the removal of deadwood as the most dramatic change in forest structure. This is reflected in this study where the largest relative difference was that of the deadwood carbon pool. Old-growth forests can produce larger amounts of deadwood in relation to managed forests because of the regular harvesting of mature and damaged trees. In this study the amount of deadwood was based on the proportion of deadwood in other old-growth forest with similar growing conditions. The results showed that about 8% of the total carbon budget in the PIF was contained in the deadwood carbon pool, but old-growth forests have shown to contain even larger quantities of deadwood. Harmon et al. (1990) estimated that about 20% of the total carbon stock in a 450-year-old Pesudotsuga-Tsuga forest was contained in deadwood and the forest floor. The amount of deadwood in virgin forests dominated by Norway spruce close to the mountain chain have shown to be able to contain volumes of 70 m3 ha-1 (Linder & Ostlund, 1992). This is more than what is reported by the food and agricultural organization for the world´s forests in total. Which in line with this study reported that 8% of the total carbon in forest ecosystem is contained in the deadwood carbon pool (FAO, 2015). On the other hand, reported volumes can differ between studies depending on inventory methods and should be compared with caution (Soderberg et al., 2014). Also, the spatial and temporal distribution differs because the amount of deadwood is not in a steady state depending on disturbance regimes (Aakala, 2011), and Lamlom and Savidge (2003) showed that carbon content in deadwood varied within and between species and decomposition stages. Furthermore, the generally accepted carbon content of 50% of DW in deadwood has also been questioned. Studies indicate that the generally used carbon content of 50% is a large simplification and will lead to overestimations of deadwood carbon pools (Weggler et al., 2012; Harmon et al., 1986). Therefore, there is a probability that the deadwood carbon pool in this study should have been somewhat lower.
Thinning in forest management leads to decreased natural drainage that otherwise would have added to the deadwood carbon pool. The 2013 HWP and deadwood carbon pool is about half of the pre-industrial deadwood carbon pool (and increasing) which implies that we take some of the deadwood carbon pool out of the forest and place it in materials and products in society while about half of the harvested wood is instantaneously oxidized.
The main part of the results of this study is explained by differences in living biomass, harvested wood, and deadwood but soil carbon is also a big part of the total carbon pool and must be accounted for. The main concern is the accumulation of carbon in the soil and how it differs depending on stand/site characteristics and other abiotic factors. Studies indicate that the accumulation in Swedish forest soils is positive but there is a gap in knowledge about factors governing the accumulation of carbon in the

29
soil such as leaching of dissolved organic carbon and continuity in stand characteristics and forest cover. According to Agren et al. (2007), it takes about 200 years for soil carbon in a forest ecosystem to reach 50% of a steady state but about 10,000 years to reach 80%. This means that if you consider the end of the ice age to be the starting point for the buildup of soils and accumulation of soil carbon in northern Swedish forests, these soils might barely have reached 80% of a steady state under optimal conditions. At the same time, Agren et al. (2007) state that when carbon is lost it takes about 250 years to lose 50% and another 10 000 years to lose an additional 50%. If soil carbon accumulation is mostly driven by the amount of litter production, coarse woody debris, and fine roots and depending on a forest cover for accumulation, it might have affected the accumulation of soil carbon negatively during the early exploitation. On the other hand, in the 19th century extraction of wood from the forest was mostly directed to large diameter timber and large parts of the trees (large tops and branches) were left on site. Simultaneously, barking occurred in the forest and these factors could have contributed to a positive accumulation in the soil carbon stock.
Because the PIF soil carbon stock was determined from present soil carbon stock by subtracting the accumulation rate for every year until 1800, the accumulation rate in the baseline was more beneficial for silviculture when it comes to comparing total carbon budgets in comparison with the lower soil carbon accumulation. However, as mentioned, the higher soil carbon accumulation rate was based on actual studies in Sweden, while the lower was based on a mean accumulation rate since the last ice age. Since the end of the 19th century, the improved fire protection diminished the frequency in natural occurring forest fires, which should decrease the amount of soil carbon that is being lost from the system. Depending on fire intensity, parts of the forest floor carbon and vegetation carbon will be emitted to the atmosphere during a fire. Simultaneously fires can create large amounts of deadwood. Lal (2005) highlighted important features of several reviews about forest soil carbon stock and found that most often forest fires decreased soil carbon stocks. Therefore, the soil carbon accumulation rate in the baseline probably better reflects the true value for the study period since there has been a decrease in frequency of wild fires.
At the time of harvest, there is the theoretical possibility to disregard that decision and leave the forest to grow further. When a managed forest stand is harvested there will be some time to repay the carbon debt. However, when the debt is paid there will still be a difference between the current carbon stock and avoided emissions, and the carbon stock that would have been if the forest stand had been allowed to grow. When this difference is zero the concept of parity is reached (Nabuurs et al., 2017). With regard to the effects of climate change on volume growth and carbon accumulation in the soil, the carbon budget of old-growth forests might also benefit from this. Yet, the difference between how the northernmost Swedish forests could have evolved if harvests had never occurred in comparison with the current stage is not addressed here. That would have demanded more variables about the PIF stage to be able to make credible simulations over time. At the same time, parity is very hypothetical and the chance that forests will be affected by storms and fires increases with stand age, especially when also the effects of climate change is considered (Kasischke et al., 1995). In Sweden, forests are expected to increase growth and accumulate more carbon from the atmosphere (Hyvonen et al., 2007) but with increasing temperatures, forests storm sensitivity increases when the ground frost during winter decreases. Furthermore drier and hotter summer months will increase risks for large forests fires when temperatures will move towards limits when these are more frequently occurring. Old-growth forest with huge carbon stocks are then at high risk to become large sources of carbon to the atmosphere.
For forest management, two major questions should be addressed; how is forest management going to evolve to minimize the risk of damage to the forest due to climate change? And how can forest management mitigate climate change? A negative effect of silviculture on carbon stocks has been described as mineralization of carbon, which leads to leaching due to large soil disturbance. However, Egnell et al. (2015) showed that some negative effects associated with silviculture can be mitigated by

30
forest management. Barring et al. (2017) developed climate indices for climate proofing of operational forestry and concluded that forest management should already today include climate change aspects in activities related to forestry. Seidl et al. (2014) outlined that forest disturbance in Europe due to climate change induced storms, pests and wildfires have increased and that forest management and forest policies should regard disturbance risk and resilience. At the same time, Nabuurs et al. (2013) showed that forest biomass in Europe has started to reach a level of carbon sink saturation and that forest management and policies need revision. When discussing the climate benefit in the carbon balance of different silviculture systems Lundmark et al. (2016) concluded that the vital choice is not the silviculture practice per se, but the growth, yield, and product use strategy although other parameters such as high bio-diversity must also be regarded.
As highlighted by Naudts et al. (2016), other factors within forests and forest management may also have an influence on the climate. For example, the choice of tree species can influence the albedo both by trees physiological character and by the amount of water transpiration to the atmosphere. Thus, carbon sequestration in the terrestrial system and avoided emissions to the atmosphere may not be the only factors within the forest sector that can mitigate climate change but it is probably one piece of the big climate change mitigation puzzle.
5.1. Conclusion This study concludes that the exploitation of the northernmost Swedish forest in the 19th century
temporary contributed to increased concentrations of CO2 in the atmosphere and that a carbon debt was created. However, with the introduction of sustainable forest management and harvest levels that did not exceed the annual volume increment Swedish forestry became not only climate neutral but also beneficial for climate change mitigation. When wood-based products and biofuels started to act as a substitute for fossil fuels and cement, the climate benefit of forestry was greatly enhanced. From the 1930s and onwards Swedish forestry in the study area has offset the increasing concentrations of CO2 in the atmosphere.
With the assumptions made in this study, the carbon debt inherited from the 19th century has been repaid, and with continued management, increased growth, and high efficiency substitution Swedish forestry will continue to mitigate increased atmospheric CO2 concentrations in the future.
The estimated PIF carbon stock in this study has uncertainties because of the many generalizations and assumptions made. Still, based on data and information available it is probably among the best estimate, on pre-industrial carbon storage in northern Sweden, ever made.
It should be noted that it is not crucial whether it is an absolute correct estimation, rather how the trajectory of forest carbon stocks has developed from the pre-industrial stage until today. By considering the time it takes to transform an old-growth forest into a managed forest, where the carbon debt has been repaid the decision whether to manage or conserve forests depends on where you are on the current forest state trajectory. If a forest ecosystem is in a steady state of old-growth or on a downward carbon storage trend due to unsustainable harvest, it might be better to direct efforts towards reforestation and conservation. But, if an established and sustainable forest management regime is practiced and have reached the point of where northern Swedish forests are today, the appropriate alternative is to continue management and focus on increased growth and efficient use of biomass to maximize long term climate benefit.
31
6. References
Aakala, T. (2011). Temporal Variability of Deadwood Volume and Quality in Boreal Old-Growth Forests. Silva Fennica, 45(5), pp. 969-981.
Agren, G.I., Hyvonen, R. & Nilsson, T. (2007). Are Swedish forest soils sinks or sources for CO2 - model analyses based on forest inventory data. Biogeochemistry, 82(3), pp. 217-227.
Agren, G.I., Hyvonen, R. & Nilsson, T. (2008). Are Swedish forest soils sinks or sources for CO(2) - model analyses based on forest inventory data (Reprinted). Biogeochemistry, 89(1), pp. 139-149.
Arpi, G. (1959). Sveriges skogar under 100 år, del 1. En sammanfattande redogörelse över det svenska skogsbruket 1859–1959.: Kungl. Domänstyrelsen i anknytning till domänverkets 100-årsjubileum.
Assmann, E. (1970). Principles of forest yield study. Pergamon Press, Headington Hill Hall, Oxford.
Barring, L., Berlin, M. & Gull, B.A. (2017). Tailored climate indices for climate-proofing operational forestry applications in Sweden and Finland. International Journal of Climatology, 37(1), pp. 123-142.
Bellassen, V., Viovy, N., Luyssaert, S., Le Maire, G., Schelhaas, M.J. & Ciais, P. (2011). Reconstruction and attribution of the carbon sink of European forests between 1950 and 2000. Global Change Biology, 17(11), pp. 3274-3292.
Berg, A., Ehnstrom, B., Gustafsson, L., Hallingback, T., Jonsell, M. & Weslien, J. (1994). THREATENED PLANT,ANIMAL, AND FUNGUS SPECIESIN SWEDISH FORESTS -DISTRIBUTION AND HABITATASSOCIATIONS. ConservationBiology, 8(3), pp. 718-731.
Bergman, I., Liedgren, L., Ostlund, L. & Zackrisson, O. (2008). Kinship and Settlements: Sami Residence Patterns in the Fennoscandian Alpine Areas around AD 1000. Arctic Anthropology, 45(1), pp. 97-110.
Braun, M., Fritz, D., Weiss, P., Braschel, N., Buchsenmeister, R., Freudenschuss, A., Gschwantner, T., Jandl, R., Ledermann, T., Neumann, M., Polz, W., Schadauer, K., Schmid, C., Schwarzbauer, P. & Stern, T. (2016). A holistic assessment of greenhouse gas dynamics from forests to the effects of wood products use in Austria. Carbon Management, 7(5-6), pp. 271-283.
Cardinale, B.J., Duffy, J.E., Gonzalez, A., Hooper, D.U., Perrings, C., Venail, P., Narwani, A., Mace, G.M., Tilman, D., Wardle, D.A., Kinzig, A.P., Daily, G.C., Loreau, M., Grace, J.B.,Larigauderie, A., Srivastava, D.S. &Naeem, S. (2012). Biodiversity loss andits impact on humanity. Nature,486(7401), pp. 59-67.
Ciais, P., Schelhaas, M.J., Zaehle, S., Piao, S.L., Cescatti, A., Liski, J., Luyssaert, S., Le-Maire, G., Schulze, E.D., Bouriaud, O., Freibauer, A., Valentini, R. & Nabuurs, G.J. (2008). Carbon accumulation in European forests. Nature Geoscience, 1(7), pp. 425-429.
Clarke, N., Gundersen, P., Jonsson-Belyazid, U., Kjonaas, O.J., Persson, T., Sigurdsson, B.D., Stupak, I. & Vesterdal, L. (2015). Influence of different tree-harvesting intensities on forest soil carbon stocks in boreal and northern temperate forest ecosystems. Forest Ecology and Management, 351, pp. 9-19.
Crowley, T.J. (2000). Causes of climate change over the past 1000 years. Science, 289(5477), pp. 270-277.
Cuzzone, J.K., Clark, P.U., Carlson, A.E., Ullman, D.J., Rinterknecht, V.R., Milne, G.A., Lunkka, J.P., Wohlfarth, B., Marcott, S.A. & Caffee, M. (2016). Final deglaciation of the Scandinavian Ice Sheet and implications for the Holocene global sea-level budget. Earth and Planetary Science Letters, 448, pp. 34-41.
Desai, A.R., Bolstad, P.V., Cook, B.D., Davis, K.J. & Carey, E.V. (2005). Comparing net ecosystem exchange of carbon dioxide between an old-growth and

32
mature forest in the upper Midwest, USA. Agricultural and Forest Meteorology, 128(1-2), pp. 33-55.
Dixon, R.K. (1994). CARBON POOLS AND FLUX OF GLOBAL FOREST ECOSYSTEMS (VOL 263, PG 185, 1994). Science, 265(5169), pp. 171-171.
Decision No 529/2013/EU of the European parliament and of the council of 21 May 2013, on accounting rules on greenhouse gas emissions and removals resulting from activities relating to land use, land-use change and forestry and on information concerning actions relating to those activities (2013).
EC (2014). Communication & Other documents 2030 Framework for Climate & Energy, Outcome of the October 2014 European Council. 30/10/2014.
Egnell, G., Jurevics, A. & Peichl, M. (2015). Negative effects of stem and stump harvest and deep soil cultivation on the soil carbon and nitrogen pools are mitigated by enhanced tree growth. Forest Ecology and Management, 338, pp. 57-67.
Ekelund, H. & Hamilton, G. (2001). Skogspolitisk historia. Rapport 8A 2001.): Swedish Forest Agency.
Elfing, B. (2014). Urskogens dynamik – 26 års utveckling på 13 boreala urskogsytor. [Unpublished].
EPA (2012). Uppdrag färdplan: Sverige utan klimatutsläpp år 2050 Sammanfattning av delrapport. Bromma: CM Gruppen AB.
EPA Swedish Environmental Protection Agency. Available at:http://www.naturvardsverket.se/Var-natur/Skyddad-natur/Nationalparker/ [05.01.17].
Eurostat (2015). Renewable energy in the EU. Share of renewables in energy consumption up to 15% in the EU in 2013. In: Office, E.P. (ed. Eurostat Press Office.
Fabel, D., Fink, D., Fredin, O., Harbor, J., Land, M. & Stroeven, A.P. (2006). Exposureages from relict lateral morainesoverridden by the Fennoscandian icesheet. Quaternary Research, 65(1), pp.136-146.
FAO (2015). Forest Resources Assessment Working Paper 180. Terms and
Definitions. Food and Agriculture Organization of the United Nations. Rome 2012.
Filip, G.M., Kanaskie, A., Kavanagh, K.L., Johnson, G., Johnson, R. & Maguire, D.A. (2000). Silviculture and Swissneedle cast: research andrecommendations. Corvallis, Or.:College of Forestry, Forest ResearchLaboratory, Oregon State University.
Fridman, J. (2000). Conservation of Forest in Sweden: a strategic ecological analysis. Biological Conservation, 96(1), pp. 95-103.
GISTEMP GISS Surface Temperature Analysis (GISTEMP). Available at: http://data.giss.nasa.gov/gistemp/ [09.30].
GSS Geological Survey of Sweden. Available at: http://www.sgu.se/om-geologi/ett-klimat-i-standig-forandring/klimatets-forandringar-over-tiden/ [02.02.17].
Harmon, M.E., Ferrell, W.K. & Franklin, J.F. (1990). EFFECTS ON CARBON STORAGE OF CONVERSION OF OLD-GROWTH FORESTS TO YOUNG FORESTS. Science, 247(4943), pp. 699-702.
Harmon, M.E., Franklin, J.F., Swanson, F.J., Sollins, P., Gregory, S.V., Lattin, J.D., Anderson, N.H., Cline, S.P., Aumen, N.G., Sedell, J.R., Lienkaemper, G.W.,Cromack, K. & Cummins, K.W.(1986). ECOLOGY OF COARSEWOODY DEBRIS IN TEMPERATEECOSYSTEMS. Advances inEcological Research, 15, pp. 133-302.
Hennigar, C.R., MacLean, D.A. & Amos-Binks, L.J. (2008). A novel approach to optimize management strategies for carbon stored in both forests and wood products. Forest Ecology and Management, 256(4), pp. 786-797.
Hiraishi, T., Krug, T., Tanabe, K., Srivastava, N., Baasansuren, J., Fukuda, M. & Troxler, T.G. (2013). Revised Supplementary Methods and Good Practice Guidance Arising from the Kyoto Protocol, 2013, IPCC, Intergovernmental Panel on Climate Change). Switzerland, 2014: Institute for Global Environmental Strategies for the Intergovernmental Panel on Climate Change.

33
Hoegh-Guldberg, O., Mumby, P.J., Hooten, A.J., Steneck, R.S., Greenfield, P.,Gomez, E., Harvell, C.D., Sale, P.F.,Edwards, A.J., Caldeira, K., Knowlton,N., Eakin, C.M., Iglesias-Prieto, R.,Muthiga, N., Bradbury, R.H., Dubi, A.& Hatziolos, M.E. (2007). Coral reefsunder rapid climate change and oceanacidification. Science, 318(5857), pp.1737-1742.
Hyvonen, R., Agren, G.I., Linder, S., Persson, T., Cotrufo, M.F., Ekblad, A., Freeman, M., Grelle, A., Janssens, I.A., Jarvis, P.G., Kellomaki, S., Lindroth, A.,Loustau, D., Lundmark, T., Norby,R.J., Oren, R., Pilegaard, K., Ryan,M.G., Sigurdsson, B.D., Stromgren,M., van Oijen, M. & Wallin, G. (2007).The likely impact of elevated CO2 ,nitrogen deposition, increasedtemperature and management oncarbon sequestration in temperate andboreal forest ecosystems: a literaturereview. New Phytologist, 173(3), pp.463-480.
IPCC (2003). Good Practice Guidance for Land Use, Land Use Change and Forestry. In: Environmental, I.f.G. & (IGES), S. (eds). Intergovernmental Panel on Climate Change.
IPCC (2014). Climate Change 2014: Synthesis Report. Contribution of Working Groups I, II and III to the Fifth Assessment Report of the Intergovernmental Panel on Climate Change. IPCC, Geneva, Switzerland.
IPCC Intergovernmental Panel on Climate Change. reports- special reports. Land Use, Land-Use Change and Forestry. 1.3. The Carbon Budget of Terrestrial Ecosystems. Available at: http://www.ipcc.ch/ipccreports/sres/land_use/index.php?idp=24 [05.04].
Jackson, R.B., Schenk, H.J., Jobbagy, E.G., Canadell, J., Colello, G.D., Dickinson, R.E., Field, C.B., Friedlingstein, P.,Heimann, M., Hibbard, K., Kicklighter,D.W., Kleidon, A., Neilson, R.P.,Parton, W.J., Sala, O.E. & Sykes, M.T.(2000). Belowground consequences ofvegetation change and their treatmentin models. Ecological Applications,10(2), pp. 470-483.
Jandl, R., Lindner, M., Vesterdal, L., Bauwens, B., Baritz, R., Hagedorn, F., Johnson,
D.W., Minkkinen, K. & Byrne, K.A.(2007). How strongly can forestmanagement influence soil carbonsequestration? Geoderma, 137(3-4),pp. 253-268.
Janzen, H.H. (2004). Carbon cycling in earth systems - a soil science perspective. Agriculture Ecosystems & Environment, 104(3), pp. 399-417.
Ji, C.Y., Cao, W.B., Chen, Y. & Yang, H.Q. (2016). Carbon Balance and Contribution of Harvested Wood Products in China Based on the Production Approach of the Intergovernmental Panel on Climate Change. International Journal of Environmental Research and Public Health, 13(11), p. 10.
Johnson, C.E., Driscoll, C.T., Fahey, T.J., Siccama, T.G. & Hughes, J.W. (1995). CARBON DYNAMICS FOLLOWING CLEAR-CUTTING OF A NORTHERN HARDWOOD FOREST. (Carbon Forms and Functions in Forest Soils. Madison: Soil Science Soc Amer. Available from: <Go to ISI>://WOS:A1995BD26V00021.
Josefsson, T., Gunnarson, B., Liedgren, L., Bergman, I. & Ostlund, L. (2010). Historical human influence on forest composition and structure in boreal Fennoscandia. Canadian Journal of Forest Research-Revue Canadienne De Recherche Forestiere, 40(5), pp. 872-884.
Josefsson, T., Hornberg, G. & Ostlund, L. (2009). Long-Term Human Impact and Vegetation Changes in a Boreal Forest Reserve: Implications for the Use of Protected Areas as Ecological References. Ecosystems, 12(6), pp. 1017-1036.
Josefsson, T. & Ostlund, L. (2010). Increased production and depletion: the impact of forestry on northern Sweden´s forest landscape. Agriculture and forestry in Sweden since 1900 -geographical and historical studies. Supplement of The Journal of the Royal Swedish Academy of Agriculture and Forestry(54), pp. 338-353.
Kalbitz, K., Solinger, S., Park, J.H., Michalzik, B. & Matzner, E. (2000). Controls onthe dynamics of dissolved organic

34
matter in soils: A review. Soil Science, 165(4), pp. 277-304.
Kasischke, E.S., Christensen, N.L. & Stocks, B.J. (1995). FIRE, GLOBAL WARMING, AND THE CARBON BALANCE OF BOREAL FORESTS. Ecological Applications, 5(2), pp. 437-451.
Klein, D., Hollerl, S., Blaschke, M. & Schulz, C. (2013). The Contribution ofManaged and Unmanaged Forests toClimate Change Mitigation-A ModelApproach at Stand Level for the MainTree Species in Bavaria. Forests, 4(1),pp. 43-69.
Knohl, A., Schulze, E.D., Kolle, O. & Buchmann, N. (2003). Large carbon uptake by an unmanaged 250-year-old deciduous forest in Central Germany. Agricultural and Forest Meteorology, 118(3-4), pp. 151-167.
Knutson, T.R., McBride, J.L., Chan, J., Emanuel, K., Holland, G., Landsea, C., Held, I., Kossin, J.P., Srivastava, A.K. & Sugi, M. (2010). Tropical cyclones and climate change. Nature Geoscience, 3(3), pp. 157-163.
Kohh, E. (1975). Studier över skogsbränder och skenhälla I älvdalsskogarna. Sveriges Skogsvårdförbunds Tidskrift 73. pp. 299-336.
Kuuluvainen, T. (2002). Natural variability of forests as a reference for restoring and managing biological diversity in boreal Fennoscandia. Silva Fennica, 36(1), pp. 97-125.
Lagergren, F., Grelle, A., Lankreijer, H., Molder, M. & Lindroth, A. (2006). Current carbon balance of the forested area in Sweden and its sensitivity to global change as simulated by Biome-BGC. Ecosystems, 9(6), pp. 894-908.
Lal, R. (2005). Forest soils and carbon sequestration. Forest Ecology and Management, 220(1-3), pp. 242-258.
Lamlom, S.H. & Savidge, R.A. (2003). A reassessment of carbon content in wood: variation within and between 41 North American species. Biomass & Bioenergy, 25(4), pp. 381-388.
Larsson, S., Lundmark, T. & Ståhl, G. (2009). Möjligheter till intensivodling av skog. Slutrapport från regeringsuppdrag Jo 2008/1885 (in Swedish with English summary).
Lehtonen, A., Makipaa, R., Heikkinen, J., Sievanen, R. & Liski, J. (2004). Biomass expansion factors (BEFs) for Scots pine, Norway spruce and birch according to stand age for boreal forests. Forest Ecology and Management, 188(1-3), pp. 211-224.
Linder, P. & Ostlund, L. (1992). Förändringar i norra Sveriges skogar 1870–1991. Svensk Bot. Tidskr. 86.
Linder, P. & Ostlund, L. (1998). Structural changes in three mid-boreal Swedish forest landscapes, 1885-1996. Biological Conservation, 85(1-2), pp. 9-19.
Lindner, M., Maroschek, M., Netherer, S., Kremer, A., Barbati, A., Garcia-Gonzalo, J., Seidl, R., Delzon, S., Corona, P., Kolstrom, M., Lexer, M.J. & Marchetti, M. (2010). Climate change impacts, adaptive capacity, and vulnerability of European forest ecosystems. Forest Ecology and Management, 259(4), pp. 698-709.
Liski, J., Perruchoud, D. & Karjalainen, T. (2002). Increasing carbon stocks in the forest soils of western Europe. Forest Ecology and Management, 169(1-2), pp. 159-175.
Lundmark, H., Josefsson, T. & Ostlund, L. (2013). The history of clear-cutting in northern Sweden - Driving forces and myths in boreal silviculture. Forest Ecology and Management, 307, pp. 112-122.
Lundmark, T., Bergh, J., Hofer, P., Lundstrom, A., Nordin, A., Poudel, B.C., Sathre, R., Taverna, R. & Werner, F. (2014). Potential Roles of Swedish Forestry in the Context of Climate Change Mitigation. Forests, 5(4), pp. 557-578.
Lundmark, T., Bergh, J., Nordin, A., Fahlvik, N. & Poudel, B.C. (2016). Comparison of carbon balances between continuous-cover and clear-cut forestry in Sweden. Ambio, 45(2), pp. 203-213.
Luyssaert, S., Inglima, I., Jung, M., Richardson, A.D., Reichstein, M., Papale, D., Piao,S.L., Schulzes, E.D., Wingate, L.,Matteucci, G., Aragao, L., Aubinet, M.,Beers, C., Bernhofer, C., Black, K.G.,Bonal, D., Bonnefond, J.M., Chambers,J., Ciais, P., Cook, B., Davis, K.J.,Dolman, A.J., Gielen, B., Goulden, M.,Grace, J., Granier, A., Grelle, A.,

35
Griffis, T., Grunwald, T., Guidolotti, G., Hanson, P.J., Harding, R., Hollinger, D.Y., Hutyra, L.R., Kolar, P., Kruijt, B., Kutsch, W., Lagergren, F., Laurila, T., Law, B.E., Le Maire, G., Lindroth, A., Loustau, D., Malhi, Y., Mateus, J., Migliavacca, M., Misson, L., Montagnani, L., Moncrieff, J., Moors, E., Munger, J.W., Nikinmaa, E., Ollinger, S.V., Pita, G., Rebmann, C., Roupsard, O., Saigusa, N., Sanz, M.J., Seufert, G., Sierra, C., Smith, M.L., Tang, J., Valentini, R., Vesala, T. & Janssens, I.A. (2007). CO2 balance of boreal, temperate, and tropical forests derived from a global database. Global Change Biology, 13(12), pp. 2509-2537.
Luyssaert, S., Schulze, E.D., Borner, A., Knohl, A., Hessenmoller, D., Law, B.E., Ciais, P. & Grace, J. (2008). Old-growthforests as global carbon sinks. Nature,455(7210), pp. 213-215.
Maestre, F.T., Quero, J.L., Gotelli, N.J., Escudero, A., Ochoa, V., Delgado-Baquerizo, M., Garcia-Gomez, M., Bowker, M.A., Soliveres, S., Escolar, C., Garcia-Palacios, P., Berdugo, M., Valencia, E., Gozalo, B., Gallardo, A., Aguilera, L., Arredondo, T., Blones, J., Boeken, B., Bran, D., Conceicao, A.A., Cabrera, O., Chaieb, M., Derak, M., Eldridge, D.J., Espinosa, C.I., Florentino, A., Gaitan, J., Gatica, M.G., Ghiloufi, W., Gomez-Gonzalez, S., Gutierrez, J.R., Hernandez, R.M., Huang, X.W., Huber-Sannwald, E., Jankju, M., Miriti, M., Monerris, J., Mau, R.L., Morici, E., Naseri, K., Ospina, A., Polo, V., Prina, A., Pucheta, E., Ramirez-Collantes, D.A., Romao, R., Tighe, M., Torres-Diaz, C., Val, J., Veiga, J.P., Wang, D.L. & Zaady, E. (2012). Plant Species Richness and Ecosystem Multifunctionality in Global Drylands. Science, 335(6065), pp. 214-218.
Makinen, H., Hynynen, J., Siitonen, J. & Sievaneni, R. (2006). Predicting the decomposition of Scots pine, Norway spruce, and birch stems in Finland. Ecological Applications, 16(5), pp. 1865-1879.
Marklund, L. (1988). Biomassafunktioner för tall, gran och björk i Sverige (Biomass
functions for pine, spruce and birch in Sweden). (report 45). Swedish University of Agricultural Sciences: Umeå.
Martinez-Boti, M.A., Foster, G.L., Chalk, T.B., Rohling, E.J., Sexton, P.F., Lunt, D.J., Pancost, R.D., Badger, M.P.S. & Schmidt, D.N. (2015). Plio-Pleistocene climate sensitivity evaluated using high-resolution CO2 records. Nature, 518(7537), pp. 49-+.
McGrath, M.J., Luyssaert, S., Meyfroidt, P., Kaplan, J.O., Burgi, M., Chen, Y., Erb, K., Gimmi, U., McInerney, D., Naudts, K., Otto, J., Pasztor, F., Ryder, J., Schelhaas, M.J. & Valade, A. (2015). Reconstructing European forest management from 1600 to 2010. Biogeosciences, 12(14), pp. 4291-4316.
Medlyn, B.E., Berbigier, P., Clement, R., Grelle, A., Loustau, D., Linder, S., Wingate, L., Jarvis, P.G., Sigurdsson, B.D. & McMurtrie, R.E. (2005).Carbon balance of coniferous forestsgrowing in contrasting climates:Model-based analysis. Agricultural andForest Meteorology, 131(1-2), pp. 97-124.
Midgley, G.F. (2012). Biodiversity and Ecosystem Function. Science, 335(6065), pp. 174-175.
Nabuurs, G.J., Arets, E. & Schelhaas, M.J. (2017). European forests show no carbon debt, only a long parity effect. Forest Policy and Economics, 75, pp. 120-125.
Nabuurs, G.J., Lindner, M., Verkerk, P.J., Gunia, K., Deda, P., Michalak, R. & Grassi, G. (2013). First signs of carbon sink saturation in European forest biomass. Nature Climate Change, 3(9), pp. 792-796.
Nabuurs, G.J., Paivinen, R., Sikkema, R. & Mohren, G.M.J. (1997). The role of European forests in the global carbon cycle - A review. Biomass & Bioenergy, 13(6), pp. 345-358.
Nabuurs, G.J., Pussinen, A., van Brusselen, J. & Schelhaas, M.J. (2007). Future harvesting pressure on European forests. European Journal of Forest Research, 126(3), pp. 391-400.
Nabuurs, G.J., Schelhaas, M.J., Mohren, G.M.J. & Field, C.B. (2003). Temporal evolution of the European forest sector
36
carbon sink from 1950 to 1999. Global Change Biology, 9(2), pp. 152-160.
Naudts, K., Chen, Y.Y., McGrath, M.J., Ryder, J., Valade, A., Otto, J. & Luyssaert, S. (2016). Europe's forest management did not mitigate climate warming. Science, 351(6273), pp. 597-600.
NFI (1991). Skogsdata 91. Aktuella uppgifter om de svenska skogarna från riksskogstaxeringen. Institutionen för skogstaxering, SLU.
NFI (2016). The Swedish National Forest Inventory. Official statistics of Sweden.
Nilsson, C. & Gotmark, F. (1992). PROTECTED AREAS IN SWEDEN - IS NATURAL VARIETY ADEQUATELY REPRESENTED. Conservation Biology, 6(2), pp. 232-242.
Nordin, A. & Sandstrom, C. (2016). Interdisciplinary science for future governance and management of forests. Ambio, 45, pp. S69-S73.
Olsson, M.T., Erlandsson, M., Lundin, L., Nilsson, T., Nilsson, A. & Stendahl, J. (2009). Organic Carbon Stocks in Swedish Podzol Soils in Relation to Soil Hydrology and Other Site Characteristics. Silva Fennica, 43(2), pp. 209-222.
Ortiz, C.A., Liski, J., Gardenas, A.I., Lehtonen, A., Lundblad, M., Stendahl, J., Agren, G.I. & Karltun, E. (2013). Soil organiccarbon stock changes in Swedish forestsoils A comparison of uncertainties andtheir sources through a nationalinventory and two simulation models.Ecological Modelling, 251, pp. 221-231.
Ostlund, L., Liedgren, L. & Josefsson, T. (2013). Surviving the Winter in Northern Forests: an Experimental Study of Fuelwood Consumption and Living Space in a Sami Tent Hut. Arctic Antarctic and Alpine Research, 45(3), pp. 372-382.
Ostlund, L., Zackrisson, O. & Axelsson, A.L. (1997). The history and transformation of a Scandinavian boreal forest landscape since the 19th century. Canadian Journal of Forest Research-Revue Canadienne De Recherche Forestiere, 27(8), pp. 1198-1206.
Ostlund, L., Zackrisson, O. & Strotz, H. (1998). Potash Production in Northern Sweden:
History and Ecological Effects of a Pre-industrial Forest Exploitation. Department of Vegetation Ecology Faculty of Forestry. Swedish University of Agricultural sciences. Environment and history 4 (1998) The White horse press, Cambridge, UK., pp. 345-358.
Pan, Y.D., Birdsey, R.A., Fang, J.Y., Houghton, R., Kauppi, P.E., Kurz, W.A., Phillips, O.L., Shvidenko, A., Lewis, S.L.,Canadell, J.G., Ciais, P., Jackson, R.B.,Pacala, S.W., McGuire, A.D., Piao,S.L., Rautiainen, A., Sitch, S. & Hayes,D. (2011). A Large and PersistentCarbon Sink in the World's Forests.Science, 333(6045), pp. 988-993.
Parmesan, C. & Yohe, G. (2003). A globally coherent fingerprint of climate change impacts across natural systems. Nature, 421(6918), pp. 37-42.
Pukkala, T. (2014). Does biofuel harvesting and continuous cover management increase carbon sequestration? Forest Policy and Economics, 43, pp. 41-50.
Pukkala, T. (2017). Does management improve the carbon balance of forestry? Forestry, 90(1), pp. 125-135.
Raich, J.W. & Schlesinger, W.H. (1992). THE GLOBAL CARBON-DIOXIDE FLUX IN SOIL RESPIRATION AND ITS RELATIONSHIP TO VEGETATION AND CLIMATE. Tellus Series B-Chemical and Physical Meteorology, 44(2), pp. 81-99.
Rautio, A.M., Josefsson, T., Axelsson, A.L. & Ostlund, L. (2016). People and pines 1555-1910: integrating ecology, history and archaeology to assess long-term resource use in northern Fennoscandia. Landscape Ecology, 31(2), pp. 337-349.
Read, D., Beerling, D., Cannell, M., Cox, P., Curran, P., Grace, J., Ineson, P., Jarvis, P., Malhi, Y., Powlson, D., Shepherd, D. & Woodward, I. (2001). Annex 2.Examples of management activities to maximise carbon sequestration. 2.2 ‘Carbon Forestry’ – the direct role of forest management. In: The role of land carbon sinks in mitigating global climate change., Policy Document 10/01. London: Royal Society.
RSAAF (2015). Forests and forestry in Sweden. The Royal Swedish Academy of
37
Agriculture and Forestry third. ed. Stockholm.
Sala, O.E., Chapin, F.S., Armesto, J.J., Berlow, E., Bloomfield, J., Dirzo, R., Huber-Sanwald, E., Huenneke, L.F., Jackson, R.B., Kinzig, A., Leemans, R., Lodge,D.M., Mooney, H.A., Oesterheld, M.,Poff, N.L., Sykes, M.T., Walker, B.H.,Walker, M. & Wall, D.H. (2000).Biodiversity - Global biodiversityscenarios for the year 2100. Science,287(5459), pp. 1770-1774.
Sathre, R. & O'Connor, J. (2010). Meta-analysis of greenhouse gas displacement factors of wood product substitution. Environmental Science & Policy, 13(2), pp. 104-114.
Schulze, E.D., Lloyd, J., Kelliher, F.M., Wirth, C., Rebmann, C., Luhker, B., Mund, M., Knohl, A., Milyukova, I.M., Schulze, W., Ziegler, W., Varlagin, A.B., Sogachev, A.F., Valentini, R.,Dore, S., Grigoriev, S., Kolle, O.,Panfyorov, M.I., Tchebakova, N. &Vygodskaya, N.N. (1999). Productivityof forests in the Eurosiberian borealregion and their potential to act as acarbon sink - a synthesis. GlobalChange Biology, 5(6), pp. 703-722.
SEA Swedish Energy Agency. Available at: http://www.energimyndigheten.se/statistik/den-officiella-statistiken/alla-statistikprodukter/ [02.01.17].
Seidl, R., Schelhaas, M.J., Rammer, W. & Verkerk, P.J. (2014). Increasing forest disturbances in Europe and their impact on carbon storage. Nature Climate Change, 4(9), pp. 806-810.
SFA Swedish Forest Agency, forest basic data. Available at: https://minasidor.skogsstyrelsen.se/skogskartan/Default.aspx?startapp=skogligagrunddata [05.01].
Oljekrislag (1975:197) Ministry of the Environment and Energy. legislated: 1975-05-22. (1975:197).
Siitonen, J. (2001). Forest management, coarse woody debris and saproxylic organisms: Fennoscandian boreal forests as an example. Ecol. Bull.,, pp. 11-41.
Sikkema, R., Junginger, M., McFarlane, P. & Faaij, A. (2013). The GHG contribution of the cascaded use of harvested wood products in comparison with the use of
wood for energy-A case study on available forest resources in Canada. Environmental Science & Policy, 31, pp. 96-108.
Simonsson, P., Ostlund, L. & Gustafsson, L. (2016). Conservation values of certified-driven voluntary forest set-asides. Forest Ecology and Management, 375, pp. 249-258.
SIO Scripps Institution of Oceanoghraphy, US San Diego. The Keeling Curve. Latest CO2 reading May 22, 2017, Carbon dioxide concentration at Mauna Loa Observatory. Available at: https://scripps.ucsd.edu/programs/keelingcurve/ [17.05.26].
Skogsstyrelsens föreskrifter m.m. till skogsvårdslagen (1979:429).Skogsstyrelsens författningssamling 1979:3, Jönköping. (1979:3).
Skogsstyrelsens föreskrifter och allmänna råd till skogsvårdslagen (1979:429). Skogsstyrelsens författningssamling 1993:2. Jönköping (1993:2).
Soderberg, U., Wulff, S. & Stahl, G. (2014). The choice of definition has a large effect on reported quantities of dead wood in boreal forest. Scandinavian Journal of Forest Research, 29(3), pp. 252-258.
SOU (1932:26). Uppskattning av Sveriges skogstillgångar. Verkställd åren 1923–1929. Del 1. Statens Offentliga Utredningar. Riksskogstaxeringsnämnden.
Stendahl, J. (2017). Pers.com, Carbon storage and accumulation in Northern Swedish forests. Forest statistics 2017: SLU-NFI.
Stendahl, J., Johansson, M.B., Eriksson, E., Nilsson, A. & Langvall, O. (2010). Soil Organic Carbon in Swedish Spruce and Pine Forests - Differences in Stock Levels and Regional Patterns. Silva Fennica, 44(1), pp. 5-21.
SvenskBetong.se Svensk Betong, Organisation, Historik. Available at: https://www.svenskbetong.se/svensk-betong/organisation/historik [02.02.17].
Teobaldelli, M., Somogyi, Z., Migliavacca, M. & Usoltsev, V.A. (2009). Generalized functions of biomass expansion factors for conifers and broadleaved by stand age, growing stock and site index.

38
Forest Ecology and Management, 257(3), pp. 1004-1013.
Tiren, L. (1937). Skogshistoriska studier i trakten av Degerfors i Västerbotten. Meddelanden från Statens skogsförsöksanstalt (0283-3093)(30:2), p. 67.
UNFCCC (2015). FCCC/CP/2015/10/Add.1. Report of the Conference of the Parties on its twenty-first session. held in Paris from 30 November to 13 December 2015. Addendum. Part two: Action taken by the Conference of the Parties at its twenty-first session.). United Nations Office at Geneva | Geneva (Switzerland) |.
Valentini, R., Matteucci, G., Dolman, A.J., Schulze, E.D., Rebmann, C., Moors, E.J., Granier, A., Gross, P., Jensen,N.O., Pilegaard, K., Lindroth, A.,Grelle, A., Bernhofer, C., Grunwald,T., Aubinet, M., Ceulemans, R.,Kowalski, A.S., Vesala, T., Rannik, U.,Berbigier, P., Loustau, D.,Guomundsson, J., Thorgeirsson, H.,Ibrom, A., Morgenstern, K., Clement,R., Moncrieff, J., Montagnani, L.,Minerbi, S. & Jarvis, P.G. (2000).Respiration as the main determinant ofcarbon balance in European forests.Nature, 404(6780), pp. 861-865.
Weggler, K., Dobbertin, M., Jungling, E., Kaufmann, E. & Thurig, E. (2012). Dead wood volume to dead wood carbon: the issue of conversion factors. European Journal of Forest Research, 131(5), pp. 1423-1438.
Werner, F., Taverna, R., Hofer, P., Thurig, E. & Kaufmann, E. (2010). National and global greenhouse gas dynamics of different forest management and wood use scenarios: a model-based assessment. Environmental Science & Policy, 13(1), pp. 72-85.
Wharton, S. & Falk, M. (2016). Climate indices strongly influence old-growth forest carbon exchange. Environmental Research Letters, 11(4), p. 11.
Wihersaari, M. (2005). Greenhouse gas emissions from final harvest fuel chip production in Finland. Biomass & Bioenergy, 28(5), pp. 435-443.
Xu, B., Yang, Y.H., Li, P., Shen, H.H. & Fang, J.Y. (2014). Global patterns of
ecosystem carbon flux in forests: A biometric data-based synthesis. Global Biogeochemical Cycles, 28(9), pp. 962-973.
Yanai, R.D., Currie, W.S. & Goodale, C.L. (2003). Soil carbon dynamics after forest harvest: An ecosystem paradigm reconsidered. Ecosystems, 6(3), pp. 197-212.
Yrjölä, T. (2002). Forest management guidelines and practices in Finland, Sweden and Norway. European Forest Institute Sweden and Norway.
Yuan, W.P., Luo, Y.Q., Richardson, A.D., Oren, R., Luyssaert, S., Janssens, I.A., Ceulemans, R., Zhou, X.H., Grunwald, T., Aubinet, M., Berhofer, C., Baldocchi, D.D., Chen, J.Q., Dunn, A.L., Deforest, J.L., Dragoni, D.,Goldstein, A.H., Moors, E., Munger,J.W., Monson, R.K., Suyker, A.E., Star,G., Scott, R.L., Tenhunen, J., Verma,S.B., Vesala, T. & Wofsy, S.C. (2009).Latitudinal patterns of magnitude and interannual variability in net ecosystem exchange regulated by biological and environmental variables. Global Change Biology, 15(12), pp. 2905-2920.
Zackrisson, O. (1977). Influence of forest fires on the north Swedish boreal forest. Oikos. pp. 22-32.
Zha, T., Barr, A.G., Black, T.A., McCaughey, J.H., Bhatti, J., Hawthorne, I.,Krishnan, P., Kidston, J., Saigusa, N.,Shashkov, A. & Nesic, Z. (2009).Carbon sequestration in boreal jackpine stands following harvesting.Global Change Biology, 15(6), pp.1475-1487.
Zhou, G.Y., Liu, S.G., Li, Z., Zhang, D.Q., Tang, X.L., Zhou, C.Y., Yan, J.H. & Mo, J.M. (2006). Old-growth forests can accumulate carbon in soils. Science, 314(5804), pp. 1417-1417.
Zubizarreta-Gerendiain, A., Pukkala, T. & Peltola, H. (2016). Effects of wood harvesting and utilisation policies on the carbon balance of forestry under changing climate: a Finnish case study. Forest Policy and Economics, 62, pp. 168-176.

SENASTE UTGIVNA NUMMER
2016:5 Författare: Elin Kollberg Tidiga tillväxteffekter av kvävetillförsel på SeedPAD och plantor
2016:6 Författare: Lukas Holmström Restoration of degraded tropical rainforests through gap and line planting: Effects on soil and light conditions and seedling performance
2016:7 Författare: Lina Edgren Naturvård och efterbehandling i Masugnsbyns dolomittäkt
2017:1 Författare: Johan Åhs The influence of precipitation and nitrogen fertilization on aboveground tree growth and how this varies across small-scale microtopography gradients in Pinus sylvestris stands in northern Sweden
2017:2 Författare: Joshua Johansson Utvärdering av en markvattenmodells förmåga att estimera markfuktighet och bärighet
2017:3 Författare: Stina Köppler Skogen som integrationsarena – kopplingen mellan svensk skogsnäring och integration
2017:4 Författare: Kristina Nilsson Överlevnad, tillväxt och snytbaggeskador i fält hos långnattsbehandlade ettåriga tallplantor med dubbelbarr
2017:5 Författare: Maria Jakobsson Naturlig föryngring efter brand – Fyra trädarters etablering i relation till mikromiljö och spridningsavstånd på Salabrännan
2017:6 Författare: Erik Sköld Lönsamhet vid fröträdsavverkningar på torvmark i östra Småland
2017:7 Författare: Anna Bergqvist Skogsbrukets brandskötsel. En intervju-undersökning utförd i Västerbotten år 2006
2018:1 Författare: Gustav Nord Tillväxteffekter för tall 33 år efter konventionell gallring och gödsling
2018:2 Författare: Felicia Dahlgren Lidman The Nitrogen fixation by cyanobacteria associated to feathermosses - A comparison between Scots pine and Norway spruce stands
2018:3 Författare: Hanna Glöd Forest drainage effects on tree growth in Northern Sweden. – Developing guidelines for ditch network maintenance
2018:4 Författare: Anna Jonsson How are riparian buffer zones around Swedish headwaters implemented? – A case study
2018:5 Författare: Martin Hederskog Är uteblivna bränder i skogslandskapet en bidragande orsak till igenväxning av myrmarker?
Hela förteckningen på utgivna nummer hittar du på www.seksko.slu.se
Copyright © 2022 FDOKUMEN