Evolutionary Models and Studies in Human Diversity - Gwern ...
393
DE GRUYTER Robert J. Meier (Ed.) etal. EVOLUTIONARY MODELS AND STUDIES IN HUMAN DIVERSITY WORLD ANTHROPOLOGY
-
Upload
khangminh22 -
Category
Documents
-
view
0 -
download
0
Transcript of Evolutionary Models and Studies in Human Diversity - Gwern ...
DE GRUYTER
Robert J. Meier (Ed.) etal.
EVOLUTIONARYMODELS AND STUDIESIN HUMAN DIVERSITY
WORLD ANTHROPOLOGY

Evolutionary Models and Studies in Human Diversity
World Anthropology
General Editor
SOL TAX
Patrons
CLAUDE LEVISTRAUSS MARGARET MEAD LAILA SHUKRY EL HAMAMSY Μ. N. SRINIVAS
MOUTON PUBLISHERS THE HAGUE PARIS DISTRIBUTED IN THE USA AND CANADA BY ALDINE, CHICAGO
Evolutionary Models and Studies in Human Diversity
Editors
ROBERT J. MEIER CHARLOTTE Μ. OTTEN FATHI ABDELHAMEED
MOUTON PUBLISHERS THE HAGUE PARIS DISTRIBUTED IN THE USA AND CANADA BY ALDINE, CHICAGO
Copyright © 1978 by Mouton Publishers. All rights reserved. No part of this publication may be reproduced,
stored in a retrieval system, or transmitted, in any form or by any means, electronic, mechanical,
photocopying, recording or otherwise without the written permission of Mouton Publishers, The Hague
Distributed in the United States of America and Canada by Aldine Publishing Company, Chicago, Illinois
ISBN 9027976406 (Mouton) ISBN 0202900916 (Aldine)
Indexes by Society of Indexers, Great Britain Jacket photo by permission of Paul L. Jamison
Cover and jacket design by Jurriaan Schrofer Printed in Great Britain

General Editor's Preface
A book now on variations in the biology of human populations is hardly recognizable as dealingwith the "racesof man,"a subject matterwhich historically has been associated with both anthropology and ethnology. Population genetics has not only been erased from our vocabularies idealtype terms for races but also has invited studies of the factors involved in changing gene frequencies in human populations. The present volume provides new data from all over the world useful to developing explanatory theory, by selected authors from different countries attracted to a most international Congress.
Like most contemporary sciences, anthropology is a product of the European tradition. Some argue that it is a product of colonialism, with one small and selfinterested part of the species dominating the study of the whole. If we are to understand the species, our science needs substantial input from scholars who represent a variety of the world's cultures. It was a deliberate purpose of the IXth International Congress of Anthropological and Ethnological Sciences to provide impetus in this direction. TheytrponlhgdWA World Anthropology volumes, therefore, offer a first glimpse of a human science in which members from all societies have played an active role. Each of the books is designed to be selfcontained; each is an attempt to update its particular sector of scientific knowledge and is written by specialists from all parts of the world. Each volume should be read and reviewed individually as a separate volume on its own given subject. The set as a whole will indicate what changes are in store for anthropology as scholars from the developing countries join in studying the species of which we are all a part.
The IXth Congress was planned from the beginning not only to include as many of the scholars from every part of the world as possible, but also with a view toward the eventual publication of the papers in highquality
VItsronlifedcaPGE General Editor's Preface
volumes. At previous Congresses scholars were invited to bring papers which were then read out loud. They were necessarily limited in length; many were only summarized; there was little time for discussion; and the sparse discussion could only be in one language. The IXth Congress was an experiment aimed at changing this. Papers were written with the intention of exchanging them before the Congress, particularly in extensive preCongress sessions; they were not intended to be read aloud at the Congress, that time being devoted to discussions — discussions which were simultaneously and professionally translated into five languages. The method for eliciting the papers was structured to make as representative a sample as was allowable when scholarly creativity—hence selfselection—was critically important. Scholars were asked both to propose papers of their own and to suggest topics for sessions of the Congress which they might edit into volumes. All were then informed of the suggestions and encouraged to rethink their own papers and the topics. The process, therefore, was a continuous one of feedback and exchange and it has continued to be so even after the Congress. The some two thousand papers comprisingytrponlhgdWA World Anthropology certainly then offer a substantial sample of world anthropology. It has been said that anthropology is at a turning point; if this is so, these volumes will be the historical directionmarkers.
As might have been foreseen in the first postcolonial generation, the large majority of the Congress papers (82 percent) are the work of scholars identified with the industrialized world which fathered our traditional discipline and the institution of the Congress itself: Eastern Europe (15 percent); Western Europe (16 percent); North America (47 percent); Japan, South Africa, Australia, and New Zealand (4 percent). Only 18 percent of the papers are from developing areas: Africa (4 percent); AsiaOceania (9 percent); Latin America (5 percent). Aside from the substantial representation from the U.S.S.R. and the nations of Eastern Europe, a significant difference between this corpus of written material and that of other Congresses is the addition of the large proportion of contributions from Africa, Asia, and Latin America. "Only 18 percent" is two to four times as great a proportion as that of other Congresses; moreover, 18 percent of 2,000 papers is 360 papers, 10 times the number of "Third World" papers presented at previous Congresses. In fact, these 360 papers are more than the total of ALL papers published after the last International Congress of Anthropological and Ethnological Sciences which was held in the United States (Philadelphia, 1956).
The significance of the increase is not simply quantitative. The input of scholars from areas which have until recently been no more than subject matter for anthropology represents both feedback and also longawaited theoretical contributions from the perspectives of very different cultural, social, and historical traditions. Many who attended the IXth Congress

General Editor's Preface VII
were convinced that anthropology would not be the same in the future. The fact that the next Congress (India, 1978) will be our first considera-tion of the present set of books will show how much, and just where and how, our discipline is being revolutionized.
There are a number of other books in this series on World Anthropology also dealing with biological evolution and human variation as well as with factors effecting cultural and social changes which in turn influence populations.
Chicago, Illinois June 19, 1978
SOL TAX

Preface
This volume grew out of the original intent of one of us (Charlotte M. Otten) to organize a session at the IXth ICAES in Chicago on various aspects and processes relating to human genetic differentiation. Of par-ticular interest was the relationship of cultural influences and population dynamics to the functioning of such processes. In order to insure an adequate coverage of major themes, a number of papers were invited. Unfortunately, the session was organized and assigned at a date later than the majority of other sessions, and only a few of the scholars personally approached found the time arbitrarily allotted for the preparation of papers to be adequate. To them, apologies are offered for the presump-tion of asking them to make substantial contributions on very short notice.
By the time of the convening of the Congress in late August, some fifty papers had been assigned to the session, including contributions from Asia, Africa, Europe, and Latin America. Some of the papers arrived too late to be listed in the Congress programs distributed at that time. It was soon apparent also that the original plan of circulating all papers to all participants in advance of the Congress could not be carried out, consid-ering the distances and time involved and the number of papers to be edited and reproduced. Those reprints that the Chicago office was able to distribute were received with interest and added greatly to the success of the discussions.
To the difficulties involved in the pre-Congress circulation of papers was added, for us, the more pressing problem of accommodating the remarks of the numerous participants within the single hour allotted the session. The majority of registrants had arrived with ideas and questions to be shared, research to be reported, and the wish to comment upon papers circulated. In the course of a presession meeting called by the
χ Preface
organizers, the hour was of necessity divided into fourminute slots in order to accommodate the largest possible number of scholars wishing to speak. Many local participants, in their role of hosts, relinquished their own remarks in order to allow for the expressions of visitors who had come long distances, often at great effort and expense, in order to exchange information.
As a result, some dozen aspects of human genetic differentiation were touched upon summarily under the chairmanship of Dr. R. J. Meier. We, the editors, would like here to express our apologies to those who were denied the opportunity to speak, as well as to those whose remarks were curtailed and abridged of necessity. In spite of the handicaps experienced, most scholars in attendence expressed their interest in the session, regretting only that general discussion as well as the prepared reports could not have been more extended.
The large number of papers (totaling almost eighty) relating to the topic of human differentiation, again offered difficulties, here spatial rather than temporal. To have included even fifty papers within a single volume would have required Atlantean efforts from all involved, including the editors, publishers, and even librarians responsible for shelving such a volume. The eventual outcome of lengthy deliberation and extended correspondence was to create a further volume on blood group distributions, under the editorship of Alice Brues. Meanwhile, some of the papers originally assigned to our session were reassigned to Chiarelli and Schwidetzky's new collections on the anthropology of Europe. These several volumes should complement each other and together reflect the significance and vitality of research being conducted in the area of genetic differentiation.
ROBERT J . MEIER
Indiana University
Bloomington,
Indiana
CHARLOTTE M . OTTEN
Northern Illinois
University
DeKalb, Illinois
FATHI A B D E L H A M E E D
Northern Illinois
University
DeKalb, Illinois
Table of Contents
Gen er a l Ed itor 's Preface ν
Preface ix
In troduction 1 by Robert J. Meier and Charlotte M. Otten
S ECTION ON E: M OD ELS OF GEN ETIC D IFFEREN TIATION
Adaptat ion : A Con ceptual Fram ework 9 by Richard B. Mazess
Gr ou p Selection and Sexual Select ion in Hum an Evolu t ion 17 by Frederick S. Hulse
Altru ism , Gr ou p Select ion , and H um an Evolu t ion 39 by Richard D. Arm strong
Differen t ia l Transm ission of Gen et ic and Cultural In form ation Ab ou t the En viron m en t : A Cybern et ic View of Gen et ic and Cultural Evolu t ion in An im al Species 47 by Carl Jay Bajem a
Curren t Direct ion s in Beh avior Gen et ics by Steven G. Vandenberg
63
XIIzywvutsrponmlkjihgfedcbaWVTSRPNMLKJHGFECBA Table of Contents
Effects of Isolation on Genetic Variability: Macaque Populations as Model Systems 105 by Laura Newell Morris and Peter E. Nute
FrequencyDependent Selection and the ABO Blood Groups 127 by Frank B. Livingstone
Impact of Neutral Mutations on Evolution 141 by George R. Gluesing and Fathi AbdelHameed
Mathematical Aspects of Genetic Equilibrium 173 by Ranajit Chakraborty
SECTION TWO: POPULATION STUDIES
Multidisciplinary Studies in Tribal Societies and Human Evolution 181 by Francisco M. Salzano
Tapipa: A Negroid Venezuelan Isolate by T. Arends, M. L. Gallango, Α. Muller, M.zronliedaPOMGB GonzδlezMarrero,yxwutsrqponmlihgfedcbaTSPMGFED 201 and O. Pirez Bandez
Population Dynamics in Tlaxcala, Mexico: The Effects of Gene Flow, Selection, and Geography on the Distribution of Gene Frequencies 215 by Μ. H. Crawford
Genetic Distances Among Certain Southern African Populations 227 by Trefor Jenkins, Henry Harpending, and G. T. Nurse
Biology and the History of Southern African Populations 245 by G. T. Nurse, Henry C. Harpending, and Tre for Jenkins
Genetic Structure in Ideles by Philippe LefevreWitier and Henri Vergnes 255
Microevolutionary Dynamics Among the Gavdas of Goa 279 by K. C. Malhotra
Founder Effect, Gene Drift, and Natural Selection Among Four Nomadic Mendelian Isolates 315 by K. C. Malhotra
Table of Contents XIII
Physical Anthropology of the Angami Nagas (Nagaland, India) 325 bywvutsronmlihgfedcbaSPOMKHF Praveen Kumar Seth and Swadesh Seth
Blood Protein Polymorphisms and the Problem of Genetic Affinities of the Ainu 333 by Keiichi Omoto
The Anthropological Usefulness of the IgA Allotypic Markers 343 by M. S. Schanfield and Η. H. Fudenberg
Biographical Notes
Index of Names
Index of Subjects
353
361
369

Introduction
ROBERT J. MEIER and CHARLOTTE Μ. OTTEN
As subsumed under modern synthetic evolutionary theory, the component processes of gene frequency change are selection, mutation, gene flow, and random genetic drift. Although these agencies appear universally applicable to evolutionary change in nonhuman species, they provide a decidedly incomplete basis from which to understand and analyze the excessive complexities involved in the formation of modern human populations. Some would go so far as to say thatsponmieaH Homo sapiens has virtually escaped the kind of evolutionary programming effected in other organisms. Some would stress the importance of random, "nonDarwinian" processes. Others are convinced that we have not yet defined the boundaries of freedom within which we have achieved our biological identities. Still others, as strict genetic determinists, see most human differentiation, both intra and interspecific, as having the same direct evolutionary and genetic bases as nonhuman organisms, and find men and women's apparent freedom in selecting environmental and cultural parameters to be a romantic selfdelusion. A growing number, however, recognize in culture a manifestation of "group selection," thus introducing a new mode and level of evolutionary process. Even though it is impossible at this time to specify adequately those many conditions and forces shaping our development as a species, nevertheless fruitful ideas and testable models bearing upon these controversies and questions are available, and they constitute a lively concern of physical anthropologists today.
The first part of this volume presents nine papers, all of which treat the question of human diversity from the standpoint of theoretical model building. These works provide exploratory approaches by which the process of diversification may be investigated and interpreted. Actual accumulations of relevant data are reported in the field studies that constitute the second section of this collection. This happy balance be

2 ROBERT J. MEIER, CHARLOTTE Μ. OTTEN
tween theory and fieldwork was not planned intentionally in organizing the session, but rather arose spontaneously from the interests and activities of the contributors.
The collection is introduced by the paper of Mazess. He approaches the process of adaptation by clarifying the diversity of environments, referred to as "domains," to which human groups have more or less successfully adapted. Herein, of course, resides one of the fundamental bases for the explanation of human polytypy, adaptation having proceeded along specific lines in response to the geographical pressures of climate, humidity, vegetation, nutrition, and so on.
The next four papers consider rather distinct and perhaps uniquely human aspects of behavioral evolution. Contributions by Hulse and Armstrong take up the issues of group selection and its role in the establishment of specifically human traits, such as the extended survival into a postreproductive period, and "altruism." Additionally, sexual selection of preferential mating practices are reviewed by Hulse, who finds no parallels in nonhuman animal behavior.
In his contribution, C. J. Bajema argues for a consideration of the interdependence between biological and cultural aspects of human evolution. This concept of mutual interaction as described within a cybernetic model continues to hold great promise in elucidating the complexities involved in past and present population systems.
Vandenberg next presents a straightforward survey of the current status of human behavioral genetics. His contribution is both methodological and substantive and offers information concerning the provocative and timely issue of race and intelligence.
The next four papers explore details of evolutionary process at the level of gene function. The illuminating contribution of Morris and Nute deals with population differentiation and loss of variation in genetic systems of macaques through separation and isolation of formerly contiguous groups. The implications for human population genetics are readily apparent and, in fact, are realized as field studies proceed in small isolated communities in North America, Latin America, Africa, and India (see the papers in the second section of this volume).
Genetic systems are once again examined by Livingstone, here with direct reference to human selection. He forcefully demonstrates by means of computer simulation that differentiation between populations in ABO allelic distributions more likely results from frequency dependent selection than the relationship of blood group immunology to disease resistance and/or prenatal antigenic incompatibility.
An entirely different outlook is presented by Gluesing and AbdelHameed. They comprehensively review the literature on the controversial issue of "nonDarwinian" evolution, and the existence and implications of selectively neutral loci to evolutionary transformation in primates.
Introduction 3
These four papers, then, discuss explanatory roles associated with three of the four traditionally cited agencies of evolutionary change. It is of interest to note that selection, mutation, and random processes all are utilized in evolutionary interpretations in various papers, albeit for differing genetic systems under differing conditions of observation. Gene flow is not directly covered in the theoretical section, but it is given a most prominent position in the section on field studies.
In the last offering of this section, Chakraborty fills out our presentation of evolutionary genetics with a proof (here condensed from a more lengthy version) of mathematical equilibria in maintaining genetic or polymorphic variability within a population according to deterministic, rather than stochastic, considerations.
Studies of pre industrial huntinggathering or simple agricultural societies continue to provide a major focus of concern for genetically oriented anthropologists. This sustained interest probably can be attributed to the urgency necessitated by the preservation of a moment in our species' history which is rapidly fading out of existence. As the huntergatherer and primitive agriculturalist move into the modern Western world, they seal off irrevocably the records of our own past. This trend can be viewed with regret not only, in many instances, by humanitarians, but also by researchers as well, since tantalizing questions and even more tantalizing answers are beginning to emerge. However, anthropologists and human biologists must, of necessity, utilize the situation of change itself as a challenge in developing new problems and new techniques of investigation. We must also learn to adapt and apply our methodologies to situations of greater cultural complexity. The past two decades or so have seen the development and florescence of studies referred to, perhaps sometimes overambitiously, as multidisciplinary. This approach is holistic, employing a team of specialists, and has as its goal the investigation of all possible aspects, especially in terms of historical, genetic, medical, ecological, and cultural parameters. Such studies will very likely provide the foundations from which investigations of more complex biocultural phenomena can be adapted and pursued. The papers included in the second section of the volume exemplify this multidisciplinary approach, and exhibit its profitable application to a variety of technologically simple societies in many areas of the world.
The contribution of Salzano was selected to introduce this section since he states excellently the rationale for multidisciplinary investigations. He follows this with a comprehensive review of major studies in this category, all of which are accompanied by numerous references to original data reports. In addition, the Cayapo Indians of Brazil serve as his own focus, furnishing his major demographic and biological findings. His is also one of several studies (see also Arendseia/., Crawford, Jenkinsef al.,

4 ROBERT J. MEIER, CHARLOTTE Μ. OTTEN
and LefevreWitier and Vergnes) employing biological distance analysis to problems of assessing evolutionary/historical relationships.
The Venezuelan community of Tapipa provides the setting for the work of Arends and his colleagues, reported in the second paper. This study is the first to apply a multidisciplinary approach to unraveling the evolutionary history of South American blacks. The Tapipas, in spite of their evident isolation from major cultural influences for the past two centuries were shown by genetic analysis to have received some gene flow from Venezuelan aboriginal and Caucasian neighbors.
Crawford, carrying out studies in Mexico, discusses admixture and genetic distances shown by his data collected from mestizos of the Tlaxcalan Valley in the central highlands. This work employs five measures of admixture, which not only serve to define the trihybrid composition of the present gene pool, but it suggests possible selective pressures acting on a blood group polymorphism, namely, the Duffy system.
In a series of two papers, Jenkins, Harpending, and Nurse report their collaboration in analyzing specific genetic systems in a number of African populations. Their first paper sets forth basic procedures utilized (a multivariate statistic called principle components) in ascertaining genetic distance. Their data involve the distributions of blood group polymorphisms in eighteen groups. Their derived information on distance is then applied in their second paper to problems of historical reconstruction and evaluating and in some instances, correcting prior interpretations (and misinterpretations) based upon ethnohistorical and linguistic sources. The interaction between cultural behavior and biology assumes especial significance when viewed from the analytical perspective of these three "ethnologically oriented human biologists" (p. 253 in this volume).
With some variation, the problem of assessing multigroup distance is also treated in the paper by LefevreWitier and Vergnes. These researchers directed their study toward reconstructing the relationships between several genetically distinguishable northern Saharan groups resident in the Valley of Ideles in southcentral Algeria. This report is offered as preliminary to future work which will extend a distance analysis to include cultural and genealogical sources along with genetic data.
The next three papers derive their subjectmatter from India. Malhotra, in the first of his two papers, asks whether monogenic or polygenic traits are more susceptible to evolutionary alterations due to isolation in groups derived from a common parental stock. He compares three subgroups of an original Indian caste, the Gavdas, in terms of serogenic, anthropometric, anthroposcopic, and dermatoglyphic traits. Since these biological variables are not concordant with regard to their degrees of divergence, the author raises further questions regarding the differential operation of evolutionary processes, and the likelihood of
Int roduct ion 5
plasticity responses in altered environm en ts. In brief, the sign ifican t issues exposed m ake this paper highly in terest ing.
Malh ot ra's second paper also exam ines evolu t ionary processes of differen t iat ion , although from a somewhat d ifferen t approach . Here he observes diversificat ion in fou r Indian subgroups from the Nandiwallis castecluster. Provisionally, he offer s random genet ic drift as the most plausible explanat ion of d ivergences, but he caut ions that before accepting any final in terpretat ion , one must exam ine more fu lly demograph ic and an th ropological param eters. Like LefevreW it ier and Vergn es, he underlines the need for a mult idisciplinary approach .
Gen et ic and m orphological characters of a relat ively isolated group of Naga Indians form the basic data used in the contribut ion by Seth and Seth . A point of part icular in terest arises from their observat ion that this group has not d ifferen t iat ed m arkedly from their indigenous neighbors in East India. Thus this study d iffers considerably in its findings from that of Malhot ra, who noted in his populat ion segments substant ial d iversificat ion.
Th e worldwide survey concludes with O m ot o's contribut ion to the racial history of the Ain u of the northern Japan ese island of Hokkaido. Aft e r reviewing the available evidence derived from blood group polymorphisms, he concludes that (a) the Ain u genet ically reveal their clear Mon goloid origins, although (b) they have d ifferen t iat ed from other Asiat ic peoples in some selected traits ( for exam ple, h irsut ism) as a consequence of small effect ive populat ion number coupled with assortat ive mating pract ices. Here, then , is a study illustrat ing the theoret ical discussions of Hulse and Arm st ron g.
Th e fin al paper, by Sch an field and Fuden berg, contrasts with the indepth and mult idisciplinary researches on local groups, concentrat ing rather upon the immunoglobin varian ts with regard to their value in assessing phylogenet ic distance between cont inen tal populat ions. Th e results of their study lead them to claim for the Gm and Inv polym orphisms a high degree of diagnost ic accuracy in indicat ing degree of relat ionship in distant ly related as well as closely related groups.

SECTION ONE
Models of Genetic Differentiation

Adaptation: A Conceptual Framework
RICHARD B. MAZESS
During the past decade interest has been growing in the topic of adaptation in both cultural and biological anthropology. However, even books and articles purporting to deal with adaptation contain little or no discussion of the concept itself, nor do the topics dealt with revolve around some central focus that can be discerned as adaptational. There is talk of "evolutionary" perspectives and "ecological" relationships, but little systematic distillation of ideas. This appears to reflect the lack of consensus as to the meaning of the term adaptation in both the biological and the social sciences, a deficiency that has led to considerable imprecision, made for unwarranted and unseemly speculation, and given rise to suitable skepticism and even condemnation. Reproaches are not the aim of this report; rather, the goal is to outline an encompassing conceptual framework. This framework has been formulated chiefly to deal with problems of assessing human biological adaptability, but the possibility of its extension to wider spheres is obvious.
THE MEANING OF ADAPTATION
The effort to define adaptation is not merely a terminological exercise, but rather the expression of a conceptual framework. The conventional "dictionary" definition of adaptation indicates that it is an adjustment to environmental conditions which enables the organism to survive and function. Prosser (1958, 1964), in one of the few attempts to deal systematically with adaptation, has incorporated this common usage in his definition of "physiological adaptation." He includes as adaptive the idea of any properties of organisms favoring survival or maintenance of function in an environment, particularly a stressful or changing environment. Other scholars (Eagan 1963; Folk 1966), in their examination of adap
1 0 RICHARD Β. MAZESS
tive terminology, have supported Prosser and advocated continued use of adaptation as an allinclusive term. This use is far less restrictive and specialized than that of evolutionary biologists and some physical anthropologists, who deal almost entirely with genetic adaptation from an evolutionary perspective, yet it is less broad than that of evolutionary and functionalist anthropologists, who are prone to see any and all sociocultural characteristics as adaptive. I, too, propose that adaptation be used as an allinclusive term, but that it be used in welldefined relation to environmental adjustments. The essence of that adjustment involves the notion of properties deemed "necessary," or relatively "beneficial." Survival, the first aspect of the definition of adaptation, is equivalent to necessity, while maintenance of function, the other aspect of the conventional definition of adaptation, is considered an example of a relatively beneficial property. Necessity and relative merit are theusqonligea sine qua non of adaptation and constitute the basis of "adaptive significance."
Adaptive significance is not a notion peculiarly germane to individual organisms or groups of organisms, but it may be applied at any level of organizational complexity — enzyme, organ, or ecosystem; that is, adaptation may have different referents. Moreover, degrees of necessity or of relative benefit or merit must be demonstrated accordingly in detail, and the criteria vary for different referential levels. The adaptive response of an enzyme to substrate alterations is evaluated differently than is the adaptive response of a population to a changing climate. Finally, it is proposed that the informational value and import of the term adaptation in a larger context derive from the demonstration of adaptive significance across referential levels.
REFERENTS OF ADAPTATION
The referents of adaptation do vary, depending on the field of study, and the term adaptation can be used in referring to different levels of biological and social complexity. In the biological sphere there is a fairly clearcut organizational hierarchy from the physicochemical level to the ecosystem. The properties and characteristics at each level are distinctive, and each level is operationally isolated from other levels for analytic purposes and has its own language. Each succeeding level of the biological hierarchy forms the dominant environmental focus of the preceding level. Thus the environment of the cell is the organ system and, of the organ system, it is the organism.
In sociocultural organization the hierarchy of the referential levels is not as clear as the biological hierarchy, but there is an analogous system for organizing individual behaviors, group activities, societal functions, and cultural patterns. Here, as in the biological hierarchy, the "environ
Adaptation: A Conceptual Framework 11
ment" can be conceived of as the succeeding level of complexity. Thus the
adaptive significance of an individual behavior can be examined in rela-
tion to the groups containing that individual, or the functioning of an
economic system can be viewed in relation to the total cultural pattern.
It is important to specify the referential levels and hierarchical system
one is dealing with when assessing adaptation because the criteria of
adaptive significance vary from level to level. Confusion will result from
not attending to this caveat. For example, if the referent is an enzyme
then the criteria of adaptive significance should be germane to that level,
and the immediate environment of the enzyme must be considered. In
biological anthropology there is often confusion or equivocation between
individual and population adaptation, and the criteria of adaptive signifi-
cance for individuals are assumed to hold as well for populations.
A D A P TIV E S IG N IFIC AN C E A N D A D A P TIV E D O M A IN S
Degree of necessity and of relative benefit are concepts that can be
defined specifically in relation to certain areas of life, or "adaptive
domains." These operationally defined domains differ at different levels
of biological and social complexity. In the biological hierarchy the major
emphasis at the physicochemical, cellular, and organ system levels is on
the ability to survive or to maintain homeostasis. For individual organ-
isms several major aspects of living are considered adaptive domains:
1. Reproduction: survival, reproductive advantage.
2. Health: morbidity, mortality, disease resistance.
3. Nutrition: nutrient requirements and utilization.
4. Nervous system: sensory, motor, and mental functions.
5. Growth and development: physical and mental progression in rate
and attainment.
6. Resistance and cross-tolerance: generalized stress resistance.
7. Physical performance: exercise and motor abilities and skills.
8. Affective function: happiness, sexuality, tolerance.
9. Intellectual ability : learning, expression.
These domains are the basis for assessing the significance of human
adaptability. At the level of the population the emphasis is placed on
evaluating necessity and benefit in relation to size, density, and distribu-
tion of the population, and in relation to its biological composition and
organization. At the ecosystem level, one considers the interrelations
among populations and the attainment of a steady-state or climax. Total
energy balance and species diversity and persistence are other domains at
this level.
1 2 RICHARD Β. MAZESS
Evaluation of the adaptive significance of sociocultural phenomena can be made on the relationship of these phenomena to biological domains at the individual and population level. For example, one may examine the effects of a group behavior, such as the institutionalization of medical treatment, on health. It is also possible that adaptive domains germane to the sociocultural hierarchy may be delineated, but this has not been attempted here.
One of the greatest shortcomings of modern research on human adaptation has been the failure to consider the adaptive value of putative advantageous traits. Of course, it is true that the environmental relationship of a characteristic or response must be demonstrated; all too often, these environmental relationships are imprecise, or based on dubious correlation as for example the widely touted relationship between the surface area: weight ratio and environmental temperature, or between nose dimensions and relative humidity. However, the failure to consider adaptive significance is at least as debilitating to the establishment of an adaptive relationship. Thus, even if it could be demonstrated that an increased surface area: weight ratio were an invariant response of populations in hot climates it would still be mandatory to demonstrate that this increase was of some benefit to an adaptive domain. Does it increase physical performance, decrease morbidity, or perhaps increase affective tolerance in this climate? These are questions which must be examined, if not answered; the detailed demonstration of benefit or necessity is essential. Moreover, the informational impact of such an analysis seems increased if such a demonstration is possible over several levels of a hierarchy. A good example of this contention is the widely quoted relationship of the sickle cell gene to malaria. Here a physicochemical change modifies a cell's functioning and provides a demonstrated advantage to individuals and to the population. Demonstration of advantage over several levels of the biological hierarchy makes this relationship highly informative.
NOMENCLATURE
A variety of terms are associated with adaptation; for example, acclimation and accommodation. A specialized nomenclature such as attempted by Folk (1966) and Eagan (1963) is, in fact, necessary, for as Dubos (1965:56) has pointed out ". . . acclimatization, acclimation, adaptation, and habituation are often used interchangeably because the processes these words are supposed to denote usually overlap and because the fundamental mechanisms involved are poorly understood." Such a systematic nomenclature for organismic adaptability has been developed, but it can be only outlined here. The essence of that system

Adapt at ion: A Concept ual Fram ework 13
lies in the utilizat ion of acclimat izat ion to include all phenotypic adapt ive responses, and to subdivide acclimat izat ion in to categories of structural (m orphological), funct ional (physiological), and psychobehavioral acclimat izat ion . Habituat ion here is viewed as a part icular kind (neurological) of funct ional acclimat izat ion , wh ereas accommodat ion is defin ed as a part icular kind (affect ive) of psychobehavioral acclimat izat ion. Regard less of the category of acclimat izat ional response, the adapt ive sign ificance has to be shown to render such an assessment more than speculat ive.
T H E ST U D Y O F H U M AN AD AP T ABI LI T Y
There are several approaches to the study of human biological adaptability. Simple trait analysis, whether of cran ial dimensions or gene frequen cies, is least likely to provide usefu l in form at ion , since such studies seldom provide in form at ion on environm en tal relat ions or on adapt ive sign ificance. Dist ribut ional studies, such as the exam inat ion of geograph ic gradien ts or clines, tend to provide only superficial environmental correlat ions and, again , adapt ive sign ificance is not assessed. Populat ion studies, part icularly those from an ecological perspect ive, tend to yield an overabundance of oft en poorly in tegrated data. Moreover , demonst ration of adapt ive sign ificance requires con t rolled comparisons in order to demonst rate degree of necessity or ben efit , and this is impossible if on ly a single populat ion is studied.
Th e most advan tageous approach to date is the examinat ion of responses to specific devian t environm en ts; that is, a st ressadaptat ion approach . Characterist ics related to a part icular st ress, such as cold , populat ion crowding, or social disorgan izat ion , may be d iscovered by study of several populat ions subject to the st ress. Aft e r an environmental relat ionsh ip is demonst rated, its import with regard to adapt ive domains can be exam in ed . It seems likely that a combinat ion of the stressadapt at ion approach with popu lat ion studies, along a m icroenvironmental gradien t , would en able clearer and more con t rolled definition of environmental relat ionsh ips and adapt ive impact .
Totally dist inct from the above approaches, but at least equally important , is the effor t to establish a coheren t set of adapt ive criteria through the study of value systems and their relat ionsh ip to adapt ive domains. Such defin it ion of adapt ive domains is especially needed for the sociocultural h ierarchy.
Th e study of the relat ionsh ips of environm en tal responses to adapt ive domains, h owever established, can lead to generalizat ions with regard to adaptability. For exam ple, adaptat ions may be classified with respect to strength and durat ion of stress exposure, age at first exposure and con
1 4 RICHARD Β. MAZESS
stancy of exposure, and rate and reversibility of the response. With regard to human adaptation to climate, it appears that shortterm acclimatization is most important, longterm and developmental acclimatization is of secondary import, and genetic adaptation is of little import in providing adjustment to climatic stresses. Human adaptation to disease stresses may exhibit a markedly different pattern. It is interesting to note that for a variety of different stresses, differences among populations in adaptive responses appear to be chiefly the result of developmental acclimatization. Formulations of this type, when thoroughly documented, can serve for construction of a theory of human adaptability.
VALUES AND ADAPTATION
Modern science has eschewed the value judgment and has operated as if our observations may be value free. This assumption has always been questioned by social scientists. The contemporary interest in adaptation indicates that we are anxious to make value judgments and that the scientist and the layman alike will do so. If this is the case, then there is an obvious need for operational precision and accuracy in assessing adaptation, and this brief framework is the preliminary outline for dealing with the problem.
The theory of adaptation has a noteworthy similarity to ethical theory. Evaluation of adaptation requires examination of necessity or relative benefit, while judgments of necessity, or obligation, and of evaluation constitute the twin bases of ethics (Sesonske 1964). For ethics, however, the orientation is toward judgments by the individual and these are considered as absolutes. In contrast, the orientation of adaptation is toward judgments about which, it is hoped, there is consensus, and these judgments are used operationally to examine environmental responses and classes of responses in the biological and sociocultural hierarchies. The study of adaptation may or may not be ethical, but whatever the case, if it tends to provide us with a more comprehensive and less confused picture of environmental responses, and even to make us happier, we surely can view it as adaptive.
REFERENCES
DUBOS, R.
1965yvutsrponmlihgedcaPMIF Man adapting. New Haven: Yale University Press. EAGAN, C. J .
1963 Introduction and terminology. Federation Proceedings 22:930932. FOLK, G. E. , JR.
1966 Introduction to environmental physiology. Philadelphia: Lea and Febiger.
Adaptation: A Conceptual Framework 15
PROSSER, C. L.
1958 "General summary: the nature of physiological adaptation," in Physiological adaptation. Edited by C. L. Prosser, 167180. Washington, D.C.: American Physiological Society.
1964 "Perspectives of adaptation: theoretical aspects," in Handbook of physiology, section four: Adaptation to the environment. Edited by D. B. Dill, E. F. Adolph, and C. G. Wilber, 1125. Baltimore: WilliamsWilkins Waverly Press.
SESONSKE, A.
1964 Value and obligation: the foundation ο fan empiricist ethical theory. New York: Oxford University Press.

Group Selection and Sexual Selection
in Human Evolution
FREDERICK S. HULSE
Among the more significant discoveries at the cave called ChouKoTien, in northern China, was the fragmentary cranium of a femaleutsrponihaS Sinan
thropus who, according to Weidenreich (1943), was well past the prime of life at the time of her death. We do not know how old she was when she died, for we lack knowledge of how rapidly people grew up and aged several hundred thousand years ago. Weidenreich placed her age at more than fifty, well past the age of childbearing. Among the skeletal remains of our more recent ancestors of the Middle and Upper Paleolithic a few are also found which bear the stigmata of approaching age. Today we find that old people, and even really senile individuals, continue to remain alive frequently enough so that almost all social groups contain a number of them. Disease or accident remove most members of the population before the signs of aging become obvious, but some remain alive for many years after they have ceased childbearing or even child rearing. Among animals in the wild, in contrast, this is very rarely the case. We may, and sometimes do, keep a domestic pet, a dog or a cat, alive for quite a while after its reproductive period is past. But the population structure of a freeliving group almost never includes senile individuals: the utility of a creature to the survival of its species ends once childbearing has ceased and its continued life offers the species no selective advantage. Indeed, the contrary is the case, for such an individual simply consumes resources which would otherwise be available to more useful members of the species. Consequently the genetic structure of a welladapted population may be expected to ensure the removal of members whose reproductive period is over. Individual organisms, therefore, are likely to die soon after such functions have been fulfilled.
We are different, and the archeological evidence suggests that our genus has been different for a long, long time. The genetic structure of
18 FREDERICK S. HULSE
human populations is such that individuals will, barring accidents, remain
alive for quite a while after they have ceased to produce offspring. The
mere fact that we find this an enjoyable situation is not an adequate
biological excuse for such an aberrant state of affairs. W e must, therefore,
seek a better reason — one which is in accord with biology. There must be
some function, useful to the population, which has led to the prolongation
of life. What can elderly people do that elderly animals cannot do?
Well, for one thing, they can take care of their grandchildren, thus
freeing the parental generation for more active tasks — hunting, collect-
ing, and scavenging no doubt during the first 99 percent of human history.
If we observe the behavior of our close relatives such as the baboon (D e
Vore and Hall 1965) or the gorilla (Schaller 1963), we note, among other
things, that the band or troop is very cohesive. Members rarely stray very
far. Among baboons the youngsters form play groups by themselves, to
be sure, but the adults are always nearby. At the first sign of trouble an
adult male baboon rushes in to settle squabbles or drive off predators.
The group moves together from place to place; a sick baboon who cannot
keep up with the others is likely to meet with a fatal disaster. Reckless
adventurers who stray too far by themselves are exposed to similar
hazards. N o one goes out to collect and bring food home. N o one gives
food to anyone else. Mothers suckle their young, but give them no other
food at all. Adult males and females are equally proficient at collecting
the vegetation which forms almost all of the diet. A small or disabled
animal may be found and eaten from time to time, but baboons do not
engage in intentional hunting. There is nothing useful that an elderly
baboon can do. There is not even a place where such a creature could
remain with the expectation that the band would return in the evening,
because the band may spend each night in a different tree.
Human societies are not like that. A firmly established headquarters is
found in most instances. Food is collected, carried, and shared. Individu-
als in the prime of life usually are able to wander off by themselves, if
necessary, and many enjoy doing so. Small children, even after they cease
to nurse, continue to be dependent for quite a while. Under these circum-
stances it is a boon rather than a hardship for the social group if one or two
members do stay home.
They can keep the home fires burning. W e do not know how long ago
our ancestors first maintained and exploited fire, but it may be more than
a coincidence thatutsrponihaS Sinanthropus did so, and that the evidence strongly
suggests that food was cooked in the cave at Chou-Ko-Tien. Plenty of
game had been brought to the cave, and many bones had been burnt. The
indications are that the group that made its headquarters there hunted
and brought the kills home to be shared. The sort of life made possible by
such habits implies a society quite different from that of other primates. It
involved the use of cutting and piercing tools in the capture and prep-

Group Select ion and Sexual Select ion in Hum an Evolut ion 19
arat ion of food supplies — a dependence upon technology which has increased cont inually ever since.
An d , of course, even a physically feeb le individual can m ake tools. H e (or she) may be unable to stand the rigors of the chase, but chipping flin t takes skill rather than st rength , just as managing a fire does, and if those who can no longer collect food are able to keep the fire going and provide tools as well as babysit , the survival of the group is made easier, and its increase in numbers more probable.
In any compet it ive situat ion , other things being equal, a group of early hominids or even protohomin ids which con tained one or two individuals who could specialize in this way would have an advan tage over groups that did not . Thus any genes or genecom plexes that tended to promote longevity would be favored in the st ruggle for existence. In the long run , it would be logical to expect that such groups would increase at the expense of others, so that the frequen cy in the species of the necessary alleles would rise.
As we exam ine the life of vert ebrat es in gen eral, and of mammals in part icular, we are struck by the evolu t ionary t rend toward greater complexity in social relat ions and, consequen t ly, in social organ izat ion . We humans are simply carrying this t rend fu rth er than have any of our cousins. In ternal fert ilizat ion is an absolute necessity, of course, for land vertebrates to produce a new generat ion . Th is requires the cooperat ion , at least br iefly, of adult male and fem ale. O th er form s of social behavior may exist , but this is a must. Am on g m am m als, which suckle their young, collaborat ion between mother and baby is equally vital. Am on g almost all primates and in quite a few other mammalian species an even greater number of social relat ionships are needed to ensure survival. Con sequent ly, select ive pressures are and have been at work upon the social or personality characterist ics, as well as upon the anatomy of the species concerned, for it is the social behavior of the individuals within a group that leads to success or failu re.
Th e demograph ic st ructure of human populat ions d iffers from that of even our closest relat ives in that it con tains a sign ifican t proport ion of elderly people simply because to do so con fers an advan tage upon the genus in the ecological zone it has exploit ed . With the adven t and developm en t of t rue language as the standard m eans of communicat ion among humans, this advan tage assumed en orm ous importance. Feeb le muscles and fading eyesigh t do not keep the old folks from talking. In their long lifet im es they have been able to accumulate all sorts of knowledge, and this is put to use. Th e older people have learned the best places to set t raps, to plant crops, to collect flin t , to lie in wait for game or enemies. They have learned all sorts of skills that need to be taught to the young: when to plant , how to prepare h ides, what to do to help the sick. Th ey can rem em ber the unusual even t s of the past and how they were
2 0 FREDERICK S . HULSE
successfully dealt with. And with speech they can pass this knowledge on to later generations, so that the band may know how to contend with difficulties and exploit opportunities, and thus survive.
Even more important, the old people know the myths whereby the morale, thetsrpoiedc esprit de corps, of the social group is maintained, so that the group has the will to live. Their knowledge and their speeches are not restricted to transmitting matter-of-fact techniques; they tell the young people how to get along with the supernatural, and why they need to. The old people can, and do, teach young people how to behave in society and to appreciate proper standards of beauty and scorn those of the next tribe. Whatever values a society may cherish can be taught by the old to the young so that the continuity of the society can be preserved over the generations. The ideas and myths which are shared by the membership of a society do not have to be scientifically accurate in order to promote morale; they just have to be accepted. Indeed, sharing identical unprov-able assumptions may be especially useful to a group since it promotes a feeling of identity among its members.
It really takes quite a long time to learn the art of being human, and it should be noted that the length of the growth period in our species has been extended to an astonishing degree. In general, large animals grow more slowly and live longer than small ones. But the human life span is out of all proportion to our size, and our period of growth is out of all proportion to our life span. It takes ten years for the human brain to reach 95 percent of its final volume and twice as long for the human body to complete its growth. By then, between one-third and one-fourth of the life span has passed. Human females rarely have babies before they are fifteen or after they are forty-five; their reproductive period is only twice as long as their pre-reproductive period. How can such a species survive? A female chimpanzee or gorilla is sexually mature in half the time, a baboon in a third or less. Their brains have ceased to grow at an even earlier age. These animals, both close cousins of ours, spend a con-sierably greater proportion of their life span in reproductive activity. Obviously, it has become biologically worthwhile for us to spend a long time in preparation for adulthood; the human population is not dying out.
It seems clear that learning one's manners takes longer than learning to use or even to manufacture tools. However, appropriate social behavior is facilitated if the members of the group are readily distinguishable from one another, since this enables youngsters, as they grow up, to learn how to act in relation to each different individual. Even among lemurs, a far from intellectual genus, Jolly (1966) noted obvious differences in facial markings which made each individual easily recognizable. Among our closer relatives, just as in our own species, minor variations in appearance serve an obvious social function. It seems clear that during the evolution
Group Selection and Sexual Selection in Human Evolution 21
of our ancestors polymorphisms at the genetic loci concerned with visible anatomical traits have been selected for. They help to ease the social relations within a group, but they do not seem to serve any other function. It seems clear that to attain the human condition, learning one's manners is more important. Motor coordination develops rapidly among young apes. But the apes will not learn how to talk. They learn how to respond emotionally to one another in a manner adequate for their way of life, but the social skills requisite for participation in human society are beyond their capacity. In order to acquire such skills many years of practice are necessary. Submission to teaching by the adults of the group as well as play and experiment with other children have to be experienced if a youngster is to function effectively as a human being.
In this respect, too, our species simply carries further a trend already well established among mammals in general and primates in particular. All young mammals play, and learn by playing, but in most species the period of dependence, during which playing is possible, has to be brief: mother loses interest in caring for her offspring when they are weaned, and they have to make their own living. Among some hunting animals, wolves among others, the family tie is not broken upon weaning; and the same is true among monkeys and apes. Juveniles continue to play, and to learn their place in society as they do so. Although no longer dependent upon mother for nourishment, they are often dependent upon her for protection and comfort. They feed themselves but are bold when she is nearby and timid otherwise. Such cousins of ours live their whole lives in social groups, and they are emotionally dependent upon their fellows all the year round. The protection afforded by the group enables them to mature more slowly, and at the same time learning to adjust to all the other members of the group takes a long time. Slow maturation is not a luxury, in other words; it is a biological necessity. Individuals who grew up too fast would not fit. Natural selection would be likely to eliminate them or, if their presence disrupted the stability of the band, to eliminate the entire band. Thus genetic constitutions promoting behavior of a socially appropriate sort tend to be favored.
SEX
As an example of how this sort of selection could have affected the course of primate and of human evolution, Chance and Mead (1953) hypothesized that young males who reached sexual maturity before their physical prowess was adequate for them to challenge mature males successfully would be killed or driven away from the band, unless they were able to control their impulses. More recent field observations Imanishi (1960), Sade (1965), Schaller (1963) and many others cast grave doubt upon the
2 2zyxwvutsrqponmlkjihgfedcbaYWUSRPONMLKIHFEDCA FREDERICK S. HULSE
hypothesis as stated. Among baboons, at any rate, dominant males monopolize the females only during the most fertile days of the oestral cycle. Younger males may copulate with the females before and after this time without arousing the jealousy of their betters, and very probably without fertilizing the females. Among gorillas, very scanty evidence is available, but what there is does not support the notion of challenge or jealousy in sexual affairs. Life appears to be very relaxed. What young primatesod do learn is that they must not interfere in the affairs of their superiors, and they seem to learn this during juvenile play. Direct sexual activity is only one aspect of this and, at least among all those species of monkeys which have been carefully studied in the field, such activity is concentrated into a relatively brief rutting season.
Nevertheless, the even greater lengthening of childhood in our species is certainly related to the requirements of human society; and the fact that human males and females are sexually arousable throughout the entire year is an important aspect of human society. Among the manners and customs which our young have to learn, if a society is to operate efficiently enough to continue, are the manners and customs concerned with sexual behavior. All human societies have such manners and customs and, since we all use language, many of them are verbally stated as specific rules. It takes a while to learn them. Furthermore, since the. sex drive has to be strong if a society is to continue, learning to control it is rather more difficult than learning how to chip a flint into an arrowpoint or when to plant crops or even how to drive an automobile.
I would not be surprised if the ability to develop what the Freudians term the "latency period" is the biological consequence of this. As is well known, infants and small children normally have an interest in sex before they have learned any inhibitions. In most cultures, however, this interest becomes either repressed or submerged for some years, until it bursts forth once more with the onset of puberty. Meanwhile the youngsters are busy learning all sorts of things human beings need to know. It seems to me of some interest to note that, in preliterate societies, puberty comes at the end of the educational period. Physical growth continues, and adolescents keep on learning by experience, but by the time of sexual maturity they are expected to be able to fend for themselves. Not uncommonly, an initiation ceremony signalizes that their elders are now ready to recognize that the youngsters have learned enough to be real members of society. Certainly there is survival value, not only for the individuals but for the society of which they are members, if youngsters can spend some years relatively undisturbed by sexual impulses while they are learning technical and social skills. One would expect that genetic constitutions capable of such a growth rhythm would have been favored in the natural selection which led to the evolution of human characteristics. We do not have to cite violent physical conflicts between mature and immature males to see
Group Selection and Sexual Selection in Human Evolution 23
the advantage of a latency period during human childhood or of the ability to restrain one's impulses.
It would appear that the social insects, such as ants, termites, and bees, are equipped with genetic constitutions which insure appropriate social behavior. This does not appear to be true of mammals. Individuals in this class have, rather, an astonishing ability to learn from experience and to modify their behavior, including their social behavior, as a result. The protection and nourishment afforded by the mother give the opportunity to learn with some degree of safety. The protection of a whole band or troop, as among monkeys, gives even greater opportunity. Flexibility of behavior, the capacity to fit into a variety of social situations, but always the urge to be in some society, is characteristic of monkeys and apes. They are not as educable as we, but they do show that selection for the precursors of human personality traits has long operated among them. It is not surprising that some ethologists have had the temerity to speak of baboon culture, although this horrified many orthodox anthropologists. As more field studies are made, we see more and more clearly that the social life of anthropoids foreshadows ours (Van LawickGoodall 1971). Their forms of behavior are indeed learned, shared, and transmitted from one generation to the next. In many instances, even social status is so transmitted, rather than being won by individual effort. According to the workers at the Japanese Monkey Center (Imanishi 1960), the son of a mother who is high in the order of dominance within a band can afford to be bold, can succeed in overaweing his agemates as a result, and thus can become a honcho, too.
BIRTH
The protection afforded by society has even further biological results. Litters are as rare among monkeys as among humans. It is true of course, that whales, seals, elephants, cattle, sea otters, and some other mammals also produce but one offspring at a time. Most of them are large, and most of them live in social groups. Monkeys are usually much smaller, but the convenience of having a single baby to care for if one lives in a tree should be obvious. A low birthrate has definite survival value, largely because it permits greater attention to the rearing of each individual. The interesting thing is that even among primates which have lived for a long time on the ground, such as baboons and people, twin births are still rare, and real litters almost absent. The danger of falling out of the tree has vanished, but the requirements of training for complex and changeable social relationships remain. In the earlier stages of human evolution, when technology was not so well developed as it later became, the problem of feeding young twins or triplets was probably insuperable, but there is no

24 FREDERICK S. HULSE
reason to suppose that this is a problem for baboons, chimpanzees, or gorillas, whose newly weaned young feed themselves.
One might easily suppose that twinning, or at the very least a very high birthrate, would have become characteristic of the human species during the scores of thousands of generations since our ancestors left the trees. If twins, triplets, and the offspring of exceedingly prolific mothers enjoyed an equal opportunity of growing up and passing on their genetic peculiar-ities this favoring of multiple births would necessarily have taken place. In fact, however, the rate of twinning is not much more than 1 percent, and only a small proportion of human mothers give birth to more than a dozen babies in any society. The problems involved in rearing, not just feeding, a "litter" of children are so great that their deathrate during the course of human evolution must have been disproportionately high. It is obvious that the necessary genes for multiple births and very high fertility exist in human populations. Some selective forces must have been in operation to have kept the frequency of such genes to its present low level. A number of mechanisms can be hypothesized, and all of them have reference to aspects of human — and possibly subhuman or protohuman — social behavior rather than to the technological aspects of human culture.
The first is overt prejudice against multiple births or excessive fertility. In many societies twins are killed out of hand; their genes vanish from the local gene pool. In others, parents of unusually large families meet with social or economic discrimination; the inherent difficulty of providing for a large family is artificially increased, and few of the offspring reach maturity and reproduce. A baby, especially a girl baby, who is born while an elder sibling is still nursing may be killed by the parents. Such prac-tices, if continued over many generations, are bound to select against genetic constitutions that lead to extra-high fertility.
A second mechanism if the economy itself. A basic characteristic of human societies is that food is shared, but shared within a specified group. A group which contains too large a number of dependent children puts a strain on the ability of adults to produce food, rear the offspring properly, and keep from quarreling over diminishing resources. If, on the other hand, the number of children is small enough so that all can receive proper training in etiquette and subsistence techniques, the chances of survival are enhanced, since there will be enough food for all and fewer reasons for internal dissension and the collapse oftsrpoiedc esprit de corps.
Still another mechanism is a result of the almost continuous sexual receptivity of the human female and the almost continuous sexual interest of the human male, which itself is probably the result of human social arrangements. Human babies may be born at any time of the year, and women who conceive easily may become pregnant again very soon. Death in childbirth has been far more common in our species than in others, and it exacts an extra toll of those who reproduce most rapidly.
Group Selection and Sexual Selection in Human Evolution 25
Women who conceive less easily live longer and are likely, in consequence, to produce more children in the end, although they are inherently less fertile.
The problem of maternal mortality at childbirth has been imposed upon our genus by the conditions of human life. The human female in contrast to her nonhuman sisters, is required to do several rather contradictory things all at the same time. The wonder is that she survives at all, rather than that she is likely to find life difficult at times. In the first place, she has to stand on her hind legs, instead of going on all fours. The human style of bipedalism, acquired at least several million years ago, involves a broadening, twisting, and strengthening of the pelvis so that all the weight may be supported by legs that are not bent at the knee. This causes little or no trouble for the human male, and since it frees the hands for manipulation has proved a very worthwhile adaptation for the genus. But the size of the pelvic opening and the flexibility of the pelvic girdle are necessarily restricted, so that ease of childbirth is not promoted. An obvious solution is to have smaller babies, or at least babies with smaller heads, since the head is the least flexible part of the baby's anatomy. Chimpanzees and orangutans, with larger and more flexible pelvic openings than humans, give birth when the baby's cranial capacity is less than 200 cubic centimeters and encounter no difficulty. Their brain size more or less doubles during growth.
In contrast, the human brain quadruples in size during growth. But if our babies had brain cases as small as those of the great apes at birth, such a quadrupling would only provide 700800 cubic centimeters at maturity — a figure which falls between the mean sizes ofutsrponlihecaPA Australopithecus and Pithecanthropus. In fact, adult humans today have brains nearly twice this size. The demands upon the mental abilities imposed by human society seem to have led to this astonishing increase. Human babies are born at an even earlier stage of development than are ape and monkey babies. They are even more dependent upon maternal care. If they are to become normal human beings their brains must grow very rapidly during their earliest youth, and this indeed occurs. But there is a limit. It might be convenient for mothers if babies were born with brains only oneeighth or onetenth of the final size, but this does not happen. It would seem that, except under hospital conditions, such babies just are not viable. The contradictory necessities of erect posture and large brain size lead to troubles which are partly but not fully solved by the quadrupling rather than the doubling of brain size after birth.
As a result of the added burdens of childbirth and infant care imposed upon human females, they are not so capable of fending for themselves during much of their adult life as are female apes or monkeys. If, indeed, we still made our living as those creatures make theirs, this would be a minor though, perhaps, still a bothersome problem. If our diet still
2 6USRLKIHFEDC FREDERICK S. HULSE
consisted of leaves, roots, grubs, and the like, and if we all lived in parts of the world where such delicacies were in constant supply yearround, females could feed themselves easily, as other primate females do. But if our ancestors basically had remained scroungers, picking up what food was available in the vicinity, there would have been no selective advantage in erect posture and bipedalism. Our ancestors would not have needed to free their hands for tool use and tool making, nor to have increased their mental capacities for tool invention and the management of complex social relationships. Our primate cousins make a perfectly good living in their ecological niches, and there is no evidence that they are evolving in a human direction.
The ecological plateau of the human genus, not just of the present human species, has been a different one. Archeological evidence assures us that for hundreds of thousands of years our ancestors were hunters rather than scroungers, and that a very long time ago they learned how to kill large meat animals. Erect posture, free hands, and weapons are all functionally related to each other, and the adaptive scheme which utilized this trio involved also a rather drastic rearrangement of society. No division of labor between the sexes is required for the scrounging way of life followed by apes and monkeys. The only labor performed by monkeys is the collection of food, and each individual collects its own. Apes make nests each night as well but, again, each individual makes its own in a few minutes. The only food sharing which has been observed has been among chimpanzees (Teleki 1973) who permit others to join in eating the carcass of a victim after cooperating in the kill. This may happen as often as once a month. Food is very rarely carried from one place to another. It is never carried home to be shared or stored, there is no established home. Wolves, which hunt in packs, do carry food to the den, especially if a nursing mother or cubs have been left there; this is a division of labor, and it adds greatly to the efficiency with which wolves can exploit their ranges. The basic form of social organization among humans had to become somewhat wolflike when our ancestors began to depend upon hunting for their livelihood. But it had to evolve from a primate system and to be consistent with preexisting primate biological characteristics, such as producing one offspring at a time, a prolonged growth period, the lack of proper anatomical equipment for killing large animals, and in some species a marked degree of sexual dimorphism in body size.
SEXUAL DIMORPHISM
Most treedwelling primates lack such a sharp difference in size between the sexes. Among grounddwelling primates, such as baboons which are monkeys and gorillas which are apes, adult males are usually at least twice
Group Selection and Sexual Selection in Human Evolution 27
the size of adult females. There are also fewer adult males than adult females, despite the fact that the sex ratio at birth is nearly even. A few large males give better protection against predation than would a greater number of small ones; and predation is a hazard to primates on the ground. The large males also have especially large canine teeth, which they are happy to display when annoyed; they rarely have to use them in combat but can do so most effectively. There are few other overt signs of sexual dimorphism. Both sexes are equally hairy, females do not have especially broad hips nor swelling breasts, males do not have especially broad shoulders. Among some species the male may have a mane or gaily colored cheeks and rump, or silver hair on the back. But size is the major difference between the sexes.
In our species the marks of sexual dimorphism are quite different. Adult males are perhaps 20 percent rather than 100 percent heavier than adult females. Both sexes have long head hair, but males may grow beards, moustaches, and hair on the chest, which females lack. Males also are likely to have hairier arms and legs than females. Men have broader shoulders, women broader hips as well as swelling breasts and buttocks. Men have deeper voices, bigger brow ridges, and more knobby joints, but their canine teeth are no more formidable than those of their mates. And there are about as many of them as there are of women. Yet we are ground dwellers. How is it that the sexual distinctions of other grounddwelling primates have vanished to be replaced by new ones? The answer must be sought, I think, in the social function of sexual dimorphism. The contrasting social roles of human males and females differ from the contrasting social roles of ape or monkey males and females.
The human male remains the protector of the social group against enemies, by using weapons rather than by using his teeth. A small man with a spear can intimidate or if necessary kill a large one who is unarmed. David, as a youth, slew Goliath. The human male also does the hunting and carries the meat home. He needs to be stronger than the female, but not enormously stronger. Wolves of both sexes hunt, but females frequently have to remain at the den with their babies, and food is brought to them. Human females, even with weapons, are less efficient hunters than males, simply because the problems of human motherhood are more exacting than are those of wolf motherhood. The problems imposed by erect posture have already been mentioned; they account for the woman's broad hips. More significant is the fact that human pregnancy is long and the period of child dependence longer. A mother who is pregnant and has one or two children to care for may easily collect vegetation and even slow game such as snails, beetles, or baby birds, but she would not be much help in hunting large animals. The division of labor between the sexes, which we find in all human societies, is far more efficient and has real survival value for the group.
2 8zyxwvutsrqponmlkihgfedcbaWUTSRNMLKIHGFEDCBA FREDERICK S. HULSE
It is also perfectly plausible to speculate that the practice of hunting may be related to the lack of a breeding season in our species. Among animals which have such seasons, births are concentrated in the months when conditions are most favorable for infant survival, for instance, when the weather is not too cold, contagion least prevalent, or food most plentiful. Food is plentiful and the weather equable yearround in the tropical forest habitats of apes, which lack breeding seasons. But in the savannahs inhabited by baboons the alternation of wet and dry seasons appears to regulate the timing of births. Hunting is better in the open country than in the forest, so it is commonly supposed that our ancestors were dwellers in open country when they began to hunt. But, although the supply of fresh vegetation may fail during the drier months, meat may be obtained throughout the year. As meat grew in importance in our ancestors' diet, selection pressure for concentrating births at one time of year probably relaxed. It no longer mattered when a baby was born.
MATING HABITS
At the same time the continued social cohesion of a group, as well as its safety from predation, might be expected to benefit from a spreading out of the breeding season over a longer period. When a breeding season is short, the attention of males and females upon one another often becomes allabsorbing, and they are distracted from the normal everyday necessities of making a living or even of protecting themselves against attack. This hazard is worthwhile only if the importance of concentrating births at a special season is considerable. At the same time, individuals who go to the extra trouble of bringing food home to be shared may well feel a greater willingness or a stronger impulse to do so if their reception at home is an affectionate one. It has been noted that, although mutual grooming is constantly engaged in by members of a monkey band, this practice is intensified before and after mating by the male and female concerned. It appears to give great emotional satisfaction to both groomer and groomee, and consequently serves as a strong social bond at all times of the year. Under conditions which require males to be away from home for a long time — and hunting often does require this — it is easy to imagine that both sexes may really be pleased to see each other and to groom each other and even to mate with each other when the separation is over.
The sexual division of labor may also help to explain the rather even sex ratio among adults in our species, which contrasts so sharply with the situation found among other primates. A few adult males suffice to protect a much larger number of females, and one would suffice to fertilize them all. Whether two or three could collect enough game for
Group Selection and Sexual Selection in Human Evolution 29
eight or ten females and their dependent offspring is more doubtful. The lengthening of the period of infant dependence for food in our species makes this problem an even greater one. Baboon or gorillas feed no one but themselves; a human adult male must do much better than that if the species is to survive. But even though meat provides much more concentrated nourishment than leaves and fruit, there is a limit to what a man armed with a spear or a stone cleaver can do. The existing sex ratio among primitive hunters demonstrates that a minimum of one adult male per adult female is required to avoid starvation.
Such a sex ratio permits, although it does not ensure, a pairing off between adult males and females. A group mating system is almost required by the sex ratio found among baboons and gorillas. It is simply one of the possible alternatives among human beings. Unions between a single male and a single female which last for a season, a year, or even several years are found among many species which provide for helpless young who are kept at a home base. Many birds, for instance, behave in this manner, and the system operates very efficiently. The individuals concerned become habituated to each other and work well together, thus helping their offspring survive (Lorenz 1952). Furthermore, such a system of pairingoff helps to inhibit any conflicts that might arise because of sexual jealousy, and this, too, is useful if thetsrpoiedc esprit de corps of the larger social group is to be maintained. It is perfectly true that such sexual jealousy may not arise in any case, but in fact it often does, and any device which reduces the occasion for conflict within a group has functional value for its survival.
And a group, rather than a single mated pair such as we find among birds, has probably always been the real functional unit of human society and, therefore, of human evolution. Several hunters in collaboration can do a better job of obtaining game than one and a far better job of bringing the meat home. Several mothers at home can do a better job of protecting the headquarters and the youngsters than could one by herself. Even more important, they can keep one another from being lonely — a primate without any company is a sorry creature, and our species seems to have inherited this personality quirk from its prehuman ancestors. A group containing several pairs of adult males and females has a competitive advantage over any single pair in exploiting a given territory or range, and, since living in groups was undoubtedly the primate heritage, there is little reason to suppose that living in single pairs was ever characteristic of our early ancestors, although it is found at present.
It is also not unreasonable to suppose that the division of labor between males who hunted in groups, and females who remained at home in groups, would have promoted the development of more complex and efficient signaling systems than the grimaces and barks of our primate cousins. The model provided by wolves (Mowat 1963) shows that lan
3 0 FREDERICK S. HULSE
guage is not required for cooperative hunting. It is nevertheless more efficient: plans may be more precisely discussed beforehand, even though hunters remain silent during the chase. This does not suffice to account for the origin of articulate symbolic speech, but it is adequate to account for its spread once a single band had begun to talk. The use of language is capable of organizing the structure of interpersonal relationships within a band on a permanent basis no matter what the mode of subsistence may be, and this, too, helps ensure the survival of such a group over the generations. In discussing the utility of keeping the old folks alive, I have already mentioned a number of other ways in which language is useful, so no further elaboration of this point will be attempted here.
Some results of the use of language upon the further development of human society are worth pointing out, however, because these further developments have had a vital impact upon the later biological evolution of our genus. It has been noted by a number of careful observers (for instance, Sade 1965) that macaques do not copulate with their mothers: the personal relations developed between mother and infant inhibit a son from anything resembling dominance over his mother, and inhibit the mother from anything resembling submission to her offspring of either sex. Among these monkeys, a standard signal of relative social position is for an inferior to salute by presenting its rump to its superior, thus simulating the posture of the female during mating. It cannot be said that these monkeys abhor incest or have a taboo against it; the lack of motherson mating is just a natural result of the social symbols employed by the band. Given such a social organization to start with, it is not at all strange to find that after language began to be used, words would be found to explain and justify the existing situation, and even to reinforce it by statements phrased in terms of ethical standards and judgments. If also, as might well be the case, the mother's mate viewed the growing strength and skill of her sons with ambivalent emotions as they approached maturity while he was approaching senescence, he could be expected to feel strongly and act vigorously to protect his own interests, feeling virtuous as he did so.
The extension of the incest taboo to include a prohibition of brothersister relationships is another, although a related, matter. Among those nonhuman primates which have been carefully studied, brothersister mating is commonly observed. Indeed, a baboon troop is a genetic isolate, an almost completely closed system into which genes from neighboring troops are very rarely introduced. Such groups are not friendly with one another, and migration between them is most uncommon. Chimpanzees and gorillas are more free and easy in intergroup relationships, and some males, at any rate, have been observed to wander from group to group, meeting little or no hostility from their hosts and hostesses. Quite possibly the habit of seeking romance away from home
Group Selection and Sexual Selection in Human Evolution 31
arose in this manner. On the other hand, our early ancestors' habit of hunting away from headquarters quite possibly led to encounters between hunters from different bands. If so, friendly encounters would have led to fewer deaths than hostile ones, and perhaps to joint hunting and even mutual visiting. An enlargement of the gene pool is an expectable consequence of established friendship between neighboring bands, for an exchange of females can serve to symbolize an alliance. Once language is in existence, including kinship terms, the extension of the incest taboo to include siblings as well as parents can be readily imagined, since people have an urge to seek justification, in words, of their own behavior.
In any case, however it arose, the incest taboo has had an effect upon the distribution of genes throughout the human species (Hulse 1962). Such a taboo may prohibit sexual relations with very few kinfolk, or with a great many. It may be extended to individuals who are not really kinfolk at all, but simply called by kinship terms, such as sisterinlaw or godfather. It is, in other words, a cultural product, an aspect of the social structure of the group. Its expression depends entirely upon the use of language, which is a facet of culture; and its observance upon the degree to which human behavior is subject to selfrestraint — a characteristic developed by living as a member of society. The incest taboo is a creation of the human mind, not a biological instinct, but it governs human behavior. To one degree or another, it is a prohibition found in all human societies and must, therefore, be of considerable antiquity. Since it is a cultural universal, it has had worldwide effects. These effects have been to enhance the extent of gene flow between populations and to promote heterozygosity within populations.
To the extent that heterozygosity has been promoted, recessive genetic characteristics which might, at a given moment, be deleterious, if expressed homozygously and so eliminated by natural selection, have continued to exist. They thus provided the material for later evolution if the environment were to change in such a way as to make what was previously a misfortune become beneficial. This is useful and rather inexpensive insurance for the species, since environments continually change. There is much evidence that heterozygosity by itself is in many instances beneficial. The sicklecell trait in malarial areas is a noted example about which more will be said later.
To the extent that gene flow between separate populations has been encouraged, the maintenance of the unity of the human species has been assisted. In any small community the percentage of kin who are restricted from mating with one another by the incest taboo often form a large proportion of the population, and lapses from virtue are known to occur. It is always less trouble to seek a mate who lives nearby. But the force of the taboo, though not absolute, is strong, and it impels many who would otherwise have remained at home to seek partners elsewhere.
32 FREDERICK S. HULSE
Thus a genetic characteristic arising in one region spreads to others with greater speed than it would were mating with siblings and first cousins or fellow clanspeople accepted as proper. Some gene flow would occur in any case; the horror of incest speeds it up and intensifies it, so that it becomes a stronger force in our species than in others which have become widespread. Such gene flow has been a factor of real importance in human evolution, for it has been among the chief reasons why, all over the world, the changes that have taken place in our biology have been so similar. The basic requirements for social life in culture are similar no matter what society is involved. Consequently, selection might be expected to have produced similar results, in time, everywhere, as Dobzhansky and Ashley Montagu pointed out in 1947. But gene flow from one population to another reinforces this tendency, and the incest taboo promotes gene flow.
It has been contended that the purposeful migration of tribes is adequate to account for the degree of unity we find in our species. But migration without miscegenation between groups newly in contact would not accomplish this result. The existence of taboos of a contrary nature, such as those that exist to keep different castes separate, has often kept neighbors from coming to resemble one another for scores of generations. Furthermore, extensive migration to distant places, which is common today, was far less frequent in early times. With horses to ride or ships to sail, people can move far and fast, but our Paleolithic ancestors had neither, and it is doubtful whether jogging from Peking to Paris was part of any ancient physicalfitness program. The habit of seeking one's mate from the next settlement or the next tribe is enough to promote the amount of gene flow that has kept our species one.
It is really remarkable that any single species should have a world wide distribution, yetsponmieaH Homo sapiens has. We have, to be sure, carried certain parasitic species, such as rats, lice, and tapeworms with us in our expansion, but we are the only species that has done it on its own and still remained a single interfertile variety. Other creatures, having had to adapt to local circumstances in climate, food, and ecological relations in the food chain, have divided, as they spread, into several species. We have not. The importance of culture as the major ecological factor to which our forefathers had to adapt is exemplified by this fact. Our cultural accomplishments have by no means abolished our biological necessities or our biological heritage. They have, however, mediated between what might be called the raw environment and ourselves. We humans have had to adapt to circumstances as they become modified by the activities of earlier generations. During the past few decades many anthropologists have investigated the results of improving technology upon the course of human evolution. As a result of their researches it has become obvious that the invention and use of tools has had a profound effect upon the
Group Selection and Sexual Selection in Human Evolution 33
physical characteristics distinctive of mankind. Less attention has been paid by students of evolution to the nonmaterial aspects of culture, to our ideologies, our social systems, our prejudices, and our fashions, yet these govern our behavior, which is what matters in the evolutionary process.
Darwin, more than a century ago, in writing The descent of man (1871), stressed the role of sexual selection in the evolution of many of the traits which distinguish our species and which also distinguish the varied populations within the species. His ideas on this subject have not met with favor but they may deserve reexamination. Standards of beauty, aesthetic ideals, are valid aspects of culture, and people in all societies attempt to beautify themselves. The notions held by one tribe may be scorned by the next, but in all cases an approximation to some standard, not uncommonly the appearance of respected leaders, is regarded as good. I do not see how selection on the basis of attractive appearance could account for the origin of any racial characteristics, but I can see how it might tend to emphasize them. It is often alleged that, since in most societies everyone marries, sexual selection could not operate. What counts, however, is how many children, are reared, not what proportion of adults marry. Some couples have many children, others have few, and ethnographers have not yet supplied us with data that could inform us as to whether the more comely are more or less successful than the ugly.
We do have data from Japan that are highly suggestive. Here, for many centuries, fair skins have been considered an asset, especially for girls. Marriage has been under parental control and, other things being equal, parents seek attractive brides for their sons. As elsewhere, members of the upper classes tend to be the luckiest. This might be expected to lead to selection as the generations have gone by. Research which I conducted a few years ago (Hulse 1967) indicates that this has taken place, for upperclass high school students have the fairest skins and those of the lower class the darkest, while middleclass students are intermediate in pigmentation. Furthermore, data from Greece (Friedl 1962) indicate that girls who are considered goodlooking marry earlier than, and need not be supplied with as large a dowry as, their lessattractive sisters. Throughout southern Europe, the upper classes contain a disproportionate number of blondes and nearblondes. Sexual preferences, though they may be based on social snobbery rather than aesthetic interest, are capable of shifting allele frequencies in human population.
The fact that caste prejudices have succeeded in keeping gene pools separate has already been mentioned. Mating between Caucasians and the American colored is frowned upon in the United States. Enough has occurred so that the American colored population is, in fact, at least onefifth Caucasian in genetic composition (Roberts 1955). Had such matings received social approval, however, the population identifiable as largely African in ancestry would be scarcely onetenth of what it is. In

3 4 FREDERICK S. HULSE
India, where there are many castes instead of only two, genetic distinctions found by Sanghvi (1953) are greater in magnitude in every area than we find in any part of the United States.
SOCIAL STRUCTURE
Caste distinctions are commonly associated with economic circumstances and, until the most recent times, the more prosperous have always succeeded in raising a greater number of offspring than have the poorest elements of the population. In the commercial and industrial societies of Europe and North America during the past few generations the situation has been reversed, so we are used to hearing that "the rich get richer and the poor get children." But this is the effect of a very unusual sort of society. Where there is little food and less sanitation the differential survival rate is in the other direction. Slave populations have often been kept as such a low subsistence level and been forced to work so hard that their numbers could be maintained only by continued kidnapping from the source of supply. At the same time, young upperclass males have, in many societies, been expected to make contributions to the gene pool of the lower classes. In other societies those who can afford it acquire wives as avidly as we acquire household gadgets. Such practices necessarily lead to a growing proportion of alleles derived from the leaders of the society at the expense of those derived from the underlings. Social structure has a definite effect upon demography and, therefore, upon the course and direction of human evolution.
Direct political action is capable of affecting the relative frequency of genetic characteristics, too. Quite a few years ago, in making a comparison of the biological traits of Cubans and Spaniards, I was surprised to note a higher frequency of blondness among the Cubans of Spanish ancestry than among the Spaniards themselves. A bit of research into history provided the explanation. Spanish law prohibited the migration of the descendants of Jews and Moors into the American colonies. The law was not directed against brunettes as such, but in fact the Jewish and Moorish elements of the Spanish population included an even higher proportion of persons with dark eyes and hair than did the Castilian, partly Visigothic, element. In the same way, the United States immigration law with its quota system has operated to exclude people with dark hair, bloodtype B, and Rhpositive people, although that was not its intention.
The settlement pattern typical of any community is a reflection of social organization, even though the houses themselves are material objects. The form of horticulture practised in much of Africa (Livingstone 1958) required that clearings be made and homes located close together. This
Group Selection and Sexual Selection in Human Evolution 35
proved worthwhile, and the habit of living in this manner spread through much of West Africa. It turned out that malariabearing mosquitos found such clearings excellent breeding places, so malaria spread as well. Now among Africans, a genetic characteristic known as sicklemia exists. The data indicate that a lethal anemia is the consequence of inheriting this trait from both parents, but those who inherit it from only one, so that they are heterozygous, seem to resist malarial plasmodia more successfully than do individuals who lack the trait altogether. Consequently, a population living where malaria is endemic benefits from the presence of the trait in the gene pool. Some die of anemia but more survive malarial attack; the profit is greater than the loss. As horticultural clearings spread, so did malaria and so did the sickle cell. A different sort of settlement pattern would have produced a different sort of genetic constitution among people in that part of the world.
Nor can the relative proportions of the genetically distinct populations of our species be explained on the basis of individual biological selection. They are clearly the result of group cultural selection, as I have demonstrated (Hulse 1955). Technological advance, which permits more people to live within any given area, seems largely responsible for this. Agriculture, then metallurgy, next power machinery, and recently scientific medicine have led to population increase in the areas where these developments occur. But more efficient social and political organization, as well as the expansion of human sympathies beyond the kindred or local band to larger and larger groups (which are also due to culture), have also contributed to this result. Thus some groups increase in numbers much more rapidly than others. The effect upon the frequency of genetic characteristics, although inadvertent, is obvious. There are, for instance, relatively more blonds and Rhnegatives than there were a thousand years ago.
Examples of the many ways in which the social and ideological aspects of human culture affect gene frequencies and, therefore, the continued evolution of our species are so numerous that one could go on and on talking about the subject. I shall conclude, however, with a few remarks upon the manner in which social organization may be expected to influence the further evolution of human intelligence. Up to the time of the Neanderthal people, brain size increased as the millennia passed. Since that time there has been no further increase. It is perfectly possible that the complexity of the brain increased; fossils cannot tell us. We may, on the average, be brighter than people were, on the average, 50,000 years ago. But there is no reason to think so. Our tools are more complicated, but this is probably irrelevant. Tool making probably imposes fewer demands upon the mentality than does adjustment to life in human society. Wisdom and judgment in dealing with other people are required for living together, whether the society includes millions of people or only
3 6zyxwvutsrqponmlkihgfedcbaZYWVUTSRPONMLKIHGFEDCBA FREDERICK S. HULSE
dozens. Not everyone is equally intelligent, of course. All societies seem to include some bright and some stupid people. How many need to be bright in order to insure the survival of the group?
It seems to me that this may depend largely upon the nature of the social organization. In a tightly organized, welldrilled, castestructured society, a few shrewd and forceful operators at the top may suffice to direct the activities of the rest of the population efficiently. In a more open society, where individuals are less well indoctrinated to take orders meekly, a greater proportion of individuals will need the ability to persuade and convince others. It is reasonable to expect, then, that the frequency of alleles leading to higher intelligence would need to be greater in an open than in a caste society. In a caste society, selection for brilliance would be weaker since there would be plenty of routine work for morons to do and we might expect the average intelligence to decline over the generations. In a less orderly society, selection for brilliance would be stronger to the extent that there would be fewer routine tasks, and the average level of intelligence would be maintained by selection. In either case, the nature of the society concerned is bound to affect the genetic potential of later generations, and consequently the course of human evolution. Prehuman, protohuman, and fully human society have made us into the sorts of creatures we are and will determine the sorts of creatures our descendants will be.
REFERENCES
CHANCE, R. Α., A. P. MEAD
1953 "Social behavior and primate evolution,"yxvutsrponmlkihgfedcbaVTSPHGEBA Symposia of the Society for
Experimental Biology, volume 7, 395439. New York: Academic Press.
DARWIN, C.
1871 The descent of man and selection in relation to sex. London: Murray.
DE VORE, I . , R. L. HALL
1965 "Baboon ecology," in Primate behavior: field studies of monkeys and
apes. Edited by I. De Vore, 2052. New York: Holt, Rinehart and Winston.
DOBZHANSKY, T., M. F. ASHLEY MONTAGU
1947 Natural selection and the mental capacities of mankind. Science 106: 587590.
FRIEDL, E.
1962 Vasilika: a village in modern Greece. New York: Holt, Rinehart and Winston.
HULSE, F. S.
1955 Technological advance and major racial stocks. Human Biology 27:184192.
1962 Race as an evolutionary episode. American Anthropologist 64: 924945.
Group Selection and Sexual Selection in Human EvolutionzyxwvutsrponmlkihgfedcbaZYWVUTSRPONMLKJIHGFEDCBA 37
1967 Selection for skin color among the Japanese. American Journal of
Physical Anthropology 27:143156. IMANISHI, K.
1960 Social organization of subhuman primates in their natural habitat. Current Anthropology 1:393407.
JOLLY, A.
1966 Lemur behavior: a Madagascar field study. Chicago: University of Chicago Press.
1972 The evolution of primate behavior. New York: Macmillan. LIVINGSTONE, F. B.
1958 Anthropological implications of sicklecell gene distribution in West Africa. American Anthropologist 66:533562.
LORENZ, Κ. Ζ .
1952 King Solomon's ring. New York: Thomas Y. Crowell. MOW AT, F.
1963 Never cry wolf. Boston: Atlantic Monthly Press. ROBERTS, D. F.
1955 The dynamics of racial intermixture in the American Negro: some anthropological considerations. American Journal of Human Genetics
7:361367. SADE, D. S.
1965 Some aspects of parentoffspring and sibling relations in a group of rhesus monkeys, with a discussion of grooming. American Journal of Physical Anthropology 23:117.
SANGHVI, L. D.
1953 Comparison of genetical and morphological methods for a study of biological differences. American Journal of Physical Anthropology
11:385404. SCHALLER, G. B.
1963 The mountain gorilla: ecology and behavior. Chicago: University of Chicago Press.
TELEKI, G.
1973 The omnivorous chimpanzee. Scientific American 228:3342. TIGER, L.
1969 Men in groups. Manchester: Philips Park Press. VAN LAWICK GOODALL, JANE
1971 In the shadow of man. Boston: Houghton Mifflin. WEIDENREICH, F.
1943 The skull of Sinanthropus pekinensis: a comparative study of a primitive hominid skull. Palaeontologia Sinica: N.S.D, no. 10.


AltruismGroup Selection, Human
Evolution
RICHARD D. ARMSTRONG
The hypothesis that natural selection could occur between breeding populations has had a checkered history of rejection and acceptance. This type of evolution, known as group selection, is closely related to a consideration of how altruistic behaviors might affect natural selection. In this context, altruistic behaviors are broadly defined as unselfish behaviors. In the following pages, we shall consider the history of the group selection hypothesis, offer evidence that it does occur, and consider how altruistic behaviors can provide advantages for some populations at the expense of less socially cooperative groups.
Fisher's brilliant formulations (1930) of population genetics theory were primarily concerned with the selection of individuals within a breeding population. His highly respected opinion was that group selection could operate in only a few unique and peculiar situations. Opinions similar to those of Fisher dominated the work on the theory of natural selection with little opposition until the early 1960's. A major force of support for group selection was presented at that time by WynneEdwards.
WynneEdwards (1962) argued that breeding populations have the ability to maintain themselves at an optimum size at the expense of individuals. This hypothesis was a rather limited application of group selection but generated a very worthwhile reconsideration of the whole question and a considerable addition to population genetics theory. WynneEdwards's hypothesis has been criticized in general by Williams (1966, 1971) who has shown that selection of individuals explains the data as well if not better. Benedict (1972) offers evidence that human population size does not conform to a theory of optimum numbers.
However, reopening the question has led to the presentation of two cases of group selection that have been accepted as valid even by most

4 0 RICHARD D. ARMSTRONG
traditionalists. The first of these was the case of selection at thevutponmliedaT t locus in the house mouse. The second involved group selection for sexuality.
The t allele in the house mouse spreads rapidly in demes replacing the normal allele by differential spermatogenesis (Lewontin 1962). However, individuals who are homozygous for thei mutant are either sterile or nonviable. As the t allele becomes fixed, the population goes to extinction.
Crow and Kimura (1965) have offered evidence that sexuality does facilitate longterm evolutionary adaptation at the expense of individuals. Their basic proposition for viewing sexuality as an adaptation due to group selection is that sexual individuals contribute only onehalf of their genomes to their offspring. Asexual organisms contribute their entire genomes. In terms of maximizing the advantage to individuals, the asexual method would be expected. However, sexual reproduction allows for a much greater evolutionary potential of the group by allowing for the accumulation of mutants and recombination of genes. These modifications of genotypes increase the variance of traits in the population and therefore the opportunity for selection.
Evidence has been accumulating that many more instances of group selection must have occurred than was believed. This is particularly true for man and the higher primates. This evidence is given primarily in terms of population genetics models that deal with interdeme selection based on extinction probabilities and the evolution of social behaviors. These models are based on the work of Haldane (1932) and Wright (1945). We shall first consider Wright's model of group selection and then examine its relationship to Haldane's model for selection of altruism.
Wright (1945), in a book review of G. G. Simpson's Tempo and mode
in evolution, proposed a model that allowed for natural selection to occur between breeding populations. Wright pointed out that the maximum opportunity for evolution of a species occurred when the species population was divided into many groups of 100 or fewer individuals. The effective population size (N,) of a group of 100 would be about thirtyfive and would consist of the members of a group capable of generating offspring.
Ideally, the overall species size is large enough so that a mutation rate of 10 5 per locus per generation would provide a reasonable supply of new variability. In addition to this variability, according to Wright, there is a large source of accumulated unexposed genetic variability present in populations. This variability can be brought out by modifications of the environment (Lewontin 1965; Lerner 1954).
If a mutation occurs that is weakly selected against in the species, it may reach an appreciable frequency in some demes due to the effects of random drift and migration and/or by conferring an advantage on the demes which possess the gene although it has a slight disadvantage for
Altruism, Group Selection, and Human Evolution 41
individual deme members. In this latter case, Wright showed that for a single additive locus, if the coefficient of group advantage is greater than 2s/(l4s), the mutant allele will be favored. 2s is the coefficient of selection against the mutant homozygote. With s on the order of 0.01 or 0.001, group selection could easily occur.
The rate of change for the mutant allele (Aq) was found to be Aq =
m(q—q0)—sq(l—q)/(l—2sq) where qt is the frequency of the mutant in the migrating population andm is the frequency of migration. Of course, m must be small. If Ne consisted of twentyfive individuals, the approximate variance in deme gene frequencies due to random drift (Wright's Fst) would be 0.09 if m = 0 and q = 0.1. Form = 0.1 however, Fst would be approximately 0.009. With very little variance between the demes there would be little opportunity for selection among them.
In his review, Wright advanced the opinion that socially advantageous traits could not have evolved unless intergroup selection took place. Haldane (1932) had considered this possibility in particular relation to the evolution of altruistic traits. Altruistic or unselfish traits are those which do not maximize the fitness of individuals. Haldane realized that altruistic traits could spread originally due to random effects of deme sizes. Small altruistic demes which found themselves in a new advantageous situation would rapidly spread the gene with their high intrinsic rate of increase. What Haldane failed to point out was that groups with altruistic traits might have an offsetting selective advantage over nonaltruistic groups. The altruistic behaviors that can lead to group advantage of this type have been dealt with in terms of kin selection (Hamilton 1964, 1971), reciprocal altruism (Trivers 1971) and sociability (Eshel 1972).
Kin selection includes those cases where the cost of the altruistic act is smaller than the degree of relatedness between the individuals. The inclusive fitness of altruistic individuals is increased because they have preserved the alleles they have in common with relatives.
Reciprocal altruism is a more general case in which the altruistic type is increased if altruistic behaviors are limited to other individuals with altruistic genotypes. Obviously, the genetic bases of these altruistic behaviors do not have to be simple, and most are probably multifactorial. Reciprocal altruistic behaviors are selected for when lifetimes are long, migration rates are low, mutual dependence is high, parental care is emphasized, dominance hierarchies are minimized, or aid in combat is necessary (Trivers 1971). Also, Trivers offers evidence that the human emotional system has evolved to insure the continuance of altruistic behaviors. Of particular importance in this regard is the evolution of the genetic bases for guilt, friendship, and love. These emotions are particularly involved in insuring that human social structures are maintained. As Trivers points out, cheating can often be so adaptive for individuals that
4 2 RICHARD D. ARMSTRONG
selfish traits and altruistic traits may occur as balanced polymorphisms. This might be particularly true of modern industrial societies.
It seems logical that many reciprocal altruistic systems could have evolved out of kin selection systems or that one would find these systems operating cooperatively rather than separately. This latter case is referred to as general sociability and neighbor effect (Eshel 1972).
Eshel shows, by extending Wright's model, that if the group has an advantage due to sociability the genes for sociability will become fixed in the population provided that the amount of migration is low. If the rate of migration is greater than the relative fitness of the altruist, the altruistic type will not become fixed in the group no matter how much of an advantage it confers on the group. If the fitness of the altruist is only slightly less than the maximum of 1.0, the population must have almost complete emigration of altruists in every generation for the selfish type to be favored. However, in this situation, selection for the altruistic type proceeds very slowly. In addition, stable polymophisms can be established between altruistic and selfish genes due to spatial effects. This is consistent with the theory on spatial polymorphism given by Karlin and McGregor (1972), which shows that differential effects of selection, migration, drift, and mutation over a geographical area can lead to balanced polymorphisms within a population composed of a number of demes.
Similar results are given for cases involving group selection for alleles that cause dispersion (Van Valen 1971). Specifically, Van Valen shows that stable polymorphisms at loci with alleles for dispersion are reached in populations with extinction probabilities from 10 6 to 0.9 per group per generation. Even with high rates of dispersal and small extinction probabilities on the order of 0.05, stable polymorphisms are maintained within groups. The results are similar when polygenic systems are considered. Of course, Van Valen's system works best for populations structured into many small groups with high probabilities of extinction and low rates of migration. As we have seen, this is also the type of population structure that is ideal for the models advanced previously.
The implications of these genetic models for man's evolution are similar to those drawn from other lines of investigation (Lee and De Vore 1968; Campbell 1966; Reynolds 1966). The evidence from the models indicates that our ancestors must have occurred in a large number of small breeding populations exhibiting kin selection and selection for reciprocal altruism. The amount of genetic migration between demes must have been similar to that found in groups of higher primates. The australopithecines were probably subject to substantial selective pressures due to predation, starvation, disease, water shortage, and other factors. One would expect that these selection pressures must have made the need for cooperation intense. The australopithecines were probably
Altruism, Group Selection, and Human Evolution 43
preadapted to make this adjustment because of the cooperative situation which seems likely to have occurred among their forest fringe ancestors (Reynolds 1966).
If the australopithecines lived on the savanna with a social structure involving onemale groups, dominance must have been much less important than it is in hamadryas or gelada societies. This conclusion seems reasonable because most dominance interactions emphasize selfish behaviors and individual selection.
SinceutsrponlihfecaA Australopithecus africanus undoubtedly occurred in groups faced with rather large probabilities of extinction, it seems reasonable to conclude that selection for long life span must have been a factor. As Kummer (1971) points out for the hamadryas, it is advantageous for the group to have elders who have lived long enough to remember where scarce resources are in times of food and water shortage. Kummer mentions that the old males are still the leaders of the groups even though their reproductive activities may have long since been turned over to younger males. One would expect that group selection might be the principal selective factor in maintaining these hamadryas elders. An extrapolation to the human line does not seem unreasonable.
From the discussion above, we can conclude that group selection based on sociability and other features has probably been more important to us and our close relatives than it has to other phyletic groups. Also, the wide occurrence of sociability in the higher primates seems to indicate that selection for this feature antedates the dryopithecines.
Eshel feels that this selection for sociability may have undergone a recent reversal. This reversal is due to the incredible dispersal ability acquired in the last few thousand years. As his model shows, if the dispersal rate is high, the altruistic type who is at a moderate selective disadvantage cannot be preserved in the population.
REFERENCES
BENEDICT, BURTON
1972 "Social regulation of fertility," in The structure of human populations.
Edited by G. A. Harrison and A. J. Boyce. New York: Oxford University Press.
BOORMAN, s . Α., Ε. R. LEVITT
1973 Group selection on the boundary of a stable population. Journal of
Theoretical Population Biology 4:85128. CAMPBELL, BERNARD
1966 Human evolution: an introduction to man's adaptations. Chicago: Aldine.
CROOK, J. H.
1970 "The socioecology of primates," in The social behavior of birds and
mammals. Edited by J. H. Crook. New York: Academic Press.
4 4 RICHARD D. ARMSTRONG
1972 "Sexual selection dimorphism and social organization," inyxwvutsrqponmlihgfedcbaTSRQPNMJIGECBA Sexual selec
tion and the descent of man. Edited by B. Campbell. Chicago: Aldine. CROW, JAMES F., ΜΟΤΟ KIMURA
1965 Evolution in sexual and asexual populations. American Naturalist 99:439450.
1970 An introduction to population genetics theory. New York: Harper and Row.
DOBZHANSKY, THEODOSIUS
1971 Genetics of the evolutionary process. New York: Columbia University Press.
ESHEL, ILLAN
1972 On the neighbor effect and the evolution of altruistic traits. Journal of Theoretical Population Biology 3:258277.
FISHER, RONALD
1930 The genetical theory of natural selection. New York: Dover. HALDANE, J. B. S.
1932 The causes of evolution. Ithaca, N.Y.: Cornell University Press. HAMILTON, WILLIAM D.
1964 The genetical evolution of social behavior. Journal of Theoretical Popu
lation Biology 7:151. 1966 The moulding of senescence by natural selection. Canadian Journal of
Biochemistry 4 4 : 1 2 ^ 5 . 1971 "Selection of selfish and altruistic behavior in some extreme models,"
in Man and beast: comparative social behavior. Edited by J. F. Eisenberg and W. S. Dillon. Washington, D.C.: Smithsonian.
KARLIN, SAMUEL, J . MCGREGOR
1972 Polymorphisms for genetic and ecological systems with weak coupling. Journal of Theoretical Population Biology 3:210238.
KUMMER, HANS
1971 Primate societies: group techniques of ecological adaptation. Chicago: Aldine.
LEE, RICHARD B., IRVEN DE VORE, editors
1968 Man the hunter. Chicago: Aldine. LERNER, I. M.
1954 Genetic homeostasis. London: Oliver and Boyd. LEVINS, RICHARD
1968 Evolution in changing environments: some theoretical explorations.
Princeton N.J.: Princeton University Press. LEWONTIN, R. C.
1962 Interdeme selection controlling a polymorphism in the house mouse. American Naturalist 96:6578.
1965 "Selection in and of populations," in Ideas on modern biology. Proceedings of the 16th International Congress of Zoology, Washington, D.C., New York: Natural History Press.
REYNOLDS, VERNON
1966 Open groups in hominid evolution. Man 1:441452. SIMPSON, G. G.
1944 Tempo and mode in evolution. New York: Columbia University Press. TRIVERS, ROBERT L.
1971 The evolution of reciprocal altruism. Quarterly Review of Biology
46:3557. VAN LA WICK GOODALL, JANE
1971 In the shadow of man. New York: Houghton Mifflin.
Altruism, Group Selection, and Human Evolution 45
VAN VALEN, LEIGH
1970 "Evolution of communities and late Pleistocene extinctions," in Proceedings of the North American Paleontological Convention, Chicago, part E: 469485. Lawrence, Kansas: Allen Press.
1971 Group selection and the evolution of dispersal. Evolution 25:5999. WILLIAMS, GEORGE C.
1966 Adaptation and natural selection: a critique of some current evolutionary thought. Princeton N.J.: Princeton University Press.
1971 Group selection. Chicago: LieberAtherton. WRIGHT, SEW ALL
1945 Tempo and mode in evolution: a critical review. Ecology 26:415419. WYNNEEDWARDS, VERO C.
1962 Animal dispersion in relation to social behavior. New York: Hafner.

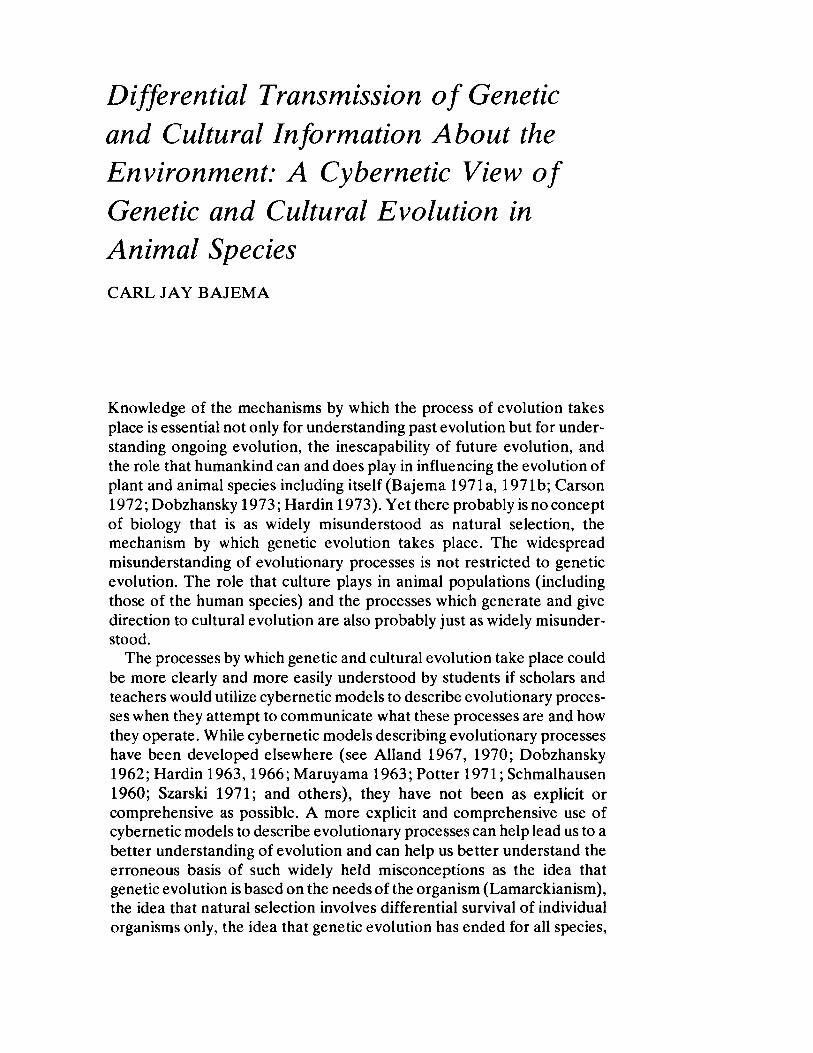
Differential Transmission of Genetic
and Cultural Information About the
Environment: A Cybernetic View of
Genetic and Cultural Evolution in
Animal Species
CARL JAY BAJEMA
Knowledge of the mechanisms by which the process of evolution takes place is essential not only for understanding past evolution but for understanding ongoing evolution, the inescapability of future evolution, and the role that humankind can and does play in influencing the evolution of plant and animal species including itself (Bajema 1971a, 1971b; Carson 1972; Dobzhansky 1973; Hardin 1973). Yet there probably is no concept of biology that is as widely misunderstood as natural selection, the mechanism by which genetic evolution takes place. The widespread misunderstanding of evolutionary processes is not restricted to genetic evolution. The role that culture plays in animal populations (including those of the human species) and the processes which generate and give direction to cultural evolution are also probably just as widely misunderstood.
The processes by which genetic and cultural evolution take place could be more clearly and more easily understood by students if scholars and teachers would utilize cybernetic models to describe evolutionary processes when they attempt to communicate what these processes are and how they operate. While cybernetic models describing evolutionary processes have been developed elsewhere (see Alland 1967, 1970; Dobzhansky 1962; Hardin 1963,1966; Maruyama 1963; Potter 1971; Schmalhausen 1960; Szarski 1971; and others), they have not been as explicit or comprehensive as possible. A more explicit and comprehensive use of cybernetic models to describe evolutionary processes can help lead us to a better understanding of evolution and can help us better understand the erroneous basis of such widely held misconceptions as the idea that genetic evolution is based on the needs of the organism (Lamarckianism), the idea that natural selection involves differential survival of individual organisms only, the idea that genetic evolution has ended for all species,
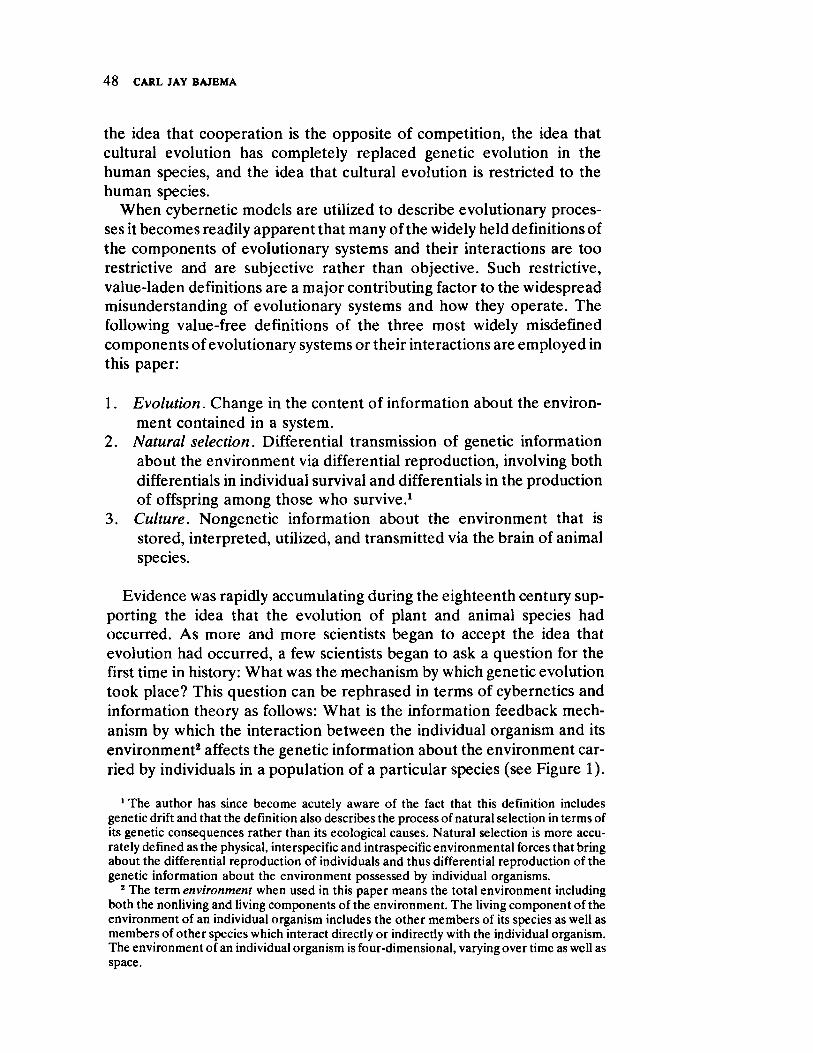
4 8YRMLJECBA CARL JAY BAJEMA
the idea that cooperation is the opposite of competition, the idea that cultural evolution has completely replaced genetic evolution in the human species, and the idea that cultural evolution is restricted to the human species.
When cybernetic models are utilized to describe evolutionary processes it becomes readily apparent that many of the widely held definitions of the components of evolutionary systems and their interactions are too restrictive and are subjective rather than objective. Such restrictive, valueladen definitions are a major contributing factor to the widespread misunderstanding of evolutionary systems and how they operate. The following valuefree definitions of the three most widely misdefined components of evolutionary systems or their interactions are employed in this paper:
1.vutsronmliecaNEC Evolution. Change in the content of information about the environment contained in a system.
2. Natural selection. Differential transmission of genetic information about the environment via differential reproduction, involving both differentials in individual survival and differentials in the production of offspring among those who survive.1
3. Culture. Nongenetic information about the environment that is stored, interpreted, utilized, and transmitted via the brain of animal species.
Evidence was rapidly accumulating during the eighteenth century supporting the idea that the evolution of plant and animal species had occurred. As more and more scientists began to accept the idea that evolution had occurred, a few scientists began to ask a question for the first time in history: What was the mechanism by which genetic evolution took place? This question can be rephrased in terms of cybernetics and information theory as follows: What is the information feedback mechanism by which the interaction between the individual organism and its environment2 affects the genetic information about the environment carried by individuals in a population of a particular species (see Figure 1).
1 The author has since become acutely aware of the fact that this definition includes genetic drift and that the definition also describes the process of natural selection in terms of its genetic consequences rather than its ecological causes. Natural selection is more accurately defined as the physical, interspecific and intraspecific environmental forces that bring about the differential reproduction of individuals and thus differential reproduction of the genetic information about the environment possessed by individual organisms.
2 The term environment when used in this paper means the total environment including both the nonliving and living components of the environment. The living component of the environment of an individual organism includes the other members of its species as well as members of other species which interact directly or indirectly with the individual organism. The environment of an individual organism is fourdimensional, varying over time as well as space.
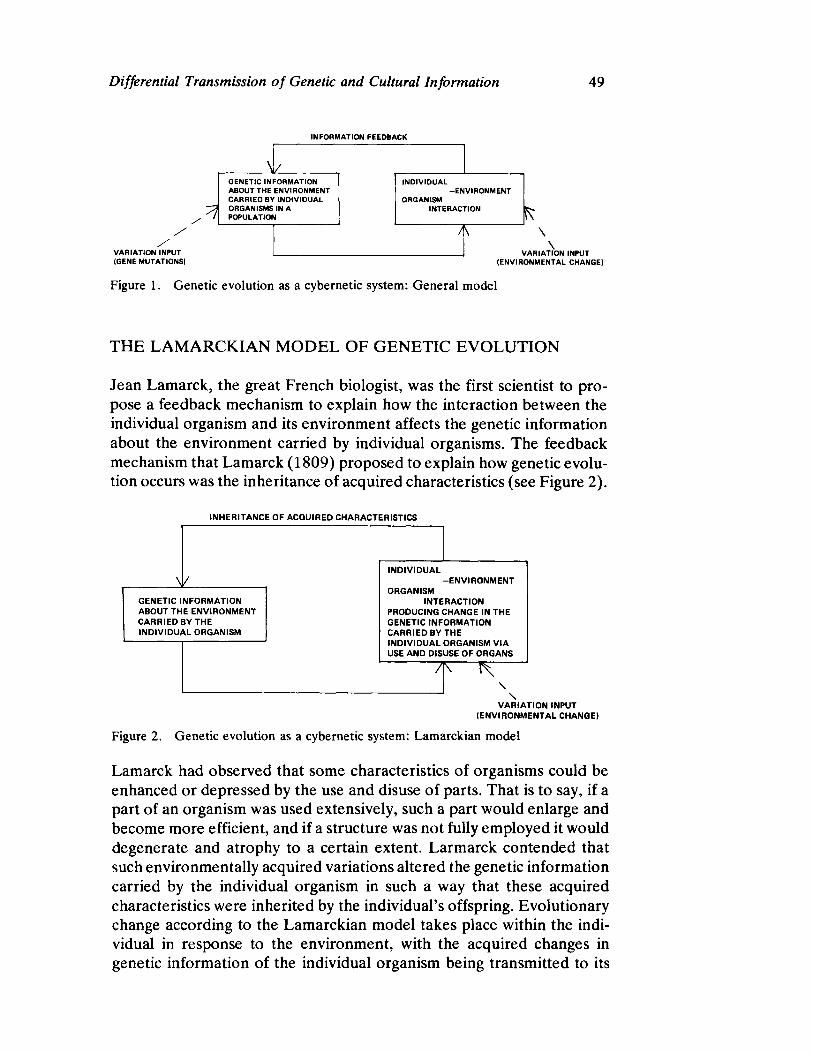
Differential Transmission of Genetic and Cultural Information 4 9
INFORM ATION FEEDBACK
/ /
VARIATION INPUT (GENE M UTATIONS)
VARIATION INPUT (ENVIRONM ENTAL CHANGE)
Figure 1. Genetic evolution as a cybernetic system: General model
THE LAMARCKIAN MODEL OF GENETIC EVOLUTION
Jean Lamarck, the great French biologist, was the first scientist to propose a feedback mechanism to explain how the interaction between the individual organism and its environment affects the genetic information about the environment carried by individual organisms. The feedback mechanism that Lamarck (1809) proposed to explain how genetic evolution occurs was the inheritance of acquired characteristics (see Figure 2).
INHERITANCE OF ACQUIRED CHARACTERISTICS
VARIATION INPUT (ENVIRONM ENTAL CHANGE)
Figure 2. Genetic evolution as a cybernetic system: Lamarckian model
Lamarck had observed that some characteristics of organisms could be enhanced or depressed by the use and disuse of parts. That is to say, if a part of an organism was used extensively, such a part would enlarge and become more efficient, and if a structure was not fully employed it would degenerate and atrophy to a certain extent. Larmarck contended that such environmentally acquired variations altered the genetic information carried by the individual organism in such a way that these acquired characteristics were inherited by the individual's offspring. Evolutionary change according to the Lamarckian model takes place within the individual in response to the environment, with the acquired changes in genetic information of the individual organism being transmitted to its
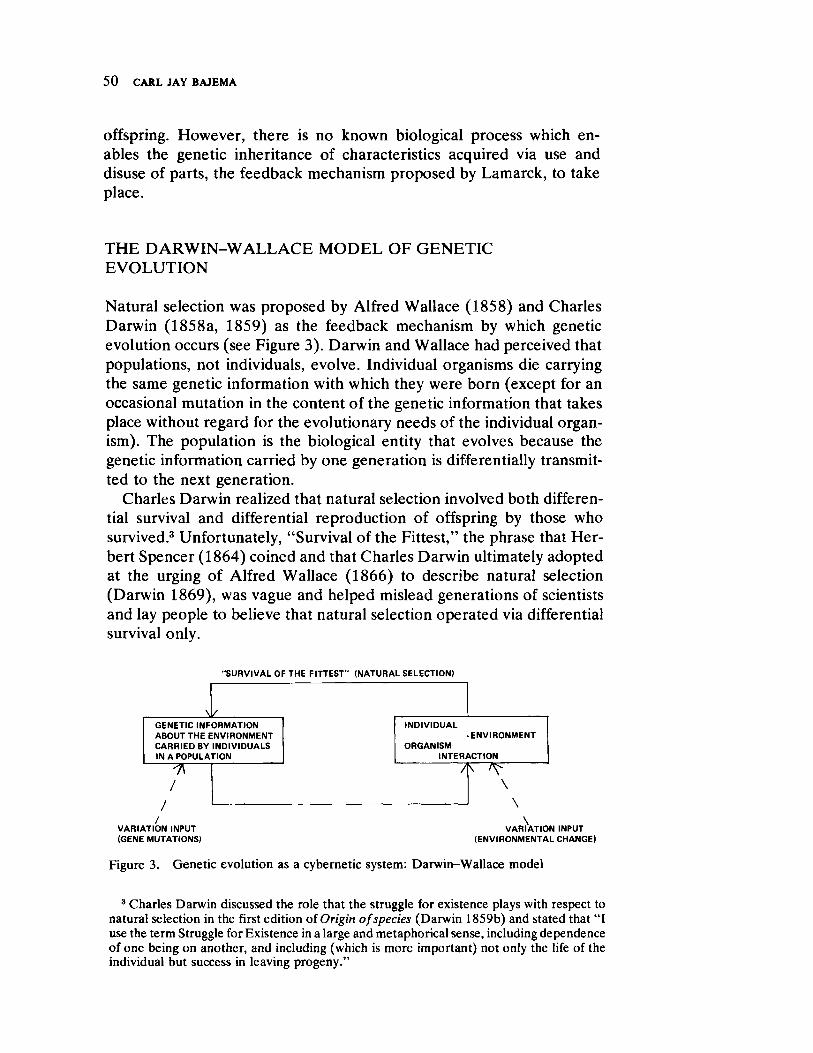
50 CARL JAY BAJEMA
offspring. However, there is no known biological process which enables the genetic inheritance of characteristics acquired via use and disuse of parts, the feedback mechanism proposed by Lamarck, to take place.
THE DARWINWALLACE MODEL OF GENETIC EVOLUTION
Natural selection was proposed by Alfred Wallace (1858) and Charles Darwin (1858a, 1859) as the feedback mechanism by which genetic evolution occurs (see Figure 3). Darwin and Wallace had perceived that populations, not individuals, evolve. Individual organisms die carrying the same genetic information with which they were born (except for an occasional mutation in the content of the genetic information that takes place without regard for the evolutionary needs of the individual organism). The population is the biological entity that evolves because the genetic information carried by one generation is differentially transmitted to the next generation.
Charles Darwin realized that natural selection involved both differential survival and differential reproduction of offspring by those who survived.3 Unfortunately, "Survival of the Fittest," the phrase that Herbert Spencer (1864) coined and that Charles Darwin ultimately adopted at the urging of Alfred Wallace (1866) to describe natural selection (Darwin 1869), was vague and helped mislead generations of scientists and lay people to believe that natural selection operated via differential survival only.
"SURVIVAL OF THE FITTEST" (NATURAL SELECTION)
^ GENETIC INFORMATION ABOUT THE ENVIRONMENT CARRIED BY INDIVIDUALS IN A POPULATION
INDIVIDUAL -ENVIRONMENT
ORGANISM INTERACTION
\
VARIATION INPUT (GENE MUTATIONS)
VARIATION INPUT (ENVIRONMENTAL CHANGE)
Figure 3. Genetic evolution as a cybernetic system: DarwinWallace model
3 Charles Darwin discussed the role that the struggle for existence plays with respect to natural selection in the first edition ofsrponigfecO Origin of species (Darwin 1859b) and stated that "I use the term Struggle for Existence in a large and metaphorical sense, including dependence of one being on another, and including (which is more important) not only the life of the individual but success in leaving progeny."
Differential Transmission of Genetic and Cultural Information 51
THE MUTATIONIST MODEL OF GENETIC EVOLUTION
The rediscovery of the particulate nature of genetic information at the turn of the century by De Vries, Tschermak, and Correns soon led to a schism between the adherents of the theory of natural selection and many workers in the new field of genetics. The nature of mutations, in particular, was misunderstood by many geneticists. This misunderstanding led Hugo De Vries, the great Dutch botanist, to propose the mutationist theory to explain the origin of species. Mutation, according to De Vries (1901), was a mode, perhaps the mode, by which new species originated. The mutationist theory did not propose a new information feedback mechanism by which the individual organismenvironment interaction affected the genetic information about the environment carried by the population of a species. Rather, the mutationist theory of evolution contended that most mutations produced such great changes in the genetic information carried by an individual organism that gradual evolution of new species via natural selection was a virtual impossibility. Natural selection was viewed by adherents of the mutationist theory as strictly a negative force capable only of maintaining the genetic status quo in a species by removing the unfit (Allen 1968, 1969; Provine 1971).
THE NEODARWINIAN OR SYNTHETIC MODEL OF GENETIC EVOLUTION
As geneticists learned more about gene mutations it became apparent that many mutations produced only minor changes in the genetic information — the kind of variation on which the theory of natural selection is based. The knowledge that most gene mutations were of the general type postulated by Darwin rather than by De Vries, coupled with the development of population genetics (Provine 1971), led to a synthesis by the 1930's which has since become widely known as the neoDarwinian or synthetic theory of evolution.
The neoDarwinian model of genetic evolution emphasizes that natural selection is differential reproduction of genetic information about the environment involving both differentials in individual survival and differentials in the production of offspring among those individual organisms who survive (see Figure 4). According to the neoDarwinian model, the direction and intensity of the selective forces operating with respect to any population are a function of the environment (both the living and nonliving components) and thus are as changeable as the environment. Genetic evolution, then, is viewed as an ongoing process brought about by constantly changing environments.
The outcome of the individual organismenvironment interaction is a
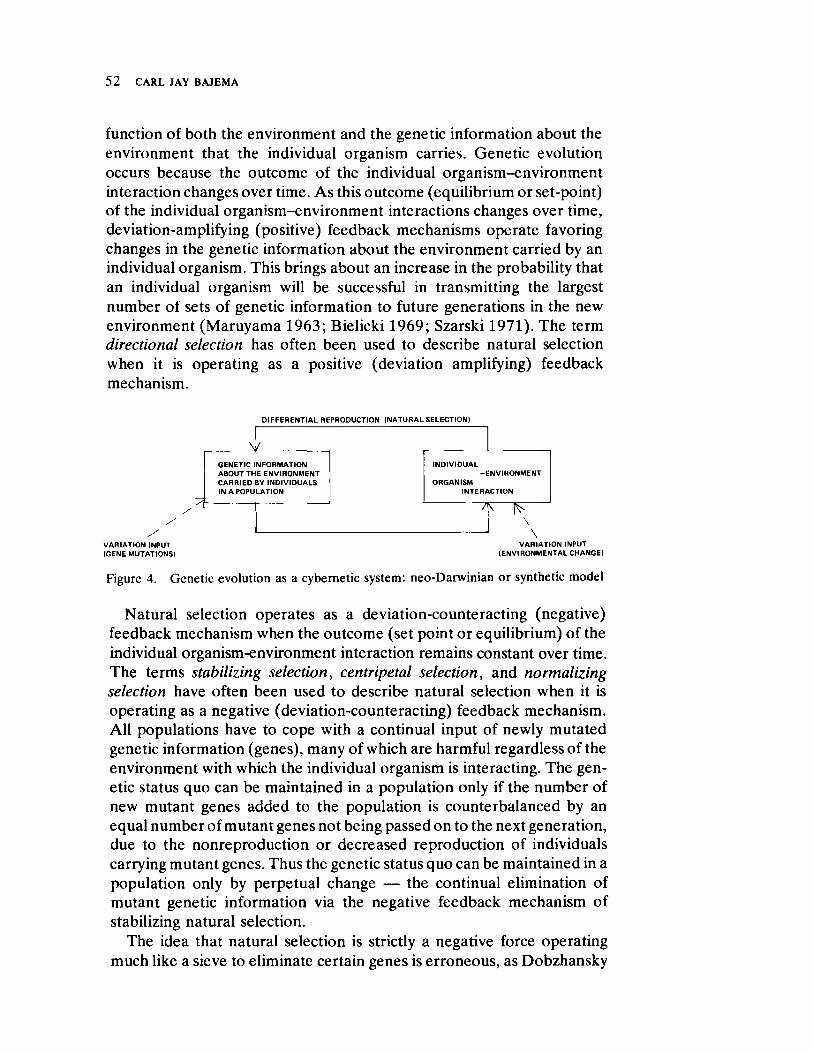
52 CARL JAY BAJEMA
function of both the environment and the genetic information about the environment that the individual organism carries. Genetic evolution occurs because the outcome of the individual organismenvironment interaction changes over time. As this outcome (equilibrium or setpoint) of the individual organismenvironment interactions changes over time, deviationamplifying (positive) feedback mechanisms operate favoring changes in the genetic information about the environment carried by an individual organism. This brings about an increase in the probability that an individual organism will be successful in transmitting the largest number of sets of genetic information to future generations in the new environment (Maruyama 1963; Bielicki 1969; Szarski 1971). The term ztsrponmligedcba
directional selection has often been used to describe natural selection when it is operating as a positive (deviation amplifying) feedback mechanism.
D I FFEREN T I A L REPRO D U CT I O N ( N A T U R A L SELECT I ON )
V A RI A T I O N I NPUT
( GENE M UT AT I ON S)
V A RI A T I O N I NPUT
( EN V I RO N M EN T A L CH A N GE)
Figure 4. Genetic evolution as a cybernetic system: neoDarwinian or synthetic model
Natural selection operates as a deviationcounteracting (negative) feedback mechanism when the outcome (set point or equilibrium) of the individual organismenvironment interaction remains constant over time. The terms stabilizing selection, centripetal selection, and normalizing
selection have often been used to describe natural selection when it is operating as a negative (deviationcounteracting) feedback mechanism. All populations have to cope with a continual input of newly mutated genetic information (genes), many of which are harmful regardless of the environment with which the individual organism is interacting. The genetic status quo can be maintained in a population only if the number of new mutant genes added to the population is counterbalanced by an equal number of mutant genes not being passed on to the next generation, due to the nonreproduction or decreased reproduction of individuals carrying mutant genes. Thus the genetic status quo can be maintained in a population only by perpetual change — the continual elimination of mutant genetic information via the negative feedback mechanism of stabilizing natural selection.
The idea that natural selection is strictly a negative force operating much like a sieve to eliminate certain genes is erroneous, as Dobzhansky

Differential Transmission of Genetic and Cultural Information 53
(1970) has pointed out on numerous occasions. A sieve cannot retain particles or let them pass depending on what other particles are present in the sieve. Natural selection can accomplish such a feat because all the genetic information an individual organism carries is subjected to natural selection as a block, rather than on a gene by gene basis. Directional natural selection can be thought of as creative in the sense that it operates via differential reproduction to increase the frequency of genetic information about the environment, thus enhancing the adaptation of the population to the newly changed environment.
EXTENSION OF THE ΝΕΟ DAR W IN IAN MODEL OF GENETIC EVOLUTION TO INCLUDE CULTURAL EVOLUTION
Many animal species possess two systems for processing, interpreting, utilizing, and transmitting information about their environments to other members of the same species — a genetic system based on genes (DNA) and a nongenetic or cultural system based on the brain.
Progress in studying the mechanisms governing the evolution of the information content of the cultural (nongenetic) system of transmitting information about the environment to other members of the same species, and in understanding how the cultural system constantly interacts with the genetic system of transmitting information in the human species, has been hampered by a number of factors. First, the persistent desire on the part of most anthropologists to define culture in such a way that it is possessed only by the human species has led to vague and virtually meaningless definitions (see Halloway 1969 for one of the most recent attempts at such a definition). Second, the vague, incomplete, and often erroneous definitions of evolution and of natural selection have made it difficult for most individuals to attain a clear understanding of the mechanisms governing the processes of genetic and cultural evolution. Herbert Spencer, the great English social theorist of the nineteenth century, was a major contributor to this problem by his advocacy of a valueladen definition of evolution and his use of the vague and misleading phrase "Survival of the Fittest" to describe natural selection.
The consistent unwillingness of scholars to accept the fact that cooperation is a special case of competition rather than the opposite of competition (Crook 1971) has been another major factor hindering progress in understanding the processes which govern genetic and cultural evolution and the interactions between these two systems for differentially transmitting information about the environment in animal species. The direction and intensity of natural selection is, in large part, a function of intraspecific competition occurring among individual organisms of the
5 4 CARL JAY BAJEMA
same species. Intraspecific competition occurs not only between individuals but also between groups of individuals. Intergroup competition could not take place if it were not for cooperation between individual members within each group. Cooperative behavior probably evolved and is evolving because it confers a selective advantage in intraspecific competition. The universal applicability of the theory of natural selection for the human species becomes apparent when cooperation is viewed as a special case of competition. The role that cooperative behavior plays in generating selective forces in genetic and cultural evolution needs to be carefully studied if the human race is to understand adequately past evolution, ongoing evolution, and if human populations are to learn how to direct their own future evolution in a more intelligent way than they are now doing.
A number of anthropologists, geneticists, and biologists have utilized cybernetic models to describe the cultural system for differentially transmitting nongenetic information about the environment in the human species and its interactions with the genetic system from a neoDarwinian perspective (see, for example, Alland 1967,1970;Bajema 1971b, 1972; Bielicki 1969; Dobzhansky 1962; Potter 1971a, 1971b).
The cultural system for transmitting information about the environment has the properties essential to a system that is evolving in a changing environment (Campbell 1969). First, the cultural information can be preserved, duplicated, and propagated. Second, variation in the information content of the cultural system is occurring constantly because of faulty communication of information between individuals and the emergence of new information about the environment as the result of the learning experiences of individual organisms as they interact with the environment. Third, the cultural information is subject to selection — selective elimination, propagation, and retention of certain types of information about the environment. As in genetic evolution, it is the environment that generates the stabilizing and directional selective feedback mechanisms which favor certain information over other information in cultural evolution. The process of cultural adaptation to the environment occurs via the differential transmission of ideas that influence how individuals perceive and interact with the environment. The differential transmission of ideas occurs because ideas affect the survival and fertility patterns within and between populations, and because the learning process enables individual organisms, especially those of the human species, to perceive to a certain extent what the probable consequences might be of utilizing a particular idea when interacting with the environment.
The feedback mechanisms linking the outcome of the organism environment interaction to the information contained in the genetic and cultural systems produce the same effect — change in the information about the environment contained in these systems. As pointed out earlier
Differential Transmission of Genetic and Cultural Information 55
in this paper, the status quo in the information content of a system can be maintained in the face of a continual input of variations (be they gene mutations or new ideas) only by perpetual change — the continual elimination of such variant information via stabilizing selection at a rate equal to the input of such variant information into the system. Thus feedback mechanisms generating change in the information about the environment contained within a system are necessary to maintain the status quo as well as to bring about a systematic change in the information about the environment which affects the outcome of the organismenvironment interaction.
While the processes of genetic and cultural evolution are similar, the specific mechanisms for storage, retrieval, and propagation of information are different. The basic unit of information is the gene in the genetic system and the idea in the cultural system. A gene carried by a particular individual organism can be transmitted only to that individual's biological offspring, while ideas can be transmitted to other individuals of the same species regardless of their genetic relationship to the individual transmitting the information. Ideas have to be duplicated each generation via the transmission of information between individuals in nonhuman animal species, while the human species can store ideas via such information storage devices as paintings, photographs, books, and computers as well as via their brains.
The genetic and cultural systems for transmitting information about the environment differ also with respect to how variation in information content is generated. While both systems have to cope with the continual input of variant information via gene mutations or faulty communication of cultural information between individuals, some new variant information emerges in the cultural system as the result of the learning experiences of individual organisms as they interact with the environment. Human beings, in particular, are often able to utilize the learning (information processing and interpreting) capacities of the brain to produce changes in the nongenetic information about the environment that are not random with respect to the effect that these changes have on the outcome of the organismenvironment interaction. A tremendous amount of selection of information occurs as the individual or group learns from the outcome of various organismenvironment interactions, so that the specific information selected for incorporation into the cultural information that is utilized as the group or individual interacts with the environment has a higher probability of better adapting the population to that specific environment. These changes in cultural information appear to be "Lamarckian" in the sense that these changes in the content of the nongenetic information about the environment are generated in response to what appear to be the specific needs of human populations. Some examples of what appears to be cultural evolution based on the
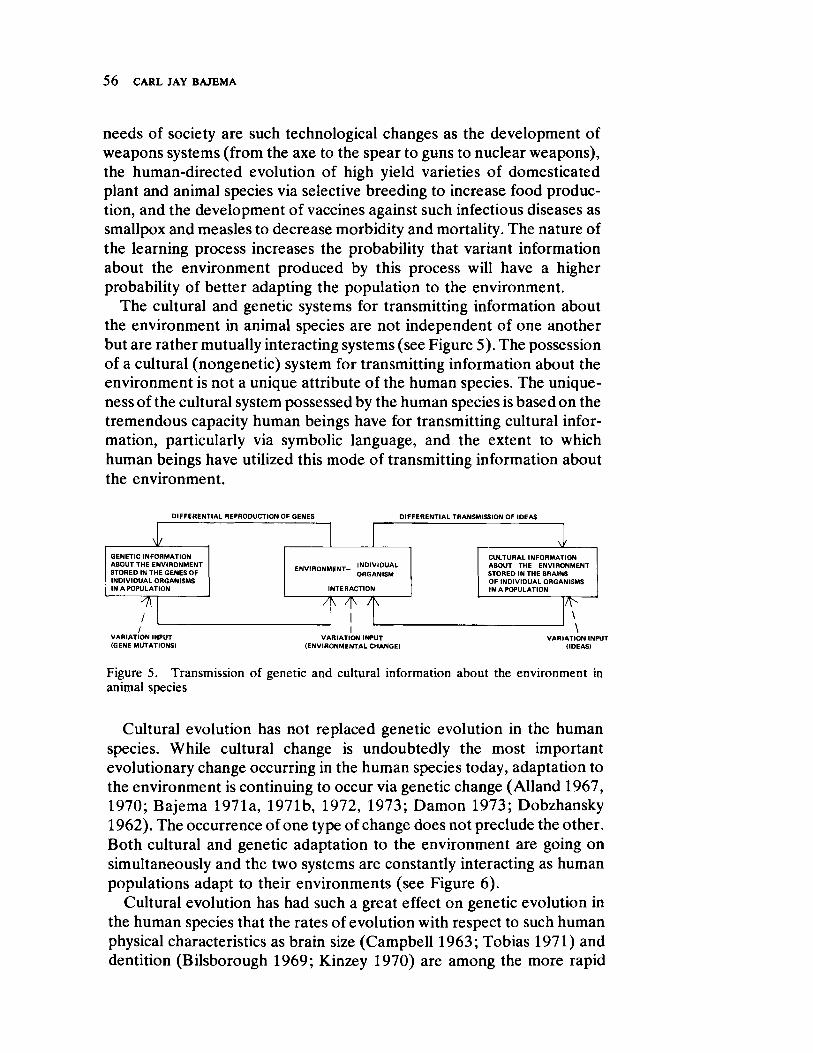
5 6 CARL JAY BAJEMA
needs of society are such technological changes as the development of weapons systems (from the axe to the spear to guns to nuclear weapons), the humandirected evolution of high yield varieties of domesticated plant and animal species via selective breeding to increase food production, and the development of vaccines against such infectious diseases as smallpox and measles to decrease morbidity and mortality. The nature of the learning process increases the probability that variant information about the environment produced by this process will have a higher probability of better adapting the population to the environment.
The cultural and genetic systems for transmitting information about the environment in animal species are not independent of one another but are rather mutually interacting systems (see Figure 5). The possession of a cultural (nongenetic) system for transmitting information about the environment is not a unique attribute of the human species. The uniqueness of the cultural system possessed by the human species is based on the tremendous capacity human beings have for transmitting cultural information, particularly via symbolic language, and the extent to which human beings have utilized this mode of transmitting information about the environment.
DI FFERENTI A! . REPRODUCTI ON OF GENES D I FFERENT I AL TRANSMI SSI ON OF I DEAS
JL GENETI C I NFORMATI ON ABOUT THE ENVI RONMENT STORED IN THE GENES OF I NDI VI DUAL ORGANI SMS IN A POPULATI ON
ENVI RONMENT I NDI VI DUAL
I NTERACTI ON
7 p O r I
CULT URAL I NFORMATI ON ABOUT THE ENVI RONMENT STORED IN THE BRAI NS OF I NDI VI DUAL ORGANI SMS IN A POPULATI ON
\
VARI AT I ON I NPUT ( GENE MUTATI ONS)
VARI AT I ON I NPUT ( ENVI RONMENTAL CHANGE)
VARI AT I ON I NPUT ( I DEAS)
Figure 5. Transmission of genetic and cultural information about the environment in animal species
Cultural evolution has not replaced genetic evolution in the human species. While cultural change is undoubtedly the most important evolutionary change occurring in the human species today, adaptation to the environment is continuing to occur via genetic change (Alland 1967, 1970; Bajema 1971a, 1971b, 1972, 1973; Damon 1973; Dobzhansky 1962). The occurrence of one type of change does not preclude the other. Both cultural and genetic adaptation to the environment are going on simultaneously and the two systems are constantly interacting as human populations adapt to their environments (see Figure 6).
Cultural evolution has had such a great effect on genetic evolution in the human species that the rates of evolution with respect to such human physical characteristics as brain size (Campbell 1963; Tobias 1971) and dentition (Bilsborough 1969; Kinzey 1970) are among the more rapid
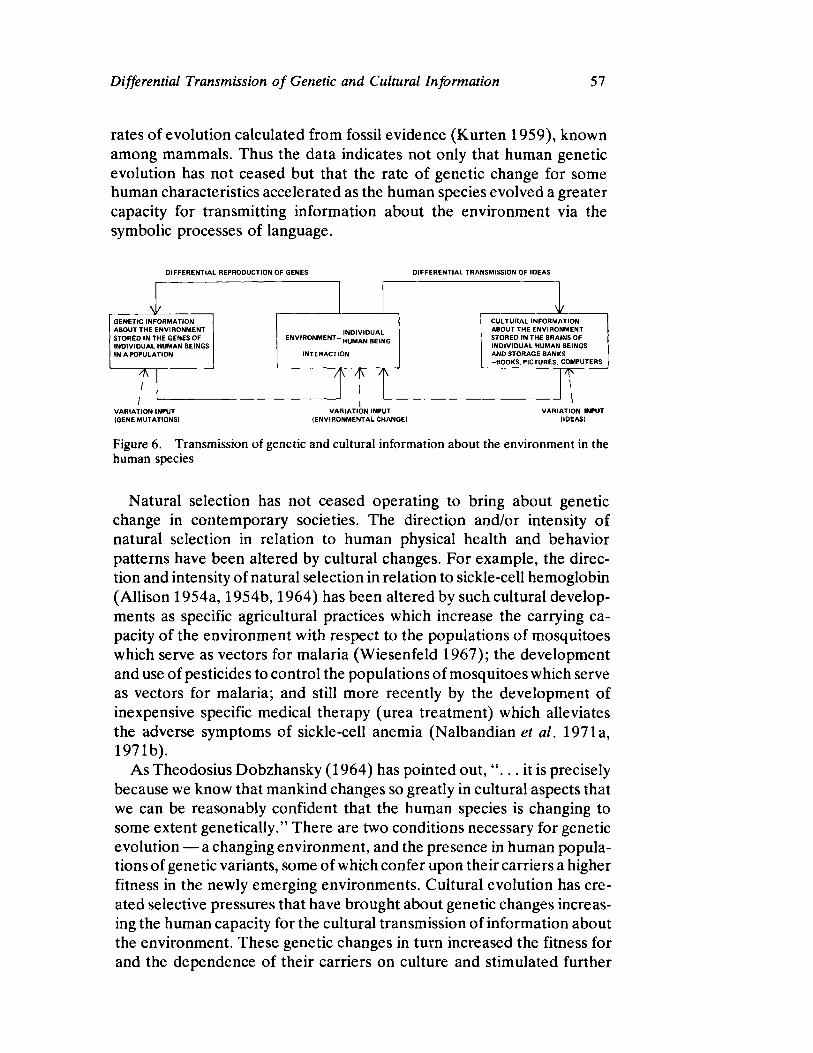
Differential Transmission of Genetic and Cultural Information 57
rates of evolution calculated from fossil evidence (Kurten 1959), known among mammals. Thus the data indicates not only that human genetic evolution has not ceased but that the rate of genetic change for some human characteristics accelerated as the human species evolved a greater capacity for transmitting information about the environment via the symbolic processes of language.
D I F F ER EN T I A L REPRO D U CT I O N OF GEN ES D I F F ER EN T I A L T RAN SM I SSI O N OF I D EAS
V A RI A T I O N I NPUT V A R I A T I O N I NPUT V A R I A T I O N I NPUT
I CEN E M U T AT I O N SI ( EN V I R O N M EN T A L CH A N GE) ( I DEAS)
Figure 6. Transmission of genetic and cultural information about the environment in the human species
Natural selection has not ceased operating to bring about genetic change in contemporary societies. The direction and/or intensity of natural selection in relation to human physical health and behavior patterns have been altered by cultural changes. For example, the direction and intensity of natural selection in relation to sicklecell hemoglobin (Allison 1954a, 1954b, 1964) has been altered by such cultural developments as specific agricultural practices which increase the carrying capacity of the environment with respect to the populations of mosquitoes which serve as vectors for malaria (Wiesenfeld 1967); the development and use of pesticides to control the populations of mosquitoes which serve as vectors for malaria; and still more recently by the development of inexpensive specific medical therapy (urea treatment) which alleviates the adverse symptoms of sicklecell anemia (Nalbandiantlea et al. 1971a, 1971b).
As Theodosius Dobzhansky (1964) has pointed out, " . . . it is precisely because we know that mankind changes so greatly in cultural aspects that we can be reasonably confident that the human species is changing to some extent genetically." There are two conditions necessary for genetic evolution — a changing environment, and the presence in human populations of genetic variants, some of which confer upon their carriers a higher fitness in the newly emerging environments. Cultural evolution has created selective pressures that have brought about genetic changes increasing the human capacity for the cultural transmission of information about the environment. These genetic changes in turn increased the fitness for and the dependence of their carriers on culture and stimulated further

5 8 CARL JAY BAJEM A
cultural developments. The cultural developments in turn initiated still further genetic changes. Thus a positive feedback relationship has existed between cultural and genetic evolution in the human species with respect to what we call intelligent behavior.
When culture is perceived as nongenetic information about the environment it becomes obvious that individual human beings vary genetically with respect to their ability to learn about the environment, to understand cultural information about the environment (for instance, mathematical equations describing the environment), and with respect to their ability to communicate such nongenetic information about the environment to other human beings in a meaningful way.
The great changes that have occurred and that are taking place in the social structure of human societies affect the direction and/or intensity of natural selection, particularly with respect to human behavior patterns (Bajema 1973). It is interesting to note that the emerging urban industrial welfare state environments of the United States appear to be environments which cause natural selection to operate to bring about a very slight increase in the frequency of those genes in the population which in interaction with the environment lead to the development of above average intelligence (as measured by IQ test scores). At least, this is the case in all three of the primarily urban, native born, white American populations where the operation of natural selection in relation to individual differences in intelligence has been studied (Bajema 1963; Osborn and Bajema 1972; Waller 1971).
The evidence clearly indicates that the genetic evolution of the human capacity for culture has greatly expanded the cultural dimension of human evolution, which in turn has had the effect of accelerating the rate of genetic evolution for a whole variety of human biochemical, physical, and behavioral patterns. Thus the genetic and cultural systems for utilizing and transmitting information about the environment are not independent of one another but are so interlocked that a change in the information content of one system frequently brings about a change in the information content of the other system.
CONCLUSION
The use of cybernetic models to describe the processes by which differential transmission of genetic and cultural (nongenetic) information about the environment occurs in animal species is a scholarly approach that can help human beings better understand the mechanisms of genetic and cultural evolution as well as the erroneous basis of many of the widely held misconceptions concerning these processes. An attempt was made in this paper to provide a more explicit and comprehensive nonmathemati
Differential Transmission of Genetic and Cultural Information 59
cal review of genetic and cultural evolutionary processes than has been done in the past.
REFERENCES
A L L A N D , ALEXANDER, JR.
1967 Evolution and human behavior. New York: Natural History Press. 1970 Adaptation in cultural evolution: an approach to medical anthropology.
New York: Columbia University Press. ALLEN, G. E.
1968 Thomas Hunt Morgan and the problem of natural selection. Journal of
the History of Biology 1:113139. 1969 Hugo de Vries and the reception of the "mutation theory." Journal of
the History of Biology 2:5587. ALLISON, A. C.
1954a Protection afforded by sicklecell trait against subtertian malarial infection. British Medical Bulletin 1:290294.
1954b Notes on sicklecell polymorphism. Annals of Human Genetics
19:3957. 1964 Polymorphism and natural selection in human populations. Cold Spring
Harbor Symposia on Quantitative Biology 29:137149. BAJEMA, C. J.
1963 Estimation of the direction and intensity of natural selection in relation to human intelligence by means of the intrinsic rate of natural increase. Eugenics Quarterly 10:175187.
1971a The genetic implications of population control. Bioscience 21:7175. 1971b Natural selection in human populations: the measurement of ongoing
genetic evolution in contemporary societies. New York: Wiley. 1972 Transmission of information about the environment in the human
species: a cybernetic view of genetic and cultural evolution. Social
Biology 19:224226. 1973 "Some thoughts concerning the direction and intensity of natural selec
tion with respect to human physical health and behavior patterns in industrial welfare state democracies," in Heredity and society. Edited by I. Porter. New York: Academic Press.
BIELICKI, Τ.
1969 Deviationamplifying cybernetic systems and hominid evolution. Materialow 1 Prac. Antropologiczncych Wroclaw 77:360 (in Polish with an English summary).
BILSBOROUGH, A.
1969 Rates of evolutionary change in the hominid dentition. Nature
223:146149. CAMPBELL, B.
1963 "Quantitative taxonomy and human evolution," in Classification and
human evolution. Edited by S. Washburn, 5074. Chicago: Aldine. CAMPBELL, D . T.
1969 Variatio.n and selective retention in sociocultural evolution. General
Systems Yearbook 14:6985. CARSON, H. L.
1972 Evolutionary biology: its value to society. Bioscience 22:349352.
6 0 CARL JAY BAJEMA
CROOK, J . Η.
1971 "Sources of cooperation in animals and man," inzyxvutsrqponmlkihgfedcbaZTSQPONMLJHGDCBA Man and beast:
comparative social behavior. Edited by J. F. Eisenberg and W. S. Dillon, 237260. Washington, D.C.: Smithsonian.
DAMON, A.
1973 "Ongoing evolution," in Heredity and society. Edited by I. Porter, New York: Academic Press.
DARWIN, c . R.
1858 On the tendency of species to form varieties; and on the perpetuation of varieties and species by natural means of selection. Journal of the
Proceedings of the Linnaean Society, Zoology 3:4653. 1859 On the origin of species by means of natural selection, or the preservation
of favoured races in the struggle for life. London: Murray. 1869 On the origin of species by means of natural selection, or the preservation
of favoured races in the struggle for life (fifth edition). London: Murray. DE VRIES, H.
1901 Die mutations theorie. Leipzig: Veit. DOBZHANSKY, T.
1962 Mankind evolving: the evolution of the human species. New Haven, Conn.: Yale University Press.
1964 Evolution — organic and superorganic. Bulletin of the Atomic Scientists
20(May):48. 1970 Genetics of the evolutionary process. New York: Columbia University
Press. 1973 "Nothing in biology makes sense except in the light of evolution."
American Biology Teacher 35:125129. HALLOWAY, R. L.
1969 Culture: a human domain. Current Anthropology 10:395^412. HARDIN, G.
1960 Nature and man's fate. New York: Holt, Rinehart and Winston. 1963 The cybernetics of competition: a biologist's view of society. Perspec
tives in Biology and Medicine 7 :5884. 1966 Biology: its principles and implications (second edition). San Francisco:
Freeman. 1973 Ambivalent aspectsof evolution. American Biology Teacher 35:1519.
KINZEY,W. 1970 Rates of evolutionary change in the hominid canine teeth. Nature
225:296. KURTEN, Β.
1959 Rates of evolution in fossil mammals. Cold Spring Harbor Symposia
on Quantitative Biology 24:205215. LAMARCK, J .
1809 Philosophie zoologique, ou exposition des considerations relatives a
l'histoire naturelle des animaux, two volumes. Paris: Dentu. MARUYAMA, M.
1963 The second cybernetics: deviation amplifying mutual causal processes. American Scientist 51:164179.
NALBANDIAN, R. , G. SHULTZ, J . M. LUSHER et al.
1971a Sickle cell crisis terminated by intravenous urea in sugar solutions — a preliminary report. American Journal ofMedical Science 261:309324.
NALBANDIAN, R. , J . W . ANDERSON, J . M. LUSHER et al.
1971b Oral urea and the prophylactic treatment of sickle cell disease — a preliminary report. American Journal of Medical Science 261:325334.
Differential Transmission of Genetic and Cultural Information 61
OSBORN, F., C. J . BAJEMA
1972 The eugenic hypothesis. Social Biology 19:337345. POTTER, V. R.
1971a Disorder as a builtin component of biological systems: the survival imperative. Zygon 6:135150.
1971b Bioethics: bridge to the future. Englewood Cliffs, N. J.: PrenticeHall. PROVINE, W .
1971 The origins of theoretical population genetics. Chicago: University of Chicago Press.
SCHMALHAUSEN, I. I.
1960 Evolution and cybernetics. Evolution 14:509524. SPENCER, H.
1864 Principles of biology, volume one. London: Williams and Norgate. SZARSKI, H.
1971 The importance of deviation amplifying circuits for the understanding of the course of evolution. Acta Biotheoretica 20:158170.
TOBIAS, P.
1971 The brain in hominidevolution. New York: Columbia University Press. WALLACE, A. R.
1858 On the tendency of varieties to depart indefinitely from the original type. Journal of the Proceedings of the Linnaean Society of London,
Zoology 3:5362. 1866 Letter to Charles Darwin, July 2, 1866 with Darwin's reply, July 5,
1866. Reprinted in Alfred Russel Wallace: letters and reminiscences.
Edited by J. Merchant. London: Harper. WALLER, J . H.
1971 Differential reproduction: its relation to IQ test score, education and occupation. Social Biology 18:122136.
WIESENFELD, S.
1967 Sicklecell trait in human biological and cultural evolution. Science
157:11341140.

Current Directions in Behavior
Genetics
STEVEN G. VANDENBERG
A survey of current work in behavior genetics might be expected to have a population genetics orientation, that is to say, to concern itself with gene frequencies for "behavioral" traits in various populations or at least with the distribution of genotypes. This idea had to be largely abandoned because such an approach has been missing in behavior genetics. The reason is not difficult to determine: It is much easier to compare groups with respect to an all or none phenomenon, such as the frequency of a certain bloodgroup allele, than it is to compare the distributions of a continuous variable in two or more groups. Yet most behavior is too complicated to fit comfortably into a dichotomous model.
The problem is even more complicated for traits that are influenced by socioeconomic and cultural factors, so that the effort to select comparable samples can become a major undertaking in itself. Even when abnormality provides a cutting point, such as in mental retardation or psychopathology, crosscultural comparisons are difficult because different cultures may use different criteria in establishing where to cut abnormal from normal. This difficulty may be exaggerated in a world where cultural relativism holds sway and where Marxists, Freudians, and Skinnerians believe as strongly as they do in the overriding importance of environmental factors. Only lately are we beginning to learn that the incidence of schizophrenia or of certain types of severe mental retardation may be rather similar all over the world.
In what follows we will first review some past studies selected mainly to emphasize the principal methods used up to now in behavior genetics. Next we will consider several other methods that have not been used to any extent so far. Finally, we will return to a population approach. In this context we will briefly look at three related questions:
1. Are there racial differences in abilities?
6 4VTSRNGEDBA STEVEN G. VANDENBERG
2. Are there socioeconomic differences in intelligence?
3. Is the national level of intelligence declining due to differential
fertility?
In the following review of methods an effort will be made not to let the
length or brevity of the discussion be determined by the number of studies
which have used that model, but rather by the potential importance of the
method.
"M E N D E L I A N " P E D I G R E E ANALYSIS FOR SINGLE G E N E
SUBSTITUTIONS
A number of sensory defects have been found to fit this model: the
several types of impaired color vision (protanopia, deuteranopia,
tritanopia and their milder forms protanomaly, deuteranomaly, tritano-
maly); taste blindness for PTC and perhaps for several other substances;
inborn insensitivity to pain (Saldanha, Schmidt, and Leon 1964) ; and
maybe tone deafness (McKusick 1966). Apparently the milder forms of
color blindness are alleles of the more serious forms, while protanopia
and deuteranopia are closely linked on the X chromosome, and tritanopia
is an autosomal dominant. The precise biochemical reason why one
defective gene in an autosomal system can interfere with the develop-
ment of normal color vision is not yet understood. In fact, the precise
nature of the three pigments responsible for normal sensitivity and the
changes present in the various anomalies are not known. Impaired color
vision occurs in insects as well but has not been studied extensively.
The taste deficiencies are at least partially independent (Kaplan 1968),
but whether there are separate deficiencies in smelling different odors is
not yet clear. Brown, MacLean and Robinette (1968) and Brown, Mac-
Lean, and Callan (1969) found no evidence for this although Amoore's
(1964) theory would lead us to expect this. The genetics of the absence of
functional pain nerve endings and of tone deafness have not been studied
widely. Kalmus (1948) was unable to fit a single locus model to the latter,
but his results may fit a model requiring only a few loci.
It is no longer clear whether some motoric phenomena such as left-
handedness, tongue curling, ear wiggling, and so oh, fit a single gene
model as was once believed. Psychologists have shown little interest in
such traits while most geneticists and anthropologists have lost theirs. The
Swedish psychologist Trankel (1955, 1956) suggested a diallelic single
locus model for handedness with right-handedness dominant and a mod-
est degree of incomplete penetrance which agrees with data published by
three different American investigators. Assuming that his model was
correct, the frequencies for the recessive gene for left-handedness in the
three populations sampled were found to be 0 . 4 2 7 , 0 . 4 0 2 , and 0.410. To
Current Directions in Behavior Genetics 65
obtain this fit he had to assume lack of penetrance for lefthandedness in the following percent of cases for these three studies: 8.03, 3.56, and 5.24. These numbers are surprisingly close and the variation could be due to different methods of assessing handedness.
A number of errors of metabolism due to single genes cause mental retardation. Why the same genetic factor can cause a range of effects on intelligence is not yet understood. There are, for instance, reports of untreated PKU cases with intelligence well into the normal range (Hsia, O'Flynn, and Berman 1968; Berman et al. 1969). Perhaps these represent other genetic conditions.
Schizophrenia and a manicdepressive condition are thought by some investigators to be due to one or a few mutant genes. All the problems enumerated above hold here, and the genetic analysis is further confounded by the greater subjectivity of diagnosis.
To my knowledge, the only "normal" psychological traits proposed so far by anyone to be under the control of one (or a few) genes are spatial visualization and schizoid personality.
In summary, the method of Mendelian pedigree analysis appears to have been used mainly in a somewhat haphazard way so far. The result is a serious neglect, which is understandable when one considers the practical difficulties inherent in collecting adequate information on all members of a substantial number of families.
There may be a lesson in the fact that PTC tasting fits a single gene model fairly well even though more detailed test procedures have shown that the mechanism may be more complicated (Kaplan 1968). Perhaps there are major gene effects to be detected in some of the special abilities.
With the exception of color blindness there has been no search for linkage of psychological traits with single gene polymorphisms. This statement does not apply to X linkage which frequently has been invoked and implicated especially in height, spatial visualization, and verbal ability but in contradictory and/or incompletely spelled out ways.
Two reports on linkage between blood groups and personality by Cattell, Young, and Hundleby (1964) and by Bourdel (1960) only report phenotypic correlations.
BIOMETRICAL ANALYSIS OF MULTIFACTORIAL TRAITS
There is enormous interest in intelligence and personality which has led to many attempts to estimate the proportion of the phenotypic variance due to hereditary factors.
While this idea goes back to Galton (1875), with appropriate methods worked out in detail by Pearson (1904), Johannsen (1903), Fisher (1918), Dahlberg (1926), and others, most empirical studies have used
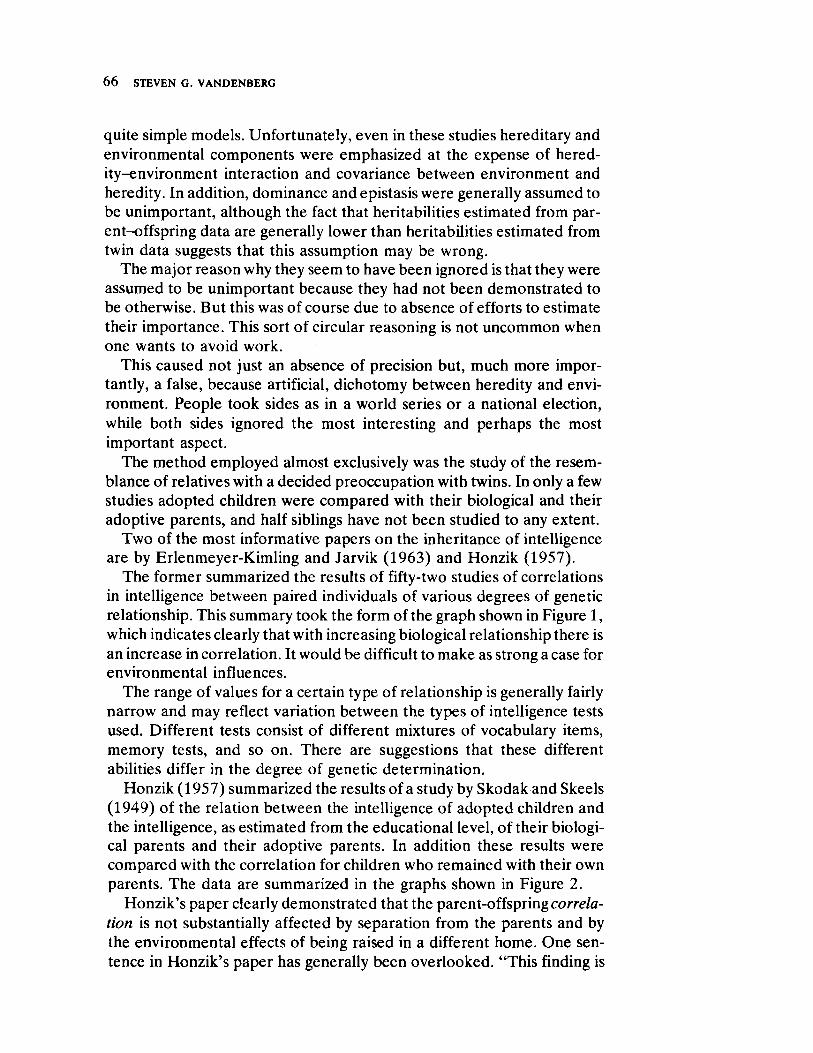
6 6 STEVEN G. VANDENBERG
quite simple models. Unfortunately, even in these studies hereditary and environmental components were emphasized at the expense of heredityenvironment interaction and covariance between environment and heredity. In addition, dominance and epistasis were generally assumed to be unimportant, although the fact that heritabilities estimated from parentoffspring data are generally lower than heritabilities estimated from twin data suggests that this assumption may be wrong.
The major reason why they seem to have been ignored is that they were assumed to be unimportant because they had not been demonstrated to be otherwise. But this was of course due to absence of efforts to estimate their importance. This sort of circular reasoning is not uncommon when one wants to avoid work.
This caused not just an absence of precision but, much more importantly, a false, because artificial, dichotomy between heredity and environment. People took sides as in a world series or a national election, while both sides ignored the most interesting and perhaps the most important aspect.
The method employed almost exclusively was the study of the resemblance of relatives with a decided preoccupation with twins. In only a few studies adopted children were compared with their biological and their adoptive parents, and half siblings have not been studied to any extent.
Two of the most informative papers on the inheritance of intelligence are by ErlenmeyerKimling and Jarvik (1963) and Honzik (1957).
The former summarized the results of fiftytwo studies of correlations in intelligence between paired individuals of various degrees of genetic relationship. This summary took the form of the graph shown in Figure 1, which indicates clearly that with increasing biological relationship there is an increase in correlation. It would be difficult to make as strong a case for environmental influences.
The range of values for a certain type of relationship is generally fairly narrow and may reflect variation between the types of intelligence tests used. Different tests consist of different mixtures of vocabulary items, memory tests, and so on. There are suggestions that these different abilities differ in the degree of genetic determination.
Honzik (1957) summarized the results of a study by Skodak and Skeels (1949) of the relation between the intelligence of adopted children and the intelligence, as estimated from the educational level, of their biological parents and their adoptive parents. In addition these results were compared with the correlation for children who remained with their own parents. The data are summarized in the graphs shown in Figure 2.
Honzik's paper clearly demonstrated that the parentoffspringtronlieca correla
tion is not substantially affected by separation from the parents and by the environmental effects of being raised in a different home. One sentence in Honzik's paper has generally been overlooked. "This finding is

Current Directions in Behavior Genetics 67
C A T E G O R Y GROUPS
000 0 10 0 20 0)0 0 40 0 50 0*0 0 70 0*0 0 90
UNRELATED REARED APART 4
PERSONS REARED TOGETHER
— l ·
5
F0STERPAREN7 CMI D 3
PARENT CHILD . . 12
REAREO APART 2 SIBLINGS
REARED TOGETHER * • · ' n l f * 1 ι ι — — · 35
OPPOSITE SEX 9 TWOEGG
IKE SEX • + · • · ·
II w
Ν _ REARED APART . ^ j . · 4 ONEEGG
REARED TOGETHER ι • * * V « 14
Figure 1. Correlations between IQs of paired individuals of genetic relations ranging from none to complete. Dots represent correlations from single studies; lines show range of values; median is shown by short vertical lines (ErlenmeyerKimling and Jarvik 1963)
EDUCATION OF FATHER IN RELATION TO CHILD'S 10
40 r
.35
30
.25
20
15
. 10
Child'« 10 ι Fother's Education: ο Guidonce Study (child
reared by own porents) • Adopted child's IQ « True
Father's Edue. (Skodok) o — » Adopted Child's 10 «
Foster Father's Educ. (Skodok)
.05
Aqe 2 4 6 θ 10 12 14 16
EDUCATION OF MOTHER IN RELATION TO CHILD'S 10
4 0
3 5 . 30
.25
.20
. 15
. IC
.05
0 5 Age
Numb«' et Ca·*«
Child's 10 > Mother's Education: aa £uidonco Study (child
reared by own mother) ο — Adopted Child's 10 χ Xrue
Mother's Educ. (Skodok) t>— Adopted Child's 10 >
Foster Mother's Educ. (Skodok)
2 4 6 ( (134 229 2" 211 IS ι 2i9 2io eos
10 l»7
12 192
14 I U I > Stiriir
Figure 2. IQ resemblance of adopted child to foster and true parents (after Honzik 1957)
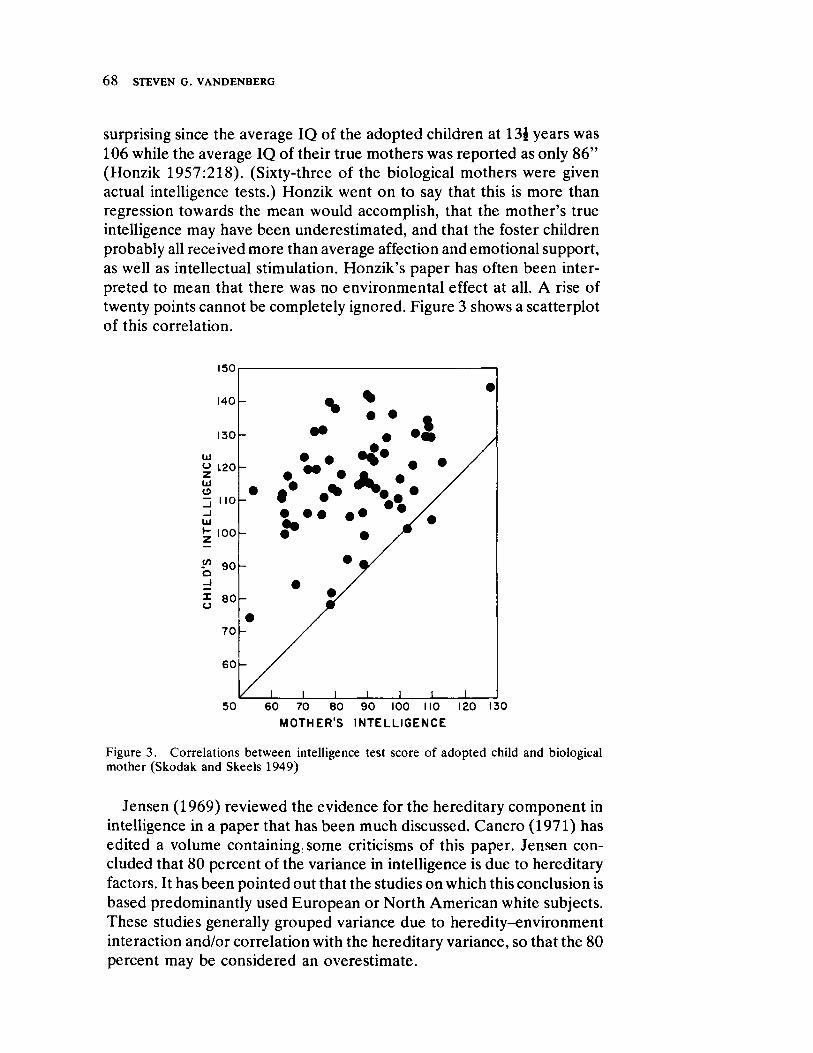
6 8 STEVEN G. VANDENBERG
surprising since the average IQ of the adopted children at 13i years was 106 while the average IQ of their true mothers was reported as only 86" (Honzik 1957:218). (Sixtythree of the biological mothers were given actual intelligence tests.) Honzik went on to say that this is more than regression towards the mean would accomplish, that the mother's true intelligence may have been underestimated, and that the foster children probably all received more than average affection and emotional support, as well as intellectual stimulation. Honzik's paper has often been interpreted to mean that there was no environmental effect at all. A rise of twenty points cannot be completely ignored. Figure 3 shows a scatterplot of this correlation.
MOT H ER'S I N T ELL I GEN CE
Figure 3. Correlations between intelligence test score of adopted child and biological mother (Skodak and Skeels 1949)
Jensen (1969) reviewed the evidence for the hereditary component in intelligence in a paper that has been much discussed. Cancro (1971) has edited a volume containing, some criticisms of this paper. Jensen concluded that 80 percent of the variance in intelligence is due to hereditary factors. It has been pointed out that the studies on which this conclusion is based predominantly used European or North American white subjects. These studies generally grouped variance due to heredityenvironment interaction and/or correlation with the hereditary variance, so that the 80 percent may be considered an overestimate.

Current Directions in Behavior Genetics 69
Since then, Jensen (1970) has reanalyzed the IQs of identical twins reared apart to show that the data from the four largest studies may be regarded as samples from the same population (Newman, Freeman, and Holzinger 1937; Burt 1966; Shields 1962; JuelNielsen 1965).
Jensen also showed that the overall intraclass correlations is 0.824, which may be regarded as an upperbound estimate of the proportion of the total variance attributable to all genetic variance (i.e., additive and nonadditive). Finally he found no significant correlation between twin pair sums and differences which suggest that differential environmental effects are not systematically related to the intelligence level of the twins.
Finally it is only recently that the effect of consanguinity on intelligence has been systematically studied, though a negative effect had been assumed to exist for a long time. Schull and Neel (1965) were able to analyze the scores of 2,111 children on the eleven subtests of a Japanese version of the Wechsler intelligence scale for children (WISC), constructed by Kodama and Shinagawa (1953). Results were available for 1,854 children in the consanguinity groups shown in Table 1.
Table 1. The number of boys and girls in the various categories of consanguinity
Unrelated Second cousins
Parents are
Η cousins
First cousins
Males 538 88 89 249 Females 451 100 102 237
Totals 989 188 191 486
A firstcousin marriage is between children of siblings. Therefore such children share,vtronhgea on the average, one pair of genes out of sixteen by common descent. A marriage of first cousins once removed is between a child of one sibling and a grandchild of another. Children of such unions will share, on the average, one pair of genes out of 32 by common descent. A marriage between second cousins is between grandchildren of siblings. Children from such marriages will, on the average, have one out of 64 pairs of genes the same by common descent. When one gene from the father and one from the mother are obtained from a common ancestor, the result is a homozygous pair of genes. The more pairs of genes, or loci, that are homozygous, the more inbreeding. Unrelated individuals are assumed to have no genes in common, so that children from such unions are taken to be heterozygous for all loci. F, the coefficient of inbreeding, is the probability that at any given locus, the two genes will be the same by descent. Some diagrams are shown in Figure 4.
In the study by Schull and Neel (1965), the scores of the consanguinity groups were compared and the effects of inbreeding estimated by multi
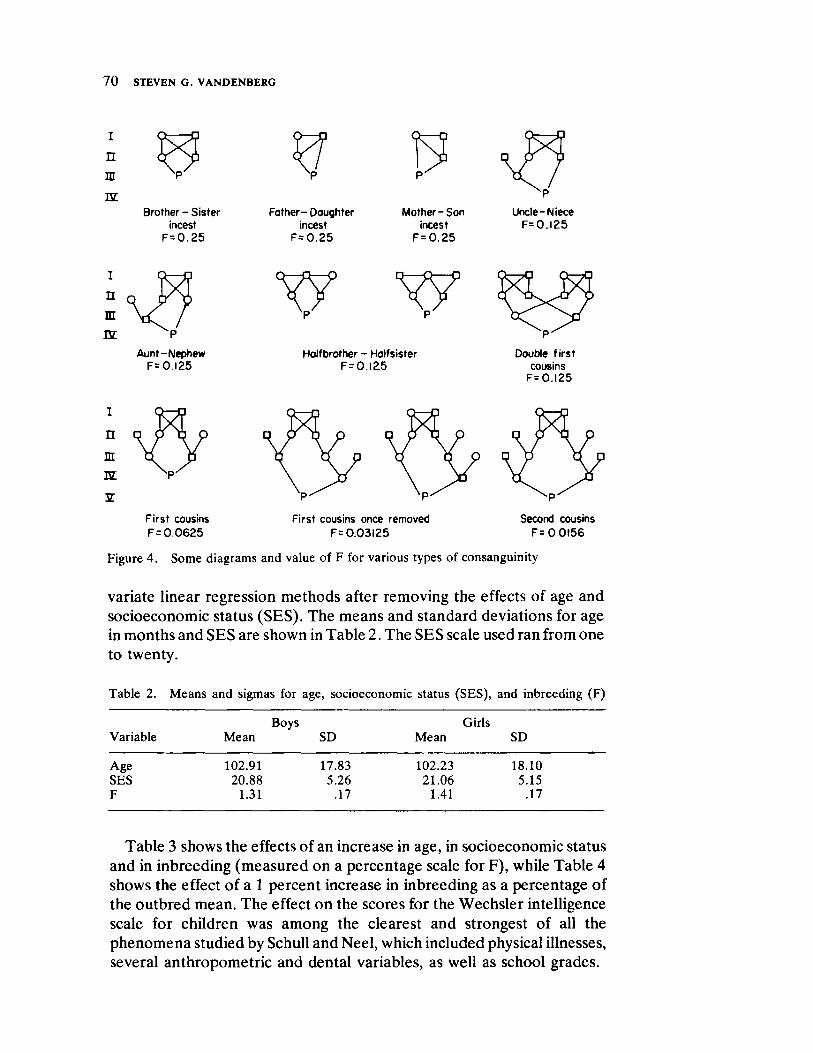
7 0wvutsrponmlihgfedcbaVUTSRNMIHGFEDBA STEVEN G. VANDENBERG
I
Π
m m
m. Brother - Sister
incest F = 0 . 2 5
Father- Daughter incest
F= 0 . 2 5
Mother-Son incest
F= 0 . 2 5
Uncle-Niece F = 0 . I 2 5
I
Π
m
12
Aunt-Nephew F= 0.125
Y? w Halfbrother - Halfsister
F= 0 .125 Double first
cousins F= 0 .125
First cousins
F = 0 . 0 6 2 5
First cousins once removed
F= 0 .03125
Second cousins
F= 0 .0156
Figure 4. Some diagrams and value of F for various types of consanguinity
variate linear regression methods after removing the effects of age and socioeconomic status (SES). The means and standard deviations for age in months and SES are shown in Table 2. The SES scale used ran from one to twenty.
Table 2. Means and sigmas for age, socioeconomic status (SES), and inbreeding (F)
Variable Mean Boys Girls
SD Mean SD
Age SES F
102.91 20.88
1.31
17.83 5.26
.17
102.23 21.06
1.41
18.10 5.15
.17
Table 3 shows the effects of an increase in age, in socioeconomic status and in inbreeding (measured on a percentage scale for F), while Table 4 shows the effect of a 1 percent increase in inbreeding as a percentage of the outbred mean. The effect on the scores for the Wechsler intelligence scale for children was among the clearest and strongest of all the phenomena studied by Schull and Neel, which included physical illnesses, several anthropometric and dental variables, as well as school grades.
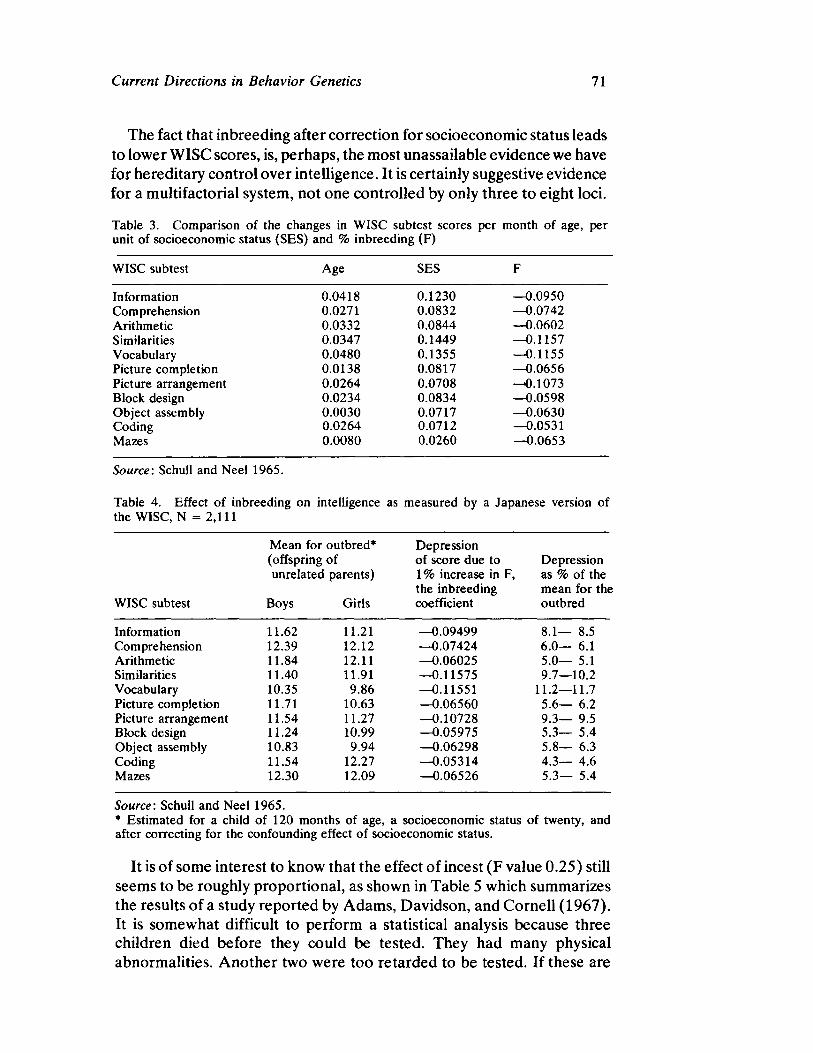
Current Directions in Behavior Genetics 71
The fact that inbreeding after correction for socioeconomic status leads to lower WISC scores, is, perhaps, the most unassailable evidence we have for hereditary control over intelligence. It is certainly suggestive evidence for a multifactorial system, not one controlled by only three to eight loci.
Table 3. Comparison of the changes in WISC subtest scores per month of age, per unit of socioeconomic status (SES) and % inbreeding (F)
WISC subtest Age SES F
Information 0.0418 0.1230 —0.0950 Comprehension 0.0271 0.0832 —0.0742 Arithmetic 0.0332 0.0844 —0.0602 Similarities 0.0347 0.1449 —0.1157 Vocabulary 0.0480 0.1355 —0.1155 Picture completion 0.0138 0.0817 —0.0656 Picture arrangement 0.0264 0.0708 —0.1073 Block design 0.0234 0.0834 —0.0598 Object assembly 0.0030 0.0717 —0.0630 Coding 0.0264 0.0712 —0.0531 Mazes 0.0080 0.0260 —0.0653
Source: Schull and Neel 1965.
Table 4. Effect of inbreeding on intelligence as measured by a Japanese version of the WISC, Ν = 2,111
Mean for outbred* Depression (offspring of of score due to Depression unrelated parents) 1 % increase in F, as % of the
the inbreeding mean for the WISC subtest Boys Girls coefficient outbred
Information 11.62 11.21 —0.09499 8.1— 8.5 Comprehension 12.39 12.12 —0.07424 6.0— 6.1 Arithmetic 11.84 12.11 —0.06025 5.0— 5.1 Similarities 11.40 11.91 —0.11575 9.7—10.2 Vocabulary 10.35 9.86 —0.11551 11.2—11.7 Picture completion 11.71 10.63 —0.06560 5.6— 6.2 Picture arrangement 11.54 11.27 —0.10728 9.3— 9.5 Block design 11.24 10.99 —0.05975 5.3— 5.4 Object assembly 10.83 9.94 —0.06298 5.8— 6.3 Coding 11.54 12.27 —0.05314 4.3— 4.6 Mazes 12.30 12.09 —0.06526 5.3— 5.4
Source : Schull and Neel 1965. * Estimated for a child of 120 months of age, a socioeconomic status of twenty, and after correcting for the confounding effect of socioeconomic status.
It is of some interest to know that the effect of incest (F value 0.25) still seems to be roughly proportional, as shown in Table 5 which summarizes the results of a study reported by Adams, Davidson, and Cornell (1967). It is somewhat difficult to perform a statistical analysis because three children died before they could be tested. They had many physical abnormalities. Another two were too retarded to be tested. If these are

72VTSRNGEDBA STEVEN G. VANDENBERG
excluded, the mean IQs are 95.85 for children of inbred matings and
102.31 for the controls.
Table 5. IQ values of children of incestuous matings and of control mothers. The mothers were matched for intelligence and socioeconomic status.
No. Incest Control
1 Died after 2 mo. 101 2 Died after 15 hr. 100 3 Died after 6 hr. 104
4 Severely retarded 107 5 Severely retarded 93
6 64 100 7 64 133 8 64 109 9 85 103
10 92 (68 later) 81 11 92 108 12 98 108 13 110 91 14 112 105 15 113 91 16 114 85 17 118 121 18 119 95
CO N SEQ U EN CES O F A N EU PLO ID IES FO R BEH A V IO RA L
TRA ITS
Because the first example in humans of an extra chromosome happened
to be trisomy 21 or mongolism, as it was then known, it was clear from the
start that normal intelligence requires a normal complement of chromo-
somes. Even the loss of a portion of this chromosome 21, as in transloca-
tion, results in lowered intelligence, though apparently the effect is less
severe.
Other aneuploidies seem to affect intelligence to about the same
degree, perhaps related to the proportion of the genome that is missing or
duplicated. There is more information on sex chromosome aneuploidies
and for these it seems clear that the effect is roughly proportional to the
amount of excess material. W hether some of the mildly retarded cases
can be interpreted as severe reductions from an above average family
standard, or whether the effect is a variable one affecting some children
more than others has not yet been investigated. This will also require
collection of information about the intelligence of the unaffected rela-
tives. In fact, for further progress methods of quantitative genetics will
have to be combined with the cytogenetic approach.
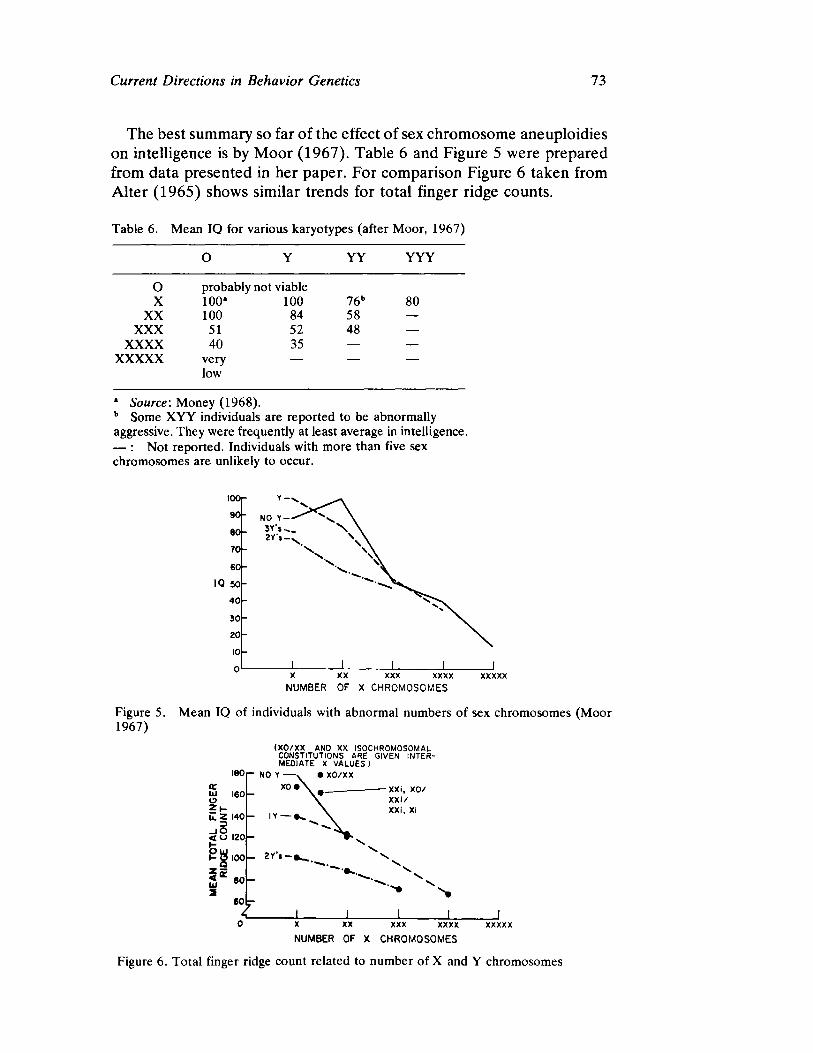
Current Directions in Behavior Genetics 73
The best summary so far of the effect of sex chromosome aneuploidies on intelligence is by Moor (1967). Table 6 and Figure 5 were prepared from data presented in her paper. For comparison Figure 6 taken from Alter (1965) shows similar trends for total finger ridge counts.
Table 6. Mean IQ for various karyotypes (after Moor, 1967)
Ο Y YY YYY
Ο probably not viable X 100* 100 76b 80
XX 100 84 58 —
XXX 51 52 48 —
x x x x 40 35 — —
x x x x x very low
— — —
• Source: Money (1968). b Some XYY individuals are reported to be abnormally aggressive. They were frequently at least average in intelligence. — : Not reported. Individuals with more than five sex chromosomes are unlikely to occur.
NUMBER OF X CHROM OSOM ES
Figure 5. Mean IQ of individuals with abnormal numbers of sex chromosomes (Moor 1967)
( XO/ XX AND XX ISOCHROM OSOM AL CON STI TUTI ON S ARE GIVEN I N TER -M ED IATE X VA LUES )
Figure 6. Total finger ridge count related to number of X and Y chromosomes
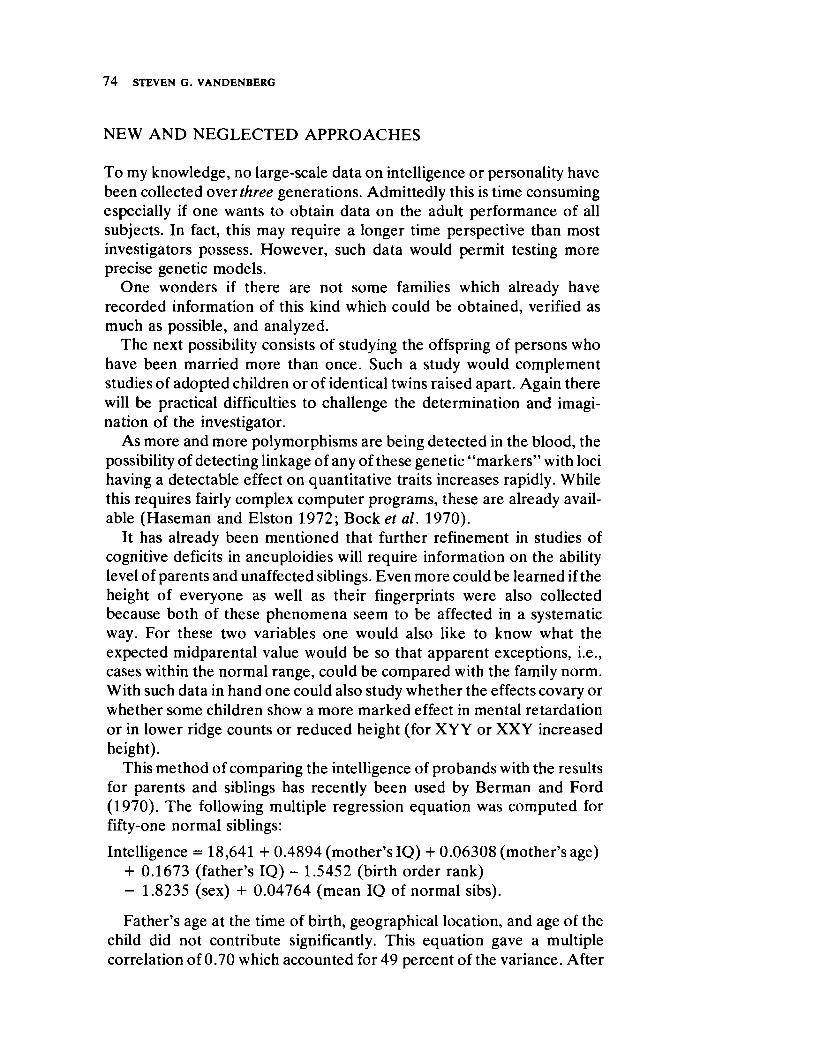
7 4 STEVEN G. VANDENBERG
NEW AND NEGLECTED APPROACHES
To my knowledge, no largescale data on intelligence or personality have been collected overtrlhea three generations. Admittedly this is time consuming especially if one wants to obtain data on the adult performance of all subjects. In fact, this may require a longer time perspective than most investigators possess. However, such data would permit testing more precise genetic models.
One wonders if there are not some families which already have recorded information of this kind which could be obtained, verified as much as possible, and analyzed.
The next possibility consists of studying the offspring of persons who have been married more than once. Such a study would complement studies of adopted children or of identical twins raised apart. Again there will be practical difficulties to challenge the determination and imagination of the investigator.
As more and more polymorphisms are being detected in the blood, the possibility of detecting linkage of any of these genetic "markers" with loci having a detectable effect on quantitative traits increases rapidly. While this requires fairly complex computer programs, these are already available (Haseman and Elston 1972; Bock et al. 1970).
It has already been mentioned that further refinement in studies of cognitive deficits in aneuploidies will require information on the ability level of parents and unaffected siblings. Even more could be learned if the height of everyone as well as their fingerprints were also collected because both of these phenomena seem to be affected in a systematic way. For these two variables one would also like to know what the expected midparental value would be so that apparent exceptions, i.e., cases within the normal range, could be compared with the family norm. With such data in hand one could also study whether the effects covary or whether some children show a more marked effect in mental retardation or in lower ridge counts or reduced height (for XYY or XXY increased height).
This method of comparing the intelligence of probands with the results for parents and siblings has recently been used by Berman and Ford (1970). The following multiple regression equation was computed for fiftyone normal siblings:
Intelligence = 18,641 + 0.4894 (mother's IQ) + 0.06308 (mother's age) + 0.1673 (father's IQ) 1.5452 (birth order rank) 1.8235 (sex) + 0.04764 (mean IQ of normal sibs).
Father's age at the time of birth, geographical location, and age of the child did not contribute significantly. This equation gave a multiple correlation of 0.70 which accounted for 49 percent of the variance. After
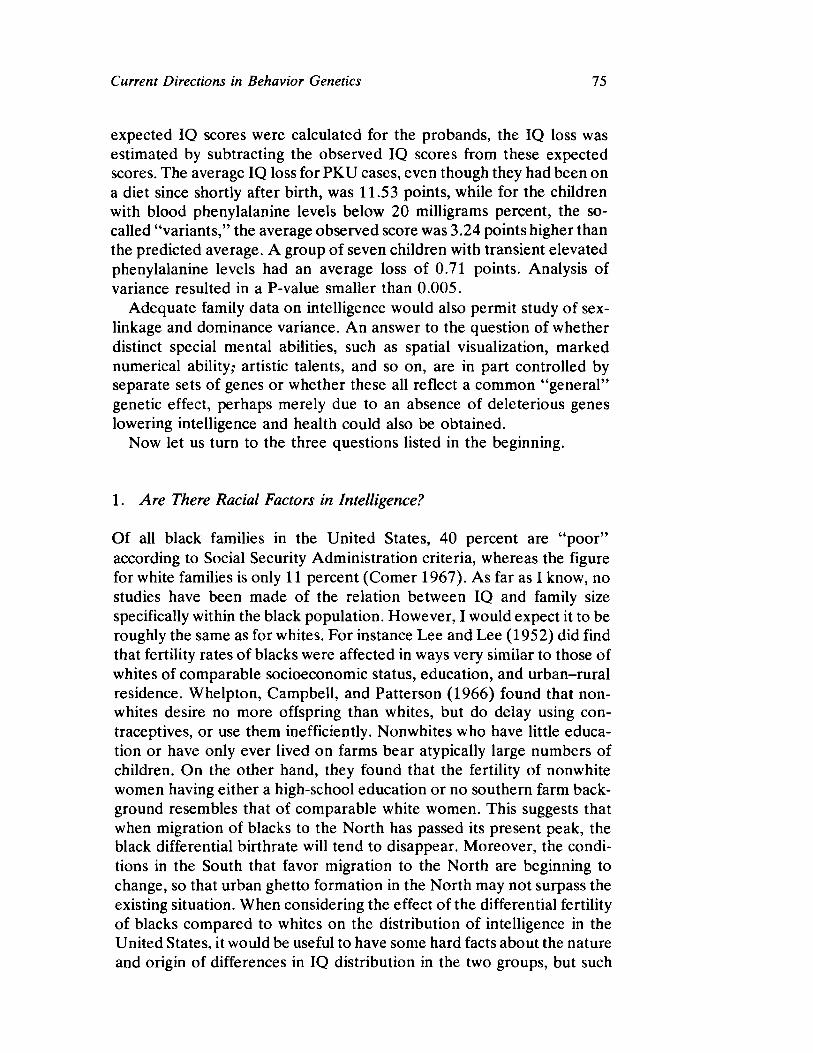
Current Directions in Behavior Genetics 75
expected IQ scores were calculated for the probands, the IQ loss was estimated by subtracting the observed IQ scores from these expected scores. The average IQ loss for PKU cases, even though they had been on a diet since shortly after birth, was 11.53 points, while for the children with blood phenylalanine levels below 20 milligrams percent, the socalled "variants," the average observed score was 3.24 points higher than the predicted average. A group of seven children with transient elevated phenylalanine levels had an average loss of 0.71 points. Analysis of variance resulted in a Pvalue smaller than 0.005.
Adequate family data on intelligence would also permit study of sexlinkage and dominance variance. An answer to the question of whether distinct special mental abilities, such as spatial visualization, marked numerical ability,· artistic talents, and so on, are in part controlled by separate sets of genes or whether these all reflect a common "general" genetic effect, perhaps merely due to an absence of deleterious genes lowering intelligence and health could also be obtained.
Now let us turn to the three questions listed in the beginning.
1. Are There Racial Factors in Intelligence?
Of all black families in the United States, 40 percent are "poor" according to Social Security Administration criteria, whereas the figure for white families is only 11 percent (Comer 1967). As far as I know, no studies have been made of the relation between IQ and family size specifically within the black population. However, I would expect it to be roughly the same as for whites. For instance Lee and Lee (1952) did find that fertility rates of blacks were affected in ways very similar to those of whites of comparable socioeconomic status, education, and urbanrural residence. Whelpton, Campbell, and Patterson (1966) found that nonwhites desire no more offspring than whites, but do delay using contraceptives, or use them inefficiently. Nonwhites who have little education or have only ever lived on farms bear atypically large numbers of children. On the other hand, they found that the fertility of nonwhite women having either a highschool education or no southern farm background resembles that of comparable white women. This suggests that when migration of blacks to the North has passed its present peak, the black differential birthrate will tend to disappear. Moreover, the conditions in the South that favor migration to the North are beginning to change, so that urban ghetto formation in the North may not surpass the existing situation. When considering the effect of the differential fertility of blacks compared to whites on the distribution of intelligence in the United States, it would be useful to have some hard facts about the nature and origin of differences in IQ distribution in the two groups, but such
7 6VTSRNGEDBA STEVEN G. VANDENBERG
information is unfortunately still incomplete. The problem is badly complicated by the simultaneous existence of large economic, educational, and cultural differences between blacks and whites — the very factors known to affect present ability measures. A good deal of the research on this topic of "race differences in ability" has been of poor quality because these complications have not been adequately dealt with, which is not to say that they can be easily controlled. Eliminating the effect of environmental factors, for instance, by matching selected black and white subjects on income and education of the parents and grandparents, would probably also eliminate a substantial part of the differences in ability distributions observed in studies in which no matching is used. Yet, such matching can usually be criticized as inadequate or begging the question. I will not discuss here the difficulties of defining race. This has been done admirably by Spuhler and Lindzey (1967), Gottesman (1968), Thoday (1969), and Vernon (1969).
Evidence from crosscultural studies in other parts of the world has not been informative about racial differences. The major findings from such studies have been that nonacculturated African adults do very poorly on Western ability measures, mainly because of basic difficulties of motivation and lack of understanding of the testing situation. But they also found that African children who have gone to Westernstyle schools do about as well as white children. I would like to describe briefly a few studies that demonstrate why the available studies from Africa cannot help us at present.
MundyCastle (1966) showed Ghanaian children four drawings in which different cues were used to suggest distance or perspective and asked them to describe what they saw. Many children failed to see distance because the Western convention of abstract representation of distance by converging lines or by depicting distant objects as smaller is not familiar to them. It would be extremely interesting to repeat a similar study with photographs or film strips rather than schematic drawings.
This work was a partial replication of a study by Hudson (1960), who found that Bantu school children and teachers in South Africa did as well as white children on a test of depth perception, but that adult Bantus of various low levels of education did not see depth in drawings. A sample of white laborers also did very poorly.
There have been several studies of the accuracy of size estimation in different cultures. Winter (1967) summarized unpublished studies of size constancy by Renning in which the amount of texture in the setting of the study was varied. African subjects did very well on this task, performing even better when the terrain varied in texture than when it was bare and open. Several white and African groups living in similar settings were also studied. Figure 7 shows a comparison of the average error of each group. The Bushmen did far better than any other group. There was no meaning
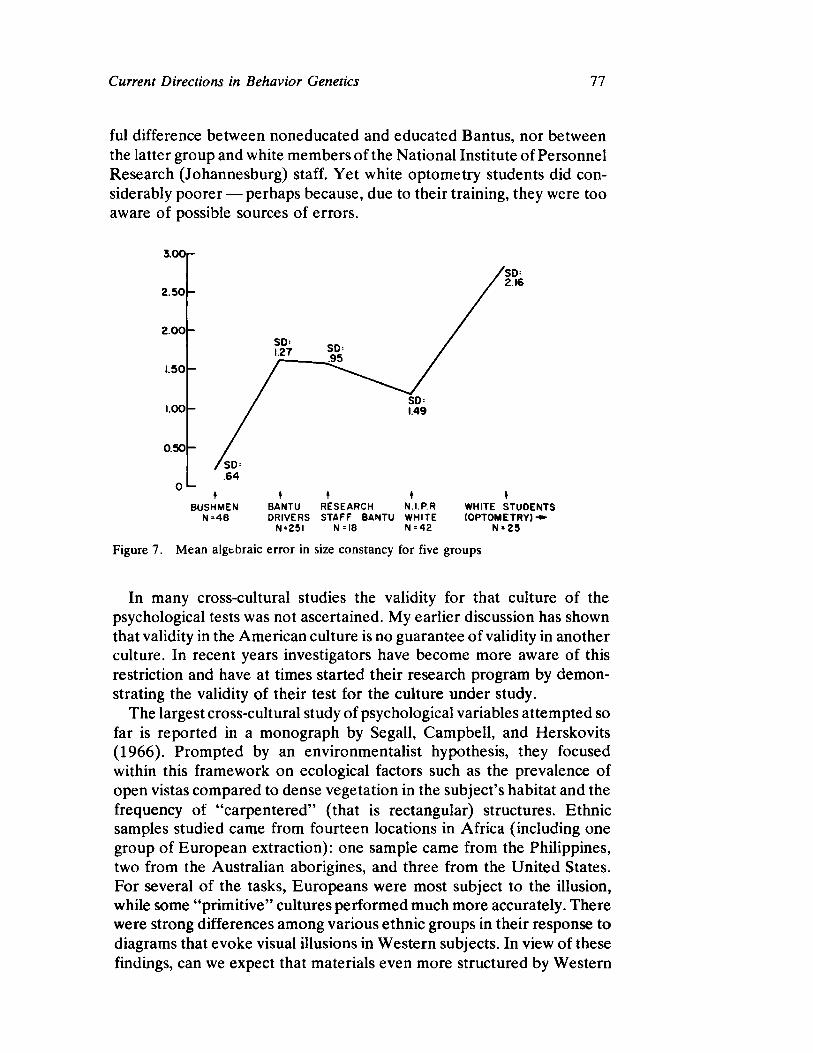
Current Directions in Behavior Genetics 77
ful difference between noneducated and educated Bantus, nor between the latter group and white members of the National Institute of Personnel Research (Johannesburg) staff. Yet white optometry students did considerably poorer — perhaps because, due to their training, they were too aware of possible sources of errors.
B U S H M E N B A N T U R E S E A R C H N. I .P.R W H I T E S T U D E N T S Ν = 4 8 D R I V E R S S T A F F B A N T U W H I T E ( O P T O M E T R Y ) •
N = 2 5 l Ν = 18 Ν 8 4 2 Ν · 2 5
Figure 7. Mean algebraic error in size constancy for five groups
In many crosscultural studies the validity for that culture of the psychological tests was not ascertained. My earlier discussion has shown that validity in the American culture is no guarantee of validity in another culture. In recent years investigators have become more aware of this restriction and have at times started their research program by demonstrating the validity of their test for the culture under study.
The largest crosscultural study of psychological variables attempted so far is reported in a monograph by Segall, Campbell, and Herskovits (1966). Prompted by an environmentalist hypothesis, they focused within this framework on ecological factors such as the prevalence of open vistas compared to dense vegetation in the subject's habitat and the frequency of "carpentered" (that is rectangular) structures. Ethnic samples studied came from fourteen locations in Africa (including one group of European extraction): one sample came from the Philippines, two from the Australian aborigines, and three from the United States. For several of the tasks, Europeans were most subject to the illusion, while some "primitive" cultures performed much more accurately. There were strong differences among various ethnic groups in their response to diagrams that evoke visual illusions in Western subjects. In view of these findings, can we expect that materials even more structured by Western
7 8 STEVEN G. VANDENBERG
cultural traditions, such as conventional intelligence tests, can be culturefair? Yet it is possible to obtain interesting results by relating differences in performance to ecological and cultural differences among groups.
Perhaps the most thorough study to date of the ecology and culture of a group of people, conducted in such a way that appropriate psychological experiments could be performed, is the study in central Liberia by Gay and Cole (1967). A few of the findings relevant to our topic are reviewed here.
Kpelle culture was studied intensively to provide a basis for recommendations concerning necessary adaptations of Western educational curricula. An analysis of the language revealed the absence of some concepts, without which the customary teaching of arithmetic degrades to rote learning. For instance, while the Kpelle language does have the concept of sets, the distinction between countable and uncountable nouns is less clear than in English. We say "a house" or "house," but "water," and not "a water." In Kpelle such a distinction has to be supplied through the context.
One experiment demonstrated the Kpelles' lack of proficiency in classifying objects into different sets. After adults and children had used one principle to sort cards with designs differing in color, number, and form, into two categories, they found it difficult to sort according to another category and very difficult to do so according to a third principle. Yet no special preference was shown for any of the three categories; it was the change of category that produced the difficulty.
Similar findings suggest other problems in teaching arithmetic by conventional methods. Thus, the Kpelle language includes words for one through ten, for 100, and a borrowed term for one thousand, but only a few ordinal terms; fractions are described by elaborate construction, indicating the infrequent nature of their use. Familiarity with arithmetic is uncommon, and somewhat of a trade secret of merchants. Yet, the smaller numbers are quite familiar, as was shown by some experiments on number recognition. Ten piles of stones with from ten to 100 stones were shown in the same random order to adult Kpelles and to several groups of Americans. Subjects were asked to estimate the number in each pile. The Kpelles were more accurate than the Americans. However, after one group of Yale students was told the number of stones in a pile containing sixty, their performance improved up to the Kpelle standards.
When a pattern of random dots was briefly exposed, Kpelle and American children gave very similar results when asked to estimate the number of dots. However, unlike Americans, Kpelle subjects do not seem to use patterns of grouping such as 2 x 4, and therefore do less well. Apparently they are not as familiar with the multiplication tables.
Until recently the Kpelles did not have a money economy; they used a
Current Directions in Behavior Genetics 79
system of barter. This means that they are more accustomed to considering the relative value of various amounts of commodities than to quantifying everything in the way Westerners do. Another experiment demonstrated this: when Kpelle and American subjects were asked to estimate the number of cups of rice in several containers, the Kpelles did better. Kpelle adults also did better at estimating the length of a stick. Lest one think that these findings are peculiar to Africa, similar conditions exist in other parts of the world and existed in Europe before general education became universal. We must conclude for the moment that neither studies from the United States nor those from other parts of the world provide useful information about the comparative intelligence of blacks and whites.
Witty and Jenkins (1936) summarized the results of five studies comparing skin color and IQ in which essentially no correlation was found, as shown in Table 7.
Table 7. Correlations between IQ and skin color
r Ν Author
0 . 1 4 4 115 Herskovits +0.044 91 Peterson and Lanier 0 . 1 8 49 Peterson and Lanier +0.09 760 Mathaisen 0 . 0 9 6 139 Klineberg
Source: Witty and Jenkins (1936).
Heyns (1963) has used abdominal decompression to reduce lower back pain and tension in pregnant women and to ease labor during delivery. This treatment consists of spending up to an hour a day in an iron lung type of device placed over the stomach. At first it seemed that this raised the mental development of babies of treated mothers (see Figure 8). A later study in which treatment was assigned randomly showed no such effect. The author suggested that the difference found in the earlier study was probably due to a selfselection factor on the part of mothers opting for the treatment (Liddicoat 1968). An incidental finding was that there was no racial difference between whites and Bantus (see Figure 8).
Bachman (1970) recently published the results of a large study of high school students. He found that blacks in integrated schools had almost the same distribution of intelligence test scores as whites, while southern segregated blacks had lower scores (see Figure 9).
Lesser, Fifer, and Clark (1965) reported some very interesting findings. They studied the effect of socioeconomic studies on four ability test scores and quite by accident found parallel profiles for middle and lowerclass children although the profiles differed between four ethnic

8 0 STEVEN G. VANDENBERG
SCORES ON THE GESELL DEVELOPMENTAL SCHEDULE
Figure 8. Comparison of mental states of babies of mothers who received abdominal decompression and those who did not (after Heyns)
QUICK TEST SCORES
Figure 9. Distribution of scores in the quick test of intelligence, Ν = 2200.uroecS Source:
Bachman 1970
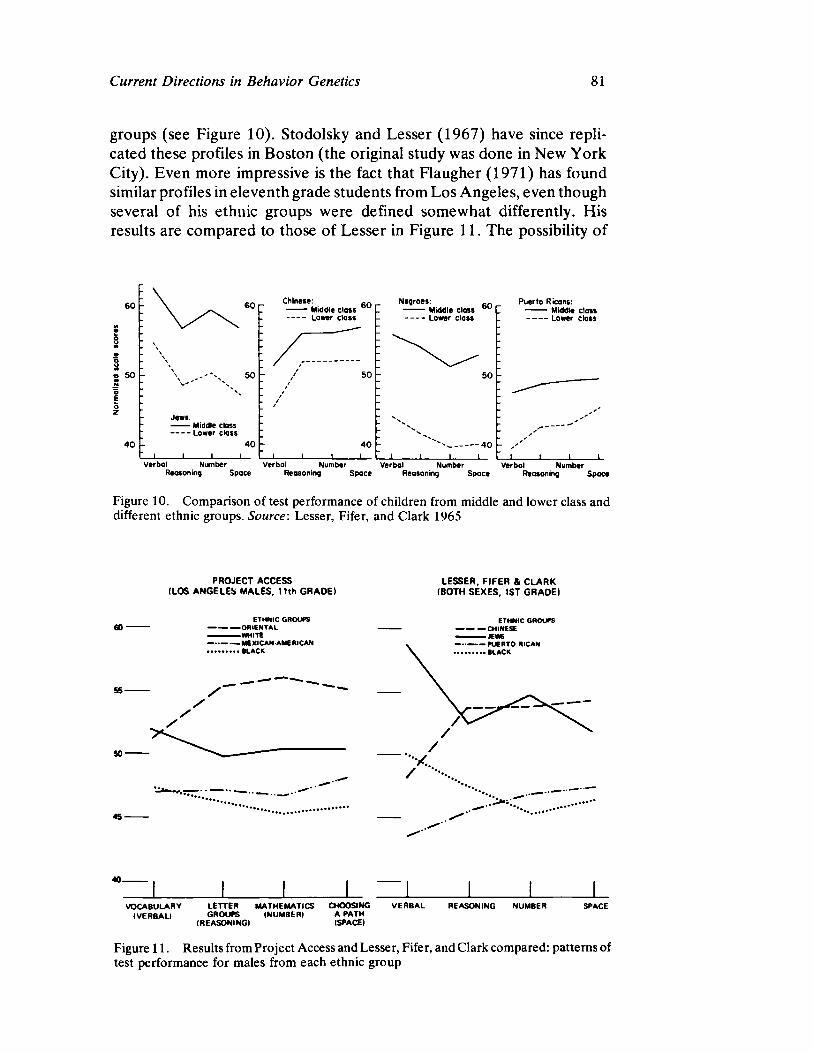
Current Directions in Behavior Genetics 81
groups (see Figure 10). Stodolsky and Lesser (1967) have since replicated these profiles in Boston (the original study was done in New York City). Even more impressive is the fact that Flaugher (1971) has found similar profiles in eleventh grade students from Los Angeles, even though several of his ethnic groups were defined somewhat differently. His results are compared to those of Lesser in Figure 11. The possibility of
6 0
5 0
4 0
6 0 ρ
5 0
Jew· : Middle class Lower cl ass
4 0
Chinese:
4 0
Negroes: Middle d oss Lower cl ass
6 0 r
5 0
- 4 0
Puert o Ricans: Middle class Lower class
verbal Number verbal Number Verbal Number Verbal Number Reasoning Space Reasoning Space Reasoning Space Reasoning Space
Figure 10. Comparison of test performance of children from middle and lower class and different ethnic groups. Source: Lesser, Fifer, and Clark 1965
PROJ ECT A CCESS
( LOS A N G E L E S M A L ES. 11th G R A D E ) L ESSER, F I F ER & C L A R K
( BOT H SEX ES, 1 ST G RA O E )
ETHNIC C R O U P S — . O R I E N T A L
WHITE MEXICANAMERICAN
«LACK
ETHNIC G R O U P S — — — CHINESE
JEWS — — P U E R T O RICAN
. • L A C K
VOCABULARY LETTER MATHEMATICS CHOOSING ( VERBAL) GROUPS ( NUMBER) A PATH
( REASONING) (SPACE I
VERBAL REASONING NUMBER SPACE
Figure 11. Results from Project Access and Lesser, Fifer, and Clark compared: patterns of test performance for males from each ethnic group
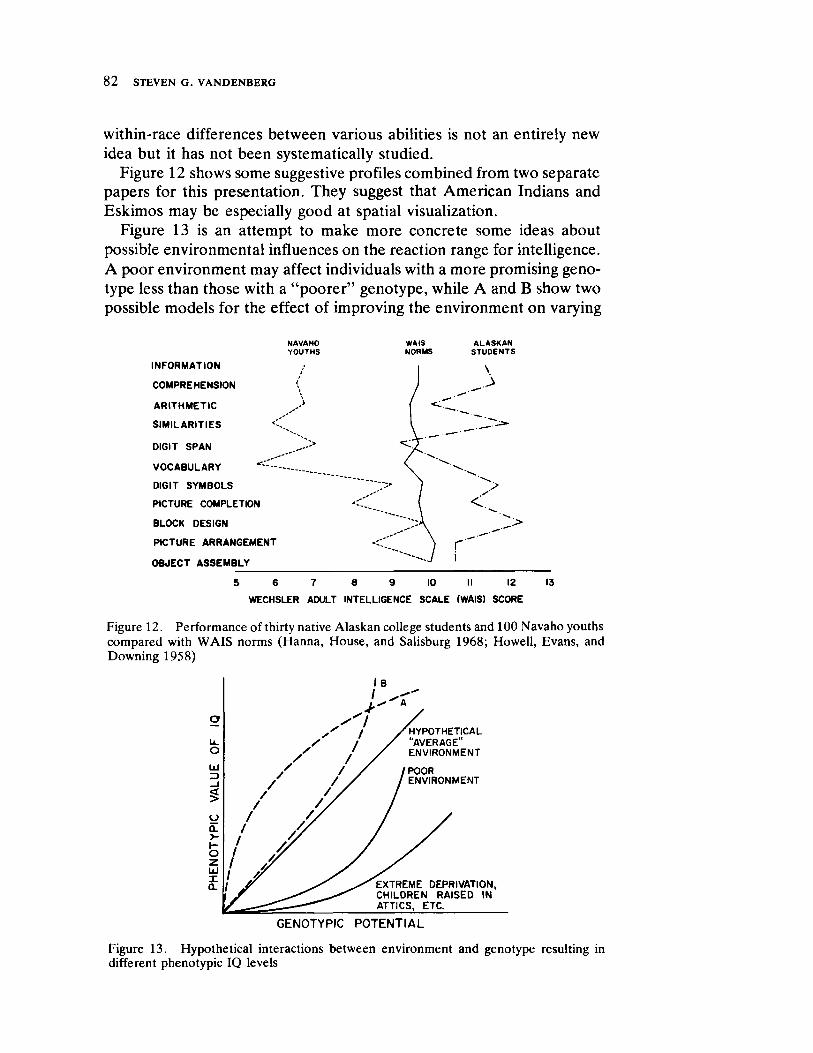
8 2VTSRNGEDBA STEVEN G. VANDENBERG
withinrace differences between various abilities is not an entirely new idea but it has not been systematically studied.
Figure 12 shows some suggestive profiles combined from two separate papers for this presentation. They suggest that American Indians and Eskimos may be especially good at spatial visualization.
Figure 13 is an attempt to make more concrete some ideas about possible environmental influences on the reaction range for intelligence. A poor environment may affect individuals with a more promising genotype less than those with a "poorer" genotype, while A and Β show two possible models for the effect of improving the environment on varying
NAVAHO YOUTHS
INFORMATION /
COMPREHENSION (
ARITHMETIC
SIMILARITIES
DIGIT SPAN
VOCABULARY
DIGIT SYMBOLS
PICTURE COMPLETION
BLOCK DESIGN
PICTURE ARRANGEMENT
OBJECT ASSEMBLY
5 6 7 β 9 10 II 12 13
WECHSLER ADULT INTELLIGENCE SCALE (WAIS) SCORE
Figure 12. Performance of thirty native Alaskan college students and 100 Navaho youths compared with WAIS norms (Hanna, House, and Salisburg 1968; Howell, Evans, and Downing 1958)
Figure 13. Hypothetical interactions between environment and genotype resulting in different phenotypic IQ levels
WAIS ALASKAN NORMS STUDENTS
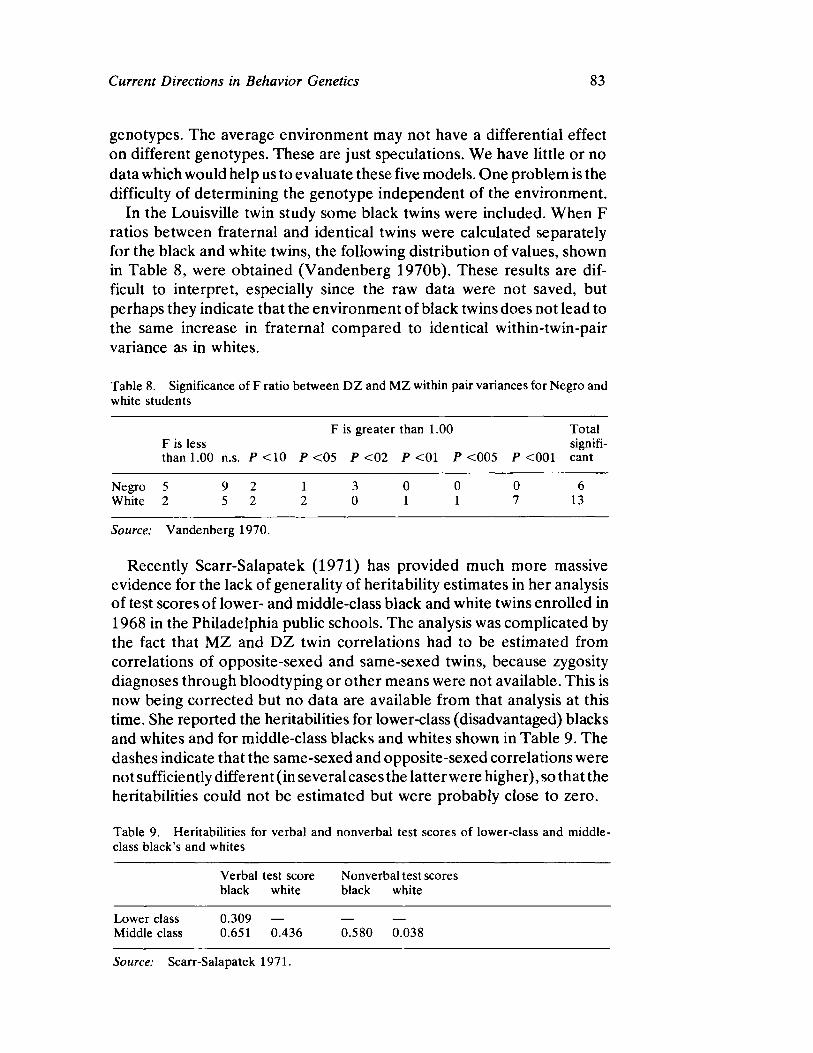
Current Directions in Behavior Genetics 83
genotypes. The average environment may not have a differential effect on different genotypes. These are just speculations. We have little or no data which would help us to evaluate these five models. One problem is the difficulty of determining the genotype independent of the environment.
In the Louisville twin study some black twins were included. When F ratios between fraternal and identical twins were calculated separately for the black and white twins, the following distribution of values, shown in Table 8, were obtained (Vandenberg 1970b). These results are difficult to interpret, especially since the raw data were not saved, but perhaps they indicate that the environment of black twins does not lead to the same increase in fraternal compared to identical withintwinpair variance as in whites.
Table 8. Significance of F ratio between D Z and M Z within pair variances for Negro and white students
F is greater than 1.00 Total F is less signifithan 1.00 n.s. Ρ < 1 0 Ρ < 0 5 Ρ < 0 2 Ρ < 0 1 Ρ < 0 0 5 Ρ < 0 0 1 cant
Negro 5 9 2 1 3 0 0 0 6
White 2 5 2 2 0 1 1 7 13
Source: Vandenberg 1970.
Recently ScarrSalapatek (1971) has provided much more massive evidence for the lack of generality of heritability estimates in her analysis of test scores of lower and middleclass black and white twins enrolled in 1968 in the Philadelphia public schools. The analysis was complicated by the fact that MZ and DZ twin correlations had to be estimated from correlations of oppositesexed and samesexed twins, because zygosity diagnoses through bloodtyping or other means were not available. This is now being corrected but no data are available from that analysis at this time. She reported the heritabilities for lowerclass (disadvantaged) blacks and whites and for middleclass blacks and whites shown in Table 9. The dashes indicate that the samesexed and oppositesexed correlations were not sufficiently different (in several cases the latter were higher), so that the heritabilities could not be estimated but were probably close to zero.
Table 9. Heritabilities for verbal and nonverbal test scores of lowerclass and middleclass black's and whites
Verbal test score Nonverbal test scores black white black white
Lower class 0 .309 — — —
Middle class 0.651 0.436 0.580 0.038
Source: ScarrSalapatek 1971.
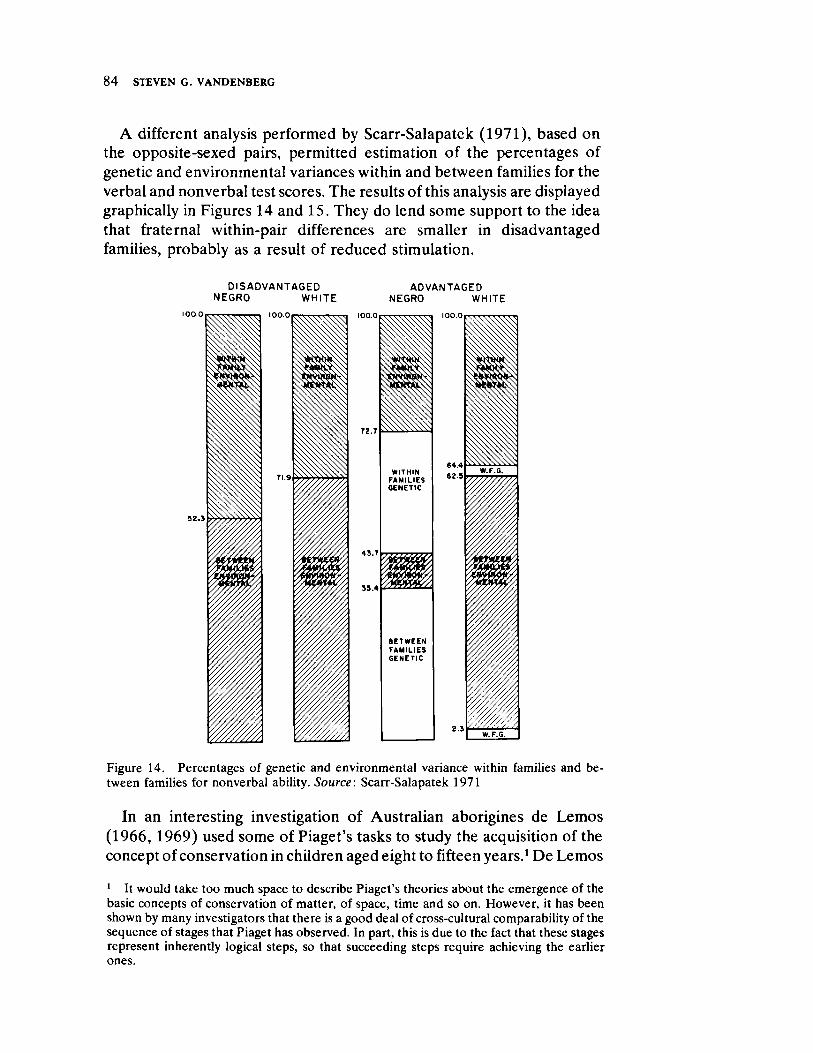
8 4nliVTSRNGEDBA STEVEN G. VA NDENBERG
A different analysis performed by Scarr-Salapatek (1971) , based on
the opposite-sexed pairs, permitted estimation of the percentages of
genetic and environmental variances within and between families for the
verbal and nonverbal test scores. The results of this analysis are displayed
graphically in Figures 14 and 15. They do lend some support to the idea
that fraternal within-pair differences are smaller in disadvantaged
families, probably as a result of reduced stimulation.
D I S AD V AN T AG E D AD V AN T AG E D NEGRO W H I T E NEGRO WHITE
100.0
\m 100.0
72 . r
« s r . n 72 . r
64.4
62.5
111 WITHIN
64.4
62.5 W.F.G.
FAMILIES GENETIC
64.4
62.5
Ι ! 43.7 ιβ 43.7
33.4
1
/ / / / / / / / /
torn i i r 33.4
1
/ / / / / / / / /
BETWEEN FAMILIES GENETIC 1 /
/ / /
/ /
Ϊ . 3 ill
/ L·
Ϊ . 3 W. F.G.
Figure 14. Percentages of genetic and environmental variance within families and be-tween families for nonverbal ability. Source: Scarr-Salapatek 1971
In an interesting investigation of A ustralian aborigines de Lemos
(1966, 1969) used some of Piaget's tasks to study the acquisition of the
concept of conservation in children aged eight to fifteen years.1 D e Lemos
1 It would take too much space to describe Piaget's theories about the emergence of the basic concepts of conservation of matter, of space, time and so on. However, it has been shown by many investigators that there is a good deal of cross-cultural comparability of the sequence of stages that Piaget has observed. In part, this is due to the fact that these stages represent inherently logical steps, so that succeeding steps require achieving the earlier ones.
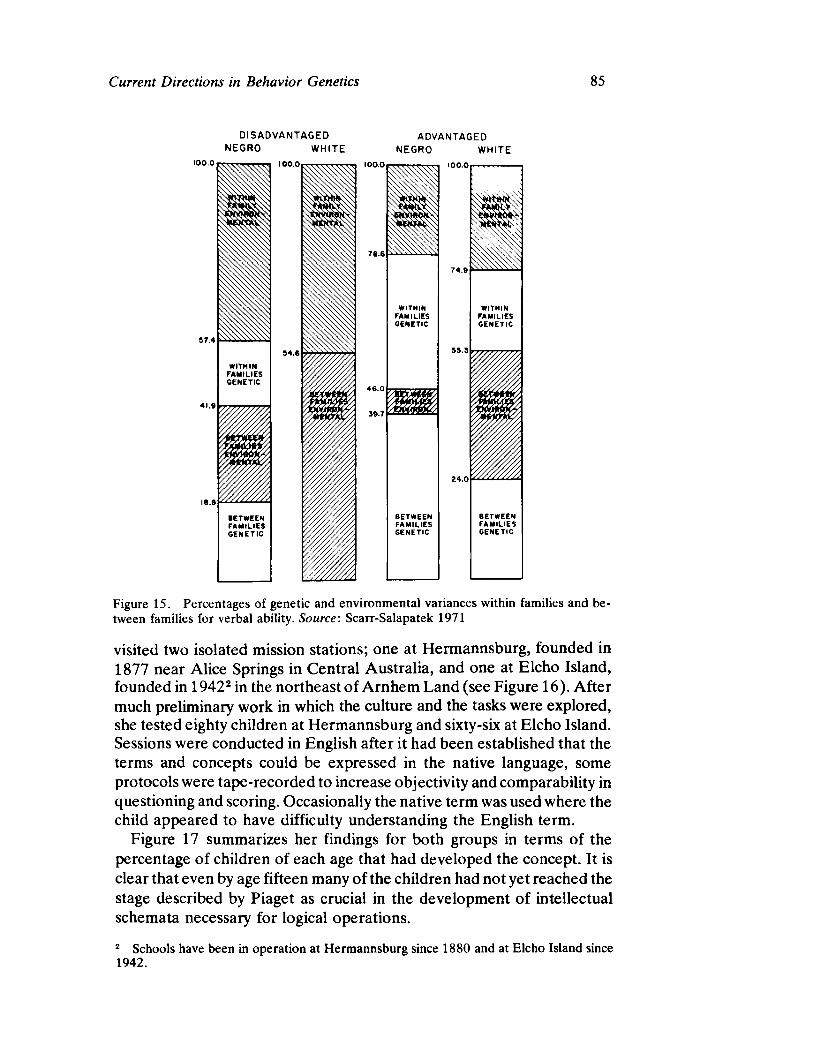
Current Directions in Behavior Genetics 85
D I SAD VANTAGED
NEGRO W HI TE
100.0
WI THI N FAMI LI ES GENETI C
BETWEEN FAMI LI ES GENETI C
4 6 . 0
3 9 . 7
AD VANTAGED
NEGRO WHI TE
Ι ΟΟ Οι . . .
WI THI N FAMI LI ES GENETI C
BETWEEN FAMI LI ES GENETI C
.«5S&-·
WI THI N FAMI LI ES GENETI C
BETWEEN FAMI LI ES GENETI C
Figure 15. Percentages of genetic and environmental variances within families and be-
tween families for verbal ability. Source: Scarr-Salapatek 1971
visited two isolated mission stations; one at Hermannsburg, founded in 1877 near Alice Springs in Central Australia, and one at Elcho Island, founded in 19422 in the northeast of Arnhem Land (see Figure 16). After much preliminary work in which the culture and the tasks were explored, she tested eighty children at Hermannsburg and sixty-six at Elcho Island. Sessions were conducted in English after it had been established that the terms and concepts could be expressed in the native language, some protocols were tape-recorded to increase objectivity and comparability in questioning and scoring. Occasionally the native term was used where the child appeared to have difficulty understanding the English term.
Figure 17 summarizes her findings for both groups in terms of the percentage of children of each age that had developed the concept. It is clear that even by age fifteen many of the children had not yet reached the stage described by Piaget as crucial in the development of intellectual schemata necessary for logical operations.
2 Schools have been in operation at Hermannsburg since 1880 and at Elcho Island since
1942.
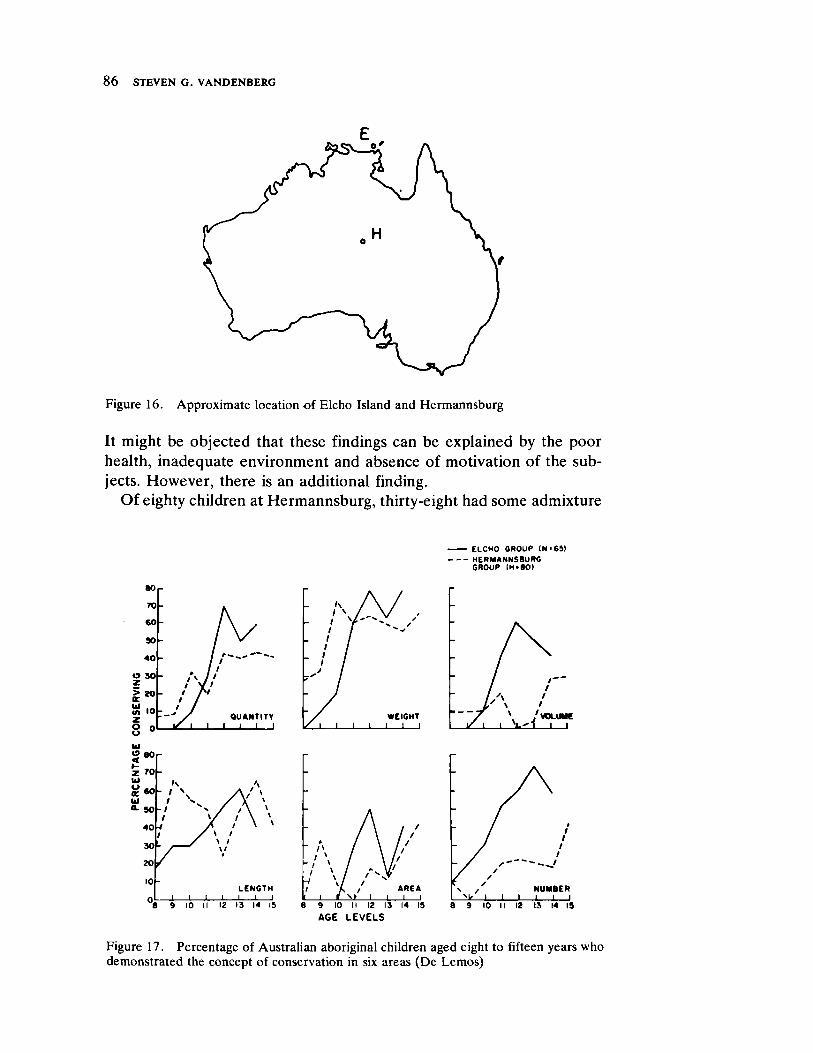
8 6 STEVEN G. VANDENBERG
It might be objected that these findings can be explained by the poor
health, inadequate environment and absence of motivation of the sub-
jects. However, there is an additional finding.
O f eighty children at Hermannsburg, thirty-eight had some admixture
ELCHO GROUP <Ν ·65 Ι HERMANNSBURG GROUP (Η·βΟ)
Figure 17. Percentage of Australian aboriginal children aged eight to fifteen years who
demonstrated the concept of conservation in six areas (D e Lemos)
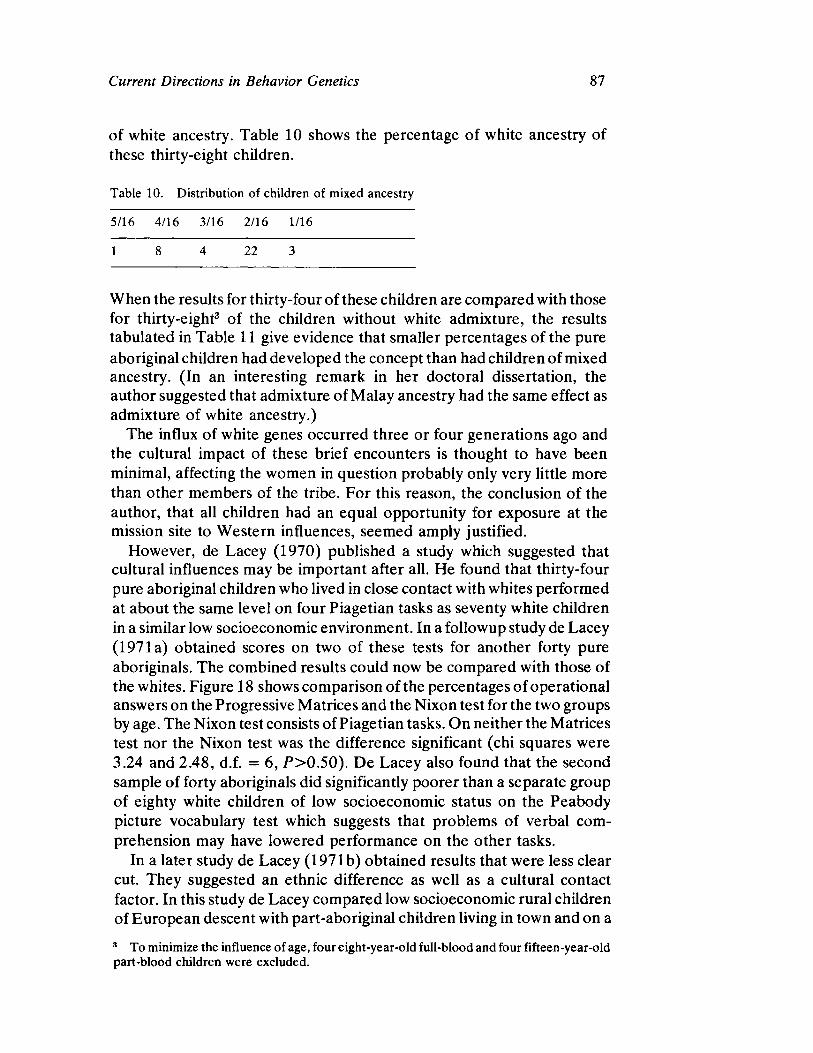
Current Directions in Behavior Genetics 87
of white ancestry. Table 10 shows the percentage of white ancestry of these thirtyeight children.
Table 10. Distribution of children of mixed ancestry
5/16 4/16 3/16 2/16 1/16
1 8 4 22 3
When the results for thirtyfour of these children are compared with those for thirtyeight3 of the children without white admixture, the results tabulated in Table 11 give evidence that smaller percentages of the pure aboriginal children had developed the concept than had children of mixed ancestry. (In an interesting remark in her doctoral dissertation, the author suggested that admixture of Malay ancestry had the same effect as admixture of white ancestry.)
The influx of white genes occurred three or four generations ago and the cultural impact of these brief encounters is thought to have been minimal, affecting the women in question probably only very little more than other members of the tribe. For this reason, the conclusion of the author, that all children had an equal opportunity for exposure at the mission site to Western influences, seemed amply justified.
However, de Lacey (1970) published a study which suggested that cultural influences may be important after all. He found that thirtyfour pure aboriginal children who lived in close contact with whites performed at about the same level on four Piagetian tasks as seventy white children in a similar low socioeconomic environment. In a followup study de Lacey (1971a) obtained scores on two of these tests for another forty pure aboriginals. The combined results could now be compared with those of the whites. Figure 18 shows comparison of the percentages of operational answers on the Progressive Matrices and the Nixon test for the two groups by age. The Nixon test consists of Piagetian tasks. On neither the Matrices test nor the Nixon test was the difference significant (chi squares were 3.24 and 2.48, d.f. = 6, P>0.50). De Lacey also found that the second sample of forty aboriginals did significantly poorer than a separate group of eighty white children of low socioeconomic status on the Peabody picture vocabulary test which suggests that problems of verbal comprehension may have lowered performance on the other tasks.
In a later study de Lacey (1971b) obtained results that were less clear cut. They suggested an ethnic difference as well as a cultural contact factor. In this study de Lacey compared low socioeconomic rural children of European descent with partaboriginal children living in town and on a
3 To minimize the influence of age, four eightyearold fullblood and four fifteenyearold partblood children were excluded.
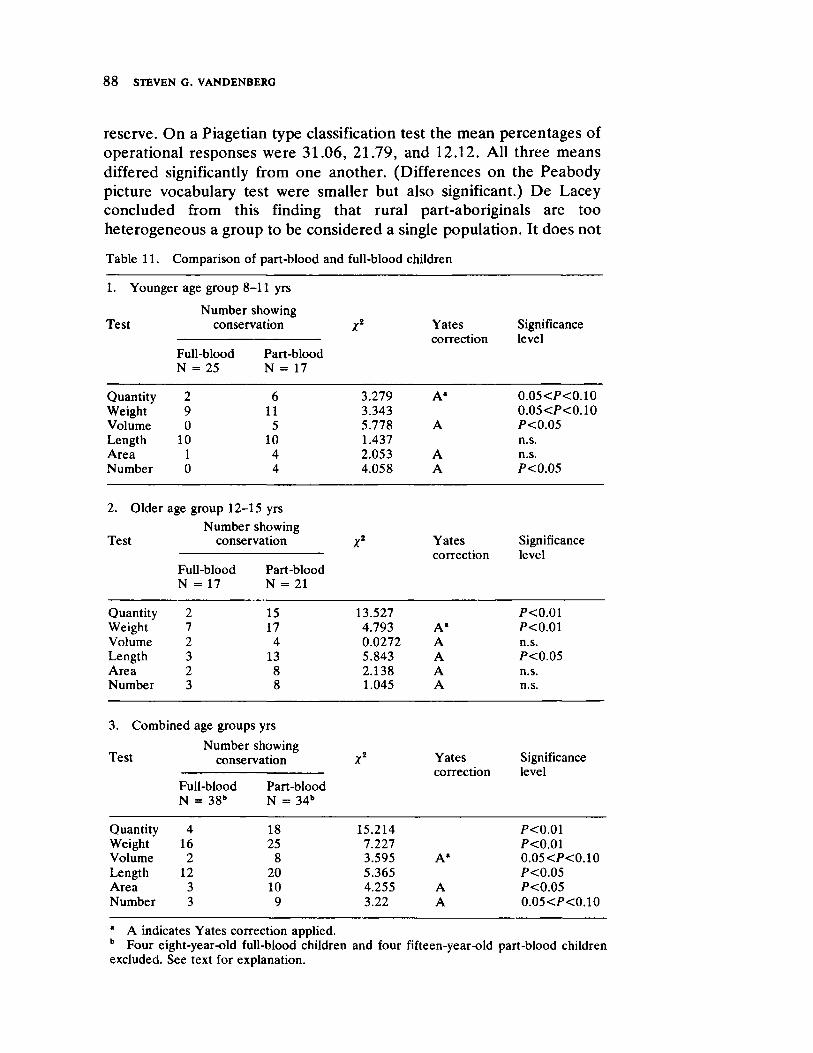
8 8 STEVEN G. VANDENBERG
reserve. On a Piagetian type classification test the mean percentages of operational responses were 31.06, 21.79, and 12.12. All three means differed significantly from one another. (Differences on the Peabody picture vocabulary test were smaller but also significant.) De Lacey concluded from this finding that rural partaboriginals are too heterogeneous a group to be considered a single population. It does not
Table 11. Comparison of partblood and fullblood children
1. Younger age group 811 yrs
Number showing Test conservationX χ2 Yates Significance
correction level Fullblood Partblood Ν = 25 Ν = 17
Quantity 2 6 3.279 A* 0.05<P<0.10 Weight 9 11 3.343 0.05<P<0.10 Volume 0 5 5.778 A P<0.05 Length 10 10 1.437 n.s. Area 1 4 2.053 A n.s. Number 0 4 4.058 A P<0.05
2. Older age group 1215 yrs
Number showing Test conservation Yates Significance
correction level Fullblood Partblood Ν = 17 Ν = 21
Quantity 2 15 13.527 PcO.Ol Weight 7 17 4.793 A* PcO.Ol Volume 2 4 0.0272 A n.s. Length 3 13 5.843 A P<0.05 Area 2 8 2.138 A n.s. Number 3 8 1.045 A n.s.
3. Combined age groups yrs
Number showing Test conservation X2 Yates Significance
correction level Fullblood Partblood Ν = 38" Ν = 34b
Quantity 4 18 15.214 P<0.01 Weight 16 25 7.227 P<0.01 Volume 2 8 3.595 A* 0.05<P<0.10 Length 12 20 5.365 P<0.05 Area 3 10 4.255 A P<0.05 Number 3 9 3.22 A 0.05<P<0.10
* A indicates Yates correction applied. b Four eightyearold fullblood children and four fifteenyearold partblood children excluded. See text for explanation.
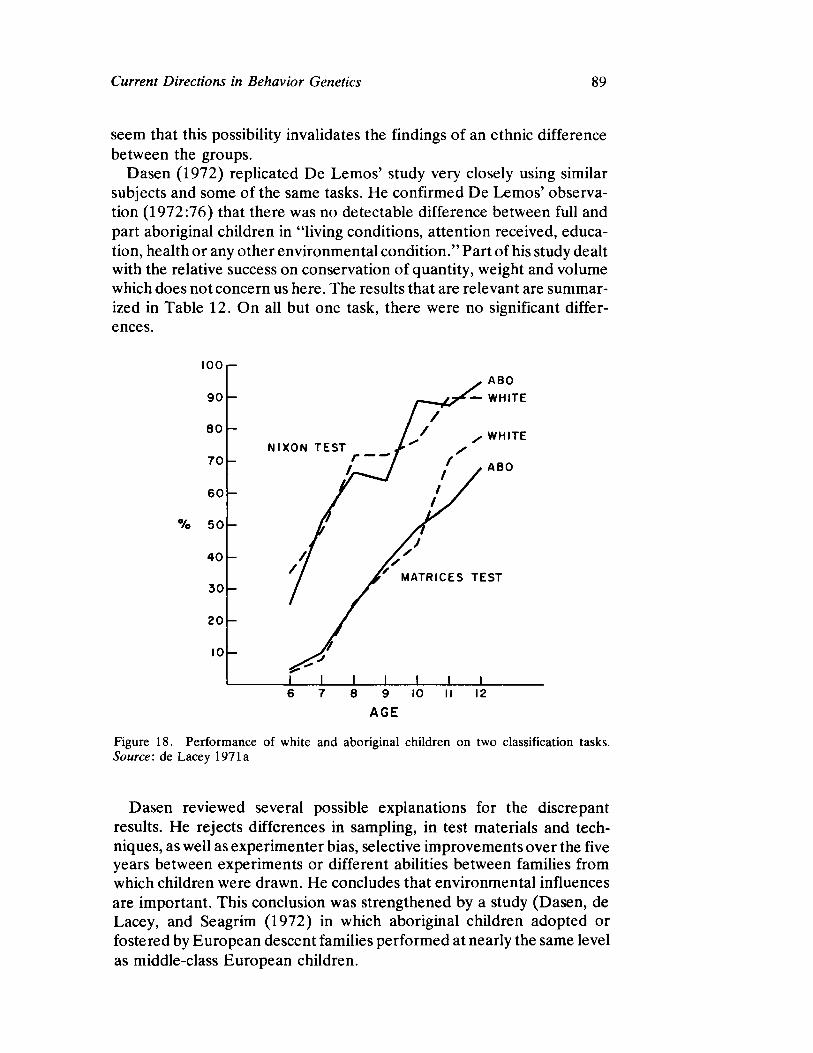
Current Directions in Behavior Genetics 89
seem that this possibility invalidates the findings of an ethnic difference between the groups.
Dasen (1972) replicated De Lemos' study very closely using similar subjects and some of the same tasks. He confirmed De Lemos' observation (1972:76) that there was no detectable difference between full and part aboriginal children in "living conditions, attention received, education, health or any other environmental condition." Part of his study dealt with the relative success on conservation of quantity, weight and volume which does not concern us here. The results that are relevant are summarized in Table 12. On all but one task, there were no significant differences.
AGE
Figure 18. Performance of white and aboriginal children on two classification tasks. Source: de Lacey 1971a
Dasen reviewed several possible explanations for the discrepant results. He rejects differences in sampling, in test materials and techniques, as well as experimenter bias, selective improvements over the five years between experiments or different abilities between families from which children were drawn. He concludes that environmental influences are important. This conclusion was strengthened by a study (Dasen, de Lacey, and Seagrim (1972) in which aboriginal children adopted or fostered by European descent families performed at nearly the same level as middleclass European children.
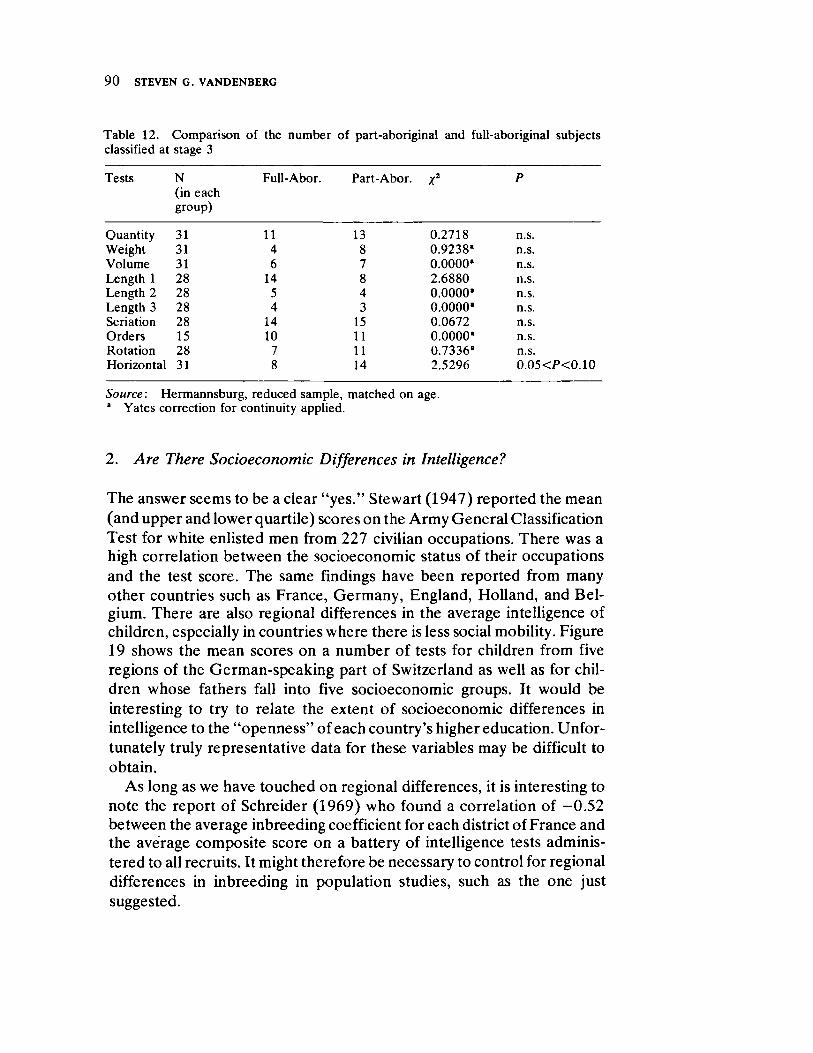
9 0 STEVEN G. VANDENBERG
Table 12. Comparison of the number of partaboriginal and fullaboriginal subjects classified at stage 3
Tests Ν (in each group)
FullAbor. PartAbor. X2 Ρ
Quantity 31 11 13 0.2718 n.s. Weight 31 4 8 0.9238* n.s. Volume 31 6 7 0.0000* n.s. Length 1 28 14 8 2.6880 n.s. Length 2 28 5 4 0.0000* n.s. Length 3 28 4 3 0.0000* n.s. Seriation 28 14 15 0.0672 n.s. Orders 15 10 11 0.0000* n.s. Rotation 28 7 11 0.7336* n.s. Horizontal 31 8 14 2.5296 0 .05</ '<0 .10
Source: Hermannsburg, reduced sample, matched on age. a Yates correction for continuity applied.
2. Are There Socioeconomic Differences in Intelligence?
The answer seems to be a clear "yes." Stewart (1947) reported the mean (and upper and lower quartile) scores on the Army General Classification Test for white enlisted men from 227 civilian occupations. There was a high correlation between the socioeconomic status of their occupations and the test score. The same findings have been reported from many other countries such as France, Germany, England, Holland, and Belgium. There are also regional differences in the average intelligence of children, especially in countries where there is less social mobility. Figure 19 shows the mean scores on a number of tests for children from five regions of the Germanspeaking part of Switzerland as well as for children whose fathers fall into five socioeconomic groups. It would be interesting to try to relate the extent of socioeconomic differences in intelligence to the "openness" of each country's higher education. Unfortunately truly representative data for these variables may be difficult to obtain.
As long as we have touched on regional differences, it is interesting to note the report of Schreider (1969) who found a correlation of —0.52 between the average inbreeding coefficient for each district of France and the average composite score on a battery of intelligence tests administered to all recruits. It might therefore be necessary to control for regional differences in inbreeding in population studies, such as the one just suggested.
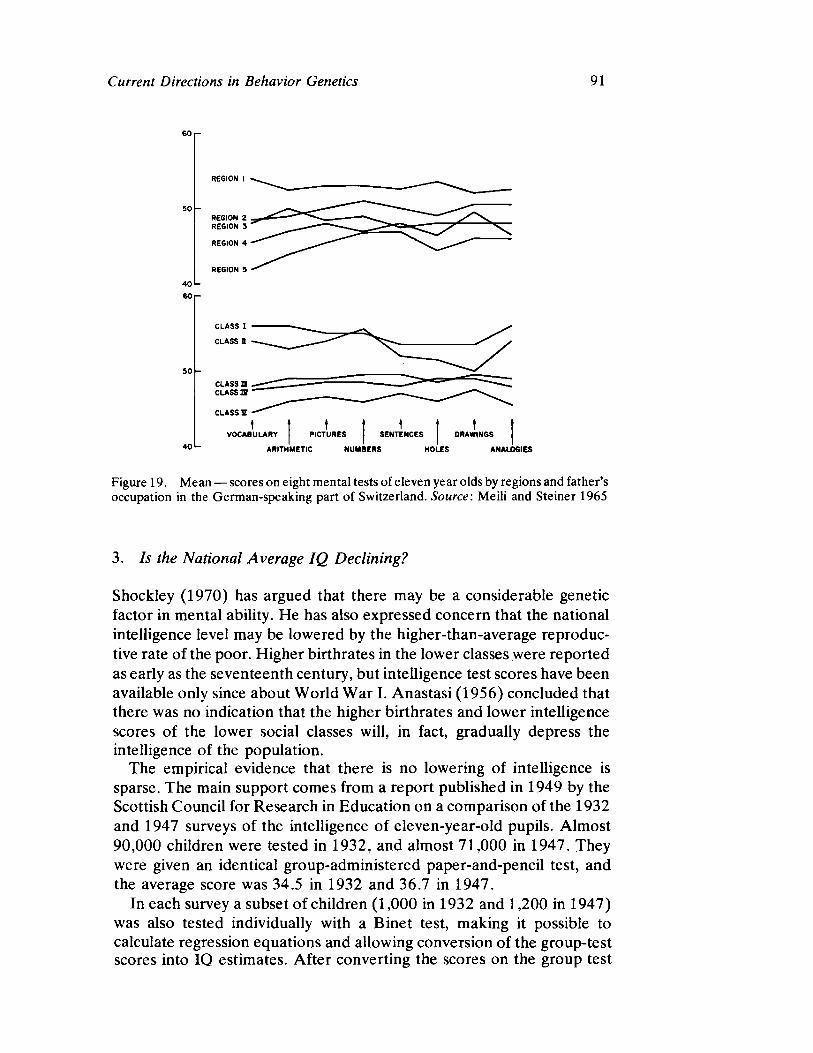
Current Directions in Behavior Genetics 91
Figure 19. Mean — scores on eight mental tests of eleven year olds by regions and father's occupation in the Germanspeaking part of Switzerland. Source: Meili and Steiner 1965
3. Is the National Average IQ Declining?
Shockley (1970) has argued that there may be a considerable genetic factor in mental ability. He has also expressed concern that the national intelligence level may be lowered by the higherthanaverage reproductive rate of the poor. Higher birthrates in the lower classes .were reported as early as the seventeenth century, but intelligence test scores have been available only since about World War I. Anastasi (1956) concluded that there was no indication that the higher birthrates and lower intelligence scores of the lower social classes will, in fact, gradually depress the intelligence of the population.
The empirical evidence that there is no lowering of intelligence is sparse. The main support comes from a report published in 1949 by the Scottish Council for Research in Education on a comparison of the 1932 and 1947 surveys of the intelligence of elevenyearold pupils. Almost 90,000 children were tested in 1932, and almost 71,000 in 1947. They were given an identical groupadministered paperandpencil test, and the average score was 34.5 in 1932 and 36.7 in 1947.
In each survey a subset of children (1,000 in 1932 and 1,200 in 1947) was also tested individually with a Binet test, making it possible to calculate regression equations and allowing conversion of the grouptest scores into IO estimates. After converting the scores on the group test
9 2VTSRNGEDBA STEVEN G. VANDENBERG
into 10 scores, the results for the two years showed a small increase for boys (0.62 IQ points) and an almost equal decrease for girls (0.67) over the period. Anastasi questioned whether this procedure gave any better understanding than did the original results, but her criticism would not affect the Scottish investigators' conclusion that there had been no decline in intelligence in recent times. This inference certainly seems warranted, even though the time interval from 1932 to 1947 was a rather short one.
The report of the Scottish investigators also provided a good illustration of the negative correlation between intelligence test score and the size of the family in which children are reared. Anastasi pointed out that the negative correlation between children's IQ and the number of brothers and sisters they have may be partly due to the fact that many of the families included in such studies are incomplete. Some of the highscoring children from small families may actually belong in one or another category of larger families where they would raise the average IQ. Anastasi also called attention to the fact that, although a negative relation between the size of sibship and IQ is well established, in all studies in which parental IQ correlated with number of offspring the relation was positive. (These studies were usually of small, selected samples.)
Further evidence of the fact that the relation between the size of sibship and IQ differs from the relation between the number of offspring and IQ comes from studies by Higgins, Reed, and Reed (1962), Bajema (1963), and Gibson and Young (1965). Higgins and his associates found a bimodal distribution for the number of children born to persons of different IQ levels, with greater number of offspring for the higher and the lower IQ levels. Gibson and Young (1965) in Great Britain also found a bimodal distribution of the number of offspring for different IQ groups. Bajema (1963) studied the reproductive pattern of 969 whites born in 1916 or 1917 who were given an intelligence test as sixth graders in the Kalamazoo (Michigan) public schools. He found no simple negative correlation but rather a curvilinear relation between the number of offspring and IQ. The correlation between the IQ of an individual and the number of offspring was 0.05, even though the relation between IQ and the size of the family the individual came from was —0.26. To take the age of death of deceased individuals into account, Bajema (1963) also calculated the intrinsic rate of natural increase and the relative fitness of the five IQ groups. (These are two technical indices from population biology in which a correction is made for the fact that an individual who dies young may not leave as many children as someone who lives longer.) These results, presented in Table 13, show even more clearly that in this population there is a positive relation between IQ and fertility.
Current Directions in Behavior Genetics 93
Table 13. The relation of IQ to the intrinsic rate of natural increase and relative fitness, using the average number of offspring as the measure of population growth
Intrinsic rate of Relative IQ range natural increase fitness
>120 0.008885 1.0000 105119 0.003890 0.8614 95104 0.000332 0.7771 80 94 0.007454 0.9484 69 79 0.010001 0.5774
Source: Bajema 1963.
In a more recent study Bajema (1971) found a nonsignificant correlation of 0.04 between completed fertility and intelligence for the 1,533 persons studied in the Third Harvard Growth Study (see Table 14).
Table 14. Mean number of children and IQ ranges for 1,533 person studied in the Third Harvard Growth Study
IQ range Number of Mean number persons of offspring
>120 206 2.17 105119 421 2.24 95104 392 2.14 80 94 420 2.08
79 94 1.87 Total 1,533 2.14
Finally, Waller (1971) found very similar results indicating higher fertility for the most intelligent and considerably reduced fertility for the lowest IQ group in a Minnesota group, consisting of relatives at least three degrees removed from 1,500 patients in the Minnesota State School and Hospital, for whom IQ scores were available for both parents and with the mother born between January 1,1918 and December 31,1927 (see Table 15).
Table 15. Intrinsic rate of natural increase (rm) in relation to IQ scores for a Minnesota cohort born between 1st Jan. 1918 and 31st Dec. 1927.
IQ range Ν r„
131150 17 0.0299 116130 132 0.0198 101115 303 0.0213 86100 200 0.0205 7185 36 0.0211 5670 11 0.0188
Source: Waller 1971.
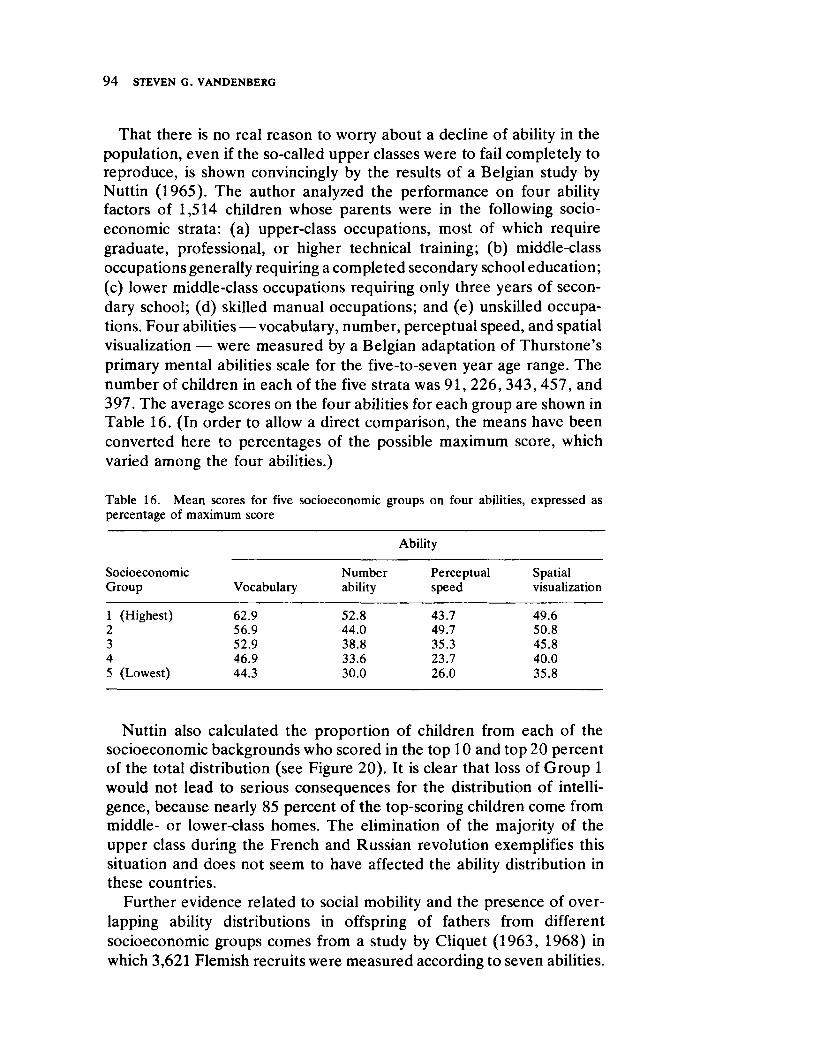
9 4VTSRNGEDBA STEVEN G. VANDENBERG
That there is no real reason to worry about a decline of ability in the population, even if the socalled upper classes were to fail completely to reproduce, is shown convincingly by the results of a Belgian study by Nuttin (1965). The author analyzed the performance on four ability factors of 1,514 children whose parents were in the following socioeconomic strata: (a) upperclass occupations, most of which require graduate, professional, or higher technical training; (b) middleclass occupations generally requiring a completed secondary school education; (c) lower middleclass occupations requiring only three years of secondary school; (d) skilled manual occupations; and (e) unskilled occupations. Four abilities — vocabulary, number, perceptual speed, and spatial visualization — were measured by a Belgian adaptation of Thurstone's primary mental abilities scale for the fivetoseven year age range. The number of children in each of the five strata was 91, 226, 343, 457, and 397. The average scores on the four abilities for each group are shown in Table 16. (In order to allow a direct comparison, the means have been converted here to percentages of the possible maximum score, which varied among the four abilities.)
Table 16. Mean scores for five socioeconomic groups on four abilities, expressed as percentage of maximum score
Ability
Socioeconomic Number Perceptual Spatial Group Vocabulary ability speed visualization
1 (Highest) 62.9 52.8 43.7 49.6 2 56.9 44.0 49.7 50.8 3 52.9 38.8 35.3 45.8 4 46.9 33.6 23.7 40.0 5 (Lowest) 44.3 30.0 26.0 35.8
Nuttin also calculated the proportion of children from each of the socioeconomic backgrounds who scored in the top 10 and top 20 percent of the total distribution (see Figure 20). It is clear that loss of Group 1 would not lead to serious consequences for the distribution of intelligence, because nearly 85 percent of the topscoring children come from middle or lowerclass homes. The elimination of the majority of the upper class during the French and Russian revolution exemplifies this situation and does not seem to have affected the ability distribution in these countries.
Further evidence related to social mobility and the presence of overlapping ability distributions in offspring of fathers from different socioeconomic groups comes from a study by Cliquet (1963, 1968) in which 3,621 Flemish recruits were measured according to seven abilities.
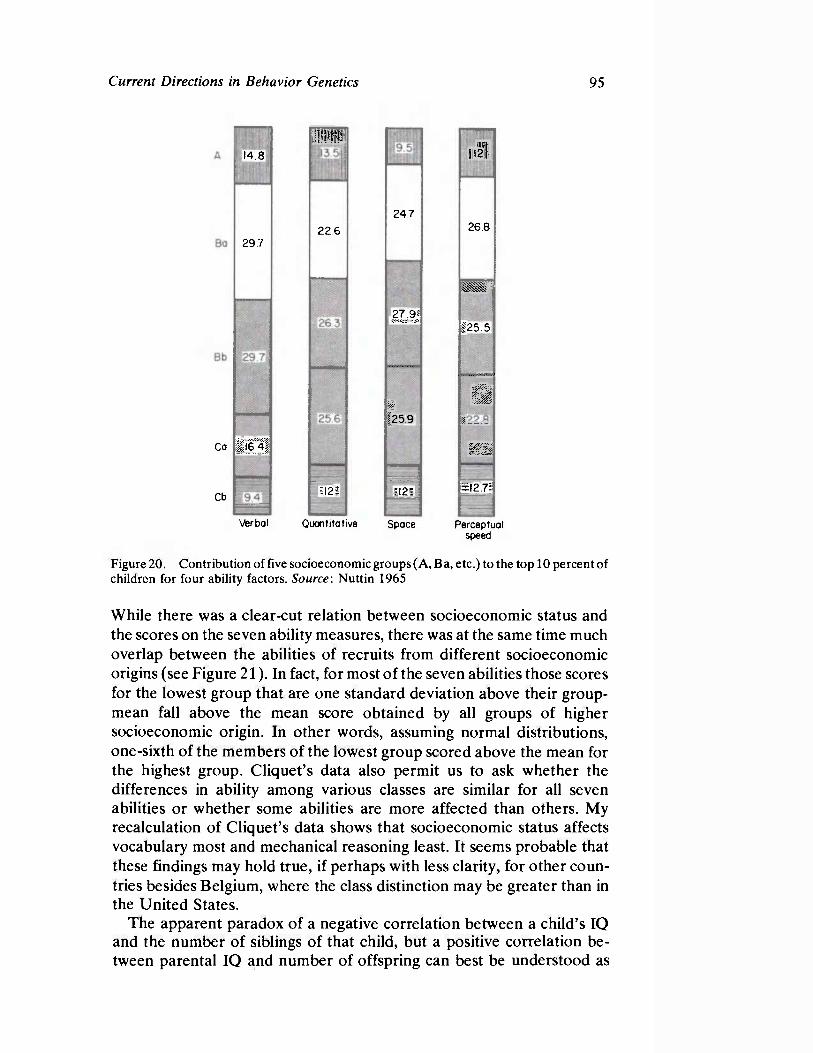
Current Directions in Behavior Genetics 95
14.8
29.7
Co
Cb
S E I
Verbal
Pfiilfi
226
1121
Quantitative
2 4 7
27 9< bfaάδtiAfl
R |25.9
SI2I
Space
IIH
26.8
R f " 1
£25.5
— ί v.... I i
g
Μ
•12.71
Perceptual speed
Figure 20. Contribution of five socioeconomic groups (A, Β a. etc.) to the top 10 percent of children for four ability factors.uroecS Source : Nuttin 1965
While there was a clearcut relation between socioeconomic status and the scores on the seven ability measures, there was at the same time much overlap between the abilities of recruits from different socioeconomic origins (see Figure 21). In fact, for most of the seven abilities those scores for the lowest group that are one standard deviation above their groupmean fall above the mean score obtained by all groups of higher socioeconomic origin. In other words, assuming normal distributions, onesixth of the members of the lowest group scored above the mean for the highest group. Cliquet's data also permit us to ask whether the differences in ability among various classes are similar for all seven abilities or whether some abilities are more affected than others. My recalculation of Cliquet's data shows that socioeconomic status affects vocabulary most and mechanical reasoning least. It seems probable that these findings may hold true, if perhaps with less clarity, for other countries besides Belgium, where the class distinction may be greater than in the United States.
The apparent paradox of a negative correlation between a child's IQ and the number of siblings of that child, but a positive correlation between parental IQ and number of offspring can best be understood as
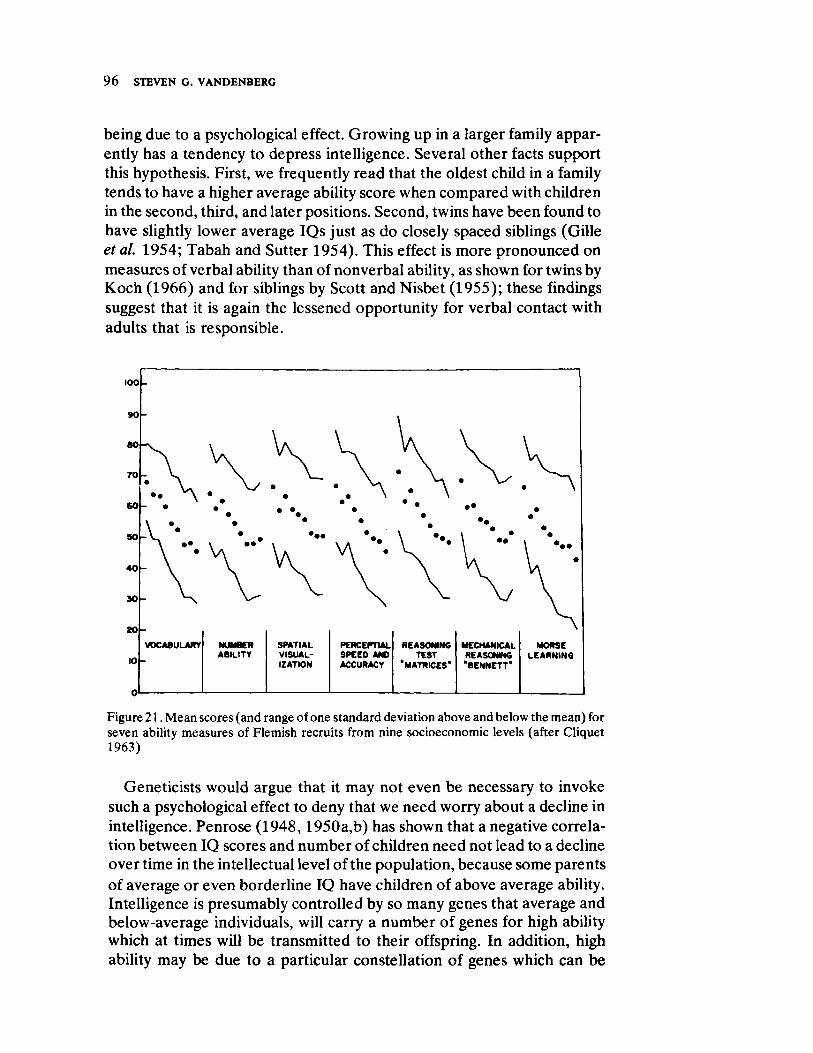
9 6ywvutsrqponmlkjihgfedcbaVTSRQPNKIGFEDBA STEVEN G. VANDENBERG
being due to a psychological effect. Growing up in a larger family appar-ently has a tendency to depress intelligence. Several other facts support this hypothesis. First, we frequently read that the oldest child in a family tends to have a higher average ability score when compared with children in the second, third, and later positions. Second, twins have been found to have slightly lower average IQs just as do closely spaced siblings (Gille tlea
et al. 1954; Tabah and Sutter 1954). This effect is more pronounced on measures of verbal ability than of nonverbal ability, as shown for twins by Koch (1966) and for siblings by Scott and Nisbet (1955); these findings suggest that it is again the lessened opportunity for verbal contact with adults that is responsible.
Figure 21. Mean scores (and range of one standard deviation above and below the mean) for
seven ability measures of Flemish recruits from nine socioeconomic levels (after Cliquet
1963)
Geneticists would argue that it may not even be necessary to invoke such a psychological effect to deny that we need worry about a decline in intelligence. Penrose (1948,1950a,b) has shown that a negative correla-tion between IQ scores and number of children need not lead to a decline over time in the intellectual level of the population, because some parents of average or even borderline IQ have children of above average ability. Intelligence is presumably controlled by so many genes that average and below-average individuals, will carry a number of genes for high ability which at times will be transmitted to their offspring. In addition, high ability may be due to a particular constellation of genes which can be

Current Directions in Behavior Genetics 97
produced just as often by the combination of genes or two low ability parents as of high ability parents.
In recent years the difference in birthrate between various socioeconomic groups has narrowed in both Great Britain and the United States (Benjamin 1966). For example, the ratio between the family size of college graduates and the family size of those who failed to complete elementary school has decreased from 2.4 to 1.4. A similar trend was reported for Japan, where the standard deviation of the average family size classified by father's occupation dropped from 0.90 in 1955 to 0.16 in 1960, while the average dropped from 3.0 to 2.3 (Kimura 1966). Perhaps we may expect increasing industrialization to produce similar trends over the entire world.
If populations continue to grow, with a differential rate for socioeconomic (and/or intelligence level) groups, the question raised by Shockley may still become a pressing one. Premiums for not having children or fines for having retarded children have been proposed but more subtle methods may have to be devised. What form might these take? The novelist Anthony Burgess has suggested in his novelwvtsonmlihgedbaTL The
wanting seed (1964), a future in which homosexuality is officially encouraged and in which completely artificial wars are held on special reservations. Bernard Wolfe (1953) described in his novelLimbo '90, a future in which young men have their legs amputated to escape service in such artificial wars. Surely such nightmares must be avoided and we have to consider alternative options that may be available.
REFERENCES
ADAMS, M. S., RUTH I. DAVIDSON, PHYLLIS CORNELL
1967 Adoptive risks of the children of incest: a preliminary result. Child
Welfare 46:137143, 166. ALTER, M.
1965 "Dermatoglyphics in birth defects," in The first conference on the
clinical delineation of birth defects, part 3, 103122. New York: National Foundation.
AMOORE, J . E.
1964 Current status of the steric theory of odor. Annals of the New York
Academy of Sciences 116:457476. ANASTASI, A.
1956 Intelligence and family size. Psychological Bulletin 53:187210. BACHMAN, J. G.
1970 Youth in transition, volume two: The impact of family background and
intelligence on tenth grade boys. Ann Arbor: Institute for Social Research.
BAJEMA, C. J .
1963 Estimation of the direction and intensity of natural selection in relation
9 8 STEVEN G. VANDENBERG
to human intelligence by means of the intrinsic rate of natural increase. ywvutsrponmlkjihgfedcbaTQPJHGEDCBA
Eugenics Quarterly 10:175187. 1971 "The relationship between intelligence and completed fertility among
Third Harvard Growth Study participants." Paper presented at the annual meeting of the American Association of Physical Anthropologists, Boston.
BENJAMIN, B.
1966 "Social and economic differentials in fertility," in Genetic and environ
mental factors in human ability. Edited by J. A. Meade and A. S. Parkes. New York: Plenum Press.
BERMAN, J. L., et al.
1969 Causes for high phenylalanine with normal tyrosine in newborn screening programs. American Journal of Diseases of Children 117:5465.
BERMAN, J . L., ROBIN FORD
1970 Intelligence quotients and intelligence loss in patients with phenylketonuria and some variant states. Journal of Pediatrics 77:764770.
BOCK, R. D. , S. G. VANDENBERG, W. BRAMBLE, W . PEARSON
1970 A behavioral correlate of bloodgroup discordance in dizygotic twins. Behavior Genetics 1:8998.
BOURDEL, L.
1960 Groupes sanguins et temperaments. Paris: Librairie Maloine. BROWN, K. S., C. J . MACLEAN, J . P. CALLAN
1969 "Quantitative aspects of odor perception as genetic traits." Paper presented at the annual meeting of the American Society for Human Genetics, San Francisco, October 14.
BROWN, K. S., C. J . MACLEAN, R. R. ROBINETTE
1968 The distribution of the sensitivity to chemical odors in man. Human Biology 40:456^72.
BURGESS, A.
1964 The wanting seed. New York: Ballantyne Books. BURT, c .
1966 The genetic determination of differences in intelligence: a study of monozygotic twins reared together and apart. British Journal of
Psychology 57:137153. CANCRO, R., editor
1971 Contributions to intelligence. Urbana: University of Illinois Press. CATTELL, R. Β., H. BOUTOURLINE YOUNG, J. D. HUNDLEBY
1964 Bloodgroups and personality traits. American Journal of Human Gen
etics 16:397402. CLIQUET, R. L.
1963 Bijdrage tot de kennis van het verband tussen de sociale status en een aantal antrobiologische kenmerken (Contribution to the knowledge of the relation between social status and a number of anthropological characteristics). Verhandelingen van de Koninklijke Vlaamse Academie voor Wetenschappen, Letteren en SchoneywvutsrponmlkihgfedcbaWTSRPONMLKJHGEDCBA K٧nsten van Belgie, Klasse der Wetenschappen, 72.
1968 Social mobility and the anthropological structure of populations. ywvutsrponmlihgfedcbaTSHBA
Human Biology 40:1743. COMER, J . P.
1967 The social power of the Negro. Scientific American 216:2127. DAHLBERG, G.
1926 Twin births and twins from a hereditary point of view. Stockholm: Tidens Tryckeri.
Current Directions in Behavior Genetics 99
DASEN, P. R.
1972 The development of conservation in aboriginal children: a replication study. International Journal of Psychology 7:7585.
DASEN, P. R., P. R. DE LACEY, G. N . SEAGRIM
1972 "An investigation of reasoning ability in adopted and fostered aboriginal children," in The psychology οfaboriginal Australians. Edited by G. N. Kearney, P. R. de Lacey and K. Davidson. Brisbane: Queensland University Press.
DE LACEY, P. R.
1970 A crosscultural study of classificatory ability in Australia. Journal of
CrossCultural Psychology 1:293304. 1971a Classificatory ability and verbal intelligence among high contact aborig
inal and low socioeconomic white Australian children. Journal of
CrossCultural Psychology 2:393396. 1971b Verbal intelligence, operational thinking and environment in part
aboriginal children. Australian Journal of Psychology 23:145149. DE LEMOS, MARION M.
1966 "The development of the concept of conservation in Australian aboriginal children." Unpublished Ph.D. dissertation, Australian National University, Canberra, Australia.
1969 The development of conservation in Aboriginal children. International
Journal of Psychology 4:255269. ERLENMEYERKIMLING, L. , L. F. JARVIK
1963 Genetics and intelligence: a review. Science 142:14771479. FISHER, R. A.
1918 The correlation between relatives on the supposition of Mendelian inheritance. Transactions of the Royal Society of Edinburgh 52: 3 9 9 ^ 3 3 .
FLAUGHER, R. S.
1971 Patterns of test performance by highschool students of four ethnic
identities. Project Access Research Report 2. Princeton: Educational Testing Service.
GALTON, F.
1875 The history of twins as a criterion of the relative powers of nature and nurture. Fraser's Magazine 12:566576.
GAY, J . Η . , M. COLE
1967 The new mathematics and an old culture: a study of learning among the
Kpelle of Liberia. New York: Holt, Rinehart and Winston. GIBSON, J . , M. YOUNG
1965 "Social mobility and fertility," in Biological aspects of social problems: a symposium by the Eugenics Society in October, 1964. Edited by J. A. Meade and A. S. Parkes, 6980. Edinburgh: Oliver and Boyd.
GILLE, R. et al.
1954 Le niveau intellectuel des enfants d'age scolaire: la determination des aptitudes; Vinfluence des facteurs constitutionnels, familiaux, et sociaux. Paris: Presses Universitaires de France.
GOTTESMAN, I .
1968 "Biogerietics of race and class," in Social class, race, and psychological development. Edited by M. Deutsch, I. Katz, and A. R. Jensen. New York: Holt, Reinhart and Winston.
HANNA, G. S . , B. HOUSE, L. H . SALISBURG
1968 WAIS performance of Alaskan native university freshmen. Journal of
Genetic Psychology 112:5761.
1 0 0 STEVEN G. VANDENBERG
HASEMAN, J. K.,R R. C. ELSTON
1972 The investigation of linkage between a quantitative trait and a marker locus.ywvutsrponmlkihgfedcbaWUTSRQPLJIHGEDCBA Behavior Genetics 2:319.
HEYNS, ο . s .
1963 Abdominal decompression. Johannesburg: Witwatersrand University Press.
HIGGINS, J . , E. REED, S. REED
1962 Intelligence and family size: a paradox resolved. Eugenics Quarterly 9:8490.
HONZIK, M. P. 1957 Developmental studies of parentchild resemblance in intelligence.
Child Development 28:215228. HOWELL, R.J J., L. EVANS, L. DOWNING
1958 A comparison of test scores for the 1617 year age group of Navaho Indians with standardized norms for the Wechsler Adult Intelligence Scale (Arizona and New Mexico). Journal of Social Psychology 47:355359.
HSIA, D. Υ. Υ., Μ. E. O'FLYNN, J . L. BERMAN
1968 A typical phenylketonuria with normal or borderline intelligence. American Journal of Diseases of Children 116:143157.
HUDSON, w .
1960 Pictorial perception in subcultural groups in Africa. Journal of Social
Psychology 52:182208. JENSEN, A. R.
1969 How much can we boost IQ and scholastic achievement? Harvard
Educational Review 39:1123. 1970 IQ's of identical twins reared apart. Behavior Genetics 1:133148.
JOHANNSEN, W.
1903 Uber Erblichkeit in Populationen und in reinen Linien. Jena: Fischer. IUELNIELSEN, N.
1965 Individual and environment: a psychiatricpsychological investigation of monozygotic twins reared apart. Acta Psychiatrica Scandinavica 40, supplement 183:158292.
KALMUS, Η.
1948 "Tune deafness and its inheritance," in Proceedings, Eighth Inter
national Congress of Genetics, Stockholm.
KAPLAN, A. R.
1968 "Physiological and pathological correlates of differences in taste acuity," in Progress in human behavior genetics. Edited by S. G. Vandenberg, 3166. Baltimore, Md.: Johns Hopkins Press.
KIMURA, M.
1966 "Current fertility patterns in Japan," in World Population Conference,
1965. New York: United Nations. KOCH, H. L.
1966 Twins and twin relations. Chicago: University of Chicago Press. KODAMA, H., F. SHINAGAWA
1953 WISCwvutsronmlkihgfedcbaSRMA chinφ shindan kensahφyutsronmlkihgfedcaWTSRNLKIHGFEDCBA (The WISC intelligence test). Tokyo: Nihon Bunka Kagakusha.
LEE, E. S., A. S. LEE
1952 The differential fertility of the American Negro. American Sociological Review 17:437^147.
LESSER, G. S., G. FIFER, D. H. CLARK
1965 Mental abilities of children from different social class and cultural
Current Directions in Behavior Genetics 101
groups. Monographs of the Society for Research on Child Development 30.
LIDDICOAT, R.
1968 IQs of babies receiving abdominal decompression and controls. Psychologia Africana 12:6574.
MC KUSICK, v .A A.
1966 Mendelian inheritance in man: catalogs of autosomal dominant, auto
somal recessive,andXlinkedphenotypes. Baltimore, Md.: Johns Hopkins Press.
MEILI, R., H. STEINER
1965 Eine Untersuchung zum Intelligenzniveau Elfjδhriger der deutschen Schweiz (A study of the intelligence level of elevenyearolds in German Switzerland). Schweizer Zeitschrift fόr Psychologie 24:2332.
MONEY, J.
1968 "Cognitive deficits in Turner's syndrome," in Progress in human
behavior genetics. Edited by S. G. Vandenberg, 2729. Baltimore, Md.: Johns Hopkins Press.
MOOR, U S E
1967 Niveau intellectuel et polygonosomie: confrontation du caryotype et du niveau mental de 374 malades dont le caryotype comporte un exces de chromosomes X ou Y (Intellectual level and polyploidy: a comparison of karyotype and intelligence of 374 patients with extra X or Y chromosomes). Revue de Neuropsychiatrie Infantile 15:325348.
MUNDYCASTLE, A. C.
1966 Pictorial depth perception in Ghanaian children. International Journal
of Psychology 1:289300. NEWMAN,ywvutsrponmlihgfedcbaZUTSRPONMLKJIHGFEDCBA Η. H. , F. N. FREEMAN, K. J . HOLZINGER
1937ywvutsronmlkjihgfedcbaTSPMLJGDBA Twins: a study of heredity and environment. Chicago: University of Chicago Press.
NICHOLS, P. L.
1970 "The effects of heredity and environment on intelligence test performance in4 and7year old white and Negro sibling pairs." Unpublished Ph.D. dissertation, University of Minnesota, Minneapolis.
NUTTIN, J.
1965 De verstandelijke begaaftheid van de jeugd in de verschillende sociale
blδssen en woonplaatsen (The intellectual ability of youth in different socioeconomic classes and urban and rural backgrounds). Mededelingen van de Koninklijke Vlaamse Akademie, Klasse Letteren 27(7).
PEARSON, Κ.
1904 On the laws of inheritance in man, part 2: On the inheritance of the mental and moral characters in man, and its comparison with the inheritance of the physical characters. Biometrika 3:131190.
PENROSE, L. S.
1948 The supposed threat of declining intelligence. American Journal of
Mental Deficiency 53:114118. 1950a Genetical influences on the intelligence level of the population. British
Journal of Psychology 40:128136. 1950b Propagation of the unfit. Lancet 259:425427.
SALDANHA, P. Η. , B. J . SCHMIDT, N . LEON
1964 A genetical investigation of congenital analgesia, part 2: Clinicogenetical studies. Acta Genetica et Statistica Medica 14:143158.
1 0 2 STEVEN G. VANDENBERG
SCARRSALAPATEK, SANDRA
1971 Race, social class, and IQ.zywvutsrponmlihgfedcbaTSRPOMJHGEBA Science 174:12851295. SCHREIDER, E.
1969 Inbreeding, biological and mental variation in France. American
Journal of Physical Anthropology 30:215220. SCHULL, W. J . , J . V. NEEL
1965 The effects of inbreeding on Japanese children. New York: Harper and Row.
SCOTT, Ε. M., J . D. NISBET
1955 Intelligence and family size in adult sample. Eugenics Review
46:233235. SEGALL, Μ. H. , D. T. CAMPBELL, M. J. HERSKOVITS
1966 The influence of culture on visual perception. Indianapolis: BobbsMerrill.
SHIELDS, JAMES
1962 Monozygotic twins brought up apart and brought up together. London: Oxford University Press.
SHOCKLEY, W.
1970 "A 'trysimplestcases' approach to the hereditypovertycrime problem," in Psychological factors in poverty. Edited by V. A. Allen, 141146. New York: Academic Press.
SKODAK, MARIE, Η. M. SKEELS
1949 A final followup study of one hundred adopted children. Journal of Genetic Psychology 75:85125.
SPUHLER, J. N. , G. LINDZEY
1967 "Racial differences in behavior," in Behaviorgenetic analysis. Edited by J. Hirsch. New York: McGrawHill.
STEWART, NAOMI
1947 AGCT scores of Army personnel grouped by occupation. Occupations
25:541. STODOLSKY, S. S., G. LESSER
1967 Learning patterns in the disadvantaged. Harvard Educational Review
37:546593. TAB AH, L., J . SUITER
1954 Le niveau intellectuel des enfants d'une meme famille. Annals of
Human Genetics 10:120150. THODAY, J . M.
1969 "Limitations to genetic comparison of populations," in Biosocial
aspects of race. Edited by G. A. Harrison and J. Reel. Journal of
Biosocial Sciences, supplement 1. TRANKEL, A.
1955 Aspects of genetics in psychology. American Journil of Human Gen
etics 7:264276. 1956 Penetrance calculus in population genetics. American Journal of
Human Genetics 8:4448. VANDENBERG, STEVEN G.
1970a "Genetic factors in poverty: a psychologist's point of view," in Psychological factors in poverty. Edited by Vernon L. Allen, 161175. New York: Academic Press.
1970b A comparison of heritability estimates of U.S. Negro and white high school students. Acta Geneticae Medicae et Gemellogiae 19:280284.
VANDENBERG, STEVEN G., RICHARD E. STAFFORD, ANNE M. BROWN 1968 "The Louisville twin study," in Progress in human behavior genetics.
Current Directions in Behavior Genetics 103
Edited by Steven G. Vandenberg. Baltimore, Md.: Johns Hopkins Press.
VERNON, P. E.
1969 Intelligence and cultural environment. London: Methuen. WALLER, JEROME H.
1971 Differential reproduction: its relation to IQ test score, education and occupation. Human Biology 18:122136.
WHELPTON, P. K., A. A. CAMPBELL, J. E. PATTERSON
1966 Fertility and family planning in the United States. Princeton, N.J.: Princeton University Press.
WINTER, W. L.
1967 Size constancy, relative size estimation, and background: a crosscultural study. Psychologia Africana 12:4258.
WITTY, P. Α., Μ. D. JENKINS
1936 Intrarace testing and Negro intelligence. Journal of Psychology 1:179192.
WOLFE, B.
1953 Limbo '90. London, Seeker and Warburg (reprinted by Penguin Books).

Effects of Isolation on Genetic
Variability:Macaque Populations as
Model Systems
LAURA NEWELL MORRIS and PETER E. NUTE
INTRODUCTION
In studying the genetics of one or a group of organisms, it is all too easy to adopt an atomistic point of view, focusing, for example, on a few loci whose products are readily detected by biochemical means. This approach is understandable, especially when applied to human populations, since the investigator is often hampered by lack of time and personnel and cannot obtain data relevant to more than a few genetic parameters. In addition, some physical anthropologists and population geneticists share the attitude, traceable to the early use and overuse of blood groups as surrogates for anthropometric measurements, that as much information can be gained from the study of a few genetic loci as might be obtained from a more broadly based investigation.
One outgrowth of this restricted approach is the tendency to regard organisms as simple sums of the discrete effects of genes at unrelated loci. This view completely disregards the fact that organisms and/or populations comprise highly complex, wellintegrated biological systems. Although several theorists have stressed the evolutionary importance of gene interaction and coadapted gene complexes with respect to both individuals and populations (Birdsell 1972; Mayr 1963), the results of genetic analyses are seldom couched in holistic terms.
Of great importance to the present analysis is the concept that the survival value of any particular gene depends not only upon those environmental conditions external to the organisms in question, but also upon the compositions of the genomes and gene pools in which the gene exists. This unifying view implies that all traits are, in a broad sense,
Supported in part by the United States Public Health Service National Institutes of Health grants RR 00166 and GM 15253.
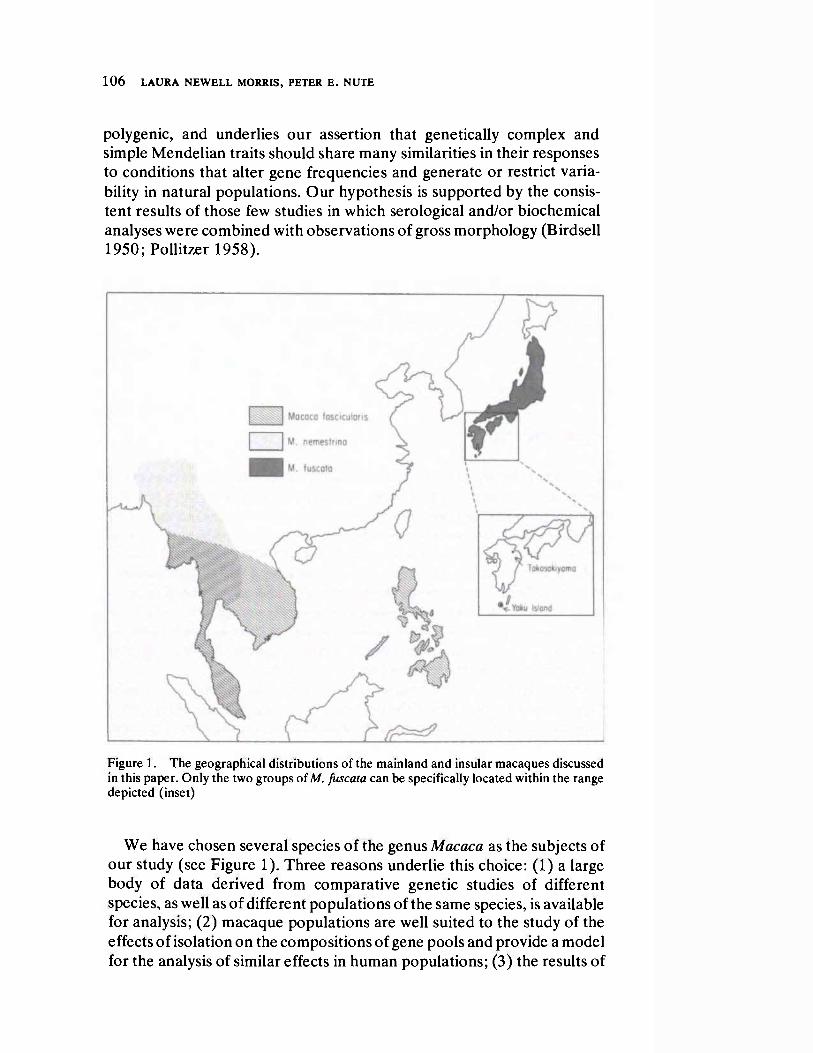
1 0 6WUTSRPONMLIEA LAURA NEWELL MORRIS, PETER E. NUTE
polygenic, and underlies our assertion that genetically complex and simple Mendelian traits should share many similarities in their responses to conditions that alter gene frequencies and generate or restrict variability in natural populations. Our hypothesis is supported by the consistent results of those few studies in which serological and/or biochemical analyses were combined with observations of gross morphology (Birdsell 1950; Pollitzer 1958).
Figure 1. The geographical distributions of the mainland and insular macaques discussed in this paper. Only the two groups ofutsfcaM M. fuscata can be specifically located within the range depicted (inset)
We have chosen several species of the genus Macaca as the subjects of our study (see Figure 1). Three reasons underlie this choice: (1) a large body of data derived from comparative genetic studies of different species, as well as of different populations of the same species, is available for analysis; (2) macaque populations are well suited to the study of the effects of isolation on the compositions of gene pools and provide a model for the analysis of similar effects in human populations; (3) the results of
Effects of Isolation on Genetic Variability 107
these studies provide information of importance to the study of human evolutionary history.
We shall discuss the extent to which variability generated in part by gene duplication, variability produced by alleles at single loci, and variability manifested in a system of morphological traits are differentially distributed among mainland and insular populations of macaques.
ANALYSIS OF DATA
Macaque Hemoglobins: Correlation of Phenotype with Genotype
The existence of duplicate loci provides a source of genetic variability of a different nature from that ascribed to multiple alleles at a single locus. While one can readily infer genotype from phenotype in most cases of multiple allelism, the introduction of duplicate loci often renders such correlations difficult. This problem is encountered in the case of the hemoglobin a chains of several species of Macaca. By first considering the hemoglobin phenotypes of animals in which duplicate αchain loci are known to exist, we shall construct a model whose application permits assessment of αchain genotypes according to the hemoglobin phenotypes found in several species of macaques.
The basic elements of our model are derived from consideration of the frequencies and kinds of hemoglobin phenotypes in Macaca arctoides ( =
speciosa). Kouba and Kitchen (1970) found that each of 150 macaques (M. arctoides) had electrophoretically fast (Hb F) and slow (Hb S) hemoglobins which differed in the structures of their α chains. In addition, Ishimoto et al. (1970) found 189 FS phenotypes among 191 animals of this species; the remaining two individuals had Hb S alone.
The large proportion of apparent heterozygotes (99.4 percent) among the total of 341 animals is most readily accounted for by postulating that the a s gene may exist singly or in close linkage with the a F gene, and that nearly all members of this species are homozygous for the linked genes. The two animals with Hb S alone are presumed to be homozygous for a single a s allele. The latter allele must be present at a low frequency among M. arctoides, but one might expect to find animals heterozygous for the single a s allele and the linked a s a F genes among 341 individuals.
How might these heterozygotes be identified when present in a group of animals, most of which produce both hemoglobins? Presumably, hemoglobin phenotypes of animals with one aF and two a s genes would differ from animals with two of each type of gene (that is, homozygotes for the linked genes) according to the relative amounts of Hb F and Hb S present in their red cells. Of the 150 animals examined by Kouba and

1 0 8 LAURA NEWELL MORRIS, PETER E. NUTE
Kitchen (1970), six (4 percent) had Hb F and Hb S in an approximate ratio of 30 F: 70 S; the remaining 144 had the hemoglobins in a60 F: 40 S ratio. Ishimototlea et al. (1970), upon examination of 52 animals of FS phenotypes, found that all had levels of Hb F between 55 and 75 percent, with a majority (39) falling between 60 and 70 percent Hb F.
In the absence of any evidence that unstable hemoglobins or /?chain variants are present, we can assume that the relative amounts of Hb F and Hb S are proportional to the amounts of a s and a F chains present in the erythrocytes. On this basis, we conclude that the leastcommon phenotype, 30 F: 70 S, is produced by heterozygosity for the linked loci and a single a s allele and that the 60 F: 40 S phenotype is produced by homozygosity for the linked loci.
It is tempting to assume that both partners in a gene duplication would govern the synthesis of equal amounts of chains. Were this the case, Hb F and Hb S would each comprise about 50 percent of the total hemoglobin in animals homozygous for the duplication. However, quantitative disparities in the amounts of hemoglobin chains produced by duplicate loci are common among primates (Nute, BuettnerJanusch, and BuettnerJanusch 1969; Nute and Stamatoyannopoulos 1971a, 1971b; Boyeref al. 1969; Wade and Barnicot 1971; Huismanetf a/. 1972; de Jong 1971). In short, there appear to be pronounced "position effects" bearing on the levels of activity of closely linked loci. This observation leads to further refinement of our model by the introduction of two assumptions, both of which were initially suggested by Barnicot, Wade, and Cohen (1970). First, one of a pair of linked αchain genes governs the synthesis of twice as much chain as does its partner; second, two αchain genes, when linked, govern the synthesis of the same amount of chain as does a single a allele. Adding these assumptions to the model, we can correlate genotypes with phenotypes as illustrated in Table 1.
Table 1. Correlation of hemoglobin αchain phenotype with genotype intsroiedcaM Macaca arctoides
Phenotypes observed (percent of each Hb) 60 F:40 S 30 F:70 S 100 S
Genotypes* aF a s aF a s a s
33 17 33 17 50
aF a s a s a s
33 17 50 50
Percent aF predicted 66 33 Percent a s predicted 34 67 100
' Numbers listed beneath the line representing each gene refer to the percentage of total a chain produced by each gene. It should be noted that the contributions of the loci residing in each of the two homologous chromosomes add up to 50 percent of the total.
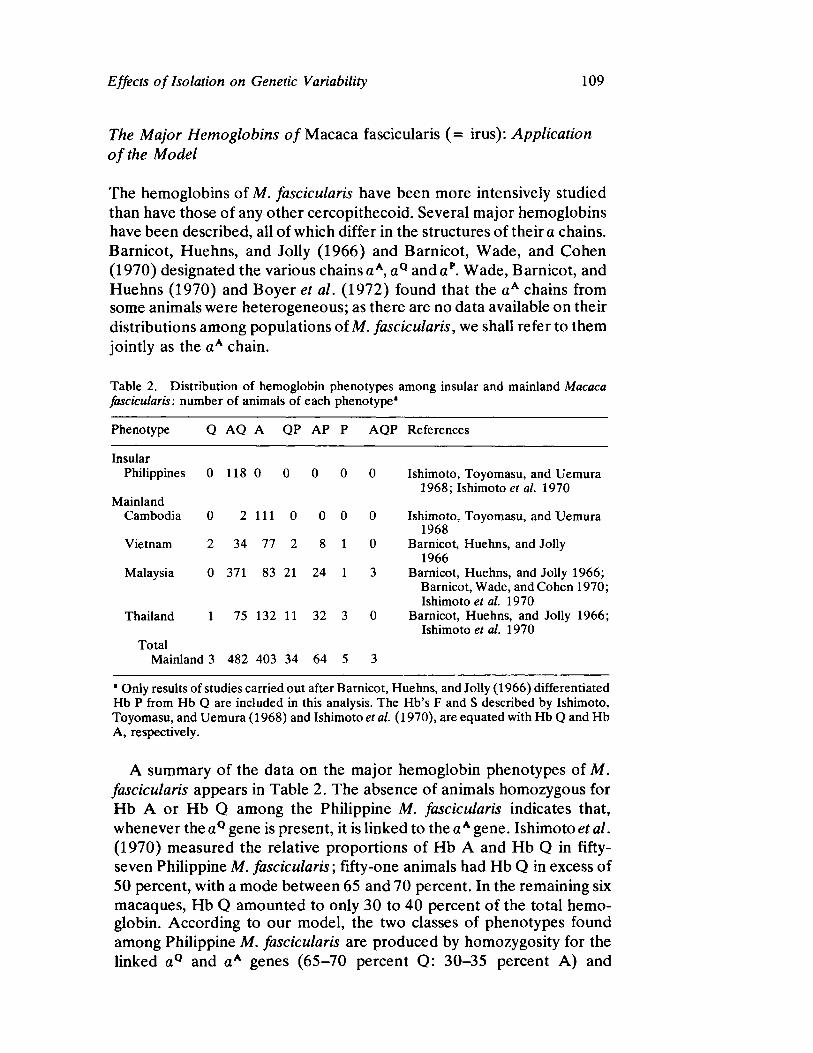
Effects of Isolation on Genetic Variability 109
The Major Hemoglobins ofzyxwvutsrqponmlkjihgfedcbaWTSQPMJIHCBA Macaca fascicularis (= irus): Application
of the Model
The hemoglobins of M. fascicularis have been more intensively studied than have those of any other cercopithecoid. Several major hemoglobins have been described, all of which differ in the structures of their α chains. Barnicot, Huehns, and Jolly (1966) and Barnicot, Wade, and Cohen (1970) designated the various chains aA, aQ andap . Wade, Barnicot, and Huehns (1970) and Boyer et al. (1972) found that the aA chains from some animals were heterogeneous; as there are no data available on their distributions among populations of M. fascicularis, we shall refer to them jointly as the aA chain.
Table 2. Distribution of hemoglobin phenotypes among insular and mainland Macaca
fascicularis: number of animals of each phenotype*
Phenotype Q AQ A QP AP Ρ AQP References
Insular
Philippines 0 118 0 0 0 0 0
Mainland Cambodia 0 2 111 0 0 0 0
Vietnam 2 34 77 2 8 1 0
Malaysia 0 371 83 21 24 1 3
Thailand 1 75 132 11 32 3 0
Total Mainland 3 482 403 34 64 5 3
Ishimoto, Toyomasu, and Uemura 1968; Ishimoto et al. 1970
Ishimoto, Toyomasu, and Uemura 1968
Barnicot, Huehns, and Jolly 1966
Barnicot, Huehns, and Jolly 1966; Barnicot, Wade, and Cohen 1970; Ishimoto et al. 1970
Barnicot, Huehns, and Jolly 1966; Ishimoto et al. 1970
* Only results of studies carried out after Barnicot, Huehns, and Jolly (1966) differentiated Hb Ρ from Hb Q are included in this analysis. The Hb's F and S described by Ishimoto, Toyomasu, and Uemura (1968) and Ishimoto et al. (1970), are equated with Hb Q and Hb A, respectively.
A summary of the data on the major hemoglobin phenotypes of M. fascicularis appears in Table 2. The absence of animals homozygous for Hb A or Hb Q among the Philippine M. fascicularis indicates that, whenever the aQ gene is present, it is linked to the aA gene. Ishimoto et al.
(1970) measured the relative proportions of Hb A and Hb Q in fiftyseven Philippine M. fascicularis; fiftyone animals had Hb Q in excess of 50 percent, with a mode between 65 and 70 percent. In the remaining six macaques, Hb Q amounted to only 30 to 40 percent of the total hemoglobin. According to our model, the two classes of phenotypes found among Philippine M. fascicularis are produced by homozygosity for the linked aQ and aA genes (6570 percent Q: 3035 percent A) and
1 1 0 LAURA NEWELL MORRIS, PETER E. NUTE
heterozygosity for the linked genes and a singleutsrlifecaQMFA aA allele (3040 percent Q: 6070 percent A).
Although duplicate genes on a single chromosome are not allelic to a single gene on the homologous chromosome in the strictest sense, the duplicate is expected to act as such in gametogensis. Hence, it is possible to calculate frequencies of duplicate and single genes in the same fashion as one calculates allelic frequencies. Basing our calculations on the data of Ishimoto et al. (1970), we find that the frequency of the duplication is 0.95. Philippine M. fascicularis thus appear to be polymorphic for the linked and single genes, but the frequency of the single aA gene is sufficiently low (0.05) to identify it as the atypical allele.
A third hemoglobin, Hb Ρ, is found among mainland M. fascicularis.
The distribution of Hb Ρ among the various phenotypes indicates that the single aA and a p genes are allelic (Wade, Barnicot, and Huehns 1967; Barnicot, Huehns, and Jolly 1966; Barnicot, Wade, and Cohen 1970). The highly complex collection of phenotypes found among mainland populations (see Table 2) might have arisen through a series of events similar to those depicted in the following scheme:
1. Alleles in ancestral gene pool; a
3. Contemporary gene pool contains: α° aA aF a° ctA
The linked genes and single alleles segregate, according to the proposed model, to produce the genotypes and phenotypes listed in Table 3. If all of the genotypes listed in Table 3 were present in a group of animals, one would expect the proportion of Hb Q in AQ individuals to vary over a wide range, with values for Hb Q at or near 33, 50, 66, 83, and 100 percent. Because of possible overlapping of amounts of aQ produced by different genotypes (see Figure 2), calculations of gene frequencies are subject to error.
Barnicot, Huehns, and Jolly (1966) and Ishimoto et al. (1970) measured the proportions of Hb Q and Hb A in 157 mainland M. fascicularis
of AQ phenotype. The resultant distribution of Hb Q is essentially bimodal, with clustering about 3540 percent and 6570 percent (see Figure 2). Phenotypes containing 4555 percent Hb Q may represent relatively small numbers of animals heterozygous for the single aA and a°
alleles, while the few animals with Hb Q in excess of 75 percent may indicate heterozygosity for the linked aA and aQ genes and the single a°
allele (see Table 3).
Duplicatior
2. Later gene pool contains: α° αΛ a° a^
Mutation
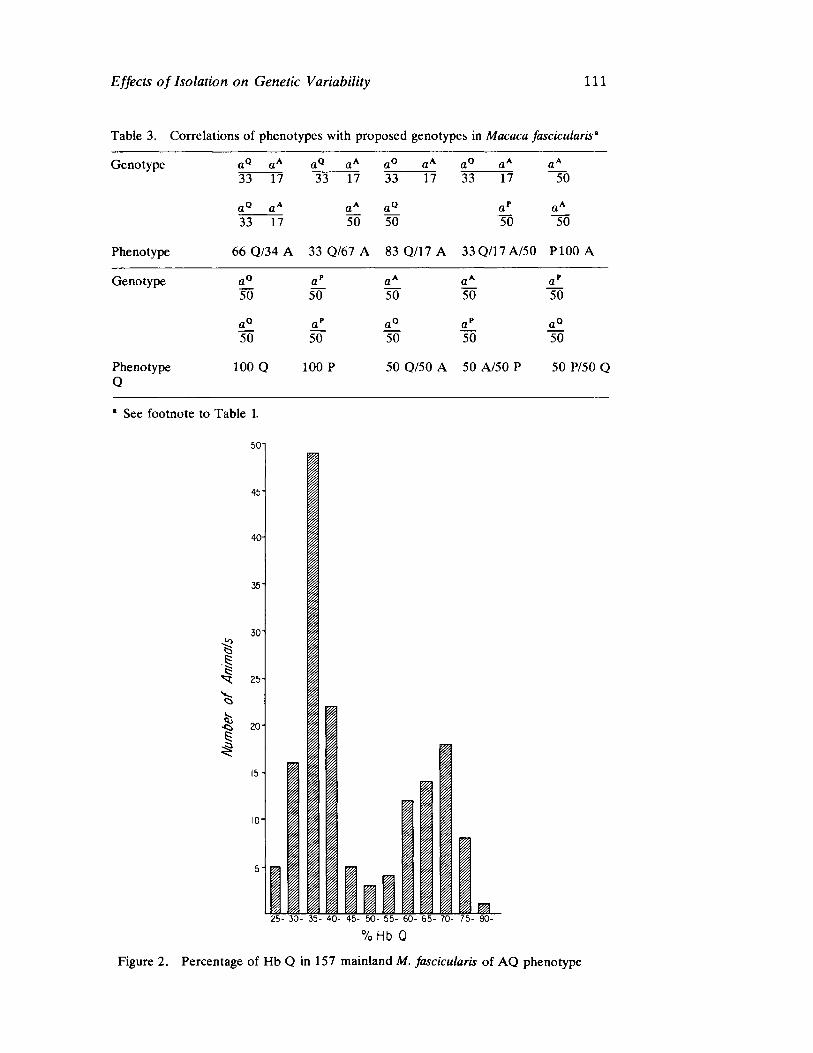
Effects of Isolation on Genetic VariabilityywutsrponmlihgfedcbaTSQPIHGFCA 111
Table 3. Correlations of phenotypes with proposed genotypes inusrlifcaMA Macaca fascicularis'
Genotype oQ aA aQ aA aQ aA a° aA aA
33 17 33 17 33 17 33 17 50
a Q aA
33 17 aA
50 a ° 50
a p
50 aA
50
Phenotype 66 Q/34 A 33 Q/67 A 83 Q/17 A 33 Q/17 A/50 P100 A
Genotype aQ
50 ar
50 aA
50 aA
50 a p
50
a° 50
a p
50 a° 50
a p
50 a Q
50
Phenotype Q
100 Q 100 Ρ 50 Q/50 A 50 A/50 Ρ 50 P/50 Q
' See footnote to Table 1.
501
45" 1
40"
35"
I
30"
25
I 20
10
ί I
I ( I I I · · · 25 30 35 40 45 50 55 60 65 70 75 8CT
% Hb Q
1 1 Figure 2. Percentage of Hb Q in 157 mainland M. fascicularis of AQ phenotype
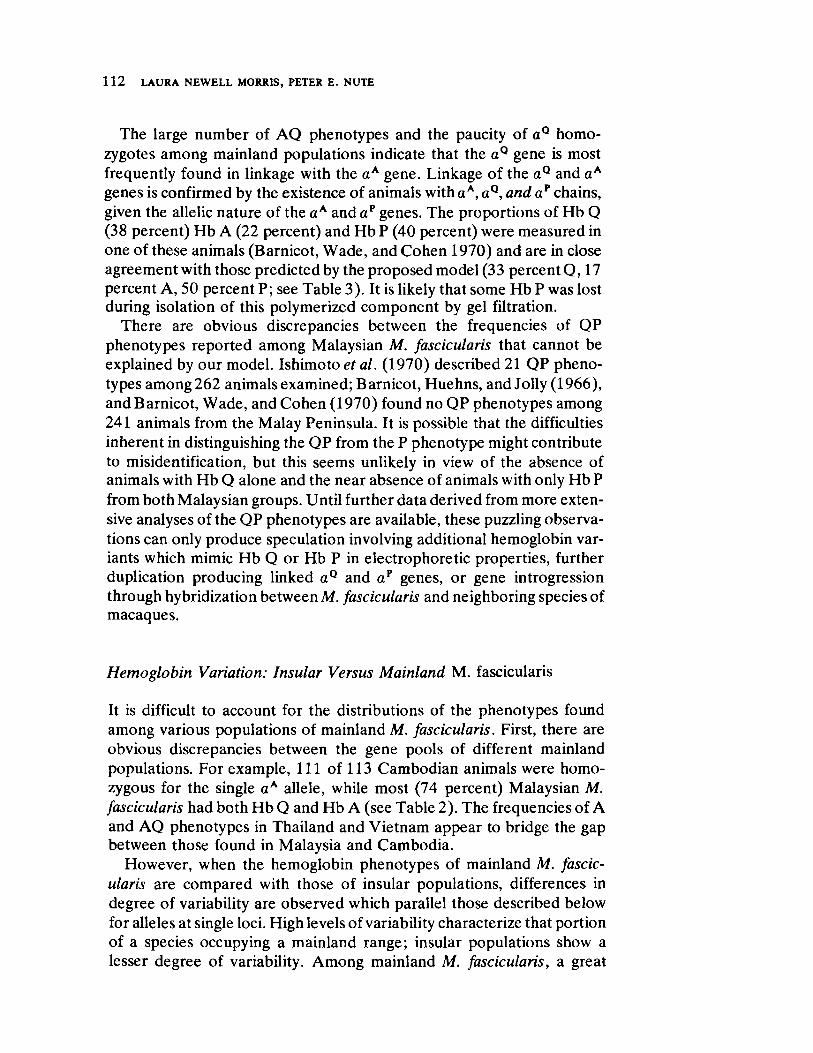
1 1 2 LAURA NEWELL MORRIS, PETER Ε. NUTE
The large number of AQ phenotypes and the paucity ofutsrponmligfedcbaVQMIHA aQ homozygotes among mainland populations indicate that the aQ gene is most frequently found in linkage with the aA gene. Linkage of the aQ and aA
genes is confirmed by the existence of animals with aA,aQ, and a p chains, given the allelic nature of the aA and ap genes. The proportions of Hb Q (38 percent) Hb A (22 percent) and Hb Ρ (40 percent) were measured in one of these animals (Barnicot, Wade, and Cohen 1970) and are in close agreement with those predicted by the proposed model (33 percent 0 , 1 7 percent A, 50 percent Ρ; see Table 3). It is likely that some Hb Ρ was lost during isolation of this polymerized component by gel filtration.
There are obvious discrepancies between the frequencies of QP phenotypes reported among Malaysian M. fascicularis that cannot be explained by our model. Ishimoto et al. (1970) described 21 QP phenotypes among 262 animals examined; Barnicot, Huehns, and Jolly (1966), and Barnicot, Wade, and Cohen (1970) found no QP phenotypes among 241 animals from the Malay Peninsula. It is possible that the difficulties inherent in distinguishing the QP from the Ρ phenotype might contribute to misidentification, but this seems unlikely in view of the absence of animals with Hb Q alone and the near absence of animals with only Hb Ρ from both Malaysian groups. Until further data derived from more extensive analyses of the QP phenotypes are available, these puzzling observations can only produce speculation involving additional hemoglobin variants which mimic Hb Q or Hb Ρ in electrophoretic properties, further duplication producing linked a° and a p genes, or gene introgression through hybridization between M. fascicularis and neighboring species of macaques.
Hemoglobin Variation: Insular Versus Mainland M. fascicularis
It is difficult to account for the distributions of the phenotypes found among various populations of mainland M. fascicularis. First, there are obvious discrepancies between the gene pools of different mainland populations. For example, 111 of 113 Cambodian animals were homozygous for the single aA allele, while most (74 percent) Malaysian M. fascicularis had both Hb Q and Hb A (see Table 2). The frequencies of A and AQ phenotypes in Thailand and Vietnam appear to bridge the gap between those found in Malaysia and Cambodia.
However, when the hemoglobin phenotypes of mainland M. fascic
ularis are compared with those of insular populations, differences in degree of variability are observed which parallel those described below for alleles at single loci. High levels of variability characterize that portion of a species occupying a mainland range; insular populations show a lesser degree of variability. Among mainland M. fascicularis, a great

Effects of Isolation on Genetic Variability 113
degree of phenotypic variation is produced by various combinations of the linked aA andyutsrponmlifecaQMA aQ genes and the single a A,aQ, and a p alleles, all of which exist at polymorphic frequencies (>0.01). It is clear that the insular (Philippine) M. fascicularis are more uniform than mainland groups with respect to their hemoglobin genotypes. In some respects, their phenotypic identity is complete, since all possess both hemoglobins A and Q.
In this context, it is noteworthy that the hemoglobins of 217 M. fuscata
(from Japan) and 101 M. cyclopis (from Taiwan) showed no signs of variation; all yielded a single electrophoretic species of hemoglobin identical to that of Hb A in M. fascicularis (Ishimoto et al 1970). However, it may be premature to describe M. fuscata and M. cyclopis as monomorphe at hemoglobin loci, as more elaborate screening procedures may demonstrate variation. For example, M. nemestrina from the Malay Peninsula and M. mulatto, once thought to be monomorphic at hemoglobin loci, show αchain variation similar to that involving the linked and nonlinked aA and a° genes of M. fascicularis when screened by sufficiently rigorous techniques (Nute and Pataryas 1974;yxwvutsrqponmljihgfedcbaTSOMIHEB Bδsch 1972).
Allelic Variability: Insular Versus Mainland Macaque Populations
Of the many allelic systems that have been demonstrated within populations of macaques, we shall consider only those listed in Table 4. Other systems were eliminated from consideration because (1) the number of animals examined was so small that the absence of allelic variation did not justify the diagnosis of monomorphism, or (2) there were difficulties in distinguishing between the presence of multiple alleles and/or multiple loci or in correlating phenotypes (in these cases, patterns produced by electrophoresis of specific proteins) with genotypes.
Most variants of human proteins differ from their normal counterparts by single amino acid substitutions whose origins can best be explained by postulating the past occurrence of point mutations at their respective loci (Harris 1970). Since the variation described for each type of protein listed in Table 4 is presumed to reflect corresponding variation at a single genetic locus, we assume that most, if not all, of the variation arose in this way.
In general, one views alleles at a single locus as comprising a polymorphic system if each of their frequencies in a gene pool exceeds 0.01. Electrophoretic variants present at lower frequencies are not included in Table 4 as they may be isolated, familial abnormalities that are in no way characteristic of the population in question. Inspection of Table 4 indicates that mainland populations harbor more genetic variability than do insular populations of macaques.
This difference is particularly impressive with respect to the trans
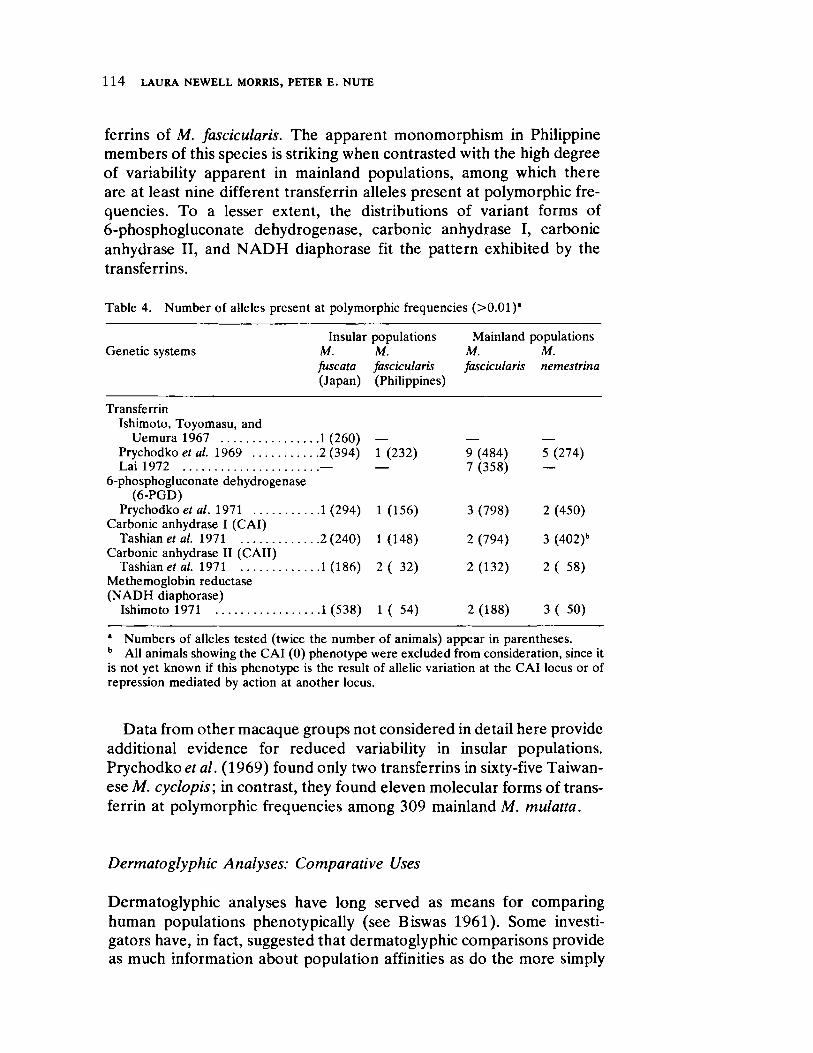
1 1 4yxwvutsrqponmlkihgfedcbaWUTSRPONMLIHEDBA LAURA NEWELL MORRIS, PETER Ε. NUTE
ferrins ofyvutsrponmlihgfecaUMDCA Μ. fascicularis. The apparent monomorphism in Philippine members of this species is striking when contrasted with the high degree of variability apparent in mainland populations, among which there are at least nine different transferrin alleles present at polymorphic frequencies. To a lesser extent, the distributions of variant forms of 6phosphogluconate dehydrogenase, carbonic anhydrase I, carbonic anhydrase II, and NADH diaphorase fit the pattern exhibited by the transferrins.
Table 4. Number of alleles present at polymorphic frequencies (>0.01)*
Insular populations Mainland populations Genetic systems Μ. Μ. Μ. M.
fuscata fascicularis fascicularis nemestrina
(Japan) (Philippines)
Transferrin Ishimoto, Toyomasu, and
Uemura 1967 1 (260) — Prychodko et al. 1969 2 ( 3 9 4 ) 1 (232) Lai 1972 — —
6phosphogluconate dehydrogenase (6PGD)
Prychodko et al. 1971 1 (294) 1 (156) Carbonic anhydrase I (CAI)
Tashian ei a/. 1971 2 ( 2 4 0 ) 1 (148) Carbonic anhydrase II (CAII)
Tashian ei α/. 1971 1 (186) 2 ( 32) Methemoglobin reductase ( N A D H diaphorase)
Ishimoto 1971 1 (538) 1 ( 54)
9 ( 4 8 4 ) 5 (274) 7 (358) —
3 ( 7 9 8 ) 2 ( 4 5 0 )
2 (794) 3 (402)"
2 ( 1 3 2 ) 2 ( 58)
2 (188) 3 ( 50)
* Numbers of alleles tested (twice the number of animals) appear in parentheses. " All animals showing the CAI (0) phenotype were excluded from consideration, since it is not yet known if this phenotype is the result of allelic variation at the CAI locus or of repression mediated by action at another locus.
Data from other macaque groups not considered in detail here provide additional evidence for reduced variability in insular populations. Prychodko etal. (1969) found only two transferrins in sixtyfive Taiwanese M. cyclopis; in contrast, they found eleven molecular forms of transferrin at polymorphic frequencies among 309 mainland M. mulatto.
Dermatoglyphic Analyses: Comparative Uses
Dermatoglyphic analyses have long served as means for comparing human populations phenotypically (see Biswas 1961). Some investigators have, in fact, suggested that dermatoglyphic comparisons provide as much information about population affinities as do the more simply

Effects of Isolation on Genetic Variability 115
inherited Mendelian traits (Rife 1954; Roberts et al. 1968). Moreover, this use of dermatoglyphic systems is illustrated by the complementary results of studies involving combinations of dermatoglyphic analyses with analyses of other morphological or Mendelian traits from the same population^) (Newman 1960; Chai 1971).
Nonhuman primates possess volar dermatoglyphic patterns that can be described by standard human dermatoglyphic nomenclature. Midlo and Cummins (1942) have analyzed in detail the dermatoglyphic similarities and differences among several primate taxonomic groups down through the generic level. However, they held that interspecific differences, if they exist, would be of little use in differentiating species. Later studies of species within the genera Presbytis, Colobus, Cer
copithecus, and Macaca (Brehme 1967a, 1967b, 1968; Morris and Kerr 1974) have shown that dermatoglyphic differences do exist between species of the same genus, and that dermatoglyphic comparisons at this taxonomic level can yield valuable information about the adaptation and divergence of species. Apart from our present comparisons of the dermatoglyphic patterns of M. fuscata fuscata and M. f . yakui, there are no data on which to base comparisons of conspecific populations of nonhuman primates.
Dermatoglyphic Pattern Frequencies and MSD
The dermatoglyphic data used here were obtained from three distinct groups (see Figure 1): 42 M. f . yakui from Yaku Island, Japan; 56 M. f .
fuscata from the Takasakiyama group of Kyushu Island, Japan (Iwamoto 1964); and 79 M. nemestrina from mainland Malaysia (Morris and Kerr 1974). The frequencies of the various pattern types were calculated for each of the seven configurational areas of the palm. Patterns from the right and left hands of both sexes were combined, giving a sample number double the number of animals used. Each of the several pattern types has been assigned to one of four general categories: open field, loop, double loop, and whorl. The frequencies at which the four categories of pattern types appear in each of the seven configurational areas of M. f . yakui, M.
f . fuscata, a n d M . nemestrina are listed in Table 5. It is obvious that there are differences among the three groups of animals, although these variations do not appear vastly different from those that have been reported for various human populations. However, it is clear that particular configurational areas of M. f . yakui are as different from those of M. f . fuscata
as they are from the corresponding areas of M. nemestrina.
The pattern frequencies offer rough indications of the dermatoglyphic similarities and dissimilarities among the three macaque groups. Although we would agree with Birdsell (1972) that no single figure can
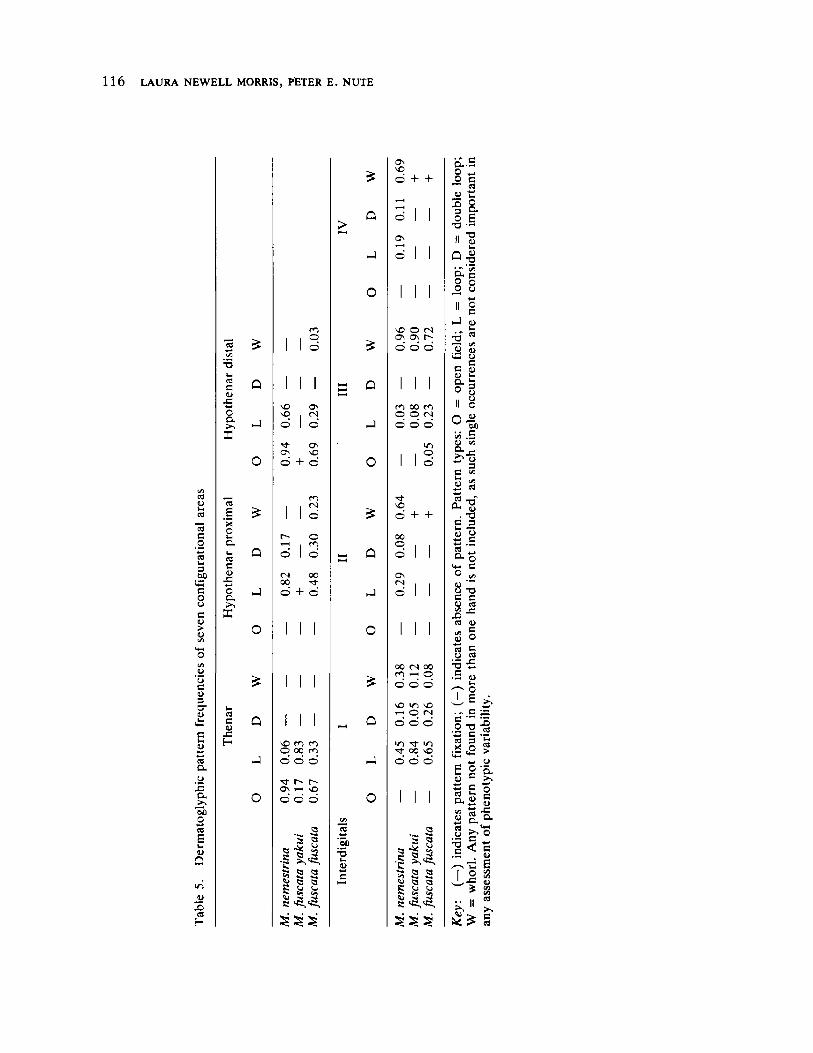
116 LAURA NEWELL MORRIS, PETER E. NUTE
CO c ο •C ο D.
X
CO ε ο
CO G ω J3 -*-» Ο CL
X
CO c <u .e Η
m ο ο
I I
Ο Ο fN
On \D Ο +IC Φ
CI (Ν
(Ν 00
ο ο
οο
Φ + ο
νο m ο ο οο m
τΐ- Γ-ο —ι νο ό ο ο
3 α
m 5» « «
£
α - j
ο
£
Q
CO
'•3 0) C
σ\ νΟ Ο + +
ο
α.
• ο ο fN ON σ\ Γ-ο ο Ο
Ο 00 ο ο ο CS ό ό Φ
Ό Ο Φ
6 + +
00 ο
σν
00 fN 00 C! ( ο
? ό ο ο
1/-1 VD ο (Ν
Φ Φ ό
Ό τΐ· m 00
J ό ο ο
•5 §L·«Sv
Sl β a ε υ υ I « 555
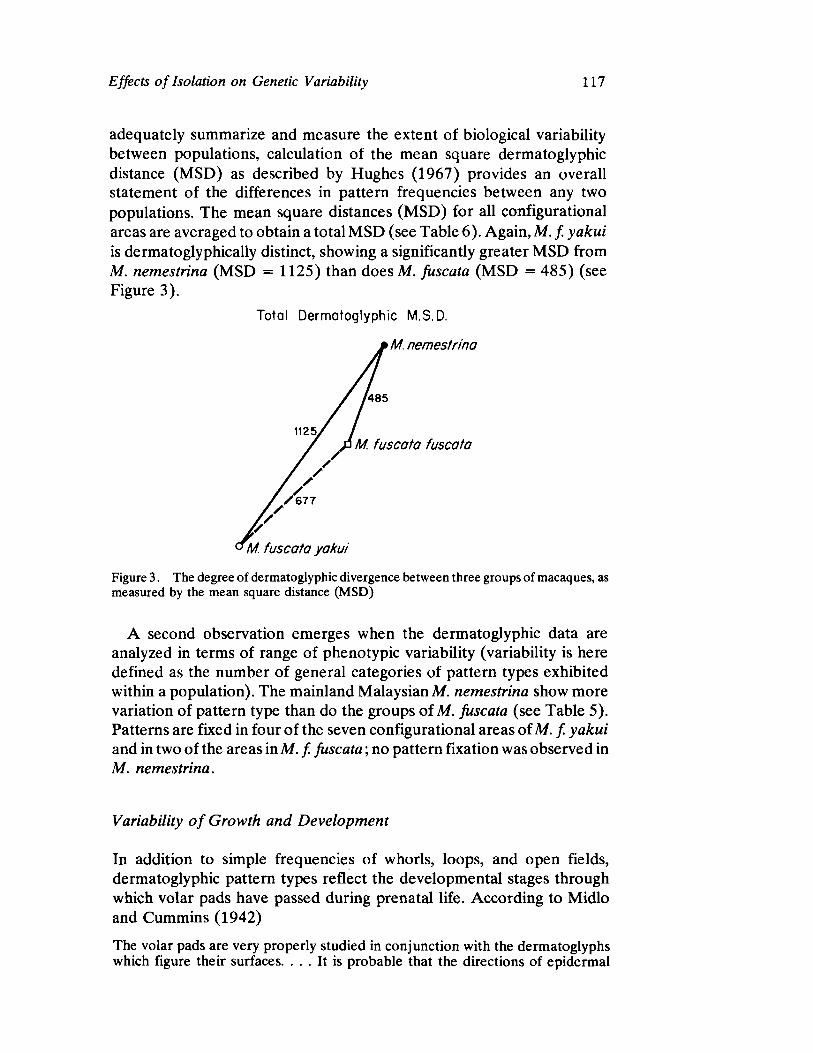
Effects of Isolation on Genetic Variability 117
adequately summarize and measure the extent of biological variability between populations, calculation of the mean square dermatoglyphic distance (MSD) as described by Hughes (1967) provides an overall statement of the differences in pattern frequencies between any two populations. The mean square distances (MSD) for all configurational areas are averaged to obtain a total MSD (see Table 6). Again, M. f . yakui
is dermatoglyphically distinct, showing a significantly greater MSD from M. nemestrina (MSD = 1125) than does M. fuscata (MSD = 485) (see Figure 3).
Figure 3. The degree of dermatoglyphic divergence between three groups of macaques, as measured by the mean square distance (MSD)
A second observation emerges when the dermatoglyphic data are analyzed in terms of range of phenotypic variability (variability is here defined as the number of general categories of pattern types exhibited within a population). The mainland Malaysian M. nemestrina show more variation of pattern type than do the groups of M. fuscata (see Table 5). Patterns are fixed in four of the seven configurational areas of M. f . yakui
and in two of the areas in M. f . fuscata; no pattern fixation was observed in M. nemestrina.
Variability of Growth and Development
In addition to simple frequencies of whorls, loops, and open fields, dermatoglyphic pattern types reflect the developmental stages through which volar pads have passed during prenatal life. According to Midlo and Cummins (1942)
Total Dermatoglyphic M.S.D.
ρ M. nemestrina
M. fuscata fuscata
The volar pads are very properly studied in conjunction with the dermatoglyphs which figure their surfaces. . . . It is probable that the directions of epidermal

118 LAURA NEWELL MORRIS, PETER E. NUTE
Λοrni ^ Η S
ι/Ί in <N 00 1-H Tt
i— vO
oo es tt
Tt SD to CO
C-©
iri ri >"H Ό
es
<N 'ί-
Ο Ο (Ν Tf co σ\
•<1-ιπ
0 0 CO
>ri οό 00 «ο to
0\
ο CS
Χ
es es es σ\
to
νο
ο \0
Χ
1/1 CO 00 00 —ι !/-)
σ\ ο to
-Ε Η
00 00 Ο 1-i Ον VO
r» !Λ>
ο 00
CS
β .κ Ε!
δ ε C
3 •ϋ β
a β · - a ~ - - « ο a β y a
s β 5 a 3
ΕWIH H I .E W C) Q _ t i <ο Λ υ to ·° u § §
β β υ ο
α 3 Ο t* Ο
Effects of Isolation on Genetic Variability 119
ridges, hence their fashioning of patterns, are conditioned by mechanical processes in growth. Irregular reliefs of the volar surfaces owe their existence to differential growth, and there is every indication that epidermal ridge directions are but another expression of the same growth processes. Thus, a local pattern of ridges, such as an apical pattern of a digit, possess a distinctive ridge configuration owing to the growth of the pad in which it is seated.
If the developmental association between volar pad morphology and dermal ridge patterning is accepted, then we have in the range and distribution of dermatoglyphic pattern types within a population a rough means of assessing the range of variability expressed throughout a part of prenatal development. For example,ywutsrponmlkihfecaMD M. nemestrina shows developmental polymorphism at all configurational areas, as expressed by range of pattern types, whereas M. f . yakui is developmentally more uniform at the hypothenar proximal, hypothenar distal, and interdigitals II and IV. Conceivably, all animals in the latter population undergo uniform development during prenatal life with respect to these particular areas.
DISCUSSION
Several studies have shown that insular populations tend to harbor less genotypic and phenotypic variability than do related mainland populations (Dobzhansky 1957; Goodman et al 1965;Prychodkoeia/. 1969). In addition, these and other studies have demonstrated inverse relationships between island size and amount of genetic diversity within resident populations and the degree of genetic differentiation between their populations (Kramer and Mertens 1938; Lowe 1955). For example, Dobzhansky's investigation (1957) of chromosomal variability in populations of Drosophila willistoni from Central and South America and the West Indies showed a decreased average number of heterozygous inversions per female in island populations (1.78) as compared with mainland populations (5.25), with the lowest number from the island of St. Kitts (0.20) and the highest from Santa Marta, Colombia (7.21). In addition, Dobzhansky correlated insular size and amount of genetic diversity; for example, females from Cuban populations contain the greatest number of inversions (2.67) while those from St. Kitts, the smallest island, approach monomorphism.
Insular and mainland populations of macaques differ in extent of variability in much the same way as do insular and mainland populations of D. willistoni. Where multiple alleles exist at single loci, mainland M.
fascicularis far outstrip their Philippine counterparts in the numbers of different alleles they possess and, hence, the numbers of phenotypes that can be produced through segregation. For example, the nine transferrin alleles found by Prychodko et al. (1969) among mainland

1 2 0 LAURA NEWELL MORRIS, PETER E. NUTE
M. fascicularis are potentially capable of combining to produce fortyfive different electrophoretic phenotypes.
By contrast, Philippine members of this species are phenotypically and genotypically identical. A similar situation is apparent in the case of the hemoglobin αchain genes. The three single αchain alleles, aA, aQ, and ap,
among mainland M. fascicularis, can produce six different αchain phenotypes. However, the addition of the tandemly linked pair of genes, α°αΑ, introduces an element of quantitative variability without altering the structural nature of any chain. In this way, the three different α chains participate in the production often different hemoglobin phenotypes (see Table 3).
The only phenotypic variation described for the hemoglobins of Philippine M. fascicularis is of a quantitative nature. More than 90 percent of the animals showed the 6570 Q: 3540 A phenotype, indicative of homozygosity for the tandemly linked a°aA genes. All other Philippine M. fascicularis were of the 3040 Q: 6070 A phenotype. Thus, although two structurally different α chains exist among the Philippine animals, variability is limited, and these insular macaques are close to achieving monomorphism for the duplicate genes.
With respect to the palmar dermatoglyphics, insular M. fuscata show less total pattern variability than do mainland M. nemestrina (see Table 5). Furthermore, M. f . yakui from Yaku Island show less variability than do M. f . fuscata (Takasakiyama group) from the larger island of Kyushu. If the developmental hypothesis of dermatoglyphic pattern formation is accepted, fixation of pattern type as exhibited by the groups of M. fuscata
reflects uniformity of the prenatal growth and development of the palmar pad.
It is difficult to discuss growth and development in genetic and evolutionary terms. Developmental polymorphisms have been described for human populations, but the effects of genetic isolation on growth and development have not been conclusively documented (Hunt 1966). Yet as Van Valen (1973) has stated, "A plausible argument could be made that evolution is the control of development by ecology." Certainly, considerations of growth and development as reflected in dermatoglyphic patterns, single loci, and linked loci lead to the same conclusions: insular populations tend to exhibit less variability than do mainland populations, and the manner in which the former have responded to isolation is reflected at several levels of biological organization.
The question of why related mainland and insular populations differ has been discussed in detail by Mayr (1963). He rejects genetic drift and natural selection as insufficient explanations for the evolutionary divergence of insular populations. Mayr's explanation for the differences between insular and mainland populations stresses the concept of an integrated gene pool and its reaction to gene flow. In a polytypic species,
Effects of Isolation on Genetic Variability 121
gene flow has two important consequences. First, opportunities for new
heterozygous genotypes are maximized in populations that continually
receive new alleles from other populations. Second, gene flow acts to
maintain the specific identity of populations by preventing the local
establishment of gene complexes in response to local selective pressures.
When a population becomes isolated from the mainstream of gene flow
the evolutionary pressures on this population change. Generally these
changes are discussed in terms of the founder principle (see Mayr 1963;
Dobzhansky 1957). One can justifiably invoke the founder principle as
an explanation of genetic discontinuities between ancestral and descen-
dant populations when the latter derive from a small number of individu-
als bearing a nonrandom sample of the alleles present in the former.
Many insular populations may owe their uniqueness to an initial founder
effect. However, isolated populations may also be created by the frag-
mentation of a previously continuous range. The direction of divergence
and the rapidity with which it will occur in newly isolated populations are
unpredictable. Fission of the range of a species, as opposed to the opera-
tion of the founder effect, may provide for different rates of evolutionary
change. However, the ultimate fate of isolated populations, whatever
their origin, is the same: heterozygosity, whether measured by complete
fixation of a single gene at a locus or by a reduction in the total number of
alleles at a given locus, will decrease.
The genetic divergence and reduced variability characteristic of insular
macaque populations is probably not a consequence of the founder effect,
but rather the result of subdivision of the range of a polytypic species and
the concurrent removal of these populations from the mainstream of gene
flow. The twelve extant species of Macaca recognized by Napier and
Napier (1967) represent, in Simons' view (1963), the descendants of a
single species that spanned the Old W orld as recently as one to three
million years ago. It is noteworthy thatM. fascicularis, M. nemestrina,M.
mulatto, and M. arctoides, whether from insular or mainland populations,
all possess duplicate hemoglobin α-chain loci. Similarly, the transferrins,
6-phosphogluconate dehydrogenases, and carbonic anhydrases I and II
of insular macaques are electrophoretically identical to certain forms of
these proteins found among mainland populations. These observations
strongly suggest a relatively recent genetic communality of insular and
mainland populations of macaques.
An Old World-wide species range would have supported numerous
populations inhabiting diverse environments and differing in the extent
of their isolation from each other. Clearly, such a situation would tend to
favor the establishment of genetic differences between various popula-
tions while permitting the flow of genes from one end of the range to the
other. Under these conditions, one suspects that genotypic (and hence
phenotypic) differences between populations accumulated to the extent
1 2 2zyxwvutsrqponmlkihgfedcbaYWUTSRPONMLJIHFEDCBA LAURA NEWELL MORRIS, PETER E. NUTE
that the single ancestral species became highly polytypic. However, gene flow between contiguous populations would have maintained conspecific identity of these populations throughout the range.
Several macaque populations were isolated as postglacial Pleistocene elevations of sea level submerged the continental shelves connecting the present islands of Japan, the Philippines, Indonesia, and Malaysia to the mainland, thus interrupting gene flow between these areas. Just as gene flow previously tended to neutralize the effects of selection on various gene pools, thereby inhibiting evolutionary divergence, so the absence of gene flow between mainland and newly isolated populations permitted more rapid divergence of the latter groups from each other and from mainland populations. In this context, the reduced variability within insular populations as compared with mainland populations is viewed as a consequence of the operation of natural selection within a more restricted geographic range, while the variability characteristic of mainland populations reflects the continual flow of genes between populations dispersed over a wider area.
The conclusions drawn from consideration of the data presented above may be applied to questions concerning the course of human evolution. UnlikeomcaMH Macaca, Homo has remained a widespread monospecific genus. In spite of the existence of geographic barriers between human populations, continual specieswide gene flow has been maintained by cultural developments that facilitated human mobility and communication. However, one important question remains unanswered: have any human populations experienced loss of variability (as distinct from the loss of heterozygosity attributable to consanguinity) to the extent described for insular populations of macaques? A satisfactory answer requires that numerous genetic systems be investigated in several human populations that have experienced little gene flow for long periods of time.
REFERENCES
BARNICOT, Ν. Α., E. R. HUEHNS, C. J . JOLLY
1966 Biochemical studies on hemoglobin variants of the irus macaque.yutsronlihgfedcaSRPNM Pro
ceedings of the Royal Society, B, 165:224244. BARNICOT, Ν. Α., P. T. WADE, P. COHEN
1970 Evidence for a second haemoglobin αlocus duplication in Macaca irus.
Nature 228:379381. BΔSCH, R. S.
1972 Haemoglobin polymorphism in the rhesus macaque.ywvutsrponmligedbaSQNHCB Nature New Bi
ology 238:238240. BIRDSELL, J . B.
1950 Some implications of the genetical concept of race in terms of spatial analysis. Cold Spring Harbor Symposia on Quantitative Biology
15:259314.
Effects of Isolation on Genetic Variability 123
1972 The problem of the evolution of human races: classification or clines? Social Biology 19:136162.
BISWAS, P. C.
1961 Ethnogeographic variations in dermatoglyphics. Proceedings of the
Scandinavian International Congress on Human Genetics 196: 14301449.
BOYER, S. Η. , E. F. CROSBY, T. F. THURMON, et al.
1969 Hemoglobins A and A2 in New World primates: comparative variation and its evolutionary implications. Science 166:14281431.
BOYER, S. Η., A. N. NOYES, C. F. TIMMONS, R. A. YOUNG
1972 Primate hemoglobins: polymorphisms and patterns. Journal of Human
Evolution 1:515543. BREHME, Η.
1967a Hautleisten System der Palma und Planta von sechs Arten der asiatischen Schlankaffen (Presbytis). ZeitschriftyvutsrponmlkihgfedcbaPNMJFECA fόr Morphologische Anthro
pologiezywvutsrponmlkihgfedcbaZVUTSPONMKJIHGEDCA 59:109145. 1967b Untersuchungen am Hautleisten System der Palma and Planta von Col
obus polykomos, Colobus badius, Colobus vertis und Nasalis larvatus.
Folia Primatologica 6:243283. 1968 Zur Variabilitδt des Hautleisten Systems der Meerkatzen (Cer
copithecus) und des Husarenaffen (Erythrocebus patas). Folia
Primatologica 9:4167. CHAI, C. K.
1971 Analysis of palm dermatoglyphics in Taiwan indigenous populations. American Journal of Physical Anthropology 34:369376.
DE JONG, w . w . w .
1971 Chimpanzee foetal haemoglobin: structure and heterogeneity of the γ
chain. Biochimica et Biophysica Acta 251:217226. DOBZHANSKY, T.
1957 Genetics of natural populations XXVI. Chromosomal variability in island and continental populations of Drosophila willistoni from Central America and the West Indies. Evolution 11:280293.
GOODMAN, M., A. KULKARNI, E. POULIK, E. REKLYS
1965 Species and geographic differences in the transferrin polymorphism of macaques. Science 147:884886.
HARRIS, H.
1970 The principles of human biochemical genetics. New York: American Elsevier.
HUGHES, D. R.
1967 Finger dermatoglyphics from Nuristan, Afghanistan. Man 2:121125.
HUISMAN, Τ. H. J . , W. A. SCHROEDER, W. H. BANNISTER, J. L. GRECH
1972 Evidence for four nonallelic structural genes for the γ chain of human fetal hemoglobin. Biochemical Genetics 7:131139.
HUNT, Ε. E.
1966 "The developmental genetics of man," in Human development. Edited by Frank Falkner. Philadelphia: W. B. Saunders.
ISHIMOTO, G.
1971 Electrophoretic patterns of red cell NADH diaphorase in macaque monkeys. Journal of the Anthropological Society of Nippon. 79:382387.
ISHIMOTO, G., Τ. TANAKA, H. NIGI, W . PRYCHODKO
1970 Hemoglobin variation in macaques. Primates 11:229241.
1 2 4 LAURA NEWELL MORRIS, PETER E. NUTE
ISHIMOTO, G. , T. TOYOMASU, K . I . UEMURA
1967 Serum transferrins of Japanese macaques: comparisons with other species of monkeys.ywvutsrponmlkihgfedcbaPNMJHGFEBA Primates 8:2934.
1968 Intraspecies variations of red cell enzymes and hemoglobin in Macaca
irus. Primates 9 : 3 9 5 ^ 0 8 . IWAMOTO, M.
1964 Morphological studies of Macaca fuscata. Dermatoglyphics of the hand. Primates 5:5373.
KOUBA, Ε. Ο. , H. KITCHEN
1970 A comparative structural study on the hemoglobins in Macaca speciosa.
Archives of Biochemistry and Biophysics 140:415424. KRAMER, G. , R. MERTENS
1938 Rassenbildung bei westistrianischen Inseleidechsen inyxwvutsrponmlkihgfedcbaYWTROMLJIHGECA Abhδngigkeit von Isolierungsalterund Arealgrφsse.vutsrponmlihgecaPNMFEAArch. Naturgeschichte 7:189234.
LAI, L. Y. C.
1972 Transferrins in Macaca irus. Folia Primatologica 17:193201. LOWE, c . H. , JR.
1955 An evolutionary study of island faunas in the Gulf of California, Mexico, with a method for comparative analysis. Evolution 9:339344.
MAYR, E.
1963 "Change of genetic environment and evolution," in Evolution as a process. Edited by J. Huxley, A. C. Hardy, and Ε. B. Ford. New York: Collier.
MIDLO, C., H. CUMMINS
1942 Palmar and plantar dermatoglyphics in primates. American Anatomical Memoirs, number twenty. Philadelphia: Wistar Institute of Anatomy and Biology.
MORRIS, L. Ν. , B. A. KERR
1974 Genetic variability in macaques: correlations between biochemical and dermatoglyphic systems. Journal of Human Evolution 3:223235.
NAPIER, J. R., P. H. NAPIER
1967 A handbook of living primates. New York: Academic Press. NEWMAN, Μ. T.
1960 Population analysis of finger and palm prints in highland and lowland Maya Indians. American Journal of Physical Anthropology 18:4558.
NUTE, P. Ε. , V. BUETTNERJANUSCH, J. BUETTNERJANUSCH
1969 Genetic and biochemical studies of transferrins and hemoglobins of Galago. Folia Primatologica 10:276287.
NUTE, P. Ε. , H. A. PATARYAS
1974 Multiple fetal and adult hemoglobins in Malaysian Macaca nemestrina:
consequences of αchain variation. American Journal of Physical
Anthropology 40:1725. NUTE, P. E., G. STAMATOYANNOPOULOS
1971a Evidence for duplication of the haemoglobin γ chain locus in Macaca
nemestrina. Nature New Biology 229:145147. 1971b The ontogenesis of hemoglobins in Macaca nemestrina. Blood
38:108115. POLLITZER, W. S.
1958 The Negroes of Charleston; a study of hemoglobin types, serology and morphology. American Journal of Physical Anthropology 16:241 263.
PRYCHODKO, W. , M. GOODMAN, E. POULIK, et al.
1969 Geographic variations of transferrin allelic frequencies in continental
Effects of Isolation on Genetic Variability 125
and insular macaque populations. Proceedings of the second Interna
tional Congress of Primatology 2:103108. PRYCHODKO, W. , M. GOODMAN, B. M. SINGAL, et al.
1971 Starchgel electrophoretic variants of erythrocyte 6phosphogluconate dehydrogenase in Asian macaques. Primates 12:175182.
RIFE, D. C.
1954 Dermatoglyphics as ethnic criteria. American Journal of Human Genetics 6:319327.
ROBERTS, D. F., Ε. Μ. COOPE, F. S. JACKSON, et al.
1968 Digital dermatoglyphics of a Lunana sample from North Bhutan. Man
3:519. SIMONS, E. L.
1963 Some fallacies in the study of hominid phylogeny. Science 141: 879889.
TASHIAN, R. Ε. , M. GOODMAN, V. E. HEADINGS, et al.
1971 Genetic variation and evolution in the red cell carbonic anhydrase isozymes of macaque monkeys. Biochemical Genetics 5:183200.
VAN VALEN, L.
1973 Review of Evolutionary biology, volume 6, edited by Theodosius Dobzhansky, Max K. Hecht, and William C. Steere. Science 180:488.
WADE, P. Τ., N. A. BARNICOT
1971 Studies on the minor haemoglobin components of anthropoid apes and New World monkeys. Comparative Biochemistry and Physiology 39B:659671.
WADE, P. Τ., N. A. BARNICOT, E. R. HUEHNS
1967 Possible duplication of haemoglobin αchain locus in the irus macaque. Nature 215:14851487.
1970 Structural studies on the major and minor haemoglobin of the monkey Macaca irus. Biochimica et Biophysica Acta 221:450466.

FrequencyDependent Selection and
the ABO Blood Groups
FRANK B. LIVINGSTONE
The causes of the variation in the ABO blood group gene frequencies among human populations have constituted a major problem for anthropology for more than fifty years. Despite the fact that in the 1920's some evidence was produced for associations between specific blood groups and various diseases, the blood group alleles were almost universally assumed to be neutral or nonadaptive, and their variations were ascribed to racial origins. Maternalfetal incompatibility is now generally accepted as occurring at the ABO locus (Wiener 1970), so that selection with regard to ABO is now known to exist. However, incompatibility selection acts against heterozygotes, so that the presence of this type of selection raises the problem of how a stable equilibrium with more than one allele present in appreciable frequency could exist for the ABO locus. The same problem was recognized earlier for the Rh blood group locus, and Haldane suggested that intermediate frequencies were due to recent admixtures of populations with only one allele. Thus, the general acceptance of an early European "race" which was predominantly Rhnegative resulted from this interpretation. Later, compensation was considered to be a possible factor which could lead to stable frequencies, but there is little evidence for its existence in human populations. In addition, compensation would have to be more complicated and of approximately equal value in many widespread human populations to maintain the ABO blood group frequencies.
Although incompatibility occurs at the ABO locus, the precise measurement of its selective effects has been a continuing problem. Most of the incompatibility selection at the ABO locus occurs between Ο mothers and A or Β offspring. Early estimates of incompatibility selection averaged about 20 percent, while later ones have been lower, about 10 percent. There is also evidence that conditions of life influence incom
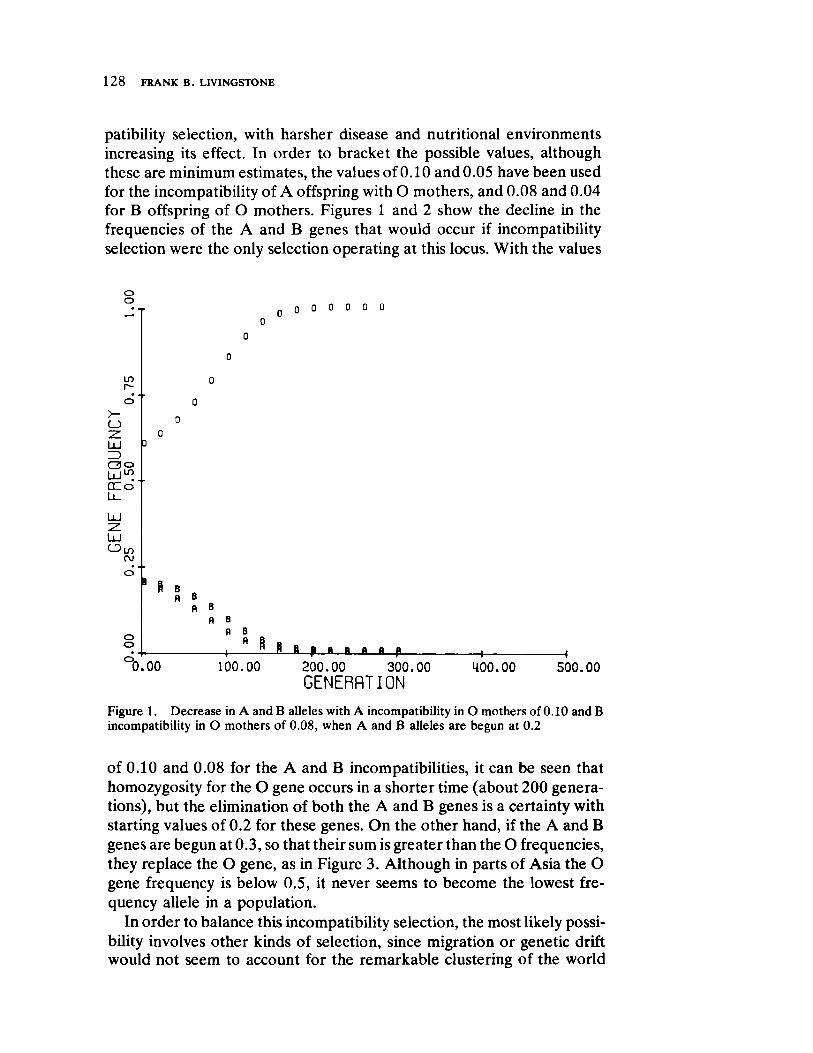
1 2 8VTSRONLKJIGFEA FRANK Β. LIVINGSTONE
patibility selection, with harsher disease and nutritional environments increasing its effect. In order to bracket the possible values, although these are minimum estimates, the values of 0.10 and 0.05 have been used for the incompatibility of A offspring with Ο mothers, and 0.08 and 0.04 for Β offspring of Ο mothers. Figures 1 and 2 show the decline in the frequencies of the A and Β genes that would occur if incompatibility selection were the only selection operating at this locus. With the values
ο ο O o 0 0 0 0 0
ο
ΙΛ Γ
Ο ζ.
LU Ρ ZD
C 3 0 UJ^ OCo U_ LU
UJ CDm
OJ
ο ο
ο
ο ο
ο
Η β R β
Β Β R Β
, " Β Β Ε ρ η a a a ρ ι ι
° 0 . 0 0 1 0 0 . 0 0 2 0 0 . 0 0 3 0 0 . 0 0 4 0 0 . 0 0 5 0 0 . 0 0
GENERATION
Figure 1. Decrease in A and Β alleles with A incompatibility in Ο mothers of 0.10 and Β incompatibility in Ο mothers of 0.08, when A and Β alleles are begun at 0.2
of 0.10 and 0.08 for the A and Β incompatibilities, it can be seen that homozygosity for the Ο gene occurs in a shorter time (about 200 generations), but the elimination of both the A and Β genes is a certainty with starting values of 0.2 for these genes. On the other hand, if the A and Β genes are begun at 0.3, so that their sum is greater than the Ο frequencies, they replace the Ο gene, as in Figure 3. Although in parts of Asia the Ο gene frequency is below 0.5, it never seems to become the lowest frequency allele in a population.
In order to balance this incompatibility selection, the most likely possibility involves other kinds of selection, since migration or genetic drift would not seem to account for the remarkable clustering of the world

FrequencyDependent Selection and the ABO Blood Groups 129
ο ο
LT) Γ»
CJ ~ΖL U
ZD C 3 0 LU^ CCo
Lά
o j
ο ο
n O O O O O O O O 0 u
δ Μ ι
f Μ η a ι ι f
0 . 00 100.00 200.00 300.00
GENERATI ON 400.00 500.00
Figure 2. Same decrease as in Figure 1 but with 0.05 A incompatibility and 0.04 Β incompatibility
ο ο
ιΓ) r
CJ Ζ LLJ
rd σ ο ό j 1 " C C o
LLJ
CVI
ο ο
Β Β Β Β Β Β Β Β Β Β Β
• · . • • : ° » · : "
Β Β fl η η fi η fi ft fl R η R η fl fl fl A
ο ο ο ο ο
0 0 0 0 0
0 . 00 100.00 200.00 300 . 00
GENERATI ON 400 . 00 500.00
Figure 3. Replacement o f Ο allele by A and Β alleles when the latter are both begun at 0.3 with same incompatibility as Figure 1
1 3 0VTSRONLKIGFEA FRANK Β. LIVINGSTONE
frequencies of the ABO genes. The ABO blood groups have been found significantly associated with many types of disease. Given the evolutionary effect of infectious disease it does seem to be the most probable cause of the balancing selection. As CavalliSforza and Bodmer (1971) have shown, the effect on fitness of duodenal ulcer is only 10 4 or 105, since it acts in later life after most reproduction has occurred. Many other diseases, such as stomach cancer, that have been associated with the ABO blood groups would also have a minimal effect on fitness. On the other hand, the associations with infectious diseases, such as smallpox and others, which have been emphasized by Vogel (1970), could apparently have an effect on fitness sufficient to balance incompatibility selection and result in stable equilibrium frequencies.
Although the mortality from infectious disease could possibly lead to sufficient selection to stabilize the ABO frequencies, this effect would also depend on the manner in which diseases alter the fitness of various genotypes. All studies which have attempted to estimate the fitness of the ABO genotypes (Brues 1963; Livingstone 1969; Thoma 1970) have assumed the heterozygotes to have increased fitness over their homozygote counterparts. More recently, CavalliSforza and Bodmer (1971) have stated that some selection effectively favoring heterozygotes must counterbalance incompatibility selection (p. 213). This paper will show that this is not necessarily true, and that the physiological evidence seems to support the alternative suggested here — frequencydependent selection.
The general assumption behind many of the associations of the blood groups with infectious diseases is that the possession of common antigens result in an inability of the host to develop an immunity to the infecting organism. Even if this inability were not complete, the common antigenicity would at least decrease the resistance of the host. A great many infectious organisms have been found to have antigens which crossreact with the ABO antigens. These include pneumonia, plague, smallpox, srolihecaE
Escherichia coli, and many others (summarized in Otten 1967 and Livingstone 1960). If the possession of a common antigen decreases the resistance of the genotype to a particular disease, then it follows that heterozygotes have on the average a fitness lower than that of homozygotes since they have more antigens. Thus, selection against heterozygotes by infectious disease seems to contradict the usual model of selection at the ABO locus.
If selection is assumed to act against specific antigens, then assigning a specific selective coefficient to each antigen so that heterozygotes would have two such selective coefficients would not result in a stable polymorphic equilibrium. On the other hand, the foregoing is true only if the antigenic similarities and the selective coefficients were to persist for several generations. Parasites adapt to their hosts, and many cases of host

FrequencyDependent Selection and the ABO Blood Groups 131
transfer by parasites have been recorded in recent years. The rate of such adaptive evolution by parasites probably varies with the size of the parasite — viruses evolve faster than helminths — but in all cases the parasites evolve much faster than their hosts. The adaptations of parasites would also vary with the particular tissues of the host they invade. The HLA histocompatibility system is now related to several diseases (Bodmer 1972), and blood parasites are being investigated for common antigens (Clegg, Smithers, and Terry 1971 on schistosomes). However, a central problem of this approach is to ascertain the manner in which parasites acquire the antigens of their hosts.
If the parasite synthesizes its own antigens and these adapt by genetic change to resemble the host antigens, then the rate of change is limited by the rate at which genetic substitution could occur in parasites. However, if parasites acquire antigens from their hosts, then the rate of change could be much faster. Clegg, Smithers, and Terry (1971) have discussed these alternatives for schistosomes, and it seems evident that even organisms as large as these worms can acquire antigens of their hosts. It is also known that viruses acquire the antigens of the host cells they infect. In both cases it seems likely that in the transfer of the disease from one host to another, recipients would be more susceptible if they possessed antigens which were common in the population. In fact, it follows that with fewer antigens individuals would have a greater probability of successfully resisting the infective organism.
In the computer models an attempt has been made to include both types of parasitic antigens, since it appears that some diseases may be due to parasites which synthesize their own antigens and some to those which acquire host antigens. The equations of gene frequency change are given in Livingstone (1969), but with the following genotype fitnesses:
Genotype and frequency Fitness
where DV, DA, DB, and DO are the selection coefficients due to viruses and antigenically similar parasites. For this model, the selection by viruses is frequencydependent, while the antigenically similar parasites select against specific antigens and hence more against heterozygotes. Frequencydependent selection also acts more strongly against heterozygotes, since they are usually more frequent.
Figures 411 show various computer runs using different values of
AA AB AO BB BO OO
(l.DV*AA)*(l.DA)
(l.DV*AB)*(l.DA)*(lDO)
(l.DV*AO)*(l.DA)*(l.DO)
(l.DV*BB)*(l.DB)
(1 .DV*BO)*{ 1 .DB)*( 1 .DO)
(l.DV*00)*(l.D0)

1 3 2 FRANK Β. LIVINGSTONE
incompatibility selection and ofVODBA DV, DA, DB, and DO. Figures 4 and 5 show the approach of the A and Β frequencies to the average frequencies of Western European populations. Since these frequencies are approached from both higher and lower frequencies, there appears to be a stable equilibrium. The fitness of the genotypes varies with their frequency, and withDV = 0.15 the OO genotype, the most frequent at 0.45, has a fitness of about 0.93. The AO and A A genotypes cannot be distinguished, but the AO would have a fitness of 0.946 and AA, of 0.989; so that the weighted average would be about 0.954. These minimal differences in fitness could be the major reason that evidence for selection at the ABO locus has been so difficult to obtain. In addition, with the gene frequencies changing and the parasites continually adapting to the host's antigens, the fitness would be constantly changing.
Figures 6 and 7 show the same approaches to equilibrium with less incompatibility and parasite selection. The equilibrium still appears to be stable, although the stable frequencies are somewhat different and approximate the average for New Guinea populations. I do not mean to imply that there is less selection in New Guinea, but only that ABO frequencies which are close to the average for the world can be approximated by this amount of selection. Figure 8 shows the approach to equilibrium for A and Β frequencies which are close to the highest in the Old World. It can be seen that with the selection by viruses or DV the same as the previous value in Figures 4 and 5, then with a change of only 0.002 for the A antigen and 0.025 for the Β antigen, the range of ABO frequencies in the Old World can be generated.
Figures 9 and 10 present two runs which attempt to bracket the amount of selection necessary to maintain the A and Β genes in the population. For incompatibility selection of 0.05 and 0.04 for A and B, and for antigen selection of about 0.01, the amount of virus selection would have to be greater than 0.035 for both the A and Β gene to remain in the population. With DV = 0.05, it can be seen that there is an equilibrium with very low A and Β frequencies.
Finally, several runs were made to determine the maximum rate of increase for a rare allele. Several North American Indian tribes have very high frequencies of blood group A. If disease is a major factor determining the frequencies of the ABO alleles, it seems likely that these frequencies are due in part to the epidemics of smallpox and other diseases which decimated these tribes at contact. With DV = 0.2 and no antigen selection, it takes about 100 generations for the A allele to increase to equilibrium, which would be 2,000 years at least. However, as shown on Figure 12, with D V = 0.5 in fifteen to twenty generations the A gene has approached 0.5. Although 0.5 is an enormous amount of selection, many of the accounts of smallpox epidemics seem to show death rates close to this figure (Stearn and Stearn 1945; Wissler 1936). This interpretation is
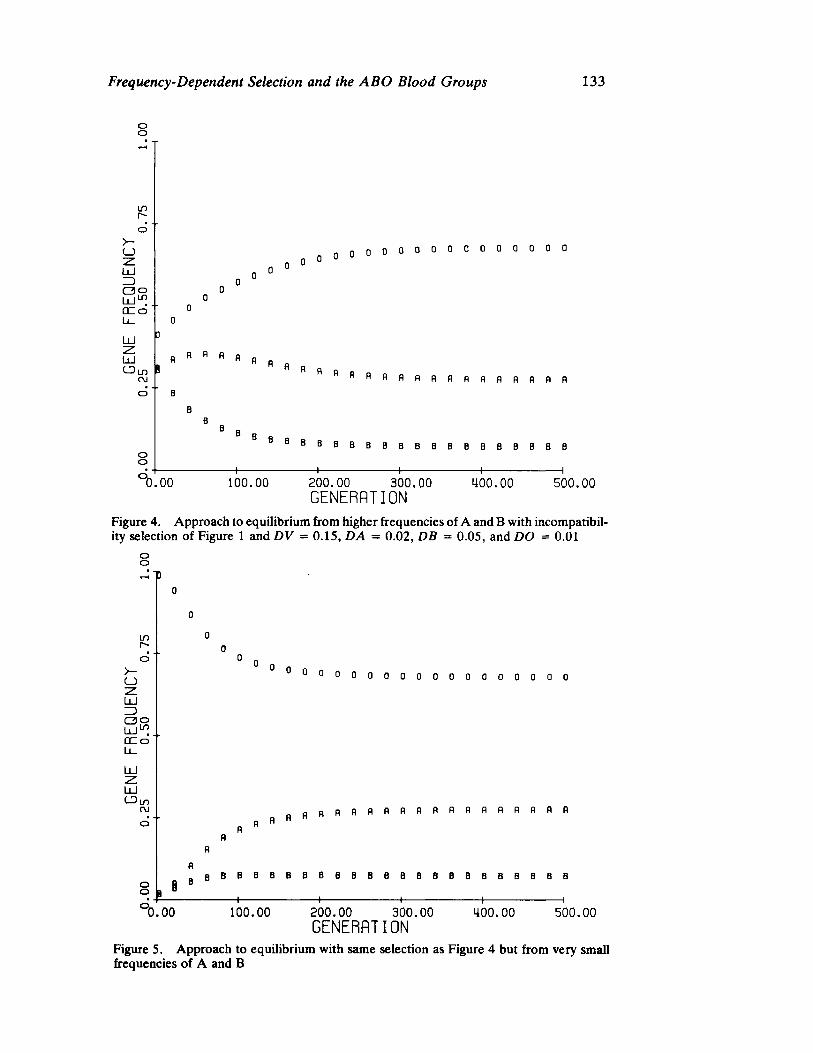
FrequencyDependent Selection and the ABO Blood Groups 133
ο ο
LO
LJ
σ ο U J ^ GCo
LU TRONIGEAO l d
c\j
ο ο
0 0 ο 0 0 0 0 0 0 0 0 0 0 0 0
fl A A " η fl fl fi Η fl fl A fl A A f l R f l f l A R f l
0 Β Β B B B B B B B B B B B Β Β Β Β Β Β
0.00 100.00 200.00 300.00 400.00 500.00 GEN ERA T I O N
Figure 4. Approach to equilibrium from higher frequencies of A and Β with incompatibility selection of Figure 1 andVODBA DV = 0.15, DA = 0.02, DB = 0.05, and DO = 0.01
ο ο
in r
CJ Z. L U ZDZD C30 LL ٧ ^ OCCO ο
<D in OJ
ο ο
° ° 0 0 0 0 0 0 0 0 0 0 0 0 0 0 0 0
fl A q q f l f i f i f l f l A A A A A A A A A
I Β β Β Β Β Β Β Β Β Β Β Β Β Β Β Β Β Β Β Β Β Β Β
0.00 100.00 200.00 300.00 400.00 500.00 GEN ERA T I O N
Figure 5. Approach to equilibrium with same selection as Figure 4 but from very small frequencies of A and Β
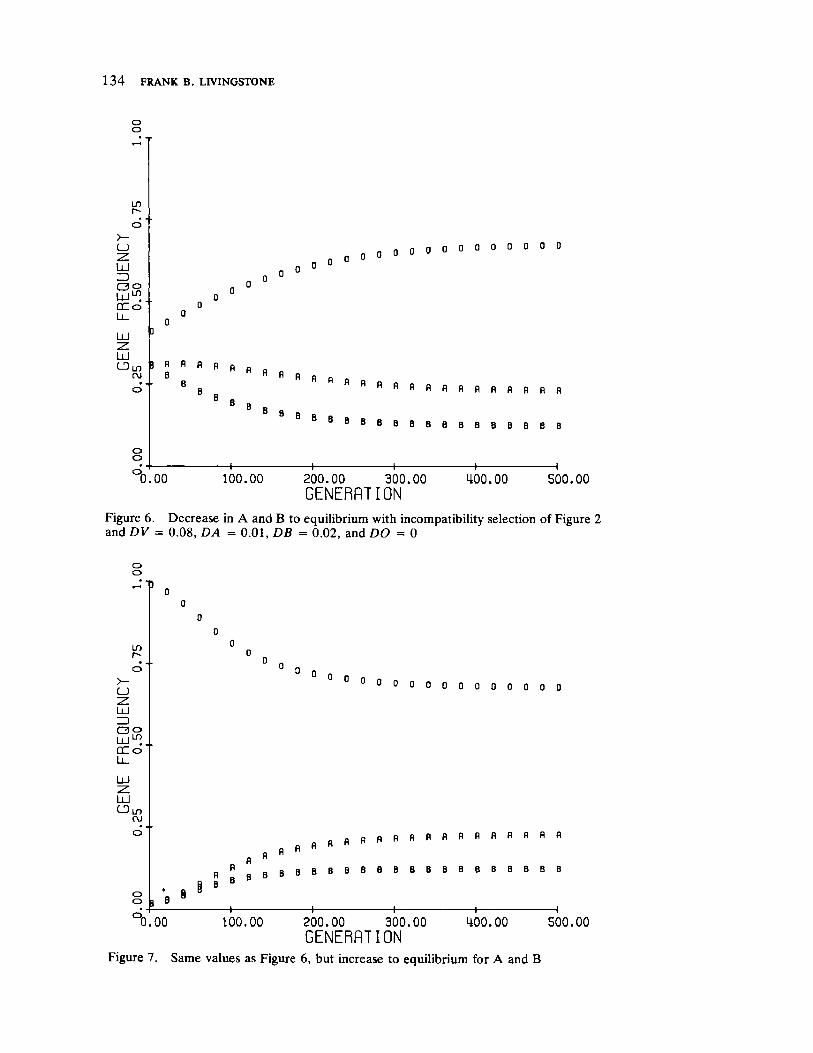
1 3 4 FRANK Β. LIVINGSTONE
ο ο
LT) Γ
(J ZVODCBA~Ζ. LU ZD C3 ο U J ^ CO ο U_
άJ ζ. UJ
in CM
Ο Ο
0 0 ο ο ο ο ο ο ο ο ο ο ο
> Β " fl fl » « « A Β
' • · .
fi fl fl
8 8 Β Β Β
" R fi fl A A A A A A A A fl fl
b b b b b b b b b b b b b b
0.00 —I
1 0 0 . 0 0
+ I 200.00 300.00 GEN ER A T I ON
400.00 500.00
Figure 6. Decrease in A and Β to equilibrium with incompatibility selection of Figure 2 and DV = 0.08, DA = 0.01, DB = 0.02, and DO = 0
ο ο Τ)
L O Γ
CJ
C30 άJL" QC Ο Ll_
άJ
L٧ CΟιλ
CM d
ο ο
ο ο ο ο 0 0 0 0 0 0 0 0 0 0 0
fl fl A fl A fl f l f lAAAAAAAAA
Β Β b b b b b b b b b b b b b b b b b b
+ Η 0.00 100.00 200.00 300.00
GEN ER A T I ON 400.00 500.00
Figure 7. Same values as Figure 6, but increase to equilibrium for A and Β

FrequencyDependent Selection and the ABO Blood Groups 135
ο ο - ID
L0 Γ -
LJ
ZD C3 ο omULJGCLό m
GCo
UJ
C\J
ο ο
0 0 ο ο ο 0 ο 0 0 0 0
β 8
A fi A fl fl fl fl R " fl
I g g Β Β Β Β 8 Β Β Β Β Β Β Β Β Β A fl Α
0.00 100.00 200.00 300.00 400.00 500.00
GENERAT I ON
Figure 8. Approach to equilibrium which is close to highest values of A and Β in the world with same values for selection as Figure 4 and 5 except DA = 0.018 and DB = 0.025
ο ο - Τ ο
LT)
ί -ο
σ ο LU ^ CCo
in Od
Ο Ο
0 ο
3 Β Β
0 0 0 0 0 0 0 0 0 0 0 ο ο ο ο ο
Β β Β Β Β
β β β β β β i a 8 8 8 8 8 § 1 1 8
•^b.OO 100.00 200.00 300.00 400.00
GENERAT I ON
Η 500.00
Figure 9. Increase from small beginning values of A and Β with incompatibility of Figure 2 and DV = 0.05, DA = 0.01, DB = 0.015, and DO = 0.005
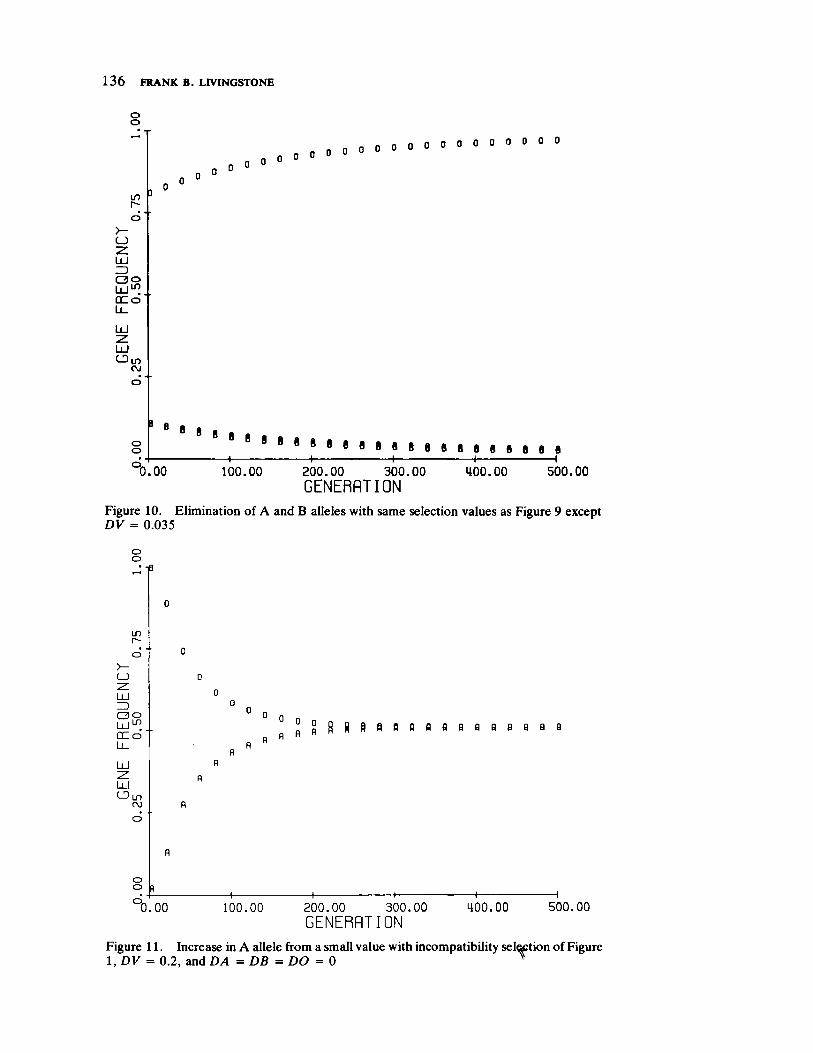
1 3 6 FRANK Β. LIVINGSTONE
ο ο
ο ° 0 0 ο 0 ο 0 0 0 0 0 0 0 0 0 0 0 0
β β Β Β β Β 8 β 8 β β β β β Β Β β β β β β β β β Β
0 .00 100.00 200.00 300.00
G EN ER A T I O N
4400.00
Η 500.00
Figure 10. Elimination of A and Β alleles with same selection values as Figure 9 except VODBADV = 0.035
ο ο
0 ο ο η η fl H f l f l H Q a a a a a a a a a
ο ο
0 .00 100.00 200.00 300.00 400.00 500.00 G EN ER A T I O N
Figure 11. Increase in A allele from a small value with incompatibility selection of Figure 1, DV = 0.2, and DA = DB = DO 0 λ
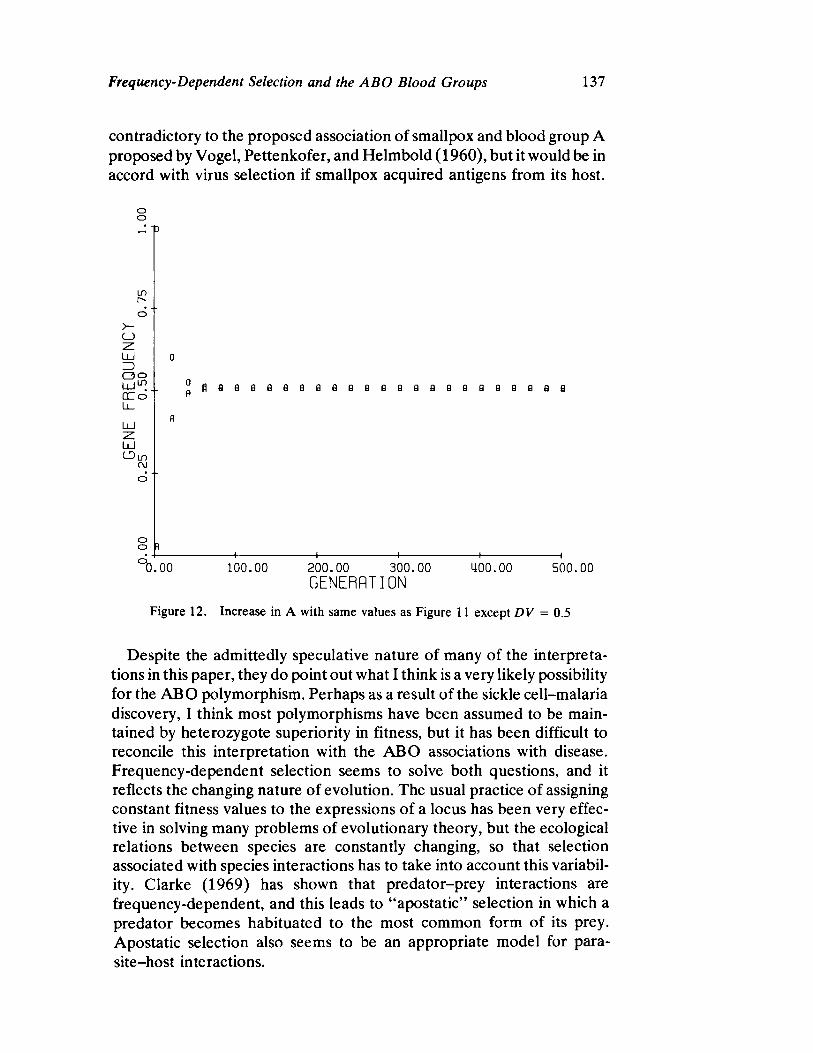
FrequencyDependent Selection and the ABO Blood Groups 137
contradictory to the proposed association of smallpox and blood group A
proposed by V ogel, Pettenkofer, and Helmbold (1960), but it would be in
accord with virus selection if smallpox acquired antigens from its host.
ο ο ~ "Ρ
LT) r-ο
>
σ ο LU^I ο oRLJCC C o " R
LLJ
COlti <\j
e a a a a a a a a e B a a a a a a a a a a a
ο ο
° 0.00 100.00 200.00 300.00 400.00 500.00 GENERATI ON
Figure 12. Increase in A with same values as Figure 11 except DV = 0.5
Despite the admittedly speculative nature of many of the interpreta-
tions in this paper, they do point out what I think is a very likely possibility
for the A BO polymorphism. Perhaps as a result of the sickle cell-malaria
discovery, I think most polymorphisms have been assumed to be main-
tained by heterozygote superiority in fitness, but it has been difficult to
reconcile this interpretation with the A BO associations with disease.
Frequency-dependent selection seems to solve both questions, and it
reflects the changing nature of evolution. The usual practice of assigning
constant fitness values to the expressions of a locus has been very effec-
tive in solving many problems of evolutionary theory, but the ecological
relations between species are constantly changing, so that selection
associated with species interactions has to take into account this variabil-
ity. Clarke (1969) has shown that predator-prey interactions are
frequency-dependent, and this leads to " apostatic" selection in which a
predator becomes habituated to the most common form of its prey.
A postatic selection also seems to be an appropriate model for para-
site-host interactions.

1 3 8ZYWVUTSRONMLKJIHGFEDCBA FRANK Β. LIVINGSTONE
In recent years the histocompatibility system with two presumed loci and multiple alleles at each has come to approximate the blood groups with its three major loci with multiple alleles (Bodmer 1972). These genetic systems are the major "self" antigens which lead to the rejection of foreign antigens by the individual. The HLA histocompatibility genes are now found to be associated, like blood groups, with various diseases. Bodmer (1972) mentioned but did not consider likely the possibility of frequencydependent selection at the HLA loci. But it would seem advantageous for the population to have many antigens, so that the likelihood of an invasive parasite encountering a foreign antigen would be increased, However, heterozygosity would be selected against, so that what is adaptive for the population is not adaptive for the individual. Bodmer (1972) considered this possibility for the HLA histocompatibility genes but rejected it because of the ineffectiveness of group selection. There has been great reluctance in biology to accept the concept of group selection, as is evidenced by the popularity of Williams's defense (1966) of individual selection as a total explanation of evolution and by Hamilton's interpretation (1964) of altruism by kin selection. Nevertheless, populations do compete for ecological niches. The entire theory of population ecology is based on population competition, and this competition surely has great genetic consequences. It can be shown that inbreeding is "bad" for the individual in that it increases the probability of homozygosity for a deleterious gene, but it is "good" for the population since it reduces the frequencies of deleterious genes. Similarly, altruism or antigenic complexity may be due to comparable genetic processes, and this paper has attempted to show that a frequencydependent model with lower fitnesses for heterozygotes fits reasonably well with our knowledge of selection at the ABO locus.
REFERENCES
BODMER, W. F.
1972 Evolutionary significance of the HLA system.yvutsrponmlihgfedcaTSPNJHBA Nature 237:139145. BRUES, A. M.
1963 Stochastic tests of selection in the ABO blood groups. American
Journal of Physical Anthropology 21:287299. CAVALLISFORZA, L. L., W. F. BODMER
1971 The genetics of human populations. San Francisco. W. H. Freeman. CLARKE, B.
1969 The evidence for apostatic selection. Heredity 24:347352. CLEGG, J . Α., S. R. SMITHERS, R. J . TERRY
1971 Acquisition of human antigens by Schistosoma mansoni during cultivation in vitro. Nature 232:653654.
HAMILTON, W. D.
1964 The genetical evolution of social behavior. Journal of Theoretical Bi
ology 7:152.
FrequencyDependent Selection and the ABO Blood Groups 139
LIVINGSTONE, F. B.
1960 Natural selection, disease, and ongoing human evolution, as illustrated by the ABO blood groups. Human Biology 32:1727.
1969 An analysis of the ABO blood group clines in Europe. American Journal of Physical Anthropology 31:19.
ot ten, c. M. 1967 On pestilence, diet, natural selection, and the distribution of microbial
and human blood group antigens and antibodies. Current Anthropology
8:209226. STEARN, E. W., A. E. STEARN
1945 The effect of smallpox on the destiny of the Amerindian. Boston: B. Humphries.
THOMA, A.
1970 Selective differentiation of the ABO blood group gene frequencies in Europe. Human Biology 42:450468.
VOGEL, F.
1970 ABO Blood groups and disease. American Journal of Human Genetics 22:464475.
VOGEL, F., Η. J . PETTENKOFER, W. HELMBOLD
1960 Uber die PopulationsGenetiks der ABO Blutgruppen. Acta Genetica
et Statistica Medica 10:267294. WIENER, A. S.
1970 Blood groups and disease. American Journal of Human Genetics 22:476483.
WILLIAMS, G. C.
1966 Adaptation and natural selection. Princeton, N.J.: Princeton University Press.
WISSLER, c .
1936 Population changes among the Northern Plains Indians. Yale University Publications in Anthropology No. 1. New Haven: Yale University Press.

Impact of Neutral Mutations on
Evolution
GEORGE R. GLUESING and FATHI ABDELHAMEED
In the last decade molecular evolution has been firmly established as a subdiscipline in the already swollen ranks of biology. The topic quickly filled the available journals and stimulated the founding of at least one, wvutsrqponlihfedcaTMJEDA
The Journal of Molecular Evolution. The critical factor in its birth, following Sanger's initial success with bovine insulin (Sanger and Tuppy 1951a, 1951b, Sanger and Thompson 1953a, 1953b), was the identification of the amino acid sequences of homologous proteins. In 1965, in order to integrate and compile all of the known sequences in one reference, Dayhoff (1971) published the Atlas of protein sequence and
structure. Among the first to attempt the interpretation of the protein sequence data in terms of evolution were Zuckerkandl and Pauling (1965). Shortly thereafter Kimura (1968a, 1969) put forth the neutral allelerandom drift theory to explain the evolution of proteins at the molecular level. Essentially, Dr. Kimura contends that most accepted point mutations of PAMs (changes in amino acids at specific sites in proteins) are selectively neutral. More explicitly, this means that they have an equivalent or nearly equivalent selective character with respect to the original protein. As a consequence, they will be fixed primarily by random processes. Strong support was quickly given by King and Jukes (1969) and Arnheim and Taylor (1969).
King and Jukes (1969) have used the term nonDarwinian to identify the concept of neutral evolution. This term, however, can be misleading. As Crow (1972a) has emphasized, such evolution is not a "rival" to evolution as a result of natural selection. It is, rather, an attempt to describe the evolution of those molecular changes that are selectively indistinguishable. Much of the controversy is centered around whether such mutations constitute a significant fraction of those observed. It is our opinion that neutral (nonDarwinian) evolution is complementary to the
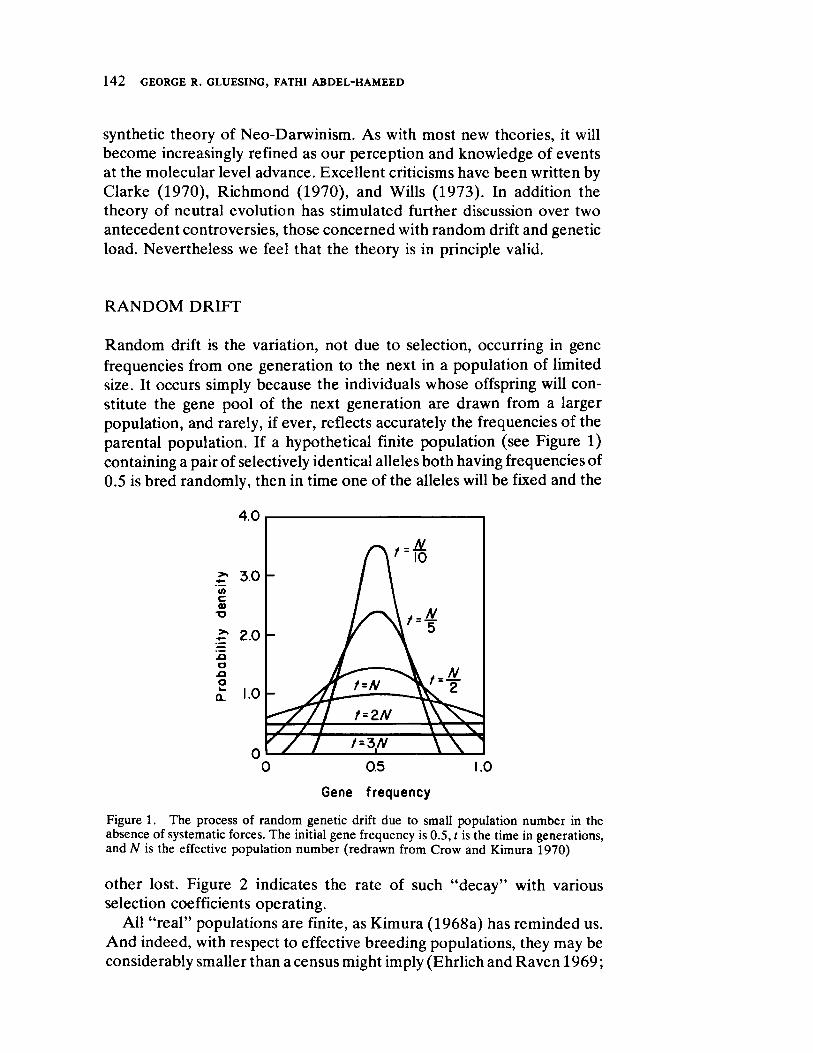
1 4 2UTSRONMLIHGFEDBA GEORGE R. GLUESING, FATHI ABDELHAMEED
synthetic theory of NeoDarwinism. As with most new theories, it will
become increasingly refined as our perception and knowledge of events
at the molecular level advance. Excellent criticisms have been written by
Clarke (1970), Richmond (1970), and Wills (1973). In addition the
theory of neutral evolution has stimulated further discussion over two
antecedent controversies, those concerned with random drift and genetic
load. Nevertheless we feel that the theory is in principle valid.
R A N D O M D RIFT
Random drift is the variation, not due to selection, occurring in gene
frequencies from one generation to the next in a population of limited
size. It occurs simply because the individuals whose offspring will con
stitute the gene pool of the next generation are drawn from a larger
population, and rarely, if ever, reflects accurately the frequencies of the
parental population. If a hypothetical finite population (see Figure 1)
containing a pair of selectively identical alleles both having frequencies of
0.5 is bred randomly, then in time one of the alleles will be fixed and the
'< / > cc a> Ό
>.
!φ σ χ» ο k_
Ο 0. 5 1.0
Gene f r e que ncy
Figure 1. The process of random genetic drift due to small population number in the absence of systematic forces. The initial gene frequency is 0.5, t is the time in generations, and Ν is the effective population number (redrawn from Crow and Kimura 1970)
other lost. Figure 2 indicates the rate of such "decay" with various
selection coefficients operating.
All "rea l" populations are finite, as Kimura (1968a) has reminded us.
And indeed, with respect to effective breeding populations, they may be
considerably smaller than a census might imply (Ehrlich and Raven 1969;
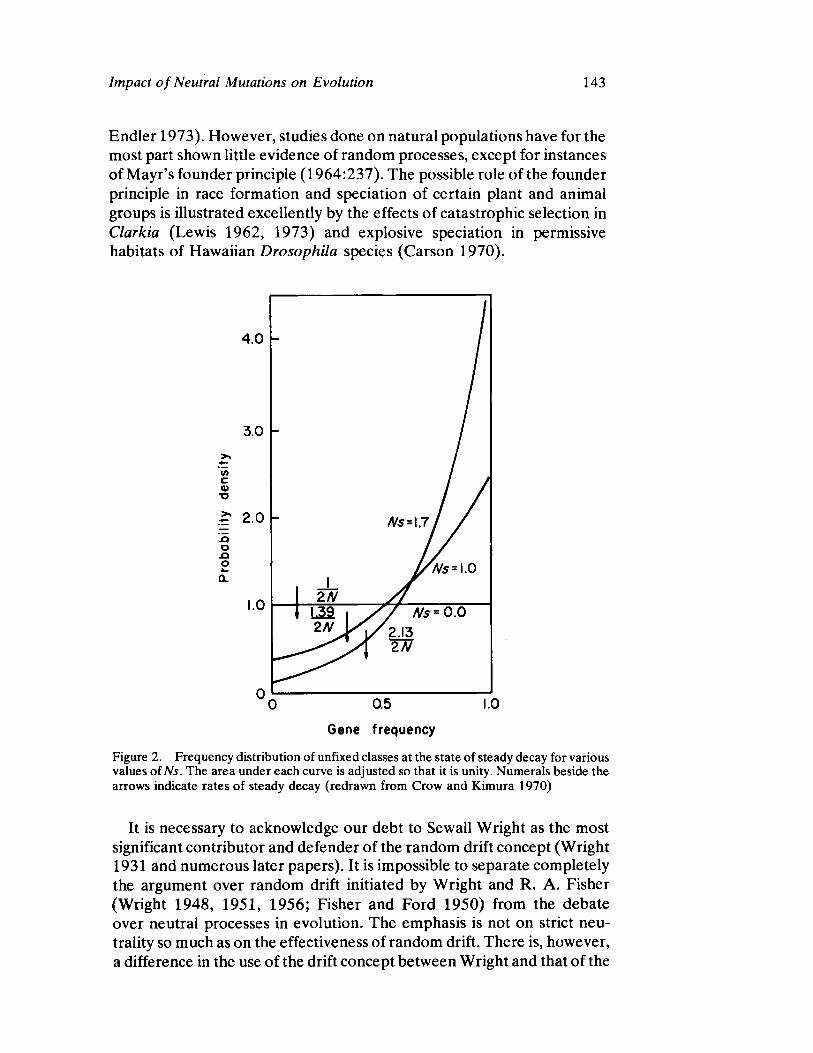
Impact of Neutral Mutations on Evolution 143
Endler 1973). However, studies done on natural populations have for the most part shown little evidence of random processes, except for instances of Mayr's founder principle (1964:237). The possible role of the founder principle in race formation and speciation of certain plant and animal groups is illustrated excellently by the effects of catastrophic selection in Clarkia (Lewis 1962, 1973) and explosive speciation in permissive habitats of Hawaiian Drosophila species (Carson 1970).
4.0
3.0
c a> Ό
χ 2 .0 Έ ο _Q Ο χ
1.0
° 0 0.5 1.0
Gene frequency
Figure 2. Frequency distribution of unfixed classes at the state of steady decay for various values of Ns. The area under each curve is adjusted so that it is unity. Numerals beside the arrows indicate rates of steady decay (redrawn from Crow and Kimura 1970)
It is necessary to acknowledge our debt to Sewall Wright as the most significant contributor and defender of the random drift concept (Wright 1931 and numerous later papers). It is impossible to separate completely the argument over random drift initiated by Wright and R. A. Fisher (Wright 1948, 1951, 1956; Fisher and Ford 1950) from the debate over neutral processes in evolution. The emphasis is not on strict neu-trality so much as on the effectiveness of random drift. There is, however, a difference in the use of the drift concept between Wright and that of the

1 4 4 GEORGE R. GLUESING, FATHI ABDELHAMEED
proponents of neutral mutations (that is, Kimura). Wright uses drift as a means by which a population can move from one adaptive "peak" to another in his "shifting balance theory" of evolution. This ability is advantageous where there are several peaks with varying adaptive values. Random drift prevents a population from being irrevocably trapped in any one particular peak (for further references on adaptive peaks see Wright 1970; Dobzhansky 1970: 2428). In the present context, random drift is the primary mode of fixing neutral alleles.
It was suggested by Kimura and Crow (1964; Kimura 1971) that any mutation may be considered unique at the molecular level due to the enormous number of nucleotide pairs found in the genome and the even larger number of permutations possible. For example, in the cistron coding for alphahemoglobin in mammals alone, there are approximately 10254 allelic alternatives theoretically possible (Kimura 1971). In this context recurrent mutation becomes a negligible factor. In the case of neutral or almost neutral mutations, random drift is left to play the predominant role in their fixation or loss.
EFFECTIVE NEUTRALITY
Neutral mutations can be defined as those that behave as if they were selectively neutral when observed over an extended period of time. They may, in fact, have at any given moment a small selection coefficient. There are three general situations in which this may occur.
The first is in relatively small populations. Inbreeding depression is an obvious, if perhaps extreme, example. Experiments by Dobzhansky and Pavlovsky (1957) demonstrated distinct drifting of the frequency of Pike's peak chromosomal arrangement in initially small populations of usrpolihedcbaND
Drosophila pseudoobscura (see Figures 3 and 4). Large populations, however, showed the frequency to be under the control of strong selective forces. According to Kimura (1968b; Kimura and Ohta 1972; Ohta and Kimura 1971a) the critical quantity is Nes, where Ne is the effective population number, and s is the selection coefficient. If 4Λ^ is "much smaller than unity," then the allele may be considered "nearly neutral."
The second situation occurs when the selection coefficient is highly variable (and this is probably the most likely case), fluctuating around the neutral point. The mutation will then have nearly the same probability of being fixed as if it were neutral (Crow 1972b; Ohta 1972a). The effect is the same as reducing the value of N j . This is in agreement with Robertson (1962) and Ewens and Thomson (1970) who concluded that heterotic selection, unless strong, is ineffective in retarding fixation. Figure 5 shows the probability of a mutation being fixed as a function of Nj .

Impact of Neutral Mutations on Evolution 145
Jun. Oct. Nov. 1955 1955 1956
Figure 3. The frequencies (in percent) of PP chromosomes in ten experimental populations of Drosophila pseudoobscura (redrawn from Dobzhansky and Pavlovsky 1957)
Jun. Oct. Nov. Θ55 1955 1956
Figure 4. The frequencies (in percent) of PP chromosomes in ten experimental populations of Drosophila pseudoobscura (redrawn from Dobzhansky and Pavlovsky (1957)
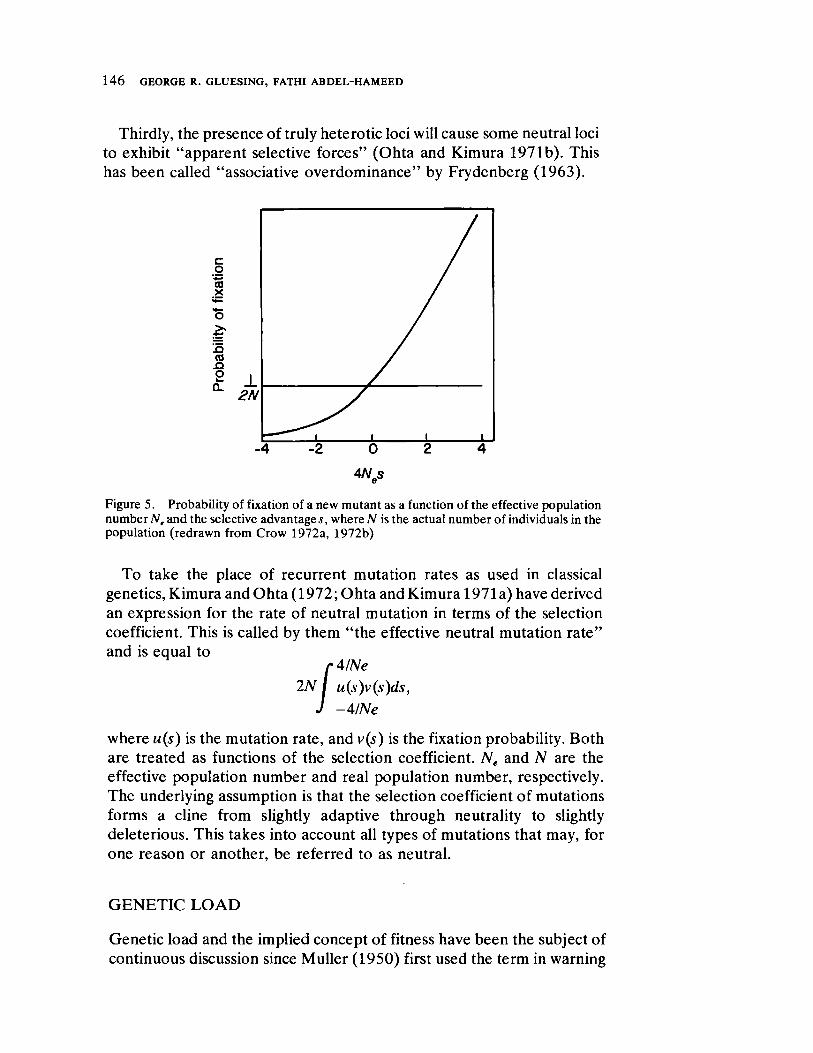
1 4 6yxwvutsrqponmlkjihgfedcbaUTSRONMLKIHGFEDCBA GEORGE R. GLUESING, FATHI ABDELHAMEED
Thirdly, the presence of truly heterotic loci will cause some neutral loci to exhibit "apparent selective forces" (Ohta and Kimura 1971b). This has been called "associative overdominance" by Frydenberg (1963).
Figure 5. Probability of fixation of a new mutant as a function of the effective population number N e and the selective advantages s, where Ν is the actual number of individuals in the population (redrawn from Crow 1972a, 1972b)
To take the place of recurrent mutation rates as used in classical genetics, Kimura and Ohta (1972; Ohta and Kimura 1971a) have derived an expression for the rate of neutral mutation in terms of the selection coefficient. This is called by them "the effective neutral mutation rate" and is equal to
where m(s) is the mutation rate, and v(s) is the fixation probability. Both are treated as functions of the selection coefficient.seN Ne and Ν are the effective population number and real population number, respectively. The underlying assumption is that the selection coefficient of mutations forms a cline from slightly adaptive through neutrality to slightly deleterious. This takes into account all types of mutations that may, for one reason or another, be referred to as neutral.
- 4 - 2 0 2
4Ns
4
GENETIC LOAD
Genetic load and the implied concept of fitness have been the subject of continuous discussion since Muller (1950) first used the term in warning
Impact of Neutral Mutations on Evolution 147
of the dangers of an increased mutation rate in man. In this usage he was supported by Dobzhansky (1957). When the concept was further developed for general usage, however, a number of criticisms appeared (see, for example, Brues 1969). The subject as a whole has been reviewed excellently by Wallace (1970). Crow (1958) has defined genetic load as "the proportional amount by which the average fitness of a population is reduced relative to that of the optimal genotype." In the present context we are interested in two elementary forms usually referred to as "substitutional load" (Kimura 1960) and "segregational load."
Haldane (1957,1960) first introduced the idea of substitutional load as "the cost of natural selection." The load, or cost, referred to the number of selective deaths that would occur in a deteriorating environment before a new favorable mutant could raise the fitness of the population to a level compatible with survival. If selection is too intense, then the population will become dangerously small before individuals with the adaptive mutations can become sufficiently numerous. Kimura (1968a) calculated that in mammals the rate of nucleotide substitution has been one substitution every two years, agreeing with Haldane's much lower limit, Kimura concluded that most of the nucleotide substitutions have been neutral.
However, Smith (1968) criticized this conclusion on two points. First, Kimura assumed that the whole genome is coded for proteins. Callan (1967) and Whitehouse (1967) have proposed a "masterslave" hypothesis which suggests that the total DNA content of the nucleus may be several times the amount of heritable DNA. In addition, satellite DNA studies have produced evidence strongly suggesting that heterochromatin does not generally code for proteins (Yunis and Yasmineh 1971). Secondly, Smith criticized the validity of Haldane's limit on the basis that his assumptions were unrealistic. To allow for the simultaneous selection of many alleles, Smith proposed a truncated selection model. The essential characteristic of this model is the idea of a threshold in terms of adaptive mutations. Selection tends to eliminate only those individuals that have a number of adaptive mutations below the threshold. This, however, presumes that there is little or no selective differential between the various genotypes above the threshold. O'Donald (1969) has argued that this is also unrealistic, and he proposed the quadrate optimum model which predicts results closer to Haldane's estimate.
Intrinsic to much of the criticism of genetic load estimates is the matter of arbitrary assignment of unity to the optimum genotype, which may be exceptionally rare in a polymorphic population (see Van Valen 1963; Brues 1964; Feller 1967). However, as long as one can measure a difference in fitness, that is, more of type A survive and reproduce than type B, then the assignment of unity to the optimum genotype is reasonable.
1 4 8 GEORGE R. GLUESING, FATHI ABDELHAMEED
The more appropriate question iswutsrponlihedcbaD what constitutes an optimum genotype? In the case of substitutional load, the stipulation by Haldane that the old genotype is being selected against makes the assignment of unity as the fitness value for the new favored genotype unavoidable. The only necessary condition is that the mutant be the most efficient in surviving in the new environment. More recently Nei (1971) and Crow (1970) have referred to substitutional load as the "excess" in fertility or survival needed by the mutant genotype to maintain a population whose fitness has been reduced for whatever reason. This definition has the advantage of not implying that the new adaptive gene decreases the fitness of the population.
In the case of segregational load, the problem is a good deal less clear. Due to gene interaction and complementation at the phenotypic level, it does not follow that the individual with the most heterozygotic loci will be the most fit. Manwell and Baker (1970:934) have reviewed heterotic selection and questioned several assumptions used by Kimura and Crow (1964). Among these are the assumptions that loci are selected independently of each other, and that heterozygotic loci are invariably superior. Nevertheless, for those loci or blocks of loci that do act independently, the calculations of Kimura and Crow (1964) should be a valid approximation. Kimura and Crow (1964; Kimura 1968b) calculated that if all the alleles at a locus were subject to heterotic selection, then only a small fraction of all loci could be polymorphic without an intolerable load occurring. Nevertheless, in Drosophilapseudoobscura individuals are, on the average, heterozygous at 12 percent of their loci (Lewontin and Hubby 1966; Hubby and Lewontin 1966). A dilemma exists when fitness values are computed using a 10 percent selective disadvantage for each locus carrying an inferior homozygote. In the case of Drosophila
pseudoobscura the fitness would be reduced to 0.24. Therefore Kimura (1968b) suggested that many of the alleles may be neutral or nearly neutral. This may be true, at least in optimal environments. Experiments by Parsons (1971) on Drosophila pseudoobscura demonstrated that heterozygote advantage decreases as the environment becomes less severe.
However, until more empirical evidence becomes available, the problem of determining the relative importance of various factors that contribute to genetic load is far from solved. Selection and mutation have undergone intensive analysis recently, and new catagories have been proposed to allow more loci to be under selective pressures. Wallace (1970) has suggested "hard" and "soft" selection, and Clarke (1973) has described three classes of disadvantageous mutations on the basis of their effect on the population. Wills (1973) also has catagorized mutations in several classes according to segregational load, among other factors, but we question whether or not "selected functional polymorphs" are identi
Impact of Neutral Mutations on Evolution 149
cal to "nearly neutral" mutations with fluctuating selection coefficients. We must also agree with Clarke (1973) who states that "in order fully to understand the consequences of mutation we must take into account its effects on the ecological parameters of populations."
NUCLEOTIDE SUBSTITUTION
The most basic point mutation is an alteration in a sequence of nucleotides. This usually occurs through the substitution of one nucleotide for another, but it may also be caused by an insertion, duplication, or deletion. In the context of protein evolution, however, the primary emphasis is placed on changes in amino acid sequences. When polymorphisms in natural populations are discussed, the allelomorphs in question are distinguished by electrostatic charge. This, however, may distinguish only half of the different amino acid substitutions possible (Lewontin and Hubby 1966). Unfortunately, the lack of electrostatic difference does not necessarily imply a lack of adaptive difference, and for this reason some questions remain concerning the validity of conclusions based on this type of investigation. We should, nevertheless, be concerned with the question of how many different proteins there are for every electrostatic enzyme variant observed; and for any protein whose amino acid sequence is known, how many different nucleotide sequences (true alleles?) are present in a population for the locus in question. In particular, we are concerned with where and to what degree we should begin to note adaptive character in the variously observed differences. Serine (see the codon catalogue, Figure 6), for example, has six alternative DNA codings. In four of these, UCU, UCC, UCA, and UCG, the identity of the third nucleotide is spurious, at least with respect to coding for serine. The degeneracy of the DNA code is not generally thought to be an accident, and a number of functions have been postulated (Goldberg and Wittes 1966; Mitchell 1968). However, at this time not enough evidence exists to make a definite conclusion concerning the adaptive character of synonymous codons. Min JoutsrolihecaE et al. (1972) have identified the complete nucleotide sequence in the cistron coding for the coat protein in the MS2 virus, and it seems possible that the identity of some of the nucleotides may be preserved for the maintenance of secondary and tertiary structure of the DNA molecule (North 1972). Bram (1971) has also suggested that base composition may be important in the secondary structure of DNA. It remains to be seen, however, how vital a particular DNA structure is, and, in addition, generalizations from knowledge based on only a virus genome would be premature.
The work by Cox and Yanofsky (1967; Gibson, Scheppe, and Cox 1970) on the effect of Treffer's mutator gene in Escherichia coli supports
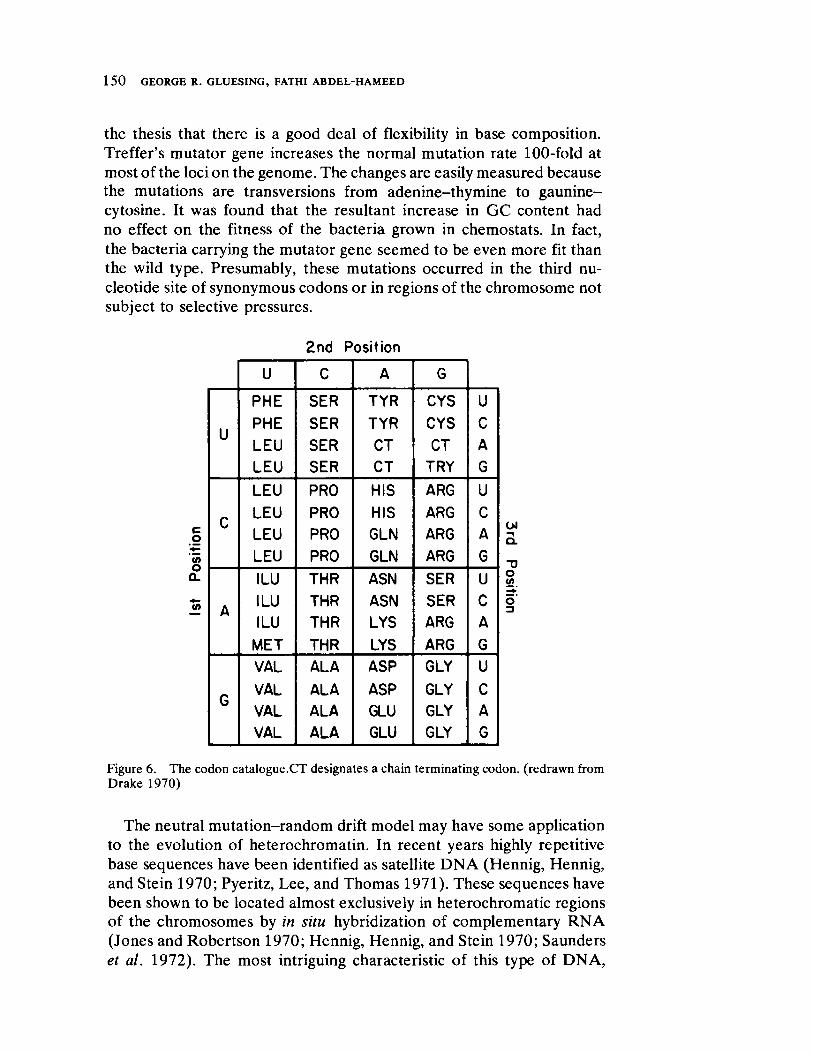
1 5 0 GEORGE R. GLUESING, FATHI ABDELHAMEED
the thesis that there is a good deal of flexibility in base composition. Treffer's mutator gene increases the normal mutation rate 100fold at most of the loci on the genome. The changes are easily measured because the mutations are transversions from adeninethymine to gauninecytosine. It was found that the resultant increase in GC content had no effect on the fitness of the bacteria grown in chemostats. In fact, the bacteria carrying the mutator gene seemed to be even more fit than the wild type. Presumably, these mutations occurred in the third nucleotide site of synonymous codons or in regions of the chromosome not subject to selective pressures.
2nd Position
u C A G
PHE SER TYR CYS U
u PHE SER TYR CYS C
u LEU SER CT CT A
LEU SER CT TRY G
LEU PRO HIS ARG U
c LEU PRO HIS ARG C Vs
LEU PRO GLN ARG A
LEU PRO GLN ARG G
ILU THR ASN SER U
Λ ILU THR ASN SER C Μ
ILU THR LYS ARG A
MET THR LYS ARG G
VAL ALA ASP GLY U
β VAL ALA ASP GLY C υ
VAL ALA GLU GLY A
VAL ALA GLU GLY G
Figure 6. The codon catalogue.CT designates a chain terminating codon. (redrawn from Drake 1970)
The neutral mutationrandom drift model may have some application to the evolution of heterochromatin. In recent years highly repetitive base sequences have been identified as satellite DNA (Hennig, Hennig, and Stein 1970; Pyeritz, Lee, and Thomas 1971). These sequences have been shown to be located almost exclusively in heterochromatic regions of the chromosomes by in situ hybridization of complementary RNA (Jones and Robertson 1970; Hennig, Hennig, and Stein 1970; Saunders et al. 1972). The most intriguing characteristic of this type of DNA,
Impact of Neutral Mutations on Evolution 151
besides the fact that it consists of such highly repetitive base sequences, is the great diversity existing between satellite fractions found in closely related species. Walker (1968) describes "grossly" different satellites in six rodents, and Hennig, Hennig and Stein (1970) found that the numbers and proportions of satellites in the sibling speciesyusrponlihedaD Drosophila hydei, D.
neohydei, and D. pseudoneohydei are distinctly different. It has been suggested that these sequences are useful in proper chromosomal arrangement, such as pairing and separation during cell division (Walker 1968, 1971; Yunis and Yasmineh 1971). In addition, Mazrimas and Hatch (1972) have suggested that satellite DNA is useful in recombination. Nevertheless, less repetitive sequences not found in satellite fractions have been described by Britten and Kohne (1968) as "intermediate." These may have evolved by the random mutation of earlier formed, highly repetitive sequences, but such mutation has not been established. However, the selective value of these repeated sequences may possibly become minimal with age as a result of the accumulation of disruptive mutations coinciding with the formation of new sequences taking over critical functions. This could result in, at least temporarily, relatively nonfunctional DNA. If so, then the age of these sequences, and to some degree the time since species divergence, could be calculated using the neutral mutationrandom drift model and gauging the degree of randomness that has accumulated in the base sequence. Southern (1970) calculated the age of guinea pig alphasatellite on this basis and found the result, fifty million years, to be acceptable. More general studies on base sequence divergence in rodents have been published by McConaughy and McCarthy (1970).
Bostock, Prescott, and Hatch (1972) have shown conclusively that euchromatin has a higher GC content than heterochromatin. In addition, Comings (1972) demonstrated that euchromatin contains more methylated cytosine than heterochromatic regions. He suggests that the ATrich heterochromatin may have originated through the accumulation of mC to Τ mutations in DNA that was no longer subject to selective pressures. Further increases in the amount of DNA could be due to subsequent saltatory replication.
MUTATION RATES
The widely varying rates of mutation or amino acid substitution present the most compelling reason to accept, at least to some degree, the neutral evolution theory. It is a fundamental assumption that the rate of nucleotide mutation is constant over the whole genome. A large fraction of these mutations are assumed to be deleterious and are, accordingly, eliminated. By differences in mutation rates we refer to the number of
1 5 2UTSRONMLIHGFEDBA GEORGE R. GLUESING, FATHI ABDELHAMEED
observed mutations. These are detected either by the effect, usually deleterious, on the organism, or as in protein evolution, by observing discrepancies in the amino acid sequence of a protein common to different species. Sites that fail to show deleterious mutations or sites in proteins that show a high acceptance rate of amino acid substitution are amenable to the interpretation given by the neutral evolution theory, that is, the mutations that occur at these sites are selectively neutral.
In the rll region of the T4 bacteriophage, proper functioning is necessary for growth insrolihecaE Escherichia coli strain Κ (Benzer 1961). Deleterious mutations can be detected by the inability of the phage to grow in the bacteria. A mutational spectrum (Figure 7) of 1,609 spontaneous mutations (those occurring in the absence of a artificial mutagenic agent) has been mapped by Benzer (1961). The sites without recorded mutations were identified by spectra of artificial mutagens. There are 308 sites identified in the spectrum, but it has been estimated that there may be as many as 2,000 sites in the rll region (Drake 1970:54). Most of the sites not yet identified have neither sustained point mutations, nor have the mutations significantly affected the function of the region. However, if all the sites are equally susceptible to point mutation, then the latter reason must be accepted as the most frequent cause. Without question laboratory conditions are much less stringent than those found in a natural environment, and consequently they have biased the results in favor of neutral mutations. Nevertheless, if 2,000 is not too large an overestimate of total sites, then there is still opportunity for a large number of these to be neutral. In addition, approximately 86 percent of the point mutations detected in the rll region involve changes in the number of nucleotide base pairs (Freese 1959, as cited in Drake 1970:51). Drake (1970:54) has calculated that only seventyone sites of those identified were discovered as the result of a base pair substitution. This is only 4 percent of the estimated 2,000 sites.
In proteins, high rates of amino acid substitution can be interpreted in two ways. The sites could be neutral; that is, they will accept the substitution of almost any amino acid. The alternative interpretation is that those sites are more responsive to environmental conditions. There is no reason for these interpretations to be mutually exclusive. From site to site and from protein to protein, their relative importance is likely to vary widely. In proteins such as cytochrome c, hemoglobins, and fibrinopeptides, neutral mutations should play a very significant role in explaining socalled hypervariable sites. We suggest this because such proteins are extremely critical in physiological chemistry and, through physiological homeostasis, are well insulated from the environment, that is, are highly canalized. Stebbins and Lewontin (1972) have argued for a concept of evolutionary homeostasis. This predicates that proteins such as histone and cytochrome c, which are involved in basic metabolic processes, are
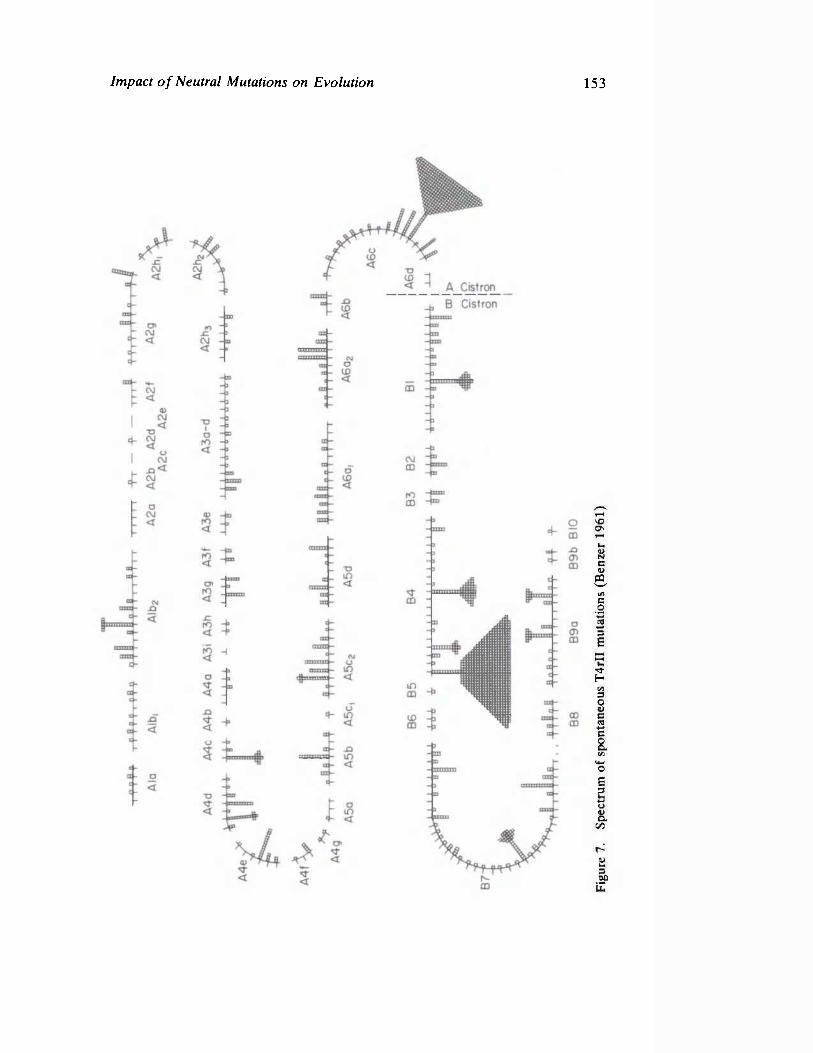
vast
ese
teec
ate
alla
lsle
cctt
escere¢—¢
—ntsate
Ala
Alb;
Albz
A2a
A2b
A2d_
Aat
A2g
A2c
A2e
Add
Adc
A4b
Ada
A3i
A3h
A3g
ABT
A3e
A3a-
dAzhsJS
tir
ARESEA
neEe
Ade
i
bed
B9a
B9b
BIO
Figure
7.Spectrum
ofsp
onta
neou
sT4rlII
muta
tion
s(Benzer1961)
Impact of Neutral Mutations on Evolution 153

1 5 4UTSRONMLIHGFEDBA GEORGE R. GLUESING, FATHI ABDELHAMEED
less likely to beyutonlifca functionally variant than those with accessory functions, such as hemoglobin and fibrinopeptides. Also, as Dickerson (1972) has pointed out, differences in functional restraints, particularly those due to molecular structure, can largely explain the difference in the rates of mutation between histones and fibrinopeptides. Figure 8 shows the average mutation rates of the proteins mentioned.
Millions of years since divergence
Figure 8. Rates of evolution in proteins. Figures in parenthesis are the length of time needed to change the protein by 1 percent, (redrawn from Dickerson 1972)
In cytochrome c there are thirtyfive amino acid sites that are invariant and eight sites where there have been six to nine substitutions (Dickerson 1972). In this protein and others, Epstein (1967) has shown that amino acids with the most similar chemical properties are most likely to be substituted for one another. In addition, those sections of the molecule that have the least effect on function sustain the most substitutions (for example, chains in hemoglobin proteins). The overall suggestion of this evidence is that the susceptibility to selection of amino acid sites in proteins froms a cline. Those sites sustaining high rates of substitutions
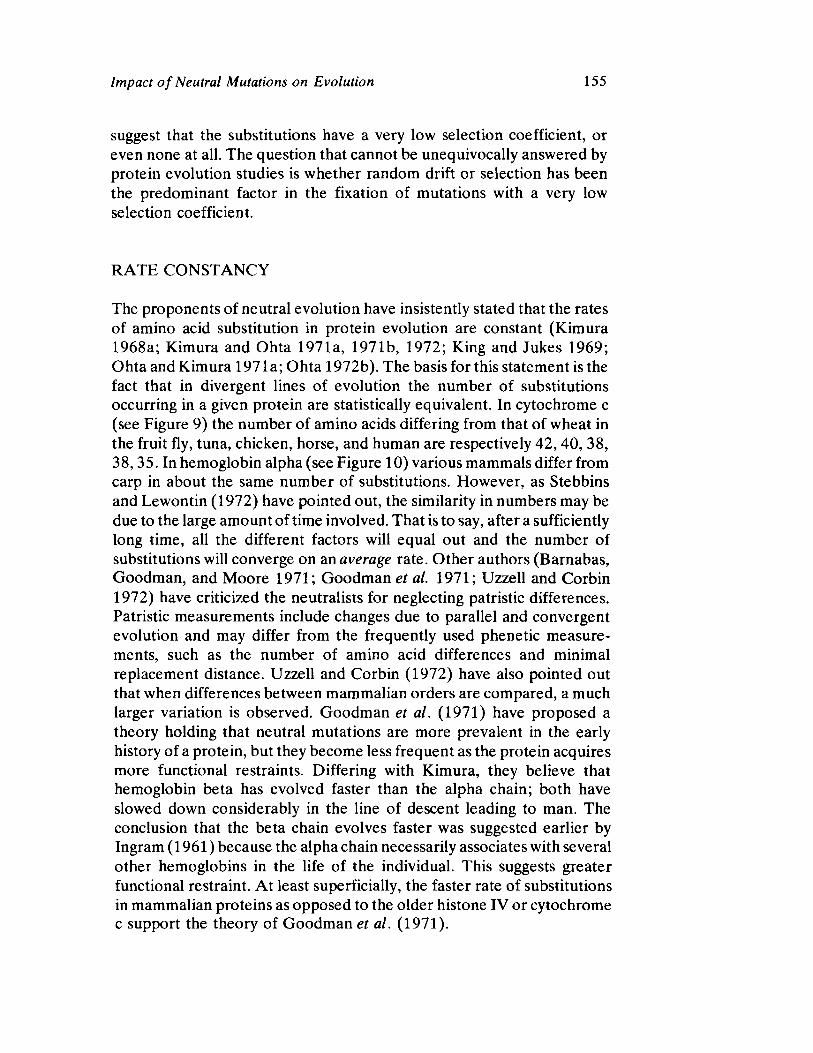
Impact of Neutral Mutations on Evolution 155
suggest that the substitutions have a very low selection coefficient, or even none at all. The question that cannot be unequivocally answered by protein evolution studies is whether random drift or selection has been the predominant factor in the fixation of mutations with a very low selection coefficient.
RATE CONSTANCY
The proponents of neutral evolution have insistently stated that the rates of amino acid substitution in protein evolution are constant (Kimura 1968a; Kimura and Ohta 1971a, 1971b, 1972; King and Jukes 1969; Ohta and Kimura 1971a; Ohta 1972b). The basis for this statement is the fact that in divergent lines of evolution the number of substitutions occurring in a given protein are statistically equivalent. In cytochrome c (see Figure 9) the number of amino acids differing from that of wheat in the fruit fly, tuna, chicken, horse, and human are respectively 42,40, 38, 38,35. In hemoglobin alpha (see Figure 10) various mammals differ from carp in about the same number of substitutions. However, as Stebbins and Lewontin (1972) have pointed out, the similarity in numbers may be due to the large amount of time involved. That is to say, after a sufficiently long time, all the different factors will equal out and the number of substitutions will converge on anvtrlgea average rate. Other authors (Barnabas, Goodman, and Moore 1971; Goodman et al. 1971; Uzzell and Corbin 1972) have criticized the neutralists for neglecting patristic differences. Patristic measurements include changes due to parallel and convergent evolution and may differ from the frequently used phenetic measurements, such as the number of amino acid differences and minimal replacement distance. Uzzell and Corbin (1972) have also pointed out that when differences between mammalian orders are compared, a much larger variation is observed. Goodman et al. (1971) have proposed a theory holding that neutral mutations are more prevalent in the early history of a protein, but they become less frequent as the protein acquires more functional restraints. Differing with Kimura, they believe that hemoglobin beta has evolved faster than the alpha chain; both have slowed down considerably in the line of descent leading to man. The conclusion that the beta chain evolves faster was suggested earlier by Ingram (1961) because the alpha chain necessarily associates with several other hemoglobins in the life of the individual. This suggests greater functional restraint. At least superficially, the faster rate of substitutions in mammalian proteins as opposed to the older histone IV or cytochrome c support the theory of Goodman et al. (1971).
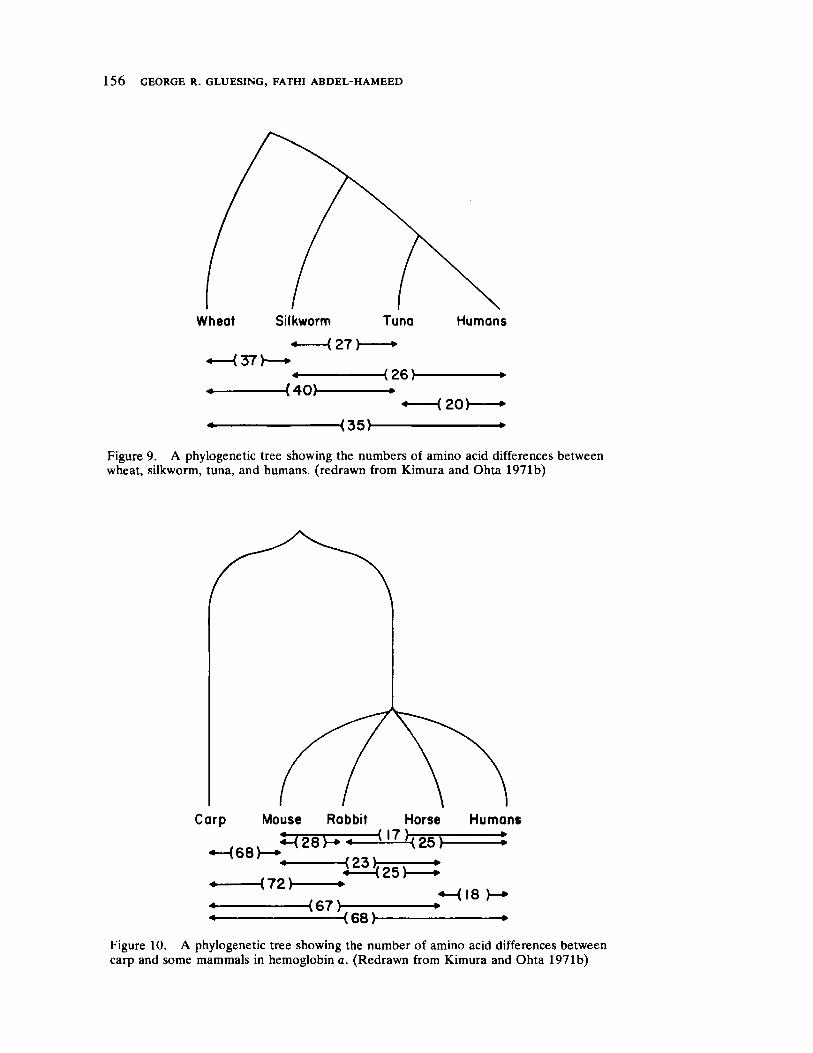
1 5 6 GEORGE R. GLUESING, FATHI ABDELHAMEED
Wheat
< 4 0 ) < 2 6 ) -
( 2 0 )
< 3 5 )
Figure 9. A phylogenetic tree showing the numbers of amino acid differences between wheat, silkworm, tuna, and humans, (redrawn from Kimura and Ohta 1971b)
Ca rp Mouse Rabbit Horse < 17 >
« — ( 6 8 ) — * • H 2 8 H · *
( 2 3 ) ;
( 7 2 ) 2 5 ]
< 2 5 T
( 6 7 > « ( 1 8 ) *
<68)
Figure 10. A phylogenetic tree showing the number of amino acid differences between carp and some mammals in hemoglobina a. (Redrawn from Kimura and Ohta 1971b)

Impact of Neutral Mutations on Evolution 157
NEUTRAL POLYMORPHISMS
Lewontin and Hubby (1966) showed unequivocally that natural populations ofsrpolihaD Drosophila are highly polymorphic. We will restate the conclusion of Kimura and Ohta. Originally Kimura (1968a) concluded that the neutral mutation rate at any locus is high, and that most mutations at polymorphic loci are neutral. In a later revision, Kimura and Ohta (1972) state that only a small fraction of the mutations at any given moment are neutral. Nevertheless, the majority of mutants fixed are neutral. This is not as unreasonable as it might at first appear. What it states is that the only mutants fixed by selection are those that are adaptive in the long run. Others that are adaptive only in the short run due to some particular and transient environmental condition will be eliminated when conditions change. Neutral mutations, as defined earlier, will be fixed by random drift essentially unimpeded by natural selection.
As Crow (1972a) has stated, neutral mutations will be hard to distinguish from overdominant types. Besides fluctuating selection coefficients and associative overdominance, migration between populations will reduce differences in frequencies that would otherwise arise due to the random drift of neutral alleles (Kimura and Maruyama 1971; Maruyama 1970). However, the migration rate need be no more than one individual per generation, a state extremely difficult to detect.
The findings of Ayala (1972) on natural populations of Drosophila are typical of the results obtained by other workers. Ayala found that in four out of five loci studied, the frequencies of the alleles converge on a particular value when artificial populations are allowed to breed. Only Est7 showed the effect of either weak selection or neutral alleles. Figures 11 and 12 present his results for the Lap5 and Est7 locus respectively. In the case of the two loci mentioned, there is significant variation in the frequencies of alleles from different populations. In these studies, alleles are distinguished electrophoretically with the most common variant given a designation of 1.00. Other isoalleles are given values according to their differences in amount of electrostatic charge. At the Lap5 locus the frequency of variant 1.03 has a low value of 0.36 and a high of 0.63. In Est7 the limiting values found for variant 1.00 are 0.39 and 0.64, and for variant 1.02 : 0.14 and 0.30. The other loci studied show much less variation, with the most frequent allele being well above 0.80. Although these experiments demonstrate the dominating effect of natural selection, they are not incompatible with neutral evolution.
The alleles studied represent only a fraction of the different amino acid sequences possible. Boyer (1972) has brought attention to the high incidence of electrophoretically "silent" mutants in primate hemoglobins. The sites where "silent" variants differ correlate with the sites that have accumulated mutations during the evolution of those proteins.

1 5 8 GEORGE R. GLUESING, FATHI ABDELHAMEED
<n
ο ο ιο ι α. <β
Φ η •*—<
OB Φ Φ "05 CO
ο
Φ
£ C φ 3 CT φ
LL 200 300
Days
Figure 11. Changes in the frequency of allele 1.03 at the Lap5 locus in six experimental populations of Drosophila willistoni. (redrawn from Ayala 1972)
200 3 0 0
Days
Figure 12. Changes in the frequency of allele 1.00 at the Est7 locus in six experimental populations of Drosophila willistoni. (redrawn from Ayala 1972)
Impact of Neutral Mutations on Evolution 159
CONCLUSION
In his opening address at the 1959 Cold Spring Harbor Symposium, Ernst Mayr commented on the status of natural selection:
The history of the first one hundred years since the publication of the Origin of
Species is a fascinating one. With its many controversies, its false starts and converging pathways toward a solution of the open problems, one might say that we have completed a full circle and that we are closer to Darwin and Darwin's original concepts than we have been at any time during the intervening periods.
More recent understanding of neutral mutations and associated stochastic processes has not superceded the validity of this statement. Neutral evolution was proposed to explain molecular changes in proteins and DNA that do not affect the biological function of the molecule. We do not interpret this as an attack on natural selection. Ultimately, it must be decided whether or not natural selection can act upon all changes at the molecular level. It is even likely that natural selection can detect many changes that a biochemist would not expect. Surprises in this area of research will probably be frequent. However, it is difficult to see how a mutation occurring in a noncatalytic section of a protein can change perceptibly the biological function of that protein. In proteins whose secondary and tertiary structure is highly developed for functional purposes, the number of sites sustaining neutral mutations will be fewer. This might explain the faster rates of evolution of such proteins as fibrinopeptides. On the other hand, hemoglobins and cytochrome c, which have a more developed structure, should be less tolerant to amino acid substitution. Also, it is difficult to explain, solely on the basis of adaptive advantage, high rates of substitution in proteins whose fluid environment is strongly protected and maintained by various physiological mechanisms against changes in the external environment. Stebbins and Lewontin (1972) have warned us not to commit the "fallacy of omniscience." That is, we should not presume that a selective advantage does not exist simply because it cannot be seen or measured. This is a fully justifiable warning. However, there is no basis for the assumption that natural selection has unlimited powers of operation.
High rates of substitution due to adaptive response are difficult to explain in terms of genetic load. Genetic load is a product of selective forces and is an expression of the fact that some genotypes are less fit than others. The littering of the geological record with evidence of extinct species unequivocally says that the cost of natural selection frequently reaches lethal levels. Although the estimates of Haldane (1957), and especially those of Kimura and Crow (1964), are higher than the actual load in a natural population, they underline the severity of natural selection. Haldane's estimate for substitutional load is probably not too
1 6 0yxwvutsrqponmlkihgfedcbaYWUTSRONMLKJIHGFEDCBA GEORGE R. GLUESING, FATHI ABDELHAMEED
far from actuality. If the future survival of a species is dependent on a few alleles found in the population at very low frequencies, then either the environmental change must occur very slowly or the species will be threatened with extinction. This is one of the strongest arguments for proposing the substitution by random drift of neutral mutations to account for the numerous substitutions found in proteins. It should also be noted that for Haldane (1957) there was no difficulty in accommodating his estimate to the evolutionary time span. If, as Haldane figured, closely related species of mammals differ by approximately 1,000 genes, then the rate of speciation and evolution in mammals, as indicated from geological evidence, is in agreement with one substitution every 300 generations. Allowances can be made for more intense periods of selection. This was, however, before molecular biology had fully exposed the massive variation existing at the molecular level. Recently Shaw (1970) estimated that all loci on a genome have undergone substitution.
We do not agree that the rates of substitution are constant for all proteins. This would assume that in any protein the number of neutral sites has also remained constant. This reasoning does not allow for functionally related changes that might alter this number. However, for those sites that have retained complete tolerance to mutation throughout the history of the protein, the rates of substitution should be constant. The same situation should exist in DNA that has become functionless. This presents the possibility of a precise method of determining the date of divergence of species or other larger groups of organisms when geological evidence is sparse or inconclusive.
The significance of neutral mutations in evolution is small when compared to the driving force of natural selection. However, neutral mutations and stochastic processes may prove to be of some value to the evolving organism; that is, they allow for the absorption of mutations without any burden to the organism. As Kimura and Ohta (1971a) suggested, they may allow for the easy accumulation of intermediate mutations needed to achieve a truly adaptive sequence of amino acids. As Edwards (1972) has stated, neutral mutations may be "of neutral value only in the sense that a lottery ticket can be said to be valueless because it is likely to be valueless." Because they cost nothing in terms of genetic load, neutral mutations might be compared to free lottery tickets.
REFERENCES
ARNHEIM, N. , C. E. TAYLOR
1969 NonDarwinian evolution: consequences for neutral allelic variation. vutsreaN
Nature 223:900903. AY ALA, F. J .
1972 "Darwinian versus nonDarwinian evolution in natural populations of
Impact of Neutral Mutations ort Evolution 161
DrosophilazyxwvutsrqponmlkjihgfedcbaZYXWUTSRPONMLKJIHGFEDCBA," in Proceedings of the Sixth Berkeley Symposium on
Mathematical Statistics and Probability, volume 5, 211236. Berkeley and Los Angeles: University of California Press.
BARNABAS, J . , M. GOODMAN, G. W. MOORE
1971 Evolution of hemoglobin in primates and other therian mammals. Comparative Biochemical Physiology 39B:455—482.
BENZER, S.
1961 On the topography of the genetic fine structure. Proceedings of the
National Academy of Science 47:403^415. BOSTOCK, C. J . , D. M. PRESCOTT, F. T. HATCH
1972 Timing of replication of the satellite and main band DNAs in cells of the kangaroo rat (Dipodomys ordii). Experimental Cell Research 74:487495.
BOYER,S. H.
1972 Extraordinary incidence of electrophoretically silent genetic polymorphisms. Nature 239:453^454.
BRAM, S.
1971 Secondary structure of DNA depends on base composition. Nature New
Biology 232:174176. BRITTEN, R. J . , D. Ε. ΚΟΗΝΕ
1968 Repeated sequences in DNA. Science 161:529540. BRUES, A. M.
1964 The cost of evolution vs. the cost of not evolving. Evolution 18:379383. 1969 Genetic load and its varieties. Science 164:11301136.
CALLAN, H. G.
1967 The organization of genetic units in chromosomes. Journal of Cell Science 2:17.
CARSON, H. L.
1970 Chromosome tracers of the origin of species. Science 168:14141418. CLARKE, B.
1970 Darwinian evolution of proteins. Science 168:10091011. 1973 The effect of mutation on population size. Nature 242:196197.
COMINGS, D. E.
1972 Methylation of euchromatic and heterochromatic DNA. Experimental
Cell Research 74:383390. COX, E. C., C. YANOFSKY
1967 Altered base ratios in the DNA of an Escherichia coli mutator strain. Proceedings of the National Academy of Science 58:18951902.
CROW, J . F.
1958 Some possibilities for measuring selection intensities in man. Human Biology 30:137150.
1970 "Genetic loads and the cost of natural selection," in Mathematical topics in population genetics. Edited by KenIchi Kojima, 128177. New York: Springer.
1972a "Darwinian and nonDarwinian evolution," in Proceedings of the Sixth Berkeley Symposium on Mathematical Statistics and Probability, volume five, 122. Berkeley and Los Angeles: University of California Press.
1972b The dilemma of nearly neutral mutations: how important are they for evolution and human welfare? Journal of Heredity 63:306316.
CROW, I . F., Μ. KIMURA
1970 An introduction to population genetics theory. New York: Harper and Row.
1 6 2 GEORGE R. GLUESING, FATHI ABDELHAMEED
DAYHOFF, M. O.
1971 "Evolution of proteins," inywvutsrponmlihgfedcbaTSRPNMJIHGEDCBA Molecular evolution, volume one: Chemical
evolution and the origin of life. Edited by R. Buvet and C. Ponnamperuma, 392419. New York: American Elsevier.
DICKERSON, R. E.
1972 The structure and history of an ancient protein. Scientific American
226:5878. DOBZHANSKY, T.
1957 Genetic loads in natural populations. Science 126:191194. 1970 Genetics of the evolutionary process. New York: Columbia University
Press. DOBZHANSKY, Τ., O. PAVLOVSKY
1957 An experimental study of interaction between genetic drift and natural selection. Evolution 11:311319.
DRAKE, J . w .
1970 The molecular basis of mutation. San Francisco: HoldenDay. EDWARDS, J . H.
1972 Advantageous detrimentals and the neutral gene. Nature New Biology
236:250. EHRLICH, P. R., P. H. RAVEN
1969 Differentiation in populations. Science 165:12281232. ENDLER, J . A.
1973 Gene flow and population differentiation. Science 179:243250. EPSTEIN, c . J .
1967 Nonrandomness of aminoacid changes in the evolution of homologous proteins. Nature 215:355359.
EWENS, W. J . , G. THOMSON
1970 Heterozygote selective advantage. Annals of Human Genetics 33: 365376.
FELLER, W .
1967 On fitness and the cost of natural selection. Genetical Research 9 :115.
FISHER, R. Α., Ε. Β. FORD
1950 The "Sewall Wright effect." Heredity 4:117119. FREESE, E.
1959 The difference between spontaneous and base analogue induced mutation of phage T4. Proceedings of the National Academy of Science 45:622633.
FRYDENBERG, O.
1963 Population studies of a lethal mutant in Drosophila melanogaster I.
Behaviour in populations with discrete generations. Hereditas
50:89116. GIBSON, T. C., M. L. SCHEPPE, E. C. COX
1970 Fitness of an Escherichia coli mutator gene. Science 169:686688.
GOLDBERG, A. L., R. Ε WITTES
1966 Genetic code: aspects of organization. Science 153:420424. GOODMAN, M., J . BARNABAS, G. MATSUDA, G. W. MOORE
1971 Molecular evolution in the descent of man. Nature 233:604613. HALDANE, J . B. S.
1957 The cost of natural selection. Journal of Genetics 55:511524. 1960 More precise expressions for the cost of natural selection. Journal of
Genetics 57:351360.

Impact of Neutral Mutations on Evolution 163
HENNIG, W . , I. HENNIG, H. STEIN
1970 Repeated sequences in the DNA of Drosophila and their localization in giant chromosomes. Chromosoma 32:3163.
HUBBY, J . L . , R. C. LEWONTIN
1966 A molecular approach to the study of genie heterozygosity in natural populations, part 1: The number of alleles at different loci in Drosophila pseudoobscura. Genetics 54:577594.
INGRAM, V. M.
1961 Gene evolution and the haemoglobins. Nature 189:704708. JONES, K. W . , F. W . ROBERTSON
1970 Localisation of reiterated nucleotide sequences in Drosophila and mouse by in situ hybridisation of complementary RNA. Chromosoma
31:331345. KIMURA, M.
1960 Optimum mutation rate and degree of dominance as determined by the principle of minimum genetic load. Journal of Genetics 57 :2134.
1968a Evolutionary rate at the molecular level. Nature 217:624626. 1968b Genetic variability maintained in a finite population due to mutational
production of neutral and nearly neutral isoalleles. Genetic Research
11:247269. 1969 The rate of molecular evolution considered from the standpoint of
population genetics. Proceedings of the National Academy of Science
63:11811188. 1971 Theoretical foundation of population genetics at the molecular level.
Theoretical Population Biology 2:174208. KIMURA, M., J . F. CROW
1964 The number of alleles that cap be maintained in a finite population. Genetics 49:725738.
KIMURA, Μ. , T. MARUYAMA
1971 Pattern of neutral polymorphism in a geographically structured population. Genetical Research 18:125131.
KIMURA, Μ. , Τ. ΟΗΤΑ
1971a Protein polymorphism as a phase of molecular evolution. Nature
229:467^169. 1971b On the rate of molecular evolution. Journal of Molecular Evolution
1:117. 1972 "Population genetics, molecular biometry, and evolution," in Proceed
ings of the Sixth Berkeley Symposium of Mathematical Statistics and
Probability, volume five, 4368. Berkeley and Los Angeles: University of California Press.
KING, J . L . , Τ. H. JUKES
1969 NonDarwinian evolution. Science 164:788798. LEWIS, H.
1962 Catastrophic selection as a factor in speciation. Evolution 16:257271.
1973 The origin of diploid neospecies in Clarkia. The American Naturalist
107:161170. LEWONTIN, R. C. , J . L. HUBBY
1966 A molecular approach to the study of genie heterozygosity in natural populations, part two: Amount of variation and degree of heterozygosity in natural populations of Drosophila pseudoobscura. Genetics
54:595609.
1 6 4ZYWUTSRPONMLKJIHGFEDCBA GEORGE R. GLUESING, FATHI ABDELHAMEED
MANWELL, C. , C. M. BAKER
1970zywvutsrponmlihgfedcbaTSRQPNMJHGEDCBA Molecular biology and the origin of species. Seattle: University of Washington Press.
MARUYAMA, T.
1970 Effective number of alleles in a subdivided population. Theoretical
Population Biology 1:273306. MAYR, E.
1959 Where are we. Cold Spring Harbor Symposia on Quantitative Biology
24:114. 1964 Systematics and the origin of species from a viewpoint of a zoologist.
New York: Dover. MAZRIMAS, J. Α . , F. Τ. HATCH
1972 A possible relationship between satellite D N A and the evolution of kangaroo rat species (genus Dipodomys). Nature New Biology
240:102105. MC CONAUGHY, B. L . , B . J. MCCARTHY
1970 Related base sequences in the D N A of simple and complex organisms, part six: The extent of base sequence divergence among the DNAs of various rodents. Biochemical Genetics 4:425—446.
MIN JOU, W . , G. HAEGEMAN, M. YSEBAERT, W . FIERS
1972 Nucleotide sequence of the gene coding for the bacteriophage MS2 coat protein. Nature 237:8288.
MITCHELL, W . M.
1968 A model for protein biosynthesis predicated on the concept of metastable states: a postulated role for genetic code degeneracy. Proceed
ings of the National Academy of Science 61:742747. MULLER, H. J.
1950 Our load of mutations. American Journal of Human Genetics
2:111176. NEI, M.
1971 Fertility excess necessary for gene substitution in regulated populations. Genetics 68:169184.
NORTH, A. c. τ. 1972 Amino acid sequence invariance and the genetic code. Nature New
Biology 239:7677. O ' D O N A L D , P.
1969 "Haldane's Dilemma" and the rate of natural selection. Nature
221:815817. Ο ΗΤΑ, Τ.
1972a Fixation probability of a mutant influenced by random fluctuation of selection intensity. Genetical Research 19:3338.
1972b Evolutionary rate of cistrons and D N A divergence. Journal of Molecu
lar Evolution 1:150157. OHTA, Τ. , M. KIMURA
1971a On the constancy of the evolutionary rate of cistrons. Journal of
Molecular Evolution 1:1825. 1971b Behavior of neutral mutants influenced by associated overdominant
loci in finite populations. Genetics 69:247260. PARSONS, P. A.
1971 Extremeenvi ronment heterosis and genetic loads. Heredity
26:479482. PYERITZ, R. E . , C. S . LEE, C. A. THOMAS, JR.
1971 The cyclization of mouse satellite DNA. Chromosoma 33:284296.
Impact of Neutral Mutations on Evolution 165
RICHMOND, R. C.
1970 NonDarwinian evolution: a critique. Nature 225:10251028.
ROBERTSON, A.
1962 Selection for heterozygotes in small populations. Genetics 47: 12911300.
SANGER, F., Η. TUPPY
1951a The amino acid sequence in the phenylalanyl chain of insulin, part 1: The identification of lower peptides from partial hydrolysates. Biochemical Journal 49:463481.
1951b The amino acid sequence in the phenylalanyl chain of insulin, part 2: The investigation of peptides from enzymic hydrolysates. Biochemical
Journal 49:481^*90. SANGER, F., Ε. Ο. P. THOMPSON
1953a The amino acid sequence in the glycyl chain of insulin, part 1: The identification of lower peptides from partial hydrolysates. Biochemical
Journal 53:353366. 1953b The amino acid sequence in the glycyl chain of insulin, part 2: The
investigation of peptides from enzymic hydrolysates. Biochemical
Journal 53:366374. SAUNDERS, G. F . , S. SHIRAKAWA, P. P. SAUNDERS, et al.
1972 Populations of repeated DNA sequences in the human genome. Journal
of Molecular Biology 63:323334. SHAW, c . R.
1970 How many genes evolve? Biochemical Genetics 4:275283. SMITH, J . M.
1968 "Haldane's Dilemma" and the rate of evolution. Nature 219: 11141116.
SOUTHERN, Ε. M.
1970 Base sequence and evolution of guineapig alphasatellite DNA. Nature
227:794798. STEBBINS, G. L.
1971 Processes of organic evolution (second edition). Englewood Cliffs N. J.: PrenticeHall.
STEBBINS, G. L., R.C C. LEWONTIN
1972 "Comparative evolution at the levels of molecules, organisms, and populations," in Proceedings of the Sixth Berkeley Symposium of
Mathematical Statistics and Probability, volume five, 2342. Berkeley and Los Angeles: University of California Press.
UZZELL, Τ., K. W. CORBIN
1972 Evolutionary rates in cistrons specifying mammalian hemoglobin alpha and betachains: phenetic versus patristic measurements. Ameri
can Naturalist 106:555573. VAN VALEN, L.
1963 "Haldane's Dilemma," evolutionary rates, and heterosis. American
Naturalist 97:185190. WALKER, P. Μ. B.
1968 How different are the DNAs from related animals? Nature
219:228232. 1971 Origin of satellite DNA. Nature 229:306308.
WALLACE, B.
1970 Genetic load: its biological and conceptual aspects. Englewood Cliffs N.J.: PrenticeHall.
1 6 6 GEORGE R. GLUESING, FATHI ABDELHAMEED
WHITEHOUSE, H. L. K.
1967 A cycloid model for the chromosome.yvutsrponmlihgfedcbaTSNMJGECA Journal of Cell Science 2:922.
WILLSyxwvutsrqponmlkihgfedcbaYVUTSRPONMLIHGFEDCBA, c .
1973 In defense of naive panselectionism. The American Naturalist
107:2334. WRIGHT, S.
1931 Evolution in Mendelian populations. Genetics 16:97159. 1948 On the roles of directed and random changes in gene frequency in the
genetics of populations. Evolution 2:279294. 1951 Fisher and Ford on "The Sewall Wright Effect." American Scientist
39:452^58. 1956 Modes of selection. American Naturalist 90:524. 1970 "Random drift and the shifting balance theory of evolution," in
Mathematical topics in population biology. Edited by KenIchi Kojima, 131. New York: Springer.
YUNIS, J. J., W. G. YASMINEH
1971 Heterochromatin, satellite DNA, and cell function. Science 174: 12001209.
ZUCKERKANDL, E., L. PAULING
1965 "Evolutionary divergence and convergence in proteins," in Evolving
genes and proteins. Edited by V. Bryson and H. J. Vogel, 97166. New York: Academic Press.
ADDENDUM: PROBLEMS RELATING TO THE USE OF MOLECULAR DATA IN EVOLUTIONARY STUDIES
Phylogenetic trees based on molecular data have been constructed from comparisons of the amino acid sequences of homologous proteins, assessing degrees of similarity in immunoglobins, and determining the consistency of DNA codons. Most precise are the trees based on studies of amino acid sequences. However, for all the precision obtained from these distinct, unambiguous, "building blocks," evolutionary studies based on proteins suffer from essentially the same problem that afflicts all other fields attempting to derive knowledge of past species from existing forms, that is the reconstruction of the ancestral morph. In protein studies, allowances must be made for back mutations and parallel evolution. In addition, synonymous codons add to the difficulty of determining accurately the number of mutations or nucleotide substitutions between one point and another. The further removed an ancestral sequence is from the present, the more difficult this problem becomes. Fortunately, in primates and other mammals enough amino acid sequences have been determined for hemoglobins and fibrinopeptides to allow for the construction of reasonably accurate trees. In the future, given the analysis of a wider variety of proteins in a larger number of species, most of the present ambiguities can be resolved.
It is a general rule (Dayhoff, Park, and McLaughlin 1972; Barnabas, Goodman, and Moore 1972) that in constructing phylogenetic trees,
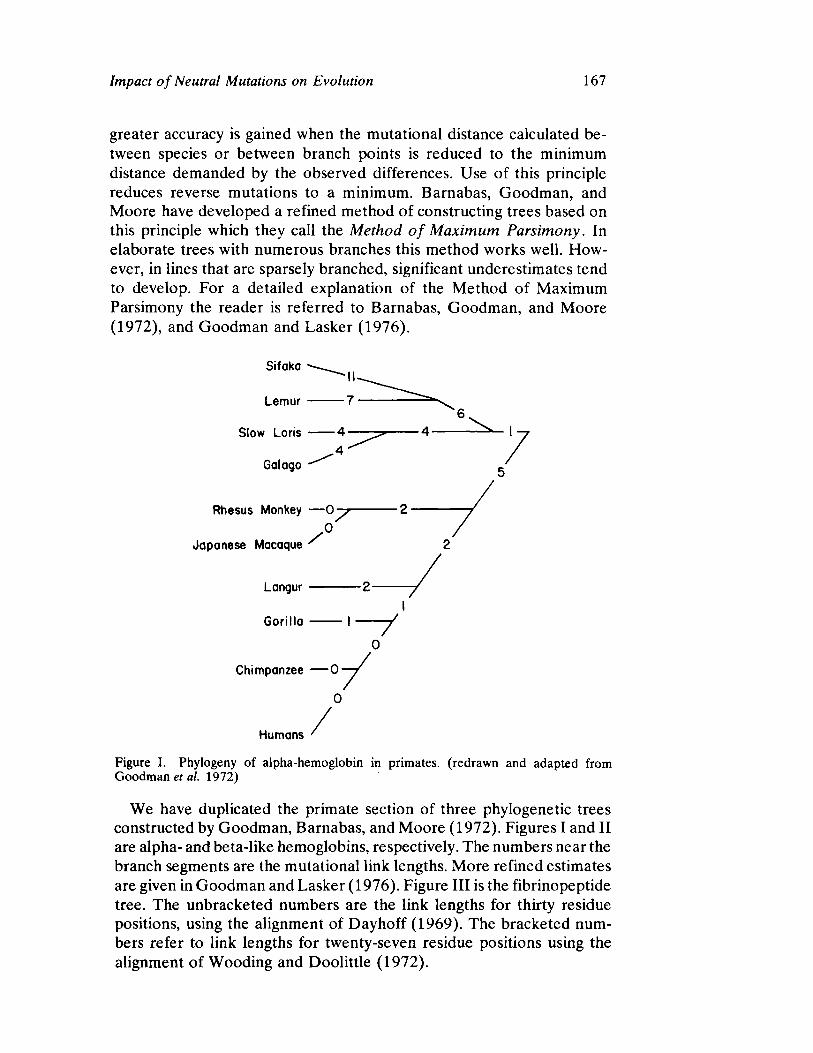
Impact of Neutral Mutations on Evolution 167
greater accuracy is gained when the mutational distance calculated between species or between branch points is reduced to the minimum distance demanded by the observed differences. Use of this principle reduces reverse mutations to a minimum. Barnabas, Goodman, and Moore have developed a refined method of constructing trees based on this principle which they call theyxutsronmihfedaPM Method of Maximum Parsimony. In elaborate trees with numerous branches this method works well. However, in lines that are sparsely branched, significant underestimates tend to develop. For a detailed explanation of the Method of Maximum Parsimony the reader is referred to Barnabas, Goodman, and Moore (1972), and Goodman and Lasker (1976).
Rhesus Monkey —
Japanese Macaque
Langur
Gorilla
Chimpanzee — 0
0
y
Humans /
Figure I. Phylogeny of alphahemoglobin in primates, (redrawn and adapted from Goodman et al. 1972)
We have duplicated the primate section of three phylogenetic trees constructed by Goodman, Barnabas, and Moore (1972). Figures I and II are alpha and betalike hemoglobins, respectively. The numbers near the branch segments are the mutational link lengths. More refined estimates are given in Goodman and Lasker (1976). Figure III is the fibrinopeptide tree. The unbracketed numbers are the link lengths for thirty residue positions, using the alignment of Day hoff (1969). The bracketed numbers refer to link lengths for twentyseven residue positions using the alignment of Wooding and Doolittle (1972).
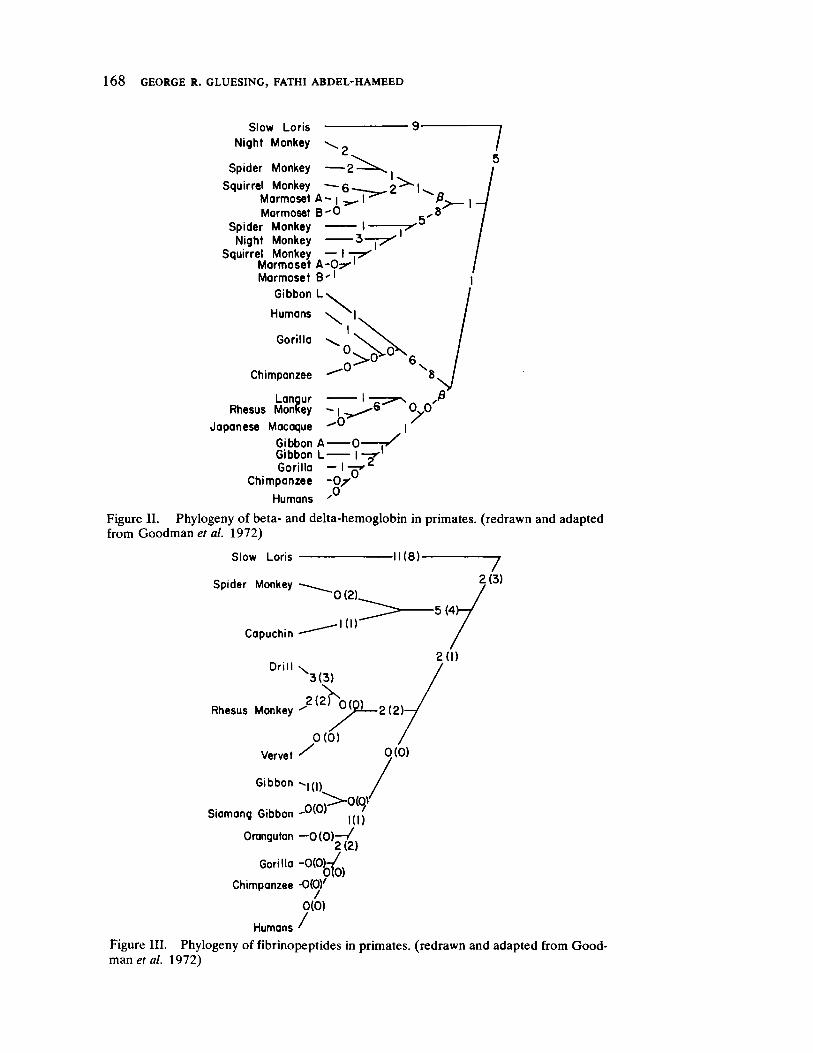
1 6 8 GEORGE R. GLUESING, FATHI ABDELHAMEED
Slow Lor is
Night Monkey
Spider Monkey 2 —
Squirrel Monkey — qq . Marmoset Α | I Marmoset B ' O
Spider Monkey I Night Monkey 3
Squirrel Monkey — I p
Marmoset AO?^ 1
Marmoset B ' 1
Gibbon L v
Humans \
Gor i l la ^
Chimpanzee "*
Langur — Rhesus Monkey
Japanese Macaque
Gibbon A — Gibbon L — Gor il la —
Chimpanzee Οχ
Humans '
Figure II. Phylogeny of beta and deltahemoglobin in primates, (redrawn and adapted from Goodmantlea et al. 1972)
Slow Lor is
Spider Monkey
11(8)
Rhesus Monkey
J x x y
HI )
Orangutan —0 ( 0 ) —/ 2( 2)
Siamang Gibbon
Gorilla 0 ( 0 ) ^
Chimpanzee 0(0) /
0( 0)
Humans ^
Figure III. Phylogeny of fibrinopeptides in primates, (redrawn and adapted from Goodman et al. 1972)
Impact of Neutral Mutations on Evolution 169
Sarich and Wilson (1967, 1973; Sarich 1971) have employed immunological data to estimate the date of divergence between chimpanzee, man, and gorilla at about 5 million years. Uzzell and Pilbeam (1971) support the more commonly held estimate of 15 million years. Critical to the validity of Sarich's estimate is the question of constancy in the evolution of albumins through time. As we have already indicated, most workers assume that a certain number of sites on a protein will remain neutral with regard to selection throughout its history. In addition, immunological differences involve all changes that have occurred in the protein, including changes due to selective pressures. It seems reasonable to expect varying amounts of selection to alter differentially rates of substitution in proteins. Sarich uses the termyutrligea regularity in reference to the equivalent degrees of difference between prosimian albumins and man (123 units), chimpanzee (120 units), rhesus monkey (120 units), and spider monkey (121 units). The consistency is curious but does not necessarily imply the regularity needed to justify the recent figure of 5 million years.
The above measurements are based on phenetic differences which can be deceptive. Uzzell and Pilbeam (1971) have called attention to a paradox that arises in considering phenetic measurements:
. . . phenetic comparisons consistently and increasingly underestimate the amount of evolutionary change at greater distances from the present, since the number of amino acid positions at which more than a single nucleotide basepair substitution has been fixed increases with time. This means that the time estimates for various more recent branches given by Wilson and Sarich (1969) are themselves too old. Placing these branches even more recently, as the above analysis would indicate, leaves one in the curious paradox of attacking the fossil record, especially that of hominids, not where it is fuzzy and subject to reinterpretation, but where it is firm and accepted by all paleontologists concerned with Primates.
The amount of credibility given to different kinds of evidence (molecular versus paleontological) is of critical importance. The rate of albumin evolution is constant if the divergence of chimpanzee, humans, and gorilla is approximately 5 million years. It cannot be constant if the date of divergence is nearer to the 15 million year date accepted by other workers. Nonmolecular evidence for these respective positions is discussed by Sarich (1971) and Uzzell and Pilbeam (1971). The point we would like to emphasize is that the accuracy of any estimation of rates of mutation derived from molecular studies must yield to the firmness of paleontological data.
Figures IV through VI are given as examples of phylogenetic trees that include time scales.
Figure IV is a representation of the phylogeny of carbonic anhydrase isozymes CA t and CA„. The numbers are the nucleotide substitutions on the link paths through the network.
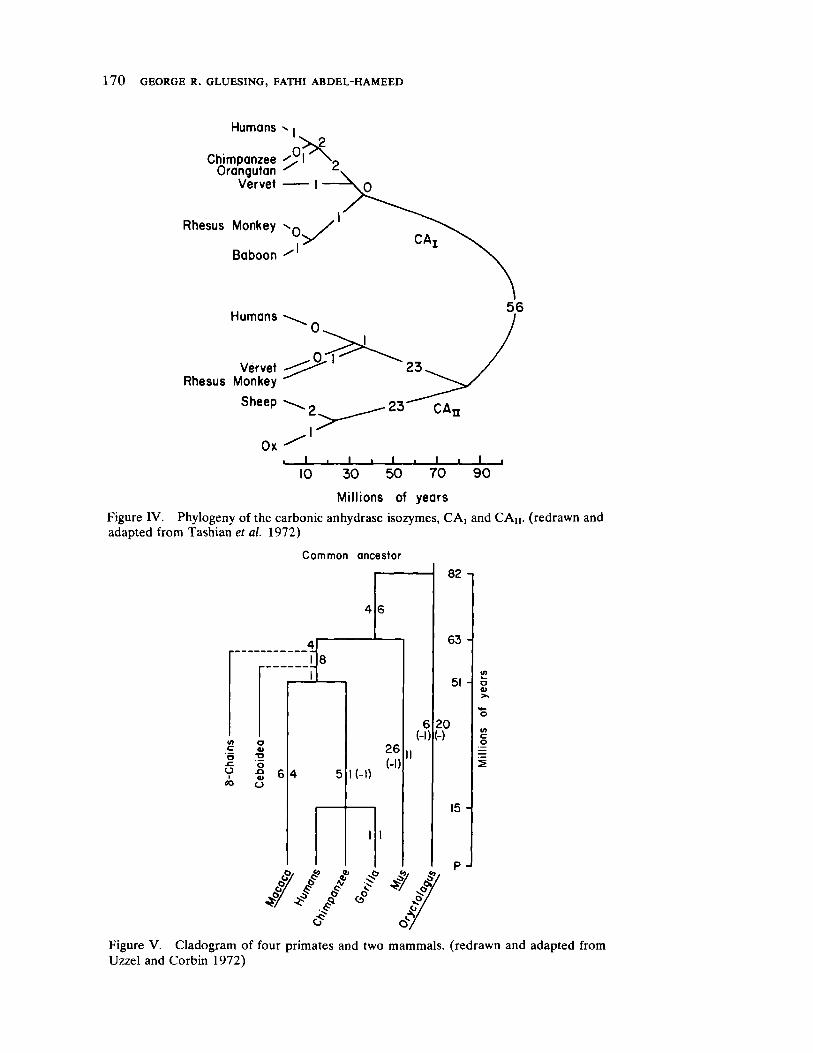
1 7 0 GEORGE R. GLUESING, FATHI ABDELHAMEED
Humans I, 0 v
Chimpanzee I " ^ j , Orangutan ^ <L·
V e r v e t —
Rhesus Monkey ^q
B a b o o n ·
H u m a n s
Vervet Rhesus Monkey
S h e e p
χ J ι L _L ΙΟ 30 50 70 90
Mi l l ions of y e a r s
Figure IV. Phylogeny of the carbonic anhydrase isozymes, C A j and CAn. (redrawn and adapted f rom Tashiantlea et al. 1972)
Common ancestor
82 ,
63
51 ο a>
σ a> Ό δ XI Kl )
6 (1)
20 ()
26 (1)
15
Figure V. Cladogram of four primates and two mammals, (redrawn and adapted from Uzzel and Corbin 1972)
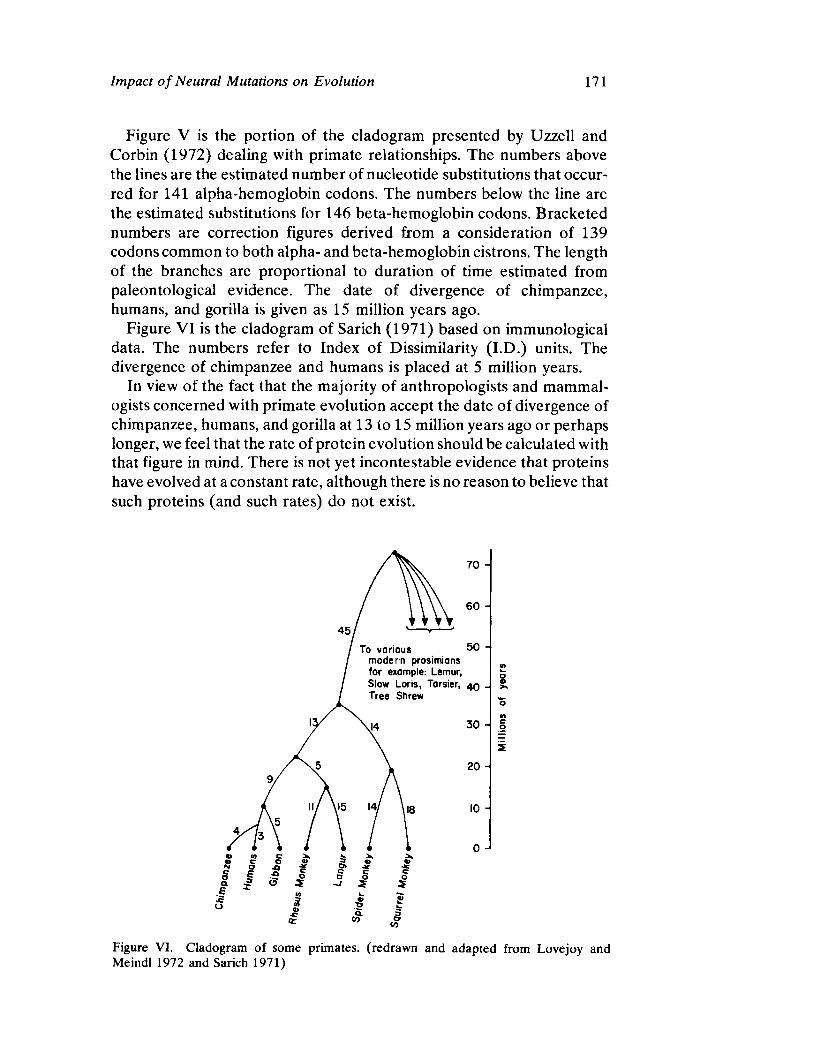
Impact of Neutral Mutations on Evolution 171
Figure V is the portion of the cladogram presented by Uzzell and Corbin (1972) dealing with primate relationships. The numbers above the lines are the estimated number of nucleotide substitutions that occurred for 141 alphahemoglobin codons. The numbers below the line are the estimated substitutions for 146 betahemoglobin codons. Bracketed numbers are correction figures derived from a consideration of 139 codons common to both alpha and betahemoglobin cistrons. The length of the branches are proportional to duration of time estimated from paleontological evidence. The date of divergence of chimpanzee, humans, and gorilla is given as 15 million years ago.
Figure VI is the cladogram of Sarich (1971) based on immunological data. The numbers refer to Index of Dissimilarity (I.D.) units. The divergence of chimpanzee and humans is placed at 5 million years.
In view of the fact that the majority of anthropologists and mammalogists concerned with primate evolution accept the date of divergence of chimpanzee, humans, and gorilla at 13 to 15 million years ago or perhaps longer, we feel that the rate of protein evolution should be calculated with that figure in mind. There is not yet incontestable evidence that proteins have evolved at a constant rate, although there is no reason to believe that such proteins (and such rates) do not exist.
Figure VI. Cladogram of some primates, (redrawn and adapted from Lovejoy and Meindl 1972 and Sarich 1971)
1 7 2 GEORGE R. GLUESING, FATHI ABDELHAMEED
REFERENCES
BARNABAS, JOHN, MORRIS GOODMAN, G. WILLIAM MOORE
1972 Descent of mammalian alpha globin chain sequences investigated by the maximum parsimony method.yvutsrqponmlkihgfedcbaYSPNMJHEBA Journal of Molecular Biology 69:249278.
DAYHOFF, MARGARET O., editor
1969 Atlas of protein sequence and structure, volume 4. Silver Spring, Md.: National Biomedical Research Foundation.
DAYHOFF, MARGARET O., C. M. PARK, P. I . MCLAUGHLIN
1972 "Building a phylogenetic tree: cytochrome c," in Atlas of protein sequence and structure, volume 5. Edited by M. O. Dayhoff. Silver Spring, Md.: National Biomedical Research Foundation.
GOODMAN, MORRIS, JOHN BARNABAS, G. W. MOORE
1972 Man, the conservative and revolutionary mammal. Molecular findings on this paradox. Journal of Human Evolution 1:663686.
GOODMAN, MORRIS, GABRIEL W. LASKER
1976 "Molecular evidence as to man's place in nature," in Primate morphol
ogy , functional morphology and evolution. Edited by R٧ssel H. Tuttle. The Hague: Mouton.
LOVEJOY, C. o . , R. S. MEINDL
1972 Eukaryote mutation and the protein clock. Yearbook of Physical
Anthropology 16:1830. SARICH, VINCENT M.
1971 "A molecular approach to the question of human origins," in Back
ground for man: readings in physical anthropology. Edited by V. M. Sarich and P. Dolhinow. Boston:Little, Brown.
SARICH, VINCENT M., ALLEN C. WILSON
1967 Immunological time scale for hominid evolution. Science 158: 12001203.
1973 Generation time and genomic evolution in primates. Science 179: 11441147
TASHIAN, RICHARD E. , ROBERT J . TANIS, ROBERT E. FERRELL et al.
1972 Differential rates of evolution in the carbonic anhydrase isozymes of catarrhine primates. Journal of Human Evolution 1:545552.
UZZELL, THOMAS, KENDALL W. CORBIN
1972 Evolutionary rates in cistrons specifying mammalian hemoglobin alpha and betachains: phenetic versus patristic measurements. Ameri
can Naturalist 106:555573. UZZELL, THOMAS, DAVID PILBEAM
1971 Phyletic divergence dates of hominoid primates: a comparison of fossil and molecular data. Evolution 25:615635.
WILSON, ALLEN C., VINCENT M. SARICH
1969 A molecular time scale for human evolution. Proceedings of the
National Academy of Science 63:10881093. WOODING, G. L. , R. F. DOOLITTLE
1972 Primate fibrinopeptides: Evolutionary significance. Journal of Human
Evolution 1:553563.
Mathematical Aspects of Genetic
Equilibrium
RANAJIT CHAKRABORTY
It is well known that polymorphism prevails in nearly all, if not all, natural populations to some degree. On a phenotypic level, which constitutes the essential description of a population, this simply means the existence of more than one morphological or physiological type in the population. On the genotypic level, this generally means that there exists in the population more than one allelomorph at a locus. The persistence of these alternate states of a gene in a population over a long period constitutes the study of evolutionary statics (Haldane 1954).
There are many ways in which such population variability can be maintained. They all depend on some kind of balance between counteracting forces, or else the variability is transient. The same degree of variability is preserved by a constancy of frequencies of different allelomorphs over generations. This event is known as genetic equilibrium. Thus, the concept of equilibrium can be conceived at three levels (phenotypic, genotypic, and genie) just as in the case of polymorphism. The distinctions among these three types are important, although not sharp enough. A detailed account of their interrelationship can be seen in Chakraborty (1972).
In this article our aim will be to analyze the mathematical aspects of equilibrium states insofar as the stability of such states are concerned. In other words, we attempt a formal classification of equilibrium systems. Such a study is relevant for the determination of the ultimate fate of a population in which the balance between the counteracting natural forces is maintained soon after an initial disturbance. To do that we consider a model with infinite population so that stochastic elements are not introduced. The generations are assumed to be discrete (that is, each genera
Research initiated when the author was associated with Indian Statistical Institute, Calcutta. Work partially supported by U.S. National Institutes of Health grant (GM 15913).
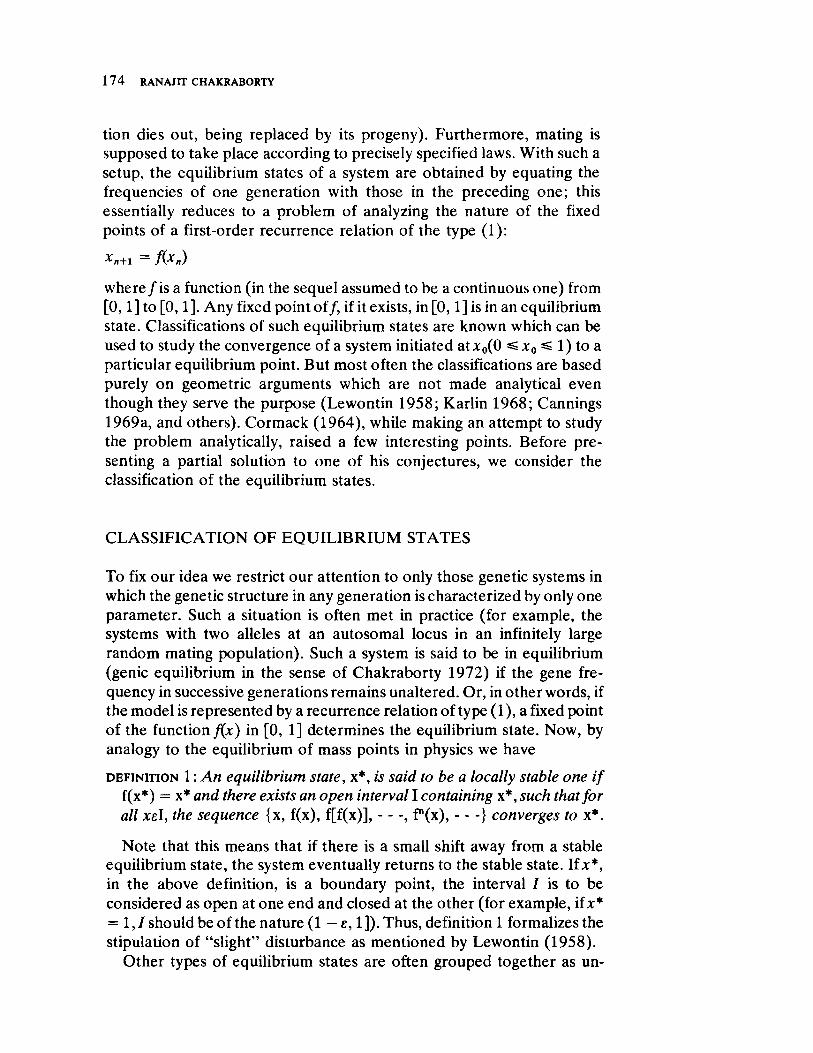
1 7 4 RA N A JIT CHA KRA BO RTY
tion dies out, being replaced by its progeny). Furthermore, mating is supposed to take place according to precisely specified laws. With such a setup, the equilibrium states of a system are obtained by equating the frequencies of one generation with those in the preceding one; this essentially reduces to a problem of analyzing the nature of the fixed points of a first-order recurrence relation of the type (1):
*n+l = f(Xn)
where/ is a function (in the sequel assumed to be a continuous one) from [0,1] to [0,1]. Any fixed pointyxvutsrqponmlihgfedcbaA o f f , if it exists, in [0,1] is in an equilibrium state. Classifications of such equilibrium states are known which can be used to study the convergence of a system initiated atxo(0 1) to a particular equilibrium point. But most often the classifications are based purely on geometric arguments which are not made analytical even though they serve the purpose (Lewontin 1958; Karlin 1968; Cannings 1969a, and others). Cormack (1964), while making an attempt to study the problem analytically, raised a few interesting points. Before pre-senting a partial solution to one of his conjectures, we consider the classification of the equilibrium states.
CLA SSIFICA TIO N O F EQ UILIBRIUM STA TES
To fix our idea we restrict our attention to only those genetic systems in which the genetic structure in any generation is characterized by only one parameter. Such a situation is often met in practice (for example, the systems with two alleles at an autosomal locus in an infinitely large random mating population). Such a system is said to be in equilibrium (genie equilibrium in the sense of Chakraborty 1972) if the gene fre-quency in successive generations remains unaltered. Or, in other words, if the model is represented by a recurrence relation of type (1), a fixed point of the function f(x) in [0, 1] determines the equilibrium state. Now, by analogy to the equilibrium of mass points in physics we have
DEFINITION 1: An equilibrium state, x*, is said to be a locally stable one if
f(x*) = x* and. there exists an open interval I containing x*,such that for
all xel, the sequence {x, f(x), f[f(x)], , f" (x), } converges to x*.
Note that this means that if there is a small shift away from a stable equilibrium state, the system eventually returns to the stable state. If jc*, in the above definition, is a boundary point, the interval I is to be considered as open at one end and closed at the other (for example, ifJC JC*
= 1,1 should be of the nature (1 — ε, 1]). Thus, definition 1 formalizes the stipulation of " slight" disturbance as mentioned by Lewontin (1958).
Other types of equilibrium states are often grouped together as un-
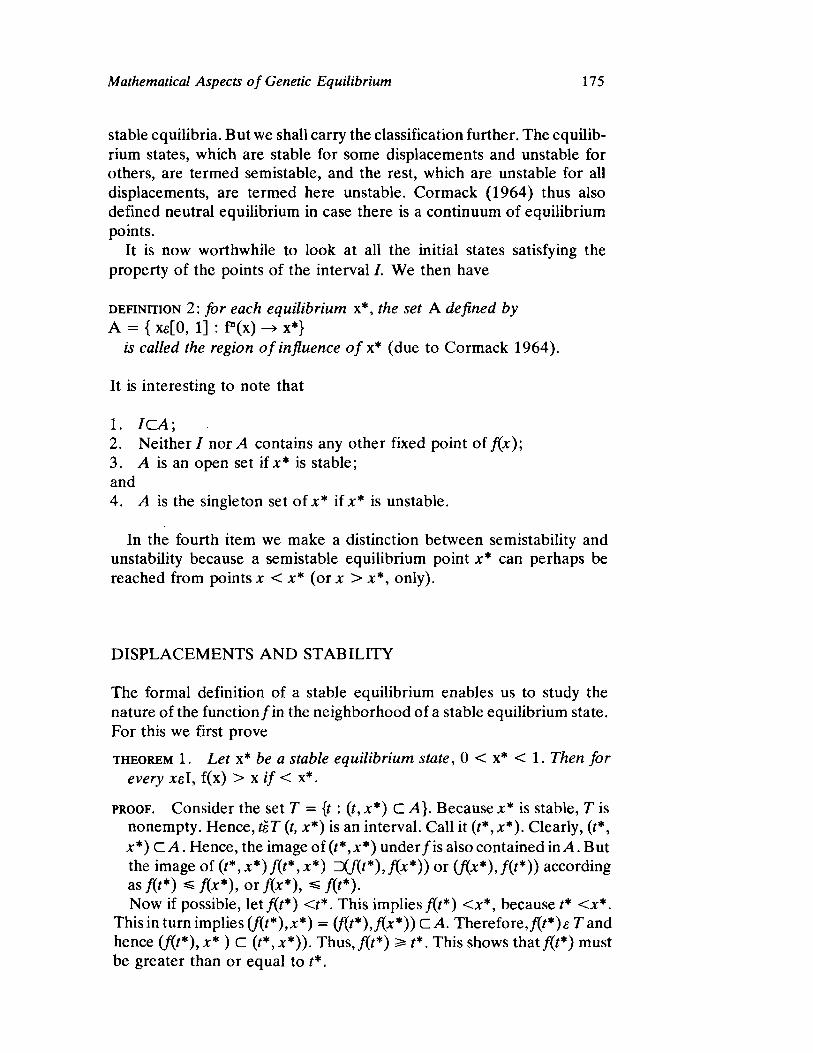
Mathematical Aspects of Genetic Equilibrium 175
stable equilibria. But we shall carry the classification further. The equilibrium states, which are stable for some displacements and unstable for others, are termed semistable, and the rest, which are unstable for all displacements, are termed here unstable. Cormack (1964) thus also defined neutral equilibrium in case there is a continuum of equilibrium points.
It is now worthwhile to look at all the initial states satisfying the property of the points of the intervalI I. We then have
DEFINITION 2 : for each equilibrium x* , the set A defined by
A = { xe[0, 1] : f"(x) > x*} is called the region of influence ofx* (due to Cormack 1964).
It is interesting to note that
1. ICA;
2. Neither I nor A contains any other fixed point of /(*); 3. A is an open set if** is stable; and 4. A is the singleton set of** if** is unstable.
In the fourth item we make a distinction between semistability and unstability because a semistable equilibrium point ** can perhaps be reached from points χ < x* (or * > **, only).
DISPLACEMENTS AND STABILITY
The formal definition of a stable equilibrium enables us to study the nature of the function/in the neighborhood of a stable equilibrium state. For this we first prove
THEOREM 1 . Let x* be a stable equilibrium state, 0 < x* < 1 . Then for
every * ε Ι , f ( x ) > x if < x * .
PROOF. Consider the set Τ = {t : (t, **) C A}. Because x* is stable, Τ is nonempty. Hence, tsT (t, **) is an interval. Call it (t*,x*). Clearly, (t*, **) C A. Hence, the image of (t*,x*) under/is also contained in A. But the image of (t*, x*) f(t*, x*) D(J(t*),f(x*)) or (f(x*),f(t*)) according as /(/*) ^ / (**) , or /(**), ^ f ( t * ) .
Now if possible, let/(i*) <t*. This implies/(/*) <**, because/* <**. This in turn implies (f(t*),x*) = (f(t*),f(x*)) CA. Therefore, f(t*)£ Γ and hence (/(/*),** ) C (i*,**)). Thus,/(/*) > t*. This shows that/(i*) must be greater than or equal to t*.
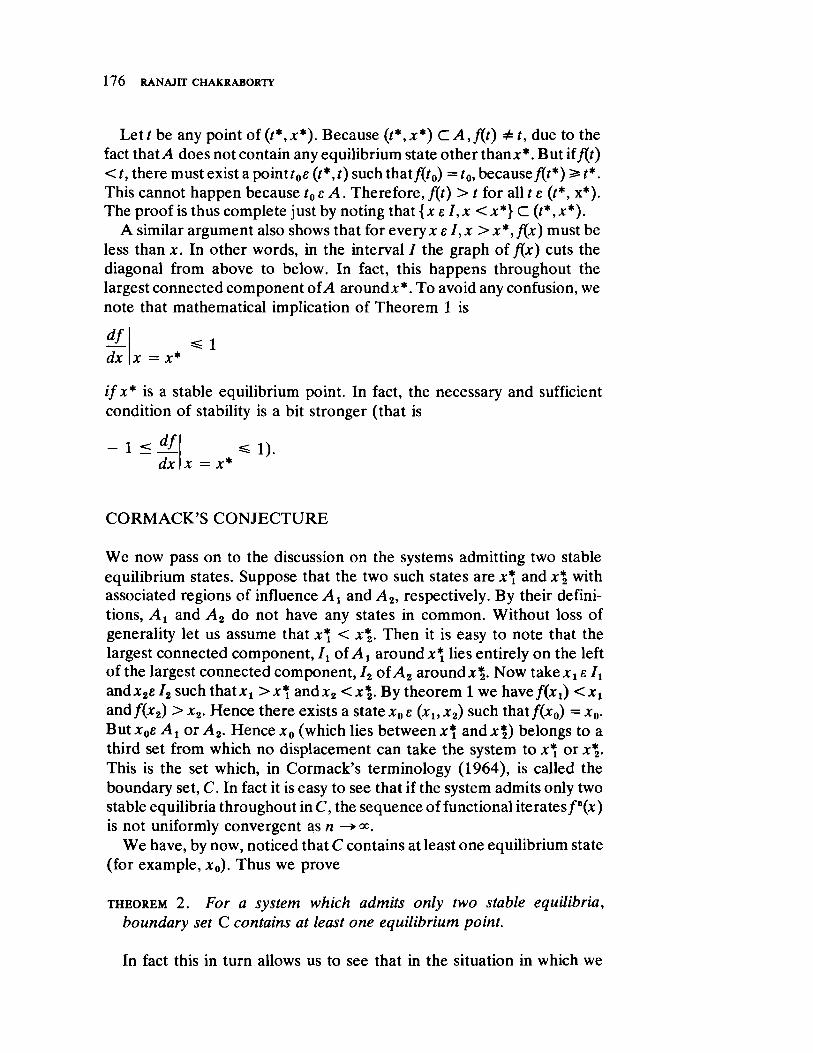
1 7 6 RANAJIT CHAKRABORTY
Let / be any point of (i*,**). Because (yxwutsrqponmlihfedcbaXIFCAt*,x*) CA,f(t) Φt, due to the fact that A does not contain any equilibrium state other than**. But if fit)
<t, there must exist a poinU0e (t*, t) such that f(t0) = t0, because f(t*) s* t*.
This cannot happen because t0 ε A. Therefore, /(f) > t for all t ε (t*, x*). The proof is thus complete just by noting tha t{*e / , * <**} C (t*,x*).
A similar argument also shows that for every* ε I,χ >x*,f(x) must be less than x. In other words, in the interval / the graph of fix) cuts the diagonal from above to below. In fact, this happens throughout the largest connected component of.A around**. To avoid any confusion, we note that mathematical implication of Theorem 1 is
df_
dx χ = x* 1
ifx* is a stable equilibrium point. In fact, the necessary and sufficient condition of stability is a bit stronger (that is
1 < dx χ = x*
1).
CORMACK'S CONJECTURE
We now pass on to the discussion on the systems admitting two stable equilibrium states. Suppose that the two such states are ** and x% with associated regions of influence Ax and A2, respectively. By their definitions, Αι and A2 do not have any states in common. Without loss of generality let us assume that ** < **. Then it is easy to note that the largest connected component, ^ ο ί Α χ around*^ lies entirely on the left of the largest connected component, /2 of^4z around*^. Now take*xe I t
and*2e /2 such that*x >*1[ and*2 <x\. By theorem 1 we have / fo ) < * i and f(x2) > x2. Hence there exists a state *0 £ (*ι> X2) s u c h that/(x0) = x0.
But*0e At or A2. Hence x0 (which lies between χ*! and*1!) belongs to a third set from which no displacement can take the system to ** or x*.
This is the set which, in Cormack's terminology (1964), is called the boundary set, C. In fact it is easy to see that if the system admits only two stable equilibria throughout in C, the sequence of functional iterates/n(*) is not uniformly convergent as η —> α°.
We have, by now, noticed that C contains at least one equilibrium state (for example, *0). Thus we prove
THEOREM 2. For a system which admits only two stable equilibria,
boundary set C contains at least one equilibrium point.
In fact this in turn allows us to see that in the situation in which we
Mathematical Aspects of Genetic Equilibrium 111
characterize the system by only one parameter, in this case the gene frequency, two stable equilibria are always separated by at least one equilibrium state and the boundary set of the two regions of influence (associated with the two stable states) is around the equilibrium state. This equilibrium state is either semistable or unstable if there are only two admissible stable states. This proves the conjecture of Cormack in the case of a single parameter.
DISCUSSION
Stability of an equilibrium state, as defined in this paper, thus appears to be a stronger concept than convergence. It is necessary to elucidate that a system may as well converge to a semistable equilibrium from a certain set of initial points. But for a stable equilibrium point, convergence is assured in its region of influence. Hence, from the very definition of such concepts it is clear that necessary and sufficient conditions for stability of the nondegenerate equilibrium are always also sufficient for convergence to that equilibrium. Cannings' observations (Cannings 1967,1969b) are thus results of this fact, too. Furthermore, the implications of Theorems 1 and 2 are even more interesting. They can be used to devise an algorithm to locate the regions of influence explicitly for any stable equilibrium point. It must be mentioned, at last, that the theory described thus far is based on strictly deterministic considerations. Under stochastic models a new approach to the whole concept of stability would be required.
REFERENCES
CANNINGS, C.
1967 Equilibrium, convergence and stability at a sexlinked locus under natural selection. Genetics 56:613618.
1969a A graphical method for the study of complex genetical systems with special reference to equilibria. Biometrics 25:747754.
1969b Unisexual selection at an autosomal locus. Genetics 62:225229. CHAKRABORTY, R.
1972 Some equilibrium conditions for genetic populations. Journal of Indian
Society of Agricultural Statistics 24:7580. CORMACK, R. M.
1964 A boundary problem arising in population genetics. Biometrics
20:785793. HALDANE, J . B. S .
1954 An exact test for randomness of mating. Journal of Genetics
52:631635.

1 7 8YWTSRONLKJIHECBA RANAJRR CHAKRABORTY
KARLIN, S.
1968 Equilibrium behaviour of population genetic models with non-random mating, part IyutsrponlifedcbaPJGA .Journal of Applied Probability 5:231-313.
LEWONTIN, R. C.
1958 A general method for investigating the equilibrium of gene frequencies in a population. Genetics 43:419-434.
SECTION TWO
Population Studies

Multidisciplinary Studies in Tribal
Societies and Human Evolution
FRANCISCO M. SALZANO
THE PHILOSOPHY OF MULTIDISCIPLINARY INVESTIGATIONS
Human beings are complex animals and have developed very diversified cultural systems. They live in a wideranging environment and are therefore subjected to a large variety of stresses to which they must adapt. These challenges may arise from natural sources, but the sociocultural structures created can lead to new tensions and can interact in many subtle ways with the forces of nature.
Adaptation in our species can be cultural or biological. The latter may involve at least three types of components: genetic, physiological, and behavioral. The main aims in any adaptability project are first, the identification of the primary stresses to which a given group is exposed, and second, the calculation of quantitative estimates of the degree of adaptation achieved in relation to these factors. This is no easy task; human biological multidisciplinary studies were organized in an effort to obtain (if not definitive at least approximate) answers to these questions.
The success of such investigations depends on a series of circumstances. Clearly, the study of a population from the point of view of several disciplines will provide important insights only if carefully prepared plans are made concerning what should be studied, and a thorough integration of the results obtained by the different specialists is carried out. More details about the philosophy of these studies can be found in Baker
The support of the Cδmara Especial de Posgraduagδo e Pesquisa da Universidade Federal do Rio Grande do Sul, Conselho Nacional de Pesquisas, Coordenagδo do Aperfeigoamento de Pessoal de Nivel Superior, Fundagδo de Amparo δ Pesquisa do Estado do Rio Grande do Sul, and the WennerGren Foundation for Anthropological Research is gratefully acknowledged.
182 FRANCISCO Μ. SALZANO
(1969) and in the World Health Organization Technical Report Series numbers 279 (1964) and 387 (1968). A useful guide to field methods is provided by Weiner and Lourie (1969).
WHY STUDIES ON TRIBAL POPULATIONS?
There are in the world today a number of communities still living in conditions that may be called "primitive," in the sense that their subsistence activities (hunting and gathering with simple agriculture) resemble those prevalent in the early phase of human history. Quite apart from discussions about what aspects of these communities should be investigated (see Morton 1968), this resemblance and their fast rate of acculturation give them a high priority in any program of human biology. By studying these populations we can, moreover, obtain important information that may be gathered only from the following groups.
1. The disease, mortality, and fertility patterns most prevalent in populations living in this cultural stage and the influence of genetic factors on them.
2. The relationship between population structure and genetic variability. (Tribal groups are especially suitable for these investigations because of their relatively small size and the simplicity of their ecology.)
3. The study of unusual diseases, abnormal frequencies of rare conditions, and new genetic variants or disorders. (Here the point to be stressed is their relative isolation and high rate of endogamy.) (World Health Organization 1964, 1968.)
There is no doubt that other groups for whom written records of morbidity, mortality, and fertility are available may provide more decisive data for the solution of some problems of population genetics. But their value is quite limited if we want to draw inferences about what happened during 99 percent of our biological evolution.
RECENT MULTIDISCIPLINARY INVESTIGATIONS IN TRIBAL AND PEASANT SOCIETIES
In recent years a series of tribal and peasant populations have been studied by groups of researchers whose aim was to understand their patterns of adaptation by using data from several disciplines. Two types of approaches can be visualized here.
1. The community to be studied can be chosen because of unusual circumstances occurring in it, such as a localized disease, or because it is located in an environment that provides a very specific type of stress, such as high altitudes; or
Multidisciplinary Studies in Tribal Societies and Human Evolution 183
2. Although the emphasis may still be ecological, the types of primary stresses may not be so obvious, and several aspects of the relationship between a given group of persons and their environment must be considered.
The advantage of the first type of study is that specific hypotheses can be established αtrpoliea priori to verify the adaptation processes developed by the different populations to the main challenges posed by their special situations; the disadvantage is that the findings cannot be easily extrapolated to groups that are not subjected to these stresses.
An example of investigations of a localized disease is the research on kuru in the eastern highlands of Australian New Guinea (Gajdusek 1964; Gajdusek and Alpers 1972). Kuru is a rapidly progressive familial degenerative disorder of the central nervous system and is responsible for a high mortality among the Fore, where it has reached an extraordinarily high incidence. The detailed fieldwork performed in the kuru region, as well as the extensive laboratory determinations done on material collected there, have clarified important aspects of the etiology and epidemiology of the disease, as well as the kinds of adaptive mechanisms developed by these individuals to cope with this situation.
Several multidisciplinary studies of how human groups adapt to a highaltitude environment have been performed; one of the more extensive is that done among the Quechua of the Andes Mountains (Baker 1971; Baker and Dutt 1972). Populations of this area show distinctive physiques, as well as many physiological indicators of adaptation. Patterns of growth, fertility, and mortality are quite different from those seen in the lowlands, but it is not yet clear how much of this is due to genetic factors, how much to phenotypic plasticity, or how much to an interaction between the two. Similar questions have been asked by Harrison et al.
(1969) on Ethiopian natives and by Rothhammer and Spielman (1972) on theyxwvutsrqponmlkjihgfedcbaTSRNMIHGFCBA Aymarδ of northern Chile.
More general multidisciplinary investigations, without a focus on specific stresses, are being performed in different regions of the world. In southwest New Guinea, for example, Simmons, Gajdusek, and Nicholson (1967) have tried to correlate the local genetic variation with the ethnography and disease patterns of the populations studied. More sophisticated analyses were done by Friedlaender (1971), Friedlaendertlea et al.
(1971) and Howells (1966), on the Melanesians of southcentral Bougainville. The technique of population structure analysis was applied to blood polymorphic, anthropometric, and demographic data. The first two sets of results reveal a striking amount of variability. Tree analyses and distance correlations show that this biological variation is related to geographic, linguistic, and migrational differences.
Morton and associates (Hussels and Morton 1972; Morton 1972; Morton and Greene 1972; Morton, Harrisei al. 1971; Morton, Roisen
184 FRANCISCO Μ. SALZANO
bergtlea et al. 1971; Morton et al. 1972) have utilized several methods of population genetic analysis to investigate the interrelationships of a series of variables studied among groups living in the Pingelap and Mokil atolls of Micronesia. They were able to relate a series of demographic and genetic features of these populations to the effects of a devastating typhoon that occurred in this area around 1775. One of the most striking consequences of this event was the increase in frequency of congenital achromatopsia with myopia, which now has an incidence of 5 percent among the Pingelapese and 1 percent among the Mokilese.
Extensive investigations were also performed by CavalliSforza and coworkers among the Babinga pygmies of the Central African Republic, but the analysis of these data has only started (Benerecetti 1970; Benerecetti and Modiano 1969; Bodmer and Bodmer 1970; CavalliSforza and Bodmer 1971; CavalliSforza et al. 1969), being restricted until now to the description of the distribution of several genetic polymorphisms, marital distances, and the application of the methods of phylogenetic trees.
Somewhat different approaches are being used in the EskimoAleut project (Laughlin 1963,1972). Here the main emphasis is on archeology and geology, to search the past for events that could have affected population size and structure, while human biological studies are performed to identify adaptive processes that could be related to the particular type of life of these people.
Several American Indian tribes are being subjected to multidisciplinary studies of different orders of magnitude. Research among North American groups includes that of Niswander and coworkers (Brown and Johnson 1970; Niswander et al. 1970; Sofaerei al. 1972; Workman and Niswander 1970) in Southwestern Indian tribes. The genetic differentiation observed among Papago groups was analyzed by the use of χ2 tests and Wright'sF F statistics; the geographic distances presently separating that tribe from the Pima and Zufii were compared with those obtained using polymorphic genes and dental morphology.
In South America the most extensive investigations were performed among the Makiritare (Arends et al. 1970; Gershowitz et al. 1970; Ward and Neel 1970; Weitkamp and Neel 1970) and Yanomama Indians (Chagnoneia/. 1970; Eveland, Oliver, and Neel 1971; Gershowitz et al.
1972; Neel 1971, 1972; Neel et al. 1970, 1972; Neel and Ward 1972; Spielman etal. 1972; Weitkamp etal. 1972; Weitkamp and Neel 1972). The Yanomama especially have been subjected to thorough genetic and ecological studies, the principal objectives being (Neel et al. 1972): (1) to develop a better understanding of the population structure in groups of this type; (2) to apply the techniques of distance analysis based upon defined genetic characteristics to the complex task of unraveling the relationships of Indian tribes and estimating rates of genetic
Multidisciplinary Studies in Tribal Societies and Human Evolution 185
divergence; and (3) to attempt to identify and quantify the manner in which "civilization" introduces the need for genetic adjustments. The analysis of these data is still going on, but the results available so far have indicated some important differences in the population structure and ecological pressures between populations living at this cultural level and those technologically more developed.
Jantztleaetal. (1969), Johnston et al. (1968,1969a, 1969b), and Johnston and Kensinger (1971) have also performed multidisciplinary investigations among the Peruvian Cashinahua; unfortunately, the populations studied were small, precluding safe generalizations.
The researches of our group using this approach started with the Caingang Indians of the southern Brazilian states of Rio Grande do Sul, Santa Catarina and Parana (Da Rocha 1971; Harrison and Salzano 1966; Keiter and Salzano 1963; Roberts, Salzano, and Wilson 1970; Roberts etal. 1971; Salzano 1961a, 1961b, 1961c, 1961d, 1963, 1964a, 1964b, 1964c, 1964d; Salzano etal. 1962; Salzano and Shreffler 1966; Salzano and Steinberg 1965; Salzano and Sutton 1963,1965; Salzano and Tondo 1968; Tondo and Salzano 1960). The studies involved demographic variables, morphology (anthropometry, dermatoglyphics, skin color, and other characteristics), hemoglobin types, blood groups and salivary secretion, serum proteins, color blindness, some rare genetic conditions, growth, active sweatgland distribution, and the effects of consanguineous marriages. The Xavante tribe was then studied, in a joint project with Neel and coworkers (Gershowitz et al. 1967; Neel et al. 1964, 1968a, 1968b; Neel and Salzano 1967; Niswander 1967; Niswander, Keiter, and Neel 1967; Salzano, Neel, and MayburyLewis 1967; Shreffler and Steinberg 1967; Tashianeia/. 1967; Weinstein, Neel, and Salzano 1967). Members of our group have also collaborated to a limited extent with the researches carried out among the Makiritare and Yanomama (Chagnon et al. 1970; Gershowitz et al. 1970, 1972; Neel et al., 1972; Spielman et al., 1972). But during the last few years we have been concerned primarily with studies among the Cayapo Indians. A summary of the main results follows.
THE CAYAPO — A CASE REPORT
The Cayapo Indians speak a Ge language and live at present in eight semiindependent communities in the Brazilian states of Para and Mato Grosso, reaching from latitude 5° to 10° south and from longitude 51° to 54° west. The sizes of their subgroups, their names, the dates when they first established peaceful contacts with nonIndians, estimates of their degree of acculturation, and the kinds of research performed among them are given in Table 1; the articles describing these results in detail are also
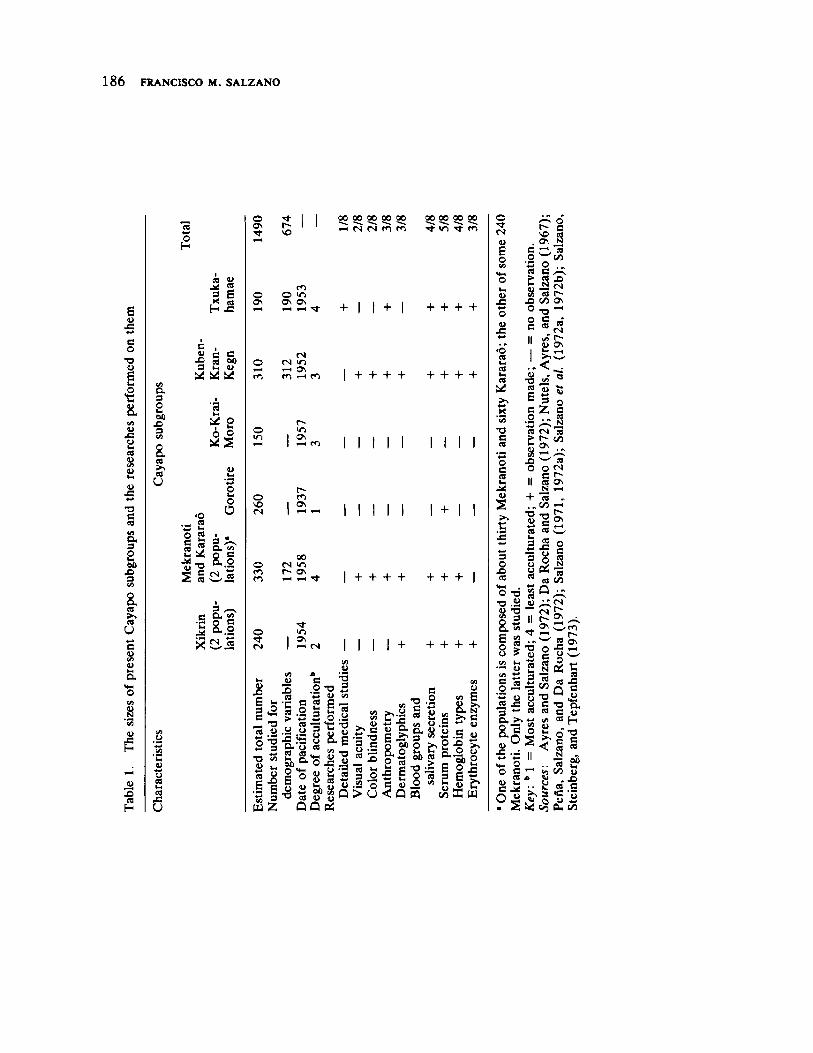
1 8 6 FRANCISCO Μ. SALZANO
ι-ω υ es
U
£ Λ 4> ^ Λ 3 Ε * S3
Η J3
c . a c ο • 2 Μ Μ 3 k II Μ Μ Μ
α 3 Ο Vh Μ Χι 3
2 . CO Λ
υ
<ο
Μ >1 * 2 ό |
M S
2 ο ά
ο C
Λ Μ m Λ
<5-2 8 -1 <Ν
i2 o-.S
ο ON
ο ON
Ο f-H Γ«Ί
Ο
ο Ό <Ν
Ο m
ο (Ν
Μ
ε * = » < 2 c £ <β ω ο ^
<Λ 4> b.
ο
r -Τ ι ON
m on
Tt >/-> On
00 00 00 00 00 sliaXUSό is is ΪΛ
00 00 00 00 T? </"1 ·<* ΓΛ
ο ON ON
+ 1 1 + + + + +
(Ν «Ν ιη η On
η Η η + + + + + + + +
I I I I I Ι Ι Ι Ι
00 CS Ό Γ- ON rt -Η Τ»"
«Ν
I I
I + + + + + + + ι
I I I I + + + + +
ό Β S .2 • S c « λ .2 5 > 3 « U S δ
£ «s a Ο· υ ce S g.«-eb α Ο S o « ε « £ « S ab
Ό π) U Q Q
< D Q-ε ο 00 8. Ρ ο
ά • ο
•α 3 υ ν>
I s «« Ο -3 ν
t JO > ,8 V ω ~ .S
^ 12 Λ S
a Λ 1 s 5 ? . 8 Ο , - _ g Q > U < Q « Ρί
ο Tt-(Ν υ
I 1 CA * -»
υ £
u .e
• ο α
α >>
χ
Ό C Λ
Ο C (β Li υ
S >> t :
3 Ο
χι η
Ο Ό ϊ( Ό ·- JU ,
8.1 ε ο υ
Λ iT > ^ > ω
C g
ο <g C Ο. &*
δ S Κ S .Ξ 4)
- 2 ·δ R Ο 00 Λ
VI Ii — ω (Λ ^ JS 3
"3 « υ u Λ
ε ν — ε 2 j= Ε ο « ρ Ρ « e 5 ο « g 8 fr
( Δ X U l
** Λ
Ι · - «
„ O S
υ Β
Ο
ο C ' a j u «
2 *

Multidisciplinary Studies in Tribal Societies and Human Evolution 187
listed there. As can be seen, the whole Cayapo population consists now of about 1,500 individuals. This figure should be compared to an estimate of the last century made by H. Coudreau (1897), who calculated a population of 5,000 for these Indians. Our demographic studies involved about half of the estimated present number. Unfortunately, it was not possible to perform all kinds of observation planned in all subgroups. For most of the gene markers, however, the number of persons tested also approached onehalf of the total population.
The recent history of the Cayapo can be summarized as follows. They may have consisted of a single large population at the end of the seventeenth century. Some time afterward, however, they split into three groups: the Pau d'Arco, Xikrin, and Gorotire. The first became extinct; the Xikrin have remained as a distinct branch ever since, dividing into two groups around 1956 ; and the Gorotire have suffered several fissions and fusions. The first split among the Gorotire occurred around 1905, giving rise to the Mekranoti subgroup. The latter divided again, with part of the population going to the Xingu area and the remaining to the Iriri region. A new fission then occurred in the Xingu population, the result being the present Txukahamae, while the other faction joined a dissident group from the Iriri band, remaining with them in that area. What is called the Bau population is a result of the fusion of the Kararaφ, who separated from the Gorotire around 1936, and part of the Mekranoti of the Iriri. A further subdivision of the Gorotire are the KubenKranKegn; this split also occurred around 1936 when the Gorotire had their first contacts with neoBrazilians. A few years later the KoKraiMoro diverged as a subbranch of the KubenKranKegn.
Information about some selected demographic characteristics of three Cayapo subgroups is given in Table 2. These are young populations. About 40 percent of the persons are less than fifteen years old, the mean age being twenty years; fertility and mortality are moderate. These values, and those observed for the admixture rates, are in accordance with previous findings in populations of hunters and gatherers with incipient agriculture. The reduced age difference between males and females, and low sex ratios and inbreeding rates are, however, at variance with previous studies in such groups (see Salzano 1972b for a general review). On the other hand, there are differences among the three communities studied in relation to age distribution, sex ratio, number of live births per married female, amount of mortality found, and inbreeding rates. The most contrasting subgroups are the Txukahamae and the KubenKranKegn, the Mekranoti showing generally intermediate values. It is interesting that the higher number of live births observed among the Txukahamae when compared to the KubenKranKegn is compensated by a higher mortality, the average number of surviving offspring being of the same order of magnitude in the two subgroups. The

1 8 8 FRANCISCO Μ. SALZANO
concordant findings observed for the KubenKranKegn and Mekranoti are in accordance with the back stochastic migration matrix obtained for these three populations (Salzano 1971) which indicated significant exchange between these two communities.
Table 2. Demographic characteristics of Cayapo subgroups
Cayapo subgroups Demographic variables Total
KubenKranMekranoti Kegn Txukahamae
Total sample 172 312 190 674 Percent less than 15 years old 43 35 49 41 Sex ratio 77 87 102 88 Mean age
Males 20 21 18 20 Females 19 22 18 20
Number of live births per married female 3.3 2.4 3.8 3.0
Number of surviving offspring 2.1 2.0 2.6 2.2
Decrease as percent of live births 36 17 32 27 Admixture rate 16 13 17 —
Inbreeding coefficient (.χ 10~4) 22 3 28 14
Source: Salzano (1971).
Mortality and fertility data can be combined in Crow's index (1958) of potential selection. The results obtained among the Cayapo are compared in Table 3 with those of two other tribes that are at about the same level of technological advance. Because of their relatively low mortality and small variance in completed family sizes, the former show a very low index (0.71, as compared to 0.88 obtained for the Yanomama and 0.90 observed among the Xavante).
Births and deaths are, of course, much influenced by the disease patterns of a given group. Unfortunately, we have been able to make detailed medical examinations in only one population (the Txukahamae). Despite some health problems—one of them, tuberculous infection, due to recent indirect contacts with nonIndians — the general impression given by these Indians was of a group in good equilibrium with their environment. The pattern observed is typical of hunting and gathering groups with incipient agriculture. Chronic and degenerative disorders were not encountered; all the congenital defects observed were of a very mild nature; malnutrition was rare and confined to ill persons who did not have relatives who could take care of them. There was a complete absence of hypertensive individuals and the mean number of carious or missing teeth was low, with malocclusion rare. Their main health problems were related to the infectious diseases prevalent in their environ
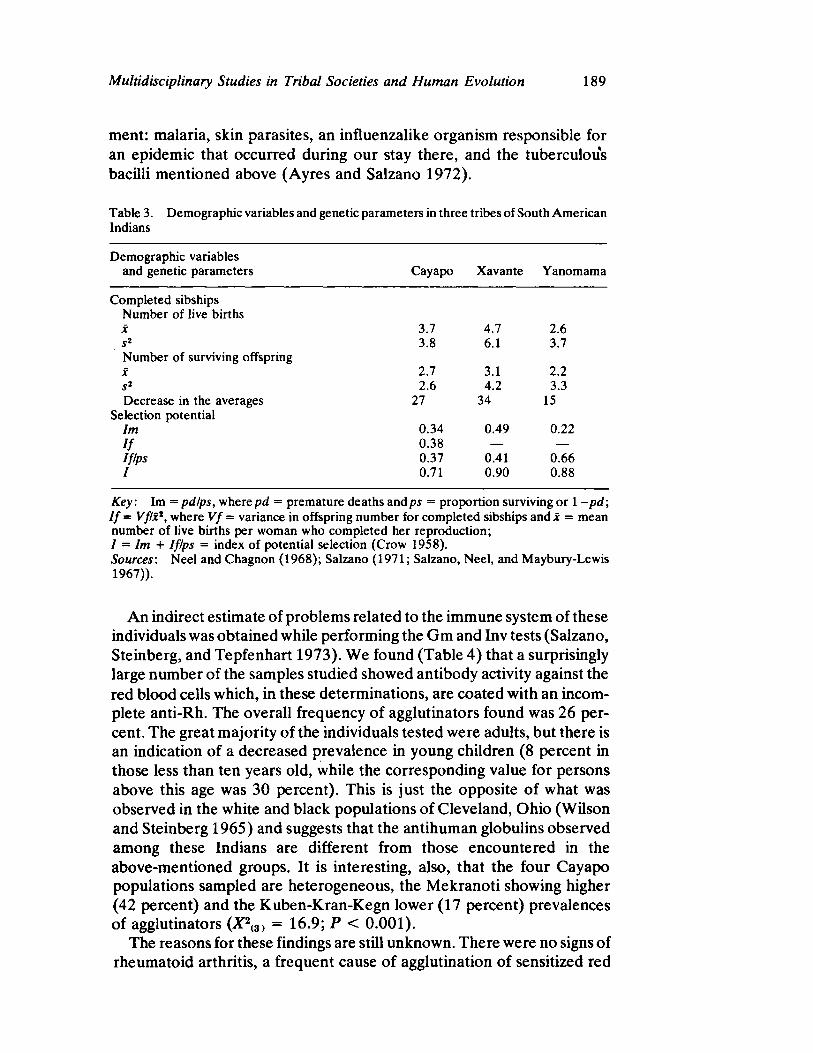
Multidisciplinary Studies in Tribal Societies and Human Evolution 189
ment: malaria, skin parasites, an influenzalike organism responsible for an epidemic that occurred during our stay there, and the tuberculous bacilli mentioned above (Ayres and Salzano 1972).
Table 3. Demographic variables and genetic parameters in three tribes of South American Indians
Demographic variables and genetic parameters Cayapo Xavante Yanomama
Completed sibships Number of live births X 3.7 4.7 2.6
S2 3.8 6.1 3.7 Number of surviving offspring X 2.7 3.1 2.2 s2 2.6 4.2 3.3 Decrease in the averages 27 34 15
Selection potential Im 0.34 0.49 0.22
If 0.38 — —
If/ps 0.37 0.41 0.66 I 0.71 0.90 0.88
Key: Im = pd/ps, wherepd = premature deaths andps = proportion surviving or 1 pd;
If = Vf/x2, where Vf = variance in offspring number for completed sibships and χ = mean number of live births per woman who completed her reproduction; / = Im + I ftps = index of potential selection (Crow 1958). Sources·. Neel and Chagnon (1968); Salzano (1971; Salzano, Neel, and MayburyLewis 1967)).
An indirect estimate of problems related to the immune system of these individuals was obtained while performing the Gm and Inv tests (Salzano, Steinberg, and Tepfenhart 1973). We found (Table 4) that a surprisingly large number of the samples studied showed antibody activity against the red blood cells which, in these determinations, are coated with an incomplete antiRh. The overall frequency of agglutinators found was 26 percent. The great majority of the individuals tested were adults, but there is an indication of a decreased prevalence in young children (8 percent in those less than ten years old, while the corresponding value for persons above this age was 30 percent). This is just the opposite of what was observed in the white and black populations of Cleveland, Ohio (Wilson and Steinberg 1965) and suggests that the antihuman globulins observed among these Indians are different from those encountered in the abovementioned groups. It is interesting, also, that the four Cayapo populations sampled are heterogeneous, the Mekranoti showing higher (42 percent) and the KubenKranKegn lower (17 percent) prevalences of agglutinators (X2
(3) = 16.9; Ρ < 0.001). The reasons for these findings are still unknown. There were no signs of
rheumatoid arthritis, a frequent cause of agglutination of sensitized red
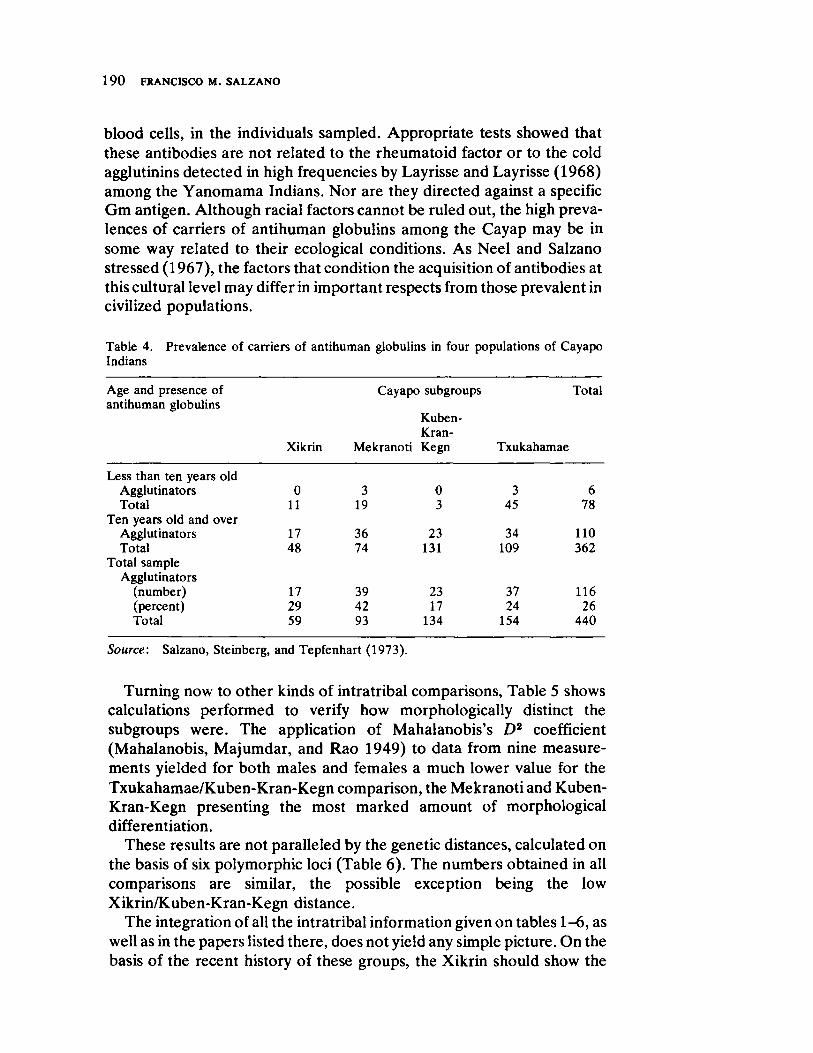
190 FRANCISCO Μ. SALZANO
blood cells, in the individuals sampled. Appropriate tests showed that these antibodies are not related to the rheumatoid factor or to the cold agglutinins detected in high frequencies by Layrisse and Layrisse (1968) among the Yanomama Indians. Nor are they directed against a specific Gm antigen. Although racial factors cannot be ruled out, the high prevalences of carriers of antihuman globulins among the Cayap may be in some way related to their ecological conditions. As Neel and Salzano stressed (1967), the factors that condition the acquisition of antibodies at this cultural level may differ in important respects from those prevalent in civilized populations.
Table 4. Prevalence of carriers of antihuman globulins in four populations of Cayapo Indians
Age and presence of Cayapo subgroups Total antihuman globulins
KubenKran
Xikrin Mekranoti Kegn Txukahamae
Less than ten years old Agglutinators 0 3 0 3 6 Total 11 19 3 45 78
Ten years old and over Agglutinators 17 36 23 34 110 Total 48 74 131 109 362
Total sample Agglutinators
(number) 17 39 23 37 116 (percent) 29 42 17 24 26 Total 59 93 134 154 440
Source: Salzano, Steinberg, and Tepfenhart (1973).
Turning now to other kinds of intratribal comparisons, Table 5 shows calculations performed to verify how morphologically distinct the subgroups were. The application of Mahalanobis's D2 coefficient (Mahalanobis, Majumdar, and Rao 1949) to data from nine measurements yielded for both males and females a much lower value for the Txukahamae/KubenKranKegn comparison, the Mekranoti and KubenKranKegn presenting the most marked amount of morphological differentiation.
These results are not paralleled by the genetic distances, calculated on the basis of six polymorphic loci (Table 6). The numbers obtained in all comparisons are similar, the possible exception being the low Xikrin/KubenKranKegn distance.
The integration of all the intratribal information given on tables 16, as well as in the papers listed there, does not yield any simple picture. On the basis of the recent history of these groups, the Xikrin should show the
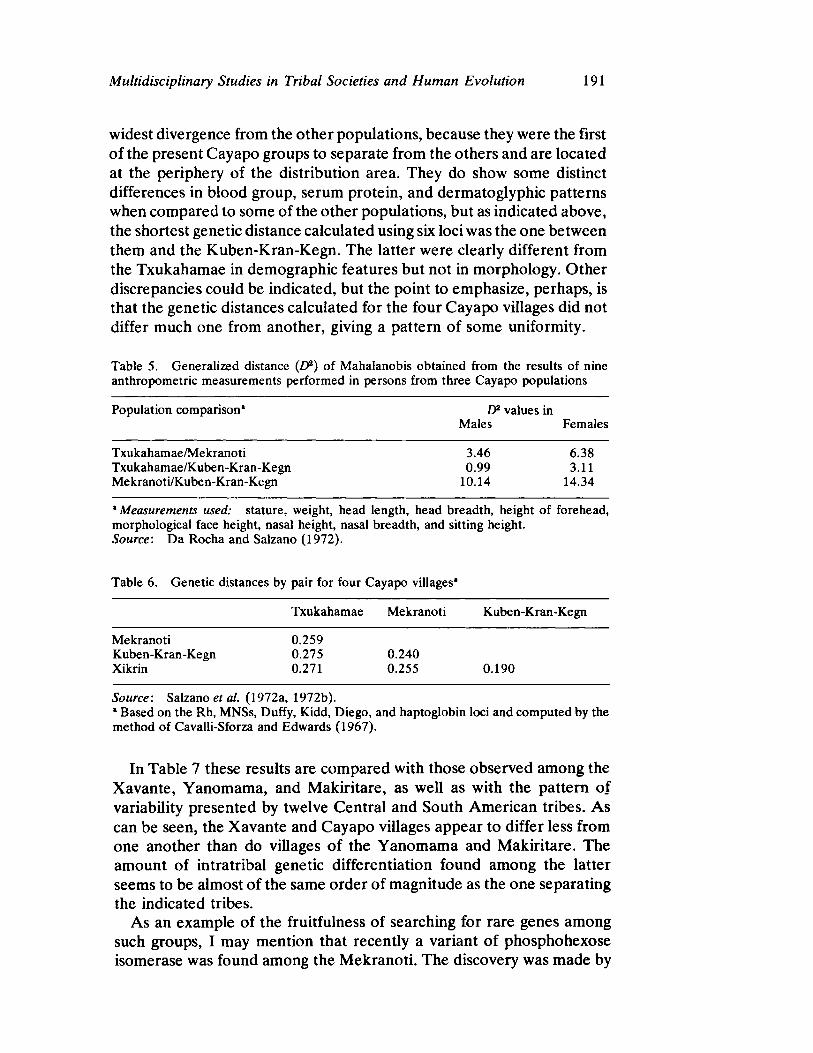
Multidisciplinary Studies in Tribal Societies and Human Evolution 191
widest divergence from the other populations, because they were the first of the present Cayapo groups to separate from the others and are located at the periphery of the distribution area. They do show some distinct differences in blood group, serum protein, and dermatoglyphic patterns when compared to some of the other populations, but as indicated above, the shortest genetic distance calculated using six loci was the one between them and the KubenKranKegn. The latter were clearly different from the Txukahamae in demographic features but not in morphology. Other discrepancies could be indicated, but the point to emphasize, perhaps, is that the genetic distances calculated for the four Cayapo villages did not differ much one from another, giving a pattern of some uniformity.
Table 5. Generalized distance (Z)2) of Mahalanobis obtained from the results of nine anthropometric measurements performed in persons from three Cayapo populations
Population comparison* D1 values in Males Females
Txukahamae/Mekranoti 3.46 6.38 Txukahamae/KubenKranKegn 0.99 3.11 Mekranoti/KubenKranKegn 10.14 14.34
' Measurements used: stature, weight, head length, head breadth, height of forehead, morphological face height, nasal height, nasal breadth, and sitting height. Source: Da Rocha and Salzano (1972).
Table 6. Genetic distances by pair for four Cayapo villages*
Txukahamae Mekranoti KubenKranKegn
Mekranoti 0.259 KubenKranKegn 0.275 0.240 Xikrin 0.271 0.255 0.190
Source: Salzano et al. (1972a, 1972b). * Based on the Rh, MNSs, Duffy, Kidd, Diego, and haptoglobin loci and computed by the method of CavalliSforza and Edwards (1967).
In Table 7 these results are compared with those observed among the Xavante, Yanomama, and Makiritare, as well as with the pattern of variability presented by twelve Central and South American tribes. As can be seen, the Xavante and Cayapo villages appear to differ less from one another than do villages of the Yanomama and Makiritare. The amount of intratribal genetic differentiation found among the latter seems to be almost of the same order of magnitude as the one separating the indicated tribes.
As an example of the fruitfulness of searching for rare genes among such groups, I may mention that recently a variant of phosphohexose isomerase was found among the Mekranoti. The discovery was made by
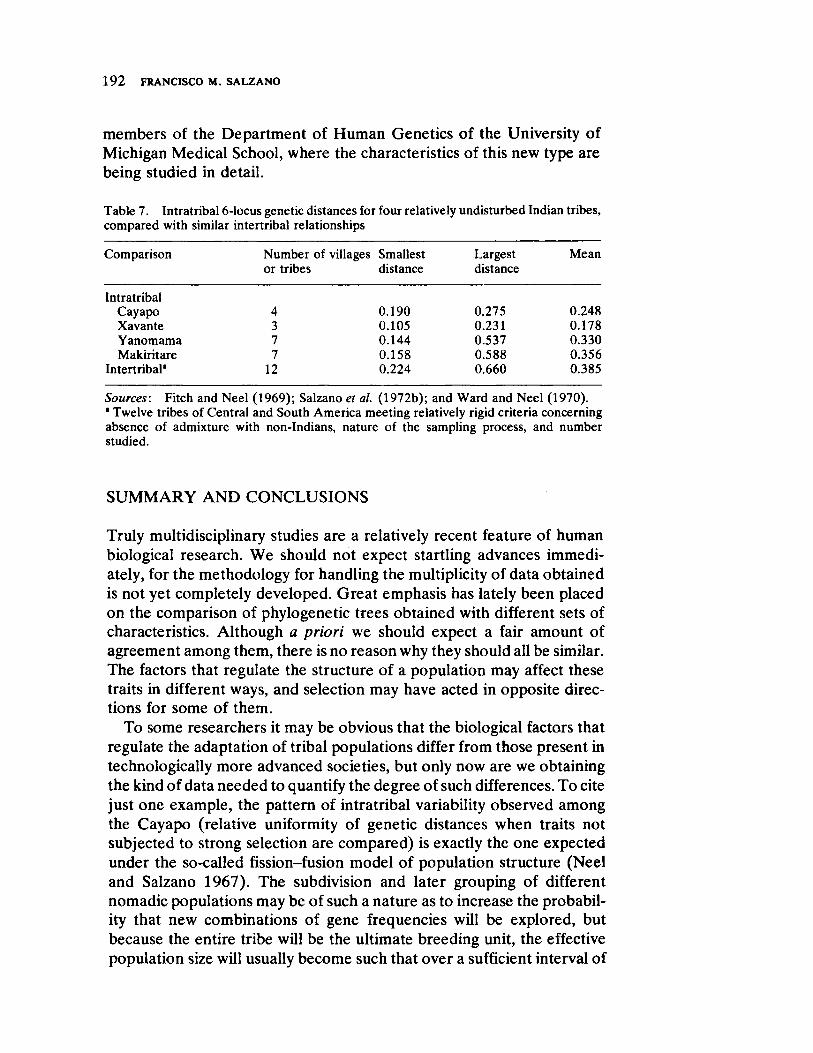
1 9 2 FRANCISCO Μ. SALZANO
members of the Department of Human Genetics of the University of Michigan Medical School, where the characteristics of this new type are being studied in detail.
Table 7. Intratribal 6locus genetic distances for four relatively undisturbed Indian tribes, compared with similar intertribal relationships
Comparison Number of villages Smallest or tribes distance
Largest distance
Mean
Intratribal Cayapo 4 0.190 0.275 0.248 Xavante 3 0.105 0.231 0.178 Yanomama 7 0.144 0.537 0.330 Makiritare 7 0.158 0.588 0.356
Intertribal* 12 0.224 0.660 0.385
Sources: Fitch and Neel (1969); Salzano et al. (1972b); and Ward and Neel (1970). * Twelve tribes of Central and South America meeting relatively rigid criteria concerning absence of admixture with nonIndians, nature of the sampling process, and number studied.
SUMMARY AND CONCLUSIONS
Truly multidisciplinary studies are a relatively recent feature of human biological research. We should not expect startling advances immediately, for the methodology for handling the multiplicity of data obtained is not yet completely developed. Great emphasis has lately been placed on the comparison of phylogenetic trees obtained with different sets of characteristics. Although a priori we should expect a fair amount of agreement among them, there is no reason why they should all be similar. The factors that regulate the structure of a population may affect these traits in different ways, and selection may have acted in opposite directions for some of them.
To some researchers it may be obvious that the biological factors that regulate the adaptation of tribal populations differ from those present in technologically more advanced societies, but only now are we obtaining the kind of data needed to quantify the degree of such differences. To cite just one example, the pattern of intratribal variability observed among the Cayapo (relative uniformity of genetic distances when traits not subjected to strong selection are compared) is exactly the one expected under the socalled fissionfusion model of population structure (Neel and Salzano 1967). The subdivision and later grouping of different nomadic populations may be of such a nature as to increase the probability that new combinations of gene frequencies will be explored, but because the entire tribe will be the ultimate breeding unit, the effective population size will usually become such that over a sufficient interval of
Multidisciplinary Studies in Tribal Societies and Human Evolution 193
time deterministic rather than nondeterministic genetic events will control subsequent developments, avoiding excessive drift.
In some cases it is as important to know what kinds of questions should be asked as to answer some of them. The field studies here reviewed already indicate that some of the theoretical models used in human population genetics are too simple and that alternative approaches should be used. One of them is computer simulation. MacCluer, Neel, and Chagnon (1971), for instance, used this technique to check the Yanomama field data for consistency, to indicate areas in which more data are needed, and to investigate in detail the longterm consequences of a given demographic structure. It is hoped that by a careful combination of these theoretical analyses with studies in natural populations we may be able to gain insight into the most important aspects of human evolution.
REFERENCES
ARENDS, T. , L. R. WEITKAMP, M. L. GALLANGO et όl.
1970 Gene frequencies and microdifferentiation among the Makiritare Indians, part two: Seven serum protein systems. American Journal of Human Genetics 22:526532.
AYRES, M., F. M. SALZANO
1972 Health status of Brazilian Cayapo Indians. Tropical and Geographical Medicine 24:178185.
BAKER, P. T.
1969 "Multidisciplinary studies of human adaptability: theoretical justification and method," in A guide to the human adaptability proposals. Edited by J. S. Weiner, 6169. Oxford: Blackwells.
1971 "Adaptation problems in Andean human populations," in The ongoing evolution of Latin American populations. Edited by F. M. Salzano, 475507. Springfield 111.: Charles C Thomas.
BAKER, P.wusrTSRONMJIGFEDCBA Τ., J. s. Durr 1972 "Demographic variables as measures of biological adaptation: a case
study of high altitude human populations," inutsrponmlihfecaTJHGA The structure of human populations. Edited by G. A. Harrison and A. J. Boyce, 352378. Oxford: Clarendon.
BENERECETTI, S. A. S.
1970 Studies on African Pygmies, part three: Peptidase C polymorphism in Babinga Pygmies: a frequent erythrocytic enzyme deficiency. American Journal of Human Genetics 22:228231.
BENERECETTI, S. A. S . , G. MODIANO
1969 Studies on African Pygmies, part two: Red cell phosphoglucomutase studies in Babinga Pygmies: a common PGMt variant allele. American Journal of Human Genetics 21:315321.
BODMER, J. G., w . F. BODMER
1970 Studies on African Pygmies, part four: A comparative study of the HLA polymorphism in the Babinga Pygmies and other African and

1 9 4 FRANCISCO Μ. SALZANO
Caucasian populations.yvutsrponmlihgfedcbaTSQPJIHGECBA American Journal of Human Genetics
22:396411. BROWN, K. S. , R. S. JOHNSON
1970 Population studies on Southwestern Indian tribes, part three: Serum protein variations of Zuni and Papago Indians. Human Heredity
20:281286. CAVALLISFORZA, L. L. , W. F. BODMER
1971 The genetics of human populations. San Francisco: W. H. Freeman. CAVALLISFORZA, L. L. , A. W. F. EDWARDS
1967 Phylogenetic analysis: models and estimation procedures. American
Journal of Human Genetics 19:233257. CAVALLISFORZA, L. L. , L. A. ZONTA, F. NUZZO, et al.
1969 Studies on African Pygmies, part one: A pilot investigation of Babinga Pygmies in the Central African Republic (with an analysis of genetic distances). American Journal of Human Genetics 21:252274.
CHAGNON, Ν . Α., J . V. NEEL, L. WEITKAMP, et al.
1970 The influence of cultural factors on the demography and pattern of gene flow from the Makiritare to the Yanomama Indians. American Journal
of Physical Anthropology 32:339350. COUDREAU, H.
1897 Voyage au TocantinsAraguaya. Paris. CROW, J. F.
1958 Some possibilities for measuring selection intensities in man. Human
Biology 30:113. DA ROCHA, F. J .
1971 Antropometria em indigenas brasileiros. Publ. 2, Departamento de Genetica, Universidade Federal do Rio Grande do Sul.
DA ROCHA, F. J . , F. M. SALZANO
1972 Anthropometric studies in Brazilian Cayapo Indians .American Journal of Physical Anthropology 36:95102.
EVELAND, W. C. , W. J. OLIVER, J. V. NEEL
1971 Characteristics of Escherichia coli serotypes in the Yanomama, a primitive Indian tribe of South America. Infection and Immunity 4 :753756.
FITCH, W. M., J . V. NEEL
1969 The phylogenic relationships of some Indian tribes of Central and South America. American Journal of Human Genetics 21:384397.
FRIEDLAENDER, J. S.
1971 The population structure of SouthCentral Bougainville. American
Journal of Physical Anthropology 35:1326. FRIEDLAENDER, J. S., L. A. SGARAMELLAZONTA, Κ. K. KIDD, et al.
1971 Biological divergences in SouthCentral Bougainville: an analysis of blood polymorphism gene frequencies and anthropometric measurements utilizing tree models, and a comparison of those variables with linguistic, geographic, and migrational "distances." American Journal
of Human Genetics 23:253270. GAJDUSEK, D. C.
1964 Factors governing the genetics of primitive human populations. Cold
Spring Harbor Symposia on Quantitative Biology 29:121135. GAJDUSEK, D. C., M. ALPERS
1972 Cultural, historical, and demographic background. Genetic studies in relation to kuru. American Journal of Human Genetics 24 (supplement): SIS38.

Multidisciplinary Studies in Tribal Societies and Human Evolution 195
GERSHOWITZ, H. , P. C. JUNQUEIRA, F. M. SALZANO, et al.
1967 Further studies on the Xavante Indians, part three: Blood groups and ABHLe'secretor types in the Simφes Lopes and Sδo MarcosXavantes. American Journal of Human Genetics 19:502513.
GERSHOWITZ,zyxwvutsrqponmlkihgfedcbaZYWVUTSRPONMLKJIHGFEDCBA Η. , M. LAYRISSE, Ζ . LAYRISSE,yxutsrponmlihgfedcaVTSRPLJHGCBA et al.
1970 Gene frequencies and microdifferentiation among the Makiritare Indians, part one: Eleven blood group systems and the ABHLe secretor traits: a note on Rh gene frequency determinations. American
Journal of Human Genetics 22:515525. GERSHOWITZ, Η. , M. LAYRISSE, Ζ . LAYRISSE, et al.
1972 The genetic structure of a tribal population, the Yanomama Indians, part two: Eleven bloodgroup systems and the ABHLe secretor traits. Annals of Human Genetics 35:261269.
HARRISON, G. Α., C. F. KUCHEMANN, Μ. A. S. MOORE, et al.
1969 The effects of altitudinal variation in Ethiopian populations. Philosophical Transactions of the Royal Society of London, B. Biological Sciences 256:147182.
HARRISON, G. Α., F. Μ. SALZANO
1966 The skin colour of the Caingang and Guarani Indians of Brazil. Human Biology 38:104111.
HOWELLS, W. W.
1966 Population distances: biological, linguistic, geographical, and environmental. Current Anthropology 7:531540.
HUSSELS, I. Ε. , Ν. E. MORTON
1972 Pingelap and Mokil atolls: achromatopsia. American Journal of
Human Genetics 24:304309. JANTZ, R. L., F. E. JOHNSTON, G. F. WALKER, et al.
1969 Finger dermatoglyphics of the Peruvian Cashinahua. American Journal
of Physical Anthropology 30:355360. JOHNSTON, F. E., B. S. BLUMBERG, Κ. Μ. KENSINGER, et al.
1969a Serum protein polymorphisms among the Peruvian Cashinahua. American Journal of Human Genetics 21:376383.
JOHNSTON, F. E. , R. L. JANTZ, Κ. M. KENSINGER, et al.
1968 Red cell blood groups of the Peruvian Cashinahua. Human Biology
40:508516. JOHNSTON, F. Ε., Κ. M. KENSINGER
1971 Fertility and mortality differentials and their implications for microevolutionary change among the Cashinahua. Human Biology 43: 356364.
JOHNSTON, F. Ε. , Κ. M. KENSINGER, R. L. JANTZ, et al.
1969b The population structure of the Peruvian Cashinahua: demographic, genetic, and cultural interrelationships. Human Biology 41:2941.
KEITER, F., Μ. SALZANO
1963 Der Wachstums und Alterungsfluss (die Β iorrhese) anthropologischer Merkmale an brasilianischen Indianern. Homo 14:193217.
LAUGHLIN, W. S.
1963 Eskimos and Aleuts: their origins and evolution. Science 142:633645. 1972 "Ecology and population structure in the Arctic," in The structure of
human populations. Edited by G. A. Harrison and A. J. Boyce, 379392. Oxford: Clarendon.
LAYRISSE, Ζ . , Μ. LAYRISSE
1968 High incidence cold autoagglutinins of antiIT specificity in Yanomama Indians of Venezuela. Vox Sanguinis 14:369382.
1 9 6 FRANCISCO Μ. SALZANO
MAC CLUER, J. W . , J. V. NEEL, Ν. A. CHAGNON
1971 Demographic structure of a primitive population: a simulation.yvutsrponmlkihgfedcaVUTSPNMLJIHGECA American Journal of Physical Anthropology 35:193208.
MAHALANOBIS, P. C., D. N. MAJUMDAR, C. R. RAO
1949 Anthropometric survey of the United Provinces, 1941: a statistical study. Sankhya 9:90324.
MORTON, Ν. E.
1968 Problems and methods in the genetics of primitive groups. American
Journal of Physical Anthropology 28:191202. 1972 Pingelap and Mokil atolls: clans and cognate frequencies. American
Journal of Human Genetics 24:290298. MORTON, Ν. E. , D. L. GREENE
1972 Pingelap and Mokil atolls: anthropometrics. American Journal of
Human Genetics 24:299303. MORTON, Ν. E., D. E. HARRIS, S. YEE, R. LEW
1971 Pingelap and Mokil atolls: migration. American Journal of Human
Genetics 23:339349. MORTON, Ν. E., R. LEW, I. E. HUSSELS, G. F. LITTLE
1972 Pingelap and Mokil atolls: historical genetics. American Journal of
Human Genetics 24:277289. MORTON, Ν. Ε. , I. ROISENBERG, R. LEW, S. YEE
1971 Pingelap and Mokil atolls: genealogy. American Journal of Human
Genetics 23:350360. NEEL, J . V.
1971 "Genetic aspects of the ecology of disease in the American Indian," in The ongoing evolution of Latin American populations. Edited by F. M. Salzano, 561590. Springfield 111.: Charles C Thomas.
1972 The genetic structure of a tribal population, the Yanomama Indians, part one: Introduction. Annals of Human Genetics 35:255259.
NEEL, J . v . , A. H. P. ANDRADE, G. E. BROWN, et al.
1968a Further studies of the Xavante Indians, part nine: Immunologic status with respect to various diseases and organisms. American Journal of
Tropical Medicine and Hygiene 17:486498. NEEL, J. V., T. ARENDS, C. BREWER, et al.
1972 Studies on the Yanomama Indians. Proceedings, IV International Con
gress of Human Genetics. Paris 1971. Amsterdam: Excerpta Medica Foundation, pp. 96111.
NEEL, J. V., W. R. CENTERWALL, Ν. A. CHAGNON, et al.
1970 Notes on the effects of measles and measles vaccine in a virginsoil population of South American Indians. American Journal of Epidemiology 91:418429.
NEEL, J . V., N. A. CHAGNON
1968 The demography of two tribes of primitive relatively unacculturated American Indians. Proceedings of the National Academy of Sciences,
USA 59:680689. NEEL, J . V., W. M. MIKKELSEN, D. L. RUCKNAGEL, et al.
1968b Further studies of the Xavante Indians, part eight: Some observations on blood, urine, and stool specimens. American Journal of Tropical Medicine and Hygiene 17:474485.
NEEL, J . v . , F. M. SALZANO
1967 Further studies on the Xavante Indians, part ten: Some hypothesesgeneralizations resulting from these studies. American Journal of
Human Genetics 19:554574.
Multidisciplinary Studies in Tribal Societies and Human Evolution 197
NEEL, J. V., F. M. SALZANO, P. C. JUNQUEIRA, et al.
1964 Studies on the Xavante Indians of the Brazilian Mato Grosso. American Journal of Human Genetics 16:52140.
NEEL, J. v . , R. H. WARD
1972 The genetic structure of a tribal population, the Yanomama Indians, part six: Analysis by Fstatistics (including a comparison with the Makiritare and Xavante). Genetics 72:639666.
NISWANDER, J . D.
1967 Further studies on the Xavante Indians, part seven: The oral status of the Xavantes of Simoes Lopes. American Journal of Human Genetics 19:543553.
NISWANDER, J. D., K. S. BROWN, Β. Y. IBA, et al.
1970 Population studies on Southwestern Indian tribes, part one: History, culture, and genetics of the Papago. American Journal of Human Genetics 22:723.
NISWANDER, J. D., F. KEITER, J. V. NEEL
1967 Further studies on the Xavante Indians, part two: Some anthropometric, dermatoglyphic, and nonquantitative morphological traits of the Xavantes ofzywvutsrponmlihgfedcbaZUTSRONMLIFEDCBA Simφes Lopes.yutsrponmlihgfedcaZSPNMJHGBA American Journal of Human Genetics 19:490501.
NUTE LS, Ν., Μ. AYRES, F. Μ. SALZANO
1967 Tuberculin reactions, xray and bacteriological studies in the Cayapo Indians of Brazil. Tubercle 48:195200.
PEftA, H. F., F. Μ. SALZANO, F. I . DA ROCHA
1972 Dermatoglyphics of Brazilian Cayapo Indians. Human Biology 44:225241.
ROBERTS, D. F., J. CHAVEZ,F F. M. SALZANO, et al.
1971 Dermatoglyphics of Caingang and Guarani Indians. Man 6:6178. ROBERTS, D. F., F. Μ. SALZANO, J . Ο. C. WILSON
1970 Active sweat gland distribution in Caingang Indians. American Journal of Physical Anthropology 32:395400.
ROTHHAMMER, F., R. S. SPIELMAN
1972 Anthropometric variation in the Aymarδ: genetic, geographic, and topographic contributions. American Journal of Human Genetics 24:371380.
SALZANO, F. M.
1961a Studies on the Caingang Indians, part one: Demography. Human Biology 33:110130.
1961b Studies on the Caingang Indians, part two: Morphological characteristics. Zeitschrift fόr Morphologie und Anthropologie 51:356371.
1961c Studies on the Caingang Indians, part three: Blood groups. American Journal of Physical Anthropology 19:391404.
196Id Rare genetic conditions among the Caingang Indians. Annals of Human Genetics 25:123130.
1963 Selection intensity in Brazilian Caingang Indians. Nature 199:514. 1964a Demographic studies on Indians from Santa Catarina, Brazil. Acta
Geneticae Medicae et Gemellologiae 13:278294. 1964b Blood groups of Indians from Santa Catarina, Brazil. American Journal
of Physical Anthropology 22:91106. 1964c Salivary secretions of Indians from Santa Catarina, Brazil. American
Journal of Human Genetics 16:301310. 1964d Color blindness among Indians from Santa Catarina, Brazil. Acta
Genetica et Statistica Medica 14:212219.
1 9 8 FRANCISCO Μ. SALZANO
1968 Intra and intertribal genetic variability in South American Indians. yutsrponmlihgfedcaTSPMJHGBA
American Journal of Physical Anthropology 28:183190. 1971 Demographic and genetic interrelationships among the Cayapo Indians
of Brazil. Social Biology 18:148157. 1972a Visual acuity and color blindness among Brazilian Cayapo Indians.
Human Heredity 22:7279. 1972b "Genetic aspects of the demography of American Indians and
Eskimos," in The structure of human populations. Edited by G. A. Harrison and A. J. Boyce, 234251. Oxford: Clarendon.
SALZANO, F. M., H. GERSHOWITZ, P. C. JUNQUEIRA, et dl.
1972a Blood groups and HLe" salivary secretion of Brazilian Cayapo Indians. American Journal of Physical Anthropology 36:417426.
SALZANO, F. M., F. A. MARCALLO, N. FREIREMAIA, et al.
1962 Genetic load in Brazilian Indians. Acta Genetica et Statistica Medica 12:212218.
SALZANO, F. M., J . V. NEEL, D. MAYBURYLEWIS
1967 Further studies on the Xavante Indians, part one: Demographic data on two additional villages: genetic structure of the tribe. American Journal
of Human Genetics 19:463489. SALZANO, F. M., J . V. NEEL, L. R. WEITKAMP, et al.
1972b Serum proteins, hemoglobins and erythrocyte enzymes of Brazilian Cayapo Indians. Human Biology 44:443458.
SALZANO, F. M., D. C. SHREFFLER
1966 The Gc polymorphism in the Caingang Indians of Brazil. Acta Genetica
et Statistica Medica 16:242247. SALZANO, F. M., A. G. STEINBERG
1965 The Gm and Inv groups of Indians from Santa Catarina, Brazil. Ameri
can Journal of Human Genetics 17:273279. SALZANO, F. M., A. G. STEINBERG, M. A. TEPFENHART
1973 Gm and Inv allotypes of Brazilian Cayapo Indians. American Journal of
Human Genetics 25:167177. SALZANO, F. Μ., Η. E. SUTTON
1963 Haptoglobin and transferrin types in Southern Brazilian Indians. Acta
Genetica et Statistica Medica 13:1—8. 1965 Haptoglobin and transferrin types of Indians from Santa Catarina,
Brazil. American Journal of Human Genetics 17:280289. SALZANO, F. M., C. V. TONDO
1968 Hemoglobin types of Brazilian Indians. American Journal of Physical
Anthropology 28:355360. SHREFFLER, D. C., A. G. STEINBERG
1967 Further studies on the Xavante Indians, part four: Serum protein groups and the SC! trait of saliva in thevtsrponmiedcaXUTSRONMLKJIGEDCA Simφes Lopes and Sδo Marcos Xavantes.utsronmlifecaJHGA American Journal of Human Genetics 19:514523.
SIMMONS, R. T., D. C. GAJDUSEK, Μ. K. NICHOLSON
1967 Blood group genetic variations in inhabitants of West New Guinea, with a map of the villages and linguistic groups of South West New Guinea. American Journal of Physical Anthropology 27:277302.
SOFAER, J . Α., J . D. NISWANDER, C. J . MACLEAN, et al.
1972 Population studies on Southwestern Indian tribes, part five: Tooth morphology as an indicator of biological distance. American Journal of
Physical Anthropology 37:357366. SPIELMAN, R. S . , F. J . DA ROCHA, L. R. WEITKAMP, et al.
1972 The genetic structure of a tribal population, the Yanomama Indians,
Multidisciplinary Studies in Tribal Societies and Human Evolution 199
part seven: Anthropometric differences among Yanomama villages. American Journal of Physical Anthropology 37:345356.
TASHIAN, R. E. , G. J . BREWER, H. LEHMANN, et al.
1967 Further studies on the Xavante Indians, part five: Genetic variability in some serum and erythrocyte enzymes, hemoglobin, and the urinary excretion of 0aminoisobutyric acid. American Journal of Human Gen
etics 19:524531. TONDO, C. V., F. M. SALZANO
1960 Hemoglobin types of the Caingang Indians of Brazil. Science
132:18931894. WARD, R. H. , J . V. NEEL
1970 Gene frequencies and microdifferentiation among the Makiritare Indians, part four: A comparison of a genetic network with ethnohistory and migration matrices; a new index of genetic isolation. American
Journal of Human Genetics 22:538561. WEINER, J . S. , J . A. LOURIE
1969 Human biology: a guide to field methods. Oxford: Blackwells. WEINSTEIN, Ε. D. , J . V. NEEL, F. M. SALZANO
1967 Further studies on the Xavante Indians, part six: The physical status of the Xavantes ofzyvutsrqponmlkihgfedcbaYWVTSRPONMLKJIGEDA Simφes Lopes.yutsronmlifecaJHGA American Journal of Human Genetics
19:532542. WEITKAMP, L. R., T. ARENDS, M. L. GALLANGO, et al.
1972 The genetic structure of a tribal population, the Yanomama Indians, part three: Seven serum protein systems. Annals of Human Genetics
35:271279. WEITKAMP, L. R., J . V. NEEL
1970 Gene frequencies and microdifferentiation among the Makiritare Indians, part three: Nine erythrocyte enzyme systems. American Jour
nal of Human Genetics 22:533537. 1972 The genetic structure of a tribal population, the Yanomama Indians,
part four: Eleven erythrocyte enyzmes and summary of protein variants. Annals of Human Genetics 35:433444.
WILSON, J . Α., A. G. STEINBERG
1965 Antibodies to gamma globulin in the serum of children and adults. Transfusion 5:516524.
WORKMAN, P. L., J . D. NISWANDER
1970 Population studies on southwestern Indian tribes, part two: Local genetic differentiation in the Papago. American Journal of Human Genetics
22:2449. WORLD HEALTH ORGANIZATION
1964 Research in population genetics of primitive groups. World Health Organization Technical Report Series Number 279, pp. 126.
1968 Research on human population genetics. World Health Organization Technical Report Series Number 387, pp. 132.

Tapipa: A Negroid Venezuelan Isolate
T. ARENDS, M. L. GALLANGO, A. MULLER, M. GONZΔLEZMARRERO, and O. PEREZ BANDEZ
Although several populations of African origin have remained in relative isolation in Venezuela (Bobures in Zulia State; Farriar, Aguas Negras, and Palmarejo in Yaracuy State; Curimagua, Macuquita, and La Chapa in Falcon State; Choroni and Ocumare de la Costa in Aragua State; and Curiepe, Tacarigua, Caucagua, Aragόita, Rio Chico, Ocumare del Tuy, Santa Lucia, Santa Teresa, San Francisco de Yare, Naiguatδ and Tapipa in Miranda State), only a few studies on particular aspects of these groups have been made (Layrisse and Arends 1955, 1957a, 1957b; Layrisse, Arends, and Sisco 1955; Arends and Layrisse 1956; Arends 1961, 1963a, 1963b, 1971; NόfiezMontiel 1963; Acosta Saignes, 1967). However, a multidisciplinary study which embraces genetic, medical, and anthropological aspects of these populations has never been carried out.
This report tabulates the preliminary results obtained in a survey of Tapipa, a Venezuelan Negroid isolate located in Miranda State. The immediate aims of this study involve medical aspects, including clinical history, physical examination, hematologic findings, urinalysis, intestinal parasites present, electrophoretic analysis of serum proteins, and determination of immunoglobins. In order to reconstruct the genetic history of the population and construct genealogies of hereditary diseases, studies of genetic markers (hemoglobin and erythroenzyme variants, blood group systems, transferrins, haptoglobins, Gc, alloalbumins) and their possible correlations with physical and social anthropology of the region were undertaken. With this information we expect to have a more complete knowledge of inhabitants and, if possible, to answer the following questions:
The authors would like to acknowledge the technical assistance of Nola Montiel, Gilberto Garlin, Rosario Suinaga, and Trina Arends.
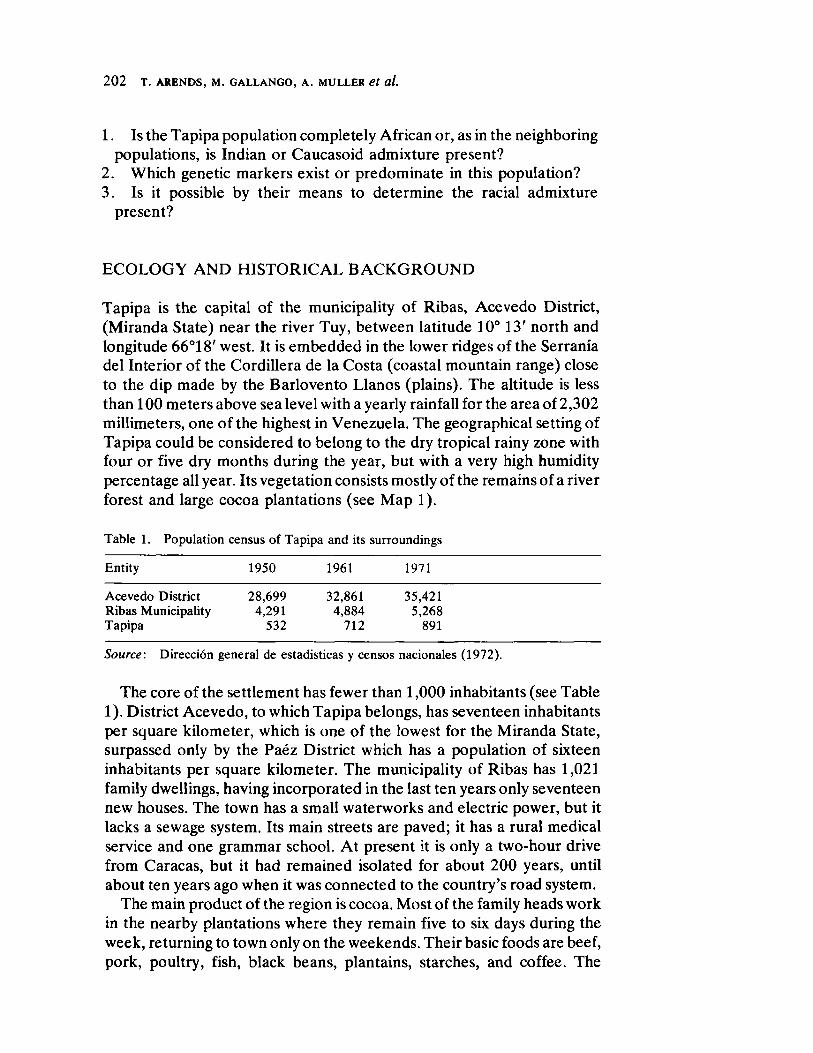
2 0 2 Τ. ARENDS, Μ. GALLANGO, Α. MULLERutrolecaS et al.
1. Is the Tapipa population completely African or, as in the neighboring populations, is Indian or Caucasoid admixture present?
2. Which genetic markers exist or predominate in this population? 3. Is it possible by their means to determine the racial admixture
present?
ECOLOGY AND HISTORICAL BACKGROUND
Tapipa is the capital of the municipality of Ribas, Acevedo District, (Miranda State) near the river Tuy, between latitude 10° 13' north and longitude 66°18' west. It is embedded in the lower ridges of the Serrania del Interior of the Cordillera de la Costa (coastal mountain range) close to the dip made by the Barlovento Llanos (plains). The altitude is less than 100 meters above sea level with a yearly rainfall for the area of 2,302 millimeters, one of the highest in Venezuela. The geographical setting of Tapipa could be considered to belong to the dry tropical rainy zone with four or five dry months during the year, but with a very high humidity percentage all year. Its vegetation consists mostly of the remains of a river forest and large cocoa plantations (see Map 1).
Table 1. Population census of Tapipa and its surroundings
Entity 1950 1961 1971
Acevedo District 28,699 32,861 35,421 Ribas Municipality 4,291 4,884 5,268 Tapipa 532 712 891
Source: Direction general de estadisticas y censos nacionales (1972).
The core of the settlement has fewer than 1,000 inhabitants (see Table 1). District Acevedo, to which Tapipa belongs, has seventeen inhabitants per square kilometer, which is one of the lowest for the Miranda State, surpassed only by the Paez District which has a population of sixteen inhabitants per square kilometer. The municipality of Ribas has 1,021 family dwellings, having incorporated in the last ten years only seventeen new houses. The town has a small waterworks and electric power, but it lacks a sewage system. Its main streets are paved; it has a rural medical service and one grammar school. At present it is only a twohour drive from Caracas, but it had remained isolated for about 200 years, until about ten years ago when it was connected to the country's road system.
The main product of the region is cocoa. Most of the family heads work in the nearby plantations where they remain five to six days during the week, returning to town only on the weekends. Their basic foods are beef, pork, poultry, fish, black beans, plantains, starches, and coffee. The
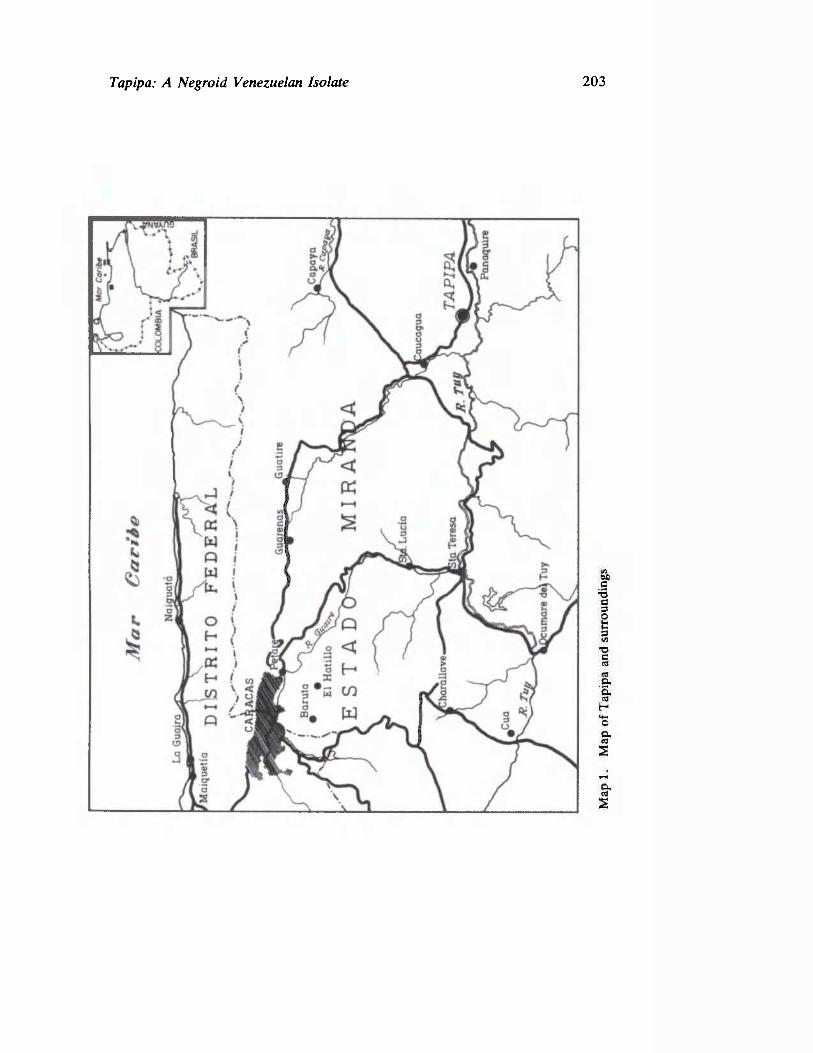
TAPIPA
Map1.
Mapof
Tapipaandsurroundings
Tapipa: A Negroid Venezuelan Isolate 203

2 0 4 Τ. ARENDS, Μ. GALLANGO, Α. MULLERtled et dl.
limitations imposed by their purchasing power results in a diet somewhat deficient in protein. Apparently they drink very little milk. The unemployment rate is high, possibly higher than 5 percent, and the young people generally migrate to Caracas in search of jobs. The 1971 census (see Table 1) demonstrated that since 1950 the annual birthrate is 2 percent, lower than the average for Venezuela, which is 3.6 percent. This might appear to indicate the existence of family planning. However, this population would show a much higher birthrate but for its being disguised by the continuous migration of the people into industrial areas.
The origin of Tapipa goes back to 1784 when, after a pastoral visit to Caucagua, Monsignor Mariano Marti decided to organize a village that assembled the cocoa laborers of the neighboring plantations. On January 20,1784, which should be taken as the date of its founding, the curate of Tapipa was founded by decree (Marti 1969:308312).
The most important neighboring city is Caucagua, twenty kilometers away. A census of 1784 for the District of Caucagua, including the population of Tapipa, gave a total of 2,422 persons, divided as follows: 141 whites, 306 mulattoes, 150 free Negroes and Zambos, and 1,691 slave Negroes and mulattoes (Marti 1969:308312). The origin of the African population, like that of the rest of the zone, dates back to expeditions arriving direct from Africa, purchased in the Antilles (mainly Curasao), and cimarron (runaway) Negroes from the nearby plantations or from the Negro markets (Curasao and Trinidad). Anthropologically, it is certain that those African populations that settled in Venezuela constitute a more heterogeneous group than those who arrived in the United States or Brazil, the latter derived from welldelimited African regions. We suspected that those who arrived in Venezuela were of Sudanese as well as of Bantu origin, although the proportion of each group and their precise origins are uncertain (Arends 1971:83). Archeologically, Tapipa's setting has been classified in the preHispanic cultural area of the Coastal Caribs.
MATERIAL
A total of 246 Tapipa inhabitants were studied; 90 percent were natives and the rest came from neighboring settlements. The average age was determined at 18.7 ± 12.4 years with extreme ages of 1 to 70. Those older than 12 numbered 161. The proportion of sexes was female to male = 1.26:1.
All subjects studied were apparently healthy with the exception of two who will be described later.

Tapipa: A Negroid Venezuelan Isolate 205
METHODS
Medical and genetic histories together with physical examinations were carried out in each subject. Samples of venous and peripheral blood were drawn for hematologic studies, for both genetic markers and serum proteins. In addition, urine and feces were examined.
For hematologic information, peripheral blood smears and hematocrits were made, and also electrophoretic hemoglobin analyses were carried out in microzonal chambers (Beckman Instruments, Inc., Palo Alto, California) using cellulose acetate membranes (Sepraphore III, Gelman Instruments, Ann Arbor, Michigan). Hemoglobin samples were prepared with saponine and EDTA according to Giorgio (1970), slightly modified (Muller and Arends 1971), using discontinuous TrisborateEDTA buffer (103:30.92:1.85 adding water to complete one liter), with 20 milliliters of stock solution plus 150 milliliters water on the positive side and 20 milliliters of stock solution plus 140 milliliters water on the negative side. Those samples with quantitative alterations or hemoglobin variants were washed three times with saline and hemolyzed with carbon tetrachloride (Lehmann and Huntsman 1968). Hemoglobin fractions were isolated by means of microzonal electrophoresis in cellulose acetate (Celagram, Shandon Scientific Co., London) in a chamber model U77 (Shandon) or Deluxe (Gelman). A similar procedure was used for Hb A2
quantification. When needed, peptide "fingerprinting" was performed by means of high voltage electrophoresis (Savant Instruments Inc., Hicksville, New York) with refrigerated Varsol for insulation and pH 6.4 buffer (pyridine, water, and acetic acid); ascendent chromatography with isoamylic alcohol, pyridine, and water as solvent; and differential staining with ninhydrin and stains for histidine, tryptophane, arginine, tyrosine, and methionine. If the peptide map was compatible with those already known, it was not considered necessary to continue peptide isolation. In the case of hemoglobin with Hb S mobility, confirmation was done by the solubility test, in phosphate buffer 2.24M and 2.58M at 25°C on reduced hemoglobin (Itano 1953).
The search for G6PD and PK deficiencies was made with Beutler's screening test (1966, 1971), as modified (Beutler and Mitchell 1968). Reading was done in a longwave ultraviolet lamp (Ultraviolet Products Inc., San Gabriel, California) with the intensity of 720 pW/cm2. AK phenotypes were determined in hydrolized starch gel electrophoresis with histidinecitrate discontinuous buffer (pH 7.0) according to the technique of Fildes and Harris (1966).
Other genetic markers examined were blood group systems, haptoglobins, transferrins, group specific component (Gc), and alloalbumins. Haptoglobins (Hp) and transferrins (Tf) were determined by means of starch gel electrophoresis using Fe59 (5 in order to identify the
2 0 6 Τ. ARENDS, Μ. GALLANGO, Α. MULLERtled et dl.
transferrins according to Giblett, Hickman, and Smithies (1959), and benzidine was used for Hp staining.
Slow transferrins were isolated by means of starch block electrophoresis, after precipitation with rivanol after the technique of Sutton and Karp (1965), or using column chromatography with dietilaminoethylSephadex A50 (Gordon and Louis 1963). The technique of Wang, Sutton, and Scott (1967) was adapted as a micromethod in order to obtain a tryptic peptide map of transferrin, with high voltage electrophoresis, ascendent chromatography, and differential peptide identification. The peptide map for tryptic digestion of Tf Dx does not show any variations with the Tf C map; this characterization permits its differentiation from Tf Ό αϊ, which is electrophoretically very similar.
The Gc groups were classified by means of agar gel electrophoresis (Ionagar, Difco) with pH 8.6 buffer following the technique described by Hirschfeld (1960).
Total serum proteins were determined by means of the biuret technique (Gornall, Bardawill, and David 1949). The protein fractions were calculated by microzonal electrophoresis in cellulose acetate using an R101 model (Beckman) with barbital buffer pH 8.6, ionic strength 0.075. Ponceau S 0.2 percent in 5 percent trichloracetic acid were used for staining. The densitometric calculations were made in an Analytrol RB model adapted with a special scanning attachment (Beckman). The run was made at room temperature for twenty minutes with 300 volts and approximately 5 milliamperes. The immunoglobulins (IgG, IgA, IgM, and IgD) were quantified by the radial immunodiffusion method in agar plates with the antibody incorporated (Mancini, Carbonara, and Heremans 1965). Known controls were included in each experiment. The calculation was made following the manufacturer's instructions (Immunoplates, Hyland Laboratories, Los Angeles, California; Meloy Laboratories, Inc., Springfield, Virginia) with several modifications (temperature, reading time, quantity of serum used, and so on). IgE determination was made by means of radioimmunoassay, using a commercial kit (Pharmacia, Uppsala, Sweden).
Stool examination was made in the usual manner with saline and iodine solution. Urinalyses were carried out with commercial indicator strips (Ames Co., Elkhart, Indiana) for pH, protein, glucose, acetone, bilirubin, blood, and urobilinogen. Other blood tests included VDRL, using commercial reagents, and determinations of Australia antigen in reactional electrophoresis, with confirmation of positive cases by immunodiffusion.
Tapipa: A Negroid Venezuelan Isolate 207
RESULTS1
Clinical History and Physical Examination
Although it was necessary to use for the medical histories a very simple form that could be adapted to the fast pace of obtaining the samples and the small number of physicians involved in the project, very important data still were obtained for evaluation of the health of the subjects examined. Two factors are common to almost all the population: a history of intestinal worm expulsion and dental caries, found in more than 95 percent of the inhabitants. Hypertrophic tonsils and cervical microadenopathies were found in almost 50 percent; hepatomegaly, palpable three to four centimeters below costal margin in 6 percent; keloids in 6 percent; varicose veins in lower limbs, and palpable thyroid and strabismus in 2 percent.
Among the group studied, menarche started at age 12.2 ± 1.4, with extreme ages of 10 and 14, but in six girls with an average age of 12.7 ± 1.8 and extreme ages of 11 and 16, menarche had not begun, which might indicate the variable existence of environmental and/or hereditary factors present in the population.
Genetic History
Using data from 100 genetical histories, we calculate the average number of children per mother as 7 ± 3 children, with a range of two to sixteen children. The number of husbands per woman, inferred by the paternity of the children, is one husband in 67 percent, two husbands in 22 percent and three to seven in 11 percent. Related to this, a pattern of matrilineal kinship can be observed in this population, and only the children born of the same mother are recognized as siblings, whoever the father may be. On the other hand, the paternal offspring of different mothers are "my father's children," or, at most, "brothers or sisters on my father's side."
The most frequent surnames in the population are Blanco, Diaz, Flores, Hernandez, Landaeta, Marrero, Moreno, Machado, Palacios, Perez, Rodriguez, Salcedo, Urbina, and Verde; first in frequency is Hernandez. Since this is a small population, isolated for many years, admixture between kin is frequent. The frequency of twins is one set for each twentyfive families.
1 Only the most important results will be presented herein, for the sake of brevity.
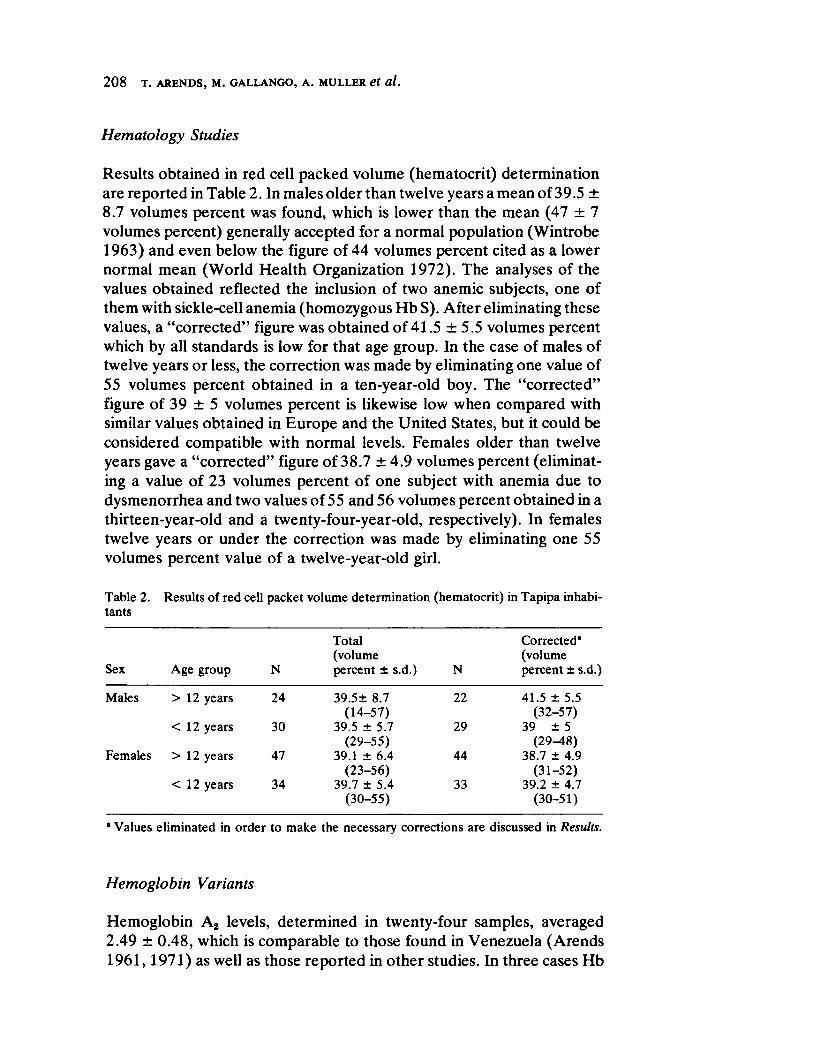
2 0 8 Τ. ASENDS, Μ. GALLANGO, Α. MULLERutsleR etl όl.
Hematology Studies
Results obtained in red cell packed volume (hematocrit) determination are reported in Table 2. In males older than twelve years a mean of39.5 ± 8.7 volumes percent was found, which is lower than the mean (47 ± 7 volumes percent) generally accepted for a normal population (Wintrobe 1963) and even below the figure of 44 volumes percent cited as a lower normal mean (World Health Organization 1972). The analyses of the values obtained reflected the inclusion of two anemic subjects, one of them with sicklecell anemia (homozygous Hb S). After eliminating these values, a "corrected" figure was obtained of 41.5 ±5.5 volumes percent which by all standards is low for that age group. In the case of males of twelve years or less, the correction was made by eliminating one value of 55 volumes percent obtained in a tenyearold boy. The "corrected" figure of 39 ± 5 volumes percent is likewise low when compared with similar values obtained in Europe and the United States, but it could be considered compatible with normal levels. Females older than twelve years gave a "corrected" figure of 38.7 ± 4.9 volumes percent (eliminating a value of 23 volumes percent of one subject with anemia due to dysmenorrhea and two values of 55 and 56 volumes percent obtained in a thirteenyearold and a twentyfouryearold, respectively). In females twelve years or under the correction was made by eliminating one 55 volumes percent value of a twelveyearold girl.
Table 2. Results of red cell packet volume determination (hematocrit) in Tapipa inhabitants
Sex Age group Ν
Total (volume percent ± s.d.) Ν
Corrected1
(volume percent ± s.d.)
Males > 1 2 years 24 39.5± 8.7 22 41.5 ± 5.5 > 1 2 years (1457) (3257)
< 1 2 years 30 39.5 ± 5.7 29 39 ± 5 < 1 2 years (2955) (2948)
Females > 1 2 years 47 39.1 ± 6.4 44 38.7 ± 4.9 (2356) (3152)
< 1 2 years 34 39.7 ± 5.4 33 39.2 ± 4.7 (3055) (3051)
' Values eliminated in order to make the necessary corrections are discussed in Results.
Hemoglobin Variants
Hemoglobin A2 levels, determined in twentyfour samples, averaged 2.49 ± 0.48, which is comparable to those found in Venezuela (Arends 1961,1971) as well as those reported in other studies. In three cases Hb
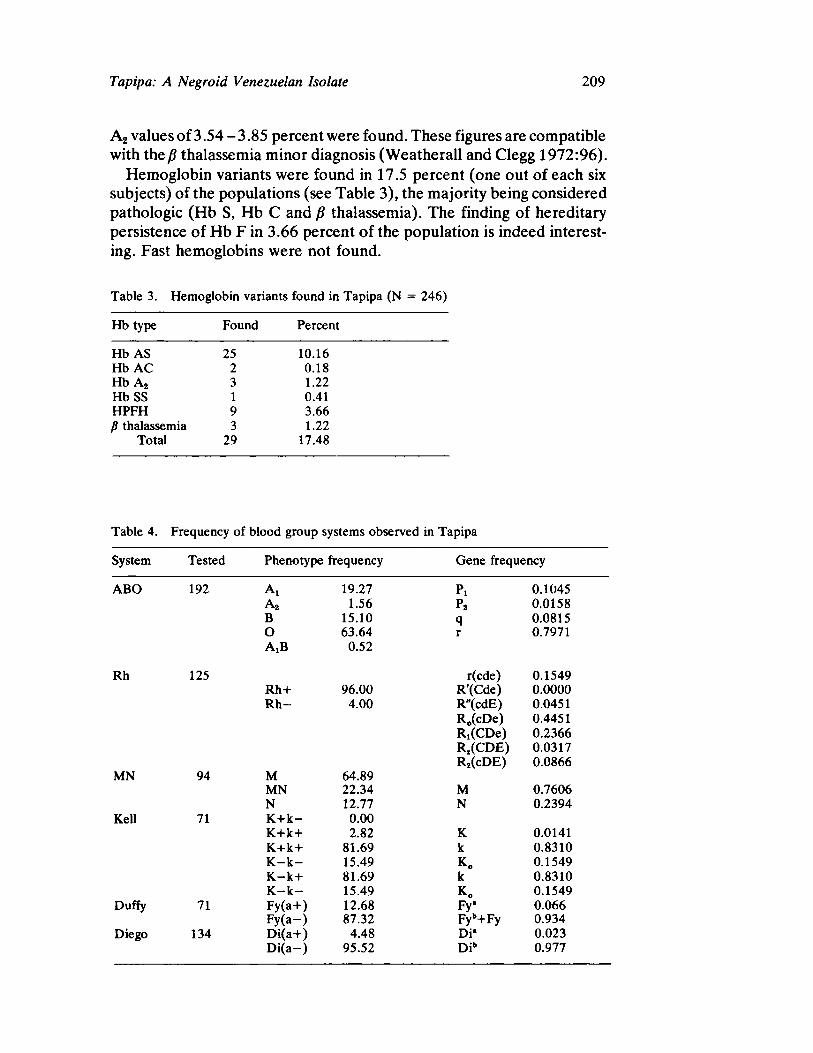
Tapipa: A Negroid Venezuelan Isolate 209
A2 values of 3.54 3 .85 percent were found. These figures are compatible with the β thalassemia minor diagnosis (Weatherall and Clegg 1972:96).
Hemoglobin variants were found in 17.5 percent (one out of each six subjects) of the populations (see Table 3), the majority being considered pathologic (Hb S, Hb C and β thalassemia). The finding of hereditary persistence of Hb F in 3.66 percent of the population is indeed interesting. Fast hemoglobins were not found.
Table 3. Hemoglobin variants found in Tapipa (N = 246)
Hb type Found Percent
Hb AS 25 10.16 Hb AC 2 0.18 Hb A2 3 1.22 Hb SS 1 0.41 HPFH 9 3.66 β thalassemia 3 1.22
Total 29 17.48
Table 4. Frequency of blood group systems observed in Tapipa
System Tested Phenotype frequency Gene frequency
ABO 192 A, 19.27 PI 0.1045 A2 1.56 p2 0.0158 Β 15.10 q 0.0815 Ο 63.64 r 0.7971 Α,Β 0.52
Rh 125 r(cde) 0.1549 Rh+ 96.00 R'(Cde) 0.0000 R h 4.00 R"(cdE) 0.0451
R.(cDe) 0.4451 Ri(CDe) 0.2366 Rj(CDE) 0.0317 R2(cDE) 0.0866
MN 94 M 64.89 MN 22.34 Μ 0.7606 Ν 12.77 Ν 0.2394
Kell 71 K + k 0.00 K+k+ 2.82 Κ 0.0141 K+k+ 81.69 k 0.8310 K k 15.49 κ„ 0.1549 K—k+ 81.69 k 0.8310 K k 15.49 κ„ 0.1549
Duffy 71 Fy(a+) 12.68 Fy* 0.066 Fy(a) 87.32 Fyb+Fy 0.934
Diego 134 Di(a+) 4.48 Di' 0.023 Di(a) 95.52 Dib 0.977
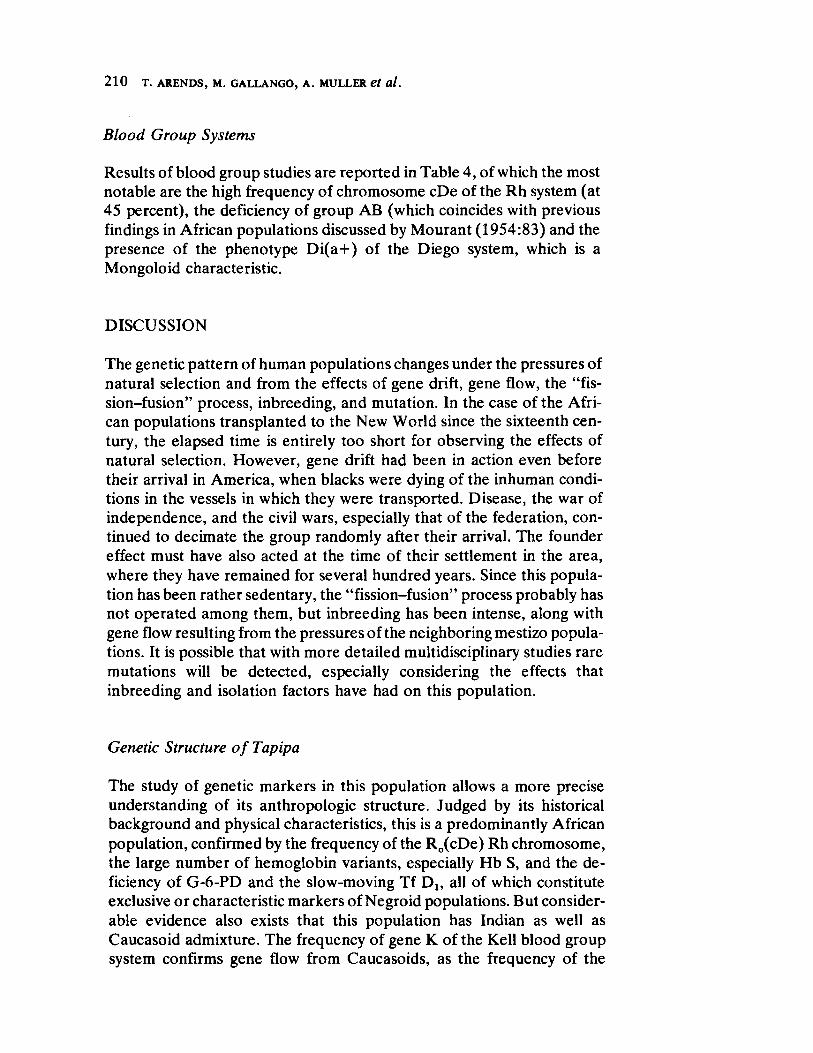
2 1 0 Τ. ARENDS, Μ. GALLANGO, Α. MULLERyutsrponmlifedcaTSGB et dl.
Blood Group Systems
Results of blood group studies are reported in Table 4, of which the most notable are the high frequency of chromosome cDe of the Rh system (at 45 percent), the deficiency of group AB (which coincides with previous findings in African populations discussed by Mourant (1954:83) and the presence of the phenotype Di(a+) of the Diego system, which is a Mongoloid characteristic.
DISCUSSION
The genetic pattern of human populations changes under the pressures of natural selection and from the effects of gene drift, gene flow, the "fission—fusion" process, inbreeding, and mutation. In the case of the African populations transplanted to the New World since the sixteenth century, the elapsed time is entirely too short for observing the effects of natural selection. However, gene drift had been in action even before their arrival in America, when blacks were dying of the inhuman conditions in the vessels in which they were transported. Disease, the war of independence, and the civil wars, especially that of the federation, continued to decimate the group randomly after their arrival. The founder effect must have also acted at the time of their settlement in the area, where they have remained for several hundred years. Since this population has been rather sedentary, the "fissionfusion" process probably has not operated among them, but inbreeding has been intense, along with gene flow resulting from the pressures of the neighboring mestizo populations. It is possible that with more detailed multidisciplinary studies rare mutations will be detected, especially considering the effects that inbreeding and isolation factors have had on this population.
Genetic Structure ofTapipa
The study of genetic markers in this population allows a more precise understanding of its anthropologic structure. Judged by its historical background and physical characteristics, this is a predominantly African population, confirmed by the frequency of the R0(cDe) Rh chromosome, the large number of hemoglobin variants, especially Hb S, and the deficiency of G6PD and the slowmoving Tf Dx, all of which constitute exclusive or characteristic markers of Negroid populations. But considerable evidence also exists that this population has Indian as well as Caucasoid admixture. The frequency of gene Κ of the Kell blood group system confirms gene flow from Caucasoids, as the frequency of the

Tapipa: A Negroid Venezuelan Isolate 211
Diego system is a proof of the contribution of the Venezuela Indian population (see Table 5).
Table 5. Estimation of the Spanish, West African Negro, and Carib Indian admixture in the population of Tapipa (after Bernstein's formula 1931)
Contributing population
Gene or chromosome Q <7 <]z
Percentage of admixture (M)
Spaniards Κ 0.0 5.00 1.67 33.40 West African R. 5.00 55.00 44.51 79.02
Negroes (cDe) Carib Indians Di* 0.0 16.00 2.30 14.38
Key: q = frequency in the contributing population; Q = frequency in other parent
Hx « populations; q, = frequency in Tapipa; Μ = x 100.
q Q
Health in the "Apparently Healthy" Populations
The schoolchildren and adults of Tapipa studied considered themselves and were thought of as apparently healthy individuals. Nonetheless, the results obtained in this survey indicate that they suffer from a series of biochemical alterations and subclinical diseases that should exert some kind of influence on their physical activity, productivity, morbidity, and mortality. The mean figure of their hematocrits, suggesting the presence of anemia; the finding of pathologic hemoglobin variants in a frequency higher than 10 percent; the deficiency of both G6PD and PK, with somewhat reduced values of serum protein as well as albumin (but with gamma globulin values higher than those found in the population of Caracas); and moderately increased levels of IgG, occasionally accompanied by IgA, but generally proportionally surpassed by IgE (Merino and Arends 1973), all constitute evidence of abnormalities tolerated. Intestinal parasitosis is seen in about 90 percent of the population (see Table 6). Urinalyses revealed the existence of renal complications in
Table 6. Frequency of intestinal parasites infections in Tapipa
Parasite Percent
Trichuris trichiura 77 Ascaris lumbricoides 66 Necator americanus 20 Lamblia intestinalis 20 Entamoeba coli 17 Strongyloides stercoralis 4 Endolimax nana 2 Negative findings 11
2 1 2 Τ. ARENDS, Μ. GALLANGO, Α. MULLERutsrponlihedcaTSNFA et dl.
volving proteinuria. Finally, Venerai Disease Research Laboratories (VDRL) tests are positive in about 20 percent of the population, although only a few individuals have a history of yaws.
These results suggest that this population carries a remarkable pathologic load and it is alarming to think that this may be common to all the rural Venezuelan populations and, even, to all of Latin America.
Future Studies
Results obtained in the multidisciplinary study of the Tapipa population indicate the need to apply this approach to those populations in danger of disappearing, especially for an initial screening phase, in order to concentrate all efforts on the more important aspects.
Although small isolated populations may not reveal the more interesting genetic diseases, exhaustive and careful surveys should offer excellent opportunities to find unusual frequencies of characters due to the effects of prolonged inbreeding, as in the case of Tapipa. Environmental studies should also provide opportunities to clarify the respective roles of nature and nurture.
SUMMARY
A multidisciplinary study of a Venezuelan Negroid population which has remained isolated during the past 200 years, was carried out in order to answer the three questions asked earlier in text (see page 202).
Clinical and genetical histories, physical examinations, hematocrits, peripheral blood smears, venous blood samples, feces, and urinalyses were obtained in 246 adults and children with the following results: hemoglobin variants (Hb S, C, F, A2 and increased A2) 16 percent; G6PD deficiency 10 percent; pyruvate kinase deficiency 1 percent; slowmoving transferrin 10 percent; the AK t phenotype of the adenylate kinase system alone present. The groupspecific component (Gc) and the haptoglobin systems showed results similar to African populations. ABO blood group system indicated a distribution resembling that of West Africa rather than the population of Caracas. The Rh system showed a frequency of 45 percent of the cDe chromosome; antigen Dia was found in 3 percent and Kell in 3 percent. Serum protein electrophoresis demonstrated an increase of gamma globulin level, and immunoglobulin determination revealed a significant increase in the IgG, and, occasionally, in IgM and IgA. However, there was no increase of IgD, but many subjects had levels of IgE above normal. Almost all fecal samples contained Ascaris eggs and Trichocephalus and a few carried Necator, Stron
Tapipa: A Negroid Venezuelan Isolate 213
gyloides,yvutsrponmljihgfedcbaTSRNIFECA and Giardia \ 20 percent of the subjects had nutritional anemia and urinalyses demonstrated several renal disorders.
The results of genetic analysis indicate that even though the population of Tapipa has biochemical characteristics indicative of African origin, it also carries an appreciable number of Indian and Caucasoid genes.
REFERENCES
ACOSTA SAIGNES, MIGUEL
1967 Vida de los esclavos negros en Venezuela. Caracas: Hespe rides. ARENDS, TULIO
1961 Frecuencia de las hemoglobinas anormales en Venezuela. Archivos del Hospital Vargas 3:225236.
1963 a Estado actual del estudio de las hemoglobinas anormales en Venezuela. Sangre 8:114.
1963b Frecuencia de hemoglobinas anormales en poblaciones humanas suramericanas. Acta Cientifica Venezolana Supplement 1:4657.
1971 "Epidemiology of hemoglobin variants in Venezuela," in Genetical, junctional, and physical studies of hemoglobins. Edited by T. Arends, G. Bemski and R. N. Nagel, 8298. Basel: Karger.
ARENDS, TULIO, MIGUEL LAYRISSE
1956 Investigation de las hemoglobinas anormales en Venezuela. Primeros casos de hemoglobina C. Memorias del VI Congreso Venezolano de Ciencias Medicas 2:777786.
BERNSTEIN, F.
1931 Die geographische Verteilung der Blutgruppen und ihre anthropologische Bedeutung. Rome: Instituto Poligrafico dello Stato.
BEUTLER, ERNEST
1966 A series of new screening proceedures for pyruvate kinase deficiency, glucose6phosphate dehydrogenase deficiency, and glutathione reductase deficiency. Blood 28:553562.
1971 Red cell metabolism: a manual of biochemical methods. New York: Grune and Stratton.
BEUTLER, ERNEST, M. MITCHELL
1968 Special modifications of the fluorescent screening method for glucose6phosphate dehydrogenase deficiency. Blood 32:816818.
DIRECCION GENERAL DE ESTADISTICAS Y CENSOS NACIONALES
1972 "X Censo General de Poblacion." Unpublished manuscript. FILDES, R. Α., Η. HARRIS
1966 Genetically determined variation of adenylate kinase in man. Nature 209:261263.
GIBLETT, E. R., C. G., HICKMAN, O. SMITHIES
1959 Serum transferrins. Nature 183:15891590. GIORGIO, A. J .
1970 A direct method of hemoglobin electrophoresis using capillary blood. Clinica Chimica Acta 27:362363.
GORDON, A. H. , L. N. LOUIS
1963 Preparation and properties of rat transferrin. Biochemical Journal 88:409414.
2 1 4 Τ. ARENDS, Μ. GALLANGO, Α. MULLERzyvutsrponmlihgfedcbaWVTSRONMJIHGDCBA et dl.
GORNALL, A. G. , C. J . BARDAWILL, Μ. M. DAVID
1949 Determination of serum proteins by means of the biuret reactions. Journal of Biological Chemistry 177:751766.
HIRSCHFELD, J .
1960 Immunoelectrophoresis: procedure and application to the study of groupspecific variations in sera. Science Tools 7:1825.
ΙΤΑΝΟ, H. A.
1953 Solubilities of naturally occurring mixtures of human hemoglobins. Archives of Biochemistry and Biophysics 47:148159.
LAYRISSE, MIGUEL, TULIO ARENDS
1957a The Diego system — steps in the investigation of a new blood group system: further studies. Blood 12:115122.
1957b The Diego blood factor in Negroid populations. Nature 179:478479. LAYRISSE, MIGUEL, TULIO ARENDS, R. DOMINGUEZ SISCO
1955 Nuevo grupo sanguineo encontrado en descendientes de indios. Acta Medica Venezolana 3:132138.
LEHMANN, Η. , R. C. HUNTSMAN
1968 Man's haemoglobins. Amsterdam: NorthHolland. MANCINI, G., A. O. CARBONARA, J . F. HEREMANS
1965 Immunochemical quantitation of antigens by single radial immunodiffusion. International Journal of Immunochemistry 2:235254.
MARTi, MARIANO
1969 Documentos relativos a su visita pastoral de la diocesis de Caracas (17711784). Caracas: Academia Nacional de la Historia.
MERINO, FERNANDO, TULIO ARENDS
1973 High levels of IgE in apparently normal Venezuelan populations, Investigacion Clinica 16:122128.
MOURANT, Α. Ε.
1954 The distribution of the human blood groups. Springfield, 111.: Charles C Thomas.
MULLER, ΑΓΧΑ, TULIO ARENDS
1971 Electrophoretic phenotypes of adenylate kinase in Venezuelan populations. American Journal of Human Genetics 23:507509.
NUNEZMONTIEL, ALONSO
1963 Investigacion de hemoglobinas anomalas en la poblacion de Bobures. Investigacion Clinica 1:3743.
SUTTON, Η. E. , G. W . KARP, JR.
1965 Adsorption of rivanol by potato starch in isolation of transferrins. Biochemical and Biophysical Acta 107:153154.
WANG, A. C., Η. E. SUTTON, I. E. SCOTT
1967 Transferrin D,: identity in Australian aborigines and American Negroes. Science 156:936937.
WEATHERALL, D. J . , J . B. CLEGG
1972 The Thalassaemia syndromes. Oxford: Blackwell. WINTROBE, MAXWELL M.
1963 Clinical hematology (third edition). Philadelphia: Lee and Febiger. WORLD HEALTH ORGANIZATION
1972 Nutritional Anaemias: Report of WHO meeting of investigators.
Geneva: World Health Organization.
Population Dynamics in Tlaxcalay
Mexico: The Effects of Gene Flow,
Selection, and Geography on the
Distribution of Gene Frequencies
Μ. Η. CRAWFORD
The purpose of this paper is fourfold: (1) to quantify the rate of gene flow from the Spanish into the Mexican Indian gene pools during the creation of a mestizo population; (2) to estimate the genetic affinities of the two Mexican populations to the surrounding populations through the use of various genetic distance measures; (3) to determine whether the various measures of genetic distance reflect the estimated proportion of hybridization experienced by the population; (4) to determine whether the admixture estimates for the mestizo populations can be employed as indicators of the actions of natural selection on specific loci controlling the blood groups and proteins of the blood.
The Tlaxcalan Valley was chosen for the study because of the historically documented low rates of gene flow into the valley. This was partially the result of a military alliance between the Tlaxcalans and the Spanish, directed against the Aztecs of the adjoining valley, and partially because of the cultural integrity of the populations in the valley. While the more isolated populations within the valley experienced little, if any, intermixture with the Spanish, the administrative towns of the state of Tlaxcala underwent considerable miscegenation.
Tlaxcala is the smallest state in Mexico with an area slightly over 4,000 square kilometers and a population of more than 400,000 inhabitants. It occupies the central and northern parts of the TlaxcalanPueblan Valley in the central Mexican highlands and is surrounded by mountain ranges that demarcate the political boundaries of the state. The mean altitude of the valley is 7,600 feet, but settlements are located at 9,500 feet elevation on the slopes of the volcano La Malinche. Two populations were studied, San Pablo del Monte (an Indian community located on the slopes of La Malinche) and the city of Tlaxcala (a mestizo town of approximately
2 1 6 Μ. Η. CRAWFORD
10,000). A total of 500 subjects from the two populations were interviewed and given medical and dental examinations. Blood samples were also collected.
HISTORICAL RECONSTRUCTIONS
A census, ordered by the Viceroy Valasco in 1556, revealed that the population of the valley had undergone considerable diminution in size, from a precontact level of approximately 300,000 to 196,703 individuals in the year 1556. The population continued to decrease until it reached its lowest level of 100,000 at the turn of the seventeenth century.
Documents from the Archives for the State of Tlaxcala revealed that few Spaniards were in residence within the valley of Tlaxcala at any one time (Halberstein, Crawford, and Nutini 1973). Their residence was limited to three administrative centers: Santa Ana Chiautempan, Huamantla, and the city of Tlaxcala. In 1537 there was a total of 45 Spaniards residing in the three centers, 35 males and 10 females. By 1591 the total Spanish population increased to 388 males and 239 females. The maximum number of Spaniards who brought their families with them to Tlaxcala never exceeded 400, with approximately 200 transients found in the large towns at any one time (Halberstein, Crawford, and Nutini 1973). For purposes of evolutionary interpretations it is important to note that 1750 marks the final documented date of Spanish settlement into Tlaxcala, with a subsequent reduction of gene flow into the population.
DEMOGRAPHY
A demographic comparison of the mestizo and Indian communities, based upon information on 3,576 individuals, revealed that the mestizos are much more mobile, in terms of mate selection and residential patterns; they are less fertile, live longer, and die less often from infectious diseases than do the Indians (Halberstein and Crawford 1972). The Indian population suffers extremely high neonatal mortality, with more than onethird of all infants failing to reach the fourth year of life. The Indian population also exhibits high variance in fertility, a necessary prerequisite for the rapid action of natural selection. Following Crow's method (1958) for calculating the likelihood of the action of natural selection, with the index for the intensity of selection, the Indian population exhibits a higher " I" than the mestizo group (2.455 versus 1.142).
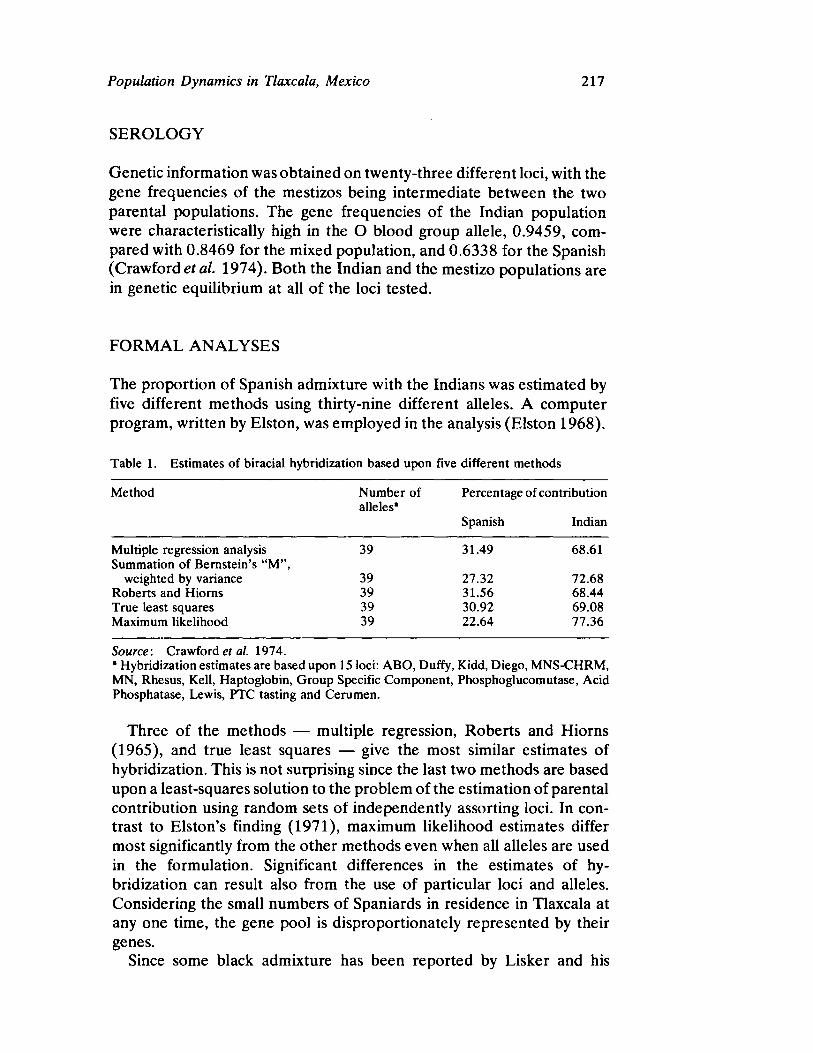
Population Dynamics in Tlaxcala, Mexico 217
SEROLOGY
Genetic information was obtained on twentythree different loci, with the gene frequencies of the mestizos being intermediate between the two parental populations. The gene frequencies of the Indian population were characteristically high in the Ο blood group allele, 0.9459, compared with 0.8469 for the mixed population, and 0.6338 for the Spanish (Crawfordtlea et al. 1974). Both the Indian and the mestizo populations are in genetic equilibrium at all of the loci tested.
FORMAL ANALYSES
The proportion of Spanish admixture with the Indians was estimated by five different methods using thirtynine different alleles. A computer program, written by Elston, was employed in the analysis (Elston 1968).
Table 1. Estimates of biracial hybridization based upon five different methods
Method Number of Percentage of contribution alleles*
Spanish Indian
Multiple regression analysis 39 31.49 68.61 Summation of Bernstein's "M",
weighted by variance 39 27.32 72.68 Roberts and Hiorns 39 31.56 68.44 True least squares 39 30.92 69.08 Maximum likelihood 39 22.64 77.36
Source: Crawford et al. 1974. • Hybridization estimates are based upon 15 loci: ABO, Duffy, Kidd, Diego, MNSCHRM, MN, Rhesus, Kell, Haptoglobin, Group Specific Component, Phosphoglucomutase, Acid Phosphatase, Lewis, PTC tasting and Cerumen.
Three of the methods — multiple regression, Roberts and Hiorns (1965), and true least squares — give the most similar estimates of hybridization. This is not surprising since the last two methods are based upon a leastsquares solution to the problem of the estimation of parental contribution using random sets of independently assorting loci. In contrast to Elston's finding (1971), maximum likelihood estimates differ most significantly from the other methods even when all alleles are used in the formulation. Significant differences in the estimates of hybridization can result also from the use of particular loci and alleles. Considering the small numbers of Spaniards in residence in Tlaxcala at any one time, the gene pool is disproportionately represented by their genes.
Since some black admixture has been reported by Lisker and his
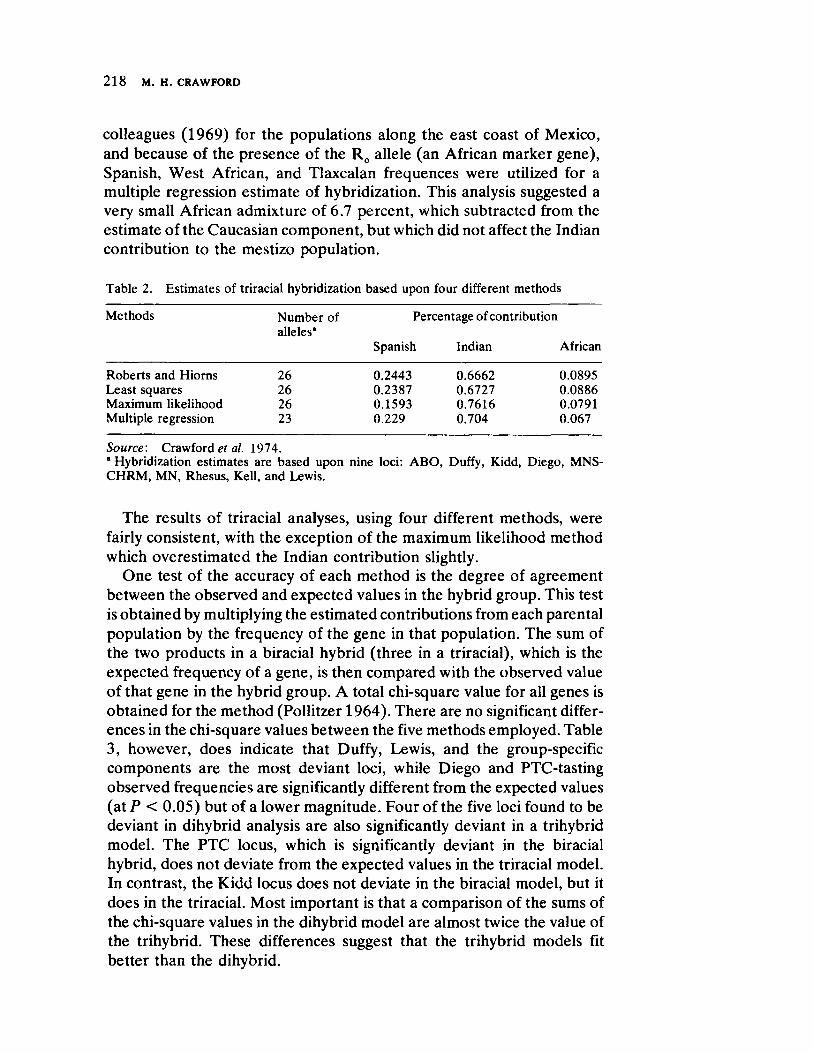
2 1 8WROFDCA Μ. Η. CRAWFORD
colleagues (1969) for the populations along the east coast of Mexico, and because of the presence of the R0 allele (an African marker gene), Spanish, West African, and Tlaxcalan frequences were utilized for a multiple regression estimate of hybridization. This analysis suggested a very small African admixture of 6.7 percent, which subtracted from the estimate of the Caucasian component, but which did not affect the Indian contribution to the mestizo population.
Table 2. Estimates of triracial hybridization based upon four different methods
Methods Number of Percentage of contribution
alleles* Spanish Indian African
Roberts and Hiorns 26 0.2443 0.6662 0.0895 Least squares 26 0.2387 0.6727 0.0886 Maximum likelihood 26 0.1593 0.7616 0.0791 Multiple regression 23 0.229 0.704 0.067
Source: Crawford et al. 1974. * Hybridization estimates are based upon nine loci: ABO, Duffy, Kidd, Diego, MNSCHRM, MN, Rhesus, Kell, and Lewis.
The results of triracial analyses, using four different methods, were fairly consistent, with the exception of the maximum likelihood method which overestimated the Indian contribution slightly.
One test of the accuracy of each method is the degree of agreement between the observed and expected values in the hybrid group. This test is obtained by multiplying the estimated contributions from each parental population by the frequency of the gene in that population. The sum of the two products in a biracial hybrid (three in a triracial), which is the expected frequency of a gene, is then compared with the observed value of that gene in the hybrid group. A total chisquare value for all genes is obtained for the method (Pollitzer 1964). There are no significant differences in the chisquare values between the five methods employed. Table 3, however, does indicate that Duffy, Lewis, and the groupspecific components are the most deviant loci, while Diego and PTCtasting observed frequencies are significantly different from the expected values (at Ρ < 0.05) but of a lower magnitude. Four of the five loci found to be deviant in dihybrid analysis are also significantly deviant in a trihybrid model. The PTC locus, which is significantly deviant in the biracial hybrid, does not deviate from the expected values in the triracial model. In contrast, the Kidd locus does not deviate in the biracial model, but it does in the triracial. Most important is that a comparison of the sums of the chisquare values in the dihybrid model are almost twice the value of the trihybrid. These differences suggest that the trihybrid models fit better than the dihybrid.

Population Dynamics in Tlaxcala, MexicoyxwvutsrqponmlkihgfedcbaTSRPONMLKHGDCBA 219
Table 3. Biracial analysis: comparison of chisquare values for different methods of calculating proportions of admixture
Locus Degrees of freedom Roberts
and Hiorns
Least squares
Methods
Maximum Multiple likelihood regression
Σ Bernste "M"
ABO 2 2.4580 2.5658 5.3137 2.4720 3.4203 Duffy 1 23.0492* 23.9745* 38.1999* 23.1715* 29.6239* Kidd 1 1.7398 1.6516 0.7142 1.7242 1.9975 Diego 1 5.6011* 5.4040* 3.2997* 5.5642* 4.3934* MNSCHRM 1.3992 1.4283 2.0937 1.4023 1.6494 MN 1 0.1102 0.1538 1.4170 0.1168 0.5397 Rhesus 6.1570 6.0831 5.2886 6.1390 5.6990 Kell 1 2.7096 2.6193 1.4840 2.6929 2.1170 HP 1 3.4146 3.2981 1.9745 3.3929 2.6890 GSC 1 10.0738* 9.9659* 8.6103* 10.0469* 9.3673* PGM 1 0.6910 0.6834 0.5878 0.6894 0.6411 AP 3.0868 3.0347 2.4833 3.0756 2.7576 Lewis 1 20.5930* 20.1450* 14.4676* 20.5017* 17.6495* PTC 1 5.1078* 4.8329* 1.9139 5.0590* 3.4158 Cerumen 1 0.9451 1.1101 4.2775* 0.9697 2.2597
Total 24 5.2610 5.2426 5.4360 5.2527 5.2247
Key. * = Ρ <0.05
Table 4. Triracial analysis: comparison of chisquare values for different methods of calculating proportions of admixture.
Locus Degrees of freedom Roberts
and Hiorns
Least squares
Methods
Maximum likelihood
Multiple regression
ABO 2 0.9859 1.0838 3.2116 1.8315 Duffy 1 10.2739* 10.8486* 22.0033* 17.8481* Kidd 1 5.8811* 5.7360* 3.1063 3.2596 Diego 1 5.6649* 5.4253* 3.5431 5.0147* MNSCHRM 2.0678 2.0803 2.2303 1.7677 MN 1 0.0802 0.1222 1.1030 0.2477 Rhesus 2.6128 2.5303 1.4930 2.1681 Kell 1 1.1384 1.0394 0.5094 1.5756 HP 1 0.5222 0.4626 0.3418 1.3117 GSC 1 5.7701* 5.6492* 5.5604* 7.3515* PGM 1 0.6189 0.6104 0.5468 0.6284 AP 2.4747 2.4415 2.2016 2.5576 Lewis 1 24.6928* 24.2078* 18.2047* 21.3304* PTC 1 0.9998 0.8432 0.2244 1.9415 Cerumen 1 0.9106 1.0915 3.7389 1.4888
Total 24 3.5564 3.5212 3.5566 3.7120
Key: *= Ρ <0.05

2 2 0WROFDCA Μ. Η. CRAWFORD
GENETIC DISTANCES
Three techniques were used to compute genetic distances between populations: (1) Sanghvi'sXD X2 (1953); (2) CavalliSforza and Edwards's D2
(1967); (3) Mahalanobis's D2 (1936). Sanghvi'sA'2, distributed as a chisquare statistic, is a simple measure of
distance between populations, developed for discrete characters occurring in multiclass situations. It provides a measure of divergence based on differences in frequencies over any number of loci, for pairs of populations. Initially this distance measure was employed by Sanghvi (1953) to determine the genetic relationships between the social castes of Bombay, India. However, Pollitzer (1964) has utilized this method to measure the genetic distance between the hybrid and the parental populations of a triracial hybrid isolate.
The method suggested by CavalliSforza and Edwards (1967) for computing distances based on gene frequencies is more complex in that each distance is proportional to chord lengths between points representing populations projected on the surface of a multidimensional sphere. This method is fully described in a number of publications (CavalliSforza and Edwards 1967; Edwards and CavalliSforza 1972). Rothhammer and Spielman (1972) have most recently applied this method of distance measure to a number ofzyxwvutsrqponmlihgfedcbaTSMIGCA Aymarδ Indian populations.
Mahalanobis's generalized distances are also computed in this study by means of a method modified to utilize allelic frequency covariance matrices. The modifications in the method of Mahalanobis (1936) are described by Crawfordtlea et al. (1974).
Table 5. Gene frequencies of the Tlaxcalan, Spanish, and African populations used in the calculation of genetic distances
Group Ο A Β Μ Ν Fy* Fy"
San Pablo TIaxcala Spanish* Afncab
0.9460 0.8410 0.6400 0.7077
0.0500 0.1150 0.2920 0.1780
0.0050 0.0440 0.0680 0.1143
0.7821 0.6920 0.5256 0.5805
0.2179 0.3080 0.4744 0.4195
0.7842 0.5261 0.3993 0.0607
0.2158 0.4739 0.6007 0.9393
Group (contd) Di* Di" R, Rt R2
R„+r
San Pablo TIaxcala Spanish* Africab
0.0560 0.0760 0.0000 0.0000
0.9440 0.9240 1.0000 1.0000
0.0400 0.0250 0.0000 0.0008
0.6020 0.5770 0.4774 0.4036
0.3230 0.2650 0.1128 0.1670
0.0350 0.1330 0.4042 0.4006
Source: Crawford et al. 1974. * Spanish frequencies are based upon Mourant (1954). b African frequencies were compiled by CavalliSforza and Bodmer (1971).
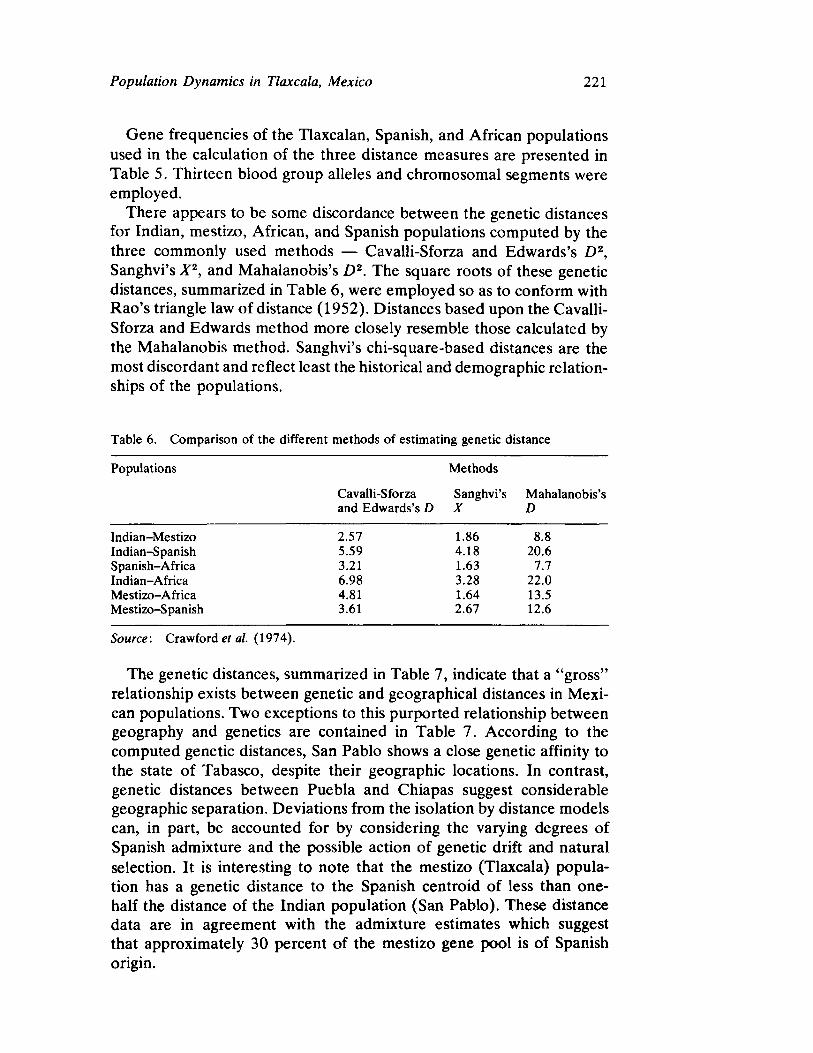
Population Dynamics in Tlaxcala, Mexico 221
Gene frequencies of the Tlaxcalan, Spanish, and African populations used in the calculation of the three distance measures are presented in Table 5. Thirteen blood group alleles and chromosomal segments were employed.
There appears to be some discordance between the genetic distances for Indian, mestizo, African, and Spanish populations computed by the three commonly used methods — CavalliSforza and Edwards's D2,
Sanghvi's X2, and Mahalanobis's D2. The square roots of these genetic distances, summarized in Table 6, were employed so as to conform with Rao's triangle law of distance (1952). Distances based upon the CavalliSforza and Edwards method more closely resemble those calculated by the Mahalanobis method. Sanghvi's chisquarebased distances are the most discordant and reflect least the historical and demographic relationships of the populations.
Table 6. Comparison of the different methods of estimating genetic distance
Populations Methods
CavalliSforza Sanghvi's Mahalanobis's and Edwards's D X D
IndianMestizo 2.57 1.86 8.8 IndianSpanish 5.59 4.18 20.6 SpanishAfrica 3.21 1.63 7.7 IndianAfrica 6.98 3.28 22.0 MestizoAfrica 4.81 1.64 13.5 MestizoSpanish 3.61 2.67 12.6
Source : Crawford et al. (1974).
The genetic distances, summarized in Table 7, indicate that a "gross" relationship exists between genetic and geographical distances in Mexican populations. Two exceptions to this purported relationship between geography and genetics are contained in Table 7. According to the computed genetic distances, San Pablo shows a close genetic affinity to the state of Tabasco, despite their geographic locations. In contrast, genetic distances between Puebla and Chiapas suggest considerable geographic separation. Deviations from the isolation by distance models can, in part, be accounted for by considering the varying degrees of Spanish admixture and the possible action of genetic drift and natural selection. It is interesting to note that the mestizo (Tlaxcala) population has a genetic distance to the Spanish centroid of less than onehalf the distance of the Indian population (San Pablo). These distance data are in agreement with the admixture estimates which suggest that approximately 30 percent of the mestizo gene pool is of Spanish origin.
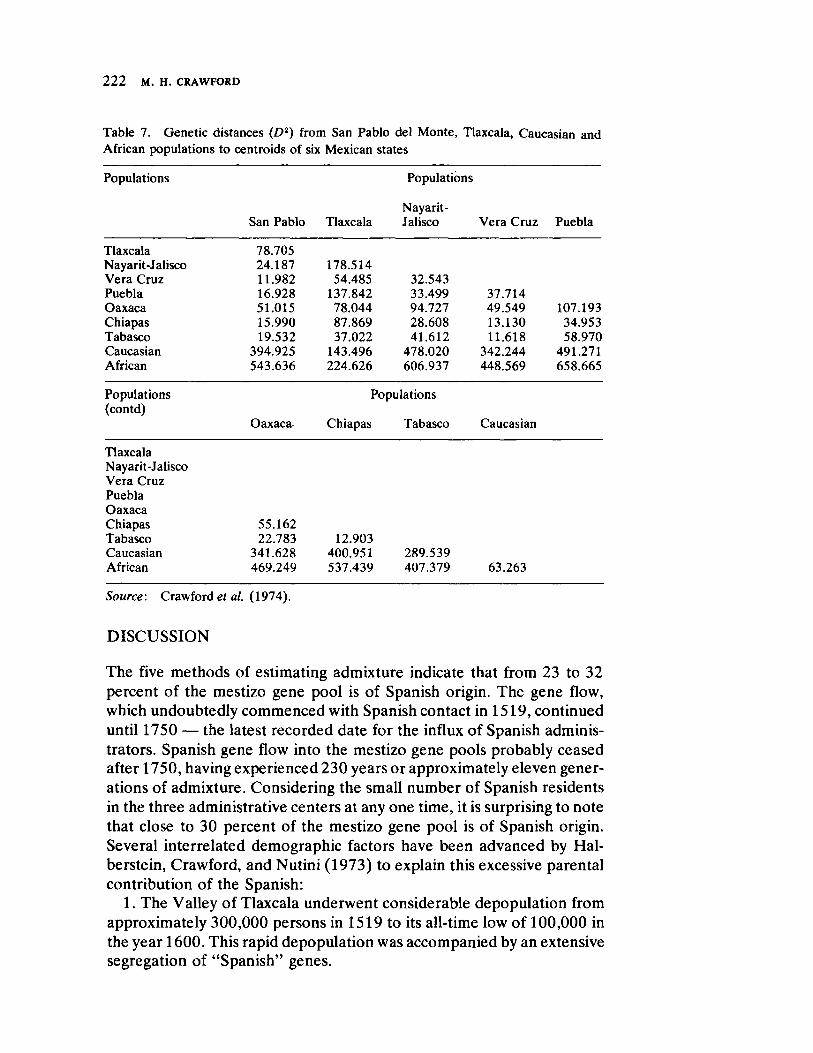
2 2 2WROFDCA Μ. Η. CRAWFORD
Table 7. Genetic distances (D s) from San Pablo del Monte, Tlaxcala, Caucasian and
African populations to centroids of six Mexican states
Populations
San Pablo Tlaxcala
Populations
NayaritJalisco Vera Cruz Puebla
Tlaxcala 78.705 NayaritJalisco 24.187 178.514 Vera Cruz 11.982 54.485 32.543 Puebla 16.928 137.842 33.499 37.714 Oaxaca 51.015 78.044 94.727 49.549 107.193 Chiapas 15.990 87.869 28.608 13.130 34.953 Tabasco 19.532 37.022 41.612 11.618 58.970 Caucasian 394.925 143.496 478.020 342.244 491.271 African 543.636 224.626 606.937 448.569 658.665
Populations (contd)
Oaxaca
Populations
Chiapas Tabasco Caucasian
Tlaxcala NayaritJalisco Vera Cruz Puebla Oaxaca Chiapas 55.162 Tabasco 22.783 12.903 Caucasian 341.628 400.951 289.539 African 469.249 537.439 407.379 63.263
Source: Crawford et al. (1974).
DISCUSSION
The five methods of estimating admixture indicate that from 23 to 32 percent of the mestizo gene pool is of Spanish origin. The gene flow, which undoubtedly commenced with Spanish contact in 1519, continued until 1750 — the latest recorded date for the influx of Spanish administrators. Spanish gene flow into the mestizo gene pools probably ceased after 1750, having experienced 230 years or approximately eleven generations of admixture. Considering the small number of Spanish residents in the three administrative centers at any one time, it is surprising to note that close to 30 percent of the mestizo gene pool is of Spanish origin. Several interrelated demographic factors have been advanced by Halberstein, Crawford, and Nutini (1973) to explain this excessive parental contribution of the Spanish:
1. The Valley of Tlaxcala underwent considerable depopulation from approximately 300,000 persons in 1519 to its alltime low of 100,000 in the year 1600. This rapid depopulation was accompanied by an extensive segregation of "Spanish" genes.
Population Dynamics in Tlaxcala, Mexico 223
2. According to Snow (1969) the precontact settlements in Tlaxcala were situated on bluffs and valley walls because of the poor drainage in the lowlands. The city of Tlaxcala was founded by the Spaniards as an administrative center after the valley floor was drained. The founding population of the city of Tlaxcala probably had a high proportion of "Spanish" genes.
3. The settlement patterns of the Spanish were highly centralized, with most of the administrators residing in either the city of Tlaxcala, Santa Ana Chiautempan, or Huamantla (documents from the Archives of the State of Tlaxcala). Thus, while most of the valley experienced little or no admixture with the Spanish, the gene pool of the administrative cities contained a disproportionate percentage of "Spanish" genes.
4. The Spanish contact with the city of Tlaxcala lasted for 230 years. During eleven or twelve generations, constant gene flow of low magnitude could account for 30 percent of the estimated admixture.
5. A fifth possible cause for the high incidence of "Spanish" genes in the mestizo gene pool is assortative mating based upon Spanish morphological features. Individuals with Spanish ancestry may have constituted preferred mates and thus disproportionately contributed genetically.
On the basis of total chisquare values for the blood loci (see Tables 3 and 4), it appears that the triracial hybrid origin of the mestizo gene pool provides a better fit than does the biracial analysis. The sum of the chisquare values for the various blood loci, assuming a triracial origin of the mestizos, are almost onehalf the values of the chisquare totals of the biracial model. These values suggest that the mestizo population received gene flow from an African component as well as a Spanish parental population. Historically, the Spanish conquest of Mexico is well documented; however, there is no evidence for the existence of slave populations in the highlands of Tlaxcala. The "African" genes may have come into Tlaxcala in one of two ways: (1) They may have come with the "Spanish" genes, carried by the soldiers of Moorish ancestry; (2) Since there is no record of African slaves being brought as far inland as Tlaxcala, the genes may have been introduced into the community by Indians from the coast whose ancestors had interbred with slaves.
The evidence more strongly supports the first alternative, because genetically the population is in equilibrium with regard to all twentythree loci and second, a fitting of the curve for a trihybrid population results in a change in the contribution of the Caucasians but not of the Indians. The demographic data suggest that gene flow from outside the valley is a recent phenomenon and if the African genes were constantly flowing into the community then the equilibrium might be disrupted.
Workman (1968) has suggested that admixture studies may be used to detect the action of natural selection. He computed admixture estimates "M" (Bernstein 1931) for a number of blood loci in American black
2 2 4ZYWVTSRONMLKJIHFEDCBA Μ. Η. CRAWFORD
populations and suggested that selection is operating on the Hb', Hbc, Hp1, G6PD, and Aj alleles. Although the hemoglobin and G6Pd expressions were not determined in this study, since African admixture was not suspected, the ABO and haptoglobin loci have been investigated for possible selection. Tables 3 and 4 suggest that selection does not appear to be acting on these loci in the Tlaxcalan population. However, the Duffy locus exhibits exceptionally high chisquare values, suggesting the possible action of natural selection. Reed (1969) has suggested that the Duffy blood group system Fya gene, may be the best available marker for estimating "M" in American blacks. Judging from these data, the Duffy system cannot be recommended for the calculation of "M" in Mexican Indian populations.
In sum, there is some discrepancy in the results based upon the various methods of calculating genetic distances and admixture. These data also demonstrate that admixture studies are useful indicators as to possible selection, despite the underlying simplifications. Lastly, it appears that geographic distance and admixture with the Spanish are the primary factors involved in determining the distribution of the allelic frequencies in Mexico.
REFERENCES
ADAMS, J . , R. H. WARD
1973 Admixture studies and the detection of selection.zyutsrponmlihgfedcbaTSPJIHGCBA Science 180:11371142.
BERNSTEIN, F.
1931 "Die geographische Verteiling der Blutgrupper und ihre anthropologische Bedeutung," in Comitato Italiano per lo studio dei problemi
delta populazione. Rome: Instituto Poligrafico dello Stato. CAVALLISFORZA, L. L. , W. F. BODMER
1971 The genetics of human populations. San Francisco: W. H. Freeman. CAVALLISFORZA, L. L., A. W. F. EDWARDS
1967 Phylogenetic analysis: models and estimation procedures. American
Journal of Human Genetics Supplement 19:233257. CRAWFORD, Μ. H. , W . C. LEYSHON, K. BROWN, et al.
1974 Human biology in Mexico, part 2: a comparison of blood group, serum, and red cell enzyme frequencies, and genetic distances of the Indian populations of Mexico. American Journal of Physical Anthropology
41:251268. CROW, J .
1958 Some possibilities for measuring selection intensities in man. Human
Biology 30:113. EDWARDS, A. W. F., L. L. CAVALLISFORZA
1972 "Affinity as revealed by differences in gene frequencies," in The
assessment of population affinities in man. Edited by J. S. Weiner and J. Huizinga. Oxford: Clarendon.
Population Dynamics in Tlaxcala, Mexico 225
ELST0N, R. C.
1968 "Estimation of admixture in racial hybrids." Revised mimeographed version. University of North Carolina, Chapel Hill.
1971 The estimation of admixture in racial hybrids. Annals of Human Genetics 35:917.
HALBERSTEIN, R. Α., Μ. Η. CRAWFORD
1972 Human biology in Tlaxcala, Mexico: demography. American Journal of
Physical Anthropology 36:199212. HALBERSTEIN, R. Α., Μ. Η. CRAWFORD, Η. G. NUTINI
1973 Historicaldemographic analysis of Indian populations in Tlaxcala, Mexico. Social Biology 20:4050.
LISKER, R., M. S. C0RDOVA, Q.zyxwvutsrponmlkihgfedcbaZYWUTSRPONMLIHGEDCBA ZΔRATE
1969 Studies on several genetic hematological traits of the Mexican population, part 16: hemoglobin S and Glucose6Phosphate Dehydrogenase deficiency in the East Coast.yvutsrponmlihgfedcbaTSQPNJIHCBA American Journal of Physical Anthropology 30:349354.
MAHALANOBIS, P. C.
1936 On the generalized distance in statistics. Proceedings of the National Institute of Science (India) 12:4955.
MORTON, N. E.
1964 Genetic studies of northeastern Brazil. Cold Spring Harbor Symposia on Quantitative Biology 29:6979.
MOURANT, A. E.
1954 The distribution ofthe human blood groups. Springfield, 111.: CharlesC. Thomas.
POLLITZER, W . S.
1964 Analysis of a triracial isolate. Human Biology 36:362373. RAO, C. R.
1952 Advanced statistical methods in biometric research. New York: Wiley. REED, Τ. E.
1969 Caucasian genes in American Negroes. Science 165:762768. ROBERTS, D. F., R. W . HIORNS
1965 Methods of analysis of the genetic composition of a hybrid population. Human Biology 37:3843.
ROTHHAMMER, F., R. S. SPIELMAN
1972 Anthropometric variation in the Aymara: genetic, geographic, and topographic contributions. American Journal of Human Genetics
24:371380. SALDANHA, P. H.
1957 Gene flow from white into Negro populations in Brazil. American Journal of Human Genetics 9:299309.
SANGHVI, L. D.
1953 Comparison of genetical and morphological methods for a study of biological differences. American Journal of Physical Anthropology 11:385404.
SNOW, D. R.
1969 Ceramic sequence and settlement location in preHispanic Tlaxcala. American Antiquity 34:131145.
WORKMAN, P. L.
1968 Gene flow and the search for natural selection in man. Human Biology
40:260279.

Genetic Distances Among Certain
Southern African Populations
TREFOR JENKINS, HENRY HARPENDING, and G. T. NURSE
Any approach to the interrelationships among population groups in southern Africa has in the first instance to take cognizance of the available historical data relating to those groups. For the information that we have, we are indebted to the records, nearly five centuries old, of Portuguese exploration, much of it peripheral and none of it complete; to the rather more accessible writings of officials and visitors of the Dutch period and later; to the labors of archeologists; and to the traditions preserved by the peoples themselves. Some of this information overlaps and shows piquant contrasts of viewpoint; some of it provides welcome corroboration of aspects of the rest; and some, by failing to fit together or, on occasion, by flatly contradicting other evidence, complicates the picture more considerably than ignorance does. In such instances, so totally independent a discipline as biology can be of great service in refuting or confirming historical hypotheses.
Until recently the biological contributions to southern African history have stressed morphological characters. Southern Africa has in a way suffered by possessing a wealth of remains not only ofsponmieaH Homo sapiens but also of human and prehuman existence, so that the broad horizons of paleoanthropology have on occasion been invoked to account for, and perhaps to confuse, the position with regard to its extant peoples. The relationships of the San to the Khoikhoi, and of both to the Negro, are capable of a number of morphological interpretations, some of which
The work of the Human SeroGenetics Unit is supported in part by a grant from the South African Medical Research Council.
We wish to thank the director of the South African Institute for Medical Research, Professor J. H. S. Gear, and the deputy director, Professor J. F. Murray, head of the School of Pathology of the University of the Witwatersrand, for the facilities which made this study possible.
2 2 8YUTSRPONKJIHGFEDA TREFOR JENKINS, HENRY HARPENDING, G. T . NURSE
necessitate assuming the intervention of the human races whose presence
otherwise in Africa would be hard to explain. One can, after all, have
large brow ridges without necessarily being of Australoid descent, as
Broom (1943) suggests for the Koranas, or medial epicanthic folds and a
yellow skin independently of the Mongoloid ancestry postulated for the
San by Dart (1953).
The investigation of morphological traits carries the great advantage
that such markers must represent in their totality a significant proportion
of the genome. Several gene loci may be responsible for each such
character — and the distribution of each, tending as it does toward the
Gaussian, indicates that this is the case. If so, even granted a certain
amount of epistatic interplay, the measurement of a few dimensions and
the calculation from them of indices will provide us with all the informa
tion obtainable about the action of a number of genes. Their numbers and
the mechanisms of their interactions remain, of course, obscure. This lack
of possible precision is the greatest shortcoming of morphometric
inquiries. The extent of the intercorrelation between such gross traits and
the curious relative independence of head and body measurements
(Barnicot and Brothwell 1959), lead to a summative effect which is
perfectly usable for comparisons; but in the absence of more precise
information about the factors causing the traits, it is difficult to be quite
sure how valuable the comparisons are.
Some monogenic markers — characteristics inherited in a simple Men
delian fashion — have been known for decades and have been extensively
used in population comparisons. Not very long after Landsteiner (1901)
had established that human individuals varied in their blood type, Hirsz
feld and Hirszfeld (1919) were applying blood grouping in anthro
pological studies. Since then each blood group system, almost as it
appeared, has been tested on a series of populations (Landsteiner and
Levine 1929; Wiener, Belkin, and Sonn 1944; Mourant 1947; Sanger tlea
et al. 1949; and numerous others). In addition to the blood groups,
certain other human characteristics such as the ability to taste phenyl
thiocarbamide or smell hydrocyanic acid, and also many hemoglobin
variants, have been known to have a simple hereditary basis for a long
time. Because these characteristics are comparatively easy to investigate
in large numbers of people they are potentially of value in discriminating
between populations.
During the past twenty years, with the recognition of common enzyme
and serum protein polymorphisms, the range of the monogenic markers
has expanded considerably. It is obvious that the ability to distinguish
between populations increases in sensitivity with the addition of each
extra polymorphism to a comparison. The number of the actual loci
whose effects are explored may amount to only a small proportion of the
total genome, much less than the proportion presumably responsible for
Genetic Distances Among Certain Southern African Populations 229
the morphological characters. The value of the cumulative assessment of gene frequencies, however, increases exponentially rather than additively. Certainty about the situation at a comparatively small number of independent loci is, therefore as information, more revealing than any broad and imprecise conclusions realizable from an equivalent number of bodily measurements and the indices derived therefrom.
Once characteristics and their distributions in populations are expressed quantitatively, they can also be used historically. Measurements, or gene frequencies, or both, can be converted into genetic "distances." These provide comprehensible, if not always scientifically satisfying, summaries of physical differences, which can be used in heuristic association with what is known of history, custom, and language to provide as comprehensive a picture as possible of the degree and type of relationship among populations.
There are many measures of genetic distance, all of them reasonable, all related to one another, and none likely seriously to mislead an investigator. There ought, however, to be more than anecdotal or ad hoc value to any measure selected; it should lend itself, for instance, equally well to the construction of cladograms and of genetic maps, and should also be adaptable to more than one class of information. Above all, it should be clearly related to genetic theory.
If the gene frequencies in two populations are similar, the genetic distance between them should be small. Such similarities can be accounted for in a number of ways, the most conspicuous of which are the following:
1. A recent common ancestor. 2. Gene exchange. 3. Size. With large populations, little drift will have occurred since their
separation. 4. Similar selection pressures operating on the loci under investigation.
The effects of population size are often overlooked. Drift of mean gene frequencies of the moieties of a subdivided group is nearly independent of mating pattern within the group (Ewens 1969). Taking size into consideration, therefore, makes reasonable the occasional finding that genetic distances between populations within a linguistic group are as large as those between linguistic groups. Selection pressures are not usually explicitly considered in studies of genetic distance, since homogenous selection over a restricted area or random changes in directional selection will be indistinguishable in their effects from drift (CavalliSforza et al.
1969). Genetic drift is described by kinship statistics, and these should be the
basis of measures of genetic distance (Harpending and Jenkins 1972). The coefficient of kinship between two groups has been described by
2 3 0 TREFOR JENKINS, HENRY HARPENDING, G. T. NURSE
Harpending and Jenkins (1971). There are two interpretations for this coefficient, and they can be used interchangeably.
1. The coefficient is the probability that a random allele at a specified locus in one population is identical by descent with a random allele at the same locus in another population.
2. Where populations are undergoing genetic drift, and either possessed a common gene frequency at a specified locus before drift occurred, or are being directed by systematic pressure toward a common gene frequency at that locus, the kinship coefficient is the normalized covariance between the gene frequencies at the time of investigation.
The second definition suggests that a reasonable measure of genetic distance is the Euclidean distance between the populations in a hyperspace whose axes are allelic frequencies, scaled by dividing by the variance of the original or ultimate gene frequency as a normalizing factor. An estimate of ultimate gene frequency can be obtained by calculating a weighted mean gene frequency of any allele in the study array. The observed or sample coefficient of kinship between the populations is given by the product of the differences of the frequencies in the populations from the mean, divided by the variance of the mean. The matrix of sample kinship coefficients is calculated for each allele, and the matrices are averaged to yield an overall matrix of sample coefficients. If the same systematic pressure operates on all the alleles, then they should all give estimates of the same "true" sample coefficients, subject only to chance deviations. On this assumption Harpending and Jenkins (1971) simply averaged the sample coefficient matrices from all the alleles they studied. It is probably better to give unequal weight to alleles by weighing estimates from different loci by the degrees of freedom at such loci (Harpending and Jenkins 1972).
Whatever method is used to combine information from the various loci, the resulting matrix of samplerelationship coefficients is amenable to analysis in several ways. These are described and discussed by Harpending and Jenkins (1972) and include both the derivation of dendrograms and the construction of genetic maps. A simple "maximumlinkage" technique for the production of dendrograms, or trees, is recommended by Jenkinstlea et al. (1971) as economical of computer time and less prone to misinterpretation as an apparent cladistic "reconstruction" of evolution. It is, in fact, difficult to determine what exactly the meaning of such trees is or to assess the details of difference which underlie their broad similarities. A genetic map is simply the result of a principal components analysis of the kinship matrix.
Principal components analysis is widely used to array measurements of metric traits in a new space. This is often very satisfactory inasmuch as it serves to account for most of the variation by a few components such as size, linearity, and so on. Used in a populationgenetic context this

Genetic Distances Among Certain Southern African Populations 231
method of analysis gives no reason to expect that a small number of new variables will account satisfactorily for the relationships among populations, since under pure drift no locus should be correlated with any other locus. On the other hand, it should be valuable in identifying clusters of related groups, as relatedness should be the only factor introducing correlations among groups. The procedure described by Harpending and Jenkins (1972) is somewhat shorter than ordinary components analysis and has the further advantage of yielding a distance matrix and population structure statistics in the course of the computation.
THE POPULATIONS
The eighteen populations included in the studies are indicated in Table 1, and their approximate geographical locations are shown on the map (see Figure 1).
Table 1. The populations included in the study*
Population Country Comments
Khoisan San
Dobe !Kung(K4) Botswana /ai/ai !Kung(K5) Botswana /du/da !Kung(K6) Botswana Kaukau(K8) Botswana
Naron(K9) Botswana
Khoikhoi Sesfontein(Kll) SouthWest Africa Keetmanshoop(K12) SouthWest Africa
Negro Damara(K14) SouthWest Africa
Herero(N2) Botswana Tswana(N4) Botswana Sotho A(N5) Lesotho Sotho B(N6) Lesotho Swazi(N18) Swaziland Pedi(N21) South Africa "Mozambique Southern
Negro" Mozambique Colored (or mixed)
Sesfontein(Cl) SouthWest Africa
Johannesburg(C9) South Africa !Kuboes(C12) South Africa
Speak a northern Bushman language.
Living on farms in Ghanzi district. Speak a northern Bushman language. Living on farms in Ghanzi district. Speak a central Bushman language.
Four Khoikhoi grandparents. Four Khoikhoi grandparents.
Living in Sesfontein. Four grandparents Damara. Living in the Dobe area. Goldminers in Johannesburg. Living at 7,000 feet (2,100 meters). Living at 5,000 feet (1,500 meters). Students at Mbabane technical school. Rural and urban populations combined. Several different studies—see Table 2 and text.
A Caucasoid/Damara/Khoikhoi hybrid population.
A triracial hybrid population (Khoikhoi/ San/Caucasoid).
* The code designations given after each population, and in Table 2, are those in use in the Human SeroGenetics Unit, Johannesburg.
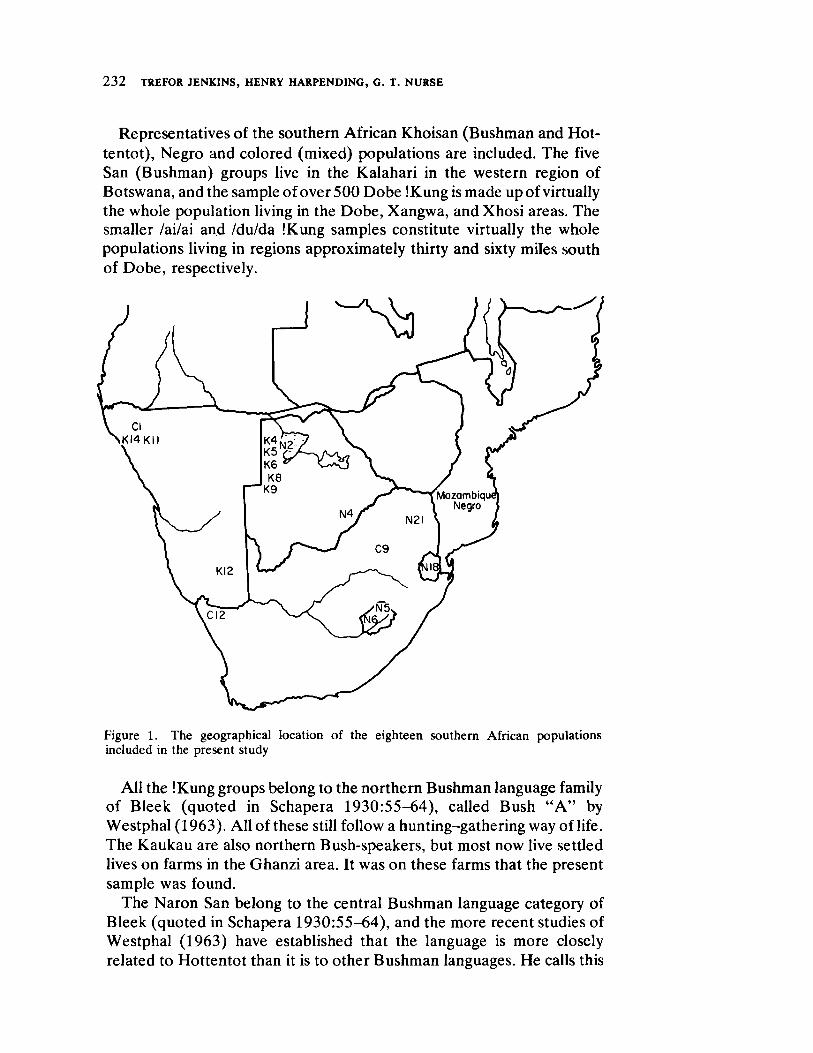
2 3 2 TREFOR JENKINS, HENRY HARPENDING, G. T. NURSE
Representatives of the southern African Khoisan (Bushman and Hottentot), Negro and colored (mixed) populations are included. The five San (Bushman) groups live in the Kalahari in the western region of Botswana, and the sample of over 500 Dobe !Kung is made up of virtually the whole population living in the Dobe, Xangwa, and Xhosi areas. The smaller /ai/ai and /du/da !Kung samples constitute virtually the whole populations living in regions approximately thirty and sixty miles south of Dobe, respectively.
Figure 1. The geographical location of the eighteen southern African populations included in the present study
All the !Kung groups belong to the northern Bushman language family of Β leek (quoted in Schapera 1930:5564), called Bush "A" by Westphal (1963). All of these still follow a huntinggathering way of life. The Kaukau are also northern Bushspeakers, but most now live settled lives on farms in the Ghanzi area. It was on these farms that the present sample was found.
The Naron San belong to the central Bushman language category of Bleek (quoted in Schapera 1930:5564), and the more recent studies of Westphal (1963) have established that the language is more closely related to Hottentot than it is to other Bushman languages. He calls this
Genetic Distances Among Certain Southern A frican Populations 233
category Tshukhwe. There are a number of other languages spoken by San peoples which fall in this Tshukhwe category but, unfortunately, none of the peoples speaking them has yet been subjected to genetical studies of the type reported here. Blood samples from the Naron were collected on various farms in the vicinity of Ghanzi.
The only surviving Khoikhoi (Hottentots) all belong to the Nama linguistic division. Khoikhoi speaking other Hottentot languages are now extinct. Two Khoikhoi groups have been sampled. First, there is almost the whole adultpopulation of Sesfontein, in the Kaokoveld of Southwest Africa. All individuals included claimed four Khoikhoi grandparents. The same criterion was used to ascertain the large sample of Khoikhoi living in Keetmanshoop, a country town in the southern part of SouthWest Africa. In spite of the attempt to include only "pure" Khoikhoi in the samples it is believed that a small number of individuals with some Caucasoid ancestry were included: the nonAfrican Gamma globulin (Gm) phenogroup Gm1,2, was found in both Khoikhoi groups. In the Keetmanshoop population, Gm 3 , 5 · l 3 · 1 4 was found as well. The acid phosphatase polymorphism is not included in this study, because only a few populations have been studied for it. It has been recently employed in the study of Keetmanshoop Khoikhoi, and out of 150 individuals one was found who possessed the classical Caucasoid allele Pc (Jenkins and Corfield 1972).
The enigmatic Damara of SouthWest Africa have been included even though the sample size is painfully small. The fiftytwo individuals are all the adults of Sesfontein who would admit to having had four Damara grandparents. We had felt that the rather high Rhesus r (cde) allele frequency may have been due to a sampling error; but a more recent study by Knussmann (1969), and Knussmann and Knussmann (1969) on over 400 Damara living in other parts of SouthWest Africa has also given a high r (cde) frequency. To even the most casual observer the physical differences between the Damara and the Khoikhoi are obvious. The two groups have lived together for some centuries (the Damara being, in times past, the slaves of the Khoikhoi) and the Damara have no traces of a language of their own, but speak the same language, Nama, as their Khoikhoi neighbors.
The Herero, a Bantuspeaking tribe, are to be found in SouthWest Africa and Botswana; the present sample is made up of individuals resident in the Dobe area. They live in a state of symbiosis with the little San, their tall stature, heavy build, and dark skin color contrasting dramatically with the characteristics of the San.
There are four southern Bantuspeaking Negro tribes included in this study. The Tswana are the most westerly, living in the western Transvaal region of South Africa and along the eastern margin of Botswana. The sample is made up of villagers from near Rustenburg and men working on

2 3 4 TREFOR JENKINS, HENRY HARPENDING, G. T. NURSE
the gold mines in Johannesburg. Sothospeaking peoples are to be found both in South Africa and Lesotho. The two samples included here were drawn from groups living in different regions of Lesotho: the one living at an altitude of about 7,000 feet, and the other living in Maseru, which is at an altitude of 5,000 feet. The blood samples were collected by Dr. B. Beaumont, and a detailed report of this study is in preparation by Beaumont and Jenkins. The Pedi tribe or chiefdom is to be found living in Sekhukhuniland in the northern Transvaal; and the sample consists of healthy men, subjects of a multidisciplinary study being carried out by the South African International Biological Programme [Human Adaptability] Committee.
Swaziland is now an independent country and is situated to the east of South Africa, bordering on Mozambique. The sample is predominantly male and consists of young adults attending a trade school in Mbabane.
Data on the Mozambique Negro are drawn from three sources: red cell antigen, haptoglobin, and Inv typings were done by Matznetter and Spielmann (1969); red cell enzyme polymorphisms by Giblett(1969) and Reys, Manso, and Stamatoyannopoulos (1970); gamma globulin (Gm) typing by Jenkins, Zoutendyk, and Steinberg (1970). It is realized that the populations studied by these various workers might not be strictly comparable, but scrutiny of the available data suggests that the differences are not very great.
Three colored (that is, mixed) populations are included. The Sesfontein sample consists of all the adult inhabitants who were not Khoikhoi or Damara by the definitions mentioned above. The Khoikhoi and Damara contributions to their gene pool were not the only ones. It was ascertained that significant contributions were made by the Europeans, chiefly of German origin, because during the early part of this century, when the territory was a German colony, a fort was built at Sesfontein and garrisoned for some years. In addition, Bantuspeaking peoples, like the Herero, have also settled into the Sesfontein community.
The colored people of Johannesburg number over 80,000, and most are descendants of immigrants coming to the Witwatersrand from the Cape Province. Until recent years there was a free movement of these people between the Cape and the Transvaal. Because of the proximity of large numbers of Negro peoples, it has been assumed that Johannesburg coloreds have received more "Negro genes" into their gene pool than have, say, those living in the Western Cape, where the Negro population is small.
IKuboes is a small settlement in the Richterveld of the northwestern Cape Province. The total population numbers about 400, and the sample consists of all the adult inhabitants, predominantly female, because the men spend most of their time away from home, seeking employment. It is certain that this area was occupied exclusively by Khoikhoi and San until
Genetic Distances Among Certain Southern African Populations 235
the eighteenth century. Then European farmers (Trekboers, mainly men) moved into the area, intermarried with the indigenous peoples, and settled in small communities, of which IKuboes is perhaps the most isolated today (Carstens 1966).
RESULTS
We have presented in Table 2 the allele frequencies at fourteen distinct genetic loci in the eighteen populations. In the multiple allelic systems, like the ABO and Rhesus blood groups, a maximum likelihood method, using the computer program MAXIM (Kurszinsky and Steinberg 1967) was employed. When the exact genotype of a sample could be deduced from its phenotype, a direct genecounting method was used for calculating the allele frequency.
The calculated genetic distances between these populations are shown in Table 3, and the dendrogram implied by the gene frequencies is presented as Figure 2. A threedimensional representation ("collapsed" from seventeen dimensions) of these distances is given in Figure 3.
DISCUSSION
The application of the genetic distance statistic described here to serogenetic data on eighteen southern African populations has proved to be simple and informative. The wider historical implications are discussed in Nurse, Harpending, and Jenkins (this volume). It is sufficient for the present to point out that this technique appears to give consistent results which are in accordance with historical probabilities.

2 3 6 TREFOR JENKINS, HENRY HARPENDING, G. T. NURSE
Table 2. The allele frequencies at fourteen loci in eighteen southern African populations used for the calculation of genetic distances*
Genetic system, sample size (N) and allele
K4 K5 K6
Populations
K8 K9 K l l K12 K14
ABO: Ν 503 65 102 264 149 42 153 52 Pi 0.239 0.247 0.178 0.163 0.141 0.129 0.120 0.039 P2 0.018 0.042 0.006 0.007 0.020 0.028 0.126 0.000 Ρ 1 bantu 0.040 0.000 0.024 0.011 0.016 0.000 0.022 0.000
q 0.020 0.016 0.009 0.033 0.013 0.228 0.171 0.168 r 0.684 0.696 0.782 0.785 0.809 0.615 0.561 0.793
MHSs: Ν 325 65 90 111 125 42 153 52 MS 0.123 0.065 0.039 0.123 0.155 0.099 0.197 0.047 MS 0.425 0.512 0.305 0.377 0.504 0.318 0.516 0.251 NS 0.025 0.016 0.018 0.072 0.0001 0.114 0.041 0.076 NS 0.427 0.407 0.638 0.428 0.340 0.469 0.247 0.626
Rhesus: Ν 448 63 102 210 147 42 153 52 R . 0.798 0.929 0.966 0.995 0.901 0.786 0.744 0.640 R. 0.046 0.064 0.034 0.021 0.017 0.155 0.118 0.010 R2 0.003 0.008 0.000 0.014 0.007 0.060 0.056 0.010 Γ 0.154 0.000 0.000 0.069 0.075 0.000 0.081 0.341 r1 0.000 0.000 0.000 0.000 0.000 0.000 0.000 0.000
Kell: Ν 387 64 10 165 147 42 153 52 Κ 0.000 0.000 0.000 0.021 0.007 0.000 0.007 0.000 k 1.000 1.000 1.000 0.979 0.993 1.000 0.993 1.000
Duffy: Ν 385 64 54 185 147 42 153 52 Fy' 0.260 0.293 0.307 0.347 0.276 0.155 0.300 0.010 Fyb+Fy 0.740 0.707 0.693 0.653 0.724 0.845 0.700 0.990
G6PD: Ν 138 138 42 43 28 20 59 25 GdA 0.030 0.030 0.000 0.023 0.071 0.000 0.000 0.040 GdA~ 0.015 0.015 0.024 0.000 0.036 0.000 0.000 0.040 GdB 0.957 0.957 0.976 0.977 0.893 1.000 1.000 0.920
6PGD: Ν 328 328 74 82 58 42 118 52 PGDA 1.000 1.000 1.000 0.994 0.991 0.988 0.996 0.942 PGDC 0.000 0.000 0.000 0.006 0.009 0.000 0.004 0.010 PGDR 0.000 0.000 0.000 0.000 0.000 0.012 0.000 0.048
* The code designations are those in use in the Human SeroGenetics Unit, Johannesburg.
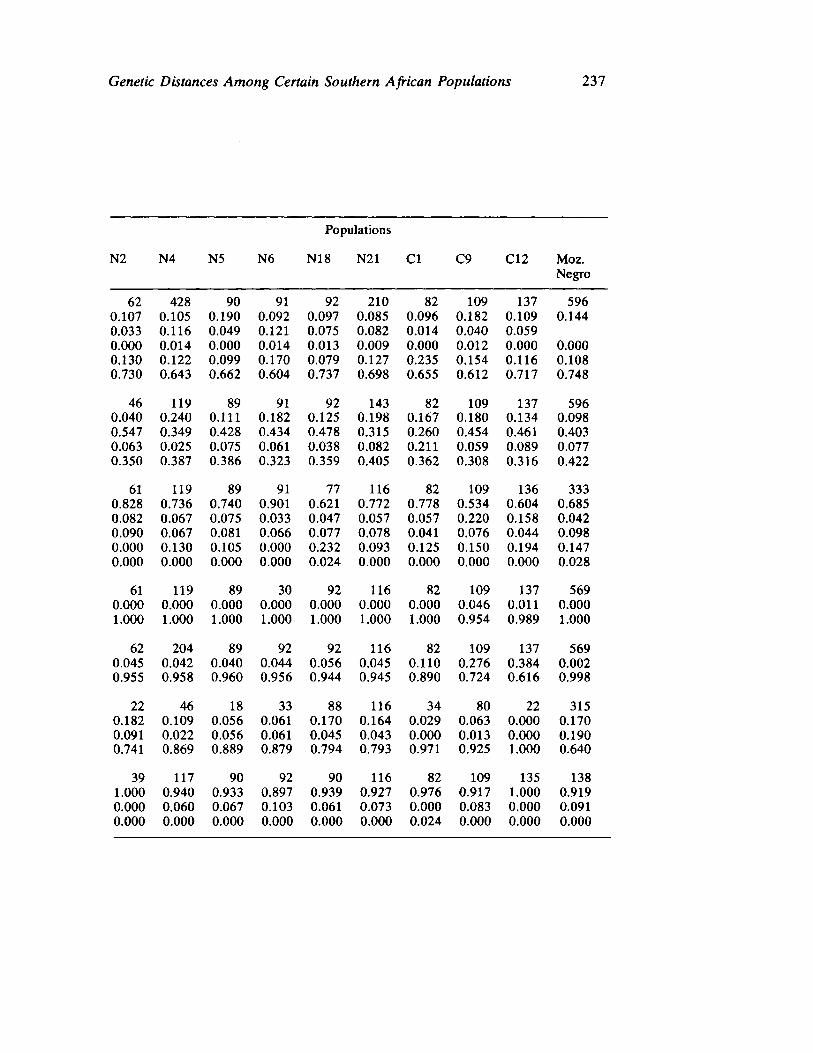
Genetic Distances Among Certain Southern African Populations 237
Populations
N2 N4 N5 N6 N18 N21 CI C9 C12 Moz. Negro
62 428 0.107 0.105 0.033 0.116 0.000 0.014 0.130 0.122 0.730 0.643
46 119 0.040 0.240 0.547 0.349 0.063 0.025 0.350 0.387
61 119 0.828 0.736 0.082 0.067 0.090 0.067 0.000 0.130 0.000 0.000
61 119 0.000 0.000 1.000 1.000
62 204 0.045 0.042 0.955 0.958
22 46 0.182 0.109 0.091 0.022 0.741 0.869
39 117 1.000 0.940 0.000 0.060 0.000 0.000
90 91 0.190 0.092 0.049 0.121 0.000 0.014 0.099 0.170 0.662 0.604
89 91 0.111 0.182 0.428 0.434 0.075 0.061 0.386 0.323
89 91 0.740 0.901 0.075 0.033 0.081 0.066 0.105 0.000 0.000 0.000
89 30 0.000 0.000 1.000 1.000
89 92 0.040 0.044 0.960 0.956
18 33 0.056 0.061 0.056 0.061 0.889 0.879
90 92 0.933 0.897 0.067 0.103 0.000 0.000
92 210 0.097 0.085 0.075 0.082 0.013 0.009 0.079 0.127 0.737 0.698
92 143 0.125 0.198 0.478 0.315 0.038 0.082 0.359 0.405
77 116 0.621 0.772 0.047 0.057 0.077 0.078 0.232 0.093 0.024 0.000
92 116 0.000 0.000 1.000 1.000
92 116 0.056 0.045 0.944 0.945
88 116 0.170 0.164 0.045 0.043 0.794 0.793
90 116 0.939 0.927 0.061 0.073 0.000 0.000
82 109 0.096 0.182 0.014 0.040 0.000 0.012 0.235 0.154 0.655 0.612
82 109 0.167 0.180 0.260 0.454 0.211 0.059 0.362 0.308
82 109 0.778 0.534 0.057 0.220 0.041 0.076 0.125 0.150 0.000 0.000
82 109 0.000 0.046 1.000 0.954
82 109 0.110 0.276 0.890 0.724
34 80 0.029 0.063 0.000 0.013 0.971 0.925
82 109 0.976 0.917 0.000 0.083 0.024 0.000
137 596 0.109 0.144 0.059 0.000 0.000 0.116 0.108 0.717 0.748
137 596 0.134 0.098 0.461 0.403 0.089 0.077 0.316 0.422
136 333 0.604 0.685 0.158 0.042 0.044 0.098 0.194 0.147 0.000 0.028
137 569 0.011 0.000 0.989 1.000
137 569 0.384 0.002 0.616 0.998
22 315 0.000 0.170 0.000 0.190 1.000 0.640
135 138 1.000 0.919 0.000 0.091 0.000 0.000
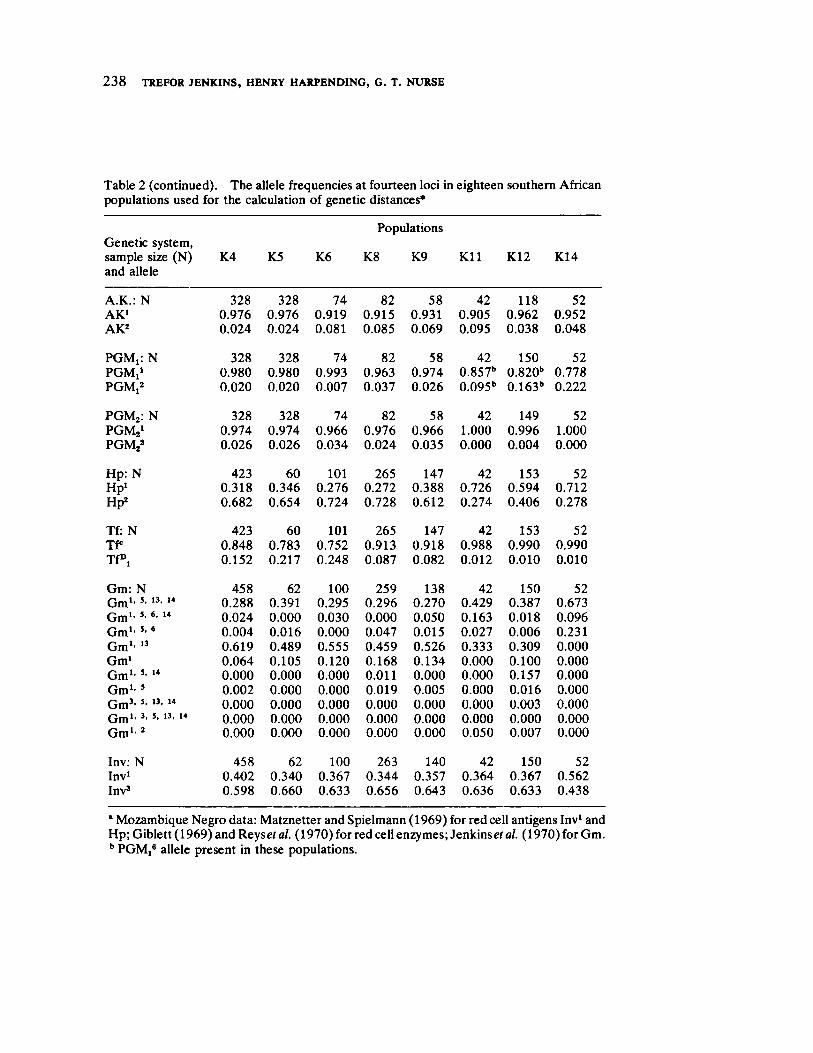
2 3 8 TREFOR JENKINS, HENRY HARPENDING, G. T. NURSE
Table 2 (continued). The allele frequencies at fourteen loci in eighteen southern African populations used for the calculation of genetic distances*
Populations Genetic system, sample size (N) and allele
K4 K5 K6 K8 K9 K l l K12 K14
A.K.: Ν 328 328 74 82 58 42 118 52 AK1 0.976 0.976 0.919 0.915 0.931 0.905 0.962 0.952 AK2 0.024 0.024 0.081 0.085 0.069 0.095 0.038 0.048
PGM!: Ν 328 328 74 82 58 42 150 52 PGM!1 0.980 0.980 0.993 0.963 0.974 0.857" 0.820" 0.778 PGM,2 0.020 0.020 0.007 0.037 0.026 0.095" 0.163" 0.222
PGM2: Ν 328 328 74 82 58 42 149 52 PGMjj1 0.974 0.974 0.966 0.976 0.966 1.000 0.996 1.000 PGM2
2 0.026 0.026 0.034 0.024 0.035 0.000 0.004 0.000
Hp: Ν 423 60 101 265 147 42 153 52 Hp1 0.318 0.346 0.276 0.272 0.388 0.726 0.594 0.712 Hp2 0.682 0.654 0.724 0.728 0.612 0.274 0.406 0.278
Tf: Ν 423 60 101 265 147 42 153 52 TP 0.848 0.783 0.752 0.913 0.918 0.988 0.990 0.990 TfD , 0.152 0.217 0.248 0.087 0.082 0.012 0.010 0.010
Gm: Ν 458 62 100 259 138 42 150 52 Gm1· 5· 13· 14 0.288 0.391 0.295 0.296 0.270 0.429 0.387 0.673 Gm1· 5· 6· 14 0.024 0.000 0.030 0.000 0.050 0.163 0.018 0.096 Gm1· 5· 4 0.004 0.016 0.000 0.047 0.015 0.027 0.006 0.231 Gm1· 13 0.619 0.489 0.555 0.459 0.526 0.333 0.309 0.000 Gm1 0.064 0.105 0.120 0.168 0.134 0.000 0.100 0.000 Gm1· 5· 14 0.000 0.000 0.000 0.011 0.000 0.000 0.157 0.000 Gm1· 5 0.002 0.000 0.000 0.019 0.005 0.000 0.016 0.000 Gm3· 5· 13· 14 0.000 0.000 0.000 0.000 0.000 0.000 0.003 0.000 Gm1· 3· 5· 13· 14 0.000 0.000 0.000 0.000 0.000 0.000 0.000 0.000 Gm 1 · 2 0.000 0.000 0.000 0.000 0.000 0.050 0.007 0.000
Inv: Ν 458 62 100 263 140 42 150 52 Inv1 0.402 0.340 0.367 0.344 0.357 0.364 0.367 0.562 Inv3 0.598 0.660 0.633 0.656 0.643 0.636 0.633 0.438
• Mozambique Negro data: Matznetter and Spielmann (1969) for red cell antigens Inv1 and Hp; Giblett (1969) andytsleaK Keyset al. (1970) for red cell enzymes; Jenkinsef al. (1970) for Gm. b PGM,® allele present in these populations.
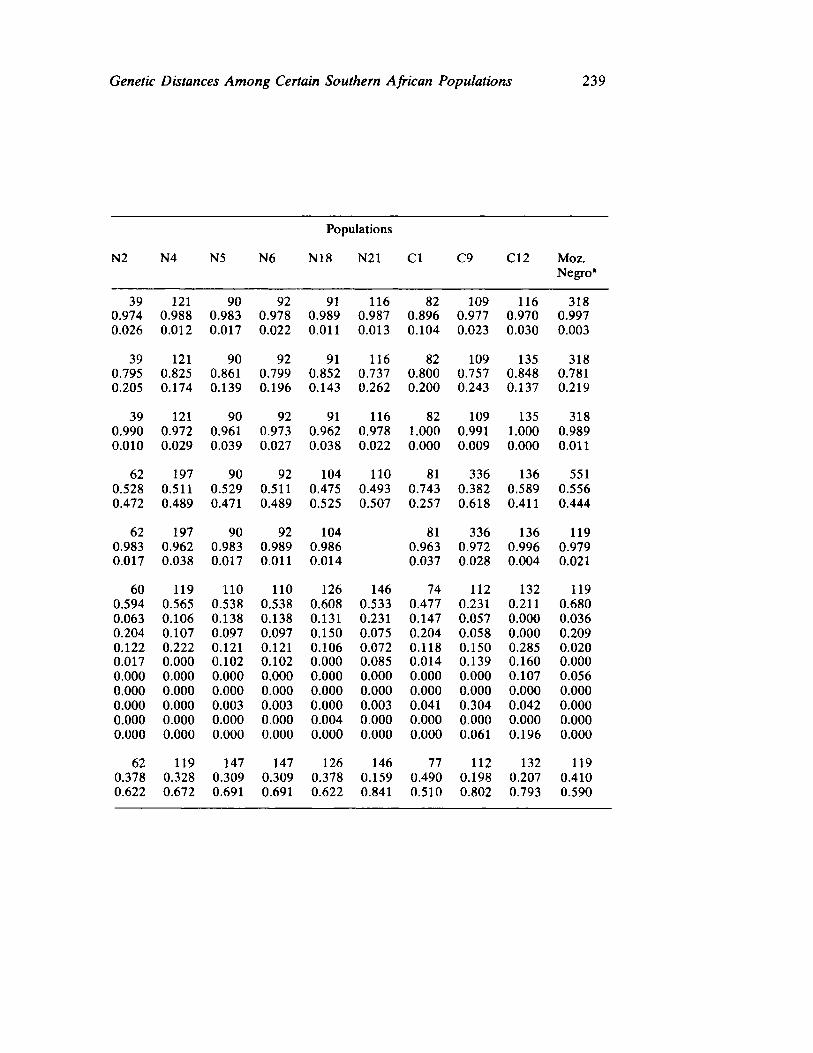
Genetic Distances Among Certain Southern African Populations 239
Populations
N2 N4 N5 N6 N18 N21 CI C9 C12 Moz. Negro*
39 121 0.974 0.988 0.026 0.012
39 121 0.795 0.825 0.205 0.174
39 121 0.990 0.972 0.010 0.029
62 197 0.528 0.511 0.472 0.489
62 197 0.983 0.962 0.017 0.038
60 119 0.594 0.565 0.063 0.106 0.204 0.107 0.122 0.222 0.017 0.000 0.000 0.000 0.000 0.000 0.000 0.000 0.000 0.000 0.000 0.000
62 119 0.378 0.328 0.622 0.672
90 92 0.983 0.978 0.017 0.022
90 92 0.861 0.799 0.139 0.196
90 92 0.961 0.973 0.039 0.027
90 92 0.529 0.511 0.471 0.489
90 92 0.983 0.989 0.017 0.011
110 110 0.538 0.538 0.138 0.138 0.097 0.097 0.121 0.121 0.102 0.102 0.000 0.000 0.000 0.000 0.003 0.003 0.000 0.000 0.000 0.000
147 147 0.309 0.309 0.691 0.691
91 116 0.989 0.987 0.011 0.013
91 116 0.852 0.737 0.143 0.262
91 116 0.962 0.978 0.038 0.022
104 110 0.475 0.493 0.525 0.507
104 0.986 0.014
126 146 0.608 0.533 0.131 0.231 0.150 0.075 0.106 0.072 0.000 0.085 0.000 0.000 0.000 0.000 0.000 0.003 0.004 0.000 0.000 0.000
126 146 0.378 0.159 0.622 0.841
82 109 0.896 0.977 0.104 0.023
82 109 0.800 0.757 0.200 0.243
82 109 1.000 0.991 0.000 0.009
81 336 0.743 0.382 0.257 0.618
81 336 0.963 0.972 0.037 0.028
74 112 0.477 0.231 0.147 0.057 0.204 0.058 0.118 0.150 0.014 0.139 0.000 0.000 0.000 0.000 0.041 0.304 0.000 0.000 0.000 0.061
77 112 0.490 0.198 0.510 0.802
116 318 0.970 0.997 0.030 0.003
135 318 0.848 0.781 0.137 0.219
135 318 1.000 0.989 0.000 0.011
136 551 0.589 0.556 0.411 0.444
136 119 0.996 0.979 0.004 0.021
132 119 0.211 0.680 0.000 0.036 0.000 0.209 0.285 0.020 0.160 0.000 0.107 0.056 0.000 0.000 0.042 0.000 0.000 0.000 0.196 0.000
132 119 0.207 0.410 0.793 0.590
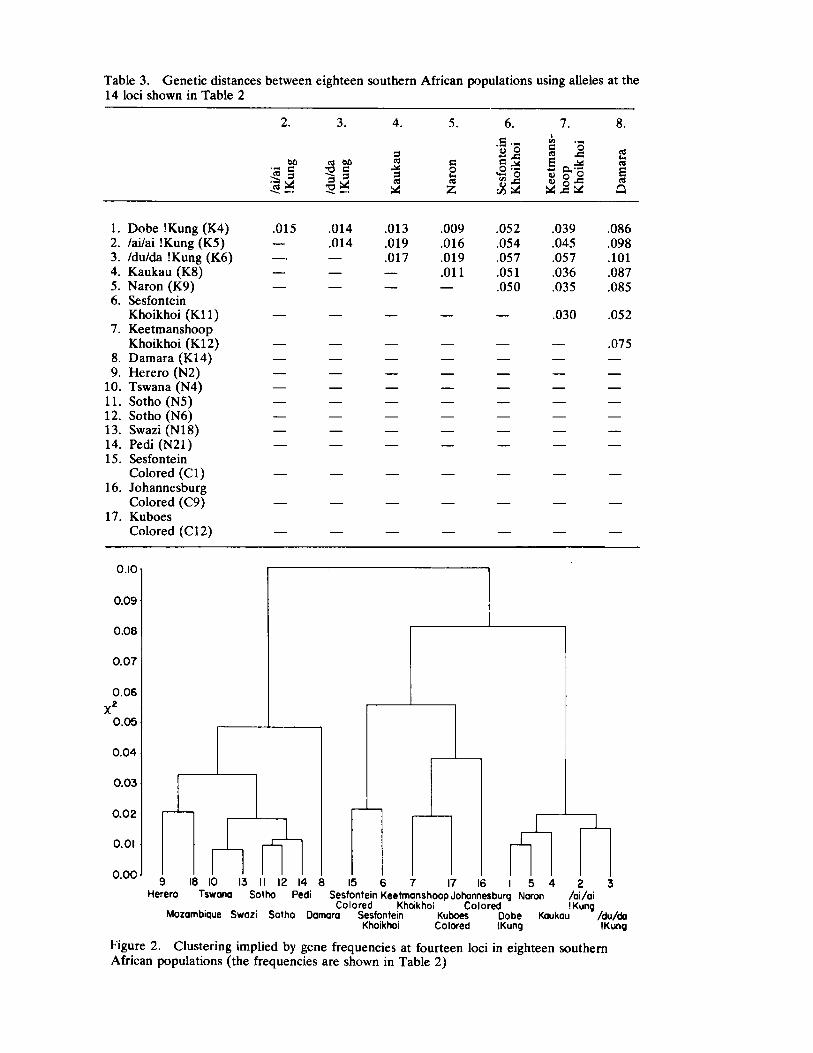
Table 3. Genetic distances between eighteen southern African populations using alleles at the 14 loci shown in Table 2
2. 3. 6. 7. 8.
00 α ββ zwutsrqponmlkihgfedcbaTSPNMKJIHDC•Ό c
3 dccd j ! 3 cd
Χ
Β Ο cd
Ζ
c 'u ο e f ο •<£5 ο « 5 00 *
C cd
ε α> υ Ui .
α * cd
ε cd
Q
1. Dobe !Kung (K4) .015 .014 2. /ai/ai !Kung (K5) — .014 3. /du/da !Kung (K6) — — 4. Kaukau (K8) — — 5. Naron (K9) — — 6. Sesfontein
Khoikhoi ( K l l ) — — 7. Keetmanshoop
Khoikhoi (Kl2) — — 8. Damara (K14) — — 9. Herero (N2) — —
10. Tswana (N4) — — 11. Sotho (N5) — — 12. Sotho (N6) — — 13. Swazi (N18) — — 14. Pedi (N21) — — 15. Sesfontein
Colored (Cl) — — 16. Johannesburg
Colored (C9) — — 17. Kuboes
Colored (C12) — —
.013 .009 .052 .039 .086
.019 .016 .054 .045 .098
.017 .019 .057 .057 .101 — .011 .051 .036 .087 — — .050 .035 .085
— — — .030 .052
1 1
1 1
—
1 1
1 1
—
.075
— — —
—
0.10
0.09
0.08
0.07
0 .06 2
0.05
0.04
0.03
0.02
0.01
0 0 0 9 18 10 13 II 12 14 8 15 6 7 17 16 1 5 4 2 3 Herero Tswana Sotho Pedi Sesfontein Keetmanshoop Johannesburg Naron / a i / a i
Colored Khoikhoi Colored IKung Mozambique Swazi Sotho Damara Sesfontein Kuboes Dobe Kaukau /du/da
Khoikhoi Colored IKung IKung
Figure 2. Clustering implied by gene frequencies at fourteen loci in eighteen southern African populations (the frequencies are shown in Table 2)
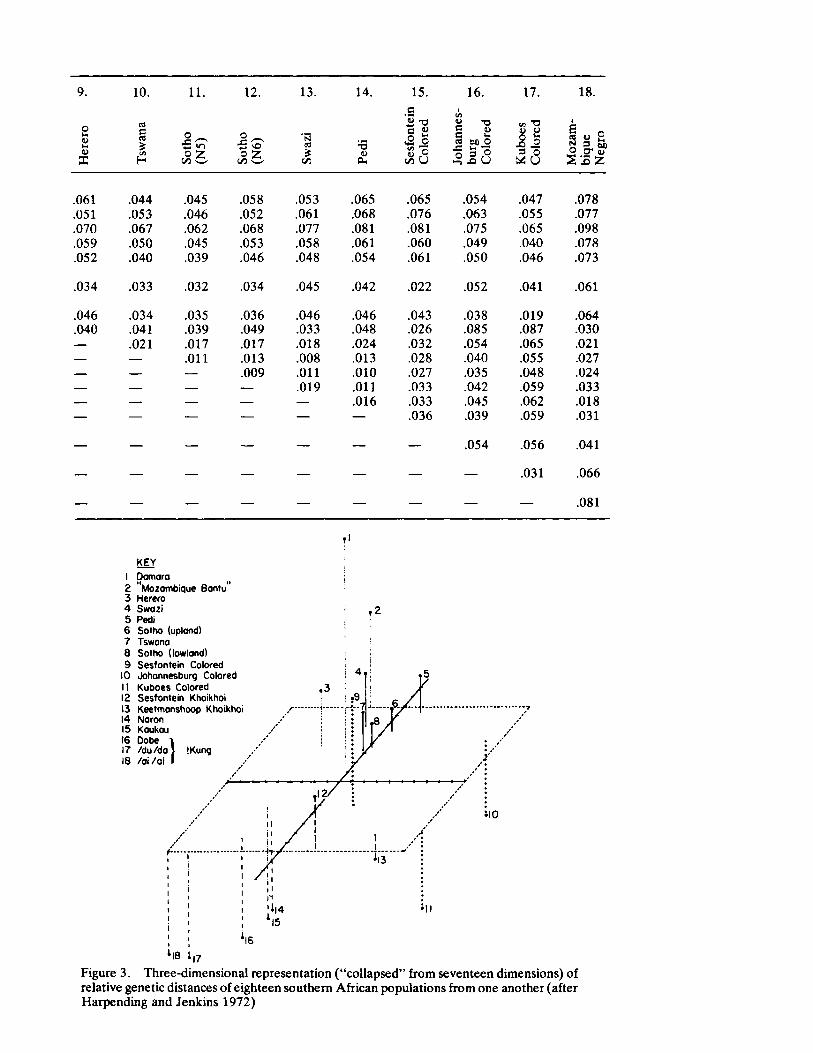
9. 10. 1 1 . 12. 13. 14. 15. 16. 17. 18.
ο ι α> υ
rt c cd ϊ ' S Ό
, S ζ ο Ζ Λ w
Ν Λ ϊ
5Λ
c CA υ e g
' 5 T3 c a
CA υ e g
•Ό υ
Pe
di A ο
ι λ υ
ce
Ο > bu
rg
Co
loi
t« Ό ω 0) ° η
Χ) . 2 °
Μ υ
ε ο t9 ω Ρ ν a & ο α· «
S 2 2
.061 .044 .045 .058 .053 .065 .065 .054 .047 .078
.051 .053 .046 .052 .061 .068 .076 .063 .055 .077
.070 .067 .062 .068 .077 .081 .081 .075 .065 .098
.059 .050 .045 .053 .058 .061 .060 .049 .040 .078
.052 .040 .039 .046 .048 .054 .061 .050 .046 .073
.034 .033 .032 .034 .045 .042 .022 .052 .041 .061
.046 .034 .035 .036 .046 .046 .043 .038 .019 .064
.040 .041 .039 .049 .033 .048 .026 .085 .087 .030 — .021 .017 .017 .018 .024 .032 .054 .065 .021 — — . 0 1 1 .013 .008 .013 .028 .040 .055 .027 — — — .009 . 0 1 1 .010 .027 .035 .048 .024 — — — — .019 . 0 1 1 .033 .042 .059 .033 — — — — — .016 .033 .045 .062 .018 — — — — — — .036 .039 .059 .031
— — — — — — — .054 .056 .041
— — — — — — — — .031 .066
.081
KEY
1 Damaro
2 Mozambique Bantu 3 Herero 4 Sw az i 5 Pedi 6 Sot ho (upland) 7 Tswona
8 Sot ho (lowland)
9 Sesfont ein Colored 10 Johannesburg Colored
11 Kuboe s Colored 12 Sesfontein Khoikhoi 13 Keetmanshoop Khoikhoi 14 Naron 15 Kaukou 16 Oobe ι 17 / du / da } IKung 18 / a i / a i I
Figure 3. Threedimensional representation ("co llapsed" from seventeen dimensions) of relative genetic distances of eighteen southern African populations from one another (after Harpending and Jenkins 1972)
2 4 2 TREFOR JENKINS, HENRY HARPENDING, G. T. NURSE
REFERENCES
BROOM, R.
1943 South Africa's part in the solution of the problem of the origin of man. yvutsrponmlkihgfedcbaTSPOMLJHGFECBA
South African Journal of Science 40:6880. BARNICOT, Ν. Α. , D. R. BROTHWELL
1959 "The evaluation of metrical data in the comparison of ancient and modern bones," in Ciba Foundation Symposium on Medical Biology and Etruscan Origins. Edited by G. E. W. Wolstenholme and C. M. O'Connor, 131149. Boston: Little, Brown.
CARSTENS, W. P.
1966 The social structure of a Cape Coloured reserve. Cape Town: Oxford University Press.
CAV ALUSFORZA, L. L., L. Α. ΖΟΝΤΑ, F. NUZZO et al.
1969 Studies on African Pygmies, part one: a pilot investigation of Babinga Pygmies in the Central African Republic (with an analysis of genetic distances). American Journal of Human Genetics 21:252274.
DART, R. A
1953 The southern aspect of pulsating humanity. South African Journal of
Science 50:3749. EWENS, W. V.
1969 Population genetics. London: Methuen. GIBLETT, E. R.
1969 Genetic markers in human blood. Oxford:Blackwell. HARPENDING, Η. , Τ. JENKINS
1971 "!Kung population structure." Paper presented at the IVth International Congress of Human Genetics, Paris.
1972 "Genetic distance among southern African populations," in Methods
and theories of anthropological genetics. Edited by Μ. H. Crawford and P. L. Workman. Albuquerque, Ν. M.: University of New Mexico Press.
HIRSZFELD, L. , H. HIRSZFELD.
1919 Serological differences between the blood of different races. The result of researches on the Macedonian front. Lancet 2:675679.
JENKINS, Τ., v . CORFIELD
1972 The red cell acid phosphatase polymorphism in southern Africa: population data and studies on the R, RA and RB phenotypes. Annals of
Human Genetics 35:379391. JENKINS, Τ., H. C. HARPENDING, Η. GORDON, et al.
1971 Red cell enzyme polymorphisms in the Khoisan peoples of southern Africa. American Journal of Human Genetics 23:513532.
JENKINS, T., A. ZOUTENDYK, A. G. STEINBERG
1970 Gammaglobulin groups (Gm and Inv) of various southern African populations. American Journal of Physical Anthropology 32:197218.
KNUSSMANN, R.
1969 BerichtzxwutsrqponmlkihgfedcbaZYWUTSRNMKIGFEDBA ٧ber eine anthropologische Forschungreise zu den Dama in S٧dwestafrika.yutsronmlihfecaWSJHGA Homo 20:3466
KNUSSMANN, R, R. KNUSSMANN
1969 Die Dama — eine Altschicht in S٧dwestafrika? Journal South West
African Scientific Society 24:932. KURSZYNSKI, T. W. , A. G. STEINBERG
1967 A general programme for maximum likelihood estimation of gene frequencies. American Journal of Human Genetics 19:178—179.
Genetic Distances Among Certain Southern African PopulationsutsronmlihgecbaUTSRONMLKIEDBA 243
LANDSTEINER, K.
1901 άber Agglutinationsercheinungen normalen menschlichen Blutes. Wiener klinische Wochenschrift 14:11321134.
LANDSTEINER,zywvutsrqponmlkihgfedcbaZYWVUTSRPONMLKJIHGEDCBA Κ., P. LEVINE
1929 On the racial distribution of some agglutinable structures of human blood.yxvutsrponmlihgfedcaTSRPNMKJIHGBA Journal of Immunology 16:123131.
MATZNETTER, T., W. SPIELMANN
1969 Blutgruppen mocambiquanischer Bantustδmme. Zeitschrift fόr Mor
phologie und Anthropologie 61:5771. MOURANT, Α. E.
1947 The use of blood groups in anthropology. Journal of the Royal Anthropological Institute 77:139144.
REYS, L., C. MANSO, G. STAMATOYANNOPOULOS
1970 Genetic studies on southeastern Bantu of Mozambique, part one: variants of glucose6phosphate dehydrogenase. American Journal of
Human Genetics 22:203215. SANGER, R., S. D. LAWLER, R. R. RACE
1949 L'heredite des groupes sanguins Ρ chez 85 families anglaises. Revue
d.' Hematologic 4:2831. SANGER, R., D. BERTINSHAW, S. D. LAWLER, et al.
1949 Les groupes sanguins humains Kell, frequences geniques et recherches genetiques. Revue d'Hematologie 4:3235.
SCHAPERA, I.
1930 The Khoisan peoples of South Africa. London: Routledge and Kegan Paul.
WESTPHAL, E. O. J .
1963 The linguistic prehistory of southern Africa: Bush, Kwadi, Hottentot and Bantu linguistic relationships. Africa 33:237265.
WIENER, A. S., R. B. BELKIN, E. B. SONN
1944 Distribution of the AxA%B0, MN, and Rh blood factors among Negroes in New York City. American Journal of Physical Anthropology
n.s. 2:187194.


Biology and the History of Southern
African Populations
G. T. NURSE, HENRY HARPENDING, and TREFOR JENKINS
Every man or woman of every society at any level of social organization is necessarily conscious of himself or herself as a member of a group. Such awareness is not concerned exclusively with the present. There must be some generally accepted idea of how and why the group functions as such, and of how it came into being. To this extent everyone is possessed of a usrpoc
corpus of historical knowledge, which is generally complete enough and rational enough to provide a satisfactory explanation for things as they are. The extent to which the explanation is rational will depend on the degree of scientific curiosity and sophistication of the group, and the extent to which it is complete will be a function of the awareness possessed by group members of all the phenomena which have at any time impinged upon them or their forebears (Vansina 1965).
It is not always easy to make close distinctions between myth, tradition, and history. The ordinary member of a politicosocial entity will retain the version that is most satisfying, that most convincingly places the present individual in the context of the collective past. History in this phenomenological sense, existential history as lived and felt (Thomas 1964), often antedates and sometimes supplants the history that can be derived from records. There may be several reasons for this, not the least of which is the overall inadequacy of any form of recording. Popular history may perforce be limited by a low level of common comprehension, but historical records also are subject to the prejudices and preferences of those who take them down. Such biases either are, or may
We wish to thank the director of the South African Institute for Medical Research, Professor J. H. S. Gear, and the deputy director, Professor J. F. Murray, chairman of the School of Pathology of the University of the Witwatersrand, for the facilities which made this study possible. The work of the Human SeroGenetics Unit is supported in part by a grant from the South African Medical Research Council.
2 4 6UTSRPONKJIHGFEDCA G. Τ. NURSE, Η. C. HARPENDING, TREFOR JENKINS
become, those of the culture from the standpoint of which the records are made, and thus are liable to merge with and perhaps to reinforce popular history. Existential history is ultimately a utility — a source of instruction or enjoyment to a people. For this reason it tends to be nondiachronic, to magnify personality and incident at the expense of process in an essentially anecdotal fashion and to be particulate, leaving large gaps where nothing colorful or relevant to what came later took place. It is often also disposed to reinforce ideology with a pattern of repetition, and the insertion of myth into concrete happenings. For these reasons it is often difficult and sometimes impossible to identify a coherent sequence of events and thereby to provide a timedepth. Even archeology can only define large tracts of time, and the sparse recollected facts fit into these with wide margins of confidence.
The people, or effective group, to which a history applies, may be as small as a kindred or as large as an empire. Aristotle, approaching the question of human groups from the standpoint of the world's first articulate human biologist, recognized that whatever historical reasons may be given for the formation of a group, the two prime factors are mutual advantage and identity of descent. Where history is unwritten the latter aspect is often stressed at the expense of the former. Fictitious kinship can come to obscure the exceptions to it and to emphasize bias in favor of the uniqueness and excellence of the group. Wide kinship, whether real or fictitious, can accentuate ethnocentricity; and in fact, Aristotle, at a rather high level of sophistication himself, illustrates this without apparently being aware of it.
Preliterate societies, or those in the early stages of literacy, tend to emphasize internal kinships and to deal only marginally with neighboring societies, even when contact with them has been considerable. This is especially to be noted in Africa, where the widespread prevalence of ancestor worship is signalized in many communities by a system of authority, vested in and proceeding from the ancestors, and necessarily excluding all who are not members of the kin group in easily recognizable positions in the authority structure. The extent to which awareness of strangers impinges is directly proportional to the extent to which they can be assimilated into the system. Alliances, or even rivalries, between groups, are rationalized by myth, and myths are, wherever possible, given a biological basis. Tales of common ancestry and of sibship rivalry are grafted on to traditional history, and the cohesion of the affected groups is thereby preserved or even enhanced.
The foregoing might appear too trite to merit recapitulation were it not that the involvement of descent in traditional history means that even at a popular level the importance and relevance of biological factors is acknowledged by a majority of African societies. Awareness of the ancestors resonates through the thoughts and activities of the people. It is
Biology and the History of Southern African Populations 247
probably for this reason that African villagers are generally so cooperative toward those engaged in serogenetic investigations. Once it has been explained that among the objects of the study are the elucidation of the past and to some extent a reconstruction of certain physical traits of the ancestors, it is usual to find that people are actually eager to donate blood specimens. Coupled with interest in the past is the realization that history as it is known to them is labile and imperfect. The process of change in oral records is obvious to them. Written records assembled and interpreted by foreigners are open to rejection by even the most literate among them; whereas the opportunity to take part in an inquiry which, within limits, may come up with some clearcut results and which can both exalt the individual participants and help to place them reassuringly within their groups.
Any mana surrounding the idea of blood does, of course, contribute to the importance attached by people to this form of investigation, which is frequently attended with brief, intense, and entirely gratuitous drama. It is less tedious to both agent and patient than full morphological examination, the shortcomings of which have been described in another paper (Jenkins, Harpending, and Nurse, this volume). It is more flexible, amenable to a great number of interpretative maneuvers, and, at the same time, concerned with precise polymorphism at stipulated gene loci. For this reason the results can generally be presented, both to the subjects of the study and to interested workers, with some degree of assurance.
The form that that presentation will most advantageously take has been described in a previous paper. It has been found that genetic comparisons between populations, employing a number of singlelocus polymorphisms, can most comprehensively be expressed, in a quantitative way, as genetic distances. Of the various measures of genetic distance so far devised, that of Harpending and Jenkins, which has been described earlier and which incorporates a principalcomponents analysis, appears to give one of the most satisfactory identifications of relatedness among groups. It can be expressed numerically or graphically with the latter conveying more information.
The genetic distance can be given precise historical meaning only when other historical information is considered. Any effective elucidation of the past of preliterate peoples demands the simultaneous deployment of a number of ostensibly unrelated disciplines. Archeology can give us the dates of major cultural change and their geographical perspective; the very broad horizons of glottochronology, interacting with archeology, can provide linguistic evidence of fissions and fusions among peoples; in the light of both of these, oral tradition can be reinterpreted and related more precisely to historical time. Biological considerations provide a further set of checks and balances. They can help to establish whether cultural exchange has been accompanied by gene exchange, they can

2 4 8ywvutsrqponmlkjihgfedcbaUTSRPONKJIHGFEDCA G. Τ. NURSE, Η. C. HARPENDING, TREFOR JENKINS
confirm or refute suggestions of common ancestry, and they can give an idea of selective pressures which have operated on peoples in the past, and so indicate their probable provenances.
KEY
Damara "Mozambique Bantu" Herero Swazi Pedi Sotho (upland) Tswana Sotho (lowland) Sesfontein Colored Johannesburg Colored Kuboes Colored Sesfontein Khoikhoi Keetmanshoop Khoikhoi Naron
•2
0
Figure 1. Threedimensional representation of the genetic distances among eighteen southern African populations, determined by the method of Harpending and Jenkins as described by Jenkinstlea et al. in this volume
Applying genetic distance to selected southern African populations generates a threedimensional graph (see Figure 1) from which a number of historically relevant facts emerge. In the first place, the populations tend to group: the Negro peoples occupy one segment of the graph, the San another, both quite discrete. Adjacent to the San but at some distance from them are the Khoikhoi. The three "colored" populations, known hybrids, do not adjoin one another, do not form a coherent group, and, in the cases of the Johannesburg and IKuboes coloreds, plainly incorporate a genetic element other than those represented in the other three groups. The IKuboes coloreds, and those of Sesfontein, show some affinity with the Khoikhoi, while the Johannesburg sample is placed

Biology and the History of Southern African Populations 249
further toward the Negro group, though it is not, indeed, as close as the Sesfontein one. In fact, it is easier to associate the coloreds of Sesfontein and IKuboes with the Khoikhoi of Sesfontein and Keetmanshoop than with one another; which is understandable enough, as there is and has been free and frequent intermixture.
What is somewhat more surprising is the separation between the /ai/ai, /du/da, and Dobe populations. All three of these are members of a single linguistic and cultural group, the !Kung, and represent the northern division of the San. Genetically closer to the Dobe !Kung than either of the other !Kung populations, though linguistically and geographically more remote, are the Kaukau, also a branch of the northern San, and the Naron representatives of the central San. These show close genetic similarity to one another. This might be an example of the situation in American Indians described by Ewens (1969), who found that genetic distances between villages could be as large as those between linguistic groups. Genetic drift obviously operates more considerably on small isolates than on large populations. We can, therefore, conclude that despite their geographical closeness to Dobe the !Kung of /du/da and /ai/ai constitute populations which have been comparatively reproductively isolated for some time from their parent group, whereas the larger IKung population of Dobe has maintained closer contact both with the Kaukau and with the central San. This is an example of the way in which historical information which is not otherwise suggested may be provided by genetic studies.
A more dramatic instance of the same type is furnished by the Damara of SouthWest Africa. The Damara are an extremely interesting people. Morphologically they are Negro; where not associated with other peoples, they practice, or until recently practiced, a later Stone Age culture; their language is Nama. When the first literate visitors reached SouthWest Africa, and for some time after, the Damara either were held in servitude by the Nama Khoikhoi or the Herero, or sparsely and elusively inhabited the neighborhood of the Brandberg (Vedder 1929). It might be expected that their genetic constitution would reflect their past enslavement, but this is not the case. Though they can be seen to cluster with the Negroes, and resemble the Herero more closely than the Negroes of South Africa, Botswana, Lesotho, or Swaziland, their closest resemblance, though still a distant one, is to the composite sample of "Mozambique Bantu." They are more remote from their erstwhile Khoikhoi masters than the inhabitants of Lesotho are. Yet the fact of their enslavement is attested both by oral tradition and by written records. In consequence, it becomes necessary to reconsider the nature of their previous status. It may have been servile but — and this is a fact which is not mentioned by any historical source — it could not have involved sexual subjection. This makes it unlikely that it was, in fact, slavery in the sense in which this is
2 5 0 G. Τ. NURSE, Η. C. HARPENDING, TREFOR JENKINS
traditionally understood in Europe, the Americas, or Asia. It calls to mind rather the hierarchical situation described by Maquet (1961) in Rwanda, where the Tutsi exercised hegemony over Hutu and Twa but did not interbreed with them; where the ethnic inequalities were part of an elaborate but stable political and religious system and did not reflect a deliberate economic policy on the part of the dominant group. In fact, the Hutu clientship was elective; the gift of cattle to a Hutu was what secured his services and simultaneously conferred on him the protection of a patron. It is at least possible that aukheba buhake contact of this nature is what bound Damara to Nama. Could two such systems have arisen independently in the same continent, or could both the Nama and Tutsi have inherited it from the same source? It seems improbable that they are in any other way "related" to each other; though there have been suggestions (von Luschan 1907; Jeffreys 1968) of a Hamitic or Semitic origin for the Khoikhoi, they have not been supported by geneticmarker studies (Jenkins 1972).
The large Sothospeaking group of Negroes ranges itself in an expectable but revealing series. The bases of the columns representing them form an approximate straight line in the horizontal plane serving as origin for the graph. The northern Sotho, or Pedi, are at one end of the line, and the western Sotho, or Tswana, are at the other, with the two populations of southern Sotho in between. In this instance genetic distance helps to confirm the finding of the linguists (Doke 1945; Doke and Cole 1962) who place the southern dialect cluster intermediate between the northern and the western. Two independent pieces of evidence consequently point to the primary fission among the Sotho having occurred as divisions of the western and northern sections from the southern rather than from one another. That in the diagram the southern Sotho appear to be closer to the Tswana than to the Pedi does not indicate that fission from the former has occurred more recently; there is constant intermingling between Tswana and southern Sotho in the populous upland plain of the Orange Free State and the propinquity probably reflects recent gene exchange. It seems likely that a more discriminant selection of samples from among the many divisions of the Tswana, and the additional investigation of the various sections of the northern Sotho, might produce an historical gradient of considerable value.
It will be noticed that the Swazi, members of the Ngunispeaking group of South African Negroes, are situated relative to the Sotho in much the same position as they are geographically — that is, between the Tswana and the "Mozambique Bantu." On the other hand, the Pedi lie at some distance from them on the graph but are geographically neighbors both of them and of some at least of the "Mozambique Bantu." This helps to correct certain impressions left by traditional history. It is known that there was a Sotho element, which was absorbed by the Swazi, in Swazi
Biology and the History of Southern African Populations 251
land at the time of its consolidation by the Ngwane (Bryant 1929); it might be expected on geographical grounds that this would have been northern rather than southern or western Sotho, but the genetic distances between the peoples indicate that it was most probably southern. Similarly, among the clans of the Mozambique Tsonga there are several which claim Pedi origins (Junod 1927), whereas the lack of close serogenetic resemblance between Pedi and "Mozambique Bantu" shows that the northern Sotho element was probably rather small.
Genetic distance is not the only biological parameter that can be historically revealing; individual gene markers can also help to provide a timedepth, particularly when it comes to dating migrations. The sicklecell hemoglobin gene is almost completely absent in all tribes south of the Limpopo (it occurs at a frequency of 0.4 percent among the Venda) and assumes only very low frequencies between that river and the Zambesi (Jenkins 1972). It seems reasonable to suppose that the southernmost population did not possess the gene when they left the nucleus of Bantu expansion. The high frequencies found in central Africa, where the gene confers an advantage due to increased resistance to malaria, could not have developed except through the operation of natural selection. Had the gene been present in the forebearers of the South African Negroes, many of whom were equally exposed to malaria, the same phenomenon could be expected to have occurred. Splaine, Hayes, and Barclay (1971) have shown that whereas a rise in frequency in response to selective pressures occurs comparatively rapidly, withdrawal of such pressures and the consequent tendency of the gene to act as a lethal recessive with loss of affected homozygotes leads to an extremely slow fall in frequency. Presuming that in malarious areas the heterozygous bearer of sicklecell hemoglobin has a 25 percent advantage over the person with normal hemoglobin, it would take only twentyfive generations for the frequency to rise from 1 percent to the level at which 30 percent of the population possessed the trait. Removal to a nonmalarious area, where the heterozygote state conferred neither an advantage nor was itself deleterious, would lead to a loss of the gene such as occurs in the case of any lethal recessive, but only at such a rate that it would take ten times as long for it to return to its original frequency. It seems likely that the added fitness of the heterozygote in central Africa is about 25 percent (Allison 1965); it must therefore be at least twentyfive generations since the South African and the central African Negroes diverged. Glottochronological estimates of divergence of southern African languages (Zulu and southern Sotho) from central African ones (Bemba, Lamba, Tumbuka) range between 2,400 and 2,800 years. Taking a generation as twentyfive years, it is probably more than 625 and less than 3,000 years since the divergence. This range fits in very well with the carbon dating of the earliest Iron Age site so far found south of the Limpopo, that at Castle Cavern in Swazi

2 5 2UTSRPONKJIHGFEDCBA G. Τ. NURSE, Η. C. HARPENDING, TREFOR JENKINS
land, which seems to have been occupied 1550 ± 30 years ago (Beaumont and Vogel 1972). The date of occurrence of the mutationproducing sicklecell hemoglobin would consequently appear to lie somewhere between 1,000 B.C. and A.D. 400; and though this may appear to be an unconscionably long period, the use of similar methods with other gene markers will, it is hoped, help to narrow it, and increasingly enable such markers to be used in adding precision to historical timedepths.
Two other abnormal hemoglobins in southern Africa also convey historical information of some interest. In 1955 Brain detected and Lehmann identified hemoglobin C in the colored community of Cape Town. Two years later a South African Caucasoid family was also found to possess the gene and, indeed, to include two members homozygous for it (Lewis, Anderson, and Baskind 1957). Since then (Botha and van Zyl 1966 ; Botha, Pritchard, and van Zyl 1967) it has been discovered that it is of no great rarity in South African Caucasoids and coloreds. The main point of interest in this is that the arrival at Cape Town of persons bearing the gene can be dated with reasonable certainty. Hemoglobin C, with its more circumscribed distribution, probably represents a later mutation than hemoglobin S and is found in greatest frequency in West Africa, particularly in northern Ghana and Upper Volta. Trade between Cape Town, which in the seventeenth and eighteenth centuries was under the control of the Dutch East India Company, and West Africa, which fell into the sphere of influence of the Dutch West India Company, was strictly interdicted [De Kock 1950 (1963)]; but two shiploads of slaves arrived from West Africa in 1658 (Blommaert 1938). The slaves disembarked at Cape Town and spent some time there before a large number were taken on to Batavia. Intermarriage between whites and slaves was not uncommon in the eighteenth century and, in contrast to the custom in North America, the offspring were generally absorbed into the white community (Heese 1972). The main source of slaves was, in fact, the East Indies and Bengal, and the presence of hemoglobin E, a characteristically Southeast Asian hemoglobin, in the colored community, attests and confirms that the Cape Town coloreds are partly of Asian origin. It is therefore all the more to be wondered at that hemoglobin C should be much more common in Caucasoids than is hemoglobin E. Hemoglobin S is also rather more common in Cape Town coloreds and Caucasoids than it is in southern African Negroes, but it could have come through slaves imported from Mozambique or Madagascar, with which there was considerable trade in the eighteenth century. The origins of the West African slaves are given as "Angola and Guinea" (Blommaert 1938). Hemoglobin C is not found in Angola, and in West Africa it occurs more in the interior than on the coast. The only coastal area where it attains a frequency of about 5 percent is the vicinity of Accra, which has been a trading area
Biology and the History of Southern African Populations 253
for centuries, and was probably thetrpone entrepot for that part of the interior where the frequency is highest. We can, therefore, be reasonably sure that some of the slaves in the 1658 shipments came from what is now Ghana.
It can be seen, therefore, that combining the consideration of single biological markers with the perspectives of genetic distance can furnish in some instances a more accurate timedepth study than either alone. The positions of the three colored populations on the graph become more comprehensible when the implications of the variant hemoglobins are examined. Had a southern African Caucasoid population been included in the distance comparison, their positions would have been clearer still. It also becomes apparent that for biology to make more than a marginal contribution to history it is necessary that as many interacting populations as possible be investigated. The number of gene markers is less important; principal components analysis, as employed in computation of the distance statistic, ensures that those which are of most significance will make the largest contributions. This paper and the preceding one cannot be presented as if they were definitive; in common with much of the work proceeding at the Human SeroGenetics Unit of the School of Pathology of the University of the Witwatersrand, South African Institute for Medical Research, they are interim explorations of the vast and as yet thinly populated borderland between history as known to historians and cultural anthropologists and the past as it appears to the eyes of ethnologically oriented human biologists.
REFERENCES
ALLISON, A. C.
1965 "Population genetics of abnormal haemoglobins and glucose6phosphate dehydrogenase deficiency," in Abnormal haemoglobins in
Africa. Edited by J. H. P. Jonxis, 365391. Oxford: Blackwell. ARISTOTLE
1962 Politics. Translated by J. A. Sinclair. Harmondsworth: Penguin. BEAUMONT, P. B., J . c . VOGEL
1972 On a new radiocarbon dating for Africa south of the equator. African
Studies 31:6589, 155182. BLOMMAERT, W.
1938 Agrief Jaarboek vir SuidAfrikaanse Geskiedenis. Pretoria: National Archives.
BOTHA, M. C., L. J . VAN ZYL
1966 Abnormal haemoglobins in Cape Town: (occurrence and significance). South African Medical Journal 40:753756.
BOTHA, M. C., J . PRITCHARD, L. J . VAN ZYL
1967 Homozygous abnormal haemoglobins in Cape Town. South African
Medical Journal 41:6675. BRAIN, p.
1955 Incidence of haemoglobin C in the "Coloured" population of Cape Town. Nature 175:262263.
2 5 4YWVUTSRQPONMLKJIHGFEDCBA G. Τ. NURSE, Η. C. HARPENDING, TREFOR JENKINS
BRYANT, A. T.
1929yxvutsrqponmlkihgfedcbaZVTSRPONJHGEDCBA Olden times in Zululand and Natal (first edition). London: Longmans. DE KOCK, V.
1950 [1963] Those in bondage. Cape Town: Howard Timmins. (Reprinted 1963 Pretoria: Union Booksellers.)
DOKE, C. M.
1945 Bantu: modern grammatical, phonetical and lexicographical studies
since 1860. London: International African Institute and Oxford University Press.
DOKE, C. M., D. T. COLE
1962 Contributions to the history of Bantu linguistics. Johannesburg: Witwatersrand University Press.
EWENS, w . v .
1969 Population genetics. London: Methuen. HEESE, J. A.
1972 Die Herkoms van die Afrikaner. Cape Town: Balkema. JEFFREYS, M. D. W.
1968 Some Semitic influences on Hottentot culture. Fourth Raymond Dart lecture. Johannesburg: Witwatersrand University Press.
JENKINS, Τ.
1972 "Genetic polymorphisms in Southern Africa." Thesis presented to the University of London.
JUNOD, H. A.
1927 The life of a South African tribe (third edition). London: Macmillan and Co.
LEHMANN, Η.
1955 Comment on "Incidence of Haemoglobin C in the coloured population of Cape Town." Nature 175:262.
LEWIS, S. M., C. G. ANDERSON, E. BASKIND
1957 Homozygous haemoglobinC disease in a white family with special reference to blood autolysis studies. British Journal of Haematology
3:6876. MAQUET, J. J.
1961 The premise of inequality in Ruanda. London: Oxford University Press. SPLAINE, Μ., Ε. B. HAYES, G. P. T. BARCLAY
1971 Calculations for changes in sickle cell trait rates. American Journal of Human Genetics 23:368374.
THOMAS, L. V.
1964 "De quelques attitudes africaines en matiere d'histoire locale," in The
historian in tropical Africa. Edited by J. Vansina, R. Mauny, and L. V. Thomas, 358374. London: International African Institute and Oxford University Press.
VANSINA, J.
1965 Oral tradition: a study in historical methodology. London: Routledge and Kegan Paul.
VEDDER, H.
1929 Die Bergdama. Journal derwtsrnlkihfedcaWSG Sόdwestafrikanischen Wissenschaftlichen
Gesellschaft,vutrponmliedR volume 2. (Reprinted in Η. Vedder 1965 Zur Vorges
chichte der Eingeborenen Volkerschaften van S.W.A Windhoek: S.W.Α. Wissenschaftliche Gesellschaft.)
VON LUSCHAN, F.
1907 The racial affinities of the Hottentots. London: Royal African Society and Macmillan and Co.
Genetic Structure of Ideles
PHILIPPE LEFEVREWITIER and HENRI VERGNES
For more than ten years, the Hemotypological Center of the National Center of Scientific Research (CNRS), Toulouse, has been carrying out an anthropological and ecological study of Saharan populations (Benabadji, Ruffie, and LefevreWitier 1969).
From a first inventory of genetic characteristics of fifteen nomadic and sedentary populations of western Sahara, it seemed that none of these marginal populations, living between Maghreb and black Africa, could be clearly assigned to either the great Caucasoid or Negroid branches. Those genes classically regarded as markers of these two human stocks are found on both sides of the desert in rather variable frequencies, and hybridization alone cannot account for that intermediate genetic condition. In a humid Sahara, with inadequately defined selected advantages, survival was probably at the time of group differentiation a matter of chance. Subsequently, migrations and admixture as well as natural selection and genetic drift were increased by the spread of desert conditions. When gene pools are subjected to such strains, they can rarely be explained by simple diagrams. In order to understand the formation and evolution of these residual human groups, we considered it necessary to investigate the basic elements represented by the tribe, the group, or the village, and whatever functional or mating units are present.
We are indebted to Marceau Gast and Guy Barrere (Laboratoire d'Anthropologie, de Prehistoire et d'Ethnologie des Pays de la Mediterranee Occidentale, AixenProvence; to Albert Jacquard (Institut National d'Etudes Demographiques), MarieTherese Valat and MarieFrance Landre (Centre de Calcul — CHU PitieSalpetriere), in Paris; and to our collaborators of Center of Hemotypology, U.92, medical computer unit, in Toulouse.
We wish to express our thanks for the assistance, in situ, of Professor M. Benabadji (National Blood Transfusion Centre, Algiers) and of the local Algerian authorities in Tamanrasset, and of all the inhabitants of Ideles.
2 5 6 PHILIPPE LEFEVREWITIER, HENRI VERGNES
Ideles, a small village of Ahaggar, was on this account selected in 1967 as the focus of a multidisciplinary study in Twareg country, within the scope of Multidisciplinary Research Project Number 151 of CNRS.
The purpose of the study was, first, to investigate the family constituents of the village, their geographical origins, their tribal links, and their lineages, as well as their social structures and local demographic evolution.
The compilation of these numerous data and the collection of linguistic, historical, and ecological information were carried out by Marceau Gast, anthropologist, and by Guy Barrere, teacher at Ideles. In the course of three expeditions, made in 1968, 1969, and 1970, hematological, serological, and epidemiological investigations were undertaken concurrently. The biological and genetic aspects were completed in 1968 with an anthropometrical study by Dr. Gerard Ignazi of Paris and a medical study by Dr. Ben Djaballah of Algiers and Dr. Trecolle of Ouargla.
The purpose of the information thus assembled was to enable us to understand the formation, settlement, and survival conditions of a population possessing limited resources in highly inimical surroundings; to assess the health of the inhabitants of Ideles, their resistance to bacterial and viral attacks, their eating habits; and, especially, to describe and explain the frequency and distribution of serological characteristics in that community, as well as the evolution of such inherited conditions.
In this article, we should like to illustrate our results by certain methods employed in population genetics (genetic distances, arborescent dendrogram analysis), and thus ascertain: (1) not only an assessment of the persistence of genetic heterogeneity in a population formed of different elements, but also of the degree of heterogeneity resulting from their slow merging for approximately a century; (2) the determination of the genetic position of Ideles subgroups with regard to their tribal origins and their geographical neighbors; and (3) the position of Ideles populations in relation to all Saharan or African populations.
ECOLOGY OF IDELES wutrponlihgedcaSG
Geographical Situation
(See Figures 1 and 2.) Ideles is a wadi (river bed or valley that is usually dry) to the north of Atakor, the central elevation in Ahaggar. Wherever the soil seemed arable, people established settlements. It now forms part of the Tamanrasset administration area (Daira) and its coordinates are longitude 6° west, latitude, 24° north, and the mean altitude is 1,500 meters. Ideles wadi opens its dry valley across Manzas, an area of recent volcanism and of granite outcroppings (Taderaz 1,822 meters at Ideles).
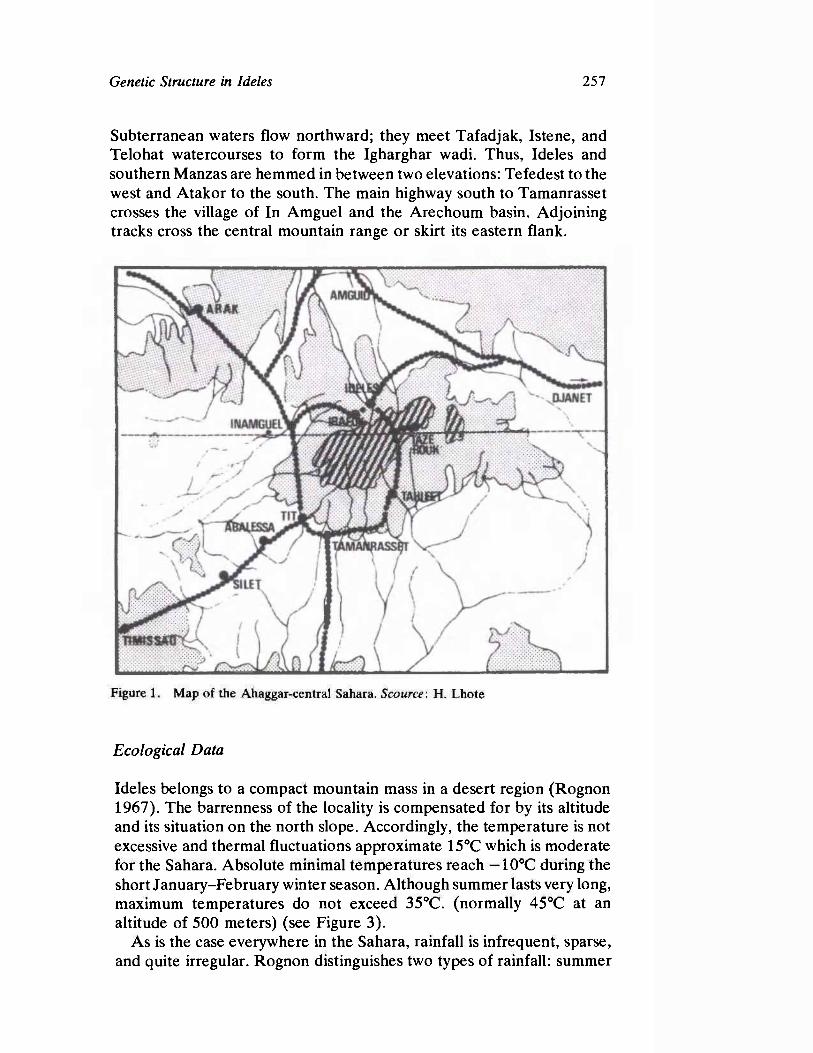
Genetic Structure in Ideles 257
Subterranean waters flow northward; they meet Tafadjak, Istene, and Telohat watercourses to form the Igharghar wadi. Thus, Ideles and southern Manzas are hemmed in between two elevations: Tefedest to the west and Atakor to the south. The main highway south to Tamanrasset crosses the village of In Amguel and the Arechoum basin. Adjoining tracks cross the central mountain range or skirt its eastern flank.
Ecological Data
Ideles belongs to a compact mountain mass in a desert region (Rognon 1967). The barrenness of the locality is compensated for by its altitude and its situation on the north slope. Accordingly, the temperature is not excessive and thermal fluctuations approximate 15°C which is moderate for the Sahara. Absolute minimal temperatures reach — 10°C during the short JanuaryFebruary winter season. Although summer lasts very long, maximum temperatures do not exceed 35°C. (normally 45°C at an altitude of 500 meters) (see Figure 3).
As is the case everywhere in the Sahara, rainfall is infrequent, sparse, and quite irregular. Rognon distinguishes two types of rainfall: summer
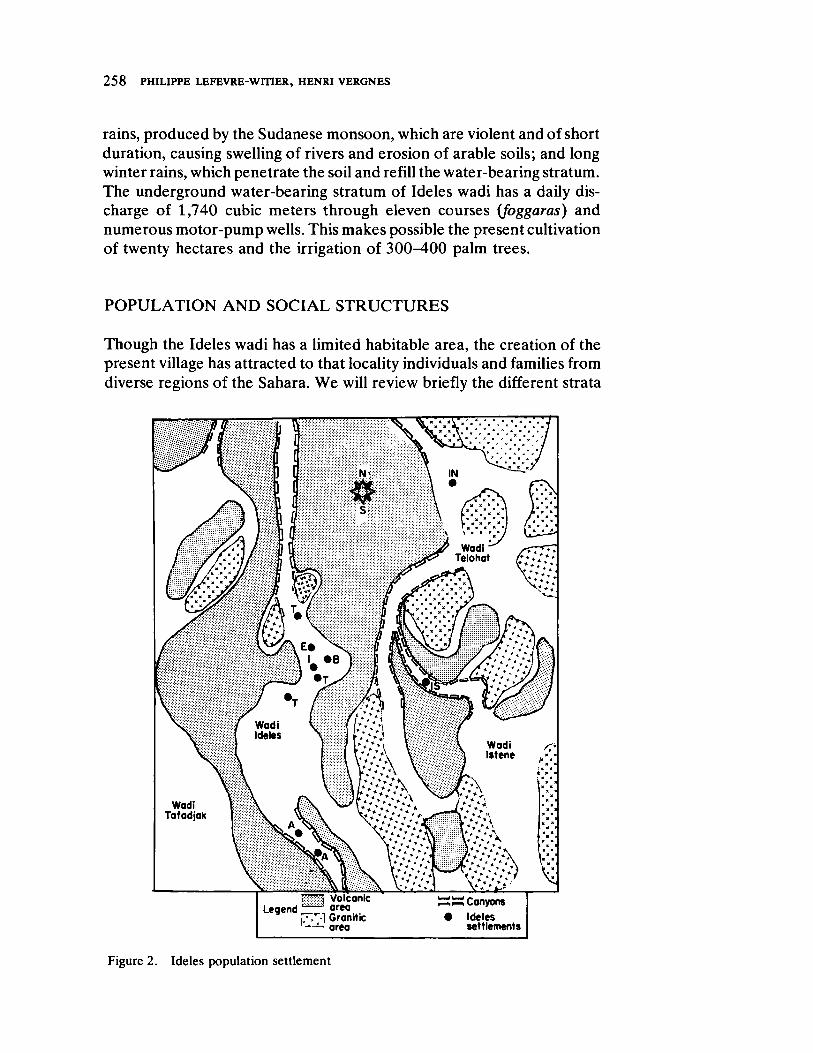
2 5 8 PHILIPPE LEFEVREWrriER, HENRI VERGNES
rains, produced by the Sudanese monsoon, which are violent and of short duration, causing swelling of rivers and erosion of arable soils; and long winter rains, which penetrate the soil and refill the waterbearing stratum. The underground waterbearing stratum of Ideles wadi has a daily discharge of 1,740 cubic meters through eleven coursessrogfa (foggaras) and numerous motorpump wells. This makes possible the present cultivation of twenty hectares and the irrigation of 300400 palm trees.
POPULATION AND SOCIAL STRUCTURES
Though the Ideles wadi has a limited habitable area, the creation of the present village has attracted to that locality individuals and families from diverse regions of the Sahara. We will review briefly the different strata
Figure 2. Ideles population settlement
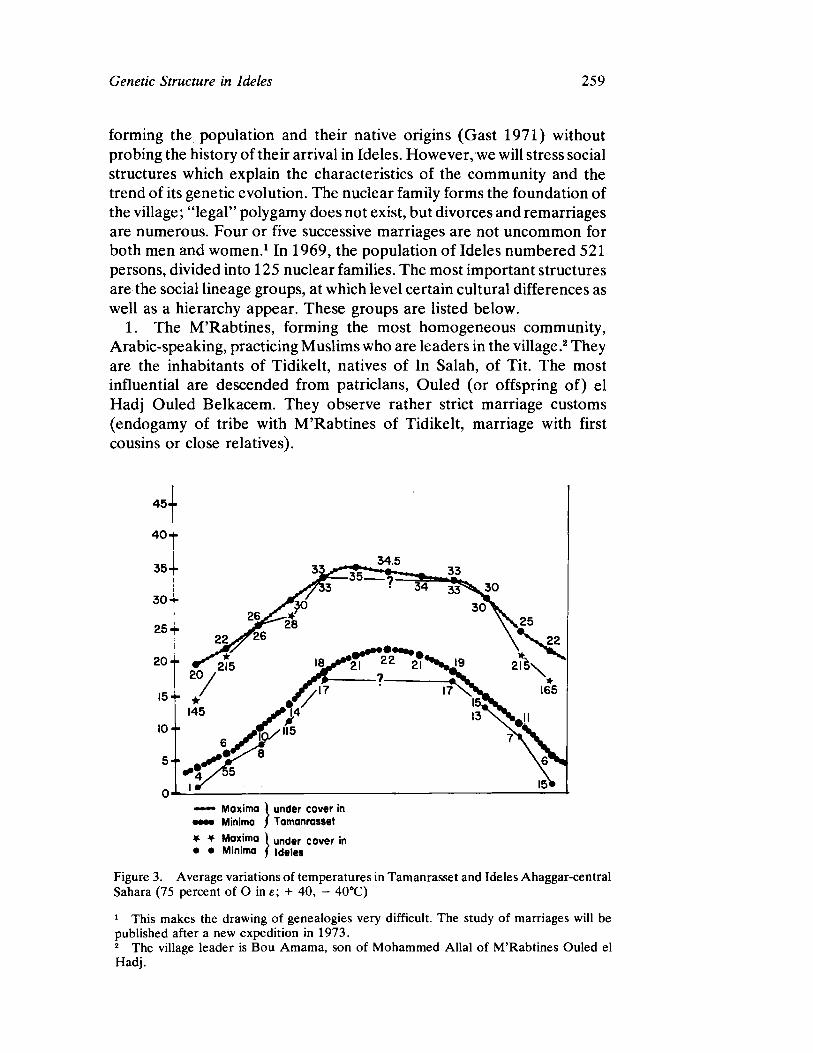
Genetic Structure in Ideles 2 5 9
forming the population and their native origins (Gast 1971) without probing the history of their arrival in Ideles. However, we will stress social structures which explain the characteristics of the community and the trend of its genetic evolution. The nuclear family forms the foundation of the village; "legal" polygamy does not exist, but divorces and remarriages are numerous. Four or five successive marriages are not uncommon for both men and women.1 In 1969, the population of Ideles numbered 521 persons, divided into 125 nuclear families. The most important structures are the social lineage groups, at which level certain cultural differences as well as a hierarchy appear. These groups are listed below.
1. The M'Rabtines, forming the most homogeneous community, Arabic-speaking, practicing Muslims who are leaders in the village.2 They are the inhabitants of Tidikelt, natives of In Salah, of Tit. The most influential are descended from patricians, Ouled (or offspring of) el Hadj Ouled Belkacem. They observe rather strict marriage customs (endogamy of tribe with M'Rabtines of Tidikelt, marriage with first cousins or close relatives).
— ·* Maximo I under cover in · · · · Minima / Tamanrasset
* * Maxima ) u n , j e r c o v e rnj jn
• · Minima f ideles
Figure 3. Average variations of temperatures in Tamanrasset and Ideles Ahaggar-central
Sahara (75 percent of Ο in ε ; + 40 , - 40°C)
1 This makes the drawing of genealogies very difficult. The study of marriages will be
published after a new expedition in 1973 . 2 The village leader is Bou Amama, son of Mohammed Allal of M'Rabtines Ouled el
Hadj.
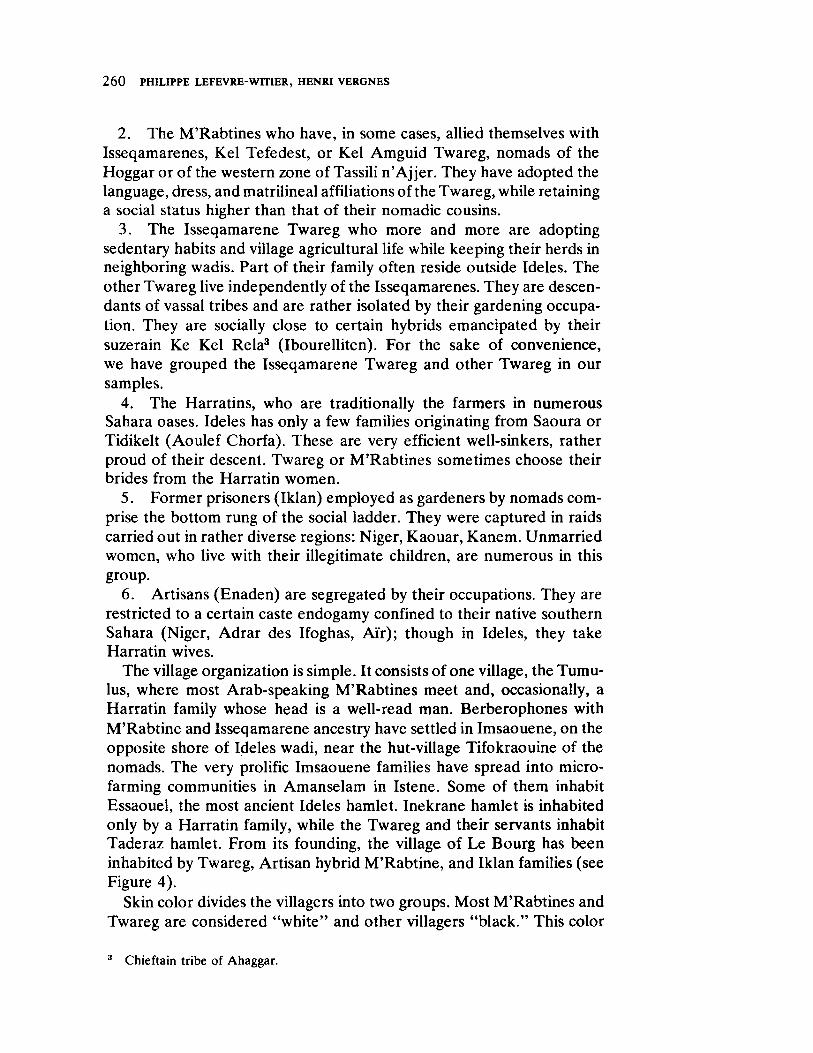
2 6 0 PHILIPPE LEFEVREWITIER, HENRI VERGNES
2. The M'Rabtines who have, in some cases, allied themselves with Isseqamarenes, Kel Tefedest, or Kel Amguid Twareg, nomads of the Hoggar or of the western zone of Tassili n'Aj jer. They have adopted the language, dress, and matrilineal affiliations of the Twareg, while retaining a social status higher than that of their nomadic cousins.
3. The Isseqamarene Twareg who more and more are adopting sedentary habits and village agricultural life while keeping their herds in neighboring wadis. Part of their family often reside outside Ideles. The other Twareg live independently of the Isseqamarenes. They are descendants of vassal tribes and are rather isolated by their gardening occupation. They are socially close to certain hybrids emancipated by their suzerain Ke Kel Rela3 (Ibourelliten). For the sake of convenience, we have grouped the Isseqamarene Twareg and other Twareg in our samples.
4. The Harratins, who are traditionally the farmers in numerous Sahara oases. Ideles has only a few families originating from Saoura or Tidikelt (Aoulef Chorfa). These are very efficient wellsinkers, rather proud of their descent. Twareg or M'Rabtines sometimes choose their brides from the Harratin women.
5. Former prisoners (Iklan) employed as gardeners by nomads comprise the bottom rung of the social ladder. They were captured in raids carried out in rather diverse regions: Niger, Kaouar, Kanem. Unmarried women, who live with their illegitimate children, are numerous in this group.
6. Artisans (Enaden) are segregated by their occupations. They are restricted to a certain caste endogamy confined to their native southern Sahara (Niger, Adrar des Ifoghas, Air); though in Ideles, they take Harratin wives.
The village organization is simple. It consists of one village, the Tumulus, where most Arabspeaking M'Rabtines meet and, occasionally, a Harratin family whose head is a wellread man. Berberophones with M'Rabtine and Isseqamarene ancestry have settled in Imsaouene, on the opposite shore of Ideles wadi, near the hutvillage Tifokraouine of the nomads. The very prolific Imsaouene families have spread into microfarming communities in Amanselam in Istene. Some of them inhabit Essaouel, the most ancient Ideles hamlet. Inekrane hamlet is inhabited only by a Harratin family, while the Twareg and their servants inhabit Taderaz hamlet. From its founding, the village of Le Bourg has been inhabited by Twareg, Artisan hybrid M'Rabtine, and Iklan families (see Figure 4).
Skin color divides the villagers into two groups. Most M'Rabtines and Twareg are considered "white" and other villagers "black." This color
3 Chieftain tribe of Ahaggar.
Genetic Structure in Ideles 261
differentiation is in fact a social trait inherited via patrilinear or matrilinear ancestry, and some surprising morphological paradoxes are encountered. Social relations will later be clarified by a study of wife exchange. The relative sexual freedom which prevails in all oases of the Sahara should be stressed at once.
Thus, Ideles appears to be a community in the process of fusion, although there still exist rather clearly defined geographical, cultural, and social cleavages. The factors making for homogeneity are isolation, religion, economic solidarity, and poverty and, of late, the social policy of the Algerian government.
Kel Amguid
3 a
01 cc ο
Tidikelt
Μ Robtines
Ouled El Hodj Ouled Belquacem
^ K e l Tit and others'
A
Kel Tit
Isseqamarenes Kel Amguid
Kel Tefedest
Twareg Imrod
Ojanti
Harratins
Kel Tef.
Iklan
Figure 4. Ideles: Social structure
METHODOLOGY: BIOLOGICAL
The study of blood genetic characters was undertaken concurrently with the sociological and demographic investigations in 1968,1969, and 1970. A total of 384 individuals were examined in the selection of parameters. These will be set forth in detail in accordance with the genetic systems studied. Only a brief reference will be made to laboratory techniques employed, which are described in articles on Ideles hematologic and

2 6 2zyxwvutsrqponmlkihgfedcbaYWVTSRPONMLKIHGFEDCA PHILIPPE LEFEVREWITIER, HENRI VERGNES
serologic investigations (Constans and LefevreWitier 1973; MauranSendrail and LefevreWitier 1973).
Our examination was confined to the following traits: 1.zyvutsrponmlihgfedbaSIHGEB Blood group polymorphisms'. A1? A2, Β, H, CC, D, Ee, MN, Ss
antigens, Vw , Pl5 Kell, LewisA, Lewis* (for a few individuals), and Fy*. 2. Gm and Inv groups of serum immunoglobulins: Gm (1), (2), (3),
(5), (6), (10), (11), (14), (17), (21), (25), Inv (I, 2) antigens.
3. Enzyme polymorphisms: G6PD, 6PGD, PGM at locus 1, acid phosphatase (AP), lactate dehydrogenase (LH).
4. Serum polymorphisms: pseudoCholinesterase (ACAH) at locus
E,. 5. Haptoglobins: normal, modified, weak or deficient (HpO). 6. Hemoglobins: investigation of the rise of A2 or F hemoglobin rate,
and structural mutations (in Ideles only S and C variants were studied). Our sample produced thirtyfour parameters. However, serum
polymorphisms could be detected in only a few individuals, and sample numbers differ according to the trait studied (see Figure 5). All the frequencies, absolute as well as relative, phenotypic or genie, relating to traits have been mentioned in the articles referred to above. The samples studied comprise 71 percent of the females and 77 percent of the males of the total population. If one subtracts from the total population the zeroto fiveyearold infants in whom venipuncture was not possible, the figures become 82 and 84 percent, respectively, of the total population.
Type of enzymes Number of Percent total individuals tested of sample
G6PD 223 58 6PGD 214 55.7 PGM 1 257 66.9 Acid phosphatases 151 39.3 LDH 45 11.7 Pseudochol. ACAH 282 73.4
Figure 5. Enzymes in Ideles: types and number of assays
METHODOLOGY: MATHEMATICAL
To begin the study of Ideles genetic structure, we chose to use the notion of distance applied to frequencies. This refers to "arcsine" distances of CavalliSforza (1962) or "chord" and χ2 distances often used in population genetics when it is possible to express measurements in terms of frequencies or of probabilities. In order to utilize best the information assembled in the laboratories with regard to the various genetic systems investigated, the measurements selected are in terms of phenotypic fre
Genetic Structure in Ideles 263
quencies, since the genetics of some systems are as yet not precisely defined. The Gm system of serum immunoglobins forms a special case. Works of Steinberg (1967), Ropartz et al. (1966), Grubb (1960), and others make it possible to determine with some certainty the allotype transmission of Gm factors. Since certain allotypes are associated with broad human branches: Negroid, Caucasoid, and Mongoloid, we have placed the observed phenomena in three classes: (1) Gm phenotypes, solely explained by Negroid allotypes; (2) Gm phenotypes, solely explained by Caucasoid allotypes; (3) Gm phenotypes, explained by allotypes common to the two branches. The phenotypic frequencies have been worked out in each of these classes.
The "arc-sine" and "chord" of Cavalli-Sforza (1962) and/2 distances are fully described by Jacquard (1973). The principles are briefly pres-ented here:
1. The Cavalli-Sforza distance is defined by the formula:
Chord ( i ,/) = J l - ε Κ J Pik Pjk
in which Pi and Pj are the frequencies of k characteristics in the two populations groups studied. This method is advantageous as it associates the distance calculation from the phenotype frequencies to the calcula-tion from gene frequencies. That association is all the better here as Hardy-Weinberg equilibrium was found in the populations studied. This would indicate a close correspondence between phenotypic and gene frequencies.
2. χΛ distance is defined by the formula:
£ (Pik Pjk)2
= 1 7 k —
in which k is the characteristic studied and pk its average frequency for the whole of the samples compared. The term distance" should not be misunderstood. It is a unit of measurement with its own characteristics and not a proof for the validity of statistical tests.
The different blood genetic systems studied can be treated as indepen-dent units. This justifies the calculation of a total distance for all the systems such as
V 2
D2 = fit .
Obviously, the above formula is only an approximation. In fact, the underlying biological and genetic determinants are still inadequately known. They are even more poorly understood in their interaction.
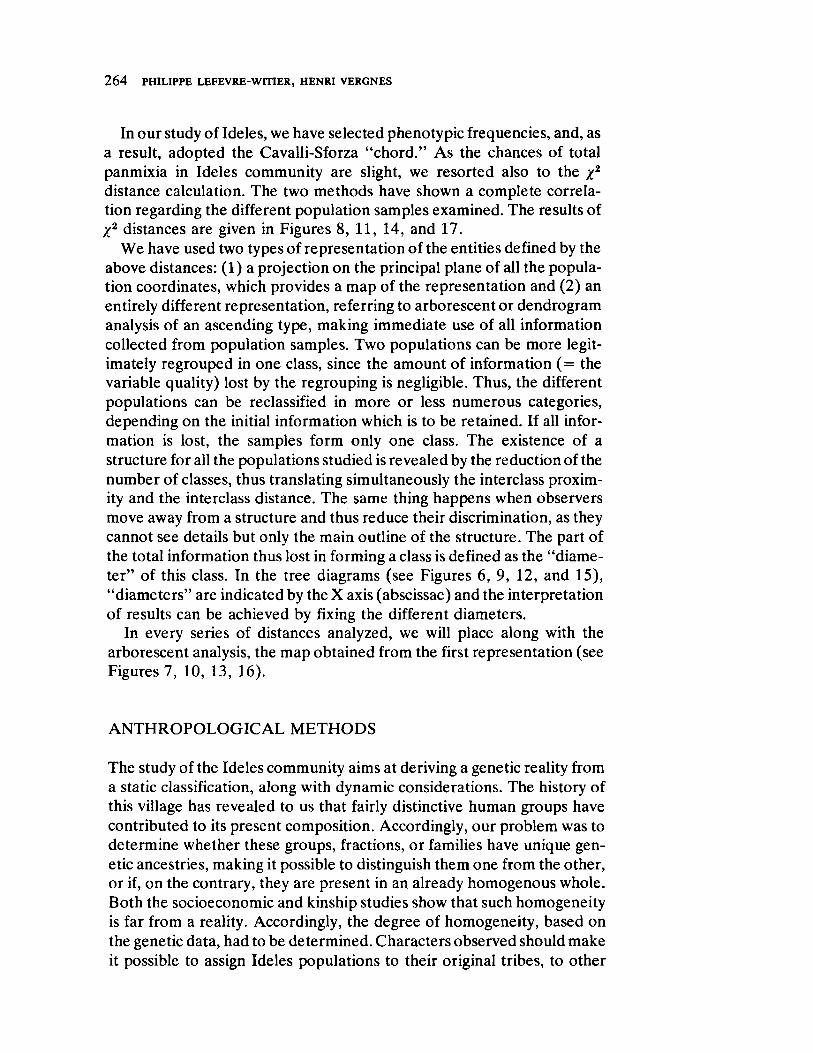
2 6 4WVTSRPNLIHGFE PHILIPPE LEFEVRE-WITIER, HENRI VERGNES
In our study of Ideles, we have selected phenotypic frequencies, and, as
a result, adopted the Cavalli-Sforza "chord." As the chances of total
panmixia in Ideles community are slight, we resorted also to the / 2
distance calculation. The two methods have shown a complete correla-
tion regarding the different population samples examined. The results of
χΛ distances are given in Figures 8, 11, 14, and 17.
We have used two types of representation of the entities defined by the
above distances: (1) a projection on the principal plane of all the popula-
tion coordinates, which provides a map of the representation and (2) an
entirely different representation, referring to arborescent or dendrogram
analysis of an ascending type, making immediate use of all information
collected from population samples. Two populations can be more legit-
imately regrouped in one class, since the amount of information ( = the
variable quality) lost by the regrouping is negligible. Thus, the different
populations can be reclassified in more or less numerous categories,
depending on the initial information which is to be retained. If all infor-
mation is lost, the samples form only one class. The existence of a
structure for all the populations studied is revealed by the reduction of the
number of classes, thus translating simultaneously the interclass proxim-
ity and the interclass distance. The same thing happens when observers
move away from a structure and thus reduce their discrimination, as they
cannot see details but only the main outline of the structure. The part of
the total information thus lost in forming a class is defined as the "diame-
ter" of this class. In the tree diagrams (see Figures 6, 9, 12, and 15),
"diameters" are indicated by the X axis (abscissae) and the interpretation
of results can be achieved by fixing the different diameters.
In every series of distances analyzed, we will place along with the
arborescent analysis, the map obtained from the first representation (see
Figures 7, 10, 13, 16).
ANTHROPOLOGICAL METHODS
The study of the Ideles community aims at deriving a genetic reality from
a static classification, along with dynamic considerations. The history of
this village has revealed to us that fairly distinctive human groups have
contributed to its present composition. Accordingly, our problem was to
determine whether these groups, fractions, or families have unique gen-
etic ancestries, making it possible to distinguish them one from the other,
or if, on the contrary, they are present in an already homogenous whole.
Both the socioeconomic and kinship studies show that such homogeneity
is far from a reality. Accordingly, the degree of homogeneity, based on
the genetic data, had to be determined. Characters observed should make
it possible to assign Ideles populations to their original tribes, to other
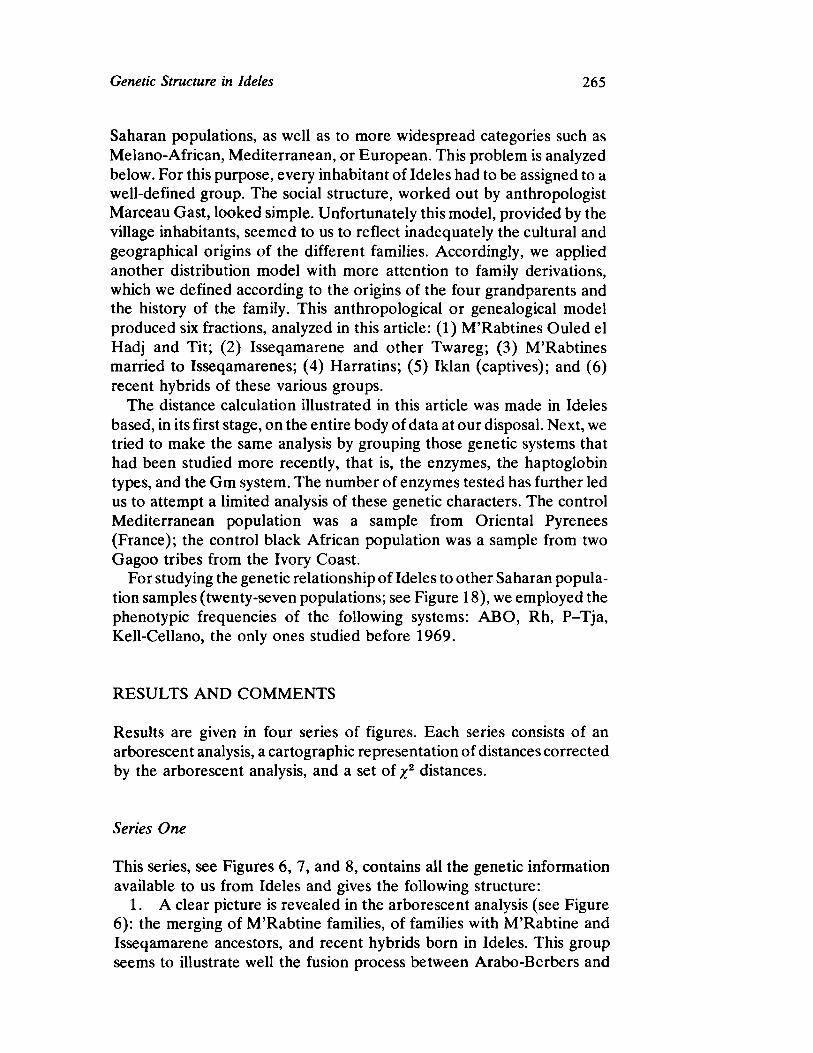
Genetic Structure in Ideles 265
Saharan populations, as well as to more widespread categories such as MelanoAfrican, Mediterranean, or European. This problem is analyzed below. For this purpose, every inhabitant of Ideles had to be assigned to a welldefined group. The social structure, worked out by anthropologist Marceau Gast, looked simple. Unfortunately this model, provided by the village inhabitants, seemed to us to reflect inadequately the cultural and geographical origins of the different families. Accordingly, we applied another distribution model with more attention to family derivations, which we defined according to the origins of the four grandparents and the history of the family. This anthropological or genealogical model produced six fractions, analyzed in this article: (1) M'Rabtines Ouled el Hadj and Tit; (2) Isseqamarene and other Twareg; (3) M'Rabtines married to Isseqamarenes; (4) Harratins; (5) Iklan (captives); and (6) recent hybrids of these various groups.
The distance calculation illustrated in this article was made in Ideles based, in its first stage, on the entire body of data at our disposal. Next, we tried to make the same analysis by grouping those genetic systems that had been studied more recently, that is, the enzymes, the haptoglobin types, and the Gm system. The number of enzymes tested has further led us to attempt a limited analysis of these genetic characters. The control Mediterranean population was a sample from Oriental Pyrenees (France); the control black African population was a sample from two Gagoo tribes from the Ivory Coast.
For studying the genetic relationship of Ideles to other Saharan population samples (twentyseven populations; see Figure 18), we employed the phenotypic frequencies of the following systems: ABO, Rh, PTja, KellCellano, the only ones studied before 1969.
RESULTS A N D COMMENTS
Results are given in four series of figures. Each series consists of an arborescent analysis, a cartographic representation of distances corrected by the arborescent analysis, and a set of y2 distances.
Series One
This series, see Figures 6, 7, and 8, contains all the genetic information available to us from Ideles and gives the following structure:
1. A clear picture is revealed in the arborescent analysis (see Figure 6): the merging of M'Rabtine families, of families with M'Rabtine and Isseqamarene ancestors, and recent hybrids born in Ideles. This group seems to illustrate well the fusion process between AraboBerbers and

2 6 6 PHILIPPE LEFEVREWITIER, H E N R I VERGNES
Iklans, Harratins, or Artisans, which had begun in Tidikelt among the M'Rabtines and had accelerated in Ideles.
2. On the other hand, three groups have kept a distinct genetic autonomy: Isseqamarenes, Twaregs, and Harratins and Iklans, who settled later in the village. For a loss of about 40 percent of information,
18 Ideles: M'Rabtines
20 Ideles: M'Rabtliies
23 Ideles: recent cross breeds
19 Ideles: Twang Isseqamaren
21 Ideles: Harratlns
24 Orleatal Pyrenees
8 Twang Kel Kummer
22 Iddes: Iklan
26 Gagooe Bokabo
27 Gagoos Toolu
8J J «
Populations
Diameters
F i g u r e 6 . I d e l e s p o p u l a t i o n s : a r b o r e s c e n t a n a l y s i s f o r e l e v e n g e n e t i c s y s t e m s in A m a g g a r
S a h a r a
. ' Twareg ·. * * · . : Isseqamaren \
· . * ! ? ·· \
/ • ' < » 2 Φ ' . . . \ /M" Rabtines '"••. . \
x Isseq. '"•.. \ Ι β · Μ Robtines
Recent / cross breds
2 3 21'ΔHarratjns^.· »
Λ • Twareg Kel Kummer \
.Oriental Pyrenees 2 4
Ideles p o p u l a t i o n s
χ 8 d is tances for eleven
gene t ic s y s t e m s : OBAABO Rh MN P T j a KellCellano G6PD 6PG0 PGM I Phosphatase acids Haptoglobins Gm systems
3 0 V Diameters of corresponding 5 2 J orb arborescent analysis
! l . · I k l a n
/ Tooka '·•. " 2 7
Bokabo':' 2 6 · J
F i g u r e 7 . I d e l e s p o p u l a t i o n s : χ 2 d i s t a n c e s f o r e l e v e n g e n e t i c s y s t e m s

Genetic Structure in Ideles 267
the affinity of the Isseqamarenes and Harratins to the village as a whole is greater, but it is not so with respect to Twareg Kel Kummer who appear more distinctly connected to the M editerranean Oriental Pyrenees. The Iklans compose a black population distinct from the Ivory Coast Gagoos. A t diameter 40, their affinity does not become any closer and they could never be confused with other Idelesians.
Iss M ri Hid lid Mid Por Bok Too Tke
M ra 1753 1189 1685 2063 1205 1976 2329 2344 2148
Iss 1217 2335 2102 1818 2027 2754 2590 2425
Mri 2039 2072 1366 2131 2517 2394 1953
Hid 2052 1534 2664 2156 2021 2738 lid 1422 2827 1842 1515 3092
Mid 2645 2001 1823 2409 Por 3307 3216 2445 Bok 1009 3384
Too 3306
Figure 8. Ideles populations: matrix o f the χ2 distances for eleven genetic systems
3. The two Gagoo tribes, which have a common origin, are the first reunited groups in spite of appreciable differences in their genetic ances-try. The rapid formation of a unique class at the diameter below 20 proves the sensitivity of the arborescent analysis.
The cartographic representation (see Figure 7) is not devoid of in-terest. It reveals better the genetic community of M 'Rabtines and of Isseqamarenes. Furthermore, hybrids appear closer to the Harratins and the Iklans. The distance between M 'Rabtines and Harratins is quite marked. The broken and continuous lines express the data of arborescent analysis with regard to diameters 30 and 53, respectively.
Series Two
A limited analysis of enzyme, haptoglobin, and Gm systems discloses another genetic structure (see Figures 9, 10, and 11). These systems contain " marker genes" whose distributions are strictly defined in the Caucasoid and Negroid branches. The position of Ideles populations studied in relation to these two branches will accordingly be revealed more distinctly here than in the previous analysis. A t diameter 30 (see Figure 9), the position is not changed. However, hybrids of M 'Rabtines and Isseqamarenes mix with their nomad cousins. A t diameter 55, new groups are formed; the Isseqamarenes, Twareg, and their hybrids merge
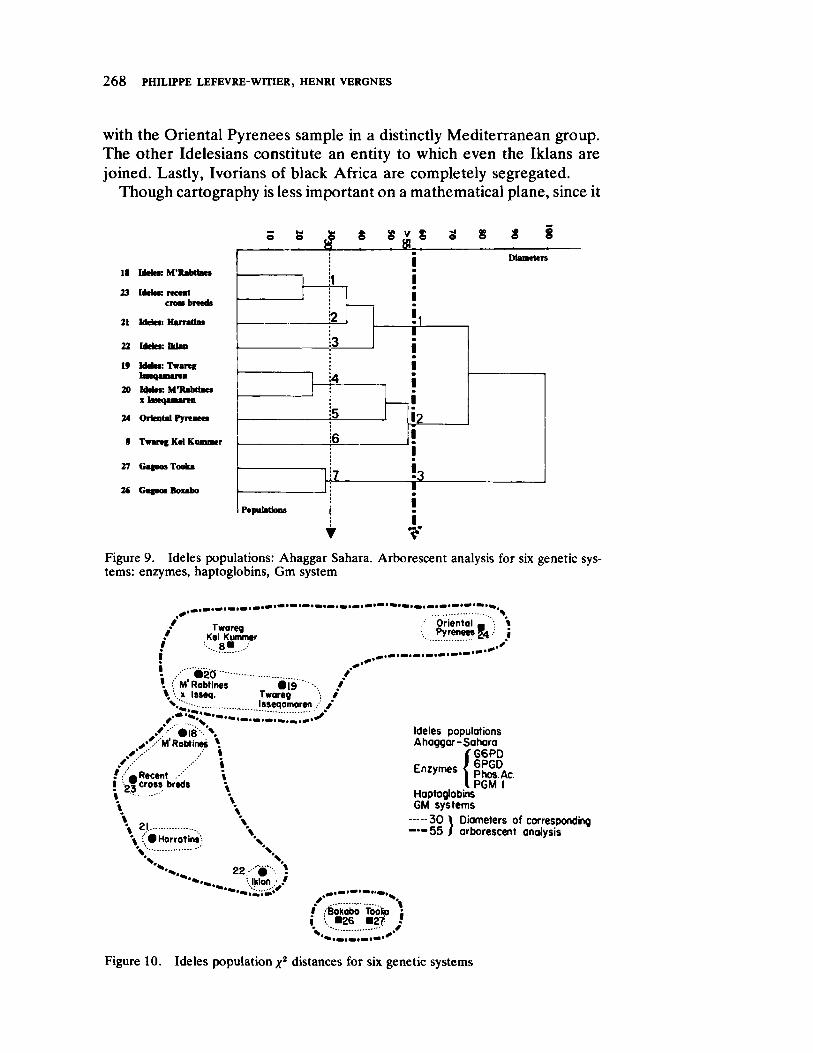
2 6 8ywvutsrponmlkjihgfedcbaWVTSRPONMLIHGFEA PHILIPPE LEFEVREWrnER, HENRI VERGNES
with the Oriental Pyrenees sample in a distinctly Mediterranean group. The other Idelesians constitute an entity to which even the Iklans are joined. Lastly, Ivorians of black Africa are completely segregated.
Though cartography is less important on a mathematical plane, since it
18 Ideles: M'RaMae*
23 Id(ki< recent
21 Meies: Herrath·
22 Idtfcs: IkUn
19 Ideles: Twang Inequnaren
20 Iddei: M'Rabdncs
24 Oriental Pyrenees
8 Twang Kd Kammer
27 Gagoos Took*
26 Gagoos Boxabo
Figure 9. Ideles populations: Ahaggar Sahara. Arborescent analysis for six genetic systems: enzymes, haptoglobins, Gm system
Tworeq • Kel Kummer
! '"• ..β·...·· ι
; , ' ; Μ Rabtlnes ·| 9 '"• ·. /
\ '••. χ Isseq. Twareg / ν ' " · Isseqamaren / / . ». • c ·—«. . " > *
/ / ' · Ι 8 \ x ' M'RoMin«y \
/ / / ϊ / :'' ® Recent .·· \ I ' „Τ cross breds ·.
\ ' \ \ \
\ ^ \ \ •'• · Hor rat ins \
\ % S 22 · )
,ΙΚΙοη !
Oriental Pyrenees "4 ·
Ideles populations AhaggarSahara
(6 6 PD
piw& Ac. PGM I
Haptoglobins GM system s 3 0 Λ Diameters of corresponding
™ 5 5 / arborescent analysis
V I Bokobo Tooko i Ι ·2 6 ·2 7 V ' V
' » ι . · · . · · » · '
Figure 10. Ideles population y2 distances for six genetic systems

Genetic Structure in Ideles 269
implies an important loss of information, it is nevertheless meaningful (see Figure 10). AfroMediterranean Twareg groups remain at a relatively great distance from the EuroMediterraneans to whom the Southwest French belong (and yet, the arborescent analysis had regrouped them). M'Rabtines, Harratins, Artisans, and recent hybrids remain at a considerable distance from Iklans, whose position is unchanged.
Thus there exist three groups: one distinctly Negroid group (MelanoAfrican), one intermediate group comprising most of the Idelesian fraction, and a Caucasoid group of Afro and EuroMediterraneans.
Iss Mri Hid lid Mid Por Bok Too Tke
Mra 1607 1070 1472 1670 907 1754 2039 2248 1839 Iss 998 2157 1809 1646 1746 2502 2486 2149 Mri 1759 1756 1181 1688 2331 2376 1485 Hid 1865 1192 2566 1951 2018 2443 lid 1247 2402 1809 1669 2549 Mid 2264 1934 1968 1916 Por 2915 2955 2353 Bok 1166 2858 Too 2911
Figure 11. Ideles populations: matrix of the χ2 distances for six genetic systems; enzymes, haptoglobins, Gm system
Series Three
We have previously referred to the variable character of information yielded by different genetic systems and to the difficulties encountered in apprehending and translating that variability. This study has made possible an assessment of the value of enzyme allotypes. Several African populations have been defined by distance methods applied to enzyme allotypes with fairly satisfactory results (Jenkins et al. 1971). Accordingly, the diagrams we obtain in this series (see Figures 12,13, and 14) are not basically different from the preceding series; once again Isseqamarenes, M'Rabtines and recent hybrids combine very quickly (compare Figures 6 and 12). Harratins and Iklans retain considerable autonomy which is broken only at 55/60 diameter. At that level, a great loss of information makes possible a confusion of Idelesian with Mediterranean populations. In spite of the existence of Negroid enzyme variants in the village ancestry, there exists no connection with the Ivorian group (union at diameter 85 only). With regard to the Kel Kummer, their isolated genetic position is shown here. The cartography (see Figure 13) agrees perfectly with the arborescent analysis (see Figure 12).
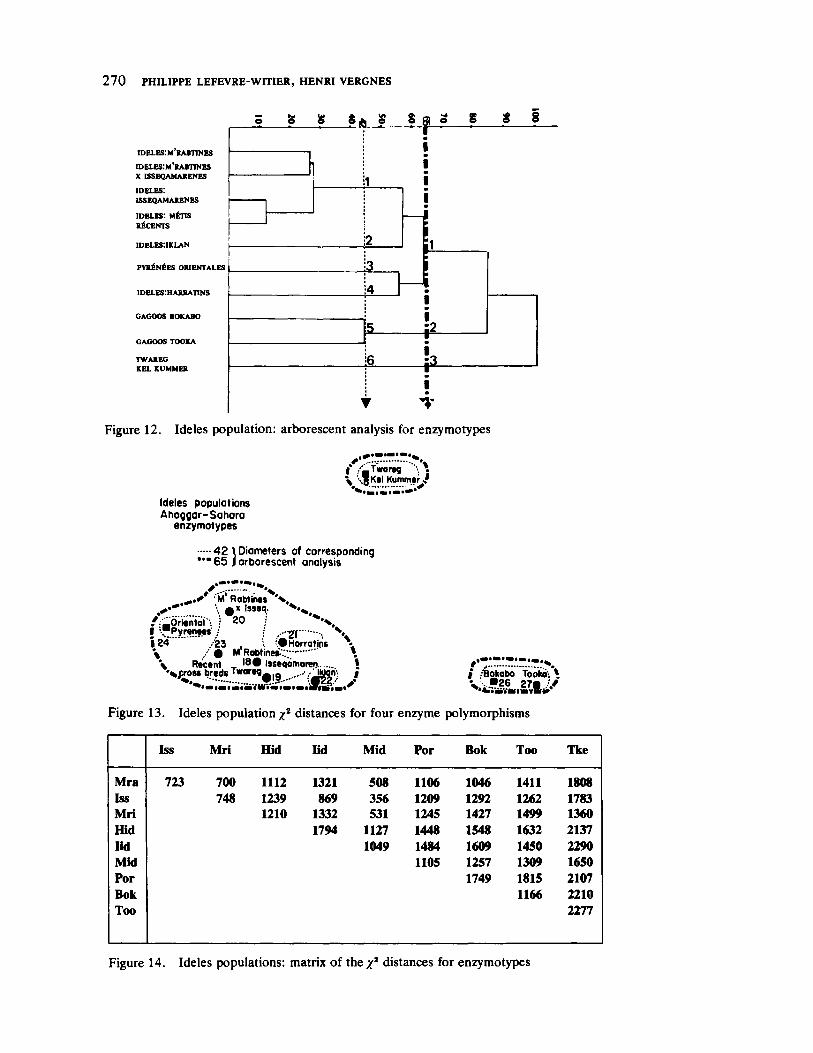
2 7 0 P H I L I P P E L E F E V R E W I T I E R , H E N R I V E R G N E S
S 8
IDELES:MRABTJNES
IDELES:M'*ABTINES X ISSEQAMAXENES
IDELES:
ISSEQAMAKENES
IDELES*. MFENS R£CENTS
1DELES:1KLAN
PY«£N£ES OKI ENTALES
IDELES:HAJUIATINS
GAGOOS BOKABO
GAGOOS TOOKA
TW AR EG KEL KUMMER
• n
Figure 12. Ideles population: arborescent analysis for enzymotypes
I ,.·'_ Tworefl 1
Ideles populations AhoggarSahara
enzymotypes
I .• H 1 wnre ·
\ \ .g Kel Kummen,·
4 2 \ Diameters of corresponding " " 6 5 / a r b o r e s c e n t analysts
„.«» Μ RoMines V \ # x Isseq.
/ OrWniai ·. ) 20 'n. I •••Pyren·»»' / V • /23 , { \®Horratips \
/ φ Μ \ V Recent _ ι β · Isseqamaren I
•%croe» bredszyxwutsrponmlkihgfedcbaVTQOLJIFB Twor*flΔIQ ..• .· JOan, « · .?" ',#22,· J
iZA
\
I /Bokobo Tooka'i · V '·. · 26 27 · L*
'^imrniuirmrmi* ·
Figure 13. Ideles population^2 distances for four enzyme polymorphisms
Iss Mri Hid lid Mid Por Bok Too Tke
Mra 723 700 1112 1321 508 1106 1046 1411 1808 Iss 748 1239 869 356 1209 1292 1262 1783 Mri 1210 1332 531 1245 1427 1499 1360 Hid 1794 1127 1448 1548 1632 2137 lid 1049 1484 1609 1450 2290 Mid 1105 1257 1309 1650 Por 1749 1815 2107 Bok 1166 2210 Too 2277
Figure 14. Ideles populations: matrix of the χ 2 distances for enzymotypes
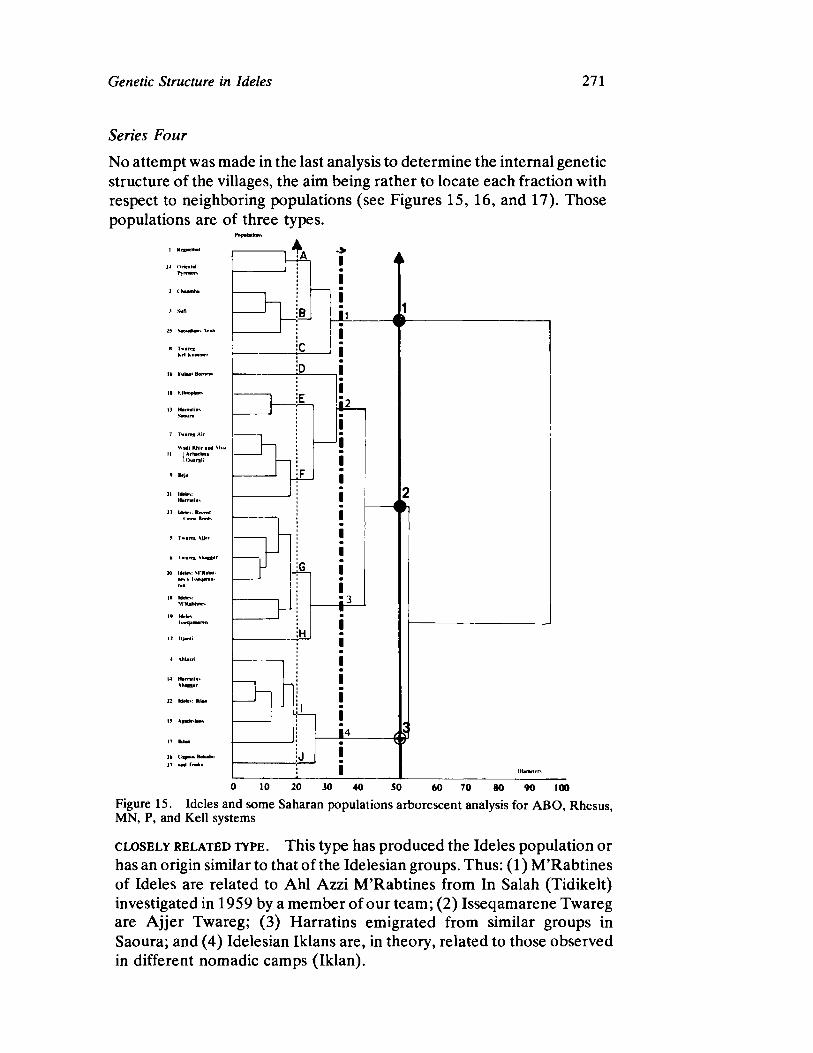
Genetic Structure in Ideles 271
Series Four
No attempt was made in the last analysis to determine the internal genetic structure of the villages, the aim being rather to locate each fraction with respect to neighboring populations (see Figures 15, 16, and 17). Those populations are of three types.
I R«gt*HiM
}4 Oriental
25 Sawdtaas 4rah
lb I'ulaoi Borneo»
10 »
13 H a r m
Wadi Rbir and M>h I Arharhna I Ovarii!
Twai*« Ihaggar
19 I «Mrs Ustqjmarvn
22 Idtlr*: IkUa
I« AfarfrOaiK
17 Iktaa if
0 10 2 0 3 0 4 0 SO 6 0 7 0 8 0 9 0 100
Figure 15. Ideles and some Saharan populations arborescent analysis for ABO, Rhesus, MN, P, and Kell systems
CLOSELY RELATED TYPE. This type has produced the Ideles population or has an origin similar to that of the Idelesian groups. Thus: (1) M'Rabtines of Ideles are related to Ahl Azzi M'Rabtines from In Salah (Tidikelt) investigated in 1959 by a member of our team; (2) Isseqamarene Twareg are Ajjer Twareg; (3) Harratins emigrated from similar groups in Saoura; and (4) Idelesian Iklans are, in theory, related to those observed in different nomadic camps (Iklan).
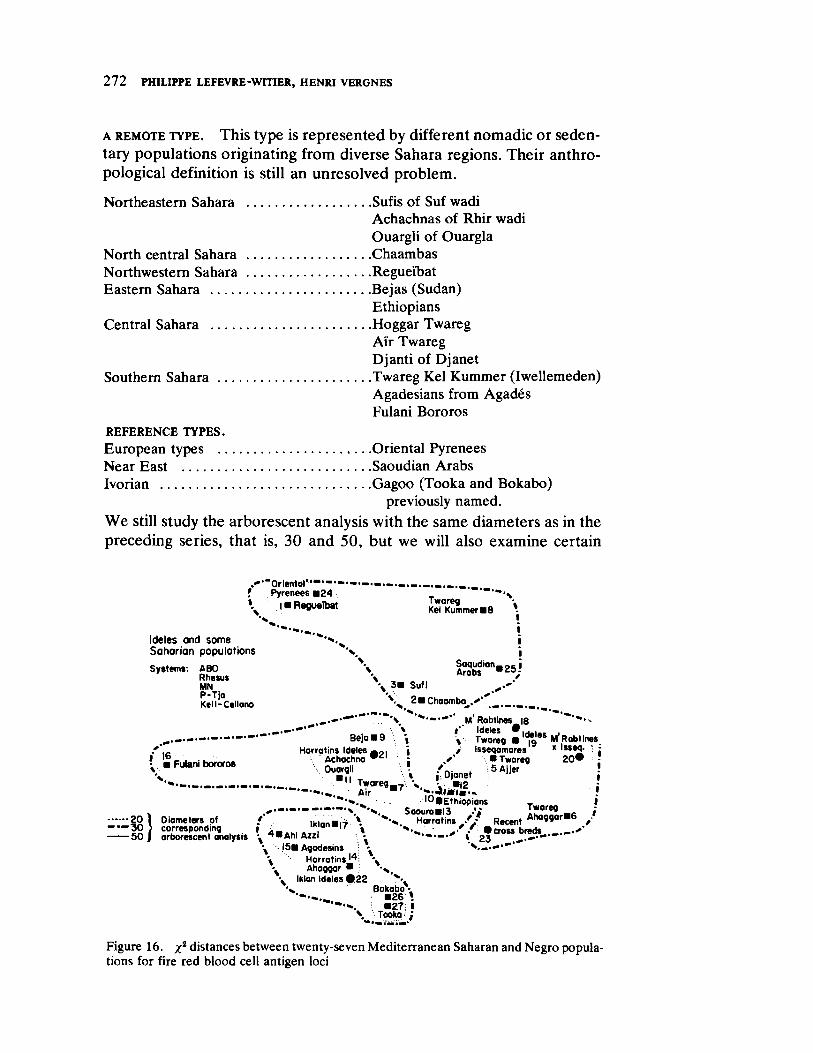
2 7 2zywvutsrqponmlkjihgfedcbaXWVUTSRPONMLKIHGFEDCBA PHILIPPE LEFEVREWITIER, HENRI VERGNES
Α REMOTE TYPE. This type is represented by different nomadic or sedentary populations originating from diverse Sahara regions. Their anthropological definition is still an unresolved problem.
Northeastern Sahara Sufis of Suf wadi Achachnas of Rhir wadi Ouargli of Ouargla
North central Sahara Chaambas Northwestern Sahara Regueibat Eastern Sahara Bejas (Sudan)
Ethiopians Central Sahara Hoggar Twareg
Air Twareg Djanti of Djanet
Southern Sahara Twareg Kel Kummer (Iwellemeden) Agadesians from Agades Fulani Bororos
REFERENCE TYPES.
European types Oriental Pyrenees Near East Saoudian Arabs Ivorian Gagoo (Tooka and Bokabo)
previously named. We still study the arborescent analysis with the same diameters as in the preceding series, that is, 30 and 50, but we will also examine certain
.«·· Oriental""···· I Pyrenees ·24
ι • Regueibat Tworeg Kel KummerlS
I deles and some Saharian populations
Systems: ABO Rhesus MN PTja KellCellano
3· Sufi
Saqudlan_OE Arabs " 2 5
« 16
\ 2 · Chaomba . Λ m' Rabtlnes |8 "" ""'"··
, •·. % Ideles · Ι Η . .„ , Be|a • 9 , v Twareg · 19 " Rabtines
Harratins Ideles \ / Isseqamares * lss®2: y . «Twareg 20®
5 Ajjer Fulani bororos
Be)a • 9 Harratins Ideles
Achaehnc m<Li . 0υϊ?!' ·% i'ojanet ί
"Twareg ?·. \ v . «12 Air " ' 7
10 «Ethiopians t « . — · — — · ~ ' v , SaouraBI3
' «bKIIUpiUMS T *
}SoouraBI3 ·•; /
Diameters of f lklonB|7 \ Harratins// Recent Ah0«0r ·6 / corresponding , 4 . 17 ΛsroC , · »Cross bredj X arborescent analysis %"»"AhlAzzl ' 1 23 «.•»• \ 15· Agadesins I \ >.«.··"
\ Horrotins ' i \ \ Ahaggar * χ \ Iklon Ideles #22
Bokabo· «. «26»
\ «27. I Tooka ;
Figure 16. χ2 distances between twentyseven Mediterranean Saharan and Negro populations for fire red blood cell antigen loci

a r
ο
g e P N 9 > i m —
Ο Ο PN I n a c i n
is M C Η
o \ S » s t · β
f S P N r l
Ν Η Ι Λ Ν 2 P I S 3
< S T T t t i l 0 0
S S
r~~ & M i l O Ν » Ν
> h W Ι Λ
» ι m m p n
W rr> s o i i e 9 s « « T T »
V C i n _ . 9 0 P N Ι Λ
S S 3 Ν
£
• β
S
a s s s r ι · *
1/1 J N
3 i s i n
n « e « Η
β \ - - — — < s i n S ®
0 C V ) rt
f i " 3
^ M i
i n m ν
t c Ν u i Ν ί
rf> η r «
W V^l M l . Ο Ρ ) Λ Μ η « — "
Ι S S
rr> β I » »
Ν ( * ϊ Γ Ο r v e i n
«hN Φ h Η v c i n £ s 0 0 0 0
t » r i n r r .
s
r ·
P N Λ f ) i n p n 9 « « N r i
v e — r » ^ £ 3
9 « h Ν η » 0 5 Μ « · Ν h « e « o o S i c
9 0 9 0 V C •
o o 9 s 9 s Μ Η Λ P N 9 s f
Λ 5 ^ m e Η Ν o e η
e n n e Η Ο Η Η o o i >— r
S R
g
C
5
2
I * » Ν f )
S ° 3
e ο t ^ v i Α v i m ί . Ή
i n r β • η «
» S V C £
I f » > «
— v c β
0 0 T f t « Η Ν Ν V ) 1 » —<
β β £
8 3 ρ Ν
v e i n Η β ν « r ^
W i e W h N f h Η 3 Λ M f ο χ
P N 9 s
β
i n r
8 8 I » &
ν ο ο η » s a o Ι - 00 0 0 t o o g g g f n « v e
3 3 5
9 s « N n o i n
η i n β * o o » « M s e o V C » S 9 0 β Γ
0 0 Ν cS00 ® 3
ν β f i 00 ν β ν
i n r m C : 9 r N h O f I I
ξ ?
« « «
8 S
a
a
£
eo o e <
1*1 Ν O f « ® ^ « P N
C J P N a Ν 3
n o w
r »> OC t « · « δ η ^ P N P N
t » 9 s t> VC v e V ) i n ρ * < s
» λ « n e s v e β o o o o ο
i l i
i n r o β \ Ν <»> * Η r 9 s ®
o o 0 0 1 1 f S Ν • η o o o o
i n v e ^ « o o
t
ί i n ^ ϊ Ο 0 0 Η 9 . Ο Μ Ν η
ΤΗ 0 0
8 S Ν P N
v e 9 s
P S
p n r § *
Λ Γ » « S β p n « m o O H i n i n o o e s 9 v v e 0 0
Η J j « i n s e Ι Λ 0 0 ι Q ί « o o ® o o f »
9 > < s
S P
9 0 V C N N Η 1 » β ν Ο σ ν t v C
e e η i n m Η ϊ M S f
9 C v e V C r j
cd
ff
« S V C V C p n « i n P N P N
o o χ Η
C J « ®
i n r o 9 0 n o o n o o f 9 s
i n » η r ^ P N P N P N ^ o o i n ( S p n
P N P N —Η
S i l ?
J S
ω
er BQ
Η
' 3
Η
J
Η
T ?
Η
Ν eg
f S
5 SS! P N P N
Ο Ν Η H « 0 0 0 0 ^ 9 s I i i β h
p n e 9 s
s s s s
Φ N «
Η Ο
i n i n w O 9 s f S 9 , r » i n
9 0 r > • η ^ i n
( H V C 3 S ® S 3
P N 9 s O ( s i n e i n 9 s p n
9 0 P N T f P N « P N
Ν « «
I i
P N
Ν 3
η Η e ι * · η S o f ) Η
S S o e i n
S f 5 = 3 y i « ^ Ξ 5 1 a 5 3 Ξ a 5 S 2 ο ? ?
υ
•Ό C Λ
Ζ
S
J 3
ο ί
Ο
CD <
<υ υ c
χ
υ JB
Ο Χ
α ο
3
α 8 .
C Λ U · ( β
Λ α
c/3
<υ ε
Ό C 03
(Λ
J B 13 Τ 3
3 6 0
2 7 4WVTSRPNLIHGFE PHILIPPE LEFEVREWITIER, HENRI VERGNES
regroupings already existing at diameter 20. Samples studied are obtained from works already published, or in the process of publication at the Hemotypological Center, CNRS. The populations of Bejas Ethiopians and Saoudite Arabs have been studied by the London Serological Population Laboratory (Mourant, Kopec, and DomaniewskaSboczak 1958).
The regrouping of Regueibat and Oriental Pyrenees (A at diameter 20, see Figure 15) is suggestive of one Mediterranean association because Afro and EuroMediterranean origins are here clearly combined. Another group (Β) seems to be quite close to the Mediterranean type, but with nearOriental trend. This group consists of Soufis and Chaambas, who are supposedly of Arab origin, and they very clearly merge with the Saoudians (S). The Kel Kummer Twareg (C), whom we have seen are close to Mediterraneans, are still isolated at this diameter, as are Fulani Bororos (D). Native Ethiopians and Harratin Ethiopians from Saoura merge (£). At this stage, it is necessary to define "Ethiopian." Native Ethiopians already have been the subject of a particular racial classification by Η. V. Vallois (1959). Their intermediate characters between blacks and whites secured for them a position in fact applicable to numerous tribes situated more to the west of the Sahara, tribes whose mixture with MelanoAfricans is still to be proved. A "hybrid" implies an intermediate genetic expression. However, this is not always the case, as seen from our investigations into unequal contributions in gene flow. All the populations in contact between white and black Africa can be labelled "Ethiopians." The best representatives, in addition to the inhabitants of Ethiopia, are the Bejas, the Danakils, the Tebbous, the Ouniangas, the Kanouris, the Nemadis, the Imraguens, the Fulani Bororos, and, lastly, certain Twareg tribes. In (F) the Idelesian Harratins are grouped with the Bejas, the Touggourt and Ouargla Harratins, and the Melanoderm Twareg of Air.
Four Ideles populations whose proximity already has been seen in analyses number 1, are grouped with the Twareg fractions with whom they are associated, Ajjer Twareg and Ahaggar Twareg (G). The Djanti form a separate group; although they are relatively endogamous in Djanet, they are quite close to Idelesians (Η). It is not at all surprising to classify in one unique group the Ahl Azzi and Hoggar Harratines, the Iklans from the Twareg camps, and, from the Ideles settlements, the Agadesians (/). In fact, the Ahl Azzi sample collected in 1959 at Tidikelt was genetically more distinctly Negroid than the Ideles sample. On the other hand, the Hoggar Harratin samples taken in 1964 in the villages of the Ahaggar included numerous captives (Iklan) recently promoted to gardener status. Lastly, the Gagoos are united in a homogenous tribe (/).
At diameter 20, a structure is easily recognized emerging from an apparently heterogenous group of Saharan populations. Four principal
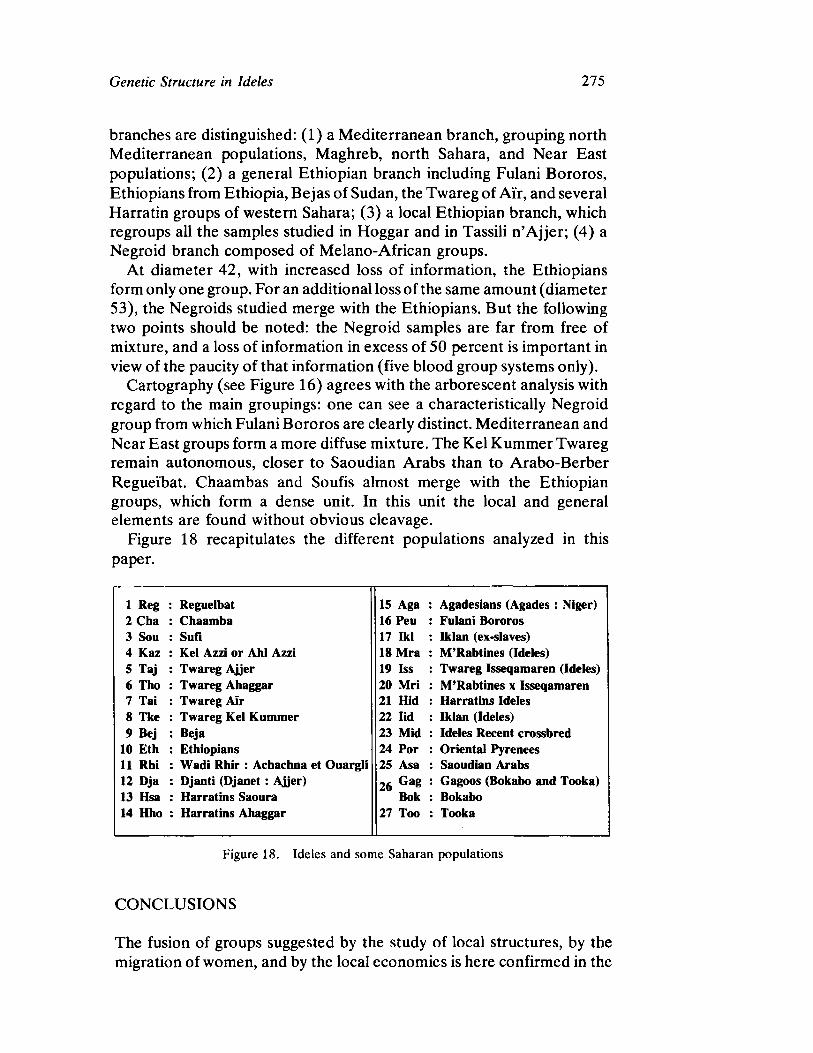
Genetic Structure in Ideles 275
branches are distinguished: (1) a Mediterranean branch, grouping north Mediterranean populations, Maghreb, north Sahara, and Near East populations; (2) a general Ethiopian branch including Fulani Bororos, Ethiopians from Ethiopia, Bejas of Sudan, the Twareg of Air, and several Harratin groups of western Sahara; (3) a local Ethiopian branch, which regroups all the samples studied in Hoggar and in Tassili n'Ajjer; (4) a Negroid branch composed of MelanoAfrican groups.
At diameter 42, with increased loss of information, the Ethiopians form only one group. For an additional loss of the same amount (diameter 53), the Negroids studied merge with the Ethiopians. But the following two points should be noted: the Negroid samples are far from free of mixture, and a loss of information in excess of 50 percent is important in view of the paucity of that information (five blood group systems only).
Cartography (see Figure 16) agrees with the arborescent analysis with regard to the main groupings: one can see a characteristically Negroid group from which Fulani Bororos are clearly distinct. Mediterranean and Near East groups form a more diffuse mixture. The Kel Kummer Twareg remain autonomous, closer to Saoudian Arabs than to AraboBerber Regueibat. Chaambas and Soufis almost merge with the Ethiopian groups, which form a dense unit. In this unit the local and general elements are found without obvious cleavage.
Figure 18 recapitulates the different populations analyzed in this paper.
1 Reg Regueibat 15 Aga Agadesians (Agades : Niger)
2 Cha Chaamba 16 Peu Fulani Bororos 3 Sou Sufi 17 Ikl Iklan (exslaves) 4 Kaz Kel Azzi or Ahl Azzi 18 Mra M'Rabtines (Ideles) 5 Taj Twareg Ajjer 19 Iss Twareg Isseqamaren (Ideles)
6 Tho Twareg Ahaggar 20 Mri M'Rabtines χ Isseqamaren 7 Tai Twareg Air 21 Hid Harratins Ideles 8 Tke Twareg Kel Kummer 22 lid Iklan (Ideles)
9 Bej Beja 23 Mid Ideles Recent crossbred
10 Eth Ethiopians 24 Por Oriental Pyrenees 11 Rhi Wadi Rhir : Achachna et Ouargli 25 Asa Saoudian Arabs
12 Dja Djanti (Djanet: Ajjer) 26 G a S Gagoos (Bokabo and Tooka)
13 Hsa Harratins Saoura Bok Bokabo 14 Hho Harratins Ahaggar 27 Too Tooka
Figure 18. Ideles and some Saharan populations
CONCLUSIONS
The fusion of groups suggested by the study of local structures, by the migration of women, and by the local economies is here confirmed in the
2 7 6ZWVUTSRPONMLJIHGFEDCBA PHILIPPE LEFEVREWITIER, HENRI VERGNES
results of calculation of genetic distances, and especially in ascending arborescent analysis. This fusion process is as yet lightly marked, contrary to what a superficial observation of the village would lead one to suppose. Distinct genetic entities endure: Harratins, Twareg Isseqamarenes, excaptives (Iklans). This is clear in three analyses, carried out using different data. The regrouping of Ideles fractions with their original populations occurs harmoniously and with no important loss of information. The Twareg Isseqamarenes merge with Ajjer Twareg at diameter 18, as do the Iklans with their counterparts of the nomad camps. The Harratins find their Saoudian homologues at diameter 25. Only the M'Rabtines of Ideles appear very different from their supposed Tidikelt cousins.
On a more general level, Harratins and Iklans are still distinct in the village and merge easily in more important groups, corresponding to their historical origins. Ideles is an original nucleus, determined geographically, an "Ethiopian" nucleus, but with recent black African admixture, as demonstrated in many genetic systems.
Subsequent investigations by analytical methods into principal components will attempt a comparison of genetic structure representations by the use of sociological and anthropological models (Langaney 1972a, 1972b) and also by direct parameter study of individuals. It will, lastly, reconstruct the evolution of each component gene pool of these Ideles fractions by computing genealogical distances (Jacquard 1972).
REFERENCES
BARRERE G.
1972 Problemes economiques d'un centre d'altitude au Sahara: Ideles (Tamanrasset) — Algeria.xvutsrqponmlihgedcbaTSLJCB Journal d'agriculture tropicale et de bot
anique appliquee 18 (12). BENABADJI M., J . RUFFIE, P. LEFEVREWITIER
1969 Les grandes donnees de l'hemotypologie des populations sahariennes. Colloque international sur la biologie des populations Sahariennes.
Algiers. CAVALLISFORZA, L. L.
1962 "The distribution of migration distances: models and applications to genetics," in Les deplacements humains. Edited by J. Sutter, 139158. Entretiens de Monaco in Sciences Humaines I. Monaco: Hachette.
CONSTANS J . , P. LEFEVREWITIER
1973 "New genetic data in Twareg area, part 1: Haptoglobins in Ideles (Ahaggar — Algerian Sahara) and in Iwellemeden Kel Kummer Twareg (Malian Sahara)," in Blood groups and blood group distribu
tion. Edited by Alice Brues and Dennis P. Van Gerven. The Hague: Mouton.
GAST M.
1971 "Le peuplement d'Ideles," in Travaux du laboratoire d'anthropologie
Genetic Structure in Ideles 277
prehistoire, ethnologie, du pays de la Mediterranee occidentale. AixenProvence: Universite de Provence.
GRUBB, R.
1960 "Hereditary gamma globulin groups in man," in Ciba Foundation Symposium on Biochemistry of Human Genetics. Edited by G. E. W. Wolstenholme and C. M. O'Connor. Boston: Little, Brown.
JACQUARD A.
1972 Evolution du patrimonie genetique des Kel Kummer. Population 45:784800.
1973 The genetic structure of human populations. Translated by B. Charlesworth and D. Charlesworth. New York: Springer.
JENKINS Τ., H. C. HAPENDING, H. J . GORDON, et al.
1971 Redcell enzyme polymorphisms in the Khoisan peoples of southern Africa. American Journal of Human Genetics 22:513532.
LANGANEY A.
1972a Description de la structure transversale d'une population: application aux Bediks. Population 1:83111.
1972b "Mesure de 1'apparentement intra et inter villages chez les Bediks." Doctoral thesis, Paul Sabatier Universite, Toulouse.
MAURANSENDRAIL Α., P. LEFEVREWITIER
1973 "New genetic data in Twareg area, part 2: Haemoglobins in Ideles (Ahaggar Algerian Sahara) and in Iwellemeden Twareg (Malian Sahara)," in Blood groups and blood group distribution. Edited by Alice Brues and Dennis P. Van Gerven. The Hague: Mouton.
MOURANT, A. E. , A. C. KOPEC, K. DOMANIEWSKASOBCZAK
1958 The ABO blood groups: comprehensive tables and maps of world dis
tribution. Oxford: Blackwell. ROGNON P.
1967 Le massif de l'Atakor et ses bordures (Sahara Central). Etude geomorphologique. CRZA geologie number 9. Paris: Centre National de la Recherche Scientifique.
ROPARTZ, C., L. RIVAT, P. Y. ROUSSEAU, et al.
1966 Seven new human serum factors presumably supported by the gamma globulins. Vox Sanguinis 11:99102.
RUFFIE J . , P. LEFEVREWITIER
1972 "Ergebnisse serologischer Forschungen in der Sahara," in Die Sahara
und ihre Randgebiete, Band II: Humangeographie. Edited by Heinrich Schiffers. Munich: Veit Forum Verlag.
STEINBERG, A. G.
1967 "Genetic variation in human immunoglobulins: the Gm and Inv types." in Advances in immunogenetics. Edited by Τ. J. Greenwalt. Philidelphia: Lippincott.
VALLOIS, Η. V.
1959 Les bedouins taamre du desert de Judee: etude anthropologique. L'Anthropologie 63 (l2):6292.

Microevolutionary Dynamics Among
the Gavdas of Goa
K. C. MALHOTRA
The several hundred Mendelian castes and tribes of India provide unique opportunities to study human variation in its several forms. Nature and history have, provided circumstances of control and variations that, in many ways, approximate laboratory conditions (Karve 1965:333). India with its many endogamous groups and its variety of cultural practices — mating patterns, professions, numerical strength, population density, and so on — offers an unusually advantageous situation in which to study problems of population dynamics, for example, founder effect, genetic drift, and natural selection. The information supplied by archaeological and historical research, that many groups having different gene pools — Parsis, Iranis, Tibetans, and so on — have immigrated to India, adds
We are extremely grateful to Shri Dayanand Baododakar, chief minister of Goa, who not only showed keen interest in our study but also helped a great deal in establishing rapport with the Gavdas. During our last trip, he was very kind and generous and kept at our disposal his jeep (and the driver) without which we could not have achieved our targets.
Thanks are due to Lt. Col. Cutta of the Armed Forces Medical College, Poona, for typing the blood samples. We are extremely thankful to Professor S. R. Das who not only supervised the bloodtyping at the Indian Statistical Institute but also guided the statistical treatment of the data.
To Dr. C. R. Rao, F.R.S., director, Indian Statistical Institute, Calcutta, the author is indebted for his encouragement and suggestions.
We are very thankful to Mrs. Kamal Patkar and B. Vijaya Bhanu, for assistance in the fieldwork and in the analysis of the data. The latter was responsible for most of the analysis of dermatoglyphic data.
We also thank D. C. Rao and R. Chakravarty and S. K. Das for help in the statistical analysis of the blood group data. We thank Miss K. Awati, Miss V. Shirole, S. Khomne, S. Panse and Patrick Dassan for helping in the analysis of the data. Mr. Dassan also typed the manuscript.
We record our sincere thanks for Dr. S. K. Mali, assistant director of education, Goa, Div and Daman, who first drew our attention to the Gavda population. Through his wide contacts he helped us a great deal in making contacts with the Gavdas. Without his painstaking efforts, the blood samples could hardly have been collected.

280 Κ. C. MALHOTRA
another dimension for study, that is, cultural and biological adaptations.
A great deal of data — historical, sociocultural, and biological (morphological and genetic) — is now available on several endogamous castes and tribes. One of the aspects of the caste system — the origin of different endogamous groups (castes and subcastes) — has received enormous attention in the past, yet is still not fully understood. Two models have been suggested to explain the origin of several subcastes.
According to one model the different endogamous groups having the same general name or rank are the products of the splitting of a single parent group. The parent group in anthropological literature is called a caste and the endogamous groups, subcastes. A brief description of this sronifaV
fission model would not be out of place.1
All the Hindus, according to this model, are divided into four Varnas:
Brahman, Kshatriya, Vaishya, and Shudra. Each Hindu by birth belongs to one of the Varnas. These Varnas are arranged in descending order of ritual status (rank), Brahmans at the top. Under each Varna there are several castes, and usually each caste belongs in one linguistic area. Finally, the castes have several subcastes.
Figure 1 is a diagrammatic representation of a classical model of caste structure. Thus, while Brahman (B) is a Varna, Bt, Bz, and B3 are Brahman castes found in Maharashtra, Tamilnadu, and Assam, respectively. These Brahman castes, in turn, through a process of fragmentation, have given rise to several subcastes in each region, for example, BY BY and B3
X in Maharashtra, BY BY and B32 in Tamilnadu, and so on.
The salient feature of this model is that it assumes a continuous process of fragmentation or fission and thus suggests the inherent genetic relationships between subcastes, castes, and Varnas. For further treatment of the subject see Malhotra (1972).
The other model of caste structures has been proposed by Karve (1958a, 1958b, 1958c, 1961). On the basis of cultural data and physical measurements it has been shown (Karve 1941, 1948; Karve and Dandekar 1951) that the subcastes are not invariably derived from the caste. While there are historical cases in which subcastes have split off from a larger group, many socalled subcastes are independent social realities, sharing with other subcastes a social status and function but lacking the biological affinity which would be expected if they were the result of a splitting.
Such subcastes probably found, or made a place for themselves, in the caste structure by assuming a caste name to indicate their status. At the same time the subcaste retains its group character through endogamy. This process continues to this day (see Karve 1961:6265; Malhotra and Karve 1971). 1 This is rather a simplified version.
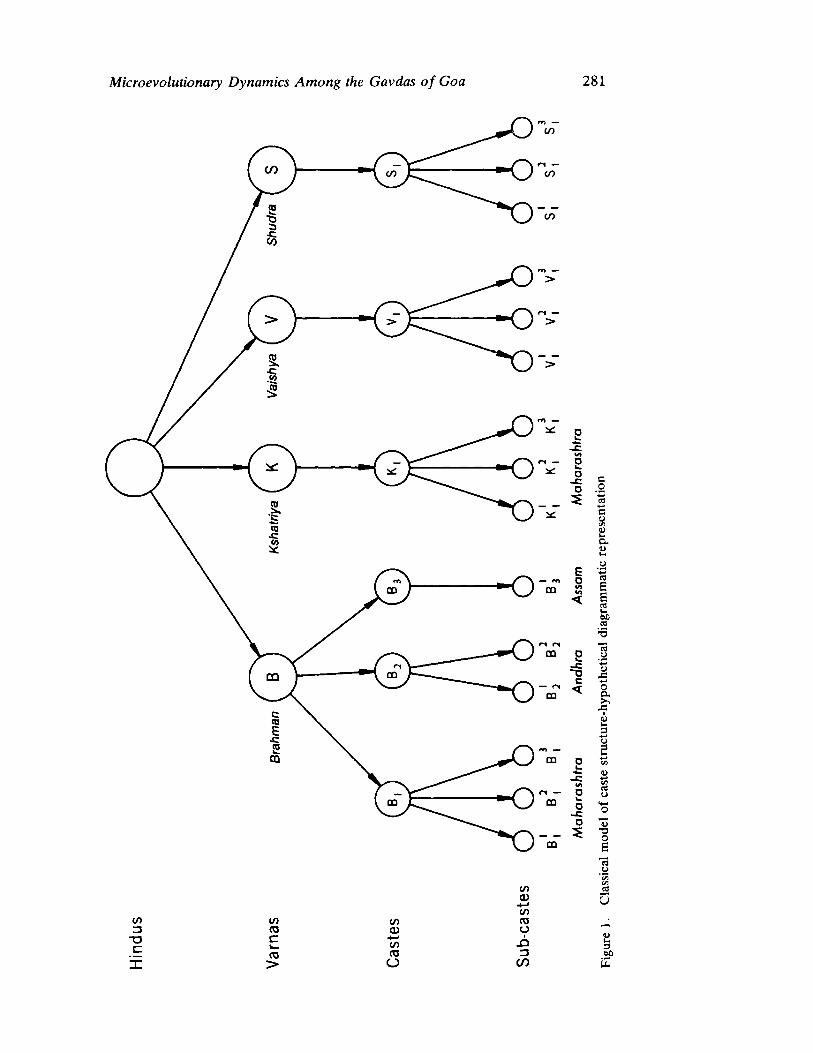
Microevolutionary Dynam ics Am ong the Gavdas ofGoa 281
D w Ο
c ο
Β Ο
5 « — — ^ w
Ε Ο
c c
ο
Cu ω
es ε ε CB 14 Μ Μ
η υ
Ο α . > .
χ :
ο 3
05 υ
<υ Ό Ο ε "λ <J
«Λ
•α c
in η c ω >
(Λ α;
·*>
co CTJ
Ο
10 α>
4J t o (Ο υ
J D
CO
U
3 Ού
2 8 2 Κ. C. MALHOTRA
Figure 2 is a diagrammatic representation of this model. There are two important aspects of this model: (a) it assumes no fusion of the endogamous groups at any level as contrasted to the classical model; and (b) the utsronmligfeca
migration seems to be the dynamic source of caste patterning. According to this model, there were people who evolved from prehis
toric times in the Indian subcontinent, as evidenced by the existence of remains of lithic industries found scattered throughout the subcontinent. It appears that most of the tribes of the Deccan and central India represent the autochthonous people. The model further focuses attention on the several migrations that brought culturally and genetically diverse populations to the subcontinent. Internal migrations of the autochthonous people have also been accounted for. The model, however, assumes that the origin of most of the migrant groups is obscure, although many of them seem to have immigrated from central Asia.
The phenomenon of fission now plays an important part. The immigrants and the autochthones often dispersed in search of new good areas and eventually separated from the parent group. Thus, different parts of the parent group perhaps went to various regions and assumed or were given different rank or status. For example, BV B4
2, and K3X are split
groups of a single group, and while the segments B1! and B42 attained
Brahmanhood in Maharashtra and Tamilnadu, respectively, and K3! found a place in the Kahatriya Varna in Maharashtra. Similarly four split groups B*4, Κ4!, V1!, S22 of an immigrant group went to Assam (B%), MaharashtraK (K^ ) , Tamilnadu ( ν \ ) and Bengal (S2
2) and attained the status of Brahman, Kshatriya, Vaishya, and Shudra, respectively. These groups, according to the model, wherever they went, maintained their identity through strict endogamy.
Each region (usually linguistic) thus had several endogamous groups with different ranks and probably specialized professions. These groups called castes, as in this model, further made certain clusters usually based on similarity in economic pursuits. To these groupings, Karve gave the name casteclusters2 (and castes per the classical model), for example, B„ B2, B3, and B4 representing Brahman castecluster in Maharashtra, Gujarat, Tamilnadu, and Assam, respectively; Kx and K2 representing Kshatriya castecluster in Maharashtra and Assam, respectively. Similarly, the Vaishya and Shudra casteclusters were found in different areas.
The four types of casteclusters, B r . . . B„, Kj .. . K„, V l ... V„, and St . . . S„, gave rise to four Varnas: Brahmans (B), Kshatriya (K), Vaishya (V), and Shudra (S); and all the Hindus by birth conform to one of these four Varnas.
It may be noted in the diagram that while different endogamous groups form a cultural fusion, due to certain common attributes within caste
2 For further details see Karve, 1961.
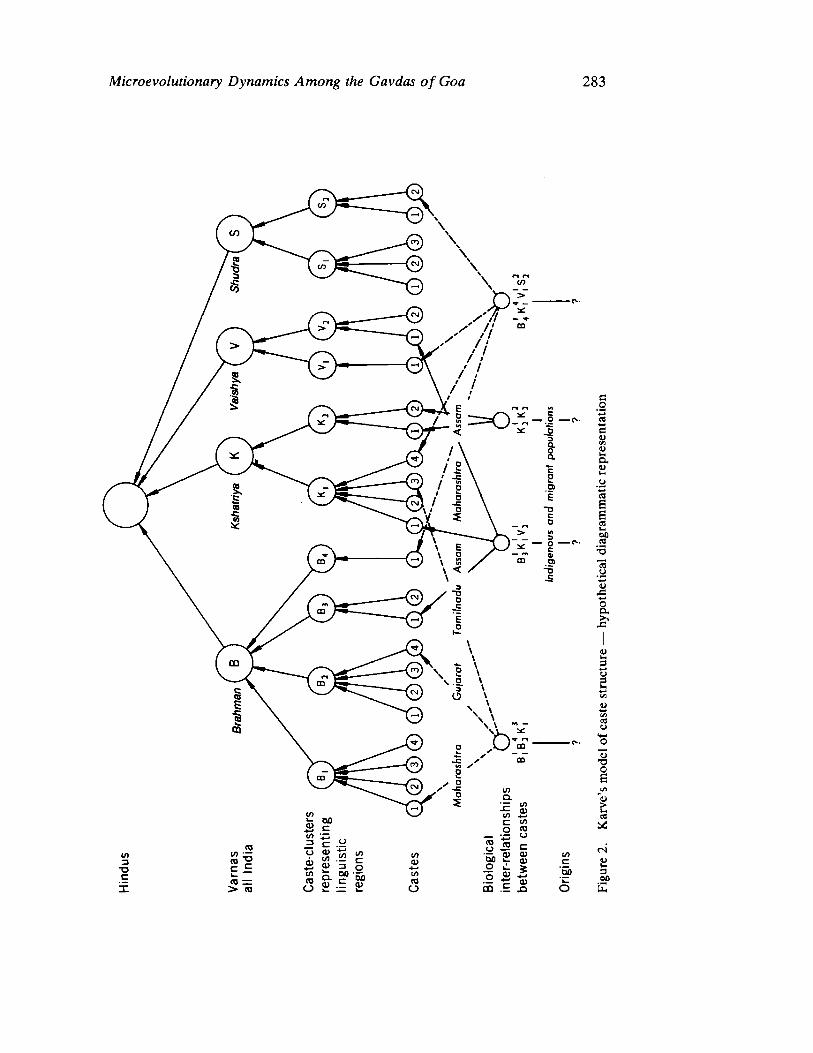
Hindus
Varnas
Brahman
Ksha
triy
aShudra
allIndia
Caste-clusters
repres
enting
(81)
CG)
@&
©©
WM®
&&
linguistic
regions
|
Castes
QVWVO®”DOOOMQO
GUdBOaQO®Q
GOOOOO
O~
\~
‘v
an
“a.
Maha
rash
tra
Guja
rat
Tami
lnad
uAs
sam
Maharashtra>
Assam
~~.
\Y
N7
Ws
we
~s
.Lf
‘4—
~‘
7“on
2
Biological
Nee
Ty
inter-relationships
oO
Oo
;y
)'
between
castes
B,BK,
B,K,V,
K5K}
B,K
I|
Indigenous
and
migrant
populations
Origins
]|
??
?
«.
Figure
2.Karve’smodelof
castestructure—
hypo
thet
ical
diagrammaticre
pres
enta
tion
Microevolutionary Dynamics Among the Gavdas of Goa 283
2 8 4TROMLHCA Κ . C. MALHOTRA
clusters, Varnas, etc., they do not intermarry. This is indicated by the
arrows. In the classical model the direction of category formation is
reversed:
Hindus—»Varnas—»castes—»subcastes
each one being the result of fission and thus having genetic affinity with its
predecessor. Thus while Karve's model takes into account the dynamic
aspects of castestructure, the classical model emphasizes its rigid aspects.
To examine Karve's model of caste structure, two population investiga
tions were undertaken by Malhotra (1966) and Gulati (1968). Both
surveys found Karve's model very useful in interpreting the biological
variation among the groups studied. The results of Malhotra's study on
eight endogamous groups of Maharashtrian Brahmans are summarized
below. For further details, see Malhotra (1966, 1967a, 1967b, 1967c)
and Karve and Malhotra (1968).
1. There appears to be great heterogeneity in both morphological
characters and genetic traits among the eight endogamous Brahman
castes.
2. The analysis reveals that independent origins can be suggested for
six of the eight groups. Two groups could not be distinguished from one
another.
3. Groups Madhyandina and Deshastah Rgvedi were found to be
nearer to Maratha, a nonBrahman caste; similarly, Saraswats showed
close affinities with a nonBrahman group — Chandra Seniya Kayshtha
Prabhu. Gulati (1968) also found similar results. This situation of biolog
ical interrelationships within the caste cluster and between the castes of
different casteclusters is expected; for example, B ^ (Brahman caste),
K1! (Kshatriya caste), and V ^ (Vaishya caste) showed close genetic
similarities as compared to the castes of the same castecluster (see Figure
2)·
We [Karve and Malhotra] were fortunate to have received critical
comments from eighteen distinguished scholars on our investigation
presented inyutrponlhgeCA Current Anthropology. Although most of them agreed on
the details of design, methodology, and statistics applied, Bhalla
(1968:116117), Hiernaux (1968:118), Hulse (1968:119), Connolly
(1968:118), Sharma (1968:123), and Singh (1969:224) felt that the
heterogeneity observed for morphological and genetic traits among the
eight endogamous groups could be due to genetic drift rather than inde
pendent racial affiliations.
In the absence of authoritative historical records on these groups, it is
very difficult to answer whether the observed differences are the result of
genetic drift or of different genetic affiliations.
We strongly feel, however, that solutions to these problems could be
found in the following ways:
Microevolutionary Dynamics Among the Gavdas of Goa 285
1. Through examination of the range of variations of a single characteristic in the various endogamous groups.
2. Through largescale comparison of a number of castes and subcastes, in other words, an analysis of the matrices of distances between all the pairs.
3. By studying the populations of the following types: (a) populations that showed historical evidence of fission; (b) split groups that shared the same environment; (c) split groups that showed no evidence of significant miscegenation; (d) split groups that did not change their food habits and in which medical care remained the same for the split groups; (e) split groups in which isolates intermingled in such a way that the individuals did not differ from each other in their daily life except in restricting the selection of mates within one's own group.
If a population of this type is studied, it may be possible to answer the question raised above. We were lucky to find the very type of population, the Gavdas, in the union territory of Goa, who form the basis of the present investigation. This is thus a followup study of Malhotra's work (1966) mentioned earlier. With certain limitations, an examination of the hypothesis on caste origins in India, proposed by I. Karve and others will be possible. The results will also be discussed from the point of view of various evolutionary processes, particularly genetic drift, founder effect, and natural selection. Earlier Karve and Malhotra (1970), Malhotra and Karve (1971), and Bhanu and Malhotra (1972) reported results of some characteristics.
THE POPULATION
The Gavdas, who number about 2.4 million are found scattered throughout the union territory of Goa. Most of them are small farmers. They speak an IndoAryan language called Konkani, held by some scholars to be a dialect of the Marathi language. Although they eat fish, there is a taboo on eating chicken and eggs. They drink liquor heavily. Their staple food is rice and fish.
Around the year A.D. 1620, part of the Gavdas were converted to Christianity. This conversion gave rise to two endogamous groups from one breeding population. Interestingly enough, during the period 19261932 part of the Christianized Gavda community was reconverted to Hinduism. This reconverted split group is known as NavHindu Gavda. The Hindu Gavda as yet do not consider NavHindus as Hindus and therefore have no marriage reciprocity with the NavHindu Gavdas. The three groups, namely, Hindu Gavdas, Christian Gavdas, and NavHindus, thus formed three religious isolates through fission from one
2 8 6 Κ. C. MALHOTRA
panmictic population. The present (1969) population3 strength of these groups is as follows:
The three split groups maintain strict endogamy and, in 240 marriages recorded, not a single instance of violation was detected. The marriages are contracted both within and outside the village. In 10 percent of the total marriages, the partner was from the same village, whereas in the rest the distance varied from two to sixtyfive kilometers, with an average of a little over twenty. Considering the length and breadth of the Goa territory, it seems that the marital alliance system is widely scattered among the Gavdas.
The Gavdas allow both matrilateral and patrilateral types of crosscousin marriage. The incidence of consanguineous marriages is incorporated in Table 1. Of all the consanguineous marriages (fortytwo, 17.5 percent) 85.7 percent are of the matrilateral type. It is interesting to note that although the patrilateral type of crosscousin marriage is theoretically permitted, the actual incidence is very low. For matrilateral crosscousin marriage it is significant to note that the Christian Gavdas have only 1.3 percent while the Hindu Gavdas and NavHindus have 23.61 percent and 19.78 percent, respectively. We are unable to explain this at the moment, but our inquiries with the Christian Gavdas showed that they continue to practice these preferential marriages.
The age at marriage for males varies from eighteen to twentyfive years with an average of twenty years, and for females it varies between fifteen and nineteen years, with an average of seventeen years. Although no data were collected regarding the average age of mothers at the birth of their children, or the average of all fathers, it can safely be guessed that since the Gavdas are mostly illiterate and do not employ contraceptives, most of the married women will get pregnant within twelve to twentyfour months after marriage. On this assumption, the calculated average age of mothers at the birth of their children and the average age of all fathers will be approximately nineteen and twentytwo years, respectively. Thus 20.5 years may be taken as the current span of a generation. Therefore, the first and the second split in terms of generations took place from about seventeen to eighteen and two generations ago, respectively.
3 These figures have been obtained from the leader of these groups and are, therefore, at best very rough popular estimates. There was no other source through which such figures could be obtained. One thing is certain: Gavdas collectively are the most numerous group in Goa.
Groups
Hindu Gavdas (H.G.) Christian Gavdas (C.G.) NavHindu Gavdas (N.H.) Total
Population strength
1,100,000 700,000 600,000
2,400,000
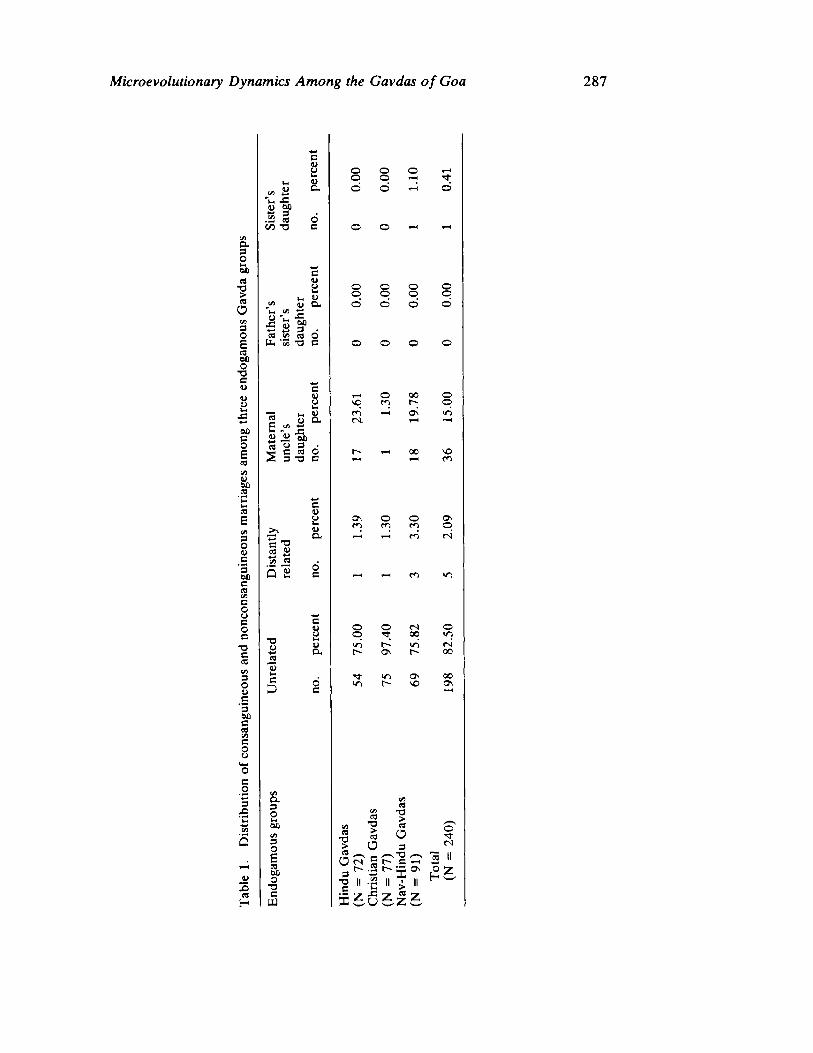
Microevolutionary Dynamics Among the Gavdas of GoaxwutsronmifedcbaVUTSONLIDC 287
α a ο
cd Ό > co ο lfODC(fl 3 Ο ε CO O D Ο •Ό Β υ υ υ
οο β ο ε S3 •SJ ω 0£| «
CO
ε β 3 Ο υ c '3 00 β Λ £Λ C ο υ Β ο c Τ) β CS tΛ 3 Ο υ β '3 60 C CO in β ο υ
3 Χ>
υ £ es Η
Μ U <υ an
3 .2 α on -ο
C ω υ ι» SL
ο Β
(Λ
Β υ υ w« u. t> <u Ο-U* ΪΛ I « §Ρ w wi ·
co co ο b ·« -α c
Β 1) υ 'S · -cSC δ? S ω α. C (Λ «ί Ά βό β ά 3 • <3 C Λ Ο 2 3 Ό Β
Β <υ υ Ια V α. α ^ cφ « [Λ CO
Τ3 ω CO "ω t-Β D
ο β
Β υ Η υ cx
ο. 3 Ο
3 Ο ε co on ο Ό Β ω
ο ο ο ο
ο ο ο ο ο ο
V5 CO •α > CO ο
τΐ-ο
ο ο
< ο 00 Ο Ν© CI t-; Ο τ—I ON ιτϊ C4- ΤΗ
NO
ON ο Ο ο ο ΡΙ (Λ © T—i
" 1 ri Γ4
ι—I CO ιο
ο Ο <Ν Ο ο TT 00 >/ >
r iri (N Γ- ON r- 00
t m ON 00 Ό t-- V© ON 1
CO <" 'S w
m
> Ο 3 ™ ^ _ Ο Ο «Ν Ε r- Β 3 r- -S r- a •σ II II i II C fc- ^ ΐ δ υ δ ζ δ
ο Tf <Ν
1 11
ο Ζ η 6
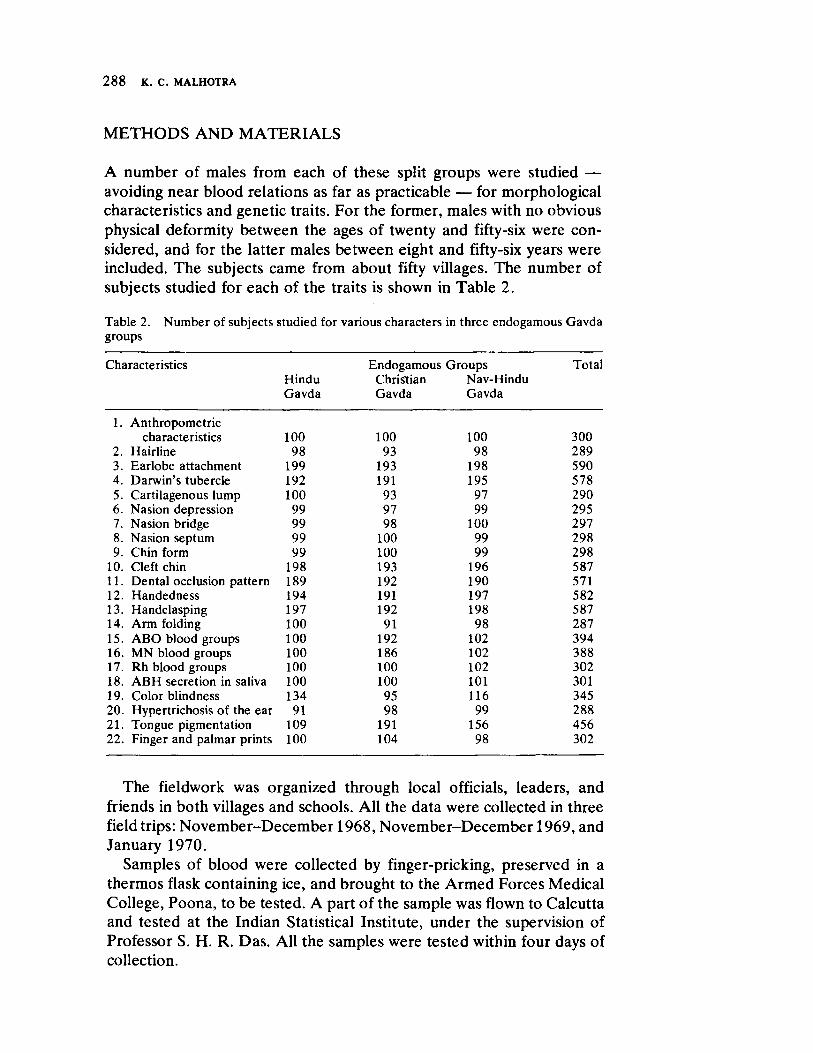
2 8 8TROMLHCA Κ. C. MALHOTRA
METHODS AND MATERIALS
A number of males from each of these split groups were studied — avoiding near blood relations as far as practicable — for morphological characteristics and genetic traits. For the former, males with no obvious physical deformity between the ages of twenty and fiftysix were considered, and for the latter males between eight and fiftysix years were included. The subjects came from about fifty villages. The number of subjects studied for each of the traits is shown in Table 2.
Table 2. Number of subjects studied for various characters in three endogamous Gavda groups
Characteristics Endogamous Groups Tots Hindu Christian NavHindu Gavda Gavda Gavda
1. Anthropometric characteristics 100 100 100 300
2. Hairline 98 93 98 289 3. Earlobe attachment 199 193 198 590 4. Darwin's tubercle 192 191 195 578 5. Cartilagenous lump 100 93 97 290 6. Nasion depression 99 97 99 295 7. Nasion bridge 99 98 100 297 8. Nasion septum 99 100 99 298 9. Chin form 99 100 99 298
10. Cleft chin 198 193 196 587 11. Dental occlusion pattern 189 192 190 571 12. Handedness 194 191 197 582 13. Handclasping 197 192 198 587 14. Arm folding 100 91 98 287 15. ABO blood groups 100 192 102 394 16. MN blood groups 100 186 102 388 17. Rh blood groups 100 100 102 302 18. ABH secretion in saliva 100 100 101 301 19. Color blindness 134 95 116 345 20. Hypertrichosis of the ear 91 98 99 288 21. Tongue pigmentation 109 191 156 456 22. Finger and palmar prints 100 104 98 302
The fieldwork was organized through local officials, leaders, and friends in both villages and schools. All the data were collected in three field trips: NovemberDecember 1968, NovemberDecember 1969, and January 1970.
Samples of blood were collected by fingerpricking, preserved in a thermos flask containing ice, and brought to the Armed Forces Medical College, Poona, to be tested. A part of the sample was flown to Calcutta and tested at the Indian Statistical Institute, under the supervision of Professor S. H. R. Das. All the samples were tested within four days of collection.
Microevolutionary Dynamics Among the Gavdas of Goa 2 8 9
In all, thirteen somatometric measurements, thirteen visual characteristics, and seven genetic markers were recorded on each subject. In addition, rolled bilateral finger and palmar prints were recorded for each subject.
In taking measurements, we have adhered strictly to the techniques recommended by Martin and Sailer (1956). The techniques for blood grouping were those described by Race and Sanger (1954); for testing color blindness, that of Ishihara (1959); for identifying hypertrichosis of the ear, that of Malhotra (1967c); and for tongue pigmentation, that of Rao (1970). The techniques followed for analyzing and collecting finger prints were those recommended by Cummins and Midlo (1961).4 With regard to ridge counting, the general principles adopted by Holt (1949) were followed.
CHOICE OF THE CHARACTERS
In the present investigation we sought to test how far genetic drift and other processes can bring in variations in gene frequencies of the split groups; therefore, traits with a known simple genetic mechanism, and also with a complex genetic background, were considered. The former were selected because genetic drift and selection can operate on these traits more effectively. On the traits having polygenetic inheritance, the action of mutation and selection is very slow and in cases of genetic drift, almost nonexistent.
In this report, results of analysis of thirteen somatometric characteristics, thirteen visual observations and eight genetic traits will be discussed. The somatometric characteristics are stature, auricular height, head length, head breadth, minimum frontal breadth, bizygomatic breadth, nasal breadth, upper facial height, external orbital breadth, interorbital breadth, orbitonasal arc, and horizontal circumference of head. The visual traits to be discussed are hairline, earlobe attachment, Darwin's tubercle, cartilagenous lump at the back of the ear, nasion depression, nasion bridge, nasion septum, chin form, cleft chin, dental occlusion pattern, handedness, handclasping, and arm folding. The genetic traits are ABO, MN, Rh blood group systems, AB Η saliva secretion, color blindness, hypertrichosis of the ear, and tongue pigmentation.
The analysis of the finger prints includes basic pattern types, and total ridge counts (in all, five characteristics), while the palmar dermatoglyphic incorporates mainline endings, simian crease, prevalence of thenar, hypothenar, and interdigital areas, Bettman's figures, atd angle and ab, bc, cd, and ad ridge counts (in all, seventeen characteristics).
4 For the classification of the Simian crease, methods advanced by de Lestrange (1969) and Bhanu (in press) have followed.
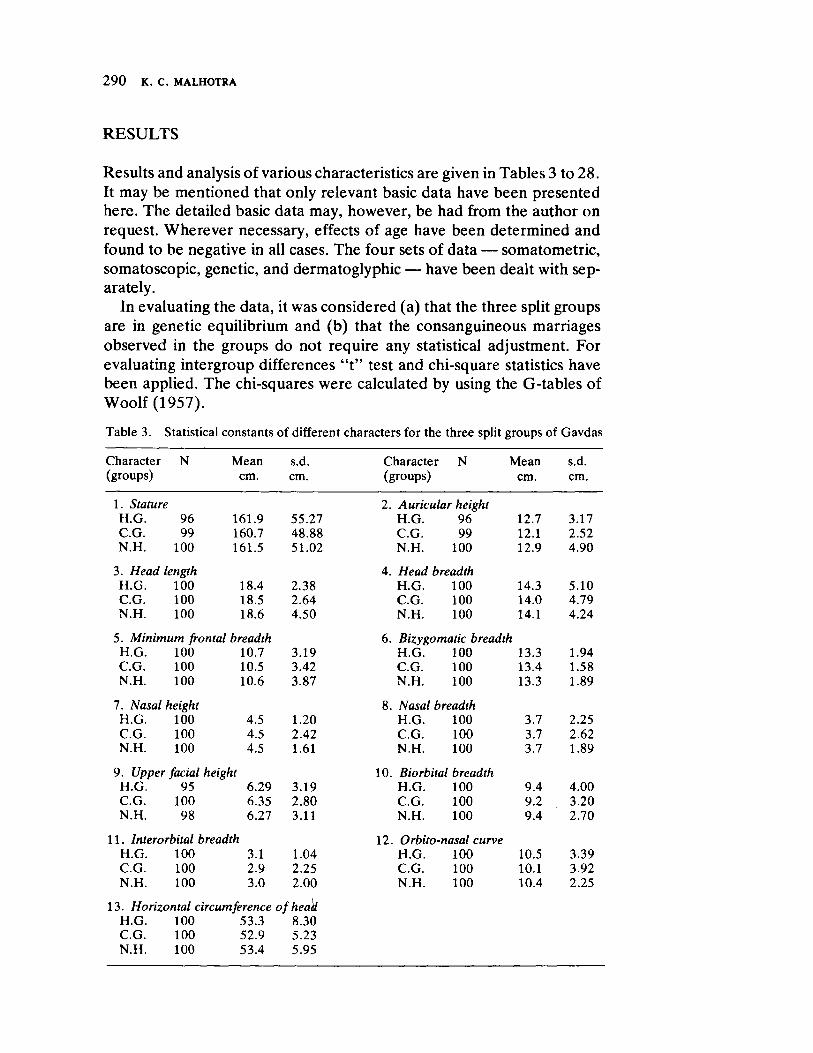
2 9 0vutsrponmlihgfedcbaTSRONMLHGCA Κ. C. MALHOTRA
RESULTS
Results and analysis of various characteristics are given in Tables 3 to 28. It may be mentioned that only relevant basic data have been presented here. The detailed basic data may, however, be had from the author on request. Wherever necessary, effects of age have been determined and found to be negative in all cases. The four sets of data — somatometric, somatoscopic, genetic, and dermatoglyphic — have been dealt with separately.
In evaluating the data, it was considered (a) that the three split groups are in genetic equilibrium and (b) that the consanguineous marriages observed in the groups do not require any statistical adjustment. For evaluating intergroup differences "t" test and chisquare statistics have been applied. The chisquares were calculated by using the Gtables of Woolf (1957).
Table 3. Statistical constants of different characters for the three split groups of Gavdas
Character Ν Mean s.d. Character Ν Mean s.d. (groups) cm. cm. (groups) cm. cm.
1.zyvutsrponmlkihgfedcbaUSONMIHBA Stature 2. Auricular height H.G. 96 161.9 55.27 H.G. 96 12.7 3.17 C.G. 99 160.7 48.88 C.G. 99 12.1 2.52 N.H. 100 161.5 51.02 N.H. 100 12.9 4.90
3. Head length 4. Head breadth H.G. 100 18.4 2.38 H.G. 100 14.3 5.10 C.G. 100 18.5 2.64 C.G. 100 14.0 4.79 N.H. 100 18.6 4.50 N.H. 100 14.1 4.24
5. Minimum frontal breadth 6. Bizygomatic breadth H.G. 100 10.7 3.19 H.G. 100 13.3 1.94 C.G. 100 10.5 3.42 C.G. 100 13.4 1.58 N.H. 100 10.6 3.87 N.H. 100 13.3 1.89
7. Nasal height 8. Nasal breadth H.G. 100 4.5 1.20 H.G. 100 3.7 2.25 C.G. 100 4.5 2.42 C.G. 100 3.7 2.62 N.H. 100 4.5 1.61 N.H. 100 3.7 1.89
9. Upper facial height 10. Biorbital breadth H.G. 95 6.29 3.19 H.G. 100 9.4 4.00 C.G. 100 6.35 2.80 C.G. 100 9.2 3.20 N.H. 98 6.27 3.11 N.H. 100 9.4 2.70
11. Interorbital breadth 12. Orbitonasal curve H.G. 100 3.1 1.04 H.G. 100 10.5 3.39 C.G. 100 2.9 2.25 C.G. 100 10.1 3.92 N.H. 100 3.0 2.00 N.H. 100 10.4 2.25
13. Horizontal circumference ofheak H.G. 100 53.3 8.30 C.G. 100 52.9 5.23 N.H. 100 53.4 5.95
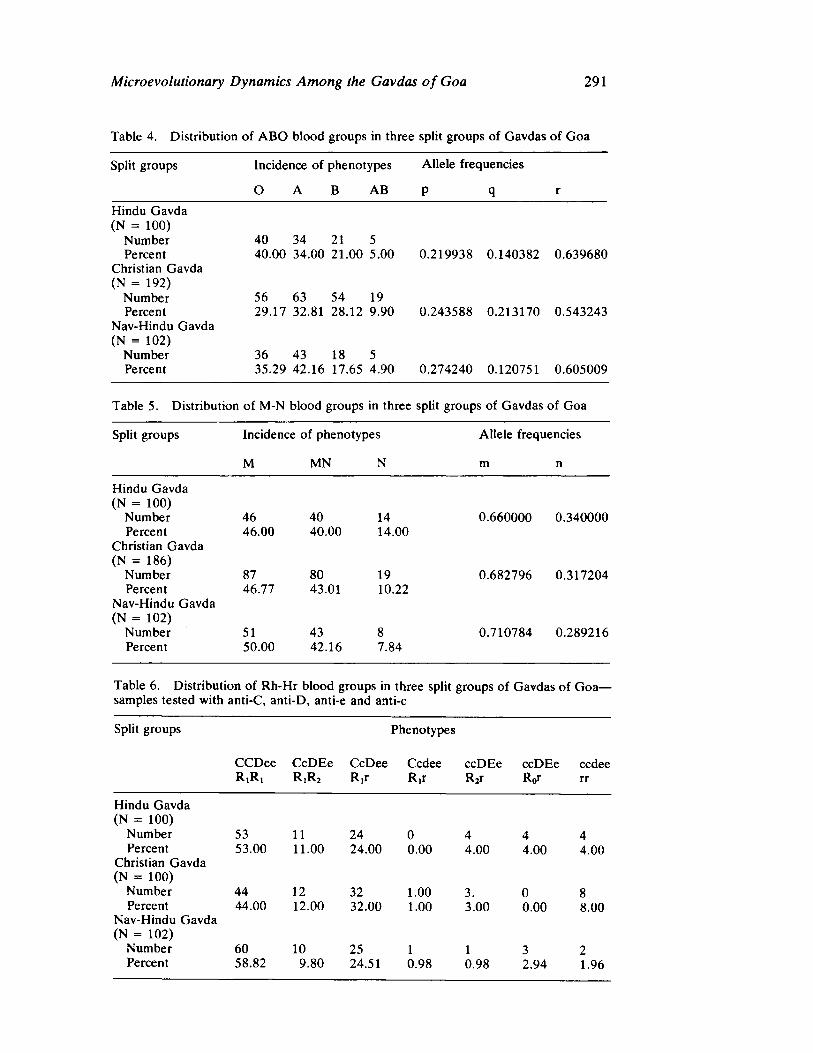
Microevolutionary Dynamics Among the Gavdas of Goa 291
Table 4. Distribution of A B O blood groups in three split groups of Gavdas of Goa
Split groups Incidence of phenotypes Allele frequencies
Ο A Β AB ρ q
Hindu Gavda N(N = 100)
Number Percent
Christian Gavda (N = 192)
Number Percent
NavHindu Gavda (N = 102)
Number Percent
40 34 21 5 40.00 34.00 21.00 5.00
56 63 54 19 29.17 32.81 28.12 9.90
0.219938 0.140382 0.639680
0.243588 0.213170 0.543243
36 43 18 5 35.29 42.16 17.65 4.90 0.274240 0.120751 0.605009
Table 5. Distribution of MN blood groups in three split groups of Gavdas of Goa
Split groups Incidence of phenotypes
Μ MN Ν
Allele frequencies
m
Hindu Gavda (N = 100)
Number Percent
Christian Gavda (N = 186)
Number Percent
NavHindu Gavda (N = 102)
Number Percent
46 46.00
87 46.77
51 50.00
40 40.00
80 43.01
43 42.16
14 14.00
19 10.22
8 7.84
0.660000 0.340000
0.682796 0.317204
0.710784 0.289216
Table 6. Distribution of RhHr blood groups in three split groups of Gavdas of Goa— samples tested with antiC, antiD, antie and antic
Split groups Phenotypes
CCDee CcDEe CcDee Ccdee ccDEe ccDEe ccdee RiRi R,R 2 Rir R,r R2r R„r rr
Hindu Gavda (N = 100)
Number Percent
Christian Gavda (N = 100)
Number Percent
NavHindu Gavda (N = 102)
Number Percent
53 53.00
44 44.00
60 58.82
11 24 0 11.00 24.00 0.00
12 12.00
10 9.80
32 32.00
25 24.51
1.00 1.00
1 0.98
4 4.00
3. 3.00
1 0.98
4 4.00
0 0.00
3 2.94
4 4.00
8 8.00
2 1.96

292 Κ. C. MALHOTRA
Table 7. Incidence of Sese phenotypes and gene frequencies in the three split groups of Gavdas of Goa
Split groups Phenotypes
SeSe and Sese Sese
Allele frequencies
Se se
Hindu Gavdas (N = 100)
Number Percent
Christian Gavdas (N = 100)
Number Percent
NavHindu Gavdas N( N = 101)
Number Percent
80 80.00
72 72.00
80 79.21
20 20. 00
28
28 . 00
21 20.79
0.85358
0.83267
0.85613
0.14142
0.16733
0.14387
Table 8. Incidence of color blindness among the three endogamous Gavda groups
Split groups Absent Present
Number Percent Number Percent
Hindu Gavda (N = 134) 127 94.78 7 5.22 Christian Gavda (N = 95) 95 100.00 0 0.00 NavHindu Gavda (N = 116) 111 95.69 5 4.31
Total (N = 345) 328 96.52 12 3.48
Table 9. Distribution of hypertrichosis of the ear among three endogamous groups of Gavdas
Endogamous groups Present Absent Number Percent Number Percent
Hindu Gavda
(N = 91) 32 35.16 59 64.84 Christian Gavda (N = 98) 41 41.84 57 58.16 NavHindu Gavda (N = 99) 32 32.32 67 67.68
Total (N = 288) 105 36.45 183 63.55
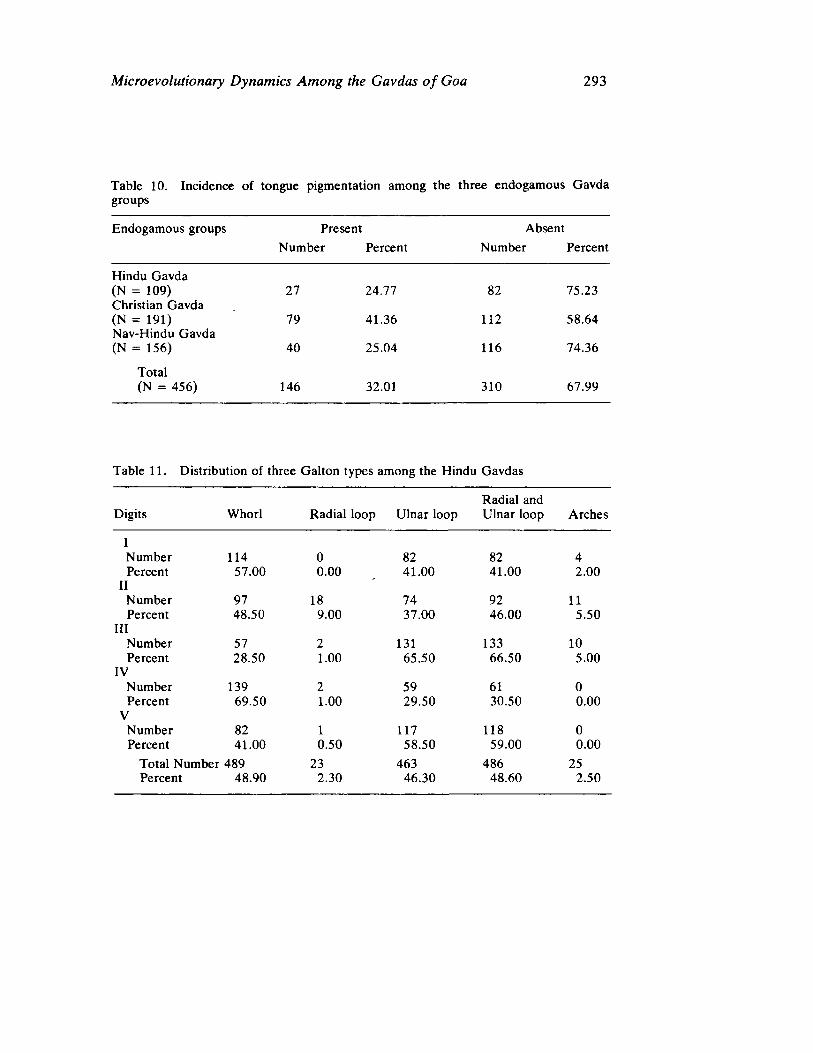
Microevolutionary Dynamics Among the Gavdas of Goa 293
Table 10. Incidence of tongue pigmentation among the three endogamous Gavda groups
Endogamous groups Present Absent
Number Percent Number Percent
Hindu Gavda (N = 109) 27 24.77 82 75.23 Christian Gavda (N = 191) 79 41.36 112 58.64 NavHindu Gavda (N = 156) 40 25.04 116 74.36
Total (N = 456) 146 32.01 310 67.99
Table 11. Distribution of three Galton types among the Hindu Gavdas
Radial and Digits Whorl Radial loop Ulnar loop Ulnar loop Arches
1 Number 114 0 Percent 57.00 0.00
II Number 97 18 Percent 48.50 9.00
III Number 57 2 Percent 28.50 1.00
IV Number 139 2 Percent 69.50 1.00
V Number 82 1 Percent 41.00 0.50
Total Number 489 23 Percent 48.90 2.30
82 82 4 41.00 41.00 2.00
74 92 11 37.00 46.00 5.50
131 133 10 65.50 66.50 5.00
59 61 0 29.50 30.50 0.00
117 118 0 58.50 59.00 0.00
463 486 25 46.30 48.60 2.50
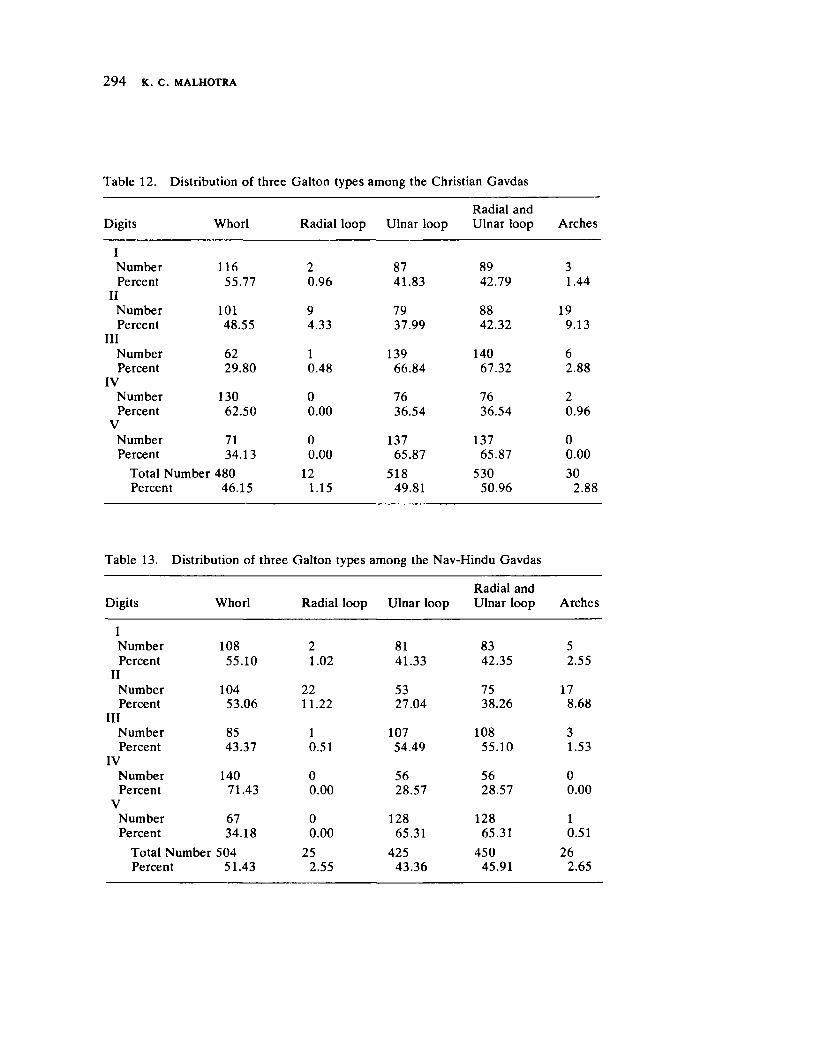
294 Κ. C. MALHOTRA
Table 12. Distribution of three Galton types among the Christian Gavdas
Radial and Digits Whorl Radial loop Ulnar loop Ulnar loop Arches
I Number 116 2 Percent 55.77 0.96
II Number 101 9 Percent 48.55 4.33
III Number 62 1 Percent 29.80 0.48
IV Number 130 0 Percent 62.50 0.00
V Number 71 0 Percent 34.13 0.00
Total Number 480 12 Percent 46.15 1.15
87 89 3 41.83 42.79 1.44
79 88 19 37.99 42.32 9.13
139 140 6 66.84 67.32 2.88
76 76 2 36.54 36.54 0.96
137 137 0 65.87 65.87 0.00
518 530 30 49.81 50.96 2.88
Table 13. Distribution of three Galton types among the NavHindu Gavdas
Radial and Digits Whorl Radial loop Ulnar loop Ulnar loop Arches
Number 108 2 81 83 5 Percent
TT 55.10 1.02 41.33 42.35 2.55
11 Number 104 22 53 75 17 Percent 53.06 11.22 27.04 38.26 8.68
III Number 85 1 107 108 3 Percent 43.37 0.51 54.49 55.10 1.53
IV Number 140 0 56 56 0 Percent 71.43 0.00 28.57 28.57 0.00
V Number 67 0 128 128 1 Percent 34.18 0.00 65.31 65.31 0.51
Total Number 504 25 425 450 26 Percent 51.43 2.55 43.36 45.91 2.65
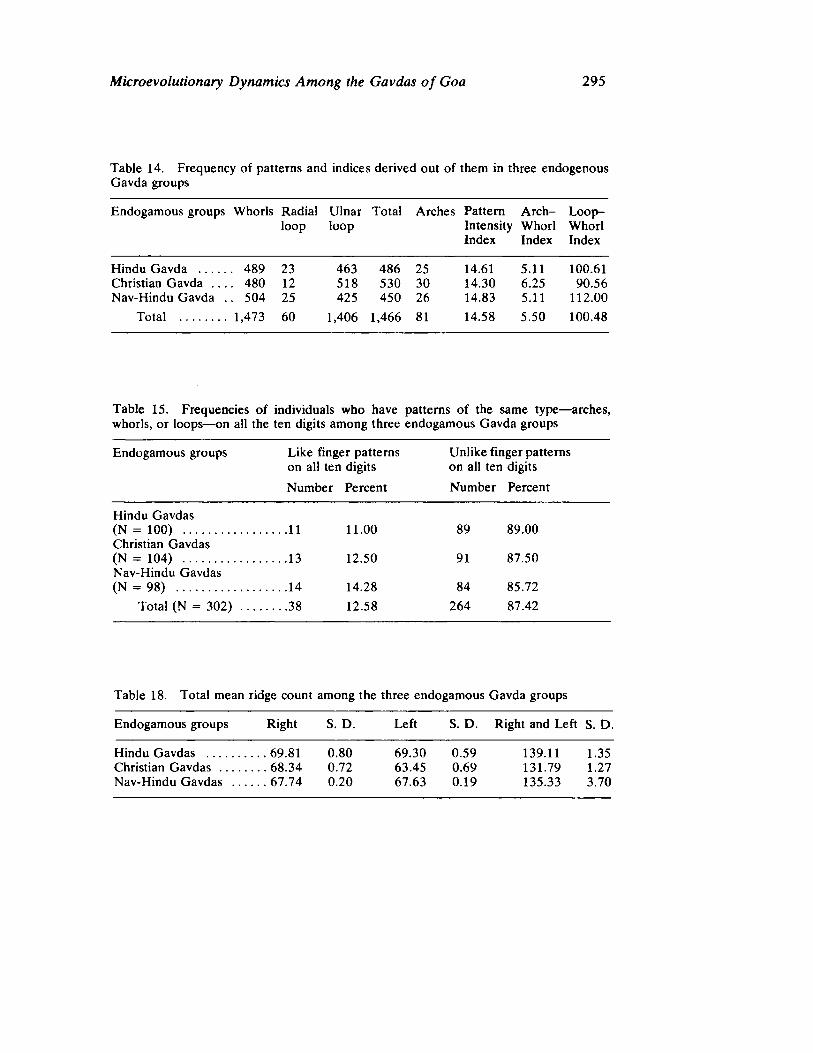
Microevolutionary Dynamics Among the Gavdas of Goa 295
Table 14. Frequency of patterns and indices derived out of them in three endogenous Gavda groups
Endogamous groups Whorls Radial Ulnar Total Arches Pattern Arch Looploop loop Intensity Whorl Whorl
Index Index Index
Hindu Gavda . 489 23 463 486 25 14.61 5.11 100.61 Christian Gavda . . . . 480 12 518 530 30 14.30 6.25 90.56 NavHindu Gavda . . 504 25 425 450 26 14.83 5.11 112.00
Total 1,473 60 1,406 1,466 81 14.58 5.50 100.48
Table 15. Frequencies of individuals who have patterns of the same type—arches, whorls, or loops—on all the ten digits among three endogamous Gavda groups
Endogamous groups Like finger patterns Unlike finger patterns on all ten digits on all ten digits
Number Percent Number Percent
Hindu Gavdas (N = 100) 11 11.00 89 89.00 Christian Gavdas (N = 104) 13 12.50 91 87.50 NavHindu Gavdas (N = 98) 14 14.28 84 85.72
Total (N = 302) . . . 38 12.58 264 87.42
Table 18. Total mean ridge count among the three endogamous Gavda groups
Endogamous groups Right S. D. Left S. D. Right and Left S. D.
Hindu Gavdas 69.81 0.80 69.30 0.59 139.11 1.35 Christian Gavdas 68.34 0.72 63.45 0.69 131.79 1.27 NavHindu Gavdas 67.74 0.20 67.63 0.19 135.33 3.70
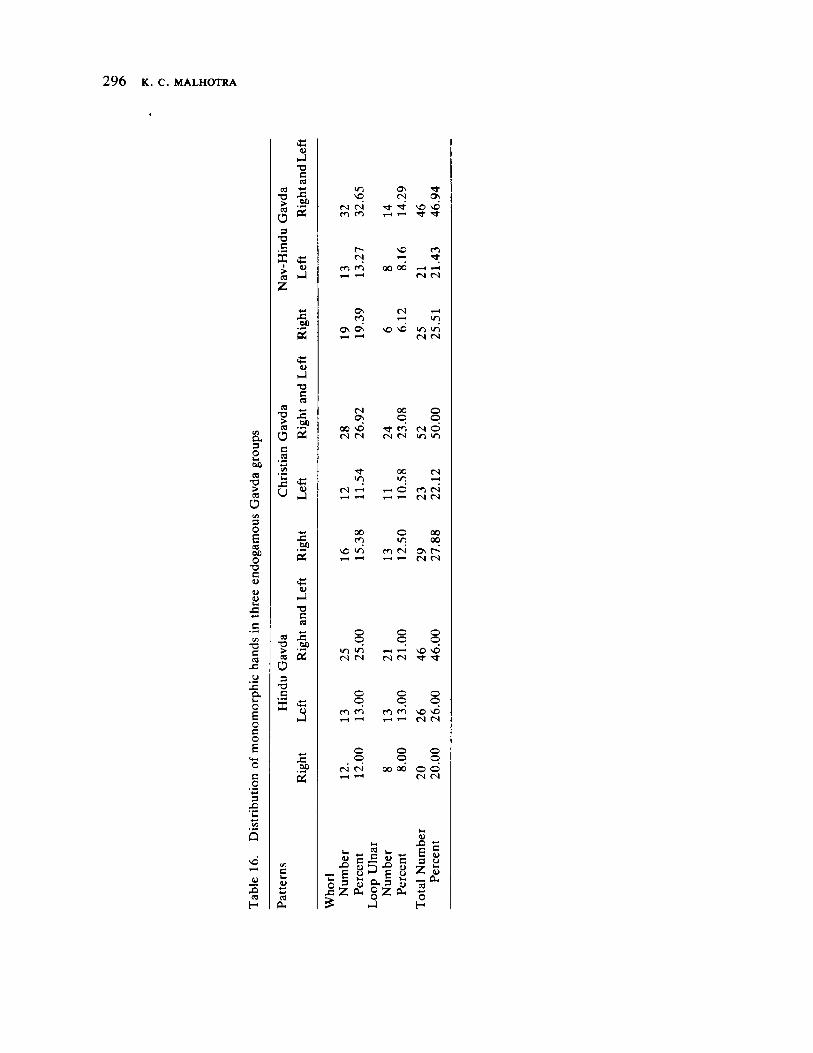
2 9 6 Κ . C . M AL H O T R A
<υ ι-J tnmaTQOJIC• Ό c a
« ϊ T3 "C > op 5 2
Ο
3 •Ό C
χ «
G. 3 Ο hi SO cd
13
tn Ο <Λ 3 Ο ε es 00 Ο
XI c ω υ oυ
- ο c Λ
J 3
£ α. ν-α Ε ο c ο ε
C ο
3 Χ>
νΟ
Λ BJ
Η
> π
Ζ
υ J
JB 00
2 υ
J •ο c CO
J 3 00
CO •D
ο 05 C π)
J 3 U
ω J
χ : 00 2 u
J •Ό C η
•C οο
to • Ό
% 2 Ο 3
Τ3 C
ω J
χ : οο
2
c ι* ω
π 0.
"Λ1
ίΝ CN cn ο
r -<Ν
ro
ON «Ν
<N
oo fN (M
•t i/->
00 ΓΟ
Ο ©
m vi CS CM
Ο ο
tnc cφ
ο Ο
SS * Ε QJ
Β · ° ρ ε Ο. 3 Ο Ζ ο
1-1
ττ σ\
• • Ο νο t
νο Ο
00 00 <Ν (Ν
σ\ t s CO
o\ o i \D ^d Ό Ό IN <N
00 Ο
Tf CO <N (N
00 in
© IT)
m cn
Ο Ο
f S © </Ί Ό
<N
{Ν (N
00 00
fN fN
Ο ο
<N CS
Ο ο
cnr rφ
ο ο
CM CN 00 00
Ο ο ν£>
TT -<t
ο ρ
so so (Ν <Ν
Ο ο
ο © fN (Ν
<υ 1 β Ι g
ζ 5 — CU π Ο
Η

Microevolutionary Dynamics Among the Gavdas of GoawvutsronmljifdcWVTSONMJIHC 297
05 ε <υ
OS
υ _3 73 >
•Ό C (β
OOS*5
05 ΐ
α . 3 Ο 14 00 CO •Ό > CO Ο (Λ 3 ο ε CO 00 Ο •Ό α υ υ «
c 3 Ο ο ω οο
Ό
υ οο c C CO ω
2
Χι CO Η
c 3 Ο υ ω οο
•Ο
C CO <u S
υ J
c οο £
00
S
(Λ <Λ <Λ ΙΛ "3 (Λ ΙΛ vi C« 3 3 3 3 οrf 3 3 3 3 Ο ο Ο Ο c ° Ο Ο Ο C C Π C
ηη η ^ C C C
<υ υ <υ α> ηη η ^ υ 1> υ οο οο 00 00 ηη η ^ οο οο 00 ο Ο Ο Ο 2 Ο ο Ο Ο
ε ε ε ε s ε ε ε ε 0 ο ο ο ω Ο ο ο ο χ Χ Χ χ 331 Χ Ι I
<0 "Ο > co Ο : : : : : ρ : : : : :
ο 1—1 S ^ ^
CO Τ3 > co ο 3 Τ3 C
(Λ [Λ (Λ VI 3 3 3 3 Ο Ο Ο Ο c Π Β C <υ ω ω ω 00 00 00 00 Ο Ο ο ο ε ε ε ε ο ο ο ο Χ Χ Χ Χ
(Ν r NO ο 00 <Ν no tH Ο ui CS ΓΛ Tj· On (Ν r on m CO Γ; CS vO 00 ι—1 ON (Ν © φ © tH ri φ ό tH Ο tH ο © Φ
t—( r (Ν vO 00 Ο tH m 00 ΙΛ> 00 Γ CM ο NO \o NO r» On >/> οο ο 00 Η tH NO
φ Ο Φ φ ό Φ φ ό (Ν 1Η Φ Ο © + + 1 1 1 + I I I + + + + + +
ON Τ <N NO 00 OS fNl NO tN 00 τ)· tH ΗΗ tH i—1 V, •Ί Tt H tH TH ό Ο ο Ο © © ο o Ο Ο Ο Ο Ο Ο ο +1 +1 +1 +1 +1 +1 +1 +1 +1 +1 +1 +1 +1 +1 +1
( S Γ IT) t s On 00 Ο Os ο ο ISt 1Λ1 NO Γ; Os 00 Ο m ON 00 On ο tH NO Ο; wi τ« (Ν CO vi τ—I <N tri tN Ο fNi Tt c4 tH tH ι—ι ι—Ι tH
'ί 00 00 m r On 00 " f r 00 On NO VO tH t—ι tH tH «η ί 'ί TH 1 tH tH tH ο Φ ό 6 Ο ο Ο ο ο Ο d Ο Ο Ο Ο +1 +1 +1 +1 +1 +1 +1 +1 +1 +1 +1 +1 + 1 +1 +1
r 00 r c i NO t ϊΗ r r r u> 00 00 t NO ro On fN HH ο o ON θΝ ο 00 >/") (Ν r; ui
tH rs in rφ r ο ri ^ tφ sd tH (Ν TT cφ I HH " j
tH »H »—(
CO •Ό > CO ο C co
> co Ζ ^ Η Η ^ ^ W
Μ Μ ^ ^
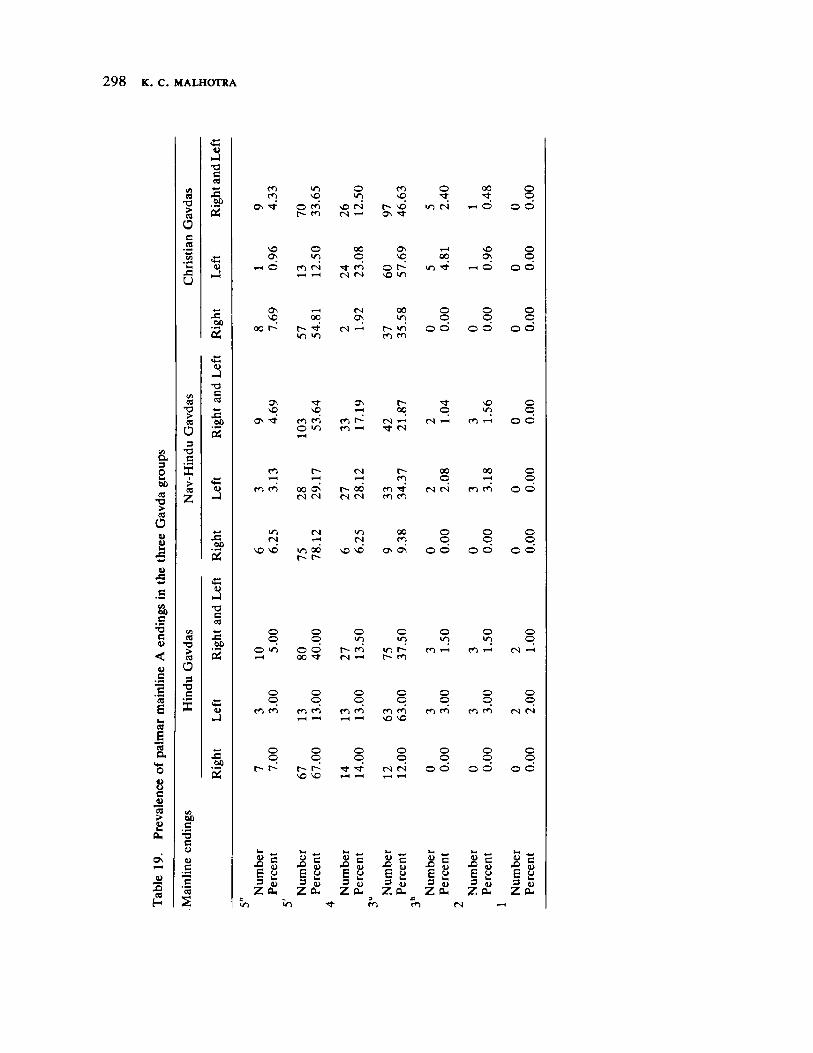
2 9 8vutsromigfcaVUTSRONMLJIHDCA Κ. C. MALHOTRA
•Ό >
ο
Ο
c Λ
JS
U
es Ό > m
Ο 3
Ό C
> Λ Ζ
« ι> J •α c Λ •C 60
5
υ J
J3 00 S
ω
Ό C (0 **
Λ ββ
ω J
OD 5
CO co
V) sO
Ο CO so
ο • t
00 ο ο
σ\ ο r
cφ CO
so (Ν
(Ν r» Ov
sφ </> es ο ο ο
ON Ο >/>
00 ο
Os SO
ι—1 SO
so Os
ο ο
Η Ο C"> (Ν I (Ν
cφ (Μ
Ο so
!/ > φ ο ο
os sO 00
(Ν os
00 U)
ο ο
ο ο
ο ο
οο r m m
(Ν r CO
vi Ο
ο ο ο ο ο ό
os sO sO
Os 00
t ο
so ο ο
ο CO ο τ—I
CO Ό
Γ«"> Π
C) T)· t s
CO τ—I ο ο
co t
Γ CS r co
00 ο
00 ο ο
co cφ 00 (Ν
os (Ν
r (Ν
00 CO CO CO
(Ν (Ν CO cφ ο ο
</Ί CS
(Ν ι—)
IT) t s
00 CO
Ο ο
Ο ο
ο ο
SO so Ό Γ
00 sO »o OS Os Ο Φ Ο Φ ο ο
η •Ο > Λ
α 3
•σ c
υ
Ό Β α
.2 βο
JC βο
5
ο ο ο ο ο ο ο ο ο Ό «1 Ό ο
ο ΙΟ ο Φ Γ cφ 1/> CO ( co τ1 (Ν fH τΗ 00 <* (Ν Γ CO
ο ο ο ο ο ο ο ο ο ο ο ο ο ο
CO CO co CO co CO co CO co co co CO (Ν (Ν ι—I I Τ—I ι—I so so
ο ο ο ο ο ο ο ο ο ο ο ο ο ο
r r Tt t s (Ν ο ο ο ο ο ό so so τ1 Τ—I I
00 C •3 C υ u c
Έ ' 3 S
Σ Έ
ε a
Ζ OL·,
ω c "g 5
Ι J3 «> Ζ ft
ω c •g 5 I a Ξ ω
Ζ ft
« C •g 5 Ι "
Ζ ft
5 ! δ
Ζ αί
υ £> ε 3 Ζ
5 Ε •g s
i ζ ft
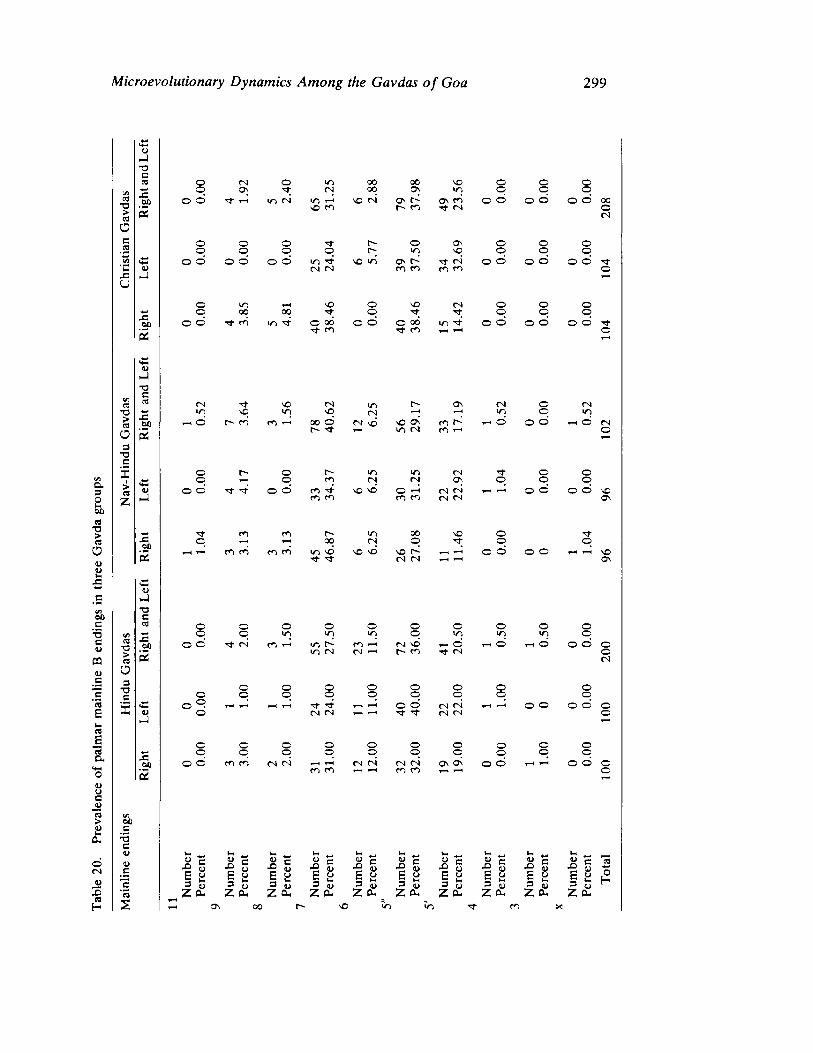
Microevolutionary Dynamics Among the Gavdas of Goa 299
C3 •Ό > re
Ο
Ε re
j = U
α 3
Ο
CS •Ό > re Ο ω υ
ο ο C
• α c 1>
<υ
" Ξ
' λ
ε
ce
ε • «
α
u ο c
1 3 >
ω
Ο ( Ν
S re
Η
<υ
— I
Ό
C re ^
χ ο ο
5
υ
J
re • Ό >
re Ο
3
Τ 3
C
> re
Ζ
Χ 00
ω
— I
Τ 3 C Λ
re Τ 3 >
re α
3 Ό Β
Oil
5
υ
J
Οίι
ω
J
•ο c Λ
Χ 0 0
<υ
J
χ 0 0
2
ο ο
c
ΐ c ο
0 )
Ε
Έ
' r e
2
ο t N ο ι ο 0 0 0 0 S O ο ο ο ο Ί ; CN 0 0 1/1 ρ ο ο
ο ό T t rt ι/-> t N ι-Η S O t N σ ν O s cφ Ο ο ο ο ο ό 0 0 ι/-> t N s © CO Γ - co t N ο
CN
ο ο © r - o O S ο ο ο
ο ο ο Ο P - ; < o S O ο ο ο
ο © ο ο ο ό 1/1 s c i n σ > r - • Ι " t N ο Φ ο ο ο ο Ί -CN t N c o CO CO co ο
ί
ο Ι Ο s o Ο s o t N ο ο ο ο 0 0 0 0 1 ; Ο Ί - ο ο ρ
ο ο " Ί f i Ο ο ό Ο Ο Ο 0 0 m • Ί- ο ο ο ο ο ο Ί -
Ί " CO Ί " co τ—1 ο 1-Η
CN Ί - s O t N V ) O s t N ο t N m S O
" " ί s O C N J T-H u-1 ο Ό
— ι 0 cφ CO 0 0 ο t N S O S O o ^ C I r - Φ ο ο I ο C N
Γ - Ί - ι—1 S O
t N CO i—1 ο
1
Ο r - © r - m </-> t N Ί - ο ο
Ο 1—ι ο CO t N t N O S Ο ο ο
Ο Ο ο ο CO S O s d Ο t N C N τ—1 ^ Η Ο ο ο ο s o Γ Λ t o c ο CO t N C N O S
Ί - co CO t— Ό 0 0 S O Ο Ί -
ρ τ—ι 0 0 t N ο ο ο
ι—I 1-Η CO r φ c o c φ SO S O S O s o r ^ fH ο ο ο ο τ—ι ,-Η s o
Ί " ' ί - CN t N O S
Ο Ο ο ο Ο Ο Ο ο ο ο
ο Ο ι ο > o " " ί
ο Ό Ό ο
Ο ο - Ί- t N CO ,-Η </Ί CO t—H ( N s d ό ό ^ Η Ο ο Φ ο 1/Ί t N t N »—ι r - CO r r t N ο
C S
ο Ο Ο ο © Ο ο ο ο ρ Ο ο ο ο ο ο ο
ο 9 1-Η Ί " ,-H I ο φ C S C N r—i ο ο ο ο ο ο ( Ν CN T—t τ—I Ί - • Ί- t N CN ο
ο Ο Ο Ο ο ο Ο ο ο ο ο ρ Ο ο ρ ρ Ο ο ρ ο
ο ο CO c i < Ν C N ^ Η C S t N C N C N O s O s ο ο τ-Η τ-Η ο ο ο Μ CO r - « τ—ι co CO 7—i »—I ο
5 Ξ
• £ 5
Ι-Η _ _ α> c
5
ha ^
« Ε
• 2 5
hH υ
Λ c υ
ι -Ο
X i C υ
kH υ
X
«- » c ω
b · ω
X )
e υ
υ χ
C υ
1-.
ω C
Λ s
t-t Ό
χ C υ
"re
ε α 3 5 Ι " 3
ε a 3 5
ε 3
υ *
υ
ε 3
υ
υ
ε 3
υ
ω
ε 3
u ^
ω
ε 3
υ i -
ν ι " ε 3
U ι^ υ
ο
Η
Ζ ΟΜ Ζ DH Ζ α . Ζ P u Ζ α . Ζ C u Ζ CU Ζ α . Ζ O u ζ 0 -
O S 0 0 Γ - s o C o ϊ η Ί - c o χ
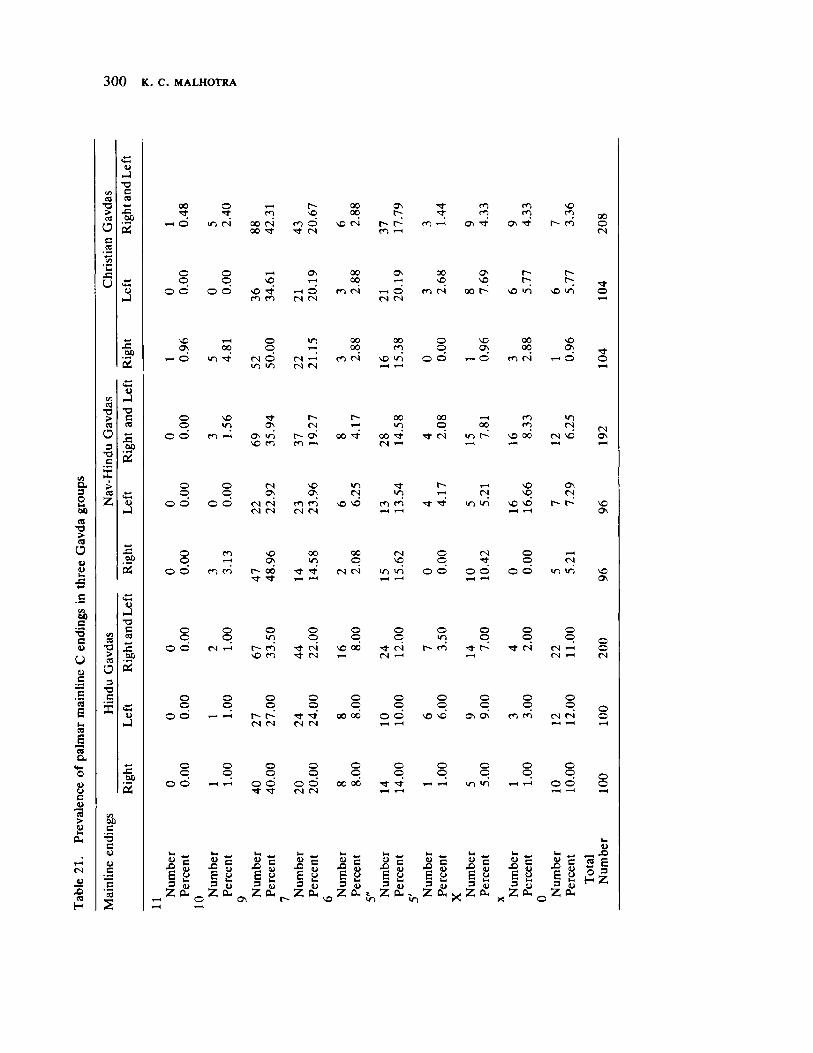
300 Κ. C. MALHOTRA
es •Ό >
w α c CO
Λ
υ
υ J Τ3 C η £ οο
υ —1
JS 00
Μ Ό > η Ο 3 13 C
> CS ζ
Ό C Cd
JS 00
2
ω
η Τ3 > eg Ο 3 Τ3 C
JS 00
1> I—I Τ3 C η
οο
£
ω J
00
00 Β
'S C <u
c
"Η " 3
2
00 ο r 00 Os co CO SO Tf •<t η Ό 00 t. CO co CO 00
Η Ο ΙΟ CS 00 (Ν CO Φ νΟ CS r r^ ro η Οι Tt Os ^t CO ο 00 τ! CS CO l—l CS
Ο ο OS 00 Os 00 Os r rο ο sO τΗ 00 so SO r Tt
ο ο ο © sO *t ^ Ο cο (Ν ιΗ d CO CS 00 r^ SO SO U") Ο CO CO CS es CN CS rH
so ο «ο 00 00 ο SO 00 SO OS οο ο ι—I 00 co ο OS 00 Os
—Ι φ es ο CS 1Η CO CS SD >o ο ο rt Ο CO <s d Ο m CS CN r1 ίΗ
ο sO Tj r Γ 00 00 co m ο ON CS Ι; ο 00 CO CS CS
ο ο CO »H ο vi r Os 00 •«f 00 •<t TT CS ST1 SO 00 CS sd 0\ so co co CS lH rt 1Η
ο ο CS SO "Π r SO Os ο ο Os Os CS Ύ—( CS so CS
Ο Ο ο ο (Ν <N co co so CO CO «ο so sd r^ so <Ν es CS ΓΝ l—1 lH Os
ο co so 00 00 CS Ο CS Ο ο τ—t Os >o ο so ο "Τ ο CS
ο ο en co Γ· oo •tt (Ν Ol «/l vi ο ο ο ό ο ο •ο u-i SO τ—) 1—1 1—( Os
ο ο © ο ο ο ο ο ο ο ο ο «Ο © ο ο ΙΓ) ο ο ο ο
ο ο (Ν *-< Γ- co CS sO 00 ' t CS CO •t r^ Tf CS CS ο sO co CS CS CS »—1 CS
ο ο Ο Ο ο ο Ο ο ο Ο ο ο ο ο ο ο ο ο ο Ο ο
ο ο 1—1 Η Γ»' 00 00 ο ο so sd Os Os co co CS CS ο (Ν (Ν (Ν Μ l-H I
ο ο Ο Ο ο ο Ο Ο ο ο ο ο ο ο ο ο Ο Ο ο ο ο
ο ο ι—I i-i ο ο Ο ο 00 οό τ 1-Η I Ι/Ι ιη Η 1—1 Ο ο ο Tf es CS ι—ι r-H »-H
UM 1«, h« b· · b· krt Ui * Jä ω S ·£ 5
ω S ·£ S
υ c ω
ω .C
Μ C υ
u χι C
ω U
£> C υ
« C •S 5
ω Λ C
υ ω c •ο 5
υ Χ) C
υ « ε
i " 5 υ ε y 5 «
ε 3
U
υ Ε 3
υ V-. <υ
ε 3
Ο 1)
ε 3
υ υ
ε a 5 δ
ε 3
υ u 1) Ι "
ε 3
υ α
Ο ^ Η Ζ
Ζ cm 0Η 0Η Pu CL, ~ Ζ ΟΜ CL, CL,
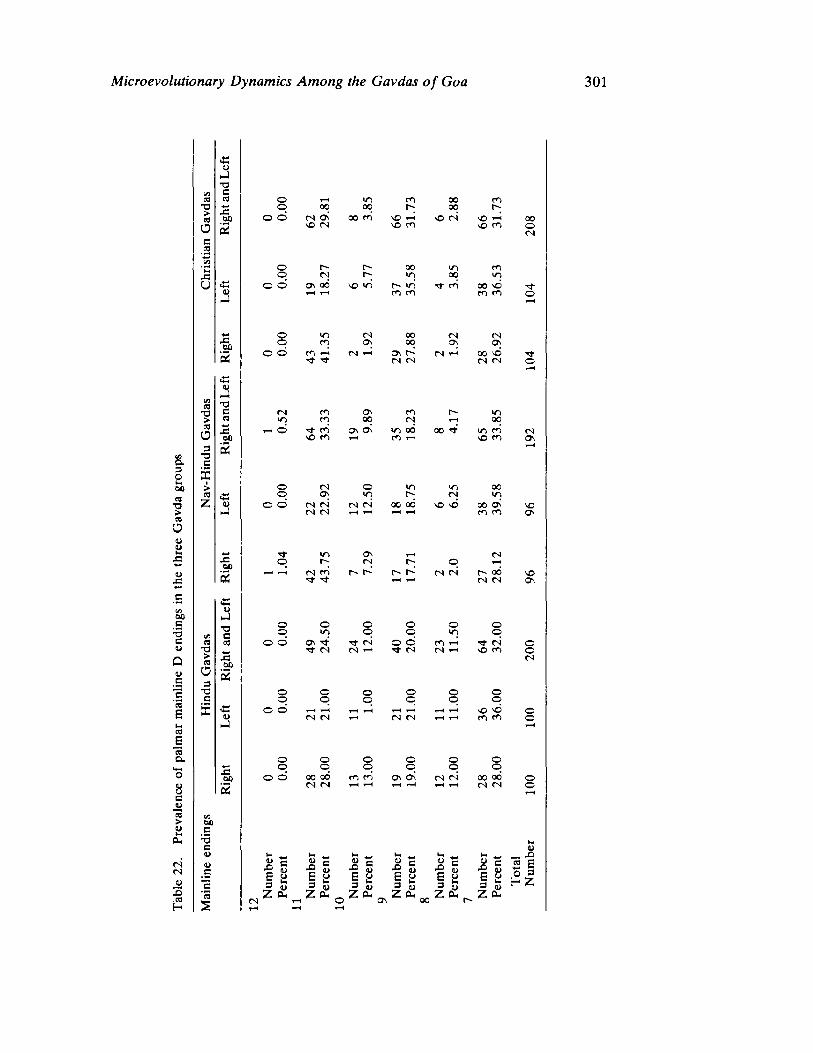
Microevolutionary Dynamics Among the Gavdas of GoazwutsronljihgfecXVUTONMJIHCB 301
cs •α > co Ο c η
.s υ
υ lJ Ό c α
J3 00
g. 3 Ο
sj •Ό > η α υ υ
οο •3 Β υ
υ c
'δ ε tl η Ε "re α
υ υ c > υ
(Ν CN
χ> CO Η
ce > cd
Ο 3 •Ό C
> η Ζ
η •Ό > CO Ο 3 •Ό C
α> iJ
00 2 <υ J Ό β 03 w Χ5 00
υ —1
J3 00
2
ω J Τ3 c ce je οο
υ Ι
j= 00
ΟΟ ε '•3 Β ω <υ β
"β
ο Η IT) CO 00 CO ο 00 00 P; 00 Γ;
ο ό (Ν σί 00 co NO H ΝΟ CN Νθ τ—1 00 NO CN NO CO NO co ο CN
ο Γ r 00 Ό CO ο CN 00 u·)
ο ο ΟΝ οό ο >/•> t vi co 00 NO •ΊτΗ τΗ CO (O CO CO Ο
ο »Π CN 00 CN (N ο CO ON 00 ON ON
ο ο CO τΗ CN H ON r CN τ—1 00 NO •ΊΊ Τ* (Ν fN CN CN ο ^
(Ν co ON CO Γ U") Ό CO 00 CN τ—1 00
^ ο Tf co ON ON m 00 00 •<t ΙΛ> CO CN Ό co ΤΗ CO τ—» NO CO Ον τΗ
ο CN Ο V) 00 ο on </") Γ; CN
ο ο (Ν cn CN CN 00 00 NO NO 00 ON NO CN CN τΗ CO co ON
ΤΙ ΙΤι ON TH CN ο CN Γ; ο τ—1 ΤΗ τΗ (Ν cφ r r r r CN CN Γ 00 NO Tf t T—1 CN CM ON
ο Ο ο ο Ο Ο ο v> © ο u1 ο
Ο ο On <ΐ •si rs ο ο CO TH t CN Ο «Ν rs l—l •<t CN CN T—1 NO CO ο (Ν
ο Ο ο ο ο Ο ο Ο ο ο Ο ο
ο ο ΤΗ τ—1 rH τΗ TH τΗ NO NO Ο CN CN τΗ (Ν CN TH τΗ CO CO ο τΗ
ο ο ο ο Ο ο ο ρ ο ο ρ ο
ο ο 00 00 CO CO ON ο\ CN CN 00 00 Ο (Ν tN τΗ ΤΗ τΗ τΗ T—i τΗ CN CN ο τΗ
ΙΗ <υ κ υ XJ •*> Β υ
ω Χ> Β ο
u XI Β ω
i— OJ
£>
• t-l Β U
ιοί XI Β 4> lH υ x> B ω
_ Χ) 2 Ε
Ε 3 U ΙΗ υ
Ε 3 υ Ιη U
ε 3 υ 14 Ο
Ε 3 υ l·* u
Ε 3 α ί* u
ε 3 υ hri α>
© J? Η Ζ Ζ ΟΜ Ζ Ο Ζ ΟΗ ~ z Ζ Ζ α. Τ"Η ο ON 00 1τΗ τΗ
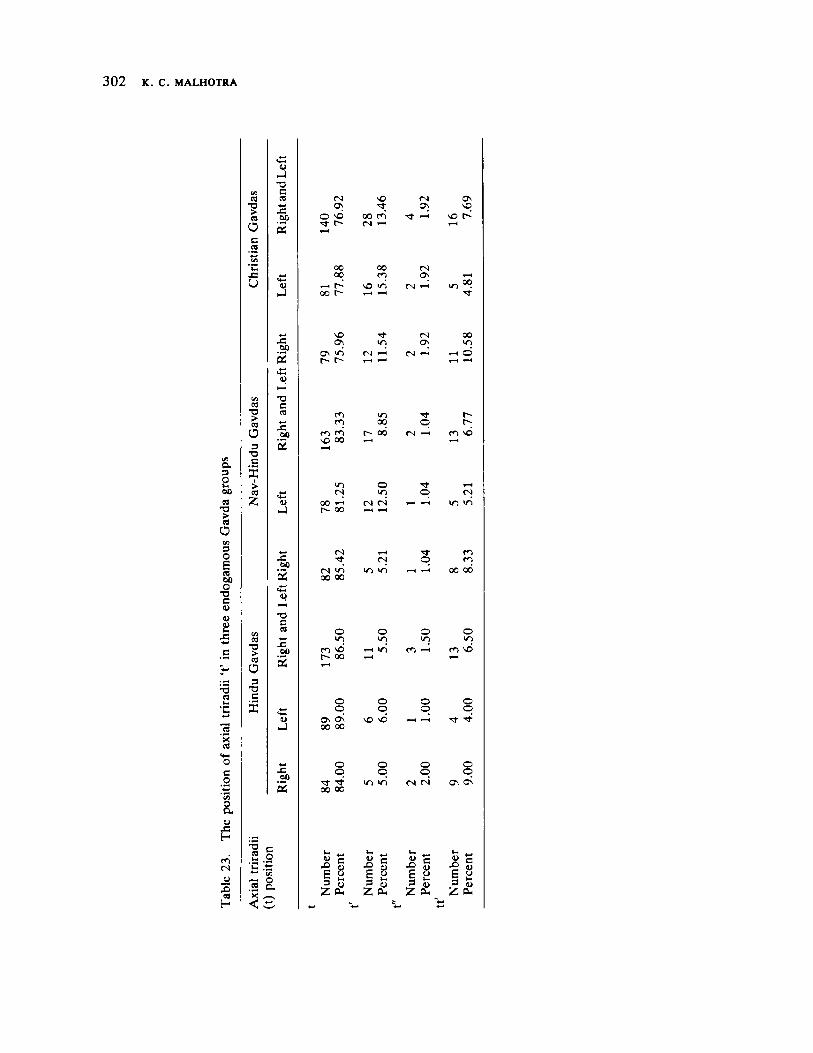
3 0 2wvutsrqonmiedcbWVTSRPONMLIHFCA Κ. C. MALHOTRA
CL. 3 Ο
η •Ό sroncOC>
cd
Ο ΪΛ 3 Ο ε η οο ο
•ο C υ ο ω
Τ3 Π]
χ es
C ο
a υ
χ : Η
ο es
Χ) η Η
CM OS
vO CS Os
o\
vq ο τ* τ—ι
VO Γ
00 00
00 CS
c i
00
Tt I
CS σ\
VO r
T—t
00 r
SO
>/Ί
ΙΛ)
(Ν
(Ν OS
Ό 00
00 ΙΟ
σ\ r r
cn
CN
<r>
00
CN
Ο
Φ
r
ο νΟ »—(
c i 00
1/1 es
00
ο >Λ
CS ι— I
^
Ο
νό
FH CN
00 Γ 00
CN TT
<N (Ν t—ι
FH (Ν
Ύ— I
ο
in «/•i
<n
η 00
wS 00
ο >o
Ό W)
Ο
ι ι—ι
Ο
00 00
ο
C) r
\ C
00
ο ο
< ΙΟ
Ο ο
ΓΟ 1Η
Ο Ο
cn
ο ο
Os 00
ON 00
ο ο
\o ν£5
Ο Ο
^
ο ο
rr
ο ο
00 00 'Ο CN (Ν σ\ ON
Nu
mb
er
Percen
t
Nu
mb
er
Percen
t
Nu
mb
er
Percen
t
Nu
mb
er
Percen
t
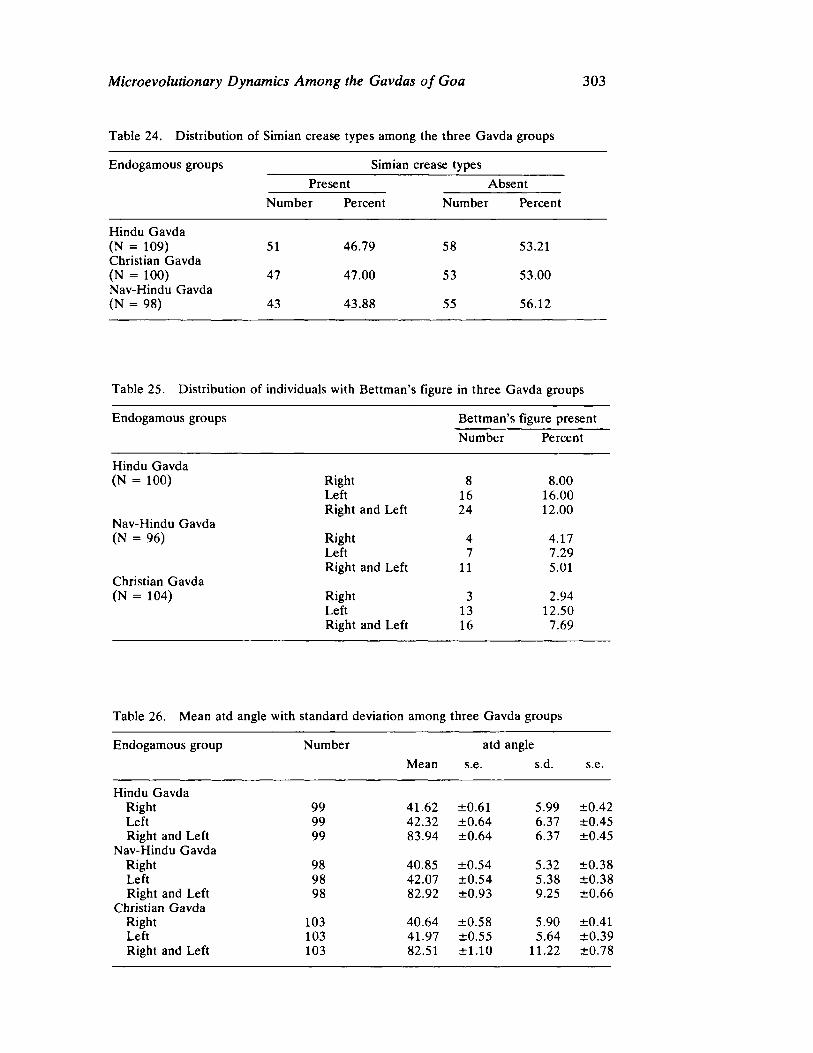
Microevolutionary Dynamics Among the Gavdas of Goa 3 0 3
Table 24. Distribution of Simian crease types among the three Gavda groups
Endogamous groups Simian crease types
Present
Number Percent
Absent
Number Percent
Hindu Gavda (N = 109) 51 Christian Gavda (N = 100) 47 NavHindu Gavda (N = 98) 43
46.79
47.00
43.88
58
53
55
53.21
53.00
56.12
Table 25. Distribution of individuals with Bettman's figure in three Gavda groups
Endogamous groups Bettman's figure present
Number Percent
Hindu Gavda (N = 100) Right 8 8.00
Left 16 16.00 Right and Left 24 12.00
NavHindu Gavda (N = 96) Right 4 4.17
Left 7 7.29 Right and Left 11 5.01
Christian Gavda (N = 104) Right 3 2.94
Left 13 12.50 Right and Left 16 7.69
Table 26. Mean atd angle with standard deviation among three Gavda groups
Endogamous group Number atd angle
Mean s.e. s.d. s.e.
Hindu Gavda Right 99 41.62 ±0.61 5.99 ±0.42 Left 99 42.32 ±0.64 6.37 ±0.45 Right and Left 99 83.94 ±0.64 6.37 ±0.45
NavHindu Gavda Right 98 40.85 ±0.54 5.32 ±0.38 Left 98 42.07 ±0.54 5.38 ±0.38 Right and Left 98 82.92 ±0.93 9.25 ±0.66
Christian Gavda Right 103 40.64 ±0.58 5.90 ±0.41 Left 103 41.97 ±0.55 5.64 ±0.39 Right and Left 103 82.51 ±1.10 11.22 ±0.78
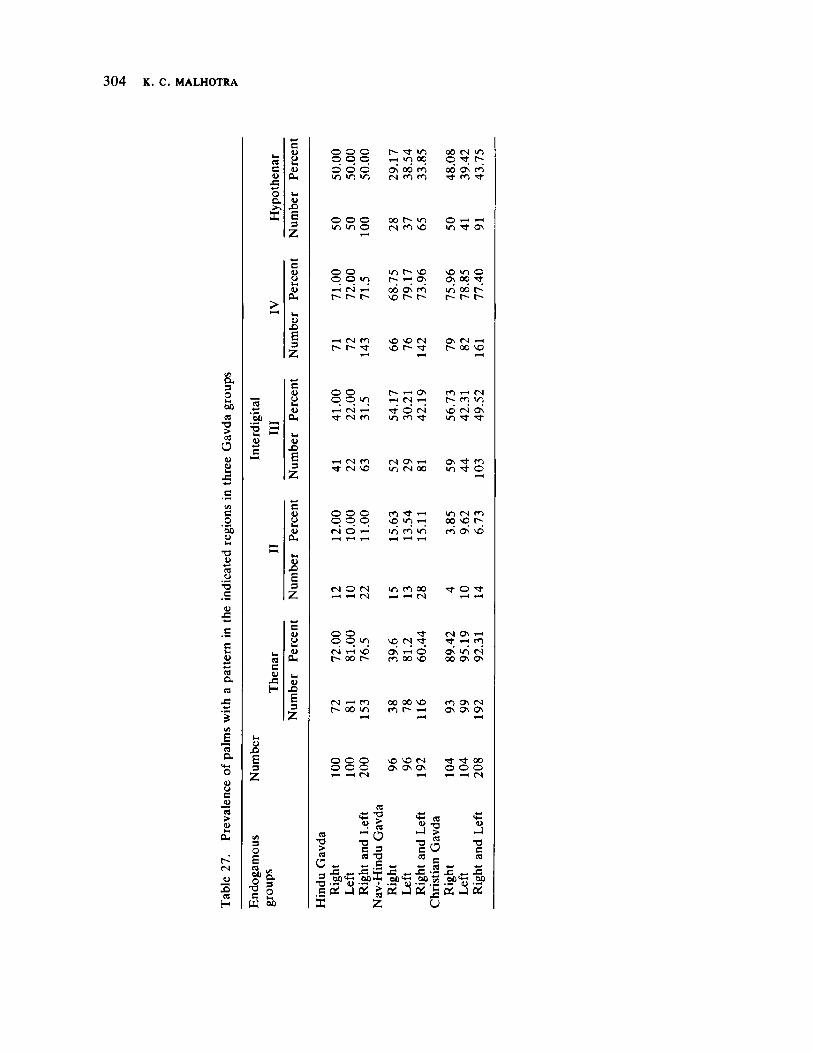
304 Κ. C. MALHOTRA
α 3 Ο In SO ee "Ο > « Ο
υ ω
β ο urhb'φb u h· •ο 4> Η· CO υ •3 ε υ J=
c tH <υ λ α. CS J3
eg D.
υ ο Β ό > <u
r» (Ν ο
3 a
Η
ce a υ
JS ^
ο ο.
Χ
co '3d •3 ιο) c
Λ C υ J3 Η
c υ a υ CU
υ
ε 3 Ζ
ο Ε Si <« ο §• Β ° ω Μ
Ο ο Ο Γ IO 00 CS IO ο ο ο τΗ >ο 00 Ο rf ο © ο os 00 rn 00 Οs rn Ό >ο >0 <Ν m d >*
Ο ο Ο 00 r IO ο τ—1 ΙΟ Ό ο (Ν m so IO os
Ο ο Ό r \C so <0 ο ο ο »Ο Γ i—I 00 Tt
(Ν ,Η ΟΟ os ci >o 00 rΓ Γ Γ SO r r r t f
Η CS tri so sO CS os CS r» t so r»· •t r— 00 so ΤΗ
ο ο Γ ( Os rr> τΗ CS ο ο ΙΟ Ι—« CS τΗ t» cn «Ο τΗ CS τΗ ^ Ο ri so <N Os •<t CS Ο ΙΟ m TT >o
Η CS «Ν OS Os es SO "Ο 00 "Ο Tt ο
Ο Ο Ο Ο tH ιο es m ο Ο Ο so •Ο 00 es ο ι—ι ιο ιο en ON SD τΗ τΗ τ—I 1—(
CS ο (Ν Ό CI 00 "t Ο 1 τΗ CM ^
τΗ CN TH τΗ
Ο Ο Ti CS Os TH q ρ •Ο SO CN Tf TH cn ts τΗ SO Os τΗ Ο Os ιο CS r 00 Γ m 00 so 00 Os Os
fN 00 00 so ΓΛ Os CS 00 >ο ο Γ TH Os Os Os τΗ H
ο ο Ο so so CS "t 00 ο ο ο Os OS OS Ο Ο ο τΗ τΗ CS TH TH TH CS
Μ Τ3 > η Ο _ =1 ·° Ό ·— Ξ Ρί
Χ
α « "ξ
ΗΙ 0 73 Β 3 (0 Ό .Ξ
Μι m
« α hJ > τι Λ
« Β cd ί 5 J3 « Λ J5 « .SP + ,ΞΡ^ .SP« .SP'S il OS > OS _| Οί Οί J
ζ υ
1> J Τ3 Β C9 W •Β ΜΙ
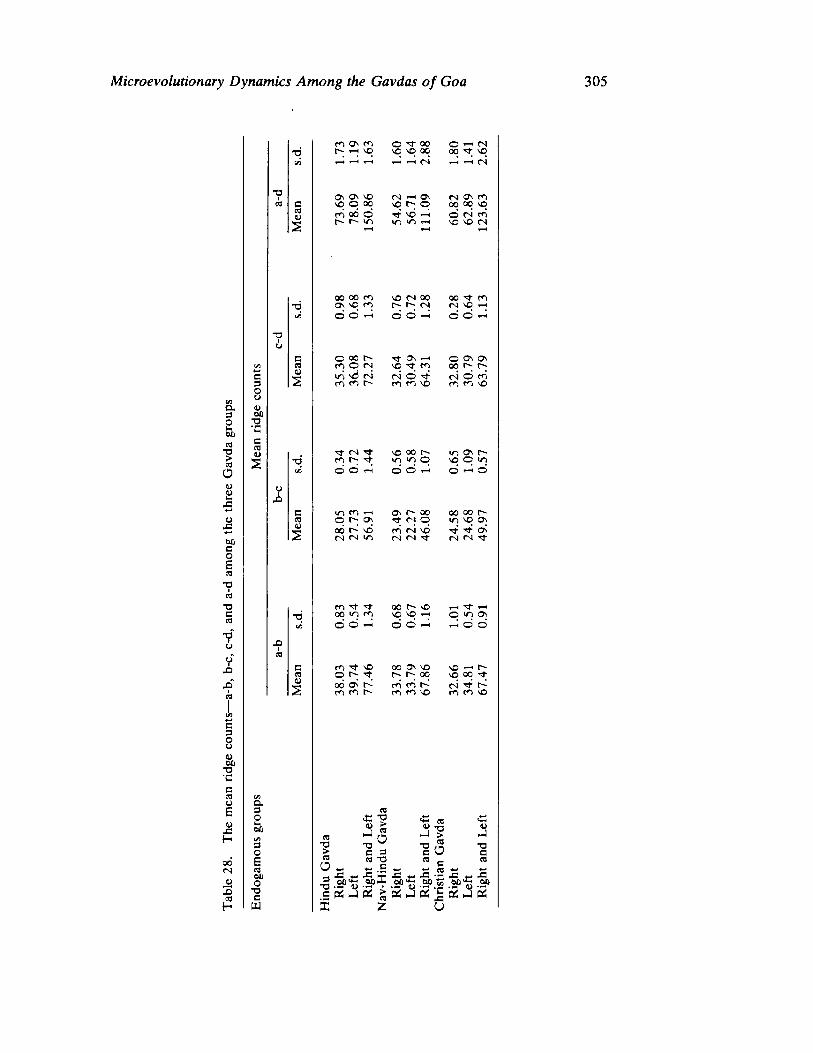
Microevolutionary Dynamics Among the Gavdas of Goa 305
a 3 Ο
η •ο > CO
Ο υ υ
υ _ c
60 C ο Ε η
Τ3 c κι
C 3 Ο u υ οο
ο
C Λ υ ε υ
•fi Η
00 CN
JJ Έ C0
ί
α η) υ
S
α ι υ
C 3 Ο υ ιυ αίι
Τ3
C CO ω
2
α . 3 Ο
00 [Λ 3 Ο Ε ™ Οΰ Ο
Χ) C
ω
co Os CO Ο TJ 00 Ο ι CN vq vO vq 00 00 vq
1 TH CS ^
CS
OS Os VO CS »—1 Os cn ON CO so p 00 sO t— ο 00 00 VO CO οό d Tf VO ο CS CO t Γ >/ > !/ "> Ι/ Ί rH VO vO CN
1 .—( ι—1
ΌΟ 00 CO vo CS 00 00 CO o s vo CO t— t CN CS vO rt
ο ο ι—ι ο d TH ο Ο ι—1
Ο οο r r t ON ^ ο σ\ σ\ C1 ρ CS so •<* CO 00 t— t—
CN (N Ο (Ν d CO CO CO Ι ro CO VO CO CO vO
Tj CS t VO 00 Ι m Os Γ
•6 co ί · < * <n Ο vO Ο ι ο
ο ο tH d d ^ ο t ο
c i n CO iH Os t 00 00 oo t— CO ο 1; OV •«fr CN ο ITl VO ON ω
00 Γ vφ CO CN vd " f r " f r Os 2 CS CS >/ ) CN CN Sf CS CS ^ f r
CO Tl t 00 t so Tt 1 00 m CO vO vo ο >/ > Os
© Ο ^ Ο ο •Η ο Ο
CO Ti SO 00 Os VO VO r ρ t t ; I— 00 VO 00 • f r
00 o s I— CO c o 1— CS r co CO Γ c o CO vO co CO vO
co « " θ ω >
co •Ό > co
Ο
ιυ 11
CO
C 3 CO Ό
. Ε
•α . S5 « . 2Ρ Ρ .SP « · 2Ρ.Η .2Ρ ω ·2Ρ c tf J Οί > « J 0 Φ * φS J Οί
ι ζ υ
™ «1 •ο ^ > J
_ Β _ Τ3 τη Τ3 C ά G co c co « (Β *· J3 S j J3 ao «5 o o · "
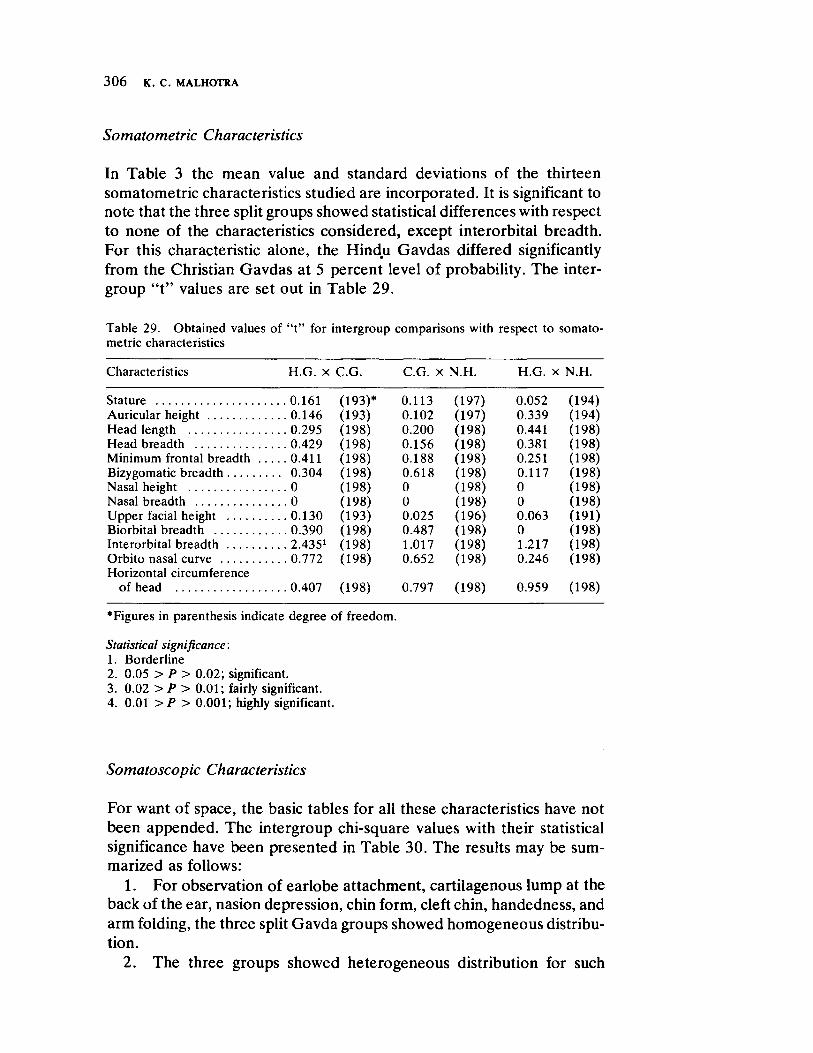
3 0 6 Κ. C. MALHOTRA
Somatometric Characteristics
In Table 3 the mean value and standard deviations of the thirteen somatometric characteristics studied are incorporated. It is significant to note that the three split groups showed statistical differences with respect to none of the characteristics considered, except interorbital breadth. For this characteristic alone, the Hindu Gavdas differed significantly from the Christian Gavdas at 5 percent level of probability. The intergroup "t" values are set out in Table 29.
Table 29. Obtained values of "t" for intergroup comparisons with respect to somatometric characteristics
Characteristics H.G. x C.G. C.G. : χ N.H. H.G. x N.H.
Stature . . . 0 . 1 6 1 (193)* 0 .113 (197) 0 .052 (194) Auricular height . . . 0 .146 (193) 0 .102 (197) 0 .339 (194) Head length . . . 0 .295 (198) 0 .200 (198) 0.441 (198) Head breadth . . . 0 .429 (198) 0 .156 (198) 0.381 (198) Minimum frontal breadth . . . . . 0 .411 (198) 0 .188 (198) 0.251 (198) Bizygomatic breadth . . 0 .304 (198) 0 .618 (198) 0.117 (198) Nasal height . . . 0 (198) 0 (198) 0 (198) Nasal breadth . . . 0 (198) 0 (198) 0 (198) Upper facial height . . . 0 . 1 3 0 (193) 0 .025 (196) 0.063 (191) Biorbital breadth . . . 0 .390 (198) 0.487 (198) 0 (198) Interorbital breadth . . . 2.4351 (198) 1.017 (198) 1.217 (198) Orbito nasal curve . . . 0 .772 (198) 0 .652 (198) 0.246 (198) Horizontal circumference
of head 0.407 (198) 0 .797 (198) 0.959 (198)
•Figures in parenthesis indicate degree of freedom.
Statistical significance :
1. Borderline 2. 0.05 > Ρ > 0.02; significant. 3. 0 .02 > Ρ > 0.01; fairly significant. 4. 0.01 >P > 0 .001; highly significant.
Somatoscopic Characteristics
For want of space, the basic tables for all these characteristics have not been appended. The intergroup chisquare values with their statistical significance have been presented in Table 30. The results may be summarized as follows:
1. For observation of earlobe attachment, cartilagenous lump at the back of the ear, nasion depression, chin form, cleft chin, handedness, and arm folding, the three split Gavda groups showed homogeneous distribution.
2. The three groups showed heterogeneous distribution for such
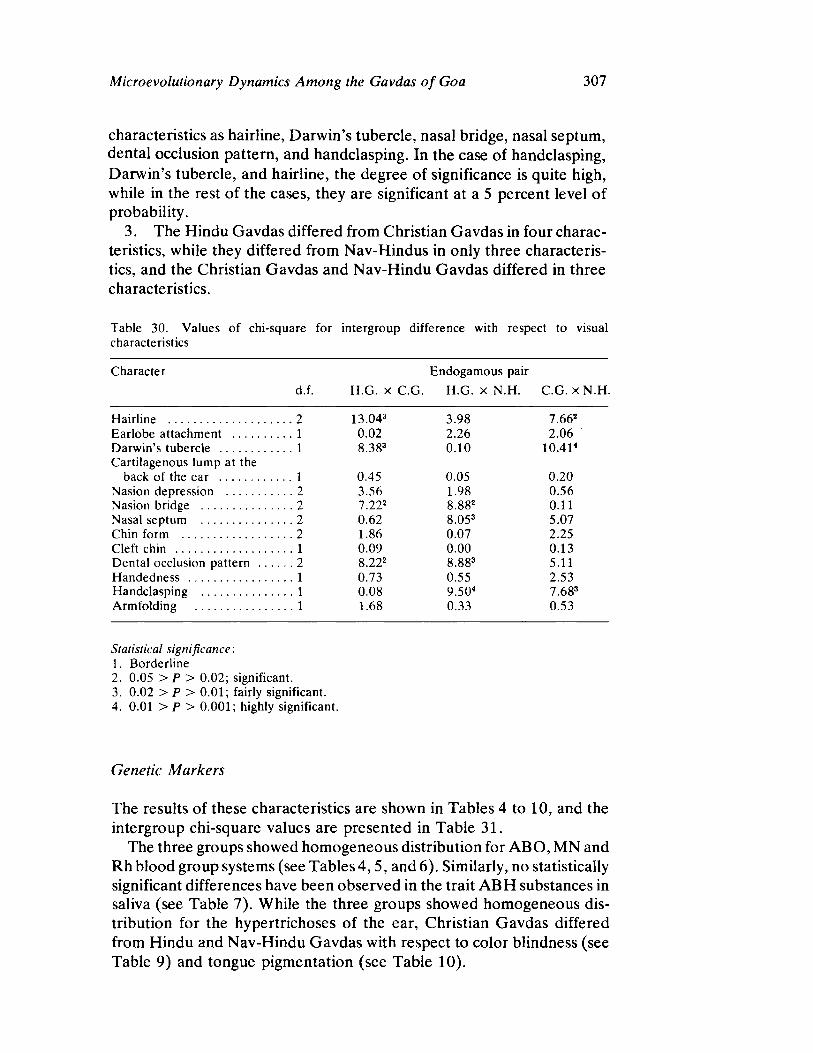
Microevolutionary Dynamics Among the Gavdas of Goa 307
characteristics as hairline, Darwin's tubercle, nasal bridge, nasal septum, dental occlusion pattern, and handclasping. In the case of handclasping, Darwin's tubercle, and hairline, the degree of significance is quite high, while in the rest of the cases, they are significant at a 5 percent level of probability.
3. The Hindu Gavdas differed from Christian Gavdas in four characteristics, while they differed from NavHindus in only three characteristics, and the Christian Gavdas and NavHindu Gavdas differed in three characteristics.
Table 30. Values of chisquare for intergroup difference with respect to visual characteristics
Character E n d o g a m o u s pair
d.f. H .G. x C.G. H.G. x N . H . C.G. x N . H .
Hairline ...2 13 .04 3 3 . 9 8 7.66*
Earlobe attachment . . . 1 0 .02 2 .26 2 .06 Darwin's tubercle . . . 1 8 .38 3 0 . 1 0 10 .41 4
Cartilagenous lump at the
back of the ear . . . 1 0 .45 0 .05 0 . 2 0
Nasion depression 3 .56 1 .98 0 .56
Nasion bridge ...2 Ί .22? 8.88 2 0 .11 Nasal septum ...2 0 .62 8 .05 3 5 .07 Chin form ...2 1.86 0 .07 2 .25 Cleft chin . . . 1 0 .09 0 . 0 0 0 . 1 3 Dental occlusion pattern . . . ...2 8.22 2 8.88 3 5.11 Handedness . . . 1 0 . 73 0 .55 2 .53 Handclasping . . . 1 0 . 0 8 9 .50 4 7.68 3
Armfolding 1 1 .68 0 .33 0 .53
Statistical significance:
1. Borderline 2. 0 .05 > Ρ > 0 .02 ; significant. 3. 0 . 0 2 > Ρ > 0 .01 ; fairly significant. 4. 0 .01 > Ρ > 0 . 0 0 1 ; highly significant.
Genetic Markers
The results of these characteristics are shown in Tables 4 to 10, and the intergroup chisquare values are presented in Table 31.
The three groups showed homogeneous distribution for ABO, MN and Rh blood group systems (see Tables 4 ,5 , and 6). Similarly, no statistically significant differences have been observed in the trait AB Η substances in saliva (see Table 7). While the three groups showed homogeneous distribution for the hypertrichoses of the ear, Christian Gavdas differed from Hindu and NavHindu Gavdas with respect to color blindness (see Table 9) and tongue pigmentation (see Table 10).

3 0 8yxwvutsrqponmlkihgfedcbaYXTSRPONMLIHGFEDCBA Κ. C. MALHOTRA
Table 31. X—values for intergroup differences with respect to genetic characters amoi the three Gavda groups
Pair of groups A B O MN Rh Sese Color Tongue Hyperblindness pigmenta trichosi
tion
H.G. X N.H. 5.73 2.00 3.25 0.02 0.11 0.03 0.17
(3)* (2) (5) (1) (1) (1) (1) H.G. x C.G. 1.48 0.93 9.68 1.76 7.664 8.614 0.89
(3) (2) (5) (1) (1) (1) (1) C .G. χ N.H. 7.73 0.56 12.551 1.42 6.083 9.554 1.91
(3) (2) (5) (1) (1) (1) (1)
'F igures in parenthesis indicate degree of f reedom.
Statistical significance (X2):
1. Borderline 2. 0.05 > Ρ > 0.02; significant. 3. 0.02 > Ρ > 0.01; fairly significant. 4. 0.01 > Ρ > 0.001; highly significant.
Dermatoglyphics
FINGER DERMATOGLYPHICS. The results of analysis of various traits pertaining to finger dermatoglyphics are incorporated in Tables 11 to 17, and the intergroup chisquare and "t" values are presented in Table 32. It is very significant to observe that all the five characteristics — three principle pattern types (whorls, loops, and arches), occurrence of like finger types, monomorphic hands, patterns of intensity index (PII) and mean total ridge count (TRC), showed rather homogeneous distribution. As
Table 32. Chisquare and " t " values for intergroup differences with respect to finger dermatoglyphics
Pair of groups Three Like Mono PII Total Pair of groups Galton finger morphic ridge types types hands count
H.G. x N.H. . . . . . . 1.75 0.48 0.99 0.49 0.61
(3)* (1) (1) (196) (196) H.G. x C.G. . . . . . . . 5.12 0.11 0.37 0.52 1.35
(3) (1) (1) (202) (202) C.G. x N.H. . . . . . . . 5.72 0.14 0.19 0.96 0.28
(3) (1) (1) (200) (200)
'F igures in parenthesis indicate degree of f reedom.
Statistical significance:
1. Borderline 2. 0.05 > Ρ > 0.02; significant. 3. 0.02 > Ρ > 0.01; fairly significant. 4. 0.01P > P> 0 .001; highly significant.
Microevolutionary Dynamics Among the Gavdas of Goa 309
observed from Table 32, the intergroup chisquare and " t " values are very small. The archwhorl and loopwhorl index also apparently showed similar distributions, although no statistics have been applied as yet.
PALMAR DERMATOGLYPHICS. In all, seventeen palmar dermatoglyphic features were studied. Out of these twelve were qualitative, while the five remaining were quantitative. The results are tabulated in Tables 19 to 29. Values of chisquares and " t " for intergroup differences with respect to all these features are contained in Table 33.
Striking intergroup differences have been observed in fourteen out of seventeen palmar dermatoglyphic features. The characteristics which show statistically nonsignificant values are simian crease, atd angle, and pattern on interdigital area IV. The Hindu Gavdas differed from both NavHindus and Christian Gavdas in ten features, while the Christian and NavHindu Gavdas differed in only six characteristics. As will be noted from Table 33, in most of the cases the differences are highly significant (0.01 > Ρ > 0.001).
In short, a comparison between the groups reveals that: 1. Out of the thirteen somatometric characteristics, one characteris
tic, interorbital breadth, showed a significant difference for only one pair of groups.
2. Six out of thirteen somatoscopic characteristics considered showed differences for at least one pair of split groups.
3. All the five finger dermatoglyphic features showed strikingly homogeneous distribution.
4. The seventeen quantitative and qualitative features considered for palmar dermatoglyphics present a very interesting picture, and fourteen of these showed highly significant values.
The results of a comparison of four sets of data are summarized in Table 34. It will be noted that in all, fiftyfive traits — quantitative and qualitative — have been studied and compared in order to evaluate the biological affinities between three split groups of Gavdas. Considering the individual pairs of groups, maximum differences are noticed among Hindu Gavdas and Christian Gavdas; they differed in seventeen (30.91 percent) characteristics. The Hindu Gavdas differed in fourteen (25.42 percent) characteristics from the NavHindu Gavdas. The shortest distance, however, is found among Christian and NavHindu Gavdas; they differed in twelve characteristics (21.82 percent). Thus of all fiftyfive traits considered, twentythree (41.82 percent) showed significant differences; of these, however, seven (30.43 percent) showed differences with only one pair of groups.
Out of the total variability observed, the palmar dermatoglyphic features showed the maximum (24.45 percent) followed by somatoscopic observationstsrniecaG (10.91 percent). Genetic traits (3.64 percent), showed
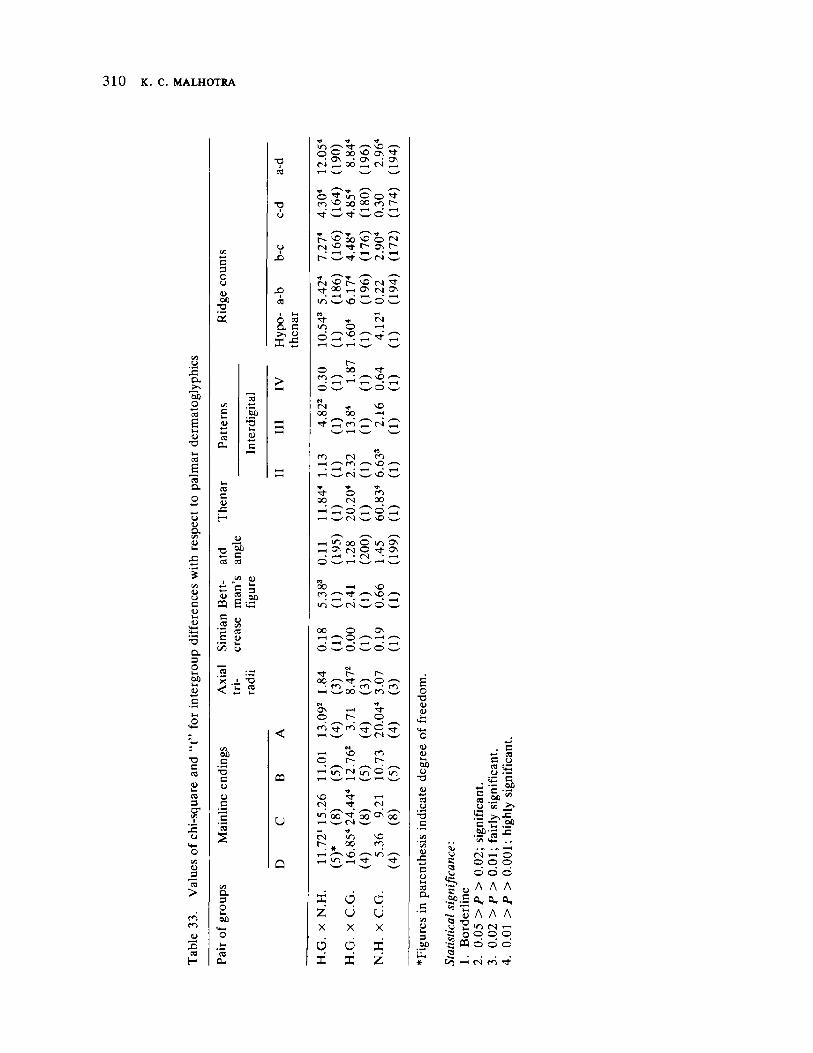
310 Κ. C. MALHOTRA
e 3 ο υ Oj 00 neXJC
•Ό
5
Ό ι CO
Τ3 I Ο
<J ι Χι
Χ>
Ο re α c
ω Ι Έ
e tH υ
Λ cu
53
'Ξο •3 <υ Ε
Λ c υ f Η
ω
•σ 1? Λ CS
^ C 00 pa Ε «
£ « < 5 < s>
'Ξ α fa U 1/5 υ
Ξ ·~ Ί< . i "ο < ϋ Ξ
οο g
'•Ό C u υ c
"Ξ '3 Ζ
α. 3 Ο ι00
Ο
CQ
U
Ό Τ ^ ο ^ οο no on • ON · :
«Ν Ζ* 00 Χ, (Ν Χ,
f '"Τ1 0 s
Ο ^ in Ο Ο ^ rr, NO οο ΟΟ fT) tπ Ό ^r w ο w
fv νο ΟΟ νο ο Ν (Ν no r ο, r^ C ^ C n C
*
(Ν tτΙ; oo ιη 1—' NO
•sr m Ο d TH NO *—< TH
ν ΟΙ Ν ON fN ο w Ο w
Ο f*1 •
fN 00
ΓΟΟ
00 "ci
tN Nf>
ο fN οο
< CT ο ' r H ^ N ·
vNO • φ •
r*i
m oo
" o : ,nOX ••
α,
^ — ^ — ^
TH in 00 Ο •n ON ,H Ο (N Ο TT ON (N
(Ν d w
^ ^
« 00 tH NO en —V s \
in ' — '
fN ο
oo Ο OS TH Ο V TH . . Ο Ο Ο '
C4 TT r Γ00 ο , ,
00 rφ ^ 00 rφ Ν TT ON τ—1 'ίο Γ Ο rφ cn rφ cn Tt Ο τΗ ' — ' fN —^
Μ tH NO Ο t— Ι
y—N fN TH fN 1/1 Ο in ^
s—' s—'
NO τΗ <N fN in 0? 00 ON So TH fN
fN in NO t— M. 00 ro
V SO 1 —4
X ο Ο z ό ά
X X X
d ά X
X 33 Ζ
ε ο
•π υ ω
ω ω ν* 00 <υ Ό
Λ ο "5 C
α ω ι* Λ Q,
3 00
Κ α (j
c u ,60 g
'Ξ —« fli β α •a >
α £5 ^
C re
s υ ra υ
Έ | ' 00 c Λ υ
Β 00
JC 'c ΙΗ 00 00
' r e Έ
'ΪΛ «Η • r . .. . τ. τΗ fN τΗ Ο Ο Ο Ο ο ο ο
Λ Λ Λ α, α, a,
Α Λ Λ in <Ν η Ο Ο Ο
ο ο ο
(Ν ci

Microevolutionary Dynamics Among the Gavdas of Goa 311
somatometric characteristics (1.82 percent) and the finger dermatoglyphic features showed nil.
A breakdown into quantitative and qualitative variables of the total characteristics considered reveals interesting information. While 25 percent of the quantitative characteristics showed significant differences, the qualitative traits revealed differences in 51.43 percent of the characteristics studied. This variability is nearly double the one revealed by quantitative traits.
Table 34. Summary of statistical comparisons among the three Gavda groups
Set of characters Number Differ significantly in number of characters
H.G. x N.H. H.G. x C.G. N . H . x C . G .
Anthropometric 13 0 0.00 1 7.69 0 0.00 Somatoscopic 13 4 30.77 4 30.77 3 23.08 Genetic 7 0 0.00 2 28.57 3 42.86 Dermatoglyphics
Finger 5 0 0.00 0 0.00 0 0.00 Palmar 17 10 58.82 10 58.82 6 35.29
Total 55 14 25.45 17 30.91 12 21.82
DISCUSSION
It is now well established that the biological variations among different populations are caused by processes such as mutation, selection, genetic drift, founder effect, and hybridization. In the present situation, however, because the three groups share the same environment, have the same dietary habits and the same pattern of mating behavior, the effect of differential selection should be nonexistent. Since these splits took place only seventeen and two generations ago, variations due to mutation must be negligible.
Migration is not applicable in the present case and since the groups maintain strict endogamy, the hybridization factor need not be considered at all. Then what could be the source of the observed variability? As the population size of the split religious isolates is so large, and considering that the time involved is so short, it is difficult to visualize the role of genetic drift and founder effect. The information collected so far seems to be inadequate to suggest that the splits took place at random: it appears more likely that at least the second split, which resulted in NavHindu Gavdas, was restricted to certain areas.
Although the significance of our findings is not yet fully understood, it is interesting to note that the groups showed significant difference in traits controlled by both diallelic (tongue pigmentation, Darwin's tubercle)

3 1 2 Κ. C. MALHOTRA
and polygenetic traits such as most of the palmar dermatoglyphic features and somatoscopic observations.
A close scrutiny of the twentythree characteristics which revealed intergroup significant differences, however, revealed that for most of the characteristics — for example, nasal septum, dental occlusion pattern and most of the palmar dermatoglyphic features — the genetic mechanism is not known, except that they appeared to be polygenetic. Handclasping seems to have a doubtful genetic background, and characteristics like hairline types and tongue pigmentation are dependent on age. As shown earlier, the largest variation is shown by the somatoscopic observations. Could it be that a certain amount of subjective element has elevated the observed variability? In this investigation it may be mentioned that the interinvestigator error is nil because all the observations and measurements were done by the author alone.
It is, however, very significant that all the characteristics with wellestablished patterns of inheritance such as ABO, MN, Rh, and ABH substances in saliva showed homogeneous distribution. In view of this homogeneity, what is most difficult to explain are the differences seen in palmar dermatoglyphic features. What could be the source? Are these due to the methodology adopted or are they more fundamental, having a genetic basis? If all the palmar characteristics are excluded from the analysis, the total variability reduces from 41.82 percent to 23.63 percent.
When the present results are compared with Malhotra's findings (1966), in which dermatoglyphic traits were not studied, the magnitude of differences in the present study seem very small. In Malhotra's study the intergroup differences were above 40 percent, the range being 25.64 percent to 64.10 percent. In addition, the most striking difference between the observations of these two studies is that, while Malhotra's work showed a great deal of heterogeneity in ABO, MN, Rh blood groups, the present study records remarkable similarity.
From the foregoing discussion it appears, therefore, that considering the time when the two splits took place and the population strength of Gavda groups, the three split groups should have shown homogeneous distribution in the absence of the play of various mechanisms causing microevolution. Part of the variability could perhaps be attributed to techniques utilized, including subjective error. The rest may be due to the nonrandomness of the conversions, or else to some mechanism whose role has not been emphasized as yet.
This investigation as it now appears seems to suggest that even when a large enough group splits, a certain amount of biological difference, which could be of microevolutionary significance, can be expected. To that extent, the observations made by several scholars (mentioned earlier) inyutrponlhgeCA Current Anthropology seem to be justified, though the processes need not be genetic drift or founder effect.
Microevolutionary Dynamics Among the Gavdas of Goa 313
Pending further research, the present findings do not add much light to Karve's hypothesis of caste origins, except that the differences shown by these split groups are much smaller when compared to many castes of the same castecluster (for example, Malhotra's study). It appears that both the processes of fission and lack of fission have contributed to the genetic and morphological heterogeneity depicted by several hundred Indian castes and tribes.
REFERENCES
BHALLA, V.
1968 Comments on Karve and Malhotra: A biological comparison of eight endogamous groups of the same rank. Current Anthropology 9:116117.
BHANU, Β. V.
1973 Simian crease in men: some methodological considerations. Journal of Human Evolution 2:153160.
BHANU, Β. V., K. C. MALHOTRA
1972 A population genetic study of cleft chin in India. American Journal of Physical Anthropology 37:367372.
CONNOLLY, R. C.
1968 Comments on Karve and Malhotra's biological comparison of eight endogamous groups of the same rank. Current Anthropology 9:118.
CUMMINS, H. , c . MIDLO
1961 Finger prints, palms and soles. An introduction to dermatoglyphics. New York: Dover.
DE LESTRANGE, Μ. T.
1969 A propos des plis de flexion de la paume: classification et rapports entre les different types descrits. Bulletin de la Society d'Anthropologie de Paris 5:251267.
GULATI, R. K.
1968 "An analysis of the intergroup differences in an artisan caste Maharashtra." Unpublished Ph.D. dissertation Poona University.
HIERNAUX, J .
1968 Comments on Karve and Malhotra's biological comparison of eight endogamous groups of the same rank. Current Anthropology 9:118.
HOLT, s . B.
1949 A quantitative survey of the finger prints of the small sample of British population. Annals of Eugenics 14:329338.
HULSE, F. s .
1968 Comments on Karve and Malhotra's biological comparison of eight endogamous groups of the same rank. Current Anthropology 9:119.
ISHIHARA, S.
1959 Tests for color blindness (14th revised edition). London: Η. K. Lewis. KARVE, 1.
1941 Anthropometric investigation of Madhyandina Brahmans of the Maratha country. Bulletin Deccan College Research Institute 3:327389.
1948 Anthropometric measurements of the Marathas. Deccan College Monograph series 2:171.
3 1 4 Κ. C. MALHOTRA
1958a What is caste? Part one: Caste as extended kin.yutsrponmlkihgfedcbaWSPMLHGECBA Economic Weekly 10 (4, 5, 6): 125138.
1958b What is caste? Part two: Caste and occupation. Economic Weekly 10 (12):401407.
1958c What is caste? Part three: Caste as a status group. Economic Weekly 10 (26, 27, 28):881888.
1961 Hindu society, an interpretation. Poona:Deccan College. 1965 Research needed. Current Anthropology 6:(3)332333.
KARVE, I., V. M. DANDEKAR
1951 Anthropometric measurements of Maharashtra. Deccan College Monograph series 8.
KARVE, I., K. C. MALHOTRA
1968 Biological comparison of eight endogamous groups of the same rank. Current Anthropology 9:109rl24.
1970 "The biology of a split community." Paper presented at the First National Congress on Human Genetics. Poona, April 1970.
MALHOTRA, K. C.
1966 "Anthropometric measurements and blood groups of Maharashtrian Brahmans." Unpublished Ph.D. dissertation. Poona University.
1967a Incidence of hand clasping among the eight endogamous groups of Maharashtrian Brahmans. Acta Geneticae Medicae et Statistica (Basel)
18:283288. 1967b Incidence of color blindness in eight endogamous groups of Maharash
trian Brahmans. Acta Genetica Medicae et Gemellologiae 16:417421. 1967c Incidence of hypertrichosis of the ear in eight endogamous groups of
Maharashtrian Brahmans. Acta Genetica Medicae et Gemellologiae
16:(Supplement)4856. 1972 "Karve's caste structure concept as a research tool in Physical Anthro
pology." Unpublished manuscript. MALHOTRA, K. C., I. KARVE
1971 "Population biology of the three split Gavda groups of Goa." Paper presented at the International Symposium on Human Genetics. Waltair, March 1971.
MARTIN, R., K. SALLER
1956 Lehrbuch der Anthropologie 3. Stuttgart: G. Fischer. RACE, R. R., R. SANGER
1954 Blood groups in man. Oxford: Blackwell. RAO, D. C.
1970 Tongue pigmentation in man: a new genetic trait. Current Science
39:161162. SHARMA, J. C.
1968 Comments on Karve and Malhotra's biological comparison of eight endogamous groups of the same rank. Current Anthropology 9:123.
SINGH, I. P.
1969 Comments on Karve and Malhotra's biological comparison of eight endogamous groups of the same rank. Current Anthropology 10:224.
WOOLF, B.
1957 The log likelihood ratio test (the G test) methods for test of heterogenicity in contingency tables. Annals of Human Genetics 21:397409.
Founder Effect, Gene Drift, and
Natural Selection Among Four
Nomadic Mendelian Isolates
K. C. MALHOTRA
In recent years the interest of anthropologists and human geneticists has shifted from large, widely scattered populations to small, unacculturated groups since " . . . the parameters of these populations come closest to reflecting the circumstances under which the vast amount of variability now known to be present in human populations arose. Such populations will not long be available for study" (Neel 1972:255). This trend is clearly reflected in a number of other studies (Basu 1969; Basu 1972; Neel 1972; Roberts 1956; Salzano 1961; and others). Demographicgenetic and anthropological analysis of these small Mendelian isolates can help us to understand particularly the controversial phenomenon of random genetic drift and can further elucidate the founder effect.
The late Professor (Mrs.) Irawati Karve initiated in 1969, in collaboration with the Indian Statistical Institute, Calcutta, a multidisciplinary project among the Nandiwallas — a nomadic migrant castecluster in Maharashtra. In AugustSeptember 1969, general ethnographic material was gathered, while in JulySeptember 1972, in collaboration with Professor G. S. Mutalik and his associates of Byrum Jeejibhoy Medical College, Poona, India, a detailed demographicgenetic, physical anthropological, and clinical genetic survey was conducted among these people. The main objectives of the biological survey were (a) to investigate the incidence of various population markers: anthroposcopic, metrical, serological, and biochemical; (b) to identify the role of genetic drift and founder effect (because of their small population size) and natural selection, particularly on G6PD and hemoglobin variants; (c) to make use of high consanguinity rates to discover "new" recessively inherited diseases and to further elucidate the "old" ones; id) to test the PostPickford hypothesis of incidence of color blindness; and (e) to determine the sociological and biological factors responsible for the increase
3 1 6 Κ. C. MALHOTRA
in numbers of these groups in spite of their small effective population size.
Earlier Malhotra (1971, 1972, 1973a, 1974) reported on the ethnographic details of these people. Elsewhere, Malhotra (1974b) Malhotra et al. (1973, 1974a, 1974b) and Mutalik, Kate, and Malhotra (1973a) and Mutaliktnlieda et al. 1973b reported details on some of the biological traits summarized here.
The present paper summarizes the results of some of the characteristics already analyzed and reported; discusses the findings in the light of the genetic structure of the Nandiwallas; and spells out the implications and significance of present findings in terms of evolutionary dynamics, particularly the possible role of random gene drift, founder effect, and natural selection in maintaining the observed gene frequencies. The data includes Α^Β,Ο,Μ,Ν, and Rh blood groups; Hp and Tf serum proteins, G6PD deficiency, hemoglobin variants, color blindness, earlobe attachment, and finger dermatoglyphics.
The Nandiwallas, numbering around 2,500, are divided into four strictly endogamous groups: Patils, Chougules, Komtis, and Daundiwallas, arranged in a clearcut social hierarchy, Patils at the top and Daundiwallas at the bottom. Their traditional occupation is to travel from village to village with their sacred bull (nandi), the vehicle of God Shiva, collecting donations from the spectators. Once in three years they assemble at the village of Wadapuri in the Indapur Taluka of the Poona District. The family structure among these people is patrilineal and patrilocal. Monogamy is the most prevalent marriage form, with some incidence of polygynous marriages. Widow marriage is permitted but divorce is not possible. They permit both matrilateral and patrilateral crosscousin marriages, as well as uncleniece marriage.
RESULTS
The salient features of the findings are given below.
ABO SYSTEM. The three groups considered are characterized by a very low frequency of the allele Ρ — 0.02603. The incidence of phenotype A(At + A2) is more than 20 percent in most Indian populations. The lowest frequency so far recorded is 10.6 percent among the Marias of Baster (Negi 1963). Paniyan of Kerala seem to possess the highest — 62.4 percent. The Nandiwallas thus record the lowest incidence of phenotypelA Al (3.75 percent) among reported Indian populations. The phenotype A2 and allele P2 are conspicuous by their absence among the Nandiwallas; we are not aware of any other Indian population wherein this allele is completely absent.

Founder Effect, Gene Drift, and Natural Selection 317
MN SYSTEM. The results of the MN system are in agreement with other Indian populations, the frequency of allele Ν being somewhat low (0.35835).
RHNEGATIVE. The incidence of Rhnegative appears to be elevated, being 15 percent for the pooled series. Compared to several Indian populations, 15 percent Rhnegative among the Nandiwallas is very high; its incidence in India is often 3 to 4 percent.
HP SYSTEM. The results of the Hp system testing are very interesting. The most predominant phenotype is Hp22 , the incidence of which is 96.67 percent among the Patils and 100 percent among the Komtis and Daundiwallas. The frequency of allele Hp1 (0.0125) is the lowest recorded in the world so far. The earlier lowest recorded was among the Irulas (0.07) of South India (Kirk and Lai 1961). The allele Hp0 has not been detected in our sample.
TRANSFERRINS. All the eighty subjects tested for this serum protein conformed to the type Tf*1. Thus Tf appears not polymorphic in this population.
G6PD DEFICIENCY. Out of the 126 Nandiwallas tested for this enzyme, five (3.97 percent) were found to be deficient.
HEMOGLOBINS. Three individuals, all belonging to the Chougules, were found to possess hemoglobin variants, two of the A + F type and one with increased A2 pattern.
COLOR BLINDNESS. A total of 1,150 Nandiwallas were examined for color blindness. Only one individual from Chougule was found to be abnormal, deuteronope type. The incidence thus works out to be 0.3 percent (only Chogule males were considered). The three isolates, Patils, Komtis, and Daundiwallas, completely lack this allele. In addition, 110 families with 334 children were also studied for this trait. All the matings were of the type normal x normal, except one, abnormal (father) x normal (mother), resulting in all normal children.
EARLOBE ATTACHMENT. All the 1,367 subjects (682 males and 685 females) examined for earlobe attachment, revealed free earlobes. The complete absence of attached earlobes among the Nandiwallas is a unique finding. No other reported population in the world has shown absence of this phenotype. A total of 140 families of the mating free x free produced 545 children, all with free lobes. This seems to be the first empirical evidence that could be detected of gene loss with respect to a polygenic trait.

3 1 8 Κ. C. MALHOTRA
DERMATOGLYPHic TRAITS. The three groups are characterized by a high frequency of loops. The maximum loops are found among the Komtis — 62.91 percent (males and females) followed by Daundiwallas and Patils, and the series average is 56.95 percent. The series whorlloop ratio is 35.85:58.80. In most of the Indian populations this ratio is about 45:50. There is a marked increase in ulnar loops among the Nandiwallas, and the value of the ratio radialulnar loop amounts to 3.95:96.55. The arches also show relatively high incidence; 8.42 percent among the Patils seems to be the highest recorded in any Indian population.
DISCUSSION
The foregoing description of various traits brings home one very important point: the four Mendelian isolates considered here are characterized by unique frequencies. They differ from virtually all the other populations of western and other regions of India from which comparative data are available. How are these unusual frequencies explained? Do the Nandiwallas represent a different racial affiliation? If so, to which race do they belong? Or is it that their demographic structure and nomadic way of life has resulted in these gene frequencies? We shall now examine the various possible processes and see which one (or more) best explains the situation.
The anthropometric characters and anthroposcopic observations (detailed reports are yet to be published) of stature, cephalic index, facial index, skin color, hair color, eye color, and so on suggest beyond doubt that the Nandiwallas belong to the racial complex called "Mediterranean." It may be noted here that this Mediterranean element is most predominantly found in the Cental and South India (Guha 1935). In short, the peculiarities depicted by the Nandiwallas cannot be attributed to a different racial origin.
More detailed interpretation of the present data will be possible only after analyses of other demographicgenetic, dermatoglyphic, and sociocultural data are completed. For now, we shall briefly discuss the genetic composition of the Nandiwallas with regard to the genetic structure of these groups, in order to see whether it explains the genetic composition. Whileutsrponmiec composition refers to the actual genes which are present in a population, the term structure refers to the way in which the genes are assembled into genotypes (Harrison 1970).
The demographic factors which determine the genetic composition and structure of a population are (a) the size, density, and spatial distribution; (b) the amount of movement (immigration and emigration); (c) the nature of mate selection within the population, including marriage distance; and (d) differential fertility and viability. The nondemographic
Founder Effect, Gene Drift, and Natural Selection 319
factors usually considered are geography, geology, climate, disease, and so on.
At the outset it may be pointed out that the four groups of Nandiwallas are completely endogamous and thus constitute strict Mendelian populations. Not a single example of marriage has been observed either between the interNandiwalla groups or between Nandiwallas and nonNandiwallas. Therefore, the role of admixture in the observed gene frequencies need not be considered.
The distribution of the population is very interesting but possesses certain difficulties. Once in three years, everyone assembles at Wadapuri village for four months, from July to October. During the rest of the period they move within a set of hereditary villages in a very wide territory comprising three linguistic states — Maharashtra, Mysore, and Andhara. Each family moves within a separate territory, thus those whose hereditary villages (vtsnavatan) are in the Satara District of Maharashtra State will not operate in the Ratnagiri District of the same state. Accordingly, depending upon the vatans, some people move very short distances (say within 100 kilometers), others have to travel 1,000 kilometers. However, since the marriages are performed only when they assemble once triennially, the effects of horizontal spread in choice of mate (marriage distance) is absent. These isolates thus present the island model situation of population distribution (Wright 1943) insofar as mate selection is concerned. On the other hand, since members of each of the four isolates move (with families) in areas that differ so markedly in ecological details, for example, coastal Maharashtra and Deccan plateau, they are exposed to different kinds of selection pressures. In this way the isolates present the situation in which a population is widespread. An understanding of these aspects, as will be shown later, seems crucial in elucidating our data.
The population size of these groups is very small — Patil 8,000, Chougules 1,150, Komtis 460, and Daundiwallas 55 — for a total of 2,465. The effective population sizes, yet to be calculated, will work out to be much smaller. If 30 percent of the total population is considered as the effective size, as suggested by the works of Salzano and FreireMaia (1970), the value of this parameter among Patils, Chougules, Komtis, and Daundiwallas is calculated as 240,345,138, and 16, respectively. Among the Kotas, a tribal population of Nilgiri Hills (India), Basu (1972) reports 26.2 percent of the total population as effective size, which is well within the range of 30 percent, as suggested by Salzano and FreireMaia.
The small effective size has two implications. First, the individuals inevitably tend to be related to each other, with this high level of inbreeding tending to produce homozygosity, which will affect the intensity of selection (Crow 1958). In this connection it may be pointed out that one
3 2 0zyxwvutsrqponmlkjihgfedcbaWUTSRPONMLKIHDCA Κ . C. MALHOTRA
family with three albino children among the Komtis and a few cases of clinodactyly, syndactyly, cleft lip, and so on have been detected (Mutalik tledca
et cd. 1973b). In addition, among the Chougules a large pedigree of inherited "Mongol-like" faces through three generations involving twenty affected individuals was studied (Malhotra et al. 1974b).
Second, the phenomenon of random genetic drift operates at its optimum in small populations. It is therefore certain that genetic drift must have played a very important role among these isolates. In this connection it is worth mentioning that in the case of populations with effective sizes of up to 259 the rate of random gene drift per generation for a gene with a frequency of 0.5 has been found to vary from 2.2 to 7.4 percent (Lasker 1954).
Another important aspect of the social structure of these groups is the relative age of the spouses. Many instances are recorded in which boys six to eight years old are married to girls sixteen to eighteen years old, adult males of twenty-one to twenty-five are married to infants of three to five years, and several males ages forty-five have yet to find spouses. This disparity between the ages of the spouses and instances of forced bachelorhood tend to reduce the reproductive performance in terms of number of children produced, and it consequently affects the variance in number of gametes contributed to the next generation, thus enhancing the probability of genetic drift.
Unfortunately, census records of the Nandiwallas are hopelessly scanty and, therefore, nothing can be said about the population increase of these people. Our inquiries of the elders of the Wadapuri village, however, reveal that in the past fifty years or so Nandiwallas have increased in number substantially. This is further corroborated by the Nandiwallas themselves, who point out that formerly they occupied only a small territory when they camped at Wadapuri, compared to the present. It is, therefore, not unlikely that part of the genetic peculiarities may be due to the founder members, particularly among the Komtis and Daundiwallas. It might be recalled here that all four isolates originally migrated from Andhara Pradesh and that they have been in Maharashtra for the last 800 years. We have also located the parent group in Andhara Pradesh and we plan to conduct detailed studies among these people, which will further help us to understand the genetic composition of the Nandiwallas. Until then, it might be said safely that since the number of people who migrated and founded these groups must have been small, and since the population has subsequently increased, the founder effect should be present.
It appears therefore that the absence of alleles P2, Hp0, the genes for attachment of earlobe, the rather low values of allele Pj and Hp1, the rather high incidence of gene d, and low values of whorls on the fingers, are due largely to genetic drift, although the role of founder effect cannot be excluded entirely.

Founder Effect, Gene Drift, and Natural Selection 321
The incidences of G6PD deficiency and hemoglobin variants among these isolates are most interesting. In this connection it is noteworthy that the Nandiwallas operate in a terrain which was (and to a large extent still is) highly infested by endemic malaria. It has been suggested that G6PD deficiency and Hb variants in heterozygote form afford protection against malaria (Livingstone 1971). In the maintenance of G6PD deficiency and Hb variants it seems that natural selection has played a decisive role.
Interestingly enough, the incidence of color blindness among the Nandiwallas supports the Post (1962) and Pickford (1963) hypothesis that natural selection would tend to eliminate color blindness in those populations that are most closely dependent on hunting and foodgathering economies. Although the Nandiwallas are not exclusively hunters and food gatherers, their patterns of living can easily be identified as such. Malhotratlea et al. (1974a) demonstrated that the pattern of life led by the people provides optimum opportunities for natural selection to operate on disadvantageous genes.
Our preliminary findings among the four inbred isolates thus emphasize that the demographic features of a population are crucial in maintaining the genetic structure, and that an intimate knowledge of various customs, especially those related to the process of shuffling of the genes in each generation, is absolutely necessary for a fuller interpretation of the data. Finally, our study stresses the need to conduct demographic, genetic, and cultural surveys among relatively unacculturated groups, since they provide extraordinary promise for unfolding the mysteries of evolution in general and human evolution in particular (Malhotra 1973; see also Neel 1972).
REFERENCES
BASU, AMITABA
1969 The Pahira: a population genetical study. American Journal of Physical
Anthropology. 31:399^*16. BASU, ARBINDU
1972 A demographic study of the Kota Nilgiri Hills. Journal of the Indian
Anthropological Society. 1:2945.
CROW, J . F.
1958 Some possibilities for measuring selection intensities in man. Human
Biology 25:6189. GUHA, B. s .
1935 "Racial affinities of the people of India," in Census of India, 1931,
volume one. Simla: Government of India Press. HARRISON, G. A.
1970 Human variation and its social causes and consequences. Proceedings of
the Royal Anthropological Institute 113.
3 2 2 Κ. C. MALHOTRA
KIRK, Η. L., L. Y. C. LAI
1961 The distribution of haptoglobins and transferrins in South East Asia. ywvutsrponmlihgfedcbaUTSRQPNMJIHGECBA
Acta Genetica et Statistica Medica 11:97105. LASKER, G. W.
1954 Human evolution in contemporary communities. Southwestern Journal of Anthropology 10:353365.
LIVINGSTONE, F. S.
1971 Malaria and human polymorphism. Annual Review of Genetics
5:3364. MALHOTRA, K. C.
1971 Group solidarity and identity in a nomadic group. S. C. Roy. Centenary
Celebrations. Ranchi. Abstract. 1972 Nandiwallas a nomadic caste in Maharastra. Preliminary observations.
Technical Report 472. Indian Statistical Institute, Calcutta. 1973a Sociobiological investigations among Nandiwallas — a nomadic
castecluster in Maharashtra. Bulletin of the International Committee
on Urgent Anthropological and Ethnological Research 16:63102. Austria, in press.
1973b "The pattern of nomadism among the Nandiwallas of Maharashtra (India)." Unpublished manuscript.
1974 Absence of attached earlobes in four Mendelian isolates. Journal of
Human Evolution 3 :429^31 . MALHOTRA, K. C., Β. V. BHANU, P. M. FUMALI, et al.
1973a "Finger dermatoglyphics among four Mendelian isolates — an example of genetic drift, and founder effect." Unpublished manuscript.
MALHOTRA, K. C., G. S. MUTALIK., Β. V. BHANU, et al.
1974a Incidence of color blindness among four endogamous nomadic groups: an example of natural selection. Heredity (in press).
MALHOTRA, K. C., G. S. MUTALIK., S. L. KATE, et al.
1974b A pedigree of "Mongol like facial forms." Indian Anthropologist
4:137141. MUTALIK, G. S. , S. L. KATE, K. C. MALHOTRA
1973a "Serological and biochemical investigations among the Nandiwallas (India)." Unpublished manuscript.
MUTALIK, G. S. , K. C. MALHOTRA., M. A. PHADKE, et al.
1973b "Incidence and inheritance of certain abnormalities among the four nomadic isolates." Unpublished manuscript.
NEEL, j . v .
1972 The genetic structure of a tribal population, the Yanomama Indians. Annals of Human Genetics 35:255259.
NEGI, R. S.
1963 ABO blood groups, sickle cell trait and color blindness in the Maria of Bastar and Ghond and Kanwar of Billaspur. Bulletin of the Anthro
pological Survey of India 12:149153. PICKFORD, R. W.
1963 Natural selection and color blindness. The Eugenics Review 55:97101.
POST, R. H.
1962 Population differences in red and green color vision deficiency: a review, and a query on selection relaxation. Eugenics Quarterly
9:131146. ROBERTS, D. F.
1956 A demographic study of a Dinka village. Human Biology 28:323349.
Founder Effect, Gene Drift, and Natural Selection 323
SALZANO, F. M.
1961 Studies on the Caingang Indians, part one: Demography. Human Bi
ology 33:110130. SALZANO, F. M., A. FREIREMAIA
1970 Problems in human biology: a study of Brazilian populations. Detroit: Wayne State University Press.
WRIGHT, S.
1943 Isolation by distance. Genetics 28:114138.

Physical Anthropology of the Angami
Nagas (Nagaland, India)
PRAVEEN KUMAR SETH and SWADESH SETH
Urgency for the study of changing human groups has long been emphasized because the disappearance of considerable somatic and genetic variability among tribal peoples can be foreseen in the near future. Accounts of the border area groups allow us to reconstruct the situation with regard to genetical variation that once existed and they provide basic data for new types of analyses. They also facilitate the study of the interaction of cultural and random agencies involved in changing gene frequencies, thereby aiding our understanding of the variations among currently observed populations. In this paper, an attempt has been made to summarize our studies on the physical anthropology of the Angami Nagas, an IndoMongoloid group living in the northeastern hills of India (state of Nagaland). They represent an isolate with no significant genetic admixture with the nonNaga populations.
Study of the border area of Nagaland, inhabited mainly by the Nagas, assumes urgency because (a) it affords an opportunity to observe somatic and genetic variation across barriers of gene flow and effects of consanguinity within various endogamous groups of Nagas living in the same environments, and (b) it allows an investigation of human physical variation among the Nagas of Kohima and between adjacent groups with different degrees of interbreeding between them. Angamis — tall, powerful and beautifully built — are the most culturally advanced members of the Naga tribes, and they are numerically the largest group. They also occupy the largest area (see Map 1). Nagaland (the sixteenth state of the Indian Union) has a bracing climate which is neither extremely hot nor cold with only moderately heavy rainfall.
This study was supported by University Grants Commission (Government of India) research grant (144[2007]/69/[F/SCH]) to Dr. P. K. Seth and research grant (F.14.2/70 SCH) to Mrs. Swadesh Seth.
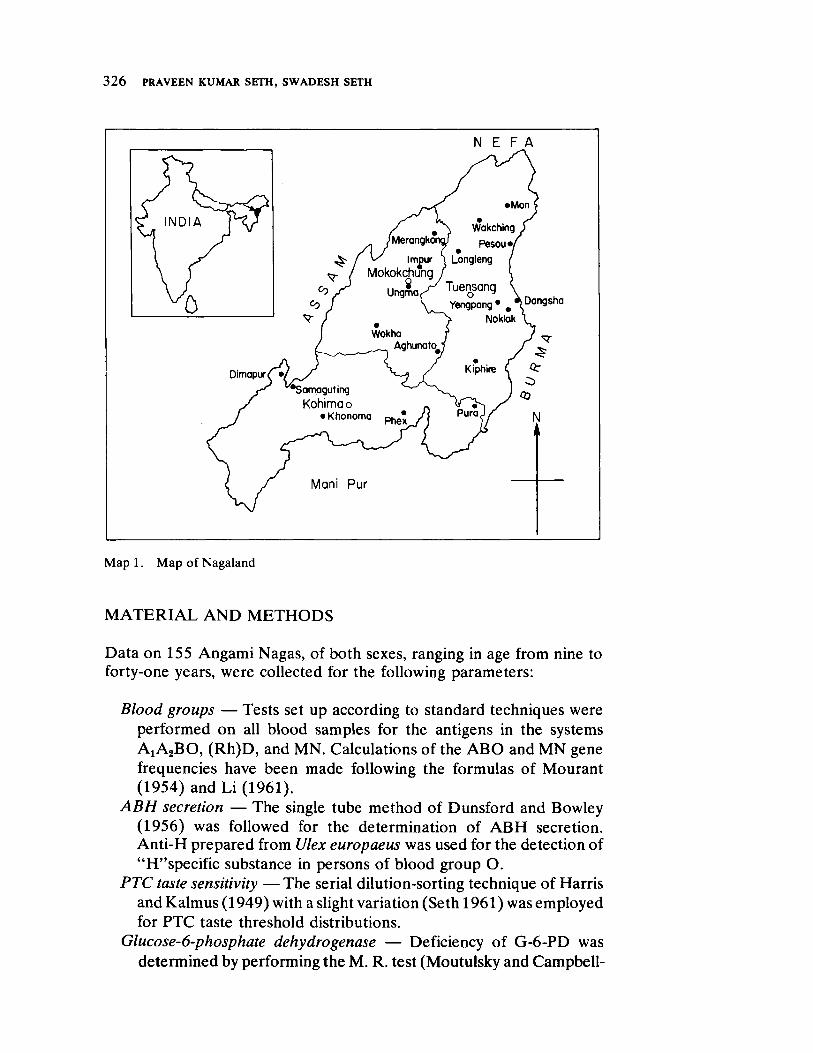
3 2 6usrpnmihgeaYWVUTSRPNMKHEDA PRAVEEN KUMAR SETH, SWADESH SETH
Ν Ε F A
Yengpang · . \Dangsha
Dimapur
Map 1. Map of Nagaland
MATERIAL AND METHODS
Data on 155 Angami Nagas, of both sexes, ranging in age from nine to fortyone years, were collected for the following parameters:
Blood groups — Tests set up according to standard techniques were performed on all blood samples for the antigens in the systems A ^ B O , (Rh)D, and MN. Calculations of the ABO and MN gene frequencies have been made following the formulas of Mourant (1954) and Li (1961).
ABH secretion — The single tube method of Dunsford and Bowley (1956) was followed for the determination of ABH secretion. AntiH prepared from Ulex europaeus was used for the detection of "H"specific substance in persons of blood group O.
PTC taste sensitivity — The serial dilutionsorting technique of Harris and Kalmus (1949) with a slight variation (Seth 1961) was employed for PTC taste threshold distributions.
Glucose6phosphate dehydrogenase — Deficiency of G6PD was determined by performing the M. R. test (Moutulsky and Campbell
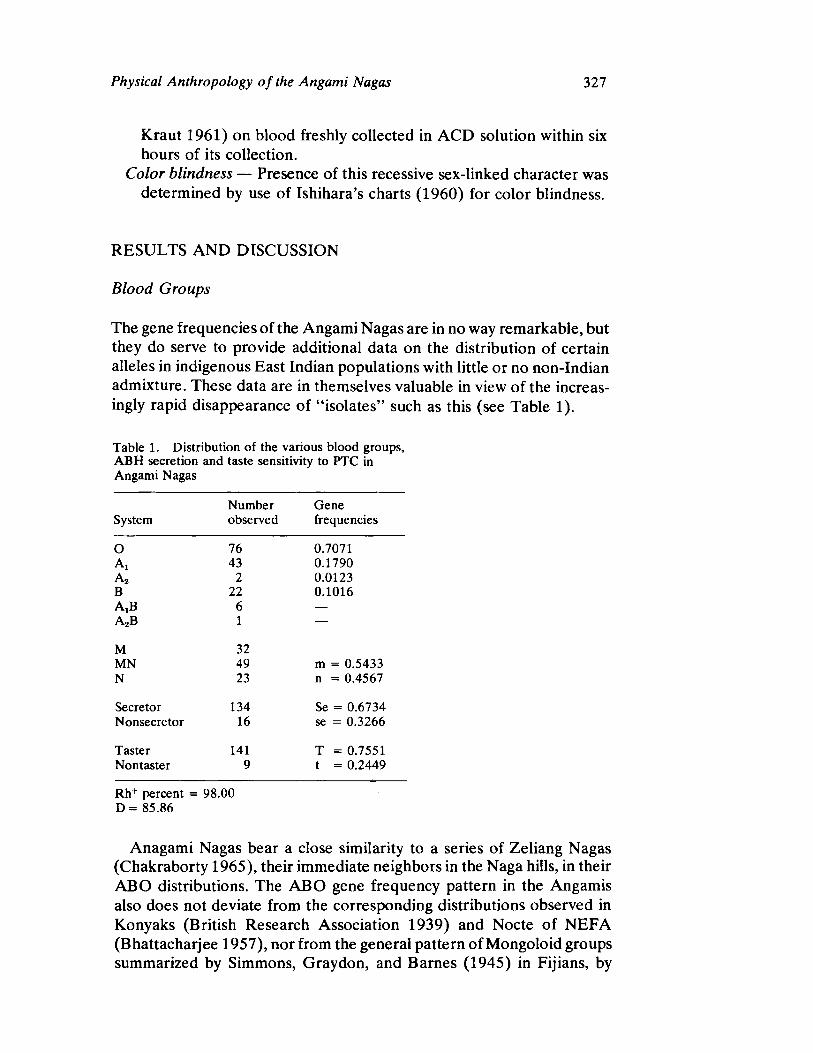
Physical Anthropology of the Angami Nagas 327
Kraut 1961) on blood freshly collected in ACD solution within six hours of its collection. usrponliedbGCB
Color blindness — Presence of this recessive sexlinked character was determined by use of Ishihara's charts (1960) for color blindness.
RESULTS AND DISCUSSION
Blood Groups
The gene frequencies of the Angami Nagas are in no way remarkable, but they do serve to provide additional data on the distribution of certain alleles in indigenous East Indian populations with little or no nonIndian admixture. These data are in themselves valuable in view of the increasingly rapid disappearance of "isolates" such as this (see Table 1).
Table 1. Distribution of the various blood groups, ABH secretion and taste sensitivity to PTC in Angami Nagas
Number Gene System observed frequencies
Ο 76 0.7071 Αι 43 0.1790 A2 2 0.0123 Β 22 0.1016 Α,Β 6 —
A2B 1 —
Μ 32 MN 49 m = 0.5433 Ν 23 η = 0.4567
Secretor 134 Se = 0.6734 Nonsecretor 16 se = 0.3266
Taster 141 Τ = 0.7551 Nontaster 9 t = 0.2449
Rh+ percent = 98.00 D = 85.86
Anagami Nagas bear a close similarity to a series of Zeliang Nagas (Chakraborty 1965), their immediate neighbors in the Naga hills, in their ABO distributions. The ABO gene frequency pattern in the Angamis also does not deviate from the corresponding distributions observed in Konyaks (British Research Association 1939) and Nocte of NEFA (Bhattacharjee 1957), nor from the general pattern of Mongoloid groups summarized by Simmons, Gray don, and Barnes (1945) in Fijians, by
3 2 8WVUTSRPNMKHEDA PRAVEEN KUMAR SETH, SWADESH SETH
Gupta (1958) in Rankhal of Tripura, by MacFarlane (1937) in Tibetans, and by Simmons, Graydon, and Semple (1953) in Paluans.
An examination of the MN system reveals marked similarities between the Angami Nagas and Filipines (Simmons and Graydon 1945), Muruts of Borneo (GraydonyvtsronliedcaTSPHGDCBA et al. 1952), Japanese (Graydon et al. 1945) and Maoris (Simmons et al. 1951).
Rh gene frequencies of the Angamis do not deviate from those of Mongoloid groups. Because of the irregular supply of electricity in the field camp and other field limitations, only the Rh(D) system was determined for the present investigations.
ABH Secretion
It is noteworthy that with regard to the distribution of A B H groupspecific substances (see Table 1) the Angamis show closer affinities with Nocte (Bhattacharjee 1957), Galong Abors (Kumar 1954), Noatia (Buchi 1954), Tibetans (MacFarlane 1937), and Kedayans of Borneo (Graydon et al. 1952).
PTC Taste Sensitivity
Similiarity taste sensitivity to PTC amongst Angamis reveals marked similarities with Mongoloid groups except for Burmese immigrants of Andamanese Islands (Agrawal 1966). This latter deviation may be due to miscegenation with people living in the area.
Color Blindness
No colorblind individuals were observed in the entire series of Angami Nagas studied, thereby suggesting that the selection against defective color vision is more intense among the Nagas, who live in a relatively isolated environment in the northeastern border hills in Nagaland State, than among the plains people (Dronamraju and Meera Khan 1963).
G6PD
Glucose6phosphate dehydrogenase deficiency has been observed in twentythree males and ten females. It seems that most of these variant females may be heterozygous carriers of the gene for G6PD deficiency

Physical Anthropology of the Angami Nagas 329
or it may be that in a large proportion of these females the Xchromosome bearing the normal gene tends to be inactivated (Seth and Seth 1971).
Skin Color
Angami Nagas show an overall increase in the reflectance along the scale directly proportional to the wavelength (see Table 2). The skin color exhibits maximum reflectance in both the Angami males and females at wave length 685 compared with the reflectance at the same wavelength by a perfectly white block of magnesium carbonate. Contrary to expectations, an equally high reflectance of the skin is observed at the forehead compared to that at the medial aspect of the upper arm. This may be explained easily because of the hair style prevalent among the Angami youth of allowing the hair to fall forwards to cover the forehead.
Angami Nagas exhibit sexual dimorphism with respect to skin reflectance: the males have a lower mean reflectance than the females at all wavelengths and at all three different sites of measurement — for example the medial aspect of the upper arm, flexer surface of the forearm, and at a point in the middle of the forehead.
Between the ages of nine and twenty years, no evidence of statistically significant effects of age in skin reflectance values were obtained at either the medial aspect of the upper arm, flexer surface of the forearm, or the forehead in the entire present series. Although slight fluctuations in the reflectance values from skin of these body sites for the various age groups were noted, they appear not significant enough for evaluating the differences therein. Similar observations are reported by Lasker (1954) in his studies on Mexican populations.
Marked and consistent sex differences have been shown in all populations studied (Weiner and Lourie 1969), and according to Huizinga (1965) there is also evidence for increased darkening of the skin with age, this aging effect being greater on the forearm than on the upper arm. The observations in the present series of Angami Nagas indicate, that the melanocyte content of the skin or the pigmentation is practically constant in the three body sites investigated. This could be easily accounted for by the bracing climate of Nagaland. Walsh (1964), Kalla (1969), Tobias (1961), and Garn, Selby, and Crawford (1956) report a slight lightening of the unexposed arm and a darkening of the forehead with increase in age. On the other hand, it seems that the skin as well as the eye color alter little after the first few months of life (Harrison 1961).

330 PRAVEEN KUMAR SETH, SWADESH SETH
ε a. Ό soS00 sΟ
ε ο uroiaο
so
ε =3. tsgSD
Ο Ο so
Β
St ο 00
ε 3.
Ο s© >/>
ε =3.
Ο (Ν V)
ε =t
ο Os TT
ε st
ο Γ
ε St sO CS
f cs co ο oo CS so so so SO <N co CS ΓΟ CO CS rJ csi +1 +1 +1 +1 +1 +1 SO "Ί (N <N SO co •«t <S 00 ui sb
Tf
m CM Γ 1/Ί Os so 00 00 co Γcs (N co CN <N +1 +1 +1 +1 +1 +1
OS Os TJο sO sd CS ό «-π Tf CO CO •<t
00 Ο © Os ο CS ο Os in >o co CO co cs CN CS +1 +1 +1 +1 +1 +1 *—t p- Os ο TT SO ,-H r^ iri CS <s co <N <S CO CO co
ΙΟ Os Os 00 p- <N 00 co CS CN CS CN (N +1 +1 +1 +1 +1 +1 l—1 co «η co Os Η CO © SO iri <N (Ν (N <N cs
ON | ON Ο CS Os SO co iri 1 in <N (Ν co co CO CO +1 +1 +1 +1 +1 +1 Ο r- rt; 0\ <s o\ SO so co' Φ
CN (S <s
Γ- CS !/ "> co Os 00 Ο TI- ΙΟ c-i co co' CS (N CS +1 +1 +1 +1 +1 +1 co q Os 00 <s Os
<o •t' φ Os 00 (N
V) CO OS Γ- CO r- 00 co vo (N CS CS CO <N es CS +1 +1 +1 +1 +1 +1 00 Os < Γ-iri CO o\ r-'
»—Η τ—1 111
r- Ο SO '/"J co sO Os Os CO CS <N (Ν CO CN (N CN +1 +1 +1 +1 +1 +1 CN so "Ί CN 00 Cs|
CS* (N ΙΟ ^ ^ ϊ-Η
" " '
r·» 00 00 OS Tt-O; SO (N co CO TT <N (N co' cn (N (S +1 +1 +1 +1 +1 +1 ο 00 Ο •<t CN m
OS O rr co CO τ—1 1-H Ϊ—ι t—I
Λ g
<u Ο.
0) D, • 3D
•Ό
a
ω "S ά
T3 a ω J= ω u Ο
u.
Physical Anthropology of the Angami Nagas 331
REFERENCES
AGRAWAL, Η. N.
1966 A study on ABO blood groups, P.T.C. taste sensitivity, sickle cell trait and middlephalangeal hairs among Burmese immigrants of Andaman islands. Eastern Anthropologist 19:107116.
BHATTACHARJEE, P. N.
1957 A study on ABO, MN blood groups, and the ABH secretion in the Noote of North East Frontier Agency. Bulletin of the Department of Anthropology. Government of India 6:7780.
BRITISH RESEARCH ASSOCIATION
1939 Blood groups among primitive peoples. Nature 144:714. BUCHI, e . c .
1954 ABH secretion in India. Anthropologist 1:39. CHAKRABORTY, M.
1965 ABO blood groups of the Zeliang Nagas. Man in India 45:311315.
DRONAMRAJU, K. R., P. MEERA KHAN
1963 Frequency of colorblindness among the tribal and nontribal peoples of Andhra Pradesh. Annals of Human Genetics 27:1721.
DUNSFORD, I. , C. C. BOWLEY
1955 Techniques in blood grouping. London: Oliver and Boyd. GARN, S. M., S. SELBY, M. R. CRAWFORD
1956 Skin reflectance studies in children and adults. American Journal of Physical Anthropology 14:101117.
GRAYDON, J . J . , R. T. SIMMONS, G. A. M. HEYDON, et el.
1945 The Rh factor and blood group frequencies in Japanese. Medical Journal of Australia 1:601.
GRAYDON, J. J . , R. T. SIMMONS, N. M. SEMPLE, et al.
1952 Blood genetics of various populations in Borneo. Medical Journal of
Australia 1:694702. GUPTA, S. P.
1958 ABO Blood groups in Tripura (North East India). Journal of the Royal
Anthropological Institute 88:109111. HARRIS, Η., H. KALMUS
1949 The measurement of taste sensitivity to phenylthiourea(P.T.C.)j4wia/.s of Eugenics 15:2431.
HARRISON, G. A.
1961 "Pigmentation" in Genetical variation in human populations. Edited by G. A. Harrison, 99115. London: Pergamon.
HUIZINGA, J.
1965 Reflectometry of the skin in Degons. Proceedings; Koninklijke Neder
landse Akademie van Wetenschappen 68:289296. ISHIHARA, S.
1960 Tests for colour blindness with 38 plates (fifteenth edition). London: Η. K. Lewis.
KALLA, Α. κ .
1969 A study of the age differences in skin pigmentation in males. Journal
of the Anthropological Society of Nippon 77:246253. KUMAR, N.
1954 Blood group and secretor frequency among the Galongs. Bulletin of the Department of Anthropology. Government of India 3:5564.
3 3 2 PRAVEEN KUMAR SETH, SWADESH SETH
KUMAR, Ν., D. Β. SASTRY
1961 A genetic survey among the Riang: a Mongoloid tribe of Tripura. yvutsrponmlihgfedcbaZTSRQPMJIHGEDCBA
ZeitschriftyutsrponmlihgfedcaVPMJHGDCA fόr Morphologie und AnthropologieyxwutsrponmlkihgfedcbaYWUTSRPONMLKJIHGFECBA 51:346355. LASKER, G . w .
1954 Photoelectric measurement of skin color in a Mexican population. American Journal of Physical Anthropology 12:115122.
LI, c. c. 1961 Human genetics: principles and methods. New York: McGrawHill.
MACFARLANE, E. W. E.
1937 Eastern Himalayan blood groups. Man 37:159. MOTULSKY, A. G. , J . M. CAMPBELLKRAUT
1961 Proceedings of the Conference on Genetic Polymorphisms and Geo
graphical Variations in Disease, 159180. New York: Grune and Stratton.
MOURANT, Α. Ε.
1954 The distribution of the human blood groups. Oxford: Blackwell. POST, R. H.
1962 Population differences in red and green color vison deficiency: a review, and a query on selection relaxation. Eugenics Quarterly 9:131146.
SETH, p . κ .
1961 "Taste sensitivity to phenylthiocarbamide among the Kumaoni Raj puts and Brahmins, 1118." Unpublished M.Sc. dissertation, University of Delhi.
SETH, P. K., S. SETH
1971 Biogenetical studies of Nagas: glucose6phosphate dehydrogenase deficiency in Angami Nagas. Human Biology 43:557561.
i.p. Variation in melanin pigmentation in Angami Nagas. SIMMONS, R. T., J . J . GRAYDON
1945 Blood groups, subgroups, M,N types and Rh subtypes in Fillipines. Medical Journal of Australia 2:325328.
SIMMONS, R. T., J . J . GRAYDON, G. BARNES
1945 Blood groups, subgroups, M,N types and the Rh factor in Fijians. Medical Journal of Australia 1:529531.
SIMMONS, R. T., J . J . GRAYDON, N. M. SEMPLE
1953 Further blood genetical surveys in Micronesia: Palauans, Turkese and Kapingas. Medical Journal of Australia 2:589596.
SIMMONS, R. T. , }. J . GRAYDON, Ν. M. SEMPLE, et al.
1951 Blood, taste and secretion: a genetical survey in Maoris. Medical Jour
nal of Australia 1:425431. TOBIAS, p. v .
1961 "Studies on skin reflectance in BushmanEuropean hybrids," in Pro
ceedings of the Second International Congress on Human Genetics, 461471.
WALSH, R. J .
1964 Variation in the melanin content of the skin of New Guinea natives at different ages .Journal of Investigative Dermatology 42:261265.
WEINER, J. S. , J . A. LOURIE
1969 Human biology: a guide to field methods. Oxford: Blackwell. WORLD HEALTH ORGANIZATION
1964 Research in population genetics of primitive groups. Technical Report Series number 279. Geneva: World Health Organization.
Blood Protein Polymorphisms and the
Problem of Genetic Affinities of the
Ainu
KEIICHI OMOTO
The history of the anthropological study of the Ainu provides an example of the change from typological to population thinking which constituted a milestone in the progress of modern biological science. Some of the characteristics of earlier Ainu studies (see Kodama 1970:263281), which aimed mainly at ascertaining the origin of the Ainu were (1) use of only a few anthropological characters, chosen because they had been thought to reinforce a certain theory; (2) predominant use of somatoscopic characters; (3) emphasis on the differences rather than the similarities between the Ainu and the Japanese; and (4) the typological "pure race" concept. Thus only characters showing differences have been emphasized, to the neglect of other characteristics common to the Ainu and the Japanese. The variation in characteristics observed among Ainu individuals has often been considered a reflection of admixture with the Japanese.
Contrary to these early efforts, recent studies of various genetic traits, which make use of statistical analyses, indicate that although there are a number of traits showing unique frequencies the Ainu population is, genetically speaking, more similar to the Japanese and other East Asiatic Mongoloid groups than to any other major racial groups (see Omoto 1972 for references).
This paper reviews the data obtained by our studies of genetic marker traits (Omoto 1970, 1972; Omoto and Harada 1972) and attempts to focus attention on the factors that may have relevance to the problem of the origins of the Ainu.
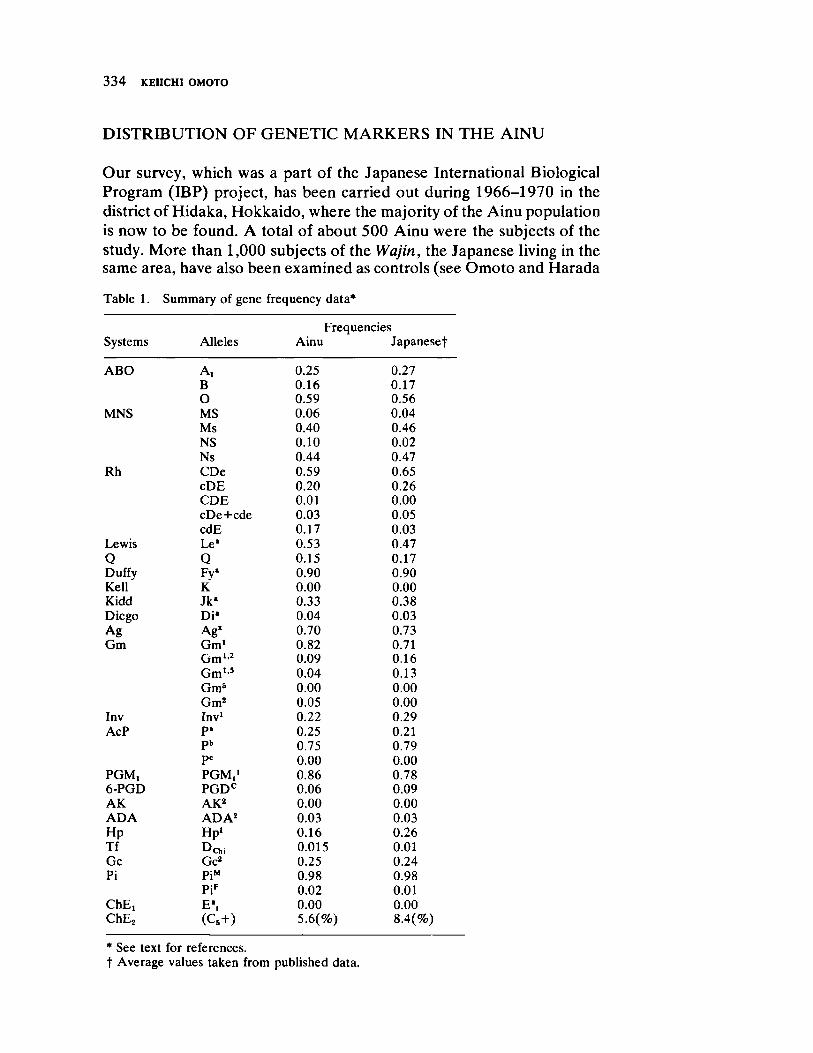
334 KEIICHI ΟΜΟΤΟ
DISTRIBUTION OF GENETIC MARKERS IN THE AINU
Our survey, which was a part of the Japanese International Biological Program (IBP) project, has been carried out during 19661970 in the district of Hidaka, Hokkaido, where the majority of the Ainu population is now to be found. A total of about 500 Ainu were the subjects of the study. More than 1,000 subjects of thenjiaW Wajin, the Japanese living in the same area, have also been examined as controls (see Omoto and Harada
Table 1. Summary of gene frequency data*
Frequencies Systems Alleles Ainu Japanese!
ABO A, 0.25 0.27 Β 0.16 0.17 Ο 0.59 0.56
MNS MS 0.06 0.04 Ms 0.40 0.46 NS 0.10 0.02 Ns 0.44 0.47
Rh CDe 0.59 0.65 cDE 0.20 0.26 CDE 0.01 0.00 cDe+cde 0.03 0.05 cdE 0.17 0.03
Lewis Le* 0.53 0.47 Q Q 0.15 0.17 Duffy Fy* 0.90 0.90 Kell Κ 0.00 0.00 Kidd Jk* 0.33 0.38 Diego Di* 0.04 0.03 Ag Ag' 0.70 0.73 Gm Gm' 0.82 0.71
Gm1·2 0.09 0.16 Gm1·5 0.04 0.13 Gm5 0.00 0.00 Gm2 0.05 0.00
Inv Inv1 0.22 0.29 AcP P* 0.25 0.21
pb 0.75 0.79 Pc 0.00 0.00
PGM, PGM,1 0.86 0.78 6PGD PGDC 0.06 0.09 AK AK2 0.00 0.00 ADA ADA2 0.03 0.03 Hp Hp' 0.16 0.26 Tf Dchi 0.015 0.01 Gc Gc2 0.25 0.24 Pi PiM 0.98 0.98
PiF 0.02 0.01 ChE, E'i 0.00 0.00 ChE2 (C.+) 5.6(%) 8.4(%)
* See text for references, t Average values taken from published data.
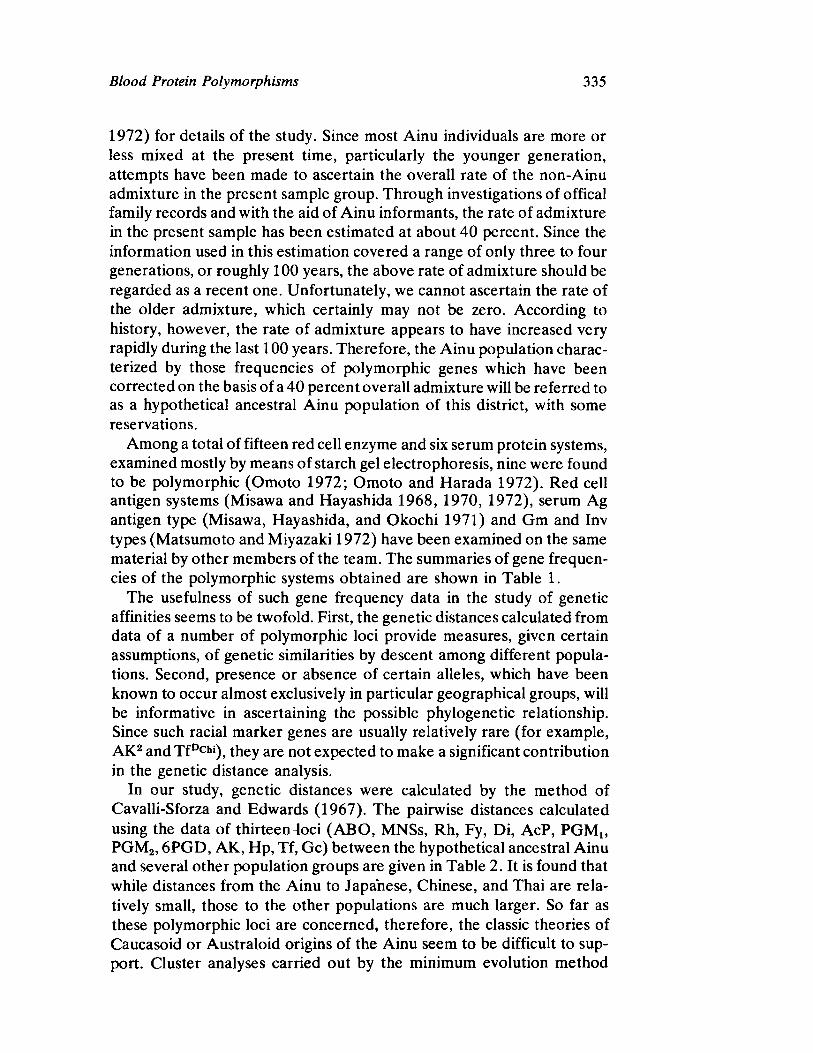
Blood Protein Polymorphisms 335
1972) for details of the study. Since most Ainu individuals are more or less mixed at the present time, particularly the younger generation, attempts have been made to ascertain the overall rate of the nonAinu admixture in the present sample group. Through investigations of offical family records and with the aid of Ainu informants, the rate of admixture in the present sample has been estimated at about 40 percent. Since the information used in this estimation covered a range of only three to four generations, or roughly 100 years, the above rate of admixture should be regarded as a recent one. Unfortunately, we cannot ascertain the rate of the older admixture, which certainly may not be zero. According to history, however, the rate of admixture appears to have increased very rapidly during the last 100 years. Therefore, the Ainu population characterized by those frequencies of polymorphic genes which have been corrected on the basis of a 40 percent overall admixture will be referred to as a hypothetical ancestral Ainu population of this district, with some reservations.
Among a total of fifteen red cell enzyme and six serum protein systems, examined mostly by means of starch gel electrophoresis, nine were found to be polymorphic (Omoto 1972; Omoto and Harada 1972). Red cell antigen systems (Misawa and Hayashida 1968, 1970, 1972), serum Ag antigen type (Misawa, Hayashida, and Okochi 1971) and Gm and Inv types (Matsumoto and Miyazaki 1972) have been examined on the same material by other members of the team. The summaries of gene frequencies of the polymorphic systems obtained are shown in Table 1.
The usefulness of such gene frequency data in the study of genetic affinities seems to be twofold. First, the genetic distances calculated from data of a number of polymorphic loci provide measures, given certain assumptions, of genetic similarities by descent among different populations. Second, presence or absence of certain alleles, which have been known to occur almost exclusively in particular geographical groups, will be informative in ascertaining the possible phylogenetic relationship. Since such racial marker genes are usually relatively rare (for example, AK2 and TfDchi), they are not expected to make a significant contribution in the genetic distance analysis.
In our study, genetic distances were calculated by the method of CavalliSforza and Edwards (1967). The pairwise distances calculated using the data of thirteen4oci (ABO, MNSs, Rh, Fy, Di, AcP, PGMj, PGM2 ,6PGD, AK, Hp, Tf, Gc) between the hypothetical ancestral Ainu and several other population groups are given in Table 2. It is found that while distances from the Ainu to Japanese, Chinese, and Thai are relatively small, those to the other populations are much larger. So far as these polymorphic loci are concerned, therefore, the classic theories of Caucasoid or Australoid origins of the Ainu seem to be difficult to support. Cluster analyses carried out by the minimum evolution method
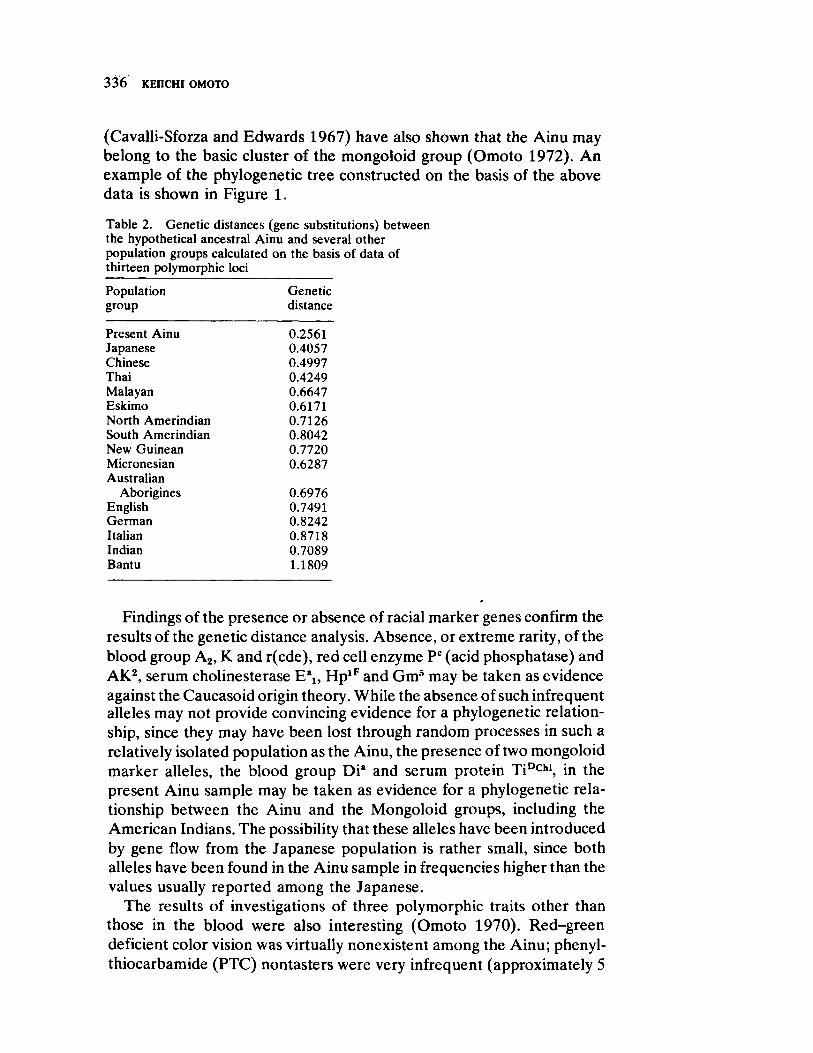
3 3 6ywvutsrponmlkihgfedcbaTSPNMKJIHGECBA KEIICHI ΟΜΟΤΟ
(CavalliSforza and Edwards 1967) have also shown that the Ainu may belong to the basic cluster of the mongoloid group (Omoto 1972). An example of the phylogenetic tree constructed on the basis of the above data is shown in Figure 1.
Table 2. Genetic distances (gene substitutions) between the hypothetical ancestral Ainu and several other population groups calculated on the basis of data of thirteen polymorphic loci
Population Genetic group distance
Present Ainu 0.2561 Japanese 0.4057 Chinese 0.4997 Thai 0.4249 Malayan 0.6647 Eskimo 0.6171 North Amerindian 0.7126 South Amerindian 0.8042 New Guinean 0.7720 Micronesian 0.6287
Findings of the presence or absence of racial marker genes confirm the results of the genetic distance analysis. Absence, or extreme rarity, of the blood group A2, Κ and r(cde), red cell enzyme Pc (acid phosphatase) and AK2, serum Cholinesterase E"x, Hp l F and Gm5 may be taken as evidence against the Caucasoid origin theory. While the absence of such infrequent alleles may not provide convincing evidence for a phylogenetic relationship, since they may have been lost through random processes in such a relatively isolated population as the Ainu, the presence of two mongoloid marker alleles, the blood group Dia and serum protein TiDchi, in the present Ainu sample may be taken as evidence for a phylogenetic relationship between the Ainu and the Mongoloid groups, including the American Indians. The possibility that these alleles have been introduced by gene flow from the Japanese population is rather small, since both alleles have been found in the Ainu sample in frequencies higher than the values usually reported among the Japanese.
The results of investigations of three polymorphic traits other than those in the blood were also interesting (Omoto 1970). Redgreen deficient color vision was virtually nonexistent among the Ainu; phenylthiocarbamide (PTC) nontasters were very infrequent (approximately 5
Australian Aborigines
English German
0.6976 0.7491 0.8242 0.8718 0.7089 1.1809
Italian Indian Bantu

Blood Protein Polymorphisms 337
percent); although the incidence of wet cerumen is much higher than in the Japanese, it is likely that the drytype cerumen was already present at considerable frequency among the hypothetical ancestral Ainu population, indicating a situation similar to that of the two Mongoloid marker genes mentioned above.
Furthermore, the isonicotinic acid hydrazid (INH) metabolic type has been studied among the Ainu by Sunahara and others (1963). A relatively low incidence of the slow inactivator type was found, a usual expectation among Mongoloid populations.
JAPANESE
— — MALAYAN
— — E S K I M O
AINU(PRESENT)
— A I N U (ANCESTRAL)
NEW GUINEAN ' MICRONESIAN
NORTH AMERINDIAN AUSTRAL.ABORIGINES
SOUTH AMERINDIAN
ENGLISH
GERMAN
ITALIAN
INDIAN
SOUTH AFRICAN BANTU
0 . 1 . 2 . 3 . 4 . 5 . 6 . 7 . 8 . 9
Number of Gene Substitutions
Figure 1. A phylogenetic tree constructed by the minimum evolution method of CavalliSforza and Edwards using data of thirteen loci
EXPLANATION OF APPARENT DISCREPANCY BETWEEN RESULTS OF SOMATOSCOPIC AND GENETIC STUDIES
It has been shown that the present Ainu population of Hidaka may possess a genetic composition basically similar to that of the Japanese and certain other Mongoloid groups, despite the wellknown dissimilarity in morphological characteristics.

338 KEIICHI ΟΜΟΤΟ
The explanation that a similarity in the distribution of genetic traits may be ascribed to longlasting gene flow into the Ainu from the surrounding Mongoloid populations cannot be supported for the following reasons. First, since gene flow must affect every genetic locus it is unlikely that certain polymorphic loci alone would show effects of gene flow. Second, although Japanese cultural influence may date back well into protohistoric times, the actual rate of gene flow may have been quite low before 1868, when Hokkaido came under Japanese rule. Before that time, intermarriage between the two populations may have been limited due to cultural and behavioral barriers. Thus, while the estimate of 40 percent for the accumulated gene flow may be an underestimate, it is unlikely that the hypothetical nonMongoloid character in the original gene pool would by now have completely disappeared. Moreover, there are a number of loci showing gene frequencies unique to the Ainu population: high frequencies ofSN NS and r ' ' (cdE), low frequency of Hp1, and occurrence of Gm2,21 phenogroup. These may indicate indirectly that the present Ainu population retains a considerable part of the ancestral gene pool.
A more plausible interpretation may be that the genetic similarity of the Ainu to the Mongoloid groups has a real phylogenetic background: the Ainu and the east Asiatic Mongoloid groups including the Japanese both may be derived from a common basic stock that later differentiated under different population histories, the two being differently affected by various evolutionary factors.
This interpretation is consistent with the results of recent multivariate analyses of the Ainu crania (Howells 1966; Yamaguchi 1967). The conclusions seem to indicate that the Ainu are a survival population out of a series of Upper Paleolithic or Mesolithic populations of East Asia, probably including the Jomon people of Japan.
It should be pointed out, however, that certain properties of the morphological characters make them inadequate for use in studies of phylogenetic relationship between populations. The genetic bases are obscure for most anthropometric characters, and many of them are known to be subject to secular change; they may show a significant difference in two populations common by descent but different in the way of life, or in cultural stage. Those characteristics of the Ainu such as the ruggedness of the face, the tendency toward dolichocephaly, rather welldeveloped supraorbital arch, the edgetoedge bite, and so on, are generalized characteristics probably possessed by most populations of the world at a certain stage of human evolution. Therefore, the occurrence of such characters in a population cannot be a definite clue to a link by descent with any of the present human races. The concept of "CroMagnonlike" appearance of the skull is misleading.
A second problem of morphological characters that may be relevant to
Blood Protein Polymorphisms 339
this discussion lies in the visible nature of most somatoscopic characters. A marked dissimilarity in visible characters, on the one hand, tends to become a reproductive barrier between human populations, as does language. On the other hand, it is through visible characters that assortative mating mostly takes place. Therefore, particularly in a small population such as the Ainu, a certain complex of somatoscopic characteristics could have attained a predominant incidence through inbreeding and assortative mating.
Probably this will explain some of the predominant somatoscopic features of the Ainu, such as hairiness. Descriptions of the Ainu as a strange, hairy people were found in the oldest Japanese documents, including a picture drawn as early as the fourteenth century. While hairiness must have played a role in promoting isolation, hence inbreeding, it may also have served as a basis for assortative mating. It is well known that Ainu men used to be very proud of their rich beards (Kodama 1970:89).
FACTORS AFFECTING MICROEVOLUTION OF THE AINU AND OTHER EAST ASIAN MONGOLOID GROUPS
If the Ainu are descended from the Upper Paleolithic population of East Asia which also gave birth to the Mongoloid groups with wellknown specialized morphological features, what were the microevolutionary factors responsible for the differentiation of the two population groups?
As the hypothesis by Coon, Gam, and Birdsell (1950) postulates, the specialized morphological characteristics of the Mongoloid group, which may be called for simplicity's sake the later Mongoloid, may have been formed as the result of selection by the extremely arid and cold climatic conditions somewhere in Northeast Asia during the last glacial period. During the postglacial period, and probably especially after the Neolithic revolution, this population began to grow rapidly in size and spread through almost the whole of Asia, absorbing aboriginal populations. New selective forces arising from the newly formed environments must have affected the genetic composition of the later Mongoloid populations.
The Ainu, on the other hand, probably remained relatively unaffected by the later Mongoloid populations because of their geographically peripheral position and probably also because of barriers mentioned above. Since their subsistence economy probably underwent only a slight change since Mesolithic times, generalized morphological features were preserved.
Limited gene flow as well as small population size may have decreased the variability and promoted the uniqueness of the Ainu both in genetic and nongenetic characteristics including their culture. The effect of ran
3 4 0zyxwvutsrqponmlkihgfedcbaZYWVUTSRONMLKJIHGFEDCBA KEIICHI OMOTO
dom genetic drift must have been strong, since the Ainu community used to be small. According to the earliest record, the Ainu in Hokkaido in 1807 numbered 21,697. They inhabited all of the island except the most mountainous interior. They lived in small settlements calledyvutsrponmlkihgfedcbaURPMJHGEA kotan which were made up of twenty or fewer households (see Watanabe 1964: 83100 for references). Also, a "bottleneck" effect on population size may have been a common phenomenon. A drastic decrease in the Ainu population number was recorded during the period 18221855. In the western half of Hokkaido the reduction was by almost 50 percent. A number of the Ainu settlements were thereby annihilated. Epidemic diseases such as smallpox, measles, tuberculosis, and Asiatic cholera introduced from the Japanese population were probably the main causes of this population decrease (Kodama 1970:3839).
The blood group study carried out before World War II has shown marked local differences of ABO blood group gene frequencies among the Ainu of different districts of Hokkaido (see Tanaka 1959 for detailed data). Unfortunately, such a study cannot be made at the present time, since it is almost impossible to obtain samples of adequate size in districts other than Hidaka. In the absence of evidence for the operation of selective factors, it is safe to consider that the unique frequencies found in a number of loci of the Ainu population mentioned above may be accounted for by random genetic drift.
Our aim is to gain a better understanding of the process of genetic differentiation of human populations, rather than to classify races. The problem of the genetic origins of the Ainu, however, poses interesting questions not only in methodological aspects but also in elucidating the factors affecting microevolution of small populations.
REFERENCES
CAVALLISFORZA, L. L., A. W. F. EDWARDS
1967 Phylogenetic analysis: models and estimation procedures. American
Journal of Human Genetics 19:(Supplement 19)233257. COON, C. s . , S. M. GARN, J . B. BIRDSELL
1950 Races: a study of race formation in man. Springfield, 111.: Charles C Thomas.
HOWELLS, w . w .
1966 The Jomon population of Japan: a study by discriminant analysis of Japanese and Ainu crania. Papers of the Peabody Museum of Archaeology and Ethnology, Harvard University 57:143.
KODAMA, S.
1970 Ainu: historical and anthropological studies. Sapporo: Hokkaido University School of Medicine.
MATSUMOTO, Η., T. MIYAZAKI
1972 Gm and Inv allotypes of the Ainu in Hidaka area, Hokkaido. Japanese
Journal of Human Genetics 17:2026.
Blood Protein Polymorphisms 341
MISAWA, S., Y. HAYASHIDA
1968 On the blood groups among the Ainu in Shizunai, Hokkaido. Proceed
ings of Japan Academy 44:8388. 1970 On the blood groups among the Ainu in Niikappu, Hokkaido. Journal
of the Anthropological Society of Nippon 78:177186. 1972 On the blood groups of the Ainu in Hidaka, Hokkaido. Japanese
Journal of Legal Medicine 26:359. MISAWA, S., Y. HAYASHIDA, K. OKOCHI
1971 Distribution of Ag(x) and Ag(y) antigens in the Ainu. Japanese Journal
of Human Genetics 16:3034. OMOTO, K.
1970 The distribution of polymorphic traits in the Hidaka Ainu. I. Defective colour vision, PTC taste sensitivity and cerumen dimorphism. Journal
of the Faculty of Science, The University of Tokyo, Section V, volume 3, part 5:337355.
1972 Polymorphisms and genetic affinities of the Ainu of Hokkaido. Human
Biology in Oceania 1:278288. OMOTO, K., S. HARADA
1972 The distribution of polymorphic traits in the Hidaka Ainu. II. Red cell enzyme and serum protein groups. Journal of the Faculty of Science, The University of Tokyo, Section V, volume 4, part 2:171211.
SUNAHARA, S., M. URANO, M. OGAWA, et al.
1963 Genetical aspect of isoniazid metabolism. Japanese Journal of Human
Genetics 8:93111. TANAKA, T.
1959 A study on the Japanese from the standpoint of the blood groups. Japanese Journal of Criminology 25:3767.
WATANABE, H.
1964 The Ainu: a study of ecology and the system of social solidarity between man and nature in relation to group structure. Journal of Faculty of
Science, The University of Tokyo, Section V, volume 2, part 6:1164. YAMAGUCHI, B.
1967 A comparative osteological study of the Ainu and the Australian aborigines. Occasional Papers in Aboriginal Studies number 10. Canberra: Australian Institute of Aboriginal Studies.


The Anthropological Usefulness of the
IgA Allotypic Markers
M. S. S C H A N F I E L D and Η. H. F U D E N B E R G
The Gm allotypic markers on the heavy chains of human IgG have been very useful anthropologically because of the presence of either unique haplotypes in different populations or marked differences in the frequencies of the haplotypes. The Inv allotypic markers on the Kappa light chains of human immunoglobulin are not as useful because of the smaller number of alleles present; however, they can be used to discriminate between populations. The discovery of a polymorphic allotypic marker on the IgA2 subclass of human IgA allowed additional information to be gained (Kunkel et al. 1969; Vyas and Fudenberg 1970), but the major gain in information came with the verification that the IgA2 allotypic marker was genetically linked to the Gm allotypic marker, creating a large G m A m haplotype (van Loghem, Natvig, and Matsumoto 1970). The ability to discriminate populations was further enhanced by the recent discovery of a second allotypic marker at the IgA2 locus which appears to be allelic to the first (van Loghem, Wang, and Shuster 1973). To allow for a single, unified nomenclature, the allotypic markers on IgA2
will be referred to as A 2 m ( l ) and A2m(2), after the suggested nomenclature of van Loghem, Wang, and Shuster (1973). In this paper we report the distribution of the G m A 2 m haplotypes in the major races of man and the unique information presented by the G m A 2 m haplotypes in answering questions that could not be answered by means of the G m haplotypes alone.
Supported in part by United States Public Health Postdoctoral Research Fellowship (HD525971). The authors would like to thank Drs. S. D. Litwin, J, Shuster and E. van Loghem for providing some of the reagents used; Drs. P. B. Booth, P. Herzog, J. Gergely, R. Hornabrook, P. Kwiterovich and E. Sutton for supplying some of the serum samples tested; and the Irwin Memorial Blood Bank for providing laboratory space during the course of this project.

3 4 4 Μ. S. SCHANFIELD, Η. Η. FUDENBERG
METHODS AND MATERIALS
Immunoglobulin allotyping for Gm and A2m allotypic markers was carried out in microtiter plates, using a standard threedrop technique (Schanfield 1971). Gm typing was done with red blood cells coated with incomplete Rh antibodies of defined specificities or with myeloma proteins coated onto red blood cells by means of chromic chloride. Chromic chloride was also used to coat IgA myeloma proteins onto red blood cells. Chromic chloride coating was done using a modification of the method of Vyastlea et al. (1968), with all proteins coated at a concentration of 1 milligram/milliliter and using 0.05 percent chromic chloride, while the special TAP diluent of the original method was replaced by 0.85 percent saline. All samples were tested at a dilution of 1/10 or 1/20 with the reagents listed in Table 1.
Table. 1. Reagents used for immunoglobulin allotyping
Specificity Agglutinator Coat Original WHO
Gm a 1 Hel Dwi X 2 Dev Yap ζ 17 Pon Dwi b2, f 3 , 4 Sta Dan b° 11 Har Hun b1 5 Ble Hun b3 13 F841* Hun b3 13 Ams* Hun b3 13 Log* Hun b5 10 Ste* Hun c3 6 And Bor* or Ada c5 24 Hod Bor* or Ada
S 21 B755* Sul
g 21 Gha* Sul
g 21 Leh Sul s 15 Gai 3068'orPuh t 16 Ros 3068*orPuh Ray — Ray Sul η 23* K9547" Jas
A2m 1 Far Her 2 Tayc For
* Not all sample types with this reagent. * Supplied by E. van Loghem. b Supplied by S. Litwin. c Supplied by J. Shuster.
A total of 1,694 samples was tested for Gm (a,χ, ζ, f, b, c3, c5, g, s, t, and Ray) and A2m (1) and (2). Many of these samples were also tested for Gm(n). Included in these samples were 630 Caucasians, 58 Chinese, 53 Japanese, 587 Papuans, 207 Melanesians, 112 AfroAmericans, and 65

The Anthropological Usefulness of the Iga Allotypic Markers 345
Mexican Indians of selected phenotypes. In addition, 119 nonhuman primates, including 59 chimpanzees, 19 orangutans, 6 gibbons, 15 baboons, 16 assorted macaques, and 4 patas monkeys, were tested for A2m (1) and (2).
RESULTS
The approximate haplotype frequencies for the major human populations studied are presented in Tables 2, 3, 4, and 6, with the racial distribution summarized in Table 7. None of the 119 nonhuman primates were positive for either A2m (1) or (2). Thus far, twentyseven different haplotypes have been found; of these, twentytwo are found in a single racial group or in populations derived from or admixed with that racial group. Seven of the twentytwo racially unique haplotypes are rare, with frequencies less than 1 percent. The haplotypes presented in Tables 2 ,3 , 4 ,5 ,6 , and 7 include the specificity (Gm(Pa), which was not tested for but is presumed to be present from the known distribution of this marker (van Loghem and Grobbelaar 1971).
Table 2. GmA2m haplotypes in Caucasians
GmA2m haplotypes Approximate frequency
Common haplotypes
Gm ( b1 Pa b5 Ray b3 b°; f ,n ) A2m (1) 0.484 ( b1 Pa b5 Ray b3 b°; f — ; ) (1) 0.292 (g Pa Ray ; ζ a : ; ) (1) 0.175 (g Pa Ray ; ζ a x: ; ) (1) 0.045
Uncommon haplotypes
(g Pa Ray ; ζ a : ; ) (2) 0.005 (g Pa Ray ; ζ a x: ; ) (2) 0.005 ( b1 Pab5 Ray b3 b°; f ; n) (2) 0.005 ( b1 Pa b5 Ray b3 b°; ζ a : ; ) (1) 0.002
(2) 0.003 ( st b5 Ray b3 b°; ζ a : ; ) (1) 0.003
(2) 0.008 ( g P a Ray ; f ; n) (1) 0.005 ( b1 Pa b5 Ray b3 b°; f x ; ?) (1) 0.002
DISCUSSION
The simplest way to discuss the anthropology of the IgG, IgA allotypic markers is by population. Thus far, thirteen GmA 2 m haplotypes have been observed in Caucasians, but only four of these have a frequency greater than 1 percent (Table 2). In contrast to its frequency among Negroes and Orientals, A2m(2) appears to be very infrequent in
3 4 6zyxwvutsrqponmlkjihgfedcbaWUTSRPONMLIHGFEDCBA Μ. S. SCHANFIELD, Η. Η. FUDENBERG
Caucasians. Only 1.1 percent of 612 Caucasians with Caucasian phenotypes were A2m(2) positive, however, 61.1 percent of 18 Caucasians with nonCaucasian phenotypes were A2m(2) positive, supporting the observation originally put forth by van Loghem, Wang, and Shuster (1973) that A2m(2) was not present originally in Caucasians. The presence of A2m(2) in Caucasians appears to be associated with either the Oriental Gma z b s t , A2m2 haplotypes or the Negro Gm a z b , A2m2 haplotype. The most common one in the Central European populations studied is the Gmazb8 t , A2m2 haplotype. In general, the presence of A2m(2) in Caucasians appears to be due to admixture with Orientals and Negroes. It is possible that the presence of A2m(2) on the Caucasian Gm f ,b ,n, A2m2
haplotype may be due to recombination between a nonCaucasian haplotype in the population and the very common Gm f ,b ,n haplotype.
Data are available thus far only on Negro populations from the Americas. In the present study, fiftysix AfroAmerican families from the United States were studied, while van Loghem, Wang, and Shuster (1973) studied thirtyone families from Surinam. It is evident that the Surinam AfroAmericans have less Caucasian admixture than the sample from the United States as indicated by the absence of Caucasian haplotypes in their study (Table 3). Nine haplotypes appear to be indigenous to Negroid populations, of which seven appear to exist in pure Negro populations in frequencies greater than 1 percent. The majority of haplotypes present in AfroAmericans are A2m(2) positive (64.2 percent United States and 76.8 percent Surinam). This is in distinction to the Papuans (Table 4), who also show a high frequency of Gm a z b haplotypes. The differences are that the Papuan Gmaz ,b haplotype is usually Gm(n) positive, while the Negro one is Gm(n) negative, and the Papuan haplotype is almost always A 2 m(l) positive, while the Negro haplotype is usually A2m(2) positive. Thus, even without the use of Gm(n), it is possible to differentiate the Gmaz ,b haplotypes found in Papuan and Negro populations by means of the A2m allotypic markers.
Papua New Guinea consists of many genetically heterogeneous populations. Further marked differences in the distribution of Gm haplotypes have been observed by some investigators between the speakers of Papuan languages and those speaking Melanesian languages (Giles, Ogan, and Steinberg 1965; Steinberg 1967; Curtaintlea et al. 1971; Curtain et al. 1972; Schanfield 1971). These differences are magnified by the addition of the Azm allotypic markers. It is evident that a certain amount of gene flow has existed between the two populations, and the marked differences may not be visible in the samples of Papuans and Melanesians presented here because they represent the pooled results of several different Papuan and Melanesian populations. The dichotomy is easily seen by looking at a subset of Melanesians from insular New Guinea who are characterized by the high frequency of the haplotype Gmaf b'n, A2m2,

The Anthropological Usefulness of the Iga Allotypic Markers 347
Table 3. GmA2m haplotypes in AfroAmericans
Texas Surinam* GmAjm haplotypes Ν = 112 N = 62
b1 Pa bs Ray b3 b°; ζ a ) A2m (1) 0.134 0.137 (2) 0.455 0.476
b1 Pa c5 c3 b°; ζ a ; ) (1) 0.036 0.040 (2) 0.143 0.234
b1 Pa bs Ray c3 b°; ζ a ; ) (1) 0.024 s bs Ray b3 b°; ζ a ; ) (1) 0.009 0.024
(2) 0.027 0.057 b1 Pa b5 Ray b3 b°; ζ a x; ) (1) 0.004 0.008 b1 Pa b5 Ray b3 b°; ζ a ; ) (2) 0.009
b1 Pa b5 Ray b3 b°; f — ; n) (1) 0.107
(2) 0.004 -
b1 Pa b5 Ray b3 b°; f ; ) (1) 0.018
P a Ray ; ζ a ; ) (1) 0.022 -
P a Ray ; ζ a x; ) (1) 0.027
(2) 0.004 -
* Taken from van Loghem, Wang, and Shuster (1973).
Table 4. GmA2m haplotypes in Papua New Guinea
Papuans Melanesians GmA2m haplotypes Ν = 587 Ν = 207
Gm ( b1 Pa b5 Ray b3 b°; f a ; n) A2m (1) 0.020 0.162 (2) 0.084 0.403
( b1 Pa b5 Ray b3 b°; f a ; ) (1) 0.009 0.048 ( b1 Pa b5 Ray b3 b°; f a ; ) (2) 0.005 0.017
( b1 Pa b5 Ray b3 b°; ζ a ; n) (1) 0.384 0.126 (2) 0.003 0.010
( b1 Pa b5 Ray b3 b°; ζ a ; ) (1) 0.025 0.027 (g Pa Ray ; ζ a ; ) (1) 0.411 0.171
(2) 0.031 0.027 (g Pa Ray ; ζ a ; n) (1) 0.001 -
(g Pa Ray ; ζ a x; ) (1) 0.027 0.010
Table 5. Comparison of selected Melanesians and Papuans
Papuans Melanesians GmA2m haplotypes Ν = 189 Ν = 129
Gm (g Pa Ray ; ζ a ; ) A2m (1) 0.205 0.108 (2) - 0.023
(g Pa Ray ; ζ a x; ) (1) 0.011 0.008 ( b1 Pa bs Ray b3 b°; ζ a ; n) (1) 0.681 0.070
(2) - 0.015 ( b1 Pa b5 Ray b3 b°; ζ a ) (1) 0.03 0.012 ( b1 Pa b5 Ray b3 b°; f a ; n) (1) 0.190
(2) - 0.535 ( b1 Pa b5 Ray b3 b°; f a ; ) (1) - 0.023
(2) - 0.015
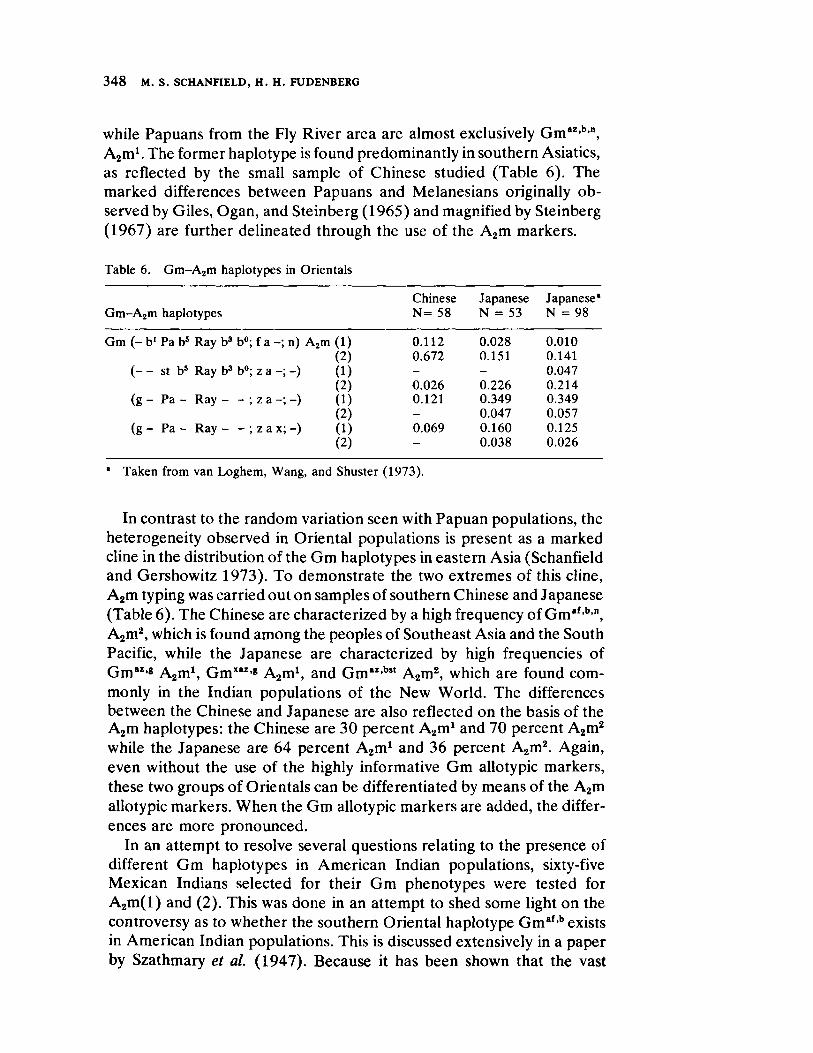
348 Μ. S. SCHANFIELD, Η. Η. FUDENBERG
while Papuans from the Fly River area are almost exclusively Gm , z b n , Ajjin1. The former haplotype is found predominantly in southern Asiatics, as reflected by the small sample of Chinese studied (Table 6). The marked differences between Papuans and Melanesiens originally ob-served by Giles, Ogan, and Steinberg (1965) and magnified by Steinberg (1967) are further delineated through the use of the Azm markers.
Table 6. Gm-A 2 m haplotypes in Orientals
Chinese Japanese Japanese*
Gm-A 2m haplotypes N = 58 Ν = 53 Ν = 98
Gm ( - b1 Pa b5 Ray b3 b°; f a - ; n) A2m (1) 0.112 0 .028 0.010
(2) 0.672 0.151 0.141
( - - st b5 Ray b3 b°; ζ a - ; - ) (1) - - 0.047
(2) 0 .026 0.226 0 .214 (g - Pa - Ray ; ζ a - ; - ) (1) 0.121 0 .349 0.349
(2) - 0.047 0.057
(g - Pa - Ray ; ζ a x; - ) (1) 0 .069 0 .160 0.125
(2) - 0.038 0.026
* Taken from van Loghem, Wang, and Shuster (1973).
In contrast to the random variation seen with Papuan populations, the heterogeneity observed in Oriental populations is present as a marked cline in the distribution of the Gm haplotypes in eastern Asia (Schanfield and Gershowitz 1973). To demonstrate the two extremes of this cline, A2m typing was carried out on samples of southern Chinese and Japanese (Table 6). The Chinese are characterized by a high frequency of Gmafb ,n, A2m2, which is found among the peoples of Southeast Asia and the South Pacific, while the Japanese are characterized by high frequencies of Gm"·« A2m1, Gm"1·« A2m\ and Grau 'b! t A2m2, which are found com-monly in the Indian populations of the New World. The differences between the Chinese and Japanese are also reflected on the basis of the A2m haplotypes: the Chinese are 30 percent Aam1 and 70 percent A2m2
while the Japanese are 64 percent Aain1 and 36 percent A2m2. Again, even without the use of the highly informative Gm allotypic markers, these two groups of Orientals can be differentiated by means of the A2m allotypic markers. When the Gm allotypic markers are added, the differ-ences are more pronounced.
In an attempt to resolve several questions relating to the presence of different Gm haplotypes in American Indian populations, sixty-five Mexican Indians selected for their Gm phenotypes were tested for A2m(l) and (2). This was done in an attempt to shed some light on the controversy as to whether the southern Oriental haplotype Gmaf,b exists in American Indian populations. This is discussed extensively in a paper by Szathmarytlea et al. (1947). Because it has been shown that the vast
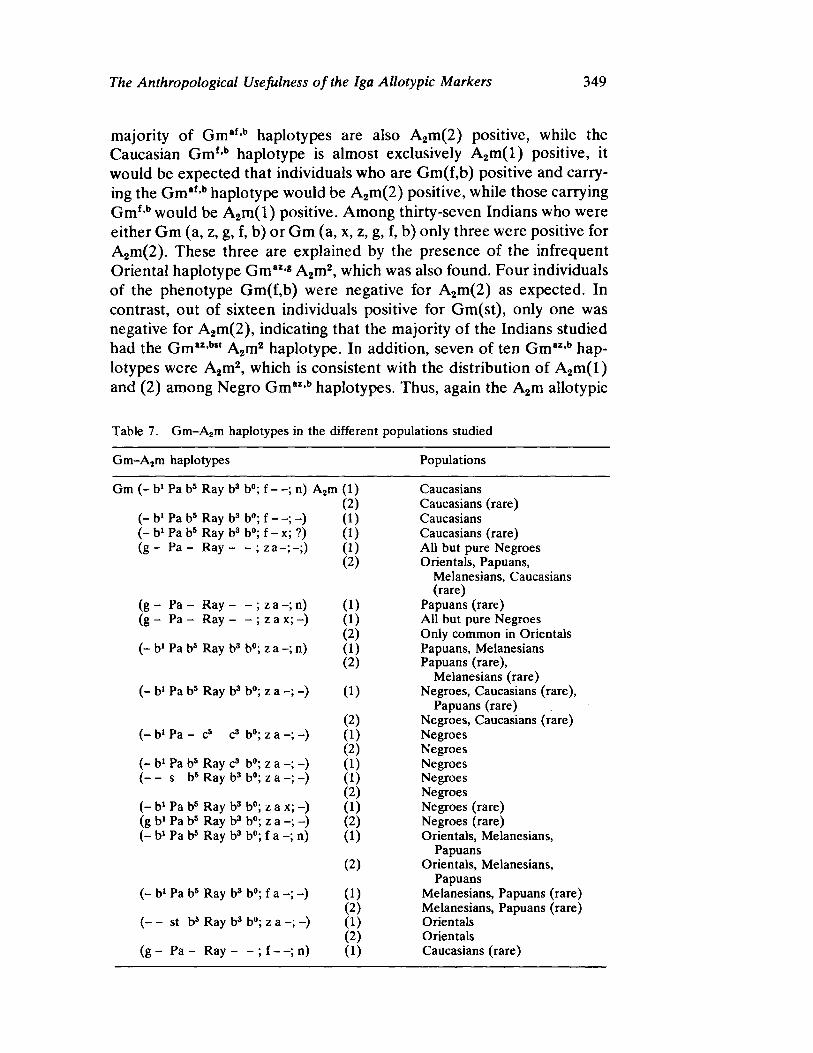
The Anthropological Usefulness of the Iga Allotypic MarkerszyxwvutsrqponmljihgfedcbaTRPONMIGFCA 349
majority of Gmaf ,b haplotypes are also A2m(2) positive, while the Caucasian Gm f ,b haplotype is almost exclusively A 2 m ( l ) positive, it would be expected that individuals who are Gm(f,b) positive and carrying the Gmaf ,b haplotype would be A2m(2) positive, while those carrying G m f b would be A 2 m(l ) positive. Among thirtyseven Indians who were either Gm (a, z, g, f, b) or Gm (a, x, z, g, f, b) only three were positive for A2m(2). These three are explained by the presence of the infrequent Oriental haplotype Gmaz,g A2m2, which was also found. Four individuals of the phenotype Gm(f,b) were negative for A2m(2) as expected. In contrast, out of sixteen individuals positive for Gm(st), only one was negative for A2m(2), indicating that the majority of the Indians studied had the Gm" ,bM A2m2 haplotype. In addition, seven of ten Gmaz,b haplotypes were A2m2, which is consistent with the distribution of A 2 m(l ) and (2) among Negro Gmaz,b haplotypes. Thus, again the A2m allotypic
Table 7. GmA2m haplotypes in the different populations studied
GmA2m haplotypes Populations
Gm ( b1 Pa b5 Ray b3 b°; f ; , n) A2m ( i ) Caucasians
(2) Caucasians (rare) ( b 1 Pa b5 Ray b3 b ° ; f ; ) (1) Caucasians ( b 1 Pa b5 Ray b3 b ° ; f x ; (1) Caucasians (rare) (g Pa Ray ; z a ; (1) All but pure Negroes
(2) Orientals, Papuans, Melanesians, Caucasians (rare)
(g Pa Ray ; ζ a ; in) (1) Papuans (rare) (g Pa Ray ; ζ a χ ; ) (1) All but pure Negroes
(2) Only common in Orientals ( b1 Pa b5 Ray b 3 b ° ; z a ; ;n) (1) Papuans, Melanesians
(2) Papuans (rare), Melanesians (rare)
( b l Pa b5 Ray b3 b°; ζ a (1) Negroes, Caucasians (rare), Papuans (rare)
(2) Negroes, Caucasians (rare) ( b l Pa c5 c3 b°; ζ a ; ) (1) Negroes
(2) Negroes ( b1 Pa b5 Ray c3 b°; ζ a ; ) (1) Negroes ( s bs Ray b3 b°; ζ a ; ) (1) Negroes
(2) Negroes ( b1 Pa b5 Ray b3 b°; ζ a χ ; ) (1) Negroes (rare) (g b1 Pa bs Ray b3 b°; ζ a ; ) (2) Negroes (rare) ( b1 Pa b5 Ray b3 b°; f a ;n) (1) Orientals, Melanesians,
Papuans (2) Orientals, Melanesians,
Papuans ( b1 Pa bs Ray bs b°; f a ; ) (1) Melanesians, Papuans (rare)
(2) Melanesians, Papuans (rare) ( st bs Ray b3 b°; ζ a (1) Orientals
(2) Orientals ( g Pa Ray ; f — ;n) (1) Caucasians (rare)
3 5 0wZWVUTSRONMLKJIHGFEDCBA Μ. S. SCHANFIELD, Η. Η . FUDENBERG
markers give us additional information on the indigenous haplotypes present and the introduced haplotypes. In this case, the Indians appear to have Gm"·« A2m1, Gm"·* A2m2, Gm""·«yvutsrponmlihgfedcaSPONJIHGA A2m\ Gm"'b,t A2m2, and Gm" ,b,t A2m* with the introduced Caucasian haplotype Gmf ,b Ajin1 and the Negro haplotypes Gmaz,b A2m* and Gm" ,b A2m2.
CONCLUSIONS
The allelic allotypic markers of the A2m system are quite informative in their own right and contribute substantially to the differentiation of human populations. However, when used in conjunction with the closely linked Gm allotypic markers, the amount of information gained is formidable. The number of racially exclusive GmA2m haplotypes may possibly exceed the number of racially unique haplotypes of the HLA system. If true, this would make the combined GmA2m haplotypes the most polymorphic system in man. Though comparisons have not been made with regard to the increase in the amount of genetic distance gained by the new haplotypes generated by the GmA2m system, it should be substantial when compared with Gm haplotypes alone. It has been previously demonstrated that the contribution of the Gm haplotypes to genetic distance measurement is significantly more than the contribution of the ABO, Inv, MN, and Rh systems (Schanfield and Gershowitz 1971).
REFERENCES
CURTAIN, C. C., E. VAN LOGHEM, A. BAUMGARTEN, et al.
1971 The ethnological significance of the gammaglobulin (Gm) factors in Melanesia. American Journal of Physical Anthropology 34:257272.
CURTAIN, c . c . , E. VAN LOGHEM, Η. H. FUDENBERG, et al.
1972 Distribution of the immunoglobulin markers at the IgG,, IgG2, IgG3, IgA2 and Kchain loci in Australian aborigines: comparison with New Guinea populations. American Journal of Human Genetics 24: 145155.
GILES, Ε. , E. OGAN, A. G. STEINBERG
1965 Gammaglobulin factors (Gm and Inv) in New Guinea: anthropological significance. Science 150:11581160.
KUNKEL, Η. G. , w . K. SMITH, F. G. JOSLIN, et al.
1969 Genetic marker on the yA2 subgroup of the γ A immunoglobulins. Nature 223:12471248.
SCHANFIELD, M. S.
1971 Population studies on the Gm and Inv antigens in Asia and Oceania. Ann Arbor: University Microfilms.
SCHANFIELD, M. S. , H. GERSHOWITZ
1971 "The comparative efficiencies of blood group and immunoglobulin markers in the measurement of intra and interpopulation differ
The Anthropological Usefulness of the Iga Allotypic MarkerszywvutsrponmlkjihgfedcbaZYXWVUTSRPONMLJIHGFEDCBA 351
ences." Paper presented at the Fourth International Congress of Human Genetics, Paris, September 611, 1971.
1973 Nonrandom distribution of Gm haplotypes in East Asia. American
Journal of Human Genetics 25:567574. STEINBERG, A. G.
1967 "Genetic variations in human immunoglobulins: the Gm and Inv types," in Advances in immunogenetics. Edited by T. J. Greenwalt, 7598. Philadelphia: Lippincott.
SZATHMARY, E. J . , D. W. COX, H. GERSHOWITZ, et al.
1974 The northern and southern Ojibwa: serum proteins and red cell enzyme systems. American Journal of Physical Anthropology 40:4966.
VAN LOGHEM, E., B. G. GROBBELAAR
1971 A new genetic marker of human IgG3 immunoglobulins. Vox Sanguinis
21:405410. VAN LOGHEM, E. , J . B. NATVIG, H. MATSUMOTO
1970 Genetic markers of immunoglobulins in Japanese. Annals of Human Genetics 33:351359.
VAN LOGHEM, E. , A. C. WANG, J . SHUSTER
1973 A new genetic marker of human immunoglobulin determined by an allele at the a2 locus. Vox Sanguinis 24 :481^88 .
VYAS, G. Ν. , Η. H. FUDENBERG
1970 Immunobiology of human antiIgA: a serologic and immunogenetic study of immunization to IgA in transfusion and pregnancy. Clinical
Genetics 1:4564. VYAS, G. Ν. , Η. H. FUDENBERG, Η. M. PRETTY, E. R. GOLD
1968 A new rapid method for genetic typing human immunoglobulins. Journal of Immunology 100:274279.


Biographical Notes
FATHI A B D E L H A M E E D ( 1 9 3 8 ) did his undergraduate and masters degree work at the University of Alexandria, Egypt. He received his doctorate in genetics from the University of California, Davis. He is currently Associate Professor in the Biological Sciences Department, Northern Illinois University. His areas of research specialization are population genetics, cytogenetics and evolutionary biology. He is also working on agricultural and biological applications in solar energy use.
Tu LI Ο ARENDS (1918 ) was born in Coro, Venezuela. He received his M.D. from Central University of Venezuela, Caracas, in 1946. Since 1954 he has been studying the distribution of abnormal hemoglobins, blood protein groups, and immunoglobins in several South American populations, with an emphasis upon South American Indians and African derived populations. He was awarded the Venezuelan Prize in Scientific Research (1956). His current position is that of Head, Experimental Medicine Department, Instituo Venezolano de Investigaciones Cientificas, Caracas, Venezuela.
RICHARD D. ARMSTRONG ( 1 9 4 1 ) received his undergraduate degree from Northern Illinois University, DeKalb in 1969. He did graduate work in anthropology at NIU and at UCLA. He is currently Director of Traffic for the Neuendorf Transportation Company, Madison, Wisconsin.
CARK JAY BAJEMA (1937 ) received B.S. and M.A. degrees from Grand Rapids Junior College, Western Michigan University, and his Ph.D. from Michigan State University. Professor Bajema has been on the faculty of the College of Arts and Sciences at Grand Valley State Colleges
354tsrpolihgecaNB Biographical Notes
since 1964. His research interests center around the measurement of natural selection in contemporary human populations and on the history of evolutionary thought. He is currently studying the fertility, occupational achievements, and health patterns of 1,500 individuals who had participated in the Third Harvard Growth Study conducted during the 1920's and 1930's. He was awarded a Senior Population Council Fellowship in Population Genetics and Demography to study at the University of Chicago (19661967). More recently he served as Visiting Professor of Anthropology at Harvard University (19741975). He is an editor of a book on natural selection and a book on eugenics, and he is a coauthor of a basic biology text soon to appear.
RANAJIT CHAKRABORTY ( 1 9 4 6 ) was born in Calcutta, India. His undergraduate and graduate work was done at the Indian Statistical Institute, Calcutta, where he received his doctorate in biostatistics in 1971. He is currently Assistant Professor of Population Genetics, Center for Demographic and Population Genetics, The University of Texas, Houston. His special research interests are in molecular genetics and evolution, human quantitative genetic variation, birth defects and cancer epidemiology. He has an ongoing research project in this last area in a southwestern community in Texas.
MICHAEL H. CRAWFORD (1939 ) was born in Shanghai, China. He was educated in China, Australia, and the United States, receiving his Ph.D. at the University of Washington in 1967. He has taught at the University of Washington, University of Pittsburgh, and is presently a Professor in the Department of Anthropology and Director of the Laboratory of Biological Anthropology at the University of Kansas. He is at present on a Public Health Service Career Development Award. His chief fields of interest have been the anthropological genetics and demography of Mexican, Black Carib, Irish Tinker, and Italian populations. He is coeditor of a book on anthropological genetics, and editor of a volume on the Tlaxcaltecan Indians.
H . HUGH FUDENBERG ( 1 9 2 8 ) received his undergraduate degree from U.C.L.A. and his M.D. from the University of Chicago. He is currently Chairman, Department of Immunology, Medical University of South Carolina, Charleston, South Carolina. He is an internationally recognized authority in the field of immunology and has studied all aspects of the field. He is a member of the expert advisory panel on immunology to W . H . O . He received the Pasteur Medal from the Institute Pasteur in Paris in 1962 and the Robert A. Cooke Memorial Medal from the American Academy of Allergy in 1967. He is on the editorial boards ofxtsrponmlihgedcaVSGECB Blood, Vox Sang., Biochemical Genetics, Clinical and Experimental
Biographical Notes 355
Immunology, J. of Immunology, Immunochemistry, Amer. J. Hum.
Genet., Transfusion and Clinical Immunology and Immunopathology.
M . L . GALLANGO. NO biographical data available.
GEORGE R. GLUESING. No biographical data available.
M . GONZALEZMARRERO. N O biographical data available.
HENRY C. HARPENDING (1944 ) received his A.B. degree from Hamilton College in 1964 and his Ph.D. degree from Harvard University in 1972. He currently holds the position of Assistant Professor in the anthropology department of the University of New Mexico. His research interests are demography and population genetics. He is currently engaged in a regional study of "Black Bushmen" of the northeast Kalahari desert.
FREDERICK S. HULSE (1906 ) was born in New York City. He completed his undergraduate and graduate degrees at Harvard University, and received his doctorate in 1934. He has been Professor in Anthropology at the University of Arizona, Tucson, since 1958. He was editor of the American Journal of Physical Anthropology (19631969) and President of the American Association of Physical Anthropologists (19671969). He also served as Vice President, VIII International Congress of Anthropological and Ethnological Sciences, Tokyo, 1968. He is a member of the National Academy of Science and several other professional societies. He has conducted fieldwork centering upon biology and culture relationships in Cuba, England, Finland, Greece, Hawaii, Israel, Japan, Mexico, Spain, Switzerland and the U.S. He is the author of a textbook in physical anthropology.
TREFOR JENKINS ( 1 9 3 2 ) was born in Merthyr Tydfil, Glamorgan, Wales. He initially undertook medical study at the University of London, later was affiliated with the Royal College of Physicians and Surgeons and then received his Doctor of Medicine from the University of London. His primary research interests are in the genetics of southern African peoples, in inborn errors of metabolism, and genetic counselling techniques. He is a Fellow of the Eugenics Society, and the Royal Society of South Africa, and is an Affiliate of the Royal Society of Medicine, as well as a member of several other professional societies. He serves as the President of the Institute for the Study of Man in Africa and is currently Professor and Head, Department of Human Genetics, School of Pathology, The South African Institute for Medical Research and University of the Witwatersrand, Johannesburg.
356tsrpolihgecaNB Biographical Notes
PHILIPPE LEFEVREWITIER ( 1 9 3 4 ) was born in Reims, France. He earned a Certificate and later a M.D. from the University of Paris. Subsequently he has been awarded a Diploma in Human Biology and is completing work toward a Doctorate in Human Biology from Toulouse. His major research efforts have involved the ecology and physical anthropology of the Twaregs of the Algerian Sahara. He holds appointments as Charge de Recherches at the Centre National de la Recherche Scientifique, as a codirector of a human ecology program at Paul Sabatier University in Toulouse, and as an Assistant to the Laboratory of Physical Anthropology, College de France, Paris and Toulouse.
FRANK B . LIVINGSTONE ( 1 9 2 8 ) received an A.B. from Harvard University (Mathematics) and a Ph.D. from the University of Michigan (Anthropology). Using the sickle cell polymorphism for some of his work, he has specialized in constructing population genetic models and their application to the hemoglobin and red blood cell antigen loci. He is currently Professor of Anthropology, University of Michigan, Ann Arbor.
KAILASH CHANDRA MALHOTRA ( 1 9 3 8 ) was born in East Pakistan. He has an M.S. from Delhi University (Anthropology) and a Ph.D. from Poona University (Anthropology). His current appointment is that of Associate Professor, Anthropometry and Human Genetics Unit, Indian Statistical Institute, Calcutta. He has done extensive research involving physical anthropology, demography, and biosocial interactions among Indian nomads and other Indian groups. He is a founding member of the Indian Society of Human Genetics and was a WHO awardee to work at the Population Genetics Laboratory, University of Hawaii ( 1 9 7 5 ) .
RICHARD B. MAZESS (1939 ) was born in Philadelphia, Pennsylvania, and educated at Pennsylvania State University where he received his B.A. and M.A. degrees. He holds a Ph.D. from the University of Wisconsin. At present he is Assistant Professor of Radiology at the University of WisconsinMadison. His research has been in the area of body composition, especially bone, and its relationship to environmental adaptation, growth and aging, and nutrition.
ROBERT J. MEIER (1934 ) did his undergraduate work at the University of WisconsinMilwaukee (B.S.) and graduate work at the University of WisconsinMadison (M.S., Ph.D.). He has conducted human biological research among the Easter Islanders and Alaskan Eskimos, specializing in microevolutionary processes and dermatoglyphic variation. He is currently Chairman and Associate Professor, Department of Anthropology, Indiana University.

Biographical Notes 357
Α .yxwvutsrponmlkjihgfedcbaZYWUTSRPONMLKJIHGFEDCBA MάLLER. NO biographical data available.
LAURA NEWELL MORRIS ( 1 9 3 3 ) has an undergraduate degree from the University of New Mexico, an A.M. from Northwestern University and a Ph.D. from the University of Washington. Her special areas of research include primate biology, genetics and development, and human demography. She has done fieldwork in Latin America and Jamaica under a PHS postdoctoral award. Her research has also involved rural Philippine people and she is continuing a study of the JapaneseAmerican population of Seattle. She is an associate editor of theyutsrponmlihgfecaPJA American Journal
of Physical Anthropology. She has edited works on population genetics and on primate population biology. At the present she is an Associate Professor in the Departments of Anthropology and Orthodontics and a Research Affiliate of the Regional Primate Research Center, University of Washington, Seattle.
GEORGE T. NURSE (1928 ) is a South African and holds a medical degree from the University of Cape Town, a Diploma in Public Health from the University of Bristol, and a doctorate from the University of the Witwatersrand. His major research interests are in the peoples of southern and central Africa, the anthropology of littorals, in glottochronology and genetic distance, and in Melanesian migrations. He is currently Senior Research Fellow in Human Genetics, Papua New Guinea Institute of Medical Research, Goroka, Papua, New Guinea.
PETER E. NUTE (1938 ) received his B.S. (Zoology) from Yale University in 1960, studied medicine at Yale for the following two years, and was awarded his Ph.D. (Anatomy and Physiology) by Duke University in 1969. He has pursued research interests in molecular genetics and evolution as a Postdoctoral Fellow in the Division of Medical Genetics at the University of Washington, and is now an Assistant Professor of Anthropology and a Research Assistant Professor of Medicine at that University. A member of the Center for Inherited Diseases, he is also on the Consulting Staff of the University Hospital and a Research Affiliate of the Regional Primate Research Center at the University of Washington.
KEIICHI OMOTO ( 1 9 3 3 ) was born in Tokyo, Japan. His degrees are from the University of Tokyo (B.S., M.S.), University of Munich, Germany (Ph.D.), and the University of Tokyo (D.Sc.). His current appointment is Associate Professor, Department of Anthropology, University of Tokyo. Human population genetics is his special research area and he is engaged in an ongoing project to study protein polymorphisms and genetic diversity of peoples of the Pacific.

358tsrpolihgecaNB Biographical Notes
CHARLOTTE M . OTTEN ( 1 9 1 5 ) did her undergraduate work at Carleton College, Northfield, Minnesota, her master's degree was taken at the University of Chicago and she received her doctorate from the University of Michigan. Currently she is Professor of Anthropology at Northern Illinois University, De Kalb and serves as President, Human Biology Council. Her research interests have focused in the area of human serology and in the interaction of biological and sociocultural phenomena. She is a Fellow of the Royal Anthropological Institute of Great Britain and Ireland, a Fellow of the Society for the Study of Human Biology, and an elected member of the Association Internationale des Anthropobiologists. She has published a manual of anthropometry, and has edited volumes on human aggression and evolution, and on primitive art.
O . PEREZ BANDEZ. N O biographical data available.
FRANCISCO MAURO SALZANO ( 1 9 2 8 ) was born in Cachoeira do Sul, Brazil, and received his undergraduate degree from the Universidade Federal do Rio Grande do Sul and graduate degrees from the Universidade de Sao Paulo (Ph.D.) and the Universidade Federal do Rio Grande do Sul (Priv. Doc.). His present appointment is at the Instituto de Biociencias, Universidade Federal do Rio Grande do Sul where he is an Associate Professor in the Department of Genetics. He has published widely in the field of human population genetics and has done much original research on the genetics of South American Indians. He received in 1973 the silver medal of the Sociedade Brasileira para ο Progresso da Ciencia for distinguished services made to the science in Brazil and was elected in the same year a member of the Brazilian Academy of Science.
MOSES S. SCHANFIELD (1944 ) received his undergraduate degree from the University of Minnesota in Anthropology and graduate degrees in Anthropology (M.A.) from Harvard University, and in human Genetics (Ph.D.) from the University of Michigan. His research has been on the distribution of immunoglobin markers in human populations, and their relationship to disease as a possible selective role. He is currently the Director of the Reference Laboratory at the Milwaukee Blood Center, Milwaukee, Wisconsin.
PRAVEEN KUMAR SETH ( 1 9 3 8 ) is of Indian nationality, and was educated at the University of Delhi from where he received his doctorate in Anthropology in 1965. He is a primatologist who has studied lorises and macaques. He has also been engaged in physical anthropological research of Indian groups, and most recently he began a study of the genetics of mental retardation. He is a recipient of a "Global Research Fellowship" in honor of Alexander von Humboldt ( 1 9 7 1 1 9 7 2 , 1 9 7 4 ) .
Biographical Notes 359
His present position is University Lecturer in Anthropology, University of Delhi.
SWADESH SETH (1936 ) was born in Mansahra, India. She holds a Ph.D. in anthropology from the University of Delhi. Her research activities have centered upon human serology and population genetics involving Indian groups and West Germans. She has also investigated primate genetics, fertility in relation to biochemical genetics and chromosomal aberrations, and has begun a study into the genetics of mental retardation. She is currently University Lecturer in Anthropology, University of Delhi.
STEVEN G. VANDENBERG ( 1 9 1 5 ) was born in Den Helder, Netherlands. His earlier degrees were taken at institutions in the Netherlands, and he received his doctorate in psychology from the University of Michigan. He has done extensive research in the area of environmental and genetic influences upon human behavior. He has received a Public Health Service Career Development Award ( 1 9 6 2 1 9 6 7 ) . He holds appointments as Professor of Psychology, University of Colorado, Professor of Clinical Psychology, Colorado Medical Center, Research Associate, Institute for Behavioral Genetics, University of Colorado, and is a member of the Graduate Faculty, University of Hawaii.
HENRI VERGNES (1933 ) was born in Mirepoix, France. He was educated at the medical school in Toulouse where he received a medical degree and also did postgraduate work specializing in hematology and human genetics. His primary research has been in red blood cell and serum enzyme polymorphisms in human populations. He is a member of the American Society of Human Genetics, and holds the title of Maitre de Recherche, at the Centre National de la Recherche Scientifique, Centre d'Hemotypologie, Toulouse.

Index of Names
AbdelHameed, Fathi, 141172, 353 Acosta Saignes, Miguel, 201 Adams, M. S., 71 Agrawal, Η. M., 328 Alland, Alexander, Jr., 47, 54, 56 Allen, G. E., 51 Allison, A. C., 57, 251 Alpers, M., 183 Alter, M., 73 Amoore, J. E., 64 Anastasi, Α., 91, 92 Anderson, C. G., 252 Anderson, J. W., 57 Andrade, A. H. P., 185 Arends, Tulio, 184, 185, 201214, 353 Aristotle, 246 Armstrong, Richard D., 3945, 353 Amheim, N., 141 Ashley Montagu, M. F., 32 Await, Κ., 279n Ayala, F. J., 157, 158 Ayres, M., 186, 189
Bachman, J. G., 79, 80 Bajema, Carl Jay, 4761, 92, 93, 353354 Baker, C. M., 148 Baker, P. T., 181, 183 Bannister, W. H., 108 Baododakar, Shri Dayanand, 279n Barclay, G. P. T., 251 Bardawill, C. J., 206 Barnabas, John, 155, 166, 167, 168 Barnes, G., 327 Barnicot, Ν. Α., 108, 109, 110, 112, 228 Barrere, G., 256 utsrnmkihgedcbaSREBABδsch, R. S., 113 Baskind, E., 252
Basu, Amitaba, 315 Basu, Arbindu, 315, 320 Baumgarten, Α., 346 Beaumont, Β., 234 Beaumont, P. B., 252 Belkin, R. B., 228 Benabadji, M., 255 Benedict, Burton, 39 Benerecetti, S. A. S., 184 Benjamin, B., 97 Benzer, S., 152, 153 Berman, J. L., 65, 74 Bernstein, F., 211, 217, 219, 223 Beutler, Ernest, 205 Bhalla, V., 284
Bhanu, Β. V., 279n, 285, 289n, 321 Bhattacharjee, P. N., 327, 328 Bielicki, T., 52, 54 Bilsborough, Α., 56 Birdsell, J. B., 105, 106, 115, 339 Biswas, P. C., 114 Blommaert, W., 252 Blumberg, Β. S., 185 Bock, R. D., 74 Bodmer, J. G, 184 Bodmer, W. F., 130, 131, 138, 184, 220 Booth, P. Β., 343n Bostock, C. J., 151 Botha, M. C., 252 Bourdel, L., 65 Bowley, C. C., 326 Boyer, S. H„ 108, 109, 157 Brain, P., 252 Bram, S., 149 Bramble, W., 74 Brehme, H„ 115 Brewer, C., 184, 185
362xsonmfedaNI Index of Names
Brewer, G. J., 185 Britten, R. J., 151 Broom, R., 228 Brothwell, D. R., 228 Brown, G. E., 185 Brown, K., 217, 218, 220, 221, 222 Brown, K. S., 64, 184 Brues, A. M., 130, 147 Bryant, A. T., 251 Buchi, E. C., 328 BuettnerJanusch, J., 108 Burgess, Anthony:wutsrqponmlihgfedcaTOA The wanting seed, 97 Burt, C., 69
Callan, H. G., 147 Callan, J. P., 64 Cancro, R., 68 Cannings, C., 174, 177 Campbell, Α. Α., 75 Campbell, Bernard, 42 Campbell, D. T., 54, 77 CampbellKraut, J. M., 326327 Carbonara, A. O., 206 Carson, H. L., 47, 143 Carstens, W. P., 235 Cattell, R. B., 65 CavalliStorza, L. L., 130, 184, 191, 220,
221, 229, 262, 263, 264, 335, 336 Centerwall, W. R., 184 Chagnon, Ν. Α., 184, 185, 189, 193 Chai, C. K., 115 Chakraborty, M., 327 Chakraborty, Ranajit, 173178, 354 Chakravarty, R., 279n Chance, R. Α., 21 Chavez, J., 185 Clark, D. H., 79, 81 Clarke, B., 137, 142, 148, 149 Clegg, J. Α., 131 Clegg, J. B., 209 Cliquet, R. L., 94, 95, 96 Cohen, P., 108, 109, 110, 112 Cole, D. T., 250 Cole, M., 78 Comer, J. P., 75 Comings, D. E., 151 Connolly, R. C., 284 Constans, J., 262 Coon, C. S., 339 Coope, Ε. M., 115 Corbin, K. W., 155, 170, 171 Cordova, M. S., 217218 Corfield, —., 233 Cormack, R. M., 174, 175, 176177 Cornell, Phyllis, 71 Coudreau, H., 187 Cox, D. W., 348 Cox, E. C., 149
Crawford, Michael H., 215225, 354 Crawford, M. R., 329 Crook, J. H., 53 Crosby, E. F., 108 Crow, J. F., 40, 141, 142, 143, 144, 146,
147, 148, 157, 159, 188, 189, 216, 320 Cummins, H., 115, 117, 119, 289 Curtain, C. C., 346 Cutta, —., 279n
Dahlberg, G., 65 Damon, Α., 56 Dandekar, V. M., 280 Da Rocha, L. R., 184, 185, 186, 191 Dart, R. Α., 228 Darwin, Charles, 50, 51; The descent of
man, 33; Origin of species, 5 On, 159 Das, S. H. R., 279n, 288 Das, S. Κ., 279n Dasen, P. R., 89 Dassan, Patrick, 279n David, Μ. M., 206 Davidson, Ruth I., 71 Dayhoff, Margaret O., 166, 167; Atlas of
protein sequence and structure, 141 De Jong, W. W., 108 De Kock, V., 252 De Lacey, P. R., 8788, 89 De Lemos, Marion M., 8485, 86, 87, 89 De Lestrange, Μ. Τ., 289n DeVore, Irven R., 18, 42 De Vries, Hugo, 51 Dickerson, R. E., 154 Djaballah, Ben, 256 Dobzhansky, T., 32, 47, 5253, 54, 56, 57,
119, 121, 144, 145, 147 Doke, C. M., 250 DomaniewskaSobczak, K., 274 Doolittle, R. F., 167 Downing, L., 82 Drake, J. W., 150, 152 Dronamraju, K. R., 328 Dubos, R., 12 Dunsford, I., 326 Dutt, J. S., 183
Eagan, C. J., 9, 12 Edwards, A. W. F., 191,220,221,335,336 Edwards, J. H., 160 Ehrlich, P. R., 142 Elston, R. C., 74, 217 Endler, J. Α., 143 Epstein, C. J., 154 ErlenmeyerKimling, L., 66, 67 Eshel, Illan, 41, 42, 43 Evans, L„ 82 Eveland, W. C., 184

Index of Names 363
Ewens, W. J., 144, 229, 249
Feller, W., 147 Ferrel, Robert E., 170 Fiers, W., 149 Fifer, G., 79, 81 Fildes, R. Α., 205 Fisher, Ronald Α., 39, 65, 143 Fitch, W. M., 192 Flaugher, R. S., 81 Folk, G. E., Jr., 9, 12 Ford, Ε. B., 143 Ford, Robin, 74 Freeman, F. N., 69 Freese, E., 152 FreireMaia, Α., 319, 320 FreireMaia, N., 185 Friedl, E., 33 Friedlaender, J. S., 183 Frydenberg, O., 146
Fudenberg, H. Hugh, 343351, 354355
Gajdusek, D. C., 183 Gallango, Μ. L., 184, 201214, 355 Galton, F., 65 Garn, S. Μ., 329, 339 Gast, Marceau, 256, 259 Gay, J. H., 78 Gergely, J., 343n Gershowitz, H., 184, 185, 186, 191, 348,
350 Giblett, E. R., 206, 234, 238 Gibson, J., 92 Gibson, Τ. C., 149 Giles, Ε., 346, 348 Gille, R., 96 Giorgio, A. J., 205 Gluesing, George R., 141172, 355 Gold, E. R., 344 Goldberg, A. L., 149 zyutsronmlkiedcbaSMJHGFDGonzδlezMarrero, M., 201214, 355 Goodman, Morris, 114,119,155,166,167,
168 Gordon, Α. H., 206 Gordon, H. J., 230, 269 Gornall, A. G., 206 Gottesman, I., 76 Graydon, J. J„ 327, 328 Grech, J. L., 108 Greene, D. L., 183 Grobbelaar, B. G., 345 Grubb, R., 263 Guha, B. S., 318 Gulati, R. K., 284 Gupta, S. P., 328
Haegeman, G., 164 Halberstein, R. Α., 216, 222
Haidane, J. B. S., 40, 41, 147, 148, 159, 160, 173
Hall, L., 18 Halloway, R. L., 53 Hamilton, William D., 41 Hanna, G. S., 82 Harada, S., 333, 334, 335 Hardin, G., 47 Harpending, Henry C., 227241, 245254,
269, 355 Harris, D. E., 183 Harris, H., 113, 205, 326 Harrison, G. Α., 183, 185, 319, 329 Haseman, J. K., 74 Hatch, F. T., 151 Hayashida, Y., 335 Hayes, Ε. Β., 251 Headings, V. Ε., 114 Heese, J. Α., 252 Helmbold, W., 137 Hennig, I., 150, 151 Hennig, W., 150, 151 Heremans, J. F., 206 Herskovits, M. J., 77 Herzog, P., 343n Heydon, G. Α. M., 328 Heyns, O. S., 79, 80 Hickman, C. G., 206 Hiernaux, J., 284 Higgins, J„ 92
Hioms, R. W., 217, 218, 219 Hirschfeld, J., 206 Hirszfeld, H., 228 Hirszfeld, L., 228 Holt, S. B., 289 Holzinger, K. J., 69 Honzik, M. P., 66, 67, 68 Hornabrook, R., 343n House, Β., 82 Howell, R. J., 82 Howells, W. W., 183, 338 Hsia, D. Υ. Y., 65 Hubby, J. L., 148, 149, 157 Hudson, W., 76 Huehns, E. R., 109, 110, 112 Hughes, D. R., 117 Huisman, Τ. H. J., 108 Huizinga, J., 329
H٧lse, Frederick S., 1737, 284, 355 Hundleby, J. D., 65 Hunt, Ε. E., 120 Huntsman, R. C., 205 Hussels, I. E., 183, 184
Iba, B. Y., 184 Ignazi, —., 256 Imanishi, K., 21, 23 Ingram, V. M., 155
364xsonmfedaNI Index of Names
Ishihara, S., 289, 327 Ishimoto, G., 107 , 108 , 109 , 110 , 112 , 113 ,
114 Itano, Η. Α ., 205 Iwamoto, M., 115
Jackson, F. S., 115 Jacquard , Α ., 263, 276 Jantz, R. L., 185 Jarvik, L. F., 66, 67 Jeffreys, M. D. W., 250 Jenkins, M. D., 79
Jenkins, Trefo r, 227 243, 245 254, 269, 355
Jensen, A . R„ 68, 69 Johannsen, W., 65 Johnson, R. S., 184 Johnston, F. E., 185 Jo lly, Α ., 20 Jo lly, C. J., 109, 110, 112 Jo nes, K. W., 150 JuelNielson, N., 69 Jukes, Τ. H., 141, 155 Junod, Η. Α ., 251
Junqueira, P. C„ 184, 185, 186, 191
Kalla, A . K„ 329 Kalmus, H„ 64, 326 Kaplan, A . R., 64, 65 Karlin, Samuel, 42, 174 Karp, G. W., Jr., 206 Karve, Irawati, 279, 280, 282, 282n, 283,
284, 285, 313, 315 Kate, S. L., 316, 320 Keiter, F., 185 Kensinger, Κ. Μ., 185 Kerr, Barbara Α ., 115 Khomne, S., 279n Kidd, Κ. K., 183 Kimura, Moto , 40, 97,141, 142, 143, 144,
146, 147, 148, 155, 156, 157, 159, 160 King, J. L., 141, 155 Kinzey, W., 56 Kirk, H. L., 317 Kitchen, H., 107, 108 Knussmann, R., 233 Koch, H. L„ 96 Kodama, H., 69 Kodama, S., 333, 339, 340 Kohne, D. E., 151 Kopec, A . C., 274 Kouba, E. O., 107, 108 Kramer, G., 119 Kuchemann, C. F., 183 Kulkarni, Α ., 119 Kumar, N., 328 Kummer, Hans, 43
Kunkel, Η. G., 343 Kurszynski, T. W., 235 Kurten, Β., 57 Kwiterovich, P., 343n
Lai, L. Y. C., 114, 317 Lamarck, Jean, 49 50 Landsteiner, K., 228 Langaney, Α ., 276 Lasker, Gabriel W ., 167, 320, 329 Laughlin, W. S., 184 Lawler, S. D., 228 Layrisse, Miguel, 184, 185, 190, 201 Layrisse, Ζ ., 184, 185, 190 Lee, A . S., 75 Lee, C. S., 150 Lee, E. S., 75 Lee, Richard B., 42 LefevreWitier, Philippe, 255 277, 356 Lehmann, H., 185, 205, 252 Leon, N., 64 Lerner, I. M., 40 Lesser, G. S., 79, 81 Levine, P., 228 Lew , R., 183, 184 Lewis, H., 143 Lewis, S. M., 252 Lew ontin, R. C., 40, 148, 149, 152, 155,
157, 159, 174 Leyshon, W . C., 217, 218, 220, 221, 222 Lho te, H., 257 Li, C. C., 326 Liddicoat, R., 79 Lindzey, G., 76 Lisker, R., 217 218 Little, G. F., 184 Litwin, S. D., 343n, 344 Livingstone, Frank B., 34, 127139, 356 Livingstone, F. S., 321 Lorenz, Κ. Z ., 29 Louis, L. N., 206 Lourie, J. Α ., 182, 329 Lo vejo y, C. O., 171 Low e, C. H., Jr., 119 Lusher, J. Μ., 57
MacCluer, J. W., 193 MacFarlane, E. W . E., 328 MacLean, C. J., 64, 184 Mahalanobis, P. C., 190, 220, 221 Majumdar, D . N., 190 Malhotra, Kailash Chandra, 279 314,
315 323, 356 Mali, S. Κ., 279n Mancini, G., 206 Manso , C., 234, 238 Manw ell, C., 148 Maquet, J. J., 250
Index of Names 365
Marcallo, F. Α., 185 Marti, Mariano, 204 Martin, R „ 289 Maruyama, M., 47, 52 Maruyama, T., 157 Matsuda, G., 155 Matsumoto, H., 335, 343 Matznetter, T „ 234, 238 Mauran-Sendrail, Α., 262 Maybury-Lewis, D., 185, 189 Mayr, Ernst, 105, 120, 121, 143, 159 Mazess, Richard B., 9 - 1 5 , 356 Mazrimas, J . Α., 151 McCarthy, B. J . , 151 McConaughy, B. L., 151 McGregor, J . , 42 McKusick, V. Α., 64 McLoughlin, P. J . , 166 Mead, A. P., 21 Meera Khan, P., 328 Meier, Robert J . , 1 - 5 , 356 Meili, R., 91 Meindl, R. S., 171 Merino, Fernando, 211 Mertens, R., 119 Midlo, C., 115, 117, 119, 289 Mikkelsen, W. M., 185 Min Jou, W., 149 Misawa, S., 335 Mitchell, M., 205 Mitchell, W. M., 149 Miyazaki, Τ . , 335 Modiano, G., 184 Money, J . , 73 Moor, Lise, 73 Moore, G. William, 155, 166, 167, 168 Moore, M. A. S., 183 Morton, Ν. E. , 182, 183, 184 Motuisky, A. G., 326 Mourant, A. E., 210, 220, 228, 274, 326 Mowat, F., 29 Muller, Α., 201 -214 , 356 Muller, Η. J . , 146 Mundy-Castle, A. C-, 76 Mutalik, G. S., 315, 316, 320, 321
Nalbandian, R., 57 Napier, J . R., 121 Napier, P. H., 121 Natvig, J . B. , 343
Neel, J . V., 69, 70, 71, 1 8 4 , 1 8 5 , 1 8 6 , 189, 190, 191, 192, 193, 315, 321
Negi, R. S., 316 Nei, M., 148 Newell-Morris, Laura, 105-125 , 357 Newman, Η. H., 69 Newman, Μ. T., 115 Nicholson, Μ. K., 183
Nigi, H., 107, 108, 109, 110, 112, 113 Nisbet, J . D., 96 Niswander, J . D., 184, 185 North, A. C. T., 149 Noyes, A. N., 109 Nόfiez-Montiel, Alonso, 201 Nurse, George T „ 2 2 7 - 2 4 3 , 2 4 5 - 2 5 4 , 357 Nute, Peter E., 105 -125 , 357 Nutels, N., 186 Nutini, H. G., 216, 222 Nuttin, J . , 94, 95 Nuzzo, F., 184, 229
O'Donald, P., 147 O'Flynn, Μ. E., 65 Ogan, E. , 346, 348 Ogawa, M., 337 Ohta, T., 144, 146, 155, 156, 157, 160 Okochi, K., 335 Oliver, W. J . , 184 Omoto, Keiichi, 333 -341 , 357 Osborn, F., 58 Otten, Charlotte M., 1 -5 , 130, 358
Panse, S., 279n Park, C. M., 166 Parsons, P. Α ., 148 Pataryas, Η. Α., 113 Patkar, Kamal, 279n Patterson, J . E. , 75 Pauling, L., 141 Pavlovsky, O., 144, 145 Pearson, K., 65 Pearson, W., 74 Pefia, H. F., 186 Penrose, L. S., 96 Perez Bandez, O., 2 0 1 - 2 1 4 , 358 Pettenkofer, H. J . , 137 Phadke, Μ. Α., 316, 320 Piaget, J . , 84n, 85 Pickford, R. W., 321 Pilbeam, David, 169 Pollitzer, W. S., 106, 218, 220 Post, R. H., 321 Potter, V. R. , 47, 54 Poulik, E. , 114, 119 Prescott, D. M., 151 Pretty, Η. M., 344 Pritchard, J . , 252 Prosser, C. L., 9, 10 Provine, W., 51 Prychodko, W., 107, 108, 109, 110, 112,
113, 114, 119 Pyeritz, R. E., 150
Race, R. R., 228, 289 Rao, C. R., 190, 221, 279n Rao, D. C., 279n, 289
366xsonmfedaNI Index of Names
Raven, P. Η., 142 Reed, Ε., 92 Reed, S., 92 Reed, Τ. E., 224 Reklys, E., 119 Reynolds, Vernon, 42, 43 Reys, L., 234, 238 Richmond, R. C., 142 Rife, D. C., 115 Rivat, L., 263 Roberts, D. F., 33,115,185,217,218,
315 Robertson, Α., 144 Robertson, F. W., 150 Robinette, R. R., 64 Rognon, P., 257 Roisenberg, I., 183 Ropartz, C., 263 Rothhammer, F., 183, 220 Rousseau, P. Y., 263 Rucknagel, D. L., 185 Ruffie, J., 255
Sade, D. S., 21, 30 Saldanha, P. H., 64 Salisbury, L. H., 82 Sailer, K., 289 Salzano, Francisco Mauro, 181199,
319, 320, 358 Sanger, F., 141 Sanger, R., 228, 289 Sanghvi, L. D., 34, 220, 221 Sarich, Vincent M., 169, 171 Saunders, G. F., 150 Saunders, P. P., 150 ScarrSalapatek, Sandra, 83, 84, 85 Schaller, G. B., 18, 21 Schanfield, M. S., 343351, 358 Schapera, I., 232 Scheppe, M. L., 149 Schmalhausen, I. I., 47 Schmidt, B. J., 64 Schreider, E., 90 Schroeder, W. Α., 108 Schull, W. J., 69, 70, 71 Scott, Ε. M., 96 Scott, I. E., 206 Seagrim, G. N., 89 Segall, Μ. H„ 77 Selby, S., 329 Semple, Ν. M., 328 Sesonske, Α., 14 Seth, Praveen Kumar, 325332, 358: Seth, Swadesh, 325332, 359 SgaramellaZonta, L. Α., 183 Sharma, J. C., 284 Shaw, C. R., 160 Shields, James, 69
Shinagawa, F., 69 Shirakawa, S., 150 Shirole, V., 279 Shockley, W., 91, 97 Shreffler, D. C., 185 Shultz, G., 57 Shuster, J., 343, 343n, 344, 346, 347, 348 Simmons, R. T., 183, 327, 328 Simons, E. L., 121 Simpson, G. G.:vutponmliedaT Tempo and mode in evolu
tion, 40 Singal, Β. M„ 114 Singh, I. P., 284 Sisco, R. Dominguez, 201 Skeels, Η. M., 66, 68 Skodak, Marie, 66, 68 Smith, J. M., 147 Smith, W. K., 343 Smithers, S. R., 131 Smithies, O., 206 Snow, D. R., 223 Sofaer, J. Α., 184 Sonn, Ε. Β., 228 Southern, Ε. Μ., 151 Spencer, Herbert, 50, 53 Spielman, R. S., 183, 184, 185, 220 Spielmann, W., 234, 238 Splaine, M., 251 Spuhler, J. N., 76 Stamatoyannopoulos, G., 108, 234, 238 Stearn, Α. E., 132 Steam, E. W., 132 Stebbins, G. L., 152, 155, 159 Stein, H., 150, 151 Steinberg, A. G., 185, 186, 189, 190, 234,
238, 263, 343, 346, 348 Steiner, H., 91 Stewart, Naomi, 90 Stodolsky, S. S., 81 Sunahara, S., 337 Sutter, J., 96 Sutton, Ε., 343η Sutton, Η. Ε., 185, 206 Szarski, Η., 47, 52 Szathmary, Ε. J. Ε., 348
Tabah, L., 96 Tanaka, Τ., 107, 108, 109, 110, 112, 113,
340 Tanis, Robert J., 170 Tashian, Richard E„ 114, 170, 185 Taylor, C. E., 141 Teleki, G., 26 Tepfenhart, Μ. Α., 186, 189, 190 Terry, R. J., 131 Thoday, J. M., 76 Thoma, Α., 130 Thomas, C. Α., Jr., 150
Index of Names 367
Thomas, L. V., 245 Thompson, E. O. P., 141 Thomson, G., 144 Thurmon, T. F., 108 Timmons, C. F., 109 Tobias, P. V., 56, 329 Tondo, C. V., 185 Toyomasu, T., 109, 114 Trankel, Α., 64 Trivers, Robert L., 41 Trecolle, —., 256 Tuppy, H., 141
Uemura, K.L, 109, 114 Urano, M., 337 Uzzell, Thomas, 155, 169, 170, 171
Vallois, Η. V., 274 Vandenberg, Steven G., 63103, 359 Van LawickGoodall, Jane, 23 Van Loghem, E., 343,343n, 344,345,346,
347, 348 Vansina, J., 245 Van Valen, Leigh, 42, 120, 147 Van Zyl, L. J., 252 Vedder, H., 249 Vergnes, Henri, 255277, 359 Vernon, P. E., 76 Vogel, F., 130, 137 Vogel, J. C., 252 Von Luschan, F., 250 Vyas, G. N„ 343, 344
Wade, P. T., 108, 109, 110, 112 Walker, G. F., 185 Walker, P. Μ. B., 151 Wallace, A. R., 50 Wallace, B., 147, 148 Waller, Jerome H., 58, 93 Walsh, R. J., 329 Wang, A. C., 206, 343, 346, 347, 348 Ward, R. H., 184, 192
Watanabe, H., 340 Weatherall, D. J., 209 Weidenreich, F., 17 Weiner, A. S., 127 Weiner, J. S., 182, 329 Weinstein, Ε. D., 185 Weitkamp, L. R., 184, 185,186, 191,192 Westphal, E. O. J., 232 Whelpton, P. K., 75 Whitehouse, H. L. K., 147 Wiener, A. S., 228 Wiesenfeld, S., 57 Williams, George C., 39, 138 Wills, C., 142, 149 Wilson, Allen C., 169 Wilson, J. O. C., 185, 189 Winter, W. L., 76 Wintrobe, Maxwell M., 208 Wissler, C., 132 Wittes, R. E., 149 Witty, Ρ. Α., 79 Wolfe, Bernard:omibL Limbo '90, 97 Wooding, G. L., 167 Woolf, B., 290 Workman, P. L., 184, 223 Wright, Sewall, 40, 41, 42, 143, 144, 319 WynneEdwards, Vero C., 39
Yamaguchi, B., 338 Yanofsky, C., 149 Yasmineh, W. G., 147, 151 Yee, S., 183 Young, H. Boutourline, 65 Young, M., 92 Young, R. Α., 109 Ysebaert, M., 164 Yunis, J. J., 147, 151
Zδrate, Q., 217218 Zonta, L. Α., 184, 229 Zoutendyk, Α., 234, 238 Zuckerkandl, E., 141

Index of Subjects
A2m alleles, 3 4 3 - 3 5 1 ; allotyping methods for, 3 4 4 - 3 4 5 ; anthropological usefulness of, 3 4 3 - 3 5 1 ; frequency of, 3 4 5 - 3 5 0
A2m immunoglobin alleles, 343, 344 Abdominal decompression, 79, 80 ABH saliva secretion: AngamiNamas, 326,
327, 328; Gavdas of Goa, 288, 289, 292, 307, 308, 312
A B O blood group alleles: in Ainu, Hok-kaido, 334, 335, 336, 340; in Angami Nagas, 326, 327; diseases associated with, 130, 137; in Gavdas of Goa, 288, 2 8 9 , 2 9 1 , 3 0 7 , 3 0 8 , 3 1 2 ; in Ideles popula-tions, Sahara, 262, 265, 266, 271, 272, 273; incompatibility in, 1 2 7 - 1 2 9 ; in Mongoloid groups, 3 2 7 - 3 2 8 ; in "Mozambique Negro", 2 3 6 - 2 3 7 ; in Nandiwallas, 316 ; selection of, 127-128 , 130; in Tapipa Negroid isolate, 209, 210, 212; in Tlaxcalan Valley populations, Mexico, 217, 218, 219, 220, 224
Achromatopsia, 184 Acid phosphatase (AP) enzyme allele, 233 ;
in Ainu, Hokkaido, 334, 335, 336; in Ideles population, Sahara, 2 6 2 , 2 6 6 , 2 6 8 , 269; in Tlaxcalan Valley populations, Mexico, 217, 219
A D A allele in Ainu, Hokkaido, 334 Adaptation, 9 - 1 5 ; definitions of, 9 - 1 0 ; dis-
tribution studies of, 13; domains, 11-12 , 13; environmental, 10 -11 ; nomenclature of, 12 -13 ; physiological, 9; population studies of, 13; referents of, 10 -11 ; stress, 13-14 ; study of, 13 -14 ; trait analysis in, 13; values and, 14
Adaptive significance, 10, 1 1 - 1 2 Adoptive children's intelligence, 66 -68 , 89
Ag allele in Ainu, Hokkaido, 334, 335 Agadesians of Sahara, 271, 272, 273, 274,
275 Aging, 17 -19 /Ai/ai !Kung of Botswana, 231, 232,
2 4 0 - 2 4 1 , 248, 249 Ainu, Hokkaido, 3 3 3 - 3 4 0 ; anthropometric
characters of, 338; genetic markers in, 3 3 4 - 3 3 7 ; morphological characters of, 338, 339
A K allele in Ainu, Hokkaido, 3 3 4 , 3 3 5 , 3 3 6 Albinoism, 320 Alloalbumins in Tapipa Negroid isolate,
201, 205 Altitude adaptations, 182, 183 Altruism, 3 9 - 4 7 ; Haldane's model of, 41 ;
kin selection in, 41; reciprocal, 4 1 - 4 2 Amerindians, 184, 185; Gm - A 2m hap-
lotypes in, 348 -349 , 350; Tlaxcalan Val-ley populations of, 2 1 5 - 2 2 5 ; Xavante, 185, 191, 192; Yanomama, 184, 185, 188, 189, 190, 191, 192, 193
Aneuploidies: behavioral, 72 -73 , 74; sex chromosome, 72 -73 , 74
Angami Nagas, India, 3 2 5 - 3 3 2 ; blood groups in, 326, 3 2 7 - 3 2 8 ; genetic markers in, 3 2 6 - 3 2 9 ; skin color in, 3 2 9 -330
Anthropometry, 185; of Cayapo Indians, 186, 191; of Gavdas of Goa, 288, 289, 290, 306, 307, 311
Antigens, 1 3 0 - 1 3 8 ; A B O cross-reactions with, 130; parasite, 1 3 0 - 1 3 1 ; selection against, 130
Appearance and social relations, 2 0 - 2 1 Arborescent analysis, 265, 266, 268, 270,
272
370xutsonjfedcbSI Index of Subjects
Armfolding in Gavdas of Goa, 288, 289, 306, 307
Artisans (Enaden) of Sahara, 260,261,266 Auricular height in Gavdas of Goa, 289,
290, 306 Australopithecines, 4243 utsrponlihfecbaSCAAustralopithecus sp., 25; A. africanus, 43 Aymarδ of Chile, 183
Babinga pygmies of Central African Republic, 184
Baboon, 20, 26, 29; birthrate in, 23; hamadryas, 43; troop behavior in, 18,22, 23, 30
Bacteriophage T4, 152; rll mutational spectrum, 152, 153
Bantu language, 233, 234 Be ja of Sahara, 271, 272, 273, 274, 275 Berberophones of Sahara, 260 Bipedalism: diet and, 2526; maternal
mortality and, 25 Birth, 2326; maternal mortality during,
25; multiple, 2324; rate and survival value, 2324; timing of, 2425, 28
Bizygomatic breadth in Gavdas of Goa, 289, 290, 306
Bleek linguistic division, 232, 233 Blood group alleles. See ABO, Diego,
Duffy, KellCellano, Kidd, Lewis, MN, MNSCHRM Q, Rhesus blood group alleles
Bokabo of Ivory Coast, 265,266,267, 268, 269, 270, 271, 272, 273, 274, 275
Bougainville Melanesians, 183 Brahman Varna, 280, 281, 282, 283;
Deshastah Rgvedi group of, 284; Madhyandina group of, 284; Saraswats group of, 284
Brain: growth, 25; size, 25, 3536 Brazil. See Cayapo Indians Bushman. See San
Caingang Indians, 185 Carbonic anhydrase I and II alleles, 114,
121; primate phylogeny of, 169, 170 Cartilagenous lump in Gavdas of Goa, 288,
289,306, 307 Cashinahua of Peru, 185 Caste, 280285; fission model of structure
of, 280, 281, 282, 284, 313; Karve's model of structure of, 280,282,283,284, 313
Caucasians, 255, 263, 269, 274, 275; GmAjm haplotypes in, 345346, 349
Cayapo Indians, 185193; age structure of, 187, 188; anthropometry of, 186, 191; Bau population of, 187; blood groups in, 186; color blindness in, 186; demography
of, 186, 187, 188, 189; dermatoglyphics of, 186; diseases in, 188189; erythrocyte enzymes of, 186; fertility of, 187; Gorotire subgroup of, 187; hemoglobin of, 186; immune systems of, 189; inbreeding coefficient in, 186; Kararao Gorotire subgroup of, 186; KoKraiMoro subgroup of, 186, 187; KubenKranKegn subgroup of, 186, 187, 188, 189, 190, 191; medical studies of, 186; Mekranoti subgroup of, 186, 187, 188, 189, 190, 191192; mortality in, 187, 188; Pau d'Arco subgroup of, 187; salivary secretions of, 186; selection potential in, 188, 189; serum proteins of, 186; sex ratio of, 187,188; Txukahamae subgroup of, 186,187,188,190,191; visual acuity of, 186; Xikrin subgroup of, 186, 187, 190, 191
Cercopithecus, 115 Cerumen allele: in Ainu, Hokkaido, 337; in
Tlaxcalan Valley populations, Mexico, 217, 219
Chaamba of Sahara, 271, 272, 273, 274, 275
Chandra Seniya Kayshtha Prabhu subcaste, 284
ChE allele in Ainu, Hokkaido, 334, 336 Chimpanzee, 20, 25, 30, 167, 168, 169,
170, 171; food sharing in, 26 Chin form in Gavdas of Goa, 288,289,306,
307 Chinese, GmA2m haplotypes in, 348, 349 Chougule Nandiwallas of Maharashtra,
India, 316, 317, 319, 320 ChouKoTien, N. China, 17, 18 Christian Gavdas of Goa, 285313; blood
groups in, 291, 307, 308, 312; dermatoglyphics in, 288,289,293305,308311, 312; marriage in, 286287; morphological characteristics in, 288, 289, 290, 306, 307, 312
Cleft chin in Gavdas of Goa, 288,289, 306, 307
Colobus, 115 Color blindness, 64, 65, 185, 186; in Ainu,
Hokkaido, 336; in Angami Namas, 326327; in Gavdas of Goa, 288, 289, 292, 307, 308; in Nandiwallas, 316, 317, 321
Colored populations of southern Africa, 231, 232, 240241, 242, 243, 248249, 252; genetic distances between, 235, 240243, 248249
Consanguineous marriages, 185 Cooking, 1819 Cormack's conjecture of equilibrium,
176177
Index of Subjects 371
Cultural models of evolution, 5358 Culture: definitions of, 48, 53 Cybernetics of evolution, 4761; models of,
4748, 4953 Cytochrome c, 152, 154, 155, 156,
159
Damara of SouthWest Africa, 231, 233, 240241, 248, 249
Darwin's tubercle in Gavdas of Goa, 288, 289, 307, 311
DarwinWallace model of evolution, 50; neoDarwinian, 5153, 54
Daundiwalla Nandiwallas of Maharashtra, India, 316, 317, 318, 319, 320
Demography: cultural control of, 35; politics and, 34; population, 17,1819; social structure and, 34
Dental morphology, 184 Dental occlusion pattern in Gavdas of Goa,
288, 289, 307, 312 Dermatoglyphics: and aneuploidies, 73,74;
in Caingang Indians, 185; in Cayapo Indians, 186; developmental, 117118; in Gavdas of Goa, 288, 289, 293305, 308311, 312; inywutsrponmlkihfedcbaSMED Macaca fuscata fuscata, 115118, 120; in M. f . yakui, 115118, 119, 120; in M. nemestrina, 115118, 119,120; in Nandiwallas, 316, 318, 321; primate, 115
Deshastah Rgvedi subcaste, 284 Deuteranomaly, 64 Deuteranopia, 64 Diego (Di) blood group allele: in Ainu,
Hokkaido, 334, 335, 336; in Tapipa Negroid isolate, 209, 211, 212; in Tlaxcalan Valley populations, Mexico, 217, 218, 219, 220
Directional selection, 52, 53 Disease, 182; and antigens, 130138; Kuru,
183 Djanti of Sahara, 271, 272, 273, 274, 275 DNA, 147; codons, 166; euchromatin in,
151; heterochromatin evolution in, 150151; nucleotide substitution in, 149151; satellite, 147, 150151
Dobe !Kung of Botswana, 231, 232, 240241, 248, 249
Drosophila sp., 157; D. hydei, 151; D. neohydei, 151; D. pseudoneohydei, 151; D. pseudoobscura, 144,145,148; D. willistoni, 119, 157, 158
/du/da !Kung of Botswana, 231, 232, 240241, 248, 249
Duffy (Fy) blood group allele: in Ainu, Hokkaido, 334, 335; in Ideles population, Sahara, 262; in "Mozambique Negro", 236237; in Tlaxcalan Valley
populations, Mexico, 217, 218,219,220, 224
Earlobe attachment: in Gavdas of Goa, 288, 289, 306, 307; in Nandiwallas, 316, 317, 321
Equilibrium states, 173179; classification of, 174; Cormack's conjecture of, 176177; definitions of, 174, 175; levels of, 173; neutral, 175; semistable, 175, 177; stable, 174, 175177; unstable, 174175, 177
Erythrocyte enzymes, 186, 201 Escherichia coli: phage T4rII mutational
spectrum of, 152,153; Treffer's mutator gene in, 149150
EskimoAleut project, 184 Ethical theory, 14 Ethiopians, 183, 271, 272, 273, 274, 275 Euchromatin, 150151 Evolution: definitions of, 48, 53 Evolutionary models: DarwinWallace, 50;
Lamarckian, 4950; mutationist, 51; neoDarwininan, 5153, 54; synthetic, 5153
Facial height in Gavdas of Goa, 289, 290, 306
Fertility, 75, 182, 187, 188 Fibrinopeptides, 152, 154, 159; primate
phylogeny of, 167, 168 Finger prints. See Dermatoglyphics Fire, 18 Fissionfusion model of population struc
ture, 192,210 Fore, 183 Frontal breadth in Gavdas of Goa, 288,
289, 306 Fulani Bororos of Sahara, 271, 272, 273,
274, 275
Gagoos Bokabo of Ivory Coast, 265, 266, 267, 268, 269, 270, 271, 272, 273, 274, 275
Gagoos Tooka of Ivory Coast, 265, 266, 267, 268, 269, 270, 271, 272, 273, 274, 275
Gamma globulin (Gm) alleles: in Ainu, Hokkaido, 334,335,336,338; allotyping methods for, 344345; frequency of, 345350; in Ideles populations, Sahara, 262,263,266,267,268,269; in southern African populations, 233, 234, 238239
GmA2m haplotypes, 343; allotyping methods for, 344345; frequency of, 345350
Gavdas of Goa, 279313; blood groups in, 291, 307, 308, 312; Christian, 285313;
3 7 2xutsonjfedcbSI Index of Subjects
Gavdas of Goa (cont.)
dermatoglyphics in, 288, 289, 293305, 308311, 312; Hindu, 285313; marriage in, 286287; morphological characteristics of, 288, 289, 290, 306, 307, 312; NavHindu, 285313
Genetic equilibrium.solecaSM See equilibrium states Genetic load, 146149 Glucose6phosphate dehydrogenase (G6
PD) enzyme allele: in Angami Namas, 326327, 328; in Ideles populations, Sahara, 262, 266, 268, 269; in Nandiwallas, 316, 317, 321
Gorilla, 167, 168, 169, 170, 171 Group selection, 1737, 3947; aged mem
bers and, 1720; altruistic behavior in, 39,4142,43; birth and, 2326; cultural, 35; fertility and, 24; Fisher's theory of, 39; Haldane's model of, 41; juveniles and, 21; latency period and, 2223; political, 34; Wright's model of, 4041, 42; WynneEdward's theory of, 39
Group specific component (Gc) allele: in Ainu, Hokkaido, 334, 335; in Tapipa Negroid isolate, 201, 205, 206, 212; in Tlaxcalan Valley populations, Mexico, 217, 218, 219
Growth, 185
Hairline of Gavdas of Goa, 288, 289, 307, 312
Handclasping in Gavdas of Goa, 288, 289, 307, 312
Handedness in Gavdas of Goa, 288, 289, 306, 307
Haptoglobin (HP) serum protein alleles: in Ainu, Hokkaido, 334, 335, 336, 338; of Ideles populations, 262, 266, 267, 268, 269; in "Mozambique Negro", 234, 238239; in Nandiwallas, 316, 317; in Tapipa Negroid isolate, 201,205,212; in Tlaxcalan Valley populations, 217, 219, 224
Harratins of Sahara, 260, 261, 265, 266, 267, 268, 269, 270, 271, 272, 273, 274, 275, 276
Head breadth in Gavdas of Goa, 289, 290, 306
Head circumference in Gavdas of Goa, 289, 290, 306
Head length in Gavdas of Goa, 289, 290, 306
Hematocrit determination in Tapipa Negroid isolate, 205, 208, 211, 212
Hemoglobin, 152,154,157,159,166,185, 186, 228; a, 107113, 114, 120, 121, 144, 155, 156, 167, 170, 171, 262; b, 155, 167, 168, 170, 171; C, 252, 262;
cistron coding for, 144; E, 252; F, 262; in Ideles populations, Sahara, 261262; in Macaca spp., 106, 107108, 113, 114, 119120,121; in Nandiwallas, 316, 317, 321; primate phylogeny of, 167, 168, 170,171; S, 252,262; specific differences in, 155, 156; in Tapipa Negroid isolate, 201, 205, 208209, 210, 211, 212
Herero of southern Africa, 231, 233, 240241, 248, 249
Heterochromatin, 150151 Hindu Gavdas of Goa, 285313; blood
groups in, 291, 307, 308, 312; dermatoglyphics in,288,289,293305,308311, 312; marriage in, 288; morphological characteristics of, 288, 289, 290, 306, 307, 312
Hindu Varnas, 280285 Histone, 152, 154, 155 HLA histocompatibility system, 131, 138 Hottentots. See Khoikhoi House mouse, t allele in, 40 Hutu of Rwanda, 250 Hydrocyanic acid smelling allele, 228 Hypertrichosis of ear in Gavdas of Goa,
288, 289, 292, 307, 308
Iburelliten of Sahara, 261 Ideles, Sahara, 255277; anthropology of,
264265; genetic structure of, 265276; geography of, 256258,259; hematology of, 261262; mathematical expression of genetic distances in, 262264; recent crossbreeds of, 266, 267, 268, 270, 271, 272, 273, 274, 275; social structure of, 258261
IgA immunoglobin alleles, anthropological usefulness of, 343351
Iklan of Sahara, 260, 261, 265, 266, 267, 268, 269, 270, 271, 272, 273, 274, 275, 276
Immune systems: antihuman globulins, 189190; of Cayapo Indians, 189190; of Yanomama Indians, 190
Immunoglobins, 166; A2m alleles, 343, 344; GmA2m haplotypes, 343; IgA2
alleles, 343351; in Tapipa Negroid isolate, 201, 206, 212. See also Gamma globulin, Inv alleles
Inbreeding, 188; in Tapipa Negroid isolate, 210
Incest: effects of, 7172; heterozygosity and, 3132;taboo, 3032
Indians. See Amerindians Intelligence, 3536; abdominal decompres
sion and, 79, 80; adoption and, 6668; aneuploidies and, 7273, 74; biological relationships and, 6672, 74; in caste

Index of Subjects 373
society, 36; components of, 71, 75, 81, 82; decline in national levels of, 9197; environment and, 68, 7576, 84, 85, 8789; fertility levels and, 64, 9197; hereditary and, 68,71,84,85,91; natural selection and increase in, 58; in PKU cases, 65; racial differences in, 63, 7577, 7990; socioeconomic differences in, 64, 9097; tests, 6772, 81, 82, 8689, 9192; threegeneration, 74; variance analysis of, 7475
Inv immunoglobin alleles, 234, 262,343; in Ainu, Hokkaido, 334, 335
Isolates: Angami Namas (India), 325332; nomadic, 315323; Tapipa Negroid isolate, 201214
Isolation: gene flow and, 120121, 122; in yvutsrponmlkihfedcaTSMJEMacaca populations, 105125; variability and, 119120, 122
Isonicotinic acid hydrazid (INH) allele, in Ainu, Hokkaido, 337
Japanese: Ainu, 333341; blood protein polymorphisms in, 333341; GmA2m haplotypes in, 348, 349
Johannesburg coloreds of South Africa, 231, 234, 240241, 248249
Journal of Molecular Evolution, The, 141
Kaukau of Botswana, 231, 232, 240241, 248, 249
Keetmanshoop Khoikhoi of SouthWest Africa, 231, 233, 240241, 248
Kel Azzi of Sahara, 271, 272, 273, 274, 275
Kell (Κ) blood group allele: in Ainu, Hokkaido, 334, 336; in Ideles populations, Sahara, 262, 265, 266, 271, 272, 273; in "Mozambique Negro", 236237; in Tapipa Negroid isolate, 209,210,212; in Tlaxcalan Valley populations, Mexico, 217, 218, 219
Khoikhoi of SouthWest Africa, 227, 231, 233, 240241, 248
Khoisan populations of Botswana, 231, 232233, 240241, 243, 244, 248, 249
Kidd (Jk) blood group allele: in Ainu, Hokkaido, 334; in Tlaxcalan Valley populations, Mexico, 217, 218, 219
Komti Nandiwallas of Maharashtra, India, 316, 317, 318, 319, 320
Konkani language, 285 Koranas, 228 Kotas of Nilgiri Hills, India, 320 Kpelle culture, 7879 Kshatriya Varna, 280, 281, 282, 283 IKuboes coloreds of South Africa, 231,
234235, 240241, 248, 249
!Kung of Botswana, 231, 232, 240241, 248, 249
Kuru, 183
Lactate dehydrogenase (LD) enzyme allele, 262
Lamarckian model of evolution, 47, 4950
Language, 20, 2930, 56, 57; Bantu, 233; Bleek, 232; Nama, 233; Sotho, 234; Tshukhwe, 233
Latency period, 22 Learning in Kpelles, 7879 Lefthandedness, 6465 Lewis (Le) blood group allele: in Ainu,
Hokkaido, 334; in Ideles populations, Sahara, 262; in Tlaxcalan Valley populations, Mexico, 217, 218, 219
Longevity, 1719
Macaca spp., 105125; M. arctoides, 107108, 121; M. cyclopis, 113,114; M. fascicularis, 109, 114, 119120, 121; M. fuscata, 106, 113, 114, 115, 120; M. f.fuscata, 115118, 120; M. f.yakui, 115118, 119, 120; M. irus, see M. fascicularis·, M. mulatto, 113, 114, 121; M. nemestrina, 113,114,115,119,120,121; M. speciosa, see M. arctoides. See also Macaque
Macaque, 30,105125; carbonic anhydrase I and II alleles in, 114, 121; distribution of, 106; hemoglobins in, 107113, 120, 121; methemoglobin reductase (NADH diaphorase) alleles in, 114; 6phosphogluconate dehydrogenase alleles in, 114, 121; populations, island versus mainland, 113115, 120, 121, 122; transferrin alleles in, 114, 119120, 121. See also Macaca spp.
Madhyandina subcaste, 284 Makiritare Indians, 184, 185, 191, 192 Maratha subcaste, 284 Marathi language, 285 Marital distances, 184 Maternalfetal incompatibility, 127129 Mating, 2834; incestuous, 3032; pairing
and, 29; signals in, 30 Maturation of human young, 2022; brain
development and, 20; dependence and, 21; latency period in, 22; sexual behavior and,2223
Mediterranean racial complex, 318 Melanesians, GmA2m haplotypes in, 346,
347, 348 Mendelian isolates. See isolates "Mendelian" pedigree analysis, 6465 Mental retardation, 65
374xutsonjfedcbSI Index of Subjects
Mestizo population of Tlaxcalan Valley, Mexico, 215225
Methemoglobin reductase (NADH diaphorase) alleles, 114
Mexican Indians.srpoliheaSD See Tlaxcalan Valley populations
Mexico. See Tlaxcalan Valley populations Mixed populations of southern Africa, 231,
234235, 240241, 242, 243, 248;genetic distances between, 235,240243,248
MN blood group alleles: in Ainu, Hokkaido, 334, 335, 338; in Angami Namas, 326, 327, 328; in Gavdas of Goa, 288, 289,291,307,308,312; in Ideles populations, Sahara, 262,266,271,272,273; in "Mozambique Negro", 236237; in Nandiwallas, 316, 317; in Tlaxcalan Valley populations, Mexico, 217, 218, 219, 220
MNSCHRM blood group allele, in Tlaxcalan Valley populations, Mexico, 217, 218, 219
Molilese of Micronesia, 184 Mongolism, 72 Mongoloid groups, 263,333,337,338,339 Morphometry, 228; of Cayapo Indians,
186, 191; of Gavdas of Goa, 288, 289, 290, 306, 307, 311
Mortality, 182 Motor phenomena at single locus, 64 "Mozambique Negro" of southern
Mozambique, 231, 234, 236239, 240241, 248, 249, 250, 251
M'Rabtines of Sahara, 259260, 261, 265, 266, 267, 268, 269, 270, 271, 272, 273, 274, 275,276
M'Rabtines of Sahara x Isseqamaren population of Sahara, 260,265,266,267,268, 269, 270, 271, 272, 273, 274, 275
MS2 virus, 149 Multifactorial analysis, 6572 Multiple births, 2324 Mutation, 52; neutral, 141166; rates,
4041 Mutationist model of evolution, 51 Myopia, 184
Nagas: Angami, 325332; Zeliang, 327 Nama linguistic division, 233, 249, 250 Nandiwallas of Maharashtra, India,
315323; characteristics of, 316318; Chougule, 316, 317, 319, 320; Daundiwalla, 316, 317, 318, 319, 320; genetic composition of, 319321; Komti, 316, 317, 318, 319, 320; marriage in, 321; Patil, 316, 317, 318, 319
Naron of Botswana, 231, 232, 253, 240241, 248
Nasal breadth in Gavdas of Goa, 289, 290, 306
Nasal bridge in Gavdas of Goa, 288, 289, 307
Nasal depression in Gavdas of Goa, 288, 289, 306, 307
Nasal septum in Gavdas of Goa, 288, 289, 307, 312
Natural selection: centripetal, 52; DarwinWallace model of, 50; definition of, 48; directional, 52, 53; intraspecific competition and, 5354; neoDarwinian model of, 5153, 54; normalizing, 52; stabilizing, 52; synthetic model of, 5153
NavHindu Gavdas of Goa, 285313; blood groups in, 291, 307, 308, 312; dermatoglyphics in, 288,289,293305, 308311, 312; marriage in, 286287; morphological characteristics in, 288, 289, 290, 306, 307, 312
Negroes, 255, 263, 269, 274, 275; GmA2m haplotypes in, 345, 346, 347, 349; genetic distances between, 235, 240243, 248, 250251; populations of southern African, 227, 231, 232, 233, 234, 240241, 242, 243, 248, 249251
Negroid isolates, 201; Tapipa, 201214 Negroid origins of Tlaxcalan Valley popula
tions, Mexico, 215225 NeoDarwinism, 142 Neutral mutations, 141166; in
Drosophila, 157; population size and, 144; random drift and, 143144, 150151; "selective forces" on, 146
New Guinea, 183 Nguni linguistic division, 250 NonDarwinian evolution. See Neutral
mutations Nucleotide substitution, 149151; in serine,
149
Old people, 1719; child care by, 18; knowledge and skills of, 1920; toolmaking by, 19; value transmission by, 20
Orangutan, 25 Orbital breadth in Gavdas of Goa, 289,
290, 306 Orbitonasal arc in Gavdas of Goa, 289,
290, 306 Oriental Pyrenees (France) population,
265, 266, 267, 268, 269, 270, 271, 272, 273, 274, 275
Orientals, GmA2m haplotypes in, 345, 348, 349
PTja blood group allele, in Ideles populations, Sahara, 265, 266, 271, 272, 273
Pain insensitivity, 64
Index of Subjects 375
Pairing, 29 Paleolithic remains, 17 Palmar prints.utsrponlihecaSP See Dermatoglyphics Papago Indians, 184 Papuans, GmA2m haplotypes in, 346,347,
348, 349 Parasites: adaptive evolution by, 130131,
antigen acquisition by, 131, 138; blood, 131; diseases due to, 131; in Tapipa Negroid isolate, 201, 207, 211, 212213
Patil Nandiwallas of Maharashtra, India, 316, 317, 318, 319
Peasant societies, 182 Pedi of South Africa, 231, 234, 240241,
248, 250, 251 PKU, untreated cases, 65, 75 Phenylthiocarbamide (PTC) tasting allele,
64, 65, 228; in Ainu, Hokkaido, 336; in Angami Namas, 326,327,328; in Tlaxcalan Valley populations, Mexico, 217, 218, 219
Phosphoglucomutase (PGM) allele: in Ainu, Hokkaido, 334, 335; in Ideles populations, Ahara, 262, 266, 268, 269; in Tlaxcalan Valley populations, Mexico, 217, 219
6phosphogluconate dehydrogenase, (6PGD) alleles, 114, 121; in Ainu, Hokkaido, 334, 335; in Ideles populations, Sahara, 262, 266, 268, 269
Phosphohexose isomerase, 191192 Phylogenetic trees, 166172, 184, 185,
192, 337; of fibrinopeptides in primates, 167, 168; of hemoglobin in primates, 167, 168; molecular data for, 166171
Pi allele in Ainu, Hokkaido, 334 Piaget's conservation concept, 8488 Pingelapese of Micronesia, 184 Pithecanthropus, 25 Primates: behaviour in, 18, 21, 22, 23, 28;
brain capacity of, 25; phylogenetic trees for, 166172
Protanomaly, 64 Protanopia, 64 Proteins, 141166; molecular evolution of,
141, 149151; phylogenetic trees from, 166172; rate of substitution in, 151158. See also Serum proteins
PseudoCholinesterase (ACAH) allele, in Ideles populations, Sahara, 262
Q allele in Ainu, Hokkaido, 334 Quechua of Andes, 183
Race and intelligence, 63, 7577, 79; in Africans, 7677, 79; in Americans, 7576, 7984, 85; in Australian aborigines, 8490
Random drift, 142146, 150, 151, 160; population size and, 144; Wright's concept of, 143144
Red cell antigens in "Mozambique Negro", 234, 238239
Red cell enzyme alleles: in Ainu, Hokkaido, 334, 335, 336; in "Mozambique Negro", 234, 238239
Regueibat of Sahara, 271, 272, 273, 274, 275
Rhesus (Rh) alleles, 127; in Ainu, Hokkaido, 334, 335, 336, 338; in Angami Nagas, 326, 327, 328; in Damara of SouthWest Africa, 233; in Gavdas of Goa, 288, 289, 291, 307, 308, 312; in Ideles populations, Sahara, 265, 266, 271,272, 273; in "Mozambique Negro", 236237; in Nandiwallas, 316, 317; in Tapipa Negroid isolate, 209,210, 212; in Tlaxcalan Valley populations, Mexico, 217, 218, 219, 220
Rhesus monkey, 167, 168, 169, 170, 171
Sahara populations. See Ideles populations Salivary secretion, 185, 186 San (Bushman) of Botswana, 227, 231,
232233, 240241, 243, 244, 248, 249 Saoudian Arabs, 271, 272, 273, 274, 275 Saraswats subcaste, 284 Schistosomes, 131 Schizophrenia, 65 Segregational load, 147, 148 Selection: apostatic, 137; centripetal, 52,
coefficients, 144, 145, 146; directional, 52, 53; frequencydependent, 131; group, 1737, 3947, 137, 138; "hard", 148; incompatibility, 132; natural, 48, 50, 5153; normalizing, 52; sexual, 1737, 40; social, 19; "soft", 148; stabilizing, 52
Serine, 149, 150 Serum protein alleles, 228; in Ainu, Hok
kaido, 334, 335, 336; in Caingang Indians, 185; in Cayapo Indians, 186; Gm, 262, 263, 266, 267, 268, 269; Hp, 316, 321; in Ideles populations, Sahara, 262, 266; Inv, 262; in Nandiwallas, 316, 321; Tf, 316; in Tapipa Negroid isolate, 201 ,205 ,206 ,211 ,212
Sesfontein coloreds of SouthWest Africa, 231, 234, 240241, 248, 249
Sesfontein Khoikhoi of SouthWest Africa, 231, 233, 240241, 242, 243, 248
Sex chromosome aneuploidies, 7273, 74 Sex ratio: human 2829; primate, 27 Sexual dimorphism, 2628; human, 27;
primate, 2627; social function of, 2728
376xutsonjfedcbSI Index of Subjects
Sexual selection, 1737; caste prejudice and, 3334; Darwin on, 33; genetic recombination in, 40; juvenile males and, 2 1 2 2
Shudra Varna, 280, 281, 282, 283 Sickle cell anemia, 35, 57,137; in southern
African Negroes, 251252 utsrponiheaSSinanthropus, 17, 18 Skin color, 185; in Angami Nagas, 329330 Smallpox virus, 132, 137 Smell deficiency, 64 Social structure, 3436; ape, 23, 26;
baboon, 18, 2122; demography and, 34; hunting groups in, 29; macaque, 30; monkey, 23, 26; Paleolithic, 1721, 26; wolf, 21, 26
Somatometric characteristics of Gavdas of Goa, 289, 290, 306307, 312
Southern African populations, 227243, 245255; colored (or mixed),^31, 232, 234235, 240241, 242, 243, 248249; genetic distances between, 235,240243, 247253; Khoisan, 231, 232233, 240241, 242, 243, 248, 249; Negro, 227, 231, 232, 233234, 240241, 242, 243, 248, 249251
Sotho language, 234 Sotho of Lesotho, 231, 234, 240241, 248,
250, 251 Spanish origins of Tlaxcalan Valley popula
tions, Mexico, 215225 Spatial visualization, 65, 75, 76 Speciation, 143 Spider monkey, 168, 169, 171 Stature of Gavdas of Goa, 289, 290, 306 Stool examination in Tapipa Negroid iso
late, 205, 206, 212 Stressadaptation, 1314 Subsistence societies, 182 Substitutional load, 147, 148, 159160 Sufi of Sahara, 271, 272, 273, 274, 275 Swazi of Swaziland, 231, 234, 240241,
248, 250251 Sweatgland distribution, 185 Synthetic theory of evolution, 5153
t allele in house mouse, 40 Tapipa negroid isolate, Venezuela,
201214; age structure of, 204; birthrate of, 204; blood groups in, 201, 205, 209, 210, 213; census of, 202, 204; demography of, 207; fertility in, 207; genetic structure of, 210211, 212213; hemoglobins of, 201, 205, 208209, 210, 211, 212; kinship in, 207
Tlaxcalan Valley populations, Mexico, 215225; African origins of, 218, 220, 221, 222, 223, 224; censuses of, 216;
demography of, 216; genetic distances in, 220222; geography and, 215216, 222223; hybridization estimates of, 217220; Indian, 215, 216, 217, 218, 220, 221, 222, 223, 224; mestizo, 215, 216, 217, 218, 220, 221, 222, 223, 224; Spanish, 215, 216, 217, 218, 220, 221, 222, 223, 224
Tone deafness, 64 Tongue pigmentation in Gavdas of Goa,
288, 289, 293, 307, 308,311,312 Tooka of Ivory Coast, 265, 266, 267, 269,
270, 271, 272, 273, 274,275 Toolmaking, 1819 Trait analysis, 13 Transferrin (Tf) serum protein alleles, 114,
119120, 121; in Ainu, Hokkaido, 334, 335; in Nandiwallas, 316, 317; in Tapipa Negroid isolate, 201, 205, 206, 212
Tribal societies, 181199 Trisomy, 21, 72, 73, 74 Tritanomaly, 64 Tritanopia, 64 Tshukhwe linguistic division, 233 Tswana of Botswana, 231, 233234,
240241, 248, 250 Tutsi of Rwanda, 250 Twa of Rwanda, 250 Twareg of Sahara, 260, 261, 265, 266, 267,
268, 269, 270, 271, 272, 273, 274, 275, 276
Twareg Isseqamaren of Sahara, 260, 261, 265, 266, 267, 268, 269, 270, 271, 272, 273, 274, 275, 276
Twin studies, 69, 83, 96
Urinalysis in Tapipa Negroid isolate, 201, 205, 206, 211, 212
Vaishaya Varna, 280, 281, 282, 283, 284 Varnas, 280285 Venezuela. See Tapipa Negroid isolate Visual acuity, 186 Visual perception, 65, 75, 7677
Wadi Rhir of Sahara, 271, 272, 273, 274, 275
Wajin, Hokkaido, 334335 Wolf, 21, 26, 2930
Xavante Indians, 185, 191, 192; selection potential in, 188, 189
Yanomama Indians, 184, 185, 191, 192, 193; immune systems of, 190; selection potential in, 188, 189
Zeliang Nagas, India, 327