![cnn.p - (° 3Puli. - V.JU - [Pennsylvania county histories]](https://static.fdokumen.com/doc/165x107/632108b4b71aaa142a040f63/cnnp-3puli-vju-pennsylvania-county-histories.jpg)
evolutionary histories of New Zealand skinks
189
Copyright is owned by the Author of the thesis. Permission is given for a copy to be downloaded by an individual for the purpose of research and private study only. The thesis may not be reproduced elsewhere without the permission of the Author.
-
Upload
khangminh22 -
Category
Documents
-
view
0 -
download
0
Transcript of evolutionary histories of New Zealand skinks

Copyright is owned by the Author of the thesis. Permission is given for a copy to be downloaded by an individual for the purpose of research and private study only. The thesis may not be reproduced elsewhere without the permission of the Author.

SEQUENCES AND SIGNALS: EVOLUTIONARY HISTORIES
OF NEW ZEALAND SKINKS.
A thesis presented in partial fulfilment of
the requirements for the degree of
Doctor of Philosophy in Genetics
at Massey University
New Zealand
Robert Eric Hickson
May 1993

Abstract
The application of DNA sequencing to studies of the New Zealand biota is illustrated by investigations
into the evolutionary relationships of skinks in the genus Leiolopisma. DNA sequences from a region of
the mitochondrial 12S rRNA gene were determined for 20 taxa by use of the polymerase chain reaction.
A vertebrate secondary structure model for this part of the gene was developed using comparative
sequence analysis and calculations of RNA folding energies. Approximately one third of the molecule
does not vary between the vertebrates examined, and there are similar patterns of sequence variability
among the vertebrates. The secondary structure model was subsequently used to assist phylogenetic
analyses of the skink sequence data set.
Analyses of the mitochondrial DNA sequence information, using newly developed and more
sophisticated algorithms, did not produce a fully resolved phylogenetic tree for all the skinks, though
relationships between some taxa are less ambiguous. The lack of resolution does not appear to be due to
limitations in the analytical methods, nor to the patterns of nucleotide substitutions in the skink 12S
rRNA sequences. The skink sequence data set is unusual in that most of the taXa have similar numbers
of nucleotide substitutions when compared to each other. These results are interpreted as reflecting a
rapid divergence of the Leiolopisma group of skinks. Simulation studies support this interpretation.
Three hypotheses are presented to account for the patterns of sequence differences between the skinks.
One proposes a Gondwanan divergence of the Leiolopisma group, about 80 million years ago. Under
this hypothesis the distribution of the skinks on islands in the Pacific and Indian oceans can be
explained, in part, by continental drift. A second hypothesis suggests that New Zealand Leioiopisma are
derived from a Miocene (15-25 million years ago) evolutionary radiation in New Zealand. This
hypothesis however is inconsistent with observations of the sequence similarities between Mauritian,
Australian, and New Zealand skinks. A third hypothesis, proposing several independent colonizations of
New Zealand by Leioiopisma, is also not as well supported by the available sequence data. However, a
close relationship between the l2S rRNA sequences of one New Zealand species L. inJrapunctatum and
the Australian Lamprophoiis guichenoti suggests that at least two skink immigrations to, or emigrations
from, New Zealand may have occurred. Predictions of the three hypotheses and strategies to test them
are discussed.
Some of the conclusions derived from analyses of the mitochondrial DNA sequences conflict with those
obtained from allozyme information, though there are points of agreement. Comparison of the allozyme
and sequence data do also revealed a case of hybridization between two sympatric species, L. n.
polychroma and L. maccanni, at a site in Southland. Analyses of both data sets indicate that the
morphological similarity of Leioiopisma species obscLI!es a large amount of genetic diversity, and the
evolutionary histories of New Zealand Leiolopisma are older and more complex than previously
considered. Further genetical and ecological studies of Leioiopisma are required, but this thesis
emphasizes both the suitability and necessity of molecular genetic approaches for evolutionary
investigations in New Zealand.

Acknowledgments
Barry Scott and Garry Latch are penultimately to blame for this thesis. None of us knew what we were really in for.
:� Financial support was provided by the University Grants Committee, the Nga Manu Trust, Massey University, the Molecular Genetics Unit and Department of Microbiology and Genetics. Additional support came from the Dean of Science, the Royal Society of New Zealand, the Alfred P. Sloan Foundation (not once but twice!), and my parents. To all I am very grateful.
ii
lain Lamont and Liz Poole of Otago University provided hospitality and Liz showed me how to doublestrand sequence. Brad Shaffer, Centre for Population Biology, University of California Davis, permitted me time, space and consumables in his lab. Ross Sadlier of the Australian Museum, Sydney, provided tissue samples of New Caledonian skinks.
.
With Robert Fisher, Centre for Population Biology, University of California Davis, I enjoyed many hours of entertaining and interesting discussions, and he let me share a room with his lizards. Thanks Robert, but get on with your thesis! Mike Hendy, Mike Steel, Mike Charleston, Peter Waddell, and Chris Simon are also thanked for stimulating discussions and ideas.
Charlie Daugherty, Victoria University, provided the initial inspiration for this study. He gave me access to the skink tissues and was ever willing to fill me in on the details of New Zealand skinks.
Barry Scott, Tim Brown, and Geoff Malcolm provided a stimulating and friendly atmosphere in which to work, freedom to do as I pleased and to go where I wanted, and money to make it possible. Mister Tucker, Paul, Laura and Terri covered administration and clerical things.
Thanks also to my travel agent Sue. But absolutely no thanks to Guido and the Linguine Gang, Milano Station, Italy, even though they too relieved me of a burden.
Lots of people have been and gone, or are still around. Thanks to them for all sorts. Especially Carolyn and Miranda
To the following, words are no recompense:
David and Eric, both much more than superb and challenging supervisors and friends.
Alan, Gina, and particularly Mary of "Capital City Campus".
Stan, Pete, Trish and Liz of the Farside (and other places).
But most of all I thank my parents, with much love.

iii
Table 0/ Contents
Abstract .................................................................................................................................................. .
Acknowledgements ................................................................................... ................................................ ii
Table o/Contents .................................................................................................................................... iii
List 0/ Figures ..................... ........ .............................................................. ............ ....... ............ ..... ......... vii
List o/Tables ............ ................................................................................................................................. x
Chapter One: Introduction •...•••...••. •.••••••••••••••••••...•....•••...•.•.•..•......••.••.••••••.•••••••• ..••••.•..••.•..•...•......•••.•..•... 1
New Zealand in an Evolutionary Context ......................................................................................... 1
The Oligocene ................................................................................................................................... 1
The Pliocene ..................................................................................................................................... 2
The Pleistocene ................................................................................................................................. 2
The Holocene ..................................................................................................................... ............... 2
Evolutionary Studies in New Zealand ........................................... .................................................... 2
Biogeographic Studies in New Zealand ............................................................................................. 3
Assessing Taxonomic Relationships .................................................................................................. 4
Secondary Metabolites ..................................................................................................................... 4
Immunological Techniques .............................................................................................................. 4
Chromosomal Studies ....................................................................................................................... 4
Allozyme Studies ................................................ ............................................................................... 5
DNA Fragments ................................................................................................................................ 5
DNA Sequences ................................................................................................................................ 6
Mitochondrial DNA and Evolution ................................................................. .................................. 6
Rates of Evolution in Cytoplasmic Organelles ................................................................................. 7
Limitations of Sequence Data .................................................................................... ... ..................... 8
Rates of Sequence Evolution .............................................................................................................. 9
Skinks as a Model Group for Evolutionary Studies ............ ............................................................ 9
Views on the Origin of New Zealand Lizards ................................................................................... 9
Ecological Aspects of Some Leiolopisma ................................. ......................................................... 10
Genetical Investigations of Leiolopisma .......................................................................................... 11
Chapter Two: Methods ...................... •..••.........••...•••.•.....•......•••..•.....•....•.•••...•.•.•••..•...•.•.........•..•.•.••.......• 13
The Polymerase Chain Reaction ...................................................................................................... 13
Mitochondrial DNA Isolation .......................................................................................................... 14
Total DNA Isolation ....................... ................................................................................................... 14
Amplification of DNA by the Polymerase Chain Reaction ........................................................... 16
Direct Sequencing of PCR Products ................................................................................................ 17
RESULTS .................... ....................................................................................................................... 18

iv
Chapter Three: A Refined Secondary Structure Model
for Domain III of Vertebrate 12S rRNA .................................................................................. 22
Refining a Secondary Structure Model ........................................................................................... 22
The Skink and Other Vertebrate 12S rRNA Sequences ............. .................................................. 23
Approaches for Refining a Vertebrate Domain m Model . ........................................................... 23
Energetics of the Folding of the rRNA Sequences ...................................................................... 23
Identifying Individual Helices .......................................................................................................... 27
Helix 35 .......................................................................................................................................... 27
Helix 36 .................................................... ...................................................................................... 27
Helix 37 .......................................................................................................................................... 27
Helix38 ........ .................................................................................................................................. 29
Helix39 ............................................................................................................. ............................. 29
Helix40 .......................................................................................................................................... 29
The Refined Secondary Structure Vertebrate Model .......................................... .......................... 29
Conserved Positions in the Secondary Structure Model ............................................................... 30
Variability within Domain ITI .......................................................................................................... 30
Nucleotide Substitutions in the Skink Structure ............................................................................ 30
DISCUSSION .................................................................................................................................... 32
Interactions Between Domain m and Ribosomal Proteins ...................................................... 32
Tetra-loops .................................................................................................................................... 36
Comparison of Secondary Structure Models ............................................................................. 36
Limitations of the RNA Folding Algorithm ............................................................................... 37
Variability bern'een Regions ........................................................................................................ 38
Secondary Structure Models and Sequencing Precision .......................................................... 38
Bias in Types of Substitutions ..................................................................................................... 39
Chapter Four: Transitions and Transversions .......•.•...•............•....•....•...•.•...•..•....••..•.•.•.............•••••..•... 40
Transitions and Transversions ........... ........................ ..................................................................... 40
Saturation of Transitions? .............................................................................. .................................. 40
Simulations ......................................................................................................................................... 45
Estimating Divergence from Transversions ................................................................................... 47
Comparisons to Other Data Sets ............... ; ..................................................................................... 47
Changes in the Context of Secondary Structure ............................................................................ 51
DISCUSSION ................... ................................................................................................................. 52
Rates of mtDNA Evolution .......................................................................................................... 53
Estimating Degree of Divergence with Transversions .............................................................. 54
Regions of Variability .................................................................................................................. 54

v
Chapter Five: Signals in the Data and Phylogenetic Analyses ............................................................. 56
Spectral Analysis of DNA Sequences .............................................................................................. 56
What is a Bipartition and How is it Represented? ................................................. ........................ 57
Lack of Resolution in the Skink 12S rRNA Data Set .................................................................. ... 60
Spectral Analysis of other Vertebrate 12S rRNA Data Sets ......................................................... 60
Parsimony and Neighbor-Joining Analyses of the Skink Data Set .............................................. 60
Partially Resolved Relationships Using the Hadamard Conjugation ........................................... 61
Weighting of Characters .................................................... ............................................................... 61
Weighting o/Transversions ............. ............................................................................................. 62
Weighting 0/ Paired Regions ........................................................................................................ 62
Weighting 0/ More Variable Sites ................................................................................................. 64 The Effect o/Constant Columns in Sequence Analysis .............................................................. 64 The Effect on Skink Phylogeny o/Weighting o/Constant Columns .......................................... 65
Summary of the Effect of Weighting Schemes on the Skink Phylogeny ............... ................. ...... 65
Spectral Analysis of Simulated Sequences ............................... ...................... ................................. 66
Relationships of Northern & Southern New Zealand Leiolopisma .............................................. 66
Spectral Analysis of Skinks from Northern New Zealand ............................................................ 68
The Complex Relationships of C. aenea .......................................................................................... 68
Spectral Analysis of Southern New Zealand Skinks ...................................................................... 69
Mitochondrial Lineages of the Skinks ............................................................................................. 69
Addition of a New Caledonian Skink .............................................................................................. 69
Cytochrome b Sequence Data .......................................................................................................... 71
DISCUSSION ...................................... .............................................................................................. 71
"Rapid" Divergence of Leiolopisma ........................................................................................... 74
Estimating Times of Divergence for the Skinks ................ .............................................. .......... 74
Estimates from Immunological Data ............................................................................... .......... 75
Estimates from Allozyme Data .................................................................................................. 75
Estimates from Biogeographic Information .............................................................................. 76
Hypothesis One: A Gondwanan Origin and Diversification .......................................... .......... 76
The Mauritian Leiolopisma are Still Enigmatic ....................................................................... 77
Origins o/the New Zealand Skinks ............................................................. ................................. 77
Diversification Within New Zealand .... : ..................................................................................... 78
Hypothesis Two: Post-Oligocene Diversification ...................................................................... 78
Phylogenetic Limitations of the Skink Allozyme Data ............................................................. 79
Hypothesis Three: Multiple Leiolopisma Colonizations of NZ ................................................ 79
Hypotheses for the testing . . .......................................................................................................... 80

vi
Chapter Six: Comparing Sequence and Allozyme Data ........................................................................ 81
Conflict Between AUozyme and 12S rRNA Sequence Data ........................... .................. . .. ... ....... 81
Congruence Between Allozyme and 12S rRNA Sequence Data ...... ......... ........................ ....... ..... 81
Hybridization .... .... ...... .................. ............. ................ ............................. ....... . ............... . . . ........ .. ....... 83
DISCUSSION ....... .. ....................... .... ............................. ..................... .......... ................... ................. 84
Hybridization. Questions to Address .................. ....... ............. ..................... ............ .... . ......... '" 85
Species Concepts ............... ... . .................... .... ............... .. ........................... .. . ................ ................. 87
Origins of Some Specific New Zealand Leiolopisma .. ......... ............... ..................... ....... ... ........ 87
Chapter Seven: Discussion ...................................................................................................................... 89
Secondary Structure and Phylogenetic Analyses ......... ........ .... ......... . ........................................... . 89
Evolution of the 12S rRNA Molecule ...... ................ .................................................................. ..... . 90
Simulation Studies .................... ...... ................. .......... ......... ... . . ...................... . . ....... ........ ................... 91
The Hadamard Conjugation and Spectral Analysis ........ ..... ............................. ........................ .... 92
Incompletely Resolved Skink Phylogeny ................... . . .............. .... . . . ............................. ................. 92
Hypotheses for the Origins of New Zealand Leiolopisma .............................. . ... ........................ .. .. 93
Predictions of the Three Hypotheses ..... . . . . . . . . ......... . ...... . . ... ..... . . ................ . .. ... .. .... . ................. ........ 94
Hypothesis One: Gondwanan Origins ........... ................. ................ ............................................... 94
Hypothesis Two: Oligocene Drowning ... .......... .... .... ....... .... ................ ... ....... ............... ................. 94
Hypothesis Three: Multiple Colonists . .. .......... . ........... .. ... .... ... ..... ................ . .... ..... .... . .. .. ....... ........ 94
Testing the Hypotheses: What Other Skinks to Sample? ............................................. ..... .... ....... 95
Testing the Hypotheses: What Other Genes to Sample? ............. .... . ........... . ................ .......... ...... 95
Investigation of Nuclear Gene Sequences .......... ........ ... . .... . . ... ........ .... ... . ... . ...................... ............ .. 96
Hybridization between L. n. polychroma and L. maccanni ...... .......... ...... ............. .. . ..................... 97
The Potential of L. n. polychroma For Population Studies . . ... .................. . .... . . ........... ................. .. 98
Rates of Molecular and Morphological Evolution in Skinks ...................... ........... ........ ....... . ....... 98
Evolutionary Investigaiions of New Zealand Biota .. ............ ........................ .. ... .... ... .. ... .... .......... .. 99
References ..................... ........................................................................................................................ 1 01
Appendix 1 ........................ . ................. ...................................................................................... on diskette
a). Skink 12S rRNA sequences
b). Skink cytochrome b sequences
Appendix 2 .................................................................................. .............................................. on diskette
a). Xantusiid 12S rRNA sequences
b). Ratite 12S rRNA sequences
c). Bovid 12S rRNA sequences
d). Great Ape 12S rRNA sequences

Figure 2.1
Figure 2.2
Figure 3.1
Figure 3.2
Figure 3.3
Figure 3.4
Figure 3.5
Figure 3.6
Figure 3.7
Figure 4.1
Figure 4.2
Figure 4.3
Figure 4.4
Figure 4.5
Figure 4.6
Figure 4.7
Figure 4.8
Figure 4.9
Figure 4.10
Figure 4.11
Figure 4.12
Figure 4.13
List of Figures
Following page
Map of New Zealand. 15
Inferred phylogenetic relationships of vertebrates based on 12S rRNA sequences. 19
Secondary structure o f prokaryote and mitochondrial small subunit rRNA.
Potential pairings for helix 36 in vertebrate 12S rRNA.
Secondary structure model for domain III of skink 12S rRNA.
Potential alternative secondary structures for skink domain Ill.
Conserved positions in vertebrate 12S rRNA domain III sequences.
Distribution of variable sites in domain III of vertebrate 1 2S rRNAs.
Regions of variability in the skink 12S rRNA sequence.
Frequency distributions for total nucleotide differences, transitions and transversions in skink 1 2S rRNA sequences.
Numbers of transversions versus numbers of transitions for skink 12S rRNA sequences.
Total number of differences versus numbers of trans versions for skink 1 2S rRNA sequences.
Relationship between numbers of transitions and numbers of transversions for ratites and pecoran bovids.
Proportion of transition substitutions in skink 12S rRNA sequences.
Relationship between number of transversions and the transition/transversion ratio for the skink data set.
Relationship between number of trans versions and the transition/transversion ratio for other data sets.
Frequency distribution of transitions and trans versions in simulated sequence data.
Relationship between numbers of transitions and numbers of transversions in simulated sequence data.
Relationship between ilUmbers of transitions and numbers of transversions in simulated sequence data using 40 and 55 expected substitutions.
Relationship between numbers of transitions and numbers of transversions for other simulations using Tsrrv ratios of 2/1 and 8/1.
Frequency distributions of transitions and transversions in simuiated sequence data for a large number of iterations.
Relationship between numbers of transitions and numbers of transversions in simulated sequence data when 500 iterations are performed.
22
28
29
29
30
31
31
42
44
44
44
44
45
45
46
46
46
46
46
46
vii

viii
Figure 4.14 Means and standard deviations of estimates for the real number of substitutions. 47
Figure 4.15 Means and standard deviations of estimates for the real numbers of substitutions for other simulations using 40 and 55 expected substitutions. 47
Figure 4.16 Means and standard deviations of estimates for the real numbers of substitutions for other simulations using Ts/Tv ratios of 2/1 and 8/ l . 47
Figure 4.17 Variable sites in the skink 12S rRNA domain III. 51
Figure 4.18 Location of nucleotide substitutions in 12S rRNA for pairs of skink taxa with a small number of differences between them. 51
Figure 4.19 Comparisons of regions of variability in the 12S rRN A sequence for pairs of closely and more distantly related skink taxa 51
Figure 4.20 Comparisons of regions of variability in the 12S rRNA sequence for closely and more distantly related ratites, and great apes. 51
Figure 5.1 Spectral analysis of skink 12S rRNA sequences. 60
Figure 5.2 Spectral analyses of ratite and bovid 12S rRNA sequences. 60
Figure 5.3 Maximum parsimony tree for skink 12S rRNA sequences. 61
Figure 5.4 Neighbor-joining tree for skink 12S rRNA sequences. ,
61
Figure 5.5 Inferred phylogenetic relationships of 20 skink taxa based on spectral )
analysis of 12S rRNA sequences. 61
Figure 5.6 Effect of weighting transversions in skink data set 62
Figure 5.7 Inferred phylogenetic relationships of 20 skink taxa based on spectral analysis of 12S rRNA sequences (transversions weighted four times higher than transitions). 62
Figure 5.8 Effect of weighting upaired regions three-fold higher than unpaired regions in skink 12S rRNA. 63
Figure 5.9 Effect of down-weighting the eight most variable sites in the skink 12S rRNA. 64
Figure 5.10 Effect of removing the eight most variable sites. 64
Figure 5.11 A resolved tree of 10 skink taxa. in which the two strongest signals are not in the tree. 65
Figure 5.12 Effect on the 10 taxa spectrum of removing constant sites from the sequence. 65
Figure 5.13 Spectral analysis of simulated sequences. 66
Figure 5.14 Spectral analysis of northern and southern skink 12S rRNA sequences. 66
Figure 5.15 Bipartitions in the optimal tree for 11 northern New Zealand skinks. 68
Figure 5.16 Bipartitions in the optimal tree for 10 northern New Zealand skinks. 68

ix
Figure 5.17 Bipartitions in the optimal tree for 10 southern New Zealand skinks. 69
Figure 5.18 Inferred phylogenetic relationships for northern and southern New Zealand skinks based on 12S rRNA sequences. 69
Figure 5.19 Influence of the first 80 bases on spectral signals in the skink data seL 70
Figure 5.20 Spectral analysis of 19 Leiolopisma skinks and the New Caledonian Tropidoscincus rohssii. 71
Figure 5.21 Inferred phylogenetic relationships of four skink taxa from Southland using 12S rRNA and cytochrome b sequences. 72
Figure 5.22 Three hypotheses for the origin of Leiolopisma skinks. 76
Figure 6.1 Evidence for sexual hybridization in a skink population. 83
Figure 6.2 Potential offspring from sexual hybridization. 84

x
List of Tables
Page
Table 2.1 Skink taxa from which DNA sequence infonnation was obtained. 15
Table 2.2 Base composition of the skink 12S rRNA sequences. 21
Table 3.1 Alignment of 20 skink 12S rRNA sequences. 24
Table 3.2 Species and sources of 12S rRNA sequences used in Table 3.3 24
Table 3.3 Alignment of vertebrate 1 2S rRNA sequences. 26
Table 3.4 Local minimal free energies for folding of helices. 28
Table 3.5 Distribution of conserved nuc1eotides in vertebrate 12S rRNA. 31
Table 3.6 Changes occurring in paired and unpaired regions of skink 1 2S rRNA. 31
Table 3.7 Substitutions among paired nucleotides in skink 12S rRNA. 33
Table 3.8 Observed and expected numbers of transitions and transversions in the skink data set 34
Table 3.9 Base composition of conserved residues in skink 12S rRNA. 35
Table 4.1 Distance matrices for skink 12S rRNA sequences. 41
Table 4.2 Mean numbers of total differences, transitions, transversions, and transitiOn/transversion ratios for each taxon. ' 43
Table 4.3 Variability in total substitutions, transitions and Ts/Tv ratio in relation to numbers of transversions. 44
Table 4.4 Parameters and results of simulations. 46
Table 4.5 Distance matrices for 12S rRNA from other vertebrates. 48
Table 4.6 Comparison of estimated times of divergence among the skinks. 50
Table 5.1 Detennining a relative weighting factor for paired regions. 63
Table 5.2 New Zealand Leiolopisma divided into northern and southern groups. 67
Table 5.3 Mitochondrial lineages in skinks. 70
Table 5.4 Distance matrices for cytochrome band 12S rRNA sequences from four skink taxa. 72
Table 6.1 Comparisons of genetic distances inferred from 1 2S rRNA sequences and allozymes. 82

pagel.
Chapter One: Introduction
New Zealand's biota is a largely untapped resource for evolutionary investigations. Despite the fact that
our flora and fauna rank alongside life forms from the islands of Hawaii, Madagascar, New Guinea and
the �pagos' in furnishing vivid examples of evolution in action (Hooker 1853, Hutton 1872, Wallace
1880, Fleming 1958, Carlquist 1974), this potential has not yet been fully exploited. Some reasons for
this are discussed below. This thesis illustrates the importance of New Zealand and its biota for
addressing evolutionary questions. It does this by examining mitochondrial DNA sequences and from
this data inferring aspects of the evolutionary history and relationships of skinks (Reptilia: Lacertilia:
Scincidae) in the genus Leiolopisma. It also investigates what phylogenetic information can be obtained
from DNA sequences by consideration of the sequences' secondary structure and by the use of new
sequence analysis algorithms.
The major conclusions of this thesis are that firstly, phylogenetic trees are hypotheses only, and close
examination of DNA sequences is necessary to have confidence in the reliability of phylogenetic
relationships. New DNA sequence algorithms are used which allow exploration of information in
sequences. Secondly, the use of molecular genetic techniques are valuable for investigations of
evolutionary problems in New Zealand, particularly when applied in conjunction with ecological and
population genetic studies. Thirdly, that the evolutionary history of New Zealand skinks is more
complex and fascinating than previously suspected. Use of model groups, such as New Zealand skinks,
is essential for an understanding of the patterns and processes of evolution.
New Zealand in an Evolutionary Context.
New Zealand contains great geological variety and complexity, diverse topography and habitats, and has
been, and is being, subjected to extensive geological, climatic and ecological disturbances (Gage 1961,
Suggate et al. 1978, Fleming 1980, Burrows & Greenland 1979, Mildenhall1980, Stevens 1980,
Pocknall1989, 1992). In addition to the origin and separation of New Zealand from Gondwanaland,
four periods have been suggested to have had a significant effect on the biota.
The Oligocene
During the Oligocene ( 25-35 million years ago [MY AD, New Zealand was a series of low lying islands,
and fluctuating sea levels changed their size and number (Suggate et al. 1978; Cooper, A., Chambers,
G.K., Cooper, R.A. in prep.). Extinction of species may have been high at this time because of the due
to rising sea levels (Cooper et al. in prep.). Subsequent tectonic uplift, and increases in land area and
relief, temperature, and habitat diversity during and after the Miocene (15-25 MY A) may have promoted
conditions suitable for diversillcation of species (see Suggate et al. 1978, Cooper et al. in prep.).

Chapter I, page 2.
The Pliocene
The Pliocene (1-15 MY A), marked the start of the rise of the southern alps in New Zealand (Suggate et
aI. 1978, Fleming 1980). With no previous alpine environment, the origins of the alpine flora has been
considered problematical. Raven (1972) suggested the alpine flora came from Australia. but adaptation
of indigenous New Zealand plants is more likely (Fisher 1965, Wardle 1978, Fleming 1980). During the
Pliocene the north of the North Island was a series of archipelagoes, which changed in size and shape.
The diversity of beetles and land snails now found there may be due to such geological changes (Powell
1949, Holloway 1963, Climo 1978; see also Fleming 1980).
The Pleistocene
Pleistocene glaciations are considered to have had an important effect upon the distribution and
speciation of many groups both here (powell 1949, Willett 1950, Dell 1955, Wardle 1963, 1988,
Burrows 1965, Bigelow 1967, Irving 1%7, Petersen 1968, Bull & Whitaker 1975, Fleming 1980, Solem
et al. 1981), and elsewhere (for example, Sylvester-Bradley 1963, Haffer 1969, Mayr & O'Hara 1986).
In New Zealand, the existence of several "refugia" for cold intolerant species during glacial periods has
been suggested (Burrows 1965, Wardle 1963, Fleming 1980). McGlone (1985) argues however that
plant distributions in New Zealand may have been influenced more by pre-Pleistocene tectonic activity
than by glacial advances. Evaluating these hypotheses requires accurate assessments of both taxonomic
relationships and times of divergence. Genetic investigations of Australian and European fauna indicate
that the effects of Pleistocene glaciation may have had less influence on the speciation of some groups
than previously assumed (Roberts & Maxson 1985, Wallis & Arntzen 1989). Similar evaluations for the
New Zealand biota are lacking, and the phylogenetic relationships of many New Zealand groups are still
poorly known (Solem et al. 1981, Fife 1985, Wardle 1988).
The Holocene
H uman settlement of New Zealand over the last millennium has also had a major influence on the biota,
through direct action and indirectly via introduced plants and animals (Molloy et al. 1963, Anderson
1983, McGlone 1983, Holdaway 1990). Evolutionary studies have relevance in this context. They can
identify taxonomically important populations in urgent need of conservation (for example, Daugherty et
aI. 1990a). Investigations of genetic diversity within and between populations is also essential to
develop rational conservation strategies (Vrijenboek et al. 1985, Cohn 1990, May 1990, V ane-Wright et
aI. 1991).
Evolutionary Studies in New Zealand
How and why species may change have been illustrated by studies in the Galapagos and Hawaiian
islands (see for example Berry 1984, Simon 1987, Grant & Grant 1989), and also by detailed
investigations of Drosophila species (see Lewontin et al. 1981, DeSalie & Hunt 1987). Despite
recognition that New Zealand is an important place to investigate evolutionary patterns and processes
(Hooker 1853, Hutton 1872, Wallace 1889, Cockayne 1911, Godley 1949, Hair 1966, Fleming 1958),
the biota have not yet been examined in sufficient detail to complement Hawaiian and Galapagan
studies.

Chapter 1. page 3.
New Zealand's antiquity, continental origins, and the large size of some of its islands make it different
from the islands of Hawaii and the Galapagos' . Studies of the origins of New Zealand's biota and how
they have evolved may therefore offer different perspectives on patterns and processes of evolution.
Studies of evolutionary relevance have been conducted here but have been primarily descriptive and
species-based, rather than being of a more theoretical and experimental nature. Few of the studies have
directly examined the evolutionary concepts established by Lyell (1830), Darwin (1859), and Wallace
(1889), and subsequently elaborated upon by Dobzbansky (1941), Stebbins (1950), Mayr (1963, 1982),
Lewontin (1974), Kimura (1983) and Nei (1987). Exceptions are studies of alpine plants (Fisher 1965,
Raven & Raven 1976, Ornduff 1964), morphological and genetic variation among introduced birds
(Baker 1975, 1992, Ross 1983, Baker & Moeed 1987), floral biology (Lloyd & Yates 1982, Lloyd & Webb 1986), and behavioural ecology (for example, Craig 1984). Recent advances in molecular genetic
techniques are however leading to renewed interest in evolutionary investigations here.
Biogeographic Studies in New Zealand
One of the major problems facing evolutionary studies in New Zealand is establishing from where, and
when, many elements of our biota came. Biogeographic studies in New Zealand (see Fleming 1980,
McGlone 1985, Craw 1989) laid the groundwork for examination of the evolution of species. As a crude
distillation two, often competing, views of the history of New Zealand's biota have been presented. f4�+
"Traditional" biogeographers (Fleming 1980) have assum�much of the flora and fauna arrived here
after the separation of the New Zealand land mass from Gondwanaland, approximately 80 MY A
(Lawver et al. 1991), and various means and routes of dispersal have been proposed to account for their
arrival (Fleming 1980, McGlone 1985, see also Kuschel 1975). Panbiogeographers (see Craw 1989)
took the alternate view that present distributions may reflect more about past geographical connections
than dispersal. Both perspectives are limited by uncertainty about the taxonomic relationships of some
of the biota that they discuss. Inaccurate assessments of the degree of genetic separation between groups
results in speculative accounts of dispersal routes (for example Hardy 1977), or biological scenarios in
conflict with geological evidence (see Cooper 1989).
The tendency to create "narratives" (Craw 1988) rather than testable hypotheses is also evident in other
discussions about the evolution of New Zealand's biota . 1'B8 rale 6f hjlb:tidizatiOlJ for example" .A.C\
notable feature of many New Zealand plant groups is their readiness to hybridize (see Allan 1961, Fisher
1965, Carlquist 1974). Rattenbury (1962) and Raven & Raven (1976) suggested that hybridization has
played a major role in the evolution of New Zealand plants, but the true extent of hybridization has often
been poorly investigated (Connor 1985). Failure to recognize that many of the hybrids occur in
disturbed habitats may also have overemphasized the role of hybridization in New Zealand (Hair 1966).
Wardle (1988, and Wardle et al. 1988) attempted to explain some disjunct plant distributions in terms of
long distance pollen dispersal, interspecific hybridization and subsequent environmental selection to
reconstitute a parental genotype. Genetic investigations to determine the taxonomic status of such

Chapter 1. page 4.
putative hybrids have not yet been conducted, so proposals involving ill defined selection processes are
not warranted at this stage. Similar uncertainty over taxonomy is also evident in discussions of the
evolution of some animal groups, such as land snails (Solem et al. 1981, Climo 1989).
Assessment of hypotheses about distributions and speciation requires information on genealogical
relationships. Taxonomic investigations in New Zealand have relied primarily upon morphological
comparisons, and as already noted, have not always adequately resolved relationships. The first priority
for evolutionary studies then, is to reliably determine phylogenies.
Assessing Taxonomic Relationships
Morphological variation is at the core of the theory of descent with modification by means of natural
selection (Wallace 1858, Darwin 1859, 1875, Mayr 1942, 1963, S tebbins 1950). Morphological
characters however, being only indirect manifestations of the genotype, can be uninformative or
misleading about the closeness of evolutionary relationships (for example, King & Wilson 1975, Systma
& Gottlieb 1986, Fitch & Atchley 1987, Wayne et al. 1989, Daugherty et al. 1990a, 1990b).
Biochemical and cytological investigations of taxonomy are an essential complement to morphological
studies (Hillis 1987, Patterson 1987, Hillis & Moritz 1990). These techniques are described below, and
examples of their applications in New Zealand noted.
Secondary Metabolites
Analysis of secondary metabolites have been used for taxonomic purposes and provide an interesting
adjunct to other phylogenetic methods (Cronquist 1980, Wright 1980). Chemotaxonomy has been used
to study several New Zealand plant groups (for example, Taylor 1 964, Markham & Godley 1972,
Wilson 1984, see also Connor 1985), but genetic methods are required to resolve their relationships.
Immunological Techniques
. Immunological affinities (Champion et al. 1974, Maxson et al. 1990), and DNA-DNA hybridization
(Sibley & Ahlquist 1987), are useful for establishing taxonomic affmities, particularly between more
distantly related groups. They provide little insight however into the genetical processes at work within
populations. The relationships of New Zealand Leiopelma frogs (Daugherty et al. 1981) and the short
tailed bat (Mystacina tuberculata; Pierson et al. 1986) have been investigated immunologically. DNA
DNA hybridization studies have been conducted for ratites and a few New Zealand passerines (Sibley & Ahlquist 1981, 1987, Sibley et al. 1982).
Chromosomal Studies
Examination of chromosomal organisation can be useful both for systematics and for inferences about
processes (Dobzhansky 1941, White 1978, Grant 1981, Carson 1983, Moritz 1986, Systma 1990), but it
is difficult to prove that such changes are causally related to the formation of new species (Bush et al.
1977, White 1978) �ther than being subsequent effects of isolation (see Endler 1986). Chromosomal
atlases for many New Zealand plant species have been compiled (see Frankel & Hair 1937, Hair 1966,

Chapter I, page 5.
1977, Rendle & Murray 1989), but the range and patterns of chromosomal changes have not been
extensively examined. Hair (1966) noted that chromosomal instability was associated with advancing
fronts of podocarp dispersal but this has not been investigated closely. Chromosomal studies of
blackflies (McLea & Lambert 1985) and Leiopelma frogs (Green 1988, Green & SharbeI 1988), and
preliminary descriptions of skink chromosomes (Hardy 1977) have been published, while karyological
investigations of weta and other invertebrates are underway (M. Richards pers. comm.).
Allozyme Studies
Enzyme electrophoresis is also applicable to studies of evolutionary patterns and processes. The
potential resolving power of a well conducted allozyme survey can exceed both restriction mapping and
nucleotide sequencing studies if 30 or so loci are examined (Nei 1987). The relative simplicity, speed,
cost effectiveness and the number and range of nuclear loci which can be surveyed by protein
electrophoresis give it great practical value (Powell 1975, Buth 1984, Murphy et al. 1990). The extent of
genetic variability revealed by this technique however depends upon assay conditions, such as
temperature, pH and buffer solutions (see Nei 1987). Allozyme surveys can be used for both phylogeny
reconstructions and for analyses of population structuring and dynamics (powell 1 975, Spieth 1975,
Gottlieb 1984, Murphy et al. 1990). Analysis of electrophoretic data for phylogeny reconstruction can
present problems though because of the uncertainty over whether to use similarity or distance
information, and whether to code the data in terms of presence or absence of alleles or in terms of allele
frequencies (Buth 1984, Swofford & Olsen 1990). Assumptions used in calculations of genetic distance
estimates from allozyme data can also be unrealistic and lead to inaccurate views of relationships (Hillis 1984, Swofford & Olsen 1990).
In New Zealand the taxonomic status of molluscs (Phillips & Lambert 1990), freshwater fish (Allibone
1990), Leiopelma frogs (Daugherty et al. 1981, Green et al. 1989), skinks (Vos 1 988, Daugherty et al.
1990b, C.H. Daugherty & G.B. Patterson pers. comm.), tuatara populations (Daugherty et al. 1990a),
and ducks (Hitchmough et al. 1990), have been investigated with allozymes. Relationships of New
Zealand weta (M. Richards pers. comm.) and geckos are also being studied (R. Hitchmough pers.
comm.). The techniques have also been used to assess the genetic diversity of molluscs (Freeth & Sin
1986, Smith et al. 1989), marine fish stocks (e.g., Smith & Johnston 1985), introduced birds (Ross 1983,
Baker & Mooed 1987, Baker 1992), the kakapo (Triggs et al. 1989), possum (Triggs & Green 1989),
rimu (Dacrydium cupressinum; Hawkins & Sweet 1989) and beech (Nothofagus species; Wilcox & Ledgard 1983, Haase 1992).
DNA Fragments
Restriction mapping of nuclear or organelle DNA had a central role in the development of molecular
systematics (Wilson et al. 1985, 1989, Nei 1987). Specillc pieces of nuclear DNA can be investigated
(for example, Hillis & Davis 1987, Crowhurst et al. 1990), but it is often easier and more informative to
isolate and use cytoplasmic genomes. Phylogenetic inferences from cytoplasmic DNA can be made by
simply noting the occurrence and sizes of fragments cut by a range of enzymes, but more accurate

Chapter 1, page 6.
reconstructions are obtained by mapping the restriction endonuclease sites (Wilson et al. 1985, Crozier
1990). Restriction analyses require relatively large amounts of DNA, and can have limited resolving
power, particularly for more distant divergences (Wilson et al. 1989, Hillis & Moritz 1 990). Recent
developments for rapidly obtaining and sequencing specific DNA sequences (see below) are resulting in
a decline in use of restriction analyses for phylogenetic studies.
DNA Sequences
Information from protein or nucleotide sequences has been extensively utilized to study taxonomic
relationships over both vast tracts of evolutionary time (for example, Goodman et al. 1 987, Gray 1989,
Lake 1990, Martin et al. 1993) and much briefer periods (for example, Hahn et al. 1986, Koop et al.
1989, Henderson et al. 1989, Vigilant et al. 1990, Miyamoto & Goodman 1990). The availability of
sequence data permits direct examination of the the basis of genetic variation, and the widespread
application of sequencing has led to a renaissance in systematics (patterson 1987 & 1990).
The effort and expense involved in 'conventional' approaches to isolating and sequencing genes
(Sambrook et al. 1989) prohibited their application to population studies, although some attempts have
been made (e.g., Hahn et al. 1986). The development of the polymerase chain reaction ("PCR", Saiki et
al. 1988, Ambeim & Erlich 1992) however now provides a system which can bring nucleotide
sequencing to a level matching or exceeding the utility of allozymes in terms of ease, speed, and sample
handling (Gyllensten & Erlich 1988, Kocher & White 1989, White et al. 1989, Arnheim et al. 1990).
The procedure (see Chapter Two) is elegantly simple (in theory), allowing specific regions of DNA to
be isolated and sequenced within hours, and from organisms for which no detailed genetic information
is available. Consequently it is being rapidly employed for both taxonomic investigations and
assessment of sequence diversity (for example, Kocher & White 1989, Kocher et al. 1 989, White et al.
1989, Ambeim et al. 1990, Simon et al. 1991), and it is the method used in this study.
Mitochondrial DNA and Evolution
The mitochondrial DNA (mtDNA) of animals in particular has several features which facilitate analysis
of evolutionary divergence over periods of time ranging from one generation to about 100 million years
(Moritz et al. 1987, Harrison 1989, Kocher et al. 1989). It is, firstly, the epitome o� economy - small and
simple. Only 14 to 39 thousand nucleotide pairs ("kbp") in size, it contains information for 22 transfer
RNAs, two ribosomal RNAs and about 13 open reading frames. In addition it lacks intervening
sequences, and recombination appears to be infrequent ( Brown 1983, Moritz et al. 1987). Insertion and
deletion events tend to occur in the control region (Moritz et al. 1987). Gene order can vary among
invertebrates (Cantatore et al. 1987, Thomas et al. 1989), and among vertebrate groups (Desjardins & Morais 1990, Moritz 1991, Paabo et al. 1991). The only region of non -coding DNA is the control region
or D-loop (D for displacement), around the site of initiation of m tDNA replication. Parts of this region
are the most rapidly changing in the mitochondrial genome, though conserved domains occur within it,
and consequently it is used for examination of intra- and inter-population diversity (Cann et al. 1984,
Vigilant et al. 1991 , Wilkinson & Chapman 1991, Ward et al. 1991). The protein-encoding and

Chapter I, page 7.
ribosomal RNA mitochondrial genes are being used to study older divergences (for example, Irwin et al.
1991 , Simon et al. 1991, Smith & Patton 1991, Ballard et al. 1992, Cooper et al. 1992, Hickson et al.
1992, Pashley & Ke 1992).
The predominance of maternal mitochondrial inheritance, absence of recombination and the apparent
rzrity of different types ofmtDNA within an organism (but see Bermingham et al. 1986, Gyllensten et
al. 1991, Hoeh et al. 1991) make analyses simpler than for nuclear loci (Brown 1983, Wilson et al.
1985, Moritz et al. 1987). The relatively rapid rate of sequence evolution of animal mtDNA in
comparison to nuclear rates is also advantageous when comparing closely related groups. In some
vertebrates the rate of mitochondrial genome evolution can exceed that of single-copy nuclear DNA by
up to ten-fold (Brown et al. 1979, 1982, Wilson et al. 1985), but this is not universal (Britten 1986,
Vawter & Brown 1986, Thomas & Beckenbach 1989, Goddard et al. 1990, Palmer 1990).
Rates of Evolution in Cytoplasmic Organelles
Reasons for variation in the rate and types of changes in mtDNA are unknown, but such variability
implies that the small mitochondrial genome size in itself is insufficient to explain rapid rates of change.
Chloroplast genomes are also relatively small but change at a slower rate than animal mtDNA (palmer
1990). Other possible causes for a fast rate of evolution, such as reduced replicative fidelity and
translational constraints, and the absence of recombination (Cann et al. 1984, Wilson et al. 1985,
Clayton 1982), have not been investigated in detail.
Cytoplasmic genomes of plants and fungi are larger and more complex than animal mtDNA and do not
exhibit such rapid sequence changes (although fungi are poorly studied; Gray 1989). Nor do they appear
to have the large bias (10:1) in transitions (changes between nucleotides of the same class, for example
adenine to guanine) over transversions (for example adenine to cytosine) found in some animal mtDNA
(Brown 1983, Palmer 1990). Chloroplast DNA and fungal mtDNA can however be used for population
comparisons (Taylor 1986, Soltis et al. 1989, Clegg & Durbin 1990, Palmer 1990). Plant mitochondrial
genomes can be both very large (sizes up to 25 ()()() kbp have been reported) and can undergo rapid and
extensive organisational rearrangements without accompanying sequence alteration (Palmer & Herbon
1988). One reason for the latter may be due to the creation of a panmictic mtDNA population by fusion
of mitochondria within cells with the consequent reduced probability of fixation of mutations (Lonsdale
et al. 1988). Paternal transmittance of mitochondria and chloroplasts can occur (for example, Harrison & Doyle 1990, Kondo et al. 1990, Gyllensten et al. 1991), but maternal inheritance predominates (Wilson
et al. 1985).
Maternal inheritance and rapid rates of change in animal mtDNA make it possible to investigate gene
evolution over relatively short periods of time, as well as permit examination of geographic structuring
and gene flow in populations (reviewed by Wilson et al. 1985, Avise et al. 1987, Avise 1989a, 1991 ,
Harrison 1989, Slatkin 1989). Th e haploid state and uniparental acquisition of mtDNA also make it
more sensitive than nuclear DNA to changes in population size, so low mtDNA variability can be

Chapter I, page 8.
indicative of past reductions in population size (Wilson el al. 1985). Examination of more distant
relationships using mtDNA sequences include studies by Ballard et al. (1992), Meyer & Dolven (1992),
Irwin el al. (1991), and Allard el al. (1992). Several molecular systematic studies are now underway in
New Zealand. Published reports are available for ratites (Cooper el al. 1992) and skinks (Hickson el al.
1992). DNA fingerprinting of sea bird populations have also been initiated (Millar el al. 1992) and
satellite DNA has been examined in the native frog Leiopelma hochstetteri (Zeyl & Green 1992).
Limitations of Sequence Data
Analysis of mtDNA sequences is a convenient starting point to investigate relationships among animals,
but it should be borne in mind that the uniparental inheritance of mtDNA means that only the
evolutionary history of the matemal line (and only a small part of that) can be examined. Reliance on
single genes can be misleading (penny et al. 1982, Wilson et al. 1987, Wyss el al. 1987). Examination
of short regions of DNA also reflects the evolutionary history of that gene rather than the organism (Nei
1987, Pamilo & Nei 1988, Martin el al. 1990). Confidence in a phylogeny requires congruence from
other data sets, such as morphology and allozymes (Hillis et al. 1987, Patterson 1987, Hillis & Moritz
1990). Sequence information from several thousand base pairs and from unlinked loci is also preferred
(Saitou & Nei 1986, Nei 1987, Martin el al. 1990), but sequencing studies employing the PCR usually
concentrate on sequences under one kilobase pairs in length (Kocher el al. 1989).
Study of nuclear sequences with PCR may require separation of allelic variants by denaturing gel
electrophoresis (Sheffield et al. 1990), use of allele specific primers (Gyllensten & Erlich 1988), or
"single molecule PCR" (Jeffreys et al. 1990) but are technically more demanding. Use of nuclear
ribosomal sequences (Hillis & Dixon 1991) and intron sequences (palumbi & Baker submitted) are
proving useful however for examination of older and more recent diveregences, respectively.
Generating sequence data is now becoming routine. The primary difficulties lie in data analysis. Most
phylogenetic trees derived from sequence data are probably incorrect (penny et al. 1990, Rohlf et al.
1990), since no current algorithm meets all the necessary criteria of being fast, efficient, consistent,
robust, and falsifiable (Henderson et al. 1989, Penny et al. 1990). Reviews of phylogeny reconstruction
generally recognise the limitations, though users of the programs may not (Felsenstein 1988, Swofford
& Olsen 1990, Cracraft & Helm-Bychowski 1991, Nei 1991, Penny et al. 1992, Stewart 1993).
Phylogenetic trees should be regarded as hypotheses and subject to error. Statistical analyses are being
developed to assess the reliability of phy logenies (Li & Gouy 1991). The emphasis of this thesis is on
what information can be extracted from DNA sequences, and confidence in relationships is obtained by
examination of conflicting associations of taxa using newly developed sequence analysis algortithms
(penny et al. 1992, 1993). This is discussed in more detail in Chapter Five.

Chapter 1. page 9.
Rates of Sequence Evolution
While patterns of evolution may be intrinsically interesting, understanding evolutionary processes also
requires a temporal framework. The apparent regularity in the accumulation of amino acid and
nucleotide substitutions led to the suggestion that evolutionary time can be measured from sequences
(Zuckerkandl & Pauling 1965, Wilson et ai. 1 977 & 1987, see also Ingram 1961). There is a growing
awareness however that single genes or proteins may not be reliable as markers of time (see Wilson et
ai. 1 987, Easteal 1990), that rates are lineage dependent (fhotpe 1982, Goddard et ai. 1990, Palmer
1990), and that models used to describe the process of substitution rates require more investigation
(Gillespie 1986, Wilson et ai. 1987). Caution must be used if rate estimates are extrapolated from one
group, such as mammalian mtDNA, to another (see Wilson et ai. 1985, 1987).
Skinks as a Model Group for Evolutionary Studies
Integrated approaches are essential to an understanding of evolutionary patterns and processes. One
emphasis of this thesis is on developing a "model" system with which to investigate in detail the
workings of evolution, as has been done for Drosophila (Lewontin et ai. 198 1 , DeSalle & Hunt 1 987),
and Galapagos' finches (Grant & Grant 1989).
Regrettably few studies have taken a comprehensive view of evolution by utilizing ecological,
morphological, biochemical and genetic data for a specific group (but see Larson 1984, DeSalle & Hunt
1987, Sytsma 1 990). As well as enhancing our understanding of how organisms and genes evolve, this
approach also has the advantage that congruence of diverse data sets encourages confidence in
phylogenetic conclusions, while inconsistencies can identify false assumptions and limitations in models
or data (Hillis 1987, Patterson 1987, Hillis & Moritz 1 990, Sytsma 1990). As discussed above, no
comprehensive evolutionary investigations of New Zealand taxa have been undertaken. New Zealand
skinks are one of many groups which offer promise however (see also Fisher 1965, Raven 1988).
Extensive morphological (McCann 1955, Hardy 1977) and allozyme studies of skink populations (Vos
1988, Daugherty et ai. 1990b, C.H. Daugherty & G.B. Patterson pers. camm.) have provided a
framework upon which to develop detailed evolutionary investigations.
Information on the basic biology (Barwick 1959, Towns 1975a,b) and ecology (Barwick 1959, Whitaker
1968, Towns 1975a, Gill 1976, Patterson 1985, Porter 1987), as well as some physiological data (Morris
197 1 , Pollock & MacAvoy 1978, Werner & Whitaker 1978, Evetts & Grimmond 1982) is also available
for various species of skinks.
Views on the Origin of New Zealand Lizards
New Zealand lizards (and the tuatara) trace their ancestry, in Maori mythology, back to Tangaroa, God
of the Oceans (Andersen 1969). Seeking to escape the avenging wrath of Tawhiri-matea (Father of
winds & storms) for the separation of Rangi (Earth) and Papa (Sky), Tu-te-wehiwehi and his
descendants fled from the sea to the land adopting lizard-like forms.

Chapter I, page 10.
Three terrestrial groups of reptiles now survive here. The ancient reptilian order Sphenodontidae has two
surviving Sphenodon species, both endemic to New Zealand (S. punctatus and S. guntheri, Daugherty et
al. 1990a). Tuatara ecology and reproductive biology has been extensively studied (Crook 1975, Bell et
al. 1985, Cree et al. 1992). Geckos and skinks are cosmopolitan families, each comprising about 600
species, in approximately 82 and 40 genera respectively (Cogger & Heatwole 1981). On the basis of
morphology, 18 species of gecko, in three endemic genera, are currently recognised in New Zealand
(Towns 1985), but the validity of one genus is uncertain (Thomas 1982a). The New Zealand skinks pose
a more difficult taxonomic problem because of their limited morphological diversification. Two species
were originally described by J. E. Gray but more were recognised (see Dieffenbach 1843), and numbers
have been continually revised upwards (McCann 1955, Hardy 1977). Two genera are currently
described here, Leiolopisma Dumeril & Bibron and Cyclodina Girard, which currently contain 20 and
six described species respectively (Towns 1985, Daugherty & Patterson 1990), but allozyme studies
indicate that these are still underestimates (C.H. Daugherty pers. comm.). Leiolopisma skinks are
generally diurnal insectivores found in grassland or coastal habitats. Cyclodina skinks tend to be slightly
larger, nocturnal, forest dwellers, and are now found primarily on offshore islands in the Northern parts
of New Zealand (Bull & Whitaker 1975, Pickard & Towns 1988). Rats, cats and collectors have
considerably reduced lizard numbers in New Zealand (Whitaker 1978, Thomas 1982b).
Our terrestrial reptilian fauna lacks a fossil record (Bull & Whitaker 1975) so there is uncertainty about
the origins of New Zealand lizards. Tuatara seem to be long term residents, dating back about 80 million
years when Gondwanaland was unfragmented (Crook 1975). Geckos and skinks have been suggested to
be more recent colonists with affinities to New Caledonian and Australian groups (Bull & Whitaker
1975, Hardy 1977, Towns et al. 1985). Morphological assessments suggest that New Zealand geckos
have closest affmities to species from New Caledonia, and could have arrived here during the Miocene,
up to 30 MY A (Kluge 1967). Members of the genus Cyclodina are known only from New Zealand but
some morphological and karyotypic features suggest closer relationships to New Caledonian and
Australian species than to New Zealand Leioiopisma (Hardy 1977, 1 979), and Hardy (1977) proposed
that Cyclodina may have arrived here independently, possibly during the early Pleistocene (up to 2.5
MY A). Cyclodina has morphological similarities to the Lord Howe skink, L. lichenigerum (Bull & Whitaker 1975), and to L. alazon from Fiji (Zug 1985). Interpretation of allozyme data (V os 1988, C.H .
Daugherty & G.B. Patterson pers. comm.) indicates that Cyclodina form a separate group, distinct from
the New Zealand Lei% pisma.
Ecological Aspects of Some LeioiopisT1Ul
The widespread distribution and ecological flexibility of some New Zealand Leioiopisma is an
interesting and important feature. Allozyme studies (Towns et al. 1985, Patterson & Daugherty 1 990)
corroborated ecological information (patterson 1985) which suggested that L. nigriplantare is a species
complex which cannot be adequately resolved by anatomical characters. One subspecies, L. n.
polychroma, is found in the lower half of the North Island and over many areas of the South Island,
encompassing approximately six degrees of latitude and an altitudinal range of 1700 metres (pickard &

Chapler 1. page 1 1 .
Towns 1988). A morphologically distinct subspecies, L. n. nigripiantare, occurs on some of the
Chatham Islands, 900 km east of the South Island, but it's allozyme profile is very similar to the
mainland subspecies (Daugherty et al. 1 990b).
L. n. polychroma is apparently closely related to L. notosaurus from Stewart Island and to two other
southern South Island species (L. maccanni, L. inconspicuum; Patterson & Daugherty 1 990). It occurs
sympatrically at several sites with these latter two but all are ecologically distinct (patterson 1985) and
apparently reproductively isolated from each other (Daugherty et al. 1990b). The sympatric species can
be distinguished on the basis of colour patterns ("striped", "spotted", and "speckled"), though this is not
always an infallible guide since the colour patterns are associated more with habitat type (for example
"striped" is common in tussock habitats) than species (as identified on the basis of allozyme profiles;
Patterson 1 985, Daugherty et al. 1990b).
Genetical Investigations of Leiolopisma
The genus Leiolopisma is a particularly complex group however, and taxonomic relationships of
members of the genus are uncertain. Preliminary immunological studies of albumin (Baverstock & Donnellan 1990, Hutchinson et al. 1990) support the view (Greer 1974 & 1982) that the genus is
polyphyletic, some members being more closely related to other genera. Hutchinson et al. (1990)
recommended restricting Leiolopisma to the type species L. telfairi from Mauritius, and they resurrected
or created several generic epithets to accommodate the Australian species. Insufficient work has been
done to clarify the affmities of New Zealand and New Caledonian species, but initial comparisons
(Hutchinson et al. 1 990) indicate that New Zealand and New Caledonian species are related to, but
immunologically quite distinct from, the Australian taxa. A new genus for the New Zealand Leiolopisma
is currently under review (C.H. Daugherty pers. comm.), but the term Leioiopisma is retained in this
thesis for the New Zealand species as well as for other taxa which are or have been included in the
genus.
Members of the Leiolopisma group occur in New Zealand, Australia. Lord Howe Island, New
Caledonia, Fiji, and also Mauritius in the Indian ocean. Morphologically, New Zealand Leiolopisma
have affinities to some New Caledonian and Australian species, and the degree of similarity between
them was used to suggest a 'recent' arrival here, within the last 5 million years (Towns 1 975a, Hardy
1977). This would have necessitated crossing hundreds of kilometers of open ocean. The Australian L.
delicata, utilizing modem forms of transportation, became established here during the 1 960's (Robb
1980).
The biochemical data (Baverstock & Donnellan 1990, Hutchinson et al. 1990, Daugherty et al. 1990b,
C.H. Daugherty & G.B. Patterson pers. comm.) make it unlikely that the initial Leioiopisma
colonisation(s) of New Zealand occurred as recently as the Pliocene (as suggested by Towns 1975a and
Hardy 1 977), but the data is either insufficient or inadequate (see Avise & Aquadro 1982, Nei 1987 and
Chapter Five) to determine precisely how long skinks have been here. A more detailed view of

Otapter 1, page 1 2.
Leiolopisma evolution based on DNA sequences is presented in this thesis. Similar analyses of
Cyclodina are being conducted by others.
A region of the mitochondrial l2S (small subunit) ribosomal RNA gene is examined using PCR and
direct DNA sequencing (described in Chapter Two). No DNA sequence information was available for
skinks before this s9 commenced so the 12S rRNA gene was selected for initial investigations since it
is well conserved among vertebrates (Kocher et al. 1989, Palumbi et al. 1991). The 12S rRNA gene has
been used for evolutionary investigations of other animal groups (Hixson & Brown 1986, Hedges et al.
1991, Simon et aI. 1991, Allard et al. 1992, Ballard et al. 1992, Cooper et al. 1992, Meyer & Dolven
1992). The skink sequences are analyzed with respect to a secondary structure model developed in
Chapter Three. However, the relationships of the Leiolopisma skinks based on the sequence information
are unclear, contrasting with the results from allozyme analyses (Chapters Five and Six). The patterns of
DNA sequence differences are interpreted as suggesting a period of rapid Le iolopisma diversification
and hypotheses to account for this are presented in Chapter Five.
An important aspect of this study is that individuals of known allozyme profile were used, so DNA
sequence and allozyme information from the same individuals was available. An advantage of this is
illustrated in Chapter Six where comparison of the allozyme and sequence information leads to the
suggestion that sexual hybridization has occlUTed at one site between two sympatric species, L. n.
polychroma and L. maccanni.
The evolutionary histories of the New Zealand skinks are not resolved and the DNA sequence
information is suggestive of a complex set of relationships. Continued molecular investigations of this
group are advocated, not only to aid in resolution of their phylogenetic relationships, but also to build
upon and extend existing studies of Leiolopisma to explore broader ecological and evolutionary
questions. Avenues for such research are discussed in the fmal chapter.

page 13.
Chapter Two: Methods
This thesis uses the polymerase chain reaction (PC�) to obtain specific regions of the mitochondrial
genome from frozen skink tail muscle. The sequences of these pieces of DNA are then determined and
analyzed to make inferences about the evolutionary relationships between the skinks. While the
p�ple of PCR is elegantly simple (Saiki et al. 1988, Ambeim et al. 1990), there can be several
difficulties in it's implementation. The sensitivity of PCR and consequent possibility of amplifying the
wrong DNA make it necessary to check the accuracy and identity of the DNA sequences. The
procedures used to extract amplify and sequence skink mitochondrial 12S rRNA sequences are
described in this chapter, along with steps taken to insure the correct identity and accuracy of the
sequences. A preliminary account of the methods was published in Hickson et al. (1992).
The Polymerase Chain Reaction
The polymerase chain reaction (PCR) is a simple and rapid means of amplifying specific regions of
DNA from tissues, cells or other sources. Its versatility, the detaileq information which can be obtained,
as well as the relatively low cost make it not only suitable, but essential, for the investigation of a variety
of problems in population and evolutionary biology (Ambeim et al. 1990). The essence of the procedure
is to have two short pieces (about 20 to 30 nucleotides long) of single-stranded DNA - the primers.
These need sufficient sequence specificity to bind to the DNA bracketing the region of interest; one
primer for each of the complementary DNA strands. The first step in the reaction is a high temperature
(usually between 90 and 94°C) denaturation to separate the DNA strands, thus allowing the primers
access to their complementary region(s). Rapid lowering of the temperature (to between 37 and 60°C) in
the second stage permits the primers to bind with the complementary sequence. In the presence of the
four nucleotide triphosphates the region of DNA between the pair of primers can be copied using a heat
stable DNA polymerase, such as Taq polymerase (Saiki et al. 1988). These three steps are repeated
sequentially 20-40 times. The amount of primers in the reaction is in sufficient excess so that the process
is exponential and able to produce a million or more copies of the desired region in a few hours.
Having appropriate DNA primers is critical to the success of the PCR This information is obtained
either by conventionally cloning and sequencing the region bf interest, or by using information held in
DNA sequence databases such as Genbank and EMBL. Relatively highly conserved regions of DNA -
such as the 1 2S ribosomal RNA encoding gene in animal mItochondria - can be isolated from a wide
range of organisms using "universal primers" (e.g. Kocher et al. 1989), but faster evolving regions of
DNA require more taxon-specific sequence data. This can pose difficulties for groups that have been
less well characterized at the molecular level; for instance reptiles, invertebrates, and many plant groups.
A difficulty of PCR is that its very power means that even slight contamination from other tissue or
DNA can lead to the amplification of the wrong sample. Ex�eme care must therefore be taken to ensure
that the correct sample of interest is amplified. A further difficulty was that no other reptilian sequences

Chapter 2. page 14.
were available to compare our gene sequences with. Considerable effort therefore was made in this
study to ensure that we were obtaining skink gene sequences.
Mitochondrial DNA Isolation
To ensure that the primers amplified the correct mitochondrial region intact mitochondria were isolated
and then the mtDNA purified. Laboratory rats were used as a test of the methods, then mitochondria
were prepared from individual L. n. poiychroma. Mitochondria were prepared following the procedure
of Fleischer et ai. (1979). Livers were removed from freshly killed animals, washed in ice cold 0.3 M
sucrose, cut into small pieces, washed again, and ground in a glass tissue grinder in ice cold 0.3 M
sucrose. Nuclear debris was removed by a low speed spin of 755 x g for 5 minutes at OOC. The
supernatant was respun at 6800 x g for 15 min., OOC, and the brown mitochondrial pellet removed with a
sterile glass rod, leaving behind the black nuclear debris. Mitochondria were resuspended in cold 0.3 M
sucrose, and the purification repeated. A final spin at 7700 x g gave a pellet which subsequently proved
to be largely free of nuclear DNA. This pellet was resuspended in cold TES buffer (10 mM Tris, pH 8, 1
mM EDTA, 100 mM NaCI). Confirmation that mitochondria had been isolated was obtained by
measuring respiratory activity using an oxygen electrode with sodium glutamate as the substrate (Lessler
& Brierly 1969). The remaining suspensions were frozen (-20°C) as 250 J..Ll aliquots.
Mitochondrial DNA was prepared from these aliquots by addition of sodium dodecyl sulphate (SDS)
and proteinase K to final concentrations of 1 % and 50 Ilg/ml, respectively, and incubating at 37°C for 1
hour. RNA was removed by a further 10 minute incubation with 4 Ilg/ml of RNase A. The solution was
then sequentially extracted with, respectively, one volume each of phenol, phenol and chloroform, and
fmally chloroform, to remove proteinaceous material. The supernatant was precipitated wiLh 95%
ethanol and 0.3 M sodium acetate and resuspended in 25 J.1l sterile water.
Total DNA Isolation
If the PCR primers are specific enough for their target and do not cross react with other regions of the
genome then highly purified DNA solutions however are not required for the PCR, it is simpler to obtain
preparations of total DNA (containing both nuclear and mitochondrial DNA). For the main part of the
study total DNA was extracted from frozen tail muscle tissue, obtained from the reptile collection of the
National Museum in Wellington (Table 2. 1). These were some of the same specimens used by
Daugherty et ai. (1990b; C.H. Daugherty & G.B. Patterson pers. comm.) for their allozyme studies.
In addition, isolation of DNA from tissues preserved in other ways was also investigated. Extractions of
DNA were performed on fresh tail muscle and tails preserved by desiccation with silica gel, storage in
95% ethanol, or fixing in fonnalin.

Oiapter 2, page 15.
Table 2.1 . Skink taxa from which DNA sequence information was obtained. Species, locality, and National Museum of New Zealand reptile collection catalogue numbers are given. The three letter abbreviation for each taxon, which are used in later tables, are shown in parentheses. Figure 2.1 shows the New Zealand localities.
Taxon
"Stewart Island Green" l (SIG) Leiolopisma graru1e (Lgr) L. notosaurus (Lno) L. lineoocellatumlchloronotum2 (LIe) L. suteri (Lsu) L. nigripiantare nigriplantare(Lnn) L. n. polychroma (Lnp)
L. microlepis (Lmi) Cyclodina aenea (Cae) L. acrinasum (Lac) L. inconspicuum (Lin) L. smithi (Lsm) L. zelandicum (Lze) L. fallai (Lfa) L. maccanni (Lma) L. injrapunctatum (Lfr) L. otagense (Lot) L. maco (Lmo) L. telfairi (Lte) Lampropholis guichenoti (Lag)
Table Hill, St. Is. CentIal Otago Masons Bay, St Is. Tekapo, Otago Aorangi, Poor Knights Is. Chatham Islands Gorge Bum, Southland Twizel, Canterbury Taihape Somes Is., Wellington Fiordland Gorge Bum, Southland Ruamahua-iti, Alderman Is. Outer Chetwode Is., Marlb. Great Island, Three Kings Gorge Burn, Southland Stephens Is., Marlb. Central Otago Poor Knights Is. Round Is., MAURmUS AUSTRALIA
a Locality abbreviations: St Is. = Stewart Island, Marlb. = Marlborough Sounds, Three Kings = Three Kings Island.
1 Stewart Island Green has not yet been formally described.
Cat. No.
FT6 CD1055 CDI089 CD1217, CD1218 CD 1027 CDI058, CD 1 060 CD 1 1 10- 11 12 CD2126 CD2123 CD1962 CD826 CD1 1OO, CDl lOl FT569 CD1952 FT598 CD 1 1 06-CD 1 108 CD535 CDI053 CD848, CD1031 CD2021 CD536
2 L. lineoocellatumlchloronotum; these individuals could not be identified defmitively on the basis of morphology and allozymes as either L. lineoocellatum or L. chloronotum (C.H. Daugherty pers. comm.).

Fig. 2.1. Map of New Zealand showing locations of the skinks examined in this thesis. Latitude and longitude are indicated along the edges of the map.
Fiordland
1 72 ' 1 7 3 1 74 ' 1 7 5 ' 1 76 ' 1 77 ' 1 78
Wellington
��r� , I I 1 36 � �' _ < 1 A;lderman Is. - - 37 1��1 � 3-e Hf -' ;P-;T+ :: .
Er l7 h r . I : ' :::1 "
" ' I , J ' ' " i , . I I , : : " Taihape " . , /
I I I :: ' , ,�_t=:' I ;� �' I U---�--L-�--�--� �2 " r-----:-1-----;1-��-, �-: '!,-zh--1'---'''';1-: - Marlborough
1---1L' _- " " -(ff;*=-;lz'- 42
r--r-...,-----,-J j' . ! it��+--/ I I ",( II ' I . , ' 3 I---I----.r---t--.-- , -r , ' I ' i ,l"" J -J-J7+J/-a,�,-�)i-_ '�:_�,�. , �. 1�"",-�, ��\��c+a�nterbu rY
f- ' , ' :? !! ChathaJll Is. , : I I . , . , .
-'" : : " . :.
) I I t'tt : . ' , : : ' : • � ?tago -1--- �5
. I >; : ' I ' :: ;: ' :: I I I I : 1 " ..L. 2 S thl d r- - ':o '{�:�� -H0U an I _' 7 Stewart Is. --��p. ---+---+--j
I ' '1 I 1 I ! 1 6 7 ' 1 68 1 69 1 70 1 7 1 1 72 1 73 ' 7�

Chapter 2. page 16.
Small samples (about 0.05 g) of muscle were removed from near the base of the tail, cut into small
pieces and incubated in 300 III of extraction buffer (10 mM Tris pH 7.5, 1 00 mM EDTA, 50 Ilg/ml
proteinase K, and 1 % SDS) at 65°C for two to four hours (Sam�rook et al. 1989). The solution was then
extracted with phenol and chloroform, precipitated, and resuspended in 25 III of sterile milliQ water.
Amplification of DNA by the Polymerase Chain Reaction.
The primers found to work best with skink DNA were:
12SAR 5 ' -AAACTGGGAT TAGATACCCC ACTAT - 3 ' ( L1 0 9 1 ) and
12SBR 5 ' -GAGGGTGACG GGCGGTGTG T - 3 ' ( H 1 4 7 8 ) ,
where L and H signify the light and heavy strands of the mitochondrial DNA (mtDNA) and the numbers
refer to the 3' ends of the primers according to the complete human mtDNA sequence (Anderson et al.
1981). These primers isolate an approximately 400 nucleotide long region in the second half of the gene
and have been used to amplify 12S rRNA from a variety of vertebrate and invertebrate groups (palumbi
et al. 1 99 1 )
DNA amplifications were performed i n 0.5 m l reaction tubes using a DNA thermal cycler (perkin Elmer
Cetus, Connecticut, USA). Initial trials were carried out in 20 jll volumes, while 80 jll was used for the
production of DNA templates for sequencing. Reactions contained 200 )lM of each deoxynucleotide,
reaction buffer (prom ega Corporation, Madison, USA; 50 mM KCl, 10 mM Tris-HCl, pH 8.8, 1 .5 mM
MgC�, 0. 1 % Triton X- 100), 0. 1 )lM of each primer, and 2 units of Taq polymerase (Promega). About
100 ng of pure mitochondrial DNA or 100 to 200 ng of total DNA were used as the template for
polymerase chain reactions. Samples were overlain with a drop of mineral oil to prevent evaporation.
Several factors influence the success of the PCR (including the quality and quantity of the DNA
template, primer sequence and concentration, magnesium concentration, the quality of the DNA
polymerase, and the type of thermal cycler used). Various temperature and time settings need to be tried
to obtain optimal specificity and amplification of the desired product (Innis & Gelfand 1990). We tried a
variety of conditions and found that good amplifications for the 12S primers and skink DNA were
obtained using the following parameters:
94°C for 60 sec to separate DNA strands,
54°C for 60 sec to allow primer annealing, and
noc for 60 sec for DNA copying.
Successful DNA sequencing requires good quality templates. Direct precipitation of the PCR reaction,
either with or without phenol extraction, did not give clear sequencing gels. Initially, good sequences

Olapter 2, page 17.
were obtained by purifying PCR products through a 1 % Seaplaque agarose gel (FMC BioProducts,
USA) prior to sequencing. Isolation of the product from the agarose used the hot phenol method of
Thwing et al. (1975). After precipitation, DNA fragments were resuspended in 1 1 J.1l of sterile milliQ
water. The availability of inexpensive centrifugal dialysis filters to remove excess primer DNA,
unincorporated dNTPs, and other inhibitors from the PCR reaction proved more efficient and cost
effective however. Most of the samples were processed using the Promega Magic PCR Preps TM DNA
purification system (Promega Corporation, Madison, Wisconsin, USA).
Mineral oil from the PCR reaction was removed by addition of approximately 30 J.1l chloroform and
brief centrifugation. The PCR sample (approximately 70 J.1l) was mixed with 100 J.1l of direct
purification buffer. This was mixed for one minute with 1 ml of DNA purification resin and then passed
through the Magic PCR Preps TM mini-column using a syringe. The column was washed with 2 ml 80%
isopropanol. Excess alcohol was removed by centrifugation for 20 seconds. Complete evaporation of the
isopropanol was ensured by leaving the column at room temperature for a further two minutes. Thirty
microlitres of sterile milliQ water was then added to the mini-column and the DNA allowed to
resuspend for one minute. The sample was then collected by a 20 second centrifugation step. Adding the
solution back to the mini-column and respinning increased the DNA recovery. Two microlitres of the
purified PCR product was checked on a mini-gel prior to sequencing. Recovery of the product using the
mini-columns was consistent and high.
Direct Sequencing of peR Products
Attempts to directly produce single-stranded DNA templates for sequencing by limiting one primer in
the amplification reaction (Gyllensten & Erlich 1988) were neither consistent nor reliable. Smearing of
DNA above the PCR product was usually seen when the single-stranded amplification reaction was
checked on a gel. Increasing annealing temperature and decreasing the template DNA concentration in
the PCR reaction had very little effect Consequently, a double-stranded sequencing procedure was tried
based on the method of Casanova et al. (1990), using the modified T7 DNA polymerase (USB, Ohio,
USA) and 35S dA TP as the radiolabel source. Two microlitres of gel purified template (about 100 ng)
was denatured at 96°C for 5 minutes in a 10 J.1l volume, containing 10 ng of one primer, and reaction
buffer. This was then immediately snap frozen in liquid nitrogen to reduce reassociation of the DNA
strands and then 5.5 Jll of the sequencing cocl1.ai1 added (as described in the Sequenase kit).
Termination reactions witb the dideoxynucleotides were incubated at 37°C for two minutes. Sequencing
reactions were run on 6% acrylamide gels, 8 M urea, then fixed, dried, and exposed to Kodak X-omat
AR film (Eastman Kodak Co., Rochester, New York, USA).
Four primers were used for sequencing. Two were the PCR amplification primers while two more were
constructed after obtaining preliminary skink sequence data. This set of four primers allowed the
complete sequence of botb strands to be determined, though use of primer 12SBR for sequencing
consistently gave faint sequencing lanes. The skink-based primers, deSignated SK12SL and SK 12SR,
were situated approximately half-way along the PCR product and were complementary, designed to read

OJapter 2, page 1 8.
off opposite strands of the product (as shown in Appendix 1). Their sequences and corresponding
location relative to the human mtDNA sequence are, respectively,
SK12SL 5 ' -CTTCTI'TCAT AAGGTAGGC - 3 ' (1..1408) and
SK12SR 5 ' -GCCTACCTTA TGAAAGAAG- 3 ' (H1390).
Attempts to amplify and sequence another mitochondrial gene were less successful. Conserved primers
to the cytochrome b gene (Kocher et al. 1989) did not consistently amplify the equivalent region in the
skinks. Altering reaction temperatures and times (to both higher and lower levels), Mg2+ concentration,
primer concentrations, Taq polymerase and buffer, did not result in improved yields. This suggests that
either the cytochrome b primers of Kocher et al. (1989) may not match the skink cytochrome b gene
target sites very well, or that there may be a secondary structure interaction inhibiting amplification. The
same cytochrome b primers have been successfully used in other studies of vertebrates (e.g. Meyer et al.
1990, Hedges et al. 1991, Irwin et al. 1991 , Moritz et al. 1993). Information was however obtained for
three taxa and will be discussed in Chapter Five. The cytochrome b primers and their location relative to
the human mtDNA sequence are:
CBS 5 ' -GCTTCCATCC AACATCTCAG CATGATG-3 ' (1..14813) and
CB3 5 ' -GCAGCCCCTC AGAATGATAT TTGTCCTC - 3 ' (HI5171)
Both strands of the PCR product were sequenced and where possible sequences from several individuals
from each population were obtained. Sequences were compared and aligned using the University of
Wisconsin GCG sequence analysis software package, Version 6.2 (Devereux et al. 1984) and
phylogenetic inferences made using the Hadamard (discrete Fourier) conjugation (Hendy & Penny 1989,
1993, Penny et al. 1992). The Hadamard conjugation is described in more detail in Chapter Five, aB9-a regy�g versjgg gf the 1:1 W� �f9gFaIB is i8elliaea i8 AjJ�eBa� 2 98 the Elisk@«e at the �aGk 9f tB8 fftesis.
RESULTS
Oxygen electrode assays conflrmed the presence of mitochondria from the rat liver preparations, though
respiratory activity could not be detected in any mitochondrial preparations from skinks. Digestion of
the DNA with the restriction endonuclease BamHI gave three distinct fragments with a total size of
approximately 16 000 base pairs, the expected size of the rat mitochondrial genome (Gadaleta et al.
1989). The absence of background smearing in these preparations conflrmed that there was little
contamination with nuclear DNA. Digestion of the skink DNA with both BamHI and EeoR! also
confirmed that the preparations were free of nuclear DNA. Enzymatic digestion also indicated that the
skink mitochondrial genome was at least 1 5 000 base pairs in size, but an accurate estimate of its size
was not obtained.
High molecular weight DNA was obtained from fresh, frozen, dried, and ethanol preserved tissues and
all proved suitable substrates for PCR ampliflcation of the mitochondrial DNA fragment. DNA could
not be obtained from tissues stored in formalin. Formalin rapidly cross-links DNA making it difflcult to

Chapter 2, page 19.
obtain DNA suitable for the PCR. even from samples stored for short periods in formalin (Greer et al.
199 1). Other sources of DNA. such as subfossil bones (eg. Cooper et al. 1992). preserved museum skins
(e.g. Thomas et al. 1990). and herbarium samples (Rogers & Bendich 1985) can be suitable for such
studies.
The same single PCR product was obtained from preparations of both total DNA and purified mtDNA.
Sequence analysis of the product showed it to be most similar to other vertebrate 12S rRNAs from the
region of the gene to which the PCR primers anneal. The very sensitivity of the PCR however makes the
procedure vulnerable to the amplification of contaminating DNA. such as that from the hands or skin of
the investigator (Kitchin et al. 1990). When this study was begun no reptilian mtDNA sequences were
available on the GenBank or EMBL sequence databases. so confrrrnation that skink sequences had been
amplified was established indirectly in several ways.
Amplification of a contaminating. non-skink. DNA template was discounted by the consistency of the
skink DNA sequences. The same sequence was obtained from separate DNA preparations of the same
individual. from separate amplifications of the same DNA sample. and from different individuals from
the same population (see Table 2. 1). The latter observation is to be expected for a relatively highly
conserved molecule such as 12S rRNA (MindeU & Honeycutt 1990). This consistency also indicates the
fidelity of the Taq polymerase. Errors can be introduced however. In one instance (out of several
hundred amplifications) a single nucleotide difference was found for separate amplifications of the same
skink DNA. S uch misincorporation errors by the Taq polymerase are known to occur at relatively low
frequencies (Bloch 1991). As these results show. repeating amplification and sequencing reactions
safeguards against these errors. Inadvertent amplification of rat 12S rRNA rather than skink sequence
was also detected on one occasion. but in general contamination was not a problem.
A final verification that the PCR products were not derived from other sources was performed by
aligning a skink sequence against the same region of the 12S rRNA gene from other vertebrates and
establishing their phylogenetic relationships. The alignment is presented in the next chapter in the
context of secondary structure features (Table 3 .3). The phylogenetic relationships of the skink and ten
other vertebrate sequences are shown in figure 2.2. The Hadamard conjugation using the two character
state option (see Chapter Five) was used. Omitting one taxon to permit four character state analysis gave
the same relationships for the remaining taxa. Parsimony analysis using PAUP 3.0s (Swofford 1990)
also produced the same result (not shown). The skink sequence is most similar to the other reptile used.
a xantusiid lizard from the Caribbean (Hedges et al. 1991). confirming that the correct target sequence
had been obtained by PCR.
In this analysis (Fig. 2.2). the birds are slighlty closer to the reptiles than to the mammals. The
phylogenetic relationship of reptiles. birds and mammals to each other are still uncertain. Benton (1990)
places birds closer to the reptiles than mammals on the basis of morphological characters. Sequence
analyses of 18S rRNA. beta-haemoglobin and myoglobin group birds with mammals. but relationships

Fig. 2.2. Inferred phylogenetic relationships of 1 1 vertebrate 12S rRNA sequences. Alignment was done with reference to sequence's secondary structure and analysis performed using the Hadamard conjugation. The skink sequence is mos,t similar to that of the xantusiid lizard. Xanlusia riversiana, confirming that reptilian DNA had been amplified by the polymerase chain reaction. Branch lengths are proportional to the probability of change along that branch. The tree is unreoted.
�oad , 7 . . , .�. ' . ,, ' . -.. ... :. : Fish
"?B't : , -
. , . . . . L . " Mouse r , .�

OJapter 2, page 20.
inferred from insulin, alpha-aystallin and alpha-haemoglobin sequences place birds with reptiles
(Hedges et al. 1990). Inferences about the order of deep branches in vertebrate evolutionary
relationships are however, unlikely to be robust using the shOrt sequence of 1 2S rRNA analysed here.
Two different 1 2S rRNA sequences were found for L n. polychroma in this study. The sequence of L. n.
polychroma from Gorge Burn was identical to that of L maccanni at the same site, while the 12S rRNA
sequence of the L n. polychroma individual from Twizel was quite different (see Table 3.1). Partial
sequence information from other L. n. polychroma populations in the North and South Islands (data not
presented) were the same as the sequence from Twizel, while partial sequence data from other
populations of L. maccanni were the same as the sequence from Gorge Burn. DNA was extracted
independently from several tissues (muscle and liver) and from several individuals for these taxa, and
amplified and sequenced several times. The same sequences were obtained from each individual every
time indicating that the identical sequences were not the result of contamination of tissue samples or
PCR amplification reactions. This point will be discussed again in Chapter Six.
The complete 12S rRNA sequence information for 20 skink taxa are given in Appendix 1, in a format
suitable for analysis using the Hadamard conjugation. The sequences are also presented in the next
chapter (Table 3.1). The nucleotide frequencies for the 20 skink taxa which are considered in most detail
in this thesis are very similar, with a slight predominance of adenine (Table 2.2). The results of the
analyses presented in the subsequent chapters are therefore not affected by differing nucleotide
compositions between taxa (see Lockhart et al. 1992, Hasegawa & Hashimoto 1993).

Oiapter 2, page 21.
Table 2.2. Base composition of the skink 1 2S rRNA sequences.
Frequency of Taxon A C G tl A+U C+G
"St Is. Green" 0.36 0.27 0.19 0.19 0.54 0.46 L grande 0.35 0.26 0.19 0.20 0.55 0.45 L notosaurus 0.35 0.27 0.19 0.19 0.54 0.46 L linlchl 0.35 0.26 0.19 0.20 0.55 0.45
L. suteri 0.35 0.26 0.19 0.20 0.55 0.45 L n. nigriplantare 0.35 0.26 0.20 0.20 0.54 0.46 L microlepis 0.34 0.27 0.20 0.19 0.53 0.47 La. guichenoti 0.35 0.26 0.19 0.20 0.55 0.46 C. aenea 0.34 0.28 0.20 0.1 8 0.52 0.48 L. acrinasum 0.35 0.27 0.19 0.19 0.54 0.46 L inconspicuum 0.34 0.28 0.20 0. 19 0.53 0.47 L. smithi 0.34 0.28 0.20 0.19 0.52 0.48 L. zelandicum 0.34 0.28 0.19 0.19 0.53 0.47 L· fallai 0.35 0.27 0.19 0.19 0.54 0.46 L. maccanni 0.34 0.27 0.19 0.20 0.54 0.46 L telfairi 0.34 0.28 0.19 0.19 0.53 0.47 L. n. po/ychroma 0.34 0.26 0.20 0.20 0.54 0.46 L. infrapunctatum 0.35 0.26 0.19 0.20 0.55 0.45 L otagense 0.34 0.27 0.20 0.19 0.53 0.47 L. maco 0.34 0.28 0.20 0.19 0.52 0.48
Mean 0.35 0.27 0.19 0.19 0.54 0.46 Standard Deviation 0.Q1 0.01 0.01 0.01 0.01 0.01

elulpter Three: A Refined Secondary Structure Model for Domain 111 of Vertebrate 12S rRNA
page 22.
A DNA sequence is not a simple string of abstract letters. Appreciation of the higher order structure of
DNA has several advantages for evolutionary analyses. Different positions and regions in the molecule
have different functional and structural constraints, and so different rates and patterns of change (see for
example Kimura 1983, Noller et al. 1990) which should be taken account of when-attempting-to
reconstruct phylogenies. Knowledge of how and where the molecule varies, and where it is constrained,
is also essential for understanding the patterns and processes of molecular evolution. The purpose of this chapter is to ftrstly refine a vertebrate secondary structure model for domain ill of mitochondrial 12S
rRNA and then to determine patterns of sequence variability among the vertebrate groups. This
information will then be used in analyses in subsequent chapters.
Refining a Secondary Structure Model
Comparative sequence analyses, free energy predictions, and experimental investigations (such as
chemical modification, nuclease digestion and intra-RNA crosslinking) have been used to determine
secondary structure models for ribosomal RNA (reviewed in Woese et al. 1983, Noller 1984). Three
different secondary structure models exist for the prokaryotic small subunit (16S) rRNA, to which the
mitochondrial 12S rRNA is related (Stiegler et al. 1981, Zwieb et al. 1981, Gutell et al. 1985). The three
models are generally similar, though they differ in the size and or placement of some base-paired
regions (Noller 1984, GuteU et al. 1985).
Structurally, the small subunit rRNA is divided into four domains (labelled I, II, ill and IV), each
separated by a highly conserved single-stranded region (Fig. 3.1a). Domains III and IV are the most
highly conserved regions of the molecule (Noller 1984, Neefs et al. 1990). The mitochondrial form of
the small subunit rRNA is a reduced structure, lacking some helices (base-paired regions) but still
having all four domains (Fig. 3. 1b). Structural and sequence conservation among rRNAs is high (even
from different kingdoms), with major changes in size involving insertion or deletion of blocks of
sequence (Noller 1984). Comparative sequence analysis is therefore an effective way of estimating
secondary structures of rRNA, the validity of which can be subsequently examined experimentally
(Noller 1984). Several compilations of rRNA sequences in a structural context are available for a wide
range of organisims (Dams et al. 1988, Gutell & Fox 1988, Gutell et al. 1990, 1 992, Neefs et al. 1990,
1991 , Specht et al. 1991, de Rijk et al. 1992). The small subunit rRNA compilation of Neefs et al.
(1990) formed the basis for refining a secondary structure model for part of animal mitochondrial 12S
rRNA. Neefs et al. ( 1991) now also provide the compilation in computer formal Models for the 12S
rRNA structure are limited by the fact that only a few mitochondrial sequences have been used in
previous compilations (Zwieb et al. 1981 , Clary & Wolstenholme 1985, Gutell et al. 1985, Neefs et al.
1990). The PCR primers 12SAR and 12SBR (Chapter Two) amplify the last part of domain IT and all of
domain III (Fig. 3 . 1b), though for simplicity in this thesis, the whole PCR fragment is usually referred to
as domain III. In this chapter I present alignments for domain III of the 12S rRNA from all five classes

Fig. 3.1. a. Secondary structure model for the prokaryote small subunit (16S) rRNA (from Neefs et al. 1990). The mitochondrial small subunit ( 12S) rRNA gene is derived from this. Helices are numbered, and regions which may be absent in some prokaryotes are drawn in thin lines and labelled VI-V9. b. Secondary structure model for human mitochondrial small subunit rRNA (from Gutell et al. 1985). Helices are numbered as in 3.1a. The location of the PCR primers 12SAR and 12SBR are indicated.
a.
'8 '-__ ___
V2
V 7
41
47 \_
VB
V9
Homo sapiens mi1ochondtion

OIapter 3, page 23.
of vertebrates. Complete 12S rRNA sequences are available for only a few vertebrates, but the use of the
polymerase chain reaction and universal l2S rRNA primers (Kocber et al. 1989, Palumbi et al. 1991)
are leading to an increasing availability of domain III sequences from a wide range of taxa
The Skink and Otber Vertebrate 12S rRNA Sequences
The sequences from 20 skink taxa are presented in Table 3.1, overlain with Neefs et al. suggested
belical (stem) regions. Other sources of vertebrate sequences used in this cbapter are listed in-table 3.2.
The 12S rRNA sequences for several snakes (Knight & Mindell I993), and a complete seal
mitocbondrial genome (Amason & Jobnsson 1992) were also recently published , but were obtained too
late to be included in the analyses presented in this thesis. A more general structural model of domain ill for both vertebrate and invertebrate 12S rRNA is being developed (AJ. Cooper, R.E. Hickson, G.M.
Lento, C. Simon & D. Penny in prep.).
Approacbes for Refining a Vertebrate Domain ill Secondary Structure Model
Three strategies were used to determine bow the region of the 1 2S rRNA between PCR primers 12SAR
and 12SBR could fold. Comparative sequence analysis establisbed wbicb belices bad the potential to
form (Table 3.3). Identification of fixed compensatory mutations (cbanges preserving base-pairing in
helical regions) was especially useful for confuming belices and locating those wbose sequences varied
between the different groups. The vertebrate sequences in table 3.3 were relatively easy to align wben
done so in the context of secondary structure. Gaps to maintain alignments were introduced at the
beginning or end of unpaired regions.
Energetics a/the Folding a/the rRNA Sequences
The third approacb was to compare minimal free energies of some of these suggested belix structures
using the MFOLD algorithm (Zuker 1989, Zuker et al. 1991) in the University of Wisconsin Genetics
Computer Group (GCG) Package, version 7.2. The program takes account of the energetic costs and
benefits of potential base pairings, and the occurrence, locations and interactions among unpaired
nucleotides (Zuker 1989, Zuker et al. 1991). The MFOLD program can sbow both optimal and
suboptimal folded structures. Other folding programs are also available (e.g., Abrahams et aI. 1990) but
were not used in this study.
On their own, and in the absence of knowledge about tertiary or quaternary structure, sucb energy
calculations may not indicate wbat can actually form, but when used in conjunction with the other two
lines of inquiry provide a well-founded basis for suggesting secondary structure models. Structures
determined on the basis of comparative sequence analysis are usually found to have a minimal free
energy within 10% of the value of the optimal structure determined by MFOLD (Zuker et al. 1991).

Table 3.1. Alignment of 20 skink taxa for 384 bases of 12S rRNA. The PCR primers 12SAR and 12SBR are not included but start immediately before and after, respectively, the sequences shown. Conserved sites are in uppercase and variable positions are in lowercase, with trans versions in bold. The suggested helical (stem) regions of Neefs et al. (1990) are shown above the sequence alignment (a ' denotes the distal arm <;>f a helix). Taxa are arranged in order of increasing numbers of differences (see Table 4.1a), and the three letter abbreviation for each taxon is shown on the right. A dot indicates no difference from the consensus, while deletions are shown as dashes. The internal sequencing primers SK12SL and SK12SR anneal between bases 185 and 203. L. telfairi has two single base deletions (positions 25 & 60) and one single base insertion (between 202 & 203). L. maccanni also has a deletion at position 25. When these two taxa are included in phylogenetic analyses (Chapter Five), the sites of deletion and insertion are not included.
St I sGreen
L . grande
L . not osaurus
L . l inlchl
L . sut eri
L . n . n i gripl .
L . mi crol epis
La . gui chenot i
C . a en ea
L . a crina sum
L . in conspi cuum
L . smi thi
L . zelandi cum
L . fa l l a i
L . maccanni
L . t e l fa i ri
L . n . polychroma
L . in frapun cta tum
L . otagense
L . moco
2 6 -li: _.:.2..;.0_' __ 30
1 2 3 4 5 6 7 8 9 1 0 1 2 3 4 5 6 7 8 9 0 1 2 3 4 5 67 8 9 0 12 3 4 5 6 7 8 9 0 12 3 4 5 6 7 8 9 0 1 2 3 4 5 6 7 8 9 0 1 2 3 4 5 6 7 8 9 0 123 4 5 67 8 9 0 12 3 4 5 6 7 89 0 1 2 3 4 5 67 89 0 12 3 4 5 67 8 9 0 GCucAGCCGUcAACAAAgAcAGuauaaaauACAauaCUgUUCGCCAGAGAAcUAcAAGcuAAaaCUcaAAACuCcAAGGACUUGGCGGUGCUCCAcAuCa . . . . . . . . . . . . . . . . . . . . . . . . . . . . . c . . . . . . . . . . . . . . . . . . . . . . . . . . . . . . . . . . . . . . . . . . . . . . . . . . . . . . . . . . . . . . . . . . . c . . · . . . . . . , . . . . . . . . . . . . . . . . c . . . . . . . . . . . . . . . . . . . . . . . . . . . . . . . . . . . . . . . . . . . . . . . . . . . . . . . . . . . . . . . . . . . . . . . . c . . · . . . . . . . . . . . . . . . . . . . . . cc . . . . . . . . . . . . . . . . . . . . . . . . . . . . . . u . . . . . . . . . . . . . . . . . . . . . . . . . . . . . . . • . . . . . . . . . . c . . · . . u . . . . . . a . . . . . . . . . . . . . . . . . . c . . . . . . . . a . . . . . . . . . . . . . . . . . . . . c . . gg . . . . . . . . . . . . . . . . . . . . . . . . . . . . . . . . . . . . · . . . . . . . . . . . . . . . . . . . . . . . c . . . . . . . . . . . . . . . . . . . . . . . . . . . . . . . . . . . . . . . . . . . . . . . . . . . . . . . . . . . . . . . . . . . . . . . . c . . . . . . . . . . . . . . . . . . . . . u . . . . . . . . . c . . . g . . . . a . . . . . . . . . . . . . . . . . . . . . . . g . . . . g . . . . . . . . . . . . . . . . . . . . . . . . . . . . . . . . . . . . . . . . . . . . . . . . . . . . . . . . c . . . . . . . . . . g . • . • . . . . . . • . . . . . . • . . . . . a . . . . . . . . . . . . . . . . . . . . . . . . . . . . . . . . . . . . . . . . · . c . . . . . . . . . . . . . . . . . . . . . . . . . . c . . . . c . . . . . . . . . . . . . . . . . . . . . . . u . . . c . . . . . . . . . . . . . . . . . . . . . . . . . . . . . . . . . . . . . · . c . . . . . . . . . . . . . . . . . . . . . . . . . . . . . . . c . . . . . . . . . . . . . . . . . . . . . . . . . . . . g . . a . . . . . c . . . . . . . . . . . . . . . . . . . . . . . . . . . · . c . . . . . . . a . . . . . . . . . . . . . a . . . . c . . . . c . . . . . . . . . . . . . . . . . . . . . . . . . . . gg . . . . . . . . . . . . . . . . . . . . . . . . . . . . . . . . . . . . . . . . . . . . . . . . . . . . . . . . . . . c . . . . . . . . . . c . . . . . . . . . . . . . . . . . . . . . . . . . . . . . . . . . . . . . . . . . . . . . . . . . . . . . . . . . . . . . . c . g . . . . . . . . . . . . . . . . . . . . . . . . c . . . . . . . . . . . . . . . . . . . . . . . . . . . . . . . . . . a . . . . . . . . . . . . . . . . . . . . . . . . . . . . . . . . . . . . . . . . · . . u . . . . . . u . . . . . . a . . . . . . . g . . cc . . . . c . . . . . . . . . . . . . . . . . . . . . . . . a . . . 9 . . . . . . . . . . . . . . . . . . . . . . . . . . . . . . . . . . . .
I . . . . . . . . . . . . ' . . . . . . . . . . . . . . . . . . . . . . c . . . . . . . . . . . . . . . . u . . . . . . . . . . . g • . a . . . . . c . . . . . . . . . . . . . . . . . . . . . . . . . . . . . . . . . . . . . a . . . . . . a . . . . . . - . . . . . . . . g . . . . . . . . . . . . . . . . . . . . . . . . . . . . . . . . . . . . . . . . . . . . . . . . . . . . . . . . . . . . . . . c . g . . . . . . . . . . a . . . . . . a . . . . . . - . . . . c . . . . . . . . . . . . . . . . . . . . . . . . . . . . . - . . . . . . . g . . . . . . . . . . . . . . . . . . . . . . . . . . . u . . . . . . . . . . . . . . . . . . . . . . . u . . . . . . . . . . . . . g . g . . a . . . . . . . . . . . . . . . . . . . . a . . g . . . . . . . . . . . u . . . . . . . . ,' . . . . . . . . . . . . . . . . · . c . . . . . . . a . . . . . . . . . . . . . . . . . . c . . . . c . . ; . . . . . . . . . . . . . . . . . . . . u . . . c . . . . . . . . . . . . . . . . . . . . . . . . . . . . . . . . . . . • . · . c . . . . . . . a . . . . . . . . . . . c . c . . . . . . . . . cg . . . . . . . . . . . . . . . . . . . . . . . . . . . . . . . . . . . . . . . . . . . . . . . . . . . . . . . . . . . . . • . 9 · . . . . . . . . . u . . . . . . . . . . . c . . . . . . c . . . . cg . . . . . . . . . . . . . . . . . . . . . . . . . . . 9 . . g . . . . . . . . . . . . . . . . . . . . . . . . . . . . . . . . .
S ig Lgr Lno L1c Lsu Lnn Lmi Lgu Cae Lac Lin Lsm Lze Lfa Lma Lte Lnp Q Lfr i Lot .l" Lmo :i (t
N �

S t I sGreen
L . 'grande
L . notosaurus
L . l in /chl
L . suteri
L . n . nigripl .
L . mi crol ep i s
L . gui chen o t i
C . a enea
L . a crinasum
L . inconspi cuum
L . smi thi
31 32 33 33 ' 34 36 37 38 3 8 '
1 1 12 13 1 4 1 5 1 6 17 1 8 1 9 2 0 1 2 3 4 56789 0 1 2 3 4 5 6 7 8 9 0 12 3 4 5 6 7 8 9 0 1 2 3 4 5 6 7 8 9 0 1 2 3 4 5 6 7 8 9 0 1 2 3 4 5 67 8 9 0 12 3 4 5 67 8 9 0 1 2 3 4 5 67 8 9 0 12 3 4 5 67 8 9 0 12 3 4 5 6 7 8 9 0 aCCUAGAGGAGCCUGUCCUAUAAUCGAUACCCCcCGAUCuACCuGAGGacUUUUUGAAacUCAGcCUAUAUACCGCCGUCGuCAGCcUACCUUaUGAaAG
Sig Lgr
. . . . . . . . . . . . . . . . . . . . . . . . . . . . . . . . . . . . . . . . . . . . . . . . . . . . . . . . . . . u . . . . . . . . . . . . . . . . . . . . . c . . . . . . . . . . . . . . . . . . Lno
. . . . . . . . . . . . . . . . . . . . . . . . . . . . . . . . . . . . . . . . . . . . . . . . . . . . . . . . . . . . . . . . . . . . . . . . . . . . . . . . . . . . . . . . . . . . . . . . . . . . L1c
. . . . . . . . . . . . . . . . . . . . . . . . . . . . . . . . . a . . . . . . . . . . . . . . . . . . . . . . . . . . . . . . . . . . . . . . . . . . . . . . . . . . . . . . . . . . . . . . . . . . Lsu
. . . . . . . . . . . . . . . . . . . . . . . . . . . . . . . . . . . . . . . . . . . . . . . . . . . . . . . . . . . u . . . . . . . . . . . . . . . . . . . . . . . . . . . . . . . . . . . . . . . . Lnn c . . . . . . . . . . . . . . . . . . . . . . . . . . . . . . . . . . . . . . . . . . . . . . . . . . . . . . . . . . . . . . . . . . . . . . . . . . . . . . . . . . . . . . . . . . . . . . . . . . . Lrni c . . . . . . . . . . . . . . . . . . . . . . . . . . . . . . . . . . . . . . . . . . . . . . . . u . . . . . . . . . . . . . . . . . . . . . . . . . . . . • . • . • . . . . . • . • • . . . . • . • • Lgu c . . . . . . . . . . . . . . . . . . . . . . . . . . . . . . . . ' . . . . . . c . . . . . . . . . . . . . . . . . . . u . . . . . . . . . . . . . . . . " . . . . . . . . . . . . . . . . g . . . . . . Cae u . . . . . . . . . . . . . . . . . . . . . . . . . . . . . . . . . . . . . . . . . . . . . . . . . . . . . . . . . . . . . . . . . . . . . . . . . . . . . . . . . . . . . • . • . . . . . . . • • . . Lac
. . . . . . . • . . • . . . . . . . . . . . . . . . . . . . . . . . . . . . . . . . . . . . . . . . . . . . • . • . . u • . • . • • . . . • . . • . . . . • • • • c • • . . • • • • • . • . . • . • • • Lin c . . . . . . . . . . . . . . . . . . . . . . . . . . . . . . . . . . . . . . . . . . . . . . . . . . . . . . . . . . . . . . . . . . . . . . . . . . . . . . . . . . . . . . . . . . . . . . . . . . . Lsm
L . zel andi cum c . . . . . . . . . . . . . . . . . . . . . . . . . . . . . . . . . . . . . . . . . . . . . . . . . . . . . . . . . . . . . . . . . . . . . . . . . . . . . . . . . . . . . . . . . . . . . . . . . . . Lze L . fa l la i c . . . . . . . . . . . . . . . . . . . . . . . . . . . . . . . . . . . . . . c . . . . . . . . . u . . . . . . . . . . . . . . . . . . . . . . . . . . . . . . . . . . . . . . . . . . . . . . . . . . Lfa L . maccanni . . . . . . . . . . . . . . . . . . . . . . . . . . . . . . . . . . . . . . . c . . . . . . . . . u . . . . . . . . . u . . . . .. . . _ . . . . . . . . . . . . . . c . . . . . . . . . . . g . . . . . . Lrna L. t e l fa i ri g . . . . . . . . . . . . . . . . . . . . . . . . . . . . . . . . . . . . . . . . . . . . . . . g . . . . . . . . . . . . . . . . . . . . . . . . . . . . . . . . . . . . . . . . . . . . g . . . . . . Lte
L . n . polychroma . . . . . . . . . . . . . . . . . . . . . . . . . . . . . . . . . a . . . . . . . . . . . . . . g . . . . . . . . . gu . . . . . . . . . . . . . . . . . . . . . . . . . . u . . . . . . . . . . . . . Lnp L . infrapuncta tum c . . . . . . . . . . . . . . . . . . . . . . . . . . . . . . . . . . . . . . . . . . . . . . . . u . . . . . . . . . . . . . . . . . . . . . . . . . . . . . . . . . • . . . . . . . . . . . . . . . . Lfr L . otagense u . . . . . . . . . . . . . . . . . . . . . . . . . . . . . . . . . . . . . . . . . . c . . . . . . . • . . . . . . . u . . . . . . . . . . . . . . . . . . . . . . . . . . . . . . . . . . . . . g . . Lot L . moco c . . . . . . . . . . . . . . . . . . . . . . . . . . . . . . . . . . . . . . . . . . . . . . . . u . . . . . . . . gu . . . . u . . . . . . . . . . . . . . . . . . . . . . . . . . . . . . . . . . . Lrno

S t I sGreen
L . grande
L . notosaurus
L . l in /chl
L . su t eri
L . n . n i gripl .
L . mi crol epis
L . gui chenoti
C . a enea
L . a crinasum
L . inconspi cuum
L . smi thi
L . zelandi cum
L . fa l l a i
L . maccanni
L . t e l fa iri
L . n . polychroma
L . infrapuncta tum
L . o tagense
L . moco
4 0 ' 3 6 ' 34 ' 32 ' 4 3 43 '
2 1 22 23 2 4 2 5 2 6 27 2 8 2 9 12 3 4 5 67 8 9 0 1 2 3 4 5 6789 0 12 3 4 5 67 89 0 123 4 5 67 8 9 0 1 2 3 4 5 6 7 8 9 0 12 3 4 5 67 8 9 0 1 2 3 4 5 6 7 8 9 0 12 3 4 5 67 8 9 0 12 3 4 5 6 7 8 9 0 1 2 3 4 56789 aa-guauAGuAaGcaAAAuAguCaccaAcUAaAACGuCAGGUCAAGGUGUAGCAcAUaaaguGGaAGAGAUGGGCUACACUCUCUcCCcCAGAGaAcACg
. a . c • • • • • • • . • . . • • • • • • • . • . • . . . . . • • c • . . • . • • • • • • • . • . • • . • • • . • • . . . . . • . . . • • • • • • • • . • • • • • • a • • u . . . . . . . . . . . S ig • . • c • • • • . . • g • • • • . . • . • . . . . • . • • . • • • c • • • . • • • . • • • • • • • • • • • • • • • • • • • • • • • • • • • • • • . . • • • • • • • • • • • u . . . . . . . • . . . Lgr a . . a • • • • g • • . • • . . • • • • • • • • • . • • • . • • • . • . • • • • • • . • • • . . • • . • • . . • • • • . . . • . • • • • • • • • • • • • • • • • • • • • • • • • • • • • • • • • • Lno . c . a • • . • • • • • • • • • • . • • • u . . . . . . . . . . . . . . . . . . . . . . . . . . . . . u . . . . . a • • • • • • • • • • • • • • • • • • • • • • • • • • • u . . . . . . . . . . . Llc . . . . . . . . . . u . . . . . . . . . . u . . . . . . . . . . . . . . . . . . . . . . . . . . . . . . . . . . . . . . . . . . . . . . . . . . . . . . . . . . . . . . . . . . . . . g • • . • • Lsu ac . . . . • . g • • • . • • . . • • • . • . • . • • • • . . • • • • • • • • • • • • • • • • • • • • • • • • • • c • • • • . • . • • • • . . . • . . • • • • • • • • • • u . . . . • . . • • . . Lnn
• • . c • • • • . • • • • • • • • • • • . • • • • • • • • • • • • . . . • . • • • • • • • • . . • . . • • . gu • • • • . • . • • • • • • • • • • • • • • • • • • • • • • u . • • • • • • • • • . Lmi · a . • • . • • • • • • • • • • • • • • • u . • • • • • g • • • • • • • • • • • • • • • • • • • • • • • . • • • • a • • . • • • • • • • • • • • • . • • • • • • • • a • • u . • • • • • • • • • • Lgu . cg • • • • • • • • . • • • . , • • • • • • . . . . • • • • . • . • • . • . • • • • . • • • • • • • • • • • • • • • c • • • • • • • • • • • • • • • • • • • • • • • • • • • • • • • • • • • • • • Cae • . . • . . . . . • • • • • . • . a • . . • • • . u . . . . . . . . . . . . . . . . . . . . . . . . . . . . . . . a • • . • • • • • • • • • • • • • . • • . • • • • a • • • • • • . • • . • • • • Lac a . . a .. . . . . . . . . . . . . . . . . . . . . . . . . . . . . . . . . . . . . . . . . . . . . . . . . . . . g • • • • c • • • • • • . . • . . • • • . • . . . . . • • • • • • • • g . . . . • Lin
· c . c . . . . . . . . . . . . . . . . . . . . . . . . . . . . . . . . . . . . . . . . . . . . . . . . . . gu • • . • • • . . . • . • . . . • . . . • • • . • . • • • • u . . . . . . . . . . . Lsrn . g a . . c . . . . . . . . . . . . . . . . . . . . . . . . . . . . . . . . . . . . . . . . . . . . . . . . . . . . . . . . . . . . . . . . . . . . . . . . . . . . . . . . . . . . . . . . . u . . . Lze
ac . c • • . • . . . . • . • • • • • • . . . • . . . . • . • . • • • • . . . . • . . • • • • • • . . u . . . . . a • . . . . . • . • • • • • • • • • • • • • • • . . • • • • • • • • • • • • • u Lfa g . . c . � . . . . . . . . . . . . . . . . . u . . . . . . . . . . . . . . . . . . . . . . . . . . . . . u . . . . -. a . . . . . . . . . . . . . . . . . . . . . . . . . . . . . .. 4 • • • • • • • • Lma . . ac . . a . . • . . • • • . • • • • • c . c . uu • • • • • . . . . • . . • • • • . • • • • • • • • • • • • • • • • • c • • • • • • • • • • . • • • • • • • • • • • • • • • • • • • • • • • • • • • Lte
· c . a . . . . 9 . . . . . . . . . . . . . . . . . . . . . . . . . . . . . . . . . . . . . . . . . . . . . . . . . . . . . . . . . . . . . . . . . . . . . . . . • . . . u . . . . . . . . . . . Lnp aa • . • • • • • • • • • • • . . • . • . u . . . . . . g . • • • . . • • • • • • • • • • • • . • • • . • • • • • a • • . • • • • • • • • . • . • . • . • • • • • • • • • u . . . . . . . . . . . Lfr . . . . . . . . . . . . . . . . . . . . . . u . . . . . . . . . . . . . . . . . . . . . . . . . . . . . . . . . . . . . . . . . . . . . . . . . . . . . . . . . . . g • • • • • • • • • • • • • • Lot
. g cc . . . • c . . . • . • • • c • . • • • • . . . . . • • • • • • • • • • . . . • • • • • • . . . . . . • . • • . a • • . • . • • • . . • . • • . . • • • • • • • • • • . • . • • • • • • • • • • Lmo

St;IsGreen L . grande
L . notosaurus
L . l in/ehl
L . suteri
L . n . nigripl .
L . mi erol epis
L. gui ehen o t i
C . a enea
L . a erinasum
L . ineonspi euum
L . smi thi
L . zelandieum
L . fa l la i
L . maeeanni
L . t e l fa iri
4 5 31 ' 4 6 4 6 ' 30 ' 3 o 3 1 3 2 3 3 3 4 3 5 3 6 3 7 3 8 0 12 3 4 5 6 7 8 9 0 1 2 3 4 56789 0 1 2 3 4 5 6 7 8 9 0 1 2 3 4 5 67 8 9 0 123 4 5 6 7 8 9 0 12 3 4 5 6 7 8 9 0 1 2 3 4 5 67 8 9 0 12 3 4 5 6 7 8 9 0 1 2 3 4 AAcaGCAucaAUGAAAcaCuGCucaAAGGuGgAUUUAGuAGUAAGAuaaaCaAGAgACuuaucUuAAAcCAGCcCUGGAGCGCGC . . . . . . . . . . . . . . . . . . . . . . . . . . . . . . . . . . . . . . . . . . . . . . . . . . . . . . . . . . . . . c . . . . . . . . . . . u . . . . . . . . . . . Sig . . . . . . . . . . . . . . . . . . . . . . . u . . . . . . . . . . . . . . . . . . . . . . . . . . . . . . . . . . . . . . a . . . . . . . . . . u . . . . . . . . . . . Lgr
. . . . . . . . . . . . . . . . . c . . . . . . . . . . . . . . . . . . . . . . . . . . . . . . . . . . . . . . . . . . . . . . . . . . . . . . . . . . . . . . . . . . .
Lno Llc
. . . . . . . . . . . . . . . . . c . . . . . . . . . . . . . . . . . . . . c . . . . . . . . . . . . . . . . a . . . . . . . . . . . . . . . . . . . . . . . . . . . . . Lsu
. . . . . . . . . . . . . . . . . c . . . . . . . . . . . . . . . . . . . . . . . . . . . . . . . . . . . . . . . . . . . . . . . . . . . . . . . . . . . . . . . . . . . Lnn • • • • • • • c • • . . • • • • • • • • • • . • • • • . • • • • . • . • • • c • . . . • . • • • • g . . . . . . . . c . • • • • • • • • u . • • . . . • • • • • • • • • • Lrni . . . . . . . . . . . . . . . . . c . . . . . . . . . . . . . . . . . . . . . . . . . . . . . . . g . . . . . . . . . . . . . . . . . . . . . . . u . . . . . . . . . . . Lgu . . . . . . . c . . . . . . . . . . . ' . . . . . . . . . . c . . . . . . . . . . . . . . . . . . . . . . . . . . . . . . . . . • . . . . . . . . . . . . . . . . . . . . . Cae · . . . . . . . . . . . . . . . . c . c . . . . . . . . . . . . . . . . . . . . . . . . . . . . . g . . . . . . . . . . . . . . . . . . . . . . . u . . . . . . . . . . . Lac . . . . . . . .. . . . . . . . . . . . . . . . u . . . . . c . . . . . . . . . . . . . . . . . . g • . . . . . . . . c . . . . . . . . . . . . . . . . . . . . . . . . . . Lin · . . . . . . c . . . . . . . . . . . . . . . . . . . . . . . . . . . . . . c . . . . . . . . 9 . g . . . . . . . . ccg . . . . . . . u . . . . . . . . . . . . . . . . Lsm · . . . . . . c . . . . . . . . . . . . . . . . • . . . . . . . . . . . . . . . . . . . . . . . g . . . . . . . . . c . . . . . . . . . . . . . . . . . . . . . . . . . . Lze . . . . . . . . . . . . . . . . . . . . . . . . . . . . . . . . . . . . . . . . . . . . . . c . . . . . . . . . . . . . g . . . a . . . . . . . . . . . . . . . . . . . . Lfa · . . . . . . • • • . . • • . . . . . . . . . ug . . . . . . . . . . . . . • . . . . . . . . • g • • • . . . . . • • • . . • • .• • . . . . . . • . • • • • • • • • • • . Lrna . . . . . . . . c . . . . . . . . . . . . . . . . . . . . . c . . . . . . . . . . . . . . . . . . . . . . . . . . . . . . . . . . . . . . . . . . . . . . . . . . . . . . . Lte
L . n . polyehroma . . . . . . . . . . . . . . . . . c . . . . . . . . . . . . . . . . . . . . c . . . . . . . . . . . . . . . . . . . . . . . . . . . . . . . . . . . . . . . . . . . . . . Lnp L . infrapune t a t um . . u . . . . . ag . . . . . . uu . . . . . . . . . . . . . . . . . . . . . . . . . . . . . • g . . . . . . . . . . a . . . . . . . • . . . . . . . . . . . . . . . . . Lfr L . o tagense
L . moco
· • . g . . . . . . . • • • . • . . . . . . eu . . . . . c . a . . . . . . . . . . . . . . . . . . . . . . . . . . . . . . . . . . . . . . . . . . . . . . . . . . . . . Lot · . . . . . . . . . . . . . . . . . . . . . . . 9 . . • • c • • • . • • • . • . . • . . • • • • • • • g . . . . . . . . • . • • • • • • . • • . . . . . . • • • • • • • . Lrno

O!apter 3, page 25.
Table 3.2. Species and sources of 12S rRNA sequences used for Table 3.3. Whether the sequence was
obtained by PCR and direct sequencing or by cloning is also indicated. An asterisk indicates a group for
which several sequences are available (see Appendix 2).
Genbank Taxon Ace. No. Ref. Note
Coelocanth S I 1 1210 1 . PCR product
Lungftsh S 1 1 1206-S 1 1 1209 1 . PCR
Crossostoma lacustre . f f�hL M91245 2. cloned
Rana castesbeiana (frog) X12841 3. cloned
Xenopus laevis (toad) MI0217 4. cloned
Xantusiid lizards *
M651 1O-M65 1 16 5. PCR
Chicken X52392 6. cloned
Ratites *
X67626-X67638 7. PCR
Whale S79330 8. cloned
Rat X 14848 9. cloned
Mouse J01420 10. cloned
Cow *
J01394 1 1 . cloned
Human *
J014 1 5 12. cloned
References: 1. Meyer & Dolven (1992). 2. Tzeng et al. (1992). 3. Nagae et al. (1988). 4. Roe et al. (1985). 5. Hedges et al. (1991). See Appendix 2. 6. Desjardins & Morais (1990). 7. Cooper et al. (1992). See Appendix 2. 8. Gadaleta et al. (1989). 9. Bibb et al. (1981).
10. Amason et al. (199 1). 1 1. Anderson et al. (1982). See Appendix 2. 12. Anderson et al. (1981). See Appendix 2.

Table 3.3. Alignment of the region of vertebrate 12S rRNA between the PCR primers 1 2SAR and 1 2SBR. The primer sequences are not included, but 1 2SAR is immediately to the left, and 1 2SBR immediatedly to the right of the sequences shown. Where more than one taxon is available for a group (see Table 3.2), the positions that are variable among them are shown in lower case. Bold regions denote helical (stem) regions following Neefs et al. (1990), with the exceptions that stem number 39 is omitted. The regions into which the sequences have been divided for further analyses are indicated below the human sequence (S denotes a stem &/or hairpin region, and L a loop). Nucleotides conserved in all the vertebrates listed here are also shown below the alignment. Coelocanth and lungfish are included in the alignment but not used in the subsequent analyses because they are incomplete. Helix regions marked with a prime ( , ) denote the distal (3 ' ) arm of the helix. Gaps, introduced to maintain alignments, are indicated by " -" .
Coe locanth
Lung f i sh
F i s h
Frog Toad . • 1 Xantu s 1.f S k i n k
C h i c ken
Moa
Wha l e
Rat Mou s e
MooCow
Human
Conserved
2 5 ' 2 6 2 6 ' 2 0 ' 2 9 2 9 ' 2 ' 3 0
GGAACAACAAGCCACA- - GCUUAAAACUCAAAGGACUUGGCGGUGCUUCAUA
CCAGGAaCUACaAGC cCAa- - GCUuAAAACcCAAAGGACUUGGCGGUGCCUCAcA
GCUCAGCUAUAAACCUAGACGUUU- - AAUCACAACAAACGUCCGCCAGGGUACUACGAGCGUCA- - GCUUAAAACCCAAAGGACUUGGCGGUGCCUUAGA
GCCUAGCCGUAAACAA- - - - -UUA- -AUUUACACCAAUAAG-CGCCAGGGAAUUACGAGCAAU- - - GCUUAAAACCCAAAGGAUUUGACGGUGUCCCA-
GCCUAGCCAUAAAC - - - - - -UUUGACUACUUACGCAAAAAUCCGCCAG- - AACUACGAGCCUAA - - GCUUAAAACCCAAAGGACUUGGCGGUGCUCCAAA
GCuuaACuguaAAC cuAgacagC - - caaaaacauuugCuGucCGCCAGgGaAcUACAAGcAAAA- -gCUcaAAACuCaAAGGACUUGGCGGUGcuCuAuA
GCucAGCCGUcAACAAAgAcAGu - auaaaauACAauaCUgUUCGCCAGAGAAcUAcAAGcuAAa - - aCUcaAAACuCcAAGGACUUGGCGGUGCUCCAcA
GCCUAGCCCUAAAUCUAGAUACCg- CCCAUCACAC�UGUAUCCGCCUGAGAACUACGAGCACAAACGCUUAAAACUCUAAGGACUUGGCGGUGCCCCAAA
GCUUaGCCcUAAAUCcaGaUaCU�- - aCcccACac�AGUAuCCGCCcGAGAACUACGAGCACAAACGCUUAAAACUCUAAGGACUUGGCGGUGCCCcAAA
GCUUAGUCGUAAACCCCAAUAGUC - -ACAAAACAAGACUAUUCGCCAGAGUACUACUAGCAACA- - GCCUAAAACUCAAAGGACUUGGCGGUGCCUCAUA
GCUUAGCCCUAAACCUUAAUAAUU-AAACCUACAAAAUUAUUUGCCAGAGAACUACUAGCUACA- - GCUUAAAACACAAAGGACUUGGCGGUACUUUAUA GCUUAGCCAUAAACCUAAAUAAUUAAAUUUAACAAAACUAUUUGCCAGAGAACUACUAGCCAUA- - GCUUAAAACUCAAAGGACUUGGCGGUACUUUAUA
GCuuAGCCcUAAACAcAgaUaauu - acauaAACAAaAuUaUUCGCCAGAGuACUACuaGCaAca - - GCuuaAAACUCAAaGGACUUGGCGGUGCUUuAuA
GCuUAGCCCUAAACuUc�CAGUU- aAAUuAACAAaACUGCUCGCCAGAACACUACGAGCCACA- -GCUUAAAACUCAAAGGACCUGGCGGUGCUUCAUA
GC AA
825 ' i 826 GCC A G
i 82 0 ' i 829 C AAAC C A GGA UG CGGU
i 82 ' i 83 0 A
i

Coelocanth Lung f i sh Fish Frog Toad . Xantus i'd Skink Chicken Moa Whal e Rat Mouse MooCow Human
Coe .locanth Lungf i sh Fish Frog Toad
c Xantusid Skink Chicken Moa Wha le Rat Mouse MooCow Human
31 32 33 33 ' 34 " 3 5 ' 36 37
CCC-CCUAGAGGAGCCUGUUCUAGA!CCGAUAAACCCCGA�CAACCUCAACCACACUU-GC-UAu(rUCAGCCUAUAUACCGCCGUCGCCA�C CCCACCUAGAGGAGCCUGUuCUAgA!CCGAUAAUCCACG�uuACCcaA-CCuucccUgGC- -Aut'uCaGc�UACCgCCGUCGCCAGCCaAC CCCCCCUAGAGGAGCCUGUUCUAGA!CCGAUAACCCCCG�AAACCUCA-CCACUUCUaGU-CAUCCCCGCCUAUAUACCGCCGUCGUCAGCUUAC CCCCACUAGAGGAGCCUGUUCUAUAAUCGAUGAUCCCCGAUAUACCCGA-CCAUUUCUCGC-AUUAUCAGU�UACCUCCGUCG�GCUUAC CCCACCUAGAGGAGCCUGUUCUGUAAUCGAUACCCCUCGCUAAACCUCA-CCACUUCUUGC-CAAACCCGCCUAUAUACCACCGUCGCCAGCCCAC - -- -- - ----- -- ----- --- --uCaAaCUAGAGGAGCCUGUCCcAUAAUCGAUAcCcCACGaUAaACCCgA-CCACucUUggaAuacUcCAGCCUAUAUACCGCCGUCacCAGccuAC uCaaCCUAGAGGAGCCUGUCCUAUAAUCGAUACCCCcCGAUCuACCuCA-CCgcUUUUUG- -AAacUCAGcCUAUAUACCGCCGUCGuCAGCcUAC CCCACCUAGAGGAGCCUGUUCUAUAAUCGAUAAUCCACGAUUCACCCAA-CCACCCCUUGC-CAGCACAGCCUAC�UACCGCCGUCG£CAGCCCAC CCCACCUAGAGGAGCCUGUUCUAUAAUCGAUAAcCCACGuUaCACCCga-CCAuCuCUuGC-CcaugCAGCCUAC�UACCGCCGUCc£CAGCcCGC CCCAUCUAGAGGAGCCUGUUCUGUA!CCGAUAAACCCCGAUCAACCUCA-CCAACCCUUGC-UACUUCAGUCUAUAUACCGCCAUC�CAQ£AAAC UCCGUCUAGAGGAGCCUGUUCUAUA!UCGAUAAACCCCG�CUACCUUA-££CCUUCUCGC-UAAUUCAGC�UACCGCC��CAGCAAAC UCCAUCUAGAGGAGCCUGUUCUAUA!UCGAUAAACCCCGCUCUACCUCA-CCAUCUCUUGC-UAAUUCAGCCUAUAUACCGCCAUC�CAGCAAAC ucCuuCUAGAGGAGCCUGUUCUaUaAUCGAUAAACCCCGAUAaACCUcA-CCAauuCUuGC-UAAUaCAGuCUAUAUACCGCCAUC�CAGCaAAC uCCCuCUAGAGGAGCCUGUUCUGUAAUCGAUAAACCCCGAUCAACCUCA-CcaCCuCUUGC- - - - -UCAGCCUAUAUACCGCCAUC�CAGCAAAC
CUAGAGGAGCCUGU C A CGAU C CG U ACC CC U C G CU AUACC CC UC AG C L3 0 'i 831 i 832 i 833 i L33 ' i 834 i L34 ' i 83 6 i40i 83 7
3 8 3 8 ' 37 ' 4 0 4 0 ' 36 ' 34 ' 32 '
CCU--GUGAAGGAAAUACAAUGGGCAAAAAUA!- -�--AAAAUUAAAAACGUCAGGUCGAGGUGUAGCAAAUG�AUGGGA!£AAAUGGGCUACA cCC - - cUGA-GGcccacuAGUugGCAaAAUaga- -�agc�- - - aCac�ca�CGAGGUGUAGCacAUGggagG�g�AaAUGGGCUACA CCU- -GUGAAGGCUCAAUAGUAAGCAAAGUGGG- -CACAACCCA- - -AAACGUCAGGUCGAGGUGUAGCGUACGAAGUGGGAAGA�AUGGGCUACA £A�- -GUGA!cQGUUGC-AGUAGGCUUAAUGACCUAACACGUCA- - -AUACGUCAGGUCAAGGUGCAGCUUAAGAAAUGGGAAGUAAUGGGCUACA CUC - -GUGAGAGAUUCUUAGUAGGCUUAAUGAU--UUUUCAUCA- - -ACACGUCAGGUCAAGGUGUAGCAUAUGAAGUGGGAAGAAAUGGGCUACA cuu - -augAgaGcacAaaAGUaAGCAaAAcuGc- - aaacaCaauU- - - -AcGcCAGGUcAAGGUGUAGCuuAcaggGUGG-Ag�A�AUGgGCUAca CUU- -aUGAaAGaaguauAGuAaGcaAAAuAgu-- - -CaccaAcUA-aAACGuCAGGUCAAGGUGUAGCAcAUaaaguGG-aAGA�AUGGGCUACA CUCUAAUGAAAGAACAACAGUGAGCUCAA�- - -UCCCUCGCUA-AUAA�ACAGGUCAAGGUAUAGCCUAUGGGGUGG-GAGAAAUGGGCUACA CUa - - -UGAaAGAACAauAGCGAGCACAAcAGC- - - - cacccGCUA-aCAA�ACAGGUCAAGGUAUAGCauAuGagaUGG-aAGAAAUGGGCUACA CCU- - -AAAGGG-AGAAAAGUAAGCAUAACCAU- - - - - CCUACAUAAAAAC�UUAGGUCAAGGUGUAACCCAUGGGUUGGGAAGUAAUGGGCUACA CCU- -AAAAAGGCACUAAAGUAAGCACAAGAAC- - - - - -AAACAUAAAaAC�UUAGGUCAAGGUGUAGCCAAUGAAGCGGAAAGAAAUGGGCUACA CCU- -AAAAAGGUAUUAAAGUAAGCAAAAGAAU- - - - -CAAACAUAAAAAC�UUAGGUCAAGGUGUAGCCAAUGAAAUGGGAAGAAAUGGGCUACA CCU- -aAAAAGGaaaAaaAGUAAGCauAA�- - - - -gauacaUAAAaACQUUAGGUCAAGGUGUAaCCuAUGaaauGGgAAGAAAUGGGCUACA CCU-GAUGAAGGcuACaAAGUAAQ£gCAAguAC- - - - - - CCACGUAAAGACGUUAGGUCAAGGUGUAGCCcAUGagGuGGCAAGAAAUGGGCUACA
A G A G A C AGGU A C A G A G GCUA 83 7 i L38 ' i 83 7 i 8L4 0 i 836 iL34 ,i 834 i 832 i

Coe locanth Lungf i sh Fish Frog Toad . Xantu s i'd Skink Chicken Moa Whale Rat Mouse MooCow Human
Coelocanth Lungf i sh Fish Frog Toad I Xantus id Skink Chicken Moa Whale Rat Mouse MooCow Human
4 3 ' 4 5 4 5 ' 4 6 ---
U�ACAU- -AGAAUAUU- - - - - - - - - - - -ACGAAAAAAACAG-CGAAACC�AC�-GAAGGAGGA�AGUA!AA�AAUAGAGAG- - UUUUCUaC - - - - -GAAaAc - - - - - - - - - - - - -ACGgAcaaCcccA-uGAAAuugggGuu- -ugAAGcUgga�uAGuA!G� UUUUCUACU- - -AGAAUAAG- - - - - - - - - - - -ACGAAUAGCAUCA-UGAAAACUUAAUGCUUGAAGGAGGA�UAGUAAAAAGGAAAUAGAGUG- - AUUUCU-C- - - -AGAACAA- - - - - - - - - - - - -ACGAAAGACUAUA-UGAAAUUAUAAUCAU-GAAGGUGGAUUUAGUAGUAAAAAGAAAAUAGAGUG- - UUUUCUACCUU-AGAAUAA- - - - - - - - - - - - -ACGAAAGAUCUCUAUGAAACCAGAUCGAGAAAAGGCGGAUUUAGCAGUAAAGAGAAACAAGAGAG- - uUUucUAAaac-agaauacgc- - - - - - - - - - -ACGgAa�CuuA-UGAAAaauaAcCu - -aAaaggcgGAUUUAgCAGUAaaAuAaa-caAgaauu - - CUCUCUcCC- - -AGAGaAc- - - - - - - - - - - - -ACgAAcaGCAucaAUGAAAcaCuGCuc- - -aAAGGuGgAUUUAGuAGUAAGAUaaa-CaAGAgA- - - UUUUCUACU- - -AGAACAAA- - - - - - - - - - - - CGAAAAAGGAUG- -UGAAACCCGCCCU-UAGAAGGAGGAUUUAGCAGUAAAGUGAGAUCAUACCCCCU UUUUCUAacaU-AGAAcAccA- - - - - - - - - - -CGaAAGAgaAGa- -UGAAAcuC-UCc�-cagAAGGcGGA�AGUAAAaua�AcaAGAacG- - UUUUCUACUA- -AGAAC�UCCCCUAUACUCACACGAAAGUUUUUA-UGAAACUUAAAAACU-AAAGGAGGAUUUAGUAGUAAAUCAAGAGCAGAGUG- - UUUUCUUCCC- -AGAGAACAUU- - - - - - - - - -ACGAAAC�- -UGAAACUAAAGGAC- -AAAGGAGGA�UAGUAAAUUAAGAAUAGAGAG- - UUUUCUUCAA- -AGAAC�UU- - - - - - - - - - - -ACUAUACCCUUUA-UGAAACUAAAGGACU- -AAGGAGGAUUUAGUAGUAAAUUAAGAAUAGAGAG- - UUcUCUacaccaAgAgaAucaagc- - - - - - - -ACGAAAGuuauuA-UGAAAccaauaACc- -AAAGGAGGAUUUAGcAGUAAaCUaagAAUAGAGuG- - UUUUCUACC- - -AGAAAAcU- - - - - - - - - - - -ACGAUAaCCCUuA-UGAAAccUAAgGGUc- gAAGGUGGAUUUAGCAGUAAACUAAGAGUAGAGUG- - -
U U GAAA UUUA AG A A t 843 t L43 ' t 845 t L45 ' t 831 t , 84 6
4 6 ' 30 '
- - -CCCCUCU -
- - -UCCUUUUGAACC-CGGCUCU�A�-GCGCGU - - -UUCUUUUUAACC-CGGCUCUGGG�ACGCGU - - -UUCC�AAAACGGCCCUGGA-GCGCGC - - -�cuugaAGa-uugcuCUaGa-GcacGC - - -CuuaucUuAAAc -CAGCcCUGGA-GCGCGC AAGCUCACUUUAAGA-CGGCUCUGA�-GCACGU - - -cCcAuUUUAAgc -uGGCcCUgGG-GCACGU - - -CUUGAUUGAAUA-AGGCCA�GCACGC - - -CUUAAUUGAAUA-GAGCAAUGAA-GUACGC - - -CUUAAUUGAAUU-GAGCAAUGAA- GUACGC - - -CUuAGuUGAAuu -AGGCuAUGAA-GCACGC - - -CUUAGUUGAACA- gGGCCCUGAA-GCGCGU
A U G t L4 6 ' t 830 t

Oiapter 3, page 27.
Identifying Individual Helices
Helices 30-33 and 36 are well conserved among the vertebrates (Table 3.3), while six helices (26, 29, 34,
43, 45, & 46) are quite variable in sequence but their pairings are easy to identify (Table 3.3). The helices
26 and 29 are part of domain IT (Fig. 3.1). The area bounded by helix 34/34 ' shows the greatest potential
for alternate structures (Table 3.3; Glotz & Brimacombe 1980, Dams et al. 1988, Neefs et al. 1990, Simon
1991) and was examined in more detail. Helices 34, 36 and 37 tended to form spontaneously' in most of the
vertebrates and so particular attention was paid to the effects of forcing other helices -to be included in the
structure.
Helix 35
Examination of the base sequence between the proximal arms of helices 34 and 36 indicated that
nucleotides in this region had the potential to pair in several of the vertebrates (see Table 3.3). This putative
"helix 35" was not included in either Neefs et al. ' s (1990) compilation or in Hixson & Brown's ( 1986)
primate model. Nucleotides which could participate in the helix are well conserve<l amongst members of a
group (for instance skinks and ratites; Table 3.3). Except for the toad however, helix 35 did not form
spontaneously using the MFOLD algorithm and its forced creation increased (made more positive) local
free energies by more than 20% (Table 3.4). In addition, few fIxed compensatory mutations occur to
support it's existence (fables 3.1 & 3.3). The 5 ' nucleotides for this helix could also be used in an
extension of helix 34 (Table 3.3), so without experimental investigations (Noller 1984, Gutell et al. 1985)
to test for its presence, helix 35 is not considered to be a general feature in vertebrate 12S rRNA.
Helix 36
This is one of the most conserved regions of domain ill (fable 3.3) but it can potentially pair in several
ways (Figure 3.2). Structure a. in figure 3.2 is the one presented in table 3.3, but structures h. and c, tend to
form in different taxa and/or when different helices are forced into the structure. Note that all forms of the
helix have several unpaired "bulges". Such unpaired bases may act as protein recognition sites (Peattie et
al. 1981 , Noller 1984, Gutell et al. 1985), and this point is discussed later.
Helix 37
Helix 37 can contain from four to six nucleotide pairs, though Neefs et al. (1991) only show it as a two
base-pair structure. This helix may contain an internal unpaired bulge (Table 3.3). Conserved nucleotides
and compensatory changes strongly support helix 37, and it forms without forcing using MFOLD (Table
3 .4).

O!apter 3, page 28.
Table 3.4. Local minimal free energies for folding of helices 34, 36 and 37 in vertebrate 12S rRNA
domain m. The additional energy cost required (less negative energy value) to include other helices - -are shown, along with their percent energy differences from the minimal value. Energies were
calculated using the MFOLD algorithm in the GCG package, version 7.2. The minimal energy for
forming the alternate helix 40 in humans is also shown, and is lower than for placing helix 40 in the
same position as other vertebrates. Energy differences more than 10% different (in kcal/mol) from
the optimal value are considered less structurally feasible (Zuker et al. 1991 & pers. comm.). A value
of 0% additional energy indicates that the helix forms without forcing.
Forcing of helix: Taxon Energy 35 38 40
(kcallmol)
Fish -1 1.2 -7.3 -7.3 - 1 1 .2 (35%) (35%) (0%)
Toad - 2.5 -2.5 +0.2 -2.5 (0%) (108%) (0%)
Skink - 3.3 -2.5 - 1 .7 -3.3 (25%) (49%) (0%)
Chicken - 5.7 -3.3 -5.5 -5.7 (42%) (3%) (0%)
Moa - 2. 1 +0.3 +0.3 -2. 1 (114%) (114%) (0%)
Mouse - 6.2 +1 .4 -2.8 -6.2 (123%) (55%) (0%)
Cow - 6.8 -3.3 -6. 1 -2.9 (52%) (10%) (57%)
Human - 2.1 +2.9 -2. 1 -2. 1 (238%) (0%) (0%)
(alt S40) - 4.5 +1 .0 -4.5 -4.5 (122%) (0%) (0%)

Fig. 3.2. Potential pairings for helix 36 in vertebrate 11$ rRNA Structure a. is the one used in Neefs et al.(1990) compilation and shown in Table 3.3. The additio� guanine and pyrimidine nucleotides which can participate in the pairings are shown in bold in b. and c. Base pairings are indicated by "I" and "*" (for G*U), and gaps by .. _ n . The proximal (36) and diStal (36 ' ) arms of the heliX are labelled. Several sequences are available for the skink, moa, and cow groups, so variable sites in these groups are indicated by lower case letters.
'
Fish 3 6
Toad
Skink
Moa
Cow
a.
CUAUAUACCGCCGUC I I I * I I I I * * 1 GAUGU_GGAGCUGG
CUAUAUACCACCGUC I I I * I I I * * I · GAUGU_GGAACUGG
CUAUAUACCGCCGUC I I I * I I I * * I GAUGU_GGAACUGG
CUAuAUACCGCCGUC I I I I I I I * * I
GAUAU_GGAACUGG
CUAUAUACCGCCAUC I I I * I I I I * I
GAUGU_GGAACUGG
36 '
b.
CUAUAUACCG_CCGGCGU I I I * I * I I I I I * * GAUGUGGAGCUGG_AcUG
CUAUAUACC_ACCGuCGC I I I * I * I I I I * I GAUGUGGAACUGG_AcUG
CUAUAUACCG_CCGUCGU I I I * I * I I I I * * GAUGUGGAACUGG_ACUG
CUAuAUACCG_CCGUCGC I I I I 1 * * I I I I GAUAUGGAACUGG_ACAG
CUAUAUACCG_CCAUCuu I I I * I * I I I I *
GAUGUGGAACUGG_AuuG
c.
CUAUAUACCGCcGuCGU I I I * 1 * I I I I * * GAUGUGGAGCUGGACUG
CUAUAUACCACCGUCGC I I I * I * I I * I GAUGUGGAACUGGACUG
CUAUAUACCGCCGUCGU I I I * I * I I I * * GAUGUGGAACUGGAcUG
CUAuAUACCGCCGUCGC I I I I I * I I I I GAUAUGGAACUGGACAG
CUAUAUACCGCCAUCUU I I I * I * I I I * GAUGUGGAACUGGAuuG

Otapter 3, page 29.
Helix 38
The energetic cost required to form helix 38 is high (Table 3.4). Although there is a large unpaired bulge
between the distal aImS of helices 38 and 37 (Table 3.3), this bulge in itself may not be responsilbe for
the increased energetic cost A similar size bulge occurs between helices 34 and 36 (Table 3.3). Helix 38
is well conserved in sequence and size among the vertebrates however, and compensatory changes also
occur (Table 3.3). Furthermore, in the skinks and many of the other vertebrates the adjacent unpaired
region is one of the most variables part of the sequence (Tables 3.1 & 3.3), suggesting that the bases
potentially able to form helix 38 are functionally constrained. Helix 38 is therefore included in the
vertebrate secondary structure model.
The hairpin loop at the end of helix 38 is often a "tetra-loop" (i.e. it consists of four bases; Table 3.3).
tetra-loops can be unusually stable and frequently exist in the form of GNRA or UNCG (where N
represents any base, and R is a G or A; Woese et al. 1990, Antao et al. 1991). They have been suggested
to act as nucleation sites for organizing tertiary folding of the RNA (Tuerk et al. 1988). Fish,
amphibians and lizards have an RTGA motif (Table 3.3). This also occurs in the great apes and birds,
but the apes and chicken have an additional one or two bases in the loop respectively. Bovids and
rodents have AAAA. Fur seaIs tend to have five adenines in this loop (G. Lento pers. comm.). The
stability of GNRA tetra-loops are recognised in the MFOLD algorithm and assigned low (more
negative) free energy values. The RTGA and AAAA motifs are not allocated similar bonus energies, but
it may be possible that they too could confer increased stability in the molecule.
Helix 39
Helix 39, a two base pair structure in the Neefs et al. ( 1990) alignment, has little support in any of the
vertebrates. Its suggested position falls within the most variable region of the skink molecule (Table
3.1), and is also variable in lungfish, xantusiids, and bovids (Table 3.3).
Helix 40
Helix 40 is not shown for 12S rRNA in the Neefs et al compilation. In the vertebrates however a helix,
usually four base pairs in size, can be formed starting four nucleotides after the end of helix 37 (and
preceeded by two A's; Table 3.3). FIxed compensatory mutations (Table 3.3) and minimal energy
calculations (Table 3.4) support this helix's presence and location in all but the rodents and primates. An energetically more favourable alternative helix 40 can be constructed closer to the 36 I helix for the
primates (Tables 3.3 & 3.4). Additional experimental and sequence data are required to establish the
existence of this alternate helix 40, but it cannot be formed in the other vertebrates (Table 3.3).
The Refined Secondary Structure Vertebrate Model
The model for domain III derived from these analyses is shown in Figure 3.3, using the skink sequence
as a framework. This model differs from that of Glotz & Brimacombe (1980) and Dams et al. (1988) in
the placement of some of the helices (Fig. 3.4). On the basis of number of bonds, free energy
calculations (Fig. 3.4), and the occurrence of high sequence variability (Tables 3 . 1 & 3.3), neither the

Fig. 3.3. Secondary structure model for L n. poJychroma 12S rRNA PCR product. Sites which vary among the 20 stink taxa are shown by lowercase letters. Every tenth base is marked by ".". Dashes (-) and I signify nucleotide pairings (* for G*U), while a colon (":") deontes less certain pairings. Underscores U represent stylistic gaps used to simplify the diagram. For secondary structure analyses the molecule was divided into regions as indicated by the underlined numbers (S25 ' , S26, S20 ' , S2 ' & S29 are part of domain ll; see Table 3 .3). The positions of the PCR primers 12SA and 12SB are also shown.
1 1 1 1 I I cAAcUGCCGAcuCG> 12SA<
A ill' A
A aAA gAuAGuau a
* I I I 1 * u . S26
UUaUCgug A
-C A C
-G
-C
-C • agc AaAGa a L38 '
-A S20 '
-G
A
G
A . !!.!i '
u U ill CC . ACC 9 C
C aCGAUCu u � A A �
G : : : . a
U UUCC - -GA a
A - -u
� U - -A .
u * *g
C - -G
G - -c
A aA
A
c
U
A . C I I I I C . A G . • C A
c A AGCUAAU ACCgcUUUUUG cCUAUAUACCG_ccGuCGu
AAGcaA U .A 1 1 1 1 1 1 1 : : I I I * I * I I I I : : I I S 2 9
cUCagA -a
U- -AaGGugaaauAC_A_CGAUGUGGAACUGG_AcuG
C - -GA C
A
A .
A
C
u
C
u g ' A
-A
-G
-G
-A .
C - -G
U--A
S32 G* *U .
U* *G
C- -G
C - -G
G- -C
. A- -UA G
G
A- -UA
S43
CACUCUCUCC
9 . G
I I I I I aGAGACu
( . A c A
C
C S 3 0
S 3 1 G* *U
L3 0 ' • A--U
--uCa U--A A u C 9 L4 3 ' U • c a C--G
C
GG c
A
A . A
Aa c c
UGGCGGUGCUCCA
I I I * I I I I I I > 12 SB<CG_CGCGAGGU
C
G . !!li ' u - - a
c
C
U
Au- -A
A U- -A
G A c - -G S4 6 L4 6 ' ACc u--A
. a - -u
. u--a
u--a
C a
A C .
9 a A GA
c
C - -G
. G- -C
u - -A
C u
c -·
A
A U
AG
A
ill
c
a
A •
SL4 0
A • C
uAgu a
I I I I AUcA c
a
c

Fig. 3.4. Potential alternative secondary structures for part �f skink domain ill bordered by helix 36. Structure a is based on the Dams et al. (1988) model, and slructure b on the model proposed by Glotz & Brimacombe (1980). Both these structures are energetically less favourable for the skink sequence than the model developed in this thesis (structure c), which has a local free energy of -1 .7 Kca1Imol. Base pairs are shown by -, I, and *, while artificial gaps included to maintain alignments are indicated by underscores U. The underlined numbers correspond to helices shown in figure 3.3, and the periods (It. It) marie every tenth base.
a. Dams et al. (1988) model
Free Energy = 6.8 Kcallmol
. GAa�_aagca
II u l l l * I a aUUCCA uGA
· U- - a . II
3 6 • • C
u* *g C - -G G--c A aA
A
h. Glotz & BrimacoI?be (1980)
free Energy = 13.1 Kcallmol
gcaa a A a G . G* *u
A A . a g A G G - - c U - - a
• a A ACCUU - -A
U I I � uCGA
• • C CUAUAUACCG_CCGUCGU A • C
uAgu a CUAUAUACCG_CCGUCGu I I I * I * I I I I I I I * I * I I I I * *
GAUGUGGAACUGG_AcuG 1 1 1 1 AUcA c
GAUGUGGAACUGG_A c c C
A a . - a A 4 0
c. Skink Model
Free Energy = -1.7 Kcallmol
• agc AaAGa a G i l l . a U UUCC - -GA
a A- -u
3 7 U--A. u * *g C - -G G - - c
l§. A aA • • C A
CUAUAUACCG_CCGUCGU A • C I I I * I * I I I I I I
GAUGUGGAACUGG_AcuG uAgu a I I I I
C AUcA c A A a a
iQ
c
C a u - -A
A g .
a
u C

o.apter 3, page 30.
Glotz & Brimacombe nor the Dams et al. models fits the skink or other vertebrate sequences as well as
the new model presented (see also Cooper, Hickson, Lento, Simon & Penny in prep.).
Conserved Positions in the Secondary Structure Model
The model shown in figure 3.3 has 120 strictly conserved nucleotide positions among the vertebrates
(human to fish; Fig. 3.5). Fifty (42%) of these bases are unpaired. While similar numbers of adenine,
guanine, cytosine and uracil are conserved, conserved adenine residues are twice as Common at unpaired
sites (fable 3.5), in agreement with observations of other small subunit rRNAs (Gutell et al. 1985).
Variability within Domain m To investigate how the molecule varies I have divided domain ill into sections corresponding to
stem+hairpin loops and other unpaired regions (see Table 3.3). The conserved vertebrate core of domain
ill comprises helices 3 1 , 32, 33 and 36 (Figs. 3 .3 & 3.5). Note also the generally conserved nucleotides
in the unpaired region between helices 33 and 34 and between helices 45 and 3 1 , and the conserved
UGAAA motif in the loop of helix 45 (fable 3.3, Fig. 3.3). The single-stranded regions (S20 ' & S2 , )
linking domains II & ill are also well conserved.
The six groups of vertebrates for which several sequences are available (skinks, xantusiid lizards, ratites,
bovids, apes and mammals) show similar trends in variability (Fig. 3.6). Region S26 is one of the most
variable, as determined by number of positions which vary. Other commonly varying regions are S34,
SL37, SL40 (Figs. 3.6a-O. Greatest variability in ratites occurs in SUO (Fig. 3.6c), while S34 and S45
have the most variable sites in the great apes (Fig. 3.6e). Except for the xantusiids, there are relatively
few insertion/deletion (indel) events within members of these families. Small, one- or two-base, indels
occur in unpaired regions in S26, S29, L34 ' , L38 ' , SUO, U3 ' & L46 ' in the skinks, ratites, and l ,
bovids (fable 3.1, Appendix I). Xantusiids however have indels occurring in fourteen of the 23 regions
of the model (Appendix 1).
Nucleotide Substitutions in the Skink Structure
The comparisons of regions shown in figure 3 .6 are a minimal estimate of variability, identifying only
sites which have changed and not how frequently they may vary. When this is adjusted for in skinks (by
multiplying each variable position by the number of taxa which vary at that site), regions L30 ' and
L38 ' are the most variable (Fig. 3.7). These are both small 6-7 base internal loops (Fig. 3 .3). Eight
positions in the skink sequences have more than two character states, and four of this very variable sites
are in either L30 ' or L38 I (see Table 3. 1). Whether closely related taxa tend to differ at these very
variable sites will be examined in the next chapter.
In the secondary structure model for skinks (Fig. 3.3), significantly more changes <x?= 4.79, df = 1 , P < 0.05) �occur in unpaired regions than in paired regions (Table 3.6). There are 86 paired poSitions
(excluding the bases in S25 I , S20 I , & S2 whose complementary pairs are not in the sequence
examined). Twenty eight (33%) of these have changes in at least one taxon (fable 3 . 1 ). Nucleotide

Fig. 3.5. Conserved <I> and non-conserved OD sites in vertebrate 12S rRNA domain III, based on comparisons of fish, amphibian, reptile, bird and mammal sequences (see Table 3.3). Every tenth base is marked by " . n . Dashes (-) and I signify nucleotide pairings (* for G*U), while a colon (":") denotes less certain pairings. Underscores U represent stylistic gaps used to simplify the diagram. For secondary structure analyses the molecule was divided into regions as indicated by the underlined numbers (S denotes a stem region, and L a loop region).
-I -I -I
:::�: S20 ' =. -
I S2 '
::::::
-I -I -I ·
I I I * I I I I I I > 12 SB<:tLHt::If fft::tl
Hf ' iJ- -t�: SL4 6 .:.:.: .:.:.:
!d§. '
L34 '
• •
ill �H:--ri .
•

OIapter 3, page 31.
Table 3.5. Distribution of conserved nucleotides at paired and unpaired sites for the vertebrate 12S
rRNA model. Since 4 1 .7% of the conserved sites shown in figUre 3.5 are unpaired, the expected
numbers of conserved nucleotides at unpaired sites were calculated by multiplying the total numbers of
each conserved nucleotide by 0.417. Conserved adenine residues are more common at unpaired sites,
while conserved guanines tend to occur more frequently at paired sites.
No. Conserved A C G U Total
Total 36 27 33 24 120
Paired Obs. 12 17 24 17 70
Unpaired Obs. 24 10 9 7 50 Exp. 15.0 1 1 .2 13.8 10.0
X2 = 8.10, P < 0.05 (3 degrees of freedom).
Table 3.6. Changes occurring in paired and unpaired regions for the skink 12S rRNA data set (see Fig.
3.3). Expected numbers of changes are calculated on the basis of numbers of paired and unpaired sites.
No. Sites Which Vary Bases Observed Expected
Paired 190 39 50
Unpaired 194 62 5 1
Total 384 101
X2= 4.79, df = I , P < 0.05
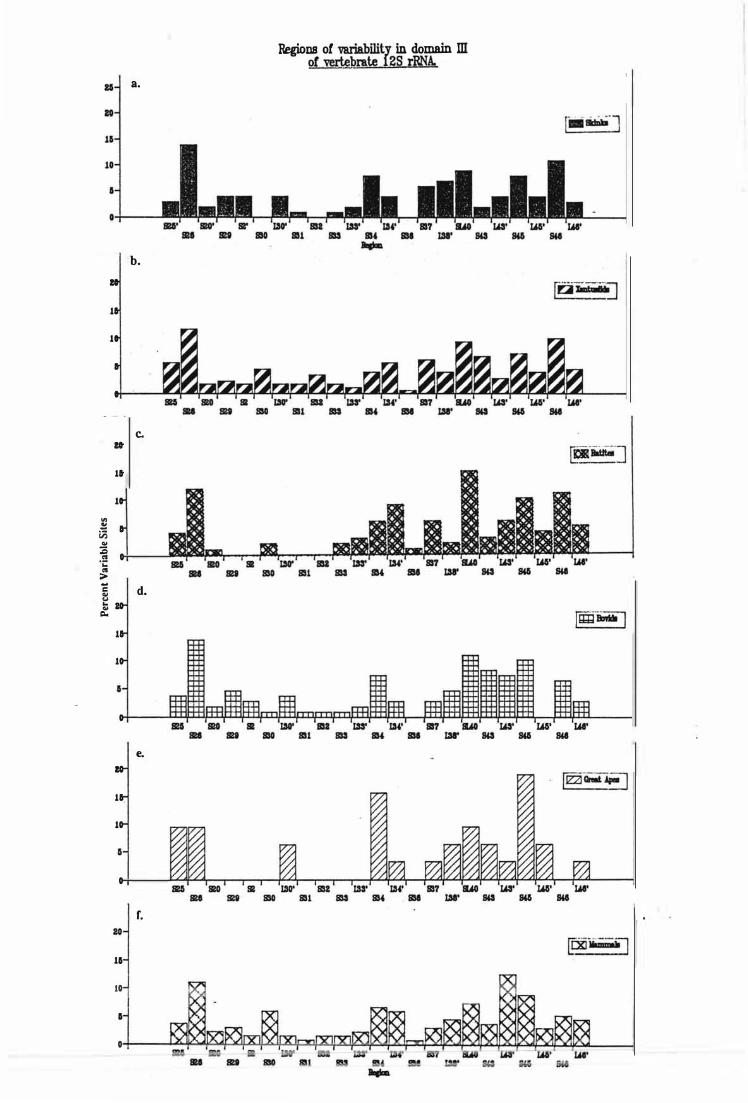
ZO
1/1
10
/I
0
ZO
1/1
10 '" � /I en .. ;Q 0 co 0;: co ;> ... c .. u .. 20 ..
I:lo
1/1
10
/I
0
ZO
1/1
10
/I
0
20
1/1
10
/I
0
8.
b.
C.
d.
e.
f.
RegioDS of variability in domain m of �brate 12S rRNA.

20
15
10
Fig. 3.7. Regions of variability in the skink 12S rRNA sequence. This figure differs from figure 3.6 in that the degree of variability of each site was accounted for using the following fonnula:
(numbe r va riable sites x numbe r taxa which vary) x 1 0 0 (tota l number o f s ites x number of tax� )
In contrast to figure 3.6a. where S26 has the highest proportion of variable sites. the most variable positions in domain III occur in L30' and L38 ' . See also figure 4.17.
926' &20' S28 S2t
S2' CIO' SSG su
-:�.:
' .....
W'

Olapter 3, page 32.
pairing (including G-U) is retained in 56 (65%) cases, significantly more than would be expected to
occur by chance (18%; ..,!= 84.80, degrees of freedom = I , P < 0.001; see also Table 3.7). Over half
(32/56) of the substitutions which maintain complementary pairing are double changes.
There are fewer than expected purine to purine (G H A) transitions (:x?= 4. 1 1 , df = I , 0.025 < P < 0.05;
Table 3.8), and a lower number of G H C trans versions (Table 3.8). Although there is a tendency for
more conserved areas (� 25% of sites vary) of the sequence to have a higher proportion of guanine
residues (Table 3.9), the base composition of conserved nQcleotides is similar to the proportions
observed for all sites in the skink sequence (Table 3.9). This suggests that differences in the types of
transitions and transversions (Table 3.8) is not due to differences in base composition.
DISCUSSION
Two major points emerge from the refinement of a vertebrate secondary structure model for domain m of 1 2S rRNA. The first is that one third of the sites do not change. This conservation is associated with
the single-stranded region linking domains II and m, and what can be termed the structural core of
domain ill (helices 3 1 , 32, 33, and 36; Fig. 3.5). The proportion of conserved sites in this model will
decrease as more vertebrate sequences are added to the compilation, but the results presented here serve
to indicate that many sites in the molecule may not be free to vary. Having part of the molecule
effectively invariant has implications for models of sequence analysis and this will be considered in
Chapter Five.
The second point is that both paired and unpaired regions can have high levels of variability. Helix 26
(and its hairpin loop), helix 34, and the unpaired region following helix 38 have many variable sites in
skinks, xantusiids, ratites and bovids (fable 3.3, Fig. 3.6). The phylogenetic and functional significance
of these changes are not yet clear, but complementary changes preserve the helices.
Interactions Between Domain ill and Ribosomal Proteins
Adenine residues tend to be more highly conserved in unpaired than paired regions (Table 3 .5). Gutell et
al. (1985) suggested that, since adenine is the least basic nucleotide, high conservation of adenine in
unpaired regions may reflect hydrophobic interactions between adenine and ribosomru proteins. This
does not however account for the observation that nearly one quarter of the conserved A' s are located in
the single-stranded regions linking domains II and ill (Figs. 3.3 & 3.5), where ribosomal proteins do not
appear to specifically bind (Ehresmann et al. 1990, Noller et al. 1990). The ribosomal proteins S7, S9
and S 19 bind to domain III (Stern et al. 1989, Ehresmann et al. 1990. Noller et aI. 1990), and the
conserved residues in L33 ' and SL45 (Fig. 3 .5) may be involved in this binding. particularly with
respect to S 19. Noller & Woese (1981) suggested that some phylogenetically variable regions may be
protein binding sites. Helix 33 is well conserved however, and appears to interact with S 19 (Stern et al.
1989, Ehresmann et al. 1990. Noller et al. 1990). Simon et aI. (1990) also noted the conservation of this
helix in cicadas. Helix 34 in contrast, can be very variable (fables 3.1 & 3.3), but does not appear to be
a primary site of protein binding (see Ehresmann et al. 1990). These observations suggest either that the

ClIapter 3, page 33.
Table 3.7. Substitutions among paired nucleotides in the skink 1 2S rRNA sequence data (helices 25 I ,
20 I & 2 � are excluded). Substitutions are categorized into changes maintaining base pairing (G*U pairs
allowed), and those (in either direction) between complemeptary and non-complementary pairs.
Expected numbers of changes were calculated separately for single and double substitutions using Dixon
& Hillis' (1992) probabilities for maintenance of complementary pairings (0.125 and 0.256,
respectively). For example, 52 single changes were observed, of which (52 x 0.125) = 6.5 are expected
to maintain base pairing by chance. Of 17 pairs where both bases changed, 16 (representing 32
substitution events) maintained complementary base pairing, whereas only (17 x 0.256) = 4.4 paired
substitutions could be expected to occur. The differences between observed and expected numbers of
fIXed compensatory changes are highly significant (P < 0.01) for both single and double substitutions.
Type of Substitution
Single base pair to base pair base pair to non-pair
Double base pair to base pair base pair to non-pair
Total
Expected
6.5 45.5
4.4 12.6
Observed X2�
24 28
53.8
16 1
41.3
86

Chapter 3, page 34.
Table 3.8a. Expected probabilities for each type of transversion and transition in the skink data set, based on observed nucleotide frequencies (numbers in parentheses). Assuming that the base composition of the sequence determines the frequency with which, for instance, an A changes to a C rather than to a U, then an A to C change should occur with a probability of [0.27/(0.27 + 0.19)] = 0.59. S imilarly, on the basis of the relative frequencies of A and G, a C is twice as likely to change to an A than it is to a G. On the basis of nucleotide frequencies, slightly more A to G transitions are expected than C to U.
Transversions:
(0.35) A
0.67
0.41
U (0. 19)
(0.19) G
0.33
0.59 C
(0.27)
Transitions:
(0.35) A
U (0.19)
0.54
0.46
(0.19) G
-<:..:.. � c (0.27)
Table 3.8b. Observed and expected (based on Table 3.8a) numbers of each type of transversion and transition among the 20 skink taxa. The direction of change is not assumed.
Transversions :
No. Obs.
No. Exp.
Transitions:
No. Obs.
No. Exp.
A <-> C 19
18.2
A <-> G 40
49.7
A <-> U 1 1
7.6
C <-> U 52
42.3
G <-> C 6
1 1 .4
G <-> U 2
3.8 '1.2= 4.97, df = 3, P > 0.1
'1.2= 4.1 1 , df = 1 , 0.025 < P < 0.05.

Cllapter 3, page 35.
Table 3.9. Base composition of conserved residues among regions of skink 12S rRNA domain ffi. Regions in bold highlight those where more than 75% of their sites are conserved. The expected
proportions of each conserved nucleotide (based on nucleotide frequency; Table 2�1) is shoW? at the
bottom of the table.
No. Conserved Conserved Region Bases No. % % A % C % G % U
S25' 1 7 14 82% 43 29 21 7 S26 24 12 50% 50 17 8 25 S20' 1 5 13 87% 46 23 23 8 S29 10 6 60% 50 17 17 17 S2' 1 8 14 78% 43 21 21 14 S30 21 21 100% 1 0 33 44 14 L30' 6 2 33% 50 50 0 0 S31 1 5 14 93% 29 14 29 29 S32 26 26 100% 27 23 3 1 19 S33 1 8 1 7 94% 29 35 12 24 L33' 8 6 75% 33 67 0 0 S34 23 14 65% 14 21 21 43 L34' 9 6 67% 50 17 17 17 S36 34 32 94% 22 25 31 22 S37&38 22 16 73% 25 19 3 1 25 L38' 7 1 14% 100 0 0 0 SL40 23 13 57% 69 23 0 8 S43 1 6 1 3 81% 15 46 15 23 L43' 8 5 62% 80 20 0 0 S45 20 13 65% 39 30 23 8 L45' 10 6 60% 50 0 50 0 S46 25 12 48% 50 17 17 17 L46' 9 7 78% 43 43 14 0
384 283 Obsened: 34% 26% 23% 17% Expected: 35% 27% 19% 19%
X2 = 1 . 1 1 , df = 3, not significant.

Chapter 3, page 36.
mitochondrial small subunit rRNA molecule may not have the same points of protein contact as the
prokaryote molecule, or that not all protein binding regions are variable. The conserved nucleotides in
the unpaired regions L33 ' and SLA5 (Fig. 3.5), and their probable interaction with S 1 9 indicate that the
latter point may be the more likely interpretation.
Helix 36 is the probable site of contact with the 50-S ribosome subunit in E. coli (Gutell et al. 1985).
The unpaired bases in this helix, as well as the different potential alternate forms of it (Fig. 3 .4), may be
associated with protein recognition sites (see Peattie et al. 198 1 , Gutell et al. 1985, Noller 1990).
Tetra-loops
While the hairpin loop of helix 38 does not conform in either sequence (or size in some cases) to the
common GNRA tetra-loop rwoese et al. 1990, Antao et al. 1991), it is interesting that the last
nucleotide in the loop is generally an adenine (Table 3.3). Sea urchins (sequences not shown) do not
conform to the GNRA or RTGA motif for loop 38 either, but they too have adenine as the final base. As
already noted above, adenine residues have been found to be associated with protein binding (Gutell et
aI. 1985), so the helix 38 hairpin loop and the adenine residue may have a critical role in the formation
of the tertiary structure. The other tetra-loop in the 1 2S rRNA alignment presented here is in helix 29
(Table 3 .3). Its sequence is not as conserved as that in helix 38, nor does it fit the more common tetra
loop motifs rwoese et al. 1990), but the terminal base is also generally an adenine (Table 3 .3).
- Insertion/deletions commonly occur in this hairpin loop however (Tables 3 . 1 & 3.3) so the significance
of these putative tetra-loops is uncertain. The number of tetra-loops varies among vertebrate 12S rRNA
sequences. There are four in human and seven in the rat (Gutell et al. 1985), suggesting that the tetra
loops may not have a major functional role.
Comparison of Secondary Structure Models
The model presented here is very similar to Noller & Woese's (Gutell et al. 1985, Noller et al. 1990),
but it provides a more detailed view of the vertebrate 12S rRNA domain III. Previous alignments and
models used only human, cow, mouse, and frog 12S rRNA sequences (Gutell et al. 1985, Dams et al.
1988, Neefs et al. 1990). Addition of reptile and bird sequences in the present study emphasizes
differences in sites of variation between groups (Fig. 3.6). The structure in figure 3.5 is different from
that proposed for the great apes (Hixson & Brown 1986). Helix 36 in the Hixson & Brown model is
shifted slightly, and a five base pair helix (labelled 24 by Hixson & Brown) occupies the region
encompassing helices 38 and 40 in figure 3 .5. Neither of these two features is supported by the
comparative approach adopted here.
Simon et al. ( 1990) found that 12S rRNA sequences from several species of cicada could fit both the
Glotz & Brimacombe ( 1980) and Dams el al. (1988) models for the region between helices 37 and 40.
Rather than being a conflict in structure, Simon el al. suggested that local switching between alternative
structures may occur. Analysis of a wider range of 1 2S rRNA sequences indicate that this switching may
not occur. On the basis of comparative sequence analysis, the presence of compensatory changes, and

OJapter 3, page 37.
examination of minimal free energy structures, one structure, common to all of the vertebrates
examined, as well as some invertebrates, is most favoured (Fig. 3.5 and Cooper et al. in prep.). As Simon et al. noted though, and the present analyses indicate, experimental evidence for the structure of
this region is desirable. Switching may occur in other parts of the rRNA, and play a role in ribosome
assembly (Glotz & Bimacombe 1980, Zwieb et al. 1981).
The degree of base conservation in a helix does not appear to be re,lated to whether the nuclootides of
one side of the helix are close to (short-range) or further away from (long-range) the nucleotides
forming the other side of the helix, as has been suggested by Simon (1991). Helix 33 is a short range
stem and well-conserved, whereas helix 34 can be classed as a long-range stem but is more variable
(Figs. 3.3 & 3.5). It is interesting to note that in the skinks, most of the variability in helix 34 occurs on
the distal arm of the helix, though pairing is still maintained (fable 3.1). This could imply that the five
uracil residues on the proximal arm are more constrained, but both sides of this helix vary in other
vertebrates (fable 3.3).
Limitations of the RNA Folding Algorithm
The energetic calculations were of some use in discounting the existence of helix 35, but implied that
helix 38 was unlikely to form (fable 3.4). Zuker et al. (1991) noted however that optimal energy
solutions for domain III of 16S rRNA were not always in agreement with the structure determined by
comparative sequence analysis, though the reasons for this are unclear. Experimental evidence (Glotz &
Brimacombe 1980, Gutell et aI. 1985), or the occurrence of fixed compensatory mutations are required
before helix 35 can be accepted. The potential for an alternative helix 40 to form in humans and other
apes (fables 3.3 & 3.4) also requires further sequence and experimental analyses. The secondary
structure folding of the 16S rRNA appears to be primarily determined by the sequence and experimental
evidence does not indicate that ribosomal proteins have a significant role in stabilizing structures
(Draper 1990, Noller et al. 1990).
Another limitation in the folding algorithm (Zuker 1989, Zuker et al. 1991) is that non-standard base
pairs (for instance A-C, and G-A) are not yet considered in the calculations, so minimal free energies
could be underestimated. A-C pairs can be relatively common in rRNA and tRNA (Topal & Fresco
1976, Anderson et al. 1981, de Bruijn & KIug 1983, Kraus et al. 1992), though they have larger free
energies (Freier et al. 1986). A-G pairs may also occur, but their formation may be determined by
adjacent nucleotides (Cheng et al. 1992). Interactions between bases within loops can also occur (Heus
& Pardi 1991), which may also affect the free energy level of the molecule. A-C pairings have the
potential to occur in helices 36 and 37 (Table 3.3, Fig. 3.3), and could also increase the size of helix 40 in mammals (Table 3.3). Taking account of A-C pairings may therefore support the more common helix
40 over the alternative helix 40 in the great apes (see Tables 3.3 & 3.4, and Fig. 3.5). While non
standard pairing may be a possibility in helix 36, the unpaired nucleotides may be important for protein
binding, and experimental investigations suggest that unpaired bases occur in helix 36 (Gutell et al.
1985, Noller et al. 1990).

Cliapter 3, page 38.
Variability between Regions
Regions of relatively high or low variability may be more informative for examining more closely or
distantly related taxa respectively (Kocher et al. 1989, Thomas & Beckenbach 1 989, Simon 1991,
Simon et al. 1991). Different regions in the 12S rRNA sequence do have different levels of variability
(Figs. 3.6 & 3 .7). Comparisons between closely and more distantly related skink taxa in relation to the
more variable regions and sites will be considered in Chapters Four and Five.
Knowledge of which regions or sites are more conservative can be also be useful for determining the
closeness of a relationship. A change shared by two taxa at a more conservative site in the molecule may
be a more reliable indicator of true phylogenetic relationships than when taxa share a common
substitution at more variable positions. L. fallai and C. aenea for example have the same change at
position 73 (Table 3.1), a conservative region in vertebrates (Table 3.3). C. aenea, L fallai and L
maccanni also differ from other taxa by a change in the otherwise conserved loop of helix 33 (Table
3.1), suggesting that C. aenea and L fallai have a relatively close relationship. However, a change in the
tetra-loop of helix 38 could also imply a strong relationship between C.aenea, L. maccanni and L.
tel/airi (position 194; Table 3.1). These conflicts will be considered in Chapter Five. In contrast, L.fallai
shares two substitutions with a New Caledonian skink, Tropidoscincus rohssii (see Chapter Five), but
these are both at quite variable positions in helix 46, implying that these two taxa are not that closely
related.
Secondary Structure Models and Sequencing Precision
Placing nucleotide sequences in the context of a secondary structure model has the additional advantage
of identifying possible errors in sequence determination. There are several cases in Table 3.3 where one
taxon differs from the rest at positions which are otherwise constant. These may be real differences or
the results of cloning, PCR, andlor sequencing artifacts. Seven positions in the skink sequences are
variable, while they are constant among the other vertebrates. At least three primers were used to
sequence the skink PCR fragment and several sequencing reactions run. Rechecking the sequencing gels
did not reveal ambiguities at these seven sites suggesting that errors during sequencing are probably not
the cause. At five of these positions several skink taxa vary (Table 3.1) supporting the reliabilty of the
amplification and sequencing reactions. At another site (position 233) however a gel reading error was
found (and corrected) when the sequence was compared to the secondary structure model.
During the compilation of table 3.3 it was noticeable that sequences obtained by cloning had more
inconsistencies that sequences obtained by PCR. Changes in otherwise well conserved positions were
particularly frequent in the frog and whale sequences. The frog sequence differs uniquely at seven
locations, including a deletion in L30 I (Table 3.3) and additional sequencing of this region is required
to confrrm the sequence. In the whale sequence there is a large, approximately 10 base, insertion in the
unpaired region following helix 43 (Table 3.3). This unusual insertion is nol remarked upon by the

Olapter 3, page 39.
authors (Amason et al. 1991). In addition, the whale sequence has only three nucleotides in the loop of
helix 38, whereas other mammals have at least four (fable 3.3). The whale also has an apparent
insertion of a guanine residue into the 30 ' helix (fable 3.3).
There are also problems with some of the other sequences. Three 12S rRNA sequences for Rattus
norvegicus can be found in GenBank (accession numbers Xl4848, J01438 & V00680). The latter two - .-
differ at several sites though from XI4848, the one used in table 3.3. The quail 12S rRNA sequence
(Desjardins & Morais 1989) was excluded from these analyses altogether because a block of about 50
nucleotides was missing. Sequencing errors are a recognized problem in the databases (see for example
Clark & Whittam 1992, States 1992). Corrections to the clolled toad 12S rRNA sequence have already
been published (Dunon-Bluteau & Brun 1986). It is prudent to confIrm the nucleotide sequences
discussed here by resequencing the relevant species.
Bias in Types of Substitutions
Bias in types of nucleotide substitutions has been observed in many sequencing studies (for example,
Aquadro et al. 1984, Thomas & Beckenbach 1989, Marshall 1992, Knight & Mindell l993; see also
Moritz et al. 1987). Thomas & Beckenbach (1989) attributed a C-+A transversion bias to preferential
loss of guanine residues by depurination (Lindahl & Nyberg 1972). The direction of transversions
cannot be determined for the skinks since an appropriate outgroup is not available, AHC transversions
are the most common however (fable 3.8), and this bias does not appear to be related to base
composition (Table 3.9).

page 40.
Chapter Four: TransitWns afUl Transversions
Two major features of the skink sequence data set are that, fIrstly, many taxa are about equally divergent I
from each other, but secondly, there is considerable variation in the numbers of transitions and
transversions between them. These two features are examined in tqis chapter and compared with other
vertebrate data sets and with simulated data. The patterns of differences are examined with respect to the
secondary structure model developed in Chapter Three to unflerstaild both how the molecule changes
and to identify the most variable regions. This information is subsequently used in Chapter Five.
Transitions and Transversions
There are 101 variable positions in the skink data set trable 3.1), of which 58 are phylogenetically
informative (parsimony sites). Fifty of the nucleotide substitutions are singletons, that is one taxon
differs from all the rest. Two single base deletions occur - at positions 25 (in both L. telfairi and L.
maccannO and 6t (L. telfairi only). L. telfairi also has an extra base inserted between nucleotides 202
and 203 (Table 3.1).
Most pairs of taxa have between 20 and 25 observed differences (Table 4.1a, Fig. 4.1 a), and four to five
transversions in pairwise comparisons (Table 4.1b, Fig. 4.tc). 1bere is Considerable variability however.
Some taxa, for instance "Stewart Island Green", L. grande anq La. guichenoti have more variation
associated with the number of transitions, while others, such as L. notosaurus, C. aenea and L.
inconspicuum, show greater variation with respect to transversions (Table 4.2). L. infrapunctatum has
the highest mean number of transversions and also the lowest trailsitionltransversion (Ts/Tv) ratio �
(Tables 4.1 & 4.2).
While there is a substitution bias in favour of transitions (Table 4.1 b), a very weak correlation exists
between the number of transversions and the number of t:I1llsitions (,.2= 0.03; Table 4.3 , Fig. 4.2).
Consequently, transversions are a poor predictor of the total number of differences between taxa
(,.2= 0.26, Fig. 4.3), particularly when there are fewer than eight transversions (Table 4.3). As a
comparison, stronger relationships exist between the n�bet of transitions and transversions in both
ratite (,.2= 0.40, Fig. 4.4a) and bovid (,.2= 0.55, Fig. 4.41» data sets.
Saturation of Transitions?
There is no evidence to suggest that the skink sequences have become saturated with nucleotide
substitutions. The skink sequences are less than 10% divergent and the proportion of transitions does not
decrease as sequence divergence increases (Fig. 4.5), which is usually an indication of saturation
(Wilson et aZ. 1985, DeSalie et aZ. 1987, Miyamoto & Boyle 1989, lrwin et aZ. 1991).

OIapter 4, page 41.
Table 4.1a. Distance matrices for skink 12S rRNA PCR fragment (384 base pairs). Total observed I nucleotide differences are given below the diagonal ahd perCentage transitions are above. Numbers in bold denote pairwise comparisons with 20 or fewer total differences. Underlined numbers identify
where transitions comprised less than 75% of the differences. The mean numbef of nucleotide - . differences for each taxon is also given. Insertions and deletiorls when they bccurred in pairwise , , ,
I comparisons were not counted. Taxon abbreviations as in Table 3 .1 .
Number of Differences (below diagonq l ) \ Percent Trans it ions ( above )
Sig Lgr Lno Llc Lsu Lnn Lmi Lag Ca. Lac Lin Lam Lz. Lfa Lma Lt. Lop Lfr Lot Lmo
Sig �% 1l% 21% 75% 77% 72% 80% 82% 7 4 % 76% 75% 77% 74% 74% 83% 70% 7 % 88% 82% Sig
Lgr 8 80% 80 79 85 75 71 87 1l 79 79 83 79 87 75 79 71 83 87 Lgr
Lno 15 15 8 6 % 7 5 75 76 72 8 1 � 92 79 78 74 90 78 81 6 8 7 8 80 Lno
Llc 17 20 2 1 84% 79 74 67 7 9 7 8 85 75 73 6 8 95 83 84 73 87 77 Llc
Lsu 16 14 16 19 90% 72 76 83 77 75 76 81 77 83 72 91 74 80 83 Lsu
Lnn 17 20 16 14 20 79% 7 5 83 77 7 9 80 81 7 6 84 72 69 7 1 83 8 1 Lnn
Lrni 18 16 2 1 2 3 18 24 74% 87 7 6 7 6 100 90 8 1 83 21 77 73 85 87 Lrni
Lag 15 2 1 2 5 18 2 1 20 23 78% 7 1 72 7 6 77 21 7 5 67 75 67 8 6 77 Lag
Cae 2 2 23 2 1 2 4 23 23 23 23 78% 78 88 87 8 8 84 68 79 7 5 87 96 Cae
Lac 19 22 2 5 18 22 22 25 14 2 3 �% 7 9 76 1l 87 74 77 7 5 92 78 Lac
Lin 2 1 19 12 27 20 24 25 29 23 29 79% 74 7 4 85 7 8 83 67 7 4 7 9 Lin
Lsrn 20 19 24 24 2 1 25 5 25 24 28 28 91% 80 84 74 80 74 87 88 Lsrn
Lze 22 24 23 22 2 6 26 20 27 23 25 23 23 7 9 % 83 70 84 2Q 87 84 Lze
Lfa 2 3 24 23 22 2 6 25 26 24 17 26 27 25 24 76% 71 75 67 84 88 Lfa
Lrna 24 22 20 2 1 23 25 30 28 25 30 20 31 30 25 89% 86 76 89 83 Lrna
Lte 2 3 24 2 3 2 4 25 25 24 30 22 27 27 27 23 3 1 2 8 80% � 7 8 80 Lte
Lnp 23 24 21 19 21 13 22 28 28 30 29 25 32 32 29 30 74% 7 8 77 Lnp
Lfr 2 4 2 8 2 8 22 27 24 30 12 2 8 24 30 3 1 27 2 7 29 32 34 8 1% 72 Lfr
Lot 26 23 23 30 25 29 26 28 23 24 23 31 31 32 28 27 32 32 85% Lot
Lrno 27 30 2 5 2 6 30 26 3 0 2 6 22 27 2 9 33 25 2 4 29 30 3 1 2 9 27 Lrno
Sig Lgr Lno L1c Lsu Lnn Lmi Lag Ca. Lac Lin Lam Lz. Lf a Lma Lt. Lnp Lfr Lot Lmo
Means 2 0 . 0 20 . 9 21 . 7 22 . 6 23 . 2 24 . 5 25 . 1 2 6 . 2 26 . 5 2 7 . 4
2 0 . 8 21 . 6 22 . 0 23 . 0 24 . 2 24 . 7 25 . 4 2 6 . 4 2 7 . 3 2 7 . 7

Sig
Lgr
Lno
LIe
Lsu
Lnn
Lmi
Lag
Cae
Lae
Lin
Lsm
Lze
L fa
Lma
Lte
Lnp
Lfr
Lot
Lmo
ClJapter 4, page 42.
Table 4.tb. Pairwise comparisons of transitions (above diagotlal) and transversions (below). Bold , '
denotes comparisons with 20 or fewer total differences. The �eail riumbers of transitions and ! '
transversions for each taxon are shown on the right and below the table, respectively.
Transversions (below diagonal ) \ Transit ions ( above)
Big Lgr Lno L1c Lsu LnD Lmi Lag Cae Lac Lin Lsm Lze Lfa Lma Lte Lnp Lfr Lot Lmo Mean Ts
3 4 5 4 4 5 3 4 5 5 5 5 6 4 7 6 7 3 5
5 11 12
3 4 3 3 4 3 4 4 5 6 7 3 4 6 7 4 1 4 5 4 5 5 6 3 2 6 5 5 4 4 9 4 5 4 5
12 16 1 8
3 3 6 6 5 4 4 6 6 7 1 4 3 6 4 6
12 13 13 12 1 8 14 11 17 12 15 2 0 16 12 1 2 16 18 17 18 16 1 1 17 1 2 1� 14
18 13 16 1 9 17 2 19 15 1 9 17 5 5 17 2 0 19 5 5 6 1 8 10 4 4 3 5 18 5 5 6 4 5 5 5 6 8 5 8 5 5 0 6 3 6 5 5 2 6 3 6 6 6 5 7 2 7 4 4 5 7 4 4 7 7 7 10 7 7 2 4 5 7 6 7 7 7 8 4 7 6 5 5 4 4 3 2 5 5 4 6 1 6
16 1 5 11 23 1 5 19 19 21 18 2 1
6 6 7 3 6 5
10 6 6
15 17 17 20 i s 20 19 19 19 18 17 18 18 16 15 20 16 21 2 0 1 9 20 2 1 19 2 1
5 1 8 2 1 25 19 2 1 17 2 1 2 1 20 1 5 2 1 2 2 19 + 9 2 6 2 2 1 7 20 17
2 1 20 26 2 19 25 5 5 19 5 5 6 7 7 9 3 5 5 8 4 8 8 9 7 4 4 5 3 4 4 3 5
16 1 8 1 8 20 18 18 17 20 15 20 2 1 2 0 1 6 2 2 25
6 10
6 6
17 19 17 16 19
9 17 2 1 22 23 24 20 27 24 25 24
9 7 7
17 20 19 16 20 17 22
8 2 1 1 8 2 0 2 3 1 9 1 8 22 22 25
6 8
2 3 22 Sig
19 26 Lgr
1 8 20 Lno
2 6 20 LIe
20 25 Lsu
2 4 2 1 Lnn
22 26 Lmi
2 4 20 Lag
2 0 2 1 Cae
22 2 1 Lac
17 23 Lin
2 7 29 Lsm
27 21 Lze
27 21 Lfa
2 5 24 Lma
2 1 24 Lte
25 24 Lnp
2 6 2 1 Lfr
23 Lot
4 Lmo
Big Lgr Lno LIe Lsu LnD Lmi Lag Cae Lac Lin Lsm Lze Lfa Lma Lte Lnp Lfr Lot Lmo
1 4 . 3
1 6 . 5
1 6 . 3
1 7 . 1
1 7 . 2
1 7 . 4
1 7 . 8
1 7 . 1
1 9 . 1
1 8 . 6
1 8 . 9
1 9 . 9
2 0 . 2
1 9 . 4
22 . 0
1 9 . 7
2 1 . 0
1 9 . 7
23 . 0
22 . 7
MeanTv4 . 7 4 . 6 4 . 5 4 . 8 4 . 1 5 . 6 4 . 9 4 . 2 5 . 5 4 . 4
4 . 3 4 . 5 4 . 6 5 . 9 5 . 6 4 . 8 6 . 0 6 . 7 7 . 6 5 . 0

111
a.
-
II
o
111 b.
" ,
0
Fig. 4.1. Frequency distributions for pairwise comparisons of nucleotide substitutions in the 20 skink 12S rRNA sequences. a. Tolal numbers of differences between taxa h. Numbers of transitions. c. Numbers of transversions.
Total Differences
. -,I ,
. ' :
.' � , � ,
Rnnn I� / :1 , �
n n � ' .: r'nn 1
" I • II ,'
7 • • II' 11 U 11 U 111 I' U H H . u a a u • • n . a M U a � "
Transitions
0 1 ' S ' II ' 7 " " l1 U H U U H � H H . � a a u . u n • • No. 'lnIIIltbII
H,-----------------------------------------------------------------------� c. Transversions

Otapter 4, page 43.
Table 4.2. Mean numbers (± standard deviation) of total observed differences, transitions, transversions,
and transition/transversion ratios for each skink taxon. The five most variable taxa for each column
(assessed as the largest standard deviations relative to their mearts) are shown ill bold.
Taxon Total
StIs.Green 20.0 ± 4.6
L.grande 20.8 ± 5.1
L.notosaurus 20.9 ± 4.3
L.linlchl 21.6 ± 3.8
L.suteri 21.7 ± 4.2
L.n.nigriplantare 22.0 ± 4.4
L.microlepis 22.6 ± S.8
La.guichenoti 23.0 ± S.3
C.aenea 23.2 ± 2.3
L.acrinasum 24.2 ± 4.2
L.inconspicuum 24.5 ± 4.7
L.smithi 24.7 ± 6.1
L.ze laruJicum 25.1 ± 3.2
L.fallai 25.4 ± 3.6
L.maccanni 26.2 ± 3.7
L.telfairi 26.4 ± 3.1
L.n.polychroma 26.5 ± 5.5
L.infrapunctatum 27.3 ± 4.8
L.otagense 27.4 ± 3.3
L.moco 27.7 ± 2.8
-Transitioils Transversions
�S.3 ± 4.4 4.7 ± 1 .2
16.5 ± 4.5 4.3 ± 1 .4
16.3 ± 3.0 4.6 ± 1.8
17. 1 ± 3.8 4.5 ± 1 .5
17.2 ± 3.6 4.5 ± 1 .4
17.4 ± 3.9 4.6 ± i.3
17.8 ± 4.9 4.8 ± 1 .8
17.� ± 4.3 5.9 ± 1 .6
19.1 ± 2.0 4.i ± 1.6
18.6 ± 3.7 5.6 ± 1 .4
18.9 ± 3.3 S.6 ± 2.0
19.9 ± 5.2 4.8 ± 1.8
20.2 ± 3.2 4.9 ± 1 .5
19.4 ± 2.9 6.0 ± 1 .8
22.0 ± :tO 4.2 ± 1.5
19.7 ± 2.9 6.7 ± 1.7
21.0 ± 4.4 5.5 ± 1 .7
19.7 ± 3.9 7.6 ± 1 .5
23.0 ± 3 .1 4.4 ± 1 .3
22.7 ± 2.5 5.0 ± 1 .6
TslTv
3 .4 ± 1 .3
4.1 ± 1 .4
4.2 ± 2.2
4.7 ± 4.0 � - --
4.2 ± 2.0
4.0 ± 1 .5
4.0 ± 1.8
3 .0 ± 0.9
S.7 ± 4.0
3.7 ± 2.0
3.9 ± 2.0
4.5 ± 2.1
4.7 ± 2.2
3 .6 ± 1 .5
6.3 ± 3.7
3.2 ± 1 .5
4.1 ± 1 .7
2.6 ± 0.6
5.7 ± 2.0
S.6 ± 4.0

Cltapter 4, page 44.
Table 4.3. Variability (mean ± standard deviation) in tile tot.a1 number of observed nucleotide
substitutions and numbers of transitions, and the transitioIJ./t.msversion (fstrv) ratio in relation to the I
numbers of transversions in the skink data set There is tio significant incr� in the number of
transitions as the number of transversions increases (F9 368= 1.81, P = 0.065). Th� correlatiol}
coefficients between numbers of transversions and res�Jvely, the total number of differences and the
numbers of transitions are also shown.
No.
No.Tv Obs. Total
I 6 18.3 ± 4.9
2 14 20.7 ± 2.2
3 40 20.5 ± 5 .1
4 76 22.8 ± 5.7
5 94 24.2 ± 3.7
6 70 25. 1 ± 2.9
7 48 26.1 ± 2.7
8 16 29.4 ± 1 .5
9 8 30.0 ± 2.9
10 6 30.7 ± 1 .0
All 24. 1 ± 4.9
0.26
Transitions
17.3 ± 5.0
18.7 ± 2.2
17.5 ± 5 .1
1 8.8 ± 5.7
19.2 ± 3.7
19.i ± 2.9
19.1 ± 2.7
21 .4 ± 1 .5
21.0 ± 2.9
20.7 ± 1 .0
18.9 ± 4.2
I 0,�3
Tslfv
17.3 ± 4.9
9.4 ± 1 . 1
5 .8 ± 1 .7
4.7 ± 1 .4
3.8 ± 0.7
3.2 ± 0.5
2.7 ± 0.4
2.7 ± 0.2
2.3 ± 0.3
2.1 ± 0.1
4.3 ± 2.5
. . --

Fig. 4.2. Numbers of transversions in pairwise comparisons of the skink 125 rRNA sequences. ploued against numbers of transitions. Note the variability iri numbers of transitions and trans versions. The correlation coefficient. ?-. is 0.03.
11�-----------------------------------------------------------------------'
10-
• III III
•
'I III III • • III • • w. � w. �
I : '" . . '" . '" . . � . III
'" • w. '" '" • • • • • III '" • III •
w. � w. '" • III W. • III '" III • • '" � '" III '" • '" III
HI '" '" '" '"
I . '" ?fI ..
1
04---------�--------�--------�----------r_--------�--------_r--------_i • 10 1� 10 SO � 5
S5
so
� 25 � � 20 � � 11\
10
5"
No. T.rauIitbJB
Fig. 4.3. Total number of differences in pairwise comparisons of the skink 125 rRNA sequences plotted against numbers of transversions. There is only a weak correlation between the number of transversions and the total number of observed nucleotide substitutions (?- = 0.26).
• '" • • • '" '"
• III '" • '" • • • '" • • • • ill '" •
• • • • '" • • '" • • • •
• '" • • '" '" '" '" • '" • • .- • • '" • • • • • '" • • • • •
• • • • • '" • '" • •
• • '" 101 • '"
• '" '" '"
• '" '" '"
• '" '"
'"
0;0-----.-----,2r-----
3r-----.-----5.-----ar-----r7 -----r----�----�
10----�11
No. 'I'nmsversions

20 -�.
18
UI
a
I" 10
d 8 Z .
8
Fig. 4.4. Relationship between numbers of transitions and numbers of transversions for a. ralites (12 taxa; ? = 0.40) and b. pecoran bovids (15 taxa; ? = 0.55). Compare to figure 4.2.
•
• •
• •
•
• • • •
• •
•
4 • 4 4
•
•
• •
•
• • • •
• • A
• • •
• •
6o . • • • •
4 •
•
• A 4
I A Ratit81

100
80-
80-
70-! j 80-
50-
1 114 41
30-
20-
10-
0
Fig. 4.5. Proportion of transition substitutions in pairwise comparisons of the skink 1 2S rRNA sequences. Note that total sequence divergence is less than 10%, and that in this data set there is no trend for the proportion of transitions to decrease as the degree of divergence increases (,.'2 = 0.(01).
* .,. .. ,; 'l'raDsitionI
iii II! . . --
II! II! iii .. !II w- .. iii iii iii
!II • iii • • II! • iii
II! II! !II II( • II( II( • iii
II! iii • iii iii lI! .. iii • • • iii .. !II lI! .. .. II! II! ... .. • .. .. II! iii
.. !II • II! • • iii JI! ;II II! ;Ii IIi it; lIC • • .. w !'< IIi • • M! iii ;Ii
!4' II! 11( iii II! II! II! iii iii
II!
10 15 20 25 30 sG Total No. Differences

Otapter 4. page 45.
The expected Ts/Tv ratio if the sequences were saturated can be calculated from equation 1 1 in
Holmquist (1983): (Aoo + Goo) (Coo + Uoo)
(AooGoo) (CooUoo)
where' �Goo etc, are the equilibrium base frequencies. Using the frequencies from table 2.2, the
saturated Ts/Tv should be 0.47, well below the smallest observed ratio of 2.6 for L. injrapunctatum
(Table 4.2).
Although there is no strong trend for the number of t:raI1sversions to increase as more transitions occur
(Fig. 4.2), the Ts/Tv ratio does decline as the number of transversions increases (Fig. 4.6). More
importantly, the variation associated with Tsffv ratios also �eclines as the number of transversions
increases (Fig. 4.6). This trend is also seen in other data sefS (Fig. 4.7) and suggests that this asymptotic
decline in Ts/Tv ratio is due to greater variability in the proportion of transition substitutions when only
a few transversions occur, rather than being indicative bf saturation of substitutions.
Simulations I
To examine the extent to which the variability in the skink data set is due to stochastic processes
computer simulations were performed to randomly generate sequences. Parameters for the simulations
are shown in table 4.4, the key variable being the Ts/Tv ratio. Values for sequence length (384) and
number of expected changes (25) were chosen to correspond with the skink data. To generate a similar
size transition and transversion matrix as the skinks (Table 4.ib), 200 iterations (runs) of the program
were performed (Table 4.4). Longer iterations of 100,000 gave similar results (Table 4.4).
The program creates a random sequence of the specifieq length. A new sequence is then derived from
this with sites of substitutions chosen randomly. All sites in the sequence are free to vary. The
probability of each change being a transition is determined �y the Ts/Tv ratio read in at the start of the
program.
The average number of substitutions between pairs of skink sequences is 25, and the Ts/Tv ratio about
four (Table 4.2). In the simulation, when the expected number of changes is set to 25 and the Ts/Tv ratio
is 4: 1 then both the frequency distributions (Fig. 4.8) and numbers (Fig. 4.9) of traDsitions and
transversions are similar to the skink data (Figs. 4. 1 & 4.2). The same pattern of variability in numbers
of transitions and transversion is also seen when different numbers of substitutions are allowed (Fig.
4. 1 0), and when the Tsffv ratio is altered (Fig. 4.1 1). The apparent skewness shown in the transition and
transversion frequency distribution (Fig. 4.8, see also the skink distributions in Fig. 4.1) is a reflection of
sampling error since this disappears when a larger number of simulation runs are performed (Fig. 4. 12).
The pattern of variability in numbers of transitions and transversions (Figs. 4.9, 4.10) is not due to
sampling error however, since increasing the number of runs does not alter the general pattern (Fig.
4.1 3). This point will be returned to shortly when other data sets are considered.

Fig. 4.6. The relationship between number of transversions and the tran,;>itibn!transversion (Ts/Tv) ratio for the skink data set. Note the decreasing means and variability of the'Ts/Tv ratios 'as the number of trans versions increases. (See also Fig. 4.7).
30,---------------------------------------------------------------------------------,
25 -
•
20- • - - . -
0
� � 15 -
�
. " . . �
• •
10-• •
.. • • I it(
5- I I • I I • I • • •
0 0 i 2 3 • 5 8 7 B g 10 11
No. Transversions

Fig. 4.7. The relationship belween number of transversions and the uansition/uansversion (fsITv) ratio for other dala selS. a. raliles (12 taxa), b. bovids (15 taxa), and c. simulaled sequences (20 taxa; see Figs. 4.8 & 4.9, and the texl). All the dala sets show the same pallern of decline in mean and variabililY in the Tsffv ratio as the number of transversions increases.
25
! a.
I .A. RaUt.e8 I II 20 $ 15 4
4
4 10 4
4 4 4
5 • t • • 4 a • ,. 4. ,. 4 4. ,. ,. ,. 4
0 0 1 2 3 • 5 8 7 8 g 10 11 12 13 a 15 18 17 18 Ig 20
No. 'l'rIDIneraioDI
25
! b.
X BovidB II 20
It :It $ % x
15
3E 10 � � )(
� ! I i 5 � I :lC: � � X * X 7. X X X A -.-
0 0 1 2 3 • 5 6 7 8 9 10 . 1 1 1 2 13 a 15 16 17 18 19 20
No. 'lnnsverBioDs
40 C. >< Simulations
iii 35 "
" " "
30 iii .. Ie Ie iii
2S " iii
0 . ., � 20 � M
"
15 .. ..
10 I " •
I I I I 5 " • I I .. I I I i I • .. • ..
0 18 19 20

OJapler 4. page 46.
Table 4.4. Parameters used in simulations of transitions and transversions. Values were assigned to be
similar to the skink data; sequence length was 384 bases and the ntimber of changes expected to occur I was assigned a value of 25. The assigned transition/transversion (tsITransversion) value is given on the
left and the mean ratio obtained from the simulations is shown in the last column:-
TslTv No. Transitions TransversionS Mean Ratio Runs (mean + Std) (mean + Std)' TslTv
2 2 0 0 1 6 . 6 ± 3 . 6 9 . 0 ± 3 . 0 1 . 9 1 0 0 , 0 0 0 1 6 . 7 ± 4 . 0 8 . 3 ± 2 . 9 2 . 0
3 2 0 0 1 9 . 0 ± 3 . 8 6 . 6 ± 2 . 5 2 . 9 1 0 0 , 0 0 0 1 8 . 7 ± 4 . 2 6 . 2 ± 2 . 5 3 . 0
-4 2 0 0 2 0 . 1 ± 4 . 6 5 . 0 ± 2 . 1 4 . 0
1 0 0 , 0 0 0 2 0 . 0 ± 4 . 4 5 . 0 ± 2 . 2 4 . 0
5 2 0 0 2 0 . 7 ± 4 . 2 4 . 3 ± 1 . 8 4 . 8 1 0 0 , 0 0 0 2 0 . 8 ± 4 . 4 4 . 2 ± 2 . 0 5 . 0
6 2 0 0 2 1 . 2 ± 4 . 5 3 . 6 ± 2 . 0 5 . 9 1 0 0 , 0 0 0 2 1 . 4 ± 4 . 5 3 . 6 ± 1 . 9 5 . 9
7 2 0 0 2 2 . 2 ± 4 . 5 3 . 3 ± 1 . 8 6 . 7 1 0 0 , 0 0 0 2 1 . 9 ± 4 . 6 3 . 1 ± 1 . 8 7 . 1
8 2 0 0 2 1 . 5 ± 4 . 4 2 . 8 ± 1 . 7 7 . 7 1 0 0 , 0 0 0 2 2 . 2 ± 4 . 6 2 . 8 ± 1 . 7 7 . 9
9 2 0 0 2 2 . 7 ± 4 . 8 2 . 6 ± 1 . 6 0 . 7 1 0 0 , 0 0 0 2 2 . 5 ± 4 . 6 2 . 5 ± 1 . 6 9 . 0
1 0 2 0 0 2 4 . 0 ± 4 . 9 2 . 5 ± 1 . 4 9 . 6 1 0 0 , 0 0 0 2 2 . 7 ± 4 . 6 2 . 3 ± 1 . 5 9 . 9

3.
20 1 -
, -� 16 -
L --
o
Fig. 4.8. Frequency distribution� of transitions (a) and transversions (b) in simulated sequence data. Sequences are 384 bases in length. Each sequence has on average 25 substitutions relative to other sequences, and a transition/transversion ratio of 4/1 . Two hundred simulation runs were performed. Compare these distributions with those of the skink data set in figure 4.1 b & c.
- -
-
..
r:"
1/ I:"
-
I " 1 /
I " [/ :.- I > , .., [/ 1 / I." ,
, /
n nnR > nn · n n T I I I I I I I I .- .- � T :T I, T .- 1 T o 1 2 S • 6 I 7 8 • 10 11 12 13 1. 16 11 17 18 18 20 21 22 2S U 26 28 27 28 2t 30 31 32 3S No. 'lraDsltioDII
26.---------------------------------------------------------------. b.
20
I � 16
1 -i L I
o

Fig. 4.10. Comparison of the relationship between the numbers of transitions and numbers of transversions for other simulations using, a.40 expected substitutions and, b.SS expected substitutions between each sequence. Sequence lengths were 384 bases, and the transition/transversion ratio was 4/1. Correlation coefficients are, respectively, 0.00 and 0.03. Compare to figure 4.9, noting that the relationship between numbers of transitions and numbers of transversions does not change as more substitutions occur. This differs from the ratite and bovid data sets where there is a trend toward a linear relationship as more substitutions occur (Fig. 4.4).
u�--------------------------�--------------�========� - I + '" c:baD&m 3.
20
•
+
+ + + +
• + + + + ...
... ... ... + + + + + + + . + + .
. + + + + + + + + + + + + + + + + + + + +
+ + + + + + + + + + + + + + + + + + + + + + + + + + + + + + + +
+
•
+
•
+
+ + + + + + . + + + + + + + + + + + + . + + + . + + + + + . + •
+ + + + + + + + • + .
+
+
+
O;---------,-----�--._--------._--------._�------_.--------_r--------� 10 20 so 40 70
No. Tnnaiticm u,-----------------------------------------------------------------------�
b.
20
Iii
� 10
Ii
!!IF ;I(
lIE
;Ii It! lIE III
!!! !!! lIE III . 111 * - * * * * - • • III
III lII. * * .'" 1It * III !!! !!! "' !I! !!! !I! 1II . IIt ;li lt! III .
III
iii *
!l! lt! 1II III III!!! !!! . . . III III lIE lIE III !!! !!! !!! !!! lIE !!! III III !I! "' lIE 1lE 1Ii !!!
!!! !!! _ !I! !!! _ . _ IIi !!! III lIE . * .1101( )If iii
O;---------,----------r---------r---------r--------_.--------�--------� 10 20 so 40 80 70
No. Tnnwlticg

�
�
Fig. 4.11. The relationship between the numbers of transitions and numbers of transversions for other simulations using, a. a Tsrrv ratio of 2/1 and, h. a Tsffv ratio of 8/1 . Sequence lengths were 384 bases, and the expected number of substitutions in each sequence was 25. Correlation coefficients are, respectively, 0.024 and 0.002. Compare to figures 4.9 and 4.10, noting the similar patterns of relationships.
20�-----------------------------------------------------------------------------' 3. x �/lT = 2
1& x ::;:: x
x x x x � x x x x x x x x
x x x x x x x x x
x x x x x x x x x x
10 x x x x x x x x x x x x x
x x x x x :It X X X X X X
X X X X X X X X X X X :It --
X X X X X X X X X X X X X
X X X X X X X X
X X X X X X X X X X
X X X X X X X
X X
04------------------.------------------.------------------r----------------� 10 20 30
No. Tnnsitiru
2O�----------------------------------------------------------------------------_, b. !8l �/lT = 8
1&
10
l1li
III III l1li l1li III
iii l1li III III III III III IIi1 III l1li IIi1 • III III III III III IQ III lIS • • • III iii 112 iii iii Ie
• III III • • III III • • • • • " • • III a iii
1lI l1li l1li • • III l1li " • • • l1li III • • III • III III III l1li • IIi1 IIIl III IZ lIS
0 10 20 31L
No. 'rlmdtIaDI

Fig. 4.12. Frequency distributions of transitions and transversions in simulated sequence data for a large number of iterations. In figure 4.8 200 runs were performed, while here the number of runs is 100,000. Increasing the number of simulation runs gives smoother frequency distributions, indicating that sampling error may account for the skewness in figures 4. 1 and 4.8.
�.---------------------------------------------------------------� 3. 10m 100, 000 l'UDII
20-
� 15--
, '[> ., 5-
��----------------------------------�========� b. IIZZ] TV, 100, 000 nms
20
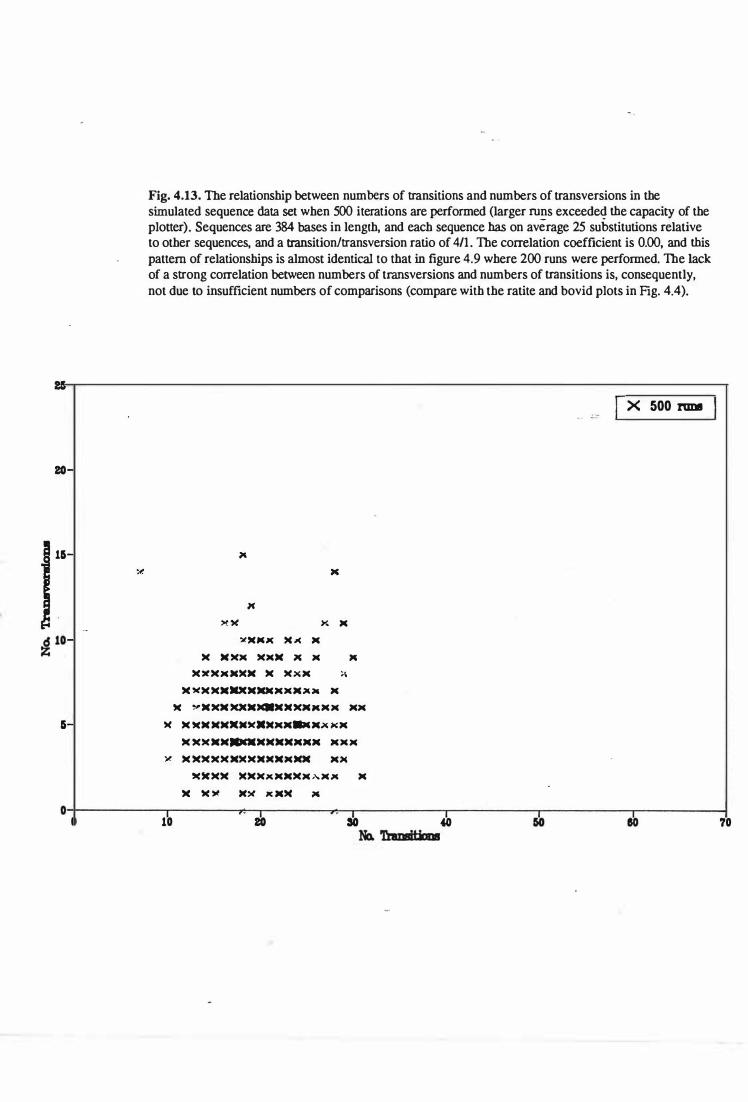
20
11
cpo �
Fig. 4.13. The relationship between numbers of transitions and numbers of transversions in the simulated sequence data set when 500 iterations are performed (larger runs exceeded the capacity of the plotter). Sequences are 384 bases in length, and each sequence has on average 25 substitutions relative to other sequences, and a transition/transversion ratio of 4/1 . The correlation coefficient is 0.00, and this pattern of relationships is almost identical to that in figure 4.9 where 200 runs were performed. The lack of a strong correlation between numbers of transversions and numbers of transitions is, consequently, not due to insufficient numbers of comparisons (compare with the ratite and bovid plots in Fig. 4.4).
x
:.1)(",)( )( .-< M
)( M )(X )(XM X M
x M
)()()(M )()(M M )( X M x
M �)( MXMXXX)(MXMXX M
M Y X XX X)(X�X)(XM "' M M MM
)( M MM MMMX)(X)(MM"MX kM
M X)( XM"'XMXXMMM M X M
x M MMX)( X)()()(XXMMX MX
X)()(M )(M)(X M)()(M � M )( M
M M >t )C)( x M)c x
X 500 nmI
Ol;----------r------�_r------�_r--------_r--------_.--------_.--------� 10 20 so 40 70
No. 'lDnait:i! OJ

Olapter 4, page 47.
Estimating Divergence from Transversions
D ue to the possibility of saturation of transitions obscuring total sequence divergence, numbers of
transversions have been used to estimate the degree of divergence between taxa (Brown et al. 1982,
Wilson et al. 1985, Miyamoto & Boyle 1989, Milinkovitch et al. 1993). As noted above however , the
numbers of transversions in pair-w ise comparisons can be very var iable (Figs. 4.2, 4 .4 , 4 .9 , 4.10, 4.13).
There will, therefore, be a higher variance associated w ith estimates of the degree of d ivergence based
on transversions than when all s ubstitutions are used . This is ill ustrated with the slDlUlation data, where
the true values for total numbers of differences are known. Multiplying the number o f observed
transversions by [1 + {TslTv ratio } ] gives an es timate fo� total numbers of differences. For example, if the number of d ifferences is set to be 25 and the TslTv ratio is 411, then on average there should be five
transversions betw een each sequence , and 5x[1 + {4 } ] w ill g ive 25 total s ubstitutions. The s tandard
deviation for this estimate of mean n umbers of s ubstit utions is however twice as large as that obtained
from using the total numbers of observed differences , as shown in figure 4.14. This is true when both the
numbers of differences (Fig 4.15) and the TslTv ratio (Fig. 4.16) are varied. Estimates of the mean
divergence between taxa are less acc urate however when the TslTv ratio is varied (Fig. 4.16)
Comparisons to Other Data Sets
The skink taxa are q uite dist inct from each other, b ut does this imply recent and rapid d ivergence or
slower change over a longer period of time ? Lack of a foss il record makes it diffic ult to detemtine what
period of time the observed sequence differences among the skinks reflec t Variation in evolutionary
rates between taxonomic groups makes estimates based on a general mtDNA evolutionary rate (W ilson
et al. 1985, 1987) d ifficult This is illustrated in tables 4.5 and 4.6. Ratite and bov id data sets (Table 4.5a
& 4.5b, respectively) show generally similar numbers of transitions and trans versions for the same
region of 12S rRNA, despite having different times of separat ion (approximately 25 and 80 million
years , respectively; Table 4.5).
Xantus iid lizards from the Caribbean and Central America are much more divergent from each other
(Table 4.5c), their sequences have many insertion/deletion events (Appendix 2), and s ubstitutions occur
in more conserved parts of the molec ule (Fig. 3.6b). They therefore either d iverged a long time ago or
their rate of sequence evolution is high. Based on fossil records, the genera in table 4.5c separated
between 35 and 70 million years (the original references for these were not seen, but are disc ussed
Hedges et al. 1991). The date of 70 million years is derived from Paleocene fossils of Paleoxantusia,
which appear to share derived features with Lepidophyma and Xantusia rather than Cricosaura (see
Hedges et al. 1991). Separation between Lepidophyma and Xantusia may have occured in the Eocene
(35-40 MY A), based on comparisons of Paleoxantusia foss ils . The phylogenetic relationships of the
Paleoxantusia are not well known however , and there are few Xantusia and Lepidophyma fossils (see
Hedges et al. 1991), so estimates of their divergence times , and hence rates of sequence evolution , are
possibly less reliable than those for the birds and mammals .

35
30
25 � -
I" 15
10
Fig. 4.14. The means and standard deviations of estimates for the real number of substitutions. One estimate ("Obs.") is based on the total number of observed differences, while the second ("Pred.") uses and the number of observed transversions to determine the total number of substitutions. Simulated sequence data were used, and the mean number of substitutions is expected to be 25. The transition/transversion ratio was set to 411, so the expected numbers of .§ubstitutiolls was calculated from transversions by multiplying the number of transversions by 5. The same mean number of differences are obtained when either the total numbers of observed differences or the numbers of transversions are used, but there is a larger standard deviation associated with the estimate derived from trans versions. There will, therefore, be greater uncertainty in the accuracy of the estimate of total sequence divergence between taxa when only the numbers of transversions are used (see the text).
.r.:
I � Obi. (25) � Pred. (25) I Mean ± Sid. Obs.
Pred. 25.3 ± 4.9 25.9 ± 1 1 .3
'10 '15 80 85 80 85 100 105 110

i{ -
40
_ 3.
so -
-
-
10 -
,-
o
40
Fig. 4.15. The means and standard deviations for estimates of the real number of substitutions based on the total number of observed differences ("Obs. to) and the number of transversions ("Pred. to). Simulated sequence data was used, and the transition/transversion ratio was set to 411. In a, the expected number of substitutions is 40, and in b it is 55. Calculations are as described in figure 4.14. The estimate based on the number of transversions has a higher standard deviation than that derived from the observed total numbers of substitutions.
I tE?l Obi. (40) IE33 Pral. (40)
Mean ± Std. Obs. 40.3 ± Pred. 39.4 ±
- -
--
- - --
W"1 � � jj W"1 In 113 In I I I I I I I I I I o 6 a � " � � � 40 � � � � � � � " e � H m a6 1a Total No. Differences
6.3 13.7
I
h. I D Obi. (55) [X) Pral. (55) I
Mean ± Std.
I -
� I -
i-
,-
� � - - � 10
> v � � x > 1\ v V >< >
- > � 1\ � X > >< D< - � � > > > >< > D< ><
� �Jlrv > 1\ X � r. >< x x � > > > [X >< >< IX r. I I I I I I o o 6 a � � � � � 40 � � � " 7 7
Total No. Dit!erences
Obs. 54.6 Pred. 55.1
n I)l ,.., n I I 1 1 11
± 6.5 ± 16.9

Fig. 4.16. The means and standard deviations for estimates of the real number of substitutions based on the total number of observed differences ("Obs .") and the number of transversions ("Pred."). Simulated
sequence data was used, and the expected number of substitutions is 25. In a. , the transition/transversion . ratio was set to 2/1, and in b. it is 8/1 . Calculations are as described in figure 4.14, except that
transversions'are now multiplied by 3 and 9 in a and b, respectively. Once again (compare with Figs.
4.14 & 4.15) the estimate obtained from numbers of transversions has a higher standard deviation than that derived from observed total numbers of substitutions.
�,-----------------------------------------------------------------------�
i{ -
30
25
10
110
75
70
55 1-
I-
i -
1 -
50
515
150
, -
1 -
, -j: 1 -30
215
20
, -, --
10 -
o
a.
o 3 8
b.
.
I o II
1_ Ob& ('lJ/lV=2) E'2I Pred. (Ts/lV=2) I Mean ± Std. Obs.
Pred. 25.5 ± 4.4 26.4 ± 8.4
II 12 16 111 21 2" 27 30 33 38 311 � � 5 1
� � )� ';1'
� I 111
. Total No. OOferences
T
� � �
. � '� � � � . ·0 ��
.>{J � �?' � , .�� ',(S:'
27 35
Total No. DitfereDceB
[ � Ob& (Ts/l'v=8) !HE Pred. (Ts/l'v=8) I Mean ± Std. Obs� 25.2 ± 5.2
Pred. 22.9 ± 13 .9
EHB -I I 83

OJapter 4. page 48.
Table 4.5. Distance matrices for 12S rRNA sequences from other vertebrates. The same region of the
gene (that bounded by the PCR prin!ers 12SAR and 12SBR) is compared for all groups. Transitions are
shown above the diagonal and transversions below. Full species names and GenBank accession numbers
are given in Appendix 2.
Table 4.5a. Ratites. Familial divergence times up to 80 million years ago (Sibley & Ahlquist 1981, Cooper et aI. 1992).
Transvers ions ( below diagona l ) \ Trans it i ons ( above ) Ram Rda Ost Cas Emu BrK RoK LSK Meg Din Ano Pac
Rhea amer . ( Ram)
DarwinsRhea ( Rda ) 0 Ostrich ( Os t ) 7 Cassowary
Emu
Brown Kiwi
Roa Kiwi
LSpot Kiwi Megalapt .
Dinornis
Allomalopt .
Pacbyornis
( Ca s ) 6 ( Emu ) 6 ( BrK ) 1 0 ( RoK ) 9 ( LSK ) 9 (Meg ) 8 ( Din) 7 ( Ano ) 7 ( Pac ) 7
1 0 2 9 3 4 3 1 3 6
7 2 4 6 3 6 3 2
1 0 7 6 9 6 5 9 6 5 8 9 8 7 8 7 7 8 7 7 8 7
3 6 3 0 37 3 0 2 4 3 0 17 22
2 7 6 5 1 5 1 8 12 7 1 1 7 1 1 7 1 1
3 0 3 1 3 0 3 1 2 6 2 7 1 8 1 9 2 2 2 3 1 5 1 3
2 o
1 1 1 1 1 0 1 0 1 0 1 0 1 0 1 0
1 9 1 8 23 2 8 2 7 2 9 2 9 3 0
1 1 1
2 5 2 4 2 8 2 8 2 7 3 1 2 9 3 0 1 0
o o
2 7 2 6 2 6 2 5 2 3 2 2 2 6 �-27 2 9 2 8 2 9 2 8 2 9 2 8 3 0 3 0 1 1 8 1 1 1 0
3 o
Table 4.5b. Pecoran bovids. Most of these bovids diverged from each other 23-28 million years ago
(Kraus & Miyamoto 1991, Allard et al. 1992).
B . tauru
Ca . birc
M. kirki
K . e l l ip
G . tboms
D . dorca
Ce . maxw
Bo . trag
Aa . mala
O . virgi
Mu . raav
H. in arm
C . unico
A . amari
T. napu
Transvers ions ( below diagonal ) \ Trans it ions ( above ) Bta Cah Mki Mki Ke l Gth 000 Cam Bot Aem ovi Mur Hin Aam Tna
3 3 3 5 5 2 2 4 5 5 6 5 7
1 3
2 7
2 2 4 4 1 3 3 4 4 5 4 6
1 0
23 2 5 3 1 3 1 22 1 9 2 9 2 3 2 5 2 5 1 4 2 2 2 5 19 1 8 2 5 2 0 2 3 2 1 2 4
2 0 1 6 2 1 17 2 1 1 6 1 4 1 5 1 9 2 2 2 2 3 2 1 23 3 0 2 6 2 5 2 5 4 4 2 6 19 2 1 2 3 2 1 2 4 2 7 4 4 6 2 1 2 9 2 6 2 7 2 8 2 8 1 1 3 3 2 1 2 0 2 2 23 2 1 3 3 5 5 2 2 3 2 2 2 2 2 1 3 3 5 5 2 4 2 1 2 9 2 9 2 4 4 6 3 5 5 1 8 1 3 4 4 4 6 3 5 5 2 17 5 5 5 7 - 4 6 6 3 3 4 4 4 6 3 5 5 2 2 3 6 6 8 8 5 5 7 8 6 9
1 0 12 1 4 1 0 1 1 1 3 1 1 12 1 4 1 5
2 4 2 6 3 3 2 3 2 8 3 9 1 8 2 4 3 4 2 8 3 0 3 5 2 9 2 7 4 0 3 0 3 0 4 1 2 2 2 5 3 9 2 2 2 8 3 7 2 5 2 5 4 4 1 2 2 7 3 3 1 6 3 0 3 5 17 27 3 3
27 3 5 8 3 2
1 4 1 6

Olapter 4. page 49.
Table 4.Sc. Xantusiid lizards. Divergence of Cricosaura and Xantusiid lineages approximately 70
million years ago, Lepidophyma and Xantusiids 40-35 million years ago (see Hedges et al. 1991).
Transvers ions ( be l ow diagona l ) \ Trans it ions ( above )
Cty Le a Xbo Xhe Xvi Xri
c . typi ca 4 8 4 4 42 - 4 0 4 0 Le . smi thi i 5 5 4 8 4 8 4 8 4 5 X . bolsonae 57 3 8 3 0 2 9 2 8 X . henshawi 57 42 1 8 2 2 23 X . vigi l i s 5 5 3 9 1 1 1 1 1 1 X . rivers . 5 1 3 7 9 1 1 4
Table 4.5d. Great Apes (Hixson & Brown 1986). Orangutan-Gorilla divergence estimated at 13-15
million years (Miyamoto et aI. 1988), and Gorilla-Chimpanzee-Human at 4-7 million years
(Miyamoto & Goodman 1990).
Tv ( below diagonal ) \ Ts ( above )
Ora Gor PCh CCh Hum
Orangutan 1 9 2 4 2 5 2 1 Gorilla 1 1 1 1 0 1 0 PygmyChimp 0 1 3 9 CommonChimp 0 1 0 1 1 Human 0 1 0 0

Olapter 4. page SO.
Table 4.6. Comparison of estimated times of divergence among the skinks based on rate estimates for
the same 12S rRNA fragment from other vertebrate taxa (see Table 4.5). Numbers of differences
between selected taxa from tables 4.5a-4.5d are sbown and the approximate nucleotide cbanges per million years are calculated from suggested divergence times. These rates are then applied to numbers of
differences observed in the skink data set. The large differences in rates between the different data sets
illustrates that rates can vary between taxonomic groups. ,Estimates �f divergence times for the skinks
based on any of these comparisons are therefore likely to be unreliable (see text).
No.2 Est.3
Taxal Difr. Time
Ost-Rama 36 80
Cri-Xrib 9 1 70
Les-Xric 82 35
Bta-Aamd 3 1 25
Ora-Hume 21 14
CCb-Humf 10 5
lComparisons between:
a Ostrich & Rhea americana (fable 4.Sa)
c L smithii & X riversiana (fable 4.Sc)
e Orang-ulan & Human (fable 4.Sd)
2 Number of observed differences bewteen taxa.
Estimated timeS
Changes per4 if Differences of Million Years 25 30
0.5 50 60
1 .3 19 23
2.3 1 1 13
1 .2 21 25
1 .5 17 20
2.0 12.5 15
b C. typica & X riversiana (fable 4.Sc)
d Bas taurus & A. americana (fable 4.5b)
f Common chimpanzee & Human (fable 4.Sd)
3 Estimated times of divergence in millions of years (see Table 4.5).
4 Number of substitutions/million years calculated from Number of Differences and Estimated Divergence Times.
35
70
27
15
28
23
17.5
S Times of divergence (in million years) based on rates in previous column and applied to a range of observed numbers of nucleotide
differences in skink pair-wise comparisons (see Table 4.2).

OJapter 4, page 51 .
Approximate rates of evolution for this region of 12S rRNA are presented in Table 4.6, using sequence
differences and times of separation from tables 4.5a-d. These values are then used to calculate times of
separation for skink taxa when between 25 and 35 nucleotide substitutions occur (fable 4.6). The rates of
change for the 12S rRNA sequence vary between the different groups, so it is difficult to determine times of
separations for skinks based soley on these comparisons, though they could have diverged 70 million years
or more ago (Table 4.6).
While the xantusiid lizards are also small lizards, using their rates of 12S rRNA evolution (Table 4.6) as
estimates for a skink rate is liable to be inaccurate. As noted above, times of separation of the xantusiids may
be imprecise. In addition, the xantusiids have many differences between them (fable 4.5c), whereas the
skinks have comparatively few (fable 4.1 b), so the error associated with extrapolating rates of sequence
evolution from xantusiids to skinks is likely to be large. Other ways of estimating times of separation of the
skinks will be discussed in Chapter Five.
Changes in the Context of Secondary Structure
One quarter of the sites in the skink sequence are variable (Fig. 4.17). For the sites which do change it is
important to establish if there are patterns in the rate at which they accumulate mutations. Rapidly changing
sites or regions are expected to be most informative for relatively closely related taxa, while greater
resolution for more divergent taxa can be obtained from consideration of more conservative sites (Simon
1991, Dixon & Hillis 1 992).
In the skinks most of the transversions, and the most variable positions (in terms of number of taxa which
differ), occur in the unpaired portions of the most variable regions (S26, S34, L38 · & S46; Fig. 4.17). Four
transversions occur in helices, but none of them have a corresponding compensatory change in the other
member of the base pair (Fig. 4.17). Eight sites had both ti'ansitions and trans versions, and more than half the
taxa are variable at four of these sites (positions 101, 203, 204 & 206; Table 3.1 , see also Fig. 4.17),
suggesting that these locations may be sites of multiple changes. The effect that these highly variable sites
have on phylogenetic analyses is investigated in Chapter Five.
Five pairs of taxa have fewer than 1 5 differences between them (L. microlepis+L. smithi, L. grande+St. Is.
Green, L. inconspicuum+L. notosaurus, L. n. polychroma+L. n. nigriplantare, and L injrapunctatum+La.
guichenoti; Table 4.1 a). There is a trend for these pairs to differ at the most variable regions (S26, L38 ' and
S46; Fig. 4.18). However, L. n. polychroma and L. n. nigriplantare differ by 1 3 substitutions but some of
these occur in the more conserved regions of the molecule (S2 ' for example; Fig. 4. 1 8). In addition, some of
the most variable sites, position 101 for example, accumulate differences only between more distantly related
taxa (Fig. 4.19). Other regions also tend to accumulate changes as the number of differences between taxa
increases (e.g., L30 ' , S34, SL40, and U5 ' ; Fig. 4. 19).
Similar analyses of closely related ratites suggest that regions S26, L34 ' and SL40 are the first to change in
these birds (Fig. 4.20a). These regions are also the most variable in comparisons between more distantly

Fig. 4.17. Variable sites in the skink 12S rRNA domain m. Constant sites are shown as it, transitions as .. and transversions by " . Sites at which both transitions and transversions occur are indicated by • . Base pairings are shown by - and I (and * for G*U pairs), while a colon (": ") denotes less certain bonds. Every tenth base is marked by ".". Regions of the molecule are identified as either paired (S) or unpaired (L) as described in Chapter Three.
I I I I I I
t:::t:rtt• tr:i:�:;:;::;::l.uSr?> 12SA<
l� t�� .l r:: · · ·
�: ::�mI::'A T • ·?:Ii: T * I I I I * � . S26 ::tr:�: :::::t�.u:\ , }H -fW ;.;.;. �{:
-@ S20 '
I I I * I I I I I I >12SB<tJI tt:fJ: tt :::n:r::
. .
T- -::r S4 6 �- -:t:
.�--� . - -� �--�
::g �
A ...... . : .... : ... :.: .. :.::: .• ?�� � �:::: ....•.
84 3
L4 3 '
)t
:tA A Am:: L4 5 ' A- -A
:t:--f:: 84 5
�- -:::::: :::::: �
T T � �

10
II
8
7
I � I � �
1
Fig. 4.18. Location of nucleotide substitutions in 12S rRNA sequences for pairs of taxa which have only a small number of differences between them. The sequence was divided into regions as described in Chapter Three. Most of the substitutions for these pairs of taxa occur in 526, L38 ' , and around helices 543-546. The L. n. polychroma+L. n. nigriplantare pair are unusual in that differences between them can occur in some of the more conserved regions of the molecule (see Figs. 3.5 & 4.17). The pairs of taxa and numbers of observed substitutions between them are:
Lmi vs Lsm Lgr vs SIG Lin vs Lno Lfr vs Lag Lnp vs Lnn
=
=
=
= =
L. micro Ie pis & L. smithi (5 substitutions). L. grande & Stewart Island Green (8). L. inconspicuum & L. notosaurus (12). L. infrapunctatum & Lampropholis guichenoti (12). L. n. polychroma & L. n. nigriplantare (13). .
r" - .. __ .. ... - . .. .... --. . . . . . . _ . .. -- -'" . .. . . . .. - - . . .. . .' 1 l _ lml w l.sm � Icr w sr; OO Un w lDo i i 9±l ltr W t., � lDp l'll lDn I C-_.� __ .. _ _ __ _ . . _. _ ___ . __ _ .. _ __ _ ... _ ._ ... _ _ _ .-J
_ .

Fig. 4.19. Comparison of regions of variability in the 12S rRNA sequences for pairs of taxa which have few ("close") or many ("far") substitutions between them. The data for taxa with few differences between them is the same as presented in figure 4.18, though the y axis now represents the proportion of sites in the molecule which are variable. Comparisons between pairs of taxa which have larger numbers of substitutions between them ("far") were done in the following way. From the "Close" data -set the locations of nucleotide substitutions between L. n. polychroma and four of the other taxa (L. microlepis [22 substitutions], L. grande [24], L. inconspicuum [29], and L. injrapunctatum [34]) were noted. The total numbers of differences in each region for these comparisons were then used to calculate the proportion of variable sites. Note that region S26 has a similar proportion of variable sites when both "close" and "far" comparisons are made. L38 ' however, is relatively more variable among taxa which have few numbers of differences between them, while S34 and L46 ' have higher proportions of substitutions when more distantly related taxa are compared. Different regions of the skink 12S rRNA molecule therefore accumulate substitutions at different rates.
��------------------------------------------------------�------------�
20-4
-a � . 1 101 p. ,
5� : 1 } !
o . 925' 920' 928 sag

Fig. 4.20a. Comparisons of regions of variability in the 12S rRNA sequence for closcly and more distantly related ratites. Calculations are described in figure 4.19. For closely related ratites the numbers of differences between the following pairs of taxa were counted;
Rhea americana & Pterocnemia pennata (Darwin's rhea) [10 subsititutions] Apteryx haastii (Roa kiwi) & A. owenii (Little spotted kiwi) [2 substitutions] Megalapteryx didinus & Dinomis novaezealandiae [ 1 1 substitutions] Dinornis novaezealandiae & Anomalopteryx didifonnis [ 1 1 substitutions] Anomalopteryx didiformis & Pac/zyornis elep/zantopus [3 substitutions]
For comparisons between more distantly related ratites the A. haastii sequence was compared to each of the four moa sequences (see Table 4.5a).
As in the skink sequences (Fig. 4. 19), S26 is one of the most variable regions in both closely and more distantly related ratite taxa. SlAO however is more variable between more closely related ratites than it is in skinks. Note that the region L38 I has very few substitutions in the ratites, in contrast with its variability
.in the skinks (Fig. 4.19). uT7----------------------------��====��====� a. � aa. n.ttt. � Elwl ll Vaa
20
b.
1
� � � � � � � m � � � � _ a _ � m � _ � � � �
Recian Fig. 4.20b. Comparisons of regions of variability in the 12S rRNA sequence for the most closely related great apes; the two chimpanzee species (pygmy chimpanzee and common chimpanzee; 3 sequence differences) and the common chimpanzee and human ( 1 1 substitutions; see Table 4.5d). There appears to be a tendency for substitutions to occur in regions S34, SlAO, S45 and lA5 I flfsL

OIapter 4, page 52.
related ratites as well (Fig. 4.20a), so it may be difficult to differentially weight regions for taxonomic
comparisons. Among the great apes, regions S26, S34, SIAO, S45 and 1A5 ' vary (Fig. 4.20b). Similar
comparisons were not made in the bovid data set since taxa differ from each other by more than 1 5
substibJtions (Table 4.5c).
DISCUSSION
The 1 2S rRNA sequences from the skinks appear unusual because of the weak correlation between numbers
of transitions and numbers of transversions (Fig. 4.2). A bias in favour of transitions is observed however, as
has been observed for other groups and sequences (Fitch 1967, Vogel 1972, Wilson et al. 1985, Jukes 1987,
Moritz et al. 1987). The cause of this bias is not clear though. Differences in the extent of the transition bias
occur in mtDNA (see for example Vawter & Brown 1986, Thomas & Beckenbach 1989, DeSalle et al.
1987), and transition biases are found in nuclear sequences as well (e.g., Fitch 1967, Jukes 1987), so the
absence of a mis-match repair system in mitochondria (Wilson et al. 1985, Schaaper & Dunn 1987) may in
itself be insufficient to account for a biased rate of fIxation of transitions.
The variability in the proportions of transitions and transversions does not seem to be due to sawration of
transition mutations. A common feature of mtDNA sequence evolution is the decline in the proportion of
transitions as time since separation increases (Wilson et al. 1985, Moritz et al. 1987, Miyamoto & Boyle
1989). The skink taxa have relatively few differences between them (less than 10%), and forty two percent
of the substitutions in the skink data set are singletons. The proportions of transitions also do not show a
tendency to decline as more differences accumulate (Fig. 4.5), which suggests that the degree of divergence
between the skink taxa has not been obscured by many unobserved changes.
The relative decline in numbers of transitions in skinks is apparent however when the Ts/Tv ratio is plotted
in relation to the number of transversions (Fig. 4.6). This is a common trend though (Fig. 4.7), and the fact
that the skink Ts/Tv ratios (fable 4.2) were much larger than the asymptotic value of 0.47 indicates that
saturation of fIxed mutations has not occurred.
The variation in the numbers of transitions and transversions among the skinks (Fig. 4.2) may be attributed
in part to the stochastic nature of the substibJtion process. There is variability in both the ratites and bovids
when fewer than 30 transitions occur (Fig. 4.4). As more transversions accumulate variability decreases
(Table 4.3, Figs. 4.4, 4.6, 4.7), which also suggests that the variability is related to having a relatively small
number of changes. The observation that there may be a relatively high number of transversions in
comparisons between taxa with few differences, but not when more divergent taxa are compared (see for
instance Stewart Island Green; Table 4. 1 b) could be related to sampling error.
The simulation studies also indicated that numbers of transversions can vary in relation to the number of
transitions (Fig. 4.9). However, the observation that this variability did not decrease as more substitutions
occurred (Fig. 4.10), or as the Ts/Tv ratio was varied (Fig. 4.1 1), suggests that there is a difference between
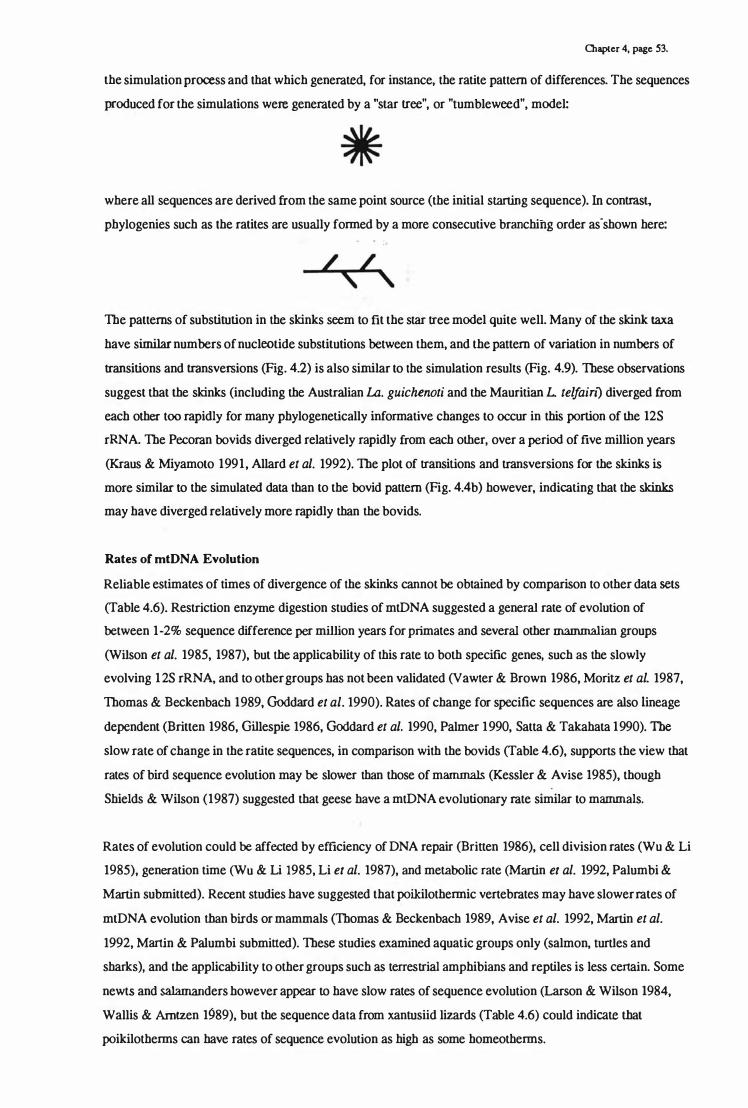
Olapter 4, page 53.
the simulation process and that which generated, for instance, the ratite pattern of differences. The sequences
produced for the simulations were generated by a "star tree", or "tumbleweed", model:
where all sequences are derived from the same point source (the initial starting sequence). In contrast,
phylogenies such as the ratites are usually formed by a more consecutive branching order as-shown here:
/ / , ,
The patterns of substitution in the sldnks seem to fit the star tree model quite well. Many of the sldnk taxa
have similar numbers of nucleotide substitutions between them, and the pattern of variation in numbers of
transitions and transversions (Fig. 4.2) is also similar to the simulation results (Fig. 4.9). These observations
suggest that the sldnks (including the Australian La. guichenoti and the Mauritian L. telfain1 diverged from
each other too rapidly for many phylogenetically informative changes to occur in this portion of the 12S
rRNA. The Pecoran bovids diverged relatively rapidly from each other, over a period of five million years
(Kraus & Miyamoto 1991 , Allard et al. 1992). The plot of transitions and transversions for the sldnks is
more similar to the simulated data than to the bovid pattern (Fig. 4.4b) however, indicating that the sldnks may have diverged relatively more rapidly than the bovids.
Rates of mtDNA Evolution
Reliable estimates of times of divergence of the skinks cannot be obtained by comparison to other data sets
(Table 4.6). Restriction enzyme digestion studies of mtDNA suggested a general rate of evolution of
between 1-2% sequence difference per million years for primates and several other mammalian groups
(Wilson et al. 1985, 1987), but the applicability of this rate to both specific genes, such as the slowly
evolving 1 2S rRNA, and to other groups has not been validated (Vawter & Brown 1986, Moritz et al. 1987,
Thomas & Beckenbach 1989, Goddard et al. 1990). Rates of change for specific sequences are also lineage
dependent (Britten 1986, Gillespie 1986, Goddard et al. 1990, Palmer 1990, Satta & Takahata 1990). The
slow rate of change in the ratite sequences, in comparison with the bovids (Table 4.6), supports the view that
rates of bird sequence evolution may be slower than those of mammals (Kessler & A vise 1985), though
Shields & Wilson (1987) suggested that geese have a mtDNA evolutionary rate similar to mammals.
Rates of evolution could be affected by efficiency of DNA repair (Britten 1986), cell division rates (Wu & Li
1985), generation time (WU & Li 1985, Li et al. 1987), and metabolic rate (Martin et al. 1992, Palumbi &
Martin submitted). Recent studies have suggested that poikilothermic vertebrates may have slower rates of
mtDNA evolution than birds or mammals (Thomas & Beckenbach 1989, Avise et al. 1992, Martin et al.
1992, Martin & Palumbi submitted). These studies examined aquatic groups only (salmon, turtles and
sharks), and the applicability to other groups such as terrestrial amphibians and reptiles is less certain. Some
newts and salamanders however appear to have slow rates of sequence evolution (Larson & Wilson 1984,
Wallis & Arntzen 1989), but the sequence data from xantusiid lizards (Table 4.6) could indicate that
poikilotherms can have rates of sequence evolution as high as some homeotherms.

OJapter 4, page 54.
Slower rates of evolution in poikilothetmS may be related to their lower basal metabolic rate. A high
metabolic rate (as in many birds and mammals) may result in a faster turnover of mtDNA, and consequently
an increased chance of DNA replication errors (Martin & Palumbi submitted). High body temperatures may
also lead to greater levels of oxidative damage in DNA (Shigenaga et al. 1989). Some lizards, and other
reptiles, however may not have a single basal metabolic rate, (e.g., Werner & Whitaker 1978; see also
Schmidt-Nielsen 1986). If the skinks do have a slower rate of mtDNA evolution than mammals then this
implies that many of the skink taxa diverged from each other much earlier than th� separatiol.l of the
orangutan from the other great apes, more than 15 million years ago (see Tables 4.5d, 4.6). This period of
time contrasts sharply with the suggestion, based on morphoiogical comparisons, of 5 million years
separation between New Zealand and Australian Leiolopisma (Hardy 1977).
Allozyme data (Daugherty et al. 1 990b, C.H. Daugherty & G.B. Patterson pers. comm.) and immunological
studies (Baverstock & Donnellan 1990, Hutchinson et aI. 1990) also indicate much greater times of
separation of skinks than morphological features imply. Skinks have no fossil record in New Zealand (Bull & Whitaker 1975) and are poorly represented in fossil faunas elsewhere as well (Carrol 1969, Molnar 1991).
Rates of skink molecular evolution cannot therefore be directly calibrated with geological time. The
dynamics of reptilian molecular evolution have not been investigated so it may be inappropriate to
extrapolate rates from other groups, such as birds or mammals. Reptilian groups with more substantial fossil
records, such as crocodilians and iguanids (Carroll 1969, Estes & Price 1973, Pregill I989), require DNA
sequencing studies so that rates of molecular evolution in reptiles can be investigated in more detail. The use
of other information to infer times of divergence for the skinks will be considered in the next chapter after
phylogenetic analyses of the sequences.
&itimating Degree of Divergence with Transversions
The variability in the number of transversions implies that estimates of total sequence divergence based on
numbers of trans versions (Brown et al. 1982, Wilson et al. 1985, Miyamoto & Boyle 1 989, Milinkovitch et
aI. 1 993) may have a high level of uncertainty (Figs. 4.14. 4.15. & 4. 16). More comprehensive simulation
experiments and analyses than those presented here however are required to examine this problem in detail.
Regions of Variability
Two points emerge from comparison of changes between closely related taxa (or those with the fewest
number of differences). The flrst is that certain regions do have a tendency to vary flrst (Figs. 4. 19, 4.20).
Helix 26, part of domain II, is very variable within and between vertebrate groups (Table 3.3), but still
retains its helical structure. Helix 34 in skinks is also variable, more so than some of the unpaired regions
(Fig. 4.17). These two helices are not primary points of contact for ribosomal proteins, nor do they appear to
be sites of tRNA binding (Gutell et al. 1985, Noller et al. 1990). Helix 33 in contrast is well conserved (Fig.
4.17, and see also Table 3.3), a fact also noted by Simon (1991) for cicadas. This helix appears to be a point
of contact for ribosomal protein S 19 (see Stem et al. 1989, Ebresmann et al. 1 990, Noller et al. 1990) and so
the conserved nucleotides may be associated with this.

OIapter 4. page 55.
The second point is that different groups of vertebrates may have different centres of variability. L38 ' is very variable in skinks, xantusiids and bovids but not in ratites or the great apes (Table 3.3, Fig. 3.6). These
latter two groups show more variability in SUO and S45, respectively (Figs. 3.6 & 4.20). The fact that
different groups tend to vary in different regions suggests either that there may be little functional
significance to these patterns of variability, or that functional constraints differ between groups. Differences
in sites and frequencies of Variability between groups will be affected by how many taxa are examined for
each group, and also by how closely related they are, so comparisons of more species and groups are
required to determine if there are taxonomic patterns of regional variability.
Skink taxa with larger numbers of differences between Qle� accumulate substitutions in regions S29, L30 ' ,
S34 and SUO, as well as S26 (Fig. 4.19). A similar pattern occurs among the ratites (Fig. 4.20). Half of the
eight most variable sites in skinks occur in S26 and L38 ' (Fig. 4.17), but the variable site (position 101) in
L30 ' tends to differ only between more distantly related taxa (for example between L. n. polychroma and L. infrapunctatum; Table 3.1).
L. n. polychroma and L. n. nigriplantare differ from each other in some of the more conserved regions of the
molecule (Fig. 4.18), despite the fact that they have relatively few differences between them (Table 4.1a).
While changes in more conserved regions may imply a more distant relationship between these two taxa, this
is not supported by morphological or genetic information (Daugberty et aI. 1990b), nor by analyses of the
sequence data (see Chapter Five). Errors in PCR or sequencing could explain why these two taxa differ in
more conserved regions, but this seems unlikely since at least two individuals were sequenced for both L. n.
polychroma and L. n. nigriplanrare (Table 2.1) and several amplification and sequencing reactions were
performed for eacb sequence. The locations of the differences between them may just reflect the fact that not
all sites in "more conserved" regions are equally conserved, just as some sites in "more variable" regions
(e.g., position 207 in L38 ' , Fig. 4.17) can be more conserved than their neighbours.
The effects on phylogenetic analyses of both a transition substitution bias and different levels of variation
bewteen sites in the sequence are investigated in the next chapter.

page 56.
Chapter Five: Signals in the DaM and Phylogenetic Analyses
Aligned macromolecular sequences contain sites of variability, the patterns of which (the "signals") can
be evaluated by clustering or phylogenetic algorithms. Different phylogenetic analysis algorithms use
differing amounts of this information and have different optimality criteria for evaluating it and
constructing evolutionary trees (see Felsenstein 1988, Swofford & Olsen 1990, Nei 199 1 , and Penny et
aI. 1992 for reviews). With biological data conflicting signals, which may arise from, for insrance,
convergence, can prevent taxa being placed into mutually exclusive groups. Such signals can complicate
analyses, but they may be reconciled. As an example, a part of the skink data set yields the following
signals (some of which are underlined):
L. notosaurus
L. Unlchl.
L. suteri
L. n. nigriplantare
aaau�uguaugua£
aag�uauauguau
aag.!!'luuauauguau
aa�cauuguaugua£
The signals in this region provide support for L. notosaurus grouping with all of the three other taxa L.
notosaurus has the most signals in common with L. n. nigriplantare however, and in this example these
two would have the strongest relationship. Quantifying the signals supporting different sets of
relationships in this way indicates the support, and hence reliability, for phylogenetic relationships.
The signals present in the skink 12S rRNA sequence are examined in this chapter using the Hadamard
conjugation, a new method for spectral analysis (Hendy & Penny 1 993). This method shows that with
New Zealand skinks the data set contains many conflicting signals and a completely resolved phylogeny
cannot be obtained with the available information. Furthermore, differential weighting of both
trans versions and more variable sites in the molecule has little effect in clarifying the skink
relationships. Rapid diversification of the skinks appears to be the cause of many of the conflicts in the
data. Three hypotheses to account for the origins of New Zealand skinks are proposed.
Spectral Analysis of DNA Sequences
The Hadamard conjugation uses a discrete Fourier transform to adjust for unobserved nucleotide
changes in DNA sequences (Hendy & Penny 1993). Application of this method gives a "spectrum"
which provides a quantitative measure of conflicting signals in the data which can support different
phylogenetic hypotheses. A unique property of the Hadamard conjugation is it's "invertibility" which
allows investigation of the properties in the data with respect to their fit to explicit assumptions of the
model. The model has three essential elements (penny et al. 1992, 1993), namely
a tree,
a mechanism for sequence change, and
probabilities of changes (lengths) along branches of the tree.

Otapter 5, page 57.
Given the model it is possible with the Hadamard conjugation to predict the data that would petfectly fit
the tree. The number of patterns in the observed data is compared to the number of patterns in the
predicted data and statistically evaluated A statistically poor fit between the observed and predicted data
can lead to an incompletely resolved set of relationships. That is, the model is a poor explanation of the
observed data. Details of the Hadamard conjugation are sboWIi in Box 5 .1 .
There are two principal programs for the Hadamard conjugation:
PREPARE - which reads sequences in a variety of fOfJIlats (interleaved, block, Nexus), and can
calculate base composition. and frequencies of patterns in the sequences. Output files can be
prepared suitable for analysis by Hadtree, PAUP, and Phylip.
HADTREE - reads the partition frequency data from Prepare. corrects for multiple changes (using
Cavender's 1978 model), and searches for an optiIp.al tree using the closest tree criterion (Box 5.1;
Hendy & Penny 1989). It also has the ability to use other optimaiity criteria, such as parsimony.
Both four- and two-character state analyses can be done using Hadtree. The four-character state model
uses Kimura's (1981) three parameter model of evolution (one dass of transition mutations, and two
classes of transversions) to analyse signals on the basis of all four types of nucleotides.
Quadripartitions of the data are created in this way, groupmg taxa whicb share patterns of A, C, G, or
U, respectively at a site. Storage limitations currently restrict fOUf-character state analysis to 10 or fewer
taxa Two parameter models divide the signals into bipartitions, segregating for example taxa having a
purine (A or G) from those baving pyrimidines (C or 1) at a specific site, as shown in Box 5.2. Currently I
up to 20 taxa can currently be analyzed using the two-chkcter state procedure. The order of taxa in the
data file does not influence the results.
In this chapter the skink data set of 20 taxa (Table 3.1) is analyzed using the two character state
condition. The "sum of seven" option (Box 5.2) was selected to find all possible signals. Use of the
"AT/Ge" and "AC/GT" options give similar spectra anq resul\S. Too few transversions occur to use the
"R/Y" option.
What is a Bipartition and How is it Represent�d?
Taxa can be grouped into bipartitions with O. 1 . 2, . . . • n taxa The number of occurrences for each
bipartition are summed for the sequence and the frequency of the bipartition is calculated by dividing by
the total sum of all bipartitions in the data set (inclpding the bipartition which contains all the taxa; i.e.
constant sites). The frequencies of bipartitions are cailed signals and the collection of signals for a
sequence is referred to as a spectrum (Hendy & Penny 1993). Indiv�dual signals in the spectrum may be
referred to as a spectral signal in this thesis. Bipartitions with only one taxon in them correspond to
pendant brancbes on a tree - the brancb leading only to that taxon. The other bipartitions (excluding the
one with all taxa in �t) are potential internal branches (or edges) in the pbylogenetic trees.

Olapter 5, page 58.
Box 5.1. Interpretation of components of the Hadamard conjugation. The Hadamard
conjugation operates on the signals in observed data and a model (tree + mechanism +
probabilities of change). It's invertible properties allow the prediction of pattem�in data tha.t
would perfectly fit the evolutionary model. It also permits correction for unobserved changes
in sequence data before such data is either viewed directly (as the 'Y spectruin) or best-fitted to
a tree, so corrections are independent of the tree. Probabilities of observing changes along
edges of a tree (P) are specified by the model. Corrections to p for unobserved changes at sites
are then made to generate inferred partition values, 'Y, or expected edge lengths in the optimal
tree. The Hadamard transform, [H}, converts these values to p, a vector which represents
corrected path lengths (distances between taxa in the tree) for subsets of taxa in the tree. The
correction for unobserved changes is then reversed to generate observed distances, T. The
Hadamard transform is then reversed, [HJI t to produce St the vector containing expected
frequencies of observed patterns in all possible trees. With real data the process is reversed by
going from s to 'Y. The closest tree optimality criterion uses the 'Y values to select the best fit
between the real data to a tree that has edge lengths p.
Model I p (probabilities of change on edges)
I (corrections for unobserved changes)
'Y (corrected estimate of edge lengths)
I [HJ
P (corrected path lengths between all taxa)
I (uncorrect for unobserved changes)
T (uncorrected distances between all taxa)
i [HJI
J, S (uncorrected estimate of edge i lengths in all possible trees). i
Sequence Data

Olapter 5, page 59.
Box 5.2. Options for two-character state analysis of sequence data using the Hadamard
conjugation. Comparisons between taxa are performed for each site in the sequence. The tilde
(-) corresponds to the mathematical expression "not".
1 . AI- A Group taxa with adenine at a site and
group those which have a differeht
nucleotide. . . .
2. G/- G Group taxa with guan�ne at a site.
3. C/- C Group taxa with cytosine at a site.
4. T/- T Group taxa with thymine (or uracil).
5. AC/GT Group taxa with adenine or cytosine at a
site and group taxa with guanine and
thymine (or uracil). 6. AT/GC Group taxa with adenine or thymine.
7. RIY Compare on the basis of transversions
only (AG/Cn.
8. All 7 Performs each of the above analyses
indi vidually.
9. Sum of7 Performs the fIrst 7 comparisons and
sums the frequencies pf the signals.

ClJapter 5, page 60.
These internal edge bipartition signals are ranked in order of descending frequency. The "strongest
signal" has the highest frequency, and means that a relativeiy large number of sites in the sequence
support the grouping of the taxa in this bipartition. If thi� sighal is in the tree, its branch would have the
largest internal length. Conflicting signals however may mean that the strongest signal is not included in
a resolved tree. This is illustrated later in the Chapter.
Each bipartition can be uniquely identified by giving each taxbn a binary number and assigning the
bipartition the sum of the taxa it contains. For example, with five taxa the binary numbers 1 , 2, 4, 8, and
15 describe each of the five taxa respectively (the last taxon's number is one less than its real binary
number so that all bipartition numbers are unique). The bipartition corresponding to a grouping of the
first two taxa can be described as either (1+2) = 3, or as (4+�+15) = 27. By convention the smaller of the
two numbers is used to label the bipartition (PeIUlY et al. 1993). A second example illustrates why the
last taxon is identified by a number one less than its true binary number. The bipartition of the first four
taxa corresponds to (1+2+4+8) = 15, which is the same as sayihg that the fifth taxon is in a bipartition of
its own.
Lack of Resolution in the Skink 12S rRNA Data Set
Analysis of the 20 skink taxa does not yield a completely resolved tree. A graphical representation of the
spectrum (Fig. 5 .1) shows that there is much conflict in the data, most of the bipartition frequencies are
the same. There are only four relatively distinct and strong signals (Fig. 5.1). However, for 20 taxa there
are {219 - 21 } or 524,267 possible bipartitions, but only 66 qccur ainong the skinks. For a functional
gene not all bipartitions will be present because of ftihctional constraints, but such a small proportion of
bipartitions in the skink data set suggests that the sequences do contain phylogenetic history. A data set
with no conflicting signals would, for 20 taxa, produce 17 signals, each representing an internal edge of
the phylogenetic tree (in addition there will also be 20 o�er signals corresponding to each pendant
branch).
Spectral Analysis of other Vertebrate 12S rRNA Data Sets
To investigate whether the skink 12S rRNA molecule was unsuitabie for the study, spectra were
determined for two other vertebrate 12S rRNA data sets. The ratite data set (12 taxa) gives a resolved
phylogeny using other methods (Cooper et al. 1992), while the Pecoran bovid data set produces a less
resolved tree (Kraus & Miyamoto 1991, Allard et al. 1992). The ratite 12S rRNA sequences have a
greater number of strong spectral signals and a resolved phylogeny is produced (Fig. 5 .2a). The bovid
data set however produces a spectrum similar to the skinks; and relationships cannot be completely
resolved (Fig. 5.2b).
Parsimony and Neighbor-Joining Analyses of the skink Data Set
Spectral analysis of the ratite and bovid sequences confirmed the results from previous phylogenetic
analyses (see Cooper et al. 1992, Allard et al. 1992). However, to conlnm that aspects of the Hadamard
conjugation were not a cause of lack of resolution among the skink sequences, maximum parsimony

Ii I
i � 31 � : II) i
I.J i 1
! I I i
1� I
Fig. 5.1. Spectral analysis of 382 bases of 12S rRNA from 20 Leiolopisma and related taxa. In this example the bipartitions are ranked. rather than each bipartition being identified by it's unique number. The taxa in the four most well supported bipartitions are identified;
-.
Lmi = L. micro/epis Lsm = L. smithi Lfr = L. injrapunctatum Lag = La.. guichenoti Cae = C. aenea Lfa = L· fallai Lze = L. zelandicum Lmo = L. maco
Note that most of the other bipartitions bave similar amounts of support in this data set No fully resolved tree is produced.
------------
+ Lag
I I 5 7 8 11 13 15 1 18 21 23 25 27 8 31 33 5 7 38 '1 " 45 ' " 1 3 55 7 8 81 83 85 8 10 12 a 18 18 20 22 U 28 28 30 32 3' 38 38 .0 � « .a .a 50 52 5' 58 58 80. 82 8' 88 Rank of Bipartition

8 3.
7-
I-
1 "-,-
S-
2-
1-
0
o '
Fig. 5.2a. Spectral analysis of 380 bases of 12S rRNA from 1 2 ratite birds (data from Cooper et aL 1992). A resolved tree is produced using HADTREE and is shown in the upper right comer of the figure. Compare this spectrum with that of the skinks in figure 5 . 1 . In particular, note the different relative frequencies of bipartitions in the ratite data set Full species names and sequences are given in Appendix 2.
Ratites
Roa Kiwi nomloptery:c >-�--�,---�--�,L.spot. KiWI
Brown Kiwi Ostrich
Fig. 5.2b. Spectral analysis of 387 bases of 12S rRNA from 15 bovids (data from Kraus & Miyamoto 1991 and Allard et al. 1992). A fully resolved tree is not produced by HADTREE. As with the skinks, many of the bipartitions have similar frequencies. The bovid data set is listed in Appendix 2.
Bovids

O!apter 5, page 61.
(Swofford 1991) and neighbor-joining (Saitou & Nei 1987) analyses were also performed. Both of these
latter two methods give similar results (Figs. 5.3 & 5.4). Internal branches are short and most of these
are collapsed when bootstrapping is performed. The unbootstrapped trees are presented in figures 5.3
and 5 .4 however since they at least provide clues for possible relationships among the taxa. Both
parsimony and neighbor-joining produce similar estimates of relationships of the skinks (Figs. 5.3 &
5.4).
Partially Resolved Relationships Using the Hadamard Conjugation
Although a completely resolved set of relationships for the Leiolopisma is not obtained, the spectrum
does indicate partially resolved relationships (Fig. 5.5). In tb:is case every taxOD is linked to at least ODe
other but an unambiguous branching order for all taxa cannot be determined. The four strongest signals
in the spectrum (Fig. 5.1) correspond to the pairs L. microlepis+L. smithi, L. infrapunctatum+La.
guichenoti, L. /aUai+C. aenea and L zelandicum+L. "!Oco respectively, though support for the latter two
is comparatively weak. The same clustering pattern of the first three of these pairs is also evident in the
parsimony (Fig. 5.3) and neighbor-joining trees (Fig. 5.4).
It is not the purpose of this thesis to compare in detaii the Hadamard conjugation with other tree I reconstruction algorithms, and more detailed comparisons between the trees are not considered here.
Discussion of the Hadamard conjugation in relatiop to other methods can be found in Penny et al. (1991,
1992).
Weighting of Characters
The preceeding analyses treated all sites and types of changes in the sequences equally. Differentially
weighting characters or regions of the sequeDce can be used to take account of different rates of change
or violations in assumptions used in the model. However deciding what to weight and appropriate
weighting values is often subjective and problematical (Swofford & Olsen 1990, Cracraft & Helm
Bychowski 1991, Mindell 1991). Weighting of sites on the basis of type or frequency of change have
been suggested.
Transversions often accumulate less rapidly than transitions in DNA sequences (see Jukes 1980, Wilson
et al. 1985, Avise et al. 1987, Moritz et al. 1987). This sjower rate may mean that they are less likely to
be obscured by multiple substitutions than transitions, �d so m�y be more phylogenetically informative
when comparing distantly related taxa Giving transversions tnore phylogenetic importance by
weighting them is therefore sometimes used (see MindeIl 1991). A seCond weighting scheme takes
account of the fact that, for rRNA sequences, fixation of tnutations in base-paired regions may not be
independent If one member of a base pair changes, selection for the maintenance of the pair bond could
increase the chance of fixation of a complemenatry charige iti the other member of the bond. Paired
regions may therefore be weighted differently from unpaired regions in phylogenetic analyses (Mindell
& Honeycutt 1990) .. A third method, as discussed by Simon (1991), is that regions of different levels of
sequence variability in a molecule may be more informative for different depths of phylogenetic

Fig. 5.3. Consensus of nine equally parsimonious (shortest) trees for the 382 bases of 12S rRNA sequence from 20 Lei% pisma and related taxa The tree shown is a 50% majority rule tree, that is, only associations of taxa which occur in at least half the trees are indicated. Lengths of edges are proportional to the number of changes along each edge. Note that many of the internal edges are short relative to pendant branches. Thick lines in the tree denote those branches which do not collapse after 1 0 bootstrap replications (more could not be performed because of the long computational time required). PAUP version 3 .0s was used for the analyses.
L. maccanni
L. notosaurus
L. smitlzi
L. telfairi L. microlepis
L. n. nigriplantare
L. n. polychroma
L. infrapunctatum
St. Is. Green
L. grande _______ L. fallai
1---"::;;;;- C. aenea
...----L. acrinasum
L. otagense

Fig. 5.4. Neighbor-joining tree for the 382 bases of 12S rRNA sequence from '20 Lei% pisma and related taxa. (phylip version 3.4 was used). Percentage values on internal edges correspond to the number of times that edge occurred in 100 bootstrap replications. Only four of the internal edges occur in more than 80% of the bootstrapped trees. Lengths of branches are proportional to the probability of change along that branch. Note that internal edges are relatively short in comparison to the pendant branches. The tree is unrooted. Compare this tree with the parsimony tree in figure 5.3 and the Hadamard tree in figure 5.5.
L . notosaurus 55%
37% L. inconspicuum
L. macca nni
I""'"" 45% C. aenea
L. fallai
� - L. moco
L. ota gense L. zelandicum
L. tel/airi -
L. lin/chl 36%
87% L. n. nigriplantare
"--- L. n. polychro ma
84% La. guichenoti
59% L. l 'nfrapunctatum
\ L. acrinasum
J suteri
l' L. microlepis 100% \
L. smithi St.Is.Gree�
87%
L. rande g

Fig. 5.5. Inferred phylogenetic relationships for the 20 skink taxa based on spectral analysis of 382 nucleotides from the 12S rRNA gene. The frequency of each grouping of taxa (bipartition) is shown next to the branch leading to that group. The clusters cannot be reconciled into a single phylogenetic tree and this is indicated by the broken lines. Low frequency values indicate that few shared nucleotide substitutions occur to support that bipartition and the true phylogenetic relationships for groupings of such taxa are therefore uncertain. Transitions and trans versions are given equal weighting. Branch lengths � proportional to the degree of divergence between taxa.
L. grande
L mOkO \ U
L. zelandicum � ..... ..... L. smithi ) ... , -;' ...
L. microlepis
L. suteri
1 .2 I
I 0.6
I
L. in!rapunctatum __ -'
.....
L. notosaurus
.i"---L. inconspicuum
L. maccanni
1 . 1 ..... ..... .....
(L. tetrairi
..... L. otagense
..... ..... ( c. aenea 1 .8
L. fallai
L. acrinasum
-r---L. n. polychroma
L. n. nigriplantare
'The Gods of the earth and sea
Sought thro' nature to find the Tree;
B uJ their search was all in vain:
There grows one in the Human Brain . "
(Blake)

OJapter 5, page 62.
branching and could be weighted differently to reflect Ibis. These three weighting options were
investigated for the skink sequences to determine if they e�an�ed or reduced signals and lead to better
phylogenetic resolution.
Weighting of Transl'ersions
Transitions outnumber transversions in the skink data set by, on average, four to one. A four-fold
weighting factor applied to transversions did not greatly alter the strongest signals in the spectrum but it
did change some of the other signals (Fig. 5.6). The relationships betWeen L. grande and Stls. Green, I
and between L. n. polychroma and L n. nigriplantare are lost for example, because many of the
differences between these pairs of taxa are transversions (Table 3.1). When the subtrees for this
differential weighting are drawn it can be seen that L. grande, L acrinasum and L otagense cannot be
linked to any other taxa (Fig. 5.7), in contrast to the more resolved relationships in the equally weighted
analysis (Fig. 5. 5). Given this result, and the fact that high numbers of transversions do not signify more
distant relationships (Table 4.3, Fig. 4.2), transitions and trarisversions are given equal weighting in all
further comparisons.
Weighting of Paired Regions
Wheeler & Honeycutt (1988) reported that for both animal and plant groups, analysis of paired regions
in 5S rRNA were phylogenetically misleading whereas phylogenies derived from unpaired regions were I
in more agreement with relationships inferred from morphological data. This they attributed to selection
maintaining base pairings in rRNA. They suggested that a c�ange in one member of a base pair
increases the chance of flxation of a complementary change in the other base pair, and Wheeler &
Honeycutt consequently recommended assigning weights of 0.5 to nucleotides involved in pairings; that
is, a change at an unpaired site can be considered twice as informative as a change in a nucleotide
which is involved in a base pair. This level of weighting is only appropriate however if complete
compensation occurs in paired regions, but this is not the case for skinks (Table 3.6) or many other
groups (Smith 1989, Hedges et al. 1990, Mindell & Honeycutt 1990, Hillis & Dixon 1991, Simon 1991,
Dixon & Hillis 1992). Nevertheless, paired regions can be phylogenetically informative. Dixon & Hillis
(1992) examined relative weighting of paired regions for 28S rRNA and found that a weighting factor
closer to 1 .0 than 0.5 was appropriate for their study since more changes in paired regions were
uncompensated than compensated.
I At least 54% of the nucleotides in the skink sequences are involved in base pairing (Fig. 3.3), and 39%
of the variable sites OCCur in paired regions (Table 4.17). A high proportion of changes have both pairing
partners changed and pairing is maintained (Table 3.7).
Dixon and Hillis (1992) adopted a linear scaling approach to weighting paired regions. With this method
the weighting given to paired nucleotides is calculated by comparison to the number of changes
expected by chance and with no compensation. Following tbeir scheme, a relative weighting of 0.7 1 is
obtained for the paired regions in the skink molecule (Table 5.1). This equates to a weighting of

10
II I-
I I-
.-7
8 1 -
J ·
1 -
,-
3 1 -
2 : -
1 -
o 1
Fig. 5.6. The effect of weighting transversion substitutions four-fold higher than transitions in the skink data set. The major difference from the equally weighted spectrum (Fig. 5 .1) is that with differential weighting there is less support for the C. aenea+L. faIlai and the L zelandicum+L. moco bipartitions. Minor differences occur in the strength of support for other bipartitions. but as in figure 5.1 most of the bipartitions have similar levels of support. Resolution of the skink relationships is not improved by giving trans versions greater pbylogenetic importance than transitions (see also Fig. 5.7).
(Transversions)*4
L m i + Lsm ' . ,
Lfr + Lag
C ae + Lfa L z e + Lmo
:11:
II
,
3 5 7 II 1 3 il i� II 1 � � � 1 � II 41 j3 &: 4 D 1 3 �j II 1 � U 2 4 8 I 10 12 a 18 11 20 22 24 28 28 30 32 34 31 31 jf j2 .. ... ... 50 52 54 58 511 80 82 84 118
Rank of Bipartition

Fig. 5.7. Inferred phylogenetic relationships for 20 skink taxa based on spectral analysis of 382 nucleotides from the 12S rRNA gene. The frequency for each bipartition is shown next to the branch leading to it. Transversions are weighted four times higher than transitions. Compare these relationships and signal strengths to Fig. 5.5. Note that using this weighting scheme, L.grande, L. acrinasum and L. otagense cannot be placed with other taxa , and that L. n. nigriplantare now groups with L. telfairi rather than with L. n. polychroma.
L. n. polychroma L. smithi L. infrapunctatum
L. suteri
i--L. microlepis -s--- La. guichenoti
1 .8 2.3
L. notosaurus
L. inconspicuum _-�
1 .8
L. lelfalry. nigriplllnlllre
L. /allai
C. aenea
L. linlchl ---....
1 . 8
L. grande L. acrinasum L. otagense
I I I

OIapter S, page 63.
Table 5.1. Determining a relative weighting factor for pHylogenetic analysis of paired regions in the
skink 12S rRNA fragment B� 888 99g�P,,!88 BtHB6ers ee eB8Bges ill I'EHre8 FegieBS are frem Table �. If changes are random all base substitutions will be �ndependeiit and therefore no differential
weighting should be applied. Alternatively, if all chang� ill paired regions were compensatory, then
each substitution should be given a weighting of 0.5. Ol;mges in the skink helices fall nearly halfway
between the two extremes.
Random Complete Expectations Observed Com,jensation
No. Changes 15.3 56 85 .J, .J, .J,
% Dependence 0 % 58.4% 100 % .J, .J, ' .J,
Relative Weighting 1 .0 - �.71 0.5

10
8
7
e
J 5
:I
2
1
0
Fig. 5.8. The effect of a three-fold higher weighting factor for substitutions in unpaired regions of the skink 12S rRNA sequence three-fold higher than changes in paired regions (see text and Table 5.1). The bipartition of L. inJrapunctatum+La. guichenoti is now the most strongly supported, indicating that substitutions supporting this bipartition occur mostly in unpaired regions. This is confIrmed by examining the sequence alignment (Table 3. 1). In contrast, substitutions supporting the L. microiepis+L. smithi bipartition are more common in paired regions (Table 3.1), and the spectral signal for this bipartition has decreased (compare with figure 5. 1). No fully resolved tree is produced with this weighting scheme.
Lfr + Lag I 1ft (Unpaired SitaI)t3 I
. e 8 W � U " " � H U H e � ft U H � � � " � � � H M � e " n " " " � n Rank of Bipartition

Chapter 5, page 64.
approximately 3: 1 for unpaired versus paired regions. The spectrum obtained using this value differs
little in general from that obtained by equal weighting - no fully resolved tree is produced (Fig. 5.8) . The
four major signals remain, though the signal for the bipartition of L. inJrapunctatum+La. guichenoti is
now the strongest, while the signal for L. microlepis+L. smithi is reduced. The three sites supporting the
L. inJrapunctatum+La. guichenoti bipartition are all in unpaired regions, while two of the three positions
which support the L. microlepis+L. smithi bipartition are in helix 34 (see Table 3. 1). The signals ranked
from 5 to 27 in figure 5.7 are proportionally higher than in the unweighted spectrum, implying that they
are derived from unpaired sites (compare Fig. 5.8 to Fig. 5. 1). The Hadamard spectrum and a relative
weighting scheme are therefore an easy way to see the extent to which paired regions contribute to
bipartition signals.
Weighting of More Variable Sites
Eight positions in the skink data set have both transitions and transversions (Fig. 4. 1 7). These sites are
potentially rapidly changing positions which could be useful for resolving relationships amongst closely
related taxa but could mislead more distant phylogenetic relationships because of unobserved
substitutions (Mindell & Honeycutt 1990, Simon 1991). This does not however appear to be the case for
the skinks. The taxa which have the fewest numbers of differences between them also tend to group
together in figure 5.5, so small numbers of nucleotide substitutions between taxa seems to be a good
indicator of closeness of relationships (see also the neighbor-joining tree, Fig. 5.4). Taxa classified on
this basis do not always differ at the most variable sites. L. microlepis and L. smithi for instance, differ
from each other at five positions, but only one of these (position 204) is classed as a highly variable site
(Table 3 . 1 ).
Down-weighting the eight most variable sites by a factor of two or four has little effect on the spectrum
(Fig. 5.9, compare to Fig. 5.1). However, excluding these eight sites entirely from the analysis results in
the loss of 14 (21 %) bipartitions (Fig. 5. 10). These lost bipartitions represent groups of seven, eight or
more taxa, rather than pairs of taxa, indicating that removal of these sites has only a minor effect on
resolution of pairs of taxa. The reduction in the number of bipartitions when the most variable sites are
removed does suggest though that these sites are a major source of conflicting signals. A resolved tree is
still not produced however.
The Effect of Consront Columns in Sequence Analysis
The correction for unobserved changes in the Hadamard conjugation assumes that all sites are free to
vary. This is not the case for functional genes (Fitch & Margoliash 1967, Shoemaker & Fitch 1989). As
shown in Chapter Three, one third of the region of the 12S rRNA molecule under scrutiny here is
conserved across the vertebrates. Assuming that all sites are free to vary will mean that corrections for
unobserved changes will underestimate the true numbers of substitutions. This is because the frequency
of change per site is lower if averaged across the whole sequence. If only a proportion of the sites can
change then the actual frequency of substitutions at variable sites is higher, and so the probability of
multiple changes sho.uld be higher. Lengths of some potential internal edges in the tree will then be
longer and may result in greater resolution.

15
,-
13 -
12 ,-
11 -
10 -
-
-
-J : 8 --
-
s -2 -
1 -
o
1
Fig. 5.9. The effect of giving a lower weighting to the eight most variable sites in the skink 12S rRNA sequence. (Both transition and transversion substitutions occur at these sites). Weighting these positions either two-fold (5.9a) or four-fold (5.9b) lower than the other sites in the sequence has little effect on the relative differences between bipartitions. The weighting of sites was done by simply duplicating. prior to analysis. the 374 less variable sites once (5.9a) or thrice (5.9b) with respect to the other 8 sites. Consequently. the frequencies of the bipartitions are proportionally higher than in the original spectrum (Fig. 5.1).
3.
b.
I � 8 lites 1ft. = 0.5
-,
,
"III,
rrrrrrrrrm 1 3 5 7 It 1 3 l� It 21 � � )0: � 1 � I! l� III 41 4S . 41 1 � I! AoJ AJ 81 as �
2 4 8 I a � u a H � � U U U � � U B B � � " � � H U " M H H a " H Rank fA Bipartition
[1118 sits 1ft. = 0.25
4 S 8 10 12 U IS 18 20 22 U 2S 28 30 32 34 3S 38 � � U 4S 48 50 52 54 5S 58 SO S2 S4 SS RJmk of BiDartition
I

5
�-
:-
2 : -
1 -
o
Fig. S.10. The effect of removing the eight sites in the skink 12S rRNA data set which have both transition and transversion substitutions. Both the original spectrum (from Fig. 5 .1) and the edited sequence spectrum are shown. Removal of the 8 sites has a greater effect than just giving them a lower weight in analyses (Fig. 5.9). Support for 14 bipartitions is lost when the eight most variable sites are removed, but the frequencies of other bipartitions are largely unchanged. The lost bipartitions generally contain eight or more taxa and so resolution of the relationships of more closely related taxa (those with few nucleotide differences between them) does not appear to be affected. Removal of the most variable sites, and consequent reduction in the number of bipartitions, does however indicate that such sites may be contributing noise to the analyses of more distantly related taxa.
In
� all sites r2'l minus 8 sites
Ill_It
1 3 5 7 I 1 13 15 17 11 1 � 7 1 31 It· 35 7 31 U .:s � .7 ., 1 3 55 57 1 81 83 85 2 • 8 8 10 12 U 18 18 20 22 2. 28 28 30 32 3. 38 38 .a � u .a .a 50 52 U 58 58 80 82 U sa
RB:nk of Bipartition
I

ClJapter 5, page 65.
The presence of an invariant core in the molecule and its affect on the Hadamard transform can be
approximated by reducing the number of constant sites in the data. As the number of columns is reduced
an expectation is that the strength of the signals should increase since there will be a greater correction
for unobserved changes. Signals whose strength is indepe�dent of the number of constant columns are
likely to be spurious and have little phylogenetic infonnatioQ.
The Effect on Skink Phylogeny of Weighting of Consllmt Columhs
To examine this problem a subset of 1 0 skink taxa were chosen so that the effects are easier to detect.
The taxa were chosen because they illustrate an extreme c� where the two largest spectral signals are
not included in the optimal tree (Fig. 5 . 1 1 ; see also Penny ef al. 1993). Are some of the conflicting
signals in this data set a result of inaccurate correctiohs for upobserved changes?
The frequencies of each bipartition in a data set are calculated by the P� ARE program. This
information is written into a separate file which is then used by HADTREE to generate the spectrum. It
was simpler to adjust for constant columns by changing paraineters in this frequency file than to remove
constant columns from the original data set Only two numbers need to be changed to achieve this; one
represents the total number of columns of data, and the other the number of these columns which
represent constant sites in the data. The effect of progressively removing constant columns (1/3, 1/2, and
213) prior to the Hadamard conjugation was investigated for the 10 taxa data set Figure 5.12a shows that
as more constant sites are removed most of the biparti�oil frequencies increase slightly, though some do
not. The increase in size of the bipartition frequencies ls relatively small (Fig. 5.12a), and all of the
seven original internal edges in the optimal tree are retained even when two-thirds of the constant sites
have been removed (Fig. 5.12b). This indicates that the majqrity of the inferred phylogenetic
relationships are robust and not due to invalid an assumption in the model (namely, that all sites are free
to vary).
The last few bipartitions in the spectrum in figure 5.12 have little change in ¢eir frequencies as more
constant sites are removed, suggesting that they are probably spurious signals caused by the correction
for unobserved changes. None of these signals in fact exist as observed changes, they are all produced
by the correction for unobserved changes.
Summary of the Effect of the Weighting Schemes on the Skink Phylogeny
Adjusting the analyses to take account of a transition bias, differences in frequency of changes between
paired and unpaired regions, and different frequencies of nucleotide substitution do not enhance
resolution of the skink phylogenetic relationships. There are no large changes in the spectral signals for
individual bipartitions which suggests that the bipartitions with the most support do represent relatively
close phylogenetic relationships rather than being artifacts due to noise or limitations of analyses.

II ._. _ _ . _ .. _ . __ . _ _ . __ ..... _ _ .. _----
G-
4-
J s- o
2-
1
A IIII .. 2G8 '1111 78 147 82 11111 �88 Sill III� 811 SII� 77 m WI 102 510 130 1" 40G 117 104 271 247 l1li 224 182 1110 2114 40S SSO 418 42S sal BipartJ.tJon
1
3>+ 1
J�nnrmnrllll-rnn� 10
-?,0 8 2 -(
1
3
7
rn � m n m m � " � m � � m � m 42S W
1. St. Is. Green .(1) 2. L. /ill/chi (2) -3. L. graTUle (4) 4. L. micro/epis (8) S. C. aenea (16)
BIpart.it.ton
6. L. inconspicuum (32) 7. L. ze/andicum (64) 8. L. maccann; (128) 9. L. n. po/ychroma (256) 10. L. otagense (5/2)
9

8�------------------------------------------------------------------------'
a. Constant Sites Remaining
5-
2
1-
258 5 88 78 �4.7 82 185 388 351 "3 88 38" 77 317 328 -402 10 130 1" "85 87 10" 271 2"7 ee 22" 182 180 28" -'03 SSO "18 -'23 381
3,-------------------------------------------------------------------------� b.
2
1
1-·
258 5 88 78 130 1" "85
1 "3 118 88 22" 1112 Bipartition

OJapter 5, page 66.
Spectral Analysis of Simulated Sequences
The preceeding analyses have demonstrated that lack of pbylogenetic resolution among the sldnk taxa is
not due to the HADTREE program, nor to insufficient variable sites, nor biases in sites or types of
substitutions. In Cbapter Four it was sbown that randomly generated sequences gave a similar pattern of
transitions and transversions as the skink: data (Figs. 4.2 & 4.9). In this section spectral analyses of
randomly generated sequences are performed and compared to the skink: spectrum (Fig. 5.1).
Using the program described in Cbapter Four, sets of twenty random sequences were made. These
sequences were 384 nucleotides long, and bad an average of 25 total cbanges and five transversions
between eacb sequence, corresponding to the mean differences between the skink: taxa (Table 4.2).
Spectral analysis of these sequences gave spectra like the one shown in figure 5.l3a. This is similar to
the skink: spectrum (Fig. 5.1) in that there is no step-wise decrease in signal frequency (as in Fig. 5.2),
and there are large numbers of signals with the same frequencies. There are differences bowever
between the skink: and simulated sequence spectra. The skink: spectrum bad only 66 signals but the
simulated sequence spectrum (Fig 5.13a) has 157. Tbere are also more variable sites (75% as compared
with 26% in the skinks) and more singleton changes (62% versus 42%) in the simulated sequences than
in the skink: sequences.
The simulated data bave an important difference from the skink: data however - every site is free to
cbange. In the vertebrate sequence only two-thirds of the molecule appears to be free to vary (Fig. 3.5).
To more closely emulate the skink: data set the simulation was modified so that the 25 cbanges occwred
in 264 bases (two-thirds the length of the original sequence). Tbe new spectrum (Fig. 5.l3b) is generally
the same as that wben all 384 sites are free to vary (Fig. 5. 13a), but the proportion of singleton changes
(46%) is now more similar to the frequency of singletons in skink: data set When invariant sites are
taken account of therefore, the simulated data describe the pattern of variation in the skink data quite
well. The implications of this are discussed later in this chapter.
Relationships of Northern and Southern New Zealand Lewlopisma
The relationsbips for all of the taxa are poorly resolved (Fig. 5.5), but can more information be obtained
from subsets of the taxa? The New Zealand species can be sub-divided into two groups, based on their
occurrence north or south of the Nelson-Marlborough region (Table 5.2; see Pickard & Towns 1988).
Biogeographic connections exist between the southern North Island and Nelson-Marlborougb, reflecting
their connection during the Pleistocene (Fleming 1980, McGlone 1985). Clines in allozyme frequency
for skinks also occur across Cook Strait supporting this past continuity (C.H. Daugberty pers. COIIllil.).
L. n. polychroma is widely distributed and so is included in both groups. L. n. nigriplantare from the
Chatham Islands shares close genetic similarity to L. n. polychroma (Table 4.1 , Fig. 5 .1 , Daugherty et
aI. 1990b), and so is also included in both northern and southern groupings. Members of the L. lineoocellatumlchloronotum complex occur in both the north and the south, and along with L. telfairi
and La. guichenoti are included in both subsets as well.

J
J
Fig. 5.13. Spectral analysis of 20 randomly generated sequences (see Chapter Three for details of the simulation program). a. Shows a sample spectrum obtained when sequences are 384 bases long, the
mean transition/transversion (TsfTv) ratio is 4/1, and an average of 25 substitutions occur (as in the skink data set). As with the skink spectrum (Fig. 5.1), there are many bipartitions of similar frequency,
but the simulated sequence spectrum has more bipartitions. The star-tree model which generated the
simulated sequence data is shown in the top right comer of the figure. In h. the spectrum of another
simulated spectrum is shown. In this example the effect of having sites not free to vary is approximated
by reducing the sequence length by one-third. to 264 bases, while still having on average 25 substitutions and a TsfTv ratio of 4/1 . The overall spectrum is similar to that in 5 .13a. though more bipartitions now occur.
s�------------------------------------------------------------------------------a.
384 Bases
2
1
158
264 Bases
1
O+----.JfHffIo

10
a
'-7
e
,-
:I
2
1
o
a.
Fig. 5.14. Spectral analyses of 12S rRNA sequences from a. 1 1 slunk taxa which occur in northem New Zealand, and b. 10 slUnk taxa which occur in southem New Zealand. The AusLralian Lampropholis guichenoti and the Mauritian LeioiopisllUl teljairi are also included in both data sets. All the spectral signals are shown in these examples, but UJe only labelled bipartitions are those corresponding to the branches leading to individual taxa (these signals are independent of the tree). The other bipartition,
representing potential intemal edges in trees, are identified in figures 5.15 and 5.17. There are two major points to note in figure 5.14. Firstly, the number of changes on branches leading to individual taxa varies greatly. Secondly, the differences between intemal edge bipartitions are smaller in LlJe spectrum for LlJe southem taxa LlJan in LlJe northem taxa, indicating poorer resolution of LlJe relationships of the southern taxa (see also Figs. 5.16 & 5. 18).
1= 3 5 7 9 11 13
1 4 6 S 10 12 ,
Northern Taxa
TTIJ ..
Bipartition 10l -·-·- ·-·-------· - -- --.. ----·---- ---.. ··-- - - - - ----·-
b Southern Taxa .
• ,-
• I-
,-7
• I- �
>-
1-
. a
-
o ,
1 I I 7 • 11 a , • • 10 11
� � t< "
T ' .
I '�nr rJ
::lnl IT. . -I
i
1 I

Chapter S. page 67.
Table 5.2. The New Zealand Leiolopisma taxa for which 12S rRNA sequence data is available
subdivided on the basis of present geographic distribution (see Pickard & Towns 1988). Stewart Island
taxa (L. notosaurus and St.Is. Green) are included with the South Island species. Taxa occuring north of
Nelson are listed as being in the North Island. L. n. polychroma. L. n. nigriplantare. and L.
lineoocellatumlchloronotum are included in both islands (see text).
South Island North Island
L.n. polychroma L.n.polychroma
L. n. nigriplantare L. n. nigriplantare
L. linlchl. L. linlchl.
L. grande L. zelandicum
StIs. Green L. infrapunctatum
L. maccanni L. microlepis
L. inconspicuum L. smithi
L. notosaurus L. suteri
L. otagense L. fallai
L. acrinasum L. moco
C. aenea

<llapter 5, page 68.
Spectral Analysis of Skinks from Northern New Zealand I The northern New Zealand skinks have stronger and more sffUctured spectral signals than the southern
group (compare Figs. 5. 14a & 5. 14b), indicating that there is less ambiguity in the phylogenetic
relationships of northern taxa This is also shown by the relatively longer internal branch lengths in the
optimal tree for the northern taxa (Fig. 5. 15).
The Complex Relationships of C. aenea
C.aenea clusters with L telfairi in this example (Fig. 5.15), though in the spectra for all 20 taxa (Fig.
5 .1), C.aenea groups with L fallai. C.aenea and L. fallai differ by only 17 differences, and the
bipartition of these two taxa is supported by Jhree shared substitutions (at poSitions 67, 73 & 140; Table
3 .1). These substitutions are in the relatively conserved si , and 1.,33 ' regions (Figs. 3.3 & 4.17), which
could imply C.aenea and L. fallai share a common ances�or. lbe bipartition of C. aenea and L. telfairi is
also supported by three substitutions (positions 194, 263, & 331 ; Table 3.1), one of which is in the tetra
loop of stem 38. In addition to these bipartitions, C. aenea, L. fallai, and L. telfairi share other
substitutions among themselves and with other taxa. One substitution (at position 291) is shared by C. I
aenea, Lfallai, and L. telfairi (along with L suteri and L. nwco; Table 3 . 1). Three observed
substitutions group C. aenea non-exclusively with L fallai (positions 30, 35, & 64), while C. aenea and
L. telfairi have a substitution in common with three other taxa at position 309 (Table 3 . 1). This
illustrates the complexity of the relationships among some of the skinks.
The case of C. aenea serves to demonstrate another feature of HADlREE. The bipartition favouring C.
aenea+L. fallai (#288) has about the same strength of suppo� as that favouring C. aenea+L. telfairi
(#544; Fig. 5.15). An option in HADlREE allows specific bipartitions to be forced into the optimal tree.
When the C. aenea+L fallai bipartition is forced however, no resolved tree is produced. This indicates
that the pattern of sequence relationships in this data set are ��tet explained by Cyclodina having a
more distant relationship to the New Zealand Leiolopisma.
C. aenea can however be made to group with L. fallai if L. lin/chi is omitted (Fig. 5 . 1 6a). The L.
lin/chi individual used in this study was collected from Otago, the main range of L. chloronotum (see
Pickard & Towns 1 988), so there is a rationale for excluding it for this example. Forcing the C.
aenea+L. telfairi bipartition (#272) into the tree changes six of the nine intemal edges, and some of the
internal edges in the u'ee shoJ1en (Fig. 5 . 1 6b). Given that some of the shared nucleotide substitutions
grouping C. aenea both with L. fallai and with L. telfairi are at relatively well conserved sites, the
phylogenetic relationships of C. aenea are uncertain.
Why L. lin/chI affects the grouping of C. aenea is not clear. Exclusion of L. lin/chi also increases the
strength of the L. n. nigriplantare+L. n. polychroma bipartition (compare figures 5 . 15 & 5.16). The
conflicting signals associated with inclusion of L lin/chi were also noted in the analyses shown in figure
5.1 1

Fig. 5.15. Bipartitions included in the optimal tree for 1 1 northern New Zealand and two overseas skink taxa (Only internal bipartitions are sbown in the grapb, and are given in their binary number notation). The optimal tree is illustrated on the right (see also Fig. 5.18), and bipartitions excluded from the tree are plotted below the x axis. The relatively strong signal supporting the bipartition of C. aenea+L. fallai (#288) is not in the tree, and C. aenea groups with L. telfairi (bipartition #544). No fully resolved tree is formed if bipartition #288 is forced to be included in the tree .
. ,-----------------------------------------------------------------------------� 10
6
4 ... 'VI3 5
7 I '12 1
9 2 31
11
1. L. lin/chi (1) 8. L zelandicum (128) 2. L. suteri (2) 9. L. fallai (256) 3. L. n. nigriplantare (4) 10. L. telfairi (512) 4. L. microlepis (8) 11 . L n. polychroma (1024) 5. La. guichenoti (16) 12. L. inJrapunctatum (2048) 6. C. aenea (32) 13. L. moco (4096) 7. L. smith; (64)

: 3. 1-Unforced ;
! I .� ! 2 I I 7� i I 2
I'" 10 / I ,
i :� I :�
12
10 1
1
0 ---
-I
�� ... -!- I I
10 Forced
• b. 9
•
7 2
• IOr- IO I
J : I
1
0
-1
�
...
1. L. suteri (1) 7. L zelandicum (64) 2. L n. nigriplantare (2) 8. L Jaiiai (128) 3. L microiepis (4) 9. L. telfairi (256) 4. La. guichenot; (8) 1 0. L n. po/ychroma (512) 5. C. aenea (16) 1 1. L. inJrapunctatum (1024) 6. L smithi (32) 12. L moco (2048)

Olapter 5, page 69.
Spectral Analysis of Southern New Zealand Skinks
In comparison with the northern taxa (Figs. 5 .15 & 5.16) the relationships of the southern taxa (Fig.
5 . 17) are less certain. All of the internal edges in the latter tree are sbort. The grouping of L. grande with
St Is. Green bas the most support. L. n. polychroma does not appear to be closely related to other
members of the cryptic species complex (L. maccanni, L. inconspicuum, and L. notosaurus) as described
by Daugberty et aI. 1990b. This point will be considered again in Chapter Six.
L. n. polychroma and L. n. nigriplantare form a distinct cluster in the tree ()f northern species (Fig.
5.18a). This is not the case with respect to southern taxa wbere these two taxa bave affinities to L.
lineoocellatumlchloronotum and L. acrinasum (Fig. 5 . 18b). A division between northern and southern
taxa (with L. n. nigriplantare and L. n. polychroma clustering with southern species) is also apparent in
the allozyme data (C.H. Daugberty & G.B. Patterson pers. comm.; and see Chapter Six). L. n.
polychroma may therefore bave spread no�wards.
Mitochondrial Lineages of the Skinks
On the basis of both the numbers of differences between taxa (Table 4.1) and the relationships inferred
by spectral analysis (Figs. 5.5, 5.15, & 5.18), twelve Leiolopisma lineages can be identified (Table 5.3).
Taxa whicb have the strongest spectral signals differ by fewer than 20 substitutions (less than 5%
sequence divergence), so I bave cbosen this value as the criterion for identifying a lineage. As an
example, L. n. nigriplanJare and L. lin/chi differ from L. n. polychroma by 13 and 19 substitutions
respectively (Table 4. 1), while 20 or more differences separate L. n. polychroma from the other taxa
These three taxa are therefore classed as one lineage, and 1 1 lineages occur in New Zealand (Table 5.3).
Ten of these lineages are no more different from eacb other �an any of them are from L. tel/airi (Table
5.3), suggesting that New Zealand bas several independent skink mitocbondrial lineages.
Addition of a New Caledonian Skink
A New Caledonian representative of the Leiolopisma group was not obtainable for this study. Sequence
information was obtained bowever from another New Caledonian skink, Tropidoscincus rohssii, a
member of the Eugongylus group to wbicb the Leiolopisnia skinks are related (Greer 1970). Only 300
bases of 1 2S rRNA could be reliably determined for T. rohssii so this taxon was excluded from the I
earlier analyses (Appendix 1). It is useful to include it bere 110wever. Since HADTREE can currently
only bandle up to 20 taxa, addition of T. rohssii required the removal of another taxon. L. microlepis
was dropped since it is very similar to L. smithi. The frrst 8d bases, wbicb include the variable belices 26
and 29, as well as the single-stranded region linking domains iI and III (Fig. 3.3), are omitted from the
data set wben T. rohssii is included. Tbis reduction appears tei remove all pbylogenetically informative
signals (Fig. 5.19a), but separate analysis of the first 80 bases sbows that this region bas low resolution
on it's own (Fig. 5. 19b). This latter point was also sbo� by the secondary structure comparisons of
both closely and more distantly related taxa in Chapter Four. Most of the variable sites occur towards
the other end of the 1II0iecuie (Figs. 3.7 & 4.17). Omission of L. micro Ie pis also removes one of the
strongest signals (see Fig. 5.1) .

Fig. 5.17. Spectrum and optimal tree for 10 southern New Zealand Leioiopisma, and the Australian and Mauritian species. In contrast to the spectra for the northern taxa (Figs. 5.15, 5.16), the internal branches of the optimal tree for southern taxa have much less support Note also that some of the strongest bipartitions included in the tree are for groups of five taxa rather than for pairs of taxa.
ID�l------- --------- ------------------- --------------------------------------------- 1 •
.J o� 7J I '1
i 1S....l I
� !
I 'I 1 s� :J
o I
6
4
1 0 :-
�i 9 _ [0 ""-i - y�'il
711 S as loes 1"' II
1. St. Is. Green (1) 2. L. grande (2) 3. L. notosaurus (4) 4. L. lin/chi (8) 5. L. n. nigriplantare (16) 6. La. guichenoti (32)
10
-.c......1--- 12 8
11 2
7. L. acrinasum (64) 8. L. inconspicuum (128) 9. L. maccanni (256) 10. L. te/fairi (512) 11 . L. n. polychroma (1024) 12. L. otagense (2048)

Fig. 5.18a. Inferred phylogenetic relationships for Leiolopisma skinks found in northern New Zealand. The Australian Lampropho/is guichenoti and the Mauritian L. telfairi are also included. Branch lengths are proportional to the probability of a nucleotide substitution along that branch.
L. smithi
L. telfairi
C. aenea
L. zelandicum . moco
L. lin/chl
L. fallai L. suten L. n. nigriplantare
. guichenod
L. infrapunctatum
L. n. polychroma
Fig. 5.18b. Inferred phylogenetic relationships for Leiolopisma skinks found in southern New Zealand. The Australian Lampropholis guichenoti and the Mauritian L. telfairi are also included. Branch lengths are proportional to the probability of a nucleotide substitution along that branch. The greater uncertainty about the relationships of the southern taxa compared with the northern group is reflected in the relatively shorter internal edges in the tree for the southern group.
L. telfairi
;------.L. otagense
L. inconspicuum
L. n. polychroma

OIapter S, page 70.
Table 5.3. Mitochondrial lineages in skinks. A lineage is defined as taxa whose 1 2S rRNA sequences
differ by less than 5%. The mean (± standard deviation) bumbets of �ucleotide differences between the
first member of each lineage and the other lineages are presented in the right-hand column. The mean
numbers of differences between all lineages are significantly different (Fl l,l20 = 3.25, P < 0.01).
However if lineage 1 is excluded, numbers of nucleotide differe�ces bewteen the other lineages are not
significantly different from each other (F 10,1 10 = 1 .9, P > 0.05), indicating that they may have diverged I ,
from each other at about the same time. The same resWts are obtained when distances are corrected for
unobserved changes using the Jukes & Cantor (1969) correction. Using other taxa within a lineage for
the comparisons also bad little effect.
Lineage & Taxa
1 . L. graru1e St Is. Green L suteri
2. L zelandicum
3. L inconspicuum L. notosaurus
4. L acrinasum
5. L. smithi L. microlepis
6. L. fallai C. aenea
7. L. maccanni
8. L. otagense
9. L. telfairi
10. L. moco
1 1. L injrapunctatum La. guichenoti
1 2. L n. polychroma L. n. nigriplantare L. lin.lchl.
Inter-Lineage DifterenceS
(mean T sid)
22.6 ± 3.3
25.Q ± 3.5
25.2 ± 4.0
25.5 ± 3.3
26.0 ± 4.0
26.4 ± 3.3
27. 1 ± 3.3
27.3 ± 3.4
27.8 ± 2.8
27.9 ± 2.5
28.7 ± 2.9
28.7 ± 3.3

a.
1
b.
s
I 2
1
Fig. 5.19a. The effect of removing the flrst 80 sites of the 12S rRNA sequence from the analysis, before adding the New Caledonian Tropidoscincus rohssii sequence. The New Zealand taxon L micro/epis has also been excluded from the data set (see text). Note the loss of all strong spectral signals (see Figs. 5 .1 , 5.19b).
l_lOnUB 1st 80 bIIIII I
, 8 8 10 12 l' 18 18 20 22 2' 28 28 30 32 3' 38 38 '" .a " " Rank of Bipartition
Fig. S.19b. Spectral analysis of the flrst 80 sites of the 12S rRNA sequence for 19 taxa This spectrum indicates that some of the support for the bipartitions c.aenea+L. lallai and L injrapunctatum+La. guichenoti is derived from this region of the sequence (see Table 3.1). Use of this region alone however provides less phylogenetic resolution than when the full sequence is analyzed (see Fig. 5. 1).
Cae + L fa .� Lfr + Lag
2 8 8 10 12 a Rank of Bipartitlon
18 20

OIapter S, page 71.
The strongest signal in this comparison links T. Tohssii with L. fallai (Fig. 5.20), but the number of pair
wise differences for the T. Tohssii sequence, and the tocation of the substitutions linking it with L. fallai
suggest that this is not a close phylogenetic relationship. T. rohssii has more substitutions (an average of
32) in pair-wise comparisons than do the 4iolopisma skinfs. For example, L. fallai and L.
infrapunctatum have for the same region of 300 bases on average 18.3 and 20.6 differences,
respectively, from other taxa. Furthermore, the bipartition containing T. rohssii and L. fallai is suppoited
by two observed substitutions, both of which occur in helix 46 (positions 346 & 364), which is one of
the most variable regions in the molecule (Fig. 4.17).
Cytochrome b Sequence Data
Sequence information (254 nucleotides) from the mitochondrial cytochrome b gene was obtained for
four skink taxa. This small data set has 13 informative (parsimony) sites and 40 singleton changes
(Appendix 1). Eighty nine percent of the substitutions occur at third codon positions. As noted in , I Chapter Two, the 12S rRNA sequences of L. n. polychroma �dividuals from G?rge Bum are identical
I to those of L. maccanni from the same location but are quite different from sequences obtained from L.
n. polychroma at other sites. The Gorge Burn populations Of L. n. polychroma and L. maccanni differ by
three transitions in their cytochrome b sequences, all at third codon positions, and are quite distinct from
the Twizel L. n. polychroma sequence (Table 5.4).
The cytochrome b sequence has changed more rapidly than the 12S rRNA sequence (Table 5.4). In
comparisons between L. n. polychToma (Twizel) and L. I'IU1{:canni there are about 50% more
substitutions in the cytochrome b than in the 12S rRNA sequence, even though a shorter length of the
former was examined. The relative lengths of the branch!!S leading to the four taxa are similar for both
the 12S rRNA and cytochrome b sequence data (Fig. 5.21), which suggests that there is nothing atypical
in the relative rate of change of the 12S rRNA sequence wi� �espect to other skink mitochondrial I
sequences. Consequently, the more well supported relationships determined from the 12S data (for
example L. microlepis+L. smithi, La. guichenoti+L. infrapunctatum, St Is. Green+L. grande, and L. n.
polychroma+L. n. nigTiplantare; figures 5.15, 5.16 & 5.17) are expected to be confirmed by other
mitochondrial sequence data. The very close sequence similarity between the Gorge B um populations of
L. n. polychToma and L. maccanni will be discussed iri the next chapter.
DISCUSSION
The skink 12S rRNA sequence data set has proven to be v�ry useful for demonstrating aspects of the
HADlREE algorithm, particularly with respect to the iuql�g of conflicting signals (Figs. 5.5 & 5. 16).
Spectral analysis is a direct and easy way for assessing conflicts and noise i� sequences and for
determining alternative sets of relationships. Unl�e boots�pping (Felsenstein 1985) or analysis of the
distribution of tree lengths (Fitch 1984, Hillis 1991 , IGUlersjo et al. 1992), spectral analysis can directly
show where the conflicting signals in the data set come from.

I
Fig. 5.20. Spectral analysis of 304 base pairs of 12S rRNA for 19 Leioiopisma and the New Caledonian species T. rohssii. The only strongly supported bipartition is that grouping the New Zealand L. fallai with T. rohssii, but see the text.
5�-------------------------------------------------------------------.
4-
3-
2-
1-
L. fallai + T. rohssii
1 3 5 7 8 11 13 15 17 18 21 23 25 27 28 31 33 35 37 38 41 4S 45 .7 2 4 8 8 10 12 a lIS 18 20 22 24 28 28 30 32 3. 38 38 .a � U 48 .a
Rank of Bipartition .

OIapter S, page 72.
Table 5.4. Numbers of transitions (above diagonal) and transversions (below diagonal) for 254 base
pairs of the cytochrome b gene. The 12S rRNA distance matrix for the same four taxa (383 bases) is also
shown. L. n. polychroma (Lnp-GB), L. maccanni (Lmac), and L. inconspicuum (Linc) are sympatric at
Gorge Burn, Southland, while the other L. n. polychroma (Lnp-Tw) population is from Twizel,
Canterbury.
Cytochrome b Transversions\Transitions Lnp-Tw Lnp-GB Lmae Line
Lnp-Tw 22 25 29 Lnp-GB 14 3 25 Lmae 14 0 24 Line 12 6 6
12S rRNA Transversions\Transitions Lnp-Tw Lnp-GB Lmae Line
Lnp-Tw 17 17 24 Lnp-GB 3 0 25 Lmae 3 0 25 Line 5 4 4

Fig. 5.21. Inferred phylogenetic relationships of four skink taxa from Southland. Trees derived from 383 nucleotides of 12S rRNA and 254 nucleotides of cytochrome b sequence. The L. n. polychroma sequences come from two populations: Twizel and Gorge Bum. L. maccanni and L. inconspicuum are sympatric with the Gorge Bum population of L. n. polychroma (patterson & Daugherty 1990). The
resulting tree when both the 12S rRNA and cytochrome b sequences are combined for analysis is also shown. Trees are unrooted and branch lengths are proportional to the number of changes expected to occur down that branch. The 12S rRNA sequences of L. n. polychroma (Gorge Bum) and L. maccanni are identical.
L. n. polychroma (Gorge Burn)
L. maccanni
12S rRNA L. n. polychroma
(Twizel)
L. inconspicuum
Cytochrome b
L. n. polychroma >----c.. (Gorge Burn)
L. maccanni
Combined seqyences
L. n. po/ychroma (Twizel)
L. inconspicuum
L. n. polychroma >-----c.. (Gorge Burn)
. maccanni

Olapter 5, page 73.
Forcing specific bipartitions to be included in the tree (Fig. 5.16) is one way of determining the
likelihood of alternative groupings of taxa Continued developIilent and refinement of the programs are
expanding their utility, enabling more detailed questioris to De asked of the data. Of particular use will
be the ability to obtain and compare suboptimal trees so that potential phylogenetic relationships can be
analyzed in more detail.
Domain ill of the skink 12S rRNA is not able to resolve relationships among many of the taxa examined
here. This portion of the 12S rRNA gene has been useful for investigating and resolving phylogenetic
relationships for a wide range of animal groups (for example, Simon et al. 1991 , Hedges et al. 1991,
Hillis & Dixon 1991, Cooper et al. 1992) so it was a reasonable premise that it would be suitable for
skinks as well. Analysis of the secondary structure (Chapter Three) demonstrated that the sidDle
sequence is evolving in a similar way to other vertebrqtes. Lack of phyiogenetic resolution is therefore
not attributable to an unusual pattern of molecular evolqtion. Nor is it a result of having too few variable
sites - the numbers of differences among the skinks are s�i1at to those occurring in other 12S rRNA
data sets (Table 4.5a-c).
Removal of constant columns from the HADTREE fr�uency input file is a preliminary, and in some
ways crude, approximation to addressing the problem of invariant (constant) sites. It serves to illustrate
however that most of the spectral signals, particularly those �cluded in the optimal tree, are robust and not artifacts of analysis. While it is important to develop more realistic models to take account of
unchanging sites, assuming all sites are free to vary does not appear to be cause for poor resolution of
the skink relationships.
Four sets of relationships in the skink data set seem robust, in that they have strong spectral signals
and/or the taxa consistently grouped together (Figs. 5.5, 5.15, 5.16, & 5.17). These taxa are L
microlepis+L smithi (which differ by 5 nUcleotide subsqtutions), L grande+StIs. Green (S differences),
L inJrapunctatum+La. guichenoti (12 differences), and L. n. polychroma+L. n. nigriplantare (13
differences; Figs. 5.5, 5 . 16, & 5.17). These are all supported by allozyme analyses (C.H. Daugherty &
G.B. Patterson pers. COmm.; and see Chapter Six). L i1lConspicuum, L. notosaurus, and L. maccanni
tend to cluster together (Figs. 5.5 & 5.17; though see Chaptet Six). As already noted, the relationship
between L. fallai and C. aenea (17 nucleotide differehces) is less certain (Figs. 5.15 & 5.16). The
number and location of shared nucleotide substitutions for these two taxa suggest however that C. aenea
may have closer phylogenetic relationships to L. fallai than to L telfairi. Additional sequence data is I '
required to investigate this.
The spectral signals and the short internal edge lengths for comparisons among the southern taxa (Fig.
5.1Sb) suggest that they have had a more complex evolutionary history than the northern species (Figs
5. 15, 5.16 & 5.1Sa). Furthermore, the distinctiveness of L. n. polychroma (widely distributed in New
Zealand) and L. n. nigriplantare (from the Chatham Islands) from the northern groups (Fig. 5. 14)
suggest a southern origin for them.

Cllapter 5, page 74.
"Rapid" Divergence of LeiolopislTUl
The most significant features of the skink data set are that most of the taxa have similar numbers of I I substitutions (Tables 4.1a, & 5.5), and a resolved phylogeny for all of them is not produced. The model
of evolution used in the Hadamard conjuagation has thtee parts; a tree, a mechanism of change, and
edge lengths (probabilities of nucleotide substitutions) for the branches of the tree. The mechanism of
change assumed all sites in the sequence were free to vary, but this is incorrect (Fig. 3.3). However
removal of constant columns, to simulate the presence of invariant sites, did not change the sequence
spectrum (Fig. 5 .13) and suggests that the assumption was not misleading analyses of the sequence data.
Furthermore, the Hadamard conjugation does produce a resolved tree for the ratite 12S rRNA data set
(Fig. 5.2a) under the same assumption of all sites are free to vary. The mechanism of change assumed by
the model does not therefore account for in.complete resolution of tbe skink sequence data.
I Analyses of simulated sequence data (Chapter Four and Fig. 5.13) gave very similar results to those I !
obtained for the skinks. The simulated sequences were derived using a star-tree model, whereas the tree
assumed by the model in the Hadamard conjugation is a binary, or bifurcating, tree (see Chapter Four).
The inability to resolve the skink phylogeny therefore appe� related to how the taxa diversified. Rather
than a slow diversification over time, the Leiolopisma sldnks examined here appear to have diversified
from each other more rapidly. The bovid data set also has a sequence spectrum (Fig. 5.2b) similar to the
sldnks (Fig. 5.1), and it also failed to produce a completely resolved phylogeny (see also Kraus &
Miyamoto 1991, Allard et al. 1992). With support from fossil evidence, Allard et al. (1992) suggested
rapid diversification of the pecoran bovids over a 5 miIiion year period.
There are no fossils for the sldnks to directly place a �e on their origin or diversification (Carrol 1969,
Molnar 1991). As discussed in Chapter Four, the rate of seql!e�ce evolution in the sldnks may be slower
than that in the bovids, so "rapid" diversification of the sldnks may still have occured over millions of
years. The fact that L. telfairi has similar numbers of differences from New Zealand taxa as these taxa
have among themselves (Table 5.3) implies that this Mauritian species diverged from them at about the
same time.
L. telfairi has two unique insertion/deletion events, bo� involving single bases (Table 3.1). Single-base
insertion/deletion events do not necessarily indicate greater genetic divergence however since such
indels occur between closely related ratites and among the bovids (see Appendix 2). Immunological
studies also support approximately equal genetic divergence between the Leioiopisma (Hutchinson et ai.
1990). The New Caledonian T. rohssii has a greater number of substitutions relative to all the
Leioiopisma however, so it probably represents an earlier split in the Eugongyius group of sldnks.
Estimating Times of Divergence for the Skinks
Analyses of immunological (Baverstock & Donnellan 1990, Hutchinson et ai. 1990), allozyme
(Daugherty et al. 1990, C.H. Daugherty & G.B. Patterson pers. comm.; and see Chapter Six), and now

OIapter 5, page 75.
sequence data all support an older origin for New Zealand skinks than suggested by morphological
studies (five million years or so, Hardy 1977, Towns et al. 1985). There is no evidence indicating that
the skink sequences are changing more rapidly than other vertebrate gtoups (Fig. 3.6) so the degree of
sequence divergence between the skinks implies periods qf separation in excess of 15 million years
(Chapter Four, and also Hickson et al. 1992). This sectioQ examines how more precise estimates for
times of separation can be inferred.
Estimates from Immunological Data
As already noted, there are no Leiolopisma fossils to indicate when they originated. The immunological
and allozyme data could however provide a means for establ�hing a time frame for Leiolopisma
evolution. In the immunological studies of Australian Leiolopisma one New Zealand species, L grande,
was included (Baverstock & Donnellan 1990, Hutchinson et aI. 1990). Assuming an albumin molecular
clock, Baverstock & Donnellan tentatively proposed that L. grande may have diverged from Australian
species 20 million years ago. L grande and the Australian La. guichenoti differ by 21 nucleotide
substitutions (Table 4.1a) so, using the immunological clock estimate, this would imply approximately
one nucleotide substitution per million years. Applying tllis rate, most of the New Zealand taxa would
have diverged between 12 and 35 million years ago.
The reliability of this immunological data for estimating time is uncertain however. Complete reciprocal
matrices were not obtained for the albumin immunological differences (AID; Baverstock & Donnellan
1990) so phylogenetic inferences made from this data may l>e unreuable (Maxson & Maxson 1990).
AID rates must also be calibrated for each taxon (Thorpe 1982), which has not yet been done for skinks.
Hutchinson et al. (1990), in a more extensive study, did not use the immunological distances to estimate
times of separation for Leiolopisma.
Estimates from Allozyme Data
Preliminary analyses of the allozyme data for New Zealand skinks do not indicate a rapid divergence of
the skinks from each other, and La. guichenoti and L. telfairi represent much earlier divergences
(Daugherty et al. 1990b, C.H. Daugherty & G.B. Patterson pers. comm.). Estimates of divergence time
based on allozyme data have been made by calibrating genetic distance values (for example Nei's D
metric value) against an AID clock. Maxson & Maxson (1979) for instance, used the AID of
salamanders to calculate that a Nei's D value of 1 .0 represented 14-15 million years separation.
Applying this calibration to the skink allozyme data would indicate a diversification of New Zealand
Leiolopisma commencing 1 1-12 million years ago (Daugherty et al. 1990b, and C.H. Daugherty pers. comm.). If this time frame is used, then if there are about 25 nucleotide differences between New
Zealand skink taxa (Tables 4.la, & 5.5), there have been approximately 2.1-2.3 nucleotide substitutions since divergence
per million year, L. mlCTolepis and L. smithi, with five <lifferences between them, could therefore have
diverged just over two million years ago, while the split between L. n. polychroma and L. n.
nigriplantare (13 differences) may have occurred about six million years ago. These dates disagree
however with those estimated from the allozyme data (C.H. Daugherty & G.B. Patterson pers. comm.,
and see Chapter Six).

Olapter 5, page 76.
As with the immunological data, the accuracy and validity of using Maxson & Maxson's (1979)
calibration for groups other than their salamanders has not been examined (Thorpe 1982, Nei et al.
1983) and there is no evidence for a common multilocus electrophoretic clock (Avise & Aquadro 1982).
Furthermore, in the skink allozyme study only 17 presumptive loci provided information for all the taxa
(C.H. Daugherty & G.B. Patterson pers. comm.). The accuracy of both the topology and branch lengths
of phylogenetic trees determined from allozyme data is low when less than 30 loci are used (Nei et aL
1983, Nei 1987), so phylogenetic inferences based on the skink allozyme data set are likely to be
unreliable.
EstimaJesfrom Biogeographic Information
A third way of estimating divergence times between the � is hy taking account of their geographic I ,
distribution. Australia. New Caledonia. and New Zealand all contain fragments of continental land and
were once part of Gondwanaland (Mayes et aL 1990, Lawver ef al. 1991). Fiji is also continental in
origin and another Leiolopisma, L. alazon, occurs there and lias morphological similarities to New
Zealand taxa, particularly Cyclodina (Zug 1985). Pacific members of the Leiolopisma group of skinks
therefore all occur on continental fragments.
L. telfairi is a biogeographic anomaly, in that it is the only member of the Leiolopisma group outside of
the Pacific. Sub-fossils of another Mauritian skink "Didosaurus" mauritianus have been found, which
Arnold (1980) considered to be a sister species of L telfairi. Leiolopisma have not been found in Asia or
Africa Africa rifted from Gondwanaland prior to 140 million years ago, while India separated at least
75 million years before present (McKenzie & Sclater 1973, Tarling 1988, Lawver et al. 1991). India
passed near to the current location of Mauritius and the Mascarene �lateau (McKenzie & Sclater 1973),
so ancestors of L telfairi and L mauritianus may have h�� the potential to be transported there from the
Australian region. Fragmentation of Gondwanaland abo�� &0 million years ago (Mayes et al. 1990,
Lawver et al. 1991) and subsequent continental drift could �erefore explain the origin and dispersal of
Leiolopisma.
Hypothesis One: A Gondwanan Origin and Diversification of Leiolopisma I
Both immunological (Hutchinson et al. 1990) and sequence data caD be interpreted in the framework of
a Gondwanan origin and diversification. A Gondwanan divergence for Leiolopisma implies a slow rate
of sequence evolution (30 nucleotide substitutions over 80 million years yields a rate of 0.38 per million
years, or one substitution per 2.7 million years, on average). This figure is not too disimilar from that for
the ratites (Table 4.6). Some of the New Zealand Leiolopisma are as distinct from each other as they are
from L telfairi (Table 5.3, Figs. 5.5 & 5.18). A Gondw'!llan origin therefore implies that several distinct
and old skink lineages inhabit New Zealand, as shown in figure 5.22a
Under this hypothesis 1 2S rRNA sequence data from New Caledonian Leiolopisma and the Fijian L. alazon should reveal similar numbers of sequence differences and patterns of change as the New
Zealand, Australian and Mauritian taxa Further investigations of New Caledonian skinks (there are 10

Fig. 5.22. Hypotheses for the origin of Lei% pisma skinks. A) A Gondwanan origin of the taxa implies that their present distribution is due to the breakup of Gondwanaland during the Creataceous (approximately 80 million years ago). B) The "Oligocene drowning" hypothesis suggests that most of New Zealand's extant skink fauna are the result of diversification after the Oligocene (36-25 million years ago), in response to increasing land area and habitat diversity (see the text). C) The "Multiple colonists" scenario indicates that diversification of the skinks occurred sometime after the fragmentation of Gondwanaland, and that several distinct groups of skinks reached New Zealand independently and still survive here. These hypotheses also have relevance to other
Pacific and New Zealand biota as discussed in the text
A. Gondwanan diversification
Australia
Lord Howe Is.
Mauritius ----... New Zealand
Fiji
New Caledonia
B. QIi�ocene drownin� Australia
Mauritius --------4�-----.. ;.-.- New Zealand
New Caledonia
C. Multiple colonists
Australia
Mauritius -----.-------- New Zealand
New Caledonia

Olapter 5, page 77.
genera; Sadlier 1986) and other members of the Eugongylus group of skinks may shed light on the
hypothesis of a general radiation of this group about the time that Gondwanaland fragmented.
Immunological studies suggest that Australian members of the Leiolopisma group are not monophyletic
but are derived from a variety of other genera (Baverstock & Donnellan 1990, Hutchinson et al. 1990).
The morphological taxonomy of the Leiolopisma group has peen misleading (Towns et al. 1985,
Daugherty et al. 1990b) so L. telfairi could be derived from a different source than the Pacific group,
possibly an Asian Mabuya species, the ancestral group for Leiolopisma (Greer 1970). Sequence and I
immunological data indicate however that there are still close phylogenetic relationships between L.
telfairi and the Pacific Leiolopisma. A close relationship among the Leiolopisma group of skinks is also
supported by comparison of the relationships of the New Caledonian skink. T. rohssii has more
sequence differences from any of the Leiolopisma than the �tter have among themselves, and T. rohssii's sequence similarities to L. fallai (Fig. 5.19) ate in � variable region so may be coincidental. L
telfairi on the other hand shares changes with C. aenea and other Leiolopisma at more conservative sites
in the 12S rRNA molecule (Table 3. 1), which suggests that L telfairi does have close phylogenetic
relationships to the Pacific Leiolopisma.
Other animal groups with representatives in New Zealand have been considered to have had an origin in
Gondwanaland. For example, the Leiopelmid frogs (BUll & Whitaker 1975), the tuatara (Crook 1975),
and the moa (Cooper et al. 1992). The distribution of some of New Zealand's insect fauna may also be
accounted for by a Gondwanan origin (Dugdale 1989). A Gondwanan origin for geckos has also been
suggested on the basis of karyological evidence (King 1979, 1987, King & Mengden 1990). Bauer
(1990), on morphological biogeographical criteria, also advocates a Gondwanan origin for some of the
geckos. The Leiolopisma skinks may therefore be just one of several groups of old New Zealand
inhabitants.
The Mauritian Leiolopisma are Still Enigmatic
The Mascarene islands, to which Mauritius belollgs, are volcanic and were formed 7-8 million years ago
(McDougall & Cbamalaun 1969). No Leiolopisma-like skinks have been recorded from India or
Madagascar, 700 kilometers west of Mauritius. India may also have separated from Gondwanaland over
100 million years ago (Lawver et al. 1991) and Leiolopisma may not have been present then. Even
under a Gondwanan origin hypothesis, the occurrence of L. telfairi on Mauritius is still enigmatic. It is
possible that the ancestral group of L. telfairi and L. mauritianus had a post-Gondwanan origin in the
Pacific region and subsequently reached Mauritius by its own dispersal abilities. This is in effect a null
hypothesis, to be retained if additional sequence and biochemical data cannot establish an independent
and old origin for L. te lfairi.
Origins of the New Zealand Skinks
Even if there was a Gondwanan origin for the skinks, New Zealand may have been colonized by them
after separation fro� Gondwanaland. If this was the case there are two alternatives for the current
diversity of them in New Zealand. New ZeaIand Leiolopisma may be a monophyletic group which

Cliapter S, page 78.
diversified in New Zealand from a common ancestor (Fig. 5.22b). Or. several groups of skinks may
have reached and colonized New Zealand independently (Fig. 5.22c). Both of these hypotheses have
some support from analyses of the sequence or allozyme data.
Diversification Within New Zealand
As the water barrier between New Zealand and Australla and New Catedonia increased following
separation from Gondwanaland, the chances of colonization of New Zealand by flightless terrestrial
animals would diminish. Many independent colon�tions of New Zealand by skinks would therefore
seem unlikely. As discussed above. the occurrence of L. telfairi on MaUritius may not be due to
continental drift. The New Zealand skinks may therefore hav� a more recent diversification. Analyses of
allozyme data for New Zealand Leiolopisma by C.H. Daugberty & G.B. Patterson (pers. comm.) suggest
that they have diversified in New Zealand, and are riot as closely related to L. telfairi and La. guichenoti
as the 12S rRNA sequence analyses indicate. Limitations of both the allozyme and sequence data will be
discussed below. but a monophyletic origin for most New Zealand Leiolopisma cannot yet be excluded.
Comparison of the 12S rRNA sequence differences among the skinks to those found among other I
vertebrates indicates that the New Zealand Leiolopisma diverged from each other at least 15 million
years ago. and probably much earlier (fable 4.6). The timing of this diversification may be related to
major changes in New Zealand's geography during and after the Oligocene (36-25 million years ago).
Hypothesis Two: Post-Oligocene Diversification of New Zeaiaild Leiolopisma
New Zealand was a low-lying landmass in -the Oligocene ll!ld rising sea levels created a series of islands.
Total land area was 80% less than at present and fluctuating �a Jevels altered the number and size of
these islands (Suggate et al. 1978, AJ. Cooper, G.K. Chambers, & R.A. Cooper in prep.). Cooper et aI. proposed that this may have resulted in population "bottlenecks" and extinctions (Fig. 5.22b). Post
Oligocene increases in land area and elevation would have led to the creation of many new habitats and
consequent diversification among terrestrial biota.
If the New Zealand lineages (fable 5.3) are the result of Miocene (i5-25 million years ago)
diversification from one or a few taxa which survived the Opgoceile (Fig. 5.22b). then it is expected that I they would have fewer differences between themselves than they would to L. infrapunctatum and L.
telfairi. This is not the case (fable 5.3).
A post-Oligocene radiation has been suggested for both �e moa and the kiwi (Cooper et al. in prep.).
The number of observed nucleotide differences between the moa genera and between the kiwi species
are about 1 1 and 15, respectively (Table 4.5a), substantially fewer than the 25 differences between the
skink taxa. A Miocene diversification of the skinks would therefore ihdicate a more rapid rate of
sequence evolution in the skinks than in the ratites. Post-Oligocene speciation may account for the
diversity of other N�w Zealand fauna, such as Leiopelma frogs (Daugherty et al. 1982, and CH.
Daugherty pers. comm.).

OIapter 5, page 79.
Population bottlenecks will decrease the number of mitocbondrial lineages, but under the neutral
framework of molecular evolution, it should not affect the rate of sequence divergence (Kimura 1983,
Wilson et al. 1985, Neigel & Avise 1986). Under a "nearly neutral" hypothesis however, population size
could affect the rate of molecular evolution (Ohta 1976, 1992). Analyses of Drosophila lineages
suggested that groups which probably passed through repeated popu1ation bottlenecks had a higher rate
of molecular evolution than lineages which had more stable popuiation sizes (DeSalle & Templeton
1988). However, the dates of separation of these Drosophila species have not yet been reliably
established, nor bas the fact that some did pass through severe bottlenecks. With respect to the
Leiolopisma, even if bottlenecks can affect rates of molecuJat evolution, this does not alter the
conclusion from the sequence data that the skinks appear to have diversified relatively rapidly, and that
the Australian and Mauritian taxa are not distinct from the New Zealand taxa
Phylogenetic Limitations of the Skink Allozyme Data
The skink allozyme data (Daugherty et al. 1990b, C.H. Daug!lerty & G.B. Patterson pers. comm.) could
indicate a monophyletic origin of New Zealand Leiolopisma and Cyc1odina. The number of
electrophoretic loci (seventeen) is too few however to reliably infer phylogenetic relationships. Ideally
at least 30 loci should be used (Nei et al. 1983). More rigourous analyses (such as parsimony analysis,
Swofford & Berlocher 1987) of the data have yet to be performed. The measure of genetic distance used
by Daugherty et aI. (1990b), Nei's unbiased D value (see Nei 1987), relies on the assumption of equal
rates of substitution at all iocl, a condition unlikely to be met (Swofford & Olsen 1990), and this
measure may therefore not be an accurate estimate of genetic divergence between taxa A modified
version of Nei's genetic distance (Hillis 1984), or Cavalli-Sforza & Edwards' (1967) distance measure
may be more appropriate (Swofford & Olsen 1990), though the limited number of loci must still be
borne in mind. Limitations of the sequence data will be discussed in Chapter Six. A post-Oligocene
diversification of the New Zealand Lei% pisma (Fig. 5.22b) does not account for the 12S rRNA
sequence similarity within and between the New Zealand and the Australian and Mauritian taxa
Hypothesis Three: Multiple Leiolopisma Colonizations of New Zealand
Similar genetic distances between the New Zealand skink �a do not by themselves indicate a Miocene
diversification in New Zealand. While the skinks may have 4iversified from each other relatively
rapidly, different groups could have reached New Zealand independently. L. infrapunctatum and La. guichenoti seem most closely related to each other on the basis of sequence similarity (Table 5.3, Figs.
5. 1 & 5.5, 5 .15, 5.16). If a Gondwanan origin for the oilier skink lineages is assumed, then 25-30
nucleotide differences implies a rate of 0.3-0.4 substitutions per million years. (The error associated with
these estimates is likely to be high, as discussed in Chapter Four). The 12 differences observed between
L. infrapunctatum and La. guichenoti 12S rRNA sequence could indicate a separation of 20-30 million
years. If this is the case then the L. infrapunctatum lineage either entered New Zealand more recently
than other taxa, or n:tembers of it dispersed west to Australia The most likely route into, or out of, New
Zealand would be via New Caledonia and the Norfolk Island ridge, which was once part of the ancestral

Cliapter S, page 80.
New Zealand landmass (Suggate et al. 1978, Stevens lQ80). Land connections along this route
disappeared by the Miocene (approximately 30 million ye� ago; Stevens 1980), which could place an
upper bound on time of entry for many flightless anim�s. Estimates for the divergence of the ancestors
of L. infrapunctatum and La. guichenoti are compatible )Vitb a pre-Miocene entry.
An independent arrival of L. infrapunctatum in New Zealand is still compatible with both a Gondwanan
diversification of Leiolopisma (Fig. 5.22a), as well as diverstflcation of other Leiolopisma in New
Zealand (Fig. 5.22b). Under the multiple colonists hypothesis the rtlnnber of different mitochondrial
lineages of Leiolopisma (Table 5.3) requires many multiple independent colonizations of New Zealand I
by skinks. Considering the distances and oceans to cross, this is perhaps less likely than the other two
hypotheses.
Hypotheses for the testing
The phylogenetic relationships of the New Zealand Leiolopisma are largely unresolved by the current
sequence data. but they support suggestions (Towns et al. i985, Daugherty et al. 1990) of a much longer
history in New Zealand than indicated by morphological similari�es. Analysis of the sequence data also
suggests a rapid divergence of Leiolopisma skinks. Whether this divergence reflects a Gondwanan or
more recent evolution requires additional sequence informaqon. Strategies to test the three hypotheses
are discussed in Chapter Seven. Regardless of which bypo�esis receives the most support, the
evolutionary history of the skinks, and probably other New Zeaiand hiota. are much more complex, and
hence interesting, than previously imagined and offer many opportUnities for more detailed
investigations of evolutionary processes.

page 81.
Chapter Six: Comparing Sequence and Allozyme Data
One of the primary reasons for selecting the skinks to address evolutionary questions in New Zealand
was that allozyme information was available for virtually all of the described taxa, as well for taxa yet to
be formally named (Towns et ai. 1985, Patterson & Daugherty 1990, C.H. Daugherty & G.B. Patterson
pers. comm.). DNA sequence information was obtained from individuals which contributed to the
allozyme study so direct comparison bewteen the two �ta Sets is possible. In this chapter the
relationships of the New Zealand Leioiopisma skinks as inferred from the sequence data are compared
with the allozyme divergence data. The data sets do not contain all �e same taxa so only the 16 New
Zealand Leioiopisma common to both are compared.
Preliminary results of the allozyme study have been published (Daugherty et ai. 1990b), but manuscripts .
containing the full analyses are in preparation (C. H. Oaugherty & G. B. Patterson pers. comm.).
Allozyme information could only be obtained from 17 presumptive loci for the sldOO, though most taxa
were distinguished by ftxed allelic differences. The accuracy of both the topology and branch lengths of
phylogenetic trees determined from allozyme data is low when less than 30 loci are used (Nei et aI. 1983), so comparisons between the sequence and allozyme data only address the question of how
similar are their estimates of genetic distance.
Conflict Between Allozyme and 12S rRNA Sequence Data
Using Nei' s unbiased D (Nei 1972) as a measure of genetic qistance Daugherty & Patterson (pers.
comm.), identifted nine sets of relationships with D values less than 0.4. Some of these groupings are
found in the sequence analyses, but D values do not correlate well with numbers of nucleotide
differences (Table 6.1). Stewart Island Green and L. gratUie, and L maccanni and L. inconspicuum are
the most closely related pairs on the basis of allozymes (Table 6.1), but their 12S rRNA sequences differ
by 8 and 20 substitutions, respectively. In contrast, only 5 nucleotide differences were found between L.
microlepis and L. smithi but they have a D value of approximately 0.55 (Table 6.1). L. fallai and L.
suteri, and L. infrapunctatum and L. otagense have no spectral signals linking them together (see
Chapter Five) despite havi�g relatively low D values (Table 6.1). Both L. telfairi and La. guichenoti
have D values in excess of 1 .0 when compared to each other and to the New Zealand Leiolopisma (C.H.
Daugherty & G.B. Patterson pers. comm.), in contrast to their sequence similarities (Table 4.1a).
Congruence Between Allozyme and 12S rRNA Sequence Data
The allozyme and sequence data are not in complete disagreement however. Members of the taxon pairs
L. n. polychroma/L. n. nigriplantare, L. grandeISt. ls. Green, and L. microlepislL.smithi are each others
closest relatives on the basis of both DNA (Table 4.1a, Fig. 5.5) and allozyme analyses (Table 6. 1 ; C.H.
Daugherty & G.B. Patterson pers. comm.).

Olapter 6, page 82.
!fable 6.1. Comparisons of genetic distances inferred from 12S rRNA sequence analysis and allozymes
(C.H. Daugherty & G.B. Patterson pers. comm.). The relationsbips of taxon pairs 1 , 2, and 4 are
(:ongruent in that both allozyme and sequence information identify the members of the pair as most I , - -liimilar to each other. The relative degree of genetic divergence between taxa differ however when the
Jlumber of nucleotide differences and Nei's unbiased D vaiue (c.lI. Daugherty & G.B. Patterson pers.
t;omm.) are compared (Spearman's rank correlation, rs =i>.245, P < 0.05).
Seque{Jces AUozymes No. Unbiased
Dirt. I
Taxon Pair Rank D Value Rank '.'
- - -
I. L. microlepislL. smithi 5 1 0.55 9
2. St.ls.GreeniL. grande 8 2 0.175 1.5
3. L. inconspicuumlL.notosaurus 12 3 0.25 4.5
4. L.n.nigri.lL.n.polychroma 13 4 0.2 3
5. L. inconspicuumiL. maccanni 20 5.5 0.175 1 .5
6. L maccannilL.notosaurus 20 5.5 0.25 4.5
7. L. fallailL maco 24 7 0.35 7
8. L. fallailL. suteri 26 8 0.275 6
9. L. inJrapunctatumlL.otagense 32 9 0.4 8

OJapter 6, page 83.
These differences between the sequence and allozyme data may be due to limitations in both the DNA
and allozyme data sets. The mitochondrial sequence da� reflect maternal relationships only while the
allozymes provide information on both maternal and paternal inherited genomes (Wilson et al. 1985,
A vise et al. 1987). Sampling errors due to the short length of DNA sequences and the small number of
allozyme loci scored may also contribute to the differing c�:mclusions in each data set Collection of
more mitochondrial and nuclear DNA sequence informa,qon is required to determine the accuracy of the I - -
phylogenetic relationships. Differing phylogenies based on mitochondrial and nuclear sequence data
will indicate whether the mtDNA of Leiolopisma is suitable for reconstructing organismal relationships.
The allozyme data has only been analyzed using clustetipg al�orithpls (Weighted Pair Group Method
using Arithmetic means, Sneath and Sokal 1973) so fat (C.H. Daugherty & G.B. Patterson pers. comm.)
and further analyses (such as parsimony) are required to defcimine the robustness of the relationships
between the skink taxa (see Swofford and Olsen 1990).
Hybridization
Comparison of the allozyme and the mitochondrial sequence information also illustrate the benefits of a
broad approach to evolutionary studies. A difference betweep the DNA sequences and allozyme profiles
of L n. polychroma populations suggests that interspecifiC hybridization has occured.
The identical 12S rRNA and very similar cytochrome b sequences for L. n. polychroma and L maccanni
at Gorge Burn were presented in the previous chapter (fable 5.4). Several observations show tha this
sequence similarity was not due to taxonomic mis-identificapon nor to mixing of tissue or DNA
samples. The allozyme profiles for L. n. polychroma individuals at Gorge Burn are consistent with those
of L. n. polychroma at other locations, and there appears to be nothing incongruous about the L.
maccanni allozyme data at Gorge Burn either (Daughetty et al. 1990b). DNA was extracted from
several individuals and from several tissues at different times for both species. Both PCR amplification
and DNA sequencing were also performed several times for each sample. Identical DNA sequences
were obtained in all cases (Hickson et al. 1992). That �e �ytochrome b sequences for L. n. polychroma
and L. maccanni differ at three positions (Table 5.4) supports the view that the identical l 2S rRNA
sequences in the Gorge Burn populations is not a result of contammation.
The conflicting relationships for the Gorge B urn popuiation pf L. n. polychroma are shown in figure 6.1 .
Note that the relationship of L notosaurus presented iIi figUre 6.1 differs from tllose in figures 5.5 and
5. 1 8, where more taxa were included. The different placemeht of L. notosaurus is a reflection of the
small number of shared sequence signals between th� taxa. For example, L. notosaurus and L.
inconspicuum have fewer nucleotide substitutions when compared to each other than either do when
compared to L. maccanni (Table 4.1a), which may suggest that the latter species is more distantly
related to them. In the comparison of six taxa shown in figure 6. 1 , the bipartition (sites where they both
differ from the other taxa) of L. notosaurus+L. inconspicuum is supported by two signals, while the L. inconspicuum+L. maccanni bipartition has three signals. When more taxa are added L. maccanni,

Fig. 6.1. Evidence for sexual hybridization in a New Zealand skink population. Twizel and Gorge Bum populations of L. n. polychroma have the same allozyme profile (Daugherty et al. 1990b), but quite different mtDNA sequences. The discrepancy between the allozyme and sequence data can be reconciled by proposing that L. maccanni females have mated with L. n. polychroma males (see text and figure 6.2).
---� <::> 0'1 0'1 � -:
� l:::I - -� � 0 » -� s-5 � ».c N � o � - �
- 0 < --
� -� 0 � c.J C � � C" � en
< Z � s-en M �
� 'i -� i � j � t::. k .... Q .;:. ... ... .a:: -.� � ;:: Q s:: Q � ...j s::
...j � {
� s ;:: .s .� .� ;:: s:: ...j
I'"'"'
=
.... e .., ;:: e ::s ;:: ::s ... 8 ::s ::s ::s � � � � .... .., � � ;:: Q - ;:: .s Q 8 <I> ;:: ...j N .5 ...j ...j ...j
J - .... � J § tk § eE - � oJ ...j e -,.... ::s e ::s � ::s .... .!:
S � � ;:: ;:: ... 8 .s ::s .5 � � .J .J -Q ;::
...j
.... -
I

OIapter 6, page 84.
because of it's larger number of differences, has more conflicpng signals to other taxa This means that
the number of signals supporting L inconspicuum+L. maccanni to the exclusion of all other taxa
decreases, and the relationship between L. notosaurus and L. inconspicuum consequently strengthens
(Figs. 5.5, 5.18). The phylogenetic position of L. notosaurus does nOt however affect the main
conclusion shown in figure 6. 1 ; that 12S rRNA sequences from the Gorge Bum population of L. n.
rngriplantare are identical to those from the sympatric L. maccanni population.
Disparity between mitochondrial and nuclear markers is often indicative of sexual hybridization (Wilson
et al. 1985, Moritz et al. 1987, Barton & Hewitt 1989, Arnolli 1992) and this seems the simplest
explanation for the Gorge Bum population of L. n. polychroma. The alternative hypothesis that the
Gorge Bum L. n. polychroma mitochondrial sequences only reflect a different mitochondrial haplotype
(see Avise et al. 1987, Moritz et al. 1987, Avise 1989a) within the L. n. polychroma species appears
unlikely. There are 29 differences between the 1 2S rRNA sciJuences of the Gorge Bum and the Twizel
populations of L. n. polychroma and 36 differences iIt their cytochrome b sequences (Table 5.4). This
level of inter-population sequence divergence has not peen reported even for more rapidly evolving
regions of mtDNA (Thomas et aI. 1990, Smith & Patton 1991). Numbers of differences in the 12S
rRNA sequences between species can be as few as three for »oth kiwi (Table 4.5a) and great apes (Table
4.5d).
The L n. polychroma individuals from Gorge gum have the L. maccanni type riltDNA and either
L.maccanni or L. n. polychroma allozyme profiles. No individuals had electromorphs ("alleles") from
both parents. Since mtDNA is primarily maternally inherited (see Wilson et al. 1985) this suggests that
one or more female L. maccanni mated with L. n. polych.roma males, introducing the L. maccanni
mtDNA into the L. n. polychroma gene pool, as shoWn in figure 6.2a. Loss of L. maccanni alleles in the
hybrids can be accounted for by the female hybrids subsequently mat.iilg with L. n. polychroma males
for several generations (Fig. 6.2b). When this hybridizappn occurred cannot be accurately determined
from the sequence data at present However if we assume d Gondwanan origin for the L. n. polychroma
and L. maccanni lineages (see Chapter Five), then the 39 differences in the cytochrome b sequences of
L. n. polychroma and L. maccanni (Table 6.1) could equate to 0.5 substitutions per million years
(39/80). The three differences between the Gorge Bum L. n. polychroma and L. T1Ul;Ccanni populations
could therefore indicate 6 million years since hybridization. A more recent separation of L. n.
polychroma and L. maccanni, say 20 million years, wou1d �ply hybridization occured about 1 .5 million
years ago.
DISCUSSION
Lack of congruence between allozyme and sequence data is often attributable to hybridization (see
Moritz et al. 1987), though it may also suggest variation in rates of change between the two types of
data (Dowling & Brown 1989). Allozyme data can be more suitable for examining relationships
amongst closely rel�ted taxa while sequences may be more informative at greater levels of separation
(Buth 1984, Hillis 1987, Hillis & Moritz 1990). The 12S rRNA sequence data indicates that few of the

Fig. 6.2a. Potential offspring from sexual hybridization between two species with different nuclear (allozyme) and mitochondrial markers.The nuclear phenotype is shown by the shading in the large oval while the mitochondrion is represented as the smaller oval. The offspring should have the mitochondrial type of its mother but nuclear markers reflecting both parents (as indicated by cross-hatching).
L. n. polychroma
Hvbrid Offspring (L fllQccanni mtDNA)
~ My �male
Hvbrid Offspring (L. n. polychrofIIQ mIDNA)
L. maccanni
Fig. 6.2b. Effects of subsequent breeding of hybrid with members of the parental populations. Mitochondrial type remains unchanged but allozyme profile should tend towards the non-hybrid parents markers over several generations.
L. maccanni
Hybrid
�( (L. fllQccanni mtDNA)
/ L. n. polychroma
L. n. polyclzroma

Otapter 6, page 85.
taxa are closely related (Tables 4.1 & 4.2, Fig. 5.5). If, in addition, many of the skinks diverged from
each other at about the same time (see Chapter Five), Uten these two factors may explain why the
sequence and allozyme data sets conflict. Nei et al. (1983) in simulation experiments showed that
relationships derived from fewer than 20 allozyme loci were less likely to be accurate than when more
than 30 loci were used. Allozyme information from otller presumptive loci could not be obtained for the
skinks (C.H. Daugherty pers. comm.), so further investigation of the nuclear gen<:me will r�uire other
strategies.
mtDNA provides information about maternal ancestors, aliq mfDNA sequence divergence may predate
speciation so analysis of mtDNA, particularly the conservative 12� rRNA, may fail to identify more I
recent population subdivisions or hybridizations (Avise et al. 1987, Moritz et al. 1987, Arnold 1992).
This is not the case with the skinks however, the sequence arid aIiozyme data identify differences in all
the taxa The conflict is in estimates of the degree of genetic divergence. Except for L. microlepis and L. smithi, the sequence data tend to show greater divergence betWeen the taxa than the allozymes (Table
6. 1). Nei's unbiased D value is calculated under the assumption of equal rates of changd>etween
different loci. This is probably incorrect and a modified version of Nei' s genetic distance (Hillis 1984),
or Cavalli-Sforza & Edwards' (1967) arc distance measure may be more appropriate (Swofford & Olsen
1990).
As discussed in Chapter Five, interpretations of immu�blogicaI data from Leiolopisma suggest that L. tel/airi is similarly distant from New Zealand and Australian Leiolopisma (Hutchinson et al. 1990). This is not apparent in the allozyme analyses (C.H. Daugherty & G.B . Patterson pers. comm.), and may
reflect the relatively small number of loci examined. A wider sampling of the mitochondrial genome,
either by restriction mapping or the sequencing of other genes, would indicate the accuracy of the 12S
rRNA sequence data Sequencing of nuclear genes, such as the 18S rRNA or intragenic spacer regions
in the rRNA cluster (Hillis & Dixon 1991), can be used to test the validity of the mtDNA and allozyme
based phylogenies.
Both the allozyme and mtDNA sequence data suggest however that the genetic diversity of New
Zealand Leiolopisma is much greater than their morphological diversity, and the skinks are consequently
much older than previously (Bull & Whitaker 1975, Hardy 1977) suggested. Similar observations have I
been made for amphibians (Cherry et al. 1978, Roberts & Maxson 1985, Wallis & Arntzen 1991) and
East African jackals (Wayne et al. 1989).
Hybridization - Questions to Address
The role and significance of hybridization in evotution is not well understood, though it has been
suggested to be a major source of genetic diversity and innovation (Huxley 1938, Dobzhansky 1940, I
Rattenbury 1962, Barton & Hewitt 1989, Arnold 1992, Grant & Grant 1992). Hybrids are often
associated with habi_tat disturbance (see Hair 1966, Arnold 1992). The putative hybridization at Gorge
Bum is therefore an important result and requires more detailed studies. There are several questions to
address;

OIapter 6, page 86.
1). What is the extent of hybridization? Only a few indlviduals front Gorge Bum were examined in this
study, many more need to be sampled. Do both hybrid and non-hybrid L. n. polychroma co-exist at "
Gorge Bum? L. inconspicuum is sympatric with L n. polychroma and L. maccanni at several sites
(Patterson 1985, Daugherty et al. 1990b) and these species and populations should be examined closely
as well.
2). The available data implies that there is directional exchange of mtDNA; L. maccanni females have
mated with L. n. polychroma males. This would implica� behavioural and reproductive factors affecting
the hybridization (Ferris et aI. 1983, Lamb & Avise 1986). Examination of more individuals from Gorge
Bum is necessary to determine in hybrids with L. n. polychroma IhtDNA also occur.
3). The large number of sequence differences between L n. polychroma and L. maccanni (Table 6.1)
suggests that they have been separated for a considerable period of time, perhaps up to 80 million years
(Chapter Five), though the allozyme data could reflect a closer relationship between them (C.H.
Daugherty & G.B . Patterson pers. comm.). Hybridizaqon between animal species is generaliy more
common among closely related taxa, that is those separated by a few million years (see Barton & Hewitt
1989, Arnold 1992). Frogs however, have a greater ability to l1ybridize across larger phylogenetic I ' distances (tens of millions of years) than mammals (Wilson et aI. 1974). The compositional organization
of the reptilian nuclear genome ma:y be more similar to amphibians (Bernardi & Bernardi 1991, Olmo
1991) than mammals (Bernardi et aI. 1988), and this maY be re�ected in a greater ability to hybridize.
4). The potential for skinks species to interbreed, and the viability and reproductive success of hybrid
offspring, can be investigated by captive breeding, as � been done for species of Drosophila (Aubert
& Solignac 1990). Close study of hybrids may also indicate if there is heterozygote advantage or
disadvantage (see for example Paige et al. 1991, Grant & Grant 1992). lf it is shown that L. n.
polychroma, L. maccanni and L. inconspicI:tum can interbreed and produce viable offspring, despite their
large genetic differences, then strong ecological and/or pe�vioural structuring between the species may
have prevented frequent interbreeding. A geological, cliqlatic or other disturbance may therefore have
been the cause of hybridization at Gorge Bum. The preliIpi� calculations in this chapter suggest
hybridization may have occurred in the Pliocene, up to six million years ago. The hybridization may
have represented a flISt meeting of L. maccanni and L. n. po!ychroma at that site.
Other New Zealand skink species are also taxonomically proplematical, for example, L. waimatense,
and the L. lineoocellatumiL chloronotum complex (Pickard & 'towns 1988; C.H. Daugherty pers. comm.). These may also provide examples of hybridization.
Hybridization has been suggested for many groups in New Zealand, both plant (Cockayne 191 1 , Allan
1961, Rattenbury 1962, Fisher 1965, Webby et aI. 1987, Wardle 1988) and animal (Powell 1949,
Bigelow 1965, Batc�elar & McLennan 1977, Climo 1978, Solem et al. 1981, Hitchmough et al. 1990).
With the exception of Hitchmough et aI. (1990), these have not been investigated genetically. Hybrids in

OJapter 6, page 87.
kiwi and in shearwaters have also recently been detected by DNA analyses (AJ. Cooper pers. comm.),
so hybridization of both plants and animals in New Zealand may be relatively common.
The ability to extract sufficient DNA for PCR analyseS frpm small tissue samples makes it feasible to
screen large numbers of individuals without the rieed to kill �em. Removal of a portion of the skinks'
tail should not adversely affect it's survival. The development of PCR primers suitable for examination - -
of both conserved and variable regions of nucleat rRNA (Hillis & Dixson 1991) will facilitate
comparison of mitochondrial and nuclear derived phylogenies, as well as permit more detailed studies of
the nuclear genome and the processes of evolution.
Species Concepts
Does the hybridization between L. n. polychroma and L. maccanni imply that they are not distinct
species? The difficulty in distinguishing these taxa. and L. inconspicuum (patterson & Daugherty 1990),
may imply that there is just one variable species. On the basis of allozymes however, they appear to be
reproductively isolated (Daugherty et al. 1990b). Genetic distance measures cannot be lise(! as the sole
criterion for identifying species (see Nei 1987, Coyne 1992), but the fact that L. n. polychroma, L. maccanni, and L. inconspicuum occur sympatrically and have distinct allozyme proflles provides strong
evidence that they do not frequently interbreed. They are also ecologically differentiated (Patterson
1985). The number of differences between their 12S rRNA sequences (Tables 4. 1a, and 5.3) are also
very high (compare to the kiwi (Table 4.5a) and the apes <Table 4.5d), supporting their taxonomic
distinctiveness.
Origins of Some Specific New Zealand LeiolopislTUl
L. n. nigriplanJare is found only on the Chatham islands, 800 km east of Christchurch. The Chathams
have long been separated from mainland New Zealand, though there is evidence for more extensive land
between them in the Eocene (45 MY A; Suggate et al. 1978, Hay et al. 1970, Craw 1988). The land area
of the Chatham Islands has been greatly reduced ill the past by rises in sea-level (Hay et al. 1970) and
consequently some of its biota may have arrived there in more recent times (see Fleming 1980, Lloyd
1982, Craw 1988). There are 1 3 nucleotide differences between L. n. nigriplantare and L. n.
polychroma. If it is assumed that skinks with 25-30 differences diverged during the. fragmentation of
Gondwanaland (about 80 MY A; see Chapter Five), then the nucleotide substitution rate is 0.3 1 -0.38
substitutions/site/million years. This would plaCe the time of qivergence between the lineages leading to
L. n. nigriplanJare and L. n. polychroma at between 34 and 42 million years, which may coincide with
the Eocene land route. A Miocene origin for New Zealand skinks (Fig. 5 .22b), say 20 MY A, could
indicate a separation of 9-10 million years between the Chatham Island and mainland skinks.
L. suteri is the only egg-laying skink in New Zealand (Whif4ke� 1968, Towns 1975b) and the lack of a
close relationship between it and La. guichenoti, which also lays eggs, indicates that this is a
physiological trait which can be gained or lost independently. The predominance of ovovivipary
(bearing live young) in New Zealand skinks was considered to Pc an adaptation to cold periods, such as

Chapter 6, page 88.
occurred during the Pleistocene (Whitaker 1968, Towns 1975a). L. suteri is now found in the north of
the North Island, and it has been suggested (Whitaker 1968, Towns 1975a) that it retained the egg
laying trait because it did not experience the same cold Pleistocene glacial climates as other New
Zealand skinks. Many other skinks are found in the far north of New Zealand however (pickard &
Towns 1988) but do not lay eggs. Analyses of both allozyme (C.H. Daugherty & G.B. Patterson pers.
comm.) and the 12S rRNA sequence data (Figs. 5.5, 5 .18) indicate that L. suteri may have relatively
close relationships to some of the ovoviviparous New Zealand taxa. Egg-laying by L. suteri may (in
some as yet unknown way) be associated with it's adaptation to living near the intertidal zone (Towns
1975a). La. guichenoti is a widespread and common s� in garden� of south-east Australia (Cogger
1986), and does not inhabit a similar niche as L. suteri.
Some skink groups are reported to have good dispersal ability because apparently closely related taxa
can be widely separated (Greer 1974), but there is circularity in this argument since the morphological
similarities are assumed to imply recent origins. The present study, and those based on allozymes
(Daugherty et al. 1990b, C.H. Daugherty & G.B. Patterson pers. comm.) and immunologjc� affinities
(Baverstock & Donnellan 1990, Hutchinson et al. 1990) have demonstrated morphological similarity to
be a poor guide to genetic relationships in the Leiolopisma group of skinks. Lack of appreciation of the
taxonomic status and antiquity of species can lead to inappropriate species management and
consequently, extinction (Avise 1989b, Daugherty et al. 1990a). Most of the New Zealand skinks have
restricted distributions, and are rare or endangered (Pickard & Towns 1988). Many are restricted to
offshore island habitats. Rats, cats and habitat destruction have contributed to their decline (Whitaker
1978, Thomas 1982b). Information about skink evolutionary relationships and genetic diversity should
be considered in conservation strategies (Vrijenhaek et al. 1985, Avise 1989b).

page 89.
Chapter Seven: Discussion
The New Zealand skinks present a much more interesting and challenging evolutionary problem than
previously suspected and there is much potential for further study. In this fmal chapter the principal
results are restated and suggestions for future work discussed.
The seven major features of this thesis are:
1). The demonstration of the utility of DNA sequ�nces for e�amining evolutionary
questions.
2). A secondary structure model for domain ill of vertebrate 125 rRNA was developed
(Chapter Three), and subsequently used to examine nucleotide substitutions in the
context of secondary structure (Chapters Four and Five). One third of this region of the
125 rRNA molecule does not vary among the vertebrate sequences examined. _ . =
3). Comparison of vertebrate 125 rRNA sequences also showed that there are similarities
in the patterns of variability within the molecule. There may however also be taxon
specific regions of variation.
4). The sequence data were analyzed using a new sequence analysis approach termed .
Spectral Analysis. One of the primary advantages of the spectral approach is that it gives
a visual and quantitative representation of conflicting patterns of relationships in the data.
5}. Most of the skink taxa have similar numbers of nucleotide substitutions when
compared to each other anJ
phylogenetic analyses of the 125 rRNA sequences did not
produce a completely resolved evolutionary tree.
6). This lack of phylogenetic resolution was interpreted as reflecting old and rapid
divergence among the Leiolopisma skinks. Three hypotheses were presented to account
for the origin of New Zealand skinks.
7). Hybridization between sympatric populations of two New Zealand skink species was
inferred from comparisons of allozyme and mitochondrial DNA sequence information.
Secondary Structure and Phylogenetic Analyses -
The refinement of the secondary structure model of domain ill of vertebrate 125 rRNA is a useful step
for phylogenetic analyses of this commonly analyzed region of mtDNA. Comparison of the vertebrate
sequences provides information on both the number of sites potentially free to vary and the pattern of
variability in the molecule within and between groups.

Oiapter 7, page 90.
That not all sites in a gene change at the same rate has long been known (FilCh & Margoliash 1967,
Fitch & Markowitz 1970), and models to take account of different rates of change among the codon
positions are available (e.g. , Holmquist & Pearl 1980, Nei & Gojobori 1987). However, as FilCh &
Margoliash (1967) and Shoemaker & Fitch (1989) demonstrated, rates of change between sites can be
more complex. Dividing codons into just fast (third codon position) and slower (frrst+second) classes
may not be sufficient to explain the patterns of variability. Methods to take account of different levels of
variability within non-protein encoding sequences, such as rRNA, have not attracted the same degree of
attention.
While failure to take account of invariant sites can result in underestimates of the numbers of
unobserved nucleotide substitutions (Palumbi 1989, Shoemaker & Fitch 1989), this does not appear to
mislead phylogenetic inferences for the skinks (Fig. 5.12). Removal of constant columns from the data
set (Fig. 5.12) is a simplistic way of investigating this problem however, and mathematical methods for
adjusting for variable rates of change among sites in a sequence are required. Manske & Cllapman
(1987) developed a model for 5S rRNA which assigns probabilities of substitution for each site based on
relative nucleotide variance. Palumbi (1989) applied a simple model for corrections to mitochondrial
restriction enzyme fragment mapping data. For mammalian D-loop sequences Saccone et al. (1991)
calculated times of divergence using only those variable sites which fitted a Poisson distribution.
Golding (1983) however, showed that gamma and lognormal distributions can be better than a Poisson
distribution for describing variable mutation rates among sites in sequences. A gamma distribution
model is being investigated for use in the Hadamard conjugation algorithms (PJ. Waddell pers. comm.).
Weighted parsimony, which weights sites on the basis of relative numbers of substitutions, is more
likely to give the correct tree than uniform weighting of characters in simulation studies (Williams &
Fitch 1989, FilCh & Ye 1991). The method is tree-dependent however and results are sensitive to initial
parameters of the tree (Williams & FilCh 1989). Tree-independent methods for taking account of sites of
differing variability are currently being considered for implementation in HADTREE.
Evolution of tbe 12S rRNA Molecule
Knowledge of secondary structure is important for investigating the structural and functional basis of
sequence variability between groups. The skink data set presented here is not a particularly useful one
for examining variability of regions in relation to increasing taxonomic distance, since most of the taxa
are equally divergent from each other and the majority of variable positions have only one or two taxa
varying (Table 3. 1). Skinks, xantusiids, ratites and mammals each showed similar patterns of variability
however(Fig. 3 .6), indicating that the skink molecule is not evolving in a different way than other 12S
rRNA genes. In general, region S26 has a high proportion of variable sites in the vertebrates. The paired
and unpaired regions around helices 43, 45 and 46 also accumulate many substitutions. In addition, it
was suggested in C�apter Three that there may be taxon specific regions of variation. Skinks for
example, had many variable in region L38 ' (Fig. 3.6, Table 3. 1), whereas ratites, bovids, and the great

Otapter 7. page 91 .
apes had relatively more variability in SL40 (Figs. 3.6. 4.20). Further comparative sequence analyses for
a larger vertebrate data set is required to determine how general these patterns of variability are. If taxon
specific regions of variability do exist it may suggest differences in secondary structure and/or tertiary
interactions among the vertebrates.
Comparative sequence studies form the basis for experimental investigations of the secondary structure
(Woese el al. 1983, Noller 1984). Most of the experimental examinations of the small subunit rRNA
have been directed at E. coli (reviews in Gutell el al. 1985, Hill el al. 1990), which has the advantages of
ease of culturing and amenability to extensive genetic manipulations. The mitochondrial small subunit
rRNA lack many of the prokaryote helices (see figure 3.1), and the functional and strutural significance
of this is not well understood. The secondary structure of the region bounded by helix 36 requires
further study (see Figs. 3.2, 3 .3, 3.4), and experimental examinations of the 12S rRNA molecule are
important in this respect (see Gutell et aI. 1985, Hill et al. 1990).
In a more general context. the small subunit rRNA offers a good system with which to investigate
molecular evolution. Functional rRNA genes occur in both the mitochondrial and nuclear genomes.
Sequences of the nuclear small subunit ( 1 8S) gene are available for many groups (see de Rijk et al.
1992), and so detailed studies of the molecular evolution of the small subunit rRNA are possible. The
mitochondrial and nuclear rRNA genes differ in size and evolve at different rates (Gutell et aI. 1985,
Mindell & Honeycutt 1 990, Hillis & D�199 1). Refmement of secondary structure models for these
genes permits patterns of sequence evolution to be related to the structure and function of the molecule.
Studies of the evolution of the rRNA genes can also be related to tertiary interactions by investigations
of the evolution of the ribosomal binding proteins. While the ribosomal proteins which interact with the
nuclear and mitochondrial molecules are all encoded by nuclear genes, the mitochondrial ribosomal
proteins are the products of a different set of genes than the nuclear ribosomal proteins. The
mitochondrial ribosomal proteins also appear to be evolving more rapidly than their nuclear counterparts
(O'Brien et al. 1985). Mitochondrial ribosomal proteins. and their genes, however have not been studied
in as much detail as nuclear ribosomal proteins, which in turn are less well studied than the equivalent
prokaryote proteins (Wool et aI. 1990. Wittmann-Liebold et al. 1990).
Simulation Studies
There were two important results from the simulation study (Chapters Four and Five). The first was that
a star tree (as used in the simulations) is a useful null model to investigate the skink diversification. This
star model describes the pattern of transitions and transversions among the skinks very well (compare
Figs. 4.2, & 4.9). Validity of the model was supported when corrections for invariant sites were made. In the skink data set 41 % of the nucleotide substitutions were singletons (occurring on pendant edges).
Assuming that all sites were free to vary in the initial simulation model resulted in approximately 60%
of substitutions being singletons. When the adjustments to accoWlt for invariant sites were made (Chapter Five), 46� of the changes were singletons, agreeing well with the skink data. Further study of
the applicability of this model is required however. For instance, the lengths of branches leading to

ClJapter 7, page 92.
skink taxa vary in size (see figures 5.3, 5.4, 5.18), which is not expected for a star tree model, unless
there is variation in the rate of m�lecular evolution between the lineages.
The second important aspect of the simulation study relates to calculating sequence divergence from
transversion substitutions. Saturation of transition nucleotide substitutions occurs with increasing
genetic divergence (Brown et al. 1982, Wilson et al. 1985, Miyamoto & Boyle 1989), so trans versions - -have been used to obtain estimates for the degree of sequence divergence (Miyamoto & Boyle 1989,
Kraus & Miyamoto 1991 , Milinkovitch et al. 1993). The preliminary analyses presented here indicate
that such estimates will have a larger variance than estimates derived from total observed substitutions
(Figs. 4.14, 4.15, 4. 16). Inferences of divergence based on transversion substitutions must therefore be
made with caution. Proper statistical analyses of the simulation data are required to investigate this
problem in more detail. A binary tree model also needs to be simulated to assess the relevance of the
results obtained from the star tree model.
The Hadamard Conjugation and Spectral Analysis
As the skink data set used in this thesis illustrates, molecular sequences contain much information.
Development of more detailed mathematical models to examine the information still remains a major
challenge. The Hadamard conjugation and spectral analysis provide a powerful tool for examining
information within DNA sequences. Data sets such as the skink one have been important and influential
in rerming the algorithms. As demonstrated bere, support for taxonomic associations and the strength of
conflicting signals can be directly assessed using spectral analysis. The technique of forcing specific
groups of taxa to be included in the tree (Fig. 5. 16) is an important means for testing the likelihood of
alternative bypotheses. Further refinements to the programs are being directed toward comparison of
sub-optimal trees, so that the effects of conflicting signals in the data can be more accurately evaluated.
Incompletely Resolved Skink Phylogeny
The lack of phylogenetic resolution among the skinks was not simply due to there being too few variable
or informative sites. Similar numbers of variable sites occur in the ratite data set of Cooper et al. 1992
(Table 4.5a), and a resolved tree is produced with this data set (Fig. 5.2a). Nor was the complexity of the
skink spectrum (Fig. 5.1) an artifact related to the presence of either invariant or highly variable sites.
Weighting or removal of some or all of these sites did not improve resolution (Figs. 5.9, 5.10).
Simulation studies (Figs. 4.9, 4. 13), as well as the bovid data set (Fig. 4.4b; Kraus & Miyamoto 1991 ,
Allard et al. 1992), indicate that a star tree model of divergence may be a good first approximation for
the evolution of the skinks. A star-like divergence of the Leiolopisma may also be supported by
immunological data (Hutchinson et al. 1990). With such a model, the many conflicting signals in the
skink data set are due to rapid diversification of the taxa, as occured in Pecoran bovids (Kraus &
Miyamoto 1991 , Allard et al. 1992). As noted above bowever, further testing of this and other models
are required.

Olapter 7, page 93.
On the basis of the 12S rRNA sequence infoxmation the 17 New Zealand Leiolopisma examined in this
thesis do not appear to have a recent and monophyletic origin in New Zealand Strongest support in the
sequence data is found for the grouping of five pairs of taxa (Fig. 5.5), implying five more recent
speciation events. These taxa are: L. microlepis and L. smithi; L. grande and "Stewart Island Green"; L.
n. polychroma and L. n. nigriplantare; L. inconspicuum and L. notosaurus; and L. infrapunctatum with
Lampropholis guichenoti (Figs. 5 .1 , 5.5, & 5.18). A relatively close relationship between L. fallai and C.
aenea was also suggested (Figs. 5 .1 , 5 .16), but sequence similarities between C. aenea and the
Mauritian L. teifairi (Fig. 5. 1 5) indicate that the phylogenetic position of Cyclodina is still uncertain.
Hypotheses for the Origins of New Zealand Leiolopisma
The occurrence of Leiolopisma on islands in both the Indian and Pacific oceans, and their apparent
divergence from each other at about the same time (Fig. 5.5) may reflect a Gondwanan origin for this
group of skinks (Fig. 5.22a). Continental drift, rather than �e skinks own powers of dispersal could
account for their present distribution. The suggested close morphological similarity of the Fijian L.
alazon to New Zealand Cyclodina (Zug 1985) is important in this respect since Fiji also 'appears to be a
continental fragment (see Stevens 1980). Australian, New Zealand (L. grande, and Cyclodina oliverI),
and New Caledonian (L. nigrofasciolatum and Caledonescincus autrocaledonicus) species all have
similar immunological distances from L. teifairi (Hutchinson et al. 1990).
Two other hypotheses for the origin of Leiolopisma were presented in Chapter Five. One proposed that
the New Zealand Leiolopisma are the result of diversification within New Zealand during the Miocene
(Fig. 5.22b). Analysis of allozyme data provides support for this hypothesis (C.H. Daugherty & G.B.
Patterson pers. comm.), but as discussed in Chapters Five and Six, the small number of electrophoretic
loci which could be sampled may make the phylogenetic relationships derived from the skink allozyme
data less reliable than the pattern of relationships based on the sequence data. The third hypothesis
suggests that many of the New Zealand Leiolopisma are derived from several independent colonizations
of New Zealand (Fig. 5 .22c). Studies of the genetic variation of geckos on Pacific islands indicate that
some species have only recently colonized some islands (Moritz et al. 1993), indicating that they have
good oceanic dispersal abilities. Similar studies are required for the skinks. If New Zealand skinks did
colonize New Zealand after the breakup of Gondwanaland, then the degree of diffe�nces between the
12S rRNA sequences of the New Zealand Leiolopisma indicates that several independent colonizations
would have had to have occurred (Fig 5.22c), pOssibly across large tracts of open ocean. The fact that
the sequences from the Australian and Mauritian species are no more distinct from the New Zealand
data set than the sequences of New Zealand taxa are from each other (Table 5.3), makes this hypothesis
less well supported than the other two hypotheses. The relative closeness of the relationship between the
New Zealand L. infrapunctatum and the Australian La. guichenoti could however imply that there have
been at least two colonizations of (or departures from) New Zealand by Leiolopisma.

Predictions of the Three Hypotheses
Hypothesis One: Gondwanan Origins
OIapter 7. page 94.
If there was rapid divergence of Leiolopisma-like skinks in Gondwanaland, then further immunological
and sequencing studies of other Leiolopisma-like species are expected to show similar levels of
immunological and sequence divergence among the taxa as Hutchinson et al. (1990) and this study have
found. Analyses of sequence (and immunological) data from other groups of plants and animals with
limited powers of dispersal, such as geckos and land molluscs, could also be expected to show that taxa
on several different islands of continental origin diverg�from each other at about the same time.
Hypothesis Two: Oligocene Drowning
If many of the New Zealand Leiolopisma speciated within New Zealand (Fig. 5 .22b), then they should
be more similar genetically to each other than to New Caledonian or Australian species. This hypothesis
is not supported by the available 12S rRNA sequence data. Most New Zealand Leiolopisma skinks are
as equally distinct from each other as they are from the Australian and Mauritian species (Tables 4.1a,
5.3). More Australian and New Caledonian species need to be examined though.
Initial analyses of allozyme data have been interpreted as indicating a diversification of Leiolopisma
within New Zealand, with La. guichenoti and L. telfairi much more distantly related (C.H. Daugherty &
G.B. Patterson peTS. comm.). The different views of the evolutionary history of New Zealand skinks
presented by allozyme data on the one hand and mitochondrial sequence data on the other may be a
reflection of the small number of loci and sequence length examined in each case, as discussed in
Chapter Six.
If the evolutionary relationships of New Zealand skinks are similar to those indicated by analyses of
allozymes and the Oligocene drowning hypothesis (Fig. 5.22b), then both immunological studies and
sequence analysis of nuclear genes should group New Zealand Leiolopisma together, distinct from other
Leiolopisma.
Hypothesis Three: Multiple Colonists
The third hypothesis, proposing multiple colonization events in New Zealand, predicts that taxa in New
Caledonia and/or Australia will have closer phylogenetic relationships to at least some New Zealand
species than the New Zealand species have among themselves. The relatively close relationship between
L. injrapunctatum and La. guichenoti gives support to this hypothesis. The proximity of New Caledonia
to New Zealand suggests that New Zealand skinks should show genetic closer similarity to New
Caledonian than Australian species, if they arrived by this route. If Leiolopisma did diversify in
Gondwanaland, then a date of separation between the ancestors of L. injrapunctatum and La. guichenoti
of approximately 40 million years is implied (Chapter Five). Land connections between New Caledonia
and New Zealand were more extensive during this period (Suggate et al. 1978), so DNA sequence
studies of New Caledonian skinks may reveal taxa there with close relationships to both L.
inJrapunctatum and La. guichenoti.

Olapter 7, page 95.
Testing the Hypotheses: What Other Skinks to Sample?
More Pacific skinks need to be examined to test all three hypotheses. Several New Zealand skinks also
have still to be studied at the DNA level. These include L. waimatense (South Island), L. Iwmalonotum
(Poor Knights Islands), and more members of the South Island L. lineoocellatum-L. chloronotum
complex, as well as several as yet undescribed species. Sequence studies of Cyclodina are already
underway. The most critical overseas species to examine are L. alazon (Fiji), L. lichenigerum (Lord
Howe), Leiolopisma species from New Caledonia (four are described; Sadlier 1986), and Australian
species of the Leiolopisma group (which are now being reassigned to several new genera; Hutchinson et
al. 1990). Other groups of skinks also need to be sampled to determine whether there has been more
widespread skink diversification. Australia has about 30 genera of skinks (Cogger 1986), New
Caledonia has ten (Sadlier 1986), New Guinea about sixteen (Allison 1982), and many more genera and
species are distributed throughout the Pacific and Asia (Greer 1974, 1979). Of particular interest would
be examination of other members of the Eugongylus group, such as Emoia and Morethia, and the New
Caledonian genera Tropidoscincus, Geoscincus, Plwboscincus, and others (Sadlier 1986). Other genera
within Lygosominae, for example Notoscincus (Australia), and Mabuya, a predominantly Asian group
which Greer (1979) regards as the stock for the Lygosominae, could also be investigated. Emoia (which
is distributed across the Pacific), is not too distant, immunologically, from the Leiolopisma (Hutchinson
et al. 1990).
Testing the Hypotheses: What Other Genes to Sample?
Maternal inheritance, lack of recombination, and the effectively haploid state of mitochondria (Brown
1985, Wilson et al. 1985, Moritz et al. 1987) make mtDNA a simpler system than the nuclear genome to
investigate at the DNA sequence level. It may not be suitable however for investigating the deep
branches in the skinks. The 12S rRNA sequence data for Leiolopisma is notable for the many conflicting
phylogenetic signals it contains (Fig. 5.1). Resolution of the evolutionary relationships of the
Leiolopisma may therefore require examination of more conservative sequences than domain ill of 12S
rRNA, as is also required for the Pecoran bovid phylogeny (Kraus & Miyamoto 1991). Analysis of the
complete 12S rRNA gene may provide greater taxonomic resolution and, as discussed above, is
important for more general studies of molecular evolution. Cloning of the skink mitochondrial genome
is underway and sequencing of the 12S rRNA gene is one of the first objectives. The mitochondrial
large subunit (16S) rRNA may be another suitable candidate gene for examining the relationships of
more distantly related taxa, though alignment of mammalian sequences in the GenBank database (data
not shown) suggest that it changes at a similar rate as the mitochondrial small subunit gene, so it may
not have greater resolving power for deeper branches in the evolutionary tree.
Other mitochondrial genes, such as cytochrome oxidase I and cytochrome b, are widely used, and
useful, for phylogenetic comparisons (for example, Kocher et al. 1989, Irwin et al. 1991 , Palumbi et al.
1991 , Simon et al. 1.991, Smith & Patton 1991, Pashley & Ke 1992). They tend to have more rapid rates
of change than the rRNA genes thougb (Moritz et al. 1987), and so may be inadequate to resolve the

Cllapter 7. page 96.
deep branching patterns of skink relationships. However, the limited cytochrome b data for the skinks
(Chapter Five, and Appendix 1), indicates that most of the differences between the skink sequences
occur in third codon positions. If there are too many conflicting signals from third codon position sites,
analysis of the more conservative ftrst and second codon positions may provide greater phylogenetic
resolution. Third codon positions may be useful for studying the relationships between more closely
related taxa, such as L. micro1epis and L. smithi. As shown in Chapter Five, the cytochrome b sequence -
did differentiate between the Gorge Burn L. maccanni and the putative hybrid (Table 5.4).
Consistent ampliftcation of the cytochrome b gene sequence could not be achieved using the
cytochrome b universal PCR primers of Kocher et al. (1989; see Chapter Two). A more efftcient, and
ultimately more useful, strategy would be to clone and sequence the skink mitochondrial genome, and
this is currently being attempted. Suitable PCR primers appropriate for various taxonomic or population
comparisons can then be designed. Few molecular sequence studies of reptiles have been undertaken
and the organization of the reptilian mitochondrial genome is not known, so such a project has general
utility. Mitochondrial gene organization differs between birds, marsupials and placental m.iUnmals (Desjardins & Morais 1990, Paabo et al. 1991), and knowledge of gene order in reptile mtDNA may
help resolve the relationships among reptiles, birds and mammals (see Chapter Two, and Marshall
1992).
Investigation of Nuclear Gene Sequences
More conserved sequences for studying the branching order of the skinks can be obtained from nuclear
genes, and analysis of nuclear rRNA and their intragenic spacer regions may be the most useful. PCR
primers for some of these genes (e.g., 18S rRNA), and which work for a range of vertebrates, have
already been designed (Hillis & Dixon 1991). As noted above, analysis of the nuclear 18S rRNA gene
(the equivalent of the mitochondrial 12S rRNA molecule) would also complement molecular
evolutionary studies of the 12S rRNA gene.
Examination of the phylogenetic relationships and evolutionary histories of skinks using sequences from
nuclear genes is also important because of the apparent conflicts between the mit�hondrial and
allozyme studies. Investigation of nuclear protein-encoding genes in this regard would be informative. It
would be particularly interesting to obtain sequence data from some of the loci used in the skink
allozyme survey. Phosphoglucomutase, for example, had the largest number of alleles among the skinks
(ten; C.H. Daugherty & G.B. Patterson pers. comm.), and may contain sufficient variable nucleotide
sites to be phylogenetically informative. Speciftc PCR ampliftcation of introns by using PCR primers
which anneal to conserved exon sequences may be the most suitable method to achieve this (Palumbi &
Baker 1993, submitted). Glucose-6-phosphate dehydrogenase has received close molecular genetic
scrutiny in other studies (Vulliamy et al. 1992) and is another potential nuclear gene to be considered for
study in the skinks (six alleles were detected for this locus by C.H. Daugherty & G.B. Patterson). If the
intron sequences are evolving rapidly then they may only be useful for resolving more recent

Otapter 7. page 97.
divergences (for example, the separation of L n. po/ychroma and L n. nigrip/antare, L microlepis and
L. smithi, and possibly the hybrid and parental populations at Gorge Burn).
Hybridization between L n. polychroma and L. maccanni
Hybridization has been considered to have an important role in the evolution of plants (Cockayne 191 1 ,
Rattenbury 1962, Grant 1981, Arnold 1992), but it's significance i n animals may_be underra!ed (Mayr
1963, Arnold 1992, Grant & Grant 1992, Dowling & DeMarais 1993). Dowling & DeMarais (1993)
investigated hybridization among freshwater fish in the genus Gila, and suggested that interspecific
hybridization has been a major factor in generating morphological and genetic diversity. Interspecific
hybridization may also be common among some groups of birds, aDd hybrids may, temporarily at least,
have greater reproductive success (Grant & Grant 1992). Hybridization between Lei% pisma therefore
requires much closer examination.
The three nucleotide differences between L. maccanni and the L. n. polychroma cytochrome b sequences
from Gorge Burn suggest hybridization may have occurred in the Pliocene, over a million years ago
(Chapter Six). That hybridization was detected by examination of only a few individuals indicates that
hybridization may be relatively common. Whether there is a hybrid zone (Barton & Hewitt 1989) or just
a localized introgression requires further examination of individuals from Gorge Burn and adjacent
populations (see Patterson 1985, Daugherty et al. 1990b). Patterson's (1985) study of the ecology of the
Central Otago skinks is the most comprehensive one of the gtoup so far, but the discovery of hybrid
skinks emphasises the need for additional detailed ecological studies of both hybrid and non-hybrid
populations to determine the behavioural and ecological features which usually keep them from
interbreeding.
Of more general significance is the fact that hybridization between the skinks can occur despite tens of
millions of years separation from a common ancestor. Reports of naturally occuring hybridization
between taxa which diverged more than five million years ago are uncommon in the literature (see
Chapter Six), though frogs which diverged up to 35 million years ago have the potential to hybridize
(Wilson et al. 1974). As discussed above, it is important to obtain more refined estimates for the
divergence times of the skinks so that their ability to hybridise can be more accurately related to their
degree of divergence.
Ecological studies to investigate the viability and reproductive success of the skink hybrids (see Barton
& Hewitt 1989, Grant & Grant 1982) are an essential complement to the genetic analyses. Captive
b�eeding of skinks is a means to examine the potentia.l for interspecific hybridization and the viability
and competitive ability of hybrids. Such experimental studies are essential for an understanding of the
processes of speciation (Endler 1986, Coyne 1992).

Oaapter 7, page 98.
The Potential of L n. polychroma For Population Studies
A strong emphasis of this thesis has been to being together ecological and evolutionary studies in New
Zealand. L. n. polychroma, and other New Zealand skinks, offer many opportunities for such research.
L. n. polychroma is a wide ranging species, encompassing six degrees of latitude (from the central North
Island to Southland), and living in a variety of habitats from sea level to 1700 m (pickard & Towns
1988, Patterson & Daugherty 1990). Wide-ranging and common species are ofte� cODSide� to be more
variable (Wallace 1 889, Mayr 1963) but genetic evidence in support of this is meagre. Reduced
phenotypic variability has also been noted for populations at the geographic or ecological margins of a
species' range (Mayr 1963, Lewontin 1974, Brossard 1984). StUdies of genetic variation within and
between populations of ecologically and geographically distinct L. n. polychroma may be informative in
this respect
Analyses of the sequence data (Fig. 5.18) led to the suggestion in Chapter Five that L. n. polychroma has an origin in Southern New Zealand. It now inhabits many areas considered to have been glaciated or
ecologically depauperate during the Pleistocene (see Fleming 1980, Stevens 1980). C.H: Daugherty
(pers. comm.) noted clines in allele frequencies for L. n. polychroma, and investigation of sequence
differences between populations may permit examination of the origins and the directions and timings of
dispersal of L. n. polychroma. If current distribution is due in part to post Pleistocene dispersal then
sequence analysis of the most variable region of mtDNA, the D-loop (Moritz et al. 1987), could be
suitable for studying this (see for example, Smith & Patton 1990, Thomas et al. 1990, Ward et al. 1991).
Chromosomal studies (see Hillis & Moritz 1990) and DNA fingerprinting (Jeffreys et al. 1991) may also
be informative for interpopulation differences.
Rates of Molecular and Morphological Evolution in Skinks
A Gondwanan origin for Leiolopisma skinks implies a low nite of sequence evolution (25 to 30
substitutions (Table 4.la) per 80 MY, or 0.3 to 0.375 substitutions per MY). The ratites have
approximately 0.5 substitutionslMY, and bovids a rate of 1 .2IMY (Table 4.6). A slower rate of
molecular evolution in lizards than in birds or mammals may be related to a lower metabolic rate in
reptiles (Martin & Palumbi submitted), though the xantusiid lizards may have a high rate of mutation
(Table 4.6; Hedges et al. 1991). A low metabolic rate may result in both less oxidative damage to DNA
(Richter et al. 1988, Shigenaga et al. 1989, Martin & Palumbi submitted) and slower turnover of DNA.
and consequently slower rates of mtDNA change (Martin & Palumbi submitted). Non-invasive analysis
of oxidative damage is now possible using HPLC (Shigenaga et aI. 1992), so more detailed
examinations of the relationship between metabolic rate and degree of DNA damage may be feasible.
A Gondwanan, or even Miocene (15-25 MY A), origin of the skinks also suggests a low rate of
morphological change in the skinks. Marked differences in rates of morpbological and genetic change
are well documented (Wilson et al. 1974, King & Wilson 1975, Cherry et al. 1978, Wayne et al. 1989).
The lack of morphological diversification in New Zealand skinks is unusual however both with respect
to their ecological and latitudinal ranges (Bull & Whitaker 1975, Pickard & Towns 1 988, Daugherty et

OIapter 7. page 99.
aI. 1 990b), and their suggested period of separation from each other. T:heif m9fJ'helogieftlllRifeRBity
may s9we't'er ge "Ia�d to ecologiGal RaWR&. Australian skinks are morphologically very diverse
(Ricklefs et ai. 198 1), and this may be due to a combination of factors, such as habitation in infertile and
arid environments, which have few avian or mammalian predators, and the abundance of termites as a
food source (Morton & James 1988). New Zealand geckos are morphologically more varied than skinks,
though the degree of genetic divergence among geckos appears to be smaller � for skinks _(R.
Hitchmough pers. comm.). A combination of exploitation of forest habitats and adoption of nocturnal
lifestyles by some New Zealand geckos may have been a contributory factor in their greater
morphological diversity (R. Hitchmough pers. comm.). -
Perhaps, as in the case of African jackals (Wayne et aI. 1989), an open and fertile grassland habitat. and
potential abundance of prey may reduce both interspecific competition and development of
morphological divergence among the New Zealand skinks. The existence of sympatric species of skinks
(patterson 1985, Daugherty et al. 1990b) however suggest that subtle microhabitat differentiation and
behavioural features must be important for maintaining separate gene pools. Some of the-sequence data
presented here indicates that such differentiation may break down occasionally.
Evolutionary Investigations of New Zealand Biota
Many of the problems which perplexed early biologists in New Zealand are still unresolved. The chief
difficulty has been accurate determination of evolutionary relationships among groups. Biochemical and
molecular approaches, as demonstrated here and elsewhere (Daugherty et ai. 1982, Green et al. 1989,
Daugherty et al. 1 990a,b, Cooper et al. 1992) are essential for evolutionary investigations of New
Zealand' s biota.
As aspects of the present study, and those of Patterson (1985) and Daugherty et al. (1990b) have shown,
evolutionary and ecological questions are linked. The coordination of ecological and evolutionary
studies of New Zealand skinks provide general insights into both the biological and geological history of
New Zealand, as well as processes of molecular and organismal evolution.
Application of molecular techniques to evolutionary questions has contributed much to an understanding
of phylogeny (Wilson et ai. 1985, Hillis 1987, Patterson 1987, Wilson et al. 1989, Moritz & Hillis
1990). They have been helpful not only in resolving relationships which have been difficult to address
by other means, but can also provide a more reliable indicator of the degree of phylogenetic divergence
(for example, King & Wilson 1975, Roberts & MaxsoIi 1985, Wayne et al. 1989, Meyer et al. 1990,
Martin et al. 1993, see also Hillis 1987, Moritz & Hillis 1990). Molecular systematics has lead to a
renaissance in morphological taxonomy (Patterson 1987), and satisfyingly, molecular and
morphological phylogenies are more often in agreement than conflict (Hillis 1987, Moritz & Hillis
1990). Where morphological and molecular data are in apparent conflict (for example with the
I MASSEY U . ' ITY-I U S f. -:. ( '----

OJaptel' 7. page 100.
mammals; Wyss et al. 1987, Gauthier et al. 1988, Hedges et aI. 1991, Marshall 1992), emphasis should
be on examination of the advantages and limitations of each data set, rather than which data set is 'right'
(Moritz & Hillis 1990).
Phylogenetic trees should be regarded as hypotheses, and steps along the way to understanding
evolutionary processes. Mayr's observation (1963, page 9) that ...
..... even today there still are some zoologists to whom the term 'evolution' signifies little
more than the determination of homologies, common ancestors, aru:I phylogenetic trees."
should not be forgotten.

References
Abrahams, J. P., van den Berg, M., van Batenburg, E., Pleij, C. (1990). Prediction of RNA secondary sttucture, including
pseudolcnotting, by computer simulation. Nucleic Acids Res. � 3035-3044.
Allan, H. H. (1961). Flora of New Zealand. VoL 1. Government Printer, Wellington.
page 101.
Allard, M W., Miyamoto, M. M., Jarecki, L., Kraus, F., Tennant, M. R. (1992). DNA systematics and evolution of the artiodactyl
family Bovidae. Proc. NatL Acad. Sci. USA 89, 3972-3976.
Allibone, R. M. (1990). Studies of genetic variation and systematics of New Zealand galaxiids using allozyme electrophlXesis.
Unpublished MSc Thesis, University of Otago, Dunedin.
Allison, A. (1982). Distribution and ecology of New Guinea lizards. In: Gressitt, J.L. (ed.) Biogeography and ecology of New Guinea. Vol. 2. Dr W. Junk b.v. Publishet's, The Hague. pp 803-813.
Andersen, J. C. (1969). Myths &: legends of the Poly�ians. Charles E. Tuttle Company.
Anderson, A. (1983). Faunal depletion and subsistence change in the early prehistory of southern New Zealand. ArchaeoL Oceania � 1- 10.
Anderson, S., Bankier, A.T., Barrell, B.G., de Bruijn, M.H., Coulson, A.R., Drouin, J., Eperon, I.e., Nierlich, D.P., Roe, B.A., Sanger,
F., Schreier, P.H., Smith, A.J., Staden, R., Young, I.G. (1981). Sequence and organization of the human mitochondrial genome
Nature 290, 457-465.
Anderson, S., de Bruijn, M.H., Coulson, A.R., Eperon, I.C., Sanger, F., Young, I.G. (1982). Complete sequence of bovine mitochondrial
DNA: conserved features of the mammalian mitochondrial genome. J. Mol. BioL 156, 683-717.
Antao, V. P., Lai, S. Y., TInoco, I. (1991). A thermodynamic study of unUSUally stable RNA and DNA hairpins. Nucleic Acids Re.r. 19,
5901-5905.
Aquadro, C. F., Kaplan, N. Risko, K. 1. (1984). An analysis of the dynamics of mammalian mitochondrial DNA sequence evolution.
Mol. BioL Evol . .!.' 423-434.
Amason, U., Gullberg, A., Widegren, B. (1991). The complete nucleotide sequence of the mitochondrial DNA of the fin whale,
Baloenoptera physalus. J. Mol. EvoL 33, 556-568.
Amason, U., Johnsson, E. (1992). The complete mitochondrial DNA sequence of the harbIX seal, Phoca vitulina. J. MoL EvoL � 493-
505.
Arnheirn, N., Erlich, H. (1992). Polymerase chain reaction strategy Ann. Rev. Biochem. 61, 131-156.
Arnheim, N., White, T., Rainey, W. E. (1990). Application of PCR: organismal and population biology. BioScience 40, 174-1 82.
Arnold, E. N. (1980). Recently extinct reptile populations from Mauritius and Reunion, Indian Ocean. J: ZooL, Lond. 191, 33-47.
Amold, M. L. (1992). Natural hybridization as an evolutionary process. Ann. Rev. &oL Syst. 23, 237-261.
Aubert, J., Solignac, M. (1990). Experimental evidence for mitochondrial DNA introgression between Drosophiw species. Evolution 44, 1272-1282.
Avise, J. e. (1986). Mitochondrial DNA and the evolutionary gen�cs of higher animals. Phil. Trans. R. Soc. Lond. B 312, 325-342.
Avise, J. e. (1989a). Gene trees and IXganismal histories: a phylogenetic approach to population biology. Evolution 43, 1 192-1208.
Avise, 1. e. (1989b). A role for molecular genetics in the recognition and conservation of endangered species. TREE 1 279-281.
Avise, J. e. (1991). Ten I!northodox perspectives on evolution prompted by comparative population genetic findings on mitochondrial
DNA. Ann. Rev. Genet. 25, 45-69.

page 102.
Avise, J. c., Aquadro, C. F. (1982). A comparative summary of genetic distances in the vertebrates. Panerns and conelations. EvoL
Bioi. 15, 151-185.
Avise, J. C., Arnold, J., Ball, R. M, Bermingham, E., Lambr, T., Neigel, J. E., Reeb, C. A., Saunders, N. C. (1987). Intraspecific
phylogeograpby: the mitochondrial DNA bridge between population genetics and systematics. Ann. Rev. Ecol. Syst. ll, 489-522.
Avise, J. C., Bowen, B. W., Lamb, T., Meylan, A. B., Benningham, E. (1992). Mitochondrial DNA evolution at a turtle's pace:
evidence for low genetic variability and reduced microevolutiolW}' rate in Testudines. Mol. BioL Evol. �, 457-473.
Baker, A. J. (1975). Morphological variation, hybridization and systematics of New Zealand oyster catchecs (CharaQriiformes:
Haematopodidae). l. ZooL Lond. 175, 357-390.
Baker, A. J. (1992). Genetic and morphometric divergence in ancestral european and descendent New Zealand populations of chaffinches (Fringilla coekbs). Evolution 46, 1784-1 800.
Baker, A. 1., Moeed, A. ( 1987). Rapid genetic differentiation and founder effect in colonizing populations of common mynas
(Acridotheres tristis). Evolution 41, 525-538.
Ballard, J. W. O., Olsen, G. J., Faith, D. P., Odgecs, W. A., Rowell, D. M., Atkinson, P. W. (1992). Evidence from 125 ribosomal RNA
sequences that onychophorans are modified arthropods. Science 258, 1345- 1348.
Barton, N. H., Hewitt, G. M. (1989). Adaptation, speciation and hybrid zones. Nature 341, 497-503. - '-
Barwick, R.E. (1959). The life history of the common New Zealand skink uiolopisma l.eJandjca (Gray, 1 843). Trans. Roy. Soc. N.Z. 86, 331-380.
Batcheler, C. L., McLennan, M. J. (1977). Craniometric study of allometry, adaptation and hybridism of red deer (CeNUs elapluu
scoticus L) and wapiti (C. e. nelsoni, Bailey) in Fiordland, New Zealand. Proc. N.Z £CoL Soc. 24, 57-75.
Bauer, A. M. (1990). Phylogenetic systematics and biogeography of the Carpbodactylini (Reptilia: Gekkonidae). Bonner Zoologische
Monographien 30, 1-128.
Baverstock, P. R., Donnellan, S. C. (1990). Molecular evolution in Australian dragons and skinks: a progress report. Memoirs Queensland Mus. 29, 323-33 1 .
Bell, B. D., Newman, D . G., Daugherty, C . H . (1985). Th e ecological and biogeography of the archaic New Zealand he:petofauna
(Leiopelmatidae, Sphenodontidae). In: Grigg, G., Shine, R., Ehmann, H. (eds.), Biology of Australasianfrogs and reptiles. Royal
Zoological Society of New South Wales. pp. 99-106.
Benton, M. J. (1990). Phylogeny of the major tetrapod groups: morphological data and divergence dates. J. Mol. EvoL 30, 409-424.
Benningham, E., Lamb, T., Avise, J. C. (1986). Size polymorphisms and heteroplasmy in the mitochondrial DNA of lowec vectetntes.
1. Heredity 77, 249-252.
Bernardi, G., Becnardi, G. (1991). Compositional properties of nuclear genes from cold-blooded vertebrates. J. MoL Evol. 33, 57-67.
Bernardi, G., Mouchiroud, D., Gautier, c., Bernardi, G. (1988). Compositional patterns in vertebrate genomes: conservation and change
in evolution. J. Mol. Evol. 28, 7-18.
Berry, R. 1. (ed.). (1984). Evolution in the Galapagos Islands. Academic Press, LondonlLinneaD Society of London. Symposium Series
no. 1 2.
Bibb, MJ., van Etten, R.A., Wright, C.T., Walberg, M.W., Clayton, D.A. (1981). Sequence and gene organization of mouse
mitochondrial DNA. Cell 26, 167- 1 80.
Bigelow, R. S. (1965). Hybrid zones an 'd reproductive isolation. Evolution 19, 449-458.
Bigelow, R. S. (1967). The grasshoppecs (Acrididae) of New Zealand. Their taxonomy and distribution. University of CanJerbury Publ.
2, 1 - 1 1 1 .
Bloch, W . (1991). A biochemical perspective of the polymerase chain reaction. Biochemistry 30, 2735-2747.

page 103.
Britten. R. J. (1986). Rates of DNA sequence evolution differ between taxonomic groups. Science 23 1. 1 393-1 398.
Brown. W. M .• 1983. Evolution of animal mitochondrial DNA. In: Nei. M .• Koehn, R.K. (eds.). Evolution of genes and proteins.
Sinauer Associates. Inc. Sunderland, Massachusetts. Pp. 62-88.
Brown. W. M . • George. M .• Wilson. A. C. (1979). Rapid evolution of animal mitochondrial DNA. Proc. NatL Acad. Sci. USA 76. 1967-
197 1 .
Brown. W . M . • Prager. E. M . • Wang. A.. Wilson. A. C . (1982). Mitochondrial DNA sequences of primates: tempo an d mode of
evolution. J. MoL Evol. J!. 225-239.
Brossard. P. I. (1984). Geographic patterns and environmental gradients: the central-marginal model in Drosophila revisited. Ann. Rev.
&oL Syst. 15. 25-64.
Bun. P. C .• Whitaku. A. H. (1975). lbe amphibians. reptiles. birds and mammals. In: Kuschel. G. (ed.). Biogeography and ecology in New Zealand. Dr W. Junk b.v. Publishers. lbe Hague. Pp. 231-276
Burrows. C. J. (1965). Some discontinuous distributions of plants within New Zealand and their ecological significance. Part n: disjunctions between Otago-Southland and Nelson-Marlborough and related distribution patterns. Tuatara Q. 9-29.
Burrows. C. J • • Greenland, D. E. (1979). An analysis of the evidence for climatic change in New Zealand in th.: �� thousand years:
evidence from divuse natural phenomena and from instrumental records. J. Roy. Soc. N.Z. 2.. 321-373.
Bush. G. L. Case. S. M .• Wilson. A. C .• Patton. J.L (1977). Rapid speciation and chromosomal evolution in mammals. Proc. Natl.
Acad. Sci. USA 74. 3942-3946.
Buth. D. G. (1984). The application of electrophoresis data in systematic studies. Ann. Rev. &oL Syst. 12. 501-522.
Cann, R. L. Brown. W. M .• Wilson. A. C. (1984). Polymorphic sites and the mechanism of evolution in human mitochondrial DNA.
Genetics 106. 479-499.
Cantatore. P .• Gadaleta. M. N .• Roberti. M .• Saccone. c.. Wilson. A. C. (1987). Duplication and remoulding oftRNA genes during the
evolutionary rearrangement of mitochondrial genomes. Nature 329. 853-855.
Casanova. J.-L. Pannetier. C .• Jaulin, c.. Kourilsky. P. (1990). Optimal conditions for directly sequencing double-stranded PCR
products with Sequenase. Nucleic acids research J!. 4028.
Carlquist, S. (1974). Island Biology. Columbia University Press. New York.
Carrol. R. L (1969). Origin of reptiles. In: Gans, C. (ed.), Biology of reptilia. Vol. I. Morphology A. Academic press. Pp. 1-44.
Carson, H. L (1983). Chromosomal sequences and interisland colonizations in Hawaiian Drosophila. Genetics 103, 465-482.
Cavalli-Sforza, L L. Edwards. A. W. F. (1967). Phylogenetic analysis: models and estimation procedures. Evolution 21. 550-570.
Cavender. J. A. (1978). Taxonomy with confidence. Math, Biosci. 40, 271-280.
Champion. A. B .• Pragu. E. M .• Wachter. D .• Wilson, A. C. (1974). Microcomplement fixation. In: Wright, C.A. (ed.) Biochemical and imnumological taxonomy 0/ animals. Academic Press. London. pp. 397-416.
Cheng. J.-W., Chou. S.-H., Reid, B. R. (1992). Base pairing geometry in GA mismatches depends entirely on the neighboring sequence.
J. MoL BioL 228. \037- 1041.
Cherry. L. M . • Case. S. M .• Wilson. A. C. (1978). Frog puspective on the morphological differences between humans and
chimpanzees. Science 200, 209-21 1 .
Qark, A. G . • Whittam, T. S . (1992). Sequencing errors and molecular evolutionary analysis. Mol. BioI. EvoL 2, 744-752.
Qary. D. O .• Wolstenholme. D. R. (1985). The ribosomal genes of Drosophila mitochondrial DNA. Nucleic Acids Res. Q. 4029-4045.

page 104.
Oayton, D. A. (1982). Replication of animal mitochondrial DNA. CeU 28, 693-705.
Oegg, M. T., Durbin, M. L. (1990). Molecular approaches to the study of plant biosystematics. Aust. Syst. Bot. lo l-8.
Oimo, F. M. (1978). The Powellip/Janta gilliesi-traversi-hochsterteri-rossiana-lignaria-superba ring species (Mollusca: Pulmonata). N.Z J. 200L 1, 289-294.
Oimo, F. M. (1989). The panbiogeography of New Zealand as illuminated by the genus Fectola lredale, 1 9 1 5 and subfamily Rotadiscinae Pilsbry, 1927 (Mollusca: Pulmonata: Punctoidea: Cbaropidae). N.Z J. 2001. 16, 587-649.
Cockayne, L (191 1 ). Observations concerning evoluuon, derived from ecological studies in New Zealand. Trans. Proc. N.Z 1nst. 44, ISO.
Cogger, H. G. (1986). RepriJes and amphibians of Australia. Reed Books Pty Ltd.
Cogger, H. G., Heatwole, H. (1981). The Australian reptiles: origins, biogeography, distribution patterns and island evolution. In: Keast, A. (ed.), Ecological biogeography of Australia. Dr. W. Junk b.v. Publishers, The Hague. pp. 1333-1373.
Cohn, J. P. (1990). Genetics for wildlife conservation. BioScience.1Q. 167-171 .
Connor, H . E. (1985). Biosystematics of higher plants i n New Zealand 1965-1984. N.Z J. Bot. 23, 61 3-644.
Cooper, A. J., Chambers, G. K., Cooper, R. A. (in prep.). The Oligocene bottleneck and New Zealand ratite phyiogeny.
Cooper, A., Mourer-Chauvir6, C., Chambers, G. K., von Haeseler, A., Wilson, A. C., Piiiibo, S. (1992). Independent origins of New Zealand moas and kiwis. Proc. Natl. Acad. Sci. USA 89, 8741-8744.
Cooper, R. A. (1989). New Zealand tectonostratigraphic terranes and panbiogeogra�y. N.Z J. Zool. 16, 699-712.
Coyne, J. A. (1992). Genetics and speciation. Nature 355, 5 1 1-5l5.
Cracraft, J., Helm-Bychowski, K. (1991). Parsimony and phylogenetic inference using DNA sequences: some methodological strategies. In: Miyamoto, M.M., Cracraft, J. (eds.), Phylogenetic analysis of DNA sequences. Oxford University Press. pp. 1 84-220.
Craig, J. (1984). Are communal pukeko caught in the prisoner's dilemma? Behav. &oL Socio. Biol. ll, 147-150.
Craw, R. C. (1988). Continuing the synthesis between panbiogeography, phyiogenetic systematics and geology as illustrated by empirical studies on the biogeography of New Zealand and the Chatham Islands. Syst. ZooL 37, 291-3 1 0.
Craw, R. (1989). New Zealand biogeography: a panbiogeographic approach. N.Z J. Zool. 16, 527-547.
Cree, A., Cockrem, J. F., Guillette, L J. (1992). Reproductive cycles of male and female tualara (Sphenodon punctatus on Stephens Island, New Zealand. J. Zool., Lond. 226, 199-217.
Cronquist, A., 1980. Chemistry in plant taxonomy: an assesment of where we stand. In: Bisby, F.A., Vaughan, J.G., Wright, c.A. (eds.), Chemosystematics: principles and practice. pp. 1-27.
Crook, I. G. (1975). The tuatara. In: Kuschel, G. (ed.), Biogeography and ecology in New Zealand. Dr W. Junk b.v. Publishers The Hague. pp. 331-352.
Crowhurst, R. N., Lints, R., Atkinson, R. G., Gardner, R. C. (1990). Restriction fragment length polymorphisms in the genus Actinida
(Actinidiaceae). Plant Syst. Evol. 172, 193-203.
Crozier, R. H. (1 990). From population genetics to phylogeny: us� and limits of mitochondrial DNA. Aust. Syst. Bot. 1, °1 1 1-124.
Darns, E., Hendriks, L, van der Peer, Y., Neefs, J.-M., Smits, G., Vandenbempt, I., De Wachter, R. (1988). Compilation of small ribosomal subunit RNA sequences. Nucleic Acids Res. 16, Suppl., r87-rI73.
Darwin, C. (1859). On thf origin of species by means of natural selectio,," or the preservation of favoured races in the struggle for life.
John Murray, London.

page 105.
Darwin, C. (1875). The variation of animals and plants under domestication. Second edition. Iohn Murray, London.
Daugherty, C. H., Bell, B. D., Adams, M., Maxson, L. R. (1981). An electrophoretic study of genetic variation in the New Zealand frog
genus Leiopelma. N.Z. J. ZooL !, 543-550.
Daugherty, C. H., Cree, A., Hay, 1. M., Thompson, M. B. (1990a). Neglected taxonomy and continuing extinctions of tuatara
(Sphenodon). Nature 347, 177-179.
Daugherty, C. H., Patterson, G. B., Thorn, C. I., French, D. C. (1990b). Diffeieiltiation of the members of the New Zealand Lewlcpisma
nigriplanrare species complex (Lacertilia: Scincidae). Herpet. Monogr. 1, 61-76.
de Bruijn, M. H. L., KIug, A. (1983). A model for the teniary structure of mammalian transfer RNAs lacking the entire ' dihydrouridine'
loop and stem. £MBO J. �, 1309-1321.
de Rijk, P., Neefs, I.-M., van de Peer, Y., de Wachter, R. (1992). Compilation of small ribosomal subunit RNA sequences. Nucleic
Acids Res. 20, Suppl., 2075-2089.
Dell, R. K. (1955). The land mollusca of Fiordland, south-west Otago. Trans. Roy. Soc. N.Z. 82, 1 1 35-1 148.
DeSalle, R., Freedman, T., Prager, E. M., Wilson, AC. (1987). Tempo and mode of sequence evolution in mitochondrial DNA of Hawaiian Drosophila. J. MoL Evol. 26, 157-164.
DeSalle, R., Hunt, 1. A (1987). Molecular evolution in Hawaiian drosophi1ids. Trends &01. Evol. �, 212-216.
DeSalle, R., Templeton, A R. (1988). Founder effects and the rate of mitochondrial DNA evolution in Hawaiian Drosophila. Evolution
42, 1076-1084.
Desjardins, P., Morais, R. (1990). Sequence and gene organization of the chicken mitochondrial genome: a novel gene order in higher
vertebrates. J. Mol. BioI. 212, 599-634.
Desjardins, P., Morais, R. (1991). Nucleotide sequence and evolution of coding and noncoding regions of a quail mitochondrial
genome. J. MoL Evol. 32, 153-161.
Devereux, I., Haeberli, P., Smithies, O. (1984). A comprehensive set of sequence analysis programs for the V AX. Nucleic acids
research 12, 387-395.
Dieffenbach, E. (1843). Travels in New Zealand. Vol. II. Iohn Murray, London.
Dixon, M. T., Hillis, D. M. ( 1992). Ribosomal RNA secondary structure: compensatory mutations and implications for phylogenetic
analysis Mol. Bioi. Evol. 10, 256-267.
Dobzhansky, T. (1941). Genetics and the origin of species. Second edition. Columbia Univecsity Press, New York.
Dowling, T. E., Brown, W. M. (1989). Allozymes, mitochondrial DNA, and levels of phylogenetic resolution among four minnow
species (Notropis: Cyprinidae). Syst. Zool. 38, 126-143.
Dowling, T. E., DeMarais, B. D. (1993). Evolutionary significance of evolutionary hybridization in cyprinid fishes. Nature 362, 444-446.
Draper, D. E. (1990). Structure and function of ribosomal protein-RNA coinplexes: thermodynamic studies. In: Hill, W.E., Dahlberg,
A., Garrett, R.A., Moore, P.B., Schlessinger, D., Warner, I.R. (eds.), The ribosome: structure, functwn, and evolutwn. American
Society for Microbiology, Washington, D.C. pp. 160- 167.
Dugdale, 1. S. (1989). New Zealand lepidoptera: basic biogeography. N.Z. J. Zool. .!2, 679-687.
Dunon-Bluteau, D., Brun, G. (1986). The secondary structures of the Xenopus Iaevis and human mitochondrial small ribosomal subunit
RNA are similar. FEBS Letters 198, 333-337.
Easteal, S. (1990). The pattern of mammalian evolution and the relative rate of molecular evolution. Genetics 124, 165-173.

page 106.
Ehresmann, B., Ehresmann, C., Romby, P., Mougel, M. Baudin, F., Westhof. E., Ebel, J.-P. (1990). Detailed structures ofrRNA.s: new
approaches. In: Hill, W.E., Dahlberg, A., Garrett, R.A., Moore, P.B., Schlessinger, D., Warner, 1.R. (eds.), The ribosome: strvcture,
function. and evolution. American Socie.ty for Microbiology, Washington, D.C. Pp. 148-159.
Endler, J. A. (1986). Natural selection i" the wild. Princeton Univasity Press, Princeton, New Jasey.
Estes, R., Price, L. I. (1973). Iguanid lizard from the upper cretaceous of Brazil. Science 1 80, 748-751 .
Evetts, P.M., Grimmond, N.M. (1982). 'llie effects oC temperarure on oxygen consumption in Leiolopisma nigripiantare maccanni and Hoplodactylus maculatus. In: Newman, D.G. (ed.), New Zealand herpetology. New Zealand Wildlife Service Occassional PubUcatWn �,
409-415.
Felsenstein, J. (1988). Phylogenies from molecular sequences: infaence and reliability. Ann. Rev. GeMt. 22, 521-565.
Felsenstein, J. (1991). PHYUP (phylogmy inference packLlge), version 3.4. Department of Genetics, Univ. Washington, Seattle.
Fetris, S. D., Sage, R. D., Huang, e.-M. , Nielsen, J. F., Rille, U., Wilson, A. e. (1983). Flow of mitochondrial DNA across species
boundary. Proc. NatL Acad. Sci. USA ��, 2290-2294.
Fife, A. 1. (1985). Biosystematics of the cryptogamic flora of New Zealand: bryophytes. N.Z. J. Bot. 23, 645-662.
Fisher, F. J. F., 1 965. The alpine RanuncuU of New Zealand. New Zealand Department of Scientific and Indus��Research Bulletin
165.
Fitch, W. M. (1967). Evidence suggesting a non-random character to nucleotide replacements in naturally occurring mutations. J. Mol.
BioI. 26, 499-507.
Fitch, W. M. (1984). Oadistic and other methods: problems, pitfalls, and potentials. In: Duncan, T., Stuessy, T.F. (eds.), Cladistics:
perspectives on the reconstrvction of evolutionary history. Columbia University Press, New York. Pp.221-252
Fitch, W. M., Atchley, W. R. (1987). Divergence in inbred strains of mice: a comparison of three diffaent types of data. In: Patterson,
C. (ed.), Moucules and morphology in t'Volution: conflict or compromise? Cambridge University Press, Cambridge. Pp. 201-216.
Fitch, W. M., Margoliash, E. ( 1967). Construction of phylogenetic trees. Science 155, 279-284.
Fitch, W. M., Markowitz, E. (1970). An imprOVed method for determining codon variability in a gene and its application to the rale of
fixation of mutations in evolution. Biochem. Genet. i, 579-593.
Fitch, W. M., Ye, J. (1991). Weighted parsimony: does it work? In: Miyamoto, M.M., Cracraft, J. (eds.), PhylogeMtic Q1IQlysis of DNA
sequences. Oxford University Press. pp. 147-1 54.
Fleischer, S., McIntyre, J.O., Vidal, J.e. ( 1979). Large-scale preparation of ral liva mitochondria in high yield. Meth. Enzym. 55, 32-39.
Fleming, C. A. (1958). Darwinism in Nc'w Zealand: some examples, influences and developments. Trans. Proc. Roy. Soc. N.Z M. 65-
86.
Fleming, C. A. (1980). The geological history of New Zealand and its Ufe. Auckland University Press.
Frankel, O. H., Hair, J. B. (1937). Studic,..; on the cytology, genetics, and taxonomy of New Zealand Hebe and Veronica. (part 1). N.Z J. Sci. Tech. ll, 669-687.
Freeth, A. L, Sin, F. Y. T. (1986). Enzyme variation in marine and estuarine populations of the chiton Sypharochiton pelliserpentis.
N.Z J. Mar. Freshwater Res. 20, 561-568.
Freier, S. M., Kierzek, R., Jaeger, J. A., Sugimoto, N., Caruthers, M. H., Neilson, T., Turna, D. H. (1986). Improved free-energy
parameters for predictions of RNA duplc:x stability. Proc. NatL Acad. Sci. USA 83, 9373-9377.
Gadaleta, G., Pepe, G., de Candia, G., Quagliariello, e., Sbisa, E., Saccone, C. (1989). The complete nucleotide sequence of the Rattus norvegicus mitochondrial. genome: cryplic signals revealed by comparative analysis between vertebrates. J. Mol. Evol. 28, 497-516.
Gage, M. (1961). New Zealand glaciations and the duration of the Pleistocene. J. Glaciology �, 940-943.

page 107.
Gauthier, J. A., Kluge, A. G., Rowe, T. (1988). Amniote phylogeny and the importance of fossils. Cladistics �, 105-209.
Gibson, A. R., Baker, A. J., Moeed, A. (1984). Morphometric variation in introduced populations of the common myna (Acridotheres
tristis): an application of the jaclclcnife to Irincipal component analysis. Syst. Zool. 33, 408-421.
Gill, B. J. (1976). Aspects of the ecolog)" morphology, and taxonomy of two skinks (Reptilia: Lacertilia) in the coastal Manawatu area of New Zealand. N.Z. J. ZooL �, 141-157.
Gillespie, 1. H. (1986). Rates of molecul:u evolution. Ann. Rev. EcoL Syst. E, 637-665.
Glotz, c., Brimacombe, R. (1980). An eRperimentally-derived model for the secondary structure of the 16S ribosomal RNA from Escherichia coli. Nucleic Acids Res. !, 2377-2395.
Goddard, K., Caccone, A., Powell, J. R. (1990). Evolutionary implicatioils of DNA divergence in the Drosophila obscura group. Evolution 44, 1656-1670.
Godley, E. J. (1949). Cytology and geneltics and their application to New Zea1ai1d plants. Tuatara �, 1 09- 1 15.
Golding, G. B. (1983). Estimates of DNA and protein sequence divergence: an examination of some assumptions. MoL Bioi. EvoL !,
125-142.
Goodman, M., Miyamoto, M. M, CzelwmiaJc. 1. (1987). Pattern and process in vertelrate phylogeny revealed Dy �volution of molecules and morphology. In: Patterson, C. (ed.), Molecules and morphology in evolution: conflict or compromise? Cambridge University Press, Cambridge. pp. 141-176.
Gottlieb, L D. (1984). Isozyme evidenCtl and Iroblem solving in plant biosystematics. In: Grant, W.P. (ed.), Plant biosystematics.
Academic Press. pp. 343-357
Grant, B. R., Grant, P. R. (1989). Evolutionary dynamics of a natural population. The large cactus finch of the Galapagos. Univeristy of Chicago Press.
Grant, P. R., Grant, B. R. (1992). Hylri(�zation and bird species. Science 256, 193-197.
Grant, V. (1981). Plant speciation. Secol'ld edition. Columbia University Press.
Gray, M. W. (1989). Origin and evolution of mitochondrial DNA. Ann. Rev. Cell BioI. �, 25-50.
Green, D. M (1988). Cytogenetics ofthl: endemic New Zealand frog, LeiopJema hochsteneri: extraordinary supernumerary chromosome variation and a unique sex chromosome system. Chromosoma 97, 55-70.
Green, D. M., Sharbel, T. F. (1988). Comparative cytogenetics of the primitive frog Leiopelma archeyi (Anura; Leiopelmatidae). Cytogenet. CelL Genet. 47, 212-216.
Green, D. M., Sharbel, T. F., Hitchmou�,h, R. A., Daugherty, C. H. (1989). Genetic variation in the genus Leiopelma and relationships to other primitive frogs. Z. 1.001. Syst. Eliolut.-forsch. 27, 65-79.
Greer, A. E. (1970). A subfamilial classification of scincid lizards. Bull. Mus. Comp. 2001. 139, 151-184.
Greer, A. E. (1974). The generic relatioliships of the Scincid lizard genus Leiolopisma and its relatives. Aust. J. Zool., Suppl. Ser. ll, 1 -
67.
Greer, A. E. (1979). A phylogenetic subdivision of Australian skinks. Rec. Aust. Mus. 32, 339-37 1 .
Greer, A. E. (1982). A new species of L..'iolopisma (Lacertilia: Scincidae) from Western Australia, with notes o n the biology and relationships of other Australian specieS. Rec. Aust. Mus. 34, 549-573.
Greer, C.E., Peterson, S.L, Kiviat, N.B., Manos, M.M. (1991). PCR amplification from paraffin-embedded tissues. Effects of fixative and IlXation time. Americ� journal of clinical pathology 95, 1 17-124.
Gutell, R. R., Fox, G. E. (1988). A compilation of large subunit RNA sequences Iresented in a structural format. Nucleic Acids Res. 16,
Supp\., rI75-r269.

page 108.
Gutell, R. R., Schnare, M. N., Gray, M. W. (1990). A compilation of large subunit (23S-like) ribosomal RNA sequences presented in a
secondary structure format. Nucleic AcUilr Res. !!, Suppl., 23 19-2330.
Gutell, R. R., Schnare, M. N., Gray, M W. (1992). A compilation of large subunit (23S- & 23S-like) ribosomal RNA structures. Nucleic
Acids Res. 20, Suppl., 2095-2109.
Gutell, R. R., WeiSel", B., Woese, C. R., Noller, H. F. (1985). Comparative anatomy of 16-S-like ribosomal RNA Prog. Nucleic Acids
Res. 32, 155-216.
Gyllensten, U. B., Erlich, H. A (1988). Generation of single-stranded DNA by the polymerase chain reaction and its application to
direct sequencing of the HlA-DQ). locu;s. Proc. Natl. Acad. Sci. USA 85, 7652-7656.
Gyllensten, U., Wharton, D., Josefsson, A., Wilson, A C. (1991). Paternal inheritance of mitochondrial DNA in mice. Nature 352, 255-
257.
Haase, P. (1992). Isozyme variability and biogeography of Nothofagus truncata (Fagaceae). N.Z J. Bot. 30, 3 15-328.
Haffer, J. (1969). Speciation in Amazonian forest birds. Science 165, 13 1-137.
Hahn, B. H., Shaw, G. M., Taylor, M. E., Redfield, R. R., M¥kham, P. D., Salahuddin, S. Z., Wong-Staal, F., Gallo, R. C., Parks, E. S.,
Parks, W. P. (1986). Genetic variation in H1LV-IIIILAV over time in patiehts with AIDS or at risk for AlDS.!��ce 232, 1548-1553.
Hair, J. B. ( 1966). Biosystematics of the New Zealand flora, 1945- 1964. N.Z J. Bot. �, 559-595.
Hair, J. B. (1977). Contribution to a chromosome atlas of the New Zealand flora- 1 8 Epilobium (Onagraceae). N.Z. J. Bot. �, 5-15.
Hardy, G. S. (1977). The New Zealand Scincidae (Reptilia: Lacertilia); a taxonomic and zoogeographic study. N.Z J. Zool. � 221-325.
Hardy, G. S. (1979). The karyotypes ofawo scincid lizards, and their bearing on relationships in genus Leiolopisma and its relatives
(Scincidae: Lygosominae). N.Z J. ZooL §, 609-612.
Harrison, R. G. (1989). Animal mitochondria) DNA as a genetic marker in population and evolutionary biology. Trends EcoL EvoL i, 6-1 1.
Harrison, R. G., Doyle, J. J. (1990). Redwoods break the rules. Nature 344, 295-296.
Hasegawa, M, Hashimoto, T. (1993). Ribosomal RNA trees misleading? Nature 361 , 23.
Hawkins, B. J., Sweet, G. B. (1989). Genetic variation in rimu-an investigation using isozyme analysis. N.Z J. Bot. 27, 83-90.
Hay, R. F., Mutch, A R., Watters, W. A. (1970). Geology of the Chatham Islands. N. Z GeoL Survey Bulletin 83, 1-86.
Hedges, S. B., Bezy, R. L., Maxson, 1.. R. (1991). Phylogenetic relationships and biogeography of xantusiid lizards, inferred from
mitochondrial DNA sequences. Mol. BioI. Evol. �, 767-780.
Hedges, S. B., Moberg, K. D., Maxson, L. R. (1990). Tetrapod phylogeny inferred from 1 8S and 28S ribosomal RNA sequences and a review of the evidence for amniote relationships. Mol. BioI. Evol. Z, 607-633.
Helm-Bychowski, K. M, Wilson, A. C. (1986). Rates of nuclear DNA evolution in pheasant-like birds: evidence from restriction maps.
Proc. Natl. Acad. Sci. USA 83, 688-692.
Henderson, I. M., Hendy, M. D., Penny,. D. (1989). Influenza viruses, comets and the science of evolutionary trees. J. Theor. Bioi . .!iQ. 289-303.
Hendy, M. D., Penny, D. (1989). A framework for the quantitative study of evolutionary trees. Syst. Zoal. 38, 297-309.
Hendy, M. D., Penny, D. (1993 in press). Spectral analysis of phylogenetic data. Cladistics 10.
Heus, H. A., Pardi, A (1991). Structural features that give rise to the unusuai stability of RNA hairpins containing GNRA loops. Science 253, 191-194.

page 109.
Hickson, R. E., Penny, D., Scott, D. B. (1.992). Molecular systematics and evolution in New Zealand: applications to cryptic skink species. N.Z. J. ZooL 19, 33-44.
Hill, W. E., Dahlbug, A., Garrett, R.A., Moore, P.B., Schlessinger, D., Warner, 1.R. (eds.) ( 1990). The ribosome: structure,function,
and evolution. American Society fOt Microbiology, Washington, D.C.
Hillis, D. M (1984). Misuse and modification of Nei's genetic distance. Syst. ZooL 33, 238-240.
Hillis, D. M. (1987). Molecular versus m.orphological approaches to systematics. Ann. Rev. &01. Syst . .!!' 23-42.
Hillis, D. M. (1991). Discriminating between phylogenetic signal and rail(!om noise in DNA sequences. In: Miyamoto, M.M., Cracraft, 1. (eds.), Phylogenetic analysis of DNA sequences. Oxford University Press. Pp. 278-294.
Hillis, D. M, Davis, S. Ie. (1987). Evolution of the 28S ribosomal RNA-ge�e in anurans: regions of variability and their phylogenetic implications. MoL BioL EvoL i, 1 17-125.
Hillis, D. M., Dixon, M. T. (1991). Ribosomal DNA: molecular evolution and phylogenetic inference. Quart. Rev. Bioi. 66, 41 1-453.
Hillis, D. M, Moritz, C. ( 1990). An overview of applications of molecular systematics. In: Hillis, D.M., Moritz, C. (eds.), Molecu14r
systematics. Sinauer Associates, Inc. SUDlderland, Massachusetts. pp. 502-5 15.
Hitchmough, R. A., Williams, M., Daugherty, C. H. (1990). A genetic analysis of maIlards, grey ducks, and their hybrids in New Zealand. N.Z. J. ZooL g, 467-472.
Hixson, 1. E., Brown, W. M. (1986). A comparison of the small ribosomal RNA genes from the mitochondrial DNA of the great apes and humans: sequence, structure, evolution, and phylogenetic implications. Mol. Bioi. Evol. 2, 1-18 .
Hoeh, W. R., Blakely, Ie. H., Brown, W. M. (1991). Heteroplasmy suggests limited biparental inheritance of Mytilus mitochondrial DNA. Science 251 , 1488-1490.
Holdaway, R. N. ( 1990). Qlanges in the diversity of New Zealand forest birds. N.Z. J. Zool. 17, 309-321.
Holloway, B. A. (1963). Wing development and evolution of New Zealand Lucanidae (Insecta: Coleoptera). Trans. Roy. Soc. N.Z. �,
99- 1 1 6.
Holmquist, R. (1983). Transitions and trllosversions in evolutionary descent: an approach to understanding. J. MoL Evol. 19, 1 34-144.
Holmquist, R., Pearl, D. (1980). Theoretical foundations fOt quantitative pa1eogenetics. Part IIi. The molecular divergence of nucleic acids and proteins for the case of genetic events of unequal probability. J. Mol. Evol. 16, 21 1-267.
Hooker, I. D. (1 853). Introductory essay .. Flora Novae-Zelandiae. 1 Cramer, Weinheim (1963 reprint).
Hotz, H., BeerH, P., Spolsky, C. (1992). Mitochondrial DNA reveals formation of nonhybrid frogs by natural matings between hemic10nal hybrids. Mol. Bioi. Evol. 2, 610-620.
Hudson, G. V. (1920). On some examplc:s of New Zealand insects illustrating the Darwinian principle of sexual selection. Trans. Proc.
N.Z. Inst. 52, 43 1-438.
Hutchinson, M. N., Donne\1an, S. C., Baverstock, P. R., Krieg, M., Simms, S., Burgin, S. (1990). Immunological relationships and generic revision of the Australian lizards assigned to the genus Leiolopisma (Scincidae: Lygosominae). Aust. J. Zool. 38, 535-554.
Hutton, F. W. (1872). On the geographical relations of the New Zealand fauna. Trans. Proc. N.Z. lnst. �, 227-256.
Huxley, I. (1938). Evolution, the mode/7il synthesis. Allen & Unwiii, London.
Ingram, V. M (1961). Gene evolution in haemoglobins. Nature 1 89, 704-708.
Innis, M.A., Gelfand, D.H. (1990). Optimization of PCRs. In: Innis, M.A., Gelfand, D.H., Sninsky. 1.1., White, T.1. (eds.), peR
protocols: a guide to methods and applications. Academic Press, Inc. Pp. 3-12.
-

page 1 10.
Irving, G. 1. (1967). Distribution and po!sible factors in evolution of some New Zealand grasshoppers. Zool. Hons. Pan III Thesis,
University of Canterbury.
Irwin, D. M., Kocher, T. D., Wilson, A. C. (1991). Evolution of the cytochrome b gene of mamrna1s. J. MoL Evol. 32, 128-144.
Jeffreys, A. 1., Neuman, R., Wilson, V. (1990). Repeat unit sequence variation in minisatellites: A novel source of DNA polyJDOqirism
for studying variation and mutation by si.ngle molecule analysis. CeU 60, 473-485.
Jukes, T. H. (1980). Silent nucleotide sulbstitutions and the molecular evolutionary clock. Science 210, 973-978.
Jukes, T. H. (1987). Transitions, transveuions, and the molecular evol�tionary clock. J. Mol. Evol. 26, 87-98.
Jukes, T. H., Cantor, C. R. (1969). Evolution of protein molecules. In: Mumo, H.N. (ed.), Mammalian protein metabolism. Academic
Press, New York. Pp. 2 1 -132.
Killersjo, M., Farris, J. S., Kluge, A. G., Bull, c. (1992). Skewness and permutation. CkuJistics �, 275-287.
Kessler, L G., Avise, J. C. (1985). A comparative description of mitochondrial DNA differentiation in selected avian and other
vertebrate genera. MoL BioI. Evol. �, 109-1 25.
Kimura, M (1981). Estimation of evolullionary distances between homologous nucleotide sequences. Proc. NatL Acad. Sci. USA 78,
5773-5777.
Kimura, M. (1983). The neutral theory afmolecular evolution. Cainbridge University Press, Cambridge.
King, M. (1979). Karyotypic evolution in Gehyra (Gekkonidae: Reptilia). I. The Gehyra variegata-punctata compleL Aust. J. Zaol. 27,
373-393.
King, M. (1987). Chromosomal evolution in diplodactylinae (Gekkonidae: Reptilia). I. Evolutionary relationships and patterns of
change. Aust. J. Zaol. 35, 507-531 .
King, M., Mengden, G. (1990). Chromosomal evolution in diplodactylinae (Gekkonidae: Reptilia). II. Chromosomal variability between
New Caledonian species. Aust. J. ZaoL :�, 219-226.
King, M.-C., Wilson, A. C. (1975). Evolution at two levels in humans and chimpanzees. Science 1 88, 107- 1 16.
Kitchin, P.A., Szotyori, Z., Frornholc, c., Almond, N. (1990). Avoidance of false PCR positives. Nature 344, 201 .
Kluge, A. G . (1967). Systematics, phyJc'geny, and zoogeography of the lizard genus Diplodactylus Gray (Gekkonidae). Aust. J. ZooL
�, 1007- 1 108.
Knight, A., Mindell, D. P. (1993). Substitution bias, weighting of DNA sequence evolution, and the phylogenetic position of Fea's
viper. Syst. BioL 42, 18-3 1 .
Kocher, T. D., Thomas, W. K., Meyer, A., Edwards, S . V., Pubo, S., Villablanca, F. X., Wilson, A. C . (1989). Dynamics of
mitochondrial DNA evolution in animals: amplification and sequencing with conserved primers. Proc. NatL Acad. Sci. USA M. 6196-
6200.
Kocher, T. D., White, T. J. (1989). Evolutionary analysis via PCR. In: Erlich, H.A. (ed.), PCR technology. Principles and applications
for DNA amplification. Stockton Press, New York. Pp. 137-147.
Kondo, R., Satta, Y., Matsuura, E. T., hhiwa, H., Takahata, N., Chigusa, S. 1. (1990). Incomplete maternal transmission of
mitochondrial DNA in Drosophila. Genetics 126, 657-663.
Koop, B. F., Tagle, D. A., Goodman, M., Slightom, J. L (1989). A molecular view of primate phylogeny and important systematic and
evolutionary questions. Mol. BioL EvoL Q, 580-612.
Kraus, F., Jarecki, L, Miyamoto, M. M., Tanhauser, S . M., Laipis, P. J. (1992). Mispairing and compensational changes during the
evolution of mitochondrial ribosomal RN A. Mol. BioI. EvoL 2, 770-774.

page I l l .
Kraus, F., Miyamoto, M. M (1991). Rapid c1adogenesis among the pecoran ruminants: evidence from mitochondrial DNA sequences.
Syst. Zool. 40, 1 17- 130.
Kuschel, G. (ed.) (1975). Biogeography ,and ecology in New Zealand. Dr W. Junk b. v. Publishers, The Hague.
Kwiatowski, J., Skarecky, D., Hernande:� S., Pham, D., Quijas, F., Ayala, F. J. (1991). High fidelity of the polymecase chain reaction.
Mol. BioL Evol. !, 884-887.
Lake, J. A. (1990). Origin of the MetazoL Proc. NaIL Acad. Sa. USA 87, 763-766.
Lamb, T., Avise, J. C. (1986). Directionnl introgression of mitochondrial DNA in a hybrid population of tree frogs: the influence of mating behavioc. Proc. NatL Acad. Sa. USA. 83, 2526-2530.
Larson, A. (1984). Neontological inferences of evolutionary pattern and process in the salamander family P1ethodontidae. EvoL BioL 17,
1 19-217.
Larson, A., Wilson, A. C. (1 989). PattenlS of ribosomal RNA evolution in salamanders. MoL BioI. EvoL �, 1 3 1-154.
Lawver, L. A., Royer, J.-Y., Sandwell, D. T., Scotese, C. R. (1991). Evoluuon of the Antarctic continental margins. In: Thomson,
M.R.A., Crame, J.A., Thomson, J.W. (eds.), Geological evolution of Antarctica. Camlxidge University Press, Cambridge. pp. 533-539.
Lessler, M.A., Brierly, G.P. (1969). Oxygen electrode measurements in biochemical analysis. Meth. Biochem. Anal. !1, 1-29.
Lewontin, R. C. (1974). The genetic bas/oS 0/ evolutionary change. Columbi� University Press, New Yorlc.
Lewontin, R. C., Moore, J. A., Provine, W. B., Wallace, B . (cds.), (1981). Dobzhansky's Genetics of natural populations I-XllII. Columbia University Press.
Li, W.-H., Gouy, M. (1991). Statistical methods for testing molecular phylogenies. In: Miyamoto, MM., Cracraft, J. (cds.),
Phylogenetic analysis 0/ DNA sequenceJ'. Oxford University Press. pp. 249-277.
Li, W.-H., Tanimura, M., Sharp, P. M (1987). The molecular clock fUns more slowly in man than in apes and monkeys. Nature 326, 93-
96.
Lindahl, T., Nyberg, B. (1972). Rate of depurioation of native deoxyribonucleic acid. Biochem. !!, 3610-3618.
Uoyd, D. G. (1982). Variation and evolution of plant species on the outlying islands of New Zealand, with particular reference to
Cotulafeatherstonii. Taxon n, 478-487.
Uoyd, D. G., Webb, C. J. (1986). The avoidance of interference between the presentation of pollen and stigmas in angiosperms. I.
Dichogamy. N.Z 1. Bot. 24, 1 35- 162.
Uoyd, D. G., Yates, J. M. A. (1982). IntJ:asexual selection and the segregation of pollen and stigmas in hermaphrodite plants,
exemplified by Wahlenbergia albomargl'nata (Campanulaceae). Evolution 36, 903-913.
Lockhart, P. J., Peony, D., Hendy, M. H., Howe, C. J., Beanland, T. J., Larkurn, A. W. D. (1992). Controversy on cblocoplast origins.
FEBS Lett. 301, 127- 1 3 1 .
Lonsdale, D . M, Brears, T., Hodge, T. P., Melville, S. E., Rottman, W . H . (1988). Th e plant mitochondrial genome: homologous
recombination as a mechanism for generating heterogeneity. PhiL Trans. Roy. Soc., LoruL B 3 19, 149-163.
Lyell, C. (1 830). Principles of geology or the tntXkm change of the earth and its inhabitants considered as illustrative of geology. John
Murray, London.
Manske, C. L., Chapman, D. J. (1987). Nonuni!ormity of nucleotide substitution rates in molecular evolution: computer simulation and
analysis of 5S ribosomal RNA sequences. 1. Mol. EvoL 26, 226-25 1.
Markham, K. R., Godley, E.J. (1972). Olemotaxonomic studies in Sophora. 1 . An evaluation of Sophora microphyUa Ait. N.Z 1. Bot.
1 0, 627-640.

page 1 12.
Marshall, C. R. (1992). Substitution bias, weighted parsimony, and amniote phylogeny as inferred from 18S rRNA sequences. MoL
Bioi. EvoL 2, 37()'373.
Martin, A. P., Kessing, B. D., Palumbi, S. R. (1990). Accuracy of estimating genetic distance between species from short sequences of
mitochondrial DNA. MoL BioL EvoL 2, 485-488.
Martin, A. P., Naylor, G. 1. P., Palumbi, S. R. (1992). Rates of mitochondrial DNA evolution in sharks are slow compared with
mammals. Nature 357, 153- 1 55.
Martin, A. P., Palumbi, S. R. (1993 submitted). Body size, metabolic rate, genecation time and the m�ecular clock. !roc. NatL Acad.
Sci. USA.
Martin, W., Lydiate, D., BrinIcmann, H., Forkmann, G., Saedler, H., Cerff, R. (1993). Molecular phylogenies in angiosperm evolution.
Mol. BioL Evol. 10, 14()'162.
Maxson, L R., Maxson, L. R. (1979). Comparative albumin and biochemical evolution in Plethodontid salamanders. Evolution 33,
1057-1062.
Maxson, L R., Maxson, R. D. (1990). Proteins II: immunological techniques. In: Hillis, D.M., Moritz, C. (cds.), Molecular systematics.
Sinauer Associates, Inc. Sunderland, Ma5sachusetts. Pp. 127-155.
May, R. M. (1990). Taxonomy as destiny. Nature 347, 129-1 30.
Mayes, C. L., Lawver, L. A., Sandwell, D. T. (1990). Tectonic history and new isochron chart of the South Pacific. J. Geophys. Res. 95,
8543-8567.
Mayr, E. (1942). Systematics and the origin 0/ species. From the viewpoint 0/ a zoologist. Columbia University Press, New York.
Mayr, E. (1963). Animal species and evolution. Belknap Press of Harvard University Press, Cambridge, Mass.
Mayr, E. (1982). The growth 0/ biologicGrl thought. The Belknap Press of Harvard Univecsity Press, Cambridge, Massachusetts.
Mayr, E., O'Hara, R. I. (1986). The biog,wgraphic evidence supporting the t'Ieistocene forest refuge hypothesis. Evolution 40, 55-67.
McCann, C. (1955). The lizards of New Zealand. Gekkonidae and Scincidae. Dom. Mus. BulL E, 1-127.
McDougall, I., Chamalaun, F. H. (1969). Isotopic dating and geomagnetic polarity studies of volcanic rocks from Mauritius, Indian
Ocean. Bull. Geol. Soc. Am. 80, 1419- 1 4t2.
McGlone. M.S. (1983). Polynesian defor,l:Station of New Zealand: a pceliminary synthesis. Archaeol. Oceania ll, 1 1-25.
McGlone, M. S. (1985). Plant biogeography and the late Cenozoic history of New Zealand. N.Z. J. Bot. 23, 723-749.
McKenzie, D. P., Sclater, 1. G. (1973). 11le evolution of the Indian Ocean. Sci. Am. 228, 62-72.
McLea, M. C., Lambert, D. M. (1985). Cytogenetics of New Zealand blackflies of the genus Austrosimulium (Diptera: Simuliidae). II. Heterozygote deficiency and non-random association of inversion hetecozygotes. Genetica 66, 203-21 1 .
Meyer, A., Dolven, S . I . (1992). Molecul,�, fossils, and the origin of tetrapods. J. MoL Evol. 35, 102- 1 1 3.
Meyer, A., Kocher, T. D., Basasibwaki, P., Wilson, A. C. (1990). Monophyletic origin of Lake Victoria cichlid fishes suggested by mitochondrial DNA sequences. Nature �!7., 55()'553.
Mildenhall, D. C. (1980). New Zealand h.te Cretaceous and Cenozoic plant biogeography: a contribution. Palaeogeogr. PalaeoclimatoL
PalaeoecoL 11, 197-233.
Milinkovitch, M. C., Orti, G., Meyer, A. (1993). Revised phylogeny of whales suggested by mitochondrial ribosomal DNA sequences. Nature 361, 346-348.
Millar, C. D., Lambert, O. M., Bellamy, A. R., Stapelton, P. M., Young, E. C. (1992). Sex-specific restriction fragments and sex ratios
revealed by DNA fingerprinting in the brown skua. J. Heredity 83, 35()'355.
MindeIl, D. P. (1991). Aligning DNA sequences: homology and phylogenetic weighting. In: Miyamoto, M.M., Cracraft, 1. (cds.),

page 1 13.
Phylogenetic analysis of DNA sequenceJ'. Oxford University Press. pp. 73-89.
Mindel!. D. P .• Honeycutt, R. I.. (1990). Ribosomal RNA in vertebrates: evolution and phylogenetic applications. Ann. Rev. EcoL Syst.
21. 541-566.
Miyamoto. M. M .• Boyle. S. M. (1989). 'The potential importance of mitochondrial DNA sequence data to eutherian mammal phylogeny. In: Fernholm, B .• Bremer. K . • Jomvall. H: (eds.). The hierarchy of life. Molecules and mcrphology in phylogenetic analysis.
Elsevier Science Publishers b.v. Amsterdam. Pp. 437-450.
Miyamoto. M. M .• Goodman. M. (1990)" DNA systematics and evolution of priinates. Ann. Rev. EcoL_Syst. 2 1 . 197:2220.
Molloy. B. P. J .• Burrows. C. J .• Cox. 1. E .• Johnston, 1. A .• Wardle. P. (1963). Distribution of subfossil forest remains. eastern South
Island, New Zealand. N.Z. J. Bot. !. 68-77.
Molnar. R. E. (1991). Fossil reptiles in Australia. In: Vickers-Rich. P .• Monaghan. J.M . • Baird, R.F .• Rich. T.H. (eds.). VertebraJe
paleontology of Australasia. Pioneer De.\:ign Studio Pty Ltd. Melbourne. Pp. 605-702.
Moritz, C. (1986). The population biology of Gehyra (Gekkonidae): chromosome change and speciation. Syst. ZooL 35. 46-67.
Moritz, C. (1991). Evolutionary dynamics of mitochondrial DNA duplications in parthenogenetic geckos. Heteronotia binoei. Genetics
129. 221-230.
Moritz, C .• Case. T. J., Bolger. D. T .• Dollnellan, S. (1993). Genetic diversity and the history of pacific island h'ou1'e geckos
(Hemidactylus and Lepidodactylus). BioI. J. Linn. Soc. 48. 1 13-133.
Moritz, C., Dowling. T. E .• Brown. W. M. (1987). Evolution of animal mitochondrial DNA: relevance for popUlation biology and
systematics. Ann. Rev. EcoL Syst. !!. 269-292.
Moritz, C .• Hillis. D. M. (1990). Molecular systematics: context and controversies. In: Hillis. D.M .• Moritz, C. (eds.). Molecular
systematics. Sinauer Associates. Inc. Sunderland. Massachusetts. pp. 1- 10.
Moritz, C .• Schneider. C. 1., Wake. D. B. (1992). Evolutionary relationships within the Ensarina eschscholtzji complex confirm the ring
species interpretation. Syst. BioL �. 273·291.
Moritz, C. C . • Wright, J . W . • Brown. W.M. (1989). Mitochondrial-DNA analyses and the origin and relative age of parthenogenetic
lizards (Genus Cnemidophorus). III. C. vdox and C. exsanguis. Evolution 43. 958-968.
Morris. R. W. (198 1). Effect of of a broad temperature range on the metabolic responses of the eurythermic lizard Leiolopisma
zelandica. Compo Biochem. PhysioL 70A, 623-626.
Morton. S. R.. James, C. D. (1988). The ctiversity and abundance of lizards in arid Australia: a new hypothesis. Am. Nat. 132. 237-256.
Murphy. R. W .• Matson, R. H. (1986). Evolution of isozyme characters in the tuatara, Sphenodon punctatus. N.Z. J. ZooL Q. 573-58 1 .
Murphy. R. W . • Sites. 1 . W .• Buth. D. G . • Haufler. C. H . (1990). Proteins I : isozyme electrophoresis. In: Hillis. D.M. Moritz, C. (eds.). Molecular systematics. Sinauer Associates, Inc. Sunderland. Massachusetts. Pp. 45-126.
Nagae. Y .• Fujii. H .• Yoneyama. Y .• Goto. Y .• Okazaki. T. (1988). Nucleotide sequence of the Rana catesbeiana mitochondrial small
( 1 2S) and large (16S) ribosomal RNA gelles. Nucleic Acids Res. 16. 10363.
Neefs. J.-M . • Van de Peer, Y .• Hendriks. L. De Wachter, R. (1 990). Compilation of small ribosomal subunit RNA sequences. Nucleic
Acids Res . .!!. SuppJ.. 2237-23 17.
Neefs. J.-M. Van de Peer. Y .• De Rijk, P., Goris. A .• De Wachter. R. (1991). Compilation of sma)) ribosomal subunit RNA sequences.
Nucleic Acids Res. 19. SuppJ.. 1987-2015.
Nei. M. (1972). Genetic distance between populations. Am. Nat. 106. 283-292.
Nei. M. (1987). Molecular evolutionary g.�netics. Columbia University Press.

page 1 14.
Nei, M. (1991). Relative efficiencies of different tree-making methods for molecular data. In: Miyamoto, M.M., Craaaft, J. (cds.), Phylogenetic analysis of DNA seqUUlces. Oxford University Press. pp. 90-1 28.
Nei, M, Gojobori, T. (1987). Simple methods for estimating the numbecs of synonymous and nonsynonymous nucleotide substitutions. Mol. Bioi. Evol. �, 418-426.
Nei, M., Tajima, F., Tateno, Y. (1983). Accuracy of estimated phylogenetic trees from molecular data. II. Gene frequency data. J. MoL
EvoL 19, 153-170.
Neigel, J. E., Avise, 1. C. (1986). Phylogenetic relationships of mitochondrial DNA under various demographic models of speciation. In: Karlin, S., Nevo, E. (cds.), Evolutionary processes and theory. Academic Press, Orlando. Pp. 5 15-534.
Noller, H. F. (1984). Structure of ribosomal RNA. Ann. Rev. Bwchem. 53, 1 19- 162.
Noller, H. F. (1991). Ribosomal RNA and translation. Ann. Rev. Bwchem. 60, 191-227.
Noller, H. F., Moazed, D., Stem, S., Powers, T., Allen, P. N., Robertson, J. M., Weiser, B., Triman, K. (1990). Structure of rRNA and its functional interactions in translation. In: Hill, W.E., Dahlberg, A., Garrett, R.A., Moore, P.B., Schlessinger, D., Warner, J.R. (cds.), The ribosome: structure, junction, and evolution. American Society for Microbiology, Washington, D.C. pp. 73-92.
Noller, H. F., Woese, C. R. (1981). Secondary structure of 16S riboso� RNA. Science 212, 403.
O'Brien, T. W., Pietromonaco, S. F., Piatyszek, M. A., Gillevet, P. M. (1985). Genes for mammalian mitoribosomal proteins. In: Quagliariello, E., Slater, E.C., Palmieri, F., Saccone, c., Kroon, A.M. (cds.), Achievements and perspectives of mitoclwndri4l research.
Volume II. Biogenesis. Elsevier Science Publications b.v. (Biomedical Division). pp. 379-387.
Ochman, H., Wilson, A. C. (1987). Evolution in bacteria: evidence for a universal substitution rate in cellular genomes. J. MoL Evol. 26,
74-86.
Ohta, T. (1976). Role of very slightly deleterious mutations in molecular evolution and polymorphism. Theor. Pop. Bioi. 10, 254-275.
Ohta, T. (1992). The nearly neutral theory of molecular evolution. Ann. Rev. &01. Syst. 23, 263-286.
Olmo, E. (1991). Genome variations in the transition from amphibiallS to reptiles. J. MoL Evol. 33, 68-75.
Omduff, R. (1964). Evolutionary pathways of the Senecw /autus alliance in New Zealand and Australia. N.z. 1. Bot . .!!. 349-360.
Paabo, S., Thomas, W. K., Whitfield, K. M., Kumazawa, Y., Wilson, A. C. (1991). Rearrangements of mitochondrial transfer RNA genes in marsupials. J. MoL Evol. 33, 426-430.
Paige, K. N., Capman, W. C., Jennetten, P. (1991). Mitochondrial inheritance patterns across a cottonwood hybrid zone: cytonuclear disequilibria and hyirid zone dynamics. Evolution 45, 13@1369.
Palmer, J. D. (1990). Contrasting modes and tempos of genome evolution in land plant organelles. Trends Genet. 2, 1 15-1 20.
Palmer, J. D., Herbon, L. A. (1988). Plant mitochondrial DNA evolves rapidly in structure but slowly in ·sequence. J. MoL EvoL 28, 87-
97.
Palumbi, S. R. (1989). Rates of molecular evolution and the fraction of nucleotide positions free to vary. 1. MoL Evol. 29, 1 8� 1 87.
Palumbi, S. R., Baker, C. S. (1993 submitted). Opposing views of humpback whale poplation structure using mitochondrial and nuclear DNA sequences. Proc. Natl. Acad. Sci. USA.
Palumbi, S., Martin, A., Romano, S., McMillan, W. O., Stice, L, GraboWSki, G. (1991). The simple fool's guide to peR. Version 2.0.
Dept. Zoology and Kewalo Marine Laboratory, University of Hawaii.
Pamilo, P., Nei, M. (1988). Relationships between gene trees and species trees. Mol. Bioi. Evol. �, 568-583.
Pashley, D. P., Ke, L. D. P992). Sequence evolution in mitochondrial ribosomal and ND-I genes in Lepidoptera: Implications for phylogenetic analyses. Mol. BwL EvoL 2, 1061-1075.

page 1 15.
Patterson, C. (1987). Introduction. In: Patterson, C. (ed.), Molecules and morphology in evolution: conflict or compromise? Cambridge
Univel"sity Press, Cambridge.
Patterson, C. (1990). Reassessing relationships. Nature 344, 199-200.
Patterson, G. B. (1985). The ecology &lid taxonomy of the common skink Leiolopisma nigriplantare maccanni in tussock grasslands in Otago. Unpublished PhD thesis, University of Otago.
Patterson, G. B., Daugherty, C. H. (1990). Four new species and one new subspecies of skinks, genus.Leiolopisma (Reptilia: Lacertilia:
Scincidae) from New Zealand. J. Roy. Soc. N.7.. 20, 65-84.
Peattie, D. A., Douthwaite, S., Garrett, R. A., Noller, H. F. (198 1 ). A "bulged" double helix in a RNA-protein contact site. Proc. NatL
Acad. Sci. USA 78, 733 1-7335.
Penny, D., Foulds, L R., Hendy, M. D. (1982). Testing the theory of evolution by comparing phylogenetic trees constructed from five
different protein sequences. Nature 297, 197-200.
Penny, D., Hendy, M. D., Steel, M. A. (1991). Testing the theory of descenL In: Miyamoto, M.M., Cracraft, J. (eds.), Phylogenetic
analysis of DNA sequences. Oxford University Press. pp. 155-183.
Penny, D., Hendy, M. D., Steel, M. A. (1992). Progress with methods for constructing evolutionary trees. TRE!_�73�79.
Penny, D., Hendy, M. D., Zimmer, E. A., Hamby, R. K. (1990). Trees from sequences: panacea or Pandora's box? Aust. Syst. Bot. 2., 21-
38.
Penny, D., Hickson, R. E., Lockhart, P. J., Watson, E. E. (1993 submitted). Recent progress with methods for evolutionary trees. N.7.. J. Bot.
Petel"son, A. J. (1968). Geographical variation in Paprides nitidus (Hutton) (Orthoptera: Acrididae). N.7.. J. Sci . .!!, 693-705.
Phillips, N. R., Lambert, D. M. (1990). A cladistic analysis of species of the molluscan genus Potamopyrgus based on aIlozyme data. N.7.. J. ZooL 17, 257-263.
Pickard, C. R., Towns, D. R. (1988). Atlas of the amphibians and reptiles of New Zealand. Conservation Sciences Publication No. 1 .
Science and Research Directorate, Department of Conservation, Wellington . .
Pierson, E. D., Sarich, V. M., Lowenstein, J. M., Daniel, M. J., Rainey, W. �. (1986). A molecular link between the bats of New
Zealand and South America. Nature 323, 60-63.
Pocknall, D. T. (1 989). Late Eocene to early Miocene vegetation and climate history of New Zealand. J. Roy. Soc. N.7.. 19, 1 -18.
Pocknall, D. T. (1990). Palynological evidence for the early to middle Eocene vegetation and climate history of New Zealand. Rev.
Palaeobot. Palynol. 65, 57-69.
Pollock, M., McAvoy, E.S. (1978). Morphological and metabolic manges in muscles ofhibemating lizards. Copeia 1978, 412·416.
Portel", P. (1987). An ecological comparison of two Cyclodina skinks (Reptilia: Lacertilia) in Auckland, New Zealand. N.Z. J. ZooL 14,
493·507.
Powell, A. W. B. (1949). The species population in New Zealand land snails. Trans. Roy. Soc. N.7.. 77, 202·208.
Powell, J. R. (1975). Protein variation in natural populations of animals. Evo!. Bioi. �, 79·1 19.
Pregill, G. K. (1 989). Prehistoric extinction of giant iguanas in Tonga. Copeia 1989, 505·508.
Rattenbury, J. A. (1962). Cyclic hybridization as a survival mechanism in the New Zealand forest flora. Evolution 16, 348· 363.
Raven, P. H. (1972). Evo!ution of subalpine and alpine plant groups in New Zealand. N.7.. 1. Bot . .!!' 1 77·200.

Raven, P. H. (1988). Onagraceae as a model of plant evolution. In: Gottlieb, LD., Jain, S.K. (cds.), Plant evolutionary biology.
Olapman & Hall Ltd, London. pp. 85-107.
page 1 16.
Raven, P. H., Raven, T. E. (1976). The genus EpiJobium in Australasia: a systematic and evolutionary study. N.Z. Dept. Sci. Res. Bull.
216, 1-321.
Rendle, H., Murray, B. G. (1989). Olromosome relationships and breeding barriers in New Zealand species of Ranunculus. N.Z. J. Bot.
27, 437-448.
Richter, C., Park, J.-W., Ames, B. N. (1988) Nonnal oxidative damage to mitochondrial and nuclear DNA is extensive. Proc. Natl.
Acad. Sci. USA 85, 6465-6467.
Ricklefs, R. E., Cockran, D., Pianka, E. R. (1981). A morphological analysis of the structure of communities of lizards in desert
habitats. Ecology 62, 1474-1483. - -
Robb, J. (1980). New Zealand amphibians and reptiles in colour. Collins.
Roberts, J. D., Maxson, L. R. (1985). Tertiary speciation models in Australian anurans: molecular data challenge Pleistocene scenario.
Evolution 39, 325-334.
Roe, B. A., Ma, D.-P., Wilson, R. K., Wong, J. F.-H. (1985). The complete nucleotide sequence of the Xenopus laevis mitochondrial
genome. J. BioL Chem. 260, 9759-9774. _ . _
Rogers, S. 0., Bendich, A. J. (1985). Extraction of DNA from milligram amounts of fresh, herbarium and mummified plant tissues.
Plant molecular biology 1, 69-76.
Rohlf, F. 1., Olang, W. S., Sokal, R. R., Kim, J. (1990). Accuracy of estimated phylogenies: effects of tree topology and evolutionary
model. Evolution 44, 1671- 1684.
Ross, H. A. (1983). Genetic differentiation of starling (Stumus vulg'lris: Aves) popUlations in New Zealand and Great Britain. J. ZooL,
Land. 201, 351-362.
Saccone, C., Pesole, G., Sbisa, E. (1991). The main regulatory region of mammalian DNA: structure-function model and evolutionary
pattern. J. MoL EvoL 33, 83-9 1 .
Sadlier, R. A. (1986). A review of the scincid lizards of New Caledonia. Rec. Aust. Mus. 39, 1-66.
Saiki, R.K., Gelfand, D.H., Stoffel, S., Scharf, S.J., Higuchi, R., Hom, G.T., Mullis, K.B., Erlich, H.A. (1988). Primer-directed
enzymatic amplification of DNA with a thennostable DNA polymerase. Science 239, 487-49 1 .
Saitou, N., Nei, M . (1987). Th e neighbor-joining method: a new method for reconstructing phylogenetic trees. MoL BioL EvoL i. 406-
425.
Sarnbrook, J., Fritsch, F. F., Maniatis, T. (1989). Molecular cloning. A laboratory manual. Second edition. Cold Spring Harbor
Laboratory Press.
Satta, Y., Talcahata, N. (1990). Evolution of Drosophila mitochondrial DNA and the history of the melanogaster subgroup. Proc. Natl.
Acad. Sci. USA 87, 9558-9562.
Schaaper, R. M., Dunn, R. L (1987). Spectra of spontaneous mutations in Escherichia coli strains defective in mismatch correction: the
nature of in vivo DNA replication errors. Proc. Natl. Acad. Sci. USA 84, 6220-6224.
Schmidt-Nielsen, K. (1986). Scaling. Why is animal size so imp0ryJnt? Cambridge University Press.
Sheffield, V. C., Cox, D. R., Myers, R. M. (1990). Identifying DNA polymorphisrns by denaturing gradient gel electropha-esis. In:
Innis, M.A., Gelfand, D.H., Sninski, JJ., White, T.J. (cds.), PCR protocols: A guide to methods and applications. Academic press, Inc.
San Diego. Pp. 206-218.
Shields, G. F., Wilson, A. C. (1987). Caliocation of mitochondrial DNA evolution in geese. J. Mol. Evol. 24, 212-217.

page 1 17.
Shigenaga, M. K., Gimeno, C. J., Ames, B. N. (1989). Urinary 8-hydroxy-2'-deoxyguanosine as a biological marka of in vivo oxidative
DNA damage. Proc. NalL Acad. Sci. USA 86, 9697-9701 .
Shigenaga, M. K., Park, J.-W., Cundy, K . C., Gimeno, C. J., Ames, B. N . (1992). In vivo oxidative DNA damage: measurement of 8-
hydroxy-2'-deoxyguanosine in DNA and urine by high-performance liquid chromatography with electrochemical detection. Meth.
Enzymol. 186, 521-530.
Shoemaker, J. S., Fitch, W. M. ( 1989). Evidence from nuclear sequences that invariable sites should be considered when sequence
divagence is calculated. Mol. BioL Evol. �, 270-289.
Sibley, C. G., Ahlquist, J. E. (1981). The phylogeny and relationships of the ratite birds as indicated by DNA-DNA hybridization. In:
Swdder, G.G.E., Reveal, J.L (eds.), Evolution today. Carnegie-Mellon University, Pittsburg. pp. 301-335.
Sibley, C. G., Ahlquist, J. E. (1987). The relationship of four species of .New Zealand passerine birds. ETTUI 87, 63-66.
Sibley, C. G., Williams, G. R., Ahlquist, J. E. (1982). The relationships of the New Zealand wrens (Acanthisittidae) as indicated by
DNA-DNA hybridization. Notomis 29, 1 13- 130.
Simon, C. (1987). Hawaiian evolutionary biology: an introduction. TREE�, 175-178.
Simon, C. (1991). Molecular systematics at the species boundary: exploiting conserved and variable regions of the mitochondrial
genome of animals via direct sequencing from amplified DNA. In: Hewitt, G.M., Johnston, A. W.B., Young, J.P.W. (eds.), Molecular
techniques in taxonomy. NATO ASI Series, Vol. H57. Pp. 33-71. - .-
Simon, C., Franke, A., Martin, A. (1991). The polymerase chain reaction: DNA extraction and amplification. In: Hewitt, G.M,
Johnston, A. W.B., Young, J.P.W. (eds.), Molecular techniques in taxonomy. Nato AS1 Series, Vol. H57. pp. 329-355.
Simon, C., Piiiibo, S., Kocher, T. D., Wilson, A. C. (1990). Evolution of mitochondrial ribosomal RNA in insects as shown by the
polymerase chain reaction. In: Oegg, M.T. O'Brien, SJ. (eds.), UClA Symposw on Molecular and Cellular Biology, New Series. 122,
235-244.
Simpson, G. G. (1944). Tempo and mode in evolution. Columbia University Press, New York.
Smith, A. B. (1989). RNA sequence data in phylogenetic reconstruction: testing the limits of its resolution. Cladistics �, 321-344.
Smith, M. F., Patton, J. L (1991). Variation in mitochondrial cytoduome b sequence in natural populations of South America
akodontine rodents (Muridae: Sigmodontinae). Mol. BioI. EvoL !, 85-103.
Smith, P. J., Johnston, A. D. (1985). GIucosephosphate isomerase and a-glycerophosphate dehydrogenase electromorph frequencies in
groper Polyprion oxygeneiosis from central New Zealand. N.Z. J. Mar. Freshwater Res. 19, 173-177.
Smith, P. J., MacArthur, G. J., Michael, K. P. (1989). Regional variation in electromorph frequencies in the tuatua, Paphies
subtriangulala, around New Zealand. N.Z. J. Mar. Freshwater Res. 23, 27-33.
Sneath, P. H. A., Sokal, R. R. (1973). Numerical ta:J:onomy. The principles and practice o/numerical classificalion. W.H. Freeman and
Comapny, San Francisco.
Solem, A., Climo, F. M., Roscoe, D. J. (1981). Sympatric species diversity of New Zealand land snails. N. Z. J. Zool. !, 453-485.
Soltis, D. E., Soltis, P. S., Ness, B. D. (1989). Chloroplast DNA variation and multiple origins of autopolyploidy in Heuchera micrantha
(Saxifragaceae). Evol. 43, 650-656.
Specht, T., Wolters, J., Erdmann, V. A. (1991). Compilation of 5S rRNA �d 5S rRNA gene sequences. Nucleic Acids Res. 19, 2189-
2191 .
Spieth, P . T. (1975). Population genetics of allozyme variation in Neurospora intennedw. Genetics 80, 785-805.
States, D. J. (1992). Molecular sequence aCaJracy: analysing imperfect data. Trends Genet. !, 52-55.
Stebbins, G. L. (1950). Variation and evolution in plants. Columbia University Press, New York.

page 1 18.
Steel, M. A., Hendy, M. D., Penny. D. (1993 submitted). Parsimony can be consistent! Syst. Bioi.
Stern, S., Powers, T., o.angchien, L-M., Noller, H. F. (1989). RNA-protein interactions in 30S ribosomal subunits: folding and
function of 16S rRNA. Science 244, 783-790.
Stevens, G. R. (1980). New Zealand adrift. The tMory of continwaJ drift in a New Zealand sening. A.H. &. A.W. Reed, Wellington.
Stewart, C.-B. (1993). The powers and pitfalls of parsimony. Nature 361, 603-607.
Stiegler, P., Carbon, P., Ebel, J. P., Ehresmann, C. (1981). A general secondary-structure model for procaryotic and eucaryotic RNAs of the small ribosomal subunits. Eur. J. BiocMm. 120, 487-495.
Suggate, R. P., Stevens, G. R., Te Punga, M. T. (cds.) (1978). The ge0I:!gicaJ histoTY. of New Zealand. Volumes I and II. Government
Printer, Wellington.
Swofford, D. L. (1991). PAUP manua� version 3.0. lliinois Natural History Survey, Champaign.
Swofford, D. L., Berlocher, S. H. (1987). Inferring evolutionary trees from gene frequency data under the principle of maximum
parsimony. Syst. ZooL 36, 293-325.
Swofford, D. L., Olsen, G. J. ( 1990). Phylogeny reconstruction. In: Hillis, D.M., Moritz. C. (cds.), Mokcular systematics. Sinauer
Associates Inc., Sunderland, Massachusetts. Pp. 41 1-501.
Sylvester-Bradley, P. C. (1963). Post-Tertiary speciation in Europe. Nature 199, 126-1 30.
Sytsma, K. J. (1990). DNA and morphology: inference of plant phylogeny. Trends EcoL Evol. �, 104- 1 10.
Sytsma, K. J., Gottlieb, L. D. (1986). o.loroplast DNA evolution and phylogenetic relationships in Clarkia sect. Peripetasma
(Onagraceae). Evolution 40, 1248-1261.
Tarling, D. H., 1988. Gondwanaland and the evolution of the Indian Ocean. In: Audley-OJarles, M.G., Hallam, A. (cds.), Gondwana and Tethys. Geological Society Special Publication No. 37. Pp. 61-77.
Taylor, A. O. (1964). A biochemical approach to some taxonomic problems in the genus Coprosma. New PhytoL 63, 135-139.
Taylor, J. W. (1986). Fungal evolutionary biology and mitochondrial DNA. Exp. MycoL 10, 259-269.
Thomas, B. W. (1982a). New Zealand gekkonidae: evolutionary trends and taxa. Wildlife Service Occ. Pub/. �, 333-337.
Thomas, B. W. (1982b). A review of the herpetofauna of southern New Zealand with taxonomic considerations. Herpetofauna 14, 22-
34.
Thomas, W. K., Beckenbach, A. T. (1989). Variation in salmonid mitochondrial DNA: evolutionary constraints and mechanisms of substitution. J. Mol. EvoL 29, 233-245.
Thomas, W. K., Paabo, S., Villablanca, F. X., Wilson, A. C. (1990). Spatial and temporal continuity of kangaroo rat populations shown
by sequencing mitochondrial DNA from museum specimens. J. Mol. EvoL ll, 101-1 12.
Thorpe, J. P. (1982). The molecular clock hypothesis: biochemical evolution, genetic differentiation and systematics. Ann. Rev. EcoL
Syst. g, 1 39-168.
Thuring, R. W. J, Sanders, 1. P. M., Borst, P. (1975). A freeze-squeeze method for recovering long DNA from agarose gels. Analytical
biochemistry 66, 21 3-220.
Topal, M. D., Fresco, J. R. (1976). Complementary base pairing and the origin of substitution mutations. Nature 263, 285-289.
. \ Towns, D. R. (1975a). Ecology of the black shore skink, Leiolopisma suteri (Lacertilia: Scincidae), in boulder beach habitats. N.Z. J. ZooL �, 389-407.
Towns, D. R. (1975b). Reproduction and growth of the black shore skink, Leiolopisma suteri (Lacertilia: Scincidae), in north-eastern
New Zealand. N.Z. J. Zool. �, 409-423.

page 1 19.
Towns, D. R. (1985). Afield guide to the lizftrds of New Zealand. New Zealand Wildlife Service Occ. Pub!. 7. Wellington.
Towns, D. R., Daugherty, C. H., Newman, D. G. (1985). AIl overview of the ecological biogeography of the New Zealand lizards (Gekkonidae, Scincidae). In: Grigg, G., Shine, R., Ehmann, H. (eds.), Biology of Australasian frogs and reptiles. Royal Zoological Society of New South Wales. pp. 107-1 15.
Triggs, S. J. , Green, W.Q. (1989). Geographic patterns of genetic variation in brushtail possums TrichosuTUS vulpecula and implications for pest control. N.Z 1. Ecol. g, 1 - 10.
Tuerk, c., Gauss, P., Therrnes, C., Groebe, D. R., Gayle, M., Guild, N., Stormo, G., d'Aubenton-Carafa, Y., Uhlenbeck, O. C., TInoco, I., Brody, E. N., Gold, L (1988). CUUCGG hairpins: extraordinarily stable RNA secondary structures associated with various biochemical processes. Proc. Nad. Acad. Sci. USA 85, 1364-1368.
Tzeng, C.-S., Hui, C. F., Shen, S. C., Huang, P. C. (1992). The complete nucleotide sequence of the Crossostoma /acustre mitochondrial genome: conservation and variations among vertelx-ates. Nucleic Acids Res. 20, 4853-4858.
Vane-Wright, R. I., Humphries, C. J., Williams, P. H. (1991). What to protect? Systematics and the agony of choice. BioL Cons. 55,
235-254.
Vawter, L, Brown, W. M. (1986). Nuclear and mitochondrial DNA comparisons reveal extreme rate variation in the molecular clock. Science 234, 194-1%.
Vigilant, L, Stoneking, M., Hupending, H., Hawkes, K., Wilson, A. C. (1991). African populations and the evolution of human mitochondrial DNA. Science ill, 1503- 1507.
Vogel, F. (1972). Non-randomness of base replacement in point mutation. 1. MoL EvoL 1, 334-367.
Vos, M. E. (1988). A biochemical, morphological and phylogenetic review of the genus Cyclodina. Unpublished BSc(Hons) thesis, Victoria University of Wellington.
Vrijenhoek, R. c., Douglas, M E., Meffe, G. K. (1985). Conservation genetics of endangered fish populations in Arizona. Science 229,
400-402.
Vulliamy, T., Mason, P., Luzzalto, L. (1992). The molecular basis of glucose-6-phosphate dehydrogenase deficiency. Trends Genet. !,
1 38-143.
Wake, D. B. (1981). The application of aIJozyme evidence to problems in the evolution of morphology. In: Scudder, G.G.E., Reveal, J.L. (eds.), Evolution Today. pp. 257-270.
Wallace, A. R. (1880). Island life. MacMillan & Co., London.
Wallace, A. R. (1889). Darwinism. An exposition of the theory of natural selection with some of its applications. MacMillan & Co. London.
Wallis, G. P., Arntzen, J. W. (1989). Mitochondrial-DNA variation in the crested newt superspecies: limited cytoplasmic gene flow among species. Evolution 43, 88-104.
Ward, R. H., Frazier, B. S., Dew, K., Piiibo, S. (1991). Extensive mitochondrial diversity within a single Amerindian tribe. Proc. Nall.
Acad. Sci. USA 88, 8720-8724.
Wardle, P. (1%3). Evolution and distribution of the New Zealand flora, as affected by quaternary climates. N.Z. J. Bot. 1, 3-17.
Wardle, P. (1978). Origin of the New Zealand mountain flora, wi� special reference to trans-Tasman relationships. N.Z. 1. Bot. 16, 535-
550.
Wardle, P. (1988). Effects of glacial climates on floristic distribution in New Zealand. 1. A review of the evidence. N.Z 1. Bot. 26, 541-
555.
Wardle, P., Harris, W., B!lxton, R. P. (1988). Effects of glacial climates on floristic distribution in New Zealand. 2. The role of longdistance hybridisation in disjunct distributions. N.Z 1. Bot. 26, 557-564.

page 120.
Wayne, R. K., Van, Valkenburg B., Kat, P. W., Fuller, T. K., Johnson, W. E., O'Brien, S. J. (1989). Genetic and morphological
divC7gence among sympatric canids. J. Heredity 80, 447-454.
Webby, R. F., Markham, K. R., Molloy, B. P. J. (1987). The characterisation of New Zealand Podocarpus hybrids using flavonoid
markC7S. N.Z J. Bot. 25, 355-366.
Werner, Y. L., Whitaker, A. H. (1978). Observations and comments on the body temperatures of some New Zealand reptiles. N.Z J. Zool. �, 375-393.
Wheeler, W. C., Honeycutt, R. L. (1988). Paired sequence difference in ribosomal RNAs: evolutionary and phylogenetic implications.
Mol. BioL Evol. �, 90-96.
Whitaker, A. H. (1968). Leiolopisma suteri (Boulenger), an oviparous skink in New Zealand. N.Z J. Sci. !!, 425-432.
Whitaker, A. H. (1978). The effects of rodents on amphibians and reptiles. In: Atkinson, LA.E., Dingwall, P.R., Hoy, C. (cds.), The
ecology and control of rodents in New Zealand nature reserves. N.Z Dept. Lands and Survey, Infonnation Smes �, 75-88.
White, M. J. D. (1978). Modes of speciation. H. Freeman & Co. San Francisco.
White, T. J., Arnheim, N., Erlich, H. A. (1989). The polymerase chain reaction. Trends Genet. �, 185- 1 89.
Wilcox, M D., Ledgard, N. J. (1983). Provenance variation in the New Zealand species of Nothofagus. N.Z J. Ecol. 2, 19-31 .
Wilkinson, G . S., Chapman, A. M . (1991). Length an d sequence variation i n evening bat D-loop mtDNA. Genetics 128, 607-617.
Willen, R. W. (1950). The New Zealand Pleistocene snow line, climatic conditions, and suggested biological effects. N.Z J. Sci.
TechnoL 32B, 1 8-48.
Williams, P. L., Fitch, W. M. (1989). Finding the weighted minimal cHange in a given tree. In: Fernholm, B., Bremer, K., Jornvall, H.
(cds), The hierarchy of life. Molecules and morphology in phylogenetic analysis. Elsevier Science PublishC7s b.v. Amsterdam. pp. 453-
470.
Wilson, A. c., Cann, R. L., Carr, S. M., George, M., Gyllensten, U. B., Helm-Bychowski, K. M., Higuchi, R. G., Palumbi, S. R., Prager,
E. M., Sage, R. D., Stoneking, M. (1985). Mitochondrial DNA and two perspectives on evolutionary genetics. BioI. J. l..inn. Soc. 26,
375-400.
Wilson, A. c., Carlson, S. S., White, T. J. (1977). Biochemical evolution. Ann. Rev. Biochem. 46, 573-639.
Wilson, A. C., Maxson, L R., Sarich, V. M. (1974). Two types of molecular evolution. Evidence from studies of interspecific
hybridization. Proc. Natl. Acad. Sci. USA n, 2843-2867.
Wilson, A. c., Ochman, H., Prager, E. M. (1987). Molecular time scale for evolution. Trends Genet . .l, 241-247.
Wilson, A. C., Zimmer, E. A., Prager, E. M, KochC7, T. D. (1989). Restriction mapping in the molecular systematics: a retrospective
salute. In: Fernholm, B., Bremer, K., Jornvall, H. (cds) The hierarchy of life. Molecules and morphology in phylogenetic analysis.
Elsevier Science PublishC7s b.v. Amsterdam. Pp. 407-419.
Wilson, R. D. (1984). ChemotaxoDomic studies of the Rubiaceae. 2. Leaf flavonoids of New Zealand Coprosmas. N.Z J. Bot. 22, 195-200.
Wittrnann-Liebold, B., Kopke, A. K. E., Arndt, E., Kromer, W., Hatakeyama, T., Wittmann, H.-G. (1990). Sequence comparison and
evolution of ribosomal proteins and their genes. In: Hill, W.E., Dahlberg, A., Garrett, R.A., Moore, P.B., Schlessinger, D., Warner, J.R. (eds.), The ribosome: Structure,functian, and evolution. American Society for Microbiology, Washington, D.C. pp. 598-616.
Woese, C. R., Gutell, R., Gupta, R., Noller, H. F. (1983). Detailed analysis of the higher-order structure of 16S-like ribosomal
ribonucleic acids. Microb. Rev. 47, 621-669.
Woese, C. R., Winker, S., Gutell, R. (1990). Architecture of ribosomal RNA: constraints on the sequence of tetra-loops. Proc. NatL
Acad. Sci. USA 87, 8467-8471.

page 121.
Wool, I. G., Endo, Y., a.an, Y.-L., Gluck, A. (1990). Structure, function, and evolution of mammalian ribosomes. In: Hill, W.E.,
Dahlberg, A., Garrett, R.A., Moore, P.B., Schlessinger, D., Warner, J.R. (eds.), The ribosome: structure, function, and evolution.
American Society for Microbiology, Washington, D.C. Pp. 203-214.
Wright, C. A., 1980. Chemosystematics: paspective, problems and prospects for the zoologist In: Bisby, F.A., Vaughan, J.G., Wright,
C.A. (cds.), Chemosystematics: principles and practice. pp. 29-38.
Wu, C.-I., Li, W.-H. (1985). Evidence for higher rates of nucleotide substitution in rodents than in man. Proc. NatL Acad. Sci. USA 82,
1741- 1745.
Wyss, A. R., Novacek, M 1., McKenna, M. C. ( 1987). Amino acid sequence versus morphological data and the interordinal
relationships of manunaIs. MoL BioL EvoL 10 99-1 16.
leyl, C. W., Green, D. M. (1992). Heteromorphism for a highly repeatid sequence iii the New Zealand frog Leioplema hochstetteri.
Evolution 46, 1891-1899.
Zuckerkandl, E., Pauling, L (1965). Molecules as documents of evolutionary history. J. Theor. BioL !, 357-366.
Zug, G. R. (1985). A new skink (Reptilia: Sauria: Leiolopisma) from Fiji. Proc. BioL Soc. Wash. 98, 221-231 .
Zuker, M . (1989). On finding all suboptimal foldings of an RNA molecule. Science 244, 48-52.
Zuker, M., Jaeger, J. A., Turner, D. H. (199l). A comparison of optimal and suboptimal RNA secondary structures predicted by free
energy minimization with structures determined by phylogenetic comparison. Nucleic Acids Res. 19, 2707-27 14.
Zwieb, C., Glotz, C., Brimacombe, R. (1981). Secondary structure comparisons between small subunit ribosomal RNA molecules from
six different species. Nucleic Acids Res. 2, 3621-3640.