Evolution of the optical spectrum of SN 1987a in the large magellanic cloud
15
J. Astrophys. Astr. (1987) 8, 195–209 Evolution of the Optical Spectrum of SN 1987a in the Large Magellanic Cloud Β. Ν. Ashoka, G. C. Anupama, Τ. P. Prabhu, S. Giridhar, K. K. Ghosh, S. K. Jain, A. K. Pati & N. Kameswara Rao Indian Institute of Astrophysics, Bangalore 560034 Received 1987 April 13; accepted 1987 April 29 Abstract. The evolution of the spectrum of SN1987a is traced from 1987 February 26 to March 31. Based on the low-resolution spectroscopic data we identify the lines of H, He I, Na I, Fe II, Sc II, Ca II which are known to be present in Type II Supernovae, and also present evidence for the existence of lines of Mg I, Ca I , Ο I, and Ν I. We discuss the evolution of the Hα profile, and draw attention to its complex structure around March 30. Close to the rest wavelength of Hα a double-peaked structure appeared in the profile with a peak-to-peak separation of ~ 1400 km s – 1 , suggestive of an expanding shell or disc of gas. Using the available broadband photometric information, we also trace the evolution of the photosphere of SN1987a assuming that it radiates like a supergiant. Key words: Supernovae, spectra—Supernovae, SN1987a 1. Introduction Supernova (SN) 1987a in the Large Magellanic Cloud (LMC) was discovered on 1987 February 24 at a brightness of m v = 4.5 (IAU Circular No. 4316). Its dramatic rise did not continue for long, and the light curve levelled off initially at about m v = 4.3, and then began a slow rise by ~ 0.017 mag day – 1 . Though the optical spectrum of SN 1987a showed characteristics similar to a typical Type II, the supernova was peculiar in many respects. In the optical region, the striking deviations from a typical supernova are in terms of very high absorption velocities of Balmer lines during the early phases, and a peculiar light curve. The observations of SN 1987a commenced at the Vainu Bappu Observatory (VBO) Kavalur (latitude = 12°34' ), on 1987 February 26. Some spectroscopic measurements have been communicated through (IAU Circular Nos 4339, 4340, 4359). We present here a brief description of the nature and evolution of the spectrum between 1987 February 26 and March 31. We also discuss the photometric behaviour based on data gathered mostly from IAU Circulars.
-
Upload
independent -
Category
Documents
-
view
0 -
download
0
Transcript of Evolution of the optical spectrum of SN 1987a in the large magellanic cloud

J. Astrophys. Astr. (1987) 8, 195–209 Evolution of the Optical Spectrum of SN 1987a in the Large MagellanicCloud Β. Ν. Ashoka, G. C. Anupama, Τ. P. Prabhu, S. Giridhar,K. K. Ghosh, S. K. Jain, A. K. Pati & N. Kameswara RaoIndian Institute of Astrophysics, Bangalore 560034 Received 1987 April 13; accepted 1987 April 29
Abstract. The evolution of the spectrum of SN1987a is traced from 1987February 26 to March 31. Based on the low-resolution spectroscopic datawe identify the lines of H, He I, Na I, Fe II, Sc II, Ca II which are known to bepresent in Type II Supernovae, and also present evidence for the existence oflines of Mg I, Ca I, Ο I, and Ν I. We discuss the evolution of the Hα profile,and draw attention to its complex structure around March 30. Close to therest wavelength of Hα a double-peaked structure appeared in the profilewith a peak-to-peak separation of ~ 1400 km s– 1, suggestive of anexpanding shell or disc of gas.
Using the available broadband photometric information, we also tracethe evolution of the photosphere of SN1987a assuming that it radiates like asupergiant. Key words: Supernovae, spectra—Supernovae, SN1987a
1. Introduction Supernova (SN) 1987a in the Large Magellanic Cloud (LMC) was discovered on 1987February 24 at a brightness of mv = 4.5 (IAU Circular No. 4316). Its dramatic rise didnot continue for long, and the light curve levelled off initially at about mv = 4.3, and thenbegan a slow rise by ~ 0.017 mag day– 1.
Though the optical spectrum of SN 1987a showed characteristics similar to a typicalType II, the supernova was peculiar in many respects. In the optical region, the strikingdeviations from a typical supernova are in terms of very high absorption velocities ofBalmer lines during the early phases, and a peculiar light curve.
The observations of SN 1987a commenced at the Vainu Bappu Observatory (VBO)Kavalur (latitude = 12°34'), on 1987 February 26. Some spectroscopic measurementshave been communicated through (IAU Circular Nos 4339, 4340, 4359). We presenthere a brief description of the nature and evolution of the spectrum between 1987February 26 and March 31. We also discuss the photometric behaviour based on datagathered mostly from IAU Circulars.

196 B. N. Ashoka et al.
2. Observations and reductions We monitored the spectrum of SN 1987a at reciprocal dispersions ranging from 100 to250 Å mm– 1 over a wavelength range of λλ4000–9000 (wavelengths are expressed in Åunits all through). Spectrograms were obtained regularly with the Bhavanagarspectrograph using gratings of 300 and 400 grooves mm– 1 and a 75-mm camera, at theCassegrain focus of the 0.75-m reflector. In addition, some spectrograms were obtainedalso at the Cassegrain focus of the 1-m reflector with the help of Carl-Zeiss UAGspectrograph, using a grating of 651 grooves mm– 1 and a 110-mm camera. Kodak 098-02 and I-N (hypersensitized) emulsions were employed. Occasionally, a 150-mmcamera was used in conjunction with a Varo 8605, single-stage, electrostatistically-focussed image tube and spectra were recorded on Kodak IIa-D plates. All plates werecalibrated for relative intensity using an auxilliary calibration spectrograph. A fewphotoelectric spectrum scans were also obtained with a bandpass of 50 Å at theCassegrain focus of the 1-m reflector.
The spectrograms were digitized using PDS-1010M microdensitometer, generally ata speed of 2 mm s– 1, using a sampling interval of 5 µm. RESPECT software (Prabhu,Anupama & Giridhar 1987) was used for final reductions, though some of thepreliminary measurements reported here have been made directly on an auxiliaryanalogue chart output of the microdensitometer. The interactive reductions usingRESPECT software include smoothing by a low-pass filter (cut-off frequency ~15cycles mm– 1), and conversion to intensity scale achieved through the characteristiccurve determined as a polynomial of third degree in Baker-transformed densities. Thewavelength scale was established as a polynomial using the laboratory comparisonspectrum (Fe + Ar or Fe + Ne hollow cathode source) exposed on both sides of thespectrum. The spectra were linearized in wavelength through natural cubic-splineinterpolation at regular intervals in wavelength.
3. Optical spectrum and its evolution The spectrum of SN 1987a conforms to the general characteristics of SN II withhydrogen lines in emission although it is not a typical Type II. Since the time of rapidrise to 4.5 mag on February 24–25, the spectrum evolved from a Balmer-line-dominated one with broad P-Cygni type emission to one with strong blue-shiftedabsorption features due mostly to Fe II and Na I.
Following Patchett & Branch (1972) we use the absorption features as more reliablemeans of identification. As pointed out by Kirshner et al. (1973), the features in bothType I and Type II Supernovae are essentially the same; hence, the identifications offeatures in Type I SN 1981b in NGC 4536 (Branch et al. 1983), and in Type II SN 1979cin M 100 (Branch et al. 1981) were used as a guide. The dominant species identified aredue to H, He I, Na I, Fe II, Mg I and perhaps Sc II.
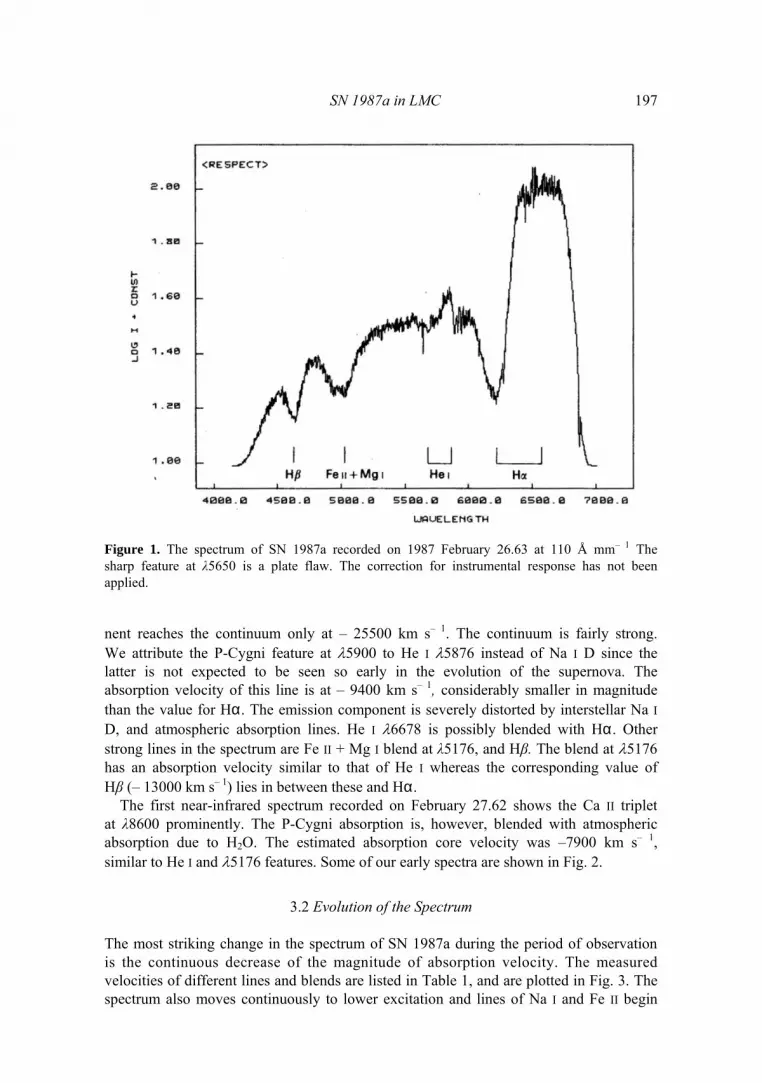
3.1 The Early Spectrum Our first spectrum recorded on February 26.63 (Fig. 1) shows broad Hα emission withstrong P-Cygni absorption at a velocity of – 16400 km s– 1. The absorption compo-
SN 1987a in LMC 197
Figure 1. The spectrum of SN 1987a recorded on 1987 February 26.63 at 110 Å mm– 1 Thesharp feature at λ5650 is a plate flaw. The correction for instrumental response has not beenapplied. nent reaches the continuum only at – 25500 km s– 1. The continuum is fairly strong.We attribute the P-Cygni feature at λ5900 to He I λ5876 instead of Na I D since thelatter is not expected to be seen so early in the evolution of the supernova. Theabsorption velocity of this line is at – 9400 km s– 1, considerably smaller in magnitudethan the value for Hα. The emission component is severely distorted by interstellar Na ID, and atmospheric absorption lines. He I λ6678 is possibly blended with Hα. Otherstrong lines in the spectrum are Fe II + Mg I blend at λ5176, and Hβ. The blend at λ5176has an absorption velocity similar to that of He I whereas the corresponding value ofHβ (– 13000 km s– 1) lies in between these and Hα.
The first near-infrared spectrum recorded on February 27.62 shows the Ca II tripletat λ8600 prominently. The P-Cygni absorption is, however, blended with atmosphericabsorption due to H2O. The estimated absorption core velocity was –7900 km s– 1,similar to He I and λ5176 features. Some of our early spectra are shown in Fig. 2.
3.2 Evolution of the Spectrum The most striking change in the spectrum of SN 1987a during the period of observationis the continuous decrease of the magnitude of absorption velocity. The measuredvelocities of different lines and blends are listed in Table 1, and are plotted in Fig. 3. Thespectrum also moves continuously to lower excitation and lines of Na I and Fe II begin

198 B. N. Ashoka et al.
Figure 2. Early spectra of SN 1987a, not corrected for instrumental response. The scale marks alternate between left and right. to appear and strengthen. We discuss in the following these changes in lines ofindividual species.
3.2.1 The Balmer Lines The profiles of Balmer lines show flat-bottomed P-Cygni absorption until aboutMarch 8 indicating high optical depths. Initially the amount of absorption was roughlyequal to emission. With time the absorption component narrowed down and theemission increased relative to absorption. The profile of March 3 compared to that ofMarch 8 in Fig. 4 exemplifies these changes. The peak of the emission component wasinitially shifted to shorter wavelengths compared to the rest wavelength. With time theemission peak moved toward the rest wavelength.
One can make crude estimates of the radius of the Hα-scattering envelope from theratios of radial velocities of blue and red extremities of the profile (Kuan & Kuhi 1975).The derived extent is about 1.2 photospheric radii on March 3 and 1.3 on March 8.
The evolution of Hα absorption cannot be traced beyond March 22 due to theincreasing strength of P-Cygni profile of Fe II λ6456. A dramatic change in the emission

SN 1987a in LMC 199

200 B. N. Ashoka et al.
Figure 3. Absorption core velocities as a function of time. Hα: open circles; Hβ: filled circles; Hγand Hδ: crosses: all other lines: dots.
profile, however, was evident on March 30. The profile had changed into a double-peaked one with the central absorption at λ6563 (Fig. 5): The two emission-peaks had aseparation of 1400 km s–1
whereas the width at the base of the emission was3150 km s– 1. The shape of the profile was similar to that in Be stars and novae.Particularly it is reminiscent of nova DQ Her during 1935 January-March (of. Fig. 9 ofBeer 1973), though the peak-to-peak separation is much larger. The double-peaked Hαemission in DQ Her has been interpreted to be arising in the expanding, recombiningshell between the star and the outer scattering shell (Rottenberg 1952).
There was another emission peak present at λ6690 since about March 22. Thisemission was varying in relative intensity with respect to the emission at λλ6538–6539.For example, on the photoelectric spectrum scan obtained on March 31 (Fig. 6) λ6690appears brighter than Hα. It is tempting to ascribe this peak to He I λ6678. We willreturn to this feature again while discussing lines due to He I.
The emission due to Hβ was generally weak, though detectable on March 2.62 and4.62. The absorption cores of Hα, Hβ and Hγ showed velocities progressively smaller inmagnitude (see Table 1). 3.2.2 Lines due to He I He I λ5876 was conspicuous during the early evolution of the spectrum until the Na I Dλ5892 began to dominate over it (March 2). The absorption trough of He I was

SN 1987a in LMC 201
Figure 4. The change in the profiles of Hα and Ca II λ8600, reduced to an estimated continuum,on 1987 March 3 and 8. shallower, and narrower compared to Hß. This is as expected since the optical depth ofHβ is larger than He I λ5876 at any given point in the atmosphere. The possibleidentification of He I λ6678 on March 30 raises the question whether the He I lines dueto inner recombining shell become visible at the later phase. The other triplettransitions at λ5876 and λ7065 are, however, not very conspicuous. A sharp peak waspresent at λ5873 in the spectra of both March 29 and 30, superposed over the Na I Dline. Some emission was evident around λ7065 on March 27 and 29. The unsmootheddata showed that the λ6678 peak was also double, but with a separation of750–900 km s– 1. If the identification is right, it would imply that the velocity in thelinear shell increases with radius as in the shells of novae.
3.2.3 Lines due to Νa I Na I D λ5893 dominated over He I λ5875 on March 2.62 and got stronger with time. Itsabsorption began to get flat-bottomed by March 8. An absorption feature at λ8004possibly due to Na I λλ8183, 8194 appeared on March 5 and began its redwardmigration. It was visible until it merged with the atmospheric absorption due to H2O.Ν I (2) λ8212 may also contribute in this region.

202 B. N. Ashoka et al.
Figure 5. The region around Hα on 1987 March 30. The data has been smoothed considerably.
Figure 6. A photoelectric spectrum scan of SN 1987a obtained on 1987 March 31 in the rangeλλ4800–8200 with a bandpass of 50 Å. Notice the double-peaked structure near Hα. The left peakis near λ6563, whereas the right one is near λ6678. Both the peaks are further split at higherresolutions.

SN 1987a in LMC 203
When Na I D is strong we expect the lines of Mg I and K I also. Mg I λ5176 wasblended with Fe II all through. The absorption due to K I λλ7665, 7699 was probablyblended with the blue edge of the atmospheric ‘A’ band. A measurable dip appeared onMarch 30 at λ7575 which yields absorption velocities consistent with Na I D line ifascribed to Κ I λ7665. 3.2.4 Lines due to Fe II and Sc II The earliest Fe II lines to appear were the multiplets 38 and 42 (March 2). An absorptionfeature at λ5421 appeared on March 4 due to Fe II λ5535. The absorption at λ6032 seenon March 6 is due to Fe II (74) λ6148, 6149. The presence of Fe II (73) λλ7449, 7462, 7515was evident on March 8 through its absorption at λ7345 close to atmospheric ‘a’ band,and excess emission at 7459. There may be some contribution due to Ν I (3) λ7452 alsohere.
An absorption feature at λ7393 seen on March 22 is probably due to Fe II (73) λ7475.It implies a velocity of – 3568 km s– 1, consistent with other Fe II lines.
An emission feature appeared dramatically at λ6461 around March 16.62, on the redside of the P-Cygni absorption of Hα and close to the expected emission peak of thestrong emission line Fe II (74) λ6456. Its P-Cygni absorption component was distinct onMarch 19 and became flat-bottomed by March 22. The presence of this feature made itimpossible to measure the absorption velocity of Hα any longer. All lines of Fe IIstrengthened with time.
Sc II has been identified by Patchett & Branch (1972) in SN 1959 in NGC 7331. Weidentify the absorption feature at λλ5517–5513 seen first on March 4 with Sc II (29)λ5606. It became saturated by March 16.
3.2.5 Lines due to Cα I and Ca II The infrared triplet of Ca II λλ8498, 8542, 8662 was strong since the very beginning. ItsP-Cygni absorption is affected by atmospheric H2O bands, but it was possible toestimate its velocity as – 7900 km s– 1 on March 3.62 and – 7700 km s– 1 on March5.62. The emission initially narrowed down (see Fig. 4), but later broadened again andbegan to show some structure by March 16. There were two emission peaks at λ8647and λ8693. The peaks shifted to λ8666 and λ8716 on March 27.
The relative intensities of the three lines of Ca II is expected to be 1:9:5 in an opticallythin case, i.e. a centroid wavelength of λ8579. The strong emission at wavelengths muchlarger than this suggests that there are other contributors to this blend. We suggest inthe following subsection that Ν I is the principal contributor.
According to Kirshner et al. (1973) most of the calcium in SN envelopes is expected tobe in the form of Ca II. However, one out of 104 atoms would still be neutral and thusshow their presence particularly when Na I D line is strong and saturated. The likelylines are Ca I (1) λ4226 and Ca I (3) λλ6127, 6166. Based on the absorption velocities weinfer that the latter contributes to Fe II (74) λ6148.
204 B. N. Ashoka et al. 3.2.6 The Lines of C, Ν and O We have looked for the presence of C I and C II lines in the spectrum of SN 1987a, butcould not identify positively even the strongest features expected.
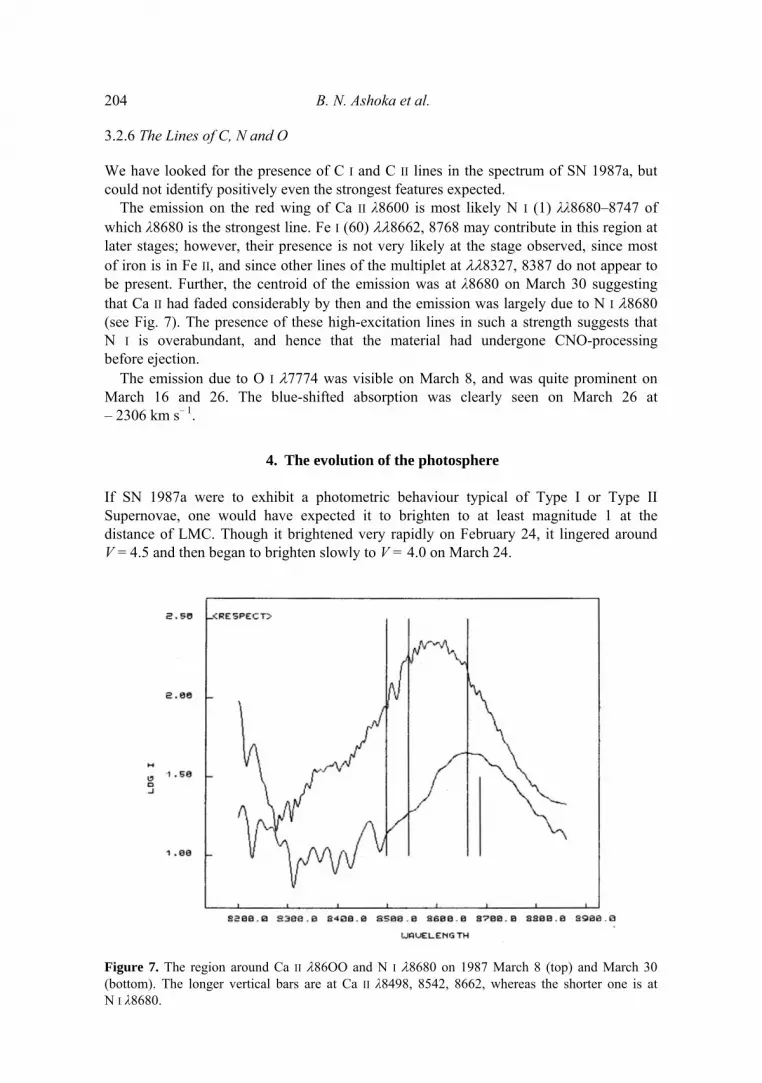
The emission on the red wing of Ca II λ8600 is most likely Ν I (1) λλ8680–8747 ofwhich λ8680 is the strongest line. Fe I (60) λλ8662, 8768 may contribute in this region atlater stages; however, their presence is not very likely at the stage observed, since mostof iron is in Fe II, and since other lines of the multiplet at λλ8327, 8387 do not appear tobe present. Further, the centroid of the emission was at λ8680 on March 30 suggestingthat Ca II had faded considerably by then and the emission was largely due to Ν I λ8680(see Fig. 7). The presence of these high-excitation lines in such a strength suggests thatΝ I is overabundant, and hence that the material had undergone CNO-processingbefore ejection.
The emission due to Ο I λ7774 was visible on March 8, and was quite prominent onMarch 16 and 26. The blue-shifted absorption was clearly seen on March 26 at– 2306 km s– 1.
4. The evolution of the photosphere If SN 1987a were to exhibit a photometric behaviour typical of Type I or Type IISupernovae, one would have expected it to brighten to at least magnitude 1 at thedistance of LMC. Though it brightened very rapidly on February 24, it lingered aroundV = 4.5 and then began to brighten slowly to V = 4.0 on March 24.
Figure 7. The region around Ca II λ86ΟΟ and N I λ8680 on 1987 March 8 (top) and March 30(bottom). The longer vertical bars are at Ca II λ8498, 8542, 8662, whereas the shorter one is atΝ I λ8680.

SN 1987a in LMC 205
We reproduce in Fig. 8 the V and Β light curves and U – B, B – V, V – R, V – I colourcurves for the period 1987 February 24–1987 March 25, based on the data published inIAU circulars. Also included is one estimate of V from VBO on March 6 (K. E.Rangarajan & K. Jayakumar 1987, personal communication) and a set of Vmagnitudes due to van Vuuren between March 15–21 (M. Feast 1987, personalcommunication). It is interesting to note that the Β light curve follows the typical trendand reaches a plateau, but shows signs of further increase in brightness. The plateau isat a magnitude of 5.7, about 1.1 mag below the maximum of February 24. The colourgets redder at a high rate, the change between February 24 and March 24 being from– 0.8 to +2.2 in U – B, from 0.0 to 1.6 in B – V, from 0.25 to 0.7 in V – R, and from 0.35
Figure 8. The B, V light curves, and Β – V, U – B, V – R, R – I colour curves of SN 1987a basedon the data compiled from various sources. The R and I bands are on the Cousins system.
206 B. N. Ashoka et al. to 1.0 in V – I The light curve was hence rising in R and I bands as well, thoughdropped sharply in U and Β before reaching a plateau at U = 7.7, Β = 5.7.
Though this photometric behaviour is so atypical that it is difficult to predict itsfuture course, it is instructive to compare it with the Type II supernova SN 1973r inNGC 3627, sometimes termed subluminous. SN 1973r reached a maximum at V 14.2and B 15.0 on 1973 December 19. About a month later, the plateau was reached atV 14.6 and B 6.5 (Ciatti & Rosino 1977). Assuming a value of E(B–V) = + 0.6, themaximum and plateau correspond to V0 = 12.2, B0 = 12.4, and V0 = 12.6, B0 = 13.9respectively. The change in (B – V) 0 ranges from 0.2 at maximum to 1.3 at plateau.
The distance modulus to NGC 3627 is 29.83 according to de Vaucouleurs (1979).Assuming a distance modulus of 18.5 for LMC, the magnitudes of SN 1973r translatedto the distance of LMC would be V0 = 0.9, B0= 1.1 at maximum, and V0 = 1.3, B0 = 2.5at the plateau. Clearly, these values are much brighter than the range of magnitudesdisplayed by SN 1987a so far. On the other hand, the steep colour curve of SN 1987aresembles, to a great degree, that of SN 1973r.
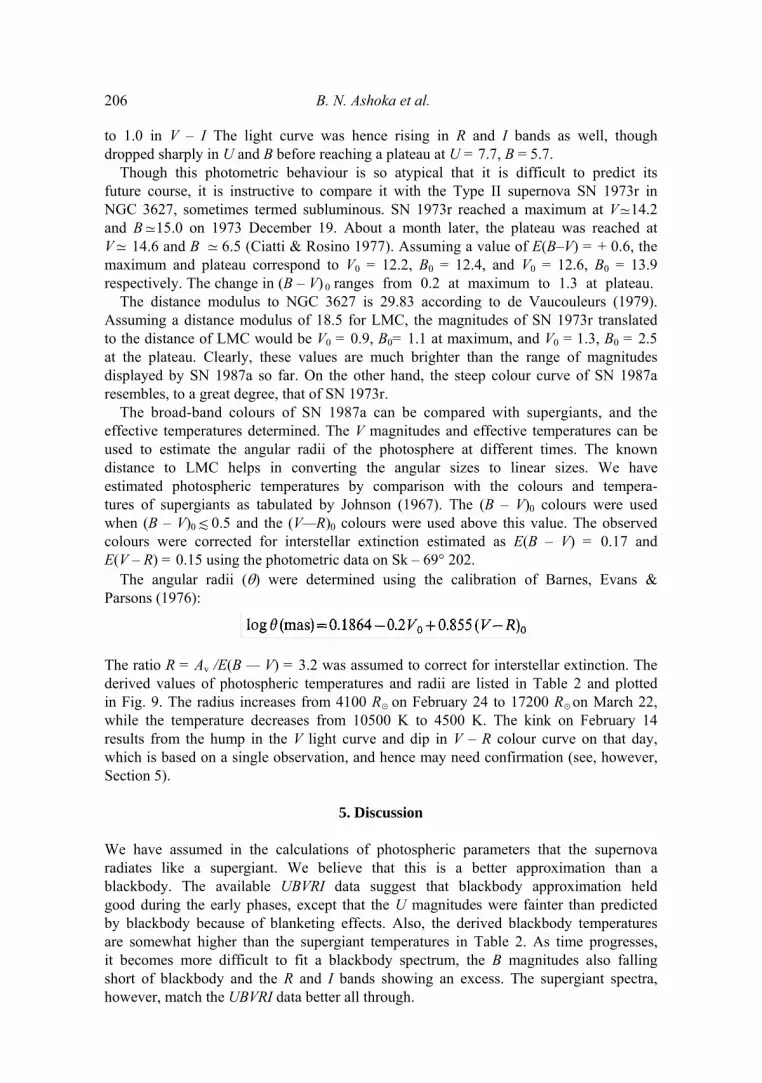
The broad-band colours of SN 1987a can be compared with supergiants, and theeffective temperatures determined. The V magnitudes and effective temperatures can beused to estimate the angular radii of the photosphere at different times. The knowndistance to LMC helps in converting the angular sizes to linear sizes. We haveestimated photospheric temperatures by comparison with the colours and tempera-tures of supergiants as tabulated by Johnson (1967). The (B – V)0 colours were usedwhen (B – V)0 0.5 and the (V—R)0 colours were used above this value. The observedcolours were corrected for interstellar extinction estimated as E(B – V) = 0.17 andE(V – R) = 0.15 using the photometric data on Sk – 69° 202.
The angular radii (θ) were determined using the calibration of Barnes, Evans &Parsons (1976):
The ratio R = Av /E(B — V) = 3.2 was assumed to correct for interstellar extinction. Thederived values of photospheric temperatures and radii are listed in Table 2 and plottedin Fig. 9. The radius increases from 4100 R on February 24 to 17200 R on March 22, while the temperature decreases from 10500 Κ to 4500 K. The kink on February 14results from the hump in the V light curve and dip in V – R colour curve on that day,which is based on a single observation, and hence may need confirmation (see, however, Section 5).
5. Discussion We have assumed in the calculations of photospheric parameters that the supernovaradiates like a supergiant. We believe that this is a better approximation than ablackbody. The available UBVRI data suggest that blackbody approximation heldgood during the early phases, except that the U magnitudes were fainter than predictedby blackbody because of blanketing effects. Also, the derived blackbody temperaturesare somewhat higher than the supergiant temperatures in Table 2. As time progresses,it becomes more difficult to fit a blackbody spectrum, the Β magnitudes also fallingshort of blackbody and the R and I bands showing an excess. The supergiant spectra,however, match the UBVRI data better all through.
≃
≃ ≃
≃
≲
⊙ ⊙

SN 1987a in LMC 207 Table 2. Photospheric temperatures and radii.
* Derived using (B – V) 0 colour. References to the photometric data: 1. IAU Circular No. 4352; 2. IAU Circular No. 4332; 3. IAU
Circular No. 4341; 4. IAU Circular No. 4352.Extinction corrections applied: E(B – V)=0.17, E(V – R)=0.15, A v = 0.54.
(V – R) was transformed from Cousins system to Johnson system using transformations of Taylor (1987).
Inclusion of infrared data helps fitting blackbody curves (of. Bouchet et al 1987)better. However, the increase in bolometric luminosity may not be as fast as predictedby the blackbody fits. The energy integrated over UBVRI bands was 3.1 × 10– 10,3.1 ×l0–10
and 6.2 × 10⁻¹⁰ Wm–2 on February 24, March 11 and March 22respectively. These variations are much smaller in magnitude compared to thevariations in total luminosity derived by Bouchet et al. between March 1–11 usingblackbody fits. Actually, during the latter period, there is a slight fall in the totalUBVRI flux because of decreasing light in U and B.
The values of radius and temperature derived in Table 2 are based on V light andV – R colour, and would represent the region of wavelengths where the bulk of theenergy is radiated. The derived photospheric radii yield a photospheric velocity of4200 km s–1 between February 24 and March 22, consistent with the observedabsorption velocities of lines other than hydrogen.
The development of the spectrum of SN 1987a is consistent with the changes incolour and temperature derived from photometry: The continuum energy distributiongenerally gets redder with time. The evolution in radius and temperature is not smooth;there are kinks around March 3 and March 14. In the latter case, the radius increasedfaster than usual whereas the temperature decreased. This coincides with a slightenhancement of lines due to neutral metals like Ca I, and the emergence of Fe II λ6456.

208 B. N. Ashoka et al.
Figure 9. The variation of temperature and angular radius of the photosphere of SN 1987a as afunction of time.
The radial velocities of the Na I D feature seem to show a higher value around this time.Such a behaviour is not obvious in the case of Fe II lines.
The radial velocities of the blueshifted absorptions show a redward movement andreach a plateau around March 22 in the case of most of the Fe II lines and possibly alsoin the case of Na I. The radial velocity of the Hα absorption core starts with a largermagnitude and decreases analogously. It is difficult to estimate its value after March 19because of the emergence of Fe II λ6456. If the dip seen at λ6487 on March 25 isattributed to the absorption of Hα, the implied velocity is –2673 km s– 1 which isabout the value shown by the Fe II lines. The variation of absorption velocities isconsistent with the picture of an expanding, scattering envelope with velocityincreasing with distance above the photosphere and the optical depth reducing withtime.
Although the V light as well as the bolometric luminosity are increasing, thespectrum is getting later and later. Many lines of Fe II and Na I show flat-bottomedabsorption indicative of high optical depths in the lines.The similarity with SN II 1973rin NGC 3627 (Ciatti & Rosino 1977) mentioned in Section 4 appears to extend to thespectroscopic evolution too; however, the process is more rapid in SN 1987a and theFe II lines are much stronger than seen in SN 1973r.
A comparison can be made of SN 1987a with Type II SN 1979c in M100 at a stagewhen the metallic lines were well developed, and when the photospheric temperaturesare roughly the same, i.e., roughly a month after the light maximum of SN 1979c (1979May 28). Though our spectra of SN 1987a were obtained before the maximum in Vlight, the similarity of the spectra suggests that the physical conditions in theatmosphere of SN 1987a had already reached by March 8 the conditions in SN 1979c

SN 1987a in LMC 209 on May 28. The spectrum of 1979c was also matched by Branch et al. (1981) with asynthetic spectrum computed by assuming solar abundances and that the lines areformed in a scattering, spherically symmetric, expanding atmosphere with a photo-sphere that emits like a blackbody. According to Branch et al., the spectrum of SN1979c was characterized by T* 6000 Κ and Vexp 8000 km s– 1 on May 26. In the caseof SN 1987a, the Hα velocity is 8000 km s– 1 and T* 5600 Κ around 1987 March 8and 9. A closer look at the spectra shows that the Fe II and Na I lines were muchstronger in SN 1987a than both observed and synthesized ones in SN 1979c, indicatinghigher optical depths in these lines of SN 1987a. Branch et al. estimate the mass of thescattering envelope of SN 1979c as 0.58 Μ . In order to produce higher opticaldepths in the case of SN 1987a one would require 0.58 Μ of envelope mass,provided the abundances are the same in both the Supernovae (relative to Η). It ispossible to reduce this limit slightly if the metal abundance is lower in SN 1987a. Insuch an event, the electron density reduces and consequently so does the continuumopacity. As a result, the contrast between the lines and the continuum will also increaseresulting in stronger lines. A more quantitative study is needed to estimate the envelopemass accurately.
Acknowledgements We would like to express our thanks to many people for their encouragement.Particular thanks are due to Prof. J. C. Bhattacharyya, and several colleagues forgenerous donation of the 40-inch telescope time for this programme. We thankDr Sushma Mallik for obtaining some of the spectra and Mr A. Jairaj for digitizing thespectrograms with the PDS microdensitometer. The digital reductions were carried outusing the VAX 11/780 systems at VBO, Kavalur, and Raman Research Insitute,Bangalore.
References Barnes, T. G., Evans, D, S., Parsons, S. B. 1976, Mon. Not. R. astr. Soc, 174, 503.Beer, A.1973, Vistas Astr., 16, 179. Branch, D., Falk, S.W., McCall, M. L, Rybski, P., Uomoto, A. K., Willis, Β. J.,1981, Astrophys.
J., 244, 780.Branch, D., Lacy, C. H., McCall, Μ. L, Sutherland, P.G., Uomoto, Α., Wheeler, J. C, Willis, B. J.
1983, Astrophys. J., 270, 123. Bouchet, P., Stanga, R., Le Bertre, T., Epchtein, N., Hamann, W. R., Lorenzetti, D. 1987, ESO
Scientific Preprint No. 500.Ciatti, F., Rosino, L. 1977, Astr. Astrophys., 56, 59.de Vaucouleurs, G. 1979, Astrophys. J., 277, 729.Johnson, Η. L.1967, Α. Rev. Astr. Astrophys., 4, 193.Kuan, P., Kuhi, L. V, 1975, Astrophys. J, 199, 148. Kirshner, R. P., Oke, J. Β., Penston, Μ. V., Searle, L. 1973, Astrophys. J., 185, 303.Patchett, B., Branch, D. 1972, Mon. Not. R. astr. Soc, 158, 375.Prabhu, T. P., Anupama, G. C, Giridhar, S. 1987, Bull astr. Soc. India, (submitted).Rottenberg, J. A. 1952, Mon. Not. R. astr. Soc, 112, 125. Taylor, B. J. 1986, Astrophys. J. Suppl. Ser., 60, 577.
≃ ≃ ≃
≃ ⊙
⊙ ≳