Evidence of changes in membrane pore characteristics due to filtration of dye bath liquors
11
Evidence of changes in membrane pore characteristics due to filtration of dye bath liquors P. Denyer, L. Shu, V. Jegatheesan* School of Engineering, James Cook University, Townsville, QLD 4811, Australia Tel. þ61 7 4781 4871; Fax þ61 7 4775 1184; e-mail: [email protected] Received 30 January 2006; accepted 05 April 2006 Abstract This study was carried out to investigate the treatment of various salt solutions and synthetic dye bath liquors by nanofiltration using Nanomax-50 membrane in a stirred cell with 150 mL working volume. Donnan exclusion was compared by filtering salts with monovalent and divalent cations and anions. This was done by comparing three salts including sodium chloride (NaCl), calcium chloride (CaCl 2 ) and sodium sulphate (Na 2 SO 4 ). The rejection order determined was Na 2 SO 4 >NaCl>CaCl 2 which is typical of a negatively charged membrane where Donnan and steric exclusion play an important role in separation. Studies on the flux and rejection characteristics of sodium sulphate were undertaken for concentrations ranging from 10 to 40 gl 1 thereby replicating actual dye bath salt concentrations. Synthetic dye bath liquors were prepared using acidic dye (Acid Green 25) at a fixed concentration of 100 mgl 1 with 10 and 15 gl 1 of sodium sulphate solutions. While, the results showed evidence of flux decline due to increased resistance and decreased transmembrane pressure, pore enlargement occurred after the filtration experiments with sodium sulphate solutions greater than 20 gl 1 . Pore enlargement was even more prominent in the two synthetic dye bath liquors filtered. Pore enlargement was determined by observing the pure water flux before and after filtering sodium sulphate solutions or dye bath liquors. An increase in pore diameter of 58 and 94% was estimated when dye bath liquors containing 10 and 15 gl 1 of sodium sulphate, respectively were filtered through the membrane. The following equation was derived in estimating the pore enlargement. d e1 2 d e2 2 ¼ R m2 R m1 ; Desalination 204 (2007) 296–306 0011-9164/07/$– See front matter Ó 2007 Elsevier B.V. All rights reserved *Corresponding author. Presented at EuroMed 2006 conference on Desalination Strategies in South Mediterranean Countries: Cooperation between Mediterranean Countries of Europe and the Southern Rim of the Mediterranean. Sponsored by the European Desalination Society and the University of Montpellier II, Montpellier, France, 21-25 May 2006
-
Upload
independent -
Category
Documents
-
view
1 -
download
0
Transcript of Evidence of changes in membrane pore characteristics due to filtration of dye bath liquors
Evidence of changes in membrane pore characteristics due tofiltration of dye bath liquors
P. Denyer, L. Shu, V. Jegatheesan*
School of Engineering, James Cook University, Townsville, QLD 4811, AustraliaTel. þ61 7 4781 4871; Fax þ61 7 4775 1184; e-mail: [email protected]
Received 30 January 2006; accepted 05 April 2006
Abstract
This study was carried out to investigate the treatment of various salt solutions and synthetic dye bathliquors by nanofiltration using Nanomax-50 membrane in a stirred cell with 150 mL working volume. Donnanexclusion was compared by filtering salts with monovalent and divalent cations and anions. This was done bycomparing three salts including sodium chloride (NaCl), calcium chloride (CaCl2) and sodium sulphate(Na2SO4). The rejection order determined was Na2SO4>NaCl>CaCl2 which is typical of a negatively chargedmembrane where Donnan and steric exclusion play an important role in separation. Studies on the flux andrejection characteristics of sodium sulphate were undertaken for concentrations ranging from 10 to 40 gl�1
thereby replicating actual dye bath salt concentrations. Synthetic dye bath liquors were prepared using acidicdye (Acid Green 25) at a fixed concentration of 100 mgl�1 with 10 and 15 gl�1 of sodium sulphate solutions.While, the results showed evidence of flux decline due to increased resistance and decreased transmembranepressure, pore enlargement occurred after the filtration experiments with sodium sulphate solutions greater than20 gl�1. Pore enlargement was even more prominent in the two synthetic dye bath liquors filtered. Poreenlargement was determined by observing the pure water flux before and after filtering sodium sulphatesolutions or dye bath liquors. An increase in pore diameter of 58 and 94% was estimated when dye bath liquorscontaining 10 and 15 gl�1 of sodium sulphate, respectively were filtered through the membrane. The followingequation was derived in estimating the pore enlargement.
de12
de22¼ Rm2
Rm1;
Desalination 204 (2007) 296–306
0011-9164/07/$– See front matter � 2007 Elsevier B.V. All rights reserved
*Corresponding author.
Presented at EuroMed 2006 conference on Desalination Strategies in South Mediterranean Countries: Cooperationbetween Mediterranean Countries of Europe and the Southern Rim of the Mediterranean. Sponsored by the European
Desalination Society and the University of Montpellier II, Montpellier, France, 21-25 May 2006
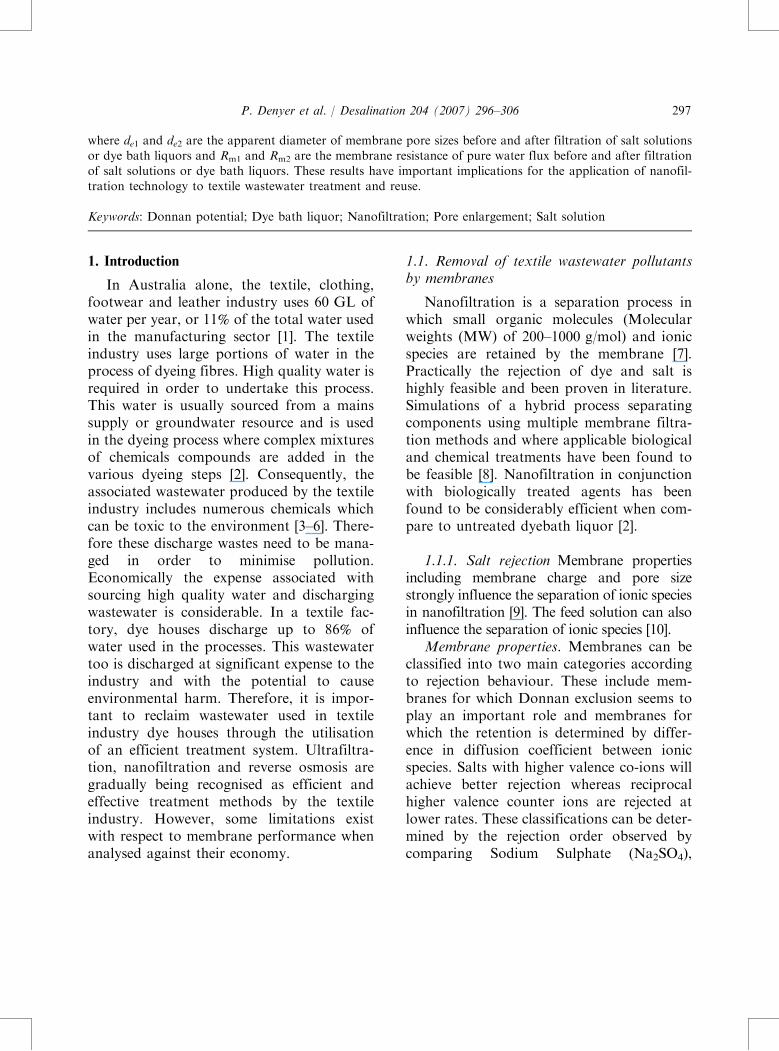
where de1 and de2 are the apparent diameter of membrane pore sizes before and after filtration of salt solutionsor dye bath liquors and Rm1 and Rm2 are the membrane resistance of pure water flux before and after filtrationof salt solutions or dye bath liquors. These results have important implications for the application of nanofil-tration technology to textile wastewater treatment and reuse.
Keywords: Donnan potential; Dye bath liquor; Nanofiltration; Pore enlargement; Salt solution
1. Introduction
In Australia alone, the textile, clothing,footwear and leather industry uses 60 GL ofwater per year, or 11% of the total water usedin the manufacturing sector [1]. The textileindustry uses large portions of water in theprocess of dyeing fibres. High quality water isrequired in order to undertake this process.This water is usually sourced from a mainssupply or groundwater resource and is usedin the dyeing process where complex mixturesof chemicals compounds are added in thevarious dyeing steps [2]. Consequently, theassociated wastewater produced by the textileindustry includes numerous chemicals whichcan be toxic to the environment [3–6]. There-fore these discharge wastes need to be mana-ged in order to minimise pollution.Economically the expense associated withsourcing high quality water and dischargingwastewater is considerable. In a textile fac-tory, dye houses discharge up to 86% ofwater used in the processes. This wastewatertoo is discharged at significant expense to theindustry and with the potential to causeenvironmental harm. Therefore, it is impor-tant to reclaim wastewater used in textileindustry dye houses through the utilisationof an efficient treatment system. Ultrafiltra-tion, nanofiltration and reverse osmosis aregradually being recognised as efficient andeffective treatment methods by the textileindustry. However, some limitations existwith respect to membrane performance whenanalysed against their economy.
1.1. Removal of textile wastewater pollutantsby membranes
Nanofiltration is a separation process inwhich small organic molecules (Molecularweights (MW) of 200–1000 g/mol) and ionicspecies are retained by the membrane [7].Practically the rejection of dye and salt ishighly feasible and been proven in literature.Simulations of a hybrid process separatingcomponents using multiple membrane filtra-tion methods and where applicable biologicaland chemical treatments have been found tobe feasible [8]. Nanofiltration in conjunctionwith biologically treated agents has beenfound to be considerably efficient when com-pare to untreated dyebath liquor [2].
1.1.1. Salt rejection Membrane propertiesincluding membrane charge and pore sizestrongly influence the separation of ionic speciesin nanofiltration [9]. The feed solution can alsoinfluence the separation of ionic species [10].
Membrane properties. Membranes can beclassified into two main categories accordingto rejection behaviour. These include mem-branes for which Donnan exclusion seems toplay an important role and membranes forwhich the retention is determined by differ-ence in diffusion coefficient between ionicspecies. Salts with higher valence co-ions willachieve better rejection whereas reciprocalhigher valence counter ions are rejected atlower rates. These classifications can be deter-mined by the rejection order observed bycomparing Sodium Sulphate (Na2SO4),
P. Denyer et al. / Desalination 204 (2007) 296–306 297

Calcium Chloride (CaCl2) and Sodium Chlor-ide (NaCl) and are specified in Table 1.
A membrane can be classified as either astrongly or weakly charged membrane basedon a comparison of the rejections of theanion and cations in solution [10].
Donnan exclusion. When an ionic solution(containing cation and anion species) is incontact with a membrane that has a surfacecharge, an ion shift occurs. For instance if amembrane has a negative surface charge,cations are attracted to the membrane sur-face, therefore the concentration of cationsin the membrane is less than the feed solu-tion. Conversely, anions are repelled from themembrane surface causing a greater concen-tration in the feed solution relative to themembrane. This creates and electric potentialknown as the Donnan potential or Donnanexclusion. Therefore, ions present in the solu-tion with the same charge as the membranesurface are excluded from passage throughthe membrane and are retained. Multivalentions have stronger rejection than monovalentions due to higher charge numbers. Highlyhydrated ions are better rejected than poorlyhydrated ions [11]. The Donnan exclusion isgreatest at mid to low salinities (1000 mgl�1
< total dissolved solids (TDS) <3000 mgl�1).For TDS < 300 mgl�1 the Donnan exclusionis negligible and above 3000 mgl�1 it beginsto weaken [10]. Increased ionic strength of
solution causes a very high cation concentra-tion in the membrane, shielding the mem-brane charge and thus the Donnan exclusion[10].
Increased flux showed a reduction in therejection of sodium sulphate while animproved rejection for both sodium chlorideand calcium chloride. Sodium sulphate hasbeen shown to be influenced by differing phe-nomena than calcium chloride and sodiumchloride [12]. The retention of salts has beenshown to be independent of the dye concen-tration [7]. The addition of small amounts ofdye has a negligible effect on the ionic con-centration, therefore having a negligible effecton salt retention.
1.1.2. Dye rejection Nanofilters have poresizes generally equivalent to molecular weightcut-offs of 400Dalton [13] which is smaller thantypical dye molecules. This has led to the inter-est in nanofiltration for the treatment of dyeeffluent. Synthetic dye streams filtered with ananofiltration membrane have yielded veryhigh dye rejections. Dye rejections are typicallyvery high at around 99% [7]. Their applicationto actual effluent streams however decreasesthe rejection, though it still remains high [14].Dye retention has been found to decrease withincreasing ionic strength [7]. For example, 90%dye rejection is achieved for dye compoundswith MW 600–900 [15].
Table 1Membrane Classification based on rejection sequence [9]
Rejection Sequence Classification
R(Na2SO4) > R(NaCl) > R(CaCl2) Negatively charged membrane for which Donnan Exclusion plays animportant role
R(CaCl2) > R(NaCl) > R(Na2SO4) Positively charged membrane for which Donnan Exclusion plays animportant role
R(Na2SO4) > R(CaCl2) > R(NaCl) Membrane for which the retention is determined by difference indiffusion coefficients between salts
298 P. Denyer et al. / Desalination 204 (2007) 296–306
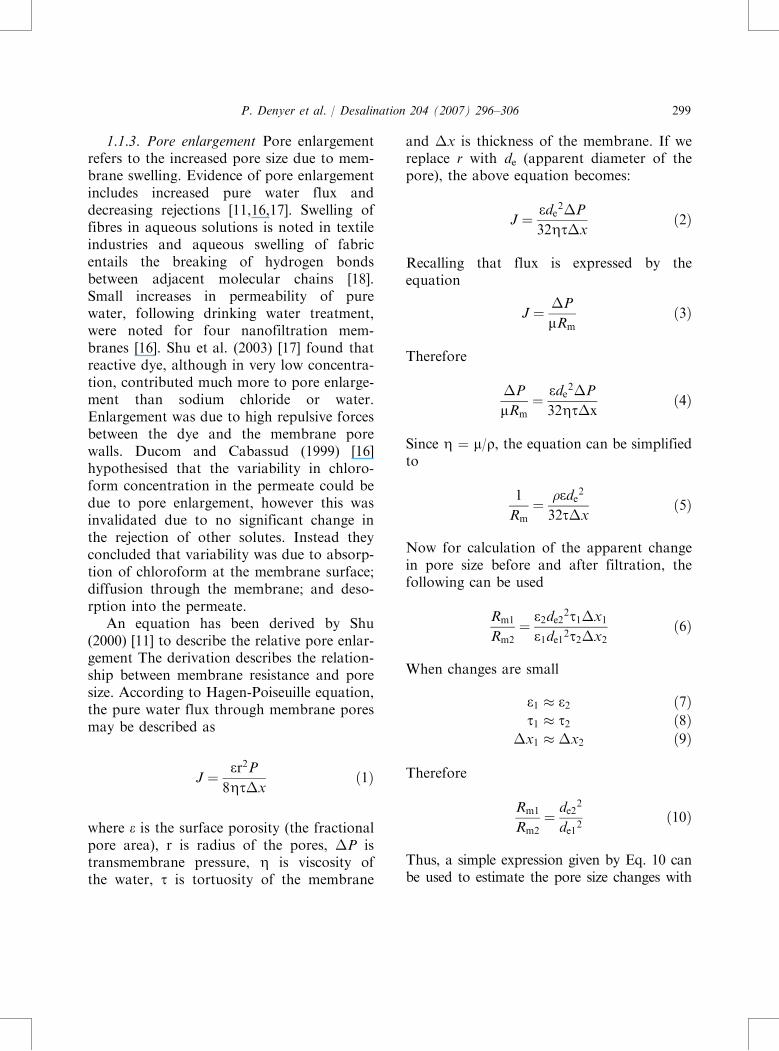
1.1.3. Pore enlargement Pore enlargementrefers to the increased pore size due to mem-brane swelling. Evidence of pore enlargementincludes increased pure water flux anddecreasing rejections [11,16,17]. Swelling offibres in aqueous solutions is noted in textileindustries and aqueous swelling of fabricentails the breaking of hydrogen bondsbetween adjacent molecular chains [18].Small increases in permeability of purewater, following drinking water treatment,were noted for four nanofiltration mem-branes [16]. Shu et al. (2003) [17] found thatreactive dye, although in very low concentra-tion, contributed much more to pore enlarge-ment than sodium chloride or water.Enlargement was due to high repulsive forcesbetween the dye and the membrane porewalls. Ducom and Cabassud (1999) [16]hypothesised that the variability in chloro-form concentration in the permeate could bedue to pore enlargement, however this wasinvalidated due to no significant change inthe rejection of other solutes. Instead theyconcluded that variability was due to absorp-tion of chloroform at the membrane surface;diffusion through the membrane; and deso-rption into the permeate.
An equation has been derived by Shu(2000) [11] to describe the relative pore enlar-gement The derivation describes the relation-ship between membrane resistance and poresize. According to Hagen-Poiseuille equation,the pure water flux through membrane poresmay be described as
J ¼ er2P8Zt�x
ð1Þ
where e is the surface porosity (the fractionalpore area), r is radius of the pores, �P istransmembrane pressure, Z is viscosity ofthe water, t is tortuosity of the membrane
and �x is thickness of the membrane. If wereplace r with de (apparent diameter of thepore), the above equation becomes:
J ¼ ede2�P
32Zt�xð2Þ
Recalling that flux is expressed by theequation
J ¼ �P
mRmð3Þ
Therefore
�P
mRm¼ ede2�P
32Zt�xð4Þ
Since Z = m/r, the equation can be simplifiedto
1
Rm¼ �ede2
32t�xð5Þ
Now for calculation of the apparent changein pore size before and after filtration, thefollowing can be used
Rm1
Rm2¼ e2de22t1�x1
e1de12t2�x2ð6Þ
When changes are small
e1 � e2 ð7Þt1 � t2 ð8Þ
�x1 � �x2 ð9Þ
Therefore
Rm1
Rm2¼ de2
2
de12ð10Þ
Thus, a simple expression given by Eq. 10 canbe used to estimate the pore size changes with
P. Denyer et al. / Desalination 204 (2007) 296–306 299
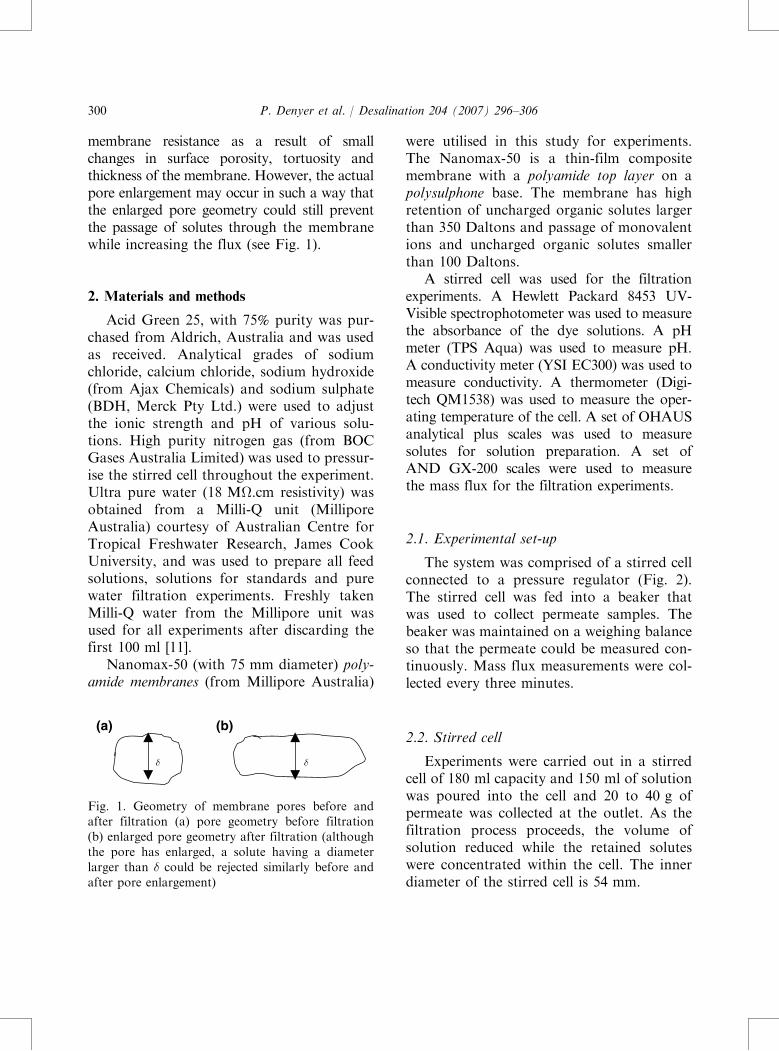
membrane resistance as a result of smallchanges in surface porosity, tortuosity andthickness of the membrane. However, the actualpore enlargement may occur in such a way thatthe enlarged pore geometry could still preventthe passage of solutes through the membranewhile increasing the flux (see Fig. 1).
2. Materials and methods
Acid Green 25, with 75% purity was pur-chased from Aldrich, Australia and was usedas received. Analytical grades of sodiumchloride, calcium chloride, sodium hydroxide(from Ajax Chemicals) and sodium sulphate(BDH, Merck Pty Ltd.) were used to adjustthe ionic strength and pH of various solu-tions. High purity nitrogen gas (from BOCGases Australia Limited) was used to pressur-ise the stirred cell throughout the experiment.Ultra pure water (18 M�.cm resistivity) wasobtained from a Milli-Q unit (MilliporeAustralia) courtesy of Australian Centre forTropical Freshwater Research, James CookUniversity, and was used to prepare all feedsolutions, solutions for standards and purewater filtration experiments. Freshly takenMilli-Q water from the Millipore unit wasused for all experiments after discarding thefirst 100 ml [11].
Nanomax-50 (with 75 mm diameter) poly-amide membranes (from Millipore Australia)
were utilised in this study for experiments.The Nanomax-50 is a thin-film compositemembrane with a polyamide top layer on apolysulphone base. The membrane has highretention of uncharged organic solutes largerthan 350 Daltons and passage of monovalentions and uncharged organic solutes smallerthan 100 Daltons.
A stirred cell was used for the filtrationexperiments. A Hewlett Packard 8453 UV-Visible spectrophotometer was used to measurethe absorbance of the dye solutions. A pHmeter (TPS Aqua) was used to measure pH.A conductivity meter (YSI EC300) was used tomeasure conductivity. A thermometer (Digi-tech QM1538) was used to measure the oper-ating temperature of the cell. A set of OHAUSanalytical plus scales was used to measuresolutes for solution preparation. A set ofAND GX-200 scales were used to measurethe mass flux for the filtration experiments.
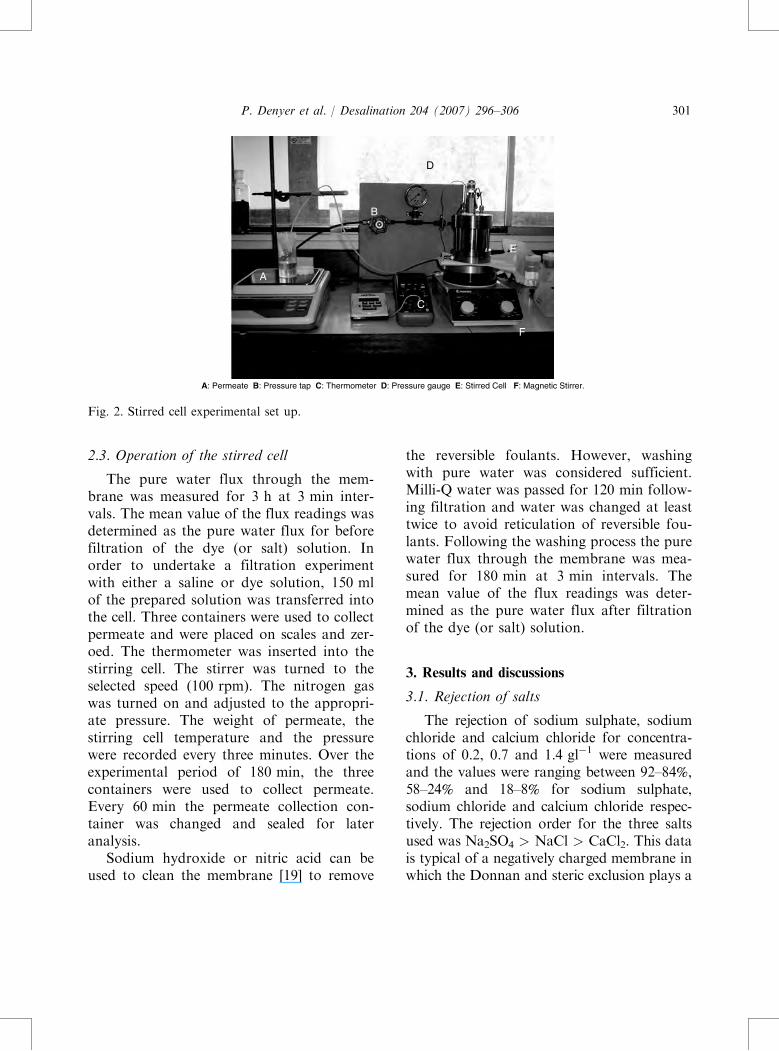
2.1. Experimental set-up
The system was comprised of a stirred cellconnected to a pressure regulator (Fig. 2).The stirred cell was fed into a beaker thatwas used to collect permeate samples. Thebeaker was maintained on a weighing balanceso that the permeate could be measured con-tinuously. Mass flux measurements were col-lected every three minutes.
2.2. Stirred cell
Experiments were carried out in a stirredcell of 180 ml capacity and 150 ml of solutionwas poured into the cell and 20 to 40 g ofpermeate was collected at the outlet. As thefiltration process proceeds, the volume ofsolution reduced while the retained soluteswere concentrated within the cell. The innerdiameter of the stirred cell is 54 mm.
(a) (b)
δ δ
Fig. 1. Geometry of membrane pores before andafter filtration (a) pore geometry before filtration(b) enlarged pore geometry after filtration (althoughthe pore has enlarged, a solute having a diameterlarger than � could be rejected similarly before andafter pore enlargement)
300 P. Denyer et al. / Desalination 204 (2007) 296–306
2.3. Operation of the stirred cell
The pure water flux through the mem-brane was measured for 3 h at 3 min inter-vals. The mean value of the flux readings wasdetermined as the pure water flux for beforefiltration of the dye (or salt) solution. Inorder to undertake a filtration experimentwith either a saline or dye solution, 150 mlof the prepared solution was transferred intothe cell. Three containers were used to collectpermeate and were placed on scales and zer-oed. The thermometer was inserted into thestirring cell. The stirrer was turned to theselected speed (100 rpm). The nitrogen gaswas turned on and adjusted to the appropri-ate pressure. The weight of permeate, thestirring cell temperature and the pressurewere recorded every three minutes. Over theexperimental period of 180 min, the threecontainers were used to collect permeate.Every 60 min the permeate collection con-tainer was changed and sealed for lateranalysis.
Sodium hydroxide or nitric acid can beused to clean the membrane [19] to remove
the reversible foulants. However, washingwith pure water was considered sufficient.Milli-Q water was passed for 120 min follow-ing filtration and water was changed at leasttwice to avoid reticulation of reversible fou-lants. Following the washing process the purewater flux through the membrane was mea-sured for 180 min at 3 min intervals. Themean value of the flux readings was deter-mined as the pure water flux after filtrationof the dye (or salt) solution.
3. Results and discussions
3.1. Rejection of salts
The rejection of sodium sulphate, sodiumchloride and calcium chloride for concentra-tions of 0.2, 0.7 and 1.4 gl�1 were measuredand the values were ranging between 92–84%,58–24% and 18–8% for sodium sulphate,sodium chloride and calcium chloride respec-tively. The rejection order for the three saltsused was Na2SO4 > NaCl > CaCl2. This datais typical of a negatively charged membrane inwhich the Donnan and steric exclusion plays a
A: Permeate B: Pressure tap C: Thermometer D: Pressure gauge E: Stirred Cell F: Magnetic Stirrer.
E
A
B
C
F
D
Fig. 2. Stirred cell experimental set up.
P. Denyer et al. / Desalination 204 (2007) 296–306 301
important role in separation. A general trendwas observed for all salts where the initialrejection is highest for all concentrations, andthen the rejection decreased with the durationof the filtration operation. Bartels et al. (2005)[10] determined an optimum ionic feed strengthfor sodium chloride when filtered by reverseosmosis and estimated that a minimum saltpassage occurred between concentrations of0.5 and 1.0 gl�1.
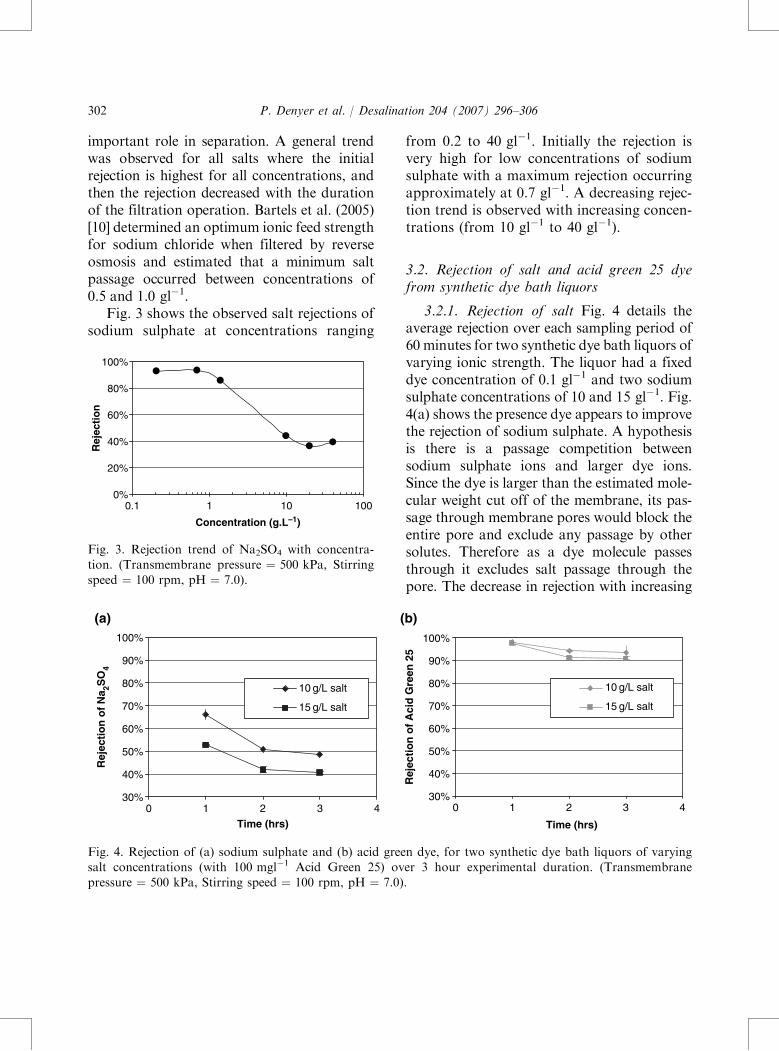
Fig. 3 shows the observed salt rejections ofsodium sulphate at concentrations ranging
from 0.2 to 40 gl�1. Initially the rejection isvery high for low concentrations of sodiumsulphate with a maximum rejection occurringapproximately at 0.7 gl�1. A decreasing rejec-tion trend is observed with increasing concen-trations (from 10 gl�1 to 40 gl�1).
3.2. Rejection of salt and acid green 25 dyefrom synthetic dye bath liquors
3.2.1. Rejection of salt Fig. 4 details theaverage rejection over each sampling period of60 minutes for two synthetic dye bath liquors ofvarying ionic strength. The liquor had a fixeddye concentration of 0.1 gl�1 and two sodiumsulphate concentrations of 10 and 15 gl�1. Fig.4(a) shows the presence dye appears to improvethe rejection of sodium sulphate. A hypothesisis there is a passage competition betweensodium sulphate ions and larger dye ions.Since the dye is larger than the estimated mole-cular weight cut off of the membrane, its pas-sage through membrane pores would block theentire pore and exclude any passage by othersolutes. Therefore as a dye molecule passesthrough it excludes salt passage through thepore. The decrease in rejection with increasing
0%
20%
40%
60%
80%
100%
0.1 1 10 100
Concentration (g.L–1)
Rej
ecti
on
Fig. 3. Rejection trend of Na2SO4 with concentra-tion. (Transmembrane pressure = 500 kPa, Stirringspeed = 100 rpm, pH = 7.0).
(a) (b)
30%
40%
50%
60%
70%
80%
90%
100%
0 1 2 3 4
Time (hrs)
Rej
ecti
on
of
Na 2S
O4
10 g/L salt
15 g/L salt
30%
40%
50%
60%
70%
80%
90%
100%
0 1 2 3 4
Time (hrs)
Rej
ecti
on
of
Aci
d G
reen
25
10 g/L salt
15 g/L salt
Fig. 4. Rejection of (a) sodium sulphate and (b) acid green dye, for two synthetic dye bath liquors of varyingsalt concentrations (with 100 mgl�1 Acid Green 25) over 3 hour experimental duration. (Transmembranepressure = 500 kPa, Stirring speed = 100 rpm, pH = 7.0).
302 P. Denyer et al. / Desalination 204 (2007) 296–306
ionic strength of the synthetic dye baths sup-ports the proposal of pore expansion. If thepore size has increased, the retention due tosteric properties will decrease allowingincreased solute passage and causing decreasedrejections. This evidence is only indicativethough since membrane variability may influ-ence rejections.
3.2.2. Rejection of dye There is a highinitial dye rejection in the first hour andthereafter the rejection decreased withincreasing duration of the experiment (Fig.4(b)). Notably the rate of change of rejectionafter the second hour decreases significantlyto an almost constant level for both syntheticdye baths and for both the dyes and salts.This may be indicative of a constant rejectionbeing achieved for the system.
3.3. Pore enlargement
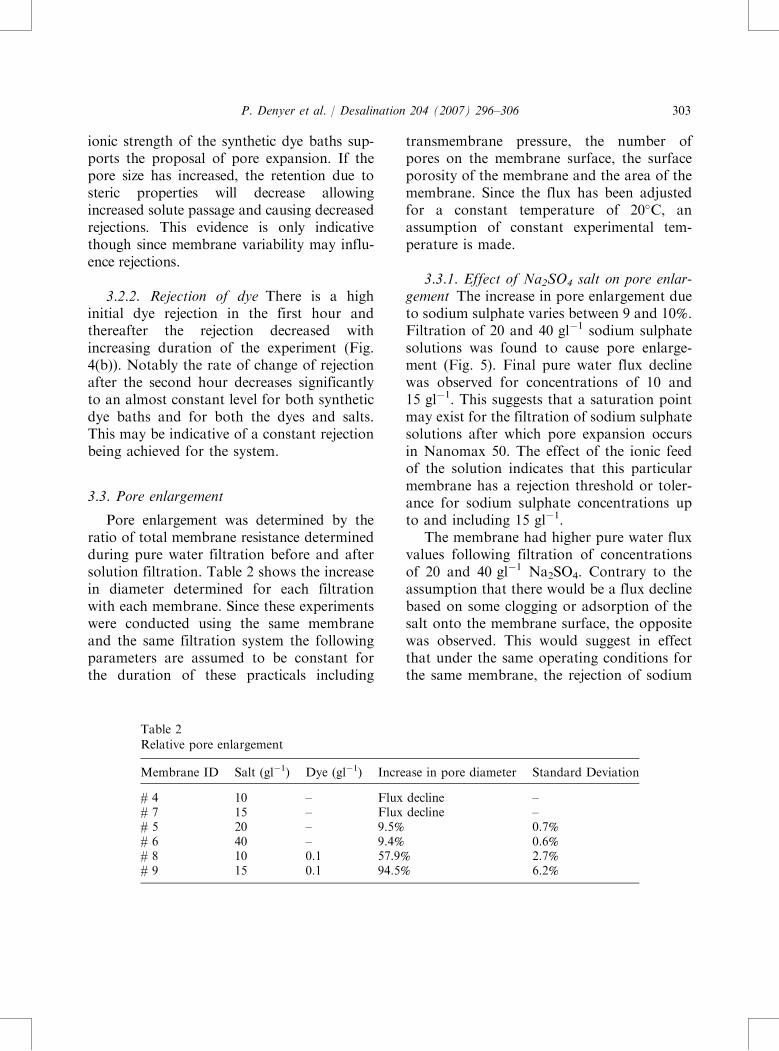
Pore enlargement was determined by theratio of total membrane resistance determinedduring pure water filtration before and aftersolution filtration. Table 2 shows the increasein diameter determined for each filtrationwith each membrane. Since these experimentswere conducted using the same membraneand the same filtration system the followingparameters are assumed to be constant forthe duration of these practicals including
transmembrane pressure, the number ofpores on the membrane surface, the surfaceporosity of the membrane and the area of themembrane. Since the flux has been adjustedfor a constant temperature of 20�C, anassumption of constant experimental tem-perature is made.
3.3.1. Effect of Na2SO4 salt on pore enlar-gement The increase in pore enlargement dueto sodium sulphate varies between 9 and 10%.Filtration of 20 and 40 gl�1 sodium sulphatesolutions was found to cause pore enlarge-ment (Fig. 5). Final pure water flux declinewas observed for concentrations of 10 and15 gl�1. This suggests that a saturation pointmay exist for the filtration of sodium sulphatesolutions after which pore expansion occursin Nanomax 50. The effect of the ionic feedof the solution indicates that this particularmembrane has a rejection threshold or toler-ance for sodium sulphate concentrations upto and including 15 gl�1.
The membrane had higher pure water fluxvalues following filtration of concentrationsof 20 and 40 gl�1 Na2SO4. Contrary to theassumption that there would be a flux declinebased on some clogging or adsorption of thesalt onto the membrane surface, the oppositewas observed. This would suggest in effectthat under the same operating conditions forthe same membrane, the rejection of sodium
Table 2Relative pore enlargement
Membrane ID Salt (gl�1) Dye (gl�1) Increase in pore diameter Standard Deviation
# 4 10 – Flux decline –# 7 15 – Flux decline –# 5 20 – 9.5% 0.7%# 6 40 – 9.4% 0.6%# 8 10 0.1 57.9% 2.7%# 9 15 0.1 94.5% 6.2%
P. Denyer et al. / Desalination 204 (2007) 296–306 303
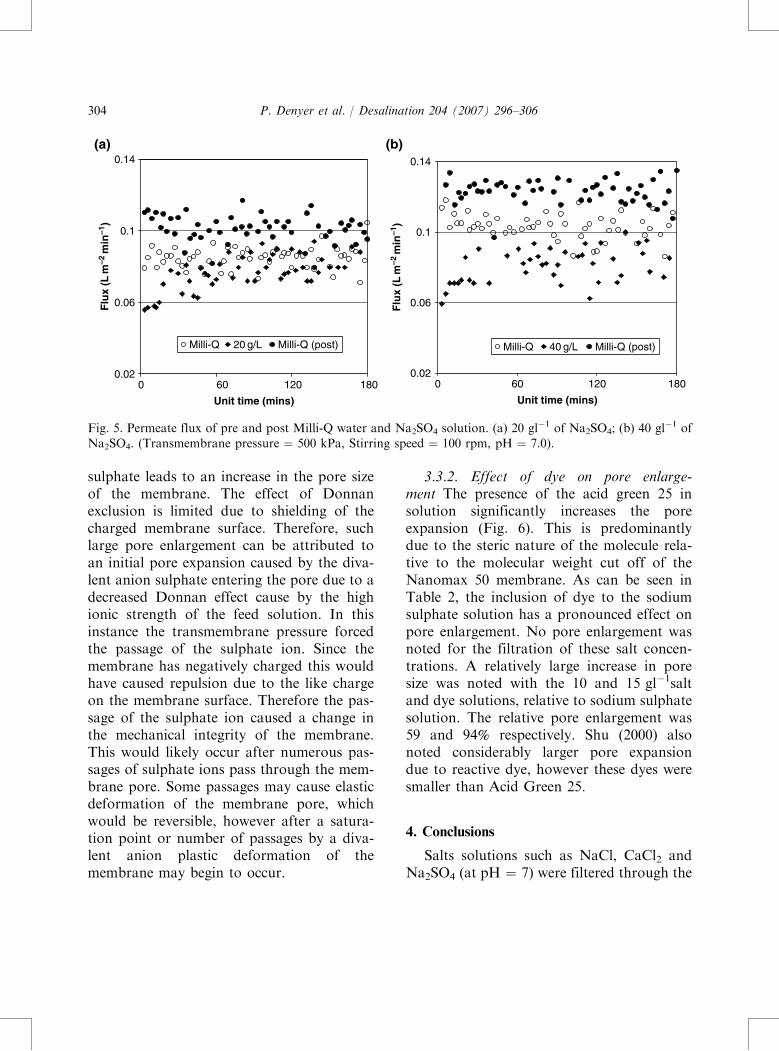
sulphate leads to an increase in the pore sizeof the membrane. The effect of Donnanexclusion is limited due to shielding of thecharged membrane surface. Therefore, suchlarge pore enlargement can be attributed toan initial pore expansion caused by the diva-lent anion sulphate entering the pore due to adecreased Donnan effect cause by the highionic strength of the feed solution. In thisinstance the transmembrane pressure forcedthe passage of the sulphate ion. Since themembrane has negatively charged this wouldhave caused repulsion due to the like chargeon the membrane surface. Therefore the pas-sage of the sulphate ion caused a change inthe mechanical integrity of the membrane.This would likely occur after numerous pas-sages of sulphate ions pass through the mem-brane pore. Some passages may cause elasticdeformation of the membrane pore, whichwould be reversible, however after a satura-tion point or number of passages by a diva-lent anion plastic deformation of themembrane may begin to occur.
3.3.2. Effect of dye on pore enlarge-ment The presence of the acid green 25 insolution significantly increases the poreexpansion (Fig. 6). This is predominantlydue to the steric nature of the molecule rela-tive to the molecular weight cut off of theNanomax 50 membrane. As can be seen inTable 2, the inclusion of dye to the sodiumsulphate solution has a pronounced effect onpore enlargement. No pore enlargement wasnoted for the filtration of these salt concen-trations. A relatively large increase in poresize was noted with the 10 and 15 gl�1saltand dye solutions, relative to sodium sulphatesolution. The relative pore enlargement was59 and 94% respectively. Shu (2000) alsonoted considerably larger pore expansiondue to reactive dye, however these dyes weresmaller than Acid Green 25.
4. Conclusions
Salts solutions such as NaCl, CaCl2 andNa2SO4 (at pH = 7) were filtered through the
0.02
0.06
0.1
0.14
0 60 120 180
Unit time (mins)
Flu
x (L
m–2
min
–1)
Milli-Q 20 g/L Milli-Q (post)
0.02
0.06
0.1
0.14
0 60 120 180
Unit time (mins)F
lux
(L m
–2 m
in–1
)
Milli-Q 40 g/L Milli-Q (post)
(a) (b)
Fig. 5. Permeate flux of pre and post Milli-Q water and Na2SO4 solution. (a) 20 gl�1 of Na2SO4; (b) 40 gl�1 ofNa2SO4. (Transmembrane pressure = 500 kPa, Stirring speed = 100 rpm, pH = 7.0).
304 P. Denyer et al. / Desalination 204 (2007) 296–306

negatively charged Nanomax-50 nanofiltermembranes placed in a stirred cell at500 kPa transmembane pressure and a stir-ring speed of 500 rpm. The rejection orderdetermined was Na2SO4>NaCl>CaCl2 forthe Nanomax-50 membrane where Donnanand steric exclusion play an important rolein separation. Studies on the flux and rejec-tion characteristics of Na2SO4 were underta-ken for concentrations ranging from 0.2 to40 gl�1. The rejection of Na2SO4 was highat lower concentrations (92 to 84% rejectionfor 0.2 to 1.4 gl�1 of Na2SO4) and decreasedat higher concentrations. Although the resultsshowed evidence of flux decline due toincreased resistance and decreased transmem-brane pressure, pore enlargement occurredafter the filtration experiments with sodiumsulphate solutions greater than 20 gl�1. Poreenlargement was determined by observing thepure water flux before and after filteringNa2SO4 solutions and an increase in apparentpore diameter of 9.5 and 9.4% were estimated
when 20 and 40 gl�1 of Na2SO4 solutionswere filtered, respectively.
Further, Synthetic dye bath liquors wereprepared using acidic dye (Acid Green 25) ata fixed concentration of 100 mgl�1 of dyewith 10 and 15 gl�1 of Na2SO4 solutions.Pore enlargement was even more prominentin the two synthetic dye bath liquors filtered.An increase in apparent pore diameter of 58and 94% were estimated when dye bathliquors containing 10 and 15 gl�1 ofNa2SO4, respectively were filtered throughthe membrane.
Acknowledgments
This project is partially funded by a MeritResearch Grant awarded to V. Jegatheesanby James Cook University in 2005. Assistancefrom Messrs. S. Petersen and J. Ellis in set-ting up the experiments and J. Faithful inproviding high purity Milli-Q water wasgreatly appreciated.
0
0.09
0.18
0.27
0 60 120 180
Unit time (mins)
Flu
x (L
m–2
min
–1)
Flu
x (L
m–2
min
–1)
Milli-Q 10 g/L + Dye Milli-Q (post)
0
0.09
0.18
0.27
0 60 120 180
Unit time (mins)
Milli-Q 15 g/L +Dye Milli-Q (post)
(a) (b)
Fig. 6. Permeate flux of pre and post Milli-Q water and synthetic dye bath (dye þ Na2SO4) solution. (a)100 mgl�1 of Acid Green 25 and 10 gl�1 of Na2SO4 (b) 100 mgl�1 of Acid Green 25 and 15 gl�1 of Na2SO4.
P. Denyer et al. / Desalination 204 (2007) 296–306 305
References
[1] J. Thomas, P. Adams, P. Dixon, N. Hall andB. Watson, Water and the Australian Economy,A joint study between the Australian Academyof Technology Sciences and Engineering and theInstitute of Engineers Australia, 1999.
[2] B. Van der Bruggen, I. De Vreese and C. Van-decasteele, Water reclamation in the textile indus-try: nanofiltration of dye baths for wool dyeing,Ind. Eng. Chem. Res., 40 (2001) 3973–3978.
[3] U. Meyer, Biodegradation of synthetic organiccolorants. Microbial degradation of xenophobioticand recalcitrant compounds, FEMS Symposium 12,T. Leisinger, A.M. Cook, R. Hunter and J. Nuesch.London, Academic Press, 1981, pp. 371–385.
[4] K.T. Chung and S. Edward, The reduction ofazo dyes by the intestinal microflora, CriticalReviews in Microbiology, 18(3) (1992) 175–190.
[5] EPA, US, Best Management Practices for Pollu-tion Prevention in the Textile Industry, EPAManual. Washington, DC, Office of Researchand Development, United States EnvironmentProtection Authority, 1996.
[6] Preiss, U. Sanger, N. Karfich, K. Levsen andC. Mugge, Characterisation of dyes and otherpollutants in the effluent of a textile company byLC/NMR and LC/MS, Anal. Chem., 72(5)(2000) 992–998.
[7] A. Akbari, S. Desclaux, J.C. Remigy andP. Aptel, Treatment of textile effluents usinga photographed nanofiltration membrane, Desa-lination, 149 (2002) 101–107.
[8] B.Van der Bruggen, B. Daems, D. Wilms andC. Vandecasteele, Mechanisms for the retentionand flux decline for the nanofiltration of dye-baths from the textile industry, Sep. Purific.Technol., 22–23 (2004) 519.
[9] J.M.M. Peeters, J.P. Boom, M.H.V. Mulder andH. Strathmann, Retention measurements ofnanofiltration membranes with electrolyte solu-tions, J. Membr. Sci., 146 (1998) 199–209.
[10] C. Bartels, R. Franks, S. Rybar, M. Schierachand M. Wilf, The effect of feed ionic strength onsalt passage through reverse osmosis mem-branes, Desalination, 184 (2005) 1165–1175.
[11] L. Shu, Membrane processing of dye waste-water: dye aggregation, membrane performanceand mathematical modelling, School of Civil andEnvironmental Engineering, University of NewSouth Wales, 2000, p. 251.
[12] A. Seidel, J.J. Waypa and M. Elimelech, Role ofcharge (Donnan) exclusion in the removal ofaresenic from water by a negatively charged por-ous nanofiltration membrane, Environ. Eng.Sci., 18(2) (2001) 105–113.
[13] A. Erswell, C.J. Broukaert and C.A. Buckley,The reuse of reactive dye liquors using chargedultrafiltration membrane technology, Desalina-tion, 70 (1998) 157–167.
[14] B. Van der Bruggen and C. Vandelcasteele,Modelling of the retention of uncharged mole-cules with nanofiltration, Water Res., 36(5)(2002) 1360–1368.
[15] B. Van der Bruggen, E. Curcio and E. Drioli,Process intensification in the textile industry: therole of membrane technology, J. Environ. Man-age., 73 (2004) 267–274.
[16] G. Ducom and C. Cabassud, Interests andlimitations of nanofiltration for the removalof volatile organic compunds in drinkingwater production, Desalination, 124 (1999)115–123.
[17] L. Shu, T.D. Waite, P.J. Bliss, M.T. Pailthorpeand V. Jegatheesan, Possible changes of poresizes during nanofiltration, Proceedings ofASIAN WATERQUAL2003, IWA Asia-PacificRegional Conference, Bangkok, 2003.
[18] J. Shore, Cellulosics Dyeing. Society of Dyersand Colourists, 1995.
[19] A. Sungpet, R. Jiraratananon and P. Luangso-wan, Treatment of effluents from textile-rinsingoperations by thermally stable nanofiltrationmembranes, Desalination, 160 (2004) 75–81.
306 P. Denyer et al. / Desalination 204 (2007) 296–306