Changes in macroscopic behaviour through segregation in niobium doped strontium titanate

RESEARCH ARTICLE
Evidence for Patterns of Selective UrbanMigration in the Greater Indus Valley (2600-1900 BC): A Lead and Strontium IsotopeMortuary AnalysisBenjamin Valentine1*, George D. Kamenov2, Jonathan Mark Kenoyer3, Vasant Shinde4,Veena Mushrif-Tripathy4, Erik Otarola-Castillo5, John Krigbaum6
1 Department of Anthropology, Dartmouth College, Hanover, NH, United States of America, 2 Department ofGeological Sciences, University of Florida, Gainesville, FL, United States of America, 3 Department ofAnthropology, University of Wisconsin—Madison, Madison, WI, United States of America, 4 Department ofArchaeology, Deccan College Post-Graduate and Research Institute, Pune, Maharashtra, India,5 Department of Human Evolutionary Biology, Harvard University, Cambridge, MA, United States ofAmerica, 6 Department of Anthropology, University of Florida, Gainesville, FL, United States of America
AbstractJust as modern nation-states struggle to manage the cultural and economic impacts of mi-
gration, ancient civilizations dealt with similar external pressures and set policies to regulate
people’s movements. In one of the earliest urban societies, the Indus Civilization, mecha-
nisms linking city populations to hinterland groups remain enigmatic in the absence of writ-
ten documents. However, isotopic data from human tooth enamel associated with Harappa
Phase (2600-1900 BC) cemetery burials at Harappa (Pakistan) and Farmana (India) pro-
vide individual biogeochemical life histories of migration. Strontium and lead isotope ratios
allow us to reinterpret the Indus tradition of cemetery inhumation as part of a specific and
highly regulated institution of migration. Intra-individual isotopic shifts are consistent with im-
migration from resource-rich hinterlands during childhood. Furthermore, mortuary popula-
tions formed over hundreds of years and composed almost entirely of first-generation
immigrants suggest that inhumation was the final step in a process linking certain urban
Indus communities to diverse hinterland groups. Additional multi disciplinary analyses are
warranted to confirm inferred patterns of Indus mobility, but the available isotopic data sug-
gest that efforts to classify and regulate human movement in the ancient Indus region likely
helped structure socioeconomic integration across an ethnically diverse landscape.
IntroductionProtohistoric South Asia holds unique insights into the evolution andmaintenance of early urban-ism, as the relatively decentralized Indus Civilization suggests an alternative to the strongly cen-tralized states of contemporaneous Egypt andMesopotamia [1]. Yet the institutional mechanisms
PLOSONE | DOI:10.1371/journal.pone.0123103 April 29, 2015 1 / 20
OPEN ACCESS
Citation: Valentine B, Kamenov GD, Kenoyer JM,Shinde V, Mushrif-Tripathy V, Otarola-Castillo E, et al.(2015) Evidence for Patterns of Selective UrbanMigration in the Greater Indus Valley (2600-1900BC): A Lead and Strontium Isotope MortuaryAnalysis. PLoS ONE 10(4): e0123103. doi:10.1371/journal.pone.0123103
Academic Editor: John P. Hart, New York StateMuseum, UNITED STATES
Received: October 21, 2014
Accepted: February 27, 2015
Published: April 29, 2015
Copyright: © 2015 Valentine et al. This is an openaccess article distributed under the terms of theCreative Commons Attribution License, which permitsunrestricted use, distribution, and reproduction in anymedium, provided the original author and source arecredited.
Data Availability Statement: All relevant data arewithin the paper and its Supporting Information files.
Funding: Funding was provided by the AmericanInstitute of Indian Studies Junior Fellowship to BV, JK(www.indiastudies.org), and Wenner-GrenDissertation Fieldwork Grant #8383 to BV, JK (www.wennergren.org). The funders had no role in studydesign, data collection and analysis, decision topublish, or preparation of the manuscript.

that structured Indus expansion in the late 3rd millennium BC remain unclear, in part because theIndus script is undeciphered. Fortunately, human tooth enamel provides a biogeochemical archiveof past behavior and residence change that offers an alternative means of reconstructing ancientinstitutions [2]. The nature of the Indus skeletal record suggests that Indus cemetery inhumationsare closely associated with the socio-political structures of the Harappa Phase (2600–1900 BC)and therefore provide a key source of isotopic data for understanding early urban mechanisms ofinteraction. Like standardized weights, measures, script, and stamp seals, a relatively homogenoustradition of cemetery inhumation endured for centuries, contemporaneous with the Indus urbanflorescence and cultural integration spanning ~680,000 km2 of northwest South Asia [3]. Thoughburials are geographically widespread, more than a century of excavation has yielded skeletal re-mains for only ca. 600 individuals [4]. Inhumations in formalized cemetery contexts are very rare,suggesting that cemetery populations represent a specific group distinct from the population-at-large. In this work, we conducted lead (Pb) and strontium (Sr) isotopic analysis of human toothenamel recovered from Harappa Phase cemeteries at Harappa, Pakistan [5] and Farmana, India[6] in order to assess the dynamics of migration and social identity for the buried individuals. Wedemonstrate how the isotopic data can be used to elucidate their distinctive social identity andpropose that a specific, culturally regulated institution of migration helped to shape ancienturban-hinterland relationships.
Indus Mortuary Practice in ContextThough peoples of the Indus Tradition were connected by trade routes since at least 5500 BC,it was not until ca. 2600 BC that diverse regional cultures developed a common repertoire of ce-ramic forms, settlement organization, urban infrastructure, and administrative practices [1, 7].Emerging elites sought to consolidate their advantages through the control of exotic resourcesand sophisticated craft technologies [8]. At the major urban center of Harappa, for example,mercantile groups acquired a wide range of resources from adjacent mineral-rich regions in-cluding the Potwar Plateau to the northwest [9] (Fig 1). Farmana was a much smaller settle-ment near the eastern limit of the Indus culture area and relatively close to the Khetri copperbelt of the northern Aravalli mountain range, a region known for ancient copper production[10]. Indus peoples likely acquired raw materials from these and other regions through trade,as there is little archaeological evidence for large-scale militarization [9]. Furthermore, Indusartifacts and stylistic influences at hinterland sites suggest relationships of reciprocity [9, 11].
Mortuary analysis of Harappa Phase cemetery populations complements approaches to un-derstanding interregional interaction that focus primarily on the movement of artifacts. As buri-als are rare, the vast majority of Indus deceased were presumably disposed of in ways that arenot apparent in the archaeological record. However, important insights have been gleaned fromavailable mortuary populations. Previous morphological and strontium isotope studies of skele-tal material at the sites of Harappa [12, 13] and Lothal [14] suggest residence change may havebeen common for certain individuals and that increased mobility facilitated gene flow with hin-terland groups. At Harappa, males show greater isotopic and morphological variation—a pat-tern previously interpreted as evidence for matrilocality [13]. Likewise, morphological similaritybetween individuals from Lothal and nearby hunter-gatherers suggests some degree of urban-hinterland mobility [14].
Despite the potential influx of immigrants, Harappa Phase burials are relatively homoge-nous in terms of material culture and contain artifacts known from domestic Indus contexts[7]. Most Indus cemetery burials consist of a rectangular or oval pit aligned north to south withmodest numbers of associated ceramics at the head of the grave. Skeletal remains typically liesupine and extended and are sometimes adorned with small quantities of jewelry or other
Selective Urban Migration in the Ancient Indus
PLOS ONE | DOI:10.1371/journal.pone.0123103 April 29, 2015 2 / 20
Competing Interests: The authors have declaredthat no competing interests exist.
personal effects. Skeletons may be incomplete or absent with grave goods present in variousquantities, but nearly all cemetery inhumations conform to a similar layout that is not readilydifferentiated into distinct social classes.
The skeletal series from Harappa (Cemetery R-37) and Farmana are consistent with theabove trends, and we suggest the inhumed participated in a shared set of mortuary practices.These practices remained relatively stable over a period of several centuries as indicated by ra-diocarbon dates from charcoal associated with early and late burials at Harappa (2550–2030cal BC) (J. M. Kenoyer, personal communication). Relative dating from ceramics associatedwith the Farmana burials indicates a similar period of use (ca. 2600–2000 BC) [6, 15]. Fewclues exist as to the social identity of the deceased, but the low incidence of skeletal pathologiesand non-specific stress indicators at Cemetery R-37 suggests improved access to resources[13]. Likewise, personal ornaments are few in number but many are of high quality [5]. Al-though Harappa Phase burials lack the kinds of ostentatious display associated with royalMesopotamian and Egyptian tombs, their relatively privileged disposition in life and deathcould indicate ties with elite Indus groups. Lastly, demographic profiles of the Harappa Phasemortuary populations at Harappa [5] and Farmana [6] further emphasize the selective natureof the mortuary program. A near total absence of infants implies certain social strictures onburial. Given the frequency with which children receive alternative mortuary treatments
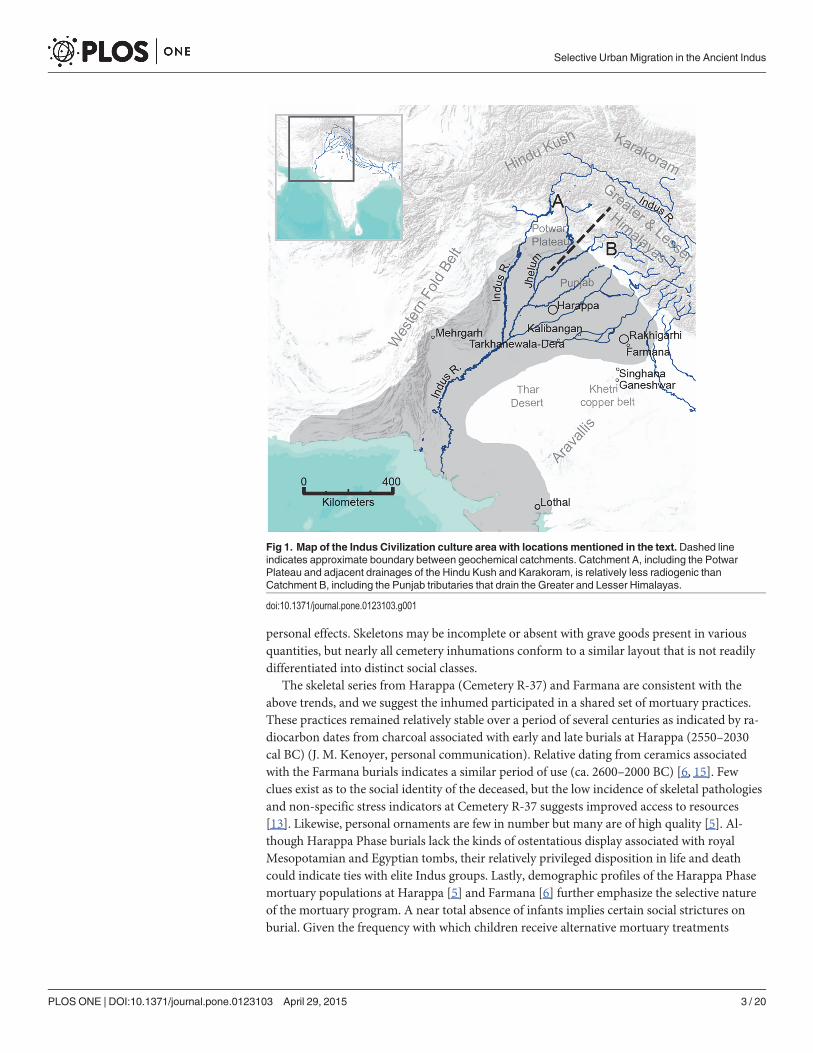
Fig 1. Map of the Indus Civilization culture area with locationsmentioned in the text. Dashed lineindicates approximate boundary between geochemical catchments. Catchment A, including the PotwarPlateau and adjacent drainages of the Hindu Kush and Karakoram, is relatively less radiogenic thanCatchment B, including the Punjab tributaries that drain the Greater and Lesser Himalayas.
doi:10.1371/journal.pone.0123103.g001
Selective Urban Migration in the Ancient Indus
PLOS ONE | DOI:10.1371/journal.pone.0123103 April 29, 2015 3 / 20
cross-culturally [16, 17], the Indus demographic profiles cannot be interpreted as direct evi-dence for a distinct social class associated only with older individuals. Nevertheless, they areconsistent with the notion that Harappa Phase mortuary populations are not wholly represen-tative cross-sections of particular breeding populations or ethnic groups.
The question of who was incorporated into cemeteries has major implications for any mor-tuary analysis. For decades, archaeologists have looked to the ordering principles of mortuarypopulations for insights into broader social systems. In certain instances, patterns of intra-cem-etery variability may provide relatively direct reflections of social hierarchies [18, 19, 20, 21].However, this view has been critiqued by scholars emphasizing the ways in which mortuaryprograms are the subject of active manipulation and capable of influencing societies in theirown right [22, 23, 24, 25]. Conceived in this way, archaeological cemeteries must be interpretedin terms of dynamic social processes embedded within particular historical contexts. A similarconceptual approach has guided the study of frontiers or borderlands [26, 27, 28], and indeed,it is not uncommon for novel mortuary programs to emerge in situations of culture contact[29, 30, 31, 32]. Therefore, isotopic methods for assessing the origins of individuals provide in-valuable tools for inferring the presence and character of cultural interaction.
Isotopic approaches coupled with bioarchaeological methods permit a more robust mortu-ary analysis because they yield data at the level of the individual. This analytical resolution canbe crucial for determining the structure of intra-population variation. However, the individualmay not always be the most relevant unit of analysis when modeling social systems. In the con-text of a mortuary program, individual bodies should not be conflated with individual socialidentities because burial assemblages are not autobiographical. They are produced by the living,and each burial gives the living an opportunity to assert their own perceptions [23]. Burialsoffer a medium in which the living can emphasize diverse relationships with the deceased [33],or in some cases, with the deceased’s corporate group [34]. Therefore, models of social systemsderived from mortuary data must consider the role of multi-bodied, multi-generational socialidentities in structuring mortuary practices. Given the relative homogeneity and extreme scar-city of Harappan Phase cemetery burials, it is possible that a common group identity was prior-itized over various individual identities. Thus, the traits that burials share may yield moreinsights into the mortuary program than traits that differentiate one burial from another.
Principles of AnalysisCombined analyses of radiogenic Sr and Pb isotope ratios (i.e., 87Sr/86Sr, 208Pb/204Pb, 207Pb/204
Pb, 206Pb/204Pb) and Sr abundances in dental enamel samples enable more detailed inferencesabout Indus mobility and cultural integration. Each bulk enamel sample yields weighted averageisotopic ratios of the bioavailable or soluble fraction of Sr and Pb ingested in food, water, and dustduring the period of enamel mineralization [35, 36, 37]. Because ratios of these heavy isotopes re-main unchanged as they pass from bedrock into the biosphere, isotopic differences between toothenamel samples can be attributed to different environmental sources of Sr and Pb originatingfrom distinct geographic regions. In other words, heavy isotope ratios in tooth enamel can bematched to those of the place (or places) where an individual was living. The same is potentiallytrue for other mineralized tissues like bone and dentine, but the crystalline structure of enamel ap-atite is much more resistant to diagenetic alteration in the burial environment and provides ahigh-fidelity record of in vivo isotopic ratios [35, 36, 37].
Once fully mineralized, enamel undergoes no additional remodeling [38] and therefore ar-chives the isotopic input acquired during a specific developmental period in an individual’s lifehistory. Variations in the timing of enamel mineralization mean that early-life residential his-tory can be inferred through analyses of multiple tooth types—grouped here into three cohorts.
Selective Urban Migration in the Ancient Indus
PLOS ONE | DOI:10.1371/journal.pone.0123103 April 29, 2015 4 / 20

The first molar cohort consists of teeth that mineralized within the first three years of life,whereas second and third molar cohorts represent ~3–7 years of age and ~8–16 years of age,respectively [39, 40]. Though we present maximum age ranges for completeness, the minerali-zation of premolars and molars has been noted to take between 3.0 and 3.4 years [39]. Compar-ison of enamel isotope ratios from different molar cohorts with estimates of interregionalisotopic variation permits inferences about the location and timing of individual residencechanges [35, 36, 37]. Although variability in diet and residence over a multi-year period mayprevent precise correlations between a given enamel sample and estimated isotopic catchments,patterning within an isotopic dataset relative to geologic end-members can support more de-tailed interpretations. In addition, mixing lines between distinct geological sources may be in-ferred using elemental concentration data, making it possible to distinguish between groups ofindividuals that have similar isotopic ratios but different elemental concentrations (i.e.,Sr ppm) [41].
Individuals are identified as non-local when their isotope ratios fall outside the estimatedrange of isotopic variation for the local dietary catchment. Local water, sediment leachates,plants, and faunal remains can all be used as proxies for the bioavailable isotopic input inhuman dietary catchments, but none are likely to give a precise weighted average of the mostfrequently ingested sources of food, water, and dust in the human diet [42]. Tooth enamelfrom archaeological fauna for species with small home ranges provides the best estimate oflocal isotopic variation because foraging behavior averages out small-scale geochemical varia-tions within a relatively constrained area. Sampling archaeological material also minimizes thepotential influence of modern environmental contamination. Nevertheless, factors includingseasonal migration or the importation of faunal resources can introduce non-local ratios intodatasets which can result in overestimates of local isotopic variability.
To deal with the challenges of defining local isotopic ranges, Burton and Price [43] sug-gested using faunal 87Sr/86Sr to confirm the local modal trends in human 87Sr/86Sr as identifiedthrough kernel density estimation. We follow a similar logic in emphasizing the internal struc-ture of the data sets, but apply a different statistical method for this multi-isotopic study. Herewe use cluster analysis algorithms DBSCAN [44] and K-means [45]. Given some knowledge ofunderlying isotopic variability in the geological setting, such methods can discriminate betweenarchaeological individuals within well-represented clusters (presumably frequently accessed di-etary catchments) and those that are peripheral to the identified clusters.
Materials and MethodsWhenever possible, teeth from the first, second, and third molar cohorts were sampled to max-imize life history information for each individual. First molars were preferred for assaying earlylife isotopic exposure, but a single first incisor from Harappa burial H87/ 72 49h was includedin the first molar cohort to maximize the dataset. Based on similar logic, three premolars wereincluded in the second molar cohort. Even though initial cusp formation begins at about 1 yearof age for canines, a single canine was also grouped with the second molar cohort for two rea-sons. First, canine crowns have a long formation time, lasting until ~5–6 years of age. Second,the sampled canine was clearly associated with the first incisor from burial H87/ 72 49h, atooth that mineralized earlier in development. Together with teeth from burials H87/ 71 49cand H94/ 253 18, these samples provide the only developmental sequences that could be con-firmed from the Harappa analyses. Unfortunately, many Harappa burials were either poorlypreserved or had been disturbed in antiquity by Harappa Phase residents re-using cemeteryland for subsequent burials [5]. All available fully mineralized teeth were sampled from collec-tions at the Harappa Museum in Harappa, Pakistan yielding 44 teeth from a minimum number
Selective Urban Migration in the Ancient Indus
PLOS ONE | DOI:10.1371/journal.pone.0123103 April 29, 2015 5 / 20
of individuals (MNI) of 38. The Farmana sample, curated at Deccan College Post-Graduateand Research Institute in Pune, India, includes 33 teeth from 17 individuals.
Additional faunal and sedimentary samples were collected to establish a baseline for localisotopic variation. Sampled archaeological fauna include pigs (Sus) and dogs (Canis), all ofwhich were collected from secure chronological contexts at Harappa (n = 13) and Rakhigarhi(n = 8). Farmana fauna were unavailable for sampling, but the major urban center of Rakhi-garhi lies ~30 km to the northwest of Farmana and is assumed to be broadly representative ofthe bioavailable dietary catchment in the region. Sediment samples (~200 mg) collected atFarmana (n = 3) augment the Rakhigarhi faunal data. Harappa and Rakhigarhi fauna are curat-ed at the Peabody Museum in Cambridge, USA and Deccan College respectively. Permission toexport samples for isotopic analysis was granted by the Archaeological Survey of India. All nec-essary permits were obtained for the described study, which complied with all relevantregulations.
Tooth enamel samples (~50 mg) were cleaned of surficial deposits and dentine under 10xmagnification using a Brassler dental drill with a diamond bit. Samples were powdered in agatemortars and pestles and pretreated according to light stable isotope protocols [46] using solu-tions of 50% reagent grade sodium hypochlorite and 0.2 N acetic acid. Approximately 10 mg ofeach pretreated enamel sample was set aside for light stable isotope analyses not reported here,and the remainder was reserved for heavy isotope analyses in the clean lab and mass spectrom-etry facilities of the Department of Geological Sciences, University of Florida. Sediments wereleached for 2 hour periods using 0.1 N acetic acid and 2 N hydrochloric acid successively, witheach acid leachate pipetted off to capture the bioavailable fraction of Sr and Pb. All enamelsand sediment leachates were dissolved in pre-cleaned Teflon vials using 8 N nitric acid, afterwhich Sr and Pb were separated from single aliquots using ion chromatography [47].
All samples were analyzed for 87Sr/86Sr using a “Micromass Sector 54” thermal ionization massspectrometer (TIMS). After being loaded onto degassed tungsten filaments, the samples were runat 1.5V for 100 ratios whenever possible, and the resulting data normalized to 86Sr/88Sr = 0.1194.The long-term reproducible 87Sr/86Sr of NBS-987 is 0.710240 ± 0.000023 (2σ). Lead isotopic ratioswere measured using a ‘‘Nu-Plasma”multiple-collector inductively-coupled-plasma mass spec-trometer (MC-ICP-MS) with Tl-normalization [48]. The data are reported relative to the follow-ing values of NBS 981: 206Pb/204Pb = 16.937 ± 0.004 (2σ), 207Pb/204Pb = 15.490 ± 0.003 (2σ),and 208Pb/204Pb = 36.695 ± 0.009 (2σ). Additionally, sample preparation, Sr and Pb separation,and TIMS andMC-ICP-MS analyses were conducted in multiple sessions over a period of severalmonths with each session incorporating samples frommultiple tooth types. As a consequence,systematic patterns within the dataset are not attributable to errors in the analytical process.
Statistical analyses were used to identify optimal clusters in the faunal isotopic distributions(206Pb/204Pb vs. 87Sr/86Sr) from Harappa and Rakhigarhi, following the assumption that themodality of the results (i.e., the most frequently returned number of clusters) reflects the un-derlying structure of the data set and the most plausible cluster size. We used the DBSCAN al-gorithm to assign data points to clusters according to density reachability. DBSCAN requiresthe operator-defined parametersminpts (minimum number of points needed to form a cluster)and � (maximum radius to consider when determining whether two points are directly densi-ty-reachable) [44]. DBSCAN analysis was conducted on the normalized data from each site(minpts = 1) with � defined at 1000 regular sequential intervals for the maximum range of val-ues that returned non-trivial results. Upper and lower bounds were defined as the highest andlowest values of � that neither assigned each data point to its own unique cluster nor groupedall data within a single cluster (Harappa: 0.214� �� 2.069, Farmana: 0.235� �� 1.706). Wethen identified the optimal clustering solution for each site using maximum-likelihood estima-tion under the Poisson model [49]. Clustering solutions with the highest likelihood were
Selective Urban Migration in the Ancient Indus
PLOS ONE | DOI:10.1371/journal.pone.0123103 April 29, 2015 6 / 20

selected as representative of the local isotopic range. Local isotopic ranges were defined as theminimum and maximum ratios for all data points within the largest cluster of the most likelyclustering solution.
DBSCAN analysis was compared against results from the K-means clustering algorithm[45]. K-means analysis was conducted for sequential values of k (the number of possible clus-ters) with the optimal solutions for k (those which explain most of the variance with the fewestclusters) identified at the “elbow” in scree plots of the sum square of errors (SSE). Replicationof the dense central clusters identified in DBSCAN lends supports to the distinction betweenclustered “local” data points and peripheral clusters or data points. All analyses were conductedusing R, version 3.1.1 [50] and the fpc package [51].
ResultsResults of the individual analyses are reported in S1 Table with means (M), standard deviations(SD) and ranges provided below. At Harappa, human 87Sr/86Sr (M = 0.71623, SD = 0.00378) has awider range (0.71113–0.72802) than that of fauna (M = 0.71865, SD = 0.00135, range = 0.71569–0.72112). The same is true for Harappa human Pb isotope ratios [208Pb/204Pb (M = 38.814,SD = 0.257, range = 38.013–39.377), 207Pb/204Pb (M = 15.713, SD = 0.026, range = 15.650–15.770), 206Pb/204Pb (M = 18.677, SD = 0.171, range = 18.054–19.099)] relative to those ofHarappa fauna [208Pb/204Pb (M = 38.970, SD = 0.159, range = 38.580–39.189), 207Pb/204Pb(M = 15.735, SD = 0.008, range = 15.720–15.749), 206Pb/204Pb (M = 18.744, SD = 0.106,range = 18.468–18.874)]. A similar relationship holds for Farmana humans [87Sr/86Sr(M = 0.71611, SD = 0.00111, range = 0.71529–0.72038), 208Pb/204Pb (M = 38.921, SD = 0.606,range = 36.279–39.413, 207Pb/204Pb (M = 15.755, SD = 0.050, range = 15.572–15.814), 206Pb/204Pb(M = 18.897, SD = 0.567, range = 16.506–19.896)] compared to Farmana sediment leachates[87Sr/86Sr (M = 0.71565, SD = 0.00015, range = 0.71553–0.71594), 208Pb/204Pb (M = 39.424,SD = 0.024, range = 39.393–39.452), 207Pb/204Pb (M = 15.819, SD = 0.004, range = 15.813–15.823), 206Pb/204Pb (M = 19.328, SD = 0.020, range = 19.297–19.343)] and Rakhigarhi fauna[87Sr/86Sr (M = 0.71618, SD = 0.00131, range = 0.71471–0.71903), 208Pb/204Pb (M = 38.949,SD = 0.256, range = 38.371–39.188), 207Pb/204Pb (M = 15.752, SD = 0.046, range = 15.655–15.799), 206Pb/204Pb (M = 18.882, SD = 0.169, range = 18.584–19.053)]. Furthermore, theHarappa human isotope data have broadly distinct distributions from the Farmana humandata set. This observed difference is also apparent in measured Sr concentrations (HarappaSr ppm—M = 332, SD = 88, range = 137–557; Farmana Sr ppm—M = 826, SD = 246,range = 246–1388).
Cluster analysis of the faunal data reveals the structure of their distributions in Pb-Sr spaceand suggests plausible ranges for defining local isotopic variability (Figs 2 and 3). Site-specificanalyses in DBSCAN yield clusters of varying size for different values of �. For Harappa fauna,the clustering solutions with highest likelihood consist of four (0.178) and five (0.175) clusters(Fig 2B). In both solutions, the large central cluster is composed of the same nine data points(Fig 2A). The nine-point cluster is further validated by K-means analysis. Fig 2D shows thatSSE is minimized as the number of clusters is increased, but the rate of minimization levelsoff rapidly (forming the “elbow”) beyond the four and five cluster solutions. The largestcluster in the four cluster solution mirrors that produced by DBSCAN (Fig 2C), whereas thefive cluster solution subdivides the central cluster into two smaller subclusters based on varia-tion in 206Pb/204Pb. Thus, both DBSCAN and K-means analyses support the partitioning of thedata set into a central cluster and peripheral clusters or data points. Furthermore, the balanceof evidence identifies a nine-point cluster having a 87Sr/86Sr SD of 0.0005. This value is broadlyconsistent with the typical SD of 0.0003 proposed by Burton and Price [43], and the relatively
Selective Urban Migration in the Ancient Indus
PLOS ONE | DOI:10.1371/journal.pone.0123103 April 29, 2015 7 / 20

larger SD inferred here for the major urban center of Harappa might be attributable to theproportionately larger provisioning area exploited by Harappan residents. We therefore definethe local range at Harappa as the minimum and maximum of 87Sr/86Sr (0.71795–0.71913)and 206Pb/204Pb (18.687–18.874) for the nine-point faunal cluster (S2 Table).
Similar partitioning is apparent within the Rakhigarhi fauna. Using DBSCAN, the mostlikely clustering solutions consist of three (0.199) and four (0.195) clusters (Fig 3B) resulting inprimary clusters of five and four points respectively (Fig 3A). K-means analysis identifies thesame clusters (Fig 3C) as outcomes of the three and four cluster solutions inferred from theelbow of the scree plot (Fig 3D). The four-point cluster has a slightly smaller 206Pb/204Pb SD(0.056) compared to that of the five-point cluster (0.066), but a striking difference is apparentin 87Sr/86Sr. In the four-point cluster, all the data points fall between 0.7157 and 0.7158(SD = 0.0001), whereas the five-point cluster (SD = 0.0006) includes a far more radiogenic datapoint (0.7170). Although 87Sr/86Sr variability for the five-point cluster is more comparablewith that of Harappa, it is not consistent with either the known 87Sr/86Sr homogeneity in theregion [52] or the distribution of the Farmana data set. All but four of the Farmana humansamples have 87Sr/86Sr at or below 0.7160. These values contrast markedly with the relativelyradiogenic data point from the five-point faunal cluster. Likewise, the sediment leachates from
Fig 2. Local dietary catchment at Harappa inferred through cluster analysis of faunal isotope ratios. The structures of the optimal clustering solutionsare depicted in Pb-Sr space (206Pb/204Pb vs. 87Sr/86Sr) with each cluster assigned a different color. Solid circles identify the local faunal cluster determinedby the four-cluster solutions, dashed circles identity the local faunal cluster determined by the five-cluster solutions. The (A) optimal DBSCAN clusteringsolution in Pb-Sr space is inferred from (B) a likelihood estimation of all non-trivial DBSCAN clustering solutions. The (C) optimal K-means clustering solutionis inferred from (D) the “elbow” in the K-means SSE plot.
doi:10.1371/journal.pone.0123103.g002
Selective Urban Migration in the Ancient Indus
PLOS ONE | DOI:10.1371/journal.pone.0123103 April 29, 2015 8 / 20

Farmana have 87Sr/86Sr more similar to that of the four-point faunal cluster (0.7155–0.7159).Lastly, radiogenic isotope data should be distributed normally for a given population exploitinga single dietary catchment [43]. A Shapiro-Wilk normality test was significant (p = 0.004) onlyfor the five-point cluster, supporting an inference of non-normality, which is inconsistentwith a single dietary catchment. Therefore, we suggest that the four-point cluster best repre-sents the local isotopic range at Rakhigarhi. For purposes of inferring migration in the Farmanamortuary population, we define the local range at Farmana as the minimum and maximumof 87Sr/86Sr (0.71553–0.71594) and 206Pb/204Pb (18.920–19.343) for the pooled sample ofFarmana sediment leachates and the four-point Rakhigarhi faunal cluster (S2 Table).
Discussion
Defining LocalIsotopic analyses of humans and fauna show considerable variability consistent with changesin residence. Although human isotopic ranges exceed those of the fauna, wide variability in thefaunal isotopic ratios nevertheless suggests that they overestimate local isotopic catchments.For example, the standard deviation of 87Sr/86Sr for all fauna at Harappa (0.0014) far exceeds
Fig 3. Local dietary catchment at Rakhigarhi inferred through cluster analysis of faunal isotope ratios. The structures of the optimal clusteringsolutions are depicted in Pb-Sr space (206Pb/204Pb vs. 87Sr/86Sr) with each cluster assigned a different color. Solid circles identify the local faunal clusterdetermined by the four-cluster solutions, dashed circles identity the local faunal cluster determined by the three-cluster solutions. Arrows indicate optimalclustering solutions. The (A) optimal DBSCAN clustering solution in Pb-Sr space is inferred from (B) a likelihood estimation of all non-trivial clusteringsolutions. The (C) optimal K-means clustering solution is inferred from (D) the “elbow” in the K-means SSE plot.
doi:10.1371/journal.pone.0123103.g003
Selective Urban Migration in the Ancient Indus
PLOS ONE | DOI:10.1371/journal.pone.0123103 April 29, 2015 9 / 20

the “typical” SD of approximately 0.0003 for archaeological sites [43]. Likewise, the relativelylarge SD at Rakhigarhi (0.0013) is inconsistent with the 87Sr/86Sr homogeneity known for re-gional sediments in general [52] and Farmana sediments (SD = 0.0002) in particular. Giventhat biological samples tend to show less variation than geological samples due to averaging ef-fects [42], the relatively narrow isotopic distribution of Farmana sediment leachates suggeststhat Rakhigarhi faunal variation exceeds that of the local dietary catchment. The best explana-tion for faunal isotopic variability at Harappa and Rakhigarhi is that some of the sampledfauna had non-local origins. Although imported foodstuffs could theoretically produce non-local Sr isotope ratios in local populations, food is an unlikely source of Pb isotope variabilitygiven the importance of particulate in controlling biological Pb burdens [37]. Indeed the occa-sional long-distance transport of faunal resources such as pigs is hardly surprising given the ex-tensive overland and riverine trade routes of the Indus Civilization [53].
The local isotopic ranges coincide with patterns observed in the human isotope data, furthersuggesting that our isotopic estimates of local dietary catchments reflect actual provisioningpractices. When plotted in multi-isotopic space, some second and third molars overlap withlocal fauna and sediments whereas first molar cohorts plot separately from the local distribu-tions (Fig 4A–4D). Overlap between the Harappa first molar cohort and a single faunal datapoint in Pb-Pb space (Fig 4D) likely represents the outermost limits of the Harappan dietarycatchment and suggests our definition of local isotopic ranges may slightly overestimate thelower limit of local isotopic variation. Similarly, the Farmana third molar cohort plots betweenRakhigarhi fauna and Farmana sediment leachates suggesting that our baseline data provide aconservative estimate of local ranges.
Explaining Human VariationFarmana first molars fall outside the inferred local ranges of isotopic variation and are entirelyseparate from second and third molar distributions (Fig 4A and 4B). Likewise, most Harappafirst molars are clearly distinguished from the local isotopic range (Fig 4C and 4D). Two indi-viduals have first molars adjacent to the local range, although they are peripheral to the rela-tively radiogenic distribution of second and third molars that most closely match the localisotopic environment. In fact, the majority of second and third molars at Farmana and Ha-rappa plot on a spectrum between the first molar distributions and inferred local ranges, sug-gesting that later developing tooth enamel in our sample recorded one or more shifts betweenisotopic environments during childhood. Intra-individual developmental sequences at Farm-ana and Harappa confirm this trend, revealing a broad convergence on local isotopic rangesduring childhood. The Farmana data indicate relative stability in 87Sr/86Sr with a shift awayfrom a non-local Pb source (or multiple Pb sources) towards local Pb ratios at approximatelythree to five years of age (Fig 5A). Linear trends in the developmental series consisting of threeisotopically distinct teeth do not necessarily imply three different environmental sources. Rath-er, second molars with intermediate values most likely represent a time-averaged record of asingle shift between two endpoint sources during the multi-year mineralization process. Of thethree developmental series available from Harappa, two individuals display inter-tooth varia-tion consistent with an early-life shift in the source of environmental Pb and Sr (Fig 5B). Heavyisotope ratios remain relatively static for a third individual (H94 /253 18), but a 3.8‰ decreasein stable oxygen isotope values (δ18O) [12] for this individual between the first and secondmolars suggests a marked environmental change during childhood. Several second and thirdmolars from Harappa plot within the range of the first molars indicating they did not reachHarappa until late childhood or adulthood (Fig 4C and 4D). However, all available develop-mental sequences are consistent with an initial early-life shift in isotopic exposure.
Selective Urban Migration in the Ancient Indus
PLOS ONE | DOI:10.1371/journal.pone.0123103 April 29, 2015 10 / 20

Residence change between distinct geochemical environments best explains the observedisotopic differences for each individual sampled. Patterning by tooth type suggests these datareflect in vivo isotope ratios rather than homogenizing effects due to diagenetic alteration. Sim-ilarly, sex-based isotopic differences suggest that first molar data cannot be explained by mater-nal residential history. Poor preservation precludes a consideration of biological sex atFarmana, but at Harappa, male first molars have significantly lower 87Sr/86Sr compared to fe-male first molars (t(14) = 1.976, p = 0.034), and overlapping yet distinct distributions in Pb-Pbspace (S1 Fig). Furthermore, after discarding the clear radiogenic outlier in the female data set(H88/ 216 219a has higher Pb ratios than the local range), female first molars have significantlylower 206Pb/204Pb (t(13) = 1.986, p = 0.034) than male first molars. In principle, first molars
Fig 4. Heavy isotope ratio scatter plots of Indus Civilization human tooth enamel. Data are sorted by tooth type and plotted against inferred local ranges(indicated by black boxes). Arrows emphasize the broad progression from non-local first molars to local third molars. Relative to local sediment leachates andRakhigarhi fauna, Farmana first molars have non-local distributions in (A) Pb-Sr space (206Pb/204Pb vs. 87Sr/86Sr) and (B) Pb-Pb space (206Pb/204Pbvs.208Pb/204Pb and 207Pb/204Pb). Relative to local fauna, Harappa first molars have non-local distributions in (C) Pb-Sr space (206Pb/204Pb vs. 87Sr/86Sr) and(D) Pb-Pb space (206Pb/204Pb vs.208Pb/204Pb and 207Pb/204Pb).
doi:10.1371/journal.pone.0123103.g004
Selective Urban Migration in the Ancient Indus
PLOS ONE | DOI:10.1371/journal.pone.0123103 April 29, 2015 11 / 20

identified as non-local might reflect the Pb and Sr content of breast milk consumed in the firstthree years of life and ultimately derived from the diet and skeleton of immigrant women[54, 55]. However, sex-structured migration more logically accounts for the observed patternthan elaborate rules of mortuary inclusion in which locally born males and females were nursedby immigrants from different regions. Furthermore, the isotopic influence of nursing on bulkenamel samples should decrease sharply in conjunction with the weaning process, the intro-duction of solid foods (generally having far higher Sr:Ca ratios than breast milk) [43], and theingestion of particulate (the primary pathway for human Pb exposure) [37]. In short, age- andsex-related dietary changes are unlikely causes of the multi-isotopic shifts observed betweentooth types.
One alternative to the ‘all-immigrant’ interpretation of the Harappa and Farmana mortuarysamples is culturally mediated, age-specific exposure to imported sources of Pb such as thatfound in certain kinds of cosmetics [56]. Non-local individuals from Harappa are clearly differ-entiated by Pb and Sr and are therefore consistent with exposure to broadly differentiated
Fig 5. Convergence on local isotopic environments over developmental time.Heavy isotope ratio(206Pb/204Pb vs. 87Sr/86Sr) developmental series progress through early, middle, and late childhood at (A)Farmana (n = 11) and (B) Harappa (n = 3). One highly radiogenic Farmana individual is not visible at thisscale, and one Harappa individual is excluded because the early-life residence change is recorded only byoxygen isotope values.
doi:10.1371/journal.pone.0123103.g005
Selective Urban Migration in the Ancient Indus
PLOS ONE | DOI:10.1371/journal.pone.0123103 April 29, 2015 12 / 20

geochemical environments. At Farmana, however, the first molar cohort is distinguished pri-marily by Pb isotope ratios. Low variation in 87Sr/86Sr ratios suggests regional homogenization,consistent with a shared source of aeolian sediments throughout much of the Thar Desert andadjacent semi-arid terrain [52, 57]. The lowest Pb isotope ratios, in contrast, suggest exposureto certain technological sources rather than relatively radiogenic Pb derived from the local con-tinental crust [58]. The least radiogenic samples reflect exposure to Pb derived frommineralswith low time-integrated U/Pb and Th/Pb ratios, such as the copper-rich sulfides of the histori-cally mined Khetri region< 150 km to the south [59]. Present isotopic evidence cannot deter-mine whether individuals lived locally and were exposed to an imported source of Pb exclusivelyin early childhood or whether they lived in proximity to mining and smelting activities in thehinterlands prior to their migration. However, the fact that two non-local pigs in the Rakhigarhisample exhibit similar Pb isotope ratios to some Farmana first molars suggests that Pb exposurepathways were at the level of the local environment rather than the direct application of Pb-bear-ing substances such as cosmetics. Furthermore, broad isotopic and archaeological similarity withthe Harappa sample suggests that a common set of practices (i.e., migration) best explains theobserved isotopic pattern.
Tracking MigrationRegional geochemical assays constrain the provenience of non-local individuals. A plot of thereciprocal of Sr concentration against soluble 87Sr/86Sr reveals two mixing systems, suggestingthat individuals lived in different biogeochemical catchments (Fig 6). The more radiogenic val-ues from Harappa fall along the same mixing line as the Farmana dataset, whereas less radio-genic values (< 0.716) reflect contributions from distinct environmental sources includinglower and upper end members with 87Sr/86Sr< 0.711 and> 0.716, respectively. Three endmembers control the Indus River Basin Sr budget [60], resulting in two convergent mixing sys-tems that underlie the linear distributions of human data apparent in Fig 6. Carbonate weather-ing of the Western Fold Belt dominates the lower Indus and results in relatively low 87Sr/86Srratios (~0.711–0.712), but tributaries of the Punjab plains and the upper Indus channel draindistinct lithological units. Moderately radiogenic contributions (~0.712–0.716) from the HinduKush and Karakoram characterize upper Indus tributaries as far south as the Potwar Plateau.With the exception of the Jhelum River (~0.712–0.713), which flows adjacent to the Potwar
Fig 6. Two hypothesized Sr mixing systems based on Harappa and Farmana human data. The lessradiogenic mixing system (87Sr/86Sr< ~0.716) is likely associated with Catchment A in Fig 1. The moreradiogenic mixing system (87Sr/86Sr> ~0.716) is likely associated with Catchment B.
doi:10.1371/journal.pone.0123103.g006
Selective Urban Migration in the Ancient Indus
PLOS ONE | DOI:10.1371/journal.pone.0123103 April 29, 2015 13 / 20

Plateau, the Punjab tributaries drain highly radiogenic terrain (> 0.716) in the Greater andLesser Himalayas. Therefore, Harappan individuals plotting on the less radiogenic mixing line(87Sr/86Sr< 0.716) (Fig 6) most likely originated to the northwest in the highlands and foothillsstretching from the Potwar Plateau to the tributaries of the upper Indus (Catchment A). In-deed, most Harappan first molars plot along the low 87Sr/86Sr mixing line, although early-liferesidence was not restricted to the northwestern areas. Harappa and Farmana individualswith 87Sr/86Sr> 0.716 probably resided in the plains and foothills to the north and east where rel-atively radiogenic sediments of the Greater and Lesser Himalayas predominate (Catchment B).
It is difficult to define similar thresholds for Pb isotope ratios based on the geological litera-ture because the published isotopic characterizations of ore bodies, bedrock, and sediments arenot wholly representative of human exposure to biologically available Pb in a given region.Given the potential for anthropogenic Pb sources to contribute to the biologically available Pbin sediment leachates [61], isotopic ratios from base metal deposits mined in antiquity can sug-gest potential end members for the distributions of human isotopic ratios in Pb-Pb space. Yetthe published data on ores and slags are equivocal, with potential end members located in up-land terrain along the southwest coast [9, 62], near the Hindu Kush range and other parts ofmodern day Afghanistan [63], the Himalayan ranges to the northeast [9, 64], and differentsites within the Aravallis [9, 65, 66]. Only additional samples from archaeological fauna andsediments in the surrounding regions can fully resolve the matter. Despite such limitations, thePb isotope data from human migrants strongly implicate the Indus hinterlands known to havebeen the source for many of the imported minerals discovered at Harappa. One of the closestand most significant sources was the Potwar Plateau and adjacent northwestern highlands ofCatchment A [9], thus suggesting a potential link between trade and migration. Indeed, Pbisotope ratios corroborate the distinction between catchments with low 87Sr/86Sr residentsof Catchment A having significantly lower 206Pb/204Pb (t(42) = 2.713, p = 0.005), 207Pb/204Pb(t(42) = 4.544, p< 0.0001) and 208Pb/204Pb (t(42) = 2.665, p = 0.005) relative to the high 87Sr/86Srresidents of Catchment B. Trade and migration may have been similarly linked for residents ofFarmana and the Khetri region. The Pb isotope ratios of copper slags from the sites of Singhanaand Ganeshwar are the geographically closest potential end member for Farmana first molars [9],and people from the Khetri region are thought to have traded extensively with their Indus Civili-zation counterparts [11, 67].
Migration as an InstitutionMigrants and trade goods may have followed the same routes, but the structure of the data setsfrom Harappa and Farmana defies intuitive models of mortuary populations as cross sectionsof a breeding population or ethnic group. Over several generations, even cemeteries used bymigrant communities are likely to contain a relatively large number of locally born individuals,but the isotopic data presented here suggest that an enduring minority practice of cemeteryburial was limited almost entirely to first generation immigrants. The hypothetical systems ofmarital residence change needed to explain the isotopic data from Harappa and Farmana re-quire multiple preconditions that appear untenable when considered collectively. Womenwould need to marry and reside extra-locally but return to their paternal residence for child-rearing and for their own burial. Men would also have to marry, reside, and be buried extra-lo-cally but at different communities than their sisters. Even unwed men and boys would need toreceive extra-local burial. Lastly, in order for the system to be reciprocal and sustainable, multi-ple communities would have to participate—communities with roughly comparable cemeteriesfrom isotopically plausible regions that have yet to be discovered despite decades of excavationin South Asia. Indeed, well documented contemporaneous cemeteries exist at only seven Indus
Selective Urban Migration in the Ancient Indus
PLOS ONE | DOI:10.1371/journal.pone.0123103 April 29, 2015 14 / 20

sites: Mehrgarh [68], Harappa [69, 70, 71, 72], Kalibangan [73], Lothal [74, 75, 76], Rakhigarhi[77, 78], Tarkhanewala-Dera [79], and Farmana [6]. None of these fall in the primary hypothe-sized source areas of Catchment A or the Khetri region.
Rather than trying to apply a conventional kin-based model, Harappa Phase mortuary prac-tices may be better understood through the lens of archaeological and contemporary cemeterystudies in which cemeteries are considered diverse and dynamic loci for complex cultural andpolitical processes [23, 25, 80, 81]. Relationships between groups can be influenced by the deci-sions to inter different kinds of people in different ways, emphasizing various group and indi-vidual identities [82]. Importantly, group identities acquired in life can take precedence overkinship or shared local residence as with many modern military and wartime cemeteries [83].Likewise, archaeological individuals with diverse geographic origins have been grouped indeath with non-kin based on their participation in particular cultural institutions. For instance,the New York African Burial Ground [84] and Inca child sacrifice or Capacocha [85] are twowell-known examples in which inclusion in a mortuary context was determined by the socialidentity of the deceased in addition to their place of residence. Therefore, the persistence overhundreds of years of all-immigrant cemeteries in the Indus context may best be interpreted asevidence for a regularized institution of immigration culminating in a distinct mode of disposalat death.
ConclusionIntra-individual isotopic analyses of human tooth enamel from Harappa Phase cemetery buri-als at Harappa and Farmana provide strong evidence that the mortuary populations were near-ly entirely composed of first generation immigrants. This inference rests primarily on the useof multiple isotope systems and standard statistical methods for assessing the most plausibleisotopic ranges of local dietary catchments at the study sites. Neither Sr nor Pb isotope dataalone are sufficient to support the inferences presented in this paper, but their combined use re-veals patterns not readily apparent when analyzing Sr alone. Beyond the increase in discrimina-tory power, the use of Sr and Pb isotope ratios for detecting migration benefits from theelements’ distinct pathways of incorporation into biological tissues. Whereas non-local Sr iso-tope ratios might be explained by imported food resources or non-local Pb isotope ratios byimported minerals, the combination of non-local Sr and Pb isotope ratios at Harappa is bestexplained by residence change between distinct geochemical environments. This interpretationis strengthened further by the separate origins of males and females.
In addition to patterns in the human data, statistical assessment of solutions derived fromDBSCAN and K-means clustering algorithms makes it possible to identify plausible local isoto-pic ranges. Variation in the faunal isotope ratios is far greater than that of typical human die-tary catchments in antiquity [43], suggesting that some of the sampled fauna were transportedfrom outlying regions. By contrast, our statistically inferred local ranges exclude non-clusteringdata points and are consistent with typical dietary catchments as well as the specific geochemi-cal characteristics of the study area [52, 57]. Comparison with human data also suggests thatthe inferred local ranges reflect actual provisioning behaviors. Local ranges overlap in Pb-Srspace with the majority of the second and third molar cohorts at Farmana and some of thethird molar cohort at Harappa. All other teeth, including the first molar cohort, fall outside ofthe local ranges and clearly demonstrate exposure to non-local isotopic environments in earlychildhood. Imported goods containing Pb could potentially explain non-local isotopic ratios inthe Farmana first molar cohort if exposure was specific to very young children or pregnantwomen, but similar Pb isotope ratios for Farmana first molars and two non-local fauna
Selective Urban Migration in the Ancient Indus
PLOS ONE | DOI:10.1371/journal.pone.0123103 April 29, 2015 15 / 20

implicate a generalized environmental source. In short, residence change best explains the dif-ferences between human values and the local isotopic ranges.
Given the limitations in the sample, however, it is conceivable that non-local first molar co-horts are not representative of the entire mortuary populations. Further analyses are necessaryto confirm the initial results, but the consistency with which first molars exhibit non-local iso-topic ratios provides strong evidence for a class of first generation immigrants. Less certain areinferences about the timing of migration in early childhood which, at Harappa, are based onlyon three developmental sequences of two teeth each. Eleven developmental sequences fromFarmana show a similar pattern, but it remains unclear whether or not the timing of migrationcan be extrapolated to the larger mortuary populations. Despite such shortcomings, the excep-tionally high frequency of first generation migrations and apparent lack of locally born off-spring demands a consideration of new interpretive models.
New models of the Harappa Phase cemetery mortuary program must acknowledge the en-during, institutional character of migration in the life histories of the deceased. A considerationof the isotopic data and their bioarchaeological context allows certain inferences to be madeabout the proposed Indus institution. Isotopic [12] and osteological [13] distinctions betweenmales and females at Harappa and the timing of migration at Farmana suggest certain hinter-land individuals from distinct genetic populations took up residence with new corporategroups at a very young age. The inclusion of modest burial wealth may indicate they were treat-ed with respect by local groups, whereas sex-based distinctions in provenience suggest migrantswere selected according to the preferences of their natal groups rather than the whims of Indusurbanites. Thus the Indus institution of immigration was integrative, accommodating variousethnic or cultural groups within a standardized set of practices reserved exclusively for a classof first generation immigrant. Furthermore, the scarcity of cemetery inhumations and their po-tential association with resource-rich regions suggests the institution may have been limited inscope to the economic interests of specific mercantile groups rather than all segments of socie-ty. Ethnography from the nearby Hindu Kush Range suggests one possible analogy for theIndus institution. Asymmetric systems of fosterage employed by fractious historical kingdomsto build hierarchical political alliances [86] may be broadly comparable to Indus practices,such that fostered individuals literally embodied the relationships between urban and hinter-land groups. Whether or not this particular model is borne out by additional multi-disciplinaryanalyses, however, our isotopic inferences of migration define key parameters in any future in-vestigation of Indus Civilization interregional interaction.
Supporting InformationS1 Fig. Differential distribution of the Harappa first molar cohort by sex (206Pb/204Pbvs.208Pb/204Pb and 207Pb/204Pb).(TIF)
S1 Table. Biogeochemical data for all analyses.(DOCX)
S2 Table. Minimum and maximum heavy isotope ratios for inferred local isotopic rangesof Indus Civilization sites.(DOCX)
AcknowledgmentsWe thank the officers and faculty of the Archaeological Survey of India, Deccan College Post-Graduate and Research Institute, Maharshi Dayanand University, and Harappa Archaeological
Selective Urban Migration in the Ancient Indus
PLOS ONE | DOI:10.1371/journal.pone.0123103 April 29, 2015 16 / 20

Research Project for providing requisite permissions and logistical support. Particular gratitudeis extended to Manmohan Kumar, Richard Meadow, Rita Wright, and Vijay Sathe for theircounsel and personal efforts towards accessing the relevant archaeological collections.
Author ContributionsConceived and designed the experiments: BV GDK JMK VS JK. Performed the experiments:BV GDK VMT JK. Analyzed the data: BV GDK EOC JK. Contributed reagents/materials/anal-ysis tools: BV GDK JMK VS VMT EOC JK. Wrote the paper: BV. Reviewed, revised, and ap-proved manuscript: BV GDK JMK VS VMT EOC JK.
References1. Wright RP (2010) The ancient Indus: Urbanism, economy, and society. Cambridge: Cambridge Univ
Press. 396 p.
2. Pollard AM, Heron C (2008) Archaeological chemistry. Cambridge: The Royal Society of Chemistry.438 p.
3. Kenoyer JM (1991) The Indus Valley Tradition of Pakistan and western India. J World Prehist 5(4):331–385.
4. Kennedy KAR (2000) God apes and fossil men: Paleoanthropology in South Asia. Ann Arbor: Univ ofMichigan Press. 504 p.
5. Dales GF, Kenoyer JM (1991) Summaries of five seasons of research at Harappa (District Sahiwal,Punjab, Pakistan) 1986–1990. In: Meadow RH, editor. Harappa excavations 1986–1990: A multidisci-plinary approach to third millennium urbanism. Madison: Prehistory Press. pp. 185–262.
6. Shinde V (2011) Harappan cemetery at Farmana. In: Shinde V, Osada T, Kumar M, editors. Excava-tions at Farmana: District Rohtak, Haryana, India, 2006–2008. Kyoto: Research Institute for Humanityand Nature. pp 550–673.
7. Kenoyer JM (1998) Ancient cities of the Indus Valley Civilization. Oxford: Oxford Univ Press. 262 p.
8. Kenoyer JM (2000) Wealth and socioeconomic hierarchies of the Indus Valley Civilization. In: RichardsJ, Van Buren M, editors. Order, legitimacy, and wealth in early states. Cambridge: Cambridge UnivPress. pp 88–109.
9. Law RW (2011) Current studies on the Indus Civilization: vol 8, parts 1 & 2: Inter-regional interactionand urbanism in the ancient Indus Valley. New Delhi: Manohar. 800 p.
10. Agrawal DP (2000) Ancient metal technology and archaeology of South Asia. New Delhi: AryanBooks. 265 p.
11. Rizvi UZ (2007) Configuring the space in between: Redefining the Ganeshwar Jodhpura Cultural Com-plex in northeastern Rajasthan, India. PhD thesis, Univ of Pennsylvania. Available: http://search.proquest.com/docview/304820172.
12. Kenoyer JM, Price TD, Burton JH (2013) A new approach to tracking connections between the IndusValley and Mesopotamia: Initial results of strontium isotope analyses from Harappa and Ur. J ArchaeolSc 40(5): 2286–2297.
13. Hemphill BE, Lukacs JR, Kennedy KAR (1991) Biological adaptations and affinities of Bronze Age Har-appans. In: Meadow RH, editor. Harappa excavations 1986–1990: A multidisciplinary approach to thirdmillennium urbanism. Madison: Prehistory Press. pp. 137–182.
14. Kennedy KAR, Chiment J, Disotell T, Meyers D (1984) Principal components analysis of prehistoricSouth Asian crania. Am J Phys Anthropol 64(2): 105–118. PMID: 6431822
15. Shinde V (2011) Stratigraphy and cultural sequence in trenches 1C11, 2D9, 1D5 and 2XD1–2XD2. In:Shinde V, Osada T, Kumar M, editors. Excavations at Farmana: District Rohtak, Haryana, India, 2006–2008. Kyoto: Research Institute for Humanity and Nature. pp 27–40.
16. Carr C (1995) Mortuary practices: Their social, philosophical-religious, circumstantial, and physical de-terminants. J Archaeol Method Th 2(2): 105–200.
17. Kamp KA (1998) Social hierarchy and burial treatments: A comparative assessment. Cross Cult Res32: 79–115.
18. Saxe AA (1970) Social dimensions of mortuary practices. Unpublished PhD thesis, Univ of Michigan.
19. Goldstein LG (1980) Mississipian mortuary practices: A case study of two cemeteries in the lower Illi-nois Valley. Evanston: Northwestern University Archaeological Program.
Selective Urban Migration in the Ancient Indus
PLOS ONE | DOI:10.1371/journal.pone.0123103 April 29, 2015 17 / 20

20. Chapman R, Kinnes I, Randsborg K, editors (1981) The archaeology of death. Cambridge: CambridgeUniv Press. 159 p.
21. Beck LA, editor (1995) Regional approaches to mortuary analysis. New York: Plenum Press. 278 p.
22. Hodder I (1982) Symbols in action: Ethnoarchaeological studies of material culture. Cambridge: Cam-bridge Univ Press. 249 p.
23. Parker Pearson M (1982) Mortuary practices, society and ideology: An ethnoarchaeological study. In:Hodder I, editor. Symbolic and structural archaeology. Cambridge: Cambridge Univ Press. pp 99–113.
24. Cannon A (1989) The historical dimension in mortuary expressions of status and sentiment. CurrAnthropol 30(4): 437–458.
25. Parker Pearson M (2000) The archaeology of death and burial. College Station: Texas A&MUnivPress. 250 p.
26. Lightfoot KG, Martinez A (1995) Frontiers and boundaries in archaeological perspective. Annu RevAnthropol 24: 471–492.
27. Stein GJ (2002) From passive periphery to active agents: Emerging perspectives in the archaeology ofinterregional interaction. Am Anthropol 104(3): 903–916.
28. NaumM (2010) Re-emerging frontiers: Postcolonial theory and historical archaeology of the border-lands. J Archaeol Method Th 17(2): 101–131.
29. Emerson TE, Hargrave E (2000) Strangers in paradise? Recognizing ethnic mortuary diversity on thefringes of Cahokia. Southeast Archaeol 19(1): 1–23.
30. Levy TE (2008) Ethnic identity in biblical Edom, Israel, and Midian: Some insights frommortuary con-texts in the lowlands of Edom. In: Schloen D, editor. Exploring the longue Durée. Winona Lake:Eisenbrauns. pp. 251–261.
31. Burmeister S (2009) Fighting wars, gaining status: on the rise of Germanic elites. In: Sayer D, WilliamsH, editors. Mortuary practices and social identities in the Middle Ages. Exeter: University of ExeterPress. pp. 46–63.
32. Mengoni LE (2010) Identity formation in a border area. J Soc Archaeol 10(2): 198–229.
33. Brück J (2004) Material metaphors: The relational construction of identity in Early Bronze Age burials inIreland and Britain. J Soc Archaeol 4(3): 307–333.
34. Gillespie SD (2001) Personhood, agency, and mortuary ritual: A case study from the ancient Maya. JAnthropol Archaeol 20: 73–112.
35. Bentley RA (2006) Strontium isotopes from the earth to the archaeological skeleton: A review. JArchaeol Method Th 13(3): 135–187.
36. Montgomery J (2002) Lead and strontium isotope compositions of human dental tissues as an indicatorof ancient exposure and population dynamics. PhD thesis, Univ of Bradford. Available: http://archaeologydataservice.ac.uk/archives/view/montgomery_2005/.
37. Kamenov GD, Gulson BL (2014) The Pb isotopic record of historical to modern human lead exposure.Sci Total Environ 490: 861–870. doi: 10.1016/j.scitotenv.2014.05.085 PMID: 24907620
38. Hillson S (1996) Dental anthropology. Cambridge: Cambridge Univ Press. 392 p.
39. Reid DJ, Dean MC (2006) Variation in modern human enamel formation times. J Hum Evol 50(3): 329–346. PMID: 16300817
40. AlQahtani SJ, Hector MP, Liversidge HM (2010) Brief communication: The London atlas of humantooth development and eruption. Am J Phys Anthropol 142(3): 481–490. doi: 10.1002/ajpa.21258PMID: 20310064
41. Montgomery J, Evans JA, Cooper RE (2007) Resolving archaeological populations with Sr-isotope mix-ing models. Appl Geochem 22(7): 1502–1514.
42. Price TD, Burton JH, Bentley RA (2002) The characterization of biologically available strontium isotoperatios for the study of prehistoric migration. Archaeometry 44(1): 117–135.
43. Burton JH, Price TD (2013) Seeking the local 87Sr/86Sr ratio to determine geographic origins of hu-mans. In: Armitage RA, Burton JH, editors. Archaeological chemistry VIII. Washington DC: AmericanChemical Society. pp. 309–320.
44. Ester M, Kriegel H-P, Sander J, Xu X (1996) A density-based algorithm for discovering clusters in largespatial databases. In: Simoudis E, Han J, Fayyad U, editors. Proceedings of the second internationalconference on knowledge discovery and data mining. Menlo Park: AAAI Press. pp. 226–231.
45. Hartigan JA, WongMA (1979) Algorithm AS 136: A K-means clustering algorithm. J Roy Statist SocSer C 28(1): 100–108.
46. Koch PL, Tuross N, Fogel ML (1997) The effects of sample treatment and diagenesis on the isotopic in-tegrity of carbonate in biogenic hydroxylapatite. J Archaeol Sci 24(5): 417–429.
Selective Urban Migration in the Ancient Indus
PLOS ONE | DOI:10.1371/journal.pone.0123103 April 29, 2015 18 / 20
47. Valentine B, Kamenov GD, Krigbaum J (2007) Reconstructing Neolithic groups in Sarawak, Malaysiathrough lead and strontium isotope analysis. J Archaeol Sci 35(6): 1463–1473.
48. Kamenov GD, Mueller PA, Perfit MR (2004) Optimization of mixed Pb-Tl solutions for high precision iso-topic analyses by MC-ICP-MS. J Anal At Spectrom 19: 1262–1267.
49. Fisher RA (1922) On the mathematical foundations of theoretical statistics. Phil Trans R Soc A 222(1922): 309–368.
50. R Core Team (2014) R: A language and environment for statistical computing ( R Foundation for Statis-tical Computing, Vienna). Available: http://www.R-project.org/.
51. Hennig C (2014) fpc: Flexible procedures for clustering. R package version 2.1–9. Available: http://CRAN.R-project.org/package = fpc.
52. Tripathi JK, Bock B, Rajamani V (2013) Nd and Sr isotope characteristics of Quaternary Indo-Gangeticplain sediments: Source distinctiveness in different geographic regions and its geological significanceChemGeol 344: 12–22.
53. Miller HM-L (2006) Comparing landscapes of transportation: Riverine-oriented and land-oriented sys-tems in the Indus Valley Civilization and the Mughal Empire. In: Robertson EC, Seibert JD, FernandezDC, Zender MU, editors. Space and spatial analysis in archaeology. Calgary: Univ Calgary Press. pp.281–292.
54. Gulson BL (2008) Stable lead isotopes in environmental health with emphasis on human investigations.Sci Total Environ 400(1–3): 75–92. doi: 10.1016/j.scitotenv.2008.06.024 PMID: 18657851
55. Humphrey LT, Dean MC, Jeffries TE, Penn M (2008) Unlocking evidence of early diet from tooth enam-el. Proc Natl Acad Sci USA 105(19): 6834–6839. doi: 10.1073/pnas.0711513105 PMID: 18458343
56. Vaishnav R (2001) An example of the toxic potential of traditional eye cosmetics. Indian J Pharmacolo-gy 33(1): 46–48.
57. Alizai A, Carter A, Clift PD, VanLaningham S, Willliams JC, Kumar R (2011) Sediment provenance, re-working and transport processes in the Indus River by U-Pb dating of detrital zircon grains. Global Plan-et Change 76(1–2): 33–55. doi: 10.1007/s11103-011-9757-1 PMID: 21387125
58. Garçon M, Chauvel C, France-Lanord C, Limonta M, Garzanti E (2013) Removing the “heavy mineraleffect” to obtain a new Pb isotopic value for the upper crust. GeochemGeophy Geosy 14(9): 3324–3333.
59. Deb M, Thorpe RI, Cumming GL, Wagner PA (1989) Age, source and stratigraphic implications of Pbisotope data for conformable, sediment-hosted, base metal deposits in the Proterozoic Aravalli-Delhiorogenic belt, northwestern India. Precambrian Res 43(1–2): 1–22.
60. Karim A, Veizer J (2000) Weathering processes in the Indus River Basin: Implications from riverine car-bon, sulfur, oxygen, and strontium isotopes. ChemGeol 170(1–4): 153–177.
61. Kamenov GD (2008) High-precision Pb isotopic measurements of teeth and environmental samplesfrom Sofia (Bulgaria): Insights for regional lead sources and possible pathways to the human body. En-viron Geol 55: 669–680.
62. Bhutta AM (1992) Isotope composition of lead in galenas from the Duddar and Kharrari zinc-lead-bariteore bodies, Las Bela district of Balochistan province, Pakistan. Acta Mineralogica Pakistanica 6: 21–29.
63. Begemann F, Schmitt-Strecker S (2009) Über das frühe kupfer Mesopotamiens. Iranica Antiqua 44: 1–45.
64. Raha PK, Chandy KC, Balasubrahmanyan MN (1978) Geochronology of the Jammu limestone,Udhampur district, Jammu & Kashmir state, India. J Geol Soc India 19(5): 221–223.
65. Balasubrahmanyan MN, Chandy KC (1976) Lead isotope studies of galena from some occurrences inIndia. Records of the Geological Survey of India 7(2): 141–149.
66. Deb M, Thorpe RI, Cumming GL, Wagner PA (1989) Age, source and stratigraphic implications of Pbisotope data for conformable, sediment-hosted base metal deposits in the Proterozoic Aravalli-Delhiorogenic belt, northwestern India. Precambrian Res 43: 1–22.
67. Agrawala RC (1984) Aravalli, the major source of copper for the Indus Civilization and Indus related cul-tures. In: Lal BB, Gupta SP, editors. Frontiers of the Indus Civilization. New Delhi: Indian Archaeolog-ical Society. Pp. 157–162.
68. Jarrige C, Jarrige J-F, Meadow RH, Quivron G (1995) Mehrgarh: Field reports 1974–1985, from Neo-lithic times to the Indus Civilization. Karachi: The Department of Culture and Tourism, Government ofSindh.
69. Dales GF, Kenoyer JM (1989) Excavation at Harappa-1988. Pakistan Archaeology 24: 68–176.
70. Mughal MR (1968) Harappa-1966 (Cemetery R-37). Pakistan Archaeology 5: 63–68.
71. Sastri KN (1965) New light on the Indus Civilization, vol. 2. Delhi: Atma Ram and Sons.
Selective Urban Migration in the Ancient Indus
PLOS ONE | DOI:10.1371/journal.pone.0123103 April 29, 2015 19 / 20
72. Wheeler REM (1947) Harappa 1946: The defences and Cemetery R-37. Ancient India 3: 58–130.
73. Sharma AK (1999) The departed Harappans of Kalibangan. Delhi: Sundeep Prakashan.
74. Rao SR (1973) Lothal and the Indus Valley Civilization. Bombay: Asia Publishing House.
75. Rao SR (1979) Lothal: A Harappan Port Town (1955–62), vol. 1. New Delhi: Archaeological Survey ofIndia.
76. Rao SR (1985) Lothal: A Harappan Port Town (1955–62), vol. 2. New Delhi: Archaeological Survey ofIndia.
77. Nath A (1998) Rakhigarhi: A Harappanmetropolis in the Saraswati-Drishadvati divide. Puratattva 28:39–45.
78. Nath A (1999) Further excavations at Rakhigarhi. Puratattva 29: 46–49.
79. Trivedi PK (2009) Excavations at Tarkhanewala-Dera and Chak 86, 2003–2004. Delhi: ArchaeologicalSurvey of India. 256 p.
80. Rugg J (1998) ‘A few remarks on modern sepulture’: Current trends and new directions in cemetery re-search. Mortality 3(2): 111–128.
81. Rugg J (2000) Defining the place of burial: What makes a cemetery a cemetery? Mortality 5(3): 259–275.
82. Francis D, Kellaher L, Neophytou G (2005) The secret cemetery. Oxford: Berg. 252 p.
83. Mant M, Lovell NC (2012) Individual and group identity in WWII commemorative sites. Mortality 17(1):18–35.
84. Blakey ML (1998) The New York African Burial Ground Project: An examination of enslaved lives, aconstruction of ancestral ties. Transforming Anthropology 7(1): 53–58.
85. Benson EP (2001) Why sacrifice? In: Benson EP, Cook AG, editors. Ritual sacrifice in ancient Peru.Austin: Univ of Texas Press. pp. 1–21.
86. Parkes P (2001) Alternative social structures and foster relations in the Hindu Kush: Milk kinship alle-giance in former mountain kingdoms of northern Pakistan. Comp Stud Soc Hist 43(1): 4–36.
Selective Urban Migration in the Ancient Indus
PLOS ONE | DOI:10.1371/journal.pone.0123103 April 29, 2015 20 / 20
Copyright © 2022 FDOKUMEN