ENVIRONMENTALLY RESPONSIBLE BEHAVIOUR (ERB) AMONG STUDENT TEACHERS

Evidence for environmentally enhanced forest growthJingyun Fanga,b,1, Tomomichi Katoc, Zhaodi Guoa, Yuanhe Yangb, Huifeng Hub, Haihua Shenb, Xia Zhaob,Ayaka W. Kishimoto-Mod, Yanhong Tange, and Richard A. Houghtonf
aDepartment of Ecology, College of Urban and Environmental Sciences, and Key Laboratory for Earth Surface Processes of the Ministry of Education, PekingUniversity, Beijing 100871, China; bState Key Laboratory of Vegetation and Environmental Change, Institute of Botany, Chinese Academy of Sciences,Beijing 100093, China; cResearch Faculty of Agriculture, Hokkaido University, Sapporo, Hokkaido 060-8589, Japan; dNational Institute for Agro-EnvironmentalSciences, Tsukuba, Ibaraki 305-8604, Japan; eNational Institute for Environmental Studies, Tsukuba, Ibaraki 305-0053, Japan; and fWoods Hole ResearchCenter, Falmouth, MA 02540
Edited by William H. Schlesinger, Cary Institute of Ecosystem Studies, Millbrook, NY, and approved May 14, 2014 (received for review February 6, 2014)
Forests in the middle and high latitudes of the northern hemispherefunction as a significant sink for atmospheric carbon dioxide (CO2).This carbon (C) sink has been attributed to two processes: age-relatedgrowth after land use change and growth enhancement due to en-vironmental changes, such as elevated CO2, nitrogen deposition, andclimate change. However, attribution between these two processes islargely controversial. Here, using a unique time series of an age-classdataset from six national forest inventories in Japan and a new ap-proach developed in this study (i.e., examining changes in biomassdensity at each age class over the inventory periods), we quantify thegrowth enhancement due to environmental changes and its contri-bution to biomass C sink in Japan’s forests. We show that the growthenhancement for four major plantations was 4.0∼7.7 Mg C·ha−1 from1980 to 2005, being 8.4–21.6% of biomass C sequestration per hectareand 4.1–35.5% of the country’s total net biomass increase of eachforest type. The growth enhancement differs among forest types,age classes, and regions. Our results provide, to our knowledge, thefirst ground-based evidence that global environmental changes canincrease C sequestration in forests on a broad geographic scale andimply that both the traits and age of trees regulate the responses offorest growth to environmental changes. These findings should beincorporated into the prediction of forest C cycling under achanging climate.
biomass carbon sink | forest age | forest inventory
Recent studies indicate that forests in the middle and highlatitudes of the northern hemisphere have functioned as
a significant sink for atmospheric carbon dioxide (CO2) over thepast decades (1–4). This carbon (C) sink results from two majorprocesses: age-related growth (regrowth) after land use changeand growth enhancement due to environmental changes (simplycalled “growth enhancement” hereafter), such as elevated CO2,nitrogen (N) deposition, and climate change (5–13). These twoprocesses have contrasting implications for predicting the mag-nitude of future C sequestration in forest ecosystems. Forest Cstorage may be expected to saturate during the late stage ofstand development if forests simply are regrowing after stand-replacing disturbance (14). In contrast, the future C storagepotential of forests will be highly uncertain if tree growth hasbeen altered by environmental changes (13, 15–17). Individual-level observation reveals that tree growth rate increases contin-uously with tree age or size for most tropical and temperate treespecies (18), but environmental change, such as climate warmingwithout an increase in precipitation, might reduce the growthrates of trees (19). Thus, knowledge of the relative contributionof tree regrowth and growth enhancement to C accumulation inforest ecosystems across a broad geographical scale is critical forpredicting future C sequestration in land ecosystems and plan-ning strategies to mitigate the increase of atmospheric CO2 con-centration (5, 11, 13, 20).During the past decade, the relative contribution of these two
mechanisms to C accumulation in forest ecosystems has receivedconsiderable attention (5, 6, 11, 12), but attribution betweenthese two is largely controversial (7–9, 13, 15, 16) because of
a lack of available data and appropriate methodology (11, 21). Forexample, simulation results from land surface models revealedthat growth enhancement might account for 25–75% of terrestrialC sink in the United States (6, 21), but ground-based studiesdemonstrated that only about 2.0% of the aboveground biomassincrease was the result of environmentally enhanced growth in fivestates of the eastern United States (5). The conflicting resultshighlight that more observations are required to distinguish therelative contribution of tree regrowth and growth enhancement toC sequestration in forest ecosystems (11, 12).Forest inventories, widely collected and designed to be statis-
tically valid by many countries, are recognized as the best ground-based observations for quantifying the size, spatial patterns, andchanges of forest C stock at regional, national, and global scales(22–24). Although the inventory data in most countries of theworld cannot be used to evaluate the relative contribution of age-related tree regrowth and environmentally enhanced growth toforest C sink because of a lack of data on stand age, fortunately,those in Japan contain detailed information on stand age formajor forest types for each region since the 1980s (for details, seeMaterials and Methods), and thus offer a unique opportunity toevaluate growth enhancement due to environmental change andits contribution to forest C accumulation at a large scale. Here,using a systematic, fine time series of age-class data obtainedfrom six forest inventories (1980, 1985, 1990, 1995, 2000, and2005) (25, 26) and forest type-specific biomass expansion factor
Significance
Northern forests have sequestered a substantial amount ofcarbon dioxide from the atmosphere during the past severaldecades. This large carbon (C) sink usually is considered to bedriven by tree regrowth after stand-replacing disturbance andgrowth enhancement due to environmental changes, but therelative contribution between these two processes remainsunclear. In this study, we evaluate the contribution of growthenhancement induced by environmental changes to biomassC sink in Japan’s forests and demonstrate that this growthenhancement accounts for 8.4–21.6% of biomass C sink infour major plantations from 1980 to 2005. This finding high-lights that global environmental changes can stimulate treegrowth and thus enhance forest C sequestration over a broadgeographical scale.
Author contributions: J.F. designed research; J.F., Z.G., Y.Y., and H.H. performed research;J.F., T.K., H.S., A.W.K-M., and Y.T. contributed new reagents/analytic tools; J.F., Z.G., Y.Y.,H.H., and R.A.H. analyzed data; and J.F., T.K., Z.G., Y.Y., H.H., H.S., X.Z., A.W.K-M., Y.T.,and R.A.H. wrote the paper.
The authors declare no conflict of interest.
This article is a PNAS Direct Submission.
Freely available online through the PNAS open access option.1To whom correspondence should be addressed. E-mail: [email protected] [email protected].
This article contains supporting information online at www.pnas.org/lookup/suppl/doi:10.1073/pnas.1402333111/-/DCSupplemental.
www.pnas.org/cgi/doi/10.1073/pnas.1402333111 PNAS | July 1, 2014 | vol. 111 | no. 26 | 9527–9532
ECOLO
GY

(BEF) (Table S1 and Materials and Methods), we distinguish therelative contribution and its regional variation of tree regrowthand growth enhancement to biomass C accumulation for majorplanted forest types in Japan from 1980 to 2005.The reasoning is that forest types of the same age class and with
similar management regimes across different inventory periodsshould have a similar biomass density (biomass per area) underequilibrium environmental conditions (i.e., atmospheric CO2 con-centration, N deposition, and climate). Thus, if the biomass densityof forests of the same age class varies through time (or across dif-ferent inventory periods), then the variation, either increasing ordecreasing biomass density, should be induced by environmentalchanges (Fig. 1). We can assess the impact of environmentalchanges on forest growth by examining differences in forest biomassdensity for the same age class but over different inventory periods.Considering that natural forests have multiple dominant tree
species of different ages, here we focused on four major plan-tations in the country: Japanese cedar (Cryptomeria japonica),Japanese cypress (Chamaecyparis obtusa), Japanese red pine(Pinus densiflora), and Japanese larch (Larix leptolepis) planta-tions. To address regional differences in the response of forestgrowth to environmental change, following the forest inventory(25), we divided the country into eight regions: Hokkaido, Tohoku,
Kanto, Chubu, Kinki, Chugoku, Shikoku, and Kyushu-Okinawa(Materials and Methods).
ResultsBiomass C Accumulation. Biomass density in all four planted foresttypes had significantly increased from 1980 to 2005 (Table 1; formore details, see Tables S2–S5). This growth was partitionedbetween two processes: age-related tree growth and environmen-tally induced enhancement. Japanese cedar plantation increasedfrom 42.0 to 89.5 Mg C·ha−1 (1 Mg = 106 g), Japanese cypressfrom 40.1 to 77.2 Mg C·ha−1, Japanese red pine from 29.2 to 58.3Mg C·ha−1, and Japanese larch from 34.2 to 69.9 Mg C·ha−1, witha net increase of 47.5, 37.1, 38.3, and 35.7 Mg C·ha−1, respectively.As a result, total biomass C stock showed a large net gain of 212.4,112.1, 23.9, and 32.9 Tg C (1 Tg = 1012 g) for cedar, cypress, redpine, and larch forests, respectively.
Environmentally Enhanced Growth and Its Contribution to Forest CAccumulation. The changes in biomass density of a forest type ata given age class, except young forests, exhibited substantialincreases over the inventory periods from 1980 to 2005 (Fig. 2),suggesting that tree growth in Japan has been enhanced by en-vironmental changes for most stands of the plantations. Thisenhanced growth was largely age dependent within a certainforest type, although the ages most sensitive to enhanced growthvaried among forest types. For Japanese cedar forests (Fig. 2A),there was no environmentally enhanced growth before the eighthage class (or 40 y old); that is, annual mean growth enhancementper area for an age class (GEPAi; for the details, see Materials andMethods) was about zero, then increased rapidly and remained ata value of 0.3∼0.5 Mg C·ha−1·y−1. For Japanese cypress forests (Fig.2B), the annual mean GEPAi was small, about 0.3 Mg C·ha−1·y−1
after the fifth age class (25 y old). For red pine forests (Fig. 2C), theannual mean GEPAi did not change significantly at ages <20 y(the fourth age class), reached a maximum (0.63 Mg C·ha−1·y−1)at the 10th age class (50 y old), and then declined. For larch forests(Fig. 2D), the annual mean GEPAi increased rapidly after the thirdage class and peaked (0.84 Mg C·ha−1·y−1) at the 13th age class(65 y old), but had small values (0.08∼0.12 Mg C·ha−1·y−1) be-tween the ninth and 11th age classes.The growth enhancement varied widely among forest types.
The highest rate of growth enhancement was observed in larchforests, with an average growth enhancement per area (GEPA)of 7.7 Mg C·ha−1 across all age classes over the period 1980–2005; that in other forest types showed a small range of 4.0–4.8Mg C·ha−1 (Table 2 and Table S6). The relative contribution ofthe growth enhancement to the total increase in biomass density(Rgepa) showed the same order: the largest in larch forests (21.6%)and the smallest in cedar plantation (8.4%), suggesting a large
Fig. 1. A conceptual diagram showing changes in biomass density inducedby environmental change. (Left) Conceptually, environmental change maylead to (a) an increase, (b) no change, or (c) a decrease in biomass density ofa forest stand at a given age class over different inventory periods. The as-sumption in the approach is that at a similar management regime over time,forest stands of similar age will have the same standing biomass, and anydifferences from the standing biomass at the initial period for a given ageare the result of environmental changes. The arrows simply imply the di-rection of the changes and do not necessarily show a monotonic increase ordecrease in biomass density; it might increase for a time then decrease, or itmight vary back and forth. (Right) Corresponding with Left, environmentalchange may lead to (A) an increase, (B) no change, or (C) a decrease inbiomass density of a forest type across all age classes in a certain inventoryperiod. The shaded bands represent the fluctuations in growth in differentage classes.
Table 1. Forest area, total biomass stock, and biomass density in different periods for four major planted forest types in Japan
YearChange over1980–2005Forest type Item 1980 1985 1990 1995 2000 2005
C. japonica Area, 106 ha 4.27 4.44 4.51 4.49 4.43 4.37 0.1Total biomass, Tg C 179.1 228.3 265.7 300.5 355.5 391.5 212.4Biomass density, Mg C·ha−1 42 51.4 59 67 80.3 89.5 47.5
C. obtusa Area, 106 ha 2.04 2.29 2.42 2.49 2.51 2.51 0.47Total biomass, Tg C 81.7 106.1 125.9 147.1 174.3 193.8 112.1Biomass density, Mg C·ha−1 40.1 46.4 52 59 69.5 77.2 37.1
P. densiflora Area, 106 ha 1.18 1.08 1.02 0.97 0.89 0.86 −0.08Total biomass, Tg C 34.4 40 44.8 48.9 55.1 58.3 23.9Biomass density, Mg C·ha−1 29.2 37.2 44 50.4 62 67.6 38.3
L. leptolepis Area, 106 ha 1.1 1.09 1.08 1.07 1.04 1.01 −0.09Total biomass, Tg C 37.7 47.7 54 60.2 67.5 70.6 32.9Biomass density, Mg C·ha−1 34.2 43.9 50 56.4 64.9 69.9 35.7
9528 | www.pnas.org/cgi/doi/10.1073/pnas.1402333111 Fang et al.

difference in the contribution of environmental enhancement toforest growth among various forest types (for details onGEPA andRgepa, see Materials and Methods).Using these rates and the total area of each forest type, we
estimated total growth enhancement (TGE) and its contributionto total forest C accumulation across the country. The cypressand larch forests presented a similar, large TGE value (11.6 and11.4 Tg C, respectively), and the other two forest types (cedarand red pine forests) showed a similar, small TGE (8.7 and 8.5Tg C) (Table 2). Overall, the relative contribution (Rge) of TGEto total biomass C accumulation [net biomass increase (NBI)]was largest in red pine forests (35.5%), with a similar value inlarch forest (34.7%), and smallest in cedar forest (only 4.1%)(for details on TGE and Rge, see Materials and Methods).
Regional Patterns of Growth Enhancement. Although environmen-tal changes have stimulated tree growth at the national scale,there were large regional differences in this enhancement (Fig. 3and Table S6). For example, environmental changes stimulatedthe growth of red pine forest in northern regions (i.e., Tohoku,Kanto, Chubu, and Kinki) but inhibited its growth in southernareas (i.e., Shikoku, Chugoku, and Kyushu-Okinawa) (Fig. 3C),probably as the result of increased damage by disease and insectoutbreaks under warmer and more humid environments insouthern regions (25). Similarly, the contribution of growth en-hancement to biomass C accumulation in larch forest tended todecrease from north to south, with more than 50% of Rgepa inHokkaido and about 10% in Chubu (Fig. 3D). Regional distri-bution of the effects of environmental changes on total treegrowth (Rge) showed patterns similar to those of Rgepa (Fig. S1),although there were greater variations in the former because ofdifferences in forest area in different regions.
DiscussionThis analysis is, to our knowledge, the first to distinguish the relativecontribution of age-related tree regrowth and environmentally en-hanced growth to biomass C accumulation at a large scale. Ourresults demonstrate that age-related tree regrowth was the prin-ciple mechanism responsible for biomass C uptake in Japan’smajor plantations but that environmentally induced growth en-hancement also made a substantial contribution to C sequestra-tion. As indicated in Table 2, the four plantations sequestratedenvironmentally enhanced C of 4.0∼7.7 Mg·ha−1 over 25 y (1980–2005). If we assume the estimates are average enhancement ratesfor the northern forests in the middle and high latitudes andsimply translate these rates into the northern forests (a total areaof 1,780 × 106 ha; see ref 27), then these forests sequestrateda total of 7.1∼13.7 Pg C over the period 1980–2005, or 0.28∼0.55Pg C per year (1 Pg = 1015 g). This is a substantial amount relativeto a total C sink of 1.2 Pg·y−1 for the world’s boreal and tem-perate forests (3), demonstrating the importance of environ-mentally enhanced forest growth in mitigating the rise inatmospheric CO2 concentration and global warming (13). How-ever, as shown in Figs. 2 and 3, the fraction of C accumulationdue to growth enhancement differed by forest type, forest age,and region. The overall fraction was estimated at 8.4–21.6% perhectare and 4.1–35.5% for the country total for the four planta-tions (Table 2 and Table S6).What environmental changes explain this observed growth
enhancement? To explore this issue, we compared the temporalchanges in biomass density for given age classes over differentinventory periods for each forest type (Fig. 4A) with the tem-poral trends in environmental factors (CO2, N deposition, andclimate) over the country during 1980–2005 (Fig. 4B). As noted,the changes in biomass density increased significantly from 1980to 2005 for all four forest types (P < 0.05; Fig. 4A). Further,
Fig. 2. Environmentally induced annual changes inbiomass density (biomass per area) with various ageclasses for four major plantations in Japan duringthe period 1980–2005. The numbers are obtainedfrom annual mean GEPAi for each age class (Eq. 6 inMaterials and Methods). Each age class represents5 y. Minus or plus value shows negative or positiveeffects of environmental changes on forest growth.(A) Japanese cedar, (B) Japanese cypress, (C) Japa-nese red pine, and (D) Japanese larch plantations.
Table 2. Country total contribution of environmentally enhanced growth to biomass carbonaccumulation for four major plantations in Japan during 1980–2005
Forest type NBIPA, Mg C·ha−1 GEPA, Mg C·ha−1 Rgepa, % NBI, Tg C TGE, Tg C Rge, %
C. japonica 47.5 4.0 8.4 212.3 8.7 4.1C. obtusa 37.1 4.1 11.0 112.0 11.6 10.4P. densiflora 38.3 4.8 12.6 23.9 8.5 35.5L. leptolepis 35.7 7.7 21.6 32.9 11.4 34.7
Fang et al. PNAS | July 1, 2014 | vol. 111 | no. 26 | 9529
ECOLO
GY

Japan has experienced dramatic environmental changes duringthe past decades, with a continuous increase in atmospheric CO2concentration, a significantly warming climate, and substantial Ninput into land ecosystems (Fig. 4B); that is, there are strongagreements between the biomass change and environmental trendsover the study period for each forest type. A general linear model(GLM) analysis suggests that the four environmental variables ex-plain >99% of the variations in enhanced growth for all four foresttypes, with elevated CO2 explaining the largest proportion of thevariations (Table 3).The results suggest that all the environmental changes stimulated
tree growth over the study period, consistent with other findings.Elevated CO2 concentrations cause C fertilization of trees (28, 29),and natural N deposition increases soil N availability and plant Nuptake and thus stimulates vegetation growth (30, 31). In addition,Japan is under an oceanic humid climate (32), and thereforewarming climate can stimulate biomass C accumulation eitherthrough its direct effects on increased rates of photosynthesis andlonger growing seasons or through indirect effects on increasednutrient availability due to increased rates of litter decompositionand N mineralization (33).Our approach is sensitive to changes in management practices,
but although practices may have varied locally, they should nothave exerted substantial effects on the national-scale analysis.Moreover, national forestry management policies and regimeshave not changed substantially over the past several decades inthe country (34). For example, there were no significant changesin standing biomass at young-age classes over the different in-ventory periods (Table S7), suggesting similar silviculturaltreatments (e.g., planting density and nurturing); managementpractices for stand density were similar throughout stand de-velopment (Ishikawa Agriculture and Forestry Research Center;http://www.pref.ishikawa.lg.jp/ringyo/); and commercial harvests didnot vary over time, because most of the wood consumed in Japan
is imported (34). In addition, as shown in Fig. 4 and Table 3,a strong correlation (P < 0.001) between increased biomassdensity and changes in environmental variables implies nosignificant effect of management on our analysis.Our results have several implications. First, the significant
contribution of environmentally enhanced growth to the forestbiomass C sink emphasizes that C accumulation in forest eco-systems will not necessarily attenuate at a predictable rate asforests mature. Second, to reduce the uncertainties in predictingfuture C dynamics in forest ecosystems, land surface modelsshould not only consider land-use history, but also account forkey physiological processes governing the fate of C sequestrationin forest ecosystems, such as the effects of CO2 fertilization, Ndeposition, and climate warming on vegetation growth. Third,the responses to environmental variability highlight that bothstand age and tree traits regulate the sensitivity of the responsesof forest growth to global environmental changes. These featuresshould be incorporated into land surface models when predictingfuture forest C dynamics under a changing environment.
Materials and MethodsForest Inventory Data. In this study, forest inventory data were used to in-vestigate the spatial–temporal pattern of forest growth and its response to
Fig. 3. Regional differences in environmentally induced growth for four majorplantations in Japan, described as the contribution of growth enhancement perhectare to the total increase in biomass density (Rgepa). (A) Japanese cedar, (B)Japanese cypress, (C) Japanese red pine, (D) Japanese larch plantations, and (E)map of Japan showing the regional divisions used in this study. Following Jap-anese inventories, the country was divided into eight regions: Hokkaido (HKD),Tohoku (THK), Kanto (KTO), Chubu (CHB), Kinki (KNK), Chugoku (CGK), Shikoku(SHK), and Kyushu-Okinawa (KYS-OKA).
Fig. 4. Comparison between temporal changes in biomass density at givenage classes and temporal trends in environmental variables over the studyperiods. (A) Changes in overall mean biomass density at 5–15 age classesover six inventory periods from 1980 to 2005 for all four forest types. Youngage-class stands (fewer than five age classes) were excluded from thisanalysis because the numbers in initial growth stages are small and may notbe influenced by environmental changes (Fig. 2). Biomass density at givenage classes (i.e., age-excluded growth) exhibits a significant increase for allforest types. (B) Temporal trends in environmental variables (CO2 concen-tration, N deposition, MAT, and AP) over the whole country during 1980–2005. All variables except AP showed a significant increase over 25 y. Solidlines indicate a statistically significant increase at P < 0.05, and dashed linesreflect a nonsignificant change. For the data of environmental variables, seeMaterials and Methods.
9530 | www.pnas.org/cgi/doi/10.1073/pnas.1402333111 Fang et al.

global environmental changes from 1980 to 2005. Japan has conducteda systematic forest inventory since the 1960s but has consistently reportedarea and volume of major forest types at each age class in each region(prefecture) only from 1980. In Japan’s forest inventory program, there are10,000 permanent plots (1,000 m2, 31.62 m × 31.62 m) with a 1-km × 1-kmgrid. The inventory provides information on forest ownership, tree species,age class, diameter at breast height, tree height, and volume. Forest is de-fined as an area with 20% or more crown cover for government-ownedforests and more than 30% crown cover for community and privately ownedforests. The error of timber volume at the country scale is less than 3% (25).According to the forest inventory, natural forests tend to have more treespecies with different ages whereas plantations generally have only a fewspecies of similar age. Therefore, this study focused on the biomass C sinkand its driving environmental factors for Japan’s plantations. The forestinventory recorded the area and volume of four coniferous plantations(Cryptomeria japonica, Chamaecyparis obtusa, Pinus densiflora, and Larixleptolepis) for each age class during 1980–2005. Among the four planta-tions, forest inventories reported the area and volume in each prefecture forevery age class (i.e., 5, 10, 15, 20, and so on). Thus, the average volume ofeach age class in each prefecture, each region, and the whole country can becalculated for each of the six inventory periods (1980, 1985, 1990, 1995, 2000,and 2005).
BEF and Biomass Estimation. Given that forest inventory reports only timbervolume rather than biomass of the whole forest, BEF is needed to convertvolume into biomass. It has been shown that BEF may be expressed asa function of volume (24, 26, 35, 36). Using 942 sets of field measurementdata on forest biomass and volume, Fang et al. (26) developed the functionsfor estimating BEF values for main forest types in Japan (Eq. 1 and Table S1).These functions are independent of stand density, age class, and site. TheseBEF values may be used for estimating living biomass of the stand, includingleaves, fruits, branches, stems, and roots of all woody plants. Forest floormaterials are not included in the BEF values because the available data arevery scarce and highly variable among studies;
BEF = a+bx, [1]
where x is stand volume and a and b are regression coefficients. BEFapproaches the constant a when stand volume increases.
Using Eq. 1, BEF can be applied to forest inventory data to estimate re-gional- or national-scale forest biomass (37). For a particular forest type,regional biomass can be estimated by the following equation:
Y =Xni=1
Ai · xi ·BEFi , [2]
where Y is total biomass in a particular region andAi, xi, and BEFi are the totalarea, volume per unit area, and BEF value for prefecture i in this region.
Estimation of National and Regional Total Biomass Across All Age Classes. Thenational total biomass for a particular forest type was calculated using Eq. 3.Similarly, we can further calculate the national total biomass (NBj, Eq. 4) andits average biomass density (BDj, Eq. 5) for this forest type at age class j. Thebiomass density at each age class (BDi) in the whole country may be usedfurther to compare growth differences among different age classes (TablesS2–S5). Likewise, the regional biomass density at each age class for a par-ticular forest type can be calculated. In the forest inventory, Japan was di-vided into eight regions: Hokkaido, Tohoku, Kanto, Chubu, Kinki, Chugoku,Shikoku, and Kyushu-Okinawa. We calculated the biomass density at eachage class in each region and compared growth differences among regions:
NB=Xmi=1
Xnj=1
Aij · xij ·BEFij [3]
NBj =Xmi=1
Aij · xij ·BEFij [4]
BDj =NBj=Aj =Xmi=1
Aij · xij ·BEFij=Xmi=1
Aij , [5]
where NB is the total national biomass for a particular forest type duringa specific inventory period; Aij, xij, and BEFij are area, volume per unit area,and BEF value of this forest type in prefecture i and at age class j; n is thenumber of age classes; m is the number of prefectures; and Aj is the totalarea of the forest type at age class j.
Calculation of Growth Enhancement Due to Environmental Changes. At thenational or regional scale, if a particular forest type has a similarmanagementregime across different periods, is under relatively constant environmentalconditions (i.e., atmospheric CO2 concentration, N deposition, and climate),and appears to be at an equilibrium state, then the overall mean biomassdensity (ρ) of this forest at a particular age class but different periods shouldbe constant (i.e., ∂ρ/∂t = 0). If ρ changes in different periods, it should becaused by environmental changes. In response to a changing environment,forest biomass density might increase, decrease, or keep relatively stable (nochange) across different periods (for details, see legend of Fig. 1). We thuscan assess the impact of environmental changes on forest biomass density(biomass per area) simply by investigating changes in biomass density at thesame age class but over different inventory periods. If we conduct thisanalysis for all age classes, we can get environment-induced growth en-hancement at different age classes.
The following equation was used to calculate the response of biomassdensity at a given age class to environmental factors during the study period(a total of six inventory periods during the 25 y from 1980 to 2005):
GEPAi =X5j=1
�BDij � BDiðj−1Þ
�, [6]
where GEPAi (growth enhancement per area for an age class) is the envi-ronment-induced change in biomass density at age class i during the studyperiod 1980–2005, indicating the magnitude of response of forest biomassdensity at age class i to environmental changes. BDij is biomass density at ageclass i and in period j: when i is 1, 2, 3, . . . n, age is 5, 10, 15, . . . 5n accordingly;when j is 1, 2, 3, 4, and 5, the period is year 1985, 1990, 1995, 2000, and 2005,respectively. BDi0 stands for biomass density at age class i and in the begin-ning year (1980) of the study period. Annual mean GEPAi (megagrams of Cper hectare per year) in the main text (and Fig. 2) is calculated by dividingGEPAi by the length of the study periods (in most cases, 25 y in this study).
The age-class averaged growth enhancement per area (GEPA) during1980–2005 thus can be expressed as
GEPA=1n
Xni=1
GEPAi =1n
Xni=1
X5j=1
�BDij −BDiðj−1Þ
�; [7]
the TGE due to environmental changes for a particular forest type can bequantified further as
TGE=Xni=1
X5j=1
�BDij −BDið j−1Þ
�·12
�Aij +Aið j−1Þ
�!, [8]
where BDij and Aij represent biomass density and area of this forest typeat age class i and in inventory period j, respectively, whereas BDi0 and Ai0
Table 3. Summary of the results obtained from a GLM showingthe integrative effects of elevated CO2, N deposition, andclimatic change on tree growth across different inventoryperiods for four major plantations in Japan
Environmental variable
Forest type Result* CO2 N MAT AP Residuals
C. japonica MS 35,908*** 205.25 40.3 2.24 11.99SS, % 99.25 0.57 0.11 0.01 0.07
C. obtusa MS 32,028*** 57.64 11.37 1.37 3.32SS, % 99.76 0.18 0.04 0.00 0.02
P. densiflora MS 17,720*** 208.92 24.91 3.12 15.22SS, % 98.51 1.16 0.14 0.02 0.17
L. leptolepis MS 21,591*** 189.59 29.72 0.01 7.05SS, % 98.93 0.87 0.14 0.00 0.06
To match biomass density data at the 5-y inventory interval, the cor-responding 5-y averaged values of the four environmental variables werecalculated and used for the GLM analysis. df, degree of freedom; MS, meansquares; SS, proportion of variances explained by the variable.*df = 1 for all variables and residuals.***P < 0.001.
Fang et al. PNAS | July 1, 2014 | vol. 111 | no. 26 | 9531
ECOLO
GY

stand for biomass density and forest area at age class i and in year 1980,respectively.
Estimation of Relative Contribution of Environmental Changes. The relativecontribution of environmental changes to total forest biomass C sink (Rge, %)was calculated as the ratio of environment-induced TGE to total NBI duringthe inventory period. In addition, the relative contribution of environmentalchanges to growth enhancement per area (Rgepa, %) was determined as theratio of environment-induced GEPA to average net biomass increase perarea across all age classes (NBIPA) during the inventory period:
NBI=NB2005 −NB1980 [9]
Rge = TGE=NBI×100% [10]
NBIPA=BD2005 −BD1980 [11]
Rgepa =GEPA=NBIPA× 100% , [12]
where NB1980 and NB2005 represent total biomass of this forest type in years1980 and 2005, respectively, and BD1980 and BD2005 are biomass density inyears 1980 and 2005, respectively.
Data of Environmental Variables. In this study, we used four environmentalvariables: mean annual temperature (MAT), annual precipitation (AP), atmo-spheric CO2 concentration, and N deposition. MAT and AP during the period
1980–2005 were averaged from 138 climatic stations across the country (JapanMeteorological Agency; http://ds.data.jma.go.jp/ghg/kanshi/ghgp/co2_e.html).Annual CO2 concentrations for 1987–2005 were averaged from three stationsin Japan (Ryori, Minamitorishima, and Yonagunijima) (Japan MeteorologicalAgency; http://ds.data.jma.go.jp/obd/stats/data/en/smp/index.html). The CO2 con-centrations were extended back to 1980 by regressing the Mauna Loa CO2 dataagainst each of the three stations (Pearson’s r2: 0.9995, 0.9994, and 0.9993 forRyori, Minamitorishima, and Yonagunijima, respectively). For wet N deposition,we used a nationwide monitoring database (Japan Acid Deposition System)that was started in 1983 (38). Mean annual wet N deposition data across thecountry were derived from all available observations.
Statistical Analysis. We performed ordinary least squares regression to ex-amine temporal changes in biomass density in the four major plantationsamong different inventory periods, as well as temporal variability in envi-ronmental variables across the country during the period 1980–2005. Wethen conducted a GLM analysis to evaluate their comprehensive effects onbiomass changes over different inventory periods. All statistical analyseswere conducted using SPSS 13.0 (39).
ACKNOWLEDGMENTS. We thank L. Y. Chen for preparing Fig. 1 and twoanonymous reviewers for helpful comments on a previous version of themanuscript. This work was funded by the National Natural Science Founda-tion of China (31321061 and 31330012), the National Basic Research Programof China on Global Change (2010CB950600), and the Chinese Academy ofSciences (XDA05050300).
1. Goodale L, et al. (2002) Forest carbon sinks in the northern hemisphere. Ecol Appl12(3):891–899.
2. Bonan GB (2008) Forests and climate change: Forcings, feedbacks, and the climatebenefits of forests. Science 320(5882):1444–1449.
3. Pan Y, et al. (2011) A large and persistent carbon sink in the world’s forests. Science333(6045):988–993.
4. Fang J, et al. (2014) Forest biomass carbon sinks in East Asia, with special reference tothe relative contributions of forest expansion and forest growth. Glob Change Biol20(6):2019–2030.
5. Caspersen JP, et al. (2000) Contributions of land-use history to carbon accumulation inU.S. forests. Science 290(5494):1148–1151.
6. Schimel D, et al. (2000) Contribution of increasing CO2 and climate to carbon storageby ecosystems in the United States. Science 287(5460):2004–2006.
7. Joos F, Prentice IC, House JI (2002) Growth enhancement due to global atmosphericchange as predicted by terrestrial ecosystem models: Consistent with US forest in-ventory data. Glob Change Biol 8(4):299–303.
8. Vetter M, et al. (2005) Partitioning direct and indirect human-induced effects oncarbon sequestration of managed coniferous forests using model simulations andforest inventories. Glob Change Biol 11(5):810–827.
9. Albani M, Medvigy D, Hurtt GC, Moorcroft PR (2006) The contributions of land-usechange, CO2 fertilization, and climate variability to the eastern US carbon sink. GlobChange Biol 12(12):2370–2390.
10. Magnani F, et al. (2007) The human footprint in the carbon cycle of temperate andboreal forests. Nature 447(7146):848–850.
11. McMahon SM, Parker GG, Miller DR (2010) Evidence for a recent increase in forestgrowth. Proc Natl Acad Sci USA 107(8):3611–3615.
12. Hember RA, et al. (2012) Accelerating regrowth of temperate-maritime forests due toenvironmental change. Glob Change Biol 18(6):2026–2040.
13. Shevliakova E, et al. (2013) Historical warming reduced due to enhanced land carbonuptake. Proc Natl Acad Sci USA 110(42):16730–16735.
14. Nabuurs G, et al. (2013) First signs of carbon sink saturation in European forest bio-mass. Nat Clim Change 3:792–796.
15. Luyssaert S, et al. (2008) Old-growth forests as global carbon sinks. Nature 455(7210):213–215.
16. Lewis SL, et al. (2009) Changing ecology of tropical forests: Evidence and drivers.Annu Rev Ecol Evol Syst 40:529–549.
17. Anderson-Teixeira KJ, et al. (2013) Altered dynamics of forest recovery under achanging climate. Glob Change Biol 19(7):2001–2021.
18. Stephenson NL, et al. (2014) Rate of tree carbon accumulation increases continuouslywith tree size. Nature 507(7490):90–93.
19. Jump AS, et al. (2006) Rapid climate change-related growth decline at the southernrange edge of Fagus sylvatica. Glob Change Biol 12(11):2163–2174.
20. Canadell JG, et al. (2007) Factoring out natural and indirect human effects on ter-restrial carbon sources and sinks. Environ Sci Policy 10(4):370–384.
21. Houghton RA, Hackler JL, Lawrence KT (1999) The U.S. carbon budget: Contributionsfrom land-use change. Science 285(5427):574–578.
22. Brown SL, Schroeder PE (1999) Spatial patterns of aboveground production andmortality of woody biomass for eastern U.S. forests. Ecol Appl 9(3):968–980.
23. Kurz WA, Apps MJ (1999) A 70-year retrospective analysis of carbon fluxes in theCanadian forest sector. Ecol Appl 9(2):526–547.
24. Fang J, Chen A, Peng C, Zhao S, Ci L (2001) Changes in forest biomass carbon storagein China between 1949 and 1998. Science 292(5525):2320–2322.
25. Japan Agency of Forestry (2000) Forest Resources of Japan 1995 (Japan Agency ofForestry, Tokyo).
26. Fang JY, et al. (2005) Biomass carbon accumulation by Japan’s forests from 1947-1995.Global Biogeochem Cycles 19:GB2004, 10.1029/2004GB002253.
27. Fang JY, et al. (2006) Overestimated biomass carbon pools of the northern mid- andhigh latitude forests. Clim Change 74(1-3):355–368.
28. Beedlow PA, et al. (2004) Rising atmospheric CO2 and carbon sequestration in forests.Front Ecol Environ 2(6):315–322.
29. Norby RJ, et al. (2005) Forest response to elevated CO2 is conserved across a broadrange of productivity. Proc Natl Acad Sci USA 102(50):18052–18056.
30. Hyvönen R, et al. (2007) The likely impact of elevated [CO2], nitrogen deposition,increased temperature and management on carbon sequestration in temperate andboreal forest ecosystems: A literature review. New Phytol 173(3):463–480.
31. Reay S, et al. (2008) Global nitrogen deposition and carbon sinks. Nat Geosci 1:430–437.
32. Kira T (1991) Forest ecosystems of east Asia and southeast Asia in a global perspective.Ecol Res 6(2):185–196.
33. Rustad LE, et al. (2001) A meta analysis of the response of soil respiration, net ni-trogen mineralization, and aboveground plant growth to experimental ecosystemwarming. Oecologia 126(4):543–562.
34. Forest Agency of Japan (2002) Annual Report on Forest and Forestry in Japan(Forestry Agency, Tokyo).
35. Brown SL, Lugo AE (1992) Aboveground biomass estimates for tropical moist forestsof Brazilian Amazon. Interciencia 17(1):8–18.
36. Schroeder P, et al. (1997) Biomass estimation for temperate broadleaf forests of theUnited States using inventory data. Forest Sci 43(3):424–434.
37. Fang JY, Chen AP (2001) Dynamic forest biomass carbon pools in China and theirsignificance. Acta Bot Sin 43(9):967–973.
38. Morino Y, et al. (2011) Temporal variations of nitrogen wet deposition across Japanfrom 1989 to 2008. J Geophys Res 116:D06307.
39. SPSS Inc. (2012) SPSS 13.0 (SPSS Inc., Chicago).
9532 | www.pnas.org/cgi/doi/10.1073/pnas.1402333111 Fang et al.
Supporting InformationFang et al. 10.1073/pnas.1402333111
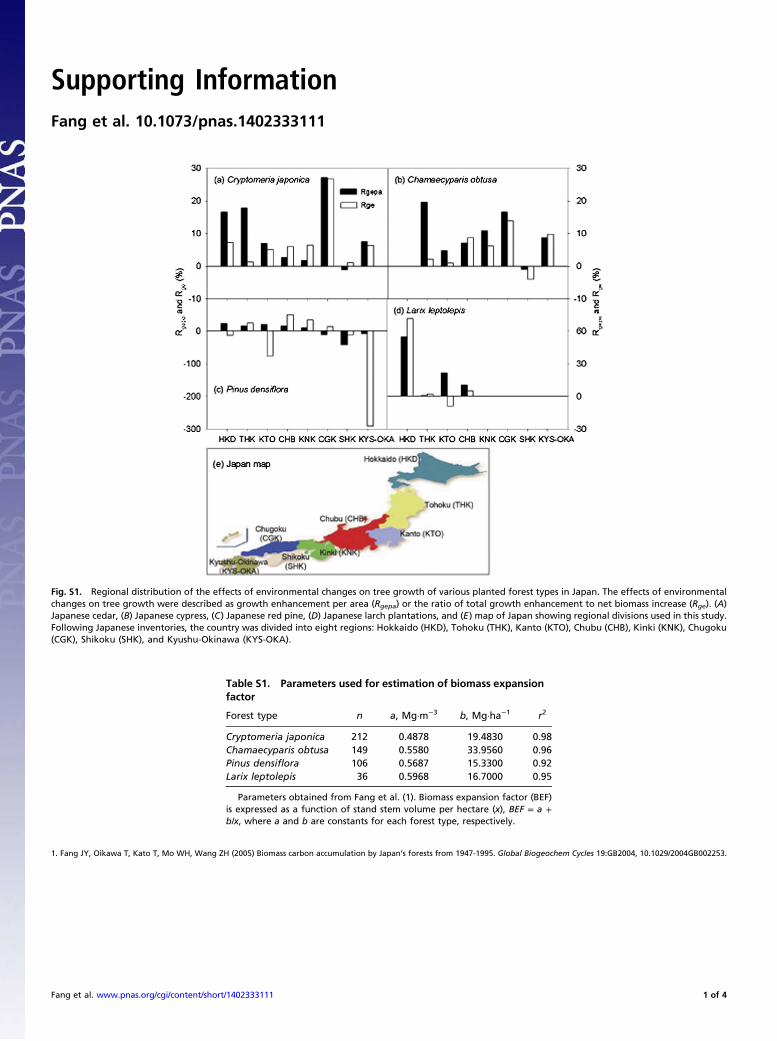
Fig. S1. Regional distribution of the effects of environmental changes on tree growth of various planted forest types in Japan. The effects of environmentalchanges on tree growth were described as growth enhancement per area (Rgepa) or the ratio of total growth enhancement to net biomass increase (Rge). (A)Japanese cedar, (B) Japanese cypress, (C) Japanese red pine, (D) Japanese larch plantations, and (E) map of Japan showing regional divisions used in this study.Following Japanese inventories, the country was divided into eight regions: Hokkaido (HKD), Tohoku (THK), Kanto (KTO), Chubu (CHB), Kinki (KNK), Chugoku(CGK), Shikoku (SHK), and Kyushu-Okinawa (KYS-OKA).
Table S1. Parameters used for estimation of biomass expansionfactor
Forest type n a, Mg·m−3 b, Mg·ha−1 r2
Cryptomeria japonica 212 0.4878 19.4830 0.98Chamaecyparis obtusa 149 0.5580 33.9560 0.96Pinus densiflora 106 0.5687 15.3300 0.92Larix leptolepis 36 0.5968 16.7000 0.95
Parameters obtained from Fang et al. (1). Biomass expansion factor (BEF)is expressed as a function of stand stem volume per hectare (x), BEF = a +b/x, where a and b are constants for each forest type, respectively.
1. Fang JY, Oikawa T, Kato T, Mo WH, Wang ZH (2005) Biomass carbon accumulation by Japan’s forests from 1947-1995. Global Biogeochem Cycles 19:GB2004, 10.1029/2004GB002253.
Fang et al. www.pnas.org/cgi/content/short/1402333111 1 of 4
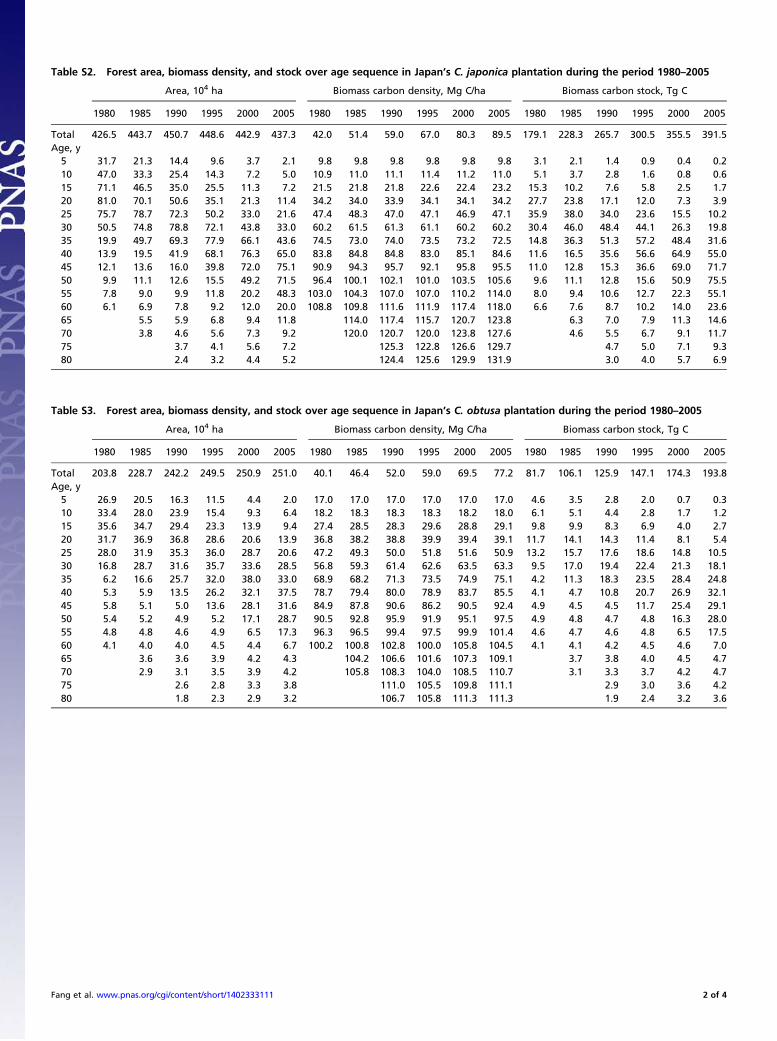
Table S2. Forest area, biomass density, and stock over age sequence in Japan’s C. japonica plantation during the period 1980–2005
Area, 104 ha Biomass carbon density, Mg C/ha Biomass carbon stock, Tg C
1980 1985 1990 1995 2000 2005 1980 1985 1990 1995 2000 2005 1980 1985 1990 1995 2000 2005
Total 426.5 443.7 450.7 448.6 442.9 437.3 42.0 51.4 59.0 67.0 80.3 89.5 179.1 228.3 265.7 300.5 355.5 391.5Age, y5 31.7 21.3 14.4 9.6 3.7 2.1 9.8 9.8 9.8 9.8 9.8 9.8 3.1 2.1 1.4 0.9 0.4 0.210 47.0 33.3 25.4 14.3 7.2 5.0 10.9 11.0 11.1 11.4 11.2 11.0 5.1 3.7 2.8 1.6 0.8 0.615 71.1 46.5 35.0 25.5 11.3 7.2 21.5 21.8 21.8 22.6 22.4 23.2 15.3 10.2 7.6 5.8 2.5 1.720 81.0 70.1 50.6 35.1 21.3 11.4 34.2 34.0 33.9 34.1 34.1 34.2 27.7 23.8 17.1 12.0 7.3 3.925 75.7 78.7 72.3 50.2 33.0 21.6 47.4 48.3 47.0 47.1 46.9 47.1 35.9 38.0 34.0 23.6 15.5 10.230 50.5 74.8 78.8 72.1 43.8 33.0 60.2 61.5 61.3 61.1 60.2 60.2 30.4 46.0 48.4 44.1 26.3 19.835 19.9 49.7 69.3 77.9 66.1 43.6 74.5 73.0 74.0 73.5 73.2 72.5 14.8 36.3 51.3 57.2 48.4 31.640 13.9 19.5 41.9 68.1 76.3 65.0 83.8 84.8 84.8 83.0 85.1 84.6 11.6 16.5 35.6 56.6 64.9 55.045 12.1 13.6 16.0 39.8 72.0 75.1 90.9 94.3 95.7 92.1 95.8 95.5 11.0 12.8 15.3 36.6 69.0 71.750 9.9 11.1 12.6 15.5 49.2 71.5 96.4 100.1 102.1 101.0 103.5 105.6 9.6 11.1 12.8 15.6 50.9 75.555 7.8 9.0 9.9 11.8 20.2 48.3 103.0 104.3 107.0 107.0 110.2 114.0 8.0 9.4 10.6 12.7 22.3 55.160 6.1 6.9 7.8 9.2 12.0 20.0 108.8 109.8 111.6 111.9 117.4 118.0 6.6 7.6 8.7 10.2 14.0 23.665 5.5 5.9 6.8 9.4 11.8 114.0 117.4 115.7 120.7 123.8 6.3 7.0 7.9 11.3 14.670 3.8 4.6 5.6 7.3 9.2 120.0 120.7 120.0 123.8 127.6 4.6 5.5 6.7 9.1 11.775 3.7 4.1 5.6 7.2 125.3 122.8 126.6 129.7 4.7 5.0 7.1 9.380 2.4 3.2 4.4 5.2 124.4 125.6 129.9 131.9 3.0 4.0 5.7 6.9
Table S3. Forest area, biomass density, and stock over age sequence in Japan’s C. obtusa plantation during the period 1980–2005
Area, 104 ha Biomass carbon density, Mg C/ha Biomass carbon stock, Tg C
1980 1985 1990 1995 2000 2005 1980 1985 1990 1995 2000 2005 1980 1985 1990 1995 2000 2005
Total 203.8 228.7 242.2 249.5 250.9 251.0 40.1 46.4 52.0 59.0 69.5 77.2 81.7 106.1 125.9 147.1 174.3 193.8Age, y5 26.9 20.5 16.3 11.5 4.4 2.0 17.0 17.0 17.0 17.0 17.0 17.0 4.6 3.5 2.8 2.0 0.7 0.310 33.4 28.0 23.9 15.4 9.3 6.4 18.2 18.3 18.3 18.3 18.2 18.0 6.1 5.1 4.4 2.8 1.7 1.215 35.6 34.7 29.4 23.3 13.9 9.4 27.4 28.5 28.3 29.6 28.8 29.1 9.8 9.9 8.3 6.9 4.0 2.720 31.7 36.9 36.8 28.6 20.6 13.9 36.8 38.2 38.8 39.9 39.4 39.1 11.7 14.1 14.3 11.4 8.1 5.425 28.0 31.9 35.3 36.0 28.7 20.6 47.2 49.3 50.0 51.8 51.6 50.9 13.2 15.7 17.6 18.6 14.8 10.530 16.8 28.7 31.6 35.7 33.6 28.5 56.8 59.3 61.4 62.6 63.5 63.3 9.5 17.0 19.4 22.4 21.3 18.135 6.2 16.6 25.7 32.0 38.0 33.0 68.9 68.2 71.3 73.5 74.9 75.1 4.2 11.3 18.3 23.5 28.4 24.840 5.3 5.9 13.5 26.2 32.1 37.5 78.7 79.4 80.0 78.9 83.7 85.5 4.1 4.7 10.8 20.7 26.9 32.145 5.8 5.1 5.0 13.6 28.1 31.6 84.9 87.8 90.6 86.2 90.5 92.4 4.9 4.5 4.5 11.7 25.4 29.150 5.4 5.2 4.9 5.2 17.1 28.7 90.5 92.8 95.9 91.9 95.1 97.5 4.9 4.8 4.7 4.8 16.3 28.055 4.8 4.8 4.6 4.9 6.5 17.3 96.3 96.5 99.4 97.5 99.9 101.4 4.6 4.7 4.6 4.8 6.5 17.560 4.1 4.0 4.0 4.5 4.4 6.7 100.2 100.8 102.8 100.0 105.8 104.5 4.1 4.1 4.2 4.5 4.6 7.065 3.6 3.6 3.9 4.2 4.3 104.2 106.6 101.6 107.3 109.1 3.7 3.8 4.0 4.5 4.770 2.9 3.1 3.5 3.9 4.2 105.8 108.3 104.0 108.5 110.7 3.1 3.3 3.7 4.2 4.775 2.6 2.8 3.3 3.8 111.0 105.5 109.8 111.1 2.9 3.0 3.6 4.280 1.8 2.3 2.9 3.2 106.7 105.8 111.3 111.3 1.9 2.4 3.2 3.6
Fang et al. www.pnas.org/cgi/content/short/1402333111 2 of 4

Table S4. Forest area, biomass density, and stock over age sequence in Japan’s P. densiflora plantation during the period 1980–2005
Area, 104 ha Biomass carbon density, Mg C/ha Biomass carbon stock, Tg C
1980 1985 1990 1995 2000 2005 1980 1985 1990 1995 2000 2005 1980 1985 1990 1995 2000 2005
Total 117.6 107.5 101.9 97.1 88.9 86.2 29.2 37.2 44.0 50.4 62.0 67.6 34.4 40.0 44.8 48.9 55.1 58.3Age, y5 5.5 1.6 0.7 0.3 0.1 0.1 7.7 7.7 7.7 7.9 7.7 8.6 0.4 0.1 0.1 0.0 0.0 0.010 12.9 5.4 2.5 0.9 0.2 0.1 9.2 9.7 10.0 10.0 8.7 8.5 1.2 0.5 0.2 0.1 0.0 0.015 24.2 11.9 6.0 2.9 0.5 0.2 18.4 19.3 19.3 20.3 19.1 15.7 4.5 2.3 1.2 0.6 0.1 0.020 29.1 21.6 12.6 6.7 1.6 0.5 27.3 28.7 29.0 29.7 29.9 27.8 8.0 6.2 3.7 2.0 0.5 0.125 19.9 26.2 21.8 13.0 4.4 1.7 35.8 38.0 38.1 39.2 42.2 41.0 7.1 9.9 8.3 5.1 1.9 0.730 10.9 17.8 24.8 21.3 8.9 4.6 43.9 45.9 48.4 47.2 51.1 51.3 4.8 8.2 12.0 10.0 4.5 2.435 4.9 9.6 14.9 22.6 17.4 9.2 48.6 49.9 53.9 56.2 58.4 59.2 2.4 4.8 8.0 12.7 10.2 5.540 2.9 4.2 7.6 13.6 22.0 17.4 54.5 53.3 56.3 59.3 64.1 65.1 1.6 2.2 4.3 8.0 14.1 11.345 2.4 2.6 3.1 6.5 16.8 21.3 57.9 58.8 59.4 62.2 70.1 70.4 1.4 1.5 1.8 4.0 11.8 15.050 2.1 2.0 2.1 2.6 8.0 15.5 59.8 60.1 62.5 64.2 71.6 75.6 1.3 1.2 1.3 1.7 5.7 11.855 1.6 1.8 1.6 1.9 3.2 7.5 64.6 61.1 65.8 67.2 71.0 75.9 1.0 1.1 1.1 1.3 2.3 5.760 1.2 1.2 1.4 1.5 1.7 3.1 67.9 65.6 66.2 64.4 71.3 72.9 0.8 0.8 0.9 1.0 1.2 2.265 0.9 0.9 1.3 1.4 1.7 69.6 71.7 67.3 70.4 72.8 0.6 0.6 0.9 1.0 1.270 0.8 0.7 0.9 1.3 1.3 66.7 73.6 70.9 67.9 70.4 0.5 0.5 0.6 0.9 0.975 0.8 0.7 0.8 1.3 69.9 68.9 70.6 68.5 0.5 0.5 0.6 0.980 0.4 0.6 0.7 0.8 73.6 66.3 70.2 68.7 0.3 0.4 0.5 0.6
Table S5. Forest area, biomass density, and stock over age sequence in Japan’s L. leptolepis plantation during the period 1980–2005
Area, 104 ha Biomass carbon density (Mg C/ha) Biomass carbon stock, Tg C
1980 1985 1990 1995 2000 2005 1980 1985 1990 1995 2000 2005 1980 1985 1990 1995 2000 2005
Total 110.2 108.5 107.9 106.7 104.0 101.0 34.2 43.9 50.0 56.4 64.9 69.9 37.7 47.7 54.0 60.2 67.5 70.6Age, y5 5.3 3.3 2.5 1.8 1.2 1.4 8.4 8.4 8.4 8.4 8.4 8.4 0.4 0.3 0.2 0.1 0.1 0.110 13.3 5.4 3.7 2.5 1.5 1.2 8.6 8.8 9.0 9.4 10.1 9.5 1.1 0.5 0.3 0.2 0.1 0.115 21.3 12.1 6.1 3.7 2.2 1.4 26.2 29.0 26.4 25.5 29.9 36.3 5.6 3.5 1.6 1.0 0.7 0.520 25.2 19.9 13.9 6.1 3.1 2.2 35.1 38.9 42.0 40.2 39.2 48.9 8.9 7.7 5.8 2.5 1.2 1.125 24.2 23.2 20.3 13.9 5.1 3.2 42.3 45.2 48.7 54.5 49.7 52.2 10.2 10.5 9.9 7.6 2.5 1.730 13.8 23.9 23.7 19.9 9.6 5.1 49.7 50.9 52.5 58.3 62.4 60.4 6.9 12.1 12.4 11.6 6.0 3.135 3.0 13.9 21.1 23.7 17.8 9.5 57.6 58.4 58.3 59.8 68.7 71.2 1.7 8.1 12.3 14.2 12.2 6.840 1.7 2.8 10.9 20.3 20.4 17.7 66.0 66.1 64.5 62.4 66.6 74.9 1.1 1.8 7.0 12.7 13.6 13.245 0.9 1.5 1.9 9.8 22.4 20.2 69.4 72.9 72.5 67.2 68.2 71.3 0.6 1.1 1.4 6.6 15.3 14.450 0.6 0.8 1.3 1.7 13.7 21.4 69.6 74.9 76.0 75.4 73.5 72.5 0.4 0.6 1.0 1.3 10.1 15.555 0.6 0.5 0.6 1.2 3.7 12.2 74.9 76.5 79.6 76.1 78.8 77.5 0.4 0.4 0.5 0.9 2.9 9.460 0.5 0.5 0.5 0.6 1.3 2.9 70.5 76.8 78.0 75.1 83.9 83.0 0.4 0.4 0.4 0.5 1.1 2.465 0.5 0.4 0.5 0.8 1.1 74.0 81.2 74.9 82.8 90.8 0.3 0.4 0.4 0.7 1.070 0.4 0.4 0.4 0.5 0.7 77.3 73.1 78.0 80.7 87.7 0.3 0.3 0.3 0.4 0.675 0.3 0.4 0.4 0.4 77.3 75.4 81.4 82.6 0.2 0.3 0.3 0.480 0.2 0.3 0.4 0.4 78.2 75.0 78.4 81.2 0.2 0.2 0.3 0.3
Fang et al. www.pnas.org/cgi/content/short/1402333111 3 of 4

Table S6. Contribution of growth enhancement to biomass carbon accumulation for four major plantations byregion during 1980–2005
Forest type Region NBIPA, Mg C·ha−1 GEPA, Mg C·ha−1 Rgepa, % NBI, Tg C TGE, Tg C Rge, %
Japanese cedar(C. japonica)
Hokkaido 35.9 5.9 16.6 1.2 0.1 7.2
Tohoku 39.8 7.1 17.8 53.0 0.7 1.2Kanto 48.2 3.3 6.9 15.9 0.8 5.0Chubu 44.5 1.2 2.6 36.7 2.2 6.0Kinki 46.5 0.8 1.7 18.9 1.2 6.4
Chugoku 64.5 17.5 27.0 20.9 5.6 26.7Shikoku 49.2 −0.5 −1.1 18.5 0.2 1.1
Kyushu-Okinawa 56.5 4.3 7.6 47.3 3.0 6.4Country total 47.5 4.0 8.4 212.3 8.7 4.1
Japanese cypress(C. obtusa)
Hokkaido — — — — — —
Tohoku 17.5 3.4 19.6 1.3 0.0 2.2Kanto 29.1 1.4 4.7 5.9 0.1 1.0Chubu 29.7 2.1 7.1 22.7 2.0 8.7Kinki 38.5 4.2 10.9 16.8 1.0 6.2
Chugoku 40.4 6.7 16.5 21.9 3.0 13.9Shikoku 34.7 −0.3 −0.9 15.8 −0.6 −4.0
Kyushu-Okinawa 49.3 4.3 8.7 27.5 2.7 9.8Country total 37.1 4.1 11.0 112.0 11.6 10.4
Red pine(P. densiflora)
Hokkaido 18.9 4.4 23.3 −0.5 0.1 −13.0Tohoku 42.2 6.8 16.1 14.5 3.5 24.0Kanto 37.4 7.4 19.9 −1.0 0.8 −75.4Chubu 30.9 4.9 15.7 3.8 1.9 49.7Kinki 37.6 3.9 10.3 1.1 0.4 33.6
Chugoku 43.5 −4.8 −11.0 5.5 0.7 13.4Shikoku 36.2 −15.0 −41.3 0.5 −0.1 −11.8
Kyushu-Okinawa 40.6 −3.3 −8.0 −0.1 0.2 −290.8Country total 38.3 4.8 12.6 23.9 8.5 35.5
Japanese larch(L. leptolepis)
Hokkaido 38.1 20.8 54.5 13.8 9.9 71.4
Tohoku 29.8 0.2 0.7 6.3 0.1 1.9Kanto 37.9 8.1 21.3 2.0 −0.2 −8.9Chubu 36.1 3.7 10.4 10.8 0.5 4.8Kinki — — — — — —
Chugoku — — — — — —
Shikoku — — — — — —
Kyushu-Okinawa — — — — — —
Country total 35.7 7.7 21.6 32.9 11.4 34.7
For location of regions, see Fig. 3E. GEPA, growth enhancement per area; NBI, net biomass increase; NBIPA, net biomass increase perarea; Rge, ratio of TGE to NBI; Rgepa, ratio of GEPA to NBIPA;TGE, total growth enhancement.
Table S7. Overall mean biomass density of young-age (e.g., 5-y-old) stands in Japan for different inventory periods
Biomass density, Mg C·ha−1
Species 1980 1985 1990 1995 2000 2005
C. japonica 9.82 9.83 9.83 9.80 9.83 9.83C. obtusa 16.99 16.99 16.98 16.99 16.99 16.99P. densiflora 7.69 7.67 7.67 7.89 7.67 8.61L. leptolepis 8.35 8.35 8.35 8.35 8.35 8.35
The similar initial standing biomass over time suggests similar silviculturaltreatments at early stages of plantations over the study periods. Data arefrom Forest Inventory of Japan (1–6).
1. Japan Agency of Forestry (1982) Forest Resources of Japan 1980 (Japan Agency of Forestry, Tokyo).2. Japan Agency of Forestry (1987) Forest Resources of Japan 1985 (Japan Agency of Forestry, Tokyo).3. Japan Agency of Forestry (1992) Forest Resources of Japan 1990 (Japan Agency of Forestry, Tokyo).4. Japan Agency of Forestry (2000) Forest Resources of Japan 1995 (Japan Agency of Forestry, Tokyo).5. Japan Agency of Forestry (2003) Forest Resources of Japan 2000 (Japan Agency of Forestry, Tokyo).6. Japan Agency of Forestry (2008) Forest Resources of Japan 2005 (Japan Agency of Forestry, Tokyo).
Fang et al. www.pnas.org/cgi/content/short/1402333111 4 of 4
Copyright © 2022 FDOKUMEN