Evaporative water use of different land uses in the upper-Thukela river basin assessed from...
13
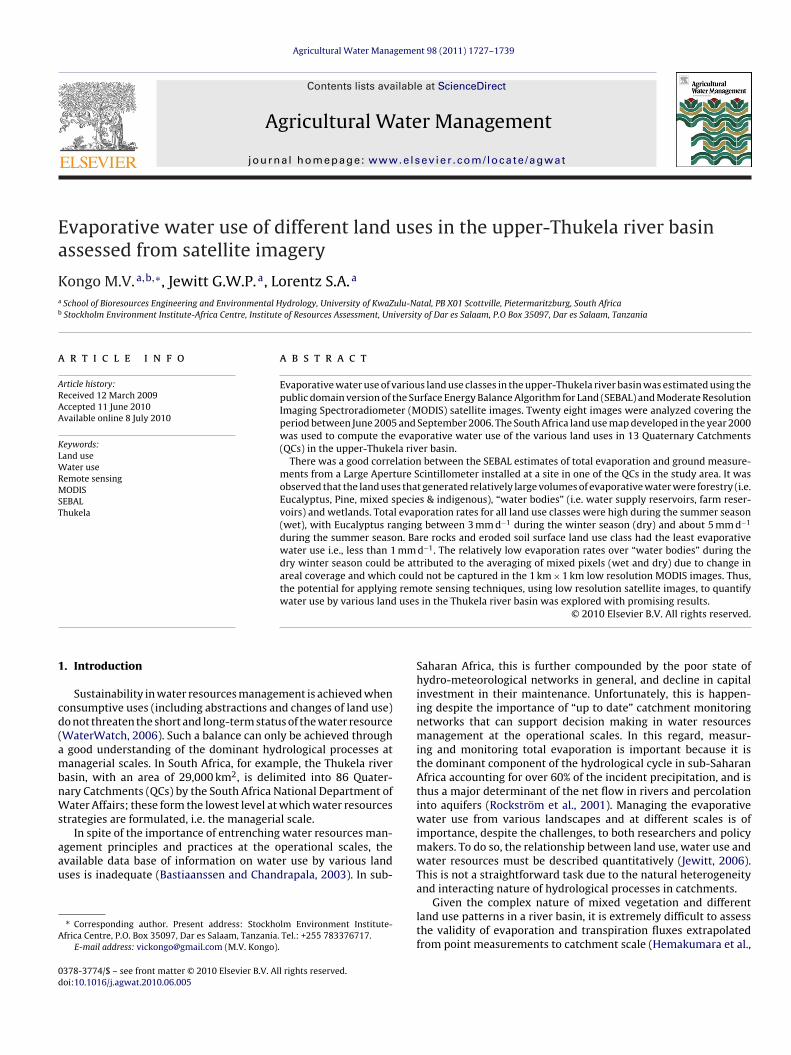
Agricultural Water Management 98 (2011) 1727–1739 Contents lists available at ScienceDirect Agricultural Water Management j ourna l ho me page: www.elsevier.com/locate/agwat Evaporative water use of different land uses in the upper-Thukela river basin assessed from satellite imagery Kongo M.V. a,b,∗ , Jewitt G.W.P. a , Lorentz S.A. a a School of Bioresources Engineering and Environmental Hydrology, University of KwaZulu-Natal, PB X01 Scottville, Pietermaritzburg, South Africa b Stockholm Environment Institute-Africa Centre, Institute of Resources Assessment, University of Dar es Salaam, P.O Box 35097, Dar es Salaam, Tanzania a r t i c l e i n f o Article history: Received 12 March 2009 Accepted 11 June 2010 Available online 8 July 2010 Keywords: Land use Water use Remote sensing MODIS SEBAL Thukela a b s t r a c t Evaporative water use of various land use classes in the upper-Thukela river basin was estimated using the public domain version of the Surface Energy Balance Algorithm for Land (SEBAL) and Moderate Resolution Imaging Spectroradiometer (MODIS) satellite images. Twenty eight images were analyzed covering the period between June 2005 and September 2006. The South Africa land use map developed in the year 2000 was used to compute the evaporative water use of the various land uses in 13 Quaternary Catchments (QCs) in the upper-Thukela river basin. There was a good correlation between the SEBAL estimates of total evaporation and ground measure- ments from a Large Aperture Scintillometer installed at a site in one of the QCs in the study area. It was observed that the land uses that generated relatively large volumes of evaporative water were forestry (i.e. Eucalyptus, Pine, mixed species & indigenous), “water bodies” (i.e. water supply reservoirs, farm reser- voirs) and wetlands. Total evaporation rates for all land use classes were high during the summer season (wet), with Eucalyptus ranging between 3 mm d −1 during the winter season (dry) and about 5 mm d −1 during the summer season. Bare rocks and eroded soil surface land use class had the least evaporative water use i.e., less than 1 mm d −1 . The relatively low evaporation rates over “water bodies” during the dry winter season could be attributed to the averaging of mixed pixels (wet and dry) due to change in areal coverage and which could not be captured in the 1 km × 1 km low resolution MODIS images. Thus, the potential for applying remote sensing techniques, using low resolution satellite images, to quantify water use by various land uses in the Thukela river basin was explored with promising results. © 2010 Elsevier B.V. All rights reserved. 1. Introduction Sustainability in water resources management is achieved when consumptive uses (including abstractions and changes of land use) do not threaten the short and long-term status of the water resource (WaterWatch, 2006). Such a balance can only be achieved through a good understanding of the dominant hydrological processes at managerial scales. In South Africa, for example, the Thukela river basin, with an area of 29,000 km 2 , is delimited into 86 Quater- nary Catchments (QCs) by the South Africa National Department of Water Affairs; these form the lowest level at which water resources strategies are formulated, i.e. the managerial scale. In spite of the importance of entrenching water resources man- agement principles and practices at the operational scales, the available data base of information on water use by various land uses is inadequate (Bastiaanssen and Chandrapala, 2003). In sub- ∗ Corresponding author. Present address: Stockholm Environment Institute- Africa Centre, P.O. Box 35097, Dar es Salaam, Tanzania. Tel.: +255 783376717. E-mail address: [email protected] (M.V. Kongo). Saharan Africa, this is further compounded by the poor state of hydro-meteorological networks in general, and decline in capital investment in their maintenance. Unfortunately, this is happen- ing despite the importance of “up to date” catchment monitoring networks that can support decision making in water resources management at the operational scales. In this regard, measur- ing and monitoring total evaporation is important because it is the dominant component of the hydrological cycle in sub-Saharan Africa accounting for over 60% of the incident precipitation, and is thus a major determinant of the net flow in rivers and percolation into aquifers (Rockström et al., 2001). Managing the evaporative water use from various landscapes and at different scales is of importance, despite the challenges, to both researchers and policy makers. To do so, the relationship between land use, water use and water resources must be described quantitatively (Jewitt, 2006). This is not a straightforward task due to the natural heterogeneity and interacting nature of hydrological processes in catchments. Given the complex nature of mixed vegetation and different land use patterns in a river basin, it is extremely difficult to assess the validity of evaporation and transpiration fluxes extrapolated from point measurements to catchment scale (Hemakumara et al., 0378-3774/$ – see front matter © 2010 Elsevier B.V. All rights reserved. doi:10.1016/j.agwat.2010.06.005
Transcript of Evaporative water use of different land uses in the upper-Thukela river basin assessed from...
Ea
Ka
b
a
ARAA
KLWRMST
1
cd(ambnWs
aau
A
0d
Agricultural Water Management 98 (2011) 1727– 1739
Contents lists available at ScienceDirect
Agricultural Water Management
j ourna l ho me page: www.elsev ier .com/ locate /agwat
vaporative water use of different land uses in the upper-Thukela river basinssessed from satellite imagery
ongo M.V.a,b,∗, Jewitt G.W.P. a, Lorentz S.A. a
School of Bioresources Engineering and Environmental Hydrology, University of KwaZulu-Natal, PB X01 Scottville, Pietermaritzburg, South AfricaStockholm Environment Institute-Africa Centre, Institute of Resources Assessment, University of Dar es Salaam, P.O Box 35097, Dar es Salaam, Tanzania
r t i c l e i n f o
rticle history:eceived 12 March 2009ccepted 11 June 2010vailable online 8 July 2010
eywords:and use
ater useemote sensingODIS
EBALhukela
a b s t r a c t
Evaporative water use of various land use classes in the upper-Thukela river basin was estimated using thepublic domain version of the Surface Energy Balance Algorithm for Land (SEBAL) and Moderate ResolutionImaging Spectroradiometer (MODIS) satellite images. Twenty eight images were analyzed covering theperiod between June 2005 and September 2006. The South Africa land use map developed in the year 2000was used to compute the evaporative water use of the various land uses in 13 Quaternary Catchments(QCs) in the upper-Thukela river basin.
There was a good correlation between the SEBAL estimates of total evaporation and ground measure-ments from a Large Aperture Scintillometer installed at a site in one of the QCs in the study area. It wasobserved that the land uses that generated relatively large volumes of evaporative water were forestry (i.e.Eucalyptus, Pine, mixed species & indigenous), “water bodies” (i.e. water supply reservoirs, farm reser-voirs) and wetlands. Total evaporation rates for all land use classes were high during the summer season(wet), with Eucalyptus ranging between 3 mm d−1 during the winter season (dry) and about 5 mm d−1
during the summer season. Bare rocks and eroded soil surface land use class had the least evaporativewater use i.e., less than 1 mm d−1. The relatively low evaporation rates over “water bodies” during thedry winter season could be attributed to the averaging of mixed pixels (wet and dry) due to change inareal coverage and which could not be captured in the 1 km × 1 km low resolution MODIS images. Thus,the potential for applying remote sensing techniques, using low resolution satellite images, to quantifywater use by various land uses in the Thukela river basin was explored with promising results.
. Introduction
Sustainability in water resources management is achieved whenonsumptive uses (including abstractions and changes of land use)o not threaten the short and long-term status of the water resourceWaterWatch, 2006). Such a balance can only be achieved through
good understanding of the dominant hydrological processes atanagerial scales. In South Africa, for example, the Thukela river
asin, with an area of 29,000 km2, is delimited into 86 Quater-ary Catchments (QCs) by the South Africa National Department ofater Affairs; these form the lowest level at which water resources
trategies are formulated, i.e. the managerial scale.In spite of the importance of entrenching water resources man-
gement principles and practices at the operational scales, thevailable data base of information on water use by various landses is inadequate (Bastiaanssen and Chandrapala, 2003). In sub-
∗ Corresponding author. Present address: Stockholm Environment Institute-frica Centre, P.O. Box 35097, Dar es Salaam, Tanzania. Tel.: +255 783376717.
E-mail address: [email protected] (M.V. Kongo).
378-3774/$ – see front matter © 2010 Elsevier B.V. All rights reserved.oi:10.1016/j.agwat.2010.06.005
© 2010 Elsevier B.V. All rights reserved.
Saharan Africa, this is further compounded by the poor state ofhydro-meteorological networks in general, and decline in capitalinvestment in their maintenance. Unfortunately, this is happen-ing despite the importance of “up to date” catchment monitoringnetworks that can support decision making in water resourcesmanagement at the operational scales. In this regard, measur-ing and monitoring total evaporation is important because it isthe dominant component of the hydrological cycle in sub-SaharanAfrica accounting for over 60% of the incident precipitation, and isthus a major determinant of the net flow in rivers and percolationinto aquifers (Rockström et al., 2001). Managing the evaporativewater use from various landscapes and at different scales is ofimportance, despite the challenges, to both researchers and policymakers. To do so, the relationship between land use, water use andwater resources must be described quantitatively (Jewitt, 2006).This is not a straightforward task due to the natural heterogeneityand interacting nature of hydrological processes in catchments.
Given the complex nature of mixed vegetation and differentland use patterns in a river basin, it is extremely difficult to assessthe validity of evaporation and transpiration fluxes extrapolatedfrom point measurements to catchment scale (Hemakumara et al.,
1 ter Management 98 (2011) 1727– 1739
2rsosWipaieeplLaieaa
illtuthtdiihr
728 M.V. Kongo et al. / Agricultural Wa
003). Nevertheless, measuring and monitoring trends in evapo-ative water use on the scale required to support judgments aboutustainability is feasible through remote sensing techniques, whichffer the potential to monitor at river basin scale (thousands ofquare kilometers in a single satellite image) (WaterWatch, 2006).
ith remote sensing, it is possible to assess the spatial variabil-ty of fluxes, and if the observations are made repeatedly, it is alsoossible to assess their temporal variability as well (Schmugge etl., 2002). Furthermore, it has been suggested that remote sens-ng offers the basis for developing and making public indicators ofquitable use of water resources by investigating the intensity ofvaporative use and production of biomass at various scales, such aser unit area or per respective land use (WaterWatch, 2006). Satel-
ite remote sensing, using the Surface Energy Balance Algorithm forand (SEBAL) (Bastiaanssen et al., 1998a,b), has successfully beenpplied to compute the evaporative water use of various land usesn several countries under different climatic conditions worldwide,.g. Egypt, Pakistan, Kenya, Sri Lanka and Sudan. Recent studies onpplication and validation of SEBAL include Pipunic et al. (2008)nd Teixeira et al. (2009).
Thus, the objective of this study was to apply remote sens-ng techniques to estimate the evaporative water use of differentand uses in the upper Thukela river basin (cf. Fig. 1) using pub-ic domain satellite images. The SEBAL methodology for computingotal evaporation on each pixel of a satellite image was appliedsing the Moderate Imaging Spectroradiometer (MODIS) images forhe period between June 2005 and September 2006. MODIS imagesave been archived since 1999 and are freely available throughhe National Aeronautics Space Administration (NASA) and have aaily coverage with pixel resolution of 1 km, with some bands hav-
ng a resolution of 250 and 500 m as well. Such a pixel resolutions well suited for monitoring fluxes at regional scale spanning toundreds of km2 and is thus considered appropriate for meso andiver basin scales as was in this study. This study builds on some
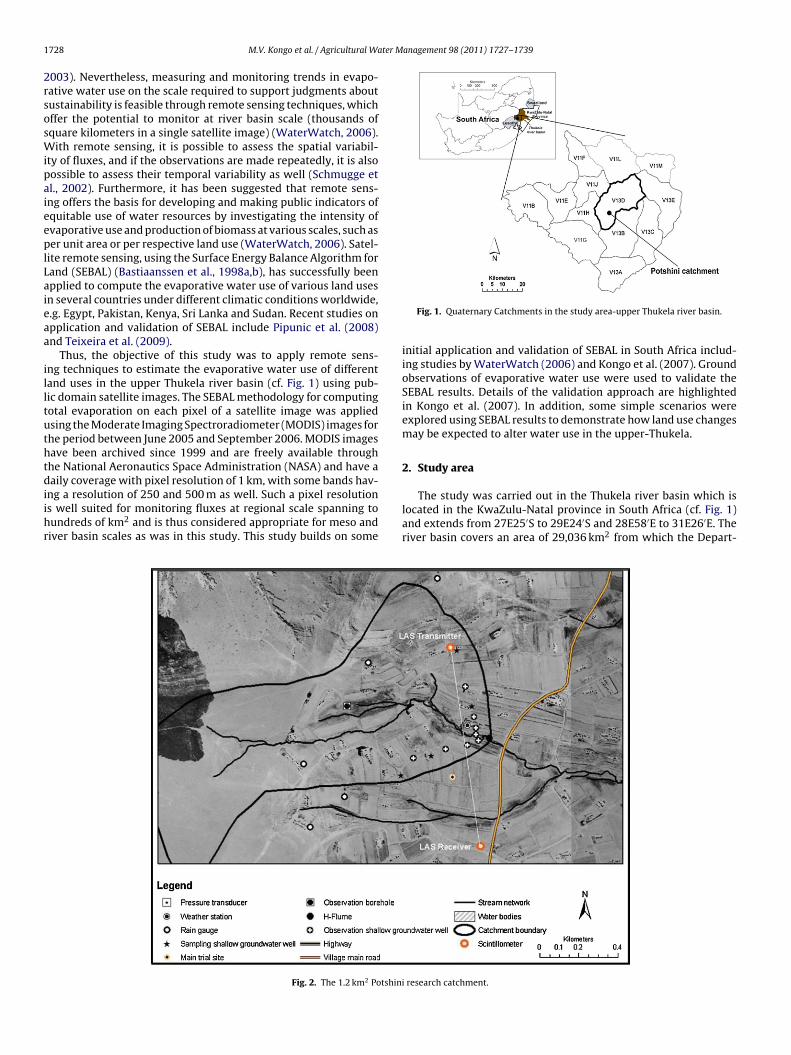
Fig. 2. The 1.2 km2 Potshin
Fig. 1. Quaternary Catchments in the study area-upper Thukela river basin.
initial application and validation of SEBAL in South Africa includ-ing studies by WaterWatch (2006) and Kongo et al. (2007). Groundobservations of evaporative water use were used to validate theSEBAL results. Details of the validation approach are highlightedin Kongo et al. (2007). In addition, some simple scenarios wereexplored using SEBAL results to demonstrate how land use changesmay be expected to alter water use in the upper-Thukela.
2. Study area
The study was carried out in the Thukela river basin which islocated in the KwaZulu-Natal province in South Africa (cf. Fig. 1)and extends from 27E25′S to 29E24′S and 28E58′E to 31E26′E. Theriver basin covers an area of 29,036 km2 from which the Depart-
i research catchment.
M.V. Kongo et al. / Agricultural Water Management 98 (2011) 1727– 1739 1729
uses in the study area.
moQ12btleoF
1iRgw
2
f2tdtar
3
ttn2Mtis
Table 1Land use classes in the study area (13 Quaternary Catchments with a total area of3028 km2).
Land use Area (km2) Percentage oftotal area (%)
Unimproved (natural) Grassland 2161.74 71.4Thicket, Bushland, Bush Clumps,High Fynbos
63.39 2.1
Cultivated, temporary, commercial,dryland
246.19 8.1
Cultivated, temporary, subsistence,dryland
214.92 7.1
Bare Rock and Soil (erosion: sheet) 0.56 < 0.1Urban/Built-up (smallholdings,grassland)
3.50 0.1
Bare Rock and Soil (erosion:dongas/gullies)
12.63 0.4
Wetlands 6.19 0.2Waterbodies 40.45 1.3Cultivated, temporary, commercial,irrigated
106.21 3.5
Degraded Unimproved (natural)Grassland
76.30 2.5
Urban/Built-up (residential) 2.27 <0.1Shrubland and Low Fynbos 23.61 0.7Urban/Built-up (residential, formalsuburbs)
1.37 <0.1
Urban/Built-up, (commercial,mercantile)
0.23 <0.1
Improved Grassland 1.04 <0.1Forest Plantations (Eucalyptusspp.)
35.53 1.2
Urban/Built-up (residential, formaltownship)
0.33 <0.1
Woodland (previously termedForest and Woodland)
0.33 <0.1
Forest Plantations (Other/mixedspp.)
5.72 0.2
Forest (indigenous) 12.30 0.4
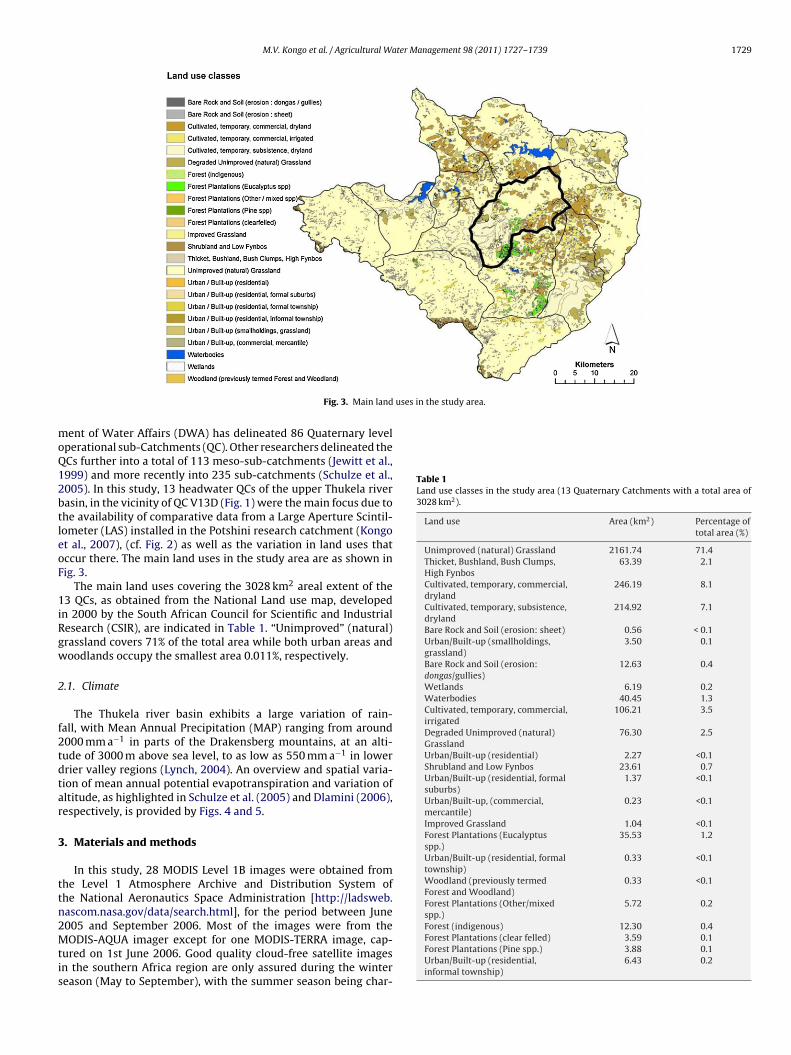
Fig. 3. Main land
ent of Water Affairs (DWA) has delineated 86 Quaternary levelperational sub-Catchments (QC). Other researchers delineated theCs further into a total of 113 meso-sub-catchments (Jewitt et al.,999) and more recently into 235 sub-catchments (Schulze et al.,005). In this study, 13 headwater QCs of the upper Thukela riverasin, in the vicinity of QC V13D (Fig. 1) were the main focus due tohe availability of comparative data from a Large Aperture Scintil-ometer (LAS) installed in the Potshini research catchment (Kongot al., 2007), (cf. Fig. 2) as well as the variation in land uses thatccur there. The main land uses in the study area are as shown inig. 3.
The main land uses covering the 3028 km2 areal extent of the3 QCs, as obtained from the National Land use map, developed
n 2000 by the South African Council for Scientific and Industrialesearch (CSIR), are indicated in Table 1. “Unimproved” (natural)rassland covers 71% of the total area while both urban areas andoodlands occupy the smallest area 0.011%, respectively.
.1. Climate
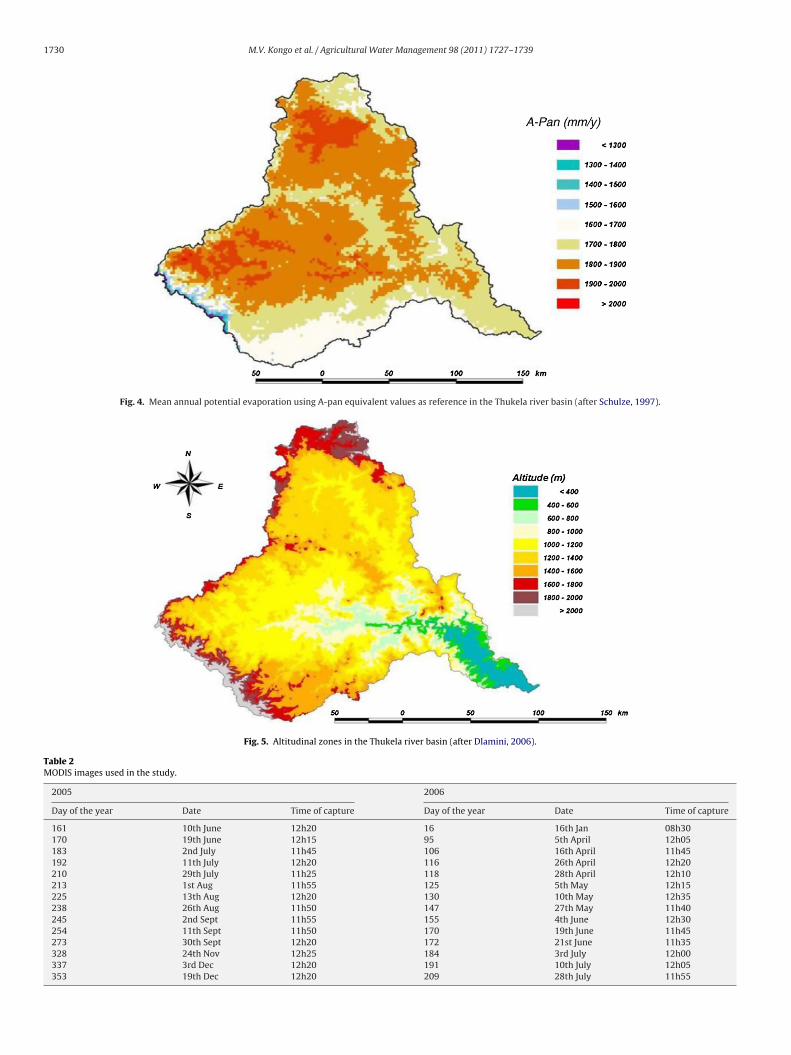
The Thukela river basin exhibits a large variation of rain-all, with Mean Annual Precipitation (MAP) ranging from around000 mm a−1 in parts of the Drakensberg mountains, at an alti-ude of 3000 m above sea level, to as low as 550 mm a−1 in lowerrier valley regions (Lynch, 2004). An overview and spatial varia-ion of mean annual potential evapotranspiration and variation ofltitude, as highlighted in Schulze et al. (2005) and Dlamini (2006),espectively, is provided by Figs. 4 and 5.
. Materials and methods
In this study, 28 MODIS Level 1B images were obtained fromhe Level 1 Atmosphere Archive and Distribution System ofhe National Aeronautics Space Administration [http://ladsweb.ascom.nasa.gov/data/search.html], for the period between June005 and September 2006. Most of the images were from the
ODIS-AQUA imager except for one MODIS-TERRA image, cap-ured on 1st June 2006. Good quality cloud-free satellite imagesn the southern Africa region are only assured during the wintereason (May to September), with the summer season being char-
Forest Plantations (clear felled) 3.59 0.1Forest Plantations (Pine spp.) 3.88 0.1Urban/Built-up (residential,informal township)
6.43 0.2
1730 M.V. Kongo et al. / Agricultural Water Management 98 (2011) 1727– 1739
Fig. 4. Mean annual potential evaporation using A-pan equivalent values as reference in the Thukela river basin (after Schulze, 1997).
Fig. 5. Altitudinal zones in the Thukela river basin (after Dlamini, 2006).
Table 2MODIS images used in the study.
2005 2006
Day of the year Date Time of capture Day of the year Date Time of capture
161 10th June 12h20 16 16th Jan 08h30170 19th June 12h15 95 5th April 12h05183 2nd July 11h45 106 16th April 11h45192 11th July 12h20 116 26th April 12h20210 29th July 11h25 118 28th April 12h10213 1st Aug 11h55 125 5th May 12h15225 13th Aug 12h20 130 10th May 12h35238 26th Aug 11h50 147 27th May 11h40245 2nd Sept 11h55 155 4th June 12h30254 11th Sept 11h50 170 19th June 11h45273 30th Sept 12h20 172 21st June 11h35328 24th Nov 12h25 184 3rd July 12h00337 3rd Dec 12h20 191 10th July 12h05353 19th Dec 12h20 209 28th July 11h55
ter M
ataio
3
1FosS((siamatttqwAscsi
3
ctps
�
w(fltast
arBrmcMTb
E
wfmov
M.V. Kongo et al. / Agricultural Wa
cterized by haze, clouds and rainfall. This was the case duringhe months of February and March 2006, when all MODIS (AQUAnd TERRA) satellite images covering the study area were contam-nated with clouds. Table 2 shows the date of acquisition and timef capture of the 28 MODIS images used in the study.
.1. Field measurements
Hydro-meteorological parameters were monitored in the.2 km2 Potshini research catchment (E 29.3679◦, S 28.8145◦) (cf.ig. 2) located in QC V13D in the upper Thukela river basin, andperated by the University of KwaZulu-Natal; School of Biore-ources Engineering and Environmental Hydrology as part of themallholder Water System Innovations (SSI) research programmeKongo and Jewitt, 2006). A Large Aperture Scintillometer (LAS)Scintec BLS 900), installed over a transect of 1.03 km, for mea-uring sensible heat flux, and subsequently determination of thentegral total evaporation along the path using the energy balancepproach, formed part of the monitoring equipment in the catch-ent as indicated in Fig. 2. The net radiation and soil heat flux were
lso measured in the catchment thus enabling the computation ofhe latent heat flux, and subsequently actual ET, as a residual ofhe surface energy balance equation. The structure and details ofhe surface energy balance equation are highlighted in the subse-uent section. The ET measurements from the field were comparedith SEBAL results as discussed in the results section of this paper.
detailed account on the installation and measurement of sen-ible heat flux using the LAS in the Potshini research catchment,omputation of actual ET from the various field measurements andubsequent validation of SEBAL in the Potshini research catchments reported in Kongo et al. (2007).
.2. The Surface Energy Balance Algorithm for Land
The SEBAL protocol comprise several steps for computing aomplete radiation and surface energy balance along with the resis-ances for momentum, heat and water vapour transport for eachixel of a satellite image (Bastiaanssen, 2000). Eq. (1) describes theurface energy balance, the basis of the SEBAL methodology.
E = Rn − G0 − H (1)
here �E is the latent heat flux (W m−2), Rn is the net radiationW m−2), G0 is the soil heat flux (W m−2) and H is the sensible heatux (W m−2). The latent heat flux is the amount of energy usedo evaporate water from surfaces including vegetative landscapesnd is calculated as a residual term of the energy balance on theurface. SEBAL requires satellite images with spectral radiance inhe visible, near-infrared and thermal infrared part of the spectrum.
In addition to satellite images, the SEBAL methodology requires limited number of weather parameters including wind speed,elative humidity and air temperature (Bastiaanssen et al., 1998a;astiaanssen, 2000). The surface albedo, surface temperature andelevant vegetation indices were derived from satellite measure-ents of surface reflectance and emissions after a geometrical
orrection process of seven reflective and two thermal bands of theODIS images, and were used together to solve for Rn, G0 and H.
he evaporative fraction, �, was computed from the surface energyalance at satellite overpass on all pixels as indicated in Eq. (2).
F = � = �E
Rn − G0= �E
�E + H= 1
1 + ˇ(2)
here ̌ is the Bowen ratio (H/�E). Computation of evaporative
raction is the last step in the SEBAL algorithm from which otheroisture indicators are derived. The advantage of using the evap-rative fraction over the Bowen ratio is that the former shows lessariation during the day time than the Bowen ratio (Farah and
anagement 98 (2011) 1727– 1739 1731
Bastiaanssen, 2001; Mohamed et al., 2004). The difference betweenthe instantaneous evaporative fraction at satellite overpass and theevaporative fraction derived from the 24-h integrated energy bal-ance is marginal and may be neglected (Brutsaert and Sugita, 1992;Crago, 1996; Farah, 2001; Farah et al., 2004). For time scales of 1day or longer, G0 can be ignored and net available energy (Rn − G0)reduces to net radiation (Rn) (Ahmad, 2002). At daily time scales,ET24 (mm day−1) can be computed as:
ET24 = 86400 × 103
��w�Rn24 (3)
where Rn24 (W m−2) is the 24-h averaged net radiation, � (J kg−1)is the latent heat of vaporization, and �w (kg m−3) is the density offresh water.
3.3. Monthly ET
The computation of the monthly ET involves extrapolating theSEBAL daily ET, within a particular month, proportionally to thepotential ET (Penman-Monteith) where the latter is derived fromstandard meteorological measurements. The fact that the potentialET is from a specific point in the image and does not represent theactual condition at each pixel is not significant for the extrapolationof the daily ET image in time since the potential ET is only used asan index of the relative change in weather (both potential ET andactual ET) for the area covered by the image (Morse et al., 2000).The procedure involves determining the cumulative potential ETbetween successive satellite images before computing the ratio,(Km), of the cumulative potential ET to the average potential ETover the period. The monthly ET, (ETmonthly), was then computed asfollows:
ETmonthly =i=n∑
i=1
(ETSEBAL)i(Km)i (4)
where ETSEBAL is the daily ET image, Km is a multiplication factorfor the representative period and n is the number of ET imagesprocessed in the respective month.
3.4. Land use change scenario analysis
The possible impact of land use change on water resources inthe study area was analyzed through a scenarios analysis (cf. Sec-tion 5.5). The scenarios centered on the possibility of expanding theforestry and agricultural land uses by 10% and subsequently deter-mining the respective change, between the baseline and scenarioland use, in volumetric evaporative water use. The volumetric evap-orative water use was computed by multiplying the areal extent ofa land use and its corresponding total evaporation rate as derivedfrom the SEBAL analysis.
4. Results and discussion
Fig. 6 shows the spatial variation of total evaporation in theThukela river basin on 1st August 2005, an output of the SEBALmethodology, with the daily ET varying from less than 1 to5.3 mm d−1. Relatively high ET was observed in the high altituderegions (cf. Fig. 5) which are naturally dominated by vegetative landcover. It is noteworthy that the ET images, the product of the SEBALanalysis, had a pixel resolution of 1 km and hence land uses withareal extents of less than 1 km2 (cf. Table 1) were not considered inthis analysis.
The time of capture of 9 out of the 28 images coincided withfield measurements of ET at the Potshini catchment using the LargeAperture Scintillometer (LAS) together with Penman-Monteithestimates of potential ET estimated using the FAO-56 method

1732 M.V. Kongo et al. / Agricultural Water M
F2
(iAte1temwstgd
grsli
ig. 6. Spatial variation of total evaporation in the Thukela river basin on 1st August005.
Allen et al., 1998) derived from weather parameters measuredn a weather station located in the Potshini research catchment.
detailed account on the installation and subsequent analysis ofhe LAS data in the Potshini catchment is highlighted in Kongot al. (2007). The SEBAL ET estimates, derived from the MODIS
km × 1 km pixel images, that coincided with the 1.03 km LASransect in the catchment, together with the Penman-Monteithstimates of potential ET, were compared with the LAS measure-ents of ET as indicated in Fig. 7. The land use along the LAS transectas mainly smallholder farming, the dominant land use in the Pot-
hini catchment (Kongo et al., 2006b). Crops are only grown duringhe wet summer season (October to April) with livestock freelyrazing on the smallholder farms during the dry winter season thusepleting the standing hay and crop residues on the farms.
The SEBAL results showed fair to good agreement with theround measurement in the Potshini catchment, with a deviation
ange of between −14% and +26% relative to the ground (LAS) mea-urements, with the actual ET obtained from LAS and SEBAL beingess than the potential evapotranspiration on most of the days asndicated in Fig. 7.Fig. 7. Comparison of LAS and SEBAL with reference ET results in
anagement 98 (2011) 1727– 1739
The lowest ET rate of less than 1 mm d−1 was observed in themonth of July, which is the coldest month in the study area. Thewinter season (May to September) is characterized by dry weatherconditions and high wind speeds especially starting from June,as indicated in Fig. 7. Windy conditions increase the atmosphericdemand of moisture as evident in the increase in potential ETwith respect to wind speed as indicated in Fig. 7. Wind speeds ofmore than 8m s−1 have previously been recorded in the catchment(Kongo et al., 2007).
4.1. Estimating evaporative water use of different land uses
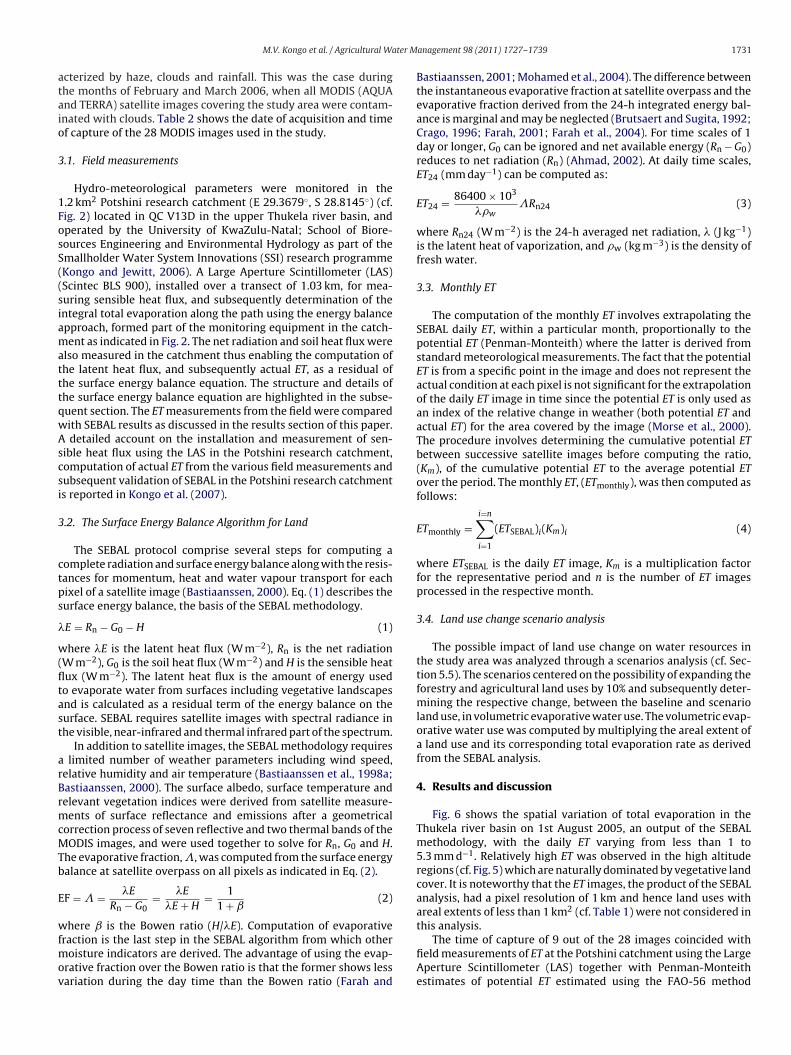
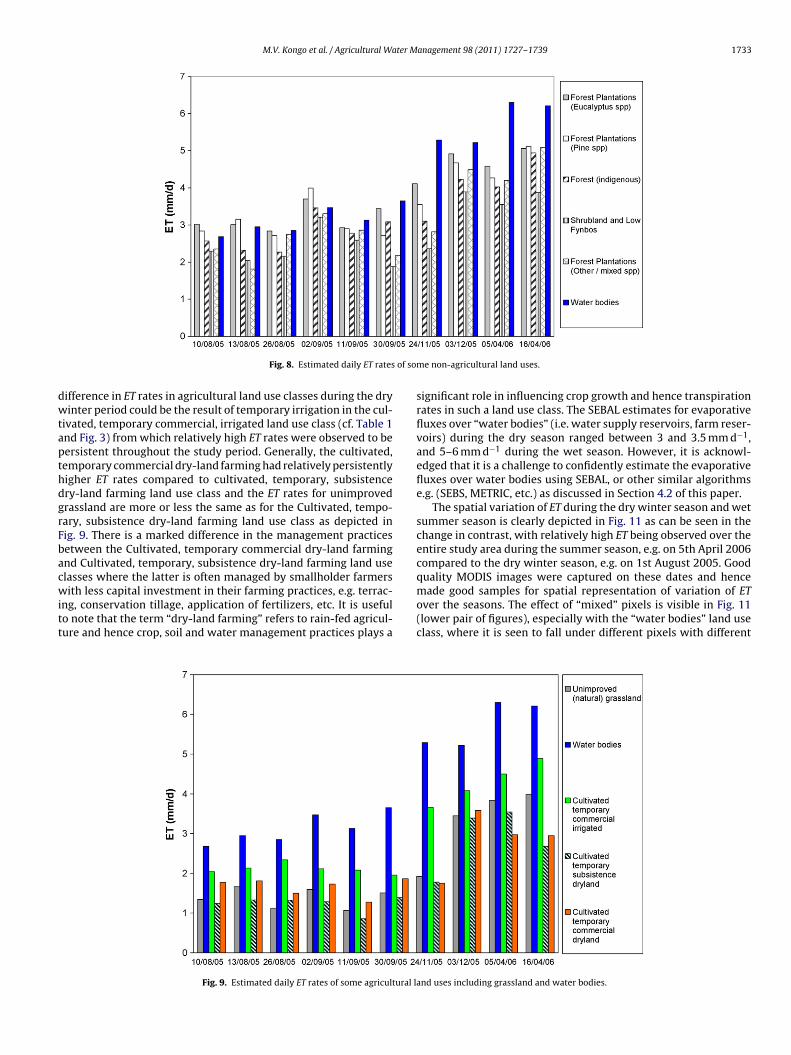
The evaporative water use of various land uses in the upperThukela river basin was then assessed, at different spatial andtemporal scales, using the ET images derived from the SEBALmethodology as described in Section 3.2. Seventeen out of thetwenty four land use classes in the study area were analyzed fortheir evaporative water use. Fig. 8 shows actual evaporation fromfive non-agricultural land use classes in the study area, mainlyforests, while Fig. 9 shows ET from agricultural land uses and grass-land for some of the days between August 2005 and April 2006.
Unfortunately, all images for the months of October, January,February and March were contaminated with clouds over the studyarea hence these months are not part of the analysis presentedherein. Only one good quality MODIS image for each month wasavailable for SEBAL analysis during November and December. Therainy season in the Thukela river basin starts in October and endsin April (summer), and total evaporation is expected to peak in thisperiod. This is illustrated in Fig. 10 where Penman-Monteith esti-mates of potential ET (FAO-56) over the same time period (Octoberto April) is highest with the maximum values being observed inJanuary and December.
The evaporative water use results (Fig. 8), particularly in thewet season, highlights the different water use characteristics of theforest vegetation types, in particular the higher water use by thecommercial forestry species relative to those which occur natu-rally. Another reason for the difference in water use among the
forestry land use classes during the wet summer season could bethe contribution of interception to the total evaporation rates withthe canopy structure of the respective forest types playing a crucialrole in this regard. Likewise, from Fig. 9, the probable reason for thethe Potshini catchment (adapted from Kongo et al., 2007).
M.V. Kongo et al. / Agricultural Water Management 98 (2011) 1727– 1739 1733
of som
dwtapthdgrFbacwitt
Fig. 8. Estimated daily ET rates
ifference in ET rates in agricultural land use classes during the dryinter period could be the result of temporary irrigation in the cul-
ivated, temporary commercial, irrigated land use class (cf. Table 1nd Fig. 3) from which relatively high ET rates were observed to beersistent throughout the study period. Generally, the cultivated,emporary commercial dry-land farming had relatively persistentlyigher ET rates compared to cultivated, temporary, subsistencery-land farming land use class and the ET rates for unimprovedrassland are more or less the same as for the Cultivated, tempo-ary, subsistence dry-land farming land use class as depicted inig. 9. There is a marked difference in the management practicesetween the Cultivated, temporary commercial dry-land farmingnd Cultivated, temporary, subsistence dry-land farming land uselasses where the latter is often managed by smallholder farmersith less capital investment in their farming practices, e.g. terrac-
ng, conservation tillage, application of fertilizers, etc. It is usefulo note that the term “dry-land farming” refers to rain-fed agricul-ure and hence crop, soil and water management practices plays a
Fig. 9. Estimated daily ET rates of some agricultural l
e non-agricultural land uses.
significant role in influencing crop growth and hence transpirationrates in such a land use class. The SEBAL estimates for evaporativefluxes over “water bodies” (i.e. water supply reservoirs, farm reser-voirs) during the dry season ranged between 3 and 3.5 mm d−1,and 5–6 mm d−1 during the wet season. However, it is acknowl-edged that it is a challenge to confidently estimate the evaporativefluxes over water bodies using SEBAL, or other similar algorithmse.g. (SEBS, METRIC, etc.) as discussed in Section 4.2 of this paper.
The spatial variation of ET during the dry winter season and wetsummer season is clearly depicted in Fig. 11 as can be seen in thechange in contrast, with relatively high ET being observed over theentire study area during the summer season, e.g. on 5th April 2006compared to the dry winter season, e.g. on 1st August 2005. Goodquality MODIS images were captured on these dates and hencemade good samples for spatial representation of variation of ET
over the seasons. The effect of “mixed” pixels is visible in Fig. 11(lower pair of figures), especially with the “water bodies” land useclass, where it is seen to fall under different pixels with differentand uses including grassland and water bodies.

1734 M.V. Kongo et al. / Agricultural Water Management 98 (2011) 1727– 1739
t (the
Eacsv
Fig. 10. Daily potential evapotransiration (FAO-56) in the Potshini catchmen
T values, especially during the dry winter season. This could bettributed to the fact that some “water bodies” e.g. farm reservoirs,
hange size during the year, becoming smaller at the end of the dryeason, but the classified land use map remain the same, hence thealues shown in Figs. 8 and 9 are an average of wet and dried areasFig. 11. Spatial variation of ET in winter an
thick smooth line is a 15-day moving average over the observation period).
of such reservoirs. Otherwise the ET rate from “water bodies” andwetlands is likely to be higher.
A study by WaterWatch (2006) in the Inkomati basin in SouthAfrica showed that “water bodies” had relatively less evaporativewater use during the dry season than agricultural land uses, notably
d summer season in the study area.

M.V. Kongo et al. / Agricultural Water Management 98 (2011) 1727– 1739 1735
use fo
ifh(to
4
c(ailG(
Fig. 12. Evaporative water
rrigated crops. In this study, a similar observation was made in theorestry land use (cf. Fig. 8), where “water bodies” were observed toave relatively less evaporative water use in the dry winter seasonMay to September) but higher in the wet summer season. Again,his could be attributed to the effect of “mixed” pixels and variationf areal extent of “water bodies” with seasons.
.2. Uncertainties in ET estimates
There are different approaches documented in literature foromputing total evaporation from satellite data, e.g. SEBALBastiaanssen et al., 1998a,b), SEBS (Su, 2002), METRIC (Allen etl., 2005) among others. An overview of some of these approaches,
ncluding the uncertainties associated with each method, is high-ighted in Courault et al. (2005) and recently in Hong et al. (2009).enerally, the main sources of uncertainty are the accuracy of dataresolution) and the basis or philosophical configuration of the
Fig. 13. Evaporative water use for
r the month of June 2005.
respective method. In this study, for example, it was a challengeto confidently estimate the evaporative flux over “water bodies”land use class given the fact that the MODIS data sets used in thisstudy has a coarse resolution (1 km × 1 km) while the land use mapwas developed from Landsat images of 30 m resolution.
SEBAL, especially the public domain version, like other similaralgorithms e.g. SEBS, METRIC which are based on the solving ofthe surface energy balance equation provide more accurate esti-mates of actual ET over land surfaces compared to “water bodies”.This is mainly attributed to the fact that it is a challenge to esti-mate and validate the heat storage in “water bodies”. SEBAL usesthe relationship between two anchor pixels, the “wet” and “dry”pixels (Bastiaanssen et al., 1998a,b; Bastiaanssen, 2000), to extract
threshold values for use, in an iterative process, for computing thesensible heat flux and the selection of these anchor pixels requiressome experience. The sensible heat flux is a very important com-ponent of the energy balance (cf. Eq. (1)) and its computation formsthe month of August 2005.
1736 M.V. Kongo et al. / Agricultural Water Management 98 (2011) 1727– 1739
se dur
tett
4
aygwoaei
ms2mwtc1w(uwmsmufsmuiIwe
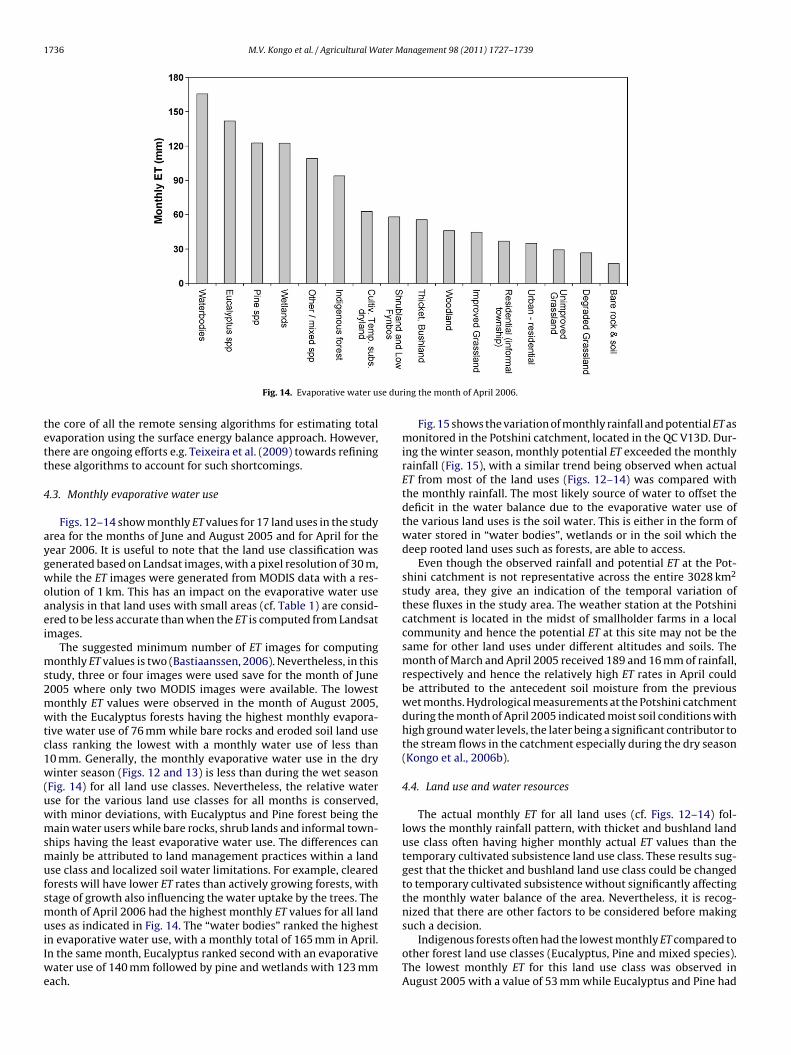
Fig. 14. Evaporative water u
he core of all the remote sensing algorithms for estimating totalvaporation using the surface energy balance approach. However,here are ongoing efforts e.g. Teixeira et al. (2009) towards refininghese algorithms to account for such shortcomings.
.3. Monthly evaporative water use
Figs. 12–14 show monthly ET values for 17 land uses in the studyrea for the months of June and August 2005 and for April for theear 2006. It is useful to note that the land use classification wasenerated based on Landsat images, with a pixel resolution of 30 m,hile the ET images were generated from MODIS data with a res-
lution of 1 km. This has an impact on the evaporative water usenalysis in that land uses with small areas (cf. Table 1) are consid-red to be less accurate than when the ET is computed from Landsatmages.
The suggested minimum number of ET images for computingonthly ET values is two (Bastiaanssen, 2006). Nevertheless, in this
tudy, three or four images were used save for the month of June005 where only two MODIS images were available. The lowestonthly ET values were observed in the month of August 2005,ith the Eucalyptus forests having the highest monthly evapora-
ive water use of 76 mm while bare rocks and eroded soil land uselass ranking the lowest with a monthly water use of less than0 mm. Generally, the monthly evaporative water use in the dryinter season (Figs. 12 and 13) is less than during the wet season
Fig. 14) for all land use classes. Nevertheless, the relative waterse for the various land use classes for all months is conserved,ith minor deviations, with Eucalyptus and Pine forest being theain water users while bare rocks, shrub lands and informal town-
hips having the least evaporative water use. The differences canainly be attributed to land management practices within a land
se class and localized soil water limitations. For example, clearedorests will have lower ET rates than actively growing forests, withtage of growth also influencing the water uptake by the trees. Theonth of April 2006 had the highest monthly ET values for all land
ses as indicated in Fig. 14. The “water bodies” ranked the highest
n evaporative water use, with a monthly total of 165 mm in April.n the same month, Eucalyptus ranked second with an evaporativeater use of 140 mm followed by pine and wetlands with 123 mmach.
ing the month of April 2006.
Fig. 15 shows the variation of monthly rainfall and potential ET asmonitored in the Potshini catchment, located in the QC V13D. Dur-ing the winter season, monthly potential ET exceeded the monthlyrainfall (Fig. 15), with a similar trend being observed when actualET from most of the land uses (Figs. 12–14) was compared withthe monthly rainfall. The most likely source of water to offset thedeficit in the water balance due to the evaporative water use ofthe various land uses is the soil water. This is either in the form ofwater stored in “water bodies”, wetlands or in the soil which thedeep rooted land uses such as forests, are able to access.
Even though the observed rainfall and potential ET at the Pot-shini catchment is not representative across the entire 3028 km2
study area, they give an indication of the temporal variation ofthese fluxes in the study area. The weather station at the Potshinicatchment is located in the midst of smallholder farms in a localcommunity and hence the potential ET at this site may not be thesame for other land uses under different altitudes and soils. Themonth of March and April 2005 received 189 and 16 mm of rainfall,respectively and hence the relatively high ET rates in April couldbe attributed to the antecedent soil moisture from the previouswet months. Hydrological measurements at the Potshini catchmentduring the month of April 2005 indicated moist soil conditions withhigh ground water levels, the later being a significant contributor tothe stream flows in the catchment especially during the dry season(Kongo et al., 2006b).
4.4. Land use and water resources
The actual monthly ET for all land uses (cf. Figs. 12–14) fol-lows the monthly rainfall pattern, with thicket and bushland landuse class often having higher monthly actual ET values than thetemporary cultivated subsistence land use class. These results sug-gest that the thicket and bushland land use class could be changedto temporary cultivated subsistence without significantly affectingthe monthly water balance of the area. Nevertheless, it is recog-nized that there are other factors to be considered before makingsuch a decision.
Indigenous forests often had the lowest monthly ET compared toother forest land use classes (Eucalyptus, Pine and mixed species).The lowest monthly ET for this land use class was observed inAugust 2005 with a value of 53 mm while Eucalyptus and Pine had
M.V. Kongo et al. / Agricultural Water Management 98 (2011) 1727– 1739 1737
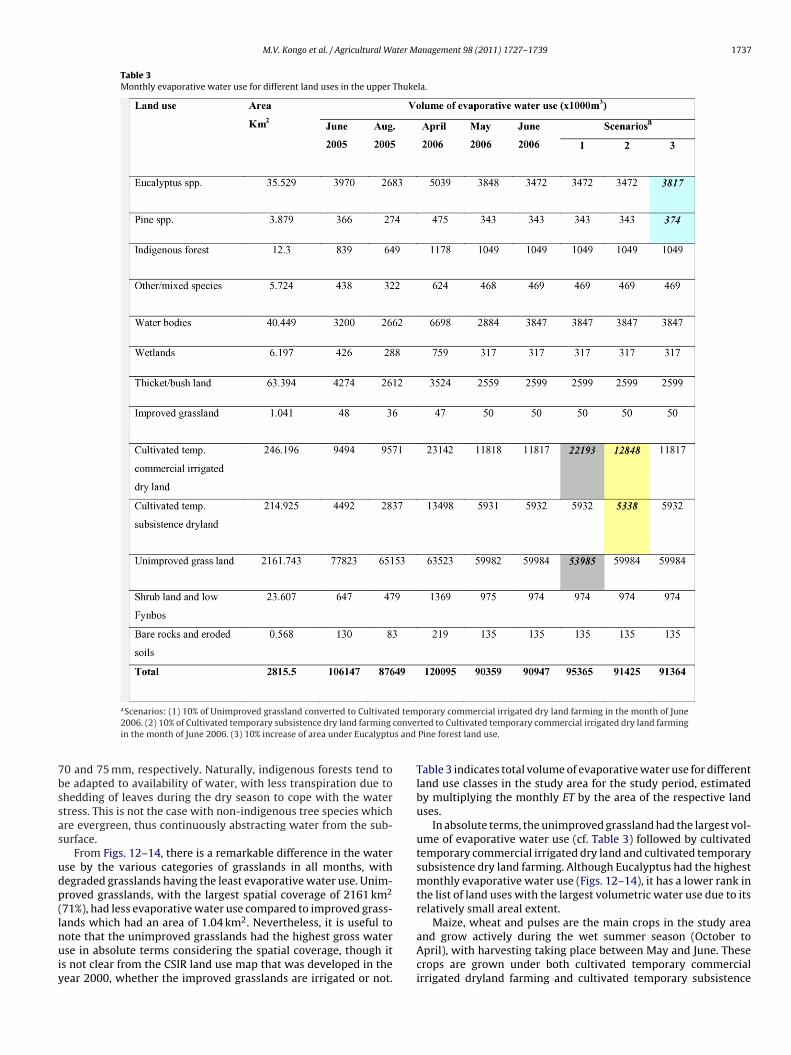
Table 3Monthly evaporative water use for different land uses in the upper Thukela.
a d temconves and
7bssas
udp(lnuiy
Scenarios: (1) 10% of Unimproved grassland converted to Cultivate2006. (2) 10% of Cultivated temporary subsistence dry land farming
in the month of June 2006. (3) 10% increase of area under Eucalyptu
0 and 75 mm, respectively. Naturally, indigenous forests tend toe adapted to availability of water, with less transpiration due tohedding of leaves during the dry season to cope with the watertress. This is not the case with non-indigenous tree species whichre evergreen, thus continuously abstracting water from the sub-urface.
From Figs. 12–14, there is a remarkable difference in the waterse by the various categories of grasslands in all months, withegraded grasslands having the least evaporative water use. Unim-roved grasslands, with the largest spatial coverage of 2161 km2
71%), had less evaporative water use compared to improved grass-ands which had an area of 1.04 km2. Nevertheless, it is useful to
ote that the unimproved grasslands had the highest gross waterse in absolute terms considering the spatial coverage, though its not clear from the CSIR land use map that was developed in theear 2000, whether the improved grasslands are irrigated or not.
porary commercial irrigated dry land farming in the month of Junerted to Cultivated temporary commercial irrigated dry land farmingPine forest land use.
Table 3 indicates total volume of evaporative water use for differentland use classes in the study area for the study period, estimatedby multiplying the monthly ET by the area of the respective landuses.
In absolute terms, the unimproved grassland had the largest vol-ume of evaporative water use (cf. Table 3) followed by cultivatedtemporary commercial irrigated dry land and cultivated temporarysubsistence dry land farming. Although Eucalyptus had the highestmonthly evaporative water use (Figs. 12–14), it has a lower rank inthe list of land uses with the largest volumetric water use due to itsrelatively small areal extent.
Maize, wheat and pulses are the main crops in the study area
and grow actively during the wet summer season (October toApril), with harvesting taking place between May and June. Thesecrops are grown under both cultivated temporary commercialirrigated dryland farming and cultivated temporary subsistence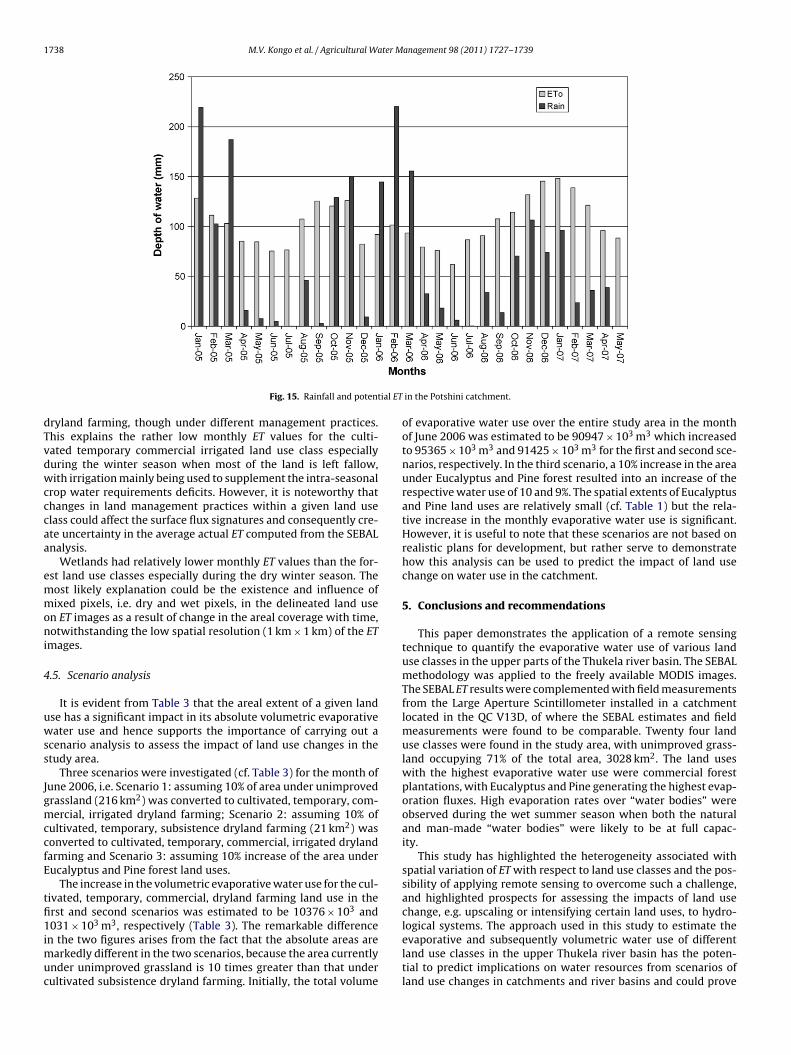
1738 M.V. Kongo et al. / Agricultural Water Management 98 (2011) 1727– 1739
ial ET
dTvdwcccaa
emmoni
4
uwss
JgmccfE
tfi1imuc
Fig. 15. Rainfall and potent
ryland farming, though under different management practices.his explains the rather low monthly ET values for the culti-ated temporary commercial irrigated land use class especiallyuring the winter season when most of the land is left fallow,ith irrigation mainly being used to supplement the intra-seasonal
rop water requirements deficits. However, it is noteworthy thathanges in land management practices within a given land uselass could affect the surface flux signatures and consequently cre-te uncertainty in the average actual ET computed from the SEBALnalysis.
Wetlands had relatively lower monthly ET values than the for-st land use classes especially during the dry winter season. Theost likely explanation could be the existence and influence ofixed pixels, i.e. dry and wet pixels, in the delineated land use
n ET images as a result of change in the areal coverage with time,otwithstanding the low spatial resolution (1 km × 1 km) of the ET
mages.
.5. Scenario analysis
It is evident from Table 3 that the areal extent of a given landse has a significant impact in its absolute volumetric evaporativeater use and hence supports the importance of carrying out a
cenario analysis to assess the impact of land use changes in thetudy area.
Three scenarios were investigated (cf. Table 3) for the month ofune 2006, i.e. Scenario 1: assuming 10% of area under unimprovedrassland (216 km2) was converted to cultivated, temporary, com-ercial, irrigated dryland farming; Scenario 2: assuming 10% of
ultivated, temporary, subsistence dryland farming (21 km2) wasonverted to cultivated, temporary, commercial, irrigated drylandarming and Scenario 3: assuming 10% increase of the area underucalyptus and Pine forest land uses.
The increase in the volumetric evaporative water use for the cul-ivated, temporary, commercial, dryland farming land use in therst and second scenarios was estimated to be 10376 × 103 and031 × 103 m3, respectively (Table 3). The remarkable difference
n the two figures arises from the fact that the absolute areas arearkedly different in the two scenarios, because the area currently
nder unimproved grassland is 10 times greater than that underultivated subsistence dryland farming. Initially, the total volume
in the Potshini catchment.
of evaporative water use over the entire study area in the monthof June 2006 was estimated to be 90947 × 103 m3 which increasedto 95365 × 103 m3 and 91425 × 103 m3 for the first and second sce-narios, respectively. In the third scenario, a 10% increase in the areaunder Eucalyptus and Pine forest resulted into an increase of therespective water use of 10 and 9%. The spatial extents of Eucalyptusand Pine land uses are relatively small (cf. Table 1) but the rela-tive increase in the monthly evaporative water use is significant.However, it is useful to note that these scenarios are not based onrealistic plans for development, but rather serve to demonstratehow this analysis can be used to predict the impact of land usechange on water use in the catchment.
5. Conclusions and recommendations
This paper demonstrates the application of a remote sensingtechnique to quantify the evaporative water use of various landuse classes in the upper parts of the Thukela river basin. The SEBALmethodology was applied to the freely available MODIS images.The SEBAL ET results were complemented with field measurementsfrom the Large Aperture Scintillometer installed in a catchmentlocated in the QC V13D, of where the SEBAL estimates and fieldmeasurements were found to be comparable. Twenty four landuse classes were found in the study area, with unimproved grass-land occupying 71% of the total area, 3028 km2. The land useswith the highest evaporative water use were commercial forestplantations, with Eucalyptus and Pine generating the highest evap-oration fluxes. High evaporation rates over “water bodies” wereobserved during the wet summer season when both the naturaland man-made “water bodies” were likely to be at full capac-ity.
This study has highlighted the heterogeneity associated withspatial variation of ET with respect to land use classes and the pos-sibility of applying remote sensing to overcome such a challenge,and highlighted prospects for assessing the impacts of land usechange, e.g. upscaling or intensifying certain land uses, to hydro-logical systems. The approach used in this study to estimate the
evaporative and subsequently volumetric water use of differentland use classes in the upper Thukela river basin has the poten-tial to predict implications on water resources from scenarios ofland use changes in catchments and river basins and could prove
ter M
umstEirstauttteat
A
h(AnDnIat
R
A
A
A
B
B
B
B
B
B
C
C
M.V. Kongo et al. / Agricultural Wa
seful in water resources planning. In particular, the ability to esti-ate the spatial variation of ET over large spatial extents using
atellite images adds value to this approach. However, the uncer-ainty associated with low resolution satellite images in mappingT over small areal extents is still a challenge as illustrated by therregular results from wetlands and “water bodies”. Thus, this studyecommends the use of high resolution satellite images to improveuch an analysis even though the inherent poor temporal resolu-ion associated with such images may affect the overall goal of such
study with regard to depicting the variation of evaporative waterse over time. Finally, it would be prudent to concurrently measurehe evaporative water use of at least two land uses, e.g. using scin-illometers installed in these land uses, and compare results withhe corresponding estimates derived from satellite images. How-ver, it is acknowledged that the cost associated with obtainingnd or installing scintillometers is high and may not be affordableo many.
cknowledgements
The work reported here was undertaken as part of the Small-older System Innovations in Integrated Watershed ManagementSSI) Programme funded by the Netherlands Foundation for thedvancement of Tropical Research (WOTRO), the Swedish Inter-ational Development Cooperation Agency (SIDA), the Netherlandsirectorate-General of Development Cooperation (DGIS), the Inter-ational Water Management Institute (IWMI) and UNESCO-IHE
nstitute for Water Education and Stockholm University (SU). Welso acknowledge the support of Wim Bastiaanssen, especially athe initial stages of this study.
eferences
hmad, M.D., 2002. Estimation of net groundwater use in irrigated river basins usinggeo-information techniques: a case study in Rechna Doab, Pakistan. Ph.D. Thesis.Wageningen University, the Netherlands.
llen, R.G., Tasumi, M., Morse, A., Trezza, R., 2005. A landsat-based energy bal-ance and evapotranspiration model in Western US water rights regulation andplanning. Journal of Irrigation and Drainage Systems 19, 251–268.
llen, R.G., Pereira, L.S., Raes, D., Smith, M., 1998. Crop Evapotranspiration—Guidelines for Computing Crop Water Requirements—FAO Irrigation andDrainage Paper, 56. FAO, Rome.
astiaanssen, W.G.M., Menenti, M., Feddes, R.A., Holtslag, A.A.M., 1998a. A remotesensing Surface Energy Balance Algorithm for Land (SEBAL), Part 1: formulation.Journal of Hydrology 212–213, 198–212.
astiaanssen, W.G.M., Pelgrum, H., Wang, J., Ma, Y., Moreno, J., Roerink, G.J., van derWal, T., 1998b. The Surface Energy Balance Algorithm for Land (SEBAL), Part 2:validation. Journal of Hydrology 212–213, 213–229.
astiaanssen, W.G.M., 2000. SEBAL-based sensible and latent heat fluxes in the irri-gated Gediz Basin, Turkey. Journal of Hydrology 229, 87–100.
astiaanssen, W.G.M., Chandrapala, L., 2003. Water balance variability across SriLanka for assessing agricultural and environmental water use. AgriculturalWater Management 58, 171–192.
astiaanssen, W.M.G., 2006. Personal communication. WaterWatch. Wageningen.Netherlands.
rutsaert, W., Sugita, M., 1992. Application of self-preservation in the diurnal evo-lution of the surface energy budget to determine daily evaporation. Journal ofGeophysical Research 97 (D17) 18,322–18,377.
rago, R.D., 1996. Conservation and variability of the evaporative fraction during theday time. Journal of Hydrology 180, 173–194.
ourault, D., Seguin, B., Olioso, A., 2005. Review on estimation of evapotranspirationfrom remote sensing data: from empirical to numerical modeling approaches.Irrigation and Drainage Systems 19, 223–249.
anagement 98 (2011) 1727– 1739 1739
Dlamini, D.J.M., 2006. Application of the water poverty index in the Thukela riverbasin. Ph.D. thesis. School of Bioresources Engineering and EnvironmentalHydrology, University of KwaZulu-Natal, South Africa.
Farah, H.O., 2001. Estimation of regional evaporation using a detailed agro-hydrological model. Journal of Hydrology 229 (1–2), 50–58.
Farah, H.O., Bastiaanssen, W.M.G., 2001. Impact of spatial variation of land surfaceparameters on a regional evaporation: a case study with remote sensing data.Hydrological Processes 15, 1585–1607.
Farah, H.O., Bastiaanssen, W.G.M., Feddes, R.A., 2004. Evaluation of the temporalvariability of the evaporative fraction in a tropical watershed. InternationalJournal of Applied Earth Observation and Geoinformation 5, 129–140.
Hemakumara, H.M., Chandrapala, L., Moene, F.A., 2003. Evapotranspiration fluxesover mixed vegetation areas measured from large aperture scintillometer. Agri-cultural Water Management 58, 109–122.
Hong, S., Hendrickx, J.M.H., Borchers, B., 2009. Up-scaling of SEBAL derived evap-otranspiration maps from Landsat (30 m) to MODIS (250 m) scale. Journal ofHydrology 370, 122–138.
Jewitt, G.P.W., 2006. Integrating blue and green water flows for water resourcesmanagement and planning. Physics and Chemistry of the Earth 31, 753–762.
Jewitt, G.P.W., Taylor, V., Hallowes, J., 1999. Thukela Water Project: Hydrology Spe-cialist Study. Report to Institute of Natural Resources, Pietermaritzburg. Schoolof Bioresources Engineering and Environmental Hydrology, University of Natal,Pietermaritzburg, RSA.
Kongo, M.V., Jewitt, G.P.W., 2006. Preliminary investigation of catchment hydrologyin response to agricultural water use innovations: a case study of the Potshinicatchment—South Africa. Physics and Chemistry of the Earth 31, 976–987.
Kongo, M.V., Jewitt, G.P.W., Lorentz, S.A., 2006b. Surface and sub-surface water inter-actions in the Potshini catchment in South Africa. In: proceedings of the 7thWaterNet/WARFSA/GWP-SA symposium, 1st to 3rd November 2006, Lilongwe-Malawi.
Kongo, M.V., Jewitt, G.P.W., Lorentz, S.A., 2007. Application of the surface energybalance methodology for estimating total evaporation using scintillation andremote sensing techniques (SEBAL) in the Thukela river basin-S.Africa. In:proceedings of the IUGG XXIV General Assembly, 2nd to 13th July 2007, Perugia-Italy.
Lynch, S.D., 2004. Development of a Raster Database of Annual, Monthly and DailyRainfall for Southern Africa. WRC Report 1156/1/04. Water Research Commis-sion, Pretoria, South Africa.
Mohamed, Y.A., Bastiaanssen, W.G.M., Savenije, H.H.G., 2004. Spatial variability ofactual evaporation and soil moisture across the Sudd determined by SEBAL andthe impact on monthly water balances. Journal of Hydrology 289, 145–164.
Morse, A., Tasumi, M., Allen, R.G., Kramber, J.W., 2000. Application of the SEBALmethodology foe estimating consumptive use of water and stream flow deple-tion in the Bear River Basin of Idaho through remote sensing. Earth ObservationSystem Data and Information System Project report. The Raytheon SystemsCompany. Idaho, USA.
Pipunic, R.C., Walker, J.P., Western, A., 2008. Assimilation of remotely sensed datafor improved latent and sensible heat flux prediction: a comparative syntheticstudy. Remote Sensing of Environment 112, 1295–1305.
Rockström, J., Barron, J., Fox, P., 2001. Water productivity in rainfed agriculture:challenges and opportunities for smallholder farmers in drought-prone tropicalagro-systems. Paper presented at an IWMI Workshop on water productivityin agriculture. International Water Management Institute, Colombo, Sri Lanka.November 12–14, 2001.
Schulze, R.E., 1997. South African Atlas of Agrohydrology and climatology atlas. WRCReport TT82/96. Water Research Commission, Pretoria, South Africa. p. 276.
Schulze, R.E., Horan, M.J.C., Gray, R., 2005. Sensitivity studies of Hydrologicalresponses in the Thukela catchment to spatial and temporal representationswhen using a baseline and a projected future climate scenario. In: Schulze, R.E.(Ed.), Climate Change and Water Resources in Southern Africa: Studies on Sce-narios, Impacts, Vulnerabilities and Adaptation. Water Research Commission,Pretoria, RSA, WRC Report 1430/1/05. pp. 211–232.
Schmugge, T.J., Kustas, W.P., Ritchie, J.C., Jackson, T.J., Rango, Al, 2002. Remote sens-ing in hydrology. Advances in Water Resources 25, 1367–1385.
Su, Z., 2002. The Surface Energy Balance System (SEBS) for estimation of turbulentheat fluxes. Hydrology and Earth System Sciences 6, 85–99.
Teixeira, A.H.D.C., Bastiaanssen, W.G.M., Ahmad, M.D., Bos, M.G., 2009. ReviewingSEBAL input parameters for assessing evapotranspiration and water productiv-
ity for the Low-Middle São Francisco River basin, Brazil: Part A: calibration andvalidation. Agricultural and Forest Meteorology 149, 462–476.WaterWatch, 2006. Combining remote sensing and economic analysis to assesswater productivity. A demonstration project in the Inkomati Basin. Projectreport. WaterWatch, The Netherlands.