Evaluation Study on Rajiv Gandhi National Drinking Water ...
98
-
Upload
khangminh22 -
Category
Documents
-
view
1 -
download
0
Transcript of Evaluation Study on Rajiv Gandhi National Drinking Water ...


PEO Report No. 213
Evaluation Study
on
Rajiv Gandhi National Drinking Water Mission
(RGNDWM)
Programme Evaluation Organisation Planning Commission Government of India
New Delhi
November, 2010


Foreword
The Central Government introduced a variety of policies and programs throughout the Five Year Plans to address the issue of drinking water. The first ever national water supply and sanitation program was introduced during 1951-56 as part of the Government health plan. The states gradually built up the Public Health Engineering Department (PHED) to tackle the problem of rural water supply and sanitation. In spite of this, it was found during the mid-1960s that majority of the schemes were being implemented in the easily accessible villages, neglecting remote villages with severe water scarcity. The Central Government requested the States to identify these problem villages and make special plan for them.
The first major push to rural water supply came with the Accelerated Rural Water Supply Programme (ARWSP) in the 1970s, which gave full grant to the State Governments for implementing water supply schemes in problem villages. By March 1981, the coverage of rural water supply was 30.8 per cent. Following the International Drinking Water Supply & Sanitation Decade (IDWSSD-1981-91), the second major push came with the launching of the National Drinking Water Mission (NDWM) that was later renamed as Rajiv Gandhi National Drinking Water Mission (RGNDWM). The Mission issued comprehensive guidelines for ARWSP (1986), helped formulate National Water Policies (1987 and 2002) and introduced the sector Reform Project (SRP) in 1999. The focus of the RGNDWM was to adopt a community based demand-driven approach instead of the hitherto government forced supply driven approach. In doing so, the projects under RGNDWM are basically oriented towards community participation with a part (minimum of 10%) of the capital cost required to be borne by the community themselves. The balance amount is contributed by the Central Government.
In order to accomplish the envisaged objective of any scheme/programme, it is essential to put in place a mechanism for regular monitoring and evaluation at recurrently close intervals. In keeping with the importance of the mission, a comprehensive evaluation study of RGNDWM was initiated by the Programme Evaluation Organization.
Among the 5 selected states, Himachal Pradesh stands out as unique in the sense that almost all women (96%) have asserted their increased participation in the community activities. As regards the program's impact on children, an overwhelming majority of women(89%) have reported that on account of improved water supply(easier access and adequate availability), children have now more time set apart for study and


play, earlier devoted to helping them collect water. Overall, an overwhelming majority (96%) of the households have reported increased usage of water.
Government accords great importance to the objective of measuring outcomes so as to ensure that policies serve the purposes for which they were adopted. The role of the Programme Evaluation Organisation (PEO) is crucial in undertaking systematic studies to assess the degree of the effectiveness of programmes, primarily as an input to future policy. Evidence of sub-optimality suggests the need to draw lessons from observed weaknesses and redesign programmes accordingly. The Planning Commission proposes to strengthen this aspect of its activity in the years ahead.
November 18, 2010


Evaluation Study on Rajiv Gandhi National Drinking Water Mission
CONTENTS
Executive Summary
1. Introduction .................................................................... 1 1.1 Background ............................................................................... 1 1.2 Rajiv Gandhi National Drinking Water Mission ...................... 3 1.3 Critical Issues ............................................................................ 4 1.4 Objectives of the Study ............................................................. 5
2. Methodology ................................................................... 6 2.1 Sampling Plan ........................................................................... 6 2.2 Information Gathering ............................................................. 9 2.3 Training of Research Team Members ...................................... 11 2.4 Scheme of Data Analysis ........................................................... 11 2.5 Computation of Sustainability Index ....................................... 11 2.6 Summary of Fieldwork ............................................................. 13
3. Physical & Financial Progress .......................................... 14 3.1 Physical Progress ....................................................................... 14 3.2 Financial Progress .................................................................... 15
4. Respondents’ Profile — Household Survey ...................... 16 4.1 Respondents’ Profile — Household Survey .............................. 16
5. Access to Safe Drinking Water ......................................... 18 5.1 Access to Safe Drinking Water ................................................. 18 5.2 Parameters of Access to Drinking Water ................................. 19 5.3 Moving towards Tapped Water Supply .................................... 24 5.4 Alternate Sources of Drinking Water ....................................... 25
6. Water Quality .................................................................. 27 6.1 Water Quality ............................................................................ 27
7. Operation & Maintenance ................................................ 32 7.1 Functional Water Sources ........................................................ 32 7.2 Responsibility of O&M .............................................................. 33 7.3 Role of GPs in O&M of Water Supply System .......................... 34 7.4 Problems faced by Gram Panchayats ....................................... 36
8. Water Tariff .................................................................... 37 8.1 Water Tariff ......................................................................................... 38 8.2 Setting-up Water Tariff — Responsibility, Basis & Community Consultation......................................................................................... 40 8.3 Adequacy of Water Tariff in Meeting the O&M Cost ............... 40

Evaluation Study on Rajiv Gandhi National Drinking Water Mission
9. Community Participation/Existence of VWSC .................. 41 9.1 Community Participation/Existence of VWSC ........................ 41
10. Knowledge, Practice and IEC on Hygiene & Sanitation .... 44 10.1 Exposure to Awareness Campaigns .......................................... 44 10.2 Details of Awareness Campaigns .............................................. 45 10.3 Source of Information on Safe Drinking Water ....................... 47 10.4 Training of VWSC Members/Teachers on Hygiene Education 48 10.5 Awareness about Diseases Caused by Unhygienic Conditions 48 10.6 Availability of Toilets ................................................................ 49 10.7 Practice of Open Defecation ..................................................... 50 10.8 Garbage Collection & Disposal in Habitations ......................... 50 10.9 Cleanliness around the Water Sources ..................................... 50
11. Program Benefits/Impact on Rural Population ............... 52 11.1 Increased Availability of Water ................................................ 52 11.2 Increased Functional Water Sources/Reduced Breakdowns ... 52 11.3 Improvement in Environmental Sanitation ............................. 53 11.4 Reduction in Water Borne Diseases ......................................... 53 11.5 Improvement in Women’s Conditions ..................................... 53 11.6 Utilization of Time Saved ......................................................... 54 11.7 Improvement in Overall Health Status .................................... 55 11.8 Overall Performance of Water Sources .................................... 56
12. Sustainability .................................................................. 57 12.1 Composite Sustainability Index ................................................ 59 12.2 Aspects-wise Overall Sustainability Index ............................... 61 12.3 Rain Water Harvesting Structure ............................................. 62
13. Major Findings .................................................................. 64 13.1 Status of Fully Covered Habitations ......................................... 64 13.2 Access to Safe Drinking Water ................................................. 64 13.3 Water Quality ............................................................................ 66 13.4 Operation & Maintenance ........................................................ 68 13.5 Water Tariff ............................................................................... 69 13.6 Community Participation/Existence of VWSC ........................ 70 13.7 Knowledge, Practice and IEC on Hygiene & Sanitation .......... 70 13.8 Program Benefits/Impact on Rural Population ....................... 70 13.9 Sustainability ............................................................................ 72
14. Recommendations ............................................................ 74
15. Project Team ..................................................................... 76

Evaluation Study on Rajiv Gandhi National Drinking Water Mission
Preface
The national goal of achieving universal access of the mammoth rural population to adequate potable drinking water at a convenient location at all times is a daunting task. The major challenge is the availability of drinking water, both in term of adequacy and quality on a sustainable basis. The Government has undertaken various programs since independence to provide safe drinking water to the rural masses. Taking into account the magnitude of the possibilities, the Central Government, in an effort to deal the issues in a mission mode, launched in 1986, National Drinking Water Mission, later renamed as Rajiv Gandhi National Drinking Water Mission (RGNDWM) in 1991.
The Government is committed to ensure that the village communities have access to safe and reliable water supply and it is evident from the fact that since the beginning of the planned era of development, huge investment of about Rs. 72,600 crore has been made in the rural water supply sector under both State and Central Plans up to 2009.
In view of the importance of the Mission, the Programme Evaluation Organisation (PEO) of Planning Commission was entrusted to conduct an evaluation study on RGNDWM to assess the processes involved during implementation and the overall impact of the mission of the rural population.
Government accords great importance to the objective of measuring outcomes so as to ensure that policies are producing the desired results. The PEO provides a key input into this process by undertaking systematic evaluation studies, primarily to draw lessons that can be applied to ensure effectiveness of the future policy and programs.
The present evaluation study covered 240 habitations spread over 10 sample districts across five geographically representative study states and looked at the extent of coverage, access and the overall impact of the Mission on the rural habitations, especially on women.
The supply of safe drinking water and provision of sanitation are the two most important contributing factors for improving the health of the people in the country.
The main findings of this evaluation study on the basis of drawn samples are:
• 93% of the rural population at present has access to safe drinking water in the covered states.
• 66% of the households having access to safe drinking water source are getting round the year supply of drinking water.
• It is encouraging to note that an overwhelming majority of the households (93%) have reported their satisfaction with the water quality.
• 70% of the handpumps and 91% of the tapped water supply sources in the sample villages were functional as reported by the respondents during the field investigation.
• 87% of the households have reported to be paying the water charges on a regular basis and 95% of the households have expressed their satisfaction with regard to

Evaluation Study on Rajiv Gandhi National Drinking Water Mission
the water charges paid by them vis-a-vis the quantity/quality received by them in the covered states.
• Most of the households mentioned about non-existence of Village Water and Sanitation Committee (VWSC) in their area.
• 74% of the households have reported that the programme has a positive impact in terms of environmental sanitation.
• 75% respondents have conveyed that the workload on women has reduced drastically due to the implementation of the programme.
• 89% of the women have also reported that the children are getting more time for studying instead of helping them in collecting water from the natural sources.
The study also brought some important suggestions for better functioning of the programme. These are:
• The Village Water and Sanitation Committees (VWSCs) are required to be revitalized and made functional.
• The PRI members should be provided adequate training for their active involvement in the implementation of the Programme.
• Awareness programmes with regard to the Mission should be organised on regular basis in the remote villages for its success.
The study received constant support and encouragement from Honourable Deputy Chairman, Planning Commission and Member-Secretary, Planning Commission. The study was outsourced to M/s AMS Consulting Pvt. Ltd. Lucknow. I extend my thanks to the Director and other associates of the Institute for conducting the field study and preparing the study report. The study was designed and conducted under the direction of Dr. R.C. Dey, Director, PEO with the assistance of Ms. Krishna Veni Motha, the then Consultant, Shri L.N. Meena and Shri Vipin Kumar, Economic Officers of PEO. The report is finalized and brought to the present shape under my supervision. The help and co-ordination received from all concerned for preparation of the report is gratefully acknowledged.
(Ratna A. Jena)
Adviser (PEO) New Delhi Dated: November, 2010

Evaluation Study on Rajiv Gandhi National Drinking Water Mission
List of Tables
Table-3.1 : Comparative Habitation Coverage — 2003 Vs 2009 ................................... 14
Table-4.1 : Gender Profile ................................................................................................ 16
Table-4.2 : Educational Profile of the Household Survey Respondents ......................... 17
Table-5.1 : State-wise Access to Safe/Unsafe Drinking Water Sources— Pre-2003 & Present Status................................................................................................. 18
Table-5.2 : Access to Safe/Unsafe Drinking Water Sources in Least & Most Affected Areas — Pre-2003 & Present Status .............................................................. 19
Table-5.3 : % Households Receiving Safe and Round-the-Year Supply of Water.......... 20
Table-5.4 : % Households Receiving Safe, Round-the-Year and Sufficient Quantity of Water............................................................................................................... 20
Table-5.5 : % Households having Access to Drinking Water Sources within or beyond 1.6 kms ...............................................................................................
21
Table-5.6 : Average Time Spent per day by Households in Collecting Drinking Water (Minutes) ........................................................................................................
22
Table-5.7 : % Households Reporting No Discrimination in Access to Drinking Water Source ............................................................................................................. 23
Table-5.8 : State-wise Break-up of Safe Water Sources — Pre-2003 & Present Status.......... 24
Table-5.9 : % Households having Access to Safe/Unsafe Alternate Water Sources.......... 25
Table-6.1 : % Households Satisfied with the Water Quality of Main Source ................. 27
Table-6.2 : % Households Satisfied with the Water Quality of Alternate Source........... 28
Table-6.3 : Gram Panchayats Reporting the Provision of Field Testing Kit................... 28
Table-6.4 : Testing of Water Sources in Habitations by Technical Personal.................. 29
Table-6.5 : Efforts made by GP/VWSC to Maintain Water Quality of Sources.............. 30
Table-6.6 : Training received by Grassroot Workers in GP ............................................ 31
Table-6.7 : Training received by Women in GP .............................................................. 31
Table-7.1 : Responsibility of O&M — Households’ Views .............................................. 33
Table-7.2 : Households Willing to Pay for O&M ............................................................. 34
Table-7.3 : Capability of GPs to take-up O&M ................................................................ 34
Table-7.4 : Formal Handing Over of O&M to GPs .......................................................... 35
Table-7.5 : Responsibility of O&M — Present Status ..................................................... 35
Table-8.1 : Tap Connections in GPs ................................................................................ 38
Table-8.2 : Households Paying Water Charges Regularly .............................................. 38
Table-8.3 : Average Monthly Charges per Household .................................................... 38
Table-8.4 : Average Installation Charge per Household ................................................. 39

Evaluation Study on Rajiv Gandhi National Drinking Water Mission
Table-8.5 : Households Saying Water Charges Affordable ............................................ 39
Table-8.6 : Households Satisfied with Water Charges ................................................... 39
Table-8.7 : GPs where Community was Consulted on Water Tariff ............................... 40
Table-9.1 : Awareness about Existence of Any Group in Village/Habitation ................ 41
Table-9.2 : Households Reporting Membership ............................................................. 42
Table-9.3 : Member Households Participating in Meetings ........................................... 42
Table-9.4 : Women’s Representation in Committee/Group .......................................... 42
Table-9.5 : Gram Panchayats having VWSC ................................................................... 43
Table-10.1 : Gram Panchayats, Habitations and Households Reporting Campaigns on Water, Sanitation & Hygiene ......................................................................... 44
Table-10.2 : % Population in GP Attending Campaign .................................................... 47
Table-10.3 : IPC on Safe Drinking Water .......................................................................... 47
Table-10.4 : Households visits by ASHA/AWW/Others in the past One Month for Water Sanitation & Hygiene Info ....................................................................... 47
Table-10.5 : Main Source of Information on Personal & Household Hygiene ................ 48
Table-10.6 : Training on Hygiene Education .................................................................... 48
Table-10.7 : Awareness about Diseases Caused by Unhygienic Conditions..................... 48
Table-10.8 : Details of Diseases due to Unhygienic Conditions — As Reported by Households ..................................................................................................... 49
Table-10.9 : Availability of Toilets in Households ............................................................ 49
Table-10.10: Habitations Free from Open Defecation ...................................................... 50
Table-10.11: Existence of Functional Mechanism for Garbage Collection & Disposal ........... 50
Table-10.12: Cleanliness around the Water Sources ......................................................... 50
Table-10.13: Responsibility of Cleaning the Water Sources in Habitations...................... 51
Table-11.1 : Water Usage at Household ............................................................................ 52
Table-11.2 : Improvement in Environmental Sanitation ................................................. 53
Table-11.3 : Reduced Workload of Women ...................................................................... 53
Table-11.4 : Women Experiencing Reduced Fatigue ........................................................ 54
Table-11.5 : Increased Women’s Participation in Community Activities ............................ 54
Table-11.6 : Utilization of Time Saved in Various Activities ............................................ 54
Table-11.7 : Improvement in Overall Health Status of the Family .................................. 55
Table-12.1 : GPs Reporting Rain Water Harvesting Structure ............................................ 62
Table-12.2 : Habitations Reporting Rain Water Harvesting Structure ............................... 62

Evaluation Study on Rajiv Gandhi National Drinking Water Mission
List of Charts
Chart-3.1 : Proportion of Fully Covered Habitations (2003 Vs 2009) ..................... 15
Chart-4.1 : Social Caste-wise Profile ........................................................................... 16
Chart-4.2 : Type of House ........................................................................................... 16
Chart-5.1 : Access to Safe Water Sources — Comparison of Pre-2003 & Present Status . 18
Chart-5.2 :
Access to Safe Water Sources in Least/Most Affected Areas—Pre-2003 &
Present Status ............................................................................................ 19
Chart-5.3 : Access to Safe, Round-the-Year & Sufficient Water Supply — By State ....... 21
Chart-5.4 : Comparison of Fully Covered Status — State-level Data Vs Hhd Survey ..... 22
Chart-5.5 : Access to Tap Water — Comparison of Pre-2003 & Present Status ........ 24
Chart-5.6 : Reasons for Using Alternate Sources ....................................................... 26
Chart-6.1 : % Households Satisfied with Water Quality ............................................ 27
Chart-6.2 : Provision of Field Testing Kit ................................................................... 29
Chart-6.3 : Testing of Water Sources .......................................................................... 29
Chart-7.1 : Breakdowns of Tapped Supply in Past One Year ..................................... 33
Chart-7.2 : Responsibility of Repairs .......................................................................... 35
Chart-10.1 : Use of Various Media in Campaign (44 GPs) .......................................... 46
Chart-10.2 : Diseases from Unhygienic Conditions ..................................................... 49
Chart-10.3 : Platforms & Drains around Water Sources .............................................. 50
Chart-11.1 : Utilization of Time Saved ......................................................................... 55
Chart-11.2 : Overall Performance of Water Sources — As Reported by Households.. 56
Chart-12.1 : State-wise Composite Sustainability Index ............................................. 59
Chart-12.2 : State-wise Sustainability Index — Technological Aspects ...................... 59
Chart-12.3 : State-wise Sustainability Index — Community & Social Aspects ........... 60
Chart-12.4 : State-wise Sustainability Index — Financial Aspects .............................. 60
Chart-12.5 : State-wise Sustainability Index — Water Quality .................................... 60
Chart-12.6 : State-wise Sustainability Index — Training ............................................. 61
Chart-12.7 : Aspects -wise Overall Sustainability Index .............................................. 61
Evaluation Study on Rajiv Gandhi National Drinking Water Mission i
Executive Summary 1. Background
Meeting the drinking water needs of 700 million rural population settled in about 1.42 million habitations spread over 15 diverse ecological regions can be a daunting task. The major challenge in the Rural Water Supply sector is the availability of drinking water, both in term of adequacy and quality on a sustainable basis. Despite collective effort of the State and Central Governments and huge investment of about Rs 72,600 crore in the rural water supply sector, the national goal of providing adequate potable drinking water to the rural community at a convenient location at all times is yet to be achieved. 2. Study Objectives
i. Assess the extent of coverage and access to improved services in the rural areas;
ii. Assess the institutional arrangements placed by the State Governments for implementation and performance of the mission;
iii. Evaluate the overall impact of the mission on the rural habitations, especially on women in terms of access to improved water services and awareness;
iv. Identify the measures adopted for ensuring the sustainability of the surface water and ground water sources and constraints there-upon;
v. Assess the role of the stakeholders at various levels in creating awareness about water and sanitation among the beneficiaries; and
vi. Document the major achievements in rural water services under Evaluation Study on Rajiv Gandhi National Drinking Water Mission (RGNDWM).
3. Sampling Plan
Sampling of the 5 study states and 10 districts was done by the Planning Commission. Two blocks in each sample district were selected based on the largest number of completed schemes. In each block, 3 Gram Panchayats and from each Gram Panchayat, 4 habitations were selected. For the purpose of impact assessment, 6 households were selected from each sample habitation giving adequate representation to the various socio-economic categories. Thus, a total of 1440 households were covered from 240 habitations in 60 Gram Panchayats spread over 20 blocks of the 10 sample districts across 5 study states. The study schedules for various stakeholders containing a judicious mix of questions seeking quantitative and qualitative information were developed and supplied by the Planning Commission. 4. Major Findings
Status of Fully Covered Habitations: As per the official records, between the period 2003 and 2009, there has been a significant increase in the proportion of fully

Evaluation Study on Rajiv Gandhi National Drinking Water Mission ii
covered (FC) habitations in all the 5 study states (14 to 62 percentage points). Presently, the fully covered habitations in these states are found to be in the range of 75% to 95%.
Access to Safe Drinking Water
There has been a tremendous improvement in the rural populations’ access to safe drinking water sources between the pre-2003 and the present period across all the 5 states. Overall, 5 states combined, over nine-tenth (93%) of the rural population at present has access to safe drinking water sources; the improvement of 32 percentage points is a reflection of the commendable progress made under the Mission. With the advent of the Mission, the situation in the most affected areas has improved to a point where the proportions of the households in least and most affected areas having access to safe drinking water are quite comparable (92% and 95%, respectively).
Safe and Round-the-year Availability : Overall, around two-third (66%) of the households having access to safe drinking water sources are getting round-the-year supply of drinking water. Among the 5 states, Assam stands out as the best performing State with nearly four-fifth (76%) of the households receiving round-the-year supply of water from safe sources. On the other hand, West Bengal is found to be the worst performing, where two-fifth (42%) of the households have reported that they are deprived of this facility.
Safe, Round-the-Year and Sufficiency : Overall, only three-fifth (63%) of the households has reported to be receiving sufficient quantity of water from safe sources on round-the-year basis. Among the 5 states, Assam stands out as the best performing State where this was reported by three-fourth (76%) of the households. On the other hand, Karnataka was found to be the worst performing State (46%). It has been found that although the proportion of households having access to safe water is quite high (85% to 100%), the proportion reporting safe, round-the-year and sufficient water supply is much smaller (54% to 76%).
Moving towards Tapped Water Supply : Compared to their status prior to 2003 and present (2009), the proportion of households having access to tap water has improved quite significantly in all the 5 states (from 24% to 71%), with a significant decline in the proportion of households dependent on hand-pump/tube-bore wells.
Water Quality
Satisfaction with the Water Quality: It is encouraging to note that overall, an overwhelming majority of the households (93%) have reported to be satisfied with the water quality. Among the 5 states, water quality is a major issue only in the State of Rajasthan, as reported by half the households (50%) surveyed in the State. There is not much difference between the ‘least affected’ and ‘most affected’ districts in terms of water quality as perceived by the households.
Evaluation Study on Rajiv Gandhi National Drinking Water Mission iii
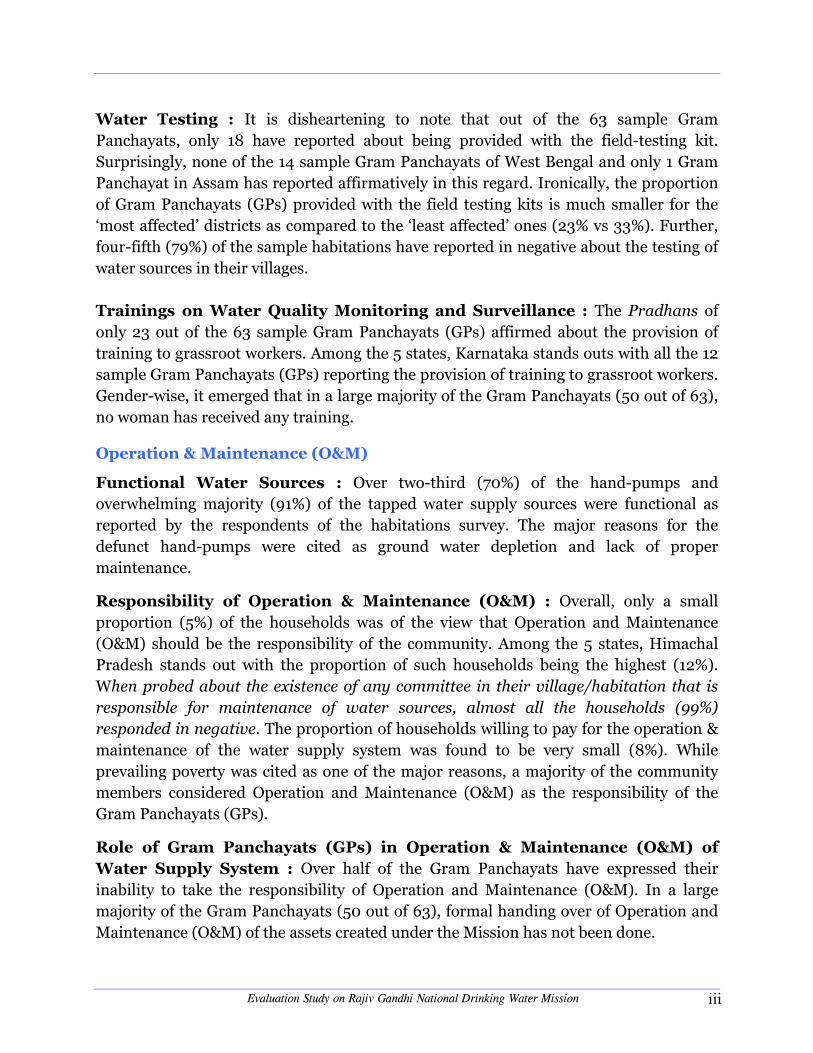
Water Testing : It is disheartening to note that out of the 63 sample Gram Panchayats, only 18 have reported about being provided with the field-testing kit. Surprisingly, none of the 14 sample Gram Panchayats of West Bengal and only 1 Gram Panchayat in Assam has reported affirmatively in this regard. Ironically, the proportion of Gram Panchayats (GPs) provided with the field testing kits is much smaller for the ‘most affected’ districts as compared to the ‘least affected’ ones (23% vs 33%). Further, four-fifth (79%) of the sample habitations have reported in negative about the testing of water sources in their villages.
Trainings on Water Quality Monitoring and Surveillance : The Pradhans of only 23 out of the 63 sample Gram Panchayats (GPs) affirmed about the provision of training to grassroot workers. Among the 5 states, Karnataka stands outs with all the 12 sample Gram Panchayats (GPs) reporting the provision of training to grassroot workers. Gender-wise, it emerged that in a large majority of the Gram Panchayats (50 out of 63), no woman has received any training.
Operation & Maintenance (O&M)
Functional Water Sources : Over two-third (70%) of the hand-pumps and overwhelming majority (91%) of the tapped water supply sources were functional as reported by the respondents of the habitations survey. The major reasons for the defunct hand-pumps were cited as ground water depletion and lack of proper maintenance.
Responsibility of Operation & Maintenance (O&M) : Overall, only a small proportion (5%) of the households was of the view that Operation and Maintenance (O&M) should be the responsibility of the community. Among the 5 states, Himachal Pradesh stands out with the proportion of such households being the highest (12%). When probed about the existence of any committee in their village/habitation that is responsible for maintenance of water sources, almost all the households (99%) responded in negative. The proportion of households willing to pay for the operation & maintenance of the water supply system was found to be very small (8%). While prevailing poverty was cited as one of the major reasons, a majority of the community members considered Operation and Maintenance (O&M) as the responsibility of the Gram Panchayats (GPs).
Role of Gram Panchayats (GPs) in Operation & Maintenance (O&M) of Water Supply System : Over half of the Gram Panchayats have expressed their inability to take the responsibility of Operation and Maintenance (O&M). In a large majority of the Gram Panchayats (50 out of 63), formal handing over of Operation and Maintenance (O&M) of the assets created under the Mission has not been done.

Evaluation Study on Rajiv Gandhi National Drinking Water Mission iv
Water Tariff
Close to nine-tenth (87%) of these households have reported to be paying water charges on a regular basis. Almost all (95%) the households have expressed satisfaction with regard to the water charges paid by them vis-a-vis the quantity/quality of water supply received by them. The average amount of monthly water charges per household is found to be lowest (Rs. 12.70/- in Himachal Pradesh and highest (Rs. 53.80/-) in Assam, with no variations in the water charges among the households belonging to the different social categories. Further, an overwhelming majority (88%) of the households having tap connections had paid installation charges. This was lowest (Rs. 526.60/- per household) in Himachal Pradesh and highest (Rs. 1840.00/- per month per household) in West Bengal.
It may be highlighted that the user charges for Public Stand Post (PSP) were collected only in
the State of Karnataka, as reported by the village Pradhans of the 12 sample Gram
Panchayats. According to them, the average monthly amount of water charges per household
was Rs. 10/- for all sections of the society.
Community Participation/Existence of Village Water and Sanitation Committee (VWSC)
It is disheartening to note that less than 1% of the households mentioned about the existence of village water and sanitation committee (VWSC) in their areas. When discussed with the Pradhans, it emerged that VWSCs were existing in only one-fifth (13 out of 63) of the sample Gram Panchayats. Among the 5 states, Karnataka stands out where the presence of VWSC was reported by half the sample Gram Panchayats. While VWSC meetings were reportedly conducted only in 9 out of the 13 Gram Panchayats (GPs), participation of women and scheduled caste community members in the VWSC meetings was reported in only 7 out of the 13 Gram Panchayats (GPs). Further, in only 6 out of the 13 Gram Panchayats (GPs), all VWSC members have reportedly received training.
Information, Education and Communication (IEC) on Hygiene & Sanitation
At the household level, barring Himachal Pradesh, the situation in the other 4 states is pathetic, with their proportion responding in affirmation about any IEC campaign ranging between 0% and 8%. In the near absence of IEC activities, it is no surprise that open defecation is so widely prevalent in most (80%) of the sample habitations.

Evaluation Study on Rajiv Gandhi National Drinking Water Mission v
Program Benefits/Impact on Rural Population
Increased Availability of Water/Reduced Breakdowns: Increased availability and consequently, increased water usage by the rural households have been found to be the biggest program benefits. Overall, an overwhelming majority (96%) of the households have reported increased usage of water. Further, four-fifth (80%) of habitations mentioned that the number of water sources in functional condition has significantly increased in the last few years, while 57% of them mentioned about noticeable decrease in the frequency of the supply system breakdowns.
Improved Environmental Sanitation & Reduction in Water Borne Diseases: Overall, three-fourth (74%) of the household survey respondents felt that the Program has had a positive impact in terms of environmental sanitation. This was most prominent in the State of Himachal Pradesh (95%). This was corroborated by three-fourth (75%) of the habitation survey respondents.
Improvement in Women’s Conditions : Overall, a significant three-fourth (75%) of the respondents have reported in affirmation about reduction in their workload. Due to reduced workload, there has been a significant reduction in fatigue experienced by women. Consequently, women have now more time to engage themselves in various community activities. Further, an overwhelming majority of women (89%) have reported that children have now more time for studying and playing, instead of helping them collect water. Utilization of Time Saved : People are now able to spend time in more productive activities instead of spending excessive time in collecting water, with a significant amount of ‘opportunity cost’ associated with it. People are now utilizing the time saved for income generating activities (agriculture, cattle rearing, etc.).
Sustainability
In order to calculate the Sustainability Index, a total of 29 parameters under 5 broad aspects, namely, technology aspects, community and social aspects, financial aspects, water quality aspects and training aspects were identified. For each of these 29 parameters, the responses from the households were quantified on a scale of 1 to 4 and State-wise averages were computed for each of them. Sustainability index of 76%-100% was considered highly satisfactory, 51%-75% considered as satisfactory, 26%-50% considered as poor and 0%-25% was considered as very poor.
Composite Sustainability Index : Overall (all states and aspects combined) sustainability index works out to 54%, which is only marginally above the range of ‘Poor’. While West Bengal and Rajasthan have performed poorly (49% & 46%,

Evaluation Study on Rajiv Gandhi National Drinking Water Mission vi
respectively), it was satisfactory for Himachal Pradesh, Assam and Karnataka (58%, 52% and 66%, respectively).
Technological Aspects : The overall (all 5 states combined) sustainability index in respect of the technology issues is found to be 71%, which is satisfactory. While it is highly satisfactory for Karnataka (78%), it is satisfactory in case of the other 4 states (65% to 74%).
Community & Social Aspects : Overall (all 5 states combined) sustainability index is found to be 63%, which is satisfactory. Performance of all the 5 states is found to be satisfactory, with Rajasthan scoring lowest (55%) and Karnataka scoring the highest (74%).
Financial Aspects : Findings on sustainability index with respect to financial aspects shows that overall situation is very poor (23%). State-wise, the performance of Rajasthan, West Bengal and Assam is found to be very poor (9%, 15% and 19%, respectively), while it was poor for Himachal Pradesh and Karnataka was found to be poor (34% and 37%, respectively).
Water Quality Aspects : In terms of water quality, the sustainability index of Karnataka and Himachal Pradesh is found to be highly satisfactory (94% and 93%, respectively), while the other 3 states have fared satisfactorily in this regard (69% to 71%). The overall (all 5 states combined) sustainability index is also found to be highly satisfactory (80%).
Training Aspects : The overall situation (all 5 states combined) presents a poor picture with a sustainability index of only 30%, implying that the provision of training to community members, especially the women has not been given adequate and much needed attention.
Evidently, the poor performance of the states with respect to ‘financial aspects’ and ‘training of community members’ has had an adverse impact on the overall composite sustainability index and it has barely managed to be in the ‘satisfactory range’ (54%). A comparison of overall sustainability index with respect to each of the 5 broad aspects for ‘most affected’ and ‘least affected’ sample districts shows any noticeable variations only in the case of ‘water quality’ aspect (76% and 84%, respectively). As regards the other four broad aspects, the values of sustainability indices are quite comparable.
Installation of Rain Water Harvesting Structures : The study has shown that rain water harvesting structures have been installed only in less than two-fifth (36%) of the sample Gram Panchayats (GPs). Surprisingly, none of the Gram Panchayats (GPs) in West Bengal and Assam have reported about installing such structures.

Evaluation Study on Rajiv Gandhi National Drinking Water Mission vii
Recommendations
1. In the light of the fact that in most cases, the Village Water and Sanitation Committees (VWSCs) are non-functional, the first step would therefore be to revitalize these committees and build the capacity of their members. Only then, the goals and objectives of the Mission can be realized.
2. In the light of the study revealing a near total absence of community involvement (what to talk of the involvement of women), it becomes crucial to engage specialist agencies for capacity building of VWSC members. Only then, the needs and aspirations of the rural poor can be fulfilled.
3. It would be worthwhile to take-up focused and sustained IEC campaigns to educate the communities on the various aspects and issues related to drinking water, sanitation and hygiene. This would also motivate the communities, especially the women for their active involvement in all aspects of the Mission, including its operation & maintenance. For the purpose, experienced professional agencies may be hired to develop appropriate and effective IEC tools.
4. There is an urgent need to organize relevant training programs for the village level PRI members so as to motivate them for their active involvement in all aspects of the Mission. For the purpose, professional training agencies may be hired.
5. The program managers may consider a separate and adequate budgetary provision, besides deputing a team of dedicated staff for ensuring timely repairs and preventive maintenance of the assets created under the project.
6. In view of less than two-fifth (36%) of the sample Gram Panchayats (GPs) having installed rainwater-harvesting structures, there is an urgent need for the renewed impetus in taking-up this important water conservation measure in a serious manner.
7. In order to ensure effectiveness and long-term sustainability of the rural water supply schemes under the Mission, it is imperative to design State-specific plans of action keeping in mind the needs and aspirations of the rural populations.
* * *

Evaluation Study on Rajiv Gandhi National Drinking Water Mission 1
Chapter - 1
Introduction 1.1 Background
In India, although the provision of rural water supply (RWS) is primarily the responsibility of the respective State Governments, the Central Government contributes a significant part of the program funds for this sector. Throughout the Five Year Plans, the Central Government introduced a variety of policies and programs to address the issue of drinking water. The first national water supply and sanitation program was introduced during 1951–56 as part of the Government’s health plan. The states gradually built up the Public Health Engineering Department (PHED) to tackle the problem of rural water supply and sanitation. In spite of this, it was found during the mid-1960s that majority of the schemes were being implemented in the easily accessible villages neglecting remote villages with severe water scarcity. The Central Government requested the states to identify these problem villages and make special plans for them.
The first major push to rural water supply came with the Accelerated Rural Water Supply Program (ARWSP) in the 1970s, which gave full grant to the State governments for implementing water supply schemes in problem villages. By March 1981, the coverage of rural water supply was 30.8 per cent. Following the International Drinking Water Supply & Sanitation Decade (IDWSSD) [1981-91], the second major push came by establishing the National Drinking Water Mission (NDWM), later renamed as the Rajiv Gandhi National Drinking Water Mission (RGNDWM). The Mission issued comprehensive guidelines for ARWSP (1986), helped formulate National Water Policies (1987 and 2002) and introduced the Sector Reform Project (SRP) in 1999.
With the introduction of the Sector Reform Project (SRP), it became the world’s largest, Government sponsored demand based and participatory drinking water supply program, which was first implemented in 67 districts of 26 states in India on a pilot basis. Community participation was sought through 10 per cent contribution to the total installation cost and full responsibility for operation & maintenance. Significant investments were made in building community capacity, and in providing information, education and communication (IEC). While there remained much to be learnt from the infirmities of the SRP, it was scaled up in the form of Swajaldhara in December 2002 with the objective of covering the entire country by the end of the Tenth Five Year Plan.
The various drinking water supply programs & policies at a glance in chronological order is presented in the following table.

Evaluation Study on Rajiv Gandhi National Drinking Water Mission 2
Drinking Water Supply Programs & Policies at a Glance
1949 The Environment Hygiene Committee (1949) recommends the provision of safe water supply to cover 90 per cent of India’s population in a timeframe of 40 years.
1950 The Constitution of India confers ownership of all water resources to the government, specifying it as a state subject, giving citizens the right to potable water.
1969 National Rural Drinking Water Supply program launched with technical support from UNICEF and Rs.254.90 crore is spent during this phase, with 1.2 million bore wells being dug and 17,000 piped water supply schemes being provided.
1972-73 Introduction of the Accelerated Rural Water Supply Program (ARWSP) by the Government of India to assist states and union territories to accelerate the pace of coverage of drinking water supply.
1981 India as a party to the International Drinking Water Supply and Sanitation Decade (1981-1990) declaration sets up a national level Apex Committee to define policies to achieve the goal of providing safe water to all villages.
1986 The National Drinking Water Mission (NDWM) is formed. 1987 Drafting of the first National Water Policy by the Ministry of Water
Resources. 1991 NDWM is renamed the Rajiv Gandhi National Drinking Water Mission
(RGNDWM). 1994 The 73rd Constitutional Amendment assigns Panchayati Raj Institutions
(PRIs) the responsibility of providing drinking water.
1999
For ensuring sustainability of the systems, steps are initiated to institutionalize community participation in the implementation of rural drinking water supply schemes through sector reform. Sector reform ushers in a paradigm shift from the ‘Government-oriented supply-driven approach’ to the ‘People-oriented demand-responsive approach’. The role of the government is envisaged to change from that of service provider to facilitator. Under reform, 90 per cent of the infrastructure is funded by the government, with the community contributing 10 per cent of the remaining infrastructure cost and 100 per cent of operation and maintenance costs. Sector reforms projects were introduced in 67 districts across the country on pilot basis.
Total Sanitation Campaign (TSC) as a part of reform principles initiated in 1999 to ensure sanitation facilities in rural areas with broader goal to eradicate the practice of open defecation. As part of the program, a nominal subsidy in the form of incentive is given to rural poor households for construction of toilets. TSC gives strong emphasis on Information, Education and Communication, Capacity Building and Hygiene Education for effective behavior change with involvement of PRIs, CBOs, and NGOs
Contd...

Evaluation Study on Rajiv Gandhi National Drinking Water Mission 3
Drinking Water Supply Programs & Policies at a Glance (Contd...)
2002
Nationwide scaling up of sector reform in the form of Swajaldhara.
The National Water Policy is revised, according priority to serving villages that did not have adequate sources of safe water and to improve the level of service for villages classified as only partially covered.
India commits to the Millennium Development Goals to halve by 2015, from 1990 levels, the proportion of people without sustainable access to safe drinking water and basic sanitation.
2004 All drinking water programs are brought under the umbrella of the RGNDWM.
2005
The Government of India launches the Bharat Nirman Program for overall development of rural areas by strengthening housing, roads, electricity, telephone, irrigation and drinking water infrastructure. The target is to provide drinking water to 55,069 uncovered habitations; those affected by poor water quality and slipped back habitations based on 2003 survey, within five years.
2007
Pattern of funding under the Swajaldhara Scheme changes from the previous 90:10 central-community share to 50:50 centre-state share. Community contribution is now optional.
The approach paper for the 11th Five Year Plan calls for a comprehensive approach which encompasses individual health care, public health, sanitation, clean drinking water, access to food and knowledge about hygiene and feeding practice. It also states the need to upscale more schemes related to community management of water reducing the maintenance burden and responsibility of the state. It is envisaged to provide clean drinking water for all by 2009 and ensure that there are no slip-backs by the end of the 11th Plan.
Source: Khurana, Indira & Sen Romit, Drinking Water Quality in Rural India : Issues & Approaches (Water Aid) 1.2 Rajiv Gandhi National Drinking Water Mission
The focus of the Rajiv Gandhi National Drinking Water Mission (RGNDWM) was to adopt a community-based demand-driven approach instead of the hitherto government forced supply driven approach. In doing so, the projects under RGNDWM are basically community participation oriented in nature – with a part (minimum of 10% of the proposal) of the capital cost required to be borne by the community themselves. The balance amount is contributed by the Government of India. As per the guidelines, the implementing agencies for the program may be decided by the respective State Governments. The implementation should be entrusted to one single Department in the State, with a view to better implementation, monitoring of the progress and the like. If the program has to be implemented through more than one Department, one of the Departments should be designated as the Nodal Department for

Evaluation Study on Rajiv Gandhi National Drinking Water Mission 4
co-coordinating the Rural Water Supply Programs and sending consolidated progress reports to the Central Government. The Panchayati Raj Institutions (PRIs) are also supposed to be involved in the implementation of schemes – particularly in the selection of the location of stand-posts, spot sources, operation and maintenance, fixing of water tariff, etc. The Population Census data indicate that in 2001, about 78 percent of the rural population had access to a safe source of drinking water, up from 56 percent in 1991. The Rajiv Gandhi National Drinking Water Mission (RGNDWM) had set a target of extending access to safe drinking water for 100 percent of the rural population by 2007. Although this target has not been fully achieved, the expansion of coverage attained during the 1990s, as reflected in the Census Data, shows the objective of 100 percent safe water access should not be difficult to achieve in the next five years or so. Indeed, the Eleventh Five Year Plan (2007-08 to 2011-12) foresees the provision of safe drinking water to all rural habitations. 1.3 Critical Issues
Availability of and access to safe potable water have been an area of deep concern mainly due to the multifarious challenges these pose in managing and ensuring a sustainable supply for the fast growing population. Rural India has more than 700 million people residing in about 1.42 million habitations spread over 15 diverse ecological regions. Meeting the drinking water needs of such a large population can be a daunting task. The non-uniformity in level of awareness, socio-economic development, education, poverty, practices & rituals and water availability add to the complexity of the task. In many parts of rural India, a crisis of drinking water has assumed such proportions that it has led to large scale out-migration, ‘water riots’, inter-state disputes over water sharing and conflict between rural and urban consumers. The major issues in the Rural Water Supply sector are lack of sustainability of drinking water sources and systems. As a consequence, availability of drinking water, both in term of adequacy and quality on a sustainable basis has become a major challenge. Water quality has become a major issue as ground water table goes down further. The levels of contaminants, such as, fluoride (66 million people across 17 States are estimated to be at risk), arsenic (nearly 13.8 million people in 75 blocks are reported at risk), varying iron levels, presence of nitrates and heavy metals, bacteriological contamination and salinity and man-made chemical pollutants, such as, pesticides and insecticides are high and still rising. The health burden of poor water quality is enormous. It is estimated that around 37.7 million Indians are affected by waterborne diseases annually, 1.5 million children are estimated to die of diarrhea alone and 73 million working days are lost due to waterborne disease each year. According to official statistics, the proportion of fully covered habitations reached 97 percent by April 2006 (Economic Survey, Government of India, 2006-07), up from about 75 percent in 1997. This, however, does not take into account the slippages that have taken place— habitations once fully covered have later slipped into ‘partially covered’ or ‘not covered’ status for various reasons (water sources going dry or getting

Evaluation Study on Rajiv Gandhi National Drinking Water Mission 5
quality affected; systems working below capacity due to poor operation and maintenance; increase in population in the habitations resulting in lower per capita availability; and so on). Indeed, the preliminary results of the Habitation Survey (2003) provide indications of significant slippage and give the impression that coverage has not been increasing much. Despite collective effort of the State and Central Governments and huge investment of about Rs 72,600 crore in the rural water supply sector, under both State and Central Plans up to 2009 since the beginning of the planned era of development, the national goal of providing adequate potable drinking water to the rural community at a convenient location at all times is yet to be achieved. In other words, reliable, sustainable and affordable service is still lagging. It may also be highlighted that traditionally, rural water supply in India has followed a supply-driven approach with access to safe water being considered a social good. Supply-driven programs incur large institutional costs, substantially raising the cost of service provision. Consequently, it has resulted as a hindrance to the development of more efficient and lower cost options for service delivery and also denying opportunity to the users to exercise their options as consumers to demand better service delivery. The demand-responsive approach on the other hand, is based on the principles of community participation and decentralization of powers for implementing and operating drinking water supply schemes with the government playing the role of a facilitator. Demand-driven programs are found to have relatively low institutional cost and other advantages, including better Operation and Maintenance (O&M) cost recovery. 1.4 Objectives of the Study
In order to accomplish the envisaged objectives of any scheme/program, it is essential to institutionalize a mechanism for regular monitoring and evaluation from time-to-time. Regular monitoring and in-depth evaluation provides valuable insights on how well we have done in the past and to report to stakeholders the return on their investment and to underpin political support for continued investment. Besides, the lessons learnt can be applied in improving the program by incorporating vital information into planning, resource allocation and prioritizing future programs & activities. In the light of the above and keeping in view the importance of the mission, a comprehensive ‘Evaluation Study of the Rajiv Gandhi National Drinking Water Mission (RGNDWM)’ was aptly initiated by Programme Evaluation Organisation (PEO), Planning Commission, Government of India. AMS Consulting (P) Limited was commissioned for this study. The reference period of the study was 2003-04 to 2006-07. The specific objectives of the study were to:—
1. Assess the extent of coverage and access to improved services in the rural areas;
2. Assess the institutional arrangements placed by the State Governments for implementation and performance of the mission;

Evaluation Study on Rajiv Gandhi National Drinking Water Mission 6
3. Evaluate the overall impact of the mission on the rural habitations, especially on women in terms of access to improved water services and awareness;
4. Identify the measures adopted for ensuring the sustainability of the surface water and ground water sources and constraints there-upon;
5. Assess the role of the stakeholders at various levels in creating awareness about water and sanitation among the beneficiaries; and
6. Document the major achievements in view of the interventions in rural water services under RGNDWM.

Evaluation Study on Rajiv Gandhi National Drinking Water Mission 7
Chapter - 2
Methodology 2.1 Sampling Plan
Sampling of States & Districts
Sampling of the 5 study states and 10 districts was done by the Planning Commission. As mentioned in the Terms of Reference, one State each was selected from the five geographical zones of the country. Additionally, it was endeavored to ensure that the sample included due representation of the DDP areas, quality affected and hilly areas. The detailed State-wise sample for the study is presented hereunder.
Sl.No. Zone State Selection Criteria 1 East West Bengal Plain Area 2 West Rajasthan Quality Affected 3 North Himachal Pradesh Hilly Area 4 South Karnataka Desert Development Program 5 North-East Assam North-East Region
Within each of the five states, a total of two districts were selected — with one district having the highest number of quality affected habitations and the second district with the least or no quality affected habitations. The details of the sample districts are presented hereunder —
Sl. No. State District Selection Criteria 1. Bankura Quality Affected 1. West Bengal 2. Howrah Least Affected 3. Barmer Quality Affected 2. Rajasthan 4. Dholpur Least Affected 5. Bilaspur Quality Affected 3. Himachal Pradesh 6. Kullu Least Affected 7. Kolar Quality Affected 4. Karnataka 8. Shimoga Least Affected 9. Nagoan Quality Affected 5. Assam 10. Guwahati Least Affected

Evaluation Study on Rajiv Gandhi National Drinking Water Mission 8
Sampling of Blocks
Two blocks in each of the two sample districts were selected. For the purpose, the AMS Consultants visited the office of the concerned implementing Agency of the sample districts and collected the detailed list of the drinking water supply schemes under Rajiv Gandhi National Drinking Water Mission (RGNDWM), which were completed during the reference period of the past 4 years (2003-04 to 2006-07). In the next step, the completed schemes were arranged block-wise and subsequently, 2 blocks having the largest number of completed schemes were selected. Due care was taken to ensure that the 2 sample blocks were representative with regard to the diverse geographical conditions of the district and quality affected areas therein. Sampling of Gram Panchayats & Habitations
After having selected the sample blocks, drinking water schemes were arranged Gram Panchayat-wise and subsequently, 3 Gram Panchayats having the largest number of completed schemes were selected. Similar to the sampling of blocks, care was taken to ensure that the 3 sample Gram Panchayats were representative with regard to the diverse geographical conditions of the sample block and quality affected areas therein. Then, from each of the sample Gram Panchayat, 4 habitations were selected. As per the ToR, one habitation each was to be selected from among the (a) Fully Covered, (b) Partially Covered, (c) Not Covered, and (d) Quality affected habitations. It may be mentioned that only those habitations were selected where the drinking water supply schemes had been completed and drinking water was being supplied to the people. Further, sampling of Gram Panchayats and habitations was finalized after discussions and consultations with the concerned officials of the sample blocks. Sampling of Households
For the purpose of impact assessment, 6 households were selected from each of the 48 habitations using the stratified purposive sampling method – giving adequate representation to the various socio-economic categories. Accordingly, four households from general category, one household from SC category and one household from ST Category were selected. In case of any shortfall in the required number of sample households in any stratum/category, the same was compensated from the remaining strata/ categories. Thus, a total of 1440 households were selected from 240 habitations in 60 Gram Panchayats spread over 20 blocks of the 10 sample districts across 5 study states. From each of the households selected for the study, in-depth interviews (IDIs) were conducted with the female member of the household, since in the rural community, it is usually the women who are the mainly responsible to make arrangements for meeting the daily requirement of drinking water in the households. In case a woman member was not available at the time of interview, IDI was then conducted with the head of the household.

Evaluation Study on Rajiv Gandhi National Drinking Water Mission 9
2.2 Information Gathering
Quantitative methods are enormously useful in impact assessment of development projects. Nonetheless, they have some important limitations in the sense that they fail to provide an adequate understanding of the mechanism instigating a series of events that ultimately result in the observed impact of the program. They fail to provide an answer to why and how the program has or has not been able to achieve its desired goals and objectives, thus limiting the scope for any corrective measures. Such limitations can be overcome by incorporating qualitative approaches that would supplement, improve and complement the quantitative data. Qualitative methods provide an in-depth understanding of the needs, behaviors, aspirations and perceptions of the community for whom the development programs are intended, besides assessing the implementers' perspectives, that is, their limitations, problems and bottlenecks in program implementation. Accordingly, the study schedules for various stakeholders developed and supplied by the Planning Commission contained a judicious mix of questions seeking quantitative and qualitative information. Besides information gathering using the aforementioned schedules, efforts were also made to conduct physical observation/verification during the transect walk through the sample Gram Panchayats/habitations. This helped us in understanding the various features within the selected villages, such as, the status of drinking water points vis-à-vis the standard of cleanliness/hygiene around these points, drainage facilities, etc. Further, we focused our attention on areas of our concern by interacting directly with the members of the community (including those accompanying us, as well as those who we met during the transect walk). In doing so, our focus was on collecting vital information regarding various habitations within the village, the residents and their specific concerns pertaining to the availability of safe drinking water and more importantly, on the aspect of quality. A schematic diagram of the study design comprising of the study sample and the key issues covered is presented ahead.
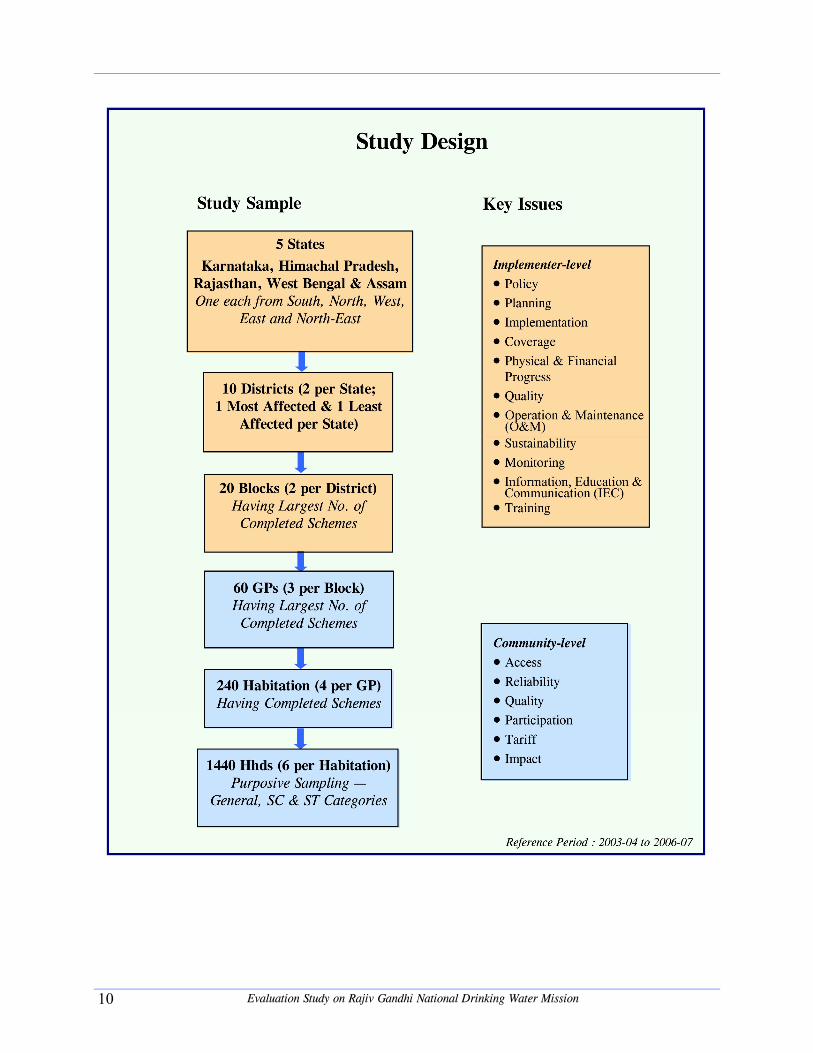
Evaluation Study on Rajiv Gandhi National Drinking Water Mission 10

Evaluation Study on Rajiv Gandhi National Drinking Water Mission 11
2.3 Training of Research Team Members
During the 2-day in-house classroom-training program, the research team members were rigorously trained on the implementation process and various other aspects of the Rajiv Gandhi National Drinking Water Mission (RGNDWM). Further, they were also trained on the technique of conducting in-depth interviews (IDIs) and focus group discussions (FGDs), besides orienting them on the sample study sites and the different stakeholders to be interviewed. On the third day, the research team members were taken for field-testing of the study instruments. This was followed by a question-answer session that allowed them to clear doubts, if any, in their minds with regard to the study instruments or otherwise. The entire training exercise (including the field visit) was conducted under the guidance of the Planning Commission officials 2.4 Scheme of Data Analysis
While quantitative data was analyzed using standard statistical software, qualitative information gathered through in-depth interviews of implementers (State, district & block-level) and focus group discussions with the community was analyzed in a systematic and methodological manner, scrutinizing the textual information for its primary as well as latent content. The following procedure was adopted for the content analysis of the qualitative data — Free Listing : The responses to a particular question were listed to obtain the range of responses for all open-ended questions. The responses that were considered irrelevant under a specific question were moved under the appropriate question. During this process, the important statements or quotable quotes with their reference were extracted for use in the report as reference material. Coding : In the final screening, for every open-ended question, responses were coded according to the domains. Some responses could be placed under more than one domain as a range of views was stated in a single sentence. After careful scrutiny, the responses found to be completely irrelevant were discarded. Summarizing : Similar information sought from different stakeholders was triangulated to arrive at a conclusion with greater degree of accuracy, as also from the viewpoint of reliability and validity. The results were then summarized for each of the issues. 2.5 Computation of Sustainability Index
One of the prime objectives of the study was to assess the sustainability of water sources in the habitations. In order to calculate the Sustainability Index, a total of 29 parameters under 5 broad aspects, namely, technology aspects, community and social aspects, financial aspects, water quality aspects and training aspects were identified as detailed in the following table.

Evaluation Study on Rajiv Gandhi National Drinking Water Mission 12
Technology Aspect 1. Functionality of Source 2. No. of functional points increased 3. Year round functionality of source 4. Break down frequency 5. Time taken for repairs 6. Availability of equipment/space 7. Technical skills of community Community & Social Aspect 8. Ownership of water sources 9. Choice of technology 10. Access to all groups 11. Usage of sources 12. Operation and Maintenance (O&M) measures taken 13. Community willingness to take Operation and Maintenance (O&M) 14. Care of sources by women 15. Satisfaction with water services Financial Aspect 16. Community contribution 17. Availability of funds 18. Entity setting-up water tariff charges 19. Affordability of water charges 20. Whether community consulted in tariff-setting 21. Flexibility in user payment 22. Provision of subsidized tariff for poor (SC/ST) Water Quality Aspect 23. Acceptability of quality 24. No. of sources with acceptable quality 25. Access to safe water 26. Source reliability Training Aspect 27. Category of personnel trained 28. Gender-wise training 29. Preference for women in training of hand-pumps repair
For each of the aforementioned 29 parameters, the responses from the households were quantified on a scale of 1 to 4 and State-wise averages were computed for each of them. This allowed us to identify the critical sustainability parameters that were relatively strong or weak in each of the sample states.

Evaluation Study on Rajiv Gandhi National Drinking Water Mission 13
2.6 Summary of Field Work
The quantum of fieldwork done toward the RGNDWM evaluation study is summarized hereunder—
Activity Total Conducted
Community Level
In-depth Interview with Village Pradhan/Secretary (GP Schedule) 60
In-depth Interview VWSC member (Habitation Schedule) 240
In-depth Interview with Women beneficiaries (Household Schedule) 1440
Focus Group Discussion 240
Implementing Agency Level
In-depth Interview with Chief Engineer (State Schedule) 5
In-depth Interview with Executive Engineer (District Schedule) 10
In-depth Interview with Asst. Executive Engineer (Block Schedule) 20

Evaluation Study on Rajiv Gandhi National Drinking Water Mission 14
Chapter - 3
Physical & Financial Progress As already mentioned in the Methodology section, a total of 5 states, one each from the five zones of the country were selected for the purpose of the study. Based on the information received from the State officials, details of physical and financial progress is presented ahead.
3.1 Physical Progress
Assessment of physical progress of the 5 study states was made in respect of the coverage status, particularly the proportion of fully covered habitations. Accordingly, during our visit to the study states and discussion with the State officials, data on habitation coverage was collected from them.
Fully Covered Habitations
The criteria for a habitation to be considered as ‘Fully Covered’ are — (a) 40 litres of safe drinking water per capita per day (lpcd) and additional 30 lpcd for cattle in the Desert Development Program Areas;(b) one hand pump or stand post for every 250 persons; and (c) the water source should exist within the habitation or within a distance of 1.6 km. in the plains and within 100 metres elevation in the hilly areas.
Drinking water is defined as safe if it is free from bacteria contamination, chemical contamination viz. fluoride, iron, arsenic, nitrate, brackishness in excess or beyond permissible limits.
Based on the Habitation Survey-2003 and the data collected from the State officials, a comparative analysis of the total number of habitations and the proportion of them that are fully covered (FC) is presented in the following table.
Table-3.1 : Comparative Habitation Coverage — 2003 Vs 2009
Habitation Coverage (2003) Habitation Coverage (2009) States Total
Habitation
Fully Covered
% (Percenta
ge)
Total Habitatio
n
Fully Covered
% (Percenta
ge) Karnataka 51543 27021 52.4% 59630 55244 92.6% Himachal 51848 19183 37.0% 51868 38983 75.2% Rajasthan 121133 40342 33.3% 122250 116023 94.9% Assam 80468 27300 33.9% 86976 73582 84.6% West Bengal 96242 66833 69.4% 96265 79659 82.7% As can be seen from the chart alongside, between the period 2003 and 2009, all the 5 states have registered a good physical progress in terms of increased level of fully covered (FC) habitations. Among the 5 states, the proportion of fully covered habitations in the states of Rajasthan and Assam is found to be quite impressive, with an increase of 62 and 51 percentage points, respectively.

Evaluation Study on Rajiv Gandhi National Drinking Water Mission 15
Chart-3.1 : Proportion of Fully Covered Habitations (2003 Vs 2009)
34%
93% 95%
69%
33%37%
52%
83%85%75%
Karnataka Himachal Rajasthan Assam W. Bengal
2003 2009
3.2 Financial Progress
Based on the financial data received from the study states, the State-wise analysis of the proportion of funds utilized is presented in the following table.
Fund Utilization (%) States Released
(Rs. in lakhs)
Utilized (Rs. in lakhs)
Utilized%
Karnataka (6 Years — 2003-04 to 2008-09)
247908.47 * -
Himachal Pradesh * * - Rajasthan (6 Years — 2003-04 to 2008-09)
612614.2 559086.7 91.2%
Assam (6 Years — 2003-04 to 2008-09)
145292.8 144002.4 99.1%
West Bengal (3 Years — 2004-05 to 2006-07)
91215.0 71434.5 78.3%
*Figures Not Available As can be seen, while the financial progress of Rajasthan is over 90%, it is close to 100% for the State of Assam. However, the performance of the State of West Bengal has not been as good. The 3-year average of the proportion of funds utilized for this State is found to be less than four-fifth (78%).

Evaluation Study on Rajiv Gandhi National Drinking Water Mission 16
Chapter – 4
Respondents’ Profile — Household Survey 4.1 Respondents’ Profile — Household Survey
Access to drinking water has special implications for women and children. The responsibility for fetching water for household needs, sometimes over long distances, is invariably assigned to women or girls. Accordingly, during the household survey, from each sample household, a woman respondent was purposively selected for administering the questionnaire. In case, a woman respondent was not available at the time of survey, the questionnaire was administered to the male respondent.
Table-4.1 : Gender Profile
Gender-wise profile of the respondents presented in the table alongside shows that overall, an overwhelming majority (85%) of the respondents were females. Among the 5 states, Karnataka and Assam stand out where almost all (96% and 99%, respectively) respondents were females. Equitable access to safe drinking water to all sections of the society is acknowledged as important development goal of the RGNDWM. Accordingly, care was taken to ensure that all sections of the soceity had due representation while selecting the households in each of the sample habitations. The social caste-wise analysis of respondents presented in the chart alongside corroborates our efforts in this regard. During the household survey, information was also recorded with respect to the type of housing of the respondents. The analysis is presented in the chart alongside. As quite expected, especially in the context of rural settings, nearly half (47%) of the sample households were ‘kuchcha’. The proportion of ‘pucca’ households stood at less than one-third (29%).
Category n Female Male Karnataka 288 95.8% 4.2% Himachal 288 67.7% 32.3% Rajasthan 287 75.6% 24.4% Assam 288 98.6% 1.4% West Bengal 288 85.4% 14.6% Overall 1439 84.6% 15.4%
Chart-4.1 : Social Caste-wise Profile (n=1440)
ST(5%)
OBC(16%)
SC(26%)
General(54%)
Chart-4.2 : Type of House (n=1440)
Semi-Pucca(24%) Pucca
(29%)
Kachcha(47%)

Evaluation Study on Rajiv Gandhi National Drinking Water Mission 17
The analysis of the educational profile of the household survey respondents presented in the following shows that overall, two-fifth (41%) of the respondents were illiterate. Among the 5 states, the situation in Rajasthan is particularly distressing where three-fourth (75%) respondents were illiterate. Further, less than one-third (30%) of the respondents had the education level of upper primary or above.
Table-4.2 : Educational Profile of the Household Survey Respondents
Category n Illiterate Up to Primary
Upper Primary
High-School
Higher Secondary
& Above Karnataka 288 40.4% 12.5% 15.7% 21.3% 10.1% Himachal Pradesh 288 29.9% 56.6% 9.0% 4.5% 0% Rajasthan 288 74.7% 23.3% 1.4% 0.6% 0% Assam 288 28.6% 20.2% 30.3% 13.6% 7.3% West Bengal 288 32.2% 31.4% 23.8% 8.0% 4.6% Overall 1440 41.2% 28.9% 16.0% 9.6% 4.3%

Evaluation Study on Rajiv Gandhi National Drinking Water Mission 18
Chapter 5
Access to Safe Drinking Water 5.1 Access to Safe Drinking Water
The household survey data was analyzed for access to safe drinking water sources and a comparison was made between the pre-2003 and the present status. The State-wise and overall findings are presented in the following table —
Table-5.1 : State-wise Access to Safe/Unsafe Drinking Water Sources — Pre-2003 & Present Status (n=1440)
Karnataka Himachal Rajasthan Assam West Bengal Overall Cate- gory Pre
2003 As on Date
Pre 2003
As on Date
Pre 2003
As on Date
Pre 2003
As on Date
Pre 2003
As on Date
Pre 2003
As on Date
Safe 69.1% 85.4% 55.6% 100% 9.0% 91.0% 84.0% 93.1% 85.8% 97.6% 60.7% 93.4%Unsafe 30.9% 17.8% 44.4% 0% 91.0% 9.0% 16.0% 2.3% 14.2% 5.9% 39.3% 6.6% Safe Sources : Tap (PWS, MWS and GLR) and Hand-pumps/Bore-Tube Wells Unsafe Sources: Open Wells and Traditional Water Bodies (Ponds, Lakes, Rivers, Springs, etc.) As can be seen, there has been a tremendous improvement in the rural populations’ access to safe drinking water sources between the pre-2003 and the present period across all the 5 states. The improvement in this regard is found to be phenomenal in the case of Rajasthan where currently over nine-tenth (91%) of the rural households have access to safe drinking water sources as compared to less than one-tenth (9%) of them prior to 2003. During the same period, Himachal Pradesh has also registered an equally impressive improvement; currently all the households (100%) have access to safe drinking water sources as compared to less than three-fifth (56%) prior to 2003. Overall, 5 states combined, over nine-tenth (93%) of the rural population at present has access to safe drinking water sources; the improvement of 32 percentage points is a reflection of the commendable progress made under the Mission. A graphical representation of the comparative analysis of pre-2003 and present status with regard to the percentage of households having access to safe drinking water sources is presented in the following chart —
61%
85%100%
91%86%84%
9%
56%69%
93%98%93%
Karnataka HimichalPradesh
Rajasthan Assam West Bengal Overall
Pre 2003 Present
Chart-5.1 : Access to Safe Water Sources — Comparison of Pre-2003 & Present Status

Evaluation Study on Rajiv Gandhi National Drinking Water Mission 19
A similar analysis of household data with regard to the least and ‘most affected’ districts of the 5 states was conducted and the overall findings are presented in the following table. Table-5.2 : Access to Safe/Unsafe Drinking Water Sources in Least & Most Affected
Areas — Pre-2003 & Present Status Least Affected (n=720) Most Affected (n=720) Category
Pre 2003 As on Date Pre 2003 As on Date Safe Sources 71.4% 91.8% 50.1% 95.0% Unsafe Sources 28.6% 8.2% 49.9% 5.0% As quite expected, compared to the households (71%) of the ‘least affected’ districts, a much smaller proportion of the households (50%) in ‘most affected’ districts had access to safe drinking water sources prior to 2003. With the advent of the Mission, the situation in the ‘most affected’ areas has improved to a point where the proportions of the households in ‘least affected’ and ‘most affected’ areas having access to safe drinking water are quite comparable (92% and 95%, respectively), as shown in the chart alongside. 5.2 Parameters of Access to Drinking Water
In order to assess the issue of access to drinking water in a holistic manner, efforts were made to elicit information from the respondents of the household survey on the following 5 key parameters. • Safe and Round-the-year Availability
• Safe, Round-the-Year and Sufficiency
• Distance of Water Source
• Time Spent in Collecting Water
• Social Inclusion It may be highlighted that the first 3 are the defining parameters of the ‘fully covered’ status of a habitation. Accordingly, these are discussed first. Safe and Round-the-year Availability
The household survey findings with regard to the availability of water from safe sources on round-the-year basis, are presented in the following table —
50%
71%
95%92%
Least Affected Most Affected
Pre 2003 As on Date
Chart-5.2 : Access to Safe Water Sources in Least/Most Affected Areas—Pre-2003 & Present Status

Evaluation Study on Rajiv Gandhi National Drinking Water Mission 20
Table-5.3 : % Households Receiving Safe and Round-the-Year Supply of Water
State No. of
Households % Households Receiving Safe & Round-the-Year
Supply Karnataka 288 58.7% Himachal Pradesh 288 66.0% Rajasthan 288 70.5% Assam 288 76.4% West Bengal 288 58.0% Overall 1440 65.9%
As can be seen, overall, around two-third (66%) of the households having access to safe drinking water sources are getting round-the-year supply of drinking water. Among the 5 states, Assam stands out as the best performing State with nearly four-fifth (76%) of the households are receiving round-the-year supply of water from safe sources. On the other hand, West Bengal is found to be the worst performing where two-fifth (42%) of the households have reported that they are deprived of this facility. Safe, Round-the-Year and Sufficiency
Analysis of the household survey data for the proportion of households receiving safe, round-the-year and sufficient quantity of water is presented in the following table — Table-5.4 : % Households Receiving Safe, Round-the-Year and Sufficient Quantity
of Water
State No. of
Households % Households Receiving Safe, Round-the-
Year and Sufficient Quantity of Water Karnataka 288 53.8% Himachal Pradesh 288 64.9% Rajasthan 288 66.0% Assam 288 76.0% West Bengal 288 55.2% Overall 1440 63.2% As can be seen, overall, only three-fifth (63%) of the households has reported to be receiving sufficient quantity of water from safe sources on round-the-year basis. Among the 5 states, Assam stands out as the best performing State where this was reported by three-fourth (76%) of the households. On the other hand, Karnataka was found to be the worst performing State where close to half the households (46%) have reported that they were not receiving round-the-year supply of sufficient quantity of water from safe sources. State-wise comparative analysis of households reporting safe, safe & round-the-year and safe, round-the-year and sufficient supply of drinking water is presented in the following chart.

Evaluation Study on Rajiv Gandhi National Drinking Water Mission 21
As can be seen, although the proportion of households having access to safe water is quite high (ranging from 85% to 100%), the proportion of households reporting safe, round-the-year supply and sufficient water supply is much smaller; the difference being as high as 43 percentage points in the case of West Bengal. Distance of Water Source
Under RGNDWM, one of the norms for a habitation to be considered as ‘Fully Covered’ is the availability of water source within the habitation or within a radius of 1.6 kms in plains and 100 meter in hilly areas. Accordingly, data was analyzed for households (having access to safe as well as unsafe water) having access to main water source within or beyond the 1.6 kms. (except Himachal Pradesh, where the criteria was within or beyond 100 meters due to the State being hilly). The findings are presented in the following table —
Table-5.5 : % Households having Access to Drinking Water Sources within or beyond 1.6 kms
State No. of
Households % Households Meeting the
‘Fully Covered’ Norm Karnataka 288 99.5% Himachal Pradesh* 288 100% Rajasthan 288 100% Assam 288 100% West Bengal 288 100% Overall 1440 99.9%
* Distance of main water source; in case of Himachal, it is within 100 m elevation difference
As can be seen, overall, all 5 states combined, almost all the households having access to safe drinking water have reported that the main source of water was located within 1.6 kms. from their homes. As regards the households who were dependent on the unsafe drinking water sources have also reported that the main water source was located within this distance. As regards the hilly State of Himachal Pradesh, all the households surveyed have reported that the main safe source of water was located within 1.6 km or within 100 m elevation difference.
Chart-5.3 : Access to Safe, Round-the-Year & Sufficient Water Supply — By State
93%98%93%91%100%
85%
66%58%
76%71%66%59%
63%55%
76%66%65%
54%
Karnataka Himachal Rajasthan Assam West Bengal Overall
Safe Safe & Round-the-Year Safe, Round-the-Year & Sufficient

Evaluation Study on Rajiv Gandhi National Drinking Water Mission 22
In view of all the sample households across the 5 states reporting access to safe source of water within the stipulated norm, it can be safely deduced that the proportion of households reporting access to safe, round-the-year and sufficient water supply (Table-5.4) represent the proportion of ‘fully covered’ habitations in the respective study states. The following chart presents a State-wise comparison between the proportion of ‘fully covered’ habitations based on the data received from the State officials and the proportion of households reporting access to safe, round-the-year and sufficient water supply within the stipulated distance/elevation norms.
As is evident from the chart, there are significant differentials between the ‘fully covered’ status based on the State-level data and the findings of the household survey. The difference is quite prominent in the State of Karnataka, Rajasthan and West Bengal (39, 29, and 28 percentage points, respectively). Time Spent in Collecting Water
Access to drinking water has implications not only for health status and human development parameters but also for opportunities depending upon the opportunity cost of time. This has special implications for women and children. The responsibility for fetching water for household needs, sometimes over long distances in rural areas, is invariably assigned to women or girls, who dropout of school to attend to these chores. Hence, the ready availability of safe drinking water lays the foundation for improvement in literacy and health indicators in communities. The household survey findings on the average time spent per day by the households in collecting water is presented in the following table —
Table-5.6 : Average Time Spent per day by Households in Collecting Drinking Water (Minutes) (Safe: n=1345; Unsafe: n=95)
Karnataka Himachal Rajasthan Assam West Bengal Overall Safe Unsafe Safe Unsafe Safe Unsafe Safe Unsafe Safe Unsafe Safe Unsafe64 48 48 48 56 60 40 40 48 48 52 48
As can be seen, overall, the average daily time spent by the households in collecting drinking water (from safe sources) is 52 minutes. Considering the numerous constraints
Chart-5.4 : Comparison of Fully Covered Status — State-level Data Vs Household Survey
83%85%95%
75%
93%
55%
76%66%65%
54%
Karnataka Himachal Rajasthan Assam West Bengal
% Habitations Fully Covered (State-level Data 2009)
% Households Reporting Access to Safe, Round-the-Year & Sufficient Supply

Evaluation Study on Rajiv Gandhi National Drinking Water Mission 23
in the rural areas (frequent power cuts for long hours and low voltage, low water pressure, lack of proper maintenance of equipment, less than adequate number of sources, etc.), the average time of 52 minutes per day spent by the households is not much and the situation can be considered as quite satisfactory.
Social Inclusion
The respondents of the household survey were asked about any discrimination in access to drinking water sources so as to assess whether or not there is any social exclusion based on caste, class, gender or income in terms of access. The findings are presented in the following table —
Table-5.7: % Households Reporting No Discrimination in Access to Drinking Water Source (Safe: n=1345; Unsafe: n=95)
Karnataka Himachal Rajasthan Assam West Bengal Overall Avg. Time Safe Unsafe Safe Unsafe Safe Unsafe Safe Unsafe Safe Unsafe Safe UnsafeNo 94.2% 97.6% 100% 100% 100% 100% 100% 100% 99.6 100% 98.8% 98.9%Yes 5.8% 2.4% 0% 0% 0% 0% 0% 0% 0.4% 0% 1.2% 1.1% It is indeed heartening to note that almost all the households across all the 5 states have reported that there is no discrimination whatsoever, with regard to access to drinking water sources. The overall situation with regard to the aforementioned 5 key parameters of access to drinking water is summarized in the following table. Particulars %
Households
% households with access to safe and round-the-year supply 65.9% % households with access to safe, round-the-year and sufficient supply 63.2% % households with access to safe, round-the-year and sufficient supply within 1.6 kms 63.2% Average time spent per day by households in collecting drinking water (Minutes) 52 % households reporting no discrimination in access to drinking water source 98.8% 5.3 Moving towards Tapped Water Supply
Water Collection from Distant Sources District Shimoga, Block Shikaripura,
GP Sunandakoppa, Habitation-Tadasanahalli
Unreliability leading to Overcrowding District Kolar, Block Srinivasapura,
GP & Habitation Masthenahalli

Evaluation Study on Rajiv Gandhi National Drinking Water Mission 24
Further analysis of the household survey data with regard to the access to the main source of safe drinking water (that is tap or hand-pump/bore-tube wells) prior to 2003 and as on date was conducted and the findings are presented in the following table —
Table-5.8 : State-wise Break-up of Safe Water Sources — Pre-2003 & Present Status (n=1440)
Karnataka Himachal Rajasthan Assam West Bengal Overall Category
Pre 2003
As on Date
Pre 2003
As on Date
Pre 2003
As on Date
Pre 2003
As on Date
Pre 2003
As on Date
Pre 2003
As on Date
Tap 54.9% 84.4% 52.4% 100% 1.0% 34.7% 2.1% 53.1% 6.9% 81.6% 23.5% 70.8%
Hand Pump
14.2% 1.0% 3.1% 0% 8.0% 56.3% 81.9% 40.0% 78.8% 16.0% 37.2% 22.8%
As can be seen, compared to their status prior to 2003, the proportion of households having access to tap water currently has improved quite significantly in all the 5 states. Overall, it has increased from 24% to 71% between the period prior to 2003 and as on date. During the same period, the proportion of households depending on hand-pump/ tube-bore wells has gone down, except in the State of Rajasthan. A closer scrutiny has revealed that in the case of this State, prior to 2003, 80% in Barmer district (most affected) and 84% households in Dholpur district (least affected) were receiving drinking water from open wells. Currently, the situation has changed to a point where only 8% households in Barmer and 6% households in Dholpur are using open well water, while the majority has now access to hand-pump or tap water — provided under the Mission. A graphical presentation of the changing scenario in terms of improved access of the rural households to the tapped water supply between the period prior to 2003 and as on date in the various states is presented in the following chart.
As can be seen, there has been a drastic change, especially in the case of Rajasthan, Assam and West Bengal where the proportion of the households in 2003 having access
2% 7%24%
84%100%
35%
53%
82%71%
1%
52%55%
Karnataka HimichalPradesh
Rajasthan Assam West Bengal Overall
Pre 2003 Present
Chart-5.5 : Access to Tap Water — Comparison of Pre-2003 & Present Status

Evaluation Study on Rajiv Gandhi National Drinking Water Mission 25
to piped water supply was next to nothing (1%, 2% and 7%, respectively). Currently, these states have registered a significant improvement, with a substantial increase in the proportion of households having access to piped water supply (35, 53 and 82 percentage points). Among the 5 states, Himachal Pradesh and Karnataka standout with cent percent households and over four-fifth (84%) households having access to piped water supply. Overall, all the 5 states combined, there has been an improvement from 24% prior to 2003 to the present level of 71% of the rural households having access to piped water supply. The overall situation with regard to the key parameters of access to tapped drinking water is summarized in the following table. Particulars %
Households % households receiving sufficient quantity of tapped water for all purposes 86% % households reporting round-the year availability of tapped water 66% % households reporting regular timing of tapped water supply 85% % households reporting convenience about the timing of tapped water supply 90% % households reporting that tapped water is sufficient even for cattle 45% % households reporting adequate pressure in the tapped water supply 59% 5.4 Alternate Sources of Drinking Water
As already detailed in Table-5.4, there are only 63% households that have access to safe, round-the-year and sufficient quantity of water. This implies that out of the total 1440 households, there are close to two-fifth (37%) households that have either sufficiency problem or round-the-year availability problem or both the problems. These are the households that have to depend on alternate sources of drinking water. The following table presents an analysis of the households accessing an alternate source, in terms of whether their alternate source is safe or unsafe.
Table-5.9: % Households having Access to Safe/Unsafe Alternate Water Sources (n=533)
Category Karnataka Himachal Rajasthan Assam West Bengal Overall Safe 81.9% 17.9% 59.1% 91.5% 87.0% 69.6% Unsafe 18.1% 92.1% 40.9% 8.5% 13.0% 30.4% As can be seen, the alternate drinking water sources for over two-third (70%) of the households are reported to be safe, that is, for around one-third of the households (30%), the alternate drinking water source is unsafe. State-wise, an overwhelming majority of the households (82% to 92%) in the states of Karnataka, Assam and West Bengal have access to safe alternate sources, while in the case of Rajasthan, the alternate sources of water was unsafe (‘open wells’ and ‘taanka’), as reported by a significant two-fifth (41%) of the households.

Evaluation Study on Rajiv Gandhi National Drinking Water Mission 26
The key parameters of access with regard to the households accessing water from alternate sources are presented in the following table. Particulars % Hhds % hhds who reported to be receiving sufficient quantity from the alternate source 85% % hhds stating the alternate source to be within 1.6 kms 97% Average time spent per day by households in collecting water (minutes) 144 As can be seen, although alternate sources are located within the statutory distance of 1.6 kms from their homes for almost all the households (97%), average time spent per trip in collecting water from the alternate sources is found to be nearly three times as compared to that of the main source (144 minutes for alternate & 52 minutes for main sources). During the household survey, the respondents were also asked about the reasons for using alternate sources. The overall (5 states combined) findings are presented in the chart alongside. Evidently, a large majority of the households (64%) have reported to be using alternate sources when their main sources of water have dried up, while one-fourth (26%) of them are doing so due to non-availability of water at their main sources because of technical fault in the supply system. Further, one-tenth (10%) of them have also reported that at times, due to poor quality of water at main sources, they have to rely on the alternate water sources.
Most (92%) of households in Himachal Pradesh have reported their alternate source of water as ‘springs’, considered as unsafe by us. However, during discussions, it emerged that especially in summer, these households were taking water from springs as it was much cooler and better than the warm piped water supply. It may be mentioned that despite 100% households receiving sufficient quantity and 95% households receiving round-the-year supply from the main sources (tapped), almost all the households access water from springs for the aforementioned reasons.
Main Source Dries Up
(64%)
No Supply due to Technical Fault
(26%)
Poor Water
Quality (10%)
Chart-5.6 : Reasons for Using Alternate Sources

Evaluation Study on Rajiv Gandhi National Drinking Water Mission 27
Chapter 6
Water Quality 6.1 Water Quality
Satisfaction with the Water Quality
Rajiv Gandhi National Drinking Water Mission envisages provision of adequate and contamination-free drinking water on a sustainable basis to the rural population. Accordingly, during the household survey, information was elicited with regard to satisfaction with the water quality of the main water sources. The findings are presented in the following table —
Table-6.1 : % Households Satisfied with the Water Quality of Main Source (n=1440)
Quality Karnataka Himachal Rajasthan Assam West Bengal Overall Satisfactory 96.9% 100% 50.5% 88.9% 84.5% 84.2% Unsatisfactory 3.1% 0% 49.5% 11.1% 15.5% 15.8% It is encouraging to note that overall, an overwhelming majority of the households (93%) have reported to be satisfied with the water quality. Among the 5 states, water quality is a major issue only in the State of Rajasthan, as reported by half the households (50%) surveyed in the State. Further analysis has revealed that almost all these households belonged to the ‘most affected’ district Barmer. It may be highlighted that overall, around four-fifth (78%) of the households in the 5 ‘most affected’ districts have reported that the water quality of their main sources was satisfactory. With 90% households in the ‘least affected’ districts satisfied with the water quality of the main sources, there is not much difference between the least and ‘most affected’ districts in terms of water quality as perceived by the households. During the discussions with the respondents of the household survey as well as with the focus group participants, the major quality problems reported in some of the states are presented hereunder — Major Water Quality Problems of Main Sources as Reported by the Households
• Red color of water — (reported mainly in West Bengal and Assam)
• Bad taste/Salinity — (reported mainly in Rajasthan and Karnataka)
• Dirt Particles — (reported mainly in Karnataka, Assam and West Bengal)
90%78%
Most Affected Least Affected
Chart-6.1 : % Households Satisfied with Water Quality

Evaluation Study on Rajiv Gandhi National Drinking Water Mission 28
“The water that is supplied under the Scheme ..., that is very saline. For this, nothing has been done. People in the village do not use this water for drinking or cooking.”
FGD Participants, Dist.-Barmer, Block-Sindari, Rajasthan
“Water is dirty and its color is brownish. We leave water in the bucket for few hours so that dirt settles down and then we use it. For drinking purpose, we take water from open well.”
FGD Participants, Dist.-Bankura, Block-Bankura-2, West Bengal
“In the village, there is this problem of red color and bad smell. Mostly people avoid this water and take water from other sources.”
FGD Participants, Dist.-Nagaon, Block-Koliobar, Rajasthan
A similar analysis with regard to satisfaction with the quality of water was also conducted for the alternate sources. The findings are presented in the following table —
Table-6.2 : % Households Satisfied with the Water Quality of Alternate Source (n=1440)
Quality Karnataka Himachal Rajasthan Assam West Bengal Overall Satisfactory 91.2% 98.5% 43.8% 49.1% 72.5% 71.0% Unsatisfactory 8.8% 1.5% 56.2 50.9% 27.5% 29.0% As can be seen, overall, 71% of the households have reported the water quality from the alternate sources to be satisfactory. Among the 5 states, water quality of the alternate sources is found to be a major issue in the states of Rajasthan and Assam where majority of the respondents (56% and 51%, respectively) have reported dissatisfaction. As regards the major quality problems in different states, the details are presented hereunder — Major Water Quality Problems of Alternate Sources as Reported by the Households • Red color of water — (reported mainly in West Bengal, Assam and Karnataka) • Bad taste — (reported mainly in Rajasthan, West Bengal and Karnataka ) • Dirt Particles — (reported mainly in Karnataka, Assam and West Bengal) Provision of Water Testing Kits to Gram Panchayats
National Rural Water Quality Monitoring & Surveillance Program, the Village Water & Sanitation Committee (VWSC) in each Gram Panchayats is required to identify and test all sources of drinking water in their respective areas. For the purpose, the Gram Panchayts are provided with Field Testing Kits. During our interaction with the Pradhans of the sample Gram Panchayats, they were asked about provision of these kits. The findings are presented in the following table —
Table-6.3 : Gram Panchayats Reporting the Provision of Field Testing Kit (n=63)
Provision of Kits
Karnataka Himachal Rajasthan Assam West Bengal Overall
Yes 11 3 3 1 0 18 (29%)
No 1 9 9 11 12 42 (71%)

Evaluation Study on Rajiv Gandhi National Drinking Water Mission 29
It is disheartening to note that out of the 63 sample Gram Panchayats, only 18 have reported about being provided with the field-testing kit. Surprisingly, none of the 14 sample Gram Panchayats of West Bengal and only 1 Gram Panchayat in Assam has reported affirmatively in this regard. Ironically, as shown in the chart alongside, the proportion of Gram Panchayats (Gram Panchayats (GPs)) provided with the field testing kits is much smaller for the ‘most affected’ districts as compared to the ‘least affected’ ones (23% vs 33%). When the issue was probed from the respondents of the habitation survey, the overall situation was found to be much worse; with only 8% of the 240 habitations reporting the provision of field testing kits in their areas. Once again, the trend was same, with the proportion of respondents in ‘most affected’ districts responding in affirmation about the provision of field testing kit being much smaller (5%) than that of those in the ‘least affected’ districts (8%). Testing of Water Sources by Technical Person
During the habitation survey, the respondents were asked if the water sources in their areas have been tested by a technical person. The findings are presented in the following table —
Table-6.4 : Testing of Water Sources in Habitations by Technical Personal (n=240 Habitations)
Water Testing
Karnataka Himachal Rajasthan Assam West Bengal
Overall
Yes 33% 32% 15% 17% 8% 21% No 67% 68% 85% 83% 92% 79%
Once again, the results are disheartening. Overall, the respondents in four-fifth (79%) of the habitations have reported in negative about the testing of water sources. Further analysis has revealed that even in the case of ‘most affected’ districts, water sources have not been tested in three-fourth (76%) of the 120 habitations, as reported by the respondents of the habitation survey.
23% 33%
MostAffected(n=33)
LeastAffected(n=30)
Chart-6.2 : Provision of Field Testing Kit
5% 8%
MostAffected(n=120)
LeastAffected(n=120)
Gram Panchayats Affirming Habitations Affirming
15%21%
Most Affected Least Affected
Chart-6.3 : Testing of Water Sources (n=240 Habitations)
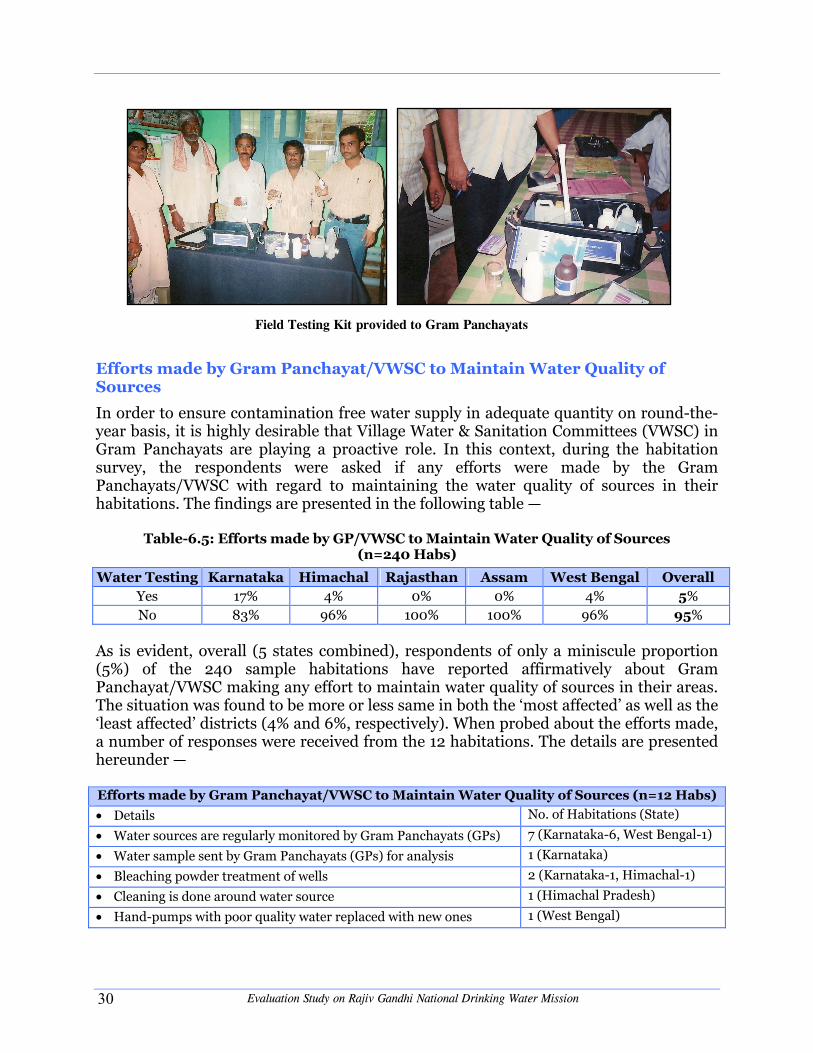
Evaluation Study on Rajiv Gandhi National Drinking Water Mission 30
Efforts made by Gram Panchayat/VWSC to Maintain Water Quality of Sources
In order to ensure contamination free water supply in adequate quantity on round-the-year basis, it is highly desirable that Village Water & Sanitation Committees (VWSC) in Gram Panchayats are playing a proactive role. In this context, during the habitation survey, the respondents were asked if any efforts were made by the Gram Panchayats/VWSC with regard to maintaining the water quality of sources in their habitations. The findings are presented in the following table —
Table-6.5: Efforts made by GP/VWSC to Maintain Water Quality of Sources (n=240 Habs)
Water Testing Karnataka Himachal Rajasthan Assam West Bengal Overall Yes 17% 4% 0% 0% 4% 5% No 83% 96% 100% 100% 96% 95%
As is evident, overall (5 states combined), respondents of only a miniscule proportion (5%) of the 240 sample habitations have reported affirmatively about Gram Panchayat/VWSC making any effort to maintain water quality of sources in their areas. The situation was found to be more or less same in both the ‘most affected’ as well as the ‘least affected’ districts (4% and 6%, respectively). When probed about the efforts made, a number of responses were received from the 12 habitations. The details are presented hereunder — Efforts made by Gram Panchayat/VWSC to Maintain Water Quality of Sources (n=12 Habs)
• Details No. of Habitations (State)
• Water sources are regularly monitored by Gram Panchayats (GPs) 7 (Karnataka-6, West Bengal-1)
• Water sample sent by Gram Panchayats (GPs) for analysis 1 (Karnataka)
• Bleaching powder treatment of wells 2 (Karnataka-1, Himachal-1)
• Cleaning is done around water source 1 (Himachal Pradesh)
• Hand-pumps with poor quality water replaced with new ones 1 (West Bengal)
Field Testing Kit provided to Gram Panchayats

Evaluation Study on Rajiv Gandhi National Drinking Water Mission 31
Trainings on Water Quality Monitoring and Surveillance
As per the State, district and block level records and discussions with the concerned officials, various trainings under water quality monitoring and surveillance were conducted at District, Block and Gram Panchayat levels. At the grassroot level, Gram Panchayat secretary, watermen, teachers, Anganwadi Workers and ANMs have been provided trainings. When probed from the village Pradhans about grassroot workers having received any training, the Pradhans of only 23 out of the 63 sample Gram Panchayats (GPs) responded in affirmation, as shown in the table alongside. According to them, training was provided on quality, monitoring and sanitation & hygiene issues. Among the 5 states, Karnataka stands outs with all the 12 sample Gram Panchayats (GPs) reporting about the provision of training to grassroot workers.
Table-6.6 : Training received by Grassroot Workers in GP
Category n Yes No Karnataka 12 12 0 Himachal Pradesh 12 3 9 Rajasthan 13 2 11 Assam 12 4 8 West Bengal 14 2 12 Overall 63 23 40
Further, when probed about the issue of women participation in trainings, it emerged that in a large majority of the Gram Panchayats (50 out of 63), no woman has received any training. Among the 5 states, Karnataka stands out where 7 out of the 12 sample Gram Panchayats (GPs) have mentioned about women having received training. Considering that the responsibility of collecting water lies mainly with the females of the households, the aforementioned findings are quite disheartening.
Table-6.7 : Training received by Women in GP
No. of Gram Panchayats (GPs) where — Category n No
Women Trained
1-2 Women Trained
3-5 Women Trained
5-10 Women Trained
Karnataka 12 5 0 6 1 Himachal 12 12 0 0 0 Rajasthan 13 11 2 0 0 Assam 12 8 2 1 1 West Bengal 14 14 0 0 0 Overall 63 50 4 7 2

Evaluation Study on Rajiv Gandhi National Drinking Water Mission 32
Chapter 7
Operation & Maintenance 7.1 Functional Water Sources
Under Operation & Maintenance (Operation and Maintenance (O&M)), efforts were made to collect information on various issues from the different stakeholders. We began by assessing the current status of the functional water sources (hand-pumps and tapped water supply system) in the study areas. As shown in the table alongside, over two-third (70%) of the hand-pumps and overwhelming majority (91%) of the tapped water supply sources were functional as reported by the respondents of the habitations survey.
% Functional Water Sources — As Reported by Habitations Water Source % Fucrnctional
Hand-pumps 70.4% Tapped Supply Sources 91.4%
“The hand-pump installed under the Scheme is lying defunct for past two years and people in the village have to collect water from private tube well located 2 kms. away. Department have not bothered about its repair. Panchayat has also not made any arrangement for this problem.”
FGD Participants, Dist.-Barmer, Block-Chohatan, Rajasthan
“There is only one stand-post in the village provided under the Scheme. This is not working for more than two years now; .....nothing has been done by the department.”
FGD Participants, Dist.-Hawrah, Block-Uluberia-2, West Bengal Considering that a significant one-third of the hand-pumps were non-functional, the respondents of the habitation survey were probed about the reasons for the same. According to the respondents of around a significant one-fifth (18%) of the sample habitations, the hand-pumps had become defunct mainly due to ground water depletion. This problem was found to be pronounced mainly in the states of Karnataka and Rajasthan, as reported by a significant proportion of habitations (54% and 25%, respectively). The other major reason for the defunct hand-pumps was cited as lack of proper maintenance, as reported by the respondents of 16% habitations.
“In this Panchayat area, hand-pump scheme is not successful because water level has gone down to very deep level. Government should construct GLR for water supply in this area.”
FGD Participants, Dist.-Barmer, Block-Chohtan, Rajasthan

Evaluation Study on Rajiv Gandhi National Drinking Water Mission 33
As already mentioned, there has been a continuing focus on increasing the tapped water supply in rural areas and currently, three-fifth (60%) of the households have access to tapped water supply. Accordingly, during the habitation survey, the respondents were asked about the frequency of breakdowns of the tapped water supply. The findings presented in the chart alongside show that in case of one-third (35%) of the habitations, there was no breakdown reported in the past one year, while around half (49%) have reported 2-3 times breakdown in the past one year. In the context of the rural settings and other constraints, the overall situation can be said to be satisfactory. 7.2 Responsibility of Operation and Maintenance (O&M)
When probed about the issue of operation & maintenance of the water supply system created under the Mission, an overwhelming majority (93%) of the households were of the view that it was the sole responsibility of the Government, indicating their unwillingness to be involved in Operation and Maintenance (O&M). As shown in the table alongside, overall, only a small proportion (5%) of the households was of the view that Operation and Maintenance (O&M) should be the responsibility of the community. Among the 5 states, Himachal Pradesh stands out with the proportion of such households being the highest (12%). When probed about the existence of any committee in their village/habitation that is responsible for maintenance of water sources, almost all the households (99%) responded in negative.
Table-7.1 : Responsibility of Operation and Maintenance — Households’ Views
Category n Community Govt. Don’t Know/ Can’t Say
Karnataka 283 7.1% 91.8% 1.1% Himachal 288 12.2% 81.9% 5.9% Rajasthan 286 1.7% 96.9% 1.4% Assam 282 0.4% 97.9% 1.7% West Bengal 283 2.5% 97.1% 0.4% Overall 1422 4.8% 93.1% 2.1%
During the focus group discussions, in most of the habitations across all the 5 study states, FGD participants reported that there was no community involvement in operation & maintenance of the scheme in their villages.
“Operation & maintenance is done by PHED. There is no community participation in Operation and Maintenance (O&M) of the scheme.”
FGD Participants, Dist.-Nagaon, Block-Binnakhandi, Assam
Chart-7.1 : Breakdowns of Tapped Supply in Past One Year (n=240 Habs.)
Nil(35%)
> 3 Times(8%) 2-3 Times
(49%)
Once(8%)

Evaluation Study on Rajiv Gandhi National Drinking Water Mission 34
As quite expected, the proportion of households willing to pay for the operation & maintenance of the water supply system was found to be very small (8%), as shown in the table alongside. Unwillingness of 92% of the households to pay for the maintenance of water supply system was corroborated by village Pradhans of over half (56%) of the sample Gram Panchayats (GPs); they mentioned prevailing poverty among the community as the main reason for their unwillingness. Pradhans of only one-fourth (26%) of the Gram Panchayats (GPs) were of the view that the communities in their respective areas would be able to pay some amount (Rs. 10/- to Rs. 50/- per month) towards Operation and Maintenance (O&M), while the Pradhans of around one-fifth (18%) of the sample Gram Panchayats (GPs) mentioned that the community in their areas considered Operation and Maintenance (O&M) as the responsibility of the Gram Panchayats (GPs). Among the 5 states, Himachal Pradesh stands out with one-fourth (25%) of the households willing to pay for Operation and Maintenance (O&M).
Table-7.2 : Hhds Willing to Pay for Operation and Maintenance (O&M)
Category n Yes No Karnataka 287 10.5% 89.5% Himachal 286 25.2% 74.8% Rajasthan 280 2.5% 97.5% Assam 278 0% 100% West Bengal 284 3.2% 96.8% Overall 1415 8.3% 91.7%
7.3 Role of Gram Panchayats (GPs) in Operation and
Maintenance (O&M) of Water Supply System
The table alongside presents the findings on the capability of Gram Panchayats to take-up Operation and Maintenance (O&M) of various drinking water sources, as reported by the village Pradhans. As can be seen, over half of the Gram Panchayats have expressed their inability to take the responsibility of Operation and Maintenance (O&M). Among the 5 states that have reported to be capable, Karnataka stands out where Pradhans of all the sample Gram Panchayats have stated that they are capable to take this responsibility.
“Operation & maintenance is done by Gram Panchayat and for this purpose, one Waterman is appointed who is responsible to the all Operation and Maintenance (O&M) works. Cost of small repairs is borne by Gram Panchayats, big repairs are done by department.”
FGD Participants, Dist.-Kolar, Block-Malur, Karnataka
Table-7.3 : Capability of Gram Panchayats (GPs) to take-up
Operation and Maintenance (O&M) Category n Yes No Karnataka 12 12 0 Himachal Pradesh 12 6 6 Rajasthan 13 2 11 Assam 12 7 5 West Bengal 14 .3 11 Overall 63 30 33

Evaluation Study on Rajiv Gandhi National Drinking Water Mission 35
On the issue of formal handing over of Operation and Maintenance (O&M) of the assets created under the Mission, a large majority of the Gram Panchayats (50 out of 63) have responded in negative. Among the 5 states, Karnataka stands out where the village Pradhans of all the 12 sample Gram Panchayats (GPs) have mentioned that Operation and Maintenance (O&M) has been formally handed over to Gram Panchayats (GPs) (Table alongside).
Table-7.4 : Formal Handing Over of Operation and Maintenance (O&M) to Gram Panchayats (GPs)
The findings on the present status with regard to the entity responsible for the operation and maintenance of the various drinking water sources in the sample Gram Panchayats are presented in the table alongside. As can be seen, in a large majority of the Gram Panchayats (GPs) (44 out of 63), the implementing agency (PHED) has the responsibility of Operation and Maintenance (O&M), as reported by the village Pradhans. Further, in 16 Gram Panchayats, the responsibility of Operation and Maintenance (O&M) lies with the Gram Panchayats (GPs). As already mentioned, with formal handing over of the Operation and Maintenance (O&M), all the 12 sample Gram Panchayats (GPs) in the State of Karnataka have the responsibility of Operation and Maintenance (O&M). Besides, 4 Gram Panchayats (GPs) in West Bengal have also reported to be having Operation and Maintenance (O&M) responsibility with them. As regards the remaining 3 Gram Panchayats (GPs), the Operation and Maintenance (O&M) responsibility lies with the Village Level Water & Sanitation Committee (VLWSC). It may be highlighted that major breakdown repairs are taken-up by the PHED only. The issue with regard to the entity responsible for the Operation and Maintenance (O&M) of the various drinking water sources was also discussed with the habitation survey respondents. The findings are presented in the chart alongside. As can be seen, these are more or less similar to the aforementioned Gram Panchayat level findings.
Category n Yes No Karnataka 12 12 0 Himachal Pradesh 12 1 11 Rajasthan 13 0 13 Assam 12 0 12 West Bengal 14 0 14 Overall 63 13 50
Table-7.5 : Responsibility of Operation and Maintenance (O&M) — Present Status
Category n PHED GP VLWSCKarnataka 12 0 12 0 Himachal 12 12 0 0 Rajasthan 13 13 0 0 Assam 12 10 0 2 West Bengal 14 9 4 1 Overall 63 44
(69.8%) 16
(25.4%)3
(4.8%)
Chart-7.2 : Responsibility of Repairs (n=240 Habs)
VWSC/User
Group(6%)
GP(33%)
PHED(62%)

Evaluation Study on Rajiv Gandhi National Drinking Water Mission 36
7.4 Problems faced by Gram Panchayats
During the course of discussion with the Pradhans of the sample Gram Panchayats, information was elicited with regard to the various problems faced by them with regard to the water supply in their respective Panchayats. Out of the 63 sample Gram Panchayats (GPs), 41 of them stated that they did not have any problem. As regards the remaining 22 Gram Panchayats (GPs), the details of the problems as reported by the Pradhans are presented in the following table.
Problems Faced by Gram Panchayats
• Ground water depletion 6 Gram Panchayats (Most Affected-5; Least Affected-1) (Karnataka-5, Assam-1)
• Lack of funds and consequent shortage of PSPs and less coverage
3 Gram Panchayats (Karnataka-1, Assam-2)
• Household connections are not picking up being too expensive due to non availability of pipe lines as well as low income level of community
2 Gram Panchayats (Himachal Pradesh-2)
• Non availability of land for laying pipelines 7 Gram Panchayats (Himachal Pradesh-6, Rajasthan-1)
• Quality Problems 3 Gram Panchayats (In Most Affected) (Assam-3)
• Irregular electricity supply 1 Gram Panchayat (Assam-1)
As can be seen, ground water depletion and quality problems were reported from the Gram Panchayats of Karnataka & Assam and barring just one GP, all the other Gram Panchayats (GPs) are from the ‘most affected’ districts. There were 3 Gram Panchayats (GPs) where the Pradhans have reported about the shortage of funds due to which adequate number of public stand posts could not be installed and as a result, coverage is adversely impacted. We also came across 7 Gram Panchayats (GPs) where the Pradhans have reported about facing problems with regard to laying of pipelines that pass through the private land. According to them, people were generally disinclined to permit laying of pipelines on their land. Efforts were also made to capture the views and suggestions of the respondents of the household survey with regard to water supply in their areas. The findings are presented in the following table —

Evaluation Study on Rajiv Gandhi National Drinking Water Mission 37
Suggestions by Households — Overall (5 States Combined)
• % of households saying hand-pumps to be installed 17.8% (Mostly in Rajasthan)
• % of households saying piped stand-posts to be increased 21.5% (All states)
• % of households saying maintenance to be improved 8.8% (All states)
• % of households saying quality to be improved 15.0% (Rajasthan, Assam & W. Bengal)
• % of households saying water supply to be regular with increased timing
19.9% (All states, except Rajasthan)
• % of households saying pressure to be increased 6.3% (All states, except Rajasthan)
As can be seen, overall, a significant proportion of households (18%), mostly in Rajasthan felt the need for the provision of more hand-pumps, while over one-fifth (22%) expressed the need for more piped stand posts in their areas. Among the other major suggestions, improving maintenance and quality of water emerged as the prominent suggestions, as expressed by 15% and 20% of the households, respectively.

Evaluation Study on Rajiv Gandhi National Drinking Water Mission 38
Chapter 8
Water Tariff 8.1 Water Tariff
As per the household survey, 14.6% (total 210) of all the households were found to be having tap connections. It may be mentioned that in Rajasthan, none of the sample households have reported to be having tap connection. Discussions with the Pradhans of the sample Gram Panchayats revealed that overall, in less than half (30 out of 63) of the Gram Panchayats (GPs), the households have been provided tap connections. Although, as shown in the table alongside, tap connections are provided to some households in 2 out of the 13 sample Gram Panchayats (GPs) in Rajasthan, the sample households in the sample habitations in these Gram Panchayats (GPs) do not have tap connections. The table alongside presents the proportion of households having tap connection paying water charges on a regular basis. As can be seen, overall, close to nine-tenth (87%) of the households are indeed paying water charges on a regular basis. Among the 4 states, Himachal Pradesh stands out where all the households are reportedly paying water charges regularly. The issue of the payment of water charges on a regular basis was also discussed with the Pradhans of the sample Gram Panchayats (GPs) where households were reported to be having tapped water supply. According to the Pradhans of two-third (19 out of 30) such Gram Panchayats (GPs), over four-fifth (83%) of all the households were paying water tariff on a regular basis. The analysis of the average amount of monthly water charges per household is presented in the table alongside. The average amount is found to be lowest (Rs. 12.70/- per month per household) in Himachal Pradesh and highest (Rs. 53.80/- per month per household) in Assam. Overall, 4 states combined, the average monthly water charges per household works out to Rs. 22.30/-. The analysis of Gram Panchayat data shows more or less the same amount of average monthly water charges per household (Rs. 23.50/-). Further, it has also been found that
Table-8.1 : Tap Connections in Gram Panchayats (GPs)
Category n Gram Panchayats
(GPs) With Tap Conn.
Karnataka 12 9 Himachal 12 12 Rajasthan 13 2 Assam 12 6 West Bengal 14 1 Overall 63 30
Table-8.2 : Households Paying Water Charges Regularly
Category n Yes No Karnataka 83 77.1% 22.9% Himachal 88 100% 0% Assam 26 80.8% 19.2% West Bengal 13 76.9% 23.1% Overall 210 87.1% 12.9%
Table-8.3 : Avg. Monthly Charges per Hhd.
Category n Rs. Karnataka 72 22.20 Himachal 87 12.70 Assam 21 53.80 West Bengal 10 41.00 Overall 190 22.30

Evaluation Study on Rajiv Gandhi National Drinking Water Mission 39
there is no variation in the water charges among the households belonging to the different social categories (general, scheduled caste or scheduled tribe). It was found that an overwhelming majority (88%) of the households having tap connections had paid installation charges. This was corroborated by the village Pradhans of almost all the Gram Panchayats (GPs) (29 out of 30) where households have been provided tap connection. The analysis of the average amount of installation charges per household is presented in the table alongside. This is found to be lowest (Rs. 526.60/- per household) in Himachal Pradesh and highest (Rs. 1840.00/- per month per household) in West Bengal. Overall, 4 states combined, the average installation charges per household works out to Rs. 644.30/-. It may be highlighted that the user charges for Public Stand Post (PSP) were collected only in the State of Karnataka, as reported by the village Pradhans of the 12 sample Gram Panchayats. According to them, the average monthly amount of water charges per household was Rs. 10/- for all sections of the society. During discussions with the Pradhans of the sample Gram Panchayats (GPs), it also emerged that there were instances of some household connections being disconnected due to non-payment of water tariff. While lack of civic responsibility was cited by half of them as the reason for non-payment on a regular basis, the other half was of the view that the irregular and sometimes inadequate water supply was the main reason that prompted the community members to shy away from making payment on a regular basis. Similar explanations were cited by the household survey respondents who were not paying on a regular basis. On the issue of affordability of the water charges, it was found that overall, almost all the households (96%) across the 4 states have responded in affirmation, as shown in the table alongside. Even according to the village Pradhans of over two-third of the Gram Panchayats (GPs) (22 out of 30), the water tariff is affordable to all sections of the society. Efforts were also made to gauge the level of satisfaction among the households having tap connection with regard to the water charges paid by them vis-a-vis the quantity/quality of water supply received by them. As is evident from the analysis presented in the table alongside, almost all (95%) the households have expressed satisfaction in this regard.
Table-8.4 : Avg. Installation Charge per Hhd.
Category n Rs. Karnataka 51 532.40 Himachal 87 526.60 Assam 21 834.30 West Bengal 10 1840.00 Overall 169 644.30
Table-8.5 : Households Saying Water Charges Affordable
Category n Yes No Karnataka 72 93.1% 6.9% Himachal 82 100% 0% Assam 23 91.3% 8.7% West Bengal 10 100% 0% Overall 187 96.3% 3.7%
Table-8.6 : Hhlds Satisfied with Water Charges
Category n Yes No Karnataka 72 90.3% 9.7% Himachal 85 98.8% 1.2% Assam 22 90.9% 9.1% West Bengal 10 100% 0% Overall 189 94.7% 5.3%

Evaluation Study on Rajiv Gandhi National Drinking Water Mission 40
8.2 Setting-up Water Tariff — Responsibility, Basis and
Community Consultation
During the discussion with the village Pradhans of the 30 Gram Panchayats (GPs) where households have been provided tap connections, it was found that in most Gram Panchayats (GPs), the implementing agency (PHED) was responsible for setting-up water tariff. Whereas, wherever the supply system had been formally handed-over to the Gram Panchayats (GPs), the PRI was responsible for setting-up water tariff. Similarly, in some Gram Panchayats, this was done by Village Level Water & Sanitation Committee. When probed about the basis for setting-up the water tariff from the village Pradhans of Gram Panchayats (GPs) having this responsibility, most of them mentioned that it was done in accordance with the Government Order. On the issue of community being consulted before setting-up the water tariff, the village Pradhans of only one-fifth (6 out of 30) of the Gram Panchayats (GPs) responded in affirmation (table alongside). As regards informing the community about the water tariff, the village Pradhans mentioned about the use of public announcement, public display or through ‘Watermen’ for the purpose. 8.3 Adequacy of Water Tariff in Meeting the Operation and
Maintenance (O&M) Cost
As already mentioned, only in the State of Karnataka, the Gram Panchayats have been formally handed over the assets created under Rajiv Gandhi National Drinking Water Mission. Since these Gram Panchayats are responsible for Operation and Maintenance (O&M) and collection of user charges, the village Pradhans of these Gram Panchayats (GPs) were asked if the amount collected from the households was enough to meet the expenditure incurred on Operation and Maintenance (O&M). To this, village Pradhans of most of the Gram Panchayats (GPs) mentioned that around 50% of the Operation and Maintenance (O&M) cost is recovered from the user charges. They also mentioned that the funds are set-aside in Water & Sanitation Account for emergencies.
Table-8.7: Gram Panchayats (GPs) where Community was Consulted on
Water Tariff Category n Yes No Karnataka 9 2 7 Himachal 12 0 12 Rajasthan 2 0 2 Assam 6 1 5 West Bengal 1 1 0 Overall 30 6 24

Evaluation Study on Rajiv Gandhi National Drinking Water Mission 41
Chapter 9
Community Participation/Existence of Village Water & Sanitation Committee (VWSC)
9.1 Community Participation/Existence of VWSC
Community Participation : Active community involvement is envisaged under Rajiv National Gandhi Drinking Water Mission (RGNDWM) and as such, their involvement is highly desirable at every stage — from planning, to implementation, Operation and Maintenance (O&M) and ownership. However, as already discussed, absence of the community participation in operation & maintenance of the water supply schemes in their areas was near universal. The only instance of community involvement was reported to be in the site selection for the stand posts and the route for laying the water supply pipeline, as revealed by the participants of FGDs conducted in the sample habitations. Existence of VWSCs : At the grass root level, the role of PRI assumes special significance in term of providing a supportive environment so as to ensure sustainable community-based drinking water supply system. During the household survey, instead of asking a direct question about the existence of VWSCs, the households were asked if they were aware about the existence of any group in the village/habitation. The analysis is presented in the following table.
Table-9.1 : Awareness about Existence of Any Group in Village/Habitation
Category n Health & Sanitation Committee
SHGs Village Education Committee
Village Water &
Sanitation Committee
Don't Know
Karnataka 281 0% 26.0% 0% 0.7% 73.3% Himachal 288 1.7% 47.2% 2.1% 0% 49% Rajasthan 279 0% 0% 0% 0% 100% Assam 282 0% 5.6% 0% 0.4% 94.0% West Bengal 287 0% 4.9% 0% 2.1% 93.0% Overall 1417 0.4% 16.8% 0.4% 0.7% 81.7%
As shown in the table, over four-fifth (82%) of the sample households were found to be unaware about the existence of any group in their areas. Among the remaining households (18%), most of the respondents have mentioned about the presence of self help groups (SHGs). As regards the proportion of households aware about the Village Water & Sanitation Committee (VWSC), it has been found to be less than 1%. Further, we also came across a few households that mentioned about the existence of Health & Sanitation Committee or Village Education Committee in their areas (0.4% each). Even during the focus group discussions, it was found that in most of the habitations across all the 5 study states, the FGD participants were unaware about the existence of Village Water & Sanitation Committee in their areas.

Evaluation Study on Rajiv Gandhi National Drinking Water Mission 42
“No, there is no such committee in our village ....., we have not heard about it. ”
FGD Participants, Dist. Bankura, Block-Patrasayer, West Bengal
“Committee has not been formed because entire work is done by the workers deployed by the I&PH department.”
FGD Participants, Dist. Bilaspur, Block-Sadar, Himachal Pradesh The households found to be aware about the existence of any group in their area were asked if they were member of any such group. The findings presented in the table alongside show that overall, around half (47%) of these households were members of any group. Since most of the households had mentioned about the existence of SHGs, it can safely be inferred that the households reporting membership to any group were referring to these SHGs. Further, the households reporting to be the member of any group were asked about their participation in groups’ meetings. As shown in the table alongside, almost all (99%) of these households have responded in affirmation. From the gender perspective, the households were also asked about the women’s representation in the existing committee/groups in their area. The findings presented in the table alongside show that according to most of the households (99%), the women’s representation was either ‘good’ or ‘fair’. As regards the issues dealt by the ‘groups/committees’, three-fifth (58%) of the member-households have mentioned about ‘fund raising’ taken-up by the group/committee across the 4 states. Obviously, these households were referring to the critical activity (fund raising) of the self help groups. Further, more or less a similar proportion of them mentioned ‘cleaning/protection of water sources’ and ‘health & sanitation issues’, taken-up by the group/committee mostly in the states of Karnataka and Himachal Pradesh. We also came across a few households (3.3%) in Himachal Pradesh that mentioned about construction of toilets.
Table-9.2 : Households Reporting Membership
Category n Yes No Karnataka 73 67.1% 32.9% Himachal 143 38.5 61.5% Assam 22 61.5% 38.5% West Bengal 25 30.0% 70.3% Overall 263 47.4% 52.6%
Table-9.3 : Member Hhds Participating in Meetings
Category n Yes No Karnataka 48 100% 0% Himachal 55 100% 0% Assam 15 94.4% 5.6% West Bengal 7 100% 0% Overall 124 99.3% 0.7%
Table-9.4 : Women’s Representation in Committee/ Group
Category n Good Fair Poor Karnataka 48 20.3% 79.7% 0% Himachal 53 90.9% 9.1% 0% Assam 14 35.3% 64.7% 0% West Bengal 8 0% 80.0% 20.0% Overall 123 51.3% 47.4% 1.3%
Issues Dealt by Committee (Multiple Responses)
% Hhds (n=124)
Fund Raising 57.6% Cleaning/Protection of Water
Sources 55.6%
Health & Sanitation Issues 59.6% Construction of Public Latrine 3.3%

Evaluation Study on Rajiv Gandhi National Drinking Water Mission 43
The issue of formation and existence of VWSCs was also discussed with the Pradhans of the sample Gram Panchayats. The analysis presented in the table alongside shows that VWSCs were existing in only one-fifth (13 out of 63) of the sample Gram Panchayats. Among the 5 states, Karnataka stands out where the presence of VWSC was reported by half the sample Gram Panchayats. The Pradhans mentioning about the presence of VWSC in their Gram Panchayats were probed about the details of the meetings and training of the VWSC members. As can be seen from the table presented alongside, VWSC meetings were conducted only in 9 out of the 13 Gram Panchayats (GPs). As regards the participation of women and scheduled caste community members in the VWSC meetings, this was reported in only 7 out of the 13 Gram Panchayats (GPs). Further, in only 6 out of the 13 Gram Panchayats (GPs), all VWSC members have reportedly received training. The findings with regard to the key activities of the VWSCs, as reported by the concerned Pradhans of their respective Gram Panchayats are presented in the table alongside. As can be seen, in 9 out of the 13 Gram Panchayats (GPs), the VWSC was reportedly involved in the decision making process. Further, in 6 Gram Panchayats, VWSCs were reported to be involved in collection of water charges and financing & managing operation & maintenance. We also came across 2 Gram Panchayats whose Pradhans mentioned about empowering women on operation & maintenance and day-to-day affairs of the Scheme.
Table-9.5 : Gram Panchayats having VWSCCategory n Yes No Karnataka 12 6 6 Himachal 12 1 11 Rajasthan 13 3 10 Assam 12 2 10 West Bengal 14 1 12 Overall 63 13 (21%) 49 (79%) Particulars (Multiple Responses)
No. of(GPs) (n=13)
VWSC Meeting Conducted 9 Women Attend VWSC Meeting 7 SC Attend VWSC Meeting 7 All VWSC Members Trained 6
Activities of VWSC (Multiple Responses)
No. of (GPs) (n=13)
Decision Making 9 Collection of Water Charges 6 Financing & Managing Operation and Maintenance (O&M)
6
Arranging Contribution (Cash & Kind) 2 Empowering Women for Operation and Maintenance (O&M)
2

Evaluation Study on Rajiv Gandhi National Drinking Water Mission 44
Chapter 10
Knowledge, Practice and IEC on Hygiene & Sanitation Interventions for providing safe drinking water can become ineffective in the absence of improved sanitation. In order to provide access to sufficient quantities of safe water, the provision of facilities for a sanitary disposal of excreta, and introducing sound hygiene behavior are of utmost importance. The ways and means by which water is collected also has an impact on its quality. It is essential to have a clean surrounding around the source to prevent contamination. Open drains and disposal of solid waste near sources of water may lead to presence of ammonia and coliform bacteria in the drinking water source. The study findings on the relevant issues are discussed ahead. 10.1 Exposure to Awareness Campaigns
Making people aware on the need to consume safe water is one of the major challenges. There are examples where despite being provided potable water by the Government, people drink water from contaminates surface sources. An integrated campaign can result in widespread information dissemination amongst the masses on all aspects of rural water supply and its related issues. This could be done by bringing about public awareness through appropriate methods, such as, folk songs, folk drama, documentary films, pamphlets, brochures, etc. GoI provides 100% grant-in aid to establish Communication and Capacity Development Unit (CCDU) in all States/UTs for the purpose of creating awareness among rural people. During the study, Gram Panchayats, habitations and households were probed about any campaign organized in their area on water & sanitation and hygiene in their villages. The findings are presented in the following table — Table-10.1: Gram Panchayats, Habitations and Households Reporting Campaigns
on Water, Sanitation & Hygiene
Gram Panchayats (GPs)
Habitations Households Category
n % n % n % Karnataka 12 66.7% 48 6.3% 287 0.7% Himachal Pradesh 12 100% 48 81.3% 282 54.6% Rajasthan 13 69.2% 47 19.1% 286 7.7% Assam 11 54.5% 48 10.4% 288 0% West Bengal 14 64.3% 48 2.1% 287 0.3% Overall 62 71.0% 239 23.8% 1430 12.5% It is interesting to note that there are significant variations among the proportion of Gram Panchayats (GPs), habitations and households responding in affirmation about the campaign on water & sanitation and hygiene (71%, 24% and 13%, respectively). This is probably an indication that some campaigns were organized at Gram Panchayat level, but this has not percolated to the grassroot-level, that is, the household level where

Evaluation Study on Rajiv Gandhi National Drinking Water Mission 45
information/awareness is needed the most. At the household level, barring Himachal Pradesh, the situation in the other 4 states is absolutely pathetic. As a matter of fact, during the focus group discussion in most of the sample habitations in Assam, West Bengal, Karnataka and Rajasthan, the FGD participants have reported that no IEC campaign was taken-up in their areas.
“No, there has not been any awareness campaign in our village.” FGD Participants, Dist. Nagaon, Block-Binna Kandi, Assam
“In our village, there was no awareness activity about water supply.”
FGD Participants, Dist. Barmer, Block-Sindari, Rajasthan
10.2 Details of Awareness Campaigns
When probed from the aware households about the details of campaigns, most of the respondents in Himachal Pradesh mentioned about Total Sanitation Campaign (TSC), while in the case of Rajasthan, most of the respondents mentioned about the Jal Rath Yatra campaign. As detailed in Table-10.1, only 24% habitations (total 58) have reported about any campaign organized in their area. The respondents of these habitations were also probed about the details of campaigns. The findings are presented in the following table- Details of Campaign on Water & Sanitation — As Reported by Habitations (n=58)
Information about sanitation & hygiene under TSC
42 habitations (Himachal-40, Karnataka-1, Rajasthan-1)
Jal Rath Yatra/Jal Chetna Abhiyan 9 habitations (Rajasthan)
Campaign by Health Deptt. on water, sanitation & pollution free environment
7 habitations (Karnataka-3, Assam-3, West Bengal-1)
As can be seen, most of the habitations have also mentioned about the Total Sanitation Campaign (42 out of 58 habitations), while Jal Rath Yatra/Jal Chetna Abhiyan was mentioned in 9 habitations of Rajasthan. We also came across 7 habitations where the respondents mentioned about the campaign on water, sanitation & pollution-free environment conducted by the Health Department. Similar information was received during the focus group discussions conducted in the sample habitations across the 5 study states.

Evaluation Study on Rajiv Gandhi National Drinking Water Mission 46
“In March 2009, IPH department through block had taken-up cleanliness campaign in our village wherein cleanliness of storage tanks & natural water sources, keeping drinking water vessel covered, etc. was communicated, .....many people in the village had participated.”
FGD Participants, Dist. & Block-Kullu, Himachal Pradesh
“Jal Rath Yatra in 2008 was conducted by the block officers and Panchayat members wherein information was given about clean drinking water. Around 50% people had participated in this program.”
FGD Participants, Dist. Barmer, Block-Sindari, Rajasthan
“In May this year, there was one campaign conducted by the block level Health Department. They told us about sanitation, cleanliness, hygiene and about clean water.
FGD Participants, Dist. Shimoga, Block-Shikaripura, Karnataka
When discussed with the Pradhans (of 71% Gram Panchayats (GPs) reporting campaign) about the details of awareness campaigns, they informed that various mass media, namely, print media, traditional media and folk media (folk songs, street plays & puppet show, etc.) were used for the purpose. As shown in the chart alongside, use of the print and the traditional media used in rural settings (wall writings, slogans & banners) were the two most common media used for the campaign, as mentioned by 44 and 36 Pradhans, respectively (who had reported about the awareness campaigns in their Gram Panchayats (GPs)). The use of folk and electronic media was relatively much smaller (reported by 13 and 8 Pradhans, respectively). The state-wise details of the various media used for campaign, as reported by the Gram Panchayats (GPs) are presented in the following table.
Category Karnataka Himachal Rajasthan Assam W.Bengal Use of Print Media in Campaign (44 Gram Panchayats (GPs)) Posters 7 10 7 6 5 Pamphlet 3 8 3 6 4 Booklet 1 1 2 1 Traditional Media using Rural Resources (36 Gram Panchayats (GPs)) Slogan 1 10 9 1 5 Wall Writing 2 7 7 5 4 Banner 1 2 4 Exhibition 1 Traditional Folk Media (13 Gram Panchayats (GPs)) Folk Songs 3 2 2 Street Play 1 1 5 2 Puppet Show 1 Use of Electronic Media (8 Gram Panchayats (GPs)) Radio 2 2 TV 2 Documentary or Short Film 2 2
8
13
36
44
Chart-10.1 : Use of Various Media in Campaign (44 Gram
Print Media
Wall Writing/Slogans/Banners
Folk Media
ElectronicMedia

Evaluation Study on Rajiv Gandhi National Drinking Water Mission 47
The Pradhans were also asked about the details of participation of the village population, including that of women in the awareness campaign. The findings are presented in the table alongside. Apparently, overall, three-fifth (60%) of the GP population had participated in the various campaigns, as reported by the Pradhans of the 44 Gram Panchayats (GPs). Further, it is also heartening to note that a significant two-fifth (37%) of the women had also participated in the awareness campaigns. 10.3 Source of Information on Safe Drinking Water
Interpersonal Communication (IPC): On the issue of awareness generation among the communities by way of interpersonal communication (IPC), the households were asked a direct question if anybody had informed them about safe drinking water. The findings contained in the table alongside presents a dismal picture, with only an abysmally small proportion of households responding in affirmation about somebody providing them information on safe drinking water. Further, the households were also asked if they were visited by ASHA/ Anganwadi Workers or any other person for providing information on water, sanitation & hygiene. The findings are once again distressing, with less than one-tenth (7%) of the households responding in affirmation in this regard. Among the 5 states, Himachal Pradesh stands out where close to one-fourth (23%) of the respondents have mentioned that these functionaries were indeed visiting them for providing information on water, sanitation & hygiene.
Table-10.2 : % Population in GP Attending Campaign
Category Gram Panchayats
(GPs)
% Population
% Women
Karnataka 8 61.9% 36.9% Himachal 11 60.3% 43.3% Rajasthan 9 45.0% 15.6% Assam 7 69.3% 46.4% West Bengal
9 64.0% 39.9%
Overall 44 59.7% 36.5%
Table-10.3 : IPC on Safe Drinking Water
Category n Yes No Karnataka 288 11% 89% Himachal 288 14% 86% Rajasthan 287 5% 95% Assam 288 5% 95% West Bengal 287 3% 97% Overall 1438 7% 93%
Table-10.4 : Hhd visits by ASHA/AWW/ Others in the past One
Month for Water Sanitation & Hygiene Info
Category n Yes No Don’t Know/ Can’t Say
Karnataka 288 3.8% 87.5% 8.7% Himachal 288 23.3% 70.8% 5.9% Rajasthan 288 4.2% 79.8% 16.0% Assam 287 2.1% 93.7% 4.2% West Bengal
286 1.4% 88.8% 9.8%
Overall 1437 7.0% 84.1% 8.9%

Evaluation Study on Rajiv Gandhi National Drinking Water Mission 48
Main Source of Information on Personal & Household Hygiene: During the household survey, the respondents were asked about their main source of information on personal and household hygiene. The findings presented in the table alongside show that an overwhelming majority (88%) of the households are getting relevant information from radio or television. Among the 5 states, the State of Rajasthan stands out where ANM, ASHA or Anganwadi Worker are reported by one-third (34%) households as the main source, while only around three-fifth (56%) have reported radio or TV as their main source of information on personal and household hygiene. As regards the other 4 states, radio or TV is the main source of the information for almost all the households. 10.4 Training of VWSC Members/Teachers on Hygiene
Education
During the habitation survey, the respondents were probed on the issue of training of VWSC members or teachers on hygiene education. The findings are presented in the table alongside. As can be seen, respondents in almost all the habitations have denied about the provision of any such training to the VWSC members or teachers. Since in most cases VWSCs are not formed, these findings are not surprising.
10.5 Awareness about Diseases Caused by Unhygienic Conditions
The table alongside presents the level of awareness among the households with regard to the diseases caused by unhygienic conditions. As can be seen, three-fourth (75%) of the households are indeed aware in this regard. Among the 5 states, Himachal Pradesh stands out with the highest level of awareness (96%), whereas in West Bengal, less than three-fifth (55%) of the households are aware. Surprisingly, in this State, a sizable proportion of the respondents (36%) were unable to provide a clear answer on this important issue.
Table-10.6 : Training on Hygiene Education
Category n Yes No Karnataka 48 4.2% 95.8% Himachal 48 0% 100% Rajasthan 48 2.1% 97.9% Assam 48 4.2% 95.8% West Bengal 48 2.1% 97.9% Overall 240 2.5% 97.5%
Table-10.5 : Main Source of Information on Personal & Household Hygiene
Category n Radio or TV
News Paper
ANM, ASHA or
AWW
Villagers
Karnataka 285 95.8% 1.4% 1.7% 1.1% Himachal 287 93.1% 0.4% 4.6% 1.9% Rajasthan 286 56.3% 4.9% 33.6% 5.2% Assam 287 97.8% 2.2% 0% 0% W. Bengal 280 97.9% 0% 1.0% 1.1% Overall 1425 88.2% 1.8% 8.2% 1.8%
Table-10.7 : Awareness about Diseases Caused by Unhygienic Conditions
Category n Yes No Don’t Know/ Can’t Say
Karnataka 285 70.2% 10.2% 19.6% Himachal 288 96.2% 0.7% 3.1% Rajasthan 286 68.9% 12.2% 18.9% Assam 288 83.0% 2.8% 14.2% West Bengal
286 55.2% 8.4% 36.4%
Overall 1433 74.7% 6.8% 18.5%

Evaluation Study on Rajiv Gandhi National Drinking Water Mission 49
It may be highlighted that ‘most affected’ districts have fared better than the ‘least affected’ ones in terms of the level of awareness (78% as against 72%). These findings were corroborated during the focus group discussion conducted in the sample habitations across the 5 study states. Further, according to most of the Pradhans of the 63 sample Gram Panchayats as well as most of the 240 sample habitations, the community is generally quite aware about the link between poor quality of water and diseases. Once again, the level of awareness was higher among the households in ‘most affected’ as compared to the ‘least affected’ districts. The households that were found to be aware were further probed about the type of diseases caused by the unhygienic conditions. The findings are presented in the following table.
Table-10.8 : Details of Diseases due to Unhygienic Conditions — As Reported by Households
Category n Diarrhea Jaundice Skin Diseases
Joint Pain Yellowness of Teeth
Karnataka 202 78.7% 56.4% 0% 0% 0% Himachal 277 59.2% 15.9% 0% 0% 0% Rajasthan 209 23.9% 20.6% 48.3% 15.3% 3.3% Assam 240 87.9% 50.4% 0% 0% 0% West Bengal 161 78.9% 78.9% 0% 0% 0% Overall 1089 65.3% 41.2% 9.3% 2.9% 0.6% As can be seen from the table, diarrhea has emerged as the most commonly occurring disease resulting from the unhygienic conditions, followed by jaundice, as reported by 65% and 41% of the households, respectively. Further, in Rajasthan, around half the households (48%) have mentioned skin disease, 15% joint pain and 3% have mentioned yellowness of teeth, indicating the presence of excessive ‘fluoride’ in the water sources used by these households. The overall picture with regard to the diseases caused by unhygienic conditions, as perceived by the households is presented in the chart alongside. 10.6 Availability of Toilets
It is well established that mere access to safe drinking water does not ensure prevention of diseases; appropriate sanitation and hygiene practices also play a crucial role in ensuring good health. Accordingly, during the household survey, information was elicited about the availability of toilets in the households. The findings presented in the table alongside show that overall, only a little over two-fifth (43%) of the households
0.6%
2.9%
9.3%
41.2%
65.3%
Chart-10.2 : Diseases from Unhygienic Conditions
Diarrhea
Jaundice
SkinDiseases
Joint Pain
Yellowness of Teeth
Table-10.9 : Availability of Toilets in Hhlds
Category n Yes No Karnataka 287 47.0% 53.0% Himachal 287 65.9% 34.1% Rajasthan 287 1.0% 99.0% Assam 286 64.3% 35.7% West Bengal 288 35.4% 64.6% Overall 1435 42.7% 57.3%

Evaluation Study on Rajiv Gandhi National Drinking Water Mission 50
have toilets. The situation is particularly pathetic in Rajasthan where the availability of toilet was reported by only 3 out of the 287 households (1%), indicating an utter failure of the Total Sanitation Campaign (TSC) in the two sample districts of this State.
10.7 Practice of Open Defecation
As regards the practice of open defecation, the findings presented in the table alongside show that overall, only 16% of the 237 habitations are ‘fully free’, while four-fifth (80%) of the habitations are reported to be ‘somewhat free’ from open defecation. With only two-fifth (43%) households reporting the availability of toilets, it is not surprising that the proportion of habitations reported to be ‘fully free’ from open defecation is so small. 10.8 Garbage Collection &
Disposal in Habitations
The table alongside presents the analysis of the habitation survey with regard to the existence of any functional mechanism for garbage collection and disposal. As quite expected, there is no such mechanism in most (96%) of the habitations. This is not surprising, especially in the light of the findings that a majority of the households do not have toilets and open defecation is quite common in most of the habitations. 10.9 Cleanliness around the
Water Sources
In order to avoid contamination of water, it is highly desirable that proper cleanliness is maintained around the water sources at all times. The analysis of the household survey in this regard is presented in the table alongside. As can be seen, according to most (98%) of the households, the level of cleanliness around the water sources in their areas is good or fair. When probed about the platform and provision of proper drainage around the water sources, overall, 70% of the households reported in affirmation. Among the 5 states, Assam and West Bengal stand
91% 92%80%
43%44%
Karnataka Himachal Rajasthan Assam W. Bengal
Chart-10.3 : Platforms & Drains around Water Sources (n=1440 Hhds)
Table-10.10 : Habitations Free from Open Defecation
Category n Fully Free
Somewhat Free
Not Free
Karnataka 47 4.3% 89.4% 6.3% Himachal 48 8.3% 83.3% 8.4% Rajasthan 48 58.3% 41.7% 0% Assam 47 0% 97.9% 2.1% West Bengal 47 10.6% 89.4% 0% Overall 237 16.4% 80.2% 3.4%
Table-10.11 : Existence of Functional Mechanism for Garbage Collection &
Disposal Category n Yes No Karnataka 45 0% 100% Himachal 48 10.4% 89.6% Rajasthan 48 2.1% 97.9% Assam 48 6.3% 93.8% West Bengal 47 0% 100% Overall 236 3.8% 96.2%
Table-10.12 : Cleanliness around the Water Sources
Category n Good Fair Bad Karnataka 288 19.4% 78.8% 1.8% Himachal 288 83.0% 17.0% 0% Rajasthan 288 25.4% 68.3% 6.3% Assam 288 69.0% 30.7% 0.3% West Bengal 288 30.1% 67.8% 2.1% Overall 1440 45.4% 52.5% 2.1%

Evaluation Study on Rajiv Gandhi National Drinking Water Mission 51
out with over nine-tenth (91% and 92%, respectively) of all the households mentioning that all water sources in their areas have platform and proper drainage. The findings on the issue of the responsibility of cleaning the water sources in the habitations presented in the table alongside show that overall, in four-fifth (80%) of the habitations, the responsibility lies with the community itself. In the case of Assam and West Bengal, 100% of the habitations have reported that cleaning of the water sources is the sole responsibility of the community. Further, around three-fifth (58%) of the habitations in Rajasthan have mentioned that the responsibility of cleaning lies with the PHED, while two-fifth (40%) of the habitations in Karnataka have mentioned that it is responsibility of Gram Panchayats to clean the area. As regard the frequency of cleaning around the water sources, it was reported as once a month by the habitations where PHED or Gram Panchayat has the cleaning responsibility. In the case of habitations where community was reported to be responsible, the proportion of habitations reporting ‘once a month’ and ‘twice a month’ was nearly the same (47% and 53%, respectively). It may be added that almost all the habitations have reported that the community is aware about preventing wastage of water and avoiding water logging in the vicinity of the water sources.
Table-10.13: Responsibility of Cleaning the Water Sources in Habitations
Category n PHED GP CommunityKarnataka 48 0% 40.0% 62.2% Himachal 48 4.2% 10.4% 87.5% Rajasthan 48 57.9% 0% 42.1% Assam 48 0% 0% 100% West Bengal 48 0% 0% 100% Overall 240 10.7% 10.3% 79.9%

Evaluation Study on Rajiv Gandhi National Drinking Water Mission 52
Chapter 11
Program Benefits/Impact on Rural Population The impact assessment of the Rajiv Gandhi National Drinking Water Mission (RGNDWM) was made taking into account the following 7 key issues —
1. Increased Availability of Water 2. Increased Functional Water Sources/Reduced Breakdowns 3. Improvement in Environmental Sanitation 4. Reduction in Water Borne Diseases 5. Improvement in Women’s Conditions 6. Utilization of Time Saved 7. Improvement in Overall Health Status
The findings with respect to each of the aforementioned issue are discussed one-by-one ahead. 11.1 Increased Availability of
Water
Increased availability and consequently, increased water usage by the rural households have been found to be the biggest program benefits. This is amply evident from the table presented alongside. Overall, an overwhelming majority (96%) of the households have reported increased usage of water. 11.2 Increased Functional Water
Sources/Reduced Breakdowns
When the issue of Program benefits was discussed with the respondents of habitation survey, an overwhelming majority of them (80%) mentioned that the number of water sources in functional condition has significantly increased in the last few years. Further, the respondents in majority (57%) of the habitations also mentioned that there has been a noticeable decrease in the frequency of the supply system breakdowns.
Table-11.1: Water Usage at HouseholdCategory n Increased DecreasedRemained
ConstantKarnataka 288 91.3% 7.3% 1.4% Himachal 288 93.4% 6.3% 0.3% Rajasthan 287 95.8% 3.9% 0.3% Assam 288 100% 0% 0% West Bengal
288 98.6% 0% 1.4%
Overall 1439 95.8% 3.5% 0.7%
Functioning Water Sources (n = 240 Habs.) Increased No Change Decreased
80.4% 17.1% 2.5% Break downs (n = 240 Habs.)
Decreased Somewhat Decr. No Change 56.7% 36.1% 7.1%

Evaluation Study on Rajiv Gandhi National Drinking Water Mission 53
11.3 Improvement in Environmental Sanitation
The household survey findings with regard to improvement in environmental sanitation are presented in the table alongside. As can be seen, overall, three-fourth (74%) of the respondents felt that the Program has had a positive impact in terms of environmental sanitation, the impact being biggest in the State of Himachal Pradesh (95%). Overall, the proportion of habitations reporting positive improvement was found to be more or less same (74%) as that of the respondents of the household survey. 11.4 Reduction in Water Borne
Diseases
Three-fourth (74.5%) of the respondents of the habitation survey also felt that there has been an improvement in the environmental sanitation conditions in their areas due to the increased availability of water. As a result, the incidences of water-borne diseases in the habitation have decreased, as reported by 70% of the respondents, highlighting a positive change in the overall well-being of the community (table alongside). 11.5 Improvement in Women’s Conditions
Access to drinking water has special implications for women and children. The responsibility for fetching water for household needs, sometimes over long distances, is invariably assigned to women or girls. As mentioned under the ‘Profile of Respondents’ section, over four-fifth (84.6%) of the respondents of the household survey were females. Accordingly, efforts were made to assess the impact of improved access to safe water on women in the villages. The findings are discussed ahead — Reduced Workload of Women: The women respondents were asked whether or not the ready and increased availability of water has reduced their workload. The analysis is presented in the table alongside. As can be seen, overall, a significant three-fourth (75%) of the respondents have reported in affirmation about reduction in their workload, the impact being most prominent in Himachal Pradesh, as reported by almost all (95%) the female respondents.
Table-11.2 : Improvement in Environmental Sanitation
Category n Yes No Don't Know
Karnataka 287 50.9% 48.4% 0.7% Himachal 283 95.4% 1.1% 3.5% Rajasthan 268 85.4% 6.0% 8.6% Assam 273 75.8% 24.2% 0% West Bengal
266 60.5% 39.5% 0%
Overall 1377 73.6% 23.9% 2.5%
Environmental Sanitation (n = 240 Habitations)
Improved Somewhat Impr.
No Change
23.4% 51.1% 25.5% Water-Borne Diseases (n = 240 Habitations) Decreased Somewhat Decr. No Change 69.5% 25.7% 4.8%
Table-11.3 : Reduced Workload of Women
Category n Yes No Karnataka 276 52.4% 47.6% Himachal 195 95.1% 4.2% Rajasthan 217 89.6% 10.4% Assam 284 79.1% 20.9% West Bengal 246 59.8% 40.2% Overall 1218 75.1% 24.9%

Evaluation Study on Rajiv Gandhi National Drinking Water Mission 54
Further, overall, three-fourth (75%) of them have also admitted that due to reduced workload, there has been a significant reduction in fatigue experienced by women. Among the 5 states, the proportion of women reporting this positive impact has been found to be the highest in the State of Himachal Pradesh, as reported by almost all (97%) the female respondents (table alongside). It has been found that consequent to reduced workload and reduced fatigue, women have now more time to engage themselves in various community activities, as reported by over two-third (71%) of the women respondents of the household survey. Among the 5 states, Himachal Pradesh stands out where almost all women (96%) have mentioned about the increased participation of women in the community activities (table alongside). As regards the Program’s impact on children, an overwhelming majority of women (89%) have reported that on account of improved water supply (easier access and adequate availability), children have now more time for studying and playing instead of helping them collect water. 11.6 Utilization of Time Saved
The table alongside presents the findings on various productive activities in which the households are utilizing the time saved on account of improved access to water. As can be seen, people are now able to spend time in more productive activities instead of spending excessive time in collecting water, with a significant amount of ‘opportunity cost’ associated with it. Among the 5 states, Assam and West Bengal stand out where around four-fifth (77% and 79%, respectively) of the households have reported that they are utilizing the time saved for income generating activities. The savings of time in collecting water has also helped people in Himachal Pradesh and Rajasthan to focus more on agriculture production, as reported by over two-fifth of the households (44% and 42%, respectively) in these states.
Table-11.4 : Women Experiencing Reduced Fatigue
Category n Yes No Karnataka 276 52.1% 47.9% Himachal 195 96.5% 3.5% Rajasthan 217 89.6% 10.4% Assam 284 79.1% 20.9% West Bengal 246 59.8% 40.2% Overall 1218 75.3% 24.7%
Table-11.5: Increased Women’s Participation in Community
Activities Category n Yes No Karnataka 276 46.3% 51.7% Himachal 195 95.6% 4.4% Rajasthan 217 75.7% 24.3% Assam 284 75.6% 24.4% West Bengal 246 59.8% 40.2% Overall 1218 70.6% 29.6%
Table-11.6 : Utilization of Time Saved in Various Activities
Category n Agriculture Production
Cattle Rearing
IGA Domestic Work
Karnataka 166 25.9% 6.6% 54.8% 15.0% Himachal 270 44.1% 24.5% 41.8% 11.1% Rajasthan 223 41.7% 37.7% 7.6% 33.6% Assam 170 0.7% 0% 77.0% 19.4% West Bengal
137 1.4% 0% 78.7% 19.2%
Overall 966 26.7% 16.6% 47.4% 19.5%

Evaluation Study on Rajiv Gandhi National Drinking Water Mission 55
Overall, 5 states combined, around a significant half (47%) of the households are reportedly utilizing the time saved for income generating activities, while over one-fourth (27%) of the households are utilizing the time saved on agriculture. People are now able to focus more even on domestic works and cattle rearing, as reported by a significant proportion of the households (20% and 17%, respectively), as shown in the chart alongside.
“Because of this scheme, many good things have happened in lives of people in the community. Earlier, people used to carrying water from far off places; now it is easily available. Women....., there is saving in their time which they are using for domestic work, agriculture or in taking rest.”
FGD Participants, Dist. Kullu, Block-Kullu, Himachal Pradesh “People are now getting water easily and nearby. So, women do not have to work very hard now. They need to spend less time in collecting water. The time saved is used by them for domestic work. Many of them use this time for income generating activities also.”
FGD Participants, Dist. Shimoga, Block-Shikaripura, Karnataka “Earlier people used to bring water from a distance of 5 kms. Since the construction of GLR in the village, people do not have to go for very far. Because of this, people do not get tired and they have saved time also, which they can use for agriculture purpose.”
FGD Participants, Dist. Barmer, Block-Sindari, Rajasthan “Since water is available near the houses, people are able to save lot of time, which they can use for domestic and other works.”
FGD Participants, Dist. Kamroop, Block-Sowalkuchi, Assam
“Water is now available close to outsource and because of this people are getting spare time for attending domestic works and income generating activities.”
FGD Participants, Dist. Hawrah, Block-Shyampur-1, West Bengal
11.7 Improvement in Overall Health Status
One would expect that improved access to safe drinking water would result in the improvement of overall health status of the community. However, the household survey findings presented in the table alongside are contrary to this expectation. According to most of the households (95%), there is no perceptible change in the overall health status of their families. The general sentiment was ‘We were O.K. before also,
Chart-11.1 : Utilization of Time Saved (n=966 Hhds)
17%
20%
27%
47%
Cattle Rearing
Domestic
Agriculture
IGA
Table-11.7 : Improvement in Overall Health Status of the Family
Category n Yes No No ChangeKarnataka 280 2.1% 0% 97.9% Himachal 288 1.0% 0% 99.0% Rajasthan 287 6.6% 2.8% 90.6% Assam 279 5.0% 0% 95.0% West Bengal 282 5.7% 0% 94.3% Overall 1416 4.1% 0.6% 95.3%

Evaluation Study on Rajiv Gandhi National Drinking Water Mission 56
and we are O.K. now’. Only a paltry 4% have reported a positive impact on the overall health of their families. Most of these households have mentioned that now they are not required as frequently to spend time & money in traveling to health facilities and they are also able to save money that was otherwise spent on medicines and doctor’s fee. It may be mentioned that the findings are more or less similar for both the ‘most affected’ as well as the ‘least affected’ districts. 11.8 Overall Performance of Water Sources
In order to assess the overall performance of the various water sources, as perceived by the beneficiaries, they were asked to rate it as ‘good’, ‘satisfactory’ or ‘bad’. The analysis is presented in the following table. As can be seen, almost all the households (97%) have rated the performance of hand-pumps as good or satisfactory, while more or less a similar proportion (92%) of household felt that the performance of piped stand post was good or satisfactory. Even in the case of household connections, 9 out of 10 households have rated it as good or satisfactory.
28%
46%
72%
62%
46%
25% 3%
10%
8%
Good Satisfactory Bad
Hand-pumps (n=867 Hhds)
Piped Stand Posts(n=1019 Hhds)
Hhds Connections(n=233 Hhds)
Chart-11.2 : Overall Performance of Water Sources — As Reported by Households

Evaluation Study on Rajiv Gandhi National Drinking Water Mission 57
Chapter 12
Sustainability Sustainability of drinking water sources and schemes is a process which facilitates the existing/new drinking water supply projects to provide safe drinking water in adequate quantity, even during distress periods, duly addressing equity, gender, vulnerability, convenience and consumer preference issues, through conjunctive use of groundwater, surface water and roof-water harvesting, exclusive to rural drinking water schemes. The main aim of providing sustainability of drinking water schemes is that such schemes will not slip back from universal access of safe drinking water to the community throughout the design period of schemes. The paradigm shift in the new framework of RGNDWM, Department of Drinking Water Supply (2009-12) is to move towards achieving universal access to rural population for having safe and sustainable drinking water supply rather than a mere coverage of habitations, the latter not necessarily speaking about equity and vulnerability issues. Therefore the aim is to work at achieving household level drinking water security, which shall obviously ensure universal access. Adoption of appropriate technology, revival of traditional systems, conjunctive use of surface and ground water, conservation, rain water harvesting and recharging of drinking water sources have been given major emphasis in the new approach. Under the new framework, the four elements of sustainability are — (a) Source Sustainability: ensuring availability of safe drinking water in adequate quantity throughout the year; (b) System Sustainability: optimizing the cost of production of water, devising proper protocol for Operation and Maintenance (O&M), capacity building of PRIs and awareness generation; (c) Financial Sustainability: proper utilization of Twelfth Finance Commission (TFC) and Operation and Maintenance (O&M) funds under Revised RWSP guidelines and recovering at least 50% cost through flexible methods devised by the local self government and improving energy efficiency; and (d) Social and environmental Sustainability: proper project management and involvement of all key stakeholders. One of the prime objectives of the study was to assess the sustainability of water sources in the habitations. In order to calculate the Sustainability Index, a total of 29 parameters under 5 broad aspects, namely, technology aspects, community and social aspects, financial aspects, water quality aspects and training aspects were identified as detailed in the following table.
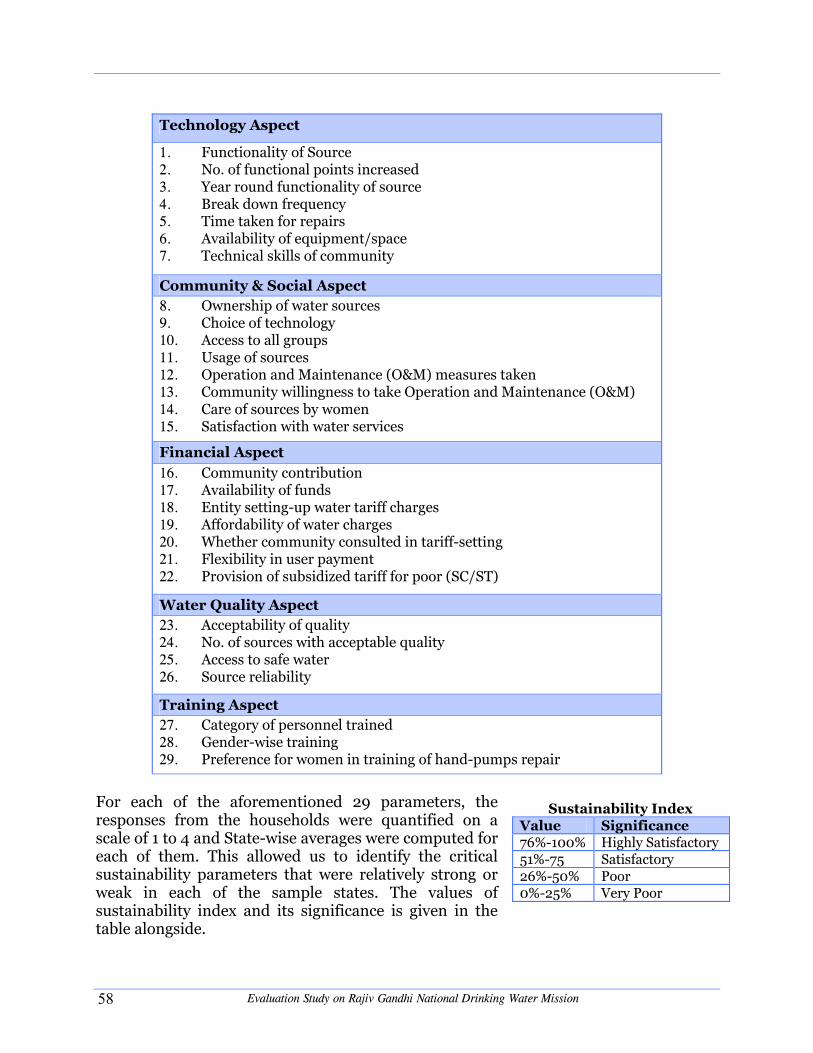
Evaluation Study on Rajiv Gandhi National Drinking Water Mission 58
Technology Aspect
1. Functionality of Source 2. No. of functional points increased 3. Year round functionality of source 4. Break down frequency 5. Time taken for repairs 6. Availability of equipment/space 7. Technical skills of community
Community & Social Aspect 8. Ownership of water sources 9. Choice of technology 10. Access to all groups 11. Usage of sources 12. Operation and Maintenance (O&M) measures taken 13. Community willingness to take Operation and Maintenance (O&M) 14. Care of sources by women 15. Satisfaction with water services
Financial Aspect 16. Community contribution 17. Availability of funds 18. Entity setting-up water tariff charges 19. Affordability of water charges 20. Whether community consulted in tariff-setting 21. Flexibility in user payment 22. Provision of subsidized tariff for poor (SC/ST)
Water Quality Aspect 23. Acceptability of quality 24. No. of sources with acceptable quality 25. Access to safe water 26. Source reliability
Training Aspect 27. Category of personnel trained 28. Gender-wise training 29. Preference for women in training of hand-pumps repair
For each of the aforementioned 29 parameters, the responses from the households were quantified on a scale of 1 to 4 and State-wise averages were computed for each of them. This allowed us to identify the critical sustainability parameters that were relatively strong or weak in each of the sample states. The values of sustainability index and its significance is given in the table alongside.
Sustainability Index Value Significance 76%-100% Highly Satisfactory 51%-75 Satisfactory 26%-50% Poor 0%-25% Very Poor

Evaluation Study on Rajiv Gandhi National Drinking Water Mission 59
12.1 Composite Sustainability Index
The State-wise findings on the composite (all 5 broad heads combined) sustainability index are presented in the chart alongside. As can be seen, the overall (all 5 states and all 5 broad aspects combined) sustainability index works out to 54%, which is only marginally above the range of ‘Poor’. The overall sustainability of water sources in the states of West Bengal and Rajasthan is found to be poor, while the performance of Himachal Pradesh, Assam and Karnataka is found to be satisfactory. Among the five states, Karnataka is found to be the best performing State with a composite sustainability index of 66%. As already mentioned, we have also worked out sustainability index for each State in respect of each of the 5 major aspects, that is, technology aspects, community & social aspects, financial aspects, water quality aspects and training aspects. The findings are presented on each aspects one-by-one hereunder — Technological Aspects
The overall (all 5 states combined) sustainability index in respect of the technology issues is found to be 71%, which is satisfactory. Among the 5 states, Karnataka stands out with a composite index of 78%, as shown in the chart alongside. This indicates that in terms of technological aspects, sustainability of water sources in this State is highly satisfactory. In other words, in the State of Karnataka, water sources were functional or partially functional throughout most part of the year and number of functional water points had increased. There were no or only few breakdowns and in these cases, the repairs were done quickly. Further, the equipment and spare parts were easily available for nearly all types of repairs. Besides, community was also aware of the technical skills required for repairs of water supply system.
74%
78%
71%
66%
65%W. Bengal
Rajasthan
Assam
Himachal
Karnataka
Chart-12.2 : State-wise Sustainability Index — Technological Aspects (Overall Index – 71%)
58%
66%
52%
49%
46%Rajasthan
W . Bengal
A ssam
Himachal
Karnataka
Chart-12.1 : State-wise Composite Sustainability Index — (Overall Index – 54%)

Evaluation Study on Rajiv Gandhi National Drinking Water Mission 60
Community & Social Aspects
The State-wise sustainability index in respect of community and social aspects presented in the chart alongside shows that the overall (all 5 states combined) index is 63%, which is satisfactory. Performance of all the 5 states is found to be satisfactory, with Rajasthan scoring lowest (55%) and Karnataka scoring the highest (74%).
Financial Aspects
The State-wise findings on sustainability index with respect to financial aspects presented in the chart alongside shows that overall (all 5 states combined) situation is very poor (23%). Among the 5 states, Rajasthan is found to be the worst performing State with the sustainability index of only 9%. Even in the case of Karnataka, that had fared very well in terms of technological and community & social aspects, the sustainability index on financial aspects is found to be poor. Water Quality Aspects
In terms of water quality, the sustainability index of Karnataka and Himachal Pradesh is found to be highly satisfactory (94% and 93%, respectively), as shown in the chart alongside. Even the other 3 states (Assam, West Bengal and Rajasthan) have fared satisfactorily in this regard. The overall (all 5 states combined) sustainability index is also found to be 80%, indicating that the level of satisfaction in the community with regard to quality and reliability of drinking water is very high.
63%
74%
55%
62%
62%
Rajasthan
Himachal
Assam
W. Bengal
Karnataka
Chart-12.3 : State-wise Sustainability Index — Community & Social Aspects (Overall Index – 63%)
34%
37%
19%
15%
9%Rajasthan
W. Bengal
Assam
Himachal
Karnataka
Chart-12.4 : State-wise Sustainability Index — Financial Aspects (Overall Index – 23%)
93%
94%
71%
71%
69%Rajasthan
W. Bengal
Assam
Himachal
Karnataka
Chart-12.5 : State-wise Sustainability Index — Water Quality (Overall Index – 80%)

Evaluation Study on Rajiv Gandhi National Drinking Water Mission 61
Training Aspects
The findings on sustainability index with regard to the training of community members are presented in the chart alongside. The overall situation (all 5 states combined) presents a poor picture with a sustainability index of only 30%. The State of Himachal Pradesh has fared very poorly with a sustainability index of only 25%, while the other 4 states have fared poorly, with the sustainability index ranging between 26% and 42%. Since women are the principal beneficiaries of the Mission and are pivot around which sustainability is evolved, it is of critical importance that women are involved at all the stages of planning, implementation and management of rural water supply schemes. Women’s associations could provide a strong framework for community participation. However, the aforementioned findings make it amply evident that provision of training to the community, especially the women has not been given adequate and much needed attention by any of the five sample states.
12.2 Aspects-wise Overall Sustainability Index
The findings on the overall (all 5 states combined) sustainability index with respect to each of the five broad aspects are presented in the chart alongside. As can be seen, the sustainability indices with respect to ‘financial aspects’ and ‘training of community members’ are only 23% (very poor) and 30% (poor), respectively. The poor performance of the states on these two major aspects has had an adverse impact on the overall composite sustainability index and it has barely managed to be in the ‘satisfactory range’ (54%), despite the fact that the sustainability indices on the other three major aspects — ‘technological aspects’, ‘financial aspects’ and ‘water quality’ are in either ‘satisfactory’ or ‘highly satisfactory’ range (71%, 63% and 80%, respectively).
29%
42%
27%
26%
25%Himachal
Rajasthan
W. Bengal
Assam
Karnataka
Chart-12.6 : State-wise Sustainability Index — Training (Overall Index – 30%)
30%
80%
23%
63%
71%
54%
Chart-12.7 : Aspects -wise Overall Sustainability Index
TechnologicalAspects
Community & Social Issues
FinancialAspects
Water Quality
Training of CommunityMembers
Overall Composite

Evaluation Study on Rajiv Gandhi National Drinking Water Mission 62
A comparison of overall sustainability index with respect to each of the 5 broad aspects for ‘most affected’ and ‘least affected’ sample districts is presented in the table alongside. As can be seen, only in the case of ‘water quality’, there is a noticeable variations between the sustainability index of ‘most affected’ and ‘least affected’ districts (76% and 84%, respectively). As regards the other four broad aspects, the values of sustainability indices are quite comparable. 12.3 Rain Water Harvesting Structure
In view of fast growing population, urbanization and industrialization on one side and diminishing water resources on the other, it has become imperative to conserve available water and harvest rain water to the maximum extent possible. Storage of rain water for drinking water both at the community level and at the household level will ensure drinking water security even in adverse conditions for few months. With sufficient storage capacity it may be sufficient for the whole year. In the context of the aforementioned, the Pradhans of the sample Gram Panchayats were asked if they had installed any rain water harvesting structure in their respective Gram Panchayat. The findings presented in the table alongside show that installation of rain water harvesting structure is reported only in less than two-fifth (36%) of the sample Gram Panchayats (GPs). Surprisingly, none of the Gram Panchayats (GPs) in West Bengal and Assam have reported about installing such structures. Further analysis has revealed that the number of Gram Panchayats (GPs) reporting rain water harvesting structures in ‘most affected’ is twice than that of those in the ‘least affected’ districts (15 Gram Panchayats (GPs) as against 7 Gram Panchayats (GPs)). This is owing to the fact that water is generally available at a shallow depth in the ‘least affected’ districts and as such, in terms of water endowments, the ‘least affected’ districts are much better off than the ‘most affected’ ones.
Sustainability Index
Broad Aspects Most Affected
Least Affecte
d Technology Issues 70.4% 70.7% Community & Social Issues
62.2% 64.0%
Financial Aspects 23.4% 22.5% Water Quality 75.6% 84.0% Training of Community Members
29.7% 29.4%
Table-12.1 : Gram Panchayats (GPs) Reporting Rain Water Harvesting
Structure Category n Yes No Karnataka 11 8 3 Himachal 12 4 8 Rajasthan 13 10 3 West Bengal 12 0 12 Assam 14 0 14 Overall 62 22
(35.5%) 40
(64.5%)
Table-12.2 : Habitations Reporting Rain Water Harvesting Structure
Category n Yes No Karnataka 48 18.7% 81.3% Himachal 48 8.3% 91.7% Rajasthan 48 47.9% 52.1% West Bengal 48 0% 100% Assam 48 0% 100% Overall 240 15.0% 85.0%

Evaluation Study on Rajiv Gandhi National Drinking Water Mission 63
Information regarding installation of rain water harvesting structure was also collected during the habitation survey. The findings presented in the table alongside show that the proportion of habitations responding in affirmation is still smaller (15%) as compared to that of the Gram Panchayats (GPs). Once again, none of the habitations in West Bengal and Assam has reported existence of any such structure. As quite expected, the proportion of habitations reporting rain water harvesting structures is found to be the highest (48%) in the State of Rajasthan. The details of water harvesting structures as reported by the habitations are presented in the following table —
Details of Water Harvesting Structures as Reported by Habitations Water harvesting tank constructed in 2007 7 Habitations
(Karnataka-7) Water harvesting tank constructed under Agriculture
Development Scheme 1 Habitations (Karnataka-1)
Water harvesting tank constructed by GP 5 Habitations (Himachal Pradesh-4, Rajasthan-1)
Water harvesting tank constructed under NREGS 19 Habitations (Rajasthan-19)
Water harvesting tank constructed by individuals 12 Habitations (Rajasthan-12)

Evaluation Study on Rajiv Gandhi National Drinking Water Mission 64
Chapter 13
Major Findings 13.1 Status of Fully Covered Habitations
Based on the information received from the State officials, between the period 2003 and 2009, there has been significant increase in the proportion of fully covered (FC) habitations in all the 5 states. Among the 5 states, Rajasthan and Assam stand out with the highest increase (62 and 51 percentage points).As per the official records, the present status of the fully covered habitations in the 5 study states is in the range of 75% (Himachal Pradesh) to 95% (Rajasthan). 13.2 Access to Safe Drinking Water
There has been a tremendous improvement in the rural populations’ access to safe drinking water sources between the pre-2003 and the present period across all the 5 states. The improvement was phenomenal in the case of Rajasthan where currently, over nine-tenth (91%) of the rural households have access to safe drinking water as compared to less than one-tenth (9%) of them prior to 2003. During the same period, Himachal Pradesh has also registered an equally impressive improvement; currently all the households (100%) have access to safe drinking water as compared to less than three-fifth (56%) prior to 2003. Overall, 5 states combined, over nine-tenth (93%) of the rural population at present has access to safe drinking water sources; the improvement of 32 percentage points is a reflection of the commendable progress made under the Mission. Prior to 2003, compared to the households (71%) of the ‘least affected’ districts, a much smaller proportion of the households (50%) in ‘most affected’ districts had access to safe drinking water. With the advent of the Mission, the situation in the ‘most affected’ areas has improved to a point where the proportions of the households in least and ‘most affected’ areas having access to safe drinking water are quite comparable (92% and 95%, respectively). Parameters of Access to Drinking Water
In order to assess the issue of access to drinking water in a holistic manner, efforts were made to elicit information from the respondents of the household survey on the following 5 key parameters.
• Safe and Round-the-year Availability
• Safe, Round-the-Year and Sufficiency
• Distance of Water Source
• Time Spent in Collecting Water
• Social Inclusion

Evaluation Study on Rajiv Gandhi National Drinking Water Mission 65
It may be highlighted that the first 3 are the defining parameters of the ‘fully covered’ status of a habitation. Accordingly, these are discussed first. Safe and Round-the-year Availability : Overall, around two-third (66%) of the households having access to safe drinking water sources are getting round-the-year supply of drinking water. Among the 5 states, Assam stands out as the best performing State with nearly four-fifth (76%) of the households receiving round-the-year supply of water from safe sources. On the other hand, West Bengal is found to be the worst performing, where two-fifth (42%) of the households have reported that they are deprived of this facility. Safe, Round-the-Year and Sufficiency : Overall, only three-fifth (63%) of the households has reported to be receiving sufficient quantity of water from safe sources on round-the-year basis. Among the 5 states, Assam stands out as the best performing State where this was reported by three-fourth (76%) of the households. On the other hand, Karnataka was found to be the worst performing State where close to half the households (46%) have reported that they were not receiving round-the-year supply of sufficient quantity of water from safe sources. A comparative analysis of households reporting safe, safe & round-the-year and safe, round-the-year and sufficient supply of drinking water shows that although, the proportion of households having access to safe water is quite high (ranging from 85% to 100%), the proportion of households reporting safe, round-the-year and sufficient water supply is much smaller (54% to 76%). The difference was found to be as high as 43 percentage points in the case of West Bengal. Distance of Water Source
Overall, all 5 states combined, almost all the households having access to safe drinking water have reported that the main source of water was located within 1.6 kms. from their homes. As regards Himachal Pradesh (hilly State), all the households surveyed have reported that the main safe source of water was located within 1.6 km or within 100 m elevation difference. Thus, it can be safely concluded that the proportion of ‘fully covered’ habitations across the 5 study states are in the range of 54% to 76%. It may be highlighted that there are significant differentials between the ‘fully covered’ status based on the State-level data and the findings of the household survey. The difference is quite prominent in the State of Karnataka, Rajasthan and West Bengal (39, 29, and 28 percentage points, respectively). Time Spent in Collecting Water
Overall, the average daily time spent by the households in collecting drinking water (from safe sources) is 52 minutes. Considering the numerous constraints in the rural areas (frequent power cuts for long hours and low voltage, low water pressure, lack of proper maintenance of equipment, less than adequate number of sources, etc.), the average time of 52 minutes per day spent by the households is not much and the situation can be considered as quite satisfactory.

Evaluation Study on Rajiv Gandhi National Drinking Water Mission 66
Social Inclusion
It is indeed heartening to note that almost all the households across the 5 study states have reported that there is no discrimination whatsoever, with regard to access to drinking water sources.
Moving towards Tapped Water Supply
Compared to their status prior to 2003 and present (2009), the proportion of households having access to tap water has improved quite significantly in all the 5 states. Overall, it has increased from 24% to 71%. During the same period, the proportion of households dependent on hand-pump/tube-bore wells has gone down, except in the State of Rajasthan, where prior to 2003, 80% in Barmer district (most affected) and 84% households in Dholpur district (least affected) were receiving drinking water from open wells. Currently, the situation has changed to a point where only 8% households in Barmer and 6% households in Dholpur are using open well water, while the majority has now access to hand-pump or tap water provided under the Mission.
There has been a drastic change, especially in the case of Rajasthan, Assam and West Bengal where prior to 2003, the proportion of the households having access to piped water supply was next to nothing (1%, 2% and 7%, respectively). Currently, these states have registered a significant improvement, with a substantial increase in the proportion of households having access to piped water supply (35, 53 and 82 percentage points). Among the 5 states, Himachal Pradesh and Karnataka stand out where the proportion of households having access to piped water supply stands at 100% and 84%, respectively. Alternate Sources of Drinking Water
As already discussed, only 63% households have access to safe, round-the-year and sufficient quantity of water, implying that a significant 37% do not have this facility. These are the households that have to depend on alternate sources of drinking water. It has been found that overall, the alternate sources for 70% of such households are safe. State-wise, most of the households (82% to 92%) in the states of Karnataka, Assam and West Bengal have reported that their alternate sources of water are safe. Whereas, in the case of Rajasthan, the alternate sources of water was unsafe (‘open wells’ and ‘taanka’), as reported by a significant two-fifth (41%) of the households.
Further, it was found that despite the alternate sources located within the statutory distance of 1.6 kms from their homes for almost all the households (97%), average time spent per trip in collecting water is reported to be nearly three times as compared to that of the main source (144 minutes for alternate & 52 minutes for main sources).
13.3 Water Quality
Satisfaction with the Water Quality
It is encouraging to note that overall, an overwhelming majority of the households (93%) have reported to be satisfied with the water quality. Among the 5 states, water

Evaluation Study on Rajiv Gandhi National Drinking Water Mission 67
quality is a major issue only in the State of Rajasthan, as reported by half the households (50%) surveyed in the State.
Almost all these households belong to the ‘most affected’ district of Barmer. It may be highlighted that overall, around four-fifth (78%) of the households in the 5 ‘most affected’ districts have reported that the water quality of their main sources was satisfactory. With 90% households in the ‘least affected’ districts satisfied with the water quality of the main sources, there is not much difference between the ‘least affected’ and ‘most affected’ districts in terms of water quality as perceived by the households. As for the alternate sources, overall, 71% of the households have expressed satisfaction about its water quality. Among the 5 states, water quality of the alternate sources is found to be a major issue in the states of Rajasthan and Assam, where majority of the respondents (56% and 51%, respectively) have reported dissatisfaction. Provision of Water Testing Kits to Gram Panchayats
It is disheartening to note that out of the 63 sample Gram Panchayats, only 18 have reported about being provided with the field-testing kit. Surprisingly, none of the 14 sample Gram Panchayats of West Bengal and only 1 Gram Panchayat in Assam has reported affirmatively in this regard. Ironically, the proportion of Gram Panchayats (GPs) provided with the field testing kits is much smaller for the ‘most affected’ districts as compared to the ‘least affected’ ones (23% vs 33%). Testing of Water Sources by Technical Person
It is also disheartening to note that overall, the respondents of four-fifth (79%) of the sample habitations have reported in negative about the testing of water sources. Further analysis has revealed that even in the case of ‘most affected’ districts, water sources have not been tested in three-fourth (76%) of the 120 habitations. As a matter of fact, only 5% of all the sample habitations have reported about Gram Panchayats making any effort with regard to maintaining water quality of sources. Trainings on Water Quality Monitoring and Surveillance
The Pradhans of only 23 out of the 63 sample Gram Panchayats (GPs) affirmed about the provision of training to grassroot workers. According to them, training was provided on quality, monitoring and sanitation & hygiene issues. Among the 5 states, Karnataka stands outs with all the 12 sample Gram Panchayats (GPs) reporting the provision of training to grassroot workers. Gender-wise, it emerged that in a large majority of the Gram Panchayats (50 out of 63), no woman has received any training. Among the 5 states, Karnataka stands out where 7 out of the 12 sample Gram Panchayats (GPs) have mentioned about women having received training. Considering that the responsibility of collecting water lies mainly with the females of the households, the overall situation is not encouraging.

Evaluation Study on Rajiv Gandhi National Drinking Water Mission 68
13.4 Operation & Maintenance
Functional Water Sources
Over two-third (70%) of the hand-pumps and overwhelming majority (91%) of the tapped water supply sources were functional as reported by the respondents of the habitations survey. According to around a significant one-fifth (18%) of them, the hand-pumps had become defunct mainly due to ground water depletion. This problem was found to be pronounced mainly in the states of Karnataka and Rajasthan, as reported by a significant proportion of habitations (54% and 25%, respectively). The other major reason for the defunct hand-pumps was cited as lack of proper maintenance, as reported by the respondents of 16% habitations. As regards the piped water supply, one-third (35%) of the habitations have reported no breakdowns in the past one year, while around half (49%) have reported the frequency of breakdowns as 2-3 times in the past one year. The breakdown frequency of more than 3 times in the past one year was reported by only 8% of them. In the context of the rural settings and other constraints, the overall situation can be said to be satisfactory. Responsibility of Operation and Maintenance (O&M)
Overall, only a small proportion (5%) of the households was of the view that Operation and Maintenance (O&M) should be the responsibility of the community. Among the 5 states, Himachal Pradesh stands out with the proportion of such households being the highest (12%). When probed about the existence of any committee in their village/habitation that is responsible for maintenance of water sources, almost all the households (99%) responded in negative.
The proportion of households willing to pay for the operation & maintenance of the water supply system was found to be very small (8%). Among the 5 states, Himachal Pradesh stands out with one-fourth (25%) of the households willing to pay for Operation and Maintenance (O&M). According to the Pradhans of over half (56%) of the sample Gram Panchayats (GPs), prevailing poverty among the community was the main reason for their unwillingness. Further, 26% of them were of the view that the communities would be able to pay some amount (Rs. 10/- to Rs. 50/- per month) towards Operation and Maintenance (O&M), while around one-fifth (18%) of them mentioned that the community in their areas considered Operation and Maintenance (O&M) as the responsibility of the Gram Panchayats (GPs). Role of Gram Panchayats (GPs) in Operation and Maintenance (O&M) of Water Supply System
Over half of the Gram Panchayats have expressed their inability to take the responsibility of Operation and Maintenance (O&M). Among the 5 states that have reported to be capable, Karnataka stands out where Pradhans of all the sample Gram Panchayats have stated that they are capable to take this responsibility. As regards the formal handing over of Operation and Maintenance (O&M) of the assets created under the Mission, a large majority of the Gram Panchayats (50 out of 63) have responded in negative. Among the 5 states, Karnataka stands out where Operation and Maintenance

Evaluation Study on Rajiv Gandhi National Drinking Water Mission 69
(O&M) has been formally handed over to all the 12 sample Gram Panchayats (GPs). It emerged that in 70% of the Gram Panchayats (GPs), PHED has the responsibility of Operation and Maintenance (O&M), while in 25% of the cases, the responsibility is reported to be with the Gram Panchayats (GPs) (mostly in Karnataka and some in West Bengal). As regards the remaining 3 Gram Panchayats (GPs), the Operation and Maintenance (O&M) responsibility lies with the VLWSC. 13.5 Water Tariff
As per the household survey, 14.6% (total 210) of all the households were found to be having tap connections. Close to nine-tenth (87%) of these households have reported to be paying water charges on a regular basis. It may be mentioned that in Rajasthan, none of the sample households have reported to be having tap connection. Among the other 4 states, Himachal Pradesh stands out where all the households are reportedly paying water charges regularly. According to the Pradhans of two-third (19 out of 30) such Gram Panchayats (GPs), over four-fifth (83%) of all the households were paying water tariff on a regular basis. Almost all (95%) the households have expressed satisfaction with regard to the water charges paid by them vis-a-vis the quantity/quality of water supply received by them.
The average amount of monthly water charges per household is found to be lowest (Rs. 12.70/- in Himachal Pradesh and highest (Rs. 53.80/-) in Assam. Overall, 4 states combined, the average monthly water charges per household works out to Rs. 22.30/. No variations were found in the water charges among the households belonging to the different social categories (general, scheduled caste or scheduled tribe). Further, an overwhelming majority (88%) of the households having tap connections had paid installation charges. This was lowest (Rs. 526.60/- per household) in Himachal Pradesh and highest (Rs. 1840.00/- per month per household) in West Bengal. Overall, 4 states combined, the average installation charges per household works out to Rs. 644.30/-.
It may be highlighted that the user charges for Public Stand Post (PSP) were collected only in the State of Karnataka, as reported by the village Pradhans of the 12 sample Gram Panchayats. According to them, the average monthly amount of water charges per household was Rs. 10/- for all sections of the society.
According to the village Pradhans, in most of the Gram Panchayats (GPs), PHED was responsible for setting-up water tariff. Whereas, wherever the supply system had been formally handed-over to the Gram Panchayats (GPs), it was PRIs’ responsibility. In these cases, water tariff was set-up in accordance with the Government Order. As regards informing the community about the water tariff, the village Pradhans mentioned about the use of public announcement, public display or through ‘Watermen’ for the purpose. On the issue of community being consulted before setting-up the water tariff, village Pradhans of only a few Gram Panchayats (GPs) responded in affirmation. According to most of them, around 50% of the Operation and Maintenance (O&M) cost is recovered from the user charges.

Evaluation Study on Rajiv Gandhi National Drinking Water Mission 70
13.6 Community Participation/Existence of VWSC
It is disheartening to note that less than 1% of the households mentioned about the existence of village water and sanitation committee (VWSC) in their areas. When discussed with the Pradhans, it emerged that VWSCs were existing in only one-fifth (13 out of 63) of the sample Gram Panchayats. Among the 5 states, Karnataka stands out where the presence of VWSC was reported by half the sample Gram Panchayats. While VWSC meetings were reportedly conducted only in 9 out of the 13 Gram Panchayats (GPs), participation of women and scheduled caste community members in the VWSC meetings was reported in only 7 out of the 13 Gram Panchayats (GPs). Further, in only 6 out of the 13 Gram Panchayats (GPs), all VWSC members have reportedly received training. 13.7 Knowledge, Practice and IEC on Hygiene & Sanitation
During the study, Gram Panchayats, habitations and households were probed about any campaign organized in their area on water & sanitation and hygiene. Interestingly, there are significant variations among the proportion of Gram Panchayats (GPs), habitations and households responding in affirmation about the campaign on water & sanitation and hygiene (71%, 24% and 13%, respectively). This is probably an indication that some campaigns were organized at Gram Panchayat level, but this has not percolated to the grassroot-level, that is, the household level where information/awareness is needed the most. At the household level, barring Himachal Pradesh, the situation in the other 4 states is pathetic, with their proportion responding in affirmation about campaign ranging between 0% and 8%.
At the habitation level, less than one-fourth (24%) of them reported about any awareness campaign organized in their area. Most of these habitations mentioned about total sanitation campaign (TSC), while a few of them mentioned about Jal Rath Yatra/Jal Chetna Abhiyan (in Rajasthan) and campaign by Health Deptt. on water, sanitation & pollution free environment. Use of interpersonal communication (IPC) for awareness generation was reported by only an abysmally small proportion of households 7%. In the near absence of IEC activities, it is no surprise that open defecation is so widely prevalent in most (80%) of the sample habitations. Besides, there is no functional mechanism for garbage collection, as reported by almost all the sample habitation (96%).
Main source of information on personal & household hygiene was found to be radio or TV, as reported by an overwhelming majority (88%) of the households. During the habitation survey, when probed on the issue of training of VWSC members or teachers on hygiene education, almost all the habitations have responded in negative. Since in most cases VWSCs are not formed, these findings are not surprising.
13.8 Program Benefits/Impact on Rural Population
Increased Availability of Water
Increased availability and consequently, increased water usage by the rural households have been found to be the biggest program benefits. Overall, an overwhelming majority (96%) of the households have reported increased usage of water.

Evaluation Study on Rajiv Gandhi National Drinking Water Mission 71
Increased Functional Water Sources/Reduced Breakdowns
When the issue of Program benefits was discussed with the respondents of habitation survey, an overwhelming majority of them (80%) mentioned that the number of water sources in functional condition has significantly increased in the last few years. Further, the respondents in majority (57%) of the habitations also mentioned that there has been a noticeable decrease in the frequency of the supply system breakdowns. Improved Environmental Sanitation & Reduction in Water Borne Diseases
Overall, three-fourth (74%) of the household survey respondents felt that the Program has had a positive impact in terms of environmental sanitation. This was most prominent in the State of Himachal Pradesh (95%). Further, three-fourth (74.5%) of the habitation survey respondents have also reported an improvement in the environmental sanitation in their areas due to the increased availability of water. As a result, the incidences of water-borne diseases in the habitation have decreased, as reported by 70% of the respondents, highlighting a positive change in the overall well-being of the community. Improvement in Women’s Conditions
Overall, a significant three-fourth (75%) of the respondents have reported in affirmation about reduction in their workload, the impact being the most prominent in Himachal Pradesh, as reported by almost all (95%) the female respondents. Three-fourth (75%) of them have also admitted that due to reduced workload, there has been a significant reduction in fatigue experienced by women. Among the 5 states, the proportion of women reporting this positive impact has been found to be the highest in the State of Himachal Pradesh, as reported by almost all (97%) the female respondents.
Consequent to reduced workload and reduced fatigue, women have now more time to engage themselves in various community activities, as reported by over two-third (71%) of the women respondents of the household survey. Among the 5 states, Himachal Pradesh stands out where almost all women (96%) have mentioned about the increased participation of women in the community activities. As regards the Program’s impact on children, an overwhelming majority of women (89%) have reported that on account of improved water supply (easier access and adequate availability), children have now more time for studying and playing, instead of helping them collect water. Utilization of Time Saved
People are now able to spend time in more productive activities instead of spending excessive time in collecting water, with a significant amount of ‘opportunity cost’ associated with it. Among the 5 states, Assam and West Bengal stand out where around four-fifth (77% and 79%, respectively) of the households have reported that they are utilizing the time saved for income generating activities. The savings of time in collecting water has also helped people in Himachal Pradesh and Rajasthan to focus more on agriculture production, as reported by over two-fifth of the households (44% and 42%, respectively) in these states. Overall, 5 states combined, around a significant half (47%) of the households are reportedly utilizing the time saved for income

Evaluation Study on Rajiv Gandhi National Drinking Water Mission 72
generating activities, while over one-fourth (27%) of the households are utilizing the time saved on agriculture. People are now able to focus more on domestic works (20%) and cattle rearing (17%). Improvement in Overall Health Status
According to most of the households (95%), there is no perceptible change in the overall health status of their families. The general sentiment was ‘We were O.K. before also, and we are O.K. now’. Only a paltry 4% have reported a positive impact on the overall health of their families. Most of these households mentioned that now they do not have to spend time & money as frequently in seeking treatment for water borne diseases. Overall Performance of Water Sources
In order to assess the overall performance of the various water sources, as perceived by the beneficiaries, they were asked to rate it as ‘good’, ‘satisfactory’ or ‘bad’. The study has revealed that almost all the households (97%) have rated the performance of hand-pumps as good or satisfactory, while more or less a similar proportion (92%) of household felt that the performance of piped stand post was good or satisfactory. Even in the case of household connections, 9 out of 10 households have rated it as good or satisfactory. 13.9 Sustainability
One of the prime objectives of the study was to assess the sustainability of water sources in the habitations. In order to calculate the Sustainability Index, a total of 29 parameters under 5 broad aspects, namely, technology aspects, community and social aspects, financial aspects, water quality aspects and training aspects were identified. For each of these 29 parameters, the responses from the households were quantified on a scale of 1 to 4 and State-wise averages were computed for each of them. Sustainability index of 76%-100% was considered highly satisfactory, 51%-75 considered as satisfactory, 26%-50% considered as poor and 0%-25% was considered as very poor. Composite Sustainability Index : Overall (all 5 states and all 5 broad aspects combined) sustainability index works out to 54%, which is only marginally above the range of ‘Poor’. The overall sustainability of water sources in the states of West Bengal and Rajasthan is found to be poor (49% & 46%, respectively), while the performance of Himachal Pradesh, Assam and Karnataka is found to be satisfactory (58%, 52% and 66%, respectively). Technological Aspects : The overall (all 5 states combined) sustainability index in respect of the technology issues is found to be 71%, which is satisfactory. While it is highly satisfactory for Karnataka (78%), it is satisfactory in case of the other 4 states (65% to 74%). Community & Social Aspects : Overall (all 5 states combined) sustainability index is found to be 63%, which is satisfactory. Performance of all the 5 states is found to be satisfactory, with Rajasthan scoring lowest (55%) and Karnataka scoring the highest (74%).

Evaluation Study on Rajiv Gandhi National Drinking Water Mission 73
Financial Aspects : Findings on sustainability index with respect to financial aspects shows that overall situation is very poor (23%). State-wise, the performance of Rajasthan, West Bengal and Assam is found to be very poor (9%, 15% and 19%, respectively), while the performance of Himachal Pradesh and Karnataka was found to be poor (34% and 37%, respectively). Water Quality Aspects : In terms of water quality, the sustainability index of Karnataka and Himachal Pradesh is found to be highly satisfactory (94% and 93%, respectively), while the other 3 states have fared satisfactorily in this regard (69% to 71%). The overall (all 5 states combined) sustainability index is also found to be highly satisfactory (80%), indicating that the level of satisfaction in the community with regard to quality and reliability of drinking water is very high. Training Aspects : The overall situation (all 5 states combined) presents a poor picture with a sustainability index of only 30%. The State of Himachal Pradesh has fared very poorly with a sustainability index of only 25%, while the other 4 states have fared poorly, with the sustainability index ranging between 26% and 42%. The aforementioned findings make it amply evident that provision of training to community members, especially the women has not been given adequate and much needed attention by any of the five sample states. Evidently, the poor performance of the states with respect to ‘financial aspects’ and ‘training of community members’ has had an adverse impact on the overall composite sustainability index and it has barely managed to be in the ‘satisfactory range’ (54%). This is despite the fact that the sustainability indices on the other three major aspects — ‘technological aspects’, ‘financial aspects’ and ‘water quality’ are in either ‘satisfactory’ or ‘highly satisfactory’ range (71%, 63% and 80%, respectively). A comparison of overall sustainability index with respect to each of the 5 broad aspects for ‘most affected’ and ‘least affected’ sample districts shows any noticeable variations only in the case of ‘water quality’ aspect (76% and 84%, respectively). As regards the other four broad aspects, the values of sustainability indices are quite comparable. Installation of Rain Water Harvesting Structures : The study has shown that rain water harvesting structures have been installed only in less than two-fifth (36%) of the sample Gram Panchayats (GPs). Surprisingly, none of the Gram Panchayats (GPs) in West Bengal and Assam have reported about installing such structures.

Evaluation Study on Rajiv Gandhi National Drinking Water Mission 74
Chapter 14
Recommendations 14.1 Recommendations
In order to achieve the objectives and goals of any development scheme, it is essential that its strengths are sustained and consolidated, and that the shortcomings are minimized by way of appropriate and timely corrective actions and applying the lessons learned. The recommendations derived from the study findings are to be viewed in this context. 1. The focus of the Rajiv Gandhi National Drinking Water Mission (RGNDWM) was to
adopt a community-based demand-driven approach instead of the hitherto government forced supply driven approach. The demand-responsive approach is based on the principles of community participation and decentralization of powers for implementing and operating drinking water supply schemes with the government playing the role of a facilitator. Demand-driven programs are found to have relatively low institutional cost and other advantages, including better Operation and Maintenance (O&M) cost recovery. In the light of the fact that in most cases, the Village Water and Sanitation Committees (VWSCs) are non-functional, the first step would therefore be to revitalize these committees and build the capacity of their members. Only then, the goals and objectives of the Mission can be realized.
2. Sustainability of water supply systems can be ensured only by ensuring the
sustainability of the water sources through efficient water resource management initiatives. For the purpose, the need for active community involvement at every stage – from planning, to implementation, Operation and Maintenance (O&M) and ownership can hardly be overemphasized. In the light of the study revealing a near total absence of community involvement (what to talk of the involvement of women), it becomes crucial to engage specialist agencies for capacity building of VWSC members. Only then, the needs and aspirations of the rural poor can be fulfilled.
3. The study has revealed that close to nine-tenth (87%) households have denied about
any awareness campaign organized in their villages. In the near absence of IEC activities, it is no surprise that open defecation is so widely prevalent in most (80%) of the sample habitations. Besides, there is no functional mechanism for garbage collection, as reported by almost all the sample habitation (96%). In this backdrop, it would be worthwhile to take-up focused and sustained IEC campaigns to educate the communities on the various aspects and issues related to drinking water, sanitation and hygiene. This would also motivate the communities, especially the women for their active involvement in all aspects of the Mission, including its operation & maintenance. For the purpose, experienced professional agencies may be hired to develop appropriate and effective IEC tools.

Evaluation Study on Rajiv Gandhi National Drinking Water Mission 75
4. The study has revealed that over half of the Gram Panchayats have expressed that they are not capable to take the responsibility of Operation and Maintenance (O&M). Besides, in a large majority of the Gram Panchayats (50 out of 63), Operation and Maintenance (O&M) of the assets created under the Mission have not been formally handed over to them. It may be highlighted that 71% of the sample Gram Panchayats (GPs) have even denied about the provision of field testing kits for water quality monitoring. As such, the communities as well as the elected representatives are generally not enthusiastic or self-motivated to participate in the decentralized planning process, largely due to lack of proper understanding of the nature and scope of the schemes. In this scenario, there is an urgent need to organize relevant training programs for the village level PRI members so as to motivate them for their active involvement in all aspects of the Mission. For the purpose, professional training agencies may be hired.
5. In many instances, a majority of the households across all the 5 study states have
complained about the ill-maintained water supply system resulting in frequent breakdowns and consequently, adversely affecting the desired quantity or quality of drinking water available to them. The program managers may consider a separate and adequate budgetary provision, besides deputing a team of dedicated staff for ensuring timely repairs and preventive maintenance of the assets created under the project.
6. Installation of rain-water harvesting is one of the key components of the RGNDWM.
However, the study has shown that rain water harvesting structures have been installed only in less than two-fifth (36%) of the sample Gram Panchayats (GPs). Surprisingly, none of the Gram Panchayats (GPs) in West Bengal and Assam have reported about installing such structures. In view of this, there is an urgent need for the renewed impetus in taking-up this important water conservation measure in a serious manner.
7. Study has revealed about the instances where the water supply provisioning under the
Mission was inappropriate. For example, in many parts of Rajasthan and Karnataka where water table is very deep, generally the hand pump schemes have not been successful. In order to ensure effectiveness and long-term sustainability of the rural water supply schemes under the Mission, it is imperative to design State-specific plans of action keeping in mind the needs and aspirations of the rural populations.

Evaluation Study on Rajiv Gandhi National Drinking Water Mission 76
Project Team
Project Director Dr. R.C.Dey Director, PEO Head Quarters
Sh. L. N. Meena Economic Officer, PEO Sh. Vipin Kumar Economic Officer, PEO Sh. Bhuwan Chander Economic Investigator, PEO Sh. D.S. Sajwan Tab. Clerk, PEO Shri Virender Rawal Young Professional, PEO
Field Team:
Name of REOs Name and Designation Name of PEOs Name and Designation Ms. Godhuli Mukharjee, Director
Shri A.K.Thakur, E.O.
Ms.Nitika Gupta, S.R.O.
PEO, Guwahati
Shri Dicken Pegu, LDC Shri M.K.Mishra, E.O. Shri S.Pradhan, S.R.O. Shri R.Haldar, E.I. Shri N.C.Samal, R.O.
REO, Kolkota
Sh Ashutosh Pandey, LDC
PEO,Bhubaneswer
Shri S.Routray, E.I. Shri B.P.Meena, Director Ms. Renu Lata, S.R.O. Sh. Anurag Bhatnagar, E.O. Sh. Manoj Kr. Pankaj,E.I Sh. Shatrughan Pandey, E.I. Shri Sudhir Kumar, LDC
REO, Lucknow
Shri Rajeev Srivastava, E.I.
PEO, Patna
Shri K.S.Kalsua, Director Sh.Shyam Lal, S.R.O. Shri K.L.Kaushik, S.R.O. Shri Birendra Singh, E.O Smt. S. K. Choudhary, R.O Shri A.K.Rai, E.I.
REO, Jaipur
Shri.R.K.Sharma, E.O.
PEO,Bhopal
Dr. S. Chandra Shekhar, Director
Shri V.Nagarajan, E.O.
Sh.P.J.RadhaKrishnan,E.O. Smt. A.M.Mercy, E.I.
REO, Chennai
PEO, Thiruvanathapuram
Smt.Sreedevi Narayan, E.IMs.Usha Suresh, Director Shri D.J.Kushwah, R.O. Shri P.G.Kulkarni, E.O.
REO, Mumbai
Shri Manish Gade, E.I.
PEO, Ahemdabad
Shri V.K.Attri, Director Shri Omesh Paul, E.O. REO,
Chandigardh Shri R.P.Singh, E.O. PEO, Shimla
Sh.Krishna V. Kulkarni, E.I.
Shri D.Koil Pillai, Director Shri K.V.Suresh, E.O. REO,Hydrabad Shri S.R.Verma, E.O.
PEO, Bangalore Shri Raj Kumar, E.O.