Evaluation Study on National Rural Health Mission (NRHM) in ...
214
u a ti l o a n v O E r e g a m n m i s a r a g t i o o r n P P l a n n o i n s i n i s g m C o m Evaluation Study on National Rural Health Mission (NRHM) in Seven States Programme Evaluation Organisation Planning Commission Government of India New Delhi February 2011 PEO Report No.217 Volume-II
-
Upload
khangminh22 -
Category
Documents
-
view
2 -
download
0
Transcript of Evaluation Study on National Rural Health Mission (NRHM) in ...

uatil oa nv OE re gam nm isar a
g tio or nP
Pla nn oin sin isg mCom
Evaluation Study onNational Rural Health Mission (NRHM)
in Seven States
Programme Evaluation OrganisationPlanning CommissionGovernment of India
New DelhiFebruary 2011
PEO Report No.217
Volume-II

Report No. 217
Evaluation Study of National Rural Health Mission (NRHM)
in 7 States
Volume II
Programme Evaluation Organisation
Planning Commission Government of India
New Delhi
February 2011


Evaluation Study of National Rural Health Mission (NRHM) in 7 States i
Contents Detailed State Level Tables Page Contents i-ii Abbreviations iii I Listing of States, Districts, CHCs, PHCs and Villages 1-10 II Health Facilities in 37 Districts Over 7 States in India 11-27 Status of Different Components of NRHM in Surveyed Districts and States of India 12 Existing facilities at District level of Uttar Pradesh 14 Existing facilities at Districts level in Madhya Pradesh 16 Existing health facilities at District level in Jharkhand 18 Existing facilities at Districts level in Orissa 20 Existing facilities at Districts level in Assam 22 Existing facilities at Districts level in Jammu & Kashmir 24 Existing facilities at Districts level in Tamilnadu 26 III Infrastructure and Services at Community Health Centre (CHC) level 28-42 Availability of Infrastructure and Services at CHCs Level in Uttar Pradesh 29 Availability of Infrastructure and Services at CHCs Level in Madhya Pradesh 31 Availability of Infrastructure and Services at CHCs Level in Jharkhand 33 Availability of Infrastructure and Services at CHCs Level in Orissa 35 Availability of Infrastructure and Services at CHCs Level in Assam 37 Availability of Infrastructure and Services at CHCs Level in Jammu & Kashmir 39 Availability of Infrastructure and Services at CHCs Level in Tamilnadu 41 IV Infrastructure and Services at Primary Health Centre (PHC) level 43-64 Availability of Infrastructure and Services at PHCs Level in Uttar Pradesh 44 Availability of Infrastructure and Services at PHCs Level in Madhya Pradesh 46 Availability of Infrastructure and Services at PHC level in Jharkhand 48 Availability of Infrastructure and Services at PHC level in Orissa 50 Availability of Infrastructure and Services at PHC level in Assam 52 Availability of Infrastructure and Services at PHC level in Jammu & Kashmir 54 Availability of Infrastructure and Services at PHC level in Tamilnadu 56 V Infrastructure and Services at Sub Centers (SC) level 58-65 Availability of Infrastructure and Services at SC level in Uttar Pradesh 59 Availability of Infrastructure and Services at SC level in Madhya Pradesh 60 Availability of Infrastructure and Services at SC level in Jharkhand 61 Availability of Infrastructure and Services at SC level in Orissa 62 Availability of Infrastructure and Services at SC level in Assam 63 Availability of Infrastructure and Services at SC level in Jammu & Kashmir 64

Evaluation Study of National Rural Health Mission (NRHM) in 7 States ii
Detailed State Level Tables Page Availability of Infrastructure and Services at SC level in Tamilnadu 65 VI Village Health and Sanitation Committee at Village level 66-80 Village Health and Sanitation Committee at Village level in Uttar Pradesh 67 Village Health and Sanitation Committee at Village level in Madhya Pradesh 69 Village Health and Sanitation Committee at Village level in Jharkhand 71 Village Health and Sanitation Committee at Village level in Orissa 73 Village Health and Sanitation Committee at Village level in Assam 75 Village Health and Sanitation Committee at Village level in Jammu & Kashmir 77 Village Health and Sanitation Committee at Village level in Tamilnadu 79 VII Accredited Social Health Activists in States 81-87 Accredited Social Health Activists Roles in Uttar Pradesh 82 Accredited Social Health Activists Roles in Madhya Pradesh 83 Accredited Social Health Activists Roles in Jharkhand 84 Accredited Social Health Activists Roles in Orissa 85 Accredited Social Health Activists Roles in Assam 86 Accredited Social Health Activists Roles in Jammu & Kashmir 87 VIII Household Characteristics 88-208 Household Characteristics of 7 States 89 Uttar Pradesh household tables 104 Madhya Pradesh household tables 119 Jharkhand household tables 134 Orissa household tables 149 Assam household tables 164 Jammu & Kashmir household tables 179 Tamilnadu household tables 194

Evaluation Study of National Rural Health Mission (NRHM) in 7 States iii
Abbreviation ANM: Auxiliary Nurse Midwife ANC: Ante Natal Care ASHA: Accredited Social Health Activist AYUSH: Ayurvadic Yoga Unani Siddha Homeopathic NRHM: National Rural Health Mission CHC: Community Health Centre DAP: District Action Plan DH: District Hospital DHP: District Health Plan DHS: District Health Society DPM: District Programme Manager DPMU: District Programme Management Unit ECG: Electrocardiagram FRU: First Refferal Unit GP: Gram Panchayat HH: Household ICU: Intensive Care Unit IUD: Intrauterine Device JSY: Janani Suraksha Yojana LHV: Lady Health Visitor MMU: Mobile Medical Unit NGO: Non Governmental Unit OBC: Other Backward Class PHC: Primary health Centre PNC: Post Natal Care PPP: Public Private Partnership RKS: Rogi Kalyan Samiti SC: Sub Centre SC: Schedule Class SHG: Self Help Group SHS: District Health Society SPM: State Programme Management SPMU: State Programme Management Unit ST: Schedule Tribe VHSC: Village Health & Sanitation Committee

E
valuation Study of National R
ural Health M
ission (NR
HM
) in 7 States 1
Listing of States, Districts, CHCs, PHCs and Villages State State
Code District Dist
Code CHC CHC
Code PHC PHC
Code Village Vill.
Code Jharota 1 Pachawar 1 Nagla Rai Singh 2 Jugsana 3
Baldev 1
Jugsana 2 Awairani 4 Paintha 5 Sounkh 3 Son 6 Rasulpur 7
Mathura 1
Govardhan 2
Kosi Khurd 4 Mahorra 8 Ghateda 9 Bhakla 5 Calarpur Gurger 10 Nenekheda 11
Rampur 3
Pahashoo 6 Ahmadpur 12 Ambethi 13 Ambetapir 7 Kheda Afghan 14 Kazi bash 15
Saharanpur 2
Nakur 4
Taber 8 Nashrullagarh 16 Karhara khurd 17 Gaurhari 9 Mausara 18 Pahretha 19
Charkhari 5
Kharela 10 Kua 20 Kashipura 21 Koniha 11 Teia 22 Chhatesar 23
Mohoba 3
Panwari 6
Killawa 12 Paharia 24 Malikpur 25 Mudiladi 13 Maghgowa 26 Belwai 27
Akhand Nagar 7
Baramad 14 Pupaipur 28 Saywara 29 Mayang 15 Saymrowona 30
Uttar Pradesh 1
Sultanpur 4
Dhanpathgang 8
Dehili Bazar 16 Pahreay 31

2
Evaluation Study of N
ational Rural H
ealth Mission (N
RH
M) in 7 States
State State Code
District Dist Code
CHC CHC Code
PHC PHC Code
Village Vill. Code
Anger 32 Itrowa dori pur 33 Kalayn pur 17 Pirrawal 34 Jham Ditt 35
Ghosi 9
Sipah Ibrahimabad
18 Sipahibrahima vrad
36
Bhadhirr 37 Bhadhirr 19 ittora Chobepur 38 Bhirra 39
Mau 5
Mohambad 10
Bhat Kal 20 Devikali Devlaspur
40
Sarosa 41 Chamrouli 21 Ajgayan 42 Dilwal 43
Nabab Ganj 11
Makur 22 Raipur Garhi 44 Semari Mau 45 Chamyani 23 Tipurar Pur 46 Behta Bhawadi 47
Unnao 6
Purva 12
Garha Kola 24 Pakra Bujurg 48 Majhgawa 49 Badgaon 25 Rudmood 50 Badkhera 51
Rithi 13
Bilheri 26 Badagaon 52 JhinnPiparia 53 Khamtara 27 Pahrua 54 Raura 55
Katni 7
Umaria Pan 14
Silodi 28 Atarsooma 56 Kijya 57 Kadbasa 29 Parlaee 58 Kakriya 59
Sigoli 15
Kakrima 30 Umar 60 Bharkhera 61
Madhya Pradesh
2
Nimach 8
Manasa 16 Parrdha 31 Alhair 62

E
valuation Study of National R
ural Health M
ission (NR
HM
) in 7 States 3
State State Code
District Dist Code
CHC CHC Code
PHC PHC Code
Village Vill. Code
Ahmed 63 Fukrashewar 32 Moma 64 Bhiakhedi 65 Shamsabad 33 Daffariyai 66 Jathoda 67
Nateran 17
Mahoo 34 Phofer 68 Swjana 69 Gulabganj 35 Mangwara 70 Dhamnod 71
Vidisha 9
Gyaraspur 18
Hadergarh 36 Gunnotha 72 Bhijhroni 73 Khatora 37 Pironth 74 Akajhiri 75
Badarwass 19
Rannod 38 Mathna 76 Rajgarh 77 Amol patha 39 Amola 78 Dinara 79
Shivpuri 10
Karera 20
Dinara 40 Thanra 80 Gochitaronda 81 Jamani 41 Bhatti 82 Satpura 83
Sukhtawa 21
Tangha 42 Chitapura 84 Guramkhedi 85 Semri 43 Barangi 86 Kharpawad 87
Hoshangabad 11
Shuhagpura 22
Kamte 44 Kamti 88 Vorda 89 Doliya 45 Bhesola 90 Chirayan 91
Vadnavar 23
Vidwal 46 Koodh 92 Bhimpura 93
Dhar 12
Kushi 24 Haldi 47 Ali 94

4
Evaluation Study of N
ational Rural H
ealth Mission (N
RH
M) in 7 States
State State Code
District Dist Code
CHC CHC Code
PHC PHC Code
Village Vill. Code
Logsi 95 Dehri 48 Teekkii 96 Sukur Hattu 97 Kamkum 49 Rampur 98 Gagi 99
Mandhar 25
Kanke 50 Barkatoli 100 Tanger 101 Ratu 51 Lundri 102 Hehal 103
Ranchi 13
Bundu 26
Channo 52 Sinrol 104 Shalimar 105 Bhaga 53 Barai 106 Horla Dih 107
Chasnal 27
Jharia 54 Dhanua Dih 108 Mehha 109 Chirkunda 55 Dumar Kunda 110 KhokhraPahari 111
Dhanbad 14
Nirsa 28
Bena garia No.1
56 Urma 112 Chitra Dih 113 Nodeeh 57 Bhupat Deeh 114 Charghara 115
Jamua 29
Mirjaganj 58 Pobi 116 Muraina 117 Tula deeh 59 Bangra Kala 118 Pesum 119
Giridih 15
Birni 30
Barhmasia 60 Shital Tola 120 Tontogram 121 Tontogram 61 Guddi Poshi 122 Baheriya 123
Tonto 31
Jugal Hat 62 Bal Jodi 124 KathVari 125
Jharkhand 33
Paschim Singhbhum
16 16
Tat Nagar 32 Khath Bhari 63 Kenjhar 126

E
valuation Study of National R
ural Health M
ission (NR
HM
) in 7 States 5
State State Code
District Dist Code
CHC CHC Code
PHC PHC Code
Village Vill. Code
Puranvasi 127 Hatt Ghumariya 64 Pueedi Gutti 128 Dwari 129 Giddhor 65 Nawadih 130 Kobna 131
Itkhori 33
Johri 66 Pandepura 132 Kolkole 133 Lawalong 67 Lamta 134 Bailgadh 135
Chatra 17
Cimaria 34
Jabra 68 Baggara 136 Kurli 137 KhemBesi 69 Chatilona 138 Kumar Dhamani 139
Bissam Cuttak 35
Durgi 70 Bethia Pada 140 Dango Badi 141 Ambodola 71 Pirani Pinda 142 Agula 143
Rayagarh 18
Muniguda 36
Kumuda Bali 72 Mudra 144 Uparbahal 145 budi Munada 73 Sargada 146 Kusanga 147
Loisingha 37
Kusanga 74 Tali Udhar 148 Jarbahli 149 TikraPada 75 Jura Bandh 150 Kusmel 151
Bolangir 19
Saintala 38
Belgaon 76 Kuanr Gaon 152 Jehangira 153 Jehangira 77 Barbil 154 Bhagamunda 155
Hari Chandan Pur 39
BhagaMunda 78 Sagadpatta 156 Digposi 157
Orissa 44
Kendhujhar 20
Udaypur 40 Raidiha 79 Tentraposi 158

6
Evaluation Study of N
ational Rural H
ealth Mission (N
RH
M) in 7 States
State State Code
District Dist Code
CHC CHC Code
PHC PHC Code
Village Vill. Code
Machagarh 159 Shoharpada 80 Demuda 160 Hatina 161 Gupti 81 Balrampur 162 Ishwarpur Dighi 163
Raj Nagar
Ishwarpur 82 Godhiamal 164
41
Kharinesi 165 Ram Nagar 83 Jambo 166 Gagua 167
Kendrapara 21
Mahakal Pada 42
Babar 84 Kalinga 168 Bolanga 169 Nayahat 85 Khadisha 170 Bhaun 171
Gop 43
Chitana 86 Inchera 172 Hantuka 173 Dobandha 87 Chamarkhera 174 Tala Junga 175
Puri 22
Chandanpur 44
Chalis Batia 88 Malti Patpur 176 Singra 177 Gahiya 89 Rauly 178 Kalita Para 179
Chenga 45
Bahari 90 Goma Furwari 180 Banbaria 181 Bhella 91 Sila 182 Baradi 183
Barpeta 23
Nagaon 46
Keot Kuchi 92 Patbaushi 184 Sirajuli 185 Doomdooma 93 Bindukuri 186 Bassasimalu 187
DhekiaJuli 47
Borsola 94 Bhangamandir 188 Alimabad 189
Assam 55
Sonit Pur 24
Chariduar 48 Dipota 95 sankarmaiban 190

E
valuation Study of National R
ural Health M
ission (NR
HM
) in 7 States 7
State State Code
District Dist Code
CHC CHC Code
PHC PHC Code
Village Vill. Code
Sita basti 191 Holeswar 96 Ghoramari 192 Sanowa 193 Garu Khuti 97 Hathi Murua 194 Pitna Khowapara 195
Sipajhar 49
Haza Rika Para 98 Bora Chuba 196 Haldha 197 Hengal Para 99 Burha 198 Berua Dol 199
Darrang 25
Patni Ghat 50
Duni 100 Gabhara 200 nakhat 201 Lengeri 101 Iangapani 202 Sensuwa Pukhudi 203
Morantiloi 51
Sessughat 102 Nahazar Naharani 204 Dhaman salmari 205 Tingkhong 103 Ratanpur 206 Dillidowania 207
Dibrugarh 26
Naharani 52
Namrup 104 Hapjan chariali 208 Moti Nagar 209 Harina 105 Didar Kush 210 Saidpur 211
Sonai 53
Sonbari ghat 106 Dhamalia 212 Bidyaratan Pur 213 Bidya Ratan Pur 107 Jamalpur 214 Kazidor 215
Cachar 27
54
Narsing Pur 108 KamakPUr 216 Bomal 217 Jourain 109 Muthi Mera 218 Piyan 219
Akhhoar 55
Mera Mandariah 110 Bruee 220 Makhanpur 221
Jammu & Kashmir
66 JammuJammu 28
Bishnah 56 Arina 111 Laswara 222

8
Evaluation Study of N
ational Rural H
ealth Mission (N
RH
M) in 7 States
State State Code
District Dist Code
CHC CHC Code
PHC PHC Code
Village Vill. Code
Khojipur 223 Rehal 112 Khairi 224 Montalai 225 Sudh Mahadev 113 Bashat 226 Sangoar 227
Chenani 57
Jaganoo 114 Jakhani 228 Nagrota 229 Chanunta 115 Dhandal 230 Dehari 231
Udham Pur 29
Ram Nagar 58
Bhugtarain 116 Kheen 232 Dranga 233 Bhalla 117 Berru 234 Bhalra 235
Bhaderwah 59
Chinta 118 Drudu 236 Kencha 237 Changa 119 Batar 238 Kilotra 239
Doda 30
Gandoh 60
Mallano 120 Khara 240 Bandbala 241 Gulmarg 121 Druncy 242 Druroo 243
Tangmarg 61
Hariwatno 122 Warpoora 244 AgriKalan 245 Gund Khwaja 123 Matipara 246 Yadipara 247
Baramula 31
Pattan 62
Wanigon 124 Haemery 248 Machwa 249 Chanpara 125 Kral Para 250 Shalina 251
Chattargam 63
Lasjan 126 Summerbagh 252 Charnggam 253
Badgam 32
Beerwah 64 Gondi para 127 Sail 254

E
valuation Study of National R
ural Health M
ission (NR
HM
) in 7 States 9
State State Code
District Dist Code
CHC CHC Code
PHC PHC Code
Village Vill. Code
Inchna 255 Ari Patan 128 Kandhoma 256 Asoor 257 Avloor 129 Velaiyanar 258 Thirukali Kedu 259
Thiruppukuzhi 65
Perumbakkam 130 Matha Patty 260 Thimayan 261 Ayyam Patti 131 Villivalam 262 Nathanallur 263
Kanchipuram 33
Prandur 66
Walazabad 132 Uthakkudu 264 Nalikkyl Petty 265 Mallur 133 Vengyam Petty 266 Neikkara Petty 267
Panamarathu Petty 67
Kondalam Petty 134 Kattur 268 Andikkarai 269 Sanththana
Petty 135
kunjan Diyur 270 P.Udaradair 271
Salem 34
Nangavalli 68
Komburen Kedu 136 Desai Nagar 272 M.Kallupatti 273 T.Pudu Pattai 137 Sithireddi patti 274 Vagai Kullam 275
Checkunurani 69
Sathan Gudi 138 Panni Kundu 276 Suthanthira Nagar 277 Otha kadai 139 Kuoi Kulam 278 Varichiyur 279
Madurai 35
Kallandiri 70
Rajakoor 140 Karuppaya Rani 280 Erachi 281 Erachi 141 Kulasakara 282 Inam Maniyachi 283
Keela Eral 71
Villliseri 142 Nalantin Puthur 284 Raja palayan 285
Tamil Nadu 7
Tuticorin 36
Pudu Kettai 72 Mappailaiura 143 Alangaraithjju 286

10
Evaluation Study of N
ational Rural H
ealth Mission (N
RH
M) in 7 States
State State Code
District Dist Code
CHC CHC Code
PHC PHC Code
Village Vill. Code
Manlagiri 287 Mudiyaitha Nendal
144 Mudinritheidor 288 P.R.Puram 289 P.R.Puram 145 Kameshwaram 290 Villunthama Vadi 291
Thiru Ponndi 73
Villunthamavadi 146 Vettaikarani Uppu 292 Titta Chery I 293 Tittachery 147 Titta Chery II 294 Kuru Vadi 295
Nagapattanam 37
Thirumarugal 74
Thirukanna Pura 148 Thiruchen Kettan Gudi
296

E
valuation Study of National R
ural Health M
ission (NR
HM
) in 7 States 11
Health Facilities in 37 D
istricts
Over
7 States in India

12
Evaluation Study of N
ational Rural H
ealth Mission (N
RH
M) in 7 States
Status of Different Components of NRHM in Surveyed Districts and States of India Indicators Uttar
Pradesh Madhya Pradesh
Jharkhand Orissa Assam Jammu & Kashmir
Tamilnadu India
No. of Districts and DHs covered 6 6 5 5 5 5 5 37 Roles and responsibilities of DHSs (In Percenages)
Discussion on PHC health Committee reports
100 100 100 100 80 80 100 95
Monthly monitoring of infrastructure provided under NRHM
100 83 100 60 80 40 80 78
Contribution in development of DHP 100 100 100 100 60 60 100 89Initiative in identification of various problems faced by patients at various level
83 100 80 100 80 80 60 84
NGOs involvement in the mission ta district level
33 67 60 100 100 80 80 73
Converged with other department of the government
67 83 80 100 100 80 80 84
Carry out any health facility survey/supervision of HH surveys
33 33 40 80 60 20 100 51
Financial Meachanism PPP initiative undertaken in the district for the implementation of JSY scheme
100 100 60 40 40 20 100 67
Vertical health societies merged under DHS 100 100 100 80 80 20 100 84Common bank accout for all programmes in district
50 33 100 80 80 20 80 62
District has prepared DAP for current financial year
100 100 100 80 100 60 100 92
Funds transfer electronically by state to districts
100 83 100 80 100 80 100 92
Physical Infrastructure in DH Environmental clearance obtained from Pollution Control Board
67 100 80 80 60 40 80 73
Hospital building is disabled friendly 50 67 40 100 80 80 100 73Availability & services in DH
Waition space adjacent to consultation & treatment room
83 100 100 60 40 80 80 78

E
valuation Study of National R
ural Health M
ission (NR
HM
) in 7 States 13
Indicators Uttar Pradesh
Madhya Pradesh
Jharkhand Orissa Assam Jammu & Kashmir
Tamilnadu India
Registration counter 100 100 60 80 100 100 100 92Blood bank/Blood srorage unit 100 100 80 100 80 100 100 95Doctor’s duty room 100 100 80 100 100 80 100 95Pharmacy 100 100 80 100 100 80 100 95ICU 50 67 60 20 20 20 80 4624 hours water supply 100 100 100 100 100 100 100 100Proper drainage & sanitation system 100 67 80 40 100 80 80 78Parking facilities 100 83 40 60 60 60 100 73Medical record section 100 100 80 80 60 40 80 78Telephone facility 100 100 100 100 100 100 100 100Fax facility 83 83 100 80 20 80 60 68Computers 100 100 100 60 100 100 100 95Internet facility 83 83 100 20 60 40 80 68Total visited (Numbers) 6 6 5 5 5 5 5 37

14
Evaluation Study of N
ational Rural H
ealth Mission (N
RH
M) in 7 States
Existing facilities at District level of Uttar Pradesh Districts Mathura Saharanpur Mahoba Sultanpur Mau Unnao
Total Existing Facilities Total number of SCs 215 342 150 388 225 356Total number of PHCs 14 43 16 10 5 11Total number of CHCs 7 10 3 12 4 5Total number of DH 2 2 2 1 1 1Total number of RKS formed 13 18 8 22 10 17DH registered with RKS 2 2 2 1 1 1CHCs registered with RKS 7 10 3 12 4 5PHCs registered with RKS 4 6 3 9 5 11Total number of ASHAs in district 1544 2005 645 3635 1746 2623Total no. of appointed ASHAs ( block wise) 1544 2005 645 3635 1746 2623
IPHS facility Survey FRUs where IPHS facility survey completed as on 31.12.2008 0 0 2 3 0 0FRUs where IPHS Up gradation completed as on 31.12.2008 0 0 2 0 0 024x7 PHCs where IPHS facility survey completed as on 31.12.2008 0 0 2 10 0 024x7 PHCs where IPHS Up gradation completed as on 31.12.2008 0 0 2 0 0 0CHCs where IPHS facility survey completed as on 31.12.2008 0 0 3 12 4 0CHCs where IPHS Up gradation completed as on31.12.2008 0 0 3 0 0 0
PPP initiative PPP initiative undertaken in the district for the implementation of JSY scheme
Yes Yes Yes Yes Yes Yes
Number of private health facilities accredited for JSY scheme 1 4 1 3 1 2Human resources in District
Medical officer 58 12 0 179 77 0Gynecologist 2 9 0 12 2 3Anaesthesist 1 7 0 4 3 3Pediatrician 0 7 0 4 5 4Other specialists 8 32 0 6 13 0Staff nurse 6 35 18 52 45 34ANM 225 354 125 456 260 381
Financial Mechanism Vertical health societies merged under DHS Yes Yes Yes Yes Yes Yes

E
valuation Study of National R
ural Health M
ission (NR
HM
) in 7 States 15
Districts Mathura Saharanpur Mahoba Sultanpur Mau Unnao Common bank account for all programmes in district Yes Yes No No No YesDistrict has prepared DAP for current year Yes Yes Yes Yes Yes YesFunds transfer electronically by state to district Yes Yes Yes Yes Yes YesNo. of SC with operational joint bank account of ANM & Sarpanch 215 337 150 388 22 356
Roles & responsibilities of DHS Discussion on PHC health committee reports Yes Yes Yes Yes Yes YesMonthly monitoring of infrastructure provided under NRHM Yes Yes Yes Yes Yes YesContribution in development of DHP Yes Yes Yes Yes Yes YesInitiative in identification of various problems faced by patient at various level
Yes Yes Yes Yes Yes No
NGOs involvement in the mission at district level Yes Yes No No No NoConverged with other department of the government Yes Yes Yes No Yes NoCarry out any health facility survey/supervision of HH surveys No Yes No No Yes No
Physical Infrastructure in DH Indoor beds 80 296 75 149 70 110Environmental clearance obtained from Pollution Control Board No Yes No Yes Yes YesHospital building is disabled friendly No No No Yes Yes Yes
Availability & services in DH Waiting space adjacent to consultation & treatment room Yes Yes Yes Yes Yes SomewhatRegistration Counter Yes Yes Yes Yes Yes YesBlood bank/blood storage unit Yes Yes Yes Yes Yes YesDoctor's duty room Yes Yes Yes Yes Yes YesPharmacy Yes Yes Yes Yes Yes YesICU Yes Yes Yes No No No24 Hours water supply Yes Yes Yes Yes Yes YesProper drainage & sanitation system Yes Yes Yes Yes Yes YesParking facilities Yes Yes Yes Yes Yes YesMedical record Section Yes Yes Yes Yes Yes YesTelephone facility Yes Yes Yes Yes Yes YesFax facility Yes Yes Yes Yes Yes NoComputers Yes Yes Yes Yes Yes YesInternet facility Yes Yes Yes Yes Yes No

16
Evaluation Study of N
ational Rural H
ealth Mission (N
RH
M) in 7 States
Existing facilities at District level in Madhya Pradesh Districts Katni Nimach Vidisha Shivpuri Hoshangabad Dhar
Total Existing Facilities Total number of SCs 156 104 146 193 152 399Total number of PHCs 18 18 18 11 15 47Total number of CHCs 7 3 6 8 7 14Total number of DH 1 1 1 1 1 1Total number of RKS formed 8 24 36 20 24 46DH registered with RKS 1 1 1 1 1 1CHCs registered with RKS 0 3 6 8 1 12PHCs registered with RKS 18 18 18 11 1 34Total number of ASHAs in district 839 525 1196 1402 750 1278Total number of appointed ASHAs ( block wise) 839 525 1086 1202 750 1336
IPHS facility Survey FRUs where IPHS facility survey completed as on 31.12.2008 0 0 0 0 0 0FRUs where IPHS Up gradation completed as on 31.12.2008 0 0 0 0 0 024x7 PHCs where IPHS facility survey completed as on 31.12.2008 0 0 0 0 0 824x7 PHCs where IPHS Up gradation completed as on 31.12.2008 0 0 0 0 0 4CHCs where IPHS facility survey completed as on 31.12.2008 2 1 0 0 0 0CHCs where IPHS Up gradation completed as on31.12.2008 0 1 0 0 0 0
PPP initiative PPP initiative undertaken in the district for the implementation of JSY scheme 1 1 1 1 1 1Number of private health facilities accredited for JSY scheme 8 10 1 3 17 4
Human resources in District Medical officer 80 25 14 134 30 130Gynecologist 3 7 1 7 1 6Anesthetist 6 4 1 5 1 3Pediatrician 7 4 1 5 1 0Other specialists 36 28 0 0 0 20Staff nurse 83 116 36 33 32 55ANM 326 104 9 216 225 485
Financial Mechanism Vertical health societies merged under DHS 1 1 1 1 1 1Common bank account for all programmes in district 0 1 0 0 1 0

E
valuation Study of National R
ural Health M
ission (NR
HM
) in 7 States 17
District has prepared DAP for current year 1 1 1 1 1 1Funds transfer electronically by state to district 1 1 0 1 1 1No. of SC with operational joint bank account of ANM & Sarpanch 156 104 0 193 0 313
Roles & responsibilities of DHS Discussion on PHC health committee reports 1 1 1 1 1 1Monthly monitoring of infrastructure provided under NRHM 1 1 1 1 1 0Contribution in development of DHP 1 1 1 1 1 1Initiative in identification of various problems faced by patient at various level 1 1 1 1 1 1NGOs involvement in the mission at district level 0 1 0 1 1 1Converged with other department of the government 0 1 1 1 1 1Carruy out any health facility survey/supervision of HH surveys 0 0 1 0 0 1
Physical Infrastructure in DH Indoor beds 100 100 300 260 140 223Environmental clearence obtained from Pollution Control Board 1 1 1 1 1 1Hospital building is disabled friendly 1 0 1 0 1 1
Availability & services in DH Waiting space adjacent to consultation & treatment room 1 1 1 1 1 1Registration Counter 1 1 1 1 1 1Blood bank/blood storage unit 1 1 1 1 1 1Doctor's duty room 1 1 1 1 1 1Pharmacy 1 1 1 1 1 1ICU 1 0 1 1 0 124 Hours water supply 1 1 1 1 1 1Proper drainage & sanitation system 1 0 1 1 1 0Parking facilities 1 0 1 1 1 1Medical record Section 1 1 1 1 1 1Telephone facility 1 1 1 1 1 1Fax facility 1 0 1 1 1 1Computers 1 1 1 1 1 1Internet facility 1 0 1 1 1 1

18
Evaluation Study of N
ational Rural H
ealth Mission (N
RH
M) in 7 States
Existing health facilities at District level in Jharkhand Districts Ranchi Dhanbad Giridih W. Singhbhum Chatra
Total Existing Facilities Total number of SCs 228 141 180 342 93Total number of PHCs 14 28 27 15 8Total number of CHCs 0 8 12 15 6Total number of DH 1 1 1 1 1Total number of RKS formed 17 9 13 31 7DH registered with RKS 1 1 1 0 0CHCs registered with RKS 0 8 0 0 0PHCs registered with RKS 14 0 0 0 0Total number of ASHAs in district 685 2160 2548 1928 1609Total number of appointed ASHAs ( block wise) 535 2160 2548 1928 1609
IPHS facility Survey FRUs where IPHS facility survey completed as on 31.12.2008 0 0 0 0 0FRUs where IPHS Up gradation completed as on 31.12.2008 0 0 0 0 024x7 PHCs where IPHS facility survey completed as on 31.12.2008 0 0 0 0 024x7 PHCs where IPHS Up gradation completed as on 31.12.2008 0 0 0 0 0CHCs where IPHS facility survey completed as on 31.12.2008 0 0 0 0 0CHCs where IPHS Up gradation completed as on31.12.2008 0 0 0 0 0PPP initiative PPP initiative undertaken in the district for the implementation of JSY scheme Yes Yes No Yes NoNumber of private health facilities accredited for JSY scheme 16 54 0 4 0
Human resources in District Medical officer 140 98 53 117 0Gynecologist 3 0 2 1 0Anaesthesist 1 0 1 1 0Pediatrician 3 0 1 1 0Other specialists 11 0 3 2 0Staff nurse 51 0 29 31 13ANM 451 220 219 398 123
Financial mechanism Vertical health societies merged under DHS Yes Yes Yes Yes YesCommon bank account for all programmes in district Yes Yes Yes Yes Yes

E
valuation Study of National R
ural Health M
ission (NR
HM
) in 7 States 19
Districts Ranchi Dhanbad Giridih W. Singhbhum Chatra District has prepared DAP for current year Yes Yes Yes Yes YesFunds transfer electronically by state to district Yes Yes Yes Yes YesNo. of SC with operational joint bank account of ANM & Sarpanch 0 141 380 342 0
Roles & responsibilities of DHS Discussion on PHC health committee reports Yes Yes Yes Yes Yesmonthly monitoring of infrastructure provided under NRHM Yes Yes Yes Yes YesContribution in development of DHP Yes Yes Yes Yes YesInitiative in identification of various problems faced by patient at various level Yes Yes Yes Yes NoNGOs involvement in the mission at district level Yes No Yes No YesConverged with other department of the government Yes Yes Yes No YesCarry out any health facility survey/supervision of HH surveys Yes No No Yes No
Physical Infrastructure in DH Indoor beds 100 300 196 100 26Environmental clearance obtained from Pollution Control Board Yes Yes Yes Yes NoHospital building is disabled friendly No Yes Yes No No
Availability & services in DH Waiting space adjacent to consultation & treatment room Yes Yes Yes Yes YesRegistration Counter Yes Yes Yes No NoBlood bank/blood storage unit Yes Yes Yes Yes NoDoctor's duty room Yes Yes Yes Yes NoPharmacy Yes Yes Yes Yes NoICU Yes Yes Yes No No24 Hours water supply Yes Yes Yes Yes YesProper drainage & sanitation system Yes Yes Yes Yes NoParking facilities No Yes Yes No NoMedical record Section Yes Yes Yes Yes NoTelephone facility Yes Yes Yes Yes YesFax facility Yes Yes Yes Yes YesComputers Yes Yes Yes Yes YesInternet facility Yes Yes Yes Yes Yes

20
Evaluation Study of N
ational Rural H
ealth Mission (N
RH
M) in 7 States
Existing health facilities at District level in Orissa Districts Rayagada Balangir Kendujhar Kendrapara Puri
Total Existing Facilities Total number of SCs 235 226 351 227 241Total number of PHCs 40 35 67 44 46Total number of CHCs 5 8 10 9 11Total number of DH 1 1 1 1 Total number of RKS formed 33 18 80 24 60DH registered with RKS 1 1 1 1 1CHCs registered with RKS 4 8 10 9 11PHCs registered with RKS 28 9 69 14 46Total number of ASHAs in district 1052 1346 1895 1411 1555Total number of appointed ASHAs ( block wise) 1052 1346 1895 1411 1555
IPHS facility Survey FRUs where IPHS facility survey completed as on 31.12.2008 0 2 0 0 0FRUs where IPHS Up gradation completed as on 31.12.2008 0 0 0 0 024x7 PHCs where IPHS facility survey completed as on 31.12.2008 0 0 0 0 1024x7 PHCs where IPHS Up gradation completed as on 31.12.2008 0 0 0 0 10CHCs where IPHS facility survey completed as on 31.12.2008 0 8 10 9 11CHCs where IPHS Up gradation completed as on31.12.2008 0 0 2 0 11
PPP initiative PPP initiative undertaken in the district for the implementation of JSY scheme No Yes Yes No NoNumber of private health facilities accredited for JSY scheme 0 2 2 0 0
Human resources in District Medical officer 102 43 136 25 NAGynecologist 8 9 11 10 NAAnaesthesist 1 2 0 0 NAPediatrician 7 7 6 8 NAOther specialists 27 5 21 24 NAStaff nurse 26 59 73 34 NAANM 266 264 326 264 NA
Financial mechanism Vertical health societies merged under DHS Yes Yes Yes No YesCommon bank account for all programmes in district No Yes Yes No Yes

E
valuation Study of National R
ural Health M
ission (NR
HM
) in 7 States 21
Districts Rayagada Balangir Kendujhar Kendrapara Puri District has prepared DAP for current year Yes Yes Yes No YesFunds transfer electronically by state to district Yes Yes Yes No YesNo. of SC with operational joint bank account of ANM & Sarpanch 235 226 351 205 241
Roles & responsibilities of DHS Discussion on PHC health committee reports Yes Yes Yes Yes Yesmonthly monitoring of infrastructure provided under NRHM Yes No Yes No YesContribution in development of DHP Yes Yes Yes Yes YesInitiative in identification of various problems faced by patient at various level Yes Yes Yes Yes YesNGOs involvement in the mission at district level Yes Yes Yes Yes YesConverged with other department of the government Yes Yes Yes Yes YesCarry out any health facility survey/supervision of HH surveys Yes No Yes Yes Yes
Physical Infrastructure in DH Indoor beds 99 185 209 165 271Environmental clearance obtained from Pollution Control Board Yes Yes No Yes YesHospital building is disabled friendly Yes Yes Yes Yes Yes
Availability & services in DH Waiting space adjacent to consultation & treatment room Yes No No Yes YesRegistration Counter Yes Yes Yes No YesBlood bank/blood storage unit Yes Yes Yes Yes YesDoctor's duty room Yes Yes Yes Yes YesPharmacy Yes Yes Yes Yes YesICU No Yes No No No24 Hours water supply Yes Yes Yes Yes YesProper drainage & sanitation system Yes No No Yes NoParking facilities Yes Yes No No YesMedical record Section Yes Yes No Yes YesTelephone facility Yes Yes Yes Yes YesFax facility Yes No No No YesComputers Yes No Yes No YesInternet facility Yes No No No No

22
Evaluation Study of N
ational Rural H
ealth Mission (N
RH
M) in 7 States
Existing health facilities at District level in Assam Districts Barpeta Sonitpur Darrang Dibrugarh Chachar
Total Existing Facilities Total number of SCs 264 279 163 231 268Total number of PHCs 20 22 14 10 14Total number of CHCs 6 4 3 5 1Total number of DH 1 1 1 1 1Total number of RKS formed 45 6 5 29 9DH registered with RKS 1 1 1 1 1CHCs registered with RKS 0 0 3 5 1PHCs registered with RKS 0 0 1 6 7Total number of ASHAs in district 1523 1762 944 1134 642Total number of appointed ASHAs ( block wise) 1523 1762 778 1134 642
IPHS facility Survey FRUs where IPHS facility survey completed as on 31.12.2008 NA NA 1 1 NAFRUs where IPHS Up gradation completed as on 31.12.2008 1 1 NA NA NA24x7 PHCs where IPHS facility survey completed as on 31.12.2008 NA NA NA NA NA24x7 PHCs where IPHS Up gradation completed as on 31.12.2008 NA NA NA NA NACHCs where IPHS facility survey completed as on 31.12.2008 NA NA NA NA 3CHCs where IPHS Up gradation completed as on31.12.2008 5 NA NA NA 2
PPP initiative PPP initiative undertaken in the district for the implementation of JSY scheme No No No Yes YesNumber of private health facilities accredited for JSY scheme 0 0 0 1 23
Human resources in District Medical officer 144 64 80 127 89Gynecologist 8 9 6 5 4Anaesthesist 2 5 4 1 2Pediatrician 4 5 2 33 1Other specialists 19 48 68 1 8Staff nurse 142 NA 94 181 124ANM 322 NA 377 371 553
Financial mechanism Vertical health societies merged under DHS Yes No Yes Yes YesCommon bank account for all programmes in district Yes No Yes Yes Yes

E
valuation Study of National R
ural Health M
ission (NR
HM
) in 7 States 23
Districts Barpeta Sonitpur Darrang Dibrugarh Chachar District has prepared DAP for current year Yes Yes Yes Yes YesFunds transfer electronically by state to district Yes Yes Yes Yes YesNo. of SC with operational joint bank account of ANM & Sarpanch 264 215 152 1365 268
Roles & responsibilities of DHS Discussion on PHC health committee reports No Yes Yes Yes Yesmonthly monitoring of infrastructure provided under NRHM No Yes Yes Yes YesContribution in development of DHP No No Yes Yes YesInitiative in identification of various problems faced by patient at various level No Yes Yes Yes YesNGOs involvement in the mission at district level Yes Yes Yes Yes YesConverged with other department of the government Yes Yes Yes Yes YesCarry out any health facility survey/supervision of HH surveys No Yes No Yes Yes
Physical Infrastructure in DH Indoor beds 100 215 152 135 56Environmental clearance obtained from Pollution Control Board No No Yes Yes YesHospital building is disabled friendly Yes Yes Yes Yes No
Availability & services in DH Waiting space adjacent to consultation & treatment room Yes No No Yes NoRegistration Counter Yes Yes Yes Yes YesBlood bank/blood storage unit Yes Yes Yes Yes NoDoctor's duty room Yes Yes Yes Yes YesPharmacy Yes Yes Yes Yes YesICU No No No Yes No24 Hours water supply Yes Yes Yes Yes YesProper drainage & sanitation system Yes Yes Yes Yes YesParking facilities Yes No No Yes YesMedical record Section Yes No No Yes YesTelephone facility Yes Yes Yes Yes YesFax facility No No No Yes NoComputers Yes Yes Yes Yes YesInternet facility No Yes No Yes Yes

24
Evaluation Study of N
ational Rural H
ealth Mission (N
RH
M) in 7 States
Existing health facilities at District level in Jammu & Kashmir Existing facilities in sampled districts of Jammu & Kashmir
Districts Jammu Udhampur Doda Baramula BudgamTotal Existing Facilities
Total number of SCs 197 75 134 131Total number of PHCs 27 13 28 35Total number of CHCs 6 3 6 9Total number of DH 2 1 1 1Total number of RKS formed 33 17 37 45DH registered with RKS 2 2 1 1CHCs registered with RKS 6 3 6 9PHCs registered with RKS 27 13 28 35Total number of ASHAs in district 887 377 980 824Total number of appointed ASHAs ( block wise) 887 377 980 824
IPHS facility Survey FRUs where IPHS facility survey completed as on 31.12.2008 5 0 0 0FRUs where IPHS Up gradation completed as on 31.12.2008 5 0 0 024x7 PHCs where IPHS facility survey completed as on 31.12.2008 11 0 8 024x7 PHCs where IPHS Up gradation completed as on 31.12.2008 11 0 1 0CHCs where IPHS facility survey completed as on 31.12.2008 6 0 5 1CHCs where IPHS Up gradation completed as on31.12.2008 5 0 5 5
PPP initiative PPP initiative undertaken in the district for the implementation of JSY scheme Yes No No No NoNumber of private health facilities accredited for JSY scheme 1 0 0 0 0
Human resources in District Medical officer 149 65 187 75Gynecologist 4 0 8 0Anaesthesist 4 3 7 3Pediatrician 4 2 2 0Other specialists 0 8 23 4Staff nurse 76 27 77 38ANM 329 125 143 NA
Financial mechanism Vertical health societies merged under DHS No No No Yes No

E
valuation Study of National R
ural Health M
ission (NR
HM
) in 7 States 25
Existing facilities in sampled districts of Jammu & Kashmir Districts Jammu Udhampur Doda Baramula BudgamCommon bank account for all programmes in district No No No Yes NoDistrict has prepared DAP for current year No Yes Yes Yes NoFunds transfer electronically by state to district Yes No Yes Yes YesNo. of SC with operational joint bank account of ANM & Sarpanch 197 75 134 131
Roles & responsibilities of DHS Discussion on PHC health committee reports Yes No Yes Yes Yesmonthly monitoring of infrastructure provided under NRHM Yes No No Yes NoContribution in development of DHP Yes No No Yes YesInitiative in identification of various problems faced by patient at various level Yes No Yes Yes YesNGOs involvement in the mission at district level Yes Yes Yes YesConverged with other department of the government Yes No Yes Yes YesCarry out any health facility survey/supervision of HH surveys No No No Yes No
Physical Infrastructure in DH Indoor beds 140 124 100 110 64Environmental clearance obtained from Pollution Control Board Yes No Yes No NoHospital building is disabled friendly Yes Yes No Yes Yes
Availability & services in DH Waiting space adjacent to consultation & treatment room Yes Yes Yes Yes NoRegistration Counter Yes Yes Yes Yes YesBlood bank/blood storage unit Yes Yes Yes Yes YesDoctor's duty room Yes Yes Yes Yes NoPharmacy Yes Yes Yes Yes YesICU No Yes No No No24 Hours water supply Yes Yes Yes Yes YesProper drainage & sanitation system Yes Yes No Yes YesParking facilities No No Yes Yes YesMedical record Section Yes Yes No No NoTelephone facility Yes Yes Yes Yes YesFax facility No Yes Yes Yes YesComputers Yes Yes Yes Yes YesInternet facility No Yes Yes No No

26
Evaluation Study of N
ational Rural H
ealth Mission (N
RH
M) in 7 States
Existing health facilities at District level in Tamilnadu Existing facilities in sampled districts of Tamilnadu
Districts Kanchipuram Salem Madurai Tuticorin NagapattanamTotal Existing Facilities
Total number of SCs 364 398 214 249 258Total number of PHCs 50 54 48 42 32Total number of CHCs 13 20 NA 6 11Total number of DH 1 1 1 1 1Total number of RKS formed 13 79 14 58 55DH registered with RKS 1 1 1 1 1CHCs registered with RKS 13 20 1 6 11PHCs registered with RKS 37 50 42 41 32
IPHS facility Survey FRUs where IPHS facility survey completed as on 31.12.2008 NA NA NA NA NAFRUs where IPHS Up gradation completed as on 31.12.2008 NA NA NA NA NA24x7 PHCs where IPHS facility survey completed as on 31.12.2008 NA NA 4 NA NA24x7 PHCs where IPHS Up gradation completed as on 31.12.2008 NA 1 NA NA NACHCs where IPHS facility survey completed as on 31.12.2008 NA NA NA NA NACHCs where IPHS Up gradation completed as on31.12.2008 NA 1 NA NA NA
PPP initiative PPP initiative undertaken in the district for the implementation of JSY scheme
Yes Yes Yes Yes Yes
Number of private health facilities accredited for JSY scheme NA NA 1 NA NAHuman resources in District Medical officer 133 183 122 98 79Gynecologist 14 8 5 12 2Anaesthesist 4 8 3 11 0Pediatrician 5 7 1 9 4Other specialists 17 30 0 22 5Staff nurse 152 243 147 164 140ANM 70 85 78 54 60Financial mechanism Vertical health societies merged under DHS Yes Yes Yes Yes YesCommon bank account for all programmes in district Yes No Yes Yes Yes

E
valuation Study of National R
ural Health M
ission (NR
HM
) in 7 States 27
Existing facilities in sampled districts of Tamilnadu Districts Kanchipuram Salem Madurai Tuticorin NagapattanamDistrict has prepared DAP for current year Yes Yes Yes Yes YesFunds transfer electronically by state to district Yes Yes Yes Yes YesNo. of SC with operational joint bank account of ANM & Sarpanch 364 385 314 249 258Roles & responsibilities of DHS Discussion on PHC health committee reports Yes Yes Yes Yes Yesmonthly monitoring of infrastructure provided under NRHM Yes Yes Yes Yes NoContribution in development of DHP Yes Yes Yes Yes YesInitiative in identification of various problems faced by patient at various level
Yes Yes No Yes No
NGOs involvement in the mission at district level Yes No Yes Yes YesConverged with other department of the government Yes Yes No Yes YesCarry out any health facility survey/supervision of HH surveys Yes Yes Yes Yes YesPhysical Infrastructure in DH Indoor beds 409 196 221 153 445Environmental clearance obtained from Pollution Control Board Yes No Yes Yes YesHospital building is disabled friendly Yes Yes Yes Yes YesAvailability & services in DH Waiting space adjacent to consultation & treatment room Yes Yes Yes No YesRegistration Counter Yes Yes Yes Yes YesBlood bank/blood storage unit Yes Yes Yes Yes YesDoctor's duty room Yes Yes Yes Yes YesPharmacy Yes Yes Yes Yes YesICU Yes Yes Yes No Yes24 Hours water supply Yes Yes Yes Yes YesProper drainage & sanitation system Yes Yes Yes No YesParking facilities Yes Yes Yes Yes YesMedical record Section Yes Yes Yes No YesTelephone facility Yes Yes Yes Yes YesFax facility No Yes Yes No YesComputers Yes Yes Yes Yes YesInternet facility Yes Yes Yes No Yes

28
Evaluation Study of N
ational Rural H
ealth Mission (N
RH
M) in 7 States
Com
munity H
ealth Centre

E
valuation Study of National R
ural Health M
ission (NR
HM
) in 7 States 29
Availability of Infrastructure and Services at CHCs Level in Uttar Pradesh CHC facilities Infrastructure and Services availability at CHC level in Uttar Pradesh Combined District Mathura Saharanpur Mahoba Sultanpur Mau Unnao Number % No of CHCs covered in each selected district 2 2 2 2 2 2 12 100
24 hrs delivery services including normal and assisted deliveries
2 2 2 2 2 2 12 100
Emergency obstetric care, caesarian and other surgical medical intervention
0 2 0 0 1 1 4 33
No. of CHCs with Emergency services
Emergencies care of sick children 1 1 2 2 1 2 9 75Full range of family planning services including laparoscopic services
2 1 2 2 1 1 9 75
Safe abortion services 0 1 0 1 1 2 5 42Treatment of STI/RTI 2 1 2 1 0 0 6 50
No. of CHCs with FP services
Referral transport services 1 2 2 2 1 2 10 83Separate wards for male/female 1 2 2 2 2 1 10 83No. of CHCs having Pediatric Beds 1 1 1 1 1 1 6 50Counseling for HIV/AIDS/STD 1 2 1 1 0 2 7 58Voluntary Counseling 2 2 1 2 0 2 9 75Ante Natal Clinic 2 2 2 2 2 2 12 100Post Natal Clinic 1 2 2 1 2 0 8 67Immunization Sessions 1 2 1 1 1 1 7 58Is separate septic room available 1 1 2 2 1 2 9 75Out0.0patient department in Gynecology/ obstetric
1 1 2 2 1 2 9 75
No. of CHCs with services of
Rogi Kalyan Samitis 2 2 2 2 2 1 11 92Lab/Diagnostic Facilities
Availability of ECG currently at CHC 0 0 0 0 0 0 0 0X0.0Ray facilities currently at CHC 1 2 2 1 2 2 10 83Ultrasound facilities currently at CHC 0 0 0 0 0 0 0 0
No. of CHCs with Lab/Diagnostic facility
Availabilities of specific lab test facilities 2 2 2 2 2 2 12 100Physical Infrastructure
completed building construction 1 2 1 0 0 1 5 42Good condition of floors 2 2 2 2 2 2 12 100
CHCs with
Good cleanness in OPD premises 2 2 2 1 1 2 10 83

30
Evaluation Study of N
ational Rural H
ealth Mission (N
RH
M) in 7 States
CHC facilities Infrastructure and Services availability at CHC level in Uttar Pradesh Combined District Mathura Saharanpur Mahoba Sultanpur Mau Unnao Number %
Good cleanness in OT 2 2 2 0 1 2 9 75Good cleanness in wards 2 2 2 0 1 2 9 75Good cleanness in premises 2 2 2 0 1 2 9 75Separate toilets for male and female 2 2 2 2 2 2 12 100Pharmacy 2 2 1 2 1 2 10 83Functional labour room 1 2 2 2 2 2 11 92Functional laboratory 2 2 2 2 2 2 12 100X0.0Ray room with dark room facility 2 2 2 2 1 2 11 92Operation theater 2 2 2 2 2 2 12 100
Manpower in regular position General surgeon 1 1 1 0 1 2 6 50Physician 1 0 1 0 0 1 3 25Obstetrician/Gynecologist 0 1 0 0 0 1 2 17Pediatrics 1 0 1 0 0 1 3 25Anesthetist 0 0 0 0 0 1 1 8Public health programme manager 1 1 0 0 0 0 2 17Eye surgeon 0 0 0 0 0 0 0 0Doctor of AYUSH 0 0 0 0 0 0 0 0General duty doctor (Medical Officer) 2 2 2 2 2 1 11 92Public health nurse 0 0 0 0 0 0 0 0ANM 1 1 1 1 1 1 6 50Staff nurse 2 2 1 2 2 2 11 92Nurse/midwife 0 1 0 1 1 2 5 42Dresser 0 1 0 1 0 1 3 25Lab. technician 2 1 2 2 1 2 10 83Radiographer 0 0 2 1 1 2 6 50Ophthalmic assistant 2 2 1 1 2 2 10 83Ward boys/nursing orderly 2 1 2 2 1 1 9 75Sweepers 2 2 2 2 2 1 11 92
CHCs with
Chowkidar 1 0 2 1 0 1 5 42

E
valuation Study of National R
ural Health M
ission (NR
HM
) in 7 States 31
Availability of Infrastructure and Services at CHCs Level in Madhya Pradesh CHC facilities Infrastructure and Services availability at CHC level in Madhya Pradesh Combined
District Katni Nimach Vidisha Shivpuri Hoshangabad Dhar Number % No of CHCs covered in each selected
district 2 2 2 2 2 2 12 100
24 hrs delivery services including normal and assisted deliveries
2 2 2 2 2 2 12 100
Emergency obstetric care, caesarian and other surgical medical intervention
2 1 0 1 1 1 6 50No. of CHCs with Emergency services
Emergencies care of sick children 2 2 0 1 2 2 9 75Full range of family planning services including laparoscopic services
2 1 2 1 2 2 10 83.3
Safe abortion services 2 2 1 0 1 2 8 66.7Treatment of STI/RTI 2 1 2 2 2 2 11 91.7
No. of CHCs with FP services
Referral transport services 1 2 2 2 1 2 10 83.3Separate wards for male/female 2 2 2 2 1 1 10 83.3No. of CHCs having Pediatric Beds 2 0 1 0 0 0 3 25.0Counseling for HIV/AIDS/STD 2 1 1 0 2 2 8 66.7Voluntary Counseling 2 2 0 0 1 2 7 58.3Ante Natal Clinic 2 2 2 2 2 2 12 100Post Natal Clinic 2 2 2 2 2 2 12 100Immunization Sessions 2 1 2 1 2 1 9 75Is separate septic room available 0 1 2 1 2 1 7 58.3Out0.0patient department in Gynecology/ obstetric
1 1 2 0 0 1 5 41.7
No. of CHCs with services of
Rogi Kalyan Samitis 2 2 2 2 2 2 12 100Lab/Diagnostic Facilities
Availability of ECG currently at CHC 1 0 0 1 0 0 2 16.7X0.0Ray facilities currently at CHC 2 2 2 1 2 1 10 83.3Ultrasound facilities currently at CHC 0 0 0 0 0 0 0 0
No. of CHCs with Lab/Diagnostic facility
Availabilities of specific lab test facilities 1 2 0 2 1 0 6 50Physical Infrastructure
completed building construction 2 0 0 1 0 0 3 25CHCs with
Good condition of floors 2 2 1 1 2 0 8 66.7

32
Evaluation Study of N
ational Rural H
ealth Mission (N
RH
M) in 7 States
CHC facilities Infrastructure and Services availability at CHC level in Madhya Pradesh Combined District Katni Nimach Vidisha Shivpuri Hoshangabad Dhar Number %
Good cleanness in OPD premises 2 2 2 1 2 2 11 91.7Good cleanness in OT 2 2 1 2 2 2 11 91.7Good cleanness in wards 2 2 1 1 1 2 9 75Good cleanness in premises 2 2 0 0 0 2 6 50Separate toilets for male and female 2 1 1 1 2 2 9 75Pharmacy 2 1 2 2 2 1 10 83.3Functional labour room 2 1 2 2 2 0 9 75Functional laboratory 2 2 2 2 2 2 12 100X0.0Ray room with dark room facility 2 2 2 0 2 2 10 83.3Operation theater 0 2 2 2 0 1 7 58.3
Manpower in position General surgeon 0 0 2 0 0 0 2 16.7 Physician 0 1 0 0 0 0 1 8.3Obstetrician/Gynecologist 0 1 1 1 0 2 5 41.7 Pediatrics 1 1 0 0 0 0 2 16.7 Anesthetist 0 0 1 0 0 1 2 16.7 Public health programme manager 0 0 0 0 0 0 0 0.0 Eye surgeon 0 0 1 1 0 0 2 16.7 Doctor of AYUSH 1 0 0 0 0 0 1 8.3General duty doctor (Medical Officer) 2 0 0 1 2 2 7 58.3Staff nurse 1 0 0 0 0 0 1 8.3 Dresser 2 2 2 2 2 2 12 100.0 Lab. technician 2 2 2 2 2 2 12 100.0 Radiographer 0 2 2 1 1 2 8 66.7 Ophthalmic assistant 2 2 2 1 2 2 11 91.7Ward boys/nursing orderly 2 2 2 2 2 2 12 100.0Sweepers 2 1 2 2 1 2 10 83.3
CHCs with
Chowkidar 0 0 0 0 0 1 1 8.3

E
valuation Study of National R
ural Health M
ission (NR
HM
) in 7 States 33
Availability of Infrastructure and Services at CHCs Level in Jharkhand CHC facilities Infrastructure and Services availability at CHCs level in Jharkhand Combined
District Ranchi Dhanbad Giridih W. Singhbhum
Chatra Number %
No of CHCs covered in each selected district 2 2 2 2 2 10 10024 hrs delivery services including normal and assisted deliveries
2 0 1 1 2 6 60
Emergency obstetric care, caesarian and other surgical medical intervention
0 0 0 0 0 0 0No. of CHCs with Emergency services
Emergencies care of sick children 2 0 2 0 2 6 60Full range of family planning services including laparoscopic services
2 0 1 0 0 3 30
Safe abortion services 1 0 0 0 1 2 20Treatment of STI/RTI 2 0 1 1 0 4 40
No. of CHCs with FP services
Referral transport services 2 0 2 1 1 6 60Bed occupancy rate in last one Year (%) 400.060% 400.060% 400.060% 400.060% <40% Separate wards for male/female 2 0 1 0 2 5 50No. of CHCs having Pediatric Beds 2 0 0 0 1 3 30Counseling for HIV/AIDS/STD 2 1 2 1 2 8 80Voluntary Counseling 2 1 2 0 2 7 70Ante Natal Clinic 2 0 1 2 1 6 60Post Natal Clinic 2 1 1 2 1 7 70Immunization Sessions 2 1 2 2 2 9 90Is separate septic room available 1 0 1 0 0 2 20Out0.0patient department in Gynecology/obstetric
1 0 0 0 0 1 10
No. of CHCs with services of
Rogi Kalyan Samitis 2 0 0 1 2 5 50Lab/Diagnostic Facilities
Availability of ECG currently at CHC 1 1 0 0 0 2 20X0.0Ray facilities currently at CHC 1 1 0 0 0 2 20Ultrasound facilities currently at CHC 0 1 0 0 0 1 10
No. of CHCs with Lab/ Diagnostic facility
Availabilities of specific lab test facilities 2 1 2 1 1 7 70Physical Infrastructure
completed building construction 1 1 2 1 0 5 50

34
Evaluation Study of N
ational Rural H
ealth Mission (N
RH
M) in 7 States
CHC facilities Infrastructure and Services availability at CHCs level in Jharkhand Combined District Ranchi Dhanbad Giridih W.
Singhbhum Chatra Number %
Good condition of floors 2 1 1 2 2 8 80Good cleanness in OPD premises 2 0 1 2 1 6 60Good cleanness in OT 2 1 0 0 1 4 40Good cleanness in wards 1 1 0 1 0 3 30Good cleanness in premises 0 1 1 1 0 3 30Separate toilets for male and female 2 1 0 2 1 6 60Pharmacy 2 1 2 2 2 9 90Functional labour room 2 2 0 2 1 7 70Functional laboratory 2 2 1 0 1 6 60X0.0Ray room with dark room facility 0 1 1 0 0 2 20
CHCs with
Operation theater 1 1 1 0 2 5 50Manpower in position
General surgeon 0 2 0 0 0 2 20 Physician 1 1 1 1 1 5 50Obstetrician/Gynecologist 1 1 0 0 0 2 20 Pediatrics 0 0 0 0 0 0 0 Anesthetist 0 1 1 0 0 2 20 Public health programme manager 0 1 0 0 0 1 10 Eye surgeon 0 0 0 0 0 0 0 Doctor of AYUSH 0 0 0 1 0 1 10General duty doctor (Medical Officer) 2 2 1 1 1 7 70Staff nurse 2 1 2 1 2 8 80 Dresser 2 1 1 0 0 4 40 Lab. technician 2 1 2 0 2 7 70 Radiographer 1 1 1 0 0 3 30 Ophthalmic assistant 1 2 0 0 1 4 40Ward boys/nursing orderly 2 2 2 0 2 8 80Sweepers 2 2 2 2 1 9 90
CHCs with
Chowkidar 2 1 2 0 0 5 50

E
valuation Study of National R
ural Health M
ission (NR
HM
) in 7 States 35
Availability of Infrastructure and Services at CHCs Level in Orissa CHC facilities Infrastructure and Services availability at CHCs level in Orissa Combined
District Rayagada Balangir Kendujhar Kendrapara Puri Number % No of CHCs covered in each selected district 2 2 2 2 2 10 100
24 hrs delivery services including normal and assisted deliveries
2 2 1 2 2 9 90
Emergency obstetric care, caesarian and other surgical medical intervention
1 0 1 0 0 2 20No. of CHCs with Emergency services
Emergencies care of sick children 1 0 1 0 1 3 30Full range of family planning services including laparoscopic services
0 0 1 1 1 3 30
Safe abortion services 1 0 2 2 2 7 70Treatment of STI/RTI 2 1 1 1 2 7 70
No. of CHCs with FP services
Referral transport services 1 1 2 2 2 8 80Separate wards for male/female 2 2 2 1 2 9 90No. of CHCs having Pediatric Beds 1 1 1 1 2 6 60Counseling for HIV/AIDS/STD 2 1 1 0 1 5 50Voluntary Counseling 2 1 0 0 1 4 40Ante Natal Clinic 2 2 2 2 2 10 100Post Natal Clinic 2 2 2 2 2 10 100Immunization Sessions 2 2 2 2 2 10 100Is separate septic room available 1 0 1 0 1 3 30Out0.0patient department in Gynecology/obstetric
1 1 1 2 0 5 50
No. of CHCs with services of
Rogi Kalyan Samitis 2 2 2 2 2 10 100Lab/Diagnostic Facilities
Availability of ECG currently at CHC 0 0 0 0 0 0 0X0.0Ray facilities currently at CHC 0 0 1 0 0 1 10Ultrasound facilities currently at CHC 0 0 0 0 0 0 0
No. of CHCs with Lab/Diagnostic facility
Availabilities of specific lab test facilities 1 0 0 0 1 2 20Physical Infrastructure
completed building construction 1 0 0 1 1 3 30Good condition of floors 1 0 2 1 1 5 50
CHCs with
Good cleanness in OPD premises 2 1 2 1 1 7 70

36
Evaluation Study of N
ational Rural H
ealth Mission (N
RH
M) in 7 States
CHC facilities Infrastructure and Services availability at CHCs level in Orissa Combined District Rayagada Balangir Kendujhar Kendrapara Puri Number %
Good cleanness in OT 2 1 2 1 0 6 60Good cleanness in wards 2 0 2 0 0 4 40Good cleanness in premises 2 2 1 1 0 6 60Separate toilets for male and female 1 1 2 1 0 5 50Pharmacy 2 2 2 1 2 9 90Functional labour room 2 2 2 2 2 10 100Functional laboratory 2 2 2 2 2 10 100X0.0Ray room with dark room facility 0 0 1 0 0 1 10Operation theater 2 2 1 1 1 7 70
Manpower in Position General surgeon 2 1 1 2 2 8 80 Physician 1 1 0 2 0 4 40Obstetrician/Gynecologist 1 1 1 1 2 6 60 Pediatrics 1 0 1 1 2 5 50 Anesthetist 0 0 0 0 0 0 0 Public health programme manager 0 0 0 0 0 0 0 Eye surgeon 0 0 0 0 0 0 0 Doctor of AYUSH 1 2 2 1 2 8 80General duty doctor (Medical Officer) 0 1 1 0 2 4 40 Nursing staff 0 1 0 0 0 1 10 Public health nurse 1 1 0 1 0 3 30 Dresser 0 0 0 1 0 1 10 Lab. technician 1 2 2 1 2 8 80 Radiographer 0 1 1 0 0 2 20 Ophthalmic assistant 0 1 0 0 0 1 10Ward boys/nursing orderly 1 2 0 0 2 5 50Sweepers 0 0 2 2 2 6 60
CHCs with
Chowkidar 0 0 0 0 0 0 0

E
valuation Study of National R
ural Health M
ission (NR
HM
) in 7 States 37
Availability of Infrastructure and Services at CHCs Level in Assam CHC facilities Infrastructure and Services availability at CHCs level in Assam Combined
District Barpeta Sonitpur Darrang Dibrugarh Chachar Number % No of CHCs covered in each selected district 2 2 2 2 2 10 100
24 hrs delivery services including normal and assisted deliveries
2 2 2 2 2 10 100
Emergency obstetric care, caesarian and other surgical medical intervention
0 0 1 1 0 2 20No. of CHCs with Emergency services
Emergencies care of sick children 0 1 0 2 0 3 30Full range of family planning services including laparoscopic services
1 2 0 1 1 5 50
Safe abortion services 1 2 0 2 1 6 60Treatment of STI/RTI 0 2 2 2 1 7 70
No. of CHCs with FP services
Referral transport services 2 1 2 2 0 7 70Separate wards for male/female 2 2 2 1 2 9 90No. of CHCs having Pediatric Beds 1 1 1 0 1 4 40Counseling for HIV/AIDS/STD 0 0 0 1 1 2 20Voluntary Counseling 0 0 0 0 1 1 10Ante Natal Clinic 2 2 2 1 2 9 90Post Natal Clinic 2 2 2 2 2 10 100Immunization Sessions 2 2 2 1 2 9 90Is separate septic room available 0 1 0 0 1 2 20Out0.0patient department in Gynecology / obstetric
0 1 1 2 0 4 40
No. of CHCs with services of
Rogi Kalyan Samitis 2 2 2 2 2 10 100Lab/Diagnostic Facilities
Availability of ECG currently at CHC 0 0 0 0 0 0 0X0.0Ray facilities currently at CHC 0 1 0 0 1 2 20Ultrasound facilities currently at CHC 0 0 0 1 0 1 10
No. of CHCs with Lab/Diagnostic facility
Availabilities of specific lab test facilities 1 1 2 1 2 7 70Physical Infrastructure
completed building construction 1 1 2 2 2 8 80Good condition of floors 0 2 1 1 2 6 60
CHCs with
Good cleanness in OPD premises 1 2 2 2 1 8 80

38
Evaluation Study of N
ational Rural H
ealth Mission (N
RH
M) in 7 States
CHC facilities Infrastructure and Services availability at CHCs level in Assam Combined District Barpeta Sonitpur Darrang Dibrugarh Chachar Number %
Good cleanness in OT 1 1 2 2 0 6 60Good cleanness in wards 1 0 2 1 0 4 40Good cleanness in premises 1 2 1 2 0 6 60Separate toilets for male and female 1 2 2 2 1 8 80Pharmacy 1 2 2 2 2 9 90Functional labour room 2 0 2 2 1 7 70Functional laboratory 2 0 2 2 2 8 80X0.0Ray room with dark room facility 0 2 0 1 1 4 40Operation theater 0 1 1 2 1 5 50
Manpower in Position General surgeon 0 1 2 0 1 4 40Physician 2 1 1 1 0 5 50Obstetrician/Gynecologist 0 0 1 0 0 1 10Pediatrics 0 0 0 0 0 0 0Anesthetist 0 0 1 0 0 1 10Public health programme manager 1 1 0 0 1 3 30Eye surgeon 0 0 0 0 0 0 0Doctor of AYUSH 2 0 1 0 1 4 40General duty doctor (Medical Officer) 1 2 1 1 2 7 70Nursing staff 0 2 2 2 2 8 80Dresser 0 0 1 1 0 2 20Lab. technician 1 2 2 2 2 9 90Radiographer 0 1 0 2 0 3 30Ophthalmic assistant 2 1 2 1 1 7 70Ward boys/nursing orderly 0 1 0 1 2 4 40Sweepers 1 2 2 2 2 9 90
CHCs with
Chowkidar 2 1 2 1 1 7 70

E
valuation Study of National R
ural Health M
ission (NR
HM
) in 7 States 39
Availability of Infrastructure and Services at CHCs Level in Jammu & Kashmir CHC facilities Infrastructure and Services availability at CHCs level in Jammu & Kashmir Combined
District Jammu Udhampur Doda Baramula Budgam Number % No of CHCs covered in each selected district 2 2 2 2 2 10 100
24 hrs delivery services including normal and assisted deliveries
2 2 2 2 2 10 100
Emergency obstetric care, caesarian and other surgical medical intervention
2 0 0 0 0 2 20No. of CHCs with Emergency services
Emergencies care of sick children 1 2 1 2 0 6 60Full range of family planning services including laparoscopic services
2 0 0 0 0 2 20
Safe abortion services 2 2 2 1 0 7 70Treatment of STI/RTI 2 2 2 1 2 9 90
No. of CHCs with FP services
Referral transport services 2 2 2 2 2 10 100Separate wards for male/female 2 2 2 2 0 8 80No. of CHCs having Pediatric Beds 1 1 2 0 0 4 40Counseling for HIV/AIDS/STD 2 2 0 1 2 7 70Voluntary Counseling 2 2 0 1 2 7 70Ante Natal Clinic 2 2 2 2 2 10 100Post Natal Clinic 2 2 2 2 2 10 100Immunization Sessions 2 1 2 2 2 9 90Is separate septic room available 2 2 1 1 0 6 60
No. of CHCs with services of
Out0.0patient department in Gynecology/obstetric
2 2 1 2 2 9 90
Lab/Diagnostic Facilities Availability of ECG currently at CHC 2 2 2 2 2 10 100X0.0Ray facilities currently at CHC 2 2 2 2 2 10 100Ultrasound facilities currently at CHC 2 2 2 2 2 10 100
No. of CHCs with Lab/Diagnostic facility
Availabilities of specific lab test facilities 2 2 2 2 2 10 100Physical Infrastructure
Completed building construction 1 2 1 2 0 6 60Good condition of floors 2 2 2 2 0 8 80Good cleanness in OPD premises 2 2 2 1 2 9 90
CHCs with
Good cleanness in OT 2 2 1 2 2 9 90

40
Evaluation Study of N
ational Rural H
ealth Mission (N
RH
M) in 7 States
CHC facilities Infrastructure and Services availability at CHCs level in Jammu & Kashmir Combined District Jammu Udhampur Doda Baramula Budgam Number %
Good cleanness in wards 1 1 0 0 1 3 30Good cleanness in premises 2 2 1 0 1 6 60Separate toilets for male and female 2 2 1 1 0 6 60Pharmacy 2 2 2 2 2 10 100Functional labour room 2 2 2 2 2 10 100Functional laboratory 2 2 2 2 2 10 100X0.0Ray room with dark room facility 2 2 2 2 2 10 100Operation theater 2 1 1 2 1 7 70
Manpower in Position General surgeon 0 1 1 2 1 5 50 Physician 2 2 1 2 1 8 80Obstetrician/Gynecologist 1 2 0 2 1 6 60 Pediatrics 2 1 0 2 0 5 50 Anesthetist 0 0 0 0 0 0 0 Public health programme manager 2 2 0 1 1 6 60 Eye surgeon 0 0 0 0 0 0 0 Doctor of AYUSH 1 0 0 0 0 1 10General duty doctor (Medical Officer) 2 2 2 2 1 9 90 Nursing staff 2 2 2 1 1 8 80 Dresser 0 1 1 1 2 5 50 Lab. technician 2 2 2 2 2 10 100Radiographer 0 1 1 2 1 5 50Ophthalmic assistant 1 2 2 1 2 8 80Ward boys/nursing orderly 1 2 2 1 1 7 70Sweepers 2 2 2 1 2 9 90
CHCs with
Chowkidar 0 0 0 2 0 2 20

E
valuation Study of National R
ural Health M
ission (NR
HM
) in 7 States 41
Availability of Infrastructure and Services at CHCs Level in Tamilnadu CHC facilities Infrastructure and Services availability at CHCs level in Tamilnadu Combined
District Kanchipuram Salem Madurai Tuticorin Nagapattanam Number %
No of CHCs covered in each selected district
2 2 2 2 2 10 100
24 hrs delivery services including normal and assisted deliveries
2 2 2 2 2 10 100
Emergency obstetric care, caesarian and other surgical medical intervention
0 0 2 2 1 5 50No. of CHCs with Emergency services
Emergencies care of sick children 1 0 1 2 1 5 50Full range of family planning services including laparoscopic services
1 0 2 2 0 5 50
Safe abortion services 0 1 1 0 0 2 20Treatment of STI/RTI 2 1 2 1 2 8 80
No. of CHCs with FP services
Referral transport services 2 2 2 2 2 10 100Separate wards for male/female 2 2 2 2 2 10 100No. of CHCs having Pediatric Beds 0 0 0 0 0 0 0 Counseling for HIV/AIDS/STD 2 2 2 2 2 10 100Voluntary Counseling 1 2 2 1 2 8 80Ante Natal Clinic 2 2 2 2 2 10 100Post Natal Clinic 2 2 2 2 2 10 100Immunization Sessions 0 2 2 1 0 5 50Is separate septic room available 2 1 2 0 1 6 60Out0.0patient department in Gynecology/obstetric
2 1 1 1 2 7 70
No. of CHCs with services of
Rogi kalyan Samitis 2 2 1 2 1 8 80Lab/Diagnostic Facilities
Availability of ECG currently at CHC 2 2 2 2 2 10 100X0.0Ray facilities currently at CHC 1 0 1 0 1 3 30Ultrasound facilities currently at CHC 1 2 2 2 2 9 90
No. of CHCs with Lab/Diagnostic facility
Availabilities of specific lab test facilities 1 2 2 2 2 9 90Physical Infrastructure
Completed building construction 0 2 2 1 1 6 60CHCs with
Good condition of floors 0 2 2 1 2 7 70

42
Evaluation Study of N
ational Rural H
ealth Mission (N
RH
M) in 7 States
CHC facilities Infrastructure and Services availability at CHCs level in Tamilnadu Combined District Kanchipuram Salem Madurai Tuticorin Nagapattanam Number %
Good cleanness in OPD premises 2 2 2 2 2 10 100Good cleanness in OT 2 2 2 2 2 10 100Good cleanness in wards 2 2 2 2 2 10 100Good cleanness in premises 2 1 2 2 1 8 80Separate toilets for male and female 1 0 2 1 2 6 60Pharmacy 2 2 2 2 2 10 100Functional labour room 2 2 2 2 2 10 100Functional laboratory 2 2 2 2 2 10 100X0.0Ray room with dark room facility 1 0 2 0 1 4 40Operation theater 2 2 2 2 1 9 90
Manpower in Position General surgeon 0 0 0 0 0 0 0 Physician 0 0 0 1 0 1 10Obstetrician/Gynecologist 0 0 0 0 0 0 0 Pediatrics 0 0 0 0 0 0 0 Anesthetist 0 0 0 0 0 0 0 Public health programme manager 0 0 0 0 0 0 0 Eye surgeon 0 0 0 0 0 0 0 Doctor of AYUSH 2 2 2 1 0 7 70General duty doctor (Medical Officer) 1 2 2 1 2 8 80 Nursing staff 2 2 2 1 2 9 90 Dresser 0 1 0 1 0 2 20 Lab. technician 2 2 2 2 2 10 100Radiographer 1 0 1 1 1 4 40Ophthalmic assistant 2 1 2 2 2 9 90Ward boys/nursing orderly 1 1 1 0 1 4 40Sweepers 2 2 2 1 1 8 80
CHCs with
Chowkidar 1 0 1 1 1 4 40

E
valuation Study of National R
ural Health M
ission (NR
HM
) in 7 States 43
Primary H
ealth Centre

44
Evaluation Study of N
ational Rural H
ealth Mission (N
RH
M) in 7 States
Availability of Infrastructure and Services at PHCs Level in Uttar Pradesh
Infrastructure and services in sampled PHCs in district of Uttar Pradesh Combined Indicators District Mathura Saharanpur Mahoba Sultanpur Mau Unnao Number % No of PHCs covered in each selected district 4 4 4 4 4 4 24 100
Physical Infrastructure Government building 4 4 4 4 3 3 22 92Completed construction of buildings 2 4 3 3 2 3 17 71Prominent display board in local language 2 2 3 3 1 4 15 63Drinking water availability 1 4 4 1 2 2 14 58Toilet facility 2 4 4 4 3 4 21 88
No. of PHC with
Good cleanliness condition 2 3 4 0 3 4 16 67Availability of Facilities
Registration Counter 2 1 3 3 4 2 15 63Pharmacy 4 3 4 4 4 4 23 96OPD room/cubical 4 4 4 2 3 4 21 88Family Welfare clinic 3 1 4 1 2 4 15 63Casualty/Emergency room 1 1 0 1 1 2 6 25Operation Theatre 1 2 3 1 2 3 12 50Separate Labour Room 1 1 3 1 2 3 11 46Adequate equipment and chemical availability 2 3 3 2 3 3 16 67Availability of adequate medicines 2 4 4 3 4 4 21 88Water Storage facility 2 4 3 1 1 2 14 58Availability of electricity 0 3 3 2 2 3 13 54Communication facility 0 0 3 1 1 0 5 21
PHCs having
Transport facility 0 0 0 0 0 0 0 0 Manpower in Position
MO(Allopathic) 1 3 4 2 3 3 16 67MO(AYUSH) 2 1 3 1 1 3 11 46Pharmacist 0 3 4 3 3 4 17 71Nurse/Midwife 2 0 1 0 2 3 8 33Female Health Worker 2 3 2 4 1 3 15 62Lab Technician 1 0 2 3 1 4 11 46
No. of PHCs with manpower
Clerks 0 1 1 0 0 0 2 8

E
valuation Study of National R
ural Health M
ission (NR
HM
) in 7 States 45
Infrastructure and services in sampled PHCs in district of Uttar Pradesh Combined Indicators District Mathura Saharanpur Mahoba Sultanpur Mau Unnao Number %
Service Delivery OPD services 4 4 4 3 4 4 23 96Emergency services 2 3 4 4 4 2 19 79Referral services 2 2 3 4 4 4 19 79In patient services 2 2 3 3 2 3 15 63Antenatal services 1 3 3 3 2 4 16 67Post natal services 2 3 4 2 4 4 19 79New born care 3 1 4 3 4 4 19 79Child care & Immunization 2 4 3 2 3 4 18 75Family Planning 4 4 4 4 4 4 24 100Management of RTI/STI 3 2 3 0 0 2 10 42Nutrition services 2 1 2 2 4 2 13 54School Health Programme 3 4 3 3 2 4 19 79Disease surveillance and control of epidemics 4 1 3 4 3 3 18 75Collection and reporting of vital statistics 1 0 1 3 2 3 10 42AYUSH services 4 0 3 0 1 1 9 38Rehabilitation services 1 0 2 0 0 4 7 29Monitoring & supervision 2 1 3 3 3 4 16 67Monitoring activities of ASHAs 3 4 4 2 0 3 16 67MO visit all SCs once in month 3 3 3 3 4 4 20 83
No. of PHC providing
HA visit all SCs once in week 3 3 3 1 1 4 15 63

46
Evaluation Study of N
ational Rural H
ealth Mission (N
RH
M) in 7 States
Availability of Infrastructure and Services at PHCs Level in Madhya Pradesh Infrastructure and services in sampled PHCs in districts of Madhya Pradesh Combined Indicators District Katni Nimach Vidisha Shivpuri Hoshangabad Dhar Number %
No of PHCs covered in each selected district
4 4 4 4 4 4 24 100
Physical Infrastructure Government building 3 3 4 4 4 4 22 91.7Completed construction of buildings 2 3 3 2 4 4 18 75.0Prominent display board in local language 4 2 4 2 4 1 17 70.8Drinking water availability 2 3 2 4 4 1 16 66.7Toilet facility 4 3 4 3 4 4 22 91.7
No. of PHC with
Good cleanliness condition 4 4 4 4 4 3 23 95.8Availability of Facilities
Registration Counter 1 1 3 4 4 1 14 58.3Pharmacy 4 3 4 4 4 2 21 87.5OPD room/cubical 4 3 4 4 4 3 22 91.7Family Welfare clinic 3 2 4 2 4 1 16 66.7Casualty/Emergency room 1 3 2 2 1 1 10 41.7Operation Theatre 1 2 2 1 2 2 10 41.7Separate Labour Room 2 2 4 3 3 3 17 70.8Adequate equipment and chemical availability
2 3 4 3 1 3 16 66.7
Availability of adequate medicines 4 4 3 4 2 3 20 83.3Water Storage facility 1 3 2 2 4 1 13 54.2Availability of electricity 4 3 4 3 4 3 21 87.5Communication facility 1 2 3 2 3 0 11 45.8
PHCs having
Transport facility 0 0 1 2 1 0 4 16.7Manpower in Position
MO(Allopathic) 4 4 4 4 3 3 22 91.7MO(AYUSH) 1 1 2 1 2 1 8 33.3Pharmacist 1 1 1 2 2 1 8 33.3Nurse/Midwife 0 3 3 2 3 2 13 54.2Female Health Worker 1 2 2 4 4 2 15 62.5
No. of PHCs with manpower
Lab Technician 1 2 0 1 1 2 7 29.2

E
valuation Study of National R
ural Health M
ission (NR
HM
) in 7 States 47
Infrastructure and services in sampled PHCs in districts of Madhya Pradesh Combined Indicators District Katni Nimach Vidisha Shivpuri Hoshangabad Dhar Number %
Clerks 0 1 3 1 1 0 6 25.0Service Delivery
OPD services 4 4 4 4 4 4 24 100.0Emergency services 2 3 3 3 1 2 14 58.3Referral services 3 2 2 3 1 4 15 62.5In0.0patient services 3 3 3 3 4 1 17 70.8Antenatal services 4 2 4 4 4 2 20 83.3Post natal services 4 2 4 4 3 2 19 79.2New born care 4 2 3 3 2 3 17 70.8Child care & Immunization 4 3 4 4 4 4 23 95.8Family Planning 4 3 3 3 3 3 19 79.2Management of RTI/STI 3 2 2 1 3 4 15 62.5Nutrition services 2 0 2 2 2 2 10 41.7School Health Programme 4 4 4 4 4 4 24 100.0Disease surveillance and control of epidemics
3 3 2 4 4 4 20 83.3
Collection and reporting of vital statistics 1 3 2 4 4 1 15 62.5AYUSH services 1 1 1 1 1 1 6 25.0Rehabilitation services 2 0 2 0 1 0 5 20.8Monitoring & supervision 4 4 4 4 4 4 24 100.0Monitoring activities of ASHAs 4 4 4 3 3 4 22 91.7MO visit all SCs once in month 4 4 3 3 4 3 21 87.5
No. of PHC providing
HA visit all SCs once in week 3 3 3 4 4 2 19 79.2

48
Evaluation Study of N
ational Rural H
ealth Mission (N
RH
M) in 7 States
Availability of Infrastructure and Services at PHCs Level in Jharkhand
Infrastructure and services in sampled PHCs in districts of Jharkhand Combined Indicators Districts Ranchi Dhanbad Giridih W. Singhbhum Chatra Number % No of PHCs covered in each selected district 4 4 4 4 4 20 100
Physical Infrastructure Government building 4 3 3 4 4 18 90Completed construction of buildings 3 2 2 2 2 11 55Prominent display board in local language 4 4 1 2 3 14 70Drinking water availability 4 2 3 3 1 13 65Toilet facility 4 2 2 3 1 12 60
No. of PHC with
Good cleanliness condition 4 4 4 3 4 19 95Availability of Facilities
Registration Counter 4 2 2 1 4 13 65Pharmacy 4 3 3 4 3 17 85OPD room/cubicles 4 3 4 4 4 19 95Family Welfare clinic 4 0 1 3 2 10 50Casualty/Emergency room 3 1 0 3 1 8 40Operation Theater 4 0 1 1 0 6 30Separate Labour Room 4 0 1 3 2 10 50Adequate equipment and chemical availability 4 3 0 4 1 12 60Availability of adequate medicines 4 4 2 4 2 16 80Water Storage facility 4 2 0 1 0 7 35Availability of electricity 4 3 0 3 0 10 50Communication facility 4 1 0 3 2 10 50
PHCs having
Transport facility 3 0 0 2 0 5 25Manpower in Position
MO(Allopathic) 4 4 0 4 2 14 70MO(AYUSH) 0 0 0 0 0 0 0Pharmacist 2 1 0 3 0 6 30Nurse/Midwife 4 4 1 4 3 16 80Female Health Worker 0 0 4 2 0 6 30Lab Technician 3 1 0 2 0 6 30
No. of PHCs with manpower
Clerks 4 2 2 3 1 12 60

E
valuation Study of National R
ural Health M
ission (NR
HM
) in 7 States 49
Infrastructure and services in sampled PHCs in districts of Jharkhand Combined Indicators Districts Ranchi Dhanbad Giridih W. Singhbhum Chatra Number %
Service Delivery OPD services 4 4 4 4 4 20 100Emergency services 4 2 0 3 1 10 50Referral services 3 2 0 3 2 10 50In0.0patient services 4 2 0 2 2 10 50Antenatal services 4 4 4 4 3 19 95Post natal services 4 2 3 4 3 16 80New born care 4 3 0 4 3 14 70Child care & Immunization 4 3 4 4 3 18 90Family Planning 3 4 2 4 1 14 70Management of RTI/STI 3 2 2 3 0 10 50Nutrition services 3 1 0 2 1 7 35School Health Programme 4 2 0 4 2 12 60Disease surveillance and control of epidemics 4 4 1 4 2 15 75Collection and reporting of vital statistics 4 3 0 3 0 10 50AYUSH services 0 1 0 0 1 2 10Rehabilitation services 2 1 0 3 1 7 35Monitoring & supervision 4 3 3 4 3 17 85Monitoring activities of ASHAs 4 4 3 4 1 16 80MO visit all SCs once in month 4 4 0 4 4 16 80
No. of PHC providing
HA visit all SCs once in week 4 4 1 4 2 15 75

50
Evaluation Study of N
ational Rural H
ealth Mission (N
RH
M) in 7 States
Availability of Infrastructure and Services at PHCs Level in Orissa
Infrastructure and services in sampled PHCs in districts of Orissa Combined Indicators Districts Rayagada Balangir Kendujhar Kendrapara Puri Number % No of PHCs covered in each selected district 4 4 4 4 4 20 100
Physical Infrastructure Government building 4 2 4 4 3 17 85Completed construction of buildings 3 4 3 3 3 16 80Prominent display board in local language 4 2 4 4 2 16 80Drinking water availability 2 2 3 4 1 12 60Toilet facility 3 1 2 4 2 12 60
No. of PHC with
Good cleanliness condition 4 4 2 2 2 14 70Availability of Facilities
Registration Counter 2 2 0 1 2 7 35Pharmacy 4 4 4 3 4 19 95OPD room/cubicles 3 4 4 4 4 19 95Family Welfare clinic 2 0 1 1 1 5 25Casualty/Emergency room 1 0 1 0 0 2 10Operation Theater 0 1 2 0 0 3 15Separate Labour Room 2 1 0 1 0 4 20Adequate equipment and chemical availability 2 0 3 0 1 6 30Availability of adequate medicines 2 1 3 3 1 10 50Water Storage facility 0 0 0 1 0 1 5 Availability of electricity 2 3 3 3 3 14 70Communication facility 0 0 2 1 1 4 20
PHCs having
Transport facility 4 4 4 4 4 20 100Manpower in Position
MO(Allopathic) 3 4 4 3 4 18 90MO(AYUSH) 3 2 2 3 4 14 70Pharmacist 4 3 2 3 4 16 80Nurse/Midwife 1 0 0 1 0 2 10Female Health Worker 1 3 1 2 2 9 45Lab Technician 0 0 1 1 0 2 10
No. of PHCs with
Clerks 0 0 0 0 0 0

E
valuation Study of National R
ural Health M
ission (NR
HM
) in 7 States 51
Infrastructure and services in sampled PHCs in districts of Orissa Combined Indicators Districts Rayagada Balangir Kendujhar Kendrapara Puri Number %
Service Delivery OPD services 4 4 4 4 4 20 100Emergency services 2 3 2 1 2 10 50Referral services 3 1 1 0 2 7 35In0.0patient services 1 1 2 2 0 6 30Antenatal services 3 4 3 3 3 16 80Post natal services 3 4 3 2 1 13 65New born care 1 0 3 2 1 7 35Child care & Immunization 1 1 3 3 3 11 55Family Planning 3 1 3 4 3 14 70Management of RTI/STI 3 1 2 2 4 12 60Nutrition services 1 0 3 3 3 10 50School Health Programme 3 2 2 0 3 10 50Disease surveillance and control of epidemics 4 3 4 3 4 18 90Collection and reporting of vital statistics 3 0 0 0 1 4 20AYUSH services 4 3 2 3 3 15 75Rehabilitation services 1 1 1 0 1 4 20Monitoring & supervision 3 4 4 4 3 18 90Monitoring activities of ASHAs 4 4 4 4 4 20 100MO visit all SCs once in month 4 4 4 3 4 19 95
No. of PHC providing
HA visit all SCs once in week 3 2 2 0 2 9 45

52
Evaluation Study of N
ational Rural H
ealth Mission (N
RH
M) in 7 States
Availability of Infrastructure and Services at PHCs Level in Assam
Infrastructure and services in sampled PHCs in districts of Assam Combined Indicators Districts Barpeta Sonitpur Darrang Dibrugarh Chachar Number % No of PHCs covered in each selected district 4 4 4 4 4 20 100
Physical Infrastructure Government building 4 4 4 4 4 20 100Completed construction of buildings 4 3 4 3 3 17 85 Prominent display board in local language 4 3 2 4 3 16 80 Drinking water availability 3 3 4 4 2 16 80 Toilet facility 3 4 4 4 4 19 95
No. of PHC with
Good cleanliness condition 4 2 4 3 4 17 85 Availability of Facilities
Registration Counter 3 2 3 4 1 13 65 Pharmacy 4 4 4 4 4 20 100OPD room/cubicles 3 4 3 4 4 18 90 Family Welfare clinic 1 2 2 2 2 9 45 Casualty/Emergency room 0 1 0 3 0 4 20 Operation Theater 0 0 0 1 0 1 5 Separate Labour Room 2 1 2 2 2 9 45 Adequate equipment and chemical availability 1 1 0 2 2 6 30 Availability of adequate medicines 2 2 2 3 3 12 60 Water Storage facility 3 2 4 4 1 14 70 Availability of electricity 4 4 4 4 3 19 95 Communication facility 2 3 4 4 2 15 75
PHCs having
Transport facility 2 2 2 3 2 11 55 Manpower in Position
MO(Allopathic) 4 3 4 4 3 18 90 MO(AYUSH) 0 2 3 1 2 8 40 Pharmacist 4 4 4 3 2 17 85 Nurse/Midwife 3 3 4 3 4 17 85 Female Health Worker 2 1 0 1 0 4 20 Lab Technician 2 1 3 4 4 14 70
No. of PHCs with
Clerks 0 0 1 0 1 2 10

E
valuation Study of National R
ural Health M
ission (NR
HM
) in 7 States 53
Infrastructure and services in sampled PHCs in districts of Assam Combined Indicators Districts Barpeta Sonitpur Darrang Dibrugarh Chachar Number %
Service Delivery OPD services 4 4 4 4 4 20 100Emergency services 3 3 1 3 3 13 65 Referral services 3 4 1 3 2 13 65 In0.0patient services 1 0 1 2 2 6 30 Antenatal services 4 3 4 4 3 18 90 Post natal services 4 3 4 4 3 18 90 New born care 1 2 0 2 4 9 45 Child care & Immunization 4 4 4 4 3 19 95 Family Planning 4 4 4 3 4 19 95 Management of RTI/STI 2 3 2 2 3 12 60 Nutrition services 2 2 2 1 0 7 35 School Health Programme 4 3 3 2 1 13 65 Disease surveillance and control of epidemics 2 3 4 4 4 17 85 Collection and reporting of vital statistics 2 0 3 1 3 9 45 AYUSH services 0 2 3 1 2 8 40 Rehabilitation services 0 1 1 1 0 3 15 Monitoring & supervision 3 4 2 3 4 16 80 Monitoring activities of ASHAs 4 4 4 4 4 20 100MO visit all SCs once in month 4 4 3 4 3 18 90
No. of PHC providing
HA visit all SCs once in week 3 4 3 2 3 15 75

54
Evaluation Study of N
ational Rural H
ealth Mission (N
RH
M) in 7 States
Availability of Infrastructure and Services at PHCs Level in Jammu & Kashmir
Infrastructure and services in sampled PHCs in district s of Jammu & Kashmir Combined Indicators Districts Jammu Udhampur Doda Baramula Budgam Number % No of PHCs covered in each selected district 4 4 4 4 4 20 100
Physical Infrastructure Government building 4 4 3 3 3 17 85Completed construction of buildings 1 2 0 1 1 5 25Prominent display board in local language 3 3 4 3 2 15 75Drinking water availability 3 3 2 4 2 14 70Toilet facility 3 3 4 4 3 17 85
No. of PHC with
Good cleanliness condition 2 4 2 4 3 15 75Availability of Facilities
Registration Counter 3 3 1 0 1 8 40Pharmacy 4 3 3 4 4 18 90OPD room/cubicles 4 4 4 3 3 18 90Family Welfare clinic 3 2 3 3 2 13 65Casualty/Emergency room 2 1 0 1 2 6 30Operation Theater 0 1 0 1 1 3 15Separate Labour Room 3 2 4 0 2 11 55Adequate equipment and chemical availability 1 1 0 2 2 6 30Availability of adequate medicines 1 2 1 3 3 10 50Water Storage facility 3 3 3 2 3 14 70Availability of electricity 4 4 4 4 4 20 100Communication facility 2 0 0 0 0 2 10
PHCs having
Transport facility 2 2 2 3 2 11 55Manpower in Position
MO(Allopathic) 4 2 3 4 3 16 80MO(AYUSH) 4 3 3 2 0 12 60Pharmacist 3 3 2 2 4 14 70Nurse/Midwife 2 1 0 1 4 8 40Female Health Worker 2 0 4 0 3 9 45Lab Technician 4 4 2 1 3 14 70
No. of PHCs with
Clerks 0 1 0 0 2 3 15

E
valuation Study of National R
ural Health M
ission (NR
HM
) in 7 States 55
Infrastructure and services in sampled PHCs in district s of Jammu & Kashmir Combined Indicators Districts Jammu Udhampur Doda Baramula Budgam Number %
Service Delivery OPD services 4 4 4 4 4 20 100Emergency services 4 2 3 2 4 15 75Referral services 3 3 3 3 2 14 70In0.0patient services 4 3 1 4 4 16 80Antenatal services 4 4 4 3 4 19 95Post natal services 4 4 4 3 4 19 95New born care 4 1 3 2 3 13 65Child care & Immunization 4 4 4 3 4 19 95Family Planning 4 4 4 3 2 17 85Management of RTI/STI 4 4 4 2 1 15 75Nutrition services 0 1 0 2 1 4 20School Health Programme 4 4 4 2 3 17 85Disease surveillance and control of epidemics 4 3 4 3 4 18 90Collection and reporting of vital statistics 4 4 4 4 4 20 100AYUSH services 3 3 3 4 0 13 65Rehabilitation services 1 2 0 0 0 3 15Monitoring & supervision 4 4 4 2 4 18 90Monitoring activities of ASHAs 4 4 4 3 4 19 95MO visit all SCs once in month 4 4 4 2 4 18 90
No. of PHC providing
HA visit all SCs once in week 3 2 1 1 4 11 55

56
Evaluation Study of N
ational Rural H
ealth Mission (N
RH
M) in 7 States
Availability of Infrastructure and Services at PHCs Level in Tamilnadu
Infrastructure and services in sampled PHCs in districts of Tamilnadu Combined Indicators Districts Kanchipuram Salem Madurai Tuticorin Nagapattanam Number % No of PHCs covered in each selected district 4 4 4 4 4 20 100
Physical Infrastructure Government building 4 4 4 4 4 20 100Completed construction of buildings 3 4 3 4 4 18 90Prominent display board in local language 4 4 4 4 4 20 100Drinking water availability 4 4 4 4 4 20 100Toilet facility 4 4 4 4 4 20 100
No. of PHC with
Good cleanliness condition 4 4 4 4 4 20 100Availability of Facilities
Registration Counter 2 2 4 3 2 13 65Pharmacy 4 4 4 4 4 20 100OPD room/cubicles 4 4 4 4 4 20 100Family Welfare clinic 3 2 3 4 2 14 70Casualty/Emergency room 1 0 1 2 2 6 30Operation Theater 1 0 0 0 0 1 5 Separate Labour Room 4 4 4 4 4 20 100Adequate equipment and chemical availability 4 2 4 3 4 17 85Availability of adequate medicines 3 4 4 4 4 19 95Water Storage facility 4 4 3 4 2 17 85Availability of electricity 4 4 4 4 4 20 100Communication facility 4 4 4 4 4 20 100
PHCs having
Transport facility 4 0 2 2 2 10 50Manpower in Position
MO(Allopathic) 4 4 4 4 3 19 95MO(AYUSH) 0 0 0 1 0 1 5 Pharmacist 3 4 4 4 4 19 95Nurse/Midwife 2 3 2 4 3 14 70Female Health Worker 3 1 4 3 1 12 60Lab Technician 1 1 3 2 1 8 40
No. of PHCs with
Clerks 0 0 0 0 0 0 0

E
valuation Study of National R
ural Health M
ission (NR
HM
) in 7 States 57
Infrastructure and services in sampled PHCs in districts of Tamilnadu Combined Indicators Districts Kanchipuram Salem Madurai Tuticorin Nagapattanam Number %
Service Delivery OPD services 4 4 4 4 4 20 100Emergency services 3 2 4 3 3 15 75Referral services 3 4 4 4 4 19 95In0.0patient services 4 4 4 4 4 20 100Antenatal services 4 3 4 4 4 19 95Post natal services 4 4 4 4 4 20 100New born care 4 4 4 4 4 20 100Child care & Immunization 4 3 4 4 4 19 95Family Planning 2 1 3 3 4 13 65Management of RTI/STI 4 3 3 4 2 16 80Nutrition services 4 4 4 4 3 19 95School Health Programme 4 4 4 4 3 19 95Disease surveillance and control of epidemics 4 4 4 4 4 20 100Collection and reporting of vital statistics 4 4 4 4 4 20 100AYUSH services 1 0 0 1 1 3 15Rehabilitation services 1 0 1 0 1 3 15Monitoring & supervision 4 4 4 3 2 17 85Monitoring activities of ASHAs 1 0 0 1 1 3 15MO visit all SCs once in month 4 4 4 4 4 20 100
No. of PHC providing
HA visit all SCs once in week 3 2 4 4 3 16 80

58
Evaluation Study of N
ational Rural H
ealth Mission (N
RH
M) in 7 States
Sub Centres

E
valuation Study of National R
ural Health M
ission (NR
HM
) in 7 States 59
Availability of Infrastructure and Services at SCs Level in Uttar Pradesh Indicators Infrastructure and facilities in sampled SCs of selected districts in Uttar Pradesh Combined District Mathura Saharanpur Mahoba Sultanpur Mau Unnao Number % No of SCs covered in each selected district 8 8 8 8 8 8 48 100
Infrastructure having buildings 8 7 6 8 6 6 41 85having govt. building 3 5 4 5 1 3 21 44with good condition of the buildings 7 4 3 3 5 0 22 46with prominent display board in local language 2 7 3 1 0 6 19 40with separate labour room 2 4 1 5 1 4 17 35with availability of drinking water 3 6 5 7 5 6 32 67with availability of toilets 2 6 4 5 1 5 23 48with availability of regular electricity 2 2 0 3 3 1 11 23with communication facilities 1 4 0 4 4 0 13 27
No. of SCs
with residential facility for staff 2 5 5 5 0 3 20 42Manpower in Position
ANM 7 7 8 8 8 8 46 96Male Health Worker 2 1 2 1 1 3 10 21Part time attendant (female) 1 3 4 8 1 0 17 35Sweeper 1 2 0 0 1 0 4 8
No. of SCs with
ASHA 29 31 27 64 24 46 Service availability
ANC services 4 7 8 4 0 8 31 65PNC services 1 4 7 5 0 6 23 48New born care 1 6 8 5 0 5 25 52Child care including immunization 7 7 7 8 6 8 41 85Family planning and contraception 6 7 8 8 6 8 43 90Adolescent health care 5 7 8 6 3 8 37 77Treatment of minor ailments 5 7 8 6 4 5 35 73Adequate amount of medicine available all time 2 5 5 5 3 4 24 5024 hours facility of referral services for complicated cases 1 7 1 3 0 1 13 27Immunization services as per government schedule 7 6 7 8 8 8 44 92Contraceptive services 7 7 8 8 4 8 42 88As a DOT centre 4 1 1 3 2 1 12 25Treatment of diarrhoea and dehydradation 6 7 7 6 1 8 35 73
No. of SCs providing
Running any national health programme 7 7 6 4 8 7 39 81

60
Evaluation Study of N
ational Rural H
ealth Mission (N
RH
M) in 7 States
Availability of Infrastructure and Services at SCs Level in Madhya Pradesh Indicators Infrastructure and facilities in sampled SCs of selected districts in Madhya Pradesh Combined District Katni Nimach Vidisha Shivpuri Hoshangabad Dhar Number % No of SCs covered in each selected district 8 8 8 8 8 8 48 100
Infrastructure having buildings 6 8 4 8 8 7 41 85.4having govt. building 4 5 3 8 6 2 28 58.3with good condition of the buildings 4 8 0 4 5 4 25 52.1with prominent display board in local language 5 3 3 6 5 2 24 50.0with separate labour room 3 3 2 3 6 3 20 41.7with availability of drinking water 4 6 2 3 7 3 25 52.1with availability of toilets 5 8 3 7 7 4 34 70.8with availability of regular electricity 2 8 0 3 1 4 18 37.5with communication facilities 1 8 0 1 1 2 13 27.1
No. of SCs
with residential facility for staff 4 6 1 7 5 3 26 54.2Manpower in Position
ANM 8 8 8 8 8 8 48 100.0Male Health Worker 8 8 8 8 8 8 48 100.0Part time attendant (female) 1 2 1 3 1 4 12 25.0Sweeper 0 0 0 1 2 0 3 6.3
No. of SCs with
ASHA 8 8 8 8 8 8 48 100.0Service availability
ANC services 8 5 7 8 7 8 43 89.6PNC services 8 4 7 6 6 6 37 77.1New born care 5 5 8 1 8 7 34 70.8Child care including immunization 8 8 8 6 8 8 46 95.8Family planning and contraception 8 6 8 8 8 8 46 95.8Adolescent health care 8 3 8 8 8 6 41 85.4Treatment of minor ailments 5 5 8 8 8 7 41 85.4Adequate amount of medicine available all time 8 8 5 7 6 8 42 87.524 hours facility of referral services for complicated cases 4 1 6 1 5 2 19 39.6Immunization services as per government schedule 8 8 8 8 8 7 47 97.9Contraceptive services 8 8 7 8 8 8 47 97.9As a DOT centre 7 8 5 3 4 6 33 68.8Treatment of diarrhoea and dehydradation 8 7 8 8 6 8 45 93.8
No. of SCs providing
Running any national health programme 8 8 8 8 8 8 48 100.0

E
valuation Study of National R
ural Health M
ission (NR
HM
) in 7 States 61
Availability of Infrastructure and Services at SCs Level in Jharkhand Indicators Infrastructure and facilities in sampled SCs of selected districts in Jharkhand Combined Districts Ranchi Dhanbad Giridih W. Singhbhum Chatra Number % No of SCs covered in each selected district 8 7 8 8 8 39 100
Infrastructure having buildings 8 7 6 8 7 36 92.3 having govt. building 4 2 5 2 5 18 46.2 with good condition of the buildings 2 5 2 2 5 16 41.0 with prominent display board in local language 5 7 6 4 6 28 71.8 with separate labour room 0 0 1 0 2 3 7.7 with availability of drinking water 3 3 4 2 4 16 41.0 with availability of toilets 2 1 4 0 5 12 30.8 with availability of regular electricity 2 5 0 0 2 9 23.1 with communication facilities 8 7 8 8 8 39 100.0
No. of SCs
with residential facility for staff 1 1 2 0 2 6 15.4 Manpower in Position
ANM 8 7 8 8 8 39 100 Male Health Worker 4 0 5 0 2 11 28.2 Part time attendant (female) 0 1 1 0 1 3 7.7 Sweeper 2 1 1 0 1 5 12.8
No. of SCs with
ASHA 8 7 8 7 8 38 97.4 Service availability
ANC services 8 7 7 7 7 36 92.3 PNC services 8 7 7 8 7 37 94.9 New born care 8 3 1 7 6 25 64.1 Child care including immunization 8 7 7 8 6 36 92.3 Family planning and contraception 8 7 7 8 6 36 92.3 Adolescent health care 8 7 7 8 7 37 94.9 Treatment of minor ailments 8 7 6 8 7 36 92.3 Adequate amount of medicine available all time 4 5 6 6 5 26 66.7 24 hours facility of referral services for complicated cases 6 0 0 2 2 10 25.6 Immunization services as per government schedule 8 7 8 8 8 39 100.0Contraceptive services 8 7 8 8 8 39 100.0As a DOT centre 4 3 4 8 6 25 64.1 Treatment of diarrhea and dehydradation 8 7 7 8 8 38 97.4
No. of SCs providing
Running any national health programme 8 7 6 8 8 37 94.9

62
Evaluation Study of N
ational Rural H
ealth Mission (N
RH
M) in 7 States
Availability of Infrastructure and Services at SCs Level in Orissa Indicators Infrastructure and facilities in sampled SCs of selected districts in Orissa Combined Districts Rayagada Balangir Kendujhar Kendrapara Puri Number % No of SCs covered in each selected district 8 7 8 8 8 39 100
Infrastructure having buildings 8 7 8 8 8 39 100 having govt. building 2 3 6 2 2 15 38.5 with good condition of the buildings 1 1 4 0 3 9 23.1 with prominent display board in local language 2 2 7 1 0 12 30.8 with separate labour room 3 2 4 0 0 9 23.1 with availability of drinking water 4 2 6 5 4 21 53.8 with availability of toilets 2 2 2 1 2 9 23.1 with availability of regular electricity 4 3 3 0 2 12 30.8 with communication facilities 1 0 3 0 2 6 15.4
No. of SCs
with residential facility for staff 4 2 6 1 1 14 35.9 Manpower in Position
ANM 8 6 8 8 8 38 97.4 Male Health Worker 3 6 6 2 7 24 61.5 Part time attendant (female) 1 1 0 0 0 2 5.1 Sweeper 0 0 0 0 0 0 0
No. of SCs with
ASHA 8 7 8 8 8 39 100 Service availability
ANC services 8 6 7 8 3 32 82.1 PNC services 7 7 8 8 8 38 97.4 New born care 3 0 8 8 8 27 69.2 Child care including immunization 8 7 8 8 8 39 100.0Family planning and contraception 8 7 8 6 8 37 94.9 Adolescent health care 8 7 8 4 5 32 82.1 Treatment of minor ailments 6 7 8 7 6 34 87.2 Adequate amount of medicine available all time 8 7 8 6 6 35 89.7 24 hours facility of referral services for complicated cases 3 0 8 3 5 19 48.7 Immunization services as per government schedule 8 7 8 8 8 39 100.0Contraceptive services 8 7 8 8 7 38 97.4 As a DOT centre 5 6 7 6 4 28 71.8 Treatment of diarrhea and dehydradation 8 7 7 7 8 37 94.9
No. of SCs providing
Running any national health programme 7 7 8 8 8 38 97.4

E
valuation Study of National R
ural Health M
ission (NR
HM
) in 7 States 63
Availability of Infrastructure and Services at SCs Level in Assam Indicators Infrastructure and facilities in sampled SCs of selected districts in Assam Combined Districts Barpeta Sonitpur Darrang Dibrugarh Chachar Number % No of SCs covered in each selected district 8 8 8 8 8 40 100
Infrastructure having buildings 4 7 8 7 7 33 82.5having govt. building 2 5 3 5 3 18 45 with good condition of the buildings 3 6 5 5 5 24 60 with prominent display board in local language 6 5 4 7 2 24 60 with separate labour room 4 1 1 2 1 9 22.5with availability of drinking water 5 3 5 7 3 23 57.5with availability of toilets 3 4 3 6 6 22 55 with availability of regular electricity 5 3 3 0 6 17 42.5with communication facilities 0 0 0 3 0 3 7.5
No. of SCs
with residential facility for staff 2 3 2 3 2 12 30 Manpower in Position
ANM 8 8 8 8 32 80 Male Health Worker 2 1 0 1 1 5 12.5Part time attendant (female) 6 2 4 6 4 22 55 Sweeper 0 0 0 0 1 1 2.5
No. of SCs with
ASHA 8 8 8 8 32 80 Service availability
ANC services 7 3 8 1 8 27 67.5PNC services 6 8 8 8 8 38 95 New born care 1 8 1 0 10 25 Child care including immunization 8 8 8 8 8 40 100Family planning and contraception 8 8 8 8 8 40 100Adolescent health care 8 2 8 8 7 33 82.5Treatment of minor ailments 8 6 8 6 7 35 87.5Adequate amount of medicine available all time 7 7 6 7 8 35 87.524 hours facility of referral services for complicated cases 1 3 0 7 1 12 30 Immunization services as per government schedule 8 8 8 8 8 40 100Contraceptive services 8 7 8 8 8 39 97.5As a DOT centre 2 6 5 5 6 24 60 Treatment of diarrhea and dehydradation 8 6 8 6 4 32 80
No. of SCs providing
Running any national health programme 7 8 8 8 8 39 97.5

64
Evaluation Study of N
ational Rural H
ealth Mission (N
RH
M) in 7 States
Availability of Infrastructure and Services at SCs Level in Jammu & Kashmir Indicators Infrastructure and facilities in sampled SCs of selected districts in Jammu & Kashmir Combined Districts Jammu Udhampur Doda Baramula Budgam Number % No of SCs covered in each selected district 8 8 8 8 8 40 100
Infrastructure having buildings 8 8 8 8 8 40 100having govt. building 3 3 2 1 3 12 30 with good condition of the buildings 3 3 2 1 3 12 30 with prominent display board in local language 6 5 7 5 2 25 63 with separate labour room 0 0 3 1 1 5 13 with availability of drinking water 4 6 5 2 3 20 50 with availability of toilets 4 5 5 2 4 20 50 with availability of regular electricity 7 3 4 2 2 18 45 with communication facilities 0 0 1 0 2 3 7.5
No. of SCs
with residential facility for staff 2 1 0 0 0 3 7.5Human resources
ANM 8 8 8 3 7 34 85 Male Health Worker 1 8 4 5 5 23 58 Part time attendant (female) 3 1 1 1 2 8 20 Sweeper 1 3 3 6 6 19 48
No. of SCs with
ASHA 8 8 8 8 7 39 98 Service availability
ANC services 4 4 3 5 4 20 50 PNC services 8 7 8 4 7 34 85 New born care 8 8 7 5 8 36 90 Child care including immunization 8 8 8 8 8 40 100Family planning and contraception 7 8 8 8 7 38 95 Adolescent health care 6 7 7 6 6 32 80 Treatment of minor ailments 8 8 8 8 8 40 100Adequate amount of medicine available all time 5 8 7 4 5 29 73 24 hours facility of referral services for complicated cases 1 6 3 0 2 12 30 Immunization services as per government schedule 8 8 8 8 8 40 100Contraceptive services 8 8 8 8 7 39 98 As a DOT centre 8 8 8 7 8 39 98 Treatment of diarrhea and dehydradation 8 7 8 8 7 38 95
No. of SCs providing
Running any national health programme 8 7 8 8 8 39 98

E
valuation Study of National R
ural Health M
ission (NR
HM
) in 7 States 65
Availability of Infrastructure and Services at SCs Level in Tamilnadu Indicators Infrastructure and facilities in sampled SCs of selected districts in Tamilnadu Combined Districts Kanchipuram Salem Madurai Tuticorin Nagapattanam Number % No of SCs covered in each selected district 8 8 8 8 8 40 100
Infrastructure having buildings 8 7 8 8 7 38 95 having govt. building 5 6 4 8 4 27 67.5with good condition of the buildings 5 3 5 7 5 25 62.5with prominent display board in local language 7 6 5 8 5 31 77.5with separate labour room 6 6 5 5 5 27 67.5with availability of drinking water 5 6 6 5 6 28 70 with availability of toilets 7 7 7 7 5 33 82.5with availability of regular electricity 6 7 4 8 8 33 82.5with communication facilities 5 6 7 6 7 31 77.5
No. of SCs
with residential facility for staff 2 4 5 7 4 22 55 Manpower in Position
ANM 8 8 8 8 8 40 100Male Health Worker 1 5 2 3 1 12 30 Part time attendant (female) 2 6 4 4 1 17 42.5
No. of SCs with
Sweeper 2 0 1 0 0 3 7.5Service availability
ANC services 8 7 8 8 8 39 97.5PNC services 8 8 8 8 7 39 97.5New born care 5 3 3 3 2 16 40 Child care including immunization 5 8 5 5 3 26 65 Family planning and contraception 7 8 8 8 7 38 95 Adolescent health care 8 8 7 8 8 39 97.5Treatment of minor ailments 8 8 8 8 8 40 100Adequate amount of medicine available all time 8 7 8 8 8 39 97.524 hours facility of referral services for complicated cases 7 6 8 8 7 36 90 Immunization services as per government schedule 8 8 8 8 8 40 100Contraceptive services 8 8 8 8 8 40 100As a DOT centre 7 8 6 8 8 37 92.5Treatment of diarrhea and dehydradation 8 8 8 2 0 26 65
No. of SCs providing
Running any national health programme 8 8 8 8 8 40 100

66
Evaluation Study of N
ational Rural H
ealth Mission (N
RH
M) in 7 States
Village H
ealth & Sanitation C
omm
ittee

E
valuation Study of National R
ural Health M
ission (NR
HM
) in 7 States 67
Village Health & Sanitation Committee at village level in Uttar Pradesh Village/GP/VHSC in Uttar Pradesh Combined Indicators Districts Mathura Saharanpur Mahoba Sultanpur Mau Unnao Number % No of GP covered in each district 8 8 7 7 5 6 41 100
Opinion regarding services existing of VHSC in sample village 8 8 7 7 5 6 41 100existence of any PHC in village 2 0 1 2 0 0 5 12existence of any SC in village 8 8 6 7 5 5 39 95SC provide timely services to patients 3 4 6 7 4 4 28 68PHC provide timely services to patients 6 5 7 2 2 5 27 66villagers are satisfied by services of SC 3 3 6 7 4 3 26 63villagers are satisfied by services of PHC 5 4 7 3 2 5 26 63night stay facility in SC 2 1 1 5 3 0 12 29villagers got free services/medicines from SC 2 5 6 5 3 5 26 63villagers got free services/medicines from PHC 4 2 7 2 4 5 24 59
No. of GP reporting about
Roles/Responsibilities is working under NRHM 5 3 6 5 5 6 30 73maintain any VHP 2 3 2 4 4 3 18 44discuss VHP with villagers 4 3 2 5 5 4 23 56analyze key issues/problems related to village level health & nutrition
3 2 3 4 4 2 18 44
maintain any village health calendar 0 2 1 1 2 2 8 20Meeting/Record keeping
maintain any village health register 5 6 4 3 3 4 25 61have any demographic data of the village 1 2 5 0 2 3 13 32maintain infant and maternal audit 3 1 5 2 3 3 17 41have record of ANM 2 3 4 6 1 4 20 49organize regular meetings 4 7 6 2 4 5 28 68
No. of GP reporting about VHSC
maintain records of meeting organized 4 3 6 6 3 5 27 66Roles in providing common facilities
safe drinking water in village 5 7 7 7 5 6 37 90community toilets in village 4 0 0 0 1 1 6 15good status of village sanitation 3 6 3 6 4 4 26 63
No. of GP reported about
VHSC has provision of Jan Samwad/Dialouge 4 5 2 1 3 3 18 44

68
Evaluation Study of N
ational Rural H
ealth Mission (N
RH
M) in 7 States
Village/GP/VHSC in Uttar Pradesh Combined Indicators Districts Mathura Saharanpur Mahoba Sultanpur Mau Unnao Number %
proper connectivity to SC/PHC/CHC 7 8 6 5 5 5 36 88communication facilities in village 8 7 4 7 3 5 34 83
Grant/Aid VHSC receives untied funds from government 5 4 6 5 4 5 29 71VHSC facing any problem in implementation of NRHM
4 2 1 1 1 2 11 27
VHSC satisfied with progress and implementation of NRHM
5 5 5 7 5 6 33 80

E
valuation Study of National R
ural Health M
ission (NR
HM
) in 7 States 69
Village Health & Sanitation Committee at village level in Madhya Pradesh Village/GP/VHSC in Madhya Pradesh Combined Indicators Districts Katni Nimach Vidisha Shivpuri Hoshangabad Dhar Number % No of GP covered in each district 7 8 8 5 7 4 39 100
Opinion regarding services existing of VHSC in sample village 7 8 8 5 7 2 37 94.9existence of any PHC in village 0 1 2 0 1 0 4 10.3existence of any SC in village 7 8 8 5 7 4 39 100SC provide timely services to patients 7 8 8 5 5 4 37 94.9PHC provide timely services to patients 6 6 8 5 4 4 33 84.6villagers are satisfied by services of SC 6 8 8 5 6 4 37 94.9villagers are satisfied by services of PHC 5 6 8 5 5 4 33 84.6Night stay facility in SC 1 8 7 4 4 3 27 69.2villagers got free services/medicines from SC 4 8 7 4 7 3 33 84.6
No. of GP reporting about
villagers got free services/medicines from PHC 7 7 8 5 4 2 33 84.6Roles & Responsibilities
is working under NRHM 6 8 6 4 6 4 34 87.2maintain any VHP 4 8 4 2 6 4 28 71.8discuss VHP with villagers 5 8 4 1 6 4 28 71.8analyze key issues/problems related to village level health & nutrition
5 8 4 1 6 3 27 69.2
maintain any village health calendar 3 0 2 1 2 0 8 20.5Meeting/Record keeping
maintain any village health register 5 6 6 2 5 3 27 69.2have any demographic data of the village 5 3 5 1 4 2 20 51.3maintain infant and maternal audit 4 0 4 1 3 0 12 30.8have record of ANM 4 6 4 0 5 3 22 56.4organize regular meetings 5 0 7 1 6 3 22 56.4
No. of GP reporting about VHSC
maintain records of meeting organized 0 0 0 0 0 0 0 0.0Roles in providing common facilities
safe drinking water in village 6 8 7 5 7 4 37 94.9community toilets in village 0 2 0 0 1 0 3 7.7good status of village sanitation 3 7 2 3 1 4 20 51.3
No. of GP reported about
VHSC has provision of Jan Samwad/ Dialouge 4 0 3 3 5 0 15 38.5

70
Evaluation Study of N
ational Rural H
ealth Mission (N
RH
M) in 7 States
Village/GP/VHSC in Madhya Pradesh Combined Indicators Districts Katni Nimach Vidisha Shivpuri Hoshangabad Dhar Number %
proper connectivity to SC/PHC/CHC 7 8 7 4 6 4 36 92.3communication facilities in village 3 8 6 0 3 3 23 59.0
Grant/Aid VHSC receives untied funds from government 6 8 2 1 3 0 20 51.3VHSC facing any problem in implementation of NRHM
1 2 0 0 2 4 9 23.1
VHSC satisfied with progress and implementation of NRHM
7 8 7 5 4 4 35 89.7

E
valuation Study of National R
ural Health M
ission (NR
HM
) in 7 States 71
Village Health & Sanitation Committee at village level in Jharkhand Village/GP/VHSC in Jharkhand Combined Indicators Districts Ranchi Dhanbad Giridih W
Singhbhum Chatra Number %
No of GP covered in each district 8 4 4 4 6 26 100Opinion regarding services
existing of VHSC in sample village 1 1 0 0 0 2 7.7existence of any PHC in village 1 0 1 2 1 5 19.2existence of any SC in village 7 4 4 4 6 25 96.2SC provide timely services to patients 8 3 3 4 6 24 92.3PHC provide timely services to patients 8 3 4 3 5 23 88.5villagers are satisfied by services of SC 7 3 3 3 6 22 84.6villagers are satisfied by services of PHC 7 3 4 2 6 22 84.6night stay facility in SC 2 1 0 1 1 5 19.2night stay facility in PHC 3 4 3 2 3 15 57.7villagers got free services/medicines from SC 6 3 3 2 4 18 69.2villagers got free services/medicines from PHC 5 3 3 1 5 17 65.4
No. of GP reporting about
Roles/Responsibilities is working under NRHM 7 2 3 4 4 20 76.9maintain any VHP 5 0 1 0 2 8 30.8discuss VHP with villagers 5 0 1 3 3 12 46.2analyze key issues/problems related to village level health & nutrition
3 0 1 1 3 8 30.8
maintain any village health calendar 1 0 0 0 0 1 3.8Meeting/Record keeping
maintain any village health register 6 0 1 0 1 8 30.8have any demographic data of the village 4 0 0 2 0 6 23.1maintain infant and maternal audit 4 0 1 0 0 5 19.2have record of ANM 2 0 1 0 2 5 19.2organize regular meetings 8 0 1 1 3 13 50.0
No. of GP reporting about VHSC
maintain records of meeting organized 8 0 2 1 2 13 50.0Roles in providing common facilities
Safe drinking water in village 7 4 4 4 5 24 92.3No. of GP reported about
community toilets in village 0 0 0 0 0 0 0.0

72
Evaluation Study of N
ational Rural H
ealth Mission (N
RH
M) in 7 States
Village/GP/VHSC in Jharkhand Combined Indicators Districts Ranchi Dhanbad Giridih W
Singhbhum Chatra Number %
Good status of village sanitation 4 0 0 0 3 7 26.9VHSC has provision of Jan Samwad/ Dialouge 3 0 0 0 0 3 11.5Proper connectivity to SC/PHC/CHC 7 4 4 4 6 25 96.2Communication facilities in village 4 1 2 0 2 9 34.6
Grant/Aid VHSC receives untied funds from government 5 0 0 2 2 9 34.6VHSC facing any problem in implementation of NRHM
1 0 0 1 3 5 19.2
VHSC satisfied with progress and implementation of NRHM
5 4 4 3 4 20 76.9

E
valuation Study of National R
ural Health M
ission (NR
HM
) in 7 States 73
Village Health & Sanitation Committee at village level in Orissa Village/GP/VHSC in Orissa Combined Indicators Districts Rayagada Balangir Kendujhar Kendrapara Puri Number % No of GP covered in each district 7 8 8 8 8 39 100
Opinion regarding services existing of VHSC in sample village 0 0 0 0 0 0 0 existence of any PHC in village 0 0 2 0 2 4 10.3existence of any SC in village 7 7 8 8 8 38 97.4SC provide timely services to patients 6 8 8 8 7 37 94.9PHC provide timely services to patients 6 7 8 8 7 36 92.3villagers are satisfied by services of SC 6 7 8 8 7 36 92.3villagers are satisfied by services of PHC 5 4 8 7 2 26 66.7night stay facility in SC 2 1 5 4 0 12 30.8night stay facility in PHC 2 1 5 5 0 13 33.3villagers got free services/medicines from SC 6 7 8 7 8 36 92.3villagers got free services/medicines from PHC 7 7 8 7 8 37 94.9
No. of GP reporting about
Roles/Responsibilities is working under NRHM 7 3 8 8 8 34 87.2maintain any VHP 0 0 7 6 6 19 48.7discuss VHP with villagers 1 5 8 7 7 28 71.8analyze key issues/problems related to village level health & nutrition
1 5 4 2 1 13 33.3
maintain any village health calendar 0 0 1 0 0 1 2.6Meeting/Record keeping
maintain any village health register 2 5 7 8 7 29 74.4have any demographic data of the village 1 5 5 1 2 14 35.9maintain infant and maternal audit 0 0 4 3 0 7 17.9have record of ANM 3 8 6 8 7 32 82.1organize regular meetings 0 0 5 2 1 8 20.5
No. of GP reporting about VHSC
maintain records of meeting organized 0 0 8 5 7 20 51.3Roles in providing common facilities
safe drinking water in village 7 8 8 8 8 39 100community toilets in village 0 0 0 0 0 0 0
No. of GP reported about
good status of village sanitation 4 0 6 7 3 20 51.3

74
Evaluation Study of N
ational Rural H
ealth Mission (N
RH
M) in 7 States
Village/GP/VHSC in Orissa Combined Indicators Districts Rayagada Balangir Kendujhar Kendrapara Puri Number %
VHSC has provision of Jan Samwad/ Dialouge 1 0 3 7 4 15 38.5proper connectivity to SC/PHC/CHC 7 8 6 1 0 22 56.4communication facilities in village 1 3 2 4 3 13 33.3
Grant/Aid VHSC receives untied funds from government 6 0 5 7 4 22 56.4VHSC facing any problem in implementation of NRHM
0 0 2 2 4 8 20.5
VHSC satisfied with progress and implementation of NRHM
7 8 5 5 8 33 84.6

E
valuation Study of National R
ural Health M
ission (NR
HM
) in 7 States 75
Village Health & Sanitation Committee at village level in Assam Village/GP/VHSC in Assam Combined Indicators Districts Barpeta Sonitpur Darrang Dibrugarh Chachar Number % No of GP covered in each district 8 8 8 8 8 40 100
Opinion regarding services existing of VHSC in sample village 0 0 0 0 0 0 0 existence of any PHC in village 0 1 2 1 2 6 15 existence of any SC in village 8 8 8 7 8 39 97.5SC provide timely services to patients 8 7 8 8 8 39 97.5PHC provide timely services to patients 8 7 8 8 8 39 97.5villagers are satisfied by services of SC 5 7 8 8 8 36 90 villagers are satisfied by services of PHC 6 2 6 6 7 27 67.5night stay facility in SC 1 1 1 3 3 9 22.5night stay facility in PHC 2 1 1 3 5 12 30 villagers got free services/medicines from SC 6 7 8 5 5 31 77.5villagers got free services/medicines from PHC 6 6 8 6 3 29 72.5
No. of GP reporting about
Roles/Responsibilities is working under NRHM 8 8 8 8 8 40 100maintain any VHP 8 6 7 6 7 34 85 discuss VHP with villagers 7 7 2 8 4 28 70 analyze key issues/problems related to village level health & nutrition
2 1 1 1 3 8 20
maintain any village health calendar 1 0 0 0 1 2 5 Meeting/Record keeping
maintain any village health register 7 2 7 3 8 27 67.5have any demographic data of the village 3 0 1 4 2 10 25 maintain infant and maternal audit 0 0 1 0 1 2 5 have record of ANM 0 4 2 2 2 10 25 organize regular meetings 8 8 7 2 7 32 80
No. of GP reporting about VHSC
maintain records of meeting organized 8 8 7 8 6 37 92.5Roles in providing common facilities
safe drinking water in village 8 8 8 8 8 40 100community toilets in village 0 0 0 0 0 0 0
No. of GP reported about
good status of village sanitation 0 0 0 0 0 0 0

76
Evaluation Study of N
ational Rural H
ealth Mission (N
RH
M) in 7 States
Village/GP/VHSC in Assam Combined Indicators Districts Barpeta Sonitpur Darrang Dibrugarh Chachar Number %
VHSC has provision of Jan Samwad /Dialouge 1 0 4 0 0 5 12.5proper connectivity to SC/PHC/CHC 3 7 8 8 8 34 85 communication facilities in village 7 4 8 7 8 34 85
Grant/Aid VHSC receives untied funds from government 8 7 8 7 8 38 95 VHSC facing any problem in implementation of NRHM
2 7 0 2 0 11 27.5
VHSC satisfied with progress and implementation of NRHM
8 7 8 7 8 38 95

E
valuation Study of National R
ural Health M
ission (NR
HM
) in 7 States 77
Village Health & Sanitation Committee at village level in Jammu & Kashmir
Village/GP/VHSC in Jammu & Kashmir Combined Indicators District Jammu Udhampur Doda Baramula Budgam Number %
No of GP covered in each district 8 8 8 7 7 38 100 Opinion regarding services
existing of VHSC in sample village 0 0 0 0 0 0 0 existence of any PHC in village 0 0 0 2 0 2 5.3 existence of any SC in village 7 8 8 7 7 37 97.4SC provide timely services to patients 8 8 8 5 6 35 92.1PHC provide timely services to patients 8 8 7 4 5 32 84.2villagers are satisfied by services of SC 8 7 8 4 6 33 86.8villagers are satisfied by services of PHC 8 5 5 2 4 24 63.2night stay facility in SC 3 1 2 0 0 6 15.8night stay facility in PHC 5 1 1 0 1 8 21.1villagers got free services/medicines from SC 5 6 6 3 5 25 65.8villagers got free services/medicines from PHC 4 4 2 1 4 15 39.5
No. of GP reporting about
Roles/Responsibilities is working under NRHM 8 8 8 7 6 37 97.4maintain any VHP 3 0 1 3 3 10 26.3discuss VHP with villagers 5 1 1 4 2 13 34.2analyze key issues/problems related to village level health & nutrition
0 0 0 1 4 5 13.2
maintain any village health calendar 0 0 0 0 0 0 0 Meeting/Record keeping
maintain any village health register 0 4 1 0 4 9 23.7have any demographic data of the village 1 0 1 0 2 4 10.5maintain infant and maternal audit 1 0 0 0 2 3 7.9 have record of ANM 5 0 8 1 6 20 52.6organize regular meetings 7 6 8 3 7 31 81.6
No. of GP reporting about VHSC
maintain records of meeting organized 7 3 4 3 6 23 60.5Roles in providing common facilities
Safe drinking water in village 8 8 8 5 7 36 94.7No. of GP reported about
community toilets in village 0 0 0 1 0 1 2.6

78
Evaluation Study of N
ational Rural H
ealth Mission (N
RH
M) in 7 States
Village/GP/VHSC in Jammu & Kashmir Combined Indicators District Jammu Udhampur Doda Baramula Budgam Number %
Good status of village sanitation 0 3 1 1 0 5 13.2VHSC has provision of Jan Samwad /Dialouge 0 0 0 1 0 1 2.6 Proper connectivity to SC/PHC/CHC 8 8 8 7 7 38 100.0Communication facilities in village 7 5 4 6 3 25 65.8
Grant/Aid VHSC receives untied funds from government 7 0 0 4 3 14 36.8VHSC facing any problem in implementation of NRHM
0 4 6 2 5 17 44.7
VHSC satisfied with progress and implementation of NRHM
8 2 2 6 4 22 57.9

E
valuation Study of National R
ural Health M
ission (NR
HM
) in 7 States 79
Village Health & Sanitation Committee at village level in Tamilnadu Village/GP/VHSC in Tamilnadu Combined
Indicators District Kanchipuram Salem Madurai Tuticorin Nagapattanam Number % No of GP covered in each district 7 7 8 7 8 37 100
Opinion regarding services existing of VHSC in sample village 0 0 0 0 0 0 0 existence of any PHC in village 0 1 1 2 1 5 13.5existence of any SC in village 7 7 7 7 8 36 97.3SC provide timely services to patients 7 7 8 7 8 37 100.0PHC provide timely services to patients 7 7 5 7 7 33 89.2villagers are satisfied by services of SC 7 7 7 7 8 36 97.3villagers are satisfied by services of PHC 7 6 3 6 6 28 75.7night stay facility in SC 3 1 3 2 4 13 35.1night stay facility in PHC 3 2 2 2 6 15 40.5villagers got free services/medicines from SC 5 4 5 7 7 28 75.7villagers got free services/medicines from PHC 5 4 6 7 6 28 75.7
No. of GP reporting about
Roles/Responsibilities is working under NRHM 7 5 8 7 8 35 94.6maintain any VHP 4 5 8 7 8 32 86.5discuss VHP with villagers 4 3 2 6 8 23 62.2analyze key issues/problems related to village level health & nutrition
3 5 3 7 3 21 56.8
maintain any village health calendar 5 2 4 4 3 18 48.6Meeting/Record keeping
maintain any village health register 7 6 8 7 6 34 91.9have any demographic data of the village 6 5 8 3 0 22 59.5maintain infant and maternal audit 5 2 5 1 8 21 56.8have record of ANM 4 0 8 2 4 18 48.6organize regular meetings 6 5 8 5 8 32 86.5
No. of GP reporting about VHSC
maintain records of meeting organized 7 3 5 5 8 28 75.7Roles in providing common facilities
Safe drinking water in village 7 7 8 7 8 37 100 community toilets in village 5 2 7 6 6 26 70.3
No. of GP reported about
Good status of village sanitation 3 6 8 6 7 30 81.1

80
Evaluation Study of N
ational Rural H
ealth Mission (N
RH
M) in 7 States
Village/GP/VHSC in Tamilnadu Combined Indicators District Kanchipuram Salem Madurai Tuticorin Nagapattanam Number %
VHSC has provision of Jan Samwad /Dialouge 4 1 0 2 8 15 40.5Proper connectivity to SC/PHC/CHC 7 7 5 6 8 33 89.2Communication facilities in village 7 5 5 6 8 31 83.8
Grant/Aid VHSC receives untied funds from government 7 7 8 6 8 36 97.3VHSC facing any problem in implementation of NRHM
1 3 1 0 4 9 24.3
VHSC satisfied with progress and implementation of NRHM
7 7 8 7 5 34 91.9

E
valuation Study of National R
ural Health M
ission (NR
HM
) in 7 States 81
Accredited Social H
ealth Activist

82
Evaluation Study of N
ational Rural H
ealth Mission (N
RH
M) in 7 States
Accredited Social Health Activist Roles in Uttar Pradesh ASHAs roles & responsibilities in Sampled districts of Uttar Pradesh Combined
Indicator Districts Mathura Saharanpur Mahoba Sultanpur Mau Unnao Number % No of ASHAs covered in each selected district 13 8 9 18 19 8 75 100receiving any kind of compensation/incentives 9 7 6 17 18 5 62 83got money in advance for providing services in emergency
9 0 0 5 8 1 23 31
staying in the serving village 13 8 7 17 18 6 69 92creating awareness and other related H&FW programme 12 8 9 16 19 8 72 96ever contacted with deprived section of the society 5 6 7 9 8 6 41 55able to provide timely services to people 11 8 9 18 19 8 73 97received drug kit 9 8 8 14 16 7 62 83provide common medicines to patient in need 12 8 9 14 15 5 63 84common medicines available all times in the kit 8 8 5 6 3 4 34 45undergone any training programme 13 8 9 18 18 8 74 99got TA/DA during training 11 8 9 14 4 8 54 72got TA/DA while called to attend/participate in monthly/bi0.0monthly meetings
6 6 7 1 1 7 28 37
ASHAs co-ordination with other bodies working with VHSC/RCH committee 9 7 5 10 4 3 38 51role in preparing Village Health Plan 8 2 2 3 9 6 30 40co-ordination with Gram0.0Panchayat 9 3 8 6 9 8 43 57helping ANM/AWW 13 8 8 7 19 8 63 84meeting with ANM/AWW 10 8 9 13 17 7 64 85interaction with any SHG 1 1 2 1 0 4 9 12attend meeting in village related to women/ health/ panchayats/others
7 8 8 7 11 6 47 63
maintain Register for Village Health 11 8 9 14 14 8 64 85organise Village Health & nutrition day 5 7 7 5 13 3 40 53
No. of ASHAs
monthly meeting at PHC level 9 8 4 1 3 7 32 43

E
valuation Study of National R
ural Health M
ission (NR
HM
) in 7 States 83
Accredited Social Health Activist Roles in Madhya Pradesh ASHAs roles & responsibilities in Sampled districts of Madhya Pradesh Combined
Indicator Districts Katni Nimach Vidisha Shivpuri Hoshangabad Dhar Number % No of ASHAs covered in each selected district 9 7 8 13 6 3 46 100
receiving any kind of compensation/incentives 9 7 8 13 6 3 46 100 got money in advance for providing services in emergency
6 7 8 13 6 3 43 93.5
staying in the serving village 1 0 0 4 0 0 5 10.9creating awareness and other related H&FW programme 9 6 8 13 6 3 45 97.8ever contacted with deprived section of the society 7 0 5 12 5 1 30 65.2able to provide timely services to people 9 7 8 13 6 3 46 100.0received drug kit 9 7 8 10 5 3 42 91.3provide common medicines to patient in need 8 6 8 13 6 3 44 95.7common medicines available all times in the kit 5 4 7 9 5 0 30 65.2undergone any training programme 9 7 8 12 6 3 45 97.8got TA/DA during training 9 7 7 13 6 2 44 95.7got TA/DA while called to attend/participate in monthly/bi0.0monthly meetings
9 0 6 12 5 0 32 69.6
ASHAs co-ordination with other bodies working with VHSC/RCH committee 8 6 7 9 5 3 38 82.6role in preparing Village Health Plan 9 5 3 6 4 2 29 63.0co-ordination with Gram0.0Panchayat 9 3 5 10 5 0 32 69.6helping ANM/AWW 9 7 8 13 6 3 46 100.0meeting with ANM/AWW 8 7 7 13 6 3 44 95.7interaction with any SHG 2 1 2 3 3 3 14 30.4attend meeting in village related to women/ health/ panchayats/others
9 6 7 9 6 3 40 87.0
maintain Register for Village Health 9 6 6 11 5 3 40 87.0organise Village Health & nutrition day 5 4 6 3 6 2 26 56.5
No. of ASHAs
monthly meeting at PHC level 7 0 6 10 4 1 28 60.9

84
Evaluation Study of N
ational Rural H
ealth Mission (N
RH
M) in 7 States
Accredited Social Health Activist Roles in Jharkhand ASHAs roles & responsibilities in Sampled districts of Jharkhand Combined
Indicator Districts Ranchi Dhanbad Giridih W. Singhbhum
Chatra Number %
No of ASHAs covered in each selected district 11 14 8 8 9 50 100receiving any kind of compensation/incentives 10 14 8 8 9 49 98got money in advance for providing services in emergency 7 3 1 6 8 25 50staying in the serving village 1 0 0 0 0 1 2 creating awareness and other related H&FW programme 11 14 7 5 4 41 82ever contacted with deprived section of the society 7 14 6 7 5 39 78able to provide timely services to people 11 14 8 8 9 50 100received drug kit 5 4 1 8 1 19 38provide common medicines to patient in need 8 4 2 6 1 21 42common medicines available all times in the kit 7 10 7 3 7 34 68undergone any training programme 11 14 7 8 9 49 98got TA/DA during training 9 14 0 2 2 27 54got TA/DA while called to attend/participate in monthly/bi0.0monthly meetings
6 13 0 0 1 20 40
ASHAs co-ordination with other bodies working with VHSC/RCH committee 6 13 5 7 7 38 76role in preparing Village Health Plan 3 13 3 3 22 44co-ordination with Gram0.0Panchayats 9 2 2 0 0 13 26helping ANM/AWW 11 14 6 8 8 47 94meeting with ANM/AWW 11 14 5 8 9 47 94interaction with any SHG 5 0 0 0 0 5 10attend meeting in village related to women/health/panchayats/others
9 4 1 7 9 30 60
maintain Register for Village Health 10 13 4 4 3 34 68organize Village Health & nutrition day 7 1 0 4 2 14 28
No. of ASHAs
monthly meeting at PHC level 11 11 5 2 2 31 62

E
valuation Study of National R
ural Health M
ission (NR
HM
) in 7 States 85
Accredited Social Health Activist Roles in Orissa ASHAs roles & responsibilities in Sampled districts of Orissa Combined
Indicator Districts Rayagada Balangir Kendujhar Kendrapara Puri Number % No of ASHAs covered in each selected district 8 10 9 10 10 47 100 receiving any kind of compensation/incentives 8 10 9 10 10 47 100 got money in advance for providing services in emergency 6 10 7 10 10 43 91.5staying in the serving village 0 0 0 0 0 0 0.0 creating awareness and other related H&FW programme 7 10 9 10 10 46 97.9ever contacted with deprived section of the society 4 10 3 2 4 23 48.9able to provide timely services to people 8 10 9 10 10 47 100.0received drug kit 8 10 8 10 10 46 97.9provide common medicines to patient in need 8 10 7 9 10 44 93.6common medicines available all times in the kit 4 0 5 8 10 27 57.4undergone any training programme 8 10 9 10 10 47 100.0got TA/DA during training 8 10 8 9 9 44 93.6got TA/DA while called to attend/participate in monthly/bi0.0monthly meetings
8 10 4 7 6 35 74.5
ASHAs co-ordination with other bodies working with VHSC/RCH committee 4 8 9 10 10 41 87.2role in preparing Village Health Plan 3 10 5 6 9 33 70.2co-ordination with Gram0.0Panchayats 7 10 5 4 1 27 57.4helping ANM/AWW 8 10 9 10 10 47 100.0meeting with ANM/AWW 8 10 9 10 10 47 100.0interaction with any SHG 0 1 2 8 3 14 29.8attend meeting in village related to women/health/panchayats/others
6 5 9 8 8 36 76.6
maintain Register for Village Health 8 9 9 9 8 43 91.5organize Village Health & nutrition day 6 2 8 10 10 36 76.6
No. of ASHAs
monthly meeting at PHC level 8 10 9 10 10 47 100.0

86
Evaluation Study of N
ational Rural H
ealth Mission (N
RH
M) in 7 States
Accredited Social Health Activist Roles in Assam ASHAs roles & responsibilities in Sampled districts of Assam Combined
Indicator District Barpeta Sonitpur Darrang Dibrugarh Chachar Number % No of ASHAs covered in each selected district 8 10 12 8 9 47 100receiving any kind of compensation/incentives 8 10 12 8 9 47 100got money in advance for providing services in emergency 8 10 12 8 9 47 100staying in the serving village 0 0 0 0 0 0 0 creating awareness and other related H&FW programme 8 10 12 8 9 47 100ever contacted with deprived section of the society 6 3 12 4 7 32 68.1able to provide timely services to people 8 10 12 8 9 47 100received drug kit 8 9 12 7 8 44 93.6provide common medicines to patient in need 8 10 12 7 9 46 97.9common medicines available all times in the kit 1 10 2 7 3 23 48.9undergone any training programme 8 10 12 8 9 47 100got TA/DA during training 8 10 12 7 9 46 97.9got TA/DA while called to attend/participate in monthly/bi0.0monthly meetings
8 4 12 0 7 31 66.0
ASHAs co-ordination with other bodies working with VHSC/RCH committee 8 10 12 8 9 47 100role in preparing Village Health Plan 7 9 12 5 7 40 85.1co-ordination with Gram0.0Panchayat 8 2 12 3 8 33 70.2helping ANM/AWW 8 10 12 8 9 47 100meeting with ANM/AWW 8 10 12 8 9 47 100interaction with any SHG 0 6 0 0 2 8 17.0attend meeting in village related to women/health/panchayats/others
8 10 11 8 7 44 93.6
maintain Register for Village Health 7 10 11 4 9 41 87.2organize Village Health & nutrition day 1 9 4 5 6 25 53.2
No. of ASHAs
monthly meeting at PHC level 8 6 11 1 6 32 68.1

E
valuation Study of National R
ural Health M
ission (NR
HM
) in 7 States 87
Accredited Social Health Activist Roles in Jammu & Kashmir ASHAs roles & responsibilities in Sampled districts of Jammu & Kashmir Combined
Indicator Districts Jammu Udhampur Doda Baramula Budgam Number % No of ASHAs covered in each selected district 9 8 8 9 8 42 100
receiving any kind of compensation/incentives 9 8 8 9 8 42 100 got money in advance for providing services in emergency 9 7 8 9 8 41 97.6staying in the serving village 0 0 1 0 0 1 2.4 creating awareness and other related H&FW programme 8 6 7 8 8 37 88.1ever contacted with deprived section of the society 1 3 1 4 1 10 23.8able to provide timely services to people 9 8 8 9 8 42 100.0received drug kit 7 8 8 8 7 38 90.5provide common medicines to patient in need 5 8 7 6 5 31 73.8common medicines available all times in the kit 1 1 1 1 1 5 11.9undergone any training programme 9 8 8 9 8 42 100.0got TA/DA during training 9 3 8 4 7 31 73.8got TA/DA while called to attend/participate in monthly/bi0.0monthly meetings
0 2 0 0 0 2 4.8
ASHAs co-ordination with other bodies working with VHSC/RCH committee 4 3 6 3 7 23 54.8role in preparing Village Health Plan 1 5 6 2 1 15 35.7co-ordination with Gram0.0Panchayat 1 1 1 2 2 7 16.7helping ANM/AWW 9 8 8 9 8 42 100.0meeting with ANM/AWW 9 8 8 9 8 42 100.0interaction with any SHG 0 0 0 0 0 0 0.0 attend meeting in village related to women/health/panchayats/others
8 8 7 8 7 38 90.5
maintain Register for Village Health 4 6 8 5 8 31 73.8organize Village Health & nutrition day 3 7 7 6 8 31 73.8
No. of ASHAs
monthly meeting at PHC level 6 6 5 7 8 32 76.2

88
Evaluation Study of N
ational Rural H
ealth Mission (N
RH
M) in 7 States
Household C
haracteristics

E
valuation Study of National R
ural Health M
ission (NR
HM
) in 7 States 89
Household Characteristics of 7 states of India
Background characteristic Background characteristics of HH UP MP Jharkhand Orissa Assam Jammu &
KashmirTamilnadu Grand
% Grand Total
1200 1200 1000 1000 1000 1000 1000 100 7400 Male 92.2 95.6 97.0 98.7 97.1 99.1 99.0 96.8 7162 Female 7.8 4.4 3.0 1.3 2.9 0.9 1.0 3.2 238 Sex of the Head
Total 1200 1200 1000 1000 1000 1000 1000 100.0 7400 SC 34.3 13.8 19.1 19.2 10.1 17.7 26.9 20.4 1507 ST 2.8 21.6 32.3 27.7 12.2 2.2 1.2 14.2 1049 OBC 36.1 50.4 41.3 28.5 42.3 18.8 58.2 39.6 2929 Others 26.8 14.2 7.3 24.6 35.4 61.3 13.7 25.9 1915
Social category
Total 1200 1200 1000 1000 1000 1000 1000 100.0 7400 Hindu 94.0 97.8 91.6 99.1 72.0 48.8 96.6 86.2 6382 Muslim 5.8 2.1 8.4 0.6 27.0 50.5 1.0 13.1 969 Others 0.3 0.1 0 0.3 1.0 0.7 2.4 0.7 49
Religion
Total 1200 1200 1000 1000 1000 1000 1000 100.0 7400 Joint 38.3 34.6 32.1 34.3 40.5 26.9 16.4 32.1 2377 Nuclear 61.7 65.4 67.9 65.7 59.5 73.1 83.6 67.9 5023 Type of Family
Total 1200 1200 1000 1000 1000 1000 1000 100.0 7400 <25000 41.1 42.8 43.2 46.4 26.5 7.6 39.3 35.6 2636 25000-50000 43.4 41.0 44.6 44.0 59.0 58.4 52.9 48.7 3602 >50000 15.5 16.3 12.2 9.6 14.5 34.0 7.8 15.7 1162
Total Income of HH
Total 1200 1200 1000 1000 1000 1000 1000 100.0 7400 1 76.6 81.8 86.8 87.4 80.9 94.4 90.5 85.1 6299 2 18.4 15.2 11.3 11.5 16.7 5.2 9.0 12.7 940 3+ 4.9 3.1 1.9 1.1 2.4 0.4 0.5 2.2 161
Total No. of earning member
Total 1200 1200 1000 1000 1000 1000 1000 100.0 7400 1 75.0 27.8 26.1 100.0 50.0 62.5 33.3 54.1 66 2 17.5 27.8 17.4 0.0 25.0 25.0 66.7 22.1 27 3+ 7.5 44.4 56.5 0.0 25.0 12.5 0.0 23.8 29
Members of family are insured for health
Total 40 18 23 2 4 32 3 100.0 122

90
Evaluation Study of N
ational Rural H
ealth Mission (N
RH
M) in 7 States
Background characteristics of HH UP MP Jharkhand Orissa Assam Jammu & Kashmir
Tamilnadu Grand %
Grand Total
Members of the HH 1-5 member 58.8 69.1 73.0 80.2 76.2 82.8 94.5 75.7 5601 6-10 member 38.8 30.6 26.8 19.8 23.5 17.2 5.5 23.8 1760 10+ member 2.5 0.3 0.2 0.0 0.3 0.0 0.0 0.5 39 Total members in the HH
Total 1200 1200 1000 1000 1000 1000 1000 100.0 7400 1 60.4 66.0 67.2 73.0 73.2 66.3 74.0 68.6 3096 2 34.7 30.0 31.2 26.5 26.1 30.7 25.4 29.5 1331 3+ 4.9 4.0 1.6 0.5 0.7 3.0 0.6 1.9 88 No. of children, 00.05 years
Total 753 744 615 586 586 564 684 100.0 4515 Land Owned
< 1 acre 19.2 11.7 31.0 19.8 8.3 5.4 26.8 15.2 545 1-3 acres 42.9 38.5 47.2 46.7 64.4 52.8 63.4 48.2 1731 4-6 acres 12.0 23.3 13.3 22.4 18.3 24.7 7.3 19.3 693 7-9 acres 8.3 8.4 2.8 5.1 5.8 5.5 0.0 6.2 223 >10 acres 17.6 18.1 5.7 6.0 3.2 11.6 2.4 11.2 401
Total Land Owned
Total 615 802 458 514 531 632 41 100.0 3593

E
valuation Study of National R
ural Health M
ission (NR
HM
) in 7 States 91
Household facilities HH Details UP MP Jharkhand Orissa Assam Jammu &
KashmirTamilnadu Grand
% Grand Total
1200 1200 1000 1000 1000 1000 1000 7400 7400Pucca 17.7 11.7 7.5 6.4 24.8 26.4 17.5 15.9 1178Semi-Pucca 50.3 40.7 40.0 36.7 60.4 60.6 74.1 51.5 3809Kuchha 31.1 46.9 52.5 56.8 14.7 13.0 8.4 32.3 2390Others 1.0 0.8 0.0 0.1 0.1 0.0 0.0 0.3 23
Type of House
Total 1200 1200 1000 1000 1000 1000 1000 100.0 7400Own 99.2 98.3 98.4 98.9 99.4 99.7 93.7 98.3 7271Rented 0.8 1.7 1.6 1.1 0.6 0.3 6.3 1.7 129Ownership of House
Total 1200 1200 1000 1000 1000 1000 1000 100.0 7400Yes 29.5 31.8 21.0 24.6 64.9 65.4 47.0 40.1 2964Separate kitchen
Total 1200 1200 1000 1000 1000 1000 1000 100.0 7400Yes 27.9 33.8 14.7 9.3 58.6 58.7 37.5 34.2 2528Toilet inside the house Total 1200 1200 1000 1000 1000 1000 1000 100.0 7400Electricity 49.9 55.5 39.1 52.2 80.7 88.3 97.9 65.5 4847Kerosene lamps 47.5 41.6 58.1 43.2 19.3 11.7 1.8 32.6 2410Others 2.6 2.9 2.8 4.6 0.0 0.0 0.3 1.9 143
Main source of lighting in the house
Total 1200 1200 1000 1000 1000 1000 1000 100.0 7400Yes 63.8 52.1 32.4 34.2 82.6 84.6 95.7 63.3 4686Source of drinking water Total 1200 1200 1000 1000 1000 1000 1000 100.0 7400Tap 2.5 12.0 2.2 4.7 26.5 30.9 87.3 30.6 1432Hand pump 95.0 81.9 76.9 67.0 68.9 65.7 9.8 62.7 2937Well 1.7 6.1 17.3 21.3 0.8 0.1 0.3 4.1 191Others 0.8 0.0 3.7 7.0 3.8 3.3 2.6 2.7 126
Source of drinking water
Total 766 625 324 342 826 846 957 100.0 4686Yes 86.5 52.1 31.9 94.2 84.1 83.0 95.4 75.0 5549Is that water potable Total 1200 1200 1000 1000 1000 1000 1000 100.0 7400Boil 5.6 0.0 0.4 5.2 4.4 2.4 2.2 1.5 27Filter 7.4 0.0 0.1 0.0 3.1 2.4 2.2 1.2 23Drink as it is 80.2 100.0 99.1 94.8 92.5 95.3 95.7 96.6 1788Others 6.8 0.0 0.3 0.0 0.0 0.0 0.0 0.7 13
If no, how do you purify it
Total 162 575 681 58 159 170 46 100.0 1851

92
Evaluation Study of N
ational Rural H
ealth Mission (N
RH
M) in 7 States
HH Details UP MP Jharkhand Orissa Assam Jammu & Kashmir
Tamilnadu Grand %
Grand Total
Diarrhea/Haiza 70.6 44.9 61.6 63.0 54.4 60.0 42.0 54.9 3077Jaundice 7.2 9.9 4.2 4.5 15.5 14.3 11.0 9.9 555Fever 14.9 6.3 26.0 29.4 28.0 25.2 45.4 26.0 1458Stomach infection 7.2 38.9 8.2 3.2 2.1 0.5 1.6 9.1 512
Perception about disease because of impure drinking water
Total 884 857 404 824 807 830 995 100.0 5602Dung cake 50.1 48.8 21.3 16.6 36.1 39.2 0.7 31.4 2326Wood 44.6 46.5 67.0 81.9 48.6 42.9 68.7 56.5 4184Kerosene 0.1 1.5 0.2 0.7 1.9 2 2.5 1.2 92Conventional energy 0.1 0.0 0.1 0.0 0.0 0.0 0.0 0.0 3LPG 5.2 3.2 2.0 0.7 13.4 15.9 28 9.5 700Electricity 0.0 0.0 0.1 0.0 0.0 0.0 0.1 0.0 1Others 0.0 0.0 9.3 0.1 0.0 0.0 0.0 1.3 94
Cooking fuel used in the House
Total 1200 1200 1000 1000 1000 1000 1000 100.0 7400

E
valuation Study of National R
ural Health M
ission (NR
HM
) in 7 States 93
ANC Services access by pregnant women Married women availing Anti natal care UP MP Jharkhand Orissa Assam JK Tamilnadu Grand
% Grand Total
1200 1200 1000 1000 1000 1000 1000 100 7400<3 months 7.4 10.8 6.2 9.5 5.8 14.7 8.0 8.8 1403-6 months 46.1 42.8 61.1 51.0 56.3 39.2 27.8 46.0 7297-9 months 46.5 46.4 32.7 39.5 37.9 46.1 64.1 45.1 715
Pregnancy registration
Total 258 250 211 200 224 204 237 100.0 1584 Yes 46.5 73.2 74.9 87.5 89.7 80.9 98.3 78.0 1235Whether going for any ANC Total 258 250 211 200 224 204 237 100.0 1584ASHA/ANM/VHM 20.8 32.8 32.9 25.7 6.0 29.7 0.9 19.8 245SC 24.2 32.8 44.3 37.1 67.7 47.9 53.2 45.6 563PHC 7.5 13.7 11.4 23.4 17.4 14.5 45.5 20.9 258CHC 19.2 12.0 2.5 11.4 7.0 1.8 0.0 7.0 86Dist Hospital 3.3 2.2 1.9 0.6 1.5 3.6 0.4 1.8 22Private Doctor 13.3 2.2 3.2 1.1 0.0 1.2 0.0 2.3 29Private Hospital 11.7 4.4 3.8 0.6 0.5 1.2 0.0 2.6 32
Whether going for prenatal check up / Place of check up
Total 120 183 158 175 201 165 233 100.0 1235Within the village 59.2 88.0 86.7 66.9 92.5 92.7 99.6 85.6 1057In other Village 40.8 12.0 13.3 33.1 7.5 7.3 0.4 14.4 178Distance of SC from Village Total 120 183 158 175 201 165 233 100.0 1235B.P 68.3 100.0 98.7 94.3 98.5 98.2 85.0 92.6 1144Height 58.3 68.9 77.8 70.3 74.1 66.7 72.1 70.4 869Weight 59.2 99.5 94.3 87.4 95.0 89.7 85.8 88.6 1094Urine 42.5 84.2 60.8 52.0 58.7 50.3 48.1 57.1 705Blood check up 31.7 15.8 1.9 1.7 1.5 0.0 1.3 19.8 244
Check ups
Total 120 183 158 175 201 165 233 100.0 1235Yes 79.8 97.6 94.3 93.5 95.9 100.0 92.0 92.9 1472Vaccinated with Anti-Tetanus Total 258 250 211 200 224 204 237 100.0 1584Diet 61.6 79.2 72.5 79.0 73.7 94.1 71.7 75.4 1195Exercise 60.9 77.6 72.0 76.0 67.9 94.1 71.7 73.8 1169Precautions 60.9 79.2 42.7 75.0 69.2 94.1 71.7 70.2 1112
Whether ASHA/ANM helps in any pregnancy related problems
Total 258 250 211 200 224 204 237 100.0 1584Grand Total 258 250 211 200 224 204 237 1584 1584

94
Evaluation Study of N
ational Rural H
ealth Mission (N
RH
M) in 7 States
Delivery Care during birth of children Services regarding Delivery UP MP Jharkhand Orissa Assam JK Tamilnadu Grand % Grand
Total 1200 1200 1000 1000 1000 1000 1000 100.0 7400
Normal 96.7 96.9 95.6 97.6 96.6 99.1 87.8 95.8 6058Caesarian 3.3 3.1 4.4 2.4 3.4 0.9 12.2 4.2 268Type of Delivery Total 1130 1050 881 793 833 779 860 100.0 6326Home 54.2 37.7 53.9 47.4 43.1 62.0 4.2 43.3 2738SC 1.9 1.0 1.1 0.1 0.1 0.0 4.0 1.3 81PHC 7.8 25.0 23.4 17.9 20.8 10.0 61.7 23.4 1480CHC 19.6 28.0 2.2 24.3 20.9 15.0 4.7 16.7 1058DH 6.3 6.9 4.8 8.3 10.8 11.7 19 9.4 595Private clinics 10.2 1.4 14.6 1.6 4.3 1.3 6.5 5.9 374
Place of Delivery
Total 1130 1050 881 793 833 779 860 100.0 6326<1.8 kgs 5.0 8.5 3.7 7.1 5.3 1.3 4.9 5.2 3301.8-2.5 Kgs 39.2 65.1 22.5 23.6 39.1 17.6 58.3 39.3 2486>2.5 kgs 22.9 26.4 22.8 28.5 29.3 20.9 32.4 26.1 1649Not taken 32.9 0.0 51.0 40.9 26.3 60.2 4.4 29.4 1861
Weight of baby at birth
Total 1130 1050 881 793 833 779 860 100.0 6326
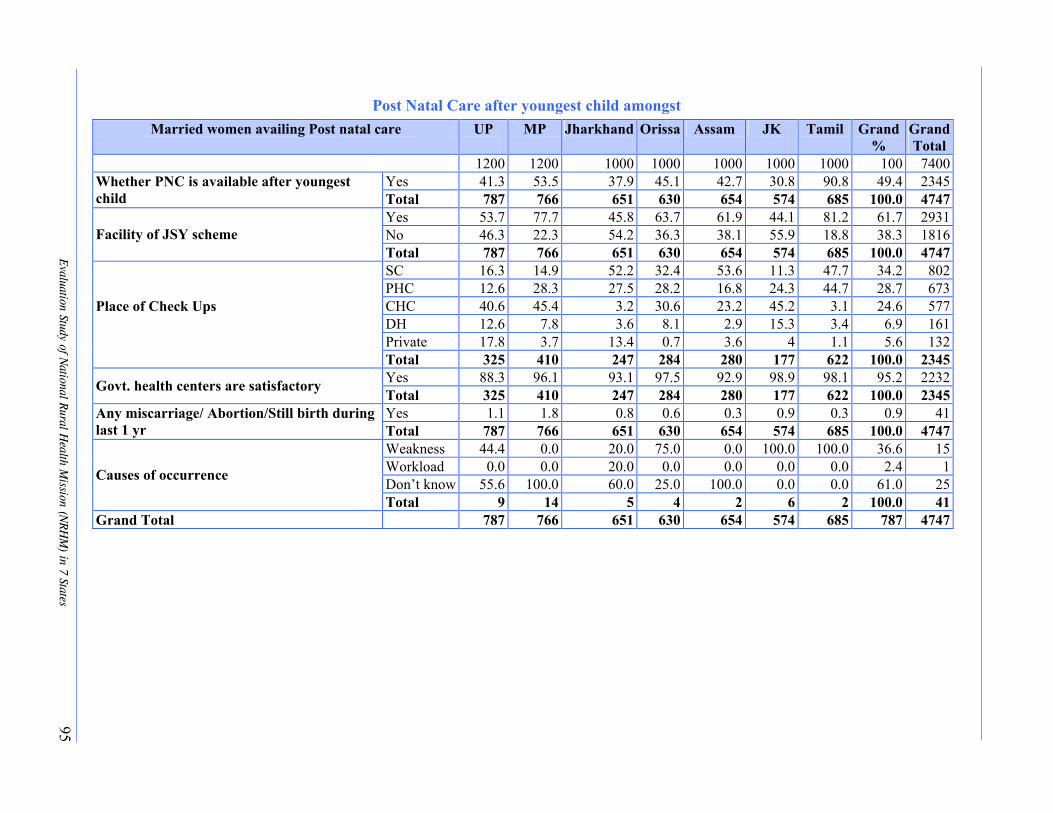
E
valuation Study of National R
ural Health M
ission (NR
HM
) in 7 States 95
Post Natal Care after youngest child amongst Married women availing Post natal care UP MP Jharkhand Orissa Assam JK Tamil Grand
% Grand Total
1200 1200 1000 1000 1000 1000 1000 100 7400Yes 41.3 53.5 37.9 45.1 42.7 30.8 90.8 49.4 2345Whether PNC is available after youngest
child Total 787 766 651 630 654 574 685 100.0 4747Yes 53.7 77.7 45.8 63.7 61.9 44.1 81.2 61.7 2931No 46.3 22.3 54.2 36.3 38.1 55.9 18.8 38.3 1816Facility of JSY scheme Total 787 766 651 630 654 574 685 100.0 4747SC 16.3 14.9 52.2 32.4 53.6 11.3 47.7 34.2 802PHC 12.6 28.3 27.5 28.2 16.8 24.3 44.7 28.7 673CHC 40.6 45.4 3.2 30.6 23.2 45.2 3.1 24.6 577DH 12.6 7.8 3.6 8.1 2.9 15.3 3.4 6.9 161Private 17.8 3.7 13.4 0.7 3.6 4 1.1 5.6 132
Place of Check Ups
Total 325 410 247 284 280 177 622 100.0 2345Yes 88.3 96.1 93.1 97.5 92.9 98.9 98.1 95.2 2232Govt. health centers are satisfactory Total 325 410 247 284 280 177 622 100.0 2345Yes 1.1 1.8 0.8 0.6 0.3 0.9 0.3 0.9 41Any miscarriage/ Abortion/Still birth during
last 1 yr Total 787 766 651 630 654 574 685 100.0 4747Weakness 44.4 0.0 20.0 75.0 0.0 100.0 100.0 36.6 15Workload 0.0 0.0 20.0 0.0 0.0 0.0 0.0 2.4 1Don’t know 55.6 100.0 60.0 25.0 100.0 0.0 0.0 61.0 25Causes of occurrence
Total 9 14 5 4 2 6 2 100.0 41Grand Total 787 766 651 630 654 574 685 787 4747

96
Evaluation Study of N
ational Rural H
ealth Mission (N
RH
M) in 7 States
Immunization and Child Care of children aged 0-5 years Immunization & Child Care UP MP Jharkhand Orissa Assam JK Tamil Grand
% GrandTotal
1200 1200 1000 1000 1000 1000 1000 100.0 7400BCG 98.4 96.5 99.8 99.5 100.0 100.0 99.8 99 6207DPT 1,2 & 3 93.7 93.0 97.7 91.0 98.3 97.1 96.0 95.2 5967Polio 1,2 & 3 82.8 96.6 94.4 84.4 98.0 95.8 91.3 90.1 5652Measles 41.2 62.1 66.4 56.2 73.5 69.9 66.4 61.4 3849Hepatitis 13 8.0 21.9 4.3 2.2 1.6 19.4 9.7 607
Whether vaccinated
Total 1094 1050 869 793 833 771 860 100.0 6270Yes 82.3 87.2 88.0 94.7 78.6 80.9 72.0.0 83.4 5230No 17.7 12.8 12.0 5.3 21.4 19.1 28 16.6 1040Have immunization card
Total 1094 1050 869 793 833 771 860 100.0 6270Lost 85.0 70.9 100.0 97.6 92.8 99.3 96.3 91.1 947Not Available 15.0 29.1 0.0 2.4 7.2 0.7 3.8 8.9 93No give reason Total 193 134 104 42 180 147 240 100.0 1040SC 62.8 74.0 70.9 48.4 87.5 88.7 43.0 67.7 4247PHC 5.9 0.7 0.2 0.9 0.5 0.3 55.1 8.9 560CHC 2.7 0.9 0.0 0.0 0.0 0.0 0.1 0.6 39DH 0.5 0.1 0.0 0.0 0.1 0.0 0.5 0.2 11Govt. mobile clinic 0.3 0.0 0.0 0.0 0.0 0.0 0.0 0.0 3ANM/AWW/MHW/ASHA 24.1 21.9 27.5 47.4 11.8 11.0 1.2 20.8 1302Private doctor 1.7 0.1 0.0 0.0 0.1 0.0 0.0 0.3 20Any other 1.3 2.4 1.4 3.3 0.0 0.0 0.1 1.4 88
Place for availing most of the facility of vaccination
Total 1094 1050 869 793 833 771 860 100.0 6270Yes 0.8 0.1 0.7 0.8 0.2 0.0 2.8 0.6 41Suffering from Polio Total 1130 1050 881 793 833 779 860 100.0 6326Yes 28.1 37.3 32.8 34.4 57.0 29.0 14.4 33.1 2096Use of Bed net Total 1130 1050 881 793 833 779 860 100.0 6326<4 months 15.1 14.9 21.5 18.5 14.7 1.6 53.3 19.7 12494-6 months 57.0 48.3 53.3 52.3 64.0 59.0 39.2 53.6 3392>6 months 27.9 36.8 25.2 29.1 21.3 39.4 7.6 26.6 1685Age up to Child only breast fed
Total 1130 1044 876 793 828 769 860 100.0 6326

E
valuation Study of National R
ural Health M
ission (NR
HM
) in 7 States 97
Family planning services utilization Family Planning UP MP Jharkhan
d Orissa Assam JK Tamil Grand
% Grand Total
1200 1200 1000 1000 1000 1000 1000 7400 7400Yes 42.3 53.7 54.7 53.4 65.5 61.6 63.3 56.0 3940No 57.7 46.3 45.3 46.6 34.5 38.4 36.7 44.0 3102You/ husband using any
Family Planning method Total 1111 1139 960 976 968 968 920 100.0 7042Female Sterilization 23.4 38.9 21.7 28.4 12.1 9.1 58.1 27.4 1079Non scalpel Vasectomy 0.2 0.3 0.8 0.4 0.0 0.3 0.2 0.3 12IUD/Copper-T/Loop 4.9 4.4 3.8 4.4 1.7 3.9 25.4 7.0 275Oral Pills 12.3 19.6 26.1 28.4 30.6 33.6 8.1 22.9 904Condom/ Nirodh 56.4 36.8 45.0 37.8 54.7 53.2 8.1 41.5 1634Rhythm/periodic abstinence 0.4 0.0 0.4 0.0 0.5 0.0 0.0 0.2 7Withdrawal 0.4 0.0 1.1 0.2 0.3 0.0 0.2 0.3 12Other Trad. Method (specify) 1.9 0.0 1.1 0.4 0.0 0.0 0.0 0.4 17
Which method you/ your husband using
Total 470 612 525 521 634 596 582 100.0 3940ASHA 59.6 40.5 24.2 35.5 18.5 24.2 46.2 34.8 1370ANM 17.0 29.6 40.6 28.6 16.1 45.3 18.6 28.0 1103Doctor 8.9 4.4 1.5 1.2 0.8 6.5 0.5 3.3 130Friends 4.5 3.8 4.6 5.6 5.5 8.6 0.7 4.7 187Relatives 4.5 5.6 9.1 10.6 8.5 5.5 18.4 8.9 352Others(specify) 5.5 16.2 20.0 18.6 50.6 9.9 15.6 20.3 798
Who mainly motivated you to use current method
Total 470 612 525 521 634 596 582 100.0 3940Yes 82.6 88.6 88.2 88.5 69.9 91.1 96.6 86.3 3402Getting contraceptives free
of cost Total 470 612 525 521 634 596 582 100.0 3940ASHA/ANM/ VHW 63.0 51.1 59.0 54.3 45.4 44.3 8.8 45.8 1805Govt. hospital/ CHC /PHC/SC 24.9 40.2 27.2 37.6 24.1 48.2 90.0 42.3 1666Pvt. hospitals/ Doctor/Chemist 7.7 4.1 6.7 5.6 29.2 7.6 1.2 9.2 362NGOS 0.2 0.8 2.7 1.3 0.6 0.0 0.0 0.8 31Others(specify) 4.3 3.8 4.4 1.2 0.6 0.0 0.0 1.9 76
What was the source for getting the method
Total 470 612 525 521 634 596 582 100.0 3940Yes 2.6 1.5 0.6 0.8 0.5 0.5 1.5 1.1 43You/husband had any
health problem while using this method
Total 470 612 525 521 634 596 582 100.0 3940

98
Evaluation Study of N
ational Rural H
ealth Mission (N
RH
M) in 7 States
Family Planning UP MP Jharkhand
Orissa Assam JK Tamil Grand %
Grand Total
Want a Child 45.9 72.3 85.3 80.4 78.1 89.0 90.5 74.5 2310Not having Sex 9.2 8.9 3.9 0.7 1.2 3.0 0.6 4.6 143Method Failed/become pregnant 8.4 4.7 0.9 4.0 1.5 1.6 0.9 3.7 115Relatives opposed 2.2 0.0 0.0 0.4 0.0 0.0 0.0 0.5 16Religious prohibition 1.1 0.0 0.0 0.0 0.3 0.8 0.3 0.4 12Not aware of any method 0.3 0.0 0.0 0.4 0.0 0.0 0.3 0.2 5Not knowing the source of availability
3.3 1.5 9.7 1.1 0.0 0.3 0.6 2.5 79
Inconvenient to use 1.4 0.2 0.0 0.0 0.0 0.0 0.0 0.3 10Health problems 13.3 2.7 1.4 2.6 3.0 1.1 0.9 4.3 134Fear of side effects 4.5 1.3 1.4 0.0 0.6 0.5 0.6 1.5 48Lack of sexual satisfaction 0.5 1.5 2.1 1.1 0.6 3.2 0.3 1.3 40Others (specify) 14.7 7.0 7.8 9.5 15.0 0.3 5.0 8.9 276
What is the main reason for not using any method
Total 641 527 435 455 334 372 338 100.0 3102

E
valuation Study of National R
ural Health M
ission (NR
HM
) in 7 States 99
Chronic diseases and curing services Chronic disease UP MP Jharkhand Orissa Assam JK Tamil Grand
% Grand Total
1200 1200 1000 1000 1000 1000 1000 100 7400Malaria 1.4 0.4 0.5 6.3 0.5 0.0 0.5 1.3 21Kala Azar 0.3 2.8 1.4 4.9 1.0 0.0 1.0 1.6 25Filaria/ microfilaria 1.7 0.4 5.7 0.0 0.0 0.0 0.5 1.2 19Cataract 0.7 1.6 0.9 0.0 0.0 0.0 1.5 0.7 11Leprosy 2.8 4.1 9.9 9.8 3.9 0.5 3.0 4.7 74TB 21.1 32.5 41.0 42.9 39.6 33.5 32.3 34.0 532Fever/cold/cough 2.1 1.2 0.9 1.5 1.9 0.0 1.0 1.3 20Hepatitis 1.0 0.4 2.4 1.5 1.4 0.0 1.0 16Diarrhea 0.0 0.0 0.0 0.0 0.0 0.0 0.0 0.0 0.0Cholera 0.0 0.0 0.0 0.0 0.0 0.0 0.0 0.0 0.0Accident 0.7 1.2 1.9 0.5 4.8 0.0 0.5 1.3 21Differently able 0.3 0.0 0.0 0.0 0.0 0.0 0.0 0.1 1Any other 67.8 55.3 35.4 32.7 46.9 66.0 59.7 52.7 826
Suffering from Chronic Disease
Total 289 246 212 205 207 206 201 100.0 1566Govt. 44.6 63.0 69.8 86.8 90.3 83.5 94.0 73.9 1158Pvt. 55.4 37.0 30.2 13.2 9.7 16.5 6.0 26.1 408Total 289 246 212 205 207 206 201 100.0 1566If went to Pvt. reasons Better Treatment 73.1 40.7 82.8 100.0 100.0 32.4 100.0 70.8 289Medicines are not available / Govt. hospital too far /Emergency
26.9 59.3 17.2 0.0 0.0 67.7 0.0 29.2 119
Total 160 91 64 27 20 34 12 100.0 408If govt. ,whether SC 5.4 4.5 14.2 1.7 7.0 13.4 0.5 6.5 75PHC 17.1 19.4 64.9 53.4 38.5 36.6 11.1 34.5 399CHC 60.5 51.0 1.4 24.7 26.2 39.5 17.5 30.5 353DH 17.1 25.2 19.6 20.2 28.3 10.5 70.9 28.6 331
Where you gone for treatment
Total 129 155 148 178 187 172 189 100.0 1158Allopathic 97.9 98.0 99.5 100.0 100.0 100.0 100.0 99.2 1554Which type of treatment was
taken Ayurvadic 1.7 0.8 0.5 0.0 0.0 0.0 0.0 0.5 8

100
Evaluation Study of N
ational Rural H
ealth Mission (N
RH
M) in 7 States
Chronic disease UP MP Jharkhand Orissa Assam JK Tamil Grand %
Grand Total
Yoga 0.0 0.4 0.0 0.0 0.0 0.0 0.0 0.1 1Unani 0.0 0.0 0.0 0.0 0.0 0.0 0.0 0.0 0.0Siddha 0.0 0.0 0.0 0.0 0.0 0.0 0.0 0.0 0.0Homeopathy 0.3 0.8 0.0 0.0 0.0 0.0 0.0 0.2 3Total 289 246 212 205 207 206 201 100.0 1566Yes 86.9 96.3 98.6 98.0 100.0
99.598.0 96.2 1507Whether doctor attended you
carefully Total 289 246 212 205 207 206 201 100.0 1566Yes 37.4 52.7 60.4 75.6 70.0 81.6 90.0 64.9 1016No 62.6 47.3 39.6 24.4 30.0 18.4 10.0 35.1 550Whether medicines received
free of cost Total 289 246 212 205 207 206 201 100.0 1566<500 Rs. 8.3 6.1 2.4 15.4 4.8 2.6 5.0 6.7 37500-1000 Rs. 6.6 5.2 7.1 1.9 3.2 13.2 5.0 5.6 31>1000 Rs. 85.1 88.7 90.5 82.7 91.9 83.8 90.0 87.6 482If no expenditure incurred
Total 181 115 84 50 62 38 20 100.0 550< 3 months 33.9 44.3 42.5 48.8 54.1 2.9 43.8 38.5 6033-6 months 17.6 13.4 25.9 23.4 22.7 25.2 39.8 23.3 3657-10 months 4.5 12.6 8.0 14.1 14.0 21.4 3.5 10.9 170>10 months 43.9 29.7 23.6 13.7 9.2 50.5 12.9 27.3 428
Duration of treatment
Total 289 246 212 205 207 206 201 100.0 1566Yes 14.2 15.0 16.5 11.7 13.6 0.5 5.0 11.2 176Have you been referred to
other doctor/hospital Total 289 246 212 205 207 206 201 100.0 1566Govt. hospital 14.6 16.2 14.3 20.8 17.9 100.0 10.0 16.5 29Pvt. Doctor/clinic 41.5 13.5 20.0 25.0 28.6 0.0 30.0 26.1 46Private hospital 43.9 70.3 65.7 54.2 53.6 0.0 60.0 57.4 101Referred to
Total 41 37 35 24 28 1 10 100.0 176Doctor's fee <300 Rs. 12.2 21.6 3.0 75.0 0.0 0.0 0.0 18.8 33 300-600 Rs. 9.8 5.4 6.1 0.0 3.6 100.0 0.0 6.3 11601-1000 Rs. 7.3 13.5 6.1 8.3 7.1 0.0 20.0 9.1 16>1000 Rs. 70.7 59.5 84.8 16.7 89.3 0.0 80.0 65.9 116
Expenditure
Total 41 37 33 24 28 1 10 100.0 176

E
valuation Study of National R
ural Health M
ission (NR
HM
) in 7 States 101
Chronic disease UP MP Jharkhand Orissa Assam JK Tamil Grand %
Grand Total
Drugs <300 Rs. 66.7 51.4 0.0 50.0 0.0 0.0 0.0 29.4 32300-600 Rs. 16.7 13.5 7.1 38.9 7.7 0.0 14.3 15.6 17601-1000 Rs. 0.0 5.4 0.0 11.1 3.8 0.0 42.9 7.3 8>1000 Rs. 16.7 29.7 92.9 0.0 88.5 100.0 42.9 47.7 52Total 6 37 14 18 26 1 7 100.0 109Special food <300 Rs. 100.0 94.6 12.5 0.0 3.8 0.0 0.0 48.1 39300-600 Rs. 0.0 5.4 25.0 0.0 0.0 100.0 16.7 6.2 5601-1000 Rs. 0.0 0.0 0.0 0.0 7.7 0.0 50.0 8.6 7>1000 Rs. 0.0 0.0 62.5 0.0 88.5 0.0 33.3 37.0 30Total 3 37 8 0.0 26 1 6 100.0 81Transport <300 Rs. 60.0 75.7 12.5 0.0 3.8 100.0 16.7 42.2 35300-600 Rs. 0.0 16.2 25.0 0.0 7.7 0.0 33.3 14.5 12601-1000 Rs. 40.0 2.7 0.0 0.0 69.2 0.0 33.3 26.5 22>1000 Rs. 0.0 5.4 62.5 0.0 19.2 0.0 16.7 16.9 14Total 5 37 8 0 26 1 6 100.0 83Other <300 Rs. 66.7 0.0 0.0 0.0 65.4 100.0 0.0 48.8 20300-600 Rs. 0.0 0.0 37.5 0.0 11.5 0.0 33.3 17.1 7601-1000 Rs. 0.0 0.0 25.0 0.0 19.2 0. 33.3 19.5 8>1000 Rs. 33.3 0.0 37.5 0.0 3.8 0.0 33.3 14.6 6Total 3 0.0 8 0.0 26 1 3 100.0 41Yes 66.8 71.5 66.5 63.4 76.3 84.0 82.6 73.1 1145No 33.2 28.5 33.5 36.6 23.7 16.0 17.4 26.9 421Whether satisfied with the
service Total 289 246 212 205 207 206 201 100.0 1566Improper treatment 35.4 77.1 47.3 33.3 0.0 83.3 40.0 19.2 81Medicine was not effective/ no relief 64.6 22.9 52.8 66.7 100.0 16.7 60.0 80.8 340If no, why Total 96 70 72 75 49 24 35 100.0 421
Grand total 289 246 212 206 217 206 201 100.0 1566

102
Evaluation Study of N
ational Rural H
ealth Mission (N
RH
M) in 7 States
Information about ASHA & NRHM Information about ASHA & NRHM UP MP Jharkhand Orissa Assam JK Tamil Grand
% Grand Total
1200 1200 1000 1000 1000 1000 1000 100.0 7400 Yes 98.4 84.4 94.6 98.0 94.5 95.5 0.0 81.4 6020Have you heard about ASHA Total 1200 1200 1000 1000 1000 1000 1000 100.0 7400Yes 68.4 58.8 49.4 65.4 61.0 61.5 97.0 65.8 4870Have you heard about NRHM Total 1200 1200 1000 1000 1000 1000 1000 100.0 7400ASHA/ANM 80.8 72.8 65.8 73.7 62.3 64.2 71.8 70.9 3455Radio/TV 15.7 14.9 13.2 11.9 29.3 28.3 19.2 18.8 916Newspapers 1.5 0.6 4.0 3.5 7.5 6.7 2.9 3.6 174Any other 2.1 11.8 17.0 10.9 0.8 0.8 6.2 6.7 325
Source of information
Total 821 706 494 654 610 615 970 100.0 4870Every week 39.4 26.6 10.7 27.4 18.4 18.4 0.0 24.2 1454Bi-weekly 32.1 29.9 27.1 28.8 19.5 17.3 0.0 26.1 1569Monthly 26.6 30.9 45.3 38.5 48.3 49.1 0.0 39.2 2358Once in 3 months 0.8 4.8 6.1 4.2 12.4 14.5 0.0 6.9 413Never 0.7 7.8 10.1 1.1 1.5 0.7 0.0 3.6 215Others 0.4 0.0 0.6 0.0 0.0 0.0 0.0 0.2 11
ASHA visits your house
Total 1181 1013 946 980 945 955 0.0 100.0 6020Yes 84.3 82.3 54.9 89.9 71.6 70.2 0.0 76.0 4576Kit carrying by ASHA Total 1181 1013 946 980 945 955 0.0 100.0 6020Yes 76.1 81.9 74.2 93.1 80.5 81.7 0.0 81.1 4884ASHA provide common medicines free of cost Total 1181 1013 946 980 945 955 0.0 100.0 6020Yes 63.0 70.5 72.4 78.1 72.9 74.7 0.0 71.6 4310ASHA tells about good health
practices/sanitation/hygiene Total 1181 1013 946 980 945 955 0.0 100.0 6020Yes 25.2 42.4 46.9 62.5 65.0 68.4 76.6 54.1 4005VHND organized at Aanganwadi Centre/Other
place in the village Total 1200 1200 1000 1000 1000 1000 1000 100.0 7400<3 times 49.7 93.1 95.1 96.6 85.5 91.8 83.6 88.8 35583-6 times 28.5 4.1 4.7 3.4 0.2 0.1 9.7 4.1 166>6 times 21.9 2.8 0.2 0.0 14.3 8.0 6.8 7.0 281Frequency of VHND in last three months
Total 302 509 469 625 650 684 766 100.0 4005 Yes 75.1 81.5 80.1 78.7 75.3 76.1 0.0 77.8 4681ASHA tells about safe drinking water Total 1181 1013 946 980 945 955 0.0 100.0 6020Yes 17.9 24.8 28.4 40.7 61.9 60.7 65.8 41.7 3087Existence of village health and sanitation
committee(VHSC) in the village Total 1200 1200 1000 1000 1000 1000 1000 100.0 7400

E
valuation Study of National R
ural Health M
ission (NR
HM
) in 7 States 103
Information about ASHA & NRHM UP MP Jharkhand Orissa Assam JK Tamil Grand %
Grand Total
Yes 6.0 6.7 1.4 4.2 2.4 2.6 0.5 2.9 88Are you member of VHSC Total 215 297 284 407 619 607 658 100.0 3087 Program support / Awareness about health
69.2 100.0 50.0 0.0 100.0 43.8 100.0 73.9 65
Not done / Don’t know 30.8 0.0 50.0 100.0 0.0 56.3 0.0 26.1 23
Perception about the contribution of VHSC in improving health & hygienic condition of the village
Total 13 20 4 17 15 16 3 100.0 88Yes 21.2 24.3 21.6 28.0 36.9 33.6 55.3 31.1 2299 Any health camps organized at
village/community/ block level Total 1200 1200 1000 1000 1000 1000 1000 100.0 7400Yes 68.9 84.9 79.6 86.1 80.8 90.5 95.8 85.6 1967No 31.1 15.1 20.4 13.9 19.2 9.5 4.2 14.4 332Health camp/programmes attended by
Household Total 254 291 216 280 369 336 553 100.0 2299 No need /No company / No knowledge /Not allowed
55.7 11.4 6.8 51.3 16.9 56.3 34.8 62.7 208
Lack of time 44.3 88.6 93.2 48.7 83.1 43.8 65.2 37.3 124
If no, give reasons
Total 79 44 44 39 71 32 23 100.0 332 Yes 35.8 43.8 54.9 64.0 89.9 91.7 79.5 64.3 4755Awareness about the timings of doctor’s visit at
SC Total 1200 1200 1000 1000 1000 1000 1000 100.0 7400 Yes 34.3 33.3 30.5 47.5 26.7 28.8 89.3 43.3 3039View about improvement after launching of
NRHM Total 1200 1200 1000 1000 1000 1000 1000 100.0 7400Benefits of JSY/ IDs 8.5 38.3 11.5 26.5 11.2 8.3 31.1 22.6 686If yes mention Improved immunization 43.8 31.8 67.5 38.3 81.3 83.3 21.3 44.2 1342
Doctor & workers attend proper / Good medicines /
14.8 21.8 13.1 31.8 4.9 6.6 13.1 16.1 488
Improvement of hospital infrastructure/ better cleanness
32.8 8.3 7.9 3.4 2.6 1.7 34.5 17.2 523
Total 411 400 305 475 267 288 893 100.0 3039

104
Evaluation Study of N
ational Rural H
ealth Mission (N
RH
M) in 7 States
Uttar Pradesh household tables
Background Characteristics HH Characteristics Mathura Saharanpur Mahoba Sultanpur Mau Unnao Total % No. Total
200 200 200 200 200 200 100 1200Background characteristics of HH
Male 90.0 81.5 95.5 96.5 94.0 95.5 92.2 1106Female 10.0 18.5 4.5 3.5 6.0 4.5 7.8 94Sex of the Head
Total 200 200 200 200 200 200 100 1200SC 19.0 36.5 44.0 51.0 27.5 27.5 34.3 411ST 0.5 1.0 1.5 1.5 1.5 11.0 2.8 34OBC 45.5 46.5 25.0 30.5 44.5 24.5 36.1 433Others 35.0 16.0 29.5 17.0 26.5 37.0 26.8 322
Social category
Total 200 200 200 200 200 200 100 1200Hindu 93.0 92.5 97.5 99.0 84.0 98.0 94.0 1128Muslim 6.5 6.5 2.5 1.0 16.0 2.0 5.8 69Others 0.5 1.0 0.0 0.0 0.0 0.0 0.3 3Religion
Total 200 200 200 200 200 200 100 1200Joint 48.0 30.5 29.0 54.0 30.0 38.5 38.3 460Nuclear 52.0 69.5 71.0 46.0 70.0 61.5 61.7 740Type of Family Total 200 200 200 200 200 200 100 1200<25000 37.0 26.0 37.5 51.5 39.0 55.5 41.1 49325000-50000 37.5 45.5 51.0 38.5 50.5 37.5 43.4 521>50000 25.5 28.5 11.5 10.0 10.5 7.0 15.5 186Total Income of HH
Total 200 200 200 200 200 200 100 12001 70.0 85.0 79.9 66.8 85.0 73.0 76.6 9182 19.0 12.0 15.1 28.6 14.0 22.0 18.4 2213+ 11.0 3.0 5.0 4.5 1.0 5.0 4.9 59Total No. of earning member
Total 200 200 200 200 200 200 100 12001 87.5 75.0 40.0 100.0 66.7 77.8 75.0 302 0.0 16.7 40.0 0.0 33.3 22.2 17.5 73+ 12.5 8.3 20.0 0.0 0.0 0.0 7.5 3
Members of family are insured for health
Total 200 200 200 200 200 200 100 1200

E
valuation Study of National R
ural Health M
ission (NR
HM
) in 7 States 105
HH Characteristics Mathura Saharanpur Mahoba Sultanpur Mau Unnao Total % No. TotalMembers of the HH
1-5 41.5 73.0 66.0 43.5 63.0 65.5 58.8 7056-10 51.0 26.0 31.5 54.0 36.5 33.5 38.8 46510+ 7.5 1.0 2.5 2.5 0.5 1.0 2.5 30
Total members in the HH
Total 200 200 200 200 200 200 100 12001 46.4 61.9 65.0 66.9 56.6 69.7 60.4 4552 43.0 31.0 32.5 30.6 39.5 28.6 34.7 261 3+ 10.6 7.1 2.6 2.4 3.9 1.7 4.9 37No. of children, 0-5 years
Total 151 113 117 124 129 119 100 753Land Owned
< 1 acre 23.5 1.1 10.9 22.1 33.0 23.2 19.2 1181-3 acres 48.1 22.2 29.4 55.0 50.9 50.0 42.9 2644-6 acres 4.9 14.4 14.3 12.2 10.7 14.6 12.0 747-9 acres 11.1 5.6 16.0 6.1 3.6 7.3 8.3 51>10acre 12.3 56.7 29.4 4.6 1.8 4.9 17.6 108
Total Land Owned
Total 81 90 119 131 112 82 100 615

106
Evaluation Study of N
ational Rural H
ealth Mission (N
RH
M) in 7 States
Household Facilities HH Details Mathura Saharanpur Mahoba Sultanpur Mau Unnao Total
% Total
Number 200 200 200 200 200 200 100 1200
Pucca 33.0 21.5 11.0 11.0 14.0 15.5 17.7 212Semi-Pucca 55.5 73.0 40.5 41.0 50.0 41.5 50.3 603Kuccha 11.5 5.0 48.5 45.0 34.0 42.5 31.1 373Others 0.0 0.5 0.0 3.0 2.0 0.5 1.0 12
Type of House
Total 200 200 200 200 200 200 100 1200Own 98.0 99.0 100.0 100.0 99.0 99.0 99.2 1190Rented 2.0 1.0 0.0 0.0 1.0 1.0 0.8 10Ownership of House
Total 200 200 200 200 200 200 100 1200Yes 27.5 55.0 26.5 19.0 20.5 28.5 29.5 354Separate kitchen
Total 200 200 200 200 200 200 100 1200Yes 20.5 66.5 24.5 13.5 16.5 26.0 27.9 335Toilet facility inside the house Total 200 200 200 200 200 200 100 1200Electricity 70.0 73.0 39.0 40.5 44.5 32.5 49.9 599Kerosene lamps 27.5 27.0 57.0 59.5 55.5 58.5 47.5 570Others 2.5 0.0 4.0 0.0 0.0 9.0 2.6 31
Main source of lighting in house
Total 200 200 200 200 200 200 100 1200Yes 54.5 90.0 14.0 78.0 92.5 54.0 63.8 766Source of drinking water Total 200 200 200 200 200 200 100 1200Tap 6.4 1.7 0.0 1.9 3.2 0.0 2.5 19Hand pump 86.2 97.8 100.0 95.5 96.8 94.4 95.0 728Well 5.5 0.0 0.0 2.6 0.0 2.8 1.7 13Others 1.8 0.6 0.0 0.0 0.0 2.8 0.8 6
Source of drinking water
Total 109 180 28 156 185 108 100 766Yes 63.0 85.0 85.5 99.0 100.0 86.5 86.5 1038No 37.0 15.0 14.5 1.0 0.0 13.5 13.5 162Is that water potable Total 200 200 200 200 200 200 100 1200Boil 6.8 3.3 3.4 0.0 0.0 7.4 5.6 9Filter 10.8 0.0 0.0 100.0 0.0 7.4 7.4 12Drink as it is 71.6 93.3 96.6 0.0 0.0 77.8 80.2 130
If no, how do you purify it
Others 10.8 3.3 0.0 0.0 0.0 7.4 6.8 11

E
valuation Study of National R
ural Health M
ission (NR
HM
) in 7 States 107
HH Details Mathura Saharanpur Mahoba Sultanpur Mau Unnao Total %
Total Number
Total 74 30 29 2 0.0 27 100 162Diarrhea 73.8 69.2 65.4 71.6 69.7 74.2 70.6 624Fever 7.1 0.0 10.1 4.5 16.4 8.4 7.8 69Cholera 0.0 0.0 0.0 0.0 0.0 0.0 0.0 0.0Malaria 4.3 2.3 4.5 3.7 0.0 5.1 3.6 32Pneumonia 6.4 0.0 0.0 0.0 0.0 0.0 1.0 9Stomach infection
7.1 10.8 10.1 3.0 0.0 10.7 7.2 65
TB 1.4 0.0 0.0 2.2 13.9 0.0 2.5 22Jaundice 0.0 17.7 10.1 14.9 0.0 1.7 7.2 64
Perception about disease because of impure drinking water
Total 141 130 179 134 122 178 100 884Dung cake 65.0 56.5 37.5 43.5 29.5 68.5 50.1 601Wood 30.5 23.5 61.0 55.0 68.5 29.0 44.6 535Kerosene 0.5 0.0 0.0 0.0 0.0 0.0 0.1 1Conventional energy
0.0 0.5 0.0 0.0 0.0 0.0 0.1 1
LPG 4.0 19.5 1.5 1.5 2.0 2.5 5.2 62Others 0.0 0.0 0.0 0.0 0.0 0.0 0.0 0.0
Cooking fuel is used in the house
Total 200 200 200 200 200 200 100 1200

108
Evaluation Study of N
ational Rural H
ealth Mission (N
RH
M) in 7 States
ANC Services Utilization by Pregnant Women Married women availing Anti Natal care Mathura Saharanpur Mahoba Sultanpur Mau Unnao Total
% Total
Number 200 200 200 200 200 200 100 1200
<3 months 10.6 15.9 9.8 4.7 0.0 2.4 7.4 194-6 months 31.9 47.7 39.0 44.2 64.3 51.2 46.1 1197-9 months 57.4 36.4 51.2 51.2 35.7 46.3 46.5 120Pregnancy registration
Total 47 44 41 43 42 41 100 258Yes 42.6 38.6 65.9 41.9 33.3 58.5 46.5 120Going for any ANC Total 47 44 41 43 42 41 100 258ASHA/ANM/VHM 25.0 11.8 14.8 11.1 35.7 29.2 20.8 25SC 5.0 17.6 59.3 33.3 0.0 12.5 24.2 29PHC 0.0 0.0 0.0 16.7 35.7 4.2 7.5 9CHC 10.0 23.5 3.7 33.3 7.1 37.5 19.2 23Dist Hospital 5.0 11.8 3.7 0.0 0.0 0.0 3.3 4Private Doctor 45.0 0.0 11.1 0.0 7.1 12.5 13.3 16Private Hospital 10.0 35.3 7.4 5.6 14.3 4.2 11.7 14
Place of check up
Total 20 17 27 18 14 24 100 120Within the village 60.0 17.6 81.5 66.7 85.7 41.7 59.2 71In other Village 40.0 82.4 18.5 33.3 14.3 58.3 40.8 49Distance of SC from Village Total 20 17 27 18 14 24 100 120B.P 75.0 94.1 77.8 27.8 28.6 87.5 68.3 82Height 70.0 76.5 81.5 22.2 0.0 70.8 58.3 70Weight 75.0 88.2 63.0 16.7 21.4 75.0 59.2 71Urine 60.0 70.6 29.6 16.7 0.0 66.7 42.5 51Blood check up 55.0 17.6 0.0 66.7 85.7 0.0 31.7 38
Check ups
Total 20 17 27 18 14 24 100 120Yes 68.1 77.3 85.4 90.7 88.1 70.7 79.8 206Vaccinated with Anti-Tetanus Total 47 44 41 43 42 41 100 258Diet 57.4 81.8 63.4 65.1 83.3 17.1 61.6 159Exercise 57.4 79.5 63.4 65.1 83.3 14.6 60.9 157Precautions 57.4 79.5 63.4 65.1 83.3 14.6 60.9 157
ASHA/ANM helps in pregnancy related problems
Total 47 44 41 43 42 41 100 258

E
valuation Study of National R
ural Health M
ission (NR
HM
) in 7 States 109
Delivery Care during birth of children 0-5 Years
Indicators Mathura Saharanpur Mahoba Sultanpur Mau Unnao Total % Total Number 200 200 200 200 200 200 100 1200
Normal 98.4 96.5 96.2 95.5 97.1 95.7 96.7 1093Caesarian 1.6 3.5 3.8 4.5 2.9 4.3 3.3 37
Type of delivery
Total 257 170 159 176 205 163 100 1130Home 55.3 56.5 48.4 54.0 60.5 48.5 54.2 613SC 1.6 1.2 1.3 6.8 1.0 0.0 1.9 22PHC 5.1 1.8 18.9 9.1 10.2 3.1 7.8 88CHC 13.6 16.5 25.2 18.8 14.6 33.7 19.6 221DH 7.8 20.0 1.9 3.4 1.0 3.7 6.3 71Pvt. clinics 16.7 4.1 4.4 8.0 12.7 11.0 10.2 115
Place of Delivery
Total 257 170 159 176 205 163 100 1130<1.8 kgs 9.3 4.1 2.5 9.1 1.0 1.8 5.0 561.8-2.5 Kgs 50.2 37.1 52.5 41.5 21.0 31.9 39.2 443 >2.5 kgs 17.5 8.8 25.8 16.5 32.7 38.0 22.9 259Not taken 23.0 50.0 19.5 58.0 45.4 28.2 32.9 372
Weight of Baby at birth
Total 257 170 159 176 205 163 100 1130

110
Evaluation Study of N
ational Rural H
ealth Mission (N
RH
M) in 7 States
Post Natal Care and JSY Benefits for the Youngest Child Born Amongst 0-5 Years Married Women availing Post natal care Mathura Saharanpur Mahoba Sultanpur Mau Unnao Total
% Total
Number 200 200 200 200 200 200 100 1200
Yes 34.2 88.7 60.0 50.4 52.6 45.7 53.7 423 No 65.8 11.3 40.0 49.6 47.4 54.3 46.3 364Availed JSY benefits after last
childbirth Total 161 115 120 129 135 127 100 787Yes 41.0 40.9 65.0 36.4 19.3 48.0 41.3 325Availed PNC services after youngest
child Total 161 115 120 129 135 127 100 787SC 10.6 12.5 26.9 23.9 11.5 8.2 16.3 53PHC 10.6 10.4 23.1 4.3 23.1 4.9 12.6 41CHC 24.2 41.7 41.0 54.3 26.9 52.5 40.6 132DH 16.7 33.3 1.3 6.5 3.8 14.8 12.6 41Private 37.9 2.1 7.7 10.9 34.6 19.7 17.8 58
Place of Check Ups
Total 66 48 78 46 26 61 100 325Yes 81.8 91.7 91.0 89.1 88.5 88.5 88.3 287Govt. health facilities are satisfactory Total 66 48 78 46 26 61 100 325Yes 1.9 0.9 0.0 1.6 1.5 0.8 1.1 9Any miscarriage/Abortion/Still birth
during last 1 yr
Total 161 115 120 129 135 127 100 787
weakness 33.3 100.0 0.0 0.0 100.0 0.0 44.4 4Don’t know
66.7 0.0 0.0 100.0 0.0 100.0 55.6 5Causes of occurrence
Total 3 1 0.0 2 2 1 100 9

E
valuation Study of National R
ural Health M
ission (NR
HM
) in 7 States 111
Immunization and Child Care of Children aged 0-5 years Immunization & Child Care Mathura Saharanpur Mahoba Sultanpur Mau Unnao Total
% Total
Number 200 200 200 200 200 200 100 1200
BCG 98.7 97.0 100.0 100.0 96.1 98.8 98.4 1076DPT 1,2 & 3 92.2 88.7 96.8 93.0 97.0 93.8 93.6 1024Polio 1,2 & 3 63.8 12.5 69.0 18.0 22.2 58.4 41.0 448Measles 80.4 15.8 86.9 22.7 28.0 73.6 51.6 565Hepatitis 56.9 0.6 0.0 0.0 0.5 5.0 13.0 142
Whether vaccinated
Total 232 168 158 172 203 161 100 1094Yes 79.7 91.1 88.0 74.4 78.3 84.5 82.3 900No 20.3 8.9 12.0 25.6 21.7 15.5 17.3 194Having immunization
card Total 232 168 158 172 203 161 100 1094Lost 44.7 100.0 100.0 84.1 90.9 80.0 78.4 152Not Available 34.0 0.0 0.0 9.1 9.1 20.0 14.9 29Torn 21.3 0.0 0.0 6.8 0.0 0.0 6.7 13
If No cards, give reason
Total 47 15 19 44 44 25 100 194SC 35.8 97.6 74.7 49.4 57.1 75.2 62.8 687PHC 14.7 0.0 2.5 2.3 7.9 3.7 5.9 64CHC 4.3 0.6 1.9 3.5 3.4 1.2 2.7 29DH 1.7 0.6 0.0 0.0 0.0 0.0 0.5 5Govt. mobile clinic 0.4 0.0 0.0 0.0 1.0 0.0 0.3 3ANM/AWW/MHW/ASHA 32.3 0.6 20.3 38.4 29.1 19.3 24.1 264Private doctor 4.3 0.0 0.6 2.3 1.5 0.6 1.7 19Any other 6.5 0.6 0.0 4.1 0.0 0.0 1.3 23
Place for availing vaccination
Total 232 168 158 172 203 161 100 1094Yes 1.2 0.0 0.6 1.7 0.0 1.2 0.8 9Suffering from Polio Total 257 170 159 176 205 163 100 1130Yes 14.4 35.9 11.3 35.8 49.3 22.7 28.1 317Use of Bed net Total 257 170 159 176 205 163 100 1130<4 months 20.2 24.7 15.1 7.4 2.0 9.6 15.1 1714-6 months 49.4 53.5 62.9 59.7 59.5 60.7 57.0 644>6 months 30.4 21.8 22.0 33.0 38.5 17.2 27.9 315
Up to age only breastfed
Total 257 170 159 176 205 163 100 1130

112
Evaluation Study of N
ational Rural H
ealth Mission (N
RH
M) in 7 States
Chronic Diseases and Treatment Seeking Patterns
Chronic Disease Mathura Saharanpur Mahoba Sultanpur Mau Unnao % Total No
200 200 200 200 200 200 100 1200Malaria 1.7 0.0 0.0 2.1 2.4 2.1 1.4 4Kala Azar 0.0 0.0 0.0 0.0 0.0 2.1 0.3 1Filaria/ microfilaria 0.0 0.0 6.5 0.0 4.8 0.0 1.7 5Cataract 0.0 0.0 0.0 0.0 0.0 4.2 0.7 2Leprosy 1.7 6.7 4.3 4.2 0.0 0.0 2.8 8TB 21.7 37.8 17.4 16.7 9.5 22.9 21.1 61Fever/cold/ cough 1.7 0.0 0.0 8.3 0.0 2.1 2.1 6Hepatitis 1.7 0.0 2.2 0.0 2.4 0.0 1.0 3Diarrhea 0.0 0.0 0.0 0.0 0.0 0.0 0.0 0Cholera 0.0 0.0 0.0 0.0 0.0 0.0 0.0 0Accident 1.7 0.0 2.2 0.0 0.0 0.0 0.7 2Differently able 0.0 0.0 0.0 0.0 2.4 0.0 0.3 1Any other 70.0 55.6 67.4 68.8 78.6 66.7 67.8 196
Suffering from Chronic disease
Total 60 45 46 48 42 48 100 289Govt. 33.3 51.1 67.4 29.2 35.7 54.2 44.6 129Pvt. 66.7 48.9 32.6 70.8 64.3 45.8 55.4 160Place of Treatment Total 60 45 46 48 42 48 100 289Better Treatment 62.5 95.5 100.0 62.9 48.1 100.0 73.1 117Better facilities 5.0 0.0 0.0 0.0 0.0 0.0 1.3 2Doctor recommended 2.5 0.0 0.0 0.0 0.0 0.0 0.6 1Govt. hospital too far 5.0 0.0 0.0 14.3 3.7 0.0 5.0 8Medicine was not effective 22.5 4.5 0.0 22.9 48.1 0.0 19.4 31In emergency 2.5 0.0 0.0 0.0 0.0 0.0 0.6 1
Reasons for go to Private
Total 40 22 15 35 27 21 100 160SC 15.0 0.0 0.0 7.1 20.0 0.0 5.4 7PHC 25.0 17.4 25.0 0.0 13.3 12.0 17.1 22CHC 20.0 69.6 68.8 71.4 46.7 76.0 60.5 78DH 40.0 13.0 6.3 21.4 20.0 12.0 17.1 22
If Govt. whether
Total 20 23 32 14 15 25 100 129

E
valuation Study of National R
ural Health M
ission (NR
HM
) in 7 States 113
AL 95.0 93.3 100.0 100.0 100.0 100.0 97.9 283AY 3.3 6.7 0.0 0.0 0.0 0.0 1.7 5HO 1.7 0.0 0.0 0.0 0.0 0.0 0.3 1Type of Treatment
Total 60 45 46 48 42 48 100 289Yes 85.0 80.0 91.3 83.3 83.3 97.9 86.9 251Doctor attended
carefully Total 60 45 46 48 42 48 100 289Yes 31.7 51.1 63.0 12.5 23.8 43.8 37.4 108No 68.3 48.9 37.0 87.5 76.2 56.3 62.6 181Medicine received free
of cost Total 60 45 46 48 42 48 100 289<500 Rs 17.1 4.5 0.0 9.5 3.1 7.4 8.3 155000-10000 Rs 4.9 9.1 0.0 7.1 12.5 3.7 6.6 12>1000 Rs 78.0 86.4 100.0 83.3 84.4 88.9 85.1 154
If No, Expenditure occurred
Total 41 22 17 42 32 27 100 181< 3 months 43.3 11.1 52.2 12.5 19.0 60.4 33.9 983-6 months 11.7 15.6 4.3 31.3 26.2 18.8 17.6 517-10 months 1.7 6.7 2.2 0.0 14.3 4.2 4.5 13> 10 months 43.3 66.7 41.3 56.3 40.5 16.7 43.9 127
Duration of treatment
Total 60 45 46 48 42 48 100 289Yes 28.3 4.4 4.3 10.4 19.0 14.6 14.2 41No 71.7 95.6 95.7 89.6 81.0 85.4 85.8 248Referred Total 60 45 46 48 42 48 100 289Govt. hospital 0.0 50.0 100.0 40.0 12.5 0.0 14.6 6Pvt. doctor/clinic 58.8 0.0 0.0 0.0 87.5 0.0 41.5 17Private hospital 41.2 50.0 0.0 60.0 0.0 100.0 43.9 18Referred to
Total 17 2 2 5 8 7 100 41 Doctor’s fee <300 Rs 11.1 0.0 100.0 0.0 0.0 16.7 13.2 5300-600 Rs 5.6 0.0 0.0 33.3 0.0 0.0 5.3 2601-1000 Rs 5.6 0.0 0.0 33.3 0.0 0.0 5.3 2>1000 Rs 77.8 100.0 0.0 33.3 100.0 83.3 76.3 29Total 18 1 2 3 8 6 100 38Drugs <300 Rs 0.0 0.0 100.0 50.0 0.0 100.0 66.7 4
Expenditure
300-600 Rs 0.0 0.0 0.0 50.0 0.0 0.0 16.7 1

114
Evaluation Study of N
ational Rural H
ealth Mission (N
RH
M) in 7 States
601-1000 Rs 0.0 0.0 0.0 0.0 100.0 0.0 16.7 1>1000 Rs 0.0 0.0 0.0 0.0 0.0 0.0 0.0 0.0Total 0 0 2 2 1 1 100 6Special food <300 Rs 0.0 0.0 100.0 100.0 0.0 0.0 100.0 3300-600 Rs 0.0 0.0 0.0 0.0 0.0 0.0 0.0 0.0601-1000 Rs 0.0 0.0 0.0 0.0 0.0 0.0 0.0 0.0>1000 Rs 0.0 0.0 0.0 0.0 0.0 0.0 0.0 0.0Total 0 0 2 1 0 0 100 3Transport <300 Rs 0.0 0.0 100.0 50.0 0.0 0.0 60.0 3300-600 Rs 0.0 0.0 0.0 0.0 0.0 0.0 0.0 0.0601-1000 Rs 0.0 0.0 0.0 50.0 0.0 0.0 20.0 1>1000 Rs 0.0 0.0 0.0 0.0 100.0 0.0 20.0 1Total 0 0 2 2 1 0 100 5Others <300 Rs 0.0 0.0 100.0 100.0 0.0 0.0 66.7 2300-600 Rs 0.0 0.0 0.0 0.0 0.0 0.0 0.0 0.0601-1000 Rs 0.0 0.0 0.0 0.0 0.0 0.0 0.0 0.0>1000 Rs 0.0 0.0 0.0 0.0 0.0 100.0 33.3 1Total 0 0 1 1 0.0 1 100 3Yes 75.0 62.2 52.2 64.6 71.4 72.9 99.8 193No 25.0 37.8 47.8 35.4 28.6 27.1 33.2 96Satisfaction
Total 60 45 46 48 42 48 100 289No better facilities 0.0 0.0 0.0 0.0 0.0 0.0 0.0 0.0No free medicines 0.0 0.0 0.0 0.0 0.0 0.0 0.0 0.0Medicine did not work 73.3 64.7 72.7 47.1 58.3 69.2 64.6 62No good treatment 0.0 0.0 0.0 0.0 0.0 0.0 0.0 0.0No relief 26.7 35.3 27.3 52.9 41.7 30.8 35.4 34
Reason for not satisfied
Total 15 17 22 17 12 13 100 96

E
valuation Study of National R
ural Health M
ission (NR
HM
) in 7 States 115
Utilization of Family Planning Services
Family Planning Mathura Saharanpur Mahoba Sultanpur Mau Unnao Total % Total Number
200 200 200 200 200 200 100 1200Yes 28.0 30.0 57.0 42.5 36.0 41.5 39.2 470No 64.5 64.0 33.5 53.5 57.5 47.5 53.4 641Not applicable 7.5 6.0 9.5 4.0 6.5 11.0 7.4 89
You/your husband using any Family planning method
Total 200 200 200 200 200 200 100 1200Female Sterilization 19.6 13.3 32.5 35.3 23.6 8.4 23.4 110Non scalpel Vasectomy 0.0 0.0 0.0 0.0 1.4 0.0 0.2 1IUD/Copper-T/Loop 10.7 6.7 0.9 7.1 8.3 0.0 4.9 23Oral Pills 21.4 21.7 4.4 10.6 5.6 18.1 12.3 58Condom/Nirodh 39.3 58.3 61.4 44.7 56.9 71.1 56.4 265Rhythm/periodic abstinence 0.0 0.0 0.9 0.0 1.4 0.0 0.4 2Withdrawal 0.0 0.0 0.0 0.0 0.0 2.4 0.4 2Other Trad. Method (specify) 8.9 0.0 0.0 2.4 2.8 0.0 1.9 9
Method using
Total 56 60 114 85 72 83 100 470ASHA 37.5 96.7 71.9 30.6 38.9 78.3 59.6 280ANM 8.9 3.3 14.9 35.3 34.7 1.2 17.0 80Doctor 14.3 0.0 0.0 21.2 13.9 7.2 8.9 42Friends 7.1 0.0 2.6 4.7 9.7 3.6 4.5 21Relatives 17.9 0.0 3.5 2.4 2.8 3.6 4.5 21Others(specify) 14.3 0.0 7.0 5.9 0.0 6.0 5.5 26
Who mainly motivated you to use current method
Total 56 60 114 85 72 83 100 470Yes 48.2 90.0 90.4 94.1 93.1 68.7 82.6 388No 51.8 10.0 9.6 5.9 6.9 31.3 17.4 82Getting Contraceptives
free of cost Total 56 60 114 85 72 83 100 470ASHA/ANM/ VHW 33.9 81.7 64.0 54.1 75.0 66.3 63.0 296Govt. hospital /CHC/PHC/SC 25.0 11.7 29.8 38.8 20.8 16.9 24.9 117Pvt. hospitals /Doctor/Chemist 30.4 0.0 5.3 3.5 2.8 9.6 7.7 36NGOS 0.0 0.0 0.9 0.0 0.0 0.0 0.2 1Others(specify) 10.7 6.7 0.0 3.5 1.4 7.2 4.3 20
Source for getting the method
Total 56 60 114 85 72 83 100 470

116
Evaluation Study of N
ational Rural H
ealth Mission (N
RH
M) in 7 States
Family Planning Mathura Saharanpur Mahoba Sultanpur Mau Unnao Total % Total Number
Yes 5.4 3.3 0.9 3.5 1.4 2.4 2.6 12No 94.6 96.7 99.1 96.5 98.6 97.6 97.4 458Health problem while
using this method Total 56 60 114 85 72 83 100 470Want a Child 34.1 38.3 38.8 66.4 71.3 23.2 45.9 294Not having Sex 15.5 16.4 1.5 3.7 2.6 10.5 9.2 59Method Failed/ become pregnant 11.6 0.8 34.3 5.6 3.5 5.3 8.4 54Relatives opposed 4.7 2.3 0.0 4.7 0.0 0.0 2.2 14Religious prohibition 0.8 0.8 0.0 0.9 3.5 0.0 1.1 7Not aware of any method 0.8 0.8 0.0 0.0 0.0 0.0 0.3 2Not knowing the source of availability 3.1 0.0 4.5 3.7 0.9 9.5 3.3 21Inconvenient to use 4.7 1.6 0.0 0.0 0.9 0.0 1.4 9Health problems 12.4 25.0 11.9 11.2 8.7 7.4 13.3 85Fear of side effects 3.1 13.3 1.5 2.8 0.0 4.2 4.5 29Lack of sexual satisfaction 0.0 0.0 1.5 0.0 0.0 2.1 0.5 3
Main reason for not using any method
Others (specify) 16.3 3.9 10.4 0.9 9.6 51.6 14.7 94 Total 129 128 67 107 115 95 100 641

E
valuation Study of National R
ural Health M
ission (NR
HM
) in 7 States 117
Information about ASHA and NRHM
Information about ASHA & NRHM
Indicator Mathura Saharanpur Mahoba Sultanpur Mau Unnao % Total
No. Total
200 200 200 200 200 200 100 1200Yes 95.5 99.5 100.0 97.0 99.5 99.0 98.4 1181Have you heard about ASHA Total 200 200 200 200 200 200 100 1200Yes 49.0 74.5 88.5 48.0 61.5 89.0 68.4 821Have you heard about NRHM Total 200 200 200 200 200 200 100 1200ASHA/ ANM 80.6 94.0 92.1 61.5 42.3 95.5 80.8 663Radio/TV 18.4 4.7 2.3 33.3 49.6 3.9 15.7 129Newspapers 0.0 0.7 0.0 3.1 5.7 0.6 1.5 12Any other 1.0 0.7 5.6 2.1 2.4 0.0 2.1 17
Source of information
Total 98 149 177 96 123 178 100 821Every week 50.8 24.1 62.5 30.9 15.6 52.5 39.4 465Bi-weekly 23.6 52.8 19.0 34.5 34.7 27.8 32.1 379Monthly 22.0 21.6 14.5 33.0 49.2 19.2 26.6 314Once in 3 months 1.0 0.0 2.0 1.5 0.5 0.0 0.8 10Never 0.0 1.5 2.0 0.0 0.0 0.5 0.7 8Others 2.6 0.0 0.0 0.0 0.0 0.0 0.4 5
ASHA visits
Total 191 199 200 194 199 198 100 1181Yes 83.2 84.4 97.5 90.2 67.8 82.8 84.3 996ASHA carry kit Total 191 199 200 194 199 198 100 1181Yes 66.0 76.9 90.5 76.3 70.9 75.8 76.1 899ASHA provide common
medicines free of cost Total 191 199 200 194 199 198 100 1181Yes 58.1 84.9 67.0 36.6 50.3 80.3 63.0 744ASHA tells about good health
practices like sanitation/hygiene Total 191 199 200 194 199 198 100 1181yes 19.5 45.5 35.5 1.0 1.0 48.5 25.2 302VHND organized at
Aanganwadi/ other places in the village
Total 200 200 200 200 200 200 100 1200
<3 times 61.5 14.3 87.3 50.0 100.0 49.5 49.7 150 3-6 times 15.4 33.0 12.7 50.0 0.0 41.2 28.5 86>6 times 23.1 52.7 0.0 0.0 0.0 9.3 21.9 66Frequency in last 3 months
Total 39 91 71 2 2 97 100 302

118
Evaluation Study of N
ational Rural H
ealth Mission (N
RH
M) in 7 States
Information about ASHA & NRHM
Indicator Mathura Saharanpur Mahoba Sultanpur Mau Unnao % Total
No. Total
Yes 60.2 89.4 79.0 64.4 78.4 78.3 75.1 887ASHA tells about safe drinking water Total 191 199 200 194 199 198 100 1181
Yes 22.5 39.5 19.5 3.0 0.5 22.5 17.9 215Existing of VHSC in your village Total 200 200 200 200 200 200 100 1200Yes 22.2 1.3 0.0 0.0 0.0 4.4 6.0 13Are you member of VHSC Total 45 79 39 6 1 45 100 215Health Awareness 70.0 100.0 0.0 0.0 0.0 50.0 69.2 9Programme support 0.0 0.0 0.0 0.0 0.0 0.0 0.0 0Aware to people 0.0 0.0 0.0 0.0 0.0 0.0 0.0 0Time to time cleanliness
0.0 0.0 0.0 0.0 0.0 0.0 0.0 0
No contribution 30.0 0.0 0.0 0.0 0.0 50.0 30.8 4
If yes, contribution of VHSC in improving health & hygienic condition of the village
Total 10 1 0 0 0 2 100 13Yes 17.0
13.046.5 4.5 2.0 44.0 21.2 254Health camps organized at
village/community/ block level Total 200 200 200 200 200 200 100 1200Yes 55.9 34.6 82.8 33.3 25.0 75.0 68.9 175If yes, have you attended that
camp/programme Total 34 26 93 9 4 88 100 254No need / No company / No knowledge /Not allowed
73.3 41.2 87.5 83.3 0.0 31.8 55.7 44
Lack of time 26.7 58.8 12.5 16.7 100.0 68.2 44.3 35
If no, reasons
Total 15 17 16 6 3 22 100 79Yes 29.0 62.5 34.0 24.5 37.0 27.5 35.8 429Awareness about timely visit of
doctors at SC Total 200 200 200 200 200 200 100 1200Yes 22.0 26.5 58.5 25.5 38.0 35.0 34.3 411Improvement after launching of
NRHM Total 200 200 200 200 200 200 100 1200

E
valuation Study of National R
ural Health M
ission (NR
HM
) in 7 States 119
Madhya Pradesh household tables
Background Characteristics
Katni Nimach Vidisha Shivpuri Hoshangabad Dhar % Total Total Number 200 200 200 200 200 200 100 1200
Background characteristics of HH Male 96.0 97.0 98.5 98.5 88.0 95.5 95.6 1147Female 4.0 3.0 1.5 1.5 12.0 4.5 4.4 53Sex of the Head Total 200 200 200 200 200 200 100 1200SC 11.5 3.5 23.5 19.5 17.5 7.5 13.8 166ST 12.5 13.0 4.0 26.0 25.5 48.5 21.6 256OBC 59.0 59.5 53.5 40.5 54.5 35.5 50.4 605Others 17.0 24.0 19.0 14.0 2.5 8.5 14.2 170
Social category
Total 200 200 200 200 200 200 100 1200Hindu 98.0 96.0 93.5 99.5 99.5 100.0 97.8 1173Muslim 2.0 3.5 6.5 0.5 0.0 0.0 2.1 25Others 0.0 0.5 0.0 0.0 0.0 0.0 0.1 1Religion
Total 200 200 200 200 200 200 100 1200Joint 31.5 27.5 49.0 33.0 32.5 34.0 34.6 415Nuclear 68.5 72.5 51.0 67.0 67.5 66.0 65.4 785Type of Family Total 200 200 200 200 200 200 100 1200<25000 Rs. 53.0 58.0 15.5 57.5 23.5 49.0 42.8 51325000-50000 Rs. 37.5 35.5 42.5 38.0 49.5 43.0 41.0 492>50000 Rs. 9.5 6.5 42.0 4.5 27.0 8.0 16.3 195Total Income of HH
Total 200 200 200 200 200 200 100 12001 76.5 81.0 87.0 76.5 87.5 82.0 81.8 9812 19.0 15.5 11.0 18.0 9.5 18.0 15.2 1823+ 4.5 3.5 2.0 5.5 3.0 0.0 3.1 37Total No. of earning member
Total 200 200 200 200 200 200 100 12001 0.0 16.7 0.0 100.0 66.7 100. 0 27.8 52 33.3 16.7 100.0 0.0 33.3 0.0 27.8 5
Members of family insured for health
3+ 66.7 66.7 0.0 0.0 0.0 0.0 44.4 8

120
Evaluation Study of N
ational Rural H
ealth Mission (N
RH
M) in 7 States
Katni Nimach Vidisha Shivpuri Hoshangabad Dhar % Total Total NumberTotal 6 6 1 1 3 1 100 18
Members of the HH 1-5 member 72.0 75.5 51.5 58.0 76.5 81.0 69.1 8296-10 member 28.0 24.5 48.5 40.5 23.0 19.0 30.6 36710+ member 0.0 0.0 0.0 1.5 0.5 0.0 0.3 4Total members in the HH
Total 200 200 200 200 200 200 100 12001 63.2 60.0 77.5 56.4 90.0 54.8 66.0 4912 36.0 34.4 19.8 36.2 9.1 39.5 30.0 2233+ 0.8 5.6 2.7 7.4 0.9 5.6 4.0 30No. of children, 0-5 years
Total 125 125 111 149 110 124 100 744Land Owned
<1 acre 17.4 27.7 0.7 4.4 2.4 13.4 11.7 94 1-3 acres 38.6 39.4 30.4 33.6 40.0 47.9 38.5 309 4-6 acres 25.8 19.4 23.0 26.5 26.4 20.4 23.3 187 7-9 acres 5.3 3.9 15.6 15.9 5.6 5.6 8.4 67 >10 acres 12.9 9.7 30.4 19.5 25.6 12.7 18.1 145
Total Land Owned
Total 132 155 135 113 125 142 100 802

E
valuation Study of National R
ural Health M
ission (NR
HM
) in 7 States 121
Household Facilities HH Details Katni Nimach Vidisha Shivpuri Hoshangabad Dhar Total % Total
Number 200 200 200 200 200 200 100 1200
Pucca 8.0 12.5 6.5 17.0 8.5 17.5 11.7 140Semi-Pucca 38.0 34.0 48.0 32.0 59.0 33.0 40.7 488Kachha 54.0 53.0 45.5 47.0 32.5 49.5 46.9 563Others 0.0 0.5 0.0 4.0 0.0 0.0 0.8 9
Type of House
Total 200 200 200 200 200 200 100 1200Own 99.0 97.0 99.0 98.5 99.5 97.0 98.3 1180Rented 1.0 3.0 1.0 1.5 0.5 3.0 1.7 20Ownership of House Total 200 200 200 200 200 200 100 1200Yes 39.0 32.0 33.0 22.0 37.0 27.5 31.8 381Separate kitchen
Total 200 200 200 200 200 200 100 1200 Yes 28.5 22.0 36.5 15.0 73.0 27.5 33.8 405Toilet inside the house Total 200 200 200 200 200 200 100 1200Electricity 34.0 58.0 56.5 33.5 61.0 90.0 55.5 666Kerosene lamps 59.0 39.5 43.5 58.5 39.0 10.0 41.6 499Others 7.0 2.5 0.0 8.0 0.0 0.0 2.9 35Main source of lighting in the house
Total 200 200 200 200 200 200 100 1200Yes 33.0 64.5 45.0 14.0 86.0 70.0 52.1 625Source of drinking water Total 200 200 200 200 200 200 100 1200 Yes 33.0 64.5 45.0 14.0 86.0 70.0 52.1 625Is that water potable Total 200 200 200 200 200 200 100 1200Boil 0.0 0.0 0.0 0.0 0.0 0.0 0.0 0.0Filter 0.0 0.0 0.0 0.0 0.0 0.0 0.0 0.0Drink as it is 100.0 100.0 100.0 100.0 100.0 100.0 100.0 575Others 0.0 0.0 0.0 0.0 0.0 0.0 0.0
If no, how do you purify it
Total 134 71 110 172 28 60 100 575Diarrhea 61.1 69.1 0.0 0.0 33.7 83.6 44.9 385Fever 15.8 7.4 0.0 0.0 2.2 6.6 6.3 54Cholera 0.0 0.0 0.0 0.0 0.0 0.0 0.0Malaria 0.0 0.0 0.0 0.0 0.0 0.0
Perception about disease because of impure drinking water
Pneumonia 0.0 0.0 0.0 0.0 0.0 0.0 0.0 0.0

122
Evaluation Study of N
ational Rural H
ealth Mission (N
RH
M) in 7 States
HH Details Katni Nimach Vidisha Shivpuri Hoshangabad Dhar Total % Total Number
Stomach infection 11.6 13.6 100.0 100.0 18.0 5.9 38.9 333TB 0.0 0.0 0.0 0.0 0.0 0.0 0.0 0.0Jaundice 11.6 9.9 0.0 0.0 46.1 3.9 9.9 85Total 190 162 77 187 89 152 100 857Dung cake 31.5 50.5 39.0 46.0 55.0 71.0 48.8 586Wood 62.5 42.0 57.0 53.0 39.0 25.5 46.5 558Kerosene 0.5 5.0 1.0 0.0 1.0 1.5 1.5 18Conventional energy 0.0 0.0 0.0 0.0 0.0 0.0 0.0 0.0LPG 5.5 2.5 3.0 1.0 5.0 2.0 3.2 38
Cooking fuel used in the House
Total 200 200 200 200 200 200 100 1200

E
valuation Study of National R
ural Health M
ission (NR
HM
) in 7 States 123
ANC Services Utilization by Pregnant women Married women availing Ante natal care Katni Nimach Vidisha Shivpuri Hoshangabad Dhar Total
% Total
Number 200 200 200 200 200 200 1200 1200
< 3 months 11.6 7.1 7.1 14.6 5.0 19.0 10.8 274-6 months 39.5 50.0 31.0 41.5 57.5 38.1 42.8 1077-9 months 48.8 42.9 61.9 43.9 37.5 42.9 46.4 116
Pregnancy registration
Total 43 42 42 41 40 42 100 250Yes 79.1 73.8 50.0 73.2 70.0 92.9 73.2 183Whether going for any ANC Total 43 42 42 41 40 42 100 250ASHA/ANM/VHM 17.6 45.2 9.5 16.7 3.6 82.1 32.8 60SC 44.1 19.4 23.8 70.0 39.3 5.1 32.8 60PHC 29.4 3.2 38.1 6.7 10.7 2.6 13.7 25CHC 5.9 9.7 23.8 0.0 35.7 5.1 12.0 22Dist Hospital 0.0 9.7 4.8 0.0 0.0 0.0 2.2 4Private Doctor 2.9 3.2 0.0 0.0 3.6 2.6 2.2 4Private Hospital 0.0 9.7 0.0 6.7 7.1 2.6 4.4 8
Place of check up
Total 34 31 21 30 28 39 100 183Within the village 79.4 74.2 85.7 100.0 96.4 92.3 88.0 161In other Village 20.6 25.8 14.3 0.0 3.6 7.7 12.0 22Distance of SC from Village Total 34 31 21 30 28 39 100 183B.P 100.0 100.0 100.0 100.0 100.0 100.0 100.0 183Height 55.9 35.5 100.0 100.0 100.0 43.6 68.9 126Weight 100.0 100.0 100.0 100.0 100.0 97.4 99.5 182Urine 94.1 96.8 100.0 100.0 96.4 35.9 84.2 154Blood check up 8.8 0.0 19.0 3.3 10.7 46.2 15.8 29
Check ups
Total 34 31 21 30 28 39 100 183Yes 100.0 97.6 97.6 90.2 100.0 100.0 97.6 244Vaccinated with Anti-Tetanus Total 43 42 42 41 40 42 100 250Diet 81.4 73.8 66.7 73.2 82.5 97.6 79.2 198Exercise 72.1 73.8 66.7 73.2 82.5 97.6 77.6 194Precautions 79.1 73.8 66.7 75.6 82.5 97.6 79.2 198
ASHA/ANM helps in any pregnancy related problems Total 43 42 42 41 40 42 100 250

124
Evaluation Study of N
ational Rural H
ealth Mission (N
RH
M) in 7 States
Delivery Care during birth of Children 0-5 years Services regarding Delivery Katni Nimach Vidisha Shivpuri Hoshangabad Dhar Total % Total Number
200 200 200 200 200 200 100 1200Normal 97.1 94.6 97.9 100.0 97.7 93.8 96.9 1017Caesarian 2.9 5.4 2.1 0.0 2.3 6.3 3.1 33Type of delivery Total 170 185 144 226 133 192 100 1050Home 26.5 40.0 19.4 41.2 36.1 56.3 37.7 396SC 1.8 2.2 0.0 0.4 0.0 1.6 1.0 11PHC 34.1 21.1 35.4 37.6 11.3 7.3 25.0 262CHC 24.7 25.9 34.0 16.8 42.9 31.3 28.0 294DH 11.2 8.1 11.1 2.2 9.0 2.6 6.9 72Private clinics 1.8 2.7 0.0 1.8 0.8 1.0 1.4 15
Place of Delivery
Total 170 185 144 226 133 192 100 1050< 1.8 kgs 14.1 13.0 4.2 6.6 6.8 5.7 8.5 891.8-2.5 Kgs 57.1 36.8 65.3 66.4 85.0 84.4 65.1 684>2.5 kgs 28.8 50.3 30.6 27.0 8.3 9.9 26.4 277Weight of baby at the time of birth
Total 170 185 144 226 133 192 100 1050

E
valuation Study of National R
ural Health M
ission (NR
HM
) in 7 States 125
Post Natal Care and JSY benefits for the Youngest Child Born Amongst 0-5 years Married Women availing Post natal Care Katni Nimach Vidisha Shivpuri Hoshangabad Dhar Total % Total
Number 200 200 200 200 200 200 100 1200
Yes 79.2 67.9 100.0 71.4 95.6 58.8 77.7 595No 20.8 32.3 0.0 28.0 4.4 41.2 22.3 171Availed JSY benefits after Last Child Total 125 131 112 154 113 131 100 766 Yes 80.0 55.7 52.7 49.4 53.1 32.1 53.5 410Availed PNC services after youngest
child Total 125 131 112 154 113 131 100 766SC 18.0 16.4 8.5 27.6 6.7 2.4 14.9 61PHC 25.0 24.7 40.7 47.4 11.7 14.3 28.3 116CHC 48.0 52.1 25.4 21.1 68.3 66.7 45.4 186DH 7.0 5.5 18.6 2.6 5.0 11.9 7.8 32Private 2.0 1.4 6.8 1.3 8.3 4.8 3.7 15
Place of Check ups
Total 100 73 59 76 60 42 100 410Yes 98.0 98.6 93.2 97.4 91.7 95.2 96.1 394Govt. health facilities are satisfactory Total 100 73 59 76 60 42 100 410Yes
0.8 0.8 0.0 6.5 1.8 0.0 1.8 14Any miscarriage/Abortion/Still birth during last 1 yr Total 125 131 112 154 113 131 100 766
weakness 0.0 0.0 0.0 0.0 0.0 0.0 0.0 0.0Don’t know 100.0 100.0 100.0 100.0 100.0 100.0 100.0 14Causes of occurrence Total 1 1 0.0 10 2 0.0 100 14
Grand Total 125 131 112 154 113 131 100 766

126
Evaluation Study of N
ational Rural H
ealth Mission (N
RH
M) in 7 States
Immunization and Child Care of Children aged 0-5 years Immunization & Child care Katni Nimach Vidisha Shivpuri Hoshangabad Dhar Total % Total
Number 200 200 200 200 200 200 100 1200 BCG 100.0 100.0 75.0 99.6 100.0 100.0 96.5 1013 DPT 1,2 & 3 95.3 98.4 72.9 94.2 97.7 96.4 93.0 977 Polio 1,2 & 3 89.4 95.1 61.1 85.8 94.7 94.8 96.6 918 Measles 81.2 79.5 29.9 68.1 47.4 55.7 62.1 652 Hepatitis 0.0 1.1 12.5 0.4 36.8 7.3 8.0 84
Whether Vaccinated
Total 170 185 144 226 133 192 100 1050 Yes 99.4 98.9 97.2 46.5 100.0 96.9 87.2 916 No 0.6 1.1 2.8 53.5 0.0 3.1 12.8 134 Have immunization card Total 170 185 144 226 133 192 100 1050 Didn’t get 100.0 100.0 25.0 28.9 0.0 0.0 29.1 39 Lost 0.0 0.0 75.0 70.2 0.0 100.0 70.1 94 Torn 0.0 0.0 0.0 0.8 0.0 0.0 0.7 1
If no, give reason
Total 1 2 4 121 0.0 6 100 134 SC 55.3 74.1 88.9 74.8 95.5 63.5 74.0 777 PHC 1.2 1.1 0.0 0.0 2.3 0.0 0.7 7 CHC 0.0 0.0 2.1 2.2 0.0 0.5 0.9 9 DH 0.0 0.0 0.7 0.0 0.0 0.0 0.1 1 Govt. mobile clinic 0.0 0.0 0.0 0.0 0.0 0.0 0.0 0.0 ANM/AWW/MHW/ASHA 41.8 24.3 8.3 22.1 2.3 25.5 21.9 230 Private doctor 0.6 0.0 0.0 0.0 0.0 0.0 0.1 1 Any other 1.2 0.5 0.0 0.9 0.0 10.4 2.4 25
Place for availing most of the facility of vaccination
Total 170 185 144 226 133 192 100 1050 Yes 0.0 0.0 0.0 0.0 0.8 0.0 0.1 1 Suffering from Polio Total 170 185 144 226 133 192 100 1050 Yes 14.7 50.8 55.6 4.9 67.7 47.9 37.3 392 Use of bed Net Total 170 185 144 226 133 192 100 1050 Less than 4 months 32.9 14.1 4.2 28.4 1.5 1.1 14.9 156 4-6 months 42.9 53.8 41.5 55.6 42.9 47.9 48.3 504 more than 6 months 24.1 32.1 54.5 16.0 55.6 51.1 36.8 384 Up to age only breastfed
Total 170 184 142 225 133 190 100 1044

E
valuation Study of National R
ural Health M
ission (NR
HM
) in 7 States 127
Chronic Diseases and Treatment Seeking Patterns
Chronic disease Katni Nimach Vidisha Shivpuri Hoshangabad Dhar Total %
Total Number
200 200 200 200 200 200 100 1200Malaria 0.0 0.0 0.0 0.0 0.0 2.4 0.4 1Kala Azar 5.1 5.0 0.0 2.3 0.0 4.9 2.8 7Filaria/microfilaria 2.6 0.0 0.0 0.0 0.0 0.0 0.4 1Cataract 0.0 5.0 0.0 4.5 0.0 0.0 1.6 4Leprosy 5.1 2.5 0.0 9.1 4.8 2.4 4.1 10TB 30.8 30.0 45.0 38.6 38.1 12.2 32.5 80fever/cold/cough 0.0 0.0 0.0 0.0 0.0 7.3 1.2 3Hepatitis 0.0 0.0 0.0 2.3 0.0 0.0 0.4 1Diarrhea 0.0 0.0 0.0 0.0 0.0 0.0 0.0 0.0Cholera 0.0 0.0 0.0 0.0 0.0 0.0 0.0 0.0Accident 5.1 0.0 0.0 0.0 0.0 2.4 1.2 3Differently able 0.0 0.0 0.0 0.0 0.0 0.0 0.0 0.0Any other 51.3 57.5 55.0 43.2 57.1 68.3 55.3 136
Suffering from Chronic Disease
Total 39 40 40 44 42 41 100 246Govt. 51.3 72.5 72.5 68.2 66.7 46.3 63.0 155Pvt. 48.7 27.5 27.5 31.8 33.3 53.7 37.0 91Where you gone for treatment Total 39 40 40 44 42 41 100 246Better facilities 0.0 0.0 0.0 71.4 100.0 59.1 40.2 37Good medicines 0.0 0.0 0.0 14.3 0.0 0.0 2.2 2Govt. hospital too far 0.0 0.0 0.0 0.0 0.0 0.0 0.0 0.0Improper treatment in govt. hospital
100.0 100.0 100.0 14.3 0.0 40.9 57.1 52
In emergency 0.0 0.0 0.0 0.0 0.0 0.0 0.0 0.0
If went to Pvt. reasons
Total 19 11 11 14 14 22 100 91SC 5.0 10.3 0.0 0.0 3.6 10.5 4.5 7PHC 40.0 10.3 41.4 20.0 3.6 0.0 19.4 30CHC 25.0 34.5 48.3 43.3 92.9 57.9 51.0 79DH 30.0 44.8 10.3 36.7 0.0 31.6 25.2 39
If Govt., Whether
Total 20 29 29 30 28 19 100 155

128
Evaluation Study of N
ational Rural H
ealth Mission (N
RH
M) in 7 States
Chronic disease Katni Nimach Vidisha Shivpuri Hoshangabad Dhar Total %
Total Number
AL 100.0 97.5 100.0 100.0 95.2 95.1 98.0 241AY 0.0 0.0 0.0 0.0 0.0 4.9 0.8 2YN 0.0 2.5 0.0 0.0 0.0 0.0 0.4 1UN 0.0 0.0 0.0 0.0 0.0 0.0 0.0 0.0SD 0.0 0.0 0.0 0.0 0.0 0.0 0.0 0.0HO 0.0 0.0 0.0 0.0 4.8 0.0 0.8 2
Type of treatment was taken
Total 39 40 40 44 42 41 100 246Yes 92.3 92.5 100.0 100.0 97.6 95.1 96.3 237Doctor attended you carefully Total 39 40 40 44 42 41 100 246Yes 43.6 60.0 70.0 40.9 66.7 39.0 53.3 131No 56.4 40.0 30.0 59.1 33.3 61.0 46.7 115Whether medicines received
free of cost Total 39 40 40 44 42 41 100 246Less than 500 Rs 4.5 6.3 0.0 0.0 0.0 20.0 6.1 7500-1000 Rs 4.5 12.5 0.0 3.8 0.0 8.0 5.2 6More than 1000 Rs 90.9 81.3 100.0 96.2 100.0 72.0 88.7 102If No, Expenditure
Total 22 16 12 26 14 25 100 115< 3 months 79.5 62.5 15.0 72.7 7.1 29.3 44.3 1093-6 months 10.3 17.5 15.0 6.8 9.5 22.0 13.4 337-10 months 10.3 15.0 12.5 4.5 21.4 12.2 12.6 31>10 months 0.0 5.0 57.5 15.9 61.9 36.6 29.7 73
Duration of the treatment
Total 39 40 40 44 42 41 100 246Yes 17.9 7.5 0.0 43.2 0.0 19.5 15.0 37No 82.1 92.5 100.0 56.8 100.0 80.5 85.0 209Referred to other
doctor/hospital Total 39 40 40 44 42 41 100 246Govt. hospital 28.6 33.3 0.0 5.3 0.0 25.0 16.2 6Pvt. Doctor/clinic 14.3 0.0 0.0 5.3 0.0 37.5 13.5 5Private hospital 57.1 66.7 0.0 89.5 0.0 37.5 70.3 26Referred to
Total 7 3 0.0 19 0.0 8 100 37 Doctor’s fee <300 Rs 14.3 33.3 0.0 10.5 0.0 50.0 21.6 8300-600 Rs 28.6 0.0 0.0 0.0 0.0 0.0 5.4 2
601-1000 Rs 14.3 0.0 0.0 15.8 0.0 12.5 13.5 5

E
valuation Study of National R
ural Health M
ission (NR
HM
) in 7 States 129
Chronic disease Katni Nimach Vidisha Shivpuri Hoshangabad Dhar Total %
Total Number
> 1000 Rs 42.9 66.7 0.0 73.7 0.0 37.5 59.5 22Total 7 3 0.0 19 0.0 8 100 37Drugs <300 Rs 42.9 66.7 0.0 36.8 0.0 87.5 51.4 19300-600 Rs 42.9 33.3 0.0 0.0 0.0 12.5 13.5 5601-1000 Rs 0.0 0.0 0.0 10.5 0.0 0.0 5.4 2> 1000 Rs 14.3 0.0 0.0 52.6 0.0 0.0 29.7 11Total 7 3 19 0.0 8 100 37Special food <300 Rs 100.0 100.0 0.0 94.7 0.0 87.5 94.6 35300-600 Rs 0.0 0.0 0.0 5.3 0.0 12.5 5.4 2601-1000 Rs 0.0 0.0 0.0 0.0 0.0 0.0 0.0 0.0<1000 Rs 0.0 0.0 0.0 0.0 0.0 0.0 0.0 0.0Total 7 3 0.0 19 0.0 8 100 37Transport Less than 300 Rs 100.0 66.7 0.0 68.4 0.0 75.0 75.7 28300-600 Rs 0.0 33.3 0.0 15.8 0.0 25.0 16.2 6601-1000 Rs 0.0 0.0 0.0 5.3 0.0 0.0 2.7 1More than 1000 Rs 0.0 0.0 0.0 10.5 0.0 0.0 5.4 2Total 7 3 0.0 19 0.0 8 100 37Others <300 Rs 0.0 0.0 0.0 0.0 0.0 0.0 0.0 0.0300-600 Rs 0.0 0.0 0.0 0.0 0.0 0.0 0.0 0.0601-1000 Rs 0.0 0.0 0.0 0.0 0.0 0.0 0.0 0.0>1000 Rs 0.0 0.0 0.0 0.0 0.0 0.0 0.0 0.0
Expenditure
Total 0.0 0.0 0.0 0.0 0.0 0.0 0.0 0.0Yes 82.1 57.5 87.5 59.1 97.6 46.3 71.5 176No 17.9 42.5 12.5 40.9 2.4 53.7 28.5 70Whether satisfied with the
service Total 39 40 40 44 42 41 100 246Medicine are not working 0.0 0.0 0.0 0.0 0.0 72.7 22.9 16Not proper treatment 100.0 100.0 100.0 100.0 100.0 27.3 77.1 54If not, reason Total 7 17 5 18 1 22 100 70

130
Evaluation Study of N
ational Rural H
ealth Mission (N
RH
M) in 7 States
Family Planning Services Utilization Family Planning Katni Nimach Vidisha Shivpuri Hoshangabad Dha
r Tota
l %
Total Number
200 200 200 200 200 200 100 1200 Yes 53.3 48.4 49.2 62.5 52.0 57.5 53.7 612 No 46.7 51.6 50.8 37.5 48.0 42.5 46.3 527 Are you/your husband using
any Family Planning method Total 184 190 199 184 196 186 100 1139 female Sterilization 35.7 43.5 35.7 45.2 25.5 46.7 38.9 238 Non scalpel Vasectomy 1.0 0.0 0.0 0.0 0.0 0.9 0.3 2 IUD/Copper-T/ Loop 0.0 4.3 9.2 0.0 7.8 5.6 4.4 27 Oral Pills 11.2 12.0 37.8 8.7 38.2 11.2 19.6 120 Condom/Nirodh 52.0 40.2 17.3 46.1 28.4 35.5 36.8 225 Rhythm/periodic abstinence 0.0 0.0 0.0 0.0 0.0 0.0 0.0 0.0 Withdrawal 0.0 0.0 0.0 0.0 0.0 0.0 0.0 0.0 Other Trad. Method (specify) 0.0 0.0 0.0 0.0 0.0 0.0 0.0 0.0
Which method you/ your husband using
Total 98 92 98 115 102 107 100 612 ASHA 36.7 33.7 72.4 27.0 72.5 4.7 40.5 248 ANM 20.4 33.7 17.3 13.9 16.7 74.8 29.6 181 Doctor 0.0 0.0 9.2 0.9 4.9 11.2 4.4 27 Friends 7.1 8.7 1.0 0.9 3.9 1.9 3.8 23 Relatives 9.2 8.7 0.0 10.4 2.0 2.8 5.6 34 Others(specify) 26.5 15.2 0.0 47.0 0.0 4.7 16.2 99
Who mainly motivated you to use current method
Total 98 92 98 115 102 107 100 612 Yes 78.6 73.9 96.9 87.8 98.0 94.4 88.6 542 No 21.4 26.1 3.1 12.2 2.0 5.6 11.4 70 Getting Contraceptives free
of cost Total 98 92 98 115 102 107 100 612 ASHA/ANM/ VHW 46.9 47.8 68.4 34.8 62.7 48.6 51.1 313 Govt. hospital /CHC/PHC/SC 39.8 43.5 29.6 49.6 35.3 42.1 40.2 246 Pvt. hospitals/ Doctor/Chemist 4.1 4.3 2.0 7.0 0.0 6.5 4.1 25 NGOS 3.1 1.1 0.0 0.9 0.0 0.0 0.8 5 Others(specify) 6.1 3.3 0.0 7.8 2.0 2.8 3.8 23
Source for getting the method
Total 98 92 98 115 102 107 100 612 Any health problem while Yes 1.0 2.2 2.0 0.0 2.0 1.9 1.5 9

E
valuation Study of National R
ural Health M
ission (NR
HM
) in 7 States 131
Family Planning Katni Nimach Vidisha Shivpuri Hoshangabad Dhar
Total
%
Total Number
No 99.0 97.8 98.0 100.0 98.0 98.1 98.5 603 using this method Total 98 92 98 115 102 107 100 612 Want a Child 72.1 82.7 68.3 34.8 73.4 96.2 72.3 381 Not having Sex 0.0 0.0 27.7 1.4 19.1 0.0 8.9 47 Method Failed/become pregnant
3.5 4.1 1.0 24.6 0.0 0.0 4.7 25
Relatives opposed 0.0 0.0 0.0 0.0 0.0 0.0 0.0 0.0 Religious prohibition 0.0 0.0 0.0 0.0 0.00.0 0.0 0.0 0.0 Not aware of any method 0.0 0.0 0.0 0.0 0.0 0.0 0.0 0.0 Not knowing the source of availability
0.0 3.1 0.0 2.9 0.0 3.8 1.5 8
Inconvenient to use 0.0 0.0 1.0 0.0 0.0 0.0 0.2 1 Health problems 5.8 3.1 1.0 0.0 5.3 0.0 2.7 14 Fear of side effects 2.3 2.0 1.0 1.4 1.1 0.0 1.3 7 Lack of sexual satisfaction 1.2 1.0 0.0 8.7 0.0 0.0 1.5 8 Others (specify) 16.3 4.1 0.0 26.1 1.1 0.0 7.0 37
What is the main reason for not using any method
Total 86 98 101 69 94 79 100 527

132
Evaluation Study of N
ational Rural H
ealth Mission (N
RH
M) in 7 States
Information about ASHA & NRHM Information about ASHA & NRHM Katni Nimach Vidisha Shivpuri Hoshangabad Dhar Total % Total
Number 200 200 200 200 200 200 100 1200
Yes 87.0 85.5 94.0 96.5 79.5 64.0 84.4 1013Have you heard about ASHA Total 200 200 200 200 200 200 100 1200Yes 87.5 68.0 23.5 85.5 36.5 52.0 58.8 706Have you heard about NRHM Total 200 200 200 200 200 200 100 1200ASHA/ANM 86.3 64.7 76.6 78.4 78.1 46.2 72.8 514Radio/TV 4.6 27.9 17.0 2.3 17.8 32.7 14.9 105Newspapers 0.0 0.0 0.0 0.0 2.7 1.9 0.6 4Any other 9.1 7.4 6.4 19.3 1.4 19.2 11.8 83
Source of information
Total 175 136 47 171 73 104 100 706Every week 44.8 32.7 6.9 34.7 13.8 25.8 26.6 269Bi-weekly 16.1 20.5 34.6 26.9 64.2 16.4 29.9 303Monthly 24.7 34.5 43.6 28.0 20.8 32.8 30.9 313Once in 3 months 6.3 5.8 4.8 4.1 0.6 7.8 4.8 49Never 8.0 6.4 10.1 6.2 0.6 17.2 7.8 79Others 0.0 0.0 0.0 0.0 0.0 0.0 0.0 0.0
ASHA visit to your house
Total 174 171 188 193 159 128 100 1013Yes 80.5 77.2 92.0 86.0 85.5 67.7 82.3 833ASHA carries kit Total 174 171 188 193 159 128 100 1013Yes 79.3 71.3 88.8 89.1 91.2 67.2 81.9 830ASHA provide common medicines
free of cost Total 174 171 188 193 159 128 100 1013Yes 71.3 59.1 85.6 64.8 85.5 52.3 70.5 714ASHA tells about good health
practices like sanitation/hygiene Total 174 171 188 193 159 128 100 1013Yes 49.0 39.5 52.0 27.5 46.5 40.0 42.4 509Any health day at Aanganwadi/Any
other place organized in village Total 200 200 200 200 200 200 100 1200<3 times 98.0 98.7 97.1 100.0 71.0 97.5 93.1 4743-6 times 0.0 0.0 1.0 0.0 19.4 2.5 4.1 21>6 times 2.0 1.3 1.9 0.0 9.7 0.0 2.8 14Frequency in last three months
Total 98 79 104 55 93 80 100 509ASHA tells about safe drinking water
Yes
79.9 77.8 88.3 72.0 97.5 73.4 81.5 826

E
valuation Study of National R
ural Health M
ission (NR
HM
) in 7 States 133
Information about ASHA & NRHM Katni Nimach Vidisha Shivpuri Hoshangabad Dhar Total % Total Number
Total 174 171 188 193 159 128 100 1013Yes 25.0 36.0 13.5 11.5 30.5 32.0 24.8 297Existence of VHSC in the village Total 200 200 200 200 200 200 100 1200Yes 10.0 8.3 7.4 0.0 6.6 4.7 6.7 20Are you member of VHSC Total 50 72 27 23 61 64 100 297Motivate to work 100.0 100.0 100.0 100.0 100.0 100.0 100.0 20If yes specify the contribution of
VHSC in improving health & hygienic condition of the village
Total 5 6 2 0.0 4 3 100 20
Yes 44.0 19.0 6.0 55.0 7.0 14.5 24.3 291Any health camps organized at village/community/ block level Total 200 200 200 200 200 200 100 1200
Yes 97.7 76.3 83.3 91.8 78.6 34.5 84.9 247If yes, have you attended that camp/programme Total 88 38 12 110 14 29 100 291
Don’t know 0.0 0.0 0.0 22.2 0.0 5.3 6.8 3Lack of time 100.0 88.9 100.0 55.6 100.0 94.7 88.6 39Transport problem 0.0 11.1 0.0 11.1 0.0 0.0 2.3 1Illness 0.0 0.0 0.0 11.1 0.0 0.0 2.3 1
If no, give reasons
Total 2 9 2 9 3 19 100 44Yes 36.0 58.0 40.0 27.0 51.0 51.0 43.8 526Awareness about timings of
doctor’s visit at SC Total 200 200 200 200 200 200 100 1200 Yes 50.5 35.5 6.0 56.5 17.0 34.5 33.3 400Any improvement after launching
of NRHM Total 200 200 200 200 200 200 100 1200Benefits of JSY 44.6 81.7 33.3 20.4 26.5 20.3 38.3 153Immunization improvement 18.8 15.5 0.0 43.4 2.9 68.1 31.8 127Medicine facilities 35.6 0.0 50.0 14.2 61.8 11.6 21.8 87Improved facilities 1.0 2.8 16.7 22.1 8.8 0.0 8.3 28
If yes mention
Total 101 71 12 113 34 69 100 400

134
Evaluation Study of N
ational Rural H
ealth Mission (N
RH
M) in 7 States
Jharkhand household tables
Background Characteristics Ranchi Dhanbad Giridih W.
SinghbhumChatra Total % Total Number
200 200 200 200 200 100 1000Background characteristics of HH
Male 98.5 93.0 96.5 99.0 98.0 97.0 970Female 1.5 7.0 3.5 1.0 2.0 3.0 30Sex of the Head
Total 200 200 200 200 200 100 1000SC 13.0 18.0 40.5 2.5 21.5 19.1 191ST 56.0 5.5 3.5 89.0 7.5 32.3 323OBC 28.0 71.5 40.0 6.0 61.0 41.3 413Others 3.0 5.0 16.0 2.5 10.0 7.3 73
Social category
Total 200 200 200 200 200 100 1000Hindu 92.0 78.0 98.0 100.0 90.0 91.6 916Muslim 8.0 22.0 2.0 0.0 10.0 8.4 84Others 0.0 0.0 0.0 0.0 0.0 0.0 0.0Religion
Total 200 200 200 200 200 100 1000Joint 47.0 28.0 30.0 27.0 28.5 32.1 321Nuclear 53.0 72.0 70.0 73.0 71.5 67.9 679Type of Family Total 200 200 200 200 200 100 1000<25000 13.0 59.0 66.0 34.0 44.0 43.2 43225000-50000 54.0 33.5 30.0 58.5 47.0 44.6 446>50000 33.0 7.5 4.0 7.5 9.0 12.2 122Total Income of HH
Total 200 200 200 200 200 100 10001 90.0 84.0 77.0 96.0 87.0 86.8 8682 8.0 13.0 19.0 4.0 12.5 11.3 1133+ 2.0 3.0 4.0 0.0 0.5 1.9 19Total No. of earning member
Total 200 200 200 200 200 100 10001 50.0 25.0 0.0 0.0 50.0 26.1 62 50.0 12.5 0.0 33.3 0.0 17.4 43+ 0.0 62.5 0.0 66.7 50.0 56.5 13members of family are insured for health
Total 2 16 0.0 3 2 100 23

E
valuation Study of National R
ural Health M
ission (NR
HM
) in 7 States 135
Ranchi Dhanbad Giridih W. Singhbhum
Chatra Total % Total Number
Members of the HH 1-5 75.0 74.5 67.0 80.0 68.5 73.0 730
6-10 25.0 25.5 32.5 20.0 31.0 26.8 26810+ 0.0 0.0 0.5 0.0 0.5 0.2 2Total members in the HH
Total 200 200 200 200 200 100 10001 64.7 65.0 71.7 69.3 65.2 67.2 4132 32.8 35.0 26.8 29.8 31.3 31.2 192
3+ 2.5 0.0 1.6 0.9 3.5 1.6 10No. of children, 0-5 years
Total 119 140 127 114 115 100 615Land Owned
< 1 acre 24.7 6.3 50.6 38.5 18.2 31.0 1421-3 acres 39.8 87.5 40.2 50.0 49.2 47.2 2164-6 acres 16.1 0.0 5.7 8.5 22.7 13.3 617-9 acres 4.3 6.3 3.4 0.8 3.0 2.8 13
>10acre 15.1 0.0 0.0 2.3 6.8 5.7 26
Total Land Owned
Total 93 16 87 130 132 100 458

136
Evaluation Study of N
ational Rural H
ealth Mission (N
RH
M) in 7 States
Household Facilities HH Details Indicators Ranchi Dhanbad Giridih W. Singhbhum Chatra Total % Total No.
200 200 200 200 200 100 1000 Pucca 2.5 15.0 9.5 0.5 10.0 7.5 75 Semi-Pucca 63.0 45.0 44.0 20.5 27.5 40.0 400 Kachha 34.5 40.0 46.5 79.0 62.5 52.5 525 Others 0.0 0.0 0.0 0.0 0.0 0.0 0.0
Type of House
Total 200 200 200 200 200 100 1000 Own 100.0 94.5 99.5 99.0 99.0 98.4 984 Rented 0.0 5.5 0.5 1.0 1.0 1.6 16 Ownership of House Total 200 200 200 200 200 100 1000 Yes 34.0 22.5 19.0 13.0 16.5 21.0 210 Separate kitchen Total 200 200 200 200 2000 100 1000 Yes 21.0 27.5 11.5 2.5 11.0 14.7 147 Toilet inside the house Total 200 200 200 200 200 100 1000 Electricity 47.5 82.5 6.5 17.0 42.0 39.1 391 Kerosene lamps 52.5 16.0 88.0 76.5 57.5 58.1 581 Others 0.0 1.5 5.5 6.5 0.5 2.8 28 Main source of lighting in the house
Total 200 200 200 200 200 100 1000 Yes 19.0 21.0 22.5 37.5 62.0 32.4 324 Source of drinking water Total 200 200 200 200 200 100 1000 Tap 0.0 9.5 0.0 1.3 1.6 2.2 7 Hand pump 65.8 81.0 68.9 74.7 83.1 76.9 249 Well 34.2 9.5 28.9 16.0 11.3 17.3 56 Others 0.0 0.0 2.2 8.0 4.0 3.7 12
Source of drinking water
Total 38 42 45 75 124 100 324 Yes 20.5 18.5 21.0 39.0 60.5 31.9 319 No 79.5 81.5 79.0 61.0 39.5 68.1 681 Is that water potable Total 200 200 200 200 200 100 1000 Boil 0.0 0.6 0.0 0.0 2.5 .4.0 3 Filter 0.0 0.6 0.0 0.0 0.0 0.1 1 Drink as it is 100.0 98.2 100.0 100.0 96.2 99.1 675 Others 0.0 0.6 0.0 0.0 1.3 0.3 2
If no, how do you purify it
Total 159 163 158 122 79 100 681

E
valuation Study of National R
ural Health M
ission (NR
HM
) in 7 States 137
HH Details Indicators Ranchi Dhanbad Giridih W. Singhbhum Chatra Total % Total No. Diarrhea 64.7 59.3 0.0 0.0 63.1 61.6 249 Fever 12.9 27.5 0.0 0.0 30.8 25.5 103 Cholera 17.6 0.0 0.0 0.0 1.5 4.2 17 Malaria 4.7 12.2 0.0 0.0 4.6 8.2 33 Pneumonia 0.0 0.0 0.0 0.0 0.0 0.0 0.0 Stomach infection
0.0 0.0 0.0 0.0 0.0 0.0 0.0
TB 0.0 1.1 0.0 0.0 0.0 0.5 2 Jaundice 0.0 0.0 0.0 0.0 0.0 0.0 0.0
Perception about disease because of impure drinking water
Total 85 189 0.0 0.0 130 100 404 Dung cake 21.0 13.0 13.0 14.0 45.5 21.3 213 Wood 74.0 42.0 79.0 86.0 54.0 67.0 670 Kerosene 0.5 0.5 0.0 0.0 0.0 0.2 2 Conventional energy
0.0 0.0 0.5 0.0 0.0 0.1 1
LPG 4.5 2.5 2.5 0.0 0.5 2.0 20 Electricity 0.0 0.5 0.0 0.0 0.0 0.1 1 Others 0.0 41.5 5.0 0.0 0.0 9.3 93
Cooking fuel used in the House
Total 200 200 200 200 200 100 1000

138
Evaluation Study of N
ational Rural H
ealth Mission (N
RH
M) in 7 States
ANC services Utilization by Pregnant Women Married women availing natal care Ranchi Dhanbad Giridih W. singhbhum Chatra To% T
No. 200 200 200 200 200 100 1000
< 3 months 12.2 12.2 2.2 2.4 2.4 6.2 134-6 months 46.3 61.0 65.2 68.3 64.3 61.1 1297-9 months 41.5 26.8 32.6 29.3 33.3 32.7 69Pregnancy registration
Total 41 41 46 41 42 100 211Yes 46.3 87.8 95.7 58.5 83.3 74.9 158
Whether going for any ANC Total 41 41 46 41 42 100 211ASHA/ANM/VHM 5.3 47.2 31.8 25.0 40.0 32.9 52SC 73.7 36.1 43.2 25.0 51.4 44.3 70PHC 10.5 8.3 2.3 41.7 5.7 11.4 18CHC 5.3 0.0 4.5 4.2 0.0 2.5 4Dist Hospital 5.3 0.0 2.3 4.2 0.0 1.9 3Private Doctor 0.0 8.3 2.3 0.0 2.9 3.2 5Private Hospital 0.0 0.0 13.6 0.0 0.0 3.8 6
Place of check up
Total 19 36 44 24 35 100 158Within the village 78.9 97.2 93.2 95.8 65.7 86.7 137In other Village 21.1 2.8 6.8 4.2 34.3 13.3 21Distance of SC from Village Total 19 36 44 24 35 100 158B.P 100.0 97.2 100.0 95.8 100.0 98.7 156Height 100.0 86.1 54.5 79.2 85.7 77.8 123Weight 100.0 97.2 86.4 91.7 100.0 94.3 149Urine 100.0 75.0 25.0 75.0 60.0 60.8 96Blood check up 0.0 0.0 0.0 0.0 8.6 1.9 3
Check ups includes
Total 19 36 44 24 35 100 158Yes 97.6 85.4 93.5 97.6 97.6 94.3 199Vaccinated with Anti-Tetanus Total 41 41 46 41 42 100 211Diet 90.2 65.9 45.7 75.6 88.1 72.5 153Exercise 90.2 63.4 45.7 75.6 88.1 72.0 152Precautions 90.2 2.4 45.7 75.6 0.0 42.7 90
ASHA/ANM helps in pregnancy related problems
Total 41 41 46 41 42 100 211

E
valuation Study of National R
ural Health M
ission (NR
HM
) in 7 States 139
Delivery Care during birth of children 0-5 years
0-5 years Indicators Ranchi Dhanbad Giridih W. singhbhum Chatra Total % Total No. 200 200 200 200 200 100 1000
Normal 100.0 85.2 97.6 98.8 97.4 95.6 842Caesarian 0.0 14.8 2.4 1.2 2.6 4.4 39
Type of delivery
Total 169 189 165 169 189 100 881Home 30.2 39.7 61.8 69.2 68.8 53.9 475SC 0.0 0.0 0.6 0.0 4.8 1.1 10PHC 53.8 13.8 15.2 21.9 14.3 23.4 206CHC 0.0 3.2 0.0 3.6 3.7 2.2 19DH 5.3 0.5 7.3 4.7 6.3 4.8 42Private clinics 10.7 42.9 15.2 0.6 2.1 14.6 129
Where did the delivery take place
Total 169 189 165 169 189 100 881<1.8 kgs 2.4 3.7 0.6 1.8 9.5 3.7 331.8-2.5 Kgs 30.2 31.2 19.4 17.2 14.3 22.5 198<2.5 kgs 40.2 22.8 19.4 14.8 17.5 22.8 201not taken 27.2 42.3 60.6 66.3 58.7 51.0 449
Weight of baby at the time of birth
Total 169 189 165 169 189 100 881

140
Evaluation Study of N
ational Rural H
ealth Mission (N
RH
M) in 7 States
Post Natal Care and JSY benefits for the Youngest Child Born Amongst 0-5 years Married Women availing Post Natal Care Ranchi Dhanbad Giridih W. Singhbhum Chatra Total % Total No.
200 200 200 200 200 100 1000Yes 75.8 37.9 37.0 45.7 35.6 45.8 298No 24.2 62.1 63.0 54.3 64.4 54.2 353Availed JSY benefits after last child Total 120 140 127 129 135 100 651Yes 52.5 48.6 43.3 17.1 28.9 37.9 247
Availed PNC Services after youngest child Total 120 140 127 129 135 100 651SC 54.0 45.6 76.4 18.2 46.2 52.2 129PHC 36.5 19.1 9.1 59.1 35.9 27.5 68CHC 3.2 1.5 0.0 4.5 10.3 3.2 8DH 1.6 0.0 7.3 18.2 0.0 3.6 9Private 4.8 33.8 7.3 0.0 7.7 13.4 33
Place of Check Ups
Total 63 68 55 22 39 100 247Yes 100.0 86.8 98.2 95.5 84.6 93.1 230Govt. health facilities are satisfactory Total 63 68 55 22 39 100 247Yes 0.8 0.7 0.8 0.0 1.5 0.8 5Any miscarriage/Abortion/Still birth during last 1 yr Total 120 140 127 129 135 100 651weakness 0.0 0.0 0.0 0.0 0.0 0.0 0.0Don’t know 100.0 0.0 100.0 0.0 100.0 80.0 4Workload 0.0 100.0 0.0 0.0 0.0 20.0 1
Causes of occurrence
Total 1 1 1 0.0 2 100 5

E
valuation Study of National R
ural Health M
ission (NR
HM
) in 7 States 141
Immunization and Child Care of Children aged 0-5 years 0-5 years Indicators Ranchi Dhanbad Giridih W. Singhbhum Chatra Total % Total No.
200 200 200 200 200 100 1000BCG 100.0 99.5 100.0 100.0 99.5 99.8 867DPT 1,2 & 3 100.0 95.7 97.5 97.6 97.9 97.7 849Polio 1,2 & 3 100.0 91.4 94.3 97.0 89.9 94.4 820Measles 84.6 51.4 82.2 69.2 49.2 66.4 577Hepatitis 65.7 14.6 0.0 14.8 14.3 21.9 190
Whether vaccinated
Total 169 185 157 169 189 100 869Yes 100.0 91.2 63.1 94.1 90.5 88.0 765No 0.0 9.7 36.9 5.9 9.5 12.0 104Having immunization card Total 169 185 157 169 189 100 869Lost 0.0 100.0 94.8 80.0 72.2 90.4 94Not Available 0.0 0.0 0.0 0.0 0.0 0.0 0.0Torn 0.0 0.0 5.2 20.0 27.8 9.6 10If no, give reason
Total 0.0 18 58 10 18 100 104SC 100.0 67.6 66.9 59.8 61.4 70.9 616PHC 0.0 0.5 0.0 0.0 0.5 0.2 2CHC 0.0 0.0 0.0 0.0 0.0 0.0 0.0DH 0.0 0.0 0.0 0.0 0.0 0.0 0.0Govt. mobile clinic 0.0 0.0 0.0 0.0 0.0 0.0 0.0ANM/AWW/MHW/ASHA 0.0 31.9 32.5 40.2 32.3 27.5 239Private doctor 0.0 0.0 0.0 0.0 0.0 0.0 0.0Any other 0.0 0.0 0.6 0.0 5.8 1.4 12
Place for availing vaccination
Total 169 185 157 169 189 100 869Yes 0.0 1.1 0.0 0.0 2.1 0.7 6Suffering from Polio Total 169 189 165 169 189 100 881Yes 49.7 15.3 27.3 25.4 46.6 32.8 289Use of Bed Net Total 169 189 165 169 189 100 881< 4 months 1.2 54.5 47.2 1.8 2.1 21.5 1884-6 months 50.9 44.4 44.8 57.7 67.7 53.3 467>6 months 47.9 1.1 8.0 40.5 30.2 25.2 221Up to age only breastfed
Total 169 187 163 168 189 100 876

142
Evaluation Study of N
ational Rural H
ealth Mission (N
RH
M) in 7 States
Chronic Disease and treatment seeking Pattern Chronic Disease Ranchi Dhanbad Giridih W. Singhbhum Chatra Total % Total No.
200 200 200 200 200 100 1000Malaria 0.0 2.1 0.0 0.0 0.0 0.5 1Kala Azar 0.0 0.0 0.0 2.5 4.9 1.4 3Filaria/microfilaria 0.0 17.0 4.5 0.0 4.9 5.7 12Cataract 0.0 0.0 0.0 0.0 4.9 0.9 2Leprosy 20.0 10.6 4.5 10.0 4.9 9.9 21TB 57.5 23.4 34.1 70.0 24.4 41.0 87fever/cold/cough 0.0 4.3 0.0 0.0 0.0 0.9 2Hepatitis 0.0 4.3 6.8 0.0 0.0 2.4 5Diarrhea 0.0 0.0 0.0 0.0 0.0 0.0 0.0Cholera 0.0 0.0 0.0 0.0 0.0 0.0 0.0Accident 0.0 0.0 6.8 0.0 2.4 1.9 4Differently able 0.0 0.0 0.0 0.0 0.0 0.0 0.0Any other 22.5 38.3 43.2 17.5 53.7 35.4 75
Chronic Disease
Total 40 47 44 40 41 100 212Govt. 90.0 57.4 61.4 95.0 48.8 69.8 148Pvt. 10.0 42.6 38.6 5.0 51.2 30.2 64Place of Treatment Total 40 47 44 40 41 100 53Better Treatment 75.0 100.0 100.0 100.0 52.4 82.8 0.0Better facilities 0.0 0.0 0.0 0.0 0.0 0.0 0.0Doctor recommended 0.0 0.0 0.0 0.0 0.0 0.0 11Govt. hospital too far 25.0 0.0 0.0 0.0 47.6 17.2 0.0Medicine was not effective 0.0 0.0 0.0 0.0 0.0 0.0 0.0In emergency 0.0 0.0 0.0 0.0 0.0 0.0
If Pvt. Reason
Total 4 20 17 2 21 100 64
SC 2.8 25.9 0.0 28.9 15.0 14.9 95PHC 94.4 48.1 48.1 55.3 70.0 64.2 2CHC 0.0 0.0 7.4 0.0 0.0 1.4 29DH 2.8 25.9 44.4 15.8 15.0 19.6 148
Place/Facilities in Govt. Hospitals
Total 36 27 27 38 20 100 211Type of treatment AL 100.0 97.9 100.0 100.0 100.0 99.5 1

E
valuation Study of National R
ural Health M
ission (NR
HM
) in 7 States 143
Chronic Disease Ranchi Dhanbad Giridih W. Singhbhum Chatra Total % Total No.AY 0.0 2.1 0.0 0.0 0.0 0.5 0.0YN 0.0 0.0 0.0 0.0 0.0 0.0 0.0UN 0.0 0.0 0.0 0.0 0.0 0.0 0.0SD 0.0 0.0 0.0 0.0 0.0 0.0 0.0AO 0.0 0.0 0.0 0.0 0.0 0.0 212Total 40 47 44 40 41 100 209Yes 100.0 95.7 100.0 100.0 97.6 98.6 212Doctor attended you carefully Total 40 47 44 40 41 100 128Yes 87.5 40.6 38.6 95.0 46.3 60.4 128No 12.5 59.6 61.4 5.0 53.7 39.6 84Whether medicines received free of costTotal 40 47 44 40 41 100 212<500 Rs 0.0 0.0 0.0 0.0 9.1 2.4 6500-1000 Rs 0.0 0.0 0.0 50.0 22.7 7.1 76>1000 Rs 100.0 100.0 100.0 50.0 68.7 90.5 84Expenditure on medicine
Total 5 28 27 2 22 100 90< 3 months 10.0 68.1 72.7 15.0 37.5 42.5 553-6 months 35.0 21.3 9.1 47.5 20.0 25.9 177-10 months 12.5 4.3 2.3 17.5 5.0 8.0 50> 10 months 42.5 6.4 15.9 20.0 37.5 23.6 212
Duration of treatment
Total 40 47 44 40 41 100Govt. hospital 0.0 23.5 6.7 0.0 0.0 14.3 5Pvt. Doctor/clinic 0.0 11.8 13.3 100.0 100.0 20.0 7Private hospital 0.0 64.7 80.0 0.0 0.0 65.7 23Referred to
Total 0.0 17 15 1 2 100 35Doctor’s fee <300 Rs 0.0 5.9 0.0 0.0 0.0 3.0 1300-600 Rs 0.0 5.9 6.7 0.0 0.0 6.1 2601-1000 Rs 0.0 11.8 0.0 0.0 0.0 6.1 2>1000 Rs 0.0 76.5 93.3 0.0 100.0 84.8 28Total 0.0 17 15 0.0 1 100 33Drugs <300 Rs 0.0 0.0 0.0 0.0 0.0 0.0 0
Expenditure, when referred
300-600 Rs 0.0 0.0 7.1 0.0 0.0 7.1 1

144
Evaluation Study of N
ational Rural H
ealth Mission (N
RH
M) in 7 States
Chronic Disease Ranchi Dhanbad Giridih W. Singhbhum Chatra Total % Total No.601-1000 Rs 0.0 0.0 0.0 0.0 0.0 0.0 0>1000 Rs 0.0 0.0 92.9 0.0 0.0 92.9 13Total 0 0 14 0 0 100 14Special food <300 Rs 0.0 0.0 12.5 0.0 0.0 12.5 1300-600 Rs 0.0 0.0 25.0 0.0 0.0 25.0 2601-1000 Rs 0.0 0.0 0.0 0.0 0.0 0.0 0>1000 Rs 0.0 0.0 62.5 0.0 0.0 62.5 5Total 0.0 0.0 8 0.0 0.0 100 8Transport >300 Rs 0.0 0.0 12.5 0.0 0.0 12.5 1300-600 Rs 0.0 0.0 25.0 0.0 0.0 25.0 2601-1000 Rs 0.0 0.0 0.0 0.0 0.0 0.0 0>1000 Rs 0.0 0.0 62.5 0.0 0.0 62.5 5Total 0.0 0.0 8 0.0 0.0 100 8Others <300 Rs 0.0 0.0 0.0 0.0 0.0 0.0 0300-600 Rs 0.0 0.0 37.5 0.0 0.0 37.5 3601-1000 Rs 0.0 0.0 25.0 0.0 0.0 25.0 2<1000 Rs 0.0 0.0 37.5 0.0 0.0 37.5 3Total 0.0 0.0 8 0.0 0.0 100 8Yes 100.0 42.6 52.3 92.5 48.8 66.5 140No 0.0 57.4 47.7 7.5 51.2 33.5 72Whether satisfied with the service Total 40 47 44 40 41 100 212No better facilities 0.0 0.0 0.0 0.0 0.0 0.0 0No free medicines 0.0 0.0 0.0 0.0 0.0 0.0 0Medicine did not work 0.0 3.7 0.0 100.0 81.0 29.2 21No good treatment 0.0 44.4 0.0 0.0 4.8 18.1 13No relief 0.0 51.9 100.0 0.0 14.3 52.8 38
Reason for not satisfied
Total 0.0 27 21 3 21 100 72

E
valuation Study of National R
ural Health M
ission (NR
HM
) in 7 States 145
Family Planning Services Utilization Family Planning Indicators Ranchi Dhanbad Giridih W.
SinghbhumChatra Total
% Total No.
200 200 200 200 200 100 1000Yes 49.5 55.7 56.8 55.6 55.9 54.7 525No 50.5 44.3 43.2 44.4 44.1 45.3 435You/your husband using any
Family planning method Total 194 185 190 196 195 100 960Female Sterilization 13.5 27.2 30.6 8.3 28.4 21.7 114Non scalpel Vasectomy 0.0 1.9 0.9 0.9 0.0 0.8 4IUD/Copper-T/Loop 11.5 0.0 1.9 2.8 3.7 3.8 20Oral Pills 43.8 16.5 14.8 30.3 26.6 26.1 137Condom/Nirodh 31.3 49.5 43.5 57.8 41.3 45.0 236Rhythm/periodic abstinence 0.0 1.0 0.9 0.0 0.0 0.4 2Withdrawal 0.0 2.9 2.8 0.0 0.0 1.1 6Other Trad. Method (specify) 0.0 1.0 4.6 0.0 0.0 1.1 6
Method using
Total 96 103 108 109 109 100 525ASHA 55.2 27.2 1.9 29.4 11.0 24.2 127ANM 37.5 18.4 26.9 43.1 75.2 40.6 213Doctor 1.0 0.0 1.9 1.8 2.8 1.5 8Friends 2.1 2.9 0.0 12.8 4.6 4.6 24Relatives 4.2 7.8 20.4 9.2 3.7 9.1 48Others(specify) 0.0 43.7 49.1 3.7 2.8 20.0 105
Who mainly motivated you to use current method
Total 96 103 108 109 109 100 525Yes 100.0 80.6 67.6 97.2 96.3 88.2 463No 0.0 19.4 32.4 2.8 3.7 11.8 62Getting Contraceptives free of cost
Total 96 103 108 109 109 100 525ASHA/ANM/ VHW 68.8 44.7 34.3 84.4 63.3 59.0 310Govt. hospital /CHC /PHC/SC 31.3 30.1 26.9 14.7 33.9 27.2 143Pvt. hospitals/ Doctor/Chemist 0.0 6.8 23.1 0.0 2.8 6.7 35NGOS 0.0 6.8 6.5 0.0 0.0 2.7 14Others(specify) 0.0 11.7 9.3 0.9 0.0 4.4 23
Source for getting the method
Total 96 103 108 109 109 100 463Yes 0.0 0.0 1.9 0.9 0.0 0.6 3Health problem while using this
method No 100.0 100.0 98.1 99.1 100.0 99.4 522

146
Evaluation Study of N
ational Rural H
ealth Mission (N
RH
M) in 7 States
Family Planning Indicators Ranchi Dhanbad Giridih W. Singhbhum
Chatra Total %
Total No.
Total 96 103 108 109 109 100 525Want a Child 90.8 75.6 73.2 95.4 89.5 85.3 371Not having Sex 8.2 2.4 2.4 2.3 3.5 3.9 17Method Failed/become pregnant 0.0 2.4 2.4 0.0 0.0 0.9 4Relatives opposed 0.0 0.0 0.0 0.0 0.0 0.0 0.0Religious prohibition 0.0 0.0 0.0 0.0 0.0 0.0 0.0Not aware of any method 0.0 0.0 0.0 0.0 0.0 0.0 0.0Not knowing the source of availability 0.0 0.0 0.0 33.3 15.1 9.7 42Inconvenient to use 0.0 0.0 0.0 0.0 0.0 0.0 0.0Health problems 1.0 1.2 2.4 0.0 2.3 1.4 6Fear of side effects 0.0 6.1 1.2 0.0 0.0 1.4 6Lack of sexual satisfaction 0.0 3.7 6.1 1.1 0.0 2.1 9
Main reason for not using any method
Others (specify) 0.0 13.4 26.8 0.0 1.2 7.8 34 Total 98 82 82 87 86 100 435

E
valuation Study of National R
ural Health M
ission (NR
HM
) in 7 States 147
Awareness about NRHM & ASHA Information about ASHA Indicator Ranchi Dhanbad Giridih W.
SinghbhumChatra Total
% Total No.
200 200 200 200 200 100 1000 Yes 100.0 95.5 86.5 99.0 92.0 94.6 946 Have you heard about ASHA Total 200 200 200 200 200 100 1000 Yes 15.5 87.5 70.0 32.5 41.5 49.4 494 Have you heard about NRHM Total 200 200 200 200 200 100 1000 ASHA/ANM 83.9 77.1 72.1 41.5 43.4 65.8 325 Radio/TV 12.9 4.0 1.4 30.8 38.6 13.2 65 Newspapers 0.0 0.0 2.1 16.9 7.2 4.0 20 Any other 3.2 18.9 24.3 10.8 10.8 17.0 84
Source of information
Total 31 175 140 65 83 100 494 Every week 1.5 26.2 8.7 6.6 10.9 10.7 101 Bi-weekly 45.5 36.6 22.5 15.7 13.6 27.1 256 Monthly 49.5 29.8 26.0 61.6 57.6 45.3 429 Once in 3 months 3.5 1.6 1.2 16.2 7.6 6.1 58 Never 0.0 5.2 39.3 0.0 9.8 10.1 96 Others 0.0 0.5 2.3 0.0 0.5 0.6 6
ASHA visits
Total 200 191 173 198 184 100 946 Yes 98.5 44.5 26.0 81.8 16.3 54.9 519 ASHA carry kit
Total 200 191 173 198 184 100 946 Yes 98.0 77.0 37.6 96.5 56.0 74.2 702 ASHA provide common medicines free of cost Total 200 191 173 198 184 100 946 Yes 95.0 69.1 35.8 91.9 64.7 72.4 685 ASHA tells about good health practices like
sanitation/hygiene Total 200 191 173 198 184 100 946 Yes 74.5 24.0 27.5 59.5 49.0 46.9 469 Any VHND at Aanganwadi/ Other place
organized in the village Total 200 200 200 200 200 100 1000 <3 times 95.3 77.1 92.7 100.0 99.0 95.1 446 3-6 times 4.7 22.9 7.3 0.0 0.0 4.7 22 >6 times 0.0 0.0 0.0 0.0 1.0 0.2 1 Frequency in last 3 months
Total 149 48 55 119 98 100 469 Yes 97.0 73.3 47.4 90.9 88.0 80.1 758 ASHA tells about safe drinking water Total 200 191 173 198 184 100 946

148
Evaluation Study of N
ational Rural H
ealth Mission (N
RH
M) in 7 States
Information about ASHA Indicator Ranchi Dhanbad Giridih W. Singhbhum
Chatra Total %
Total No.
Yes 69.0 1.5 3.5 32.5 35.5 28.4 284 Existing of VHSC in your village Total 200 200 200 200 200 100 1000 Yes 0.7 0.0 0.0 0.0 4.2 1.4 4 Are you member of VHSC Total 138 3 7 65 71 100 284 Health Awareness 0.0 0.0 0.0 0.0 0.0 0.0 0.0 Programme support 0.0 0.0 0.0 0.0 0.0 0.0 0.0 Aware to people 100.0 0.0 0.0 0.0 0.0 25.0 1 Time to time cleanliness 0.0 0.0 0.0 0.0 100.0 75.0 3 No contribution 0.0 0.0 0.0 0.0 0.0 0.0 0.0
If yes specify the contribution of VHSC in improving health & hygienic condition of the village
Total 1 0.0 0.0 0.0 3 100 4 Yes
14.0 38.5 17.0 21.5 17.0 21.6 216 Health camps organized at village/community/ block level Total 200 200 200 200 200 100 1000
Yes 85.7 92.2 94.1 60.5 55.9 79.6 172 If yes, have you attended that camp/programme Total 28 77 34 43 34 100 216
No need / No company / No knowledge / Not allowed
0.0 0.0 100.0 0.0 6.7 6.8 3
Lack of time 100.0 100.0 0.0 100.0 93.3 93.2 41 If no, give reasons
Total 4 6 2 17 15 100 44 Yes 84.0 30.5 51.0 57.0 52.0 54.9 549 Awareness about timely visit of doctors at SC Total 200 200 200 200 200 100 1000 Yes 5.5 54.0 46.0 19.0 28.0 30.5 305 Improvement after launching of NRHM Total 200 200 200 200 200 100 1000 Benefits of JSY 9.1 13.9 18.5 0.0 1.8 11.1 34 Immunization improvement 45.5 67.6 48.9 86.8 89.3 67.5 206 Medicine facilities 27.3 17.6 14.1 10.5 3.6 13.4 41 Improved facilities 18.2 0.9 18.5 2.6 5.4 7.9 24
If yes mention
Total 11 108 92 38 56 100 305

E
valuation Study of National R
ural Health M
ission (NR
HM
) in 7 States 149
Orissa household tables
Background Characteristics Indicators Rayagada Balangir Kendujhar Kendrapara Puri Total
% Total Number
200 200 200 200 200 100 1000Background characteristics of HH
Male 98.0 97.5 99.5 98.5 100.0 98.7 987Female 2.0 2.5 0.5 1.5 0.0 1.3 13Sex of the Head Total 200 200 200 200 200 100 1000SC 40.0 17.5 3.5 20.5 14.5 19.2 192ST 37.5 27.5 68.0 5.5 0.0 27.7 277OBC 15.5 49.0 21.0 35.5 21.5 28.5 285Others 7.0 6.0 7.5 38.5 64.0 24.6 246
Social category
Total 200 200 200 200 200 100 1000Hindu 100.0 99.5 99.5 98.0 98.5 99.1 991Muslim 0.0 0.5 0.5 0.5 1.5 0.6 6Others 0.0 0.0 0.0 1.5 0.0 0.3 3Religion
Total 200 200 200 200 200 100 1000Joint 27.5 35.5 36.5 32.5 39.5 34.3 343Nuclear 72.5 64.5 63.5 67.5 60.5 65.7 657Type of Family Total 200 200 200 200 200 100 1000<25000 66.5 65.5 37.5 23.0 39.5 46.4 46425000-50000 30.5 32.0 47.5 61.0 49.0 44.0 440>50000 3.0 2.5 15.0 16.0 11.5 9.6 96Total Income of HH
Total 200 200 200 200 200 100 10001 83.0 80.5 91.0 92.0 90.5 87.4 8742 15.5 17.0 9.0 7.5 8.5 11.5 1153+ 1.5 2.5 0.0 0.5 1.0 1.1 11Total No. of earning member
Total 200 200 200 200 200 100 10001 100.0 0.0 0.0 0.0 0.0 100.0 22 0.0 0.0 0.0 0.0 0.0 0.0 0.03+ 0.0 0.0 0.0 0.0 0.0 0.0 0.0
members of family are insured for health
Total 2 0 0 0 0 100 2

150
Evaluation Study of N
ational Rural H
ealth Mission (N
RH
M) in 7 States
Indicators Rayagada Balangir Kendujhar Kendrapara Puri Total %
Total Number
Members of the HH 1-5 75.5 79.0 86.5 82.0 78.0 80.2 8026-10 24.5 21.0 13.5 18.0 22.0 19.8 19810+ 0.0 0.0 0.0 0.0 0.0 0.0 0.0Total members in the HH
Total 200 200 200 200 200 100 10001 81.3 73.5 68.5 69.5 71.1 73.0 4282 18.7 26.5 29.6 29.5 28.9 26.5 155 3+ 0.0 0.0 1.9 1.0 0.0 0.5 3No. of children, 0-5 years
Total 123 136 108 105 114 100 586Land Owned
< 1 acre 14.0 1.0 23.3 30.2 21.7 19.8 1021-3 acres 32.6 54.6 46.7 48.2 43.5 46.7 2404-6 acres 20.9 27.8 24.2 15.1 25.2 22.4 1157-9 acres 16.3 2.1 1.7 6.5 5.2 5.1 26>10acre 16.3 14.4 4.2 0.0 4.3 6.0 31
Total Land Owned
Total 43 97 120 139 115 100 514

E
valuation Study of National R
ural Health M
ission (NR
HM
) in 7 States 151
Household Facilities HH Details Indicators Rayagada Balangir Kendujhar Kendrapara Puri Total % Total Number
200 200 200 200 200 100 1000Pucca 9.5 9.5 3.5 2.0 7.5 6.4 64Semi-Pucca 35.5 46.0 39.0 20.5 42.5 36.7 367Kachha 55.0 44.5 57.5 77.0 50.0 56.8 568Others 0.0 0.0 0.0 0.5 0.0 0.1 1
Type of House
Total 200 200 200 200 200 100 1000Own 98.5 99.5 99.0 100.0 97.5 98.9 989Rented 1.5 0.5 1.0 0.0 2.5 1.1 11Ownership of House Total 200 200 200 200 200 100 1000 Yes 26.0 24.5 27.5 20.0 25.0 24.6 246Separate kitchen Total 200 200 200 200 200 100 1000Yes 12.5 4.5 8.5 7.0 14.0 9.3 93Toilet inside the house Total 200 200 200 200 200 100 1000Electricity 51.0 70.0 45.0 36.5 58.5 52.2 522Kerosene lamps 37.5 27.5 51.0 62.5 37.5 43.2 432Others 11.5 2.5 4.0 1.0 4.0 4.6 46
Main source of lighting in the house
Total 200 200 200 200 200 100 1000Yes 26.0 9.0 48.0 40.5 47.5 34.2 342Source of drinking water Total 200 200 200 200 200 100 1000Tap 7.7 5.6 3.2 0.0 8.3 4.7 16Hand pump 67.3 22.2 68.4 59.3 80.2 67.0 229Well 19.2 66.7 20.0 29.6 8.3 21.3 73Others 5.8 5.6 8.4 11.1 3.1 7.0 24
Source of drinking water
Total 52 18 95 81 96 100 342Yes 96.0 98.0 91.0 93.5 92.5 94.2 942No 4.0 2.0 9.0 6.5 7.5 5.8 58Is that water potable Total 200 200 200 200 200 100 1000Boil 0.0 0.0 11.1 7.7 0.0 5.2 3Filter 0.0 0.0 0.0 0.0 0.0 0.0 0.0Drink as it is 100.0 100.0 88.9 92.3 100.0 94.8 55Others 0.0 0.0 0.0 0.0 0.0 0.0 0.0
If no, how do you purify it
Total 8 4 18 13 15 100 58

152
Evaluation Study of N
ational Rural H
ealth Mission (N
RH
M) in 7 States
HH Details Indicators Rayagada Balangir Kendujhar Kendrapara Puri Total % Total Number Diarrhea 37.0 31.5 62.5 71.0 57.5 51.9 519Fever 40.5 59.0 5.0 0.0 16.5 24.2 242Cholera 0.0 0.0 0.0 0.0 0.0 0.0 0.0Malaria 0.0 0.0 0.0 0.0 0.0 0.0 0.0Pneumonia 0.0 0.0 0.0 0.0 0.0 0.0 0.0Stomach infection
6.0 5.0 1.5 0.0 0.5 2.6 26
TB 0.0 0.0 0.0 0.0 0.0 0.0 0.0Jaundice 7.5 0.0 4.0 0.0 7.0 3.7 37
Perception about disease because of impure drinking water
Total 182 191 146 142 163 100 824Dung cake 11.0 1.5 26.5 15.0 29.0 16.6 166Wood 85.5 98.0 73.0 85.0 68.0 81.9 819Kerosene 1.5 0.0 0.0 0.0 2.0 0.7 7Conventional energy
0.0 0.0 0.0 0.0 0.0 0.0 0.0
LPG 1.5 0.5 0.5 0.0 1.0 0.7 7Others 0.5 0.0 0.0 0.0 0.0 0.1 1
Cooking fuel used in the house
Total 200 200 200 200 200 100 1000

E
valuation Study of National R
ural Health M
ission (NR
HM
) in 7 States 153
ANC Services Utilization by Pregnant Women Married women availing Ante natal care Rayagada Balangir Kendujhar Kendrapara Puri Total
% Total
Number 200 200 200 200 200 100 1000
Less than 3 months 5.6 17.1 14.6 4.9 4.9 9.5 194-6 months 52.8 46.3 46.3 65.9 43.9 51.0 1027-9 months 41.7 36.6 39.0 29.3 51.2 39.5 79Pregnancy registration
Total 36 41 41 41 41 100 200Yes 88.9 87.8 85.4 90.2 85.4 87.5 175
Going for any ANC Total 36 41 41 41 41 100 200ASHA/ANM/VHM 34.4 19.4 34.3 13.5 28.6 25.7 45SC 46.9 58.3 28.6 5.4 48.6 37.1 65PHC 9.4 22.2 17.1 59.5 5.7 23.4 41CHC 6.3 0.0 17.1 18.9 14.3 11.4 20Dist Hospital 0.0 0.0 0.0 0.0 2.9 0.6 1Private Doctor 3.1 0.0 0.0 2.7 0.0 1.1 2Private Hospital 0.0 0.0 2.9 0.0 0.0 0.6 1
Place of check up
Total 32 36 35 37 35 100 175Within the village 90.6 88.9 77.1 37.8 42.9 66.9 117In other Village 9.4 11.1 22.9 62.2 57.1 33.1 58Distance of SC from Village Total 32 36 35 37 35 100 175B.P 96.9 97.2 82.9 100.0 94.3 94.3 165Height 40.6 75.0 48.6 97.3 85.7 70.3 123Weight 84.4 88.9 68.6 100.0 94.3 87.4 153Urine 9.4 27.8 42.9 94.6 80.0 52.0 91Blood check up 0.0 0.0 0.0 2.7 5.7 1.7 3
Check ups Includes
Total 32 36 35 37 35 100 175 Yes 94.4 78.0 100.0 100.0 95.1 93.5 187Vaccinated with Anti-Tetanus Total 36 41 41 41 41 100 200Diet 83.3 22.0 95.1 100.0 95.1 79.0 158Exercise 83.3 7.3 95.1 100.0 95.1 76.0 152Precautions 83.3 0.0 95.1 100.0 97.6 75.0 150
ASHA/ANM helps in pregnancy related problems
Total 36 41 41 41 41 100 200

154
Evaluation Study of N
ational Rural H
ealth Mission (N
RH
M) in 7 States
Delivery Care during birth of Children 0-5 years 0-5 years Indicators Rayagada Balangir Kendujhar Kendrapara Puri Total
% Total
Number 200 200 200 200 200 100 1000
Normal 94.6 99.4 98.0 98.0 97.7 97.6 774Caesarian 5.4 0.6 2.0 2.0 2.3 2.4 19Type of delivery Total 148 172 153 149 171 100 793Home 41.2 43.6 56.9 55.0 41.5 47.4 376SC 0.0 0.0 2.0 0.0 0.0 0.4 3PHC 29.7 7.6 19.6 24.8 10.5 17.9 142CHC 21.6 39.0 11.8 16.8 29.8 24.3 193DH 2.0 9.3 9.8 2.7 16.4 8.3 66Private clinics 5.4 0.6 0.0 0.7 1.8 1.6 13
Where did the delivery take place
Total 148 172 153 149 171 100 793Less than 1.8 kgs 8.1 12.2 2.0 4.7 7.6 7.1 561.8-2.5 Kgs 26.4 19.8 22.2 21.5 28.1 23.6 187more than 2.5 kgs 33.8 27.9 24.8 24.8 31.0 28.5 226not taken 31.8 40.1 51.0 49.0 33.3 40.9 324
Weight of baby at the time of birth
Total 148 172 153 149 171 100 793

E
valuation Study of National R
ural Health M
ission (NR
HM
) in 7 States 155
Post Natal Care and JSY benefits for the Youngest Child Born Amongst 0-5 years Married Women availed PNC Rayagada Balangir Kendujhar Kendrapara Puri Total
% Total
Number 200 200 200 200 200 100 1000
Yes 60.2 66.2 56.9 65.8 68.1 63.7 401No 39.8 33.8 43.1 34.2 31.9 36.3 229Availed JSY benefits after Last child Total 123 136 116 117 138 100 630Yes 44.7 42.6 42.2 35.9 58.0 45.1 284
Availed PNC services after youngest child Total 123 136 116 117 138 100 630SC 50.9 53.4 26.5 11.9 18.8 32.4 92PHC 32.7 31.0 28.6 31.0 21.3 28.2 80CHC 14.5 15.5 26.5 50.0 45.0 30.6 87DH 0.0 0.0 18.4 4.8 15.0 8.1 23Private 1.8 0.0 0.0 2.4 0.0 0.7 2
Place of Check Ups
Total 55 58 49 42 80 100 284Yes 98.2 96.6 100.0 92.9 98.8 97.5 277Govt. health centers are satisfactory Total 55 58 49 42 80 100 284Yes 1.6 0.0 0.0 0.0 1.4 0.6 4Any miscarriage/Abortion/Still birth
during last 1 yr Total 123 136 116 117 138 100 630weakness 100.0 0.0 0.0 0.0 50.0 75.0 3Don’t know
0.0 0.0 0.0 0.0 50.0 25.0 1Causes of occurrence
Total 2 0 0 0 2 100 4

156
Evaluation Study of N
ational Rural H
ealth Mission (N
RH
M) in 7 States
Immunization and Child Care of Children 0-5 years 0-5 years Indicators Rayagada Balangir Kendujhar Kendrapara Puri Total % Total Number
200 200 200 200 200 100 1000 BCG 99.3 98.8 99.3 100.0 100.0 99.5 789 DPT 1,2 & 3 64.9 97.1 97.4 95.3 98.2 91.0 722 Polio 1,2 & 3 60.1 78.5 96.1 94.0 92.4 84.4 669 Measles 52.7 31.4 69.3 47.0 80.7 56.2 446 Hepatitis 0.7 2.3 1.3 4.7 11.7 4.3 34
Whether vaccinated
Total 148 172 153 149 171 100 793 Yes 100.0 98.4 92.2 91.9 97.1 94.7 751 No 0.0 7.6 7.8 8.1 2.9 5.3 42 Having immunization card Total 148 172 153 149 171 100 793 Lost 0.0 76.9 100.0 83.3 60.0 83.3 35 Not Available 0.0 7.7 0.0 0.0 0.0 2.4 1 Torn 0.0 15.4 0.0 16.7 40.0 14.3 6 If no, give reason
Total 0.0 13 12 12 5 100 42 SC 66.9 54.7 60.1 28.9 32.7 48.4 384 PHC 0.7 0.6 2.6 0.0 1.2 1.0 8 CHC 0.0 0.0 0.0 0.0 0.0 0.0 0.0 DH 0.0 0.0 0.0 0.0 0.0 0.0 0.0 Govt. mobile clinic 0.0 0.0 0.0 0.0 0.0 0.0 0.0 ANM/AWW/MHW/ASHA 31.8 44.8 37.3 55.0 66.1 47.4 376 Private doctor 0.0 0.0 0.0 0.0 0.0 0.0 0.0 Any other 0.7 0.0 0.0 16.1 0.0 3.2 25
Place for availing vaccination
Total 148 172 153 149 171 100 793 Yes 1.4 0.6 0.0 1.3 0.6 0.8 6 Suffering from Polio Total 148 172 153 149 171 100 793 Yes 19.6 40.1 32.0 40.3 38.6 34.4 273 Use of Bed Net Total 148 172 153 149 171 100 793 Less than 4 months 39.9 29.7 8.5 2.7 11.7 18.5 147 4-6 months 45.9 65.7 50.3 53.7 43.9 52.1 413 more than 6 months 14.2 4.7 41.2 43.6 44.4 29.4 233 Up to age only breastfed
Total 148 172 153 149 171 100 793

E
valuation Study of National R
ural Health M
ission (NR
HM
) in 7 States 157
Chronic Disease and Treatment Seeking Behavior
Indicators Rayagada Balangir Kendujhar Kendrapara Puri Total %
Total Number
200 200 200 200 200 100 1000 Malaria 14.6 7.3 0.0 0.0 7.1 5.8 12Kala Azar 12.2 2.4 2.4 0.0 7.1 4.9 10Filaria/microfilaria 0.0 0.0 0.0 0.0 0.0 0.0 0.0Cataract 0.0 0.0 0.0 0.0 0.0 0.0 0.0Leprosy 2.4 24.4 9.5 5.0 7.1 9.7 20TB 19.5 36.6 73.8 50.0 35.7 43.2 89fever/cold/cough 2.4 2.4 2.4 0.0 0.0 1.5 3Hepatitis 4.9 0.0 2.4 0.0 0.0 1.5 3Diarrhea 0.0 0.0 0.0 0.0 0.0 0.0 0.0Cholera 0.0 0.0 0.0 0.0 0.0 0.0 0.0Accident 2.4 0.0 0.0 0.0 0.0 0.5 1Differently able 0.0 0.0 0.0 0.0 0.0 0.0 0.0Any other 41.5 26.8 9.5 45.0 42.9 33.0 68
Chronic Disease
Total 41 41 42 40 42 100 206Govt. 75.6 97.6 95.2 80.0 85.7 86.9 179Place of Treatment Pvt. 24.4 2.4 4.8 20.0 14.3 13.1 27Better Treatment 0.0 0.0 0.0 50.0 100.0 81.5 22Better facilities 0.0 100.0 0.0 50.0 0.0 18.5 5Doctor recommended 0.0 0.0 0.0 0.0 0.0 0.0 0.0Govt. hospital too far 0.0 0.0 0.0 0.0 0.0 0.0 0.0Medicine was not effective
0.0 0.0 0.0 0.0 0.0 0.0 0.0
In emergency 0.0 0.0 0.0 0.0 0.0 0.0 0.0
Reason for go to Pvt. Hospitals
Total 10 1 2 8 6 100 27SC 3.2 2.5 0.0 0.0 2.8 1.7 3PHC 38.7 60.0 75.0 87.5 5.6 53.6 96CHC 29.0 7.5 15.0 12.5 61.1 24.6 44DH 29.0 30.0 10.0 0.0 30.6 20.1 36
Places/facilities in Govt. Hospitals
Total 31 40 40 32 36 100 179

158
Evaluation Study of N
ational Rural H
ealth Mission (N
RH
M) in 7 States
Indicators Rayagada Balangir Kendujhar Kendrapara Puri Total %
Total Number
AL 100.0 97.6 100.0 100.0 100.0 99.5 205AY 0.0 2.4 0.0 0.0 0.0 0.5 1YN 0.0 0.0 0.0 0.0 0.0 0.0 0.0UN 0.0 0.0 0.0 0.0 0.0 0.0 0.0SD 0.0 0.0 0.0 0.0 0.0 0.0 0.0AO 0.0 0.0 0.0 0.0 0.0 0.0 0.0
Type of Treatment
Total 41 41 42 40 42 100 206% 95.1 100.0 100.0 95.0 97.6 99.5 201Doctor attended Carefully Total 41 41 42 40 42 100 206<500 Rs 11.8 25.0 33.3 0.0 16.7 15.4 8500-1000 Rs 5.9 0.0 0.0 0.0 0.0 1.9 1Expenditure on Medicines >1000 Rs 82.4 75.0 66.7 100.0 83.3 82.7 43< 3 months 70.7 100.0 23.8 0.0 47.6 48.5 1003-6 months 19.5 0.0 35.7 27.5 33.3 23.3 487-10 months 7.3 0.0 21.4 30.0 14.3 14.6 30> 10 months 2.4 0.0 19.0 42.5 4.8 13.6 28
Duration of treatment
Total 41 41 42 40 42 100 206Yes 17.1 26.8 4.8 0.0 9.5 11.7 24No 82.9 73.2 95.2 100.0 90.5 88.3 182Have you been referred to other
doctor/hospital Total 41 41 42 40 42 100 206Govt. hospital 42.9 0.0 0.0 0.0 50.0 20.8 5Pvt. Doctor/clinic 0.0 36.4 100.0 0.0 0.0 25.0 6Private hospital 57.1 63.6 0.0 0.0 50.0 54.2 13Referred to
Total 7 11 2 0.0 4 100 24 Doctor’s fee Less than 300 Rs 71.4 63.6 100.0 0.0 100.0 75.0 18300-600 Rs 0.0 0.0 0.0 0.0 0.0 0.0 0.0601-1000 Rs 0.0 18.2 0.0 0.0 0.0 8.3 2More than 1000 Rs 28.6 18.2 0.0 0.0 0.0 16.7 4Total 7 11 2 0.0 4 100 24Drugs
Expenditure
Less than 300 Rs 100.0 60.0 50.0 0.0 0.0 50.0 9

E
valuation Study of National R
ural Health M
ission (NR
HM
) in 7 States 159
Indicators Rayagada Balangir Kendujhar Kendrapara Puri Total %
Total Number
300-600 Rs 0.0 20.0 50.0 0.0 100.0 38.9 7601-1000 Rs 0.0 20.0 0.0 0.0 0.0 11.1 2More than 1000 Rs 0.0 0.0 0.0 0.0 0.0 0.0 0.0Total 2 10 2 0 4 100 18Special food Less than 300 Rs 0.0 0.0 0.0 0.0 0.0 0.0 0300-600 Rs 0.0 0.0 0.0 0.0 0.0 0.0 0601-1000 Rs 0.0 0.0 0.0 0.0 0.0 0.0 0More than 1000 Rs 0.0 0.0 0.0 0.0 0.0 0.0 0Total 0 0 0 0 0 0 0Transport Less than 300 Rs 0.0 0.0 0.0 0.0 0.0 0.0 0300-600 Rs 0.0 0.0 0.0 0.0 0.0 0.0 0601-1000 Rs 0.0 0.0 0.0 0.0 0.0 0.0 0More than 1000 Rs 0.0 0.0 0.0 0.0 0.0 0.0 0Total 0 0 0 0 0 0 0Others Less than 300 Rs 0.0 0.0 0.0 0.0 0.0 0.0 0300-600 Rs 0.0 0.0 0.0 0.0 0.0 0.0 0601-1000 Rs 0.0 0.0 0.0 0.0 0.0 0.0 0More than 1000 Rs 0.0 0.0 0.0 0.0 0.0 0.0 0Total 0 0 0 0 0 0 0Yes 43.9 19.5 92.9 90.0 71.4 63.6 131No 56.1 80.5 7.1 10.0 28.6 36.4 75Whether satisfied with the service Total 41 41 42 40 42 100 206No better facilities 0.0 0.0 0.0 0.0 0.0 0.0 0No free medicines 0.0 0.0 0.0 0.0 0.0 0.0 0Medicine did not work 0.0 42.4 100.0 100.0 33.3 33.3 25No good treatment 0.0 0.0 0.0 0.0 0.0 0.0 0No relief 100.0 57.6 0.0 0.0 66.7 66.7 50
Reason for not satisfied
Total 23 33 3 4 12 100 75

160
Evaluation Study of N
ational Rural H
ealth Mission (N
RH
M) in 7 States
Family Planning Services Utilization Family Planning Indicators Rayagada Balangir Kendujhar Kendrapara Puri Total
% Total
Number 200 200 200 200 200 100 1000
Yes 56.0 45.4 56.9 56.9 51.8 53.4 521No 44.0 54.6 43.1 43.1 48.2 46.6 455You/your husband using any
Family planning method Total 193 196 195 97 195 100 976Female Sterilization 38.0 39.3 19.8 21.4 25.7 28.4 148Non scalpel Vasectomy 0.0 1.1 0.9 0.0 0.0 0.4 2IUD/Copper-T/ Loop 1.9 1.1 8.1 6.3 4.0 4.4 23Oral Pills 23.1 25.8 32.4 37.5 21.8 28.4 148Condom/Nirodh 35.2 32.6 38.7 34.8 47.5 37.8 197Rhythm/periodic abstinence 0.0 0.0 0.0 0.0 0.0 0.0 0.0Withdrawal 0.9 0.0 0.0 0.0 0.0 0.2 1Other Trad. Method (specify) 0.9 0.0 0.0 0.0 1.0 0.4 2
Method using
Total 108 89 111 112 101 100 521ASHA 34.3 33.7 39.6 39.3 29.7 35.5 185ANM 18.5 9.0 39.6 40.2 31.7 28.6 149Doctor 0.0 0.0 0.9 1.8 3.0 1.2 6Friends 4.6 1.1 3.6 5.4 12.9 5.6 29Relatives 22.2 14.6 2.7 4.5 9.9 10.6 55Others(specify) 20.4 41.6 13.5 8.9 12.9 18.6 97
Who mainly motivated you to use current method
Total 108 89 111 112 101 100 521Yes 78.7 91.0 91.0 95.5 86.1 88.5 461No 21.3 9.0 9.0 4.5 13.9 11.5 60Contraceptives free of cost Total 108 89 111 112 101 100 521ASHA/ANM/ VHW 43.5 47.2 60.4 57.1 62.4 54.3 283Govt. hospital/ CHC/PHC/SC 39.8 44.9 32.4 40.2 31.7 37.6 196Pvt. hospitals/ Doctor/Chemist 13.9 0.0 6.3 2.7 4.0 5.6 29NGOS 0.0 7.9 0.0 0.0 0.0 1.3 7Others(specify) 2.8 0.0 0.9 0.0 2.0 1.2 6
Source for getting the method
Total 108 89 111 112 101 100 521Yes 0.0 0.0 2.7 0.9 0.0 0.8 4Health problem while using
this method No 100.0 100.0 97.3 99.1 100.0 99.2 517

E
valuation Study of National R
ural Health M
ission (NR
HM
) in 7 States 161
Family Planning Indicators Rayagada Balangir Kendujhar Kendrapara Puri Total %
Total Number
Total 108 89 111 112 101 100 521Want a Child 67.1 69.2 94.0 88.2 86.2 80.4 366Not having Sex 0.0 0.9 1.2 1.2 0.0 0.7 3Method Failed/become pregnant 4.7 10.3 1.2 1.2 1.1 4.0 18Relatives opposed 0.0 1.9 0.0 0.0 0.0 0.4 2Religious prohibition 0.0 0.0 0.0 0.0 0.0 0.0 0.0Not aware of any method 0.0 0.0 1.2 1.2 0.0 0.4 2Not knowing the source of availability 1.2 0.0 1.2 2.4 1.1 1.1 5Inconvenient to use 0.0 0.0 0.0 0.0 0.0 0.0 0.0Health problems 5.9 0.9 0.0 3.5 3.2 2.6 12Fear of side effects 0.0 0.0 0.0 0.0 0.0 0.0 0.0Lack of sexual satisfaction 1.2 1.9 0.0 2.4 0.0 1.1 5Others (specify) 20.0 15.9 1.2 0.0 8.5 9.5 43
Main reason for not using any method
Total 85 107 84 85 94 100 455

162
Evaluation Study of N
ational Rural H
ealth Mission (N
RH
M) in 7 States
Information about ASHA & NRHM Information about ASHA & NRHM Indicator Rayagada Balangir Kendujhar Kendrapara Puri Total
% Total
Number 200 200 200 200 200 100 1000
Yes 98.5 100.0 99.0 100.0 92.5 98.0 980Have you heard about ASHA Total 200 200 200 200 200 100 1000Yes 80.5 81.0 56.0 45.5 64.0 65.4 654Have you heard about NRHM Total 200 200 200 200 200 100 1000ASHA/ANM 79.5 78.4 69.6 68.1 68.0 73.7 482Radio/TV 5.6 4.3 16.1 17.6 21.9 11.9 78Newspapers 0.6 0.0 8.9 8.8 3.1 3.5 23Any other 14.3 17.3 5.4 5.5 7.0 10.9 71
Source of information
Total 161 162 112 91 128 100 654Every week 38.1 36.5 22.2 16.0 24.3 27.4 269Bi-weekly 33.0 35.5 33.8 22.0 18.9 28.8 282Monthly 24.9 24.5 37.9 55.0 50.8 38.5 377Once in 3 months 3.0 1.5 4.5 7.0 4.9 4.2 41Never 1.0 2.0 1.5 0.0 1.1 1.1 11Others 0.0 0.0 0.0 0.0 0.0 0.0 0.0
ASHA visits
Total 197 200 198 200 185 100 980Yes 88.3 94.5 92.4 87.0 87.0 89.9 881ASHA carry kit
Total 197 200 198 200 185 100 980Yes 87.8 95.5 92.9 98.5 90.3 93.1 912ASHA provide common medicines free
of cost Total 197 200 198 200 185 100 980Yes 68.5 66.0 90.4 87.5 77.8 78.1 765ASHA tells about good health practices
like sanitation/hygiene Total 197 200 198 200 185 100 980Yes 56.0 68.0 64.0 73.0 51.5 62.5 625VHND organized at Aanganwadi/any
other place organized in your village Total 200 200 200 200 200 100 1000 <3 times 97.3 88.2 100.0 99.3 99.0 96.6 604 3-6 times 2.7 11.8 0.0 0.7 1.0 3.4 21 > 6 times 0.0 0.0 0.0 0.0 0.0 0.0 0.0Frequency in last 3 months
Total 200 200 200 200 200 100 1000Yes 68.5 68.0 90.9 86.5 79.5 78.7 771ASHA tells about safe drinking water Total 197 200 198 200 185 100 980

E
valuation Study of National R
ural Health M
ission (NR
HM
) in 7 States 163
Yes 19.0 19.0 60.0 58.5 47.0 40.7 407Existing of VHSC in your village Total 200 200 200 200 200 100 1000Yes 5.3 5.3 5.0 3.4 3.2 4.2 17Are you member of VHSC Total 38 38 120 117 94 100 407Health Awareness 0.0 0.0 0.0 0.0 0.0 0.0 0.0Programme support 0.0 0.0 0.0 0.0 0.0 0.0 0.0Aware to people 0.0 0.0 0.0 0.0 0.0 0.0 0.0Time to time cleanliness 0.0 0.0 0.0 0.0 0.0 0.0 0.0No contribution 1.0 1.0 3.0 2.0 1.5 1.7 17
If yes specify the contribution of VHSC in improving health & hygienic condition of the village
Total 2 2 6 4 3 100 17Yes 33.0 25.5 32.0 27.5 22.0 28.0 280Health camps organized at
village/community/ block level Total 200 200 200 200 200 100 1000Yes 87.9 98.0 84.4 74.5 86.4 86.1 241If yes, have you attended that
camp/programme Total 66 51 64 55 44 100 280 No need / No company / No knowledge /Not allowed
100.0 100.0 40.0 21.4 66.7 51.3 20
Lack of time 0.0 0.0 60.0 78.6 33.3 48.7 19If no, give reasons
Total 8 1 10 14 6 100 39Yes 54.5 53.5 63.5 80.0 68.5 64.0 640Awareness about timely visit of doctors
at SC Total 200 200 200 200 200 100 1000Yes 55.0 80.5 35.0 27.0 40.0 47.5 475
Improvement after launching of NRHM Total 200 200 200 200 200 100 1000Benefits of JSY 47.3 34.2 11.4 0.0 13.8 26.5 126Immunization improvement
38.2 34.2 42.9 92.6 6.3 38.3 182
Medicine facilities 0.0 31.7 45.7 7.4 80.0 31.8 151Improved facilities 14.5 0.0 0.0 0.0 0.0 3.4 16
If yes mention
Total 110 161 70 54 80 100 475

164
Evaluation Study of N
ational Rural H
ealth Mission (N
RH
M) in 7 States
Assam household tables
Background Characteristics Barpeta Sonitpur Darrang Dibrugarh Cachar Total % Total Number
200 200 200 200 200 100 1000Background characteristics of HH
Male 95.0 99.5 99.0 98.5 93.5 97.1 971Female 5.0 0.5 1.0 1.5 6.5 2.9 29Sex of the Head Total 200 200 200 200 200 100 1000SC 4.0 6.0 10.5 1.0 29.0 10.1 101ST 0.0 17.5 3.0 39.0 1.5 12.2 122OBC 25.5 42.0 51.0 54.0 39.0 42.3 423Others 70.5 34.5 35.5 6.0 30.5 35.4 354
Social category
Total 200 200 200 200 200 100 1000Hindu 59.5 68.0 75.0 99.0 58.5 72.0 720Muslim 37.5 31.5 24.5 0.5 41.0 27.0 270Others 3.0 0.5 0.5 0.5 0.5 1.0 10Religion
Total 200 200 200 200 200 100 1000Joint 47.0 18.0 52.0 34.0 51.5 40.5 405Nuclear 53.0 82.0 48.0 66.0 48.5 59.5 595Type of Family Total 200 200 200 200 200 100 1000<25000 37.0 20.0 31.5 9.0 35.0 26.5 26525000-50000 52.5 65.5 60.0 64.5 52.5 59.0 590>50000 10.5 14.5 8.5 26.5 12.5 14.5 145Total Income of HH
Total 200 200 200 200 200 100 10001 74.5 93.5 71.0 93.0 72.5 80.9 8092 23.0 6.0 26.5 6.0 22.0 16.7 1673+ 2.5 0.5 2.5 1.0 5.5 2.4 24Total earning member
Total 200 200 200 200 200 100 10001 0.0 50.0 0.0 50.0 0.0 50.0 22 0.0 50.0 0.0 0.0 0.0 25.0 13+ 0.0 0.0 0.0 50.0 0.0 25.0 1members insured for health
Total 0.0 2 0.0 2 0.0 100 4

E
valuation Study of National R
ural Health M
ission (NR
HM
) in 7 States 165
Barpeta Sonitpur Darrang Dibrugarh Cachar Total % Total Number Members of the HH
1-5 67.0 92.5 72.0 86.5 63.0 76.2 7626-10 32.0 7.5 28.0 13.5 36.5 23.5 23510+ 1.0 0.0 0.0 0.0 0.5 0.3 3Total members in the HH
Total 200 200 200 200 200 100 10001 66.4 70.0 80.3 84.9 68.2 73.2 4292 32.1 29.1 19.7 15.1 31.0 26.1 153 3+ 1.5 0.9 0.0 0.0 0.8 0.7 40-5 years children
Total 134 110 127 86 129 100 586Land Owned
< 1 acre 4.5 25.2 2.7 6.6 0.0 8.3 441-3 acres 76.1 64.9 79.3 42.4 73.6 64.4 3424-6 acres 16.4 5.4 13.5 31.1 19.8 18.3 977-9 acres 3.0 4.5 4.5 10.6 3.3 5.8 31>10acre 0.0 0.0 0.0 9.3 3.3 3.2 17
Total Land Owned
Total 67 111 111 151 91 100 531

166
Evaluation Study of N
ational Rural H
ealth Mission (N
RH
M) in 7 States
Household Facilities HH Details Indicators Barpeta Sonitpur Darrang Dibrugarh Cachar Total % Total Number
200 200 200 200 200 100 1000Pucca 36.0 26.0 21.0 8.5 32.5 24.8 248Semi-Pucca 52.0 64.5 65.0 65.5 55.0 60.4 604Kachha 12.0 9.5 14.0 25.5 12.5 14.7 147Others 0.0 0.0 0.0 0.5 0.0 0.1 1
Type of House
Total 200 200 200 200 200 100 1000Own 100.0 100.0 100.0 97.0 100.0 99.4 994Rented 0.0 0.0 0.0 3.0 0.0 0.6 6Ownership of House Total 200 200 200 200 200 100 1000 Yes 69.0 74.5 64.5 49.0 67.5 64.9 649Separate kitchen Total 200 200 200 200 200 100 1000Yes 68.0 70.0 50.5 47.0 57.5 58.6 586Toilet inside the house Total 200 200 200 200 200 100 1000Electricity 87.5 94.0 88.0 44.0 90.0 80.7 807Kerosene lamps 12.5 6.0 12.0 56.0 10.0 19.3 193Others 0.0 0.0 0.0 0.0 0.0 0.0 0.0Main source of lighting in house
Total 200 200 200 200 200 100 1000Yes 95.0 92.5 84.5 64.5 76.5 82.6 826Source of drinking water in house Total 200 200 200 200 200 100 1000Tap 3.7 34.1 39.6 16.3 39.9 26.5 219Hand pump 95.3 62.7 57.4 75.2 51.0 68.9 569Well 0.0 0.5 0.0 4.7 0.0 0.8 7Others 1.1 2.7 3.0 3.9 9.2 3.8 31
Source of drinking water
Total 190 185 169 129 153 100 826Yes 91.5 91.5 83.5 79.5 74.5 84.1 841No 8.5 8.5 16.5 20.5 25.5 15.9 159Is that water potable Total 200 200 200 200 200 100 1000Boil 0.0 0.0 0.0 7.3 7.8 4.4 7Filter 11.8 5.9 3.0 2.4 0.0 3.1 5Drink as it is 88.2 94.1 97.0 90.2 92.2 92.5 147Others 0.0 0.0 0.0 0.0 0.0 0.0 0.0
If no, how do you purify it
Total 17 17 33 41 51 100 159

E
valuation Study of National R
ural Health M
ission (NR
HM
) in 7 States 167
Diarrhea 72.5 23.0 54.0 66.2 25.0 43.7 437Fever 11.5 41.5 13.0 4.5 8.0 15.2 154Cholera 0.0 0.0 0.0 0.0 0.0 0.0 0.0Malaria 0.0 0.0 0.0 0.0 0.0 0.0 0.0Pneumonia 0.0 0.0 0.0 0.0 0.0 0.0 0.0Stomach infection
1.5 0.0 0.0 10.5 0.0 1.7 17
TB 0.0 9.5 6.5 8.2 15.5 7.4 74Jaundice 2.0 11.0 13.5 10.5 29.0 12.5 125
Perception about disease because of impure drinking water
Total 175 170 174 133 155 100 807Dung cake 46.0 44.0 30.5 16.5 43.5 36.1 361Wood 37.5 48.0 48.0 76.5 33.0 48.6 486Kerosene 1.0 3.0 0.5 0.0 5.0 1.9 19Conventional energy
0.0 0.0 0.0 0.0 0.0 0.0 0.0
LPG 15.5 5.0 21.0 7.0 18.5 13.4 134
Cooking Fuel used in the House
Total 200 200 200 200 200 100 1000

168
Evaluation Study of N
ational Rural H
ealth Mission (N
RH
M) in 7 States
ANC Services Utilization by Pregnant Women Married women availing Ante natal care Barpeta Sonitpur Darrang Dibrugarh Cachar Total
% Total
Number 200 200 200 200 200 100 1000
Less than 3 months 8.9 4.4 4.5 4.4 6.7 5.8 134-6 months 51.1 60.0 59.1 48.9 62.2 56.3 1267-9 months 40.0 35.6 36.4 46.7 31.1 37.9 85Pregnancy registration
Total 45 45 44 45 45 100 224Yes 82.2 91.1 97.7 80.0 97.8 89.7 201
Going for any ANC Total 45 45 44 45 45 100 224ASHA/ANM/VHM 10.8 9.8 0.0 11.1 0.0 6.0 12SC 62.2 68.3 74.4 63.9 68.2 67.7 136PHC 21.6 17.1 9.3 19.4 20.5 17.4 35CHC 5.4 2.4 14.0 5.6 6.8 7.0 14Dist. Hospital 0.0 0.0 2.3 0.0 4.5 1.5 3Private Doctor 0.0 0.0 0.0 0.0 0.0 0.0 0.0Private Hospital 0.0 2.4 0.0 0.0 0.0 0.5 1
Place of check up
Total 37 41 43 36 44 100 201Within the village 97.3 95.1 93.0 94.4 84.1 92.5 186In other Village 2.7 4.9 7.0 5.6 15.9 7.5 15Distance of SC from Village Total 37 41 43 36 44 100 201B.P 94.6 100.0 100.0 100.0 97.7 98.5 198Height 51.4 97.6 65.1 83.3 72.7 74.1 149Weight 86.5 97.6 95.3 100.0 95.5 95.0 191Urine 54.1 92.7 27.9 83.3 40.9 58.7 118Blood check up 8.1 0.0 0.0 0.0 0.0 1.5 3
Check ups includes
Total 37 41 43 36 44 100 201Yes 100.0 100.0 95.5 88.9 93.3 95.5 214Vaccinated with Anti-Tetanus Total 45 45 44 45 45 100 224Diet 80.0 100.0 86.4 20.0 82.2 73.7 165Exercise 71.1 100.0 86.4 0.0 82.2 67.9 152Precautions 80.0 97.8 86.4 0.0 82.2 69.2 155
ASHA/ANM helps in pregnancy related problems
Total 45 45 44 45 45 100 224

E
valuation Study of National R
ural Health M
ission (NR
HM
) in 7 States 169
Delivery Care during birth of children 0-5 years Services regarding Delivery Barpeta Sonitpur Darrang Dibrugarh Cachar Total % Total
Number 200 200 200 200 200 100 1000
Normal 97.3 100.0 94.1 94.3 92.5 96.6 805Caesarian 2.7 0.0 5.9 0.7 7.5 3.4 28Type of delivery Total 182 179 153 146 173 100 833Home 46.2 61.5 32.6 38.4 34.1 43.1 359SC 0.0 0.0 0.0 0.0 0.6 0.1 1PHC 18.6 17.2 26.8 16.4 24.8 20.8 173CHC 15.4 10.1 20.3 34.9 26.6 20.9 174DH 13.2 10.6 13.1 8.9 8.1 10.8 90Private clinics 6.6 0.6 7.2 1.4 5.8 4.3 36
Where did the delivery take place
Total 182 179 153 146 173 100 833Less than 1.8 kgs 8.2 4.5 6.5 5.5 1.7 5.3 441.8-2.5 Kgs 45.6 29.1 47.1 34.2 39.9 39.1 326more than 2.5 kgs 21.4 24.0 23.5 35.6 42.8 29.3 244not taken 24.8 42.4 22.9 24.7 15.6 26.3 219
Weight of baby at the time of birth
Total 182 179 153 146 173 100 833

170
Evaluation Study of N
ational Rural H
ealth Mission (N
RH
M) in 7 States
Post Natal Care and JSY benefits for the Youngest Child Born Amongst 0-5 years Married Women availing PNC Barpeta Sonitpur Darrang Dibrugarh Cachar Total
% Total
Number 200 200 200 200 200 100 1000
Yes 59.6 43.9 64.6 69.7 73.8 61.9 405 No 40.4 56.1 35.4 30.3 26.2 38.1 249Facility of JSY scheme Total 136 139 127 122 130 100 654Yes 36.0 35.3 42.5 42.6 58.5 42.7 280Facility of Post Natal Check up after last
child Total 136 139 127 122 130 100 654SC 73.5 32.7 66.7 21.2 67.1 53.6 150PHC 14.3 36.7 9.3 23.1 6.6 16.8 47CHC 4.1 28.6 16.7 46.2 21.1 23.2 65DH 4.1 0.0 0.0 5.8 5.3 2.9 8Private 4.1 2.0 7.4 3.8 0.0 3.6 10
Place of Check Ups
Total 49 49 54 52 76 100 280Yes 93.9 95.9 94.4 76.9 100.0 92.9 260Whether facilities at the Govt. health centers
are satisfactory Total 49 49 54 52 76 100 280Yes 0.0 1.4 0.0 0.0 0.0 0.3 2Any miscarriage/Abortion/Still birth during
last 1 yr Total 136 139 127 122 130 100 654weakness 0.0 50.0 0.0 0.0 0.0 50.0 1Don’t know
0.0 50.0 0.0 0.0 0.0 50.0 1Causes of occurrence
Total 0 2 0 0 0 100 2

E
valuation Study of National R
ural Health M
ission (NR
HM
) in 7 States 171
Immunization and Child Care of Children aged 0-5 years 0-5 years Children Barpeta Sonitpur Darrang Dibrugarh Cachar Total
% Total
Number 200 200 200 200 200 100 1000
BCG 100.0 100.0 100.0 100.0 100.0 100.0 833DPT 1,2 & 3 98.9 100.0 100.0 93.8 98.3 98.3 819Polio 1,2 & 3 98.4 99.4 99.3 93.8 98.3 98.0 816Measles 85.2 59.2 89.5 53.4 78.6 73.5 612Hepatitis 2.7 1.1 0.7 0.7 5.2 2.2 18
Whether vaccinated
Total 182 179 153 146 173 100 833Yes 77.5 86.0 70.6 100.0 61.3 78.6 655No 22.5 14.0 29.4 0.0 38.7 21.4 178Having immunization card Total 182 179 153 146 173 100 833Lost 97.6 44.0 100.0 0.0 77.6 83.1 148Not Available 0.0 0.0 0.0 0.0 14.9 5.6 10Torn 2.4 56.0 0.0 0.0 7.5 11.2 20If no, give reason
Total 41 25 45 0.0 67 100 178SC 87.4 82.1 92.2 84.2 91.9 87.5 729PHC 2.2 0.0 0.0 0.0 0.0 0.5 4CHC 0.0 0.0 0.0 0.0 0.0 0.0 0.0DH 0.0 0.0 0.7 0.0 0.0 0.1 1Govt. mobile clinic 0.0 0.0 0.0 0.0 0.0 0.0 0.0ANM/AWW/MHW/ASHA 10.4 17.9 6.5 15.8 8.1 11.8 98Private doctor 0.0 0.0 0.7 0.0 0.0 0.1 1Any other 0.0 0.0 0.0 0.0 0.0 0.0 0.0
Place for availing most of the vaccination
Total 182 179 153 146 173 100 833Yes 1.1 0.0 0.0 0.0 0.0 0.2 2Suffering from Polio Total 182 179 153 146 173 100 833Yes 64.3 49.7 55.6 32.2 79.2 57.0 475Use of Bed net Total 182 179 153 146 173 100 833Less than 4 months 29.7 2.8 15.7 0.7 22.1 14.7 1224-6 months 59.3 55.4 71.2 70.8 65.7 64.0 530more than 6 months 11.0 41.8 13.1 28.5 12.2 21.3 176Up to age only breastfed
Total 182 177 153 144 172 100 828

172
Evaluation Study of N
ational Rural H
ealth Mission (N
RH
M) in 7 States
Chronic Disease and Treatment Seeking Patterns
Chronic Disease and Treatment Barpeta Sonitpur Darrang Dibrugarh Cachar Total %
Total Number
200 200 200 200 200 100 1000Malaria 0.0 0.0 2.3 0.0 0.0 0.5 1Kala Azar 4.9 0.0 0.0 0.0 0.0 1.0 2Filaria/microfilaria 0.0 0.0 0.0 0.0 0.0 0.0 0.0Cataract 0.0 0.0 0.0 0.0 0.0 0.0 0.0Leprosy 7.3 0.0 0.0 7.1 5.0 3.9 8TB 36.6 80.5 30.2 33.3 17.5 39.6 82fever/cold/cough 0.0 7.3 2.3 0.0 0.0 1.9 4Hepatitis 2.4 0.0 4.7 0.0 0.0 1.4 3Diarrhea 0.0 0.0 0.0 0.0 0.0 0.0 0.0Cholera 0.0 0.0 0.0 0.0 0.0 0.0 0.0Accident 12.2 0.0 4.7 7.1 0.0 4.8 10Differently able 0.0 0.0 0.0 0.0 0.0 0.0 0.0Any other 36.6 12.2 55.8 52.4 77.5 46.9 97
Suffering from Chronic Disease
Total 41 41 43 42 40 100 207Govt. 90.2 97.6 90.7 97.6 75.0 90.3 187Pvt. 9.8 2.4 9.3 2.4 25.0 9.7 20Place of Treatment Total 41 41 43 42 40 100 207Better Treatment 100.0 100.0 100.0 100.0 100.0 100.0 20Better facilities 0.0 0.0 0.0 0.0 0.0 0.0 0.0Doctor recommended 0.0 0.0 0.0 0.0 0.0 0.0 0.0Govt. hospital too far 0.0 0.0 0.0 0.0 0.0 0.0 0.0Medicine was not effective
0.0 0.0 0.0 0.0 0.0 0.0 0.0
In emergency 0.0 0.0 0.0 0.0 0.0 0.0 0.0
Reason for go to Pvt. hospitals
Total 4 1 4 1 10 100 20If govt. ,whether SC 0.0 32.5 0.0 0.0 0.0 7.0 13PHC 43.2 57.5 25.6 31.7 33.3 38.5 72CHC 16.2 7.5 41.0 39.0 26.7 26.2 49DH 40.5 2.5 33.3 29.3 40.0 28.3 53
Place/Facilities in Govt. Hospitals
Total 37 40 39 41 30 100 187

E
valuation Study of National R
ural Health M
ission (NR
HM
) in 7 States 173
Chronic Disease and Treatment Barpeta Sonitpur Darrang Dibrugarh Cachar Total %
Total Number
AL 100.0 100.0 100.0 100.0 100.0 100.0 207AY 0.0 0.0 0.0 0.0 0.0 0.0 0.0YN 0.0 0.0 0.0 0.0 0.0 0.0 0.0UN 0.0 0.0 0.0 0.0 0.0 0.0 0.0SD 0.0 0.0 0.0 0.0 0.0 0.0 0.0AO 0.0 0.0 0.0 0.0 0.0 0.0 0.0
Which type of treatment was taken
Total 41 41 43 42 40 100 207% 100.0 100.0 100.0 100.0 100.0 100.0 207Doctor attended you carefully Total 41 41 43 42 40 100 207Yes 65.9 97.6 51.2 95.2 40.0 70.0 145No 34.1 2.4 48.8 4.8 60.0 30.0 62Total 41 41 43 42 40 100 207<500 Rs 0.0 0.0 4.8 100.0 0.0 4.8 3500-1000 Rs 7.1 0.0 4.8 0.0 0.0 3.2 2>1000 Rs 92.9 100.0 90.5 0.0 100.0 91.9 57
Expenditure on medicine
Total 14 1 21 2 24 100 62< 3 months 68.3 12.2 65.1 38.1 87.5 54.1 1123-6 months 29.3 31.7 20.9 26.2 5.0 22.7 477-10 months 2.4 31.7 4.7 31.0 0.0 14.0 29> 10 months 0.0 24.4 9.3 4.8 7.5 9.2 19
Duration of treatment
Total 41 41 43 42 40 100 207Yes 29.3 0.0 16.3 4.8 17.5 13.6 28No 70.7 100.0 83.7 95.2 82.5 86.4 179Have you been referred to other
doctor/hospital Total 41 41 43 42 40 100 207Govt. hospital 16.7 0.0 42.9 0.0 0.0 17.9 5Pvt. Doctor/clinic 25.0 0.0 28.6 0.0 42.9 28.6 8Private hospital 58.3 0.0 28.6 100.0 57.1 53.6 15Referred to
Total 12 0 7 2 7 100 28 Doctor’s fee Less than 300 Rs 0.0 0.0 0.0 0.0 14.3 3.6 1300-600 Rs 0.0 0.0 0.0 50.0 14.3 7.1 2601-1000 Rs 100.0 0.0 100.0 50.0 71.4 89.3 25More than 1000 Rs 0.0 0.0 0.0 0.0 0.0 0.0 0.0
Expenditure
Total 12 0 7 2 7 100 28

174
Evaluation Study of N
ational Rural H
ealth Mission (N
RH
M) in 7 States
Chronic Disease and Treatment Barpeta Sonitpur Darrang Dibrugarh Cachar Total %
Total Number
Drugs Less than 300 Rs 0.0 0.0 0.0 0.0 0.0 0.0 0.0300-600 Rs 8.3 0.0 0.0 0.0 14.3 7.7 2601-1000 Rs 0.0 0.0 0.0 0.0 14.3 3.8 1More than 1000 Rs 91.7 0.0 100.0 0.0 71.4 88.5 23Total 12 0 7 0 7 100 26Special food Less than 300 Rs 0.0 0.0 0.0 0.0 14.3 3.8 1300-600 Rs 0.0 0.0 0.0 0.0 0.0 0.0 0.0601-1000 Rs 8.3 0.0 0.0 0.0 14.3 7.7 2More than 1000 Rs 91.7 0.0 100.0 0.0 71.4 88.5 23Total 12 0 7 0 7 100 26Transport Less than 300 Rs 0.0 0.0 0.0 0.0 14.3 3.8 1300-600 Rs 8.3 0.0 0.0 0.0 14.3 7.7 2601-1000 Rs 66.7 0.0 85.7 0.0 57.1 69.2 18More than 1000 Rs 25.0 0.0 14.3 0.0 14.3 19.2 5Total 12 0 7 0 7 100 26Others Less than 300 Rs 66.7 0.0 85.7 0.0 42.9 65.4 17300-600 Rs 8.3 0.0 0.0 0.0 28.6 11.5 3601-1000 Rs 25.0 0.0 14.3 0.0 14.3 19.2 5More than 1000 Rs 0.0 0.0 0.0 0.0 14.3 3.8 1Total 12 0 7 0 7 100 26Yes 70.7 100.0 67.4 100.0 42.5 76.3 158No 29.3 0.0 32.6 0.0 57.5 23.7 49Whether satisfied with the service Total 41 41 43 42 40 100 207No better facilities 100.0 0.0 100.0 0.0 17.4 61.2 30No free medicines 0.0 0.0 0.0 0.0 82.6 38.8 19Medicine did not work 0.0 0.0 0.0 0.0 0.0 0.0 0No good treatment 0.0 0.0 0.0 0.0 0.0 0.0 0No relief 0.0 0.0 0.0 0.0 0.0 0.0 0
Reason for not satisfied
Total 12 0.0 14 0.0 23 100 49

E
valuation Study of National R
ural Health M
ission (NR
HM
) in 7 States 175
Family Planning Family Planning Barpeta Sonitpur Darrang Dibrugarh Cachar Total % Total Number
200 200 200 200 200 100 1000Yes 66.1 54.6 69.6 59.7 77.2 65.5 634No 33.9 45.4 30.4 40.3 22.8 34.5 334
You/your husband using any Family planning method Total 192 194 194 191 197 100 968
Female Sterilization 18.9 2.8 10.4 14.9 12.5 12.1 77Non scalpel Vasectomy 0.0 0.0 0.0 0.0 0.0 0.0 0.0IUD/Copper-T/Loop 0.8 2.8 0.0 4.4 1.3 1.7 11Oral Pills 29.1 32.1 29.6 30.7 31.6 30.6 194Condom/Nirodh 49.6 62.3 58.5 50.0 53.9 54.7 347Rhythm/periodic abstinence 0.8 0.0 0.7 0.0 0.7 0.5 3Withdrawal 0.8 0.0 0.7 0.0 0.0 0.3 2Other Trad. Method (specify) 0.0 0.0 0.0 0.0 0.0 0.0 0.0
Method using
Total 127 106 135 114 152 100 634ASHA 18.1 24.5 18.5 21.9 11.8 18.5 117ANM 2.4 40.6 3.7 40.4 3.3 16.1 102Doctor 0.8 1.9 0.0 0.9 0.7 0.8 5Friends 1.6 16.0 0.0 13.2 0.7 5.5 35Relatives 8.7 4.7 5.9 7.9 13.8 8.5 54Others(specify) 68.5 12.3 71.9 15.8 69.7 50.6 321
Who mainly motivated you to use current method
Total 127 106 135 114 152 100 634Yes 63.8 91.5 52.6 88.6 61.2 69.9 443No 36.2 8.5 47.4 11.4 38.8 30.1 191Contraceptives free of
cost Total 127 106 135 114 152 100 634ASHA/ANM/VHW 42.5 63.2 37.8 43.0 44.1 45.4 288Govt. hospital /CHC/PHC/SC 22.0 28.3 16.3 41.2 17.1 24.1 153Pvt. hospitals/ Doctor/Chemist 33.1 8.5 45.2 12.3 38.8 29.2 185NGOS 2.4 0.0 0.7 0.0 0.0 0.6 4Others(specify) 0.0 0.0 0.0 3.5 0.0 0.6 4
Source for getting the method
Total 127 106 135 114 152 100 443Yes 0.0 0.0 0.0 1.8 0.7 0.5 3No 100.0 100.0 100.0 98.2 99.3 99.5 631
Health problem while using this method Total 127 106 135 114 152 100 634

176
Evaluation Study of N
ational Rural H
ealth Mission (N
RH
M) in 7 States
Family Planning Barpeta Sonitpur Darrang Dibrugarh Cachar Total % Total NumberWant a Child 46.2 96.6 67.8 92.2 77.8 78.1 261Not having Sex 0.0 1.1 3.4 1.3 0.0 1.2 4Method Failed/become pregnant
1.5 0.0 3.4 2.6 0.0 1.5 5
Relatives opposed 0.0 0.0 0.0 0.0 0.0 0.0 0.0Religious prohibition 0.0 0.0 0.0 1.3 0.0 0.3 1Not aware of any method 0.0 0.0 0.0 0.0 0.0 0.0 0.0Not knowing the source of availability
0.0 0.0 0.0 0.0 0.0 0.0 0.0
Inconvenient to use 0.0 0.0 0.0 0.0 0.0 0.0 0.0Health problems 4.6 2.3 3.4 2.6 2.2 3.0 10Fear of side effects 0.0 0.0 0.0 0.0 4.4 0.6 2Lack of sexual satisfaction 3.1 0.0 0.0 0.0 0.0 0.6 2
Main reason for not using any method
Others (specify) 44.6 0.0 22.0 0.0 17.8 15.0 50 Total 65 88 59 77 45 100 334

E
valuation Study of National R
ural Health M
ission (NR
HM
) in 7 States 177
Information about ASHA & NRHM Information about ASHA & NRHM Barpeta Sonitpur Darrang Dibrugarh Cachar Total
% Total
Number 200 200 200 200 200 100 1000
Yes 94.0 96.5 96.0 96.0 90.0 94.5 945Have you heard about ASHA Total 200 200 200 200 200 100 1000Yes 64.0 63.0 53.5 66.5 58.0 61.0 610Have you heard about NRHM Total 200 200 200 200 200 100 1000ASHA/ANM 62.5 61.1 51.4 65.4 69.8 62.3 380Radio/TV 28.9 31.0 43.9 22.6 22.4 29.3 179Newspapers 6.3 7.9 4.7 12.0 6.0 7.5 46Any other 2.3 0.0 0.0 0.0 1.7 0.8 5
Source of information
Total 128 126 107 133 116 100 610Every week 23.9 17.6 13.5 16.7 20.6 18.4 174Bi-weekly 17.6 20.7 15.1 28.6 15.0 19.5 184Monthly 49.5 54.4 46.4 41.7 49.4 48.3 456Once in 3 months 9.0 6.2 23.4 9.4 13.9 12.4 117Never 0.0 1.0 1.6 3.6 1.1 1.5 14Others 0.0 0.0 0.0 0.0 0.0 0.0 0.0
ASHA visits
Total 188 193 192 192 180 100 945Yes 81.4 65.3 66.1 84.9 60.0 71.6 677ASHA carry kit Total 188 193 192 192 180 100 945Yes 92.6 66.3 79.7 82.8 81.7 80.5 761ASHA provide common medicines free of
cost Total 188 193 192 192 180 100 945Yes 84.0 67.9 76.0 67.7 68.9 72.9 689ASHA tells about good health practices like
sanitation/hygiene Total 188 193 192 192 180 100 945Yes 74.0 60.0 71.5 62.5 57.0 65.0 650VHND has organized at Aanganwadi
centre/Other place in the village Total 200 200 200 200 200 100 1000 Less 3 times 100.0 100.0 81.8 45.6 100.0 85.5 556 3-6 times 0.0 0.0 0.7 0.0 0.0 0.2 1 More than 6 times 0.0 0.0 17.5 54.4 0.0 14.3 93Frequency in last three months
Total 200 200 200 200 200 100 1000Yes 85.6 69.9 76.0 71.9 73.3 75.3 712ASHA tells about safe drinking water Total 188 193 192 192 180 100 945

178
Evaluation Study of N
ational Rural H
ealth Mission (N
RH
M) in 7 States
Information about ASHA & NRHM Barpeta Sonitpur Darrang Dibrugarh Cachar Total %
Total Number
Yes 71.0 57.0 54.5 75.0 52.0 61.9 619Existing of VHSC in your village Total 200 200 200 200 200 100 1000Yes 1.4 2.6 4.6 2.0 1.9 2.4 15Are you member of VHSC Total 142 114 109 150 104 100 619Health Awareness 0.5 0.0 0.0 1.5 1.0 0.6 6Programme support 0.5 1.5 2.5 0.0 0.0 0.9 9Aware to people 0.0 0.0 0.0 0.0 0.0 0.0 0.0Time to time cleanliness 0.0 0.0 0.0 0.0 0.0 0.0 0.0No contribution 2 3 5 3 2 100 15
If yes specify the contribution of VHSC in improving health & hygienic condition of the village
Total 10 1 0.0 0.0 0.0 2 100Yes 36.0 34.0 27.5 47.0 40.0 36.9 369Health camps organized at
village/community/ block level Total 200 200 200 200 200 100 1000Yes 84.7 100.0 92.7 47.9 91.3 80.8 298If yes, have you attended that
camp/programme Total 72 68 55 94 80 100 369 No need / No company / No knowledge / Not allowed
27.3 0.0 50.0 0.0 100.0 16.9 12
Lack of time 72.7 0.0 50.0 100.0 0.0 83.9 59If no, give reasons
Total 11 0.0 4 49 7 100 71Yes 90.0 87.5 92.5 91.0 88.5 89.9 899Awareness about timely visit of doctors at SC Total 200 200 200 200 200 100 1000Yes 33.5 21.5 24.5 26.5 27.5 26.7 267Improvement after launching of NRHM Total 200 200 200 200 200 100 1000Benefits of JSY 9.0 7.0 0.0 32.1 7.3 30 11.2Immunization improvement 77.6 90.7 81.6 67.9 90.9 217 81.3Medicine facilities 9.0 0.0 12.2 0.0 1.8 13 4.9Improved facilities 4.5 2.3 6.1 0.0 0.0 7 2.6
If yes, mention
Total 67 43 49 53 55 100 267

E
valuation Study of National R
ural Health M
ission (NR
HM
) in 7 States 179
Jammu & Kashmir household tables
Background Characteristics Jammu Udhampur Doda Baramula Budgam Total % Total
Number 200 200 200 200 200 200 1000
Background characteristics of HH Male 99.0 99.5 99.5 98.5 99.0 99.1 991Female 1.0 0.5 0.5 1.5 1.0 0.9 9 Sex of the Head Total 200 200 200 200 200 100 1000SC 40.0 32.0 15.0 0.0 1.5 17.7 177ST 1.5 6.5 2.5 0.5 0.0 2.2 22OBC 16.5 26.5 28.5 3.0 19.5 18.8 188Others 42.0 35.0 54.0 96.5 79.0 61.3 613
Social category
Total 200 200 200 200 200 100 1000Hindu 96.5 87.5 54.0 0.0 6.0 48.8 488Muslim 3.0 11.5 46.0 99.0 93.0 50.5 505Others 0.5 1.0 0.0 1.0 1.0 0.7 7Religion
Total 200 200 200 200 200 100 1000Joint 29.5 23.5 26.5 35.0 20.0 26.9 269Nuclear 70.5 76.5 73.5 65.0 80.0 73.1 731Type of Family Total 200 200 200 200 200 100 1000<25000 12.0 10.0 6.5 5.0 4.5 7.6 7625000-50000 60.0 54.0 55.5 57.5 65.0 58.4 584>50000 28.0 36.0 38.0 37.5 30.5 34.0 340Total Income of HH
Total 200 200 200 200 200 100 10001 95.5 92.5 95.5 93.0 95.5 94.4 9442 4.5 6.5 4.5 6.5 4.0 5.2 523+ 0.0 1.0 0.0 0.5 0.5 0.4 4Total No. of earning member
Total 200 200 200 200 200 100 10001 54.5 50.0 33.3 100 88.9 62.5 202 27.3 25.0 50.0 0.0 11.1 25.0 83+ 18.2 25.0 16.7 0.0 0.0 12.5 4
members insured for health
Total 11 4 6 2 9 100 32

180
Evaluation Study of N
ational Rural H
ealth Mission (N
RH
M) in 7 States
Jammu Udhampur Doda Baramula Budgam Total % Total Number
Members of the HH 1-5 members 88.0 80.5 89.5 68.5 87.5 82.8 8286-10 members 12.0 19.5 10.5 31.5 12.5 17.2 17210+ member 0.0 0.0 0.0 0.0 0.0 0.0 0.0Total members in the HH
Total 200 200 200 200 200 100 10001 69.5 67.0 67.0 51.2 78.7 66.3 3742 30.5 28.4 31.1 43.1 18.5 30.7 1733+ 0.0 4.6 1.9 5.7 2.8 3.0 17
0-5 years children
Total 118 109 106 123 108 100 564Land Owned
<1 acre 7.3 9.7 2.6 5.3 1.7 5.4 34 1-3 acres 65.7 68.1 47.9 24.0 65.2 52.8 334 4-6 acres 21.9 8.8 26.5 42.0 19.1 24.7 156 7-9 acres 1.5 5.3 2.6 12.7 4.3 5.5 35 >10 acres 3.6 8.0 20.5 16.0 9.6 11.6 73
Total Land Owned
Total 137 113 117 150 115 100 632

E
valuation Study of National R
ural Health M
ission (NR
HM
) in 7 States 181
Household Facilities HH Facilities Jammu Udhampur Doda Baramula Budgam Total % Total
Number 200 200 200 200 200 100 1000
Pucca 36.0 21.5 16.0 26.0 32.5 26.4 264Semi-Pucca 52.0 62.0 69.5 64.5 55.0 60.6 606Kachha 12.0 16.5 14.5 9.5 12.5 13.0 130Others 0.0 0.0 0.0 0.0 0.0 0.0 0.0
Type of House
Total 200 200 200 200 200 100 1000Own 100.0 98.5 100.0 100.0 100.0 99.7 997Rented 0.0 1.5 0.0 0.0 0.0 0.3 3Ownership of House Total 200 200 200 200 200 100 1000Yes 69.0 54.5 61.5 74.5 67.5 65.4 654separate kitchen Total 200 200 200 200 200 100 1000Yes 68.0 53.0 45.0 70.0 57.5 58.7 587Toilet inside the house Total 200 200 200 200 200 100 1000Electricity 87.5 77.5 92.5 94.0 90.0 88.3 883Kerosene lamps 12.5 22.5 7.5 6.0 10.0 11.7 117Others 0.0 0.0 0.0 0.0 0.0 0.0 0.0main source of lighting in the household
Total 200 200 200 200 200 100 1000Yes 95.0 77.5 81.5 92.5 76.5 84.6 846Source of drinking water Total 200 200 200 200 200 100 1000Tap 3.7 20.0 60.7 34.1 39.9 30.9 261Hand pump 95.3 80.0 35.0 62.7 51.0 65.7 556Well 0.0 0.0 0.0 0.5 0.0 0.1 1Others 1.1 0.0 4.3 2.7 9.2 3.3 28
Source of drinking water
Total 190 155 163 185 153 100 846 Yes 91.5 76.0 81.5 91.5 74.5 83.0 830Is that water potable
Total 200 200 200 200 200 100 1000Boil 0.0 0.0 0.0 0.0 7.8 2.4 4Filter 11.8 2.1 0.0 5.9 0.0 2.4 4Drink as it is 88.2 97.9 100.0 94.1 92.2 95.3 162Others 0.0 0.0 0.0 0.0 0.0 0.0 0.0
If no, how do you purify it
Total 17 48 37 17 51 100 170

182
Evaluation Study of N
ational Rural H
ealth Mission (N
RH
M) in 7 States
HH Facilities Jammu Udhampur Doda Baramula Budgam Total % Total Number
Diarrhea 81.1 81.6 64.9 37.1 32.9 59.9 498Fever 14.3 6.1 13.7 36.5 18.1 17.8 148Cholera 0.0 0.0 0.0 0.0 0.0 0.0 0.0Malaria 0.0 0.0 0.0 0.0 0.0 0.0 0.0Pneumonia 0.0 0.0 0.0 0.0 0.0 0.0 0.0Stomach infection 2.3 0.0 0.6 0.0 0.0 0.6 5TB 0.0 3.1 7.1 12.4 14.8 7.4 61Jaundice 2.3 9.2 13.7 14.1 34.2 14.3 119
Perception about disease because of impure drinking water
Total 175 163 168 170 155 100 831Dung cake 46.0 33.5 29.0 44.0 43.5 39.2 392Wood 37.5 40.5 55.5 48.0 33.0 42.9 429Kerosene 1.0 1.0 0.0 3.0 5.0 2.0 20Conventional energy 0.0 0.0 0.0 0.0 0.0 0.0 0.0LPG 15.5 25.0 15.5 5.0 18.5 15.9 159
Cooking fuel used in the house
Total 200 200 200 200 200 100 1000

E
valuation Study of National R
ural Health M
ission (NR
HM
) in 7 States 183
ANC Services Utilization by Pregnant Women Married women availing Ante natal care Jammu Udhampur Doda Baramula Budgam Total% Total
Number 200 200 200 200 200 100 1000
Less than 3 months 9.5 15.0 20.0 16.7 12.5 14.7 304-6 months 45.2 37.5 40.0 28.6 45.0 39.2 807-9 months 45.2 47.5 40.0 54.8 42.5 46.1 94Pregnancy registration
Total 42 40 40 42 40 100 204Yes 78.6 85.0 75.0 78.6 87.5 80.9 165Going for any ANC Total 42 40 40 42 40 100 204ASHA/ANM/VHM 60.6 0.0 50.0 9.1 31.4 29.7 49SC 36.4 73.5 26.7 57.6 42.9 47.9 79PHC 3.0 11.8 20.0 15.2 22.9 14.5 24CHC 0.0 2.9 0.0 3.0 2.9 1.8 3Dist Hospital 0.0 0.0 3.3 15.2 0.0 3.6 6Private Doctor 0.0 5.9 0.0 0.0 0.0 1.2 2Private Hospital 0.0 5.9 0.0 0.0 0.0 1.2 2
Place of Check ups
Total 33 34 30 33 35 100 165Within the village 100.0 100.0 83.3 78.8 100.0 92.7 153In other Village 0.0 0.0 16.7 21.2 0.0 7.3 12Distance of SC from Village Total 33 34 30 33 35 100 165B.P 100.0 100.0 90.0 100.0 100.0 98.2 162Height 39.4 100.0 56.7 66.7 68.6 66.7 110Weight 87.9 100.0 83.3 87.9 88.6 89.7 148Urine 36.4 97.1 40.0 21.2 54.3 50.3 83Blood check up 100.0 100.0 100.0 100.0 100.0 100.0 165
Check ups
Total 33 34 30 33 35 100 165Yes 100.0 100.0 100.0 100.0 100.0 100.0 204Vaccinated with Anti-Tetanus Total 42 40 40 42 40 100 204Diet 100.0 90.0 92.5 90.5 97.5 94.1 192Exercise 100.0 90.0 92.5 90.5 97.5 94.1 192Precautions 100.0 90.0 92.5 90.5 97.5 94.1 192ASHA/ANM helps in any pregnancy related problems
Total 42 40 40 42 40 100 204

184
Evaluation Study of N
ational Rural H
ealth Mission (N
RH
M) in 7 States
Delivery Care during birth of children 0-5 years Services regarding Delivery Jammu Udhampur Doda Baramula Budgam Total % Total No. 200 200 200 200 200 100 1000
Normal 100.0 100.0 100.0 98.4 97.0 99.1 772Caesarian 0.0 0.0 0.0 1.6 3.0 0.9 7 Type of delivery Total 157 151 145 191 135 100 779Home 57.3 58.9 56.6 72.3 62.2 62.0 483SC 0.0 0.0 0.0 0.0 0.0 0.0 0.0PHC 12.1 7.9 18.6 6.3 5.9 10.0 78CHC 13.4 17.9 17.9 11.5 15.6 15.0 117DH 15.9 13.9 6.9 6.8 16.3 11.7 91Private clinics 1.3 1.3 0.0 3.1 0.0 1.3 10
Where did the delivery take place
Total 157 151 145 191 135 100 779Less than 1.8 kgs 1.3 0.7 2.1 1.0 1.5 1.3 101.8-2.5 Kgs 22.3 22.5 29.0 9.9 5.2 17.6 137more than 2.5 kgs 20.4 19.2 16.6 18.8 31.1 20.9 163not taken 56.1 57.6 52.4 70.2 62.2 60.2 469
Weight of baby at the time of birth
Total 157 151 145 191 135 100 779

E
valuation Study of National R
ural Health M
ission (NR
HM
) in 7 States 185
Post Natal Care and JSY benefits for the Youngest Child Born Amongst 0-5 years Married Women availing PNC Jammu Udhampur Doda Baramula Budgam % Total No.
Total 200 200 200 200 200 100 1000
Yes 43.8 48.6 57.9 29.1 43.5 44.1 253 No 56.2 51.4 42.1 70.9 56.5 55.9 321Availed JSY Benefits after Last child Total 121 111 107 127 108 100 574Yes 34.7 47.7 33.6 15.7 24.1 30.8 177Availed PNC Services after youngest Child Total 121 111 107 127 108 100 574SC 19.0 5.7 11.1 10.0 11.5 11.3 20PHC 28.6 15.1 55.6 10.0 3.8 24.3 43CHC 23.8 43.4 27.8 80.0 80.8 45.2 80DH 21.4 30.2 5.6 0.0 0.0 15.3 27Private 7.1 5.7 0.0 0.0 3.8 4.0 7
Place of Check Ups
Total 42 53 36 20 26 100 177Yes 97.6 100.0 100.0 95.0 100.0 98.9 175Whether facilities at the Govt. health centers are satisfactory Total 42 53 36 20 26 100 177Yes 0.8 0.0 0.9 1.6 1.9 0.9 6Any miscarriage/Abortion/Still birth during last 1 yr Total 121 111 107 127 108 100 574Weakness 100.0 0.0 100.0 100.0 100.0 100.0 6Don’t know 0.0 0.0 0.0 0.0 0.0 0.0 0.0Causes of occurrence Total 1 0.0 1 2 2 100 6

186
Evaluation Study of N
ational Rural H
ealth Mission (N
RH
M) in 7 States
Immunization and Child Care of Children aged 0-5 years 0-5 years Children Jammu Udhampur Doda Baramula Budgam Total
% Total No.
200 200 200 200 200 100 1000BCG 100.0 100.0 100.0 100.0 100.0 100.0 771DPT 1,2 & 3 98.1 93.3 97.9 97.9 98.5 97.1 749Polio 1,2 & 3 97.4 92.0 94.4 96.9 98.5 95.8 739Measles 56.8 73.3 70.1 74.3 74.8 69.9 539Hepatitis 0.0 0.0 1.4 3.1 3.1 1.6 12
Whether vaccinated
Total 155 150 144 191 131 100 771Yes 89.0 74.7 81.9 80.6 77.9 80.9 624No 11.0 25.3 18.1 19.4 22.1 19.1 147Do you have immunization card Total 155 150 144 191 131 100 771Lost 82.4 94.7 42.3 70.3 65.5 72.1 106Not Available 0.0 0.0 0.0 0.0 0.0 0.0 0.0Torn 17.6 5.3 57.7 29.7 34.5 27.9 41No give reason
Total 17 38 26 37 29 100 147SC 86.5 96.0 91.7 85.9 84.0 88.7 684PHC 0.0 0.0 1.4 0.0 0.0 0.3 2CHC 0.0 0.0 0.0 0.0 0.0 0.0 0.0DH 0.0 0.0 0.0 0.0 0.0 0.0 0.0Govt. mobile clinic 0.0 0.0 0.0 0.0 0.0 0.0 0.0ANM/AWW/MHW/ASHA 13.5 4.0 6.9 14.1 16.0 11.0 85Private doctor 0.0 0.0 0.0 0.0 0.0 0.0 0.0Any other 0.0 0.0 0.0 0.0 0.0 0.0 0.0
Place for availing most of the facility of vaccination
Total 155 150 144 191 131 100 771Yes 0.0 0.0 0.0 0.0 0.0 0.0 0.0Suffering from Polio Total 157 151 145 191 135 100 779Yes 47.8 29.8 14.5 20.4 34.1 29.0 226Use of Bed Net Total 157 151 145 191 135 100 779Less than 4 months 3.2 1.3 0.7 2.1 0.0 1.6 124-6 months 52.2 60.4 60.0 53.7 71.9 59.0 454more than 6 months 44.6 38.3 39.3 44.1 28.1 39.4 303Up to age only breastfed
Total 157 149 140 188 135 100 769

E
valuation Study of National R
ural Health M
ission (NR
HM
) in 7 States 187
Chronic Disease and Treatment Seeking Pattern Chronic disease Jammu Udhampur Doda Baramula Budgam Total % Total No.
200 200 200 200 200 100 1000Malaria 0.0 0.0 0.0 0.0 0.0 0.0 0Kala Azar 0.0 0.0 0.0 0.0 0.0 0.0 0Filaria/microfilaria 0.0 0.0 0.0 0.0 0.0 0.0 0Cataract 0.0 0.0 0.0 0.0 0.0 0.0 0Leprosy 0.0 2.5 0.0 0.0 0.0 0.5 1TB 37.2 47.5 51.3 9.3 24.4 33.5 69fever/cold/cough 0.0 0.0 0.0 0.0 0.0 0.0 0Hepatitis 0.0 0.0 0.0 0.0 0.0 0.0 0Diarrhea 0.0 0.0 0.0 0.0 0.0 0.0 0Cholera 0.0 0.0 0.0 0.0 0.0 0.0 0Accident 0.0 0.0 0.0 0.0 0.0 0.0 0Differently able 0.0 0.0 0.0 0.0 0.0 0.0 0Any other 62.8 50.0 48.7 90.7 75.6 66.0 136
Suffering from any Chronic Disease
Total 43 40 39 43 41 100 206Govt. 95.3 87.5 100.0 65.1 70.7 83.5 172Pvt. 4.7 12.5 0.0 34.9 29.3 16.5 34Where gone for treatment Total 43 40 39 43 41 100 206Better Treatment 0.0 0.0 0.0 66.7 0.5 32.4 11Better facilities 100.0 100.0 0.0 0.0 58.8 41.2 14Doctor recommended 0.0 0.0 0.0 0.0 0.0 0.0 0Govt. hospital too far 0.0 0.0 0.0 0.0 0.0 0.0 0Medicine are not available 0.0 0.0 0.0 33.3 2.0 26.5 9In emergency 0.0 0.0 0.0 0.0 0.0 0.0 0.0
Reason for go to private
Total 2 5 0 15 12 100 34SC 7.3 28.6 2.6 14.3 17.2 13.4 23PHC 51.2 22.9 61.5 7.1 27.6 36.6 63CHC 31.7 45.7 35.9 46.4 41.4 39.5 68DH 9.8 2.9 0.0 32.1 13.8 10.5 18
In Govt. facility, Whether
Total 41 35 39 28 29 100 172AL 100.0 100.0 100.0 100.0 100.0 100.0 206AY 0.0 0.0 0.0 0.0 0.0 0.0 0YN 0.0 0.0 0.0 0.0 0.0 0.0 0
Which type of treatment was taken
UN 0.0 0.0 0.0 0.0 0.0 0.0 0

188
Evaluation Study of N
ational Rural H
ealth Mission (N
RH
M) in 7 States
Chronic disease Jammu Udhampur Doda Baramula Budgam Total % Total No.SD 0.0 0.0 0.0 0.0 0.0 0.0 0HO 0.0 0.0 0.0 0.0 0.0 0.0 0Total 43 40 39 43 41 100 206Yes 100.0 100.0 100.0 97.7 100.0 99.5 205Whether doctor attended you carefully Total 43 40 39 43 41 100 206Yes 93.0 90.0 100.0 65.1 61.0 81.6 168No 7.0 10.0 0.0 34.9 39.0 18.4 38Medicine Provided Free of Cost Total 43 40 39 43 41 100 206<500 Rs 0.0 0.0 0.0 6.7 0.0 2.6 1500-1000 Rs 0.0 0.0 0.0 13.3 20.0 13.2 5>1000 Rs 100.0 100.0 0.0 80.0 80.0 84.2 32If No, Expenditure
Total 3 4 0 15 16 100 38<3 months 0.0 10.0 0.0 4.7 0.0 2.9 63-6 months 20.9 45.0 20.5 16.3 24.4 25.2 527-10 months 27.9 5.0 33.3 11.6 29.3 21.4 44>10 months 51.2 40.0 46.2 67.4 46.3 50.5 104
Duration of treatment
Total 43 40 39 43 41 100 206Yes 2.3 0.0 0.0 0.0 0.0 0.5 1No 97.7 100.0 100.0 100.0 100.0 99.5 205Referred to other doctor/hospital Total 43 40 39 43 41 100 206Govt. hospital 100.0 0.0 0.0 0.0 0.0 100.0 1Pvt. Doctor/clinic 0.0 0.0 0.0 0.0 0.0 0.0 0Private hospital 0.0 0.0 0.0 0.0 0.0 0.0 0Referred to
Total 1 0 0 0 0 100 1 Doctor’s fee <300 Rs 0.0 0.0 0.0 0.0 0.0 0.0 0300-600 Rs 100.0 0.0 0.0 0.0 0.0 100.0 1601-1000 Rs 0.0 0.0 0.0 0.0 0.0 0.0 0.0<1000 Rs 0.0 0.0 0.0 0.0 0.0 0.0 0Total 1 0.0 0.0 0.0 0.0 100 1Drugs <300 Rs 0.0 0.0 0.0 0.0 0.0 0.0 0300-600 Rs 0.0 0.0 0.0 0.0 0.0 0.0 0601-1000 Rs 0.0 0.0 0.0 0.0 0.0 0.0 0
>1000 Rs 100.0 0.0 0.0 0.0 0.0 100 1

E
valuation Study of National R
ural Health M
ission (NR
HM
) in 7 States 189
Chronic disease Jammu Udhampur Doda Baramula Budgam Total % Total No.Total 1 0 0 0 0 100 1Special food <300 Rs 0.0 0.0 0.0 0.0 0.0 0.0 0300-600 Rs 100.0 0.0 0.0 0.0 0.0 100.0 1601-1000 Rs 0.0 0.0 0.0 0.0 0.0 0.0 0.0>1000 Rs 0.0 0.0 0.0 0.0 0.0 0.0 0Total 1 0.0 0.0 0.0 0.0 100 1Transport 0.0 0.0 0.0 0.0 0.0 0.0 0<300 Rs 100.0 0.0 0.0 0.0 0.0 100.0 1300-600 Rs 0.0 0.0 0.0 0.0 0.0 0.0 0601-1000 Rs 0.0 0.0 0.0 0.0 0.0 0.0 0>1000 Rs 0.0 0.0 0.0 0.0 0.0 0.0 0Total 1 0 0 0 0 100 1Others 0.0 0.0 0.0 0.0 0.0 0.0 0.0<300 Rs 100.0 0.0 0.0 0.0 0.0 100.0 1300-600 Rs 0.0 0.0 0.0 0.0 0.0 0.0 0.0601-1000 Rs 0.0 0.0 0.0 0.0 0.0 0.0 0.0>1000 Rs 0.0 0.0 0.0 0.0 0.0 0.0 0.0
Expenditure Total 1 0.0 0.0 0.0 0.0 100 1
Yes 90.7 90.0 76.9 79.1 82.9 84.0 173No 9.3 10.0 23.1 20.9 17.1 16.0 33Whether satisfied with the service Total 43 40 39 43 41 100 206Improper treatment in govt. hospital 25.0 0.0 0.0 22.9 28.6 15.2 5No free medicines 0.0 0.0 0.0 0.0 0.0 0.0 0.0Medicine did not work 75.0 100.0 100.0 77.8 71.4 84.8 28No good treatment 0.0 0.0 0.0 0.0 0.0 0.0 0.0No relief 0.0 0.0 0.0 0.0 0.0 0.0 0.0
If no, Reasons
Total 4 4 9 9 7 100 33

190
Evaluation Study of N
ational Rural H
ealth Mission (N
RH
M) in 7 States
Family Planning Services Utilization Family Planning Jammu Udhampur Doda Baramula Budgam Total % Total No.
200 200 200 200 200 100 1000Yes 60.7 61.6 58.9 56.7 69.7 61.6 596No 39.3 38.4 41.1 43.3 30.3 38.4 372Are you/your husband using any
Family Planning method Total 196 198 192 187 195 100 968Female Sterilization 8.4 13.9 6.2 11.3 5.9 9.1 54Non scalpel Vasectomy 0.0 0.0 1.8 0.0 0.0 0.3 2IUD/Copper-T/Loop 0.8 4.9 7.1 2.8 3.7 3.9 23Oral Pills 33.6 41.0 35.4 23.6 33.1 33.6 200Condom/Nirodh 57.1 40.2 49.6 62.3 57.4 53.2 317Rhythm/periodic abstinence 0.0 0.0 0.0 0.0 0.0 0.0 0.0Withdrawal 0.0 0.0 0.0 0.0 0.0 0.0 0.0Other Trad. Method (specify) 0.0 0.0 0.0 0.0 0.0 0.0 0.0
Which method you/ your husband using
Total 119 122 113 106 136 100 596ASHA 18.5 20.5 24.8 37.7 21.3 24.2 144ANM 67.2 64.8 49.6 13.2 30.1 45.3 270Doctor 0.0 0.0 5.3 14.2 13.2 6.5 39Friends 4.2 4.1 4.4 11.3 17.6 8.6 51Relatives 4.2 3.3 8.8 5.7 5.9 5.5 33Others(specify) 5.9 7.4 7.1 17.9 11.8 9.9 59
Who mainly motivated you to use current method
Total 119 122 113 106 136 100 596Yes 96.6 93.4 81.4 91.5 91.9 91.1 543No 3.4 6.6 18.6 8.5 8.1 8.9 53Do you get contraceptives free of
cost Total 119 122 113 106 136 100 596ASHA/ANM/VHW 74.8 50.0 41.6 20.8 33.1 44.3 264Govt. hospital/ CHC/PHC/SC 22.7 43.4 43.4 72.6 59.6 48.2 287Pvt. hospitals/ Doctor/ Chemist 2.5 6.6 15.0 6.6 7.4 7.6 45NGOS 0.0 0.0 0.0 0.0 0.0 0.0 0Others(specify) 0.0 0.0 0.0 0.0 0.0 0.0 0
What was the source for getting the method
Total 119 122 113 106 136 100 596Yes 0.0 0.0 0.0 0.0 2.2 0.5 3No 100.0 100.0 100.0 100.0 97.8 99.5 593Health problem while using this
method Total 119 122 113 106 136 100 596

E
valuation Study of National R
ural Health M
ission (NR
HM
) in 7 States 191
Family Planning Jammu Udhampur Doda Baramula Budgam Total % Total No.Want a Child 96.1 85.5 88.6 92.6 79.7 89.0 331Not having Sex 2.6 2.6 1.3 0.0 10.2 3.0 11Method Failed/become pregnant 1.3 0.0 5.1 1.2 0.0 1.6 6Relatives opposed 0.0 0.0 0.0 0.0 0.0 0.0 0.0Religious prohibition 0.0 1.3 0.0 2.5 0.0 0.8 3Not aware of any method 0.0 0.0 0.0 0.0 0.0 0.0 0.0Not knowing the source of availability 0.0 0.0 0.0 1.2 0.0 0.3 1Inconvenient to use 0.0 0.0 0.0 0.0 0.0 0.0 0.0Health problems 0.0 3.9 1.3 0.0 0.0 1.1 4Fear of side effects 0.0 0.0 2.5 0.0 0.0 0.5 2Lack of sexual satisfaction 0.0 6.6 1.3 1.2 8.5 3.2 12Others (specify) 0.0 0.0 0.0 0.0 1.7 0.3 2
Main reason for not using any method
Total 77 76 79 81 59 100 372

192
Evaluation Study of N
ational Rural H
ealth Mission (N
RH
M) in 7 States
Awareness about ASHA and NRHM Information about NRHM & ASHA Jammu Udhampur Doda Baramula Budgam Total
% Total No.
200 200 200 200 200 100 1000 Yes 97.5 95.5 94.5 98.0 92.0 95.5 955Have you heard about ASHA Total 200 200 200 200 200 100 1000Yes 66.0 55.0 63.0 64.0 59.5 61.5 615Have you heard about NRHM Total 200 200 200 200 200 100 1000ASHA/ANM 62.9 68.2 61.1 60.2 69.7 64.2 395Radio/TV 28.8 27.3 31.0 31.3 22.7 28.3 174Newspapers 6.1 4.5 7.9 8.6 5.9 6.7 41Any other 2.3 0.0 0.0 0.0 1.7 0.8 5
Source of information
Total 132 110 126 128 119 100 615Every week 24.1 13.1 16.9 17.3 20.7 18.4 176Bi-weekly 17.4 12.0 20.6 20.9 15.2 17.3 165Monthly 48.7 50.3 42.9 54.6 48.9 49.1 469Once in 3 months 9.7 24.6 18.0 6.1 14.1 14.5 138Never 0.0 0.0 1.6 1.0 1.1 0.7 7Others 0.0 0.0 0.0 0.0 0.0 0.0 0.0
ASHA visits
Total 195 191 189 196 184 100 955 Yes 80.5 69.6 75.7 64.8 59.8 70.2 670ASHA carry kit Total 195 191 189 196 184 100 955 Yes 92.8 85.3 83.1 66.3 81.0 81.7 780ASHA provide common medicines free
of cost Total 195 191 189 196 184 100 955Yes 84.6 78.0 73.5 67.9 69.0 74.7 713Whether ASHA tells about good health
practices like sanitation/hygiene Total 195 191 189 196 184 100 955Yes 76.5 74.5 71.5 61.0 58.5 68.4 684VHND organized at Aanganwadi/Other
place organized in your village Total 195 191 189 196 184 100 955 Less 3 times 100.0 100.0 60.8 100.0 100.0 91.8 6283-6 times 0.0 0.0 0.7 0.0 0.0 0.1 1More than 6 times 0.0 0.0 38.5 0.0 0.0 8.0 55
Frequency in last 3 months
Total 153 149 143 122 117 100 684Yes 86.2 77.0 73.5 70.4 73.4 76.1 727Whether ASHA tells about safe
drinking water Total 195 191 189 196 184 100 955

E
valuation Study of National R
ural Health M
ission (NR
HM
) in 7 States 193
Information about NRHM & ASHA Jammu Udhampur Doda Baramula Budgam Total %
Total No.
Yes 73.5 62.5 57.5 57.0 53.0 60.7 607Any VHSC in village Total 200 200 200 200 200 100 1000Yes 1.4 1.6 6.1 2.6 1.9 2.6 16Are you member of VHSC Total 147 125 115 114 106 100 607Aware people for sanitation 100.0 100.0 42.9 0.0 0.0 43.8 7Help them about sanitation 0.0 0.0 57.1 100.0 100.0 56.3 9
If yes specify the contribution of VHSC in improving health & hygienic
condition of the village Total 2 2 7 3 2 100 16Yes 37.5 28.0 27.5 34.0 41.0 33.6 336Any health camps organized at
village/community/ block level Total 200 200 200 200 200 100 1000
Yes 85.3 83.9 90.9 100.0 91.5 90.5 304
No 14.7 16.1 9.1 0.0 8.5 9.5 32
If yes, have you attended that camp/programme
Total 75 56 55 68 82 100 336 Don’t like 36.4 77.8 0.0 0.0 100.0 56.3 18 Lack of time 63.6 22.2 100.0 0.0 0.0 43.8 14
If no, give reasons
Total 11 9 5 0.0 7 100 32Yes 93.5 95.5 90.0 89.0 90.5 91.7 917Awareness about timings of doctor’s
visit at SCs Total 200 200 200 200 200 100 1000Yes 50.8 54.5 48.4 34.4 47.1 46.8 288Whether seen any improvement after
launching of NRHM Total 132 110 126 128 119 100 615Benefit of JSY 9.0 3.3 5.0 18.2 8.9 8.3 24Improved facilities 6.0 0.0 0.0 2.3 0.0 1.7 5Immunization has improved 77.6 96.7 78.3 75.0 87.5 83.3 240Medicines are available 7.5 0.0 16.7 4.5 3.6 6.6 19
If yes mention
Total 67 61 60 44 56 100 288

194
Evaluation Study of N
ational Rural H
ealth Mission (N
RH
M) in 7 States
Tamilnadu household tables
Background Characteristics kanchipuram Salem Madurai Tuticorin Nagapattanam Total % Total
Number 200 200 200 200 200 100 1000
Background characteristics of HH Male 99.5 99.5 99.0 98.5 98.5 99.0 990Female 0.5 0.5 1.0 1.5 1.5 1.0 10Sex of the Head Total 200 200 200 200 200 100 1000SC 43.0 29.0 15.5 31.0 16.0 26.9 269ST 4.5 0.5 0.5 0.0 0.5 1.2 12OBC 42.5 62.5 55.5 52.5 78.0 58.2 582Others 10.0 8.0 28.5 16.5 5.5 13.7 137
Social category
Total 200 200 200 200 200 100 1000Hindu 99.5 99.0 98.5 91.0 95.0 96.6 966Muslim 0.0 0.5 1.5 0.0 3.0 1.0 10Others 0.5 0.5 0.0 9.0 2.0 2.4 24Religion
Total 200 200 200 200 200 100 1000Joint 13.5 27.5 20.5 13.5 7.0 16.4 164Nuclear 86.5 72.5 79.5 86.5 93.0 83.6 836Type of Family Total 200 200 200 200 200 100 1000<25000 45.5 10.5 34.0 55.0 51.5 39.3 39325000-50000 47.5 71.5 59.0 41.5 45.0 52.9 529>50000 7.0 18.0 7.0 3.5 3.5 7.8 78Total Income of HH
Total 200 200 200 200 200 100 10001 91.0 81.5 87.0 95.0 98.0 90.5 9052 8.5 17.0 12.5 5.0 2.0 9.0 903+ 0.5 1.5 0.5 0.0 0.0 0.5 5Total No. of earning member
Total 200 200 200 200 200 100 10001 0.0 0.0 0.0 50.0 0.0 33.3 12 100.0 0.0 0.0 50.0 0.0 66.7 23+ 0.0 0.0 0.0 0.0 0.0 0.0 0.0Members insured for health
Total 1 0.0 0.0 2 0.0 100 3

E
valuation Study of National R
ural Health M
ission (NR
HM
) in 7 States 195
kanchipuram Salem Madurai Tuticorin Nagapattanam Total % Total Number
Members of the HH 1-5 94.0 89.5 94.5 97.5 97.0 94.5 9456-10 6.0 10.5 5.5 2.5 3.0 5.5 5510+ 0.0 0.0 0.0 0.0 0.0 0.0 0.0Total members in the HH
Total 200 200 200 200 200 100 10001 70.1 79.3 67.4 75.2 78.3 74.0 5062 29.9 19.3 31.9 24.1 21.7 25.4 1743+ 0.0 1.4 0.7 0.7 0.0 0.6 4No. of children 0-5 years
Total 137 140 141 137 129 100 684Land Owned
< 1 acre 40.0 0.0 66.7 16.7 19.0 26.8 111-3 acres 40.0 100.0 33.3 50.0 81.0 63.4 264-6 acres 20.0 0.0 0.0 16.7 0.0 7.3 37-9 acres 0.0 0.0 0.0 0.0 0.0 0.0 0.0>10acre 0.0 0.0 0.0 16.7 0.0 2.4 1
Total Land Owned
Total 10 1 3 6 21 100 41

196
Evaluation Study of N
ational Rural H
ealth Mission (N
RH
M) in 7 States
Household facilities HH Details Indicators kanchipuram Salem Madurai Tuticorin Nagapattanam Total % Total Number
200 200 200 200 200 100 1000Pucca 20.5 21.5 13.5 12.0 20.0 17.5 175Semi-Pucca 69.5 76.5 78.5 79.5 66.5 74.1 741Kachha 10.0 2.0 8.0 8.5 13.5 8.4 84Others 0.0 0.0 0.0 0.0 0.0 0.0 0.0
Type of House
Total 200 200 200 200 200 100 1000Own 98.5 99.0 86.0 85.5 99.5 93.7 937Rented 1.5 1.0 14.0 14.5 0.5 6.3 63Ownership of House Total 200 200 200 200 200 100 1000Yes 40.5 38.5 44.5 55.5 56.0 47.0 470
Separate kitchen Total 200 200 200 200 200 100 1000Yes 22.0 38.0 39.5 45.0 43.0 37.5 375Toilet inside the house Total 200 200 200 200 200 100 1000Electricity 97.5 99.0 99.5 99.5 94.0 97.9 979Kerosene lamps 1.5 0.5 0.5 0.5 6.0 1.8 18Others 1.0 0.5 0.0 0.0 0.0 0.3 3
Main source of lighting in the household
Total 200 200 200 200 200 100 1000Yes 95.5 100.0 85.5 98.0 99.5 95.7 957Source of drinking water Total 200 200 200 200 200 100 1000Tap 71.7 91.0 91.8 100.0 81.9 87.3 835Hand pump 26.7 0.0 5.3 0.0 17.1 9.8 94Well 1.0 0.0 0.6 0.0 0.0 0.3 3Others 0.5 9.0 2.3 0.0 1.0 2.6 25
Source of drinking water
Total 191 200 171 196 199 100 957Yes 95.0 100.0 85.0 98.0 99.0 95.4 954No 5.0 0.0 15.0 2.0 1.0 4.6 46Is that water potable Total 200 200 200 200 200 100 1000Boil 0.0 0.0 3.3 0.0 0.0 2.2 1Filter 0.0 0.0 0.0 0.0 50.0 2.2 1Drink as it is 100.0 0.0 96.7 100.0 50.0 95.7 44Others 0.0 0.0 0.0 0.0 0.0 0.0 0.0
If no, how do you purify it
Total 10 0.0 30 4 2 100 46

E
valuation Study of National R
ural Health M
ission (NR
HM
) in 7 States 197
HH Details Indicators kanchipuram Salem Madurai Tuticorin Nagapattanam Total % Total NumberDiarrhea 56.0 27.5 53.8 41.4 31.3 42.0 418Fever 36.5 67.0 31.7 42.9 49.0 45.4 452Cholera 0.0 0.0 0.0 0.0 0.0 0.0 0.0Malaria 0.0 0.0 0.0 0.0 0.0 0.0 0.0Pneumonia 0.0 0.0 0.0 0.0 0.0 0.0 0.0Stomach infection
3.5 0.0 0.5 4.0 0.0 1.6 16
TB 0.0 0.0 0.0 0.0 0.0 0.0 0.0Jaundice 4.0 5.5 14.1 11.6 19.7 11.0 109
Perception about disease because of impure drinking water
Total 200 200 199 198 198 100 995Dung cake 0.0 1.5 1.0 0.0 1.0 0.7 7Wood 73.0 45.5 75.0 68.5 81.5 68.7 687Kerosene 3.5 0.0 4.0 4.0 1.0 2.5 25Conventional energy/Electricity
0.0 0.0 0.0 0.5 0.0 0.1 1
LPG 23.5 53.0 20.0 27.0 16.5 28.0 280
Cooking fuel used in the House
Total 200 200 200 200 200 100 1000

198
Evaluation Study of N
ational Rural H
ealth Mission (N
RH
M) in 7 States
ANC Services Utilization by Pregnant Women Married women availing pre natal care kanchipuram Salem Madurai Tuticorin Nagapattanam Total
% Total
Number 200 200 200 200 200 100 1000
< 3 months 4.2 7.8 8.9 13.5 4.9 8.0 193-6 months 39.6 19.6 31.1 23.1 26.8 27.8 667-9 months 56.3 72.5 60.0 63.5 68.3 64.1 152Pregnancy registration
Total 48 51 45 52 41 100 237Yes 100.0 98.0 100.0 94.2 100.0 98.3 233Going for any ANC Total 48 51 45 52 41 100 237ASHA/ ANM/ VHM 2.1 0.0 0.0 2.0 0.0 0.9 2SC 54.2 80.0 33.3 38.8 58.5 53.2 124PHC 43.8 20.0 64.4 59.2 41.5 45.5 106CHC 0.0 0.0 0.0 0.0 0.0 0.0 0.0Dist Hospital 0.0 0.0 2.2 0.0 0.0 0.4 1Private Doctor 0.0 0.0 0.0 0.0 0.0 0.0 0.0Private Hospital 0.0 0.0 0.0 0.0 0.0 0.0 0.0
Place of check up
Total 48 50 45 49 41 100 233Within the village 100.0 100.0 100.0 98.0 100.0 99.6 232In other Village 0.0 0.0 0.0 2.0 0.0 0.4 1Distance of SC from Village Total 48 50 45 49 41 100 233B.P 29.2 100.0 100.0 98.0 100.0 85.0 198Height 50.0 82.0 88.9 69.4 70.7 72.1 168Weight 41.7 92.0 100.0 98.0 100.0 85.8 200Urine 52.1 18.0 68.9 59.2 43.9 48.1 112Blood check up 2.1 0.0 2.2 2.0 0.0 1.3 3
Check ups includes
Total 48 50 45 49 41 100 233Yes 97.9 80.4 93.3 92.3 97.6 92.0 218Vaccinated with Anti-Tetanus Total 48 51 45 52 41 100 237Diet 93.8 66.7 2.2 94.2 100.0 71.7 170Exercise 93.8 66.7 2.2 94.2 100.0 71.7 170Precautions 93.8 66.7 2.2 94.2 100.0 71.7 170
ASHA/ANM helps in any pregnancy related problems
Total 48 51 45 52 41 100 237

E
valuation Study of National R
ural Health M
ission (NR
HM
) in 7 States 199
Delivery Care during birth of Children 0-5 years
0-5 years Indicators Kanchipuram Salem Madurai Tuticorin Nagapattanam Total %
Total Number
200 200 200 200 200 100 1000 Normal 88.0 97.6 88.8 81.3 82.8 87.8 755 Caesarian 12.0 2.4 11.2 18.7 17.2 12.2 105 Type of delivery Total 175 170 187 171 157 100 860 Home 5.7 12.4 1.1 1.2 0.6 4.2 36 SC 1.1 11.2 0.5 2.3 5.1 4.0 34 PHC 65.1 68.8 68.4 54.4 50.3 61.7 531 CHC 1.7 5.9 8.6 2.9 3.8 4.7 40 DH 22.3 0.0 11.2 28.1 35.0 19.0 163 Private clinics 4.0 1.8 10.2 11.1 5.1 6.5 56
Where did the delivery take place
Total 175 170 187 171 157 100 860 Less than 1.8 kgs 1.1 12.4 1.6 4.7 5.1 4.9 42 1.8-2.5 Kgs 57.1 75.9 67.4 47.4 41.4 58.3 501 More than 2.5 kgs 38.3 0.6 30.5 40.9 53.5 32.4 279 not taken 3.4 11.2 0.5 7.0 0.0 4.4 38
Weight of baby at the time of birth
Total 175 170 187 171 157 100 860

200
Evaluation Study of N
ational Rural H
ealth Mission (N
RH
M) in 7 States
Post Natal Care and JSY benefits for the Youngest Child Born Amongst 0-5 years Married Women availing PNC
Kanchipuram Salem Madurai Tuticorin Nagapattanam Total
% Total
Number 200 200 200 200 200 100 1000
Yes 78.1 67.4 84.3 89.1 87.6 81.2 556No 21.9 32.6 15.7 10.9 12.4 18.8 129Availed JSY benefits after Last
Childbirth Total 137 141 140 138 129 100 685Yes 94.2 82.3 97.9 89.9 89.9 90.8 622Availed PNC Services after Youngest
child Total 137 141 140 138 129 100 685SC 51.9 70.7 34.3 39.5 44.8 47.7 297PHC 34.1 27.6 56.2 54.0 50.0 44.7 278CHC 5.4 1.7 2.9 3.2 1.7 3.1 19DH 8.5 0.0 1.5 3.2 3.4 3.4 21Private 0.0 0.0 5.1 0.0 0.0 1.1 7
Place of Check Ups
Total 129 116 137 124 116 100 622Yes 100.0 100.0 92.0 100.0 99.1 98.1 610Whether facilities at the Govt. health
centers are satisfactory Total 129 116 137 124 116 100 622Yes 0.0 0.0 0.0 1.4 0.0 0.3 2Any miscarriage/Abortion/Still birth
during last 1 yr Total 137 141 140 138 129 100 685weakness 0.0 0.0 0.0 100.0 0.0 100.0 2Don’t know
0.0 0.0 0.0 0.0 0.0 0.0 0.0Causes of occurrence
Total 0.0 0.0 0.0 2 0.0 100 2

E
valuation Study of National R
ural Health M
ission (NR
HM
) in 7 States 201
Immunization and Child Care of Children 0-5 years 0-5 years Children kanchipuram Salem Madurai Tuticorin Nagapattanam Total
% Total
Number 200 200 200 200 200 100 1000
BCG 100.0 100.0 98.9 100.0 100.0 99.8 858DPT 1,2 & 3 98.9 91.2 94.7 97.7 98.1 96.0 826Polio 1,2 & 3 92.6 98.8 86.6 94.7 94.3 91.3 785Measles 73.1 77.1 35.8 70.8 79.0 66.4 571Hepatitis 33.1 2.4 2.1 19.9 38.9 18.7 161
Whether vaccinated
Total 175 170 187 171 157 100 860Yes 77.1 56.5 64.7 77.2 86.0 72.0 619No 22.9 43.5 35.3 22.8 14.0 28.0 241Having immunization card Total 175 170 187 171 157 100 860Lost 87.5 90.5 86.4 94.9 90.9 89.6 216Not Available 0.0 9.5 0.0 0.0 0.0 2.9 7Torn 12.5 0.0 13.6 5.1 9.1 7.5 18If no, give reason
Total 40 74 66 39 22 100 241SC 39.4 90.0 24.1 26.9 36.3 43.0 370PHC 60.6 4.1 75.4 70.2 63.7 55.1 474CHC 0.0 0.0 0.5 0.0 0.0 0.1 1DH 0.0 0.0 0.0 2.3 0.0 0.5 4Govt. mobile clinic 0.0 0.0 0.0 0.0 0.0 0.0 0.0ANM/AWW/MHW/ASHA 0.0 5.9 0.0 0.0 0.0 1.2 10Private doctor 0.0 0.0 0.0 0.0 0.0 0.0 0.0Any other 0.0 0.0 0.0 0.6 0.0 0.1 1
Place for availing most of the facility of vaccination
Total 175 170 187 171 157 100 860Yes 0.0 1.2 11.2 0.6 0.0 2.8 24Suffering from Polio Total 175 170 187 171 157 100 860Yes 14.9 22.4 15.5 8.8 12.7 14.9 128 Use of Bed net Total 175 170 187 171 157 100 860Less than 4 months 30.9 74.1 61.0 52.0 47.8 53.3 4584-6 months 58.3 16.5 38.0 39.2 43.9 39.2 337more than 6 months 10.9 9.4 1.1 8.8 8.3 7.6 65
Up to age only breastfed
Total 175 170 187 171 157 100 860

202
Evaluation Study of N
ational Rural H
ealth Mission (N
RH
M) in 7 States
Chronic Disease and Treatment Seeking Pattern Chronic disease Indicators Kanchipuram Salem Madurai Tuticorin Nagapattanam Total
% Total
Number 200 200 200 200 200 100 1000
Malaria 0.0 0.0 0.0 2.5 0.0 0.5 1Kala Azar 0.0 2.5 0.0 2.5 0.0 1.0 2Filaria/microfilaria 0.0 0.0 0.0 0.0 2.4 0.5 1Cataract 0.0 2.5 5.1 0.0 0.0 1.5 3Leprosy 9.8 2.5 0.0 0.0 2.4 3.0 6TB 36.6 47.5 25.6 30.0 22.0 32.3 65fever/cold/cough 4.9 0.0 0.0 0.0 0.0 1.0 2Hepatitis 0.0 0.0 0.0 0.0 0.0 0.0 0.0Diarrhea 0.0 0.0 0.0 0.0 0.0 0.0 0.0Cholera 0.0 0.0 0.0 0.0 0.0 0.0 0.0Accident 0.0 0.0 2.6 0.0 0.0 0.5 1Differently able 0.0 0.0 0.0 0.0 0.0 0.0 0.0Any other 48.8 45.0 66.7 65.0 73.2 59.7 120
Suffering from Chronic Disease
Total 41 40 39 40 41 100 201Govt. 95.1 100.0 84.6 92.5 97.6 94.0 189Pvt. 4.9 0.0 15.4 7.5 2.4 6.0 12Where you gone for treatment Total 41 40 39 40 41 100 201Better Treatment 100.0 0.0 100.0 100.0 100.0 100.0 12Better facilities 0.0 0.0 0.0 0.0 0.0 0.0 0Doctor recommended 0.0 0.0 0.0 0.0 0.0 0.0 0Govt. hospital too far 0.0 0.0 0.0 0.0 0.0 0.0 0Medicine was not effective
0.0 0.0 0.0 0.0 0.0 0.0 0
In emergency 0.0 0.0 0.0 0.0 0.0 0.0 0
Reason for went to private
Total 2 0 6 3 1 100 12SC 0.0 0.0 3.0 0.0 0.0 0.5 1PHC 15.4 0.0 27.3 10.8 5.0 11.1 21CHC 7.7 20.0 12.1 29.7 17.5 17.5 33DH 76.9 80.0 57.6 59.5 77.5 70.9 134
If Govt. then where
Total 39 40 33 37 40 100 189AL 100.0 100.0 100.0 100.0 100.0 100.0 201Which type of treatment was taken AY 0.0 0.0 0.0 0.0 0.0 0.0 0.0

E
valuation Study of National R
ural Health M
ission (NR
HM
) in 7 States 203
Chronic disease Indicators Kanchipuram Salem Madurai Tuticorin Nagapattanam Total %
Total Number
YN 0.0 0.0 0.0 0.0 0.0 0.0 0.0UN 0.0 0.0 0.0 0.0 0.0 0.0 0.0SD 0.0 0.0 0.0 0.0 0.0 0.0 0.0HO 0.0 0.0 0.0 0.0 0.0 0.0 0.0Total 41 40 39 40 41 100 201Yes 95.1 95.0 100.0 100.0 100.0 98.0 197Whether doctor attended you carefully Total 41 40 39 40 41 100 201Yes 92.7 95.0 76.9 92.5 92.7 90.0 181No 7.3 5.0 23.1 7.5 7.3 10.0 20Medicines received free of cost Total 41 40 39 40 41 100 201<500 Rs 0.0 0.0 11.1 0.0 0.0 5.0 1500-1000 Rs 33.3 0.0 0.0 0.0 0.0 5.0 1>1000 Rs 66.7 100.0 88.9 100.0 100.0 90.0 18If no, expenditure
Total 3 2 9 3 3 100 20< 3 months 39.0 2.5 56.4 67.5 53.7 43.8 883-6 months 43.9 75.0 23.1 20.0 36.6 39.8 807-10 months 7.3 7.5 2.6 0.0 0.0 3.5 7> 10 months 9.8 15.0 17.9 12.5 9.8 12.9 26
Duration of treatment
Total 41 40 39 40 41 100 201Yes 7.3 2.5 5.1 0.0 9.8 5.0 10No 92.7 97.5 94.9 100.0 90.2 95.0 191Have you been referred to other
doctor/hospital Total 41 40 39 40 41 100 201Govt. hospital 0.0 100.0 0.0 0.0 0.0 10.0 1Pvt. Doctor/clinic 66.7 0.0 50.0 0.0 0.0 30.0 3Private hospital 33.3 0.0 50.0 0.0 100.0 60.0 6Referred to
Total 3 1 2 0.0 4 100 10Doctor’s fee <300 Rs 0.0 0.0 0.0 0.0 0.0 0.0 0.0300-600 Rs 0.0 0.0 0.0 0.0 0.0 0.0 0.0601-1000 Rs 0.0 100.0 0.0 0.0 25.0 20.0 2>1000 Rs 100.0 0.0 100.0 0.0 75.0 80.0 8Total 3 1 2 0 4 100 10Drugs
Expenditures
<300 Rs 0.0 0.0 0.0 0.0 0.0 0.0 0.0

204
Evaluation Study of N
ational Rural H
ealth Mission (N
RH
M) in 7 States
Chronic disease Indicators Kanchipuram Salem Madurai Tuticorin Nagapattanam Total %
Total Number
300-600 Rs 0.0 0.0 50.0 0.0 0.0 14.3 1601-1000 Rs 0.0 100.0 50.0 0.0 25.0 42.9 3>1000 Rs 0.0 0.0 0.0 0.0 75.0 42.9 3Total 0 1 2 0 4 100 7Special food <300 Rs 0.0 0.0 0.0 0.0 0.0 0.0 0.0300-600 Rs 0.0 0.0 0.0 0.0 25.0 16.7 1601-1000 Rs 0.0 0.0 100.0 0.0 50.0 50.0 3>1000 Rs 0.0 100.0 0.0 0.0 25.0 33.3 2Total 0 1 1 0 4 100 6Transport <300 Rs 0.0 0.0 0.0 0.0 25.0 16.7 1300-600 Rs 0.0 100.0 100.0 0.0 0.0 33.3 2601-1000 Rs 0.0 0.0 1 0.0 50.0 33.3 2>1000 Rs 0.0 0.0 1 0.0 25.0 16.7 1Total 0 1 1 0 4 100 6Others <300 Rs 0.0 0.0 0.0 0.0 0.0 0.0 0.0300-600 Rs 0.0 0.0 100.0 0.0 0.0 33.3 1601-1000 Rs 0.0 0.0 0.0 0.0 50.0 33.3 1>1000 Rs 0.0 0.0 0.0 0.0 50.0 33.3 1Total 0 0 1 0.0 2 100 3Yes 90.2 87.5 74.4 82.5 78.0 82.6 166No 9.8 12.5 25.6 17.5 22.0 17.4 35Whether satisfied with the service Total 41 40 39 40 41 100 201No better facilities 0.0 0.0 0.0 0.0 0.0 0.0 0.0No free medicines 50.0 40.0 50.0 57.1 11.1 40.0 14Medicine did not work 0.0 0.0 0.0 0.0 0.0 0.0 0.0No good treatment 50.0 60.0 50.0 42.9 88.9 60.0 21No relief 0.0 0.0 0.0 0.0 0.0 0.0 0.0
If no, reason
Total 4 5 10 7 9 100 35

E
valuation Study of National R
ural Health M
ission (NR
HM
) in 7 States 205
Family Planning Services Utilization Family Planning Indicators Kanchipuram Salem Madurai Tuticorin Nagapattanam Total
% Total
Number 200 200 200 200 200 100 1000
Yes 64.8 65.4 63.9 56.7 65.6 63.3 582No 35.2 34.6 36.1 43.3 34.4 36.7 338You/your husband using any
Family Planning method Total 182 182 183 187 186 100 920Female Sterilization 49.2 40.3 65.8 66.0 69.7 58.1 338Non scalpel Vasectomy 0.0 0.8 0.0 0.0 0.0 0.2 1IUD/Copper-T/ Loop 25.4 28.6 23.9 22.6 26.2 25.4 148Oral Pills 11.0 15.1 4.3 6.6 3.3 8.1 47Condom/ Nirodh 13.6 15.1 6.0 4.7 0.8 8.1 47Rhythm/periodic abstinence
0.0 0.0 0.0 0.0 0.0 0.0 0.0
Withdrawal 0.8 0.0 0.0 0.0 0.0 0.2 1Other Trad. Method (specify)
0.0 0.0 0.0 0.0 0.0 0.0 0.0
Method using
Total 118 119 117 106 122 100 582ASHA 41.5 35.3 61.5 42.5 50.0 46.2 269ANM 19.5 32.8 9.4 18.9 12.3 18.6 108Doctor 1.7 0.0 0.9 0.0 0.0 0.5 3Friends 1.7 1.7 0.0 0.0 0.0 0.7 4Relatives 18.6 3.4 17.9 26.4 26.2 18.4 107Others(specify) 16.9 26.9 10.3 12.3 11.5 15.6 91
Who mainly motivated you to use current method
Total 118 119 117 106 122 100 582Yes 91.5 99.2 99.1 93.4 99.2 96.6 562No 8.5 0.8 0.9 6.6 0.8 3.4 20Contraceptives free of cost Total 118 119 117 106 122 100 582ASHA/ANM/ VHW 13.6 4.2 11.1 7.5 7.4 8.8 51Govt. hospital/ CHC/PHC/SC
83.1 95.8 88.9 89.6 92.6 90.0 524
Pvt. hospitals/ Doctor/Chemist
3.4 0.0 0.0 2.8 0.0 1.2 7
Source for getting the method
NGOS 0.0 0.0 0.0 0.0 0.0 0.0 0.0

206
Evaluation Study of N
ational Rural H
ealth Mission (N
RH
M) in 7 States
Family Planning Indicators Kanchipuram Salem Madurai Tuticorin Nagapattanam Total %
Total Number
Others (specify) 0.0 0.0 0.0 0.0 0.0 0.0 0.0Total 118 119 117 106 122 100 582Yes 1.7 5.0 0.9 0.0 0.0 1.5 9No 98.3 95.0 99.1 100.0 100.0 98.5 573Health problem while using this
method Total 118 119 117 106 122 100 582Want a Child 93.8 90.5 95.5 88.9 84.4 90.5 306Not having Sex 1.6 0.0 0.0 1.2 0.0 0.6 2Method Failed/become pregnant
1.6 0.0 1.5 1.2 0.0 0.9 3
Relatives opposed 0.0 0.0 0.0 0.0 0.0 0.0 0.0Religious prohibition 0.0 0.0 1.5 0.0 0.0 0.3 1Not aware of any method 0.0 1.6 0.0 0.0 0.0 0.3 1Not knowing the source of availability
0.0 3.2 0.0 0.0 0.0 0.6 2
Inconvenient to use 0.0 0.0 0.0 0.0 0.0 0.0 0.0Health problems 0.0 0.0 0.0 2.5 1.6 0.9 3Fear of side effects 0.0 0.0 0.0 0.0 3.1 0.6 2Lack of sexual satisfaction 0.0 1.6 0.0 0.0 0.0 0.3 1Others (specify) 3.1 3.2 1.5 6.2 10.9 5.0 17
What is the main reason for not using any method
Total 64 63 66 81 64 100 338

E
valuation Study of National R
ural Health M
ission (NR
HM
) in 7 States 207
Information about NRHM & ASHA Information about ASHA Indicators kanchipuram Salem Madurai Tuticorin Nagapattanam Total
% Total
Number 200 200 200 200 200 100 1000
Yes 0.0 0.0 0.0 0.0 0.0 0.0 0.0Have you heard about ASHA Total 0.0 0.0 0.0 0.0 0.0 0.0 0.0Yes 97.5 99.5 97.5 94.5 96.0 97.0 970Have you heard about NRHM Total 200 200 200 200 200 100 1000ASHA/ANM 68.7 48.7 77.4 86.2 78.6 71.8 696Radio/TV 21.0 31.7 20.5 7.4 14.6 19.2 186Newspapers 3.6 9.5 0.0 0.0 1.0 2.9 28Any other 6.7 10.1 2.1 6.3 5.7 6.2 60
Source of information
Total 195 199 195 189 192 100 970Yes 77.0 64.0 85.5 74.5 82.0 76.6 766VHND organized at
Aanganwadi/ other place in your village
Total 200 200 200 200 200 100 1000
Less 3 times 96.1 100.0 31.0 98.7 100.0 83.6 6403-6 times 3.2 0.0 39.2 1.3 0.0 9.7 74More than 6 times 0.6 0.0 29.8 0.0 0.0 6.8 52Frequency in last 3 month
Total 154 128 171 149 164 100 766Yes 62.0 58.5 70.5 64.0 74.0 65.8 658 Existing of VHSC in your
village Total 200 200 200 200 200 100 1000Yes 0.0 0.0 0.7 1.6 0.0 0.5 3Are you member of VHSC Total 124 117 141 128 148 100 658Health Awareness 0.0 0.0 100.0 100.0 0.0 100.0 3Programme support 0.0 0.0 0.0 0.0 0.0 0.0 0.0Aware to people 0.0 0.0 0.0 0.0 0.0 0.0 0.0Time to time cleanliness
0.0 0.0 0.0 0.0 0.0 0.0 0.0
If yes specify the contribution of VHSC in improving health & hygienic condition of the village
Total 0.0 0.0 1 2 0.0 100 3Yes 50.5 61.0 50.0 63.5 51.5 55.3 553Health camps organized at
village/community/ block level Total 200 200 200 200 200 100 1000Yes 99.0 84.4 100.0 98.4 99.0 95.8 530If yes, have you attended that
camp/programme Total 101 122 100 127 103 100 553

208
Evaluation Study of N
ational Rural H
ealth Mission (N
RH
M) in 7 States
Information about ASHA Indicators kanchipuram Salem Madurai Tuticorin Nagapattanam Total %
Total Number
No need /No company / No knowledge /Not allowed
0.0 42.1 0.0 0.0 0.0 34.8 8
Lack of time 100.0 57.9 0.0 100.0 100.0 65.2 15
If no, give reasons
Total 1 19 0 2 1 100 23Yes 73.0 59.0 94.5 84.0 87.0 79.5 795Are you aware with the
timings of doctor’s visit at SC Total 200 200 200 200 200 100 1000Yes 84.0 90.0 98.0 87.0 87.5 89.3 893Whether seen any
improvement after launching of NRHM
Total 200 200 200 200 200 100 1000
Benefits of JSY 38.7 17.2 31.6 44.3 24.6 31.1 278Immunization improvement
31.0 27.8 5.1 24.1 20.6 21.3 190
Medicine facilities 19.0 8.3 17.9 13.2 6.9 13.1 117Improved facilities 11.3 46.7 45.4 18.4 48.0 34.5 308
If yes mention
Total 168 180 196 174 175 100 893


![Mission Manager[1]](https://static.fdokumen.com/doc/165x107/6313fe215cba183dbf075a68/mission-manager1.jpg)