Evaluation Report of Irrigation Improvement Project (S 08 - W 13-14)
170
Transcript of Evaluation Report of Irrigation Improvement Project (S 08 - W 13-14)

Arab Republic of Egypt Ministry of Water Resources and Irrigation National Water Research Center Water Management Research Institute
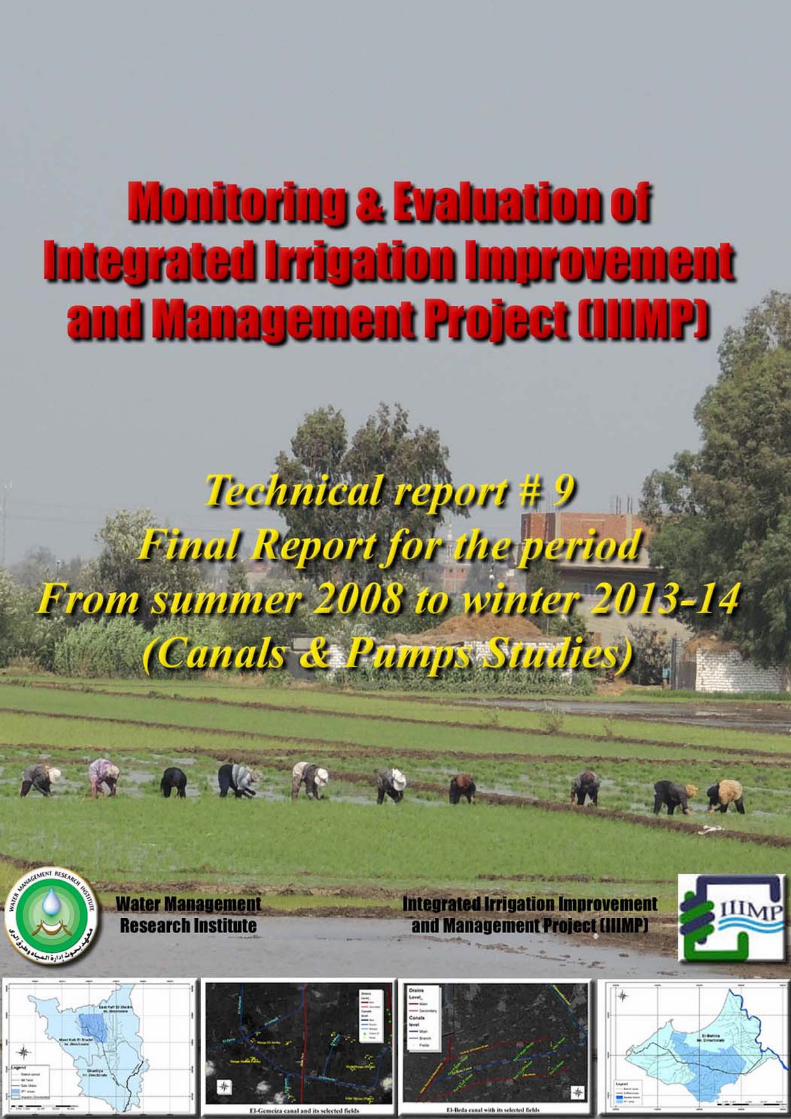
MMoonniittoorriinngg && EEvvaalluuaattiioonn ooff IInntteeggrraatteedd IIrrrriiggaattiioonn IImmpprroovveemmeenntt aanndd MMaannaaggeemmeenntt
PPrroojjeecctt ((IIIIIIMMPP))
Technical report # 9 Final Report for the period
From summer 2008 to winter 2013-14 (Canals & Pumps Studies)
Submitted to
Integrated Irrigation Improvement and Management Project

2
List of Contents
1. INTRODUCTION 15
2. METHODOLOGY 17
2.1 Data collection 17 2.1.1 Canals study 17 2.1.2 Pump study 18
2.2 Data analysis 19 2.2.1 Canals indicators (WUI, RWS) 19 2.2.1 Pump study indicators 19
2.3 Statistic analysis 21
2.4 Accuracy issue 22 2.4.1 The dependence on manually collected data 22 2.4.2 Accuracy of calculating water consumption data 23 2.4.3 The accuracy of calculating water supply 23
3. STUDYING AREAS 24
3.1 General describing of the investigated canals 24 3.1.1 Mit Yazid command area 24 3.1.2 El-Mahmoudia command area 34
4. SOME POINTS THAT AFFECT THE RESULTS 44
4.1 Operating the system 44
4.2 Additional water resources 45
5. CANALS RESULTS 47
5.1 Cropping pattern and water requirements 47 5.1.1 Cropping pattern 47 5.1.2 Water requirements 52
5.2 Relative water supply 55 5.2.1 The main canals 55 5.2.2 Investigated branch canals 71 5.2.3 Incidence of canal escape flows 82 5.2.4 Feeding back from the drains 87
5.3 Drainage run-off values 91 5.3.1 Secondary drains in El-Mahmoudia canal 91 5.3.2 Secondary drains in Mit Yazid command area 93 5.3.3 The drainage ratios 94
5.4 Water use index (WUI) values 96

3
5.4.1 El-Mahmoudia command area 96 5.4.2 Mit Yazid command area 98
6. PUMPS RESULTS 100
6.1 Collected data 100 6.1.1 Selected fields 100 6.1.2 Irrigation results 105 6.1.3 The salinity at different canals 115 6.1.4 Productivity 118
6.2 Analyzed data 126 6.2.1 WUI 126 6.2.2 Cost elements 130 6.2.3 Cost of lifting water 138 6.2.4 Cost of irrigating a unit area 143 6.2.6 Irrigation distribution 152
7. MONITORING FRAMEWORK INDICATORS 158
7.1 Reliability of water supply 158
7.2 Water productivity 161 7.2.1 Rice crop 161 7.2.2 Cotton crop 163 7.2.3 Maize crop 165 7.2.4 Wheat crop 165 7.2.5 Sugar beet crop 167
7. CONCLUSION 169

4
List of Figures
Figure (1): water consumption values for major summer crops in different regions based on matching report (201)..................................................................................................................................18
Figure (2): Mit Yazid command area...................................................................................................25
Figure (3): The selected branch canals in Mit Yazid command area................................................25
Figure (4): Khadega canal in its first reach .........................................................................................26
Figure (5): Longitudinal cross section of Khadega canal ...................................................................26
Figure (6): Bahr Nemra canal with its selected fields .........................................................................27
Figure (7): Actual cross sections at two locations at the beginning of Dakalt canal with design bed and water levels............................................................................................................................................28
Figure (8): Actual and design cross sections at km 10.78 of Dakalt canal with design water levels.......................................................................................................................................................................28
Figure (9): Shalma canal with a sliding on the banks.........................................................................29
Figure (10): Longitudinal cross section of El-Masharka canal ..........................................................30
Figure (11): Tail end of El-Masharka canal full of the drainage water ............................................30
Figure (12): The head of Mars El-Gamal canal ..................................................................................31
Figure (13): The feedback reach at the tail end of El-Gemeiza canal ...............................................32
Figure (14): Longitudinal cross section of El-Gemeiza canal.............................................................32
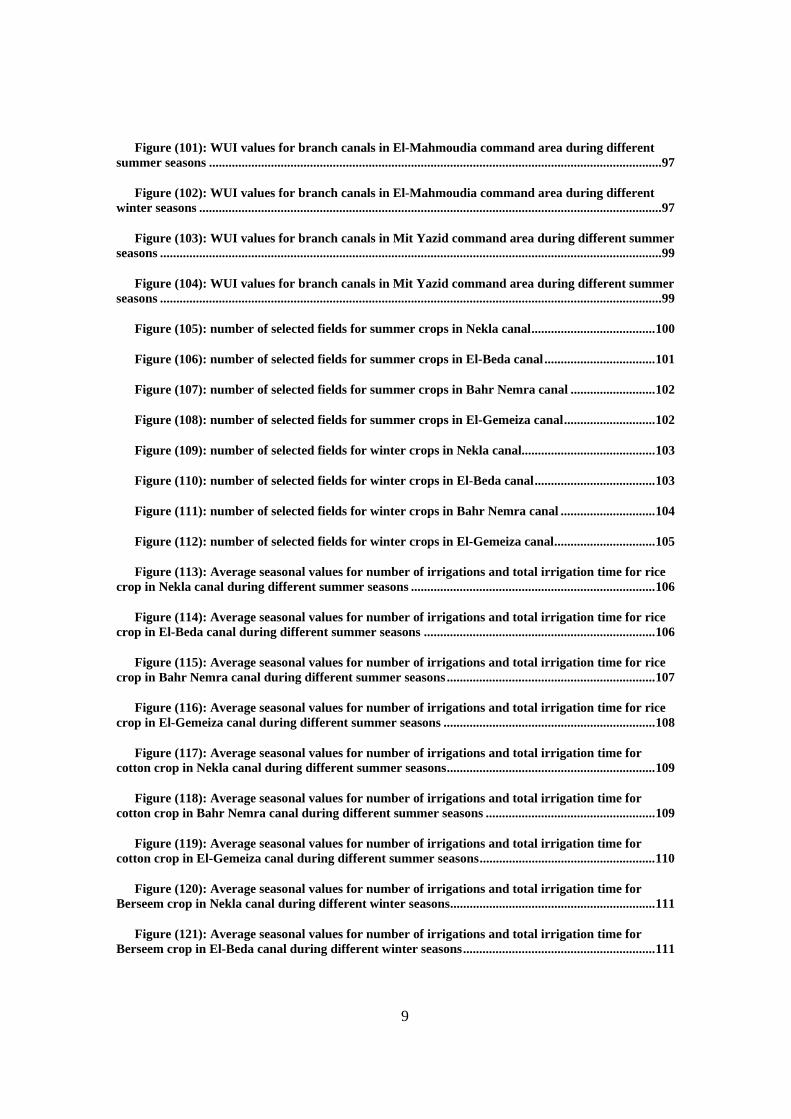
Figure (15): El-Gemeiza canal with its selected fields.........................................................................33
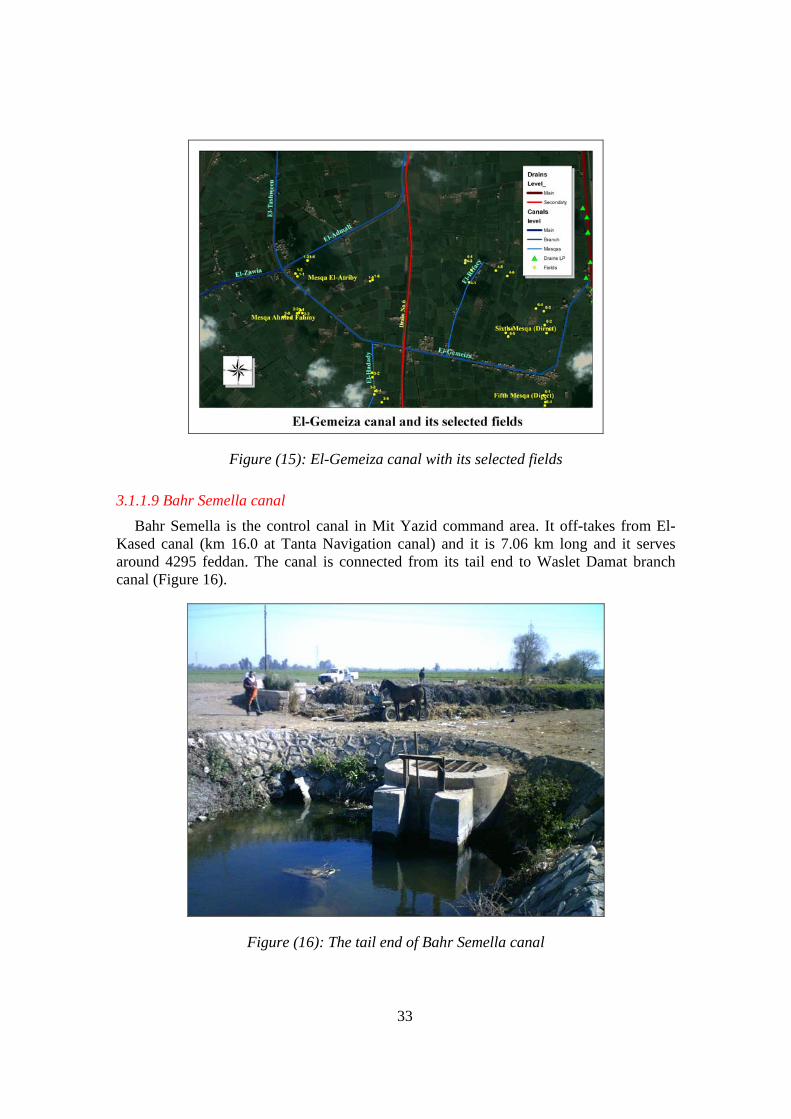
Figure (16): The tail end of Bahr Semella canal..................................................................................33
Figure (17): El-Mahmoudia command area ........................................................................................34
Figure (18): The selected canals and drains of El-Mahmoudia command area ...............................35
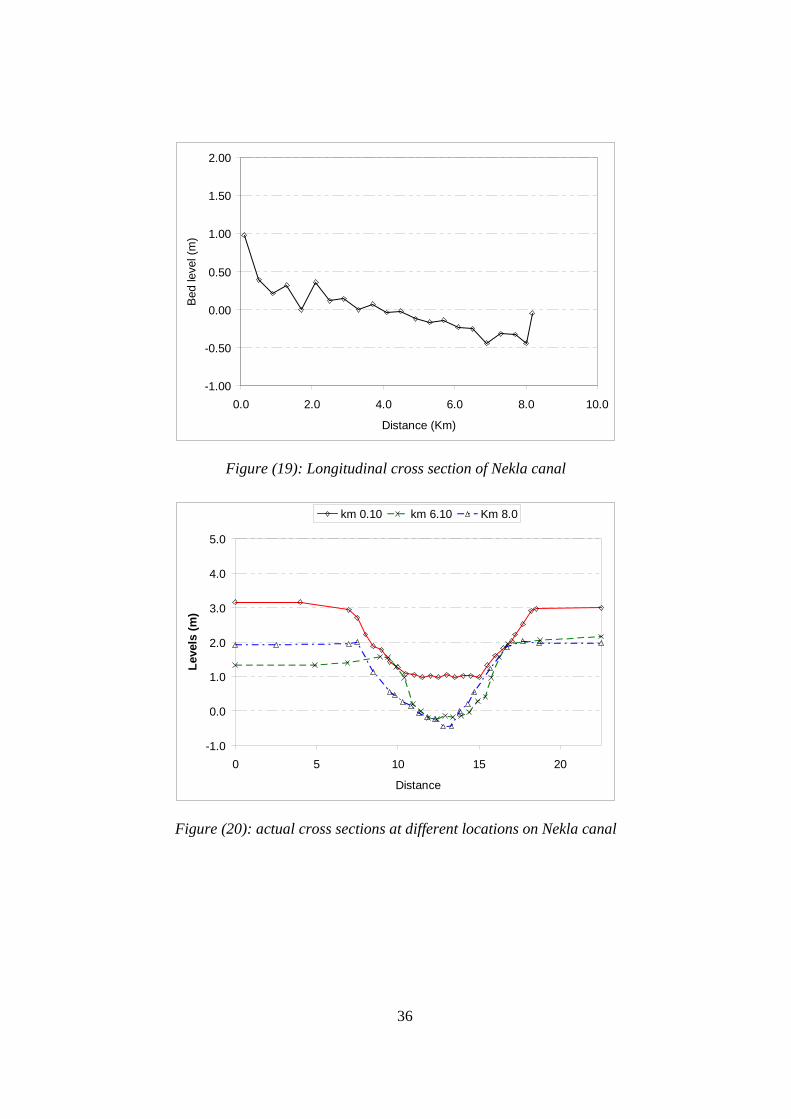
Figure (19): Longitudinal cross section of Nekla canal ......................................................................36
Figure (20): actual cross sections at different locations on Nekla canal............................................36
Figure (21): Nekla canal with its selected fields ..................................................................................37
Figure (22): The layout of Besentway canal with the monitoring points on the canal.....................38
Figure (23): The longitudinal section of Besentway canal..................................................................38
Figure (24): The layout of El-Berka canal with the monitoring points on the canal........................39

5
Figure (25): The longitudinal section of El-Berka canal.....................................................................39
Figure (26): El-Karion canal with an expansion .................................................................................40
Figure (27): Schematic drawing of El-Saraniya canal and its secondary drains..............................41
Figure (28): The first weir on El-Beda canal .......................................................................................42
Figure (29): El-Beda canal with its selected fields...............................................................................42
Figure (30): The head regulator of Bany Helal canal .........................................................................43
Figure (31): The longitudinal section of Bany Helal canal .................................................................43
Figure (32): Water levels downstream the distributor of Besentway canal during summer 2005 & summer 2010. ...............................................................................................................................................45
Figure (33): Different lifting points from the drains to Mit Yazid command area (After "An exploratory survey of the Meet Yazid canal command area" by IWMI & WMRI)..............................46
Figure (34): Rice ratios for different investigated branch canals in El-Mahmoudia command areas during different summer seasons .....................................................................................................48
Figure (35): Wheat ratios for different investigated branch canals in El-Mahmoudia command areas during different sinter seasons .........................................................................................................49
Figure (36): Berseem ratios for different investigated branch canals in El-Mahmoudia command areas during different winter seasons ........................................................................................................49
Figure (37): Rice ratios for different investigated branch canals in Mit Yazid command areas during different summer seasons ...............................................................................................................51
Figure (38): Wheat ratios for different investigated branch canals in Mit Yazid command areas during different winter seasons ..................................................................................................................52
Figure (39): Berseem ratios for different investigated branch canals in Mit Yazid command areas during different winter seasons ..................................................................................................................52
Figure (40): Seasonal water requirements for different investigated branch canals in El-Mahmoudia command areas during different summer seasons..............................................................53
Figure (41): Seasonal water requirements for different investigated branch canals in El-Mahmoudia command areas during different winter seasons.................................................................54
Figure (42): Seasonal water requirement for different investigated branch canals in Mit Yazid command areas during different summer seasons ...................................................................................54
Figure (43): Seasonal water requirements for different investigated branch canals in Mit Yazid command areas during different winter seasons ......................................................................................55
Figure (44): Total water supply values at different locations of EL-Mahmoudia canal from summer 2008 to summer 2013....................................................................................................................56
Figure (45): Total water supply values at different locations of EL-Mahmoudia canal from winter 2008-09 to winter 2012-13 ...........................................................................................................................57

6
Figure (46): Seasonally RWS values downstream two sections in El-Mahmoudia canal during different summer seasons............................................................................................................................58
Figure (47): Seasonally RWS values downstream two sections in El-Mahmoudia canal during different winter seasons ..............................................................................................................................58
Figure (48): Average daily water supply downstream El-Mahmoudia intake during summer 2008, 2010 and 2013...............................................................................................................................................59
Figure (49): Average daily water supply values for the area of El-Mahmoudia canal downstream km 16.3 during summer 2008, 2010 and 2013...........................................................................................59
Figure (50): Average daily water supply values for the area of El-Mahmoudia canal downstream Kafr El-Dawar regulator during summer 2008, 2010 and 2013..............................................................60
Figure (51): Average daily water supply downstream El-Mahmoudia intake during winter 2008-09, 2009-10 and 2012-13 ..............................................................................................................................61
Figure (52): Average daily water supply values for the area of El-Mahmoudia canal downstream km 16.3 during winter 2008-09, 2009-10 and 2012-13..............................................................................61
Figure (53): Average daily water supply values for the area of El-Mahmoudia canal downstream Kafr El-Dawar regulator during winter 2008-09, 2009-10 and 2012-13.................................................62
Figure (54): Seasonal water supply downstream Mit Yazid head regulator from summer 2011 to summer 2013 ................................................................................................................................................63
Figure (54): Seasonal water supply downstream Mit Yazid head regulator from summer 2011 to summer 2013 ................................................................................................................................................63
Figure (55): Average seasonally water supply values downstream different sections on Mit Yazid canal during different summer seasons .....................................................................................................64
Figure (56): Average seasonally water supply values downstream different sections on Mit Yazid canal during different winter seasons ........................................................................................................65
Figure (57): The bank between Mit Yazid and El-Nazaz drain in Kafr El-Sheikh city ..................67
Figure (58): Average seasonally water consumption (and losses) at different regions of Mit Yazid canal during different summer seasons .....................................................................................................67
Figure (59): Average seasonally water consumption (and losses) at different regions of Mit Yazid canal during different winter seasons ........................................................................................................68
Figure (60): Average daily water supply at the head of Mit Yazid in summer 2009, 2010 and 2013.......................................................................................................................................................................69
Figure (61): Average daily water supply downstream Beltag regulator in summer 2008, 2010 and 2013...............................................................................................................................................................69
Figure (62): Average daily water supply downstream El-Mofty Regulator in summer 2008, 2010 and 2013........................................................................................................................................................70
Figure (63): Average daily water supply at the head of Mit Yazid in winter 2008-09, 2009-10 and 2012-13..........................................................................................................................................................70

7
Figure (64): Average daily water supply downstream Beltag regulator in winter 2008-09, 2009-10 and 2012-13 ..................................................................................................................................................71
Figure (65): Average daily water supply downstream El-Mofty Regulator in winter 2008-09, 2009-10 and 2012-13 .............................................................................................................................................71
Figure (66): The average seasonally water supply values for the monitored branch canals in El-Mahmoudia command area during different summer seasons ...............................................................74
Figure (67): The average seasonally water supply values for the monitored branch canals in El-Mahmoudia command area during different winter seasons ..................................................................74
Figure (68): Average daily water supply values for Nekla canal during summer seasons 2011, 2012 and 2013........................................................................................................................................................75
Figure (69): Average daily water supply values for Besentway canal during summer seasons 2008, 2010 and 2012...............................................................................................................................................75
Figure (70): Average daily water supply values for El-Karion canal during summer seasons 2008, 2010 and 2012...............................................................................................................................................76
Figure (71): Average daily water supply values for Nekla canal during winter seasons 2011-12 and 2012-13..........................................................................................................................................................76
Figure (72): Average daily water supply values for Besentway canal during winter seasons 2008-09, 2009-10 and 2011-12 ..............................................................................................................................77
Figure (73): Average daily water supply values for El-Karion canal during winter seasons 2008-09, 2009-10 and 2012-13 ..............................................................................................................................77
Figure (74): The average seasonally values for the monitored branch canals in Mit-Yazid command area during different summer seasons .....................................................................................79
Figure (75): The average seasonally values for the monitored branch canals in Mit-Yazid command area during different winter seasons........................................................................................79
Figure (76): Average daily water supply in Bahr Nemra branch canal during summer 2011, 2012 and 2013........................................................................................................................................................80
Figure (77): Average daily water supply in Dakalt branch canal during summer 2008, 2010 and 2013...............................................................................................................................................................80
Figure (78): Average daily water supply in El-Masharka branch canal during summer 2008, 2010 and 2013........................................................................................................................................................81
Figure (79): Average daily water supply in Khadega branch canal during winters 2008-09, 2009-10 and 2012-13 .............................................................................................................................................81
Figure (80): Average daily water supply in Dakalt branch canal during winters 2008-09, 2009-10 and 2012-13 ..................................................................................................................................................82
Figure (81): Average daily water supply in El-Masharka branch canal during winters 2008-09, 2009-10 and 2012-13 ....................................................................................................................................82

8
Figure (82): The tail end of Nekla canal during June month and water is overtopping escape weir.......................................................................................................................................................................83
Figure (83): Water levels at the tail end of Nekla canal......................................................................83
Figure (84): Average seasonally escape flow time and volume at the end of Dakalt canal during different summer seasons............................................................................................................................84
Figure (85): Average seasonally escape flow time and volume at the end of Dakalt canal during different winter seasons ..............................................................................................................................85
Figure (86): Average seasonally escape flow time at the tail end of Besentway canal during different summer seasons............................................................................................................................85
Figure (87): Average seasonally escape flow time at the tail end of Besentway canal during different winter seasons ..............................................................................................................................86
Figure (88): Average seasonally escape flow time at the tail end of El-Berka canal during different summer seasons ...........................................................................................................................................87
Figure (89): Average seasonally escape flow time at the tail end of El-Berka canal during different summer seasons ...........................................................................................................................................87
Figure (90): Average measured discharges downstream Sefsafa head regulator and at the tail end of Safan canal (from Nashart drain) during summer seasons .................................................................88
Figure (91): Average measured discharges downstream Sefsafa head regulator and at the tail end of Safan canal (from Nashart drain) during winter seasons....................................................................89
Figure (92): Average measured discharges downstream El-Masharka head regulator and at its tail end (from Nashart drain) during summer seasons ............................................................................89
Figure (93): Average measured discharges downstream El-Masharka head regulator and at its tail end (from Nashart drain) during winter seasons ...............................................................................90
Figure (94): Average measured discharges downstream El-Gemeiza head regulator and at its tail end (from El-Gharbiya main drain) during summer seasons..................................................................90
Figure (95): Average measured discharges downstream El-Gemeiza head regulator and at its tail end (from El-Gharbiya main drain) during winter seasons ....................................................................91
Figure (96): Average seasonal runoff values for El-Ghezlan and Abes secondary drains during summer seasons ...........................................................................................................................................92
Figure (97): Average seasonal runoff values for El-Ghezlan and Abes secondary drains during winter seasons ..............................................................................................................................................93
Figure (98): Average seasonal runoff values for El-Raghama and El-Bashier secondary drains during summer seasons...............................................................................................................................94
Figure (99): Average seasonal runoff values for El-Raghama and El-Bashier secondary drains during winter seasons..................................................................................................................................94
Figure (100): seasonally run off ratio of El-Raghama and Abes drains from summer 2011 to summer 2013 ................................................................................................................................................95
9
Figure (101): WUI values for branch canals in El-Mahmoudia command area during different summer seasons ...........................................................................................................................................97
Figure (102): WUI values for branch canals in El-Mahmoudia command area during different winter seasons ..............................................................................................................................................97
Figure (103): WUI values for branch canals in Mit Yazid command area during different summer seasons ..........................................................................................................................................................99
Figure (104): WUI values for branch canals in Mit Yazid command area during different summer seasons ..........................................................................................................................................................99
Figure (105): number of selected fields for summer crops in Nekla canal......................................100
Figure (106): number of selected fields for summer crops in El-Beda canal..................................101
Figure (107): number of selected fields for summer crops in Bahr Nemra canal ..........................102
Figure (108): number of selected fields for summer crops in El-Gemeiza canal............................102
Figure (109): number of selected fields for winter crops in Nekla canal.........................................103
Figure (110): number of selected fields for winter crops in El-Beda canal.....................................103
Figure (111): number of selected fields for winter crops in Bahr Nemra canal .............................104
Figure (112): number of selected fields for winter crops in El-Gemeiza canal...............................105
Figure (113): Average seasonal values for number of irrigations and total irrigation time for rice crop in Nekla canal during different summer seasons ...........................................................................106
Figure (114): Average seasonal values for number of irrigations and total irrigation time for rice crop in El-Beda canal during different summer seasons .......................................................................106
Figure (115): Average seasonal values for number of irrigations and total irrigation time for rice crop in Bahr Nemra canal during different summer seasons................................................................107
Figure (116): Average seasonal values for number of irrigations and total irrigation time for rice crop in El-Gemeiza canal during different summer seasons .................................................................108
Figure (117): Average seasonal values for number of irrigations and total irrigation time for cotton crop in Nekla canal during different summer seasons................................................................109
Figure (118): Average seasonal values for number of irrigations and total irrigation time for cotton crop in Bahr Nemra canal during different summer seasons ....................................................109
Figure (119): Average seasonal values for number of irrigations and total irrigation time for cotton crop in El-Gemeiza canal during different summer seasons......................................................110
Figure (120): Average seasonal values for number of irrigations and total irrigation time for Berseem crop in Nekla canal during different winter seasons...............................................................111
Figure (121): Average seasonal values for number of irrigations and total irrigation time for Berseem crop in El-Beda canal during different winter seasons...........................................................111

10
Figure (122): Average seasonal values for number of irrigations and total irrigation time for Berseem crop in Bahr Nemra canal during different winter seasons ...................................................112
Figure (123): Average seasonal values for number of irrigations and total irrigation time for Berseem crop in El-Gemeiza canal during different winter seasons.....................................................112
Figure (124): Average seasonal values for number of irrigations and total irrigation time for wheat crop in Nekla canal during different winter seasons ...................................................................113
Figure (125): Average seasonal values for number of irrigations and total irrigation time for wheat crop in El-Beda canal during different winter seasons ...............................................................114
Figure (126): Average seasonal values for number of irrigations and total irrigation time for wheat crop in Bahr Nemra canal during different winter seasons........................................................114
Figure (127): Average seasonal values for number of irrigations and total irrigation time for wheat crop in El-Gemeiza canal during different winter seasons .........................................................115
Figure (128): Average salinity values at different regions of Nekla canal ......................................116
Figure (129): Average salinity values at different regions of El-Beda canal...................................116
Figure (130): Average salinity values at different regions of Bahr Nemra canal ...........................117
Figure (131): Average salinity values at different regions of El-Gemeiza canal ............................117
Fig (132): Rice production in Nekla canal during different seasons................................................118
Fig (133): Rice production in El-Beda canal during different seasons............................................119
Fig (134): Rice production in Bahr Nemra canal during different seasons ....................................119
Fig (135): Rice production in El-Gemeiza canal during different seasons......................................120
Fig (136): Cotton production in Nekla canal during different seasons ...........................................121
Fig (137): Cotton production in Bahr Nemra canal during different seasons ................................121
Fig (138): Cotton production in El-Gemeiza canal during different seasons .................................122
Fig (139): Cotton production in El-Beda canal during different seasons........................................122
Fig (140): Wheat production in Nekla canal during different seasons............................................123
Fig (141): Wheat production in El-Beda canal during different seasons ........................................124
Fig (142): Wheat production in Bahr Nemra canal during different seasons ................................124
Fig (143): Wheat production in El-Gemeiza canal during different seasons..................................125
Fig (144): Sugar beet production in El-Gemeiza canal during different seasons...........................125
Figure (145): WUI values in Nekla canal during summer seasons ..................................................126
Figure (146): WUI values in El-Beda canal during summer seasons ..............................................127

11
Figure (147): WUI values in Bahr Nemra canal during summer seasons.......................................127
Figure (148): WUI values in El-Gemeiza canal during summer seasons ........................................128
Figure (149): WUI values in Nekla canal during winter seasons.....................................................129
Figure (150): WUI values in El-Beda canal during winter seasons .................................................129
Figure (151): WUI values in Bahr Nemra canal during winter seasons .........................................130
Figure (152): WUI values in El-Gemeiza canal during winter seasons...........................................130
Figure (153): Cost elements (electricity & labour) in Nekla canal during summer seasons..........131
Figure (154): Cost elements (energy & labour) in Nekla canal during summer 2011 ...................132
Figure (155): Cost elements (energy & labour) in El-Beda canal during summer seasons ...........132
Figure (156): Cost elements (energy & labour) in Bahr Nemra canal during summer seasons ...133
Figure (157): Cost elements (energy & labour) in El-Gemeiza regular pumps during summer seasons ........................................................................................................................................................133
Figure (158): Cost elements (energy & labour) in El-Gemeiza waterwheel during summer seasons.....................................................................................................................................................................134
Figure (159): Cost elements (electricity & labour) in Nekla canal during winter seasons ............135
Figure (160): Cost elements (energy & labour) in Nekla canal during winter 2011-12 .................135
Figure (161): Cost elements (energy & labour) in El-Beda canal during winter seasons..............136
Figure (162): Cost elements (energy & labour) in Bahr Nemra canal during winter seasons ......136
Figure (163): Cost elements (energy & labour) in El-Gemeiza regular pumps during winter seasons ........................................................................................................................................................137
Figure (164): Cost elements (energy & labour) in El-Gemeiza waterwheels during winter seasons.....................................................................................................................................................................137
Figure (165): The cost of lifting cubic meter of water in Nekla canal during summer seasons ....138
Figure (166): The cost of lifting cubic meter of water in El-Beda canal during summer seasons.139
Figure (167): The cost of lifting cubic meter of water in Bahr Nemra canal during summer seasons ........................................................................................................................................................139
Figure (168): The cost of lifting cubic meter of water in El-Gemeiza canal during summer seasons.....................................................................................................................................................................140
Figure (169): The cost of lifting cubic meter of water in Nekla canal during winter seasons .......141
Figure (170): The cost of lifting cubic meter of water in El-Beda canal during winter seasons ...141

12
Figure (171): The cost of lifting cubic meter of water in Bahr Nemra canal during winter seasons.....................................................................................................................................................................142
Figure (172): The cost of lifting cubic meter of water in El-Gemeiza canal during winter seasons.....................................................................................................................................................................142
Figure (173): Irrigation cost for rice crop in Nekla canal during different summer seasons........143
Figure (174): Irrigation cost for rice crop in El-Beda canal during different summer seasons....144
Figure (175): Irrigation cost for rice crop in Bahr Nemra canal during different summer seasons.....................................................................................................................................................................144
Figure (176): Irrigation cost for rice crop in El-Gemeiza canal during different summer seasons.....................................................................................................................................................................145
Figure (177): Irrigation cost for cotton crop in Nekla canal during different summer seasons ...146
Figure (178): Irrigation cost for cotton crop in Bahr Nemra canal during different winter seasons.....................................................................................................................................................................146
Figure (179): Irrigation cost for cotton crop in El-Gemeiza canal during different winter seasons.....................................................................................................................................................................147
Figure (180): Irrigation cost for Berseem crop in Nekla canal during different winter seasons ..148
Figure (181): Irrigation cost for Berseem crop in El-Beda canal during different winter seasons.....................................................................................................................................................................148
Figure (182): Irrigation cost for Berseem crop in Bahr Nemra canal during different winter seasons ........................................................................................................................................................149
Figure (183): Irrigation cost for Berseem crop in El-Gemeiza canal during different winter seasons ........................................................................................................................................................149
Figure (184): Irrigation cost for wheat crop in Nekla canal during different winter seasons.......150
Figure (185): Irrigation cost for wheat crop in El-Beda canal during different winter seasons ...151
Figure (186): Irrigation cost for wheat crop in Behr Nemra canal during different winter seasons.....................................................................................................................................................................151
Figure (187): Irrigation cost for wheat crop in El-Gemeiza canal during different winter seasons.....................................................................................................................................................................152
Figure (188): Average number of irrigations and average irrigation time for wheat crop in Nekla canal during different summer seasons ...................................................................................................153
Figure (189): Average number of irrigations and average irrigation time for wheat crop in El-Beda canal during different summer seasons..........................................................................................153
Figure (190): Average number of irrigations and average irrigation time for wheat crop in Bahr Nemra canal during different summer seasons.......................................................................................154

13
Figure (191): Average number of irrigations and average irrigation time for wheat crop in El-Gemeiza canal during different summer seasons ...................................................................................154
Figure (192): Average number of irrigations and average irrigation time for wheat crop in Nekla canal during different summer seasons ...................................................................................................155
Figure (193): Average number of irrigations and average irrigation time for wheat crop in El-Beda canal during different summer seasons..........................................................................................156
Figure (193): Average number of irrigations and average irrigation time for wheat crop in Bahr Nemra canal during different summer seasons.......................................................................................156
Figure (195): Average number of irrigations and average irrigation time for wheat crop in El-Gemeiza canal during different summer seasons ...................................................................................157
Figure (196): The change in reliability ratios for Dakalt and Besentway canals from summer 2005 to summer 2013..........................................................................................................................................159
Figure (197): Water levels at the tail end of Besentway canal during summer 2005 .....................159
Figure (198): Water levels at the tail end of Besentway canal during summer 2013 .....................160
Figure (199): Water levels at the tail end of Dakalt canal during summer 2013............................160
Figure (200): Productivity ratios for rice crop in Nekla canal during different summer seasons 161
Figure (201): Productivity ratios for rice crop in El-Beda canal during different summer seasons.....................................................................................................................................................................162
Figure (202): Productivity ratios for rice crop in Bahr Nemra canal during different summer seasons ........................................................................................................................................................162
Figure (203): Productive ratios for rice crop in El-Gemeiza canal during different summer seasons ........................................................................................................................................................163
Figure (204): Productivity ratios for cotton crop in Bahr Nemra canal during different summer seasons ........................................................................................................................................................164
Figure (205): Productivity ratios for cotton crop in El-Gemeiza canal during different summer seasons ........................................................................................................................................................164
Figure (206): Productivity ratios for maize crop in El-Beda canal during different summer seasons ........................................................................................................................................................165
Figure (207): Productivity ratios for wheat crop in Nekla canal during different winter seasons166
Figure (208): Productivity ratios for wheat crop in El-Beda canal during different winter seasons.....................................................................................................................................................................166
Figure (209): Productivity ratios for wheat crop in Behr Nemra canal during different winter seasons ........................................................................................................................................................167
Figure (210): Productivity ratios for wheat crop in El-Gemeiza canal during different winter seasons ........................................................................................................................................................167

14
Figure (211): Productivity ratios for sugar beet crop in El-Gemeiza canal during different winter seasons ........................................................................................................................................................168

15
1. Introduction "The unfortunate truth is that most efforts to develop formal water users associations bear little lasting fruit. In short run, meetings are held, leaders chosen and rules drafted. In long run, such organizations often only exist on paper, with little new activity beyond what farmers had already been doing"
Bryan Bruns "Just enough organization: Water users associations and episodic mobilization"
Instead of covering the current season, this report covered the period from summer 2008 to winter 2013-14 in the two studies; canals and drains study & pumps operations study. It was planned to summarize all the collected data during this period to give a chance for the administration to accomplish the general progress during the project period in a quick glance.
The long term monitoring, either in this programme or in the previous programmes, can tell many successful and unsuccessful stories. The real success of irrigation improvement, as a genera trend, depends on isolating these points, focusing on the successful stories and giving up the unsuccessful points.
For instance, it is clear that the acceptance of the project, from the farmers, is increasing. After many rejections, which led to applying the project in many areas by force, the farmers now is accepting the project and insisting on completing the improvement by improving Marwas. Some other points, such as the operating of the system at different levels are telling some unsuccessful stories, and the main reason was the disability to understand or consider the characteristics of the Egyptian irrigation system and the Egyptian society.
On Mesqa level, WUA and their boards did not show up a lot progress, based on the design scheme. However, the system is running and farmers are irrigating. The Egyptian farmers, who gathered for long time around their Saqia, in natural and unofficial organizations, should be capable to coordinate. The problem was in assigning many unimportant tasks that do not fit with the characteristics of the society. This was not a special case in Egypt and some stated, "Farmers rarely need the full complexity of bureaucratic institutions in order to accomplish the tasks of irrigation management" and they argued to develop less complex organizations1. Considering the actual requirements and actual capacities of the farmers should lead to better development of such organizations.
On branch canals levels, the problem was bigger. The associations on this level are almost unseen. No actual activities could be recorded, and likely transferring the management to these will not be possible in current situation. On the other hand, applying
1 Bryan Bruns "Just enough organization: Water users associations and episodic mobilization"

16
the continuous flow seems to be a chronic problem. After decades of trails, and after using downstream control gates, automated gates and currently the old sluice gates, there were no successful stories about the application of this system. The main problem was the ignorance of the actual situation and displaying the issue as a change from a design "rotation" to another design "continuous flow", but the problem was far from this. The decay of the irrigation network and the strategy of operating the system at its different levels (between irrigation directorates or between branch canals) enforced the irrigation directorates to manipulate between different canals to fulfill their obligations and to face different farmers' complaints, and therefore, the system is not a design system. Chapter four discusses this point in brief. Under such conditions, transferring the management or applying any design / automated system will not be feasible.
These were just examples about successful and unsuccessful stories. Reviewing different monitoring results could illustrate many other stories. Defining these stories, simplifying the improvement project to focus only on the successful ones, with full understand and considering of our situations is the short way for the real success in improving the irrigation in Egypt.

17
2. Methodology This chapter describes the methodologies that were used in canals and pumps studies.
Some of presented points here were not shown up in this report, but they were found in seasonal reports.
2.1 Data collection
2.1.1 Canals study
2.1.1.1 Water levels & Gate openings In principle, water levels should be measured using automatic recorders at different
points on the branch canals each half an hour. As the recorders were used since 2002 or 2005 for maximum, some of them began to malfunction. This led to the dependence on manually collected water levels. Some gate openings were also recorded automatically, but the dependence on manually collected data was higher as their fluctuation was less. The accuracy of the manual data is low and this will be discussed later.
2.1.1.2 Cropping pattern Cropping pattern values should be provided by III-MP office to WMRI. During
summer 2008 and winter 2008-09, the satellite images results were available through the study that was conducted by WaterWatch. For other seasons, data was collected manually by agricultural departments. For some canals during some canals, the values were not available and they were anticipated.
2.1.1.3 Crop water consumption For crop water consumption, two different sources were used in previous seasonal
reports. The first source was the outputs of matching reports that were developed by WMRI, and the other source was the reports of WaterWatch that was developed for summer 2008 and winter 2008-09. In the last few reports, a new version of matching report that was developed in 2010 was used (figure 1).

18
774
885
473 459
839
969
517 498
845
975
523 497
0
200
400
600
800
1000
1200
Rice Cotton Corn Other crops
Cro
p co
nsum
ptio
n (m
m)
Kafr El-Sheikh Gharbia Beheria
Figure (1): water consumption values for major summer crops in different regions based on matching report (201)
The previous version divided the country to few regions, calculated the consumption for some crops and the consumption was defined for each two weeks. In the current version, the data was defined for each governorate in the country, more crops were defined, but only the total amount for each crop was provided.
2.1.1.4 Flow measurements Flow measurements were conducted in some canals to calibrate the head regulators
and to establish a level-discharge relationship in the case of the drains and free open regulators. For the canals that had stable relationships since the monitoring of IIP1, the previous established relationships were used and other measurements were used.
Flow measurements were also used as stand-alone data to describe average water supply to different canals and average effluent in drains when the relationships are not valid. This was especially used to define the ratio of feeding back from the drains and the runoff values of the selected drains.
2.1.2 Pump study The original collected data for pump study includes selecting fields with the associated
information about served area and cropping pattern. It also includes pumps calibration results, and the operation results that normally collected from the farmers. Since the second part of the monitoring (July 2011), some additional data were added, such as the moisture content at different selected locations, soil salinity before and after the season, conveyance efficiency in the Marwas, and the yield.

19
2.2 Data analysis
2.2.1 Canals indicators (WUI, RWS) The most important indicators in canals study were WUI and RWS. Water Use Index
(WUI) is the ratio between the water supply and the water requirements. Water requirements include water consumption besides 10% leaching. Average seasonal values were calculated for different canals. In addition, half-monthly WUI values were calculated to illustrate the change of the WUI through the year. Summer season is considered from the beginning of May until the end of September. Only the inflow to the canal is used as the water supply. The rainfall during winter season and any drainage re-use was not included.
Relative Water Supply (RWS) value is the ratio between water supply at the head regulator of the canal and the served area in this canal. Water supply at the head regulator of the canal is calculated based on the calibration of the head regulator with recorded water levels (and gate openings) at that head regulator.
2.2.1 Pump study indicators
2.2.1.1 Water Use Index at the point of lifting The goal of this indicator is to measure the equity of water distribution between
Mesqas. WUI value is calculated as a ratio between actual applied water and water consumption (with leaching) for the selected fields. The procedure is as the following:
Applied water is calculated based on total operation hours for the selected field multiplied by average pump discharge of the pump serving that field. For the improved Mesqas, the average value of the two pumps is considered. It was considered that one valve was opened by a pump. Because some water application values in some irrigation seemed to be illogic, an upper limit for the irrigation event was considered. Normally, the illogic values refer to a problem in recording the irrigation time or probably because the actual pump discharge during this event was different from the calibrated value.
Water consumption values were defined using the Matching/ WaterWatch outputs. CropWAT program was used during some seasons when the weather information was available.
WUI are calculated using the two previous items. WUI for each Mesqa is the average value from selected fields. In addition, average WUI values are calculated for different locations on the canal (Head, Middle, and Tail end). These average values are used to assess the equity through the investigated branch canals.
2.2.1.2 Calculating the irrigation cost There were two types of the pumps; farmers' regular pumps and the improved pumps.
The difference in the irrigation cost was one of the main indicators for the improvement project.

20
Irrigation costs have different elements, such as:
Seasonal fixed cost, which expresses the decay rate, is defined for pumps only in regular pumps. For the improved Mesqas, the price of the whole Mesqa is considered. It was assumed that the regular pumps would be decay in 10 years. For the improved Mesqas, the decay period is 20 years.
The labor cost is the same in both types, which is the irrigation time multiplied by the average hourly wages for the worker. The salary of the operator in the improved Mesqas will be added to the operation cost.
The energy is the main difference between both types. For diesel pumps, total consumed fuel is calculated as the product of average consumption rate, which is defined during the calibration multiplied by the total operation hours of that pump during the season. Lubricant is assumed as 10% of the fuel cost. For the improved Mesqas, average electricity consumption per feddan was defined based on a survey and it used in the current report.
The maintenance and the repair were collected directly from the farmers or the operators in the improved Mesqas.
The current study focused on the operation costs, which includes energy, lubricant (electricity) and labour costs.
The ratio between the previous defined operational cost and total applied water during the season expresses the cost of lifting a unit of water. Average values are defined for different Mesqas and different locations. On the other hand, the ratio of the previous defined cost and the area served by the pump express the cost of irrigating a unit area. Average values for different Mesqas and locations are defined for specific crops. The common crops used in this study are rice and cotton / or corn during summer season and wheat and Berseem during winter season.
2.2.1.3 Irrigation time Two indicators are related to the irrigation time, which are average irrigation time and
total irrigation time. Total irrigation time is the summation of the irrigation times during the season. Average irrigation time is the ratio between total irrigation time and the number of irrigations. The averages of both indicators are calculated for specific crops during the summer and the winter seasons. Average values are calculated for different Mesqas and locations of the investigated branch canal.
2.2.1.4 Irrigation distribution through the day The distribution of the irrigation through the day is one of the main characteristics that
should distinguish the improved system from the unimproved system. The procedure to describe the irrigation distribution through the day in the current study is as follows:
The day is divided into specific intervals. The interval of 15 minutes is used in this study.

21
Each interval should have an integer number (zero or one). Zero means that no irrigation was performed during this interval. Number one has the opposite meaning. The procedure is performed for all irrigations in all Mesqas.
The values of each interval from different irrigations in each Mesqa are summed. The ratio between the summation value of each interval and the summation value of all intervals express the ratio of irrigation during this interval.
Hourly average values are calculated for different locations of both investigated canals.
2.3 Statistic analysis Different statistic analysis was used in the current programme to establish
relationships or to illustrate the dispassion of the data. This includes linear regression analysis, Box plots and descriptive analysis.
2.3.1 Linear regression analysis This tool was used in canals study to develop relationships that were used to calculate
water supply at different canals/ regions. Linear regression analysis was used to establish two different relationships. The first relationship is between the discharge as a dependent variable and three independent variables, which are gate opening, upstream water level, and the difference between the upstream and the downstream water levels. This relationship is used for controlled gates at the head regulators of different canals. The second relationship is between the discharge as dependent variable and the water level as independent variable. The second relationship is used for free open regulators and drains. Stepwise procedure is used in the linear regression analysis.
2.3.2 Box plots Box Plots were used in pumps study to define the desperation of the data. Box plots or
(box-and-whiskers display) is a graphical five-number summary that is used to describe the distribution of the data. It is constructed using:
The first quartile (Q1): Q1 is the value below which 75% of the measurements lie or above which 25% of the measurements lie.
The Median Md. Md is the value below which and above which 50% of the measurements lie.
The third quartile (Q3): Q3 is the value below which 25% of the measurements lie or above which 75% of the measurements lie.
Inner and outer fences: Inner fences are calculated using the equations:
)(*5.1&)(*5.1 31 IQRQIQRQ +−
The outer fences are calculated using the equations:
)(*0.3&)(*0.3 31 IQRQIQRQ +−

22
Where:
13 QQIQR −=
The values between inner and outer fences are called the mild outliers and (*) signs are used to refer to them. Values outside the outer fences are called the extreme outliers and (o) signs are used to refer to them.
2.3.3 Descriptive analysis The following statistical tools were also used in pumps study to define the desperation
of the data.
Std. Deviation Std. Deviation is the positive square root of population variance.
Variance Variance is the average of the squared deviations of the individual population
measurements from the population mean.
Percentile The definition of Pth percentile of a set of measurements is the value cuch that P
percent of the measurements fall at or below it.
2.4 Accuracy issue
2.4.1 The dependence on manually collected data Regarding the collected data, automatic recorders normally provide very accurate data
and the problem was in the malfunction of some of them with the time, which leaded to the dependence on the manually collected data. Besides automatic recorders, the dependence on the ultrasonic flow meters to measure the discharges has started since June 2007. Ultrasonic flow meters provide excellent data, but unfortunately, most of the devices suffered from accidents and problems in last few seasons of the programme.
WMRI used to collect the manual data from gatekeepers directly. However, the accuracy in some sites was seriously affected. Summer 2013 report (canals report) presented good example about this in Besentway canal.
The situation became worse when the programme stopped (between January and June 2011). For some sites that were not recorded automatically, water levels were collected from the irrigation directorate, but the accuracy seems to be very low. In addition, gate openings were not recorded in the irrigation directorate. For the sites that depend on calibrating the head regulators, alternative equations that connect discharges with upstream water level and the head difference around the gate were developed. These equations were used to calculate water supply during May, June and part of July. This includes some sites, such as Dakalt, Nekla and El-Mofty cross regulator. In El-Karion canal, some adjustment was used to define water levels downstream the distributor based

23
the data of recorded downstream the head regulator considering that the automatic structures are out of service and the difference is only a kind of head loss.
2.4.2 Accuracy of calculating water consumption data The accuracy associated with calculating total water consumption in the investigated
canals depends on two factors, the cropping pattern and crop water consumption.
The accuracy of the cropping pattern collected from irrigation and agricultural districts was discussed many times in the previous reports. Regarding crop consumption values, the main source of inaccuracy was the dependence on some fixed values, while planting dates and in consequence, the crop durations were different from a field to the other.
2.4.3 The accuracy of calculating water supply The accuracy of calculating water supply values depends on the developed equations
for different canals / regions and the collected data (water levels and gate openings). The accuracy of some developed equations and the difference in the accuracy between calibrating the regulators (ABAK) or using flow-stage hydrograph was discussed with examples in some previous reports.

24
3. Studying areas
3.1 General describing of the investigated canals A description about the main and the selected branch canals in the two command areas
(Mit Yazid and El-Mahmoudia) are presented in this section.
3.1.1 Mit Yazid command area
3.1.1.1 Mit Yazid canal Mit Yazid canal (figure 2) is 63.0 km long and it serves around 197,000 feddan, with a
variation between different sources. Mit Yazid canal has four cross regulators: Beltag regulator (km 21.600), El-Wasat Regulator (km 34.60), El-Mofty regulator (km 50.15) and El-Masharka regulator (km 59.50). Water resources include a drainage water source from Mehalet Roah drain behind the intake.
Water supply at the head of Mit Yazid is controlled by its physical characteristics and especially low banks downstream Beltag regulator.
The construction of the new lifting points covered most of the areas. The main problem might be the electricity.
The investigated branch canals in Mit Yazid command area (figure 3) includes seven canals (Khadega, Bahr Nemra, Dakalt, Shalma, El-Masharka, Mars El-Gamal and El-Gemeiza). In addition, the investigation includes a control canal (Bahr Semella) that off-takes from El-Kased canal.

25
Figure (2): Mit Yazid command area
RegulatorEl-Mofty
RegulatorEl-Wasat
Dra
inEl
-Rag
ham
a
Shal
ama
cana
l
Dakalt
cana
l
ARAB REPUBLIC OF EGYPTNational Water Research Center
Water Management Research InstituteWMRI
Monitoring & Evaluation of IIIMP
Mit Yazid command area Layout
Mar
s El G
amal
can
alEl-Z
awia
canal
Mit YazidCanal
El Gemeiza
Khadega canal
BeltagRegulator
Canal
El-Masharka canal
Figure (3): The selected branch canals in Mit Yazid command area
3.1.1.2 Khadega canal literature Khadega canal represents the head region of Mit Yazid command area. It off-takes
from Mit Yazid (km 13.01) and it serves 1610 feddan. The canal is feeding back from a Mesqas that is connected to Neshiel El-Gededa and therefore, water supply from the head

26
is considerably low considering average water consumption at the head region. The canal is also affected by the low banks at the first region, the urbanization and covering the area inside the village. It is also affected by the accumulation of the trash upstream the covered part (figure 4). Figure (5) presents the longitudinal section of Khadega canal.
Figure (4): Khadega canal in its first reach
1.0
2.0
3.0
4.0
5.0
6.0
0 1 2 3
Distance (Km)
Bed
leve
l (m
)
Figure (5): Longitudinal cross section of Khadega canal
3.1.1.3 Bahr Nemra canal Bahr Nemra canal should be an improved canal. The improvement works have almost
finished but the improved pumps were not operated yet. Therefore, it is considered as

27
unimproved canal during the study. The canal off-takes from Mit Yazid canal at km 19.6. The canal is 11.9 km long and it serves 8447 feddans, and it is served by Neshil and Samatai El-Asfal drains. The canal was investigated in canals and pumps studies. Figure (5) presents the canals and its selected Mesqas/fields that are used in pump study, and the lifting points from Neshiel drain.
Figure (6): Bahr Nemra canal with its selected fields
3.1.1.4 Dakalt canal Dakalt branch canal is an improved canal representing the middle of Mit Yazid
command area. Dakalt canal is about 11.4 km long. It serves about 5230 feddans, and it is served by two drains; No 7 drain on the right hand side and El-Raghama drain in the left hand side. El-Raghama drain was studied as an example for the secondary drains that serves improved areas.
The head regulator was usually controlled and the canal was open continuously, but in a trend close to the rotation, and with a big difference around the head regulator. There were many drought events at the tail end regardless the continuous opening of the head regulator.
Figures (7 and 8) present the cross sections at the head and at the tail end of the canal. The figures show the change in the cross section at the head and the reduction of the cross section at the tail end.
The canal was open continuously, even with varies levels. In last years, the canal returned to explicit rotation system.

28
0
1
2
3
4
5
6
0 5 10 15 20 25
Distance (m)
Leve
ls (m
)
km 0.58 km 1.513 Design Min design WL Max design WL
Figure (7): Actual cross sections at two locations at the beginning of Dakalt canal with design bed and water levels
-1
0
1
2
3
4
5
-5 0 5 10 15 20
Distance (m)
Leve
ls (m
)
Actual Design Min design WL Max design WL
Figure (8): Actual and design cross sections at km 10.78 of Dakalt canal with design water levels
3.1.1.5 Shalma canal Shalma canal is closer to the end of Mit Yazid command area (km 50.15) but it
represents the middle region upstream El-Mofty regulator (figure 9). It is 20.3 km long and it serves around 18350 feddan. The head regulator of Shalma canal was free open for

29
the most of the monitoring period and water is controlled at the head of its two branches (El-Khawalid and El-Monshia). Discharges-water levels relationship was used to calculate the water supply in the canal. The head regulator should be automated during W10 project, but the data from the ultrasonic devices in these sites were not available yet, and the developed equation was still used to calculate water supply.
Figure (9): Shalma canal with a sliding on the banks
3.1.1.6 El-Masharka canal El-Masharka is representing the tail end of Mit Yazid canal (km 56.70). El-Masharka
has one branch, which is Sidi Salem canal. The whole served area of El-Masharka canal is 1750 feddan. Water supply to the canal was very low and the canal and its sub-branch depend mainly on the drainage water from Nashart drain. Figure (10) presents the longitudinal section of the canal, and the steep slope is obvious. Figure (11) presents the tail end of the canal that was full by contaminated drainage water.

30
-2.0
-1.5
-1.0
-0.5
0.0
0.5
1.0
1.5
2.0
0 0.5 1 1.5 2 2.5 3 3.5 4 4.5
Distance(Km)
Bed
Lev
el(m
)
Figure (10): Longitudinal cross section of El-Masharka canal
Figure (11): Tail end of El-Masharka canal full of the drainage water
3.1.1.7 Mars El-Gamal canal The improvement of Mars El-Gamal canal was in progress in last years. By the end of
the programme, the improvement was almost finished and in many Mesqas, Marwas improvement was taken place as well. The canal representing the middle of Mit Yazid command area and off-takes from El-Zawia canal (km 3.70). It is 11.50 km long and it serves around 9400 Feddan. The canal is served by two main secondary drains; No 7 drain and Farsh El-Ganaien drain besides other small secondary drains.

31
Figure (12): The head of Mars El-Gamal canal
3.1.1.8 El-Gemeiza canal El-Gemeiza canal represents the tail end of Mit Yazid command area. It off-takes from
El-Zawia canal (km 21.235) and it serves around 1500 feddans. El-Gemeiza canal is feeding back from the El-Gharbiya main drain directly and through a pump (figure 13) and this drainage-water from El-Gharbiya main drains is a main source for the tail end of El-Gemeiza canal. Figure (14) presents the longitudinal section of the canal and the fluctuation of the bed levels is obvious.
El-Gemeiza canal was investigated in pump study as well. Most of the Mesqas are short and for last part of the canals, farmers are lifting water directly from the canal. Some Mesqas are using waterwheels, which have a considerable higher discharge and lower fuel consumption rate, and therefore, they studied separately in pump study. Figure (15) presents the canals with its selected fields and with the lifting points from El-Gharbiya main drain.

32
Figure (13): The feedback reach at the tail end of El-Gemeiza canal
-2.0
-1.0
0.0
1.0
2.0
3.0
0 1 2 3
Distance (Km)
Bed
leve
l (m
)
Figure (14): Longitudinal cross section of El-Gemeiza canal
33
Figure (15): El-Gemeiza canal with its selected fields
3.1.1.9 Bahr Semella canal Bahr Semella is the control canal in Mit Yazid command area. It off-takes from El-
Kased canal (km 16.0 at Tanta Navigation canal) and it is 7.06 km long and it serves around 4295 feddan. The canal is connected from its tail end to Waslet Damat branch canal (Figure 16).
Figure (16): The tail end of Bahr Semella canal

34
3.1.2 El-Mahmoudia command area
3.1.2.1 El-Mahmoudia canal El-Mahmoudia canal (figure 17) off-takes from Rosetta branch (km 194.2). The total
length of El-Mahmoudia canal is 77.17 km. El-Mahmoudia canal has three water sources; two fresh water sources and one drainage water source. The two fresh water sources are El-Atf pumps station at the head of the canal, and El-Khandk El-Sharki (km 16.0 on El-Mahmoudia canal). The drainage water source is the mixing point from Edco drain. The mixing station is at km 8.5 on El-Mahmoudia canal and its discharge changes from 0.20 to 1.0 million m3/day. The accuracy of El-Mahmoudia is affected of the by the anticipating the share of El-Khandk El-Sharki to the canals. Since the beginning of summer 2009, an ultrasonic flow meter was installed at the feeding point at the end of El-Khandk, but there was a problem in the device during the time of the current report.
Recently, the canal was dredged and this to be able conveying higher discharges.
Figure (17): El-Mahmoudia command area
The general characteristics of El-Mahmoudia include high municipal consumption at the tail end of the main canal, which affect the operation of the whole canal. Rice ratios in El-Mahmoudia command area were considerably lower than the rice ratios in Mit Yazid command area affecting WUI values in the command area. Six branch canals were investigated in the monitoring programme (figure 18). Four of these six canals were studied before in the previous monitoring programme. In addition to these six canals, Bany Helal canal that off-takes from El-Khandk EL-Sharki was studied as a control canal.

35
EL-S
aran
iya c
anal
El-Ghiz
lan dr
ain
Bese
ntwa
y
El-Mahmoudia canal
El-BerkaEl-K
rioun
LayoutEl-Mahmoudia command area
Monitoring & Evaluation of IIIMP
WMRIWater Management Research Institute
National Water Research CenterARAB REPUBLIC OF EGYPT
El Beda C
anal
Nekla Canal
Figure (18): The selected canals and drains of El-Mahmoudia command area
3.1.2.2 Nekla canal Nekla canal off-takes from El-Mahmoudia canal (km 2.02) representing the head
region in El-Mahmoudia command area. The cropped area was considered as 2442 feddans in some previous reports. In last WaterWatch report, the served area was defined as 3996 feddans. The canal has steep longitudinal slop as could be observed from the cross sections (figures 19 & 20). Nekla canal is an improved canal. All Mesqas and Marwas in the canal were improved. The canal is served by Kafr Amlet and El-Babli drains and it is ended in El-Atf drain. Figure (21) presents the selected fields in the canals that were used in pump study.
36
-1.00
-0.50
0.00
0.50
1.00
1.50
2.00
0.0 2.0 4.0 6.0 8.0 10.0
Distance (Km)
Bed
leve
l (m
)
Figure (19): Longitudinal cross section of Nekla canal
-1.0
0.0
1.0
2.0
3.0
4.0
5.0
0 5 10 15 20
Distance
Leve
ls (m
)
km 0.10 km 6.10 Km 8.0
Figure (20): actual cross sections at different locations on Nekla canal

37
Figure (21): Nekla canal with its selected fields
3.1.2.3 Besentway canal Besentway canal is located just after the feeding point from El-Khandk El-Sharki (km
16.32). Figure (22) presents the schematic drawing of the canal. The canal is an improved canal with 8.6 km long and 5339 feddans served area. The canal has many sub-branches, which have a big ratio of the cultivated area of the canal and more than the half of the improved lifting points. Besentway canal is served by two drains; El-Ghezlan drain and El-Farnsawia drain. El-Ghezlan drain was studied as an example for the drains that serve improved areas.
The canal is passing through two urban areas. The first one is located between Km 2.0 and Km 4.10 and the second located around Km 6.0. The bed level at this area is much higher than the design level especially beneath the bridges (figure 23).
The canal was monitored since summer 2005 and during the last few years, the head regulator was free open. Since the last summer, the sluice gate began to be used again in controlling the flow, and lastly, the explicit rotation is applied in the canal. Since July 2007, an ultrasonic device was installed on the canal to calculate water supply, but there was a problem in the device during last seasons.

38
LayoutBisintaway command area
In Mit Yazid and El-Mahmoudia canalsInstallation of five ultrasonic flowmeters
WMRIWater Management Research Institute
National Water Research CenterARAB REPUBLIC OF EGYPT
El-Edkawia
El-A
hkar
Saif
El-D
ein
El Kammahia
El Raml
El-M
ahm
oudi
a C
anal
Ba r
s eik
Dr a
i n
El-Gezlan Drain
El-Faranswia Drain
BesentwayAbu Gamil
Investigated Canal
Monitoring locationTail escapeBridgeCulvert/AquaductAVIO\AVIS gateOld cross regulatorOld head regulatorDrainSub Branches
Main Canal
IC01
IC02
IC03
IC04
IC05
IC06
IC07
IC08
GD01
Auto Gate
Auto Gate
Distributer
El Bahary
El KeblyAbu Gamil
Figure (22): The layout of Besentway canal with the monitoring points on the canal
-1.0
0.0
1.0
2.0
3.0
4.0
5.0
6.0
0.0 2.0 4.0 6.0 8.0 10.0
Distance (km)
Leve
ls (m
)
Actual Design Left Bank Right Bank
Figure (23): The longitudinal section of Besentway canal
3.1.2.4 El-Berka canal El-Berka canal is another improved canal representing the middle of El-Mahmoudia
command area. El-Berka canal off-takes from El-Mahmoudia canal at km 31.79 (figure 24). It is 5.0 km long and it serves 1828 feddan. The head regulator of the canal was

39
monitored since summer 2002 and the whole canal was monitored since summer 2006. The longitudinal section of the canal is steep and so the water is passing quickly to the tail end (figure 25).
LayoutEl-Berka command area
In Mit Yazid and El-Mahmoudia canalsInstallation of five ultrasonic flowmeters
WMRIWater Management Research Institute
National Water Research CenterARAB REPUBLIC OF EGYPT
Investigated Canal
Monitoring locationTail escapeBridgeCulvert/AquaductAVIO\AVIS gateOld cross regulatorOld head regulatorDrain
Main Canal
El-Berka
El-M
ahm
oudi
a Can
alAbu El Dahb
Amin Drain
Barsiq Drain
Distributer
Auto Gate
Auto Gate
ED01
ED01ED01
ED01
KC04
KC0
1
KC0
3
Figure (24): The layout of El-Berka canal with the monitoring points on the canal
-2.00
-1.75
-1.50
-1.25
-1.00
-0.75
-0.50
-0.25
0.00
0.25
0.50
0.75
1.00
0 500 1000 1500 2000 2500 3000 3500 4000 4500 5000
Distance (m)
Leve
ls (m
)
Designed bed level Actual bed level
Figure (25): The longitudinal section of El-Berka canal

40
3.1.2.5 El-Karion canal El-Karion (figure 26) is another improved canal represents the middle of El-
Mahmoudia command area. However, it is close to tail-canals characteristics. It off-takes from El-Mahmoudia (km 38.85) and it serves around 5370 feddans. Although the canal was handed-over as an improved canal, the irrigation rotation was applied in the canal and it was never opened free. The canal was studied since summer 2006.
Figure (26): El-Karion canal with an expansion
3.1.2.6 El-Saraniya canal El-Saraniya canal off-takes from El-Mahmoudia canal at km 44.375 (figure 27). It is
the first canal downstream Kafr El-Dawar regulator. It is 7.10 km long and it has an extension that is 8.67 km long, with three sub-branches. The total served area for El-Saraniya and its extension is 12306 feddans. The canal is covered for 1.2 km from the intake. El-Saraniya canal is served by five secondary drains. The improvement was applied during the current season. In July 2007, ultrasonic device water installed downstream the head of the canal and it was used to calculate water supply to the canal, but the device had some problems.

41
Layout
WMRIWater Management Research Institute
National Water Research CenterARAB REPUBLIC OF EGYPT
Investigated Canal
DrainsSub Branches
Main Canal
8
Gabniet
El Sara
nia
Gabniet El Amom Drain
Baslkon DrainZalet Canal
Yousry Canal
El Sheikh Hasen Drain
El She
ikh H
asen C
anal
El Sarania Canal
Sidi Ghazi
Canal
El Sabin Drain
El Dashodi Drain
Abes Canal
Mahmoudia Canal
Monitoring & Evaluation of IIIMP
El Am
om D
rain
Baslkon Drain
Baslkon Canal
Baslko
n Can
al
Sidi
Gha
zi D
rain
El Saraniya Canal
Figure (27): Schematic drawing of El-Saraniya canal and its secondary drains
3.1.2.7 El-Beda canal El-Beda is the tail canal in El-Mahmoudia command area. The improvement has
started during last seasons. The canal off-takes from El-Mahmoudia command area (km 50.24). The canal serves around 5548 feddans. There were few weirs downstream the head regulator (figure 28). The area is relatively new land compared to other canals. The canal is served mainly by Abes and Gezert El-Gameh drains and is ended in Muhet Marout El-Sharki drain. There was a sever water shortage at the tail end of the canal. Moreover, the tail end Mesqas are not direct connected to the drain, which increase the difficulties for the tail end farmers. The canal is studied in more details in pump operation study. Figure (29) presents the selected fields in the canal that were used in pump study.

42
Figure (28): The first weir on El-Beda canal
Figure (29): El-Beda canal with its selected fields
3.1.2.8 Bany Helal canal Bany Helal (figure 30) is the control canal in El-Mahmoudia command area. It off-
takes from El-Khandk El-Sharki (km 25.75) and it serves around 5790 feddan.

43
Figure (30): The head regulator of Bany Helal canal
By surveying the cross section, the longitudinal section has no regular slope. The bed level increase and decrease consequently. From the survey, the higher bed level was found at km 3.3 and the lower bed level was found at km 3.7 (figure 31).
1.0
1.5
2.0
2.5
3.0
3.5
4.0
0 2 4 6 8
Distance(km)
Bed
Leve
l(m)
Figure (31): The longitudinal section of Bany Helal canal

44
4. Some points that affect the results This chapter highlights some points that affect the results. In general, there was a
difference between main canals' results and branch canals' results. In main canals, a certain trend is repeated in consecutive seasons with small difference. In branch canals, the trend is fluctuating between different seasons. The main reason is the difference in operation strategy between both levels. In addition, there are some values regarding escape flow / feeding back from the drains that were not counted while calculating water supply values.
4.1 Operating the system One general point that could be observed easily in different reports is the existence of
specific trend in the main canals, while there was no such trend in branch canals. To understand such difference, it is important to consider the general strategy of water distribution in Egypt. The difference between operation strategy in main and branch canals is as follows:
In main canals, the flow is available continuously and the flow is distributed on volumetric-basis, therefore, it is easy to see the same trend through the whole irrigation network. Irrigation directorates have the necessity through their obligations towards other directorates or critical points, and they have the tools to control the flow through the main canals by controlling the withdraw sources (branch canals). To achieve their targets, they manipulate between different branch canals, and because the operation of the system depends on the reaction basis, some canals (normally bigger canals) are affected more by this manipulation. Moreover, water levels and water supply in main canals are controlled by the capacity of the system and the presence of some priorities, such as municipal water points.
In branch canals and regardless the applied system (Rotation vs. CF) or (maintaining DSWL vs. distributing water based on the volume), the main features are that the absence of specific obligations (except reacting to farmers complains) and the inability to control the flow inside branch canals. Moreover and as mentioned, irrigation directorates maneuver with branch canals to satisfy their obligations on main canals level. Therefore, it is hard to work with a volumetric basis. Therefore, there is no specific trend for different canals. Moreover, the information that is used in such operation has very low accuracy as they less important to the irrigation directorates, and the main point in this level is to react to farmers' complaints.
Such differences between the results in main and branch canals were obvious in all previous reports. Apart from these general characteristics, one important point that could affect the results is that irrigation directorates tend to change from the continuous flow

45
back to the rotation system. Figure (32) presents water levels downstream the distributor during summer 2005 & summer 2010 and the difference of the trend is clear.
1.0
1.5
2.0
2.5
3.0
3.51-
May
11-M
ay
21-M
ay
31-M
ay
10-J
un
20-J
un
30-J
un
10-J
ul
20-J
ul
30-J
ul
9-A
ug
19-A
ug
29-A
ug
8-S
ep
18-S
ep
28-S
ep
Wat
er le
vels
(m)
2005 2010
Figure (32): Water levels downstream the distributor of Besentway canal during summer 2005 & summer 2010.
4.2 Additional water resources One point that affects the results is the situation at the tail ends. There is escape flow
from the tail end of some head canals. On the other hand, many tail end canals depend partly on the drainage water. These values were not subtracted or added to water supply. Therefore, there was a big difference between WRS values per unit area at different canals. In addition, these values might be different from the values in pump study. One special case was Khadega canal, which is fed back from Neshiel El-Gendeda through a Mesqa. Such amount is not calculated and therefore, water supply values at the head is not consistent with thee characteristics at the tail end.
In El-Mahmoudia, there was a considerable escape flow from Nekla canal (head). At the middle, the escape flow is little and the dependence on the drainage water is little as well. In Besentway, the escape flow is little, but it increased in last years after fixing banks problems at the tail end. Previously, the increase of water levels at the tail end might flood the banks. In El-Berka, escape flow is higher than Besentway. At the tail end, there was a considerable dependence on the drainage water. El-Saraniya is connected form tail end regions to the surrounding drains. El-Beda is not connected to the drains, and only farmers are lifting water from the drains. This increases water shortage problem in the canals.
In Mit Yazid command area, there was a considerable escape flow from Khadega. In Dakalt and Mars El-Gamal (middle region), the escape flow is found only in scatter

46
events. The dependence on the drainage water is small, but it is higher in Mars El-Gamal. At the tail end, the dependence on the drainage water is essential and is considered as a main source for some canals. The dependence on the ground water is increasing gradually in last decades, although water supply to the command areas increased during the same time. Figure (33) presents the feeding point from the drains in Mit Yazid command area. Most of these points were established during last decades.
Figure (33): Different lifting points from the drains to Mit Yazid command area (After "An exploratory survey of the Meet Yazid canal command area"
by IWMI & WMRI)

47
5. Canals Results This section presents summary of the results of Canals & Drains study since the
beginning of the programme in summer 2008 up to the end of winter 2013-14. The concern here is to present seasonal average value to illustrate the progress during the monitoring period.
5.1 Cropping pattern and water requirements
5.1.1 Cropping pattern Cropping pattern values were collected from more than one source during different
monitoring seasons, and in general, the accuracy of the cropping pattern was less than the accuracy of other elements. Some results were obtained from WaterWatch reports, such as the first two seasons. Some were collected from Agricultural ministry through IIIMP. During some seasons, such as summer 2013, the available results were the available data was the average ratio for the irrigation directorates and they were used for all canals. In last season, the wheat ratios were obtained from eLEAF report. The ratios for other winter crops were adjusted based on that.
5.1.1.1 El-Mahmoudia command area This sub-section presents the ratios of rice crop during summer seasons, and wheat and
Berseem during winter seasons for different investigated canals in El-Mahmoudia command area.
For rice crop (figure 34):
The values were considerably high in Nekla (between 39% in summer 2010 & 55% in summer 2012)
In Besentway, the ratio was high in the first season (52%). During the following seasons, the ratios were between 34% & 40%.
In El-Berka, the ratios were between 45% & 48% from summer 2009 to summer 2012. In first and last seasons, the ratios were 39% & 34% respectively.
In El-Karion, the ratios decreased gradually from 45% in summer 2008 to 36% in summer 2011, and then they increased gradually again to 43% in summer 2013.
El-Saraniya were available for few seasons, and El-Beda had very low values (between 15% & 19%)
Rice ratios in Bany Helal were high during first two seasons (58%). In the following seasons, the ratios were between 30% & 44%.

48
0%
10%
20%
30%
40%
50%
60%
70%
80%
90%
100%
Nekla
Besen
tway
El-Berk
a
El-Kari
on
Saraniy
a
El-Bed
a
Bany H
elal
Ric
e ra
tios
(%)
S 2008 S 2009 S 2010 S 2011 S 2012 S 2013
Figure (34): Rice ratios for different investigated branch canals in El-Mahmoudia command areas during different summer seasons
Considering wheat and Berseem crops (figures 35 & 36):
In Nekla, wheat ratios were between 51% & 56% in most of the years. In winter 2011-12, the ratio was 59% and in last season, the ratio was very low (22%). For Berseem crop, the ratios were between 30% during winter 2010-11 & winter 2013-14 and 44% in winter 2012-13.
In Besentway, wheat ratios were between 43% and 46% in the first five seasons. In last season, the ratio was 16%. For Berseem crop, the ratios decreased gradually from 48% to 40% during the first five seasons. In last season, the ratio was 56%.
In El-Berka, wheat ratio was 48% in winter 2008-09. In the following four seasons, the ratios were between 38% & 39%. In last season, the ratio was 29%. For Berseem crop, the ratios were 50% during winter 2009-10 and winter 2013-14. For other seasons, the ratios were between 36% & 38%.
In El-Karion, wheat ratio was 52% during winter 2008-09. In the following four seasons, the ratios were between 39% & 45%. In last season, the ratio was 34%. For Berseem crop, the ratios were 30% in winter 2008-09, and 32% from winter 2010-11 to winter 2012-13. During winter 2009-10 and winter 2013-14, the ratios were 37% and 40% respectively.
El-Saraniya results were available for the first two seasons. During these two seasons, wheat ratios decreased from 51% to 43%, Berseem ratios decreased from 36% to 34% during these two seasons.
In Bany Helal, wheat ratios were 51% in the first two seasons and 38% in the following two seasons. In winter 2012-13 & winter 2013-14, the ratios were

49
57% & 52% respectively. Berseem ratios were 42% in the first two seasons and 51% in the following two seasons. In winter 2012-13, Berseem ratio was only 9%! In winter 2013-14, the ratio was 30%.
0%
10%
20%
30%
40%
50%
60%
70%
80%
90%
100%
Nekla
Besen
tway
El-Berk
a
El-Kari
on
Saraniy
a
El-Bed
a
Bany H
elal
Whe
at ra
tios
(%)
W 2008-09 W 2009-10 W 2010-11 W 2011-12 W 1012-13 W 2013-14
Figure (35): Wheat ratios for different investigated branch canals in El-Mahmoudia command areas during different sinter seasons
0%
10%
20%
30%
40%
50%
60%
70%
80%
90%
100%
Nekla
Besen
tway
El-Berk
a
El-Kari
on
Saraniy
a
El-Bed
a
Bany H
elal
Ber
seem
ratio
s (%
)
W 2008-09 W 2009-10 W 2010-11 W 2011-12 W 2012-13 W 2013-14
Figure (36): Berseem ratios for different investigated branch canals in El-Mahmoudia command areas during different winter seasons
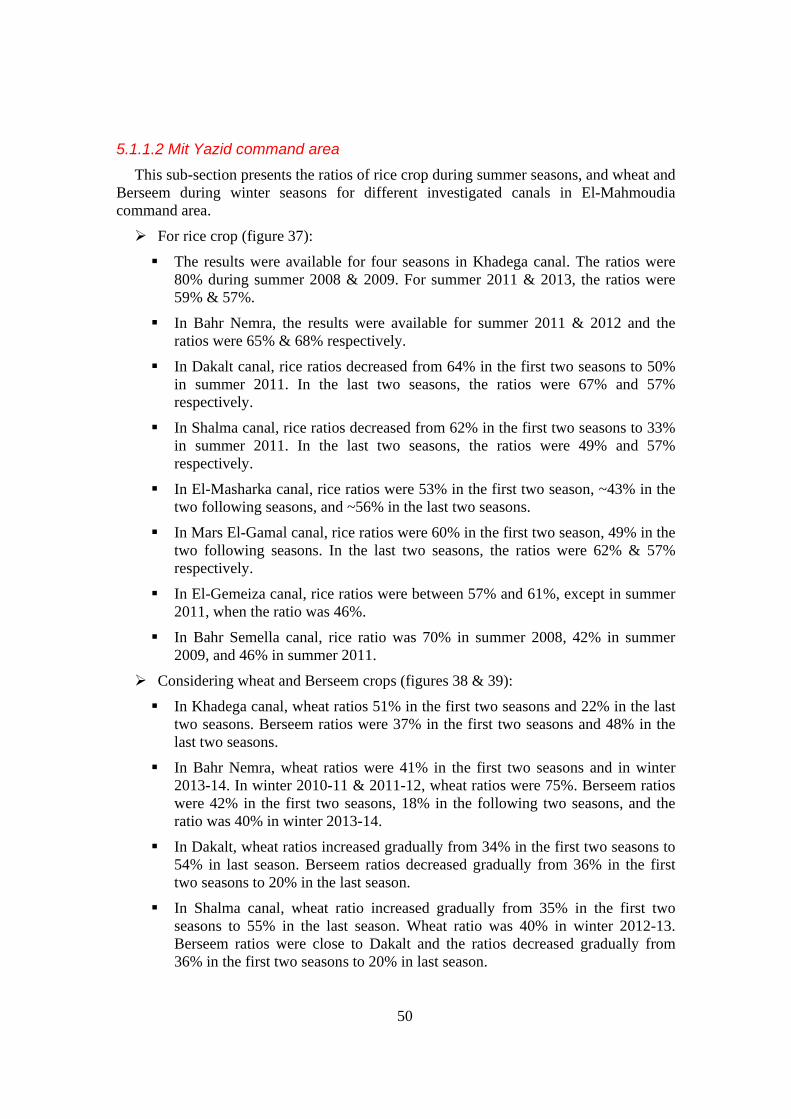
50
5.1.1.2 Mit Yazid command area This sub-section presents the ratios of rice crop during summer seasons, and wheat and
Berseem during winter seasons for different investigated canals in El-Mahmoudia command area.
For rice crop (figure 37):
The results were available for four seasons in Khadega canal. The ratios were 80% during summer 2008 & 2009. For summer 2011 & 2013, the ratios were 59% & 57%.
In Bahr Nemra, the results were available for summer 2011 & 2012 and the ratios were 65% & 68% respectively.
In Dakalt canal, rice ratios decreased from 64% in the first two seasons to 50% in summer 2011. In the last two seasons, the ratios were 67% and 57% respectively.
In Shalma canal, rice ratios decreased from 62% in the first two seasons to 33% in summer 2011. In the last two seasons, the ratios were 49% and 57% respectively.
In El-Masharka canal, rice ratios were 53% in the first two season, ~43% in the two following seasons, and ~56% in the last two seasons.
In Mars El-Gamal canal, rice ratios were 60% in the first two season, 49% in the two following seasons. In the last two seasons, the ratios were 62% & 57% respectively.
In El-Gemeiza canal, rice ratios were between 57% and 61%, except in summer 2011, when the ratio was 46%.
In Bahr Semella canal, rice ratio was 70% in summer 2008, 42% in summer 2009, and 46% in summer 2011.
Considering wheat and Berseem crops (figures 38 & 39):
In Khadega canal, wheat ratios 51% in the first two seasons and 22% in the last two seasons. Berseem ratios were 37% in the first two seasons and 48% in the last two seasons.
In Bahr Nemra, wheat ratios were 41% in the first two seasons and in winter 2013-14. In winter 2010-11 & 2011-12, wheat ratios were 75%. Berseem ratios were 42% in the first two seasons, 18% in the following two seasons, and the ratio was 40% in winter 2013-14.
In Dakalt, wheat ratios increased gradually from 34% in the first two seasons to 54% in last season. Berseem ratios decreased gradually from 36% in the first two seasons to 20% in the last season.
In Shalma canal, wheat ratio increased gradually from 35% in the first two seasons to 55% in the last season. Wheat ratio was 40% in winter 2012-13. Berseem ratios were close to Dakalt and the ratios decreased gradually from 36% in the first two seasons to 20% in last season.

51
In El-Masharka canal, wheat ratios increased gradually from 30% in the first two seasons to 57% in last two seasons. For Berseem crop, the ratios were 23% in winter 2010-11 and winter 2011-12. For other seasons, the ratios were between 7% and 13%.
In Mars El-Gamal, wheat ratios were between 44% in winter 2010-11 and winter 2011-12 and ~50% in other seasons. Berseem ratios were between 12% and 15% during different seasons.
Wheat ratio in El-Gemeiza canal was 56% during winter 2013-14. For other seasons, the ratios were between 38% and 40%. Berseem ratios were ~30% in winter 2010-11, winter 2011-12 and winter 2013-14. For other seasons, the ratios were between 9% and 11%.
For Bahr Semella canal, the data was available for the first three years. Wheat ratios were between 27% and 39% and Berseem ratios were between 26% and 40%.
0%
10%
20%
30%
40%
50%
60%
70%
80%
90%
100%
Khadig
a
Bahr N
emra
Dakalt
Shalm
a
Masha
rka
Mars E
l-Gam
al
Gemeiz
a
Semell
a
Ric
e ra
tios
(%)
S 2008 S 2009 S 2010 S 2011 S 2012 S 2013
Figure (37): Rice ratios for different investigated branch canals in Mit Yazid command areas during different summer seasons

52
0%
10%
20%
30%
40%
50%
60%
70%
80%
90%
100%
Khadig
a
Bahr N
emra
Dakalt
Shalm
a
Masha
rka
Mars E
l-Gam
al
Gemeiz
a
Semell
a
Whe
at ra
tios
(%)
W 2008-09 W 2009-10 W 2010-11 W 2011-12 W 1012-13 W 2013-14
Figure (38): Wheat ratios for different investigated branch canals in Mit Yazid command areas during different winter seasons
0%
10%
20%
30%
40%
50%
60%
70%
80%
90%
100%
Khadig
a
Bahr N
emra
Dakalt
Shalm
a
Masha
rka
Mars E
l-Gam
al
Gemeiz
a
Semell
a
Ber
seem
ratio
s (%
)
W 2008-09 W 2009-10 W 2010-11 W 2011-12 W 2012-13 W 2013-14
Figure (39): Berseem ratios for different investigated branch canals in Mit Yazid command areas during different winter seasons
5.1.2 Water requirements Water requirements were calculated based on the previous cropping pattern with crop
consumption values that were obtained from Matching or WaterWatch reports.

53
5.1.2.1 El-Mahmoudia command area In El-Mahmoudia, water requirements were between 3000 & 3500 m3/fed for different
summer seasons in Nekla, El-Berka and Bany Helal (figure 40). In Besentway and El-Karion, summer water requirements were close to 3000 m3/fed for most of summer seasons except in the first season, when the values were close to 3500 m3/fed. At tail end canals, the values were between 2500 & 3000 m3/fed except during summer 2013 in El-Saraniya, when the values were extremely higher!
During winter seasons (figure 41), water requirements were between 1500 and 2000 m3/fed for most of the canals. There were considerably higher values during last season in El-Berka and El-Karion canals (2400-2500 m3/fed.
5.1.2.2 Mit Yazid command area In Mit Yazid, water requirements were between 3000 & 3600 m3/fed for most of the
canals, except in Khadega during first season, when the value was ~ 3900 m3/fed. In General, the values were higher in the first season in different canals (figure 42).
During winter seasons (figure 43), water requirements were between 1500 and 2000 m3/fed for most of the canals and the trends in different canals were very close. Few values in Khadega, Bahr Nemra and Bahr Semella exceeded 2000 m3/fed.
0
500
1000
1500
2000
2500
3000
3500
4000
4500
5000
Nekla
Besen
tway
El-Berk
a
El-Kari
on
El-Sara
niya
El-Bed
a
Bany H
elal
Seas
onal
wat
er re
quire
men
ts (m
3 )
S 2008 S 2009 S 2010 S 2011 S 2012 S 2013
Figure (40): Seasonal water requirements for different investigated branch canals in El-Mahmoudia command areas during different summer seasons

54
0
500
1000
1500
2000
2500
3000
3500
4000
4500
5000
Nekla
Besen
tway
El-Berk
a
El-Kari
on
El-Sara
niya
El-Bed
a
Bany H
elal
Seas
onal
wat
er re
quire
men
ts (m
3 )
W 2008-09 W 2009-10 W 2010-2011 W 2011-2012W 2012-2013 W 2013-2014
Figure (41): Seasonal water requirements for different investigated branch canals in El-Mahmoudia command areas during different winter seasons
0
500
1000
1500
2000
2500
3000
3500
4000
4500
5000
Khade
ga
Bahr N
emra
Dakalt
Shalm
a
El-Mas
harka
Mars E
l-Gam
al
El-Gem
eiza
Semell
a
Sea
sona
l wat
er re
quire
men
ts (m
3 )
S 2008 S 2009 S 2010 S 2011 S 2012 S 2013
Figure (42): Seasonal water requirement for different investigated branch canals in Mit Yazid command areas during different summer seasons

55
0
500
1000
1500
2000
2500
3000
3500
4000
4500
5000
Khade
ga
Bahr N
emra
Dakalt
Shalm
a
El-Mas
harka
Mars E
l-Gam
al
El-Gem
eiza
Semell
a
Sea
sona
l wat
er re
quire
men
ts (m
3 )
W 2008-09 W 2009-10 W 2010-11 W 2011-12 W 2012-13 W 2013-14
Figure (43): Seasonal water requirements for different investigated branch canals in Mit Yazid command areas during different winter seasons
5.2 Relative water supply This section discusses water supply values at different regions and selected branches
of El-Mahmoudia and Mit Yazid command areas during different investigated seasons.
5.2.1 The main canals The previous chapter discussed the differences between water distribution in main and
branch canals. As was mentioned, a specific trend could be observed in the main canals, and it is affected by the general characteristics of the investigated canals. This sub-section discussed the characteristics of water supply in El-Mahmoudia & Mit Yazid canals.
5.2.1.1 El-Mahmoudia command area Figures (44 & 45) present total seasonal water supply values at the three main
locations on El-Mahmoudia canal, downstream the head2, downstream the connection with El-Khandk El-Sharki (km 16.3)3 and downstream Kafr El-Dawar regulator (km 47.5). Water supply was calculated based on a developed equation that connected water levels with the discharge. As was discussed before, the results are affected by the
2 The equation used water levels upstream Nekla with some addition to express water levels upstream
Sawaqe El-Haded (first branch on El-Mahmoudia) 3 The equation used water levels upstream Besentway canal, so that it calculates the flow downstream
this point

56
dependence on manual water levels during some periods. In addition, some periods were lost and the seasonal values were calculated rationally based on the available data.
During summer seasons, the values downstream the head were between 1277 million m3 in summer 2010 and 1441 million m3 in summer 2013. The consumption between the head and El-Khandk was close to or less than the contribution from El-Khandk, and therefore the values downstream El-Khandk, were between 1319 million m3 in summer 2011 and 1439 million m3 in summer 2008. Downstream Kafr El-Dawar, water supply values were between 693 and 741 million m3.
During winter seasons, the contribution from El-Khandk was higher than the consumption in the region from the head to El-Khandk. The value downstream the head were considerably low during 2011-12 (919 million m3)! For other seasons, the values were between 1110 million m3 in winter 2010-11 and 1244 million m3 in winter 2012-13. After the junction of El-Khandk El-Sharki, the values were between 1392 million m3 in winter 2009-10 and 1723 million m3 in winter 2012-13. this means that the contribution from El-Khandk was much higher than the consumption between the head and El-Khandk. Downstream Kafr El-Dawar, water supply values were between 892 and 951 million m3.
0
200
400
600
800
1000
1200
1400
1600
1800
Head
Km 16.3
Km 47.5
Seas
onal
wat
er s
uppl
y (m
illio
n m3 )
S 2008 S 2009 S 2010 S 2011 S 2012 S 2013
Figure (44): Total water supply values at different locations of EL-Mahmoudia canal from summer 2008 to summer 2013

57
0
200
400
600
800
1000
1200
1400
1600
1800
Head
Km 16.3
Km 47.5
Seas
onal
wat
er s
uppl
y (m
illio
n m3 )
W 2008-09 W 2009-10 W 2010-11 W 2011-12 W 2012-13
Figure (45): Total water supply values at different locations of EL-Mahmoudia canal from winter 2008-09 to winter 2012-13
For the last two sections, relative water supply values (m3/fedday) were calculated after subtracting municipal water supply. Municipal water-supply values were other sources for inaccuracy as fixed values were used during the whole year. Total municipal water consumption downstream El-Khandk was 3.61 millions m3/day. Most of this amount was downstream Kafr El-Dawar (3.46 millions m3/day).
Figures (46 & 47) present seasonally value for two regions during summer and winter seasons. Consider summer seasons, and downstream km 16.3, relative water supply values were between 27.5m3/fed/day in summer 2011 and 35.6m3/fed/day in summer 2013. For the area downstream Kafr El-Dawar, the values were between 23.1 in summer 2010 and 32.7 in summer 2012.
During winter seasons, RWS values were between 16.2m3/fed/day during winter 2009-10 and 24.7m3/fed/day during winter 2012-13. For the region downstream Kafr El-Dawar, the values were between 12.0m3/fed/day during winter 2009-10 and 20.4m3/fed/day during winter 2008-09.

58
0.0
5.0
10.0
15.0
20.0
25.0
30.0
35.0
40.0
km 16
.3
km 47
.5
Seas
onal
RW
S (m
3 /fed/
day)
S 2008 S 2009 S 2010 S 2011 S 2012 S 2013
Figure (46): Seasonally RWS values downstream two sections in El-Mahmoudia canal during different summer seasons
0.0
5.0
10.0
15.0
20.0
25.0
30.0
35.0
40.0
km 16
.3
km 47
.5
Seas
onal
RW
S (m
3 /fed/
day)
W 2008-09 W 2009-10 W 2010-11 W 2011-12 W 2012-13
Figure (47): Seasonally RWS values downstream two sections in El-Mahmoudia canal during different winter seasons
Figures (48 to 50) represent some examples about the daily variation of water supply at the three different locations. During summer seasons, the values were more stable and there was no clearly difference in the values at the three different location of El-Mahmoudia.

59
0.0
20.0
40.0
60.0
80.0
100.0
120.0
140.0
1-M
ay
15-M
ay
29-M
ay
12-J
un
26-J
un
10-J
ul
24-J
ul
7-A
ug
21-A
ug
4-S
ep
18-S
ep
Ave
daily
wat
er s
uppl
y (m
3/se
c
S 2008 S 2010 S 2013
Figure (48): Average daily water supply downstream El-Mahmoudia intake during summer 2008, 2010 and 2013
0.0
20.0
40.0
60.0
80.0
100.0
120.0
140.0
1-M
ay
15-M
ay
29-M
ay
12-J
un
26-J
un
10-J
ul
24-J
ul
7-A
ug
21-A
ug
4-S
ep
18-S
ep
Ave
daily
wat
er s
uppl
y (m
3/se
c
S 2008 S 2010 S 2013
Figure (49): Average daily water supply values for the area of El-Mahmoudia canal downstream km 16.3 during summer 2008, 2010 and 2013

60
0.0
10.0
20.0
30.0
40.0
50.0
60.0
70.0
80.0
1-M
ay
15-M
ay
29-M
ay
12-J
un
26-J
un
10-J
ul
24-J
ul
7-A
ug
21-A
ug
4-S
ep
18-S
ep
Ave
daily
wat
er s
uppl
y (m
3/se
c
S 2008 S 2010 S 2013
Figure (50): Average daily water supply values for the area of El-Mahmoudia canal downstream Kafr El-Dawar regulator during summer 2008, 2010 and
2013
During winter seasons (figures 51 to 53), there was highly difference in the values especially during winter 2012-013 and this is duo to the dependence on the manual data at the head of El-Mahmoudia. At the second location, the values were more stable during winter 2008-09 and winter 2012-013 and they differs during winter 2009-010. At the third location, the values were more stable and there was no clearly difference among the different winter seasons. Water levels are almost stable in this region due to the necessity of municipal water consumption.
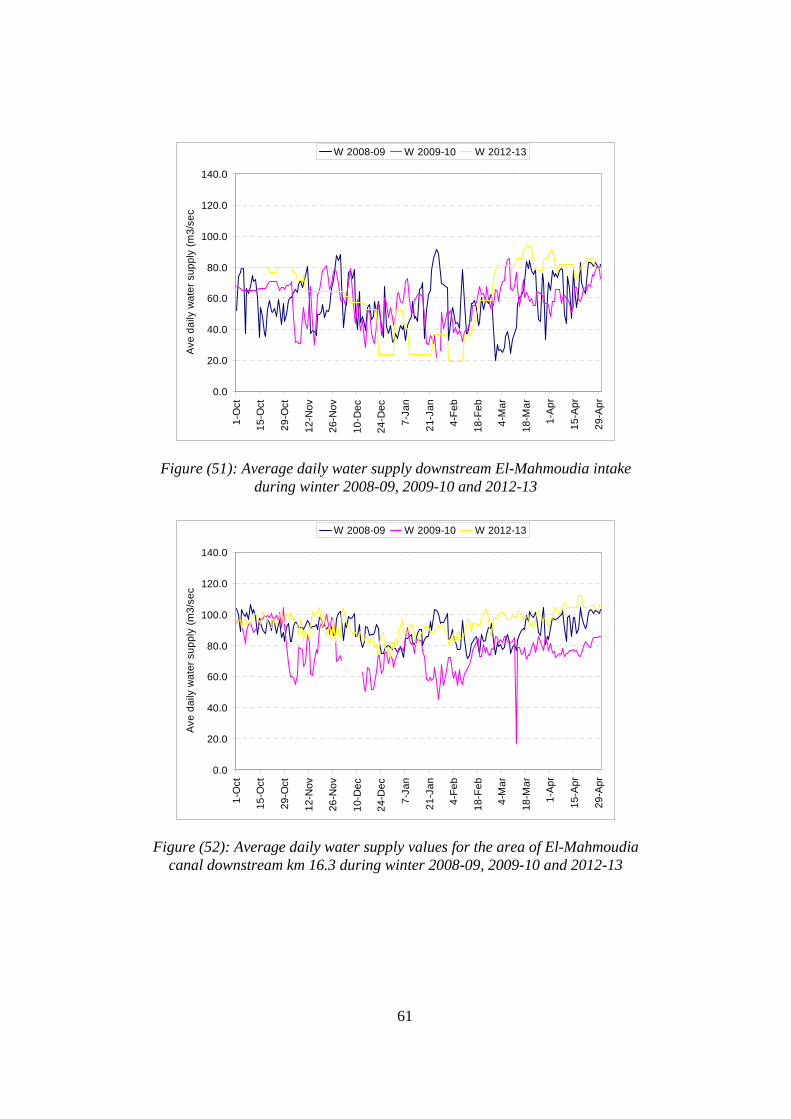
61
0.0
20.0
40.0
60.0
80.0
100.0
120.0
140.0
1-O
ct
15-O
ct
29-O
ct
12-N
ov
26-N
ov
10-D
ec
24-D
ec
7-Ja
n
21-J
an
4-Fe
b
18-F
eb
4-M
ar
18-M
ar
1-Ap
r
15-A
pr
29-A
pr
Ave
daily
wat
er s
uppl
y (m
3/se
c
W 2008-09 W 2009-10 W 2012-13
Figure (51): Average daily water supply downstream El-Mahmoudia intake during winter 2008-09, 2009-10 and 2012-13
0.0
20.0
40.0
60.0
80.0
100.0
120.0
140.0
1-O
ct
15-O
ct
29-O
ct
12-N
ov
26-N
ov
10-D
ec
24-D
ec
7-Ja
n
21-J
an
4-Fe
b
18-F
eb
4-M
ar
18-M
ar
1-Ap
r
15-A
pr
29-A
pr
Ave
daily
wat
er s
uppl
y (m
3/se
c
W 2008-09 W 2009-10 W 2012-13
Figure (52): Average daily water supply values for the area of El-Mahmoudia canal downstream km 16.3 during winter 2008-09, 2009-10 and 2012-13

62
0.0
10.0
20.0
30.0
40.0
50.0
60.0
70.0
80.0
1-O
ct
15-O
ct
29-O
ct
12-N
ov
26-N
ov
10-D
ec
24-D
ec
7-Ja
n
21-J
an
4-Fe
b
18-F
eb
4-M
ar
18-M
ar
1-Ap
r
15-A
pr
29-A
pr
Ave
daily
wat
er s
uppl
y (m
3/se
c
W 2008-09 W 2009-10 W 2012-13
Figure (53): Average daily water supply values for the area of El-Mahmoudia canal downstream Kafr El-Dawar regulator during winter 2008-09, 2009-10
and 2012-13
5.2.1.2 Mit Yazid command area Mit Yazid is easier in calculation. It has only one source at the head and manual water
levels are more reliable. Figures (54 and 55) present total water supply at different sections during different summer and winter seasons.
The values were more stable during summer seasons. For instance, the gradual decrease from summer 2008 to summer 2010 is obvious and it is associated with a general trend in the Egyptian irrigation system. Downstream the head, the maximum value was during summer 2008 (1215 million m3) and the minimum value was during summer 2013 (1141 million m3). Downstream Beltag, the maximum value was during summer 2008 (875 million m3) and the minimum value was during summer 2013 (792 million m3). El-Wasat and El-Zawia were close to each other and the seasonal values were between 340 & 385 millions m3. Downstream El-Mofty, the values were between 59 millions m3 in summer 2008 & 39 millions m3 in summer 2010.
During winter seasons, there was a fluctuation in the values. Downstream the head, the values of winter 2009-10 and winter 2011-12 were the lower values (834 and 797 million m3 respectively). The maximum value was during winter 2010-11 (968 million m3). Downstream Beltag, the value of winter 2008-09 was considerably high (708 million m3). During other seasons, the values were between 584 & 593 million m3. El-Wasat values were between 232 & 305 million m3, and El-Zawia values were between 249 & 285 millions m3. Downstream El-Mofty, the values were between 48 millions m3 in winter 2008-09 & 35 millions m3 in winter 2012-13.

63
0
200
400
600
800
1000
1200
1400
1600
1800
Mit- Yaz
ied
Beltag
e
El-Was
at
El-Zaw
ai
El-Moft
y
Seas
onal
wat
er s
uppl
y (m
illio
n m3 )
S 2008 S 2009 S 2010 S 2011 S 2012 S 2013
Figure (54): Seasonal water supply downstream Mit Yazid head regulator from summer 2011 to summer 2013
0
200
400
600
800
1000
1200
1400
1600
1800
Mit- Yaz
ied
Beltag
e
El-Was
at
El-Zaw
ai
El-Moft
y
Seas
onal
wat
er s
uppl
y (m
illio
n m3 )
W 2008-09 W 2009-10 W 2010-11 W 2011-12 W 2012-13
Figure (54): Seasonal water supply downstream Mit Yazid head regulator from summer 2011 to summer 2013
Regarding RWS values downstream different regulators, figures (55 & 56) present the values during summer and winter seasons respectively. During summer seasons, the values were as follows:
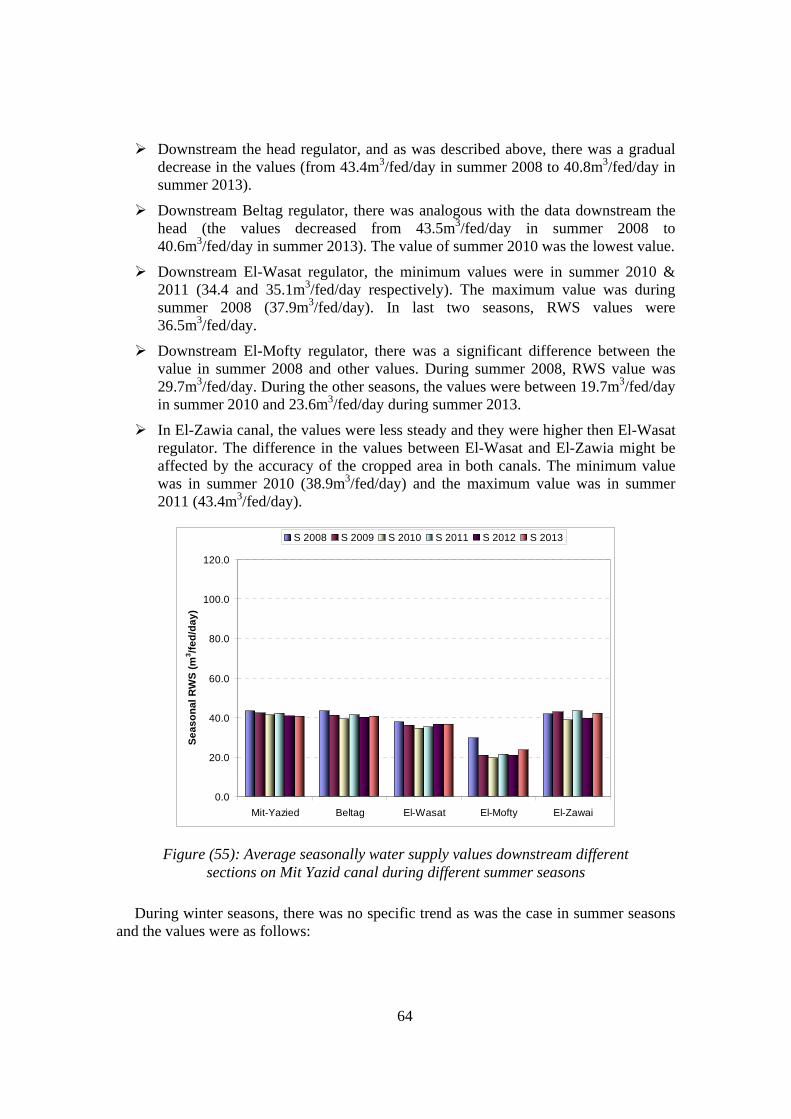
64
Downstream the head regulator, and as was described above, there was a gradual decrease in the values (from 43.4m3/fed/day in summer 2008 to 40.8m3/fed/day in summer 2013).
Downstream Beltag regulator, there was analogous with the data downstream the head (the values decreased from 43.5m3/fed/day in summer 2008 to 40.6m3/fed/day in summer 2013). The value of summer 2010 was the lowest value.
Downstream El-Wasat regulator, the minimum values were in summer 2010 & 2011 (34.4 and 35.1m3/fed/day respectively). The maximum value was during summer 2008 (37.9m3/fed/day). In last two seasons, RWS values were 36.5m3/fed/day.
Downstream El-Mofty regulator, there was a significant difference between the value in summer 2008 and other values. During summer 2008, RWS value was 29.7m3/fed/day. During the other seasons, the values were between 19.7m3/fed/day in summer 2010 and 23.6m3/fed/day during summer 2013.
In El-Zawia canal, the values were less steady and they were higher then El-Wasat regulator. The difference in the values between El-Wasat and El-Zawia might be affected by the accuracy of the cropped area in both canals. The minimum value was in summer 2010 (38.9m3/fed/day) and the maximum value was in summer 2011 (43.4m3/fed/day).
0.0
20.0
40.0
60.0
80.0
100.0
120.0
Mit-Yazied Beltag El-Wasat El-Mofty El-Zawai
Seas
onal
RW
S (m
3 /fed/
day)
S 2008 S 2009 S 2010 S 2011 S 2012 S 2013
Figure (55): Average seasonally water supply values downstream different sections on Mit Yazid canal during different summer seasons
During winter seasons, there was no specific trend as was the case in summer seasons and the values were as follows:
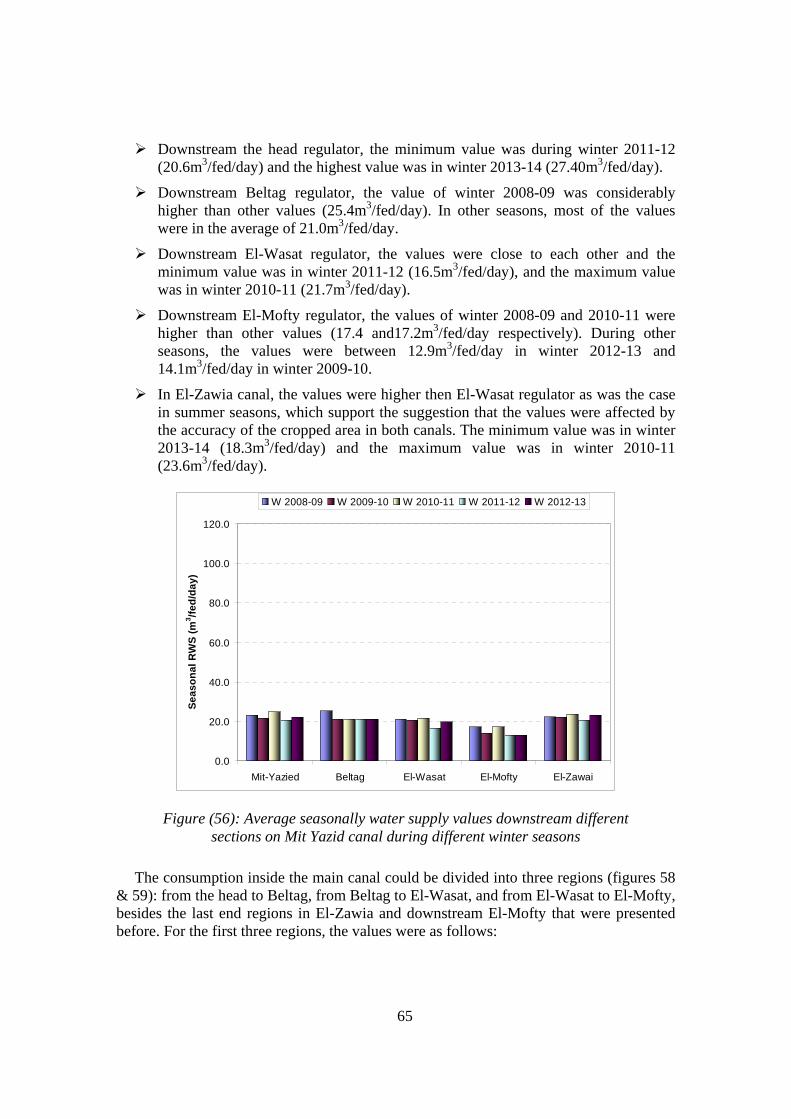
65
Downstream the head regulator, the minimum value was during winter 2011-12 (20.6m3/fed/day) and the highest value was in winter 2013-14 (27.40m3/fed/day).
Downstream Beltag regulator, the value of winter 2008-09 was considerably higher than other values (25.4m3/fed/day). In other seasons, most of the values were in the average of 21.0m3/fed/day.
Downstream El-Wasat regulator, the values were close to each other and the minimum value was in winter 2011-12 (16.5m3/fed/day), and the maximum value was in winter 2010-11 (21.7m3/fed/day).
Downstream El-Mofty regulator, the values of winter 2008-09 and 2010-11 were higher than other values (17.4 and17.2m3/fed/day respectively). During other seasons, the values were between 12.9m3/fed/day in winter 2012-13 and 14.1m3/fed/day in winter 2009-10.
In El-Zawia canal, the values were higher then El-Wasat regulator as was the case in summer seasons, which support the suggestion that the values were affected by the accuracy of the cropped area in both canals. The minimum value was in winter 2013-14 (18.3m3/fed/day) and the maximum value was in winter 2010-11 (23.6m3/fed/day).
0.0
20.0
40.0
60.0
80.0
100.0
120.0
Mit-Yazied Beltag El-Wasat El-Mofty El-Zawai
Seas
onal
RW
S (m
3 /fed/
day)
W 2008-09 W 2009-10 W 2010-11 W 2011-12 W 2012-13
Figure (56): Average seasonally water supply values downstream different sections on Mit Yazid canal during different winter seasons
The consumption inside the main canal could be divided into three regions (figures 58 & 59): from the head to Beltag, from Beltag to El-Wasat, and from El-Wasat to El-Mofty, besides the last end regions in El-Zawia and downstream El-Mofty that were presented before. For the first three regions, the values were as follows:

66
For the region between the head and Beltag regulator, which represent the head region, water consumption was as follows:
During summer seasons, the values increased gradually from 43.3m3/fed/day in summer 2008 to 46.6m3/fed/day in summer 2010 and then decreased again gradually to 41.1m3/fed/day in summer 2013.
During winter seasons, the trend was close to summer trend with an exception in winter 2011-12. The values were between 19.5m3/fed/day in winter 2011-12 and 41.9m3/fed/day in winter 2013-14
The region between Beltag and El-Wasat was a critical region. There was a problem in the banks, with big leakage ratio, between Mit Yazid canal and El- left & right Nazaz drains (figure 57). In addition, most of the Mesqas in this region were open continuously. On the other hand, there was a doubt about the served area. Beside the official served area on Mit Yazid, a part of El-Kased branches is irrigated on Mit Yazid in this region. This partially explains high values in this region. Water consumption in this region was as follows:
During summer season, the value of summer 2008 was very high (close to 100m3/fed/day). For the next seasons, there was a gradual decrease in the values from 82.1m3/fed/day in summer 2010 to 63.9m3/fed/day in summer 2013. The rehabilitation of the area that is taken place recently might be the reasons for such decrease.
During winter season, there was no specific trend as was the case for the values downstream different sections. The values for 2010-11 was not available (The programme for a long time during this season and the collected data make the value unfeasible). During the seasons 2009-10 & 2012-13, the values were 20.0m3/fed/day. The highest value was in winter 2008-09 (~80.0m3/fed/day) following by the value of winter 2013-14 (~67.0m3/fed/day).
For the region between El-Wasat and El-Mofty, the values were almost steady during summer and winter seasons as follows:
For summer seasons, the trend was close to the trend for the values down stream El-Wasat regulator. During summer 2010 & 2011, the values were around 38.0m3/fed/day. During other seasons, the values were close to 40.0m3/fed/day.
For winter seasons, the value of winter 2011-12 was lower than other values (17.4m3/fed/day). During other winter seasons, the values were between 20.6 and 22.8m3/fed/day.

67
Figure (57): The bank between Mit Yazid and El-Nazaz drain in Kafr El-Sheikh city
0.0
20.0
40.0
60.0
80.0
100.0
120.0
MitYazied - Beltag Beltag - Wasat Wasat - Mofty
Seas
onal
RW
S (m
3 /fed/
day)
S 2008 S 2009 S 2010 S 2011 S 2012 S 2013
Figure (58): Average seasonally water consumption (and losses) at different regions of Mit Yazid canal during different summer seasons

68
0.0
20.0
40.0
60.0
80.0
100.0
120.0
MitYazied - Beltag Beltag - Wasat Wasat - Mofty
Seas
onal
RW
S (m
3 /fed/
day)
W 2008-09 W 2009-10 W 2010-2011 W 2011-2012 W 2012-2013
Figure (59): Average seasonally water consumption (and losses) at different regions of Mit Yazid canal during different winter seasons
Figures (60 to 62) present the daily variation of water supply at different sections of Mit Yazid canal during summer seasons. Downstream the head and downstream Beltag, the trends were the same, the values were almost constant, especially during high consumption period, and they were constant during different years. Downstream El-Mofty, there was a frequent fluctuation in the data, and there was a difference between different years. The difference between first sites and El-Mofty reflect the difference in operation strategy in these sites. The first sites were open free, especially during high consumption period as the flow is barely enough. El-Mofty is controlled with a frequent adaptation of the gate openings to offer the required upstream water level to feed Shalma canal with its requirements.
During winter seasons (figures 63 to 65), the fluctuation of the data could be observed at different locations, and the differences between different years were obvious. In general, the highest values were at the beginning and at the end of the season, and this was more obvious downstream the head and Beltag more than downstream El-Mofty.

69
0.0
20.0
40.0
60.0
80.0
100.0
120.0
1-M
ay
15-M
ay
29-M
ay
12-J
un
26-J
un
10-J
ul
24-J
ul
7-A
ug
21-A
ug
4-S
ep
18-S
ep
Ave
daily
wat
er s
uppl
y (m
3/se
c
S 2009 S 2010 S 2013
Figure (60): Average daily water supply at the head of Mit Yazid in summer 2009, 2010 and 2013
0.0
10.0
20.0
30.0
40.0
50.0
60.0
70.0
80.0
90.0
100.0
1-M
ay
15-M
ay
29-M
ay
12-J
un
26-J
un
10-J
ul
24-J
ul
7-A
ug
21-A
ug
4-S
ep
18-S
ep
Ave
daily
wat
er s
uppl
y (m
3/se
c
S 2008 S 2010 S 2013
Figure (61): Average daily water supply downstream Beltag regulator in summer 2008, 2010 and 2013
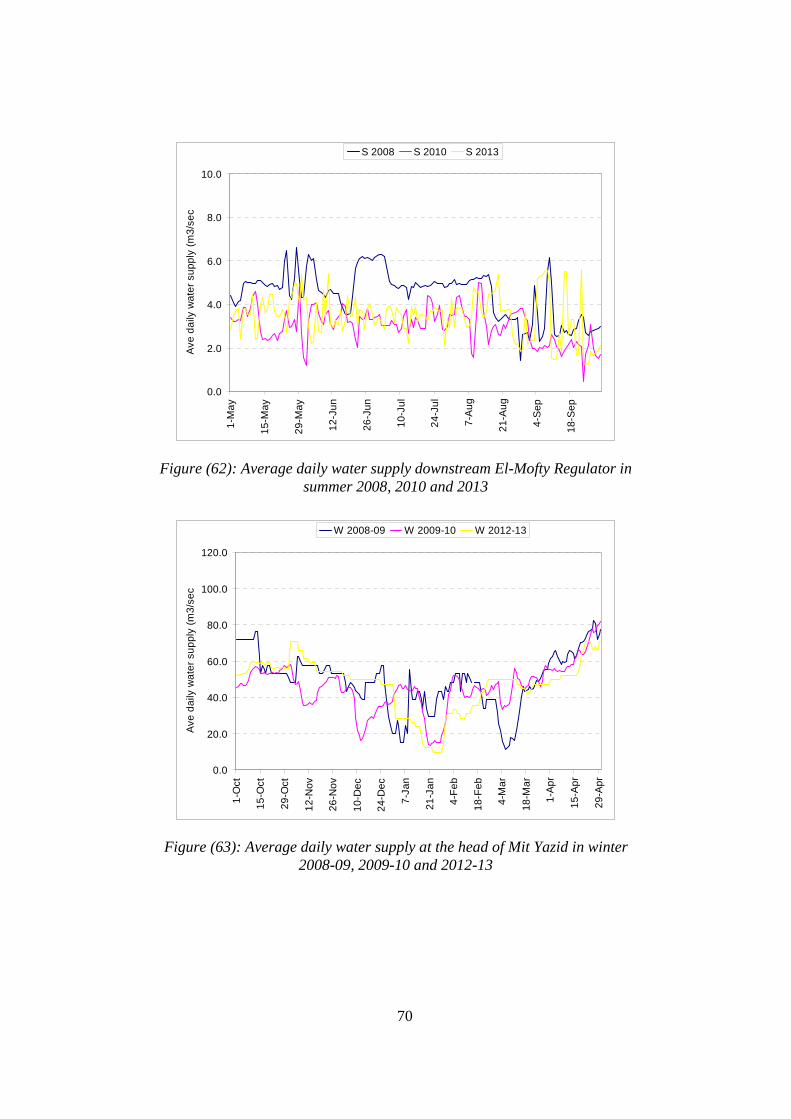
70
0.0
2.0
4.0
6.0
8.0
10.0
1-M
ay
15-M
ay
29-M
ay
12-J
un
26-J
un
10-J
ul
24-J
ul
7-A
ug
21-A
ug
4-S
ep
18-S
ep
Ave
daily
wat
er s
uppl
y (m
3/se
c
S 2008 S 2010 S 2013
Figure (62): Average daily water supply downstream El-Mofty Regulator in summer 2008, 2010 and 2013
0.0
20.0
40.0
60.0
80.0
100.0
120.0
1-O
ct
15-O
ct
29-O
ct
12-N
ov
26-N
ov
10-D
ec
24-D
ec
7-Ja
n
21-J
an
4-Fe
b
18-F
eb
4-M
ar
18-M
ar
1-Ap
r
15-A
pr
29-A
pr
Ave
daily
wat
er s
uppl
y (m
3/se
c
W 2008-09 W 2009-10 W 2012-13
Figure (63): Average daily water supply at the head of Mit Yazid in winter 2008-09, 2009-10 and 2012-13

71
0.0
10.0
20.0
30.0
40.0
50.0
60.0
70.0
80.0
90.0
100.0
1-O
ct
15-O
ct
29-O
ct
12-N
ov
26-N
ov
10-D
ec
24-D
ec
7-Ja
n
21-J
an
4-Fe
b
18-F
eb
4-M
ar
18-M
ar
1-Ap
r
15-A
pr
29-A
pr
Ave
daily
wat
er s
uppl
y (m
3/se
c
W 2008-09 W 2009-10 W 2012-13
Figure (64): Average daily water supply downstream Beltag regulator in winter 2008-09, 2009-10 and 2012-13
0.0
2.0
4.0
6.0
8.0
10.0
1-O
ct
15-O
ct
29-O
ct
12-N
ov
26-N
ov
10-D
ec
24-D
ec
7-Ja
n
21-J
an
4-Fe
b
18-F
eb
4-M
ar
18-M
ar
1-Ap
r
15-A
pr
29-A
pr
Ave
daily
wat
er s
uppl
y (m
3/se
c
W 2008-09 W 2009-10 W 2012-13
Figure (65): Average daily water supply downstream El-Mofty Regulator in winter 2008-09, 2009-10 and 2012-13
5.2.2 Investigated branch canals As was explained in the previous chapter, it is hard to define specific trend for
different investigated branch canals due to the operation strategy. In addition, the

72
dependence on the drainage water, led to some misleading results. For instance, it is hard to understand how El-Masharka canal is surviving with such amount of water supply at the head unless knowing that most of its water supply is feeding back from Nashart drain. Therefore, the next sub-section presents examples about the feeding back from the drains in tail end canals and the escape flow to the drains from head and middle canals for better understanding of the results.
5.2.2.1 El-Mahmoudia command area During summer seasons (figure 66), water supply values in investigated branch canals
of El-Mahmoudia command area were as follows:
In Nekla canal, the minimum RWS value ~ 34.5m3/fed/day during summer 2009 and summer 2011. The maximum value was 45.7m3/fed/day during summer 2013.
Regarding Besentway canals, the value during summer 2013 was illogic and it was discussed in this summer report. For other seasons, the values were between 28.5m3/fed/day during summer 2010 and 40.6m3/fed/day during summer 2011.
In El-Berka canal, the value of summer 2013 was suspected as well. For other seasons, the values were between 44.5m3/fed/day during summer 2010 and 50.4m3/fed/day during summer 2011.
In El-Karion canal, the values decreased in the last two were lower than other seasons (~22.0m3/fed/day). For other seasons, the values were between 27.5m3/fed/day in summer 2011 and 30.9m3/fed/day in summer 2008.
El-Beda, as a tail end canal, had the same average of El-Karion canal. The values were between 21.6m3/fed/day in summer 2011 and 27.2m3/fed/day in summer 2008.
For the control canal (Bany Helal), RWS value in summer 2013 was lower than all other seasons (36.1m3/fed/day). For other seasons, the values were between 42.2m3/fed/day in summer 2008 and 54.8m3/fed/day in summer 2009.
The only general observation that could be obtained is the effect of the location (head # tail end). The main difference was between El-Karion and El-Beda canals, as tail canals, and other canals. The difference between consecutive seasons had no specific trend.
During winter seasons (figure 67), the fluctuation was even more and the values were as follows:
In Nekla canal, the value of winter 2009-10 was considerably high (30.8m3/fed/day). During other seasons, the values were between 18.1m3/fed/day in winter 2010-11 and 25.6m3/fed/day in winter 2013-014.
In Besentway canals, RWS values were considerably low during winter 2013-014, due to depend on the manual data only, except this season the values were between 14.6m3/fed/day in winter 2010-11 and 25.9m3/fed/day in winter 2011-12.
In El-Berka canal, the values of the first two seasons were higher than the other seasons (31.8 and 35.6m3/fed/day respectively). For the following seasons, the

73
values were ~23.5m3/fed/day during winter 2010-11 and winter 2012-13, and 29.4m3/fed/day in winter 2013-14.
In El-Karion canal, RWS values were between 8.6m3/fed/day in winter 2013-14 and 13.6m3/fed/day in winter 2009-10.
El-Beda, the values were decreased gradually from winter 2008-09 to winter 2012-013 then they increased during winter 2013-014. The values were between 11.2m3/fed/day in winter 2012-013 and 19.6m3/fed/day in winter 2008-09.
In Bany Helal canal and to the opposite of El-Beda canal, RWS value increased gradually from winter 2008-09 to winter 2012-013,then they decreased during winter 2013-014. The values were between 23.0m3/fed/day in winter 2008-09 to 30.4m3/fed/day in winter 2012-13.
Figures (68 to 70) present examples about the daily variation of water supply at the head some investigated branch canals. These examples illustrate the operation strategy.
In all canals, the random fluctuation of daily water supply refers to a reaction strategy, which is the dominant strategy for complained-based network, such as the Egyptian irrigation network. The general, the canals were operated as follows:
Nekla canal was open for most of the time, expect at the beginning and the end of the season.
Besentway canal, which was opened continuously (check previous reports for IIP1), returned to the rotation.
The rotation was applied in El-Karion canal since the monitoring programme.
Like summer results, the location of the canal (head-tail) is the key element that affects its operation.

74
0.0
10.0
20.0
30.0
40.0
50.0
60.0
Nekla
Besen
tway
El-Berk
a
El-Kari
on
El-Bed
a
Bany H
elal
Seas
onal
ly R
WS
(m3 /fe
d/da
y)
S 2008 S 2009 S 2010 S 2011 S 2012 S 2013
Figure (66): The average seasonally water supply values for the monitored branch canals in El-Mahmoudia command area during different summer
seasons
0.0
5.0
10.0
15.0
20.0
25.0
30.0
35.0
40.0
Nekla
Besen
tway
El-Berk
a
El-Kari
on
El-Sara
niya
El-Bed
a
Bany H
elal
WU
I
W 2008-09 W 2009-10 W 2010-2011 W 2011-2012W 2012-2013 W 2013-2014
Figure (67): The average seasonally water supply values for the monitored branch canals in El-Mahmoudia command area during different winter
seasons

75
0.0
0.5
1.0
1.5
2.0
2.5
1-May
15-M
ay
29-M
ay
12-Ju
n
26-Ju
n10
-Jul
24-Ju
l
7-Aug
21-A
ug4-S
ep
18-S
ep
Ave
dai
ly w
ater
sup
ply
(m3/
sec
S 2011 S 2012 S 2013
Figure (68): Average daily water supply values for Nekla canal during summer seasons 2011, 2012 and 2013
0.0
1.0
2.0
3.0
4.0
5.0
6.0
7.0
1-May
15-M
ay
29-M
ay
12-Ju
n
26-Ju
n10
-Jul
24-Ju
l
7-Aug
21-A
ug4-S
ep
18-S
ep
Ave
dai
ly w
ater
sup
ply
(m3/
sec
S 2008 S 2010 S 2012
Figure (69): Average daily water supply values for Besentway canal during summer seasons 2008, 2010 and 2012

76
0.0
1.0
2.0
3.0
4.0
5.0
6.0
7.0
8.0
9.0
10.0
1-M
ay
15-M
ay
29-M
ay
12-J
un
26-J
un
10-J
ul
24-J
ul
7-A
ug
21-A
ug
4-S
ep
18-S
ep
Ave
daily
wat
er s
uppl
y (m
3/se
c
S 2008 S 2010 S 2013
Figure (70): Average daily water supply values for El-Karion canal during summer seasons 2008, 2010 and 2012
During winter seasons (figures 71 to 73), the fluctuation of the values increased, and no specific trend could be observed in the three presented examples.
0.0
0.3
0.6
0.9
1.2
1.5
1.8
2.1
2.4
2.7
3.0
1-Oct
15-O
ct
29-O
ct
12-N
ov
26-N
ov
10-D
ec
24-D
ec7-J
an
21-Ja
n4-F
eb
18-F
eb4-M
ar
18-M
ar1-A
pr
15-A
pr
29-A
pr
Ave
dai
ly w
ater
sup
ply
(m3/
sec
W 2011-12 W 2012-13
Figure (71): Average daily water supply values for Nekla canal during winter seasons 2011-12 and 2012-13

77
0.0
0.5
1.0
1.5
2.0
2.5
3.0
3.5
4.0
4.5
5.0
1-Oct
15-O
ct
29-O
ct
12-N
ov
26-N
ov
10-D
ec
24-D
ec7-J
an
21-Ja
n4-F
eb
18-F
eb4-M
ar
18-M
ar1-A
pr
15-A
pr
29-A
pr
Ave
dai
ly w
ater
sup
ply
(m3/
sec
W 2008-09 W 2009-10 W 2011-12
Figure (72): Average daily water supply values for Besentway canal during winter seasons 2008-09, 2009-10 and 2011-12
0.0
1.0
2.0
3.0
4.0
5.0
6.0
7.0
8.0
1-Oct
15-O
ct
29-O
ct
12-N
ov
26-N
ov
10-D
ec
24-D
ec7-J
an
21-Ja
n4-F
eb
18-F
eb4-M
ar
18-M
ar1-A
pr
15-A
pr
29-A
pr
Ave
dai
ly w
ater
sup
ply
(m3/
sec
W 2008-09 W 2009-10 W 2012-13
Figure (73): Average daily water supply values for El-Karion canal during winter seasons 2008-09, 2009-10 and 2012-13
5.2.2.2 Mit Yazid command area Mit Yazid canals were affected by the operation strategy, as was the case in El-
Mahmoudia canals, and they are affected more by the additional water resources. This includes some head canals, such as Khadega canal that is feeding from Neshil El-Gededa

78
through a Mesqa. It is includes, tail end canals, such as El-Masharka, which is feeding back from Nashart drain.
Figures (74 & 75) present average seasonally values for different investigated canals in Mit Yazid command area and the control canal during different summer and winter seasons.
During summer seasons, Shalma was the most stable canal during different seasons. Except the values of summer 2008 & summer 2010, most RWS values in Shalma were between 35.0 & 36.0m3/fed/day. Dakalt had the same range during first four seasons. In last two seasons, the values decreased. Such decrease could be the result of changing the operation system that was returning to the rotation system. It could also be affected by the accuracy due to higher dependence on manual water levels. The changes in the other canals had no specific trend. Mars El-Gamal had RWS values close to 35.0m3/fed/day in few years. The values of El-Masharka were extremely low as the canal was depending on Nashart drain as a main source, especially during summer seasons.
The fluctuations of the data during winter seasons were close to summer regions. Comparing summer results, the following remarks could be highlighted:
Water supply value in Shalma was considerably higher than the values in Dakalt & Mars El-Gamal, although they were close to each other during summer seasons.
Water supply values in El-Gemeiza canal, which is a tail-end canal, were higher than the corresponding values in other canals.
El-Masharka continued having the lowest water supply values, as was the case in summer seasons.
Excluding the high values in Shalma and El-Gemeiza and the low values in El-Masharka, most of water supply values in different canals were between 10.0 and 20.0 m3/fed/day.
The results confirmed what was stated before about the operation of the branch canals, which depends mainly on the reaction to farmers' complements. No rigid strategy (either rotation or continuous flow) is applied in the investigated branch canals.

79
0.0
5.0
10.0
15.0
20.0
25.0
30.0
35.0
40.0
45.0
50.0
Khade
ga
Bahr N
emra
Dakalt
Shalm
a
El-Mas
harka
Mars E
l-Gam
al
El-Gem
eiza
Semell
a
Seas
onal
RW
S (m
3/fe
d/da
y)
S 2008 S 2009 S 2010 S 2011 S 2012 S 2013
Figure (74): The average seasonally values for the monitored branch canals in Mit-Yazid command area during different summer seasons
0.0
5.0
10.0
15.0
20.0
25.0
30.0
35.0
40.0
45.0
50.0
Khade
ga
Bahr N
emra
Dakalt
Shalm
a
El-Mas
harka
Mars E
l-Gam
al
El-Gem
eiza
Semell
a
RW
S (m
3 /fed/
day)
W 2008-09 W 2009-10 W 2010-2011 W 2011-2012W 2012-2013 W 2013-2014
Figure (75): The average seasonally values for the monitored branch canals in Mit-Yazid command area during different winter seasons
Figures (76 to 78) present the daily variation of water supply at some branch canals at head, middle and tail end of the command area. At the head (Bahr Nemra), the rotation is explicit, especially during high consumption period. Dakalt, such as Besentway in El-Mahmoudia command area, is returned gradually to the rotation. In El-Masharka (tail

80
end), the canal was open continuously as water is this region was barely available. The difference between different years was due to the availability of the water at tail end regions. In that regard, there was a clear difference between summer 2008 and other seasons.
0.0
1.0
2.0
3.0
4.0
5.0
6.0
7.0
8.0
9.0
10.0
1-M
ay
15-M
ay
29-M
ay
12-J
un
26-J
un
10-J
ul
24-J
ul
7-A
ug
21-A
ug
4-S
ep
18-S
ep
Ave
dai
ly w
ater
sup
ply
(m3 /s
ec)
S 2011 S 2012 S 2013
Figure (76): Average daily water supply in Bahr Nemra branch canal during summer 2011, 2012 and 2013
0.0
0.5
1.0
1.5
2.0
2.5
3.0
3.5
4.0
4.5
5.0
1-May
15-M
ay
29-M
ay
12-Ju
n
26-Ju
n10
-Jul
24-Ju
l
7-Aug
21-A
ug4-S
ep
18-S
ep
Ave
dai
ly w
ater
sup
ply
(m3 /s
ec)
S 2008 S 2010 S 2013
Figure (77): Average daily water supply in Dakalt branch canal during summer 2008, 2010 and 2013
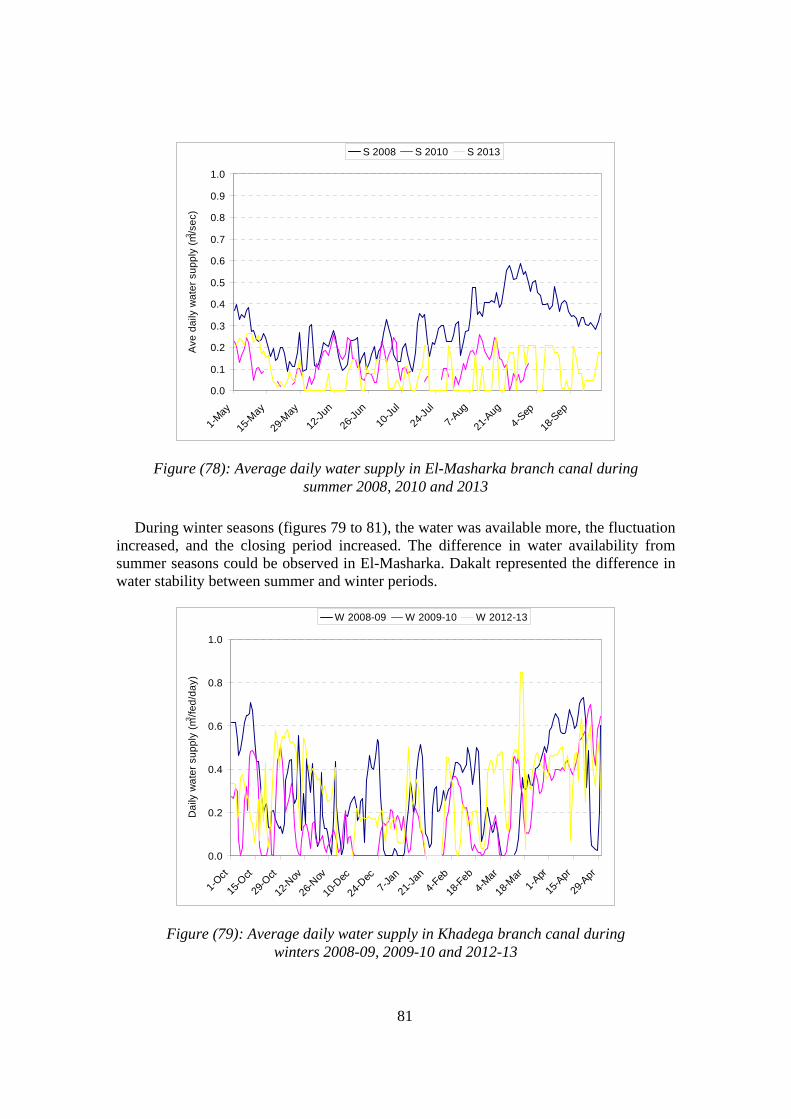
81
0.0
0.1
0.2
0.3
0.4
0.5
0.6
0.7
0.8
0.9
1.0
1-May
15-M
ay
29-M
ay
12-Ju
n
26-Ju
n10
-Jul
24-Ju
l
7-Aug
21-A
ug4-S
ep
18-S
ep
Ave
dai
ly w
ater
sup
ply
(m3 /s
ec)
S 2008 S 2010 S 2013
Figure (78): Average daily water supply in El-Masharka branch canal during summer 2008, 2010 and 2013
During winter seasons (figures 79 to 81), the water was available more, the fluctuation increased, and the closing period increased. The difference in water availability from summer seasons could be observed in El-Masharka. Dakalt represented the difference in water stability between summer and winter periods.
0.0
0.2
0.4
0.6
0.8
1.0
1-Oct
15-O
ct
29-O
ct
12-N
ov
26-N
ov
10-D
ec
24-D
ec7-J
an
21-Ja
n4-F
eb
18-F
eb4-M
ar
18-M
ar1-A
pr
15-A
pr
29-A
pr
Dai
ly w
ater
sup
ply
(m3 /fe
d/da
y)
W 2008-09 W 2009-10 W 2012-13
Figure (79): Average daily water supply in Khadega branch canal during winters 2008-09, 2009-10 and 2012-13

82
0.0
0.5
1.0
1.5
2.0
2.5
3.0
1-Oct
15-O
ct
29-O
ct
12-N
ov
26-N
ov
10-D
ec
24-D
ec7-J
an
21-Ja
n4-F
eb
18-F
eb4-M
ar
18-M
ar1-A
pr
15-A
pr
29-A
pr
Dai
ly w
ater
sup
ply
(m3 /fe
d/da
y)
W 2008-09 W 2009-10 W 2012-13
Figure (80): Average daily water supply in Dakalt branch canal during winters 2008-09, 2009-10 and 2012-13
0.0
0.2
0.4
0.6
0.8
1.0
1-Oct
15-O
ct
29-O
ct
12-N
ov
26-N
ov
10-D
ec
24-D
ec7-J
an
21-Ja
n4-F
eb
18-F
eb4-M
ar
18-M
ar1-A
pr
15-A
pr
29-A
pr
Dai
ly w
ater
sup
ply
(m3 /fe
d/da
y)
W 2008-09 W 2009-10 W 2012-13
Figure (81): Average daily water supply in El-Masharka branch canal during winters 2008-09, 2009-10 and 2012-13
5.2.3 Incidence of canal escape flows Escape flow refers to the increase of water supply in the canal, and it could explain the
increase of water supply at some head canals. Since the previous monitoring programme

83
(IIP1 programme), escape flow was recorded in some middle canals (Dakalt, Besentway and El-Berka). Water levels were recorded at the tail end of some head canals, such as Khadega and Nekla in last years, but there was no exact calculation for escape flow ratios. However, the general observation indicated that escape flow ratios were considerably higher than middle canals.
Figure (82): The tail end of Nekla canal during June month and water is overtopping escape weir
-0.6
-0.4
-0.2
0.0
0.2
0.4
0.6
0.8
1.0
1.2
1.4
1.6
1-May
11-M
ay
21-M
ay
31-M
ay
10-Ju
n
20-Ju
n
30-Ju
n10
-Jul
20-Ju
l
30-Ju
l
9-Aug
19-A
ug
29-A
ug8-S
ep
18-S
ep
28-S
ep
Leve
ls (m
)
Tail end WL Bed level Weir crest
Figure (83): Water levels at the tail end of Nekla canal

84
5.2.3.1 Dakalt canal (Mit-Yazid command area) Figures (84 & 85) present average seasonal ratios of the escape time and volume in
Dakalt canal from during different summer and winter seasons. During summer seasons, and considering the time of escape flow, the values were between 6.4% in summer 2012 and 17.5% in summer 2013. The volume of escape flow (as a ratio from water supply at the head) was very low in summer 2008 (1.1%). During other summer seasons, the ratios were between 2.3% in summer 2012 and 6.0% in summer 2010.
During winter seasons, the ratios for the time of escape flow were between 12.5% in winter 2009-10 and ~26.0% in winter 2010-11 and winter 2012-13. The ratios for volume of escape flow were between 1.2% in winter 2009-10 and 12.9% in winter 2010-11.
5.2.3.2 Besentway canal (El-Mahmoudia command area) Figures (86 & 87) present seasonally escape-flow time at the tail end of Besentway
canal during different summer and winter seasons. Considering summer seasons, the ratio of summer 2009 was considerably high (18.4%). For other seasons, the ratios were between 0.6% in summer 2011 and 4.8% in summer 2010.
During winter seasons, the ratio was very high during winter 2008-09 (22.5%). In the following three seasons, the ratios were between 12.8% and 17.5%, and the ratio decreased significantly during last season (2.3%).
13.3%
1.1%
14.4%
6.0%9.5%
2.7%6.4%
2.3%
17.5%
3.5%
0%
10%
20%
30%
40%
50%
Escape flow time Escape flow volume
Rat
io %
S 2008 S 2009 S 2010 S 2011 S 2012 S 2013
Figure (84): Average seasonally escape flow time and volume at the end of Dakalt canal during different summer seasons

85
22.0%
8.7%12.5%
1.2%
25.7%
12.9%13.4%
4.0%
26.0%
11.5%
0%
10%
20%
30%
40%
50%
Escape flow time Escape flow volume
Rat
io %
W 2008-09 W 2009-10 W 2010-11 W 2011-12 W 2012-13
Figure (85): Average seasonally escape flow time and volume at the end of Dakalt canal during different winter seasons
4.3%
18.4%
4.8%
0.6%2.0% 1.1%
0%
10%
20%
30%
40%
50%
Esca
pe ra
tio %
S 2008 S 2009 S 2010 S 2011 S 2012 S 2013
Figure (86): Average seasonally escape flow time at the tail end of Besentway canal during different summer seasons

86
22.5%
12.8%
16.9% 17.5%
2.3%
0%
10%
20%
30%
40%
50%Es
cape
ratio
%
W 2008-09 W 2009-10 W 2010-11 W 2011-12 W 2012-13
Figure (87): Average seasonally escape flow time at the tail end of Besentway canal during different winter seasons
5.2.3.3 El-Berka canal (El-Mahmoudia command area) In El-Berka canal, there was a gradual decrease in escape flow ratios during both
summer and winter seasons. During summer seasons, there was no escape flow in summer 2008! During the following seasons, the ratios decreased from 13.1% in summer 2009 to 0.3% in summer 2012 and increased again to 1.8% in summer 2013. During winter seasons, the ratios decreased gradually from 13.5% in winter 2008-09 to 0.9% in winter 2012-13.
The decrease of escape flow ratios in some canals, such as Besentway and El-Berka during last seasons, raises an important question about the responsibility of applying the continuous flow about the increase of the escape flow. We should consider that all downstream automatic gates were out of service and the system was not applied in the right way as was discussed in many previous reports. With the return to the rotation system during last seasons, the escape flow decreased.

87
0.0%
5.7%4.3%
0.3%1.8%
13.1%
0%
10%
20%
30%
40%
50%Es
cape
ratio
%
S 2008 S 2009 S 2010 S 2011 S 2012 S 2013
Figure (88): Average seasonally escape flow time at the tail end of El-Berka canal during different summer seasons
13.5%
9.3%
2.9%0.9%
12.1%
0%
10%
20%
30%
40%
50%
Esca
pe ra
tio %
W 2008-09 W 2009-10 W 2010-11 W 2011-12 W 2012-13
Figure (89): Average seasonally escape flow time at the tail end of El-Berka canal during different summer seasons
5.2.4 Feeding back from the drains One of the points that are required to explain the results is the feeding back from the
drains. Water supply values for some tail end canals, such as El-Masharka, were very low, while they were considerably high for other canals, such as El-Gemeiza. The

88
difference between these two canals is related to the dependence on the drainage water to complete their water requirements. This sub-section presents the average values of the measured discharges in three canals in Mit Yazid command area. The first is at the beginning of DS El-Mofty region (Sefsafa), the second is at the end of DS El-Mofty region (El-Masharka), and the third is at the end of El-Zawia (El-Gemeiza)
In Sefsafa canal (figures 90 & 91), the ratios of the feeding back from the drain during summer seasons constituted between 21% & 45% of total water supply to the canal. During winter seasons, the ratios were between 26% & 50%.
In El-Masharka canal (figures 92 & 93), the ratios of the feeding back from the drain during summer seasons constituted between 63% & 82% of total water supply to the canal. During winter seasons, the ratios were between 51% & 66%.
In El-Gemeiza canal (figures 94 & 95), the ratios of the feeding back from the drain during summer seasons constituted between 21% & 32% of total water supply to the canal. During winter seasons, the ratios were between 24% & 28%.
Such results could explain low RWS values at the head of some canals, such as El-Masharka. Two additional points have to be considered in that regard. First, farmers are using the drainage water from the drains directly and such amount should be added to the feeding back values, but it was not calculated. Second, some canals are connected from their tail end to other canals (not drains), such as Khadega and Bahr Semella.
0.50
0.34
0.56
0.45
0.56
0.15
0.00
0.20
0.40
0.60
0.80
1.00
From Head From Drain
Ave
val
ue fo
r mea
sure
d di
scha
rges
(m3 /s
ec)
S 2011 S 2012 S 2013
Figure (90): Average measured discharges downstream Sefsafa head regulator and at the tail end of Safan canal (from Nashart drain) during
summer seasons

89
0.21
0.210.
26
0.26
0.19
0.07
0.00
0.20
0.40
0.60
0.80
1.00
From Head From Drain
Ave
val
ue fo
r mea
sure
d di
scha
rges
(m3 /s
ec)
W 2011-2012 W 2012-2013 W 2013-2014
Figure (91): Average measured discharges downstream Sefsafa head regulator and at the tail end of Safan canal (from Nashart drain) during
winter seasons
0.08
0.37
0.19
0.32
0.16
0.32
0.00
0.10
0.20
0.30
0.40
0.50
From Head From Drain
Ave
val
ue fo
r mea
sure
d di
scha
rges
(m3 /s
ec)
S 2011 S 2012 S 2013
Figure (92): Average measured discharges downstream El-Masharka head regulator and at its tail end (from Nashart drain) during summer seasons

90
0.17 0.17
0.12 0.
14
0.09
0.17
0.00
0.10
0.20
0.30
0.40
0.50
From Head From Drain
Ave
val
ue fo
r mea
sure
d di
scha
rges
(m3 /s
ec)
W 2011-2012 W 2012-2013 W 2013-2014
Figure (93): Average measured discharges downstream El-Masharka head regulator and at its tail end (from Nashart drain) during winter seasons
1.17
0.39
1.49
0.40
1.07
0.50
0.00
0.40
0.80
1.20
1.60
2.00
From Head From Drain
Ave
val
ue fo
r mea
sure
d di
scha
rges
(m3 /s
ec)
S 2011 S 2012 S 2013
Figure (94): Average measured discharges downstream El-Gemeiza head regulator and at its tail end (from El-Gharbiya main drain) during summer
seasons

91
0.67
0.26
0.56
0.18
0.71
0.25
0.00
0.40
0.80
1.20
1.60
2.00
From Head From Drain
Ave
val
ue fo
r mea
sure
d di
scha
rges
(m3 /s
ec)
W 2011-2012 W 2012-2013 W 2013-2014
Figure (95): Average measured discharges downstream El-Gemeiza head regulator and at its tail end (from El-Gharbiya main drain) during winter
seasons
5.3 Drainage run-off values Drainage ratio is the main indicator to assess the irrigation efficiency. However, the
precise calculation of such indicator is difficult as it is hard to define a catchment area with explicit boundary conditions. Each canal is served by more than one drain and each drain is serving more than one canal. To overcome such difficulty, average water supply value for a unit area of the branch canal with average runoff value for a unit area of the drain, were compared to define the drainage ratio. As the investigated drains were serving more than one canal, and the contribution of these canals were different some results were illogic results. Another point is that the served areas of some drains were not precise as only a part of these drains were considered, and the flow measurements were not performed at the tail ends of these drains.
5.3.1 Secondary drains in El-Mahmoudia canal Figures (97 & 97) present seasonal runoff values for El-Ghezlan and Abes secondary
drains in El-Mahmoudia command area during different summer & winter seasons.
During summer seasons:
The values in El-Ghezlan drain were completely different between first three seasons and later seasons. It should be mentioned that the methodology has changed from using flow-stage relationship to calculate drainage runoff values to using the actual measurements. The values during three first seasons were

92
between 27.0 and 35.0m3/fed/day! In the last three seasons, the values were between 15.0 and 17.0m3/fed/day. It was hard to apply the methodology in the first three seasons as there were no actual measurements in these drains during these period and the equation was developed based on the measurements during the monitoring programme of IIP1.
In Abes drain, the data was not available during first summer seasons. For the other seasons, the values were between 16.0 and 22.5m3/fed/day.
During winter seasons:
In El-Ghezlan, there was a considerable difference between first three seasons and last two seasons. The values in the first three seasons were between 15.0 and 26.0m3/fed/day. In the last two seasons, the values were between 6.0 and 10.0m3/fed/day.
In Abes drain, the value of the first season was very high (24.0m3/fed/day). For the following seasons, the values were between 15.0 and 19.0m3/fed/day.
Figure (68 & 69) present two examples about the fluctuation of the flow measurements during summer 2013.
26.9
35.3
16.8
30.6
22.5
15.3
19.8
15.517.317.8
16.0
0.0
5.0
10.0
15.0
20.0
25.0
30.0
35.0
40.0
El-Ghezlan Abes
Seas
onal
ly d
rain
age
runo
ff (m
3 /fed/
day)
S 2008 S 2009 S 2010 S 2011 S 2012 S 2013
Figure (96): Average seasonal runoff values for El-Ghezlan and Abes secondary drains during summer seasons

93
15.3
24.0 25.9
15.4 14.8 14.8
6.0
16.5
9.6
18.8
0.0
5.0
10.0
15.0
20.0
25.0
30.0
35.0
40.0
El-Ghezlan Abes
Sea
sona
lly d
rain
age
runo
ff (m
3 /fed
/day
)
W 2008-09 W 2009-10 W 2010-011 W 2011-012 W 2012-013
Figure (97): Average seasonal runoff values for El-Ghezlan and Abes secondary drains during winter seasons
5.3.2 Secondary drains in Mit Yazid command area In Mit Yazid command area, drainage runoff values were studied in two secondary
drains; El-Raghama that serves Dakalt canal and El-Bashier that serves part of Mars El-Gamal canal.
During summer seasons (figure 98), the results were as follows:
In El-Raghama drain, there was no significant difference between first and last seasons regardless the change of the methodology except having high values in the last two seasons (~21.0m3/fed/day). During other seasons, the values were between 14.6m3/fed/day in summer 2011 and 18.9m3/fed/day in summer 2010.
In El-Bashier, the value in the last season was considerably low (8.3m3/fed/day). This value might be affected by the change of the measurement location. For other seasons, there was a fluctuation in the results (between 16.0 and 22.5m3/fed/day)
During winter seasons (figure 99), the results for winter 2010-11 were not available as the programme was stopped for big period of it. For other seasons, the results were as follows:
In El-Raghama drain, the values were between 5.4m3/fed/day in winter 2009-10 and 8.3m3/fed/day in winter 2012-13. During last season (winter 2013-14), the value was considerably high (14.9m3/fed/day)
In El-Bashier drain, the values were considerably higher especially in the first two seasons (13.4 and 18.3m3/fed/day). During last three seasons, the values were 9.8 and 13.4m3/fed/day respectively.

94
16.0 17
.0
20.6
18.9
16.0
14.6
22.5
21.3
16.7
20.5
8.3
0.0
5.0
10.0
15.0
20.0
25.0
30.0
El-Raghama El-Bashier
Seas
onal
ly d
rain
age
run
off (
m3 /fe
d/da
y)
S 2008 S 2009 S 2010 S 2011 S 2012 S 2013
Figure (98): Average seasonal runoff values for El-Raghama and El-Bashier secondary drains during summer seasons
7.1
13.4
5.4
18.3
6.3
9.8 8.3
13.4 14.9
11.8
0.0
5.0
10.0
15.0
20.0
25.0
30.0
El-Raghama El-Bashier
Seas
onal
ly d
rain
age
runo
ff (m
3 /fed
/day
)
W 2008-09 W 2009-10 W 2010-011 W 2011-012 W 2012-013 W 2013-014
Figure (99): Average seasonal runoff values for El-Raghama and El-Bashier secondary drains during winter seasons
5.3.3 The drainage ratios The drainage runoff values were affected by many factors, and this led to some illogic
results as was discussed before. During some seasons, average calculated runoff values that were presented before exceeded the average water supply for a unit area. Therefore,

95
only few summer seasons are presented here (figure 100). The results in this figure showed the following:
The drainage ratios for El-Raghama drains during last two seasons (60% and 54%) were close to its normal values that were recorded before during the monitoring of IIP1 that was obtained from the equations. The ratio for summer 2011 was an odd value and it was likely affected by some constructions in the drain during this time that affected the measured discharges.
In El-Ghezlan drain the values of summer 2013 was illogic due to the problems in calculating water supply value in Besentway canal (check the report of summer 2013). For the other two summer seasons, the ratios were 38% & 42% respectively.
The values for El-Bashier and Abes drains were always high values. The values decreased during summer 2013. The reduction in El-Bashier was very big and it was affected by changing the location of measuring the flow in the drain. The values in Abes drain during summer 2013 became close to the normal range of drainage ratios.
In general, the values of El-Raghama and El-Ghezlan drains were the most trusted data and the difference between them might reflect the change in rice ratios in Mit Yazid and El-Mahmoudia command areas.
28%
80%
38%
82%
60%
69%
42%
79%
54%
24%
63%
0%
10%
20%
30%
40%
50%
60%
70%
80%
90%
El-Raghama El-Bashier El-Ghezlan Abes
Run
off r
atio
s (%
)
S 2011 S 2012 S 2013
Figure (100): seasonally run off ratio of El-Raghama and Abes drains from summer 2011 to summer 2013

96
5.4 Water use index (WUI) values Based on water supply and water requirements values that were presented before,
WUI values were calculated for different investigated branch canals.
5.4.1 El-Mahmoudia command area Regarding the investigated branch canals in El-Mahmoudia command area, the results
were as follows:
During summer seasons (figure 101):
In Nekla canal, most of the values were between 1.59 in summer 2011 and 2.12 in summer 2013. The values of summer 2008, 2009 and 2012 were close to 1.8.
In Besentway canal, the value of the last season was suspicious as was described in summer 2013 report. The value of summer 2011 was considerably high as well (2.17). Other values were ~1.5 during summer 2008 & 2010 and ~1.8 during summer 2009 and 2012.
El-Berka canal has higher values in most of the seasons (between 1.87 and 2.42). During the last season, the value was also accused as was the case in Besentway and it was 1.15.
El-Karion and El-Beda had similar values representing the tail end conditions and most of the values were between 1.15 and 1.5.
The values in the control canal (Bany Helal) were considerably high. Except first and last seasons, where the values were between 1.7 and 1.8, the values were between 2.28 and 2.6.
During winter seasons (figure 102), the values were considerably higher than summer season as follows:
In Nekla canal, the value of winter 2009-10 was very high (3.9). During other seasons, the values were between 1.8 and 2.7.
In Besentway canal, the accuracy problem continued during last winter season and the value of winter 2013-14 was illogic. During other seasons, the values were between 1.6 and 2.7.
El-Berka canal had the highest values and this was the trend of the canal during previous programme as well. The values during the first two seasons were very high (3.9 and 4.5 respectively). During the following seasons, the values were between 2.4 and 3.1.
El-Karion canal had very low value during last season (0.7). The values of the previous seasons were lower than other canals including El-Saraniya and El-Beda! The values were between 1.2 and 1.8.
WUI values were calculated for El-Saraniya canal during first two seasons only. The values were 2.0 and 2.2 respectively.

97
WUI values in El-Beda was low during winter 2011-12 and 2012-13 (1.6 and 1.3). During other seasons, the values were between 1.9 and 2.1.
The values in the control canal (Bany Helal) were considerably high and they were between 2.6 and 3.6.
0.0
0.5
1.0
1.5
2.0
2.5
3.0
3.5
4.0
4.5
5.0
Nekla
Besen
tway
El-Berk
a
El-Kari
on
El-Bed
a
Bany H
elal
WU
I
S 2008 S 2009 S 2010 S 2011 S 2012 S 2013
Figure (101): WUI values for branch canals in El-Mahmoudia command area during different summer seasons
0.0
0.5
1.0
1.5
2.0
2.5
3.0
3.5
4.0
4.5
5.0
WU
I
W 2008-09 W 2009-10 W 2010-2011W 2011-2012 W 2012-2013 W 2013-2014
Figure (102): WUI values for branch canals in El-Mahmoudia command area during different winter seasons

98
5.4.2 Mit Yazid command area It Mit Yazid command area, the values of WUI values could be summarized as
following:
During summer seasons (figure 103):
In Khadega canal, the values were very low for head canal as there was another source from Neshil El-Gededa not considered. The values were not available for all seasons and the available values were between 0.6 and 1.2.
In Bahr Nemra canal, the values were available for the last three years and they decreased gradually from 1.23 to 0.8.
The most stable results were for Dakalt and Shalma canals and they were between 1.5 and 1.9.
WUI values for El-Masharka were very low, and the dependence on the drainage water was discussed before. The values were between 0.2 and 0.6.
The values of Mars El-Gamal were close to the values of Dakalt and Shalma, but the stability was lower. The values were between 1.3 and 1.8.
In El-Gemeiza canal, the values in the first three seasons were considerably lower than the values in the last three seasons. In the first three seasons, the values were between 0.6 and 0.8. During last three seasons, the values were between 1.2 and 1.4.
In Bahr Semella (control canal), the values were higher in first and last seasons (~1.5). For other seasons, the values were between 1.0 and 1.2.
During winter seasons (figure 104), the values were higher as was the case in El-Mahmoudia command area and they were as follows:
In Khadega canal, the values were between 0.9 and 1.9.
In Bahr Nemra canal, the values decreased gradually from 1.8 in winter 2010-11 to 1.0 in winter 2012-13, and it increased again to 1.7 in sinter 2013-14.
In Dakalt canal, the values were still steady and they decreased gradually from 2.5 in winter 2008-09 to 2.0 in winter 2012-13.
Shalma canal had very high values (between 2.7 in winter 2010-11 and 3.6 in winter 2008-09).
El-Masharka canal had considerably high value in winter 2008-09 (2.1). During other seasons, the values were between 0.7 and 1.0
In Mars El-Gamal canal, there was a fluctuation in the results, which were between 1.2 and 2.0
El-Gemeiza canal had very high values as a tail-end canal especially during winter 2012-13 and winter 2013-14 (3.2 & 3.0 respectively). During other seasons, the values were between 2.0 and 2.8.
Bahr Semella canal had high value during the first season (2.5). During other seasons, the values were between 1.5 and 1.8.

99
0.0
0.5
1.0
1.5
2.0
2.5
3.0
3.5
4.0
4.5
5.0
Khade
ga
Bahr N
emra
Dakalt
Shalm
a
El-Mas
harka
Mars E
l-Gam
al
El-Gem
eiza
Semell
a
WU
I
S 2008 S 2009 S 2010 S 2011 S 2012 S 2013
Figure (103): WUI values for branch canals in Mit Yazid command area during different summer seasons
0.0
0.5
1.0
1.5
2.0
2.5
3.0
3.5
4.0
4.5
5.0
WU
I
W 2008-09 W 2009-10 W 2010-11 W 2011-12 W 2012-13 W 2013-14
Figure (104): WUI values for branch canals in Mit Yazid command area during different summer seasons

100
6. Pumps Results
6.1 Collected data
6.1.1 Selected fields This part discusses fields in the investigated branch canals. This does not reflect the
cropping pattern in the selected canals, but it gives an idea about the intensity of different crops and therefore, its effect on different results.
6.1.1.1 Summer season During summer seasons, the selected fields (for major crops) were as follows:
In Nekla canal, selected rice fields were between 16 fields in summer 2012 and 29 fields in summer 2011. Cotton fields were between 5 fields in summer 2013 and 8 fields in summer 2012.
29
1618
68
5
0
5
10
15
20
25
30
35
S 2011 S 2012 S2013
No
of fi
elds
Rice Cotton
Figure (105): number of selected fields for summer crops in Nekla canal
In El-Beda canal, the number of rice fields was low in summer 2012 (8 fields). During other seasons, the number were between 15 in summer 2008 & summer 2010 and 20 fields in summer 2009. The second major crop was the maize. The number of fields was low in summer 2013 (four fields). During other seasons, the numbers were between 16 in summer 2009 and 21 in summer 2008 and summer 2010. Rice was not the dominant due to the water shortage in this area.

101
15
20
15 16
8
16
21
16
21 20
17
4
0
5
10
15
20
25
30
35
S 2008 S 2009 s2010 S 2011 S 2012 S2013
No
of fi
elds
Rice Corn
Figure (106): number of selected fields for summer crops in El-Beda canal
In Bahr Nemra canal, selected rice fields were 19 fields in summer 2011. During the two consecutive seasons, numbers of fields were 28 and 29. Number of cotton fields was 17 fields in summer 2011. In the next two seasons, the numbers were 7 and 8.
In El-Gemeiza canal, rice crop was the dominant crop although it is a tail end canal as it depends on the drainage water. Number of rice fields were between 20 fields in summer 2010 and 27 fields in summer 2013. Number of cotton fields were between 9 fields in summer 2013 and 15 fields in summer 2011.

102
19
29 28
17
7 8
0
5
10
15
20
25
30
35
S 2011 S 2012 S2013
No
of fi
elds
Rice Cotton
Figure (107): number of selected fields for summer crops in Bahr Nemra canal
25 24
20 21 22
27
11 12 12
15 14
9
0
5
10
15
20
25
30
35
S 2008 S 2009 S2010 S 2011 S 2012 s2013
No
of fi
elds
Rice Cotton
Figure (108): number of selected fields for summer crops in El-Gemeiza canal
6.1.1.2 Winter season The major crops in winter seasons were Berseem and wheat.

103
In Nekla canal, Berseem fields were more in winter 2011-12 (21) and they were less in the other (15 & 16).
In El-Beda canal, wheat fields were between 9 fields in winter 2012-13 and 23 fields in winter 2013-14. Berseem fields were between 9 fields in winter 2013-14 and 27 fields in winter 2012-13.
15
21
15 16
2120
0.0
5.0
10.0
15.0
20.0
25.0
W11-12 W12-13 W13-14
No
of fi
eld
Berseem Wheat
Figure (109): number of selected fields for winter crops in Nekla canal
27
911
9
2325 25
2423
1112
13
0.0
5.0
10.0
15.0
20.0
25.0
30.0
W08-09 W09-10 W10-11 W11-12 W12-13 W13-14
No
of fi
eld
Berseem Wheat
Figure (110): number of selected fields for winter crops in El-Beda canal

104
In Bahr Nemra canal, both Berseem and wheat fields were 18 fields in all winter seasons.
In El-Gemeiza canal, there were three major crops: wheat, Berseem and sugar beet. Wheat fields were between 12 fields in winter 2011-12 and 18 fields in winter 2009-10. Berseem fields were between 10 fields in winter (2011-12, 2013-14) and 18 fields in winter 2011-11. Sugar beet fields were between two fields in winter 2010-11 and 14 fields in winter 2011-12.
1818 18 1818 18
0.0
5.0
10.0
15.0
20.0
25.0
W11-12 W12-13 W13-14
No
of fi
eld
Berseem Wheat
Figure (111): number of selected fields for winter crops in Bahr Nemra canal

105
16
13
18
1011
10
1716 16
3
5
2
14
910
18
16
12
0.0
5.0
10.0
15.0
20.0
25.0
W08-09 W09-10 W10-11 W11-12 W12-13 W13-14
No
of fi
eld
Berseem Wheat Suger Beat
Figure (112): number of selected fields for winter crops in El-Gemeiza canal
6.1.2 Irrigation results This part summarizes the results regarding number of irrigations and total irrigation
time during different seasons. This section presents average seasonal values. However, there was high dispersion of the data regardless these average values, and could be checked in previous seasonal reports.
6.1.2.1 Summer crops The concern in summer seasons will be about rice and cotton crops.
6.1.2.1.1 Rice crop In Nekla canal, average seasonal values for number of irrigations were between
26.6 in summer 2012 and 33.0 in summer 2011. The average values for total irrigation time were between 51.0 hr/fed in summer 2013 and 57.0 hr/fed in summer 2011 and summer 2012.
In El-Beda canal, there was a difference in numbers of irrigations between the last two seasons and previous seasons. From summer 2008 to summer 2011, the average values were between 19.5 and 20.5. In the last two seasons, the values were 25.0 and 23.0 respectively. Regarding total irrigation time, the value was very low in summer 2009 (37.7 hr/fed). During the other seasons, the values were between 47.0 and 60.0 hr/fed.

106
33.0
26.628.4
57.2 57.1
51.1
0.0
5.0
10.0
15.0
20.0
25.0
30.0
35.0
S 2011 S 2012 S 2013
No
of ir
rigat
ions
10.0
20.0
30.0
40.0
50.0
60.0
70.0
80.0
Tota
l irr
igat
ion
time
(hr/f
ed)
No of Irr Irr Time
Figure (113): Average seasonal values for number of irrigations and total irrigation time for rice crop in Nekla canal during different summer seasons
20.919.4 19.7 19.4
25.023.1
56.4
37.7
59.956.2
47.151.0
0.0
5.0
10.0
15.0
20.0
25.0
30.0
S 2008 S 2009 S 2010 S 2011 S 2012 S 2013
No
of ir
rigat
ions
10.0
20.0
30.0
40.0
50.0
60.0
70.0
Tota
l irr
igat
ion
time
(hr/f
ed)
No of Irr Irr Time
Figure (114): Average seasonal values for number of irrigations and total irrigation time for rice crop in El-Beda canal during different summer
seasons
In Bahr Nemra canal, there was a gradual increase in the number of irrigations (from 19.0 in summer 2011 to 26.2 in summer 2013) and in total irrigation time (from 34.9 hours/fed in summer 2011 to 58.4 hr/fed in summer 2013).

107
In El-Gemeiza canal, number of irrigation was lower in summer 2009 (20.5). For other seasons, the values were between 23.5 and 25.1. Total irrigation time was very low in summer 2008 (27.3 hr/fed). The values increased gradually to 45.3 hr/fed in summer 2011, and then they decreased slightly to 41.1 hr/fed in summer 2013.
19.020.6
26.2
34.9
42.2
58.4
0.0
5.0
10.0
15.0
20.0
25.0
30.0
S 2011 S 2012 S 2013
No
of ir
rigat
ions
10.0
20.0
30.0
40.0
50.0
60.0
70.0
Tota
l irr
igat
ion
time
(hr/f
ed)
No of Irr Irr Time
Figure (115): Average seasonal values for number of irrigations and total irrigation time for rice crop in Bahr Nemra canal during different summer
seasons

108
24.9
20.5
23.525.1
23.8 24.3
27.3
38.2
45.0 45.3 43.841.4
0.0
5.0
10.0
15.0
20.0
25.0
30.0
S 2008 S 2009 S 2010 S 2011 S 2012 S 2013
No
of ir
rigat
ions
10.0
20.0
30.0
40.0
50.0
60.0
70.0
80.0
Tota
l irr
igat
ion
time
(hr/f
ed)
No of Irr Irr Time
Figure (116): Average seasonal values for number of irrigations and total irrigation time for rice crop in El-Gemeiza canal during different summer
seasons
6.1.2.1.2 Cotton crop Regarding the results of cotton crop:
In Nekla canal, average seasonal values for number of irrigations were between 5.8 in summer 2012 and 7.3 in summer 2011. Total irrigation time was different from season to the other (26.5 hr/fed in summer 2011, 12.8 hr/fed in summer 2011 and 15.6 hours/fed in summer 2013)
In Bahr Nemra canal, numbers of irrigation were considerably low (between 4.1 in summer 2012 and 5.9 in summer 2011). Total irrigation time values were between 12.0 hr/fed in summer 2012 and 20.1 hr/fed in summer 2013.
In El-Gemeiza canal, the average seasonal values for number of irrigations were between 5.9 irrigation in summer 2011 and 8.4 irrigation in summer 2008. The average values for total irrigation time were between 12.1 hr/fed in summer 2011 and 20.5 in summer 2010.

109
7.3
5.8
6.826.5
12.8
15.6
0.0
1.0
2.0
3.0
4.0
5.0
6.0
7.0
8.0
S 2011 S 2012 S 2013
No
of ir
rigat
ions
0.0
4.0
8.0
12.0
16.0
20.0
24.0
28.0
32.0
Tota
l irr
igat
ion
time
(hr/f
ed)
No of Irr Irr Time
Figure (117): Average seasonal values for number of irrigations and total irrigation time for cotton crop in Nekla canal during different summer
seasons
5.9
4.1
5.5
16.6
12.0
20.1
0.0
1.0
2.0
3.0
4.0
5.0
6.0
7.0
S 2011 S 2012 S 2013
No
of ir
rigat
ions
0.0
4.0
8.0
12.0
16.0
20.0
24.0
28.0
Tota
l irr
igat
ion
time
(hr/f
ed)
No of Irr Irr Time
Figure (118): Average seasonal values for number of irrigations and total irrigation time for cotton crop in Bahr Nemra canal during different summer
seasons

110
8.4
7.4 7.6
5.96.3
7.9
16.3 16.8
20.5
12.114.2
19.2
0.0
1.0
2.0
3.0
4.0
5.0
6.0
7.0
8.0
9.0
S 2008 S 2009 S 2010 S 2011 S 2012 S 2013
No
of ir
rigat
ions
0.0
4.0
8.0
12.0
16.0
20.0
24.0
28.0
32.0
Tota
l irr
igat
ion
time
(hr/f
ed)
No of Irr Irr Time
Figure (119): Average seasonal values for number of irrigations and total irrigation time for cotton crop in El-Gemeiza canal during different summer
seasons
6.1.2.2 Winter crops In winter seasons, the major crops were Berseem and wheat crops.
6.1.2.2.1 Berseem crop The results of number of irrigations and total irrigation time for Berseem crop in
different investigated canals were as follows:
In Nekla canal, average seasonal number of irrigation increased 6.5 in winter 2011-12 to 9.5 in winter 2012-13 and decreased in winter 2013-14 to 4.47. Total irrigation time increased from 20.0 hr/fed in winter 2011-12 to 26.25 hr/fed in winter 2012-13 and decreased to 13.1 hr/fed in winter 2013-14.
In El-Beda canal, average seasonal number of irrigations was between 4.6 and 7.1. The average values for total irrigation time were between 13.9 and 25.0 hr/fed.
In Bahr Nemra canal, average seasonal numbers of irrigation increased 5.9 in winter 2011-12 to 7.1 in winter 2013-14. Total irrigation time increased from 16.2 hr/fed in winter 2011-12 to 20.2 hr/fed in winter 2013-14.
In El-Gemeiza canal, average seasonal number of irrigations was between 4.0 and 8.4. The average values for total irrigation time were between 9.0 and 17.9 hr/fed.

111
6.5
9.5
4.5
20.5
26.3
13.1
0.0
1.0
2.0
3.0
4.0
5.0
6.0
7.0
8.0
9.0
10.0
11.0
12.0
W11-12 W12-13 w13-14
No
of ir
rigat
ions
0.0
3.0
6.0
9.0
12.0
15.0
18.0
21.0
24.0
27.0
30.0
33.0
36.0
Tota
l irr
igat
ion
time
(hr/f
ed)
No of Irr Irr Time
Figure (120): Average seasonal values for number of irrigations and total irrigation time for Berseem crop in Nekla canal during different winter
seasons
6.4
7.2
6.5
5.1
6.7
4.621.3
23.622.1
18.6
24.9
13.9
0.0
1.0
2.0
3.0
4.0
5.0
6.0
7.0
8.0
W08-09 W09-10 W10-11 W11-12 W12-13 w13-14
No
of ir
rigat
ions
0.0
4.0
8.0
12.0
16.0
20.0
24.0
28.0
32.0
Tota
l irr
igat
ion
time
(hr/f
ed)
No of Irr Irr Time
Figure (121): Average seasonal values for number of irrigations and total irrigation time for Berseem crop in El-Beda canal during different winter
seasons

112
5.9 6.2 7.1
16.2 17.3
20.2
0.0
2.0
4.0
6.0
8.0
10.0
12.0
14.0
16.0
18.0
20.0
22.0
0.0
1.0
2.0
3.0
4.0
5.0
6.0
7.0
8.0
9.0
10.0
11.0
12.0
w11-12 w12-13 w13-14
Tota
l irr
igat
ion
time
(hr/f
ed)
No
of ir
rigat
ions
No of Irr Irr Time
Figure (122): Average seasonal values for number of irrigations and total irrigation time for Berseem crop in Bahr Nemra canal during different winter
seasons
8.4 8.2
4.0
7.1
7.78
17.4 16.9
9.0
16.717.8 18.0
0.0
1.0
2.0
3.0
4.0
5.0
6.0
7.0
8.0
9.0
10.0
W08‐09 W09‐10 W10‐11 W11‐12 W12‐13 W13‐14
No of irrig
ations
0.0
3.0
6.0
9.0
12.0
15.0
18.0
21.0
24.0
27.0
30.0
Total irrigation tim
e (hr/fed)
No of Irr Irr Time
Figure (123): Average seasonal values for number of irrigations and total irrigation time for Berseem crop in El-Gemeiza canal during different winter
seasons
6.1.2.2.2 Wheat crop

113
The results of number of irrigations and total irrigation time for Berseem crop in different investigated canals were as follows:
In Nekla canal, average seasonal numbers of irrigation were 3.3 in all winter seasons. Total irrigation time decreased from 12.0 hr/fed in winter 2011-12 to 9.7 hr/fed in winter 2013-14.
In El-Beda canal, average seasonal numbers of irrigations were between 2.44 and 4.1. The average values for total irrigation time were between 8.9 and 15.0 hr/fed.
In Bahr Nemra canal, average seasonal numbers of irrigation were between 3.4 hr/fed in winter 2012-13and 3.8 hr/fed in winter 2013-14. Total irrigation time increased from 10.4 hr/fed in winter 2011-12 to 12.1 hr/fed in winter 2013-14.
In El-Gemeiza canal, average seasonal numbers of irrigations were between 2.4 and 4.2. The average values for total irrigation time were between 5.6 and 10.6 hr/fed.
3.3 3.3 3.3
12.0
10.39.7
0.0
1.0
2.0
3.0
4.0
5.0
6.0
W11-12 W12-13 W13-14
No
of ir
rigat
ions
0.0
3.0
6.0
9.0
12.0
15.0
18.0
Tota
l irr
igat
ion
time
(hr/f
ed)
No of Irr Irr Time
Figure (124): Average seasonal values for number of irrigations and total irrigation time for wheat crop in Nekla canal during different winter seasons

114
4.1 3.9
3.43.6
3.2
2.4
15.014.2
10.9
13.212.5
8.9
0.0
1.0
2.0
3.0
4.0
5.0
6.0
W08-09 W09-10 W10-11 W11-12 W12-13 W13-14
No
of ir
rigat
ions
0.0
3.0
6.0
9.0
12.0
15.0
18.0
Tota
l irr
igat
ion
time
(hr/f
ed)
No of Irr Irr Time
Figure (125): Average seasonal values for number of irrigations and total irrigation time for wheat crop in El-Beda canal during different winter
seasons
3.5 3.4 3.8
10.4 11.2
12.1
0.0
2.0
4.0
6.0
8.0
10.0
12.0
14.0
0.0
1.0
2.0
3.0
4.0
5.0
6.0
7.0
8.0
w11-12 w12-13 w13-14
Tota
l irr
igat
ion
time
(hr/f
ed)
No
of ir
rigat
ions
No of Irr Irr Time
Figure (126): Average seasonal values for number of irrigations and total irrigation time for wheat crop in Bahr Nemra canal during different winter
seasons

115
4.1 4.2
2.4
3.7 3.7 3.8
8.9
10.4
5.6
9.6
10.610.0
0.0
1.0
2.0
3.0
4.0
5.0
6.0
W08‐09 W09‐10 W10‐11 W11‐12 W12‐13 W13‐14
No of irrig
ations
0.0
2.0
4.0
6.0
8.0
10.0
12.0
Total irrigation tim
e (hr/fed)
No of Irr Irr Time
Figure (127): Average seasonal values for number of irrigations and total irrigation time for wheat crop in El-Gemeiza canal during different winter
seasons
6.1.3 The salinity at different canals The salinity was assessed during pump study and the results were as follows:
In Nekla, the salinity values were low at the head (~ 0.1 ds/m) and at the middle (~ 0.2 ds/m). At the tail end, the values were considerable high (between 1.2 and 1.7 ds/m).
In El-Beda, the values still considerably low. The salinity at the head and the middle were in the average of 0.5 ds/m. at the tail end, the values were in the average of 0.8 ds/m.
In Bahr Nemra canal, highest salinity values were at the middle of the canal (~ 0.6 ds/m). At the head, the values were in the average of 0.2 ds/m and the tail end; the values were in the average of 0.4 ds/m.
In El-Gemeiza canal, the salinity values were between 0.45 and 1.0 ds/m with a variation between different depths and locations.

116
0.00
0.20
0.40
0.60
0.80
1.00
1.20
1.40
1.60
1.80
2.00
Haed Middle Tail
Soil
salin
ity (d
s/m
)
0-30 30-60 60-90
Figure (128): Average salinity values at different regions of Nekla canal
0.00
0.20
0.40
0.60
0.80
1.00
1.20
1.40
1.60
1.80
2.00
Head Middle Tail
Soil
salin
ity (d
s/m
)
0-30 30-60 60-90
Figure (129): Average salinity values at different regions of El-Beda canal

117
0.00
0.20
0.40
0.60
0.80
1.00
1.20
1.40
1.60
1.80
2.00
Haed Middle Tail
Soil
salin
ity (d
s/m
)
0-30 30-60 60-90
Figure (130): Average salinity values at different regions of Bahr Nemra canal
0.00
0.20
0.40
0.60
0.80
1.00
1.20
1.40
1.60
1.80
2.00
Haed Middle Tail
Soil
salin
ity (d
s/m
)
0-30 30-60 60-90
Figure (131): Average salinity values at different regions of El-Gemeiza canal

118
6.1.4 Productivity
6.1.4.1 Summer seasons
6.1.4.1.1 Rice crop During summer seasons, Production was as follows:
In Nekla canal, the values were between 2.2 ton and 3.8 ton. The lowest values were in summer 2013.
In El-Beda canal, the values were between 2.8 and 3.6 ton.
In Bahr Nemra canal, the values were between 2.8 and 3.5 ton.
In El-Gemeiza canal, the values at different locations were between 2.3 and 4 ton the highest values in summer 2012.
3.53.8
3.53.8
3.3
2.6
2.2
2.93.2
0.0
0.5
1.0
1.5
2.0
2.5
3.0
3.5
4.0
4.5
5.0
Head Middle Tail
Ric
e pr
oduc
tion
(ton/
fed)
2011 2012 2013
Fig (132): Rice production in Nekla canal during different seasons

119
2.9 3.02.8
3.6
2.93.2
2.92.6
0.0
0.5
1.0
1.5
2.0
2.5
3.0
3.5
4.0
4.5
5.0
Head Middle Tail
Ric
e pr
oduc
tion
(ton/
fed)
2011 2012 2013
Fig (133): Rice production in El-Beda canal during different seasons
2.8
3.2 3.23.0
3.3
2.9
3.53.3
2.8
0.0
0.5
1.0
1.5
2.0
2.5
3.0
3.5
4.0
4.5
5.0
Head Middle Tail
Ric
e pr
oduc
tion
(ton/
fed)
2011 2012 2013
Fig (134): Rice production in Bahr Nemra canal during different seasons

120
2.42.7
2.3
3.6
4.03.7
2.9
3.3 3.2
0.0
0.5
1.0
1.5
2.0
2.5
3.0
3.5
4.0
4.5
5.0
Head Middle Tail
Ric
e pr
oduc
tion
(ton/
fed)
2011 2012 2013
Fig (135): Rice production in El-Gemeiza canal during different seasons
6.1.4.1.2 Cotton crop In Nekla canal, there was no cotton at head region. The values in other location
were between 5.3 ton and 10.0 tons. The lowest values were in summer 2013.
In Bahr Nemra canal, the values were between 6.3 and 8.0 tons.
In El-Gemeiza canal, the values at different locations were between 5.0 and 8.9 tons. The highest values were in summer 2012.

121
7.98.8
6.8 6.6
10.0
5.3
0.0
2.0
4.0
6.0
8.0
10.0
12.0
Head Middle Tail
Cot
ton
prod
uctio
n (K
enta
r/fed
)
2011 2012 2013
Fig (136): Cotton production in Nekla canal during different seasons
6.37.1
6.7
8.0
6.5
8.28.3 8.2
0.0
2.0
4.0
6.0
8.0
10.0
12.0
Head Middle Tail
Cot
ton
prod
uctio
n (K
enta
r/fed
)
2011 2012 2013
Fig (137): Cotton production in Bahr Nemra canal during different seasons

122
6.86.3
5.6
8.5 8.6 8.9
5.05.6 5.5
0.0
2.0
4.0
6.0
8.0
10.0
12.0
Head Middle Tail
Cot
ton
prod
uctio
n (K
enta
r/fed
)
2011 2012 2013
Fig (138): Cotton production in El-Gemeiza canal during different seasons
6.1.4.1.3 Corn crop Corn crop find in El Beda canal only the values between 9.5 and 17.5 Ardap4.
9.510.3
11.2
16.4
11.012.212.0
11.0
17.5
0.0
2.0
4.0
6.0
8.0
10.0
12.0
14.0
16.0
18.0
20.0
Head Middle Tail
Cor
n pr
oduc
tion
(Ard
ab/fe
d
2011 2012 2013
Fig (139): Cotton production in El-Beda canal during different seasons
4 One Ardep equals 150 kg.
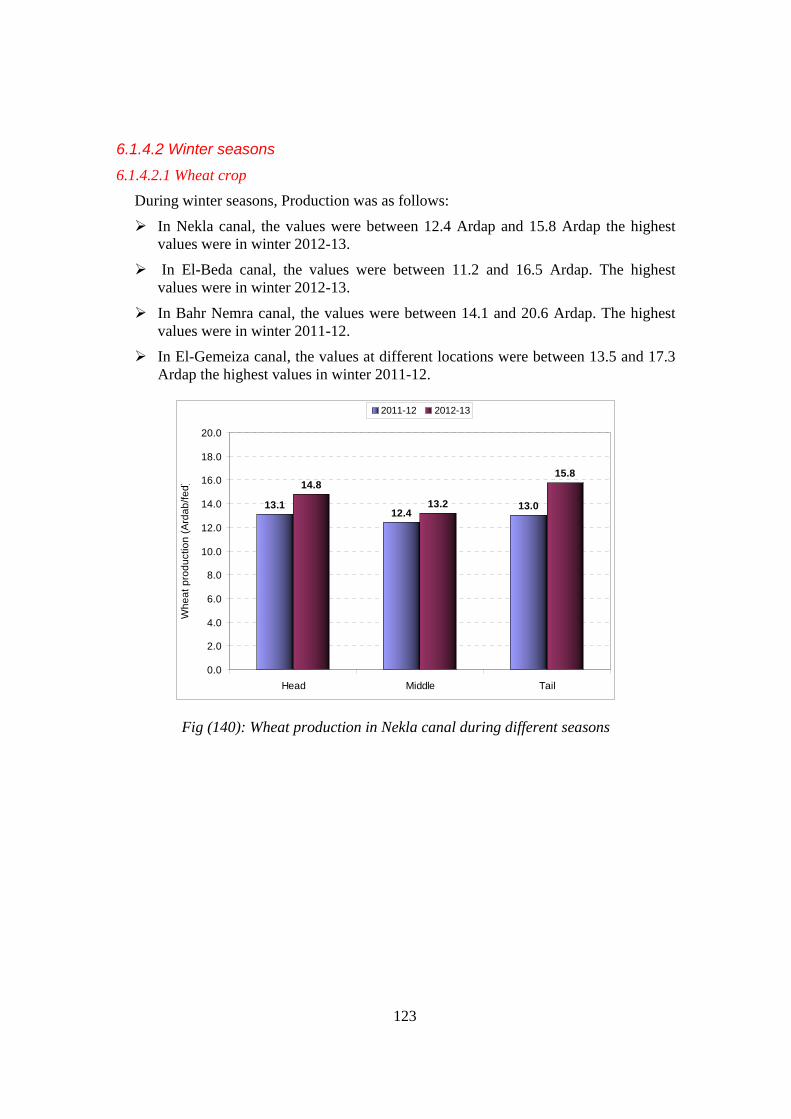
123
6.1.4.2 Winter seasons
6.1.4.2.1 Wheat crop During winter seasons, Production was as follows:
In Nekla canal, the values were between 12.4 Ardap and 15.8 Ardap the highest values were in winter 2012-13.
In El-Beda canal, the values were between 11.2 and 16.5 Ardap. The highest values were in winter 2012-13.
In Bahr Nemra canal, the values were between 14.1 and 20.6 Ardap. The highest values were in winter 2011-12.
In El-Gemeiza canal, the values at different locations were between 13.5 and 17.3 Ardap the highest values in winter 2011-12.
13.112.4
13.0
14.8
13.2
15.8
0.0
2.0
4.0
6.0
8.0
10.0
12.0
14.0
16.0
18.0
20.0
Head Middle Tail
Whe
at p
rodu
ctio
n (A
rdab
/fed)
2011-12 2012-13
Fig (140): Wheat production in Nekla canal during different seasons

124
11.2 11.7 11.8
13.5
16.5
11.4
0.0
2.0
4.0
6.0
8.0
10.0
12.0
14.0
16.0
18.0
20.0
Head Middle Tail
Whe
at p
rodu
ctio
n (A
rdab
/fed)
2011-12 2012-13
Fig (141): Wheat production in El-Beda canal during different seasons
17.2
20.6
14.816.4
14.1 14.4
0.0
2.0
4.0
6.0
8.0
10.0
12.0
14.0
16.0
18.0
20.0
22.0
Head Middle Tail
Whe
at p
rodu
ctio
n (A
rdab
/fed)
2011-12 2012-13
Fig (142): Wheat production in Bahr Nemra canal during different seasons

125
16.5 16.8 17.3
14.3
15.8
13.5
0.0
2.0
4.0
6.0
8.0
10.0
12.0
14.0
16.0
18.0
20.0
Head Middle Tail
Whe
at p
rodu
ctio
n (A
rdab
/fed)
2011-12 2012-13
Fig (143): Wheat production in El-Gemeiza canal during different seasons
6.1.4.2.2 Sugar beet crop Sugar beet found only in El-Gemeiza canal the values were between 18.4 and 22 ton.
19.4 20.021.0
18.4
22.0
18.6
0.0
3.0
6.0
9.0
12.0
15.0
18.0
21.0
24.0
27.0
30.0
Head Middle Tail
Whe
at p
rodu
ctio
n (A
rdab
/fed)
2011-12 2012-13
Fig (144): Sugar beet production in El-Gemeiza canal during different seasons

126
6.2 Analyzed data
6.2.1 WUI
6.2.1.1 Summer seasons During summer seasons, the results of WUI were as follows:
In Nekla canal, the values in the head were decreased from 1.65 to 1.1. In The other locations, the values were between 0.67 and 1.1.
In El-Beda canal, the values were between 0.77 and 1.6 except at the head and middle during summer 2008.
In Bahr Nemra canal, the values increased in all locations from summer 2011 to summer 2013. The values were between 0.77 and 1.8.
In El-Gemeiza canal, the values at different locations were between 0.7 and 2.0.
1.7
1.11.1
1.3
1.0
0.7
1.11.0 0.9
0.0
0.5
1.0
1.5
2.0
2.5
3.0
Head Middle Tail
WU
I
S 2011 S 2012 S 2013
Figure (145): WUI values in Nekla canal during summer seasons

127
2.6
2.2
1.61.5
1.4
1.1
1.9
1.7
1.3
0.8 0.8 0.8
1.51.6
0.9
1.7
0.9
1.2
0.0
0.5
1.0
1.5
2.0
2.5
3.0
Head Middle Tail
WU
I
S 2008 S 2009 S 2010 S 2011 S 2012 S 2013
Figure (146): WUI values in El-Beda canal during summer seasons
0.8 0.8 0.8
1.31.1
1.0
1.9
1.41.2
0.0
0.5
1.0
1.5
2.0
2.5
3.0
Head Middle Tail
WU
I
S 2011 S 2012 S 2013
Figure (147): WUI values in Bahr Nemra canal during summer seasons

128
2.0
1.61.8
1.0
0.7
1.1
0.81.0
1.8
1.11.0
1.21.3
1.0
1.41.5
1.1
1.6
0.0
0.5
1.0
1.5
2.0
2.5
3.0
Head Middle Tail
WU
I
S 2008 S 2009 S 2010 S 2011 S 2012 S 2013
Figure (148): WUI values in El-Gemeiza canal during summer seasons
6.2.1.2 Winter seasons During winter seasons, the results of WUI were as follows:
In Nekla canal, the values increased from winter 2011-12 to winter 2013-14 in all locations, and they were between 0.82 and 1.2.
In El-Beda canal, the values were between 0.8 and 1.4 except in winter 2008-09.
In Bahr Nemra canal, the values increased in all locations from winter 2011-12 to winter 2013-14. The values were between 0.9 and 1.4.
In El-Gemeiza canal, the values at different locations were between 0.7 and 1.8. The highest values were at w2008-09 and w2013-14.

129
1.11.0
0.8
1.2 1.21.1
0.9 0.9 0.8
0.0
0.5
1.0
1.5
2.0
2.5
3.0
Head Middle Tail
WU
I
W 2011-2012 W 2012-2013 W2013-2014
Figure (149): WUI values in Nekla canal during winter seasons
2.5
2.2 2.1
1.3 1.31.4
1.1
1.41.31.3
1.2 1.31.4 1.3 1.3
1.00.9 0.8
0.0
0.5
1.0
1.5
2.0
2.5
3.0
Head Middle Tail
WU
I
W 2008-2009 W 2009-2010 W 2010-2011 W 2011-2012W 2012-2013 W2013-2014
Figure (150): WUI values in El-Beda canal during winter seasons

130
0.9 0.9 0.91.1 1.2 1.1
1.21.4
1.2
0.0
0.5
1.0
1.5
2.0
2.5
3.0
Head Middle Tail
WU
I
W 2011-2012 W 2012-2013 W2013-2014
Figure (151): WUI values in Bahr Nemra canal during winter seasons
1.51.4
1.5
0.7 0.7
1.00.9 0.9
1.21.1 1.1
1.3
1.6
1.3
1.7
1.4 1.4
1.8
0.0
0.5
1.0
1.5
2.0
2.5
3.0
Head Middle Tail
WU
I
W 2008-2009 W 2009-2010 W 2010-2011 W 2011-2012W 2012-2013 W2013-2014
Figure (152): WUI values in El-Gemeiza canal during winter seasons
6.2.2 Cost elements
6.2.2.1 Summer seasons During summer seasons, the cost of irrigation was as follows:
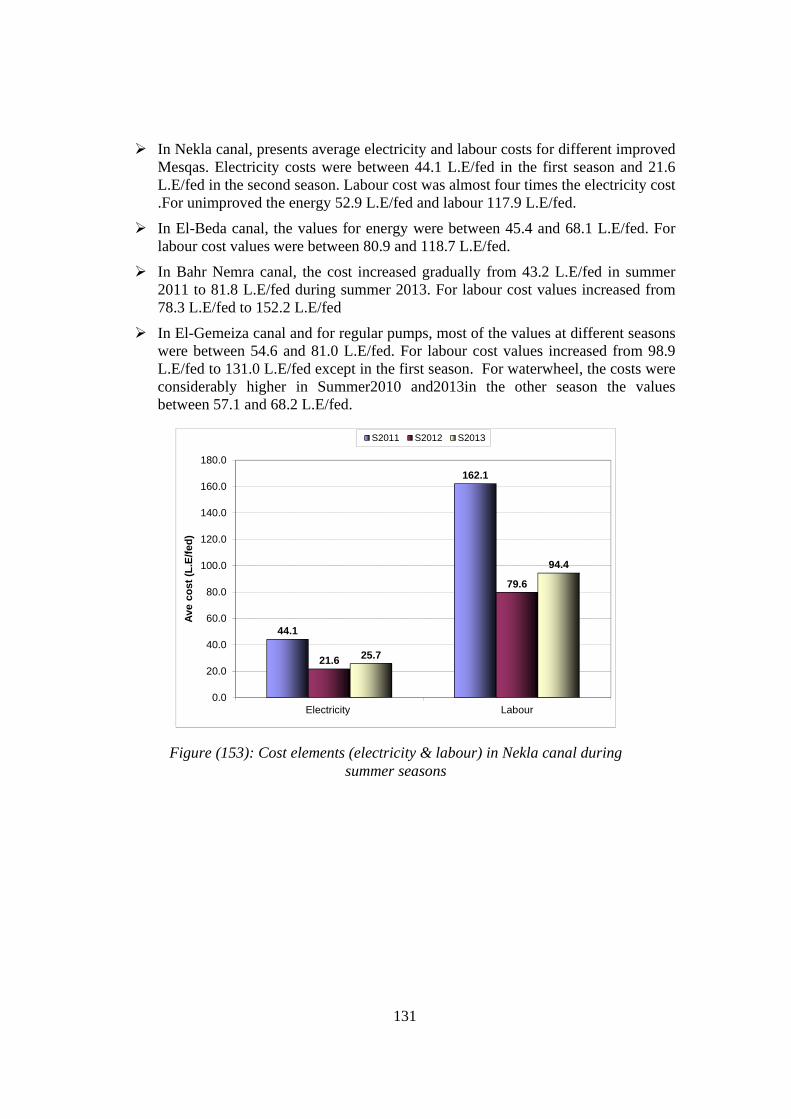
131
In Nekla canal, presents average electricity and labour costs for different improved Mesqas. Electricity costs were between 44.1 L.E/fed in the first season and 21.6 L.E/fed in the second season. Labour cost was almost four times the electricity cost .For unimproved the energy 52.9 L.E/fed and labour 117.9 L.E/fed.
In El-Beda canal, the values for energy were between 45.4 and 68.1 L.E/fed. For labour cost values were between 80.9 and 118.7 L.E/fed.
In Bahr Nemra canal, the cost increased gradually from 43.2 L.E/fed in summer 2011 to 81.8 L.E/fed during summer 2013. For labour cost values increased from 78.3 L.E/fed to 152.2 L.E/fed
In El-Gemeiza canal and for regular pumps, most of the values at different seasons were between 54.6 and 81.0 L.E/fed. For labour cost values increased from 98.9 L.E/fed to 131.0 L.E/fed except in the first season. For waterwheel, the costs were considerably higher in Summer2010 and2013in the other season the values between 57.1 and 68.2 L.E/fed.
44.1
162.1
21.6
79.6
25.7
94.4
0.0
20.0
40.0
60.0
80.0
100.0
120.0
140.0
160.0
180.0
Electricity Labour
Ave
cost
(L.E
/fed)
S2011 S2012 S2013
Figure (153): Cost elements (electricity & labour) in Nekla canal during summer seasons

132
52.9
117.9
0.0
20.0
40.0
60.0
80.0
100.0
120.0
140.0
Energy Labour
Ave
cost
(L.E
/fed)
Figure (154): Cost elements (energy & labour) in Nekla canal during summer 2011
62.5
110.8
68.1
118.7
63.3
107.3
63.4
113.6
45.4
80.9
48.9
90.7
0.0
20.0
40.0
60.0
80.0
100.0
120.0
140.0
Energy Labour
Ave
cos
t (L.
E/fe
d)
S2008 S2009 S2010 S2011 S2012 S2013
Figure (155): Cost elements (energy & labour) in El-Beda canal during summer seasons

133
43.2
78.3
61.8
114.0
81.8
152.2
0.0
20.0
40.0
60.0
80.0
100.0
120.0
140.0
160.0
Energy Labour
Ave
cost
(L.E
/fed)
S 2011 S 2012 S 2013
Figure (156): Cost elements (energy & labour) in Bahr Nemra canal during summer seasons
74.5
140.1
54.6
98.9
65.0
108.1
76.0
119.7
77.9
123.0
81.0
131.0
0.0
20.0
40.0
60.0
80.0
100.0
120.0
140.0
160.0
Energy Labour
Ave
cost
(L.E
/fed)
S2008 S2009 S2010 S2011 S2012 S2013
Figure (157): Cost elements (energy & labour) in El-Gemeiza regular pumps during summer seasons

134
68.2
35.2
57.1
29.5
100.3
51.8
64.1
33.1
61.9
32.0
98.3
50.8
0.0
20.0
40.0
60.0
80.0
100.0
120.0
Energy WW Labour WW
Ave
cost
(L.E
/fed)
S2008 S2009 S2010 S2011 S2012 S2013
Figure (158): Cost elements (energy & labour) in El-Gemeiza waterwheel during summer seasons
6.2.2.2 Winter seasons During winter seasons, the results were as follows:
Nekla canal presents average electricity and labour costs for different improved Mesqas. Electricity costs between 17.0 and 28.9 L.E/fed from summer 11-12 to summer 13-14. Labour cost was decreased from 62.7 L.E/fed to 10.3 during the same period. For unimproved Mesqas, the energy 10.7 L.E/fed and labour 26.5 L.E/fed.
In El-Beda canal, the values for energy were between 17.1 and 36.0 L.E/fed. For labour cost values were between 30.5 and 63.0 L.E/fed.
In Bahr Nemra canal, the cost increased gradually from 12.1 to 17.8 L.E/fed during winter seasons. For labour cost values increased from 21.8 to 32.7 L.E/fed
In El-Gemeiza canal and for regular pumps, the values were between 27.2 and 31.9 L.E/fed. For labour cost values were between 47.2 L.E/fed to 52.6 L.E/fed. For waterwheel, the costs were between 22.2 and 35.7 L.E/fed. For labour cost values were between 11.5 to 21.8 L.E/fed.

135
17.0
62.7
28.9
14.520.6
10.3
0.0
20.0
40.0
60.0
80.0
100.0
120.0
Electricity Labour
Ave
cos
t (L.
E/fe
d)
W11-12 W12-13 W13-14
Figure (159): Cost elements (electricity & labour) in Nekla canal during winter seasons
10.7
26.5
0.0
5.0
10.0
15.0
20.0
25.0
30.0
Energy Labour
Ave
cost
(L.E
/fed)
Figure (160): Cost elements (energy & labour) in Nekla canal during winter 2011-12

136
32.9
58.5
36.0
63.0
29.9
54.7
27.3
48.3
32.5
60.5
17.1
30.5
0.0
20.0
40.0
60.0
80.0
100.0
120.0
Energy Labour
Ave
cos
t (L.
E/fe
d)
W08-09 W09-10 W10-11 W11-12 W12-13 W13-14
Figure (161): Cost elements (energy & labour) in El-Beda canal during winter seasons
12.1
21.813.6
2517.8
32.7
0.0
20.0
40.0
60.0
80.0
100.0
120.0
Energy Labour
Ave
cos
t (L.
E/fe
d)
W11-12 W12-13 W13-14
Figure (162): Cost elements (energy & labour) in Bahr Nemra canal during winter seasons

137
27.2
50.2
28.4
47.2
29.4
47.8
32.9
52.0
31.9
52.6
29.7
48.7
0.0
20.0
40.0
60.0
80.0
100.0
120.0
Energy Labour
Ave
cos
t (L.
E/fe
d)
W08-09 W09-10 W10-11 W11-12 W12-13 W13-14
Figure (163): Cost elements (energy & labour) in El-Gemeiza regular pumps during winter seasons
22.2
11.5
34.2
17.7
35.7
18.422.5
17.2
29.121.8
26.319.1
0.0
20.0
40.0
60.0
80.0
100.0
120.0
Energy Labour
Ave
cos
t (L.
E/fe
d)
W08-09 W09-10 W10-11 W11-12 W12-13 W13-14
Figure (164): Cost elements (energy & labour) in El-Gemeiza waterwheels during winter seasons

138
6.2.3 Cost of lifting water
6.2.3.1 Summer seasons During summer seasons, the cost of lifting a cubic meter of irrigation water was as
follows:
In Nekla canal, the values were between 0.032 and 0.044 L.E/m3 at different locations. The same values could be also realized in El-Beda canal, except at the head during summer 2013.
In Bahr Nemra canal, the cost increased and the values were in average between 0.04 and 0.06 L.E/m3.
In El-Gemeiza canal, the costs for regular pumps at different locations were between 0.032 and 0.052 L.E/m3. For waterwheel, the cost was in average of 0.02 L.E/m3.
0.04 0.04
0.04
0.04
0.03 0.
04
0.04
0.04
0.04
0.00
0.02
0.04
0.06
0.08
0.10
Head Middle Tail
Wat
er li
fting
cos
t (L.
E/m3 )
S 2011 S 2012 S2013
Figure (165): The cost of lifting cubic meter of water in Nekla canal during summer seasons

139
0.04
0.03 0.
040.04
0.04 0.04
0.03
0.03 0.
03
0.03
0.03
0.030.
04
0.03 0.
04
0.05
0.04
0.04
0.00
0.02
0.04
0.06
0.08
0.10
Head Middle Tail
Wat
er li
fting
cos
t (L.
E/m3 )
S 2008 S 2009 S2010 S 2011 S 2012 S2013
Figure (166): The cost of lifting cubic meter of water in El-Beda canal during summer seasons
0.04 0.04
0.04
0.06
0.05 0.
05
0.06
0.05
0.05
0.00
0.02
0.04
0.06
0.08
0.10
Head Middle Tail
Wat
er li
fting
cos
t (L.
E/m3 )
S 2011 S 2012 S2013
Figure (167): The cost of lifting cubic meter of water in Bahr Nemra canal during summer seasons

140
0.05
0.05
0.03
0.02
0.05
0.05
0.04
0.02
0.05
0.05
0.04
0.02
0.04
0.05
0.04
0.02
0.05
0.05
0.04
0.03
0.05
0.05
0.04
0.02
0.00
0.02
0.04
0.06
0.08
0.10
Head Middle Tail W W
Wat
er li
fting
cos
t (L.
E/m3 )
S 2008 S 2009 S2010 S 2011 S 2012 S2013
Figure (168): The cost of lifting cubic meter of water in El-Gemeiza canal during summer seasons
6.2.3.2 Winter seasons During winter seasons, the cost of lifting a cubic meter of irrigation water was:
In Nekla canal, the values were higher in the first season (between 0.038 and 0.055 L.E/m3). In the other seasons, the values were between0.01and 0.02 L.E/m3.
In El-Beda canal, most of the values were between 0.03 and 0.04 L.E/m3, except the value at the middle during winter2011-2012, which was below 0.03 L.E/m3.
In Bahr Nemra canal, the cost was lower than other canals and the values were between 0.02 and 0.03 L.E/m3.
In El-Gemeiza canal, the costs increased than summer seasons. For regular pumps at different locations, the values were between 0.03 and 0.055 L.E/m3. For waterwheel, the costs were between of 0.01 and 0.035 L.E/m3.

141
0.05
0.03
0.03
0.02
0.02
0.020.02
0.02
0.01
0.00
0.02
0.04
0.06
0.08
0.10
Head Middle Tail
Wat
er li
fting
cos
t (L.
E/m3 )
W 2011-2012 W 2012-2013 W2013-2014
Figure (169): The cost of lifting cubic meter of water in Nekla canal during winter seasons
0.03
0.03 0.
03
0.03
0.03 0.
04
0.03
0.03
0.04
0.03
0.02
0.04
0.03
0.03 0.
04
0.00
0.02
0.04
0.06
0.08
0.10
Head Middle Tail
Wat
er li
fting
cos
t (L.
E/m3 )
W 2008-2009 W 2009-2010 W2010-2011 W 2011-2012 W 2012-2013
Figure (170): The cost of lifting cubic meter of water in El-Beda canal during winter seasons

142
0.02
0.02 0.
02
0.02
0.02 0.020.
02
0.02
0.02
0.00
0.02
0.04
0.06
0.08
0.10
Head Middle Tail
Wat
er li
fting
cos
t (L.
E/m3 )
W 2011-2012 W 2012-2013 W2013-2014
Figure (171): The cost of lifting cubic meter of water in Bahr Nemra canal during winter seasons
0.05
0.05
0.04
0.03
0.06
0.06
0.05
0.03
0.05 0.
05
0.04
0.040.
04
0.04
0.04
0.01
0.04
0.03
0.03
0.02
0.03
0.03
0.03
0.01
0.00
0.02
0.04
0.06
0.08
0.10
Head Middle Tail W W
Wat
er li
fting
cos
t (L.
E/m
3 )
W 2008-2009 W 2009-2010 W2010-2011 W 2011-2012W 2012-2013 W2013-2014
Figure (172): The cost of lifting cubic meter of water in El-Gemeiza canal during winter seasons

143
6.2.4 Cost of irrigating a unit area
6.2.4.1 Summer crops
6.2.4.1.1 Rice crop The cost of irrigation a unit area of rice was as follows:
In Nekla canal, most of the values were close to 200.0 L.E/fed. The maximum value was at the head during summer 2011 (270.0 L.E/fed) and the lowest value was at the middle during summer 2012 (140.0 L.E/fed).
In El-Beda canal, most of the values were between 200.0 and 250.0 L.E/fed. Some values were close to 300.0 L.E/fed especially at the head during first three seasons.
In Bahr Nemra canal, the trend was the same at all locations, where the cost increased gradually from ~170.0 L.E/fed in summer 2011 to ~270.0 L.E/fed during summer 2013.
In El-Gemeiza canal and for regular pumps, most of the values were between 210 and 270 L.E/fed with few exceptions. For waterwheel, the costs were between of 110 and 150 L.E/fed.
277.1
220.5
177.5198.0
141.2
184.9189.6211.1 199.5
0.0
50.0
100.0
150.0
200.0
250.0
300.0
350.0
400.0
Head Middle Tial
Irrig
atio
n co
st (L
.E/fe
d)
S 2011 S 2012 S 2013
Figure (173): Irrigation cost for rice crop in Nekla canal during different summer seasons

144
323.
8
256.
2
220.
1
301.
8
228.
4
120.
6
303.
7
242.
9 284.
3
232.
0
227.
3
296.
1
235.
1
329.
7
220.
3
215.
1
210.
0
0.0
50.0
100.0
150.0
200.0
250.0
300.0
350.0
400.0
Head Middle Tial
Irrig
atio
n co
st (L
.E/fe
d)
S 2008 S 2009 S 2010 S 2011 S 2012 S 2013
Figure (174): Irrigation cost for rice crop in El-Beda canal during different summer seasons
168.2 158.2182.0
200.7 192.1204.3
275.4 270.7 282.5
0.0
50.0
100.0
150.0
200.0
250.0
300.0
350.0
400.0
Head Middle Tial
Irrig
atio
n co
st (L
.E/fe
d)
S 2011 S 2012 S 2013
Figure (175): Irrigation cost for rice crop in Bahr Nemra canal during different summer seasons

145
274.
1
265.
7
212.
0
138.
6
227.
8
125.
8
217.
7
106.
3
233.
5
186.
7
286.
9
131.
0
255.
6
264.
9
222.
9
145.
9
245.
1
234.
9
242.
3
172.
8
238.
0
231.
6
245.
7
160.
0
0.0
50.0
100.0
150.0
200.0
250.0
300.0
350.0
400.0
Head Middle Tial WW
Irrig
atio
n co
st (L
.E/fe
d)
S 2008 S 2009 S 2010 S 2011 S 2012 S 2013
Figure (176): Irrigation cost for rice crop in El-Gemeiza canal during different summer seasons
6.2.4.1.2 Cotton crop The cost of irrigation a unit area of cotton was as follows:
In Nekla canal, three was a gradual decrease in the cost during the consecutive seasons. At the middle, the values decreased from 120.0 L.E/fed in summer 2011 to 60.0 L.E/fed in summer 2013. At the tail end, the highest value was ~100.0 L.E/fed and the lowest value was ~40.0 L.E/fed.
In Bahr Nemra canal, the costs were considerably higher in the last season. During the first two seasons, the values were between 70.0 and 100.0 L.E/fed. In summer 2013, the values were between 150.0 L.E/fed at the middle and 185.0 L.E/fed at the tail end.
In El-Gemeiza canal and considering the regular pumps, most of the costs were between 100.0 and 120.0 L.E/fed with few exceptions. For waterwheel, the costs were between 60.0 and 80.0 L.E/fed with few exceptions.

146
122.0
99.377.3
45.061.6 59.3
0
50
100
150
200
250
300
Head Middle Tial
Irrig
atio
n co
st (L
.E/fe
d)
S 2011 S 2012 S 2013
Figure (177): Irrigation cost for cotton crop in Nekla canal during different summer seasons
71.1
105.988.7
76.166.3
78.2
151.1
184.2
0.0
50.0
100.0
150.0
200.0
250.0
300.0
Head Middle Tial
Irrig
atio
n co
st (L
.E/fe
d)
S 2011 S 2012 S 2013
Figure (178): Irrigation cost for cotton crop in Bahr Nemra canal during different winter seasons

147
110.
9
92.8
62.1
106.
0
100.
1
66.8
152.
5
101.
1
173.
3
102.
6
97.0
80.9
110.
3 127.
3
69.0
115.
0
108.
8
114.
6
91.0
0.0
50.0
100.0
150.0
200.0
250.0
300.0
Head Middle Tial WW
Irrig
atio
n co
st (L
.E/fe
d)
S 2008 S 2009 S 2010 S 2011 S 2012 S 2013
Figure (179): Irrigation cost for cotton crop in El-Gemeiza canal during different winter seasons
6.2.4.2 Winter crops
6.2.4.2.1 Berseem crop The cost of irrigating a unit area of Berseem was as follows:
In Nekla canal, the values were decreased at the head from 92.0 to 41.2 L.E/fed respectively). In other locations, the values were between 30.8 and 62.2 L.E/fed.
In El-Beda canal, most of the values were between 47.2 and 136.6 L.E/fed. Some values were higher at the head during of last season 152.3 L.E/fed.
In Bahr Nemra canal, the cost values were between 68.0 and 112.2 L.E/fed.
In El-Gemeiza canal and considering the regular pumps, most of the costs were between 70.0 and 100.0 L.E/fed with few exceptions in last two seasons. For waterwheel, the costs were between 40.1 and 69.5 L.E/fed with few exceptions.

148
91.6
59.749.2
80.8
57.6 61.8
41.230.8
62.2
0.0
20.0
40.0
60.0
80.0
100.0
120.0
140.0
160.0
Head Middle Tial
Irrig
atio
n co
st (L
.E/fe
d)
W11-12 W12-13 W13-14
Figure (180): Irrigation cost for Berseem crop in Nekla canal during different winter seasons
101.
6 113.
0
113.
7
104.
5 115.
0
111.
1
75.4
136.
6
47.2
94.7
73.2
112.
9
152.
3
92.0
117.
2
61.8
49.6 57
.3
0.0
20.0
40.0
60.0
80.0
100.0
120.0
140.0
160.0
Head Middle Tial
Irrig
atio
n co
st (L
.E/fe
d)
W08-09 W09-10 W10-11 W11-12 W12-13 W13-14
Figure (181): Irrigation cost for Berseem crop in El-Beda canal during different winter seasons

149
68.0
90.1
75.882.1 84.3 79.8
87.2
112.9107.8
0.0
20.0
40.0
60.0
80.0
100.0
120.0
140.0
160.0
Head Middle Tial
Irrig
atio
n co
st (L
.E/fe
d)
w11-12 w12-13 W13-14
Figure (182): Irrigation cost for Berseem crop in Bahr Nemra canal during different winter seasons
90.2 99
.2
88.5
40.1
59.8
77.8
74.6
69.6
66.0
117.
6
70.4
57.3
42.0
106.
8
113.
6
54.3
96.9
111.
3
114.
8
69.5
54.7
138.
0
103.
3
52.3
0.0
20.0
40.0
60.0
80.0
100.0
120.0
140.0
160.0
Head Middle Tial WW
Irrig
atio
n co
st (L
.E/fe
d)
W08-09 W09-10 W10-11 W11-12 W12-13 W13-14
Figure (183): Irrigation cost for Berseem crop in El-Gemeiza canal during different winter seasons
6.2.4.2.2 Wheat crop The cost of irrigating a unit area of wheat was as follows:

150
In Nekla canal, most of the values were between 26.5 and 31.23 L.E/fed. Except in the head of the first season was high (73.1 L.E/fed) and the tail of last season was low (12.9 L.E/fed).
In El-Beda canal, the values were higher in the first three seasons (between 58 and 138 L.E/fed). In the next seasons, the values were between 21.0 and 67.8 L.E/fed.
In Bahr Nemra canal, the cost values were between 39.6 and 70.5 L.E/fed.
In El-Gemeiza canal and considering the regular pumps, most of the costs were between 50.6 and 73.0 L.E/fed with few exceptions. For waterwheel, the costs were between 28.6 and 37.4 L.E/fed with few exceptions
73.1
26.5 31.230.8 28.821.9
33.327.3
12.9
0.0
20.0
40.0
60.0
80.0
100.0
120.0
140.0
160.0
Head Middle Tial
Irrig
atio
n co
st (L
.E/fe
d)
W11-12 W12-13 W13-14
Figure (184): Irrigation cost for wheat crop in Nekla canal during different winter seasons

151
60.7
58.5
52.7
70.0
119.
8
41.9
138.
8
71.1
105.
2
21.3
63.2 67
.8
66.1
24.2
60.3
43.9
33.8
47.3
0.0
20.0
40.0
60.0
80.0
100.0
120.0
140.0
160.0
Head Middle Tial
Irrig
atio
n co
st (L
.E/fe
d)
W08-09 W09-10 W10-11 W11-12 W12-13 W13-14
Figure (185): Irrigation cost for wheat crop in El-Beda canal during different winter seasons
40.650.0 50.0
39.6
58.8
43.5
62.670.5
58.2
0.0
20.0
40.0
60.0
80.0
100.0
120.0
140.0
160.0
Head Middle Tial
Irrig
atio
n co
st (L
.E/fe
d)
w11-12 w12-13 W13-14
Figure (186): Irrigation cost for wheat crop in Behr Nemra canal during different winter seasons

152
57.8
53.1
50.6
29.3
73.0
59.7
79.5
28.7
54.0 60
.2
51.7
37.5
23.5
59.8
42.8
31.3
61.7
56.4 66
.0
34.3
57.8
55.2
53.6
36.2
0.0
20.0
40.0
60.0
80.0
100.0
120.0
140.0
160.0
Head Middle Tial WW
Irrig
atio
n co
st (L
.E/fe
d)
W08-09 W09-10 W10-11 W11-12 W12-13 W13-14
Figure (187): Irrigation cost for wheat crop in El-Gemeiza canal during different winter seasons
6.2.6 Irrigation distribution This part describes the distribution of the irrigation in different hours of the day.
6.2.6.1 Summer seasons During summer seasons, the results were as follows:
In Nekla canal, the highest ratios were between 9% and 11%. The irrigation was almost distributed between 6:00 AM and 6:00 PM.
In El-Beda canal, the irrigation is concentrated during forenoon hours (between 7:00 and 10:00 AM) and during afternoon hours (between 4:00 and 6:00 PM). During summer 2008, 2011, and 2013, the irrigation concentrated more in forenoon hours. Maximum irrigation ratios were around 16%.
In Bahr Nemra canal, the irrigation is concentrated during forenoon hours (between 7:00 and 10:00 AM) and maximum values were around 22%
In El-Gemeiza canal, the irrigation is concentrated during forenoon hours and slightly in afternoon hours. The highest ratios were between 8:00 AM and they were between 15 & 18%. No specific difference is found between different seasons.

153
0%
5%
10%
15%
20%
25%
30%
35%
00:00
02:00
04:00
06:00
08:00
10:00
12:00
14:00
16:00
18:00
20:00
22:00
Irr d
istribution through the
day
S2011 S2012 S2013
Figure (188): Average number of irrigations and average irrigation time for wheat crop in Nekla canal during different summer seasons
0%
5%
10%
15%
20%
25%
30%
35%
00:00
02:00
04:00
06:00
08:00
10:00
12:00
14:00
16:00
18:00
20:00
22:00
Irr d
istribution through the day
S2008 S2009 S2010 S2011 S2012 S2013
Figure (189): Average number of irrigations and average irrigation time for wheat crop in El-Beda canal during different summer seasons

154
0%
5%
10%
15%
20%
25%
30%
35%
0:00
2:00
4:00
6:00
8:00
10:00
12:00
14:00
16:00
18:00
20:00
22:00
Irr d
istr
ibut
ion
thro
ugh
the
day
S2011 S2012 S2013
Figure (190): Average number of irrigations and average irrigation time for wheat crop in Bahr Nemra canal during different summer seasons
0%
5%
10%
15%
20%
25%
30%
35%
00:00
02:00
04:00
06:00
08:00
10:00
12:00
14:00
16:00
18:00
20:00
22:00
Irr d
istribution through the day
S2008 S2009 S2010 S2011 S2012 S2013
Figure (191): Average number of irrigations and average irrigation time for wheat crop in El-Gemeiza canal during different summer seasons
6.2.6.2 Winter seasons During winter seasons, the results were as follows:

155
In Nekla canal, there was a concentration of the irrigation during forenoon hours and the highest ratios were between 13 & 17%.
In El-Beda canal, the irrigation was distributed more during the first two seasons. During the last two seasons, there was a concentration of the irrigation during forenoon hours and the highest ratios were around 17%.
In Bahr Nemra canal, there was high concentration during forenoon hours and maximum values were between 22 & 26%
In El-Gemeiza canal, the irrigation concentration increased than summer seasons and the highest ratios were between 17 & 21%.
0%
5%
10%
15%
20%
25%
30%
35%
00:00
02:00
04:00
06:00
08:00
10:00
12:00
14:00
16:00
18:00
20:00
22:00
Irr d
istribution through the day
W11-12 W12-13
Figure (192): Average number of irrigations and average irrigation time for wheat crop in Nekla canal during different summer seasons

156
0%
5%
10%
15%
20%
25%
30%
35%
00:00
02:00
04:00
06:00
08:00
10:00
12:00
14:00
16:00
18:00
20:00
22:00
Irr d
istribution through the day
W09-10 W10-11 W11-12 W12-13
Figure (193): Average number of irrigations and average irrigation time for wheat crop in El-Beda canal during different summer seasons
0%
5%
10%
15%
20%
25%
30%
35%
0:00
2:00
4:00
6:00
8:00
10:00
12:00
14:00
16:00
18:00
20:00
22:00
Irr d
istr
ibut
ion
thro
ugh
the
day
W2011-12 W2012-13
Figure (193): Average number of irrigations and average irrigation time for wheat crop in Bahr Nemra canal during different summer seasons

157
0%
5%
10%
15%
20%
25%
30%
35%
00:00
02:00
04:00
06:00
08:00
10:00
12:00
14:00
16:00
18:00
20:00
22:00
Irr d
istribution through the day
W08-09 W09-10 W10-11 W11-12 W12-13
Figure (195): Average number of irrigations and average irrigation time for wheat crop in El-Gemeiza canal during different summer seasons

158
7. Monitoring framework indicators Monitoring framework includes different indicators. Some of these indicators were
covered implicitly in the previous chapters, such as relative water supply, equity and overall efficiency. Other indicators were not covered. This chapter presents two indicators, which are the reliability of water supply and the productivity ratios.
7.1 Reliability of water supply The reliability of water supply is defined as the ratio of water availability at the head
and the tail end of the investigated branch canals. The numbers of readings that satisfy specific water depth in both locations (head and tail end) were defined and the ratios between them represent the reliability.
In some canals, the reliability ratios were 100%, but this is mainly due to the characteristics of these branch canals. This includes El-Berka canal with its steep slope (see figure 25) and Nekla canal as a head canal and due to its steep slope (see figure 19). It also includes Khadega canal as a head canal and due to its additional water resources from Neshil El-Gededa. In reality, water might be presence at the tail end while the head is close, especially during low consumption periods.
On the other hand, it clear that the reliability at tail end canal that depend mainly on the drainage water, such as El-Masharka and El-Saraniya is very low.
The questions might be about the middle canals. Figure (196) presents the reliability ratios in two canals that were monitored for a long time (Dakalt and Besentway). It was mentioned before that the operation strategy in these two canals are returning gradually to the rotation system. It was also mentioned that escape flow ratios decreased in last seasons in both canals. From figure (196), it is clear that the reliability ratios are decreasing in both canals from 2005 until 2013.
Figures (197 to 199) present water levels at the tail end of Besentway canal during summer 2005 & 2013 and at the tail end of Dakalt canal during summer 2013. In Dakalt canal, the system was clear the rotation system. In Besentway, the water shortage events increased in summer 2013.
Although returning to the rotation decreased the reliability of water supply, other effects and the reasons that push the irrigation directorates to return to the rotation should be studied carefully.

159
76%70%
57%61%
0%
20%
40%
60%
80%
100%
Dakalt Besentway
Rel
iabi
lity
ratio
s %
Summer 2005 Summer 2013
Figure (196): The change in reliability ratios for Dakalt and Besentway canals from summer 2005 to summer 2013
Water levels in Besentway tail end (S 2005)
-1.0
-0.5
0.0
0.5
1.0
1.5
2.0
2.5
3.0
5/1/20
05
5/11/2
005
5/21/2
005
5/31/2
005
6/10/2
005
6/20/2
005
6/30/2
005
7/10/2
005
7/20/2
005
7/30/2
005
8/9/20
05
8/19/2
005
8/29/2
005
9/8/20
05
9/18/2
005
9/28/2
005
Wat
er le
vels
(m)
Water levels Tail escape
Figure (197): Water levels at the tail end of Besentway canal during summer 2005

160
Water levels at Besentway tail end (S 2013)
-1.0
-0.5
0.0
0.5
1.0
1.5
2.0
2.5
3.0
1-May
-13
11-M
ay-13
21-M
ay-13
31-M
ay-13
10-Ju
n-13
20-Ju
n-13
30-Ju
n-13
10-Ju
l-13
20-Ju
l-13
30-Ju
l-13
9-Aug
-13
19-A
ug-13
29-A
ug-13
8-Sep
-13
18-S
ep-13
28-S
ep-13
Wat
er L
evel
(m)
Water Levels Tail Escape
Figure (198): Water levels at the tail end of Besentway canal during summer 2013
Water levels at Dakalt tail end (S 2013)
-1.0-0.50.00.51.01.52.02.53.03.54.0
5/1/20
13
5/11/2
013
5/21/2
013
5/31/2
013
6/10/2
013
6/20/2
013
6/30/2
013
7/10/2
013
7/20/2
013
7/30/2
013
8/9/20
13
8/19/2
013
8/29/2
013
9/8/20
13
9/18/2
013
9/28/2
013
Wat
er L
evel
s(m
)
Water Levels Tail Escape
Figure (199): Water levels at the tail end of Dakalt canal during summer 2013

161
7.2 Water productivity Water productivity is the relation between crop production and water application
(km/m3). The indicator was assessed for the pumps' investigated branch canals and for the main crops rice, cotton and wheat whenever available.
7.2.1 Rice crop Water productivity for rice crop was assessed for the four investigated canals, and the
results were as follows:
In Nekla canal, the values in summer 2011 increased gradually from 0.48 kg/m3 at the head to 0.75 kg/m3 at the tail end. During summer 2012, the values were between 0.56 and 0.75 kg/m3. In last summer season, the values increased gradually from 0.42 kg/m3 to 0.69 kg/m3.
In El-Beda canal, the values at the head increased and decreased again during the consecutive seasons. The range was between 0.42 and 0.77 kg/m3.
In Bahr Nemra canal, most of the values were between 0.46 and 0.92 kg/m3.
In El-Gemeiza canal, most of the values for regular pumps were between 0.34 and 0.76 kg/m3.
0.48
0.62
0.75
0.65
0.75
0.56
0.42
0.58
0.69
0.0
0.2
0.4
0.6
0.8
1.0
Head Middle Tail
Wat
er p
rodu
ctiv
ity (k
g/m3 )
S2011 S2012 S2013
Figure (200): Productivity ratios for rice crop in Nekla canal during different summer seasons

162
0.47
0.77
0.50
0.48
0.43
0.52
0.470.49
0.44
0.44
0.55
0.42
0.0
0.2
0.4
0.6
0.8
1.0
Head Middle Tail
Wat
er p
rodu
ctiv
ity (k
g/m3 )
S2008 S2009 S2010 S2011 S2012 S2013
Figure (201): Productivity ratios for rice crop in El-Beda canal during different summer seasons
0.76
0.94
0.82
0.65 0.
70
0.69
0.55
0.62
0.46
0.0
0.2
0.4
0.6
0.8
1.0
Head Middle Tail
Wat
er p
rodu
ctiv
ity (k
g/m3 )
S2011 S2012 S2013
Figure (202): Productivity ratios for rice crop in Bahr Nemra canal during different summer seasons

163
0.63
0.34
0.50
0.49
0.39
0.76
0.68
0.540.55
0.62
0.46
0.0
0.2
0.4
0.6
0.8
1.0
Head Middle Tail
Wat
er p
rodu
ctiv
ity (k
g/m3 )
S2009 S2010 S2011 S2012 S2013
Figure (203): Productive ratios for rice crop in El-Gemeiza canal during different summer seasons
7.2.2 Cotton crop Water productivity for cotton crop was assessed for the two canals (Bahr Nemra and
El-Gemeiza), and the results were as follows:
In Bahr Nemra canal, the values was decreased from first to second season (0.85 to 0.64 kg/m3) then increased in the last season (0.79 kg/m3).
In El-Gemeiza canal, most of the values were between 0.26 and 0.54 kg/m3.

164
0.52
0.50 0.51
0.85
0.64
0.79
0.70
0.49
0.0
0.2
0.4
0.6
0.8
1.0
Head Middle Tail
Wat
er p
rodu
ctiv
ity (k
g/m3 )
S2011 S2012 S2013
Figure (204): Productivity ratios for cotton crop in Bahr Nemra canal during different summer seasons
0.31
0.26
0.35
0.43
0.35
0.54
0.45 0.
50
0.32 0.
38
0.30
0.0
0.2
0.4
0.6
0.8
1.0
Head Middle Tail
Wat
er p
rodu
ctiv
ity (k
g/m3 )
S2009 S2010 S2011 S2012 S2013
Figure (205): Productivity ratios for cotton crop in El-Gemeiza canal during different summer seasons

165
7.2.3 Maize crop Water productivity for maize crop was assessed in El-Beda canal and most of the
results were between 4.0 and 7.5 kg/m3. The results at the middle and the tail end during last summer season were extremely low.
5.63
5.57
5.18
6.23
4.20
5.04
4.60
7.52
3.91
5.51
0.0
2.0
4.0
6.0
8.0
10.0
Head Middle Tail
Pro
duct
ivity
(kg/
m3 )
S2008 S2009 S2010 S2011 S2012 S2013
Figure (206): Productivity ratios for maize crop in El-Beda canal during different summer seasons
7.2.4 Wheat crop Total irrigating time for a unit area of rice was as follows:
In Nekla canal, the values were between 0.98 and 1.35 kg/m3.
In El-Beda canal, most of the values were between 0.65 and 1.19 kg/m3. The exceptions were in winter 2010-11 at the tail, which had higher values (1.99 kg/m3).
In Bahr Nemra canal, the values were between 1.11 and 1.75 kg/m3.
In El-Gemeiza canal, the values were between 1.26 and 1.96 kg/m3 at the tail end. At the head and the middle, there was no wheat except in winter 2012-13, and the values were 1.32 and 1.11 kg/m3 respectively.

166
0.98 1.
06
1.35
1.16
1.05
1.35
0.0
0.5
1.0
1.5
2.0
2.5
Head Middle Tail
Wat
er p
rodu
ctiv
ity (k
g/m3 )
W11-12 W12-13
Figure (207): Productivity ratios for wheat crop in Nekla canal during different winter seasons
1.88
0.77
0.65 0.70
1.08 1.
19
0.78
0.0
0.5
1.0
1.5
2.0
2.5
Head Middle Tail
Wat
er p
rodu
ctiv
ity (k
g/m3 )
W08-09 W10-11 W11-12 W12-13
Figure (208): Productivity ratios for wheat crop in El-Beda canal during different winter seasons

167
1.60 1.
75
1.52
1.32
1.11 1.
26
0.0
0.5
1.0
1.5
2.0
2.5
Head Middle Tail
Wat
er p
rodu
ctiv
ity (k
g/m3 )
w11-12 w12-13
Figure (209): Productivity ratios for wheat crop in Behr Nemra canal during different winter seasons
1.96
1.6 1.65
1.32
1.11 1.
26
0.0
0.5
1.0
1.5
2.0
2.5
Head Middle Tail
Wat
er p
rodu
ctiv
ity (k
g/m3 )
W09-10 W10-11 W11-12 W12-13
Figure (210): Productivity ratios for wheat crop in El-Gemeiza canal during different winter seasons
7.2.5 Sugar beet crop Sugar beet was found only in El-Gemeiza canal. The values were available at the tail
end during different seasons, and the values were between 5.41 and 7.36 kg/m3. At the

168
head and the middle, the values were available during last two seasons, and the values were. In winter 2011-12, the values were in the average of 6.5 kg/m3. In winter 2012-13, the values increased from 6.3 kg/m3 at the head to ~8.0 kg/m3 at the middle.
6.09
5.71
8.53 8.60
7.36
6.26
7.95
5.41
0.0
2.0
4.0
6.0
8.0
10.0
Head Middle Tail
Pro
duct
ivity
(kg/
m3 )
W09-10 W10-11 W11-12 W12-13
Figure (211): Productivity ratios for sugar beet crop in El-Gemeiza canal during different winter seasons

169
7. Conclusion
This report, which is the ninth report since the beginning of monitoring IIIMP, should cover winter 2013-14. However, and as the current monitoring phase is concluding, the report was designed to present the summary of all previous results.
The report presents the investigated canals, with all available details, the methodology that was used in this report or in previous reports, and it discusses some points, which are important to explain the results.
Chapter five and six presents the summary of canals and pumps results. Last chapter presents some framework indicators that were not discussed before in the previous reports. Chapter five presents different canals results including cropping pattern and water requirements, water supply with the escape flow and the feeding back from the drains, drainage runoff values and WUI values. Chapter six presents different pumps results. This includes direct collected data, such as selected fields, irrigation results, salinity and productivity. In also included the analyzed results, such as WUI on Mesqa level, different cost results and irrigation distribution through the day. The chapter, which was titles by "main indicators" in the previous reports, was omitted here, as it will be just a repeating of what was mentioned in these reports.
In general, the results referred to a big fluctuation in different canals and in different seasons. The characteristics of the canals; head – tail, some geometrical features, such as steep slope, etc, are affecting the results more the improvement project.
The real success of the project could be realized in the spread of farmers' acceptance after their rejection that was obvious at the beginning of the project. Completing the successful story will be through deep investigating and understanding of real farmers' need especially with a rapid change in the social condition in rural areas. It also stands above the real understanding of the current situations and the real capabilities of the Egyptian irrigation network. Such understanding should result on focusing on applicable targets and actual farmers' requirements, and in lopping the project from non-infeasible targets and procedures. This might include different operational and institutional activities