Evaluation of the Suchey–Brooks Method of Age Estimation in an Australian Subpopulation using...
14
Evaluation of the Suchey–Brooks Method of Age Estimation in an Australian Subpopulation using Computed Tomography of the Pubic Symphyseal Surface Nicolene Lottering, 1 Donna M. MacGregor, 1 Matthew Meredith, 2 Clair L. Alston, 3 and Laura S. Gregory 1,4 * 1 Skeletal Biology and Forensic Anatomy Research Program, School of Biomedical Sciences, Faculty of Health, Queensland University of Technology, Brisbane, QLD 4001, Australia 2 Forensic Pathology, Queensland Health Forensic and Scientific Services, Coopers Plains, QLD 4108, Australia 3 School of Mathematical Sciences, Science and Engineering Faculty, Queensland University of Technology, Brisbane, QLD 4001, Australia 4 Institute of Health and Biomedical Innovation, Queensland University of Technology, Brisbane, QLD 4001, Australia KEY WORDS forensic anthropology; population standards; pubic symphysis; bayesian statistics; Queensland ABSTRACT Despite the prominent use of the Suchey–Brooks (S–B) method of age estimation in forensic anthropological practice, it is subject to intrinsic limitations, with reports of differential interpopulation error rates between geographical locations. This study assessed the accuracy of the S–B method to a contempo- rary adult population in Queensland, Australia and provides robust age parameters calibrated for our popu- lation. Three-dimensional surface reconstructions were generated from computed tomography scans of the pubic symphysis of male and female Caucasian individuals aged 15–70 years (n 5 195) in Amira 1 and Rapidform 1 . Error was analyzed on the basis of bias, inaccuracy and percentage correct classification for left and right sym- physeal surfaces. Application of transition analysis and Chi-square statistics demonstrated 63.9 and 69.7% cor- rect age classification associated with the left symphy- seal surface of Australian males and females, respec- tively, using the S–B method. Using Bayesian statistics, probability density distributions for each S–B phase were calculated, providing refined age parameters for our population. Mean inaccuracies of 6.77 (62.76) and 8.28 (64.41) years were reported for the left surfaces of males and females, respectively; with positive biases for younger individuals (<55 years) and negative biases in older individuals. Significant sexual dimorphism in the application of the S–B method was observed; and asym- metry in phase classification of the pubic symphysis was a frequent phenomenon. These results recommend that the S–B method should be applied with caution in med- ico-legal death investigations of Queensland skeletal remains and warrant further investigation of reliable age estimation techniques. Am J Phys Anthropol 150:386–399, 2013. V V C 2013 Wiley Periodicals, Inc. Forensic anthropological analysis of Australian indi- viduals is constrained by a paucity of population-specific standards for adult age-at-death estimation using the pubic symphysis. The present study investigates the application of the Suchey–Brooks (S–B) method for age estimation of the pubic symphysis in an Australian sub- population. Specifically, this study aims to (i) establish probability distributions for estimating individual male and female ages-at-death in an Australian Caucasian subpopulation using a Bayesian statistical approach; (ii) report the probability of correct age classification utiliz- ing the S–B method in an Australian subpopulation and assess interpopulation variation on bias and inaccuracy values of age estimation; (iii) investigate the age range in which the morphological S–B descriptors are observed in our population; (iv) assess the impact of asymmetry and sex on the S–B phase allocations for age estimation. In this article, new probability estimates for calculating individual ages-at-death are provided for independent analysis of the left and right surfaces to increase the effi- ciency of medico-legal investigation of Queensland indi- viduals based on the evaluation of the pubic symphysis. The symphyseal surface of the pubic region of the os coxa is anatomically located at the interface between the fibrocartilage of the joint and the body of the pubis. The pubic symphysis is considered a frequent and established skeletal aging site (Aykroyd et al., 1999) as it exhibits a series of distinct morphological changes with age (Brown, 2009). Early age estimation techniques of the symphyseal surface developed by Todd (1920) were superseded by the construction of the Suchey–Brooks (S–B) method (Brooks and Suchey, 1990). The S–B method was constructed using a large multi-racial sam- ple from the Los Angeles County Medical Examiner’s Office (n 5 1012). Reanalysis of the Todd system using regression analysis by Katz and Suchey (1986) demon- *Correspondence to: Laura Gregory, School of Biomedical Scien- ces, Faculty of Health, Institute of Health and Biomedical Innova- tion, Queensland University of Technology, GARDENS POINT, 2 George Street, Brisbane 4001, Australia. E-mail: [email protected] Received 6 May 2012; accepted 27 November 2012 DOI 10.1002/ajpa.22213 Published online 3 January 2013 in Wiley Online Library (wileyonlinelibrary.com). V V C 2013 WILEY PERIODICALS, INC. AMERICAN JOURNAL OF PHYSICAL ANTHROPOLOGY 150:386–399 (2013)
Transcript of Evaluation of the Suchey–Brooks Method of Age Estimation in an Australian Subpopulation using...

Evaluation of the Suchey–Brooks Method of AgeEstimation in an Australian Subpopulation usingComputed Tomography of the Pubic Symphyseal Surface
Nicolene Lottering,1 Donna M. MacGregor,1 Matthew Meredith,2 Clair L. Alston,3
and Laura S. Gregory1,4*
1Skeletal Biology and Forensic Anatomy Research Program, School of Biomedical Sciences, Faculty of Health,Queensland University of Technology, Brisbane, QLD 4001, Australia2Forensic Pathology, Queensland Health Forensic and Scientific Services, Coopers Plains, QLD 4108, Australia3School of Mathematical Sciences, Science and Engineering Faculty, Queensland University of Technology,Brisbane, QLD 4001, Australia4Institute of Health and Biomedical Innovation, Queensland University of Technology, Brisbane,QLD 4001, Australia
KEY WORDS forensic anthropology; population standards; pubic symphysis; bayesian statistics;Queensland
ABSTRACT Despite the prominent use of theSuchey–Brooks (S–B) method of age estimation inforensic anthropological practice, it is subject to intrinsiclimitations, with reports of differential interpopulationerror rates between geographical locations. This studyassessed the accuracy of the S–B method to a contempo-rary adult population in Queensland, Australia andprovides robust age parameters calibrated for our popu-lation. Three-dimensional surface reconstructions weregenerated from computed tomography scans of the pubicsymphysis of male and female Caucasian individualsaged 15–70 years (n 5 195) in Amira1 and Rapidform1.Error was analyzed on the basis of bias, inaccuracy andpercentage correct classification for left and right sym-physeal surfaces. Application of transition analysis andChi-square statistics demonstrated 63.9 and 69.7% cor-rect age classification associated with the left symphy-
seal surface of Australian males and females, respec-tively, using the S–B method. Using Bayesian statistics,probability density distributions for each S–B phasewere calculated, providing refined age parameters forour population. Mean inaccuracies of 6.77 (62.76) and8.28 (64.41) years were reported for the left surfaces ofmales and females, respectively; with positive biases foryounger individuals (<55 years) and negative biases inolder individuals. Significant sexual dimorphism in theapplication of the S–B method was observed; and asym-metry in phase classification of the pubic symphysis wasa frequent phenomenon. These results recommend thatthe S–B method should be applied with caution in med-ico-legal death investigations of Queensland skeletalremains and warrant further investigation of reliableage estimation techniques. Am J Phys Anthropol150:386–399, 2013. VVC 2013 Wiley Periodicals, Inc.
Forensic anthropological analysis of Australian indi-viduals is constrained by a paucity of population-specificstandards for adult age-at-death estimation using thepubic symphysis. The present study investigates theapplication of the Suchey–Brooks (S–B) method for ageestimation of the pubic symphysis in an Australian sub-population. Specifically, this study aims to (i) establishprobability distributions for estimating individual maleand female ages-at-death in an Australian Caucasiansubpopulation using a Bayesian statistical approach; (ii)report the probability of correct age classification utiliz-ing the S–B method in an Australian subpopulation andassess interpopulation variation on bias and inaccuracyvalues of age estimation; (iii) investigate the age rangein which the morphological S–B descriptors are observedin our population; (iv) assess the impact of asymmetryand sex on the S–B phase allocations for age estimation.In this article, new probability estimates for calculatingindividual ages-at-death are provided for independentanalysis of the left and right surfaces to increase the effi-ciency of medico-legal investigation of Queensland indi-viduals based on the evaluation of the pubic symphysis.
The symphyseal surface of the pubic region of the oscoxa is anatomically located at the interface between the
fibrocartilage of the joint and the body of the pubis. Thepubic symphysis is considered a frequent and establishedskeletal aging site (Aykroyd et al., 1999) as it exhibits aseries of distinct morphological changes with age(Brown, 2009). Early age estimation techniques of thesymphyseal surface developed by Todd (1920) weresuperseded by the construction of the Suchey–Brooks(S–B) method (Brooks and Suchey, 1990). The S–Bmethod was constructed using a large multi-racial sam-ple from the Los Angeles County Medical Examiner’sOffice (n 5 1012). Reanalysis of the Todd system usingregression analysis by Katz and Suchey (1986) demon-
*Correspondence to: Laura Gregory, School of Biomedical Scien-ces, Faculty of Health, Institute of Health and Biomedical Innova-tion, Queensland University of Technology, GARDENS POINT, 2George Street, Brisbane 4001, Australia.E-mail: [email protected]
Received 6 May 2012; accepted 27 November 2012
DOI 10.1002/ajpa.22213Published online 3 January 2013 in Wiley Online Library
(wileyonlinelibrary.com).
VVC 2013 WILEY PERIODICALS, INC.
AMERICAN JOURNAL OF PHYSICAL ANTHROPOLOGY 150:386–399 (2013)
strated that the combination of Todd phases I, II, andIII, phases V and VI and phases VII and VIII increasedmodel performance in comparison to the original 10phase system. Consequently, the less ambiguous S–Bmethod uses this six-phase archetypal cast system,encompassing early and late phases, to assess age-related changes of osteological features of the male andfemale pubic symphyseal surface. In an assessment ofthe accuracy of major symphyseal age determinationtechniques using retrospective Joint POW/MIA (Pris-oners of War/ Missing in Action) Accounting Command—Central Identification Laboratory Hawaii (JPAC-CIL)data derived from deceased military personnel between1972 and 2008, Brown (2009) verified that the S–Bmethod demonstrated the highest correct age classifica-tion (97.9%) in comparison to the McKern and Stewart(82.3%) and Todd (70%) methods.
Despite the ubiquitous use of the S–B method in foren-sic casework, limitations including sample composition,interpopulation variation and high observer error havebeen frequently cited in current literature (Pasquieret al., 1999; Hartnett, 2010, Tocheri et al., 2002; Berg,2008; Kimmerle et al., 2008a). Application of the S–Bmethod to contemporary Balkan (Djuric et al., 2007;Kimmerle et al., 2008b) and Asian (Schmitt, 2004;Sakaue, 2006; Chen et al., 2008) populations demon-strate that a single standard of senescence for popula-tions of different geographic locations is not appropriatefor age determination due to reported variation in themagnitude of error. For example, Sakaue (2006) reportsthat the S–B method can be reliably applied to Japaneseosteological material while Schmitt (2004) recommendsthat the application of the S–B method to Asian archeo-logical remains should be avoided due to high inaccuracyvalues.
Furthermore, the representativeness of the S–B stand-ards to contemporary populations has been questioned(Hoppa, 2000) due to secular trends, increase in longev-ity and the influence of factors including nutrition, phys-ical activity type and frequency, health care access andsocio-economic status (Lai et al., 2008; Langley-Shirleyand Jantz, 2010). However, evidence is lacking inthe current field of literature as the methodological
approaches for the majority of studies evaluating S–Bmethodology are limited to historical osteological skeletalcollections. This promotes the importance of calibratingcurrent aging techniques to model a contemporaneouspopulation.
The S–B system does not account for bilateralasymmetry associated with genetic determinants, biome-chanical factors, and environmental stress (Albert andGreene, 1999; Halgrimsson, 1999; Boulay et al., 2006;Overbury et al., 2009) with phase allocation originallyconstructed from left symphyseal surfaces. Both Schmitt(2004) and Overbury et al. (2009) have reported asymme-tries in phase allocation for left and right symphysealsurfaces attained from the same individual. Refinementsof the S–B method based on asymmetry have not beendeveloped despite the findings of these recent studies.Current studies either (i) provide an average age estimatefor the pair of surfaces (Schmitt, 2004; Djuric et al., 2007;Kimmerle et al., 2008b) or (ii) incorporate the left (Goddeand Hens, 2012) or right (Sakaue, 2006) surface in isola-tion, in their methodological approaches. This studyacknowledges the influence of bilateral asymmetry on ageestimation, thus reporting independent statistical analy-sis and age parameters for the examination of the left andright surfaces of Australian individuals.
Utilizing contemporary postmortem computed tomog-raphy (CT) for data acquisition, the methodologicalapproach of this study advances Australian forensicanthropological research capabilities, which are con-strained by an absence of osteological collections andlack of skeletal reference material. In this study, visual-ization protocols for nondestructive, three-dimensional(3D) examination of the symphyseal surface have beenformulated utilizing CT imaging. Similar methodologicalapproaches are utilized by the Centre of Forensic Sci-ence, The University of Western Australia (Franklin etal., 2012) and The Victorian Institute of Medicine, Mel-bourne (Bassed et al., 2011). The accuracy attributed toage estimation using visualization modalities such asCT has been validated through baseline studies in ourlaboratory and several published studies (Pasquier et al.,1999; Telmon et al., 2005; Ferrant et al., 2009 andTocheri et al., 2002). For example, Telmon et al. (2005)applied the S–B method to 3D CT reconstructions of thepubic symphysis and demonstrated no statistically sig-nificant difference between the application to physicalbone samples and high-quality images. The scanningresolution (0.5mm slice thickness/0.1mm overlap) uti-lized in our study is the finest to date for any agingstudy, demonstrating the potential for CT imaging inroutine casework proceedings specifically for high-qual-ity visualization of fragile and decomposing material.
More recently, forensic anthropological journals haveseen an influx of research implementing transition anal-ysis coupled with Bayesian statistics for age-at-deathdetermination (Kimmerle et al., 2008b; Langley-Shirleyand Jantz, 2010; Godde and Hens, 2012.) This is the firstAustralian anthropological study to utilize a Bayesianstatistical approach to publish calibrated age parametersfor each S–B phase to reflect the senescent changes in aQueensland population.
MATERIALS AND METHODS
Population sample
The sample consisted of CT scans of left and rightpubic symphyseal surfaces (scanned simultaneously)
AbbreviationsCommence delimit:
commencing delimitation of either extremity;Hor Ridging:
horizontal ridge development;Lack Delimitation:
lack of delimitation of lower/upper extremities;Mod rim erosion:
moderate erosion of the symphyseal rim;Prom depression:
prominent depression of the symphyseal face;Prom Lig Attach:
prominent/ marked ventral ligamentous attachments;Prom rim erosion:
prominent erosion of the symphyseal rim;PT Sep bony knob:
pubic tubercle appears as a separate bony knob;SVM Resorption:
resorption of the superior ventral margin;Vent Lig Attach:
ventral ligamentous attachments;VR complete:
complete formation of the ventral rampart.
387ACCURACY OF SUCHEY-BROOKS METHOD IN AUSTRALIA
American Journal of Physical Anthropology

obtained from 195 anonymized autopsy patients ofCaucasian ancestry aged 15–70 years (male n 5 119,female n 5 76; Fig. 1). Samples were collected from theQueensland Health Forensic and Scientific Services(QHFSS)—Forensic Pathology Mortuary, Coopers Plains,Queensland, Australia across a 7-month duration in2011. Ancestry data was obtained as per the ‘‘Queens-land Health Coronial Form 1’’ (determined through vis-ual inspection and family interviews by the reportingpolice officer) lodged with the deceased upon arrival atthe mortuary. Ethical approval for this research wasgranted by the Queensland Health Forensic ScientificServices—Human Ethics Committee (FSS-HEC AU/1/1188012) and ‘‘Genuine Research Approval’’ was grantedby the Queensland State Coroner. The sample size wasreliant on autopsy data and thus dependent upon unpre-dictable Queensland mortality rates within the studyperiod. This resulted in a sampling bias in the older agecategories in both the male and female sample.Exclusion Parameters: Because of ethical parameters
associated with this study, data collection was limited toa 7-month duration. All individuals autopsied duringthis period were included with the exception of Austra-lian Aboriginal and Mongoloid individuals; individualswhich exhibited pelvic fractures across the symphysealsurface or exhibited foreign bodies within the scan field;children under the age of 15 or individuals over 70 yearsof age.
Data acquisition and processing
CT scans were conducted using a Toshiba1 AquilionLB2 CT 16 slice multidetector scanner (Toshiba MedicalSystems, Minnetonka, Europe) at a 0.5/0.1 mm slicethickness and overlap (135 kV, mA varied according toToshiba ‘‘Sure Exposure’’). Scans specific to the anteriorpelvic region with soft tissue subtraction were isolatedand saved in Digital Imaging and Communications inMedicine (DICOM) format. This region of interestextended from the pubic symphyseal surface to themedial border of the obturator foramen. An independentoperator (M.M) managed data acquisition prior to dataprocessing and analysis, such that the S–B techniquewas applied blind to the documented age-at-death ofeach individual.
Amira1 (Visage Imaging GmbH, San Diego) was usedas an interface for the conversion of binary DICOM
data. A global threshold technique was performed toextract the bone surface from extraneous backgroundmaterial. The isosurface (a 3D polygonal mesh con-structed from a series of contour points in a scalar field)model was converted to a stereo lithography (stl) file forRapidform1 XOS (INUS Technology, Seoul, Korea) proc-essing. Rapidform1 XOS was utilized for 3D reconstruc-tion of the symphyseal surface and subsequent morpho-logical assessment. Utilizing the automated wire-meshmanipulation tools, the polygon mesh was optimized byretriangulating the original co-ordinates of the modelthrough interpolating mesh data and smoothing imagenoise.
As a consequence of the high quality scan resolution,extraneous background material, specifically image noiseand extra-osseous calcifications in the ligaments andmuscles surrounding the pubic symphysis, were visual-ized for individuals over the age of 60 years. Thisincreased the complexity of isolating the surface usingthe above protocol and therefore limited the breadth ofsamples examined in the older age categories due tocompromised visibility of the symphyseal surface. Thesecalcifications are likely to have become more severe andfrequent with increasing age and hence this study wasrestricted to individuals up to the age of 70 using thecurrent noninvasive CT protocol to maintain high visibil-ity and avoid distortions of the pubic symphysis. Fur-thermore, since samples were sourced from standardQHFSS autopsy operating procedures, few individualsover the age of 70 years are subject to external autopsydue to the higher frequency of death by natural causes;therefore limiting the sample demographics to individu-als aged 15–70 years.
Scoring and morphological analysisof the pubic symphysis
Utilizing the S–B method, each digital pubic symphy-seal model of known sex was classified into early/latestage of one of the six S–B phases, blind to the actualage of the individual (N.L). Suchey–Brooks pubic sym-physeal plaster casts scanned under the same CT dataacquisition protocol were used for comparative referenceduring scoring. The estimated age was considered as themean age of the obtained phase using the S–B methodfor utilization in the calculation of inaccuracy and bias.Once age-at-death had been estimated, the actual agewas provided by QHFSS and associated statistical analy-sis performed.
For each S–B phase, the morphological descriptorsthat complement the S–B method were used to aid inphase classification (Brooks and Suchey, 1990). To assessthe applicability of the S–B method, the pubic symphysisof each individual (right surfaces reported only) wasexamined for the presence of the morphological featuresprovided in the S–B technique’s descriptors (for example,ossific nodules and ventral beveling) blind to the actualage of the individual. The percentage frequency ofappearance and corresponding age ranges in which eachfeature was observed in each S–B phase were calculated.
Observer error
Ten percent of samples were randomly selected toassess intraobserver and interobserver variation inphase classification of the S–B method. Spearman’s rankcorrelation coefficients (rs) and a weighted Kappa Statis-
Fig. 1. Age and sex distribution of the study sample of Cau-casians in Queensland, Australia. The frequency of male (black)(n 5 119) and female (white) (n 5 76) individuals in each agecohort.
388 N. LOTTERING ET AL.
American Journal of Physical Anthropology
tic were calculated to evaluate the consistency betweenobserver scores. Kappa measures the agreement betweenthe observers adjusted by the amount of agreementexpected by chance alone. A kappa value of 1 indicatesperfect agreement, while a kappa of 0 favors chance. Forthe theoretical basis underlying the Kappa Statistic,refer to the work of Ferrante and Cameriere (2009).
Probit regression and Bayesian analysis
Consistent with methodology by Langley-Shirley andJantz (2010), Kimmerle et al. (2008b), and Konigsberg etal. (2008), transition analysis and Bayesian statisticswere conducted to obtain age ranges to model theQueensland population. Transition analysis was per-formed separately for left and right surfaces using theFortran-based Nphases2 program developed by Dr. LyleKonigsberg (http://konig.la.utk.edu/nphases2.htm), whichperforms a logistic regression wherein the intercept andslope are converted to the mean and standard deviation(Boldsen et al., 2002). A log-age cumulative probit modelwas used for the transition analysis to calculate themean and standard error of the ages-of-transition foreach phase (Kimmerle et al., 2008b). Transition analysisand Bayesian statistical results for the left symphysealsurface will be reported in text, unless specified other-wise. As it is the intention of this paper to determine theapplicability of the S–B method, results pertaining tothe left side are emphasized as the S–B technique wasoriginally designed using left symphyseal surfaces in iso-lation. However, independent results of the right and leftsurfaces are published in the tables accompanying thisarticle as our research team encourages independentapplication of the age-parameters depending on the sur-face recovered.
Bayes’ theorem
The probability that an individual is a specific age atthe time of death is estimated from a particular phaseconditional on age, using Bayes’ Theorem (Konigsberg etal., 1994; Lucy et al., 1996; Boldsen et al., 2002; Konigs-berg and Frankenberg, 2002; Kimmerle et al., 2008b).The posterior probability is proportional to the productof the prior probability and likelihood ratio. Bayes’ Theo-rem is represented below:
PrðajcjÞ ¼ PrðcjjaÞf ðaÞR1
0PrðcjjxÞf ðxÞdx
Pr(cj|a) is the probability of obtaining the observed S–Bphase from someone who is exactly a years old. Thisprobability is obtained from the transition analysis(Langley-Shirley and Jantz, 2010); and f(a) is a probabil-ity density function for age. A Gompertz–Makeham(GM) parametric model was used to estimate the age-at-death distributions. The GM model is expressed as:
hðtÞ ¼ a2 þ a3 expðb3tÞ
sðtÞ ¼ expð�a2tþ a3=b3ð1 � expðb3 � tÞÞÞ
where h is the hazard rate, t is age shifted by 15 yearsand s represents survivorship (Konigsberg and Franken-berg, 2002; Kimmerle et al., 2008b). Due to a lack ofskeletal reference material available for an Australianpopulation, Queensland life tables and mortality data
from 2008 to 2010 (Australian Bureau of Statistics,2011) were used to calculate a2, a3, and b3. The followingparameters were used for our population: Male—a2 50.0151, a3 5 0.0001, b3 5 0.1027; Female—a2 5 0.0156,a3 5 0.0001, b3 5 0.1194. The GM distribution and Bayes-ian analysis were conducted in ‘‘R’’ (http://www.r-project.org). ‘‘R’’ scripts for the GM hazards and for estimatingthe highest posterior density regions were sourced fromDr. Lyle Konigsberg’s webpage (http://konig.la.utk.edu).The posterior density regions for each S–B phase areequivalent to the most likely age-at-death in each phase.These results are not ‘‘point estimates’’ but rather theprobability estimates of the most likely age-at-death.
Estimating error and probability of ageestimation using S–B
To assess interpopulation variation, error was quanti-fied by inaccuracy (
P(|estimated age 2 actual age|)/n)
and bias (P
(estimated age 2 actual age)/n) calculations,where n is the number of samples, estimated age is themean S–B phase age and actual age refers to the chrono-logical age-at-death. Inaccuracy depicts the averagemagnitude of absolute error and bias represents thetendency of overestimation or underestimation of age inyears.
Consistent with methodology by Konigsberg et al.(2008), likelihood ratios were calculated as the probabil-ity that an individual would be in the observed S–Bphase conditional on the known age-at-death divided bythe probability of obtaining the observed S–B phase fromthe ‘‘population at large.’’ Using an improvement Chi-square test the probability of obtaining a particular S–Bphase is estimated by the observed frequency in eachS–B phase dependent on mean age-at-transition calcu-lated for our population.
To assess the implications of bilateral asymmetry onage-at-death estimation, left and right symphyseal surfa-ces were analyzed and reported as separate entities forall statistical analyses in this study. Each surface wasclassified into the following categories: same-phase,categorical, or greater than one phase asymmetry as perdefinitions by Overbury et al. (2009).
Kolmogorov–Smirnov tests demonstrated that actualage was normally distributed in males, but not females.An improvement Chi-square test was used to assessasymmetrical differences in phase classification, whilestatistically significant differences in error were investi-gated using nonparametric Wilcoxon Signed Rank andMann–Whitney U tests. Statistical analyses wereperformed in SPSS1 v19 (SPSS, Chicago). Statisticalsignificance was regarded as marginal at P \ 0.1 andsignificant at P\ 0.05.
RESULTS
Accuracy and reliability of the S–B method
The analysis of the application of the S–B method by anovice versus experienced anthropologist using k statis-tics demonstrated that both examiners were in ‘‘almostperfect agreement’’ in categorization into S–B age phases(k5 0.878), contrary to reports of high inter-observererror of the S–B technique (Kimmerle et al., 2008a).There was ‘‘substantial agreement’’ in intraobserverclassification into S–B phases (k 5 0.748) (Viera andGarrett, 2005). The Spearman’s rank correlation coeffi-
389ACCURACY OF SUCHEY-BROOKS METHOD IN AUSTRALIA
American Journal of Physical Anthropology

cient demonstrated consistency of 0.92 and 0.88 forintraobserver and interobserver agreement, respectively.
The Spearman’s correlation between estimated age(S–B phase) and chronological age-at-death in theQueensland cohort was 0.77 for males and 0.68 for
females (P \ 0.01) when examining the left surface ofthe pubic symphysis. When examining the right symphy-seal surface, the correlation coefficients were slightlyhigher at 0.82 for males and 0.70 for females (P \ 0.01).The relationship between chronological age-at-death andestimated age determined by the mean of each S–Bphase for both sexes are visually depicted in Figure 2with mean and standard deviation values presented inTable 1. Figure 2 demonstrates significant error in theestimation of age using the S–B methodology on ourcohort sample. Figure 2 also provides a visual represen-tation of the prominent asymmetry in phase allocationwhen examining both right and left symphyseal surfacesof the same individual. In fact, bilateral asymmetry inphase classification was exhibited in 53.33% of the sam-ple (v2: 172.07(1), P\ 0.001), with 23.59% of asymmetricsurfaces exhibiting categorical asymmetry (late phasex to early phase y) and 25.64% containing asymmetrywithin the same phase (early phase x to late phase x).Meanwhile, significant sexual dimorphism in individualsexhibiting categorical asymmetry was noted (males:16.41%; females: 7.18%). Asymmetry greater than onephase was noted in less than 0.85% of the population.
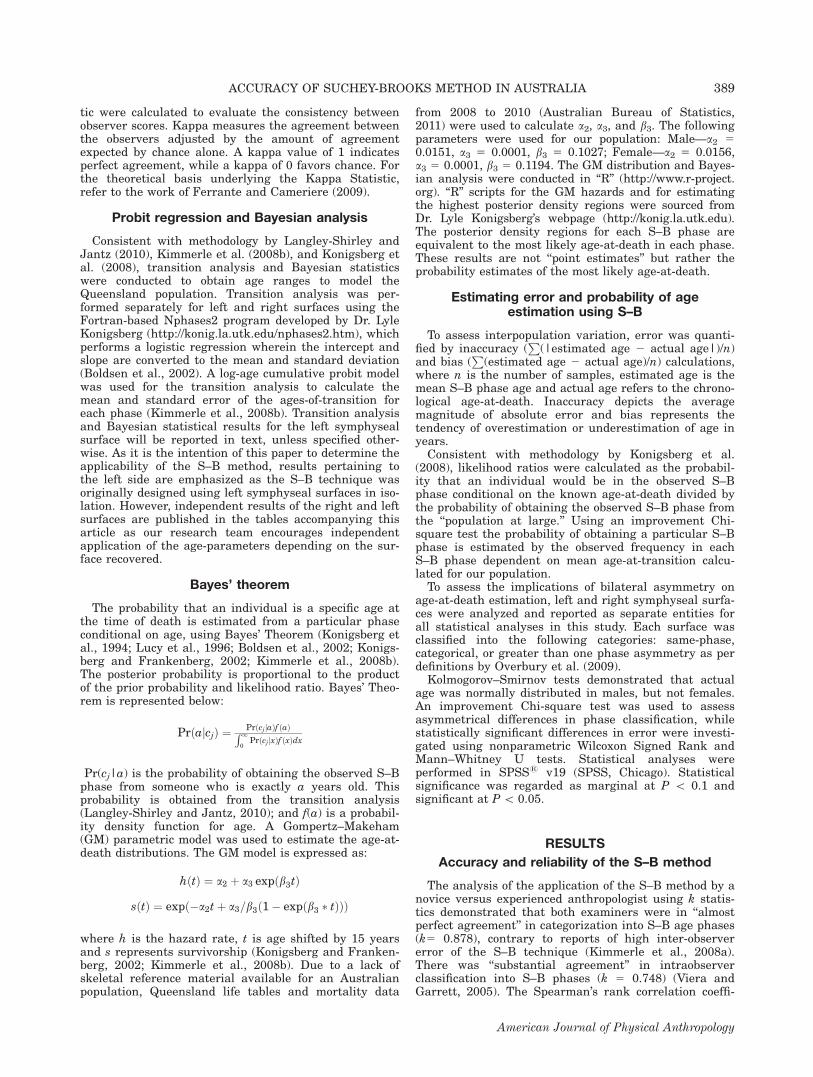
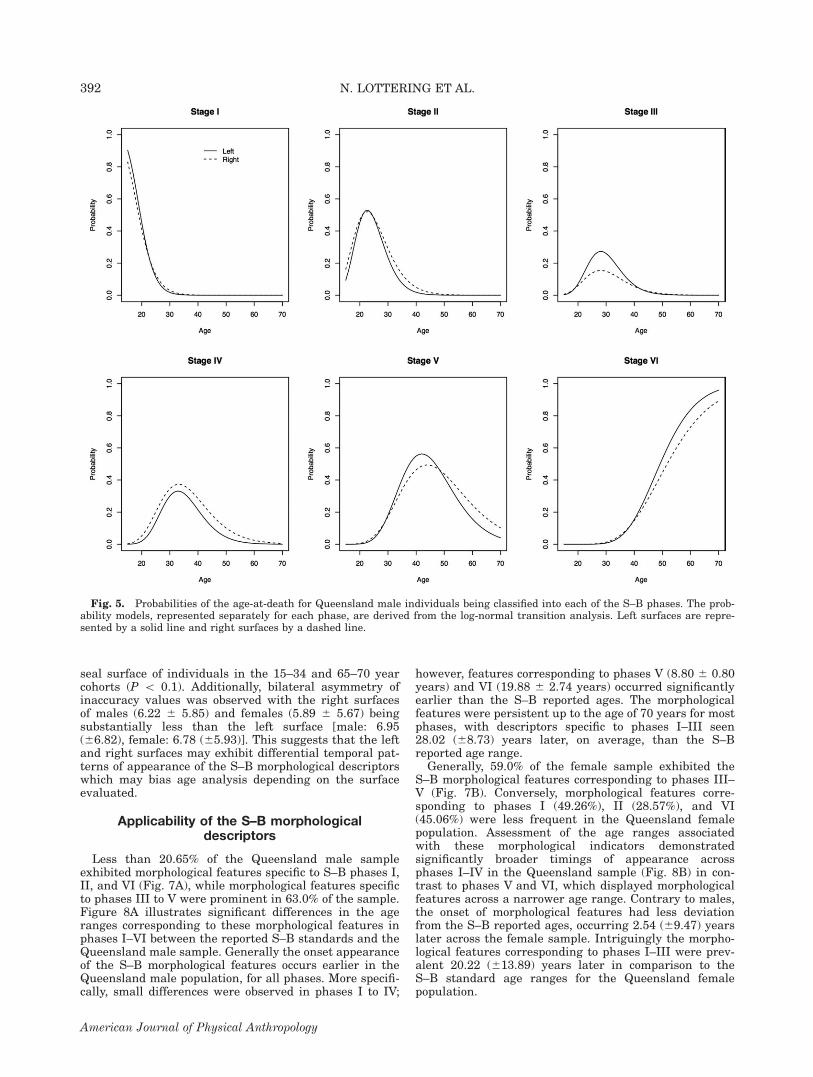
Population-specific mean ages-at-transition and stand-ard error, which represent the average age at which aQueensland individual is most likely to transition fromone S–B phase to the next, is provided in Table 2.Figures 3 and 4 provide a visual illustration of these dis-tributions. The varying dispersion of each distribution isindicative of the standard deviation for each transition,reflecting the age variation among phases. Considerableoverlap among phases reflects the wide range ofobserved ages for each phase. The degree of overlap fortransition distributions is greater for females in compari-son to males. Furthermore, increased clustering andoverlap of these distributions was observed in the rightsymphyseal samples for both males and females. Figures5 and 6 represent the probability from the log-age cumu-lative probit model of being classified into each S–Bphase at a given age. The performance of the right ver-sus left symphyseal surface can be visualized in thesefigures. From the transition ages, the highest posteriordensity for each S–B phase was calculated with Bayes-ian analysis for the Queensland population indicatingthe most likely age-at-death in each phase (Tables 3 and4). Four different probabilities are given for each phase(50, 75, 90, and 95%). Individuals attributed to phases Iand VI have truncated age ranges starting at 15 yearsand not extending beyond 70 years of age due to meth-odological considerations.
Fig. 2. Comparison of chronological and estimated agesusing the S–B method for Queensland individuals (A: Male, B:Female). The degree of overestimation or underestimation (bias)may be seen in estimated points that fall above or below thechronological age line of points (thick black line with shadedcircles). NOTE: Individual scatter points represent estimatedage (S–B mean) for left and right surfaces of each individual;open circles represent that the estimated age for both surfaceswas the same, while ‘‘L’’ and ‘‘R’’ symbols connected by a verticalline demonstrate bilateral asymmetry in the age estimation ofone individual.
TABLE 1. Mean estimated ages-at-death and chronological age range in years and standard deviation (SD) in the male and femaleQueensland sample, sub-divided into left and right symphyseal surfacesa
Male Female
Left Right Left RightPhase n Mean (SD) Mean (SD) D Range n Mean (SD) Mean (SD) D Range
I 16 17.75 (2.12) 17.75 (2.12) – 15–22 13 20.71 (5.77) 18.83 (3.19) 21.88 15–32II 22 26.25 (5.24)* 25.80 (5.49) 20.45 21–40 3 34.50 (4.95) 32.00 (0.00) 22.50 31–38III 13 35.40 (10.40) 33.00 (8.69) 22.40 25–49 10 31.67 (8.62) 31.71 (4.35) 10.04 24–41IV 30 36.12 (8.05) 33.77 (4.83) 22.35 26–58 4 39.00 (7.07) 42.5 (2.12) 13.50 34–44V 67 49.17 (8.84)** 46.25 (8.79) 22.92 31–66 28 49.00 (9.42) 52.76 (5.69)** 13.76 23–67VI 90 55.93 (10.90)** 56.98 (9.26)** 11.05 29–70 94 57.33 (9.22)* 58.16 (9.46) 10.83 23–70
a Statistical differences between chronological and estimated age (**P � 0.05, *P � 0.1) are indicated. Asymmetrical differences (D)in age classification for each phase are reported in years with reference to the left innominate.
390 N. LOTTERING ET AL.
American Journal of Physical Anthropology

By applying the age-at-transition means for our popu-lation, utilization of the S–B method on left symphysealsurfaces resulted in correct age classification for 63.9%of females and 69.7% of males in the Queensland sample(Table 5). The highest percentage classification corre-sponded to phases I and VI regardless of sex (>75%). Totest the null hypothesis that the estimated S–B phase isjust as likely to come from the identified individual of aspecific chronological age as from an individual selectedfrom random, a Chi-square likelihood ratio was deter-mined. Because of the small sample size (n � 5) of somephases in the Queensland male and female cohorts,the Chi-square likelihood ratio rather than Pearson’sChi-square statistic was used to test the null hypothesis(Agresti, 2002). The log likelihood ratios for the leftsurfaces of males and females were calculated as 1.25(5),P 5 0.001 and 1.33(5), P 5 0.003, respectively. Likeli-hood ratios greater than 1 argue for a relationshipbetween the two variables, with increasing ratios sug-gesting a more convincing relationship further awayfrom chance. Therefore we reject the null hypothesis,confirming that the likelihood of an individual beingaged correctly based on S–B phase allocation is greaterthan chance alone for the left pubic symphyseal analysis.Upon examination of right surfaces a log likelihood ratioof 1.05(5), P 5 0.048 for males and 1.75(5), P\ 0.001 forfemales was calculated. This suggests that the S–B clas-
sification of right symphyseal surfaces in males isapproaching the same odds as chance.
Table 6 presents the results for bias, inaccuracy andmean estimated age sub-divided by age subsets. Statisti-cally significant differences between chronological andS–B estimated ages (P \ 0.05) were noted for malesaged 15–34 and 55–70 years, as well as the 45–54 and65–70 year cohorts for females in the Queensland popu-lation. Bias ranged from 28.63 to 6.45 years and 27.13to 6.88 years in males and females, respectively. Biaswas greatest for individuals aged 65–70 years, irrespec-tive of sex. Based on left surfaces, the method overesti-mated age in younger males and females with averageinaccuracies of 6.29 (63.35) and 9.92 (64.31) years inindividuals aged 15–44 and 15–54 years, respectively.Application of the method to older individuals resultedin an under estimation of age with average inaccuraciesof 7.25 (61.20) years and 5.00 (63.01) years in malesand females, respectively. Greatest inaccuracy corre-sponded to the 35–44 year subset in both male (8.79 68.21 years) and female (14.18 6 5.93 years) samples.The left symphyseal surface of Queensland femalesexhibited significantly greater inaccuracy values for the15–24 and 35–44 year cohorts, but significantly lowervalues for individuals aged 55–65 years in comparison tothe male sample (P \ 0.1). Significant sexual dimor-phism in inaccuracy was recorded for the right symphy-
TABLE 2. Descriptive statistics for Australian age-of-transition distribution from one S–B phase to the next for Queensland malesand females, independently reported for the left and right symphyseal surface, based on a log-age cumulative probit modela
Queensland males (n 5 238) Queensland females (n 5 152)
Left Right Left Right
Transitionphases Estimate SEM exp(Est) Estimate SEM exp(Est) Estimate SEM exp(Est) Estimate SEM exp(Est)
I–II 2.94 0.07 18.93 2.97 0.07 19.53 3.20 0.09 24.61 3.13 0.09 22.99II–III 3.29 0.05 26.77 3.27 0.05 26.19 3.31 0.09 27.59 3.21 0.09 24.88III–IV 3.38 0.04 29.44 3.41 0.04 30.17 3.45 0.08 31.40 3.53 0.07 34.35IV–V 3.62 0.04 37.34 3.58 0.03 35.89 3.52 0.07 33.82 3.61 0.07 36.97V–VI 3.95 0.03 51.68 3.89 0.03 49.17 3.76 0.05 43.05 3.89 0.04 48.69SD 0.24 0.03 – 0.20 0.01 – 0.25 0.03 – 0.23 0.03 –
a Values represent the mean log age-of-transition (estimate) with standard error (SEM) which have been converted to the maximumlikelihood estimate of age-at-transition in years [exp(Est)]. SD 5 standard deviation.
Fig. 3. Age-at-transition distributions derived from a log-agecumulative probit model for the S–B phases for left and rightsymphyseal surfaces of Queensland males.
Fig. 4. Age-at-transition distributions derived from a log-agecumulative probit model for the S–B phases for left and rightsymphyseal surfaces of Queensland females.
391ACCURACY OF SUCHEY-BROOKS METHOD IN AUSTRALIA
American Journal of Physical Anthropology
seal surface of individuals in the 15–34 and 65–70 yearcohorts (P \ 0.1). Additionally, bilateral asymmetry ofinaccuracy values was observed with the right surfacesof males (6.22 6 5.85) and females (5.89 6 5.67) beingsubstantially less than the left surface [male: 6.95(66.82), female: 6.78 (65.93)]. This suggests that the leftand right surfaces may exhibit differential temporal pat-terns of appearance of the S–B morphological descriptorswhich may bias age analysis depending on the surfaceevaluated.
Applicability of the S–B morphologicaldescriptors
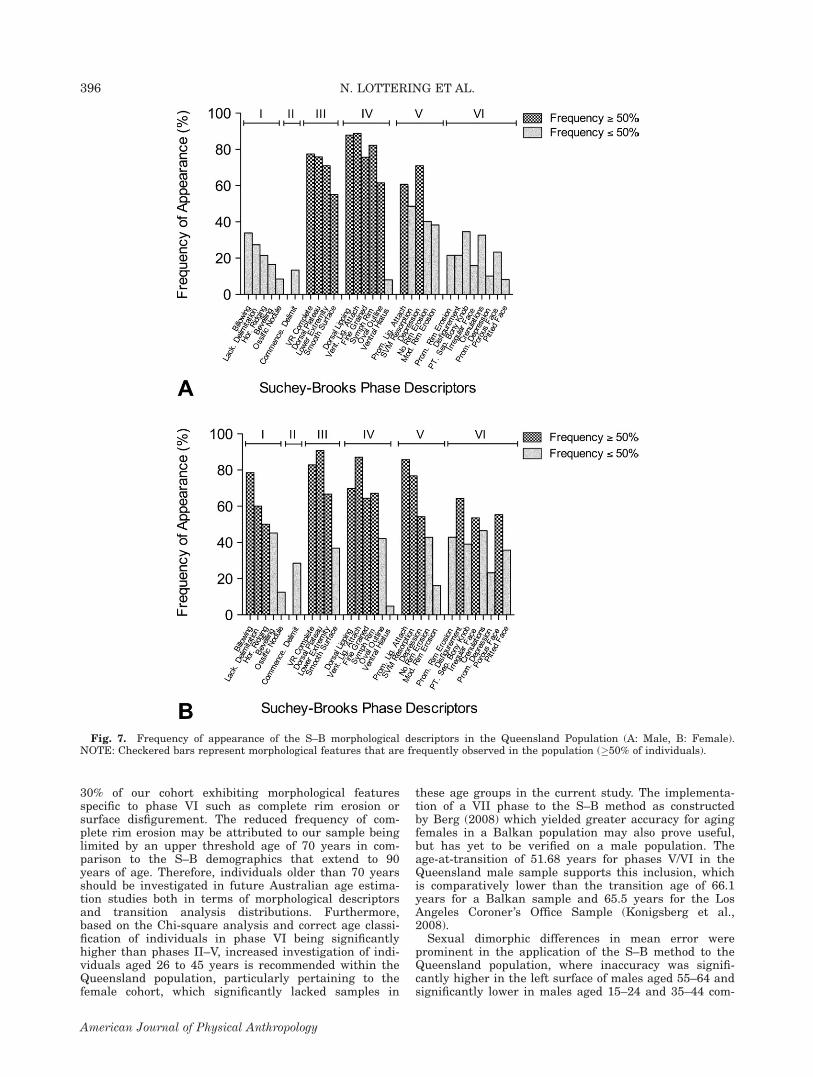
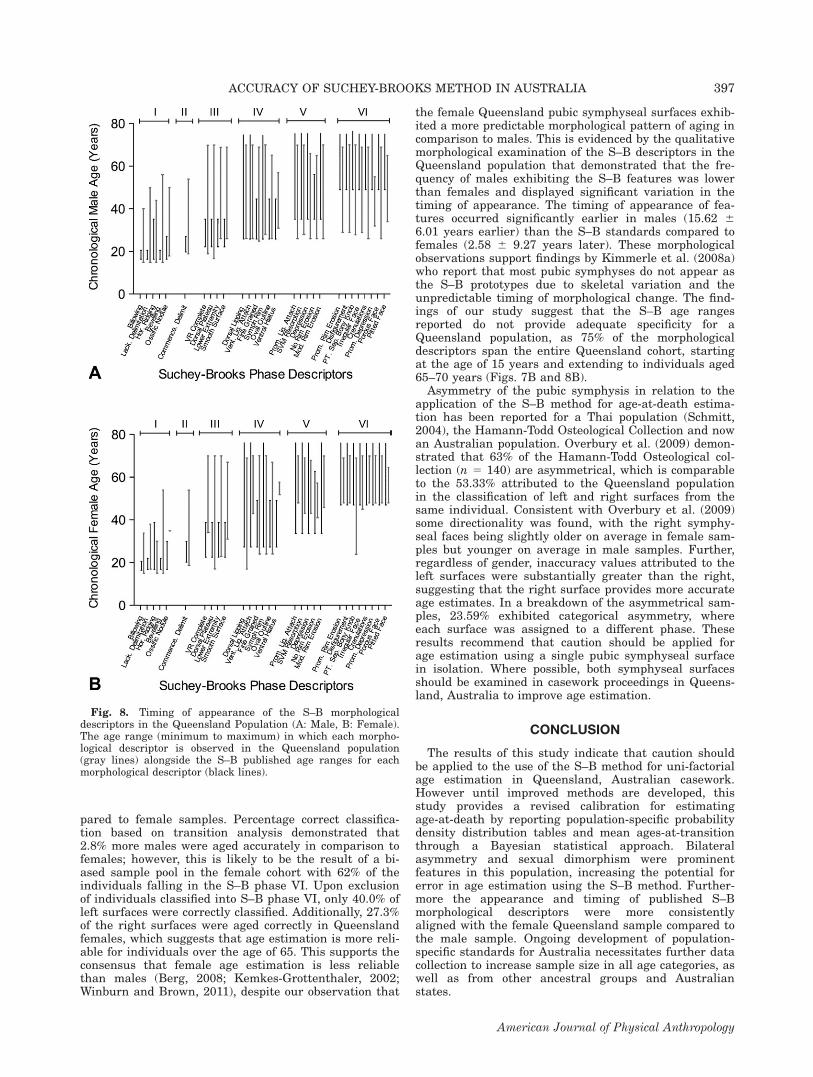
Less than 20.65% of the Queensland male sampleexhibited morphological features specific to S–B phases I,II, and VI (Fig. 7A), while morphological features specificto phases III to V were prominent in 63.0% of the sample.Figure 8A illustrates significant differences in the ageranges corresponding to these morphological features inphases I–VI between the reported S–B standards and theQueensland male sample. Generally the onset appearanceof the S–B morphological features occurs earlier in theQueensland male population, for all phases. More specifi-cally, small differences were observed in phases I to IV;
however, features corresponding to phases V (8.80 6 0.80years) and VI (19.88 6 2.74 years) occurred significantlyearlier than the S–B reported ages. The morphologicalfeatures were persistent up to the age of 70 years for mostphases, with descriptors specific to phases I–III seen28.02 (68.73) years later, on average, than the S–Breported age range.
Generally, 59.0% of the female sample exhibited theS–B morphological features corresponding to phases III–V (Fig. 7B). Conversely, morphological features corre-sponding to phases I (49.26%), II (28.57%), and VI(45.06%) were less frequent in the Queensland femalepopulation. Assessment of the age ranges associatedwith these morphological indicators demonstratedsignificantly broader timings of appearance acrossphases I–IV in the Queensland sample (Fig. 8B) in con-trast to phases V and VI, which displayed morphologicalfeatures across a narrower age range. Contrary to males,the onset of morphological features had less deviationfrom the S–B reported ages, occurring 2.54 (69.47) yearslater across the female sample. Intriguingly the morpho-logical features corresponding to phases I–III were prev-alent 20.22 (613.89) years later in comparison to theS–B standard age ranges for the Queensland femalepopulation.
Fig. 5. Probabilities of the age-at-death for Queensland male individuals being classified into each of the S–B phases. The prob-ability models, represented separately for each phase, are derived from the log-normal transition analysis. Left surfaces are repre-sented by a solid line and right surfaces by a dashed line.
392 N. LOTTERING ET AL.
American Journal of Physical Anthropology
DISCUSSION
Although the application of the S–B method to aQueensland Caucasian population demonstrated correctclassification more often than would be seen if an indi-vidual was selected at random from the sample, signifi-cant error associated with this method was observed.Our study supports the findings of research on Asian(Schmitt, 2004) and Balkan (Djuric et al., 2007; Kim-merle et al., 2008a) populations, highlighting problemsin the extrapolation of the S–B method to populationsoutside the United States. Interpopulation studiesassessing the applicability of the S–B method have usedthe mean age and standard deviation of each S–B phaseto calculate the percentage correct classification, despitethe broad age ranges and significant overlap representedby the S–B phases. To account for this, this studyapplied transition analysis to identify mean ages-at-tran-sition and probability density distributions to demon-strate the ability of the S–B morphological indicators todiscriminate age in the Queensland sample. This comple-ments the work of Konigsberg et al. (2008) whom affirmthe use of transition analysis to provide appropriatecoverage in age estimation. The transition analysisresults demonstrate significant overlap between phasedistributions, particularly for individuals aged 18–45
years (Figs. 3 and 4) and more distinctly so for femalesand when evaluating right surfaces in isolation. Wereport for the first time highest posterior density ages foreach S–B phase for an Australian subpopulation with arange of probability intervals. As purported by Langley-Shirley and Jantz (2010) posterior density tables may beadvantageous in a number of industry environmentsincluding forensic anthropology casework which may leadto improved age estimation in an Australian context.
To provide comparative data to previously publishedpopulation studies, we compare the magnitude anddirectionality of error between the chronological andestimated ages based on mean age and standard devia-tion of the S–B phases. Inaccuracy in the Queenslandpopulation did not exceed 14.18 years, therefore themagnitude of error is smaller in comparison to the Thaipopulation (17.20 years) (Schmitt, 2004) but greaterthan the 3.36 and 8 year inaccuracies for Spanish (Ris-sech et al., 2012) and Japanese (Sakaue, 2006) individu-als, respectively, regardless of gender. Furthermore, cau-tion is recommended for the comparison of the abovestudies to our contemporary Queensland population, asthe methodological approaches of these comparativestudies are limited to historical osteological collectionsand/or retrospective autopsy specimens.
Fig. 6. Probabilities of the age-at-death for Queensland female individuals being classified into each of the S–B phases. Theprobability models, represented separately for each phase, are derived from the log-normal transition analysis. Left surfaces arerepresented by a solid line and right surfaces by a dashed line.
393ACCURACY OF SUCHEY-BROOKS METHOD IN AUSTRALIA
American Journal of Physical Anthropology
Such demographic variability may be attributed to twoparameters. First, resulting from developmental advan-ces, the S–B collection is not representative of a 21stcentury population. This is supported by Hoppa (2000)who identifies that age-related changes of the pubic sym-physis can be significantly different (P \ 0.001) betweentarget and reference samples. Specifically, in a compari-son between the reference distribution for the S–Bmethod to a 20th century autopsy sample (Dade CountyMedical Examiner, Miami, Florida) (Klepinger et al.,1992) and the 18th–19th century Spitalfields sample(Christ Church, Spitalfields, London) (Molleson et al.,
1993), Hoppa (2000) demonstrated differential timing ofage-related changes in osteological features of the pubicsymphysis, with significant differences in mean ageswithin each 10-year-subset between the populations.Studies on secular changes in diaphyseal length, cranialdimensions and the fusion of the medial clavicle (Loderet al., 1993; Meadows and Jantz, 1995; Jantz and Jantz,1999; Jantz and Wescott, 2002; Langley-Shirley andJantz, 2010) illustrate that modern skeletal samples arerequired for the maintenance of forensic standards. Skel-etal acceleration has been attributed to secular changesin height, neonate and postnatal weight, and sexual
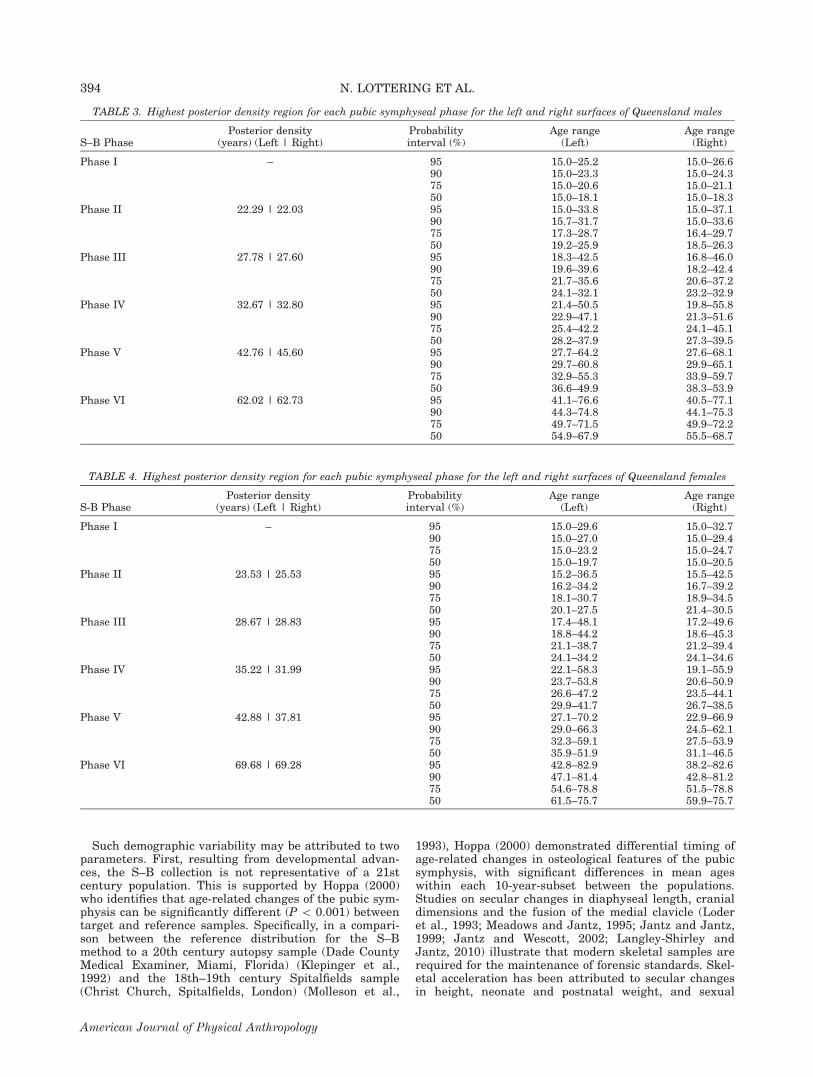
TABLE 3. Highest posterior density region for each pubic symphyseal phase for the left and right surfaces of Queensland males
S–B PhasePosterior density
(years) (Left | Right)Probabilityinterval (%)
Age range(Left)
Age range(Right)
Phase I – 95 15.0–25.2 15.0–26.690 15.0–23.3 15.0–24.375 15.0–20.6 15.0–21.150 15.0–18.1 15.0–18.3
Phase II 22.29 | 22.03 95 15.0–33.8 15.0–37.190 15.7–31.7 15.0–33.675 17.3–28.7 16.4–29.750 19.2–25.9 18.5–26.3
Phase III 27.78 | 27.60 95 18.3–42.5 16.8–46.090 19.6–39.6 18.2–42.475 21.7–35.6 20.6–37.250 24.1–32.1 23.2–32.9
Phase IV 32.67 | 32.80 95 21.4–50.5 19.8–55.890 22.9–47.1 21.3–51.675 25.4–42.2 24.1–45.150 28.2–37.9 27.3–39.5
Phase V 42.76 | 45.60 95 27.7–64.2 27.6–68.190 29.7–60.8 29.9–65.175 32.9–55.3 33.9–59.750 36.6–49.9 38.3–53.9
Phase VI 62.02 | 62.73 95 41.1–76.6 40.5–77.190 44.3–74.8 44.1–75.375 49.7–71.5 49.9–72.250 54.9–67.9 55.5–68.7
TABLE 4. Highest posterior density region for each pubic symphyseal phase for the left and right surfaces of Queensland females
S-B PhasePosterior density
(years) (Left | Right)Probabilityinterval (%)
Age range(Left)
Age range(Right)
Phase I – 95 15.0–29.6 15.0–32.790 15.0–27.0 15.0–29.475 15.0–23.2 15.0–24.750 15.0–19.7 15.0–20.5
Phase II 23.53 | 25.53 95 15.2–36.5 15.5–42.590 16.2–34.2 16.7–39.275 18.1–30.7 18.9–34.550 20.1–27.5 21.4–30.5
Phase III 28.67 | 28.83 95 17.4–48.1 17.2–49.690 18.8–44.2 18.6–45.375 21.1–38.7 21.2–39.450 24.1–34.2 24.1–34.6
Phase IV 35.22 | 31.99 95 22.1–58.3 19.1–55.990 23.7–53.8 20.6–50.975 26.6–47.2 23.5–44.150 29.9–41.7 26.7–38.5
Phase V 42.88 | 37.81 95 27.1–70.2 22.9–66.990 29.0–66.3 24.5–62.175 32.3–59.1 27.5–53.950 35.9–51.9 31.1–46.5
Phase VI 69.68 | 69.28 95 42.8–82.9 38.2–82.690 47.1–81.4 42.8–81.275 54.6–78.8 51.5–78.850 61.5–75.7 59.9–75.7
394 N. LOTTERING ET AL.
American Journal of Physical Anthropology

maturation (menarche and puberty) due to healthimprovements, improved socioeconomic status andincreased life expectancy (Malina, 1979; Langley-Shirleyand Jantz, 2010). As a result, the importance of usingcontemporary populations for skeletal aging should notbe underestimated.
Second, the S–B collection was derived from a Califor-nian population which has a very specific, but biasedracial demographic comprised of Caucasian (65.8%), Ne-groid (18.9%), Mexican (10.6%), and Mongoloid (2.0%)individuals and potentially excludes appropriate interpo-pulation variability from its analysis. A study conductedby Langley-Shirley and Jantz (2010) ascertain that nosignificant ethnic differences between African Americansand European Americans were detected using standardage estimation methods of the medial clavicle due to thefact that factors affecting growth are similar for theAmerican population as a whole. Socioeconomic statusand nutritional status has therefore been reported as aninfluential variable in maturation differences as docu-mented by the correlation between high levels of eco-nomic progress and medical advances with earlier ossifi-cation timings (Katz and Suchey, 1986; Kemkes-Grot-tenthaler, 2002; Schmeling et al., 2006). Therefore the
interpopulation differences observed in our study com-pared to S–B standards may represent secular trendsand/or differences in lifestyle factors in Queensland,Australian samples. Sample acquisition and analysisfrom other Australian states may help to assess thepresence of intrapopulation variability in the Australianpopulation, thus determining whether the findings ofthis study may be extrapolated to model the collectiveAustralian population or are limited to the state ofQueensland.
The greatest error, defined by the measure of inaccur-acy was associated with Queensland individuals aged35–44 years in both male and female samples. Sucherror may be correlated to inherent confusion in distin-guishing between the formation and degradation of theventral rampart, reported in this study. According toSuchey and Katz (1998) the formation of the ventralrampart peaks in the mid/late twenties, however thereare outlying cases reported in individuals in the 601year cohort. This potentially contributes to interpretativeerrors of the ventral rampart, resulting in high errorrates attributed to late phase III/early phase IV in thisstudy. These findings also suggest a ‘lag’ in the appear-ance of morphological features in the Queensland popu-lation, as this particular contingent is more commonlyreported between phases III and VI (Katz and Suchey,1986; Kimmerle et al., 2008b).
In the Queensland sample, error rates were lowerfor older individuals ([45 years). These findings con-tradict studies by Komar (2003) and Berg (2008) whichsuggest that once an individual reaches 40 years, theS–B technique loses precision. Instead, the error associ-ated with aging Queensland males (mean inaccuracy of7.24 6 1.20) and females (mean inaccuracy of 5.49 62.29) greater than 45 years of age is smaller than theerror attributed to younger individuals (\45 years:Male: 6.29 6 3.35, Female: 4.47 6 11.07). Thus,greater caution should be applied when aging Queens-land individuals under the age of 45 years using theS–B method.
In an evaluation of the frequency and timing of theS–B morphological descriptors, the Queensland sampleexhibits a delay in surface degradation with less than
TABLE 6. Inaccuracy and bias values of error for the left (A) and right (B) pubic symphyseal surfaces of male and female individu-als in the Queensland population for each chronological age subseta
Male Female
Age subsetMean
estimated ageInaccuracy(years, SD)
Bias (years,SD) n
Meanestimated age
Inaccuracy(years, SD)
Bias (years,SD) n
(A)15–24 20.38* 1.55^^ 1.11 0.85 1.75 13 24.40 5.95 7.97 4.40 9.05 825–34 36.02** 8.53 9.27 6.45 10.89 23 38.88 13.08 11.9 6.88 17.00 635–44 43.12 8.79^ 8.21 3.63 11.62 20 45.65 14.18 5.93 4.48 15.89 645–54 50.12 6.67 4.75 20.07 8.29 25 56.21** 6.47 3.55 5.35 5.15 2255–64 55.03** 6.44^^ 5.85 24.29 7.62 27 58.12 2.87 2.81 21.09 3.92 1965–70 58.36** 8.63 5.81 28.63 5.81 11 60.00** 7.13 1.64 27.13 1.64 15(B)15–24 20.38* 1.55^^ 1.11 0.85 1.75 13 25.89 7.43 12.1 5.89 13.03 825–34 35.52** 7.49^ 8.27 5.95 9.48 23 29.75 2.48 2.62 22.25 2.87 635–44 42.87 8.25 6.81 3.36 10.30 20 45.87 10.0 8.11 4.69 13.68 645–54 51.79 7.43 4.79 1.59 8.83 25 53.51* 5.91 3.59 2.65 6.49 2255–64 57.73 4.93 4.67 21.59 6.67 27 58.12 3.41 3.51 21.09 4.83 1965–70 61.2** 5.80^^ 1.84 25.80 1.84 11 59.21** 7.93 3.45 27.93 3.45 15
a Mean estimated age as calculated by S–B phase allocation. Statistical differences between chronological and estimated age (**P �0.05, *P � 0.1) and between male and female inaccuracy scores (^^P �0.05, ^P � 0.1) within each age subset are indicated. SD 5standard deviation.
TABLE 5. Contingency table of percentage correct ageclassification for Queensland male and female individuals:observed age falls within Suchey–Brook phases as defined
by ages-at-transition
Male Female
Correctclassification
(%)
Correctclassification
(%)
Phase n Left Right n Left Right
I 16 87.5 75.0 13 71.4 0.0II 22 66.7 70.0 3 0.0 0.0III 13 60.0 25.0 10 33.3 42.9IV 30 41.1 53.9 4 50.0 0.0V 67 42.9 53.1 28 27.3 0.0VI 90 83.3 77.1 94 86.3 95.4Total 238 63.9 64.7 152 69.7 64.5
395ACCURACY OF SUCHEY-BROOKS METHOD IN AUSTRALIA
American Journal of Physical Anthropology
30% of our cohort exhibiting morphological featuresspecific to phase VI such as complete rim erosion orsurface disfigurement. The reduced frequency of com-plete rim erosion may be attributed to our sample beinglimited by an upper threshold age of 70 years in com-parison to the S–B demographics that extend to 90years of age. Therefore, individuals older than 70 yearsshould be investigated in future Australian age estima-tion studies both in terms of morphological descriptorsand transition analysis distributions. Furthermore,based on the Chi-square analysis and correct age classi-fication of individuals in phase VI being significantlyhigher than phases II–V, increased investigation of indi-viduals aged 26 to 45 years is recommended within theQueensland population, particularly pertaining to thefemale cohort, which significantly lacked samples in
these age groups in the current study. The implementa-tion of a VII phase to the S–B method as constructedby Berg (2008) which yielded greater accuracy for agingfemales in a Balkan population may also prove useful,but has yet to be verified on a male population. Theage-at-transition of 51.68 years for phases V/VI in theQueensland male sample supports this inclusion, whichis comparatively lower than the transition age of 66.1years for a Balkan sample and 65.5 years for the LosAngeles Coroner’s Office Sample (Konigsberg et al.,2008).
Sexual dimorphic differences in mean error wereprominent in the application of the S–B method to theQueensland population, where inaccuracy was signifi-cantly higher in the left surface of males aged 55–64 andsignificantly lower in males aged 15–24 and 35–44 com-
Fig. 7. Frequency of appearance of the S–B morphological descriptors in the Queensland Population (A: Male, B: Female).NOTE: Checkered bars represent morphological features that are frequently observed in the population (�50% of individuals).
396 N. LOTTERING ET AL.
American Journal of Physical Anthropology
pared to female samples. Percentage correct classifica-tion based on transition analysis demonstrated that2.8% more males were aged accurately in comparison tofemales; however, this is likely to be the result of a bi-ased sample pool in the female cohort with 62% of theindividuals falling in the S–B phase VI. Upon exclusionof individuals classified into S–B phase VI, only 40.0% ofleft surfaces were correctly classified. Additionally, 27.3%of the right surfaces were aged correctly in Queenslandfemales, which suggests that age estimation is more reli-able for individuals over the age of 65. This supports theconsensus that female age estimation is less reliablethan males (Berg, 2008; Kemkes-Grottenthaler, 2002;Winburn and Brown, 2011), despite our observation that
the female Queensland pubic symphyseal surfaces exhib-ited a more predictable morphological pattern of aging incomparison to males. This is evidenced by the qualitativemorphological examination of the S–B descriptors in theQueensland population that demonstrated that the fre-quency of males exhibiting the S–B features was lowerthan females and displayed significant variation in thetiming of appearance. The timing of appearance of fea-tures occurred significantly earlier in males (15.62 66.01 years earlier) than the S–B standards compared tofemales (2.58 6 9.27 years later). These morphologicalobservations support findings by Kimmerle et al. (2008a)who report that most pubic symphyses do not appear asthe S–B prototypes due to skeletal variation and theunpredictable timing of morphological change. The find-ings of our study suggest that the S–B age rangesreported do not provide adequate specificity for aQueensland population, as 75% of the morphologicaldescriptors span the entire Queensland cohort, startingat the age of 15 years and extending to individuals aged65–70 years (Figs. 7B and 8B).
Asymmetry of the pubic symphysis in relation to theapplication of the S–B method for age-at-death estima-tion has been reported for a Thai population (Schmitt,2004), the Hamann-Todd Osteological Collection and nowan Australian population. Overbury et al. (2009) demon-strated that 63% of the Hamann-Todd Osteological col-lection (n 5 140) are asymmetrical, which is comparableto the 53.33% attributed to the Queensland populationin the classification of left and right surfaces from thesame individual. Consistent with Overbury et al. (2009)some directionality was found, with the right symphy-seal faces being slightly older on average in female sam-ples but younger on average in male samples. Further,regardless of gender, inaccuracy values attributed to theleft surfaces were substantially greater than the right,suggesting that the right surface provides more accurateage estimates. In a breakdown of the asymmetrical sam-ples, 23.59% exhibited categorical asymmetry, whereeach surface was assigned to a different phase. Theseresults recommend that caution should be applied forage estimation using a single pubic symphyseal surfacein isolation. Where possible, both symphyseal surfacesshould be examined in casework proceedings in Queens-land, Australia to improve age estimation.
CONCLUSION
The results of this study indicate that caution shouldbe applied to the use of the S–B method for uni-factorialage estimation in Queensland, Australian casework.However until improved methods are developed, thisstudy provides a revised calibration for estimatingage-at-death by reporting population-specific probabilitydensity distribution tables and mean ages-at-transitionthrough a Bayesian statistical approach. Bilateralasymmetry and sexual dimorphism were prominentfeatures in this population, increasing the potential forerror in age estimation using the S–B method. Further-more the appearance and timing of published S–Bmorphological descriptors were more consistentlyaligned with the female Queensland sample compared tothe male sample. Ongoing development of population-specific standards for Australia necessitates further datacollection to increase sample size in all age categories, aswell as from other ancestral groups and Australianstates.
Fig. 8. Timing of appearance of the S–B morphologicaldescriptors in the Queensland Population (A: Male, B: Female).The age range (minimum to maximum) in which each morpho-logical descriptor is observed in the Queensland population(gray lines) alongside the S–B published age ranges for eachmorphological descriptor (black lines).
397ACCURACY OF SUCHEY-BROOKS METHOD IN AUSTRALIA
American Journal of Physical Anthropology

ACKNOWLEDGMENTS
The authors acknowledge Queensland Health Forensicand Scientific Services (Brisbane, Australia)—ForensicPathology Division. Gratitude is extended to the Officeof the State Coroner, particularly State Coroner Mr.Michael Barnes. They thank Queensland University ofTechnology High Performance Computing and ResearchServices, particularly Mr. Mark Barry for his invaluabletechnical expertise and Dr. Helen Thompson for statisti-cal expertise. They owe many thanks to Dr. Walter Woodfor access to the Suchey-Brooks cast sets and osteometricequipment. Finally, they acknowledge Dr. Natalie Shir-ley for her advice regarding likelihood ratios and theBayesian analysis. The conclusions in this article do notrepresent the opinions of any of the aforementioned indi-viduals and institutions.
LITERATURE CITED
Agresti A. 2002. Categorical data analysis, 2nd ed. New York:Wiley.
Albert AM, Greene DL. 1999. Bilateral asymmetry in skeletalgrowth and maturation as an indicator of environmentalstress. Am J Phys Anthropol 110:341–346.
Aykroyd RG, Lucy DA, Pollard M, Roberts CA. 1999. Nasty, bru-tish, but not necessarily short: a reconsideration of the statisti-cal methods used to calculate age at death from adult humanskeletal and dental age indicators. Am Antiq 64:55–70.
Australian Bureau of Statistics. 2011. Life Tables, Queensland,2008-2010. Data cube: Excel Spreadsheet, cat.no. 3302.3.55.001, viewed 13 August 2012.
Bassed RB, Briggs C, Drummer OH. 2011. Age estimation andthe developing third molar tooth: an analysis of an Australianpopulation using computed tomography. J Forensic Sci56:1185–1191.
Berg GE. 2008. Pubic bone age estimation in adult women.J Forensic Sci 53:569–577.
Boldsen JL, Milner GR, Konigsberg LW, Wood JW. 2002. Tran-sition analysis: a new method for estimate age from skeletons.In: Hoppa R, Vaupel JW, editors. Paleodemography: agedistributions from skeletal samples. Cambridge: CambridgeUniversity Press. p 73–107.
Boulay CB, Tardieu C, Benaim C, Hecquest J, Marty C, Prat-Pradal D, Legaye J, Duval-Beaup’ere G, Pelissier J. 2006.Three-dimensional study of pelvic asymmetry on anatomicalspecimens and its clinical perspectives. J Anat 208:21–33.
Brooks ST, Suchey JM. 1990. Skeletal age determination basedon the male os pubis: a comparison of the Acsadi-Nemeskeriand Suchey-Brooks methods. Hum Evol 5:227–238.
Brown CA. 2009. Uncertainty in skeletal aging: A retrospectivestudy and test of skeletal aging methods at the Joint POW/MIA Accounting Command Central Identification Laboratory[master’s thesis]-[California, Chico]: California State Univer-sity.
Chen X, Zhang Z, Tao L. 2008. Determination of male age atdeath in Chinese Han population: using quantitative varia-bles statistical analysis from pubic bones. Forensic Sci Int175:36–43.
Djuric M, Djonic D, Nikolic S, Popovic D, Marinkovic J. 2007.Evaluation of the Suchey-Brooks method for aging skeletonsin the Balkans. J Forensic Sci 52:21–23.
Ferrant O, Rouge-Maillart C, Guittet L, Papin F, Clin B, Fau G,Telmon N. 2009. Age at death estimation of adult males usingcoxal bone and CT scan: a preliminary study. Forensic Sci Int186:14–21.
Ferrante L, Cameriere R. 2009. Statistical methods to assessthe reliability of measurements in procedures for forensic ageestimation. Int J Legal Med 123:277–283
Franklin D, Flavel A, Kuliukas A, Cardini A, Marks M, OxnardC, O’Higgins P. 2012. Estimation of sex from sternal measure-
ments in a Western Australian population. Forensic Sci Int217:230.e1–230.e5.
Godde K, Hens SM. 2012. Age-at-death estimation in an Italianhistorical sample: a test of the Suchey-Brooks and TransitionAnalysis methods. Am J Phys Anthropol 149:259–265.
Halgrimsson B. 1999. Ontogenetic patterning of skeletal fluctu-ating asymmetry among primates. Am J Phys Anthropol20:121–151.
Hartnett KM. 2010. Analysis of age at death estimation usingdata from a new, modern autopsy sample. Part I: Pubic bone.J Forensic Sci 55:1145–1151.
Hoppa RD. 2000. Population variation in osteological aging cri-teria: an example from the pubic symphysis. Am J PhysAnthropol 111:185–191.
Jantz L, Jantz R. 1999. Secular change in long bone length andproportion in the United States, 1800-1970. Am J PhysAnthropol 110:57–67.
Jantz R, Wescott D. 2002. Assessing craniofacial secular changein American whites and blacks using geometric morphometry.Am J Phys Anthropol 117:90.
Katz D, Suchey JM. 1986. Age determination of the male ospubis. Am J Phys Anthropol 69:427–435.
Kemkes-Grottenthaler A. 2002. Aging through the ages: histori-cal perspectives on age indicator methods. In: Hoppa RD,Vaupel JW, editors. Paleodemography: age distributions fromskeletal samples. Cambridge: Cambridge University Press. p48–72.
Kimmerle EH, Prince DA, Berg GE. 2008a. Inter-observer vari-ation in methodologies involving the pubic symphysis, sternalribs, and teeth. J Forensic Sci 53:594–600.
Kimmerle EH, Konigsberg LW, Jantz RL, Baraybar JP. 2008b.Analysis of age at death estimation through the use of pubicsymphyseal data. J Forensic Sci 53:558–568.
Klepinger LL, Katz D, Micozzi MS, Carroll L. 1992. Evaluationof cast methods for estimating age from the os pubis. J Foren-sic Sci 37:763–770.
Komar D. 2003. Lessons from Srebrenica: the contributions andlimitations of physical anthropology in identifying victims ofwar crimes. J Forensic Sci 48:713–716.
Konigsberg WL, Frankenberg SR, Walker RB. 1994. Regresswhat on what: paleodemographic age estimation as a calibra-tion problem. In: Paine RR, editor. Integrating archaeologicaldemography: multidisciplinary approaches to prehistoric pop-ulation. Carbondale, IL: Southern Illinois University. p 64–88.
Konigsberg LW, Frankenberg SR. 2002. Deconstructing death inpaleodemography. Am J Phys Anthropol 117:297–309.
Konigsberg LW, Herrmann NP, Wescott DJ, Kimmerle EH.2008. Estimation and evidence in forensic anthropology: age-at-death. J Forensic Sci 53:541–557.
Lai EHH, Chang JZC, Jane Yao CC, Tsai SJ, Liu JP, Chen YJ.2008. Relationship between age at menarche and skeletalmaturation stages in Taiwanese female orthodontic patients.J Formosan Med Assoc Taiwan 107:527–532.
Langley-Shirley N, Jantz RL. 2010. A Bayesian approach to ageestimation in modern Americans from the clavicle. J ForensicSci 55:571–583.
Loder RT, Estle DT, Morrison K, Eggleston D, Fish DN, Grenn-field ML, Guire KE. 1993. Applicability of the Greulich andPyle skeletal age standards to black and white children oftoday. Am J Dis Child 147:1329–1333.
Lucy D, Aykroyd RG, Pollard RM, Solheim T. 1996. A Bayesianapproach to adult human age estimation from dental observa-tions by Johanson’s age changes. J Forensic Sci 41:189–194.
Malina R. 1979. Secular changes in size and maturity: causesand effects. Monogr Soc Res Child 44:59–102.
Meadows L, Jantz R. 1995. Allometric secular change in thelong bones from the 1800s to the present. J Forensic Sci40:762–767.
Molleson, TI, Cox M, Waldron AH, Whittake DK. 1993. The Spi-talfields Project, Vol. 2: the anthropology. CBA ResearchReport 86. York: Council for British Archeology.
Overbury RS, Cabo LL, Dirkmaat DC, Symes S. 2009. Asymme-try of the os pubis: implications for the Suchey-Brooksmethod. Am J Phys Anthropol, 139:261–268.
398 N. LOTTERING ET AL.
American Journal of Physical Anthropology
Pasquier E, De Saint Martin Pernot L, Burdin V, Mounayer C.1999. Determination of age at death: assessment of an algo-rithm of age prediction using numerical three-dimensional CTdata from pubic bones. Am J Phys Anthropol 108:261–268.
Rissech C, Wilson J, Winburn AP, Turbon D, Steadman D. 2012.A comparison of three established age estimation methods onan adult Spanish sample. Int J Legal Med 126:145–155.
Sakaue K. 2006. Application of the Suchey-Brooks system of pu-bic age estimation to recent Japanese skeletal material.Anthropol Sci 114:59–64.
Schmeling A, Schulz R, Danner B, Rosing FW. 2006. The impactof economic progress and modernization in medicine on theossification of hand and wrist. Int J Legal Med 120:121–126.
Schmitt A. 2004. Age-at-death assessment using the os pubicand the auricular surface of the ilium: a test on an identifiedAsian sample. Int J Osteoarcheol 14:1–6.
Suchey JM, Katz D. 1998. Applications of pubic age determina-tion in a forensic setting. In: Reichs KJ, editor. Forensic oste-
ology: advances in the identification of human remains,, 2nded. Springfield, IL: CC Thomas. p 204–236.
Telmon N, Gaston A, Chemla P, Blanc A, Joffre F, Rouge D.2005. Application of the Suchey-Brooks method to three-dimensional imaging of the pubic symphysis. J Forensic Sci50:507–512.
Tocheri MW, Razdan A, Dupras TL, Bae M, Liu D. 2002. Three-dimensional quantitative analysis of human pubic symphysealmorphology: Can current limitations of skeletal aging meth-ods be resolved? Am J Phys Anthropol 117:155.
Todd TW. 1920. Age change in the pubic bone. I: The whitemale pubis. Am J Phys Anthropol, 3:467–470.
Viera AJ, Garrett JM. 2005. Understanding interobserver agree-ment: the Kappa statistic. Fam Med 37:360–363.
Winburn AP, Brown CA. 2011. Error and uncertainty in pelvisage estimation, Part II: Younger vs. older adult. Paper pre-sented at the 63rd Annual Scientific Meeting of the AmericanAcademy of Forensic Sciences, Chicago, February 21–26.
399ACCURACY OF SUCHEY-BROOKS METHOD IN AUSTRALIA
American Journal of Physical Anthropology