LNCS 6768 - Accessible Education for Autistic Children: ABA ...

Evaluation of the Protein Solvent-Accessible SurfaceUsing Reduced Representations in Terms of Critical
Points of the Electron Density
A. BECUE,* N. MEURICE,† L. LEHERTE, D.P. VERCAUTERENLaboratoire de Physico-Chimie Informatique, Facultes Universitaires Notre-Dame de la Paix,
Rue de Bruxelles 61, B-5000 Namur; Belgium
Received 7 October 2003; Accepted 6 February 2004
Abstract: The aim of our study is the development of a method for calculating the interface of dimerization ofprotein–protein complexes based on simplified medium-resolution structures. In particular, we wished to evaluate if theexisting concepts for the computation of the Solvent-Accessible Surface Area (SASA) of macromolecules could beapplied to medium-resolution models. Therefore, we selected a set of 140 protein chains and computed their reducedrepresentations by topological analysis of their electron density maps at 2.85 Å crystallographic resolution. Thisprocedure leads to a limited number of critical points (CPs) that can be identified and associated to backbone andside-chain parts. To evaluate the SASA and interfaces of dimerization of the reduced representations, we chose andmodified two existing programs that calculate the SASA of atomic representations, and tested (1) several radii tables ofamino acids, (2) the influence of the backbone and side-chain points, and (3) the radius of the solvent molecule, whichrolls over the surface. The results are shown in terms of relative error compared to the values calculated on thecorresponding atomic representations of the proteins.
© 2004 Wiley Periodicals, Inc. J Comput Chem 25: 1117–1126, 2004
Key words: solvent accessible surface area; electron density; medium resolution; topological analysis; reducedrepresentations; critical points
Introduction
The way macromolecules, such as proteins and DNA, interact witheach other to regulate DNA transcription and expression is ofincreasing interest in biotechnology. In this sense, many studiesfocus on how proteins and ligands can selectively bind to the DNAgrooves with respect to the base-pair sequences. However, becauseof the huge size of the systems involved, the theoretical approachesthat are developed so for far smaller molecules, for example,all-atoms representations, cannot reasonably be applied to macro-molecular docking, as they would require too heavy computationalresources. A possible solution is thus to work with reduced rep-resentations of the macromolecular partners. In this article, weshow how to evaluate the interface of dimerization of macromo-lecular complexes by calculating the solvent-accessible surfaceareas using such reduced representations. This study is part of amore global project that consists of developing an original mac-romolecular docking method based on reduced representations ofthe partners.
With this aim, we already proposed a method that allows toobtain low-scale representations of macromolecules without lossof significant information.1–4 The strategy is based on the analysis
of the critical points (CPs) of electron density maps (EDMs) of themolecules calculated at medium crystallographic resolution. Thetopological analysis of an EDM leads to a graph of CPs that aredefined as the points where the gradient of the ED equals zero. Inthis domain, we showed that a 2.85 Å resolution was particularlyadapted to the representation of proteins and DNA strings.4 In-deed, at this resolution, amino acids (aa) are represented by one CPfor the backbone, and zero to two CPs for the side chain accordingto the size of the aa. An interesting point of this method is thatmany physicochemical descriptors can be assigned to each CP, thatis, position, electron density at the CP position, eigenvalues, eig-envectors, anisotropic volume, as well as additional informationabout the nature and properties of the chemical group or functionassociated to the point, as for example, the hydrophobic behavioror the electronic charge for the electrostatic interactions in ourcase. In this sense, the possible consideration of this large set ofdescriptors surely constitutes an advantage compared to the other
*F.N.R.S. Ph.D. Research Fellow
†F.N.R.S. Scientific Research Worker
Correspondence to: A. Becue; e-mail: [email protected]
© 2004 Wiley Periodicals, Inc.
reduced representations already proposed in the literature, such asin refs. 5–7, especially when studying the complementarity be-tween two macromolecules.
In our global strategy, we first determined the best crystallo-graphic resolution to represent adequately the macromolecules,that is, proteins and nucleic acids, in terms of reduced represen-tations as explained in ref. 4. As a second aspect, we concentratedon the study of the contribution of the solvent in terms of acces-sible surface. More particularly, the shape complementarity, whichcan be expressed in terms of the surface that is buried into theinterface of complexation between the two macromolecules, con-tributes to drive the docking process. To define such a shapecontribution, we developed a method for calculating the solvent-accessible surface area (SASA) particularly adapted to the previ-ously defined reduced representations of the two partners.
The concept of the solvent-accessible surface of a proteinmolecule was originally introduced by Lee and Richards8 as a wayof quantifying hydrophobic burial. When a protein folds or whentwo protein chains dimerize, the hydrophobic effects cause non-polar side chains to cluster together in the protein interior orinterface, whereas polar side chains tend to maximize the contactswith the outer solvent molecules. The stability of the system is thuspartially due to the burial of the nonpolar residues, and can bemeasured by the loss of SASA of the system, defined as the part ofthe complex surface in direct contact with the solvent. An atom orgroup of atoms is defined as accessible if a solvent molecule ofspecified size, generally water, can be brought into van der Waals(vdW) contact. It is thus simply defined as the surface traced outby the center of a probe sphere, which represents the solventmolecule, as it rolls over the vdW surface of the protein.
The calculation of the SASA has thus already shown a greatinterest in several fields as protein folding studies,9 proteing dock-ing,10 to explain the stability of proteins,11 as well as to simulatephospholipid membranes.12 Computationally, the contact surfacebetween the molecule and the solvent is defined as the vdWenvelope of the solute molecule expanded by the radius of thesolvent sphere around each solute atom center. It can be veryprecisely calculated on atomic structures knowing the vdW radii ofall atoms and setting the probe radius to an optimal value, gener-ally 1.4 Å for water as in the original work of Lee and Richards.8
Since their pioneering work, various implementations of the cal-culation of the SASA have been developed. We can distinguish, onthe one hand, approximate methods,13,14 which rely on numericalintegrations by representing the surface with a large number ofdots, and, on the other hand, exact methods, which were firstintroduced by Connolly15,16 and Richmond17 and constantly im-proved to maximize their efficiency.18–20
In this context, we needed to develop a surface calculationmethod totally adapted to the reduced representations of macro-molecules introduced earlier,4 including the definition of variousparameters comparable to those needed when using atomic repre-sentations of the partners. Therefore, one of the main difficultieswas to find a set of radii that are no more related to atoms, but toaa residues. Furthermore, the 1.4 Å value usually set as proberadius could probably not be the most adequate when using re-duced representations. We thus had to find the best match between(1) the already existing methodologies used to evaluate the surfacevalues, (2) the representations used in terms of graphs of CPs, (3)
the set of radii for each aa, and (4) the radius of the solvent probe.All these points will be developed and discussed in the Method-ology and Results sections.
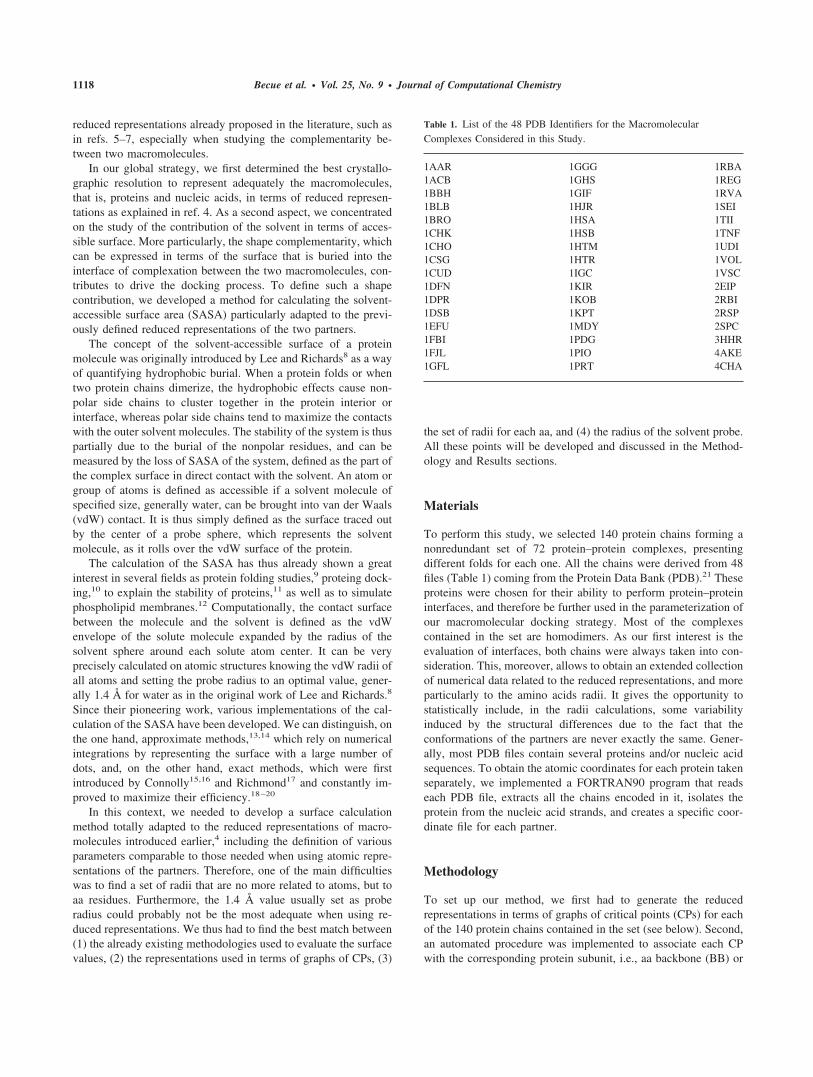
Materials
To perform this study, we selected 140 protein chains forming anonredundant set of 72 protein–protein complexes, presentingdifferent folds for each one. All the chains were derived from 48files (Table 1) coming from the Protein Data Bank (PDB).21 Theseproteins were chosen for their ability to perform protein–proteininterfaces, and therefore be further used in the parameterization ofour macromolecular docking strategy. Most of the complexescontained in the set are homodimers. As our first interest is theevaluation of interfaces, both chains were always taken into con-sideration. This, moreover, allows to obtain an extended collectionof numerical data related to the reduced representations, and moreparticularly to the amino acids radii. It gives the opportunity tostatistically include, in the radii calculations, some variabilityinduced by the structural differences due to the fact that theconformations of the partners are never exactly the same. Gener-ally, most PDB files contain several proteins and/or nucleic acidsequences. To obtain the atomic coordinates for each protein takenseparately, we implemented a FORTRAN90 program that readseach PDB file, extracts all the chains encoded in it, isolates theprotein from the nucleic acid strands, and creates a specific coor-dinate file for each partner.
Methodology
To set up our method, we first had to generate the reducedrepresentations in terms of graphs of critical points (CPs) for eachof the 140 protein chains contained in the set (see below). Second,an automated procedure was implemented to associate each CPwith the corresponding protein subunit, i.e., aa backbone (BB) or
Table 1. List of the 48 PDB Identifiers for the MacromolecularComplexes Considered in this Study.
1AAR 1GGG 1RBA1ACB 1GHS 1REG1BBH 1GIF 1RVA1BLB 1HJR 1SEI1BRO 1HSA 1TII1CHK 1HSB 1TNF1CHO 1HTM 1UDI1CSG 1HTR 1VOL1CUD 1IGC 1VSC1DFN 1KIR 2EIP1DPR 1KOB 2RBI1DSB 1KPT 2RSP1EFU 1MDY 2SPC1FBI 1PDG 3HHR1FJL 1PIO 4AKE1GFL 1PRT 4CHA
1118 Becue et al. • Vol. 25, No. 9 • Journal of Computational Chemistry

aa side chain (SD). Third, we modified an existing program ded-icated initially to atomic structures to allow the evaluation of theSASA of the generated CPs graphs (see later). Fourth, we testedseveral available sets of aa radii as well as radii calculated directlyfrom the graphs of CPs, and, finally, we compared the obtainedSASA and interface values with those calculated from the atomicstructures to validate our method.
Reduced Representations of the Proteins
As explained in the Introduction, our method is based on thecalculation of the electron density (ED) function for each macro-molecular partner and its simplification in terms of graphs of CPsby topological analysis, each aa being described by a limitednumber of points according to the size of the residue (Fig. 1).
Each ED function was generated by simulating an X-ray dif-fraction experiment at a specific crystallographic resolution R,using the XTAL program.23 Therefore, we developed an auto-mated procedure to manage the entire set of protein chains, that is,
loading the atomic positions file, setting the cell dimension to theprotein dimension with an extra 10 Å in each direction, centeringthe molecule in a cell, determining the best grid spacing, andrunning XTAL at a resolution of 2.85 Å. The 10 Å added to eachcell dimension ascertain that each calculated 3D electron densitymap (EDM) is well circumscribed inside the simulating box cell.Each molecular EDM is obtained by calculating the adequate set ofstructure factors F(h), and then taking their Fourier transform. Atmedium crystallographic resolution, the ED function is indicativeof the chemical groups and functions,1,24 which hence constitutesa well-adapted stereoelectronic descriptor.
The CPs, that is, the points where the gradient of the EDvanishes, are retrieved by topological analysis of the EDMs usingORCRIT.25 These CPs can be of four different kinds, that is, peak(PK), pass, pale, and pit, corresponding to a maximum of ED, twodifferent types of saddle points, and a minimum of ED, respec-tively. In our study, we only considered the PKs as they reflect aphysical and chemical reality, that is, chemical bonds and func-tions. The management of the topological analysis, the storage ofthe PKs only, and their identification by association with thecorresponding protein subunits, that is, aa BB or aa SD, was doneby an in-house computer code. Thanks to this procedure, we couldeasily compute the reduced representations of the chosen proteinchains in a few minutes on a 1.0 GHz PC/Linux computer.
Each PK associated with an aa BB or aa SD was furtherrepresented by an ellipsoid that constitutes a good geometricaldescriptor. Indeed, at the PK location, the three main curvatures ofthe ED function, given by the three eigenvalues and eigenvectors,constitute a local information that can be transferred in the spacesurrounding the PK. It is thus possible to reconstruct a 3D functionby considering the PK location r as the center of expansion of a 3DGaussian function:
��r� � ��0�.e�.rT.H.r/��0� (1)
where � was set to 2.0 to fit the ORCRIT results,1 H is the HessianMatrix constructed from the second derivatives of the ED, and�(0), the ED value at the PK position.
Doing so, an anisotropic volume could thus be constructedaround each PK by integrating the exponential part of the Gaussianfunction over the space within the frame of an ellipsoid charac-terized by three main radii R1, R2, and R3. As each PK is associatedwith a BB or a SD, these values were stored for the entire set ofproteins and used further to calculate the sets of radii extractedfrom the graphs of PKs (see later).
Solvent-Accessible Surface Area (SASA) Calculation
To evaluate the surface of the proteins in their atomic and reducedrepresentations, we chose two freeware codes, that is, Vega26 and“SASA,”14 respectively.
Vega (http://users.unimi.it/�ddl/) was chosen because it waseasy to use and for the clarity of informations it provides for eachprotein input. It reads several types of molecular files, amongwhich the PDB files, and has thus been used to evaluate thereference surface values of the atomic representations of the 140protein chains. As mentioned in the Methodology, an importantparameter that had to be determined when calculating a surface is
Figure 1. Comparison between (a) the atomic representation and (b)the reduced representation in terms of graph of peaks (PKs) obtainedby performing a topological analysis of the electron density mapcalculated at a crystallographic resolution of 2.85 Å for the chain B ofthe 1HTM PDB file. The PKs are color-coded per amino acid theybelong to. Visualization of the atomic and reduced representationswere obtained using RaSMol [WWW1] and IBM Data Explorer[IBM],22 respectively.
Evaluation of the Protein Solvent-Accessible Surface 1119

the “probe radius” value. The probe is generally set to 1.4 Å(corresponding to water) when calculating surfaces at atomic scale.We chose to keep this value for the calculations carried out withVega.
“SASA” (http://www.doe-mbi.ucla.edu/Services/Download/SASA.tar.gz), written in C, was originally developed for treatingPDB files and performing calculations on atomic coordinates byreading a table of radii for each atom type. It was selected becauseit was easy to modify (only several parameters and a few lineswere changed) to be compatible with the graphs of PKs. Themodifications we made are summarized as follows:
1. In our application, the original “SASA” code is a subroutinecalled by our main program, encoded in Fortran90, whichmanages the positions, orientations, and descriptor values as-sociated to the graphs of PKs;
2. “SASA” now reads a PDB-like file in which the atomic posi-tions and types are replaced by the PK positions as well as theiraa nature, that is, the usual three-letter aa code, plus either a BBor a SD identifier;
3. the table of atomic types and radii has been replaced by a fileof columns, containing the aa codes and the radii of the BB andSD, respectively.
Another aspect to consider was the definition of a probe radius,suitable for reduced representations. A large range of values, from0.0 to 6.6 Å, was tested to see the influence of the probe radius onthe surface values and finally determine an optimal value that willfurther be used in our studies.
The modifications of the “SASA” program that allowed us toevaluate the surfaces for the graphs of PKs were done to allowdynamical changes of the table of radii that needed to be consid-ered, as well as of the probe radius value.
Results and Discussion
As explained in the Materials section, we worked with a set of 140protein chains, leading to 140 graphs of PK. To evaluate thesurface of each reduced representation with “SASA,” we had tofind reference radii values for each aa BB and aa SD. In this study,we tested several values found in the literature on one hand andcalculated radii values directly from the graphs of PKs on the otherhand. We also tested the probe radius influence by ranging it from0.0 to 6.6 Å. Finally, we plotted the relative error compared to thereference atomic values. The obtained results are discussed in thefollowing sections.
Radii Obtained from Tabulated Amino Acid Values
Various tables describing the aa shapes, that is, atomic vdW radii,sizes of groups of atoms or functions, and, more interestingly inour case, volumes of each type of aa can be found in the literature.In this study, we were particularly interested by four aa volumetables, that is, Chothia,27 Harpaz et al.,28 Pontius et al.,29 and Tsaiet al.30 The radii (R) values corresponding to all these volumes
have been calculated assuming a spherical shape to the givenvolumes (V).
The four sets of volumes and the corresponding radii are listedin Table 2. A great similitude between the four sets can beobserved. Indeed, the given radii values are very close to eachother and present a similar average value and variability, that is,about 3.25 � 0.30 Å. According to this observation, we selectedthe most recent Tsai et al. values30 as the unique set of radii for theatomic representations that will be compared with the ones ob-tained by our method.
Radii Obtained from the Graphs of PKs
The 140 obtained PK graphs represent a total number of 42,819PKs. For each of the 20 aa, we calculated the corresponding PKradii, that is, R1, R2, and R3, using the PKs associated with eitherthe aa backbone (BB) or aa side chain (SD). Furthermore, inaddition of the three abovementioned different radii that charac-terize a PK, we also included a fourth value, Raver, which is simplythe average value of the three Ri values. These four radii sets willbe denominated as “subsets” to avoid confusion with the other setsthat are described below.
We imagined three different ways to evaluate the size of eachaa. First, we considered the totality of the PKs, that is, BB � SD,and we calculated an average over all the BB as well as the SD PKradii. Second, we considered only the PKs associated to the BB,which allows to obtain R1, R2, R3, and Raver values that areexclusively attached to the BB PKs. Finally, we considered onlythe SD PKs to have a set of radii that would suit the SD only. Thismakes a total of 12 sets of radii that have been calculated on thebasis of the totality of the PK radii values cumulated among the140 graphs set. The values are listed in Table 3.
From this table, we can observe that:
1. Gly does not have any SD values as it is exclusively describedby a BB PK. Ala is also mainly represented by a BB PK only,as 52 hits only are associated to SD and constitute only 3% ofthe total Ala of the set. This absence of SD PKs for these twoaas was expected at the 2.85 Å crystallographic resolution asalready shown previously;4
2. The variability of R1 values is low between all aas as well asbetween the BB and SD PKs, with an average value of 1.45 �0.01 and 1.43 � 0.03 Å, respectively. Consequently, R1 is nota discriminant descriptor of the aas;
3. The variability of R2 and R3 values is higher; they thus allow abetter differentiation between the aas. The R3 SD values presenta higher variability compared to the R3 BB values, that is,2.65 � 0.43 and 2.66 � 0.11 Å, respectively. This can be easilyexplained as the nature of the SD basically allows to differen-tiate all aas;
4. The Raver values follow in general the R2 radii values, andhence, would not improve the descriptor set.
Representations of the Graphs of PKs
To determine the importance of the BB and SD peaks in the SASAevaluation, we carried out three different calculations for each ofthe 140 graphs of PKs.
1120 Becue et al. • Vol. 25, No. 9 • Journal of Computational Chemistry
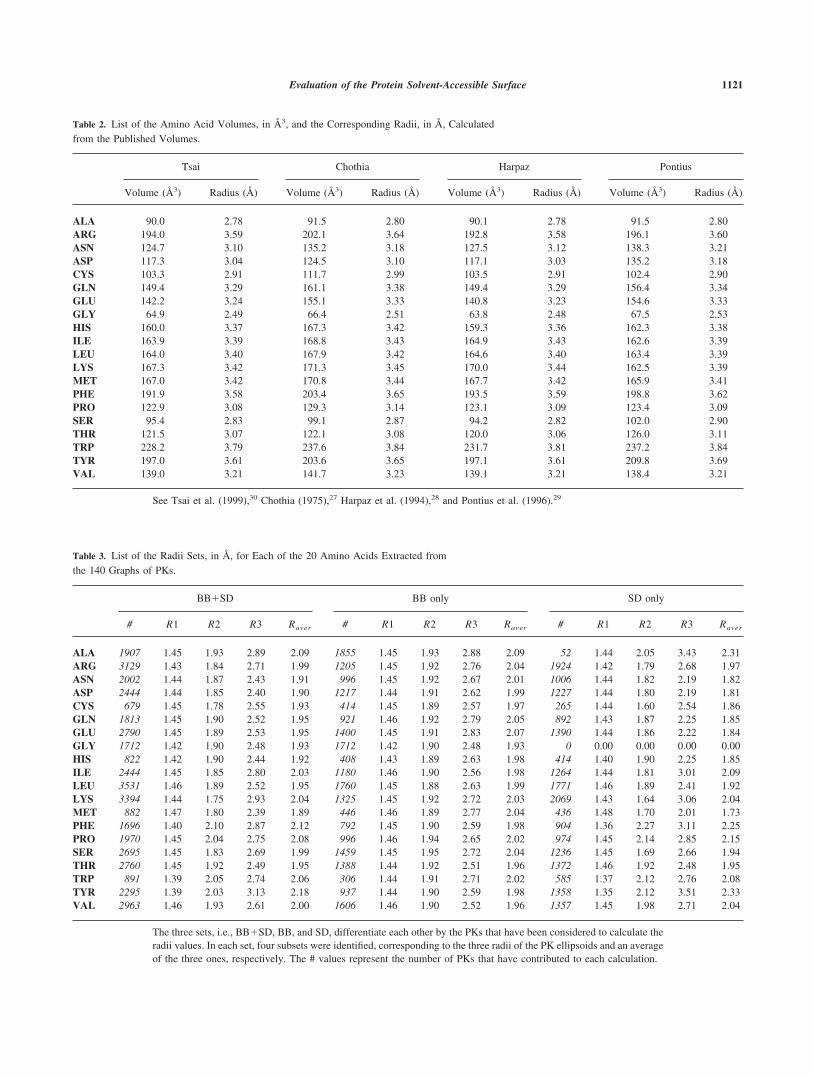
Table 2. List of the Amino Acid Volumes, in Å3, and the Corresponding Radii, in Å, Calculatedfrom the Published Volumes.
Tsai Chothia Harpaz Pontius
Volume (Å3) Radius (Å) Volume (Å3) Radius (Å) Volume (Å3) Radius (Å) Volume (Å3) Radius (Å)
ALA 90.0 2.78 91.5 2.80 90.1 2.78 91.5 2.80ARG 194.0 3.59 202.1 3.64 192.8 3.58 196.1 3.60ASN 124.7 3.10 135.2 3.18 127.5 3.12 138.3 3.21ASP 117.3 3.04 124.5 3.10 117.1 3.03 135.2 3.18CYS 103.3 2.91 111.7 2.99 103.5 2.91 102.4 2.90GLN 149.4 3.29 161.1 3.38 149.4 3.29 156.4 3.34GLU 142.2 3.24 155.1 3.33 140.8 3.23 154.6 3.33GLY 64.9 2.49 66.4 2.51 63.8 2.48 67.5 2.53HIS 160.0 3.37 167.3 3.42 159.3 3.36 162.3 3.38ILE 163.9 3.39 168.8 3.43 164.9 3.43 162.6 3.39LEU 164.0 3.40 167.9 3.42 164.6 3.40 163.4 3.39LYS 167.3 3.42 171.3 3.45 170.0 3.44 162.5 3.39MET 167.0 3.42 170.8 3.44 167.7 3.42 165.9 3.41PHE 191.9 3.58 203.4 3.65 193.5 3.59 198.8 3.62PRO 122.9 3.08 129.3 3.14 123.1 3.09 123.4 3.09SER 95.4 2.83 99.1 2.87 94.2 2.82 102.0 2.90THR 121.5 3.07 122.1 3.08 120.0 3.06 126.0 3.11TRP 228.2 3.79 237.6 3.84 231.7 3.81 237.2 3.84TYR 197.0 3.61 203.6 3.65 197.1 3.61 209.8 3.69VAL 139.0 3.21 141.7 3.23 139.1 3.21 138.4 3.21
See Tsai et al. (1999),30 Chothia (1975),27 Harpaz et al. (1994),28 and Pontius et al. (1996).29
Table 3. List of the Radii Sets, in Å, for Each of the 20 Amino Acids Extracted fromthe 140 Graphs of PKs.
BB�SD BB only SD only
# R1 R2 R3 Raver # R1 R2 R3 Raver # R1 R2 R3 Raver
ALA 1907 1.45 1.93 2.89 2.09 1855 1.45 1.93 2.88 2.09 52 1.44 2.05 3.43 2.31ARG 3129 1.43 1.84 2.71 1.99 1205 1.45 1.92 2.76 2.04 1924 1.42 1.79 2.68 1.97ASN 2002 1.44 1.87 2.43 1.91 996 1.45 1.92 2.67 2.01 1006 1.44 1.82 2.19 1.82ASP 2444 1.44 1.85 2.40 1.90 1217 1.44 1.91 2.62 1.99 1227 1.44 1.80 2.19 1.81CYS 679 1.45 1.78 2.55 1.93 414 1.45 1.89 2.57 1.97 265 1.44 1.60 2.54 1.86GLN 1813 1.45 1.90 2.52 1.95 921 1.46 1.92 2.79 2.05 892 1.43 1.87 2.25 1.85GLU 2790 1.45 1.89 2.53 1.95 1400 1.45 1.91 2.83 2.07 1390 1.44 1.86 2.22 1.84GLY 1712 1.42 1.90 2.48 1.93 1712 1.42 1.90 2.48 1.93 0 0.00 0.00 0.00 0.00HIS 822 1.42 1.90 2.44 1.92 408 1.43 1.89 2.63 1.98 414 1.40 1.90 2.25 1.85ILE 2444 1.45 1.85 2.80 2.03 1180 1.46 1.90 2.56 1.98 1264 1.44 1.81 3.01 2.09LEU 3531 1.46 1.89 2.52 1.95 1760 1.45 1.88 2.63 1.99 1771 1.46 1.89 2.41 1.92LYS 3394 1.44 1.75 2.93 2.04 1325 1.45 1.92 2.72 2.03 2069 1.43 1.64 3.06 2.04MET 882 1.47 1.80 2.39 1.89 446 1.46 1.89 2.77 2.04 436 1.48 1.70 2.01 1.73PHE 1696 1.40 2.10 2.87 2.12 792 1.45 1.90 2.59 1.98 904 1.36 2.27 3.11 2.25PRO 1970 1.45 2.04 2.75 2.08 996 1.46 1.94 2.65 2.02 974 1.45 2.14 2.85 2.15SER 2695 1.45 1.83 2.69 1.99 1459 1.45 1.95 2.72 2.04 1236 1.45 1.69 2.66 1.94THR 2760 1.45 1.92 2.49 1.95 1388 1.44 1.92 2.51 1.96 1372 1.46 1.92 2.48 1.95TRP 891 1.39 2.05 2.74 2.06 306 1.44 1.91 2.71 2.02 585 1.37 2.12 2.76 2.08TYR 2295 1.39 2.03 3.13 2.18 937 1.44 1.90 2.59 1.98 1358 1.35 2.12 3.51 2.33VAL 2963 1.46 1.93 2.61 2.00 1606 1.46 1.90 2.52 1.96 1357 1.45 1.98 2.71 2.04
The three sets, i.e., BB�SD, BB, and SD, differentiate each other by the PKs that have been considered to calculate theradii values. In each set, four subsets were identified, corresponding to the three radii of the PK ellipsoids and an averageof the three ones, respectively. The # values represent the number of PKs that have contributed to each calculation.
Evaluation of the Protein Solvent-Accessible Surface 1121

1. In the first calculation, referred as “BBSD,” all the PKs asso-ciated to both the aa backbones (BB) and those linked to the aaside chains (SD) were considered (Fig. 2a);
2. In the second set, referred as “noSD,” a simplified representa-tion where only the PKs associated with the backbones isconsidered (Fig. 2b). All the SD radii values were set to zero;
3. In the third set, referred as “noBB” and being the opposite of“noSD,” only the PKs associated to the side chains take part tothe radii calculations (Fig. 2c). All the BB radii values were setto zero, with two exceptions, that is, Gly and Ala, for which theBB PKs were considered in place of the SD because these twoaas have no or very few SD PKs.
For the three approaches, the radii values that were associatedwith each relevant PK were those reported by Tsai (Table 2) andthe electron density (ED)-based values calculated using formula 1(Table 3).
Consequently, according to the radius set that is selected, threesets of calculation have been referenced as “Tsai_BBSD,”“Tsai_noSD,” and “Tsai_noBB,” and 12 sets of calculationhave been labeled as “PK_RxBBSD,” “PK_RxnoSD,” and“PK_RxnoBB,” respectively, where x � 1, 2, 3, or aver. Theexample given in Table 4 allows understanding which radii set isused according to the considered representation.
Surface Evaluation of the Graphs of PKs
For each of the 140 protein chains, we have performed 16 SASAevaluations: (1) 12 with the radii sets extracted from the graphs ofPKs; (2) three using the “Tsai” values with “BBSD,” “noSD,” and“noBB” representations; (3) one for the atomic representation,using Vega; combined with a variation of the probe radius rangingfrom 0.0 to 6.6 Å, by a step of 0.2 Å.
To validate the obtained SASA values and to measure theinfluence of the probe radius value, we calculated, for each surfaceestimation, the relative error as:
�S ��SPKs � Satoms�
Satoms� 100.0 (2)
and plotted the average values of �S for each probe radius valueand each set of radii (Figs. 3 and 4).
Analysis of the SASA Results Obtained Using Tsai’sRadii Values
The influence of the probe radius value for the “Tsai” set of radii,combined with the “BBSD,” “noSD,” and “noBB” representations,is illustrated in Figure 3. It is observed that the error presentsseveral minima, which are located at different probe radius de-pending upon the representation (Table 5).
It is thus concluded that the representation “BBSD” is the bestof all three when using a probe radius of 0.8 Å. This optimal valueis lower than the 1.4 Å radius that is commonly used whencalculating SASA at atomic scale. The one or two points repre-sentation and the lost of details in the side chains surface can
Figure 2. Schematic views of the (a) “BBSD,” (b) “noSD,” and (c) “noBB” representations of the PKgraphs. In (b) and (c), SD PKs and BB PKs, respectively, are ignored when calculating the solventaccessible surface area of the proteins.
Table 4. Example Showing the Use of the Radii Sets for (A) the“PK_R3” and (B) “Tsai” Values According to the ConsideredRepresentations, i.e., “BBSD,” “noSD,” or “noBB.”
(A)
PK_R3BBSD PK_R3noSD PK_R3noBB
BB SD BB SD BB SD
ALA 2.89 0.00 2.88 0.00 2.88 0.00ARG 2.71 2.71 2.76 0.00 0.00 2.68ASN 2.43 2.43 2.67 0.00 0.00 2.19
GLY 2.48 0.00 2.48 0.00 2.48 0.00
(B)
Tsai_BBSD Tsai_noSD Tsai_noBB
BB SD BB SD BB SD
ALA 2.78 2.78 2.78 0.00 2.78 0.00ARG 3.59 3.59 3.59 0.00 0.00 3.59ASN 3.10 3.10 3.10 0.00 0.00 3.10
GLY 2.49 0.00 2.49 0.00 2.49 0.00
Regarding the “noBB” representation, Gly and Ala are exceptions as theyare mainly (�97%) represented by a backbone peak only. Their radius wasthus transferred into the BB PKs because these amino acids would other-wise have been neglected in the calculation. The values of radii showedhere are taken from Tables 2 and 3.
1122 Becue et al. • Vol. 25, No. 9 • Journal of Computational Chemistry

explain that a smaller probe is needed to retrieve the same SASAvalues. In addition, the radii extracted from the published residuevolumes are equally used for the BB and the SD. This can causea slight overvaluation of the SD spherical representation. Thesetwo reasons can explain the observed shift to a lower optimalradius.
It is also seen that the “noBB” representation tends to overes-timate the values compared to the “noSD” one. This is due to thefact that, for the “noBB” calculations, the only spheres taken intoconsideration are those around the SD PKs, as represented inFigure 2c. The solvent probe can thus approach the SD PK fromany direction, without any overlap with the protein BB. Theresulting SASA values are thus higher. Another observation is thatthe “noBB” and “BBSD” curves present an identical behavior athigh probe radius values. Indeed, when the probe radius becomestoo large, it is only able to probe the outer surface of the PKs andbecomes thus unable to differentiate the “noBB” from the “BBSD”representation.
Analyzing of the SASA Results Obtained Using ED-BasedRadii Values
The results obtained for the “PK_Rx” representations (x � 1, 2,3, and aver.) are shown in Figure 4a– c. As in the case of the“Tsai” results, we can observe various values of the proberadius for which the relative error reaches a minimum. Theerror averages and the corresponding radius probe are reportedin Table 5.
The observations that were made for the “Tsai” radii setremain true for the “PK_Rx” series. It is additionally observedthat in each case, the values calculated on the basis of the R3
radii present lower errors compared to the other PK radii.Finally, the “PK_R3BBSD” representation leads to the lowesterror minimum of this set, with only 1.3% of error, at a proberadius of 1.4 Å.
Quite surprisingly, the optimal probe radius is equal to the onecommonly used for the calculation of SASA on atomic represen-tations, that is, 1.4 Å. By comparison with the results obtained withthe “Tsai” radii set, we can observe that no shift is present in thiscase. The “BBSD” representation and radii values seem to be moreadapted to the SD characterization. Indeed, if we compare thevalue of Tables 2 and 3, we can observe that when the “Tsai” radiiare generally above 3.0 Å, the “BBSD” radii are mainly lower than
Figure 3. Distribution of the average of the relative errors between thesurfaces calculated using the reduced representations and the onesusing atomic representation, according to the probe radius value withthe set of “Tsai” radii, combined with the “BBSD,” “noBB,” and“noSD” representations. [Color figure can be viewed in the onlineissue, which is available at www.interscience.wiley.com.]
Figure 4. Distribution of the average of the relative errors between thesurfaces calculated using the reduced representations and the onesusing atomic representation, according to the probe radius value withthe sets of “PK_R1,” “_R2,” “_R3,” and “_Raver” radii, combinedwith the (a) “BBSD,” (b) “noBB,” and (c) “noSD” representations.[Color figure can be viewed in the online issue, which is available atwww.interscience.wiley.com.]
Evaluation of the Protein Solvent-Accessible Surface 1123

this value. By this way, there is no overvaluation of the surface andthe commonly used probe radius suits well when following theouter surface.
Discussion
In summary, the two sets that gave the best results were“Tsai_BBSD,” with a probe radius of 0.8 Å and 1.5% of error, and“PK_R3BBSD” at 1.4 Å with 1.3% of error. We thus decided tocompare them by plotting the relative differences calculated foreach of the 140 protein chains that were studied (Fig. 5).
It can be observed that the two curves are quite similar, withsomewhat higher relative error values with the “Tsai” radii set.
However, three protein chains present a relative error superior to5% in both sets and also a major difference between “Tsai” and“PK_R3” radius series, that is, 1HSA_C, 1HSA_F, and 1HTM_C.After analyzing their aa sequences, it appeared that the first twoproteins possess very small aa chains with only nine aas, and thelast one 27 aas. It thus seems that the surface evaluation method isless adapted to small aa chains. But as the method is originallydeveloped to perform macromolecular docking, this drawback isnegligible. Furthermore, the errors remain acceptable with �5% oferror for the “PK_R3BBSD” set.
Interface Calculation of Protein–Protein Complexes
The interface of dimerization can simply be evaluated if knowingthe SASAs of the individual molecules and the one of the complexobtained when the partners are set in their crystallographic posi-tions:
Interface � �i�1
N
SASAi � SASAcplx (3)
where N is the number of partners.As the optimal radii obtained for the surface calculations might
not be optimal for the interface, we performed the same fullmethodology of optimization as for the SASA study, that is,consideration of several radii sets and test of a range of proberadius values from 0.0 to 6.6 Å. Finally, we studied the evolutionof the relative error compared to the values obtained with theatomic representations.
The results confirm the conclusions of the above study, that is,the 1.4 Å radius with a “PK_R3BBSD” representation remains thebest for our graphs of PKs with a relative error of �6.4% (Fig. 6).The “Tsai” radius set presents also a similar error behavior with abest radius probe of 0.8 Å and a relative error of 6.8%.
Table 5. Minima of Relative Error and Corresponding Probe Values forthe 15 SASA Evaluation Sets Using Reduced Representations ofProteins with Different Radii Sets, i.e., Tsai and “PK_RX,” with x � 1,2, 3, or Average.
BBSD noSD noBB
Tsai 1.5% at 0.8 Å 10.7% at 1.4 Å7.9% at 4.2 Å
8.1% at 2.0 Å
PK_R1 1.3% at 2.6 Å 9.7% at 3.4 Å8.0% at 6.0 Å
17.8% at 0.6 Å8.1% at 3.8 Å
PK_R2 1.5% at 2.2 Å 9.6% at 2.8 Å8.0% at 5.6 Å
18.0% at 0.2 Å7.6% at 3.4 Å
PK_R3 1.3% at 1.4 Å 9.5% at 2.2 Å8.0% at 4.8 Å
7.8% at 2.6 Å
PK_Raver 1.3% at 2.0 Å 9.6% at 2.8 Å8.0% at 5.4 Å
7.8% at 3.4 Å
The relative errors for each set are evaluated by comparison with the valuesobtained using atomic representations.
Figure 5. Distribution of the relative error between the surfacescalculated using the atomic representation and the ones using reducedrepresentations, for each one of the proteins constituting the set. Thetwo curves represent the results obtained using (1) the set of “Tsai”radii with a full representation and a probe radius of 0.8 Å (dottedgreen line) and (2) the set of “PK_R3” radii with a full representationand a probe radius of 1.4 Å (plain blue line). [Color figure can beviewed in the online issue, which is available at www.interscience.wiley.com.]
Figure 6. Distribution of the average of the relative errors between theinterfaces calculated using the reduced representations and the onesusing atomic representation, according to the probe radius value withthe sets of “PK_R1,” “_R2,” “_R3,” and “_Raver” radii, combinedwith the “BBSD” model. [Color figure can be viewed in the onlineissue, which is available at www.interscience.wiley.com.]
1124 Becue et al. • Vol. 25, No. 9 • Journal of Computational Chemistry

Conclusions
This study was focused on the compatibility of reduced represen-tations of protein chains with existing concepts for evaluating thesolvent accessible surface area (SASA) at the atomic level. Moreparticularly, the question was: “Will a SASA calculation methodgive realistic values when applied to simplified models?” It con-stitutes a crucial question as we wish to use these representationsin an automated docking procedure between proteins and nucleicacids, wherein the interface calculation logically plays a majorrole. To this purpose, we had to find a good match between (1) thereduced representations we use, (2) the program used to evaluatethe surface values, (3) the radii set for the amino acids (aa), and (4)the probe radius that rolls over the molecular surface. The relativeerrors between the SASA and interface values obtained with ourmethod and those calculated for the atomic representations withref. 26 have constituted a good criterion of quality.
1. The reduced representations of proteins are obtained by amethod that was already successfully applied to macromole-cules,4 that is, the topological analysis of electron density (ED)maps calculated at a crystallographic resolution of 2.85 Å. Suchan analysis leads to graphs of critical points, from which weonly retain the peaks (PKs) corresponding to the maxima ofED. When applied to proteins, this method allows to representthe amino acids sequence by a succession of backbone (BB)PKs and side chain (SD) PKs, each SD being associated with 0to 2 PKs according its size. When compared to other reducedrepresentations, for example, C� combined with the side-chaincentroid, our method presents the nonnegligible advantage thateach PK is associated with several descriptors and presents ananisotropic behavior. Indeed, to each PK can be assigned itsposition, the ED at PK position, three eigenvalues, three eig-envectors, an anisotropic volume defined by three radii, as wellas the physicochemical properties of the chemical group orfunction to which it is associated. From a strictly structuralpoint of view, the reduced representations look alike; but oursis superior by the quantity of included data that is associated toeach point of the graphs. As our future aim is to combine thesedescriptors with the present results on SASA calculations inmacromolecular complementarity studies, this constitutes a stepforward in the validation of our method.
2. As previously said, we chose a program that was alreadyimplemented for the calculation of the molecular surface, thatis, “SASA.”14 It was modified to make it compatible with thegraphs of PKs. One of the major modifications was to build anew reference table for the aa BB and aa SD radii, to consideramino acids in place of atoms. We had at our disposal valuescalculated from published volumes of each aa27–30 from whichonly the Tsai et al.30 values were retained, as well as the threeradii sets extracted from the graphs of PKs, that is, R1, R2, andR3, to which we added a fourth radius, that is, Raver, whichsimply was the average value of the three first ones. As the PKscan be associated separately to either the BB or a SD, it waspossible to obtain a set of radii that is coming from BB only, SDonly, or from both. Furthermore, to determine the importance ofthe BB and SD PKs in the SASA calculation, three different
models were used, that is, a full representation, referred as“BBSD,” and two simplified, named “noSD” and “noBB.”
3. To test the influence of the probe radius on the calculated SASAvalues, it ranged from 0.0 to 6.6 Å. When calculating SASA ofindividual partners, two situations presented a minimal errorcompared to the reference values, that is, “Tsai_BBSD” with aprobe radius of 0.8 Å, and “PK_R3BBSD” with 1.4 Å. Wechose to retain this last one as it presents the lowest error, thatis, 1.3%, and also because it is directly related to our method oftopological analysis of the EDMs calculated at medium reso-lution. The same conclusions have been observed when calcu-lating the interface of dimerization of proteins, with a slightlyhigher error, that is, 6.4%.
It can thus be concluded that we were able to develop a methodallowing to evaluate the surface of reduced representations ofproteins in terms of graphs of PKs with values very similar to thoseobtained using atomic representations. This study showed that theevaluation of the interface of dimerization of protein–protein com-plexes gives good results also. This will be followed by a fullyautomated docking procedure using reduced representations ofmacromolecules in which the interface of dimerization, as well asthe data contained in the PKs will be of a great interest.
Acknowledgments
The authors would like to thank the FUNDP and the ScientificComputing Facility (SCF) center for their computing resources.A.B. and N.M. are grateful to the “Fonds National de la RechercheScientifique” (F.N.R.S.) for their Ph.D. Research Fellowship andScientific Research Worker position, respectively.
References
1. Leherte, L.; Allen, F. H. J Comput Aided Mol Des 1994, 8, 257.2. Leherte, L.; Fortier, S.; Glasgow, J.; Allen, F. H. Acta Crystallogr D
1994, 50, 155.3. Leherte, L.; Glasgow, J.; Baxter, K.; Steeg, E.; Fortier, S. J Art Intell
Res 1997, 7, 125.4. Becue, A.; Meurice, N.; Leherte, L.; Vercauteren, D. P. Acta Crystal-
logr D 2003, 59, 2150.5. Levitt, M. J Mol Biol 1976, 104, 59.6. Wallqvist, A.; Ullner, M. Proteins: Struct Funct Genet 1994, 18, 267.7. Hassinen, T.; Perakyla, M. J Comput Chem 2001, 22, 1229.8. Lee, B.; Richards, F. M. J Mol Biol 1971, 55, 379.9. Wang, Y. H.; Zhang, H.; Scott, R. A. Protein Sci 1995, 4, 1402.
10. Seidl, T.; Kriegel, H.-P. Proc Int Conf Intell Syst Mol Biol 1995, 3,350.
11. Pan, X.; Bott, R.; Glatz, C. E. J Crystallogr Growth 2003, 254, 492.12. Tuchsen, E.; Jensen, M. Ø. Westh, P. Chem Phys Lipids 2003, 123,
107.13. Shrake, A.; Rupley, J. A. J Mol Biol 1973, 79, 351.14. LeGrand, S. M.; Merz, K. M., Jr. J Comput Chem 1993, 14, 349.15. Connolly, M. L. J Appl Crystallogr 1983, 16, 548.16. Connolly, M. L. Science 1983, 221, 709.17. Richmond, T. J. J Mol Biol 1984, 178, 63.18. von Freyberg, B.; Richmond, T. J.; Braun, W. J Mol Biol 1993, 233,
275.
Evaluation of the Protein Solvent-Accessible Surface 1125
19. Gogonea, V.; Osawa, E. J Comput Chem 1995 , 16, 817.20. Fraczkiewicz, R.; Braun, W. J Comput Chem 1998, 19, 319.21. Berman, H. M.; Westbrook, J.; Feng, Z.; Gilliland, G.; Bhat, T. N.;
Weissig, H.; Shindyalov, I. N.; Bourne, P. E. Nucleic Acids Res 2000,28, 235–242.
22. [IBM] IBM Visualization Data Explorer (IBM Corporation, 1996);http://www.research.ibm.com/dx [WWW1] http://www.biochem.arizona.edu/classes/bioc568/rasmletc.htm.
23. Hall, S. R.; du Boulay, D. J.; Olthof–Hazekamp, R. Xtal3.7 System,2000, University of Western Australia.
24. Leherte, L.; Latour, T.; Vercauteren, D. P. J Comput Aided Mol Des1996, 10, 55.
25. Johnson, C. K. ORCRIT. The Oak Ridge Critical Point Network Program,1977, Chemistry Division, Oak Ridge National Laboratory, NC.
26. Pedretti, A.; Villa, L.; Vistoli, G. J Mol Graphics Model 2002, 21, 47.27. Chothia, C. Nature 1975, 254, 304.28. Harpaz, Y.; Gerstein, M.; Chothia, C. Structure 1994, 2, 641.29. Pontius, J.; Richelle, J.; Wodak, S. J. J Mol Biol 1996, 264, 121.30. Tsai, J.; Taylor, R.; Chothia, C.; Gerstein, M. J Mol Biol 1999, 290,
253.
1126 Becue et al. • Vol. 25, No. 9 • Journal of Computational Chemistry
Copyright © 2022 FDOKUMEN


![[Regulation of telomeres length: making the telomeres accessible?]](https://static.fdokumen.com/doc/165x107/633f1028d121719806096682/regulation-of-telomeres-length-making-the-telomeres-accessible.jpg)