
“ZigBee Wireless Sensor Based Prototype Design ... - Jetir.Org

S. Hailes, S. Sicari, and G. Roussos (Eds.): S-Cube 2009, LNICST 24, pp. 256–271, 2009. © Institute for Computer Sciences, Social-Informatics and Telecommunications Engineering 2009
Evaluation of the Impact of the Topology and Hidden Nodes in the Performance of a ZigBee Network
Helena Fernández-López1, Pedro Macedo1, José A. Afonso1, J.H. Correia1, and Ricardo Simões2,3
1 Industrial Electronics Engineering Department, University of Minho, Guimarães, Portugal {hlopez,pmacedo,jose.afonso,higino.correia}@dei.uminho.pt
2 Institute of Polymers and Composites, University of Minho, Guimarães, Portugal [email protected]
3 Polytechnic Institute of Cávado and Ave, Barcelos, Portugal
Abstract. Low power and small footprint IEEE 802.15.4/ZigBee based devices are a promising alternative to 802.11a/b/g and proprietary protocols for non-critical patient monitoring under important scenarios such as post-op and emergency rooms. However, their use in a healthcare facility to monitor several mobile patients poses several difficulties, mainly because these protocols were primarily designed to operate in low traffic load scenarios. This work presents simulation results used to evaluate the performance of an IEEE 802.15.4/ Zig-Bee based wireless sensors network (WSN) in a vital signs monitoring scenario, for both star and tree based network topologies. The scalability problem in non-beacon enabled networks is addressed to quantify the degradation in quality of service (QoS) markers when the number of sensor nodes increase. Additionally, the impact of hidden nodes is assessed for the star topology. Results indicate that, to achieve a delivery ratio (DR) higher than 99%, the number of electro-cardiogram (ECG) nodes in a star network must not exceed 35. However, con-sidering a tree topology, the maximum number of nodes must be reduced to 18 to maintain the same DR. The network performance is severely impacted by hidden nodes. For instance, in the absence of hidden nodes, a star network consisting of 32 ECG nodes presents a DR higher than 99%; however, if the percentage of hidden nodes is increased to 5%, it drops to 94%. If the same per-centage of hidden nodes is maintained, it is necessary to reduce the number of nodes to 13 to reestablish a 99% DR.
Keywords: ZigBee, wireless sensor networks, e-Health, remote vital signs monitoring.
1 Introduction
Non-critical patients can greatly benefit from continuous vital signs monitoring based on WSN technologies. WSNs are comprised of a large number of spatially distrib-uted small devices with sensing, processing and radio communication capabilities [1]. Low power consumption, topology adaptation in response to changes in propagation conditions or node failures, and multi-hop routing, among other important features,

Evaluation of the Impact of the Topology and Hidden Nodes 257
make these networks attractive for pervasive healthcare applications. Despite of the evident benefits wireless communications can offer, some concerns prevent the spread use of WSNs for patient monitoring purposes. In a system designed to constantly monitor patients, large amounts of data have to be gathered and transmitted by the network, which is forced to operate in a high load scenario, non-typical for WSNs. A healthcare monitoring system should satisfy strict QoS requirements, such as sustain-able throughput, small delay and high reliability; nevertheless, most of the research carried out in the field of WSNs does not address these issues.
In [2], we have proposed a wireless vital signs monitoring system for non-critical in-patients based on non-beacon enabled mode IEEE 802.15.4/ZigBee networks. Medical sensors were designed to be minimally obtrusive and modular. In this work, we present the performance analysis of an IEEE 802.15.4/ZigBee network in star and tree topologies and analyze the behavior of important QoS markers when the number of sensor nodes increases. We consider that each node generates traffic corresponding to one ECG signal. Only ECG sensors are considered because they are the most de-manding ones, since they generate the largest amount of traffic. Although we examine the transmission of biomedical signals in this paper, results are also relevant for other WSN applications, especially for data-intensive scenarios.
This paper is organized as follows. In the next section, we present the related work and their conclusions. In Section 3, we briefly review the IEEE 802.15.4 and ZigBee protocols, focusing on the CSMA-CA algorithm. In Section 4, the star and tree net-work simulation scenarios and parameters are introduced, followed by the presenta-tion and discussion of the results. The hidden node simulation scenario, including results and discussion, is also presented in this section. Finally, in Section 5, the con-clusions and future work are presented.
2 Related Work
Several authors have assessed the performance of IEEE 802.15.4 based star networks used specifically for patient monitoring [3-5]; however, as far as we know, none have considered tree networks or the presence of hidden nodes. Most of the authors have also considered that each sensor node integrate a body area network (BAN) whose coordinator (usually, a PDA) also functions as a gateway, relaying traffic to a local area network (LAN). In the motivating application behind this work, sensor nodes from several patients share a common WSN infrastructure, which relays the data generated by all sensors to the coordinator, avoiding the need of several BAN coordi-nators.
In [6], the maximum data throughput and the delay of unslotted IEEE 802.15.4 is evaluated, in a simple one sender one receiver network, in different frequency bands and address structures. Due to the limited packet length of 127 bytes (maximum PHY service data unit size) and the relatively large overhead required, the maximum band-width efficiency under optimal circumstances (addressing field are omitted and no acknowledgment - ACK - is used) for the 2.4 GHz band is 64.9%. The maximum and minimum delays are also determined considering the use of the maximum data packet length. Although it is not referred, the packet delay varies as a function of the number of nodes and the network topology, among other factors. Therefore, in larger net-works, packets can experience considerably higher delays.

258 H. Fernández-López et al.
In [7], the authors considered a non-beacon enabled star network consisting of IEEE 802.15.4 based ECG monitoring nodes as a case study to analyze the network performance as a function of the payload size variation. Considering a restricted sce-nario consisting of 10, 15 or 20 ECG nodes, where each ECG node generates 12 kbps of data, the authors observe that although the DR grows as the payload size increases, larger size packets may experience larger transmission delays due to the larger trans-mission times. So, in critical time medical applications, it is suggested that the trade-off between end-to-end latency and packet DR is considered.
In [8], the authors present simulation results used to evaluate the suitability of the IEEE 802.15.4 standard to a healthcare monitoring application. In a first experience, a star network consisting of up to 16 patient monitoring devices operating in the unslot-ted mode is considered. The most demanding sensor, a multiple-lead ECG, generates 1500 bytes every 250 ms. It is shown that using just three of such devices results in an overload of the network capacity. If packets are spaced out, rather than transmitted successively, the goodput is slightly improved, but the effects on packet loss and DR are not shown. Higher throughput and smaller delays are also achieved decreasing the maximum number of backoff periods or reducing the backoff exponent. Again, the impact of these changes in the DR is not analyzed. Unlike the monitoring device considered by the authors, our system uses three-lead one-channel ECG sensors, which generates much less data but are appropriate for continuous cardiac activity observation and arrhythmia detection.
No specific mechanism to avoid the hidden node problem is provided by the IEEE 802.15.4 protocol, which motivated some authors to consider specific scenarios and propose strategies to mitigate this problem. In [9], the author specifies, implements and evaluates H-NAMe, a new mechanism to solve the hidden node problem in syn-chronized multiple cluster tree IEEE 802.15.4/ZigBee networks. It is assumed that a synchronization service able to reach all nodes exists. Inside a cluster, time windows during the contention access period are assigned to groups consisting of fully con-nected nodes. As a result, these nodes can transmit without the risk of hidden-node collisions. The proposed mechanism is shown to improve the network performance by up to 100%. An alternative approach to mitigate the hidden node problem in IEEE 802.15.4 beacon enabled networks is proposed in [10]. Unlikely H-NAMe, this strat-egy requires that the network coordinator discover the hidden node situation before proceeding on a grouping strategy. Based on simulations, the authors demonstrate that, in the presence of hidden nodes, the proposed strategy guarantees the goodput achieved by the standard protocol in a hidden node free environment. Moreover, a considerable power saving is achieved. In [11], the authors propose TIme zone COor-dinated Sleep Scheduling (TICOSS), a mechanism that provides multi-hop support over IEEE 802.15.4 through the division of the network in time zones to mitigate packet collision due to hidden nodes belonging to nearby clusters. According to the time zone where a device is located; a time slot is allocated for it to transmit. Three timeslots types are allocated: upstream transmission, downstream transmission and local broadcast. Based on experiments and simulation, the authors conclude that TI-COSS considerably extends nodes lifetime and provides more stable and deterministic performance in IEEE 802.15.4 networks. All the mechanisms presented consider

Evaluation of the Impact of the Topology and Hidden Nodes 259
beacon-enabled networks consisting of static nodes, which is not the scenario consid-ered in this work. Rather than proposing a mechanism to solve the problem, the effect of hidden-nodes will be quantified, in order to contribute to further understanding of the problem.
3 IEEE 802.15.4 and ZigBee Protocols
The IEEE 802.15.4 standard [12] defines the physical (PHY) and medium access control (MAC) layers of the ZigBee network. The standard defines three operating frequency bands. The higher frequency band ranges from 2400 MHz to 2483.5 MHz and is divided into sixteen channels that operate at a rate of 250 kbps. The two other bands operate at lower data rates and will not be considered here. The MAC layer uses a contention based CSMA-CA scheme. An optional TDMA (Time Division Multiple Access) based scheme called guaranteed time slot (GTS) is also provided.
The unslotted CSMA-CA algorithm is represented in Fig. 1 [12]. Before accessing the channel, the device must wait for a random backoff interval defined in the interval from 0 to (2BE – 1) backoff periods, where BE, the backoff exponent, initially takes the value macMinBE and one backoff period is equal to aUnitBackoffPeriod symbols. After that, if the clear channel assessment (CCA) function indicates that the channel is idle, the device starts its transmission after a turnaround time delay, which is the time necessary to for the radio transceiver to switch from receive to the transmit state. If the channel is busy, the device defers its transmission and increments NB, the number of transmission attempts for the current packet. BE is also incremented if it has not reached its maximum value, aMaxBE. If the maximum number of transmission attempts, macMaxCSMAbackoffs, was not reached, a new backoff interval is deter-mined; otherwise, the algorithm declares a channel access failure. Unslotted CSMA-CA parameters are described in Table 1.
Fig. 1. Unslotted CSMA-CA algorithm

260 H. Fernández-López et al.
Table 1. Unslotted CSMA-CA parameters
Parameter Description Value macMinBE The minimum value of the backoff exponent [0-3], default = 3 aUnitBackoffPeriod The length of the backoff period, where the
symbol period (SP) is 16 µs 20 SP
aMaxBE The maximum value of the backoff exponent 5 macMaxCSMAbackoffs The maximum number of backoff periods [0-5], default = 4
The ZigBee protocol [13], developed by the ZigBee Alliance, stands on top of the
IEEE 802.15.4 and defines the network and application layers. The network layer is responsible for routing frames to their intended destinations and provides functional-ities such as network starting, newly associated devices address assignment, and mechanisms to join and leave the network. It also provides an interface to the applica-tion layer, which holds application objects and provides mechanisms for discovering and binding devices.
4 IEEE 802.15.4/ZigBee Performance Analysis
The performance of the IEEE 802.15.4 protocol was evaluated through simulations performed using OMNeT++ [14]. In all simulations, an increasing number of ECG sensors was considered. The unslotted mode is used because it presents the least overhead and complexity. It is assumed that the wireless channel is not affected by fading or external interferences, yet packets can be lost due to collisions or failure to access the channel, according to the CSMA-CA algorithm.
Every 250 ms, ECG sensors generate 108-byte messages. These messages are made up of 75 data bytes, 3 control bytes added by the application, 15 ZigBee over-head bytes, and 15 overhead bytes included by the IEEE 802.15.4 protocol. ACK packets consist of 5 bytes sent by the coordinator back to the sensor node. A retrans-mission is triggered in case of channel access failure or when a transmitted packet is not acknowledged. Sensors start to generate data at a random instant between the beginning of the simulation and 250 ms, so data generation from different sensors is not synchronized. Each simulation run ends when the network coordinator receives 100,000 messages.
In this paper, the terms message and packet are frequently used. A message repre-sents a piece of information to be sent and a packet is an instance of a message that is transmitted in the channel. To send one message, a node may need to transmit more than one packet, depending on whether collisions occur.
4.1 Topology Analysis
The topologies considered in this section are exemplified in Fig. 2. Fig. 2 (a) shows a star network that consists of three end nodes, N1 to N3, which communicate directly to the network coordinator, C. A simple tree network is shown in Fig. 2 (b). In this case, all end nodes communicate to the coordinator through the router R.

Evaluation of the Impact of the Topology and Hidden Nodes 261
(a) (b)
Fig. 2. Star (a) and tree (b) network topologies
Two sets of simulations were done to compare the performance of a star and a tree network consisting of an increasing number of ECG nodes. This analysis assumed that each node could hear each other’s transmissions. Four operation modes were considered:
a) no retransmissions (without ACK – 0 Ret); b) up to one retransmission attempt per message (1 Ret); c) up to three retransmission attempts (3 Ret); and d) up to six retransmission attempts (6 Ret).
In the first case, the acknowledgment mechanism is not used. In the other cases, a retransmission is triggered each time a packet is not acknowledged or the channel access fails.
Collisions and failed transmission attempts. As the presence of hidden nodes is not considered in this section, collisions are only possible if, during a node’s turnaround time, another node senses the idle channel and, consequently, starts to transmit after its own turnaround time. In this case, it is considered that both packets are lost. Fig. 3 presents the collided packets (a) and failed transmission attempts (b) curves for the star network, where it is possible to observe that, in general, when the number of nodes increases, the percentage of collided packets and failed transmission attempts also increases as a result of the crescent number of messages. It is also possible to verify that, for the same number of nodes, if more retransmissions are possible, the channel gets more congested and, consequently, more packets collide and more failed transmission attempts occur. Moreover, when a critical number of nodes is exceeded, the slopes of the curves increase quickly, which, depending on the number of allowed retransmissions, might cause an abrupt deterioration in the network performance if only a few more nodes are added.
0
0.1
0.2
0.3
0.4
0.5
0.6
0.7
0 5 10 15 20 25 30 35 40 45 50
Colli
ded
Fram
es (%
)
Number of Nodes
Without ack - 0 Ret 1 Ret 3 Ret 6 Ret
0
0.1
0.2
0.3
0.4
0.5
0.6
0 5 10 15 20 25 30 35 40 45 50Faile
d Tr
ansm
issi
on A
ttem
pts
(%)
Number of Nodes
Without ack - 0 Ret 1 Ret 3 Ret 6 Ret (a) (b)
Fig. 3. Star network curves: (a) collided packets; and (b) failed transmission attempts
262 H. Fernández-López et al.
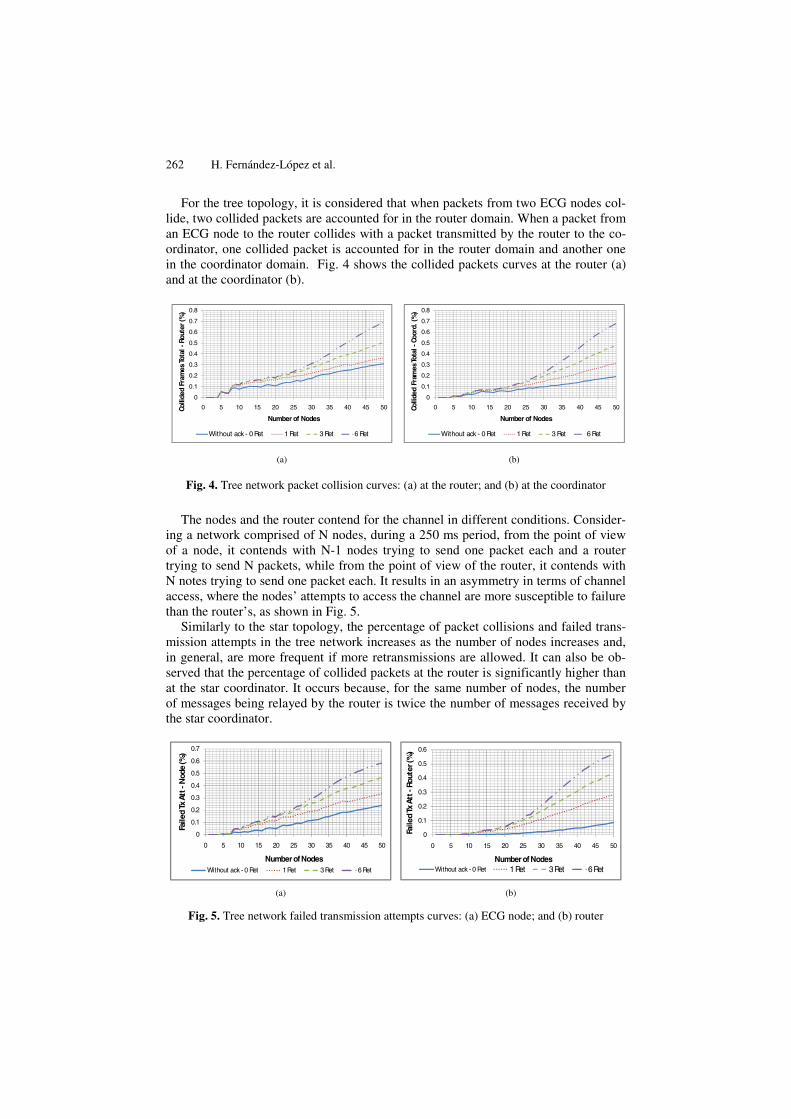
For the tree topology, it is considered that when packets from two ECG nodes col-lide, two collided packets are accounted for in the router domain. When a packet from an ECG node to the router collides with a packet transmitted by the router to the co-ordinator, one collided packet is accounted for in the router domain and another one in the coordinator domain. Fig. 4 shows the collided packets curves at the router (a) and at the coordinator (b).
0
0.1
0.2
0.3
0.4
0.5
0.6
0.7
0.8
0 5 10 15 20 25 30 35 40 45 50Colli
ded
Fram
es T
otal
-Ro
uter
(%)
Number of Nodes
Without ack - 0 Ret 1 Ret 3 Ret 6 Ret
0
0.1
0.2
0.3
0.4
0.5
0.6
0.7
0.8
0 5 10 15 20 25 30 35 40 45 50Colli
ded
Fram
es T
otal
-Co
ord.
(%
)Number of Nodes
Without ack - 0 Ret 1 Ret 3 Ret 6 Ret
(a) (b)
Fig. 4. Tree network packet collision curves: (a) at the router; and (b) at the coordinator
The nodes and the router contend for the channel in different conditions. Consider-ing a network comprised of N nodes, during a 250 ms period, from the point of view of a node, it contends with N-1 nodes trying to send one packet each and a router trying to send N packets, while from the point of view of the router, it contends with N notes trying to send one packet each. It results in an asymmetry in terms of channel access, where the nodes’ attempts to access the channel are more susceptible to failure than the router’s, as shown in Fig. 5.
Similarly to the star topology, the percentage of packet collisions and failed trans-mission attempts in the tree network increases as the number of nodes increases and, in general, are more frequent if more retransmissions are allowed. It can also be ob-served that the percentage of collided packets at the router is significantly higher than at the star coordinator. It occurs because, for the same number of nodes, the number of messages being relayed by the router is twice the number of messages received by the star coordinator.
0
0.1
0.2
0.3
0.4
0.5
0.6
0.7
0 5 10 15 20 25 30 35 40 45 50
Faile
d Tx
Att
-N
ode
(%)
Number of NodesWithout ack - 0 Ret 1 Ret 3 Ret 6 Ret
0
0.1
0.2
0.3
0.4
0.5
0.6
0 5 10 15 20 25 30 35 40 45 50
Faile
d Tx
Att
-Ro
uter
(%)
Number of NodesWithout ack - 0 Ret 1 Ret 3 Ret 6 Ret
(a) (b)
Fig. 5. Tree network failed transmission attempts curves: (a) ECG node; and (b) router
Evaluation of the Impact of the Topology and Hidden Nodes 263
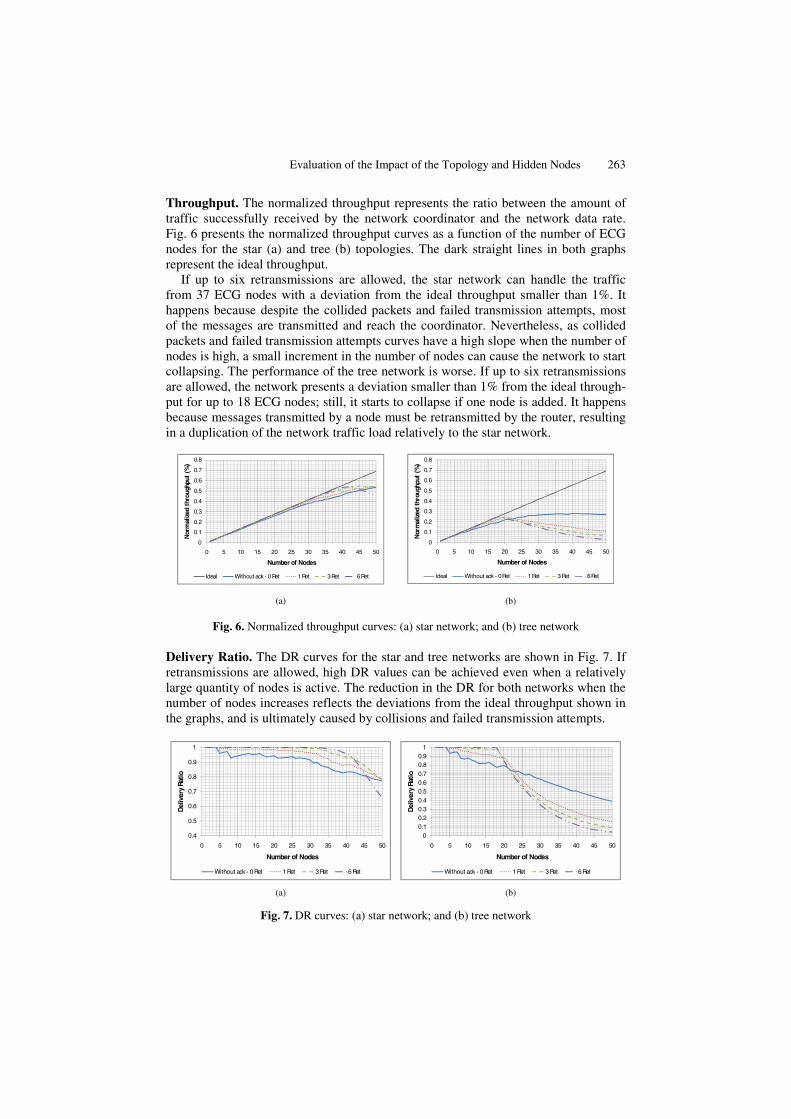
Throughput. The normalized throughput represents the ratio between the amount of traffic successfully received by the network coordinator and the network data rate. Fig. 6 presents the normalized throughput curves as a function of the number of ECG nodes for the star (a) and tree (b) topologies. The dark straight lines in both graphs represent the ideal throughput.
If up to six retransmissions are allowed, the star network can handle the traffic from 37 ECG nodes with a deviation from the ideal throughput smaller than 1%. It happens because despite the collided packets and failed transmission attempts, most of the messages are transmitted and reach the coordinator. Nevertheless, as collided packets and failed transmission attempts curves have a high slope when the number of nodes is high, a small increment in the number of nodes can cause the network to start collapsing. The performance of the tree network is worse. If up to six retransmissions are allowed, the network presents a deviation smaller than 1% from the ideal through-put for up to 18 ECG nodes; still, it starts to collapse if one node is added. It happens because messages transmitted by a node must be retransmitted by the router, resulting in a duplication of the network traffic load relatively to the star network.
0
0.1
0.2
0.3
0.4
0.5
0.6
0.7
0.8
0 5 10 15 20 25 30 35 40 45 50
Nor
mal
ized
thr
ough
put
(%)
Number of Nodes
Ideal Without ack - 0 Ret 1 Ret 3 Ret 6 Ret
0
0.1
0.2
0.3
0.4
0.5
0.6
0.7
0.8
0 5 10 15 20 25 30 35 40 45 50
Nor
mal
ized
thr
ough
put
(%)
Number of Nodes
Ideal Without ack - 0 Ret 1 Ret 3 Ret 6 Ret
(a) (b)
Fig. 6. Normalized throughput curves: (a) star network; and (b) tree network
Delivery Ratio. The DR curves for the star and tree networks are shown in Fig. 7. If retransmissions are allowed, high DR values can be achieved even when a relatively large quantity of nodes is active. The reduction in the DR for both networks when the number of nodes increases reflects the deviations from the ideal throughput shown in the graphs, and is ultimately caused by collisions and failed transmission attempts.
0.4
0.5
0.6
0.7
0.8
0.9
1
0 5 10 15 20 25 30 35 40 45 50
Del
iver
y Ra
tio
Number of Nodes
Without ack - 0 Ret 1 Ret 3 Ret 6 Ret
00.10.20.30.40.50.60.70.80.9
1
0 5 10 15 20 25 30 35 40 45 50
Del
iver
y Ra
tio
Number of Nodes
Without ack - 0 Ret 1 Ret 3 Ret 6 Ret (a) (b)
Fig. 7. DR curves: (a) star network; and (b) tree network

264 H. Fernández-López et al.
Delay. The delay a message experiences includes the queuing delay (time spent in the buffer of the node/router) and the access delay (time spent in the backoff process). Fig. 8 (a) and Fig. 8 (b) show the mean and maximum delay curves for the star net-work. It is possible to observe that the maximum delay is smaller than 150 ms for all cases. Since packets are generated with an interval of 250 ms, the buffer is always empty in this case.
0
10
20
30
40
50
0 5 10 15 20 25 30 35 40 45 50
Mea
n D
elay
(m
s)
Number of Nodes
Without ack - 0 Ret 1 Ret 3 Ret 6 Ret
0
50
100
150
200
0 5 10 15 20 25 30 35 40 45 50M
axim
um D
elay
(ms)
Number of Nodes
Without ack - 0 Ret 1 Ret 3 Ret 6 Ret
(a) (b)
Fig. 8. Star network curves: (a) mean delay; and (b) maximum delay
Fig. 9 (a) and Fig. 9 (b) show the mean and maximum delay for tree network. For a small number of nodes, the maximum delay is small; however, when the number of nodes reaches 18 and up to six retransmissions are allowed, the maximum delay ex-ceeds 250 ms. It was observed that message delays occur mainly due to the time they wait in the router’s buffer to be transmitted, so the maximum number of nodes of the network and the router buffer size must be carefully considered depending on the delay bound requirements of the network.
0
1
2
3
4
5
6
7
8
0 5 10 15 20 25 30 35 40 45 50
Mea
n D
elay
(s)
Number of Nodes
Without ack - 0 Ret 1 Ret 3 Ret 6 Ret
0123456789
10
0 5 10 15 20 25 30 35 40 45 50
Max
imum
Del
ay (s
)
Number of Nodes
Without ack - 0 Ret 1 Ret 3 Ret 6 Ret
(a) (b)
Fig. 9. Tree network curves: (a) mean delay (up to 50 nodes); (b) maximum delay (up to 50 nodes)
Energy Consumption. The average value of the energy spent by one node to deliver a message to the coordinator can be obtained as the ratio of the total energy spent by the node to deliver all messages, including packets retransmissions where applicable, to the number of messages sent by the node. For the energy consumption estimation,

Evaluation of the Impact of the Topology and Hidden Nodes 265
we have considered the voltage and current consumption values specified for JN5139 ZigBee modules [15], as we have based our sensors nodes on these devices. A voltage supply of 3 V was considered. When the microcontroller (CPU) of the module is on, the module consumption is 9.21 mA, as shown in Fig. 10. During sampling, the ADC is switched on, and the current increases to 9.79 mA. When the module switches the transceiver on during the backoff process, the current increases to 32 mA and, when the module starts transmitting, the current increases to 37 mA.
Fig. 10. JN5139 ZigBee module current consumption in distinct modes
Fig. 11 presents the curves of energy consumption per message, considering only the transceiver consumption. The total energy consumption of a node during one second interval is calculated as follows. For instance, for a star network consisting of 15 nodes that are allowed to make up to three retransmissions, the average energy spent by a node to transmit a message is equal to 0.607 mJ. Since during any one second interval the node transmits 4 messages, the consumption relative to the trans-ceiver is 2.43 mJ. Additionally, the ADC is used to make 200 measurements, with each measurement taking 1 ms, which results in a consumption of 0.348 mJ [3 * 200 * (9.79 – 9.21) * 0.001]. The consumption of the microcontroller is 27.63 mJ (3 * 9.21 * 1), so the total energy consumption is equal to 30.41 mJ. If the module is pow-ered by a +3V, 1200 mAh battery (12960 J), a lifetime of 118 hours of continuous operation can be achieved.
0.0
0.5
1.0
1.5
2.0
2.5
3.0
3.5
4.0
4.5
0 5 10 15 20 25 30 35 40 45 50
Ener
gy p
er M
essa
ge -
Star
(m
J)
Number of Nodes
Without ack - 0 Ret 1 Ret 3 Ret 6 Ret
0.0
1.0
2.0
3.0
4.0
5.0
6.0
0 5 10 15 20 25 30 35 40 45 50
Ener
gy p
er M
essa
ge -
Tree
(mJ)
Number of Nodes
Without ack - 0 ret 1 ret 3 ret 6 Ret
(a) (b)
Fig. 11. Transceiver consumption per message curves: (a) star network; and (b) tree network
As can be observed from this analysis, the module consumption is dominated by the microcontroller consumption, which is constantly on as a consequence of the frequent ADC measurements required by the ECG signal. So, although the nodes from the star network spend less energy to transmit each message than the nodes from the tree network, the resulting lifetime of both sensors will not be much different.

266 H. Fernández-López et al.
Star and tree topologies comparison analysis. Table 2 summarizes the simulation results presented in this section. Three important QoS markers are considered: a throughput deviation from ideal smaller than 1%, a delivery rate greater than 99% and a maximum message delay smaller than 250 ms. The maximum number of nodes each network can have and still comply with the established requirements are shown in the unshaded cells. The % columns refer to the reduction in the number of ECG nodes supported by the tree network with relation to the star network. For instance, if up to 3 retransmissions are allowed, a star network with up to 35 ECG nodes presents a throughput deviation smaller than 1% from the ideal throughput. In the same operation mode, a tree network must contain no more than 18 ECG nodes to achieve a similar performance, which means a reduction of 47% in the number of ECG nodes.
Table 2. Star and tree topologies comparison summary
Throughput dev. < 1% DR > 99% Max. delay < 250 ms Operation mode Star Tree % Star Tree % Star Tree
Without ACK – 0 Ret 16 7 56 4 4 0 > 50 42 1 Ret 25 11 56 7 7 0 > 50 19 3 Ret 34 18 47 32 12 62 > 50 18 6 Ret 37 18 51 35 18 49 > 50 17
It is possible to observe that an increase in the maximum number of allowed re-
transmissions contributes favorably to the performance of the networks, though an increase in the maximum delay is experienced and a small decrease in the lifetime of each ECG node is also expected. If up to three retransmissions are allowed, a star network must not exceed 32 ECG nodes to comply with the QoS requirements estab-lished, while in the case of a tree network, the maximum number of ECG nodes can-not exceed 12.
4.2 Hidden-Node Analysis
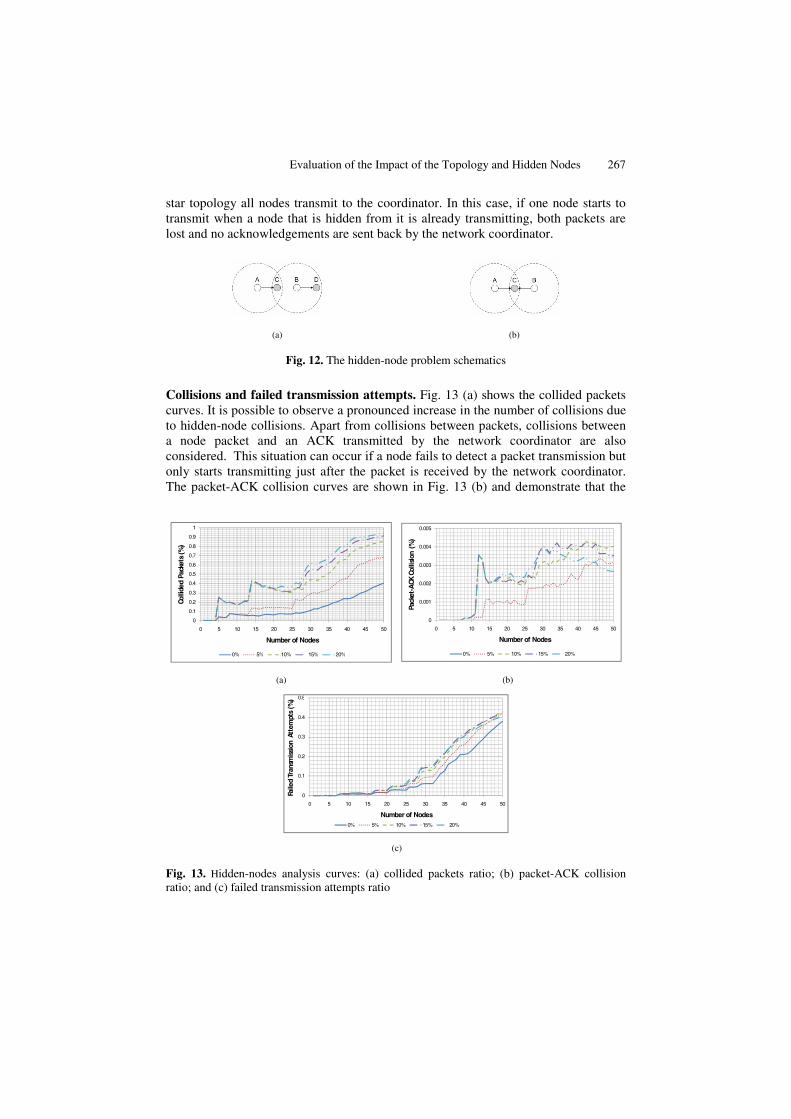
The performance of WSNs can be seriously degraded by collisions caused by hidden nodes. In a CSMA-based network, a node can only transmit if it senses the channel idle. The hidden-node problem occurs when the carrier sensing fails, so a node starts transmitting when other node has already occupied the channel. If both transmissions are within the reach of a receiver, a collision occurs. A generic hidden-node situation is illustrated in Fig. 12 (a), where the transmission range of nodes A and B are repre-sented by circles drawn around the nodes. If B starts to transmit to D while A is transmitting to C, A’s and B’s packets collide at C. In this case, the transmission from A, which is hidden from B, is corrupted by the B’s transmission. A more severe prob-lem happens if C and D happen to be the same node, that is, if A and B transmit to a common receiver, C, as seen in Fig. 12 (b). In this case, if B starts to transmit while A is transmitting (or vice-versa), both packets are corrupted.
The hidden-node simulation runs were executed considering an increasing number of ECG sensors that send data directly to the coordinator, in a star topology. Five scenarios were simulated, considering that up to three retransmissions are allowed. Each scenario considered a different percentage of hidden nodes in the network, vary-ing from 0% to 20%. The situation depicted in Fig. 12 (b) was simulated, since in the
Evaluation of the Impact of the Topology and Hidden Nodes 267
star topology all nodes transmit to the coordinator. In this case, if one node starts to transmit when a node that is hidden from it is already transmitting, both packets are lost and no acknowledgements are sent back by the network coordinator.
(a) (b)
Fig. 12. The hidden-node problem schematics
Collisions and failed transmission attempts. Fig. 13 (a) shows the collided packets curves. It is possible to observe a pronounced increase in the number of collisions due to hidden-node collisions. Apart from collisions between packets, collisions between a node packet and an ACK transmitted by the network coordinator are also considered. This situation can occur if a node fails to detect a packet transmission but only starts transmitting just after the packet is received by the network coordinator. The packet-ACK collision curves are shown in Fig. 13 (b) and demonstrate that the
0
0.1
0.2
0.3
0.4
0.5
0.6
0.7
0.8
0.9
1
0 5 10 15 20 25 30 35 40 45 50
Colli
ded
Pack
ets
(%)
Number of Nodes
0% 5% 10% 15% 20%
0
0.001
0.002
0.003
0.004
0.005
0 5 10 15 20 25 30 35 40 45 50
Pack
et-A
CK C
ollis
ion
(%)
Number of Nodes
0% 5% 10% 15% 20%
(a) (b)
0
0.1
0.2
0.3
0.4
0.5
0 5 10 15 20 25 30 35 40 45 50
Faile
d Tr
ansm
issi
on A
ttem
pts
(%)
Number of Nodes0% 5% 10% 15% 20%
(c)
Fig. 13. Hidden-nodes analysis curves: (a) collided packets ratio; (b) packet-ACK collision ratio; and (c) failed transmission attempts ratio

268 H. Fernández-López et al.
occurrence of this type of collision is infrequent when compared to the collisions between packets. The failed transmission attempts ratio as a function of the number of nodes is presented in Fig. 13 (c). When the number of nodes increases, more collisions and, consequently, more retransmissions occur and the channel gets busier, increasing the failure ratio. Similarly, since collisions gets more frequent as the percentage of hidden nodes increases, the failure ratio also increases as the percentage of hidden nodes increases.
Throughput. Fig. 14 shows the normalized throughput curves as a function of the number of ECG nodes, considering a percentage of hidden nodes ranging from 0 to 20%. Additionally, the straight continuous line represents the ideal throughput. In the absence of hidden nodes, a deviation smaller than 1% from the ideal throughput can be achieved if the number of ECG nodes does not exceed 34 but, if the percentage of hid-den nodes achieves 5%, the number of nodes must be reduced to 25 for the same devia-tion. If this percentage is increased to 20%, the number of nodes must not exceed 13.
0
0.1
0.2
0.3
0.4
0.5
0.6
0.7
0.8
0 5 10 15 20 25 30 35 40 45 50
Nor
mal
ized
thr
ough
put
(%)
Number of Nodes
0% 5% 10% 15% 20% Ideal
Fig. 14. Normalized throughput in presence of hidden nodes
Delivery Ratio. The DR variation as a function of the number of nodes and the percent-age of hidden nodes is shown in Fig. 15. Due to the random selection of hidden-node combinations, the curves exhibit some fluctuations. Nevertheless, they correctly evi-dence the highly negative effect of hidden nodes in the network performance. In fact, if no hidden nodes are present, very high DR values are achieved with a relatively high
0.4
0.5
0.6
0.7
0.8
0.9
1
0 5 10 15 20 25 30 35 40 45 50
Delivery Ratio
Number of Nodes
0% 5% 10% 15% 20%
Fig. 15. DR variation in presence of hidden nodes

Evaluation of the Impact of the Topology and Hidden Nodes 269
number of nodes, but if even a small amount of hidden nodes is present, the perform-ance of the network is seriously affected by the high amount of resulting packet colli-sions. For instance, more than 99% of the messages are delivered if the number of ECG nodes is equal to 32 but, if the percentage of hidden nodes is increased to 5% or 10%, the number of ECG nodes must be reduced to 13 or 4, respectively.
Delay. The maximum and mean message delay curves are shown in Fig. 16. It can be observed that the maximum delay is smaller than 150 ms for all cases. Additionally, it can be noticed that the mean delay is quite small, not exceeding 34 ms.
0
20
40
60
80
100
120
140
0 5 10 15 20 25 30 35 40 45 50
Max
imum
Del
ay (m
s)
Number of Nodes
0% 5% 10% 15% 20%
0
5
10
15
20
25
30
35
0 5 10 15 20 25 30 35 40 45 50
Mea
n D
elay
(m
s)
Number of Nodes
0% 5% 10% 15% 20% (a) (b)
Fig. 16. Maximum (a) and mean (b) delay curves in presence of hidden nodes
Energy Consumption. The energy consumption curves shown in Fig. 17 were de-termined following the same procedure explained in Section 4.1, that is, they just consider the consumption from the transceiver. It is possible to notice that if the per-centage of hidden nodes increases, the energy consumption also increases. Despite of this, the reduction in nodes’ lifetime is not high, since most of the energy consump-tion is due to the microcontroller. If we consider a network with 25 nodes, with no hidden nodes, the average energy spent by each node to transmit a message is equal to 0.718 mJ. In this case, the energy spent during one second is equal to 30.85 mJ, re-sulting in a lifetime equal to approximately 117 hours. On the other hand, if the per-centage of hidden nodes is 20%, each node spends an average of 1.22 mJ to transmit each message, resulting in an average consumption of 32.06 mJ during one second and a lifetime of approximately 112 hours, a small reduction of 4%.
0.0
0.5
1.0
1.5
2.0
2.5
3.0
3.5
4.0
4.5
0 5 10 15 20 25 30 35 40 45 50
Ener
gy p
er M
essa
ge (
mJ)
Number of Nodes
0% 5% 10% 15% 20%
Fig. 17. Energy per message in the presence of hidden nodes

270 H. Fernández-López et al.
Hidden-node comparison analysis. Table 3 summarizes the simulation results presented in this section. The second column contains the maximum number of nodes a star network can have and still achieve a throughput that deviates less than 1% from the ideal. The third column presents the same information, but considering a delivery ratio greater than 99%. The maximum delay and the lifetime are not considered because the first is smaller than 250 ms in all cases and the second does not suffer a considerable variation. As can be observed, the effect of hidden nodes in the network throughput is significant, but the effect on the DR is quite severe. In fact, without hidden nodes a star network comprised of up to 32 ECG nodes is capable of achieving a minimum DR of 99%. To achieve this performance in the presence of 10% of hidden nodes, the maximum number of ECG nodes must be reduced to only 4.
Table 3. Hidden-node analysis summary
Percentage of hidden nodes (%) Throughput dev. < 1% DR > 99% 0 34 32 5 25 13
10 13 4 15 13 4 20 13 4
5 Conclusions and Future Work
In this work, the performance of an IEEE 802.15.4/ZigBee based WSN designed for continuous vital signs monitoring is evaluated in terms of scalability and topology. Additionally, different retransmission modes are considered. Assuming that the wire-less channel is not affected by fading or external interferences, simulation results indicate that a star network, operating in the unslotted mode, can contain up to 34 ECG nodes and still comply with the performance criteria specified. Otherwise, if a tree topology, where are all sensor nodes are directly associated to a single router, is considered, the duplication of the network traffic load relatively to the star network causes a significant increase in the packet collisions and failed transmission attempts, resulting in a considerable deterioration of the DR. Moreover, the queuing delay suf-fered by messages in the router causes a significant increase in the maximum and mean delays. As a result, if the same performance relatively to the star network is to be achieved, it is necessary to reduce the number of sensor nodes, relatively to the star network, by half or even less.
The network achieves better throughput and DR if nodes are allowed to make sev-eral attempts to access the channel, which can be implemented at the application level. However, it was shown that the network collapses rapidly when the number of nodes grows, tightly constraining the maximum number of nodes. Additionally, an increase of the maximum delay is observed, which, in the case study presented, did not represent a constraint.
The impact of a variable percentage of hidden nodes is considered in the second part of this work. Simulation results indicate that in high traffic load scenarios the number of collisions due to hidden nodes increases substantially, seriously degrading
Evaluation of the Impact of the Topology and Hidden Nodes 271
the network performance, namely the throughput and the DR. This scenario is valid even for a small percentage of hidden nodes, as we have considered it ranging from 5% to 20%. For instance, in the absence of hidden nodes, a star network consisting of 32 ECG nodes presents a DR greater than 99%; however, if the percentage of hidden nodes is increased to 5%, it drops to 94%. Moreover, if the percentage of hidden nodes increases to 20%, it is necessary to further reduce the number of ECG nodes to only 4 to sustain the desired DR.
Our future work includes the study of techniques that could help alleviate the hidden-node problem in non-beacon enabled networks where nodes can be highly mobile.
Acknowledgments. This work has been supported by the Portuguese Foundation for Science and Technology and the POCTI and FEDER programs.
References
1. Ilyas, M., Mahgoub, I. (eds.): Handbook of Sensor Networks: Compact Wireless and Wired Sensing Systems. CRC Press, New York (2004)
2. Fernández-López, H., Afonso, J.A., Correia, J.H., Simões, R.: Extended Health Visibility in the Hospital Environment. In: BioDevices 2009, pp. 422–425 (2009)
3. Gao, T., Pesto, C., Selavo, L., Chen, Y., Ko, G., Lim, H., Terzis, A., Watt, A., Jeng, J., Chen, B., Lorincz, K., Welsh, M.: Wireless Medical Sensor Networks in Emergency Response: Im-plementation and Pilot Results. In: IEEE Conf. on Tech. for Homeland Security (2008)
4. Patel, S., Lorincz, K., Hughes, R., Huggins, N., Growdon, J.H., Welsh, M., Bonato, P.: Analysis of Feature Space for Monitoring Persons with Parkinson’s Disease With Applica-tion to a Wireless Wearable Sensor System. In: 29th Annual International Conference of the Engineering in Medicine and Biology Society (2007)
5. Lorincz, K., Malan, D.J., Fulford-Jones, T.R.F., Nawoj, A., Clavel, A., Shnayder, V., Mainland, G., Welsh, M., Moulton, S.: Sensor networks for emergency response: chal-lenges and opportunities. IEEE Pervasive Computing 3(4), 16–23 (2004)
6. Latre, B., Mil, P.D., Moerman, I., Dhoedt, B., Demeester, P., Dierdonck, N.V.: Through-put and Delay Analysis of Unslotted IEEE 802.15.4. J. Networks 1(1), 20–28 (2006)
7. Liang, X., Balasingham, I.: Performance Analysis of the IEEE 802.15.4 based ECG Moni-toring Network. In: 7th IASTED, pp. 100–104 (2007)
8. Golmie, N., Cypher, D., Rebala, O.: Performance Analysis of Low Rate Wireless Tech-nologies for Medical Applications. Computer Comm. (28), 1266–1275 (2005)
9. Severino, R.: On the use of the IEEE 802.15.4/ZigBee for Time-Sensitive Wireless Sensor Network Applications. Polytechnic Institute of Porto, MSc Thesis (2008)
10. Lain-Jinn, H., Lain-Jinn, H., Shiann-Tsong, S., Yun-Yen, S., Yen-Chieh, C.: Grouping strategy for solving hidden node problem in IEEE 802.15.4 LR-WPAN. In: First Interna-tional Conference on Wireless Internet, pp. 26–32 (2005)
11. Ruzzelli, A.G., Tynan, R., O’Hare, G.M.P.: An energy-efficient and low-latency routing protocol for wireless sensor networks. Systems Communications, 449–454 (2005)
12. IEEE Std 802.15.4-2003—Part 15.4: Wireless LAN Medium Access Control (MAC) and Physical Layer (PHY) Specifications for Low-Rate Wireless Personal Area Networks (2003)
13. ZigBee Alliance, ZigBee Specification 053474r17, v. 1.0 r17 (2007) 14. OMNet++ Discrete Event Simulation System, http://www.omnet.org 15. Jennic Wireless Microcontrollers, http://www.jennic.com/
Copyright © 2022 FDOKUMEN